foliar fungicide application in northeast texas: yield response
TRANSCRIPT

Foliar Fungicide Application in Northeast Texas: Yield Response and Profitability
Jose A. Lopez Assistant Professor, Agricultural Sciences, Texas A&M University-Commerce
Kandy Rojas M.S. student, Agricultural Sciences, Texas A&M University-Commerce
Teresa Duch-Carvallo Extension Associate, Agricultural Sciences, Texas A&M University-Commerce
Jim Heitholt Professor and Department Head, Agricultural Sciences, Texas A&M University-Commerce
James Swart Extension Specialist, Hunt County Texas AgriLife Extension Office
[email protected] Selected Paper prepared for presentation at the Southern Agricultural Economics Association
Annual Meeting, Dallas, TX, February 1-4, 2014
Copyright 2013 by Jose Lopez et al. All rights reserved. Readers may make verbatim copies of this document for non-commercial purposes by any means, provided that this copyright notice appears on all such copies.

2
Abstract
Fungal diseases are the number one reason for crops losses around the world and have a
significant impact on yield and quality. Previous studies suggest that up to 42% yield loss
caused by fungal diseases can be prevented by applying foliar fungicides to winter wheat.
Contemporaneous research on wheat cultivars and foliar fungicides is essential to find solutions
to the instability of farm incomes from the various economic, environmental, and biological
factors. Local wheat production data on fungicide application, yield, and disease severity for
four soft-red winter wheat cultivars (Magnolia, Terral LA 841, Pioneer 25R47, Coker 9553) for
two years (2011 and 2012) and three locations in Northeast Texas (Royce City, Howe, and
Leonard) was used to study the economics of one foliar fungicide (tebuconazole). The fungicide
was applied as a preventive measure, and the study found positive (two-year average) net returns.
The profitability analysis indicated that 66% of the observations resulted in positive net returns
from fungicide applications during the two years. A sensitivity analysis showed that most of the
cultivars considered have the potential to produce a yield gain that would break even the cost of
fungicide application.
Key words: winter wheat, foliar fungal diseases, fungicides, net returns, profitability

3
Introduction
Many economic, environmental, and biological factors influence whether many U.S. farmers will
have positive or negative net returns. Among the biological factors, fungal diseases are the
number one reason for crops losses around the world and have a significant impact on yield and
quality in wheat production. Up to 42% yield loss caused by fungal diseases can be prevented by
applying foliar fungicides to winter wheat (Wegulo et. al, 2009). Fungal diseases have a
significant economic impact on most crops’ yield and quality, and for that reason, managing
fungal diseases is an essential component of the production system.
Universities, farm associations, farm organizations, and many government agencies are
constantly conducting research on wheat cultivars and foliar fungicides to find solutions to the
instability of farm incomes. This study was conducted to earn a better understanding of the
impact of foliar fungicides on wheat yields and net returns in Northeast Texas, and to assist
wheat growers in Northeast Texas with economic tools that may allow them to assess the
economic benefits from foliar fungicide applications. The objective is to evaluate yield and net
return from using the foliar fungicide Tebuconazole in wheat production.
Wheat is the third largest crop planted in the U.S., behind corn and soybean. It generates
about 198,000 jobs and accounts for $20.6 billion to the U.S. economy (Richardson, Outlaw and
Raulston, 2006). In 2007, Texas ranked as the 4th largest wheat producing state with about 3.84
million acres in production (2007 Census of Agriculture, 2007, pp. 475-483). Wheat is the third
most planted crop behind forages and cotton in Texas. In 2005, the wheat industry generated
11,273 jobs and contributed with $658.8 million to the Texas economy (Richardson, Outlaw and
Raulston, 2006).
4
The U.S. is the world’s largest wheat producing and exporting country. World wheat
trade is expected to increase with the continuous population growth in Egypt, Algeria, Iraq,
Brazil, Mexico, Indonesia, Nigeria, and other developing countries (USDA-ERS, 2012). Wheat
is very likely to remain an important agricultural export for years to come.
According to Wegulo et al. (2012), the most prevailing foliar diseases in winter wheat in
the Great Plains of the United States are leaf rust (Puccinia triticina), powdery mildew (Blumeria
graminis f. sp. graminis), tan spot (Pyrenophora tritici-repentis; anamorph: Drechslera tritici-
repentis), Septoria tritici blotch (Mycosphaerella graminicola; anamorph: Septoria tritici), spot
blotch (Cochliobolus sativus; anamorph: Bipolaris sorokiniana), and Stagonospora nodorum
blotch (Phaeosphaeria nodorum; anamorph: Stagonospora nodorum). Stripe rust (Puccinia
striiformis f. sp. tritici) and stem rust (Puccinia graminis f. sp. tritici) are sometimes considered
less common (Wegulo et al., 2012), and sometimes considered the most frequent in the wheat
producing regions of the U.S. (Kolmer, 2007).
A fungicide is a specific type of pesticide which is used to control fungal diseases
(McGrath, 2004). In the U.S., the foliar fungicides used in wheat are usually grouped in two
categories: strobilurins and triazoles. Wegulo et al. (2012) explain that strobilurins are quinone
outside inhibitors (QoI) that interfere with energy production in fungi (Vincelli, 2002).
Strobilurins act as local systemics by inhibiting fungal spore germination and early infection, and
are highly effective when applied preventively. The strobilurins have a single-site mode of
action. Azoxystrobin, pyraclostrobin and trifloxystrobin are examples of strobilurin fungicides
used in the U.S. Wegulo et al. (2012) explain that, triazoles, on the other hand, are characterized
by having a five-membered ring of two carbon atoms and three nitrogen atoms. They are
curative and move systemically through the plant xylem. Triazoles slow fungal growth through

5
the inhibition of sterol biosynthesis (Horst, 1987, pp. 205-231). Sterols are essential building
blocks of fungal cell membranes and are inhibited at a single site by triazoles. Triazoles are
highly effective and reliable because of their curative activity against early fungal infections and
their ability to redistribute in the crop (Hewitt, 1998). Metconazole, propiconazole,
prothioconazole, and tebuconazole are examples of triazoles used in cereal crop production in the
U.S.
There are three main reasons to use fungicides: control the disease during the
establishment and development of the wheat crop, increase productivity and reduce leaf and seed
damage, and to improve the storage life and quality of harvested products (McGrath, 2004).
Fungicides are commonly applied as dust, granules, gas, and most commonly as a liquid.
Fungicides are applied to seeds, bulbs, roots, soils, foliage, and plant trunks. They are also
sprayed in the air in enclosed areas such as greenhouses and covered soil, and applied as a dip or
spray to harvested products in the packinghouse (McGrath, 2004).
Fungicide prices influence the decision of spraying or not spraying. To be effective, most
fungicides need to be applied before the disease occurs or at the appearance of the first
symptoms. When the fungicide is applied before flag leaf emergences, it generally results in less
disease control on the upper leaves during grain development and smaller yield benefits (De wolf
et al., 2012). In general, fungicides primarily protect plants from getting infected and just few
fungicides are effective in plants that have already been infected (McGrath, 2004). The benefits
from fungicide applications in crop production are reflected in returns of up to three times the
cost involved (McGrath, 2004). However, Hershman (2012) and McGrath (2004) explained that
when the disease severity is low and there is minimal yield loss, applying a fungicide will not
6
result in either a yield or an economic advantage. Consequently, at the appearance of the first
symptoms, it is critical to assess the potential yield loss.
Various studies in the U.S have demonstrated yield increases in winter wheat from
fungicide applications. Wegulo et al. (2009) showed that up to 42% yield loss was prevented by
applying foliar fungicides to winter wheat. Chen (2012) explained that yield losses of up to 60%
due to stripe rust have been documented in experimental fields. O’Brien (2007) showed that
potential average wheat yield losses of 30 % are common in Kansas when leaf rust is not
controlled at flowering. Wiik and Rosenqvist (2010) showed that the use of a fungicide in winter
wheat in Southern Sweden was more profitable (net return of $27 per ha on average).
Data
Wheat production data on fungicide treatment, location, yield, and disease severity for four soft-
red winter wheat cultivars (Magnolia, Terral LA 841, Pioneer 25R47, Coker 9553) was obtained
from the Texas A&M AgriLife Extension Representative in Commerce, TX.
Their field trials were conducted in 2011 and 2012 at three locations in Northeast Texas:
a location in Royce City (32°58′27″N, 96°19′58″W), a location in Howe town (33°30′18″N,
96°36′51″W), and a location in Leonard city (33°22′59″N, 96°14′43″W). The corresponding
elevations at each of these locations are 167 m, 256 m, and 219 m. The soil types in all three
locations are either Houston Black Clay (calcareous clays and marls) or Leson Clay (alkaline
shale and clays). Both soil types are very deep, moderately well drained, and very slowly
permeable soils. Those are typical soils characteristics where wheat is grown in Northeast
Texas.
The fungicide treatments consisted of a tebuconazole application of 280 g/ha. The
application was done when the plants were approximately at Feekes Growth stage 10. The plots
7
were sprayed with a CO2 powered backpack sprayer equipped with a three-nozzle boom with
8002VS stainless steel tips 48 cm apart. The fungicide was diluted in 93 liters of water per
hectare with 8002VS tapered, flat-fan nozzles at 30 pounds per square inch (p.s.i.) and was
applied over the top and directly to the foliage. Each trial was replicated six times in a
randomized complete block design. Each plot was 1.22 meters wide and 6.06 meters long and a
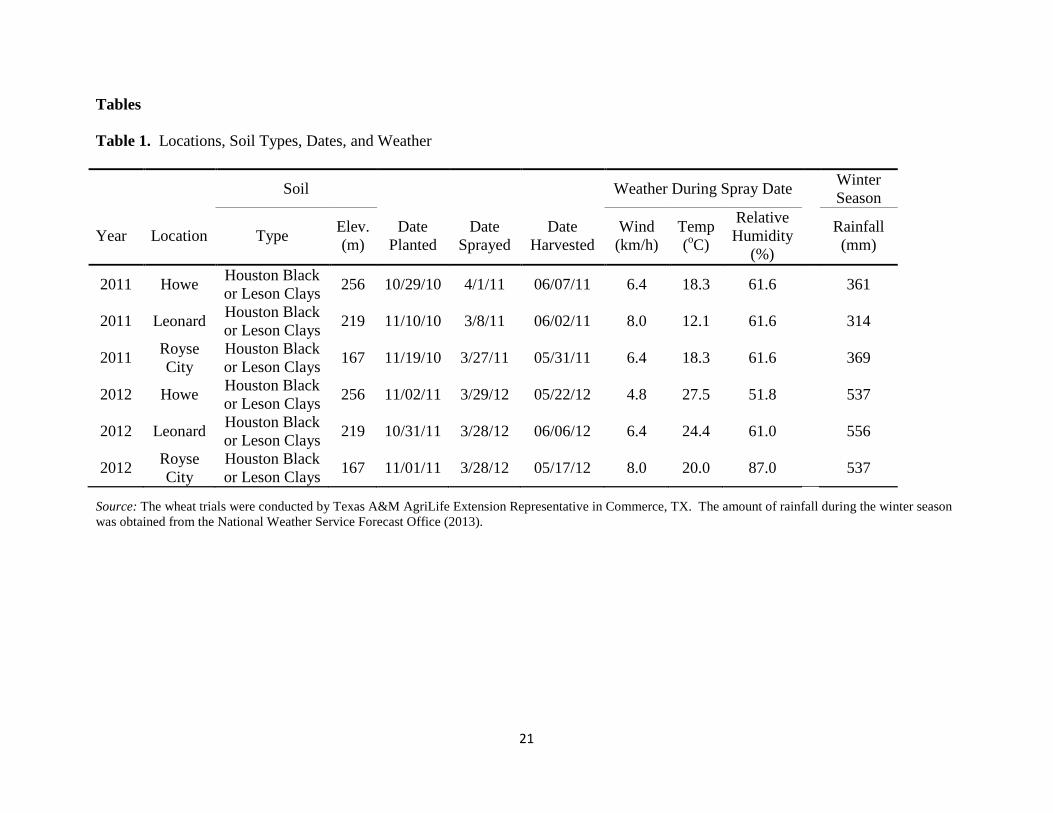
row spacing of 5.24 centimeters. Table 1 summarizes the three locations where the trials were
conducted, their soil types, the weather conditions, and the planting, spraying, and harvesting
dates.
The most common months of fungal disease infection in Northeast Texas are February, March
and April. According to the National Weather Service Forecast Office (2013), the average
rainfall during those three months in Royse City, Howe, and Leonard were 86 millimeters, 89
millimeters, and 95 millimeters respectively. During the same three months, the corresponding
minimum and maximum temperatures in Royse City, Howe, and Leonard were 8 oC and 20 oC, 7
oC and 18 oC, and 11 oC and 16 oC respectively.
Each experimental unit was evaluated one month after the tebuconazole application
treatment by the Texas A&M AgriLife Extension Representative in Commerce, TX. Ten plants
per plot (subsamples) were randomly selected. Flag leaves on each plant were visually assessed
for the presence of Septoria, barley yellow dwarf, leaf rust, and strip rust.
The harvest was done with a research Kincaid combine (Kincaid Manufacturing, Haven,
Kansas). Grain yield in bushels per acre was recorded at the end of the experiment. After
weighing the grain and correcting to 13% moisture, yield was calculated and reported in
bushels/acre. Samples were analyzed at the Agronomy Lab of Texas A&M University-
Commerce in Commerce, TX.
8
Wheat prices per bushel were obtained Texas A&M AgriLife Extension-Extension
Agricultural Economics (2011, 2012). The average wheat price regardless of variety and
location over the two yeas analyzed was $0.25/kg. The tebuconazole cost ($12.36/ha) and its
application cost ($4.94) were obtained from fungicide companies in Northeast Texas, and they
did not change over the two years analyzed.
Methods and Procedures
Effects of tebuconazole applications on disease severity, net returns, and wheat yields
response were evaluated by analyses of variance using the GLM procedure in SAS version 9.3.
Several linear models were developed to test treatment interactions with location, cultivar, year
and block. The general form of the linear model is
(1) Yijkɭmn = µ +αi +βj +γk+ δɭ+λm+αγik+εijkɭmn,
where µ is the overall yield mean from the treated group, αi is the effect due to the ith treatment,
βj represents the effect from the jth block, γk is the effect from the kth cultivar, δɭ is the effect from
the lth location, λm is the effect from the mth year, αγik represents the interaction effect of the ith
level of treatment depending on the kth level of cultivar, and εij is the error term. The errors are
assumed to be independently normally distributed with a zero mean and constant variance.
Tukey means separation tests at 5% significance levels were used to perform means
comparisons between sprayed and non-sprayed treatments for yield gain and net returns from
tebuconazole application, among cultivars, location, and years. Subsequently, the differences in
yield between the sprayed and non-sprayed treatments were used to analyze wheat yield response
and net returns from tebuconazole treatments. Finally, similar to Bestor (2011), Munkvold et al.
(2001), De Bruin et al. (2010), and Esker and Conley (2012), a profitability analysis was
conducted based on Bayesian inference.

9
Net returns ($/kg), Rn = P * (Yt – Yc) – (Cf + Ca), were calculated using treatment means.
Following Bestor (2011) and Munkvold et al. (2001), the probability of tebuconazole treatments
resulting in a yield difference larger than the estimated yield difference needed to offset the cost
of tebuconazole was calculated from the observed yield difference between the treated and
untreated plots and their observed standard deviation which was calculated from a pooled
variance. That is, the probability that net returns from a tebuconazole treatment will at least
break even, PT [Rn > (1+0)*(Cf + Ca)]; be at least 25% greater than the investment on
tebuconazole, PT [Rn > (1+0.25)*(Cf + Ca)]; and be at least 50% greater than the investment on
tebuconazole PT [Rn > (1+0.50)*(Cf + Ca)] are estimated as
(2) PT= 1 – Prob ( )
( )
−−e
cf dfSp
YYt ,
1/n + 1/n 2/1ct
20β ,
where Cf is the fungicide cost ($/ha), Ca is the cost of fungicide applications ($/ha); β0 is the yield
difference needed to offset the cost of tebuconazole application (kg/ha), Yf is the observed yield
from tebuconazole treatment (kg/ha), Yc is the observed yield from the untreated plots (kg/ha),
𝑆𝑝2 = (𝑛𝑡−1)𝑆12+(𝑛𝑐−1)𝑆22
(𝑛𝑡−1)+(𝑛𝑐−1) is a pool variance (Box and Tiago, 1973), 𝑆12 is the variance of the
observed yield from the treated plot, 𝑆22 is the variance of the observed yield from the untreated
plot, nt is the number of observations in the treated plot, and nc is the number of observations in
the control plot.
The yield difference needed to offset the cost of tebuconazole application is computed as
(3) ( ) ( )
PCCER afn ++
=1
0β ,

10
where P is the wheat price ($/kg); Cf is the fungicide cost ($/ha); and Ca is the cost of fungicide
applications ($/ha); and ERn = 0, 0.25, or 0.50, when breaking even, achieving net returns 25%
greater, or achieving net returns 50% greater than the investment in tebuconazole respectively.
Finally, a sensitivity analysis at various wheat prices and fungicide cost was used to
evaluate net return and the yield response needed to break even from spraying tebuconazole.
The sensitivity analysis assists wheat farmers in Northeast Texas with educated expectations
about their net returns and yield gains needed to break even given wheat prices and fungicide
costs. It provides insight in deciding whether to spray or not spray given the farmers’
expectations about wheat prices and fungicide costs.
Results and Discussion
Overall (treated + untreated) average yields (kg/ha) in 2011 and 2012 were found to be
statistically different at the 5% significance level (Table 2). This statistical difference in yield
may be attributed to the presence of a disease in the Howe location in 2011 as discussed below,
but it could also be partially attributed to the 56.13% increase in precipitation from 2011 to 2012
and other differences in uncontrollable factors between 2011 and 2012 (Table 1). Although the
difference in yield may not be attributed to the fungicide application, it is worth noting that
fungicide application was found to have a statistical significant effect (P<0.05) on the overall
yield (Table 3).
The fungal diseases Septoria, leaf rust, and stripe rust were not found in both the treated
and untreated plots during the two years analyzed. However, barley yellow dwarf infected both
the treated and untreated plots only at the Howe location in 2011. Table 4 reports the infection
levels in both the treated and untreated plots at the Howe location while table 5 shows that Coker

11
9553 had the lowest infection level and the highest overall yield in the presence of barley yellow
dwarf.
Table 6 shows that, in 2011, there was no significant difference on overall yield between
the treated and untreated plots. Several studies have found statistical differences in yield
between fungicide treated and untreated plots (Reid and Swart 2004; Wiik and Rosenqvist 2010).
Our unexpected findings in 2011 may be attributed to the infection of barley yellow dwarf in the
Howe location in 2011. Wiik and Rosenqvist (2010) explain that uncontrollable factors such as
the emergence of new diseasses can affect yield gain.
Unlike 2011, in 2012, there was statistical difference on overall yield between the treated
and untreated plots (Table 7). Our findings in 2012, although conservative, are consistent with
previous studies. The difference in wheat yield in 2012 represented an 8.6% increase of the
treated group over the untreated group. Reid and Swart (2004) reported yield increases of 34%
to 41% of treated plots over untreated plots.
Several results, although expected, were also important to confirm. For example, similar
to Orum, Pinnschmidt, and Jorgensen (2006), there were statistical differences in yields (Table 8)
and net returns (Table 9) among locations during each year. Statistical differences in locations
are usually attributed to agronomic practices such as crop rotation, soil quality, and disease
severity (Orum, Pinnschmidt, and Jorgensen, 2006), but they may also be attributed to
differences in fungicides used and temperature conditions (Tadesse, Ayalew, and Badebo, 2010).
There were two different but similar soil types in study. Statistical differences among locations
in this study may be attributed to small differences in soil types, amount of rainfall, and
elevations over the sea level; and/or several other uncontrollable factors such as temperature and
wind (Table 1).

12
There were also statistical differences in yield (Table 10) and net returns (Table 11)
among cultivars during each year. Interestingly, Coker 9553 was not only statistically different
from other cultivars each year; but unexpectedly, it also consistently resulted in the highest
average yield each year. Although Coker 9553 provided the highest average yield in each of the
two years (Table 10), it did not necessarily provide the highest average net return (Table 11).
This means that high net yields do not necessarily mean high net returns from fungicide
applications.
Net returns from investing in tebuconazole in 2011 were estimated at -3.53 $/ha (Table
12). This was expected since there was no statistical difference in yield between the treated and
untreated plots. For the opposite reason, in 2012, net returns from investing in tebuconazole
were $107.7/ha (Table 12). More importantly, our conservative 8.6% yield increase of the
treated over the untreated plot results in a positive return from investing in tebuconazole. In fact,
the positive net return in 2012 offset the relatively small negative net return in 2011, and it
results in an overall positive net return.
Sensitivity analyses on net returns and yield were conducted to investigate the impact of
various wheat prices and fungicide costs (fungicide + application costs) on net returns and break-
even yield responses from tebuconazole. Table 13 reports the net return change ($/ha) from
tebuconazole applications under various wheat prices and fungicide cost. Table 14 reports the
yield gain (kg/ha) that is needed to break even at various wheat prices and fungicide cost.
Conclusion
Wheat is the third largest crop planted in the U.S. with Texas being the fourth largest wheat
producing state. For wheat to remain competitive locally, nationally, and internationally; wheat
growers must obtain appropriate yields and net returns, and reduce its dependency on

13
government programs. A feasible solution to this challenge may simply be a crop loss reduction.
Fungal diseases are the number one reason for crops losses around the world and have a
significant impact on yield and quality in wheat production (McGrath, 2004).
Up to 42% yield loss caused by fungal diseases can be prevented by applying foliar
fungicides to winter wheat (Wegulo et. al, 2009). However, for foliar fungicides to be effective,
they need to be applied before the disease occurs or at the appearance of the first symptoms
(McGrath, 2004). Wegulo et al. (2011) and Wiik and Rosenqvist (2010) suggested that net
returns can be negative when disease severity rates are low and yet fungicides are applied. This
study found positive (two-year average) net returns when a foliar fungicide (tebuconazole) was
applied as a preventive measure. During the first year (2011) the net return was estimated to be
negative, -$3.53/ha, but wheat yield from the treated plots were not statistically different from
the untreated plots at the 5% significant level. The emergence of a disease in one of the
locations after the fungicide was applied may have affected yield in 2011. Unlike 2011, the net
return from spraying tebuconzole in 2012 was estimated to be $107.70/ha, and wheat yield from
the treated plots were statistically different from the untreated plots.
Several studies have found statistical differences in yield between fungicide treated and
untreated plots (Reid and Swart 2004; Wiik and Rosenqvist 2010). Our findings in 2012,
although conservative (an 8.6% increase of the treated group over the untreated group), are
consistent with previous studies. Reid and Swart (2004) reported yield increases of 34% to 41%
of treated plots over untreated plots. Our conservative 8.6% yield gain resulted in a positive
return from investing in tebuconazole. In fact, the positive net return of $107.7/ha in 2012 offset
the relatively small negative net return of -$3.53/ha in 2011, resulting in an overall positive net
return.

14
Similar to Orum, Pinnschmidt, and Jorgensen (2006), there were statistical differences in
yields and net returns among locations during each year. These differences may be attributed to
small differences in soil types and their elevation above the sea level, and/or differences in
several other uncontrollable factors such as rainfall, temperature, and wind. There were also
statistical differences in yield and net returns among cultivars. Interestingly, Coker 9553 was
statistically different from other cultivars and it also provided the highest average. However, it
did not necessarily provide the highest average net return, which suggests that high net yields do
not necessarily mean high probabilities of obtaining net returns from fungicide applications.
Our profitability analysis found that 66% of the observations resulted in positive net
returns from fungicide applications during the two years of study. In addition, our sensitivity
analysis of net returns and yield gains at various wheat prices and fungicide costs showed that
most of the cultivars have the potential to produce a yield gain that at least breaks even the
fungicide application decision.
Our study made several contributions to the current literature review on the economics of
fungicide applications in wheat production. First, the study contributes with additional findings
related to the economic effect of fungicide applications to prevent fungal diseases on wheat
production. Second, the study illustrates the applicability of a Bayesian inference approach in
evaluating net returns from fungicide applications. Finally, our study assists wheat farmers in
Northeast Texas, who regularly use fungicides to control foliar fungal diseases, with economic
tools to make educated decisions about their fungicide selection and expectations.
Our study is also an interdisciplinary (Agricultural Economics and Plant and Soil
Science) and inter-institutional (a higher education institution and an extension service office). It
is an example of how higher education and service institutions can join efforts to address the

15
needs of Northeast Texas wheat growers of using economic tools to assess potential economic
benefits from foliar fungicide applications. The study combines agronomical and economic
procedures to provide insight and/or assist farmers in their decision making process.
Acknowledgements
This study was sponsored by the Breaking Barriers for Beginning Farmers and Ranchers project
(NIFA-USDA #2010-49400-21729), which was funded by the Beginning Farmers and Ranchers
Development Program (BFRDP), National Institute of Food and Agriculture (NIFA), United
States Department of Agriculture (USDA).
References
2007 Census of Agriculture. Washington, DC: National Agricultural Statistics Service, United
States Department of Agriculture, 2007. Internet site:
http://www.agcensus.usda.gov/Publications/2007/Full_Report/usv1.pdf (Accessed on
December 17, 2013).
Bestor, N. “The Effect of Fungicides on Soybean in Iowa Applied Alone or in Combination with
Insecticides at Two Application Growth Stages on Disease Severity and Yield.” M.S.
Thesis, Iowa State University, Ames, Iowa, 2011. Internet site:
http://lib.dr.iastate.edu/cgi/viewcontent.cgi?article=3213&context=etd (Accessed on
December 17, 2013).
Box, G. E. P., and Tiao, G. C. Bayesian Inference in Statistical Analysis. MA: Addison-Wesley,
1973.
Chen, X. “Crop Year 2012 Stripe Rust Alerts.” Department of Crop and Soil Sciences,
Washington State University, 2012. Internet site:
16
http://striperustalert.wsu.edu/2012%20archive%20alerts.html (Accessed on September
10, 2012).
De Bruin, J.L., P. Pedersen, S.P. Conley, J.M. Gaska, S.L. Naeve, J.E. Kurle, R.W. Elmore, L.J.
Giesler, and L.J. Abendroth. “Probability of Yield Response to Inoculants in Fields with
a History of Soybean.” Crop Science Society of America 1 (January 2010):265–272.
Internet site: https://www.crops.org/publications/cs/abstracts/50/1/265 (Accessed on
December 17, 2013).
De Wolf, E., W. Bockus, D. Shoup, R. Eddy, S. Duncan, and J. Shroyer. “Evaluating the Need
for Wheat Foliar Fungicides.” Agricultural Experiment Station and Cooperative
Extension Service, Kansas State University, 2012. Internet site:
http://www.ksre.ksu.edu/library/plant2/mf3057.pdf (Accessed on September 19, 2012).
Esker, P.D. and S.P Conley. “Probability of Yield Response and Breaking Even For Soybean
Seed Treatments.” Crop Science Society of America 1(January 2012):351-359. Internet
site: https://www.crops.org/publications/cs/abstracts/52/1/351 (Accessed on December
17, 2013).
Hershman, D. “Fungicide Use in Wheat.” Cooperative Extension Service, University of
Kentucky, 2012. Internet site:
http://www.ca.uky.edu/agcollege/plantpathology/ext_files/PPFShtml/ppfsagsg5.pdf
(Accessed on August 22, 2012).
Hewitt, H.G. Fungicides in Crop Protection. Wallingford, UK: CAB International, 1998.
Horst, L.. Modern Selective Fungicides: Properties, Applications, Mechanisms of Action. New
York: Longman Sc & Tech, 1987.
17
Kolmer, J. “Wheat Leaf and Stem Rust in the United States.” Australian Journal of Agricultural
Research 58 (2007): 631–638. Internet site:
http://www.ars.usda.gov/SP2UserFiles/ad_hoc/36400500Publications/JAK/Leaf%20and
%20stem%20rust%20US.pdf (Accessed on September 15, 2012).
McGrath, M. “What are Fungicides?” The Plant Health Instructor, The American
Psychopathological Society, 2004. Internet site:
http://www.apsnet.org/edcenter/intropp/topics/Pages/Fungicides.aspx (Accessed on
October 1, 2012).
Munkvold, G.P., C.A. Martinson, J.A. Shriver, and P.M. Dixon. “Probabilities for Profitable
Fungicide Use against Gray Leaf Spot in Hybrid Maize.” The American Phytopathology
Society 18 (January 2001):477-484. Internet site:
http://apsjournals.apsnet.org/doi/pdf/10.1094/PHYTO.2001.91.5.477 (Accessed on
December 17, 2013).
National Weather Service Forecast Office, Fort Worth Weather Forecast Office. Internet site:
http://www.nws.noaa.gov/climate/index.php?wfo=fwd (Accessed on January 2, 2013).
O’Brien, D. “The Economics of Applying Fungicides to Wheat to Control Leaf Rust.” Kansas
State Research and Extension, Kansas State University, 2012. Internet site:
http://www.agmanager.info/about/contributors/Presentations/O'brien/WheatFungicideEc
onomicsJune2007.pdf (Accessed on September 25, 2012).
Orum, J., H. Pinnschmidt, and L. Jorgensen. “A Model for Fungicide Applications in Winter
Wheat.” Department of Integrated Pest Management, The Royal Veterinary and
Agricultural University, 2006. Internet site:
https://www.landbrugsinfo.dk/Planteavl/Plantevaern/Plantesygdomme/Kemisk-

18
bekaempelse/Sider/plk06_98_3_J_E_Oerum.pdf?download=true (Accessed on
December 17, 2013).
Reid, D., and J. Swart. “Evaluation of Foliar Fungicides for the Control of Stripe Rust (Puccinia
Striiformis) in SRWW in the Northern Texas Blacklands.” Department of Agricultural
Sciences, Texas A & M University-Commerce, 2004. Internet site:
http://amarillo.tamu.edu/files/2010/11/evaluationof_foliar_fungicides_2004.pdf
(Accessed on December 17, 2013).
Richardson, J.W., J.L. Outlaw, and J.M. Raulston. Impact of the Wheat Industry on the U.S.
Economy. Agricultural and Food Policy Center, Department of Agricultural Economics,
Texas A&M University, College Station, Texas, 2006. Internet site:
http://www.wheatworld.org/wp-content/uploads/2006-NAWG-Report-on-Impact-of-the-
Wheat-Industry.pdf (Accessed on December 17, 2013).
Tadesse, K., A. Ayalew, and A. Badebo. “Effect of Fungicide on the Development of Wheat
Stem Rust and Yield of Wheat Cultivars in Highlands of Ethiopia.” African Crop
Science Journal 18(2010):23-33. Internet site: http://www.bioline.org.br/pdf?cs10004
(Accessed on December 17, 2013).
Texas A&M AgriLife Extension–Extension Agricultural Economics, Department of Agricultural
Economics, Texas A&M University, 2011. Internet site:
http://agecoext.tamu.edu/files/2013/10/wwd132.pdf (Accessed on January 10, 2013).
Texas A&M AgriLife Extension–Extension Agricultural Economics, Department of Agricultural
Economics, Texas A&M University, 2012. Internet site:
http://agecoext.tamu.edu/files/2013/10/wwd131.pdf (Accessed on January 10, 2013).

19
United States Department of Agriculture–Economic Research Service. World Wheat Trade,
2012. Internet site: http://www.ers.usda.gov/topics/crops/wheat/trade.aspx (Accessed on
September 12, 2012).
Vincelli, P. “QoI (Strobilurin) Fungicides: Benefits and Risks.” The Plant Health Instructor, The
American Psychopathological Society, 2002. Internet site:
http://www.apsnet.org/edcenter/advanced/topics/Pages/StrobilurinFungicides.aspx.
Wegulo, S., J. Stevens, M. Zwingman and P. Baenziger. “Yield Response to Foliar Fungicide
Application in Winter Wheat.” Fungicides for Plant and Animal Diseases, 2012:227-244.
Internet site: http://www.intechopen.com/download/get/type/pdfs/id/26031 (Accessed on
December 17, 2013).
Wegulo, S., M. Zwingman, J. Breathnach, and P. Baenziger. “Economic Returns from Fungicide
Application to Control Foliar Fungal Diseases in Winter Wheat.” Crop Protection
30(June 2011): 685-692. Internet site:
http://digitalcommons.unl.edu/cgi/viewcontent.cgi?article=1223&context=plantpathpaper
s (Accessed on December 17, 2013).
Wegulo, S.N., J.A. Breathnach, and P.S. Baenziger. “Effect of Growth Stage on the Relationship
between Tan Spot and Spot Blotch Severity and Yield in Winter Wheat.” Crop
Protection 28 (August 2009):696-702. Internet site:
http://digitalcommons.unl.edu/cgi/viewcontent.cgi?article=1159&context=plantpathpaper
s (Accessed on December 17, 2013).
Wiik, L., and H. Rosenqvist. “The Economics of Fungicide Use in Winter Wheat in Southern
Sweden.” Crop Protection 29(January 2010):11-19. Internet site:

20
http://pub.epsilon.slu.se/4176/1/Wiik_et_al_091201_2.pdf (Accessed on December 17,
2013).
21
Tables
Table 1. Locations, Soil Types, Dates, and Weather
Source: The wheat trials were conducted by Texas A&M AgriLife Extension Representative in Commerce, TX. The amount of rainfall during the winter season was obtained from the National Weather Service Forecast Office (2013).
Soil Weather During Spray Date Winter Season
Year Location Type Elev. (m)
Date Planted
Date Sprayed
Date Harvested
Wind (km/h)
Temp (oC)
Relative Humidity
(%)
Rainfall (mm)
2011 Howe Houston Black or Leson Clays 256 10/29/10 4/1/11 06/07/11 6.4 18.3 61.6 361
2011 Leonard Houston Black or Leson Clays 219 11/10/10 3/8/11 06/02/11 8.0 12.1 61.6 314
2011 Royse City
Houston Black or Leson Clays 167 11/19/10 3/27/11 05/31/11 6.4 18.3 61.6 369
2012 Howe Houston Black or Leson Clays 256 11/02/11 3/29/12 05/22/12 4.8 27.5 51.8 537
2012 Leonard Houston Black or Leson Clays 219 10/31/11 3/28/12 06/06/12 6.4 24.4 61.0 556
2012 Royse City
Houston Black or Leson Clays 167 11/01/11 3/28/12 05/17/12 8.0 20.0 87.0 537

22
Table 2. Yield Response (kg/ha) to Fungicide Applications per Year
Year N Mean (kg/ha)*
2012 144 5,750.36a 2011 144 4,632.10b
* Means represent averages across three locations and four cultivars. Means with the same letter are not statistically
different at α=0.05 significance level. Table 3. ANOVA for Wheat Yield Response (kg/ha) to Fungicide Applications in 2011 and 2012
Source DF F Value Pr > F Year 1 601.25 <0.0001 Location 2 111.08 <0.0001 Location*Year 2 6.98 0.0011 Treatment 1 39.45 <0.0001 Treatment*Year 1 25.48 <0.0001 Location*Treatment 2 6.66 0.0015 Location*Treatment*Year 2 4.01 0.0195 Cultivar 3 35.71 <0.0001 Cultivar*Year 3 14.13 <0.0001 Location*Cultivar 6 10.13 <0.0001 Location*Cultivar*Year 6 14.56 <0.0001 Treatment*Cultivar 3 2.59 0.0535 Treatment*Cultivar*Year 3 1.77 0.1540 Location*Treatment*Cultivar 6 1.31 0.2515 Location*Treatment*Cultivar*Year 6 0.80 0.5706 Rep(location) 15 2.81 0.0005
Table 4. Levels of Barley Yellow Dwarf Infection (%) from the Non-Treated and the Treated Experiments with Tebuconazole at the Howe Location in 2011
Level of Treatment
N Yield (kg/ha) Barley Yellow Dwarf Infection (%)
Mean* Std. Dev. Mean* Std. Dev.
Control 24 5,143.98 527.52 1.42 0.52
Treatment 24 5,257.28 542.08 1.31 0.44 * Means represent averages across four cultivars.

23
Table 5. ANOVA for Barley Yellow Dwarf Disease Infection (%) and Overall Yield (kg/ha) per Cultivar at the Howe Location in 2011
Cultivar N Overall Yield (kg/ha) Barley Yellow Dwarf
Infection (%) Mean Std. Dev. Mean Std. Dev.
Coker 9553 12 5,646.26 340.98 1.04 0.14 Magnolia 12 5,013.74 387.13 1.54 0.50 Pioneer 25R47 12 4,633.61 260.46 1.79 0.45 Terral AL841 12 5,508.88 408.85 1.08 0.29
Table 6. ANOVA for the Wheat Yield Response (kg/ha) to Fungicide Applications in 2011
Source DF F Value Pr > F Location 2 93.94 <0.0001 Treatment 1 0.83 0.3629 Location*Treatment 2 0.25 0.7792 Cultivar 3 23.57 <0.0001 Location*Cultivar 6 3.50 0.0034 Treatment*Cultivar 3 0.34 0.7941 Location*Treatment*Cultivar 6 0.62 0.7131 Rep(location) 15 1.31 0.2119
Table 7. ANOVA for Yield Response (kg/ha) to Fungicide Applications in 2012
Source DF F Value Pr > F Location 2 40.76 <0.0001 Treatment 1 80.59 <0.0001 Location*Treatment 2 13.12 <0.0001 Cultivar 3 35.62 <0.0001 Location*Cultivar 6 27.00 <0.0001 Treatment*Cultivar 3 5.08 0.0025 Location*Treatment*Cultivar 6 1.95 0.0802 Rep(location) 15 5.86 <0.0001

24
Table 8. Yield Response (kg/ha) to Fungicide Applications per Location
2011 2012 Location N Mean (kg/ha)* Location N Mean (kg/ha)* Howe 48 5,200.63a Howe 48 6,113.62a Royse City 48 4,504.90b Royse City 48 5,616.40b Leonard 48 4,190.78c Leonard 48 5,521.06b
* Means represent averages across four cultivars. Means with the same letter in a year are not statistically different at α=0.05 significance level.
Table 9. Net Return ($/ha) from Fungicide Applications per Location
2011 2012 Location N Mean (kg/ha)* Location N Mean (kg/ha)* Howe 24 11.77a Howe 24 204.46a Leonard 24 -5.45a Royse City 24 73.25b Royse City 24 -16.90a Leonard 24 45.39b
* Means represent averages across four cultivars. Means with the same letter in a year are not statistically different at α=0.05 significance level.
Table 10. Yield Response (kg/ha) to Fungicide Applications per Cultivar
2011 2012 Cultivar N Mean (kg/ha)* Cultivar N Mean (kg/ha)* Coker 9553 36 4,974.75a Coker 9553 36 6,215.04a Terral LA841 36 4,698.27b Pioneer 25R47 36 5,763.93b Magnolia 36 4,604.81b Magnolia 36 5,619.46b Pioneer 25R47 36 4,250.59c Terral LA841 36 5,403.00c
* Means represent averages across locations. Means with the same letter are not statistically different at α=0.05 significance level.
Table 11. Net Return ($/ha) from Fungicide Applications per Cultivar
2011 2012 N Mean Cultivar N Mean ($/ha)* Cooker 9553 18 16.83a Magnolia 18 182.80a Magnolia 18 -0.32a Terral LA841 18 133.43ab Terral LA841 18 -1.55a Coker 9553 18 73.92b Pioneer 25R47 18 -29.06a Pioneer 25R47 18 40.66b
* Means represent averaged across three locations. Means with the same letter in a year are not statistically different at α=0.05 significance level.

25
Table 12. Net Return ($/ha) from Fungicide Applications per Year
Year N Mean ($/ha)* 2012 72 107.70a 2011 72 -3.53b
* Means represent averages across three locations and four cultivars. Means with the same letter are not statistically
different at α=0.05 significance level. Table 13. Net Returns Increase ($/ha) from Tebuconazole Applications at Various Wheat Prices and Fungicide Costs
Tebuconazole Cost ($/ha)*
24.21 22.48 20.75 19.02 17.29 15.56 13.83 12.10 10.37
Whe
at P
rice
($/k
g)
0.15 18.76 20.49 22.22 23.95 25.68 27.41 29.13 30.86 32.59 0.18 25.92 27.65 29.38 31.11 32.84 34.57 36.30 38.02 39.75 0.20 33.08 34.81 36.54 38.27 40.00 41.73 43.46 45.19 46.92 0.23 40.24 41.97 43.70 45.43 47.16 48.89 50.62 52.35 54.08 0.25 47.41 49.13 50.86 52.59 54.32 56.05 57.78 59.51 61.24 0.28 54.57 56.30 58.02 59.75 61.48 63.21 64.94 66.67 68.40 0.30 61.73 63.46 65.19 66.91 68.64 70.37 72.10 73.83 75.56 0.33 68.89 70.62 72.35 74.08 75.80 77.53 79.26 80.99 82.72 0.35 76.05 77.78 79.51 81.24 82.97 84.69 86.42 88.15 89.88
* Tebuconazole cost includes fungicide cost plus application cost. Table 14. Yield Increase (kg/ha) Needed to Break Even at Various Wheat Prices and Fungicide Costs
Tebuconazole Cost ($/ha)*
24.21 22.48 20.75 19.02 17.29 15.56 13.83 12.10 10.37
Whe
at P
rice
($/k
g)
0.15 161.37 149.85 138.32 126.79 115.27 103.74 92.21 80.69 69.16 0.18 138.32 128.44 118.56 108.68 98.80 88.92 79.04 69.16 59.28 0.20 121.03 112.39 103.74 95.10 86.45 77.81 69.16 60.52 51.87 0.23 107.58 99.90 92.21 84.53 76.84 69.16 61.48 53.79 46.11 0.25 96.82 89.91 82.99 76.08 69.16 62.24 55.33 48.41 41.50 0.28 88.02 81.73 75.45 69.16 62.87 56.59 50.30 44.01 37.72 0.30 80.69 74.92 69.16 63.40 57.63 51.87 46.11 40.34 34.58 0.33 74.48 69.16 63.84 58.52 53.20 47.88 42.56 37.24 31.92 0.35 69.16 64.22 59.28 54.34 49.40 44.46 39.52 34.58 29.64
* Tebuconazole cost includes fungicide cost plus application cost.