fomc 20070131 blue book 20070125
TRANSCRIPT

Content last modified 02/07/2013.
Prefatory Note The attached document represents the most complete and accurate version available based on original files from the FOMC Secretariat at the Board of Governors of the Federal Reserve System. Please note that some material may have been redacted from this document if that material was received on a confidential basis. Redacted material is indicated by occasional gaps in the text or by gray boxes around non-text content. All redacted passages are exempt from disclosure under applicable provisions of the Freedom of Information Act.

CLASS I FOMC - RESTRICTED CONTROLLED (FR)
JANUARY 25, 2007
MONETARY POLICY ALTERNATIVES
PREPARED FOR THE FEDERAL OPEN MARKET COMMITTEE BY THE STAFF OF THE BOARD OF GOVERNORS OF THE FEDERAL RESERVE SYSTEM

Class I FOMC - Restricted Controlled (FR) January 25, 2007
MONETARY POLICY ALTERNATIVES
Recent Developments
(1) The Committee’s decision at its December meeting to leave the target
federal funds rate unchanged conformed to investor expectations, as did the retention
of the tilt and risk assessment from the previous statement. 1 The language in the
rationale portion of the statement, in contrast, was apparently read as suggesting a
slight softening in the Committee’s outlook for economic growth, and the expected
path for monetary policy beyond the near term edged down in response. Over the
intermeeting period, the release of the minutes of the December FOMC meeting and
speeches by FOMC officials had little net effect on market perceptions. However,
stronger-than-expected reports on the economy, significant declines in oil prices, and
generally benign inflation readings seemed to prompt investors to boost their
expectations of growth and to mark down their assessment of near-term inflation
pressures. In terms of the implications for investors’ expectations for the path of the
federal funds rate, the revisions to the growth outlook apparently predominated: The
expected trajectory of the federal funds rate over the next two years rotated up, with
futures markets putting the federal funds rate at around 4.75 percent at the end of
2008, about 45 basis points higher than at the time of the December meeting
(Chart 1). Market participants—including respondents to the Desk’s survey of
primary dealers—now appear to believe that the federal funds rate will probably
remain unchanged through the first half of this year. Option-implied measures of
uncertainty about the path of policy more than reversed their increases over the
1 The effective federal funds rate averaged 5.24 percent over the intermeeting period. During the period, the Desk purchased $3.4 billion of Treasury coupon securities in the market. The volume of outstanding long-term RPs decreased $4 billion, to $15 billion, to offset the seasonal reflow of currency.

Chart 1Interest Rate Developments
Note: Vertical lines indicate December 11, 2006. Last daily observations are for January 25, 2007.
Jan. Apr. July Oct. Jan. Apr. July Oct.2007 2008
4.0
4.5
5.0
5.5
6.0Percent
January 25, 2007December 11, 2006
Expected Federal Funds Rates*
*Estimates from federal funds and Eurodollar futures, with an allowance for term premiums and other adjustments.
Implied Distribution of Federal Funds Rate about Six Months Ahead*
3.25 3.50 3.75 4.00 4.25 4.50 4.75 5.00 5.25 5.50 5.75 6.00 6.25
Recent: 01/25/2007 Last FOMC: 12/11/2006
0
5
10
15
20
25
30
35
40Percent
*Estimates from options on Eurodollar futures contracts, adjusted to estimate expectations for the federal funds rate.
1
3
5
7
9
11
13
15
40
80
120
160
200
240Percent Basis points
Ten-Year Treasury (left scale)Six-Month Eurodollar (right scale)*
Jan. Jan. Jan. Jan. Jan. Jan.2002 2003 2004 2005 2006
Implied Volatilities
Daily
*Width of a 90 percent confidence interval computed from the termstructures for the expected federal funds rate and implied volatility.
FOMC
Apr. Sept. Feb. July Dec. May Oct.2004 2005 2006
0
1
2
3
4
5
6
7Percent
Ten-YearTwo-Year
Nominal Treasury Yields*
Daily
*Par yields from a smoothed nominal off-the-run Treasury yield curve.
FOMC
1 2 3 5 7 10
0
10
20
30
40
50Basis points
Change in Implied One-Year Forward Treasury Ratessince Last FOMC Meeting*
Years Ahead*Forward rates are the one-year rates maturing at the end of the year shownon the horizontal axis that are implied by the smoothed Treasury yield curve.
1.5
2.0
2.5
3.0
3.5
4.0
Apr. Sept. Feb. July Dec. May Oct.2004 2005 2006
30
40
50
60
70
80
90Percent $/barrel
Next Five Years (left axis)Five-to-Ten Year Forward (left axis)Spot WTI (right axis)
Inflation Compensation and Oil Prices*
Daily
*Estimates based on smoothed nominal and inflation-indexedTreasury yield curves and adjusted for the indexation-lag (carry) effect.
FOMC
Class I FOMC - Restricted Controlled (FR) Page 2 of 38

previous intermeeting period, and the implied distribution of the funds rate about six
months ahead now shows less of a skew toward significantly lower rates.
(2) Yields on Treasury securities shifted up in a parallel fashion across the term
structure, with two- through ten-year nominal Treasury rates increasing about 35 basis
points over the intermeeting period. Increases in forward rates at longer horizons
appeared to reflect both the expectation of higher future short rates and wider term
premiums. TIPS-based inflation compensation was little changed at medium- and
long-term maturities. Inflation expectations as measured by the Reuters-Michigan
survey were also about unchanged.
(3) Broad equity indexes were little changed over the intermeeting period
(Chart 2), as higher bond yields evidently countered the effects of favorable economic
news and generally upbeat early readings on fourth-quarter earnings. Implied
volatility of the S&P 500 remained near historical lows. The equity risk premium, as
gauged by the difference between the twelve-month forward trend earnings-price ratio
and the real long-term Treasury yield, declined a bit. Spreads of yields on investment-
grade bonds over those on comparable-maturity nominal Treasuries held steady, while
those on speculative-grade corporate bonds narrowed. Corporate credit quality
remained solid, with realized and expected default rates staying very low.
(4) Indications of stronger U.S. economic growth helped lift the trade-weighted
value of the dollar about 2 percent, on balance, versus major foreign currencies over
the intermeeting period (Chart 3).2 The dollar’s largest gain—3¼ percent—came
against the yen as investors reportedly came to expect the Japanese economy to
recover more slowly and Japanese monetary authorities to tighten less in the near term
than had been anticipated. The dollar rose about 2 percent against the Canadian
2
.
Class I FOMC - Restricted Controlled (FR) Page 3 of 38

Chart 2Asset Market Developments
Note: Vertical lines indicate December 11, 2006. Last daily observations are for January 25, 2007.
Apr. Sept. Feb. July Dec. May Oct.2004 2005 2006
90
100
110
120
130
140Index(12/31/03=100)
FOMC
Wilshire 5000 Index
Daily
1989 1992 1995 1998 2001 2004 2007-30
-20
-10
0
10
20
30
S&P 500 EPSNIPA, economicprofits before tax
Quarterly*
Corporate Earnings Growth Percent
*Change from four quarters earlier. Source. I/B/E/S for S&P 500 EPS.
Q4
Q3
e
Apr. Sept. Feb. July Dec. May Oct.2004 2005 2006
0
10
20
30
40Percent
S&P 500Nasdaq
Implied Volatilities
DailyFOMC
80
120
160
200
240
280
Apr. Sept. Feb. July Dec. May Oct.2004 2005 2006
0
125
250
375
500
625
750
Basis points Basis points
Ten-Year BBB (left scale)Five-Year High-Yield (right scale)
FOMC
Corporate Bond Spreads*
Daily
*Measured relative to an estimated off-the-run Treasury yield curve.
1990 1993 1996 1999 2002 2005
0
1
2
3
4
5
6
7
Bond Default and C&I Loan Delinquency RatesPercent of outstandings
C&I loan delinquency rate (Call Report)
Bond default rate*
*Six-month moving average, from Moody’s Investors Service.
Q3
Dec.
1999 2000 2001 2002 2003 2004 2005 20060.0
0.5
1.0
1.5
2.0
Percent of liabilitiesExpected Year-Ahead Defaults*
Monthly
*Firm-level estimates of year-ahead defaults from KMV corporation, weightedby firm liabilities as a percent of total liabilities, excluding defaulted firms.
Dec.
Class I FOMC - Restricted Controlled (FR) Page 4 of 38

Chart 3International Financial Indicators
Note: Vertical lines indicate December 12, 2006. Last daily observations are for January 25, 2007.
Jan. May Oct. Mar. Aug. Jan. May Oct.2004 2005 2006
90
92
94
96
98
100
102
104
106
108
110
112
BroadMajor CurrenciesOther Important Trading Partners
Nominal Trade-Weighted Dollar Indexes
Daily
Index(12/31/03=100)
2.5
3.0
3.5
4.0
4.5
5.0
5.5
6.0
Jan. May Oct. Mar. Aug. Jan. May Oct.2004 2005 2006
0.0
0.5
1.0
1.5
2.0
2.5
3.0
UK (left scale)Germany (left scale)Japan (right scale)
Ten-Year Government Bond Yields (Nominal)
Daily
Percent
Jan. May Oct. Mar. Aug. Jan. May Oct.2004 2005 2006
90
100
110
120
130
140
150
160
170UK (FTSE-350)Euro Area (DJ Euro)Japan (Topix)
Stock Price IndexesIndustrial Countries
Daily
Index(12/31/03=100)
Jan. May Oct. Mar. Aug. Jan. May Oct.2004 2005 2006
70
100
130
160
190
220
250
280
310
340
Brazil (Bovespa)Korea (KOSPI)Mexico (Bolsa)
Stock Price IndexesEmerging Market Economies
Daily
Index(12/31/03=100)
Class I FOMC - Restricted Controlled (FR) Page 5 of 38

dollar and the euro. By contrast, the dollar fell slightly on net against sterling as the
Bank of England, citing concerns about inflation pressures, wrong-footed markets on
January 11 by increasing its policy rate 25 basis points. Yields on long-term
government securities in most major foreign industrial countries rose 30 to 35 basis
points, roughly matching the increases on comparable U.S. issues. As in the United
States, most of the increases abroad appeared to be in the real component of yields, as
market participants seemed to be factoring in expectations of greater strength in the
global economy, including expected support to growth from the recent drop in oil
prices. A notable exception to this pattern was Japan, where nominal yields were
roughly unchanged on net over the intermeeting period. Stock markets in the major
industrial countries recorded gains of 1 to 6 percent.
(5) The foreign exchange value of the dollar was about unchanged on net
against an index of currencies of our other important trading partners. In Thailand,
financial markets continued to be volatile, reacting in part to authorities’ efforts to
deter capital inflows; share prices fell more than 10 percent. The Thai turmoil did not
appear to spill over to other Asian financial markets, and most Asian currencies
moved in fairly narrow ranges. The dollar declined ¾ percent versus the Chinese
renminbi over the intermeeting period. The dollar edged lower versus the Brazilian
real, and the Brazilian EMBI+ spread narrowed to a record low of about 185 basis
points.
(6) The debt of domestic nonfinancial sectors is estimated to have expanded at
an annual rate of 7½ percent in the fourth quarter of last year, close to the pace
registered over 2006 as a whole (Chart 4). Business debt grew more quickly last
quarter, boosted in large part by a pickup in merger-related borrowing. Among the
major components of business debt, a sharp rise in the issuance of corporate bonds
and commercial paper more than offset a moderation in the growth of C&I loans. In
the household sector, home mortgage debt is thought to have decelerated further in
Class I FOMC - Restricted Controlled (FR) Page 6 of 38

Chart 4Debt and Money
Growth of Debt of Nonfinancial Sectors
Percent, s.a.a.r.
2005
2006
Q1Q2Q3Q4e
Total_____
9.5
7.8
9.56.76.67.5
Nonfederal__________
10.1
8.6
9.18.77.38.3
e Estimated.
-20
-10
0
10
20
30
40
50
60
70
C&I LoansCommercial PaperBonds
Sum
Changes in Selected Components of Debt ofNonfinancial Business
$Billions
2004 2005 H1 Q3 Q4
2006
Monthly rate
Note. Commercial paper and C&I loans are seasonally adjusted,bonds are not.
1991 1993 1995 1997 1999 2001 2003 2005 2007
-3
0
3
6
9
12
15
18
21
Growth of Debt of Household SectorPercent
Quarterly, s.a.a.r.
p Projected.
Q4p
Q4p
ConsumerCredit
HomeMortgage
1993 1995 1997 1999 2001 2003 2005 0
2
4
6
8
10
12
Growth of House PricesPercent
Quarterly
Note. Four-quarter growth rate.
Q3
OFHEO Purchase-Only Index (s.a.)
-4
-2
0
2
4
6
8
10
Growth of M2
s.a.a.r.Percent
2004 H1 H2 Q1 Q2 Q3 Q4
2005 2006
0.25
0.50
1.00
2.00
4.00
8.00
1993 1995 1997 1999 2001 2003 2005
1.8
1.9
2.0
2.1
2.2
2.3
M2 Velocity and Opportunity CostVelocityPercent
Quarterly
Opportunity Cost*(left axis)
Velocity(right axis)
*Two-quarter moving average.
Q4
Q4
Class I FOMC - Restricted Controlled (FR) Page 7 of 38

the fourth quarter, reflecting in part the ongoing slowing in house price appreciation.
Respondents to the January Senior Loan Officer Opinion Survey reported weaker
demand for mortgage loans, and some indicated that they had tightened standards for
such loans. The growth of consumer credit appears to have remained moderate last
quarter.
(7) M2 expanded briskly in December, bringing fourth-quarter growth to
6¾ percent.3 Some of this strength probably reflected the lagged influence of declines
in opportunity cost since midyear. In January, the aggregate appears to have
accelerated to a 9 percent rate, as growth of liquid deposits has picked up further.
Retail money funds have continued to increase at a robust rate, while small time
deposits appear to be decelerating. Currency growth has been restrained as solid
domestic demand has partially offset weak international demand.
3 These data incorporate the results of the annual review of seasonal factors.
Class I FOMC - Restricted Controlled (FR) Page 8 of 38

Economic Outlook through 2008
(8) The incoming data over the intermeeting period led the staff to mark up its
assessment of real GDP in the fourth quarter of 2006. The contours of the
Greenbook forecast are otherwise little changed: Real GDP is again projected to
grow about 2¼ percent this year and 2½ percent in 2008. With output expanding
somewhat more slowly than the staff’s estimate of potential GDP this year and about
at potential next year, the unemployment rate rises to almost 5 percent early next year
and then levels off. The path of core inflation is slightly below the December
projection, mainly owing to new inflation data, lower energy and other commodity
prices, and lower core import prices. The staff now expects core PCE inflation to
average 2¼ percent this year and 2 percent in 2008, while total PCE prices are
projected to rise a bit faster than 2 percent in both years. The forecast assumes that
the Committee holds policy unchanged over the next two years, rather than easing
slightly in mid-2008, as in the previous round. Long-term Treasury yields are
projected to edge up a bit over the forecast horizon as market participants come to
realize that policy will not be eased as they had anticipated. Stock prices are again
assumed to rise at about a 6½ percent annual rate. The real trade-weighted foreign
exchange value of the dollar is projected to depreciate gradually, but from a higher
level. Reflecting the sharp decline in both spot and futures quotes, oil prices
throughout the forecast period are about $9 per barrel lower than in the December
Greenbook.
Medium-Term Strategies
(9) To shed additional light on the economic outlook and possible policy
strategies, the FRB/US model was used to construct an illustrative extension of
the Greenbook forecast beyond 2008 based on a set of medium-term assumptions
together with some judgmental adjustments. Important influences on the outlook
Class I FOMC - Restricted Controlled (FR) Page 9 of 38

include trend multifactor productivity growth of about 1¾ percent per year,
approximately flat energy prices, and a pickup in the pace of real dollar depreciation
to an average rate of 3 percent per year. Given the impetus to inflation from the
declining foreign exchange value of the dollar, the unemployment rate would need
to be a bit above the staff’s assumed long-run NAIRU of 5 percent to keep core
PCE inflation stable. The contours of aggregate demand are influenced by the
unified federal budget deficit, which rises from 2 percent of GDP next year to about
2¾ percent by 2012, and by the current account deficit, which stabilizes at around
8 percent of GDP in response to the dollar’s depreciation and steady growth abroad.
Further assuming that term, credit, and equity risk premiums gradually revert back
to their historical norms, the real federal funds rate would need to decline about a
percentage point from its current level, to around 2 percent, by 2012 to keep output
expanding along the path of its potential.
(10) As shown in Chart 5, the Greenbook-consistent estimate of short-run
r*—the value of the real federal funds rate that would put the level of real GDP at its
potential twelve quarters ahead—has shifted up about 50 basis points since the
previous Bluebook. This increase owes mainly to the upward revision to the staff’s
assessment of aggregate demand implied by lower energy prices and recent robust
readings on consumer spending. The Greenbook-consistent measure of short-run r*
now stands at about 3¼ percent, a bit above the actual real funds rate, while all three
model-based estimates are considerably lower, at around 2½ percent. The model-
based estimates of medium-run r*—the value of the real funds rate consistent with
keeping output at potential at a seven-year horizon—are close to 2¼ percent, just
above the TIPS-based measure of about 2 percent.
(11) Chart 6 depicts optimal control simulations of the FRB/US model in which
policymakers are assumed to place equal weight on three stabilization objectives:
keeping core PCE inflation close to a specified goal of either 1½ or 2 percent, keeping
Class I FOMC - Restricted Controlled (FR) Page 10 of 38

Chart 5Equilibrium Real Federal Funds Rate
1990 1991 1992 1993 1994 1995 1996 1997 1998 1999 2000 2001 2002 2003 2004 2005 2006
-2
-1
0
1
2
3
4
5
6
7
8Percent
Note: Appendix A provides background information regarding the construction of these measures and confidence intervals.
Short-Run Estimates with Confidence Intervals
Short-Run and Medium-Run Measures
Actual real federal funds rateRange of model-based estimates70 percent confidence interval90 percent confidence intervalGreenbook-consistent measure
Current Estimate Previous Bluebook
Short-Run Measures Single-equation model 2.4 2.1 Small structural model 2.4 2.2 Large model (FRB/US) 2.6 2.7 Confidence intervals for three model-based estimates 70 percent confidence interval (1.0 - 3.9( 90 percent confidence interval (0.1 - 4.8(
Greenbook-consistent measure 3.3 2.8
Medium-Run Measures Single-equation model 2.3 2.2 Small structural model 2.3 2.1 Confidence intervals for two model-based estimates 70 percent confidence interval (1.4 - 3.2( 90 percent confidence interval (0.8 - 3.8(
TIPS-based factor model 2.1 2.1
Memo Actual real federal funds rate 3.0 2.9
Class I FOMC - Restricted Controlled (FR) Page 11 of 38

Chart 6
Optimal Policy Under Alternative Inflation Goals
2007 2008 2009 2010 2011 2012
3.0
3.5
4.0
4.5
5.0
5.5
6.0
6.5Percent
1½ Percent Inflation Goal
Federal funds rate
Current BluebookDecember BluebookOctober Bluebook
2007 2008 2009 2010 2011 2012
4.0
4.5
5.0
5.5
6.0Percent
Civilian unemployment rate
2007 2008 2009 2010 2011 2012
1.0
1.5
2.0
2.5
3.0Percent
Core PCE inflationFour-quarter average
2007 2008 2009 2010 2011 20123.0
3.5
4.0
4.5
5.0
5.5
6.0
6.5Percent
2 Percent Inflation Goal
Current BluebookDecember BluebookOctober Bluebook
2007 2008 2009 2010 2011 2012
4.0
4.5
5.0
5.5
6.0Percent
2007 2008 2009 2010 2011 20121.0
1.5
2.0
2.5
3.0Percent
Four-quarter average
Class I FOMC - Restricted Controlled (FR) Page 12 of 38
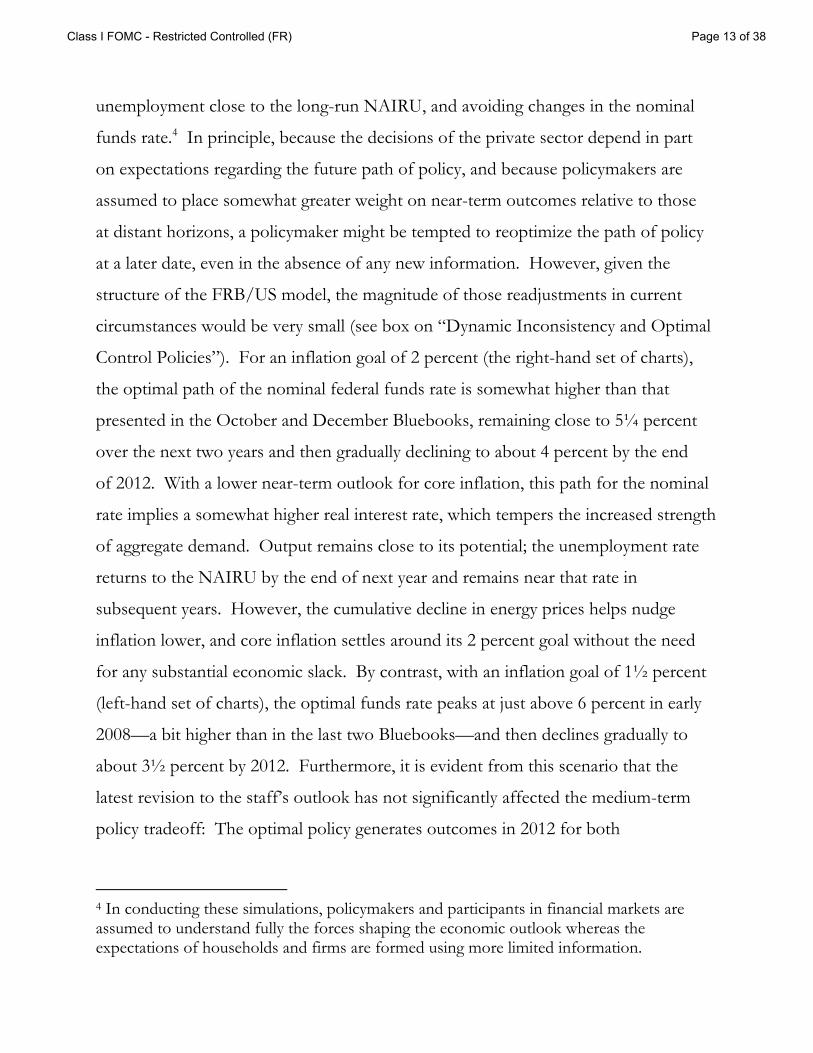
unemployment close to the long-run NAIRU, and avoiding changes in the nominal
funds rate.4 In principle, because the decisions of the private sector depend in part
on expectations regarding the future path of policy, and because policymakers are
assumed to place somewhat greater weight on near-term outcomes relative to those
at distant horizons, a policymaker might be tempted to reoptimize the path of policy
at a later date, even in the absence of any new information. However, given the
structure of the FRB/US model, the magnitude of those readjustments in current
circumstances would be very small (see box on “Dynamic Inconsistency and Optimal
Control Policies”). For an inflation goal of 2 percent (the right-hand set of charts),
the optimal path of the nominal federal funds rate is somewhat higher than that
presented in the October and December Bluebooks, remaining close to 5¼ percent
over the next two years and then gradually declining to about 4 percent by the end
of 2012. With a lower near-term outlook for core inflation, this path for the nominal
rate implies a somewhat higher real interest rate, which tempers the increased strength
of aggregate demand. Output remains close to its potential; the unemployment rate
returns to the NAIRU by the end of next year and remains near that rate in
subsequent years. However, the cumulative decline in energy prices helps nudge
inflation lower, and core inflation settles around its 2 percent goal without the need
for any substantial economic slack. By contrast, with an inflation goal of 1½ percent
(left-hand set of charts), the optimal funds rate peaks at just above 6 percent in early
2008—a bit higher than in the last two Bluebooks—and then declines gradually to
about 3½ percent by 2012. Furthermore, it is evident from this scenario that the
latest revision to the staff’s outlook has not significantly affected the medium-term
policy tradeoff: The optimal policy generates outcomes in 2012 for both
4 In conducting these simulations, policymakers and participants in financial markets are assumed to understand fully the forces shaping the economic outlook whereas the expectations of households and firms are formed using more limited information.
Class I FOMC - Restricted Controlled (FR) Page 13 of 38

Dynamic Inconsistency and Optimal Control Policies The optimal control policies shown in the Bluebook assume that the policymaker specifies a particular funds rate path starting from that date and then follows that path. In principle, a policymaker might be tempted to reoptimize the path of policy at some later date, even in the absence of new information; that is, the prescriptions from these simulations might exhibit dynamic inconsistency. The academic literature has emphasized two possible sources of this temptation. First, policymakers might desire to keep the unemployment rate below its sustainable rate and hence be inclined towards inflation surprises; however, because such surprises cannot be systematic if the private sector’s expectations are rationally determined, this inclination toward stimulative policies only raises inflation. Second, if current decisions of the private sector depend on expected future monetary policy actions and if policymakers discount the future, then the central bank may be tempted to view private-sector expectations of future policy actions as a separate instrument from actual actions. In the optimal control scenarios shown in the Bluebook, the first source of dynamic inconsistency does not arise because, along with other goals, policymakers are always assumed to have the objective of keeping unemployment close to its natural rate. However, the second source could be relevant for the optimal control simulations that have become a staple of the Bluebook. The magnitude of this dynamic inconsistency can be gauged, for example, by considering the optimal control scenario shown in the left column of Chart 6, in which the policymaker has an inflation goal of 1½ percent. As shown in the chart below, in the absence of any new information, reoptimizing the policy path in either 2009 (the dashed line) or 2010 (the dash-dotted line) yields funds rate prescriptions that differ by less than ¼ percentage point from those of the optimal policy in the benchmark scenario (the solid line). Additional simulations (not shown) indicate that the small magnitude of these deviations is robust to alternative values of the policymaker’s discount rate and to the relative weight placed on the objective of avoiding interest rate changes.
2007 2008 2009 2010 2011 2012
3.0
3.5
4.0
4.5
5.0
5.5
6.0
6.5Percent
Optimized from 2007Q1Optimized from 2009Q1Optimized from 2010Q1
Federal funds rate
The small magnitude of dynamic inconsistency provides some reassurance that the optimal control simulations shown in each Bluebook can serve as useful benchmarks in assessing medium-term policy strategies. Of course, this issue might well loom larger under different macroeconomic circumstances or under alternative assumptions about policymaker preferences and private-sector expectations formation.1
_______________________________ 1 For further discussion on the sensitivity of the optimal control simulations, see the memo to the Committee by Michael Kiley, Thomas Laubach, and Robert Tetlow, “Optimal-Control Monetary Policies,” June 20, 2006.
Class I FOMC - Restricted Controlled (FR) Page 14 of 38

unemployment and core inflation that are quite close to those presented in October
and December.
(12) The upper panels of Chart 7 depict model- and market-based assessments
of the policy outlook through the end of 2012. In the absence of shocks, the
outcome-based rule prescribes a funds rate path that declines gradually to about
4 percent by the end of 2012, while interest rate forwards imply a faster decline over
the next two years and a leveling off at about 4½ percent after that. Stochastic
simulations of the FRB/US model indicate a 70 percent probability that the
prescriptions of the outcome-based rule will fall in a range of 2 to 6½ percent during
2012; information from at-the-money interest rate caps also indicates considerable
uncertainty in financial markets regarding the prospective path of policy at longer
horizons (see box on “Assessing Medium-Term Policy Uncertainty using Interest Rate
Caps”).
(13) The lower portion of Chart 7 reports the near-term prescriptions of simple
policy rules for inflation goals of 1½ or 2 percent. For example, the rule proposed
by Taylor (1999) prescribes a funds rate of about 4¾ to 5 percent for the current
quarter, whereas a funds rate of 5½ to 5¾ percent is stipulated by a variant of that
rule incorporating a higher value of r*. In each of these cases, the rule is consistent
with a cut next quarter of about 25 basis points. In contrast to the Taylor rules, the
first-difference rule—which does not require estimates of the levels of the output gap
or the equilibrium real interest rate—generates a funds rate that rises to 5¾ percent
next quarter if the inflation goal is 1½ percent, or a flat funds rate if the inflation goal
is 2 percent.
Class I FOMC - Restricted Controlled (FR) Page 15 of 38

Chart 7
The Policy Outlook in an Uncertain Environment
2007 2008 2009 2010 2011 2012
0
1
2
3
4
5
6
7
8
9
10Percent
Note: Appendix B provides background information regarding the specification of each rule and the methodology used inconstructing confidence intervals and near-term prescriptions.
FRB/US Model Simulations ofEstimated Outcome-Based Rule
Current Bluebook70 Percent confidence interval90 Percent confidence intervalPrevious Bluebook
2007 2008 2009 2010 2011 2012
0
1
2
3
4
5
6
7
8
9
10Percent
Information from Financial Markets
Expectations from forward contracts70 Percent confidence interval90 Percent confidence intervalActual and Greenbook assumption
Near-Term Prescriptions of Simple Policy Rules
2007Q1 2007Q2 2007Q1 2007Q2
2007Q1 2007Q2
1½ PercentInflation Objective
2 PercentInflation Objective
Memo
Taylor (1993) rule 4.8 4.6 4.6 4.4 Previous Bluebook 4.9 4.7 4.7 4.5
Taylor (1999) rule 5.0 4.7 4.7 4.5 Previous Bluebook 4.9 4.7 4.6 4.4
Taylor (1999) rule with higher r* 5.7 5.5 5.5 5.2 Previous Bluebook 5.6 5.4 5.4 5.2
First-difference rule 5.4 5.7 5.2 5.2 Previous Bluebook 5.5 5.7 5.2 5.2
Estimated outcome-based rule 5.3 5.3 Estimated forecast-based rule 5.1 5.0 Greenbook assumption 5.3 5.3 Market expectations 5.2 5.2
Class I FOMC - Restricted Controlled (FR) Page 16 of 38

Assessing Medium-Term Policy Uncertainty using Interest Rate Caps Uncertainty around the prospective path of the federal funds rate can be assessed using implied volatilities derived from interest rate derivatives. In previous Bluebooks, options on Eurodollar futures were used to construct confidence intervals at relatively short horizons, but these derivatives only trade out to two years. By contrast, interest rate caps, which are among the most liquid over-the-counter fixed income derivatives, provide information about uncertainty at much longer horizons; hence, starting with this Bluebook, these derivatives are used to construct confidence intervals for the funds rate at horizons extending out six years.1
An interest rate cap is a sequence of call options—referred to as caplets—that insures the holder against increases in short-term interest rates above a certain level over the horizon of the cap. For example, a standard ten-year cap comprises thirty-nine quarterly caplets on three-month LIBOR, where the first caplet is linked to the realized three-month rate three months ahead, and the final caplet is linked to the realized rate 9¾ years ahead. Given prices of interest rate caps at several distinct maturities, it is feasible to compute an entire term structure of implied volatilities. Translating these estimates from three-month LIBOR to overnight federal funds requires some assumptions regarding the magnitudes of term premiums and the relative volatility of overnight versus three-month interest rates. While interest rate caps are useful for assessing market uncertainty about policy at relatively long horizons, the confidence intervals presented in Chart 7 rest on two important assumptions that are commonly employed by options traders: Short-term interest rates are assumed to be log-normally distributed and to follow a simple autoregressive process over the life of the contract.2 Furthermore, these confidence intervals are based solely on the prices of at-the-money options, whereas using the prices of both in- and out-of-the-money options could reveal significant information about market perceptions of skewness or heavy tails in the distribution of short-term interest rates; indeed, such information might well indicate more substantial downside risks than depicted in Chart 7. These issues are the subject of ongoing research by Board staff. _____________________ 1 For further information regarding methodology, see the January 9, 2007 memo by Benson Durham, “Federal Funds Confidence Intervals Derived from Interest Rate Caps.” 2 Note that the log-normal assumption by construction implies that the distribution of rates is skewed somewhat toward higher rates.
Class I FOMC - Restricted Controlled (FR) Page 17 of 38

Short-Run Policy Alternatives
(14) This Bluebook presents three policy alternatives for the Committee’s
consideration, summarized by the draft statements in Table 1. Under Alternatives A
and B, the Committee would leave the federal funds rate unchanged at this meeting,
while under Alternative C it would tighten policy by 25 basis points. Alternative A
would reflect a judgment that the risks to economic growth and inflation are now
roughly balanced. In Alternatives B and C, the accompanying statement would
continue to indicate that inflation is the predominant risk, suggesting that additional
firming is still more likely than policy easing in the near term. The rationale portion
of all three alternatives has been trimmed some, given that the references in the
December statement to prior monetary policy actions and the impetus to inflation
from rising energy prices seemed stale.
(15) The implications for monetary policy of better-than-expected news on both
inflation and economic growth may be seen as roughly offsetting, suggesting that the
Committee has little reason to alter its current policy stance and risk assessment. If
so, the Committee may be attracted to Alternative B, under which the federal funds
rate would remain unchanged at 5¼ percent and the statement would continue to
highlight concern about inflation. The Committee may see the contours of the staff
projection—output running close to its potential and core inflation edging down to
2 percent by next year—as both reasonably likely and about the best possible in
current circumstances. In the staff’s analysis, the real federal funds rate is near the
Greenbook-consistent measure of its equilibrium value (Chart 5), suggesting that the
current policy stance is likely to be consistent with fostering output near potential
over time. Maintaining the current policy stance would be consistent with
prescriptions from both the optimal policy path simulations of the FRB/US model
(Chart 6) and the first-difference rule (Chart 7), based on an assumed 2 percent
inflation objective. Although the Committee may view inflation running at or above
Class I FOMC - Restricted Controlled (FR) Page 18 of 38

Table 1: Alternative Language for the January FOMC Announcement
December FOMC Alternative A Alternative B Alternative C
Policy Decision
1. The Federal Open Market Committee decided today to keep its target for the federal funds rate at 5¼ percent.
The Federal Open Market Committee decided today to keep its target for the federal funds rate at 5¼ percent.
The Federal Open Market Committee decided today to keep its target for the federal funds rate at 5¼ percent.
The Federal Open Market Committee decided today to raise its target for the federal funds rate by 25 basis points to 5½ percent.
2. Economic growth has slowed over the course of the year, partly reflecting a substantial cooling of the housing market. Although recent indicators have been mixed, the economy seems likely to expand at a moderate pace on balance over coming quarters.
The economy seems likely to continue to expand at a moderate pace on balance over coming quarters. However, the substantial cooling of the housing market remains a drag on economic growth.
Although some tentative signs of stabilization have appeared in the housing market, weakness in residential construction remains a drag on economic growth. Nevertheless, supported in part by recent gains in incomes and declines in energy prices, the economy seems likely to expand at a moderate pace over coming quarters.
Economic growth seems to be rebounding and some tentative signs of stabilization have appeared in the housing market. Going forward, the economy seems likely to expand at a moderate pace over coming quarters.
Rationale 3. Readings on core inflation have been elevated, and the high level of resource utilization has the potential to sustain inflation pressures. However, inflation pressures seem likely to moderate over time, reflecting reduced impetus from energy prices, contained inflation expectations, and the cumulative effects of monetary policy actions and other factors restraining aggregate demand.
Readings on core inflation have improved modestly in recent months, and inflation pressures seem likely to moderate over time, partly reflecting the recent decline in energy prices.
Readings on core inflation have improved modestly in recent months, and inflation pressures seem likely to moderate over time. However, the high level of resource utilization has the potential to sustain inflation pressures.
Readings on core inflation have improved modestly in recent months but remain elevated. Inflation pressures seem likely to moderate over time, but the extent and speed of that moderation remain uncertain.
Assessment of Risk
4. Nonetheless, the Committee judges that some inflation risks remain. The extent and timing of any additional firming that may be needed to address these risks will depend on the evolution of the outlook for both inflation and economic growth, as implied by incoming information.
In these circumstances, future policy adjustments will depend on the evolution of the outlook for both inflation and economic growth, as implied by incoming information.
The Committee judges that some inflation risks remain. The extent and timing of any additional firming that may be needed to address these risks will depend on the evolution of the outlook for both inflation and economic growth, as implied by incoming information.
The Committee judges that inflation remains the predominant concern, and consequently that in the near term policy firming is more likely than policy easing. Future policy adjustments will depend on the evolution of the outlook for both inflation and economic growth, as implied by incoming information.
Class I FOMC - Restricted Controlled (FR) Page 19 of 38

2 percent as uncomfortably high, downside risks to employment and growth,
especially given the potentially delicate state of the housing sector, may persuade the
Committee to refrain from tightening at this time. If so, the Committee may continue
to indicate that inflation is the predominant risk to the outlook, especially given the
high rate of utilization in the labor market.
(16) In light of the flurry of stronger-than-expected economic data over the
intermeeting period, the rationale paragraph in the statement under Alternative B
could indicate that the economy seems likely to expand at a moderate pace. It could
drop the reference to “a substantial cooling of the housing market” and note, instead,
that “although some tentative signs of stabilization have appeared in the housing
market, weakness in residential construction remains a drag on economic growth.”
With regard to inflation, the statement could acknowledge that readings on core
inflation “have improved modestly in recent months,” but reiterate the Committee’s
concern that inflation pressures remain. In its assessment of risks, the Committee
could essentially repeat the language from its statement in December.
(17) Investors see virtually no chance of a policy change at this meeting, and the
Desk’s survey suggests that primary dealers unanimously expect that the
accompanying statement will note that the Committee continues to see inflation as the
dominant risk. Consequently, implementation of Alternative B is unlikely to elicit
significant market reaction.
(18) In light of the improvement in the outlook for inflation during the
intermeeting period and the persistence of downside risks arising from the substantial
cooling of the housing market, the Committee may now judge that the risks to the
attainment of its dual objectives are roughly balanced, as in Alternative A. Removing
the bias toward further tightening would leave the Committee better positioned to
respond to the adverse effects of a possible further deterioration in residential
construction or spillovers to consumer spending, along the lines of the “more
Class I FOMC - Restricted Controlled (FR) Page 20 of 38

extensive housing correction” alternative Greenbook scenario. Even absent such
concerns, the expected path for inflation is somewhat lower than in December,
implying that the real federal funds rate is poised to edge higher—a development that
the Committee may view as reducing the likelihood of policy tightening in the near
term. Furthermore, the Committee might see core inflation as declining faster than in
the staff forecast because, for instance, it perceives less tightness in labor markets than
the staff (a possibility suggested by the “lower NAIRU” alternative Greenbook
scenario), or because it is more optimistic about the disinflationary impetus from
lower energy and other commodity prices and the stronger foreign exchange value of
the dollar.
(19) The rationale portion of Alternative A reflects the improved readings on
economic growth but notes that the substantial cooling of the housing market remains
a drag on the expansion. The paragraph on inflation observes that “inflation
pressures seem likely to moderate over time, partly reflecting the recent decline in
energy prices.” To indicate the Committee’s overall assessment of balanced risks, the
statement then simply points to the dependence of future policy adjustments on the
evolution of the outlook for both inflation and economic growth, as implied by
incoming information.
(20) Shorter-term interest rates would likely fall in response to an announcement
along the lines of Alternative A, and longer-term yields might follow suit. However, if
investors read the statement as suggesting that the Committee was willing to tolerate
somewhat higher rates of inflation over the long haul, longer-term yields could be
pushed higher and the foreign exchange value of the dollar would likely weaken.
(21) In contrast, the surprisingly strong economic performance in the fourth
quarter and continued tightness in labor markets might heighten the concern of some
members that the current stance of policy is likely to produce insufficient progress on
inflation. If so, the Committee might judge that an additional 25 basis point increase
Class I FOMC - Restricted Controlled (FR) Page 21 of 38

in the federal funds rate at this meeting, as in Alternative C, is warranted. Both the
optimal policy path simulations of the FRB/US model (Chart 6) and the first-
difference rule (Chart 7) suggest that additional firming of policy should be
undertaken if the Committee wishes to achieve a long-term inflation objective of
1½ percent. With signs indicating that the housing market is stabilizing, the major
downside risk to the outlook appears to be less pressing. In light of the economy’s
resilience over the past several quarters, the Committee may also be concerned that
the recent rebound in personal consumption expenditures may prove more persistent
than in the staff projection (as in the “buoyant consumer spending” alternative
Greenbook scenario), suggesting that the current stance of policy may not prevent the
economy from stretching its resource use tighter. In these circumstances, and with
core inflation uncomfortably high, a slight policy firming at this meeting may be seen
as both appropriate to ensure that the modest improvement in core inflation in recent
months is not reversed and as desirable to signal the Committee’s resolve to foster a
further decline.
(22) Under Alternative C, the paragraph on economic activity in the rationale
section notes the improvement in economic growth and observes that the housing
market may be stabilizing. The announcement also points out that, despite modest
improvements, readings on core inflation remain elevated and that the extent and
speed of further moderation in inflation remains uncertain. In its assessment of risks,
the Committee would once again indicate that inflation risks are the predominant
concern, but could omit the clause referring to “the extent and timing of any
additional firming” in the last sentence. Instead, the statement would note that “in
the near term policy firming is more likely than policy easing,” which may better
reflect the Committee’s views regarding the range of likely outcomes about the
direction of policy, especially following a firming at this meeting and the change in
other forward-looking language.
Class I FOMC - Restricted Controlled (FR) Page 22 of 38

(23) The choice of Alternative C would stun market participants, leading to an
upward revision of their short-term outlook for the path of policy and a significant
rise in short- and intermediate-term interest rates. Longer-term rates would likely step
up, especially if market participants became concerned that the inflation outlook is
less benign than they had thought. That said, by reaffirming the Committee’s
determination to reduce inflation, this policy action might also lead market
participants to expect a more rapid decline in inflation and possibly even to revise
downward their perceptions of the Committee’s long-term inflation objective. If this
is the case, long-term forward rates might decline and the foreign exchange value of
the dollar could strengthen.
Money and Debt Forecasts
(24) Under the Greenbook forecast, M2 is expected to grow about 5½ percent
in 2007 and 5 percent in 2008, close to the rates projected in December. Opportunity
costs edge down this year, as deposit rates continue to catch up to earlier increases in
short-term interest rates. As a result, M2 grows faster than nominal income in 2007.
In 2008, opportunity costs are about flat and M2 grows broadly in line with nominal
income. In the forecast, continuing rapid growth in retail money funds offsets more
sluggish growth in small time deposits, while liquid deposits expand moderately, on
net. Currency growth continues to be restrained by weak foreign demand.
(25) The growth of domestic nonfinancial sector debt is projected to fall from
about 7¾ percent last year to 6½ percent in 2007 and to about 6 percent in 2008. In
the household sector, the weakness in housing prices continues to dampen mortgage
borrowing over the forecast horizon. Corporate debt is also projected to slow
appreciably, as the strong merger-related debt issuance seen last year wanes. With the
unified budget deficit expected to widen, federal debt growth is projected to pick up
this year and next.
Class I FOMC - Restricted Controlled (FR) Page 23 of 38

No Change/
Greenbook Forecast* 25 bp Tightening
Monthly Growth Rates
Oct-06 8.7 8.7
Nov-06 7.1 7.1
Dec-06 7.6 7.6
Jan-07 9.0 9.0
Feb-07 6.0 5.6
Mar-07 4.5 3.7
Apr-07 5.5 4.7
May-07 4.3 3.6
Jun-07 3.5 3.0
Quarterly Growth Rates
2006 Q1 5.4 5.4
2006 Q2 3.3 3.3
2006 Q3 4.2 4.2
2006 Q4 6.8 6.8
2007 Q1 7.3 7.2
2007 Q2 4.9 4.2
2007 Q3 4.8 4.3
2007 Q4 4.8 4.5
Annual Growth Rates
2006 5.0 5.0
2007 5.5 5.1
2008 5.0 5.0
Growth From To
Jan-07 Mar-07 5.3 4.7
Jan-07 Jun-07 4.8 4.1
2006 Q4 Mar-07 6.8 6.5
2006 Q4 Jun-07 5.8 5.4
Table 2
Alternative Growth Rates for M2
(percent, annual rate)
* No change in the target federal funds rate at this meeting. This forecast is consistent with
nominal GDP and interest rates in the Greenbook forecast.
Class I FOMC - Restricted Controlled (FR) Page 24 of 38

Directive and Balance of Risks Statement
(26) Draft language for the directive and draft risk assessments identical to those
presented in Table 1 are provided below.
Directive Wording The Federal Open Market Committee seeks monetary and financial
conditions that will foster price stability and promote sustainable growth
in output. To further its long-run objectives, the Committee in the
immediate future seeks conditions in reserve markets consistent with
maintaining/INCREASING/REDUCING the federal funds rate at/TO
an average of around ________________ 5¼ percent.
Risk Assessments
A. In these circumstances, future policy adjustments will depend on the
evolution of the outlook for both inflation and economic growth, as
implied by incoming information.
B. The Committee judges that some inflation risks remain. The extent and
timing of any additional firming that may be needed to address these
risks will depend on the evolution of the outlook for both inflation and
economic growth, as implied by incoming information.
C. The Committee judges that inflation remains the predominant concern,
and consequently that in the near term policy firming is more likely than
policy easing. Future policy adjustments will depend on the evolution of
the outlook for both inflation and economic growth, as implied by
incoming information.
Class I FOMC - Restricted Controlled (FR) Page 25 of 38

Appendix A: Measures of the Equilibrium Real Rate
The equilibrium real rate is the real federal funds rate that, if maintained, would be projected to return output to its potential level over time. The short-run equilibrium rate is defined as the rate that would close the output gap in twelve quarters given the corresponding model’s projection of the economy. The medium-run concept is the value of the real federal funds rate projected to keep output at potential in seven years, under the assumption that monetary policy acts to bring actual and potential output into line in the short run and then keeps them equal thereafter. The TIPS-based factor model measure provides an estimate of market expectations for the real federal funds rate seven years ahead. The actual real federal funds rate is constructed as the difference between the nominal rate and realized inflation, where the nominal rate is measured as the quarterly average of the observed federal funds rate, and realized inflation is given by the log difference between the staff’s estimate of the core PCE price index and its lagged value four quarters earlier. For the current quarter, the nominal rate is specified as the target federal funds rate on the Bluebook publication date. Confidence intervals reflect uncertainties about model specification, coefficients, and the level of potential output. The final column of the table indicates the values for the current quarter based on the estimation for the previous Bluebook, except that the TIPS-based measure and the actual real funds rate are the values published in the previous Bluebook.
Measure Description
Single-equation Model
The measure of the equilibrium real rate in the single-equation model is based on an estimated aggregate-demand relationship between the current value of the output gap and its lagged values as well as the lagged values of the real federal funds rate.
Small Structural Model
The small-scale model of the economy consists of equations for five variables: the output gap, the equity premium, the federal budget surplus, the trend growth rate of output, and the real bond yield.
Large Model (FRB/US)
Estimates of the equilibrium real rate using FRB/US—the staff’s large-scale econometric model of the U.S. economy—depend on a very broad array of economic factors, some of which take the form of projected values of the model’s exogenous variables.
Greenbook-consistent
The FRB/US model is used in conjunction with an extended version of the Greenbook forecast to derive a Greenbook-consistent measure. FRB/US is first add-factored so that its simulation matches the extended Greenbook forecast, and then a second simulation is run off this baseline to determine the value of the real federal funds rate that closes the output gap.
TIPS-based Factor Model
Yields on TIPS (Treasury Inflation-Protected Securities) reflect investors’ expectations of the future path of real interest rates, but also include term and liquidity premiums. The TIPS-based measure of the equilibrium real rate is constructed using the seven-year-ahead instantaneous real forward rate derived from TIPS yields as of the Bluebook publication date. This forward rate is adjusted to remove estimates of the term and liquidity premiums based on a three-factor arbitrage-free term-structure model applied to TIPS yields, nominal yields, and inflation. Because TIPS indexation is based on the total CPI, this measure is also adjusted for the medium-term difference—projected at 40 basis points—between total CPI inflation and core PCE inflation.
Class I FOMC - Restricted Controlled (FR) Page 26 of 38

Appendix B: Analysis of Policy Paths and Confidence Intervals
Rule Specifications: For the following rules, it denotes the federal funds rate for quarter t, while the explanatory variables include the staff’s projection of trailing four-quarter core PCE inflation (πt), inflation two and three quarters ahead (πt+2|t and πt+3|t), the output gap in the current period and one quarter ahead ( *
t ty y− and *1| 1|t t t ty y+ +− ), and the three-quarter-ahead forecast of annual average GDP
growth relative to potential ( 4 4 *3| 3|t t t ty y+ +Δ − Δ ), and *π denotes an assumed value of policymakers’
long-run inflation objective. The outcome-based and forecast-based rules were estimated using real-time data over the sample 1988:1-2005:4; each specification was chosen using the Bayesian information criterion. Each rule incorporates a 75 basis point shift in the intercept, specified as a sequence of 25 basis point increments during the first three quarters of 1998. The first two simple rules were proposed by Taylor (1993, 1999), while the third is a variant of the Taylor (1999) rule—introduced in the August Bluebook—with a higher value of r*. The prescriptions of the first-difference rule do not depend on assumptions regarding r* or the level of the output gap; see Orphanides (2003).
Outcome-based rule it = 1.17it-1–0.37it-2+0.20[1.04 + 1.76 πt + 3.32( *t ty y− ) – 2.37( *
1 1t ty y− −− )]
Forecast-based rule it = 1.16it-1–0.36it-2+0.20[0.89+ 1.74 πt+2|t+2.32( *1| 1|t t t ty y+ +− )–1.40( *
1 1t ty y− −− )]
Taylor (1993) rule it = 2 + πt + 0.5(πt – *π ) + 0.5( *t ty y− )
Taylor (1999) rule it = 2 + πt + 0.5(πt – *π ) + ( *t ty y− )
Taylor (1999) rule with higher r*
it = 2.75 + πt + 0.5(πt – *π ) + ( *t ty y− )
First-difference rule it = it-1 + 0.5(πt+3|t – *π ) + 0.5( 4 4 *3| 3|t t t ty y+ +Δ − Δ )
FRB/US Model Simulations: Prescriptions from the two empirical rules are computed using dynamic simulations of the FRB/US model, implemented as though the rule is followed starting at this FOMC meeting. This quarter’s prescription is a weighted average of the actual value of the federal funds rate thus far this quarter and the value obtained from the FRB/US model simulations using the timing of this meeting within the quarter to determine the weights. Confidence intervals are based on stochastic simulations of the FRB/US model with shocks drawn from the estimated residuals over 1986-2005. Information from Financial Markets: The expected funds rate path is based on forward rate agreements, and the confidence intervals for this path are constructed using prices of interest rate caps. Near-Term Prescriptions of Simple Policy Rules: These prescriptions are calculated using Greenbook projections for inflation and the output gap. Because the first-difference rule involves the lagged funds rate, the value labeled “Previous Bluebook” for the current quarter is computed using the actual value of the lagged funds rate, and the one-quarter-ahead prescriptions are based on this rule’s prescription for the current quarter.
References: Taylor, John B. (1993). “Discretion versus policy rules in practice,” Carnegie-Rochester Conference Series on Public Policy, vol. 39 (December), pp. 195-214. ————— (1999). “A Historical Analysis of Monetary Policy Rules,” in John B. Taylor, ed., Monetary Policy Rules. The University of Chicago Press, pp. 319-341. Orphanides, Athanasios (2003). “Historical Monetary Policy Analysis and the Taylor Rule,” Journal of Monetary Economics, vol. 50 (July), pp. 983-1022.
Class I FOMC - Restricted Controlled (FR) Page 27 of 38

Short-term Long-term
Federalfunds
Treasury billssecondary market
CDssecondary
market
Comm.paper Off-the-run Treasury yields Indexed yields Moody’s
Baa
MunicipalBondBuyer
Conventional homemortgages
primary market
4-week 3-month 6-month 3-month 1-month 2-year 5-year 10-year 20-year 5-year 10-year Fixed-rate ARM
1 2 3 4 5 6 7 8 9 10 11 12 13 14 15 16
4.30 4.01 4.08 4.37 4.49 4.30 4.52 4.59 4.79 5.04 2.11 2.22 6.48 5.24 6.37 5.222.19 1.86 2.31 2.63 2.50 2.24 3.11 3.58 3.97 4.28 0.98 1.50 5.64 4.72 5.53 4.10
5.34 5.27 5.13 5.33 5.50 5.32 5.32 5.20 5.32 5.45 2.63 2.68 6.94 5.31 6.80 5.834.22 3.91 4.17 4.37 4.50 4.22 4.34 4.28 4.42 4.59 1.82 1.94 6.08 4.52 6.10 5.15
4.29 4.10 4.34 4.47 4.56 4.36 4.42 4.35 4.50 4.67 1.92 2.03 6.24 5.11 6.15 5.174.49 4.38 4.54 4.69 4.72 4.47 4.69 4.60 4.66 4.75 1.97 2.06 6.27 5.12 6.25 5.344.59 4.55 4.63 4.79 4.88 4.61 4.77 4.72 4.82 4.93 2.08 2.21 6.41 5.10 6.32 5.424.79 4.60 4.72 4.90 5.03 4.80 4.92 4.90 5.07 5.24 2.25 2.41 6.68 5.19 6.51 5.624.94 4.69 4.84 5.01 5.15 4.95 5.00 4.98 5.19 5.36 2.26 2.45 6.75 5.24 6.60 5.634.99 4.71 4.92 5.18 5.35 5.12 5.15 5.04 5.18 5.30 2.41 2.54 6.78 5.24 6.68 5.715.24 4.89 5.08 5.27 5.46 5.24 5.15 5.02 5.15 5.26 2.43 2.52 6.76 5.21 6.76 5.795.25 5.17 5.09 5.17 5.38 5.22 4.93 4.79 4.94 5.09 2.24 2.32 6.59 4.98 6.52 5.645.25 4.76 4.93 5.08 5.34 5.21 4.78 4.64 4.80 4.94 2.35 2.35 6.43 4.82 6.40 5.565.25 4.97 5.05 5.12 5.33 5.20 4.81 4.66 4.80 4.95 2.49 2.43 6.42 4.78 6.36 5.555.25 5.22 5.07 5.15 5.32 5.21 4.74 4.54 4.66 4.79 2.39 2.30 6.20 4.59 6.24 5.515.24 4.86 4.98 5.07 5.32 5.23 4.68 4.50 4.63 4.79 2.27 2.27 6.22 4.54 6.14 5.45
5.24 5.24 5.06 5.15 5.32 5.21 4.75 4.53 4.64 4.77 2.40 2.32 6.18 4.60 6.18 5.495.27 5.25 5.04 5.11 5.31 5.21 4.64 4.44 4.56 4.70 2.23 2.20 6.12 4.55 6.14 5.465.24 4.95 4.99 5.05 5.30 5.20 4.57 4.41 4.55 4.71 2.16 2.16 6.13 4.53 6.11 5.435.25 4.84 4.94 5.07 5.31 5.21 4.69 4.49 4.63 4.78 2.23 2.23 6.21 4.52 6.12 5.455.24 4.82 4.97 5.08 5.32 5.25 4.72 4.52 4.67 4.83 2.33 2.34 6.26 4.53 6.13 5.445.23 4.74 5.00 5.10 5.32 5.25 4.80 4.61 4.74 4.88 2.42 2.42 6.32 4.56 6.18 5.475.22 4.79 5.05 5.09 5.32 5.23 4.78 4.61 4.73 4.86 2.38 2.39 6.27 4.50 6.18 5.425.24 4.92 5.09 5.14 5.32 5.24 4.84 4.66 4.77 4.89 2.44 2.46 6.29 4.55 6.21 5.445.24 4.97 5.12 5.16 5.32 5.20 4.90 4.73 4.84 4.96 2.51 2.49 6.35 4.55 6.23 5.51 -- 4.98 5.14 5.18 5.32 5.20 4.94 4.78 4.88 5.01 2.46 2.44 -- -- 6.25 5.49
5.25 4.90 5.08 5.13 5.31 5.26 4.80 4.61 4.73 4.84 2.40 2.41 6.25 -- -- --5.26 4.94 5.09 5.13 5.32 5.23 4.83 4.64 4.76 4.88 2.43 2.44 6.28 -- -- --5.27 4.98 5.11 5.15 5.32 5.19 4.88 4.70 4.81 4.93 2.49 2.50 6.33 -- -- --5.22 4.97 5.09 5.15 5.32 5.24 4.89 4.73 4.84 4.97 2.51 2.53 6.36 -- -- --5.22 -- -- -- -- -- -- -- -- -- -- -- -- -- -- --5.28 4.98 5.11 5.16 5.31 5.20 4.87 4.71 4.82 4.95 2.50 2.49 6.34 -- -- --5.25 5.01 5.12 5.16 5.32 5.21 4.92 4.75 4.86 4.99 2.52 2.52 6.37 -- -- --5.23 4.96 5.12 5.16 5.32 5.20 4.89 4.72 4.82 4.95 2.51 2.48 6.33 -- -- --5.25 4.94 5.14 5.17 5.32 -- 4.92 4.75 4.85 4.97 2.50 2.48 6.35 -- -- --5.24 4.95 5.13 5.18 5.31 5.19 4.91 4.73 4.83 4.95 2.47 2.44 6.33 -- -- --5.26 5.02 5.14 5.18 5.32 5.23 4.95 4.78 4.88 5.01 2.45 2.45 6.38 -- -- --5.27 4.99 5.13 5.17 5.32 5.19 4.93 4.78 4.88 5.02 2.44 2.43 6.38 -- -- --5.27 4.96 5.14 5.18 5.32 -- 4.98 4.83 4.93 5.07 2.50 2.49 -- -- -- --
Appendix C Table 1
Selected Interest Rates(Percent)
NOTE: Weekly data for columns 1 through 13 are week-ending averages. Columns 2 through 4 are on a coupon equivalent basis. Data in column 6 are interpolated from data on certain commercial paper trades settled by theDepository Trust Company. Column 14 is the Bond Buyer revenue index, which is a 1-day quote for Thursday. Column 15 is the average contract rate on new commitments for fixed-rate mortgages (FRMs) with 80 percentloan-to-value ratios at major institutional lenders. Column 16 is the average initial contract rate on new commitments for 1-year, adjustable-rate mortgages (ARMs) at major institutional lenders offering both FRMs andARMs with the same number of discount points.
p - preliminary data
Jan Feb Mar Apr May Jun Jul Aug Sep Oct Nov Dec
Nov Dec Dec Dec Dec Dec Jan Jan Jan Jan
Jan Jan Jan Jan Jan Jan Jan Jan Jan Jan Jan Jan Jan
060606060606060606060606
2418
152229
5121926
9101112151617181922232425
06060606060607070707
07070707070707070707070707
05 -- High-- Low
06 -- High-- Low
Monthly
Weekly
Daily
p
MFMA
Class I FOMC - Restricted Controlled (FR) Page 28 of 38

Appendix C Table 2Money Aggregates
Seasonally Adjusted
NontransactionsComponents in M2
M1 M2
1 2 3
Period
Annual growth rates (%):
Annually (Q4 to Q4)2004 5.4 5.4 5.32005 0.3 4.1 5.12006 -0.5 5.0 6.4
Quarterly (average)2006-Q1 1.3 5.4 6.4
Q2 0.5 3.3 4.0Q3 -3.5 4.2 6.2Q4 -0.1 6.8 8.5
Monthly2006-Jan. 5.0 8.0 8.7
Feb. -3.2 4.2 6.1Mar. 7.5 3.3 2.3Apr. -3.2 3.4 5.1May 6.3 1.9 0.8June -10.2 4.5 8.3July -3.8 4.3 6.4Aug. 0.4 4.9 6.0Sep. -6.6 4.0 6.7Oct. 4.6 8.7 9.7Nov. 1.1 7.1 8.5Dec. -4.1 7.6 10.4
2007-Jan. e 8.3 9.0 9.2
Levels ($billions):
Monthly2006-Aug. 1371.5 6863.4 5491.8
Sep. 1363.9 6886.5 5522.6Oct. 1369.1 6936.2 5567.1Nov. 1370.4 6977.0 5606.5Dec. 1365.7 7021.0 5655.3
Weekly2006-Dec. 4 1378.0 6993.1 5615.1
11 1367.9 7003.8 5635.918 1364.4 7014.6 5650.225 1374.5 7043.4 5668.9
2007-Jan. 1 1358.0 7060.8 5702.78p 1363.3 7057.2 5693.9
15p 1378.1 7075.5 5697.4
p preliminar ye estimated
Class I FOMC - Restricted Controlled (FR) Page 29 of 38

Appendix C Table 3
Changes in System Holdings of Securities 1
(Millions of dollars, not seasonally adjusted)
January 25, 2007
Treasury Bills Treasury Coupons Federal Net change Net RPs 5
Agency totalNet Redemptions Net Net Purchases 3 Redemptions Net Redemptions outright Short- Long- Net
Purchases 2 (-) Change < 1 1-5 5-10 Over 10 (-) Change (-) holdings 4 Term 6 Term 7 Change
2004 18,138 --- 18,138 7,994 17,249 5,763 1,364 --- 32,370 --- 50,507 -2,522 -331 -2,853
2005 8,300 --- 8,300 2,894 11,309 3,626 2,007 2,795 17,041 --- 25,341 -2,415 -192 -2,607
2006 5,748 --- 5,748 4,967 26,354 4,322 3,299 10,552 28,390 --- 34,138 -2,062 -556 -2,618
2005 QIV 1,512 --- 1,512 1,596 2,789 800 902 189 5,897 --- 7,410 -1,202 -1,293 -2,496
2006 QI 4,099 --- 4,099 1,200 7,443 1,704 1,219 1,321 10,245 --- 14,345 793 1,839 2,631
QII --- --- --- 1,375 6,063 1,181 --- 1,217 7,402 --- 7,402 -627 -4,413 -5,040
QIII 1,649 --- 1,649 415 3,323 548 228 3,931 583 --- 2,232 -3,229 -839 -4,068
QIV --- --- --- 1,977 9,525 889 1,852 4,084 10,159 --- 10,159 -2,379 4,848 2,469
2006 May --- --- --- 1,375 2,317 101 --- 1,217 2,576 --- 2,576 -756 2,511 1,755
Jun --- --- --- --- 2,650 1,080 --- --- 3,730 --- 3,730 -2,633 -2,077 -4,710
Jul 1,649 --- 1,649 --- 549 --- --- 3,931 -3,382 --- -1,733 -909 110 -800
Aug --- --- --- 415 1,454 --- --- --- 1,869 --- 1,869 -231 548 318
Sep --- --- --- --- 1,320 548 228 --- 2,096 --- 2,096 -469 -2,291 -2,761
Oct --- --- --- 1,757 1,395 33 --- 3,749 -564 --- -564 -2,037 1,195 -842
Nov --- --- --- 220 3,151 411 780 335 4,227 --- 4,227 -1,370 7,639 6,268
Dec --- --- --- --- 4,979 445 1,072 --- 6,496 --- 6,496 2,851 -155 2,696
2006 Nov 1 --- --- --- --- 1,430 --- --- --- 1,430 --- 1,430 -3,702 2,000 -1,702
Nov 8 --- --- --- --- 173 311 10 --- 494 --- 494 1,900 -1,000 900
Nov 15 --- --- --- --- --- --- --- 335 -335 --- -335 -1,060 3,000 1,940
Nov 22 --- --- --- 220 1,548 100 --- --- 1,868 --- 1,868 -397 7,857 7,460
Nov 29 --- --- --- --- --- --- 770 --- 770 --- 770 4,360 -857 3,503
Dec 6 --- --- --- --- 878 445 324 --- 1,647 --- 1,647 203 -4,000 -3,797
Dec 13 --- --- --- --- 1,430 --- --- --- 1,430 --- 1,430 -3,095 -3,000 -6,095
Dec 20 --- --- --- --- 1,329 --- 748 --- 2,077 --- 2,077 8,005 -3,000 5,005
Dec 27 --- --- --- --- 1,342 --- --- --- 1,342 --- 1,342 -6,860 10,000 3,140
2007 Jan 3 --- --- --- --- --- --- --- --- --- --- --- 6,785 2,000 8,785
Jan 10 --- --- --- --- --- --- --- --- --- --- --- -5,400 -9,000 -14,400
Jan 17 --- --- --- --- --- --- --- --- --- --- --- 1,101 -1,000 101
Jan 24 --- --- --- --- --- --- --- --- --- --- --- -4,817 -3,000 -7,817
2007 Jan 25 --- --- --- --- --- --- --- --- --- --- --- 3,482 --- 3,482
Intermeeting Period
Dec 12-Jan 25 --- --- --- --- 2,671 --- 748 --- 3,419 --- 3,419 -313 -4,000 -4,313
Memo: LEVEL (bil. $)
Jan 25 277.0 128.9 222.7 69.8 80.5 501.9 --- 778.9 -21.9 15.0 -6.9
1. Change from end-of-period to end-of-period. Excludes changes in compensation for the effects of 4. Includes redemptions (-) of Treasury and agency securities. inflation on the principal of inflation-indexed securities. 5. RPs outstanding less reverse RPs.2. Outright purchases less outright sales (in market and with foreign accounts). 6. Original maturity of 13 days or less.3. Outright purchases less outright sales (in market and with foreign accounts). Includes short-term notes 7. Original maturity of 14 to 90 days. acquired in exchange for maturing bills. Excludes maturity shifts and rollovers of maturing issues, except the rollover of inflation compensation.
MRA:BEW
Class I FOMC - Restricted Controlled (FR) Page 30 of 38

Appendix C Chart 1
Treasury Yield Curve
1960 1964 1968 1972 1976 1980 1984 1988 1992 1996 2000 2004
−4
−2
0
2
4Percentage points
+ Denotes most recent weekly value.Note. Blue shaded regions denote NBER−dated recessions.
+
Spread Between Ten−Year Treasury Yield and Federal Funds Rate
Quarterly
1 3 5 7 10 20
3.5
4.0
4.5
5.0
5.5
6.0Percent
January 25, 2007 December 11, 2006
Treasury Yield Curve*
Maturity in Years*Smoothed yield curve estimated from off−the−run Treasury coupon securities. Yields shown are those on notional par Treasury securities with semi−annual coupons.
Class I FOMC - Restricted Controlled (FR) Page 31 of 38

Appendix C Chart 2
Dollar Exchange Rate Indexes
1972 1975 1978 1981 1984 1987 1990 1993 1996 1999 2002 2005
80
90
100
110
120
130
140
150
Ratio scaleMarch 1973=100
+ Denotes most recent weekly value.
+
Nominal
Major Currencies
Monthly
1973 1976 1979 1982 1985 1988 1991 1994 1997 2000 2003 2006
80
90
100
110
120
130
140
Ratio scaleMarch 1973=100
Real
MajorCurrencies
Broad
Other Important
Monthly
Note. The major currencies index is the trade−weighted average of currencies of the euro area, Canada, Japan, the U.K., Switzerland, Australia, and Sweden. The other important trading partners index is the trade−weighted average of currencies of 19 other important trading partners. The Broad index is the trade−weighted average of currencies of all important trading partners. Real indexes have been adjusted for relative changes in U.S. and foreign consumer prices. Blue shaded regions denote NBER−dated recessions.
Class I FOMC - Restricted Controlled (FR) Page 32 of 38

Appendix C Chart 3
Stock Indexes
0
5
10
15
20
25
30
35
40
45Ratio
+
1960 1964 1968 1972 1976 1980 1984 1988 1992 1996 2000 2004
125
250
500
1000
1500
2000
Ratio scale1941−43=10
* Based on trailing four−quarter earnings.+ Denotes most recent weekly value.
+
Nominal
Monthly
P/E Ratio*
S&P 500
1960 1964 1968 1972 1976 1980 1984 1988 1992 1996 2000 2004
20
40
60
80
100
120
140160
Ratio scale1941−43=10
* Deflated by the CPI.+ Denotes most recent weekly value.Note. Blue shaded regions denote NBER−dated recessions.
+
Real
Monthly
S&P 500*
Class I FOMC - Restricted Controlled (FR) Page 33 of 38

Appendix C Chart 4
One−Year Real Interest Rates
1984 1986 1988 1990 1992 1994 1996 1998 2000 2002 2004 2006−4
0
4
8Percent
* Mean value of respondents.
+
Monthly
One−Year Treasury Constant Maturity Yield Less One−Year Inflation Expectations (Michigan Survey)*
1984 1986 1988 1990 1992 1994 1996 1998 2000 2002 2004 2006−4
0
4
8Percent
* ASA/NBER quarterly survey until 1990:Q1; Philadelphia Federal Reserve Bank Survey of Professional Forecastersthereafter. Median value of respondents.
++
GDP Deflator
CPI
Monthly
One−Year Treasury Constant Maturity Yield Less One−Year Inflation Expectations (Philadelphia Fed)*
1984 1986 1988 1990 1992 1994 1996 1998 2000 2002 2004 2006−4
0
4
8Percent
+ Denotes most recent weekly Treasury constant maturity yield less most recent inflation expectation.Note. Blue shaded regions denote NBER−dated recessions.
+
Monthly
One−Year Treasury Constant Maturity Yield Less Change in the Core CPI from Three Months Prior
Class I FOMC - Restricted Controlled (FR) Page 34 of 38

Appendix C Chart 5
Long−Term Real Interest Rates*
1984 1986 1988 1990 1992 1994 1996 1998 2000 2002 2004 2006 0
2
4
6
8
10Percent
+
+
+
Monthly
Real Ten−Year Treasury Yields
Real rate usingPhiladelphia Fed Survey
Real rate usingMichigan Survey
Ten−year TIPS yield
1984 1986 1988 1990 1992 1994 1996 1998 2000 2002 2004 2006
2
4
6
8
10
12
14Percent
+
+
+
Nominal and Real Corporate Bond Rates
Monthly
Nominal rate on Moody’sA−rated corporate bonds
Real rate usingPhiladelphia Fed Survey
Real rate usingMichigan Survey
* For real rates, measures using the Philadelphia Fed Survey employ the ten−year inflation expectations from the Blue Chip Survey until April 1991 and the Philadelphia Federal Reserve Bank Survey of Professional Forecasters thereafter (median value of respondents). Measures using the Michigan Survey employ the five− to ten−year inflation expectations from that survey (mean value of respondents).
+ For TIPS and nominal corporate rate, denotes the most recent weekly value. For other real rate series, denotes the most recent weekly nominal yield less the most recent inflation expectation. Note. Blue shaded regions denote NBER−dated recessions.
Class I FOMC - Restricted Controlled (FR) Page 35 of 38

Appendix C Chart 6
Commodity Price Measures
1985 1987 1989 1991 1993 1995 1997 1999 2001 2003 2005 2007
80
100
120
140
160
180200
Ratio scale, index (1980=100)Journal of Commerce Index
Weekly
TotalMetals
1985 1987 1989 1991 1993 1995 1997 1999 2001 2003 2005 2007
250
300
350
400
450
500Ratio scale, index (1967=100)
CRB Spot Industrials
Weekly
1985 1987 1989 1991 1993 1995 1997 1999 2001 2003 2005 2007
200
250
300
350
400
450Ratio scale, index (1967=100)
Note. Blue shaded regions denote NBER−dated recessions.
CRB Futures
Weekly
Class I FOMC - Restricted Controlled (FR) Page 36 of 38

Appendix C Chart 7
Growth of M2
1960 1963 1966 1969 1972 1975 1978 1981 1984 1987 1990 1993 1996 1999 2002 2005 2008 0
2
4
6
8
10
12
14Percent
1960 1963 1966 1969 1972 1975 1978 1981 1984 1987 1990 1993 1996 1999 2002 2005 2008 0
2
4
6
8
10
12
14Percent
Nominal M2
Quarterly
1960 1963 1966 1969 1972 1975 1978 1981 1984 1987 1990 1993 1996 1999 2002 2005 2008
−5
0
5
10Percent
1960 1963 1966 1969 1972 1975 1978 1981 1984 1987 1990 1993 1996 1999 2002 2005 2008
−5
0
5
10Percent
Real M2
Quarterly
Note. Four−quarter moving average. Blue shaded regions denote NBER−dated recessions. Gray areas denote projection period. Real M2 is deflated by CPI.
Class I FOMC - Restricted Controlled (FR) Page 37 of 38

Appendix C Chart 8
Inflation Indicator Based on M2
Note: P* is defined to equal M2 times V* divided by potential GDP. V*, or long-run velocity, is estimatedusing average velocity over the 1959:Q1-to-1989:Q4 period and then, after a break, over the interval from1993:Q1 to the present. For the forecast period, P* is based on the staff M2 forecast and P is simulated using ashort-run dynamic model relating P to P*. Blue areas indicate periods in which P* is notably less than P.Gray areas denote the projection period.
1965 1968 1971 1974 1977 1980 1983 1986 1989 1992 1995 1998 2001 2004 2007
40
60
80
100
120
140Ratio scalePrice Level
Quarterly
Implicit GDPprice deflator (P) Long-run equilibrium
price level (P*)
1965 1968 1971 1974 1977 1980 1983 1986 1989 1992 1995 1998 2001 2004 2007
40
60
80
100
120
140Ratio scale
1965 1968 1971 1974 1977 1980 1983 1986 1989 1992 1995 1998 2001 2004 2007
2
4
6
8
10
12PercentInflation 1
Quarterly
1965 1968 1971 1974 1977 1980 1983 1986 1989 1992 1995 1998 2001 2004 2007
2
4
6
8
10
12Percent
1. Change in the implicit GDP price deflator over the previous four quarters.
Class I FOMC - Restricted Controlled (FR) Page 38 of 38