fomc 20070131 g bpt 120070124
TRANSCRIPT

Content last modified 02/07/2013.
Prefatory Note The attached document represents the most complete and accurate version available based on original files from the FOMC Secretariat at the Board of Governors of the Federal Reserve System. Please note that some material may have been redacted from this document if that material was received on a confidential basis. Redacted material is indicated by occasional gaps in the text or by gray boxes around non-text content. All redacted passages are exempt from disclosure under applicable provisions of the Freedom of Information Act.

Class II FOMC - Restricted (FR)
Part 1 January 24, 2007
CURRENT ECONOMICAND FINANCIAL CONDITIONS
Summary and Outlook
Prepared for the Federal Open Market Committeeby the staff of the Board of Governors of the Federal Reserve System

Class II FOMC - Restricted (FR)
January 24, 2007
Summary and Outlook
Prepared for the Federal Open Market Committeeby the staff of the Board of Governors of the Federal Reserve System

Class II FOMC—Restricted (FR)
Domestic Developments
I-1
On balance, the incoming spending data have been stronger than we anticipated at the time of the last Greenbook; in response, we have boosted our projection for the trajectory of aggregate activity in the near term. Most notably, the data suggest considerably more vigor in consumer spending late last year than we had expected, and we have carried forward some of that strength into the first quarter. Real GDP also appears to have received a boost in the fourth quarter from a pickup in defense spending and a surge in net exports, but we believe that these factors will prove transitory. The contraction in housing construction is unfolding very much as we had expected, but business fixed investment has come in to the soft side of our earlier expectation. All told, we have marked up our estimate for the growth of real GDP in the fourth and first quarters by an average of about ¾ percentage point at an annual rate, leaving it at about 2½ percent for last quarter and 2 percent for this quarter. Beyond the near term, however, our forecast for the growth of real activity is little changed from the one in the last Greenbook. Although interest rates are projected to be a little higher than in our previous forecast and the dollar is assumed to be somewhat stronger, the additional restraint implied by these factors is offset by a significantly lower projected path for oil prices. As a result, we continue to forecast that real GDP will rise about 2¼ percent in 2007 and 2½ percent in 2008 and that the unemployment rate will gradually rise over the projection period. Because the level of activity is higher throughout the forecast period, the unemployment rate is now projected to remain below 5 percent through the end of next year. Although the higher level of resource utilization in this projection would, by itself, have implied a slight upward adjustment to our inflation forecast, that effect is more than offset by the recent favorable readings on consumer prices, the lower projected path of energy prices, and the restraint on import prices from the higher assumed path of the dollar. Consequently, we have marked down our projection for core PCE inflation to 2.2 percent this year and 2.0 percent next year, 0.1 percentage point lower in each year than we forecast in the December Greenbook. Key Background Factors We now assume that the FOMC will keep the federal funds rate at 5¼ percent through the end of 2008 rather than nudging it down to 5 percent around the middle of next year as we had assumed in the previous Greenbook forecast. Financial market participants responded to the recent economic data by marking up the expected path of the federal

I-2 Class II FOMC—Restricted (FR) Part 1: Summary and Outlook, January 24, 2007
funds rate beyond the near term by roughly 50 basis points, leaving the expected funds rate somewhat below 4¾ percent by the end of 2008. Interest rates on longer-term securities also have risen since the December Greenbook. We assume that long-term rates will drift up a bit further over the projection period as market participants come to recognize that the federal funds rate will remain higher than they currently anticipate. Broad equity prices have increased about 1 percent since the December Greenbook. As in previous Greenbooks, we assume that share prices will increase at an annual rate of 6½ percent over the next two years, a pace that would roughly maintain risk-adjusted parity with the returns on long-term Treasury securities. Regarding house prices, we expect the OFHEO purchase-only price index to decelerate from a pace of about 4 percent in 2006 to a pace of 1 percent this year and next, leaving the path of house prices a shade below that in our last projection. Our fiscal policy assumptions are unchanged. We continue to expect increases in defense spending to fund ongoing activities in Iraq and Afghanistan. Although the shift in control of the Congress may alter the composition of nondefense spending, we are assuming that it will not affect total spending. On the revenue side, we continue to assume that alternative minimum tax relief will be extended through 2008 without any offsetting tax increases or spending cuts. All told, we expect the unified budget to show a deficit of $232 billion in fiscal 2007, a touch less than in the previous fiscal year. For fiscal 2008, we project that the deficit will step up to $269 billion, as receipts decelerate to a pace more in line with that of nominal income and as spending increases only a little more slowly than its average in recent years. On net, federal fiscal policy is expected to provide an impetus to real GDP growth of about 0.3 percentage point this year and 0.1 percentage point next year. In the state and local sector, where finances have improved, policy is expected to provide an impetus to real GDP growth of about ¼ percentage point this year and next. The foreign exchange value of the dollar (as measured by the real trade-weighted index) is about 1¼ percent above where we thought it would be as of the December Greenbook. Going forward, with the dollar depreciating modestly as in past Greenbooks, its path is commensurately higher over the forecast period. We forecast that foreign real GDP will increase about 3½ percent this year and next, a touch faster than in the previous Greenbook.

Class II FOMC -- Restricted (FR)
Key Background Factors Underlying the Baseline Staff Projection
2003 2004 2005 2006 2007 20080
1
2
3
4
5
6
7
0
1
2
3
4
5
6
7Percent
Federal Funds Rate
Quarterly average
Note. In each panel, shading represents the projection period.
Current Greenbook
December Greenbook
Market forecast
2003 2004 2005 2006 2007 20083
4
5
6
7
8
9
3
4
5
6
7
8
9Percent
Long-Term Interest Rates
Quarterly average
Baa corporate rate
December GB
10-yearTreasury rate
December GB
2003 2004 2005 2006 2007 200870
2102003:Q1=100, ratio scale
70
90
110
130
150
170
190
210Quarter-end
Equity Prices
Wilshire 5000
December GB
2003 2004 2005 2006 2007 200890
1702003:Q1=100, ratio scale
90
110
130
150
170Quarterly
House Prices
Note. The projection period begins in 2006:Q4.
OFHEO purchase-only index
December GB
2003 2004 2005 2006 2007 200816
32
48
64
80
16
32
48
64
80
Dollars per barrel
Crude Oil Prices
Quarterly average
West Texasintermediate
December GB
2003 2004 2005 2006 2007 200875
80
85
90
95
100
105
75
80
85
90
95
100
1052003:Q1=100
Broad Real Dollar
Quarterly average
December GB
I-3

I-4 Class II FOMC—Restricted (FR) Part 1: Summary and Outlook, January 24, 2007
Since the last Greenbook, the spot price of West Texas intermediate (WTI) crude oil has fallen more than $8 per barrel, to around $54 per barrel. This decline in spot prices appears to have resulted largely from warmer-than-usual weather this winter in North America and Europe. Further-dated oil futures prices also moved down noticeably in recent weeks, possibly reflecting a market reevaluation of Saudi Arabia’s willingness to defend elevated oil prices. Nevertheless, with global demand likely to remain firm, we expect the price of WTI to rise gradually on a path consistent with futures quotes to about $61 per barrel by the end of next year. This projection leaves the price of WTI at the end of 2008 more than $9 per barrel below that in the last Greenbook. Recent Developments and the Near-Term Outlook As noted above, we have revised up sharply our estimate of real GDP growth in the fourth quarter, as data for consumer expenditures, federal defense spending, and the contribution of net exports all came in above our expectations. We now project that the Bureau of Economic Analysis (BEA) will report that real GDP increased at an annual rate of about 2½ percent in the fourth quarter, compared with our estimate of 1¼ percent in the December Greenbook. We have revised up projected growth of real GDP in the first quarter by considerably less—just ¼ percentage point—to 2 percent at an annual rate. Extracting a meaningful signal from the quarterly pattern of real GDP growth is more challenging than usual because we believe that anomalies in the way that the BEA measures the output of the motor vehicle sector caused important distortions in the quarterly pattern of real GDP.1 Perhaps the clearest picture of underlying aggregate demand can be gleaned from the recent behavior of private domestic final purchases (PDFP)—that is, the sum of consumption, residential investment, and business fixed investment. This aggregate is largely unaffected by the measurement anomalies in the motor vehicle sector and wholly unaffected by the swings in defense spending and net exports. We estimate that real PDFP increased in the fourth quarter at a pace of about 2 percent—nearly the same rate as in the second and third quarters of last year—and we expect this pace to continue into the current quarter. For the fourth and first quarters, this
1 As reported in the national accounts, the real value of new motor vehicle output is currently estimated
to have risen at an annual rate of nearly 29 percent in the third quarter even though motor vehicle assemblies declined at an annual rate of almost 600,000 units. As discussed in the December Greenbook, we believe that the BEA’s measurement procedures are not correctly capturing motor vehicle production. According to our best estimates, these anomalies boosted reported GDP growth nearly 1 percentage point in the third quarter, will pull down reported growth in the fourth quarter by about the same amount, and will add a little in the first quarter.

Domestic Developments Class II FOMC—Restricted (FR) I-5
Summary of the Near-Term Outlook (Percent change at annual rate except as noted)
2006:Q4 2007:Q1 Measure Dec.
GB Jan. GB
Dec. GB
Jan. GB
Real GDP 1.3 2.6 1.7 2.0 Private domestic final purchases 1.2 2.1 1.3 2.0 Personal consumption expenditures 3.1 4.6 2.7 3.6 Residential investment -23.8 -20.6 -20.3 -21.2 Business fixed investment 4.1 -1.4 3.9 3.9 Government outlays for consumption and investment 3.4 4.9 2.9 2.3
Contribution to growth (percentage points)
Inventory investment -.9 -1.2 .3 .3 Net exports .5 1.1 -.3 -.5
pace is about ¾ percentage point faster than we had projected in the December Greenbook. That unexpected strength in private spending has been mirrored in the recent labor market data, which continue to provide little indication of the slowdown in the pace of hiring that we had expected. Increases in private payroll employment averaged 119,000 in the fourth quarter, close to the average pace in the previous two quarters, and the unemployment rate held steady at 4.5 percent in December. In response, we have revised up our forecast for private payroll gains in the first quarter by 25,000 per month, to an average of about 100,000 per month. We continue to expect the unemployment rate to average 4.6 percent in the first quarter. Manufacturing production jumped 0.7 percent in December after some very soft readings in the fall. Forward-looking indicators point to more-modest monthly increases in manufacturing output—on the order of 0.2 percent—in coming months. Production of semiconductors, computers, and aircraft appears poised for continued solid gains, but output in sectors related to construction and motor vehicles appears likely to remain soft. As for motor vehicles, automakers’ schedules call for only a slight increase in the production of light vehicles from the low pace of the fourth quarter. Production of medium and heavy trucks is expected to drop sharply this quarter after last year’s surge to

I-6 Class II FOMC—Restricted (FR) Part 1: Summary and Outlook, January 24, 2007
fill orders before the new EPA emission standards took effect at the beginning of this year. On the spending side, the robust readings on retail sales in November and December boosted our estimate of the growth in real consumer outlays in the fourth quarter to an annual rate of about 4½ percent, well above the rate projected in the December Greenbook. The fundamentals have remained quite solid, with steady gains in employment, increases in stock market wealth in the second half of last year, and declines in energy prices that have raised real incomes and boosted consumer sentiment. Fourth-quarter spending seems to have been even stronger than what would have been consistent with these underlying fundamentals; we have reacted by carrying into the current quarter some of the unexplained strength in the growth of real consumption spending. Overall, we expect real consumption outlays to increase about 3½ percent this quarter, nearly 1 percentage point more than we had projected in the last Greenbook. The latest data on new and existing home sales, as well as recent readings on homebuying attitudes and mortgage applications, appear consistent with our view that home sales are stabilizing, albeit at a level more than 13 percent below their peak in 2005. With the inventory of unsold new homes still high, the level of new home construction should remain quite weak. Single-family starts fell to an annual rate of 1.23 million units in the fourth quarter, and we anticipate a further drop, to 1.18 million units, in the first quarter. Accordingly, we project that real residential investment declined at an annual rate of more than 20 percent in the fourth quarter and will fall at a similar pace in the first quarter. These declines subtract about 1¼ percentage points from real GDP growth each quarter. We estimate that real outlays for equipment and software fell at an annual rate of about 4 percent in the fourth quarter. This decline in E&S spending is accentuated by a drop in the volatile transportation sector, but the most recent indicators now suggest that real spending outside transportation and high-tech softened last quarter. However, the fourth-quarter decline in this so-called other category appears to have particularly reflected weakness in equipment related to construction and motor vehicle manufacturing. With orders remaining above shipments in the other category and imports of capital goods expected to move up, we forecast that real spending will rise modestly in the first quarter. Purchases of high-tech equipment and software are anticipated to accelerate in the first quarter after a fourth-quarter lull. Overall, we project that spending for equipment and

Domestic Developments Class II FOMC—Restricted (FR) I-7
software will increase at an annual rate of about 3½ percent this quarter, somewhat more than we anticipated in the December Greenbook. We estimate that real outlays for nonresidential structures rose at an annual rate of 5 percent in the fourth quarter and will rise at a similar pace in the first quarter. This pace is a bit below that projected in the December Greenbook because of smaller increases in activity in the drilling and mining sector. Spending on drilling and mining remains at a high level; however, incoming data on drilling rigs in operation and footage drilled have been weaker than we were expecting. Our near-term forecast of real nonfarm inventory investment continues to be distorted by the anomaly in the BEA’s measurement of motor vehicle output that was noted above. When we abstract from this measurement issue, the automakers appear to have made some progress in paring stocks last quarter. Nevertheless, inventories of light vehicles at year-end appear still to have been above desired levels. We expect the pace of production currently scheduled for the first quarter to be restrained enough to allow the manufacturers to trim their inventories somewhat further. Outside motor vehicles, businesses appear to be making relatively prompt production adjustments in response to emerging buildups of inventories; we believe that, as a result of these adjustments, the level of inventory investment stepped down in the fourth quarter and will be little changed in the first quarter. Real federal expenditures on consumption and investment are estimated to have increased at an annual rate of 8¾ percent in the fourth quarter, a noticeably faster pace than we had projected in the December Greenbook. This upward revision reflects indications from recent monthly Treasury statements that defense spending posted a larger increase than we had anticipated. We believe that much of this additional spending is a pull-forward of outlays that would have occurred later in the fiscal year. Accordingly, we have marked down our near-term forecast of the growth rate of real defense purchases, leading us to lower our forecast of growth in real total federal spending to about 2 percent in the current quarter. For the state and local sector, we estimate that real expenditures rose 2¾ percent in the fourth quarter, supported by continued gains in employment and a return to positive growth in construction outlays following a third-quarter dip. We expect real expenditures in the current quarter to increase about 2½ percent, with continued increases in both employment and construction.

I-8 Class II FOMC—Restricted (FR) Part 1: Summary and Outlook, January 24, 2007
Regarding the external sector, we estimate that real net exports added more than 1 percentage point to real GDP growth in the fourth quarter, more than double the contribution that we had forecast in the December Greenbook. Monthly data on exports have come in somewhat stronger than we had expected, and imports—notably of oil, other industrial supplies, and capital goods—were lower than we had anticipated. With the growth of exports expected to slow and imports expected to rebound, real net exports are projected to subtract about ½ percentage point from real GDP growth in the first quarter. The incoming data on consumer price inflation have been favorable. The core PCE price index was unchanged in November, and our translation of the December CPI suggests an increase of 0.2 percent in core PCE prices last month. As a result, we have marked down our forecast of core PCE inflation in the fourth quarter 0.5 percentage point, to 2.1 percent, and in the first quarter we have revised down the forecast 0.2 percentage point, to 2.2 percent. Although consumer energy prices rose in December, they were down substantially for the fourth quarter as a whole, and the recent decline in oil prices points to some further retreat in consumer energy prices this quarter. As a result, we project that overall PCE prices will rise at an annual rate of about 2 percent in the current quarter after declining at a ¾ percent pace in the fourth quarter. The Longer-Term Outlook for the Economy As the restraint from housing diminishes this year, economic growth is expected to move back up toward our estimate of the growth in potential output. Relative to the December Greenbook, our forecast for the growth of real GDP this year and next is little changed, as the effect of lower oil prices is about offset by slightly higher interest rates and a higher path for the dollar. Household spending. After increasing 3¾ percent last year, consumption growth is expected to slow to an annual rate of about 2¾ percent this year and next. That slowdown reflects a diminishing impetus to PCE growth from household wealth and a greater drag on spending from past increases in interest rates. In addition, we expect that households will gradually bring their spending back into line with fundamentals after a period of unexplained strength. With the growth of real disposable income running ahead of spending, we project that the saving rate will rise from negative ¾ percent in the fourth quarter of last year to 1 percent by the end of 2008. Our forecast of real PCE growth in the second half of this year and in 2008 is a little stronger than it was in the December

Domestic Developments Class II FOMC—Restricted (FR) I-9
Projections of Real GDP (Percent change at annual rate from end of
preceding period except as noted)
Measure 2006: H2
2007: H1 2007 2008
Real GDP 2.3 2.2 2.3 2.5 Previous 1.7 2.0 2.2 2.5
Final sales 2.9 2.0 2.2 2.5 Previous 2.1 1.9 2.1 2.5
PCE 3.7 3.0 2.8 2.7 Previous 3.0 2.5 2.5 2.6
Residential investment -19.6 -15.2 -8.8 2.0 Previous -21.3 -14.0 -7.6 1.4
BFI 4.1 5.8 5.1 4.2 Previous 6.7 4.1 3.9 4.1
Government purchases 3.3 2.2 2.1 1.9 Previous 2.7 2.7 2.4 1.9
Exports 7.2 5.2 5.1 5.1 Previous 5.9 5.5 5.4 5.6
Imports 1.8 5.1 5.0 5.1 Previous 3.0 3.9 4.2 5.1
Contribution to growth (percentage points)
Inventory change -.6 .1 .1 -.0 Previous -.4 .0 .1 .0
Net exports .5 -.2 -.2 -.3 Previous .1 -.0 -.1 -.2
Greenbook, the strength largely reflecting the lagged effects of the faster pace of real income growth that we now project over the first half of this year. As noted earlier, the inventory of unsold new homes remains high. Accordingly, we forecast that single-family housing starts will remain weak in 2007, averaging 1.2 million units. That level of starts should go a long way toward eliminating the excess stock of unsold new homes, given our forecast that sales will stabilize and begin to edge up in the middle of this year. As the inventory adjustment proceeds, we expect single-family starts to turn up and to reach a pace of 1.3 million units by the end of 2008. In the multifamily sector—where construction activity has been relatively stable in recent years—we expect

I-10 Class II FOMC—Restricted (FR) Part 1: Summary and Outlook, January 24, 2007
starts to average about 330,000 units this year and 350,000 units next year. Putting together the pieces, we project that real residential investment will fall another 8¾ percent this year, before rising 2 percent next year. Business spending. Real spending on equipment and software (E&S) is projected to accelerate from a growth rate of 4¼ percent in 2006 to 5¼ percent in 2007 and 5¾ percent in 2008. Among other factors, the step-up in E&S growth reflects a partial recovery of spending on transportation equipment following last year’s decline: Although outlays for medium and heavy trucks are expected to be held down this year by a payback for last year’s bulge, purchases of aircraft by domestic airlines should turn up sharply this year. In addition, we expect continued solid increases in spending on high-tech equipment, as telecommunications service providers further expand their fiber optic networks and as businesses continue to invest in information technology equipment to improve the efficiency of their business processes. Outside the transportation and high-tech categories, we expect growth in real equipment spending to slow from about 3¾ percent in 2006 to 2 percent this year and then to edge up to about 2¼ percent in 2008; this contour largely reflects the pattern of changes in the growth of business output. After rising 12¼ percent in 2006, real outlays for nonresidential structures are expected to decelerate to a pace of 4¾ percent this year and 1 percent next year. Incoming information on construction outlays for nonresidential buildings suggests that spending growth has downshifted, and our projection for next year brings growth in this component of nonresidential structures closer to its long-run average. Drilling and mining activity is projected to flatten out at a high level by the end of the forecast period; our projection for this component is down slightly from the December Greenbook, reflecting the lower path of energy prices. Although there are some signs that inventories were elevated in a number of sectors toward the end of last year, most businesses appear to be responding quickly to keep inventories well aligned with sales, so we expect any imbalances to be short-lived. Consequently, we project that inventories will be a roughly neutral influence on real GDP growth this year and next. Government spending. Real federal expenditures on consumption and investment are expected to increase 1½ percent this year and 1¼ percent next year. Across both years, increases in real defense spending average about 2 percent, and real nondefense outlays are projected to remain flat. Our projection for defense spending is predicated on the

Domestic Developments Class II FOMC—Restricted (FR) I-11
assumption that the Administration will ask for, and the Congress will approve, a further increase in the level of funding. In the state and local sector, real spending is expected to increase about 2½ percent this year and 2¼ percent next year. Although these projected increases are down slightly from last year’s rate, they are noticeably above the very subdued pace that prevailed during the previous several years. State and local governments appear to have stepped up the rate of increase in their spending in response to the improvements in their finances that occurred in recent years. Net exports. Both real exports and real imports are projected to increase at annual rates of about 5 percent over the forecast period. Relative to the last Greenbook, the projected growth rate of exports has been revised down a little owing to the higher path for the dollar; at the same time, our projection of real import growth has been revised up a bit, reflecting the higher dollar and stronger U.S. demand. Because the volume of imports is larger than that of exports, these projected growth rates imply that real net exports will subtract about ¼ percentage point from real GDP growth both this year and next, a little more than in the December Greenbook. (The International Developments section provides more detail on the outlook for the external sector.) Aggregate Supply, the Labor Market, and Inflation We continue to assume that structural productivity will increase 2½ percent per year over the forecast period and that the growth rate of potential output will edge down from 2.7 percent in 2006 to 2.5 percent in 2008. This slowdown reflects our assumptions of a steepening downward trend in labor force participation and a slowdown in the rate of growth of the working-age population. With a higher projected level of actual real GDP over the forecast period and unchanged estimates of potential output, we have revised up our projection of the GDP gap (meaning more-intensive utilization of resources). Indeed, the below-trend output growth that we anticipate this year will not suffice to push the level of GDP below the level of potential. In addition, the unemployment rate at the end of the projection period remains a touch below our estimate of the NAIRU. Productivity and the labor market. Productivity growth stepped down last year, as firms made only small adjustments to the rate of increase in their labor input in the latter part of the year despite the slower pace of output growth. We expect employers to reduce

I-12 Class II FOMC—Restricted (FR) Part 1: Summary and Outlook, January 24, 2007
Decomposition of Structural Labor Productivity Nonfarm Business Sector
(Percent change, Q4 to Q4, except as noted)
Measure 1974-95
1996-2000
2001-04 2005 2006 2007 2008
Structural labor productivity 1.5 2.5 3.0 2.5 2.6 2.5 2.5 Previous 1.5 2.5 3.0 2.5 2.6 2.5 2.5
Contributions1 Capital deepening .7 1.4 .6 .5 .7 .6 .6 Previous .7 1.4 .6 .5 .7 .6 .6 Multifactor productivity .5 .8 2.1 1.8 1.7 1.7 1.7 Previous .5 .8 2.1 1.8 1.7 1.7 1.7 Labor composition .3 .3 .3 .3 .2 .2 .2
MEMO Potential GDP 3.0 3.3 2.9 2.6 2.7 2.6 2.5 Previous 3.0 3.3 2.9 2.6 2.7 2.6 2.5
NOTE. Components may not sum to totals because of rounding. For multiyear periods, the percent change is the annual average from Q4 of the year preceding the first year shown to Q4 of the last year shown. 1. Percentage points.
The Outlook for the Labor Market
(Percent change, Q4 to Q4, except as noted)
Measure 2005 2006 2007 2008
Output per hour, nonfarm business 2.5 1.5 2.4 2.6 Previous 2.5 1.2 2.6 2.7 Nonfarm private payroll employment 1.6 1.5 .7 .4 Previous 1.6 1.4 .5 .4 Household survey employment 1.9 2.1 .4 .5 Previous 1.9 1.8 .2 .5 Labor force participation rate1 66.1 66.3 66.0 65.7 Previous 66.1 66.2 65.8 65.6 Civilian unemployment rate1 5.0 4.5 4.8 4.9 Previous 5.0 4.5 5.0 5.1 MEMO GDP gap2 -.0 .4 .1 .1 Previous -.0 .1 -.3 -.3
1. Percent, average for the fourth quarter. 2. Percent difference between actual and potential GDP in the fourth quarter of the year indicated. A negative number indicates that the economy is operating below potential.

Domestic Developments Class II FOMC—Restricted (FR) I-13
Inflation Projections (Percent change, Q4 to Q4, except as noted)
Measure 2005 2006 2007 2008
PCE chain-weighted price index 3.1 1.9 2.2 2.1 Previous 3.1 2.0 2.8 2.1
Food and beverages 2.1 2.3 2.9 2.2 Previous 2.1 2.6 2.5 2.3
Energy 21.2 -3.9 1.8 2.2 Previous 21.2 -4.7 9.5 1.1
Excluding food and energy 2.1 2.3 2.2 2.0 Previous 2.1 2.4 2.3 2.1
Consumer price index 3.7 2.0 2.4 2.2 Previous 3.7 2.0 3.1 2.2
Excluding food and energy 2.1 2.7 2.4 2.2 Previous 2.1 2.8 2.5 2.3
GDP chain-weighted price index 3.1 2.6 2.6 2.3 Previous 3.1 2.5 2.6 2.4
ECI for compensation of private industry workers1 2.9 3.2 4.0 4.0 Previous 2.9 3.2 4.1 4.1
Compensation per hour, nonfarm business sector 4.1 4.9 4.9 4.9 Previous 4.1 4.9 5.1 5.0
Prices of core nonfuel imports 2.2 2.9 1.5 1.0 Previous 2.2 2.9 2.1 1.0
1. December to December. the pace of hiring in coming quarters. Consequently, productivity is forecast to rise about in line with its trend this year and next, whereas payroll employment gains are expected to slow to about 60,000 per month in the second half of 2007 and in 2008.2 These projected employment gains are below our estimate of the pace needed to absorb the projected increases in the labor force; accordingly, we expect the unemployment rate to rise to 4.9 percent by the end of 2008. Prices and wages. Core PCE inflation is expected to edge down to 2.2 percent this year and 2 percent next year, 0.1 percentage point less each year than anticipated in the
2 We estimate that the monthly pace of payroll employment growth consistent with no change in the unemployment rate will slow from about 110,000 in 2006 to roughly 80,000 in 2008.
I-14 Class II FOMC—Restricted (FR) Part 1: Summary and Outlook, January 24, 2007
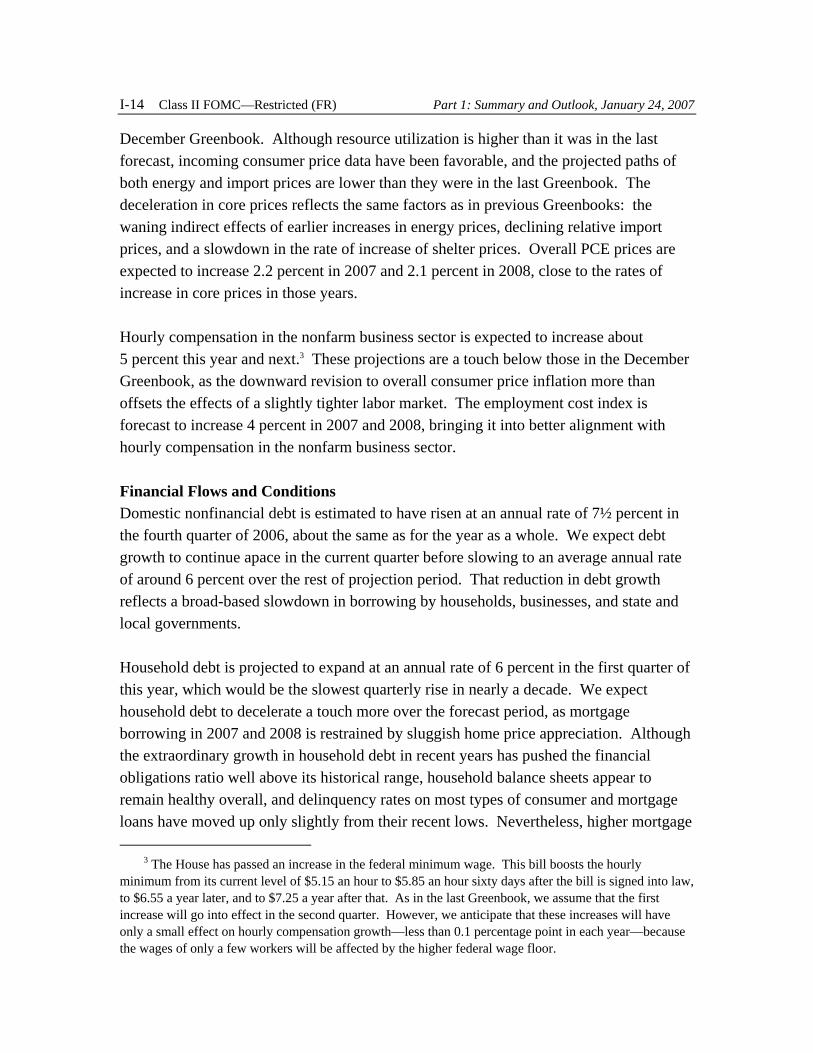
December Greenbook. Although resource utilization is higher than it was in the last forecast, incoming consumer price data have been favorable, and the projected paths of both energy and import prices are lower than they were in the last Greenbook. The deceleration in core prices reflects the same factors as in previous Greenbooks: the waning indirect effects of earlier increases in energy prices, declining relative import prices, and a slowdown in the rate of increase of shelter prices. Overall PCE prices are expected to increase 2.2 percent in 2007 and 2.1 percent in 2008, close to the rates of increase in core prices in those years. Hourly compensation in the nonfarm business sector is expected to increase about 5 percent this year and next.3 These projections are a touch below those in the December Greenbook, as the downward revision to overall consumer price inflation more than offsets the effects of a slightly tighter labor market. The employment cost index is forecast to increase 4 percent in 2007 and 2008, bringing it into better alignment with hourly compensation in the nonfarm business sector. Financial Flows and Conditions Domestic nonfinancial debt is estimated to have risen at an annual rate of 7½ percent in the fourth quarter of 2006, about the same as for the year as a whole. We expect debt growth to continue apace in the current quarter before slowing to an average annual rate of around 6 percent over the rest of projection period. That reduction in debt growth reflects a broad-based slowdown in borrowing by households, businesses, and state and local governments. Household debt is projected to expand at an annual rate of 6 percent in the first quarter of this year, which would be the slowest quarterly rise in nearly a decade. We expect household debt to decelerate a touch more over the forecast period, as mortgage borrowing in 2007 and 2008 is restrained by sluggish home price appreciation. Although the extraordinary growth in household debt in recent years has pushed the financial obligations ratio well above its historical range, household balance sheets appear to remain healthy overall, and delinquency rates on most types of consumer and mortgage loans have moved up only slightly from their recent lows. Nevertheless, higher mortgage
3 The House has passed an increase in the federal minimum wage. This bill boosts the hourly minimum from its current level of $5.15 an hour to $5.85 an hour sixty days after the bill is signed into law, to $6.55 a year later, and to $7.25 a year after that. As in the last Greenbook, we assume that the first increase will go into effect in the second quarter. However, we anticipate that these increases will have only a small effect on hourly compensation growth—less than 0.1 percentage point in each year—because the wages of only a few workers will be affected by the higher federal wage floor.

Domestic Developments Class II FOMC—Restricted (FR) I-15
rates and lackluster house price appreciation are expected to put some downward pressure on household credit quality over the forecast period. Growth of nonfinancial business debt is estimated to have stepped up to a robust annual rate of 10¼ percent in the fourth quarter of 2006, boosted by the additional debt associated with elevated levels of cash-financed mergers and acquisitions and share repurchases. We expect that the growth of business debt will drop back to an average of 7 percent in 2007 and 2008, as M&A and share repurchase activity returns to more-typical levels. Debt defaults will likely tick up from their extraordinarily low levels as profit growth is projected to slow and corporate leverage is expected to increase somewhat. Federal debt rose moderately in the fourth quarter, bringing its growth for the year as a whole to 4 percent. The growth of federal debt is projected to pick up to about 5½ percent in 2008 as the unified deficit widens. In the state and local government sector, issuance for advance refunding as well as new capital projects was quite strong in the fourth quarter of 2006. We expect new capital issuance to remain robust over the forecast period, although a drop in issuance for advance refunding as interest rates rise causes debt growth to ease somewhat this year and next. M2 is estimated to have expanded 5 percent in 2006, a bit less than the growth of nominal GDP because of a modest drag from the rise in opportunity costs. With opportunity costs expected to decline over the forecast period, M2 is projected to rise at an average pace of 5¼ percent in 2007 and 2008, a shade faster than the rate of growth projected for nominal GDP. Alternative Simulations In this section, we evaluate several alternatives to the staff forecast using simulations of the FRB/US model. In the first scenario, the recent strength in consumer spending is assumed to be more persistent than we anticipate in the baseline forecast. We then focus on downside risks to aggregate demand—that the pace of business equipment spending will not pick up as we expect and that the ongoing slump in the housing market will prove deeper than we project. The next set of simulations considers the implications of alternative assumptions about aggregate supply, including a lower NAIRU, slower productivity growth, and faster trend labor force growth. We evaluate each of these risks under the assumption that monetary policy responds to changes in the outlook according

I-16 Class II FOMC—Restricted (FR) Part 1: Summary and Outlook, January 24, 2007
Alternative Scenarios (Percent change, annual rate, from end of preceding period except as noted)
2006 2007 2008 Measure and scenario
H2 H1 H2 H1 H2
Real GDP Greenbook baseline 2.3 2.2 2.4 2.5 2.5 Buoyant consumer spending 2.8 3.2 3.5 3.2 Weak investment 1.8 1.9 1.9 1.9 More extensive housing correction 2.1 1.8 2.0 2.3 Lower NAIRU 2.4 2.6 2.8 2.8 Slower productivity growth 1.9 1.5 1.3 1.3 with stable participation 2.2 2.2 2.3 2.3 Market-based federal funds rate 2.2 2.4 2.7 2.8
Unemployment rate1 Greenbook baseline 4.5 4.7 4.8 4.9 4.9 Buoyant consumer spending 4.6 4.6 4.5 4.3 Weak investment 4.7 4.9 5.1 5.2 More extensive housing correction 4.7 4.9 5.1 5.2 Lower NAIRU 4.7 4.7 4.8 4.7 Slower productivity growth 4.7 4.8 5.1 5.2 with stable participation 4.7 4.8 4.9 5.0 Market-based federal funds rate 4.7 4.8 4.9 4.8
Core PCE inflation Greenbook baseline 2.1 2.2 2.1 2.0 2.0 Buoyant consumer spending 2.2 2.1 2.0 2.1 Weak investment 2.2 2.1 2.1 2.1 More extensive housing correction 2.2 2.1 2.0 2.0 Lower NAIRU 2.1 1.9 1.7 1.7 Slower productivity growth 2.3 2.3 2.2 2.3 with stable participation 2.3 2.4 2.4 2.4 Market-based federal funds rate 2.2 2.1 2.1 2.1
Federal funds rate1 Greenbook baseline 5.3 5.3 5.3 5.3 5.3 Buoyant consumer spending 5.5 5.9 6.4 6.7 Weak investment 5.2 5.0 4.8 4.7 More extensive housing correction 5.3 5.0 4.7 4.6 Lower NAIRU 5.2 5.1 4.9 4.8 Slower productivity growth 5.6 5.7 5.7 5.4 with stable participation 5.4 5.5 5.6 5.6 Market-based federal funds rate 5.2 5.1 4.8 4.7
1. Percent, average for the final quarter of the period.

Domestic Developments Class II FOMC—Restricted (FR) I-17
to an estimated version of the Taylor rule. In the final scenario, we assume that monetary policy follows the path implied by quotes from the futures market. Buoyant consumer spending. At least by the lights of some of our models, consumer expenditures advanced more rapidly last year than would have been expected given income, wealth, and interest rates. In contrast to our baseline view that household spending will gradually come back into better alignment with fundamentals, in this scenario the recent surprising strength is assumed to persist, and outlays expand in line with income. As a result, the personal saving rate remains below zero rather than rising to 1 percent as in the baseline. Under these conditions, real GDP increases about 3 percent this year and 3¼ percent in 2008, and the unemployment rate continues to move down rather than rising as in the baseline. In response to the further tightening of labor and product markets, the federal funds rate moves up to 6¾ percent next year. Inflation is up only slightly relative to baseline, largely because expectations remain well anchored but also because the rise in the funds rate causes a modest appreciation of the dollar and thus lowers import prices. If demand continued to outstrip supply past 2008, however, inflation would move up more noticeably. Weak investment. Recent readings on orders and shipments have come in weaker than we expected, but we view this slowdown as likely to prove temporary, in part because we believe firms have ample investment opportunities and are not financially constrained given the high level of profits. However, the sizable cash positions of firms could be a signal that the return on new capital is not in fact viewed as that favorable; moreover, businesses may have recently become more cautious about their capital expenditures pending a resolution of the slowdown in the housing market. In this scenario, real E&S outlays are projected to continue to advance at their estimated average pace since the spring of less than 1 percent per year, compared with 5½ percent in the baseline. In addition, real investment in nonresidential construction levels out more quickly than in the staff forecast. The slower pace of business spending causes real GDP to expand by a little less than 2 percent both this year and next, and the unemployment rate rises a bit more than in the baseline, to 5¼ percent. As a result, the federal funds rate falls to 4¾ percent next year. Inflation is slightly above baseline next year despite the additional slack and stable inflation expectations because of the combined effects of dollar depreciation and smaller productivity gains arising from less capital deepening. More-extensive housing correction. In the baseline forecast, we expect construction activity to begin to recover later this year and house prices to be roughly unchanged from
I-18 Class II FOMC—Restricted (FR) Part 1: Summary and Outlook, January 24, 2007
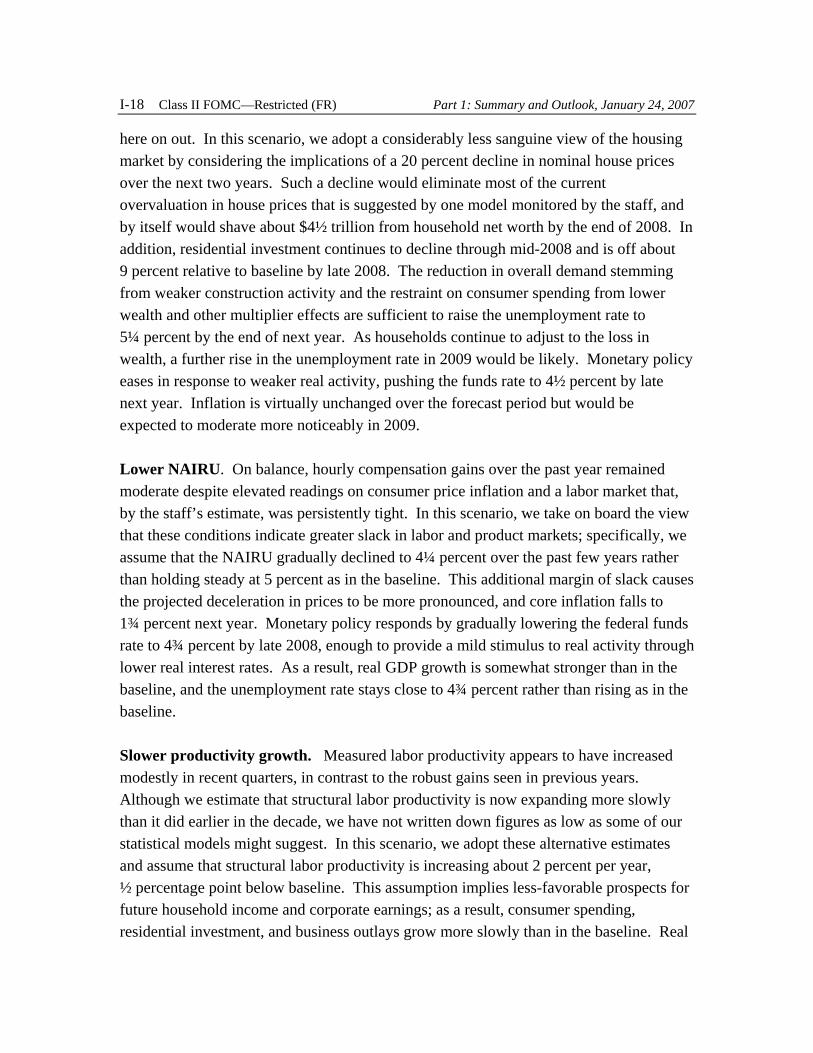
here on out. In this scenario, we adopt a considerably less sanguine view of the housing market by considering the implications of a 20 percent decline in nominal house prices over the next two years. Such a decline would eliminate most of the current overvaluation in house prices that is suggested by one model monitored by the staff, and by itself would shave about $4½ trillion from household net worth by the end of 2008. In addition, residential investment continues to decline through mid-2008 and is off about 9 percent relative to baseline by late 2008. The reduction in overall demand stemming from weaker construction activity and the restraint on consumer spending from lower wealth and other multiplier effects are sufficient to raise the unemployment rate to 5¼ percent by the end of next year. As households continue to adjust to the loss in wealth, a further rise in the unemployment rate in 2009 would be likely. Monetary policy eases in response to weaker real activity, pushing the funds rate to 4½ percent by late next year. Inflation is virtually unchanged over the forecast period but would be expected to moderate more noticeably in 2009. Lower NAIRU. On balance, hourly compensation gains over the past year remained moderate despite elevated readings on consumer price inflation and a labor market that, by the staff’s estimate, was persistently tight. In this scenario, we take on board the view that these conditions indicate greater slack in labor and product markets; specifically, we assume that the NAIRU gradually declined to 4¼ percent over the past few years rather than holding steady at 5 percent as in the baseline. This additional margin of slack causes the projected deceleration in prices to be more pronounced, and core inflation falls to 1¾ percent next year. Monetary policy responds by gradually lowering the federal funds rate to 4¾ percent by late 2008, enough to provide a mild stimulus to real activity through lower real interest rates. As a result, real GDP growth is somewhat stronger than in the baseline, and the unemployment rate stays close to 4¾ percent rather than rising as in the baseline. Slower productivity growth. Measured labor productivity appears to have increased modestly in recent quarters, in contrast to the robust gains seen in previous years. Although we estimate that structural labor productivity is now expanding more slowly than it did earlier in the decade, we have not written down figures as low as some of our statistical models might suggest. In this scenario, we adopt these alternative estimates and assume that structural labor productivity is increasing about 2 percent per year, ½ percentage point below baseline. This assumption implies less-favorable prospects for future household income and corporate earnings; as a result, consumer spending, residential investment, and business outlays grow more slowly than in the baseline. Real

Domestic Developments Class II FOMC—Restricted (FR) I-19
GDP increases only 1½ percent on average this year and next. This shortfall relative to baseline is somewhat larger than the downward revision to potential output, partly because the less-favorable prospects for growth are assumed to come as a surprise to financial-market participants and therefore to depress equity values. Slower structural productivity growth also implies larger increases in trend unit labor costs, and so core inflation remains roughly stable at 2¼ percent rather than moderating as in the baseline. Reflecting the offsetting influences of greater slack and higher inflation, monetary policy is little changed. Slower productivity growth and stable participation. Although we may be overestimating the contribution to potential output from labor productivity, we may also be underestimating the contribution from an expanding labor force. This scenario builds on the previous one by combining slower productivity growth with a flat labor force participation rate, in contrast to the baseline assumption that the participation rate will fall steadily owing to demographic factors. The combination of these two adjustments leaves the growth of potential output little changed from baseline even though the sources of trend growth are changed considerably. For this reason, real activity is only slightly weaker than baseline in this scenario. Nevertheless, inflation is still elevated relative to baseline because the slower structural productivity growth translates into more-rapid increases in trend unit labor costs. As a result, monetary policy is somewhat more restrictive. Market-based federal funds rate. Quotes from futures markets suggest that investors expect a policy stance that is easier than the baseline assumption in the second half of 2007 and 2008. Were the funds rate to decline to a bit below 4¾ percent, as the market expects, real GDP growth would rise to 2¾ percent in 2008, and inflation would be slightly above baseline.

I-20 Class II FOMC—Restricted (FR) Part 1: Summary and Outlook, January 24, 2007
Selected Greenbook Projections and70 Percent Confidence Intervals Derived from
Historical Forecast Errors and FRB/US Simulations
Measure 2007 2008
Real GDP(percent change, Q4 to Q4)Projection 2.3 2.5Confidence interval
Greenbook forecast errors .8–3.8 .8–4.2FRB/US stochastic simulations 1.1–3.6 .9–4.3
Civilian unemployment rate(percent, Q4)Projection 4.8 4.9Confidence interval
Greenbook forecast errors 4.4–5.3 4.0–5.8FRB/US stochastic simulations 4.5–5.2 4.3–5.4
PCE pricesexcluding food and energy(percent change, Q4 to Q4)Projection 2.2 2.0Confidence interval
Greenbook forecast errors 1.6–2.7 1.1–2.9FRB/US stochastic simulations 1.7–2.7 1.3–2.8
Federal funds rate(percent, Q4)Projection 5.2 5.2Confidence interval
FRB/US stochastic simulations 4.4–6.2 4.0–6.8
Note. Shocks underlying FRB/US stochastic simulations arerandomly drawn from the 1986-2005 set of model equation residuals.Intervals derived from Greenbook forecast errors are based on the1986-2005 set of Greenbook historical errors.

Class II FOMC - Restricted (FR)
Forecast Confidence Intervals and Alternative Scenarios under
the Assumption that Monetary Policy Follows an Estimated Taylor Rule
Confidence Intervals based on FRB/US Stochastic Simulations
Greenbook baselineBuoyant consumer spendingWeak investment
More extensive housing correctionLower NAIRUSlower productivity growth
Slower productivity growth withstable participation
Market-based federal funds rate
2005 2006 2007 2008
-1
0
1
2
3
4
5
6
-1
0
1
2
3
4
5
64-quarter percent change
90 percent interval
70 percent interval
Real GDP
2005 2006 2007 2008
0.5
1.0
1.5
2.0
2.5
3.0
3.5
0.5
1.0
1.5
2.0
2.5
3.0
3.54-quarter percent change
PCE Prices excluding Food and Energy
2005 2006 2007 2008
2
3
4
5
6
7
8
2
3
4
5
6
7
8Percent
Federal Funds Rate
2005 2006 2007 2008
3.5
4.0
4.5
5.0
5.5
6.0
3.5
4.0
4.5
5.0
5.5
6.0Percent
Unemployment Rate
I-21

Class II FOMC - Restricted (FR)
Evolution of the Staff Forecast
1.5
2.0
2.5
3.0
3.5
4.0
1.5
2.0
2.5
3.0
3.5
4.0
Percent, Q4/Q4
1/26 3/16 4/28 6/22 8/4 9/14 10/26 12/7 1/25 3/22 5/3 6/21 8/3 9/13 10/18 12/6 1/24 3/14 5/2 6/20 8/2 9/12 10/24 12/5
2006
2007 2008
Greenbook publication date 2005 2006 2007
Change in Real GDP
4.4
4.6
4.8
5.0
5.2
5.4
5.6
4.4
4.6
4.8
5.0
5.2
5.4
5.6
Percent, fourth quarter
1/26 3/16 4/28 6/22 8/4 9/14 10/26 12/7 1/25 3/22 5/3 6/21 8/3 9/13 10/18 12/6 1/24 3/14 5/2 6/20 8/2 9/12 10/24 12/5
Greenbook publication date 2005 2006 2007
2006
2007
2008
Unemployment Rate
1.0
1.5
2.0
2.5
3.0
1.0
1.5
2.0
2.5
3.0
Percent, Q4/Q4
1/26 3/16 4/28 6/22 8/4 9/14 10/26 12/7 1/25 3/22 5/3 6/21 8/3 9/13 10/18 12/6 1/24 3/14 5/2 6/20 8/2 9/12 10/24 12/5
Greenbook publication date
2005 2006 2007
2006
2007
2008
Change in PCE Prices excluding Food and Energy
I-22

Cla
ss I
I FO
MC
Janu
ary
24, 2
007
Res
tric
ted
(FR
)C
hang
es in
GD
P, P
rice
s, a
nd U
nem
ploy
men
t(P
erce
nt, a
nnua
l rat
e ex
cept
as
note
d)
Nom
inal
GD
P
R
eal G
DP
PC
E p
rice
inde
x
C
ore
PCE
pri
ce in
dex
Une
mpl
oym
ent r
ate1
Inte
rval
12/0
6/06
01/2
4/07
12/0
6/06
01/2
4/07
12/0
6/06
01/2
4/07
12/0
6/06
01/2
4/07
12/0
6/06
01/2
4/07
Qua
rter
ly20
06:Q
19.
09.
05.
65.
62.
02.
02.
12.
14.
74.
7
Q2
5.9
5.9
2.6
2.6
4.0
4.0
2.7
2.7
4.7
4.7
Q
33.
83.
82.
02.
02.
42.
42.
22.
24.
74.
7
Q4
2.9
4.6
1.3
2.6
-.5
-.8
2.6
2.1
4.5
4.5
2007
:Q1
5.2
5.7
1.7
2.0
3.7
1.9
2.4
2.2
4.6
4.6
Q
24.
74.
72.
22.
32.
62.
42.
32.
24.
84.
7
Q3
4.9
4.7
2.4
2.4
2.5
2.4
2.3
2.2
4.9
4.8
Q
44.
74.
72.
42.
52.
32.
22.
32.
15.
04.
8
2008
:Q1
5.1
5.0
2.5
2.5
2.2
2.2
2.2
2.1
5.0
4.9
Q
25.
04.
92.
52.
52.
12.
12.
12.
05.
04.
9
Q3
4.9
4.8
2.5
2.5
2.1
2.0
2.1
2.0
5.1
4.9
Q
44.
84.
72.
52.
52.
02.
02.
12.
05.
14.
9
Tw
o-qu
arte
r2
2006
:Q2
7.5
7.5
4.1
4.1
3.0
3.0
2.4
2.4
-.3
-.3
Q
43.
34.
21.
72.
31.
0.8
2.4
2.1
-.2
-.2
2007
:Q2
5.0
5.2
2.0
2.2
3.1
2.2
2.4
2.2
.3.2
Q
44.
84.
72.
42.
42.
42.
32.
32.
1.2
.1
2008
:Q2
5.1
4.9
2.5
2.5
2.2
2.1
2.2
2.0
.0.1
Q
44.
84.
72.
52.
52.
02.
02.
12.
0.1
.0
Fou
r-qu
arte
r3
2005
:Q4
6.4
6.4
3.1
3.1
3.1
3.1
2.1
2.1
-.4
-.4
2006
:Q4
5.4
5.8
2.9
3.2
2.0
1.9
2.4
2.3
-.5
-.5
2007
:Q4
4.9
5.0
2.2
2.3
2.8
2.2
2.3
2.2
.5.4
2008
:Q4
4.9
4.8
2.5
2.5
2.1
2.1
2.1
2.0
.1.1
Ann
ual
2005
6.3
6.3
3.2
3.2
2.9
2.9
2.1
2.1
5.1
5.1
2006
6.3
6.4
3.3
3.3
2.8
2.8
2.3
2.2
4.6
4.6
2007
4.5
4.9
1.9
2.3
2.3
1.8
2.4
2.2
4.8
4.7
2008
4.9
4.8
2.5
2.5
2.2
2.2
2.2
2.1
5.0
4.9
1. L
evel
, exc
ept f
or tw
o-qu
arte
r an
d fo
ur-q
uart
er in
terv
als.
2. P
erce
nt c
hang
e fr
om tw
o qu
arte
rs e
arlie
r; f
or u
nem
ploy
men
t rat
e, c
hang
e is
in p
erce
ntag
e po
ints
. 3
. Per
cent
cha
nge
from
fou
r qu
arte
rs e
arlie
r; f
or u
nem
ploy
men
t rat
e, c
hang
e is
in p
erce
ntag
e po
ints
.
I-23

Cla
ss I
I FO
MC
Janu
ary
24, 2
007
Res
tric
ted
(FR
)C
hang
es in
Rea
l Gro
ss D
omes
tic
Pro
duct
and
Rel
ated
Ite
ms
(Per
cent
, ann
ual r
ate
exce
pt a
s no
ted)
2
006
20
07
200
8
Item
Q1
Q2
Q3
Q4
Q1
Q2
Q3
Q4
Q1
Q2
Q3
Q4
2006
1 20
071
2008
1
Rea
l GD
P
5.6
2.6
2.0
2.6
2.
02.
32.
42.
5
2.5
2.5
2.5
2.5
3.
22.
32.
5P
revi
ous
5.
62.
62.
01.
3
1.7
2.2
2.4
2.4
2.
52.
52.
52.
5
2.9
2.2
2.5
Fina
l sal
es
5.6
2.1
1.9
3.9
1.
62.
42.
52.
0
2.2
2.8
2.7
2.5
3.
42.
22.
5P
revi
ous
5.
62.
11.
92.
2
1.4
2.5
2.7
2.0
2.
22.
82.
82.
1
3.0
2.1
2.5
Priv
. dom
. fin
al p
urch
.
5.5
1.8
2.1
2.1
2.
02.
32.
52.
5
2.8
2.8
2.8
2.9
2.
82.
32.
8P
revi
ous
5.
51.
82.
01.
2
1.3
2.0
2.4
2.5
2.
72.
72.
72.
8
2.6
2.0
2.7
Pers
onal
con
s. e
xpen
d.
4.8
2.6
2.8
4.6
3.
62.
42.
52.
6
2.7
2.7
2.7
2.7
3.
72.
82.
7P
revi
ous
4.
82.
62.
93.
1
2.7
2.3
2.4
2.4
2.
62.
62.
62.
6
3.3
2.5
2.6
Dur
able
s
19.8
-.1
6.4
10.2
6.
11.
43.
93.
9
4.8
4.2
4.0
4.1
8.
83.
84.
3N
ondu
rabl
es
5.9
1.4
1.5
6.8
5.
33.
12.
62.
6
2.8
2.8
2.9
2.9
3.
93.
42.
8Se
rvic
es
1.6
3.7
2.8
2.6
2.
42.
22.
22.
3
2.3
2.3
2.3
2.3
2.
72.
22.
3
Res
iden
tial i
nves
tmen
t
-.3
-11.
1-1
8.7
-20.
6
-21.
2-8
.7-2
.2-1
.6
-.7
2.2
2.7
4.1
-1
3.0
-8.8
2.0
Pre
viou
s
-.3
-11.
1-1
8.7
-23.
8
-20.
3-7
.2-1
.5.0
-1
.3.8
1.8
4.5
-1
3.9
-7.6
1.4
Bus
ines
s fi
xed
inve
st.
13
.74.
410
.0-1
.4
3.9
7.7
4.4
4.2
4.
94.
04.
04.
0
6.5
5.1
4.2
Pre
viou
s
13.7
4.4
9.4
4.1
3.
94.
33.
73.
9
4.8
4.2
3.9
3.6
7.
83.
94.
1E
quip
men
t & s
oftw
are
15
.6-1
.47.
7-4
.1
3.4
8.5
4.5
4.7
6.
35.
25.
65.
9
4.2
5.2
5.7
Pre
viou
s
15.6
-1.4
7.2
3.0
2.
84.
03.
74.
3
6.0
5.4
5.5
5.3
5.
93.
75.
6N
onre
s. s
truc
ture
s
8.7
20.3
15.7
5.0
5.
36.
04.
33.
1
1.9
1.5
.7.1
12
.34.
71.
1P
revi
ous
8.
720
.314
.86.
6
6.2
4.8
3.7
3.0
2.
11.
8.6
.0
12.5
4.4
1.1
Net
exp
orts
2
-637
-624
-629
-596
-6
10-6
10-6
09-6
25
-642
-643
-646
-657
-6
21-6
13-6
47P
revi
ous2
-6
37-6
24-6
29-6
15
-624
-617
-609
-624
-6
37-6
33-6
31-6
50
-626
-619
-638
Exp
orts
14
.06.
26.
87.
5
5.3
5.2
5.0
4.8
4.
95.
15.
25.
3
8.6
5.1
5.1
Impo
rts
9.
11.
45.
6-1
.8
6.7
3.5
3.2
6.5
6.
93.
74.
25.
8
3.5
5.0
5.1
Gov
t. co
ns. &
inve
st.
4.
9.8
1.7
4.9
2.
32.
22.
02.
0
2.0
2.0
1.8
1.8
3.
02.
11.
9P
revi
ous
4.
9.8
2.0
3.4
2.
92.
62.
02.
0
2.0
2.0
1.8
1.8
2.
82.
41.
9Fe
dera
l
8.8
-4.5
1.3
8.8
1.
91.
51.
31.
3
1.4
1.4
1.3
1.3
3.
41.
51.
3D
efen
se
8.9
-2.0
-1.2
14.9
2.
82.
22.
02.
0
2.0
2.0
2.0
2.0
4.
92.
22.
0N
onde
fens
e
8.5
-9.3
6.5
-2.7
.0
.0.0
.0
.0.0
.0.0
.5
.0.0
Stat
e &
loca
l
2.7
4.0
1.9
2.7
2.
62.
62.
42.
4
2.4
2.4
2.1
2.1
2.
82.
52.
2
Cha
nge
in b
us. i
nven
tori
es2
41
5455
20
3027
2235
44
3631
30
4329
35P
revi
ous2
41
5457
31
4034
2740
49
4034
45
4635
42N
onfa
rm2
37
5253
21
3127
2235
44
3630
30
4129
35Fa
rm2
4
22
-1
-01
11
1
11
1
21
1
1. C
hang
e fr
om f
ourt
h qu
arte
r of
pre
viou
s ye
ar to
fou
rth
quar
ter
of y
ear
indi
cate
d. 2
. Bill
ions
of
chai
ned
(200
0) d
olla
rs.
I-24

Cla
ss I
I FO
MC
Janu
ary
24, 2
007
Res
tric
ted
(FR
)C
hang
es in
Rea
l Gro
ss D
omes
tic
Pro
duct
and
Rel
ated
Ite
ms
(Per
cent
, ann
ual r
ate
exce
pt a
s no
ted)
Item
2000
1
20
011
2002
1
20
031
2004
1
20
051
2006
1
20
071
2008
1
Rea
l GD
P
2.2
.21.
93.
73.
43.
13.
22.
32.
5P
revi
ous
2.
2.2
1.9
3.7
3.4
3.1
2.9
2.2
2.5
Fina
l sal
es
2.9
1.5
.83.
73.
13.
23.
42.
22.
5P
revi
ous
2.
91.
5.8
3.7
3.1
3.2
3.0
2.1
2.5
Priv
. dom
. fin
al p
urch
.
4.3
1.0
1.1
4.1
4.4
3.6
2.8
2.3
2.8
Pre
viou
s
4.3
1.0
1.1
4.1
4.4
3.6
2.6
2.0
2.7
Pers
onal
con
s. e
xpen
d.
4.1
2.8
1.9
3.4
4.0
2.9
3.7
2.8
2.7
Pre
viou
s
4.1
2.8
1.9
3.4
4.0
2.9
3.3
2.5
2.6
Dur
able
s
4.7
10.8
1.2
8.3
5.6
2.5
8.8
3.8
4.3
Non
dura
bles
3.
01.
92.
13.
93.
84.
43.
93.
42.
8Se
rvic
es
4.5
1.6
1.9
2.2
3.7
2.3
2.7
2.2
2.3
Res
iden
tial i
nves
tmen
t
-1.9
1.4
7.0
11.7
6.1
9.0
-13.
0-8
.82.
0P
revi
ous
-1
.91.
47.
011
.76.
19.
0-1
3.9
-7.6
1.4
Bus
ines
s fi
xed
inve
st.
7.
8-9
.6-6
.54.
96.
95.
66.
55.
14.
2P
revi
ous
7.
8-9
.6-6
.54.
96.
95.
67.
83.
94.
1E
quip
men
t & s
oftw
are
7.
5-9
.0-3
.46.
68.
37.
04.
25.
25.
7P
revi
ous
7.
5-9
.0-3
.46.
68.
37.
05.
93.
75.
6N
onre
s. s
truc
ture
s
8.8
-11.
1-1
4.9
.22.
71.
812
.34.
71.
1P
revi
ous
8.
8-1
1.1
-14.
9.2
2.7
1.8
12.5
4.4
1.1
Net
exp
orts
2
-379
-399
-471
-519
-591
-619
-621
-613
-647
Pre
viou
s2
-379
-399
-471
-519
-591
-619
-626
-619
-638
Exp
orts
6.
5-1
1.9
3.8
5.8
7.0
6.7
8.6
5.1
5.1
Impo
rts
11
.2-7
.69.
74.
810
.65.
23.
55.
05.
1
Gov
t. co
ns. &
inve
st.
.4
5.0
4.0
1.7
1.1
1.2
3.0
2.1
1.9
Pre
viou
s
.45.
04.
01.
71.
11.
22.
82.
41.
9Fe
dera
l
-2.2
6.4
7.8
5.5
2.3
2.1
3.4
1.5
1.3
Def
ense
-3
.56.
58.
47.
52.
51.
94.
92.
22.
0N
onde
fens
e
.36.
36.
81.
91.
82.
4.5
.0.0
Stat
e &
loca
l
1.7
4.2
2.1
-.4
.4.8
2.8
2.5
2.2
Cha
nge
in b
us. i
nven
tori
es2
56
-32
1214
5320
4329
35P
revi
ous2
56
-32
1214
5320
4635
42N
onfa
rm2
58
-32
1514
4720
4129
35Fa
rm2
-1
0-2
06
02
11
1. C
hang
e fr
om f
ourt
h qu
arte
r of
pre
viou
s ye
ar to
fou
rth
quar
ter
of y
ear
indi
cate
d. 2
. Bill
ions
of
chai
ned
(200
0) d
olla
rs.
I-25

Cla
ss I
I FO
MC
Janu
ary
24, 2
007
Res
tric
ted
(FR
)C
ontr
ibut
ions
to
Cha
nges
in R
eal G
ross
Dom
esti
c P
rodu
ct(P
erce
ntag
e po
ints
, ann
ual r
ate
exce
pt a
s no
ted)
2
006
200
7
20
08
Item
Q1
Q2
Q3
Q4
Q1
Q2
Q3
Q4
Q1
Q2
Q3
Q4
2006
1 20
071
2008
1
Rea
l GD
P
5.6
2.6
2.0
2.6
2.
02.
32.
42.
5
2.5
2.5
2.5
2.5
3.
22.
32.
5P
revi
ous
5.
62.
62.
01.
3
1.7
2.2
2.4
2.4
2.
52.
52.
52.
5
2.9
2.2
2.5
Fina
l sal
es
5.6
2.1
1.9
3.8
1.
72.
42.
52.
0
2.2
2.8
2.7
2.5
3.
42.
22.
5P
revi
ous
5.
62.
11.
92.
2
1.4
2.5
2.6
2.0
2.
22.
82.
72.
1
3.0
2.1
2.5
Priv
. dom
. fin
al p
urch
.
4.7
1.5
1.8
1.8
1.
72.
02.
12.
2
2.4
2.4
2.4
2.5
2.
42.
02.
4P
revi
ous
4.
71.
51.
71.
1
1.1
1.7
2.0
2.1
2.
32.
32.
32.
4
2.3
1.7
2.3
Pers
onal
con
s. e
xpen
d.
3.4
1.8
2.0
3.2
2.
51.
61.
71.
8
1.9
1.9
1.9
1.9
2.
61.
91.
9P
revi
ous
3.
41.
82.
02.
1
1.9
1.6
1.7
1.7
1.
81.
81.
81.
8
2.3
1.7
1.8
Dur
able
s
1.5
.0.5
.8
.5.1
.3.3
.4
.3.3
.3
.7.3
.3N
ondu
rabl
es
1.2
.3.3
1.4
1.
1.6
.5.5
.6
.6.6
.6
.8.7
.6Se
rvic
es
.71.
51.
11.
1
1.0
.9.9
.9
1.0
1.0
1.0
1.0
1.
1.9
1.0
Res
iden
tial i
nves
tmen
t
.0-.
7-1
.2-1
.3
-1.2
-.4
-.1
-.1
.0
.1.1
.2
-.8
-.5
.1P
revi
ous
.0
-.7
-1.2
-1.5
-1
.2-.
4-.
1.0
-.
1.0
.1.2
-.
9-.
4.1
Bus
ines
s fi
xed
inve
st.
1.
4.5
1.0
-.2
.4
.8.5
.4
.5.4
.4.4
.7
.5.5
Pre
viou
s
1.4
.51.
0.4
.4
.5.4
.4
.5.5
.4.4
.8
.4.4
Equ
ipm
ent &
sof
twar
e
1.1
-.1
.6-.
3
.2.6
.3.3
.5
.4.4
.4
.3.4
.4P
revi
ous
1.
1-.
1.5
.2
.2.3
.3.3
.4
.4.4
.4
.4.3
.4N
onre
s. s
truc
ture
s
.3.6
.5.2
.2
.2.1
.1
.1.1
.0.0
.4
.2.0
Pre
viou
s
.3.6
.4.2
.2
.2.1
.1
.1.1
.0.0
.4
.1.0
Net
exp
orts
.0
.4-.
21.
1
-.5
.0.0
-.5
-.
6.0
-.1
-.4
.3
-.2
-.3
Pre
viou
s
.0.4
-.2
.5
-.3
.3.2
-.5
-.
5.1
.1-.
6
.2-.
1-.
2E
xpor
ts
1.4
.7.7
.8
.6.6
.6.5
.6
.6.6
.6
.9.6
.6Im
port
s
-1.5
-.2
-.9
.3
-1.1
-.6
-.5
-1.1
-1
.1-.
6-.
7-1
.0
-.6
-.8
-.8
Gov
t. co
ns. &
inve
st.
.9
.2.3
.9
.4.4
.4.4
.4
.4.3
.4
.6.4
.4P
revi
ous
.9
.2.4
.6
.6.5
.4.4
.4
.4.3
.3
.5.5
.4Fe
dera
l
.6-.
3.1
.6
.1.1
.1.1
.1
.1.1
.1
.2.1
.1D
efen
se
.4-.
1-.
1.7
.1
.1.1
.1
.1.1
.1.1
.2
.1.1
Non
defe
nse
.2
-.2
.2-.
1
.0.0
.0.0
.0
.0.0
.0
.0.0
.0St
ate
& lo
cal
.3
.5.2
.3
.3.3
.3.3
.3
.3.3
.3
.3.3
.3
Cha
nge
in b
us. i
nven
tori
es
.0.4
.1-1
.2
.3-.
1-.
2.4
.3
-.3
-.2
.0
-.2
.1.0
Pre
viou
s
.0.4
.1-.
9
.3-.
2-.
2.5
.3
-.3
-.2
.4
-.1
.1.0
Non
farm
.0
.5.1
-1.1
.3
-.1
-.2
.4
.3-.
3-.
2.0
-.
2.1
.0Fa
rm
.0-.
1.0
-.1
.0
.0.0
.0
.0.0
.0.0
.0
.0.0
1. C
hang
e fr
om f
ourt
h qu
arte
r of
pre
viou
s ye
ar to
fou
rth
quar
ter
of y
ear
indi
cate
d.
I-26

Cla
ss I
I FO
MC
Janu
ary
24, 2
007
Res
tric
ted
(FR
)C
hang
es in
Pri
ces
and
Cos
ts(P
erce
nt, a
nnua
l rat
e ex
cept
as
note
d)
2006
200
7
20
08
Item
Q1
Q2
Q3
Q4
Q1
Q2
Q3
Q4
Q1
Q2
Q3
Q4
2006
1 20
071
2008
1
GD
P ch
ain-
wt.
pric
e in
dex
3.3
3.3
1.9
1.9
3.7
2.4
2.3
2.2
2.4
2.3
2.2
2.1
2.6
2.6
2.3
Pre
viou
s3.
33.
31.
81.
53.
52.
42.
42.
32.
52.
42.
32.
22.
52.
62.
4PC
E c
hain
-wt.
pric
e in
dex
2.0
4.0
2.4
-.8
1.9
2.4
2.4
2.2
2.2
2.1
2.0
2.0
1.9
2.2
2.1
Pre
viou
s2.
04.
02.
4-.
53.
72.
62.
52.
32.
22.
12.
12.
02.
02.
82.
1E
nerg
y.1
29.7
3.7
-36.
6-5
.73.
26.
14.
03.
22.
31.
91.
4-3
.91.
82.
2P
revi
ous
.129
.73.
7-3
8.9
26.2
5.9
4.7
2.8
1.9
1.3
.8.4
-4.7
9.5
1.1
Food
2.7
1.7
2.9
1.8
3.6
3.1
2.6
2.4
2.3
2.2
2.2
2.2
2.3
2.9
2.2
Pre
viou
s2.
71.
72.
92.
92.
72.
42.
42.
42.
42.
42.
32.
32.
62.
52.
3E
x. f
ood
& e
nerg
y2.
12.
72.
22.
12.
22.
22.
22.
12.
12.
02.
02.
02.
32.
22.
0P
revi
ous
2.1
2.7
2.2
2.6
2.4
2.3
2.3
2.3
2.2
2.1
2.1
2.1
2.4
2.3
2.1
CPI
2.2
4.9
3.0
-2.1
2.0
2.6
2.6
2.4
2.3
2.2
2.1
2.1
2.0
2.4
2.2
Pre
viou
s2.
24.
93.
0-1
.94.
32.
92.
72.
52.
32.
32.
22.
12.
03.
12.
2E
x. f
ood
& e
nerg
y2.
43.
63.
01.
82.
42.
52.
32.
32.
22.
22.
22.
22.
72.
42.
2P
revi
ous
2.4
3.6
3.0
2.3
2.7
2.6
2.5
2.5
2.4
2.4
2.3
2.3
2.8
2.5
2.3
EC
I, h
ourl
y co
mpe
nsat
ion2
2.4
3.2
3.6
3.8
4.0
4.0
4.0
4.0
4.0
4.0
4.0
4.0
3.2
4.0
4.0
Pre
viou
s22.
43.
23.
63.
84.
04.
14.
14.
14.
14.
14.
14.
13.
24.
14.
1N
onfa
rm b
usin
ess
sect
orO
utpu
t per
hou
r4.
31.
2-.
2.9
1.5
2.5
2.7
2.8
2.7
2.6
2.6
2.5
1.5
2.4
2.6
Pre
viou
s4.
31.
2.0
-.5
1.9
2.8
2.9
2.9
2.7
2.7
2.6
2.6
1.2
2.6
2.7
Com
pens
atio
n pe
r ho
ur13
.7-1
.23.
14.
64.
94.
94.
94.
94.
95.
04.
84.
84.
94.
94.
9P
revi
ous
13.7
-1.2
2.6
4.9
5.0
5.2
5.1
5.0
5.0
5.2
5.0
4.9
4.9
5.1
5.0
Uni
t lab
or c
osts
9.0
-2.4
3.2
3.7
3.3
2.3
2.2
2.0
2.1
2.3
2.1
2.2
3.3
2.4
2.2
Pre
viou
s9.
0-2
.42.
65.
53.
02.
32.
12.
02.
22.
42.
32.
23.
62.
42.
3
1. C
hang
e fr
om f
ourt
h qu
arte
r of
pre
viou
s ye
ar to
fou
rth
quar
ter
of y
ear
indi
cate
d. 2
. Pri
vate
-ind
ustr
y w
orke
rs.
I-27
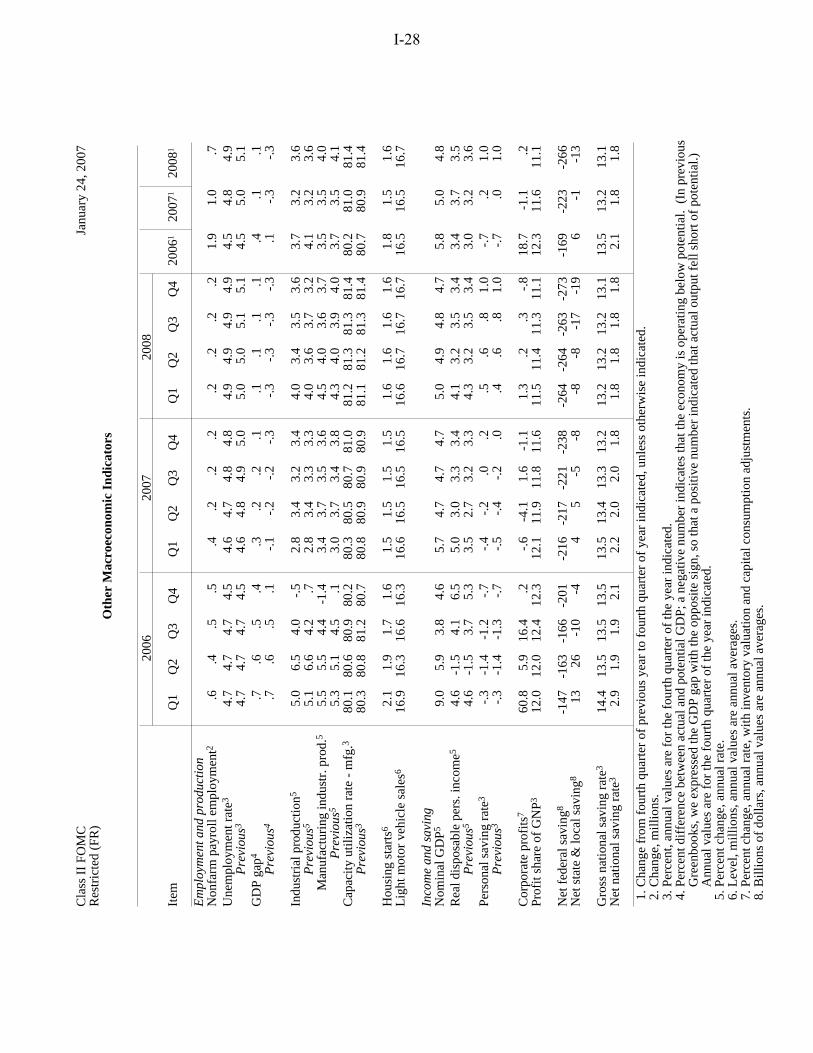
Cla
ss I
I FO
MC
Janu
ary
24, 2
007
Res
tric
ted
(FR
)O
ther
Mac
roec
onom
ic I
ndic
ator
s
20
06
200
7
200
8
Item
Q1
Q2
Q3
Q4
Q1
Q2
Q3
Q4
Q1
Q2
Q3
Q4
2006
1 20
071
2008
1
Em
ploy
men
t and
pro
duct
ion
Non
farm
pay
roll
empl
oym
ent2
.6.4
.5.5
.4.2
.2.2
.2.2
.2.2
1.9
1.0
.7U
nem
ploy
men
t rat
e34.
74.
74.
74.
54.
64.
74.
84.
84.
94.
94.
94.
94.
54.
84.
9P
revi
ous3
4.7
4.7
4.7
4.5
4.6
4.8
4.9
5.0
5.0
5.0
5.1
5.1
4.5
5.0
5.1
GD
P ga
p4.7
.6.5
.4.3
.2.2
.1.1
.1.1
.1.4
.1.1
Pre
viou
s4.7
.6.5
.1-.
1-.
2-.
2-.
3-.
3-.
3-.
3-.
3.1
-.3
-.3
Indu
stri
al p
rodu
ctio
n55.
06.
54.
0-.
52.
83.
43.
23.
44.
03.
43.
53.
63.
73.
23.
6P
revi
ous5
5.1
6.6
4.2
.72.
83.
43.
33.
34.
03.
63.
73.
24.
13.
23.
6M
anuf
actu
ring
indu
str.
pro
d.5
5.5
5.5
4.4
-1.4
3.4
3.7
3.5
3.6
4.5
4.0
3.6
3.7
3.5
3.5
4.0
Pre
viou
s55.
35.
14.
5.1
3.0
3.7
3.4
3.8
4.3
4.0
3.9
4.0
3.7
3.5
4.1
Cap
acity
util
izat
ion
rate
- m
fg.3
80.1
80.6
80.9
80.2
80.3
80.5
80.7
81.0
81.2
81.3
81.3
81.4
80.2
81.0
81.4
Pre
viou
s380
.380
.881
.280
.780
.880
.980
.980
.981
.181
.281
.381
.480
.780
.981
.4
Hou
sing
sta
rts6
2.1
1.9
1.7
1.6
1.5
1.5
1.5
1.5
1.6
1.6
1.6
1.6
1.8
1.5
1.6
Lig
ht m
otor
veh
icle
sal
es6
16.9
16.3
16.6
16.3
16.6
16.5
16.5
16.5
16.6
16.7
16.7
16.7
16.5
16.5
16.7
Inco
me
and
savi
ngN
omin
al G
DP5
9.0
5.9
3.8
4.6
5.7
4.7
4.7
4.7
5.0
4.9
4.8
4.7
5.8
5.0
4.8
Rea
l dis
posa
ble
pers
. inc
ome5
4.6
-1.5
4.1
6.5
5.0
3.0
3.3
3.4
4.1
3.2
3.5
3.4
3.4
3.7
3.5
Pre
viou
s54.
6-1
.53.
75.
33.
52.
73.
23.
34.
33.
23.
53.
43.
03.
23.
6Pe
rson
al s
avin
g ra
te3
-.3
-1.4
-1.2
-.7
-.4
-.2
.0.2
.5.6
.81.
0-.
7.2
1.0
Pre
viou
s3-.
3-1
.4-1
.3-.
7-.
5-.
4-.
2.0
.4.6
.81.
0-.
7.0
1.0
Cor
pora
te p
rofi
ts7
60.8
5.9
16.4
.2-.
6-4
.11.
6-1
.11.
3.2
.3-.
818
.7-1
.1.2
Prof
it sh
are
of G
NP3
12.0
12.0
12.4
12.3
12.1
11.9
11.8
11.6
11.5
11.4
11.3
11.1
12.3
11.6
11.1
Net
fed
eral
sav
ing8
-147
-163
-166
-201
-216
-217
-221
-238
-264
-264
-263
-273
-169
-223
-266
Net
sta
te &
loca
l sav
ing8
1326
-10
-44
5-5
-8-8
-8-1
7-1
96
-1-1
3
Gro
ss n
atio
nal s
avin
g ra
te3
14.4
13.5
13.5
13.5
13.5
13.4
13.3
13.2
13.2
13.2
13.2
13.1
13.5
13.2
13.1
Net
nat
iona
l sav
ing
rate
32.
91.
91.
92.
12.
22.
02.
01.
81.
81.
81.
81.
82.
11.
81.
8
1. C
hang
e fr
om f
ourt
h qu
arte
r of
pre
viou
s ye
ar to
fou
rth
quar
ter
of y
ear
indi
cate
d, u
nles
s ot
herw
ise
indi
cate
d. 2
. Cha
nge,
mill
ions
. 3
. Per
cent
, ann
ual v
alue
s ar
e fo
r th
e fo
urth
qua
rter
of
the
year
indi
cate
d. 4
. Per
cent
dif
fere
nce
betw
een
actu
al a
nd p
oten
tial G
DP;
a n
egat
ive
num
ber
indi
cate
s th
at th
e ec
onom
y is
ope
ratin
g be
low
pot
entia
l. (
In p
revi
ous
Gre
enbo
oks,
we
expr
esse
d th
e G
DP
gap
with
the
oppo
site
sig
n, s
o th
at a
pos
itive
num
ber
indi
cate
d th
at a
ctua
l out
put f
ell s
hort
of
pote
ntia
l.)
A
nnua
l val
ues
are
for
the
four
th q
uart
er o
f th
e ye
ar in
dica
ted.
5. P
erce
nt c
hang
e, a
nnua
l rat
e. 6
. Lev
el, m
illio
ns, a
nnua
l val
ues
are
annu
al a
vera
ges.
7. P
erce
nt c
hang
e, a
nnua
l rat
e, w
ith in
vent
ory
valu
atio
n an
d ca
pita
l con
sum
ptio
n ad
just
men
ts.
8. B
illio
ns o
f do
llars
, ann
ual v
alue
s ar
e an
nual
ave
rage
s.
I-28

Cla
ss I
I F
OM
CJa
nuar
y 24
, 200
7R
estr
icte
d (F
R)
Staf
f P
roje
ctio
ns o
f F
eder
al S
ecto
r A
ccou
nts
and
Rel
ated
Ite
ms
(Bill
ions
of
dolla
rs e
xcep
t as
note
d)
Fisc
al y
ear
2006
2007
2008
Item
2005
a20
06a
2007
2008
Q1a
Q2a
Q3a
Q4
Q1
Q2
Q3
Q4
Q1
Q2
Q3
Q4
Uni
fied
bud
get
Not
sea
sona
lly a
djus
ted
Rec
eipt
s121
5424
0725
3126
61
507
772
597
574
519
832
607
602
552
873
634
619
Out
lays
124
7326
5527
6329
30
691
676
639
654
728
706
674
735
744
732
719
768
Surp
lus/
defi
cit1
-319
-248
-232
-269
-1
8496
-42
-80
-209
125
-67
-133
-192
141
-85
-149
P
revi
ous
-3
19-2
48-2
47-2
85
-184
96-4
2-1
02-2
0011
8-6
4-1
34-1
8812
3-8
6-1
47
On-
budg
et
-494
-435
-417
-469
-2
1611
-60
-143
-232
37-8
0-2
00-2
1646
-98
-222
O
ff-b
udge
t
17
518
618
519
9
3285
1962
2288
1367
2495
1373
Mea
ns o
f fi
nanc
ing
B
orro
win
g
297
237
216
271
15
6-7
543
5918
1-9
470
123
165
-110
9413
9
Cas
h de
crea
se
1
-16
170
28
-38
-621
16-2
55
1015
-25
010
O
ther
222
28-1
-2
-116
50
12-6
-8-0
12-6
-8-0
Cas
h op
erat
ing
bala
nce,
end
of
peri
od
36
5235
35
846
5231
1540
3525
1035
3525
NIP
A f
eder
al s
ecto
r
Se
ason
ally
adj
uste
d an
nual
rat
es
Rec
eipt
s
21
7424
8226
2227
33
2491
2523
2565
2571
2612
2638
2667
2692
2719
2747
2775
2802
Exp
endi
ture
s
2509
2667
2836
2990
26
3826
8627
3027
7228
2828
5528
8829
2929
8330
1230
3830
76
Con
sum
ptio
n ex
pend
iture
s
758
797
845
886
80
480
280
982
584
485
185
986
688
589
290
090
7
D
efen
se
50
953
357
060
1
538
538
539
556
569
575
581
587
600
606
612
618
Non
defe
nse
24
926
427
428
4
266
265
270
269
275
276
278
279
285
286
288
289
O
ther
spe
ndin
g
1751
1870
1991
2105
18
3418
8419
2119
4719
8420
0420
2920
6320
9821
2021
3821
68C
urre
nt a
ccou
nt s
urpl
us
-3
35-1
85-2
14-2
57
-147
-163
-166
-201
-216
-217
-221
-238
-264
-264
-263
-273
Gro
ss in
vest
men
t
107
117
126
130
11
811
711
812
412
512
612
712
812
913
013
113
2G
ross
sav
ing
less
gro
ss
i
nves
tmen
t3-3
44-1
99-2
31-2
73
-163
-177
-179
-219
-234
-234
-239
-254
-280
-280
-278
-288
Fis
cal i
ndic
ator
s4H
igh-
empl
oym
ent (
HE
B)
sur
plus
/def
icit
-3
39-2
22-2
52-2
82
-191
-208
-205
-250
-256
-252
-252
-266
-289
-288
-285
-295
Cha
nge
in H
EB
, per
cent
of
pote
ntia
l GD
P
-0
.3-1
.00.
10.
1
-0.7
0.1
-0.0
0.3
0.0
-0.0
-0.0
0.1
0.1
-0.0
-0.0
0.0
Fisc
al im
petu
s (F
I),
per
cent
of
GD
P
0.
20.
30.
30.
1
0.2
-0.0
0.0
0.1
0.1
-0.0
-0.0
0.0
0.0
0.0
0.0
0.0
P
revi
ous
0.
20.
30.
30.
1
0.2
-0.0
0.0
0.1
0.2
-0.0
-0.0
0.0
0.0
0.0
0.0
0.0
1
. Bud
get r
ecei
pts,
out
lays
, and
sur
plus
/def
icit
incl
ude
corr
espo
ndin
g so
cial
sec
urity
(O
ASD
I) c
ateg
orie
s. T
he O
ASD
I su
rplu
s an
d th
e Po
stal
Ser
vice
sur
plus
are
exc
lude
d fr
om th
e on
-bud
get
s
urpl
us a
nd s
how
n se
para
tely
as
off-
budg
et, a
s cl
assi
fied
und
er c
urre
nt la
w.
2
. Oth
er m
eans
of
fina
ncin
g ar
e ch
ecks
issu
ed le
ss c
heck
s pa
id, a
ccru
ed it
ems,
and
cha
nges
in o
ther
fin
anci
al a
sset
s an
d lia
bilit
ies.
3
. Gro
ss s
avin
g is
the
curr
ent a
ccou
nt s
urpl
us p
lus
cons
umpt
ion
of f
ixed
cap
ital o
f th
e ge
nera
l gov
ernm
ent a
s w
ell a
s go
vern
men
t ent
erpr
ises
.
4. H
EB
is g
ross
sav
ing
less
gro
ss in
vest
men
t (N
IPA
) of
the
fede
ral g
over
nmen
t in
curr
ent d
olla
rs, w
ith c
yclic
ally
sen
sitiv
e re
ceip
ts a
nd o
utla
ys a
djus
ted
to th
e st
aff’
s m
easu
re o
f po
tent
ial o
utpu
t and
the
NA
IRU
. Qua
rter
ly f
igur
es f
or c
hang
e in
HE
B a
nd F
I ar
e no
t at a
nnua
l rat
es.
The
sig
n on
Cha
nge
in H
EB
, as
a pe
rcen
t of
nom
inal
pot
entia
l GD
P, is
rev
erse
d. F
I is
the
wei
ghte
d di
ffer
ence
of
disc
retio
nary
chan
ges
in f
eder
al s
pend
ing
and
taxe
s in
cha
ined
(20
00)
dolla
rs, s
cale
d by
rea
l GD
P. T
he a
nnua
l FI
estim
ates
are
on
a ca
lend
ar y
ear
basi
s. A
lso,
for
FI
and
the
chan
ge in
HE
B, p
ositi
ve v
alue
s in
dica
teag
greg
ate
dem
and
stim
ulus
.
a--
Act
ual
I-29

Cla
ss I
I F
OM
CC
hang
e in
Deb
t of
the
Dom
esti
c N
onfi
nanc
ial S
ecto
rsJa
nuar
y 24
, 200
7 R
estr
icte
d (F
R)
(Per
cent
)
Hou
seho
lds
Mem
o:H
ome
Con
sum
erSt
ate
and
loca
lFe
dera
lN
omin
alPe
riod
1T
otal
Tot
alm
ortg
ages
cred
itB
usin
ess
gove
rnm
ents
gove
rnm
ent
GD
P
Yea
r20
016.
39.
310
.18.
66.
08.
8-.
22.
720
027.
210
.612
.95.
92.
511
.07.
63.
620
038.
211
.614
.35.
22.
78.
310
.95.
920
049.
011
.614
.15.
55.
97.
49.
06.
7
2005
9.5
11.8
13.8
4.2
7.8
10.2
7.0
6.4
2006
7.8
8.2
8.7
4.7
9.3
8.4
3.9
5.8
2007
6.5
5.9
6.1
4.4
7.6
7.4
5.7
5.0
2008
6.1
5.7
6.1
3.6
6.6
7.1
5.6
4.8
Qua
rter
2006
:19.
59.
710
.92.
49.
63.
511
.39.
02
6.7
9.1
9.1
6.3
8.4
6.6
-2.4
5.9
36.
66.
87.
25.
57.
79.
33.
33.
84
7.5
6.2
6.3
4.5
10.3
13.3
3.3
4.6
2007
:17.
95.
96.
14.
88.
26.
812
.95.
72
4.8
5.8
6.0
4.5
7.5
7.5
-3.9
4.7
36.
25.
76.
04.
27.
27.
45.
44.
74
6.5
5.6
6.0
4.0
6.5
7.2
8.2
4.7
2008
:16.
85.
66.
03.
86.
27.
111
.05.
02
4.2
5.6
6.0
3.6
6.6
7.0
-4.9
4.9
36.
25.
56.
03.
56.
56.
96.
94.
84
6.5
5.5
6.0
3.5
6.5
6.8
9.0
4.7
N
ote.
Qua
rter
ly d
ata
are
at s
easo
nally
adj
uste
d an
nual
rat
es.
1.
Dat
a af
ter
2006
:Q3
are
staf
f pr
ojec
tions
. Cha
nges
are
mea
sure
d fr
om e
nd o
f th
e pr
eced
ing
peri
od to
end
of
peri
od in
dica
ted
exce
pt f
or a
nnua
l nom
inal
GD
P gr
owth
, whi
ch is
cal
cula
ted
from
Q4
to Q
4.
2.6.
3 F
OF
I-30

Cla
ss I
I F
OM
CF
low
of
Fun
ds P
roje
ctio
ns:
Hig
hlig
hts
Janu
ary
24, 2
007
Res
tric
ted
(FR
)(B
illio
ns o
f do
llars
at s
easo
nally
adj
uste
d an
nual
rat
es e
xcep
t as
note
d)
2006
2007
2008
Cat
egor
y20
0520
0620
0720
08Q
3 Q
4 Q
1 Q
2 Q
3 Q
4 Q
1 Q
2 Q
3 Q
4
Dom
esti
c no
nfin
anci
al s
ecto
rsN
et f
unds
rai
sed
T
otal
1953
.714
41.0
1551
.316
19.0
1287
.012
81.9
1852
.510
50.7
1589
.317
12.8
1848
.910
81.6
1703
.718
42.0
Net
equ
ity is
suan
ce-3
63.4
-637
.3-3
14.0
-232
.0-5
54.6
-823
.6-4
20.0
-352
.0-2
52.0
-232
.0-2
32.0
-232
.0-2
32.0
-232
.0
N
et d
ebt i
ssua
nce
2317
.120
78.3
1865
.318
51.0
1841
.621
05.5
2272
.514
02.7
1841
.319
44.8
2080
.913
13.6
1935
.720
74.0
Bor
row
ing
indi
cato
rs
Deb
t (pe
rcen
t of
GD
P) 1
204.
620
9.0
213.
321
6.3
209.
921
1.3
212.
321
3.2
213.
721
4.6
215.
521
5.9
216.
121
7.1
B
orro
win
g (p
erce
nt o
f G
DP)
18.6
15.7
13.4
12.7
13.8
15.6
16.6
10.2
13.2
13.8
14.5
9.1
13.2
14.0
H
ouse
hold
s
Net
bor
row
ing
212
41.6
965.
074
9.9
766.
283
5.5
777.
375
8.5
747.
974
4.7
748.
575
4.7
762.
176
9.5
778.
5
H
ome
mor
tgag
es10
77.7
768.
459
3.3
625.
367
2.7
601.
659
2.1
587.
459
2.1
601.
661
1.1
620.
663
0.0
639.
5
C
onsu
mer
cre
dit
94.3
109.
910
8.0
92.7
129.
710
7.6
116.
211
1.6
104.
599
.596
.093
.691
.190
.3
Deb
t/DPI
(pe
rcen
t) 3
123.
712
8.7
130.
013
0.1
129.
913
0.2
129.
913
0.1
130.
113
0.1
129.
913
0.0
130.
113
0.1
B
usin
ess
F
inan
cing
gap
4-1
38.6
25.9
55.2
147.
847
.9-1
4.0
15.3
44.7
61.7
99.1
129.
013
8.0
151.
617
2.5
N
et e
quity
issu
ance
-363
.4-6
37.3
-314
.0-2
32.0
-554
.6-8
23.6
-420
.0-3
52.0
-252
.0-2
32.0
-232
.0-2
32.0
-232
.0-2
32.0
C
redi
t mar
ket b
orro
win
g59
7.3
773.
968
5.1
643.
966
9.8
911.
474
4.0
695.
667
4.8
625.
860
6.8
655.
865
1.7
661.
4
S
tate
and
loca
l gov
ernm
ents
N
et b
orro
win
g17
1.3
156.
014
9.7
153.
717
6.3
258.
813
7.7
153.
715
3.7
153.
715
3.7
153.
715
3.7
153.
7
Cur
rent
sur
plus
520
3.8
203.
018
1.6
177.
817
1.8
173.
818
3.5
186.
617
8.5
177.
817
9.3
181.
817
5.1
174.
7
F
eder
al g
over
nmen
t
Net
bor
row
ing
306.
918
3.4
280.
728
7.2
160.
115
8.0
632.
3-1
94.5
268.
041
6.8
565.
7-2
58.0
360.
848
0.4
N
et b
orro
win
g (n
.s.a
.)30
6.9
183.
428
0.7
287.
243
.458
.618
1.3
-94.
470
.412
3.3
164.
7-1
10.2
93.6
139.
2
Uni
fied
def
icit
(n.s
.a.)
321.
820
9.2
284.
528
5.4
41.7
80.4
209.
5-1
25.3
67.1
133.
319
2.0
-141
.085
.214
9.2
Dep
osit
ory
inst
itut
ions
Fund
s su
pplie
d81
4.1
810.
249
2.3
333.
440
4.0
829.
658
5.8
590.
966
4.2
128.
593
.350
7.5
370.
236
2.7
N
ote.
Dat
a af
ter
2006
:Q3
are
staf
f pr
ojec
tions
.
1. A
vera
ge d
ebt l
evel
s in
the
peri
od (
com
pute
d as
the
aver
age
of p
erio
d-en
d de
bt p
ositi
ons)
div
ided
by
nom
inal
GD
P.
2. I
nclu
des
chan
ge in
liab
ilitie
s no
t sho
wn
in h
ome
mor
tgag
es a
nd c
onsu
mer
cre
dit.
3.
Ave
rage
deb
t lev
els
in th
e pe
riod
(co
mpu
ted
as th
e av
erag
e of
per
iod-
end
debt
pos
ition
s) d
ivid
ed b
y di
spos
able
per
sona
l inc
ome.
4.
For
cor
pora
tions
, exc
ess
of c
apita
l exp
endi
ture
s ov
er U
.S. i
nter
nal f
unds
.
5. N
IPA
sta
te a
nd lo
cal g
over
nmen
t sav
ing
plus
con
sum
ptio
n of
fix
ed c
apita
l and
net
cap
ital t
rans
fers
.
n.s.
a. N
ot s
easo
nally
adj
uste
d.
2.6.
4 F
OF
I-31

(This page intentionally blank.)

Class II FOMC—Restricted (FR)
International Developments
I-33
Since the December FOMC meeting, prospects for foreign economic growth have been improved by a decline in spot and future oil prices of around $8 to $10 per barrel and an increase in the broad nominal value of the dollar of a little more than 1 percent. We have lowered our projected path of oil prices and raised our projected path of the broad real dollar accordingly. In addition, readings on foreign activity during the intermeeting period have been strong. All together, these developments suggest that the expansion abroad should continue at a pace that is a notch higher than the already healthy pace in the previous Greenbook. Foreign consumer price inflation, which declined as oil prices trended down, will move back up as oil prices reverse some of their decline but will remain below the rate previously forecast.
Summary of Staff Projections (Percent change from end of previous period, s.a.a.r.)
2006 Projection
2007 Indicator H1 Q3 2006
Q4 Q1 Q2 H2 2008
Foreign output 4.4 3.3 3.5 3.3 3.4 3.4 3.5 December GB 4.4 3.4 3.3 3.2 3.3 3.3 3.4
Foreign CPI 2.4 1.8 1.5 2.1 2.0 2.1 2.1 December GB 2.4 1.8 1.4 2.5 2.4 2.3 2.2
Note. Changes for years are measured as Q4/Q4; for half-years, Q2/Q4 or Q4/Q2. Core import price inflation is forecast to remain subdued, moving from about 2 percent at present to 1 percent in 2008 as nonfuel commodity prices flatten out and the dollar depreciates only slightly. The forecast for core import price inflation is lower this year than in the previous Greenbook, largely reflecting the recent increase in the dollar. Real net exports of goods and services are estimated to have made a positive arithmetic contribution to U.S. GDP growth of more than 1 percentage point in the last quarter of 2006—more than ½ percentage point higher than projected in the December Greenbook. This year and next, net exports are forecast to subtract around ¼ percentage point from U.S. GDP growth. The magnitude of the negative contribution is somewhat greater than in the previous Greenbook, largely because of the higher path for the dollar.

I-34 Class II FOMC—Restricted (FR) Part I: Summary and Outlook, January 24, 2007
The U.S. current account deficit widened to a record $902 billion in the third quarter of last year. We estimate that the deficit subsequently narrowed with the decline in oil prices, but we project it to resume widening later this year, reaching about $1 trillion or 6.7 percent of GDP by the end of 2008. Oil Prices The spot price of West Texas intermediate (WTI) crude oil closed at $53.90 per barrel on January 23, a decline of over $8 per barrel since the time of the December Greenbook. Our projected path of oil prices over the next two years follows the path of NYMEX futures prices; it climbs gradually to about $61 per barrel by the end of 2008, supported by continued concerns about possible production disruptions and by expectations of solid global demand. Compared with the December Greenbook, our forecast calls for the spot price to average $9.75 per barrel less in 2007 and $9.20 per barrel less in 2008. The sharp fall in the spot price appears largely to have reflected unusually warm weather throughout much of the northern hemisphere, which has reduced the demand for heating oil. Because oil is a storable commodity, the recent weather helps to explain a portion of the fall in prices of further-dated futures contracts, but the decline is larger than can be reasonably explained by near-term weather conditions alone. A possible additional factor is that market participants have reevaluated the willingness of Saudi Arabia to defend elevated oil prices, in light of official statements that the Saudis see no need for an emergency meeting of OPEC to address recent declines. International Financial Markets Over the intermeeting period, the nominal trade-weighted exchange value of the dollar rose 2¼ percent against the major foreign currencies and was about flat against the currencies of our other important trading partners. Accordingly, we have raised our current-quarter forecast of the broad real dollar 1¼ percent relative to the December Greenbook. Going forward, we continue to project that the dollar will depreciate at a modest pace, as the large and growing U.S. current account deficit diminishes the willingness of investors to accumulate additional dollar-denominated assets at unchanged exchange rates. Since the December FOMC meeting, the dollar has appreciated 3¾ percent against the yen and about 2 percent against the euro and the Canadian dollar but has depreciated ¾ percent against the renminbi. The yen’s depreciation early in the period came largely in reaction to several weaker-than-expected Japanese data releases. Subsequently,

International Developments Class II FOMC—Restricted (FR) I-35
growing expectations among market participants that the Bank of Japan’s Policy Board would leave its target rate unchanged at its meeting on January 17 and 18, which it did, put further downward pressure on the yen. Sterling appreciated following the unexpected decision by the Bank of England’s Monetary Policy Committee on January 11 to raise its policy interest rate 25 basis points, but retraced that move later in the period. Nominal and inflation-adjusted long-term government bond yields rose 25 to 30 basis points on net in Europe and Canada, the rise roughly matching the runups in U.S. yields. In contrast, nominal and inflation-adjusted JGB yields were little changed. Share prices rose 2½ to 6 percent in Europe and Japan but were more variable in some emerging-market economies. The Shanghai Composite index soared 34 percent, reportedly in reaction to takeover speculation affecting some large firms. The Stock Exchange of Thailand index fell 11 percent on net, as investors reacted sharply to new restrictions on stock ownership announced by the government to curb short-term capital inflows. Venezuelan share prices tumbled in the first half of January on news that President Chavez would seek to nationalize companies in the telecommunications and energy sectors, but they subsequently partially recovered. Emerging market risk spreads declined: The EMBI+ measure was down about 15 basis points, to a record low of less than 170 basis points.
. The Desk did not intervene during
the period for the accounts of the System or the Treasury. Advanced Foreign Economies Real GDP growth in the advanced foreign economies rose to an estimated annual rate of 2¾ percent in the fourth quarter, a rise that was broadly based. In Japan, an apparent surge in consumption and production suggests that GDP advanced 3½ percent. Euro-area growth picked up as well; French GDP growth recovered to an estimated 2 percent pace, and German GDP growth climbed to an estimated 3½ percent, in part because of strong consumer spending in anticipation of the scheduled hike in the value-added tax (VAT). In Canada, indicators have been somewhat mixed, but with employment remaining strong, we estimate that GDP grew 2¼ percent in the fourth quarter. Fourth-quarter GDP in the United Kingdom rose 3.4 percent. We forecast that growth in the advanced foreign economies will slow in the current quarter to around 2¼ percent because of more moderate Japanese growth and some
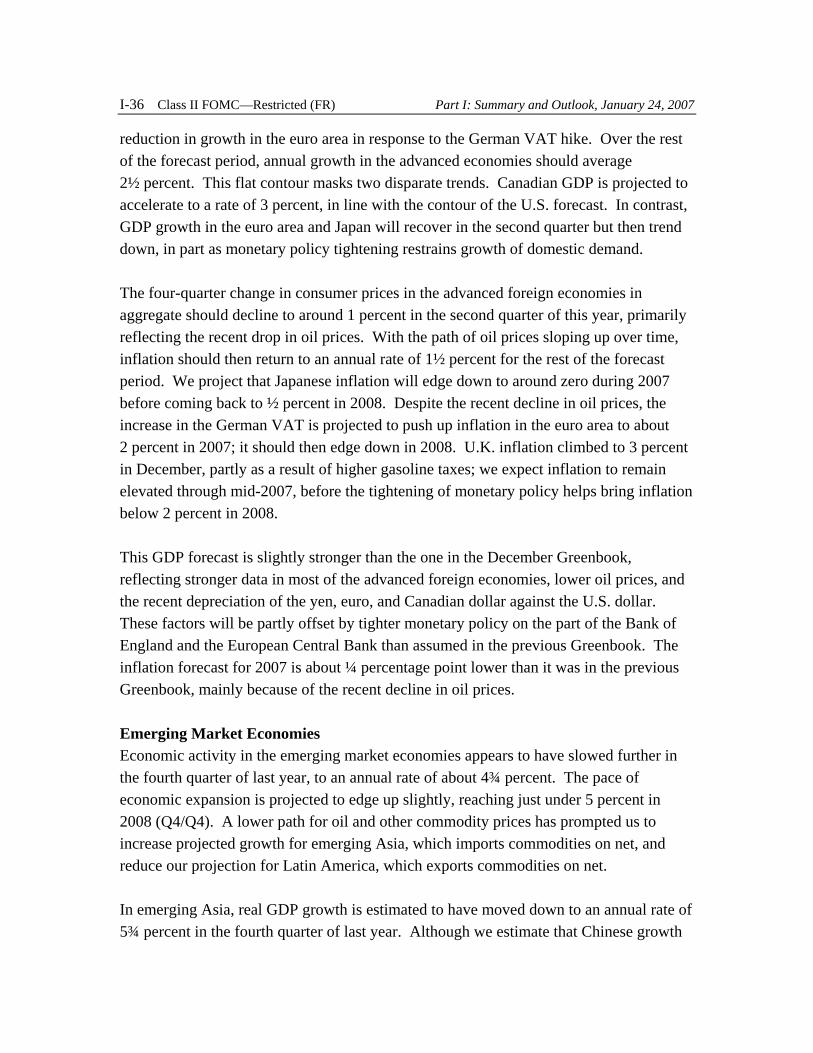
I-36 Class II FOMC—Restricted (FR) Part I: Summary and Outlook, January 24, 2007
reduction in growth in the euro area in response to the German VAT hike. Over the rest of the forecast period, annual growth in the advanced economies should average 2½ percent. This flat contour masks two disparate trends. Canadian GDP is projected to accelerate to a rate of 3 percent, in line with the contour of the U.S. forecast. In contrast, GDP growth in the euro area and Japan will recover in the second quarter but then trend down, in part as monetary policy tightening restrains growth of domestic demand. The four-quarter change in consumer prices in the advanced foreign economies in aggregate should decline to around 1 percent in the second quarter of this year, primarily reflecting the recent drop in oil prices. With the path of oil prices sloping up over time, inflation should then return to an annual rate of 1½ percent for the rest of the forecast period. We project that Japanese inflation will edge down to around zero during 2007 before coming back to ½ percent in 2008. Despite the recent decline in oil prices, the increase in the German VAT is projected to push up inflation in the euro area to about 2 percent in 2007; it should then edge down in 2008. U.K. inflation climbed to 3 percent in December, partly as a result of higher gasoline taxes; we expect inflation to remain elevated through mid-2007, before the tightening of monetary policy helps bring inflation below 2 percent in 2008. This GDP forecast is slightly stronger than the one in the December Greenbook, reflecting stronger data in most of the advanced foreign economies, lower oil prices, and the recent depreciation of the yen, euro, and Canadian dollar against the U.S. dollar. These factors will be partly offset by tighter monetary policy on the part of the Bank of England and the European Central Bank than assumed in the previous Greenbook. The inflation forecast for 2007 is about ¼ percentage point lower than it was in the previous Greenbook, mainly because of the recent decline in oil prices. Emerging Market Economies Economic activity in the emerging market economies appears to have slowed further in the fourth quarter of last year, to an annual rate of about 4¾ percent. The pace of economic expansion is projected to edge up slightly, reaching just under 5 percent in 2008 (Q4/Q4). A lower path for oil and other commodity prices has prompted us to increase projected growth for emerging Asia, which imports commodities on net, and reduce our projection for Latin America, which exports commodities on net. In emerging Asia, real GDP growth is estimated to have moved down to an annual rate of 5¾ percent in the fourth quarter of last year. Although we estimate that Chinese growth

International Developments Class II FOMC—Restricted (FR) I-37
picked up after a sharp slowdown in the third quarter, economic growth in several other Asian economies appears to have dropped from their very rapid third-quarter rates. Over the forecast period, output growth in China is projected to edge up gradually, reflecting the diminished effect of the recent administrative measures to restrain investment. For the rest of the region, growth is expected to benefit from a moderate increase in the growth of global high-tech demand. Latin American growth is estimated to have declined further to an annual rate of 3 percent in the fourth quarter of last year, as weak U.S. manufacturing production weighed on the pace of economic expansion in Mexico. However, such developments are not expected to persist. In the current quarter, recovery in U.S. manufacturing production is projected to boost activity in Mexico; going forward, Mexican growth should average about 3½ percent. Over the forecast period, growth in South America trends down as commodity prices stabilize and output decelerates in Argentina and Venezuela. Four-quarter consumer price inflation in the emerging market economies was 2¾ percent last year and is projected to remain at about this pace in 2007 and 2008. In emerging Asia, inflation is expected to rise from about 2 percent last year to 2¼ percent this year and next, in response to fuel prices. In contrast, in Latin America, consumer price inflation is projected to decline to a four-quarter rate of 3¾ percent over the next two years, after surging to 4¼ percent last year in response to a temporary increase in Mexican food prices. Our forecast for inflation in the emerging market economies is slightly lower than that in the December Greenbook, reflecting the lower level of oil prices throughout the forecast period. Prices of Internationally Traded Goods We estimate that core import price inflation dropped from a 4¼ percent annual rate in the third quarter to 1¾ percent in the fourth quarter, reflecting sharp decelerations in the prices of both finished and material intensive goods; in particular, the runup in metals prices slowed from their surge earlier in the year. This estimate is little changed from that in the December Greenbook, as incoming data on core import prices in November and December were very close to our expectations, with core import prices rising at an average monthly rate of ¼ percent in those months. The rise in the dollar and a fall in metals prices since the time of the previous Greenbook are expected to keep core import price inflation in the current quarter relatively low, at 2 percent. Thereafter, inflation steps down further and hovers just above 1 percent for most of the forecast period. This forecast reflects our projection that commodity prices will remain flat, consistent with

I-38 Class II FOMC—Restricted (FR) Part I: Summary and Outlook, January 24, 2007
futures markets, and that the effects of earlier commodity price increases will diminish quickly over the next several quarters. Compared with the December Greenbook, our projection is down 1 percentage point on average in the first half, in light of the recent strengthening of the dollar, but it is little changed thereafter.
Staff Projections of Selected Trade Prices (Percent change from end of previous period excepted as noted; s.a.a.r.)
2006 Projection
2007 Indicator H1 Q3 2006:
Q4 Q1 Q2 H2 2008
Exports Core goods 5.3 5.8 1.0 4.0 2.7 1.4 1.0 December GB 5.3 5.8 -0.2 4.0 3.7 1.5 1.2
Imports Core goods 2.7 4.3 1.7 2.0 1.6 1.3 1.0 December GB 2.7 4.2 2.0 3.3 2.2 1.5 1.0
Oil (dollars per barrel) 63.75 66.55 55.43 50.08 51.39 54.48 55.97 December GB 63.75 66.58 56.08 58.68 61.32 63.98 65.03 NOTE. Prices for core exports exclude computers and semiconductors. Prices for core imports exclude computers, semiconductors, oil, and natural gas. Both price series are on a NIPA chain-weighted basis. The price of imported oil for multiquarter periods is the price for the final quarter of the period. Imported oil includes both crude oil and refined products.
We estimate that core export price inflation dropped from 5¾ percent at an annual rate in the third quarter to just 1 percent in the fourth quarter. Data on export prices in the fourth quarter were quite weak on average, in part reflecting the slower pace of commodity price increases relative to the third quarter. Even so, this estimate is up noticeably from the last Greenbook, when we projected that core export prices had fallen slightly. Core export prices came in very close to our expectations in November but exceeded our expectations in December; prices for agricultural industrial supplies, fuels, and building materials all moved up strongly. We expect core export price inflation to move up in the current quarter to 4 percent, in line with projected increases in U.S. prices, especially agricultural prices, and reflecting the high level of core export prices in December. Further out we project core export price inflation to slow gradually to 1 percent by the end of 2008, as agricultural prices flatten out. Compared with the previous Greenbook, this outlook is little changed aside

International Developments Class II FOMC—Restricted (FR) I-39
from the second quarter, which is down 1 percentage point primarily because we now project smaller increases in U.S. producer prices for intermediate goods. Trade in Goods and Services Based on incoming trade data for October and November, we estimate that real net exports contributed 1.1 percentage points to real GDP growth in the fourth quarter, up from the ½ percentage point contribution projected in the December Greenbook. Exports were stronger than had been expected, while imports slowed to a greater extent than we had anticipated. In 2007 and 2008 we expect export growth to edge down while import growth recovers, so that exports and imports expand at about the same pace. Even so, real net exports subtract ¼ percentage point from GDP growth in 2007 and 2008, as imports grow off a much larger base. This projection is nearly ¼ percentage point more negative in 2007 than in the previous Greenbook, as a result of the higher dollar and slightly stronger near-term U.S. GDP growth. We estimate that real imports of goods and services fell 1¾ percent at an annual rate in the fourth quarter, as declining imports of oil, natural gas, and high-tech goods more than offset both a slight gain in imports of core goods and a more robust increase in imports of services. Our estimate for import growth in the fourth quarter is 2½ percentage points lower than in the December Greenbook, primarily on account of weaker-than-expected imports of oil, non-oil industrial supplies, and capital goods in both the October and November trade data. In the current quarter, we expect imports to increase 6¾ percent, as real oil imports resume growth and core import growth recovers from its surprising weakness in the fourth quarter to a rate consistent with the projection for U.S. GDP and relative prices. In contrast, the growth of services imports is expected to moderate somewhat following surprisingly strong growth in the fourth quarter. Compared with the previous Greenbook, we have increased our projection for the growth rate of overall imports by 1 percentage point in the first quarter, as the current and lagged effects of the faster projected pace of U.S. growth and the higher path of the dollar boost imports of core goods and services.

I-40 Class II FOMC—Restricted (FR) Part I: Summary and Outlook, January 24, 2007
Staff Projections for Trade in Goods and Services (Percent change from end of previous period, s.a.a.r.)
2006 Projection
2007Measure H1 Q3 2006:
Q4 Q1 Q2 H2 2008
Real exports 10.0 6.8 7.5 5.3 5.2 4.9 5.1 December GB 10.0 6.3 5.4 5.5 5.6 5.4 5.6
Real imports 5.2 5.6 -1.8 6.7 3.5 4.9 5.1 December GB 5.2 5.3 .7 5.6 2.2 4.5 5.1
NOTE. Changes for years are measured as Q4/Q4; for half-years, Q2/Q4 or Q4/Q2.
We project that import growth will slow to 3½ percent in the second quarter, largely on account of a quirky seasonal adjustment factor that depresses real oil imports, before climbing to about 5 percent in the second half of 2007 and in 2008. Core import growth is expected to pick up throughout 2007, supported by firming U.S. GDP growth and a deceleration in core import prices, before leveling off at just over 5½ percent in 2008. Imports of services are expected to grow steadily throughout the projection period, as are imports of computers and semiconductors. Our forecast for import growth in the final three quarters of this year has been revised up about ¾ percentage point from the December Greenbook forecast, because of a smaller projected decline in real oil imports as well as the positive effect of the higher projected path of the dollar on imports of core goods and services. Real exports of goods and services are estimated to have increased 7½ percent in the fourth quarter, a bit faster than the pace of growth in the third quarter, as an acceleration in exports of services more than offsets a decline in the growth rate of core exports. This estimate is about 2 percentage points stronger than the one in the December Greenbook, largely because of stronger-than-expected exports in both the October and the November trade data, with exports of aircraft exhibiting particular strength. We project that real export growth will decline to 5¼ percent in the current quarter, as exports of aircraft flatten out and exports of both core goods and services decelerate to rates consistent with the pace of foreign GDP growth and recent developments in relative prices. Our projection for the first quarter is about ¼ percentage point lower than that in the previous Greenbook, largely because of negative effects of the higher projected path of the dollar on exports of core goods and services.

International Developments Class II FOMC—Restricted (FR) I-41
For the remainder of 2007 and in 2008, we expect total export growth to stay in the vicinity of 5 percent. Against the backdrop of steady support from foreign growth, core export growth edges down over the rest of this year in response to current and lagged effects of the past few year’s swings in the dollar and then picks up in 2008, buoyed by slowing core export price inflation. In contrast, exports of services, which respond to exchange rate movements more rapidly than do core exports, are expected to slow over 2008 as the lagged effect of real dollar depreciation in 2006 fades and in line with our projection of only modest real dollar depreciation going forward. Exports of computers and semiconductors are expected to continue to grow in line with their historical pace. Compared with the previous Greenbook, we have revised down about ½ percentage point our projection for total export growth in the remainder of 2007 and in 2008, primarily because of the effect of the higher projected path of the dollar on core exports and services. Alternative Simulations In our baseline forecast, relatively strong growth abroad is expected to contribute to a continued expansion in U.S activity. However, foreign growth may expand less robustly than projected. To explore this possibility, we used the FRB/Global model to consider two alternative scenarios associated with lower foreign activity. In the first scenario, we examine a large autonomous fall in foreign investment and consumption. The shock is phased in gradually over two years beginning in the first quarter of 2007, and it lowers foreign GDP 2 percent relative to baseline by the second half of 2008. U.S. real net exports fall directly in response to weaker foreign demand for U.S. goods and indirectly in response to an appreciation of the dollar. The dollar appreciates as monetary authorities abroad cut policy interest rates in reaction to lower foreign inflation and activity. U.S. GDP growth falls 0.2 percentage point below baseline in the second half of this year and 0.4 percentage point in 2008. Core PCE inflation falls 0.1 percentage point relative to baseline in the second half of this year and about 0.2 percentage point in 2008, reflecting both falling import prices and the effects of lower aggregate demand on domestic prices. Although the nominal trade balance improves initially because of J-curve effects, it deteriorates by 0.3 percentage point of GDP relative to baseline in the second half of 2008 and 0.7 percentage point in the second half of 2009 (not shown). In the second scenario, we examine the effects of an inflationary supply shock such as might be generated by an acceleration of wages or a widening of mark-ups over cost.

I-42 Class II FOMC—Restricted (FR) Part I: Summary and Outlook, January 24, 2007
This leads monetary policy abroad to tighten, raising real interest rates and causing foreign activity to decelerate. This shock is phased in beginning in the first quarter of 2007 and is also calibrated to lower foreign GDP 2 percent below baseline in the second half of 2008. In the second scenario, there are noticeably smaller spillover effects on U.S. activity and prices than in the first scenario because the dollar depreciates in response to higher real interest rates abroad. Accordingly, the reduction of U.S. real net exports is smaller, and U.S. GDP growth declines only 0.1 percentage point below baseline in the second half of 2007 and in 2008. Core PCE inflation is unchanged in the second half of 2007 and is down about 0.1 percentage point on average in 2008, as the effect of lower resource utilization on domestic inflation is offset to some extent by a rise in import prices.
Alternative Scenarios Lower Foreign Demand and Higher Foreign Inflation
(Percent change from previous period, annual rate, except as noted)
2007 2008 Indicator and simulation
H1 H2 H1 H2
U.S. real GDP Baseline 2.2 2.4 2.5 2.5 Lower foreign demand 2.1 2.2 2.2 2.1 Higher foreign inflation 2.1 2.3 2.4 2.4
U.S. core PCE inflation Baseline 2.2 2.1 2.0 2.0 Lower foreign demand 2.2 2.0 1.8 1.8 Higher foreign inflation 2.2 2.1 1.9 1.8
U.S. federal funds rate (percent) Baseline 5.3 5.3 5.3 5.3 Lower foreign demand 5.2 5.0 4.7 4.4 Higher foreign inflation 5.3 5.2 5.1 4.9
U.S. trade balance (percent of GDP) Baseline -5.1 -5.2 -5.3 -5.2 Lower foreign demand -5.0 -5.2 -5.4 -5.5 Higher foreign inflation -5.1 -5.2 -5.3 -5.2
NOTE. Half year changes are measured as Q2/Q4 or Q4/Q2. The federal funds rate is the average rate for the final quarter of the period. The monetary authorities in the United States and the major foreign adjust their policy rates according to Taylor rules.

Evolution of the Staff Forecast
-8.0
-7.5
-7.0
-6.5
-6.0
-5.5
Class II FOMC -- Restricted (FR)
2006
2007
2008
Greenbook publication date
Current Account BalancePercent of GDP
1/26 3/16 4/28 6/22 8/4 9/14 10/26 12/7 1/25 3/22 5/3 6/21 8/3 9/1310/18 12/6 1/24 3/14 5/2 6/20 8/2 9/12 10/24 12/51/242005 2006 2007
2.5
3.0
3.5
4.0
2006
20072008
Greenbook publication date
Foreign Real GDPPercent change, Q4/Q4
1/26 3/16 4/28 6/22 8/4 9/14 10/26 12/7 1/25 3/22 5/3 6/21 8/3 9/1310/18 12/6 1/24 3/14 5/2 6/20 8/2 9/12 10/24 12/51/242005 2006 2007
-1
0
1
2
3
4
5
2006
2007
2008
Greenbook publication date*Prices for merchandise imports excluding computers, semiconductors, oil, and natural gas.
Core Import Prices*Percent change, Q4/Q4
1/26 3/16 4/28 6/22 8/4 9/14 10/26 12/7 1/25 3/22 5/3 6/21 8/3 9/1310/18 12/6 1/24 3/14 5/2 6/20 8/2 9/12 10/24 12/51/242005 2006 2007
I-43

Class II FOMC January 24, 2007
Restricted (FR)
OUTLOOK FOR FOREIGN REAL GDP AND CONSUMER PRICES: SELECTED COUNTRIES
(Percent, Q4 to Q4)
___________________________________________________________________________________________________
-----Projected----
Measure and country 2000 2001 2002 2003 2004 2005 2006 2007 2008
___________________________________________________________________________________________________
REAL GDP (1)
------------
Total foreign 4.2 0.3 3.1 3.0 3.8 3.7 3.9 3.4 3.5
Advanced Foreign Economies 3.6 0.9 2.5 1.8 2.6 2.6 2.7 2.4 2.5
of which:
Canada 4.1 1.3 3.5 1.5 3.7 2.8 2.5 2.6 2.9
Japan 3.1 -1.7 2.0 2.4 1.1 2.9 2.0 1.9 1.7
United Kingdom 3.1 2.0 2.3 3.3 2.6 2.0 3.0 2.9 2.5
Euro Area (2) 3.3 1.0 1.1 1.0 1.5 1.8 3.0 1.8 1.8
Germany 2.3 1.1 0.0 0.2 0.2 1.7 3.4 1.5 1.6
Emerging Market Economies 5.2 -0.4 3.8 4.7 5.6 5.4 5.6 4.8 4.9
Asia 5.8 1.0 6.2 6.8 6.0 7.3 6.5 6.0 6.2
Korea 4.3 4.7 7.8 4.2 2.9 5.3 4.2 4.6 4.8
China 7.8 7.1 8.4 10.1 9.6 9.9 9.9 8.8 9.1
Latin America 4.4 -1.3 1.5 2.4 5.2 3.2 4.9 3.5 3.5
Mexico 4.8 -1.3 2.0 2.0 4.8 2.7 4.7 3.4 3.4
Brazil 3.8 -1.0 4.1 0.9 4.8 1.6 3.0 3.5 3.5
CONSUMER PRICES (3)
-------------------
Advanced Foreign Economies 1.9 0.9 2.1 1.3 1.8 1.5 1.4 1.5 1.5
of which:
Canada 3.1 1.1 3.8 1.7 2.3 2.3 1.3 1.7 2.0
Japan -0.5 -1.1 -0.5 -0.4 0.5 -1.0 0.4 0.2 0.5
United Kingdom (4) 0.9 1.1 1.5 1.3 1.4 2.1 2.7 2.0 1.8
Euro Area (2) 2.5 2.1 2.3 2.0 2.3 2.3 1.8 1.9 1.7
Germany 1.7 1.5 1.2 1.1 2.1 2.2 1.3 2.4 1.4
Emerging Market Economies 4.1 2.8 2.9 3.0 3.9 3.0 2.7 2.8 2.7
Asia 1.8 1.2 0.8 2.2 3.2 2.6 2.1 2.3 2.2
Korea 2.5 3.3 3.4 3.5 3.4 2.5 2.1 2.0 2.3
China 1.0 -0.1 -0.5 2.7 3.3 1.4 1.8 2.1 1.9
Latin America 8.4 5.3 6.4 4.9 5.7 3.8 4.2 3.8 3.7
Mexico 8.7 5.1 5.2 3.9 5.3 3.1 4.1 3.6 3.5
Brazil 6.4 7.5 10.7 11.5 7.2 6.1 3.1 3.5 3.5
___________________________________________________________________________________________________
1. Foreign GDP aggregates calculated using shares of U.S. exports.
2. Harmonized data for euro area from Eurostat.
3. Foreign CPI aggregates calculated using shares of U.S. non-oil imports.
4. CPI excluding mortgage interest payments, which is the targeted inflation rate.
I-44

Class II FOMC January 24, 2007
Restricted (FR)
OUTLOOK FOR FOREIGN REAL GDP AND CONSUMER PRICES: SELECTED COUNTRIES
(Percent changes)
______________________________________________________________________________________________________________
-------------------- Projected ------------------------
2006 2007 2008
----------------------- ----------------------- -----------------------
Measure and country Q1 Q2 Q3 Q4 Q1 Q2 Q3 Q4 Q1 Q2 Q3 Q4
______________________________________________________________________________________________________________
REAL GDP (1) -------------------- Quarterly changes at an annual rate ------------------
------------
Total foreign 4.7 4.1 3.3 3.5 3.3 3.4 3.4 3.4 3.5 3.5 3.5 3.5
Advanced Foreign Economies 3.3 2.7 2.0 2.7 2.2 2.4 2.5 2.4 2.5 2.5 2.5 2.4
of which:
Canada 3.8 2.0 1.7 2.3 2.5 2.4 2.7 2.7 2.9 2.9 3.0 2.9
Japan 2.7 1.1 0.8 3.5 1.8 2.0 1.9 1.9 1.7 1.7 1.7 1.6
United Kingdom 2.9 3.0 2.8 3.4 3.2 3.0 2.8 2.6 2.5 2.5 2.5 2.5
Euro Area (2) 3.3 4.0 2.1 2.6 1.4 2.1 2.0 1.9 1.8 1.8 1.8 1.8
Germany 3.2 4.4 2.6 3.6 -0.2 2.2 2.1 1.8 1.7 1.7 1.6 1.6
Emerging Market Economies 6.6 6.1 5.2 4.7 4.7 4.8 4.8 4.8 4.8 4.8 4.9 4.9
Asia 7.5 5.9 7.0 5.8 5.8 6.0 6.0 6.1 6.2 6.2 6.3 6.3
Korea 4.9 3.4 4.4 4.2 4.5 4.5 4.6 4.7 4.7 4.8 4.8 4.8
China 12.2 12.0 7.0 8.6 8.8 8.8 8.8 8.8 9.0 9.0 9.1 9.3
Latin America 6.2 5.9 4.3 3.1 3.6 3.6 3.5 3.5 3.5 3.5 3.5 3.5
Mexico 6.6 5.6 4.1 2.6 3.3 3.4 3.4 3.4 3.4 3.4 3.4 3.4
Brazil 4.8 1.7 2.0 3.8 3.5 3.5 3.5 3.5 3.5 3.5 3.5 3.5
CONSUMER PRICES (3)
------------------- --------------------------- Four-quarter changes --------------------------
Advanced Foreign Economies 1.8 2.0 1.6 1.4 1.3 1.0 1.2 1.5 1.6 1.6 1.5 1.5
of which:
Canada 2.5 2.6 1.6 1.3 1.0 0.8 1.3 1.7 2.0 2.0 2.0 2.0
Japan -0.1 0.2 0.6 0.4 -0.0 0.0 -0.2 0.2 0.4 0.5 0.5 0.5
United Kingdom (4) 2.0 2.2 2.4 2.7 2.8 2.5 2.1 2.0 1.9 1.9 1.8 1.8
Euro Area (2) 2.3 2.5 2.1 1.8 2.0 1.6 1.7 1.9 1.8 1.8 1.7 1.7
Germany 2.1 2.1 1.6 1.3 2.5 2.2 2.3 2.4 1.5 1.5 1.4 1.4
Emerging Market Economies 3.0 2.9 2.7 2.7 2.9 2.7 2.8 2.8 2.7 2.7 2.7 2.7
Asia 2.4 2.6 2.1 2.1 2.4 2.1 2.3 2.3 2.2 2.2 2.2 2.2
Korea 2.1 2.3 2.5 2.1 2.0 1.6 1.4 2.0 2.3 2.6 2.5 2.3
China 1.2 1.4 1.2 1.8 2.2 2.1 2.3 2.1 2.0 2.0 1.9 1.9
Latin America 4.2 3.5 3.8 4.2 4.0 4.3 4.1 3.8 3.7 3.7 3.7 3.7
Mexico 3.7 3.1 3.5 4.1 4.0 4.3 3.9 3.6 3.5 3.5 3.5 3.5
Brazil 5.6 4.3 3.8 3.1 2.6 2.9 3.5 3.5 3.5 3.5 3.5 3.5
______________________________________________________________________________________________________________
1. Foreign GDP aggregates calculated using shares of U.S. exports.
2. Harmonized data for euro area from Eurostat.
3. Foreign CPI aggregates calculated using shares of U.S. non-oil imports.
4. CPI excluding mortgage interest payments, which is the targeted inflation rate.
I-45

Class II FOMC January 24, 2007
Restricted (FR)
OUTLOOK FOR U.S. INTERNATIONAL TRANSACTIONS
________________________________________________________________________________________________________________
------ Projected ------
2000 2001 2002 2003 2004 2005 2006 2007 2008
________________________________________________________________________________________________________________
NIPA REAL EXPORTS and IMPORTS
Percentage point contribution to GDP growth, Q4/Q4
Net Goods & Services -0.9 -0.2 -0.9 -0.1 -0.8 -0.1 0.3 -0.2 -0.3
Exports of G&S 0.7 -1.3 0.4 0.6 0.7 0.7 0.9 0.6 0.6
Imports of G&S -1.6 1.1 -1.3 -0.7 -1.5 -0.8 -0.6 -0.8 -0.8
Percentage change, Q4/Q4
Exports of G&S 6.5 -11.9 3.8 5.8 7.0 6.7 8.6 5.1 5.1
Services 1.8 -8.9 10.2 3.0 7.1 3.1 5.4 5.8 5.0
Computers 22.7 -23.5 -1.1 11.3 6.4 14.1 10.0 14.2 14.4
Semiconductors 27.6 -34.6 10.1 38.3 -6.3 17.2 5.5 19.2 17.0
Core Goods 1/ 5.9 -10.2 0.6 4.9 8.0 7.5 10.2 3.6 4.1
Imports of G&S 11.2 -7.6 9.7 4.8 10.6 5.2 3.5 5.0 5.1
Services 10.6 -5.9 8.8 2.2 7.6 1.9 5.4 3.2 3.5
Oil 13.3 3.7 3.8 1.2 9.6 0.9 -9.1 4.0 -0.2
Natural Gas 37.3 -6.5 19.5 1.3 6.6 11.9 -13.7 4.7 1.5
Computers 13.9 -13.6 13.2 17.0 22.5 11.8 15.9 17.3 17.5
Semiconductors 22.8 -51.1 11.0 -0.1 9.3 7.5 1.7 17.0 17.0
Core Goods 2/ 10.3 -6.5 10.0 5.2 10.7 6.2 5.5 4.5 5.5
Billions of Chained 2000 Dollars
Net Goods & Services -379.5 -399.1 -471.3 -518.9 -590.9 -619.2 -621.5 -613.5 -646.6
Exports of G&S 1096.3 1036.7 1013.3 1026.1 1120.4 1196.1 1300.4 1376.6 1445.7
Imports of G&S 1475.8 1435.8 1484.6 1545.0 1711.3 1815.3 1921.9 1990.1 2092.2
________________________________________________________________________________________________________________
Billions of dollars
US CURRENT ACCOUNT BALANCE -415.2 -389.0 -472.4 -527.5 -665.3 -791.5 -870.4 -886.0 -971.7
Current Acct as Percent of GDP -4.2 -3.8 -4.5 -4.8 -5.7 -6.4 -6.6 -6.4 -6.7
Net Goods & Services (BOP) -377.6 -362.8 -421.1 -494.9 -611.3 -716.7 -763.1 -714.7 -767.4
Investment Income, Net 25.7 30.3 17.8 42.3 33.6 17.6 -12.3 -71.9 -103.7
Direct, Net 94.9 115.9 102.4 112.8 123.9 134.4 140.7 130.3 157.5
Portfolio, Net -69.2 -85.5 -84.6 -70.5 -90.2 -116.8 -153.1 -202.1 -261.1
Other Income & Transfers,Net -63.3 -56.5 -69.2 -74.9 -87.6 -92.4 -95.0 -99.4 -100.6
________________________________________________________________________________________________________________
1. Merchandise exports excluding computers and semiconductors.
2. Merchandise imports excluding oil, natural gas, computers, and semiconductors.
I-46

Class II FOMC January 24, 2007
Restricted (FR)
OUTLOOK FOR U.S. INTERNATIONAL TRANSACTIONS
___________________________________________________________________________________________________________________________
2003 2004 2005
---------------------------- ---------------------------- ---------------------------
Q1 Q2 Q3 Q4 Q1 Q2 Q3 Q4 Q1 Q2 Q3 Q4
___________________________________________________________________________________________________________________________
NIPA REAL EXPORTS and IMPORTS
Percentage point contribution to GDP growth
Net Goods & Services 0.2 -0.7 0.5 -0.5 -0.7 -1.6 -0.2 -0.8 -0.2 0.7 -0.1 -1.1
Exports of G&S -0.5 -0.2 1.0 1.8 0.7 0.6 0.5 1.0 0.5 0.9 0.3 1.0
Imports of G&S 0.7 -0.6 -0.5 -2.3 -1.4 -2.2 -0.7 -1.8 -0.6 -0.2 -0.4 -2.0
Percentage change from previous period, s.a.a.r.
Exports of G&S -5.3 -1.7 11.4 20.8 7.2 6.2 4.8 9.9 4.7 9.4 3.2 9.6
Services -20.0 -2.8 17.5 23.1 7.5 5.6 -2.8 19.2 2.9 2.0 2.1 5.5
Computers -2.3 -5.2 34.7 23.2 -5.8 -3.1 20.7 16.5 13.6 21.9 17.8 3.9
Semiconductors 37.4 30.9 44.6 40.7 11.5 -7.8 -19.1 -7.2 -7.7 21.3 26.3 33.6
Core Goods 1/ 0.2 -2.9 5.2 18.3 7.7 8.2 9.7 6.4 5.8 11.9 1.8 10.7
Imports of G&S -5.0 4.1 3.8 17.6 10.2 16.0 4.4 12.0 4.1 1.4 2.5 13.2
Services -10.6 -15.7 21.2 19.6 10.9 7.6 3.1 9.0 -0.2 -1.5 1.2 8.3
Oil -9.7 12.4 -6.0 9.9 37.2 -22.9 -6.4 45.5 7.0 -21.2 -12.5 40.5
Natural Gas -45.9 72.5 66.4 -32.1 16.2 72.0 43.7 -55.1 23.0 12.3 109.8 -45.9
Computers 11.4 10.7 11.1 36.9 21.1 30.2 27.5 11.9 9.2 9.4 19.6 9.3
Semiconductors -6.3 1.1 -4.2 9.7 43.3 19.6 3.8 -19.9 -7.4 8.4 15.6 14.9
Core Goods 2/ -3.1 7.2 -0.1 18.1 5.3 23.2 4.2 11.0 4.4 5.8 2.7 12.3
Billions of Chained 2000 Dollars, s.a.a.r.
Net Goods & Services -507.2 -526.9 -513.8 -527.8 -548.5 -593.9 -599.4 -621.9 -626.4 -606.1 -607.6 -636.6
Exports of G&S 1003.3 999.0 1026.3 1075.8 1094.8 1111.3 1124.3 1151.3 1164.5 1191.0 1200.5 1228.4
Imports of G&S 1510.5 1525.9 1540.0 1603.6 1643.2 1705.2 1723.7 1773.1 1790.9 1797.1 1808.1 1865.0
___________________________________________________________________________________________________________________________
Billions of dollars, s.a.a.r.
US CURRENT ACCOUNT BALANCE -548.7 -524.4 -526.2 -510.8 -583.3 -667.1 -665.3 -745.4 -766.9 -773.0 -733.7 -892.4
Current Account as % of GDP -5.1 -4.8 -4.7 -4.6 -5.1 -5.7 -5.6 -6.2 -6.3 -6.3 -5.8 -7.0
Net Goods & Services (BOP) -496.9 -492.9 -491.9 -497.9 -544.6 -605.6 -626.7 -668.3 -672.4 -688.2 -727.2 -779.1
Investment Income, Net 24.4 41.7 39.2 63.8 57.3 28.2 33.4 15.6 20.7 14.2 37.9 -2.3
Direct, Net 97.2 108.4 109.3 136.3 130.4 113.4 122.8 128.8 121.4 124.2 161.5 130.6
Portfolio, Net -72.7 -66.6 -70.1 -72.5 -73.1 -85.2 -89.4 -113.2 -100.7 -110.0 -123.6 -132.9
Other Inc. & Transfers, Net -76.2 -73.2 -73.5 -76.7 -96.1 -89.7 -72.0 -92.7 -115.1 -99.0 -44.3 -111.0
___________________________________________________________________________________________________________________________
1. Merchandise exports excluding computers and semiconductors.
2. Merchandise imports excluding oil, natural gas, computers, and semiconductors.
I-47

Class II FOMC January 24, 2007
Restricted (FR)
OUTLOOK FOR U.S. INTERNATIONAL TRANSACTIONS
___________________________________________________________________________________________________________________________
------------------------- Projected ----------------------------
2006 2007 2008
---------------------------- ---------------------------- ---------------------------
Q1 Q2 Q3 Q4 Q1 Q2 Q3 Q4 Q1 Q2 Q3 Q4
___________________________________________________________________________________________________________________________
NIPA REAL EXPORTS and IMPORTS
Percentage point contribution to GDP growth
Net Goods & Services -0.0 0.4 -0.2 1.1 -0.5 0.0 0.0 -0.5 -0.6 -0.0 -0.1 -0.4
Exports of G&S 1.4 0.7 0.7 0.8 0.6 0.6 0.6 0.5 0.6 0.6 0.6 0.6
Imports of G&S -1.5 -0.2 -0.9 0.3 -1.1 -0.6 -0.5 -1.1 -1.1 -0.6 -0.7 -1.0
Percentage change from previous period, s.a.a.r.
Exports of G&S 14.0 6.2 6.8 7.5 5.3 5.2 5.0 4.8 4.9 5.1 5.2 5.3
Services 6.7 6.7 0.8 7.4 5.7 6.1 5.9 5.6 5.3 5.1 4.9 4.9
Computers 9.8 12.0 -0.1 19.3 13.7 14.4 14.4 14.4 14.4 14.4 14.4 14.4
Semiconductors 15.7 29.9 -12.4 -5.9 26.2 17.0 17.0 17.0 17.0 17.0 17.0 17.0
Core Goods 1/ 17.8 4.4 11.4 7.8 3.7 3.7 3.5 3.3 3.7 4.1 4.3 4.5
Imports of G&S 9.1 1.4 5.6 -1.8 6.7 3.5 3.2 6.5 6.9 3.7 4.2 5.8
Services 7.4 9.9 -2.6 7.2 2.3 3.5 3.5 3.5 3.5 3.5 8.0 -0.8
Oil -4.8 -18.3 7.1 -18.1 25.5 -8.8 -12.6 16.9 18.6 -14.2 -15.7 15.5
Natural Gas -24.6 42.1 -26.4 -29.5 -21.8 40.8 19.0 -8.3 -14.4 34.3 20.5 -23.5
Computers 34.3 17.0 18.4 -3.0 16.9 17.5 17.5 17.5 17.5 17.5 17.5 17.5
Semiconductors 3.6 -1.3 21.6 -13.9 17.0 17.0 17.0 17.0 17.0 17.0 17.0 17.0
Core Goods 2/ 12.4 2.4 6.9 0.8 4.4 4.0 4.6 5.0 5.3 5.6 5.7 5.7
Billions of Chained 2000 Dollars, s.a.a.r.
Net Goods & Services -636.6 -624.2 -628.8 -596.3 -610.3 -610.0 -609.0 -624.6 -641.7 -642.5 -645.5 -656.5
Exports of G&S 1269.3 1288.5 1310.0 1333.9 1351.3 1368.5 1385.3 1401.5 1418.4 1436.2 1454.6 1473.5
Imports of G&S 1905.9 1912.7 1938.8 1930.2 1961.6 1978.4 1994.3 2026.1 2060.1 2078.7 2100.1 2130.0
___________________________________________________________________________________________________________________________
Billions of dollars, s.a.a.r.
US CURRENT ACCOUNT BALANCE -852.8 -868.5 -902.2 -858.1 -850.1 -876.5 -888.0 -929.3 -953.8 -960.8 -971.6 -1000.4
Current Account as % of GDP -6.6 -6.6 -6.8 -6.4 -6.2 -6.3 -6.4 -6.6 -6.7 -6.6 -6.6 -6.7
Net Goods & Services (BOP) -764.6 -772.5 -801.3 -714.3 -702.0 -706.1 -713.0 -737.7 -764.7 -762.4 -764.6 -777.8
Investment Income, Net -3.6 -2.1 -8.7 -34.8 -52.3 -73.2 -76.2 -85.7 -90.2 -99.5 -108.1 -116.7
Direct, Net 137.2 152.2 143.2 130.4 126.9 121.0 133.7 139.5 149.5 154.7 160.4 165.4
Portfolio, Net -140.8 -154.4 -151.9 -165.2 -179.2 -194.3 -209.8 -225.2 -239.8 -254.2 -268.5 -282.1
Other Inc. & Transfers, Net -84.7 -93.9 -92.3 -109.0 -95.8 -97.2 -98.9 -105.9 -98.9 -98.9 -98.9 -105.9
___________________________________________________________________________________________________________________________
1. Merchandise exports excluding computers and semiconductors.
2. Merchandise imports excluding oil, natural gas, computers, and semiconductors.
Last Page
I-48