fonterra - nzx · 2 agenda welcome and introduction john shewan chairman’s address john shewan...
TRANSCRIPT

FONTERRA
SHAREHOLDERS’
FUND
ANNUAL MEETING
FRIDAY 27 NOVEMBER 2015
COMMENCING AT 10AM

1
JOHN SHEWAN
Chairman
FSF Management Company

2
AGENDA
Welcome and introduction John Shewan
Chairman’s address John Shewan
Opening remarks from Fonterra Chairman John Wilson
Fonterra CEO’s address Theo Spierings
Questions Theo Spierings
Resolution to elect retiring Director John Shewan Pip Dunphy
Address by John Shewan
General business John Shewan

3
KEY EVENTS IN THE YEAR
1 December 2014 Distribution Reinvestment Plan introduced
16 March 2015 Beingmate Partial Tender Offer completed
25 March 2015 Interim Results announcement
20 April 2015 Interim Distribution of 10 cents per unit paid
24 April 2015 Appointment of Jacqueline Chow as Chief Operating Officer Velocity
17 July 2015 First results of business transformation
1 August 2015 Fonterra Co-op Support Loan announced
24 September 2015 Annual Results announcement – forecast EPS range of 40 – 50 cents
20 October 2015 Final Distribution of 15 cents per unit paid
16 November 2015 Forecast EPS range increased to 45 – 55 cents

4
UNIT PRICE PERFORMANCE
• 12-month price performance
disappointing
• Fonterra’s performance back on track
– Ingredients
• ROC of 9%
– Consumer and foodservice
• ROC of 25%
– Group ROC of 9%
• Business transformation delivering
• FY16 EPS of 45 to 55 cents 0
1,000
2,000
3,000
4,000
0
1
2
3
4
5
6
7
Aug-2014 Jan-2015 Jun-2015 Nov-2015
Volume (000s)
Closing Price ($)

5
FUND KEY STATISTICS
Units on Issue¹: 97 million
Fund Market Capitalisation¹: $525 million
Fonterra Market Capitalisation¹: $8.7 billion
Fund Size¹: 6% of Fonterra shares on issue
12-month High/Low¹: $6.22 / $4.60
Liquidity Ranking on the NZX²: 1st
1. At 23 November 2015
2. Liquidity has been calculated as median daily value traded (12 months) / Average Daily New Zealand Free Float Market Cap (12 months) (Source: NZX) –
at 31 October 2015.

6
Holding by Country
65%
31%
4%
New Zealand Australia Other
Holding by Investor Type
55% 34%
10%
Retail Institution Farmer Other
UNIT REGISTER ANALYSIS
As at November 2015.

7
INVESTOR RELATIONS INITIATIVES
• Investor roadshows in New Zealand (x2), Australia (x2), Europe and the
United States
• Investor conferences – Macquarie and UBS
• Presented to wealth managers and financial advisors
• Refreshed the ‘Investor Centre’ website on fonterra.com - Our Financials
• Monthly Global Dairy Update available on fonterra.com - Our Financials

8
DIRECTORS
Fonterra Co-operative Group
• Sir Ralph Norris retires
• Clinton Dines appointed
– Independent Director
• Ashley Waugh appointed
– Elected Director
FSF Management Company
• Sir Ralph Norris retires
• Ian Farrelly appointed
• With effect post annual meeting

JOHN WILSON
CHAIRMAN
FONTERRA CO-OPERATIVE GROUP LIMITED
© Fonterra Co-operative Group Ltd. Page 10
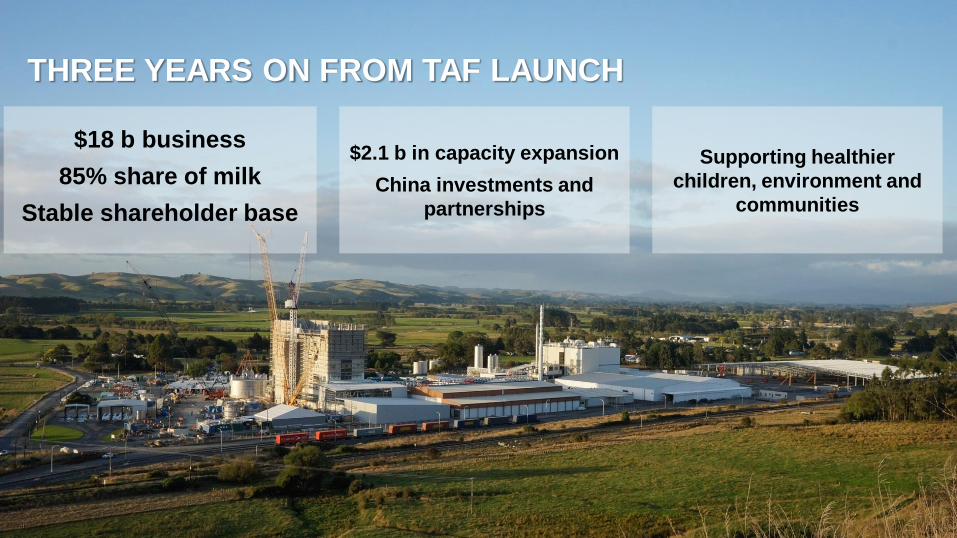
THREE YEARS ON FROM TAF LAUNCH
$18 b business
85% share of milk
Stable shareholder base
$2.1 b in capacity expansion
China investments and
partnerships
Supporting healthier
children, environment and
communities

© Fonterra Co-operative Group Ltd. Page 11
Economic and
geopolitical issues
• China Slowdown
• Eurozone
• Oil and mineral prices
• Russian embargo
• ISIS Middle East
CHALLENGING YEAR GLOBALLY
0
2,000
4,000
6,000
Jan-14 Jul-14 Jan-15 Jul-15
US
D p
er
MT
Whole Milk Powder
Demand
Supply
Fall in dairy prices Dairy supply/demand
imbalance

© Fonterra Co-operative Group Ltd. Page 12
• Very tight financial conditions – stressful for families
• Losses in region of $1 kgMS – or $140,000 + per average farm
• Fonterra Co-operative Support developed for 2015/16 – 76% take up
LIFE ON THE FARM

© Fonterra Co-operative Group Ltd. Page 13
• Higher returns and sustainable
payout
• Greater Co-op unity
• Strengthened Governance and
Representation
THREE PRIORITIES
© Fonterra Co-operative Group Ltd. Page 14
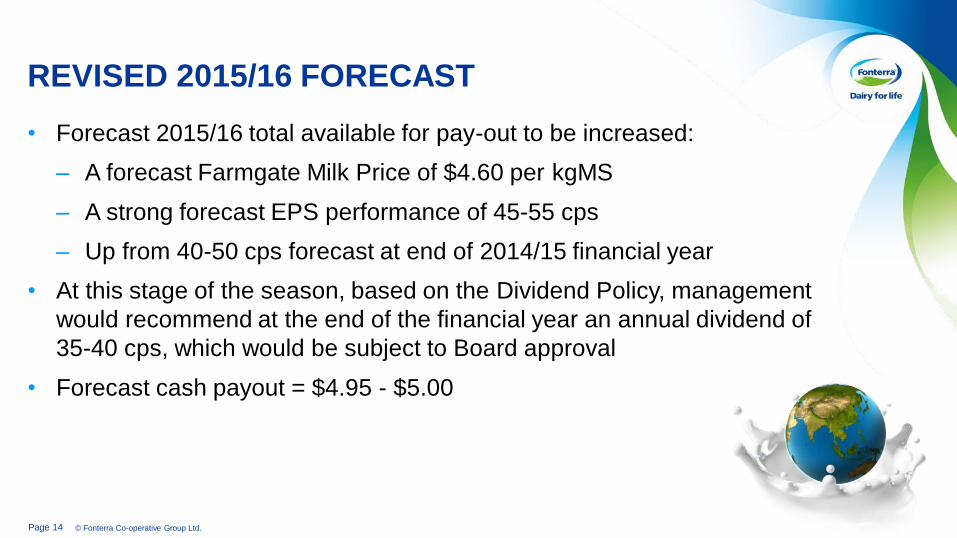
• Forecast 2015/16 total available for pay-out to be increased:
– A forecast Farmgate Milk Price of $4.60 per kgMS
– A strong forecast EPS performance of 45-55 cps
– Up from 40-50 cps forecast at end of 2014/15 financial year
• At this stage of the season, based on the Dividend Policy, management
would recommend at the end of the financial year an annual dividend of
35-40 cps, which would be subject to Board approval
• Forecast cash payout = $4.95 - $5.00
REVISED 2015/16 FORECAST
© Fonterra Co-operative Group Ltd. Page 15
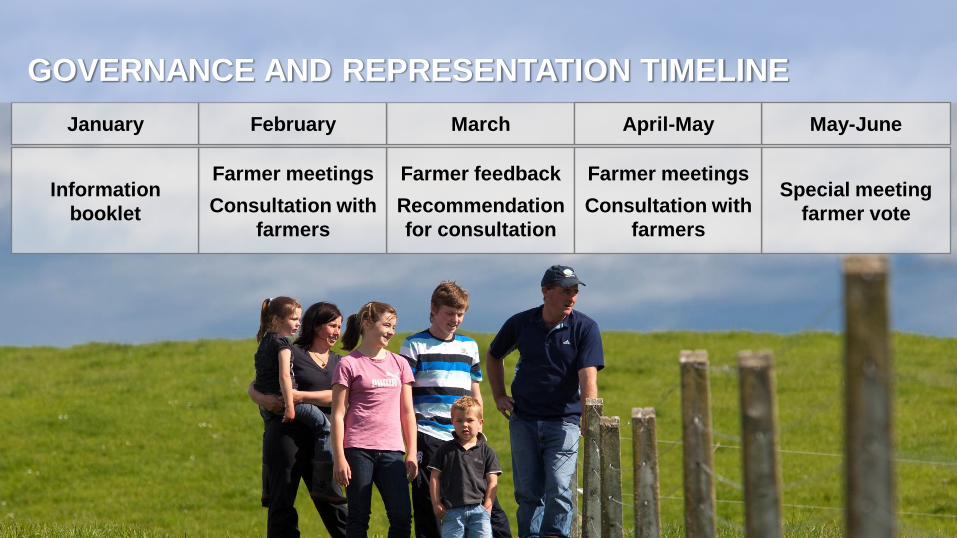
Information
booklet
Farmer meetings
Consultation with
farmers
Farmer feedback
Recommendation
for consultation
Farmer meetings
Consultation with
farmers
Special meeting
farmer vote
January February March April-May May-June
GOVERNANCE AND REPRESENTATION TIMELINE

© Fonterra Co-operative Group Ltd. Page 16
FUNDAMENTALS FOR DAIRY REMAIN STRONG
17
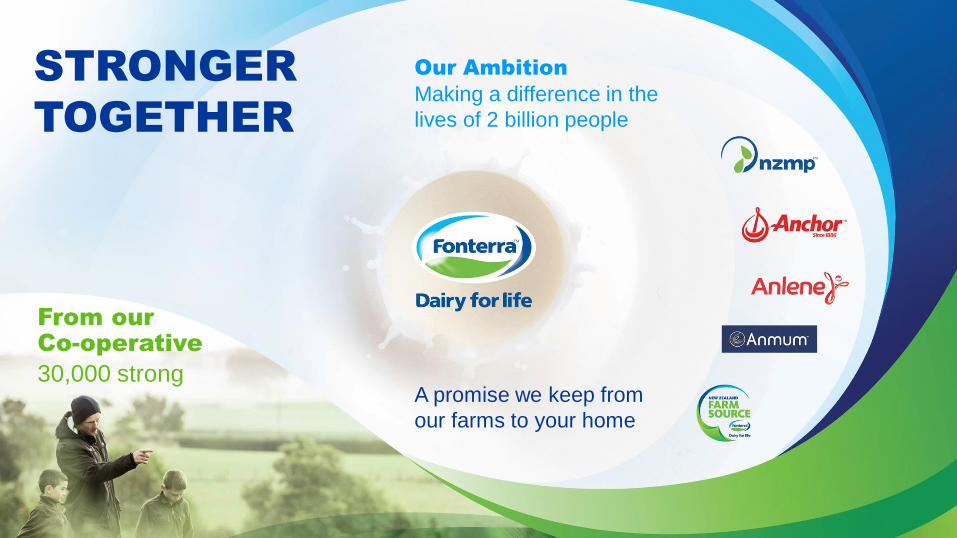
STRONGER
TOGETHER
Our Ambition
Making a difference in the
lives of 2 billion people
A promise we keep from
our farms to your home
From our
Co-operative
30,000 strong

THEO SPIERINGS
CEO
FONTERRA CO-OPERATIVE GROUP LIMITED

© Fonterra Co-operative Group Ltd. Page 19
TURBULENT YEAR – STRONG RESPONSE
GLOBAL DYNAMICS:
• Middle East turmoil
• Russian embargoes
• Ebola outbreaks
• Oil and mineral price slumps
• China downturn
• Supply demand imbalance/low prices
• Terror in Europe
OUR RESPONSE:
• Stay on strategy – gain momentum
• Move volume to higher value
• Maximise gross margin
• Strong cost focus
• Maximise cash
• Invest for the future
• Financial discipline
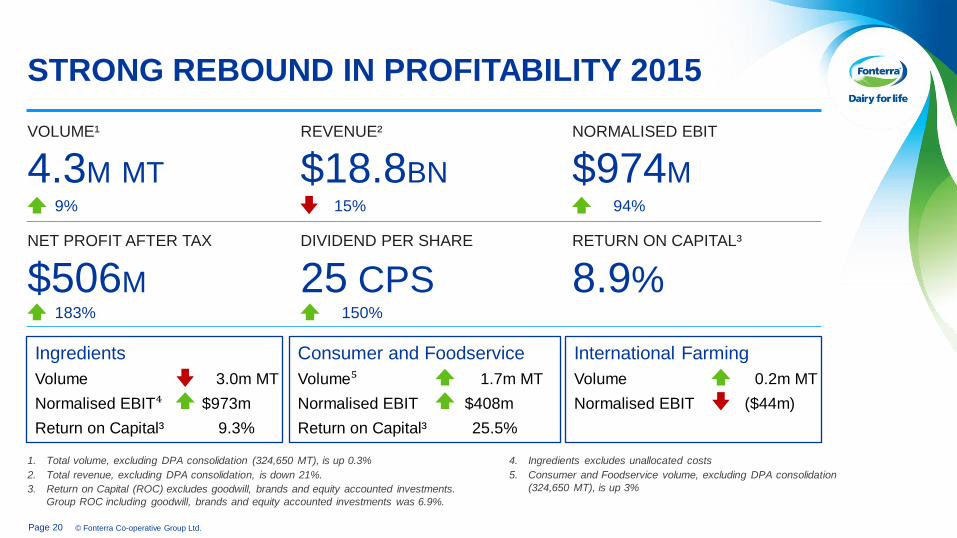
© Fonterra Co-operative Group Ltd. Page 20
$974M
25 CPS
4.3M MT
$506M
$18.8BN
STRONG REBOUND IN PROFITABILITY 2015
1. Total volume, excluding DPA consolidation (324,650 MT), is up 0.3%
2. Total revenue, excluding DPA consolidation, is down 21%.
3. Return on Capital (ROC) excludes goodwill, brands and equity accounted investments.
Group ROC including goodwill, brands and equity accounted investments was 6.9%.
DIVIDEND PER SHARE
NORMALISED EBIT
Consumer and Foodservice
Volume⁵ 1.7m MT
Normalised EBIT $408m
Return on Capital³ 25.5%
International Farming
Volume 0.2m MT
Normalised EBIT ($44m)
Ingredients
Volume 3.0m MT
Normalised EBIT⁴ $973m
Return on Capital³ 9.3%
VOLUME¹
NET PROFIT AFTER TAX
REVENUE²
94% 9% 15%
150% 183%
8.9%
RETURN ON CAPITAL³
4. Ingredients excludes unallocated costs
5. Consumer and Foodservice volume, excluding DPA consolidation
(324,650 MT), is up 3%

© Fonterra Co-operative Group Ltd. Page 21
STRATEGY DELIVERING – SHIFTING VOLUME
TO HIGHER VALUE
Deliver on Foodservice potential
Selectively invest in milk pools
Grow our Anlene™ business
Develop leading positions in
paed & maternal nutrition
Optimise NZ milk
1
Align our business and organisation
Build and grow beyond our current
consumer positions
3
2
4
5
6
7
• Volume off GDT and
increased sales
through bilateral
customer agreements
• Increasing volume
through value-add
consumer and
foodservice
DIRA
GDT
Ingredient Sales
Foodservice
Consumer

© Fonterra Co-operative Group Ltd. Page 22
Volume
-2%
Normalised
EBIT Growth
+43%
INGREDIENTS
292 299
387
674
679
973
2014 2015
First Half Second Half
• NZ ingredients:
$264 million gross margin higher
– Improved stream returns
– Optimised product mix to pricing
– Lower peak costs
• Australian ingredients:
($92) million normalised EBIT
– Adverse product mix
• Stanhope cheese fire
• Darnum – lower nutritionals
• Return on Capital of 9.3%
1. Ingredients EBIT excludes unallocated group costs
A solid result driven by New Zealand ingredients
Normalised EBIT¹ ($m)

© Fonterra Co-operative Group Ltd. Page 23
Amsterdam
Chicago
Mexico City
Auckland
Dubai
Singapore
Shanghai
Tokyo AMERICAS
EUROPE & MEA
SEA
CHINA
NEW ZEALAND
360k MT 630k MT
680k MT 190k MT
160k MT
34%
45%
26%
12%
6%
19%
GLOBAL INGREDIENTS MARKET REACH
NORTH ASIA
480k MT
1Volume rounded
Source: Fonterra Annual Report 2015 and Internal Fonterra Data (NZ and Globally sourced product) excl. intercompany sales
Key
Major sales hub
FY15 volume1
Δ% from FY14
© Fonterra Co-operative Group Ltd. Page 24
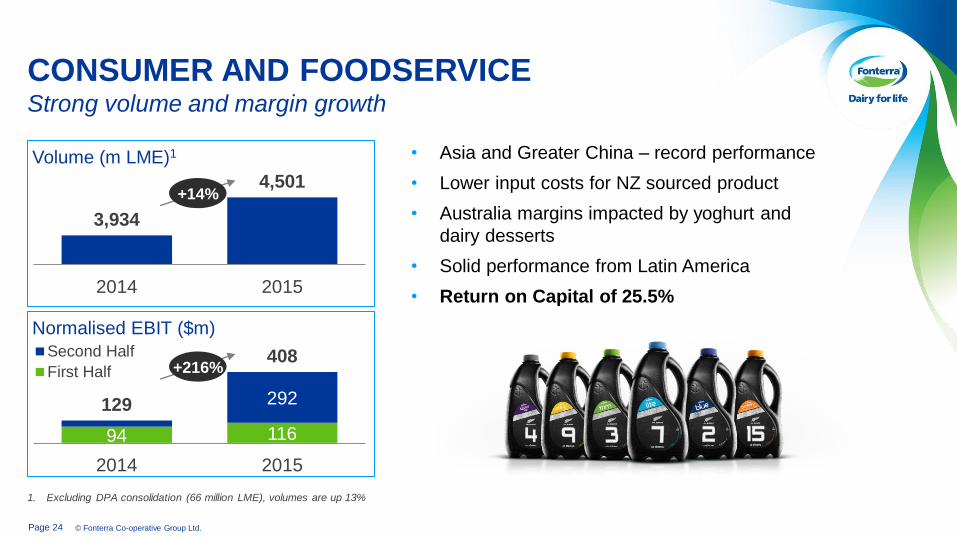
94 116
292 129
408
2014 2015
Second Half
First Half
3,934
4,501
2014 2015
Volume (m LME)1
+14%
Normalised EBIT ($m)
+216%
1. Excluding DPA consolidation (66 million LME), volumes are up 13%
CONSUMER AND FOODSERVICE Strong volume and margin growth
• Asia and Greater China – record performance
• Lower input costs for NZ sourced product
• Australia margins impacted by yoghurt and
dairy desserts
• Solid performance from Latin America
• Return on Capital of 25.5%

© Fonterra Co-operative Group Ltd. Page 25
$258M 945K MT $3.6BN
Q1 PERFORMANCE SUMMARY 2016
CAPEX
Consumer and
Foodservice
Volume Change2 3%
Gross Margin3 % 28%
International Farming
Volume Change2 56%
Gross Margin3 % -5%
Ingredients
Volume Change2 2%
Gross Margin3 % 15%
VOLUME (MT) REVENUE
0.6% 1 17.6% 1 36.5% 1
22.7%
GROSS MARGIN
$628M
OPEX
3.5% 1 FROM 14.1% 1
1. Compared to the first quarter of the 2015 financial year
2. Volume change is FY16 Q1 relative to FY15 Q1
3. Gross Margin % is for FY16 Q1, the arrow represents change relative to FY15 Q1

© Fonterra Co-operative Group Ltd. Page 26
FINANCIAL STRENGTH AND DISCIPLINE
Solid credit rating reflects strong
fundamentals
Strategic investments for the
future
• Strongest rating for an agricultural co-
operative in the world
• In top tier of all Australasian corporates
• Recognises strong financial flexibility and
discipline of our co-operative structure
Credit
Rating
Fitch A (stable outlook)
S&P A- (stable outlook)
• Investment in NZ capacity and #1 market of
China
• Supported farmer cash flows through timing
of advance rate ($900 million)
• Coincided with new S&P rating
methodology for agricultural co-operatives
in March
• Year end gearing ratio forecast to be down
and within 40-45% range
• Half year will reflect normal seasonal profile
Leverage reduction to plan
© Fonterra Co-operative Group Ltd. Page 27
CURRENT REALITY
• Our strategy is working
• Strong performance base
• Invested in our future
• Continued turbulence and volatile
global commodity prices
• Winds of change bring opportunities
© Fonterra Co-operative Group Ltd. Page 28
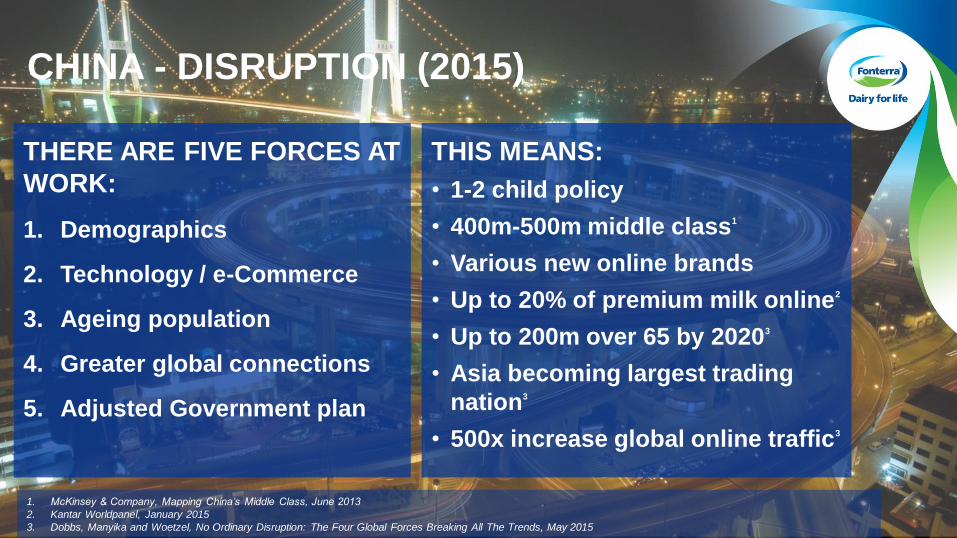
THERE ARE FIVE FORCES AT
WORK:
1. Demographics
2. Technology / e-Commerce
3. Ageing population
4. Greater global connections
5. Adjusted Government plan
THIS MEANS:
• 1-2 child policy
• 400m-500m middle class1
• Various new online brands
• Up to 20% of premium milk online2
• Up to 200m over 65 by 20203
• Asia becoming largest trading
nation3
• 500x increase global online traffic3
CHINA - DISRUPTION (2015)
1. McKinsey & Company, Mapping China’s Middle Class, June 2013
2. Kantar Worldpanel, January 2015
3. Dobbs, Manyika and Woetzel, No Ordinary Disruption: The Four Global Forces Breaking All The Trends, May 2015

© Fonterra Co-operative Group Ltd. Page 29
AMBITION CHINA: OUR #1 MARKET
Ambition $10b business - #1 dairy player
60% ingredients, 20% consumer, 20% foodservice
#1 preferred ingredients supplier
Leading brands
Offline to online strategy
Access to high quality fresh milk
Strong successful partnerships
Multi hub assets connected to China to meet demand

30
STRONGER
TOGETHER
Our Ambition
Making a difference in the
lives of 2 billion people
A promise we keep from
our farms to your home
From our
Co-operative
30,000 strong
QUESTIONS

FONTERRA
SHAREHOLDERS’
FUND
ANNUAL MEETING
FRIDAY 27 NOVEMBER 2015

33
RESOLUTION 1
That John Shewan, who retires by rotation and, being eligible,
offers himself for re-election, be re-elected as Director of the
Manager of the Fund

34
JOHN SHEWAN
Chairman
FSF Management Company

35
RESOLUTION 1
That John Shewan, who retires by rotation and, being eligible,
offers himself for re-election, be re-elected as Director of the
Manager of the Fund

36
VOTING
• In respect of each resolution, please tick the “for”, “against” or
“abstain” box.
• Once you have completed your voting, please place your vote in a
ballot box.
• Please raise your hand if you require a pen.
• Results will be announced to the NZX and ASX as soon as they
are available.

FONTERRA
SHAREHOLDERS’
FUND
ANNUAL MEETING
FRIDAY 27 NOVEMBER 2015

38
GENERAL BUSINESS

39
THANK YOU
MEETING CLOSED.