fonterra strategy refresh - new zealand … · fonterra strategy refresh & 2012 interim results...
TRANSCRIPT
FONTERRA STRATEGY REFRESH& 2012 INTERIM RESULTS
29 March 2012
Fonterra Co-operative Group Ltd

OVERVIEW• 2012 INTERIM RESULTS• STRATEGY REFRESH
Page 2Fonterra Co-operative Group Ltd
• QUESTIONS & ANSWERS

SIR HENRY VAN DER HEYDEN
Fonterra Co-operative Group Ltd

HIGHLIGHTS• Net profit after tax up 18% to $346m
• Normalised earnings before interest and tax(1)
up 8% to $552m552
Normalised EBIT ($m)(1)
Page 4Fonterra Co-operative Group Ltd
up 8% to $552m
• Strong growth in NZ milk production, up 10% season-to-date
• Sales volume gains of 5%(2) were broad based, reflecting attractiveness of dairy around the world
• Declared higher interim dividend of 12 cents per share, up 4 cents
Notes:(1) Represents normalised earnings before interest and tax, adjusted for non-recurring items(2) Excludes the sales volumes of the Western Australia business that was sold in March 2011
509496
H1 2011 H2 2011 H1 2012
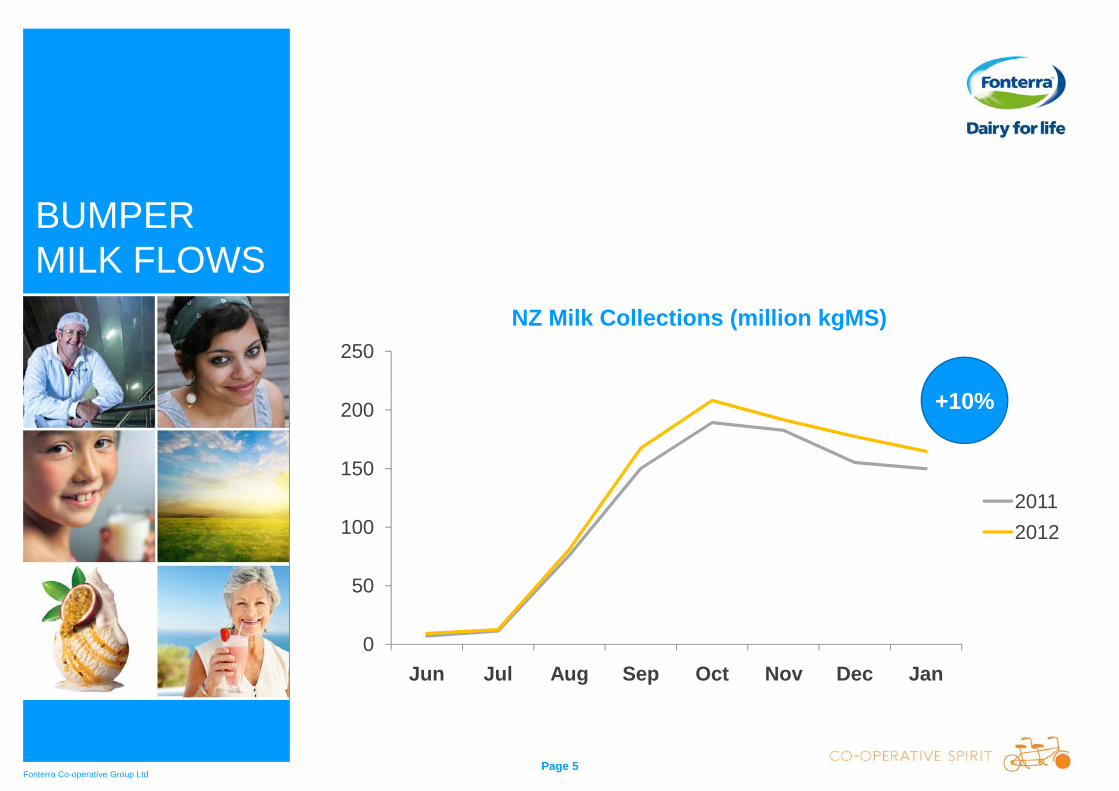
BUMPER MILK FLOWS
250NZ Milk Collections (million kgMS)
+10%
Page 5Fonterra Co-operative Group Ltd
0
50
100
150
200
Jun Jul Aug Sep Oct Nov Dec Jan
20112012
+10%

4 500
5,000
GDTTM WMP Prices
GDTTM PRICES RELATIVELY FLAT COMPARED TO LAST YEAR
Page 6Fonterra Co-operative Group Ltd
2,000
2,500
3,000
3,500
4,000
4,500
USD
per
met
ric to
nne

FONTERRACO-OP CHALLENGES
$8.25 $6.75-$6.85
Page 7Fonterra Co-operative Group Ltd
2011 Final Payout
Latest Payout Forecast(1)
Note:(1) Payout before retentions assumes a farmer is 100 per cent shared up (owning one share per kg MS of annual milk production).
(1)

THEO SPIERINGS
Fonterra Co-operative Group Ltd

STRONG FIRST HALF 1H 2012 $m Change %
External Volume(thousand metric tonnes) 1,927 5(1)
Revenue 10,026 7
Page 9Fonterra Co-operative Group Ltd
Normalised EBIT(2) 552 8
Normalised EBIT Margin(3) 5.5% 7 bps
Profit after tax 346 18
Earnings per share(4) 24 14
Dividend per share(4) 12 50
Note:(1) Excludes the sales volumes of the Western Australia business that was sold in March 2011(2) Earnings before interest and tax, adjusted for non-recurring items(3) Calculated as normalised EBIT as percentage of revenue(4) Cents per share

KEY DRIVERS
• Solid growth in total sales volume • Improved margins in Standard & Premium
Page 10Fonterra Co-operative Group Ltd
Ingredients• ANZ impacted by challenging trading conditions• Stronger NZD had negative impact on earnings
of our Asia/AME & Latam operations

OUTLOOK• Stronger global milk production expected in
2012
Page 11Fonterra Co-operative Group Ltd
• Milk powder demand appears robust but dairy commodity prices likely to remain under some pressure through to mid 2012
• Forecast Farmgate Milk Price of $6.35 per kgMS and net profit after tax guidance of 40-50 cents per share equating to $570-$720 million

MILK FOR SCHOOLS
• Milk is packed with goodness for growing children
• Fonterra Milk for Schools aims to
Page 12Fonterra Co-operative Group Ltd
Fonterra Milk for Schools aims to give New Zealand primary-aged children the opportunity to enjoy the goodness of dairy every school day by offering free milk in schools

JONATHAN MASON
Fonterra Co-operative Group Ltd

STANDARD & PREMIUM INGREDIENTS
• Normalised EBIT growth of 44%(1)
• Key performance drivers:- improved margins
External Volume
Growth(1)
+7%273
Normalised EBIT ($m)
Page 14Fonterra Co-operative Group Ltd
improved margins
- swapping long-term contracts to those with shorter tenure indexed to GDTTM
- strong underlying growth in foodservice & infant nutrition
- effective optimisation of sales book
- productivity improvements and cost savings helped offset cost of inflation on a per unit basis
+7%
Revenue Growth(1)(2)
+10%
Notes:(1) H1 2012 versus H1 2011(2) Includes inter-segment revenue of $868m (H1 2011 - $873m)
189231
H1 2011 H2 2011 H1 2012
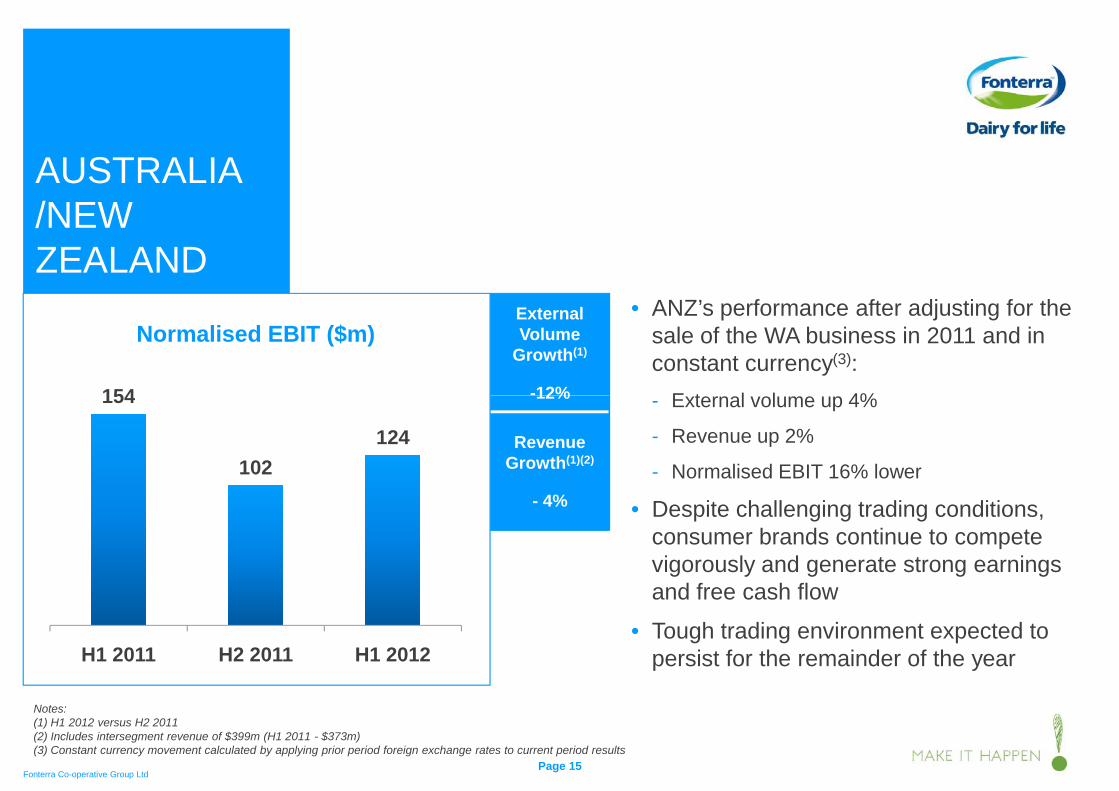
AUSTRALIA /NEW ZEALAND
• ANZ’s performance after adjusting for the sale of the WA business in 2011 and in constant currency(3):
E t l l 4%
External Volume
Growth(1)
-12%154
Normalised EBIT ($m)
Page 15Fonterra Co-operative Group Ltd
- External volume up 4%
- Revenue up 2%
- Normalised EBIT 16% lower
• Despite challenging trading conditions, consumer brands continue to compete vigorously and generate strong earnings and free cash flow
• Tough trading environment expected to persist for the remainder of the year
12%
Revenue Growth(1)(2)
- 4%
Notes:(1) H1 2012 versus H2 2011(2) Includes intersegment revenue of $399m (H1 2011 - $373m)(3) Constant currency movement calculated by applying prior period foreign exchange rates to current period results
154
102124
H1 2011 H2 2011 H1 2012

ASIA/AFRICA & MIDDLE EAST
• On a constant currency basis, normalised EBIT was 5%(1)(2) lower, due largely to:
hi h l & k ti t
External Volume
Growth(1)
+4%
Normalised EBIT ($m)
Page 16Fonterra Co-operative Group Ltd
Notes:(1) H1 2012 versus H2 2011(2) Constant currency movement calculated by applying prior period foreign exchange rates to current period results
- higher sales & marketing costs
- increased input costs
• Core focus is execution of growth strategy:
- investing in China
- growing foodservices
- category expansion
• Continued positive outlook for the region
+4%
Revenue Growth(1)
+7%
97 9684
H1 2011 H2 2011 H1 2012

LATIN AMERICA
• On a constant currency basis, normalised EBIT was up 6%(1)(3)
• Soprole had a strong first half in
External Volume
Growth(1)
-6%64 62
Normalised EBIT ($m)
Page 17Fonterra Co-operative Group Ltd
p gconstant currency terms with earnings up 15%
• Normalised contribution from Dairy Partners of America was $2m lower, impacted by trading conditions in Brazil
6%
Revenue Growth(1)(2)
-5%
Notes:(1) H1 2012 versus H2 2011(2) Includes no inter-segment revenue (H1 2011:$3m)(3) Constant currency movement calculated by applying prior period foreign exchange rates to current period results
556
H1 2011 H2 2011 H1 2012

STRONG BALANCE SHEET
57.6%
59.6%
53.0%54.3%
48 5%
Economic Gearing(1)
Page 18Fonterra Co-operative Group Ltd
44.9%
48.5%
41.8%
46.9%
Jul 08 Jan 09 Jul 09 Jan 10 Jul 10 Jan 11 Jul 11 Jan 12
Target Range 45-50%
Note:(1) Gearing is measured in terms of economic net interest bearing debt over economic net interest bearing debt plus equity (reflecting the effect of debt hedging in place at balance date). Equity excludes the cashflow hedge reserve

TRADING AMONG FARMERS
MARCH
• Strategy Refresh
APRIL/MAY
• Board considers
JUNE/JULY
• Shareholders’
AUGUST-DECEMBER
• Workshops on the
Page 19Fonterra Co-operative Group Ltd
gy
• Interim Result
first four pre-conditions and prepares report to Shareholders’ Council
Council considers Board report and fifth pre-condition
• DIRA Amendment Bill final reading expected
• Due Diligence Committee Report
• Board and Shareholders’ Council formal resolution on pre-conditions
ponline broker system for farmer shareholders, and registration for share trading
• Prepare & launch market

THEO SPIERINGS
Fonterra Co-operative Group Ltd
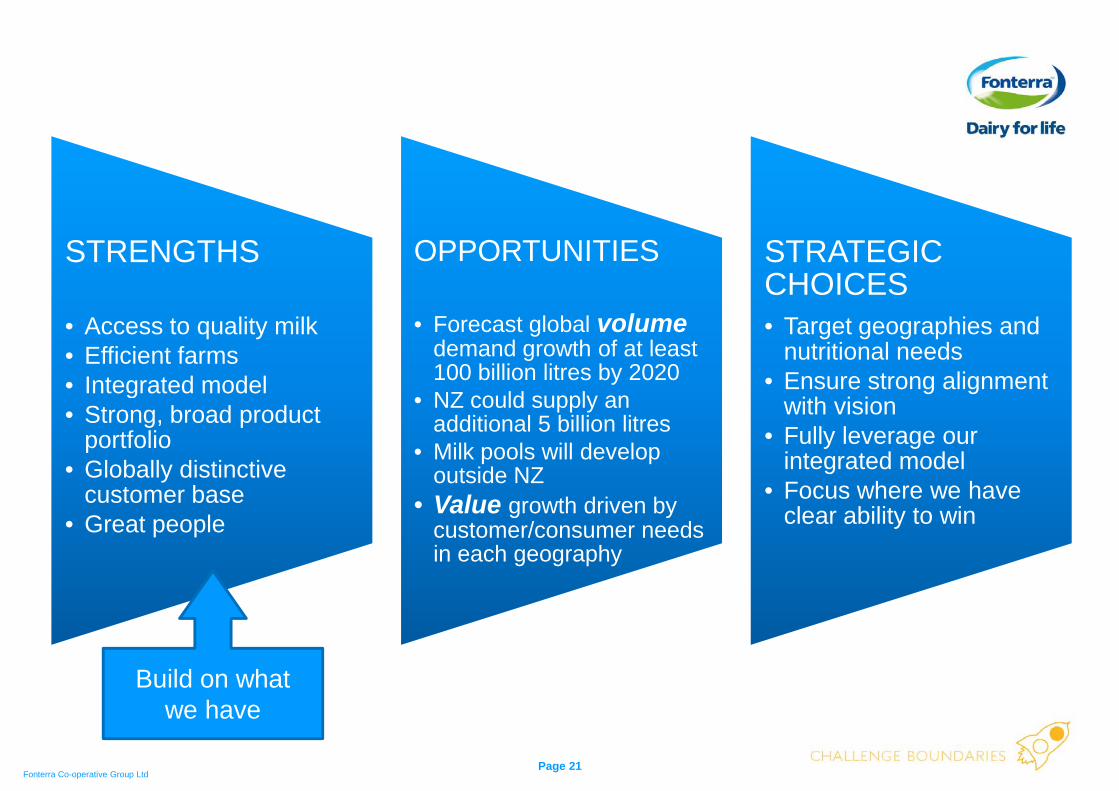
STRENGTHS
• Access to quality milk• Efficient farms• Integrated model
OPPORTUNITIES
• Forecast global volumedemand growth of at least 100 billion litres by 2020NZ ld l
STRATEGIC CHOICES• Target geographies and
nutritional needs• Ensure strong alignment
Page 21Fonterra Co-operative Group Ltd
g• Strong, broad product
portfolio• Globally distinctive
customer base• Great people
• NZ could supply an additional 5 billion litres
• Milk pools will develop outside NZ
• Value growth driven by customer/consumer needs in each geography
with vision• Fully leverage our
integrated model• Focus where we have
clear ability to win
Build on what we have

EMERGING MARKETS ARE KEY 10%
2%
7%
China
4%
1%
Nth America
<1%
Outlook to 2020
<1%
Europe
<1%
STRENGTHS OPPORTUNITIESOPPORTUNITIES STRATEGIC CHOICES
Page 22Fonterra Co-operative Group Ltd
Demand Growth Milk Supply Growth
MENA
2%4% India
2-3%
LATAM
2%2%
ANZ
<1%
Nth America
Source: FAO, Euromonitor, Fonterra estimates

EXCITING GROWTH FORECASTS
Globally Traded D i M k t
Formal Dairy Market
500 bn L by 2020 (3% CAGR)
STRENGTHS OPPORTUNITIESOPPORTUNITIES STRATEGIC CHOICES
Page 23Fonterra Co-operative Group Ltd
17 Bn L
49 billion litres
375 billion litresNew Zealand
Dairy Market
22 bn L by 2020(2% CAGR)
84 bn L by 2020 (5-6% CAGR)
Source: FAO, UN Comtrade, Euromonitor, Fonterra estimates

GLOBAL MEGATRENDS INFORMING STRATEGY
STRENGTHS OPPORTUNITIESOPPORTUNITIES STRATEGIC CHOICES
Rise of Emerging
Increase in commodity
Rising demand for
dairy
Social demographics (e g Aging in
Nutrition for Healthy
Increased focus on
New technology
Page 24Fonterra Co-operative Group Ltd
Markets & Urbanisation
prices & volatility
dairy nutritional benefits
(e.g. Aging in OECD & China)
Healthy Ageing
focus on sustainability
technology & innovation

STRATEGY PRINCIPLES
Our Vision and Objectives
Cash Generators Growth Generators New Business Generators
STRENGTHS OPPORTUNITIES STRATEGIC CHOICES
STRATEGIC CHOICES
Page 25Fonterra Co-operative Group Ltd
Organisational Capabilities
Generators
Capital Structure
What is our source of cash to generate &
finance our growth?
‘Must do’
What will be the sources of our future cash flow?
‘Can do’
What are our mould-breaking opportunity
areas to invest in?
‘Want to do’

NEW GROUP PORTFOLIO
Our Vision and Objectives
Cash Generators
‘M t d ’
Growth Generators
‘C d ’
New Business
‘W t t d ’
STRENGTHS OPPORTUNITIES STRATEGIC CHOICES
STRATEGIC CHOICES
Page 26Fonterra Co-operative Group Ltd
‘Must do’ ‘Can do’ ‘Want to do’
Organisational Capabilities Capital Structure
New Zealand Milk
Middle-east & North Africa (MENA)
ANZ
US
Europe
China
ASEAN
Latin America (LATAM)
Out-of-Home Nutrition
India
Advanced Nutrition
Optimise
Right size

SEVEN STRATEGIC PATHS
1. Optimise New Zealand milk
2. Build and grow beyond our current consumer positions
3. Deliver on foodservice potential
STRENGTHS OPPORTUNITIES STRATEGIC CHOICES
STRATEGIC CHOICES
Page 27Fonterra Co-operative Group Ltd
4. Grow our position in mobility
5. Develop selected leading positions in paediatrics and maternal
6. Selectively invest in milk pools
7. Alignment of business & organisation to enable strategy
Source: FAO, Euromonitor, Fonterra estimates

1.OPTIMISE NEW ZEALAND MILK
• Grow with the market• Enhance asset footprint
D i i d i
STRENGTHS OPPORTUNITIES STRATEGIC CHOICES
STRATEGIC CHOICES
Page 28Fonterra Co-operative Group Ltd
• Drive improved price achievement and cost to serve
• Increase speed/agility of our supply chain
• Expand financial risk management tools

2.BUILD & GROW BEYOND CURRENT CONSUMER POSITIONS
• Leverage our leadership position in ANZ
• Invest in key emerging markets
STRENGTHS OPPORTUNITIES STRATEGIC CHOICES
STRATEGIC CHOICES
Page 29Fonterra Co-operative Group Ltd
Invest in key emerging markets- New/underpenetrated Asian
markets- China- Latin America- MENA

3.DELIVER ON FOODSERVICE POTENTIAL
• Drive cash from established & profitable businesses
• Drive growth in key emerging
STRENGTHS OPPORTUNITIES STRATEGIC CHOICES
STRATEGIC CHOICES
Page 30Fonterra Co-operative Group Ltd
Drive growth in key emerging markets- China- ASEAN- LATAM- MENA
• Continue innovation investment

4.GROW OUR POSITION IN MOBILITY
• Strengthen Anlene leadership in ASEAN through portfolio expansion and increased
STRENGTHS OPPORTUNITIES STRATEGIC CHOICES
STRATEGIC CHOICES
Page 31Fonterra Co-operative Group Ltd
ppenetration
• Drive Anlene in China across selected regions

5. DEVELOP SELECTED LEADING POSITIONS IN PAEDIATRICS & MATERNAL
• Step change in focus on paediatric ingredients in China
• Strengthen our leadership
STRENGTHS OPPORTUNITIES STRATEGIC CHOICES
STRATEGIC CHOICES
Page 32Fonterra Co-operative Group Ltd
g pposition in our branded maternal category
• Enhance position in infant formula in selected Asian markets
• Continued investment in supply innovation

6.SELECTIVELY INVEST IN MILK POOLS
• Maintain strong milk supply position in New Zealand, Australia & Latam
• Stage-gated investment in additional
STRENGTHS OPPORTUNITIES STRATEGIC CHOICES
STRATEGIC CHOICES
Page 33Fonterra Co-operative Group Ltd
g gChina farms, through partnerships
• Focus on food security & safety• Pilot farms in selected markets to
test and create options for integrated business models

7.ALIGNMENT OF BUSINESS & ORGANISATION TO ENABLE STRATEGY
• Re-align overhead spend to focus on fastest growing markets
• Exit unprofitable uncompetitive
STRENGTHS OPPORTUNITIES STRATEGIC CHOICES
STRATEGIC CHOICES
Page 34Fonterra Co-operative Group Ltd
Exit unprofitable, uncompetitive and non-core categories and markets
• Improve efficiency and effectiveness of corporate centre
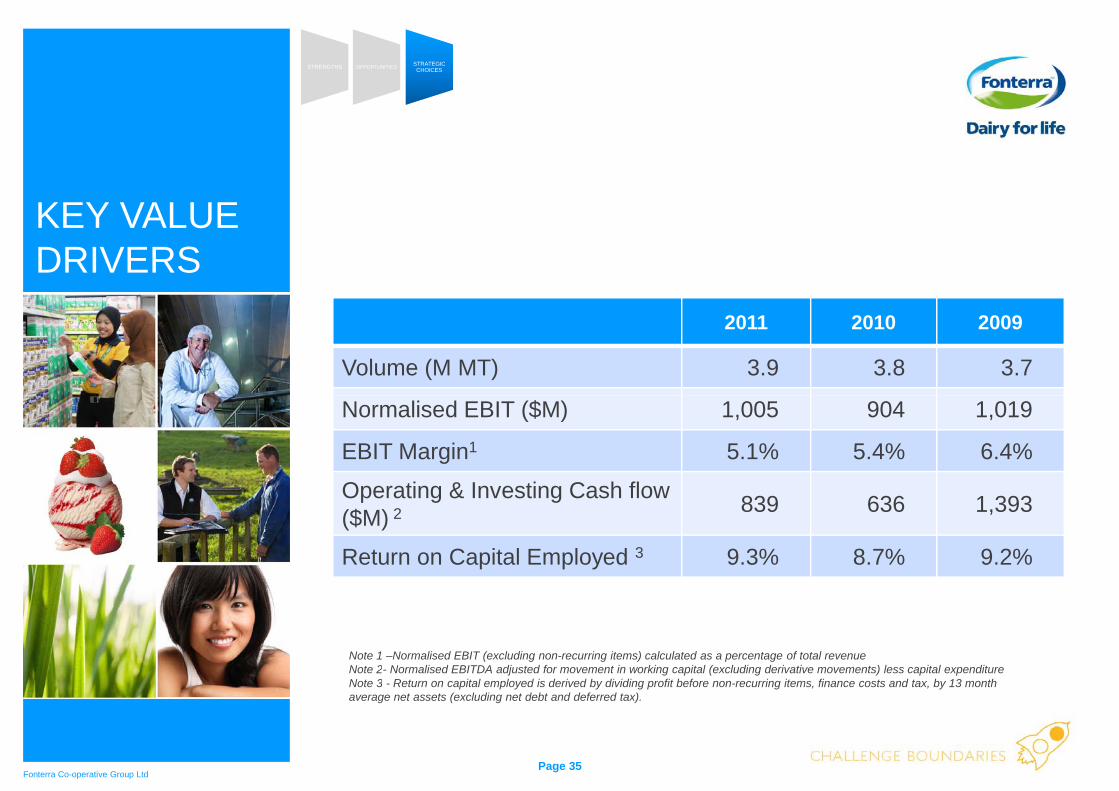
KEY VALUE DRIVERS
2011 2010 2009
Volume (M MT) 3.9 3.8 3.7
STRENGTHS OPPORTUNITIES STRATEGIC CHOICES
STRATEGIC CHOICES
Page 35Fonterra Co-operative Group Ltd
Normalised EBIT ($M) 1,005 904 1,019
EBIT Margin1 5.1% 5.4% 6.4%
Operating & Investing Cash flow ($M) 2 839 636 1,393
Return on Capital Employed 3 9.3% 8.7% 9.2%
Note 1 –Normalised EBIT (excluding non-recurring items) calculated as a percentage of total revenueNote 2- Normalised EBITDA adjusted for movement in working capital (excluding derivative movements) less capital expenditureNote 3 - Return on capital employed is derived by dividing profit before non-recurring items, finance costs and tax, by 13 month average net assets (excluding net debt and deferred tax).

STRATEGY SETS PLATFORM FOR GROWTH
Dri e Ret rn on Impro e Shareholder
STRENGTHS OPPORTUNITIES STRATEGIC CHOICES
STRATEGIC CHOICES
Page 36Fonterra Co-operative Group Ltd
Improve Value Drivers Drive Return on Capital (ROCE)
Improve Shareholder Value
• Volume growth
• Value growth
• Strong operating & investing cash flow
Improve Return on Capital Employed
Farmer Income
Value of Fonterra
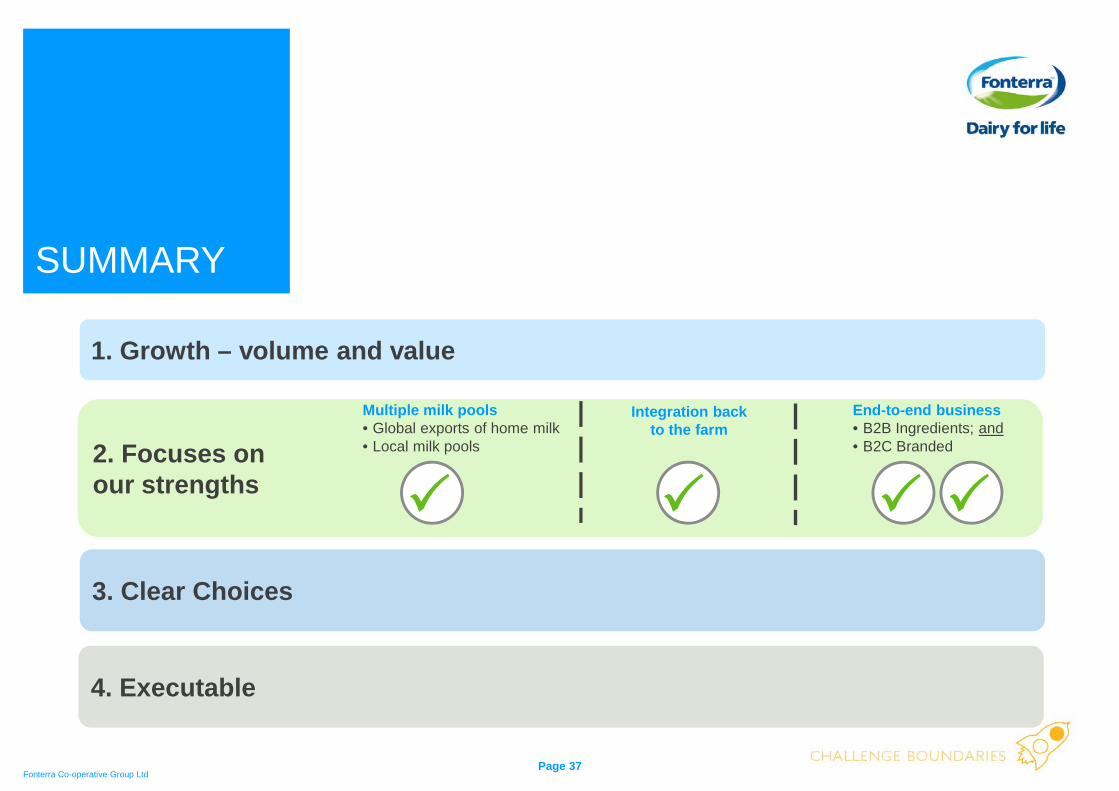
SUMMARY
1. Growth – volume and value
Page 37Fonterra Co-operative Group Ltd
2. Focuses on our strengths
3. Clear Choices
Multiple milk pools• Global exports of home milk• Local milk pools
Integration backto the farm
End-to-end business• B2B Ingredients; and• B2C Branded
4. Executable

SUPPLEMENTARY INFORMATION
Fonterra Co-operative Group Ltd

INTERIM RESULT
1H 2012 ($m) 1H 2011 ($m) Change ($m) Change %
Revenue 10,026 9,356 670 7.2
Page 39Fonterra Co-operative Group Ltd
Profit after tax 346 293 53 18.1
Normalised EBITDA(1) 795 752 43 5.7
Normalised EBIT(2) 552 509 43 8.4
Earnings per share(3) 24 21 3 14.3
Operating cash flow (442) (189) (253) (133.9)
Economic gearing(4) 46.9% 48.5% 160 bps
Notes:(1) Earnings before interest, tax, depreciation and amortisation, adjusted for non-recurring items(2) Earnings before interest and tax, adjusted for non-recurring items(3) Cents per share(4) Economic gearing is measured in terms of economic net interest bearing debt over economic net interest bearing debt plusequity (reflecting the effect of debt hedging in place at balance date). Equity excludes the cash flow hedge reserve.

NORMALISED EBIT
1H 2012 ($m) 1H 2011 ($m)
Operating Profit 516 452
Page 40Fonterra Co-operative Group Ltd
Plus share of profit of equity accounted investees 14 40
EBIT 530 492
Add back non-recurring items
- Impairment losses recorded in equity accounted investees 20
- Impact of Christchurch earthquake 3
- Costs associated with sale of Western Australia dairy business 3
- Other 2 11
Total Non-recurring Items 22 17
Normalised EBIT 552 509

STANDARD & PREMIUM INGREDIENTS
6 months to 31 Jan 2012
6 months to 31 Jan 2011 % Change
Volume (000 MT) 1,234 1,151 7.2
Page 41Fonterra Co-operative Group Ltd
Total Revenue ($M) 7,965 7,231 10.2
External Revenue ($M) 7,097 6,358 11.6
Normalised EBIT ($M) 273 189 44.4
Operating Margin(1) 3.4% 2.3%
Normalised EBITDA ($M) 463 378 22.5
EBITDA Margin(2) 5.8% 5.2%
Notes:(1) Normalised EBIT (excluding non-recurring items) less share of equity accounted investees earnings calculated as a percentage of total revenue(2) Normalised EBITDA calculated as a percentage of total revenue.
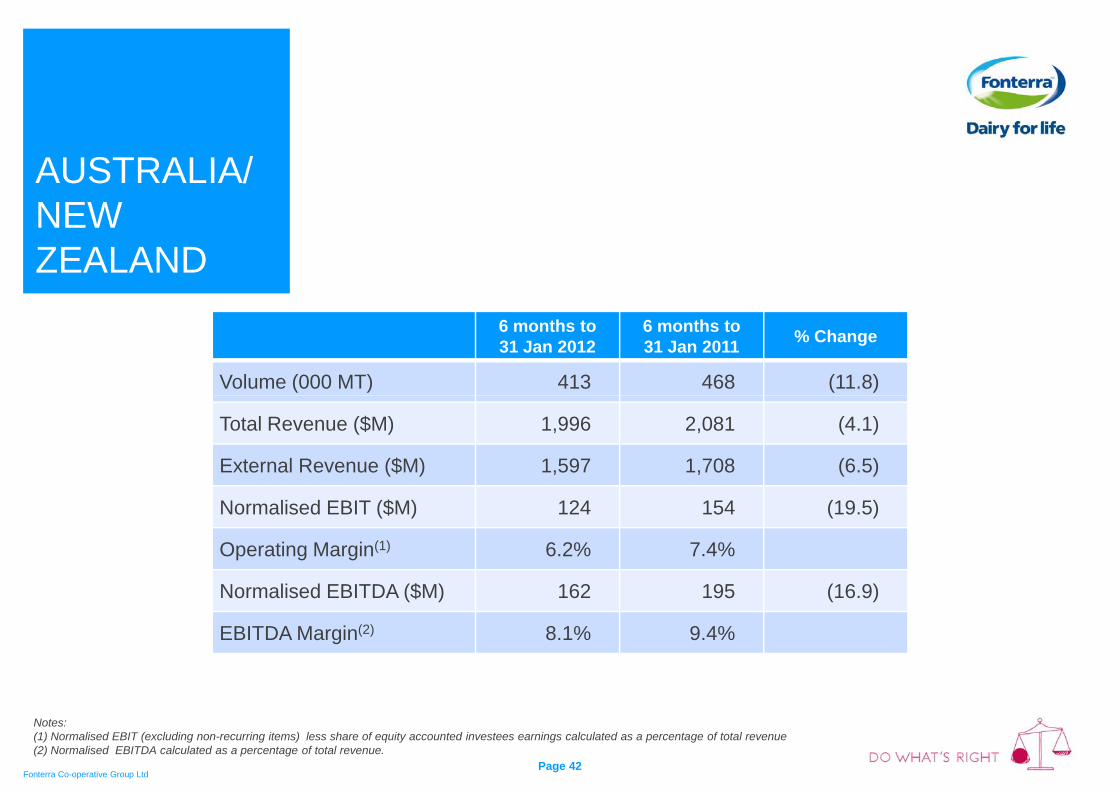
AUSTRALIA/ NEW ZEALAND
6 months to 31 Jan 2012
6 months to 31 Jan 2011 % Change
Volume (000 MT) 413 468 (11.8)
Page 42Fonterra Co-operative Group Ltd
Total Revenue ($M) 1,996 2,081 (4.1)
External Revenue ($M) 1,597 1,708 (6.5)
Normalised EBIT ($M) 124 154 (19.5)
Operating Margin(1) 6.2% 7.4%
Normalised EBITDA ($M) 162 195 (16.9)
EBITDA Margin(2) 8.1% 9.4%
Notes:(1) Normalised EBIT (excluding non-recurring items) less share of equity accounted investees earnings calculated as a percentage of total revenue(2) Normalised EBITDA calculated as a percentage of total revenue.

ASIA/AFRICA & MIDDLE EAST
6 months to 31 Jan 2012
6 months to 31 Jan 2011 % Change
Volume (000 MT) 132 127 3 9
Page 43Fonterra Co-operative Group Ltd
Notes:(1) Nil Intersegment Revenue(2) Normalised EBIT (excluding non-recurring items) less share of equity accounted investees earnings calculated as a percentage of total revenue(3) Normalised EBITDA calculated as a percentage of total revenue.
Volume (000 MT) 132 127 3.9
Total Revenue ($M) (1) 947 887 6.8
Normalised EBIT ($M) 84 97 (13.4)
Operating Margin(2) 8.9% 10.9%
Normalised EBITDA ($M) 88 101 (12.9)
EBITDA Margin(3) 9.3% 11.4%

LATIN AMERICA
6 months to 31 Jan 2012
6 months to 31 Jan 2011 % Change
Volume (000 MT) 148 157 (5.7)
Page 44Fonterra Co-operative Group Ltd
Notes:(1) Normalised EBIT (excluding non-recurring items) less share of equity accounted investees earnings calculated as a percentage of total revenue(2) Normalised EBITDA calculated as a percentage of total revenue.
o u e (000 ) 8 5 (5 )
Total Revenue ($M) 385 406 (5.2)
External Revenue ($M) 385 403 (4.5)
Normalised EBIT ($M) 62 64 (3.1)
Operating Margin(1) 13.8% 11.1%
Normalised EBITDA ($M) 73 73 -
EBITDA Margin(2) 19.0% 18.0%

CASHFLOW SUMMARY
6 months to 31 Jan 2012
($m)
6 months to 31 Jan 2011
($m)
C h fl f ti ti iti (442) (189)
Page 45Fonterra Co-operative Group Ltd
Cash flows from operating activities (442) (189)
Cash flows from investing activities (294) (257)
Cash flows from financing activities 621 724
Net cash (outflow)/inflow (115) 278

GEARING31Jan 2012
($m)31 Jan 2011
($m)31 July 2011
($m)
Net Interest bearing debt position
Page 46Fonterra Co-operative Group Ltd
Total borrowings 5,802 5,854 4,650Cash and cash equivalents (684) (831) (785)
Interest bearing advances included in other non-current assets (126) (117) (122)
Bank overdraft 27 29 23
Value of derivatives used to manage changes in hedged risks and other FX movement on debt
429 396 565
Economic net interest bearing debt 5,448 5,331 4,331Total equity less cash flow hedge reserves 6,179 5,654 6,025
Economic debt: debt plus equity 46.9% 48.5% 41.8%