food and nutrition strategic framework 2012-2018
TRANSCRIPT

ACT Government Health Directorate Food and Nutrition Strategic Framework
2012-2018
STR
AT
EG
IC F
RA
ME
WO
RK

Food and nutrition strategic framework: 2012 - 2018
1
Photo credits:
Page 16 - Warm Roasted Vegetable Salad image from Healthy Food Fast © State of Western Australia 2012, reproduced with permission.

Food and nutrition strategic framework: 2012 - 2018
2
Contents Foreword Key messages Abbreviations
1. Introduction ............................................................................................................... 8
2. Strategic goal and aims ............................................................................................ 8
3. Scope and purpose ................................................................................................... 9
4. Guiding principles ..................................................................................................... 9
5. Governance .............................................................................................................. 10
6. Policy context .......................................................................................................... 10
6.1. National policy context ...................................................................................... 10
6.2. ACT policy context ............................................................................................ 10
6.3. Links with other strategic documents ................................................................ 11
7. Diet and the burden of disease .............................................................................. 11
8. Healthy eating – the economic imperative ............................................................ 13
9. Australian Dietary Guidelines and recommendations ......................................... 13
10. Food and nutrition issues in the ACT .................................................................... 14
10.1. Reducing rates of overweight and obesity ........................................................ 14
10.2. Improving adherence to Australian Dietary Guidelines ..................................... 15
10.3. Increasing vegetable and fruit consumption ...................................................... 15
10.4. Increasing breastfeeding rates and duration ..................................................... 16
10.5. Reducing salt consumption ............................................................................... 17
10.6. Improving nutrition in the elderly ....................................................................... 18
10.7. Reducing specific micronutrient deficiencies..................................................... 18
10.8. Improving food and nutrition security ................................................................ 19
10.9. Advocating for a sustainable and healthy food supply ...................................... 19
10.10. Protecting food safety ....................................................................................... 20

Food and nutrition strategic framework: 2012 - 2018
3
11. Factors that influence food and dietary intakes ................................................... 21
12. Strategic areas for action ....................................................................................... 22
12.1. Support individuals to adopt healthy eating behaviours. ................................... 23
12.2. Foster environments that support healthy eating. ............................................. 25
12.3. Promote safe, nutritious and sustainable food supply. ...................................... 26
12.4. Build the evidence for intervention. ................................................................... 27
12.5. Build capacity .................................................................................................... 28
Appendix A: Guiding principles ..................................................................................... 29
Appendix B: Associated strategic documents .............................................................. 30
Appendix C: Burden of disease ..... ................................................................................ 32
Appendix D: Australian Dietary Guidelines ................................................................... 36
Appendix E: Consumption of energy dense foods and drinks .................................... 37
Appendix F: Benefits of breastfeeding .......................................................................... 38
Appendix G: Undernutrition in the elderly ..................................................................... 39
Appendix H: Micronutrient deficiencies ........................................................................ 43
Appendix I: Food insecurity ........................................................................................... 48
Appendix J: Factors impacting on the sustainability of Australia’s food supply ...... 50
Appendix K: Examples of factors that influence food and dietary choices ............... 52
References ....................................................................................................................... 55

Food and nutrition strategic framework: 2012 - 2018
4
Foreword
It gives me great pleasure to endorse the ACT Government Health Directorate Food and Nutrition Strategic Framework 2012- 2018. Although Canberrans enjoy comparatively good health, the prevalence of chronic disease is increasing and our ageing population places ever-increasing pressures on the finite resources of our health system. Promoting and supporting healthy eating and the availability of healthy food within the population can play a vital role in relieving these pressures. Good nutrition can help protect against ill health as well as helping to improving the quality of life of those with a chronic disease. Poor nutrition, on the other hand, plays a direct role in the development and progression of chronic health conditions. This Framework seeks to highlight good nutrition as a priority for the
Health Directorate and create greater recognition of the importance of healthy eating in optimising health outcomes. It brings together current evidence and identifies key food and nutrition issues for the ACT population. It also sets out our key strategic priorities. Many factors which can make a positive contribution to the availability of healthy food and healthy eating are outside of the direct control of the Health Directorate, including: the sale and promotion of healthier food by food outlets; improving access by vulnerable populations to fresh healthy food; socioeconomic factors such as income support and education; encouraging local food production and provision of incentives to promote consumption of fresh fruit and vegetables. The Framework therefore describes the role of the Health Directorate in advocating with other sectors for the role they can play in promoting good nutrition. The recent Healthy Weight ACT budget initiative will build on the foundation work captured in this Framework to inform the development of the ACT Healthy Weight Action Plan. The Health Directorate for its own part will continue to work towards, and advocate for, innovative ways to promote healthy food and healthy eating in our daily work and play, and in our schools, families and communities, so that the healthy food and drink choices can be the easy choice.
Katy Gallagher Minister for Health 7 September 2012
Food and nutrition strategic framework: 2012 - 2018
5
Key Messages
Optimal nutrition is necessary for healthy growth and development and maintaining good physical and mental health throughout the whole of life.
Poor nutrition plays a direct role in the development and progression of chronic conditions that account for a high proportion of deaths, disability and illness in the ACT, such as cardiovascular disease, overweight and obesity, type 2 diabetes and some forms of cancer.
Most diet-related disease is associated with: - excessive intake of foods and drinks (including alcohol) that are high in energy
(kilojoules), saturated fat, added or refined sugars or salt; and/or - inadequate intake of nutrient-dense foods, including vegetables, fruit and wholegrain
cereals.
In 2009-10 over half of ACT adults and almost 20% of children were either overweight or obese. Over 16% of the population had high blood pressure and over 12% had high blood cholesterol. In addition, over 90% of the adult population did not eat sufficient vegetables to support good health.
There are significant economic costs associated with diet-related disease including direct health care system costs associated with managing diet-related conditions, and the indirect and intangible costs to individuals and society from pain and suffering, income loss and lost productivity. There is therefore an important economic imperative for the Health Directorate to work to improve dietary intakes and nutrition.
The Health Directorate’s food and nutrition strategic goal is to improve the health and wellbeing of the ACT population and reduce rates of diet-related chronic disease through promoting and supporting optimal nutrition. It aims to: - increase the proportion of the population who consume a diet consistent with Australian
Dietary Guidelines (including breastfeeding); and - improve access by the population to a safe, nutritious, affordable and sustainable food
supply.
Key food and nutrition issues facing the ACT include: - Reducing rates of overweight and obesity - Improving adherence to Australian Dietary Guidelines - Increasing vegetable and fruit consumption - Increasing breastfeeding rates and duration - Reducing salt consumption - Improving nutrition in the elderly - Reducing specific micronutrients deficiencies - Improving food and nutrition security - Advocating for a sustainable and healthy food supply - Protecting food safety
Dietary behaviours are influenced by the interrelationship of personal factors (which shape motivation and abilities), social factors and environmental factors, supported by the availability of research, information and workforce capacity. Healthy behaviours occur when individuals have the necessary motivation and abilities plus opportunities provided by their environment.
Disadvantaged groups tend to have fewer personal and economic resources to help them overcome negative environmental factors, therefore creating supportive environments is

Food and nutrition strategic framework: 2012 - 2018
6
essential to making healthy food choices the easy choices for individuals in this group in particular.
The factors that influence the food supply and nutrition behaviours need to be addressed when developing strategies to improve dietary intakes. The Health Directorate can influence a number of these factors either directly (through Health Directorate policies, strategies, programs and services) or indirectly through advocacy and collaboration with other agencies and sectors.
Priority strategic areas for action by the Health Directorate are: - Support individuals to adopt healthy eating behaviours - Foster environments that support healthy eating - Promote a safe, healthy and sustainable food supply - Build the evidence for intervention - Develop capacity of the workforce

Food and nutrition strategic framework: 2012 - 2018
7
Abbreviations ABS Australian Bureau of Statistics ACDPA Australian Chronic Disease Prevention Alliance ACT Australian Capital Territory ADG Australian Dietary Guidelines AFGC Australian Food and Grocery Council AGHE Australian Guide to Healthy Eating AICR American Institute for Cancer Research ANPHA Australian National Preventive Health Agency BoD Burden of Disease and Injury CSIRO Commonwealth Scientific and Industrial Research Organisation CVD Cardiovascular Disease FAO Food and Agriculture Organization of the United Nations Health Directorate ACT Government Health Directorate HIB Health Improvement Branch, Population Health Division HPS Health Protection Service, Population Health Division MACH Maternal and Child Health NHMRC National Health and Medical Research Council NOTF National Obesity Taskforce NPAPH National Partnership Agreement on Preventive Health NPHT National Preventative Health Taskforce OCHO Office of the Chief Health Officer PHD Population Health Division, Health Directorate PEU Protein-Energy Undernutrition QSRI Quick-Service Restaurant Industry The Framework ACT Government Health Directorate Food and Nutrition Strategic
Framework USA United States of America WCRF World Cancer Research Fund WHO World Health Organization

Food and nutrition strategic framework: 2012 - 2018
8
1. Introduction There is a close relationship between nutrition and health. Optimal nutrition1 is necessary for healthy growth and development in infants, children and adolescents. Consumption of a varied and nutritious diet is essential for maintaining good physical and mental health throughout the whole of life (WHO 2003). In addition, sharing and enjoying food in a social setting can contribute to social connectedness, mental health and wellbeing. On average, the population of the ACT enjoys relatively good health. However chronic diseases such as cardiovascular disease (CVD), type 2 diabetes and cancer are of significant concern and account for a high proportion of deaths, disability and illness in the ACT (ACT Health 2010a). The World Health Organization (WHO) has identified that healthy eating plays a key role in the prevention and management of a number of chronic lifestyle-related diseases (WHO 2003). Amongst the Australian population, most of the burden of chronic disease associated with poor nutrition is due to:
excessive intake of foods and drinks (including alcohol) that are high in energy (kilojoules), saturated fat, added or refined sugars or salt; and/or
inadequate intake of nutrient-dense foods, including vegetables, fruit and wholegrain cereals (NHMRC 2011a).
2. Strategic goal and aims The ACT Government Health Directorate (Health Directorate) works towards a vision of good health and wellbeing for the population of the ACT. Improving the nutrition of the ACT population is an important element of this vision. The Health Directorate’s food and nutrition strategic goal is:
to improve health and wellbeing and reduce rates of diet-related chronic disease through promoting and supporting optimal nutrition.
In working towards this strategic goal, the Health Directorate aims to:
increase the proportion of the population who consume a diet consistent with Australian Dietary Guidelines (including breastfeeding); and
increase access by the population to a safe, nutritious, affordable and sustainable food supply.
The Health Directorate works in the areas of food and nutrition in a variety of ways across the continuum of care, from health promotion and disease prevention through to provision of health services to assist individuals to manage health conditions through diet. The types of food and nutrition interventions undertaken by the Health Directorate include:
population-based health promotion and disease prevention programs
legislation, regulation and enforcement
health services targeting individuals and groups (including nutrition and dietetics)
1 Nutrition that meets an individual’s needs for a healthy active life

Food and nutrition strategic framework: 2012 - 2018
9
communication and social marketing
education and skill development
food and nutrition policies
food services
capacity building within the health workforce
leadership in workplace health and wellbeing
health, nutrition and food safety surveillance, monitoring and reporting
research and evaluation, including quality improvement activities.
3. Scope and purpose This ACT Government Health Directorate Food and Nutrition Strategic Framework: 2012-2018 (the Framework) has been developed to assist Health Directorate staff to understand the key food and nutrition issues facing the population of the ACT and to take action to address these issues. The Framework therefore identifies:
key food and nutrition issues affecting the ACT population
strategic areas for action by the Health Directorate
guiding principles to underpin the Health Directorate’s roles in food and nutrition.
The Framework has a high level strategic focus on issues and areas for action that affect the whole ACT population and vulnerable subgroups of the population. It focuses on promoting healthy eating in accordance with Australian Dietary Guidelines amongst the general population. The Framework is not intended to guide clinical practice in the management of individuals’ health conditions where specific dietary advice and intervention is required. The Framework will also be used to inform stakeholders and the community about the Health Directorate’s roles in food and nutrition.
4. Guiding principles In implementing this Framework, the Health Directorate will be guided by the following principles: a) Implementing evidence-based policy and practice b) Developing whole-of-population approaches c) Developing whole-of-system approaches d) Implementing sustainable approaches e) Valuing prevention and health promotion f) Empowering consumers g) Recognising human rights h) Addressing health inequalities i) Leading by example A description of these guiding principles can be found at Appendix A.

Food and nutrition strategic framework: 2012 - 2018
10
5. Governance The Framework has been endorsed by the Health Directorate’s Executive Council. The Executive responsible for the oversight of the Framework is the Chief Health Officer. Responsibility for monitoring of the Framework lies with the Population Health Division, however the responsibility for implementation and evaluation of individual action areas lies with relevant divisions and branches within the Health Directorate. The Framework recognises the key roles played by other sectors of government, and by the non-government, community and business sectors in producing positive food and nutrition outcomes for the ACT population. While the Health Directorate has no authority to direct the activities of these sectors, its skill in influencing and advocating effectively for positive policy outcomes through establishing and maintaining effective and productive partnerships will be a key factor in the success of the Framework.
6. Policy context
6.1. National policy context
The Framework is set in the context of an increased national focus on prevention. In November 2008, the Council of Australian Governments agreed to a National Partnership Agreement on Preventive Health (NPAPH), to focus all States and Territories on prevention of chronic disease. The NPAPH aims to ensure Australians are equipped and supported to make healthy lifestyle choices and manage key risk factors relating to chronic disease including poor nutrition. A primary focus of the NPAPH is to address the rising prevalence of lifestyle related chronic diseases through the implementation of a broad range of initiatives in settings such as communities, early childhood education and care environments, schools and workplaces. As part of the NPAPH, States and Territories are working towards seven agreed outcomes related to physical activity, nutrition, healthy weight, and smoking. The nutrition-related outcomes are:
1) increase the proportion of children and adults meeting national guidelines for healthy eating by 15 per cent within six years.
2) increase the proportion of children and adults at healthy body weight by three percentage points within ten years.
The Australian National Preventive Health Agency (ANPHA) was established by the Australian Government on 1 January 2011 to strengthen Australia’s investment and infrastructure in preventive health. ANPHA supports the development and implementation of evidence-based approaches to preventive health initiatives targeting obesity, harmful alcohol consumption, tobacco and other substance abuse.
6.2. ACT policy context
The 2009-10 ACT Budget allocated $11 million over three years to support a Healthy Future - Preventative Health Program which included a range of initiatives aimed at promoting healthy lifestyles and preventing or reducing risk factors for chronic disease. These initiatives were

Food and nutrition strategic framework: 2012 - 2018
11
focussed on priority areas of action that closely reflect developments in the preventive health agenda at the national level through the NPAPH.
NPAPH Nutrition Outcomes: Key Performance Benchmarks Under the NPAPH, the four key performance benchmarks relevant to food and nutrition in the ACT are:
a) increase in proportion of children at unhealthy weight held at less than five per cent from baseline for each state by 2015; proportion of children at healthy weight returned to baseline level by 2018.
b) increase in proportion of adults at unhealthy weight held at less than five per cent from baseline
for each state by 2015; proportion of adults at healthy weight returned to baseline level by 2018.
c) increase in mean number of daily serves of fruits and vegetables consumed by children by at least 0.2 for fruits and 0.5 for vegetables from baseline for each State by 2015; 0.6 for fruits and 1.5 for vegetables by 2018.
d) increase in mean number of daily serves of fruits and vegetables consumed by adults by at least
0.2 for fruits and 0.5 for vegetables from baseline for each state by 2015; 0.6 for fruits and 1.5 for vegetables from baseline by 2018.
6.3. Links with other strategic documents
This Framework is designed to be consistent with the goals and underlying principles of a range of ACT and Health Directorate strategic documents which provide a focus to the Health Directorate’s commitment to promoting healthy lifestyles amongst the ACT population. A list of relevant associated Health Directorate and ACT Government Frameworks, plans and strategies is located at Appendix B.
7. Diet and the burden of disease Poor diet plays a direct role in the development and progression of a number of conditions, including coronary heart disease, stroke, hypertension, obesity, some forms of cancer, type 2 diabetes, osteoporosis, dental caries, gall bladder disease, and dementia (NHMRC 2003b; WHO 2003). In addition, shortage of food and a lack of dietary variety cause malnutrition and deficiency diseases (Wilkinson & Marmot 2003). It has been estimated that poor nutrition is implicated in more than 56% of all deaths in Australia (Crowley et al 1992). Diet-related disease is a major contributor to the total burden of disease and injury2 (BoD) in Australia, including in the ACT (ACT Health 2010a). The diet-related diseases with the greatest
2 The key indicator to measure the burden of disease and injury is the disability-adjusted life year (DALY). It describes
the amount of time lost due to both fatal and non-fatal events or the years of life lost due to premature death coupled with years of ‘healthy’ life lost due to disability.

Food and nutrition strategic framework: 2012 - 2018
12
burden in the ACT are CVD (especially coronary heart disease and stroke), type 2 diabetes and some cancers. The BoD associated with diet is a result of both the direct effects of nutrition factors on disease states and the effects on diet-related conditions such as high blood pressure, high blood cholesterol, overweight and obesity, which in themselves are risk factors for disease. Information about the burden of disease, prevalence and/or incidence and relationship of key diet-related diseases and risk factors in the ACT is provided at Appendix C. A recent analysis by Jardine et al (2010) identified high body mass3 followed by smoking as the largest contributing risk factors to the total BoD in Queensland, with high body mass responsible for 8.5% of the total burden and smoking responsible for 7.2%. These were followed by physical inactivity (6.4%), high blood pressure (5.9%) and high blood cholesterol (5.3%). Low fruit and vegetable intake contributed 2.2% of the total BoD (Jardine et al 2010). The analysis indicates that the four diet-related risk factors (high body mass, high blood pressure, high blood cholesterol, low fruit and vegetable intake) together with physical inactivity were responsible for around 16% of the total BoD in 2007 (Jardine et al 2010), ie around double the burden due to smoking. In the UK, poor nutrition has been estimated to be responsible for around 10% of the total burden of disease (Rayner & Scarborough 2005) which is consistent with the results of the Queensland study. Table 1 shows the prevalence and percentage of total BoD associated with four diet-related risk factors in the ACT. Table 1: Snapshot: Prevalence and percentage of total BoD associated with four
diet-related risk factors in the ACT.
Prevalence in 2009-10
Percentage of total BoD in 2003
High blood pressure
16.1%* 7.6%
High body mass
52.9% of adults over 18 years 19.4% of children 5-17 years
6%
High blood cholesterol
12.4%* 5%
Low fruit & vegetable consumption
90.1% of adults for vegetables 42.9% of adults for fruit 41% of Year 6 children for vegetables
2%
Source: ACT Health 2010a; ACT Government Health Directorate 2011a; ACT Government Health Directorate 2012a; ACT Government Health Directorate 2012b. * This prevalence was based on the proportion of adults that reported ever being told that they had high blood pressure or high cholesterol that reported still having the condition at the time of the ACT General Health Survey.
3 High body mass is defined as body mass index ≥ 25

Food and nutrition strategic framework: 2012 - 2018
13
8. Healthy eating – the economic imperative Health expenditure in Australia is projected to grow from 4.0 % of Gross Domestic product (GDP) in 2009-10 to 7.1 % of GDP in 2049-50 (Commonwealth of Australia 2010). Chronic diseases place significant strain on Australia’s health care system. There are significant economic costs associated with diet-related chronic disease, including direct costs to the health care system associated with managing diet-related conditions and the indirect and intangible costs to individuals and society from pain and suffering, income loss and lost productivity. In 2007-08, CVD accounted for 11 per cent ($5.9 billion) of total Australian health expenditure and cancer accounted for 7 per cent ($3.8 billion) (AIHW 2009b). However, not all CVD and cancer are diet-related. It has been estimated that the healthcare cost of CVD associated with low consumption of fruit and vegetables is around $235 million per year and that increasing vegetable or fruit intake in Australia by one serve a day would save $157 million per year from the costs of CVD alone (Miller 2002). In 2008, Access Economics (2008) estimated the financial cost of obesity for Australia at $8.3 billion and when the net cost of lost wellbeing was added, the total cost of obesity was estimated at $58.2 billion. They calculated that obesity (BMI ≥ 30) in Australia causes:
23.8% of type 2 diabetes;
21.3% of CVD;
24.5% of osteoarthritis; and
20.5% of colorectal, breast, uterine and kidney cancer. Based on population share, the estimated cost of obesity in the ACT was $133 million in financial costs and a total of $936 million including the cost of lost wellbeing. The economic burden of diet-related disease in the ACT is expected to increase over the next decade due to the ageing population and increases in life expectancy, which will result in a heavier demand for health services (ACT Health 2010a). The potential economic benefit of effective nutrition-based preventive strategies is therefore substantial.
9. Australian Dietary Guidelines and recommendations The Australian Dietary Guidelines (ADG) provide population based recommendations aimed at promoting health and reducing the burden of preventable diet-related disease. They are developed by the National Health and Medical Research Council (NHMRC) and are based on the best available scientific evidence. The ADG include Infant Feeding Guidelines for Health Workers and a food selection guide, the Australian Guide to Healthy Eating (AGHE). The AGHE provides information about the amounts and types of food that need to be eaten each day to get enough of the nutrients essential for good health and wellbeing, thereby helping Australians to develop the skills and knowledge necessary to choose a healthy diet. The NHMRC is revising the current ADG and AGHE. Revised Guidelines are expected to be

Food and nutrition strategic framework: 2012 - 2018
14
available late in 2012. The current ADG are set out at Appendix D. The full documentation for the current ADG can be found at http://www.nhmrc.gov.au/guidelines/publications/n29-n30-n31-n32-n33-n34. The revised ADG will be available when released at http://www.eatforhealth.gov.au/. The NHMRC’s Nutrient Reference Values for Australia and New Zealand Including the Recommended Dietary Intakes (2006) outlines the intake levels of essential nutrients considered adequate to meet the nutritional needs of healthy people for prevention of nutrient deficiencies. The document is intended for use by health professionals to assess the likelihood of inadequate intake in individuals or groups of people. The Nutrient Reference Values can be located at http://www.nrv.gov.au/.
10. Food and nutrition issues in the ACT This section presents key food and nutrition issues that affect a significant proportion of the ACT population. It is not intended to represent all issues relating to food and nutrition experienced by individuals in the ACT. These key issues have been identified on the basis of ACT data where they are available and Australia-wide data where no ACT specific data exists. This section provides a basis for identifying strategic areas for action at a population level by the Health Directorate.
10.1. Reducing rates of overweight and obesity
Overweight and obesity are associated with increased risk of type 2 diabetes, cardiovascular disease, some cancers, hypertension, musculoskeletal conditions, respiratory conditions, social isolation, depression and other psychological disorders, sleep apnoea, cholecystitis (inflammation of the gallbladder), insulin resistance and metabolic syndrome (a combination of conditions that increase the risk of cardiovascular disease), hernia, reproductive disorders, urinary incontinence and skin conditions (NHMRC 2011a). Overweight and obesity are significant public health problems for Australia, including in the ACT. In 2009-10, 19.4% of ACT children aged 5 to 17 years and 52.9% of adults 18 years and over were either overweight or obese, with higher rates in adult males (59.9%) than adult females (46.1%) (ACT Government Health Directorate 2012a; ACT Government Health Directorate 2012b). Overweight and obesity in childhood is particular problematic as it tends to continue into adulthood. Rates of obesity and overweight are roughly similar for Aboriginal and Torres Strait Islander people in the ACT compared to non-Indigenous people (ACT Health 2010a). Along with inadequate levels of physical activity and increasingly sedentary lifestyle, excess energy intake from food is a major contributor to overweight and obesity. In Australian adults, between 1983 and 19954 there was an increase in mean energy intakes of 3% in men, 4% in women, 15% in boys and 11% in
4 Data on more recent energy intake trends in adults and children is expected to be available when the results of the
Australian Health Survey 2011-2012 are available.
Food and nutrition strategic framework: 2012 - 2018
15
girls aged 10-15 years (Cook, Rutishauser and Seelig 2001). A major contributing factor has been the increase in consumption of energy dense foods and beverages over recent decades. Some information about the consumption of energy dense foods and drinks is provided at Appendix E. Reducing rates of overweight and obesity will increase the health and wellbeing of the ACT population and reduce rates of chronic disease.
10.2. Improving adherence to Australian Dietary Guidelines
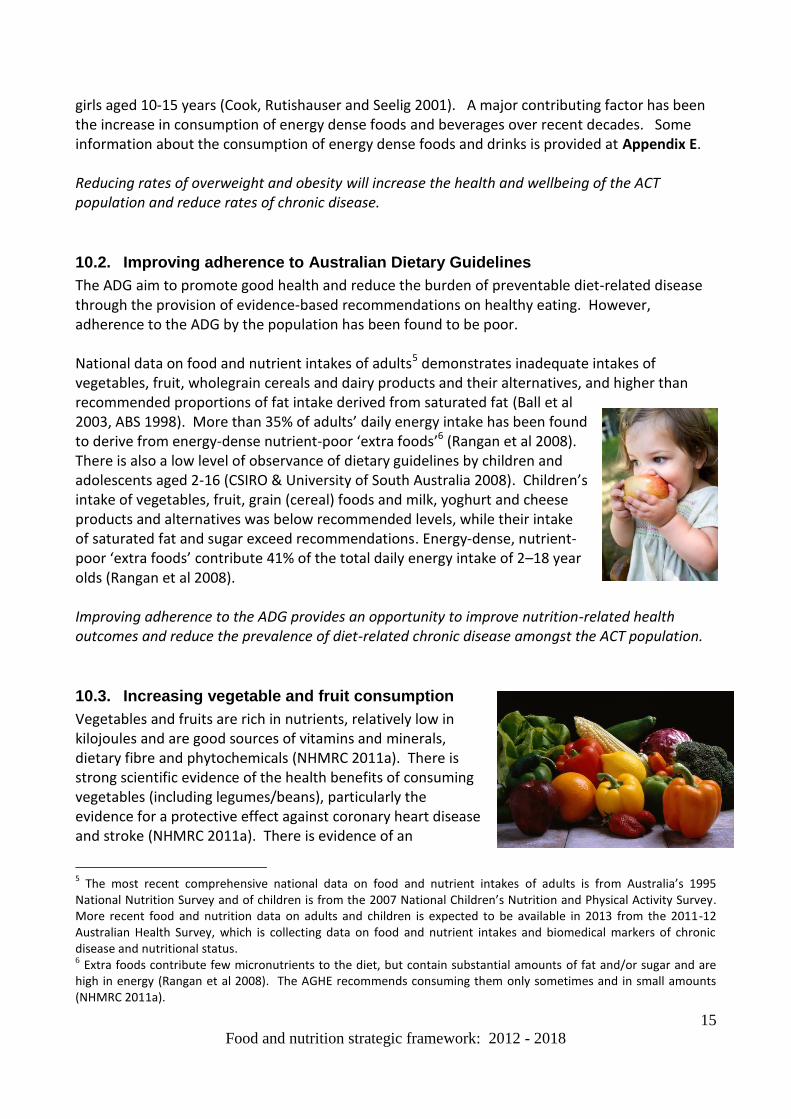
The ADG aim to promote good health and reduce the burden of preventable diet-related disease through the provision of evidence-based recommendations on healthy eating. However, adherence to the ADG by the population has been found to be poor. National data on food and nutrient intakes of adults5 demonstrates inadequate intakes of vegetables, fruit, wholegrain cereals and dairy products and their alternatives, and higher than recommended proportions of fat intake derived from saturated fat (Ball et al 2003, ABS 1998). More than 35% of adults’ daily energy intake has been found to derive from energy-dense nutrient-poor ‘extra foods’6 (Rangan et al 2008). There is also a low level of observance of dietary guidelines by children and adolescents aged 2-16 (CSIRO & University of South Australia 2008). Children’s intake of vegetables, fruit, grain (cereal) foods and milk, yoghurt and cheese products and alternatives was below recommended levels, while their intake of saturated fat and sugar exceed recommendations. Energy-dense, nutrient-poor ‘extra foods’ contribute 41% of the total daily energy intake of 2–18 year olds (Rangan et al 2008). Improving adherence to the ADG provides an opportunity to improve nutrition-related health outcomes and reduce the prevalence of diet-related chronic disease amongst the ACT population.
10.3. Increasing vegetable and fruit consumption
Vegetables and fruits are rich in nutrients, relatively low in kilojoules and are good sources of vitamins and minerals, dietary fibre and phytochemicals (NHMRC 2011a). There is strong scientific evidence of the health benefits of consuming vegetables (including legumes/beans), particularly the evidence for a protective effect against coronary heart disease and stroke (NHMRC 2011a). There is evidence of an
5 The most recent comprehensive national data on food and nutrient intakes of adults is from Australia’s 1995
National Nutrition Survey and of children is from the 2007 National Children’s Nutrition and Physical Activity Survey. More recent food and nutrition data on adults and children is expected to be available in 2013 from the 2011-12 Australian Health Survey, which is collecting data on food and nutrient intakes and biomedical markers of chronic disease and nutritional status. 6 Extra foods contribute few micronutrients to the diet, but contain substantial amounts of fat and/or sugar and are
high in energy (Rangan et al 2008). The AGHE recommends consuming them only sometimes and in small amounts (NHMRC 2011a).

Food and nutrition strategic framework: 2012 - 2018
16
association between some specific subgroups of vegetables and some site specific cancers and also of an association between consumption of vegetables and reduced risk of weight gain (NHMRC 2011a). Australia’s dietary guidelines recommend that adults eat at least five serves of vegetables and two serves of fruit per day7 (NHMRC 2003), yet 94% of Australian adults do not consume the recommended number of serves of fruit or vegetables (ABS 2009a). In 2009-10, only 9.9% of ACT adults 18 years and over were eating sufficient vegetables on a daily basis, while 57.1% of adults were eating sufficient fruit (ACT Government Health Directorate 2012b). Aboriginal and Torres Strait Islander people in the ACT consume fruit and vegetables at rates similar to the general ACT population (ACT Government Health Directorate 2012a). Children and young people in the ACT also do not meet recommendations for fruit and vegetable consumption. Based on parent-reported data, only 54.5% of children aged 2-15 years consumed the recommended 2 to 4 serves of vegetables a day (boys: 53.6%, girls: 55.5%) while 83.3% ate the recommended 1 to 3 serves of fruit a day (boys: 82.6%, girls: 84.0%) (ACT Government Health Directorate 2012a). Given the low consumption of (especially) vegetables and fruit, increasing intakes is a priority for the ACT population.
10.4. Increasing breastfeeding rates and duration
Breast milk provides all the nutrients necessary for optimum physical and mental development of the infant in the first six months of life. Information about the benefits of breastfeeding is at Appendix F. The protective effects of breastfeeding in infancy extend to later life, with reduced risks of obesity and chronic disease in individuals who had been breastfed (Horta et al 2007). Australian dietary guidelines recommend exclusive breastfeeding from birth to around 6 months of age and ongoing breastfeeding with complementary foods until at least 12 months of age (NHMRC 2003a; NHMRC 2011a). A recent review of the evidence has found that exclusive breastfeeding to around six months is associated with the lowest risk of morbidity and mortality over the short, medium and long term, including the risk of obesity and allergic disease. The evidence also indicates that introduction of complementary foods before 3-4 months is associated with increased risk of allergic disease while delay in the introduction of solid foods until after the age of six months is associated with increased risk of developing allergies. Around six months is considered to be the “window of tolerance” for the introduction of complementary foods to minimize allergies (NHMRC 2011c).
7 A serve of vegetables is defined as one cup of salad vegetables, half a cup of cooked vegetables or cooked legumes,
or one medium sized potato. A serve of fruit is defined as 1 medium piece, eg apple, banana, orange, pear; 2 small pieces, eg apricots, kiwi fruit, plums; 1 cup diced pieces or canned fruit; 1/2cup juice; dried fruit, eg 4 dried apricot halves; 1½ tablespoons sultanas (AGTHE).

Food and nutrition strategic framework: 2012 - 2018
17
In the ACT, 76% of babies are still breastfeeding at 2 months, 68% at 4 months and 56% are breastfeeding at 6 months, while only 23% of babies are still breastfeeding at 12 months (ACT Government Health Directorate 2011b). This data does not provide information about the extent to which the infants were exclusively breastfed, which limits the ability to compare breastfeeding rates with NHMRC guidelines. Information is now being collected on indicators including ‘exclusive’, ‘predominant’ and ‘any’ breastfeeding. The quality of this data is being monitored and the data will be available for future reports. Increasing breastfeeding initiation and duration rates consistent with NHMRC recommendations will improve the health of infants and mothers and potentially reduce rates of chronic disease in later life.
10.5. Reducing salt consumption
Dietary salt is the major source of sodium intake. Excess sodium intake has been associated with a number of conditions such as high blood pressure, CVD, renal disease (chronic kidney disease), osteoporosis, gastric cancer, Meniere’s disease and asthma. There is a direct relationship between dietary sodium intake and blood pressure, ie blood pressure rises with increased sodium intake and lowers as sodium intake decreases (WHO 2003; NHMRC 2006). Australian recommendations provide a suggested dietary target of 4 grams of salt per day and an upper daily intake of 6 grams of salt (NHMRC 2006). However, average salt intakes in the Australian population are 7 to 10 grams per day (Beard et al 1997; Huggins et al 2011). Intakes of sodium in children of all groups exceed the recommended upper level of intake (CSIRO & University of South Australia 2008). Population modelling undertaken in the USA found that a reduction of three grams of dietary salt intake per day would reduce the annual number of coronary heart disease cases by between 60,000 and 120,000, stroke between 32,000 and 66,000, and heart attack or myocardial infarction between 54,000 and 99,000 through a decrease in prevalence of high blood pressure. The model calculated that such a reduction would save between $10 and $24 billion in healthcare costs annually in the US (Bibbins-Domingo et al 2010). People in the ACT are becoming more aware of the need to consume less salt. In 2009-10, 38.8% of ACT adults reported never adding salt to their food compared with 22.4% in 2007-08 (ACT Government Health Directorate 2012a). However, three-quarters of Australians’ salt intake comes from processed foods, not from salt added during food preparation or consumption. There is therefore a need to encourage people to consume more fresh foods and to select processed foods with lower salt content, in order to reduce rates of high blood pressure and related cardiovascular disease.

Food and nutrition strategic framework: 2012 - 2018
18
10.6. Improving nutrition in the elderly
While many diet-related health problems are related to excess food and energy intake across the lifecourse, undernutrition resulting from inadequate intake and/or absorption of food can be a significant problem for vulnerable people. In Australia, elderly people are the largest population group experiencing nutritional vulnerability (Nowson 2007). Deficiency of protein and energy accompanied by associated deficiencies in micronutrients is a major concern in the elderly and is characterized by the presence of: insufficient dietary intake, muscle wasting, weight loss, poor appetite, and a downward trajectory of subsequent adverse health outcomes (Chen, Schilling & Lyder 2001). Undernutrition in the elderly is associated with an increased risk of morbidity and mortality, poor health outcomes and increased health care costs (ANZSGM 2007; Lazarus & Hamlyn 2005). Undernutrition is under-recognised and under-treated in all Australian settings - acute care, rehabilitation, residential aged care and community settings (DAA 2009), with prevalence rates as high as 50% in residential aged care (Banks et al 2007; Grieger & Nowson 2007) and 20-40% in the hospital setting (Barker, Gout & Crowe 2011). Appendix G provides a definition of undernutrition and brief information about assessment, prevalence, causes and consequences of undernutrition in the elderly. Australian guidelines for the management of undernutrition recommend that undernutrition should be “identified, treated and action taken to reduce the prevalence in Australian healthcare settings and in community-dwelling adults” (DAA 2009). Management strategies include addressing non-physiological causes (eg food and nutrition education, provision of dentures, treatment for depression, referral to “Meals on Wheels”), supplementation with macro- and/or micro-nutrients and referral where needed for specialist nutritional care (Newbury, Chapman & Visvanathan 2004). Improving nutrition in older people can reduce the risk of morbidity and mortality, improve health outcomes and reduce health care costs.
10.7. Reducing specific micronutrient deficiencies
Some population groups in Australia are at risk of inadequate or marginal intakes of some vitamins or minerals. For example adolescent girls are at risk of low intakes of calcium due to replacement of milk as a drink with soft drinks, potentially contributing to osteoporosis in later life. Adolescent girls are also at risk of low iron intakes which can affect brain development, growth and immunity, due to onset of menstruation, fad dieting or vegetarianism. Vitamin D deficiency is emerging as a world-wide public health problem. There is increasing recognition that a significant number of Australians may have less than optimal vitamin D status (Daly et al 2011) placing them at risk of a number of health problems. Pregnant women need higher intakes of iodine
Food and nutrition strategic framework: 2012 - 2018
19
and folate than the general population to protect their children from serious health consequences. Additional folate is recommended to prevent neural tube defects (NTD) in babies and iodine deficiency can lead to intellectual disability in children. Further information about micronutrient deficiencies is at Appendix H. Micronutrient deficiencies in the population can be reduced through national population measures such as food fortification programs and public awareness campaigns, and by provision of targeted advice to at-risk individuals regarding the need for dietary changes and/or supplementation.
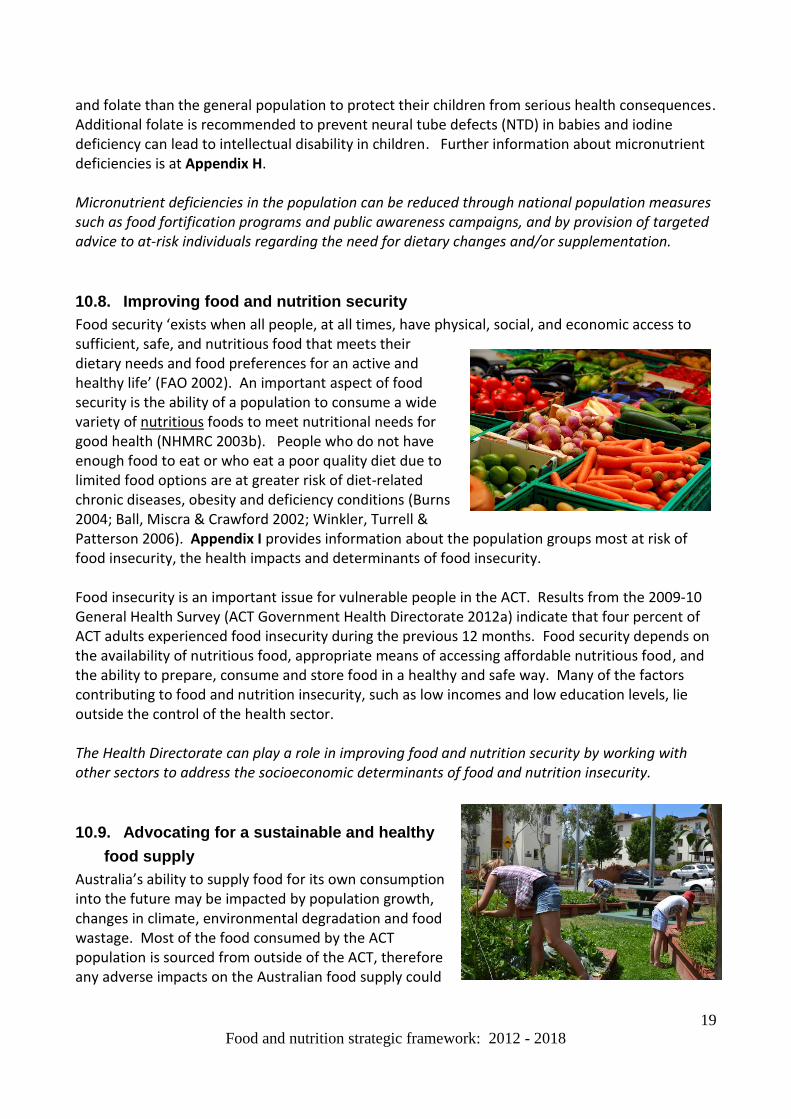
10.8. Improving food and nutrition security
Food security ‘exists when all people, at all times, have physical, social, and economic access to sufficient, safe, and nutritious food that meets their dietary needs and food preferences for an active and healthy life’ (FAO 2002). An important aspect of food security is the ability of a population to consume a wide variety of nutritious foods to meet nutritional needs for good health (NHMRC 2003b). People who do not have enough food to eat or who eat a poor quality diet due to limited food options are at greater risk of diet-related chronic diseases, obesity and deficiency conditions (Burns 2004; Ball, Miscra & Crawford 2002; Winkler, Turrell & Patterson 2006). Appendix I provides information about the population groups most at risk of food insecurity, the health impacts and determinants of food insecurity. Food insecurity is an important issue for vulnerable people in the ACT. Results from the 2009-10 General Health Survey (ACT Government Health Directorate 2012a) indicate that four percent of ACT adults experienced food insecurity during the previous 12 months. Food security depends on the availability of nutritious food, appropriate means of accessing affordable nutritious food, and the ability to prepare, consume and store food in a healthy and safe way. Many of the factors contributing to food and nutrition insecurity, such as low incomes and low education levels, lie outside the control of the health sector. The Health Directorate can play a role in improving food and nutrition security by working with other sectors to address the socioeconomic determinants of food and nutrition insecurity.
10.9. Advocating for a sustainable and healthy
food supply
Australia’s ability to supply food for its own consumption into the future may be impacted by population growth, changes in climate, environmental degradation and food wastage. Most of the food consumed by the ACT population is sourced from outside of the ACT, therefore any adverse impacts on the Australian food supply could

Food and nutrition strategic framework: 2012 - 2018
20
affect food and nutrition security in the ACT. Appendix J describes factors impacting on the sustainability of Australia’s food supply. The Health Directorate can play a role in ensuring a sustainable food supply for the ACT by working with other sectors and national forums, for example to encourage local food production, reduce food waste, promote sustainable patterns of food consumption and contribute to climate change mitigation and adaptation strategies.
10.10. Protecting food safety
Consumers trust that the food they purchase will be safe and of high quality. While Australia has one of the safest food supplies in the world, the reported incidence of foodborne illness has been increasing. Across Australia there are at least 5.4 million cases of gastroenteritis caused by contaminated food each year (Hall et al 2005). Based on national surveys, there is an estimated 60,600 to 88,000 cases of foodborne illness in the ACT per year, costing the community between $61 million and $89 million (KPMG 2012). Often, the food that makes people sick, looks, smells and tastes normal. Despite this, most food poisoning can easily be prevented by following basic food safety practices.
A Commonwealth and NSW Government jointly funded study established that the key contributing factors to food poisoning outbreaks are:
inappropriate storage (food stored too long or too warm) - 29.0%
food handlers’ contamination (poor hygiene) - 14.5%
inadequate cooking or reheating - 14.1%
cross-contamination - 14.1%
foods from an unsafe source - 14.1% (Food Science Australia & Minter Elliston 2002 ).
The Health Protection Service (HPS) has responsibility for registration, monitoring and enforcing ACT’s public health legislation. This includes managing risks and implementing strategies to protect public health in accordance with the Food Act 2001, Food Regulation 2002 and the Australia New Zealand Food Standards Code. The Health Directorate works to increase the safety of food available to all ACT residents and to reduce the impact of foodborne illness.
Food and nutrition strategic framework: 2012 - 2018
21
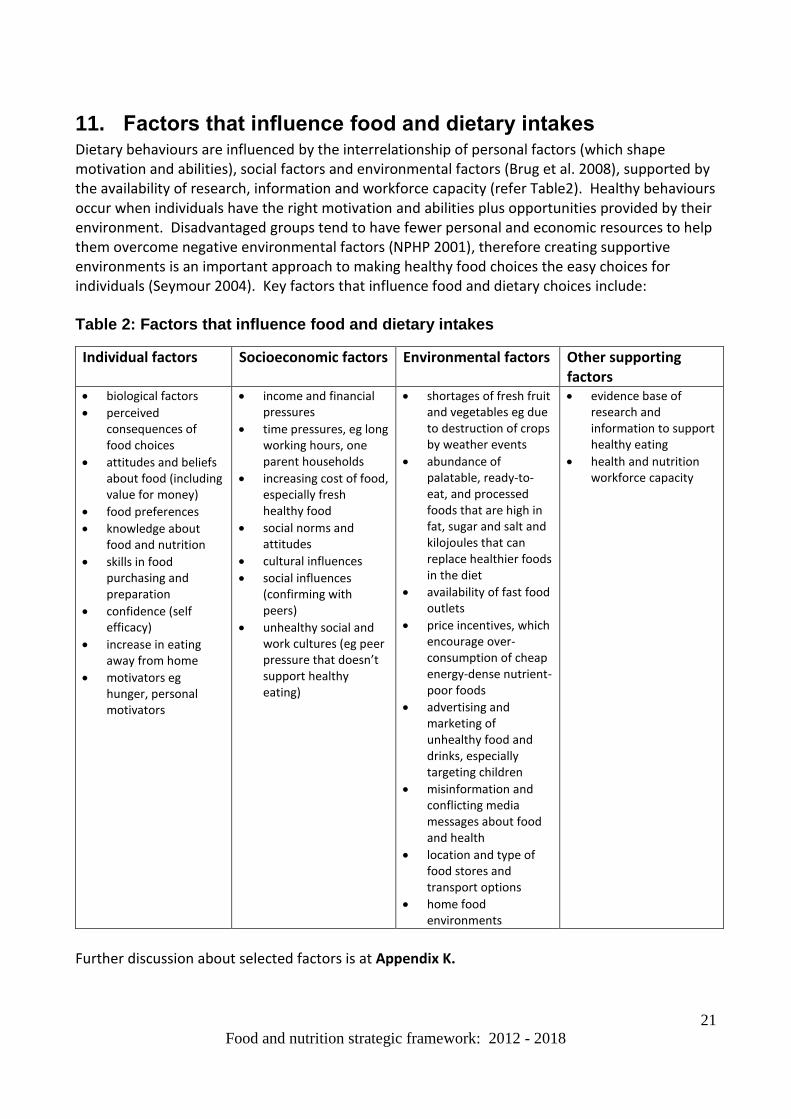
11. Factors that influence food and dietary intakes Dietary behaviours are influenced by the interrelationship of personal factors (which shape motivation and abilities), social factors and environmental factors (Brug et al. 2008), supported by the availability of research, information and workforce capacity (refer Table2). Healthy behaviours occur when individuals have the right motivation and abilities plus opportunities provided by their environment. Disadvantaged groups tend to have fewer personal and economic resources to help them overcome negative environmental factors (NPHP 2001), therefore creating supportive environments is an important approach to making healthy food choices the easy choices for individuals (Seymour 2004). Key factors that influence food and dietary choices include: Table 2: Factors that influence food and dietary intakes
Individual factors Socioeconomic factors Environmental factors Other supporting factors
biological factors
perceived consequences of food choices
attitudes and beliefs about food (including value for money)
food preferences
knowledge about food and nutrition
skills in food purchasing and preparation
confidence (self efficacy)
increase in eating away from home
motivators eg hunger, personal motivators
income and financial pressures
time pressures, eg long working hours, one parent households
increasing cost of food, especially fresh healthy food
social norms and attitudes
cultural influences
social influences (confirming with peers)
unhealthy social and work cultures (eg peer pressure that doesn’t support healthy eating)
shortages of fresh fruit and vegetables eg due to destruction of crops by weather events
abundance of palatable, ready-to-eat, and processed foods that are high in fat, sugar and salt and kilojoules that can replace healthier foods in the diet
availability of fast food outlets
price incentives, which encourage over-consumption of cheap energy-dense nutrient-poor foods
advertising and marketing of unhealthy food and drinks, especially targeting children
misinformation and conflicting media messages about food and health
location and type of food stores and transport options
home food environments
evidence base of research and information to support healthy eating
health and nutrition workforce capacity
Further discussion about selected factors is at Appendix K.

Food and nutrition strategic framework: 2012 - 2018
22
12. Strategic areas for action The factors that influence food and dietary intakes need to be addressed when developing strategies to improve population eating patterns. The Health Directorate can influence a number of these factors either directly, for example through policies, strategies, programs, services, regulation, communication and education, or indirectly through advocacy and collaboration with other agencies and sectors. Strategies to address individual factors include for example: improving awareness and knowledge about food, nutrition and breastfeeding; improving food and nutrition skills; and providing services that support behaviour change. Social factors may be addressed through: advocating to other sectors and building partnerships to address the social determinants of health; and encouraging community participation in developing strategies to improve nutrition. Strategies to address environmental factors include: working with other sectors to build healthy and supportive food environments; developing healthy public policy; regulation to protect food safety and provide nutrition information to consumers; and collaborating across sectors to build a sustainable food supply. Other supporting strategies include building the evidence for intervention; and building capacity amongst the health and nutrition workforce to promote healthy eating. The Health Directorate can take action on the key food and nutrition issues facing the ACT population and address the factors that influence food and dietary intakes by taking action in five main strategic areas: 1. Support individuals to adopt healthy eating behaviours 2. Foster environments that support healthy eating 3. Promote a safe, nutritious and sustainable food supply 4. Build the evidence for intervention 5. Building capacity The aims and priorities for these strategic areas for action are set out in Sections 12.1 to 12.5.

Food and nutrition strategic framework: 2012 - 2018
23
12.1. Support individuals to adopt healthy eating behaviours.
Aims Priorities Health Directorate areas involved
Increase the proportion of the population who consume a healthy diet consistent with the Australian Dietary Guidelines - Increase the
proportion of the population who are at a healthy weight
- Increase fruit and vegetable consumption
- Increase breastfeeding initiation and duration rates consistent with NHMRC recommendations
- Reduce excess salt consumption
- Reduce rates of undernutrition
- Reduce micronutrient deficiencies in the population
Population-based initiatives
Implement evidence-based initiatives and programs that promote healthy eating and breastfeeding to the general ACT population in a range of settings such as schools, child-care, workplaces and community settings.
Protect, promote and support breastfeeding through implementation of The ACT Breastfeeding Strategic Framework 2010 – 2015.
Targeted interventions
Provide targeted nutrition support through: - nutrition and dietetic services to individuals and
groups - programs and services that build food and nutrition
literacy and food skills - provision of general nutrition advice as part of clinical
practice and timely referral as required to a dietitian - health coaching programs - strategies for women who need additional support to
commence and continue breastfeeding.
Public awareness and information
Implement communication and social marketing approaches that: - Improve community understanding of healthy eating
and its relationship with health - Increase community awareness of, and demand for,
healthy food choices - Assist people to use nutrition information and food
labels to make healthy food choices. - Provide targeted information and resources about
healthy eating to non-government and community organisations
- Increase community awareness and acceptance of breastfeeding as the normal method of infant feeding
- Address the needs of specific priority populations - Build awareness amongst health care professionals,
caregivers, meal providers and health educators about the nutrition needs of vulnerable population groups, especially the risk of undernutrition in the elderly.
Community development
Advocate for community engagement in the development of initiatives that support healthy eating, eg community gardens, farmers’ markets, location of food outlets.
PHD – OCHO, HIB & HPS (through health promotion activities and programs, as well as food regulation and food policy) Community Health Programs Dietitians/nutritionists Canberra Hospital and Health Service clinicians, eg medical practitioners, nurses (hospital, community, MACH), midwives, dietitians:
whose scope of practice includes provision of general advice to clients/patients about healthy eating
who refer clients/patients to dietitians
who provide breastfeeding support to mothers
Communications and Marketing

Food and nutrition strategic framework: 2012 - 2018
24
Reduce the proportion of the population experiencing food and nutrition insecurity
Advocating for food security
Advocate with other sectors to address the social determinants of food and nutrition insecurity
Work in collaboration with health stakeholders and foster effective partnerships with non-health sectors to ensure all ACT residents have access to healthy food supply that meets their nutritional needs.
Participate in Territory and national planning to address the potential impacts of climate change and demographic change on food availability, accessibility and price in the ACT, with a particular focus on ensuring food security for vulnerable groups.
PHD – OCHO, HIB Policy developers Dietitians/nutritionists Social workers, welfare officers Community nurses Mental health workers Justice health workers Aged care workers Drug and alcohol workers

Food and nutrition strategic framework: 2012 - 2018
25
12.2. Foster environments that support healthy eating.
Aims Priorities Health Directorate areas involved
Foster environments that support healthy eating
Advocating for healthy food environments
Work with ACT Government agencies and the local food industry to improve the nutritional quality of the local food supply; increase promotion of healthier options; increase the provision of easy to understand nutrition information at point-of-sale; ensure tap water is freely available; and create breastfeeding-friendly environments.
Encourage local food producers and retailers to better meet the needs of elderly and vulnerable people, for example by providing simple-to-open packaging, clearer labelling, single portion products, easier access to and navigation of food stores.
Implementing policies and guidelines that support healthy eating
Support the development and implementation of local policies, guidelines and recommendations that encourage a healthy food supply, healthy eating and breastfeeding within key settings, including schools, child-care, workplaces and community settings.
Participate in national and ACT policy development processes and programs to improve diet-related health outcomes at a population level.
Legislation and regulation
Contribute to the development of food legislation and regulation that supports healthy eating and provides consumers with nutritional information.
Work with whole of government on regulatory approaches to environmental modifications that make healthy food and drink choices the easy choices, for example provision of nutrition information at point of sale.
Work with the Commonwealth Government and other jurisdictions towards the protection of breastfeeding through current legislation.
Incentives
Consider provision of incentives to increase the availability of healthy8 food and drink in various settings, and decrease the availability of less healthy choices.
Demonstrating leadership
Demonstrate leadership by providing healthy food environments within the Health Directorate.
PHD - OCHO, HIB & HPS Policy developers Dietitians/nutritionists Community Health programs MACH nurses, midwives, lactation consultants, obstetricians, paediatricians Food services Occupational therapists Infrastructure planners
8 Healthy food and drinks provide a good source of nutrients that are important for health, and are generally low in
energy (kilojoules), salt, saturated fat and added sugars.

Food and nutrition strategic framework: 2012 - 2018
26
12.3. Promote a safe, nutritious and sustainable food supply.
Aims Priorities Health Directorate areas involved
Contribute to ensuring a safe, nutritious and sustainable supply of healthy food for the ACT.
Promoting a sustainable and nutritious food supply
Advocate for a sustainable and nutritious food supply for the ACT.
Raise consumer awareness about the need to reduce food waste and advocate for Territory-wide action to reduce food waste.
Contribute to national and ACT climate change and sustainability agendas and policies and provide input into plans for ensuring sustainability of the ACT‘s future food supply.
Work with stakeholders on strategies for increasing local production of nutritious food.
Promote sustainable patterns of food consumption.
Protecting food safety
Manage public health risks associated with the food supply in the ACT.
Implement strategies and timely responses to food-related public health events through a range of regulatory and policy activities.
Implement effective communication approaches that support and promote food safety.
PHD – OCHO, HIB & HPS Dietitians/nutritionists Food services

Food and nutrition strategic framework: 2012 - 2018
27
12.4. Build the evidence for intervention.
Aims Priorities Health Directorate areas involved
Increase the body of evidence to underpin approaches to addressing food and nutrition issues in the ACT
Research and evaluation
Explore opportunities for collaboration in research to build the evidence base for food and dietary impacts on health and effectiveness and cost-effectiveness of interventions to improve diet and diet-related health outcomes.
Ensure that quality and timely evaluations are conducted for innovative food and nutrition programs and interventions in order to contribute to the evidence of effectiveness, and that evaluation findings are appropriately disseminated and applied.
Monitoring and reporting
Monitor and report on local food and nutrition issues, including diet-related risk factors, health outcomes and key population indicators relating to food, nutrition and breastfeeding.
Contribute to the development of national health, nutrition and food data collections.
Contribute to national disease surveillance and local and national epidemiological investigations to enable evidence-based interventions.
PHD – OCHO, HIB & HPS Dietitians/nutritionists Professional Leadership, Research and Education Branch CH&HS Research Office GP liaison unit

Food and nutrition strategic framework: 2012 - 2018
28
12.5. Build capacity
Aims Priorities Health Directorate areas involved
To increase the capacity of the workforce and the community to promote and support healthy eating
Build the capacity of the health workforce
Build the capacity of the health workforce to support and promote healthy eating and food safety.
Build the capacity of health care professionals, caregivers, meal providers and health educators to screen clients and improve the nutrition of their client groups.
Contribute to the education and training of nutrition professionals by working with universities on mentoring and supervising nutrition and dietetics students.
Build capacity in the community
Build the capacity of non-government and community organisations to provide training and support to the community in healthy eating and food skills.
Support community groups that strive to promote healthy food and nutrition.
Strategic coordination
Build on and establish strategic partnerships with ACT Government agencies, National, State and Territory governments, non-government agencies, the community sector and the business sector to increase healthy eating and breastfeeding consistent with Australian Dietary Guidelines and the Australian Guide to Healthy Eating.
Establish mechanisms for effective intersectoral and cross-government co-ordination and collaboration on food and nutrition issues.
PHD – OCHO, HIB & HPS Dietitians/nutritionists & other clinicians All Health Directorate Divisions responsible for direct patient care Business and Infrastructure Canberra Hospital Foundation Communications and Marketing Unit ACT Chief Nurse Volunteer Manager Health Centre Coordinator People, Strategy and Services, especially Staff Development Unit Professional Leadership, Research and Education Branch

Food and nutrition strategic framework: 2012 - 2018
29
Appendix A: Guiding principles
a) Implementing evidence-based policy and practice Research, analysis and evaluation support the development of evidence based policy and programs. The Health Directorate’s work in food and nutrition is underpinned by the National Health and Medical Research Council’s Australian Dietary Guidelines, which are based on the best available scientific evidence. Food and nutrition initiatives should integrate the best available evidence with professional, community and peer-based expertise.
b) Developing whole-of-population approaches A whole-of population approach aims to achieve maximum health gains by working with whole populations or sub-groups of the population. Population approaches are complemented by programs and services targeting individuals.
c) Developing whole-of-system approaches The Framework recognises the value of adopting a systems approach to effect change to whole systems that influence food and nutrition in the ACT, rather than targeting individual elements of systems in isolation.
d) Implementing sustainable approaches The Health Directorate is committed to ensuring that health spending is as efficient and effective as possible. Improving nutrition can help to prevent a range of health problems, and contribute to reduced health costs over the longer term. Initiatives should be sustainable over time and responsive to changing community needs.
e) Valuing prevention and health promotion The Health Directorate recognises the value of preventive approaches to address diet-related disease and foodborne illness. This includes promotion of healthy lifestyles, education, social inclusion and advocacy. Effective health promotion recognises the political, economic, social, cultural, environmental, behavioural and biological determinants of health.
f) Empowering consumers The Ottawa Charter for Health Promotion (WHO 1986) and the Jakarta Declaration (WHO 1997) emphasise the importance of enabling people to increase control over and improve their health. The Framework recognises the importance of empowering people to participate directly in decisions about their health and wellbeing. It recognises the right of all people to participate in the planning and development of food and nutrition policies and programs.
g) Recognising human rights The ACT Human Rights Act 2004 is an underpinning guide for ACT government policy development. The Framework recognises basic human rights such as the right to be treated with dignity and respect. This Framework recognises the right of all people to have access to a safe, affordable and nutritious food
supply.
h) Addressing health inequalities The Health Directorate recognises that some population groups experience inequities in health and access to health services. Reducing health inequalities linked to education, income and other environmental considerations is a matter of equity and social justice (Marmot et. al 2010). The Health Directorate is committed to addressing structural and systemic issues which reinforce the divide between the health outcomes amongst different population groups.
i) Leading by example The Health Directorate values its responsibility to set a leading example by modelling healthy nutritional
approaches and policies in the workplace.
Food and nutrition strategic framework: 2012 - 2018
30
Appendix B: Associated strategic documents The ACT Government Health Directorate Food and Nutrition Strategic Framework: 2012-2018 is intended to be consistent with the goals and underlying principles of the following Health Directorate and ACT Government policies, plans and frameworks, and their successors from time to time. Health Directorate
Towards a Healthier Australian Capital Territory: A Strategic Framework for the Population Health Division 2010-2015
‘A New Way’ – The Aboriginal and Torres Strait Islander Health and Family Wellbeing Plan 2006-2011
ACT Health Corporate Plan 2010-2012
ACT Primary Health Care Strategy 2011-14
ACT Government Health Directorate Physical Activity Strategic Framework 2012-2015
ACT Health Sustainability Strategy July 2010
The ACT Breastfeeding Strategic Framework 2010-2015
Health Directorate Reconciliation Action Plan ACT Government
ACT Strategy for Improving Care and Support for those with Chronic Conditions 2012-2017 (currently under development)
ACT Children’s Plan 2010-2014
ACT Women’s Plan 2004-2014
Weathering the Change – ACT Climate Change Strategy 2007-2025 The Health Directorate’s Reconciliation Action Plan 2010-2012 demonstrates our commitment to creating a culturally aware and sensitive healthcare environment that contributes to closing the unacceptable gaps in life expectancy for Aboriginal and Torres Strait Islander Peoples living in the ACT and surrounding region. Building improved working relationships and partnerships with Aboriginal and Torres Strait Islander Peoples to improve quality and access to health care is central to ‘Closing the Gap’. Many of the strategic approaches to improving food and nutrition outcomes described in this document will benefit from an integrated strategic approach. Changes to the ACT Public Service structure in 2011 following the Hawke Review have paved the way for a more strategic and collaborative approach across Government Directorates. The ACT Government has released an accountability framework Strengthening Performance and Accountability: A Framework for the ACT Government (2011). This framework has also identified the objective of ‘Strong co-ordination of activity across government’. As a result, the Framework’s strategic focus areas that address social and environmental determinants of health will place the achievement of improved food and nutrition outcomes within a whole of government context.

Food and nutrition strategic framework: 2012 - 2018
31
National Preventative Health Taskforce In addition, the Framework is set in the context of the final report of the National Preventative Health Taskforce, Australia: The Healthiest Country by 2020 (NPHT 2009), which identified the need to increase healthy eating in the population and to take action to address the associated problem of overweight and obesity. Key recommended action areas include:
Driving change within the food supply to increase the availability and demand for healthier food products, and decrease the availability and demand for unhealthy food products
Embedding physical activity and healthy eating patterns in everyday life
Encouraging people to improve their levels of physical activity and healthy eating through comprehensive and effective social marketing
Reducing exposure of children and others to marketing, advertising, promotion and sponsorship of energy-dense nutrient-poor foods and beverages
Strengthening, up skilling and supporting primary healthcare and public health workforce to support people in making healthy choices
Addressing maternal and child health, enhancing early life and growth patterns
Supporting low income communities to improve their levels of physical activity and healthy eating
Reducing obesity prevalence and burden among Indigenous Australians
Building the evidence base, monitoring and evaluating effectiveness of actions.

Food and nutrition strategic framework: 2012 - 2018
32
Appendix C: Burden of disease 1. Burden of disease (BoD), prevalence and/or incidence of key diet-related diseases
Snapshot: BoD, prevalence and/or incidence of key diseases associated with diet-related risk factors in the ACT
Proportion of total BoD in 20039 (Source: ACT Health 2010a)
Prevalence and/or incidence
CVD* 15%
In 2007-08, 15.2% of the ACT population reported having a disease of the circulatory system (ABS 2009b)
Type 2* Diabetes
3.5%
In 2007-08, 2.4% of the ACT population had ever been diagnosed with type 2 diabetes (ABS 2009b).
Colorectal* cancer
2.4%
The age standardised rate for colorectal cancer in the ACT in 2004-08 was 61.9 per 100,000 (ACT Cancer Registry 2011)
*Notes accompanying table: 1) Cardiovascular disease During 2007, 31% of all deaths in the ACT were due to CVD. Of these, 45% were due to coronary heart disease and 25% due to cerebrovascular disease (ACT Health 2010a). 2) Type 2 diabetes The prevalence of type 2 diabetes as set out in the table above was collected from self-reported data, which generally underestimate the true prevalence of diabetes (ABS 2006). Projections indicate that by 2020, this figure is expected to increase to between 15,000 and 22,000, mostly driven by increases in the prevalence of overweight and obesity. Overweight and obesity currently account for about 41% of type 2 diabetes in Australia (Marks, Coyne & Pang 2001). 3) Cancer “Cancer” is not a single disease. There is evidence of a convincing causal relationship with dietary factors exists for only some cancers. These include:
red meat and processed meat - cancers of the colon and rectum
excess body fat - cancers of the breast (postmenopausal), oesophagus, pancreas, colon, rectum, endometrium and kidney)
alcoholic drinks - cancers of the mouth, pharynx, larynx, oesophagus, colon and rectum for men and breast cancer (pre- and post-menopausal) (WCRF/AICR 2007).
In addition, there is evidence of a probable causal relationship between other dietary factors and a number of different cancers (WCRF/AICR 2007).
9 2003 burden of disease data is the most recent for Australia and the ACT.

Food and nutrition strategic framework: 2012 - 2018
33
2. Prevalence of diet-related risk factors and relationship to disease High blood pressure Prevalence: In 2009-10, 27.8% of all respondents 18 years and older to the ACT General Health Survey reported to have ever been told they had high blood pressure and of these, 57.8% reported still having high blood pressure (ACT Government Health Directorate 2012b). Relationship: High blood pressure is the single most important risk factor for cardiovascular and renal diseases, and accounts for around half of all coronary heart disease and strokes. There is extensive scientific evidence of a direct relationship between dietary sodium intake and blood pressure, ie blood pressure increases progressively with increased sodium intake and a reduction in sodium intake lowers blood pressure (WHO 2003, NHMRC 2006). The major source of sodium in the diet is salt (sodium chloride). The development of high blood pressure is also linked to other dietary factors including: lower intakes of potassium, calcium and magnesium; lower fruit and vegetable consumption; and higher alcohol consumption. Other key factors include overweight and metabolic syndrome, lack of physical activity and genetic predisposition (NHMRC 2006). A randomised controlled trial of reduction of dietary sodium in combination with the Dietary Approaches to Stop Hypertension Diet (DASH diet), found that both lowered blood pressure substantially compared with a typical diet in the United States, with greater effects in combination than singly. The DASH diet emphasizes fruits, vegetables and low-fat dairy products, and includes whole grains, poultry, fish, and nuts, with only small amounts of red meat, sweets, and sugar-containing beverages and decreased amounts of total and saturated fat and cholesterol (Sacks et al 2001). High body mass10 Prevalence: In 2009-10, 52.9% of ACT adults 18 years and over were either overweight or obese (ACT Government Health Directorate 2012b). Males (59.9%) were more likely to be categorised as overweight or obese than females (46.1%). In addition, 19.4% of children aged 5 to 17 years were classified as overweight or obese (ACT Government Health Directorate 2012a). Relationship: High body mass (specifically high body fat) results from consuming more energy from food on a regular basis than is needed to meet energy requirements, leading to storage of energy as excess body fat (NHMRC 2003b). Excess body fat is a major public health problem in Australia including in the ACT, with substantial health, social and economic consequences. Overweight and obesity11 are risk factors for a wide range of debilitating and life threatening conditions, including coronary heart disease, type 2 diabetes, high blood pressure, stroke, dyslipidaemia, some cancers, kidney and gall bladder disease, sleep apnoea, liver disease, osteoarthritis, musculoskeletal problems and infertility (NHMRC 2003b). In addition, obesity can destroy self-esteem, lead to social discrimination and contribute towards mental illness (NOTF 2003). The risk for chronic disease rises with increasing levels of overweight as measured by Body Mass Index (NOTF 2006).
10
High body mass refers to Body Mass Index (BMI) categories of Overweight (BMI scores of between 25.0 and 29.9 for adults) and Obese (BMI scores of 30.0 and above for adults). BMI cut-offs for children are age and sex related.
11 See note above

Food and nutrition strategic framework: 2012 - 2018
34
High blood cholesterol Prevalence: In 2009-10, 22.1% of all respondents 18 years and older to the ACT General Health Survey reported ever having been told that they had high cholesterol and of these, 56.1% reported still having high cholesterol (ACT Government Health Directorate 2012b). Relationship: High blood cholesterol contributes to the build-up of fatty deposits on blood vessel walls (atherosclerosis) and is an important risk factor for coronary heart disease and stroke. Saturated fat from dairy foods and meats are major dietary contributors to blood cholesterol (WHO 2003). Other significant contributors to saturated fat intakes and blood cholesterol include: cakes, biscuits, confectionary, chocolate, pastries, pies, ice confections, butter, cream, and spreads. Trans fatty acids have also been shown to elevate levels of LDL cholesterol and lower the levels of the beneficial HDL cholesterol (NHMRC 2006). There is a strong consistent association between dietary saturated and trans fats and CVD, especially coronary heart disease (NHMRC 2006; WHO 2003). Evidence indicates that replacing saturated fats and trans fats in the diet with monounsaturated and polyunsaturated fats is associated with improved blood cholesterol levels and reduced risk of coronary heart disease (NHMRC 2011a) Low fruit and vegetable consumption Prevalence: In 2009-10, only 9.9% of ACT adults 18 years and over were eating sufficient vegetables on a daily basis, and 57.1% of adults were eating sufficient fruit on a daily basis (ACT Government Health Directorate 2012b). Results from the 2009 ACT Year 6 Physical Activity and Nutrition Survey show that around 45% of Year 6 students reported eating less than the recommended 3-4 serves of vegetables per day (ACT Government Health Directorate 2011a). Relationship: Vegetables (including legumes/beans) and fruit are high in food components that are beneficial for health, including vitamins and minerals (such as vitamin C, folate and magnesium), phytochemicals and dietary fibre and low in kilojoules, sodium and saturated fat which are associated with health problems if consumed in excess. Different vegetables and fruits are rich in different nutrients. Components with antioxidant properties (such as vitamins C and E) and phytochemicals may reduce the risk of inflammation and formation of the atherosclerotic plaques in blood vessels that underlie many cardiovascular conditions. A range of mechanisms are thought to be involved in the protective effect of vegetables and fruit for some cancers, and these may differ for different cancer sites. There may also be interactions between food components that confer a health benefit (NHMRC 2011a). There is evidence of a probable association between vegetable consumption and reduced risk of coronary heart disease and stroke (NHMRC 2011b). Evidence suggests that vegetable consumption is associated with a reduced risk of weight gain and a reduced risk of some cancers (oral, nasopharyngeal) and that some subgroups of vegetables are associated with a reduced risk of some site-specific cancers (tomato and prostate cancer; spinach and colorectal cancer; cruciferous vegetables and lung cancer). Evidence also suggests an association between consumption of preserved vegetables (salted, dried, fermented or pickled)and increased risk of oral and nasopharyngeal cancer. There is also evidence suggesting associations between consumption of soy foods and reduced total and LDL-cholesterol and between consumption of legumes and reduced risk of colorectal cancer (NHMRC 2011b).

Food and nutrition strategic framework: 2012 - 2018
35
There is evidence of a probable association between fruit consumption and reduced risk of coronary heart disease and stroke and evidence of a suggestive association between fruit consumption and reduced risk of obesity and weight gain as well as reduced risk of oral and nasopharyngeal cancer (NHMRC 2011b). It has been estimated that an increase of one daily serve of fruit and vegetables per person in Australia could save $180 million a year in direct health care costs (ACDPA 2004). Contribution of Diet-Related Risk Factors to the Burden of Disease and Injury There are limitations to existing BoD studies. The total BoD attributed to diet-related risk factors has not been fully assessed in Australian studies or studies elsewhere. Australian BoD studies have assessed the contribution of four diet-related risk factors: high blood pressure; high body mass; high blood cholesterol; and low fruit and vegetable consumption (Begg et al 2007). However, there are interactions between the effects of these risk factors such that the contribution of the individual risk factors cannot be disaggregated. In addition, the burden attributable to under- and over-consumption of specific foods and nutrients has not been assessed and not all of high blood pressure and cholesterol is related to diet. Therefore, further work is required to develop a more comprehensive estimate of the BoD due to poor diet. A Queensland burden of disease study (Jardine et al 2010) has estimated the contribution of four diet-related risk factors to key diet-related diseases- cancer, CVD and diabetes as set out in the table below.
The Contribution of Four Diet-related Risk Factors to the Burden of Disease for Cancer, CVD and Diabetes for QLD, 2007 (Jardine et al 2010)
Cancer CVD Diabetes
High body mass 4.6% 23.4% 64.2%
High blood pressure 36.8%
High blood cholesterol 33.3%
Low fruit and vegetable intake
2.5% 11%

Food and nutrition strategic framework: 2012 - 2018
36
Appendix D: Australian Dietary Guidelines DIETARY GUIDELINES FOR CHILDREN AND ADOLESCENTS IN AUSTRALIA 2003 Encourage and support breastfeeding Children and adolescents need sufficient nutritious foods to grow and develop normally Growth should be checked regularly for
young children
Physical activity is important for all children and adolescents
Enjoy a wide variety of nutritious foods Children and adolescents should be encouraged to:
Eat plenty of vegetables, legumes and fruits
Eat plenty of cereals (including breads, rice, pasta and noodles), preferably wholegrain
Include lean meat, fish, poultry and/or alternatives
Include milks, yoghurts, cheese and/or alternatives
- Reduced-fat milks are not suitable for young children under 2 years, because of their high energy needs, but reduced-fat varieties should be encouraged for older children and adolescents
Choose water as a drink - Alcohol is not recommended for
children and care should be taken to:
Limit saturated fat and moderate total fat intake
- Low-fat diets are not suitable for infants
Choose foods low in salt
Consume only moderate amounts of sugars and foods containing added sugars
Care for your child’s food: prepare and store it safely
DIETARY GUIDELINES FOR AUSTRALIAN ADULTS 2003
Enjoy a wide variety of nutritious foods
Eat plenty of vegetables, legumes and fruits
Eat plenty of cereals (including breads, rice, pasta and noodles), preferably wholegrain
Include lean meat, fish, poultry and/or alternatives
Include milks, yoghurts, cheeses and/or alternatives. Reduced-fat varieties should be chosen, where possible
Drink plenty of water. and take care to
Limit saturated fat and moderate total fat intake
Choose foods low in salt
Limit your alcohol intake if you choose to drink
Consume only moderate amounts of sugars and foods containing added sugars.
Prevent weight gain: be physically active and eat according to your energy needs Care for your food: prepare and store it safely Encourage and support breastfeeding
Sources: (NHMRCa; NHMRCb)

Food and nutrition strategic framework: 2012 - 2018
37
Appendix E: Consumption of energy dense foods and drinks
The increase in consumption of energy dense foods and drinks over recent decades has contributed to excess energy intakes amongst the population and an increased prevalence of overweight and obesity. The Australian Guide to Healthy Eating recommends that energy dense foods and drinks that are also low in nutrients essential for good health be consumed only sometimes and in small amounts. Yet, consumption of these “extra foods” remains high, especially amongst children. In 2009 in the ACT , 64% of boys and 56% of girls in Year 6 at school reported eating energy dense foods such as energy bars, confectionary, hot chips, crisps, salty snacks, pies, sausage rolls cakes, biscuits, pastries, ice-cream and iceblocks at least 4 times a week (ACT Government Health Directorate 2011a). One quarter of the boys (25%) and 21% of the girls reporting eating these foods every day. In addition, almost one-half (48.0%) of the boys and 36.6% of the girls reported drinking sugary soft-drinks once a week or more (ACT Government Health Directorate 2011a). Comparison with data from 2006 shows a reduction in the percentage of children eating energy dense foods every day (22.8% in 2009 compared with 29.1% in 2006), however it is clear that consumption of energy dense foods and drinks remains high amongst Year 6 children. Increased consumption of take away and fast food has contributed to the increased consumption of energy dense foods and drinks. Across Australia, the percentage of total expenditure on meals prepared and consumed out of the home (including fast food) increased from 18% in 1975-76 (ABS cited in Cashel) to 30.8% in 2009-10 (ABS 2010). In 2009 in the ACT, 26% of Year 6 boys and 17% of Year 6 girls reported eating food from a fast-food outlet once a week or more (ACT Government Health Directorate 2011a). Commonly consumed fast food (eg hamburgers, pizzas, fried chicken, hot chips, hot dogs, soft drinks, thickshakes and ice-cream) are typically high in energy content and this is compounded by the fact that they are often consumed in combination with each other, eg hamburger and hot chips and a soft drink.

Food and nutrition strategic framework: 2012 - 2018
38
Appendix F: Benefits of breastfeeding
Breastfeeding provides nutritional, health, social and economic benefits for the Australian community (NHMRC 2003a) and significant benefits to infants and mothers. Breast milk provides all the nutrients necessary for optimum physical and mental development of infants to around six months of age. Breastfeeding contributes to improved cognitive development and breastfed infants have a reduced risk of illness and infection (eg gastroenteritis, respiratory illness, middle ear infection), asthma, atopic disease (allergies) and Sudden Infant Death Syndrome and (AIHW 2009a; NHMRC 2003a; NHMRC 2011a). The protective effects of breastfeeding in infancy may extend to later life, with reduced risks of obesity, hypertension and some chronic diseases (Horta et al 2007; NHMRC 2011a). Several studies suggest that obesity in later childhood and adolescence is less common among breastfed children, with a longer duration of breastfeeding associated with a lower risk (WHO 2009). Breastfeeding also promotes faster maternal recovery from childbirth and progress to a healthy body weight (NHMRC 2011a). Women who have breastfed have reduced risks of breast and ovarian cancers (AIHW 2009a, NHMRC 2003a) and reduced risk of postmenopausal hip fracture (NHMRC 2011a). Breastfeeding can be an important factor in the bonding between mother and infant (NHMRC 2003a). Several studies have estimated substantial hospitalisation costs associated with premature weaning because of the association with infant illness (Productivity Commission 2009).

Food and nutrition strategic framework: 2012 - 2018
39
Appendix G: Undernutrition in the elderly
Definitions Undernutrition has been defined as “a state of energy, protein or other specific nutrient deficiency which produces a measurable change in body function, and is associated with a worse outcome from illness as well as being specifically reversible by nutritional support” (Allison 2000, page 590). Protein-energy undernutrition (PEU) is undernutrition resulting from an inadequate intake of protein, fat, and carbohydrate (Stratton, Green & Elia 2003). PEU is characterised by weight loss, and associated depletion of fat stores and muscle mass (ANZSGM 2007). Assessment There is no single gold standard method of assessing undernutrition (Nowson 2007). Undernutrition can be diagnosed by a variety of methods, often in combination, including assessment of dietary intake, biochemical measures, anthropometric measures and clinical assessment. A number of screening and assessment tools are available, for example the Subjective Global Assessment tool which defines undernutrition as “a greater than 10% continuing weight loss, continuing loss of subcutaneous fat and muscle, poor appetite, suboptimal intake [of food], excess nutrient losses and loss of functional ability” (Lazarus & Hamlyn 2005 page 42). Prevalence Figures on prevalence of undernutrition in a population tend to vary depending on the assessment method, therefore prevalence is often expressed as a range. Prevalence of undernutrition in Australian residential aged care facilities has been reported to be around 50% (Banks et al 2007; Grieger & Nowson 2007). One study of 346 residents of eight residential aged care facilities in south-east Queensland, mean age 84.2 years (SD 8.7), found 49.5% to be undernourished, with 43.1% moderately undernourished and 6.4% severely undernourished. The prevalence of undernutrition across the facilities varied from 72.1% to 31.8% (Gaskill et al 2008). Undernutrition has been reported as particularly prevalent in Australian hospitals (20-40%) depending on the patient population and definition and criteria used for diagnosis (Barker, Gout & Crowe 2011). Data on the prevalence of undernutrition in community living older adults are limited. A recent study of 235 community living older people in Melbourne, aged 65+ years who were receiving home nursing services, found that over 40% of participants were either at risk of undernutrition (34.5%) or undernourished (8.1%) (Rist, Miles & Karimi 2012). Nutrition screening of 1145 Brisbane Home and Community Care eligible clients living in the community (mean age 76.5 ± 7.2 years) found 15% to be at risk of undernutrition and estimated 5-11% to be undernourished (Leggo et al 2008). An earlier Australian study of 250 adults ≥65 years receiving domiciliary services in the community reported the 43.2% were not well nourished (Visvanathan et al 2003). The results of these studies may not be applicable to the total population of community living older adults because participants were receiving or eligible for home care services and therefore may be at a higher nutritional risk. However, an Australian Longitudinal Study on Ageing of 1098
Food and nutrition strategic framework: 2012 - 2018
40
adults ≥70 years residing in Adelaide, found 30% to be at high nutritional risk and a further 20.6% at moderate risk (Cobiac & Syrette 1995). Causes Undernutrition can be caused by a deficiency in dietary intake, increased requirements associated with disease, complications of disease or illness (eg poor absorption or excessive nutrient losses), or a combination of factors (Gout, Barker & Crowe 2009). Undernutrition is more common in people with certain disease states including: cancer, critical illness, neurological disease, orthopaedic injury, respiratory disease, gastrointestinal and liver disease, renal disease, HIV and AIDS (DAA 2009). Elderly people are at increased risk of undernutrition due to the physiological, physical and social changes associated with ageing that affect their food intake and nutrition status. Physiological/individual factors Ageing is associated with a decline in energy intake and appetite (known as ‘anorexia of ageing’). This reduction in energy intake often exceeds a decrease in energy expenditure, resulting in an unintended decrease in body weight and disproportionate loss of lean body tissue (sarcopenia) (ANZSGM 2007; MacIntosh, Morley & Chapman 2000). These changes are associated with metabolic, physiologic and functional changes that increase the risk of protein-energy malnutrition (MacIntosh, Morley & Chapman 2000). Intakes of most nutrients decrease with age particularly in people aged between 70 and 80 years (Herne 1995), yet requirements for some nutrients increase with age, such as protein, vitamin D, calcium and riboflavin (NHMRC 2006). Ageing adults are at risk of deficiencies of protein, energy, water, thiamin, vitamins D, B6, B12, fibre, antioxidants, folic acid, phytochemicals, iron and zinc (Wahlqvist & Savige 2000; Hunter, Raats & Lumbers 2007). Decreases in older people’s taste acuity (ability to perceive taste), smell, appetite, thirst and their lower energy needs can reduce their intake of food and water (Donkin, Johnson & Lilley 1998). Eating ability can be impaired by poor cognition, dementia and dysphagia (difficulty swallowing) (NHMRC 1999), resulting in texture modified diets which are often less palatable and lead to decreased intake. Diseases of the teeth and gums may also reduce the ability to eat a variety of foods. In 2007-09, 14% of ACT people aged 65 years and over reported to have all their natural teeth missing (ACT Government Health Directorate 2012a). An earlier report (ACT DHCC 1999) indicated that 17% of ACT residents in this age group avoided eating certain foods because of tooth or mouth problems. A cross-sectional study of adults aged ≥65 years found that frequency of vegetable consumption decreased significantly with increasing age (Donkin, Johnson & Lilley 1998). Poor health and increasing illness are also associated with impaired nutritional status (Newbury, Chapman & Visvanathan 2004). Commonly used medications often have side effects such as nausea and vomiting and may affect nutrient absorption, metabolism and retention (NHMRC 1999).

Food and nutrition strategic framework: 2012 - 2018
41
Social factors Decreased mobility resulting from chronic illness and disability can affect individuals’ capacity to shop for and prepare food (NHMRC 1999). Social isolation can lead to decreased nutrient intake and also to depression. Depression and eating alone can result in lower food intakes (NHMRC 1999; Newbury, Chapman & Visvanathan 2004). People living alone may not feel like cooking meals for themselves and eating in the company of others has been associated with increased food intakes (de Castro 1997 cited in Wahlqvist & Savige 2000). Widowhood can particularly affect men who have to take on tasks previously carried out by their spouse such as shopping and cooking (Hunter, Raats & Lumbers 2007). Studies have shown that older men have poorer nutrition knowledge and cooking skills than older women, suggesting that community based nutrition and cooking education interventions targeting older men are needed (Keller et al 2004 cited in Hunter, Raats & Lumbers 2007; Hughes, Bennett & Hetherington 2004; Baker & Wardle 2003). Poverty may limit access to food and lower income groups have been found to consume significantly less energy, protein, fibre and micronutrients than others (Finch 1998 cited in Hickson 2006). Dwindling savings and reduced earning capacity puts older people at increased risk of undernutrition (Newbury, Chapman & Visvanathan 2004). Environmental factors The needs of older people or vulnerable people may not be well met by the food industry. Food labels may be difficult to read and some individuals may experience difficulties with in-store environments such as signage, packaging, accessibility of products, trolleys or lack of staff assistance (Hunter, Raats & Lumbers 2007; Moschis 2003).
Nonphysiological causes of undernutrition in older people (Newbury, Chapman & Visvanathan 2004; MacIntosh, Morley & Chapman 2000)
Social factors Poverty Inability to shop Inability to prepare and cook meals Inability to feed oneself Living alone, social isolation, or lack of social support network Failure to cater to ethnic food preferences
Psychological factors Alcoholism Bereavement Depression Dementia or Alzheimer disease Cholesterol phobia
Medical factors (eg mediated through anorexia, early satiation, malabsorption, increased metabolism)
Cancer Alcoholism Cardiac failure

Food and nutrition strategic framework: 2012 - 2018
42
Chronic obstructive airways disease Infection Dysphagia Rheumatoid arthritis Parkinson disease Hypermetabolism (eg. hyperthyroidism) Malabsorption syndromes Gastrointestinal symptoms: dyspepsia, atrophic gastritis, vomiting, diarrhoea Constipation Poor dentition
Medications
Nausea/vomiting: antibiotics, opiates, digoxin, theophylline, nonsteroidal anti-inflammatory agents (NSAIDs)
Anorexia: antibiotics, digoxin
Decreased sense of taste: metronidazole, calcium channel blockers, angiotensin converting enzyme inhibitors (ACE), metformin
Early satiety: anticholinergic drugs, sympathomimetic agents
Reduced feeding ability: sedatives, opiates, psychotropic agents
Dysphagia: potassium supplements, NSAIDs, biphosphonates, prednisolone
Constipation: opiates, iron supplements, diuretics
Diarrhoea: laxatives, antibiotics
Hypermetabolism: thyroxine, ephedrine
Consequences In the elderly, PEU has been associated with increased risk of pressure ulcers, stroke, bleeding, respiratory failure, cardiac complication, infections, poor immunity, apathy, a reduction in the ability to perform self-care activities and a loss of mobility, quality of life and independence (Chen Schilling & Lyder 2001; Gaskill 2008). PEU exacerbates the effects of the normal decline in lean muscle mass and strength (sarcopenia) associated with ageing (Chen, Schilling & Lyder 2001). Deficiencies of vitamin D and/or calcium cause loss of bone density and muscle function, further contributing to frailty and increased risk of falling and fractures (Newbury, Chapman & Visvanathan 2004). Older women in residential care have been found to experience the highest incidence of falls and one-third of all hip fractures in Australia (Flicker et al. 2005). Supplementation with calcium and vitamin D has been shown to reduce fracture incidence (Chapuy et al. 1992). A Cochrane review of interventions for preventing falls concluded that supplementation with vitamin D is effective in reducing the rate of falls in nursing care facilities (Cameron et al 2010). Included in the review was an Australian randomised trial, which demonstrated a significant reduction in falls with vitamin D supplementation and recommended that all older people in residential care should be considered for vitamin D supplementation (Flicker et al. 2005).

Food and nutrition strategic framework: 2012 - 2018
43
Appendix H: Micronutrient deficiencies
Calcium and Vitamin D
Function: Calcium is important for the development and maintenance of the skeleton and for neuromuscular and cardiac function. The body’s calcium reserve is stored in the skeleton and the size of the reserve depends on the relationship between calcium intake and absorption, and losses of calcium through the skin, kidney and bowel. The major function of vitamin D is to maintain serum calcium concentrations by enhancing the ability of the small intestine to absorb calcium from the diet (NHMRC 2006). Vitamin D is also believed to play a role in maintaining the immune system, healthy skin and muscle strength (NHMRC 2006). Low intakes of calcium and vitamin D have been associated with low bone density and osteoporosis which often results in bone fracture (NHMRC 2006). Osteoporosis is one of the major causes of morbidity amongst older Australians, particularly postmenopausal women. Calcium balance deteriorates at menopause due to a decline in intestinal calcium absorption and/or an increase in urinary calcium excretion (NHMRC 2006). Adequate calcium intake throughout life, adequate vitamin D status and exercise are key factors affecting the incidence of osteoporosis (NHMRC 2006). In 2007-08, an estimated 2.9% of the ACT population reported suffering from osteoporosis as a long term condition (ABS 2009b; ACT Health 2010a). There is evidence that a high calcium intake in post menopausal women will slow the rate of bone loss and may reduce the risk of fracture (NHMRC 2006). Deficiency of vitamin D causes inadequate mineralisation or demineralisation of the skeleton, which can lead to rickets in children, and osteoporosis or osteomalacia (less common) in adults (NHMRC 2006). Inadequate intakes of Vitamin D affect fracture risk though its influence on bone mass and also through its effect on the risk of falls. Vitamin D deficiency has re-emerged as a significant paediatric health problem in Australia, with complications including rickets, poor linear growth, motor delay, bone fragility, limb pain, fracture and hypocalcaemic seizures (Munns et al 2006; Munns et al 2012). Maternal deficiency of vitamin D in pregnancy is an important predictor of deficiency in the infant, while adequate maternal vitamin D status provides the infant with an 8-12 week store of vitamin D (Munns et al 2006). Holmes et al (2009) point to evidence that children born to vitamin D deficient mothers have an increased incidence of rickets and also that maternal vitamin D insufficiency is associated with a deficit in bone-mineral accrual in children that persists to age 9 years. Also, there is emerging evidence that in-utero or early life vitamin D deficiency is associated with non-skeletal health outcomes including increased risk of schizophrenia, type 1 diabetes and asthma (Holmes et al 2009). Recent evidence suggests a wider role for calcium and vitamin D in chronic disease prevention (NHMRC 2006). There is evidence from observational studies and clinical trials that deficiencies in calcium and vitamin D levels may increase the risk of several common chronic diseases including malignancies, particularly of colon, breast and the prostate gland, of chronic inflammatory and autoimmune diseases such as type 1 diabetes, inflammatory bowel disease and multiple sclerosis, as well as metabolic disorders (metabolic syndrome and hypertension) (Peterlik & Cross 2005).

Food and nutrition strategic framework: 2012 - 2018
44
Populations at risk of inadequate intakes: The 2007 National Children’s Nutrition and Physical Activity Survey found that older girls (12–16 years) appeared to be most at risk of not meeting their dietary requirements for calcium. This group had relatively low intakes of dairy foods (one of the richest dietary sources of calcium), possibly due to increased consumption of sweetened beverages replacing milk as a drink (CSIRO & University of South Australia 2008). Vitamin D deficiency is an emerging public health problem in Australia. Groups at particular risk include: older people living in the community; people in residential care with limited mobility; dark-skinned people; veiled women who have limited exposure to sunlight; and breast-fed infants of veiled women (NHMRC 2006). An estimated 31% of adults in Australia were found to have inadequate vitamin D status, increasing to more than 50% in women during winter to spring and in people residing in southern states (Daly et al 2011)12. Analysis of a national sample of 11,247 Australian adults found that vitamin D deficiency is common in Australia, affecting nearly one-third of adults 25 years and over (Daly et al 2011). The prevalence of vitamin D deficiency was found to be 31% (39% women; 22% men), increasing to more than 50% in women during winter-spring and in people residing in southern states (latitude >35°S). Prevalence of deficiency increased with age and was greater in people who were female; obese; physically inactive; more highly educated; Aboriginal Australians; Strait Torres Islanders; and those born in Southern Europe, Asia, the Middle East, India, Sri Lanka, Pacific Islands, Africa and South and Central America. Sources: Calcium is found primarily in milk and other dairy foods. Smaller amounts of calcium can be found in bony fish, legumes, some types of nuts (eg almonds), fortified breakfast cereals and calcium enriched soy, almond, rice and oat beverages. Vitamin D is produced in the body by the action of sunlight on skin. The vitamin D status of a population is generally maintained by their exposure to sunlight. Vitamin D is found in a limited range of foods and very few foods contain significant amounts of vitamin D. If sunlight exposure is adequate, obtaining vitamin through the diet is not necessary (NHMRC 2006).
12
Serum 25-hydroxyvitamin D (25-OHD) is the circulating form of vitamin D that is routinely used to assess vitamin D status. Based on a review of available evidence, the ANZ Bone and Mineral Society, Endocrine Society of Australia and Osteoporosis Australia (Nowson et al 2012) define vitamin D status according to the following levels of serum 25-OHD: • Vitamin D adequacy: ≥ 50 nmol/L at the end of winter (level may need to be 10–20 nmol/L higher at the end of summer, to allow for seasonal decrease) • Mild vitamin D deficiency: 30–49 nmol/L • Moderate vitamin deficiency: 12.5–29 nmol/L • Severe vitamin D deficiency: < 12.5 nmol/L A target level for vitamin D adequacy for mineral homeostasis, bone health and muscle function is considered to be > 50 or 60 nmol/L, although optimal values, even for bone and muscle health, are not clear (Nowson et al 2012). An international consensus statement recently agreed on a 25-OHD serum concentration range between 50 and 62.5 nmol/L (20–25 ng/mL) to prevent adverse musculoskeletal outcomes, including falls and fractures (Henry et al 2010).
Food and nutrition strategic framework: 2012 - 2018
45
Iron
Function: Iron is a mineral involved in transporting oxygen to tissues throughout the body via the blood (NHMRC 2006). It is important for making red blood cells and is essential in providing energy for brain development and growth. Iron is also needed for a healthy immune system. Inadequate intake of iron can lead to varying degrees of iron deficiency such as low iron stores, iron deficiency or iron deficiency anaemia. Iron deficiency may lead to reduced capacity for physical work, delayed psychomotor development in infants, impaired cognitive function, impaired immunity and adverse pregnancy outcomes (NHMRC 2006). Populations at risk of inadequate intake: Low iron intakes are common in Australia and iron deficiency is a significant public health concern (NHMRC 2003b). Population groups at risk of iron deficiency include: women of childbearing age (due to menstrual losses), pregnant women, adolescent females (fad dieting), vegetarians and semi-vegetarians, elite athletes (increased requirements), children aged 6 months to one year (due to loss of stores from birth and introduction to solids). The 1995 National Nutrition Survey found that iron intakes in premenopausal women were below recommended dietary intakes (NHMRC 2003b). WHO has estimated that 8% of preschool children, 12% of pregnant women and 15% of non-pregnant women of reproductive age in Australia have anaemia, with iron deficiency anaemia a major cause (WHO 2008). Sources: Iron cannot be made by the body therefore people need to get iron from the food they eat. There are two types of iron: haem iron and non-haem iron. Haem-iron is found in animal products such as red meat, chicken, fish, pate and offal. Animal foods are rich in iron and the form of iron in animal foods is better absorbed by the body than the iron in plant foods. Non-haem iron is found in plant products such as dried peas, beans, lentils, legumes, green leafy vegetables, nuts and dried fruit. Iodine
Function: Iodine is needed by the body for the development of essential thyroid hormones which regulate many metabolic processes such as growth and energy use. Iodine deficiency can lead to preventable intellectual disability in children. In adults, iodine deficiency can lead to an enlarged thyroid gland (goitre) and hypothyroidism, with symptoms including dry skin, hair loss, fatigue and slowed reflexes. Goitres can increase the risk of thyroid cancer. Goitre can be associated with hyperthyroidism, a condition in which too much thyroid hormone is produced. Populations at risk of inadequate intake: Intakes of iodine have fallen in Australia since early 1970 due to a decline in the use of iodised salt and a decline in iodine in milk because of changes in treatment methods (NHMRC 2006). In 2003-04, the Australian National Iodine Nutrition Study of school children aged 8-10 years found that overall, children in mainland Australian states were borderline iodine deficient (Li et al 2006). The study found children in Victoria and New South Wales to be mildly iodine deficient, South Australian children to be borderline iodine deficient, while children in Western Australia and Queensland appeared to have adequate intakes. Recent studies have highlighted the existence of iodine deficiency in pregnant women (Hamrosi, Wallace & Riley 2005; Travers et al 2006). Iodine deficiency in pregnant women can retard normal

Food and nutrition strategic framework: 2012 - 2018
46
development in babies. Iodine requirements are higher for women during pregnancy and lactation. The NHMRC recommends that women who are pregnant, breastfeeding or considering pregnancy take an iodine supplement of 150 µg each day to make sure their needs are met. However, iodine supplements can sometimes be contraindicated for some women taking medication for thyroid disease. These women need clarification from their medical practitioner before starting supplementation. Sources: The iodine content of most foods is low and can be affected by soil, irrigation and fertilisers. Seafood is a valuable source of iodine, however pregnant women are advised to limit consumption of certain seafood that may contain large amounts of mercury. Since October 2009, iodised salt has replaced non-iodised salt in all bread sold in Australia (except organic bread) to help address the re-emergence of iodine deficiency across most of the population. Bread fortified with iodised salt can provide sufficient amounts of iodine for the general population without the need to add iodised salt to the diet. Folate
Function: Folate is a B group vitamin which is essential for DNA synthesis and the healthy development of the foetus in early pregnancy. Folate is also increasingly thought to play a role in reduction of chronic disease risk, including risk of cardiovascular disease, cancer, fracture in older people, dementia and Alzheimer’s disease (NHMRC 2006). Populations at risk of inadequate intake: Comparison of folate intakes observed in the 1995 National Nutrition Survey with current recommendations shows that population intakes are well below recommended levels (NHMRC 2006). In order to reduce overall chronic disease risk, the NHMRC (2006) has identified a need to increase consumption of folate through replacement of nutrient-poor, energy-dense foods and drinks with folate-rich foods such as vegetables and fruits and wholegrain cereals. In Australia over 600 pregnancies every year are affected by neural tube defects (NTDs) such as spina bifida (Victorian Government 2012a). A baby’s neural tube is formed and closed in the first four to six weeks of pregnancy, during the time before most women know or suspect they are pregnant. NTDs can cause a wide range of disabilities like loss of bladder and bowel control and paralysis of the legs. In some cases, the effects can be more severe. The NHMRC (2006) recommends that women of child-bearing age take extra folate daily to reduce the risk of NTDs in their babies. Because about half of all pregnancies in Australia are unplanned, all women of childbearing age and women planning a pregnancy are advised to consume additional folic acid as a supplement or in the form of fortified foods at a level of 400 µg/day folic acid for at least one month before and three months after conception, in addition to consuming folate from a varied diet. Maximal protection against neural tube defects is obtained when the mother is consuming very high levels (5,000 µg) of folic acid as supplements, in the month preceding conception and in the first trimester (NHMRC 2006). Such higher levels of folic acid are sometimes prescribed for high risk pregnancies such as those with previous NTD, family history of NTD, obesity, or diabetes in pregnancy. 1000µg daily is sometimes prescribed to these patients based on medical practitioner’s clinical opinion and recent evidence regarding high dose folic acid supplementation and asthma in the offspring.

Food and nutrition strategic framework: 2012 - 2018
47
Sources: Folate is found naturally in many foods, and is also added to food or used as dietary supplements in the form of folic acid. Good sources of folate include green leafy vegetables, chickpeas, nuts, orange juice, some fruits, dried beans and peas. Many types of breakfast cereals and other packaged foods such as orange juice, cereal and cereal products, and formulated beverages contain added folic acid. In September 2009, it became a legal requirement in Australia that all bread-making flour, except organic flour, contain added folic acid. Three slices of bread (100g) contains an average of 120 micrograms of folic acid. This was introduced to help reduce the incidence of neural tube defects.

Food and nutrition strategic framework: 2012 - 2018
48
Appendix I: Food insecurity
Population groups at risk of food insecurity Across Australia, population groups at risk of poor access to and inadequate consumption of nutritious food include people who are: unemployed; homeless; chronically ill; disabled; alcohol or drug abusers; frail or older; carers; Aboriginal and Torres Strait Islanders; refugees; migrants; single parent, low-income and one-person households; and people with dementia (ACT Health 2004; NPHP 2001). The ACT General Health Survey collects data on food insecurity by asking the question: ‘In the last twelve months, were there any times that you ran out of food and couldn’t afford to buy more?’ Responses to this question need to be interpreted carefully, since the question not only identifies individuals for whom running out of food is a chronic situation but also those who may have run out of food only once during a 12 month period. An additional reason for caution in interpreting the data is the small numbers of people sampled. However, food insecurity is a problem for some people in the ACT. The age group with the highest prevalence of ‘Yes’ responses to the question in 2009-10 was the 25 to 34 year olds (6.9%), compared with lower prevalence in older age groups (0.8% for 65 to 74 years and 0.6% for those aged 75+) (ACT Government Health Directorate 2012a). Determinants of food & nutrition insecurity Food security is dependent on the availability of nutritious food, appropriate means of accessing affordable nutritious food and the ability to prepare, consume and store food in a healthy way. Many factors that support food and nutrition security lie outside the control of the health sector such as employment, education, social support and environmental factors. Population groups with restricted access to these social determinants often experience poor nutrition and health inequalities (DHS 2007). Key determinants of nutritional vulnerability in the ACT have been identified as: socioeconomic disadvantage, poor access to transport, limited food skills and knowledge; food preferences; access to culturally appropriate foods; poor access to food storage and cooking facilities; health & mobility problems and age (ACT Health 2004). Access to nutritious food can be affected by the types of local shops, opening hours, distance to shops, parking, public transport and price. The accessibility of shopping environments is different for different individuals, as factors such as car ownership, mobility and disposable income affect accessibility (Winkler, Turrell & Patterson 2006). Disadvantaged individuals may be restricted to shopping locally, where there may be limited food choice or higher prices (NPHP 2001). Town planning is therefore an important determinant of food accessibility, and the availability and cost of public transport influences food access (NPHP 2001). For homeless people and people living in supported accommodation, public housing or institutions, inadequate access to food storage and cooking facilities can lead to nutritional vulnerability (ACT Health 2004). The cost of food is an important determinant of food purchased and consumed (Burns & Friel 2007). People on low incomes are more affected by high prices, especially for fruit and vegetables, and consider price a deciding factor when making food purchases (Kamphuis et al. 2007). In the ACT, over 13% of ACT households lie in the bottom Australian income quintile (NATSEM 2007). Food insecurity is likely to increase with rising food prices and the increasing

Food and nutrition strategic framework: 2012 - 2018
49
number of Australians living in poverty (SCARC 2004). Social factors such as poor social participation, isolation and living alone can be risk factors for nutrition insecurity, ie poor diet and nutritional deficiencies (Kamphuis et al. 2007; Donkin, Johnson & Lilley 1998). In addition, migrant groups are vulnerable to nutrition insecurity, poor nutrition and obesity when they change from traditional diets to overconsumption of energy-dense foods (Wilkinson & Marmot 2003). For example, Asians migrating to Australia generally experience a decrease in energy expenditure, an increase in food energy density through increased intakes of fat and sugary drinks, and a decrease in some health protective foods (lentils, soy, greens) and beverages (tea) (Wahlqvist 2002). Health impact Evidence indicates that Australians of lower socioeconomic status have diets that are least consistent with dietary recommendations (Winkler, Turrell & Patterson 2006) and are therefore at greater risk of diet-related chronic disease. People on low incomes tend to eat more of cheap, energy-dense foods of low nutritional value than do people on higher incomes (Andrieu, Darmon & Drenowski 2006; Williams 2011). A review of Australian studies indicates that the diets of food insecure women include fewer fruit and vegetables and are deficient in nutrients compared with those who are food secure (Burns 2004). A higher prevalence of both underweight and obesity has been observed amongst people who are food insecure compared to food secure individuals (Burns 2004; Ball, Miscra & Crawford 2002). A review of Australian studies found food insecure women had a 20% to 40% higher risk of obesity, while extreme food insecurity with hunger was associated with thinness (Burns 2004). In addition, National Health Survey and National Nutrition Survey data indicate higher obesity rates in adults who are not in the workforce and whose main source of income is a government pension, compared with higher SES adults (Ball, Miscra & Crawford 2002).

Food and nutrition strategic framework: 2012 - 2018
50
Appendix J: Factors impacting on the sustainability of Australia’s food supply
Population growth The resident population of the ACT has been projected to increase from 352,189 persons in June 2009, to 400,000 by 2018 and 500,000 by 2043 (ACT CMD 2011). This increase may contribute to increasing demands on the ACT’s food supply. Impact of climate change on food production and food security A substantial body of literature indicates that climate change will have a negative and severe impact on world food production (Cohen et al 2008; Battisti and Naylor 2009; Costello et al 2009; Schmidhuber and Tubiello2007). Australian agriculture is particularly vulnerable due to our dry and variable climate (Garnaut 2008). Climate change is predicted to reduce the amount of food produced in Australia by over 15% (PMSEIC 2010), for example agricultural production in the Murray Darling Basin could fall by more than 90% by 2100 (Garnaut 2008). Climate change will also have potential adverse impacts on the quality of produce and reliability of production (Hennessey et al 2007) due to crop failure and destruction, livestock loss and new patterns of pests and diseases (Garnaut 2008). Climate change could also disrupt ocean currents, which would have serious ramifications for fish stocks (Garnaut 2008). Food supply systems may be affected, eg by failing electricity supplies, food spoilage, and increase in food-borne diseases, with negative implications for food availability, quality, access, price and affordability. These impacts on food production have the potential to affect the population’s capacity to consume an adequate and varied intake of nutritious food. High prices caused by food shortages particularly affect the diet and nutrition of low-income groups and contribute to food insecurity, dietary inadequacy and chronic disease risk. Australia is already experiencing impacts from climate change (Hennessy et al. 2007) and there are expected to be further impacts regardless of future efforts to reduce greenhouse gas emissions. Impacts of food production on the environment Food production is a significant contributor to greenhouse gas emissions, accounting for at least 23% of all Australian emissions (including agriculture, energy, transport and waste) (Morgan 2009). The impact is greater for production of animal foods. Methane emissions from ruminant animals accounted for two thirds of these emissions or 11% of Australia’s total annual greenhouse gas emissions (Garnaut 2008), while emissions from the vegetable industry account for about 0.7% of Australia’s total emissions (O'Halloran, Fisher & Rab 2008). In one study (Kramer et al. 1999), total emissions from meat, meat products and fish were greater than for any other food category, suggesting that households could reduce their GHG emissions by substituting meat with lower emission foods such as eggs, nuts and pulses. Food production also has broader environmental impacts, including pollution of water from animal waste, pesticides and chemical fertilizers; agricultural land use for animal production; clearing of forests; damage to air quality from inorganic chemical compounds; consumption of fossil fuels; and water consumption. A study by Baroni et al (2007) found that greater

Food and nutrition strategic framework: 2012 - 2018
51
consumption of animal products resulted in a greater impact on the environment, with beef having the greatest impact. Increasing local food production can help to reduce the environmental impact of food production and costs associated with transporting food over long distances, refrigeration and storage. Increasing local food production may also encourage greater social connectedness and increased consumption of fresh produce such as vegetables and fruit. Local food production can be increased, for example through encouraging home, community and school gardens; peri-urban agriculture; and rooftop and vertical gardens; and should be a priority for all future urban planning, design and construction. Impact of food consumption patterns on the environment Consuming foods with a lower environmental impact are also likely to be better for health. The draft revised Australian Dietary Guidelines (NHMRC 2011a) suggest practical steps for consumers to eat more sustainably:
buy and consume foods and drinks that are consistent with Australian Dietary Guidelines
avoid overconsumption
minimise food wastage
consider your food buying, storage, preparation and disposal practices, and
minimise and recycle the packaging of food Food wastage There are also serious environmental impacts associated with food wastage in the food supply chain (production, transportation, processing and refrigeration through to consumption and waste disposal). At the retail and consumer end of the supply chain, food waste is a major problem. Recent research by the Australia Institute shows that Australians throw away about $5.2 billion worth of food every year (Baker, Fear & Denniss 2009). This includes $1.1 billion of fruit and vegetables, $1 billion of restaurant and take-away food and $972.5 million of meat and fish. The Institute estimates that annually, the average Australian household throws away $616 worth of food, or around $239 per person. In addition, an estimated 20 to 40% of fruit and vegetables are rejected before they reach the shops, mostly because they do not match the supermarkets' cosmetic standards (OzHarvest 2011). The environmental impact of food waste is substantial, and is associated with excessive GHG emissions and water use (Baker, Fear & Denniss 2009). In the ACT, the composition of domestic garbage bins includes 52% (23,450 tonnes) of food and kitchen waste (ACT TAMS 2001), and this waste ends up in landfill. The decomposition of organic matter in landfill creates greenhouse gas emissions - mostly methane - which is 25 times more potent than the carbon pollution from car exhaust (FoodWise 2011). Wasting food also wastes the water that went into its production. According to CSIRO data, throwing out a kilogram of beef wastes the 50,000 litres of water it took to produce that meat, a kilogram of white rice wastes 1,550 litres and wasting a kilogram of potatoes wastes 500 litres of water (FoodWise 2011).

Food and nutrition strategic framework: 2012 - 2018
52
Appendix K: Examples of factors that influence food and dietary choices
Food and nutrition knowledge A number of studies have shown that nutrition knowledge influences dietary behaviour (Hendrie, Coveny & Cox 2008). A study of nutrition knowledge levels in an Australian community in Adelaide found that while basic messages about eating more fruit, vegetables and fibre, and less fatty and salty foods were well understood, there was confusion about more detailed nutrition information (Hendrie, Coveny & Cox 2008). For example, 90% of the people surveyed were aware of the recommendations to eat more fruit and vegetables, but only 56% and 62% knew the recommended number of servings of fruit and vegetables, respectively. Seventy-five per cent of people were unaware that fat is the most energy-dense macronutrient and about two-thirds did not know that dairy products are a source of saturated fat. Over half the sample (54 %) believed that brown sugar was a healthier alternative to white sugar. The study also found significant socioeconomic variation in nutrition knowledge levels, indicating a need for targeted nutrition education to meet the needs of different groups such as new mothers, culturally and linguistically diverse populations, or people who are disadvantaged, disabled or live with chronic disease.
Many consumers want information about the food that is for sale to help them make informed purchasing decisions. Food labelling can play an important role in promoting healthy eating through the provision of easy to interpret nutrition information. The complexity and density of information on many food labels and the increasing consumer demand for information about food available for purchase has made food labelling a focus of public debate. In general, food labels must list a product’s ingredients and additives, and have a nutrition information panel with details such as energy, fat and protein content. Foods that have a shelf life of less than two years must carry a 'use-by' or 'best before' date. Under certain circumstances, labels may also make nutrition and health-related claims. A number of interpretive labelling schemes and symbols are currently displayed by manufacturers on food packaging. The Government response to the final report of the independent Review of Food Labelling Law and Policy, Labelling Logic, includes a decision to develop an agreed easily understood, interpretive front-of-pack labeling system for packaged foods. In addition, menu labelling is being introduced by some quick serve restaurant chains in response to new ACT government regulation to provide information about energy (kilojoule) content. Menu labelling of other food components that may have a particular effect on health such as salt, fat, sugar, and fibre may be considered by governments in the future. Supportive environments Some environmental factors that may support healthy eating include:
availability of fresh, healthy foods - good local availability of fruit and vegetables, such as having a vegetable garden or access to a supermarket, can positively influence fruit and vegetable consumption (Kamphuis et al 2006)
provision of nutritional information at point of sale to support consumers to make healthy

Food and nutrition strategic framework: 2012 - 2018
53
food and beverage choices,13 including menu labelling and food labelling14
prominent placement of healthy foods in supermarkets
food marketing regulations and practices that restrict the advertising and marketing of less healthy foods
a safe food supply Food advertising to children Advertising of food to children is of significant concern amongst the community and amongst health professionals. A systematic review of the evidence of the extent, nature and effects of food promotion to children undertaken for the WHO (Cairns, Angus & Hastings 2009) found that food promotion has an equally important effect on children’s food behaviours as family, parents, peers and socioeconomic status. The research found modest but consistent evidence of a causal link between food promotion and children’s food behaviours (purchase or purchase requests, consumption patterns), determinants of food behaviour (preferences, attitudes, knowledge) and diet quality. The review also found a significant relationship between television viewing and obesity. The food products promoted in the studies examined in the review had a heavy emphasis on energy dense, high fat, high salt and high sugar foods, with almost no promotion of foods that public health evidence encourages greater consumption of such as fruit and vegetables. In Australia, an analysis of children’s television viewing habits in 2001, 2005 and 2006 undertaken by the rating company OzTAM (ACMA 2007) found that in 2006 children aged zero to 14 years spent an average of 142 minutes per day watching free-to-air television and the majority of this time was spent watching commercial channels. Children from the same age group in homes with subscription television spent 177 minutes watching television. Studies of the extent and nature of food advertising to children (Kelly et al 2007; Kelly et al 2011) have found that Australian children are exposed to a disproportionate volume of television advertisements for unhealthy food and beverages during times when the highest numbers of children are watching television, and that advertisers use child-focussed persuasive marketing techniques. In 2009, the food industry in Australia spent $402 million and $149 million respectively on advertising of food and non-alcoholic beverages (CEASA cited in Jolly 2011, p. 22). Jolly speculates that a significant proportion of this expenditure is targeted at advertising to children, based on evidence from other studies and information on market spending by food companies. For example, McDonald’s spent $55 - 60 million on advertising in 2008 (Nielson 2009). At the end of 2008, the Australian Food and Grocery Council (AFGC) and the Quick-Service Restaurant Industry (QSRI) announced two initiatives on responsible advertising to children. The AFGC’s Responsible Children’s Marketing Initiative commenced on 1 January 2009, and the QSRI’s Initiative for Responsible Advertising and Marketing to Children commenced on 1 August 2009. In December 2011, the Australian Communications and Media Authority released a monitoring
13
The 2011 Review of Food Labelling Law and Policy found “general agreement in submissions from consumers and consumer groups that food outlets should provide more nutrition and ingredient information at the point of sale to assist consumers with their selections” (Blewett et al 2011, page 70). 14
A 2007 FSANZ survey of consumer attitudes to food issues found that 84% of Australian consumers cited food labels as their main source of information about the nutritional content of foods (FSANZ 2008).
Food and nutrition strategic framework: 2012 - 2018
54
report into these industry self-regulation initiatives (ACMA 2011) which found that: “the community concerns flagged with the ACMA in 2007–09 remain industry initiatives have not yet addressed all these community concerns any real-life change in the level of children‘s exposure to food and beverage advertising on
free-to-air television is unclear” (ACMA 2011, p. 6). Since the introduction of the RCMI and the QSRI, concern has also been expressed by public health groups, community groups and governments that these voluntary initiatives do not adequately limit children’s exposure to marketing of energy-dense nutrient-poor foods and beverages. Direct marketing to children takes place through a diverse range of media including: television, internet, computer and video games, films and DVDs, children’s magazines, outdoor venues, print media, mobile phones. Other strategies include: product placement in television programs and films; peer-to-peer or viral marketing; supermarket sales promotions; use of licensed characters and spokes-characters; celebrity endorsements; sponsorship of school and sporting activities; and branding on toys and clothing (Jolly 2011). The recently established Australian National Preventive Health Agency (ANPHA) has identified the marketing of food with low nutritional value to children as a priority action area. ANPHA’s Strategic Plan 2011–2015 states that ANPHA will
“Monitor and engage with industry and other partners on food products and marketing, including products for children and marketing to which they are exposed with attention to energy-dense, nutrient-poor foods and beverages” (ANPHA 2011, p. 18)
On 9 May 2012, the Minister for Health & Ageing in South Australia (SA), the Hon. John Hill hosted a national seminar on food advertising and marketing to children, attended by around 60 representatives from government, industry, academia and non-government public health bodies. The seminar followed a decision by the Australian Health Ministers' Conference to “ask the Australian Health Ministers Advisory Council to organise, in conjunction with the Australian National Preventive Health Agency (ANPHA) and South Australia, a national seminar in 2012 of key stakeholders to discuss action on unhealthy food advertising”. Discussions by an invited group following the seminar have led to the formation of a working group to develop advice for Health Ministers on options for reducing children’s exposure to the advertising and marketing of non-core foods.

Food and nutrition strategic framework: 2012 - 2018
55
References
ABS 1998, National Nutrition Survey: Nutrient intakes and physical measurements, Australia 1995, Australian Bureau of Statistics: Canberra. ABS 2006, National Health Survey: Summary of Results, Australia. ABS Cat.no.4360.0. Canberra: Australian Bureau of Statistics. ABS 2009a, 2007-08 National Health Survey: Summary of results, retrieved 13 April 2010, <http://abs.gov.au/AUSSTATS/[email protected]/mf/4364.0 >. ABS 2009b, National Health Survey 2007-08. Summary of results, State Tables, ACT. ABS Cat. no. 4362.0. Canberra: Australian Bureau of Statistics, retrieved 15 February 2012, < http://www.abs.gov.au/AUSSTATS/[email protected]/DetailsPage/4362.02004-05?OpenDocument> and <http://www.abs.gov.au/AUSSTATS/[email protected]/DetailsPage/4362.02007-2008%20(Reissue)?OpenDocument>. ABS 2010, Household Expenditure Survey, Australia: Summary of Results, 2009-10 http://www.abs.gov.au/ausstats/[email protected]/Latestproducts/6530.0Main%20Features22009-10?opendocument&tabname=Summary&prodno=6530.0&issue=2009-10&num=&view=, retrieved 15 November 2011. Access Economics 2008, The growing cost of obesity in 2008: three years on, Diabetes Australia, retrieved 7 May 2012, <http://www.diabetesaustralia.com.au/PageFiles/7830/FULLREPORTGrowingCostOfObesity2008.pdf>. ACDPA - Australian Chronic Disease Prevention Alliance. ACDPA 2004, Chronic Illness: Australia’s Health challenge - The Economic Case for Physical Activity and Nutrition in the Prevention of Chronic Disease. Canberra, Australian Chronic Disease Prevention Alliance, retrieved 13 April 2010, <http://www.goforyourlife.vic.gov.au/hav/admin.nsf/Images/economic_costs_inactivity.pdf/$File/economic_costs_inactivity.pdf>. ACMA – Australian Communications and Media Authority. ACMA 2007, Children’s viewing patterns on commercial, free-to-air and subscription television, 2007, retrieved 20 January 2012, <http://www.acma.gov.au/webwr/_assets/main/lib310132/children_viewing_patterns_commercial_free-to-air_subscription_television.pdf>. ACMA 2011, Industry self-regulation of food and beverage advertising to children: ACMA monitoring report December 2011, Australian Communications and Media Authority, retrieved 20 January 2012, <http://www.acma.gov.au/WEB/STANDARD/pc=PC_90095#food>

Food and nutrition strategic framework: 2012 - 2018
56
ACT Cancer Registry 2011, Cancer in the ACT Incidence and Mortality, Health Series Number 56, ACT Government, Canberra ACT, retrieved 13 April 2012, <
http://www.health.act.gov.au/c/health?a=sendfile&ft=p&fid=1320182791&sid=>. ACT CMD 2011, ACT Population Projections 2009 to 2059, ACT Chief Minister’s Department, retrieved 14 February 2012, < http://www.cmd.act.gov.au/__data/assets/pdf_file/0010/192457/2009-2059_ACT_Population_Projections.pdf>. ACT DHCC 1999, Health Status of Older People in the ACT, Health Series Number 23, ACT Government, Canberra, retrieved 3 June 2011, < http://www.health.act.gov.au/c/health?a=sendfile&ft=p&fid=1075690854&sid=>. ACT Government Health Directorate 2011a, Report on the 2009 ACT Year 6 Physical Activity and Nutrition Survey (ACTPANS): Health Series Number 52, Epidemiology Branch, Population Health Division, ACT Government, Canberra, retrieved 27 January 2012 <http://health.act.gov.au/health-services/public-health/epidemiology-branch/epidemiology-publications-health-series/act-year-6-physical-activity-and-nutrition-survey-2009>. ACT Government Health Directorate 2011b, Division of Women, Youth and Children Community Health Programs Report July 2010-June 2011, unpublished data, ACT Government, Canberra. ACT Government Health Directorate 2012a, ACT General Health Survey 2007-09 & 2009-10, unpublished data, ACT Government, Canberra. ACT Government Health Directorate 2012b, Australian Capital Territory Chief Health Officer’s Report 2012, ACT Government, Canberra. ACT Health 2004, Eat Well ACT: A public health nutrition plan 2004-1010, ACT Health, Canberra. ACT Health 2010a, Australian Capital Territory Chief Health Officer’s Report 2010, ACT Government, Canberra, retrieved 6 February 2011, <http://www.health.act.gov.au/c/health?a=sendfile&ft=p&fid=1285049820&sid=>. ACT Health 2010b, ACT Breastfeeding Strategic Framework 2010 – 2015, retrieved 6 February 2011, <http://health.act.gov.au/c/health?a=dlpubpoldoc&document=2169>. ACT TAMS 2001, Household Organic Material Collection Trial Chifley August 2000 - June 2001, retrieved 6 February 2011, <http://www.tams.act.gov.au/__data/assets/pdf_file/0018/12456/biobintrialfinalreport.pdf>. AIHW - Australian Institute of Health and Welfare. AIHW 2009a, A picture of Australia’s children 2009, Cat. no. PHE 112, Canberra, retrieved 6 February 2011, <http://www.aihw.gov.au/publications/index.cfm/title/10704>.
Food and nutrition strategic framework: 2012 - 2018
57
AIHW 2009b, Health expenditure Australia 2007-08. AIHW Cat. no. HWE 46. AIHW: Canberra. Allison 2000, ‘Malnutrition, disease and outcome’, Nutrition, Vol. 16, No. 7-8, pp 590–3. Andrieu E, Darmon M, Drenowski A 2006, ‘Low-cost diets: more energy, fewer nutrients’, European Journal of Clinical Nutrition, Vol 60, pp 434–436. ANPHA – Australian National Preventive Health Agency. ANPHA 2011, Australian National Preventive Health Agency Strategic Plan 2011–2015, retrieved 20 January 2012 <http://www.anpha.gov.au/internet/anpha/publishing.nsf/Content/strategic-plan>. ANZ Bone and Mineral Society, Endocrine Society of Australia and Osteoporosis Australia 2005, ‘Vitamin D and adult bone health in Australia and New Zealand: a position statement’, Medical Journal of Australia, Vol. 182, No. 6. ANZSGM – Australian and New Zealand Society for Geriatric Medicine. ANZSGM 2007, Position statement No. 6: Under-nutrition and the older person, Australian and New Zealand Society for Geriatric Medicine, retrieved 2 May 2012, <
http://www.anzsgm.org/documents/PositionStatementNo6Under-NutritionintheElderly.pdf>. Baker AH and Wardle J 2003, ‘Sex differences in fruit and vegetable intake in older adults’, Appetite, vol. 40, pp. 269-275. Baker D, Fear J, Denniss R 2009, What a waste – an analysis of household expenditure on food, Policy Brief No. 6, November 2009, The Australian Institute 2009, retrieved 6 February 2011, <https://www.tai.org.au/index.php?q=node%2F19&act=display&pubid=696>. Ball K, Mishra G and Crawford D 2002, ‘Which aspects of socioeconomic status are related to obesity among men and women?, International Journal of Obesity, vol. 26, pp 559-565. Ball K, Mishra G, Thane C and Hodge A 2003, ‘How well do Australian women comply with dietary guidelines?’, Public Health Nutrition, Vol. 7, No. 3, pp 443–452. Banks M, Ash S, Bauer J and Gaskill D 2007, ‘Prevalence of malnutrition in adults in Queensland public hospitals and residential aged are facilities’, Nutrition & Dietetics, vol. 64, pp 172-178. Baroni L, Cenci L,Tettamani M & Berati M 2007, ‘Evaluating the environmental impact of various dietary patterns combined with different food production systems’, European Journal of Clinical Nutrition, vol 61, pp279-286. Battisti DS and Naylor RL 2009, ‘Historical warnings of future food insecurity with unprecedented seasonal heat’, Science 2009, vol 323, pp 240–44.

Food and nutrition strategic framework: 2012 - 2018
58
Beard TC, Woodward DR, Ball PJ, Hornsby H, von Witt RJ and Dwyer T, 1997, ‘The Hobart Salt Study 1995: few meet national sodium intake target’, Medical Journal of Australia, vol 166, pp 404-407. Begg S, Vos T, Barker B, Stevenson C, Stanley L and Lopez A 2007, The burden of disease and injury in Australia 2003. PHE 82. Canberra: AIHW. Bibbins-Domingo K, Chertow GM, Coxson PG, Moran A, Lightwood JM, Pletcher MJ and Goldman L 2010, ‘Projected effect of dietary salt reductions on future cardiovascular disease’, New England Journal of Medicine, vol 362, pp 590-599. Blewett N, Goddard N, Pettigrew S, Reynolds C and Yeatman H 2011, Labelling Logic: Review of Food Labelling Law and Policy, Commonwealth of Australia, Canberra, retrieved 29 March 2012, <http://www.foodlabellingreview.gov.au/internet/foodlabelling/publishing.nsf/content/48C0548D80E715BCCA257825001E5DC0/$File/Labelling%20Logic_2011.pdf>. Burns C 2004, A review of the literature describing the link between poverty, food insecurity and obesity with specific reference to Australia, retrieved 13 April 2010, < http://www.vichealth.vic.gov.au/~/media/ResourceCentre/PublicationsandResources/healthy%20eating/Literature%20Review%20Poverty_Obesity_Food%20Insecurity.ashx>. Burns C and Friel S 2007, ‘It’s time to determine the cost of a healthy diet in Australia’, Australian and New Zealand Journal of Public Health, vol. 31, no. 4, pp 363-365. Cairns G, Angus K and Hastings G 2009, The extent, nature and effects of food promotion to children: a review of the evidence to December 2008, World Health Organization, Geneva, retrieved 18 January 2012, < http://www.who.int/dietphysicalactivity/Evidence_Update_2009.pdf>. Cameron ID, Murray GR, Gillespie LD, Robertson MC, Hill KD, Cumming RG and Kerse N 2010, Interventions for preventing falls in older people in nursing care facilities and hospitals. Cochrane Database of Systematic Reviews, Issue 1. Art.No.: CD005465. DOI: 10.1002/14651858.CD005465.pub2. Cashel K ‘Changing patterns of eating’, retrieved 14 October 2007, <http://www.natsoc.org.au/html/papers/cashel.pdf>. Chapuy MC, Arlot MD, Duboeuf F, Brun J, Crouzet B, Arnaud S, Delmas PD and Meunier PJ 1992, ‘Vitamin D3 and calcium to prevent hip fractures in elderly women’, New England Journal of Medicine, vol. 327, pp. 1637-42. Chen CC, Schilling LS, Lyder CH 2001, ‘A concept analysis of malnutrition in the elderly’, Journal of Advanced Nursing, Vol. 36, No. 1, pp 131-142. Cobiac L and Syrette J 1995, ‘What is the nutritional status of older Australians?’, Proceedings of the Nutrition Society Australia, Vol. 19, pp 139–45.

Food and nutrition strategic framework: 2012 - 2018
59
Cohen MJ, Tirado C, Aberman N-L and Thompson B 2008, ‘Impact of climate change and bioenergy on nutrition’, International Food Policy Research Institute, retrieved 6 February 2011, < http://www.ifpri.org/publication/impact-climate-change-and-bioenergy-nutrition>. Commonwealth of Australia 2010, Australia to 2050: future challenges, Canberra, retrieved 3 May 2012, <http://archive.treasury.gov.au/igr/igr2010/report/pdf/IGR_2010.pdf>. Cook T, Rutishauser I and Seelig M 2001, Comparable data on food and nutrient intake and physical measurements from the 1983, 1985 and 1995 national nutrition surveys, 2001, Commonwealth of Australia: Canberra. Costello A, Abbas M, Allen A, Ball S, Bell S, Bellamy R et al. 2009, ‘Managing the health effects of climate change’, Lancet, vol 373, pp 1693–733. Crowley S, Antioch K, Carter R, Waters AM, Conway L, Mathers C 1992, The cost of diet-related disease in Australia, Australian Institute of Health and Welfare, Catalogue Number AIHW 297, Canberra. CSIRO and University of South Australia 2008, 2007 Australian National Children’s Nutrition and Physical Activity Survey- Main Findings, Australian Government Department of Health and Ageing, Australian Food and Grocery Council, Australian Government Department of Agriculture, Fisheries and Forestry, retrieved 6 February 2011, <http://www.health.gov.au/internet/main/publishing.nsf/Content/66596E8FC68FD1A3CA2574D50027DB86/$File/childrens-nut-phys-survey.pdf>. DAA 2009, ‘Evidence Based Practice Guidelines for the Nutritional Management of Malnutrition in Adult Patients across the Continuum of Care’, Nutrition & Dietetics, Vol 66, Suppl. 3, pp S1- S34. Daly RM, Gagnon C, Lu ZX, Magliano DJ, Dunstan DW, Sikaris KA, Zimmet PZ, Ebeling PR and Shaw, JE 2011, ‘Prevalence of vitamin D deficiency and its determinants in Australian adults aged 25 years and older: A national, population-based study’, Clinical Endocrinology, ‘Accepted article’, DOI: 10.1111/j.1365-2265.2011.04320.x. DHS 2007, Developing a new framework for promoting health and wellbeing in Victoria: A discussion paper, Victorian Department of Human Services, Melbourne, retrieved 13 April 2010, <http://www.health.vic.gov.au/healthpromotion/downloads/framework_paper_aug07.pdf>. Donkin JM, Johnson AE and Lilley JM 1998, ‘Gender and living alone as determinants of fruit and vegetable consumption among the elderly living at home in urban Nottingham’, Appetite, 1998, vol.30, pp 39–51. FAO 2002, The State of Food Insecurity in the World 2001. Rome: Food and Agriculture Organization. Retrieved 12 December 2011 http://www.fao.org/docrep/003/y1500e/y1500e06.htm#P0_2.

Food and nutrition strategic framework: 2012 - 2018
60
Flicker L, MacInnis R, Stein M, Scherer S, Mead K, Nowson C, Thomas J, Lowndes C, Hopper J and Wark J 2005, ‘Should Older People in Residential Care Receive Vitamin D to Prevent Falls? Results of a Randomized Trial’, Journal of the American Geriatrics Society, Vol. 53, pp1881–1888. FoodWise 2011, Fast facts, FoodWise web page, <http://foodwise.com.au/did-you-know/fast-facts.aspx>, retrieved 6 February 2011. Food Science Australia & Minter Elliston Consulting 2002, National Risk Validation Project: Final Report. FSANZ 2008, Consumer Attitudes Survey 2007: A benchmark survey of consumers’ attitudes to food issues, Food Standards Australia New Zealand, retrieved 29 March 2012, <http://www.foodstandards.gov.au/_srcfiles/Consumer%20Attitudes%20Survey.pdf>. Garnaut R, 2008. The Garnaut Climate Change Review Final Report. Cambridge University Press, Port Melbourne, retrieved 6 February 2011, <http://www.garnautreview.org.au/CA25734E0016A131/WebObj/GarnautClimateChangeReview-FinalReport-30September2008(Fullversion)/%24File/Garnaut%20Climate%20Change%20Review%20-%20Final%20Report%20-%2030%20September%202008%20(Full%20version).pdf>. Gaskill D, Black L, Isenring E, Hassall S, Sanders F and Bauer J 2008, ‘Malnutrition prevalence and nutrition issues in residential aged care facilities’, Australasian Journal on Ageing, Vol. 27, No. 4, pp 189–194. Grieger JA and Nowson CA 2007, ‘Nutrient intake and plate waste from an Australian residential care facility’, European Journal of Clinical Nutrition, Vol. 61, pp 655-663. Hall G, Kirk MD, Becker N, Gregory JE, Unicomb L, Millard G, Stafford R, Lalor K and OzFoodNet Working Group 2005, Estimating foodborne gastroenteritis, Australia, Emerging Infectious Diseases, Vol.11, No. 8, pp 1257-64. Hamrosi MA, Wallace EM and Riley MD 2005, ‘Iodine status in pregnant women living in Melbourne differs by ethnic group’, Asia Pacific Journal of Clinical Nutrition, Vol. 14, pp 27-31. Hendrie GA, Coveny J and Cox D 2008, ‘Exploring nutrition knowledge and the demographic variation in knowledge levels in an Australian community sample’, Public Health Nutrition, Vol. 11, No. 12, pp 1365-1371. Hennessy K, Fitzharris B, Bates BC, Harvey N, Howden SM, Hughes L, Salinger J and Warrick R 2007, ‘Australia and New Zealand’, in: Parry ML, Canziani OF, Palutikof JP, van der Linden PJ, Hanson CE (eds), Climate Change 2007: Impacts, Adaptation and Vulnerability. Contribution of Working Group II to the Fourth Assessment Report of the Intergovernmental Panel on Climate Change. Cambridge University Press, UK, pp 507-540, retrieved 6 February 2011, <http://www.ipcc.ch/ipccreports/ar4-wg2.htm>.

Food and nutrition strategic framework: 2012 - 2018
61
Henry HL, Bouillon R, Norman AW, Gallagher JC, Lips P, Heaney RP, Vieth R, Pettifor JM, Dawson-Hughes B, Lamberg-Allardt CJ, Ebeling PR 2010, ‘14th Vitamin D Workshop consensus on vitamin D nutritional guidelines’ Journal of Steroid Biochemistry and Molecular Biology; Vol. 121, Issues 1-2: pp.4-6. Herne S 1995, ‘Research on food choice and nutritional status in elderly people: a review’, British Food Journal, Vol. 97, No. 9, pp. 12-29. Hickson M 2006, ‘Malnutrition and Ageing’, Postgraduate Medical Journal, Vol. 82, pp. 2-8. Holmes VA, Barnes MS, Alexander HD, McFaul P and Wallace JMW 2009, ‘Vitamin D deficiency and insufficiency in pregnant women: a longitudinal study’, British Journal of Nutrition, Vol. 102, Issue 6, pp 876–881. Horta BL, Bahl R, Martines JC & Victora CG 2007, Evidence on the long-term effects of breastfeeding: systematic review and meta-analyses Geneva : World Health Organization, retrieved 6 February 2011, <http://whqlibdoc.who.int/publications/2007/9789241595230_eng.pdf>. Huggins CE, O’Reilly S, Brinkman M, Hodge A, Giles GG, English DR and Nowson CA 2011, ‘Relationship of urinary sodium and sodium-to-potassium ratio to blood pressure in older adults in Australia’, Medical Journal of Australia, Vol. 195, pp 128–132. Hughes G, Bennett K and Hetherington MM. 2004, ‘Old and alone: barriers to healthy eating in older men living on their own’, Appetite, vol. 43, pp. 269-276. Hunter W, Raats M and Lumbers M 2007, ‘Older adults’, in Public Health Nutrition: From Principles to Practice, eds M Lawrence & T Worsley, Allen & Unwin, Crows Nest, NSW, Australia, pp 247-264. Jardine A, Endo T, Bright M, Macleod S and Harper C 2010, ‘Risk factor impact on the burden of disease and injury in Queensland, 2007’, Queensland Burden of Disease and Injury circular, series 2 no. 6, Brisbane: Queensland Health, retrieved 23 March 2012, <http://www.health.qld.gov.au/ph/documents/pdu/c6_series2.pdf>. Jolly R, 2011, Marketing obesity? Junk food, advertising and kids, Parliamentary Library Research Paper No. 9, 2010–11, Parliament of Australia Department of Parliamentary Services, retrieved 20 January 2012, < http://www.aph.gov.au/library/pubs/rp/2010-11/11rp09.pdf>. Kamphuis CBM, Giskes K, de Bruijn G, Wendel-Vos W, Brug J and van Lenthe F.J. 2006, ‘Environmental determinants of fruit and vegetable consumption among adults: a systematic review’, British Journal of Nutrition, Vol. 96, No 4, pp 620–635. Kamphuis CBM, van Lenthe FJ, Giskes K, Brug J and Mackenbach JP 2007, ‘Perceived environmental determinants of physical activity and fruit and vegetable consumption among high and low socioeconomic groups in the Netherlands’, Health & Place, vol. 13, pp 493–503.

Food and nutrition strategic framework: 2012 - 2018
62
Kelly B, Smith B, King L, Flood V, & Bauman A 2007. ‘Television food advertising to children: the extent and nature of exposure, Public Health Nutrition, Vol.10, No 11, pp 1234-1240. Kelly B, Chapman K, King L and Hebden H 2011, ‘Trends in food advertising to children on free-to-air television in Australia’, Australian and New Zealand journal of Public Health, Vol. 35, No 2, pp 131-134. KPMG 2012, ‘Scores on Doors’: Regulatory Impact Statement on options for improving transparency of food regulation in the ACT, ACT Government, Canberra, retrieved 26 June 2012, <http://www.cmd.act.gov.au/__data/assets/pdf_file/0003/315912/Report-SoD-Regulatory-Impact-Statement.pdf>. Kramer KJ, Moll HC, Nonhebel S and Wilting HC 1999, ‘Greenhouse gas emissions related to Dutch food consumption’, Energy Policy, vol. 27, pp. 203-216. Lazarus C and Hamlyn J 2005, ‘Prevalence and documentation of malnutrition in hospitals: A case study in a large private hospital setting’, Nutrition and Dietetics Vol. 62, No.1, pp 41-47. Leggo M, Banks M, Isenring E, Stewart L, and Tweeddale M 2008, ‘A quality improvement nutrition screening and intervention program available to Home and Community Care eligible clients’, Nutrition & Dietetics, Vol. 65, pp 162-167. Li M, Eastman CJ, Waite KV, Ma G, Zacharin MR, Topliss DJ, Harding PE, Walsh JP, Ward LC, Mortimer RH, Mackenzie EJ, Byth K and Doyle Z 2006, ‘Are Australian children iodine deficient? Results of the Australian National Iodine Nutrition Study’, Medical Journal of Australia, Vol. 184, pp 165-169. MacIntosh C, Morley J and Chapman I 2000, ‘The anorexia of aging’, Nutrition, Vol. 16, pp 983–995. Marks G, Coyne T and Pang G 2001, Type 2 diabetes costs in Australia - the potential impact of changes in diet, physical activity and levels of obesity. Canberra: Department of Health and Aged Care. Marmot M, Allen J, Goldblatt P, Boyce T, McNeish D, Grady M, Geddes I 2010, The Marmot Review: Fair Society, Healthy Lives: A Strategic Review of Health Inequalities in England Post-2010, The Marmot Review, retrieved 11 May 2012, < http://www.instituteofhealthequity.org/projects/fair-society-healthy-lives-the-marmot-review>. Miller M 2002, Eat more fruit and vegetable. The case for a five-year campaign to increase more fruit and vegetable consumption in Australia. Morgan E 2009, Fruit and vegetable consumption and waste in Australia. VicHealth, retrieved 6 February 2011, <http://www.vichealth.vic.gov.au/~/media/ResourceCentre/PublicationsandResources/healthy%20eating/FruitVegConsumptionWaste.ashx>.

Food and nutrition strategic framework: 2012 - 2018
63
Moschis GP 2003, ‘Marketing to older adults: an updated overview of present knowledge and practice’, Journal of Consumer Marketing, vol. 20, no. 6, pp. 516-525. Munns C, Zacharin MR, Rodda CP, Batch JA, Morley R, Cranswick NE, Craig ME, Cutfield WS, Hofman PL, Taylor BJ, Grover SR, Pasco JA, Burgner D and Cowell CT 2006, ‘Prevention and treatment of infant and childhood vitamin D deficiency in Australia and New Zealand: a consensus statement’, Medical Journal of Australia, Vol. 185, No. 5, pp 268-272. NATSEM 2007, Characteristics of Low Income ACT Households, NATSEM, University of Canberra, retrieved 13 April 2010, <http://www.actcoss.org.au/publications/Publications_2007/2407REP.pdf>. Newbury J, Chapman I and Visvanathan R 2004, ‘Malnutrition in older people: Screening and management strategies’, Australian Family Physician, Vol. 33, No. 10, pp 799 – 805. NHMRC – National Health and Medical Research Council. NHMRC 1999, Dietary Guidelines for Older Australians (rescinded 31 December 2005), Commonwealth of Australia, Canberra. NHMRC 2003a, Food for Health: Dietary Guidelines for Children and Adolescents in Australia, National Health and Medical Research Council, Canberra. NHMRC 2003b, Food for Health: Dietary Guidelines for Australian Adults, National Health and Medical Research Council, Canberra. NHMRC 2006, Nutrient Reference values for Australia and New Zealand Including Recommended Dietary Intakes, Commonwealth of Australia, Canberra. NHMRC 2011a, Australian Dietary Guidelines, Incorporating the Australian Guide to Healthy Eating: Providing the scientific evidence for healthier Australian diets, Draft for public consultation, December 2011, National Health and Medical Research Council, retrieved 15 February 2012, <https://www.eatforhealth.gov.au/sites/default/files/files/public_consultation/n55_draft_australian_dietary_guidelines_consultation_111212.pdf>. NHMRC 2011b, A review of the evidence to address targeted questions to inform the revision of the Australian Dietary Guidelines (Evidence Report) November 2011, National Health and Medical Research Council, retrieved 02 March 2012, <https://www.eatforhealth.gov.au/sites/default/files/files/public_consultation/n55b_dietary_guidelines_evidence_report_111212.pdf>. NHMRC 2011c, Infant Feeding Guidelines for Health Workers, Draft for public consultation, October 2011, National Health and Medical research Council, retrieved 23 August 2012, http://consultations.nhmrc.gov.au/files/consultations/draft_ifghw_public_consult.pdf

Food and nutrition strategic framework: 2012 - 2018
64
Nielson 2009, Australia’s top advertisers, retrieved 20 January 2012 <http://au.nielsen.com/site/documents/TopAdvertisers2008ADNEWSMarch2709.pdf>. NOTF 2003, Healthy Weight 2008 Australia’s future: The national action agenda for children and young people and their families, National Obesity Taskforce, Commonwealth of Australia, Canberra. NOTF 2006, Healthy Weight for Adults and Older Australians: A national action agenda to address overweight and obesity in adults and older Australians 2006-2010, National Obesity Taskforce, Commonwealth of Australia, Canberra. Nowson C 2007, ‘Nutritional challenges for the elderly’, Nutrition & Dietetics, Vol. 64, Suppl. 4, pp S150–S155. Nowson CA, McGrath JJ, Ebeling PR, Haikerwal A, Daly RM, Sanders KM, Seibel MJ, Mason RS (Working Group of the Australian and New Zealand Bone and Mineral Society, Endocrine Society of Australia and Osteoporosis Australia 2012, ‘Vitamin D and health in adults in Australia and New Zealand: a position statement’, Medical Journal of Australia, Vol. 196, No. 11, pp 686-7. NPHP 2001, Eat Well Australia: An Agenda for Action for Public Health Nutrition, 2000-2010, National Public Health Partnership, Melbourne. NPHT 2009, Australia: The Healthiest Country by 2020. National Preventative Health Strategy – the roadmap for action, National Preventative Health Taskforce, retrieved 3 February 2012, <http://www.health.gov.au/internet/preventativehealth/publishing.nsf/Content/nphs-roadmap>. O'Halloran N, Fisher P and Rab A 2008, Preliminary estimation of the carbon footprint of the Australian vegetable industry. Sydney: Horticulture Australia Limited. OzHarvest 2011, Food Waste Figures, OzHarvest web page, <http://www.ozharvest.org.au/ourimpact.asp?pageID=611>, retrieved 6 February 2011. Peterlik M and Cross HS 2005, ‘Vitamin D and calcium deficits predispose for multiple chronic diseases’, European Journal of Clinical Investigation, Vol. 35, Issue 5, pp 287-350. PMSEIC 2010, Australia and Food Security in a Changing World, The Prime Minister’s Science, Engineering and Innovation Council, Canberra, Australia, retrieved 13 March 2012, <http://www.chiefscientist.gov.au/wp-content/uploads/FoodSecurity_web.pdf>. Productivity Commission 2009, Paid Parental Leave: Support for Parents with Newborn Children, Productivity Commission Inquiry Report, No. 47, retrieved 6 February 2011, <http://www.pc.gov.au/projects/inquiry/parentalsupport/report>.

Food and nutrition strategic framework: 2012 - 2018
65
Rayner M and Scarborough P 2005, ‘The burden of food related ill health in the UK’, Journal of Epidemiology and Community Health, Vol. 59, No. 12, pp 1054-7. Rangan AM, Randall D, Hector DJ, Gill TP and Webb KL 2008, ‘Consumption of ‘extra’ foods by Australian children: types, quantities and contribution to energy and nutrient intakes’, European Journal of Clinical Nutrition, Vol. 62, pp 356–364. Rist G, Miles G and Karimi L 2012, ‘The presence of malnutrition in community-living older adults receiving home nursing services’, Nutrition & Dietetics, Vol. 69, pp 46 -50. Sacks FM, Svetkey LP, Vollmer WM, Appel LJ, Bray GA, Harsha D, Obarzanek E, Conlin PR, Miller ER, Simons-Morton DG, Karanja N, Lin P-H (the DASH-Sodium Collaborative Research Group) 2001, Effects on blood pressure of reduced dietary sodium and the Dietary Approaches to Stop Hypertension (DASH) Diet, The New England Journal of Medicine Vol. 344, No. 1, pp 3-10. SCARC - Senate Community Affairs References Committee. SCARC 2004, A hand up not a hand out: Renewing the fight against poverty. Canberra: The Senate, Parliament of Australia, retrieved 6 February 2011, <http://www.aph.gov.au/senate/committee/clac_ctte/completed_inquiries/2002-04/poverty/report/report.pdf>. Schmidhuber J, Tubiello FN 2007, Global food security under climate change, Proceedings of the National Academy of Sciences of the United States of America, Vol. 104, No. 50, pp: 19703–19708. Stratton RJ, Green CJ, Elia M 2003, Disease-related malnutrition. An evidence-based approach to treatment, CABI Publishing UK. Travers CA, Guttikonda K, Norton CA, Lewis PR, Mollart LJ, Wiley V, Wilcken B, Eastman CJ and Boyages SC 2006, ‘Iodine status in pregnant women and their newborns: are our babies at risk of iodine deficiency?’ Medical Journal of Australia, Vol. 184, No. 12, pp 617-620. Victorian Government 2012a, Folate for Women: Better Health Channel Fact Sheet, retrieved 27 January 2012, < http://www.betterhealth.vic.gov.au/bhcv2/bhcarticles.nsf/pages/Folate_for_women?open>. Visvananthan R, Macintosh C, Callary M, Penhall R, Horowitz M and Chapman I 2003, ‘The nutritional status of 250 older Australian recipients of domiciliary care services and its association with outcomes at 12 months’, Journal of the American geriatrics Society, Vol. 51, pp 1007–11. Wahlqvist M 2002, ‘Asian migration to Australia: food and health consequences’, Asia Pacific Journal of Clinical Nutrition, Vol. 11(Suppl), pp S562–S568. Wahlqvist ML and Savige GS 2000, ‘Interventions aimed at dietary and lifestyle changes to promote healthy aging’, European Journal of Clinical Nutrition, vol. 54, Suppl. 3, ppS148-S156.

Food and nutrition strategic framework: 2012 - 2018
66
WCRF/AICR - World Cancer Research Fund / American Institute for Cancer Research. WCRF/AICR 2007, Food, Nutrition, Physical Activity, and the Prevention of Cancer: a Global Perspective, AICR ,Washington DC. WHO - World Health Organisation. WHO 1986, The Ottawa Charter for Health Promotion, WHO, Geneva. WHO 1997, Jakarta Declaration on Leading Health Promotion into the 21st Century, WHO, Geneva. WHO 2003. Diet, nutrition and the prevention of chronic diseases: report of a joint WHO/FAO expert consultation, WHO Technical Report Series 916, WHO, Geneva. WHO 2008, Worldwide prevalence of anaemia 1993–2005: WHO global database on anaemia, edited by de Benoist B, McLean E, Egli I and Cogswell M, retrieved 16 April 2012, <
http://whqlibdoc.who.int/publications/2008/9789241596657_eng.pdf>. WHO 2009, Infant and young child feeding: Model Chapter for textbooks for medical students and allied health professionals, World Health Organization, Geneva, retrieved 24 February 2011, <http://whqlibdoc.who.int/publications/2009/9789241597494_eng.pdf>. Wilkinson R and Marmot M (eds), 2003, Social determinants of health: The solid facts (2nd edn), World Health Organization, Europe, retrieved 13 April 2010, <http://www.euro.who.int/document/e81384.pdf>. Williams PG 2011, ‘Can the poor in Australia afford healthy food?’ Nutrition & Dietetics, vol. 68, issue 1, pp 6-7. Winkler E, Turrell G and Patterson C 2006, ‘Does living in a disadvantaged area mean fewer opportunities to purchase fresh fruit and vegetables in the area? Findings from the Brisbane food study’, Health & Place, vol. 12, pp 306–319.