food consumption patterns and household food security in calabarzon
TRANSCRIPT
J. ISSAAS Vol. 16, No.2: 53-66 (2010)
53
FOOD CONSUMPTION PATTERNS AND HOUSEHOLD FOOD SECURITY IN CALABARZON
Julieta A. Delos Reyes and Marc Savio G. Himatay
Department of Agricultural Economics, College of Economics and Management,
University of the Philippines Los Baños
(Received: January 3, 2010; Accepted: October 5, 2010)
ABSTRACT
A study was conducted to determine the household food security in CALABARZON using calorie intakes of the selected households. Secondary data from the 2003 Family Income and Expenditures Survey of the National Statistics Office and the 2003 Food Consumption Survey of the Food and Nutrition Research Institute covering 251 households in CALABARZON were subjected to descriptive (using simple frequencies, percentages, mean and totals and pie and bar charts) and multiple regression analyses as well as Chi-square tests.
The average annual per capita income in CALABARZON was estimated at PhP36,212 while the average food expenditure was PhP37.9 per person per day. The average food consumption was 923 grams per person per day and the major food groups consumed were: cereal and cereal products (45%), fish, meat and poultry products (23%) and fruits (13%). The mean one-day per capita intake was 1,894 kcals but the poor had an average of 1,572 and the non-poor households had 1,953 kcals per day. It was further revealed that 60% of the households in CALABARZON were food insecure. Of the poor households, 74% were food insecure while for the non-poor families only 57% were food insecure. Key words: calorie intake, nutritional status, poverty incidence
INTRODUCTION The Food and Agriculture Organization (FAO) defines food security as existing when “all
people, at all times, have access to sufficient, safe and nutritious food to meet their dietary needs and food preferences for an active and healthy life.” Similarly, the United States Department of Agriculture (USDA) holds that “food security for a household means access by all members at all times to enough food for an active, healthy life.” The World Bank has a more encompassing and simplified definition, “the availability of food and affordability of food to all the citizens in a country, with the essential elements being the availability of food and the affordability to acquire it.” Studies operationalizing this definition have already been conducted. Melgar-Quinonez et. al. (2006) examined the relationship between household food insecurity and food expenditure using sample households taken from rural areas with small central urban district from Bolivia, Burkina Faso and the Philippines. Households which are food insecure, even at moderate levels, might have a very poor dietary quality (low intake of micro-nutrient-rich foods) and that severely food-insecure households might have limited access even to staple foods. Further, in Bolivia, the high price of imported fruits resulted in lower dietary variety among the households. The group concluded that there is significant negative correlation between household food insecurity and food intake, with food intake being considered as a function of affordability. In like manner, Ibrahim et al (2009) assessed the state of food security among urban households in the Federal Capital Territory of Nigeria using 120 randomly chosen respondents. Food insecurity is not only prevalent in the rural areas but in urban areas as well.

Food consumption patterns and household food security.....
54
Policies that can lead to increased farm income should be prioritized by the Nigerian government since the high income level of the urban households was found to be the major contributor to their high food security status.
Considering the above, an individual’s concern for food security is anchored on his/her ability to acquire or access food, be it free or at a given cost. However, from the point of view of nutrition, accessibility/availability and affordability need not be the only concern but should also cover food quality. Food availability is a major function of the producers and the distribution channel, accessibility and affordability are a function of the buying power of the consumers. The level of poverty or income of the consuming public therefore, plays a major role in ensuring food security of a population (Briones et al 1999). Buying power also affects the quality of food bought by consumers with the premise that the poor households or individuals can only afford low quality or less nutritious foods. This is the very reason why when food security is the main concern, the calorie adequacy of households must also be considered. The access to available and nutritious foods, is manifested in the number of people who are able to meet the Recommended Energy and Nutrient Intake (RENI) for Filipinos (FNRI 2005).
Several studies show that income is the determining factor of the nutritional status of the
household. Food accessibility depends on the average per capita income such that regions with higher per capita incomes had higher food consumption (Bautista 2005; FNRI 2005). This paper therefore is an effort to determine the association between hunger (or food security) and poverty. The need to conduct the study in CALABARZON is imperative because the area has over one-third of the country’s special economic zones and accounts for approximately 12 percent of the Philippine population (BAS 2007) implying that it is a good source of manpower and skills for the country’s industrial sector. CALABARZON is composed of five provinces: CAvite, LAguna, BAtangas, Rizal and QueZON and is located southwest of Metro Manila.
Similar to other regions in the Philippines, hunger in CALABARZON is also prevalent.
Table 1 reveals that in 1997 up to 2006, the percentage of both families and the total population who are considered poor are getting higher. In 1997, 20.62% of the people in the area were poor and such proportion rose to 22.34% in 2006. More recent estimates at the national level emphasize the unabated growth in the number of people who are getting hungry in many areas in the country.
The region was studied as it is one of the spillover areas of Metro Manila when it comes to
population, especially the urban poor, mainly because the two areas are adjacent to each other. It is hoped that through the information on consumption pattern, income distribution and calorie intake of the selected households provided by this paper, more appropriate local policies which can improve the food security situation in the area can be implemented. Table 1. Family and population poverty incidence (%), CALABARZON, 1997-2003.
1997 2000 2003 2006 Province Family Population Family Population Family Population Family Population
Cavite 8.0 11.0 10.2 13.0 8.6 12.5 7.8 11.2
Laguna 12.3 14.9 8.1 10.8 8.4 10.6 10.6 13.2
Batangas 22.1 25.6 20.7 25.8 24.5 30.4 25.6 30.7
Rizal 8.3 10.2 5.6 8.1 3.4 4.9 6.4 8.9
Quezon 36.5 41.4 32.9 39.3 32.8 39.8 38.4 47.7
Average 17.44 20.62 15.5 19.4 15.54 19.64 17.76 22.34 Source of basic data: National Statistics Coordination Board
J. ISSAAS Vol. 16, No.2: 53-66 (2010)
55
Generally, the study aimed to assess the status of household food security in CALABARZON. Specifically, it sought to: (1) describe the selected households in CALABARZON; (2) determine the food consumption patterns of the selected households; (3) assess the calorie intakes of the selected households; and (4) determine the factors affecting food security in CALABARZON.
METHODOLOGY
The study used primary data generated by the 2003 Family Income and Expenditures Survey
(FIES) of the National Statistics Office (NSO) and the 2003 Food Consumption Survey (FCS) of the Food and Nutrition Research Institute (FNRI), Nutrition Assessment and Monitoring Division. At the time of the study, only the 2003 data were available for public access. FIES and FCS respondents were cross-matched and a total of 251 matched households from CALABARZON were considered for the study. The FCS-generated household data included among others: calorie intake, household size, gender, age, educational attainment of the household head and food expenditures. On the other hand, the FIES data include household income, non-food expenditures like electricity, fuel, and water. Other data such as the poverty and food thresholds were gathered from the National Statistical Coordination Board (NSCB), Poverty, Labor, Human Development and Gender Statistics Division. Of the 251 sample households, 110 were located in partially urban areas while 141 lived in urban areas. Barangays are considered urban if these have at least 1,000 inhabitants with at least six establishments providing either commercial, manufacturing, recreational and/or personal services and with at least three of the following: a town hall, church or chapel with religious service at least once a month; a public plaza, park or cemetery; a market place, or building, where trading activities are carried on at least once a week; and public building like a school, hospital, puericulture and health center or library. While the NSCB classified all poblaciones or central districts and all barrios that do not meet the requirements for urban classification in March 2008 as rural, it gave a classification of partially urban on those municipalities with both urban and rural barangays. From among the provinces in CALABARZON, the following were taken as samples: Rizal (64), Laguna (52), Cavite (47), Batangas (46), and Quezon (42). Households were further classified into poor and non-poor based on Republic Act 8425 (Social Reform and Poverty Alleviation Act). The poor refers to individuals and families whose income fall below the poverty threshold officially set by the government. Data were analyzed using simple frequencies, percentages, mean and totals and pie and bar charts. Food security was measured through estimate of calorie adequacy using the following formula: % Calorie Adequacy = Calorie intake of the household x 100
Recommended energy and nutrient intake Both calorie intake of the households and the RENI were measured in kilocalories. RENI, defined as levels of intakes of energy and nutrients that on the basis of current scientific knowledge, are considered adequate for the maintenance of health and well-being of nearly all healthy persons in the population, was obtained from the FNRI and is previously known as “Recommended Dietary Allowances (RDA). Thus, a household with a calorie intake of less than 100% is considered food insecure. Chi-square tests were performed to determine the dependence of food security on the given variables. Similarly, regression analysis was done to determine the factors affecting food security.

Food consumption patterns and household food security.....
56
Limitations of the Study Although the study has been quite comprehensive in terms of covering all the provinces in CALABARZON, it however was limited by the availability of more up-to-date data from the two national agencies of the country mandated to do such a detailed survey. The use of more recent data could have yielded more time-relevant research results and therefore more meaningful issues and recommendations.
While a lot of changes have already occurred between 2003 up to the present, both at the national and the international economic scenes, such changes have been in fact for the worse implying that the results of the study are still very much relevant, although it may have been under-estimated.
The annual per capita poverty threshold in CALABARZON rose from only P13,670 in 2003
to P17,171 in 2006, up by almost 26% within a period of only four years. Similarly, the country’s per capita food threshold increased from only P8,339 in 2003 to P10,855 in 2006. This implies that more households could have been more food insecure than what the paper actually reported. If this is the case then the recommendations and policy implications of these results are also still very much relevant and worthy of public dissemination even at the international level.
RESULTS AND DISCUSSION Household Characteristics The mean age of the household head-respondents was 47 years with a range of 16 to 90 years. Urban household heads were relatively younger at 46 years old while those in partially urban areas were, on the average, 49 years old. The households were dominated by male (82%) but in terms of formal schooling 41% reached elementary level, 35% high school level and 22% college level. Those engaged in jobs related to industry and services dominated with 36% and 35%, respectively. Those who performed agriculture-related work comprised only 20% further emphasizing the urban and partially urban classification of the areas considered (Table 2). The average household size was found to be 5 for both the partially urban and urban areas The average monthly income in CALABARZON was PhP36,212 but those in the former have lower average monthly income (PhP28,142) than those in the latter (PhP42,508). Those earning PhP15,000 and below were found to be 18% but those who received more than PhP45,000 accounted for 22%. As a consequence, non-poor households comprised 84% while the poor households were only 16% (Fig. 1).
Fig. 1. Proportion of poor households by classification, CALABARZON, 2003

J. ISSAAS Vol. 16, No.2: 53-66 (2010)
57
Table 2. Socio-economic characteristics of 251 household heads, CALABARZON, 2003*
Classification Partially Urban Urban
CALABARZON Characteristic
Number Percent Number Percent Number Percent
11 37 38 24
10 34 35 22
20 50 48 23
14 35 34 16
31 87 86 47
12 35 34 19
Age (Years) 16-30 31-45 46-60 >60 Average 49 46 47 Gender Female Male
15 95
14 86
30 111
21 79
45 206
18 82
Educational Attainment No Schooling Elementary High School College
2 54 43 11
2 49 39 10
2 49 46 44
1 35 33 31
4
103 89 55
2 41 35 22
Occupation No Occupation Agriculture Industry Service
6 41 41 22
5 37 37 20
16 8 50 67
11 6 35 48
22 49 91 89
9 20 36 35
Household Size ≤ 2 3 4 5 6 ≥ 7
19 16 21 14 16 24
17 15 19 13 15 22
8 29 28 29 24 23
6 21 20 21 17 16
27 45 49 43 40 47
11 18 20 17 16 19
Average 5 5 5
Income (PhP) ≤ 15,000 15,001-30,000 30,001-45,000 ≥45,001
32 42 20 16
29 38 18 15
13 48 41 39
9 34 29 28
45 90 61 55
18 36 24 22
Average 28,142 42,508 36,212
Poverty Status Non-Poor Poor
83 27
75 25
129 12
91 9
212 39
84 16
*Sources of Basic Data: Food and Nutrition Research Institute and National Statistics Office, Philippines Food Consumption and Expenditure The daily per capita food consumption in CALABARZON was 923 g with partially urban households having higher consumption rate at 983 g than their urban counterparts with only 876 g. The partially urban households had higher consumption of all food groups except for sugars and syrups, milk and milk products, and dried beans and nuts (Table 3).

Food consumption patterns and household food security.....
58
Table 3. Mean daily per capita food consumption (in grams) and expenditure (in pesos) by major food groups, CALABARZON, 2003
Food Consumption Food Expenditure Major Food
Group Partially Urban
Urban CALA
BARZON Partially Urban
Urban CALA
BARZON
Cereals and cereal products
448 401 421 10.61 11.84 11.30
Starchy roots and tubers
8 8 8 0.27 0.50 0.40
Sugars and syrups 43 76 61 1.27 2.23 1.81
Dried beans, nuts, and seeds
8 9 9 0.28 0.41 0.36
Green leafy vegetables
31 8 18 0.48 0.27 0.36
Fruits 138 112 124 3.37 3.08 3.21
Fish, meat, and poultry
219 199 208 13.81 15.30 14.65
Milk and milk products
9 10 10 1.81 1.85 1.83
Fats and oils 20 16 18 1.04 0.82 0.92
Miscellaneous 59 35 46 3.67 2.65 3.10
ALL GROUPS 983 876 923 36.60 38.96 37.93
Source: Food and Nutrition Research Institute Furthermore, cereals and cereal products accounted for the largest share among the major food groups with 46%. Fish, meat and poultry products accounted for 23% share while fruit consumption was 13% share. Although miscellaneous consumption was noted to be higher than the more important food groups, it should be emphasized that condiments, vinegar, salt and spices and other items which are commonly used for meal preparations are lumped in this item (Figure 2).
The bulk of cereal consumption was accounted for by rice and since rice is a staple food, its demand has a greater tendency to increase as population continues to rise also. Similarly, demand for rice which is a good source of energy increases as the need for more energy of the working classes in CALABARZON increases. In the same way, the high demand for fish, meat, and poultry products was due to the higher energy requirements as more household members become more active at work. Moreover, there is a point that a person will require so much only of cereals particularly rice, and if that is already satisfied or met, the extra income can be spent for other food items like fish, meat and poultry products. Household preferences tend to favor fish and meat consumption due mainly to their higher calorie and protein contents which are likewise essential for a more energetic and healthful living. It is said that proteins are the building blocks of human growth and development hence the increasing demand for this food group by the working class. This is well supported by the fact the region has high production of meat and poultry products (BAS, 2008).

J. ISSAAS Vol. 16, No.2: 53-66 (2010)
59
Fig. 2. Percentage share on mean daily per capita food consumption by major food groups, CALABARZON, 2003
On the other hand, the mean one-day per capita food expenditure of a household in CALABARZON amounted to PhP37.9 with the urban households (PhP38.96) having a higher food expenditure than the partially urban households (PhP36.60) (Table 4). As income increased, the per capita food consumption and expenditure also increased for both the partially urban and urban households implying that income is indeed directly proportional to food consumption and expenditure. Table 4. Mean daily per capita food consumption (in grams) and expenditure (in pesos) by income
group, CALABARZON, 2003.
Food Consumption Food Expenditure
Income Group Partially Urban
Urban CALA
BARZON Partially Urban
Urban CALA
BARZON
≤ 15,000 755 608 712 25.97 23.27 25.1
15,001 – 30,000 975 765 863 33.93 31.62 32.7
30,001 – 45,000 1135 872 958 38.21 41.89 40.7
› 45,000 1271 1105 1154 62.89 50.14 53.9
ALL GROUPS 983 876 923 36.60 38.96 37.9
Source: Food and Nutrition Research Institute
Figure 3 on the other hand, shows that the share of cereal expenditure (30%) of the households in the region was only second to the expenditures on meat, fish and poultry (39%) and that the share of cereal and cereal products expenditures of the households in the urban area was higher than those in the partially urban areas. The differences in commodity prices might have influenced the food expenditures of the households on the different food items. For instance, the prices per kilogram of fish, meat and poultry products were higher than the price per kilogram of cereals and other food groups, thus the larger share in food expenditure for the former.

Food consumption patterns and household food security.....
60
Fig. 3. Percentage share on mean daily per capita food expenditure by major food groups,
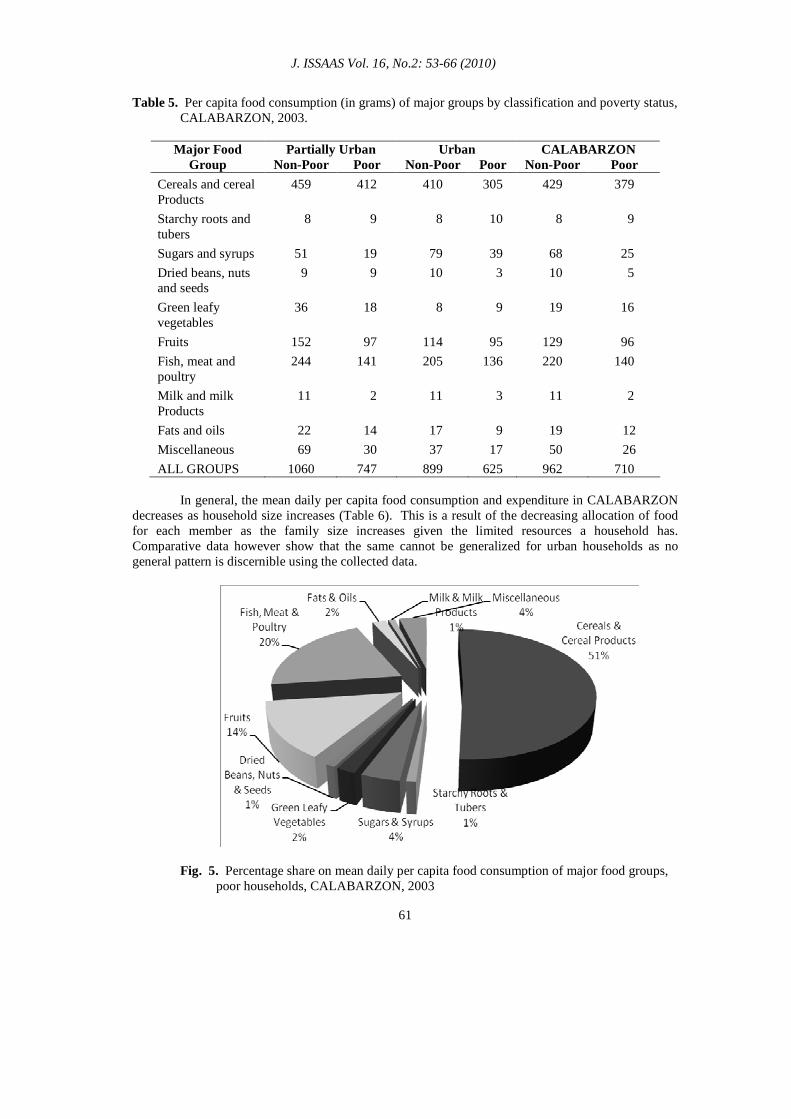
CALABARZON, 2003 Considering poverty status, the per capita food consumption of non-poor households (962 g) was higher than that of the poor households (710 g) in the whole region and in both the partially urban and the urban areas (Table 5). Also, the non-poor households had a higher consumption of majority of the food groups except for the starchy roots and tubers. In contrast, the share of low calorie foods like cereals to the total food consumption was higher for poor households while the share of high calorie foods like meat and poultry products to the total food consumption was higher for the non-poor households (Figs. 4 and 5). Low calorie foods are generally cheaper than high calorie foods hence the poor households can better afford them.
Fig. 4. Percentage share of mean daily per capita food consumption of major food groups, non-poor households, CALABARZON, 2003
J. ISSAAS Vol. 16, No.2: 53-66 (2010)
61
Table 5. Per capita food consumption (in grams) of major groups by classification and poverty status, CALABARZON, 2003.
Partially Urban Urban CALABARZON Major Food
Group Non-Poor Poor Non-Poor Poor Non-Poor Poor
Cereals and cereal Products
459 412 410 305 429 379
Starchy roots and tubers
8 9 8 10 8 9
Sugars and syrups 51 19 79 39 68 25
Dried beans, nuts and seeds
9 9 10 3 10 5
Green leafy vegetables
36 18 8 9 19 16
Fruits 152 97 114 95 129 96
Fish, meat and poultry
244 141 205 136 220 140
Milk and milk Products
11 2 11 3 11 2
Fats and oils 22 14 17 9 19 12
Miscellaneous 69 30 37 17 50 26
ALL GROUPS 1060 747 899 625 962 710
In general, the mean daily per capita food consumption and expenditure in CALABARZON decreases as household size increases (Table 6). This is a result of the decreasing allocation of food for each member as the family size increases given the limited resources a household has. Comparative data however show that the same cannot be generalized for urban households as no general pattern is discernible using the collected data.
Fig. 5. Percentage share on mean daily per capita food consumption of major food groups, poor households, CALABARZON, 2003

Food consumption patterns and household food security.....
62
Table 6. Mean daily per capita food consumption (in grams) and expenditure (in pesos) by household size, CALABARZON, 2003.
FOOD CONSUMPTION FOOD EXPENDITURE
Household Size Partially
Urban Urban
CALA- BARZON
Partially Urban
Urban CALA-
BARZON
≤ 2 1439 954 1295 51 40 48
3 1099 794 903 35 32 33
4 858 1014 947 40 45 43
5 837 847 844 33 38 36
6 914 949 935 31 47 41
≥7 785 744 765 30 33 31
ALL GROUPS
983 876 923 37 39 38
Source: Food and Nutrition Research Institute Energy Intake and Household Food Security The average per capita energy intake of a household in CALABARZON was 1,894 kcals while the RENI was 1,938 kcal (Table 7). Although the average daily per capita energy intake of households in the partially urban areas was higher (1,940 kcal) than those in the urban areas (1,858 kcal), the difference was found to be statistically insignificant. In contrast, the per capita energy intake of non-poor households was consistently higher than that of the poor households in both areas and the difference was found to be significant at 1% level of probability. This finding is well supported by the fact that the non-poor households had a higher consumption of high calorie foods (i.e. fish, meat and poultry products) than their poor counterparts (Table 4). Table 7. Mean daily per capita energy intake (kcals), RENI (kcals), and food insecurity (%) by
poverty status, CALABARZON, 2003.
Partially Urban Urban CALABARZON Poverty Status Energy
Intake RENI
Food
Insecure Energy Intake
RENI Food Insecure
Energy Intake
RENI Food Insecure
Non-Poor 1905 1937 59 2028 1967 56 1953 1949 57
Poor 1346 1884 67 1672 1875 92 1572 1878 74
AVERAGE 1940 1944 61 1858 1933 59 1894 1938 60
Source: Food and Nutrition Research Institute In CALABARZON, 6 out of 10 families were found to be food insecure (Fig. 6). Although food insecurity seems higher in partially urban areas (61% as opposed to 59% for urban areas), the difference when tested was found to be statistically insignificant. On the other hand, the relationship between food insecurity and poverty status was found significant at 5% level of probability (Fig. 7). That is, poor households are more food insecure than non-poor households.

J. ISSAAS Vol. 16, No.2: 53-66 (2010)
63
Fig. 6. Proportion of food insecure households by classification, CALABARZON, 2003
Fig. 7. Proportion of food insecure households by poverty status and classification,
CALABARZON, 2003 Factors Affecting Household Food Security Among the factors looked into, only per capita income was found to significantly affect food security at the household level (Table 8). This is to be expected because most of the food items consumed by the respondents were bought since urban and partially urban areas have less or no soil to plant vegetables and raise animals even for home consumption only. In this case, the buying power which is the per capita income is the main determining factor of how much food can be bought by the consuming household. Results of the regression analysis revealed that except for fruits, all the major food groups included in the model were significant. Per capita income was confirmed to be a strong determinant along with the dummy for program participation (Table 9). These results are to be expected since the major food groups were almost all necessities. Fruits on the other hand, especially for the poor households can be considered a luxury. Program participation as used in the context of this paper
Fo
od
In
secu
rity
(%
) F
oo
d I
nse
curi
ty (
%)

Food consumption patterns and household food security.....
64
refers to the participation of household-respondents in government programs related to nutrition education and food production. The results imply that those who were able to participate in such programs had the greater tendency to increase their per capita energy intake. Table 8. Results of chi-square tests of independence between food security and its determinant
variables, CALABARZON, 2003
Variable X2 - Stat Degrees of Freedom
Age of the household head 3.440ns 3
Educational attainment of the household head
1.262ns 3
Per capita income 17.266*** 3
Household size 6.363ns 5 Table 9. Regression results for per capita energy intake, CALABARZON, 2003
Variable Coefficient T-Ratio
Constant 1.194*** 11.634
Per capita income 0.061*** 2.876
Cereals and cereal products 0.597*** 17.577
Starchy roots and tubers 0.028*** 3.270
Sugars and syrups 0.027*** 3.381
Fruits 0.006 0.756
Fish, meat and poultry 0.043*** 3.600
Milk and milk products 0.020** 2.212
Fats and oils 0.047*** 4.833
Miscellaneous 0.033*** 3.279
Electricity expenditure -0.0028 -0.391
Water expenditure 0.002 0.446
Education expenditure -0.001 -0.342
Transportation expenditure -0.0001 -0.005
Dummy for own food production 0.008 0.761
Dummy for program participation 0.067*** 2.821
Dummy for classification -0.015 -1.378 *** Significant at 1% level of probability ** Significant at 5% level of probability * Significant at 10% level of probability
CONCLUSIONS
Income had a positive effect on household food consumption and expenditures, thus,
resulting in higher percentage share of low calorie foods like cereal and cereal products to the total food consumption and lower energy intake of the poor households than the non-poor households. On the other hand, the percentage share of high calorie foods like fish, meat and poultry products to the total food consumption by the non-poor households was higher than the poor group.
J. ISSAAS Vol. 16, No.2: 53-66 (2010)
65
Finally, the study revealed that 60% of the households in CALABARZON were food insecure and that poor households were more food insecure than the non-poor ones. Government programs related to nutrition education and food production are positive motivators to enhance food security.
POLICY IMPLICATIONS AND RECOMMENDATIONS
The food insecurity is a cause for concern considering that CALABARZON has several
industrial and technology parks that employ more skilled and service workers than anywhere else in the country. There is a need for a more institutional approach to the food insecurity problem in the area. More forceful implementation of minimum wage laws among the company-locators is recommended since there are company-locators that are still offering lower than the mandated minimum wage. In addition, company-locators can be given more incentives by the concerned LGUs so that they will be encouraged to provide more non-wage benefits to the workers. Non-wage benefits could ease the burden in the employees’ out-of-pocket expenses on other items and therefore leave them more money to buy the necessary food items. According to a key informant who is a manager of the Human Resource Department in one of the company-locators in the area, the workers refuse a raise in their salaries because this would exceed the minimum wage level. Salaries set above the minimum are subject to tax which lowers an employee’s take home pay. Non-wage incentives/benefits are therefore preferred. Reduced tax burden for those who will give more non-wage benefits to their employees is only one of the many incentive schemes for the locators.
In order to cope, it is also recommended that the LGUs encourage the households both in the partially urban and in urban areas to find alternative sources of food (Cuevas, 2002). The Food Always in the Home (FAITH) Program of the Laguna Provincial Office is one program that can help ensure the availability of food within a household. FAITH advocates the planting of a variety of vegetables and raising of fowl and fish in the yard for the family’s own consumption. Its supposedly self-sustaining way of feeding a family should reduce the food expenses of a household. It was reported by the FAITH monitoring group that a family can save PhP30 to PhP106 a week through the program. Apart from ensuring that the family has something to eat on the table, a more innovative family who is able to produce a surplus from home consumption, even in small amounts, can earn extra income.
Similarly in the urban areas, where soil or space for growing crops is limited, households can
still produce crops through the use of Simple Nutrient Addition Program (SNAP) hydroponics (Armada and S&T Media Services, undated). This space saving technology, which is essentially soil-less containerized farming, is a good alternative for urban households with very little or no soil at all for gardening (Alaban 2008; Santos and Ocampo 2005). It can be done in apartments and townhouses where small terraces can be used for growing plants. The Institute of Plant Breeding of the University of the Philippines Los Baños has perfected this technology and is ready to share with interested parties.
Aside from finding alternative sources of food, the role of women not only in helping earn
the much-needed money but also in ensuring good nutrition for the family must be given due attention and recognition. Good nutrition can be achieved through correct combination and preparation of cheap but healthy food items. The FNRI through the DSWD and also the LGU can play an important role in this endeavor by teaching the womenfolk how to prepare simple and yet delicious, nutritious and low-cost food for the family.

Food consumption patterns and household food security.....
66
REFERENCES
Alaban, R.A. Jr. Simplified, Non-circulating Hydroponics. Retrieved from http://ra-initiatives.tripod.com/id4.html on May 23, 2008.
Armada, A. and S & T Media Services. Grow Crops Without Soil with Snap Hydroponics.
Philippine Council for Agriculture, Forestry and Natural Resources Research and Development (PCARRD). Retrieved from http://www.pcarrd.dost.gov.ph/news/ press%20released/jan%202004/prl1jan04.htm
Bautista, A.D. 2005. “An Analysis of Regional Food Security and Poverty in the Philippines.”
Undergraduate Thesis, University of the Philippines Los Baños, College, Los Baños, Laguna. Briones, R.M., R.G. Corcolon, Z.M. Sumalde and V.T. Villancio. 1999. “Food Security: Household
Perspective,” in Food Security in the Philippines. Cabanilla, L. S. and M.M. Paunlagui (eds.) Institute of Strategic Planning and Policy Studies and UP Center for Integrative and Development Studies.
Cuevas, L.C. 2002. “Home Gardens to Feed the Filipinos,” BAR Chronicle, Vol. 3 No. 11, Pp. 1-15 Food and Agriculture Organization (FAO). 2003. The World Food Summit: Rome Declaration on
World Food Security and World Food Summit Plan of Action. Rome, 1996. Pp. 1-47 Ibrahim, H., N.R. Uba-Eze, S.O. Oyewole and E.G. Onuk. 2009. Food Security Among Urban
Households: A Case Study of Gwagwalada Area Council of the Federal Capital Territory Abuja, Nigeria. Pakistan Journal of Nutrition 8(6):810-813
Melgar-Quinonez, H.R., A.C. Zubieta, B. McNelly, A. Nteziyaremye, M.F.D. Gerardo, and C.
Dunford. 2006. Household Food Insecurity and Food Expenditure in Bolivia, Burkina Faso , and the Philippines. American Society for Nutrition Journal. Nutr. 136:1431S-1437S
National Nutrition Survey -- Food Consumption Survey [Electronic data file]. 2007. Bicutan, Taguig
City, Philippines: Food and Nutrition Research Institute. National Statistics Coordination Board. 2007. Metro Manila Families Needed P7,854 per month in
2005 to Keep Out of Poverty. In Press Releases retrieved from www.nscb.gov.ph on March 19, 2007
Santos, P.J.A. and E.T.M. Ocampo. 2005. “SNAP Hydroponics: Development and Potential for
Urban Vegetable Production.” Philippine Journal of Crop Science. Vol. 30 No. 2. Pp 3-11. Bureau of Agricultural Statistics [BAS]. 2008. Statistical Databases -- Philippines.
http://countrystat.bas. gov.ph/ selection.asp World Development Report. 1986. The Hesitant Recovery and Prospects for Sustained Growth.
Trade and Pricing Policies in World Agriculture. World Development Indicators http://www.rrojasdatabank.info/wdr1986toc.htm