food security in a perfect storm: using the ecosystem...
TRANSCRIPT

on May 31, 2018http://rstb.royalsocietypublishing.org/Downloaded from
rstb.royalsocietypublishing.org
ResearchCite this article: Poppy GM et al. 2014 Food
security in a perfect storm: using the ecosys-
tem services framework to increase
understanding. Phil. Trans. R. Soc. B 369:
20120288.
http://dx.doi.org/10.1098/rstb.2012.0288
One contribution of 16 to a Discussion Meeting
Issue ‘Achieving food and environmental
security: new approaches to close the gap’.
Subject Areas:ecology, environmental science, plant science,
demography, social science and governance
Keywords:agriculture – forest interface, ecosystem
services, food security, Malawi, models
Author for correspondence:G. M. Poppy
e-mail: [email protected]
& 2014 The Authors. Published by the Royal Society under the terms of the Creative Commons AttributionLicense http://creativecommons.org/licenses/by/3.0/, which permits unrestricted use, provided the originalauthor and source are credited.
Food security in a perfect storm: usingthe ecosystem services framework toincrease understanding
G. M. Poppy1, S. Chiotha4, F. Eigenbrod1, C. A. Harvey5, M. Honzak5,M. D. Hudson2, A. Jarvis6, N. J. Madise3, K. Schreckenberg2, C. M. Shackleton7,F. Villa8 and T. P. Dawson9
1Centre for Biological Sciences, 2Centre for Environmental Sciences, Faculty of Engineering and the Environment,and 3Social Statistics and Demography, University of Southampton, Southampton SO17 1BJ, UK4LEAD, Chancellor College, University of Malawi, Zomba, Malawi5Betty and Gordon Moore Center for Science and Oceans, Conservation International, 2011 Crystal Drive,Suite 500, Arlington, VA 22202, USA6International Centre for Tropical Agriculture (CIAT) and CGIAR Research Program on Climate Change,Agriculture and Food Security (CCAFS), CALI AA6317, Colombia7Department of Environmental Science, Rhodes University, Grahamstown, South Africa8Basque Centre for Climate Change (BC3), IKERBASQUE, Basque Foundation for Science, Bilbao 48008, Spain9School of the Environment, University of Dundee, Dundee DD1 4HN, UK
Achieving food security in a ‘perfect storm’ scenario is a grand challenge for
society. Climate change and an expanding global population act in concert to
make global food security even more complex and demanding. As achieving
food security and the millennium development goal (MDG) to eradicate
hunger influences the attainment of other MDGs, it is imperative that we
offer solutions which are complementary and do not oppose one another. Sus-
tainable intensification of agriculture has been proposed as a way to address
hunger while also minimizing further environmental impact. However, the
desire to raise productivity and yields has historically led to a degraded
environment, reduced biodiversity and a reduction in ecosystem services
(ES), with the greatest impacts affecting the poor. This paper proposes
that the ES framework coupled with a policy response framework, for
example Driver-Pressure-State-Impact-Response (DPSIR), can allow food
security to be delivered alongside healthy ecosystems, which provide many
other valuable services to humankind. Too often, agro-ecosystems have
been considered as separate from other natural ecosystems and insufficient
attention has been paid to the way in which services can flow to and from
the agro-ecosystem to surrounding ecosystems. Highlighting recent research
in a large multi-disciplinary project (ASSETS), we illustrate the ES approach
to food security using a case study from the Zomba district of Malawi.
1. IntroductionIn 2009, Sir John Beddington, the UK’s chief scientist, described an oncoming ‘per-
fect storm’ scenario. Unless 50% more food, 50% more energy and 30% more
freshwater were available by 2030, he argued, there would be simultaneous
food, water and energy shortages on a global scale [1]. While there have been pre-
dictions for each of these key ‘commodities’ from 2050 onwards and in isolation,
this ‘perfect storm’ metaphor has struck a chord with governments and civil
society owing to the immediacy and complexity of the linked issues; pursuit of
food security is inextricably linked to water and energy security, especially
with the increasing demand and desire for biorenewables [2]. A key challenge
highlighted in several recent high-level reports and reviews is how to increase
rstb.royalsocietypublishing.orgPhil.Trans.R.Soc.B
369:20120288
2
on May 31, 2018http://rstb.royalsocietypublishing.org/Downloaded from
food security sustainably in a climate-change-resilient manner,
while reducing greenhouse gas emissions, alleviating poverty
and conserving biodiversity [3–6].
It is important to recognize that food security is not just
about increasing yields. Food security ‘exists when all people,
at all times, have physical and economic access to sufficient,
safe and nutritious food to meet their dietary needs and food
preferences for an active and healthy life’ [7]. It is determined
by four factors: (i) availability (from agricultural production
and land-use or exchange); (ii) stability of supplies (e.g. season-
ally and from year to year); (iii) access (dependent on financial
means but also physical access and social factors); and (iv) bio-
logical utilization of food (e.g. nutritional diversity and food
safety issues) [8]. Thus, increasing yields will address only one
aspect of what makes individuals, households, communities
and nations food secure or insecure. Addressing food insecurity
requires multi-disciplinary perspectives and solutions.
Agricultural ecosystems are managed by humans largely to
optimize provisioning ecosystem services (ES), such as food,
fibre and fuel, yet these benefits depend upon regulating ES,
for example pollination, from the wider landscape and environ-
ment for their long-term provision and sustainability [9].
Agriculture, in turn, also provides essential regulating, provi-
sioning and cultural services to communities. Managing the
cultivated agro-ecosystems and their interaction with unculti-
vated ‘natural’ ecosystems is thus not only important now,
but will also become increasingly important while seeking to
achieve or increase food security and maintain environmental
integrity and resilience. Agriculture currently accounts directly
for approximately 19–29% of global greenhouse gas emissions
and is also the leading driver of deforestation and forest degra-
dation globally, which accounts for an additional 17% of global
carbon emissions [10]. For example, between 1980 and 2000,
83% of new croplands and pastures in the tropics were created
at the expense of natural forests [11]. Reducing emissions from
agriculture (e.g. through broad-scale adoption of ‘climate
smart’ agriculture) and preventing the expansion of agriculture
into remaining forested areas [12] must be central components
of any mitigation plan. Indeed, ongoing policy discussions on
REDDþ (Reducing Emissions from Deforestation and Forest
Degradation and forest enhancement) recognize that tackling
the drivers of deforestation and degradation, particularly agri-
culture, is the key for success [13]. The contribution of
agriculture to biodiversity loss [14] means that finding ways
to ensure that agriculture can meet the growing food
demand without further degrading natural ecosystems is also
critical for the overall goals of the Convention on Biological
Diversity.
In its Ecosystem Management Policy report on Food and
Ecological Security, the United Nations Environment Pro-
gramme (UNEP) attempts to identify the trade-offs and
synergies of these two objectives [15]. However, traditional
approaches to investigating the interacting processes between
food security and ES, e.g. based upon deterministic conceptu-
alizations and neoclassical economics, fail to capture causality
or even acknowledge that stocks of natural capital are dwind-
ling and may already be too low to sustainably support
long-term societal benefits, health and well-being. Power [16]
is optimistic in suggesting that ‘there have been several
recent advances in our ability to estimate the value of various
ecosystem services related to agriculture, and to analyze the
potential for minimizing tradeoffs and maximizing synergies’
(p. 2969). The Millennium Ecosystem Assessment and UNEP
reports also offer optimism and solutions, while highlight-
ing the need for future research to generate spatially and
temporally explicit frameworks [15,17].
The ES framework—in which services and goods provided
by natural and semi-natural ecosystems are explicitly linked to
human well-being [18]—has considerable potential for mana-
ging land to achieve both food security and environmental
sustainability. This is because both agricultural production,
and services associated with agro-ecosystems, as well as
more natural environments (i.e. the existence value of biodiver-
sity, flood and climate regulation services), are encompassed
by the framework.
Since the publication of the Millennium Ecosystem Assess-
ment, the ES framework has become highly influential in
both academia and policymaking. At international level,
an example of this is the establishment in 2012 of the new
Intergovernmental Platform for Biodiversity and Ecosystem
Services. The Millennium Ecosystem Assessment has also
been instrumental in generating numerous national ecosystem
assessments [19–21] and ES valuation reports [22], resulting in
the possibility of taking an ES approach to address global
environmental challenges, such as in the World Bank’s
Wealth Accounting and Valuation of Ecosystem Services
(http://www.wavespartnership.org/waves/) initiative, the
International Council for Science and UNESCO’s Programme
for Ecosystem Change and Society initiative [23], and the
UK’s Ecosystem Services for Poverty Alleviation (ESPA, see
http://www.espa.ac.uk/) research programme.
Surprisingly, in spite of this growing interest, few attempts
have been made to explicitly outline how an ES framework can
be operationalized to sustainably fulfil the multiple demands
made of food security as well as addressing the need for
environmental sustainability. Although the Convention
on Biological Diversity has defined principles and guide-
lines for its ecosystem approach [24,25], the latter has a
strong focus on the conservation and sustainable use of bio-
logical diversity. By contrast, the human well-being focus
of the ES framework of the Millennium Ecosystem Assess-
ment introduces additional challenges relating to the need to
recognize and negotiate trade-offs between producers and
beneficiaries of different services.
Here, we outline how the ES framework needs to be unpack-
aged to achieve food security in a sustainable manner. We argue
that three key interlinked entry points are vital to achieving this:
(i) understanding the spatial and temporal scale of ES; (ii) disag-
gregation of the beneficiaries of different ES and (iii) supporting
the negotiation of trade-offs (including quantification, valuation
and governance) between the demands of different ES users. We
focus specifically on the application of such an approach for
the rural poor at the forest–agricultural interface owing both
to its importance for the 550 million people globally [26]
who live in such areas and the linkages between natural and
agro-ecosystems within them. We argue that the disaggrega-
tion of both beneficiaries and of the different elements of food
security within the broader supply and use of ES, and quantifi-
cation of both, are essential for effective management of ES for
sustained human well-being and environmental sustainability
in such regions.
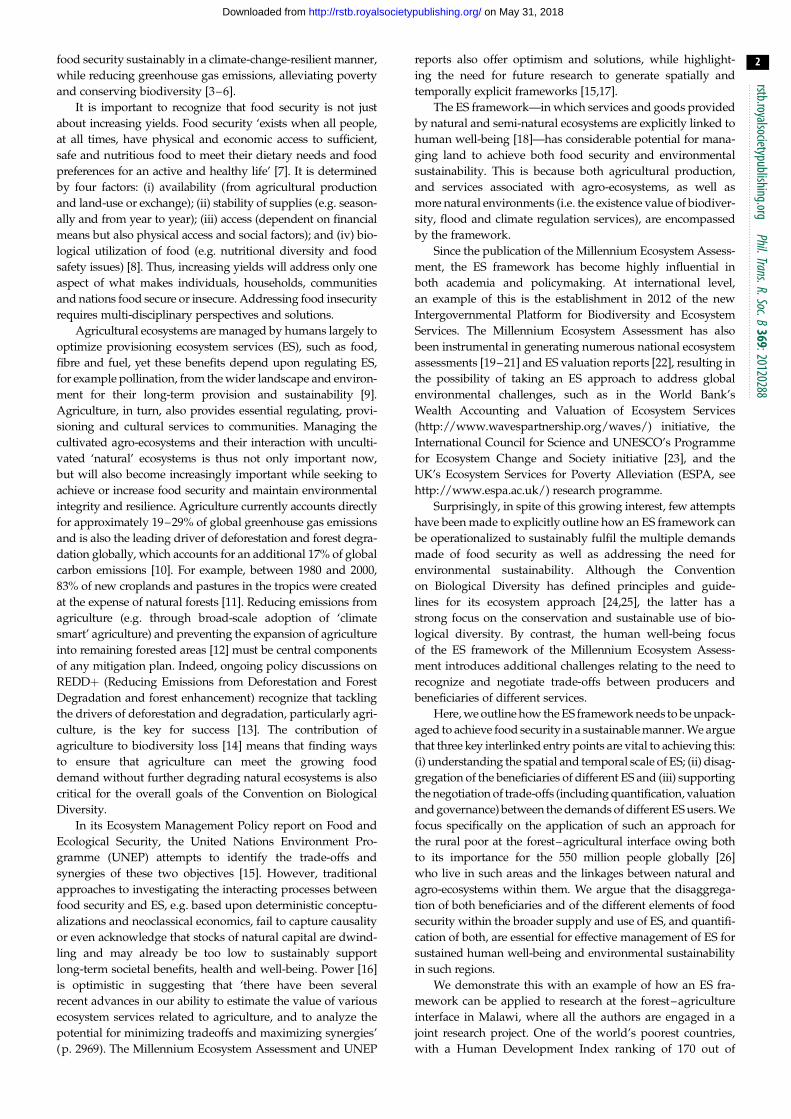
We demonstrate this with an example of how an ES fra-
mework can be applied to research at the forest–agriculture
interface in Malawi, where all the authors are engaged in a
joint research project. One of the world’s poorest countries,
with a Human Development Index ranking of 170 out of

endogenous drivers – human/natural
exogenous drivers – human/natural
forest
food
water mulch pollinators biomass
rivers,grasslands, etc.
sacred siteNTFPs
income cooking fuel communitycohesion
agriculture
drinkingand
cooking water
individual–men/womenhousehold–rich/poor
community–close/distant
food security(health outcomes)
bene
fit
serv
ice
ecos
yste
mbe
nefic
iari
es(p
oten
tial a
ndac
tual
)
Figure 1. Schematic of the direct and indirect routes by which ES and benefits contribute to food and nutritional outcomes.
rstb.royalsocietypublishing.orgPhil.Trans.R.Soc.B
369:20120288
3
on May 31, 2018http://rstb.royalsocietypublishing.org/Downloaded from
186 [27], Malawi had a population estimated at 13.1 million in
2008 growing at a rapid rate of 2.9% per year [28]. Some 39%
of the population lives on less than US$1 per day [29]. The
country’s principal economic activity is agriculture, which is
predominantly rain-fed, making it vulnerable to climatic
shocks [30]. Deforestation rates range from 1 to 2.8% per
year, varying across different parts of the country and across
different types of forestry resources [28]. Malawi serves here
as an example of many developing regions of the world
where agricultural and forest products and services constitute
the primary foundations of local livelihoods and well-being.
2. The relationship between food security andthe environment
As highlighted by the food systems approach [31], the
relationship between food security outcomes and the
environment is complex and multi-directional. Thus, food
security is not only dependent on (non-provisioning) ES but
is also one of the greatest drivers of the loss of ES. The pursuit
of food security through increased agricultural production,
including through changes in land-use, land-cover, manage-
ment practices and agricultural inputs (such as fertilizer,
pesticides, irrigation), is a key driver of landscape change
[15]. Even less-intensively managed types of provisioning
services, for example harvesting of non-timber forest pro-
ducts (NTFPs), can lead to resource depletion, especially
when harvested for commercial purposes, unless appropriate
governance and education systems are in place [32,33].
Food availability for many of the world’s rural poor is
particularly dependent on their being able to benefit from
the flow of ES from non-agricultural ecosystems (figure 1).
This may take many forms. The first is regular direct con-
sumption of wild foods [34,35]. For example, wild foods
account for over one-fifth of the diet of children in parts of
South Africa and are particularly important for those from
vulnerable households [36]. Secondly, wild foods are also
often important safety nets for farmers when crops fail or
food stocks run low [37,38]. Thirdly, food availability is
further assured by ES to agriculture, from water for irriga-
tion, timber for fencing and implements, to crop pollination
[39–41] and pest regulation [22,42].
Food utilization is heavily dependent on the availability
of fuelwood and clean water to enable households to prepare
food safely [43]. Where people have poor access to fuelwood,
they may be unable to cook or will shift to lower quality
foods or eat fewer meals [44,45], all of which has impacts
on health and nutrition, particularly of young children [46].
Incomes from trade in non-agricultural provisioning ES,
such as fruit, nuts, fibres, resins and other NTFPs, also play
a critical indirect role in food access by enabling households,
particularly poor ones, to purchase food [47–49]. Less tangi-
ble contributions to food security from ecosystems include
the use of sacred forests for harvest festivals [50] or, among
the Loita Maasai, for initiation ceremonies conferring respon-
sibility for different aspects of resource management [51].
These reserved sacred sites may also be important for the
supply of other ES, such as pollination, pest control, fodder,
biodiversity or water [52], which support a stable system of
food security.
Flows of ES are shaped by complex and dynamic systems
that operate over multiple temporal and spatial scales and
often exhibit stochastic behaviour [53]. This complexity
often makes it difficult to resolve an appropriate course of
collective action to pursue sustainable livelihoods. In times
of livelihood shocks (e.g. crop failure), the maintenance of
flows of ES to the rural poor can become the only lifeline
available [54]. In addition, the nature of many ES is dynamic,
changing both in predictable cycles (e.g. seasonal) and in
response to extreme events (such as floods, droughts, fires
and pest outbreaks). Thus, the contribution of NTFPs to
household livelihoods is known to be particularly important
during the ‘lean’ or non-agricultural season [55,56]. Crises,
for example Hurricane Mitch in Honduras, can bring to the
fore the importance of forests as a ‘natural insurance’ for
poor families [57]. The importance of direct use of ES is also
a function of distances from the sites where specific ES are
provided, such that the use declines with increasing opportu-
nity costs of harvesting associated with increasing travel

rstb.royalsocietypublishing.orgPhil.Trans.R.Soc.B
369:20120288
4
on May 31, 2018http://rstb.royalsocietypublishing.org/Downloaded from
distances [58]. Thus, the loss of ES provisioning sites can
severely disadvantage poorer households who subsequently
have to travel much farther to obtain their needs. Within house-
holds, women may be the hardest hit; Sorenson et al. [59]
highlight the disproportionate burden of water collection,
which rests with women, particularly as the distance to the
water source increases.
As indicated in figure 1, the relationship between food
security and the environment can be affected by a range of
internal and external drivers, of varying predictability and
intensity. Communities may be able to adapt their use of
ES in response to gradual trends, such as demographic
changes and declining soil fertility. However, sudden
shocks (e.g. droughts, earthquakes, commodity price col-
lapses, disease or war), and unusual combinations of these
in time or space, can lead to excessive pressure being exerted
on ecosystems and cause degradation. The fact that develop-
ing countries typically have inadequate institutional ‘safety
nets’, and inequitable access to fertile lands, resources and
secure income often forces the rural poor to prioritize their
short-term needs (i.e. feeding their families) over long-term
sustainability [60]. Consequently, daily decisions for poor
rural communities at the forest-agriculture interface are
driven by coping strategies involving trade-offs of different
ES. These decisions may be at odds with ES management
priorities at other spatial or temporal scales.
3. Integration of food security andenvironmental sustainability within anecosystem services framework
In this section, we examine in more detail the three elements
of an ES framework we consider to be key in relation to
achieving food security and environmental sustainability.
There is a great deal of common ground between our first
two elements (multiple scales of analysis and disaggregation
of beneficiaries) and the five operational guidelines of the
Convention on Biological Diversity [24]: however, our third
element moves beyond what is provided for within the
Convention’s ecosystem approach by explicitly dealing with
the trade-offs decision-makers need to make to achieve mul-
tiple outcomes (for example, delivering both food security
and environmental sustainability) from one area.
(a) Scales of analysisAs previously argued, the scale of analysis has a strong influ-
ence on how one views and describes a system. Focus on a
single scale may obscure important processes at either finer
or broader scales [60,61]. With respect to ES, it is neces-
sary to consider not only biophysical processes but also
institutional processes, which may operate at very different
scales. Water catchments, for example, may cross several
administrative boundaries, requiring the establishment of
new forms of joint decision-making between upstream land
managers and downstream beneficiaries. To achieve multiple
goals (e.g. food production and ecosystem integrity and resi-
lience), it is necessary to integrate across all pertinent spatial
and temporal scales. Spatially, the local to national focus is
important to really understand the local issues but these
need to be set within a national context—i.e. identifying
and understanding internal and external drivers of particular
situations. At the forest–agriculture interface, which typically
consists of a mosaic of more- and less-intensively managed
habitats, there is a particular need for an integrated landscape
approach to understand how the dynamic interactions
between patches affect the delivery of ES [62–64].
Temporally, the flow of ES and human needs is not static
[53]. Consequently, any analytical approach must embrace a
wide range of temporal scales, fostering learning from past
events and also giving a sense of the biophysical limits of
what can be sustainably extracted from an ecosystem over
time. Establishing institutional systems that can deal with the
varying temporal scales (e.g. continuous, episodic, cyclical
and stochastic) at which many biophysical processes operate
is a particular challenge. This is further hampered by our lack
of understanding of interconnectivity and feedback across
overlapping scales within social–ecological systems [60].
(b) Disaggregation of the beneficiariesRecognition of the importance of disaggregating beneficiaries
is relatively recent (e.g. [65]), but is now increasingly accepted
to be critical for managing ES fairly [66]. We highlight the
need to understand the disaggregation of two components.
The first is to understand who benefits from different ES (in
space and time) and how the benefits flow through to food
production or other utility. This is a key difference to much
policy-level food security work which deals with aggregated
data for whole countries, regions or zones (e.g. [67]) as illus-
trated in the Food Estimation and Export for Diet and
Malnutrition Evaluation (FEEDME) model (see box 1). The
same applies to much ES work, where mapping scales are at
catchment or larger scales, with limited explicit links to who
the beneficiaries are for specific ES and where in the landscape
they reside or farm [69]. Community and household-based
studies are particularly important in disaggregating local ben-
eficiaries (e.g. by gender or socioeconomic status) of different
ES. However, for ES of global concern, such as biodiversity
conservation and carbon sequestration, it is also important to
determine how the needs of global beneficiaries interact with
or affect the ability of local people to obtain the ES they need
to support their livelihoods [70–72].
The second dimension requiring disaggregation therefore
pertains to governance: understanding who takes decisions
about different ES (both about the management of the
source ecosystem and the management of the flow of service,
e.g. in irrigation or fuelwood-harvesting situations) and
whether other users and stakeholders respect their authority
to do so. Participatory engagement is the key to understanding
this at the local level but this has to be combined with district-
and national-level analysis to consolidate the official govern-
ance perspective on management activities with what is
happening de facto on the ground. Increasingly, we must also
consider the impacts of governance at the international level.
(c) Consideration of trade-offs in policy- anddecision-making
The two points above lead to the clear understanding that
there are always going to be trade-offs between which ser-
vices are prioritized from which ecosystems and for whom.
Some authors go so far as to argue that all environmental
management interventions in the Global South are likely to
lead to both justices and injustices [73]. The greater the

Box 1. The food estimation and export for diet and malnutrition evaluation (FEEDME) model.
The FEEDME model has been developed for predicting climate change impacts on food security at a global scale (figure 2)
and uses the Food and Agriculture Organisation (FAO) food energy deficiency methodology [68]. This methodology uses
dietary energy supply, minimum dietary energy requirements and inequality in access to food to model the proportion of
undernourishment within populations (at a national or local community scale).
— Food availability based on production, trade and non-food uses, etc. is recorded in a Food Balance Sheet (FBS), an
account of all food items consumed at the household level, to calculate the mean dietary energy supply mx in calories
per capita per day.
— Inequality in income and access to food is measured using a Gini coefficient, which is used to skew the distribution using
a lognormal probability density function (figure 3).
— Minimum dietary energy requirement (MDER) per person per day is calculated using basic metabolic rate and physical
activity levels according to the age and gender structure of the population. Population below this minimum cut-off is
considered undernourished.
The FEEDME model uses projections of population and gross domestic product (GDP), world trade impacts, land use and
agricultural productivity developed under future social-economic scenarios and associated climate change to estimate num-
bers of undernourished people in developing countries. Crop modelling data and a world trade model are used to update
FBSs through changes in productivity and agricultural trade, respectively, as a percentage of change from a defined baseline.
Changes in the amount of cropland, fisheries and livestock data can also be used to update FBSs.
fisheriesand marine
climate change
number of people undernourished
proportion of population undernourished
crop model totalpopulation
land use andland usechange
socio-economic drivers
globaltrademodel
FAO foodbalance sheets
population(age andgenderstructure)
householdbudgetsurveys
coefficient ofvariation (incomeGini and foodrequirement Gini)
minimum dietaryenergyrequirements
dietary energysupply (caloriesavailable percapita)
GDP andvariationin incomes
Figure 2. Schematic of the FEEDME model.
prevalence ofundernourishment
P (U
)
f (x)
probability density function - dietary energy consumption
mean dietary energy consumption
energy (kcal)
µx
0 1000 2000
MDER
3000 4000 5000 6000
Figure 3. Distribution of dietary energy consumption.
rstb.royalsocietypublishing.orgPhil.Trans.R.Soc.B
369:20120288
5
on May 31, 2018http://rstb.royalsocietypublishing.org/Downloaded from

rstb.royalsocietypublishing.orgPhil.Trans.R.Soc.B
369:20120288
6
on May 31, 2018http://rstb.royalsocietypublishing.org/Downloaded from
human demands on a landscape, and the less transparent or
legitimate local governance or authority systems are, the
more intractable the trade-offs (e.g. between provisioning, reg-
ulating and cultural ES) become [74,75]. We argue that taking
an ES approach means firstly that there is a greater opportunity
for integration, and hence a reduced need for trade-offs
between social and ecological needs [76] and secondly, that
trade-off decisions are made more transparently, and more
equitable compromises can be reached that recognize the
needs of current stakeholders and future generations in differ-
ent locations. It is important to recognize, however, that the
trade-off analysis is inevitably a risk-based process, especially
where the lives of poor people are concerned. While priority
should be given to those ES that can alleviate poverty and
hunger in the short term, this should not lead to a reduced
capacity in other critical ES on a sustainable basis. The chal-
lenge for policymakers is to adopt a risk evaluation method
that can be used to analyse trade-offs and demonstrate causal
relationships in future scenarios.
Achieving an integrated approach is supported by the
widespread recent recognition in the ES literature of the impor-
tance of managing for ‘bundles’ of services [74] rather than
individual services. Ecosystem ‘bundles’ are defined as sets
of ES that repeatedly appear together across space or time
[74]. Focusing on bundles rather than on individual services
allows a way to consider the trade-off analysis in diverse land-
scapes shaped by both social and ecological forces and could
be a powerful way of looking at agro-ecosystems [75,77]. This
contrasts with many Payments for Ecosystem Services schemes
which, by promoting maximization of a single marketed ES
(like sequestered carbon or biodiversity), can reduce the
flows of other services [78,79], thus constituting a potential
risk to the achievement of food, energy or water security for
certain beneficiaries. Achieving food security sustainably
therefore requires examining bundle-based trade-offs between
provisioning and other ES for multiple beneficiaries [66].
Although a variety of integrated platforms for spatial
modelling of ES have been developed over the last few
years [80–82], these have barely begun to enable the investi-
gation of the interactions and complex trade-offs between
services under different scenarios that are crucial to food
security. Because ES are inherently process-based and con-
nect complex systems whose dynamic nature is poorly
understood, high levels of ingenuity are required to produce
useful models without oversimplifying the system [83,84].
Novel methodologies, for example the ARtificial Intelligence
for Ecosystem Services approach (ARIES: [81,82,85,86]), are
designed to be applied in the data-scarce contexts that are typical
of ES applications (even more so in developing countries) but
without dismissing the complex and dynamic nature of the ES
problem. Such methods are waiting to be put to the test in the
highly complex, real-life contexts studied by projects, for
example the ASSETS project (http://espa-assets.org/) in
which all authors are involved. Delivering on the promise of
addressing this complexity and its consequences, while remain-
ing tractable and ‘scalable’ to different levels of detail and
available information, remains a primary test case for the ability
of twenty-first century science to address social needs and to
usefully inform real-life decision-making workflows.
The results from advanced modelling frameworks, for
example ARIES, must be linked to policy needs to use this infor-
mation to design response mechanisms that are robust and
consistent at multiple scales. The Driver–Pressure–State–
Impact–Response (DPSIR) framework, which originated in
social sciences over 30 years ago [87], is a useful analytical fra-
mework for developing conceptual understandings of such
interactions and feedbacks for ES (e.g. [88]). On the surface,
DPSIR appears to be limited by its linearity: Drivers (such as
population increase) deliver Pressures (e.g. overharvesting of a
natural resource), which change the State of the ecosystem or
ES (e.g. the standing stock of NTFPs), which produces Impacts(e.g. in human well-being) which lead to Responses (policy
change, switch to other resources, etc.). Rounsevell et al. [89]
suggest that this perceived linearity obscures the feedbacks pre-
sent in social–ecological systems, although others (e.g. [90])
point out that the DPSIR model explicitly accounts for feed-
backs via responses (either by local agents or by policy on a
wider scale) and can easily be adapted to deal with complex
questions relating to the relationships between environmental
change and ES and how society might adapt to maintain ES
provision at the levels it needs to maintain or enhance human
well-being. A key element of applying the DPSIR framework
is that it must be used to define the right question, i.e. to deal
with the local challenge of environmental degradation, societal
need, agricultural policies, etc. For this reason, the questions
should be framed by the relevant stakeholders via participa-
tory approaches rather than imposed by external agencies or
developed at a scale that may not be relevant.
Scenario-building exercises can also be immensely helpful
to allow stakeholders to discuss different options [65]. While
an inclusive process using the best possible data in formats
accessible to the widest group of stakeholders can help to
achieve a fairer outcome, political ecologists caution against
the hopeful ideal of a simple evidence-based policy process
[91]. Resolving trade-offs requires a process for valuing ES
together with clear and transparent criteria for deciding
whose values to prioritize. Methods for valuing ES are
varied and remain contested [92]. This applies particularly
to non-marketed ES, similar to some cultural and spiritual
services, with the possible result that their real value to com-
munities may be trivialized and not given proper weight
in decision-making [93]. Thus scenario-building or DPSIR
processes, at local or national level, must take account of
power differentials and consider carefully who is recognized
as eligible to take part in decision-making [94]. Most impor-
tantly, there should be transparency about the goals of the
process, whether these are concerned primarily with environ-
mental improvement or strive for poverty alleviation and
perhaps even reduction of existing inequities [92,95].
4. Applying the ecosystem services framework tofood security predictions: Malawi case study
Here, we use the example of Malawi to illustrate our pro-
posed approach of managing ES for food and nutritional
security considering each of the three elements outlined
above in §3. Malawi is a country experiencing rapid popu-
lation growth and significant land-use change already
exacerbated by climate change. The country is characterized
by persistent high fertility rates underpinning the high popu-
lation growth. On average, Malawian women have more than
five births, and as a consequence the population of the
country has more than quadrupled in 50 years since 1960
to just under 15 million [96], placing an increasing strain
on the country’s natural resources [28]. By 2050, the UN

100
80
60
40
202000 2010 2020 2030 2040 2050
50
45
40
35
30
25
20
15
10
popu
latio
n (m
illio
n)
population
% u
nder
nour
ishe
d
% undernourished
year
Figure 4. Population growth and % undernourishment projected from the FEEDME model for Malawi for the period 2000 – 2050 under the SRES A1b scenario (forassumptions and caveats, see text).
rstb.royalsocietypublishing.orgPhil.Trans.R.Soc.B
369:20120288
7
on May 31, 2018http://rstb.royalsocietypublishing.org/Downloaded from
predicts that Malawi’s population will exceed 45 million.
Although the uptake of family planning methods is increas-
ing, there is still a preference for large families [97].
Approximately half of all children under the age of 5 years
are chronically malnourished [97] and more than 50% of
the population live below the national poverty line [98].
The Malawi Vulnerability Assessment Committee [99]
estimates that the number of people at risk of being food inse-
cure in October 2012 was 1.97 million (13%). In the following
sections, we show how national-level estimates of undernour-
ishment are important but may need to be grounded at
local scale in order to design appropriate policy responses.
In particular, we highlight the importance of disaggregating
beneficiaries and of supporting a transparent negotiation of
trade-offs among different ES users.
(a) Linking national-scale predictions ofundernourishment to the local level
At national level, the dietary energy provision-based method-
ology for rapid assessment of undernourishment has become
the de facto standard indicator of food insecurity [100]. Taking
advantage of national level annual FAO data on food pro-
duction and dietary statistics [101], this approach has the
advantages of being transparent and globally applicable
using existing datasets. It can directly empower governments
and development agencies to tailor policies that match
national dietary needs with strategies and mechanisms that
directly support those needs, such as agricultural production
and international trade in food commodities. This method-
ology is based upon the premise that food deprivation is
based on a comparison of usual household food consumption
expressed in terms of dietary energy (kcal) with minimum
energy requirement norms. Populations with food consump-
tion below the minimum energy requirement are considered
underfed [68]. Box 1 shows how the FAO methodology has
been integrated into a conceptual framework with a range
of climatic and demographic factors. The FEEDME frame-
work can be used to develop future scenarios of climate,
population and social-economic change.
Taking Malawi as an example, we estimated current assess-
ments and future changes in undernourishment using
FEEDME for the period 2000–2050 using climate change and
population drivers according to the Special Report on Emis-
sions Scenarios (SRES) A1b scenario and the 2010 revisions
of the UN medium variant population growth projections
(figure 4). Although the SRES A1b, a high global emissions
scenario leading to a mean global warming of around 28Crelative to the 1961–1990 baseline, is only one of many possi-
ble future greenhouse gas emissions trajectories, we used
this, together with the UK Meteorological Office HadCM3
General Circulation Model, to highlight trends that support
Beddington’s ‘perfect storm’ scenario. Climate change impacts
on food production were simulated by modifying food balance
sheets through adopting results from crop simulation models
[102]. The analysis presented here used changes in wheat and
maize production as proxies for all C3- and C4- (photosyn-
thetic pathway) type crops, respectively. While most crops
(more than 85%) are classified as C3 types (wheat and rice
being the two most important cereals on a global scale), C4-
type crops (e.g. maize, millet, sugarcane and sorghum) are
also very important food crops for many developing countries,
including Malawi. The results (figure 4) show a dramatic
increase in undernourishment which is clearly a function of
both population growth and projected decline in primarily
maize production which, on a global scale, shows a 35–40%
mean reduction [103]. However, it should be noted that the
model scenario assumed that the population demographics
(age and sex structures), food inequality Gini coefficients,
minimum dietary energy requirements and food imports all
remained at the baseline values. These assumptions are impor-
tant caveats, which mean that the projected proportion of
undernourished people in figure 4 must be interpreted as an
indicator of potential exposure to undernourishment. The steep
increase from 2010 can therefore be read as an urgent need
for some form of policy response. This might take the form,
for example, of increasing yields through the adoption of
improved technologies, clearing more land which decreases
the supply of other ES, increasing food imports or reducing
food exports, or promoting a different range of crops, or
policies to slow down the population growth through volun-
tary schemes, for example meeting the demands for modern
contraception. Approximately 26% of married women have
an unmet need for family planning methods [97]. Currently,
Malawi has adopted a Farm Input Subsidy programme to
increase crop yield, though this is dependent on international
donor support [104]. This scenario for Malawi is not unique.
Many developing countries with growing populations face
enormous challenges to meet their future food needs. This
will require international efforts as well as national- and

rstb.royalsocietypublishing.orgPhil.Trans.R.Soc.B
369:20120288
8
on May 31, 2018http://rstb.royalsocietypublishing.org/Downloaded from
local-level changes in land use to increase food production and
sustainable population growth.
While the FAO methodology and FEEDME projections for
current and future undernourishment assessments are useful
for identifying potential trends and responses at the national
and policy level to strengthen food security, the approach is
not very helpful at the community and landscape scales, or
in recognizing the links between food production, food secur-
ity and ES which underpin this production. This is because the
national-level food balance sheets used in the FAO method-
ology are generated from aggregated agricultural statistics.
These are frequently unreliable as illustrated in the case of
Malawi by the discrepancy in maize yields for 2006/2007
reported by the Ministry of Agriculture and the National
Statistics Office [104]. Although yields per hectare were simi-
lar in the two reports, the Ministry of Agriculture assumed
the number of rural households was 1 million higher than
the National Statistics Office, with the inflated number of
households thought to be linked to the popularity of the
Farm Input Subsidy programme [104]. The implications are
not trivial as the inflated number of households results in
national production estimates that suggest the country is pro-
ducing more than 4000 calories per person per day, which is
more than double the amount commonly assumed [104].
Another problem with agricultural statistics is that they do
not account for foodstuffs that are not traded commercially, or
more traditional crops or wild foods within the agro-ecosystems
and fields. For example, in South Africa, High & Shackleton
[105] reported that over 30% of the value of all edible plants
harvested from homestead plots and gardens came from
non-conventional or wild species. A good example of this
in Zomba District, Malawi, is a vegetable dish made from
wild-harvested orchid tubers, locally known as Chikande.
In addition, for the very poorest and rural communities, their
diets are likely to be significantly different from the national food
consumption lists thereby making the relationship between
access to food (based upon income) and dietary intake uncertain.
For these reasons, it is necessary to identify ways to bridge the
gap in food security from the national to local levels, and
ensure different spatial scales of analysis are integrated. This
requires information and insights at the local scales, which can
be gained through a variety of approaches, such as food diaries,
focus group discussions, participant/household observation
and the use of participatory rural appraisal techniques.
(b) Disaggregating ecosystem service beneficiaries interms of their food security needs
A growing bodyof literature highlights the particular importance
of wild foods to children, HIV/AIDS-affected households and
the poor [36–38,106]. This pattern is evidenced in Malawi.
For example, dependence on forest reserves and customary
forests for fuelwood is the greatest among poorer house-
holds [107]. Kamanga et al. [48] reported that in Chiradzulu
district, the poorest households obtained 65% of their cash
and non-cash income from NTFPs, compared with 25% from
agricultural production and that the relative proportion
declined with increasing wealth. Abu-Basutu [108] found
at two sites in South Africa that HIV/AIDS vulnerable
households had lower calorie intakes than non-vulnerable
households, despite the higher need, and that in both sites
males in the age groups aged 14–30 in vulnerable households
had daily calorie intakes significantly below those recommend
by the FAO. Females and all other age groups of males had
satisfactory calorie intakes. The costs of obtaining essential
ES may fall on different people within a household, as is the
case for water collection in Malawi, which is predominantly
considered a job for girls and women. Despite this recognition,
the majority of studies on ES assume, implicitly or otherwise,
that a given ES has a single value for all beneficiaries (see
[109] for a rare large-scale study that considers the ability of
beneficiaries to replace ES in their mapping of services).
We suggest that there are several complementary approa-
ches to identify the relative contributions of ES to food
security for different groups of beneficiaries. One of these is to
use participatory rural appraisal methods [110,111] to priori-
tize, and hence value, the most important ES (in relation to
food security) for different social groups. Such prioritization
should use local criteria (as opposed to opportunity cost
which is the dominant economic approach to value commu-
nities’ use of provisioning ES), such as taste, frequency of use,
volume of use, availability during times of stress, accessibility
or cultural requirements (e.g. [112]). In Malawi, participatory
methods have served to highlight the importance not just of
wild foods but also of income obtained from ES (such as
through sale of fuelwood and charcoal) as coping strategies
during periods of food insecurity [113,114]. Such participatory
datasets can then be linked to spatially explicit maps showing
the source of the prioritized ES in the landscape (e.g. [115]).
By combining these maps with models of the impacts of climate
change on ES, e.g. through the use of FEEDME for crop yields or
KINEROS (kinematic runoff and erosion model) combined
with GIS AGWA (Geographic Information Systems Automated
Geospatial Watershed Assessment) for water flow projections
[116], scenarios can be developed of current and future food
and nutrition security faced by local populations.
While models similar to FEEDME can project estimates of
per-capita energy (calories) provision as an important aspect
of food security, a more complete picture of the role ES play
for food security might focus on obtaining data on macronutri-
ents or protein intake as an important part of peoples’ diets or
dietary diversity. A good example of this approach is demon-
strated by Golden et al. [106] who showed that removing access
to bushmeat for a forest community in Madagascar would
increase anaemia in children by 29% and triple the number
of cases in the poorest households. Work by Kaschula [117]
showed that HIV/AIDS vulnerable households had lower diet-
ary diversity, unless they had access to wild foods which could
compensate for the loss of certain purchased foods (owing to
declining household income from increased healthcare
demands and perhaps the loss of income owing to ill health)
or self-produced crops owing to labour shortages. To gain
this level of understanding of nutritional outcomes participa-
tory methods are required, such as food diaries (e.g. [36]),
health diaries and mapping [118], and anthropometric
measurements (e.g. [119]). The latter typically involve measur-
ing the height, weight and mid-upper arm circumference of
children under the age of five since nutritional deficiencies
are most notable among this age-group, and often have
devastating and long-lasting consequences [120,121].
Large-scale datasets which contain information on the
nutritional status of young children (and their mothers) exist
(for example the Malawi Demographic and Health Surveys
(MDHS) conducted every 5 years and the Malawi Integrated
Household Survey (MIHS) also collected on a 5-yearly basis).
Both the MDHS and MIHS collect some data on food

rstb.royalsocietypublishing.orgPhil.Trans.R.Soc.B
369:20120288
9
on May 31, 2018http://rstb.royalsocietypublishing.org/Downloaded from
consumption. In the case of the former, the focus is on children
under the age of 5 years and on food consumed in the 24 h
before the survey. The MIHS collects data on household food
consumption but this is not accurately measured, and thus
the calorific estimates are crude. Additionally, since these sur-
veys are not repeated at household level, it is not possible to
assess the seasonal changes in dietary intake or the nutritional
status of individuals. By conducting repeated household sur-
veys and anthropometric measurements in different seasons
and improving on the estimation of calorific inputs using diet-
ary diaries and food scales, it is possible to begin to understand
the transitions into food insecurity and poor health of the rural
poor and how much they depend on ES for their well-being
(e.g. [106]).
(c) Recognizing trade-offs between ecosystem servicesfor food security
Understanding the direct and indirect contributions of ES
to food security of different social groups is necessary to recog-
nize and manage the trade-offs that may occur. This extends to
the consideration of the clear temporal dimensions (both in
terms of seasonal support and in times of stress) of dependence
on ES [36,37,122,123]. A typical example is the commercializa-
tion of NTFPs by elites, which can lead to the loss of the
resource as a safety-net for the poorest [32,33]. In Malawi,
this applies to the trade in firewood or charcoal [48], which
may undermine supplies at a local level for direct household
needs and, if not managed sustainably, may lead to the degra-
dation of other provisioning and regulating ES. Here, we
hypothesize about how the use of a combination of a DPSIR
process and a modelling platform, such as ARIES, could help
to improve the outcome of ES trade-offs in relation to food
security and environmental sustainability.
The charcoal trade employs over 200 000 people [124] and
is considered to be the third largest industry in the country
(valued at over US$40 million or 0.5% of GDP), yet produces
no official revenue [125]. In spite of legal production being
possible there was no single case of legal charcoal production
in 2010 [125]. Charcoal is predominantly (but not exclusively)
produced by men [126]. Although charcoal is considered to
be a key contributor to deforestation [28], as yet there appears
to be no information about how this ES may conflict with the
use of the same resource for firewood, which is predomi-
nantly collected by women and children, and for other ES
that play an important role for food security such as
NTFPs, bushmeat, drinking and irrigation water. The conflict
between these ES uses can only get worse as the charcoal
market is expected to double by 2023 [124].
Participatory mapping of the source of different ES at
local level and quantification of their use by different societal
groups are the first step towards achieving more equitable man-
agement. As some of the drivers of the charcoal trade (e.g. urban
fuel demand) are external to the local level, it is imperative that
discussions are held at multiple levels. Stakeholder workshops
bringing together community representatives with district and
national decision-makers are needed. In line with the call of
the Convention on Biological Diversity for intersectoral collab-
oration, such workshops can only be useful if they bring
together people with an interest in food security as well as
those concerned with energy and the environment. Informed
decision-making can be supported through the use of modelling
platforms, such as ARIES, to present information about flows
of different ES to different beneficiaries as well as playing
through different policy scenarios. While one option might be
to further restrict access to forest resources, this has been
found to lead to increased income inequality [48,127].
Experience from elsewhere [128,129] suggests that greater
decision-making at local level might lead to a possible win–
win scenario in which community-based natural resource
management (CBNRM) plans ensure sustainable charcoal pro-
duction. Participatory work on understanding natural resource
governance at local level might explain why options for
CBNRM and legal charcoal production—which are already
available in the national policy—have not been taken up in
practice and lead to modifications in their implementation. In
the area around Zomba, understanding the impacts of different
forest use scenarios on ES, such as water flow and siltation,
could open the door for the local hydroelectric power producer
to support CBNRM in communities to ensure more regular
electricity supplies (M. Longwe 2012, personal communi-
cation). Understanding which beneficiaries benefit from
which ‘bundles’ of ES could be important to determine how
costs and benefits of land-use changes are allocated. Similar
scenario building based on a disaggregated understand-
ing of ES flows and beneficiaries could be helpful for
decisions on proposals for large-scale land-use conversion
to bioenergy crops. For example, a Jatropha oil-processing
plant has become operational in Lilongwe and there is pressure
on Mkuwazi forest in Northern Malawi for conversion to
sugarcane production.
These examples highlight that, with explicit under-
standing of disaggregated sources and beneficiaries of ES,
and the complex relationships between ES and food security
at different scales, appropriate response mechanisms can be
designed through policy and education. The translation of
those diverse drivers and pressures into tangible and quanti-
fiable directions for policymakers is vital and requires the
development and implementation of new strategies that sup-
port the needs of local communities. While changes are
taking place on a global scale, the effects at local and regional
levels are poorly understood, hard to predict and thus diffi-
cult to mitigate with appropriate policy actions. Sahley et al.[30] argue that the debate about how best to achieve food
security in Malawi has been concentrated too much at the
national level between government and donors, rather than
engaging civil society and the private sector. The FEEDME
results highlight the dangers of policies made to address
issues observed at the national scale having potentially dire
consequences at the local level when ‘hidden’ ES benefits are
not explicitly understood or taken into account. For example,
many poor people survived the Malawi famine in 2001/2002,
which was primarily caused by failed maize crop production
through flooding and drought, by harvesting food, such as
fruits and bush millet from remaining natural habitats. It is
easily conceivable that the national response to challenges
highlighted with the FEEDME analysis presented earlier may
result in increased pressure on natural habitats through more
natural land conversion to cropland. This may in turn generate
perverse incentives for local communities, which increase
pressure on the ES that they depend on. Conversely, the
application of the ES framework, as we have outlined above,
could lead to the recognition of the spatially and temporally
differentiated importance of ES to different societal groups.
A clear goal to resolve trade-offs to the benefit of the poorest
could give rise to a response which focuses on improving the

rstb.royalso
10
on May 31, 2018http://rstb.royalsocietypublishing.org/Downloaded from
enabling environment (e.g. provision of community natural
resource management rights and expertise) needed to support
the coping strategies of the rural poor, ultimately contribut-
ing to greater food security and more sustainable use of
the environment.
cietypublishing.orgPhil.Trans.R.Soc.B369:20120288
5. ConclusionMany forecasts of the future show that human development
cannot continue on the current trajectory without large-
scale changes in ES that underpin human well-being. Using
the example of the ES framework as applied to promoting
or ensuring food security, we have demonstrated the inextric-
able links between ES and human well-being, illustrated by
the situation in Malawi as a typical developing country.
From this, we offer the following conclusions:
(i) Business as usual in science, agriculture and ecosystem
management is not going to be sufficient to meet the chal-
lenges of near- and longer term futures, especially in the
face of ‘perfect storm’ combinations of stressors. We need
novelty in the questions asked and the frameworks used.
(ii) Food security represents the epitome of needing the natural
and social sciences to work together in interdisciplinary
ways and, for implementation, in transdisciplinary ways.
The ES framework is a potentially useful vehicle for this.
Agriculture and food security are moulded by (non-
agricultural) ES and ES are impacted by agriculture,
population increase and climate change, making the
relationship both complex and very challenging.
(iii) Because of the need for novelty and inter- and transdis-
ciplinary cooperation, bundling of conceptual and
analytical frameworks is the key. No single framework
can capture all salient aspects of the system at
appropriate resolutions and at multiple scales. If used
at multiple scales, and with a view to impacts on differ-
ent societal groups, the DPSIR framework may be
helpful by explicitly focusing on drivers of different
kinds, their impacts and possible responses.
(iv) Average outcomes, predictions and policies are insuffi-
cient as demonstrated in our FEEDME example from
Malawi. There must be appropriate resolution to identify
who are the vulnerable, when, where and why, and how
these change with context and time. Uncertainty is a
reality and needs to be integral to frameworks used.
Agro-ecosystems, including managed forests and pastures,
cover almost 40% of the Earth’s terrestrial surface [130]. As
major providers and consumers of ES, effective and sustainable
management of these agro-ecosystems is essential within the
broader landscape. We conclude that implementing the ES fra-
mework to understand and negotiate trade-offs at the critical
interface between agro-ecosystems and less transformed systems
is a promising way forward for meeting the simultaneous needs
of food security and environmental sustainability.
Acknowledgements. The ideas and discussion developed in this paperwere formed during the authors’ participation in the ASSETS project(see http://espa-assets.org/). We thank two anonymous reviewersfor their constructive comments.
Funding statement. ASSETS is financially supported under the EcosystemServices for Poverty Alleviation Programme (ESPA) project no.NE-J002267-1. The ESPA programme is financially supported by theDepartment for International Development (DFID), the Economic andSocial Research Council (ESRC) and the Natural Environment ResearchCouncil (NERC), as part of the UK’s Living with EnvironmentalChange Programme (LWEC). The Development of the FEEDMEmodel was financially supported under the NERC QUEST-GSI projectno. NE/E001866/1.
References
1. Beddington J. 2009 Food, energy, water and theclimate: a perfect storm of global events? InConference presentation given to the SustainableDevelopment UK Annual Conference, QEIIConference Centre, London, 19 March 2009. Seehttp://www.bis.gov.uk/assets/goscience/docs/p/perfect-storm-paper.pdf (accessed 1 September2013).
2. Godfray HCJ et al. 2010 Food security: the challengeof feeding 9 billion people. Science 327, 812 – 818.(doi:10.1126/science.1185383)
3. FAO. 2010 ‘Climate-smart’ agriculture: policies,practices and finances for food security, adaptationand mitigation. Rome, Italy: FAO.
4. Foresight. 2011 The future of food and farming:executive summary. London, UK: The GovernmentOffice for Science.
5. Godfray HCJ, Beddington JR, Crute IR, Haddad L,Lawrence D, Muir JF, Pretty J, Robinson S, ToulminC. 2010 Theme issue ‘food security: feeding theworld in 2050’. Phil. Trans. R. Soc. B 365,2767 – 3097. (doi:10.1098/rstb.2010.0181)
6. Tomlinson I. 2013 Doubling food production to feedthe 9 billion: a critical perspective on a key
discourse of food security in the UK. UK J. RuralStud. 29, 81 – 90.
7. FAO. 1996 Rome declaration on world food securityand world food summit plan of action, World FoodSummit 13 – 17 November 1996. Rome, Italy: FAO.
8. Barrett CB. 2010 Measuring food insecurity. Science327, 825 – 828. (doi:10.1126/science.1182768)
9. Zhang W, Ricketts TH, Kremen C, Carney K, SwintonSM. 2007 Ecosystem services and dis-services toagriculture. Ecol. Econ. 64, 253 – 260. (doi:10.1016/j.ecolecon.2007.02.024)
10. Vermeulen SJ, Campbell BM, Ingram JSI. 2012Climate change and food systems. Annu. Rev.Environ. Resour. 37, 195 – 222. (doi:10.1146/annurev-environ-020411-130608)
11. Gibbs HK, Ruesch AS, Achard F, Clayton MK,Holmgren P, Ramankutty N, Foley JA. 2010 Tropicalforests were the primary sources of new agriculturalland in the 1980s and 1990s. Proc. Natl Acad. Sci.USA 107, 16 732 – 16 737. (doi:10.1073/pnas.0910275107)
12. Wollenberg E, Campbell B, Holmgren P, Seymour F,Sibanda L, Von Braun J. 2011 Actions needed to haltdeforestation and promote climate-smart agriculture,
Policy Brief no. 4. Copenhagen, Denmark: CGIARResearch Program on Climate Change, Agricultureand Food Security (CCAFS).
13. Visseren-Hamakers IJ, McDermott C, Vijge MJ,Cashore B. 2012 Trade-offs, co-benefits andsafeguards: current debates on the breadth ofREDDþ. Curr. Opin. Environ. Sustain. 4, 646 – 653.(doi:10.1016/j.cosust.2012.10.005)
14. Foley JA et al. 2005 Global consequences of landuse. Science 309, 570 – 574. (doi:10.1126/science.1111772)
15. UNEP. 2011 Food and ecological security: identifyingsynergy and trade-offs. UNEP policy series ecosystemmanagement issue no. 4. Nairobi, Kenya: UNEP.
16. Power A. 2010 Ecosystem services and agriculture:tradeoffs and synergies. Phil. Trans. R. Soc. B 365,2959 – 2971. (doi:10.1098/rstb.2010.0143)
17. Millennium Ecosystem Assessment. 2005 Ecosystemsand human well-being: synthesis. Washington, DC:Island Press.
18. Fisher B, Turner RK, Morling P. 2009 Defining andclassifying ecosystem services for decision making.Ecol. Econ. 68, 643 – 653. (doi:10.1016/j.ecolecon.2008.09.014)

rstb.royalsocietypublishing.orgPhil.Trans.R.Soc.B
369:20120288
11
on May 31, 2018http://rstb.royalsocietypublishing.org/Downloaded from
19. Biggs R et al. 2004 Nature supporting people: thesouthern African millennium ecosystem assessment.Pretoria, South Africa: Council for Scientific andIndustrial Research.
20. USEPA. 2009 Ecosystem services decision support: aliving database of existing tools, approaches, andtechniques for supporting decisions related toecosystem services. Science brief publication no.EPA/600/R-09/102. USEPA, Washington, DC.
21. UK National Ecosystem Assessment. 2011 The UKnational ecosystem assessment: synthesis of the keyfindings. Cambridge, UK: UNEP-WCMC.
22. TEEB. 2010 The economics of ecosystems andBiodiversity. Mainstreaming the economics of nature:a synthesis of the approach, conclusions andrecommendations of TEEB. Nairobi, Kenya: UNEP.
23. Carpenter SR et al. 2012 Program on ecosystemchange and society: an international researchstrategy for integrated social – ecological systems.Curr. Opin. Environ. Sustain. 4, 134 – 138. (doi:10.1016/j.cosust.2012.01.001)
24. Smith RD, Maltby E. 2003 Using the ecosystemapproach to implement the convention on biologicaldiversity: key issues and case studies. Gland,Switzerland: IUCN.
25. Shepherd G. 2004 The ecosystem approach: five stepsto implementation. Gland, Switzerland: IUCN.
26. Zomer R, Trabucco A, Coe R, Place F. 2009 Trees onfarm: analysis of global extent and geographicalpatterns of agroforestry. ICRAF Working Paper 89.World Agroforestry Centre, Nairobi, Kenya.
27. UNDP. 2013 Human development report 2013. Therise of the South: human progress in a diverse world.New York, NY: UNDP.
28. Government of Malawi. 2010 Malawi state ofenvironment and outlook 2010. Lilongwe, Malawi:Environmental Affairs Department.
29. Government of Malawi. 2010 Malawi millenniumdevelopment goals report. Lilongwe, Malawi:Ministry of Development Planning and Cooperation.
30. Sahley C, Groelsema B, Marchione T, Nelson D. 2005The governance dimensions of food security inMalawi. Washington, DC: USAID.
31. Ericksen PJ. 2008 Conceptualizing food systems forglobal environmental change research. Glob.Environ. Change 18, 234 – 245. (doi:10.1016/j.gloenvcha.2007.09.002)
32. Kusters K, Achdiawan R, Belcher B, Perez MR. 2006Balancing development and conservation? Anassessment of livelihood and environmentaloutcomes of nontimber forest product trade in Asia,Africa, and Latin America. Ecol. Soc. 11, 20.
33. Marshall E, Schreckenberg K, Newton AC (eds). 2006Commercialization of non-timber forest products.Cambridge, UK: UNEP-WCMC.
34. Bharucha Z, Pretty J. 2010 The roles and values ofwild foods in agricultural systems. Phil.Trans. R. Soc. B 365, 2913 – 2926. (doi:10.1098/rstb.2010.0123)
35. Dugan P, Delaporte A, Andrew N, O’Keefe M,Welcomme R. 2010 Blue harvest: inland fisheries asan ecosystem service. Working Paper 39222.WorldFish Center, Penang, Malaysia.
36. McGarry DK, Shackleton CM. 2009 Childrennavigating rural poverty: rural children’s use of wildresources to counteract food insecurity in theEastern Cape, South Africa. J. Child. Poverty 15,19 – 37. (doi:10.1080/10796120802677594)
37. Challe JFX, Price LL. 2009 Endangered edible orchidsand vulnerable gatherers in the context of HIV/AIDSin the Southern Highlands of Tanzania. J. Ethnobiol.Ethnomed. 5, 41. (doi:10.1186/1746-4269-5-41)
38. Harvey CA, Rakotobe ZL, Rao NS, Dave R,Razafimahatratra H, Rabarijohn RH, Rajaofara H,MacKinnon JL. 2014 Extreme vulnerability ofsmallholder farmers to agricultural risks and climatechange in Madagascar. Phil. Trans. R. Soc. B 369,20130089. (doi:10.1098/rstb.2013.0089)
39. Holzschuh A, Dudenhoffer J-H, Tscharntke T. 2012Landscapes with wild bee habitats enhancepollination, fruit set and yield of sweet cherry. Biol.Conserv. 153, 101 – 107. (doi:10.1016/j.biocon.2012.04.032)
40. Jha S, Vandermeer JH. 2010 Impacts of coffee andagroforestry management on tropical forest beecommunities. Biol. Conserv. 143, 1423 – 1431.(doi:10.1016/j.biocon.2010.03.017)
41. Montero-Castano A, Vila M. 2012 Impact oflandscape alteration and invasions on pollinators: ameta-analysis. J. Ecol. 100, 884 – 893. (doi:10.1111/j.1365-2745.2012.01968.x)
42. Bianchi FJJa, Booij CJH, Tscharntke T. 2006Sustainable pest regulation in agriculturallandscapes: a review on landscape composition,biodiversity and natural pest control. Proc. R. Soc. B273, 1715 – 1727. (doi:10.1098/rspb.2006.3530)
43. Mazet JaK, Clifford DL, Coppolillo PB, Deolalikar AB,Erickson JD, Kazwala RR. 2009 A ‘one health’approach to address emerging zoonoses: the HALIproject in Tanzania. PLoS Med. 6, e1000190. (doi:10.1371/journal.pmed.1000190)
44. McMichael A, Scholes R, Hefny M, Pereira E, Palm C,Foale S. 2005 Linking ecosystem services and humanwell-being. Ecosystem and human well-being:multiscale assessment. In Ecosystems and human well-being: multi-scale assessments. Millenium ecosystemassessment series, 4 (eds D Capistrani, CK Samper,MJ Lee, C Raudsepp-Hearne), pp. 43 – 60. Washington,DC: Island Press.
45. World Food Programme. 2012 Handbook on safeaccess to firewood and alternative energey (SAFE).Rome, Italy: World Food Programme.
46. Reddy AKN. 2000 Energy and social issues. In Worldenergy assessment: energy and the challenge ofsustainability (ed. J Goldemberg), pp. 39 – 60.New York, NY: UNDP.
47. Belcher B, Schreckenberg K. 2007 Commercialisationof non-timber forest products: a reality check. Dev.Policy Rev. 25, 355 – 377. (doi:10.1111/j.1467-7679.2007.00374.x)
48. Kamanga P, Vedeld P, Sjaastad E. 2009 Forestincomes and rural livelihoods in Chiradzulu District,Malawi. Ecol. Econ. 68, 613 – 624. (doi:10.1016/j.ecolecon.2008.08.018)
49. Shackleton SE, Campbell B, Lotz-Sisitka H,Shackleton CM. 2008 Links between the local trade
in natural products, livelihoods and povertyalleviation in a semi-arid region of South Africa.World Dev. 36, 505 – 526. (doi:10.1016/j.worlddev.2007.03.003)
50. Chandrakanth MG, Bhat MG, Accavva MS. 2004Socio-economic changes and sacred groves in SouthIndia: protecting a community-based resourcemanagement institution. Nat. Resour. Forum 28,102 – 111. (doi:10.1111/j.1477-8947.2004.00077.x)
51. Maundu P, Berger D, Saitabau C, Nasieku J, KipelianM, Mathenge S, Morimoto Y, Hoft R. 2001Ethnobotany of the Loita Maasai: towardscommunity management of the forest of the lostchild—experiences from the Loita Ethnobotanyproject. People and plants Working Paper 8.UNESCO, Paris, France.
52. Zegeye H, Teketay D, Kelbessa E. 2011 Diversityand regeneration status of woody species in TaraGedam and Abebaye forest, northwestern Ethiopia.J. Forestry Res. 22, 315 – 328. (doi:10.1007/s11676-011-0176-6)
53. Koch EW et al. 2009 Non-linearity in ecosystemservices: temporal and spatial variability in coastalprotection. Front. Ecol. Environ. 7, 29 – 37. (doi:10.1890/080126)
54. Delacote P. 2009 Commons as insurance: safety netsor poverty traps? Environ. Dev. Econ. 14, 305 – 322.(doi:10.1017/S1355770X08004993)
55. Shackleton C, Shackleton S. 2004 The importance ofnon-timber forest products in rural livelihoodsecurity and as safety nets: a review of evidencefrom South Africa. South Afr. J. Sci. 100, 658 – 664.
56. Devereux S, Longhurst R. 2010 Incorporatingseasonality into agricultural project design andlearning. IDS Bull. 41, 88 – 95. (doi:10.1111/j.1759-5436.2010.00186.x)
57. McSweeney K. 2005 Natural insurance, forest access,and compounded misfortune: forest resources insmallholder coping strategies before and afterHurricane Mitch, northeastern Honduras. WorldDev. 33, 1453 – 1471. (doi:10.1016/j.worlddev.2004.10.008)
58. Toivonen JM, Kessler M, Ruokolainen K, Hertel D.2011 Accessibility predicts structural variation ofAndean Polylepis forests. Biodivers. Conserv. 20,1789 – 1802. (doi:10.1007/s10531-011-0061-9)
59. Sorenson SB, Morssink C, Campos PA. 2011 Safeaccess to safe water in low income countries: waterfetching in current times. Soc. Sci. Med. 72,1522 – 1526. (doi:10.1016/j.socscimed.2011.03.010)
60. Dawson TP, Rounsevell MDa, Kluvankova-Oravska T,Chobotova V, Stirling A. 2010 Dynamic properties ofcomplex adaptive ecosystems: implications for thesustainability of service provision. Biodivers. Conserv.19, 2843 – 2853. (doi:10.1007/s10531-010-9892-z)
61. Lovell C, Mandondo A, Moriarty P. 2002 Thequestion of scale in integrated natural resourcemanagement. Conserv. Ecol. 5, 25.
62. Tscharntke T, Klein AM, Kruess A, Steffan-DewenterI, Thies C. 2005 Landscape perspectives onagricultural intensification and biodiversity:ecosystem service management. Ecol. Lett. 8,857 – 874. (doi:10.1111/j.1461-0248.2005.00782.x)

rstb.royalsocietypublishing.orgPhil.Trans.R.Soc.B
369:20120288
12
on May 31, 2018http://rstb.royalsocietypublishing.org/Downloaded from
63. Chazdon RL, Harvey CA, Komar O, Griffith DM,Ferguson BG, Mart M. 2009 Beyond reserves: aresearch agenda for conserving biodiversity inhuman-modified tropical landscapes. Biotropica 41,142 – 153. (doi:10.1111/j.1744-7429.2008.00471.x)
64. Scherr SJ, McNeely J. 2008 Biodiversity conservationand agricultural sustainability: towards a newparadigm of ‘ecoagriculture’ landscapes. Phil.Trans. R. Soc. B 363, 477 – 494. (doi:10.1098/rstb.2007.2165)
65. Daw T, Brown K, Rosendo S, Pomeroy R. 2011Applying the ecosystem services concept to povertyalleviation: the need to disaggregate human well-being. Environ. Conserv. 38, 370 – 379. (doi:10.1017/S0376892911000506)
66. Reyers B, Biggs R, Cumming GS, Elmqvist T,Hejnowicz AP, Polasky S. 2013 Getting the measureof ecosystem services: a social – ecological approach.Front. Ecol. Environ. 11, 268 – 273. (doi:10.1890/120144)
67. FAO, WFP & IFAD. 2012 The state of food insecurityin the world 2012. Economic growth is necessary butnot sufficient to accelerate reduction of hunger andmalnutrition. Rome, Italy: FAO.
68. Naiken L. 2003 FAO methodology for estimating theprevalence of undernourishment. In Measurementand assessment of food deprivation andundernutrition, International Sci. Symp., 26 – 28June, 2002. Rome, Italy: FAO. See http://www.fao.org/docrep/005/Y4249E/y4249e00.htm#Contents(accessed 1 September 2013).
69. Van Jaarsveld AS, Biggs R, Scholes RJ, Bohensky E,Reyers B, Lynam T, Musvoto C, Fabricius C. 2005Measuring conditions and trends in ecosystemservices at multiple scales: the Southern Africanmillennium ecosystem assessment (SAfMA)experience. Phil. Trans. R. Soc. B 360, 425 – 441.(doi:10.1098/rstb.2004.1594)
70. Brown K, Corbera E. 2003 Exploring equity andsustainable development in the new carboneconomy. Clim. Policy 3, S41 – S56. (doi:10.1016/j.clipol.2003.10.004)
71. Ghazoul J, Butler R, Mateo-Vega J, Koh LP. 2010REDD: a reckoning of environment and developmentimplications. Trends Ecol. Evol. 25, 396 – 402.(doi:10.1016/j.tree.2010.03.005)
72. Mahanty S, Dressler W, Milne S, Filer C. 2013Unravelling property relations around forest carbon.Singapore J. Trop. Geogr. 34, 188 – 205. (doi:10.1111/sjtg.12024)
73. Sikor T. 2013 Introduction: linking ecosystemservices with environmental justice. In The justicesand inustices of ecosystem services (ed. T Sikor),pp. 1 – 18. Abingdon, UK: Routledge.
74. Bennett EM, Peterson GD, Gordon LJ. 2009Understanding relationships among multipleecosystem services. Ecol. Lett. 12, 1394 – 1404.(doi:10.1111/j.1461-0248.2009.01387.x)
75. Raudsepp-Hearne C, Peterseon GD, Bennett EM.2010 Ecosystem service bundles for analyzingtradeoffs in diverse landscapes. Proc. Natl Acad. Sci.USA 107, 5242 – 5247. (doi:10.1073/pnas.0907284107)
76. De Groot RS, Alkemade R, Braat L, Hein L, WillemenL. 2010 Challenges in integrating the concept ofecosystem services and values in landscapeplanning, management and decision making. Ecol.Complex. 7, 260 – 272. (doi:10.1016/j.ecocom.2009.10.006)
77. Robert N, Stenger A. 2013 Can payments solve theproblem of undersupply of ecosystem services?Forest Policy Econ. 35, 83 – 91. (doi:10.1016/j.forpol.2013.06.012)
78. Hansson L-A, Bronmark C, Anders Nilsson P,Abjornsson K. 2005 Conflicting demands on wetlandecosystem services: nutrient retention, biodiversityor both? Freshwater Biol. 50, 705 – 714. (doi:10.1111/j.1365-2427.2005.01352.x)
79. Jackson RB et al. 2005 Trading water for carbonwith biological carbon sequestration. Science 310,1944 – 1947. (doi:10.1126/science.1119282)
80. Kareiva PM, Tallis H, Ricketts T, Daly G. 2011Natural capital: theory and practice of mappingecosystem services. New York, NY: OxfordUniversity Press.
81. Bagstad KJ, Villa F, Johnson GW, Voigt B. 2011ARIES – ARtificial Intelligence for Ecosystem Services:a guide to models and data, version 1.0. ARIESreport series no. 1. Burlington, VT: ARIESConsortium.
82. Bagstad KJ, Johnson GW, Voigt B, Villa F. 2012Spatial dynamics of ecosystem service flows: acomprehensive approach to quantifying actualservices. Ecosyst. Serv. I4, 117 – 125. (doi:10.1016/j.ecoser.2012.07.012)
83. Carpenter SR et al. 2009 Science for managingecosystem services: beyond the millenniumecosystem assessment. Proc. Natl Acad. Sci. USA106, 1305 – 1312. (doi:10.1073/pnas.0808772106)
84. Swetnam RD et al. 2011 Mapping socio-economicscenarios of land cover change: a GIS method toenable ecosystem service modelling. J. Environ.Manag. 92, 563 – 574. (doi:10.1016/j.jenvman.2010.09.007)
85. Farley J. 2008 The role of prices in conservingcritical natural capital. Conserv. Biol. 22, 1399 –1408. (doi:10.1111/j.1523-1739.2008.01090.x)
86. Villa F, Bagstad K, Johnson GW, Voigt B. 2011Scientific instruments for climate changeadaptation: estimating and optimizing the efficiencyof ecosystem services provision. Economia Agraria yRecursos Naturales 11, 83 – 98.
87. Rapport D, Friend A. 1979 Towards a comprehensiveframework for environmental statistics: a stressresponse approach. Statistics Canada Catalogue11 – 510. Ottawa, Canada: Minister of Supply andServices Canada.
88. Atkins JP, Burdon D, Elliott M, Gregory AJ. 2011Management of the marine environment:integrating ecosystem services and societal benefitswith the DPSIR framework in a systems approach.Mar. Pollut. Bull. 62, 215 – 226. (doi:10.1016/j.marpolbul.2010.12.012)
89. Rounsevell MDA, Dawson TP, Harrison PA. 2010 Aconceptual framework to assess the effects ofenvironmental change on ecosystem services.
Biodivers. Conserv. 19, 2823 – 2842. (doi:10.1007/s10531-010-9838-5)
90. Maxim L, Spangenberg JH, O’Connor M. 2009 Ananalysis of risks for biodiversity under the DPSIRframework. Ecol. Econ. 69, 12 – 23. (doi:10.1016/j.ecolecon.2009.03.017)
91. Forsyth T. 2003 Critical political ecology: the politicsof environmental science. London, UK: Routledge.
92. Kallis G, Gomez-Baggethun E, Zografos C. 2013To value or not to value? That is not the question.Ecol. Econ. 94, 97 – 105. (doi:10.1016/j.ecolecon.2013.07.002)
93. Laband DN. 2013 The neglected stepchildren offorest-based ecosystem services: cultural, spiritual,and aesthetic values. Forest Policy Econ. 35, 39 – 44.(doi:10.1016/j.forpol.2013.06.006)
94. Ribot JC. 2003 Democratic decentralisation ofnatural resources: institutional choice anddiscretionary power transfers in Sub-Saharan Africa.Public Adm. Dev. 23, 53 – 65. (doi:10.1002/pad.259)
95. McDermott MH, Mahanty S, Schreckenberg K. 2012Examining equity: a multidimensional frameworkfor assessing equity in payments for ecosystemservices. Ecol. Soc. 33, 416 – 427. (doi:10.1016/j.envsci.2012.10.006)
96. Mutunga C, Zulu E, De Souza R. 2012 Populationdynamics, climate change, and sustainabledevelopment in Africa. Nairobi, Kenya: AFIDEP. Seehttp://www.afidep.org/images/downloads/pai_afidep_regional_reportsept2012.pdf (accessed1 September 2013).
97. National Statistics Office (NSO) and ICF Macro. 2011Malawi demographic and health survey 2010.Calverton, MA: NSO and ICF Macro.
98. World Bank. 2012 World Bank online data 2012. Seehttp://data.worldbank.org/country/malawi (accessed1 September 2013).
99. Malawi Vulnerability Assessment Committee(MVAC). 2012 National Food Security Assessment:June 2012 and October 2012. See http://reliefweb.int/sites/reliefweb.int/files/resources/Malawi%20-%20Humanitarian%20Bulletin%20Southern%20Africa%2C%20Issue%2007%20-%20November%202012.pdf (accessed 1 September 2013).
100. Maxwell D. 1996 Measuring food insecurity: thefrequency and severity of ‘coping strategies’. FoodPolicy 21, 291 – 303. (doi:10.1016/0306-9192(96)00005-X)
101. FAO. 2001 Food balance sheets: a handbook. Rome,Italy: FAO.
102. Challinor AJ, Wheeler TR, Craufurd PQ, Slingo JM,Grimes DIF. 2004 Design and optimisation of alarge-area process-based model for annual crops.Agric. Forest Meteorol. 124, 99 – 120. (doi:10.1016/j.agrformet.2004.01.002)
103. Arnell NW, Wheeler T, Osborne T, Rose R, GoslingSN, Dawson TP, Penn AS, Perryman AN. 2010 Theimplications of climate policy for avoided impacts onwater and food security. Report to DECC/DEFRA.Exeter, UK: Met Office.
104. Jerven M. 2013 Poor numbers: how we are misledby African development statistics and what to doabout it. Ithaca, NY: Cornell University Press.

rstb.royalsocietypublishing.orgPhil.Trans.R.Soc.B
369:20120288
13
on May 31, 2018http://rstb.royalsocietypublishing.org/Downloaded from
105. High C, Shackleton CM. 2000 The comparative valueof wild and domestic plants in home gardens of aSouth African rural village. Agroforestry Syst. 48,141 – 156. (doi:10.1023/A:1006247614579)
106. Golden CD, Fernald LCH, Brashares JS,Rasolofoniaina BJR, Kremen C. 2011 Benefits ofwildlife consumption to child nutrition in abiodiversity hotspot. Proc. Natl Acad. Sci. USA 108,19 653 – 19 656. (doi:10.1073/pnas.1112586108)
107. Jumbe CBL, Angelsen A. 2011 Modeling choice offuelwood source among rural households in Malawi:a multinomial probit analysis. Energy Econ. 33,732 – 738. (doi:10.1016/j.eneco.2010.12.011)
108. Abu-Basutu K. 2013 The contribution of wild foodsto food security in the face of climate change andHIV/AIDS. MSc thesis. Rhodes University,Grahamstown, South Africa.
109. Luck GW, Ricketts TH, Daily GC, Imhoff M. 2004Alleviating spatial conflcits between people andbiodiversity. Proc. Natl Acad. Sci. USA 101,182 – 186. (doi:10.1073/pnas.2237148100)
110. Pretty JN, Guijt I, Thompson J, Scoones I. 1995Participatory learning and action: a trainer’s guide.London, UK: International Institute for Environmentand Development.
111. World Bank. 2007 Participatory tools for micro-levelpoverty and social impact analysis. PSIA Sourcebook(online). See http://go.worldbank.org/ZGZHJEDBZ0(accessed 11 August 2013).
112. Termote C, van Damme P, Djailo BD. 2011 Eatingfrom the wild: Turumbu, Mbole and Bali traditionalknowledge on non-cultivated edible plants, DistrictTshopo, DRCongo. Genet. Resour. Crop Evol. 58,585 – 618. (doi:10.1007/s10722-010-9602-4)
113. Ali M, Delisle HF. 1999 A participatory approach toassessing Malawi villagers’ perception of their ownfood security. Ecol. Food Nutr. 38, 101 – 121.(doi:10.1080/03670244.1999.9991572)
114. Kayambazinthu D. 2005 HIV/AIDS and the miombowoodlands of Mozambique and Malawi: an exploratorystudy. Part 3: Malawi case study findings. Rome, Italy:FAO. See ftp://ftp.fao.org/docrep/fao/008/j4827e/j4827e00.pdf (accessed 1 September 2013)
115. Fagerholm N, Kayhko N, Ndumbaro F, Khamis M.2012 Community stakeholders’ knowledge inlandscape assessments: mapping indicators forlandscape services. Ecol. Indicators 18, 421 – 433.(doi:10.1016/j.ecolind.2011.12.004)
116. Nedkov S, Burkhard B. 2012 Flood regulatingecosystem services: mapping supply and demand,in the Etropole municipality, Bulgaria. Ecol.Indicators 21, 67 – 79. (doi:10.1016/j.ecolind.2011.06.022)
117. Kaschula SA. 2008 Wild foods and household foodsecurity responses to AIDS: evidence from SouthAfrica. Popul. Environ. 29, 162 – 185. (doi:10.1007/s11111-008-0068-7)
118. Najnin N, Sinclair M, Forbes A, Leder K. 2012Community based study to compare the incidenceand health services utilization pyramid forgastrointestinal, respiratory and dermal symptoms.BMC Health Serv. Res. 12, 211. (doi:10.1186/1472-6963-12-211)
119. Blankson B, Hall A. 2012 The anthropometric statusof elderly women in rural Ghana and factorsassociated with low body mass index. J. Nutr.Health Aging 16, 881 – 886. (doi:10.1007/s12603-012-0065-5)
120. Lartey A. 2008 Maternal and child nutrition in sub-Saharan Africa: challenges and interventions. Proc.Nutr. Soc. 67, 105 – 108. (doi:10.1017/S0029665108006083)
121. WHO. 2003 Global strategy for infant and youngchild feeding. Geneva, Switzerland: WHO.
122. Hunter LM, De Souza R-M, Twine W. 2008 Theenvironmental dimensions of the HIV/AIDS
pandemic: a call for scholarship and evidence-basedintervention. Popul. Environ. 29, 103 – 107. (doi:10.1007/s11111-008-0069-6)
123. Fisher M, Chaudhury M, McCusker B. 2010 Doforests help rural households adapt to climatevariability? Evidence from Southern Malawi. WorldDev. 38, 1241 – 1250. (doi:10.1016/j.worlddev.2010.03.005)
124. MARGE. 2009 Malawi biomass energy strategy.Consultancy study for the government of Malawi andEuropean Union partnership dialogue facility.Lilongwe, Malawi: Marechage et Gestion del’Environnement (MARGE).
125. Macqueen D, Korhaliller S. 2011 Bundles of energy:the case for renewable biomass energy. NaturalResource Issues No. 24. London, UK: InternationalInstitute for Environment and Development.
126. Kambewa PS, Mataya BF, Sichinga WK, Johnson TR.2007 Charcoal: the reality—a study of charcoalconsumption, trade and production in Malawi. Smalland medium forestry enterprise series no. 21.London, UK: International Institute for Environmentand Development.
127. Zulu LC. 2010 The forbidden fuel: charcoal, urbanwoodfuel demand and supply dynamics,community forest management and woodfuelpolicy in Malawi. Energy Policy 38, 3717 – 3730.(doi:10.1016/j.enpol.2010.02.050)
128. Persha L, Agrawal A, Chhatre A. 2011 Social andecological synergy: local rulemaking, forestlivelihoods, and biodiversity conservation. Science331, 1606 – 1608. (doi:10.1126/science.1199343)
129. Ribot JC. 1995 From exclusion to participation:turning Senegal’s forestry policy around? World Dev.23, 1587 – 1599. (doi:10.1016/0305-750X(95)00060-P)
130. FAO. 2009 The state of food and agriculture, 2009.Rome, Italy: FAO.