review nitrous oxide emissions from wastewater treatment...
TRANSCRIPT
on June 18, 2018http://rstb.royalsocietypublishing.org/Downloaded from
Phil. Trans. R. Soc. B (2012) 367, 1265–1277
doi:10.1098/rstb.2011.0317
Review
* Autho
One conoxide: th
Nitrous oxide emissions from wastewatertreatment processes
Yingyu Law, Liu Ye, Yuting Pan and Zhiguo Yuan*
Advanced Water Management Centre (AWMC), The University of Queensland, St Lucia,Queensland 4072, Australia
Nitrous oxide (N2O) emissions from wastewater treatment plants vary substantially between plants,ranging from negligible to substantial (a few per cent of the total nitrogen load), probably because ofdifferent designs and operational conditions. In general, plants that achieve high levels of nitrogenremoval emit less N2O, indicating that no compromise is required between high water quality andlower N2O emissions. N2O emissions primarily occur in aerated zones/compartments/periods owingto active stripping, and ammonia-oxidizing bacteria, rather than heterotrophic denitrifiers, are themain contributors. However, the detailed mechanisms remain to be fully elucidated, despitestrong evidence suggesting that both nitrifier denitrification and the chemical breakdown of inter-mediates of hydroxylamine oxidation are probably involved. With increased understanding of thefundamental reactions responsible for N2O production in wastewater treatment systems and theconditions that stimulate their occurrence, reduction of N2O emissions from wastewater treatmentsystems through improved plant design and operation will be achieved in the near future.
Keywords: emissions; greenhouse gases; nitrous oxide; nitrogen removal; wastewater treatment
1. INTRODUCTIONNitrous oxide (N2O) is a potent greenhouse gas, whichaccounts for 7.9 per cent of the global anthropogenicgreenhouse gas emissions in 2004 [1]. It is also pre-dicted to be the most dominant ozone-depletingsubstance in the twenty-first century [2]. Since 1750,the atmospheric N2O concentration has increased byabout 16 per cent, from around 270 ppb, to 319 ppbin 2005. Human activity has been responsible for40–50% of the annual increase in N2O emissionsover its pre-industrial levels [1]. While agriculture isthe major contributor accounting for 80 per cent ofthe anthropogenic N2O source, other contributorsinclude biomass and fossil combustion, manure man-agement, adipic acid and nitric acid production andwaste management [1,3].
Since the first published data by Czepiel et al. [4],reporting N2O emissions from a wastewater treatmentplant, awareness and concern of N2O emissions duringwastewater treatment have grown significantly amongurban water authorities. Owing to the complexityinvolved in measuring N2O emissions from full-scaleplants and the lack of standardized measurementmethods, N2O emissions for the wastewater sectorhave been estimated based on models without theinput of measured data. The Environmental Protec-tion Agency of the United States [5] reported thatN2O from the wastewater sector accounts for about3 per cent of N2O emissions from all sources and
r for correspondence ([email protected]).
tribution of 12 to a Theo Murphy Meeting Issue ‘Nitrouse forgotten greenhouse gas’.
1265
ranks as the sixth largest contributor. Similarly, theIntergovernmental Panel on Climate Change alsoreports that N2O emissions from wastewater accountfor approximately 2.8 per cent of the total anthropo-genic sources [1]. Global N2O emissions fromwastewater treatment are expected to increase byapproximately 13 per cent between 2005 and 2020.
N2O is mainly released during biological nitrogenremoval in biological nutrient removal (BNR) plants.There are various configurations of BNR plants thatcan achieve high levels of nitrogen removal from waste-water by promoting nitrification and denitrification indifferent reaction zones. N2O is a known obligatoryintermediate in the heterotrophic denitrification path-way and is also produced by autotrophic nitrifyingbacteria, mainly ammonia-oxidizing bacteria (AOB)[6], as a by-product.
The microbial nitrogen transformation processes ina wastewater treatment plant are fundamentally thesame as in other environments such as soil, marineand freshwater habitats. However, unlike most otherenvironments, wastewater treatment plants are engin-eered systems designed to achieve high nitrogenconversion rates. There are several key features thatdistinguish these plants from other environments:
— Domestic wastewater usually contains relativelyhigh concentrations of nitrogen, around 20–70 mg l21 total nitrogen as N. In order to attainalmost complete nitrogen removal within 3–8 h,high nitrogen loading rates are applied, incurringrelatively high nitrification and denitrificationrates [7]. These are expected to impact on therate of N2O production.
This journal is q 2012 The Royal Society

biologicalreaction tank
clarifier
influent
(a)
(b)
(c)
(d)
effluent
return activated sludge
mixedliquor
aerobic
clarifier
influent
mixed liquor recycle
return activated sludge
anoxic
anoxic
aerobic
influent
clarifier
return activated sludge
aerator
influent
fill settle decant
air
effluent
wastesludge
effluent
wastesludge
waste sludge
effluent
wastesludge
anoxicmix
aerobicmix
idle
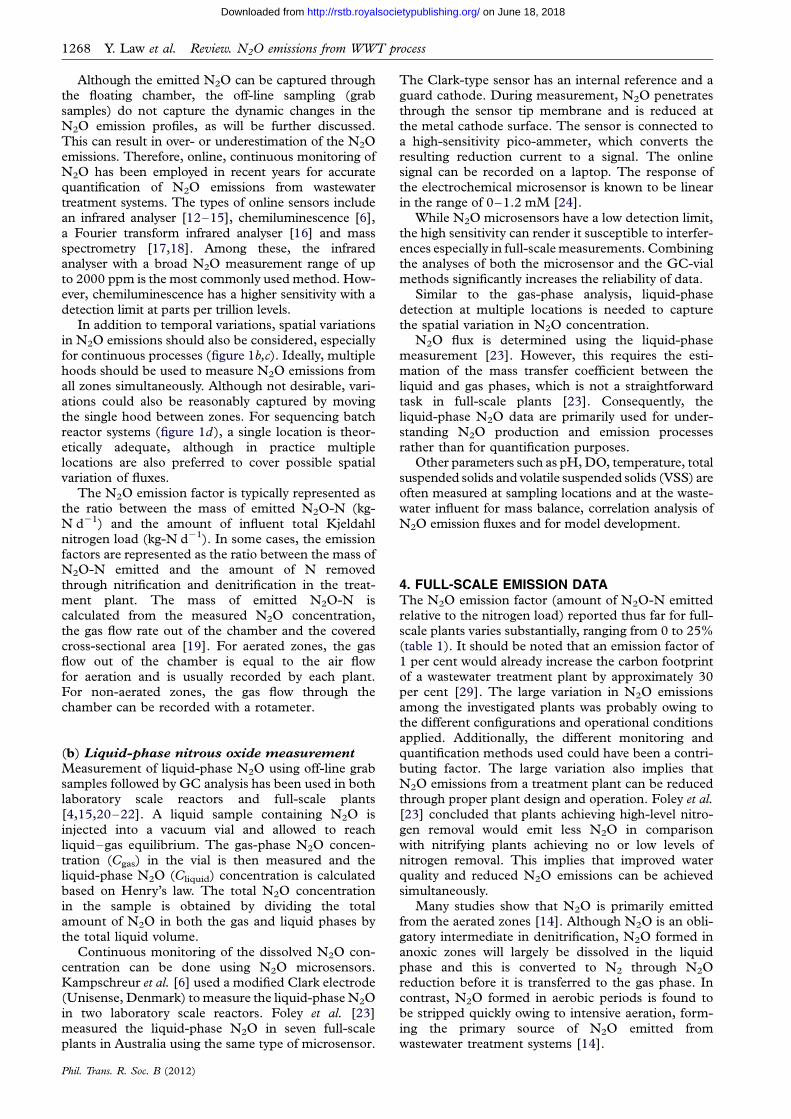
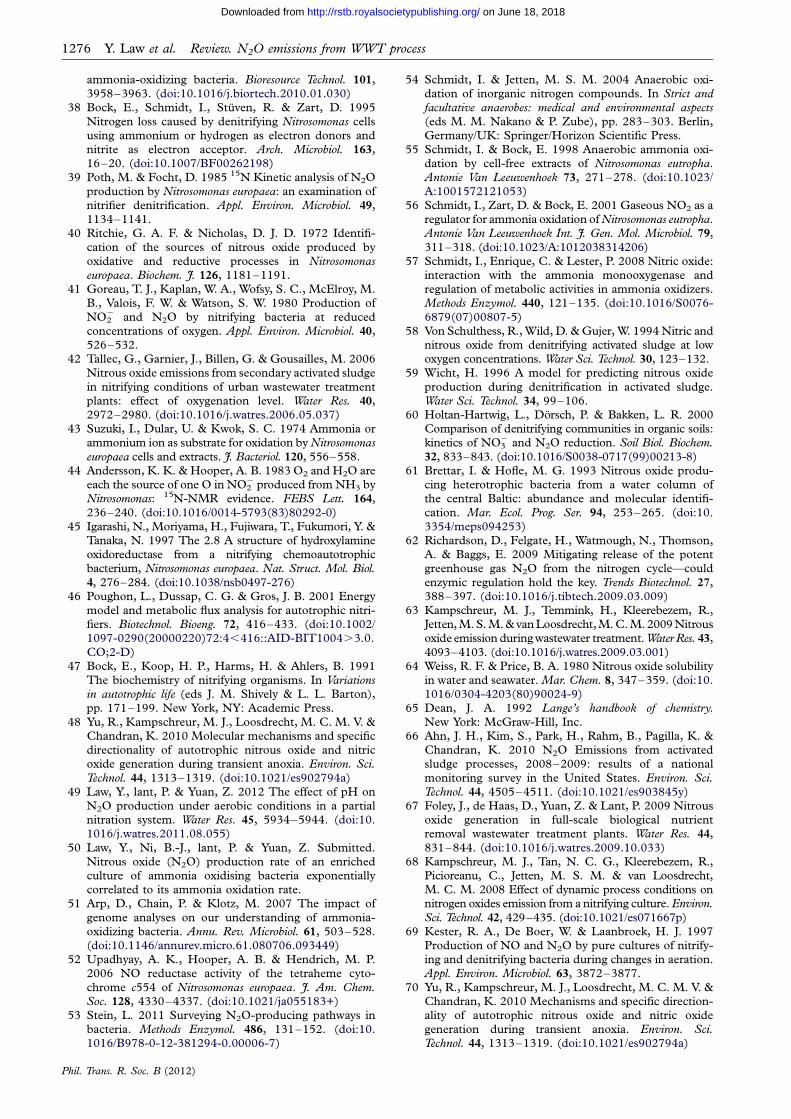
Figure 1. Diagram of (a) a conventional activated sludge system; (b) a modified Ludzack–Ettinger system; (c) an oxidationditch; and (d) a sequencing batch reactor system.
1266 Y. Law et al. Review. N2O emissions from WWT process
on June 18, 2018http://rstb.royalsocietypublishing.org/Downloaded from
— Bacterial communities in the plants are subjectedto rapid changes in process conditions that areapplied to promote aerobic or anoxic microbialreactions. Such rapid changes in environmentalconditions probably cause physiological stress toboth the nitrifying and denitrifying communities,with the potential to induce transient behaviours.
— Active aeration is used to induce aerobic con-ditions. The aeration systems are engineered toefficiently provide oxygen to the bioreactor, whichalso enables efficient transfer of N2O from theliquid phase to the gas phase. Therefore, any tem-porary imbalance between N2O production andconsumption could result in accumulation andthen stripping of N2O during aeration.
— Given that wastewater treatment systems are highlyengineered systems, there are opportunities to miti-gate N2O emissions by improving process designand/or operational conditions.
In this paper, we review the key outcomes arising fromthe research on N2O production and emissions fromwastewater systems. Following a brief description ofthe design and operation of wastewater treatment sys-tems, the methods for measuring N2O in wastewater
Phil. Trans. R. Soc. B (2012)
systems and the emission rates thus far measured aresummarized. This is followed by discussions on thekey metabolic pathways contributing to N2O pro-duction, and the most important influencing factors.Finally possible mitigation strategies are discussed.
2. DESIGN AND OPERATION OF BIOLOGICALWASTEWATER TREATMENT PLANTS(a) Activated sludge systems for biological
wastewater treatment
Activated sludge is the most widely used process forbiological treatment of wastewater. This process usesa microbial community suspended in wastewater tometabolize the biodegradable organic and inorganiccomponents. The microbial community usuallyclumps together forming three-dimensional aggregatesor flocs, known as activated sludge. The sludge andwastewater mixture is called the mixed liquor andthe treatment process takes place in a biological reac-tion tank (bioreactor). At the end of the biologicaltreatment process, the mixed liquor is passed intothe clarifier where the sludge is settled and separatedfrom the treated water (figure 1a) [7]. The latter is dis-charged as the effluent. Most of the settled sludge isreturned to the bioreactor, with a hydraulic flow rate
Review. N2O emissions from WWT process Y. Law et al. 1267
on June 18, 2018http://rstb.royalsocietypublishing.org/Downloaded from
that is comparable with that of the influent flow. Asmall fraction of the sludge, called the waste activatedsludge, is removed and disposed of after several stepsof sludge treatment (figure 1a). The rate of sludgewastage determines the average amount of time thatthe sludge is retained in the activated sludge system,and is termed the solids retention time. The keycomponents typically removed during the activatedsludge treatment process are solids, organic carboncompounds, nitrogen and phosphorus.
(b) Biological processes for nitrogen removal
Nitrogen in wastewater is present in the form of com-plex organic nitrogen compounds, ammonium (NH4
þ),and low (often negligible) levels of nitrite (NO2
2) andnitrate (NO3
2) [7]. The organic nitrogen fractionsuch as amino acids, amino sugars and proteins arereadily converted to NH4
þ by microbial degradationin sewer systems and in the bioreactor. In conventionalBNR plants, NH4
þ is first converted to NO22 and NO3
2
via autotrophic nitrification, which is followed bythe reduction of NO3
2 and NO22 by heterotrophic
denitrification to form N2.The bioreactor used for nitrogen removal provides
conditions enabling both nitrification and denitrifica-tion. Aerobic conditions are required for nitrification,whereas a sufficient amount of organic carbon com-pound is required to support denitrification underanoxic conditions. To achieve this, conventionalBNR plants are usually configured as continuous sys-tems whereby wastewater flows through thedenitrification and nitrification processes, which areseparated into either different compartments or zones.
In a typical modified Ludzack–Ettinger configur-ation, an anoxic compartment/zone precedes theaerobic compartment (figure 1b) [7]. At the end ofthe aerobic compartment, the nitrified wastewatercontaining NO3
2 is re-circulated back to the anoxiccompartment with a flow rate that is a few times thatof the wastewater influent. Wastewater is also fed tothe anoxic compartment, which provides the organiccarbon for denitrification. A wide range of solidsretention time (10–30 days) depending on treatmentneeds can be applied. There are many variantsof this configuration. For example, another pair ofanoxic and aerobic compartments can be added tothe end of the bioreactor shown in figure 1b, to forma four-stage anoxic–aerobic–anoxic–aerobic process.With this design, wastewater is often fed to both thefirst and second anoxic compartments, thus resultingin a step-feed process. In all cases, the sludge, wheremicro-organisms reside, is passed between anoxicand aerobic conditions frequently (in hours and inmany cases even less than an hour). The dissolvedoxygen (DO) concentration in the aerobic compart-ment is typically within the range of 0.5–2 mg l21.Although, in some cases could be outside of thisrange, particularly when the DO is not controlledautomatically. In comparison, DO in the anoxic com-partment is usually not detectable. However, a limitedamount of oxygen is brought into the anoxic compart-ment through the recirculation stream(s) and throughnatural surface oxygen transfer.
Phil. Trans. R. Soc. B (2012)
Figure 1c shows an oxidation ditch system, which isalso commonly used for BNR [7]. Oxidation ditchesare usually equipped with horizontal brush aeratorsto provide aeration and also to move the mixedliquor along the ditch at a relatively high velocity(0.25–0.35 m s21) [8]. Each pass of mixed liquor inthe ditch typically lasts for several minutes. A relativelyhigh DO concentration is obtained at or close to theaerator and anoxic conditions develop further awayfrom the aerator. The high recirculation flow and thelarge tank volume dampen the load variations, givingrise to more stable operating conditions in comparisonwith the modified Ludzack–Ettinger configuration(figure 1b). A further feature of an oxidation ditch isthat the DO is typically low (e.g. around 0.5 mg l21),favouring simultaneous nitrification and denitrifica-tion. Low DO conditions allow a buildup of anoxygen concentration gradient within the microbialflocs as a result of diffusion limitation. Nitrifiersreside at the outer layer of the flocs where there is suf-ficient oxygen supply, whereas denitrifiers can remainactive in the anoxic zone of the flocs allowing nitrifica-tion and denitrification to occur simultaneously [9].
Unlike continuous flow systems outlined above,sequencing batch reactors can also be used to achievethe removal of nitrogen and organic carbon. Aerobicand anoxic conditions are separated by time instead ofspace [10] (figure 1d). All the phases in continuous sys-tems that are spatially separated are provided in a singlereactor. A sequencing batch reactor mimics a plug-flowcontinuous system producing significant concentrationgradients of substrates and products with time.This clearly contrasts with the operational conditionsfound in an oxidation ditch. When a low DO(e.g. 0.5 mg l21) is provided during an aerobic periodof a sequencing batch reactor cycle, simultaneousnitrification and denitrification can also be encouraged.
3. NITROUS OXIDE MEASUREMENT INWASTEWATER TREATMENT PROCESSES(a) Gas-phase nitrous oxide measurement
In full-scale wastewater treatment plants, the N2Oemitted from activated sludge tanks is usually capturedusing a closed floating chamber. This technique wasoriginally adapted from emission measurements ofsolid surfaces. It was first used to measure N2O fluxfrom liquid surfaces in a municipal wastewater treat-ment plant located in Durham, New Hampshire inUSA [4]. During aeration, dissolved N2O was strippedfrom the liquid phase into the gas; during non-aeratedphases, air was blown into the headspace of thechamber for sampling. Owing to the lack of onlineN2O measurement at that time, samples were grabbedfrom the headspace of the chamber into 20 ml nylonsyringes at specific time intervals. Analysis for N2Owas accomplished using a gas chromatograph (GC)with an electron capture detector. A similar approachwas applied in full-scale studies [11] of an intermittentactivated sludge process in Japan. An air pump wasused to collect part of the emitted gas from a capturechamber into a gas sampling bag. During the anoxicperiod, argon was supplied into the chamber as asweeping gas.
1268 Y. Law et al. Review. N2O emissions from WWT process
on June 18, 2018http://rstb.royalsocietypublishing.org/Downloaded from
Although the emitted N2O can be captured throughthe floating chamber, the off-line sampling (grabsamples) do not capture the dynamic changes in theN2O emission profiles, as will be further discussed.This can result in over- or underestimation of the N2Oemissions. Therefore, online, continuous monitoring ofN2O has been employed in recent years for accuratequantification of N2O emissions from wastewatertreatment systems. The types of online sensors includean infrared analyser [12–15], chemiluminescence [6],a Fourier transform infrared analyser [16] and massspectrometry [17,18]. Among these, the infraredanalyser with a broad N2O measurement range of upto 2000 ppm is the most commonly used method. How-ever, chemiluminescence has a higher sensitivity with adetection limit at parts per trillion levels.
In addition to temporal variations, spatial variationsin N2O emissions should also be considered, especiallyfor continuous processes (figure 1b,c). Ideally, multiplehoods should be used to measure N2O emissions fromall zones simultaneously. Although not desirable, vari-ations could also be reasonably captured by movingthe single hood between zones. For sequencing batchreactor systems (figure 1d), a single location is theor-etically adequate, although in practice multiplelocations are also preferred to cover possible spatialvariation of fluxes.
The N2O emission factor is typically represented asthe ratio between the mass of emitted N2O-N (kg-N d21) and the amount of influent total Kjeldahlnitrogen load (kg-N d21). In some cases, the emissionfactors are represented as the ratio between the mass ofN2O-N emitted and the amount of N removedthrough nitrification and denitrification in the treat-ment plant. The mass of emitted N2O-N iscalculated from the measured N2O concentration,the gas flow rate out of the chamber and the coveredcross-sectional area [19]. For aerated zones, the gasflow out of the chamber is equal to the air flowfor aeration and is usually recorded by each plant.For non-aerated zones, the gas flow through thechamber can be recorded with a rotameter.
(b) Liquid-phase nitrous oxide measurement
Measurement of liquid-phase N2O using off-line grabsamples followed by GC analysis has been used in bothlaboratory scale reactors and full-scale plants[4,15,20–22]. A liquid sample containing N2O isinjected into a vacuum vial and allowed to reachliquid–gas equilibrium. The gas-phase N2O concen-tration (Cgas) in the vial is then measured and theliquid-phase N2O (Cliquid) concentration is calculatedbased on Henry’s law. The total N2O concentrationin the sample is obtained by dividing the totalamount of N2O in both the gas and liquid phases bythe total liquid volume.
Continuous monitoring of the dissolved N2O con-centration can be done using N2O microsensors.Kampschreur et al. [6] used a modified Clark electrode(Unisense, Denmark) to measure the liquid-phase N2Oin two laboratory scale reactors. Foley et al. [23]measured the liquid-phase N2O in seven full-scaleplants in Australia using the same type of microsensor.
Phil. Trans. R. Soc. B (2012)
The Clark-type sensor has an internal reference and aguard cathode. During measurement, N2O penetratesthrough the sensor tip membrane and is reduced atthe metal cathode surface. The sensor is connected toa high-sensitivity pico-ammeter, which converts theresulting reduction current to a signal. The onlinesignal can be recorded on a laptop. The response ofthe electrochemical microsensor is known to be linearin the range of 0–1.2 mM [24].
While N2O microsensors have a low detection limit,the high sensitivity can render it susceptible to interfer-ences especially in full-scale measurements. Combiningthe analyses of both the microsensor and the GC-vialmethods significantly increases the reliability of data.
Similar to the gas-phase analysis, liquid-phasedetection at multiple locations is needed to capturethe spatial variation in N2O concentration.
N2O flux is determined using the liquid-phasemeasurement [23]. However, this requires the esti-mation of the mass transfer coefficient between theliquid and gas phases, which is not a straightforwardtask in full-scale plants [23]. Consequently, theliquid-phase N2O data are primarily used for under-standing N2O production and emission processesrather than for quantification purposes.
Other parameters such as pH, DO, temperature, totalsuspended solids and volatile suspended solids (VSS) areoften measured at sampling locations and at the waste-water influent for mass balance, correlation analysis ofN2O emission fluxes and for model development.
4. FULL-SCALE EMISSION DATAThe N2O emission factor (amount of N2O-N emittedrelative to the nitrogen load) reported thus far for full-scale plants varies substantially, ranging from 0 to 25%(table 1). It should be noted that an emission factor of1 per cent would already increase the carbon footprintof a wastewater treatment plant by approximately 30per cent [29]. The large variation in N2O emissionsamong the investigated plants was probably owing tothe different configurations and operational conditionsapplied. Additionally, the different monitoring andquantification methods used could have been a contri-buting factor. The large variation also implies thatN2O emissions from a treatment plant can be reducedthrough proper plant design and operation. Foley et al.[23] concluded that plants achieving high-level nitro-gen removal would emit less N2O in comparisonwith nitrifying plants achieving no or low levels ofnitrogen removal. This implies that improved waterquality and reduced N2O emissions can be achievedsimultaneously.
Many studies show that N2O is primarily emittedfrom the aerated zones [14]. Although N2O is an obli-gatory intermediate in denitrification, N2O formed inanoxic zones will largely be dissolved in the liquidphase and this is converted to N2 through N2Oreduction before it is transferred to the gas phase. Incontrast, N2O formed in aerobic periods is found tobe stripped quickly owing to intensive aeration, form-ing the primary source of N2O emitted fromwastewater treatment systems [14].
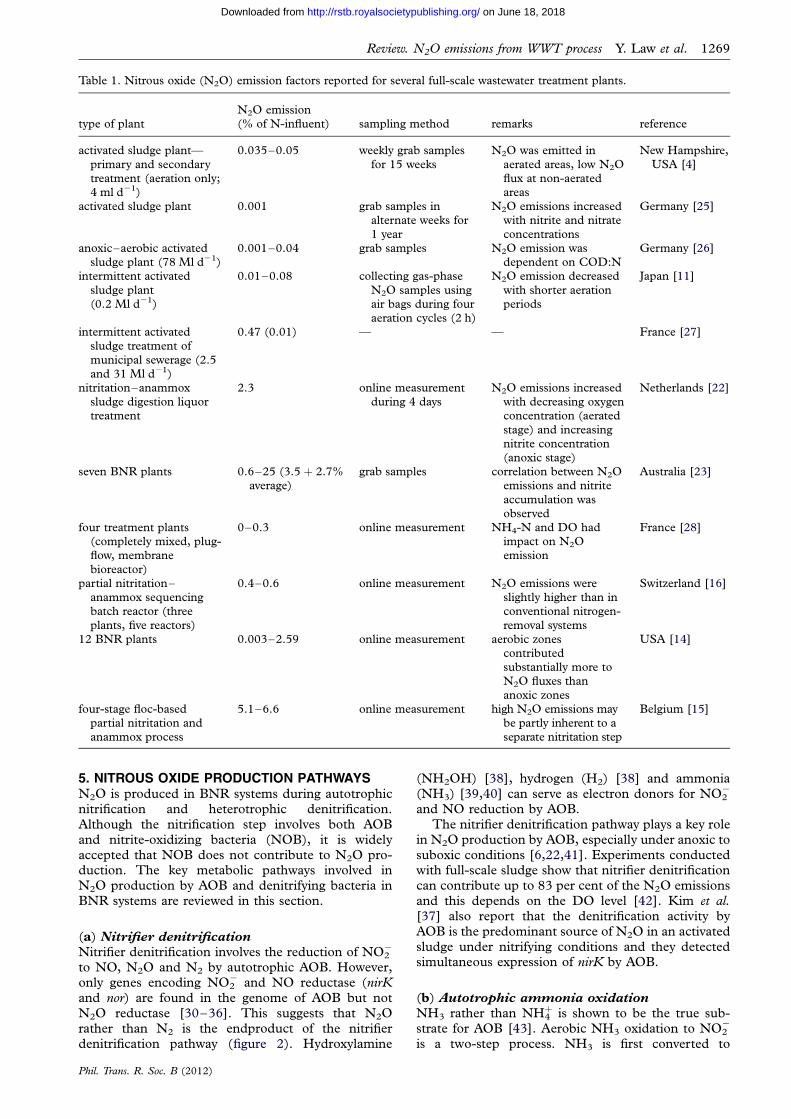
Table 1. Nitrous oxide (N2O) emission factors reported for several full-scale wastewater treatment plants.
type of plant
N2O emission
(% of N-influent) sampling method remarks reference
activated sludge plant—
primary and secondarytreatment (aeration only;4 ml d21)
0.035–0.05 weekly grab samples
for 15 weeks
N2O was emitted in
aerated areas, low N2Oflux at non-aeratedareas
New Hampshire,
USA [4]
activated sludge plant 0.001 grab samples inalternate weeks for
1 year
N2O emissions increasedwith nitrite and nitrate
concentrations
Germany [25]
anoxic–aerobic activatedsludge plant (78 Ml d21)
0.001–0.04 grab samples N2O emission wasdependent on COD:N
Germany [26]
intermittent activated
sludge plant(0.2 Ml d21)
0.01–0.08 collecting gas-phase
N2O samples usingair bags during fouraeration cycles (2 h)
N2O emission decreased
with shorter aerationperiods
Japan [11]
intermittent activatedsludge treatment of
municipal sewerage (2.5and 31 Ml d21)
0.47 (0.01) — — France [27]
nitritation–anammoxsludge digestion liquortreatment
2.3 online measurementduring 4 days
N2O emissions increasedwith decreasing oxygenconcentration (aerated
stage) and increasingnitrite concentration(anoxic stage)
Netherlands [22]
seven BNR plants 0.6–25 (3.5 þ 2.7%average)
grab samples correlation between N2Oemissions and nitrite
accumulation wasobserved
Australia [23]
four treatment plants(completely mixed, plug-flow, membrane
bioreactor)
0–0.3 online measurement NH4-N and DO hadimpact on N2Oemission
France [28]
partial nitritation–anammox sequencingbatch reactor (three
plants, five reactors)
0.4–0.6 online measurement N2O emissions wereslightly higher than inconventional nitrogen-
removal systems
Switzerland [16]
12 BNR plants 0.003–2.59 online measurement aerobic zonescontributedsubstantially more toN2O fluxes than
anoxic zones
USA [14]
four-stage floc-basedpartial nitritation andanammox process
5.1–6.6 online measurement high N2O emissions maybe partly inherent to aseparate nitritation step
Belgium [15]
Review. N2O emissions from WWT process Y. Law et al. 1269
on June 18, 2018http://rstb.royalsocietypublishing.org/Downloaded from
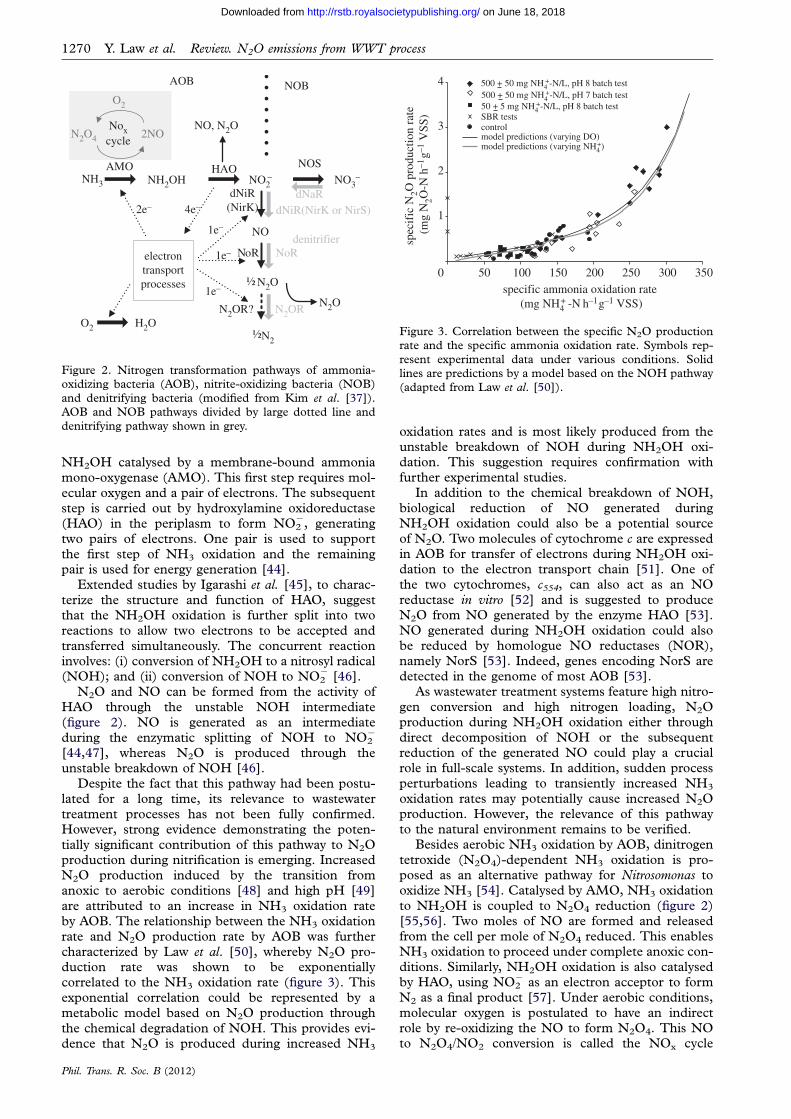
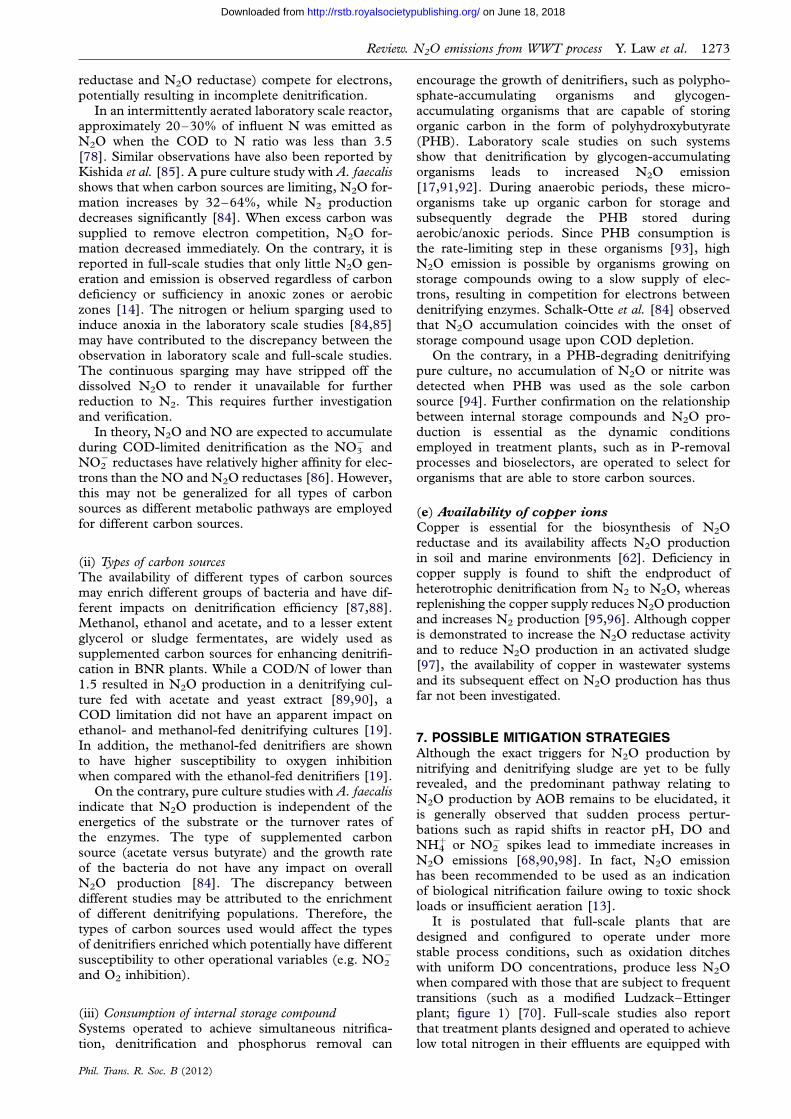
5. NITROUS OXIDE PRODUCTION PATHWAYSN2O is produced in BNR systems during autotrophicnitrification and heterotrophic denitrification.Although the nitrification step involves both AOBand nitrite-oxidizing bacteria (NOB), it is widelyaccepted that NOB does not contribute to N2O pro-duction. The key metabolic pathways involved inN2O production by AOB and denitrifying bacteria inBNR systems are reviewed in this section.
(a) Nitrifier denitrification
Nitrifier denitrification involves the reduction of NO22
to NO, N2O and N2 by autotrophic AOB. However,only genes encoding NO2
2 and NO reductase (nirKand nor) are found in the genome of AOB but notN2O reductase [30–36]. This suggests that N2Orather than N2 is the endproduct of the nitrifierdenitrification pathway (figure 2). Hydroxylamine
Phil. Trans. R. Soc. B (2012)
(NH2OH) [38], hydrogen (H2) [38] and ammonia(NH3) [39,40] can serve as electron donors for NO2
2
and NO reduction by AOB.The nitrifier denitrification pathway plays a key role
in N2O production by AOB, especially under anoxic tosuboxic conditions [6,22,41]. Experiments conductedwith full-scale sludge show that nitrifier denitrificationcan contribute up to 83 per cent of the N2O emissionsand this depends on the DO level [42]. Kim et al.[37] also report that the denitrification activity byAOB is the predominant source of N2O in an activatedsludge under nitrifying conditions and they detectedsimultaneous expression of nirK by AOB.
(b) Autotrophic ammonia oxidation
NH3 rather than NH4þ is shown to be the true sub-
strate for AOB [43]. Aerobic NH3 oxidation to NO22
is a two-step process. NH3 is first converted to
NH3 NH2OH NO2– NO3
–AMO HAO
AOB NOB
NO
N2O
N2
2e– 4e–
1e–
NoR1e–
N2OR?
1e–
O2 H2O
N2ON2OR
NoR
dNiR(NirK or NirS)dNaR
denitrifier
NO, N2ONoxcycle
NOS
electrontransportprocesses
dNiR(NirK)
2NON2O4
O2
Figure 2. Nitrogen transformation pathways of ammonia-oxidizing bacteria (AOB), nitrite-oxidizing bacteria (NOB)and denitrifying bacteria (modified from Kim et al. [37]).AOB and NOB pathways divided by large dotted line and
denitrifying pathway shown in grey.
50 100 150 200 250 300 3500
1
2
3
4
SBR testscontrolmodel predictions (varying DO)model predictions (varying NH4
+)
500 + 50 mg NH4+-N/L, pH 8 batch test
500 + 50 mg NH4+-N/L, pH 7 batch test
50 + 5 mg NH4+-N/L, pH 8 batch test
specific ammonia oxidation rate (mg NH4
+ -N h–1g–1 VSS)
spec
ific
N2O
pro
duct
ion
rate
(m
g N
2O-N
h–1
g–1 V
SS)
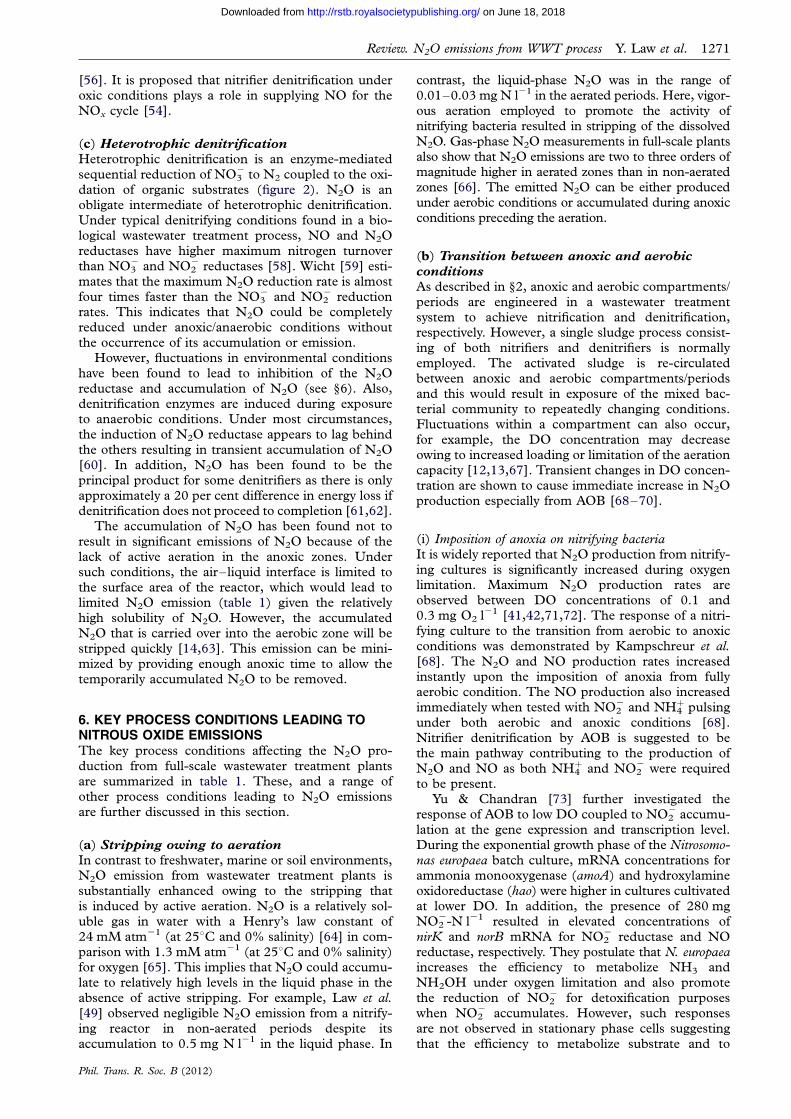
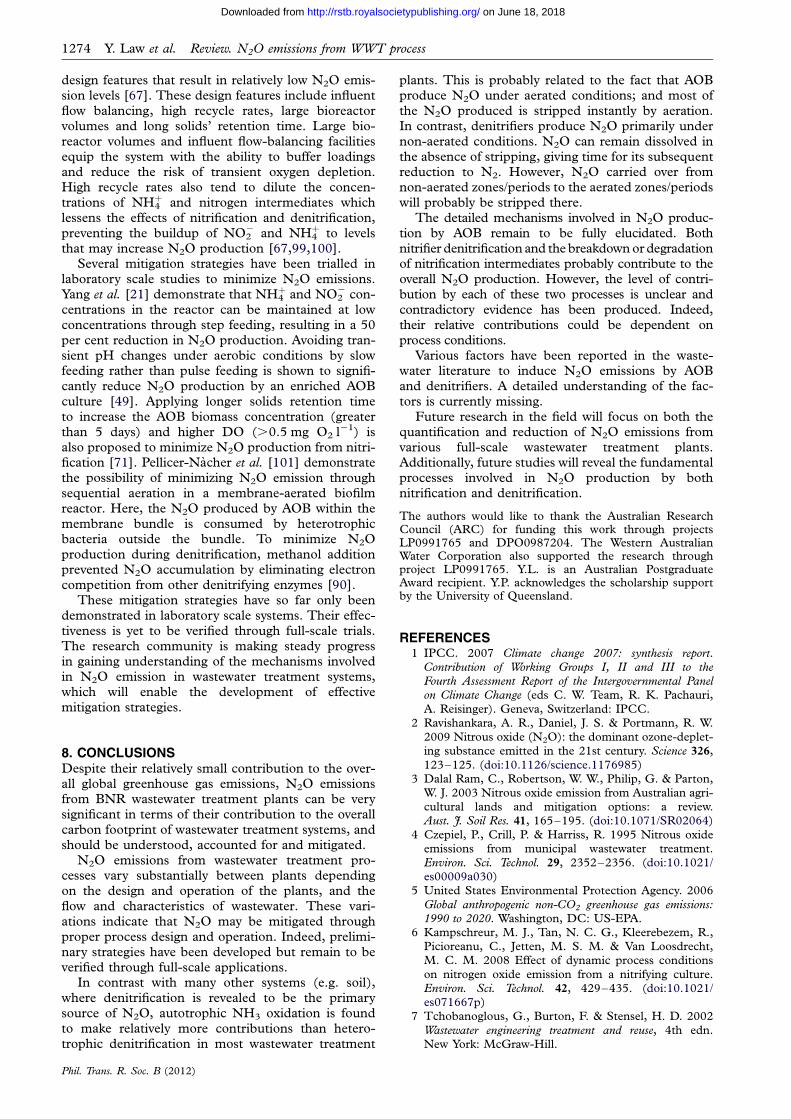
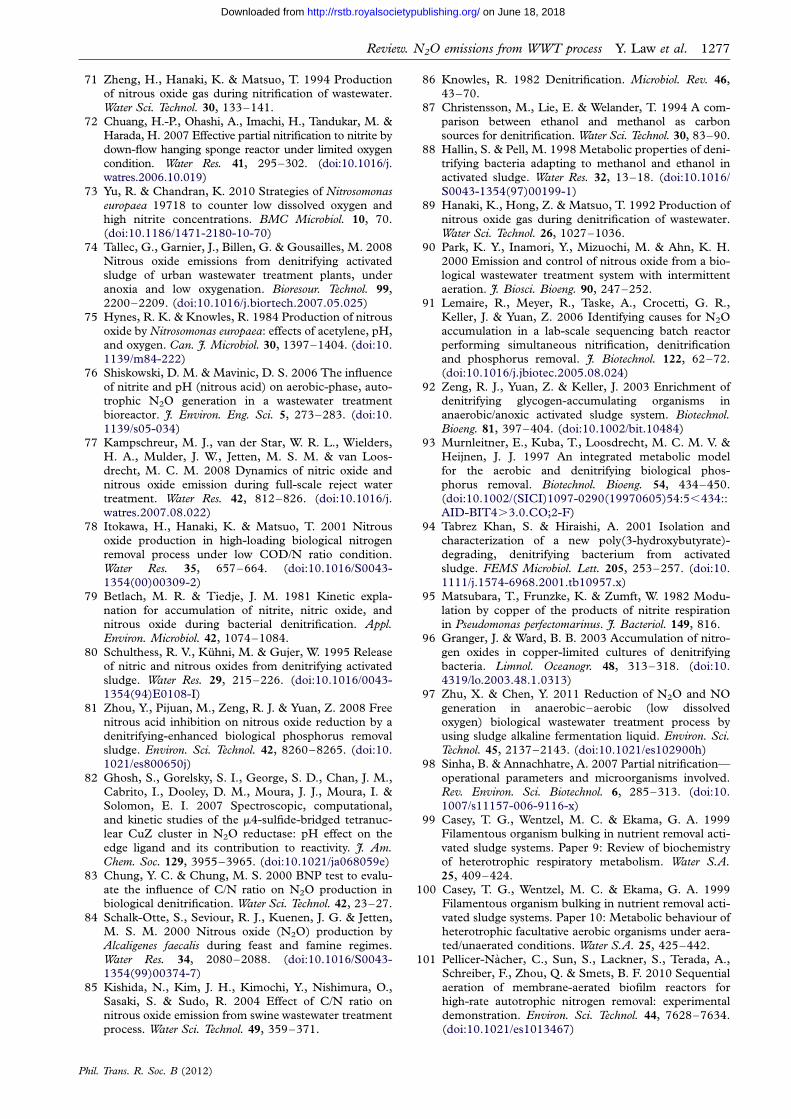
Figure 3. Correlation between the specific N2O productionrate and the specific ammonia oxidation rate. Symbols rep-
resent experimental data under various conditions. Solidlines are predictions by a model based on the NOH pathway(adapted from Law et al. [50]).
1270 Y. Law et al. Review. N2O emissions from WWT process
on June 18, 2018http://rstb.royalsocietypublishing.org/Downloaded from
NH2OH catalysed by a membrane-bound ammoniamono-oxygenase (AMO). This first step requires mol-ecular oxygen and a pair of electrons. The subsequentstep is carried out by hydroxylamine oxidoreductase(HAO) in the periplasm to form NO2
2, generatingtwo pairs of electrons. One pair is used to supportthe first step of NH3 oxidation and the remainingpair is used for energy generation [44].
Extended studies by Igarashi et al. [45], to charac-terize the structure and function of HAO, suggestthat the NH2OH oxidation is further split into tworeactions to allow two electrons to be accepted andtransferred simultaneously. The concurrent reactioninvolves: (i) conversion of NH2OH to a nitrosyl radical(NOH); and (ii) conversion of NOH to NO2
2 [46].N2O and NO can be formed from the activity of
HAO through the unstable NOH intermediate(figure 2). NO is generated as an intermediateduring the enzymatic splitting of NOH to NO2
2
[44,47], whereas N2O is produced through theunstable breakdown of NOH [46].
Despite the fact that this pathway had been postu-lated for a long time, its relevance to wastewatertreatment processes has not been fully confirmed.However, strong evidence demonstrating the poten-tially significant contribution of this pathway to N2Oproduction during nitrification is emerging. IncreasedN2O production induced by the transition fromanoxic to aerobic conditions [48] and high pH [49]are attributed to an increase in NH3 oxidation rateby AOB. The relationship between the NH3 oxidationrate and N2O production rate by AOB was furthercharacterized by Law et al. [50], whereby N2O pro-duction rate was shown to be exponentiallycorrelated to the NH3 oxidation rate (figure 3). Thisexponential correlation could be represented by ametabolic model based on N2O production throughthe chemical degradation of NOH. This provides evi-dence that N2O is produced during increased NH3
Phil. Trans. R. Soc. B (2012)
oxidation rates and is most likely produced from theunstable breakdown of NOH during NH2OH oxi-dation. This suggestion requires confirmation withfurther experimental studies.
In addition to the chemical breakdown of NOH,biological reduction of NO generated duringNH2OH oxidation could also be a potential sourceof N2O. Two molecules of cytochrome c are expressedin AOB for transfer of electrons during NH2OH oxi-dation to the electron transport chain [51]. One ofthe two cytochromes, c554, can also act as an NOreductase in vitro [52] and is suggested to produceN2O from NO generated by the enzyme HAO [53].NO generated during NH2OH oxidation could alsobe reduced by homologue NO reductases (NOR),namely NorS [53]. Indeed, genes encoding NorS aredetected in the genome of most AOB [53].
As wastewater treatment systems feature high nitro-gen conversion and high nitrogen loading, N2Oproduction during NH2OH oxidation either throughdirect decomposition of NOH or the subsequentreduction of the generated NO could play a crucialrole in full-scale systems. In addition, sudden processperturbations leading to transiently increased NH3
oxidation rates may potentially cause increased N2Oproduction. However, the relevance of this pathwayto the natural environment remains to be verified.
Besides aerobic NH3 oxidation by AOB, dinitrogentetroxide (N2O4)-dependent NH3 oxidation is pro-posed as an alternative pathway for Nitrosomonas tooxidize NH3 [54]. Catalysed by AMO, NH3 oxidationto NH2OH is coupled to N2O4 reduction (figure 2)[55,56]. Two moles of NO are formed and releasedfrom the cell per mole of N2O4 reduced. This enablesNH3 oxidation to proceed under complete anoxic con-ditions. Similarly, NH2OH oxidation is also catalysedby HAO, using NO2
2 as an electron acceptor to formN2 as a final product [57]. Under aerobic conditions,molecular oxygen is postulated to have an indirectrole by re-oxidizing the NO to form N2O4. This NOto N2O4/NO2 conversion is called the NOx cycle
Review. N2O emissions from WWT process Y. Law et al. 1271
on June 18, 2018http://rstb.royalsocietypublishing.org/Downloaded from
[56]. It is proposed that nitrifier denitrification underoxic conditions plays a role in supplying NO for theNOx cycle [54].
(c) Heterotrophic denitrification
Heterotrophic denitrification is an enzyme-mediatedsequential reduction of NO3
2 to N2 coupled to the oxi-dation of organic substrates (figure 2). N2O is anobligate intermediate of heterotrophic denitrification.Under typical denitrifying conditions found in a bio-logical wastewater treatment process, NO and N2Oreductases have higher maximum nitrogen turnoverthan NO3
2 and NO22 reductases [58]. Wicht [59] esti-
mates that the maximum N2O reduction rate is almostfour times faster than the NO3
2 and NO22 reduction
rates. This indicates that N2O could be completelyreduced under anoxic/anaerobic conditions withoutthe occurrence of its accumulation or emission.
However, fluctuations in environmental conditionshave been found to lead to inhibition of the N2Oreductase and accumulation of N2O (see §6). Also,denitrification enzymes are induced during exposureto anaerobic conditions. Under most circumstances,the induction of N2O reductase appears to lag behindthe others resulting in transient accumulation of N2O[60]. In addition, N2O has been found to be theprincipal product for some denitrifiers as there is onlyapproximately a 20 per cent difference in energy loss ifdenitrification does not proceed to completion [61,62].
The accumulation of N2O has been found not toresult in significant emissions of N2O because of thelack of active aeration in the anoxic zones. Undersuch conditions, the air–liquid interface is limited tothe surface area of the reactor, which would lead tolimited N2O emission (table 1) given the relativelyhigh solubility of N2O. However, the accumulatedN2O that is carried over into the aerobic zone will bestripped quickly [14,63]. This emission can be mini-mized by providing enough anoxic time to allow thetemporarily accumulated N2O to be removed.
6. KEY PROCESS CONDITIONS LEADING TONITROUS OXIDE EMISSIONSThe key process conditions affecting the N2O pro-duction from full-scale wastewater treatment plantsare summarized in table 1. These, and a range ofother process conditions leading to N2O emissionsare further discussed in this section.
(a) Stripping owing to aeration
In contrast to freshwater, marine or soil environments,N2O emission from wastewater treatment plants issubstantially enhanced owing to the stripping thatis induced by active aeration. N2O is a relatively sol-uble gas in water with a Henry’s law constant of24 mM atm21 (at 258C and 0% salinity) [64] in com-parison with 1.3 mM atm21 (at 258C and 0% salinity)for oxygen [65]. This implies that N2O could accumu-late to relatively high levels in the liquid phase in theabsence of active stripping. For example, Law et al.[49] observed negligible N2O emission from a nitrify-ing reactor in non-aerated periods despite itsaccumulation to 0.5 mg N l21 in the liquid phase. In
Phil. Trans. R. Soc. B (2012)
contrast, the liquid-phase N2O was in the range of0.01–0.03 mg N l21 in the aerated periods. Here, vigor-ous aeration employed to promote the activity ofnitrifying bacteria resulted in stripping of the dissolvedN2O. Gas-phase N2O measurements in full-scale plantsalso show that N2O emissions are two to three orders ofmagnitude higher in aerated zones than in non-aeratedzones [66]. The emitted N2O can be either producedunder aerobic conditions or accumulated during anoxicconditions preceding the aeration.
(b) Transition between anoxic and aerobic
conditions
As described in §2, anoxic and aerobic compartments/periods are engineered in a wastewater treatmentsystem to achieve nitrification and denitrification,respectively. However, a single sludge process consist-ing of both nitrifiers and denitrifiers is normallyemployed. The activated sludge is re-circulatedbetween anoxic and aerobic compartments/periodsand this would result in exposure of the mixed bac-terial community to repeatedly changing conditions.Fluctuations within a compartment can also occur,for example, the DO concentration may decreaseowing to increased loading or limitation of the aerationcapacity [12,13,67]. Transient changes in DO concen-tration are shown to cause immediate increase in N2Oproduction especially from AOB [68–70].
(i) Imposition of anoxia on nitrifying bacteriaIt is widely reported that N2O production from nitrify-ing cultures is significantly increased during oxygenlimitation. Maximum N2O production rates areobserved between DO concentrations of 0.1 and0.3 mg O2 l21 [41,42,71,72]. The response of a nitri-fying culture to the transition from aerobic to anoxicconditions was demonstrated by Kampschreur et al.[68]. The N2O and NO production rates increasedinstantly upon the imposition of anoxia from fullyaerobic condition. The NO production also increasedimmediately when tested with NO2
2 and NH4þ pulsing
under both aerobic and anoxic conditions [68].Nitrifier denitrification by AOB is suggested to bethe main pathway contributing to the production ofN2O and NO as both NH4
þ and NO22 were required
to be present.Yu & Chandran [73] further investigated the
response of AOB to low DO coupled to NO22 accumu-
lation at the gene expression and transcription level.During the exponential growth phase of the Nitrosomo-nas europaea batch culture, mRNA concentrations forammonia monooxygenase (amoA) and hydroxylamineoxidoreductase (hao) were higher in cultures cultivatedat lower DO. In addition, the presence of 280 mgNO2
2-N l21 resulted in elevated concentrations ofnirK and norB mRNA for NO2
2 reductase and NOreductase, respectively. They postulate that N. europaeaincreases the efficiency to metabolize NH3 andNH2OH under oxygen limitation and also promotethe reduction of NO2
2 for detoxification purposeswhen NO2
2 accumulates. However, such responsesare not observed in stationary phase cells suggestingthat the efficiency to metabolize substrate and to

1272 Y. Law et al. Review. N2O emissions from WWT process
on June 18, 2018http://rstb.royalsocietypublishing.org/Downloaded from
detoxify is probably dependent on the physiologicalgrowth state of the N. europaea culture.
(ii) Recovery of nitrifying bacteria from anoxic conditionIn contrast to the above study, Yu et al. [70] report thatit is the recovery from anoxia rather than the transitionto anoxia that causes N2O production from AOB.Such observation was also reported in variousfull-scale wastewater treatment plants [66]. In an N.europaea pure culture grown in chemostat, NO accu-mulated under anoxic conditions, however N2O wasproduced only during the recovery from anoxic toaerobic conditions [70]. The N2O production duringthe transient recovery period correlated positively tothe accumulation of NH4
þ during anoxia, and theoxygen concentration upon recovery. In addition, theincreased N2O production during the recoveryperiod did not correlate with changes in the gene-expression level. It was therefore concluded that thetendency of nitrifying cultures to produce N2O isowing to a shift in metabolism from a low specificactivity (q , qmax) towards the maximum specificactivity (qmax).
Various other studies also report increased N2Oproduction during increased aeration rate. Sumeret al. [25] found that increased N2O productioncoincides with increased oxygen concentration in theactivated sludge process. Kampschreur et al. [68]also observed that N2O production by AOB in a nitri-tation–anammox process decreased with decreasedDO concentrations. However, the mechanisms leadingto these observations were not identified.
(iii) Nitrous oxide reduction by denitrifying bacteria duringtransient aerobic and anaerobic conditionsSimilar to nitrifier denitrification, N2O emission fromheterotrophic denitrification is also shown to be thehighest under low DO concentrations of around0.1–0.3 mg O2 l21 [18,42,74]. Therefore, transientand dynamic aerobic and anaerobic conditions willlikely increase N2O emission from heterotrophic deni-trification. Oxygen inhibits both the synthesis andactivity of denitrifying enzymes of Alcaligenes faecalis,in particular the N2O reductase [18]. The synthesisof the N2O reductase has a longer lag phase comparedwith the NO2
2 reductase synthesis after the transitionfrom aerobic to anaerobic conditions. In addition,N2O reductase activity stops immediately during thetransition from anaerobic to aerobic conditions,while the activity of NO2
2 reductase continues at alower rate for several hours.
(c) The effect of nitrite, free nitrous acid and pH
(i) Nitrifying bacteriaHynes & Knowles [75] demonstrate that addition ofexogenous NO2
2 does not cause an increase in N2Oproduction from a fully aerobic N. europaea culture.In addition, the optimum pH for the production ofNO2
2 and N2O is approximately 8.5, in the investi-gated pH range of 5.4–9.5, further suggesting that ahigh free nitrous acid (HNO2) concentration, thetrue substrate for NO2
2 reduction [76], is not requiredfor higher N2O production. As the aerobic N2O
Phil. Trans. R. Soc. B (2012)
production is completely inhibited by acetylene(C2H2), the authors suggest that N2O is predomi-nantly produced through degradation of NOH underaerobic conditions [75]. Increased N2O productionrate of an enriched AOB culture at pH 8.0 when com-pared with pH 6.0 is also reported by Law et al. [49].
However, contradictory evidence is produced insome recent studies that report elevated N2O pro-duction rates by AOB in the presence of NO2
2.Correlation between N2O production and high NO2
2
concentration by AOB is reported in several full-scalestudies [15,25,63,67,77]. In laboratory scale studies,NO2
2 pulses of 10 mg NO22-N l21 are shown to
increase N2O production by a nitrifying mixed cultureespecially at higher DO concentrations, with eightfoldand fourfold increases occurring at DO concentrationsof 1.0 and 0.1 mg O2 l21, respectively [42]. Kamps-chreur et al. [68] also reveal that NO2
2 pulsingincreases N2O production by an enriched AOB cultureunder aerobic conditions. The contrasting obser-vations on the effect of NO2
2 on N2O production byAOB are yet to be resolved.
(ii) Denitrifying bacteriaThe presence of NO2
2 has been shown to affect theactivity of N2O reductase in a denitrifying bacterialculture leading to increased N2O emission. NO2
2
accumulation of up to 10 mg NO22-N l21 was ident-
ified as a possible cause of N2O production indenitrifying sludge [78]. However, the effect of NO2
2
addition on N2O accumulation is seen to be highlyinconsistent [79]. Schulthess et al. [80] suggest thatNO rather than NO2
2, which accumulates uponNO2
2 addition, is the true inhibitor of N2O reductase.Zhou et al. [81] show that HNO2 rather than
NO22 is responsible for inhibiting the N2O reductase
in an enriched denitrifying biological phosphorusremoval system. N2O reductase activity was inhibitedby 50 per cent at a HNO2 concentration of 0.0007–0.001 mg HNO2-N l21 (equivalent to 3–4 mg NO2
2
N l21 at pH 7). However, an internal storage polymerwas the sole carbon source available as shown in thestudy of Zhou et al. [81], which is suggested to be afactor affecting N2O production (further discussed in§6d(iii)). Since the concentration of NO in the studywas not reported, it is unclear whether HNO2 couldhave triggered transient NO accumulation to affectthe N2O reductase activity. The high sensitivity ofN2O reductase to low pH (,6.5) [82] also renders itdifficult to distinguish the effect of pH and HNO2 indenitrifying cultures.
(d) Effect of carbon sources
(i) Availability of carbon sourceThe lack of biodegradable organic carbon is an impor-tant factor governing N2O production duringdenitrification [83,84]. The availability of organiccarbon is typically measured as chemical oxygendemand (COD). For complete denitrification, aCOD to N ratio above 4 is required. Under conditionsof limited carbon sources, the various denitrificationenzymes (NO3
2 reductase, NO22 reductase, NO
Review. N2O emissions from WWT process Y. Law et al. 1273
on June 18, 2018http://rstb.royalsocietypublishing.org/Downloaded from
reductase and N2O reductase) compete for electrons,potentially resulting in incomplete denitrification.
In an intermittently aerated laboratory scale reactor,approximately 20–30% of influent N was emitted asN2O when the COD to N ratio was less than 3.5[78]. Similar observations have also been reported byKishida et al. [85]. A pure culture study with A. faecalisshows that when carbon sources are limiting, N2O for-mation increases by 32–64%, while N2 productiondecreases significantly [84]. When excess carbon wassupplied to remove electron competition, N2O for-mation decreased immediately. On the contrary, it isreported in full-scale studies that only little N2O gen-eration and emission is observed regardless of carbondeficiency or sufficiency in anoxic zones or aerobiczones [14]. The nitrogen or helium sparging used toinduce anoxia in the laboratory scale studies [84,85]may have contributed to the discrepancy between theobservation in laboratory scale and full-scale studies.The continuous sparging may have stripped off thedissolved N2O to render it unavailable for furtherreduction to N2. This requires further investigationand verification.
In theory, N2O and NO are expected to accumulateduring COD-limited denitrification as the NO3
2 andNO2
2 reductases have relatively higher affinity for elec-trons than the NO and N2O reductases [86]. However,this may not be generalized for all types of carbonsources as different metabolic pathways are employedfor different carbon sources.
(ii) Types of carbon sourcesThe availability of different types of carbon sourcesmay enrich different groups of bacteria and have dif-ferent impacts on denitrification efficiency [87,88].Methanol, ethanol and acetate, and to a lesser extentglycerol or sludge fermentates, are widely used assupplemented carbon sources for enhancing denitrifi-cation in BNR plants. While a COD/N of lower than1.5 resulted in N2O production in a denitrifying cul-ture fed with acetate and yeast extract [89,90], aCOD limitation did not have an apparent impact onethanol- and methanol-fed denitrifying cultures [19].In addition, the methanol-fed denitrifiers are shownto have higher susceptibility to oxygen inhibitionwhen compared with the ethanol-fed denitrifiers [19].
On the contrary, pure culture studies with A. faecalisindicate that N2O production is independent of theenergetics of the substrate or the turnover rates ofthe enzymes. The type of supplemented carbonsource (acetate versus butyrate) and the growth rateof the bacteria do not have any impact on overallN2O production [84]. The discrepancy betweendifferent studies may be attributed to the enrichmentof different denitrifying populations. Therefore, thetypes of carbon sources used would affect the typesof denitrifiers enriched which potentially have differentsusceptibility to other operational variables (e.g. NO2
2
and O2 inhibition).
(iii) Consumption of internal storage compoundSystems operated to achieve simultaneous nitrifica-tion, denitrification and phosphorus removal can
Phil. Trans. R. Soc. B (2012)
encourage the growth of denitrifiers, such as polypho-sphate-accumulating organisms and glycogen-accumulating organisms that are capable of storingorganic carbon in the form of polyhydroxybutyrate(PHB). Laboratory scale studies on such systemsshow that denitrification by glycogen-accumulatingorganisms leads to increased N2O emission[17,91,92]. During anaerobic periods, these micro-organisms take up organic carbon for storage andsubsequently degrade the PHB stored duringaerobic/anoxic periods. Since PHB consumption isthe rate-limiting step in these organisms [93], highN2O emission is possible by organisms growing onstorage compounds owing to a slow supply of elec-trons, resulting in competition for electrons betweendenitrifying enzymes. Schalk-Otte et al. [84] observedthat N2O accumulation coincides with the onset ofstorage compound usage upon COD depletion.
On the contrary, in a PHB-degrading denitrifyingpure culture, no accumulation of N2O or nitrite wasdetected when PHB was used as the sole carbonsource [94]. Further confirmation on the relationshipbetween internal storage compounds and N2O pro-duction is essential as the dynamic conditionsemployed in treatment plants, such as in P-removalprocesses and bioselectors, are operated to select fororganisms that are able to store carbon sources.
(e) Availability of copper ions
Copper is essential for the biosynthesis of N2Oreductase and its availability affects N2O productionin soil and marine environments [62]. Deficiency incopper supply is found to shift the endproduct ofheterotrophic denitrification from N2 to N2O, whereasreplenishing the copper supply reduces N2O productionand increases N2 production [95,96]. Although copperis demonstrated to increase the N2O reductase activityand to reduce N2O production in an activated sludge[97], the availability of copper in wastewater systemsand its subsequent effect on N2O production has thusfar not been investigated.
7. POSSIBLE MITIGATION STRATEGIESAlthough the exact triggers for N2O production bynitrifying and denitrifying sludge are yet to be fullyrevealed, and the predominant pathway relating toN2O production by AOB remains to be elucidated, itis generally observed that sudden process pertur-bations such as rapid shifts in reactor pH, DO andNH4
þ or NO22 spikes lead to immediate increases in
N2O emissions [68,90,98]. In fact, N2O emissionhas been recommended to be used as an indicationof biological nitrification failure owing to toxic shockloads or insufficient aeration [13].
It is postulated that full-scale plants that aredesigned and configured to operate under morestable process conditions, such as oxidation ditcheswith uniform DO concentrations, produce less N2Owhen compared with those that are subject to frequenttransitions (such as a modified Ludzack–Ettingerplant; figure 1) [70]. Full-scale studies also reportthat treatment plants designed and operated to achievelow total nitrogen in their effluents are equipped with
1274 Y. Law et al. Review. N2O emissions from WWT process
on June 18, 2018http://rstb.royalsocietypublishing.org/Downloaded from
design features that result in relatively low N2O emis-sion levels [67]. These design features include influentflow balancing, high recycle rates, large bioreactorvolumes and long solids’ retention time. Large bio-reactor volumes and influent flow-balancing facilitiesequip the system with the ability to buffer loadingsand reduce the risk of transient oxygen depletion.High recycle rates also tend to dilute the concen-trations of NH4
þ and nitrogen intermediates whichlessens the effects of nitrification and denitrification,preventing the buildup of NO2
2 and NH4þ to levels
that may increase N2O production [67,99,100].Several mitigation strategies have been trialled in
laboratory scale studies to minimize N2O emissions.Yang et al. [21] demonstrate that NH4
þ and NO22 con-
centrations in the reactor can be maintained at lowconcentrations through step feeding, resulting in a 50per cent reduction in N2O production. Avoiding tran-sient pH changes under aerobic conditions by slowfeeding rather than pulse feeding is shown to signifi-cantly reduce N2O production by an enriched AOBculture [49]. Applying longer solids retention timeto increase the AOB biomass concentration (greaterthan 5 days) and higher DO (.0.5 mg O2 l21) isalso proposed to minimize N2O production from nitri-fication [71]. Pellicer-Nacher et al. [101] demonstratethe possibility of minimizing N2O emission throughsequential aeration in a membrane-aerated biofilmreactor. Here, the N2O produced by AOB within themembrane bundle is consumed by heterotrophicbacteria outside the bundle. To minimize N2Oproduction during denitrification, methanol additionprevented N2O accumulation by eliminating electroncompetition from other denitrifying enzymes [90].
These mitigation strategies have so far only beendemonstrated in laboratory scale systems. Their effec-tiveness is yet to be verified through full-scale trials.The research community is making steady progressin gaining understanding of the mechanisms involvedin N2O emission in wastewater treatment systems,which will enable the development of effectivemitigation strategies.
8. CONCLUSIONSDespite their relatively small contribution to the over-all global greenhouse gas emissions, N2O emissionsfrom BNR wastewater treatment plants can be verysignificant in terms of their contribution to the overallcarbon footprint of wastewater treatment systems, andshould be understood, accounted for and mitigated.
N2O emissions from wastewater treatment pro-cesses vary substantially between plants dependingon the design and operation of the plants, and theflow and characteristics of wastewater. These vari-ations indicate that N2O may be mitigated throughproper process design and operation. Indeed, prelimi-nary strategies have been developed but remain to beverified through full-scale applications.
In contrast with many other systems (e.g. soil),where denitrification is revealed to be the primarysource of N2O, autotrophic NH3 oxidation is foundto make relatively more contributions than hetero-trophic denitrification in most wastewater treatment
Phil. Trans. R. Soc. B (2012)
plants. This is probably related to the fact that AOBproduce N2O under aerated conditions; and most ofthe N2O produced is stripped instantly by aeration.In contrast, denitrifiers produce N2O primarily undernon-aerated conditions. N2O can remain dissolved inthe absence of stripping, giving time for its subsequentreduction to N2. However, N2O carried over fromnon-aerated zones/periods to the aerated zones/periodswill probably be stripped there.
The detailed mechanisms involved in N2O produc-tion by AOB remain to be fully elucidated. Bothnitrifier denitrification and the breakdown or degradationof nitrification intermediates probably contribute to theoverall N2O production. However, the level of contri-bution by each of these two processes is unclear andcontradictory evidence has been produced. Indeed,their relative contributions could be dependent onprocess conditions.
Various factors have been reported in the waste-water literature to induce N2O emissions by AOBand denitrifiers. A detailed understanding of the fac-tors is currently missing.
Future research in the field will focus on both thequantification and reduction of N2O emissions fromvarious full-scale wastewater treatment plants.Additionally, future studies will reveal the fundamentalprocesses involved in N2O production by bothnitrification and denitrification.
The authors would like to thank the Australian ResearchCouncil (ARC) for funding this work through projectsLP0991765 and DPO0987204. The Western AustralianWater Corporation also supported the research throughproject LP0991765. Y.L. is an Australian PostgraduateAward recipient. Y.P. acknowledges the scholarship supportby the University of Queensland.
REFERENCES1 IPCC. 2007 Climate change 2007: synthesis report.
Contribution of Working Groups I, II and III to theFourth Assessment Report of the Intergovernmental Panelon Climate Change (eds C. W. Team, R. K. Pachauri,
A. Reisinger). Geneva, Switzerland: IPCC.2 Ravishankara, A. R., Daniel, J. S. & Portmann, R. W.
2009 Nitrous oxide (N2O): the dominant ozone-deplet-ing substance emitted in the 21st century. Science 326,
123–125. (doi:10.1126/science.1176985)3 Dalal Ram, C., Robertson, W. W., Philip, G. & Parton,
W. J. 2003 Nitrous oxide emission from Australian agri-cultural lands and mitigation options: a review.Aust. J. Soil Res. 41, 165–195. (doi:10.1071/SR02064)
4 Czepiel, P., Crill, P. & Harriss, R. 1995 Nitrous oxideemissions from municipal wastewater treatment.Environ. Sci. Technol. 29, 2352–2356. (doi:10.1021/es00009a030)
5 United States Environmental Protection Agency. 2006
Global anthropogenic non-CO2 greenhouse gas emissions:1990 to 2020. Washington, DC: US-EPA.
6 Kampschreur, M. J., Tan, N. C. G., Kleerebezem, R.,Picioreanu, C., Jetten, M. S. M. & Van Loosdrecht,M. C. M. 2008 Effect of dynamic process conditions
on nitrogen oxide emission from a nitrifying culture.Environ. Sci. Technol. 42, 429–435. (doi:10.1021/es071667p)
7 Tchobanoglous, G., Burton, F. & Stensel, H. D. 2002
Wastewater engineering treatment and reuse, 4th edn.New York: McGraw-Hill.

Review. N2O emissions from WWT process Y. Law et al. 1275
on June 18, 2018http://rstb.royalsocietypublishing.org/Downloaded from
8 Seviour, R. J., Lindrea, K. C., Griffiths, P. C. &Blackall, L. L. 1999 The activated sludge process. InThe microbiology of activated sludge (eds R. J. Seviour &
L. L. Blackall). Boston, MA: Kluwer Publishing.9 Munch, E. V., Lant, P. & Keller, J. 1996 Simultaneous
nitrification and denitrification in bench-scale sequen-cing batch reactors. Water Res. 30, 277–284. (doi:10.1016/0043-1354(95)00174-3)
10 Irvine, R. L., Ketchum, L. H. & Asano, T. 1989Sequencing batch reactors for biological wastewatertreatment. Crit. Rev. Environ. Sci. Technol. 18,255–294. (doi:10.1080/10643388909388350)
11 Kimochi, Y., Inamori, Y., Mizuochi, M., Xu, K.-Q. &Matsumura, M. 1998 Nitrogen removal and N2Oemission in a full-scale domestic wastewater treatmentplant with intermittent aeration. J. Ferment. Bioeng.86, 202–206. (doi:10.1016/S0922-338X(98)80114-1)
12 Burgess, J. E., Colliver, B. B., Stuetz, R. M. &Stephenson, T. 2002 Dinitrogen oxide production bya mixed culture of nitrifying bacteria during ammoniashock loading and aeration failure. J. Indust. Microbiol.Biotechnol. 29, 309–313. (doi:10.1038/sj.jim.7000286)
13 Butler, M. D., Wang, Y. Y., Cartmell, E. & Stephenson,T. 2009 Nitrous oxide emissions for early warning of bio-logical nitrification failure in activated sludge. Water Res.43, 1265–1272. (doi:10.1016/j.watres.2008.12.027)
14 Ahn, J. H., Kim, S. P., Park, H. K., Rahm, B., Pagilla,
K. & Chandran, K. 2010 N2O Emissions from activatedsludge processes, 2008–2009: results of a nationalmonitoring survey in the United States. Environ. Sci.Technol. 44, 4505–4511. (doi:10.1021/es903845y)
15 Desloover, J., De Clippeleir, H., Boeckx, P., Du Laing,G., Colsen, J., Verstraete, W. & Vlaeminck, S.E. 2011Floc-based sequential partial nitration and anammox atfull scale with contrasting N2O emissions. Water Res.45, 2811–2821. (doi:10.1016/j.watres.2011.02.028)
16 Joss, A. et al. 2009 Full-scale nitrogen removal fromdigester liquid with partial nitration and anammox inone SBR. Environ. Sci. Technol. 43, 5301–5306.(doi:10.1021/es900107w)
17 Zeng, R. J., Lemaire, R., Yuan, Z. & Keller, J. 2003
Simultaneous nitrification, denitrification, and phos-phorus removal in a lab-scale sequencing batchreactor. Biotechnol. Bioeng. 84, 170–178. (doi:10.1002/bit.10744)
18 Otte, S., Grobben, N., Robertson, L., Jetten, M. &
Kuenen, J. 1996 Nitrous oxide production by Alcali-genes faecalis under transient and dynamic aerobic andanaerobic conditions. Appl. Environ. Microbiol. 62,2421–2426.
19 Lu, H. & Chandran, K. 2010 Factors promoting emis-sions of nitrous oxide and nitric oxide from denitrifyingsequencing batch reactors operated with methanol andethanol as electron donors. Biotechnol. Bioeng. 106,390–398. (doi:10.1002/bit.22704)
20 Garrido, J. M., Moreno, J., Mendez-Pampn, R. & Lema,J. M. 1998 Nitrous oxide production under toxic con-ditions in a denitrifying anoxic filter. Water Res. 32,2550–2552. (doi:10.1016/S0043-1354(97)00433-8)
21 Yang, Q., Liu, X., Peng, C., Wang, S., Sun, H. & Peng,
Y. 2009 N2O production during nitrogen removal vianitrite from domestic wastewater: main sources andcontrol method. Environ. Sci. Technol. 43, 9400–9406.(doi:10.1021/es9019113)
22 Kampschreur, M. J., van der Star, W. R. L., Wielders,
H. A., Mulder, J. W., Jetten, M. S. M. & vanLoosdretch, M. C. M. 2008 Dynamics of nitric oxideand nitrous oxide emission during full-scale rejectwater treatment. Water Res. 42, 812–826. (doi:10.1016/j.watres.2007.08.022)
Phil. Trans. R. Soc. B (2012)
23 Foley, J., De Haas, D., Yuan, Z. & Lant, P. 2009Nitrous oxide generation in full scale BNR wastewatertreatment plants. Water Res. 44, 831–844. (doi:10.
1016/j.watres.2009.10.033)24 Andersen, K., Kjaer, T. & Revsbech, N. P. 2001 An
oxygen insensitive microsensor for nitrous oxide. Sens.Actuat. B-Chem. 81, 42–48. (doi:10.1016/S0925-4005(01)00924-8)
25 Sumer, E., Weiske, A., Benckiser, G. & Ottow, J. C. G.1995 Influence of environmental conditions on theamount of N2O released from activated sludge in adomestic waste water treatment plant. Cell. Mol. LifeSci. 51, 419–422. (doi:10.1007/BF01928908)
26 Benckiser, G., Eilts, R., Linn, A., Lorch, H. J., Sumer,E., Weiske, A. & Wenzhofer, F. 1996 N2O emissionsfrom different cropping systems and from aerated, nitri-fying and denitrifying tanks of a municipal waste water
treatment plant. Biol. Fertility Soils 23, 257–265.(doi:10.1007/BF00335953)
27 Peu, P., Beline, F., Picard, S. & Heduit, A. 2006Measurement and quantification of nitrous oxide emis-sions from municipal activated sludge plants in France.
In Proceedings of the 5th IWAWorld Water Congress, 10–14September 2006, Beijing, China. International WaterAssociation.
28 Foley, J., Yuan, Z., Keller, J., Senante, E., Chandran,K., Willis, J., Shah, A. & van Loosdrecht, M. 2011
N2O and CH4 emission from wastewater collectionand treatment systems. Technical report, Global WaterResearch Coalition, London, UK.
29 de Haas, D. & Hartley, K. 2004 Greenhouse gas emis-
sion from BNR plants: do we have the right focus?Proceeedings of EPA Workshop: Sewage Management:Risk Assessment and Triple Bottom Line, 5–7 April 2004,Cairns, Australia.
30 Casciotti, K. L. & Ward, B. B. 2001 Dissimilatory
nitrite reductase genes from autotrophic ammonia-oxi-dizing bacteria. Appl. Environ. Microbiol. 67, 2213–2221. (doi:10.1128/AEM.67.5.2213-2221.2001)
31 Casciotti, K. L. & Ward, B. B. 2005 Phylogenetic analy-sis of nitric oxide reductase gene homologues from
aerobic ammonia-oxidizing bacteria. FEMS Microbiol.Ecol. 52, 197–205. (doi:10.1016/j.femsec.2004.11.002)
32 Beaumont, H., Lens, S., Reijinders, W., Westerhoff, H.& van Spanning, R. 2004 Expression of nitritereductase in Nitrosomonas europaea involves NsrR, a
novel nitrite-sensitive transcription repressor. Mol.Microbiol. 54, 148–158.
33 Beaumont, H. J. E., Lens, S. I., Westerhoff, H. V. & vanSpanning, R. J. M. 2005 Novel nirK cluster genes in
Nitrosomonas europaea are required for NirK-dependenttolerance to nitrite. J. Bacteriol. 187, 6849–6851.(doi:10.1128/JB.187.19.6849-6851.2005)
34 Cantera, J. J. L. & Stein, L. Y. 2007 Molecular diversityof nitrite reductase genes (nirK) in nitrifying bacteria.
Environ. Microbiol. 9, 765–776. (doi:10.1111/j.1462-2920.2006.01198.x)
35 Shaw, L. J., Nicol, G. W., Smith, Z., Fear, J., Prosser,J. I. & Baggs, E. M. 2006 Nitrosospira spp. can producenitrous oxide via a nitrifier denitrification pathway.
Environ. Microbiol. 8, 214–222. (doi:10.1111/j.1462-2920.2005.00882.x)
36 Garbeva, P., Baggs, E. M. & Prosser, J. I. 2007 Phylo-geny of nitrite reductase (nirK) and nitric oxidereductase (norB) genes from Nitrosospira species iso-
lated from soil. FEMS Microbiol. Lett. 266, 83–89.(doi:10.1111/j.1574-6968.2006.00517.x)
37 Kim, S.-W., Miyahara, M., Fushinobu, S., Wakagi, T. &Shoun, H. 2010 Nitrous oxide emission from nitrifyingactivated sludge dependent on denitrification by
1276 Y. Law et al. Review. N2O emissions from WWT process
on June 18, 2018http://rstb.royalsocietypublishing.org/Downloaded from
ammonia-oxidizing bacteria. Bioresource Technol. 101,3958–3963. (doi:10.1016/j.biortech.2010.01.030)
38 Bock, E., Schmidt, I., Stuven, R. & Zart, D. 1995
Nitrogen loss caused by denitrifying Nitrosomonas cellsusing ammonium or hydrogen as electron donors andnitrite as electron acceptor. Arch. Microbiol. 163,16–20. (doi:10.1007/BF00262198)
39 Poth, M. & Focht, D. 1985 15N Kinetic analysis of N2O
production by Nitrosomonas europaea: an examination ofnitrifier denitrification. Appl. Environ. Microbiol. 49,1134–1141.
40 Ritchie, G. A. F. & Nicholas, D. J. D. 1972 Identifi-
cation of the sources of nitrous oxide produced byoxidative and reductive processes in Nitrosomonaseuropaea. Biochem. J. 126, 1181–1191.
41 Goreau, T. J., Kaplan, W. A., Wofsy, S. C., McElroy, M.B., Valois, F. W. & Watson, S. W. 1980 Production of
NO22 and N2O by nitrifying bacteria at reduced
concentrations of oxygen. Appl. Environ. Microbiol. 40,526–532.
42 Tallec, G., Garnier, J., Billen, G. & Gousailles, M. 2006Nitrous oxide emissions from secondary activated sludge
in nitrifying conditions of urban wastewater treatmentplants: effect of oxygenation level. Water Res. 40,2972–2980. (doi:10.1016/j.watres.2006.05.037)
43 Suzuki, I., Dular, U. & Kwok, S. C. 1974 Ammonia orammonium ion as substrate for oxidation by Nitrosomonaseuropaea cells and extracts. J. Bacteriol. 120, 556–558.
44 Andersson, K. K. & Hooper, A. B. 1983 O2 and H2O areeach the source of one O in NO2
2 produced from NH3 byNitrosomonas: 15N-NMR evidence. FEBS Lett. 164,
236–240. (doi:10.1016/0014-5793(83)80292-0)45 Igarashi, N., Moriyama, H., Fujiwara, T., Fukumori, Y. &
Tanaka, N. 1997 The 2.8 A structure of hydroxylamineoxidoreductase from a nitrifying chemoautotrophicbacterium, Nitrosomonas europaea. Nat. Struct. Mol. Biol.4, 276–284. (doi:10.1038/nsb0497-276)
46 Poughon, L., Dussap, C. G. & Gros, J. B. 2001 Energymodel and metabolic flux analysis for autotrophic nitri-fiers. Biotechnol. Bioeng. 72, 416–433. (doi:10.1002/1097-0290(20000220)72:4,416::AID-BIT1004.3.0.
CO;2-D)47 Bock, E., Koop, H. P., Harms, H. & Ahlers, B. 1991
The biochemistry of nitrifying organisms. In Variationsin autotrophic life (eds J. M. Shively & L. L. Barton),pp. 171–199. New York, NY: Academic Press.
48 Yu, R., Kampschreur, M. J., Loosdrecht, M. C. M. V. &Chandran, K. 2010 Molecular mechanisms and specificdirectionality of autotrophic nitrous oxide and nitricoxide generation during transient anoxia. Environ. Sci.Technol. 44, 1313–1319. (doi:10.1021/es902794a)
49 Law, Y., lant, P. & Yuan, Z. 2012 The effect of pH onN2O production under aerobic conditions in a partialnitration system. Water Res. 45, 5934–5944. (doi:10.1016/j.watres.2011.08.055)
50 Law, Y., Ni, B.-J., lant, P. & Yuan, Z. Submitted.Nitrous oxide (N2O) production rate of an enrichedculture of ammonia oxidising bacteria exponentiallycorrelated to its ammonia oxidation rate.
51 Arp, D., Chain, P. & Klotz, M. 2007 The impact of
genome analyses on our understanding of ammonia-oxidizing bacteria. Annu. Rev. Microbiol. 61, 503–528.(doi:10.1146/annurev.micro.61.080706.093449)
52 Upadhyay, A. K., Hooper, A. B. & Hendrich, M. P.2006 NO reductase activity of the tetraheme cyto-
chrome c554 of Nitrosomonas europaea. J. Am. Chem.Soc. 128, 4330–4337. (doi:10.1021/ja055183+)
53 Stein, L. 2011 Surveying N2O-producing pathways inbacteria. Methods Enzymol. 486, 131–152. (doi:10.1016/B978-0-12-381294-0.00006-7)
Phil. Trans. R. Soc. B (2012)
54 Schmidt, I. & Jetten, M. S. M. 2004 Anaerobic oxi-dation of inorganic nitrogen compounds. In Strict andfacultative anaerobes: medical and environmental aspects(eds M. M. Nakano & P. Zube), pp. 283–303. Berlin,Germany/UK: Springer/Horizon Scientific Press.
55 Schmidt, I. & Bock, E. 1998 Anaerobic ammonia oxi-dation by cell-free extracts of Nitrosomonas eutropha.Antonie Van Leeuwenhoek 73, 271–278. (doi:10.1023/
A:1001572121053)56 Schmidt, I., Zart, D. & Bock, E. 2001 Gaseous NO2 as a
regulator for ammonia oxidation of Nitrosomonas eutropha.Antonie Van Leeuwenhoek Int. J. Gen. Mol. Microbiol. 79,
311–318. (doi:10.1023/A:1012038314206)57 Schmidt, I., Enrique, C. & Lester, P. 2008 Nitric oxide:
interaction with the ammonia monooxygenase andregulation of metabolic activities in ammonia oxidizers.Methods Enzymol. 440, 121–135. (doi:10.1016/S0076-
6879(07)00807-5)58 Von Schulthess, R., Wild, D. & Gujer, W. 1994 Nitric and
nitrous oxide from denitrifying activated sludge at lowoxygen concentrations. Water Sci. Technol. 30, 123–132.
59 Wicht, H. 1996 A model for predicting nitrous oxide
production during denitrification in activated sludge.Water Sci. Technol. 34, 99–106.
60 Holtan-Hartwig, L., Dorsch, P. & Bakken, L. R. 2000Comparison of denitrifying communities in organic soils:kinetics of NO3
2 and N2O reduction. Soil Biol. Biochem.32, 833–843. (doi:10.1016/S0038-0717(99)00213-8)
61 Brettar, I. & Hofle, M. G. 1993 Nitrous oxide produ-cing heterotrophic bacteria from a water column ofthe central Baltic: abundance and molecular identifi-
cation. Mar. Ecol. Prog. Ser. 94, 253–265. (doi:10.3354/meps094253)
62 Richardson, D., Felgate, H., Watmough, N., Thomson,A. & Baggs, E. 2009 Mitigating release of the potentgreenhouse gas N2O from the nitrogen cycle—could
enzymic regulation hold the key. Trends Biotechnol. 27,388–397. (doi:10.1016/j.tibtech.2009.03.009)
63 Kampschreur, M. J., Temmink, H., Kleerebezem, R.,Jetten, M. S. M. & van Loosdrecht,M. C. M. 2009 Nitrousoxide emission during wastewater treatment. Water Res. 43,
4093–4103. (doi:10.1016/j.watres.2009.03.001)64 Weiss, R. F. & Price, B. A. 1980 Nitrous oxide solubility
in water and seawater. Mar. Chem. 8, 347–359. (doi:10.1016/0304-4203(80)90024-9)
65 Dean, J. A. 1992 Lange’s handbook of chemistry.New York: McGraw-Hill, Inc.
66 Ahn, J. H., Kim, S., Park, H., Rahm, B., Pagilla, K. &Chandran, K. 2010 N2O Emissions from activatedsludge processes, 2008–2009: results of a national
monitoring survey in the United States. Environ. Sci.Technol. 44, 4505–4511. (doi:10.1021/es903845y)
67 Foley, J., de Haas, D., Yuan, Z. & Lant, P. 2009 Nitrousoxide generation in full-scale biological nutrientremoval wastewater treatment plants. Water Res. 44,
831–844. (doi:10.1016/j.watres.2009.10.033)68 Kampschreur, M. J., Tan, N. C. G., Kleerebezem, R.,
Picioreanu, C., Jetten, M. S. M. & van Loosdrecht,M. C. M. 2008 Effect of dynamic process conditions onnitrogen oxides emission from a nitrifying culture. Environ.Sci. Technol. 42, 429–435. (doi:10.1021/es071667p)
69 Kester, R. A., De Boer, W. & Laanbroek, H. J. 1997Production of NO and N2O by pure cultures of nitrify-ing and denitrifying bacteria during changes in aeration.Appl. Environ. Microbiol. 63, 3872–3877.
70 Yu, R., Kampschreur, M. J., Loosdrecht, M. C. M. V. &Chandran, K. 2010 Mechanisms and specific direction-ality of autotrophic nitrous oxide and nitric oxidegeneration during transient anoxia. Environ. Sci.Technol. 44, 1313–1319. (doi:10.1021/es902794a)
Review. N2O emissions from WWT process Y. Law et al. 1277
on June 18, 2018http://rstb.royalsocietypublishing.org/Downloaded from
71 Zheng, H., Hanaki, K. & Matsuo, T. 1994 Productionof nitrous oxide gas during nitrification of wastewater.Water Sci. Technol. 30, 133–141.
72 Chuang, H.-P., Ohashi, A., Imachi, H., Tandukar, M. &Harada, H. 2007 Effective partial nitrification to nitrite bydown-flow hanging sponge reactor under limited oxygencondition. Water Res. 41, 295–302. (doi:10.1016/j.watres.2006.10.019)
73 Yu, R. & Chandran, K. 2010 Strategies of Nitrosomonaseuropaea 19718 to counter low dissolved oxygen andhigh nitrite concentrations. BMC Microbiol. 10, 70.(doi:10.1186/1471-2180-10-70)
74 Tallec, G., Garnier, J., Billen, G. & Gousailles, M. 2008Nitrous oxide emissions from denitrifying activatedsludge of urban wastewater treatment plants, underanoxia and low oxygenation. Bioresour. Technol. 99,2200–2209. (doi:10.1016/j.biortech.2007.05.025)
75 Hynes, R. K. & Knowles, R. 1984 Production of nitrousoxide by Nitrosomonas europaea: effects of acetylene, pH,and oxygen. Can. J. Microbiol. 30, 1397–1404. (doi:10.1139/m84-222)
76 Shiskowski, D. M. & Mavinic, D. S. 2006 The influence
of nitrite and pH (nitrous acid) on aerobic-phase, auto-trophic N2O generation in a wastewater treatmentbioreactor. J. Environ. Eng. Sci. 5, 273–283. (doi:10.1139/s05-034)
77 Kampschreur, M. J., van der Star, W. R. L., Wielders,
H. A., Mulder, J. W., Jetten, M. S. M. & van Loos-drecht, M. C. M. 2008 Dynamics of nitric oxide andnitrous oxide emission during full-scale reject watertreatment. Water Res. 42, 812–826. (doi:10.1016/j.
watres.2007.08.022)78 Itokawa, H., Hanaki, K. & Matsuo, T. 2001 Nitrous
oxide production in high-loading biological nitrogenremoval process under low COD/N ratio condition.Water Res. 35, 657–664. (doi:10.1016/S0043-
1354(00)00309-2)79 Betlach, M. R. & Tiedje, J. M. 1981 Kinetic expla-
nation for accumulation of nitrite, nitric oxide, andnitrous oxide during bacterial denitrification. Appl.Environ. Microbiol. 42, 1074–1084.
80 Schulthess, R. V., Kuhni, M. & Gujer, W. 1995 Releaseof nitric and nitrous oxides from denitrifying activatedsludge. Water Res. 29, 215–226. (doi:10.1016/0043-1354(94)E0108-I)
81 Zhou, Y., Pijuan, M., Zeng, R. J. & Yuan, Z. 2008 Free
nitrous acid inhibition on nitrous oxide reduction by adenitrifying-enhanced biological phosphorus removalsludge. Environ. Sci. Technol. 42, 8260–8265. (doi:10.1021/es800650j)
82 Ghosh, S., Gorelsky, S. I., George, S. D., Chan, J. M.,Cabrito, I., Dooley, D. M., Moura, J. J., Moura, I. &Solomon, E. I. 2007 Spectroscopic, computational,and kinetic studies of the m4-sulfide-bridged tetranuc-lear CuZ cluster in N2O reductase: pH effect on the
edge ligand and its contribution to reactivity. J. Am.Chem. Soc. 129, 3955–3965. (doi:10.1021/ja068059e)
83 Chung, Y. C. & Chung, M. S. 2000 BNP test to evalu-ate the influence of C/N ratio on N2O production inbiological denitrification. Water Sci. Technol. 42, 23–27.
84 Schalk-Otte, S., Seviour, R. J., Kuenen, J. G. & Jetten,M. S. M. 2000 Nitrous oxide (N2O) production byAlcaligenes faecalis during feast and famine regimes.Water Res. 34, 2080–2088. (doi:10.1016/S0043-1354(99)00374-7)
85 Kishida, N., Kim, J. H., Kimochi, Y., Nishimura, O.,Sasaki, S. & Sudo, R. 2004 Effect of C/N ratio onnitrous oxide emission from swine wastewater treatmentprocess. Water Sci. Technol. 49, 359–371.
Phil. Trans. R. Soc. B (2012)
86 Knowles, R. 1982 Denitrification. Microbiol. Rev. 46,43–70.
87 Christensson, M., Lie, E. & Welander, T. 1994 A com-
parison between ethanol and methanol as carbonsources for denitrification. Water Sci. Technol. 30, 83–90.
88 Hallin, S. & Pell, M. 1998 Metabolic properties of deni-trifying bacteria adapting to methanol and ethanol inactivated sludge. Water Res. 32, 13–18. (doi:10.1016/
S0043-1354(97)00199-1)89 Hanaki, K., Hong, Z. & Matsuo, T. 1992 Production of
nitrous oxide gas during denitrification of wastewater.Water Sci. Technol. 26, 1027–1036.
90 Park, K. Y., Inamori, Y., Mizuochi, M. & Ahn, K. H.2000 Emission and control of nitrous oxide from a bio-logical wastewater treatment system with intermittentaeration. J. Biosci. Bioeng. 90, 247–252.
91 Lemaire, R., Meyer, R., Taske, A., Crocetti, G. R.,
Keller, J. & Yuan, Z. 2006 Identifying causes for N2Oaccumulation in a lab-scale sequencing batch reactorperforming simultaneous nitrification, denitrificationand phosphorus removal. J. Biotechnol. 122, 62–72.(doi:10.1016/j.jbiotec.2005.08.024)
92 Zeng, R. J., Yuan, Z. & Keller, J. 2003 Enrichment ofdenitrifying glycogen-accumulating organisms inanaerobic/anoxic activated sludge system. Biotechnol.Bioeng. 81, 397–404. (doi:10.1002/bit.10484)
93 Murnleitner, E., Kuba, T., Loosdrecht, M. C. M. V. &
Heijnen, J. J. 1997 An integrated metabolic modelfor the aerobic and denitrifying biological phos-phorus removal. Biotechnol. Bioeng. 54, 434–450.(doi:10.1002/(SICI)1097-0290(19970605)54:5,434::
AID-BIT4.3.0.CO;2-F)94 Tabrez Khan, S. & Hiraishi, A. 2001 Isolation and
characterization of a new poly(3-hydroxybutyrate)-degrading, denitrifying bacterium from activatedsludge. FEMS Microbiol. Lett. 205, 253–257. (doi:10.
1111/j.1574-6968.2001.tb10957.x)95 Matsubara, T., Frunzke, K. & Zumft, W. 1982 Modu-
lation by copper of the products of nitrite respirationin Pseudomonas perfectomarinus. J. Bacteriol. 149, 816.
96 Granger, J. & Ward, B. B. 2003 Accumulation of nitro-
gen oxides in copper-limited cultures of denitrifyingbacteria. Limnol. Oceanogr. 48, 313–318. (doi:10.4319/lo.2003.48.1.0313)
97 Zhu, X. & Chen, Y. 2011 Reduction of N2O and NOgeneration in anaerobic–aerobic (low dissolved
oxygen) biological wastewater treatment process byusing sludge alkaline fermentation liquid. Environ. Sci.Technol. 45, 2137–2143. (doi:10.1021/es102900h)
98 Sinha, B. & Annachhatre, A. 2007 Partial nitrification—
operational parameters and microorganisms involved.Rev. Environ. Sci. Biotechnol. 6, 285–313. (doi:10.1007/s11157-006-9116-x)
99 Casey, T. G., Wentzel, M. C. & Ekama, G. A. 1999Filamentous organism bulking in nutrient removal acti-
vated sludge systems. Paper 9: Review of biochemistryof heterotrophic respiratory metabolism. Water S.A.25, 409–424.
100 Casey, T. G., Wentzel, M. C. & Ekama, G. A. 1999Filamentous organism bulking in nutrient removal acti-
vated sludge systems. Paper 10: Metabolic behaviour ofheterotrophic facultative aerobic organisms under aera-ted/unaerated conditions. Water S.A. 25, 425–442.
101 Pellicer-Nacher, C., Sun, S., Lackner, S., Terada, A.,Schreiber, F., Zhou, Q. & Smets, B. F. 2010 Sequential
aeration of membrane-aerated biofilm reactors forhigh-rate autotrophic nitrogen removal: experimentaldemonstration. Environ. Sci. Technol. 44, 7628–7634.(doi:10.1021/es1013467)