food traceability using rfid and wireless sensor networks in
TRANSCRIPT
ESCUELA TÉCNICA SUPERIOR DE INGENIERÍA DE TELECOMUNICACIÓN
UNIVERSIDAD POLITÉCNICA DE CARTAGENA
Trabajo Fin de Master
Food traceability using RFID and Wireless Sensor Networks
in an Aquaculture Enterprise.
AUTOR: Alfredo Parreño Marchante
DIRECTORES: Alejandro Álvarez Melcón
Fernando Quesada Pereira
Septiembre / 2011
Alfredo Parreño Marchante Food traceability using RFID and Wireless Sensor Networks in an Aquaculture Enterprise Page 2
Autor Alfredo Parreño Marchante
E-mail del Autor [email protected]
Director(es) Alejandro Álvarez Melcón, Fernando Quesada Pereira
E-mail del Director [email protected], [email protected]
Codirector(es)
Título del PFC Food traceability using RFID and Wireless Sensor Networks in an Aquaculture
Enterprise.
Descriptores RFID, Redes de Sensores, WSN, Trazabilidad, EPCIS
Resúmen
El proyecto que se presenta trata de mejorar la trazabilidad dentro de la industria alimentaria mediante
la introducción de la tecnología RFID y las Redes de Sensores Inalámbricas. Las empresas de alimentación
son un sector con un gran potencial para demostrar la capacidad de Retorno de la Inversión (ROI) de la
tecnología RFID.
El proyecto consiste en la realización del estudio de un sistema de trazabilidad adaptado a las
necesidades de la industria alimentaria para ello se ha definido lo necesario en cuanto a:
Equipamiento Hardware RFID y WNS.
Software y Middleware.
Bases de datos.
Formatos para identificación de productos (ID´s).
Con este sistema se pretende recopilar la información de producción, sensorización (temperatura,
humedad, etc.), movimientos de las mercancías a lo largo de la cadena de suministro y la distribución. Toda
esta información se incluirá en sistemas estandarizados EPCIS para posibilitar su acceso y distribución a los
agentes intervinientes en el proceso. Toda la información estará relacionada e indexada de tal forma que
cualquier agente pueda acceder a ella y realizar consultas mediante interfaces adecuadas.
Titulación Master Universitario en Tecnologías de la Información y las Comunicaciones
Intensificación
Departamento Tecnologías de la Información y las Comunicaciones
Fecha de Presentación Septiembre- 2011

Alfredo Parreño Marchante Food traceability using RFID and Wireless Sensor Networks in an Aquaculture Enterprise Page 3
CCoonntteenntt
1 Abstract ..................................................................................................................... 6
2 Introduction ................................................................................................................ 8
2.1 Business case .......................................................................................................... 10
2.2 Maturity of the technical solution............................................................................... 11
2.2.1 Farm ................................................................................................................. 11 2.2.2 Processing ........................................................................................................ 12 2.2.3 Transportation and logistics. ............................................................................. 12 2.2.4 Retail ................................................................................................................ 13
3 Objectives ................................................................................................................ 15
4 Standards Revision .................................................................................................. 17
4.1 Low Level Reader Protocol (LLRP) Interface ............................................................ 20
4.2 Application Level Events (ALE) ................................................................................ 21
4.3 Electronic Product Code Information Services (EPCIS) ............................................ 23
4.4 Object Name Service (ONS) ..................................................................................... 25
5 Hardware and Software ............................................................................................ 27
5.1 Hardware Reviewed ................................................................................................. 27
5.1.1 Handheld reader ............................................................................................... 27 5.1.2 Fixed Reader .................................................................................................... 28 5.1.3 Antennas .......................................................................................................... 32 5.1.4 Tags ................................................................................................................. 34 5.1.5 RFID printer ...................................................................................................... 36 5.1.6 Wireless Sensor Network .................................................................................. 38
5.2 Software Reviewed................................................................................................... 39
5.2.1 Open Source EPC (Fosstrak) ........................................................................... 39 5.2.2 Open Source EPC (Aspire) ............................................................................... 41
5.3 Hardware Tests ........................................................................................................ 49
5.3.1 Set up ............................................................................................................... 49 5.3.2 Planned Hardware Tests .................................................................................. 49 5.3.3 Tests Results .................................................................................................... 51
5.3.3.1 Tests without portal intervention ............................................................... 51
5.3.3.1.1 Set Up ................................................................................................ 51
5.3.3.1.2 Handheld Reader ............................................................................... 52
5.3.3.1.2.1 Open Air Tests ................................................................................ 53
5.3.3.1.2.2 Tests in a room with reflections ....................................................... 56
5.3.3.1.2.3 Tests with tags attached to boxes.................................................... 58
5.3.3.1.3 Fixed reader ....................................................................................... 61
5.3.3.1.3.1 Test with 7dbi Antenna. ................................................................... 61
Alfredo Parreño Marchante Food traceability using RFID and Wireless Sensor Networks in an Aquaculture Enterprise Page 4
5.3.3.1.3.2 Test with 12dbi Antenna. ................................................................. 62
5.3.3.1.4 Conclusions ........................................................................................ 63
5.3.3.2 Tests with portal intervention .................................................................... 64
5.3.3.2.1 Set up ................................................................................................. 64
5.3.3.2.2 Test Scenario 1 .................................................................................. 66
5.3.3.2.2.1 Single reading ................................................................................. 66
5.3.3.2.2.1.1 Tags attached to exterior faces..................................................... 66
5.3.3.2.2.1.2 Tags inside the box ...................................................................... 67
5.3.3.2.2.1.2.1 With empty box .......................................................................... 67
5.3.3.2.2.1.2.2 With box full of objects ............................................................... 70
5.3.3.2.2.2 Multiple reading ............................................................................... 72
5.3.3.2.2.2.1 Group 1 ........................................................................................ 73
5.3.3.2.2.2.1.1 Conclusions ............................................................................... 80
5.3.3.2.2.2.2 Group 2 ........................................................................................ 80
5.3.3.2.2.2.2.1 Conclusions ............................................................................... 85
5.3.3.2.2.2.3 Group 3 ........................................................................................ 86
5.3.3.2.2.2.3.1 Conclusions ............................................................................... 91
5.3.3.2.2.2.4 Group 4 ........................................................................................ 91
5.3.3.2.2.2.4.1 Conclusions ............................................................................... 97
5.3.3.2.2.2.5 Group 5 ........................................................................................ 97
5.3.3.2.2.2.5.1 Conclusions ............................................................................. 100
5.3.3.2.2.2.6 Group 6 ...................................................................................... 100
5.3.3.2.2.2.6.1 Conclusions ............................................................................. 105
5.3.3.2.3 General conclusions. ........................................................................ 105
6 Culmárex Business processes definition .................................................................. 106
6.1 Company ................................................................................................................ 106
6.2 Products ................................................................................................................. 106
6.2.1 Fresh Fish ....................................................................................................... 106 6.2.2 Processed Fish ............................................................................................... 107 6.2.3 Juveniles......................................................................................................... 108
6.3 Organization ........................................................................................................... 108
6.3.1 Culmárex ........................................................................................................ 108 6.3.2 Aquicultura Balear (ABSA) .............................................................................. 109 6.3.3 Basademar ..................................................................................................... 109 6.3.4 Granja Marina Bahía de Santa Pola................................................................ 109 6.3.5 Piscifactoria Aguadulce ................................................................................... 109 6.3.6 Cultivos del Ponto ........................................................................................... 109 6.3.7 Blue & Green .................................................................................................. 109
Alfredo Parreño Marchante Food traceability using RFID and Wireless Sensor Networks in an Aquaculture Enterprise Page 5
6.4 Business processes ................................................................................................ 110
6.4.1 Group processes ............................................................................................ 110 6.4.2 Breeding Farm Processes .............................................................................. 111 6.4.3 On-growing farm processes ............................................................................ 112 6.4.4 Processing and Packing Plant Processes ....................................................... 113
6.5 Conclusions ............................................................................................................ 116
7 Traceability System Definition ................................................................................. 117
7.1 Pilot Architecture .................................................................................................... 117
7.1.1 RFID System .................................................................................................. 117 7.1.2 Materials ......................................................................................................... 121
7.2 Information Flow ..................................................................................................... 121
7.3 Middleware ............................................................................................................. 125
7.3.1 Identity Types ................................................................................................. 125
7.3.1.1 Entities to identify ................................................................................... 125
7.3.1.2 Products ................................................................................................. 125
7.3.1.3 Assets .................................................................................................... 127
7.3.1.4 Locations ............................................................................................... 127
7.3.2 EPCIS Events ................................................................................................. 128
8 Pilot Implementation ............................................................................................... 132
8.1 System architecture ................................................................................................ 132
8.2 Culmárex Pilot ........................................................................................................ 133
8.3 Hardware Deployment ............................................................................................ 136
8.4 Software Implementation ........................................................................................ 141
9 Conclusions ........................................................................................................... 149
10 References ............................................................................................................ 151
Abstract
Alfredo Parreño Marchante Food traceability using RFID and Wireless Sensor Networks in an Aquaculture Enterprise Page 6
UPCT is undertaken a Pilot in the fish farm business in the scope of the RFID-F2F project. This
work has been supported by European Union (CIP-Pilot Actions), under the project “RFID from Farm
to Fork”. In the project “RFID from Farm to Fork” an implementation of RFID technologies will be
used along the food supply chain: from farm to the consumer. The company name, in which the pilot
will be carried out, is Culmárex. We are going to deploy RFID and WSN technologies to improve their
business processes.
Currently, most enterprises are using bar codes to identify their products. Bar codes provide
little additional information and most small and medium enterprises (SME) don´t have a system to
collect and store data on computer systems in an automatized fashion. Thus, they cannot query
information about products life cycle.
Furthermore, the products traceability information is not available for clients or end users and
they cannot know important information about production and distribution processes of the
product they have purchased. They cannot be sure whether cold chain has been maintained
throughout all the processes, or they cannot know the harvest, collection or fishing day. It is not
possible to know how much time the product has been stored and in which conditions, and so on.
The work presented tries to improve traceability in the food industry using RFID technology and
Wireless Sensor Networks. The food business is one that provides huge potential for demonstration
of return on investment for RFID. The technology has been proven to provide a return:
By providing authentication of the origin of foodstuffs, thereby increasing consumer
confidence and allowing access to premium markets
By reducing wastage and optimizing logistics costs
By increasing quality of goods to the consumer
Project lie in developing a traceability system adapted to food industry needs. For this, it will be
necessary to define the following:
RFID and WNS Hardware.
Software and Middleware.
Webservices.
Data bases.
Identification schemas.
With this system, it is intended to collect information about production, sensors (temperature,
humidity, etc.), movements of goods throughout supply chain and distribution. All this information
will be included on standardized EPCIS systems to allow data access and distribution by all
11 AAbbssttrraacctt

Abstract
Alfredo Parreño Marchante Food traceability using RFID and Wireless Sensor Networks in an Aquaculture Enterprise Page 7
stakeholders. Data will be indexed so that any stakeholder will be able query information through
appropriate interfaces.
Besides, an access interface through internet will be deployed. The clients and end consumers
will be able to query traceability information of products they have purchased. Thus, the client can
query the whole life cycle of a product through its unique identity code.
After the traceability system is defined, it will be tested with pilot deployed in an aquaculture
enterprise. By demonstrations of new real implementations it would be possible to raise awareness
among companies, in particular SMEs, on the potential benefits associated to the use of RFID
technology.

Introduction
Alfredo Parreño Marchante Food traceability using RFID and Wireless Sensor Networks in an Aquaculture Enterprise Page 8
The production and distribution of food is becoming one of the most important issues in many
countries all over the world. The extension of food economy deals with rising concerns of food
quality, and origin of products is opening a place to collect as much as possible information from the
whole supply chain.
The 'Farm to Fork' philosophy that involves agriculture, processing, storage and distribution,
authenticity, quality and safety requires an extensive and a specific expertise in each country. To
show the importance of that fact it is needed a successful execution and effective functioning of the
RFID pilot in supply chain management linked up together in several countries.
In the food production chain, there already exist many applications in Europe (Italy, UK), USA
and Canada where RFID technology was applied. Mainly large companies in EU are dealing with
distribution and retail (UK supermarket chain Tesco, an example of beef traceability from farm to
slaughter RFID pilot (Ireland). They are performed on national level which shows the mature RFID
technology implementation that could be enlarged to an EU level by linking a supply chain that
includes companies in several countries and specially to involve SMEs. With RFID technology used in
their value chain, SMEs benefit in [1]:
Improved worker productivity and efficiency.
Reduction in labour costs.
Quality problems should be detected as quickly as possible with monitoring environmental
variables using sensor networks;
More efficient control of the supply chain due to increased information accuracy.
Reduction of human errors from manual scanning operations.
Better tracking and tracing of products.
Enhanced profit margins.
The implementation of RFID pilots in different countries with hardware and software solutions
including local and global data base systems could impact on competitiveness and productivity gains
nationwide and European Union. Many SMEs would have opportunities to:
Enlarge their market by selling their products in EU.
Enlarge the productivity and employ more people.
Assure and improve traceability in EU.
Intensify the competitiveness by the recognition of their quality, authenticity.
Get help in the respective RFID application.
22 IInnttrroodduuccttiioonn

Introduction
Alfredo Parreño Marchante Food traceability using RFID and Wireless Sensor Networks in an Aquaculture Enterprise Page 9
There have been several pilots of RFID in the food sector, and these are now leading to
commercial implementations. In 2010 DHL and METRO Group announced they would start the first
national roll-out of radio frequency identification (RFID) in France and the largest in French retail
logistics.
Beginning autumn 2010, DHL will equip all shipments to the 89 Metro Cash & Carry self-service
wholesale stores in France with RFID transponders and read them out along the entire supply chain.
Some 1.3 million pallets per year will be fitted with the RFID tags to facilitate contactless and
automated monitoring of the supply chain.
Five DHL food logistics centres will equip all shipments to the self-service wholesale stores with
RFID tags. These RFID transponders are read out during the loading process, and the data are
electronically transmitted to the individual stores. When the shipments arrive at the recipient's
facilities, the tags are read out again and the data are automatically checked against the order.
Such projects are commonly centred around a major retailer (such as the Metro group, in this
case) which has control over its supply chains. While they do show the potential of the technology,
they are unsuitable as a model for SME's to gain value from RFID. This needs a business model which
returns value to all stakeholders, and also needs to depend on an open standards regime, rather
than one imposed by a large controlling stakeholder.
Previous work funded under the EU framework programs includes TRASER, which research the
linkage of the automatically retrievable identity of products (items in general) to identity-specific
tracking and tracing, and related web services. The output was an open-source TraSer community
which, through its web services, assists the targeted group of users (mainly SMEs) to improve their
efficiency in changing environments, such as supply-chains, service operations and project delivery
networks. This concept of traceability of product through web services is obviously related to the
present project, and the project will build on the experience of TRASER. Food is a specific case, which
will require an additional element of traceability, in that it is perishable, hence this project proposes
to link RFID traceability with sense data from the environments in which the products grow, are
processed stored and transported.
The SMART project focussed on the use of RFID in consumer information services, store
management, promotion/ event execution, product traceability and reverse logistics, inventory
management and collaborative replenishment. Thus, its work is directly applicable to the transport
and retail parts of this project, and will be built on. It did not, however cover the whole value chain,
nor did it make the linkage between RFID and sensor networks for product environment monitoring.
In particular, this project will stimulate the take up and acceptance of RFID by the provision of a
popular use, which provides direct benefits for consumers. This project is also original in that it
proposes to link sensor networks to enable condition monitoring of the foodstuffs, in addition to
their tracing.
Introduction
Alfredo Parreño Marchante Food traceability using RFID and Wireless Sensor Networks in an Aquaculture Enterprise Page 10
22..11 BBuussiinneessss ccaassee
A report published at the end of 2008 by the EU IP Bridge project concludes that: RFID
technology will have especially generate significant impacts on applications with a unique selling
proposition, e.g. anti-counterfeiting, secure supply chains, and cold chain and quality monitoring
providing as well as better information for decision makers.
The cost of RFID implementations usually depends on the special demands of companies in
manufacturing, warehousing, distribution and retailing. According to the research some RFID
projects warehousing and distribution and retailing have achieved a 200-percent return on
investment. Supply chain costs can be cut by 3 to 5 percent and a 2 to 7 percent increase can be
achieved in revenue due to better visibility and accuracy that RFID technology provides.
By saying that farming needs to feed the growing world population and to supply consumers
with safe, wholesome food it means that the proposed global RFID pilot idea should include mainly
SMEs and the pilot versions implemented in different countries. This could give many of them the
opportunity to be recognized and included into the supply chain management system nationwide
and also in EU.
Placing RFID pilot version would show a special case of SMEs redesign in the sense of
modification of a software system, generally to add new functionality to improve the supply chain
management. By demonstrations of new real implementations it would be possible to raise
awareness among companies, in particular SMEs, on the potential benefits associated to the use of
RFID technology.
Global RFID database could support the planning and operational activities in national and EU
dimension and will give a subsequent feedback into the financial sense when the information is
provided real-time to the user who must remedy the situation. However, the speed and quantity of
data from RFID solution will be dynamically integrated with the operational and decision-making
tools. Triggering management or operational alerts. The key is having the information received by
the right person at the right time, giving them the opportunity to correct or address the situation.
The privacy, data protection and information security aspects of RFID technology deployment is
intended to be taken with respect to the national and EU legislation that were addressed in the
Communication "RFID in Europe: steps towards a policy framework", namely the governance of
resources in the Internet of Things. The RFID application operators should:
Conduct a privacy impact assessment to determine how to implement the
privacy and the protection of personal data.
Inform individuals on the use of RFID.
Enable the possibility of the tag removal and the use of deactivation systems,
encryption included.
Introduction
Alfredo Parreño Marchante Food traceability using RFID and Wireless Sensor Networks in an Aquaculture Enterprise Page 11
22..22 MMaattuurriittyy ooff tthhee tteecchhnniiccaall ssoolluuttiioonn
The pilot must guarantee considerable benefits to consumers and institutes as it allows the
following controls to be effected:
Origin of agricultural products.
Production method.
Processing process.
Controls effected.
Genetic identity of the livestock, vegetables and phytosanitary controls effected
Anagraphical data (passport).
Means of transportation and distribution of the meat, vegetables and end-products.
All the traceability data to be written on the end product can be collected from a wireless
sensor network and sent to a system that will work as central database (actually to be a federated
database with a single major portal). Our main idea is to link the central system and the wireless
sensor network within M2M – Machine To Machine, i.e. internet of objects – that will send the data
via HTTP connections. Thus, a Wireless data access will be made between the central system and all
the supply chain, from farm to retail.
In this section we will illustrate how a product can be traced from the farm to consumer
merging existing ICT solutions.
22..22..11 FFaarrmm
Farm monitoring using WSN and RFID relates to the identification of products and assessment of
the conditions in which food is handled and grown. Both aspects provide an added value to the
farmer in respectively automating and facilitating sorting of goods and assessing the quality and
safety of the food based on the characteristics collected from the field.
Care needs to be taken when improving farm operations as the integration of new technologies
in farm operations might substantially impact on the way ICT is used in farm operations. For that
reason a farm solution should present clear added value and ROI together with ease of use. The
combination of both will determine which technology integration has the lowest threshold for
introduction and highest potential for remaining viable and maintainable.
The fish pilot is rather more specialized due to the nature of the fish farm.
Young fish from the hatchery to the fish farm are carried in tanks.
Identification of young fish includes the origin of eggs and parents of the fish issued on a
documents or labelled tanks. The data will be written at the hatchery (document) and
the transportation details (temperature and water conditions) could be added and sent
to the central system at the farm.
Introduction
Alfredo Parreño Marchante Food traceability using RFID and Wireless Sensor Networks in an Aquaculture Enterprise Page 12
It is interesting to have the data about the hatchery, scientific and commercial name,
production method, production area, quantity of number, hatchery supplier.
The information will provide an added value to the farmer in assessing the quality and
safety of the fish based on the origin of the fish parents and bloodstock farms.
The producer of fish feed delivers food to fish farm. Feed is packed in bags on pallets,
labelled and already implemented.
Identification is done before feeding the fish in the sea nets:
Feeding data (fish feed type and ingredients, weight, supplier, production date) using
bar code labelling of bags.
Medication and vitamins applied to the fish feeding using bar code or RFID labelling of
bottles, bags.
The quality of fish feed can be monitored and the collected data might have a great
impact on the way that SME is recognized in a way of an added value to the consumer.
22..22..22 PPrroocceessssiinngg
The processing stage will obviously differ enormously from product to product, although the
general principles of operation are the same:
RFID tags are used to identify batches of product passing through processing.
Information from existing process control and monitoring systems will be linked to each
batch and passed to the database.
Additional useful information may be derived using WSN.
Storage, as it happens within the manufacturing process, will be monitored using WSN.
The processing for the fish pilot consists of slaughtering and packing. Fish is at slaughterhouse
prepared to the processing, labelled by RFID tag, packed in boxes or packaged ready for retail sale
and carried by road, air, sea. The following information encoded in RFID tag is exchanged between
slaughtering and processing: commercial and scientific name, production method, production area,
quantity, slaughter date, quality grade, and size of fish.
22..22..33 TTrraannssppoorrttaattiioonn aanndd llooggiissttiiccss..
The general transport phase includes trucks that will transport the different processed products
from their production plants to the warehouses or retail stores. The traceability of the products has
to be linked with other information related to those products and coming from previous or
subsequent phases in order to provide a consistent logistic chain. Tags have to be placed on both the
products and the trucks in order to identify exactly which truck has loaded which product. Other
information as where, when those products have been loaded/unloaded could be linked with
additional information coming from WSN devices like temperature sensors inside the truck. All those
data may be sent to the central database through specific cheap RFID/NFC mobile phones or
professional devices.

Introduction
Alfredo Parreño Marchante Food traceability using RFID and Wireless Sensor Networks in an Aquaculture Enterprise Page 13
The transport phase should be global and general without specificities related to a specific
industrial domain. The monitored data could be:
ID of the truck
ID of the driver
ID of the supplier
ID of the destination
ID of all the loaded products
Date of loading/unloading coupled with GPS information during the travel
Environment parameters coming from the truck like temperature, humidity.
The central database will periodically receive all the information collected by the network
sensors properly applied to the various trucks.
22..22..44 RReettaaiill
The retail phase may use the RFID tags and barcodes for different internal processes like stock
entering, inventory, shelves replenishment and sales. It could also trace sensible products from store
room to fridges and collect temperature data from the fridges in order to insure complete cold chain
traceability. It is also the first part of the chain that may need to retrieve traceability data in case of
any problem encountered with the products.
Concerning the consumers, the shops are the places where they will enter in contact with the
products and decide based on the information they may have or find, to buy or not the product.
Therefore they need to find the right information at the right moment for them to help them in their
decision. It is the first place where the consumer will receive global information coming from the
central database. That information needs to be synthetic and adjusted to the consumer profile as he
will only take time to get information interesting for himself in particular.
The data sent by the retail to the central database may use internet technologies or SMS but the
consumer will definitely use his personal mobile phone to get data from the products. The first
technologies to be used will be mobile internet access letting the consumer enter the EAN13
number placed on the product. However new technologies like barcode scanning with the integrated
camera or NFC/RFID reading with emerging new models of mobile phones would help him to reach a
more interesting experience.
The information managed by the retail will depend on the specific process on-going. However
we can list the following interesting data:
ID of the pallet/boxes/products
ID of the geo-localized situation in the backroom
ID of the fridges and shelves
Date of shelves replenishments
Environment parameters coming from the fridges like temperature, humidity
Introduction
Alfredo Parreño Marchante Food traceability using RFID and Wireless Sensor Networks in an Aquaculture Enterprise Page 14
Marketing considerations
Consumer identification if voluntary.
The consumers will want more and more to get information about products they purchased.
The possible scenarios are wide. Their interest may be to get a decision help before to buy the
product, knowing the internal quality of the product linked to its nutritional characteristics, get
information about its provenance, its quality labels, the processes the product has passed through.
He may want also to be prevented at once an issue arises regarding the product he purchased.
However in order to bring him those kind of services, a whole specific architecture needs to be
put in place. This architecture would provide:
Information about the available mobile services
Specific profiling databases for letting the consumer define the types of data interesting
for him
Download servers that will contain the applications to install in the various mobile
phones of the market
Redirection servers that will make the link between the ID of the product and the
various information databases. The central database will be one of those but there will
surely be existing proprietary databases to get information from.
Specific databases containing processed data coming from the central database
according to the Consumer profiles.
Privacy will be of concern firstly regarding the data coming from the consumers. However some
data needs to be used in order to make the link between them and the products:
ID of the consumer mobile phone
Voluntary data given by the consumer in his/her profile
Statistical information regarding what product ID has been accessed from where
(national focus)

Introduction
Alfredo Parreño Marchante Food traceability using RFID and Wireless Sensor Networks in an Aquaculture Enterprise Page 15
This work is part of the European Project RFID from Farm to Fork within the Competitiveness
and Innovation Framework Programme of the EU Commission.
The project will showcase the ability of RFID technologies to make a return on investment for
SMEs in the food industry. The opportunities for such a return on investment arise from the
following [1]:
Opportunities to create markets for premium products (organic, etc) if technology can
address authentication, condition monitoring and quality control.
By including processing, logistics and retail new opportunities are created to increase
quality, reduce wastage, reduce energy used for refrigeration, reduce chemical usage
for preservatives, optimise carbon use, etc.
Impact on competitiveness and productivity gains, privacy and authentication issues.
Potential for new markets for food producers in the regions.
Increased productivity through reduced wastage.
Authentication of origin, process and transport of products.
These advantages have been realised in large concerns, which have control over most or all of
the value chain and are in a position to make an end-to-end investment. However, they are not
available to independent SMEs, which only participate in one stage of the value chain. By linking
RFID and sensor network technologies with a Europe wide database, which can store the exact
history of any food product, SMEs will be given the opportunity to optimise their own business
process to maximise return. In addition, a pan-union resource will be created which will allow
producers to demonstrate unequivocally the quality and freshness of their product, which will have
the effect both of increasing consumer confidence, and increasing producer margins.
This project is divided into a set of Pilots geographically localized to produce a 'federated pilot'
which demonstrates the use of RFID at all stages of the production and sales chain, allowing some
products to be tracked across Europe, from the producer to the end consumer. Within this project
UPCT is developing a Pilot in the Fish industry. The pilot is developed in the aquaculture company
Culmárex. This company is situated in Águilas (Murcia) and they are dedicated to the rearing and
marketing of sea bream and sea bass.
The pilot work began in May 2010 and will be finished in May 2012. The objective of this
document is to present the realized work within the pilot. In May 2011 begun the implementation
phase of the pilot, so the results presented in this document are related to laboratory research,
hardware and software work.
33 OObbjjeeccttiivveess

Introduction
Alfredo Parreño Marchante Food traceability using RFID and Wireless Sensor Networks in an Aquaculture Enterprise Page 16
First, it is presented a revision of RFID standards used in the development of the pilot. The
EPCglobal Architecture Framework will be used.
Then, it is presented the hardware and software investigation which will consist of selection of
suitable antennas, study of antenna performance in different scenarios; enumeration of suitable
technologies, standards and frequency bands; enumeration of available chips, chipsets,
development kits and other hardware requirements for existing tags and readers; identification of
the Database architecture to be used, middleware, etc.
Moreover, it is presented the business processes of Culmárex, products and its organization.
Besides, it is presented the definition of the traceability system, where it is defined the RFID
system to be used, the information flow, the implementation of the standard and the software
developed.
Finally, it is presented the conclusions of the work.
Standards Revision
Alfredo Parreño Marchante Food traceability using RFID and Wireless Sensor Networks in an Aquaculture Enterprise Page 17
Standardization ensures compatibility and interoperability between different manufacturers and
technical applications. The growing need for interoperable products requires the standardization of
regulatory controls on spectrum usage and international standards to support compatibility or
interoperability of RFID systems. Standardization factors enters into the business thinking when
considering identification and data capture solutions that are required to operate in different
countries and/or require compatibility for the purposes of data capture and transfer [2].
Various players are involved in working with and standardizing RFID technologies. The ISO and
EPCglobal have both been leading figures in standardization, the ISO has their 18000 standard and
the EPCglobal Center has introduced the EPC standard.
The EPCglobal Architecture Framework is a collection of interrelated standards for hardware,
software, and data interfaces (“EPCglobal Standards”), together with core services that are operated
by EPCglobal and its delegates (“EPCglobal Core Services”), all in service of a common goal of
enhancing the supply chain through the use of Electronic Product Codes (EPCs).
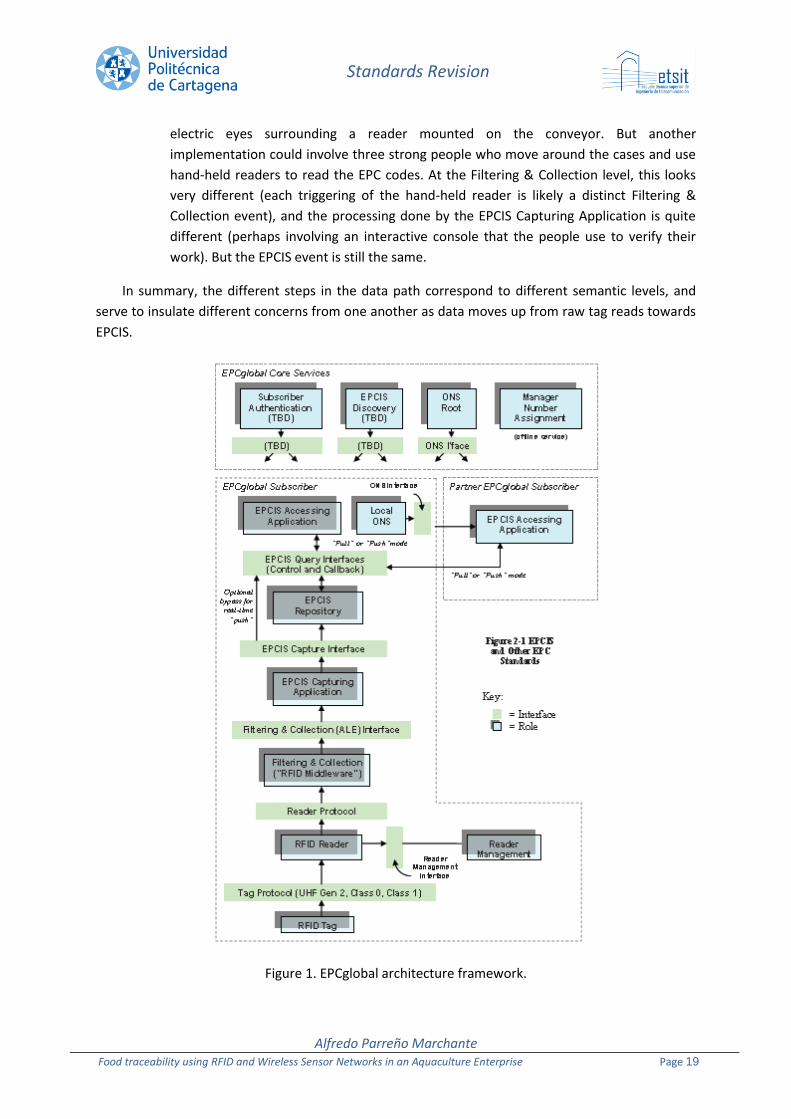
Consider a typical use case involving the reading of RFID Tags. Several processing steps are
shown in Figure 1, each mediated by an EPCglobal standard interface. At each step progressing from
raw tag reads at the bottom to EPCIS data at the top, the semantic content of the data is enriched.
Following the data flow from the bottom of the figure to the top:
Readers. Make multiple observations of RFID tags while they are in the read zone.
Reader Interface. Defines the control and delivery of raw tag reads from Readers to the
Filtering & Collection role. Events at this interface say “Reader A saw EPC X at time T.”
Filtering & Collection. This role filters and collects raw tag reads, over time intervals
delimited by events defined by the EPCIS Capturing Application (e.g. tripping a motion
detector).
Filtering & Collection (ALE) Interface. Defines the control and delivery of filtered and
collected tag read data from Filtering & Collection role to the EPCIS Capturing Application
role. Events at this interface say “At Location L, between time T1 and T2, the following EPCs
were observed,” where the list of EPCs has no duplicates and has been filtered by criteria
defined by the EPCIS Capturing Application.
EPCIS Capturing Application. Supervises the operation of the lower EPC elements, and
provides business context by coordinating with other sources of information involved in
executing a particular step of a business process. The EPCIS Capturing Application may, for
example, coordinate a conveyor system with Filtering & Collection events, may check for
exceptional conditions and take corrective action (e.g., diverting a bad case into a rework
area), may present information to a human operator, and so on. The EPCIS Capturing
44 SSttaannddaarrddss RReevviissiioonn

Standards Revision
Alfredo Parreño Marchante Food traceability using RFID and Wireless Sensor Networks in an Aquaculture Enterprise Page 18
Application understands the business process step or steps during which EPCIS data capture
takes place. This role may be complex, involving the association of multiple Filtering &
Collection events with one or more business events, as in the loading of a shipment. Or it
may be straightforward, as in an inventory business process where there may be “smart
shelves” deployed that generate periodic observations about objects that enter or leave the
shelf. Here, the Filtering & Collection-level event and the EPCIS-level event may be so similar
that no actual processing at the EPCIS Capturing Application level is necessary, and the EPCIS
Capturing Application merely configures and routes events from the Filtering & Collection
interface directly to an EPCIS Repository.
EPCIS Capture Interface. The interface through which EPCIS data is delivered to enterprise-
level roles, including EPCIS Repositories, EPCIS Accessing Applications, and data exchange
with partners. Events at this interface say, for example, “At location X, at time T, the
following contained objects (cases) were verified as being aggregated to the following
containing object (pallet).”
EPCIS Accessing Application Responsible for carrying out overall enterprise business
processes, such as warehouse management, shipping and receiving, historical throughput
analysis, and so forth, aided by EPC-related data.
EPCIS Repository Records EPCIS-level events generated by one or more EPCIS Capturing
Applications, and makes them available for later query by EPCIS Accessing Applications.
The interfaces within this stack are designed to insulate the higher levels of the stack from
unnecessary details of how the lower levels are implemented. One way to understand this is to
consider what happens if certain changes are made:
The Reader Interface insulates the higher layers from knowing what reader
makes/models have been chosen. If a different reader is substituted, the information at
the Reader Interface remains the same. The Reader Interface may, to some extent, also
provide insulation from knowing what tag protocols are in use, though obviously not
when one tag type or tag protocol provides fundamentally different functionality from
another.
The Filtering & Collection (ALE) Interface insulates the higher layers from the physical
design choices made regarding how tags are sensed and accumulated, and how the time
boundaries of events are triggered. If a single four-antenna reader is replaced by a
constellation of five single-antenna “smart antenna” readers, the events at the Filtering
& Collection level remain the same. Likewise, if a different triggering mechanism is used
to mark the start and end of the time interval over which reads are accumulated, the
Filtering & Collection event remains the same.
The EPCIS interfaces insulate enterprise applications from understanding the details of
how individual steps in a business process are carried out at a detailed level. For
example, a typical EPCIS event is “At location X, at time T, the following cases were
verified as being on the following pallet.” In a conveyor-based business implementation,
this likely corresponds to a single Filtering & Collection event, in which reads are
accumulated during a time interval whose start and end is triggered by the case crossing
Standards Revision
Alfredo Parreño Marchante Food traceability using RFID and Wireless Sensor Networks in an Aquaculture Enterprise Page 19
electric eyes surrounding a reader mounted on the conveyor. But another
implementation could involve three strong people who move around the cases and use
hand-held readers to read the EPC codes. At the Filtering & Collection level, this looks
very different (each triggering of the hand-held reader is likely a distinct Filtering &
Collection event), and the processing done by the EPCIS Capturing Application is quite
different (perhaps involving an interactive console that the people use to verify their
work). But the EPCIS event is still the same.
In summary, the different steps in the data path correspond to different semantic levels, and
serve to insulate different concerns from one another as data moves up from raw tag reads towards
EPCIS.
Figure 1. EPCglobal architecture framework.
Standards Revision
Alfredo Parreño Marchante Food traceability using RFID and Wireless Sensor Networks in an Aquaculture Enterprise Page 20
44..11 LLooww LLeevveell RReeaaddeerr PPrroottooccooll ((LLLLRRPP)) IInntteerrffaaccee
The LLRP protocol enables the middleware to communicate with LLRP protocol compliant
readers. The low level reader protocol [3] is a standard specification defined by EPCglobal to allow
standardized communication with RFID readers. This communication involves interacting with RFID
tags and low level configuration of the reading devices. In comparison to the previous reader
protocol (RP), which is a high level protocol isolated from the physical and other low layers
parameters, LLRP was designed after communities realized that it was convenient for the reader
operation to have knowledge of the low level parameters such as reader transmit power, frequency
band configuration, etc. in order to tackle in a more efficient manner problems such as reader
collision and interference. LLRP also allows retrieval of manufacturer information of the reader and
discovery of reader capabilities, among several other enhancements over the RP protocol.
The LLRP interface is part of the Application Level Events (ALE) server. It enables this component
to interact with LLRP compliant readers using standard LLRP messages.
The design of this interface recognizes that in some RFID systems, there is a requirement for
explicit knowledge of RFID air protocols and the ability to control Readers that implement RFID
air protocol communications. It also recognizes that coupling control to the physical layers of an
RFID infrastructure may be useful for the purpose of mitigating RFID interference.
Following are the responsibilities of this interface:
Provide means to command an RFID Reader to inventory tags (read the EPC codes carried on
tags), read tags (read other data on the tags apart from the EPC code), write tags, and
execute other protocol-dependent access commands (such as ‘kill’ and ‘lock’ from EPCglobal
Class 1 Generation 2).
Provide means for robust status reporting and error handling during tag access operations.
Provide means for conveying tag passwords necessary to effect commands that may require
them, such as the ‘Kill’ command in the EPCglobal Class 1 Generation 2 UHF Air Interface
Protocol.
Provide means to control the forward and reverse RF link operation to manage RF power
levels and spectrum utilization, and assess RF interference, among RFID Readers in a system.
Provide means to control aspects of Tag Protocol operation, including protocol parameters
and singulation parameters.
Provide means to facilitate the addition of support for new air protocols.
Provide means for the retrieval of Reader device capabilities.
Provide means for vendors of Reader devices to define vendor-specific extensions to the
protocol in a manner that is non-interfering among vendors, and which, to the extent
possible, is vendor-administered.
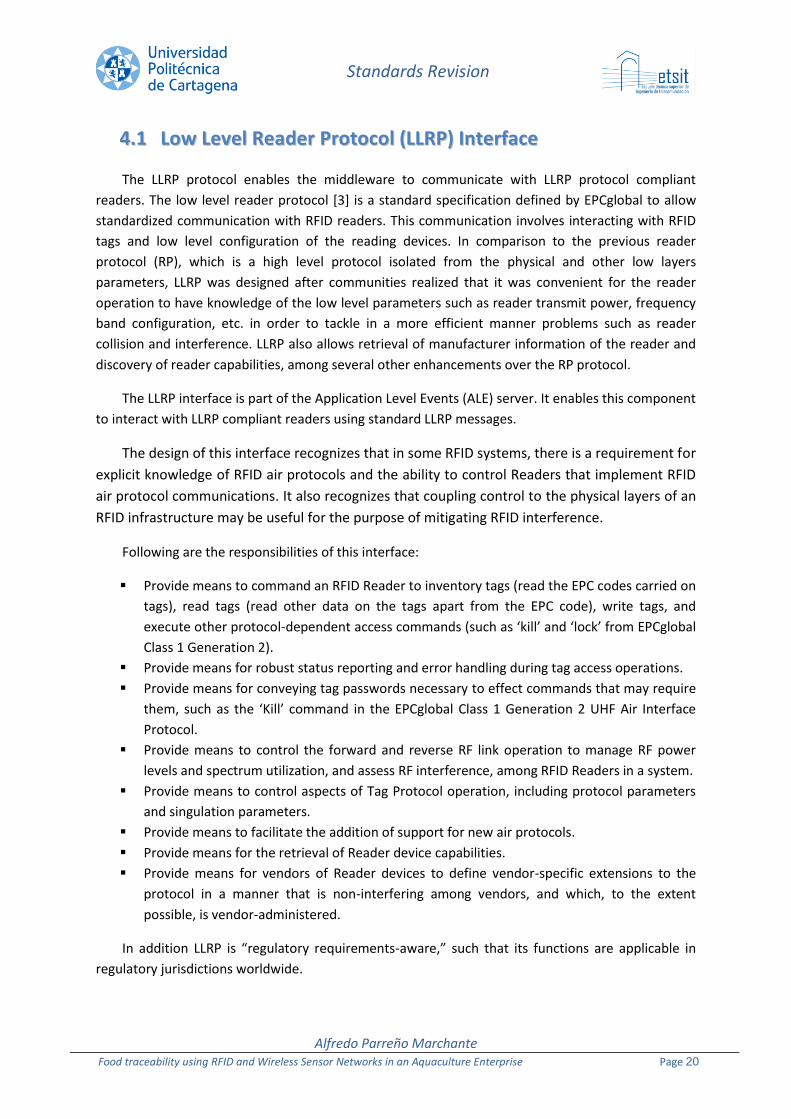
In addition LLRP is “regulatory requirements-aware,” such that its functions are applicable in
regulatory jurisdictions worldwide.
Standards Revision
Alfredo Parreño Marchante Food traceability using RFID and Wireless Sensor Networks in an Aquaculture Enterprise Page 21
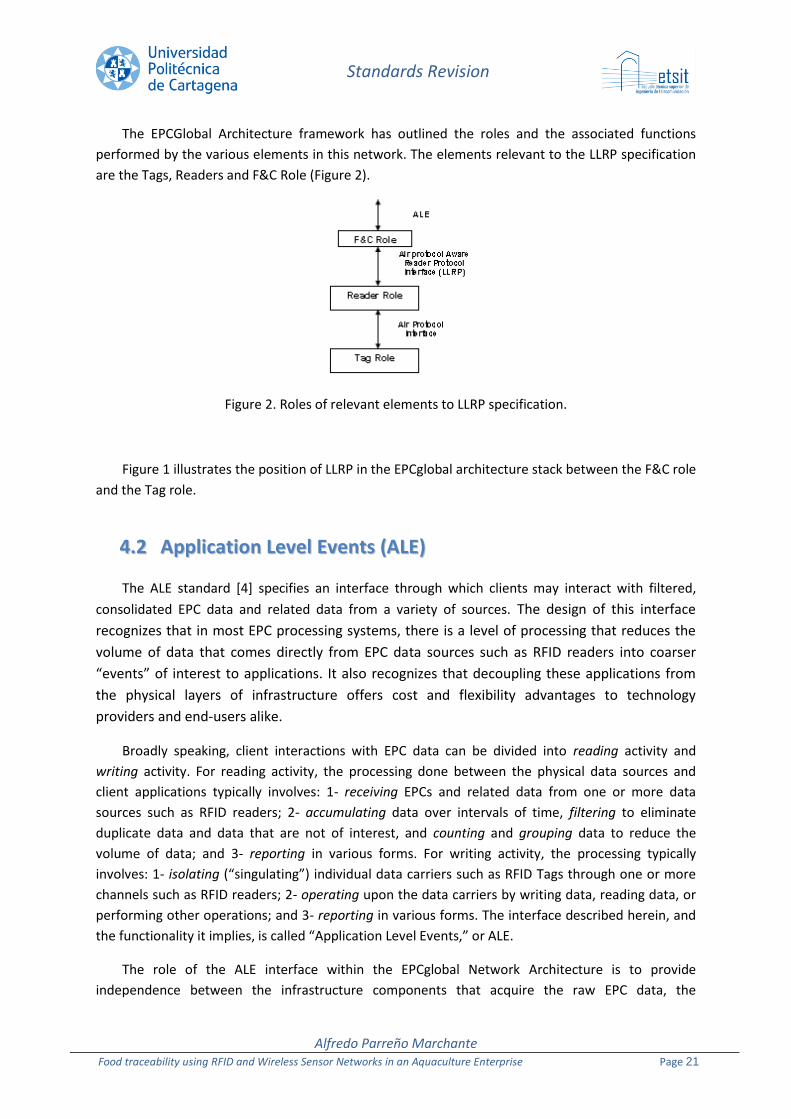
The EPCGlobal Architecture framework has outlined the roles and the associated functions
performed by the various elements in this network. The elements relevant to the LLRP specification
are the Tags, Readers and F&C Role (Figure 2).
Figure 2. Roles of relevant elements to LLRP specification.
Figure 1 illustrates the position of LLRP in the EPCglobal architecture stack between the F&C role
and the Tag role.
44..22 AApppplliiccaattiioonn LLeevveell EEvveennttss ((AALLEE))
The ALE standard [4] specifies an interface through which clients may interact with filtered,
consolidated EPC data and related data from a variety of sources. The design of this interface
recognizes that in most EPC processing systems, there is a level of processing that reduces the
volume of data that comes directly from EPC data sources such as RFID readers into coarser
“events” of interest to applications. It also recognizes that decoupling these applications from
the physical layers of infrastructure offers cost and flexibility advantages to technology
providers and end-users alike.
Broadly speaking, client interactions with EPC data can be divided into reading activity and
writing activity. For reading activity, the processing done between the physical data sources and
client applications typically involves: 1- receiving EPCs and related data from one or more data
sources such as RFID readers; 2- accumulating data over intervals of time, filtering to eliminate
duplicate data and data that are not of interest, and counting and grouping data to reduce the
volume of data; and 3- reporting in various forms. For writing activity, the processing typically
involves: 1- isolating (“singulating”) individual data carriers such as RFID Tags through one or more
channels such as RFID readers; 2- operating upon the data carriers by writing data, reading data, or
performing other operations; and 3- reporting in various forms. The interface described herein, and
the functionality it implies, is called “Application Level Events,” or ALE.
The role of the ALE interface within the EPCglobal Network Architecture is to provide
independence between the infrastructure components that acquire the raw EPC data, the
Standards Revision
Alfredo Parreño Marchante Food traceability using RFID and Wireless Sensor Networks in an Aquaculture Enterprise Page 22
architectural component(s) that filter & count that data, and the applications that use the data. This
allows changes in one without requiring changes in the other, offering significant benefits to both
the technology provider and the end-user. The ALE interface described in the specification achieves
this independence through five means:
It provides a means for clients to specify, in a high-level, declarative way, what data they
are interested in or what operations they want performed, without dictating an
implementation. The interface is designed to give implementations the widest possible
latitude in selecting strategies for carrying out client requests; such strategies may be
influenced by performance goals, the native abilities of readers or other devices which
may carry out certain filtering or counting operations at the level of firmware or RF
protocol, and so forth.
It provides a standardized format for reporting accumulated, filtered data and results
from carrying out operations that is largely independent of where the data originated or
how it was processed.
It abstracts the channels through which data carriers are accessed into a higher-level
notion of “logical reader,” often synonymous with “location,” hiding from clients the
details of exactly what physical devices were used to interact with data relevant to a
particular logical location. This allows changes to occur at the physical layer (for
example, replacing a 2-port multi-antenna reader at a loading dock door with three
“smart antenna” readers) without affecting client applications. Similarly, it abstracts
away the fine-grained details of how data is gathered (e.g., how many individual tag
read attempts were carried out). These features of abstraction are a consequence of the
way the data specification and reporting aspects of the interface are designed.
It abstracts the addressing of information stored on Tags and other data carriers into a
higher-level notion of named, typed “fields,” hiding from clients the details of how a
particular data element is encoded into a bit-level representation and stored at a
particular address within a data carrier’s memory. This allows application logic to
remain invariant despite differences between the memory organization of different
data carriers (for example, differences between Gen 1 and Gen 2 RFID Tags), and also
shields application logic from having to understand complex layout or data parsing
rules.
It provides a security mechanism so that administrators may choose which operations a
given application may perform, as a policy that is decoupled from application logic itself.
The ALE specification does not specify a particular implementation strategy, or internal
interfaces within a specific body of software. Instead, this specification focuses exclusively on
external interfaces, admitting a wide variety of possible implementations so long as they fulfill
the contract of the interfaces. For example, it is possible to envision an implementation of these
interfaces as an independent piece of software that speaks to RFID readers using their network
wire protocols. It is equally possible, however, to envision another implementation in which the
software implementing these interfaces is part of the reader device itself.
Standards Revision
Alfredo Parreño Marchante Food traceability using RFID and Wireless Sensor Networks in an Aquaculture Enterprise Page 23
The objectives of ALE as described above are motivated by twin architectural goals:
1. To drive as much filtering, counting, and other low-level processing as low in the
architecture as possible (i.e., in first preference to readers or other devices, then to low-
level, application-independent software (“middleware” or embedded software), and as a last
resort to “applications”), while meeting application and cost needs;
2. At the same time, to minimize the amount of “business logic” embedded in the tags,
readers, embedded software/middleware, where business logic is either data or processing
logic that is particular to an individual product, product category, industry or business
process.
Figure 1 shows the relationships between several EPCglobal Standards, from a data flow
perspective. The plain green bars in the diagram below denote interfaces governed by EPCglobal
standards, while the blue “shadowed” boxes denote roles played by hardware and software
components of typical system architecture. In any given deployment the mapping of roles in this
diagram to actual hardware and software components may not be one-to-one. For example, in one
deployment the “Filtering and Collection” role may be implemented by a software component and
the “RFID Reader” role implemented by a hardware component. In another deployment, a “smart
reader” may combine the “Filtering and Collection” role and the “RFID Reader” role into a single
hardware component.
44..33 EElleeccttrroonniicc PPrroodduucctt CCooddee IInnffoorrmmaattiioonn SSeerrvviicceess ((EEPPCCIISS))
The goal of EPCIS is to enable disparate applications to leverage Electronic Product Code (EPC)
data via EPC-related data sharing, both within and across enterprises [5]. Ultimately, this sharing is
aimed at enabling participants in the EPCglobal Network to gain a shared view of the disposition of
EPC-bearing objects within a relevant business context.
The objective of EPCIS as stated above is obviously very broad, implying that the “S” in EPCIS
stands for EPC Information Sharing. The intent of this broad objective is to encompass the widest
possible set of use cases and to not overly constrain the technical approaches for addressing them.
This specification focuses on an EPC Information Service approach, recognizing that some of
what must be defined in this approach (such as data element standards) will be applicable to other
approaches as well. The EPC Information Service approach will define a standard interface to enable
EPC-related data to be captured and queried using a defined set of service operations and associated
EPC-related data standards, all combined with appropriate security mechanisms that satisfy the
needs of user companies. In many or most cases, this will involve the use of one or more persistent
databases of EPC-related data, though elements of the Services approach could be used for direct
application-to-application sharing without persistent databases.
With or without persistent databases, the EPCIS specification specifies only a standard data
sharing interface between applications that capture EPC-related data and those that need access to

Standards Revision
Alfredo Parreño Marchante Food traceability using RFID and Wireless Sensor Networks in an Aquaculture Enterprise Page 24
it. It does not specify how the service operations or databases themselves should be implemented.
This includes not defining how the EPCISs should acquire and/or compute the data they need, except
to the extent the data is captured using the standard EPCIS capture operations. The interfaces are
needed for interoperability, while the implementations allow for competition among those providing
the technology and EPC Information Service.
As depicted in the Figure 1, EPCIS sits at the highest level of the EPCglobal Architecture
Framework, both above the level of raw EPC observations (e.g., the Tag Protocol and the Reader
“Wireline” Protocol), as well as above the level of filtered, consolidated observations (e.g., the
Filtering & Collection Interface). In the diagram, the plain green bars denote interfaces governed by
EPCglobal standards, while the blue shadowed boxes denote roles played by hardware and/or
software components of the system.
It is common to have enterprise applications such as Warehouse Management Systems that
simultaneously play the role of EPCIS Capturing Application (e.g. detecting EPCs during product
movement during truck loading), an EPCIS-enabled Repository (e.g. recording case-to-pallet
associations), and an EPCIS Accessing Application (e.g. carrying out business decisions based on
EPCIS-level data).)
While EPCIS is an integral part of the EPCglobal Network, it differs from elements at the lower
layers of the Architecture in three key respects:
EPCIS deals explicitly with historical data (in addition to current data). The lower layers
of the stack, in contrast, are oriented exclusively towards real-time processing of EPC
data.
EPCIS often deals not just with raw EPC observations, but also in contexts that imbue
those observations with meaning relative to the physical world and to specific steps in
operational or analytical business processes. The lower layers of the stack are more
purely observational in nature. An EPCIS-level event, while containing much of the same
EPC data as a Filtering & Collection event, is at a semantically higher level because it
incorporates an understanding of the business context in which the EPC data were
obtained. Moreover, there is no requirement that an EPCIS event be directly related to a
specific physical tag observation. For example, an EPCIS Quantity Event (Section 7.2.11)
contains information that may be generated purely by software, such as an inventory
application.
EPCIS operates within enterprise IT environments at a level that is much more diverse
and multi-faceted than the lower levels of the EPCglobal Network Architecture. In part,
and most importantly, this is due to the desire to share EPCIS data between enterprises
which are likely to have different solutions deployed to perform similar tasks. In part, it
is also due to the persistent nature of EPCIS data. And lastly, it is due to EPCIS being at
the highest level of the EPCglobal Network Architecture, and hence the natural point of
entry into other enterprise systems, which vary widely from one enterprise to the next
(or even within parts of the same enterprise).
Standards Revision
Alfredo Parreño Marchante Food traceability using RFID and Wireless Sensor Networks in an Aquaculture Enterprise Page 25
44..44 OObbjjeecctt NNaammee SSeerrvviiccee ((OONNSS))
The Object Name Service (ONS) is a service that returns a list of network accessible service
endpoints that pertain to a requested Electronic Product Code (EPC). The ONS does not contain
actual data about the EPC, it only contains the network address of services that contain the actual
data. The ONS uses the Internet´s existing Domain Name System (DNS) for resolving requests about
an EPC. In order to use DNS to find information about an item, the item´s EPC must be converted
into a format that DNS can understand, which is the typical, “dot” delimited, left to right form of all
domain-names. The ONS resolution process requires that the EPC being asked about is in its pure
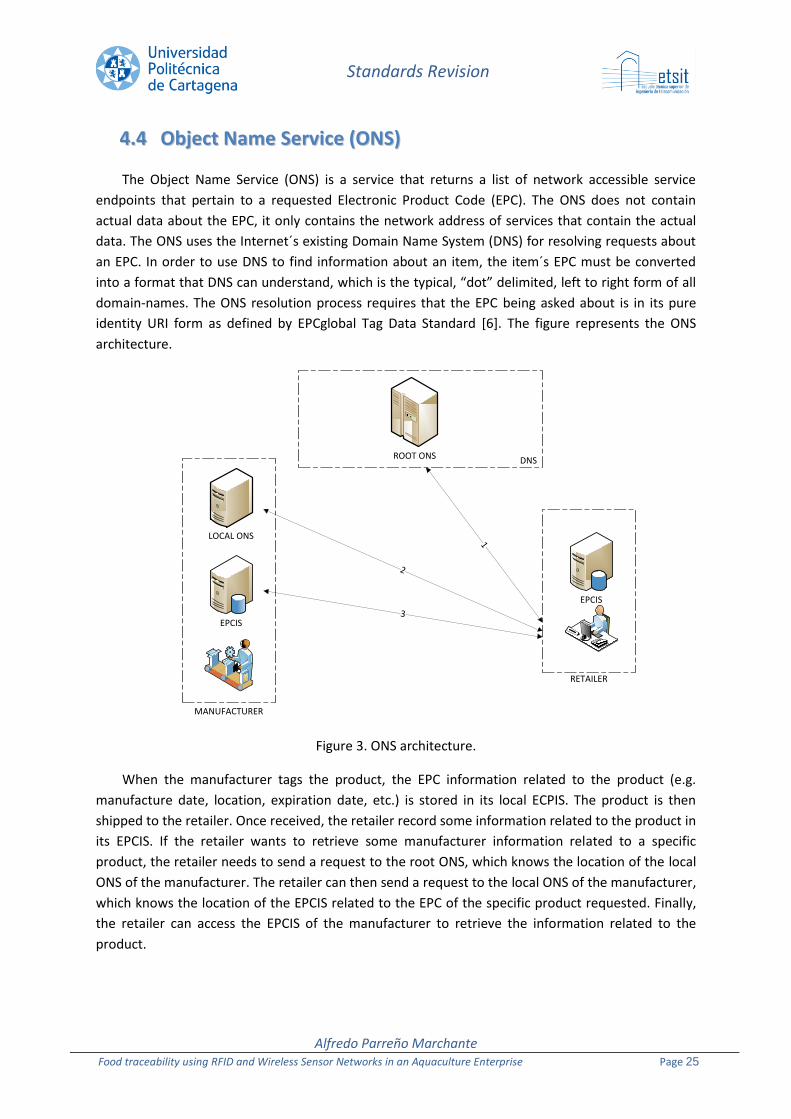
identity URI form as defined by EPCglobal Tag Data Standard [6]. The figure represents the ONS
architecture.
ROOT ONS
LOCAL ONS
EPCIS
EPCIS
DNS
MANUFACTURER
RETAILER
1
2
3
Figure 3. ONS architecture.
When the manufacturer tags the product, the EPC information related to the product (e.g.
manufacture date, location, expiration date, etc.) is stored in its local ECPIS. The product is then
shipped to the retailer. Once received, the retailer record some information related to the product in
its EPCIS. If the retailer wants to retrieve some manufacturer information related to a specific
product, the retailer needs to send a request to the root ONS, which knows the location of the local
ONS of the manufacturer. The retailer can then send a request to the local ONS of the manufacturer,
which knows the location of the EPCIS related to the EPC of the specific product requested. Finally,
the retailer can access the EPCIS of the manufacturer to retrieve the information related to the
product.

Standards Revision
Alfredo Parreño Marchante Food traceability using RFID and Wireless Sensor Networks in an Aquaculture Enterprise Page 26
If there are several links (e.g. shipping company, large retailer, etc.) in the distribution chain, the
ONS will always and only redirect the request to the manufacturer that produced the tag. The data
related to a specific EPC and stored in the local EPCIS of the different links cannot be retrieved by
requesting the ONS.
Hardware and Software
Alfredo Parreño Marchante Food traceability using RFID and Wireless Sensor Networks in an Aquaculture Enterprise Page 27
In order for the pilot to operate successfully the integration of the RFID and sensor systems will
need to be undertaken to full commercial standards. Therefore, a hardware and software
investigation has been conducted in order to choose the appropriate system. The investigation is
split into two parts, first hardware and then software.
55..11 HHaarrddwwaarree RReevviieewweedd
We have contacted several RFID and sensor manufacturers and distributors. Among all of them
we have chosen some to purchase and test in the laboratory. Below, we depict their characteristics.
We have purchased the following equipment:
55..11..11 HHaannddhheelldd rreeaaddeerr
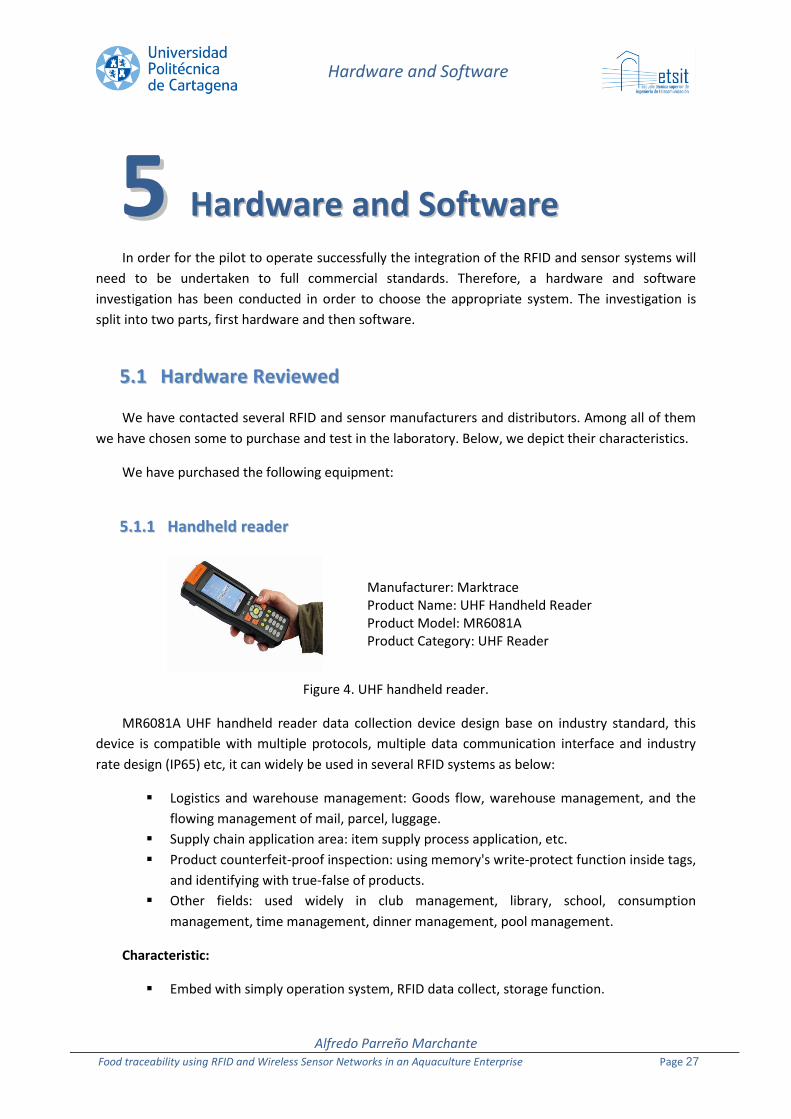
Manufacturer: Marktrace Product Name: UHF Handheld Reader Product Model: MR6081A Product Category: UHF Reader
Figure 4. UHF handheld reader.
MR6081A UHF handheld reader data collection device design base on industry standard, this
device is compatible with multiple protocols, multiple data communication interface and industry
rate design (IP65) etc, it can widely be used in several RFID systems as below:
Logistics and warehouse management: Goods flow, warehouse management, and the
flowing management of mail, parcel, luggage.
Supply chain application area: item supply process application, etc.
Product counterfeit-proof inspection: using memory's write-protect function inside tags,
and identifying with true-false of products.
Other fields: used widely in club management, library, school, consumption
management, time management, dinner management, pool management.
Characteristic:
Embed with simply operation system, RFID data collect, storage function.
55 HHaarrddwwaarree aanndd SSooffttwwaarree
Hardware and Software
Alfredo Parreño Marchante Food traceability using RFID and Wireless Sensor Networks in an Aquaculture Enterprise Page 28
Full-featured with Bluetooth, WIFI, GPS, GPRS, 2D barcode, 1D barcode.
Exceptional ergonomics ensure comfortable usage.
ID function supply multi protocol configuration, easy to operate.
Model MR6081A
Protocol ISO18000-6B,ISO18000-6C(EPC GEN2)
Frequency Range Standard ISM 902~928MHz or ISM 865~868MHz,other frequency available
Operation Mode FHSS
RF Power ~30dBm,software adjustable
Identify Distance Read 2m (card type), write 1.5m (card type)
Operating System Microsof t WinCE 5.0
CPU c2440 Samsung 400MHz
Memory Capacity 64M Flash ROM, 64MROM
Data Interface standard: Bluetooth, WIFI custom-made:1D barcode, 2D barcode, GPS, GPRS
Power Supply 3.7V (lithium battery) supply power adapter
Working Time Can sustaining working over 9 hours
Protection Grade IP65
Net Weight 0.5KG
Dimension 210mm×90mm×53mm
Operation Temp -20℃~+80℃
Table 1. UHF handheld reader Technical Parameters.
55..11..22 FFiixxeedd RReeaaddeerr
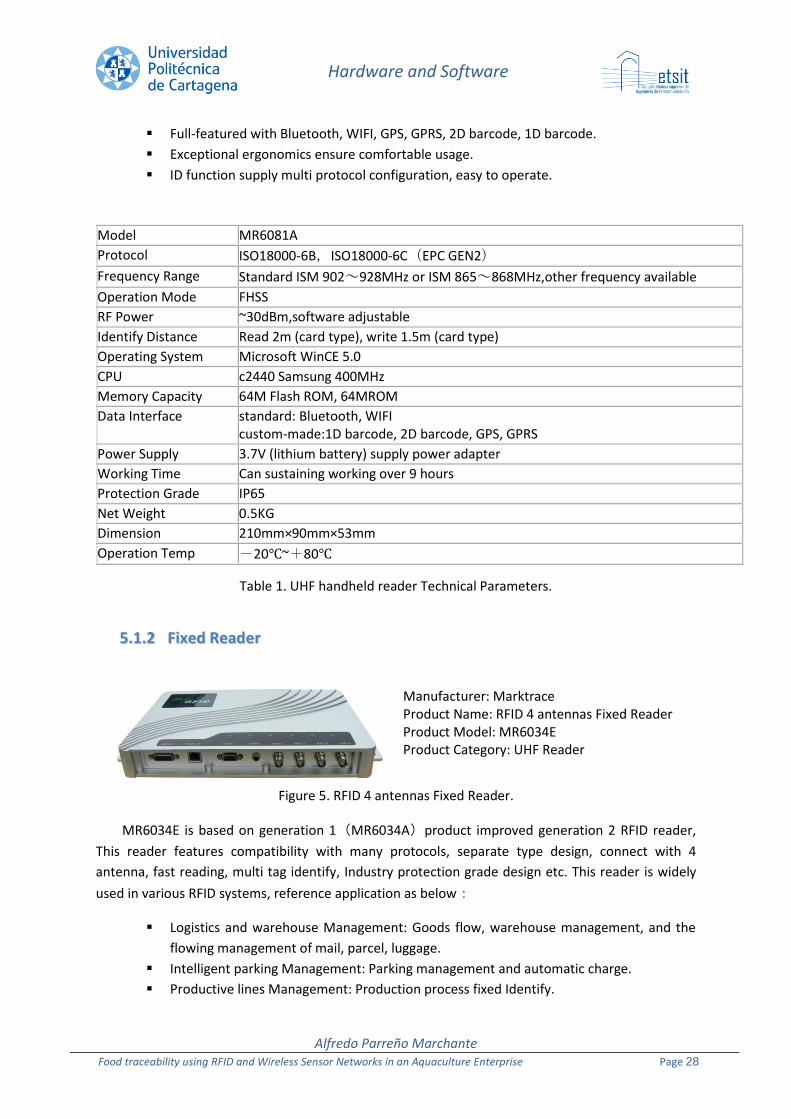
Manufacturer: Marktrace Product Name: RFID 4 antennas Fixed Reader Product Model: MR6034E Product Category: UHF Reader
Figure 5. RFID 4 antennas Fixed Reader.
MR6034E is based on generation 1(MR6034A)product improved generation 2 RFID reader,
This reader features compatibility with many protocols, separate type design, connect with 4
antenna, fast reading, multi tag identify, Industry protection grade design etc. This reader is widely
used in various RFID systems, reference application as below:
Logistics and warehouse Management: Goods flow, warehouse management, and the
flowing management of mail, parcel, luggage.
Intelligent parking Management: Parking management and automatic charge.
Productive lines Management: Production process fixed Identify.
Hardware and Software
Alfredo Parreño Marchante Food traceability using RFID and Wireless Sensor Networks in an Aquaculture Enterprise Page 29
Product counterfeit-proof inspection: Using memory’s write-protect functions inside
tags, and identifying with true-false of products.
Other fields: Used widely in club management, library, student’s school, consumption
management, time management, dinner management, pool management.
Reader characteristic:
Special Anti-collision algorithm, high efficient of multi-tag identify capability.
Four separate transmit/receive antenna to make wider of area in the application.
Compatible ISO18000-6B and ISO18000-6C(EPC-GEN2) protocol standard.
Read/Write tag capability:read>12m, write is 60% of read reading (depend on
different tag).
Reader support multi tag identify, single tag read, tag write, lock, and Kill tag, etc.
Model MR6034E
Protocol ISO18000-6B,ISO18000-6C(EPC GEN2)
Frequency Standard ISM 902~928MHz and ISM 865~868MHz, other frequency available
Operation Mode FHSS
RF Power 0~30dBm,software programmable
Reading Speed Software Programmable,Average Reading per 64Bits:<6ms
Reading Mode Timing or Touch, Software Programmable
Data Ports Standard: RS485,RS232,RJ45(TCP/IP);software programmable
Output Port 4 Team outport (can control output high/low level)
Reading Range Depends on antenna gain, when connect with 12dbi antenna, the reading distance is about 12m
Reading Clue Buzzer and LED
Antenna One to four Antennas, TNC connector
Power Supply DC+9V (supply AC/DC power adapter)
Dimension 310mm×210mm×40mm
Weight 2Kg
Operation Temp -20℃+80℃
Table 2. RFID 4 antennas Fixed Reader Technical Parameters.
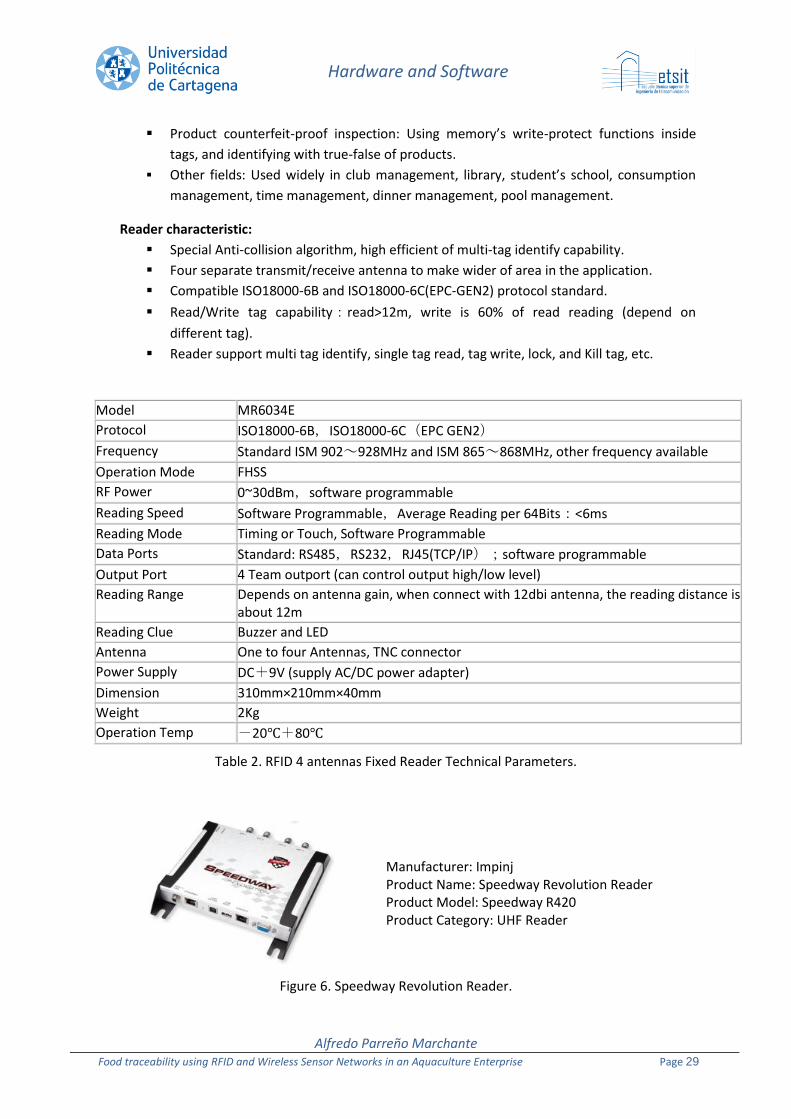
Manufacturer: Impinj Product Name: Speedway Revolution Reader Product Model: Speedway R420 Product Category: UHF Reader
Figure 6. Speedway Revolution Reader.
Hardware and Software
Alfredo Parreño Marchante Food traceability using RFID and Wireless Sensor Networks in an Aquaculture Enterprise Page 30
With Autopilot, a set of unique firmware features work together to automatically optimize the
RFID reader's operation for its environment:
Autoset—continuously optimizes the reader's configuration for the best, most reliable
performance
Low duty cycle—reduces RF interference, power consumption, and energy costs
Dynamic antenna switching—improves throughput and helps the reader work more efficiently
The Speedway Revolution RFID reader also delivers increased application flexibility via support
for Power over Ethernet (PoE), which simplifies deployment and dramatically reduces cost by
eliminating the need for AC outlet installation at read points.
Speedway R420
Air Interface Protocol EPCglobal UHF Class 1 Gen 2 / ISO 18000-6C Performance Includes all possible performance configurations and functionality to
deliver peak performance for even the most challenging of
applications
Supported Regions and Geographies
US, Canada, and other regions following US FCC Part 15
regulations
Europe and other regions following ETSI EN 302 208 v1.2.1
without LBT regulations
Brazil, Uruguay
Pending regulatory approval—Australia, China, Hong Kong, India,
Malaysia, Singapore, Taiwan, Thailand, and Vietnam
Antennas 4 high performance, monostatic antenna ports optimized for Impinj
reader antennas (RP TNC)
Transmit Power +10.0 to +30.0 dBm (PoE)
+10.0 to +32.5 dBm1 (external universal power supply)
Note 1: Speedway Revolution requires professional installation, may
only be operated with Impinj-approved antennas, and can radiate no
more than 36 dBm EIRP per FCC Part 15.247 regulations. Other
regulatory regions have similar restrictions. Consult the Installation
and Operations Guide to learn more.
Max Receive Sensitivity -82 dBm
Max Return Loss 10 dB
Application Interface EPCglobal Low Level Reader Protocol (LLRP) v1.0.1
Network Connectivity 10/100BASE-T auto-negotiate (full/half) with auto-sensing MDI/MDX for auto-crossover (RJ-45)
Cellular Connectivity* Sierra Wireless AirLink PinPoint XT (CDMA or GSM connectivity with GPS data)

Hardware and Software
Alfredo Parreño Marchante Food traceability using RFID and Wireless Sensor Networks in an Aquaculture Enterprise Page 31
Sierra Wireless AirLink Raven XT (CDMA or GSM connectivity)
(* Available through Impinj-authorized partners)
IP Address Configuration DHCP, Static, or Link local Addressing (LLA) with Multicast DNS (mDNS)
Time Sychronization Network Time Protocol (NTP) Management Interfaces Impinj Web Management UI
Impinj RShell Management Console using serial management console port, telnet or SSH
SNMPv2 MIBII EPCglobal Reader Management v1.0.1 Syslog
Reliable Firmware Upgrade Dual image partitions enable smooth transition to new firmware while the reader is still operating
Scalable upgrade mechanism enabling simultaneous scheduled upgrades of multiple reader
USB Flash Drive
Impinj Web Management UI
Management Console
RS-232 using a standard Cisco-style management Cable (DB-9 to RJ-45)
Baud rate: 115200; Data: 8 bit; Parity: none; Stop: 1 bit; Flow control: none
USB USB 1.1 Device (Type B) and Host (Type A) ports USB Virtual COM Serial Port and USB drive support for
embedded applications GPIO 4 inputs, optically isolated, 3–30V
4 outputs, optically isolated, 0– 30V, non-isolated 5V, 100 mA supply (DB-15)
Power Sources Power over Ethernet (PoE) IEEE 802.3af +24 VDC @ 800 mA via external universal power supply with
locking connector—sold separately Power Consumption
Note 2:Maximum is 31.5 dBm for ETSI region readers
Idle Typical LDC
PoE at +30 dBm 3 W 11.5 W 6 W
Power Supply at +30 dBm 3 W 13.5 W 6 W
Power Supply at +32.52 dBm 3 W 15 W 6 W
Environmental Sealing IEC IP52 Shock and Vibration Mil-Std-810G Certified
Operating Temperature -20ºC to +50ºC Humidity 5% to 95%, non-condensing Dimensions (H x W x D) 7.5x 6.9 x1.2 in (19x17.5 x 3 cm) Weight 1.5 lbs (0.68kg) RoHS Compliant to European Union directive 2002/95/EC
Table 3. Speedway Revolution Reader Technical Parameters.

Hardware and Software
Alfredo Parreño Marchante Food traceability using RFID and Wireless Sensor Networks in an Aquaculture Enterprise Page 32
55..11..33 AAnntteennnnaass
Manufacturer: Marktrace Product Name: 915MHz 7dbi Circular Polarization Antenna Product Model: MR6528 Product Category: RFID Antenna
Figure 7. 7dbi Circular Polarization Antenna.
This product can connect with MR series separated readers, has the function of data collection,
and can be used widely in all kinds of RFID systems; the typical applying situation is like the following
indicated:
Logistics and warehouse Management: Goods flow, warehouse management, and the
flowing management of mail, parcel, luggage.
Intelligent parking Management: Parking management and automatic charge.
Productive lines Management: Production process fixed identification.
Product counterfeit-proof inspection: Using memory’s write-protect functions inside
tags, and identifying with true- false of products.
Other fields: Used widely in club management, library, student’s school, consumption
management, time management, dinner management, pool management.
Model MR6528
Operation Frequency ISM 902~928MHz, ISM865~868MHz
Gain 7dBi
Horizontal (3dB) 68 degree
Vertical (3dB) 68 degree
Front-back more than 25dB
Polarization Circular
Impedance (Ω) 50
VSWR <1.2
Maximum Input Power (W) 500
Connector SMA/N
IM.3rd Order(2x43dBm) <-150dBc
Lightning Protection Direct Ground
Dimensions 240*240*30mm
Net weight 1KG
Radome Material ABS/Glass fibre
Bracket Weight 0.5kg
Rated Wind Velocity 120 km/h
Working Temp -25℃~85℃
Table 4. 7dbi Circular Polarization Antenna Technical Parameters.
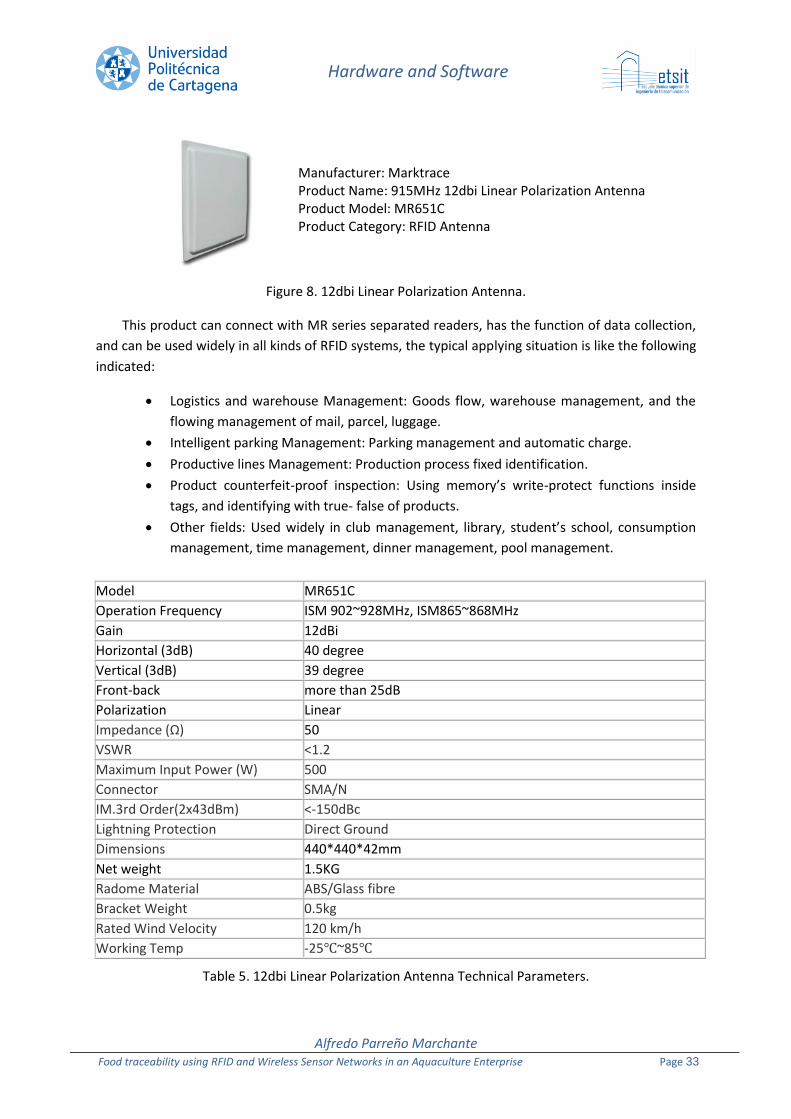
Hardware and Software
Alfredo Parreño Marchante Food traceability using RFID and Wireless Sensor Networks in an Aquaculture Enterprise Page 33
Manufacturer: Marktrace Product Name: 915MHz 12dbi Linear Polarization Antenna Product Model: MR651C Product Category: RFID Antenna
Figure 8. 12dbi Linear Polarization Antenna.
This product can connect with MR series separated readers, has the function of data collection,
and can be used widely in all kinds of RFID systems, the typical applying situation is like the following
indicated:
Logistics and warehouse Management: Goods flow, warehouse management, and the
flowing management of mail, parcel, luggage.
Intelligent parking Management: Parking management and automatic charge.
Productive lines Management: Production process fixed identification.
Product counterfeit-proof inspection: Using memory’s write-protect functions inside
tags, and identifying with true- false of products.
Other fields: Used widely in club management, library, student’s school, consumption
management, time management, dinner management, pool management.
Model MR651C
Operation Frequency ISM 902~928MHz, ISM865~868MHz
Gain 12dBi
Horizontal (3dB) 40 degree
Vertical (3dB) 39 degree
Front-back more than 25dB
Polarization Linear
Impedance (Ω) 50
VSWR <1.2
Maximum Input Power (W) 500
Connector SMA/N
IM.3rd Order(2x43dBm) <-150dBc
Lightning Protection Direct Ground
Dimensions 440*440*42mm
Net weight 1.5KG
Radome Material ABS/Glass fibre
Bracket Weight 0.5kg
Rated Wind Velocity 120 km/h
Working Temp -25℃~85℃
Table 5. 12dbi Linear Polarization Antenna Technical Parameters.
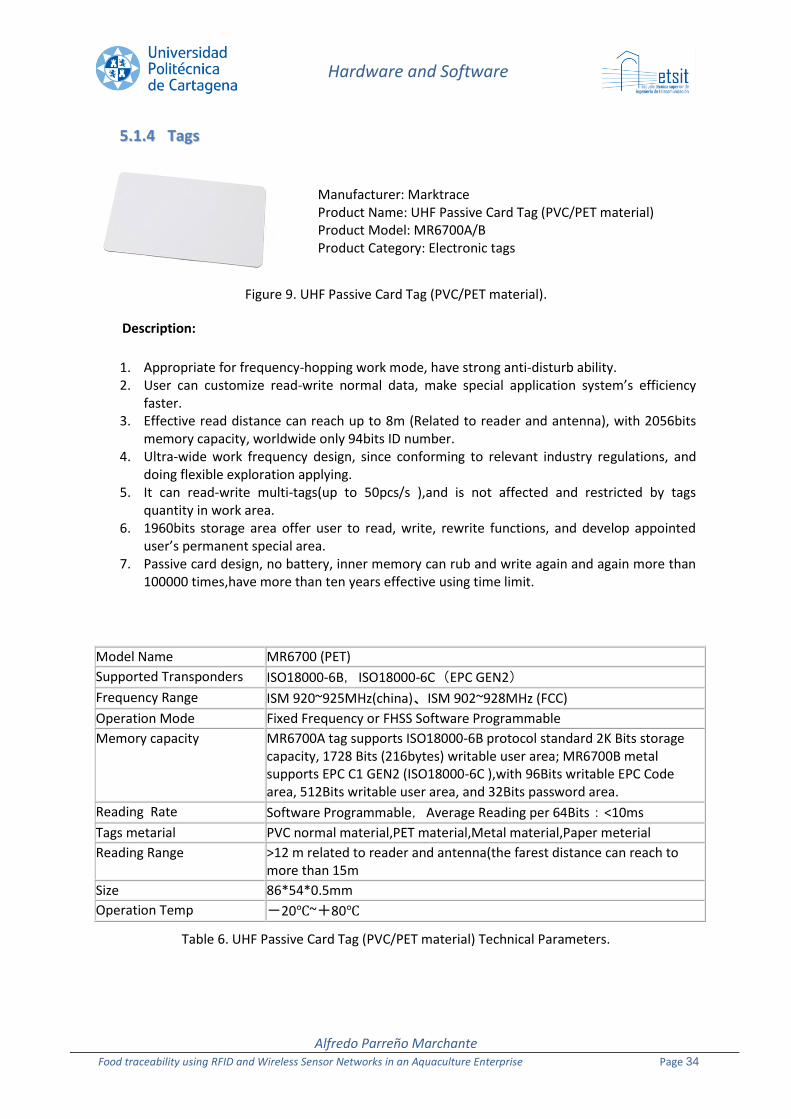
Hardware and Software
Alfredo Parreño Marchante Food traceability using RFID and Wireless Sensor Networks in an Aquaculture Enterprise Page 34
55..11..44 TTaaggss
Manufacturer: Marktrace Product Name: UHF Passive Card Tag (PVC/PET material) Product Model: MR6700A/B Product Category: Electronic tags
Figure 9. UHF Passive Card Tag (PVC/PET material).
Description:
1. Appropriate for frequency-hopping work mode, have strong anti-disturb ability. 2. User can customize read-write normal data, make special application system’s efficiency
faster. 3. Effective read distance can reach up to 8m (Related to reader and antenna), with 2056bits
memory capacity, worldwide only 94bits ID number. 4. Ultra-wide work frequency design, since conforming to relevant industry regulations, and
doing flexible exploration applying. 5. It can read-write multi-tags(up to 50pcs/s ),and is not affected and restricted by tags
quantity in work area. 6. 1960bits storage area offer user to read, write, rewrite functions, and develop appointed
user’s permanent special area. 7. Passive card design, no battery, inner memory can rub and write again and again more than
100000 times,have more than ten years effective using time limit.
Model Name MR6700 (PET)
Supported Transponders ISO18000-6B,ISO18000-6C(EPC GEN2)
Frequency Range ISM 920~925MHz(china)、ISM 902~928MHz (FCC)
Operation Mode Fixed Frequency or FHSS Software Programmable
Memory capacity MR6700A tag supports ISO18000-6B protocol standard 2K Bits storage capacity, 1728 Bits (216bytes) writable user area; MR6700B metal supports EPC C1 GEN2 (ISO18000-6C ),with 96Bits writable EPC Code area, 512Bits writable user area, and 32Bits password area.
Reading Rate Software Programmable,Average Reading per 64Bits:<10ms
Tags metarial PVC normal material,PET material,Metal material,Paper meterial
Reading Range >12 m related to reader and antenna(the farest distance can reach to more than 15m
Size 86*54*0.5mm
Operation Temp -20℃~+80℃
Table 6. UHF Passive Card Tag (PVC/PET material) Technical Parameters.
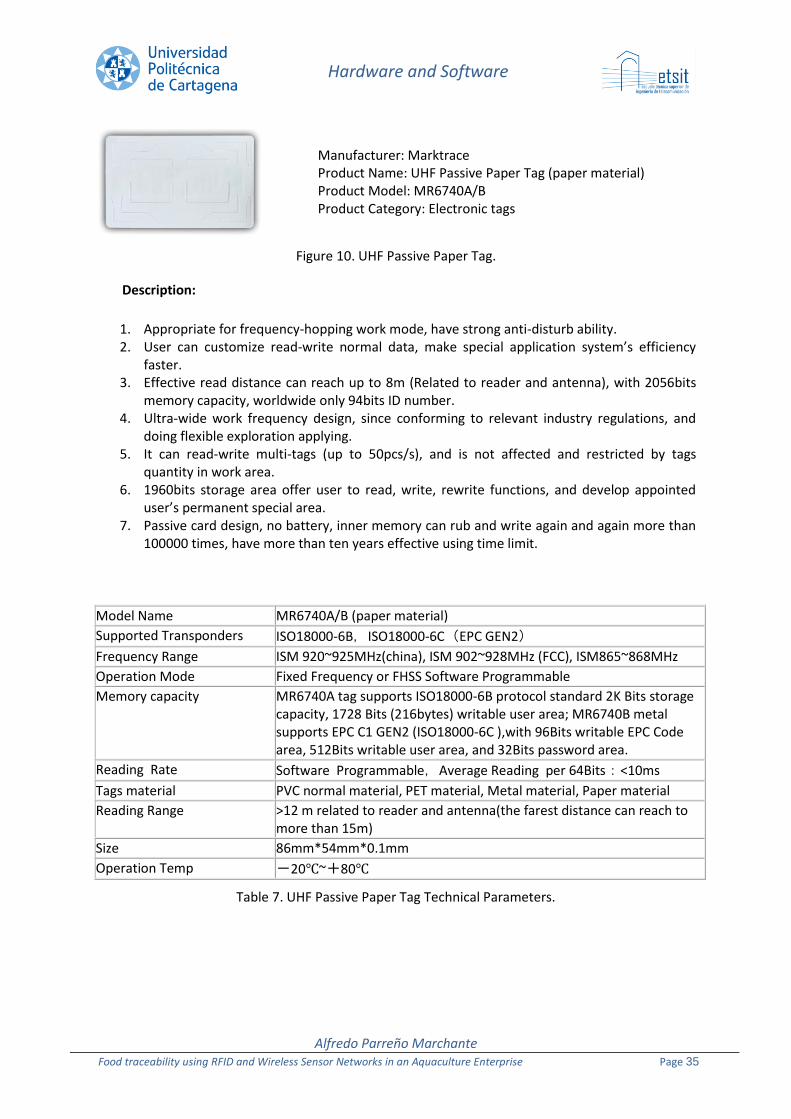
Hardware and Software
Alfredo Parreño Marchante Food traceability using RFID and Wireless Sensor Networks in an Aquaculture Enterprise Page 35
Manufacturer: Marktrace Product Name: UHF Passive Paper Tag (paper material) Product Model: MR6740A/B Product Category: Electronic tags
Figure 10. UHF Passive Paper Tag.
Description:
1. Appropriate for frequency-hopping work mode, have strong anti-disturb ability. 2. User can customize read-write normal data, make special application system’s efficiency
faster. 3. Effective read distance can reach up to 8m (Related to reader and antenna), with 2056bits
memory capacity, worldwide only 94bits ID number. 4. Ultra-wide work frequency design, since conforming to relevant industry regulations, and
doing flexible exploration applying. 5. It can read-write multi-tags (up to 50pcs/s), and is not affected and restricted by tags
quantity in work area. 6. 1960bits storage area offer user to read, write, rewrite functions, and develop appointed
user’s permanent special area. 7. Passive card design, no battery, inner memory can rub and write again and again more than
100000 times, have more than ten years effective using time limit.
Model Name MR6740A/B (paper material)
Supported Transponders ISO18000-6B,ISO18000-6C(EPC GEN2)
Frequency Range ISM 920~925MHz(china), ISM 902~928MHz (FCC), ISM865~868MHz
Operation Mode Fixed Frequency or FHSS Software Programmable
Memory capacity MR6740A tag supports ISO18000-6B protocol standard 2K Bits storage capacity, 1728 Bits (216bytes) writable user area; MR6740B metal supports EPC C1 GEN2 (ISO18000-6C ),with 96Bits writable EPC Code area, 512Bits writable user area, and 32Bits password area.
Reading Rate Software Programmable,Average Reading per 64Bits:<10ms
Tags material PVC normal material, PET material, Metal material, Paper material
Reading Range >12 m related to reader and antenna(the farest distance can reach to more than 15m)
Size 86mm*54mm*0.1mm
Operation Temp -20℃~+80℃
Table 7. UHF Passive Paper Tag Technical Parameters.
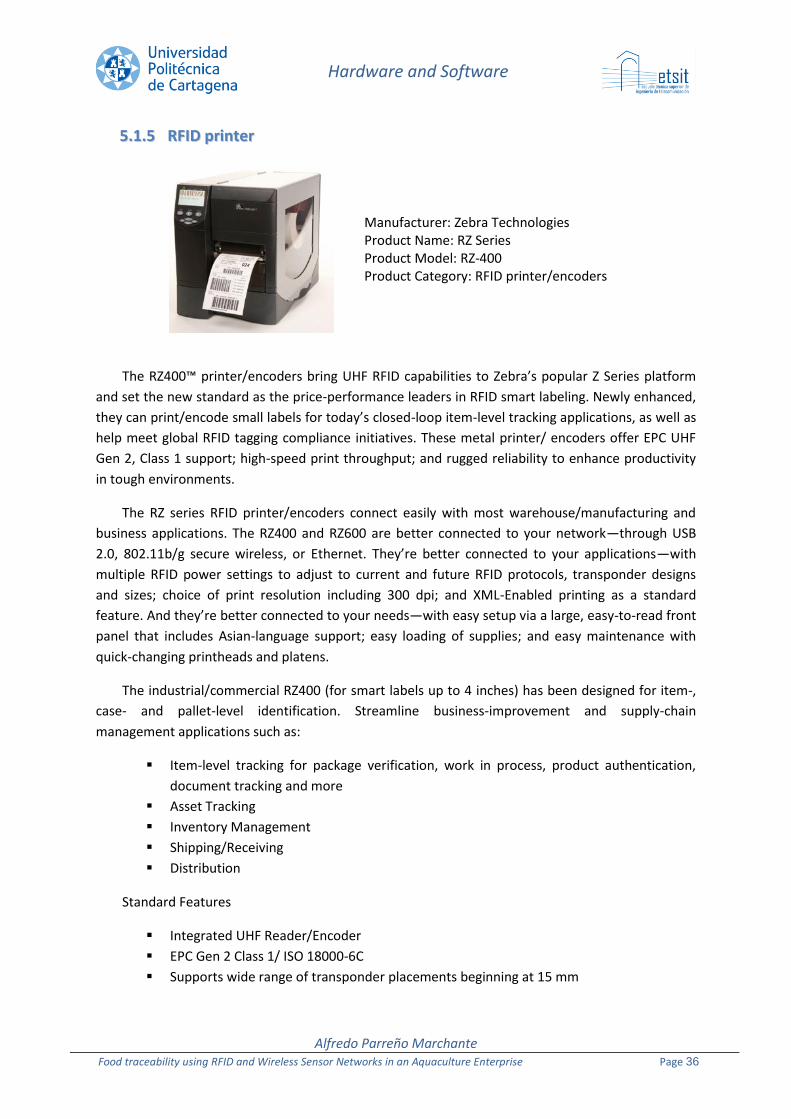
Hardware and Software
Alfredo Parreño Marchante Food traceability using RFID and Wireless Sensor Networks in an Aquaculture Enterprise Page 36
55..11..55 RRFFIIDD pprriinntteerr
Manufacturer: Zebra Technologies Product Name: RZ Series Product Model: RZ-400 Product Category: RFID printer/encoders
The RZ400™ printer/encoders bring UHF RFID capabilities to Zebra’s popular Z Series platform
and set the new standard as the price-performance leaders in RFID smart labeling. Newly enhanced,
they can print/encode small labels for today’s closed-loop item-level tracking applications, as well as
help meet global RFID tagging compliance initiatives. These metal printer/ encoders offer EPC UHF
Gen 2, Class 1 support; high-speed print throughput; and rugged reliability to enhance productivity
in tough environments.
The RZ series RFID printer/encoders connect easily with most warehouse/manufacturing and
business applications. The RZ400 and RZ600 are better connected to your network—through USB
2.0, 802.11b/g secure wireless, or Ethernet. They’re better connected to your applications—with
multiple RFID power settings to adjust to current and future RFID protocols, transponder designs
and sizes; choice of print resolution including 300 dpi; and XML-Enabled printing as a standard
feature. And they’re better connected to your needs—with easy setup via a large, easy-to-read front
panel that includes Asian-language support; easy loading of supplies; and easy maintenance with
quick-changing printheads and platens.
The industrial/commercial RZ400 (for smart labels up to 4 inches) has been designed for item-,
case- and pallet-level identification. Streamline business-improvement and supply-chain
management applications such as:
Item-level tracking for package verification, work in process, product authentication,
document tracking and more
Asset Tracking
Inventory Management
Shipping/Receiving
Distribution
Standard Features
Integrated UHF Reader/Encoder
EPC Gen 2 Class 1/ ISO 18000-6C
Supports wide range of transponder placements beginning at 15 mm
Hardware and Software
Alfredo Parreño Marchante Food traceability using RFID and Wireless Sensor Networks in an Aquaculture Enterprise Page 37
Full range of RFID power settings
RFID processes optimized for fastest label throughput
RFID counters keep track of the good and unusable labels
Variable RFID power settings for both read and write allow maximum flexibility for
printing small labels
32 bit 133 MHz RISC processor
Zebra printer driver for Windows® 3.X and 95/98/ NT/2000/XP/2003 operating systems
Advanced label/media counters
Print methods: Thermal transfer or direct thermal
Construction: Die-cast aluminum base, frame and printhead mechanism
Metal media cover with large clear window
Element Energy Equalizer™ (E3™) for superior print quality
Auto-calibration
Real-time clock
Auto-ranging (90–265 VAC) power supply
Color-coded operator cues
Multi-language control panel with back-lit
240 x 128 pixel display
ZPL II®
XML-Enabled printing—Direct-connect integration for bar code label printing that
eliminates license fees and print server hardware, and lowers customization and
programming costs
Resolution
203 dpi/8 dots per mm; 300 dpi/12 dots per mm; 600
dpi/24 dots per mm (RZ400 only)
Memory
Standard: 8 MB Flash, 16 MB DRAM
Optional: Factory Installed 64 MB Flash
Print Width
RZ400: 4.09”/104 mm
Print Length
RZ400: with 203 dpi: 157”/3,988 mm; with 300 dpi 73”/1,854 mm;
Print Speed
203 dpi: 10”/254 mm per second;
Media Sensors
Hardware and Software
Alfredo Parreño Marchante Food traceability using RFID and Wireless Sensor Networks in an Aquaculture Enterprise Page 38
Fixed reflective sensor
Adjustable transmissive sensor
55..11..66 WWiirreelleessss SSeennssoorr NNeettwwoorrkk
With the Product Series 3000, Ambient introduced its novel Dynamic Wireless Sensor Network
(DWSN) specifically designed for supply chain applications [7].
The 3000 Series consists of a network infrastructure, entailing Gateways and MicroRouters, and
intelligent tags, called SmartPoints, which come in many different flavors. In contrast with other
WSN solutions, the 3000 Series supports large scale networks able to cover >100.000 square meters,
but also supports dynamic tags that can roam freely from one network to another without the
necessity to configure every network. The extreme low energy footprint of both infrastructure and
SmartPoints make it possible to operate networks all wireless, for example, using solar power. Due
to the fact that the 3000 Series is based on the worldwide license-free 2.4 GHz frequency band,
crossing borders is what the 3000 Series has been designed for.
In contrast with other Active RFID and RTLS solutions, Ambient utilizes the intelligence of its
SmartPoints and the intrinsic benefits of DWSNs that are considerably more low-cost and easier to
install. Infrastructure is quickly deployed both inside and outside: standard infrastructure runs on
mains power, All-Wireless infrastructure is solar-powered. No additional Ethernet cables need to be
drawn for MicroRouters apart from the Gateway and optionally a Connect Box of which there is only
one in every network.
The Product Series 3000 creates an unprecedented level of Supply Chain visibility in which
companies are enabled to respond in near real-time to critical business events. The multi-purpose
SmartPoints are employed to monitor static locations, function as wireless data loggers, and are
used to track and locate assets.
The Ambient Network
The 3000 Series at its core is a so-called Dynamic Wireless Sensor Network (DWSN). Unlike other
Wireless Sensor Network (WSN) technologies, the Ambient Network is specifically designed for
highly dynamic application scenarios, such as Supply Chain applications, and characterizes itself due
to its capability to scale to up to >100 MicroRouters and >1000 SmartPoints and remain energy-
efficient enough to operate on batteries and solar-power only. Furthermore, unlike traditional Active
Radio Frequency Identification (RFID) and Realtime Location Systems (RTLS), a WSN builds on low-
power networking technology enabling every part of the network to operate at minute energy
levels, whereas Active RFID and RTLS infrastructure is very energy consuming.
The 3000 Series is based on the IEEE 802.15.4 PHY standard which has specifically been designed for
largescale and low-energy DWSNs, license-free world-wide. The wireless network consists of two
main layers: 1) an infrastructure layer that comprises of a Gateway and MicroRouters that are
spread out across a location offering radio coverage for 2) SmartPoints that are deployed throughout

Hardware and Software
Alfredo Parreño Marchante Food traceability using RFID and Wireless Sensor Networks in an Aquaculture Enterprise Page 39
a location and/or attached to objects that move through the network and in & out of networks. An
overview of the system is provided in Figure 11.
Figure 11. 3000 Series Network Overview.
The infrastructure layer is fixed. SmartPoints can be both fixed as well as mobile, depending on
the type of SmartPoint and its intended operation. In the overview (see Figure 11) it can be seen that
infrastructure devices communicate with each other and with SmartPoints, whereas SmartPoints
only communicate with infrastructure devices. SmartPoints cannot communicate with each other.
All communication in an Ambient network is bi-directional, meaning that every device can send and
receive messages. As such, it is always possible, for example, to reconfigure a SmartPoint while it is
already installed.
55..22 SSooffttwwaarree RReevviieewweedd
55..22..11 OOppeenn SSoouurrccee EEPPCC ((FFoossssttrraakk))
Fosstrak is an open source EPC tool [EPChome] [8]. It is an RFID software platform
[Fosstrak] that implements the EPC Network specifications and is intended to support
application developers and integrators by providing core software components for track and
trace applications Figure 12.

Hardware and Software
Alfredo Parreño Marchante Food traceability using RFID and Wireless Sensor Networks in an Aquaculture Enterprise Page 40
Figure 12. Fosstrak architecture
Fosstrak EPCIS is a complete implementation of the EPCIS standard specification (Version 1.0.1
of September 21, 2007). It comprises three separate modules Figure 13.
EPCIS Repository
Interactive EPCIS Capture Application
Interactive EPCIS Query Application
Figure 13. Fosstrak EPCIS module
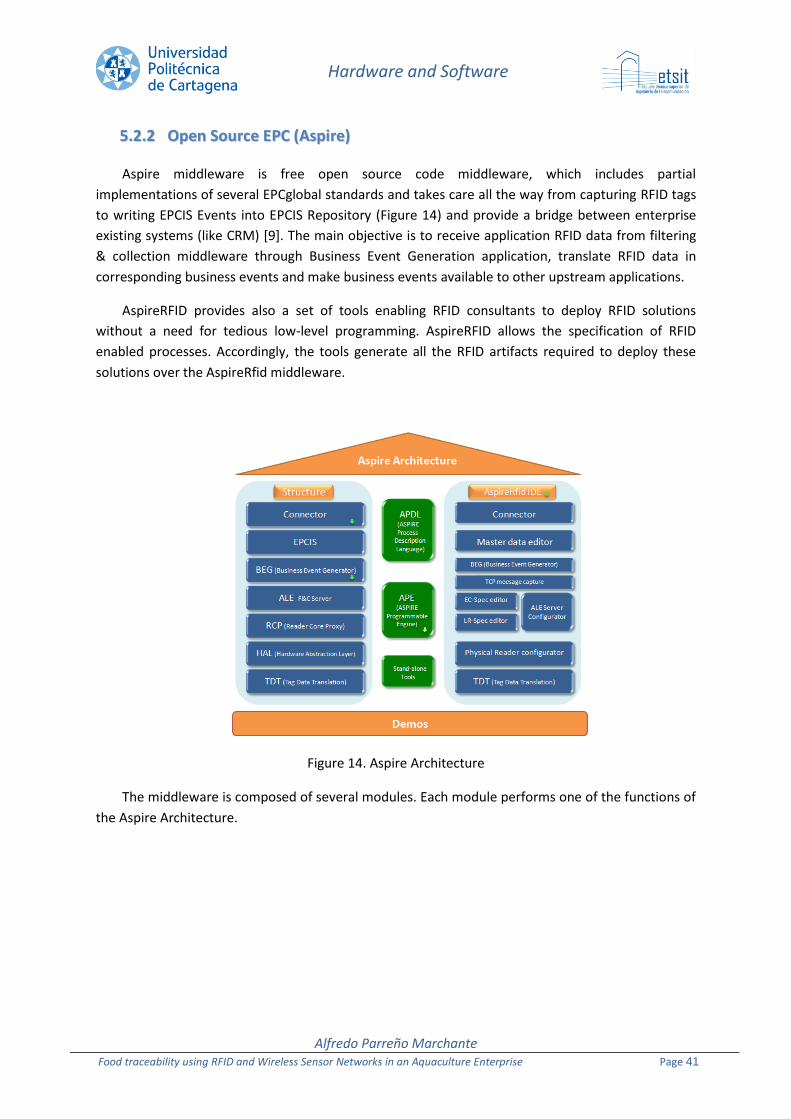
Hardware and Software
Alfredo Parreño Marchante Food traceability using RFID and Wireless Sensor Networks in an Aquaculture Enterprise Page 41
55..22..22 OOppeenn SSoouurrccee EEPPCC ((AAssppiirree))
Aspire middleware is free open source code middleware, which includes partial
implementations of several EPCglobal standards and takes care all the way from capturing RFID tags
to writing EPCIS Events into EPCIS Repository (Figure 14) and provide a bridge between enterprise
existing systems (like CRM) [9]. The main objective is to receive application RFID data from filtering
& collection middleware through Business Event Generation application, translate RFID data in
corresponding business events and make business events available to other upstream applications.
AspireRFID provides also a set of tools enabling RFID consultants to deploy RFID solutions
without a need for tedious low-level programming. AspireRFID allows the specification of RFID
enabled processes. Accordingly, the tools generate all the RFID artifacts required to deploy these
solutions over the AspireRfid middleware.
Figure 14. Aspire Architecture
The middleware is composed of several modules. Each module performs one of the functions of
the Aspire Architecture.
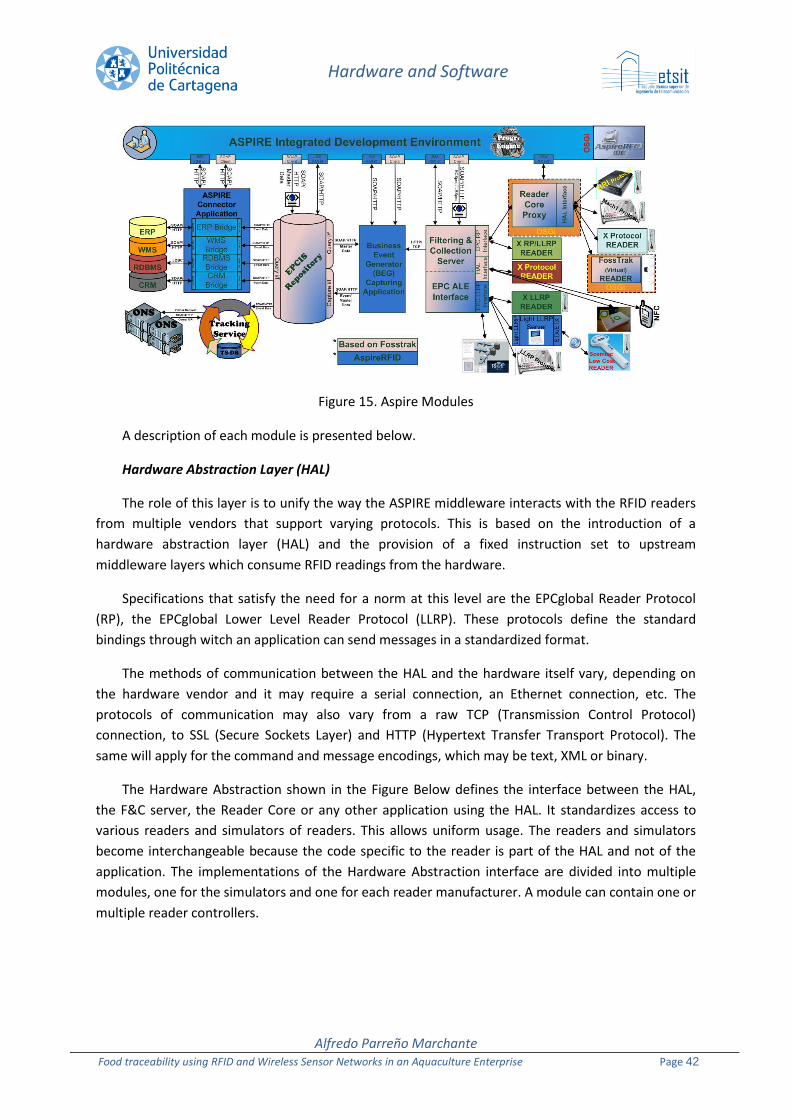
Hardware and Software
Alfredo Parreño Marchante Food traceability using RFID and Wireless Sensor Networks in an Aquaculture Enterprise Page 42
Figure 15. Aspire Modules
A description of each module is presented below.
Hardware Abstraction Layer (HAL)
The role of this layer is to unify the way the ASPIRE middleware interacts with the RFID readers
from multiple vendors that support varying protocols. This is based on the introduction of a
hardware abstraction layer (HAL) and the provision of a fixed instruction set to upstream
middleware layers which consume RFID readings from the hardware.
Specifications that satisfy the need for a norm at this level are the EPCglobal Reader Protocol
(RP), the EPCglobal Lower Level Reader Protocol (LLRP). These protocols define the standard
bindings through witch an application can send messages in a standardized format.
The methods of communication between the HAL and the hardware itself vary, depending on
the hardware vendor and it may require a serial connection, an Ethernet connection, etc. The
protocols of communication may also vary from a raw TCP (Transmission Control Protocol)
connection, to SSL (Secure Sockets Layer) and HTTP (Hypertext Transfer Transport Protocol). The
same will apply for the command and message encodings, which may be text, XML or binary.
The Hardware Abstraction shown in the Figure Below defines the interface between the HAL,
the F&C server, the Reader Core or any other application using the HAL. It standardizes access to
various readers and simulators of readers. This allows uniform usage. The readers and simulators
become interchangeable because the code specific to the reader is part of the HAL and not of the
application. The implementations of the Hardware Abstraction interface are divided into multiple
modules, one for the simulators and one for each reader manufacturer. A module can contain one or
multiple reader controllers.
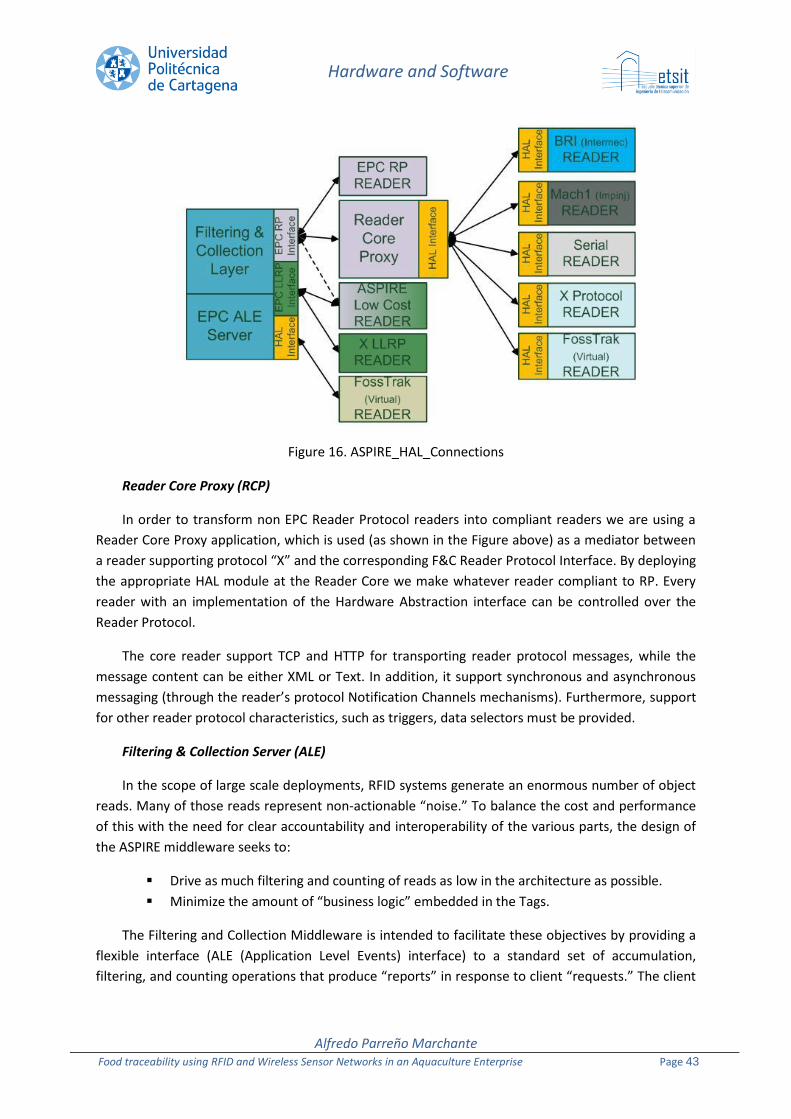
Hardware and Software
Alfredo Parreño Marchante Food traceability using RFID and Wireless Sensor Networks in an Aquaculture Enterprise Page 43
Figure 16. ASPIRE_HAL_Connections
Reader Core Proxy (RCP)
In order to transform non EPC Reader Protocol readers into compliant readers we are using a
Reader Core Proxy application, which is used (as shown in the Figure above) as a mediator between
a reader supporting protocol “X” and the corresponding F&C Reader Protocol Interface. By deploying
the appropriate HAL module at the Reader Core we make whatever reader compliant to RP. Every
reader with an implementation of the Hardware Abstraction interface can be controlled over the
Reader Protocol.
The core reader support TCP and HTTP for transporting reader protocol messages, while the
message content can be either XML or Text. In addition, it support synchronous and asynchronous
messaging (through the reader’s protocol Notification Channels mechanisms). Furthermore, support
for other reader protocol characteristics, such as triggers, data selectors must be provided.
Filtering & Collection Server (ALE)
In the scope of large scale deployments, RFID systems generate an enormous number of object
reads. Many of those reads represent non-actionable “noise.” To balance the cost and performance
of this with the need for clear accountability and interoperability of the various parts, the design of
the ASPIRE middleware seeks to:
Drive as much filtering and counting of reads as low in the architecture as possible.
Minimize the amount of “business logic” embedded in the Tags.
The Filtering and Collection Middleware is intended to facilitate these objectives by providing a
flexible interface (ALE (Application Level Events) interface) to a standard set of accumulation,
filtering, and counting operations that produce “reports” in response to client “requests.” The client
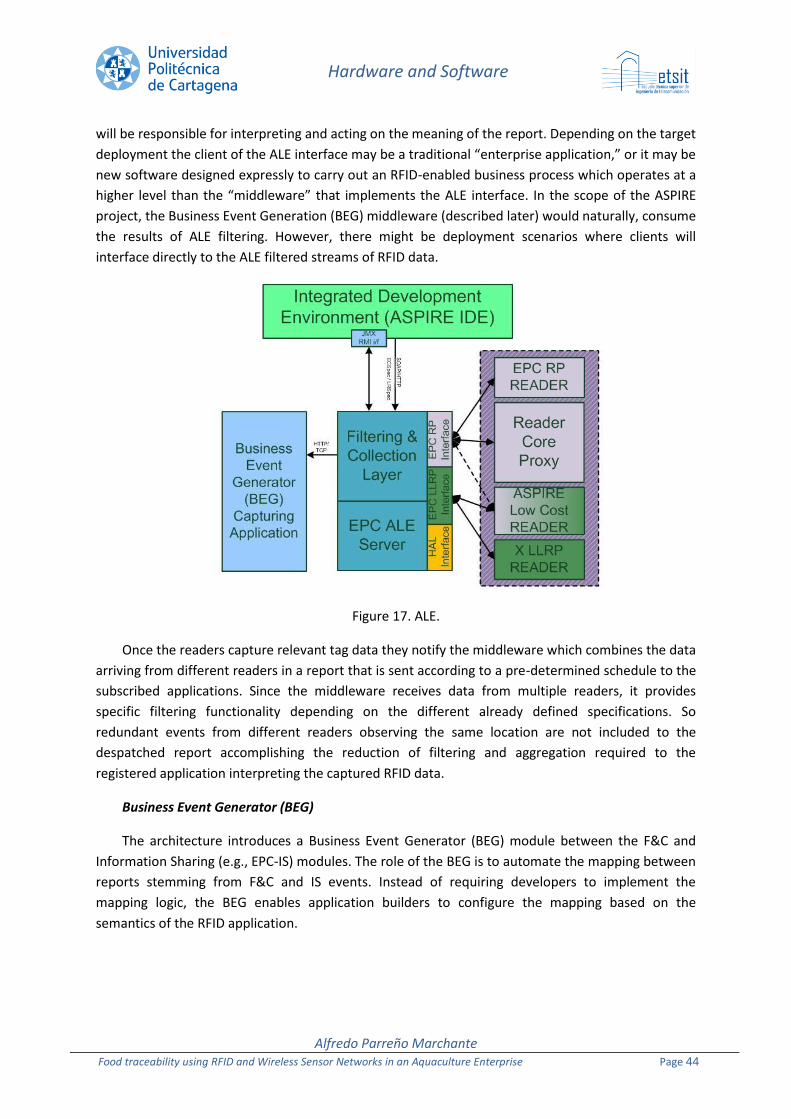
Hardware and Software
Alfredo Parreño Marchante Food traceability using RFID and Wireless Sensor Networks in an Aquaculture Enterprise Page 44
will be responsible for interpreting and acting on the meaning of the report. Depending on the target
deployment the client of the ALE interface may be a traditional “enterprise application,” or it may be
new software designed expressly to carry out an RFID-enabled business process which operates at a
higher level than the “middleware” that implements the ALE interface. In the scope of the ASPIRE
project, the Business Event Generation (BEG) middleware (described later) would naturally, consume
the results of ALE filtering. However, there might be deployment scenarios where clients will
interface directly to the ALE filtered streams of RFID data.
Figure 17. ALE.
Once the readers capture relevant tag data they notify the middleware which combines the data
arriving from different readers in a report that is sent according to a pre-determined schedule to the
subscribed applications. Since the middleware receives data from multiple readers, it provides
specific filtering functionality depending on the different already defined specifications. So
redundant events from different readers observing the same location are not included to the
despatched report accomplishing the reduction of filtering and aggregation required to the
registered application interpreting the captured RFID data.
Business Event Generator (BEG)
The architecture introduces a Business Event Generator (BEG) module between the F&C and
Information Sharing (e.g., EPC-IS) modules. The role of the BEG is to automate the mapping between
reports stemming from F&C and IS events. Instead of requiring developers to implement the
mapping logic, the BEG enables application builders to configure the mapping based on the
semantics of the RFID application.
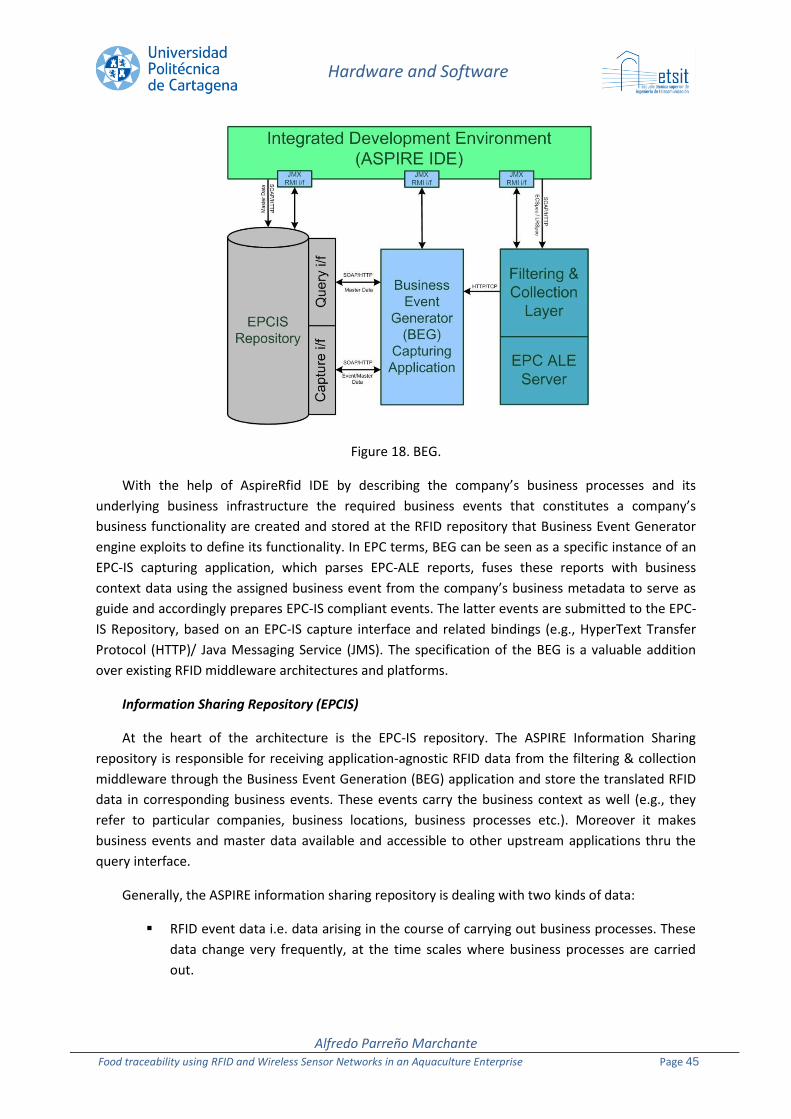
Hardware and Software
Alfredo Parreño Marchante Food traceability using RFID and Wireless Sensor Networks in an Aquaculture Enterprise Page 45
Figure 18. BEG.
With the help of AspireRfid IDE by describing the company’s business processes and its
underlying business infrastructure the required business events that constitutes a company’s
business functionality are created and stored at the RFID repository that Business Event Generator
engine exploits to define its functionality. In EPC terms, BEG can be seen as a specific instance of an
EPC-IS capturing application, which parses EPC-ALE reports, fuses these reports with business
context data using the assigned business event from the company’s business metadata to serve as
guide and accordingly prepares EPC-IS compliant events. The latter events are submitted to the EPC-
IS Repository, based on an EPC-IS capture interface and related bindings (e.g., HyperText Transfer
Protocol (HTTP)/ Java Messaging Service (JMS). The specification of the BEG is a valuable addition
over existing RFID middleware architectures and platforms.
Information Sharing Repository (EPCIS)
At the heart of the architecture is the EPC-IS repository. The ASPIRE Information Sharing
repository is responsible for receiving application-agnostic RFID data from the filtering & collection
middleware through the Business Event Generation (BEG) application and store the translated RFID
data in corresponding business events. These events carry the business context as well (e.g., they
refer to particular companies, business locations, business processes etc.). Moreover it makes
business events and master data available and accessible to other upstream applications thru the
query interface.
Generally, the ASPIRE information sharing repository is dealing with two kinds of data:
RFID event data i.e. data arising in the course of carrying out business processes. These
data change very frequently, at the time scales where business processes are carried
out.
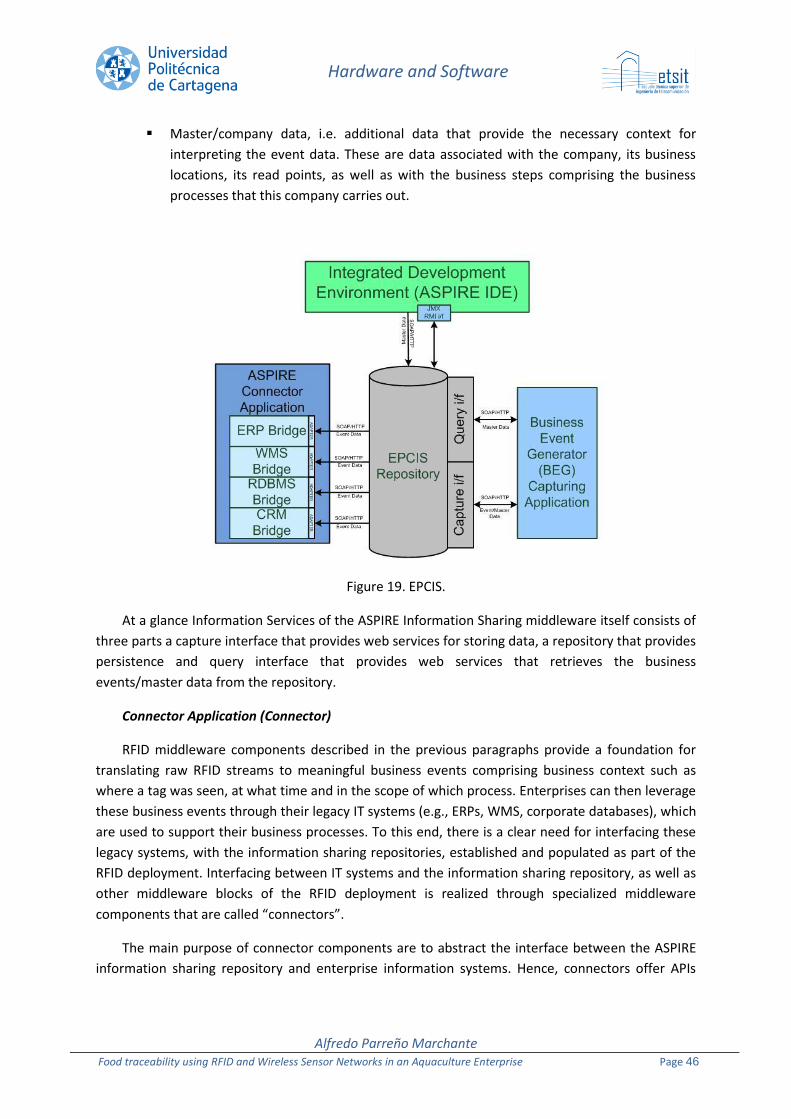
Hardware and Software
Alfredo Parreño Marchante Food traceability using RFID and Wireless Sensor Networks in an Aquaculture Enterprise Page 46
Master/company data, i.e. additional data that provide the necessary context for
interpreting the event data. These are data associated with the company, its business
locations, its read points, as well as with the business steps comprising the business
processes that this company carries out.
Figure 19. EPCIS.
At a glance Information Services of the ASPIRE Information Sharing middleware itself consists of
three parts a capture interface that provides web services for storing data, a repository that provides
persistence and query interface that provides web services that retrieves the business
events/master data from the repository.
Connector Application (Connector)
RFID middleware components described in the previous paragraphs provide a foundation for
translating raw RFID streams to meaningful business events comprising business context such as
where a tag was seen, at what time and in the scope of which process. Enterprises can then leverage
these business events through their legacy IT systems (e.g., ERPs, WMS, corporate databases), which
are used to support their business processes. To this end, there is a clear need for interfacing these
legacy systems, with the information sharing repositories, established and populated as part of the
RFID deployment. Interfacing between IT systems and the information sharing repository, as well as
other middleware blocks of the RFID deployment is realized through specialized middleware
components that are called “connectors”.
The main purpose of connector components are to abstract the interface between the ASPIRE
information sharing repository and enterprise information systems. Hence, connectors offer APIs
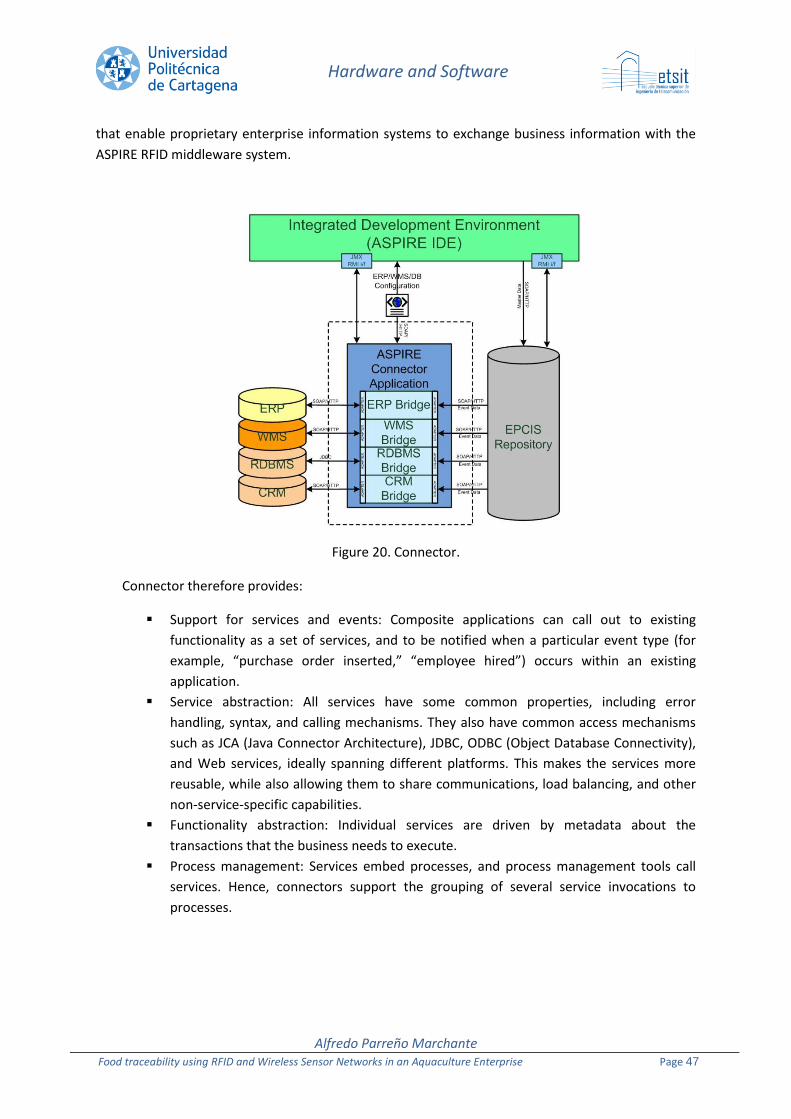
Hardware and Software
Alfredo Parreño Marchante Food traceability using RFID and Wireless Sensor Networks in an Aquaculture Enterprise Page 47
that enable proprietary enterprise information systems to exchange business information with the
ASPIRE RFID middleware system.
Figure 20. Connector.
Connector therefore provides:
Support for services and events: Composite applications can call out to existing
functionality as a set of services, and to be notified when a particular event type (for
example, “purchase order inserted,” “employee hired”) occurs within an existing
application.
Service abstraction: All services have some common properties, including error
handling, syntax, and calling mechanisms. They also have common access mechanisms
such as JCA (Java Connector Architecture), JDBC, ODBC (Object Database Connectivity),
and Web services, ideally spanning different platforms. This makes the services more
reusable, while also allowing them to share communications, load balancing, and other
non-service-specific capabilities.
Functionality abstraction: Individual services are driven by metadata about the
transactions that the business needs to execute.
Process management: Services embed processes, and process management tools call
services. Hence, connectors support the grouping of several service invocations to
processes.
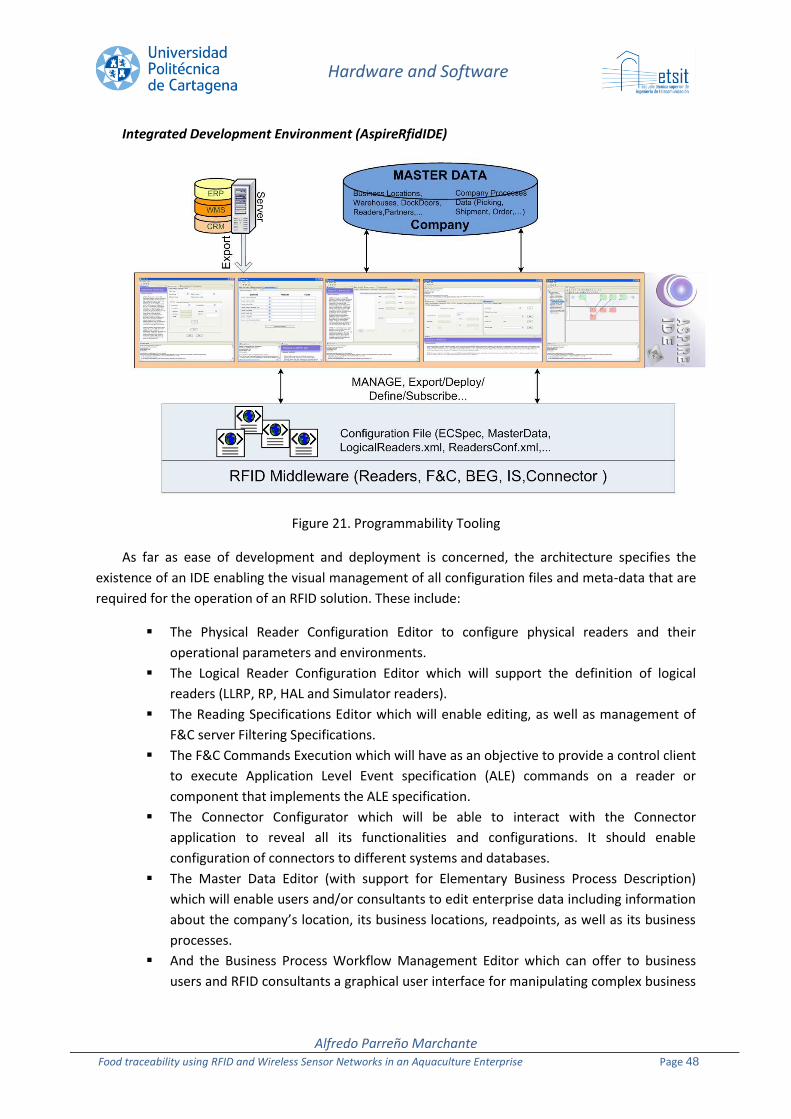
Hardware and Software
Alfredo Parreño Marchante Food traceability using RFID and Wireless Sensor Networks in an Aquaculture Enterprise Page 48
Integrated Development Environment (AspireRfidIDE)
Figure 21. Programmability Tooling
As far as ease of development and deployment is concerned, the architecture specifies the
existence of an IDE enabling the visual management of all configuration files and meta-data that are
required for the operation of an RFID solution. These include:
The Physical Reader Configuration Editor to configure physical readers and their
operational parameters and environments.
The Logical Reader Configuration Editor which will support the definition of logical
readers (LLRP, RP, HAL and Simulator readers).
The Reading Specifications Editor which will enable editing, as well as management of
F&C server Filtering Specifications.
The F&C Commands Execution which will have as an objective to provide a control client
to execute Application Level Event specification (ALE) commands on a reader or
component that implements the ALE specification.
The Connector Configurator which will be able to interact with the Connector
application to reveal all its functionalities and configurations. It should enable
configuration of connectors to different systems and databases.
The Master Data Editor (with support for Elementary Business Process Description)
which will enable users and/or consultants to edit enterprise data including information
about the company’s location, its business locations, readpoints, as well as its business
processes.
And the Business Process Workflow Management Editor which can offer to business
users and RFID consultants a graphical user interface for manipulating complex business
Hardware and Software
Alfredo Parreño Marchante Food traceability using RFID and Wireless Sensor Networks in an Aquaculture Enterprise Page 49
processes that are composed as workflows of elementary business processes. The
workflow management tool will leverage (though. using/ invoking) the functionality of
the above tools in order to support RFID deployments in accordance to particular
business processes.
55..33 HHaarrddwwaarree TTeessttss
55..33..11 SSeett uupp
We wanted to recreate real conditions in our lab for hardware testing. For this, we´ll need a
structure that simulates an RFID portal in our lab. The structure must be mobile and have to be able
to fix the antennas and RFID reader in different positions. We have to be able to set the antennas at
the same distance from the objects to be read than in real application.
We have two portal settings possibilities in our pilot;
Portal one is for the gate where the tanks are introduced to the processing plant
Portal two is for the conveyor belt that transports the fish boxes.
Therefore, our lab portal will need to be ready to reproduce both scenarios. We have designed
the lab portal depicted inFigure 22.
We will need some other material for our tests like:
Culmarex´s fish boxes for tag reading testing.
Ice and water.
55..33..22 PPllaannnneedd HHaarrddwwaarree TTeessttss
The planned tests that will be carried out in hardware include reading tests and connection with
software tests.
Tests without portal intervention
Fixed Reader
Test LLRP compliance.
Test Reader with Aspire.
Test Reader with Fosstrak.
Handheld Reader
Test LLRP compliance.
Test Reader with Aspire.

Hardware and Software
Alfredo Parreño Marchante Food traceability using RFID and Wireless Sensor Networks in an Aquaculture Enterprise Page 50
Test Reader with Fosstrak.
Tag reads at different distances.
Figure 22. Portal.
Tests with portal intervention
Tag reads in different scenarios and configurations. We can set up: Reader with two 7db
Antennas, with two 12db Antennas and with 4 antennas:
Tag set in different faces of an empty box.
Tags
We have several different Tag samples to test. For each Tag we have to test:
Read distance with handheld reader.
Read distance with fixed reader.
Write data in User memory.
Hardware and Software
Alfredo Parreño Marchante Food traceability using RFID and Wireless Sensor Networks in an Aquaculture Enterprise Page 51
Read data from User Memory.
Lock and Kill functions.
Write data distance with handheld reader.
Write data distance with fixed reader.
55..33..33 TTeessttss RReessuullttss
5.3.3.1 Tests without portal intervention
We have tested in our laboratory the equipment which has been purchased till now:
Handheld Reader MR6081A.
Fixed Reader MR6034E.
Antenna 12dbi MR651C.
Antenna 7dbi MR6528.
Several models of tags.
All of them were supplied by Marktrace and their characteristics were described above.
Tests are intended to get insight into the equipment and to know what they are capable to do. It
will help us to choose the best options and configurations.
In a first approach, tags readings have been done. We pretend to know about read capabilities
of the readers and tags in several scenarios.
These are the tested scenarios:
Handheld Reader.
o Maximum reading distance in open air conditions.
o Maximum reading distance in a place with wave reflections.
o Maximum reading distance with tags attached to boxes made of several materials.
Fixed Reader.
o Maximum reading distance with one 7dbi antenna.
o Maximum reading distance with one 12dbi antenna.
5.3.3.1.1 Set Up
For testing we have used the following material:
1 Laptop with RFID software connected to the RFID reader by local network.
Handheld Reader MR6081A.
1 support base.

Hardware and Software
Alfredo Parreño Marchante Food traceability using RFID and Wireless Sensor Networks in an Aquaculture Enterprise Page 52
1 PVC column.
1 Carton box with dimensions of 31x23x16cm.
1 Polyurethane box with dimensions of 30x30x10cm.
The tag models used for tests are the following:
Tag number Material Type
#1 Inlay EPC Class 1 Gen 2
#2 Inlay EPC Class 1 Gen 2
#3 Inlay EPC Class 1 Gen 2
#4 Plastic Card EPC Class 1 Gen 2
#5 Paper EPC Class 1 Gen 2
#6 Paper EPC Class 1 Gen 2
Table 8. Tags tested.
The definition of 3D coordinate system (x,y,z) to present position of tags with respect to the
RFID reader is depicted below (Figure 23 and Figure 24).
5.3.3.1.2 Handheld Reader
Available tags have been tested with the handheld reader in several conditions. We try to
establish what the real reader range is and which tags are best for our application. In Figure 25 the
equipment used for tests can be seen.
The reader is not LLRP compliant, so a HAL (Hardware Abstraction Layer) module should be
developed to connect to Fosstrak or Aspire.
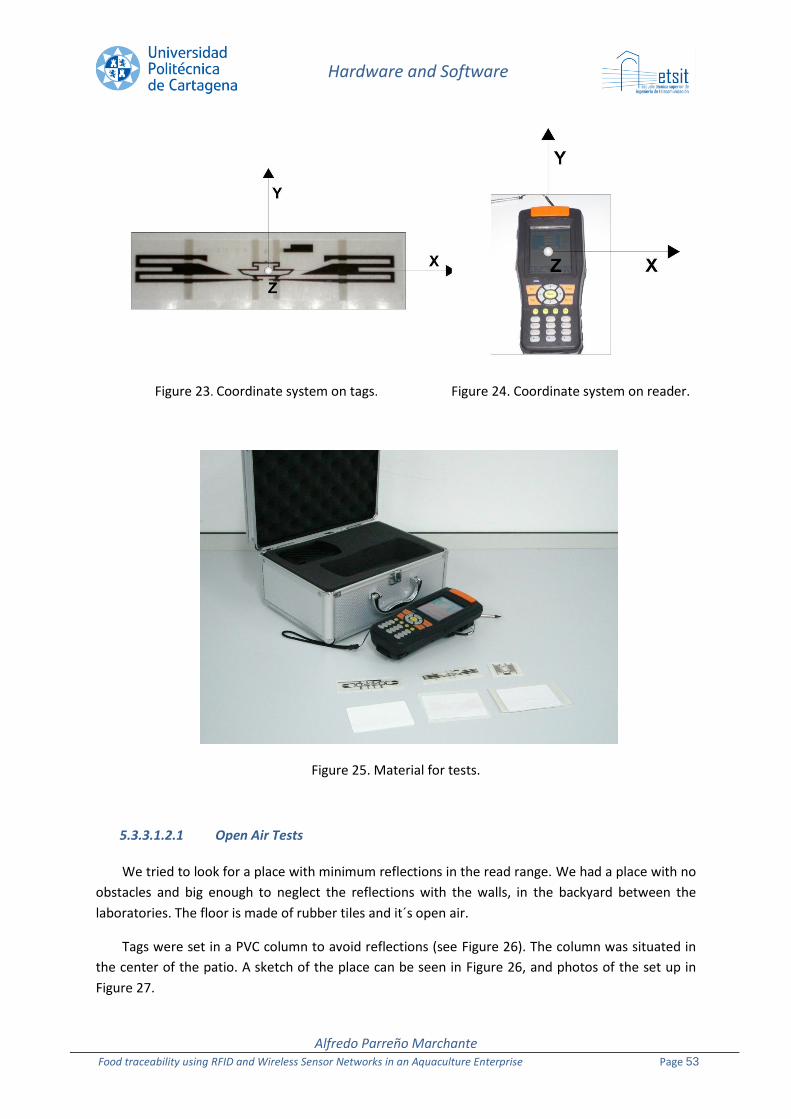
Hardware and Software
Alfredo Parreño Marchante Food traceability using RFID and Wireless Sensor Networks in an Aquaculture Enterprise Page 53
Figure 23. Coordinate system on tags. Figure 24. Coordinate system on reader.
Figure 25. Material for tests.
5.3.3.1.2.1 Open Air Tests
We tried to look for a place with minimum reflections in the read range. We had a place with no
obstacles and big enough to neglect the reflections with the walls, in the backyard between the
laboratories. The floor is made of rubber tiles and it´s open air.
Tags were set in a PVC column to avoid reflections (see Figure 26). The column was situated in
the center of the patio. A sketch of the place can be seen in Figure 26, and photos of the set up in
Figure 27.
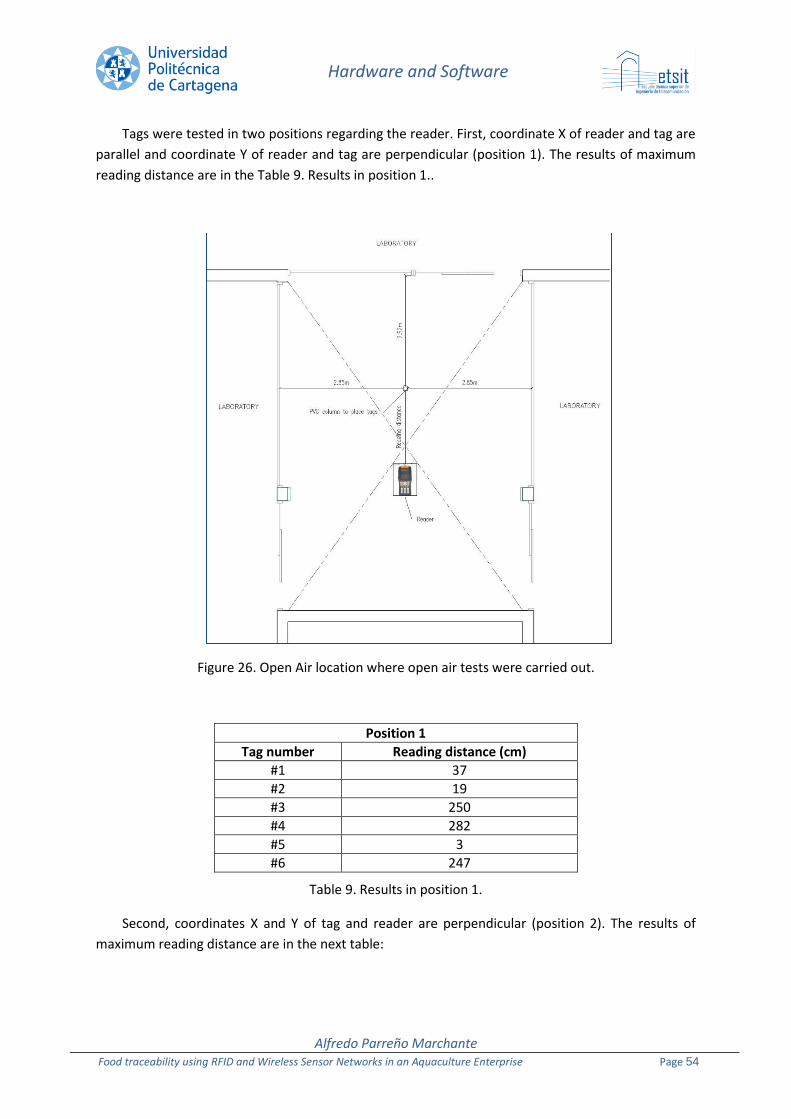
Hardware and Software
Alfredo Parreño Marchante Food traceability using RFID and Wireless Sensor Networks in an Aquaculture Enterprise Page 54
Tags were tested in two positions regarding the reader. First, coordinate X of reader and tag are
parallel and coordinate Y of reader and tag are perpendicular (position 1). The results of maximum
reading distance are in the Table 9. Results in position 1..
Figure 26. Open Air location where open air tests were carried out.
Position 1
Tag number Reading distance (cm)
#1 37
#2 19
#3 250
#4 282
#5 3
#6 247
Table 9. Results in position 1.
Second, coordinates X and Y of tag and reader are perpendicular (position 2). The results of
maximum reading distance are in the next table:
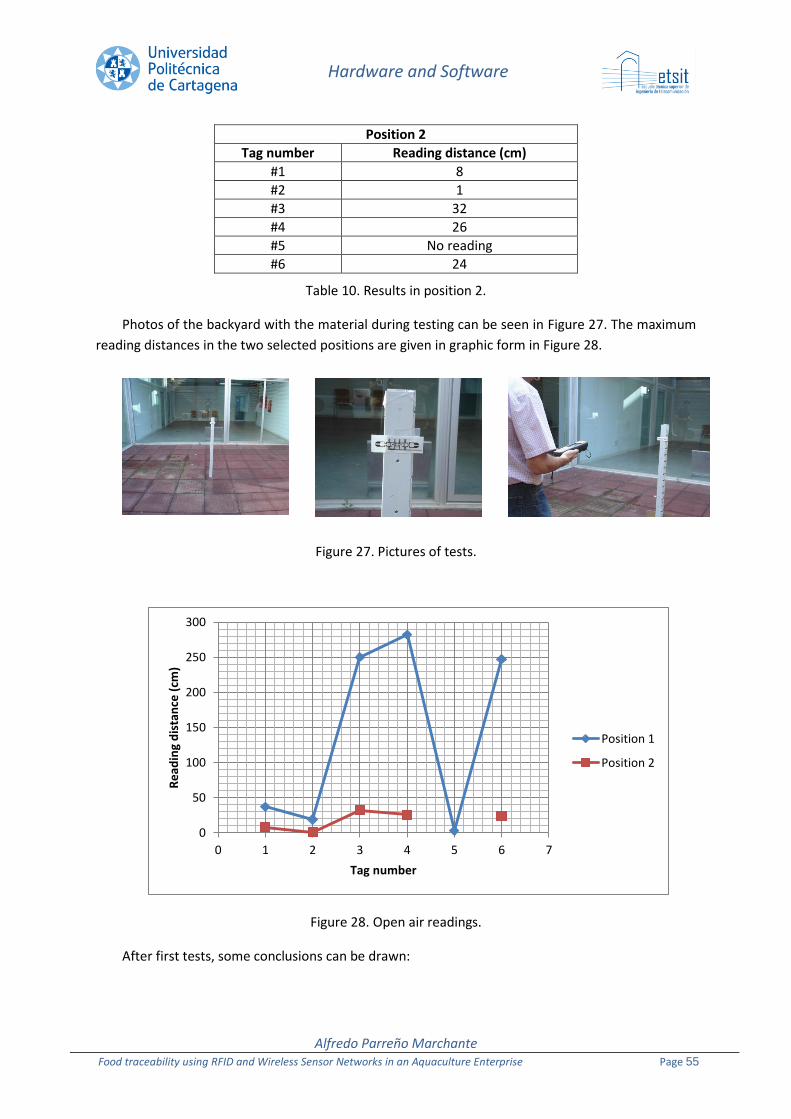
Hardware and Software
Alfredo Parreño Marchante Food traceability using RFID and Wireless Sensor Networks in an Aquaculture Enterprise Page 55
Position 2
Tag number Reading distance (cm)
#1 8
#2 1
#3 32
#4 26
#5 No reading
#6 24
Table 10. Results in position 2.
Photos of the backyard with the material during testing can be seen in Figure 27. The maximum
reading distances in the two selected positions are given in graphic form in Figure 28.
Figure 27. Pictures of tests.
Figure 28. Open air readings.
After first tests, some conclusions can be drawn:
0
50
100
150
200
250
300
0 1 2 3 4 5 6 7
Re
adin
g d
ista
nce
(cm
)
Tag number
Position 1
Position 2
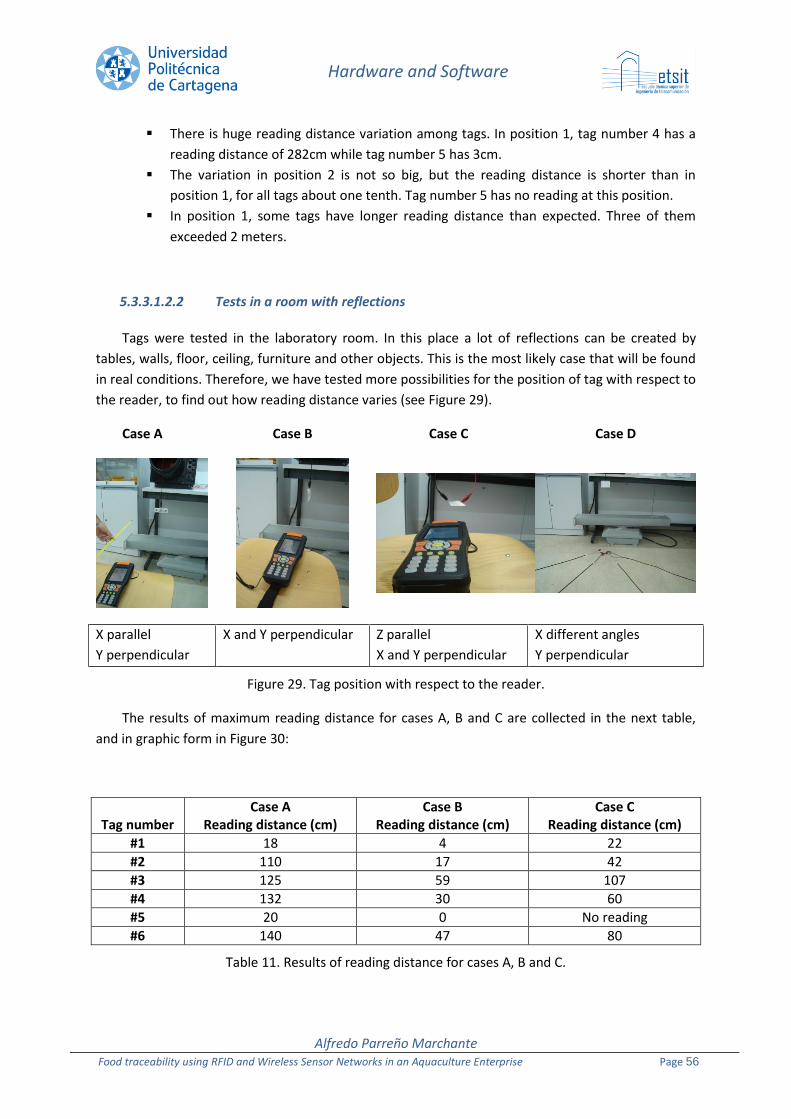
Hardware and Software
Alfredo Parreño Marchante Food traceability using RFID and Wireless Sensor Networks in an Aquaculture Enterprise Page 56
There is huge reading distance variation among tags. In position 1, tag number 4 has a
reading distance of 282cm while tag number 5 has 3cm.
The variation in position 2 is not so big, but the reading distance is shorter than in
position 1, for all tags about one tenth. Tag number 5 has no reading at this position.
In position 1, some tags have longer reading distance than expected. Three of them
exceeded 2 meters.
5.3.3.1.2.2 Tests in a room with reflections
Tags were tested in the laboratory room. In this place a lot of reflections can be created by
tables, walls, floor, ceiling, furniture and other objects. This is the most likely case that will be found
in real conditions. Therefore, we have tested more possibilities for the position of tag with respect to
the reader, to find out how reading distance varies (see Figure 29).
Case A Case B Case C Case D
X parallel
Y perpendicular
X and Y perpendicular Z parallel
X and Y perpendicular
X different angles
Y perpendicular
Figure 29. Tag position with respect to the reader.
The results of maximum reading distance for cases A, B and C are collected in the next table,
and in graphic form in Figure 30:
Tag number Case A
Reading distance (cm) Case B
Reading distance (cm) Case C
Reading distance (cm)
#1 18 4 22
#2 110 17 42
#3 125 59 107
#4 132 30 60
#5 20 0 No reading
#6 140 47 80
Table 11. Results of reading distance for cases A, B and C.
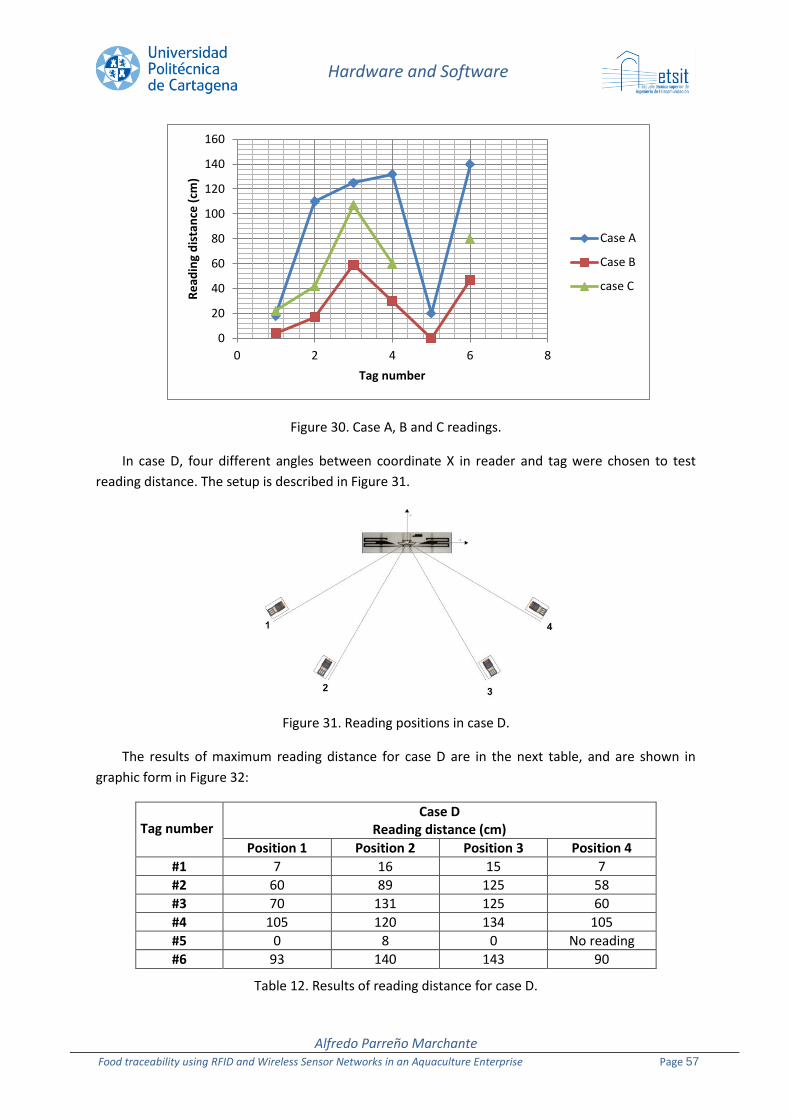
Hardware and Software
Alfredo Parreño Marchante Food traceability using RFID and Wireless Sensor Networks in an Aquaculture Enterprise Page 57
Figure 30. Case A, B and C readings.
In case D, four different angles between coordinate X in reader and tag were chosen to test
reading distance. The setup is described in Figure 31.
Figure 31. Reading positions in case D.
The results of maximum reading distance for case D are in the next table, and are shown in
graphic form in Figure 32:
Tag number Case D
Reading distance (cm)
Position 1 Position 2 Position 3 Position 4
#1 7 16 15 7
#2 60 89 125 58
#3 70 131 125 60
#4 105 120 134 105
#5 0 8 0 No reading
#6 93 140 143 90
Table 12. Results of reading distance for case D.
0
20
40
60
80
100
120
140
160
0 2 4 6 8
Re
adin
g d
ista
nce
(cm
)
Tag number
Case A
Case B
case C

Hardware and Software
Alfredo Parreño Marchante Food traceability using RFID and Wireless Sensor Networks in an Aquaculture Enterprise Page 58
Figure 32. Case D readings.
After tests, some conclusions can be drawn:
In all cases, trends in the readings are consistent. It can be seen that tags 1 and 5 have shortest read ranges, and tags 4 and 6 have the longest.
Best read ranges are obtained in case A, but for most tags reading distance is about a half of the distance in open air conditions.
Case B (X and Y perpendicular) is the worst possible scenario for reading.
The position of the reader regarding the tag is important for reading distance as seen in Figure 32. The greater the angle between coordinate X in the reader and the tag is, the shorter the reading distance.
5.3.3.1.2.3 Tests with tags attached to boxes
With these tests we want to find out if the material to which the tag is attached affects the
reading distance.
These tests were done with two boxes. One made of carton (31x23x16cm) and another made of
polyurethane (30x30x10cm). We wanted to test the real fish box used by the company, but it wasn´t
available yet. Tags were attached to the boxes as shown in Figure 33 and the readings were done
with the tag attached to every face of the box. The boxes were empty.
Re
adin
g n
um
be
r (c
m)
Position (1 to 4)
Tag 1
Tag 2
Tag 3
Tag 4
Tag 5
Tag 6
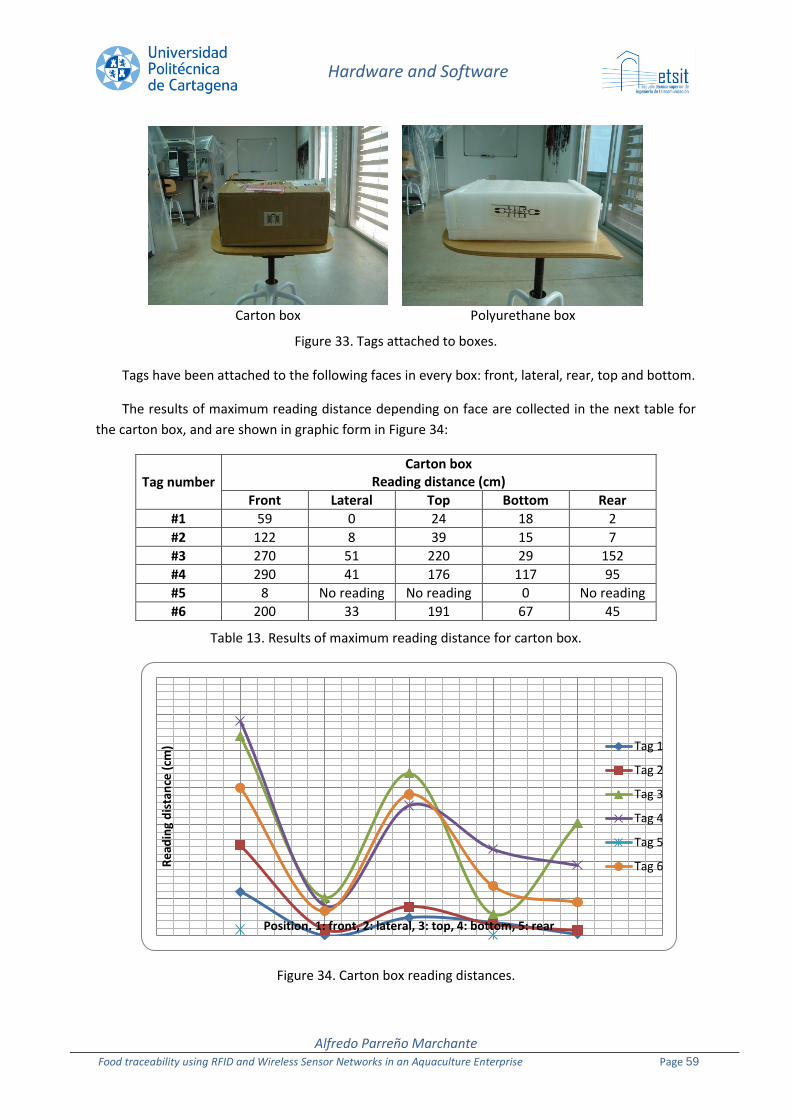
Hardware and Software
Alfredo Parreño Marchante Food traceability using RFID and Wireless Sensor Networks in an Aquaculture Enterprise Page 59
Carton box Polyurethane box
Figure 33. Tags attached to boxes.
Tags have been attached to the following faces in every box: front, lateral, rear, top and bottom.
The results of maximum reading distance depending on face are collected in the next table for
the carton box, and are shown in graphic form in Figure 34:
Tag number Carton box
Reading distance (cm)
Front Lateral Top Bottom Rear
#1 59 0 24 18 2
#2 122 8 39 15 7
#3 270 51 220 29 152
#4 290 41 176 117 95
#5 8 No reading No reading 0 No reading
#6 200 33 191 67 45
Table 13. Results of maximum reading distance for carton box.
Figure 34. Carton box reading distances.
Re
adin
g d
ista
nce
(cm
)
Position. 1: front, 2: lateral, 3: top, 4: bottom, 5: rear
Tag 1
Tag 2
Tag 3
Tag 4
Tag 5
Tag 6
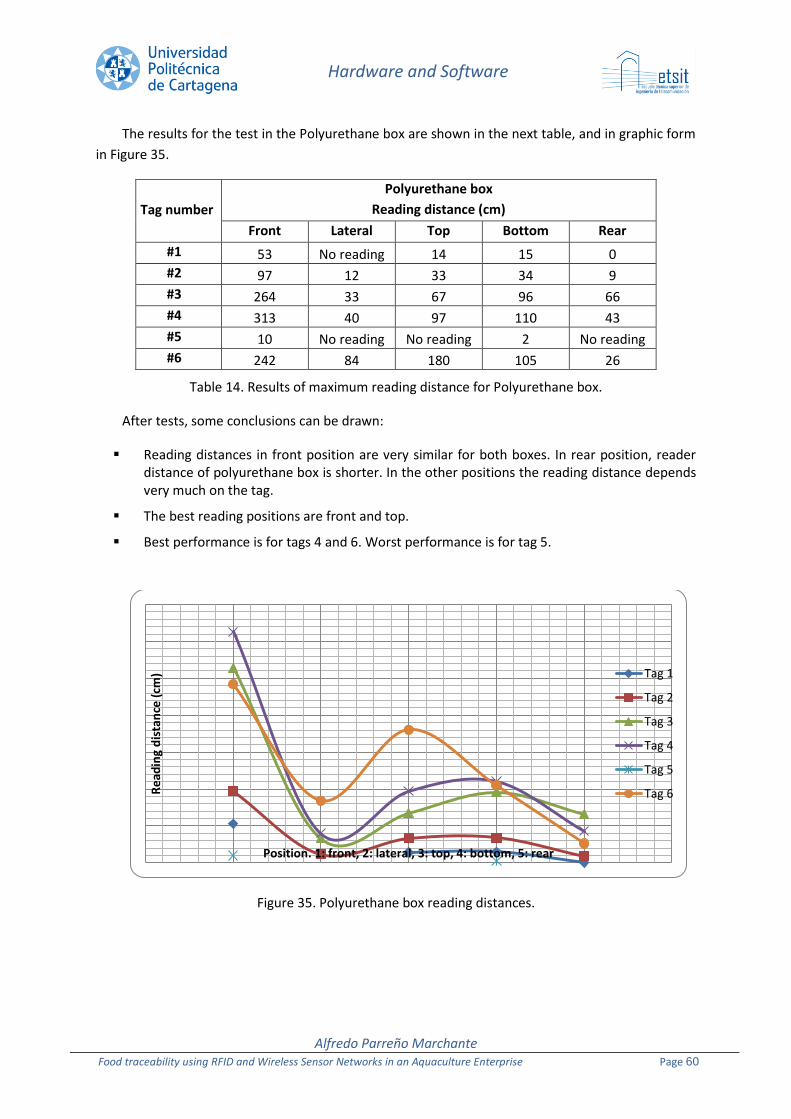
Hardware and Software
Alfredo Parreño Marchante Food traceability using RFID and Wireless Sensor Networks in an Aquaculture Enterprise Page 60
The results for the test in the Polyurethane box are shown in the next table, and in graphic form
in Figure 35.
Tag number
Polyurethane box
Reading distance (cm)
Front Lateral Top Bottom Rear
#1 53 No reading 14 15 0
#2 97 12 33 34 9
#3 264 33 67 96 66
#4 313 40 97 110 43
#5 10 No reading No reading 2 No reading
#6 242 84 180 105 26
Table 14. Results of maximum reading distance for Polyurethane box.
After tests, some conclusions can be drawn:
Reading distances in front position are very similar for both boxes. In rear position, reader distance of polyurethane box is shorter. In the other positions the reading distance depends very much on the tag.
The best reading positions are front and top.
Best performance is for tags 4 and 6. Worst performance is for tag 5.
Figure 35. Polyurethane box reading distances.
Re
adin
g d
ista
nce
(cm
)
Position. 1: front, 2: lateral, 3: top, 4: bottom, 5: rear
Tag 1
Tag 2
Tag 3
Tag 4
Tag 5
Tag 6
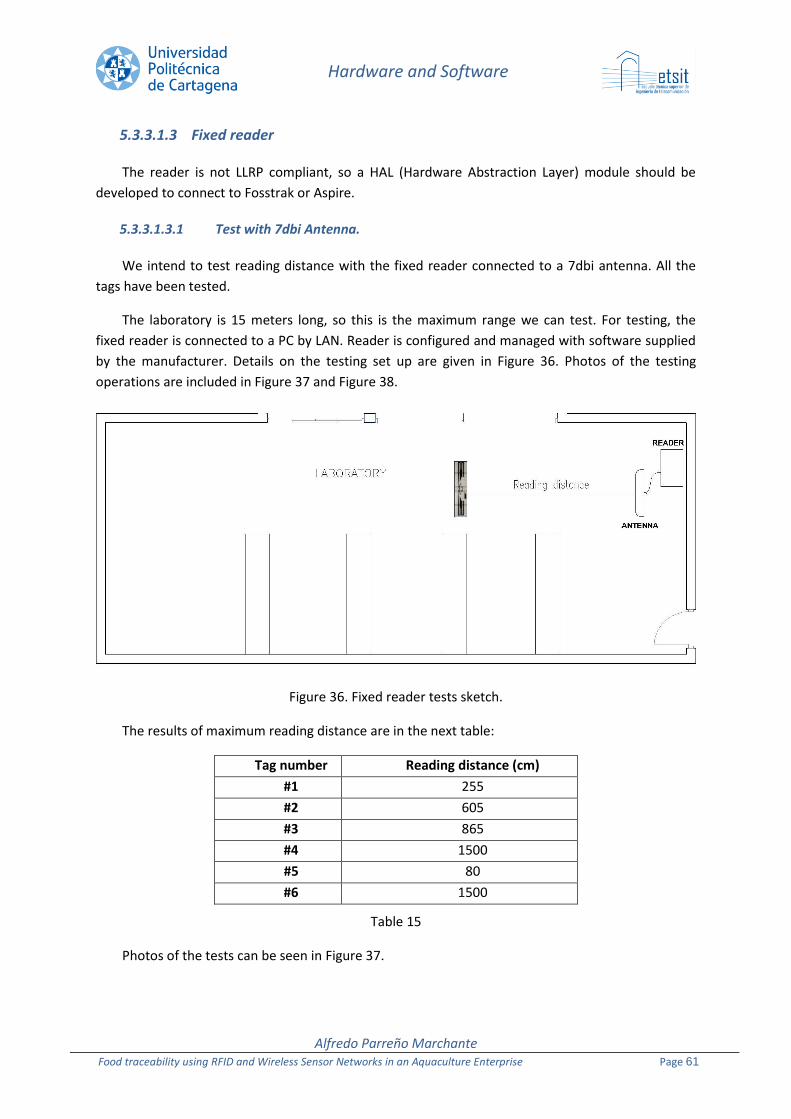
Hardware and Software
Alfredo Parreño Marchante Food traceability using RFID and Wireless Sensor Networks in an Aquaculture Enterprise Page 61
5.3.3.1.3 Fixed reader
The reader is not LLRP compliant, so a HAL (Hardware Abstraction Layer) module should be
developed to connect to Fosstrak or Aspire.
5.3.3.1.3.1 Test with 7dbi Antenna.
We intend to test reading distance with the fixed reader connected to a 7dbi antenna. All the
tags have been tested.
The laboratory is 15 meters long, so this is the maximum range we can test. For testing, the
fixed reader is connected to a PC by LAN. Reader is configured and managed with software supplied
by the manufacturer. Details on the testing set up are given in Figure 36. Photos of the testing
operations are included in Figure 37 and Figure 38.
Figure 36. Fixed reader tests sketch.
The results of maximum reading distance are in the next table:
Tag number Reading distance (cm)
#1 255
#2 605
#3 865
#4 1500
#5 80
#6 1500
Table 15
Photos of the tests can be seen in Figure 37.
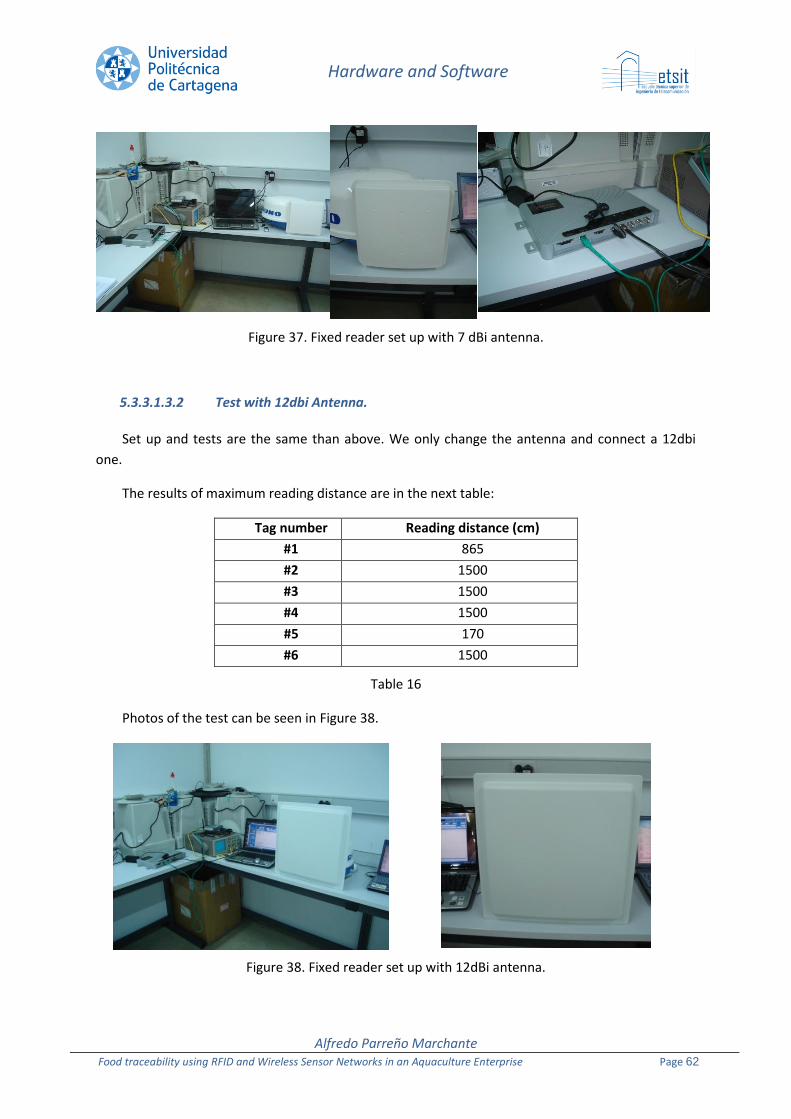
Hardware and Software
Alfredo Parreño Marchante Food traceability using RFID and Wireless Sensor Networks in an Aquaculture Enterprise Page 62
Figure 37. Fixed reader set up with 7 dBi antenna.
5.3.3.1.3.2 Test with 12dbi Antenna.
Set up and tests are the same than above. We only change the antenna and connect a 12dbi
one.
The results of maximum reading distance are in the next table:
Tag number Reading distance (cm)
#1 865
#2 1500
#3 1500
#4 1500
#5 170
#6 1500
Table 16
Photos of the test can be seen in Figure 38.
Figure 38. Fixed reader set up with 12dBi antenna.

Hardware and Software
Alfredo Parreño Marchante Food traceability using RFID and Wireless Sensor Networks in an Aquaculture Enterprise Page 63
After tests, some conclusions can be drawn:
We get bigger reading distances than with handheld reader as expected. The maximum reading distance allowed for these tests is 15 meters because of laboratory dimensions.
With the 7dbi antenna, two tags get maximum distance (numbers 4 and 6). Tag number 5 only gets 80cm as maximum reading distance.
With the 12dbi antenna, four tags get maximum distance (numbers 2, 3, 4 and 6). Tag number 5 has still the shortest range, but it is increased to 170 cm.
A big difference can be seen in the ranges when switching between the two antennas. There is an improvement from double to triple in reading distance.
The reading distances obtained for both antennas are given in graphic form in Figure 39.
Figure 39. Fixed reading distances.
5.3.3.1.4 Conclusions
There are big differences in reading distances among tags. Best performance is for tag 4 and 6.
Worst performance is for tags 1 and 5.
Tag 6 is a good candidate to be used in our pilot because it is a paper tag, perfect for stick in fish
boxes and it´s possible to print on it.
Handheld reader´s performance is better than expected and it´s read range is good enough to
work in our pilot. Additional tests will be done.
In our first tests, fixed reader´s performance is good enough when combined with both 7dBi and
12 dBi antennas, but additional tests must be done.
0
200
400
600
800
1000
1200
1400
1600
0 1 2 3 4 5 6 7
Re
adin
g d
ista
nce
(cm
)
Tag number
Antenna 7dbi
Antenna 12dbi
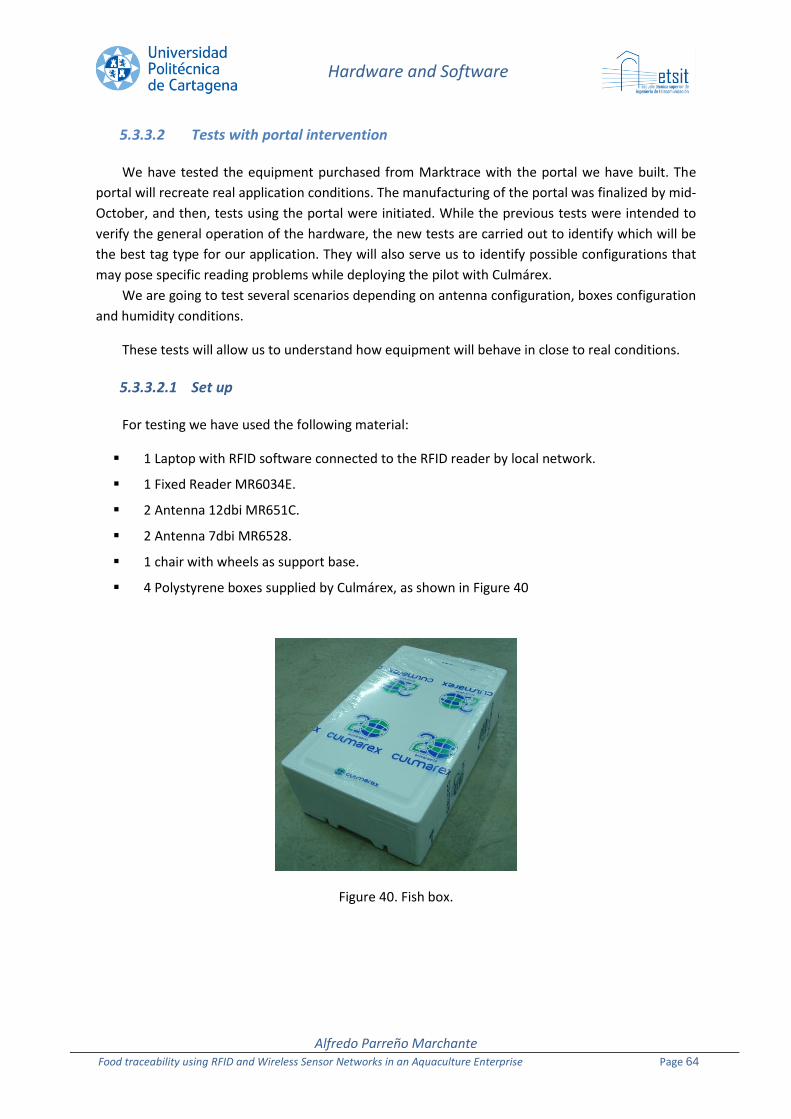
Hardware and Software
Alfredo Parreño Marchante Food traceability using RFID and Wireless Sensor Networks in an Aquaculture Enterprise Page 64
5.3.3.2 Tests with portal intervention
We have tested the equipment purchased from Marktrace with the portal we have built. The
portal will recreate real application conditions. The manufacturing of the portal was finalized by mid-
October, and then, tests using the portal were initiated. While the previous tests were intended to
verify the general operation of the hardware, the new tests are carried out to identify which will be
the best tag type for our application. They will also serve us to identify possible configurations that
may pose specific reading problems while deploying the pilot with Culmárex.
We are going to test several scenarios depending on antenna configuration, boxes configuration
and humidity conditions.
These tests will allow us to understand how equipment will behave in close to real conditions.
5.3.3.2.1 Set up
For testing we have used the following material:
1 Laptop with RFID software connected to the RFID reader by local network.
1 Fixed Reader MR6034E.
2 Antenna 12dbi MR651C.
2 Antenna 7dbi MR6528.
1 chair with wheels as support base.
4 Polystyrene boxes supplied by Culmárex, as shown in Figure 40
Figure 40. Fish box.
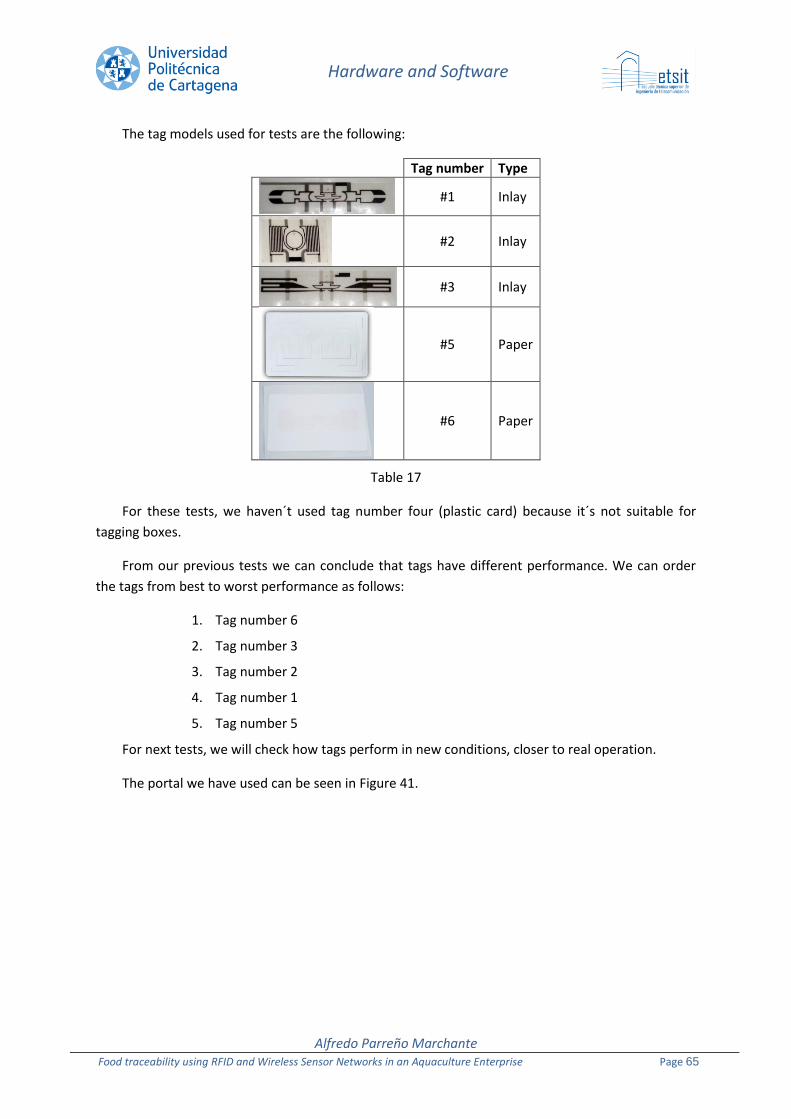
Hardware and Software
Alfredo Parreño Marchante Food traceability using RFID and Wireless Sensor Networks in an Aquaculture Enterprise Page 65
The tag models used for tests are the following:
Tag number Type
#1 Inlay
#2 Inlay
#3 Inlay
#5 Paper
#6 Paper
Table 17
For these tests, we haven´t used tag number four (plastic card) because it´s not suitable for
tagging boxes.
From our previous tests we can conclude that tags have different performance. We can order
the tags from best to worst performance as follows:
1. Tag number 6
2. Tag number 3
3. Tag number 2
4. Tag number 1
5. Tag number 5
For next tests, we will check how tags perform in new conditions, closer to real operation.
The portal we have used can be seen in Figure 41.
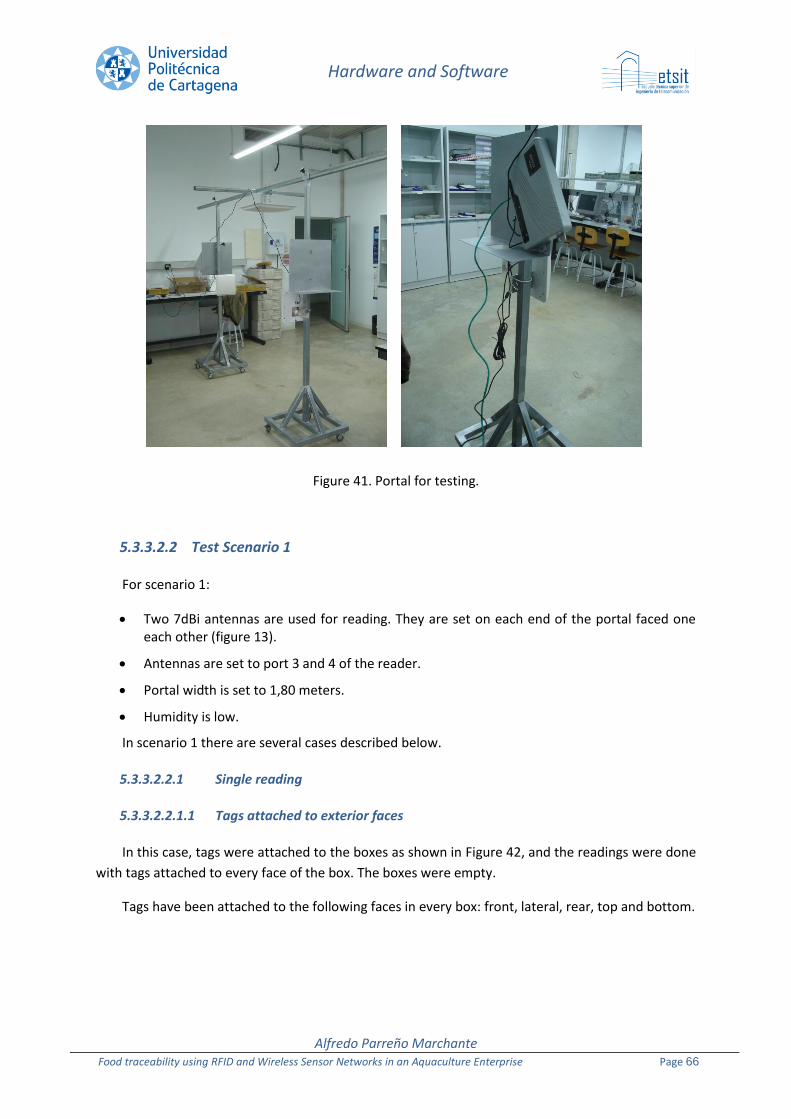
Hardware and Software
Alfredo Parreño Marchante Food traceability using RFID and Wireless Sensor Networks in an Aquaculture Enterprise Page 66
Figure 41. Portal for testing.
5.3.3.2.2 Test Scenario 1
For scenario 1:
Two 7dBi antennas are used for reading. They are set on each end of the portal faced one each other (figure 13).
Antennas are set to port 3 and 4 of the reader.
Portal width is set to 1,80 meters.
Humidity is low.
In scenario 1 there are several cases described below.
5.3.3.2.2.1 Single reading
5.3.3.2.2.1.1 Tags attached to exterior faces
In this case, tags were attached to the boxes as shown in Figure 42, and the readings were done
with tags attached to every face of the box. The boxes were empty.
Tags have been attached to the following faces in every box: front, lateral, rear, top and bottom.
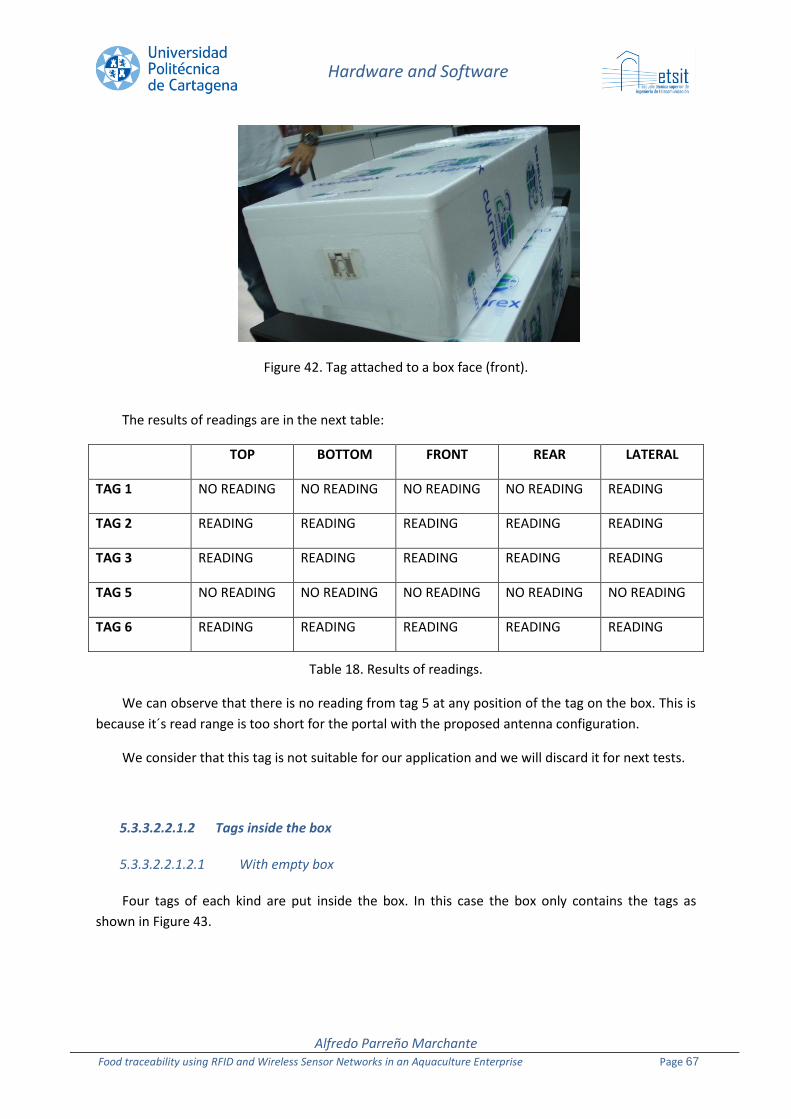
Hardware and Software
Alfredo Parreño Marchante Food traceability using RFID and Wireless Sensor Networks in an Aquaculture Enterprise Page 67
Figure 42. Tag attached to a box face (front).
The results of readings are in the next table:
TOP BOTTOM FRONT REAR LATERAL
TAG 1 NO READING NO READING NO READING NO READING READING
TAG 2 READING READING READING READING READING
TAG 3 READING READING READING READING READING
TAG 5 NO READING NO READING NO READING NO READING NO READING
TAG 6 READING READING READING READING READING
Table 18. Results of readings.
We can observe that there is no reading from tag 5 at any position of the tag on the box. This is
because it´s read range is too short for the portal with the proposed antenna configuration.
We consider that this tag is not suitable for our application and we will discard it for next tests.
5.3.3.2.2.1.2 Tags inside the box
5.3.3.2.2.1.2.1 With empty box
Four tags of each kind are put inside the box. In this case the box only contains the tags as
shown in Figure 43.
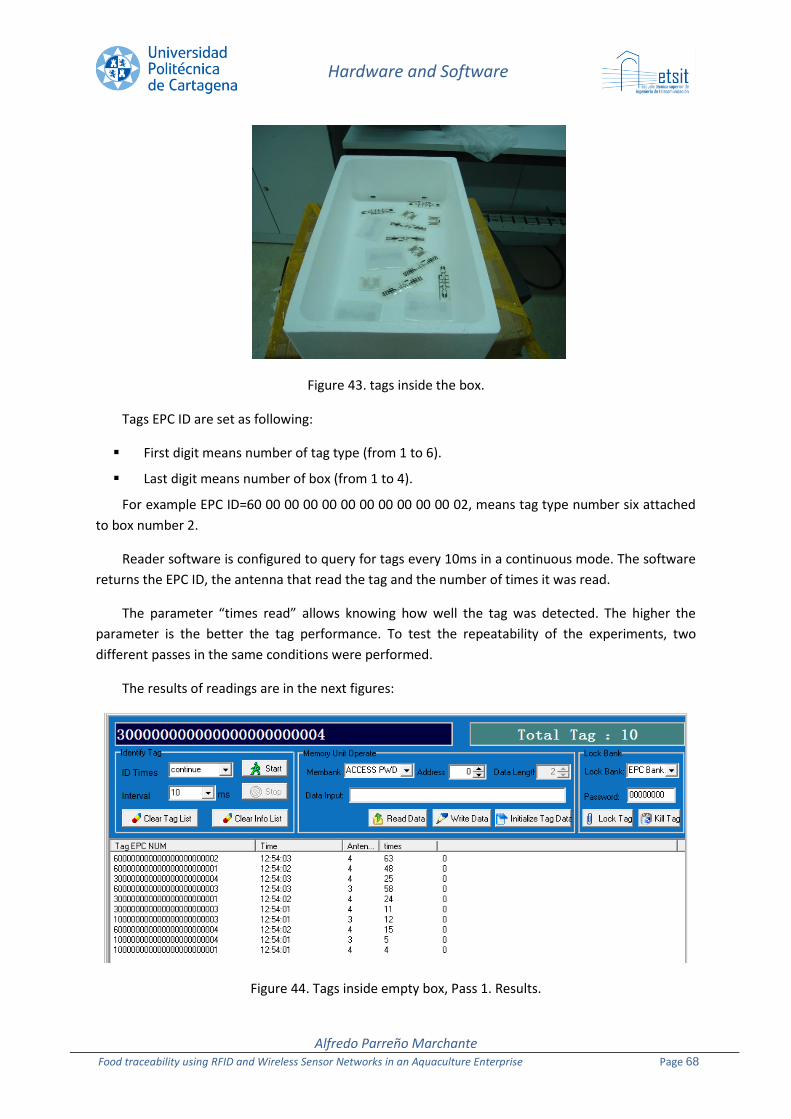
Hardware and Software
Alfredo Parreño Marchante Food traceability using RFID and Wireless Sensor Networks in an Aquaculture Enterprise Page 68
Figure 43. tags inside the box.
Tags EPC ID are set as following:
First digit means number of tag type (from 1 to 6).
Last digit means number of box (from 1 to 4).
For example EPC ID=60 00 00 00 00 00 00 00 00 00 00 02, means tag type number six attached
to box number 2.
Reader software is configured to query for tags every 10ms in a continuous mode. The software
returns the EPC ID, the antenna that read the tag and the number of times it was read.
The parameter “times read” allows knowing how well the tag was detected. The higher the
parameter is the better the tag performance. To test the repeatability of the experiments, two
different passes in the same conditions were performed.
The results of readings are in the next figures:
Figure 44. Tags inside empty box, Pass 1. Results.

Hardware and Software
Alfredo Parreño Marchante Food traceability using RFID and Wireless Sensor Networks in an Aquaculture Enterprise Page 69
Figure 45. Tags inside empty box, Pass 2. Results.
For passes 3 and 4 we have moved the tags inside the box, to change their positions. Results are
shown in Figure 46 and Figure 47.
Figure 46. Tags inside empty box, Pass 3. Results.
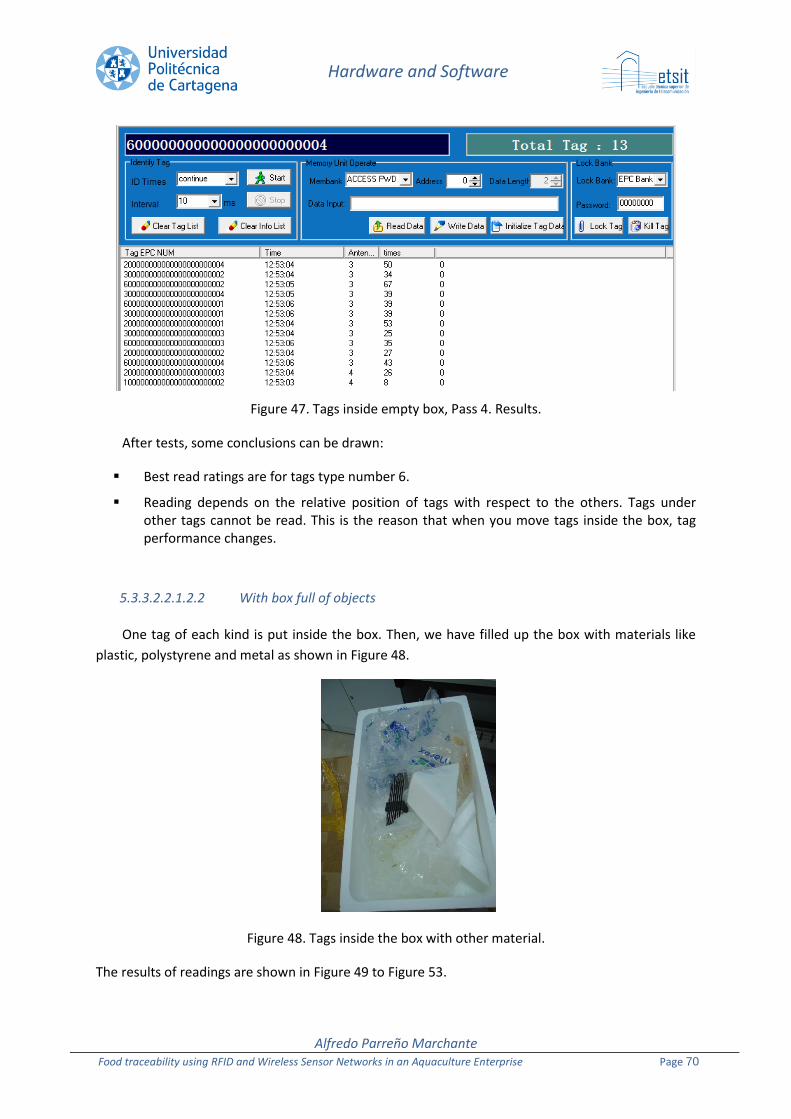
Hardware and Software
Alfredo Parreño Marchante Food traceability using RFID and Wireless Sensor Networks in an Aquaculture Enterprise Page 70
Figure 47. Tags inside empty box, Pass 4. Results.
After tests, some conclusions can be drawn:
Best read ratings are for tags type number 6.
Reading depends on the relative position of tags with respect to the others. Tags under other tags cannot be read. This is the reason that when you move tags inside the box, tag performance changes.
5.3.3.2.2.1.2.2 With box full of objects
One tag of each kind is put inside the box. Then, we have filled up the box with materials like
plastic, polystyrene and metal as shown in Figure 48.
Figure 48. Tags inside the box with other material.
The results of readings are shown in Figure 49 to Figure 53.
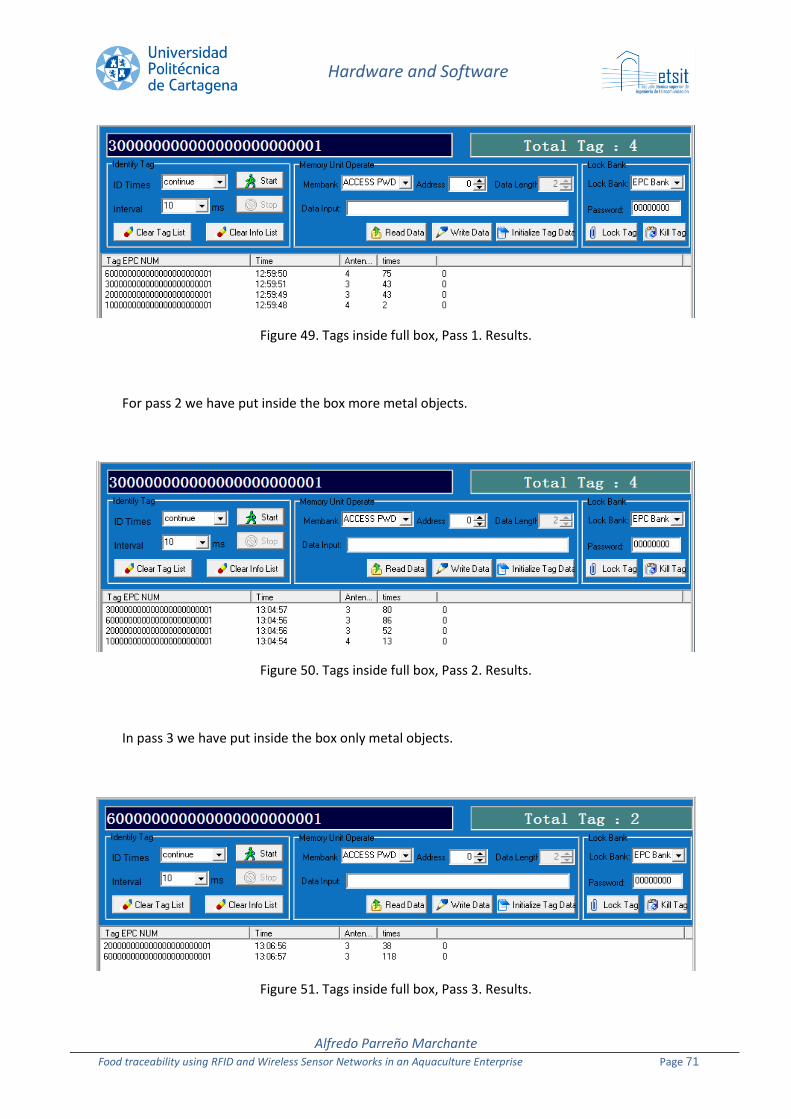
Hardware and Software
Alfredo Parreño Marchante Food traceability using RFID and Wireless Sensor Networks in an Aquaculture Enterprise Page 71
Figure 49. Tags inside full box, Pass 1. Results.
For pass 2 we have put inside the box more metal objects.
Figure 50. Tags inside full box, Pass 2. Results.
In pass 3 we have put inside the box only metal objects.
Figure 51. Tags inside full box, Pass 3. Results.
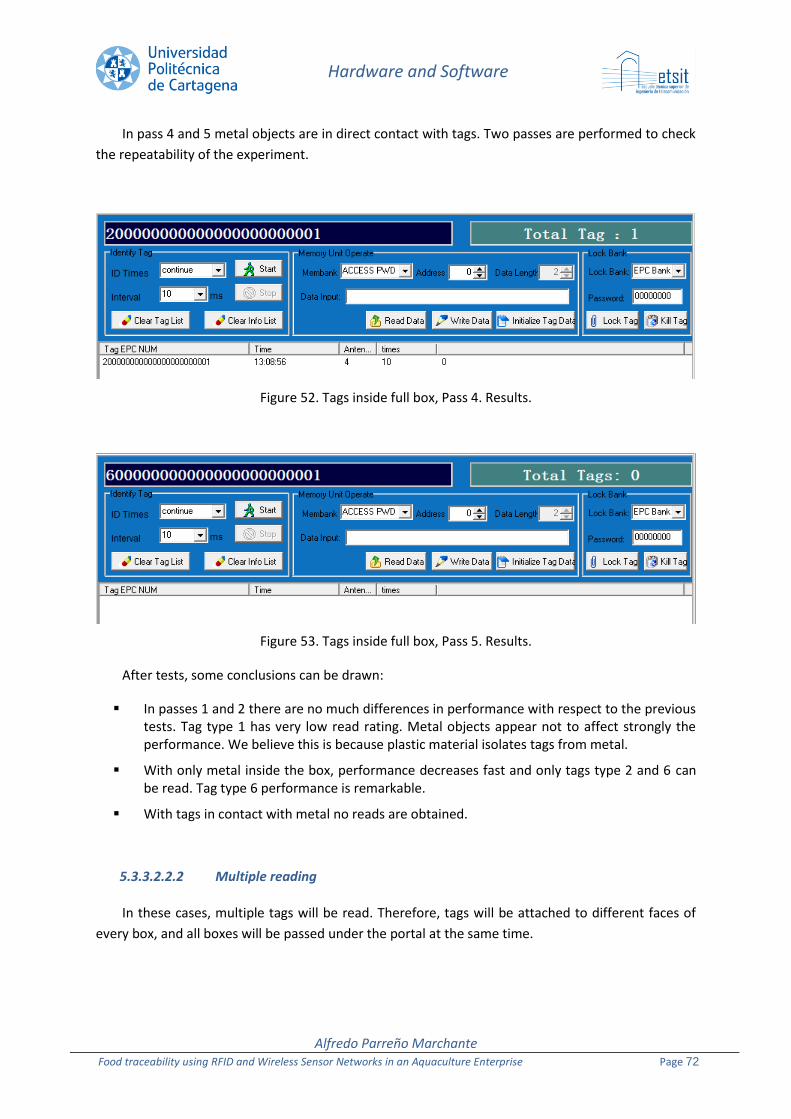
Hardware and Software
Alfredo Parreño Marchante Food traceability using RFID and Wireless Sensor Networks in an Aquaculture Enterprise Page 72
In pass 4 and 5 metal objects are in direct contact with tags. Two passes are performed to check
the repeatability of the experiment.
Figure 52. Tags inside full box, Pass 4. Results.
Figure 53. Tags inside full box, Pass 5. Results.
After tests, some conclusions can be drawn:
In passes 1 and 2 there are no much differences in performance with respect to the previous tests. Tag type 1 has very low read rating. Metal objects appear not to affect strongly the performance. We believe this is because plastic material isolates tags from metal.
With only metal inside the box, performance decreases fast and only tags type 2 and 6 can be read. Tag type 6 performance is remarkable.
With tags in contact with metal no reads are obtained.
5.3.3.2.2.2 Multiple reading
In these cases, multiple tags will be read. Therefore, tags will be attached to different faces of
every box, and all boxes will be passed under the portal at the same time.
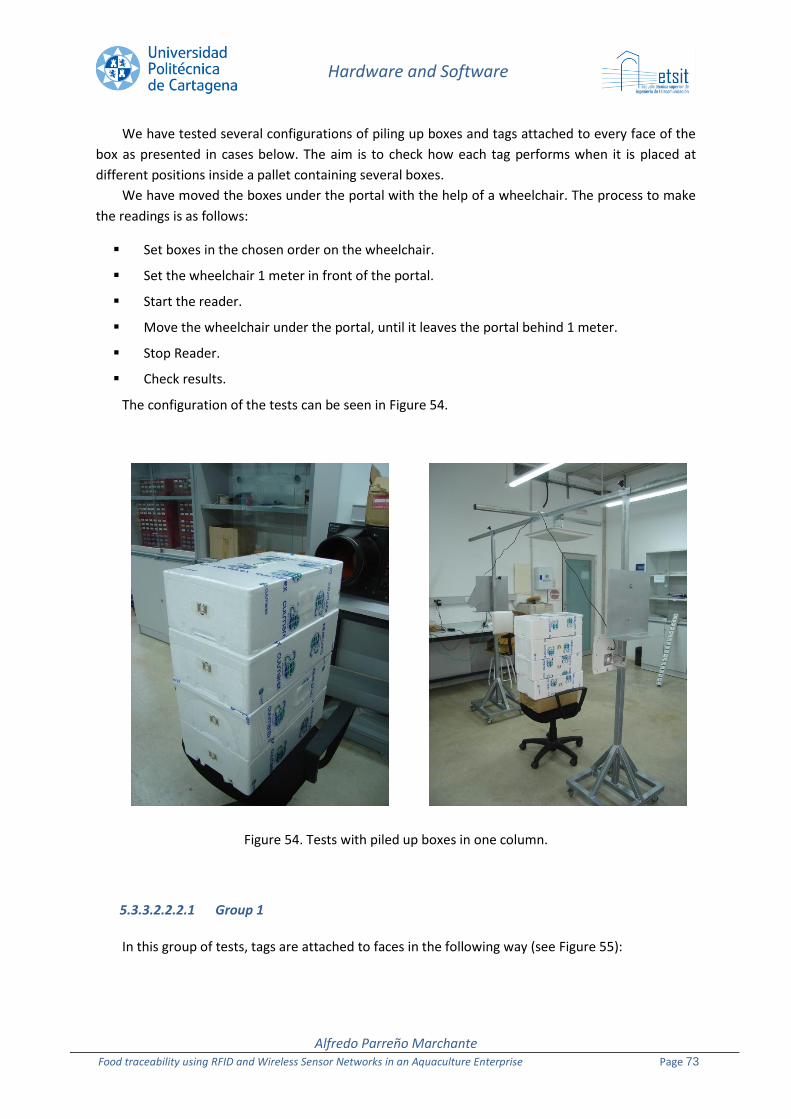
Hardware and Software
Alfredo Parreño Marchante Food traceability using RFID and Wireless Sensor Networks in an Aquaculture Enterprise Page 73
We have tested several configurations of piling up boxes and tags attached to every face of the
box as presented in cases below. The aim is to check how each tag performs when it is placed at
different positions inside a pallet containing several boxes.
We have moved the boxes under the portal with the help of a wheelchair. The process to make
the readings is as follows:
Set boxes in the chosen order on the wheelchair.
Set the wheelchair 1 meter in front of the portal.
Start the reader.
Move the wheelchair under the portal, until it leaves the portal behind 1 meter.
Stop Reader.
Check results.
The configuration of the tests can be seen in Figure 54.
Figure 54. Tests with piled up boxes in one column.
5.3.3.2.2.2.1 Group 1
In this group of tests, tags are attached to faces in the following way (see Figure 55):
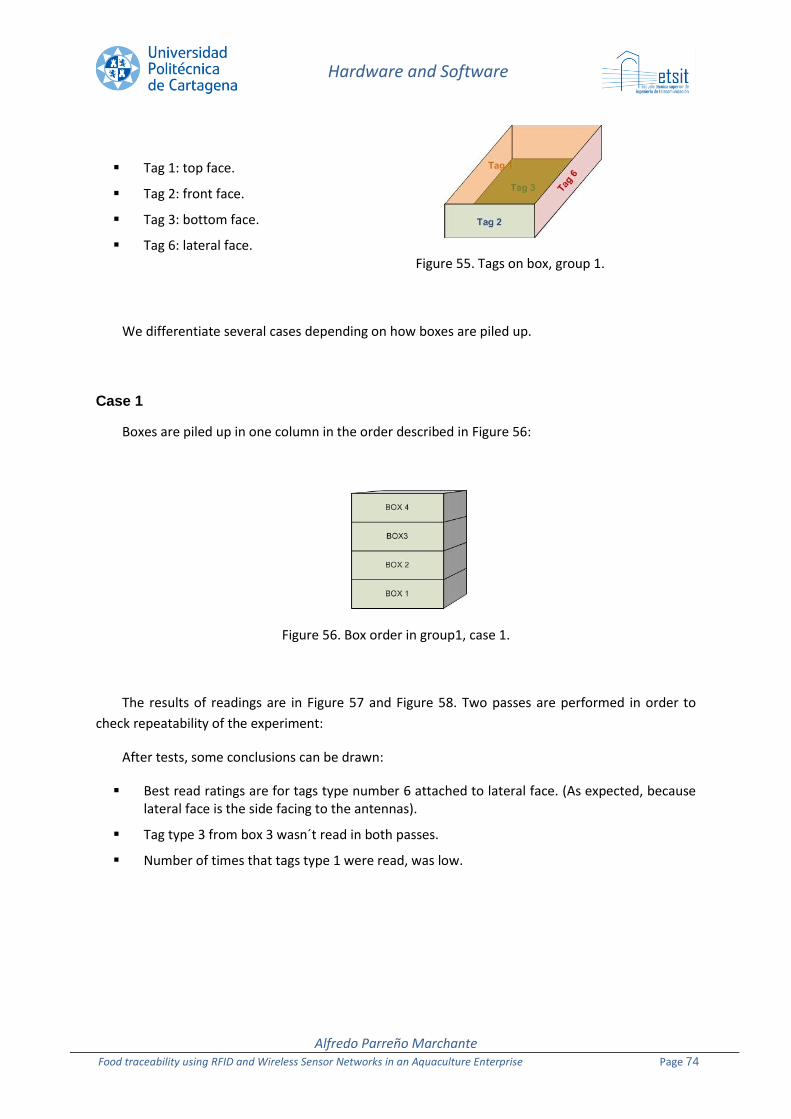
Hardware and Software
Alfredo Parreño Marchante Food traceability using RFID and Wireless Sensor Networks in an Aquaculture Enterprise Page 74
Tag 1: top face.
Tag 2: front face.
Tag 3: bottom face.
Tag 6: lateral face.
Figure 55. Tags on box, group 1.
We differentiate several cases depending on how boxes are piled up.
Case 1
Boxes are piled up in one column in the order described in Figure 56:
Figure 56. Box order in group1, case 1.
The results of readings are in Figure 57 and Figure 58. Two passes are performed in order to
check repeatability of the experiment:
After tests, some conclusions can be drawn:
Best read ratings are for tags type number 6 attached to lateral face. (As expected, because lateral face is the side facing to the antennas).
Tag type 3 from box 3 wasn´t read in both passes.
Number of times that tags type 1 were read, was low.
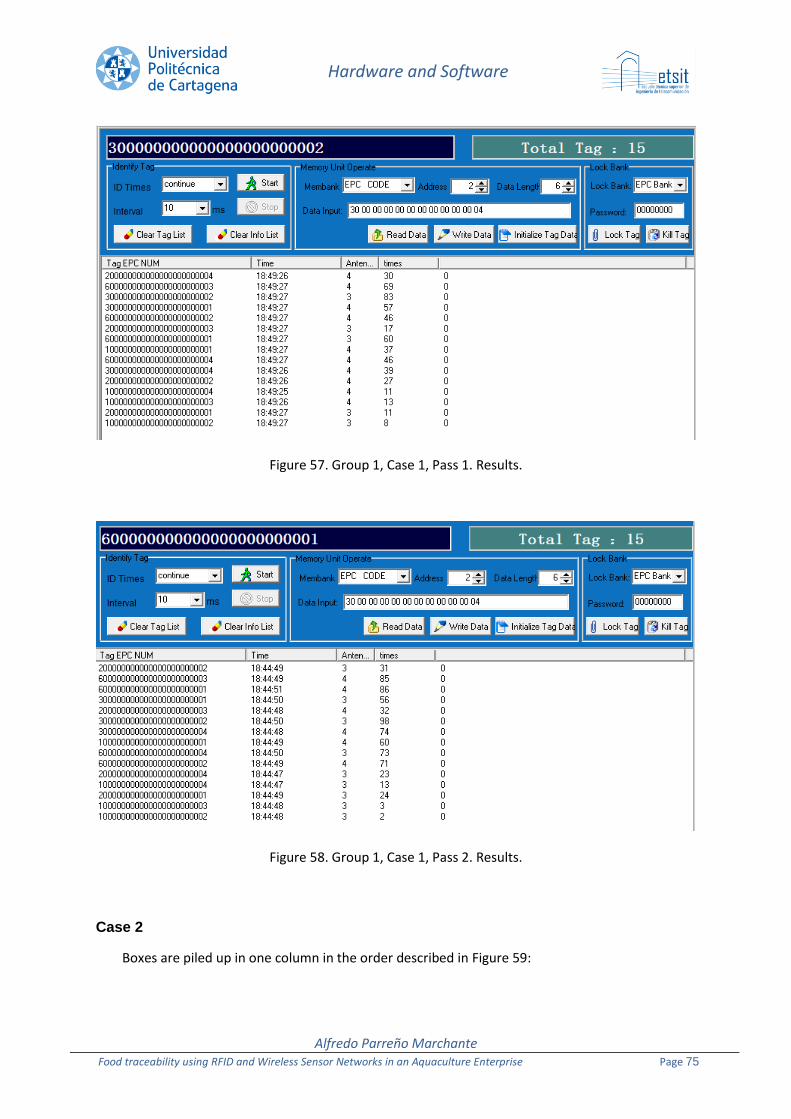
Hardware and Software
Alfredo Parreño Marchante Food traceability using RFID and Wireless Sensor Networks in an Aquaculture Enterprise Page 75
Figure 57. Group 1, Case 1, Pass 1. Results.
Figure 58. Group 1, Case 1, Pass 2. Results.
Case 2
Boxes are piled up in one column in the order described in Figure 59:
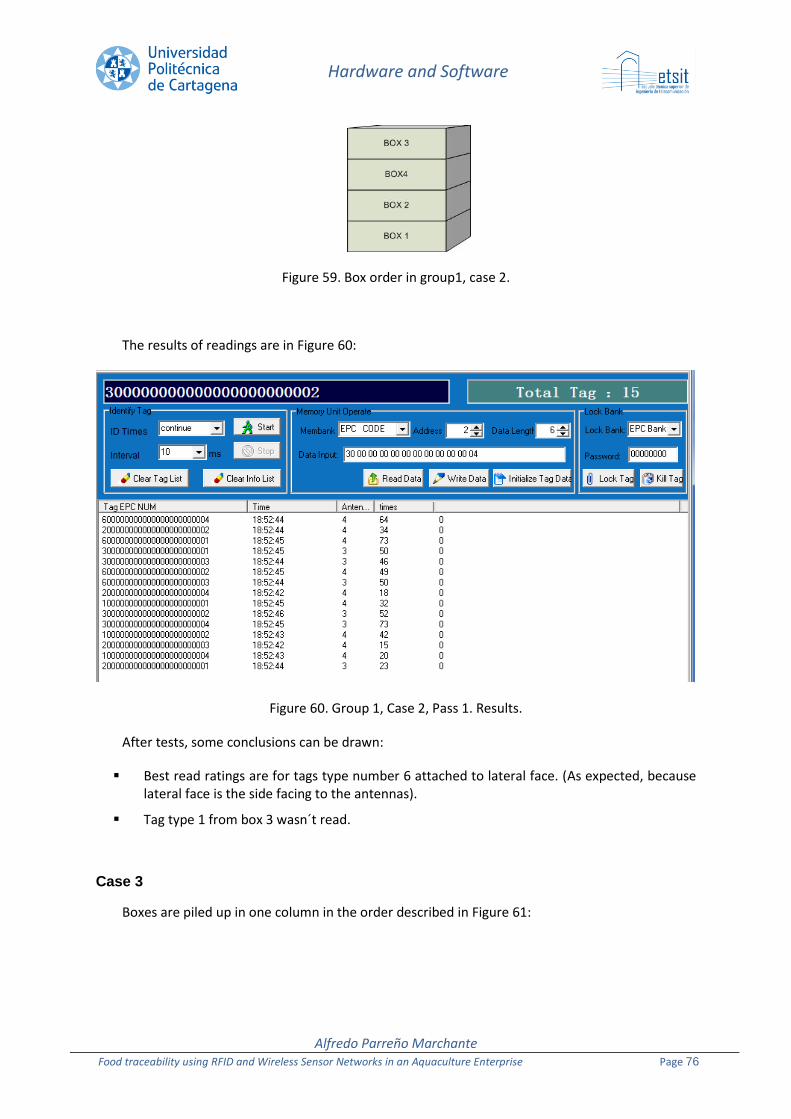
Hardware and Software
Alfredo Parreño Marchante Food traceability using RFID and Wireless Sensor Networks in an Aquaculture Enterprise Page 76
Figure 59. Box order in group1, case 2.
The results of readings are in Figure 60:
Figure 60. Group 1, Case 2, Pass 1. Results.
After tests, some conclusions can be drawn:
Best read ratings are for tags type number 6 attached to lateral face. (As expected, because lateral face is the side facing to the antennas).
Tag type 1 from box 3 wasn´t read.
Case 3
Boxes are piled up in one column in the order described in Figure 61:
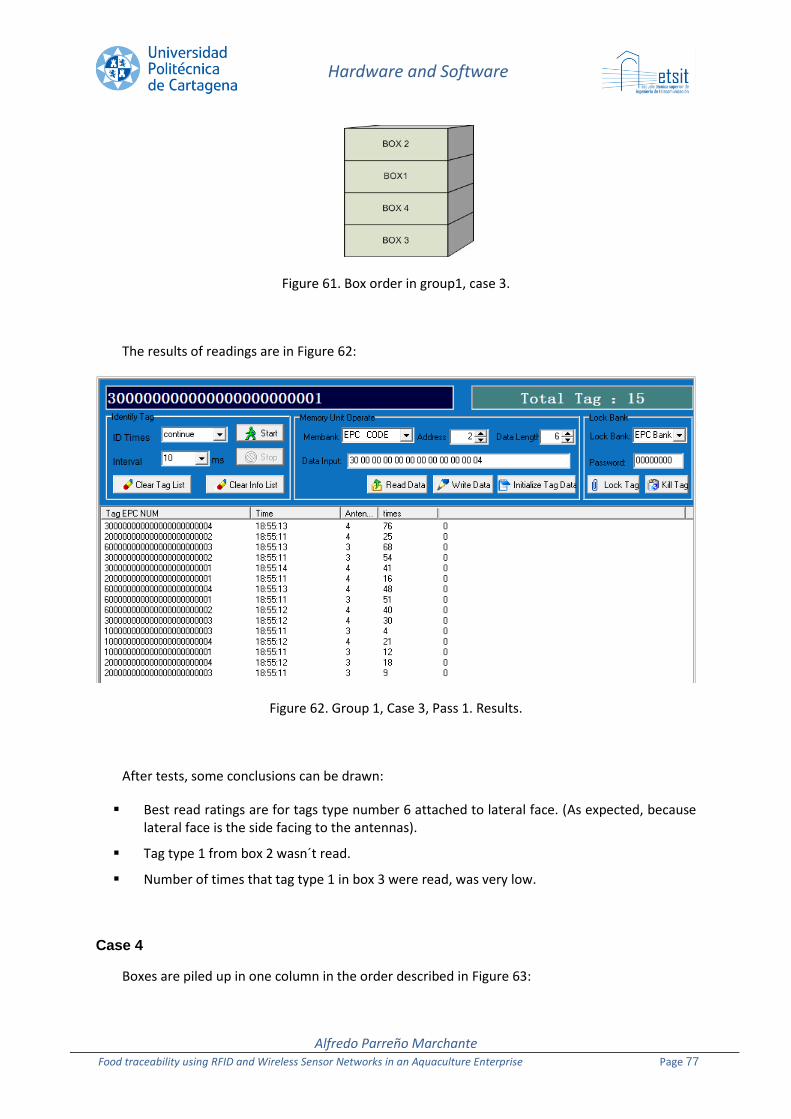
Hardware and Software
Alfredo Parreño Marchante Food traceability using RFID and Wireless Sensor Networks in an Aquaculture Enterprise Page 77
Figure 61. Box order in group1, case 3.
The results of readings are in Figure 62:
Figure 62. Group 1, Case 3, Pass 1. Results.
After tests, some conclusions can be drawn:
Best read ratings are for tags type number 6 attached to lateral face. (As expected, because lateral face is the side facing to the antennas).
Tag type 1 from box 2 wasn´t read.
Number of times that tag type 1 in box 3 were read, was very low.
Case 4
Boxes are piled up in one column in the order described in Figure 63:
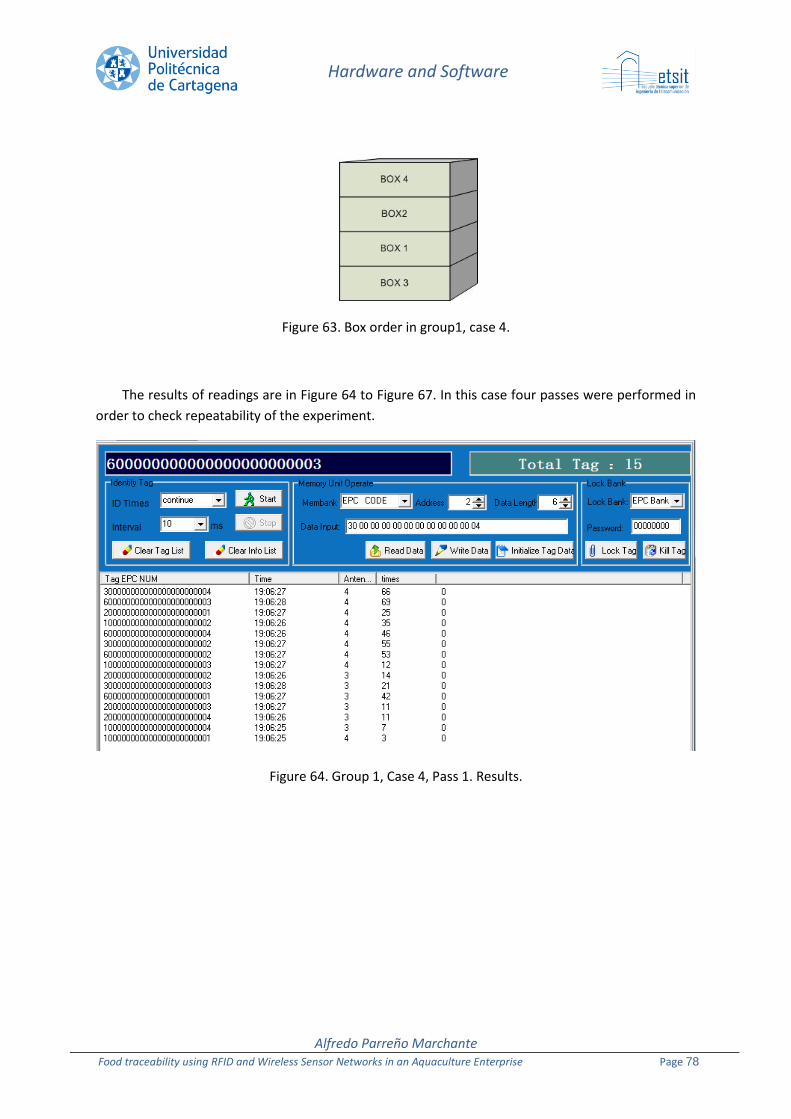
Hardware and Software
Alfredo Parreño Marchante Food traceability using RFID and Wireless Sensor Networks in an Aquaculture Enterprise Page 78
Figure 63. Box order in group1, case 4.
The results of readings are in Figure 64 to Figure 67. In this case four passes were performed in
order to check repeatability of the experiment.
Figure 64. Group 1, Case 4, Pass 1. Results.
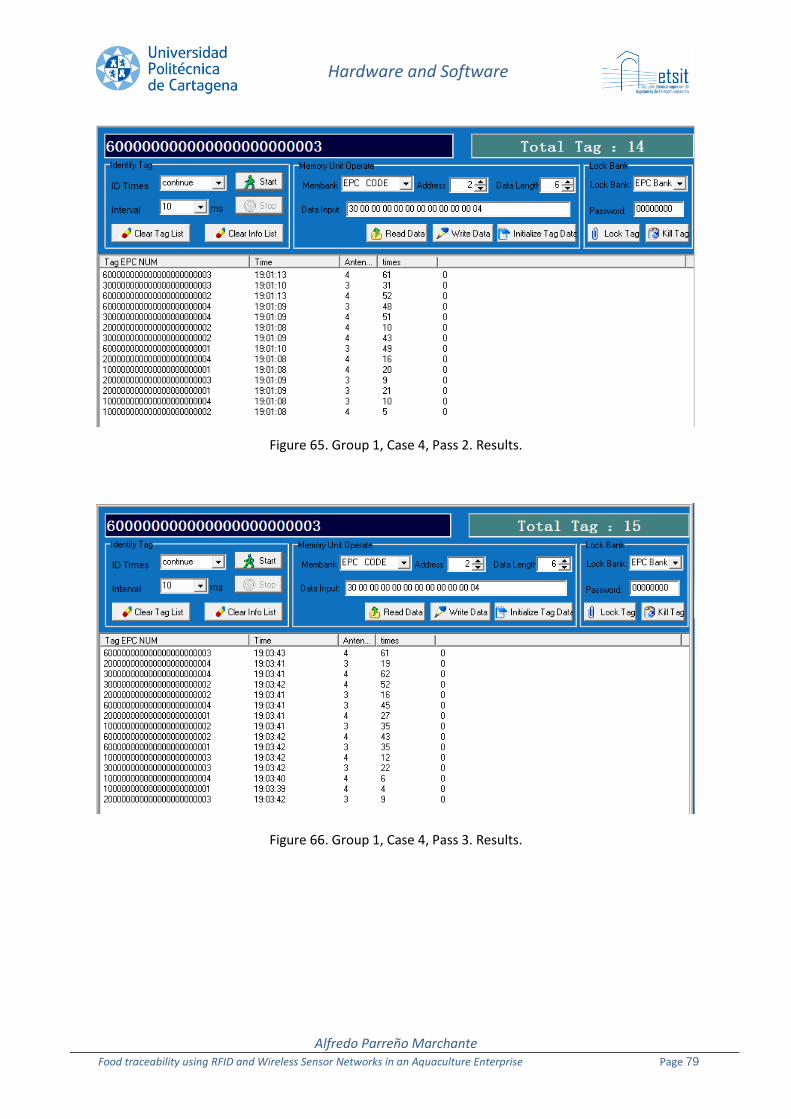
Hardware and Software
Alfredo Parreño Marchante Food traceability using RFID and Wireless Sensor Networks in an Aquaculture Enterprise Page 79
Figure 65. Group 1, Case 4, Pass 2. Results.
Figure 66. Group 1, Case 4, Pass 3. Results.
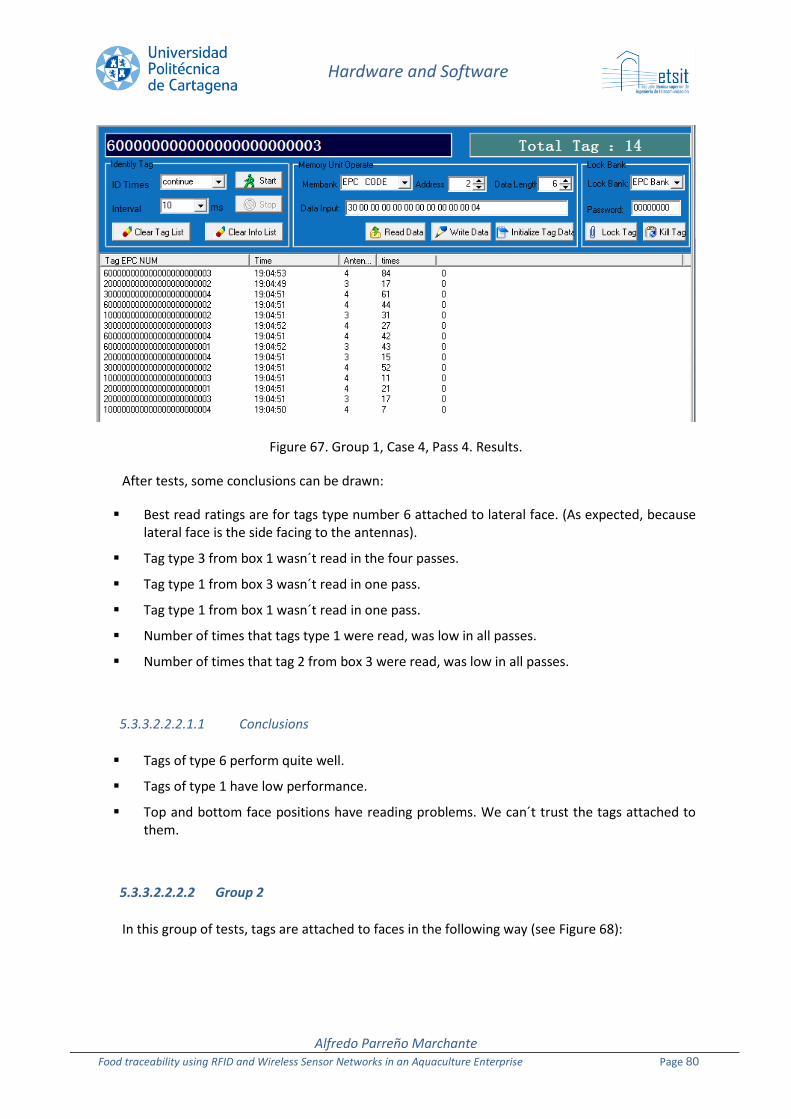
Hardware and Software
Alfredo Parreño Marchante Food traceability using RFID and Wireless Sensor Networks in an Aquaculture Enterprise Page 80
Figure 67. Group 1, Case 4, Pass 4. Results.
After tests, some conclusions can be drawn:
Best read ratings are for tags type number 6 attached to lateral face. (As expected, because lateral face is the side facing to the antennas).
Tag type 3 from box 1 wasn´t read in the four passes.
Tag type 1 from box 3 wasn´t read in one pass.
Tag type 1 from box 1 wasn´t read in one pass.
Number of times that tags type 1 were read, was low in all passes.
Number of times that tag 2 from box 3 were read, was low in all passes.
5.3.3.2.2.2.1.1 Conclusions
Tags of type 6 perform quite well.
Tags of type 1 have low performance.
Top and bottom face positions have reading problems. We can´t trust the tags attached to them.
5.3.3.2.2.2.2 Group 2
In this group of tests, tags are attached to faces in the following way (see Figure 68):
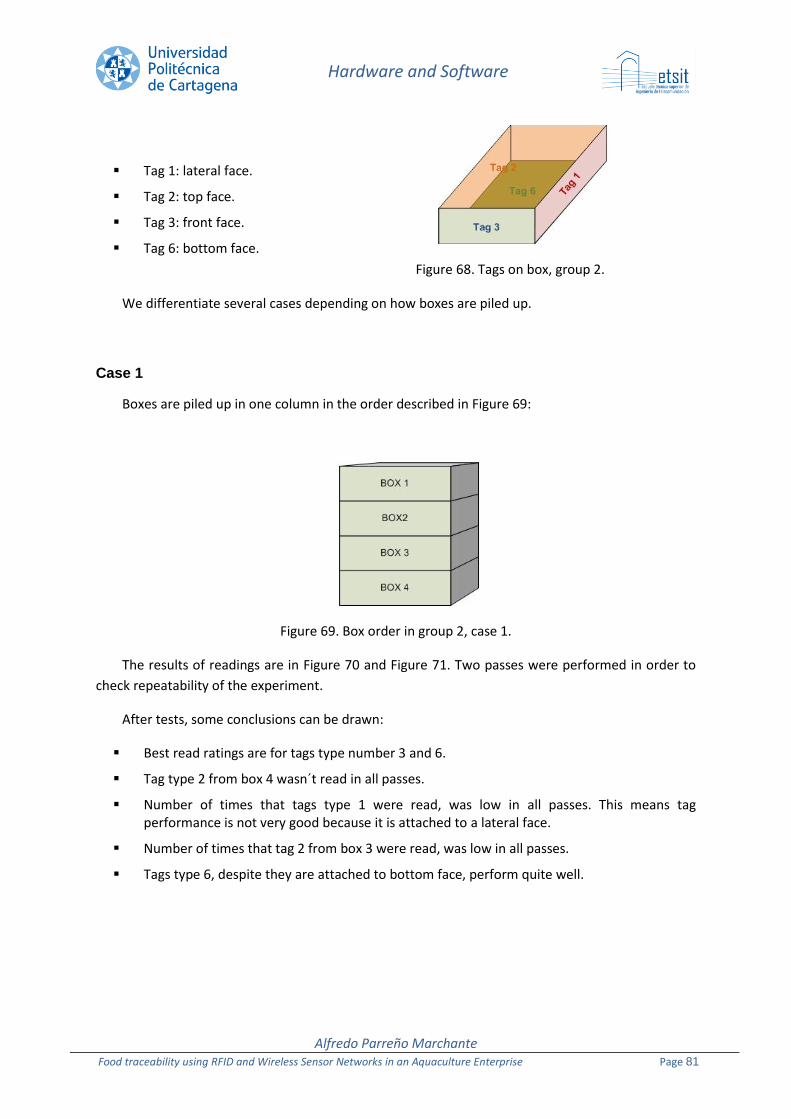
Hardware and Software
Alfredo Parreño Marchante Food traceability using RFID and Wireless Sensor Networks in an Aquaculture Enterprise Page 81
Tag 1: lateral face.
Tag 2: top face.
Tag 3: front face.
Tag 6: bottom face.
Figure 68. Tags on box, group 2.
We differentiate several cases depending on how boxes are piled up.
Case 1
Boxes are piled up in one column in the order described in Figure 69:
Figure 69. Box order in group 2, case 1.
The results of readings are in Figure 70 and Figure 71. Two passes were performed in order to
check repeatability of the experiment.
After tests, some conclusions can be drawn:
Best read ratings are for tags type number 3 and 6.
Tag type 2 from box 4 wasn´t read in all passes.
Number of times that tags type 1 were read, was low in all passes. This means tag performance is not very good because it is attached to a lateral face.
Number of times that tag 2 from box 3 were read, was low in all passes.
Tags type 6, despite they are attached to bottom face, perform quite well.

Hardware and Software
Alfredo Parreño Marchante Food traceability using RFID and Wireless Sensor Networks in an Aquaculture Enterprise Page 82
Figure 70. Group 2, Case 1, Pass 1. Results.
Figure 71. Group 2, Case 1, Pass 2. Results.
Case 2
Boxes are piled up in one column in the order described in Figure 72:
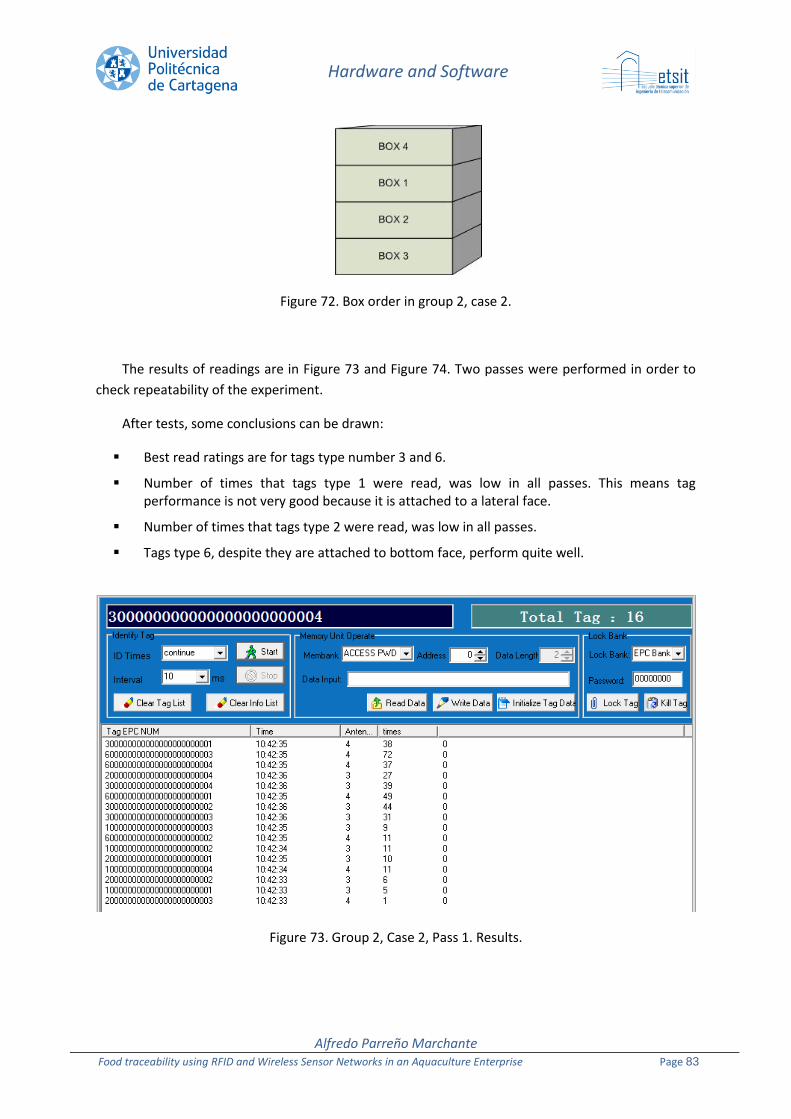
Hardware and Software
Alfredo Parreño Marchante Food traceability using RFID and Wireless Sensor Networks in an Aquaculture Enterprise Page 83
Figure 72. Box order in group 2, case 2.
The results of readings are in Figure 73 and Figure 74. Two passes were performed in order to
check repeatability of the experiment.
After tests, some conclusions can be drawn:
Best read ratings are for tags type number 3 and 6.
Number of times that tags type 1 were read, was low in all passes. This means tag performance is not very good because it is attached to a lateral face.
Number of times that tags type 2 were read, was low in all passes.
Tags type 6, despite they are attached to bottom face, perform quite well.
Figure 73. Group 2, Case 2, Pass 1. Results.
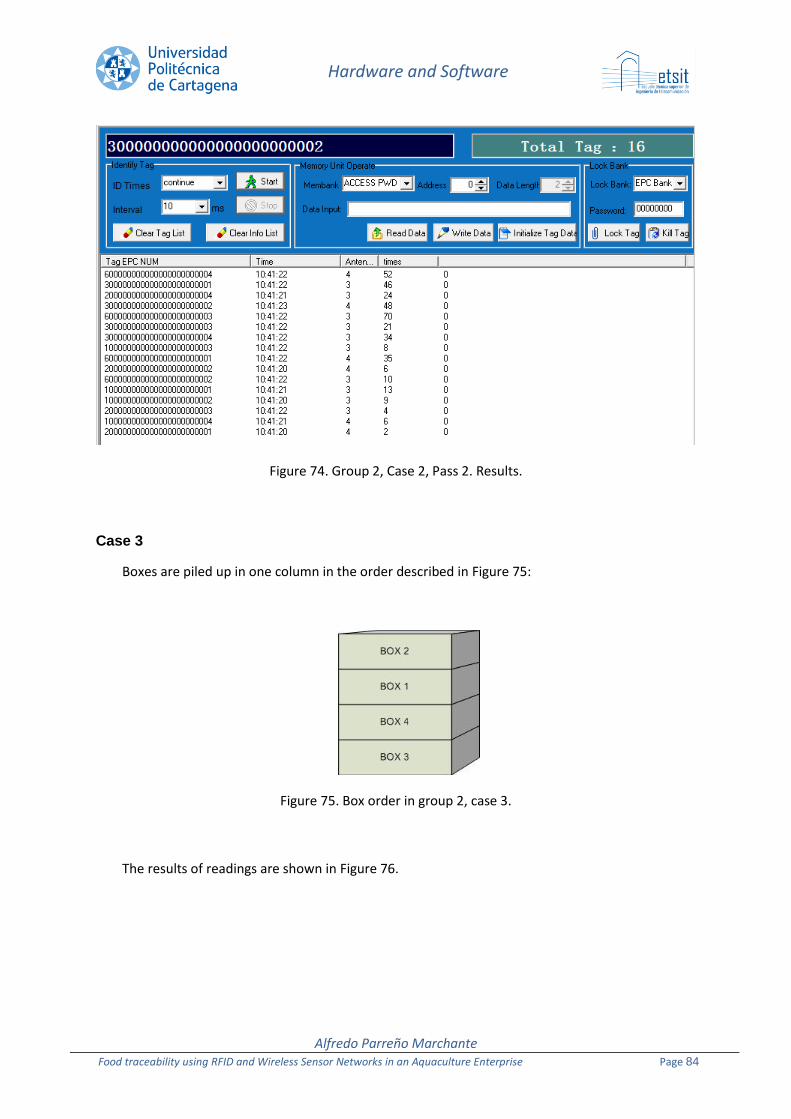
Hardware and Software
Alfredo Parreño Marchante Food traceability using RFID and Wireless Sensor Networks in an Aquaculture Enterprise Page 84
Figure 74. Group 2, Case 2, Pass 2. Results.
Case 3
Boxes are piled up in one column in the order described in Figure 75:
Figure 75. Box order in group 2, case 3.
The results of readings are shown in Figure 76.

Hardware and Software
Alfredo Parreño Marchante Food traceability using RFID and Wireless Sensor Networks in an Aquaculture Enterprise Page 85
Figure 76. Group 2, Case 3, Pass 1. Results.
After tests, some conclusions can be drawn:
Best read ratings are for tags type number 6.
Number of times that tags type 1 were read, was low. This means tag performance is not very good because it is attached to a lateral face.
Tags type 6, despite they are attached to bottom face, perform quite well.
Tag type 2 from box 3 wasn´t read.
5.3.3.2.2.2.2.1 Conclusions
Tags type 6, despite they are attached to bottom face, perform quite well.
Tags of type 1 are attached to lateral faces and have low performance. Therefore they are not a recommended option for our application.
Tags of type 2 have low performance.
Bottom face positions have reading problems. We can´t trust the tags attached to them.
We had less fail readings that in group 1. It is because of the good performance of tags of type 6.
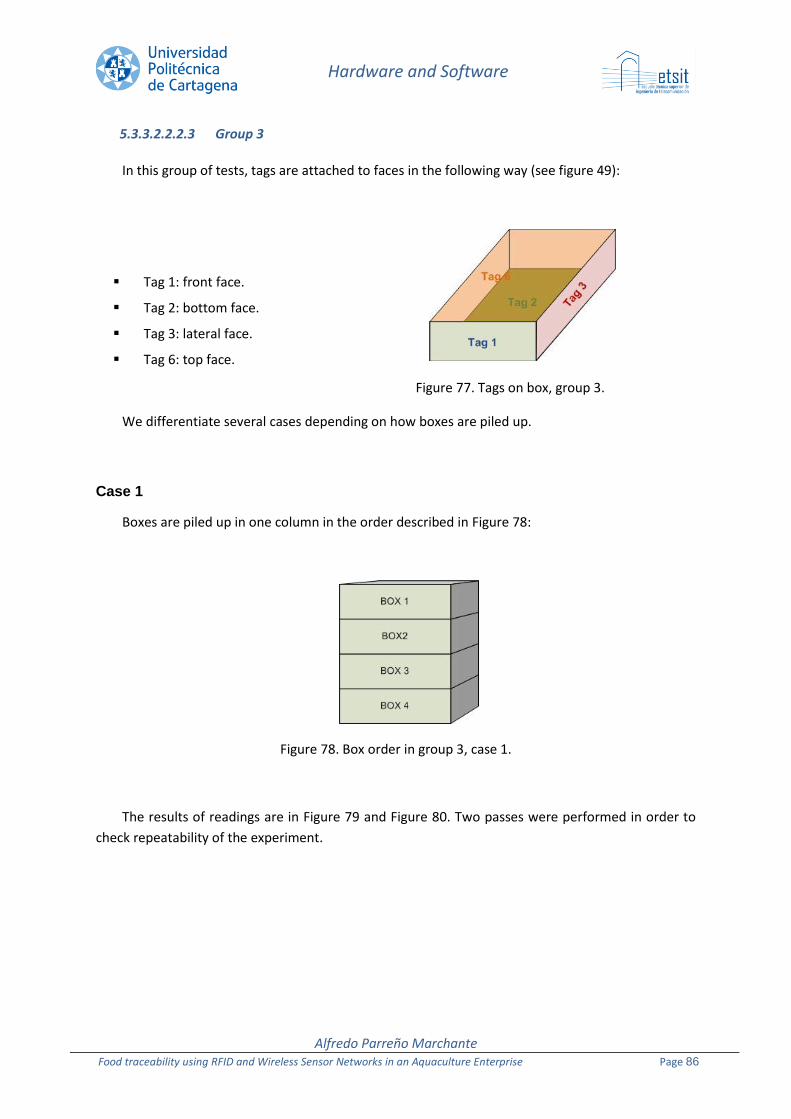
Hardware and Software
Alfredo Parreño Marchante Food traceability using RFID and Wireless Sensor Networks in an Aquaculture Enterprise Page 86
5.3.3.2.2.2.3 Group 3
In this group of tests, tags are attached to faces in the following way (see figure 49):
Tag 1: front face.
Tag 2: bottom face.
Tag 3: lateral face.
Tag 6: top face.
Figure 77. Tags on box, group 3.
We differentiate several cases depending on how boxes are piled up.
Case 1
Boxes are piled up in one column in the order described in Figure 78:
Figure 78. Box order in group 3, case 1.
The results of readings are in Figure 79 and Figure 80. Two passes were performed in order to
check repeatability of the experiment.
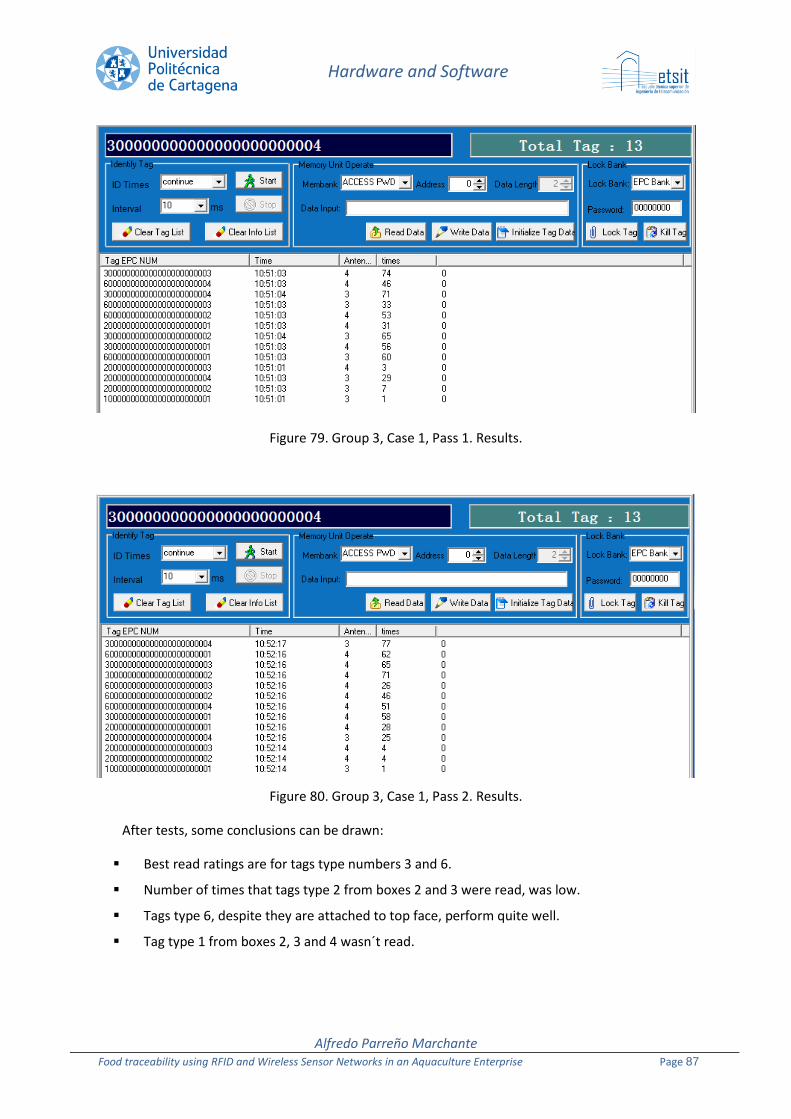
Hardware and Software
Alfredo Parreño Marchante Food traceability using RFID and Wireless Sensor Networks in an Aquaculture Enterprise Page 87
Figure 79. Group 3, Case 1, Pass 1. Results.
Figure 80. Group 3, Case 1, Pass 2. Results.
After tests, some conclusions can be drawn:
Best read ratings are for tags type numbers 3 and 6.
Number of times that tags type 2 from boxes 2 and 3 were read, was low.
Tags type 6, despite they are attached to top face, perform quite well.
Tag type 1 from boxes 2, 3 and 4 wasn´t read.
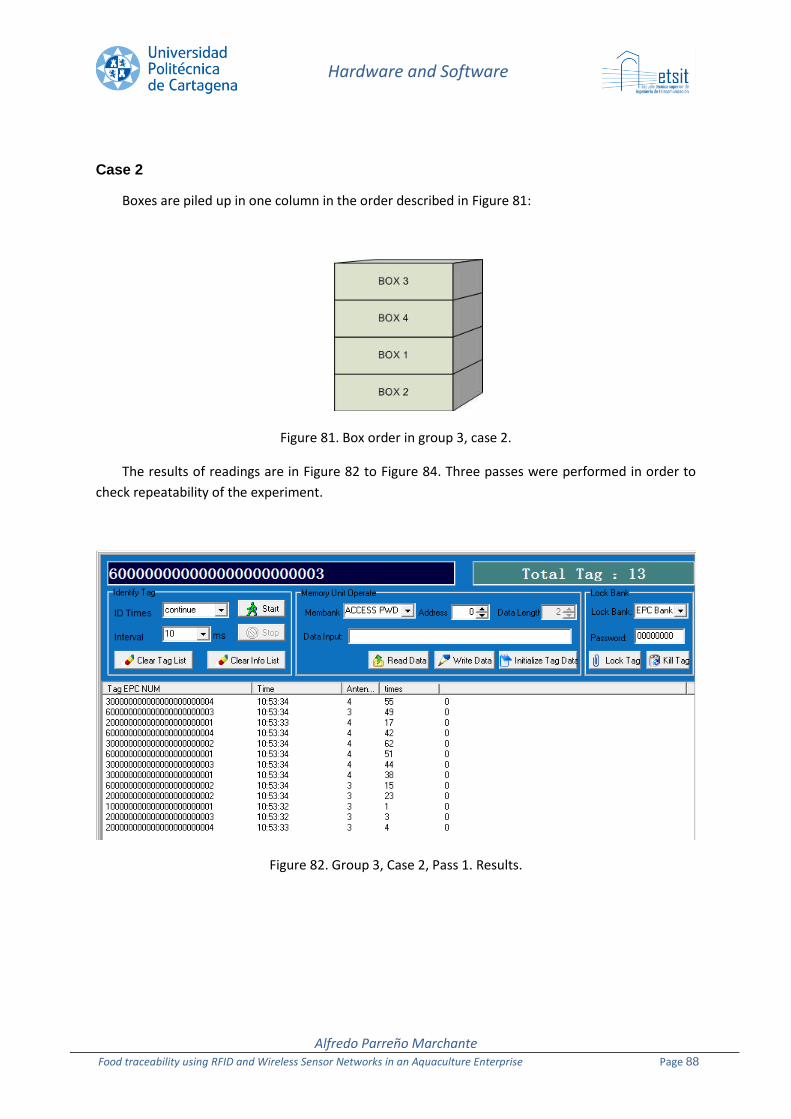
Hardware and Software
Alfredo Parreño Marchante Food traceability using RFID and Wireless Sensor Networks in an Aquaculture Enterprise Page 88
Case 2
Boxes are piled up in one column in the order described in Figure 81:
Figure 81. Box order in group 3, case 2.
The results of readings are in Figure 82 to Figure 84. Three passes were performed in order to
check repeatability of the experiment.
Figure 82. Group 3, Case 2, Pass 1. Results.
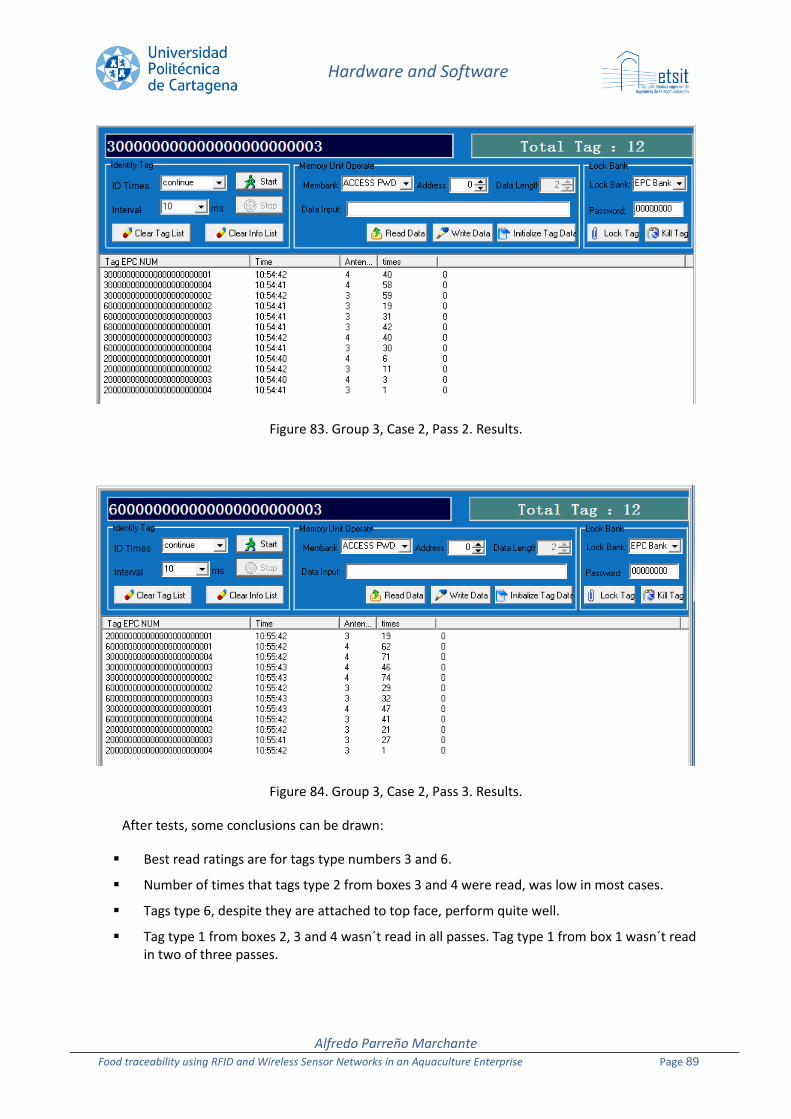
Hardware and Software
Alfredo Parreño Marchante Food traceability using RFID and Wireless Sensor Networks in an Aquaculture Enterprise Page 89
Figure 83. Group 3, Case 2, Pass 2. Results.
Figure 84. Group 3, Case 2, Pass 3. Results.
After tests, some conclusions can be drawn:
Best read ratings are for tags type numbers 3 and 6.
Number of times that tags type 2 from boxes 3 and 4 were read, was low in most cases.
Tags type 6, despite they are attached to top face, perform quite well.
Tag type 1 from boxes 2, 3 and 4 wasn´t read in all passes. Tag type 1 from box 1 wasn´t read in two of three passes.
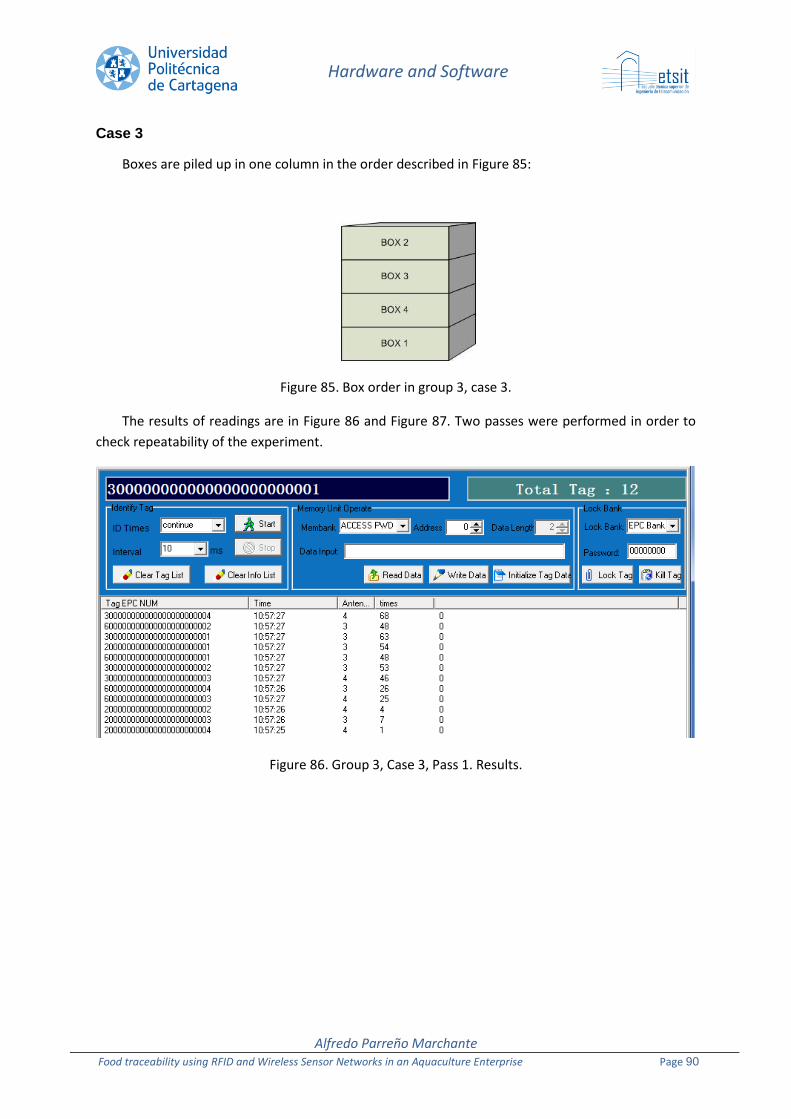
Hardware and Software
Alfredo Parreño Marchante Food traceability using RFID and Wireless Sensor Networks in an Aquaculture Enterprise Page 90
Case 3
Boxes are piled up in one column in the order described in Figure 85:
Figure 85. Box order in group 3, case 3.
The results of readings are in Figure 86 and Figure 87. Two passes were performed in order to
check repeatability of the experiment.
Figure 86. Group 3, Case 3, Pass 1. Results.
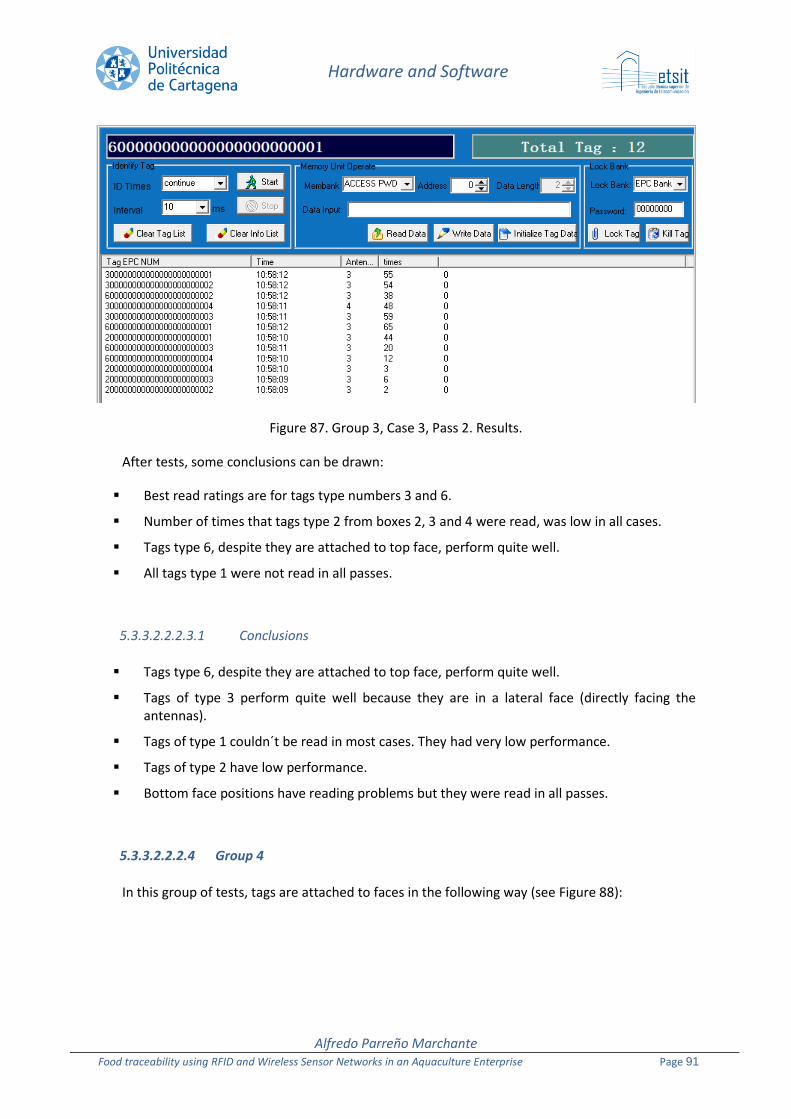
Hardware and Software
Alfredo Parreño Marchante Food traceability using RFID and Wireless Sensor Networks in an Aquaculture Enterprise Page 91
Figure 87. Group 3, Case 3, Pass 2. Results.
After tests, some conclusions can be drawn:
Best read ratings are for tags type numbers 3 and 6.
Number of times that tags type 2 from boxes 2, 3 and 4 were read, was low in all cases.
Tags type 6, despite they are attached to top face, perform quite well.
All tags type 1 were not read in all passes.
5.3.3.2.2.2.3.1 Conclusions
Tags type 6, despite they are attached to top face, perform quite well.
Tags of type 3 perform quite well because they are in a lateral face (directly facing the antennas).
Tags of type 1 couldn´t be read in most cases. They had very low performance.
Tags of type 2 have low performance.
Bottom face positions have reading problems but they were read in all passes.
5.3.3.2.2.2.4 Group 4
In this group of tests, tags are attached to faces in the following way (see Figure 88):
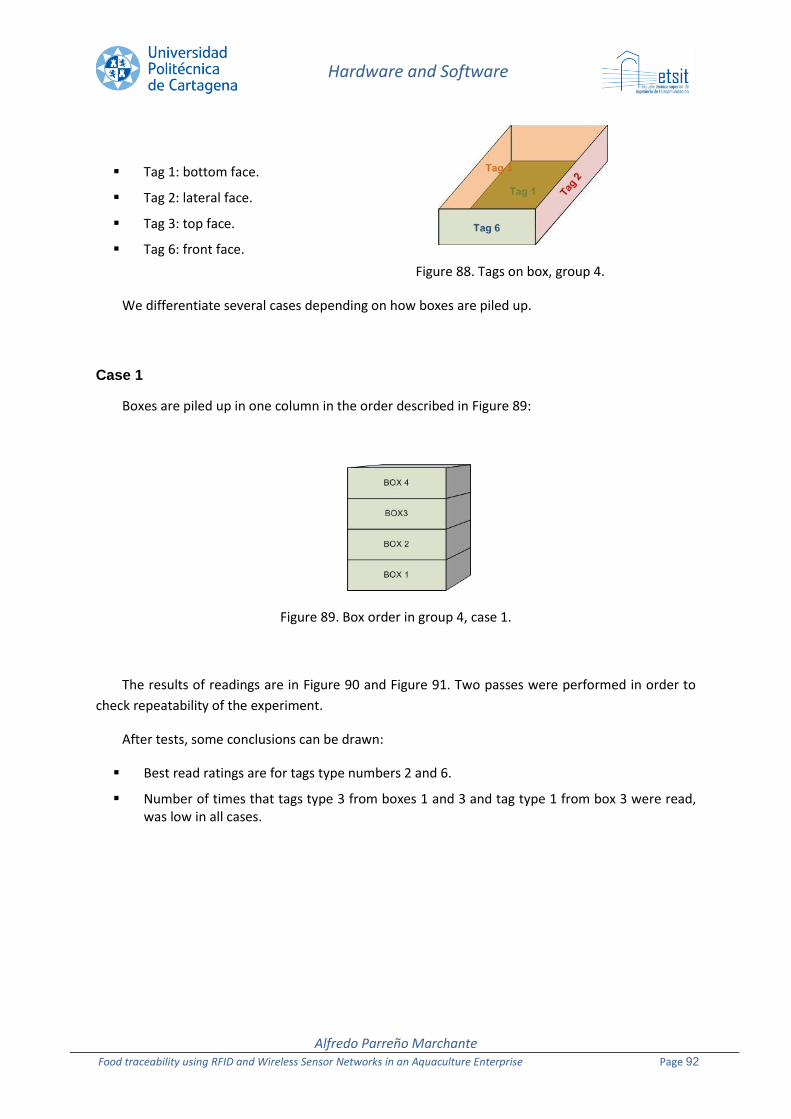
Hardware and Software
Alfredo Parreño Marchante Food traceability using RFID and Wireless Sensor Networks in an Aquaculture Enterprise Page 92
Tag 1: bottom face.
Tag 2: lateral face.
Tag 3: top face.
Tag 6: front face.
Figure 88. Tags on box, group 4.
We differentiate several cases depending on how boxes are piled up.
Case 1
Boxes are piled up in one column in the order described in Figure 89:
Figure 89. Box order in group 4, case 1.
The results of readings are in Figure 90 and Figure 91. Two passes were performed in order to
check repeatability of the experiment.
After tests, some conclusions can be drawn:
Best read ratings are for tags type numbers 2 and 6.
Number of times that tags type 3 from boxes 1 and 3 and tag type 1 from box 3 were read, was low in all cases.
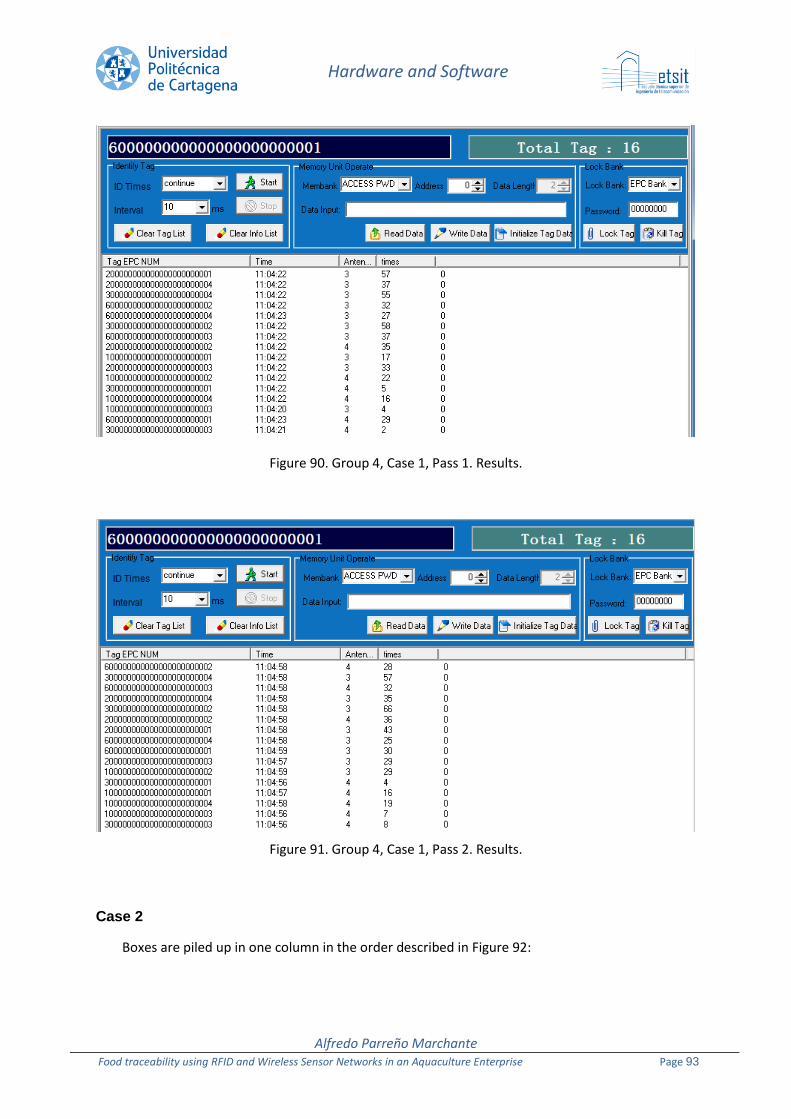
Hardware and Software
Alfredo Parreño Marchante Food traceability using RFID and Wireless Sensor Networks in an Aquaculture Enterprise Page 93
Figure 90. Group 4, Case 1, Pass 1. Results.
Figure 91. Group 4, Case 1, Pass 2. Results.
Case 2
Boxes are piled up in one column in the order described in Figure 92:
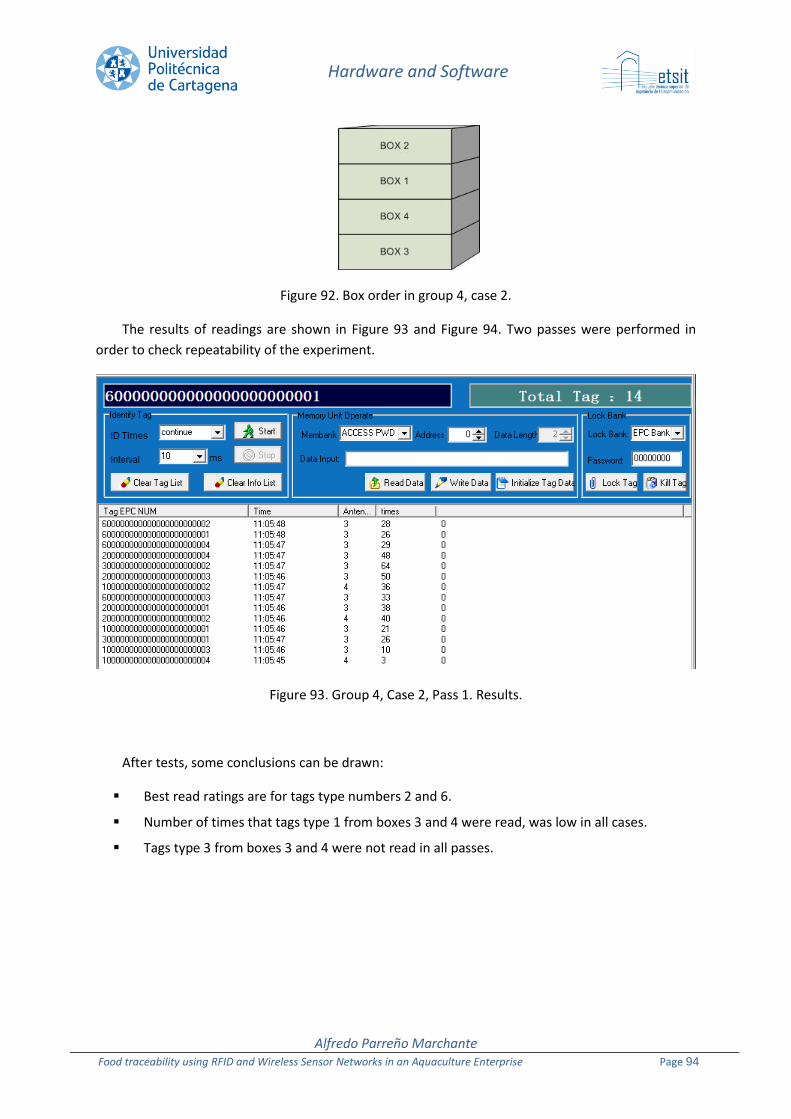
Hardware and Software
Alfredo Parreño Marchante Food traceability using RFID and Wireless Sensor Networks in an Aquaculture Enterprise Page 94
Figure 92. Box order in group 4, case 2.
The results of readings are shown in Figure 93 and Figure 94. Two passes were performed in
order to check repeatability of the experiment.
Figure 93. Group 4, Case 2, Pass 1. Results.
After tests, some conclusions can be drawn:
Best read ratings are for tags type numbers 2 and 6.
Number of times that tags type 1 from boxes 3 and 4 were read, was low in all cases.
Tags type 3 from boxes 3 and 4 were not read in all passes.

Hardware and Software
Alfredo Parreño Marchante Food traceability using RFID and Wireless Sensor Networks in an Aquaculture Enterprise Page 95
Figure 94. Group 4, Case 2, Pass 2. Results.
Case 3
Boxes are piled up in one column in the order described in Figure 95:
Figure 95. Box order in group 4, case 3.
The results of readings are shown in Figure 96 and Figure 97. Two passes were performed in
order to check repeatability of the experiment.

Hardware and Software
Alfredo Parreño Marchante Food traceability using RFID and Wireless Sensor Networks in an Aquaculture Enterprise Page 96
Figure 96. Group 4, Case 3, Pass 1. Results.
Figure 97. Group 4, Case 3, Pass 2. Results.
After tests, some conclusions can be drawn:
Best read ratings are for tags type numbers 2 and 6.
Number of times that tags type 1 from boxes 3 and 4 were read, was low in all cases.
Tag type 3 from box 2 wasn´t read in all passes.
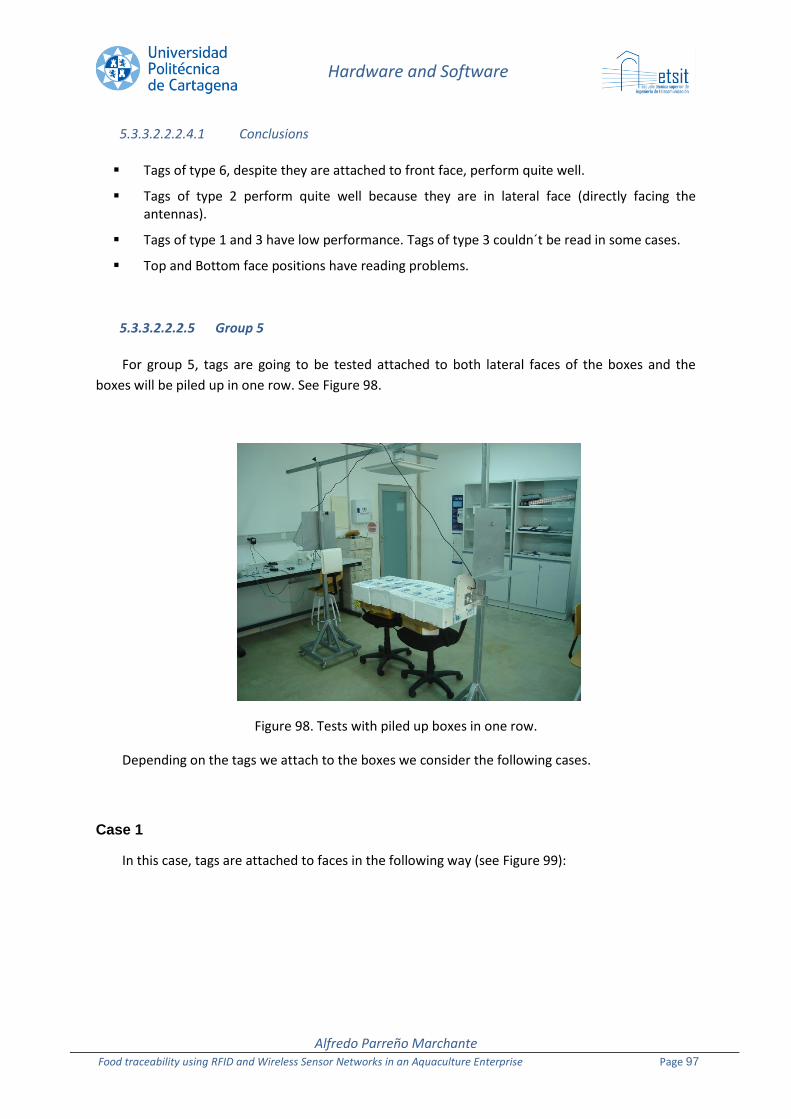
Hardware and Software
Alfredo Parreño Marchante Food traceability using RFID and Wireless Sensor Networks in an Aquaculture Enterprise Page 97
5.3.3.2.2.2.4.1 Conclusions
Tags of type 6, despite they are attached to front face, perform quite well.
Tags of type 2 perform quite well because they are in lateral face (directly facing the antennas).
Tags of type 1 and 3 have low performance. Tags of type 3 couldn´t be read in some cases.
Top and Bottom face positions have reading problems.
5.3.3.2.2.2.5 Group 5
For group 5, tags are going to be tested attached to both lateral faces of the boxes and the
boxes will be piled up in one row. See Figure 98.
Figure 98. Tests with piled up boxes in one row.
Depending on the tags we attach to the boxes we consider the following cases.
Case 1
In this case, tags are attached to faces in the following way (see Figure 99):
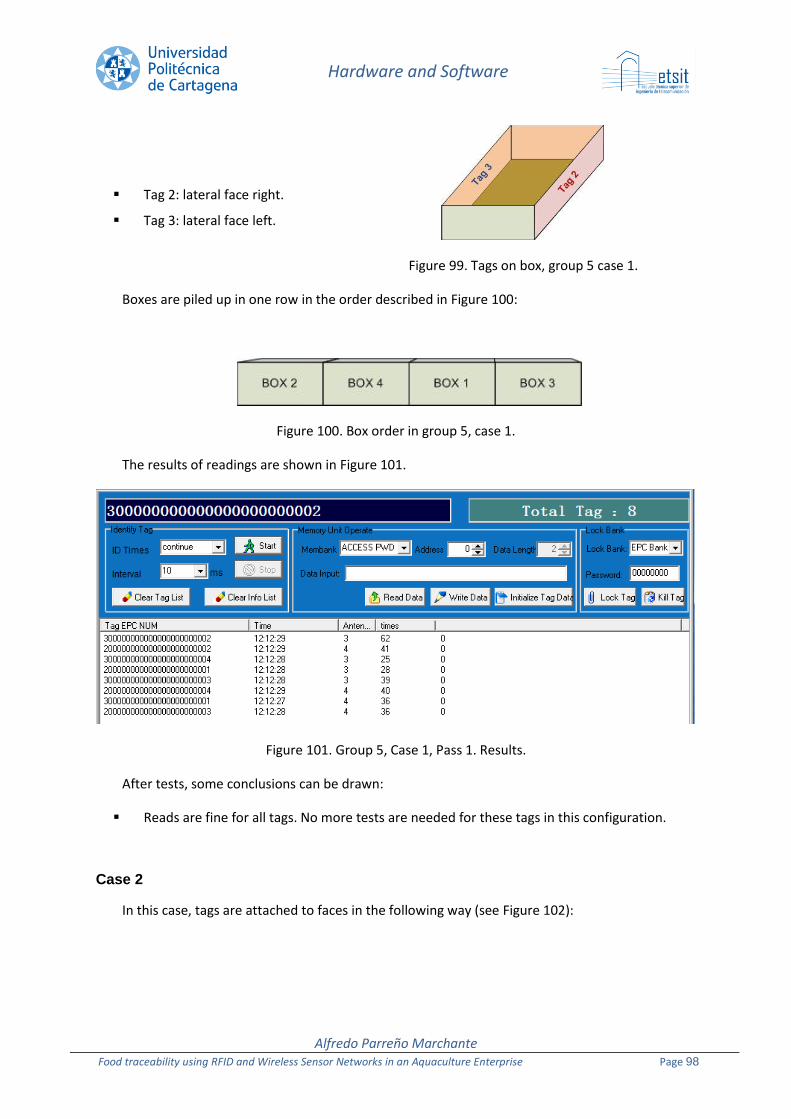
Hardware and Software
Alfredo Parreño Marchante Food traceability using RFID and Wireless Sensor Networks in an Aquaculture Enterprise Page 98
Tag 2: lateral face right.
Tag 3: lateral face left.
Figure 99. Tags on box, group 5 case 1.
Boxes are piled up in one row in the order described in Figure 100:
Figure 100. Box order in group 5, case 1.
The results of readings are shown in Figure 101.
Figure 101. Group 5, Case 1, Pass 1. Results.
After tests, some conclusions can be drawn:
Reads are fine for all tags. No more tests are needed for these tags in this configuration.
Case 2
In this case, tags are attached to faces in the following way (see Figure 102):
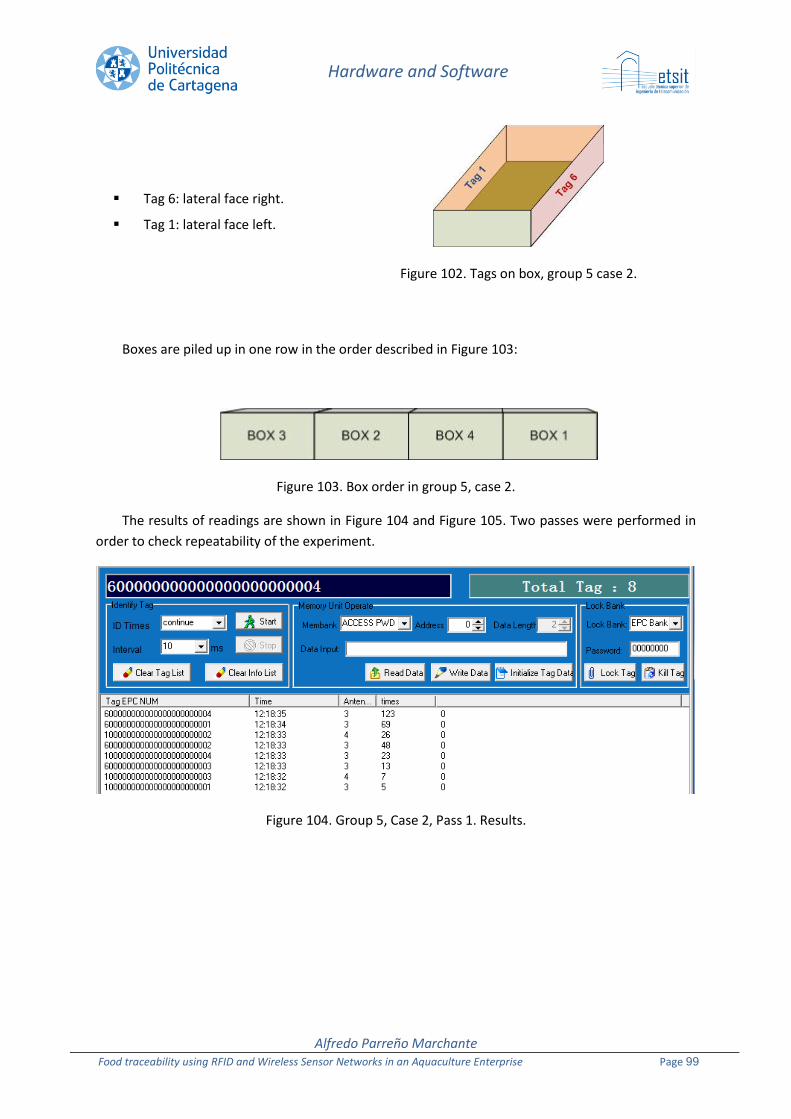
Hardware and Software
Alfredo Parreño Marchante Food traceability using RFID and Wireless Sensor Networks in an Aquaculture Enterprise Page 99
Tag 6: lateral face right.
Tag 1: lateral face left.
Figure 102. Tags on box, group 5 case 2.
Boxes are piled up in one row in the order described in Figure 103:
Figure 103. Box order in group 5, case 2.
The results of readings are shown in Figure 104 and Figure 105. Two passes were performed in
order to check repeatability of the experiment.
Figure 104. Group 5, Case 2, Pass 1. Results.
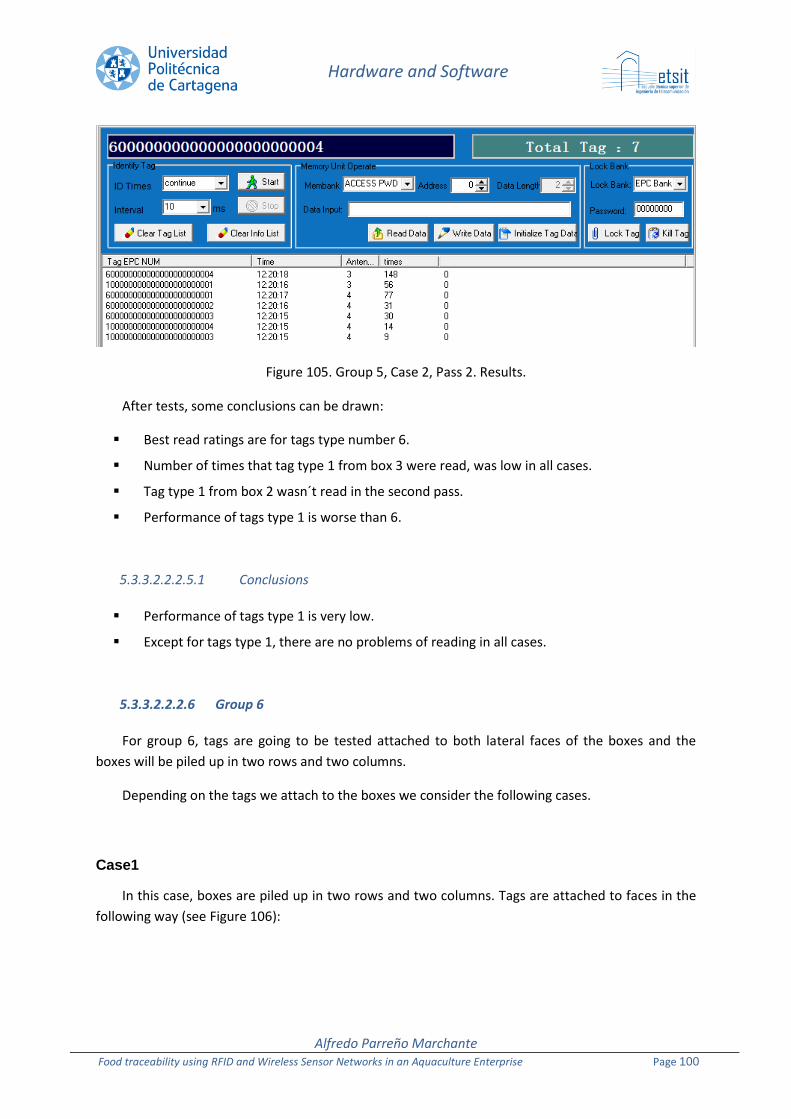
Hardware and Software
Alfredo Parreño Marchante Food traceability using RFID and Wireless Sensor Networks in an Aquaculture Enterprise Page 100
Figure 105. Group 5, Case 2, Pass 2. Results.
After tests, some conclusions can be drawn:
Best read ratings are for tags type number 6.
Number of times that tag type 1 from box 3 were read, was low in all cases.
Tag type 1 from box 2 wasn´t read in the second pass.
Performance of tags type 1 is worse than 6.
5.3.3.2.2.2.5.1 Conclusions
Performance of tags type 1 is very low.
Except for tags type 1, there are no problems of reading in all cases.
5.3.3.2.2.2.6 Group 6
For group 6, tags are going to be tested attached to both lateral faces of the boxes and the
boxes will be piled up in two rows and two columns.
Depending on the tags we attach to the boxes we consider the following cases.
Case1
In this case, boxes are piled up in two rows and two columns. Tags are attached to faces in the
following way (see Figure 106):
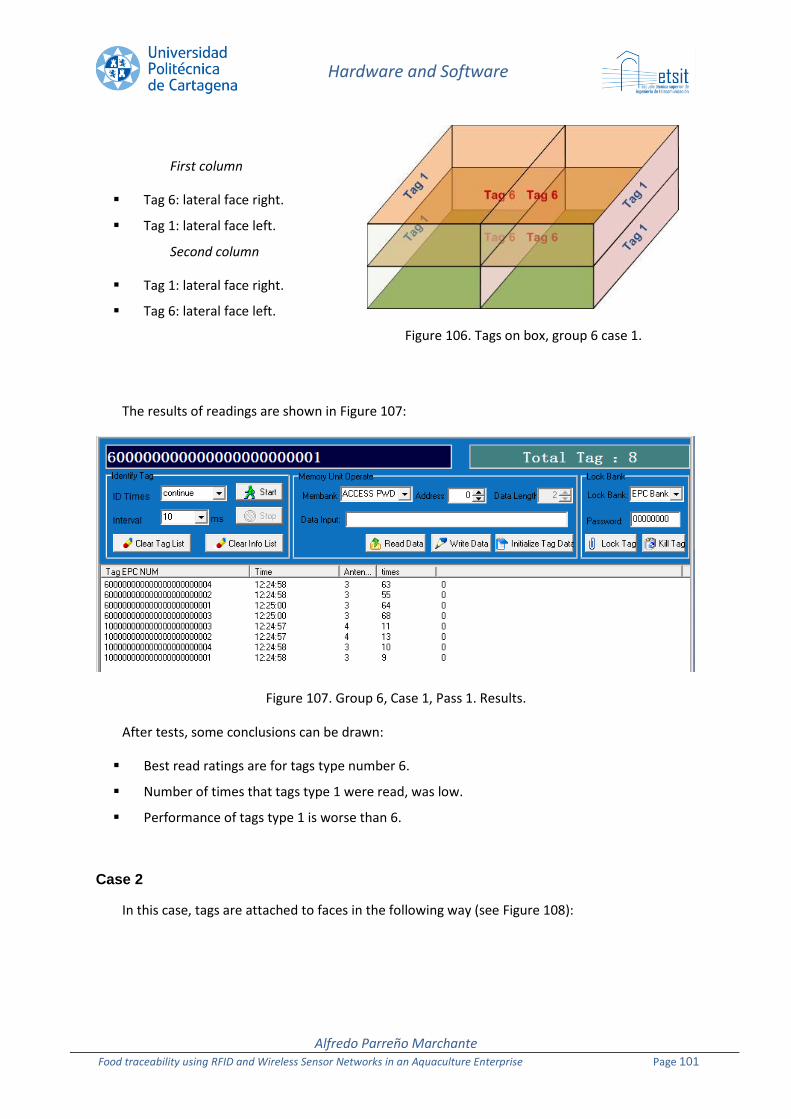
Hardware and Software
Alfredo Parreño Marchante Food traceability using RFID and Wireless Sensor Networks in an Aquaculture Enterprise Page 101
First column
Tag 6: lateral face right.
Tag 1: lateral face left.
Second column
Tag 1: lateral face right.
Tag 6: lateral face left.
Figure 106. Tags on box, group 6 case 1.
The results of readings are shown in Figure 107:
Figure 107. Group 6, Case 1, Pass 1. Results.
After tests, some conclusions can be drawn:
Best read ratings are for tags type number 6.
Number of times that tags type 1 were read, was low.
Performance of tags type 1 is worse than 6.
Case 2
In this case, tags are attached to faces in the following way (see Figure 108):
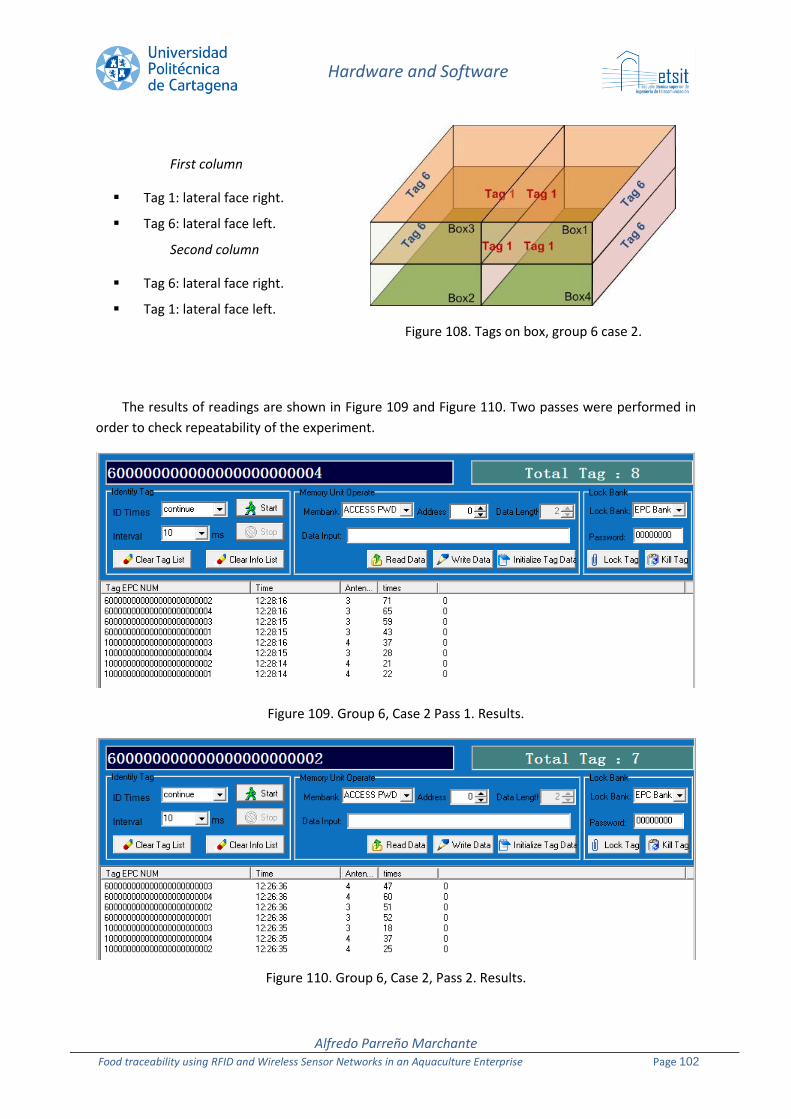
Hardware and Software
Alfredo Parreño Marchante Food traceability using RFID and Wireless Sensor Networks in an Aquaculture Enterprise Page 102
First column
Tag 1: lateral face right.
Tag 6: lateral face left.
Second column
Tag 6: lateral face right.
Tag 1: lateral face left.
Figure 108. Tags on box, group 6 case 2.
The results of readings are shown in Figure 109 and Figure 110. Two passes were performed in
order to check repeatability of the experiment.
Figure 109. Group 6, Case 2 Pass 1. Results.
Figure 110. Group 6, Case 2, Pass 2. Results.
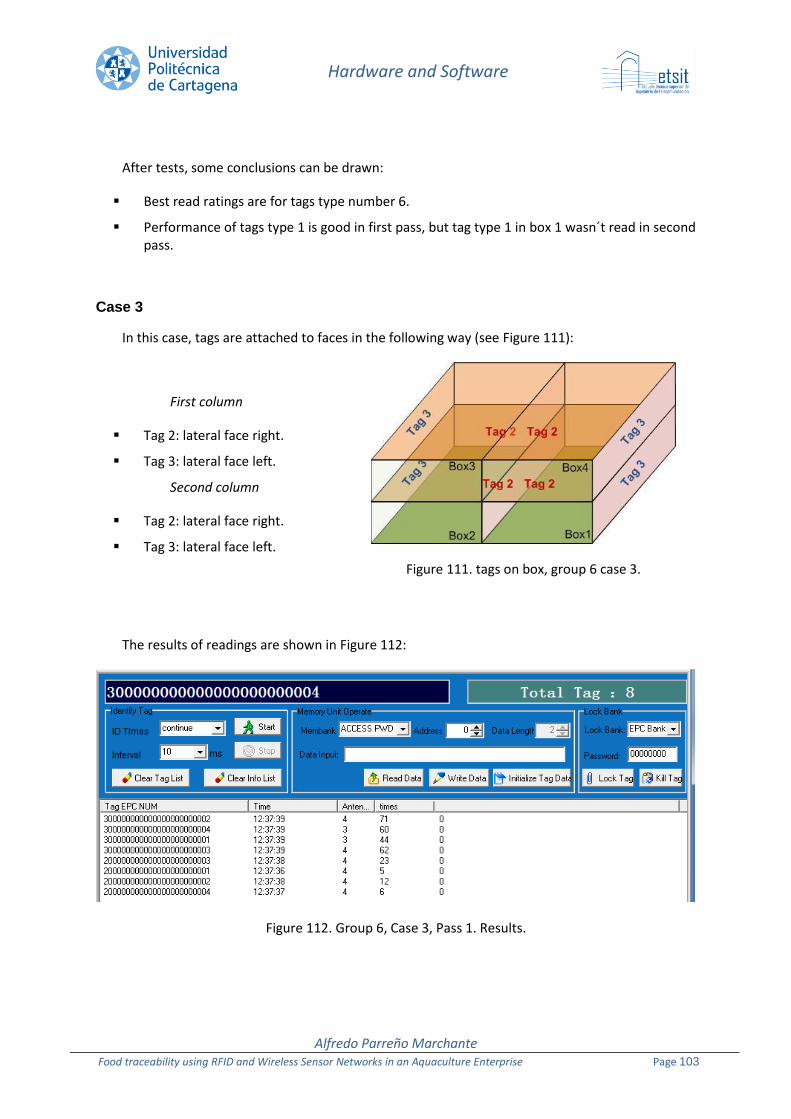
Hardware and Software
Alfredo Parreño Marchante Food traceability using RFID and Wireless Sensor Networks in an Aquaculture Enterprise Page 103
After tests, some conclusions can be drawn:
Best read ratings are for tags type number 6.
Performance of tags type 1 is good in first pass, but tag type 1 in box 1 wasn´t read in second pass.
Case 3
In this case, tags are attached to faces in the following way (see Figure 111):
First column
Tag 2: lateral face right.
Tag 3: lateral face left.
Second column
Tag 2: lateral face right.
Tag 3: lateral face left.
Figure 111. tags on box, group 6 case 3.
The results of readings are shown in Figure 112:
Figure 112. Group 6, Case 3, Pass 1. Results.
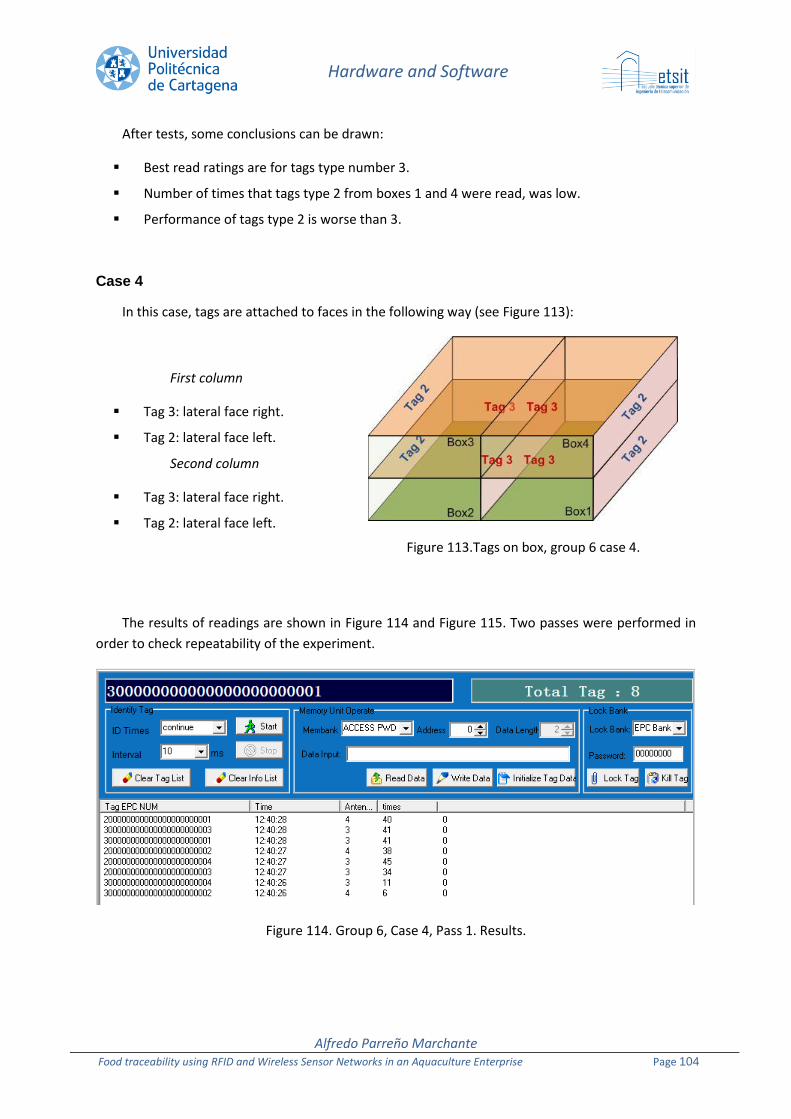
Hardware and Software
Alfredo Parreño Marchante Food traceability using RFID and Wireless Sensor Networks in an Aquaculture Enterprise Page 104
After tests, some conclusions can be drawn:
Best read ratings are for tags type number 3.
Number of times that tags type 2 from boxes 1 and 4 were read, was low.
Performance of tags type 2 is worse than 3.
Case 4
In this case, tags are attached to faces in the following way (see Figure 113):
First column
Tag 3: lateral face right.
Tag 2: lateral face left.
Second column
Tag 3: lateral face right.
Tag 2: lateral face left.
Figure 113.Tags on box, group 6 case 4.
The results of readings are shown in Figure 114 and Figure 115. Two passes were performed in
order to check repeatability of the experiment.
Figure 114. Group 6, Case 4, Pass 1. Results.
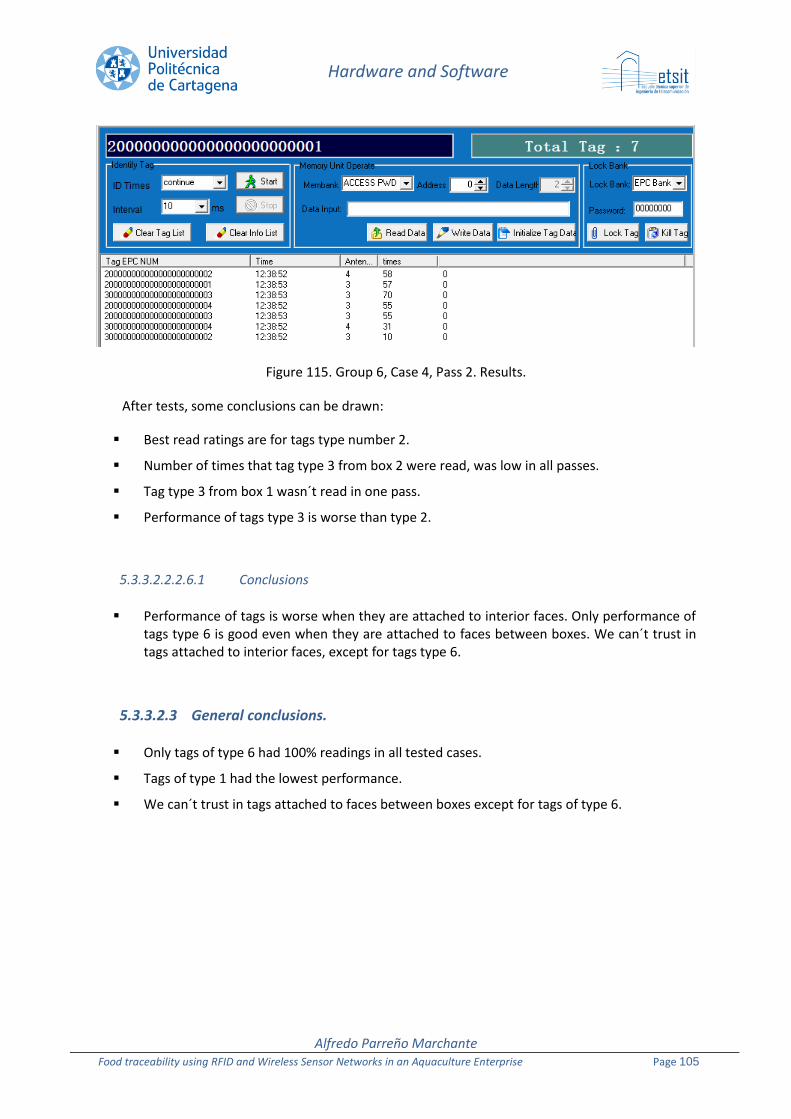
Hardware and Software
Alfredo Parreño Marchante Food traceability using RFID and Wireless Sensor Networks in an Aquaculture Enterprise Page 105
Figure 115. Group 6, Case 4, Pass 2. Results.
After tests, some conclusions can be drawn:
Best read ratings are for tags type number 2.
Number of times that tag type 3 from box 2 were read, was low in all passes.
Tag type 3 from box 1 wasn´t read in one pass.
Performance of tags type 3 is worse than type 2.
5.3.3.2.2.2.6.1 Conclusions
Performance of tags is worse when they are attached to interior faces. Only performance of tags type 6 is good even when they are attached to faces between boxes. We can´t trust in tags attached to interior faces, except for tags type 6.
5.3.3.2.3 General conclusions.
Only tags of type 6 had 100% readings in all tested cases.
Tags of type 1 had the lowest performance.
We can´t trust in tags attached to faces between boxes except for tags of type 6.

Culmárex Business processes definition
Alfredo Parreño Marchante Food traceability using RFID and Wireless Sensor Networks in an Aquaculture Enterprise Page 106
66..11 CCoommppaannyy
Since 1990, Culmárex Group has been dedicated to the rearing and marketing of sea bream and
sea bass, the tastiest and healthiest fish in the Mediterranean diet [10].
Culmárex was founded in 1986 in Aguilas by a group of Spanish investors to rear yellowtail and
oysters. In 1990, the company became 50% owned by Marine Farms a Norwegian multinational
dedicated to aquaculture and operating in Europe, Asia & Central America.
After some years of growth, Culmárex became 100% owned by Marine Farms in 1996.
Culmárex’s operations remain centred on the Murcian coastal town of Aguilas, in Spain.
During the last few years, the Culmárex Group has expanded and adapted its production to the
necessities and demands of current market. This has led to the incorporation of new production
units allowing them to control the complete process from breeding to marketing.
66..22 PPrroodduuccttss
66..22..11 FFrreesshh FFiisshh
Culmárex Group offers sea bream and sea bass of the highest quality in different sizes to satisfy
a wide range of demand. By all means, the products comply with consumers demands for healthy
options.
Culmárex Group, in addition to producing typical portion sizes, it also offers registered brands -
Imperial Sea bream and Sea bass ® and Royal Sea bream and Sea bass ® - through which they can
offer fish with special characteristics as regards quality, weight and size. The whole range of
products covers the needs of the most demanding markets.
66 CCuullmmáárreexx BBuussiinneessss pprroocceesssseess
ddeeffiinniittiioonn
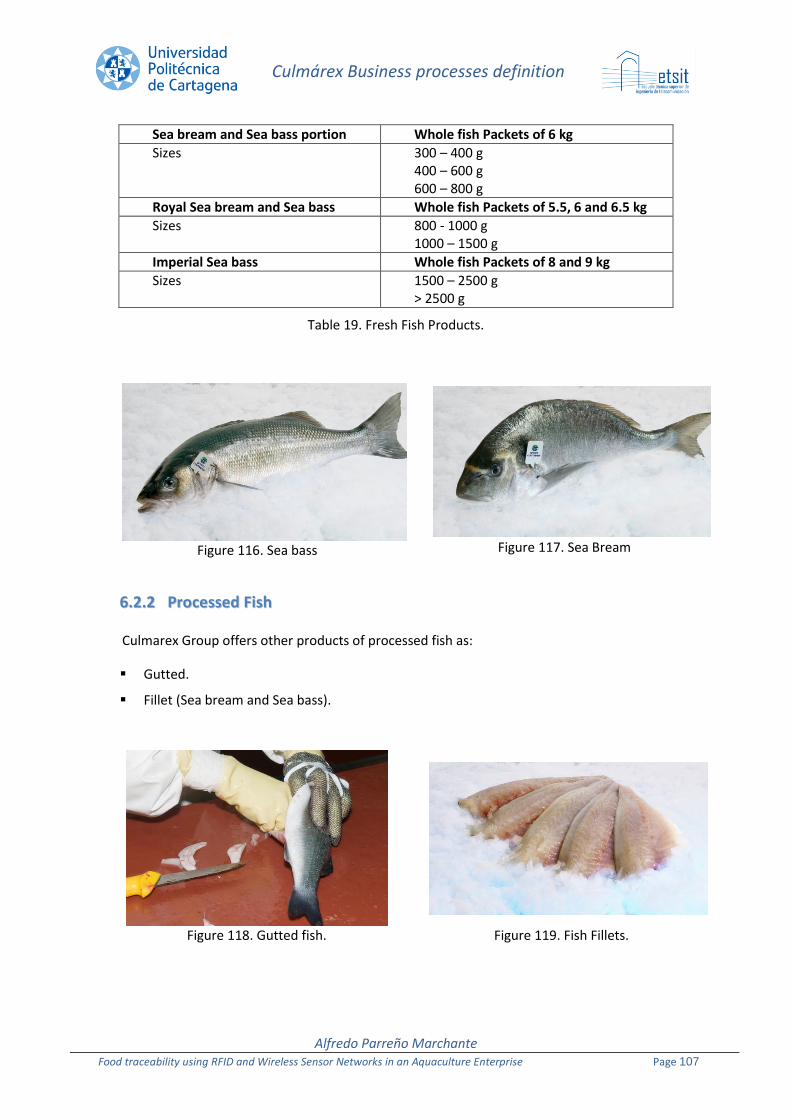
Culmárex Business processes definition
Alfredo Parreño Marchante Food traceability using RFID and Wireless Sensor Networks in an Aquaculture Enterprise Page 107
Sea bream and Sea bass portion Whole fish Packets of 6 kg
Sizes 300 – 400 g 400 – 600 g 600 – 800 g
Royal Sea bream and Sea bass Whole fish Packets of 5.5, 6 and 6.5 kg
Sizes 800 - 1000 g 1000 – 1500 g
Imperial Sea bass Whole fish Packets of 8 and 9 kg
Sizes 1500 – 2500 g > 2500 g
Table 19. Fresh Fish Products.
Figure 116. Sea bass
Figure 117. Sea Bream
66..22..22 PPrroocceesssseedd FFiisshh
Culmarex Group offers other products of processed fish as:
Gutted.
Fillet (Sea bream and Sea bass).
Figure 118. Gutted fish. Figure 119. Fish Fillets.
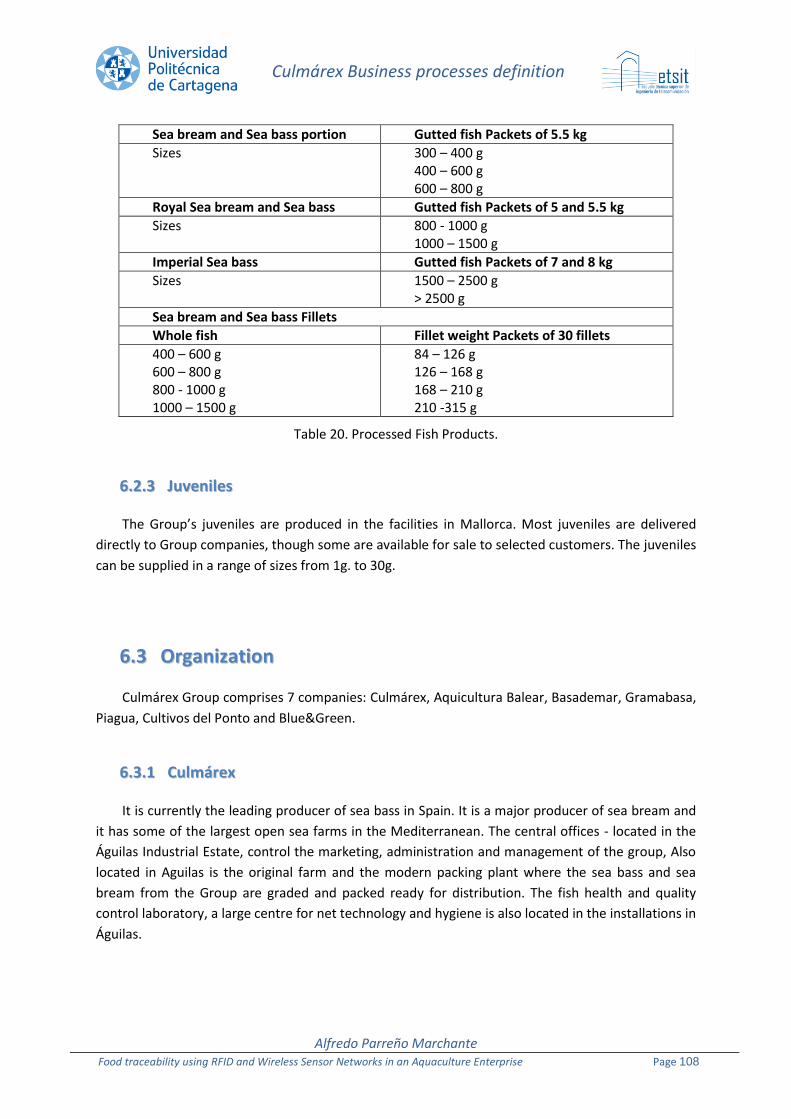
Culmárex Business processes definition
Alfredo Parreño Marchante Food traceability using RFID and Wireless Sensor Networks in an Aquaculture Enterprise Page 108
Sea bream and Sea bass portion Gutted fish Packets of 5.5 kg
Sizes 300 – 400 g 400 – 600 g 600 – 800 g
Royal Sea bream and Sea bass Gutted fish Packets of 5 and 5.5 kg
Sizes 800 - 1000 g 1000 – 1500 g
Imperial Sea bass Gutted fish Packets of 7 and 8 kg
Sizes 1500 – 2500 g > 2500 g
Sea bream and Sea bass Fillets
Whole fish Fillet weight Packets of 30 fillets
400 – 600 g 600 – 800 g 800 - 1000 g 1000 – 1500 g
84 – 126 g 126 – 168 g 168 – 210 g 210 -315 g
Table 20. Processed Fish Products.
66..22..33 JJuuvveenniilleess
The Group’s juveniles are produced in the facilities in Mallorca. Most juveniles are delivered
directly to Group companies, though some are available for sale to selected customers. The juveniles
can be supplied in a range of sizes from 1g. to 30g.
66..33 OOrrggaanniizzaattiioonn
Culmárex Group comprises 7 companies: Culmárex, Aquicultura Balear, Basademar, Gramabasa,
Piagua, Cultivos del Ponto and Blue&Green.
66..33..11 CCuullmmáárreexx
It is currently the leading producer of sea bass in Spain. It is a major producer of sea bream and
it has some of the largest open sea farms in the Mediterranean. The central offices - located in the
Águilas Industrial Estate, control the marketing, administration and management of the group, Also
located in Aguilas is the original farm and the modern packing plant where the sea bass and sea
bream from the Group are graded and packed ready for distribution. The fish health and quality
control laboratory, a large centre for net technology and hygiene is also located in the installations in
Águilas.
Culmárex Business processes definition
Alfredo Parreño Marchante Food traceability using RFID and Wireless Sensor Networks in an Aquaculture Enterprise Page 109
66..33..22 AAqquuiiccuullttuurraa BBaalleeaarr ((AABBSSAA))
The breeding farm of the Group, is situated in Mallorca with two installations; one close to the
capital, Palma de Mallorca and the other in Alcudia in the north of the island, where the bream and
sea bass juveniles are bred and pre-ongrowing, with guaranteed high quality. The quality of the
water with its strategic allocation in the Mediterranean is outstanding, and the transportation of the
juveniles by Well Boat ensures a fast and efficient delivery of the juveniles to the on growing cages.
66..33..33 BBaassaaddeemmaarr
It´s situated in the Bahía de Altea in Alicante. This company rears the sea bream and sea bass in
the open sea. It has a production capacity of 1,250 tonnes.
66..33..44 GGrraannjjaa MMaarriinnaa BBaahhííaa ddee SSaannttaa PPoollaa
GRAMABASA Is the collective name for three concessions grouped together in Guardamar Del
Segura in Alicante. Their combined production potential of 3,500 tonnes makes them the largest
producers within the Group.
66..33..55 PPiisscciiffaaccttoorriiaa AAgguuaadduullccee
The sea bream and sea bass are reared in open waters in the Bahía de Almeria, in the area
known as Palmer, off the coast of Enix. It has 36 cages for ongrowing and a feeding platform which is
unique in the Spanish coastline. It is the largest sea bream and sea bass farm in Andalucía and is one
of the largest producers in Spain.
66..33..66 CCuullttiivvooss ddeell PPoonnttoo
It has been integrated into Culmárex Group at the beginning of 2007. It is situated off the coast
of Malaga and is authorized for the production of 1,200 tonnes of sea bream and sea bass.
66..33..77 BBlluuee && GGrreeeenn
This Company’s installations are placed within a specially designated aquaculture park in the sea
off San Pedro del Pinatar in Murcia.
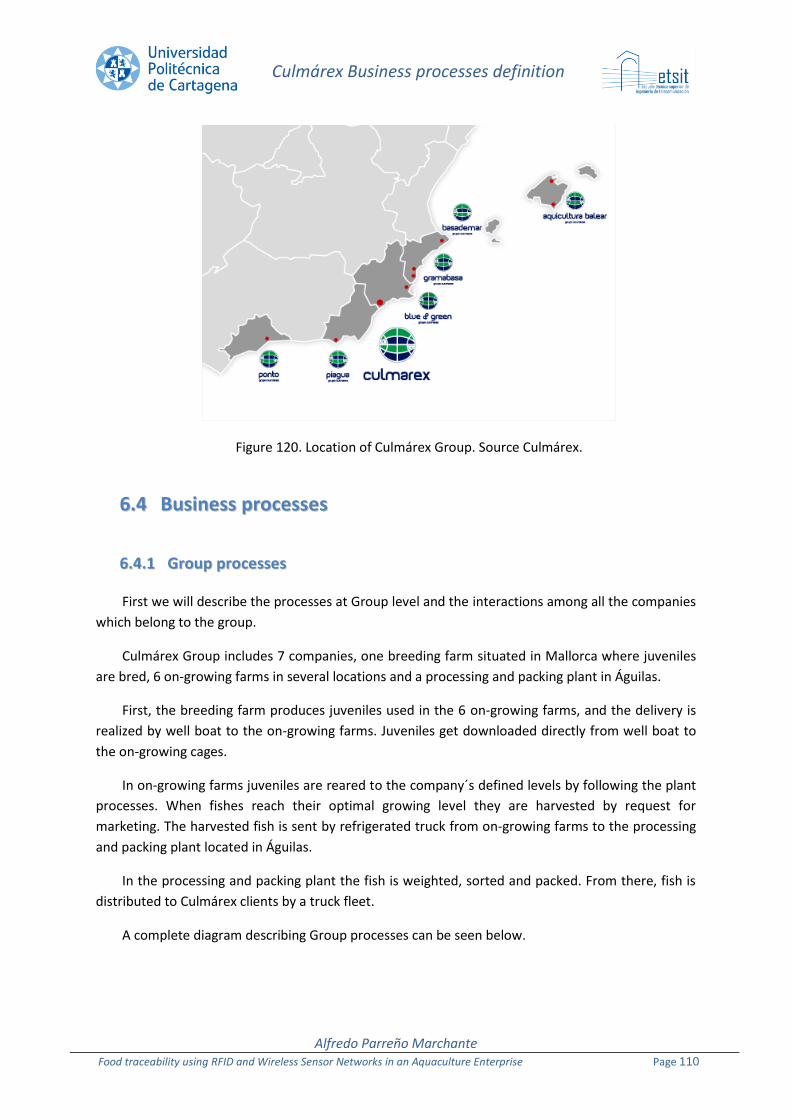
Culmárex Business processes definition
Alfredo Parreño Marchante Food traceability using RFID and Wireless Sensor Networks in an Aquaculture Enterprise Page 110
Figure 120. Location of Culmárex Group. Source Culmárex.
66..44 BBuussiinneessss pprroocceesssseess
66..44..11 GGrroouupp pprroocceesssseess
First we will describe the processes at Group level and the interactions among all the companies
which belong to the group.
Culmárex Group includes 7 companies, one breeding farm situated in Mallorca where juveniles
are bred, 6 on-growing farms in several locations and a processing and packing plant in Águilas.
First, the breeding farm produces juveniles used in the 6 on-growing farms, and the delivery is
realized by well boat to the on-growing farms. Juveniles get downloaded directly from well boat to
the on-growing cages.
In on-growing farms juveniles are reared to the company´s defined levels by following the plant
processes. When fishes reach their optimal growing level they are harvested by request for
marketing. The harvested fish is sent by refrigerated truck from on-growing farms to the processing
and packing plant located in Águilas.
In the processing and packing plant the fish is weighted, sorted and packed. From there, fish is
distributed to Culmárex clients by a truck fleet.
A complete diagram describing Group processes can be seen below.
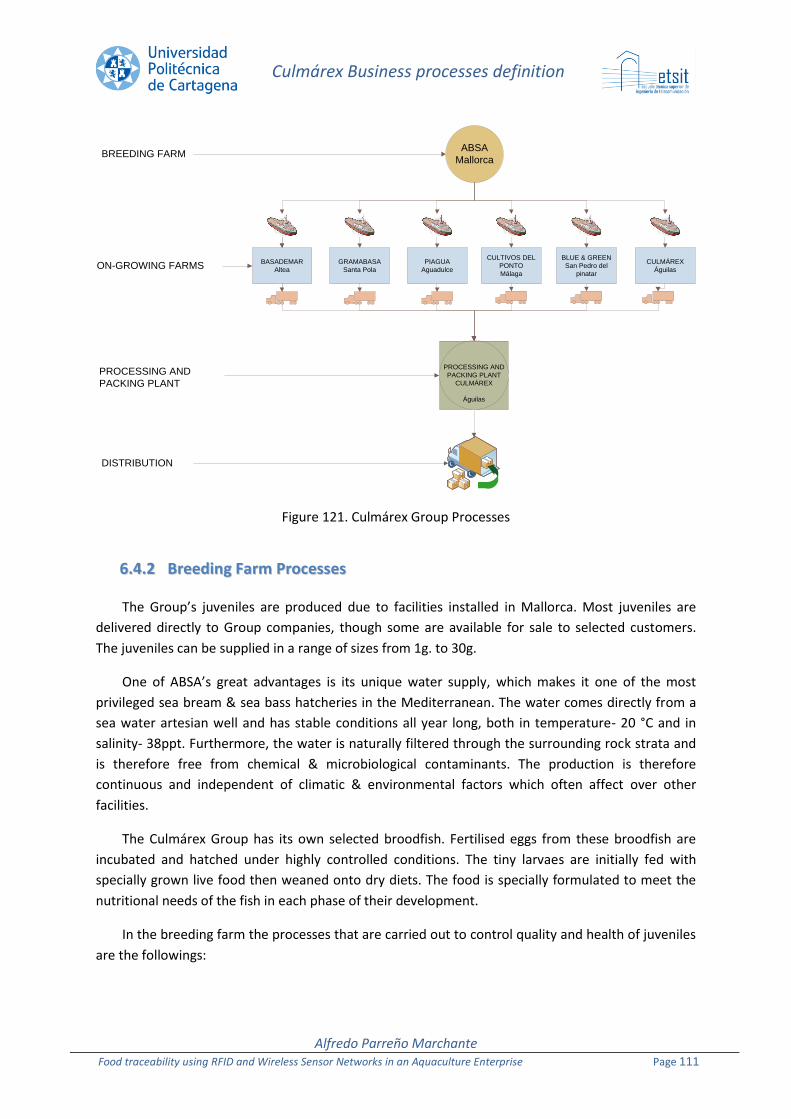
Culmárex Business processes definition
Alfredo Parreño Marchante Food traceability using RFID and Wireless Sensor Networks in an Aquaculture Enterprise Page 111
ABSA
Mallorca
BASADEMAR
Altea
GRAMABASA
Santa Pola
PIAGUA
Aguadulce
CULTIVOS DEL
PONTO
Málaga
BLUE & GREEN
San Pedro del
pinatar
CULMÁREX
Águilas
PROCESSING AND
PACKING PLANT
CULMÁREX
Águilas
BREEDING FARM
ON-GROWING FARMS
PROCESSING AND
PACKING PLANT
DISTRIBUTION
Figure 121. Culmárex Group Processes
66..44..22 BBrreeeeddiinngg FFaarrmm PPrroocceesssseess
The Group’s juveniles are produced due to facilities installed in Mallorca. Most juveniles are
delivered directly to Group companies, though some are available for sale to selected customers.
The juveniles can be supplied in a range of sizes from 1g. to 30g.
One of ABSA’s great advantages is its unique water supply, which makes it one of the most
privileged sea bream & sea bass hatcheries in the Mediterranean. The water comes directly from a
sea water artesian well and has stable conditions all year long, both in temperature- 20 °C and in
salinity- 38ppt. Furthermore, the water is naturally filtered through the surrounding rock strata and
is therefore free from chemical & microbiological contaminants. The production is therefore
continuous and independent of climatic & environmental factors which often affect over other
facilities.
The Culmárex Group has its own selected broodfish. Fertilised eggs from these broodfish are
incubated and hatched under highly controlled conditions. The tiny larvaes are initially fed with
specially grown live food then weaned onto dry diets. The food is specially formulated to meet the
nutritional needs of the fish in each phase of their development.
In the breeding farm the processes that are carried out to control quality and health of juveniles
are the followings:

Culmárex Business processes definition
Alfredo Parreño Marchante Food traceability using RFID and Wireless Sensor Networks in an Aquaculture Enterprise Page 112
Broodstock: in this process broodfish, is being maintained in order to provide fertilised eggs. Broodfish are selected by their characteristics to get best quality juveniles and fish.
Hatchery: after collecting fertilized eggs, they are taken to Hatchery. Larvaes feeding in this process is live food.
Live food (algae, rotifers & artemia): this process ensures the feeding in the Hatchery.
Weaning: after Hatchery process larvaes get to Weaning process in which feeding is dry food.
Nursery: This process is after weaning and it continues until juveniles reach 1gr weight.
Pre-ongrowing: after nursery, the process consists of the growing from a size of 1gr to a size of more than 30gr.
Logistics: transport and deliver of juveniles by a well boat. It is a specially adapted vessel allowing a large numbers of pre-ongrown juveniles to be transported in ideal conditions and delivered directly to the sea cages. This procedure reduces significantly the stress caused to the fish in comparison with conventional truck transportations.
Another unique characteristic is the ability to supply & deliver juveniles at a range of sizes
up to 30g. Stocking big juveniles in the on-growing farm has the advantage of maximizing the
growth period in the on-growing cages.
With each juveniles deliver, a breeding data sheet is created. This sheet is manually written
and transported in the well boat along with juveniles. On the On-growing farm of destination
they check the information of sheet, which are then stored.
66..44..33 OOnn--ggrroowwiinngg ffaarrmm pprroocceesssseess
The on-growing phase is carried out in open sea, taking advantage of the natural currents which
provide a constant renewing of the water, and create an ideal environment to develop high quality
aquaculture production.
In on-growing Farms the following processes are carried out:
First Process. Juveniles receiving. They are transported from the breeding farm by prepared well boat. Juveniles are transferred directly to special cages moored in the sea, which allow the fish freedom of movement, while protection from predators. The well boat transports juveniles along with a breeding data sheet. The data included in the breeding data sheet are load time and date, origin batch and type of fish. Then, a new receiving sheet is created including breeding sheet data, date and time of arrival and destination cage ID.
Second Process. Fish rearing. The juveniles are reared in the special cages moored in the sea. The rearing cycle is strictly controlled by trained personnel. State of the art underwater video-vigilance technology is used to optimise feeding and to ensure the best husbandry conditions. Temperature of water is controlled manually daily.
Third Process. Transfer to Commercial Cages. When fish has reached proper size and weight, according to commercial needs, it gets transferred to commercial Cages. In these

Culmárex Business processes definition
Alfredo Parreño Marchante Food traceability using RFID and Wireless Sensor Networks in an Aquaculture Enterprise Page 113
cages, fish is maintained isolated until selling time. In commercial cages is where fast process takes place. Fish is unfed for two days before harvesting. The purpose of fast is to clean fish bowels in order to extend the time during which the fish is suitable for human consumption.
Forth Process. Harvest. The harvest of the fish is done at night or at sunrise, collecting only the exact amount required, with no excess. This activity is carried out with utmost care in order not to damage or stress the fish. The estimation of fish catch is done by collected orders of clients. After harvest, fish is transferred in insulated tanks with sea water and ice until arrival at the packing plant. After the harvest, it is fulfilled the harvest control sheet. The data included in harvest control sheets are harvest date, harvest begin time, harvest end time, harvest number, temperature of sea water, tank ID, farm batch, ongrowing cage ID, commercial cage ID and last meal date and time.
Fifth Process. Shipment to Processing and Packing Plant. After storing the fish into insulated tanks, they are loaded into refrigerated trucks. Trucks transport the tanks from each On-growing Farm to the Processing and Packing Plant. Every tank must be identified and must have been linked with the overall information on breeding and rearing processes. For it, a Harvest Control Sheet is created and it is transported along with the tanks to the Processing and Packing Plant.
66..44..44 PPrroocceessssiinngg aanndd PPaacckkiinngg PPllaanntt PPrroocceesssseess
Processing and Packing is centralized in the plant situated in Águilas. All the fish from the 6 On-
growing farms is sent to Águilas into insulated tanks with sea water and ice.
The fish is received in the Processing and Packing Plant with the Harvest Control Sheet that
comes along with the fish tanks. Data in this document is included in a new Receiving Control Sheet.
Besides, it includes the receiving date and time, truck identification and origin farm. This sheet is
fulfilled manually.
From here on the process is continual and efficient.
1. The fish is introduced into a sorting machine and it is graded according to weight automatically. The machine sends the fish to different compartments according fish´s weight. The total weight in each compartment can´t exceed 6kg.
2. The sorting machine has a printer in each compartment that prints barcode labels. The barcode is composed of 25 digits that identify batch, type of fish, date and time of processing and packing, size and net weight.
3. Then, operators put fish pieces into special conservation boxes and stick the label created by the printer. The boxes have drainage which guarantees freshness and delivery to its final destination in perfect condition.
4. Boxes are placed in a conveyor belt.
5. A group of operators situated in the conveyor belt, label manually every piece of fish with plastic labels. For this purpose a compressed air applicator gun is used.
6. The operators fill with ice the boxes and close them.
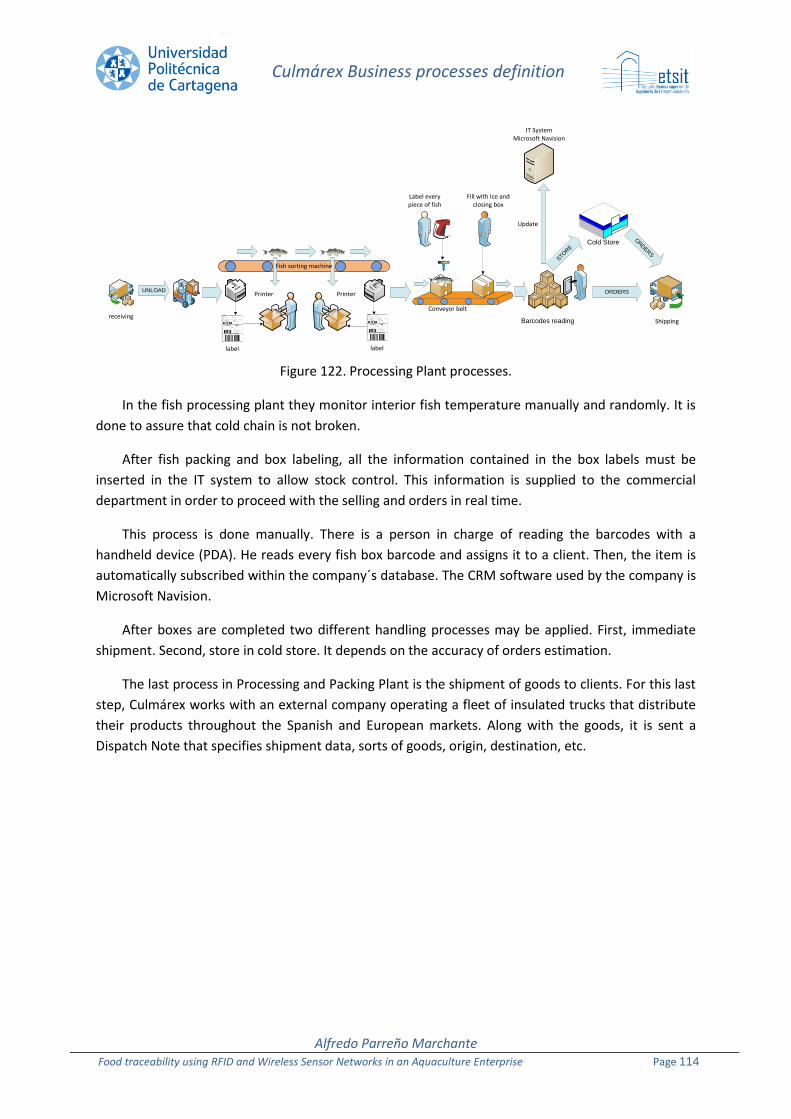
Culmárex Business processes definition
Alfredo Parreño Marchante Food traceability using RFID and Wireless Sensor Networks in an Aquaculture Enterprise Page 114
receiving
UNLOAD
label
Printer Printer
Barcodes reading
STO
RE
ORDERS
Shipping
Fish sorting machine
Conveyor belt
label
Cold StoreORDERS
Label every piece of fish
Fill with Ice and closing box
IT SystemMicrosoft Navision
Update
Figure 122. Processing Plant processes.
In the fish processing plant they monitor interior fish temperature manually and randomly. It is
done to assure that cold chain is not broken.
After fish packing and box labeling, all the information contained in the box labels must be
inserted in the IT system to allow stock control. This information is supplied to the commercial
department in order to proceed with the selling and orders in real time.
This process is done manually. There is a person in charge of reading the barcodes with a
handheld device (PDA). He reads every fish box barcode and assigns it to a client. Then, the item is
automatically subscribed within the company´s database. The CRM software used by the company is
Microsoft Navision.
After boxes are completed two different handling processes may be applied. First, immediate
shipment. Second, store in cold store. It depends on the accuracy of orders estimation.
The last process in Processing and Packing Plant is the shipment of goods to clients. For this last
step, Culmárex works with an external company operating a fleet of insulated trucks that distribute
their products throughout the Spanish and European markets. Along with the goods, it is sent a
Dispatch Note that specifies shipment data, sorts of goods, origin, destination, etc.
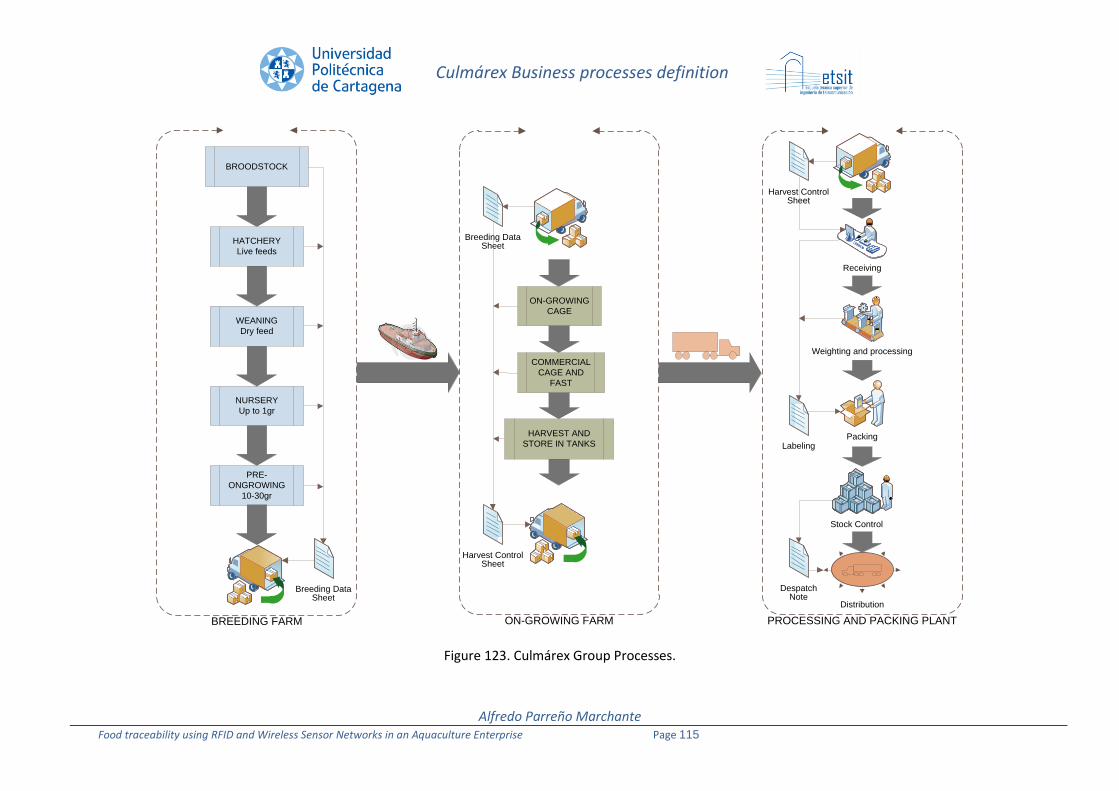
Culmárex Business processes definition
Alfredo Parreño Marchante Food traceability using RFID and Wireless Sensor Networks in an Aquaculture Enterprise Page 115
BROODSTOCK
HATCHERY
Live feeds
WEANING
Dry feed
NURSERY
Up to 1gr
PRE-
ONGROWING
10-30gr
BREEDING FARM ON-GROWING FARM
ON-GROWING
CAGE
COMMERCIAL
CAGE AND
FAST
HARVEST AND
STORE IN TANKS
PROCESSING AND PACKING PLANT
Distribution
Breeding DataSheet
Breeding DataSheet
Harvest ControlSheet
Harvest ControlSheet
Labeling
DespatchNote
Weighting and processing
Packing
Stock Control
Receiving
Figure 123. Culmárex Group Processes.

Culmárex Business processes definition
Alfredo Parreño Marchante Food traceability using RFID and Wireless Sensor Networks in an Aquaculture Enterprise Page 116
66..55 CCoonncclluussiioonnss
Culmárex collects all business processes information manually. This means that to collect
information they fill in several sheets manually and they store them in paper. Some data are entered
from sheets into computer applications (Excel). So they do double work.
When any client request for traceability data, company staff should look for archived sheets.
This is not a very efficient way to work.
RFID can help to automatize information flow and remove paper sheets from their business
processes.

Traceability System Definition
Alfredo Parreño Marchante Food traceability using RFID and Wireless Sensor Networks in an Aquaculture Enterprise Page 117
77..11 PPiilloott AArrcchhiitteeccttuurree
We have described all Culmárex Group business processes. However, for a pilot project is not
possible to cope with all of them, because of their complexity. We have decided to focus the pilot on
the On-growing farm situated in Águilas and on the Process and Packing Plant. In this way, we´ll
work in the same city, so it will be easier to deploy and work on the pilot.
Work environment in these two places is very different. On the one hand, on-growing farm is in
open sea and conditions are very harsh. Water and salt are harmful for electronic equipment.
Besides, wave propagation on the sea is not easy because of fading, multipath and so on. So,
wireless communication is a problem.
On the other hand, Process and Packing Plant is situated in an industrial building. Environmental
conditions are better than in the farm but there are some problems to solve as well. We will find
humid environment, water and controlled temperature.
We aim to remove all handwriting sheets and replace them with an automatic record of data
that will allow tracking and tracing the fish by software. All data will be stored in several databases
and that´s why we will use RFID readers and tags.
We plan to tag with RFID tags the tanks used to transport fish from farm to plant and the boxes
of fish. Tanks are reusable, so tags will be reusable too. They will be attached to the tank and they
will identify unequivocally the tank.
For fish boxes we will use tags stuck on a box face. It will include an EPC ID in RFID tag, and a
barcode and information printed on it.
Data acquisition will be made by fixed and handheld RFID readers, situated in different points of
the supply chain.
Besides, temperature and humidity parameters will be controlled by including sensors.
77..11..11 RRFFIIDD SSyysstteemm
The whole application is depicted in Figure 124. Below, we will describe what elements are used
and their integration with Culmárex business processes.
77 TTrraacceeaabbiilliittyy SSyysstteemm DDeeffiinniittiioonn

Traceability System Definition
Alfredo Parreño Marchante Food traceability using RFID and Wireless Sensor Networks in an Aquaculture Enterprise Page 118
The scope of the RFID pilot will begin with the arrival of the well boat with the juveniles to the
on-growing farm and will end with the shipping of fish boxes to clients.
At the on-growing farm we will use handheld readers that will allow us to store information in a
database. Therefore, we should write an application for the handheld device to perform this
operation. This application will consist of several application forms. Each one will store:
1. Application form for storing breeding and transport data. (Old Breeding farm sheet).
2. Application form for storing transfer from on-growing to commercial cage.
3. Application form for storing harvest data (Old Harvest control sheet).
4. Application form for storing shipment data.
5. Application form for storing receiving data.
Every cage will be tagged with an RFID tag.
The temperature of water will be monitored with sensor loggers. Sensors will be read with
handheld readers.
We also plan to include a sensor logger in each tank to monitor the fish temperature in the
transport from farm to processing plant.
Additional research can be done by tracking other parameters during transportation, like
temperature in real time, GPS position, open door alert and so on.
At the Processing and Packing Plant, we will need a handheld reader and fixed readers. The
implementation is as follows:
The handheld reader will need an application form for storing receiving process data. We should
write it.
After tanks are received, they are inserted in the sorting machine by a gate and the fish is
downloaded from the tanks to a pool. We will install an RFID portal with a fixed reader and several
antennas that will read tank´s EPC tag. Business event will be stored in a database. At the same time,
the tank´s temperature sensor logger will be read and data will be stored in a database.
The sorting machine has software that generates important data for business process, such as
weight, number of pieces, size, etc. We want to include these data in our system, so we will have to
write an application to link data from the sorting machine to our database. This will be done by
reading the barcode that produces the sorting machine, process the data and store them.
We need to identify each fish box. Therefore, we need to tag them with an RFID tag. The sorting
machine has printers that admit the installation of an RFID module over it which will allow them to
print and write RFID tags.
We will write an application to print tags and write their internal memory with RFID printers.
Their memory will be written with an EPC number, and the tag will be printed with the same
Traceability System Definition
Alfredo Parreño Marchante Food traceability using RFID and Wireless Sensor Networks in an Aquaculture Enterprise Page 119
information and barcodes used so far. Operators will stick the tags on fish boxes, as they are
currently doing now.
Then, boxes go to the conveyor belt where an RFID portal with a fixed reader and several
antennas will read the tag and will store the box identification on a database, ready to be used for
sale.

Traceability System Definition
Alfredo Parreño Marchante Food traceability using RFID and Wireless Sensor Networks in an Aquaculture Enterprise Page 120
Figure 124. RFID System
lunes, 20 de septiembre de 2010
Página 1
RFID from farm to forkPilot definition. System. Version.2
Well boat
FishTankShipping
Ongrowing cage
Commercial cage
fish fish
harvest
terminal
Data base AspireEPCIS
HandheldRFID
reader
HandheldRFID
reader
GPRS GPRS
Sensor dataTraceability data
Business event data
Breeding farm
LOAD LOAD
UNLOAD
HandheldRFID
reader
GPRS
HandheldRFID
reader
GPRS
receiving
TRANSPORT
BY ROADUNLOAD
HandheldRFID
reader
WIFI
RFID Portal
WIFI or
RJ45
RFID Portal
WIFI or
RJ45
WIFI or
RJ45
WIFI or
RJ45
WIFI or
RJ45
tag tag
RFID Printer RFID PrinterSTORE LOAD
RFID Portal
Shipping
WIFI or
RJ45
Breeding dataTransport data
Ongrowing dataOngrowing cage Sensor data
Ongrowing dataCommercial cage Sensor data
Shipping dataReceiving data
Unload dataTank Sensor data
RFID Label data RFID Label dataSorting machine dataPacking room Sensor data
Package data Shipping data
Fixed tag
Temperature
sensor logger
Temperature
sensor logger
Temperature
sensor tag Adhesive tag
Packing room
temperature sensor
Packing room
Humidity sensor
Fill up application form in
handheld device to introduce
breeding information and
transport data
Monitor water temperature
in cages and fish flow
between cages
Fill up application form in
handheld device to introduce
harvest data and Monitor
temperature inside the tank
Get data from
shipping and
receiving
Pass tanks under a RFID
portal and get data and
temperature values.
Fish sorting machine data are included in
database. System generates RFID tag
labels by printers to stick them in every
package box
RFID portal reads RFID label of every
package box and enlist them in database.
Shipping process is controled by a RFID
portal that check if shipping is correct.
terminalFish sorting machine
Conveyor belt
UNIVERSIDAD POLITÉCNICA DE CARTAGENA AUTHOR: ALFREDO PARREÑO MARCHANTE

Traceability System Definition
Alfredo Parreño Marchante Food traceability using RFID and Wireless Sensor Networks in an Aquaculture Enterprise Page 121
The last process in which we are going to work is shipping. We will install an RFID portal with a
fixed reader, several antennas and a PC. We will have to write an application to check orders with
loaded goods in trucks. Therefore, shipping errors will be removed.
Regarding sensors, we will install temperature and humidity sensors to control processing,
packing and cold store rooms’ environment. We will use wireless sensor loggers distributed across
the rooms for a complete coverage.
Additional research can be done by tracking parameters during transportation to clients like
temperature in real time, GPS position, open door alert, etc.
To store all data we plan to use several databases; one EPCIS database for master data, business
events and traceability information and another database for sensor information.
77..11..22 MMaatteerriiaallss
For the implementation of the RFID system we plan to use the following set of hardware:
2 handheld readers.
2 portals for gates consisting in a support structure, fixed reader and antennas.
1 portal for conveyor belt consisting in a support structure, fixed reader and antennas.
1 PC for shipment process.
1 RFID printer for RFID writing.
Adhesive tags.
Fixed reusable tags for tanks.
Temperature Sensors for sea water.
Temperature sensors for tanks.
Temperature and Humidity sensors.
Gateways for sensors.
Routers for sensors.
1 Server.
77..22 IInnffoorrmmaattiioonn FFllooww
In the deploying process we need to identify the company´s information flow. We need to
identify critical information for the food chain and the places where it is generated. Also it is
required to plan which information will be collected on each point of the supply chain. Then, we will
process and store it in a proper way.
The information can be divided into three groups:

Traceability System Definition
Alfredo Parreño Marchante Food traceability using RFID and Wireless Sensor Networks in an Aquaculture Enterprise Page 122
1. Business events group. This information is related to business events like shipping, receiving, stocking, etc. The information collected is event type, identification numbers, date, time and location.
2. Traceability data. This information is related to the food chain like broodfish, type of fish, batch, fish food, fishing process, weight, size and number of pieces.
3. Sensor information. This information is collected by the sensor network integrated by temperature and humidity sensors.
According to Culmárex business processes, we have identified the relevant information in every
food and supply chain step. Currently, they are collecting most of this information, but they are
collecting it with paper sheets and they have only some of the information computerized. The
computerized information is done manually and with barcode handheld readers, thus these
processes have low level of automation. Only sorting and weighting are automatized.
By introducing RFID and WSN we will try to improve the automation of information flow and we
will integrate all the information to be accessible together by IT systems and web services.
We have to collect the information of every business event. The business events are:
Shipping from breeding farm.
Receiving in growing farm.
Move between cages.
Harvesting.
Shipping from growing farm.
Receiving in process plant.
Enter in packing process.
Finish packing and enter in stock.
Shipping to retailers.
In every business event the information collected is date, time, ID of read objects and ID of
reader.
We also have to collect information of traceability data. This information is:
Type of fish.
Batch.
Harvest date and time.
Harvest Number.
Last meal date and time.
Number of pieces.
Net weight.

Traceability System Definition
Alfredo Parreño Marchante Food traceability using RFID and Wireless Sensor Networks in an Aquaculture Enterprise Page 123
Fish size
Sorting and Packing date and time.
Finally, we have to collect information of sensors. This information is:
Temperature in on-growing and commercial cages.
Temperature in fish tank.
Temperature and humidity in processing plant.
For more details, please refer to the figure below. All the details of the information flow can be observed in Figure 125.
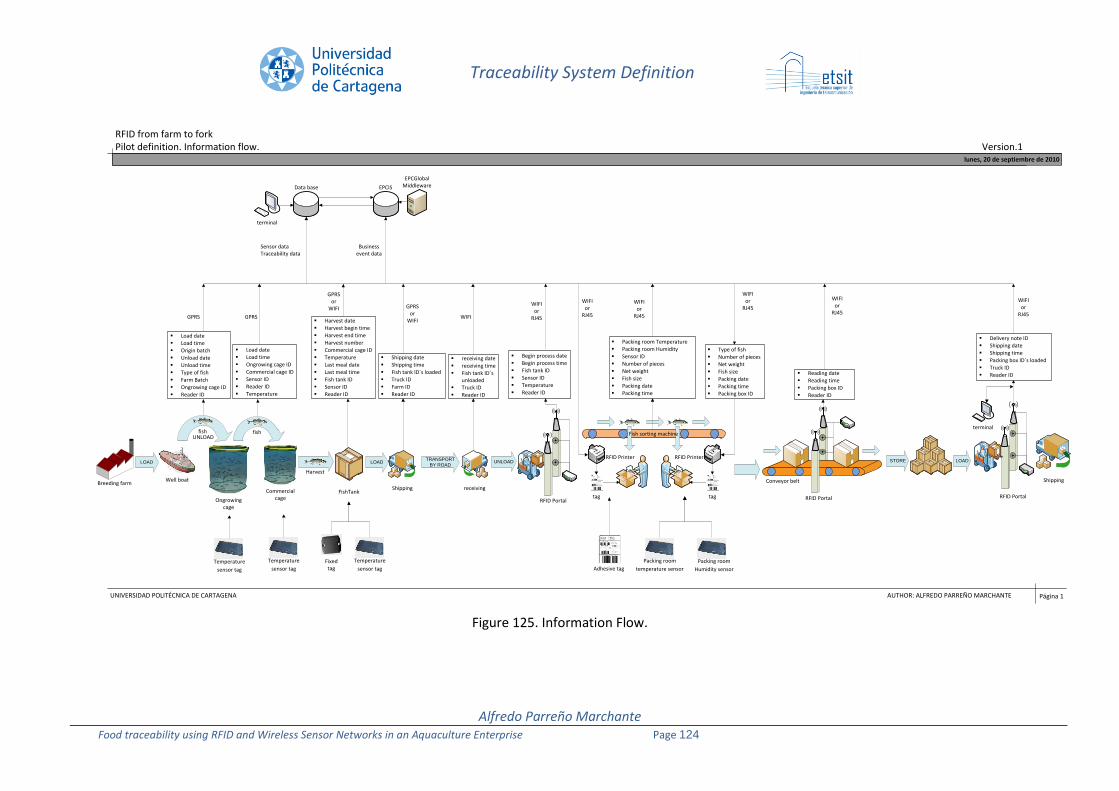
Traceability System Definition
Alfredo Parreño Marchante Food traceability using RFID and Wireless Sensor Networks in an Aquaculture Enterprise Page 124
lunes, 20 de septiembre de 2010
Página 1
RFID from farm to forkPilot definition. Information flow. Version.1
Well boat
FishTankShipping
Ongrowing cage
Commercial cage
fish fish
Harvest
terminal
Data base
EPCGlobal MiddlewareEPCIS
GPRS GPRS
Sensor dataTraceability data
Business event data
Breeding farm
LOAD LOAD
UNLOAD
GPRSor
WIFI GPRSor
WIFI
receiving
TRANSPORT
BY ROADUNLOAD
WIFI
RFID Portal
WIFI or
RJ45
RFID Portal
WIFI or
RJ45
WIFI or
RJ45
WIFI or
RJ45
WIFI or
RJ45
tag tag
RFID Printer RFID PrinterSTORE LOAD
RFID Portal
Shipping
WIFI or
RJ45
Fixed tag
Temperature
sensor tag
Temperature
sensor tag
Temperature
sensor tag Adhesive tag
Packing room
temperature sensor
Packing room
Humidity sensor
Load date Load time Origin batch Unload date Unload time Type of fish Farm Batch Ongrowing cage ID Reader ID
Load date Load time Ongrowing cage ID Commercial cage ID Sensor ID Reader ID Temperature
Harvest date Harvest begin time Harvest end time Harvest number Commercial cage ID Temperature Last meal date Last meal time Fish tank ID Sensor ID Reader ID
Shipping date Shipping time Fish tank ID´s loaded Truck ID Farm ID Reader ID
receiving date receiving time Fish tank ID´s
unloaded Truck ID Reader ID
Begin process date Begin process time Fish tank ID Sensor ID Temperature Reader ID
Packing room Temperature Packing room Humidity Sensor ID Number of pieces Net weight Fish size Packing date Packing time
Type of fish Number of pieces Net weight Fish size Packing date Packing time Packing box ID
Reading date Reading time Packing box ID Reader ID
Delivery note ID Shipping date Shipping time Packing box ID´s loaded Truck ID Reader ID
terminalFish sorting machine
Conveyor belt
UNIVERSIDAD POLITÉCNICA DE CARTAGENA AUTHOR: ALFREDO PARREÑO MARCHANTE
Figure 125. Information Flow.

Traceability System Definition
Alfredo Parreño Marchante Food traceability using RFID and Wireless Sensor Networks in an Aquaculture Enterprise Page 125
77..33 MMiiddddlleewwaarree
77..33..11 IIddeennttiittyy TTyyppeess
7.3.1.1 Entities to identify
In the pilot, two different items will be tagged, tanks to transport fish and boxes of fish to send
to customers.
Tanks are reusable items. They are used again and again to transport fish from ongrowing farms
to processing plant.
Boxes of fish are the products that the company sells to its customers. They are not reusable
and must be uniquely identified.
There are other entities that are not items but must be also identified. These are locations, read
points and trucks.
According to web services structure, all these can be classified in three groups:
Products: boxes of fish.
Assets: tanks and trucks.
Locations: read points and locations.
7.3.1.2 Products
The EPCglobal tag standard defines SGTIN as Serialized Global Trade Item Number. It is used to
identify products and it will be used to identify fish boxes. There are two encoding formats for STGIN
96 and 198 bits.
The SGTIN consists of the following information elements:
The Company Prefix, assigned by GS1 to a managing entity. The Company Prefix is the same as the Company Prefix digits within an EAN.UCC GTIN decimal code. In our case it is fixed to 7 decimal digits (2000005).
The Item Reference, assigned by the managing entity to a particular object class. The Item Reference for the purposes of EPC Tag Encoding is derived from the GTIN by concatenating the Indicator Digit of the GTIN and the Item Reference digits, and treating the result as a single integer. In our case it is fixed to 6 decimal digits.
The Serial Number, assigned by the managing entity to an individual object. The serial number is not part of the GTIN code, but is formally a part of the SGTIN. Depending on the format it has a different number of digits. In the case of SGTIN-96, it has 12 decimal digits. In the case of SGTIN-198 it has 20 alphanumerical digits.
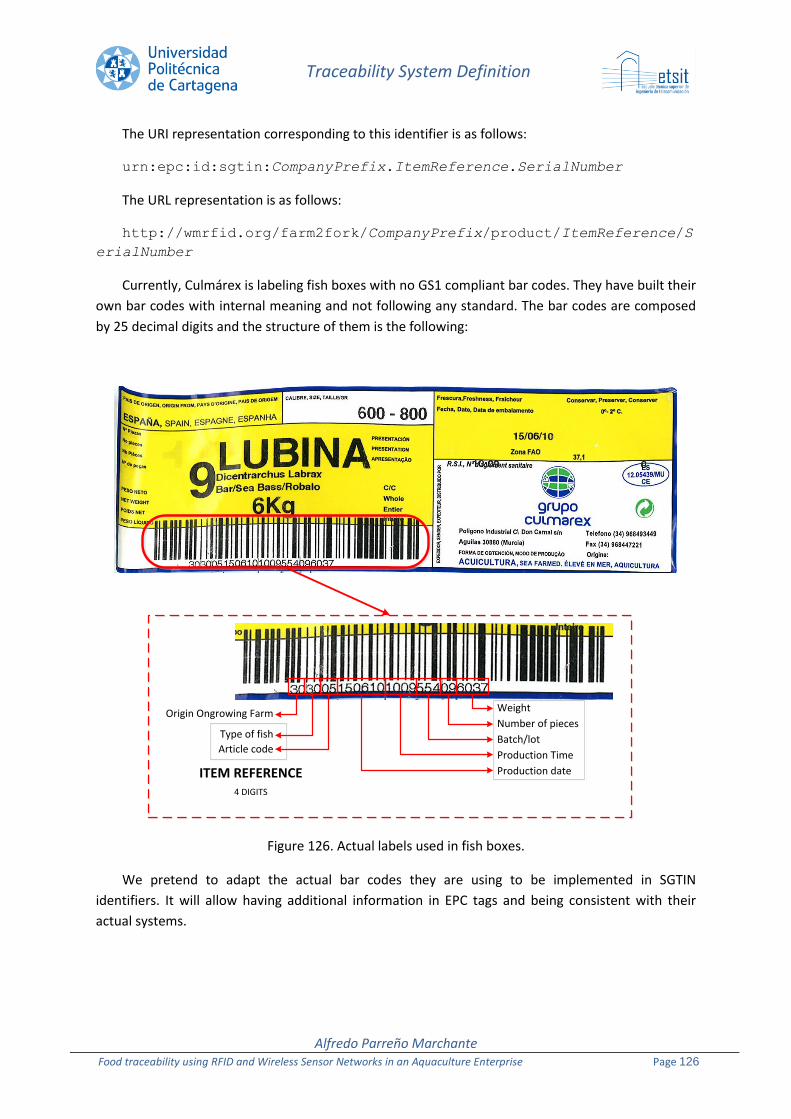
Traceability System Definition
Alfredo Parreño Marchante Food traceability using RFID and Wireless Sensor Networks in an Aquaculture Enterprise Page 126
The URI representation corresponding to this identifier is as follows:
urn:epc:id:sgtin:CompanyPrefix.ItemReference.SerialNumber
The URL representation is as follows:
http://wmrfid.org/farm2fork/CompanyPrefix/product/ItemReference/S
erialNumber
Currently, Culmárex is labeling fish boxes with no GS1 compliant bar codes. They have built their
own bar codes with internal meaning and not following any standard. The bar codes are composed
by 25 decimal digits and the structure of them is the following:
Weight
Number of pieces
Batch/lot
Production Time
Production date
Article code
Type of fish
Origin Ongrowing Farm
ITEM REFERENCE4 DIGITS
Figure 126. Actual labels used in fish boxes.
We pretend to adapt the actual bar codes they are using to be implemented in SGTIN
identifiers. It will allow having additional information in EPC tags and being consistent with their
actual systems.

Traceability System Definition
Alfredo Parreño Marchante Food traceability using RFID and Wireless Sensor Networks in an Aquaculture Enterprise Page 127
7.3.1.3 Assets
The EPCglobal tag standard defines GRAI as Global Returnable Asset Identifier. It will be used to
identify tanks and trucks.
The GRAI consists of the following information elements:
The Company Prefix, assigned by GS1 to a managing entity. The Company Prefix is the same as the Company Prefix digits within an EAN.UCC GRAI decimal code. In our case it is fixed to 7 decimal digits (2000005).
The Asset Type, assigned by the managing entity to a particular class of asset. In our case it is fixed to 5 decimal digits.
The Serial Number, assigned by the managing entity to an individual object. The GRAI-96 representation is only capable of representing a subset of Serial Numbers allowed in the General EAN.UCC Specifications. Specifically, only those Serial Numbers consisting of one or more digits, with no leading zeros, are permitted. For the requirement of using longer serial number, or alphabet and other non-numeric coding, this version of specification introduces longer bit encoding format GRAI-170.
The URI representation corresponding to this identifier is as follows:
urn:epc:id:grai:CompanyPrefix.AssetType.SerialNumber
The URL representation is as follows:
http://wmrfid.org/farm2fork/CompanyPrefix/asset/ItemReference/Ser
ialNumber
We will use two asset types in our pilot:
00001: for tanks.
00002: for trucks.
To assign serial numbers, in the case of tanks incremental numbers will be used. In the case of
trucks the number plate will be included in the serial number.
7.3.1.4 Locations
The EPCglobal tag standard defines SGLN as Serialized Global Location Number. It represents
only the physical location sub-type of GLN AI (414). It will be used to identify locations and read
points.
The SGLN consists of the following information elements:
The Company Prefix, assigned by GS1 to a managing entity. The Company Prefix is the same as the Company Prefix digits within an EAN.UCC GLN decimal code. In our case it is fixed to 7 decimal digits (2000005).
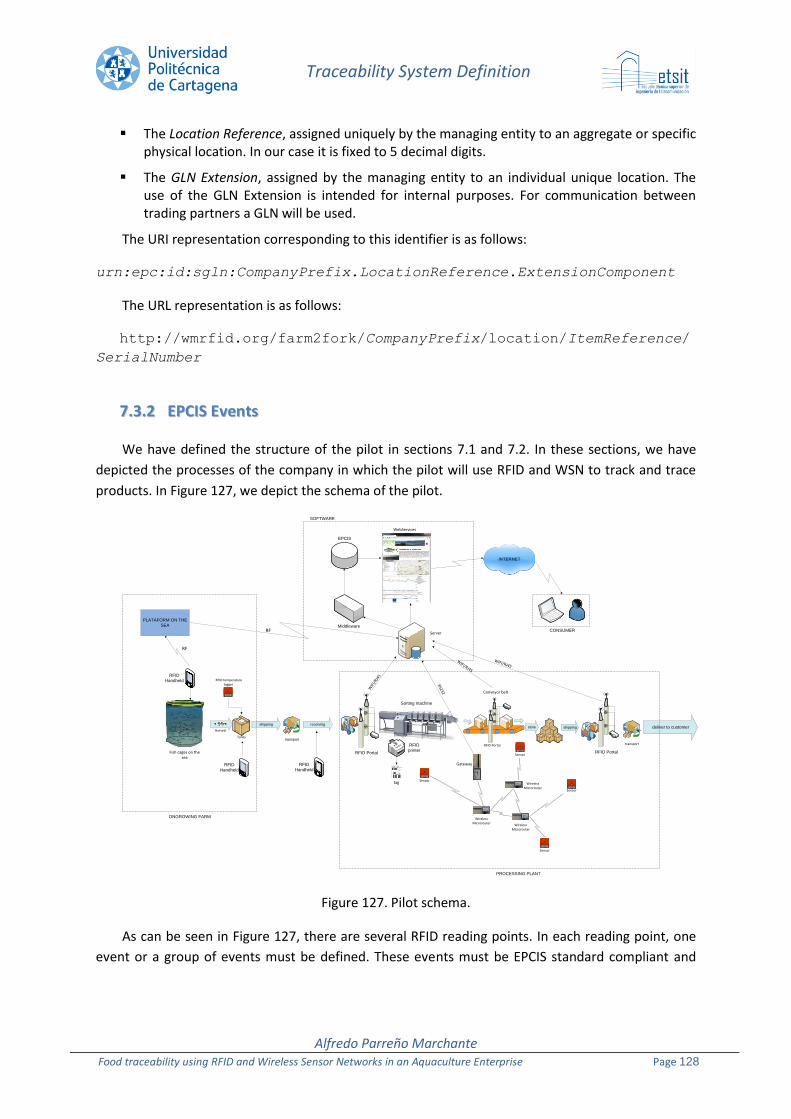
Traceability System Definition
Alfredo Parreño Marchante Food traceability using RFID and Wireless Sensor Networks in an Aquaculture Enterprise Page 128
The Location Reference, assigned uniquely by the managing entity to an aggregate or specific physical location. In our case it is fixed to 5 decimal digits.
The GLN Extension, assigned by the managing entity to an individual unique location. The use of the GLN Extension is intended for internal purposes. For communication between trading partners a GLN will be used.
The URI representation corresponding to this identifier is as follows:
urn:epc:id:sgln:CompanyPrefix.LocationReference.ExtensionComponent
The URL representation is as follows:
http://wmrfid.org/farm2fork/CompanyPrefix/location/ItemReference/
SerialNumber
77..33..22 EEPPCCIISS EEvveennttss
We have defined the structure of the pilot in sections 7.1 and 7.2. In these sections, we have
depicted the processes of the company in which the pilot will use RFID and WSN to track and trace
products. In Figure 127, we depict the schema of the pilot.
Figure 127. Pilot schema.
As can be seen in Figure 127, there are several RFID reading points. In each reading point, one
event or a group of events must be defined. These events must be EPCIS standard compliant and
RF
INTERNET
Server
RFID PortalFish cages on the sea
RFID
Handheld
PLATAFORM ON THE
SEA
RF
transport
Harvest
shipping receiving
Tanks
RFID temperature logger
Gateway
Wireless Microrouter
Wireless Microrouter
Wireless Microrouter
Sensor
Sensor
Sensor
Sensortag
RFID
printer
shipping
RFID Portal
transport
deliver to customer
ONGROWING FARM
PROCESSING PLANT
CONSUMER
SOFTWARE
RFID Portal
Conveyor belt
WebServices
Middleware
EPCIS
RFID
Handheld
RFID
Handheld
Sorting machine
store
WIFI/RJ45W
IFI/RJ45
WIF
I/RJ
45
RS232

Traceability System Definition
Alfredo Parreño Marchante Food traceability using RFID and Wireless Sensor Networks in an Aquaculture Enterprise Page 129
consist of an Event Type and one or more named Event Fields. The values that can be included in
each event field are specified in the EPCglobal Core Business Vocabulary Standard [11].
Taking into account the above, we have defined the EPCIS events that will be generated in each
reading point and their content. It is depicted in Figure 128.
Two types of events have been used, object events and aggregation events. Some read points
generate only one event and other generate 2 events. We have tried to build a hierarchical structure
to allow tracing a box of fish to the batch of origin. For it, we have created aggregation events. The
structure can be seen in Figure 129.
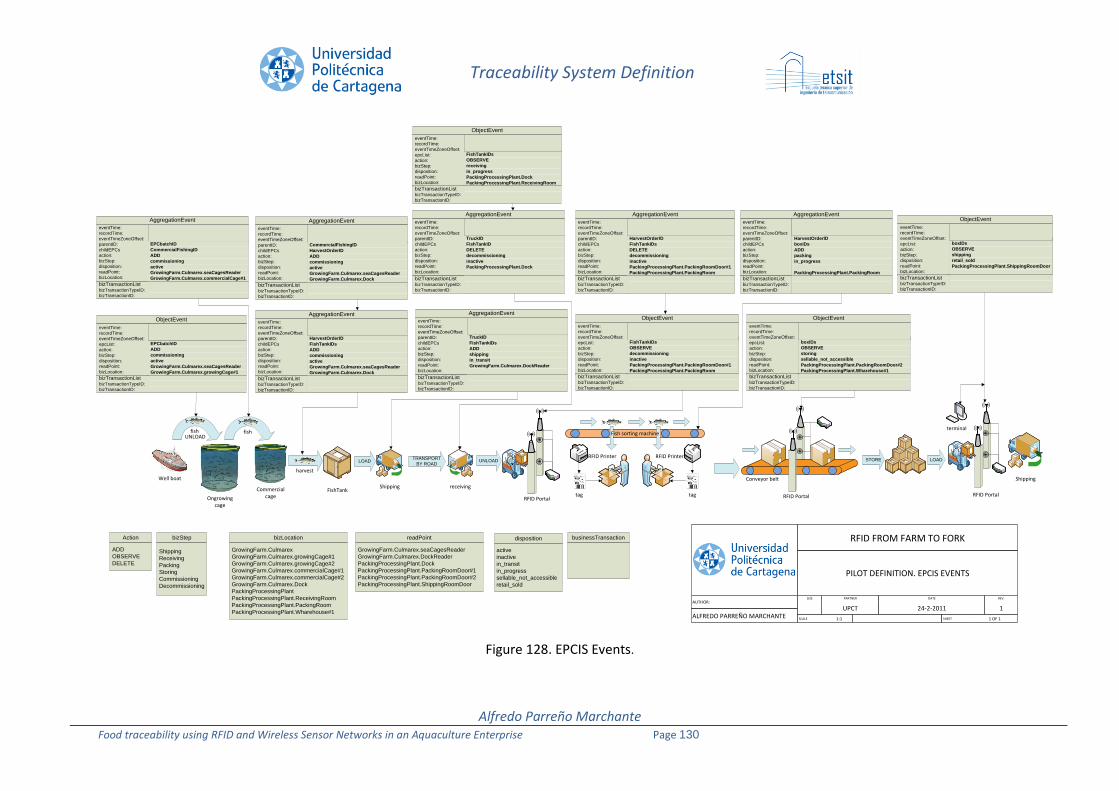
Traceability System Definition
Alfredo Parreño Marchante Food traceability using RFID and Wireless Sensor Networks in an Aquaculture Enterprise Page 130
Well boat
FishTankShipping
Ongrowing cage
Commercial cage
fish fish
harvest
LOAD
UNLOAD
receiving
TRANSPORT
BY ROADUNLOAD
RFID Portal RFID Portaltag tag
RFID Printer RFID PrinterSTORE LOAD
RFID Portal
Shipping
terminalFish sorting machine
Conveyor belt
disposition
active
inactive
in_transit
in_progress
sellable_not_accessible
retail_sold
readPoint
GrowingFarm.Culmarex.seaCagesReader
GrowingFarm.Culmarex.DockReader
PackingProcessingPlant.Dock
PackingProcessingPlant.PackingRoomDoor#1
PackingProcessingPlant.PackingRoomDoor#2
PackingProcessingPlant.ShippingRoomDoor
bizLocation
GrowingFarm.Culmarex
GrowingFarm.Culmarex.growingCage#1
GrowingFarm.Culmarex.growingCage#2
GrowingFarm.Culmarex.commercialCage#1
GrowingFarm.Culmarex.commercialCage#2
GrowingFarm.Culmarex.Dock
PackingProcessingPlant
PackingProcessingPlant.ReceivingRoom
PackingProcessingPlant.PackingRoom
PackingProcessingPlant.Wharehouse#1
bizStep
Shipping
Receiving
Packing
Storing
Commissioning
Decommissioning
Action
ADD
OBSERVE
DELETE
businessTransaction
ObjectEvent
eventTime:
recordTime:
eventTimeZoneOffset:
epcList:
action:
bizStep:
disposition:
readPoint:
bizLocation:
bizTransactionListbizTransactionTypeID:
bizTransactionID:
GrowingFarm.Culmarex.growingCage#1
GrowingFarm.Culmarex.seaCagesReader
active
EPCbatchID
ADD
commissioning
AggregationEvent
eventTime:
recordTime:
eventTimeZoneOffset:
parentID:
childEPCs
action:
bizStep:
disposition:
readPoint:
bizLocation:
bizTransactionListbizTransactionTypeID:
bizTransactionID:
GrowingFarm.Culmarex.seaCagesReader
active
commissioning
EPCbatchID
CommercialFishingID
ADD
GrowingFarm.Culmarex.commercialCage#1
AggregationEvent
eventTime:
recordTime:
eventTimeZoneOffset:
parentID:
childEPCs
action:
bizStep:
disposition:
readPoint:
bizLocation:
bizTransactionListbizTransactionTypeID:
bizTransactionID:
GrowingFarm.Culmarex.seaCagesReader
active
commissioning
HarvestOrderID
FishTankIDs
ADD
GrowingFarm.Culmarex.Dock
AggregationEvent
eventTime:
recordTime:
eventTimeZoneOffset:
parentID:
childEPCs
action:
bizStep:
disposition:
readPoint:
bizLocation:
bizTransactionListbizTransactionTypeID:
bizTransactionID:
GrowingFarm.Culmarex.seaCagesReader
active
commissioning
CommercialFishingID
HarvestOrderID
ADD
GrowingFarm.Culmarex.Dock
AggregationEvent
eventTime:
recordTime:
eventTimeZoneOffset:
parentID:
childEPCs
action:
bizStep:
disposition:
readPoint:
bizLocation:
bizTransactionListbizTransactionTypeID:
bizTransactionID:
GrowingFarm.Culmarex.DockReader
in_transit
shipping
TruckID
FishTankIDs
ADD
AggregationEvent
eventTime:
recordTime:
eventTimeZoneOffset:
parentID:
childEPCs
action:
bizStep:
disposition:
readPoint:
bizLocation:
bizTransactionListbizTransactionTypeID:
bizTransactionID:
PackingProcessingPlant.Dock
inactive
decommissioning
TruckID
FishTankID
DELETE
ObjectEvent
eventTime:
recordTime:
eventTimeZoneOffset:
epcList:
action:
bizStep:
disposition:
readPoint:
bizLocation:
bizTransactionListbizTransactionTypeID:
bizTransactionID:
PackingProcessingPlant.ReceivingRoom
PackingProcessingPlant.Dock
in_progress
FishTankIDs
OBSERVE
receiving
ObjectEvent
eventTime:
recordTime:
eventTimeZoneOffset:
epcList:
action:
bizStep:
disposition:
readPoint:
bizLocation:
bizTransactionListbizTransactionTypeID:
bizTransactionID:
PackingProcessingPlant.PackingRoom
PackingProcessingPlant.PackingRoomDoor#1
inactive
FishTankIDs
OBSERVE
decommissioning
ObjectEvent
eventTime:
recordTime:
eventTimeZoneOffset:
epcList:
action:
bizStep:
disposition:
readPoint:
bizLocation:
bizTransactionListbizTransactionTypeID:
bizTransactionID:
PackingProcessingPlant.Wharehouse#1
PackingProcessingPlant.PackingRoomDoor#2
sellable_not_accessible
boxIDs
OBSERVE
storing
AggregationEvent
eventTime:
recordTime:
eventTimeZoneOffset:
parentID:
childEPCs
action:
bizStep:
disposition:
readPoint:
bizLocation:
bizTransactionListbizTransactionTypeID:
bizTransactionID:
in_progress
packing
HarvestOrderID
boxIDs
ADD
PackingProcessingPlant.PackingRoom
ObjectEvent
eventTime:
recordTime:
eventTimeZoneOffset:
epcList:
action:
bizStep:
disposition:
readPoint:
bizLocation:
bizTransactionListbizTransactionTypeID:
bizTransactionID:
PackingProcessingPlant.ShippingRoomDoor
retail_sold
boxIDs
OBSERVE
shipping
RFID FROM FARM TO FORK
PILOT DEFINITION. EPCIS EVENTS
AUTHOR:
ALFREDO PARREÑO MARCHANTE
SIZE PARTNER DATE REV.
UPCT 24-2-2011 1
SCALE 1:1 SHEET 1 OF 1
AggregationEvent
eventTime:
recordTime:
eventTimeZoneOffset:
parentID:
childEPCs
action:
bizStep:
disposition:
readPoint:
bizLocation:
bizTransactionListbizTransactionTypeID:
bizTransactionID:
PackingProcessingPlant.PackingRoomDoor#1
inactive
decommissioning
HarvestOrderID
FishTankIDs
DELETE
PackingProcessingPlant.PackingRoom
Figure 128. EPCIS Events.

Traceability System Definition
Alfredo Parreño Marchante Food traceability using RFID and Wireless Sensor Networks in an Aquaculture Enterprise Page 131
Fishing batch ID
Commercial Fishing ID
Harvest Order ID
Fish Tanks ID Box ID
AGGREGATION EVENT
AGGREGATION EVENT
AGGREGATION EVENTAGGREGATION EVENT
Figure 129.Hierarchical structure.
URN´s for event fields must be specified as following to be standard compliant:
The value of the bizStep field shall be a URI consisting of the prefix urn:epcglobal:cbv:bizstep: followed by the string specified in the first column of some row of the table in Section 7.1.2 of the EPCglobal Core Business Vocabulary Standard [11].
The value of the disposition field shall be a URI consisting of the prefix urn:epcglobal:cbv:disp: followed by the string specified in the first column of some row of the table in Section 7.2.2 of the EPCglobal Core Business Vocabulary Standard [11]
If a given bizTransaction element includes a type attribute, the value of the type attribute SHALL be a URI consisting of the prefix urn:epcglobal:cbv:btt: followed by the string specified in the first column of some row of the table in Section 7.3.2 2 of the EPCglobal Core Business Vocabulary Standard [11].
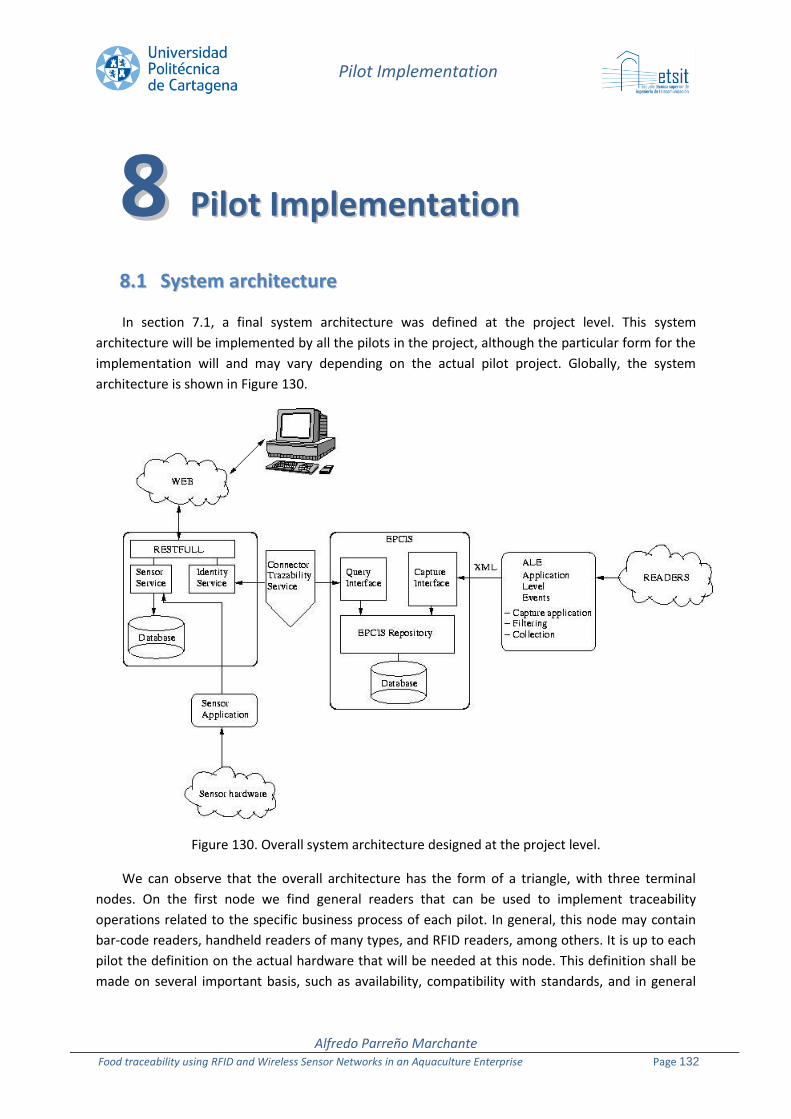
Pilot Implementation
Alfredo Parreño Marchante Food traceability using RFID and Wireless Sensor Networks in an Aquaculture Enterprise Page 132
88..11 SSyysstteemm aarrcchhiitteeccttuurree
In section 7.1, a final system architecture was defined at the project level. This system
architecture will be implemented by all the pilots in the project, although the particular form for the
implementation will and may vary depending on the actual pilot project. Globally, the system
architecture is shown in Figure 130.
Figure 130. Overall system architecture designed at the project level.
We can observe that the overall architecture has the form of a triangle, with three terminal
nodes. On the first node we find general readers that can be used to implement traceability
operations related to the specific business process of each pilot. In general, this node may contain
bar-code readers, handheld readers of many types, and RFID readers, among others. It is up to each
pilot the definition on the actual hardware that will be needed at this node. This definition shall be
made on several important basis, such as availability, compatibility with standards, and in general
88 PPiilloott IImmpplleemmeennttaattiioonn
Pilot Implementation
Alfredo Parreño Marchante Food traceability using RFID and Wireless Sensor Networks in an Aquaculture Enterprise Page 133
adequacy to the intended business processes implementation. As indicated Figure 130, the software
needed at this node is called Application Level Event, and it generally consists on a capture
application, and on a filtering and collection of the data received from the readers. This application
serves to connect the physical data received from the readers to the EPCIS repository used to store
the relevant traceability data generated during the business process of the company.
The second terminal node corresponds to the sensor hardware. At this node specific sensor
components will collect relevant parameters of the environment, such as temperature, humidity,
salinity, etc. The specific design of the wireless sensor network and of the hardware used will again
depend on the particular pilot implementation. This design should be based on the best possible
matching between the environment and the business process to be run by the company. The
software needed at this node is a sensor application as clearly indicated in Figure 130. This part of
the software will be in charge of capturing the data coming from the sensor hardware, and
subsequent storage in the appropriate databases. In particular, in the system architecture designed,
the sensor data will be send to a so-called sensor service.
The last terminal node corresponds to web-services provided to end users. The idea is to create
a service that presents all the information collected during the business process of a particular
company to the relevant end-users. This information can be accessed by simple web-browsers and
shall to be presented in a user-friendly way, combining information about traceability with the
information gathered by the wireless sensor network. This part of the system was developed by UW.
Only the connector between the EPCIS and the identity service shown in Figure 130 will have to be
developed as per each pilot implementation. This will be the last part to be developed in the system
architecture, and has not started yet.
88..22 CCuullmmáárreexx PPiilloott
As already said in the previous section, the hardware and the software to be developed will be
dependent on the particular business process to be run in each pilot. Therefore, one of the key
factors in the project was the definition of the information model and business processes relevant to
each pilot. All this information was collected in section 7.2. A summary of the information model and
business processes relevant to Culmárex Company is shown in Figure 131.
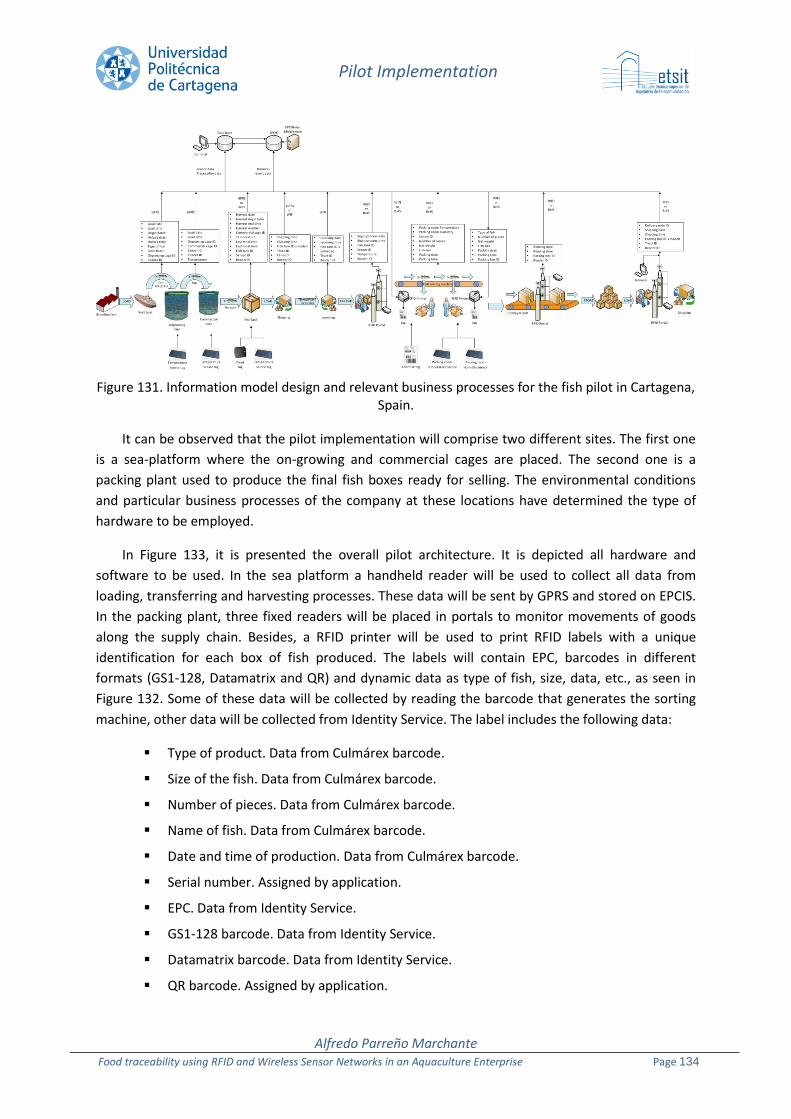
Pilot Implementation
Alfredo Parreño Marchante Food traceability using RFID and Wireless Sensor Networks in an Aquaculture Enterprise Page 134
Figure 131. Information model design and relevant business processes for the fish pilot in Cartagena, Spain.
It can be observed that the pilot implementation will comprise two different sites. The first one
is a sea-platform where the on-growing and commercial cages are placed. The second one is a
packing plant used to produce the final fish boxes ready for selling. The environmental conditions
and particular business processes of the company at these locations have determined the type of
hardware to be employed.
In Figure 133, it is presented the overall pilot architecture. It is depicted all hardware and
software to be used. In the sea platform a handheld reader will be used to collect all data from
loading, transferring and harvesting processes. These data will be sent by GPRS and stored on EPCIS.
In the packing plant, three fixed readers will be placed in portals to monitor movements of goods
along the supply chain. Besides, a RFID printer will be used to print RFID labels with a unique
identification for each box of fish produced. The labels will contain EPC, barcodes in different
formats (GS1-128, Datamatrix and QR) and dynamic data as type of fish, size, data, etc., as seen in
Figure 132. Some of these data will be collected by reading the barcode that generates the sorting
machine, other data will be collected from Identity Service. The label includes the following data:
Type of product. Data from Culmárex barcode.
Size of the fish. Data from Culmárex barcode.
Number of pieces. Data from Culmárex barcode.
Name of fish. Data from Culmárex barcode.
Date and time of production. Data from Culmárex barcode.
Serial number. Assigned by application.
EPC. Data from Identity Service.
GS1-128 barcode. Data from Identity Service.
Datamatrix barcode. Data from Identity Service.
QR barcode. Assigned by application.
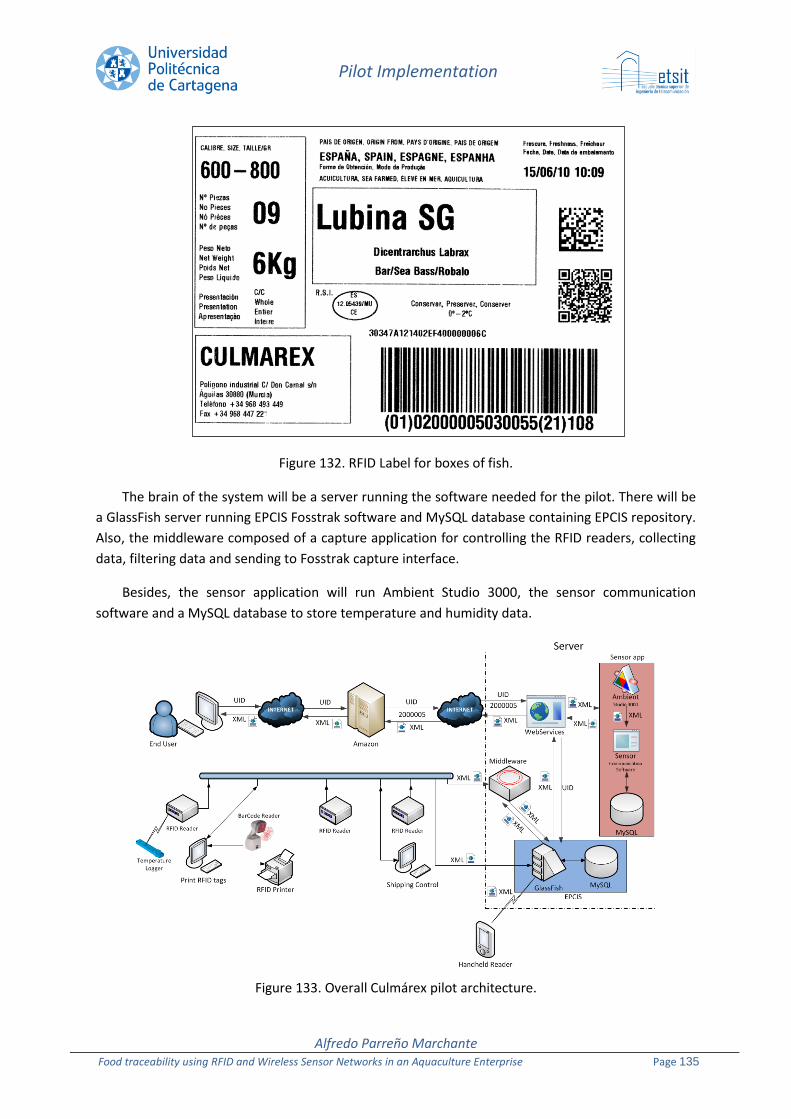
Pilot Implementation
Alfredo Parreño Marchante Food traceability using RFID and Wireless Sensor Networks in an Aquaculture Enterprise Page 135
Figure 132. RFID Label for boxes of fish.
The brain of the system will be a server running the software needed for the pilot. There will be
a GlassFish server running EPCIS Fosstrak software and MySQL database containing EPCIS repository.
Also, the middleware composed of a capture application for controlling the RFID readers, collecting
data, filtering data and sending to Fosstrak capture interface.
Besides, the sensor application will run Ambient Studio 3000, the sensor communication
software and a MySQL database to store temperature and humidity data.
Figure 133. Overall Culmárex pilot architecture.
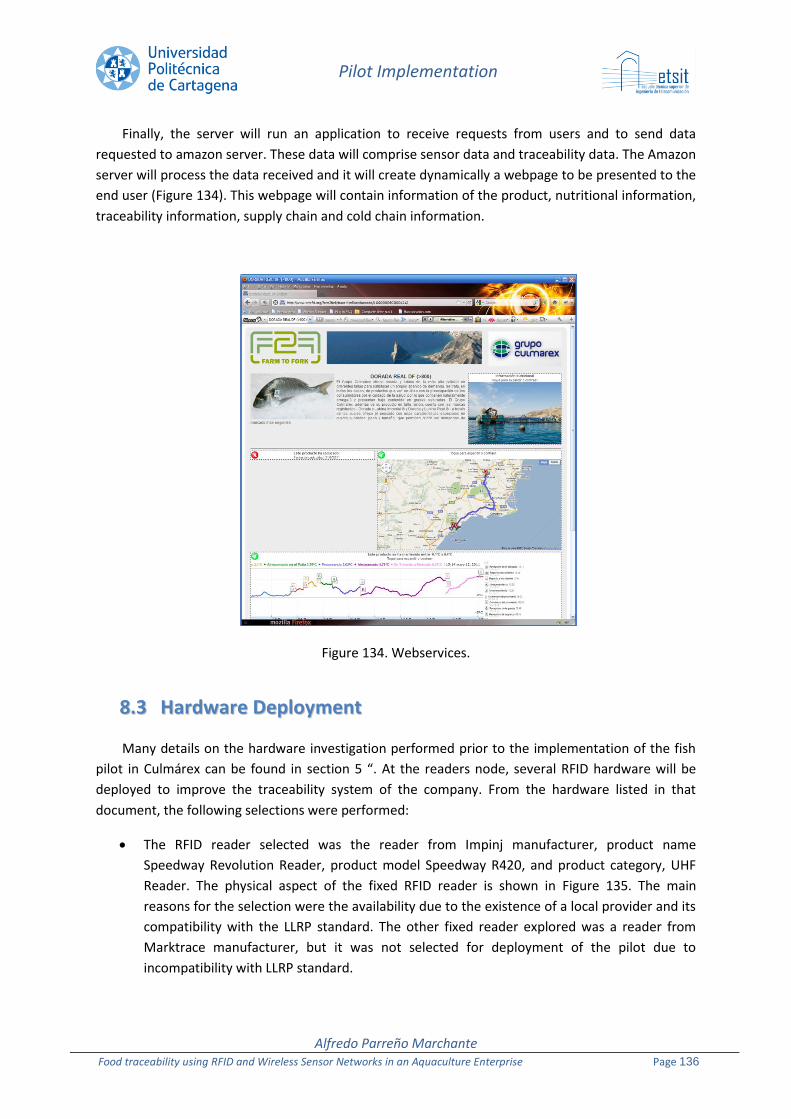
Pilot Implementation
Alfredo Parreño Marchante Food traceability using RFID and Wireless Sensor Networks in an Aquaculture Enterprise Page 136
Finally, the server will run an application to receive requests from users and to send data
requested to amazon server. These data will comprise sensor data and traceability data. The Amazon
server will process the data received and it will create dynamically a webpage to be presented to the
end user (Figure 134). This webpage will contain information of the product, nutritional information,
traceability information, supply chain and cold chain information.
Figure 134. Webservices.
88..33 HHaarrddwwaarree DDeeppllooyymmeenntt
Many details on the hardware investigation performed prior to the implementation of the fish
pilot in Culmárex can be found in section 5 “. At the readers node, several RFID hardware will be
deployed to improve the traceability system of the company. From the hardware listed in that
document, the following selections were performed:
The RFID reader selected was the reader from Impinj manufacturer, product name
Speedway Revolution Reader, product model Speedway R420, and product category, UHF
Reader. The physical aspect of the fixed RFID reader is shown in Figure 135. The main
reasons for the selection were the availability due to the existence of a local provider and its
compatibility with the LLRP standard. The other fixed reader explored was a reader from
Marktrace manufacturer, but it was not selected for deployment of the pilot due to
incompatibility with LLRP standard.
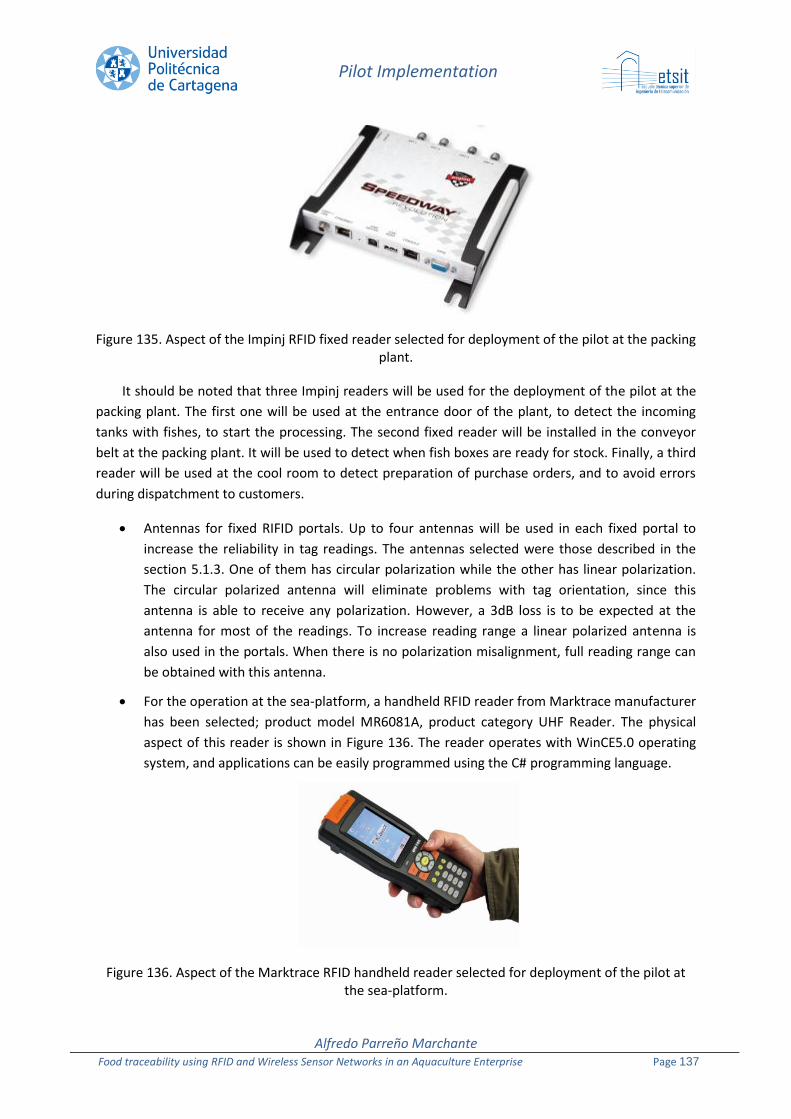
Pilot Implementation
Alfredo Parreño Marchante Food traceability using RFID and Wireless Sensor Networks in an Aquaculture Enterprise Page 137
Figure 135. Aspect of the Impinj RFID fixed reader selected for deployment of the pilot at the packing plant.
It should be noted that three Impinj readers will be used for the deployment of the pilot at the
packing plant. The first one will be used at the entrance door of the plant, to detect the incoming
tanks with fishes, to start the processing. The second fixed reader will be installed in the conveyor
belt at the packing plant. It will be used to detect when fish boxes are ready for stock. Finally, a third
reader will be used at the cool room to detect preparation of purchase orders, and to avoid errors
during dispatchment to customers.
Antennas for fixed RIFID portals. Up to four antennas will be used in each fixed portal to
increase the reliability in tag readings. The antennas selected were those described in the
section 5.1.3. One of them has circular polarization while the other has linear polarization.
The circular polarized antenna will eliminate problems with tag orientation, since this
antenna is able to receive any polarization. However, a 3dB loss is to be expected at the
antenna for most of the readings. To increase reading range a linear polarized antenna is
also used in the portals. When there is no polarization misalignment, full reading range can
be obtained with this antenna.
For the operation at the sea-platform, a handheld RFID reader from Marktrace manufacturer
has been selected; product model MR6081A, product category UHF Reader. The physical
aspect of this reader is shown in Figure 136. The reader operates with WinCE5.0 operating
system, and applications can be easily programmed using the C# programming language.
Figure 136. Aspect of the Marktrace RFID handheld reader selected for deployment of the pilot at the sea-platform.
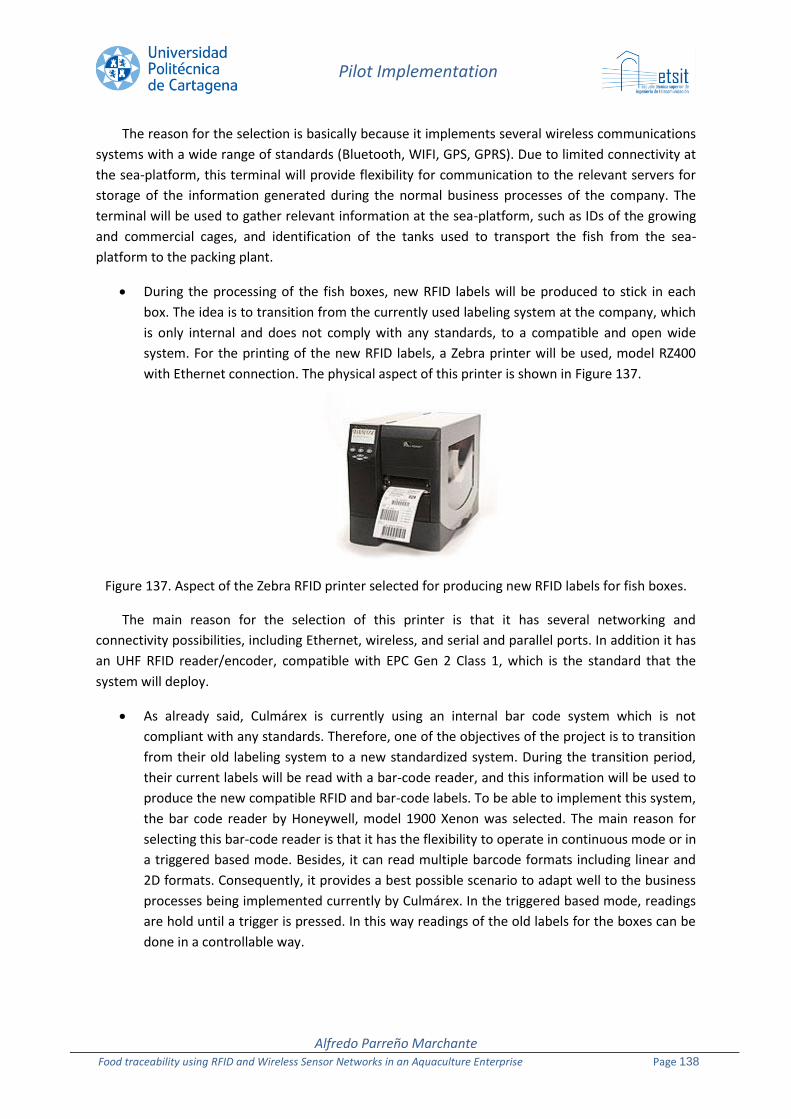
Pilot Implementation
Alfredo Parreño Marchante Food traceability using RFID and Wireless Sensor Networks in an Aquaculture Enterprise Page 138
The reason for the selection is basically because it implements several wireless communications
systems with a wide range of standards (Bluetooth, WIFI, GPS, GPRS). Due to limited connectivity at
the sea-platform, this terminal will provide flexibility for communication to the relevant servers for
storage of the information generated during the normal business processes of the company. The
terminal will be used to gather relevant information at the sea-platform, such as IDs of the growing
and commercial cages, and identification of the tanks used to transport the fish from the sea-
platform to the packing plant.
During the processing of the fish boxes, new RFID labels will be produced to stick in each
box. The idea is to transition from the currently used labeling system at the company, which
is only internal and does not comply with any standards, to a compatible and open wide
system. For the printing of the new RFID labels, a Zebra printer will be used, model RZ400
with Ethernet connection. The physical aspect of this printer is shown in Figure 137.
Figure 137. Aspect of the Zebra RFID printer selected for producing new RFID labels for fish boxes.
The main reason for the selection of this printer is that it has several networking and
connectivity possibilities, including Ethernet, wireless, and serial and parallel ports. In addition it has
an UHF RFID reader/encoder, compatible with EPC Gen 2 Class 1, which is the standard that the
system will deploy.
As already said, Culmárex is currently using an internal bar code system which is not
compliant with any standards. Therefore, one of the objectives of the project is to transition
from their old labeling system to a new standardized system. During the transition period,
their current labels will be read with a bar-code reader, and this information will be used to
produce the new compatible RFID and bar-code labels. To be able to implement this system,
the bar code reader by Honeywell, model 1900 Xenon was selected. The main reason for
selecting this bar-code reader is that it has the flexibility to operate in continuous mode or in
a triggered based mode. Besides, it can read multiple barcode formats including linear and
2D formats. Consequently, it provides a best possible scenario to adapt well to the business
processes being implemented currently by Culmárex. In the triggered based mode, readings
are hold until a trigger is pressed. In this way readings of the old labels for the boxes can be
done in a controllable way.

Pilot Implementation
Alfredo Parreño Marchante Food traceability using RFID and Wireless Sensor Networks in an Aquaculture Enterprise Page 139
Figure 138. Aspect of the Honeywell bar-code reader selected for reading old Culmárex labels.
Finally, for monitorization of the temperature in the tanks during the transportation of the fish
from the sea-platform to the packing plant, a temperature logger UHF semi-passive tag was
selected. The model selected is the A927Z, commercialized by the company CAEN RFID, and it is
shown in Figure 139.
The reasons for selecting this tag is that it is compatible with EPC Class1 Gen2, operates at the
frequency band of the system (UHF), and has a high degree of accuracy in the temperature sensor,
with 0.75ºC maximum error (typical 0.1ºC). In addition, it can be programmed to store temperatures
with minimum intervals of 8 seconds, and maximum intervals of 18 hours. This should cover all
practical needs of the business processes being run by Culmárex.
At the sensors node (see Figure 130), a wireless sensor network will be set up in order to
monitor the temperature and humidity of the packing plant and cool warehouse. We have selected
sensor hardware provided by Ambient Systems. This is a system that can be regarded as the third
generation of Active RFID solutions built on Dynamic Wireless Sensor Network technology. It is
based on the IEEE 802.15.4 standard 2.4GHz. The main reason for the selection is that it is a flexible
system that works well in indoor environments. The wireless network is built with micro-routers that
can communicate between them to build a mesh network infrastructure. The final connectivity is
done through a gateway that is connected to the relevant server or computer. The cells provided
contain both temperature and humidity sensors, which are required to monitor these parameters in
the packing plant and cool room. Another important reason for the selection of this system is that it
has a tool to assist during the deployment and installation of the network. This system is called
Ambient Studio 3000, and it is convenient for the initial installation and operation of the wireless
sensor network. The basic idea of the wireless network that can be built with this system is shown in
Figure 140. Finally, Figure 141 presents the Ambient Studio 3000 tool that can be used for the initial
deployment and installation of the system.
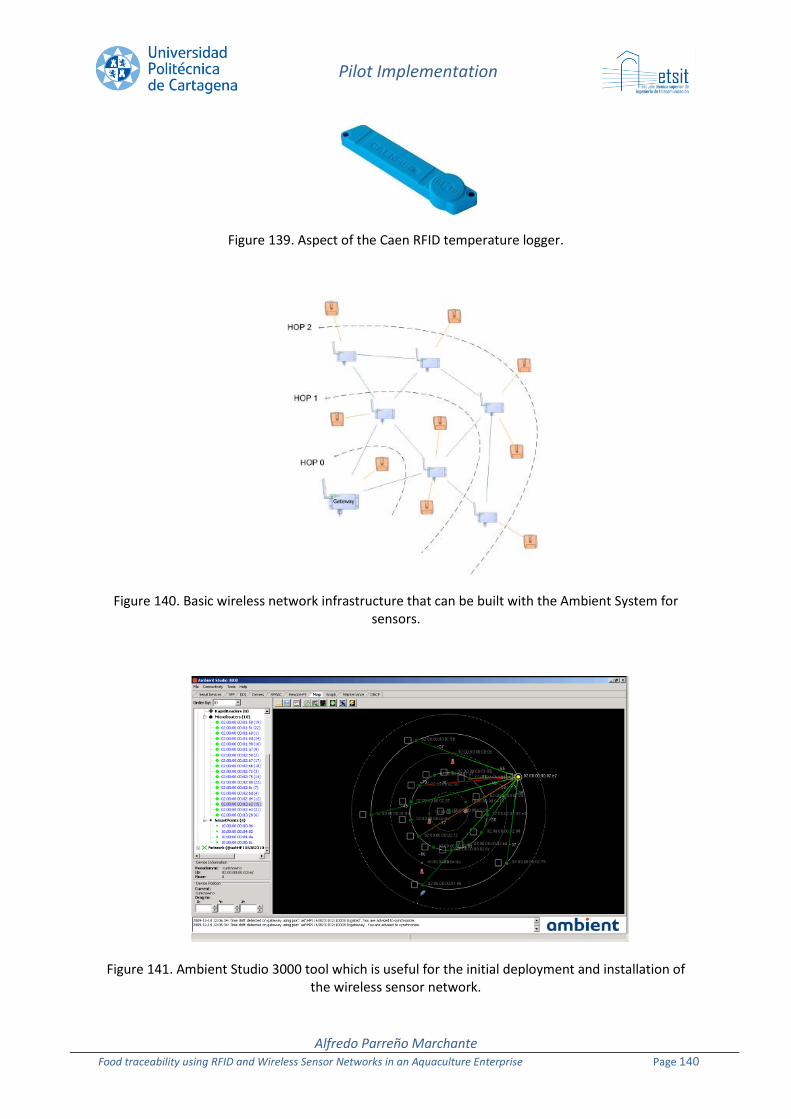
Pilot Implementation
Alfredo Parreño Marchante Food traceability using RFID and Wireless Sensor Networks in an Aquaculture Enterprise Page 140
Figure 139. Aspect of the Caen RFID temperature logger.
Figure 140. Basic wireless network infrastructure that can be built with the Ambient System for sensors.
Figure 141. Ambient Studio 3000 tool which is useful for the initial deployment and installation of the wireless sensor network.
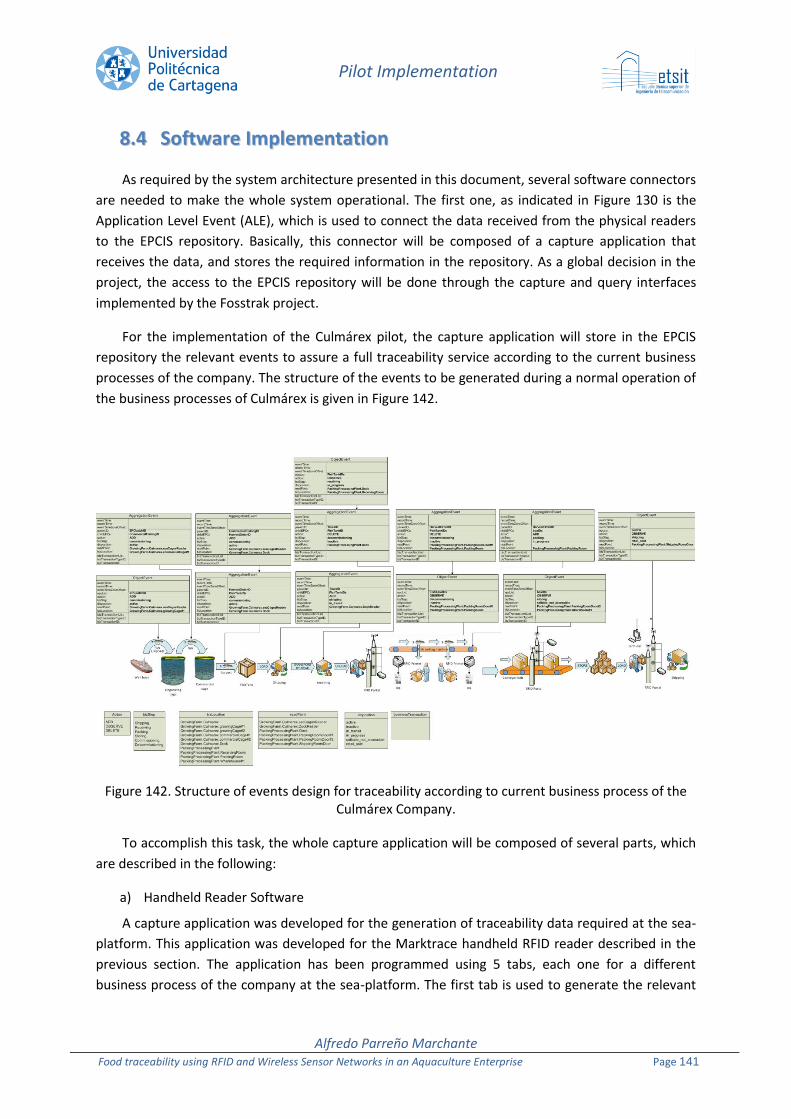
Pilot Implementation
Alfredo Parreño Marchante Food traceability using RFID and Wireless Sensor Networks in an Aquaculture Enterprise Page 141
88..44 SSooffttwwaarree IImmpplleemmeennttaattiioonn
As required by the system architecture presented in this document, several software connectors
are needed to make the whole system operational. The first one, as indicated in Figure 130 is the
Application Level Event (ALE), which is used to connect the data received from the physical readers
to the EPCIS repository. Basically, this connector will be composed of a capture application that
receives the data, and stores the required information in the repository. As a global decision in the
project, the access to the EPCIS repository will be done through the capture and query interfaces
implemented by the Fosstrak project.
For the implementation of the Culmárex pilot, the capture application will store in the EPCIS
repository the relevant events to assure a full traceability service according to the current business
processes of the company. The structure of the events to be generated during a normal operation of
the business processes of Culmárex is given in Figure 142.
Figure 142. Structure of events design for traceability according to current business process of the Culmárex Company.
To accomplish this task, the whole capture application will be composed of several parts, which
are described in the following:
a) Handheld Reader Software
A capture application was developed for the generation of traceability data required at the sea-
platform. This application was developed for the Marktrace handheld RFID reader described in the
previous section. The application has been programmed using 5 tabs, each one for a different
business process of the company at the sea-platform. The first tab is used to generate the relevant

Pilot Implementation
Alfredo Parreño Marchante Food traceability using RFID and Wireless Sensor Networks in an Aquaculture Enterprise Page 142
events during the unloading of the young fish arriving with the well-boat, into the on-growing cages
(to identify the fish with a particular batch ID and origin farm). The second tab will keep track on the
fish operations to transfer grown fish to the commercial cages (what we call commercial fish orders).
The third tab will be in charge to track the final fish tasks to catch the fish that will be processed in a
given day (what we call harvest orders). These fishes will be transferred to appropriate tanks for
transportation. The fourth tab is used to control the loading of the tanks in the truck for
transportation to the packing plant. Finally, the fifth tab is used to control the unloading process of
the tanks in the packing plant, ready for processing. At each stage, the capture application will
generate the events detailed in Figure 142, and will store them in the EPCIS repository by accessing
the capture interface implementation of Fosstrak. As can be seen in Figure 142, the basic events
consist on aggregation events to link harvest orders to commercial fish orders, and commercial fish
orders with batch IDs. At the different steps, each growing cage, commercial cage, tanks for
transportation and trucks, will be given a unique business location or asset identifier as appropriate.
b) Fixed Readers Software
At the packing plant, the capture interface will be composed of four different components.
There will be one component to take care of traceability operations at each one of the RFID portals
shown in Figure 131. An additional component will be used to read the old labels being used by
Culmárex, to process the information contained in these old labels, and to produce the new labels
compatible with the system and with the EPCIS standards. In addition, this component will also
update the relevant information in the Identity Service (the core component of the web-services for
easy access of the information by end users, see Figure 130). All these four components are
described next.
The first component was programmed to take care of the initial stage of processing at the
entrance door of the packing plant. When a tank is unloaded at the entrance door, a fixed RFID
reader will detect the tank. At the packing plant we use the described Impinj Speedway Revolution
fixed Reader. This component of the capture application will first query the EPCIS repository to find
the ID of the fish order linked with the current tank to be processed. This will be done using the
query interface implementation of the Fosstrak project. Once this is obtained, the application will
generate the events as indicated in Figure 142, and will store them in the EPCIS repository using the
capture interface implementation of Fosstrak.
The next component of the capture interface is an application to read old Culmárex barcodes
and print new RFID labels. It is placed at the end of the processing machine shown in Figure 142. At
this stage of the process, boxes have already been prepared, and also the old labels used by
Culmárex are already stuck on them. The basic operation of this component is shown in Figure 143.
The first operation is to query the EPCIS repository to get the last serial number for box fishes that
was used and stored in the EPCIS database. This previous operation is needed, since from this last
serial number, we will be able to generate the next serial number for the current box being
processed. At the same time, EPCIS is queried to obtain harvest orders identifiers of the day (origin
of the fish being processed). This will allow assigning boxes to the appropriate harvest order. The
next step will be to read the old label used by Culmárex on the current box. This will be done using
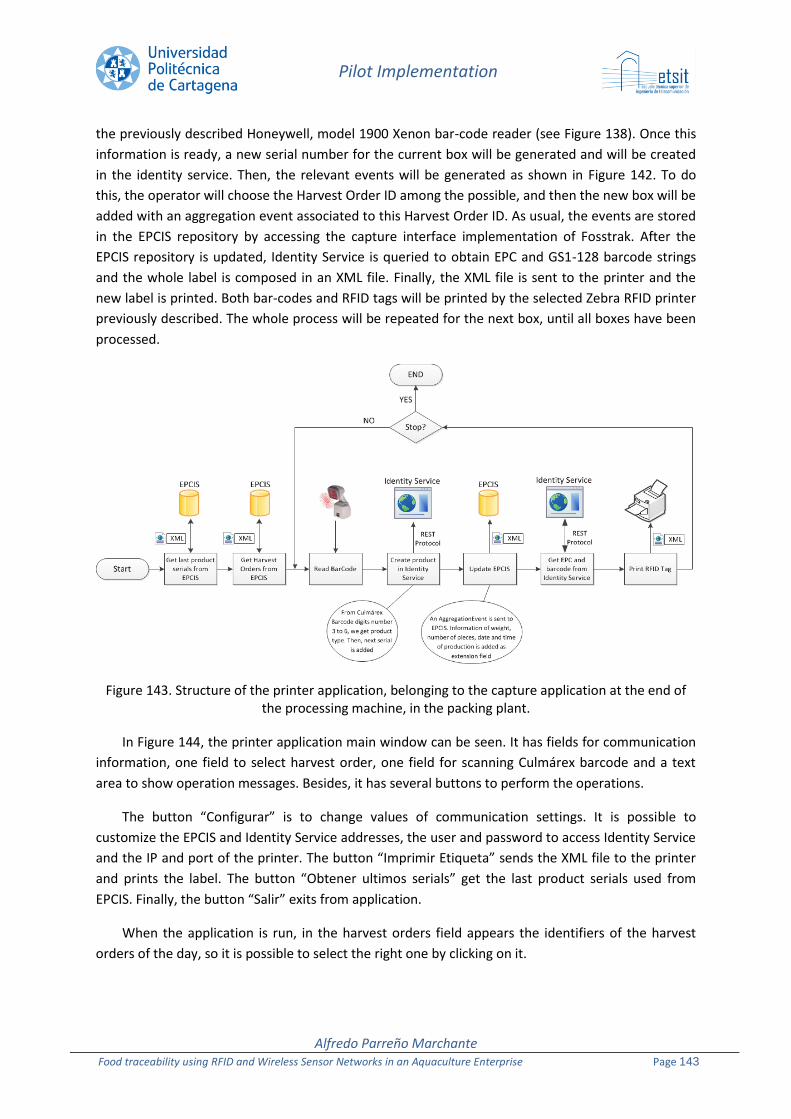
Pilot Implementation
Alfredo Parreño Marchante Food traceability using RFID and Wireless Sensor Networks in an Aquaculture Enterprise Page 143
the previously described Honeywell, model 1900 Xenon bar-code reader (see Figure 138). Once this
information is ready, a new serial number for the current box will be generated and will be created
in the identity service. Then, the relevant events will be generated as shown in Figure 142. To do
this, the operator will choose the Harvest Order ID among the possible, and then the new box will be
added with an aggregation event associated to this Harvest Order ID. As usual, the events are stored
in the EPCIS repository by accessing the capture interface implementation of Fosstrak. After the
EPCIS repository is updated, Identity Service is queried to obtain EPC and GS1-128 barcode strings
and the whole label is composed in an XML file. Finally, the XML file is sent to the printer and the
new label is printed. Both bar-codes and RFID tags will be printed by the selected Zebra RFID printer
previously described. The whole process will be repeated for the next box, until all boxes have been
processed.
Figure 143. Structure of the printer application, belonging to the capture application at the end of the processing machine, in the packing plant.
In Figure 144, the printer application main window can be seen. It has fields for communication
information, one field to select harvest order, one field for scanning Culmárex barcode and a text
area to show operation messages. Besides, it has several buttons to perform the operations.
The button “Configurar” is to change values of communication settings. It is possible to
customize the EPCIS and Identity Service addresses, the user and password to access Identity Service
and the IP and port of the printer. The button “Imprimir Etiqueta” sends the XML file to the printer
and prints the label. The button “Obtener ultimos serials” get the last product serials used from
EPCIS. Finally, the button “Salir” exits from application.
When the application is run, in the harvest orders field appears the identifiers of the harvest
orders of the day, so it is possible to select the right one by clicking on it.
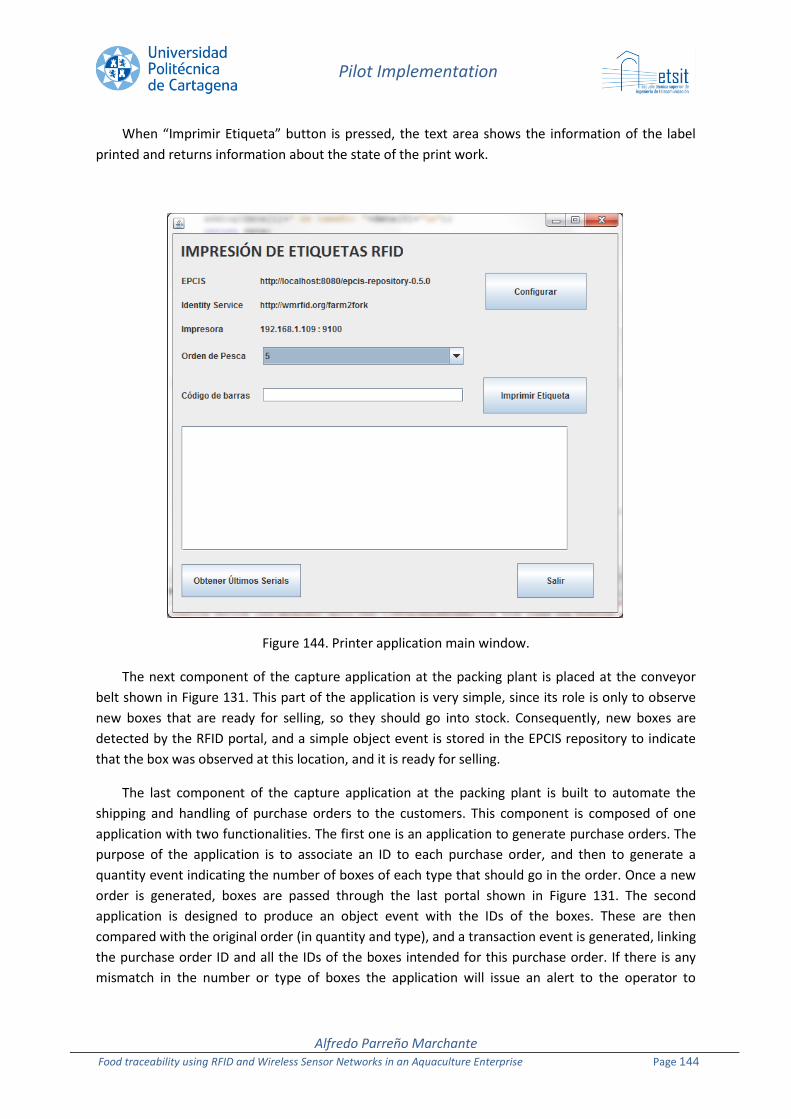
Pilot Implementation
Alfredo Parreño Marchante Food traceability using RFID and Wireless Sensor Networks in an Aquaculture Enterprise Page 144
When “Imprimir Etiqueta” button is pressed, the text area shows the information of the label
printed and returns information about the state of the print work.
Figure 144. Printer application main window.
The next component of the capture application at the packing plant is placed at the conveyor
belt shown in Figure 131. This part of the application is very simple, since its role is only to observe
new boxes that are ready for selling, so they should go into stock. Consequently, new boxes are
detected by the RFID portal, and a simple object event is stored in the EPCIS repository to indicate
that the box was observed at this location, and it is ready for selling.
The last component of the capture application at the packing plant is built to automate the
shipping and handling of purchase orders to the customers. This component is composed of one
application with two functionalities. The first one is an application to generate purchase orders. The
purpose of the application is to associate an ID to each purchase order, and then to generate a
quantity event indicating the number of boxes of each type that should go in the order. Once a new
order is generated, boxes are passed through the last portal shown in Figure 131. The second
application is designed to produce an object event with the IDs of the boxes. These are then
compared with the original order (in quantity and type), and a transaction event is generated, linking
the purchase order ID and all the IDs of the boxes intended for this purchase order. If there is any
mismatch in the number or type of boxes the application will issue an alert to the operator to
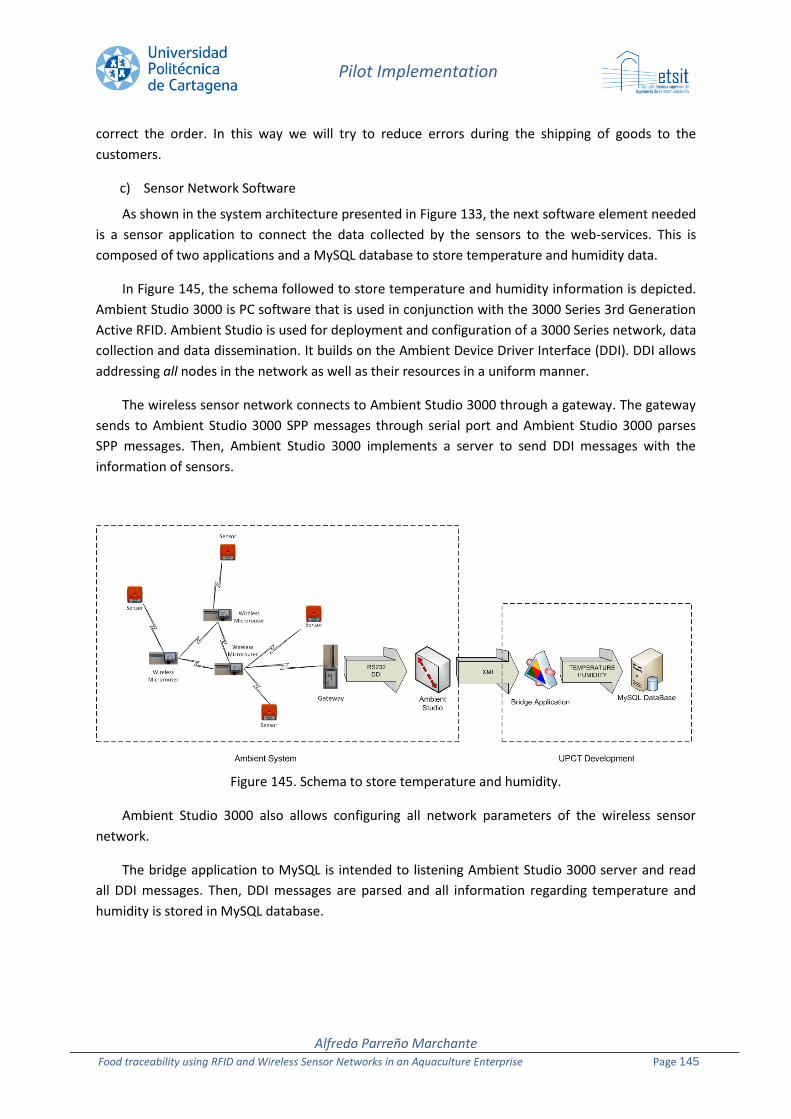
Pilot Implementation
Alfredo Parreño Marchante Food traceability using RFID and Wireless Sensor Networks in an Aquaculture Enterprise Page 145
correct the order. In this way we will try to reduce errors during the shipping of goods to the
customers.
c) Sensor Network Software
As shown in the system architecture presented in Figure 133, the next software element needed
is a sensor application to connect the data collected by the sensors to the web-services. This is
composed of two applications and a MySQL database to store temperature and humidity data.
In Figure 145, the schema followed to store temperature and humidity information is depicted.
Ambient Studio 3000 is PC software that is used in conjunction with the 3000 Series 3rd Generation
Active RFID. Ambient Studio is used for deployment and configuration of a 3000 Series network, data
collection and data dissemination. It builds on the Ambient Device Driver Interface (DDI). DDI allows
addressing all nodes in the network as well as their resources in a uniform manner.
The wireless sensor network connects to Ambient Studio 3000 through a gateway. The gateway
sends to Ambient Studio 3000 SPP messages through serial port and Ambient Studio 3000 parses
SPP messages. Then, Ambient Studio 3000 implements a server to send DDI messages with the
information of sensors.
Figure 145. Schema to store temperature and humidity.
Ambient Studio 3000 also allows configuring all network parameters of the wireless sensor
network.
The bridge application to MySQL is intended to listening Ambient Studio 3000 server and read
all DDI messages. Then, DDI messages are parsed and all information regarding temperature and
humidity is stored in MySQL database.
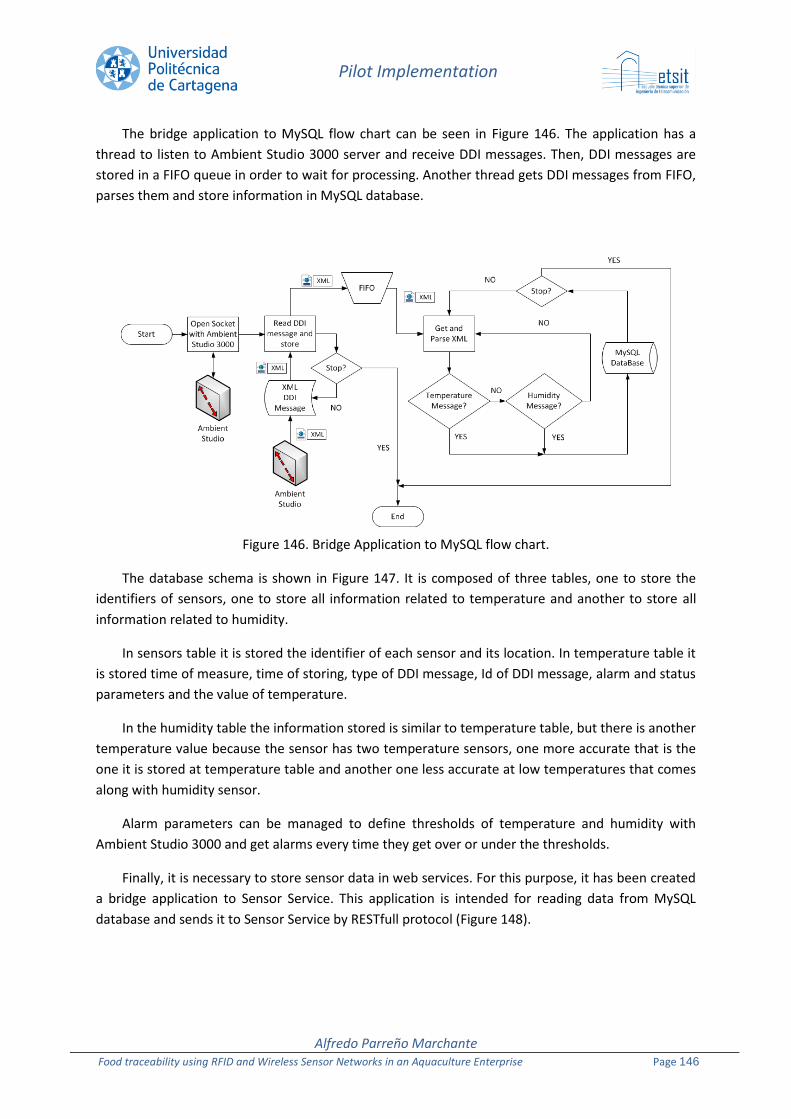
Pilot Implementation
Alfredo Parreño Marchante Food traceability using RFID and Wireless Sensor Networks in an Aquaculture Enterprise Page 146
The bridge application to MySQL flow chart can be seen in Figure 146. The application has a
thread to listen to Ambient Studio 3000 server and receive DDI messages. Then, DDI messages are
stored in a FIFO queue in order to wait for processing. Another thread gets DDI messages from FIFO,
parses them and store information in MySQL database.
Figure 146. Bridge Application to MySQL flow chart.
The database schema is shown in Figure 147. It is composed of three tables, one to store the
identifiers of sensors, one to store all information related to temperature and another to store all
information related to humidity.
In sensors table it is stored the identifier of each sensor and its location. In temperature table it
is stored time of measure, time of storing, type of DDI message, Id of DDI message, alarm and status
parameters and the value of temperature.
In the humidity table the information stored is similar to temperature table, but there is another
temperature value because the sensor has two temperature sensors, one more accurate that is the
one it is stored at temperature table and another one less accurate at low temperatures that comes
along with humidity sensor.
Alarm parameters can be managed to define thresholds of temperature and humidity with
Ambient Studio 3000 and get alarms every time they get over or under the thresholds.
Finally, it is necessary to store sensor data in web services. For this purpose, it has been created
a bridge application to Sensor Service. This application is intended for reading data from MySQL
database and sends it to Sensor Service by RESTfull protocol (Figure 148).
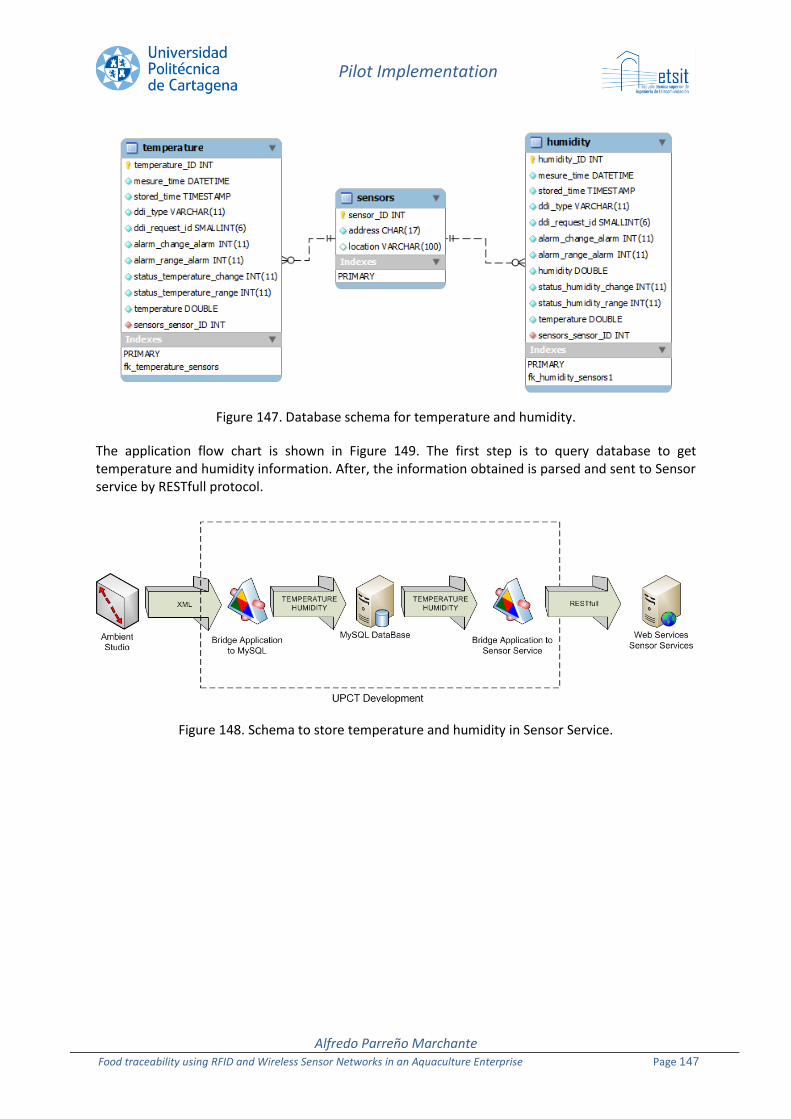
Pilot Implementation
Alfredo Parreño Marchante Food traceability using RFID and Wireless Sensor Networks in an Aquaculture Enterprise Page 147
Figure 147. Database schema for temperature and humidity.
The application flow chart is shown in Figure 149. The first step is to query database to get temperature and humidity information. After, the information obtained is parsed and sent to Sensor service by RESTfull protocol.
Figure 148. Schema to store temperature and humidity in Sensor Service.
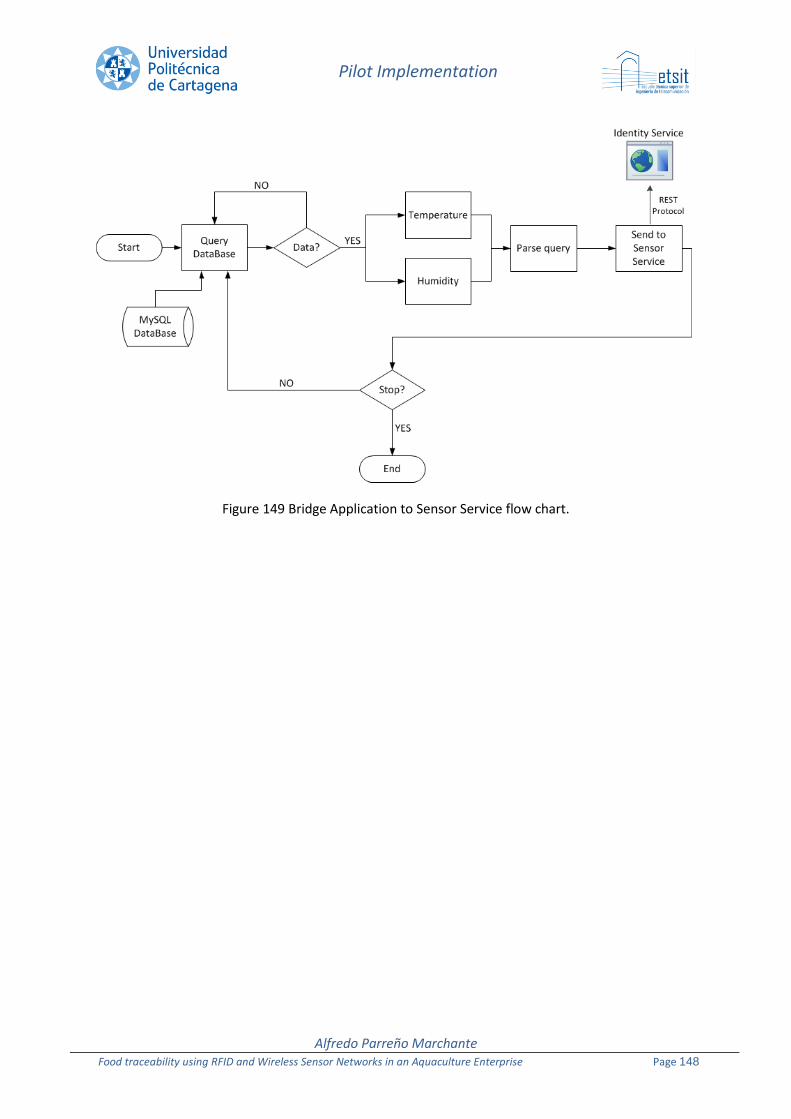
Pilot Implementation
Alfredo Parreño Marchante Food traceability using RFID and Wireless Sensor Networks in an Aquaculture Enterprise Page 148
Figure 149 Bridge Application to Sensor Service flow chart.

Conclusions
Alfredo Parreño Marchante Food traceability using RFID and Wireless Sensor Networks in an Aquaculture Enterprise Page 149
This document has presented the results of the first year work of the “RFID from Farm to Fork”
European project. During this first year of work, it has been developed information models, selected
standards, hardware and software, developed software and made tests in laboratory.
We decided to work with EPCglobal standards and we focused on understanding them in order
to be able to complain all standards in our pilot. We had to learn how to use LLRP protocol to
communicate with RFID readers, how to build a capture application and how to use EPCIS standard.
We decided to use Fosstrak as EPCIS implementation for the pilot among other possibilities as
Aspire.
We purchased hardware for testing purposes. Two RFID readers were purchased, a non-LLRP
compliant and a LLRP compliant from Marktrace and Impinj respectively, and we test them on
laboratory. We decided to use Impinj reader because of its advanced features and its LLRP compliant
features.
Tag performance tests were performed too in laboratory, and we concluded that performance
of tags varies a lot depending on the tag design, environment, orientation and disposition. We
tested too the tag performance in pallet conditions in which a pallet can be composed of a lot of fish
boxes. Results showed that boxes in the interior of the pallet were more difficult to detect, as
expected. After all these tests, we chose the tag that best fitted our needs.
We studied all business processes of Culmárex in order to create the architecture of the pilot.
We did a first approach and discussed with Culmárex in order to find the best solution. We defined
the information flow and the information to be captured by our pilot within Culmárex business
process. The resulting pilot architecture will allow to the company to study the improvement of the
processes involved and the return of inversion they can get from it. The automation of the processes
will reduce the personnel work and the collection of information will make possible to access
traceability information in real time. The improvements we will reach with the introduction of
technology are the following:
Automation of temperature readings inside farm cages. (Now reads are done manually).
Computerize traceability information. (Now most traceability data is on paper).
Reduce staff work by removing traceability handmade sheets.
Reduce staff work by Customer access to traceability data by web (Now a person has to
collect all handmade sheets to send them to the customer).
Automation of shipping and receiving processes.
Ensure the cold chain supply by the sensor network.
Reduce personnel by automating box reads (Now 1 person is dedicated to this work).
99 CCoonncclluussiioonnss

Conclusions
Alfredo Parreño Marchante Food traceability using RFID and Wireless Sensor Networks in an Aquaculture Enterprise Page 150
Increase accuracy and update time for stock by automating box reads.
Increase customer confidence and improve company image.
Ensure Shipping process by the introduction of RFID technology. We can ensure the goods
load are correct by using a RFID portal and tags on each box or pallet.
Besides, an implementation of EPCIS events compliant with Core Business Vocabulary standard
[11] has been presented. We had two options, first to adopt a compliant implementation, and
second to adopt a compatible implementation. We chose first one because it is necessary to be able
to exchange data among organizations.
Finally we have presented the hardware we have chosen for pilot implementation and the
software developed. We have developed several applications to control readers, to collect data and
to print labels. All this system is under testing in laboratory to debug software.
In May 2011 began the second year of the project, in it, the deployment phase will begin. After
all laboratory work is finished, the hardware and software developed will be deployed at Culmárex
sites. It is planned to test the system in real conditions of production and environment to evaluate
its performance.

References
Alfredo Parreño Marchante Food traceability using RFID and Wireless Sensor Networks in an Aquaculture Enterprise Page 151
[1] “EU Project “F2F-RFID from Farm to Fork” ICT PSP Programme,” 2011. [Online]. Available:
http://www.rfid-f2f.eu.
[2] H. Lehpamer, RFID Design Principles, Artech House, 2008.
[3] EPCglobal, Low Level Reader Protocol (LLRP), Version 1.0.1., 2007.
[4] EPCglobal, The Application Level Events (ALE) Specification, Version 1.1.1, 2009.
[5] EPCglobal, EPC Information Services (EPCIS) Version 1.0.1 Specification, 2011.
[6] EPCglobal, EPC Tag Data Standard Version 1.5, 2010.
[7] Ambient, 3000 Series White Paper, 2010.
[8] "Fosstrak," 2011. [Online]. Available: http://www.fosstrak.org/epcis/index.html.
[9] Aspire, "AspireRFID Wiki," 2011. [Online]. Available:
http://wiki.aspire.ow2.org/xwiki/bin/view/Main.Documentation/APE.
[10] Cumárex, "Grupo Culmárex," [Online]. Available: www.culmarex.com.
[11] EPCglobal, Core Business Vocabulary Standard, 2010.
[12] "The EuroFIR project - A story of success," 2011. [Online]. Available:
http://www.eurofir.org/foodinformation.
1100 RReeffeerreenncceess