food waste thesis - jmu
TRANSCRIPT

Food Loss and Waste Disposal Analysis of James Madison University
Thesis Submitted By:
Nicole Raftery Student ID: 109742045
Senior Capstone Project
April, 2017
Advisor: Dr. Steven Frysinger
1
Table of Contents
1 Acknowledgements 4 2 Abstract 5 3 Introduction 6 4 Food Waste or Wasted Food 7
4.1 Expiration Dates 8 4.1.1 Expiration Dating in Major Grocery Stores 8 4.1.2 Expiration Dating at JMU 9
4.2 Liquid Waste 10 4.3 Food Waste Regulation in the U.S. 11
4.3.1 Food Waste Regulation in France 11 5 Issues with Food Waste 12
5.1 Landfill Consumption 12 5.1.1 Generation of Methane and Other Pollutants 15 5.1.2 Groundwater Contamination 16 5.1.3 Landfill Construction 18
5.2 Overall Soil Quality 20 5.2.1 What is soil? 20 5.2.2 Functions of Soil 20 5.2.3 Use of Pesticides 20 5.2.4 Use of Fertilizers 21 5.2.5 Erosion 21
5.3 Malnutrition 22 5.4 Loss of Natural Resources 23 5.5 Energy Usage 25
5.5.1 Transportation of Food 25 5.5.2 Transportation of Food Waste 25
5.6 Water Consumption 26 5.7 Cost 27 5.8 Farmland Loss 27 5.9 Lack of Data 29 5.10 Social Stigma 29 5.11 Municipal Solid Waste Management 30 5.12 Greenhouse Gas (GHG) Emissions 30

2
6 Food Waste Disposal Options 31 6.1 Landfills 34 6.2 Composting 34 6.3 Recycling 35 6.4 Anaerobic Digestion 35
7 Wasted Food at James Madison University 36 7.1 Composting at JMU 36
7.1.1 Black Bear Composting 36 7.2 Aramark 38
7.2.1 Weigh-the-Waste 38 8 Literature Review 39
8.1 University of Texas at Austin 39 8.2 Reed College of Portland, Oregon 39 8.3 Messiah College of Mechanicsburg, Pennsylvania 39 8.4 The Campus Kitchens Project 39 8.5 Stanford University of Stanford, California 40
9 Survey 40 9.1 Study Area 40 9.2 Interviews 41 9.3 Methods 41
9.3.1 Institutional Review Board (IRB) 42 9.4 Survey 42
9.4.1 Survey Factors Explained 45 9.4.1.1 Factors Involved with Returning or Not Returning Food 45
9.4.1.1.1 Upbringing 45 9.4.1.1.2 Social Pressure 46 9.4.1.1.3 Unawareness/Awareness of Impacts 46 9.4.1.1.4 Time 46 9.4.1.1.5 “Eyes are too big for stomach” 46 9.4.1.1.6 Convenience 47 9.4.1.1.7 “Everyone else does” 47 9.4.1.1.8 Financial 47
9.4.1.2 Factors Influencing the Proper Disposal of Waste 47 9.4.1.2.1 Informed/Uninformed of What Goes Where 47

3
9.4.1.2.2 Availability/Unavailability of Bins 48 9.4.1.2.3 Social Pressure 48 9.4.1.2.4 Time 48 9.4.1.2.5 “No one else does” 49
10 Survey Results 50 10.1 “All you care to eat” Facilities 51
10.1.1 Wasted Food 51 10.1.2 Factors Influencing the Wasting of Food 52 10.1.3 Factors Influencing Conservation of Food 53
10.2 Retail Dining Facilities 55 10.2.1 Factors Influencing Proper and Improper Waste Disposal 56
10.3 Overall Food Waste Opinions 58 11 Suggestions for James Madison University 60
11.1 Raise Student Awareness 60 11.1.1 Frog Week 60 11.1.2 Publicity 61
11.1.2.1 Potty Mouth 61 11.1.2.2 The Breeze 61
11.1.3 Stickers 62 11.1.4 Student Incentives 62 11.5.5 Dining Hall Reminders 62 11.5.6 Weighing Stations 62
11.2 Unwanted Food Options 63 11.2.1 Clearance Racks 63 11.2.2 Taste Testing 63 11.2.3 Campus Kitchens at JMU 63
11.3 More Disposal Bins 63 11.3.1 Waste Disposal Clarification 64
11.4 Individual Tips 64 12 Conclusion 67 13 Works Cited 68

4
1 Acknowledgements I would like to thank Dr. Steven Frysinger, my capstone advisor, for all of his guidance throughout my project. With his help and support, I was able to complete my project with confidence. I would like to thank Dr. C.J. Brodrick Hartman for her assistance in the creation of my survey. Dr. Brodrick Hartman spoke with me during the early stages of the project and provided information about current sustainability measures at James Madison University. The information she provided helped me tremendously. I would like to thank Charlie Leventry, former Sustainability Coordinator for Aramark, for speaking with me about Aramark dining services at James Madison University. I would like to thank all survey participants for taking the time to complete my survey.

5
2 Abstract The loss of food is a heartache felt all around the world. Rich or poor, developed or undeveloped, no country is innocent to this ever-growing problem. As of 2014, as much as 40% of the food sold in the United States is wasted according to the U.S. Department of Agriculture (USDA). In order to make a difference, small-scale changes need to be made on a global scale. James Madison University (JMU) is a large-scale educational institution located in Harrisonburg, Virginia. JMU, like any college, disposes of a large amount of food waste each year. The university itself is taking strides to reduce overall waste production, but the real waste problem lies with the JMU community members. In order to significantly and permanently reduce food loss at JMU and increase proper disposal of said waste, community members must change their careless, thoughtless, and wasteful dining and disposal habits. By developing an understanding of why people waste food and how they dispose of it, appropriate actions may be implemented to bring about change among the people at JMU now and the people in the years to come. Some of these measures include educational activities, campus reminders, and the option to sample food in the dining halls. If implemented, these measures could provide the education JMU community members need to reduce their “foodprints”.

6
3 Introduction Of the 7.5 billion people in the world, approximately 800 million of those people do not have enough food to acquire all necessary nutrients for a healthy life, or are “food insecure” (FAO, n.d.). The majority of the starving people in the world reside in developing countries, but even developed countries are home to food insecure people. FeedingAmerica.org states that in 2015, over 42 million people were considered food insecure in the United States (U.S.). Below are a collection of waste facts:
• According to the National Public Radio (NPR), 1 out of every 6 Americans go hungry each day (Poon, 2015).
• Consequently, according to the U.S. Department of Agriculture (USDA), 30% to 40% of all the food supply in the U.S. becomes wasted food.
• Furthermore, of all of the waste that enters municipal solid waste landfills in the U.S., the EPA stated that 21.6% came from food waste in 2014.
• During 2010, the USDA estimated that 133 billion pounds of food waste was from the retail and/or consumer level. So, not only is there a high amount of wasted food, but there is also a high rate of landfilling that wasted food.
To attempt to deal with this problem, USDA Secretary Tom Vilsack and EPA Deputy Administrator Stan Meiburg made a statement about food loss and waste reductions goals in the United States (Food Waste, 2015). This statement says that through the conjoined efforts of the USDA, the Environmental Protection Agency (EPA), and other institutions, the goal for food loss and waste reduction is to have a 50% reduction by the year 2030 (Food Waste, 2015). In order to accomplish this goal, the United States federal government, along with state governments and the private sector, need to work together on reducing food loss in all realms of American infrastructure and culture. The majority of food losses come from retail and consumer activities (Gustavsson, 2011). In order to reduce the amount of food waste throughout the U.S., businesses and people alike need to consciously think about their individual contribution to the problem. James Madison University (JMU) is an institution that significantly contributes to food loss every day. With a current population of over 21,000 students, faculty, and staff, the university is responsible for providing food for the students who reside on campus with required meal plans and the students’ off-campus who purchase on-campus meal plans. Additionally, faculty, staff, students without meal plans, and visitors frequently purchase food in the dining facilities as well. In order to supply enough food for the JMU community, food must be prepared in advance and in copious amounts. Unfortunately, large-scale institutions like this and others struggle with minimizing food waste without failing to meet consumer demand. However, JMU dining services, provided by Aramark, is making strides towards reducing waste. It seems that now the majority of wasted food at JMU comes from consumers simply throwing out food they do not want or need. I was not able to obtain the exact waste information, but from my experience working in the largest dining hall on campus (E-Hall), I quickly learned who is responsible for the majority of wasted food. Additionally, in an interview with Charlie Leventry, former Sustainability Coordinator for Aramark, he stated that the majority of waste comes from the consumers as well. This wasted

7
food may end up in a landfill or may be composted, but often it is not used for its’ intended purpose: to feed people.
4 Food Waste or Wasted Food The EPA describes food waste as “food that is unfit for human consumption.” Food that is seen as unfit for human consumption may have become spoiled, contaminated, etc. For example, a food item that would classify as food waste is an eggshell. The shell is inedible and therefore is considered food waste. The term “wasted food” means something slightly different. Wasted food is food that is fit for human consumption, but is instead sent for disposal (Sustainable Management, n. d.). Wasted food is generated from multiple sources, such as residences, food-service entities, institutions, agriculture, etc. Considering the previous egg example, the egg itself would be considered wasted food if the contents of the egg were cooked and the leftovers were disposed of. Another similar term is “food loss”, which refers to the general loss of any food items during the different stages of the life cycle. For the purposes of this paper, the terms food waste, wasted food, and food loss will be used interchangeably. All terms will be used to describe the food that is disposed of by consumers on campus. Below is a bar graph that shows the different types of food waste from the production of cereal to the consumption.
Figure 1. Bar graph of food losses in each stage of production to consumption.
Focusing on the second column from the left of the graph (North America and Oceania), it is clear that the majority of food loss in the U.S. comes from the consumers (Gustavsson, 2011). When looking at another developed area, such as Europe, the majority of their food waste comes from the consumer level too. This is occurring because developed nations have industrialized production procedures, such as automated packaging, that minimize processing waste. Whereas developing countries, such as South and Southeast Asia, have more food loss from the production processes. According to the USDA, 31% of all food waste comes from the retailer

8
and consumer level (U.S. Food Waste Challenge, n.d.). This is a clear indicator that American citizens need to be more aware of the food they waste in order to reduce the amount of food waste the nation generates altogether. Due to the high rate of consumer loss versus production loss, the rest of this study will focus on the consumer side food waste and disposal.
4.1 Expiration Dates
According to the United States Department of Agriculture (USDA), “open dating” is used for retailers to determine how long a specific product should be on display. There are many types of dates that can been seen on products, such as “best by”, “best if used by”, “expires”, “sell by”, etc. In the United States today, there is no universal way for food dating. Additionally, the only product that is required by law under the Food and Drug Administration (FDA) to have a product date is infant formula (Food Product Dating, n.d.). This presents a problem for the consumers because every retailers and/or manufacturer is allowed to label food as they see fit. In one grocery store alone, there could be several different terms used to describe when an item should be sold or eaten by. Such a variety of dating techniques can cause confusion among consumers, leading to more food waste (Van Garde, 1987).
4.1.1 Expiration Dating in Major Grocery Stores Due to a lack in federal regulation, there is a collection of different labeling methods used by different producers, retailers, and manufacturers. Instead of informing consumers, it can confuse them. To help with such confusion, the FDA website contains information about food safety. For example, there is online access to a “Refrigerator and Freezer Storage Chart” that gives guidelines to consumers about how long certain food items can remain in storage before they are most likely to go bad (Food Safety for Seniors, 2011). However, it is known that the FDA airs on the side of caution toward food expiration dates in order to protect uninformed U.S. citizens (Bloom, 2011). Additionally, many citizens rely solely on the date labeled on the product to determine if the product is edible or not. Below is a list of some common date labels and their tentative definitions that are seen in food stores across the United States (Bloom, 2011):
● “Sell by” = the last date that retailers should sell the food ● “Best by/Best if used by” = the last date for peak freshness of product ● “Use by” = the last date to be used by the consumer
None of the previous labeling methods state when the food is likely to expire. Furthermore, it is possible to have more than one date present on an item. Jonathan Bloom, acclaimed author of American Wasteland, discusses an example of this in his book. He states that while shopping for a cheese product in a grocery store, the item he was looking for had both a “sell by” date and a “use by” date on the packaging. Interestingly, both of these dates were for the same day (Bloom, 2011). Bloom admits his own confusion towards the item’s safety and then points out another serious problem with the open dating system: freshness.

9
In American Wasteland, he states “the cult of freshness, not confusion, prompts date label problems.” (Bloom, 2011). More specifically, Bloom is addressing the idea that peak freshness results in tremendous food waste. According to Business Insider, many grocery stores will remove items from the shelves if they are close to their “sell by” dates (Jacobs, 2014). Let me repeat that, perfectly good food is removed from the shelves before the “sell by” date, which by no means represents the expiration date. As mentioned above, the “sell by” date is used for the retailer to know when to stop selling the item. This type of date does not represent when a found item has spoiled. Therefore, thousands of grocery stores pull items from the shelves that are days or longer away from being expired to ensure that only the “freshest” products are on display. Although food donations from chain stores has grown, the majority of these removed products get sent to the landfill (Phillips, 2016). Food donation will be discussed later in the analysis.
4.1.2 Expiration Dating at JMU
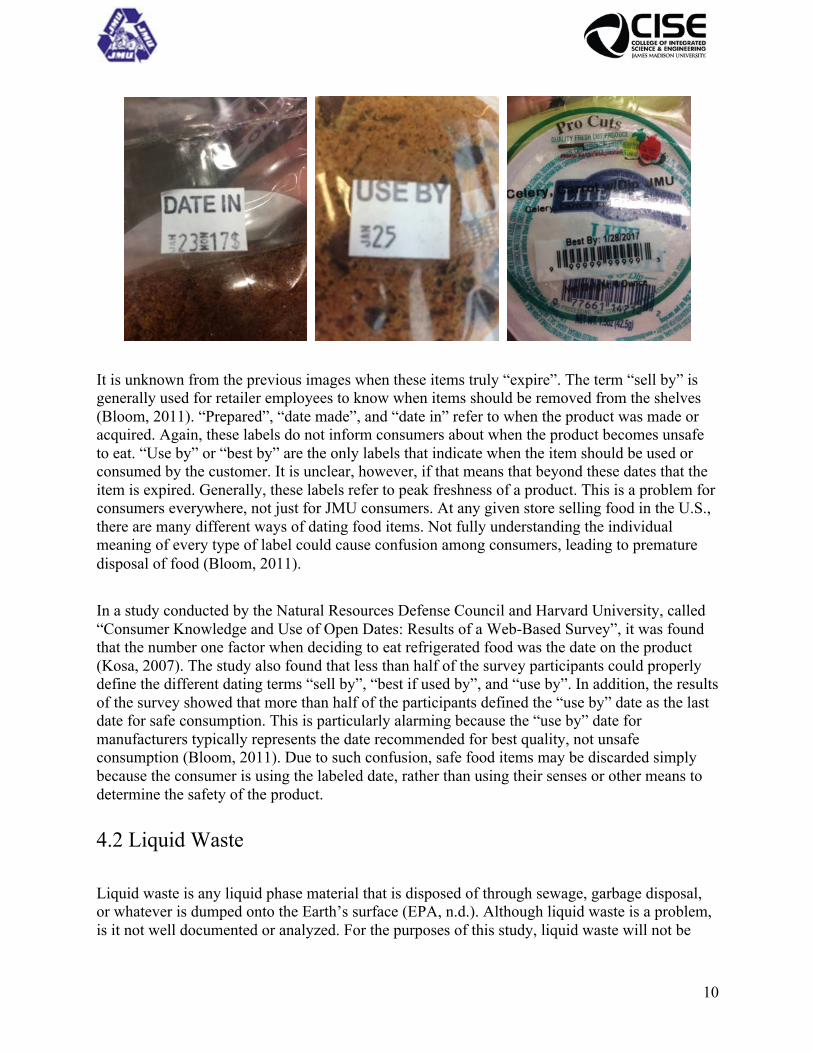
JMU dining services provide a multitude of pre-made and prepackaged food for consumers on the go. This food can be purchased at any retailer store on campus. Within the small community of JMU, I found that the lack of consistency in chain stores happens on campus as well. Below are a few images I took of the different labeling methods I’ve seen on campus.
Images 1-6. Food dating labels at James Madison University retail dining facilities.
10
It is unknown from the previous images when these items truly “expire”. The term “sell by” is generally used for retailer employees to know when items should be removed from the shelves (Bloom, 2011). “Prepared”, “date made”, and “date in” refer to when the product was made or acquired. Again, these labels do not inform consumers about when the product becomes unsafe to eat. “Use by” or “best by” are the only labels that indicate when the item should be used or consumed by the customer. It is unclear, however, if that means that beyond these dates that the item is expired. Generally, these labels refer to peak freshness of a product. This is a problem for consumers everywhere, not just for JMU consumers. At any given store selling food in the U.S., there are many different ways of dating food items. Not fully understanding the individual meaning of every type of label could cause confusion among consumers, leading to premature disposal of food (Bloom, 2011). In a study conducted by the Natural Resources Defense Council and Harvard University, called “Consumer Knowledge and Use of Open Dates: Results of a Web-Based Survey”, it was found that the number one factor when deciding to eat refrigerated food was the date on the product (Kosa, 2007). The study also found that less than half of the survey participants could properly define the different dating terms “sell by”, “best if used by”, and “use by”. In addition, the results of the survey showed that more than half of the participants defined the “use by” date as the last date for safe consumption. This is particularly alarming because the “use by” date for manufacturers typically represents the date recommended for best quality, not unsafe consumption (Bloom, 2011). Due to such confusion, safe food items may be discarded simply because the consumer is using the labeled date, rather than using their senses or other means to determine the safety of the product.
4.2 Liquid Waste
Liquid waste is any liquid phase material that is disposed of through sewage, garbage disposal, or whatever is dumped onto the Earth’s surface (EPA, n.d.). Although liquid waste is a problem, is it not well documented or analyzed. For the purposes of this study, liquid waste will not be

11
addressed or analyzed any further. However, it is important to note that this is a problem as well, and should be further investigated by the federal government.
4.3 Food Waste Regulation in the U.S. Currently in the United States, there are no regulations that target food waste. However, there is one policy that encourages food redistribution. According to the Federal Registry, the Bill Emerson Good Samaritan Food Donation Act protects individuals and businesses from any adverse effects of donating food “in good faith” (Federal Acquisition Regulation, 2009). Under this act, the following are protected:
● Individuals ● Corporations ● Organizations ● Partnerships ● Associations ● Government Entities ● Retail Grocers ● Wholesalers ● Hotels/Motels ● Manufacturers ● Caterers ● Farmers ● Gleaners ● Non-Profit Food Distributors ● Hospitals
The fear behind donating food is the possibility of giving away food that may cause food poisoning or other food related illnesses. This act was created in order to ensure protection to those who donate their leftover food instead of throwing it away. This is the only policy in the United States that acknowledges and partially addresses the amount of food waste produced annually. As stated in the policy, as long as the donated food meets all federal, state, and local labeling and quality standards, donors are protected under the law. Although this regulation protects good faith food donations, many businesses are hesitant to donate for the fear of negative repercussions (Stuart, 2009). According to Patty Larson, the executive director of Food Rescue, which is a nonprofit meal recovery organization, stores are reluctant to donate because they are afraid of a consumer getting sick and taking legal action (Jacobs, 2014). What most retailers do not know is that to date, there have been no documented lawsuits against food donors (Chasek, 2016). With this information, there is no reason that a retailer should fear donating their leftover food to the hungry.
4.3.1 Food Waste Regulation in France In 2016, France passed a law to help combat their own food waste problems. The law requires all supermarkets in France to donate their excess food to charity (Chrisafis, 2016). This law also bans the destruction of leftover food by supermarkets. The practice of destroying food, through bleach or other means, has been used by large-scale food retailers in order to deter people from

12
“dumpster diving” or looking through retailer trash bins for leftover food (Bloom, 2016). Essentially, the essence of this new law is to redirect the copious amounts of wasted food from supermarkets to those in need. France is the first country ever to implement a federal law that addresses food waste. Not only does this show France’s acceptance of the problem, but it also shows their forward thinking toward practical solutions. As seen in Figure 1, food loss occurs during every step of a food product’s life cycle. Although developed countries, like France, have more food waste on the consumer level, reducing food waste from distribution level will still have a large impact. The redirection of leftover food from retailers can help reduce the amount of food that ends up in landfills, all while helping feed the less fortunate. France is on the forefront of food loss reduction, and with time, hopefully other countries will be too.
5 Issues with Food Waste There are many obvious issues that result from wasting food, such as hunger and malnutrition. However, there are less obvious issues that are just as detrimental to human and environmental health. Many of these issues are only growing in scale, due to the current rate of population growth worldwide. The following subsections of this section will go into further detail about the main issues.
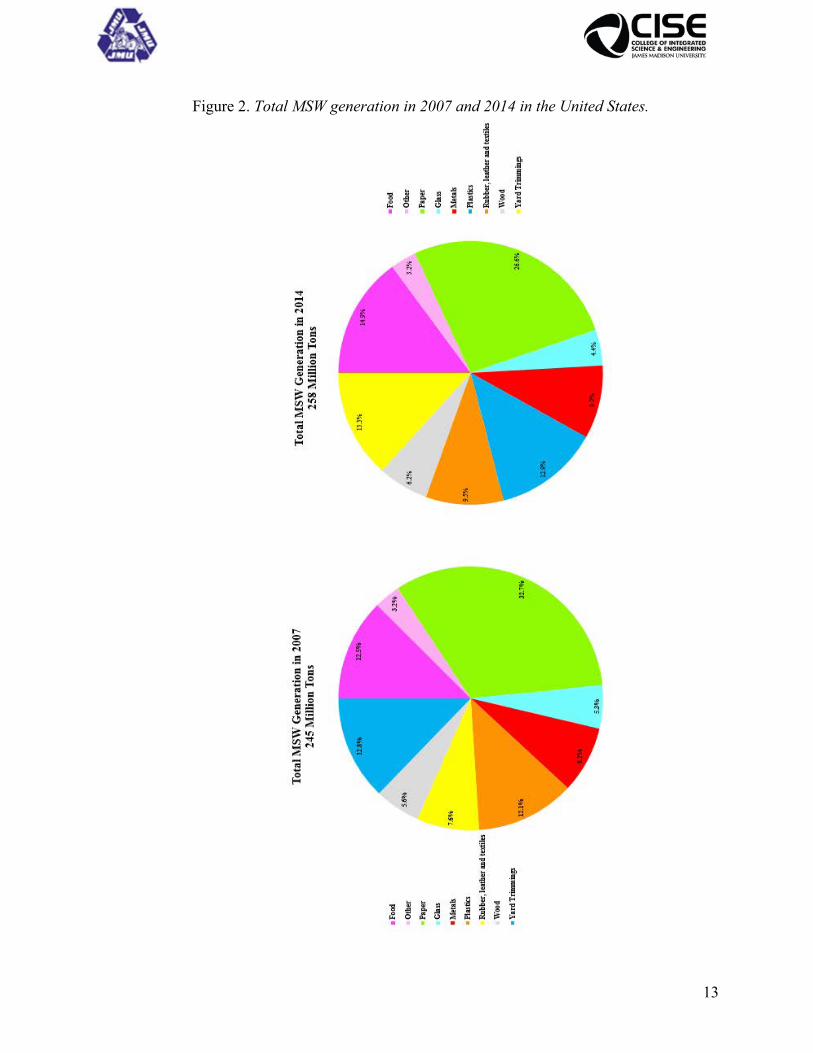
5.1 Landfill Consumption In 2014, according to the EPA, food was the largest contributor to municipal landfills (Phillips, 2016), see Figure 3. Below are two pie charts using data from the EPA regarding municipal solid waste (MSW) generation in 2007 and 2014 (Municipal Solid Waste Generation, Recycling, and Disposal in the United States: Facts and Figures for 2007, 2008). In 2007, food was the third largest MSW generated at 12.5% of all waste. Seven years later in 2014, this percentage rose slightly to 14.9%. However, many food items are wrapped in plastic to maintain freshness, bring on the go, store leftovers, etc. and because of this, these items may contribute to the plastic waste generation of both years. Although food is not the most generated MSW, it is the top landfill consumer.
13
Figure 2. Total MSW generation in 2007 and 2014 in the United States.

14
Landfills in the U.S. do not need any more sources of waste than they currently receive. The addition of food waste to these landfills takes up large amounts of space that could be used for other sources of trash with no alternative disposal options. Food waste in general should be avoided at all costs, but if it is generated, it does have alternative disposal options other than landfills. Below is a pie chart of the materials sent to MSW landfills in 2014, using data collected from the EPA.
Figure 3. Pie chart of MSW materials landfilled in 2014.
Food is the top MSW material in landfills, consuming 21.6% of landfill space in 2014 (Phillips, 2016). Paper comes in second place taking up 14.3% of all landfill consumption that year. Like paper, food waste has alternative disposal options such as composting (Molles, 2013). Additionally, if the food is edible, it can be repurposed or donated to feed the hungry or feed farm livestock (Weinzierl, 1996). Food can also be repurposed as a source of energy through the creation of biofuel. Yet even with so many alternatives, 21.6% of landfilled waste that year were not used for their intended purpose. In the Journal of the American Dietetic Association, a study conducted by SJ Van Garde and MJ Woodburn, called “Food discard practices of householders”, observed food disposal habits of

15
243 households in Oregon. The study consisted of recording household disposal habits and found that 29% of disposal came from belief of unsafe food. The study did not determine if the food thrown away was actually edible or inedible, but it was found that reliance on product dating was the most common indicator of food safety. Additionally, the study concluded that “consumers generally lacked criteria for evaluating the safety of foods” (Van Garde & Woodburn, 1987). For families that do not compost or repurpose their food, wasted food gets sent to landfills. The confusion of how long foods last leads to more landfilled food. Ten years after the previously mentioned study, the USDA “Estimating and Addressing America’s Food Losses” study found that discarded products (damaged or past the “sell by” date items) equated to 10% of the total food losses from retailers (Kantor, 1997). From this, it is clear that edible food items are constantly being disposed of, for one reason or another. Items that are unpleasant to sell in stores could be donated to help feed the hungry instead, thus supporting the local community and reducing landfill consumption.
5.1.1 Generation of Methane and Other Pollutants Space is not the only concern of food waste that enters landfills. The biggest concern of food that is disposed of in landfills is the decomposition of organic material. As organic materials decompose, without the presence of oxygen, methane is created. Therefore, food that rots in a landfill generates methane gas (Mitchell, 2007). Below is a chart from the EPA that shows the top methane producing sources in the U.S. (Methane Emissions, 2017). As seen in the pie chart, landfills produce 20% of U.S. methane emissions.
Figure 4. Pie chart of methane emission sources in the U.S.

16
Newer and larger landfills are built to accommodate gas generation, but the majority of landfills in the U.S. today have less desired methods of gas removal. Landfills can either have “passive vents” or “active vents”. “Active vents” are vents that regulate and contain gases generated in the landfill. However, many landfills have “passive vents”, which are vents that allow the slow release of gases into the atmosphere over time (Landfill Gas Control Measures, 2011). Below is an image from the Agency for Toxic Substances and Disease Registry (ATSDR) website showing the typical construction of a passive vent in a landfill.
Image 7. Diagram of a typical passive vent in a landfill.
The image above reveals that passive vents slowly allow landfill gases to enter the atmosphere. The collection well connects to a plastic container that is placed between the landfill liners and the landfill waste. This allows for methane and other landfill gases to slowly be released through the collection well into the atmosphere. Although this method and waste-to-energy methods attempt to reduce and control the amount of pollutants that enter the atmosphere, landfills still largely contribute to air pollution and may continue to do so for decades to come. According to the book “Assessment of the Performance of Engineered Waste Containment Barriers”, by James K. Mitchell and others, “the period during which a large landfill will potentially release contaminants at unacceptably high levels may be on the order of hundreds of years for municipal solid wastes (Mitchell, 2007). Mitchell is stating that even though landfills are made to control and reduce air pollution, it is possible that these landfills will continue contributing to air pollution centuries from now.
5.1.2 Groundwater Contamination There are many sources of groundwater contamination. The use of pesticides and fertilizers in the agricultural industry can eventually leak deep enough into the soil that it contaminates underlying groundwater. This is also true for any leaks or spills associated with machinery used on many industrial farms. Groundwater contamination is challenging to detect and even more challenging to clean up (Sellers, 1999). Additionally, water usage in recent times has risen due to growing droughts and higher needs for irrigation. Therefore, the use of groundwater aquifers has

17
risen as well. Contamination of groundwater may result in the pollution of drinking water sources. Landfills can also contribute to groundwater contamination from leakage of pollutants, known as leachate. Leachate is defined as any liquid that comes from a landfill containing contaminants (Chemical Contamination of Groundwater, 1993). In the process of decomposition, the releasing of water creates a liquid substance composed of various chemicals. Because food waste is partially made of water, its presence in a landfill promotes and increases the production of leachate. Below is a diagram that explains the different pathways leachate can take that put human and environmental health at risk.
Figure 5. Diagram of leachate pathways from municipal solid waste landfills.
According to this chart, pollutants within the leachate can attach to groundwater, surface water, or soil particles which can lead to adverse human and environmental health affects (Mitchell, 2007). Older landfills tend to have more problems with leakage than newer landfills, but overall, the risk of groundwater contamination is present for all municipal solid waste landfills in the U.S. (Letcher & Blight, 2011).

18
5.1.3 Landfill Construction In the United States today, there are over 3,500 active landfills (Mitchell, 2007). The majority of these landfills are used for storage of municipal solid waste which includes food, paper, glass, certain forms of plastic, etc. As mentioned before, 21.6% of the waste in municipal landfills comes from food waste. Although the use of landfills has decreased, a way to help the problem is by keeping items with other means of disposal out of them. Food waste can be repurposed through composting, donations, etc., and therefore should never end up in a landfill. Below is a table that lists all of the active landfills in the United States and Protectorates as of March, 1996 (List of Municipal Solid Waste Landfills, 1996). Virginia is among the top ten states with the highest amount of active landfills, with 152 landfills across the state.
Table 1. Table of active municipal waste landfills in the U.S.

19
This table reveals the prevalence of municipal solid waste landfills in each U.S. state or protectorate. The majority of locations have less than 100 landfills, indicating that only a few states hold the majority of America’s trash. With a growing population, competition for landfill space will become a bigger problem as more residential development will be desired to support all citizens (Mitchell, 2007). Another problem with landfill construction is the proximity of landfills to impoverished and/or colored areas. According to the Yale Law Journal, locally undesirable land uses (LULUs) correlate to socioeconomic characteristics. The study found that LULUs are more common among racial minorities and the poor (Been, 1994). However, the study clearly states that the sites for LULUs are not selected because of race or financial reasons, mainly they result in lowering the value of the area selected. This, in turn, causes land and homes in the area to decrease in price, thus bringing in low-income citizens. Due to financial challenges, many poor citizens become stuck living in areas that have higher rates of pollution because of the activities that take place in the area. In the film “The Last Mountain” by Bill Haney, mountaintop removal in West Virginia is addressed. The film targets one energy business in particular, Massey Energy, who is responsible for more mountaintop removal than any other company (The Last Mountain, 2011). Throughout the film, it is mentioned several times that the people living around the mountains under construction have adverse health problems. The correlation between proximity and rate of illness is unprecedented. It is clear that the actions of Massey Energy are harming U.S. citizens and the environment. A study of power plants in the U.S. by the National Association for the Advancement of Colored People found that citizens that live within a three mile radius of a power plant have a lower average income than the overall U.S. average income. Furthermore, the study found that 39% of all residents with a three mile radius are people of color (Patterson, n.d.). The concept of “not in my backyard” or NIMBY is seen here. Although power plants are a vital part of American culture, few people want to be associated with them or live near them (American Chemical Society, 2012). This results in power plant construction in areas where there is little education on the matter, mainly poorer and/or colored areas. The ingestion of pollutants from power plants can result in any of the following:
● Ingestion of carcinogens (cancer causing chemicals) ● Respiratory irritation or infection ● Decreased lung capacity and function ● Development or worsening of diseases such as asthma. bronchitis, and emphysema
Additionally, the longer the exposure, the more serious health problems become (American Chemical Society, 2012). Similar health problems can occur from exposure to gases generated in landfills. Like power plants, landfills are typically located in low-income areas or colored neighborhoods. Decreasing landfill consumption reduces the need for more landfills in general, which reduces the amount of environmental injustice experienced by the lower class citizens.

20
5.2 Overall Soil Quality The health of soil greatly determines the quality and quantity of produce a farm can yield. Wasting food requires the production of more food, which leads to soil degradation. The loss of quality soil results in ecosystem disruption and loss of arable farmland.
5.2.1 What is soil? Soil is composed of five factors (Molles, 2013):
1. Parent material on the surface 2. Climate of the area 3. Topography of the land 4. Plant life present 5. Amount of time
These factors combined over long periods of time to create the multitude of soil types found on earth today. However, at the rate that humans use soil for development, farming, residential living, etc., the amount of arable soil remaining is quickly diminishing (Milman, 2015). The loss of such soil puts more pressure on current farms to produce higher yields with weaker soil, thus furthering the degradation process. Not only will this create unusable farmland, but it also promotes other environmental problems such as erosion and flooding.
5.2.2 Functions of Soil Soil has five major functions to support life on earth (Molles, 2013):
1. Support the growth of higher plants (ex. crops) 2. Controls the movement of water in the hydrologic system 3. Recycles nutrients 4. Creates species habitats 5. Creates engineering medium (to build upon)
All of the functions of soil can be destroyed by poor soil management. According to an article in The Guardian, called “Earth Has Lost a Third of Arable Land in the Past 40 Years, Scientists Say,” 33% of all high-quality arable land has been lost due to extreme soil erosion and environmental pollution (Milman, 2015). To make matters worse, the conversion rate of arable land to nutrient poor land is happening faster than natural ecosystems can replenish it. With expanding populations and high amounts of food waste, the remaining farmlands may not be enough to support every single person in the years to come. Reducing food waste would reduce the amount of food that needs to be produced, thus conserving farmland and protecting soils from nutrient loss.
5.2.3 Use of Pesticides Pesticides are chemicals that are added to crops in order to reduce spread of diseases, parasites, etc. during growing seasons (Hidden Costs of Industrial Agriculture, n.d.). To have the highest yield possible on a farm, pesticides are typically used to protect crops. This effective method has devastating consequences on the environment. The use of pesticides can lead to soil and microorganism contamination (American Chemical Society, 2012). Once the chemicals have

21
entered the soil, there is the potential of transportation of the chemicals through soil erosion, surface water runoff, and sediment deposition (Molles, 2013). The issue with the use of pesticides is the disruption of nutrient balance within the soil. Excess chemicals in the soil can adversely affect the microorganisms living in the soil, thus allowing for the growth of harmful bacteria. This bacteria can not only hurt the organisms in the soil, but it can also hurt the crops growing from that soil (Soil Erosion and Degradation, n.d.). As the expectation of food surplus continues in the U.S., farmers are expected to produce more and more food, which results in increased pesticide usage. If farmers were not expected to produce endless amounts of products, they may not need to use pesticides as often and in such large quantities.
5.2.4 Use of Fertilizers Farming on the same soil year after year can significantly decrease the amount of available nutrients. The less nutrients available, the lower the crop yield. To avoid this, many farmers apply fertilizers to their soil in order to restore any missing vital nutrients, such as nitrogen and phosphorus (Molles, 2013). According to the Food and Agricultural Organization (FAO) of the United Nations, the use of fertilizers can result in the eutrophication of surface waters (Chapter 3: Fertilizers as Water Pollutants, n.d.). The process starts with the application of fertilizer to the soil. The soil then absorbs the nutrients and uses those nutrients to produce crops. However, during wet conditions, the soil (which now contains copious amounts of nutrients) can be transported via surface water into nearby waterbodies. The surplus of nutrients in the water body can lead to eutrophication. The general definition of eutrophication is the enrichment of an ecosystem with excess nutrients (Molles, 2013). The result of eutrophication in water bodies is the creation of algal blooms which cause anoxic (oxygen free) conditions in the water, resulting in reduced biodiversity (American Chemical Society, 2012). This not only decreases the water quality, but it also decreases ecosystem health. Wasting food contributes to the use of fertilizers the way it does to pesticides, the more food that is wasted means more food that needs to be produced. The production of excessive amounts of produce requires the application of excessive amounts of nutrients through fertilizers. Although there are alternative ways to increase nutrient content of soil, using fertilizers is the common choice among farmers (Letcher, 2011).
5.2.5 Erosion Soil erosion is defined as the wearing away of the surface of earth through water, wind, or other agents that remove the soil and deposit it in another location (Soil Erosion and Degradation, n.d.). There are several issues regarding soil erosion. First and foremost, soil erosion results in the removal of topsoil which is crucial to farming high yields. The loss of topsoil results in increased needs for fertilizers and water input. Second, soil erosion results in the deposition of sediment in a different location. Soil transportation is usually through water and therefore the removed soil tends to end up in surface waters. Currently, sediment is the largest pollutant by volume for all surface waters in the U.S. (Sediment Pollution, n.d.). It is estimated by the EPA that 70% of erosion comes from human uses of land. High amounts of soil erosion leads to

22
increases in sediment in surface waters and greatly decreases the potential of arable land. The third problem is that the movement of sediment results in the movement of potentially harmful chemicals and/or excess nutrients. An example of the detrimental effects of soil erosion can be seen in the Gulf of Mexico. This body of water has been deemed a “dead zone” because of the decrease in marine life due to excess sediment triggering the growth of algal blooms (Gulf of Mexico Dead Zone, n.d.). Sediment runoff from farms, sewage treatment plants, etc. enters the Mississippi River and eventually ends up in the Gulf of Mexico. The abundance of excess nutrients, like nitrogen and phosphorus, have caused high production rates of algal blooms. The presence of these algal blooms continuously removes oxygen from the water, resulting in the death of the marine life. The only way to counteract the effects of sediment deposition is to reduce the amount of sediment that enters the Mississippi River upstream. Eroding soils presents a problem because quality soil is essential to farming. Without it, farms cannot produce high quality and quantity of crops. As more food is wasted, more food must be produced to compensate the losses, which results in more degraded soils. As this cycle continues, quality soils will continue to decrease which could result in less food production potential in the future.
5.3 Malnutrition Wasting food is not only detrimental to the environment. As mentioned in the introduction, over 800 million people are malnourished across the globe (FAO, n.d.). There are several different forms of malnutrition, most of which could be improved through the reduction of and redirection of wasted food. According to the World Health Organization, the four main types of malnutrition are (What Is Malnutrition? 2016):
1. Overnutrition- the ingestion of excessive amounts of nutrients a. Overweight/Obesity are common forms of this malnourishment b. More common in developed countries and/or among the wealthy because of the
intake of processed foods 2. Undernutrition- deficiency of nutrients (calories and/or protein)
a. Marasmus is a severe deficiency in calorie b. Kwashiorkor is a severe deficiency in protein c. Marasmic Kwashiorkor is a severe deficiency in both calories and protein d. More common in developing/impoverished countries
3. Secondary Malnutrition- factors that limit the supply of nutrient absorption in the body a. Ex. diarrheal diseases cause nutrients to leave the body before being absorbed b. More common in developing/impoverished countries
4. Dietary Deficiency- having a deficiency in one or more vital nutrients a. Ex. an iron deficiency can lead to anemia b. More common in developing/impoverished countries
With so many people suffering from malnutrition, it seems wrong that so much food is wasted every single day. Additionally, with a rapidly increasing population, it is estimated that food production must increase 60% in the next 30 years in order to meet the demands of the growing
23
population (Chasek, 2016). With decreasing amounts of arable land and an increasing population, reduction in food waste is crucial to reducing malnutrition.
5.4 Loss of Natural Resources Throwing away food is much more than just wasting the product itself. Behind every piece of food that is produced there is a multitude of natural resources that are being wasted too. Generally speaking, the production of food requires hefty amounts of water, soil, and fossil fuels. The use of these natural resources conversely effects of health of the environment. To determine the extent that any given product has on the environment, a life cycle analysis (LCA) can be used. LCAs examine the details of the production, distribution, consumption, and disposal of an item to determine what and how much resources are used during each stage (Molles, 2013). An LCA of any food item will include the input of many natural resources. Therefore, the act of throwing away food is similar to letting the faucet run for no reason or driving around with no destination, it is the act of wasting precious resources. Below is an image created by the Food and Agricultural Organization of the United Nations to help explain some of the impacts of wasting food (Full-Cost Accounting, 2014). This illustration shows the different sources of waste through the life cycle of a typical produce item. This image focuses on the waste that occurs before reaching the consumer. This is provided to show how many natural resources go into the making of food.

24
Image 8. Illustration of natural resources used during the agricultural stages of food production.
The collection of input needs for efficient farming incorporates both natural and human resources. In the image above, the tree contains the adverse effects of higher input needs for agriculture. This image also points out the human resources needed for food production. The natural resources consist of water, soil, nutrients, fossil fuels, etc. All of these resources are required for one harvesting season of produce. The high amounts of ecological and human inputs required to grow crops prove that wasting food is equal to wasting valuable natural and human resources.

25
5.5 Energy Usage Farming today consumes much more energy than it did 50 years ago. This is the result of increased population, increased demand, and industrialization of farming equipment. This has resulted in the agricultural industry consuming about 10% of the total U.S. energy supply (Bloom, 2011). Energy use in the agricultural industry comes primarily from fueling machinery, such as tractors, on large and small farms (USDA, n.d.). To produce enough crops to feed a nation, industrial equipment is necessary to match the labor required. Additionally, energy usage also comes in the form of transportation, which will be discussed in greater detail in the next two subsections.
5.5.1 Transportation of Food According to the Natural Resources Defense Council (NRDC), the term “food miles” represents the distance food items have to travel to get from their origin to their destination (“Food Miles: How Far Your Food Travels Has Serious Consequences for Your Health and the Climate, 2007). Additionally, this report states that since 1968, food trading worldwide has increased by 184%. As trade increases, so does environmental degradation. Importing food results in multiple forms of pollution, such as air, water, and soil pollution. The main sources of transportation for international trade are by ship and airplane. Trucks and trains are more commonly used for interstate trade and transportation. According to the USDA Agricultural Marketing Service report of 1997, one average non-local food item traveled approximately 1,300 miles to reach its destination (Andreatta, 2003). Not only does this amount of transportation require fossil fuels, but it also increases the risk of produce damage (Bloom, 2011). Damaged produce is likely to get discarded before hitting the shelves of a store due to customer expectations. In recent years, the concept of “perfect produce” has hit all major grocery store chains and food retailers. As competition among stores increase, the demand for pretty, uniform, and large produce has increased, resulting in greater food loss (Stuart, 2009). This results in greater food loss because stores are willing to throw away produce if it does not look a certain way. Stores want to keep their clientele by always having beautiful, uniform display cases of produce. Therefore, in the presence of “unfit” products, stores will have more purchased and transported in order to meet that expectation.
5.5.2 Transportation of Food Waste Once food has been disposed of, waste management companies must transport that waste to its predetermined destination (most likely a landfill). According to an article from Resources of the Future, called “The New Economics of Managing the Nation’s Waste”, increased government regulation has led to long-haul transportation of municipal solid waste (Macauley, 2009). The reason behind this shift is the creation of regional, out-of-state landfill sites versus the traditional local dump. Before, individuals would personally transport their waste to the local dump for disposal. Now, waste removal is institutionalized, resulting in more traveling time for the waste. The increase of food waste generation and the growing distances between people and disposal options has increased the amount of traveling MSW must endure to be properly disposed of.

26
An example of this can be seen at JMU. The university sends its compostable waste to Black Bear Composting. This facility is approximately 24 miles away from JMU. Because the Black Bear Composting facility is closing, the waste is then sent to Royal Oak farms. Royal Oak farms is approximately 90 miles away from the composting facility, which means that all of the compostable waste generated by JMU travels at least 114 miles to be properly disposed of. Every single time something gets thrown into the composting bin on campus, it will likely be traveling a far distance to be repurposed.
5.6 Water Consumption In order to grow crops, there must be a constant supply of water. To ensure a constant supply, a farmer cannot only rely on rainwater. Irrigation is typically a system of channels that connects an area of farmland to a consistent water supply. It has been estimated that approximately 33% of all crops come from farms with irrigation systems (Bloom, 2011). Furthermore, it is estimated that agricultural water use accounts for approximately 70% of all global water consumption (Chasek, 2016). Due to the increasing demand for crops, the use of groundwater has become a more common practice. Below is a bar graph created by the United States Geological Survey showing the changes in water consumption from irrigation since the 1950s (Irrigation Water Use, 2010).
Figure 6. Bar graph of irrigation requirements in the United States.
The bar graph above shows that withdrawals of water on a daily basis has slightly decreased as of 2010, but use of groundwater has inclined since the 1970s. Although this graph depicts less water withdrawals in recent times, it is important to note that this chart is seven years old. The amount of water withdrawals over the last several years has likely increased with population increases. With global warming taking an effect, it is likely that the amount of water required for irrigation is higher than the 2010 numbers, due to more frequent droughts and natural disasters (Molles, 2013). Additionally, this chart is only for the United States. The majority of farming

27
occurs outside of the U.S., thus other countries are likely to use this much water or more for their farming requirements (Hoekstra, 2011). The increase in water consumption has not only been a result of more people and more production, but also the result of changing diets (Bloom, 2011). Particularly in America, there has been a growth in the amount of meat consumed by citizens. An increase in this type of food production requires higher amounts of water because it takes more water to produce animal meat than it does to produce crops. For example, it takes approximately 15,000 liters of water to produce one kilogram of beef, while only requiring 1,500 liters of water to produce one kilogram of grain (Chasek, 2016). Thinking about this in terms of waste, if 25% of that one kilogram of beef goes to waste, 3,750 liters of water go to waste as well. According to the Centers for Disease Control and Prevention, approximately 1.15 liters of water/day was consumed by American adults from 2005-2010 (Nutrition, 2017). With that average in mind, throwing away that percentage of beef results in the loss of water that could have supplied over 3,000 U.S. citizens with their daily water intake.
5.7 Cost As natural resources become scarcer and agricultural yields reduce, the price of food may increase. Additionally, new environmental effects, such as irregular weather patterns from climate change, have resulted in changes international food supply and prices (Chasek, 2016). Another increase in costs may be seen in the form of waste disposal. As the population increases, the amount of waste increases. However, with a definite amount of space on this planet, the price of waste management may increase (Macauley, 2009). The cost of wasting food is not only an economical one either. As seen in Section 5.4, the loss of natural resources is also a cost of wasting food.
5.8 Farmland Loss Overproduction of food strains the environment through the depletion of nutrients in the soil and the depletion of fresh groundwater and surface water. The loss of those two vital elements in an ecosystem negatively affects the wildlife as well. All of these natural resource losses can contribute to the loss of arable farmland (Molles, 2013). Consequently, due to the constant need for food, the United States imports a large portion of food from foreign countries (U.S. Food Imports, 2015). Below is a graph that displays the volume of food imports to the U.S. from 1999 to 2014.

28
Figure 7. Graph of amount of food imports to the U.S. from 1999-201.
According to the data seen in this chart, food imports have steadily inclined since the beginning of the 21st century. There is a slight dip in imports from 2008 to 2009, which likely reflects the economic crash of that year. Since then, it has continued to increase, reflecting the dependency America has on foreign food production. Because food can be imported from other nations, there has been an overall decrease in the number of farms in the country. Below is a graph displaying the number of farms in the United States from the years 1982 to 2012 (Farms and Farmland: Numbers, Acreage, Ownership, and Use, 2014).
Figure 8. Graph of number of farms in the U.S. from 1982-2012.

29
From this graph, it is clear that the number of farms has significantly decreased since the 1980s. As of 2012, there are approximately 2.1 million farms in America. As imports increase, the number of farms are likely to decrease. This presents a problem because many acres of the remaining arable land are being developed on, thus destroying the land’s ability to produce crops (Molles, 2013). According to the USDA Farm Service Agency, cropland was converted for non-cropland uses at a rate of 400.29 acres per day in 2012, totaling 146,107.50 acres converted that year (Cropland Conversion, 2013). Reducing food waste will not stop cropland conversion, but it will reduce the degradation of arable land in general. If less food is wasted, less food will need to be produced. The less food produced reduces the need for excessively high crop yields. Using the cropland conversion rate in 2012, it is clear that the U.S. is losing thousands of acres of cropland every single week. To combat these losses, Americans need to lose the expectation of surplus and excess food. The remaining cropland should only produce what is needed, not what is expected in order to ensure arable farmland in the future.
5.9 Lack of Data The last comprehensive study of food waste in the United States was conducted by the U.S. Department of Agriculture in 1997 called “Estimating and Addressing America’s Food Losses”. This study estimated that retailers, foodservice, and consumers wasted approximately 96 billion pounds of food in 1995. Besides the fact that this study is now 20 years old, the study did not analyze waste that occurred from the farms to the retailers (Kantor, 1997). Although agricultural waste has not been completely studied, it is clear that there is a tremendous amount of wasted food that occurs on farms and during the transportation of goods to the retailers (Bloom, 2011). It would be in the best interest of the U.S. government to conduct another, more thorough study of wasted food in North America. In addition to lack of government interest, there are the hidden figures behind grocery store, restaurant, and food retailer food waste. Grocery stores and other food businesses that sell food are not legally required to track their food waste, although many do in order to become more efficient and save money (Stuart, 2009). However, even if food waste is tracked, that does not mean that information will be released to the public. In fact, supermarkets and other food retailers strive to keep that information private.
5.10 Social Stigma Wasting food is something that most people seem to think is wrong, but is something that occurs so frequently that it has become a social norm. The endless food options at grocery stores, extremely large portions at restaurants, and 10-15% surplus of catering food (you know, just in case) are all socially acceptable in the United States (Bloom, 2011). Furthermore, the concept of “doggie bagging” leftover food at a meal is still seen as undignified to some people. As stated in an article by Debra A. Aleksinas, called “Restaurant Leftovers Aren’t for the Dogs Anymore”, “customers are taking home those last morsels, which in more robust economic times would

30
have gone to a trash bin” (Aleksinas, 2009). Essentially, this article is stating that taking home leftovers is only an economic benefit and is likely a response to the 2008 economic crash. Calling something “yesterday’s food” is a form of food degradation that some people do not want to be associated with. However, taking leftover food is not only economically responsible, it is environmentally responsible too. After all, who would want to throw away a perfectly good piece of food simply because it was prepared the day before? In order to significantly reduce food waste, the social norm needs to shift from expecting surplus to appreciating what is already available.
5.11 Municipal Solid Waste Management Wasted food is now the number one source of landfill consumption (Phillips, 2016). Therefore, the more food that is landfilled, the more landfills that will be needed. The overall increase in population has already increased the amount of municipal solid waste (MSW) generation in the U.S. Generating more food waste will only continue to make waste management more challenging and more expensive (Letcher, 2011). With limited places to put landfills and the overall desire to reduce their presence, MSW transportation will likely increase which could result in higher waste management costs.
5.12 Greenhouse Gas (GHG) Emissions Many of the processes required for food production, distribution, and disposal release greenhouse gases (GHGs) into the atmosphere (Sources of Greenhouse Gas Emissions, 2017). Below is a pie chart that shows the total GHGs emissions in the U.S. in 2014.
Figure 9. Pie chart of GHGs emissions by sector in the U.S. in 2014.
Although agriculture may be the least contributing sector, the production of food requires services from much more than farms. A part of each sector in the chart above tie into food production and waste in some way. Commercial and residential emissions include food waste
31
that is disposed of in landfills and individual transportation to acquire food. Industrial emissions include industrialized equipment needed on farms and for the production of processed foods. Transportation emissions include transporting the food from its origin to its destination within the country or internationally. Electricity emissions include cooling needs of certain types of food, home storage of food, and the power required to cook food. Each of these sectors intertwine with food and food waste, and therefore an overall reduction in wasted food would result in decreased GHG emissions across all sectors.
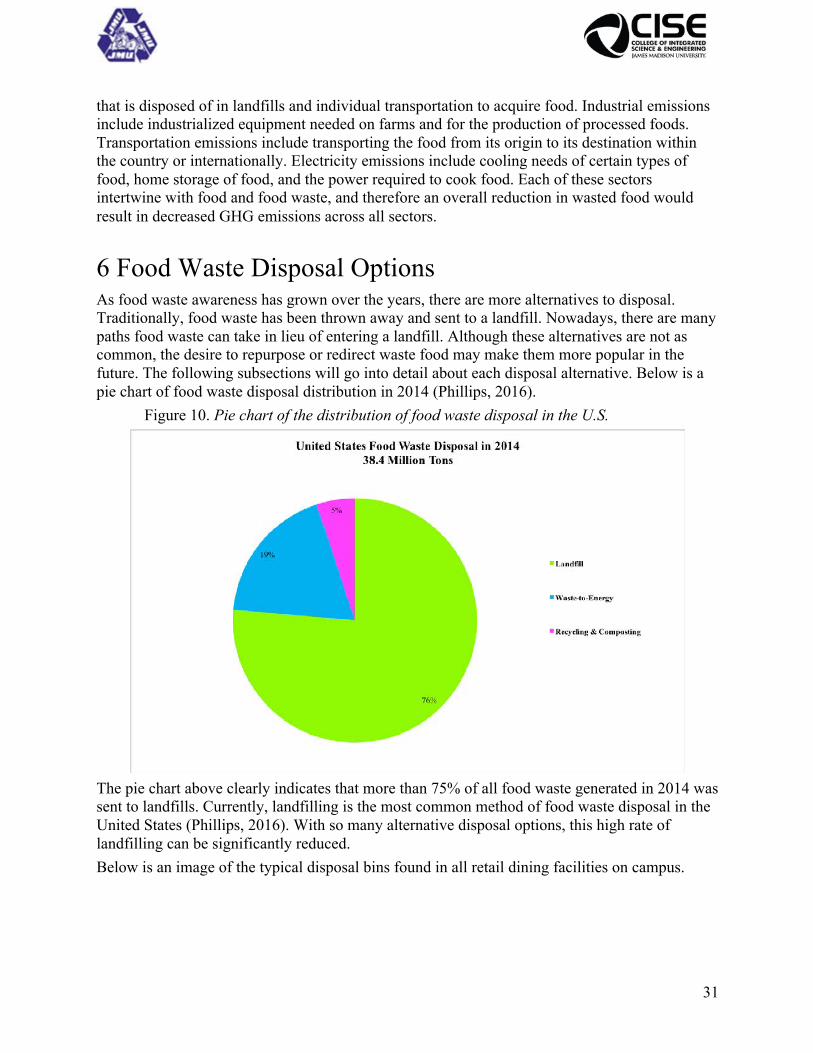
6 Food Waste Disposal Options As food waste awareness has grown over the years, there are more alternatives to disposal. Traditionally, food waste has been thrown away and sent to a landfill. Nowadays, there are many paths food waste can take in lieu of entering a landfill. Although these alternatives are not as common, the desire to repurpose or redirect waste food may make them more popular in the future. The following subsections will go into detail about each disposal alternative. Below is a pie chart of food waste disposal distribution in 2014 (Phillips, 2016).
Figure 10. Pie chart of the distribution of food waste disposal in the U.S.
The pie chart above clearly indicates that more than 75% of all food waste generated in 2014 was sent to landfills. Currently, landfilling is the most common method of food waste disposal in the United States (Phillips, 2016). With so many alternative disposal options, this high rate of landfilling can be significantly reduced. Below is an image of the typical disposal bins found in all retail dining facilities on campus.

32
Image 9. Dining facility waste disposal options on JMU’s campus.
As seen in the image above, JMU diners can dispose of organic materials, recyclable items, and other trash in their appropriate bins. These bins are at every dining facility, but are not in every building. Above each bin is a poster (guide) showing which waste items go where. These are in place to help diners dispose of waste properly. Below is an image from the EPA’s Sustainable Management of Food guidelines that can be accessed online (Sustainable Operations, 2016). This image shows the hierarchy of food waste reduction methods suggested by the EPA.

33
Figure 11. Diagram of food recovery options in the U.S.
1. The most preferred option is source reduction. An example of this is at the University of
Texas at Austin. This university started offering samples of food items in order to reduce the number of students that take food they may not like (How to Prevent Wasted Food Through Source Reduction, 2016). This example is discussed a bit further in Section 8.1.
2. The second most preferred option is to feed the hungry. JMU just recently started a club called Campus Kitchen at James Madison University. I was hired by the club to help sort out the logistics of the club before public announcement of it to JMU students. This club collects food waste from JMU catering and donates it to clients in the Harrisonburg area. Due to the club’s recent start, the only client receiving donations currently is the Salvation Army. Whatever food collected from JMU catering gets prepared in the Dietetics Kitchen on campus or in the Salvation Army kitchen by a team of volunteers. The food is then served to those who need it.
3. The third option is to use leftover food to feed livestock. An example of this is at Rutgers University in New Jersey. At this university, food scraps from the dining halls are collected by a local farm, Pinter Farms, to be used as food for their cattle (Feeding Animals- The Business Solution to Food Scraps, 2009).
4. The fourth option is to use food waste for industrial purposes. Food waste can be broken down to create biodiesel that can be used for cars, generators, etc. The breakdown of such waste can be conducted through anaerobic digestion. In the absence of oxygen, microorganisms break down the organic materials which produces a biogas (from fats, oils, and grease) and a solid waste that can be used as compost (American Chemical Society, 2012). Purdue University in Lafayette, Indiana converts its fats, oils, grease, and food waste through a partnership with a wastewater treatment plant in West Lafayette.

34
This process creates energy that is used to help run the treatment plant (Food Waste Digester, n.d.). The overall partnership has helped reduce their contribution to climate change through less energy consumption, less food waste, and less landfill consumption.
5. The second to last preferred option is to compost the food waste. Composting is the process of breaking down organic materials to create fertilizer. JMU composts food waste that comes from the dining falls and the retail dining facilities.
6. The least preferred option is disposal via a MSW landfill. This is the least preferred option because the decomposition of organic material in landfills creates methane that is then leaked into the atmosphere either accidentally or subtly as a method to control gas volume (Mitchell, 2007). Currently in the United States, the number one method of disposal is the least preferred option to the EPA, landfilling. As was touched upon in Section 5.1, food consumed 21.6% of all landfill space in 2014. It is clear that even with all of these disposal methods, the majority of wasted food goes into landfills.
From the hierarchy of Figure 11, it is clear that there is a serious problem with food waste. Not only is the act of wasting food somewhat immoral, but it is also very harmful for the environment. The EPA has many pages of information on their website that inform U.S. citizens of the problems, solutions, and any other important information regarding the issue.
6.1 Landfills The Solid Waste Disposal Act (SWDA) of 1965 was the first environmental law created by the U.S. government to promote the creation and implementation of waste disposal technologies (EPA History: Resource Conservation and Recovery Act, 2016). This act was later amended in 1970 to better address growing waste production and disposal problems. In 1976, Congress had passed the Resource Conservation and Recovery Act (RCRA) as the first amendment to the SWDA in order to further address waste disposal in the U.S. The Resource Conservation and Recovery Act of 1976 was created by the EPA to address hazardous and municipal waste treatment, storage, and disposal (TSD) (Farber, 2014). The goals of RCRA are to protect human and environmental health from adverse effects of waste disposal, conserve energy and natural resources, reduce the overall amount of waste produced, and manage waste in environmentally-friendly ways (EPA History: Resource Conservation and Recovery Act, 2016). Under RCRA, strict guidelines are in place to ensure the proper disposal of municipal and hazardous waste. Wasted food classifies as municipal solid waste (MSW) under Subtitle D. To date, the most common disposal option for wasted food in the United States is landfill disposal (Letcher & Blight, 2011).
6.2 Composting Composting is the process of converting a variety of organic materials, such as wasted food or yard trimmings, into a product that can be repurposed (Weizierl, 1996). Typically, composted materials are used as fertilizers. Fertilizers help replenish nutrients to the soil, which in turn helps the growth of produce and improves the overall quality of the soil. Using food waste as a source for fertilizer allows the waste to give back to the environment. There are both financial and moral reasons to compost wasted food over landfill disposal. The financial motivation comes

35
from the reduced amount of waste that has to be sent to a landfill (Sustainable Management of Food Basics, 2017). The less waste produced, the less waste transported, eventually leading to less waste collection. Over time, this process could lead to cheaper disposal requirements. The moral motivation comes from the idea that food waste is organic and can be repurposed for other uses.
6.3 Recycling Recycling food is not the same as recycling traditional materials such as aluminum. Recycling food is the process of using wasted food for other purposes like feeding cattle or the homeless. For instance, once a food item is past its “sell by” or “best by” date, most retailers will throw it away. The likelihood of that food item ending up in a landfill is high. Instead of throwing the food away, the food could be donated to a local charity or homeless shelter. There are hundreds of organizations, such as the Campus Kitchens Project, that focus on repurposing food waste to feed the hungry. Additionally, many organizations will gladly pick up the excess food and redistribute it without any assistance from the retailers themselves. Another way to recycle food is to reuse it in a creative way. A classic example of this comes from the American holiday Thanksgiving. With insurmountable amounts of leftovers remaining after the feast, it seems impossible to be able to eat whatever remains without getting tired of the same foods. Chicken pot pie is a creative way to use the leftover foods from Thanksgiving dinner as an entirely new meal. This type of practice is common in restaurants to reduce food costs and improve kitchen efficiency. For example, a trick used in restaurants is the creation of a “specials” menu. Restaurant owners may create a special food option that uses a surplus item remaining in the kitchen (Bloom, 2011).
6.4 Anaerobic Digestion
Anaerobic digestion is the process of breaking down organic materials by microorganisms, such as bacteria, in an oxygen-free environment (American Chemical Society, 2012). This breakdown of materials can result in the creation of a biogas that can be combusted to generate electricity which can be used for cooking, lighting, etc. Typically this has been used to handle manure from livestock, but more recently it has been used for wastewater solids, food waste, and other forms of organic waste too (American Biogas Council, n.d.). Additionally, any leftover waste can be used as a source for compost. This alternative to landfill consumption allows food waste to produce energy all while providing more organic materials for composting. Currently in the U.S., there are over 2.3 million households that are supplied power from waste-to-energy plants (American Chemical Society, 2012). With increasing populations and industrialization, alternative energy resources are in demand and using food waste to create energy is a great way to help that demand, while simultaneously keeping food out of landfills.

36
7 Wasted Food at James Madison University As a whole, JMU dining services serve approximately 155,000 meals per week during the school year. Each semester is fifteen weeks. With two semesters per year, JMU dining services provides approximately 4.6 million meals annually. Serving this much food in a variety of dining venues makes food loss inevitable. Dining services describes wasted food in the dining facilities in two ways. There is wasted food in the “back of house” and there is wasted food in the “front of house.” “Back of house” food waste comes from the preparation scraps and expired leftovers from the cooking processes. “Front of the house” food waste is waste acquired from consumers throwing away food they have selected and/or purchased, but have not consumed. The majority of wasted food at JMU comes from the “front of house”, or the consumers. Most of the consumers at the dining facilities are JMU students, with some faculty, staff, and visitors as well. A program in Massachusetts, called Recycling Works, calculated that the average college student produces approximately 142 pounds of food waste annually (Poon, 2015). Also, the Food Recovery Network concluded that collectively, college campuses generate an average of 22 million pounds of wasted food each year. The specific waste data from JMU could not be accessed, but composted waste data was acquired from Black Bear Composting. This is discussed in the following section.
7.1 Composting at JMU
Composting was introduced to the university in 2010. All compostable materials were sent to a Roanoke based composting organization, approximately two hours away. To reduce the amount of transportation required for composting, JMU started working with a different company. In 2013, JMU started sending its’ compostable waste to Black Bear Composting in Blacksburg, Virginia (Composting, n.d.). However, this partnership will not be continuing come 2017. Black Bear Composting terminated its business with JMU at the end of 2016 because the company itself is closing their composting facility. During this transitional period, Black Bear Composting is rerouting compostable materials to Royal Oak Farms instead.
7.1.1 Black Bear Composting
After communicating with Eric Walter, a Black Bear Composting employee, the following data regarding JMU’s composted material was acquired. The collected data began in 2013 and ended in December of 2016. It is important to know that the average monthly values were calculated

37
and used to fill missing composting information for the months of January and February of 2013 and December of 2016.
Figure 12. Graph of waste composted from JMU from 2013 to 2016.
The data in this graph indicates a slight decrease in composted waste from 2015 to 2016. This suggests an overall reduction in food waste generation for that year. Hopefully this trend will continue. The average amount of composted waste per student is roughly 35 pounds of composted waste per year. The amount is the average for the entire student population. However, only students on campus are required to have a meal plan and therefore the number of students actually contributing to the amount of composted waste is likely less than the JMU population. Thus, the average amount of composted waste per student is likely higher than the average calculated here. Contamination of organic wastes can cause them to be landfilled instead of composted. Black Bear Composting aimed for zero contamination of compostable waste. Mr. Walter said that approximately 1% of compostable waste from the school is sent to a landfill due to contamination. This small amount of contamination occurs when consumers throw non-compostable trash items into the compostable bin. Luckily, the school separates the trash out before sending it to the composting facility which results in the majority of the organic waste being composted. Mr. Walter stated that there were few issues with contamination of the university’s compostable waste because of the separation of waste materials that occur before waste transport.
38
7.2 Aramark Aramark is a dining business that supplies food and dining services to JMU, along with many other schools and facilities across the country. As mentioned in a previous section, “back of house” food waste is the waste that comes from Aramark employees. Aramark is very aware of this waste and is currently trying to reduce said waste by using past data to predict food quantities and customer demands of the future. Aramark also conducts surveys at JMU to help gain an understanding of the consumer wants and needs. I briefly worked for Aramark at JMU’s dining hall, E-Hall from September to November 2015. From an inside perspective, it is clear that Aramark tries to limit the amount of food waste they produce in several ways. A few of these methods include:
● Instituting “trayless” dining halls ○ Aramark has done this at many schools and reported a 25-30% decrease in food
waste because of it (Bloom, 2011). ● Recording and monitoring the amount and type of food waste in the “back of house” ● Interactive activities such as “Weigh the Waste” to bring awareness to the JMU
community ● Incorporation of composting, recycling, and landfill bins in all retail dining facilities ● Composting consumer and retailer food waste from the dining halls ● Distribution of reusable drink containers ● Slogan is “All you care to eat” not “All you can eat”
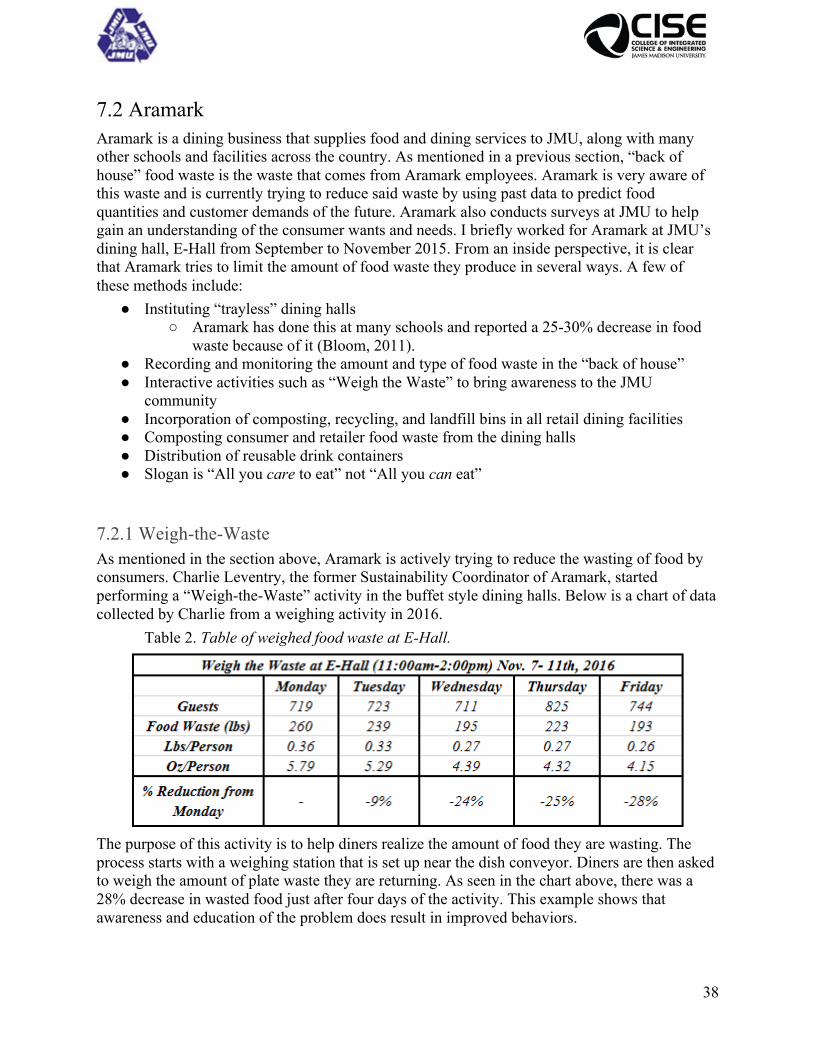
7.2.1 Weigh-the-Waste As mentioned in the section above, Aramark is actively trying to reduce the wasting of food by consumers. Charlie Leventry, the former Sustainability Coordinator of Aramark, started performing a “Weigh-the-Waste” activity in the buffet style dining halls. Below is a chart of data collected by Charlie from a weighing activity in 2016.
Table 2. Table of weighed food waste at E-Hall.
The purpose of this activity is to help diners realize the amount of food they are wasting. The process starts with a weighing station that is set up near the dish conveyor. Diners are then asked to weigh the amount of plate waste they are returning. As seen in the chart above, there was a 28% decrease in wasted food just after four days of the activity. This example shows that awareness and education of the problem does result in improved behaviors.

39
8 Literature Review The following subsections contain examples of food waste reduction techniques at different colleges across the nation.
8.1 University of Texas at Austin The University of Texas at Austin dining facilities started offering samples of the food before students were to take a helping of it. From this act alone, the school calculated a 1.8 ounce (oz.) decrease in food waste among consumers (How to Prevent Wasted Food Through Source Reduction, 2016). The school then decided to have “trayless” dining halls. This resulted in a 48% decrease in the amount of food waste (How to Prevent Wasted Food Through Source Reduction, 2011). These two small changes have helped this school reduce its environmental impact.
8.2 Reed College of Portland, Oregon In Portland Oregon, Reed College practices a tradition that reduces their food waste on campus. In this school, students who cannot afford a meal plan sit near the dish return area, and when a student with leftover food goes to dispose of it, these students ask them to take their leftovers instead. These students are known as “scroungers” to the Reed community (Rendleman, 2011). It has been socially accepted by students so much so that students with meal plans will warn scroungers if they are sick as a common courtesy (Bloom, 2011). Although this method is unlikely to become a social norm across the country, it is a great disposal alternative to food waste for this school.
8.3 Messiah College of Mechanicsburg, Pennsylvania Messiah College is one of many schools in the U.S. that composts their leftover food. The school then uses the compost as a fertilizer for the school-owned organic garden. The garden is maintained by the students and is financially supported by the selling of leftover composting material (History of Sustainability, 2014). Messiah College President, Kim Phipps, also signed the American College and University President's Climate Commitment to promise further sustainability efforts by their school.
8.4 The Campus Kitchens Project The Campus Kitchens Project is a non-profit organization that works with schools across the country to help redirect their wasted food through student run clubs at participating schools. The project started in 2001 and has expanded tremendously in the last decade. The image below is a map locating all of the different colleges and universities that have opened a Campus Kitchen on their campus (Student-Powered Hunger Relief - Campus Kitchens n.d.). Currently, there are 60 schools across the nation that have a Campus Kitchen, including JMU.

40
Image 10. Map of all Campus Kitchen locations in the U.S.
8.5 Stanford University of Stanford, California Stanford University is currently involved in many sustainable programs that benefit both their school and the environment. One of those practices is the conversion of waste oil, from food and cooking processes, to a biodiesel. Annually, the school converts 7,000 gallons worth of waste oil into fuel that is used by a non-profit in the local area (Sustainable Operations, n.d.). The school also practices common food waste reduction methods such as trayless dining halls and reusable water bottles.
9 Survey
In order to reduce food waste on campus, as well as increase proper disposal of waste, an understanding of why students waste food and/or improperly dispose of waste is needed. The Office of Environmental Stewardship at JMU informed me that they do not conduct surveys regarding behaviors or attitudes toward environmental issues. Therefore, I decided to conduct a survey that would attempt to understand why it is that JMU community members waste copious amounts of food and improperly dispose of waste.
9.1 Study Area To capture the true attitudes of the JMU community, habits regarding waste and disposal at a few of the busiest dining facilities on campus were studied. The dining halls, or “all you care to eat” facilities, include:
● E-hall (East campus): survey conducted during dinner time ● Mrs. Greens (West campus): survey conducted during lunchtime
The retailer dining facilities include: ● Festival (East campus): survey conducted during lunch time

41
● PC Dukes (West campus): survey conducted during dinner time Each of these facilities were surveyed once, either at lunchtime or dinner time. For the purposes of this study, lunchtime was from 11:00AM to 1:00PM and dinner time was from 5:30PM to 7:30PM. To ensure random selection of participants, a section of each facility was selected as the surveying parameters. Any person that dined within the boundaries of the surveying section was asked to participate in the survey during the duration of the surveying period. The minimum amount of participants was to be at least 300.
9.2 Interviews Reducing wasted food and improving proper disposal of waste on campus requires an understanding of student’s thoughts and opinions regarding food and waste itself. To gather an understanding of the mindset of the students, surveys were given to capture what is going through the student’s mind. To create the survey, I interviewed knowledgeable employees for their insight of food waste and disposal on campus. To further my research, I conducted interviews with important, influential people on campus to help create the survey. Dr. CJ Brodrick Hartman runs the Office of Environmental Stewardship and Sustainability on campus. After interviewing her, I developed an understanding of what is currently happening at JMU in terms of sustainable practices. Charles Leventry is the former Sustainability Coordinator of Dining Services at JMU and I interviewed him as well to gather information about specific efforts being conducted on behalf of dining services to reduce wasted food.
9.3 Methods
In order to better understand why community members, mainly students, at JMU waste food, they must be asked directly. By developing a survey that accurately captures the JMU mindsets towards wasting food and improper disposal, appropriate measures can be taken to help solve these problems. To create a survey that will accurately represent the JMU student body, appropriate and specific questions need to be asked. The survey will serve to discover how aware the community members are of their food waste and disposal habits. To conduct my survey, I wrote out a list of questions that relate specifically to dining on JMU’s campus. However, the responses of the questions relate to any reason or factor associated with wasting food and waste disposal. The survey was conducted anonymously, with no identifying information recorded. JMU community members were approached in various dining locations and asked to participate in the survey. I was the only person involved with the application of the survey. Surveying occurred at multiple dining facilities during peak lunch and dinner hours during the month of March. Specific sections of the dining facilities were chosen as surveying locations to ensure random selection of the survey participants. Any person that sat within the

42
surveying section was asked to complete to survey. If the person declined the offer to complete the survey, I thanked them for their time and moved along.
9.3.1 Institutional Review Board (IRB) To ethically conduct a survey at JMU, a number of steps must be completed to ensure the protection of the survey participants. I have submitted a form to the Institutional Review Board (IRB) confirming training from myself and my advisor, Dr. Steven Frysinger. The Board granted me permission to conduct the survey anonymously at the JMU dining facilities during the month of March, 2017. The study was approved by the IRB, protocol # 17-0339.
9.4 Survey Below are images of the paper survey I used for my study (Figures 13 & 14):

43
Figure 13. Picture of the front side of my survey.

44
Figure 14. Picture of the back side of my survey.

45
Questions 1-4 relate to one’s relationship to the JMU community and to campus itself. These questions are to help myself determine the demographics of the responses I receive from the study. Question 5 and its’ subsequent questions address the way community members eat in the dining facilities, or the “all you care to eat” facilities. For a price, anyone in the dining hall has access to unlimited food as long as the hall is open. To determine how often the majority of surveyors eat at these types of dining halls:
● Every day - at least once per day ● Often - at least 3-5 times per week ● Occasionally - at least 2-3 times per week ● Rarely - less than 2 times per week ● Never - less than once a week for majority of school year
Question 6 and its’ subsequent questions address the way community members dispose of waste in the retail dining facilities/around campus. The previous description of visiting frequencies is the same in this question as well. Question 7 asks the respondent to select any activity that might influence their dining habits. This question includes a write in option for participants that have an idea that is not already stated. Question 8 asks the participant if they believe food waste is a problem.
9.4.1 Survey Factors Explained Many factors were included within the survey to ensure that any reasoning behind a specific action could be identified. The following subsections explain my definitions of the factors listed in the survey.
9.4.1.1 Factors Involved with Returning or Not Returning Food The first subsection of questions in the survey (questions 5-5III) addressed wasting food at “all you care to eat” dining facilities on campus.
9.4.1.1.1 Upbringing The way one is raised may greatly influence their habits in adult life. Whether or not wasting food was allowed or acceptable during childhood may influence dining habits later in life. Participants that selected this factor as a reason for returning food (or throwing away food) may be indicating that the concept of wasting food was not addressed during their upbringing. The saying “old habits die hard” comes into play here with the idea that taking what you want and throwing away the rest may be second nature to some people. Participants that selected this factor as a reason for not returning food (or eating everything on their plate) may be indicating that they were raised to not waste food. There are many reasons that would explain why parents would instill this idea into their children’s heads, including poverty, morality, etc. Selection of this factor suggests that the respondent has had experience with food conservation before.

46
9.4.1.1.2 Social Pressure Many people, including myself, can likely recall a time or an instance where they did something simply because they thought that is what society would have wanted them to do. These instances sometimes cause us to do things we would not normally do or not do things we usually do, depending on the situation. Participants that selected this factor as a reason for returning food may be indicating that the societal desire of surplus condones the act of wastefulness. People may feel that the current infrastructure of food culture in the United States makes wasting food acceptable, simply because there is always more food available. Therefore, the act of wasting food is not considered a negative action. Participants that selected this factor as a reason for not returning food may be indicating that the more recent societal pressure of environmental awareness makes them more conscious of their own ecological footprint. This type of societal pressure may be pushing the idea that wasting food is a negative action.
9.4.1.1.3 Unawareness/Awareness of Impacts Being aware of the consequences of one’s actions may influence the decision making process. Conversely, being unaware of the consequences of one’s actions influences people as well. Participants that selected “unawareness of impacts” as a reason for returning food may be indicating that they simply do not know the consequences of wasting food. This lack of awareness influences their food consumption and waste habits in a negative way. Participants that selected “awareness of impacts” as a reason for not returning food may be indicating that they are aware of the environmental impact that occurs through wasting food. This awareness influences their food consumption and waste habits in a positive way.
9.4.1.1.4 Time Time can be a crucial factor to eating habits. In a country filled with fast food and pre-prepared meals, it is clear that many people in the United States rush through some of their meals. This factor was only listed under the factors that influence food being returned simply because running out of time may cause people to toss any remaining food in order to get where they need to be. This is a particular struggle in dining halls because food that is not consumed is not allowed to be taken from the dining facility in to-go containers, although it may happen anyway.
9.4.1.1.5 “Eyes are too big for stomach” The idea that our “eyes are too big for our stomach” goes hand in hand with the “freshman 15” concept. Many students overload their plates with various food items with the intention of eating everything, only to realize that they cannot physically consume all that they have selected. This results in excessive amounts of food getting throw away simply because the consumers are full. This factor was only listed as a reason for returning food because people who do not return food seem to not take more than they can consume. Participants that selected this factor may be indicating that they take food with pure intentions of consumption, but later realize that they cannot eat all they have taken. This is one of the factors that could be improved by incorporating an information session during orientation of incoming students. By talking to students about the excitement and overwhelming atmosphere of “all you care to eat”, JMU may be able to make students aware that this mindless, innocent action has grave environmental consequences.

47
9.4.1.1.6 Convenience Being able to conveniently do anything seems to be the preferred choice of human nature. It may be seen as more convenient to grab all desired food at once, as opposed to grabbing one plate at a time. This factor is only included as an influence for returning food because people that collect multiple plates before eating, for the sake of convenience, are likely left with excess food. Not returning food would indicate that the JMU community member may eat plate by plate. Participants that selected this factor may be indicating that the act of collecting all food at once, whether that be to avoid lines or reduce the amount of trips needed throughout the meal, is more convenient than eating plate by plate. However, this factor tends to leave full plates of food at the end of a meal.
9.4.1.1.7 “Everyone else does” Aside from societal pressure, immediate pressure from the current surroundings can influence one’s behavior. This factor was only listed as an influence for the act of returning food because the overwhelming majority of diners return food. The norm at JMU, as seen in the dining halls, seems to not be clear the plate, but more of eat what you want and dispose of the rest. Participants that selected this factor may be indicating that the atmosphere of the dining halls allow them to waste food without feeling guilty because many others do the same.
9.4.1.1.8 Financial Money influences every aspect of life, including food. This option was listed as only a reason to not return food because it is more likely that someone will eat all of their food simply because they spent money on it. Participants that selected this factor may be indicating that they do not return food simply because they do not want to waste their money by throwing food away. An important note, however, is that this factor should have been listed under factors that cause the returning of food. This is because people may feel that because they paid for an “all you care to eat” facility, they are at liberty to take whatever amount of food they please, and what they do with it is up to them. Unfortunately, this mistake within the survey was noticed after the survey was conducted. Therefore, it is just simply understood that this could have been a factor that influence the habits of the JMU community.
9.4.1.2 Factors Influencing the Proper Disposal of Waste There are three main disposal bins that can be found at the JMU retail dining facilities: composting bins, recycling bins, and landfill bins. These labeled bins are available to consumers for proper disposal of waste from the dining facilities/amenities offered at JMU. Although these bins are labeled, and some have pictures to help consumer clarity, many community members do not properly dispose of waste on campus. For the purposes of this study, waste disposal includes remaining food and/or eating and drinking accessories, such as silverware, containers, napkins, etc.
9.4.1.2.1 Informed/Uninformed of What Goes Where Located in all of the dining facilities and in multiple buildings on campus are some labeled and unlabeled disposal bins that attempt to guide waste disposal on campus.

48
Participants that selected informed of what goes where are indicating that they properly dispose of waste materials because they are aware of what material goes in which bin. The knowledge of the participants influences them to properly dispose of waste. Participants that selected uninformed of what goes where are indicating that they may improperly dispose of waste materials simply because they do not know where certain materials belong. Even with labeled bins, some people may not be able to completely understand where all materials belong.
9.4.1.2.2 Availability/Unavailability of Bins Although all dining facilities have all three bins available, many locations on campus only have one or a combination of the bins available. Participants that selected availability of bins as a factor are indicating that they dispose of waste properly because of readily available bins. Participants that selected unavailability of bins as a factor are indicating that they improperly dispose of waste because the appropriate bin(s) may not be readily accessible. This is a problem on JMU’s campus because many of the dining facilities are grab-and-go food services, which means that community members may be purchasing their food and taking it somewhere else. As mentioned before, many buildings may only have landfill bins, resulting in compostable and/or recyclable materials getting sent to a landfill.
9.4.1.2.3 Social Pressure The definition of social pressure that is described in Section 9.4.1.1.2 is similar to the definition regarding waste disposal. It has become second nature to dispose of whatever item you have in the nearby trash can (or worse, the outdoors) where it is presumed that someone will take care of it. At the same time, increasing environmental awareness and slogans such as “Reduce, Reuse, Recycle” have infiltrated societal views as well. Society may use recycling or composting as an example of how to be more environmentally friendly Participants that selected social pressure as a factor for properly disposing of waste may be indicating that the environmental concern of society may be influencing them to properly dispose of waste materials. Participants that selected social pressure as a factor for improperly disposing of waste may be indicating that the longstanding idea that all waste can be thrown into one waste bin influences them to disregard labeled bins.
9.4.1.2.4 Time The amount of time allotted for eating in the United States is relatively small (Bloom, 2011). Not having enough time to eat can cause people to throw away remaining food items. It can also cause people to improperly dispose of said remains. Participants that selected time as a factor for properly disposing of waste may be indicating that they have enough time to sort through their waste to ensure that each item is disposed of correctly. Participants that selected time as a factor for improperly disposing of waste may be indicating that they do not have enough time to shift through their waste. The time crunch results in discarding of waste materials in the wrong bin.

49
9.4.1.2.5 “No one else does” This idea goes hand in hand with “everyone else does” that is explained in section 9.4.1.1.7. The idea that the immediate, in-situation habits of others influence the habits of oneself. Participants that selected this as a factor for properly disposing of waste may be indicating that they feel the need or desire to dispose properly because others do not. Participants that selected this as a factor for improperly disposing of waste may be indicating that they do not worry about proper disposal because it seems like many others do not worry either.

50
10 Survey Results After approaching hundreds of JMU diners during peak lunch and dinner hours, a total of 316 surveys were completed. The results of the survey concluded that 97% of the respondents are currently students at JMU. Faculty and staff members both represented 1% of respondents. Graduate students had one response and 5th-year students had a total of two responses. For the remainder of the results section, the analysis will focus on JMU undergraduate students as they comprised the majority of the survey respondents. Figure 15 below shows the breakdown of academic years among the student participants.
Figure 15. Doughnut pie chart of academic year of student respondents.
A total of 66% of respondents are underclassmen, with the remaining percent of respondents being upperclassmen. The higher occurrence of underclassman participants is due to the stronger likelihood of having a meal plan. Any student living on campus is required to have a meal plan and therefore eats in the dining facilities more often than students without meal plans. Incoming freshman are required to live on campus or commute and therefore represent the majority of students who live on campus. Sophomores have the option to live on campus as well, but there are much fewer resident halls available. Therefore, the general composition of students that live on campus consists of mostly freshman halls with some sophomore halls as well.

51
10.1 “All you care to eat” Facilities The first collection of questions in the survey target wasting food in the “all you care to eat” dining halls.
10.1.1 Wasted Food Below is a table that breaks down how much food is wasted depending on the academic year of student participants.
Table 3. Table of student year and amount of food returned to dish conveyor.
The table above shows how much waste is typically generated depending on the academic year of the student. There is no specific trend to notice from this chart except that very few students believe they typically waste more than half a plate of food. However, while conducting the survey, I made many observations of respondents’ that had multiple plates of food on their table. From my survey notes, I would estimate that at least half of the respondents had multiple plates of food on their table when I approached them. I also noted many respondents’ carrying full plates of food to the dish conveyor on their way out of the dining hall. Yet, only 3% of student respondents’ selected that they typically waste a full plates worth of food. This indicates that students may not be as aware of their true food waste habits, or that they may be uncomfortable admitting their true amount of waste. Below is a pie chart showing results to the question, “If appropriate, how much food is typically returned on your plate to the dish conveyor?” from my survey. The values of this pie chart are out of 100% because respondents were asked to select only one response.

52
Figure 16. Pie chart of respondents’ amount of food remaining on the plate when brought to the dish conveyor.
The majority of respondents (74%) selected that they typically return some amount of food to the dish conveyor for disposal, with the most common response being 25% of the plate holds food when it is returned to the dishwashing station. This result further suggests that students are less aware of how much they truly waste in the “all you care to eat” dining facilities.
10.1.2 Factors Influencing the Wasting of Food Knowing how much food people waste is only one of the important concepts that need to be understood in order to change the habits of the JMU community. After asking respondents how much food they waste, they were asked to disclose the factors or reasons that influence that amount. Below is a bar graph that shows which particular factors influence respondents’ food waste habits. The percentages of the factors in this graph are not based on a 100% scale because respondents’ were asked to choose all factors that influence their habits.

53
Figure 17. Bar graph of respondents’ selection of factors that contribute to their disposal of edible food.
The survey revealed that the number one factor for wasting food in the dining halls is because respondents’ “eyes are too big for stomach”. Diners are allowed to take as much food as they desire, thus resulting in gross overestimations of how much food one can actually consume. When dining within an “all you care to eat” facility on campus, taking home leftovers is not allowed and therefore any remaining food must be thrown away. This result suggests that the freedom of unlimited quantities and varieties of food offered in the dining halls causes overconsumption of food or high food waste generation. The second most influential factor, receiving 48% of respondent selection, is time. This suggests that diners are disposing of leftovers simply because they run out of time to completely consume everything they have selected. The remaining factors cumulatively impact less than 20% of the respondents. A positive note to take from this result is that students seem to be unintentionally generating food waste. This behavior may be able to change with a little guidance.
10.1.3 Factors Influencing Conservation of Food The respondents were then asked to disclose what factors positively influence their food waste habits, or prompt them to clear their plates. Below is a bar graph that shows the factors that influenced respondents to not waste food. The percentages of the factors in this graph are not based on a 100% scale because respondents were asked to choose all factors that influence their habits.

54
Figure 18. Bar graph of respondents’ selection of factors that contribute to not wasting food.
The number one reason for not wasting food is upbringing, with 59% of respondents’ selecting that factor. This suggests that respondents learned during their childhoods that wasting food is unethical, wasteful, etc. The second most influential factor is awareness of impacts, which received 46% of respondent selection. It is clear that respondents who are aware of the environmental and social impacts of wasting food actively try to reduce their personal food waste generation. From this conclusion, raising awareness of the impacts of wasting food will positively influence dining hall behaviors. Overall, the first section of survey questions regarding dining hall behaviors showed that being aware of the impacts of food waste results in less wasted food, while overestimating one’s consumption capabilities results in more wasted food. Diners that are aware of the negative economic, social, and environmental impacts of wasting food actively try to reduce their waste habits. Diners that use their eyes to dictate their food selection and amount unknowingly contribute to food waste generation at JMU. Another highly influential factor is a diner’s upbringing. It is clear that the habits of many diners are influenced by the way they were raised. For the diners that were raised without any food waste education, their waste habits are worse than those raised with a food waste education. These three factors can be addressed together through the same type of activity: education. Food waste information sessions could help students better understand the problem and what they can do now and in the future to combat it.

55
10.2 Retail Dining Facilities This section explains the results of the questions pertaining to waste disposal at retail dining facilities. The following pie chart contains the results to the question “Do you discard waste according to marked bins?” The part chart values are of out 100% because respondents’ had to choose only one response.
Figure 19. Pie chart of frequency of accurate waste disposal in retail dining facilities.
When participants were asked how often they dispose of their waste according to the marked bins on campus, 43% selected that they always dispose properly. A total of 36% of respondents said that they often properly dispose of waste. Less than 25% of all respondents occasionally to never properly dispose of waste. With more than 75% of respondents stating that they frequently try to dispose of waste according to the marked bins, it is clear that respondents are aware of the different disposal options on campus. However, to gather a better understanding about respondent disposal habits, respondents were asked about the factors that influence disposal behaviors. Below is a table that shows the frequency of proper disposal of waste by academic year.

56
Table 4. Table of school year and frequency of proper disposal.
The table above reveals that more than 75% of all freshmen, sophomores, juniors, seniors, and 5th-year students frequently (often or more) dispose of waste properly. Upperclassman have higher percentages of proper waste disposal, suggesting that older students may be more aware of how and where to properly dispose of waste on campus.
10.2.1 Factors Influencing Proper and Improper Waste Disposal The next two bar graphs below show the factors that influence proper and improper disposal of waste from respondents. The percentages are not out of 100% because the survey asked the respondent to select all influential factors.
Figure 20. Bar graph of respondents’ selection of factors that influence proper disposal according to marked bins.

57
The number one factor that influences respondents waste disposal habits is being informed about what waste item goes in which disposal bin. JMU dining facility bins have posters (informative keys) that are above each bin to help consumers properly dispose. A close second, at 66%, is the availability of bins. This suggests that students are likely to properly dispose of waste if the correct bins are readily available.
Figure 21. Bar graph of respondents’ selection of factors that influence them to dispose of waste regardless of marked bins.
As seen above, there are three factors that are the main influences toward improper disposal of waste. The most influential factor is unavailability of bins, suggesting that respondents dispose of waste in the wrong bin simply because the right bin is not readily available or accessible. The second most influential factor is time, with 45% of respondent selection. This result suggests that respondents do not have enough time to sort out their waste before disposal, leading to waste materials ending up in the wrong bins. The third most influential factor, with 42% of respondents’ selecting it, is being uninformed of what materials go in which bin. A lack of education toward how to properly dispose of waste may be resulting in respondents’ total disregard for proper disposal altogether. Overall, the results of this section of the survey suggest that students are not certain of how to dispose of different types of waste. By providing information sessions or classes to the students, they may be able to properly dispose more often. Additionally, it is clear that bin availability is a problem on campus. The simple solution to this is to place more bins in the buildings across campus.

58
10.3 Overall Food Waste Opinions The following pie chart shows respondents’ selection of campus-wide actions that could positively influence their habits toward wasting food and proper disposal of waste. The following values are not on a 100% scale because respondents were asked to select all actions that may influence their habits. The category “other” will be explained in greater detail below.
Figure 22. Pie chart of JMU actions that may influence food waste and waste disposal habits.
The purpose of this question was to ask JMU diners what they think might have an influence on the way they handle food waste and disposal. The number one action JMU could take to influence consumer habits is to incorporate dining hall reminders in the dining facilities on campus. A total of 62% of respondents selected this option as the best option to help combat food waste generation and disposal. Respondents then selected being aware of the impacts of food waste and disposal as the second most influential action toward their dining habits. The incorporation of information sessions during the orientation of new students was selected by 19% of the respondents. The remaining ways to influence dining habits, residence hall programming and other, both received 8% of respondents’ selection. In the survey, the selection of “other” required a written response. Here is a list of some of the responses written in as is from the survey:
● “Competitions” ● “Incentives” ● “Classes on environment” ● “Taste of food” ● “Taste” ● “Class” ● “More bins”

59
● “Good food” ● “Nothing” ● “An extreme American hunger” ● “Education from working at Aramark” ● “More available waste facilities around campus” ● “More information on composting, etc.”
A few of the written suggestions appear more than once, such as taste. It seems that several respondents’ feel that improved taste is a way to reduce their food waste. The lack of sampling capabilities in the dining halls and retail facilities forces diners to pick something and hope that they like it. Generally speaking, most food items on campus are well-prepared, but sometimes people have preferences and those preferences may lead to food loss. The last question of the survey asked the participants “Do you think food waste is a problem?”. The pie chart in Figure 29 below shows the results of that question. The chart values are out of 100% because respondents either had to select yes or no to the question.
Figure 29. Pic chart of respondents’ opinion towards food waste.
The results of this question are clear, the majority of the JMU community believes that food waste is a problem. With such consumer concern, incorporating ways to reduce food waste on campus may be encouraged and even appreciated by students. The next section is a compilation of different methods/ideas that could be used on campus to promote less waste and proper disposal. These options are specific to JMU, but could be altered to fit with other schools, institutions, etc.

60
11 Suggestions for James Madison University The purpose of my survey was to develop a basic understanding as to why JMU community members waste food and/or improperly dispose of waste. After analyzing the results from my survey, I have developed a few ideas, specific to JMU, that could help decrease the amount of wasted food and improper disposal of waste on campus.
11.1 Raise Student Awareness There are a multitude of methods for raising student awareness on a college campus. With hundreds of groups, teams, and other organizations throughout the university, somewhere on campus there is someone trying to get a message across to the student body. Flyers, games, and bake sales are a few that I’ve seen personally. The following subsections contain different methods and ideas that JMU and/or others can use to provide education on food waste and waste disposal.
11.1.1 Frog Week First YeaR Orientation Guide Week, or FROG Week, is a mandatory orientation session for all incoming students to JMU. This week occurs before the first Monday of the school year and is only for new students. The purpose of this week is to make students more familiar and comfortable with campus life through programs, group activities, and information sessions. Myself, along with many of my friends, look back at FROG week fondly and remember it clearly. During this week, students are encouraged to meet new people and learn about the university culture. All students are required to participate in certain learning activities as well, such as alcohol awareness. The purpose of the various information sessions throughout the week is to teach students how to enjoy all aspects of college, safely and legally. During my FROG week experience, I do not recall any information session or activity that was specific to environmental issues or environmental initiatives on campus. I feel that this is the perfect time to talk to incoming students about the environment, and more specifically, about how their actions on and off campus can help protect it. Slowly but surely, JMU is becoming a more environmentally friendly campus. Dining halls are trayless, composting bins can be found in the retail dining facilities, and freshman are given reusable shopping bags during their first week of school. However, much more can be done to encourage environmental protection on campus. Information sessions during FROG week are a great time to teach new students about the basics of environmental issues and how to combat those issues. In particular, an information session before students start eating at “all you care to eat” facilities multiple times a week could help decrease the amount of wasted food on campus. Anyone who has gone away to a university or college can relate to the well-known concept of the “freshman 15”. This concept is based around the idea that students are eating at buffets several times a week, resulting in overeating or overindulging in more decadent goods. No matter how comical this idea may seem, it is highlighting a major problem on college campuses: a large surplus of food. From my own personal experience, I have seen (and engaged) in the art of collecting plate after plate of all the foods I desire for that meal. This action, as harmless as it seems, resulted in myself returning full plates of food to the dish conveyor. Furthermore, because
61
of my careless overestimations of how much I thought I could consume, I inadvertently encouraged dining services to continue the lure of surplus food. As a freshman, with little knowledge about food waste or environmental issues, I had no idea how much damage I was causing to the planet because of my dining behaviors. Every item of food that I threw away represented a loss of natural resources, labor, money, etc. I believe that many other students innocently committed the same acts, simply due to a lack of awareness. FROG week would be a great time to talk to incoming students about what I like to call “dining hall etiquette”. This etiquette would address the more environmentally responsible way to eat at a buffet style facility. The information session could teach students to get one plate at a time, take smaller portions, and to be more appreciative of the plentiful amount of food that is being provided for them. The first year of college is an exciting transition period that can cause students to overindulge in many ways, including food consumption. A simple information session or fun activity during FROG week could help students understand why wasting food is environmentally unsustainable. A reduction in the amount of food that is taken by students (being that some of it is not actually used for nutrient acquisition) would reduce the amount of food ordered by Aramark. The less food ordered by Aramark, on a small scale, helps reduce the amount of food that needs to be produced or imported in the U.S. Although it seems that the actions of one school are not big enough to completely change the infrastructure of surplus, it is a step in the right direction. The results of my study indicate that only 19% of respondents’ selected this option. However, 52% of all respondents’ selected awareness of impacts as a way to influence their habits. Combining these two actions, such as impact awareness information sessions during FROG week, could be a method of educating diners about food waste and waste disposal.
11.1.2 Publicity For the students that are not new to JMU, the incorporation of an orientation class to promote less wasteful habits is not an option. However, a way to make this issue more public is to utilize the sources of news for students on campus.
11.1.2.1 Potty Mouth JMU’s Potty Mouth is a monthly newsletter that hangs on the inside of bathroom stall doors all over campus. These newsletters consist of small blurbs of information regarding a variety of topics. With some incentive from JMU, the Potty Mouth writers could incorporate simple environmental tips into every issue. These tips could give people advice on small, individual ways address food waste, waste disposal, and many other environmental issues.
11.1.2.2 The Breeze The Breeze is the university’s newspaper. Like any newspaper, The Breeze covers many topics relating to things going on in the world and on campus. This is another great resource for environmental tips and facts. This newspaper is distributed all throughout campus and is a free resource. Incorporating environmental facts of the day could help spread awareness of current environmental issues and possible solutions.
62
11.1.3 Stickers A new trend that can be seen all over campus is the prevalence of stickers as means for personal expression. Stickers can be seen on cars, water bottles, laptops, etc. A great way for JMU to subtly spread the message that wasting food can be reduced by personal behaviors could be through the distribution of creative sticker. Many items are given away for free on campus throughout the school year, and this could be another addition to inventory.
11.1.4 Student Incentives From the survey, there were two written responses to the last question “What might influence your habits” that stated incentives. Incentives could be used to encourage food waste reduction from the students. Some ideas for incentives are:
● Educational games that include prizes ● Volunteering opportunities that help students learn, while also providing them with
community service hours that can go on resumes or towards a club/organization requirement
○ Presents the possibility to incorporate volunteer work for school credit ● Competitions among students to see who knows the most, maybe dining hall vouchers for
the most informed students
11.5.5 Dining Hall Reminders Visual messages are a great way to remind, and even encourage, students to be conscious about the food that they are taking. In the moment, it is easy to get excited about seeing many great foods that are all readily available at any time. This excitement can cloud people’s judgement towards how much they can actually eat. A friendly reminder may help people recognize that food is a wonderful gift from the planet and that it takes many natural and human resources to acquire it. The results of my study indicate that 62% of respondents’ selected dining hall reminders as a method to reduce wasted food and improper waste disposal on campus. This was the most selected option and should absolutely be incorporated into the dining facilities. It is a low cost, low maintenance effort that could make a huge impact. Dining services could work with the School of Media, Art, and Design (SMAD) to create these visual aids.
11.5.6 Weighing Stations As discussed in Section 7.2.1, the process of weighing food that is about to be discarded helped reduce the amount of food waste in E-Hall the week of the activity. Although these activities are done periodically throughout the year, a more permanent implementation of this may have a strong impact. I am proposing that the dining hall facilities have optional weighing stations that diners can use to see how much waste they are disposing of.

63
With greater development and technological enhancements, this could potentially be used for diners to personally track their waste habits. Additionally, the data collected could be used for a more in depth food waste analysis of waste generation.
11.2 Unwanted Food Options There will always be undesirable or unwanted food on campus. However, as the saying goes, “one man’s trash is another man’s treasure”. If some students do not want or like certain foods, other students should have the opportunity to acquire those unwanted foods.
11.2.1 Clearance Racks For items that are made by Aramark and have certain dates as guidelines for sale, clearance racks could be put in place. Reducing the price of an item that is close to, on, or past its “sell by” date would be an efficient way to reduce waste. Considering the majority of college students are on a tight budget, a clearance rack in the retail dining locations may be just what the students need to get the nutrients they require, all while keeping perfectly edible food out of landfills.
11.2.2 Taste Testing Several of the surveys had written comments mentioning the taste of food within the dining halls. Some respondents’ expressed that they will take a food hoping to like it, but if they do not, they will simply discard of it and get something new. This is particularly a problem in the “all you care to eat facilities”. So, I am proposing a sampling system that allows diners to taste test something they are uncertain about before they take an entire helping. This way, if the diner does not like the item they sample, they will not have to take an entire plate full to find out! This may not only provide dining services with a better understanding of consumer demands, but it also reduces the amount of food that is sent for composting.
11.2.3 Campus Kitchens at JMU Whatever food is not put on display or used by Aramark should be donated to the hungry. Campus Kitchen at JMU does exactly that. At the start of January, 2017, the Campus Kitchen (CK) club began collecting leftover food from JMU catering services. The club then prepares a meal and serves it to the hungry. Currently, the club is only getting leftover food from catering. Therefore, I am proposing that more Aramark facilities find ways to donate any leftover food to the club. The dining halls are unable to donate leftover food due to FDA regulations, so any other leftover food on campus would have to come from the retail facilities. Through the cooperation of all dining facility management and the Campus Kitchen club, more excess food could be repurposed. It is a great way to help the less fortunate and reduce JMU’s ecological “foodprint”!
11.3 More Disposal Bins Many respondents’ selected unavailability of bins as a major influence on proper waste disposal. To solve this problem, more disposal bins can be placed in non-dining facilities, like academic buildings and libraries, to encourage proper disposal everywhere on campus.

64
11.3.1 Waste Disposal Clarification Incorporating technical definitions onto the posters above the disposal bins may help clarify confused diners. For example, a composting bin could have this description above the item images: “Composting is the process of breaking down organic waste to produce other organic products, such as fertilizer. The process of composting not only turns organic waste into a new product, but it also helps reduce the amount of organic waste in landfills. Therefore, only organic waste can be placed in the composting bin.” A simple explanation of why certain items belong in certain bins may guide confused consumers. For instance, if a consumer has an item that is not pictured on any of the posters, the working definitions of the bins may be able to reduce confusion.
11.4 Individual Tips The purpose of this study is to make suggestions that JMU can incorporate into their campus to help reduce consumer waste. However, individual efforts make a big difference too. Below is a list of quick tips that can help you reduce your personal “foodprint”:
● Buy ugly produce ~ stores will dispose of these items simply because they do not fit the status quo of what a produce item “should” look like
● Purchase “sell by” ~ items close to this date typically get pulled, so if you happen to see one buy it, chances are it has a much longer shelf life than what the date says
● Buy local ~ local markets use significantly less energy for transportation because they are local!
● Bring a to-go container out to eat ~ reduces the need for plastic/aluminum containers and allows you to bring home your leftovers (which you should always try to do!)
● Check the fridge/freezer before food shopping ~ you never know what you might find in there/helps reduce purchasing items that you may already have
● Educate yourself ~ use the FDA website to inform yourself about open dating, food expiration, etc.
● Food literacy ~ learn about the proper ways to store produce for longer lasting food items ● Freezer ~ free items that are close to their expiration date if you do not plan to use them
before the approaching date ● Tightly seal ~ make certain that re-sealable items are fully sealed, oxygen is the enemy
when it comes to long-lasting food ● Share ~ any items that you know you will not use, share them! ● Reusable items~ shopping bags, lunch container, water bottle, glassware, etc. ● Recipe databases ~ when making a new recipe that calls for unique ingredients, search for
other recipes that use those same ingredients so that they do not rot in your fridge after one use
● Tracking ~ keep a whiteboard or calendar in your kitchen to keep track of items in the fridge, items close to expiration, and leftover items with small shelf life
● Make a shopping list ~ impulse buying can lead to throwing away food, so make a list and stick with it
● Go produce picking ~ help farmers harvest their produce and get some food out of it

65
● Repurpose ~ certain foods can be repurposed after their “use by” dates, such as using stale bread for breadcrumbs or croutons
● Cook ~ learn to cook for one and/or try cooking with someone ● SPEAK UP ~ spread the word about food waste and food loss, many people are unaware
and a simple conversation might just put them on the right track!

66

67
12 Conclusion Food loss and food waste will never be completely avoided. There will always be scraps, human error, and thoughtless actions that will result in some amount of wasted food. The key, though, is to minimize the amount of food waste generated as much as absolutely possible. James Madison University is well on its way to reducing retailer and consumer food waste. With the incorporation of the suggestions mentioned above, JMU and its’ community members may be more capable of doing their part to properly dispose and ultimately reduce waste. Everyone has a role in this effort. Every single person can make a difference by making environmentally conscious decisions regarding food waste and proper disposal. Although the problem is influenced by the habits of billions, every individual effort counts.

68
13 Works Cited "Advancing Sustainable Materials Management: 2014 Fact Sheet." EPA. Environmental
Protection Agency, Nov. 2016. Web. 14 Apr. 2017. Alesksinas, Debra A. "Restaurant Leftovers Aren't for the Dogs Anymore." South Coast Today.
N.p., 09 Apr. 2009. Web. 13 Apr. 2017.
American Biogas Council. "What Is Anaerobic Digestion?" American Biogas Council. N.p., n.d.
Web. 10 Apr. 2017.
American Chemical Society. Chemistry in Context: Applying Chemistry to Society. 7th ed. New York: McGraw-Hill, 2012. Print.
Andreatta, Susan L. "From Farm to Table: Making the Connection in the Mid-Atlantic Food
System." Journal of Culture, Agriculture, Food and Environment (CAFE) (2003): 51-54. Web. 13 Apr. 2017.
Been, Vicki. "Locally Undesirable Land Uses in Minority Neighborhoods: Disproportionate
Siting or Market Dynamics?" The Yale Law Journal 103.6 (1994): 1383-422. Web. 13 Apr. 2017.
Bloom, Jonathan M. American Wasteland: How America Throws Away Nearly Half of Its Food
(and What We Can Do about It). Cambridge: Da Capo, 2011. Print.
"Chapter 3: Fertilizers as Water Pollutants." Control of Water Pollution from Agriculture. Food
and Agricultural Organization of the United Nations, n.d. Web. 13 Apr. 2017.
Chasek, Pamela S., David Leonard Downie, and Janet Welsh Brown. Global Environmental Politics. 7th ed. Boulder, CO: Westview, 2016. Print.
"Chemical Contamination of Groundwater." Getting Up to Speed: Groundwater Contamination.
EPA, 1993. Web. 13 Apr. 2017.
"Composting." James Madison University - Composting. Facilities Management, n.d. Web. 10
Apr. 2017. "Cropland Conversion." USDA FSA. United States Department of Agriculture, 31 Aug. 2013.
Web. 15 Apr. 2017.
"EPA and USDA Join Private Sector, Charitable Organizations to Set Nation’s First Goals to
Reduce Wasted Food." EPA. Environmental Protection Agency, 18 Apr. 2016. Web. 06 Apr. 2017.
"EPA History: Resource Conservation and Recovery Act." EPA. Environmental Protection Agency, 18 Oct. 2016. Web. 13 Apr. 2017.

69
"Farms and Farmland: Numbers, Acreage, Ownership, and Use." Census of Agriculture: 2012
Highlights. United States Department of Agriculture, Sept. 2014. Web. 15 Apr. 2017.
Farber, Daniel A. Environmental Law in a Nutshell. 9th ed. St. Paul, MN: West Academic, 2014. Print.
"Federal Acquisition Regulation; FAR Case 2008-017, Federal Food Donation Act of 2008 (Pub.
L. 110-247)." Federal Register. N.p., 10 Dec. 2009. Web. 08 Apr. 2017.
"Food Miles: How Far Your Food Travels Has Serious Consequences for Your Health and the
Climate." Health Facts. Natural Resources Defense Council, Nov. 2007. Web. 13 Apr. 2017.
"Food Product Dating." Food Safety and Inspection Service. United States Department of
Agriculture, n.d. Web. 10 Apr. 2017.
“Food Waste Digester." Campus Master Planning and Sustainability. Purdue University, n.d.
Web. 12 Apr. 2017.
"Food Waste FAQ's." USDA | OCE | U.S. Food Waste Challenge | FAQ's. United States Department of Agriculture, n.d. Web. 11 Oct. 2016.
"Food Safety for Seniors." U S Food and Drug Administration Home Page. Center for Food
Safety and Applied Nutrition, Nov. 2011. Web. 10 Apr. 2017.
"Frequently Asked Questions." USDA | OCE | U.S. Food Waste Challenge | FAQ's. United States
Department of Agriculture, n.d. Web. 06 Apr. 2017. "Full-Cost Accounting." Food Wastage Footprint (2014): n. pag. FAO. Web. 13 Apr. 2017.
Gunders, Dana. "Wasted: How America Is Losing Up to 40 Percent of Its Food from Farm to
Fork to Landfill." NRDC Issue Paper. Natural Resources Defense Council, Aug. 2012. Web. 7 Apr. 2017.
Gustavsson, Jenny, Christel Cederberg, Ulf Sonesson, Robert Van Otterdijk, and Alexandre
Meybeck. Global Food Losses and Food Waste. Food and Agricultural Organization of the United Nations, 2011. Web. 18 Apr. 2017.
"Hidden Costs of Industrial Agriculture." Industrial Agriculture. Union of Concerned Scientists, n.d. Web. 13 Apr. 2017.
"History of Sustainability." History of Sustainability | Messiah College. Messiah College, 12
May 2014. Web. 13 Apr. 2017.
Hoekstra, Arjen Y., and Mesfin M. Mekonnen. "The Water Footprint of Humanity." Proceedings

70
of the National Academy of Sciences of the United States of America 109.9 (2011): 3232-237. PNAS. Web. 13 Apr. 2017.
"How to Prevent Wasted Food Through Source Reduction." EPA. Environmental Protection
Agency, 25 Aug. 2016. Web. 11 Apr. 2017. "Hunger Statistics." WFP | United Nations World Food Programme - Fighting Hunger
Worldwide. World Food Programme, n.d. Web. 11 Oct. 2016.
"Irrigation Water Use." USGS Water Use in the United States. United States Department of
Interior, 2010. Web. 13 Apr. 2017.
Jacobs, Harrison. "Why Grocery Stores Like Trader Joe's Throw Out So Much Perfectly Good Food." Business Insider. Business Insider, 15 Oct. 2014. Web. 12 Apr. 2017.
Jacobs, Harrison. "Here's Why Wasted Food Doesn't Get To Poor People." Business Insider.
Business Insider, 16 Oct. 2014. Web. 15 Apr. 2017.
Kantor, Linda Scott, Kathryn Lipton, Alden Manchester, and Victor Oliveira. "Estimating and
Addressing America's Food Losses." USDA. United States Department of Agriculture, Jan. 1997. Web. 7 Apr. 2017.
Kosa, Katherine M., Sheryl C. Cates, Shawn Karns, Sandria L. Godwin, and Delores Chambers.
"Consumer Knowledge and Use of Open Dates: Results of a Web-Based Survey." Journal of Food Protection 70.5 (2006): 1213-219. Web. 12 Apr. 2017.
Letcher, Trevor, and Daniel Vallero. Waste: A Handbook for Management. 1st ed. San Diego,
CA: Elsevier, 2011. Print.
"List of Municipal Solid Waste Landfills." EPA. Environmental Protection Agency, 20 Mar.
1996. Web. 13 Apr. 2017. "Methane Emissions." EPA: Overview of Greenhouse Gases. Environmental Protection Agency,
14 Feb. 2017. Web. 13 Apr. 2017.
Milman, Oliver. "Earth Has Lost a Third of Arable Land in past 40 Years, Scientists Say." The
Guardian. Guardian News and Media, 02 Dec. 2015. Web. 13 Apr. 2017. Mitchell, James K. Assessment of the Performance of Engineered Waste Containment Barriers.
Washington, DC: National Academies, 2007. Print.
Molles, Manuel C., Jr. Ecology: Concepts and Applications. 6th ed. New York: McGraw-Hill,
2013. Print.
"Municipal Solid Waste Generation, Recycling, and Disposal in the United States: Facts and Figures for 2007." EPA. Environmental Protection Agency, Nov. 2008. Web. 14 Apr. 2017.

71
"Nutrition." Get the Facts: Drinking Water and Intake. Centers for Disease Control and
Prevention, 07 Mar. 2017. Web. 13 Apr. 2017.
Patterson, Jacqui, Kimberly Wasserman, Amanda Starbuck, Annie Sartor, Judy Hatcher, John Fleming, and Katie Fink. "Coal Blooded: Putting Profits Before People." NAACP. National Association of the Advancement of Colored People, n.d. Web. 15 Apr. 2017.
Phillips, Steven P., Laurel Lynn Rogers, and Claudia Faunt. "Advancing Sustainable Materials
Management: 2014 Fact Sheet." (2016): n. pag. Environmental Protection Agency. Nov. 2016. Web. 13 Apr. 2017.
Poon, Linda. "When Food Is Too Good To Waste, College Kids Pick Up The Scraps." NPR.
NPR, 27 Feb. 2015. Web. 13 Apr. 2017.
Rendleman, Raymond. "Origin of the Scrounge." Reed Magazine. Reed College, Oct. 2011. Web. 12 Apr. 2017.
"Sediment Pollution." (n.d.). Environmental Protection Agency. Mid-America Regional Council.
Web. 13 Apr. 2017.
Sellers, Kathleen. Fundamentals of Hazardous Waste Site Remediation. Boca Raton: Lewis, 1999. Print.
"Soil Erosion and Degradation." WWF. World Wildlife Fund, n.d. Web. 13 Apr. 2017.
Stuart, Tristram. Waste: Uncovering the Global Food Scandal. London: Penguin, 2009. Print.
"Sources of Greenhouse Gas Emissions." EPA. Environmental Protection Agency, 14 Feb. 2017.
Web. 13 Apr. 2017. "Sustainable Management of Food Basics." EPA. Environmental Protection Agency, n.d. Web.
11 Oct. 2016.
"Sustainable Operations." Stanford Residential and Dining Enterprises. Stanford University, n.d.
Web. 13 Apr. 2017.
"The Floods' Lingering Effects: New Study Shows Gulf "Dead Zone" One of the Largest on Record." Gulf of Mexico Dead Zone. The Nature Conservancy, n.d. Web. 13 Apr. 2017.
The Last Mountain. Dir. Bill Haney. Solid Ground Films, 2011. Web. 15 Apr. 2017.
"U.S. Food Waste Challenge | FAQ's." Office of the Chief Economist. United States Department
of Agriculture, n.d. Web. 19 Apr. 2017. "U.S. Food Imports." USDA ERS - U.S. Food Imports. United States Department of Agriculture,
04 Nov. 2015. Web. 15 Apr. 2017.
Van Garde, S. J., and M. J. Woodburn. "Food Discard Practices of Householders." Journal of the

72
American Dietetic Association. U.S. National Library of Medicine, Mar. 1987. Web. 12 Apr. 2017.
Weinzierl, Richard, Patrick Weicherding, Brenda Cude, David Williams, and Doug Peterson. 57
Ways to Protect Your Home Environment (and Yourself). Urbana, IL: Cooperative Extension Service, U of Illinois at Urbana-Champaign, 1996. Print.
"What Is Malnutrition?" World Health Organization. World Health Organization, 2016. Web. 13 Apr. 2017.