food web 2010 - welcome - faculty of fisheries web.pdfgrowth rapid uptake endoactivity exoactivity...
TRANSCRIPT
TheThe AquaticAquatic Food Web Food Web and and
thethe MicrobialMicrobial LoopLoop
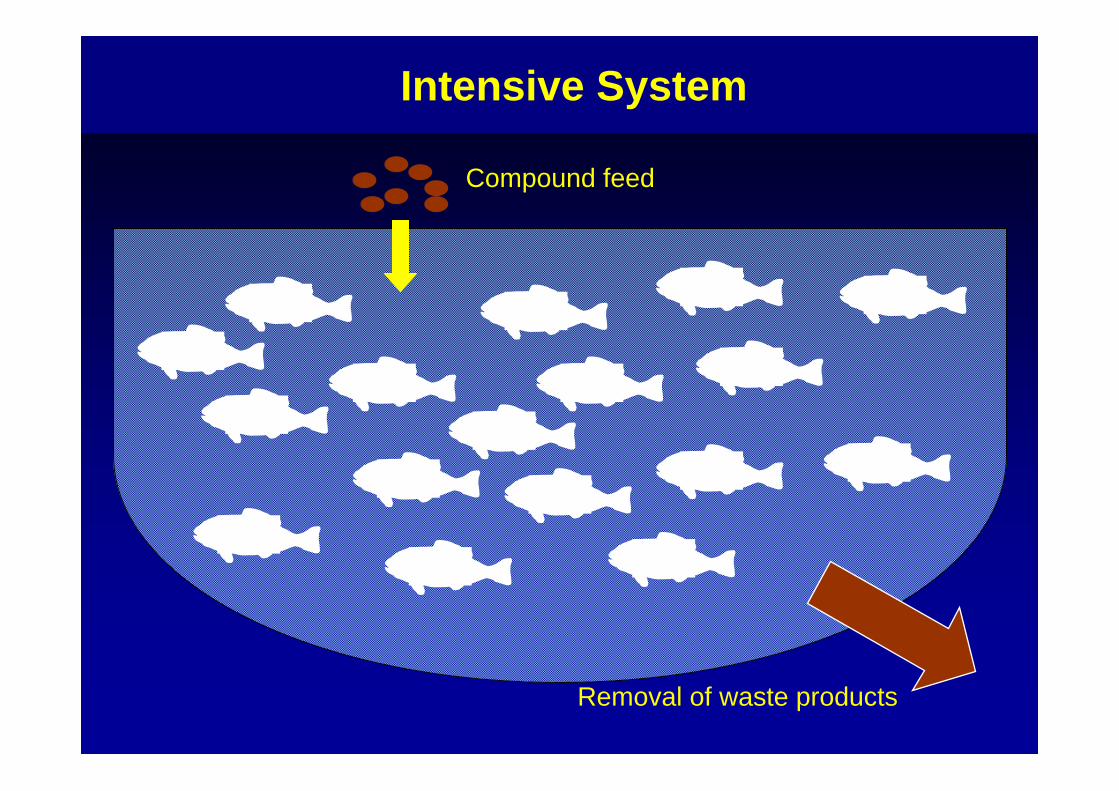
Intensive System
Compound feed
Removal of waste products

Extensive System
Compound feed
Removal of waste products
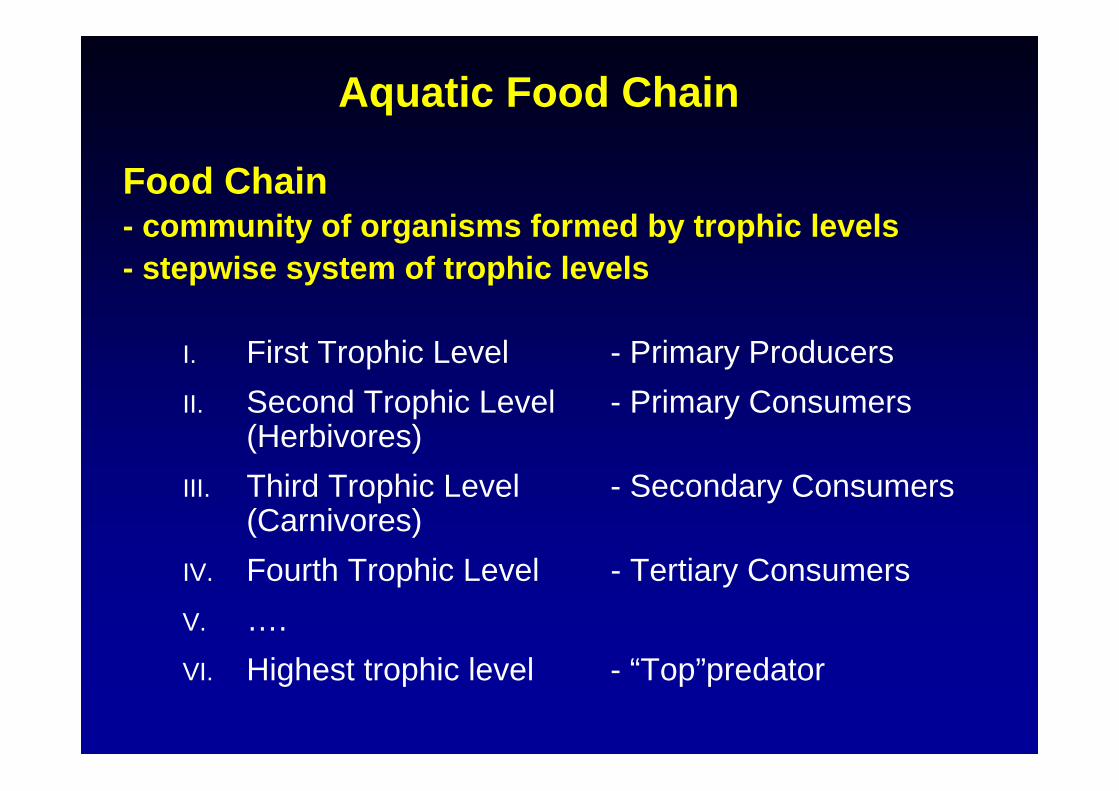
Food Chain - community of organisms formed by trophic levels- stepwise system of trophic levels
I. First Trophic Level - Primary ProducersII. Second Trophic Level - Primary Consumers
(Herbivores)III. Third Trophic Level - Secondary Consumers
(Carnivores)IV. Fourth Trophic Level - Tertiary ConsumersV. ….VI. Highest trophic level - “Top”predator
Aquatic Food Chain

Pelagial
Benthal Compensation depth*
Littoral
Profundal
* Between cm and > 30 meters, dependent on season, weather, species, amount of phytoplankton, suspended particles
Biocoenoses - Compartements
Sediment
euphotic
aphotic

Primary Production
hv 6 CO2 + 6 H2O → C6H12O6 + 6 O2
Macronutrients: N, P, S, K, Mg, Ca, Na, Cl, (Si)
Trace elements: Fe, Mn, Cu, Zn, B, Si, Mo, V, Co
CD*
* Between cm and > 30 m, depending on season, weather, species, turbidity (amount of phytoplankton)
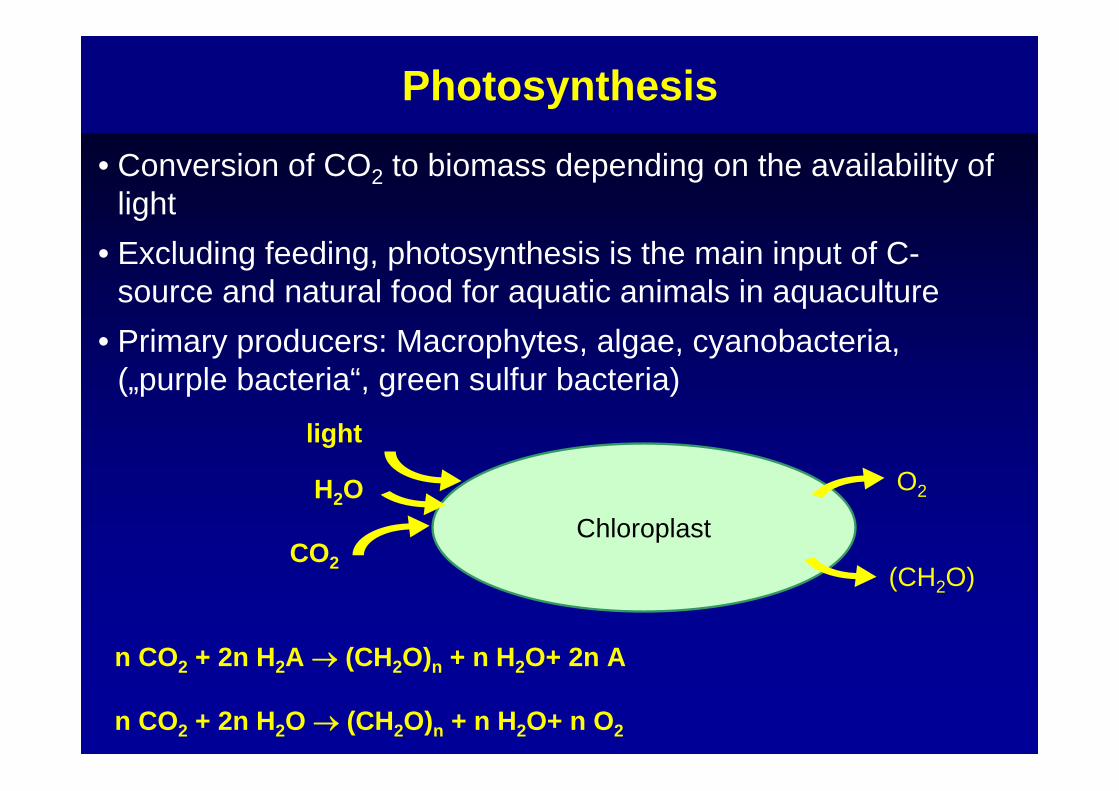
Photosynthesis
ChloroplastH2O
CO2
light
O2
(CH2O)
n CO2 + 2n H2A → (CH2O)n + n H2O+ 2n A
n CO2 + 2n H2O → (CH2O)n + n H2O+ n O2
• Conversion of CO2 to biomass depending on the availability of light
• Excluding feeding, photosynthesis is the main input of C-source and natural food for aquatic animals in aquaculture
• Primary producers: Macrophytes, algae, cyanobacteria, („purple bacteria“, green sulfur bacteria)

„Dark“ respiration in mitochondria
Light reaction (PSI and PSII)H2O O2
Dark reaction (Calvin cycle)CO2
carbohydrates(CH2O)
heat
heat
light
2 NADP+ 2 NADPH/H+ 3 ADP 3 ATP

Dependent on:1. climate (light and temperature) → annual PP in lakes decreases from
tropics to poles2. cultural (enrichment from catchment and man‘s activities)3. morphometric (size and shape)
Trophic status= Intensity of organic photoautotrophic production
temperate ultra-oligotrophic Ptot < 5 µg/Loligotrophic Ptot 5-10 µg/Lmesotrophic Ptot 10-30 µg/Leutrophic Ptot 30-100 µg/Lhypereutrophic Ptot > 100 µg/L
Phytoplankton (Redfield ratio) C:N:P = 106:16:1Peripyhton (Hillebrand & Sommer 1999) C:N:P = 119:17:1
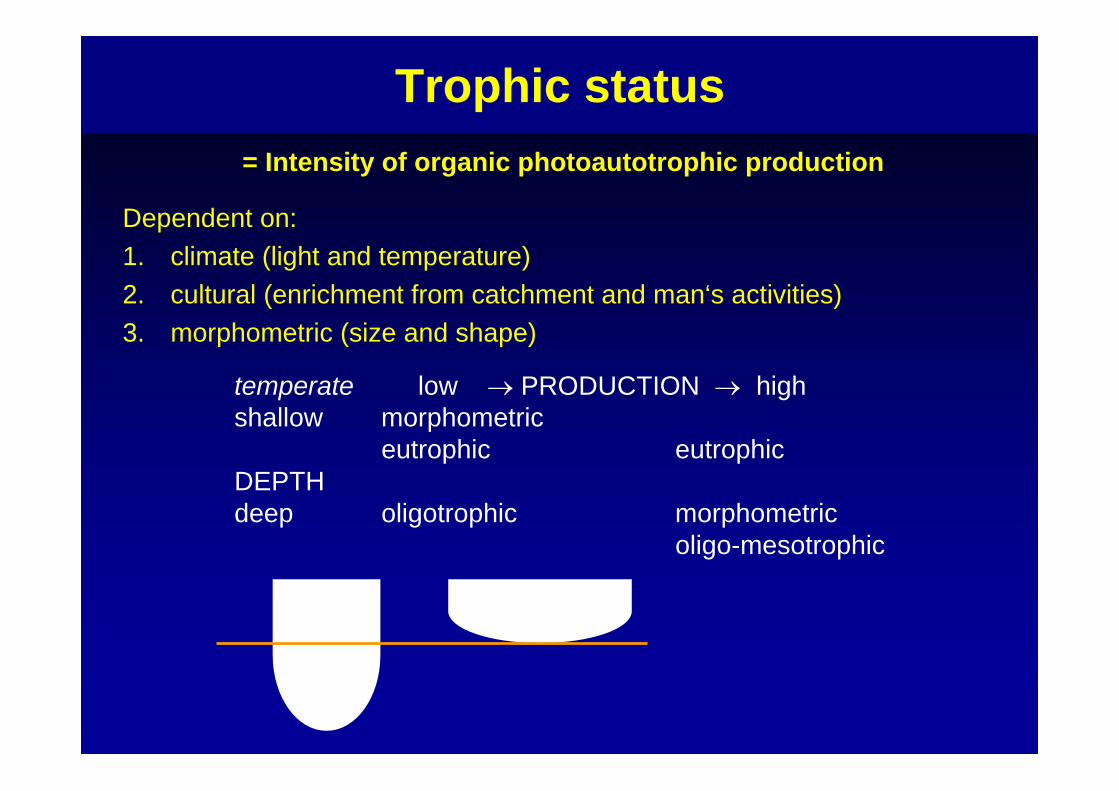
Dependent on:1. climate (light and temperature)2. cultural (enrichment from catchment and man‘s activities)3. morphometric (size and shape)
Trophic status= Intensity of organic photoautotrophic production
temperate low → PRODUCTION → highshallow morphometric
eutrophic eutrophicDEPTHdeep oligotrophic morphometric
oligo-mesotrophic
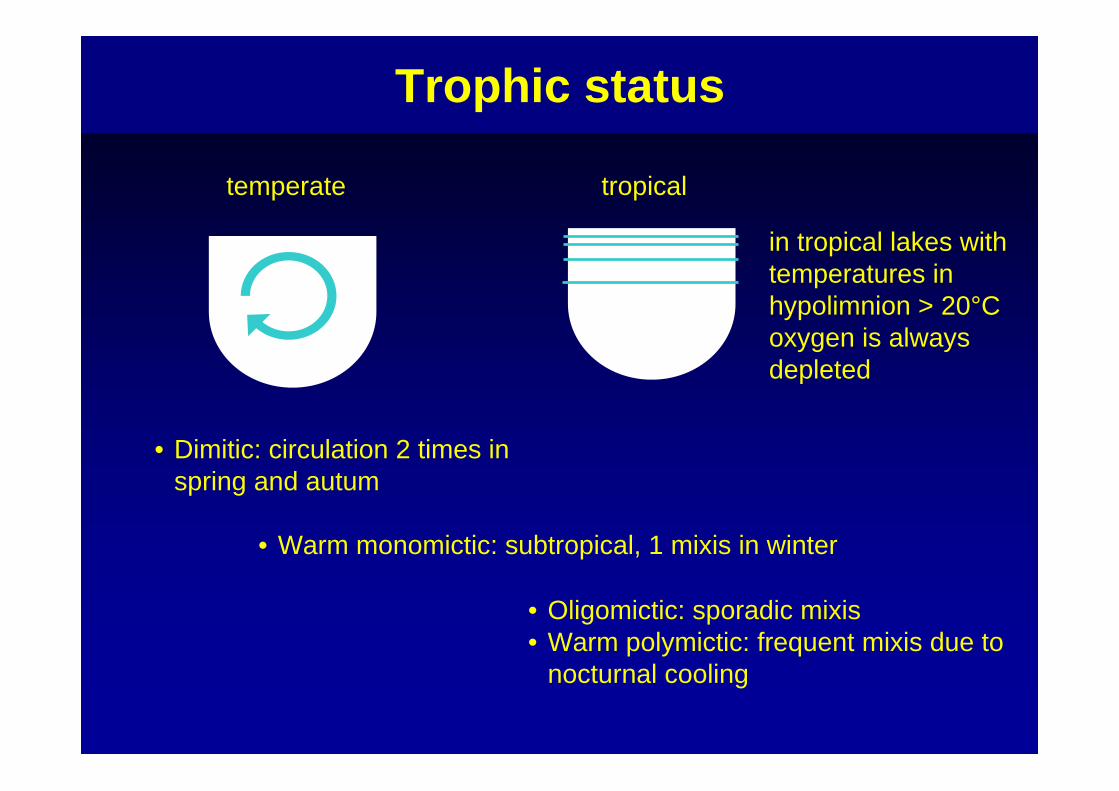
temperate tropical
• Dimitic: circulation 2 times in spring and autum
• Warm monomictic: subtropical, 1 mixis in winter
• Oligomictic: sporadic mixis• Warm polymictic: frequent mixis due to
nocturnal cooling
Trophic status
in tropical lakes withtemperatures in hypolimnion > 20°C oxygen is alwaysdepleted

Photosynthesis
radiance
dept
h
PAR (photosynthetic active radiation) 380-740 nm (bacteria > 800 nm)
Zeu : Izeu = 0.01 I0‘
I0I0‘
Izeu
Photosynthesis
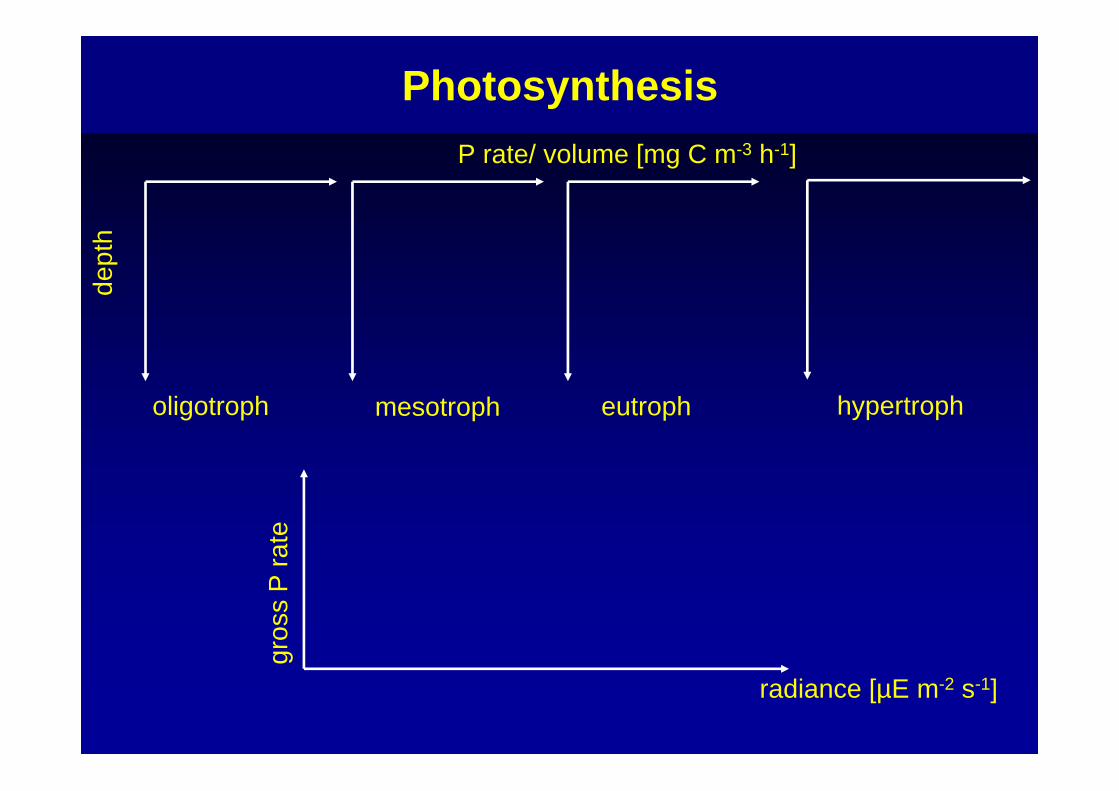
oligotroph mesotroph eutroph hypertroph
dept
h
gros
sP
rate
radiance [µE m-2 s-1]
P rate/ volume [mg C m-3 h-1]

Photosynthesis
oligotroph mesotroph eutroph hypertroph
dept
h
P rate/ volume [mg C m-3 h-1]
zeuzeu
zeu
zeu
Pmax
inhibitionsaturationlimitationradiance [µE m-2 s-1]
gros
sP
rate
Ik
Ik =20-300 µE m-2 s-1
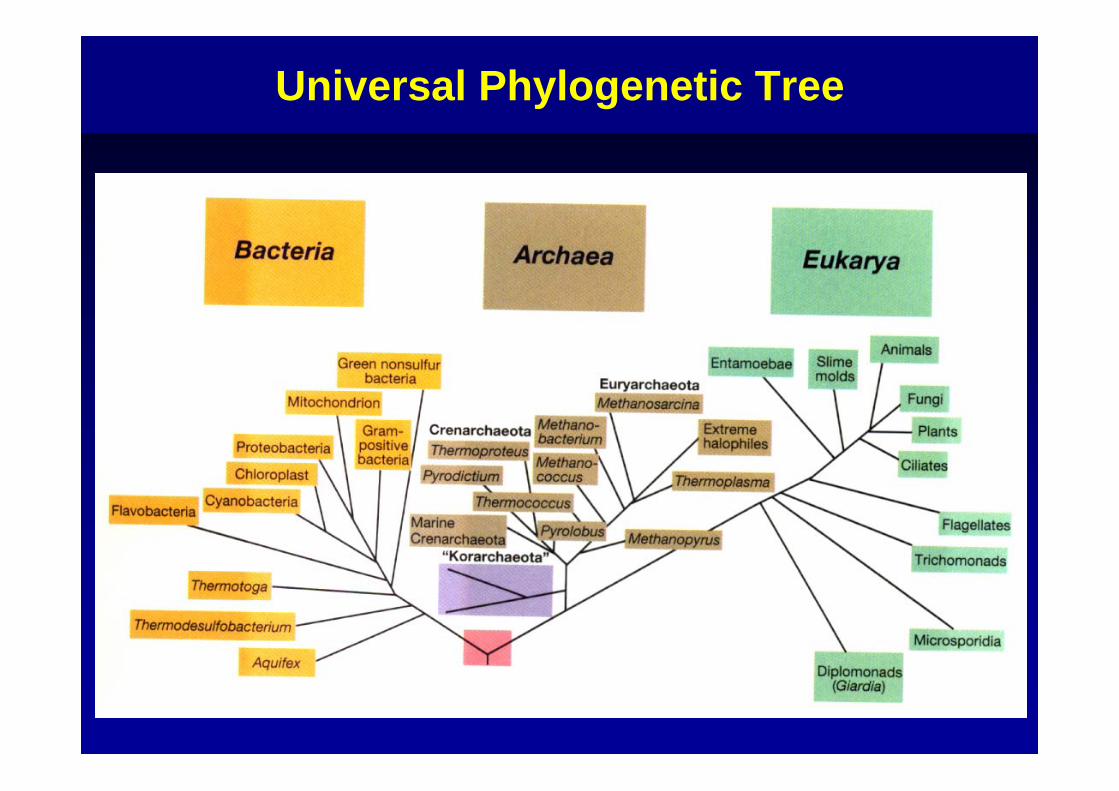
Universal Phylogenetic Tree

Macrophyta
• Utilization of littoral production by benthic consumersmainly by DOM release and microbial decay, taken up as detritus with bacterial and fungal cells
• Direct usage only by few organism groups (snails, insectlarvae, beetles)
• Contribution of macrophytes to total primary prodcution depends on ratio of littoral : pelagial→ high in swallow tropical lakes
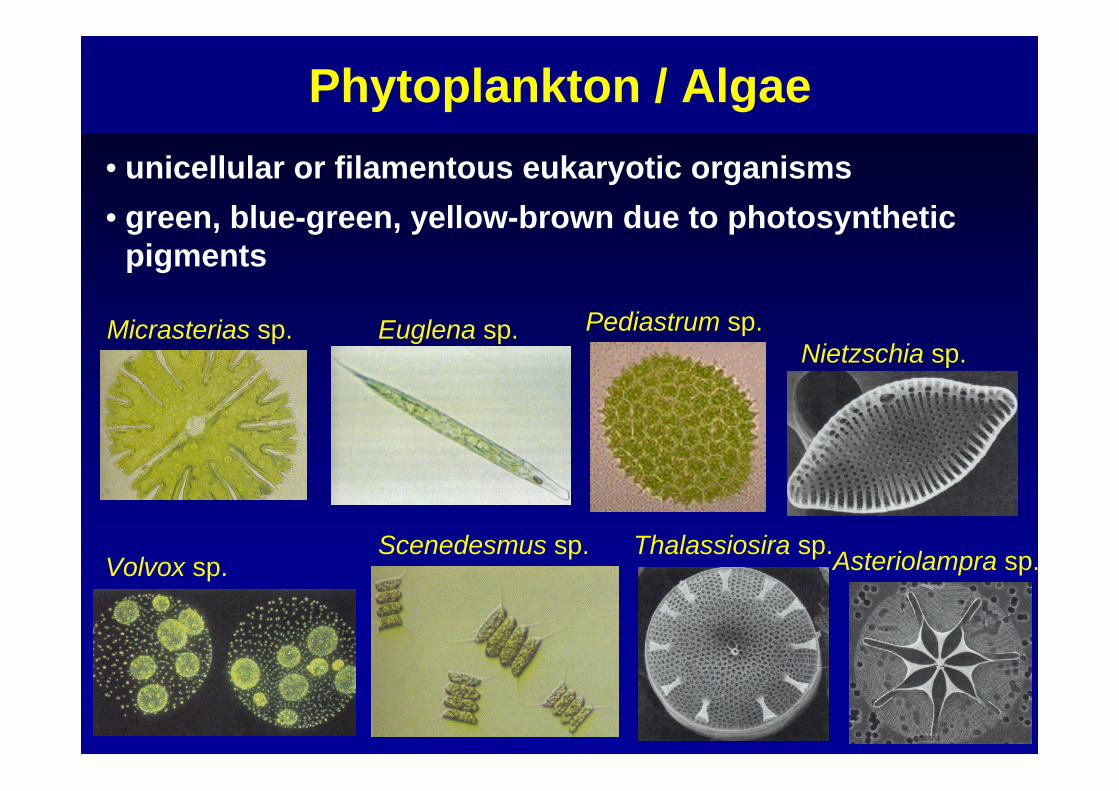
Phytoplankton / Algae• unicellular or filamentous eukaryotic organisms• green, blue-green, yellow-brown due to photosynthetic
pigments
Micrasterias sp.
Scenedesmus sp.Volvox sp.
Nietzschia sp.
Thalassiosira sp.Asteriolampra sp.
Euglena sp. Pediastrum sp.
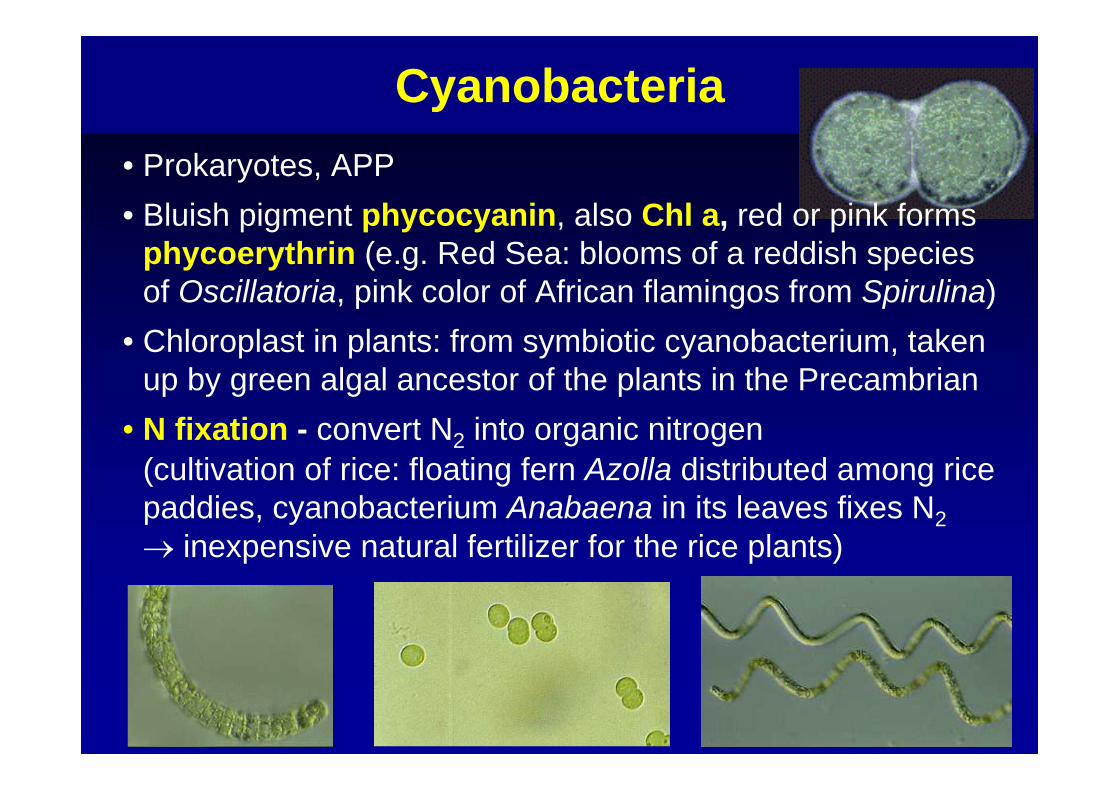
Cyanobacteria• Prokaryotes, APP • Bluish pigment phycocyanin, also Chl a, red or pink forms
phycoerythrin (e.g. Red Sea: blooms of a reddish species of Oscillatoria, pink color of African flamingos from Spirulina)
• Chloroplast in plants: from symbiotic cyanobacterium, taken up by green algal ancestor of the plants in the Precambrian
• N fixation - convert N2 into organic nitrogen(cultivation of rice: floating fern Azolla distributed among rice paddies, cyanobacterium Anabaena in its leaves fixes N2 → inexpensive natural fertilizer for the rice plants)
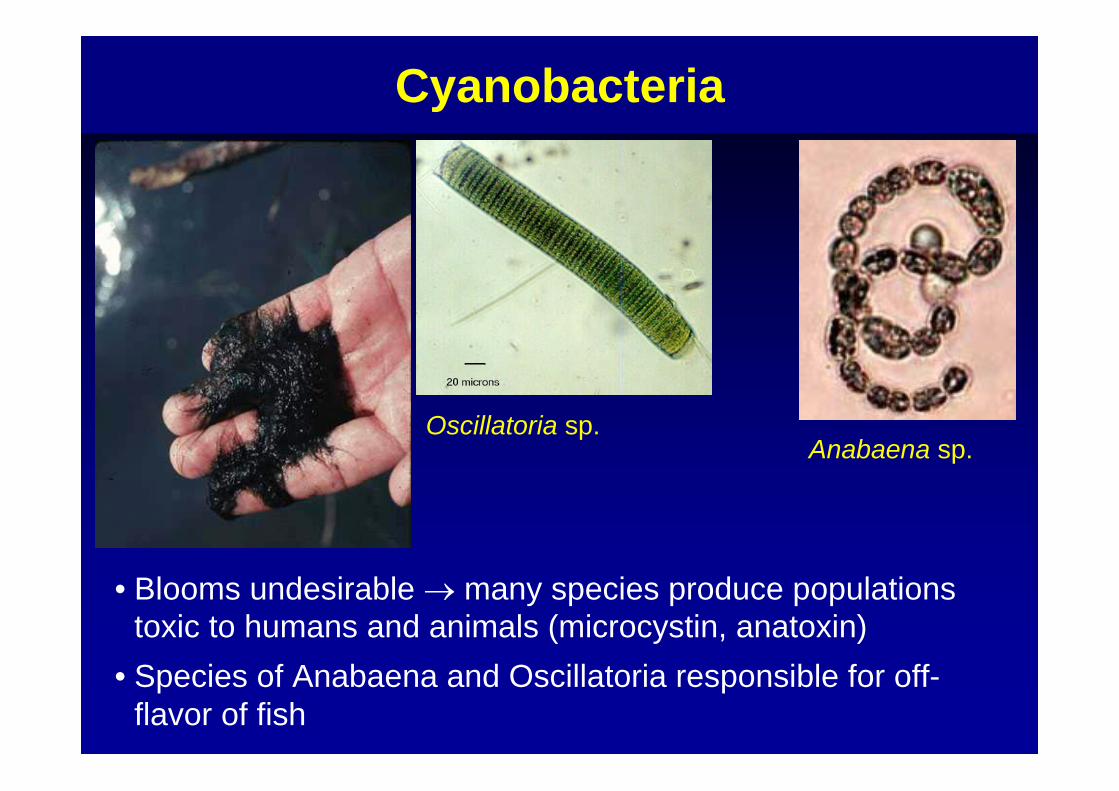
Oscillatoria sp.
Cyanobacteria
• Blooms undesirable → many species produce populations toxic to humans and animals (microcystin, anatoxin)
• Species of Anabaena and Oscillatoria responsible for off-flavor of fish
Anabaena sp.
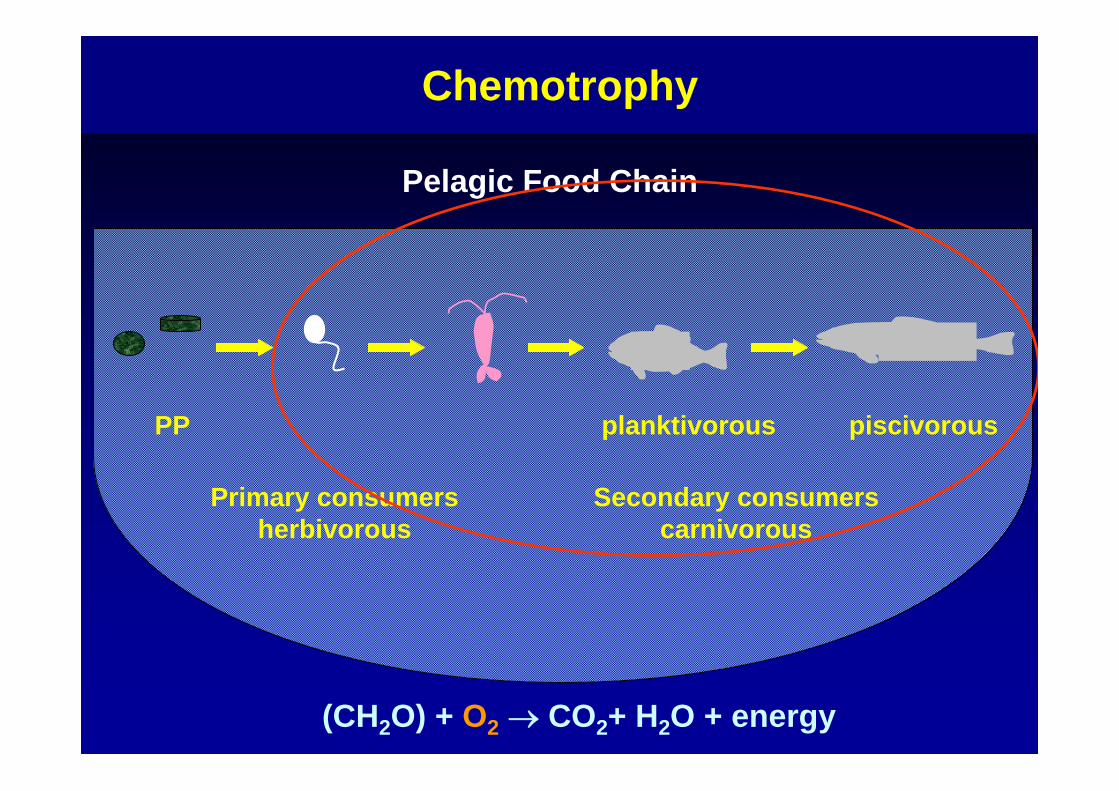
Chemotrophy
PP piscivorousplanktivorous
Primary consumersherbivorous
Secondary consumerscarnivorous
Pelagic Food Chain
(CH2O) + O2 → CO2+ H2O + energy
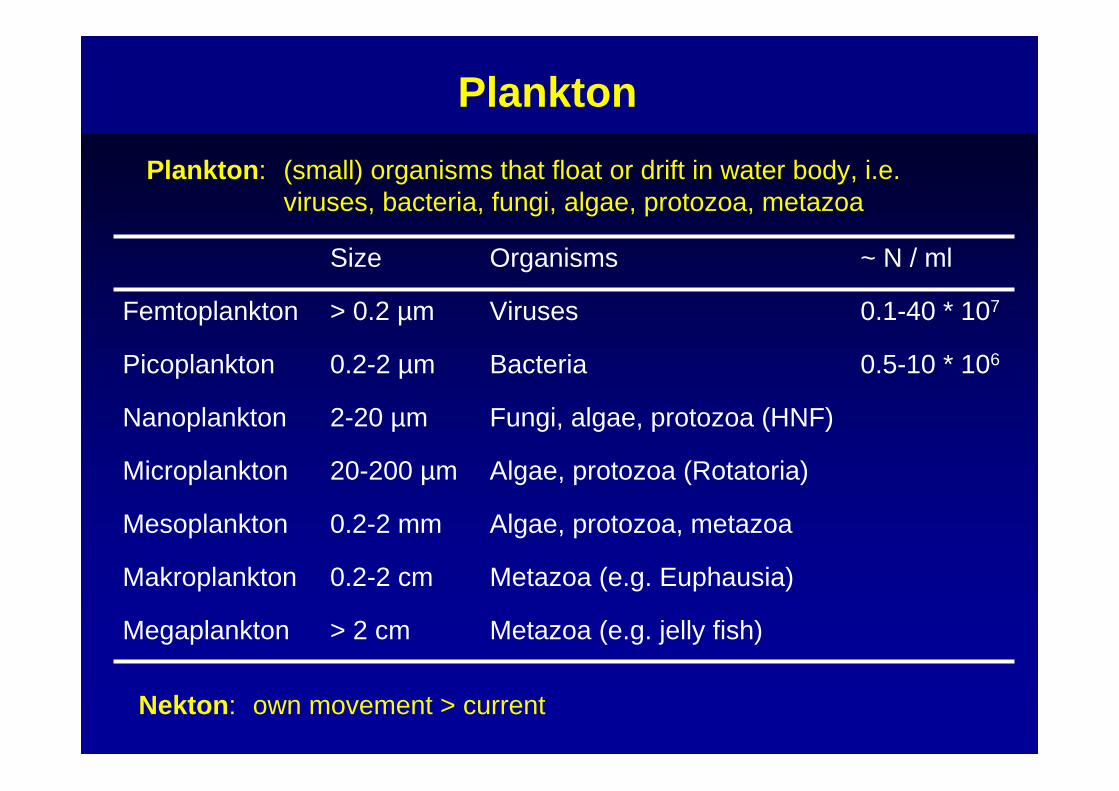
Metazoa (e.g. jelly fish)
Metazoa (e.g. Euphausia)
Algae, protozoa, metazoa
Algae, protozoa (Rotatoria)
Fungi, algae, protozoa (HNF)
Bacteria
Viruses
Organisms
0.5-10 * 1060.2-2 µmPicoplankton
> 2 cmMegaplankton
0.2-2 cmMakroplankton
0.2-2 mmMesoplankton
20-200 µmMicroplankton
2-20 µmNanoplankton
0.1-40 * 107> 0.2 µmFemtoplankton
~ N / mlSize
PlanktonPlankton: (small) organisms that float or drift in water body, i.e.
viruses, bacteria, fungi, algae, protozoa, metazoa
Nekton: own movement > current
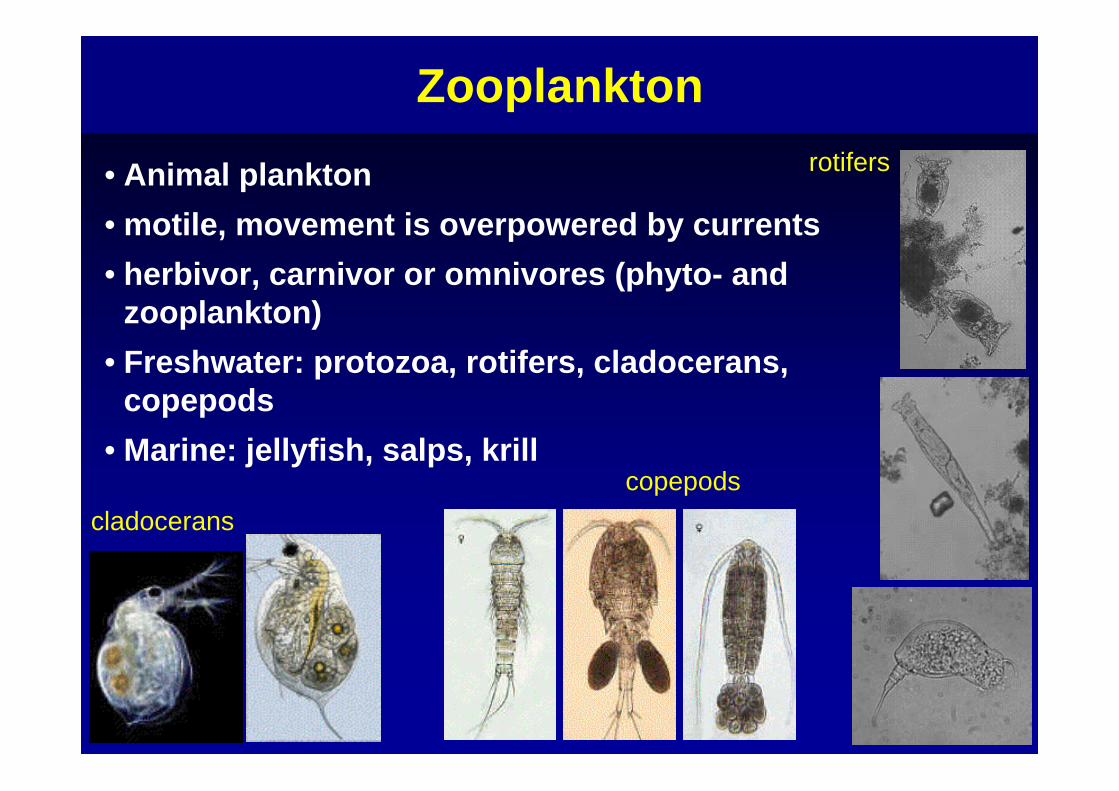
Zooplankton
• Animal plankton• motile, movement is overpowered by currents• herbivor, carnivor or omnivores (phyto- and
zooplankton) • Freshwater: protozoa, rotifers, cladocerans,
copepods• Marine: jellyfish, salps, krill
copepodscladocerans
rotifers
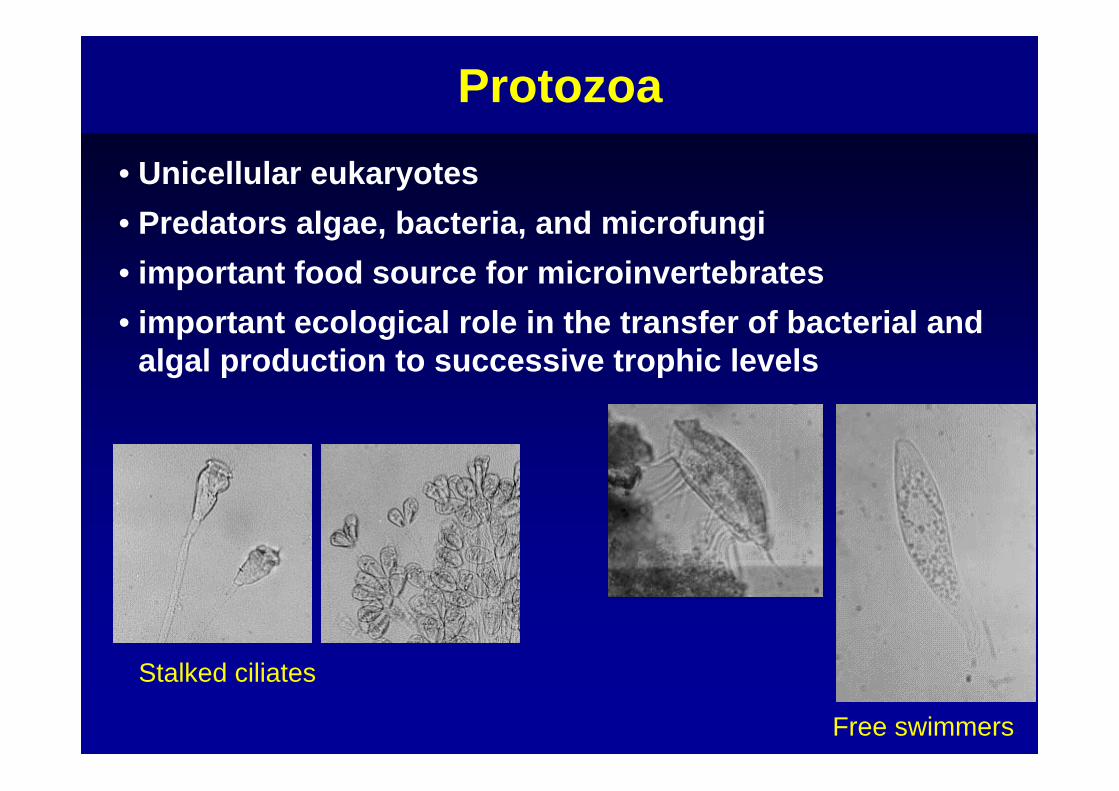
Protozoa• Unicellular eukaryotes• Predators algae, bacteria, and microfungi• important food source for microinvertebrates• important ecological role in the transfer of bacterial and
algal production to successive trophic levels
Stalked ciliates
Free swimmers

Chemotrophy
Benthic Food Chain
Herbivorousanimals(larvae of insects, snails, grasscarp)
Carnivorousanimals(insects, turbellaria, crustacea, etc. Benthic fish
Primary consumers Secondary consumers
→ Interactions with pelagic food chain
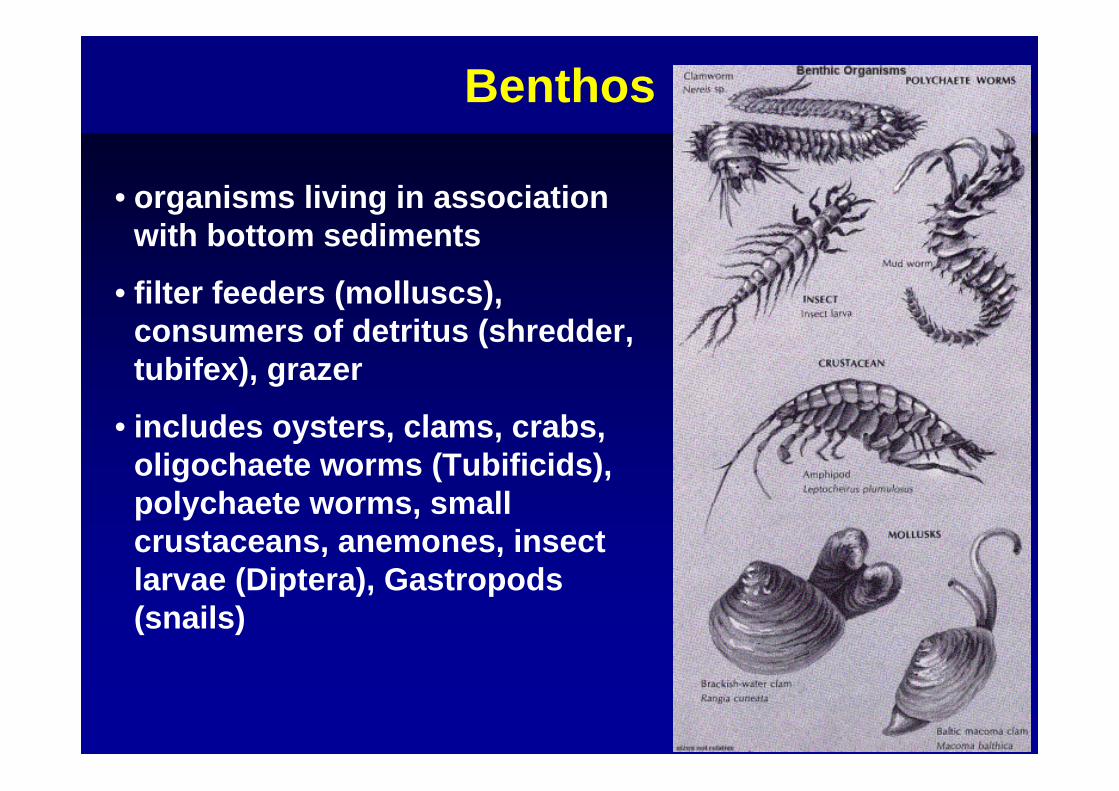
Benthos
• organisms living in association with bottom sediments
• filter feeders (molluscs), consumers of detritus (shredder, tubifex), grazer
• includes oysters, clams, crabs, oligochaete worms (Tubificids),polychaete worms, small crustaceans, anemones, insectlarvae (Diptera), Gastropods (snails)
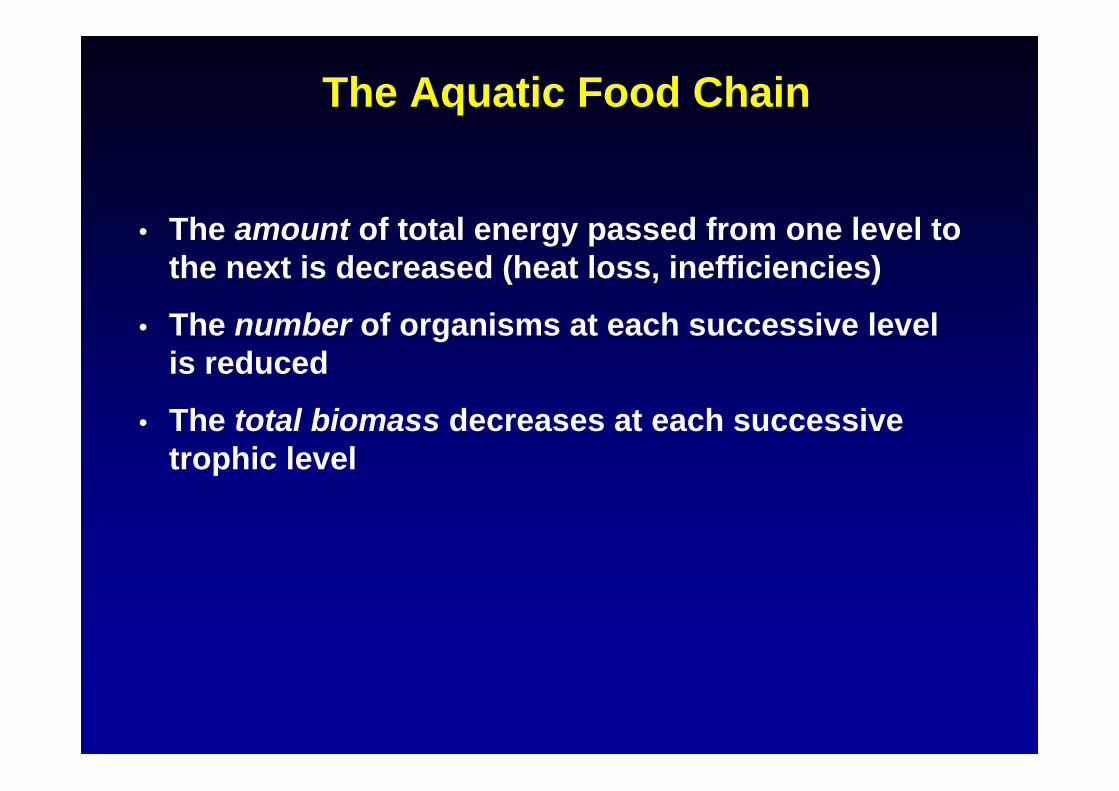
• The amount of total energy passed from one level to the next is decreased (heat loss, inefficiencies)
• The number of organisms at each successive level is reduced
• The total biomass decreases at each successive trophic level
The Aquatic Food Chain

Tota
l Bio
mas
s(g
)
Phyt
opla
nkto
n
Zoop
lank
ton
Fish
Fish
Fish
Food Chain and Energy Flow
10 000
1 000
100
10
1
Trophic Level1 2 3 4 5
Turnover ↔ Standing cropPhytoplankton > (multiple times)Zooplankton ~Higher trophic levels <
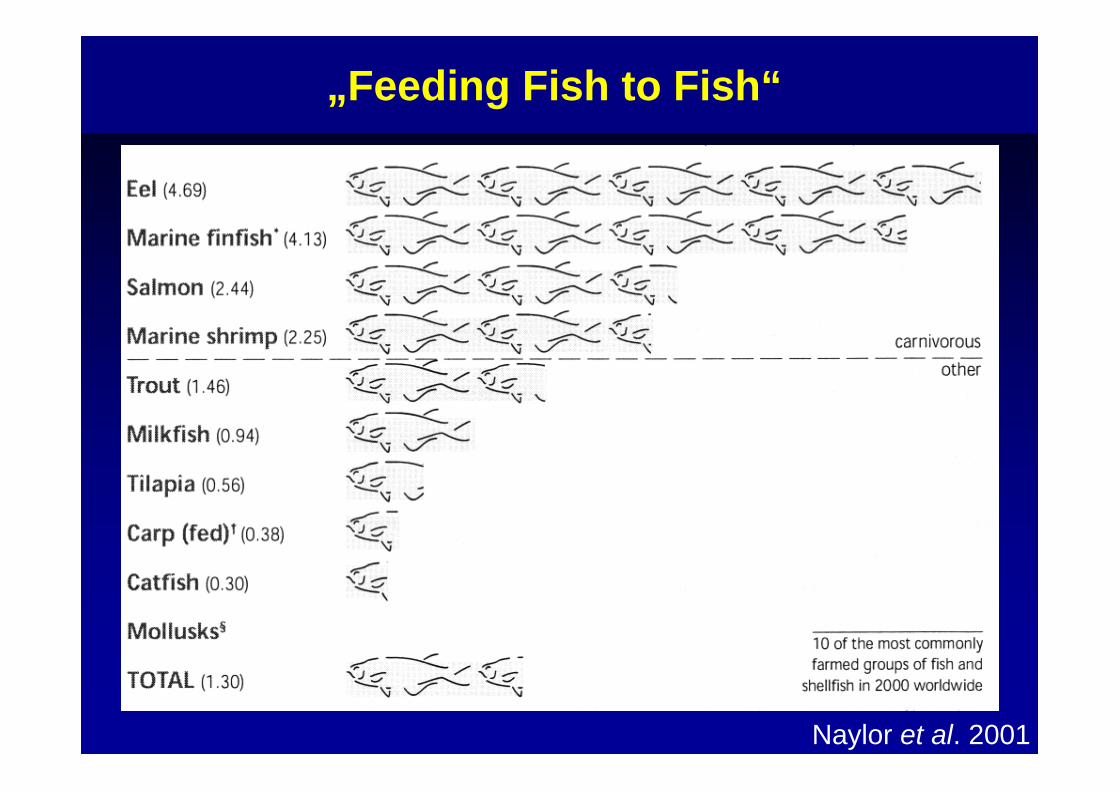
Naylor et al. 2001
„Feeding Fish to Fish“

Ecological pyramid of global aquaculture production in 1999 according to taxonomic group and trophic level (FAO 2001)
Aquaculture Production
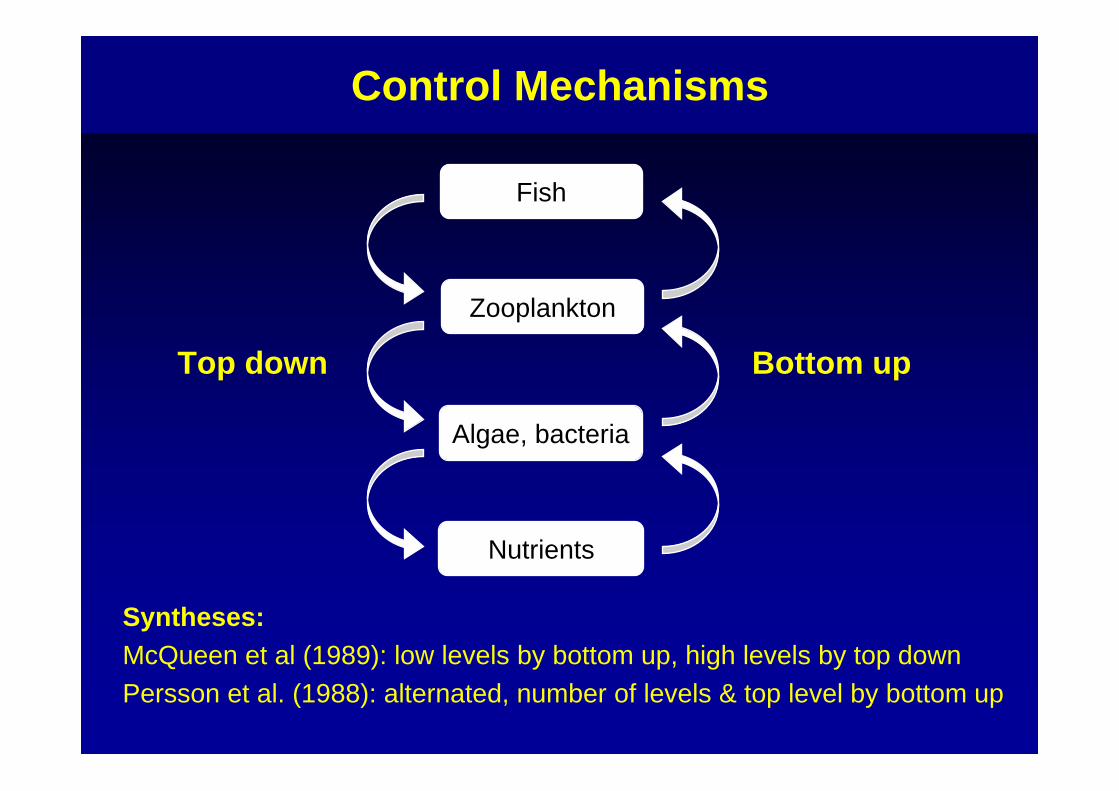
Top down
Fish
Zooplankton
Algae, bacteria
Nutrients
Bottom up
Control Mechanisms
Syntheses:McQueen et al (1989): low levels by bottom up, high levels by top downPersson et al. (1988): alternated, number of levels & top level by bottom up
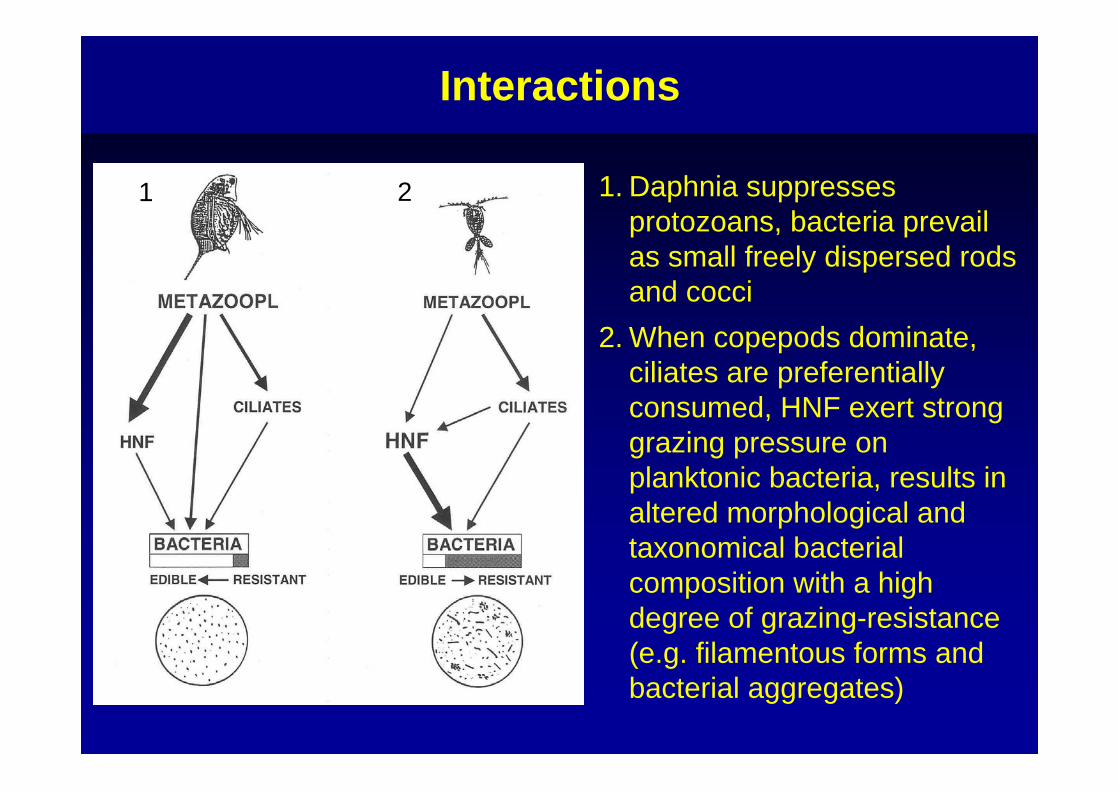
1. Daphnia suppresses protozoans, bacteria prevail as small freely dispersed rods and cocci
2. When copepods dominate, ciliates are preferentially consumed, HNF exert strong grazing pressure on planktonic bacteria, results in altered morphological and taxonomical bacterial composition with a high degree of grazing-resistance (e.g. filamentous forms and bacterial aggregates)
Interactions
1 2
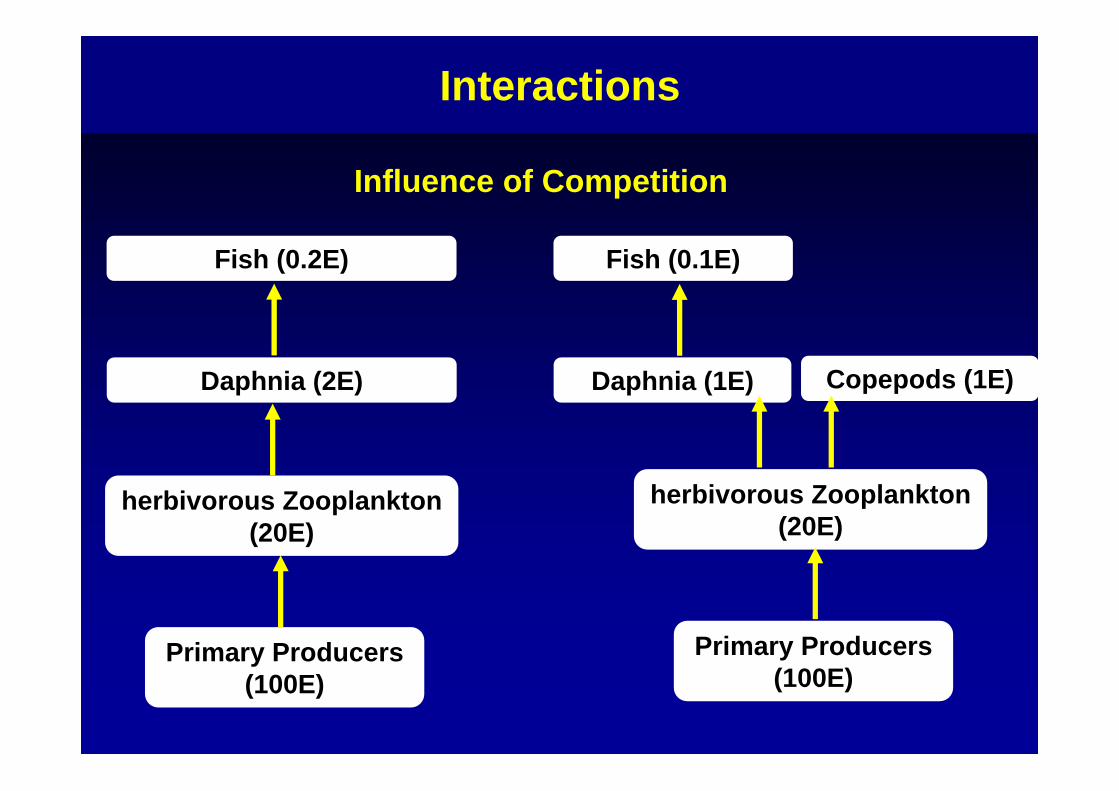
Interactions
Influence of Competition
Primary Producers(100E)
herbivorous Zooplankton (20E)
Daphnia (2E)
Fish (0.2E)
Primary Producers(100E)
herbivorous Zooplankton (20E)
Daphnia (1E)
Fish (0.1E)
Copepods (1E)
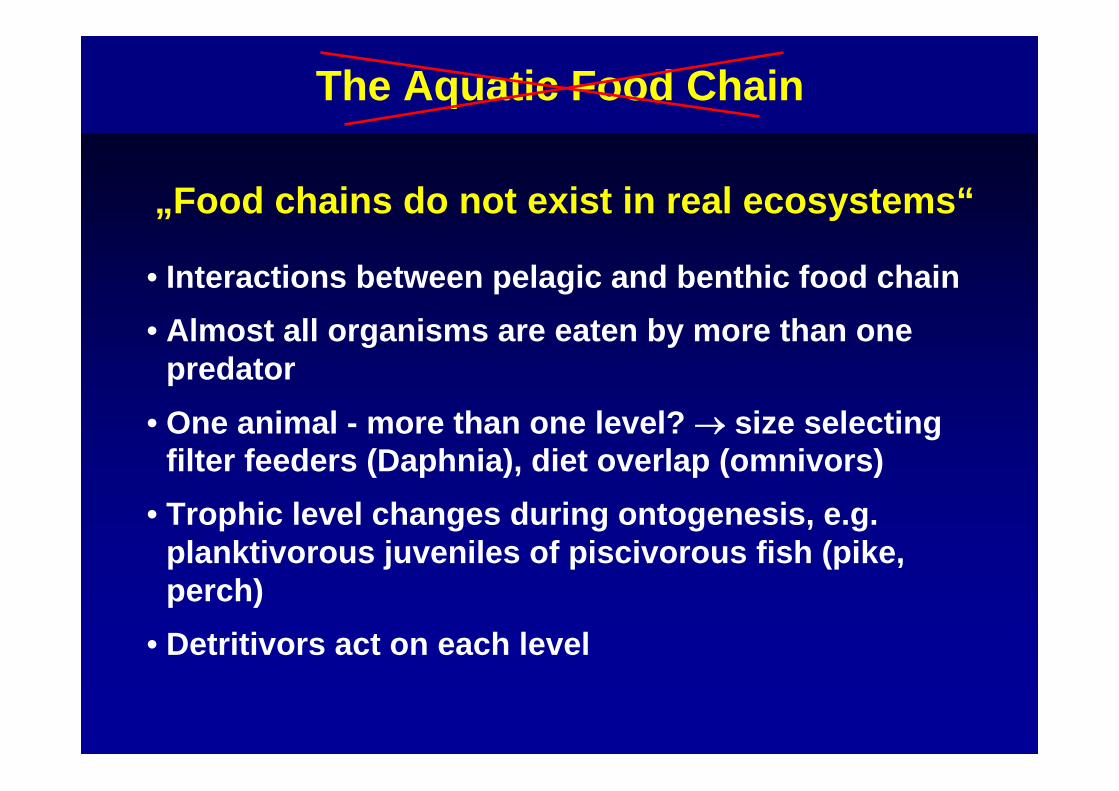
The Aquatic Food Chain
• Interactions between pelagic and benthic food chain• Almost all organisms are eaten by more than one
predator• One animal - more than one level? → size selecting
filter feeders (Daphnia), diet overlap (omnivors)• Trophic level changes during ontogenesis, e.g.
planktivorous juveniles of piscivorous fish (pike, perch)
• Detritivors act on each level
„Food chains do not exist in real ecosystems“
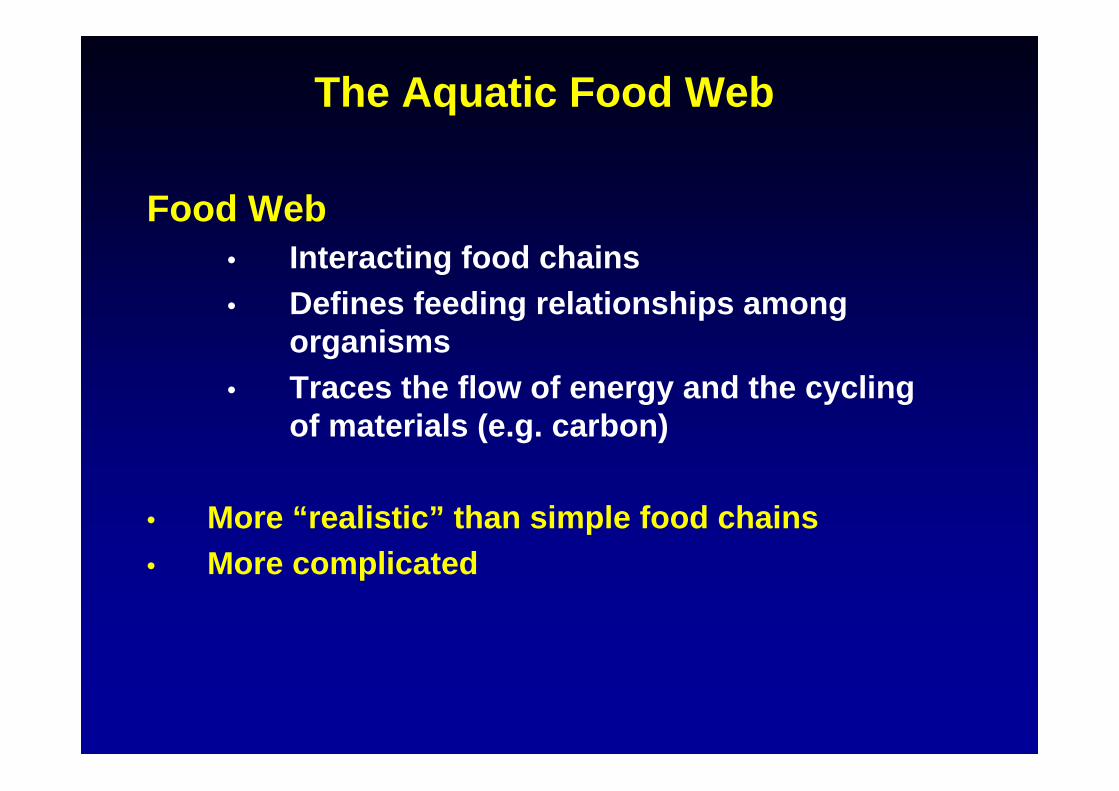
Food Web• Interacting food chains• Defines feeding relationships among
organisms• Traces the flow of energy and the cycling
of materials (e.g. carbon)
• More “realistic” than simple food chains• More complicated
The Aquatic Food Web
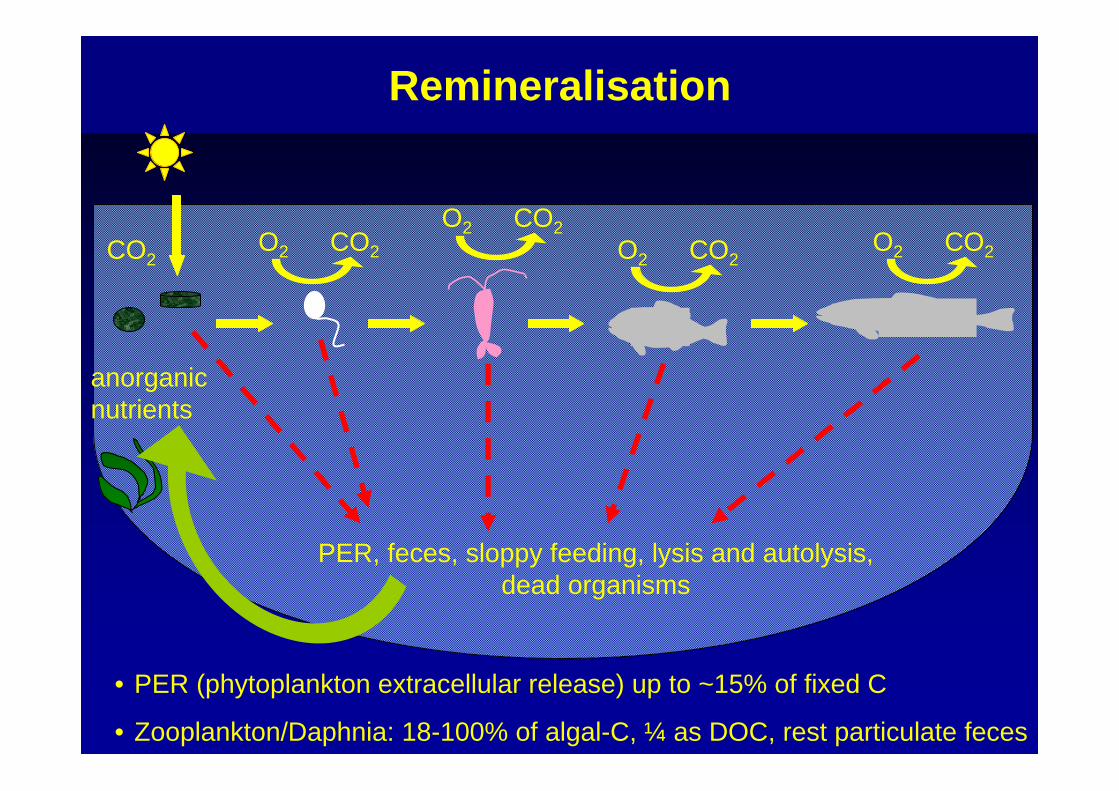
Remineralisation
anorganicnutrients
CO2
PER, feces, sloppy feeding, lysis and autolysis, dead organisms
• PER (phytoplankton extracellular release) up to ~15% of fixed C
• Zooplankton/Daphnia: 18-100% of algal-C, ¼ as DOC, rest particulate feces
CO2O2
CO2O2CO2O2
CO2O2
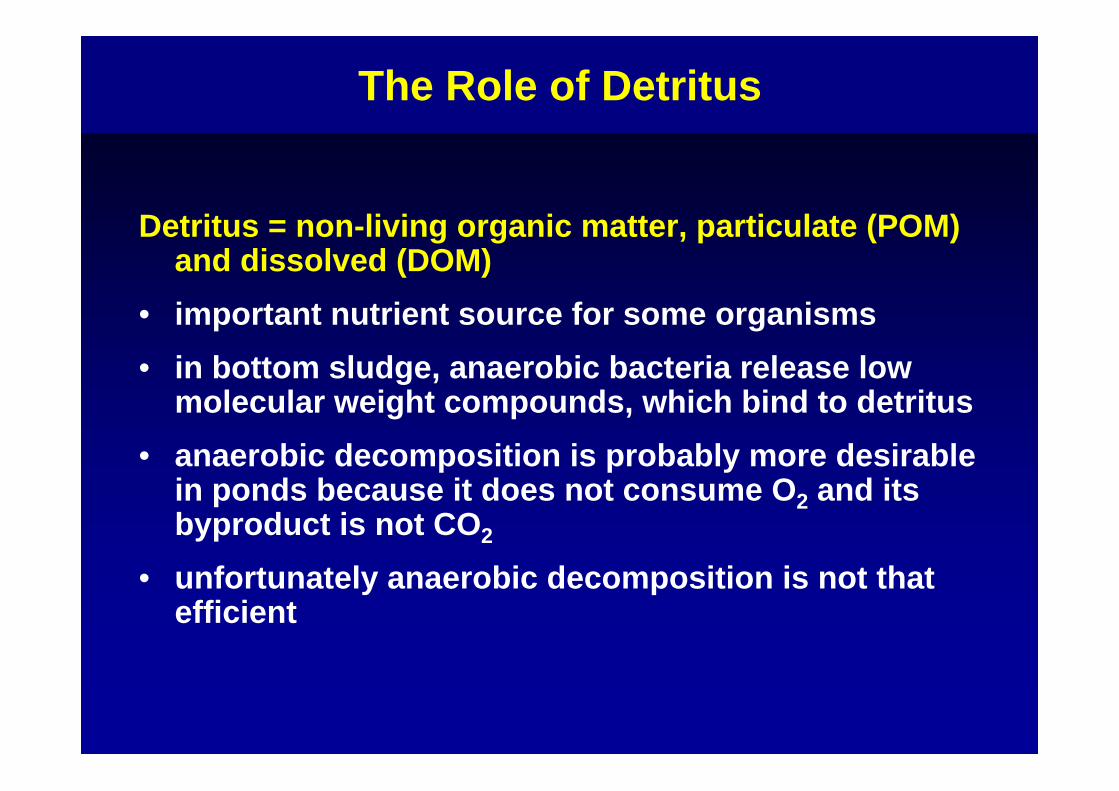
Detritus = non-living organic matter, particulate (POM) and dissolved (DOM)
• important nutrient source for some organisms • in bottom sludge, anaerobic bacteria release low
molecular weight compounds, which bind to detritus• anaerobic decomposition is probably more desirable
in ponds because it does not consume O2 and its byproduct is not CO2
• unfortunately anaerobic decomposition is not that efficient
The Role of Detritus
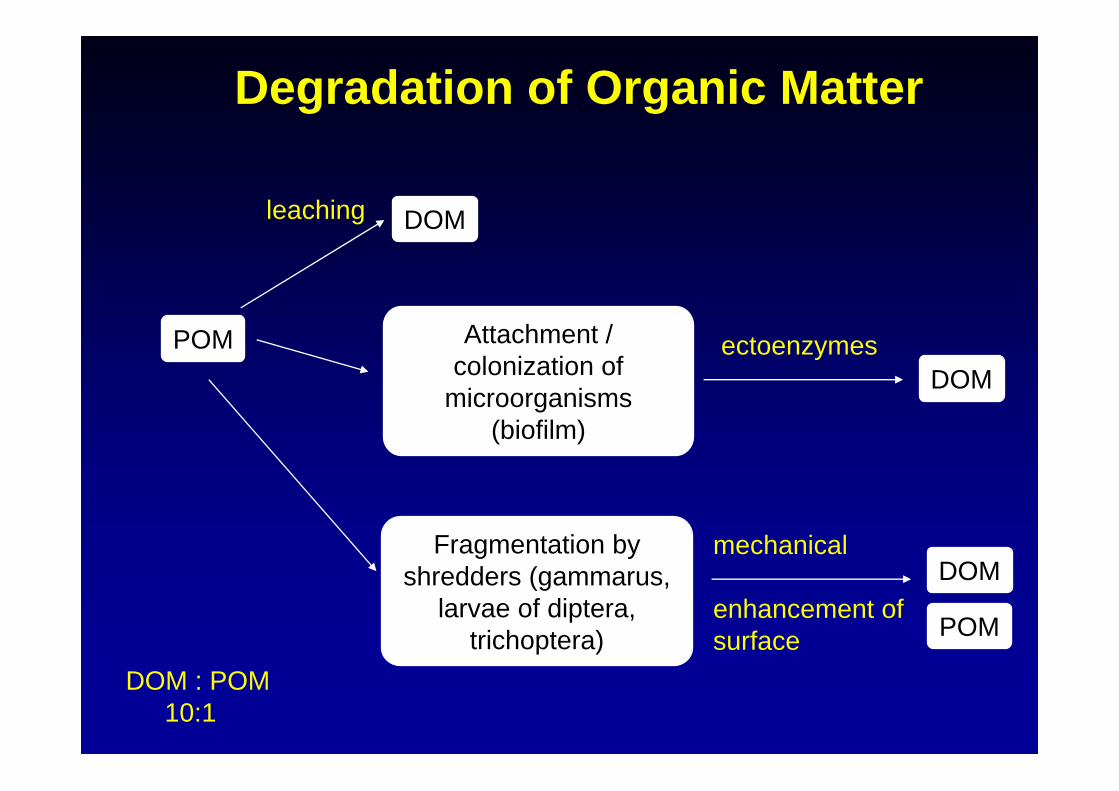
Degradation of Organic Matter
POM
DOMleaching
Attachment / colonization of
microorganisms(biofilm)
Fragmentation byshredders (gammarus,
larvae of diptera, trichoptera)
ectoenzymes
mechanical
enhancement of surface
DOM
DOM : POM 10:1
DOM
POM
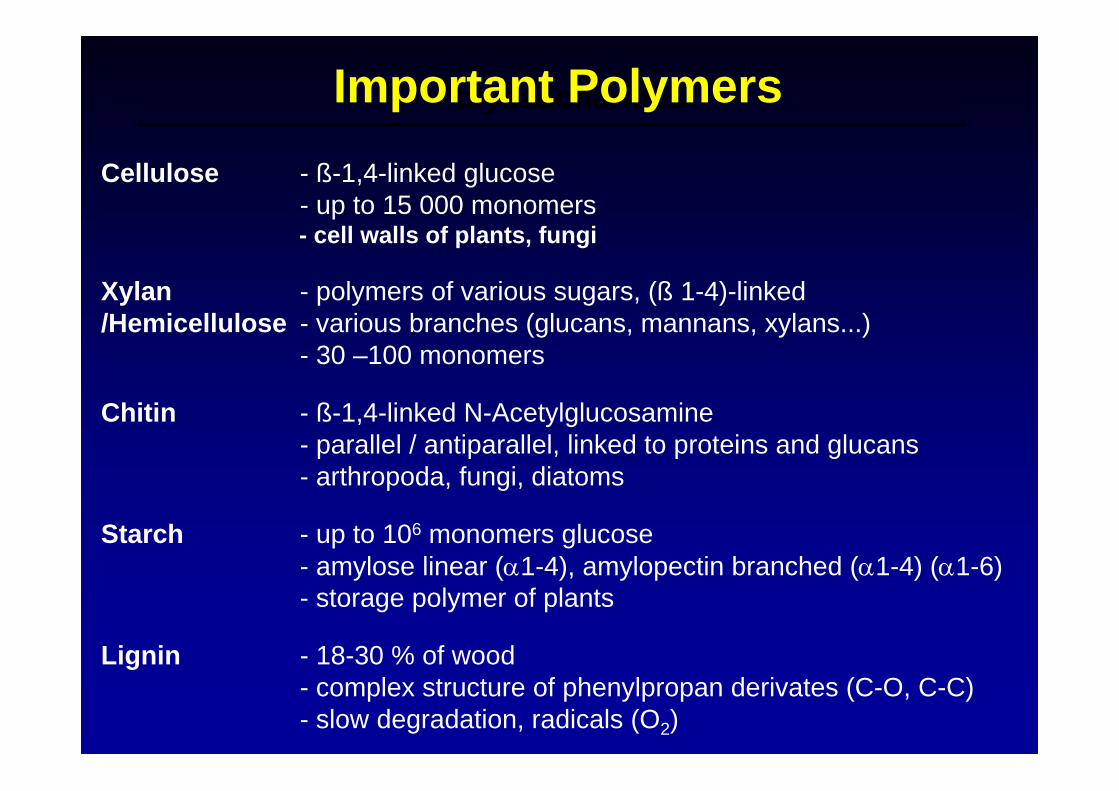
Cellulose - ß-1,4-linked glucose- up to 15 000 monomers- cell walls of plants, fungi
Xylan - polymers of various sugars, (ß 1-4)-linked/Hemicellulose - various branches (glucans, mannans, xylans...)
- 30 –100 monomers
Chitin - ß-1,4-linked N-Acetylglucosamine- parallel / antiparallel, linked to proteins and glucans- arthropoda, fungi, diatoms
Starch - up to 106 monomers glucose- amylose linear (α1-4), amylopectin branched (α1-4) (α1-6)- storage polymer of plants
Lignin - 18-30 % of wood- complex structure of phenylpropan derivates (C-O, C-C)- slow degradation, radicals (O2)
PolysaccharidesImportant Polymers
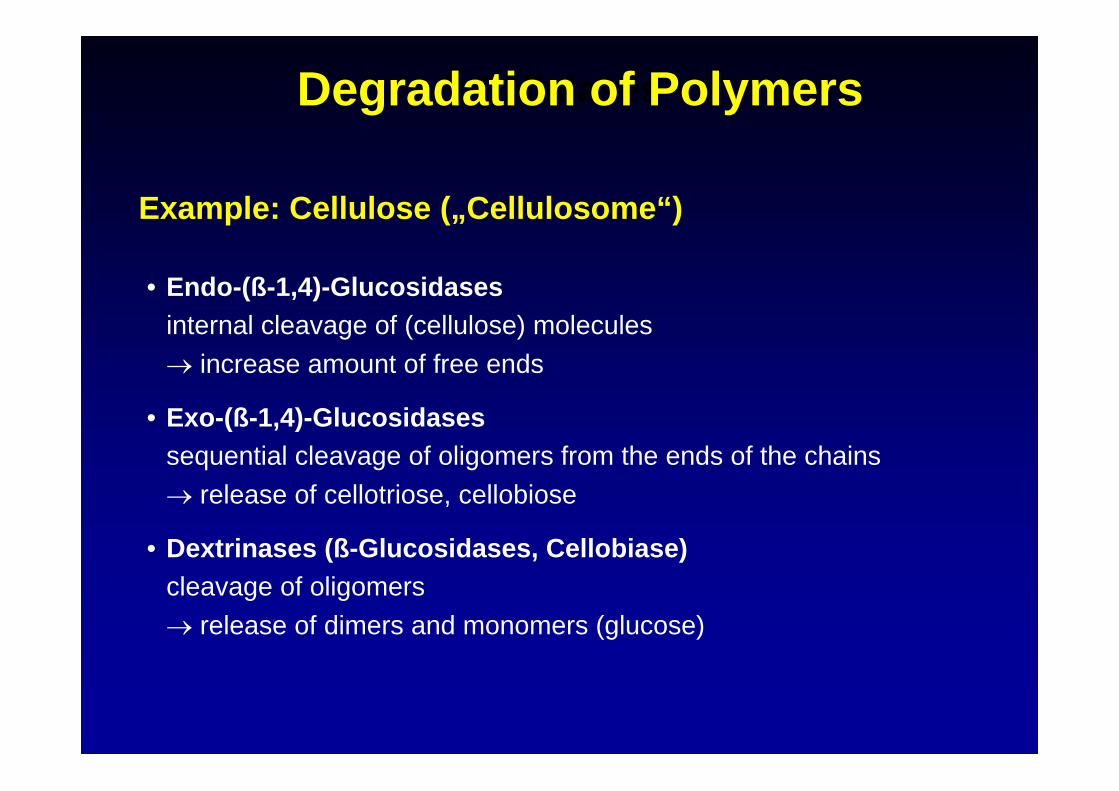
• Endo-(ß-1,4)-Glucosidasesinternal cleavage of (cellulose) molecules→ increase amount of free ends
• Exo-(ß-1,4)-Glucosidasessequential cleavage of oligomers from the ends of the chains→ release of cellotriose, cellobiose
• Dextrinases (ß-Glucosidases, Cellobiase)cleavage of oligomers→ release of dimers and monomers (glucose)
CellulasesDegradation of Polymers
Example: Cellulose („Cellulosome“)

Model for Detritus ProcessingAutochthonous
DOM/POMPolymers
Polynucleotides (DNA, RNA), polysaccharides, proteins, lipids, waxes,
lignins, polyphenols, humic matter
AllochthonousDOM/POM
OligomersNucleotides, sugars (DCCHO), peptides
(DCAA), lipids, polyphenols
DimersNucleotides, sugars, peptides, lipids
Monomers (UDOM)Amino acids (DFAA), sugars (DFCHO),
fatty acidsExtr
acel
lula
rrel
ease
of D
OM
by
aqua
ticor
gani
sms
Microbial biomass
Microbial loop processes
Higher food web processes
Microbialextracellularezym
aticdepolym
erizationprocesses
Microbialenzymesystems
Nucleotidases, Phosphatases, Glucosidases,
Proteases, Lipases, Ligninases,
Sulfatases, ...
Microbialcommunity
Algae, bacteria, fungi, viruses,
protozoa
After Münster 1991
control
growth
rapid uptake
endoactivity
exoactivity

Michaelis-Menten-Model
• 80-90% of DOM is polymeric• Depolymerization is rate-limiting step in nutrition of microheterotrophs
[S]
v
Km
vmax
Vmax/2 E + S ES E + Pk1
k2
k3
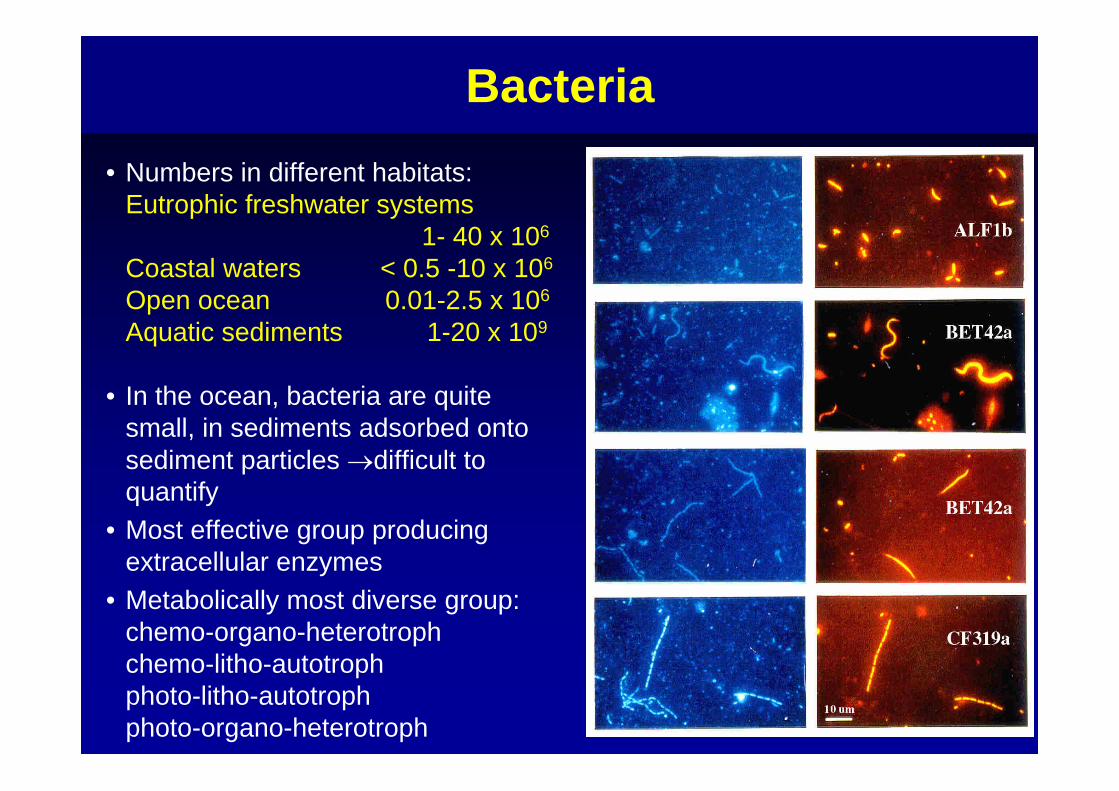
Bacteria• Numbers in different habitats:
Eutrophic freshwater systems1- 40 x 106
Coastal waters < 0.5 -10 x 106
Open ocean 0.01-2.5 x 10⁶
Aquatic sediments 1-20 x 109
• In the ocean, bacteria are quite small, in sediments adsorbed onto sediment particles →difficult to quantify
• Most effective group producing extracellular enzymes
• Metabolically most diverse group:chemo-organo-heterotrophchemo-litho-autotrophphoto-litho-autotrophphoto-organo-heterotroph
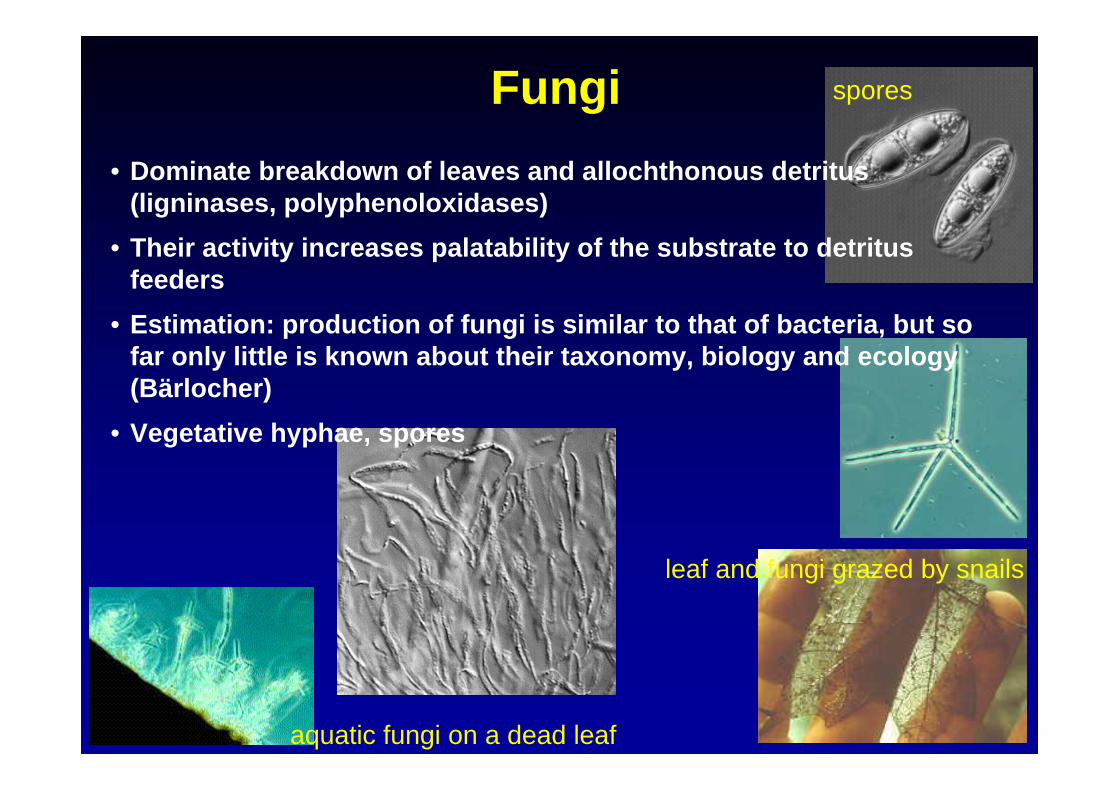
Fungi spores
aquatic fungi on a dead leaf
leaf and fungi grazed by snails
• Dominate breakdown of leaves and allochthonous detritus(ligninases, polyphenoloxidases)
• Their activity increases palatability of the substrate to detritusfeeders
• Estimation: production of fungi is similar to that of bacteria, but so far only little is known about their taxonomy, biology and ecology (Bärlocher)
• Vegetative hyphae, spores

Secondary production (DOM to POM) by heterotrophic microorganisms is of great quantitative importance in most aquaculture situations
• microbes can attack organic substrates that can’t be utilized by animals
• microbes produce particulate food materials from dissolved organic material
• link between DOM and classical food chain, lead to fast turnover
• also competitors to primary producers for nutrients(esp. when limiting)
Secondary Production by Microbes

Plagioselmis prolongaBodo saliens
Heterotrophic nanoflagellates (HNF) 2-20µm• most important predators of bacteria• grazed by large flagellates and ciliates
Protozoa: HNF
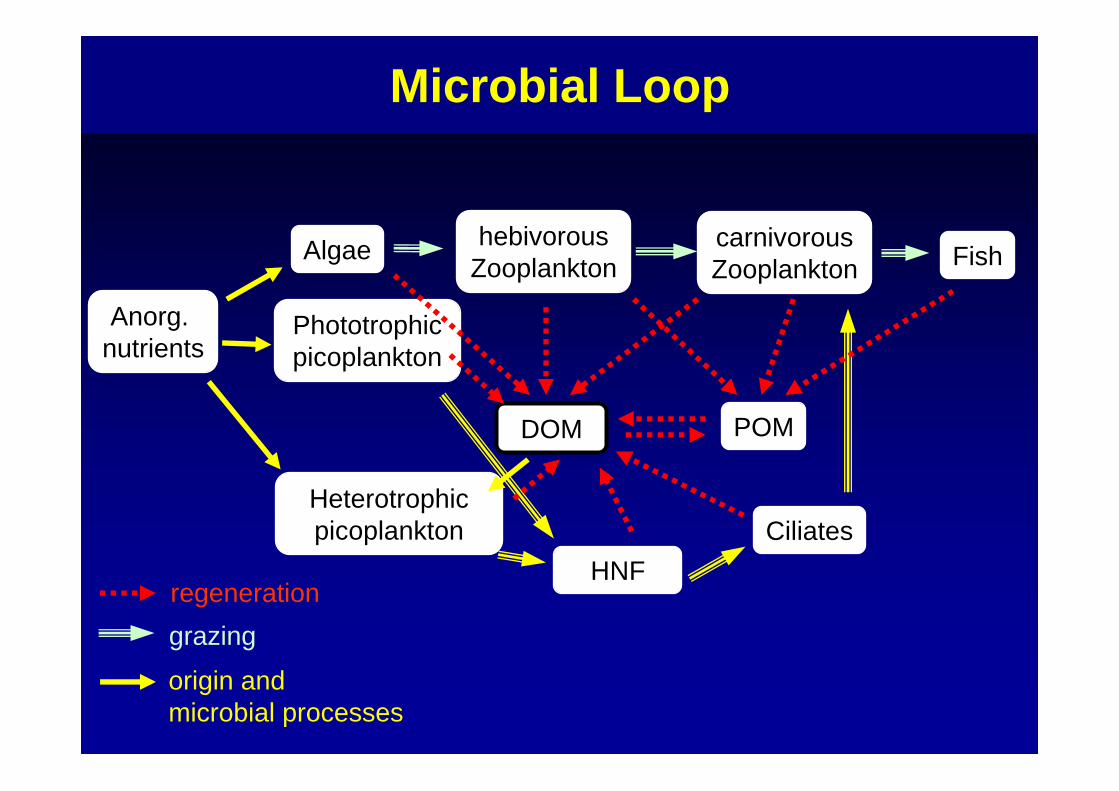
Microbial Loop
Anorg. nutrients
Phototrophicpicoplankton
HNFCiliates
DOM
Algae hebivorousZooplankton Fish
Heterotrophicpicoplankton
carnivorousZooplankton
POM
grazingregeneration
origin and microbial processes
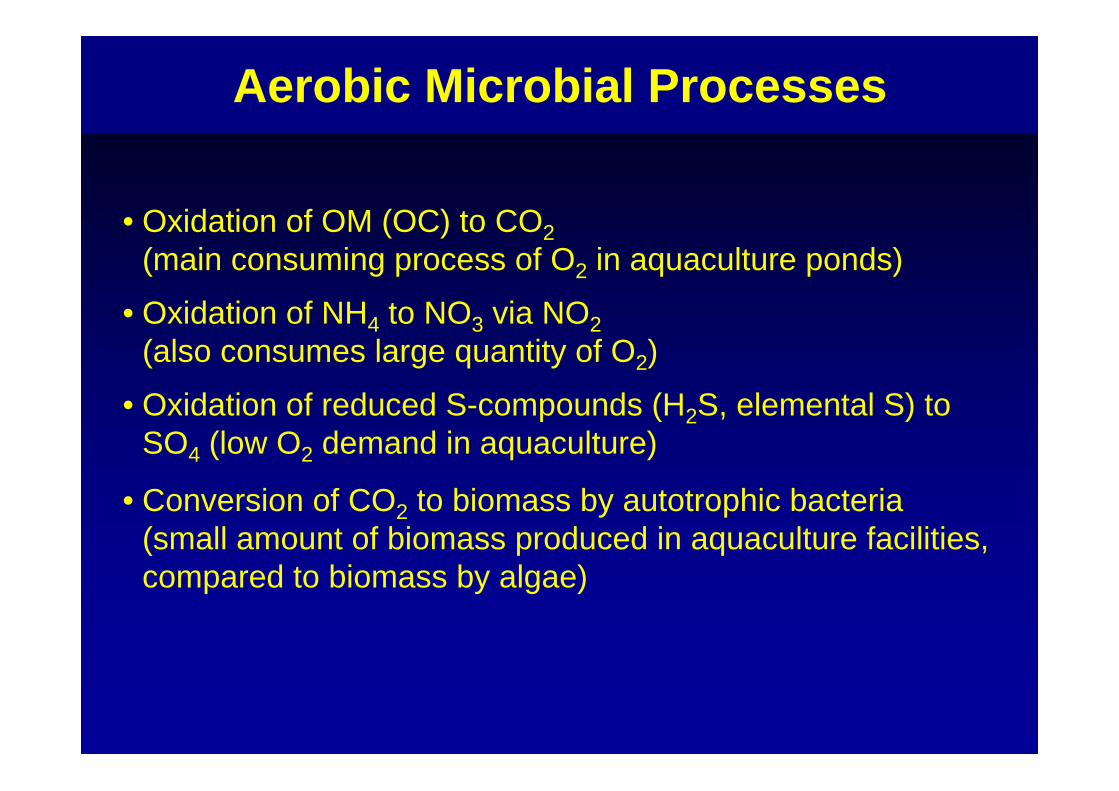
• Oxidation of OM (OC) to CO2(main consuming process of O2 in aquaculture ponds)
• Oxidation of NH4 to NO3 via NO2(also consumes large quantity of O2)
• Oxidation of reduced S-compounds (H2S, elemental S) to SO4 (low O2 demand in aquaculture)
• Conversion of CO2 to biomass by autotrophic bacteria(small amount of biomass produced in aquaculture facilities, compared to biomass by algae)
Aerobic Microbial Processes

• O2 depletion may lead to complete deoxygenation or anoxia in deeper layers of lakes or reservoirs, esp. in shallow lakes with high plant production, deoxygenation of sediment and water occurs frequently
• Can produce compounds that are toxic to cultured animals
• Reduction of NO3 and NO2 yields N2 gas or NH4, in aquaculture not welcomed due to the toxicity of NH4 and NO2, while N2 production is beneficial
• Reduction of oxidized S-compounds to H2S, toxic to most animals at even very low concentrations
• Consumption of OM without the reduction of O2, results in products which are not fully oxidized (alcohols, organic acids)
Anaerobic Microbial Processes

<CH2O>n CO2
O2 H2O
N2
NO3-
anaerobic respiration
lithotrophy
E0‘
-0.4
-0.3
-0.2
-0.1
0.0
+0.1
+0.2
+0.3
+0.4
+0.5
+0.6
+0.7
+0.8
NO2-
NH4+
NO3-
organotrophy
aerobic respiration
reduced respiratory chains⇒ less energy yield⇒ slow growth rates
Bacterial Respiration Processes
chemoorganoheterotrophy,anaerobicdenitrifying bacteriaChemolithoautotrophy,
aerobicnitrifying bacteria
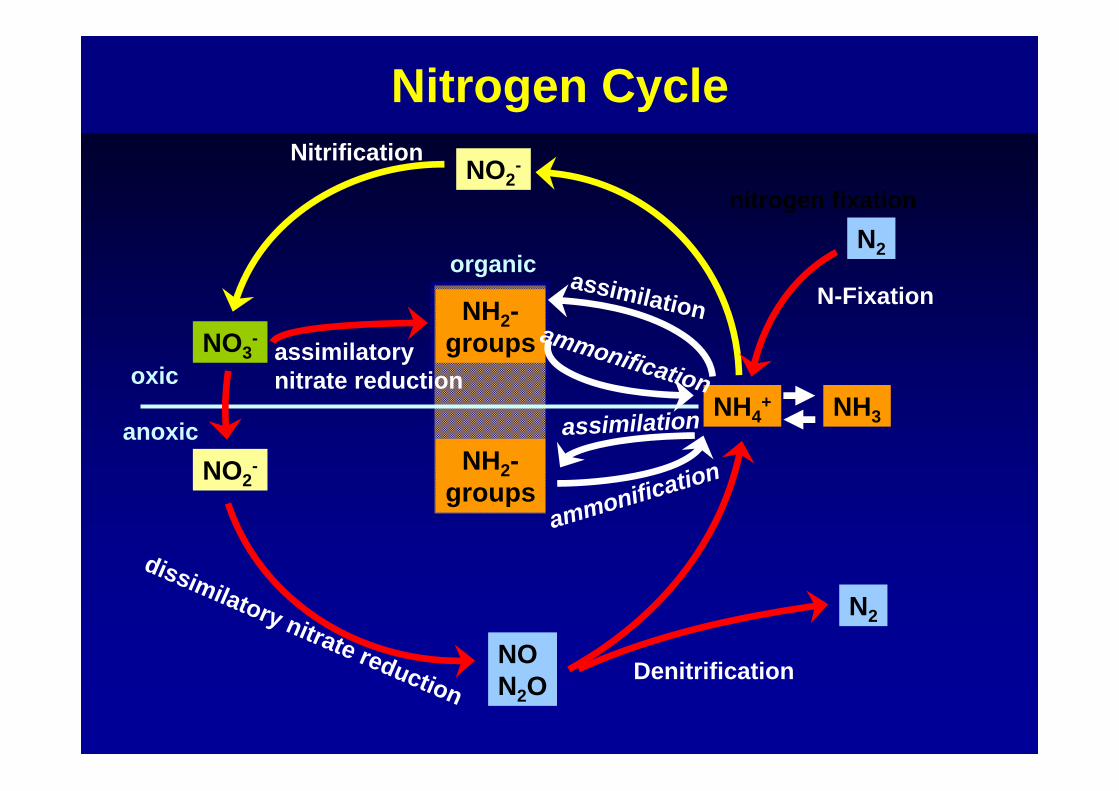
NitrificationNO2
-
NO2-
NO3-
NH2-groups
NH2-groups
NH4+
NON2O
N2
N2
Denitrification
oxic
anoxic assimilation
ammonification
nitrogen fixation
assimilatorynitrate reduction
assimilationammonification
dissimilatory nitrate reduction
NH3
organic
Nitrogen Cycle
N-Fixation
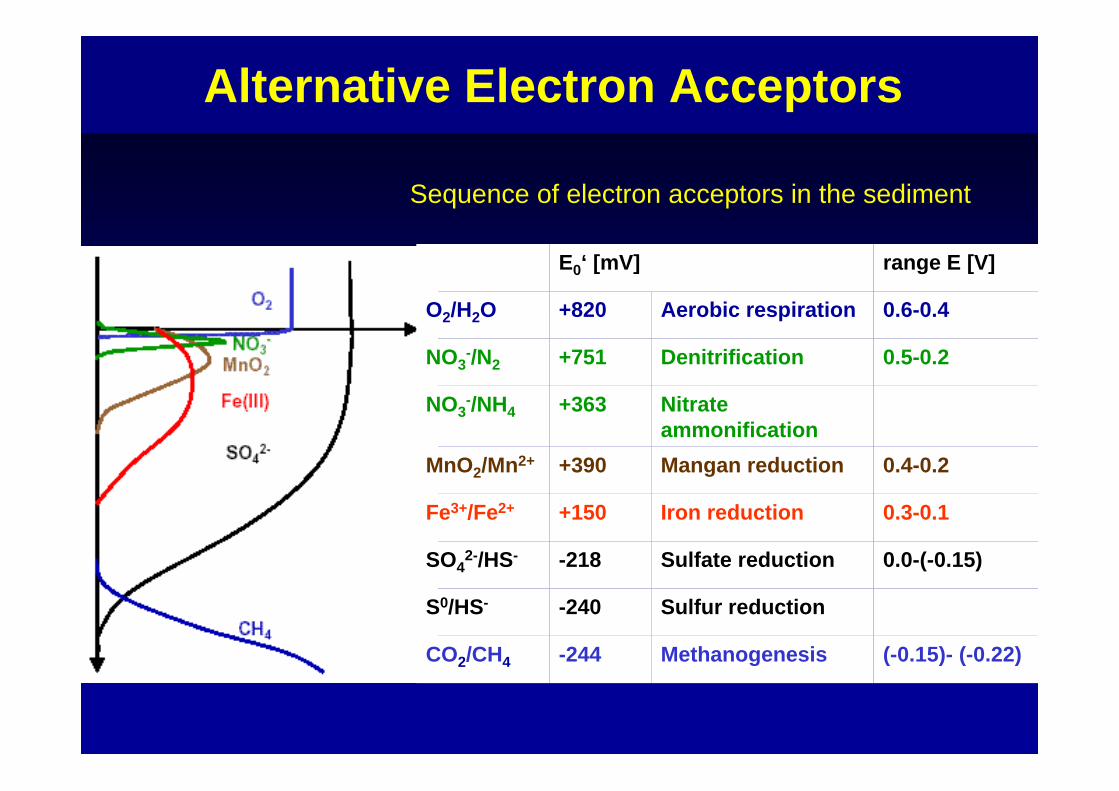
Alternative Electron Acceptors
Sequence of electron acceptors in the sediment
(-0.15)- (-0.22)Methanogenesis-244CO2/CH4
Sulfur reduction-240S0/HS-
0.0-(-0.15)Sulfate reduction-218SO42-/HS-
0.3-0.1Iron reduction+150Fe3+/Fe2+
0.4-0.2Mangan reduction+390MnO2/Mn2+
Nitrate ammonification
+363NO3-/NH4
0.5-0.2Denitrification+751NO3-/N2
0.6-0.4Aerobic respiration+820O2/H2O
range E [V]E0‘ [mV]
Fermentation
• Chemo-organo-heterotroph metabolism
• Organic compounds serve as primary electron donorsand ultimate electron acceptor (disproportionation)
• ATP is produced via substrate level phosphorylationnot via membran potential and proton motive force
• Little energy yield: C only partially oxidized, ΔEhbetween substrate and product is small
→ Glucose respirated: 36 - 38 ATP
→ Glucose fermented: 2 - 4 ATP, 2 - 4 NADH
• Products: CO2, H2, ethanol, butanol, formiat, acetate, propionate, lactate, ...
Sediment
• „Solid material that settled down from a state of suspension“
• 3 major sources: detrital (erosion, catchment), biogenic, authigenic
• Complex environment (interstitial), strong gradients in chemical (Eh, pH) and microbial parameters
• Number of microorganims 3-4 magnitudes higher than in pelagial
• Sediment respiration as a measure of decomposition (BOD), related to trophic status, quantity and quality of available organic carbon and concentration of electron acceptors
• Absorption/desorption processes, crucial redox conditions at sediment-water-interface → influence overlying water
• P and NH3 may be released from sediments into the water (internalloading) → nutrient enrichment
• Bioturbation → heterogenity, deeper Eh gradient, less steep
Aqua“culture“ = manipulation of environment
Problem: direct use of resource that itself is vulnerable to water pollution (pond)
Manipulation
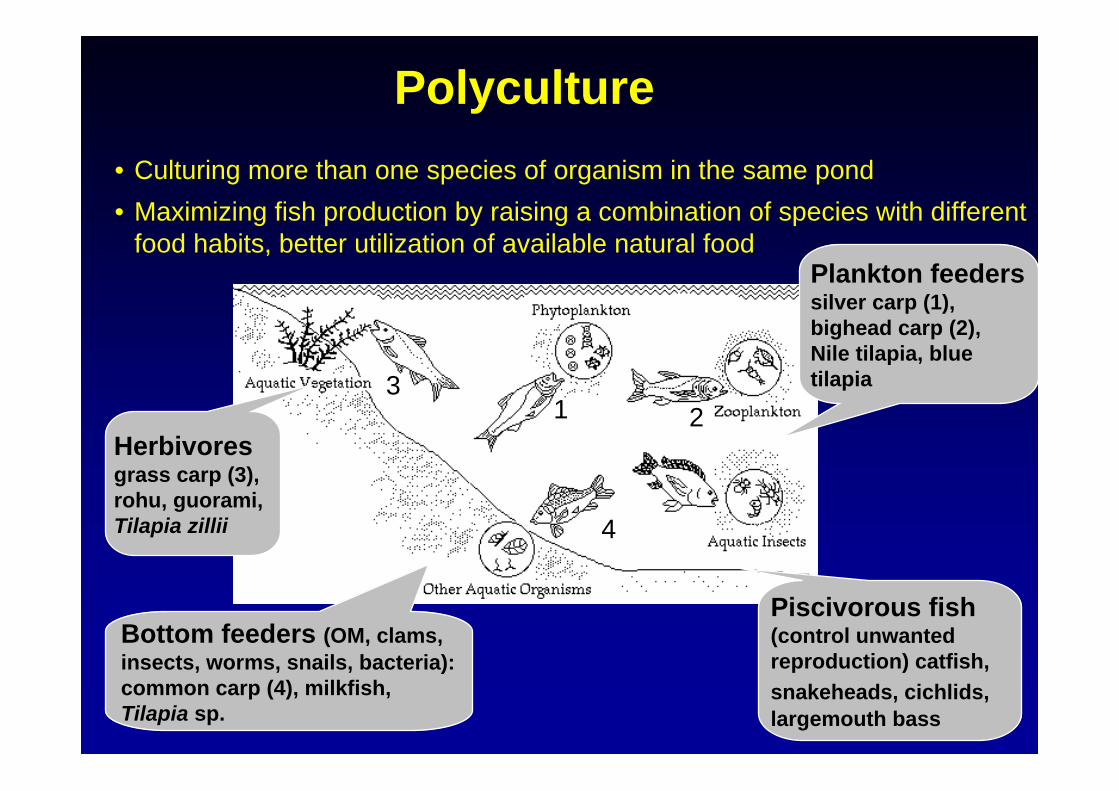
Polyculture • Culturing more than one species of organism in the same pond• Maximizing fish production by raising a combination of species with different
food habits, better utilization of available natural food
1 23
4
Plankton feederssilver carp (1), bighead carp (2),Nile tilapia, bluetilapia
Herbivoresgrass carp (3),rohu, guorami, Tilapia zillii
Bottom feeders (OM, clams, insects, worms, snails, bacteria): common carp (4), milkfish, Tilapia sp.
Piscivorous fish(control unwanted reproduction) catfish, snakeheads, cichlids,largemouth bass
Enhancement of Productivity
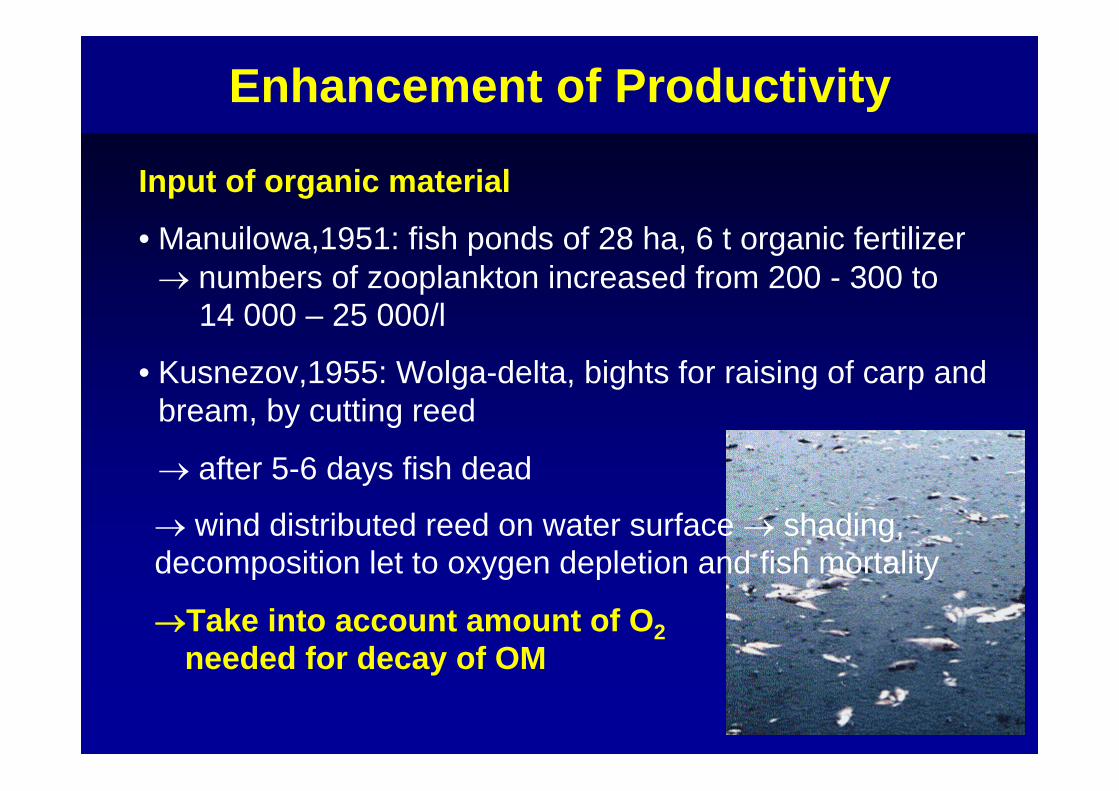
Input of organic material
• Manuilowa,1951: fish ponds of 28 ha, 6 t organic fertilizer→ numbers of zooplankton increased from 200 - 300 to
14 000 – 25 000/l
• Kusnezov,1955: Wolga-delta, bights for raising of carp and bream, by cutting reed
→ after 5-6 days fish dead
→ wind distributed reed on water surface → shading, decomposition let to oxygen depletion and fish mortality
→Take into account amount of O2needed for decay of OM

CO2 Balance
CO2 + H2O ↔ H2CO3 ↔ H+ + HCO3- ↔ 2H+ + CO3
2-
pH < 6 CO2pH 7-10 HCO3
-
pH >10 CO32-
CO2 + H2O + CaCO3 ↔ Ca(HCO3)2
Study: Bangladesh
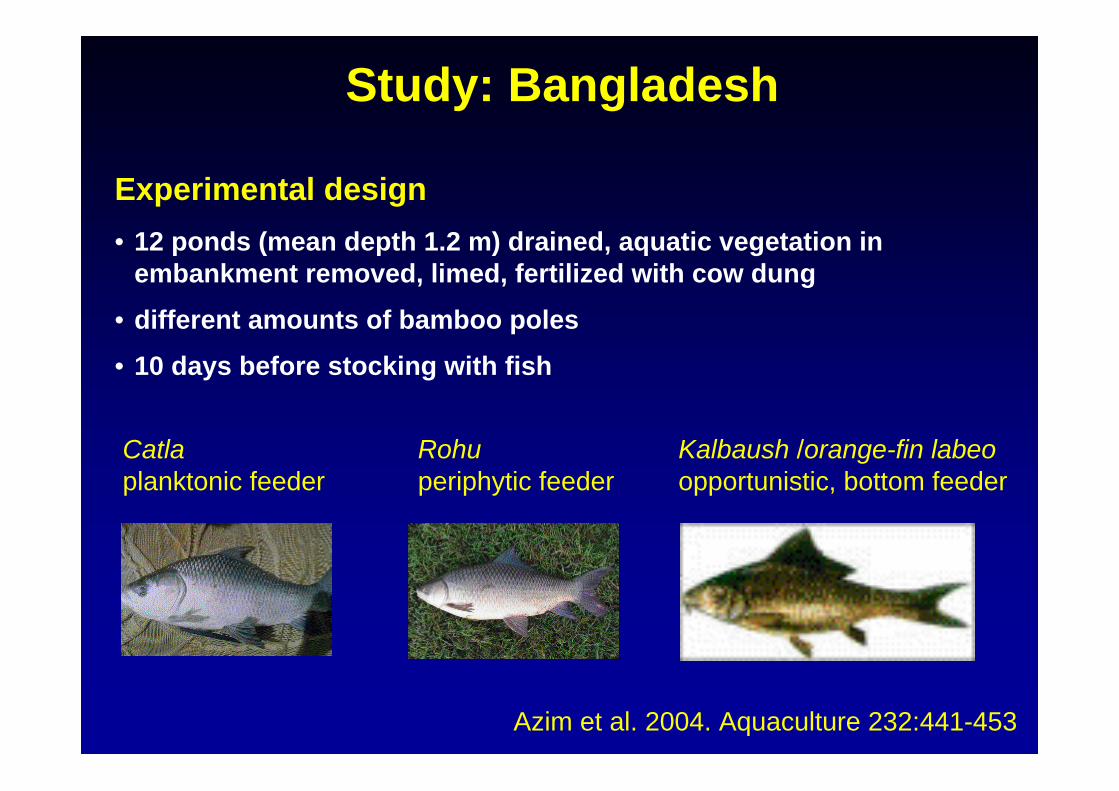
Catlaplanktonic feeder
Rohuperiphytic feeder
Kalbaush /orange-fin labeoopportunistic, bottom feeder
Experimental design• 12 ponds (mean depth 1.2 m) drained, aquatic vegetation in
embankment removed, limed, fertilized with cow dung
• different amounts of bamboo poles
• 10 days before stocking with fish
Azim et al. 2004. Aquaculture 232:441-453
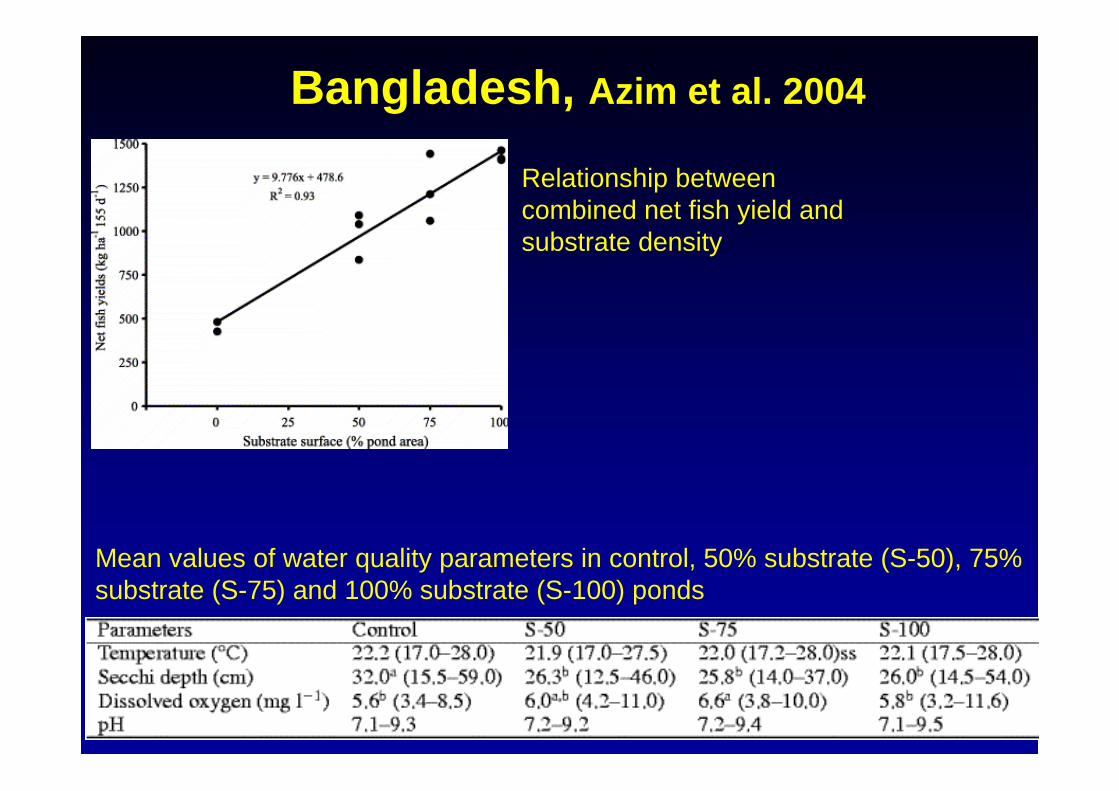
Relationship between combined net fish yield and substrate density
Bangladesh, Azim et al. 2004
Mean values of water quality parameters in control, 50% substrate (S-50), 75% substrate (S-75) and 100% substrate (S-100) ponds
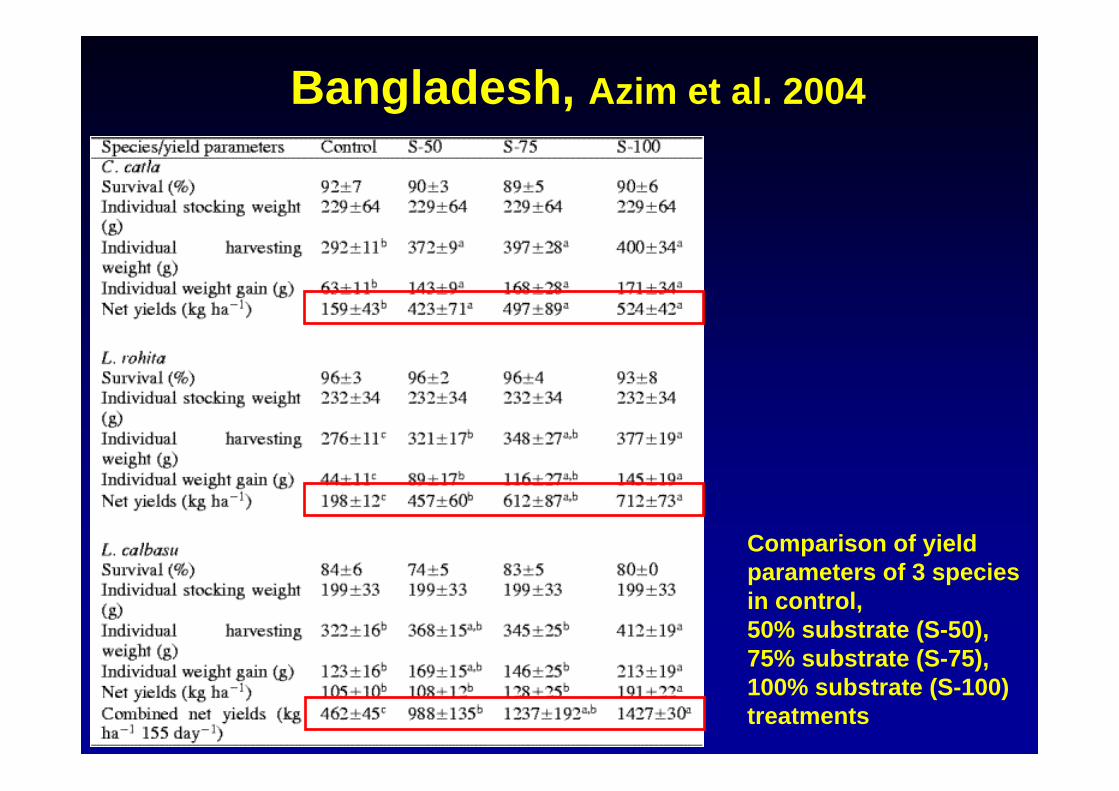
Comparison of yield parameters of 3 species in control, 50% substrate (S-50), 75% substrate (S-75),100% substrate (S-100) treatments
Bangladesh, Azim et al. 2004
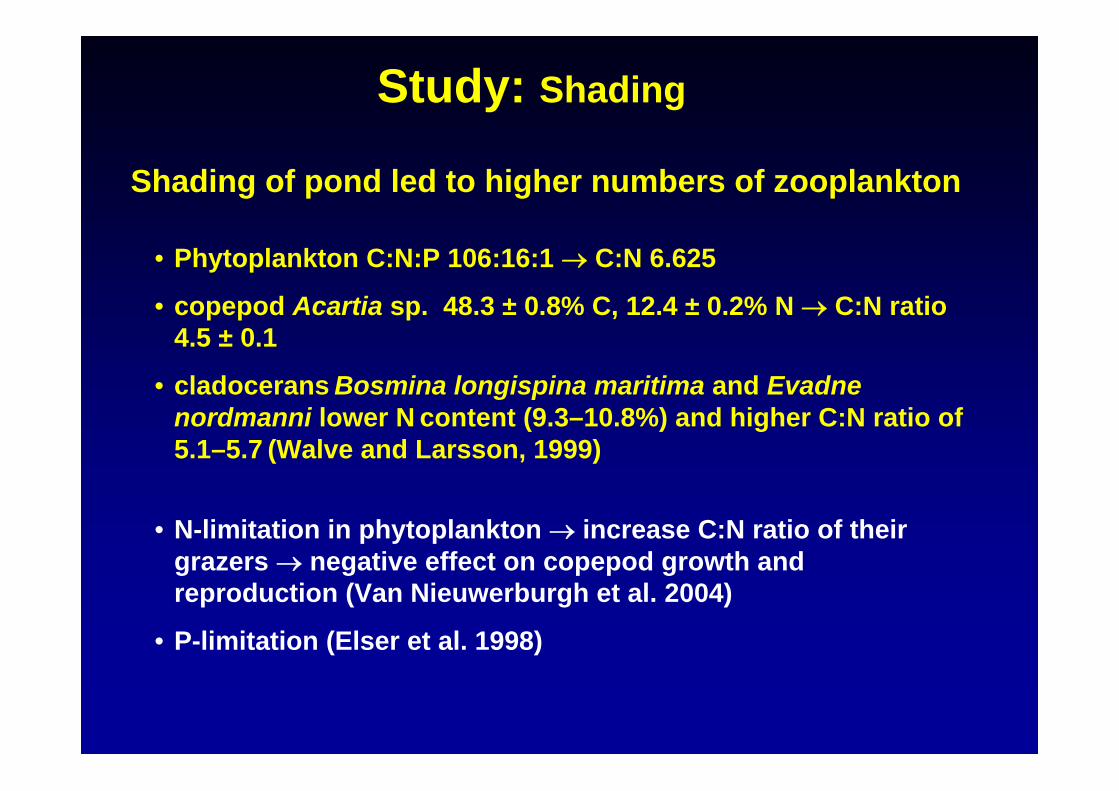
Shading of pond led to higher numbers of zooplankton
• N-limitation in phytoplankton → increase C:N ratio of their grazers → negative effect on copepod growth and reproduction (Van Nieuwerburgh et al. 2004)
• P-limitation (Elser et al. 1998)
• Phytoplankton C:N:P 106:16:1 → C:N 6.625
• copepod Acartia sp. 48.3 ± 0.8% C, 12.4 ± 0.2% N → C:N ratio4.5 ± 0.1
• cladocerans Bosmina longispina maritima and Evadnenordmanni lower N content (9.3–10.8%) and higher C:N ratio of 5.1–5.7 (Walve and Larsson, 1999)
Study: Shading
Environmental Problems
WaterWaste and nutrient loadings (solids, N, P, chemicals, antibiotics, salinisation)Impacts on benthos and water column, on speciescomposition/diversity (tolerant species dominate), quality indices, stimulation of blooms, eutrophication, oxygen depletion
BiodiversityEscaped stocks → competition with/genetic contamination of localstocks, competition for feed and space, predators pressure on preyspecies, disease transmission→ directly or indirectly reduced biodiversity
Terrestrial environment (coastal areas)Salinisation of soils, excessive clearance of mangroves and protectivecover → degradation
Integrated agriculture-aquaculture systems use low levels of inputs→ less reliance on heavy feed and fertilizers, lower densities of farmed organisms → less chances of causing serious pollution and disease risks than intensive, feedlot-type systems
BUT: development of better domesticated breeds increases international demand → increased transfers of exotic breeds
Environmental Problems