for a/m 306v -...
TRANSCRIPT

Document of
The World Bank
FOR OFFICIAL USE ONLY
A/M 306vReport No. 7417-CHA
STAFF APPRAISAL REPORT
CHINA
HUBEI PHOSPHATE PROJECT
APRIL 25, 1989
Industry, Trade and Finance Operations DivisionCountry Department IIIAsia Regional Office
This document has a restricted distribution and may be used by recipients only in the performance oftheir official duties. Its contents may not otherwise be disclosed without World Bank authorization.
Pub
lic D
iscl
osur
e A
utho
rized
Pub
lic D
iscl
osur
e A
utho
rized
Pub
lic D
iscl
osur
e A
utho
rized
Pub
lic D
iscl
osur
e A
utho
rized
Pub
lic D
iscl
osur
e A
utho
rized
Pub
lic D
iscl
osur
e A
utho
rized
Pub
lic D
iscl
osur
e A
utho
rized
Pub
lic D
iscl
osur
e A
utho
rized

CURRENCY EQUIVALENTS(As of February 5, 1989)
Currency name Renminbi (RMB)Currency unit - Yuan (Y) = 100 FenY lQon US$0.27US$1.00 - Y 3.72
WEIGHTS AND MEASURES
1 hectare (ha) 2.47 acres1 metric tcn (ton) 1,000 kilograms (kg)1 kilometer (km) 0.621 miles1 cuibic meter (m3 ) 35.3147 cubic feet (cf)1 kilocalories (kcal) 3,968 British thermal units (BTU)1 kilowatt (kW) 1,000 watts1 megawatt (MW) 1,000 kilowatts (kW)
FISCAL YEARJanuary 1 - December 31
GLOSSARY OF ABBREVIATIONS AND ACRONYMS
ABC - Ammonium Bicarbon'tte K20 - Potassium OxideAMPC - Agricultural Means of Production kWh - Kilowatt Hour
Corporation MA" - Ministry of Agriculture, AnimalBICEM - Beijing Institute of Chemical Husbandry and Fishery
Engineering and Management MgO - Magnesium OxideCIB - China Investment Bank MAP Monoammonium PhosphateCIF - Cost, Insurance and Freight MCI - Ministry of Chemical IndustryCNCCC - China National Chemical MOC - Ministry of Commerce
Construction Corporation Mtpy - Million Tons per YearCMP - Calcium Magnesium Phosphate MWh - Megawatt HourCMPDI - Chinese Chemical Mines Planning N - Nitrogen Content in Fertilizer
and Design Institute NCDI - Nanjing Chemical DesignCMRDI - Chinese Chemical Mines Research Institute
and Dasign Institute NPK - Complex Fertilizers of N.P205CPI - Chemical Planning Institute and K20DAP - Diammonium Phosphate p.a. - Per AnnumFOB - Free on Board PA - Phosphoric AcidFAO - Food and Agricultural PCBC - People's Construction Bank of
Organization of the United ChinaNations P205 - Phosphorous Pentoxide
FY - Fiscal Year ppm - Parts per MillionGDP - Gross Domestic Product PRS - Production Responsibility SystemGOC - Government of Cnilna ROM Run of Mineha - Hectare SAM State Audit AdministrationHAZOP - Hazard and Operability SINOCHEM - China Chemical Export and ImportHMC - Huangmailing Mining Company CorporationHPCC - Huangmailing Phosphate Chemical SPB - State Pricing Bureau
Company SPC - State Planning CommissionHPG - Hubei Provincial Government SSP - Single SuperphosphateICB - International Competitive Bidding TSP - Triple SuperphosphateICBC - Industrial and Commercial Bank of tpd - Tons per Day
China tpyn - Tons per Year of NutrientsIDC - Interest During Construction UNIDO - United Nations IndustrialIFC - International Finance Corporat.on Development OrganizationJPCC - Jinxiang Phosphate Chemical WCEDI - Wuhan Chemical Engineering
Company Design Institute

FOR OFFICIAL USE3 ONLY
CHINA
HUBEI PHOSPHATE PROJECT
Table of Contents
Page No.
LOAN AND PROJECT SUMKARY ..................................... i-iii
I. INTRODUCTION ................................................. 1
II. AN OVERIIEW OF THE CHINESE INDUSTRY .......................... 2
A. General Industry Background ............................. 2B. Government Objectives and Strategy for Industrial
Development ........................................... 3C. Bank Support for Industry ............................... 3
III. THE FERTILIZER SECTOR ........................................ 5
A. Agricultural Background ................................. 5B. Fertilizer Use in Agriculture ........................... 6C. Fertilizer Demand and Supply ............................ 6D. Structure of the Fertilizer Industry .................... 9E. Fertilizer Marketing and Distribution ................... 9F. Fertilizer Pricing ...................................... 10G. Goveranent Strategy in the Fertilizer Sector ............ 13
IV. THE PHOSPHATE SUBSECTOR ...................................... 14
A. World Phosphate Market .---------------------------- 14B. The Chinese Phosphate Industry ......................... 15C. Supply of Raw Materials ................................ 16D. The Phosphate Subsector Study-.......................... 17E. lnvestment Program for the Phosphate Subsector .18F. Bank Role and Project Justification .18
V. PROJECT INSTITUTIONS .........................................-19
A. Background ........................ 20B. The Jinxiang Phospb te Chemical Company (JPCC) .......... 21C. The Huangmailing ehosphate Chemical Company (HPCC) ....... 2D. The Ministry of Chemical Industry (MCI) ................. 23
This report has been prepared by Messrs. K. Song (AS3IF), K. Constant (ASTIF),H. Hendriks (ASTEG), and D. Lilaoonwala (CTRMI). Messrs. W. Sheldrick(Consultant) and B. Stone (Consultant) contributed to the fertilizer sectorand phosphate subsector chapters. Ms. G. Mohadjer-Niederreiter and Mr. K. Hur(AS3IF) contributed to the financial and economic analysis chapters. Ms. D.Christmas provided secretarial support in the preparation of this report.
This document has a restricted distribution and may be used by recipients only in the ptrformanceof their official duties. Its contents may not otherwise be disclosed without World Bank authorization.

- ii -
Page No.
VI. THE PROJECT ......... ... 23
A. Objectivesb.. .. ................... 23B. Dayukou Phosphate Mine and Fertilizer Development
Component ... . ....... 24C. Huangmailing Phosphate Mine and Fertilizer
Development Component ... 24D. Technical Assistance Component . . 24
VII. PROJECT MANAGEMENT AND ENVIRONMENTAL PROTECTION... 25
A. Engineering Arrangements..... 25B. Project Management..... 26C. Implementation Schedule..... 26D. Training. .. 27E. Environmental Aspects. . ...... 27
VIII. CAPITAL COSTS, FINANCING PLAN, PROCUREMENT AND DISBURSEMENT.. 28
A. Capital Cost Estimates ......... 28B. Financing Plan ......... 29C. Procurement ......... 31D. Allocation and Disbursement of the Bank Loan . ...... 32
IX. FINANCIAL ANNALJSIYSIS ......... 35
A. Financial Management Practices in China. . 35B. Financial Performance and Projections . . .36
C. Financial Rate of Return and Sensitivity Analysis 38D. Financial Covenants. 39E. Auditing and Reporting Requirements .. .39
X. ECONOMIC ANALYSIS .40
A. Economic Costs and Benefits .40B. Economic Rate of Return and Sensitivity Analyss .40C. Other Benefits .41D. Project Risks .42
XI. AGREEMENTS REACHED DURING LOAN NEGOTIATIONSAND RECOMMENDATION .42
ANNkXES
3.1 Fertilizer Application Rates for Various Countries, 19853.2 Consumption, Production and Imports of Chemical Fertilizers, 1972-873.3 Comparison of Domestic and international Prices of Fertilizers, Main
Energy Inputs, and Main Agricultural Products, December 1988

- iii -
4.i Trends in Domest.ic Iroduction of Phosphate Fertilizers, by Product,1970-86
4.2 Domestic Production of Phosphate Fertilizers by Produict and Province,1985
4.3 Consumption of Chemical Fertilizers by Province, 19854.4 Major Phosphate Deposits in China4.5 Major Pyrite Eieposits and Mines in China4.6 An Outline of the Phosphate Subsector Investment Optimization Model4.7 Planned Phosphate Investment Projects to the lear 2000
5.1 Production Performance of JPCC and HPCC5.2 Organization Chart of JPCC5.3 Organization Chart of HPCC
6.1 Summary of the Dayukou Mine and Fertilizer Development Component6.2 Summary of the Huangmailing Mine and Fertilizer Development Component6.3 Summary of the Terms of Reference for Consulting Services to Support
Project Implementation Under the Technical Assistance Componient6.4 Outline for Training on Hazard and Operability (HAZOP) Analysis
7.1 Organizat' _hart of MCI's Project Coordination Unit7.2 Organization Chart of Project Management Teams for JPCC and HPCC7.3 Project Implementation Schedule and Key Milestones7.4 Environmental Protectiun and Standards
8.1 Capital Cost Estimates8.2 Estimated Disbursement Schedule for Bank Loan
9.1 Assumptions Underlying the Financial Analysis9.2 JFCC - Summary of Historical and Projected Financial Statements9.3 HPCC - Summary of Historical and Projected Financial Statements9.4 Incremental Cost and Revenue Streams for FRR Calculations
10.1 Assumptions Underlying the Economic Analysis10.2 Incremental Cost and Benefit Streams for ERR Calculations10.3 Net Savings of Foreign Exchange over Project Life
MAP
IBRD 20919R: China - Phosphate Reserves and Production FacilitiesIBRD 20504R: Dayukou Phosphate Mine and Fertilizer Development
ComponentIBRD 20505R: Huangmailing Phosphate Mine and Fertilizer Development
Component
DOCUMENTS AVAILABLE IN PROJECT FILES
Reference
1. Feasibility Studies for the Two Development Components2. Terms of Reference for Consulting Services to Support Project
Implementation3. A Blackbook Explaining the Economic and Financial Analyses

- i -
CHINA
HUBEI PHOSPHATE PROJECT
Loan and Project Summary
Borrower: The People's Republic of China
Beneficiaries: Jinxiang Phosphate Chemical Company (JPCC, Hubei Province);Huangmailing Phosphate Chemical Company (HPCC, Hubei Prov-ince); Ministry of Chemical Industry (MCI)
Loan Amount: US$137.0 million equivalent
Terms of Loan: 20-year repayment, including 5 years of grace, at the stan-dard variable interest rate
On-lending Terms: The Government will on-lend the loan proceeds, through theHubei provincial government, to the two Project companiesat an on-lending rate equal to 105% of the IBRD variablerate, with a repayment period of 20 years, including 5years of grace. The commitment charge and foreign exchangerisks will be passed on to the companies.
ProjectObjectives: The Project will assist China in achieving its priority for
the fertilizer sector under the Seventh and Eighth Five-Year Plans (1986-95), which is to reduce the nutrientimbalance in fertilizer use by expanding the productioncapacity for phosphate fertilizers, particularly high-gradeproducts such as monoammonium phosphate (MAP) and triplesuperphosphate (TSP), based on domestic phosphateresources. More specifically, the Project will help GOCto: (a) implement the integrated development of two majorphosphate mines and their downstream high-grade fertilizercomplexes, the first such operations in China in terms ofsize and configuration; and (b) strengthen MCI's projectmanagement capabilities and the capacity cf Chinese designinstitutes to identify and analyze potential safety hazardsand plant operability in chemical plant design and opera-tions. The major investments to be implemrnted under theProject are consistent with the overall dLvelopment strate-gies worked out through the Phosphate Subsector Study (theStudy), which was carried out during project preparationjointly by the Bank and MCI and which resulted in a phos-phate subsector investment program to the year 2000. Theproject investments which comprise the integrated develop-ment of domestic phosphate deposits and fertilizers usingmodern mining, beneficiation and fertilizer productiontechnologies, are also expected to serve as models for thefuture development of the fertilizer sector. The Project

- ii -
will increase China's local supply of phosphate fertilizersby about 25Z.
ProjectDescriptiont The Project has three componentst (a) Dayukou mine and
fertilizer developmernt - initiation of a new open-pit mineof 1.5 Mtpy ROM rock capacity, construiction of a bereficia-tion plant, and establishment of a 560,000 t-py TSP ferti-lizer complex; (b) Huang&ailin& mine and fertilizer devel-opment - expansion of the capacity of an existing opern-pitmine from 0.3 Mtpy ROM rock to J.0 Mtpy, constrlictiozn of abeneficiation plant, rehabilita:ion of a small low-gradenitrogenous fertilizer plant to supply ammoinla as feedstockfor MAP production, and establishment of a l0,O000 tpy MAPplant near the mine site; and (c) technical assistance -consulting services for project implementation, technologyselection, production start-up and mine workshop mainte-nance and for training on modern methodologies for Hazardand Operability (HAZOP) analysis.
Project Benefits The Project will generate indirectly significant economicand Risks: benefits in agriculture by reducing the nutrient imbalance
and increasing the synergism of fertilizer application. Noextraordinary commercial risk are foreseen, given thegeneral shortage of phosphate fertilizers and theapparently buoyant Chinese fertilizer market. The maintechnical risks relate to the need for coordinated imple-mentation and commissioning of high-grade phosphate ferti-lizer plants and associated mines. In the past, the lackof proper coordination has been a persistent problem inimplementing integrated mine and fertilizer investments,executed by separate entities under separate budgets. Thisrisk will be mitigated by implementing both mine develop-ment and fertilizer plant construction under the sameproject management team and from the same budget, as wellas by assurances of diligent monitoring and coordinationfrom the Government. The risk will be further mitigated byinvolving internationally experienced consultants under thetechnical assistance component; they will assist MCI'sproject coordination team and the project companies withproject implementation and production start-up. In addi-tion, the project coripanies will undertake comprehensivestaff recruitment and training .rograms for core opera-tional and maintenance personnel during Project implementa-tion.

- iii -
Project Costt Local Foreign Total----- (US$ million) -----
Dayukou mine and fertilizer development160.2 73.4 233.6
Huangmailing mine and fertilizerdevelopment 75.5 35.1 110.6
Technical assistance - 0.4 0.4
Base cost (January 1989 prices) 235.7 108.9 344.6
Physical contingencies 23.6 10.9 34.5Price contingencies 37.4 19.6 57.0
Installed cost 296.7 139.4 436.1
Incremental working capital 27.2 - 27.2Interest during construction 24.4 22.9 47.3
Total Financing Required /a 348.3 162.3 510.6
Financing Plan: Local Foreign Total----- (US$ million) -----
IBRD loan - 137.0 137.0GOC loan 240.7 - 240.7Provincial government loan 80.4 25.2 105.6Industrial and Commercial Bank loans 8.3 - 8.3Companies' internal funds 18.9 - 18.9Bilateral aid - 0.1 0.1
Total Financing 348.3 162.3 510.6
Estimated Disbursements:
IBRD PY 1990 1991 1992 1993 1994 1995-------------- (US$ million) ----------------
Annual 4.1 23.3 48.0 48.3 20.6 2.7Cumulative 4.1 27.4 75.4 113.7 134.3 137.0
Economic Rate of Return: 172
La The total cost net of sales taxes on locally purchased equipment and mate-rials (US$6.0 million) is US$504.6 million.
CHINA
HUBEI PHOSPHATE PROJECT
I. INTRODUCTION
1.1 The Government of the People's Republic of China (the Government,GOC) has requested a Bank loan of US$137.0 million equivalent to finance aHubei Phosphate Project for (the ProJect). The Project embodies an evolutionof the Bank's fertilizer operations in China, geared toward broadening theimpact of Bank support for developing and improving the efficiency of theentire fertilizer sector. The Fertilizer Rehabilitation and Energy SavingProject (Loan 2541-CHA, FY85), the first Ba fertilizer operation, supportsthe rehabilitation of four large and one medium-sized nitrogenous fertilizerplants. The subsequent Fertilizer Rationalization Project (Loan 2838-CHA,FY87) aims to demonstrate alternatives for improving production efficiency atmedium-size nitrogenous fertilizer plants, which currently produce low-gradefertilizers, by converting products from five such plants into high-gradefertilizers. It also aims to strengthen sector-wide institutional efficiencyby introducing improved management systems at the enterprise level. ThePhosphate Development Project (Loan 2958-CHA, FY88), the third Bank-supportedoperation in the fertilizer sector in China (which was prepared and appraisedconcurrently with the Project), broadens the Bank's involvement beyond thenitrogenous fertilizer subsector. It supports the development of a large-scale, modern phosphate mine in Guizhou Province which would provide high-quality phosphate concentrates to several downstream fertilizer plants.Through the Phosphate Sector Study carried out during the preparation of thethird project and this project (prepared concurrently), a subsectoral approachto Bank assistance was initiated, with the Bank providing financial and tech-nical support to the Ministry of Chemical Industry (MCI) for the design ofsubsector-wide strategies. That effort resulted in the preparation of anoptimal investment program that would allow China to meet its rapidly growingdemand for phosphate fertilizers in the least-cost manner.
1.2 Consistent with the overall development strategies and investmentprogram worked out under the above Study, the Project will support: (a) inte-grated development of two pnosphate mines in Hubei Province and their down-stream high-grade phosphate fertilizer (MAP and TSP) plants at the mine sites;and (b) provision of consultant services to MCI's project coordination teamand the project companies for project implementation, technology selection,production start-up, and mine workshop maintenance.
1.3 The Project investments were initially identified in 1985, and wereprepared and appraised by the Bank's project team as part of the PhosphateDevelopment Project in December 1987. However, GOC wished to delay the loanprocessing for these investments and prepare a separate project on a differentschedule as its own internal review of them was getting delayed. Consideringthe urgency of developing the Guizhou mine in time for the commissioning ofdownstream fertilizer plants currently under construction, the remaining por-tion of the Phosphate Development Project was processed according to the ori-

- 2
ginal schedule, and presented to the Board in June 1988. Key parameters ofthe Project were updated during postappraisal in February 1989. The earlierPhosphate Subsector Study was carried out during 1986-88.
1.4 This report recommends a Bank loan of US$137.0 million equivalent,which would cover 26.82 of the total financing required and 84.5Z of the totalforeign exchange financing tequired (equivalent to 98.3% of the foreign com-ponent of the installed cost).
II. AN OVERVIEW OF THE CHINESE INDUSTRY
A. General Industry Background
2.1 Industry is China's largest productive sector, accounting for nearly47X of its Gross Domestic Product (GDP) and employing 18% of the total laborforce. About 97,600 state enterprises generate 62X of total industrial out-put, the remainder being produced by more than a million non-stateenterprises, mainly urban and rural collectives. While state enterprisesproduce mainly important raw materials, capital goods and strategiccommodities such as fertilizers, and light industrial and consumer goods, mostnon-state enterprises are involved in the production of downstream consumerproducts. Gross industrial output amouinted to Y 1,381 billion (US$371billion) in 1987. The chemical industry, which produces mainly fertilizers,petrochemicals and pharmaceuticals, accounted for 10% of the total industrialoutput.
2.2 The grois value of industrial production has grown rapidly !etween1978 and 1987, at a rate of over 10.8X in real terms per year. This growthreflects in large part the high rate of capital accumulation in industry.Until the late 1970s, when the Government began to view external trade as animportant element of economic development, Chinese industry was orientedmainly toward the domestic market. Since then, Chinese manufactured exportshave grown rapidly from around US$9 billion equivalent in 1980 to about US$26billion equivalent in 1987. The share of exports in industrial output was7.4Z in 1987.
2.3 China's industrial development has been constrained by several struc-tural deficiencies which stemmed mainly from rigid economic planning and thepast industrial strategies oriented towards self-sufficiency at the nationaland regional levels. Major deficiencies include outdated technologies,institutional rigidities stemming in part from quota and price controls, adistorted structure of prices, inadequate infrastructure, and an under-developed financial sector. Reflecting these problems, labor productivity andthe efficiency of resource use for Chinese plants are low. Nearly 80% of thecurrent capital stock is obsolete and needs replacement or technical renova-tion. The industry structure is biased toward basic, heavy industry. Anover-emphasis on self-sufficiency at the regional level has also led to afragmented national market, reduced domestic competition, and the suboptimaluse of scarce skills and resources. Consequently, potential gains from econ-omies of scale are often missed. Institutional inflexibility, compounded byinadequate market integration, has provided little incentives for industrial

enterprises to improve managerial efficiency and product quality. The lowprices of energy and basic intermediates for industrial production also con-tribute to the inefficient use of inputu. nvestments in infrastructure,particularly for transportation and telecomriunication, have lagged behindthose in industry. This in turn has posed a major constraint to industrialdevelopment. The financial markets, which are in their infancy, have untilrecently only provided limited intermediation services for enterprises.
B. Government Objectives and Strategy for Industrial Development
2.4 Since 1979, the Chinese Government has shifted the focus of indus-trial development towards light industry and introduced incentives and marketforces as a means of improving economic efficiency under ongoing economicreforms. The development strategy has emphasized modernization of existingequipment, development of manufactured exports and more efficient lightindustry, and material and energy conservation in industry. Price reforms,which the Government views as one of the most important elements of the on-going economic reforms, are designed to gradually reduce distortions toenhance allocative economic efficiency, particularly by allowing market forcesto play a greater role in price determination. Since the start of economicreforms, the prices of major industrial inputs, including energy, have beenraised significantly qo that effect. Recently the worries relating to theinflationary implications of these reforms have resulted in a cautiousapproach, and the reform process has been temporarily slowed at present.However, price reforms remain a critical item on the Government's reformagenda. Reforms adopted in 1984 aim to decentralize economic decision-makingtoward the provinces and enterprises, and make greater use of market signalsto provide production incentives. State enterprise reforms, which includeirT'roduction of the contract management responsibility system and, uniformprofit tax rates (55Z) and wage incentives, have provided greater autonomy andmore appropriate incentives for enterprise management. However, significantdistortions in relative prices still remain, and the objective of replacingthe traditionally "soft" enterprise budget constraint has yet to be achieved.Reforms in the financial sector have focused on reducing the role of centralplanning in the economy by increasing competition among existing and newfinancial institutions and the introduction of new types of financial instru-ments. The reforms are being implemented at different paces among the regionsand subsectors. Because of the nature and structure of the fertilizer sector,the process of decentralization has already progressed to a greater degreethan in some other industrial sectors.
C. Bank Support for Industry
2.5 The Bank Group's industrial lending operations in China began inDecember 1982 with the approval of a loan of US$70.6 million to finance theFirst China Investment Bank Project (Loan/Credit 2226/1313-CHA, FY83). Threeadditional loans/credits of US$575 million to the China Investment Bank (CIB)(Loan/Credit 2434/1491-CHA in FY84; Loan/Credit 2659/1594-CHA in FY86; andLoan/Credit 2783/1763-CHA in FY87) have been approved subsequently. The mainpurpose of the CIB operations has been to develop CIB as the premier financialintermediary providing term financing for small- and medium-sized enterprises.CIB operations to date have supported a wide range of subsectors, including:textile, light industry, electronics, food processing, pharmaceuticals, pack-

- 4 -
aging materials, machinery and spare parts, building materials, chemicals andmetallurgical, and other, in a number of provinces. Disbursementl of the CIBloans and cred..~s have, apart from some delays in the first operation, pro-ceeded satisfactorily. Altiuough CIB's manoower and system require furtherstrengthening, the basis of a sound development bank in China has been estab-lished.
2.6 Besides the four CIB operations, Bank involvement in the industrialsector comprisess (a) three fertilizer loans, totaling US$257.3 million (para.1.1); (b) a loan of US$100 million for the Shanghai Machine Tool Project (Loan2784-CHA, FY87), involving rehabilitation and modernization of the machinetool sector in Shanghai; (c) a loan of US$128 million for the PharmaceuticalsProject (Loan 2943-CHA, FY88), to expand pharmaceutical production usingmodern technologies and improve manufacturing practices; (d) a regionaldevelopment project for Gansu Province (Loan 2812-CHA, and Credit 1793-CHA,FY87), including an industrial development component of US$20 million, to beused for diversification and modernization of the predominantly rural indus-trial base in the province; and (e) a loan of US$154 million for the TianjinLight Industry Project (Loan 3022-CHA, FY89) to support the restructuring ofthree important subsectors (textile dyeing and finishing, pulp and paper, andpackaging) of the light industry in Tianjin Municipality. Physical implemen-tation of the three fertilizer projects is proceeding generally on schedule.A Planning Support and Special Studies Project, which includes components forsupporting long-term planning activities in selected subsectors includingpetrochemicals, was approved in June 1987. No Project Completion Reports(PCRs) have been prepared on any of the above projects. The InternationalFinancial Corporation (IFC) has provided support of US$44.3 million equivalent(equity participation of US$4.3 million and loans of US$40.0 million) sinceits first operation in 1985, through the following five investments:Guangzhou and Peugeot Automobile Co., Ltd. (Investment No. 813, FY85), ChinaInvestment Co., Ltd. (Investment No. 974, FY87), Shenzhen China Bicycles Co.,Ltd. (Investment No. 1020, PY87), Shenzhen Crown Electronics Co., Ltd.(Investment No. 1066, FY88), and Shenzhen Chronar Solar Energy Co., Ltd.(Investment No. 1119, FY89).
2.7 The Bank's overall objectives in support of China's industrialdevelopment are to assist the Government in: (a) improving the policy frame-work for the industrial sector as a whole; (b) building sound institutions andpractices for financial intermediation, subsector planning, project approvaland implementation; (c) promoting and implementing technology upgrading, plantrestructuring and rehabilitation, and energy and material conservation inselected sectors at the national and provincial levels; and (d) carrying outthe reforms needed in the financial system.
2.8 Specific plans include further support for both CIB and other finan-cial intermediaries and industrial enterprises in the overall sector reformnow under way, assistance to selected major subsectors at the national andprovincial levels: fertilizers, pharmaceuticals and machine tools, and thedevelopment of broad-based industrial lending operations at the provinciallevel, involving restructuring of major subsectors. The increasing devolutionof planning and implementation responsibility to the provinces has the poten-tial to have a significant impact on industrial development provided that theprovincial authorities can effectively formulate and carry out their new role.The anticipated series of provincial operations is designed to help selected

- 5 -
provinces articulate and implement their new responsibilities. The Bank'sprogram for economic and sectcr work in industry and finance has prov,ded thebasis for an active dialogue with the Government. Major studies completed sofar include those on the state enterprise management system, finance andinvestment, external trade and capital, and phosphate subsector planning.Further work is being carried out and is planned in such areas as tax reform,enterprise and financial reforms, and several subsector studies at thenational and provincial levels. This work is increasingly being carried outjointly with Chinese agencies.
2.9 The various reform measures introduced in recent years have expandedsignificantly the scope for non-state enterprises, mainly urban and ruralcollectives. The environment for foreign investment in China has alsoimproved significantly since the promulgation of the joint venture law in1979. Bank operations designed to assist the rapidly growing non-state sectorare contemplated. For example, assistance to the rural industrial sector isexpected through support for the Government's SPARK program, and CIB, hithertothe major beneficiary of Bank support for financial intermediation, isexpected to gradually expand its financing of non-state enterprises and jointventures. IFC support for the Chinese industrial sector has hitherto beenlimited to export-oriented joint ventures. With minor exceptions only, jointventures are required to earn their own foreign exchange to service foreignobligations, which in turn has tended to make it difficult for IFC to supportimport substituting joint ventures; most potential joint venture partners inChina are interested in the domestic market. As part of the ongoing economicand sector dialogue, both the Bank and IFC have proposed major changes in theforeigni exchange allocation and management system designed to alleviate thesedifficulties. The growing importance and role of the foreign exchange cen-ters, which were established recently in important trading cities and prov-inces, have the potential for alleviating this constraint.
III. THE FERTILIZER SECTOR
A. Agricultural Background
3.1 The agriculture sector in China employs some 190 million farmfamilies and accounts for about 34X of the country's GDP. Although it has ashortage of cultivatable land--only 102 of China's 960 million hectares (ha)is cultivated, compared with 75Z in India--China has achieved self-sufficiencyin its basic food requirements. That accomplishment is all the more remark-able given that China has 22% of the world's population but only 8% of itscultivated area. The reasor. for this success is intensive cultivation prac-tices, with relatively heavy inputs of labor, chemical and organic ferti-lizers, and water per unit of land. Foodgrains occupy about 70Z of the totalcultivated area. Cotton is the most important industrial crop.
3.2 The agricultural sector has performed exceptionally well since 1979,when the Government introduced a new agricultural incentive program, the"production responisibility system (PRS).n Reflecting these initiatives, thegross value of agricultural production increased by 10% p.a. over the period1980-86, compared to an average of 3% p.a. in the preceding 20 years. Majorchanges that have taken Dlace under the PRS include: (a) a larger role for

-6-
farm households, which now function as the fundamental units of agriculturalproduction and management; (b) replacement of the mandatory procurement quotawith voluntary contracts, which gives farmers more flexibility in determiningwhat to grow and where to sell; (c) price increases for major farm products;and (d) the introduction of some flexibility in prices for deliveries of cer-tain products by collectives and individual producers in excess of contractedtargets.
B. Fertilizer Use in Agriculture
3.3 While China is the third largest user of chemical fertilizers and thelargest consumer of nitrogen in the world, the level of fertilizer use in1985--167 kg of nutrients per hectare of culti"zated land--was still only abouta third of that in neighboring countries such as Japan and Korea (see Annex3.1 for a comparison with other countries). The implication is that thepotential for increased fertilizer use is large. Since expansion of the cul-tivated area is not feasible, increasing and more balanced fertilizer use willremain central to China's strategy for increased agricultural output.
3.4 At present, there is an imbalance in the use of nitrogen (N), phos-phate (P205) and potash (K20) fertilizers. China's low application of phos-phate and potash (para. 3.6) reduces the synergistic benefits that couldderive from the relatively high level of nitrogen application. This imbalanceis a major constraint to increasing the application of nitrogenousfertilizers. Compared with the application rates in the other countries givenin Annex 3.1, China's level of application of phosphate and potash fertilizersis quite low. According to results from surveys by the Ministry of Agricul-ture, Animal Husbandry and Fishery (MAAF) during 1981-83, the soil throughout73.4X of the cultivated area was deficient in phosphate, and 39.8X of it wasseriously deficient.
C. Fertilizer Demand and Supply
3.5 Table 3.A summarize the consumption, producti(n and importation ofchemical fertilizers from 1974 to 1986 and presents projections of these acti-vities for 1990 and 1995 (greater detail can be found in Annex 3.2).

TIb ..LA: O4INA - Q4EICAL tERTILIZER CONSUMPTION, PRODUCTION AND ISPOR, PAST AND PROJECtED L
('000 tons of nutrient)
Nitrooan Pho8shntbm 445).... PqoQsos h Total nutrient.
Cone.La Prod. Imp. Cono.zaa Prod. Imp. Cons.LN Prod. Imp. Con&./a Prod. Imp.
1072 3,168 2,444 1,342 1.038 1,249 11 12 8 2 4,219 3,701 1,S5S
1Q81 10,36S 9,868 1,641 2,785 2,508 499 281 24 2E0 13,349 12,390 2,290
1984 18,878 12,211 2,828 8,686 2,389 1.342 804 31 788 17,868 14,601 4,928
1988 18,477 11,438 2,052 3,531 1,760 960 920 24 364 17.898 18,222 3,866
1986 18,728 11,888 1,700 4,802 2,826 648 1,078 25 600 19,306 18,987 2,045
1990 (proj.)g 14.860 18,160 2,899 S,880 3,000 8,880 1,768 10 1,786 22,505 16.800 8.005
1995 (proj.)/d 16,400 lS,160 2,562 8,200 4,900 3,956 3,280 160 8,S92 27,880 20,200 9,910
_veran Annug
(trowth Rate (O)
1972-41 14.1 16.8 11.4 8.1 40.2 18.0 18.7 19.1
1972-6 11.0 11.8 11.0 - - - ll.8 9.9
1981-86 8.8 8.8 10.5 (1.4) 47.7 0.8 7.7 2.4
16 8.6 1.8 12.4 38.0 (2.8) 4.2 8.7 5.6
1986-95 2.0 8.5 6.9 10.7 18.2 22.0 4.2 -
L The consumption figures (sales to farmers) do not equal production plus imports because of distribution losses,
stock changes and some unrecorded imports.
L Actual phosphate fertilizer consumption figures include phosphate rock. directly applied without processing.
, Actual potash consumption figures appear to be overestimated because of atstieticsl Inconsistency.
Ld The projected Imports for the yesr4 1990, 1995 snd 2000 were darived from supply Caps between domestic production
and consumption, takino into account an S8 fertilizer lo"s in transit, storage and distribution.
Sources: Consumption data--Chins Agricultural Handbooks 1981-86, Agricultural Yearbook of China 1988 and KMAF;
production dats--MCI. and Food and Agriculture Organization (FAO); and trade data--General Administration of
Custom and FAD.
3.6 Fertilizer Demand. The consumption of all fertilizers increased from4.2 million tons per year of nutrients (tpyn) in 1975 to 19.3 million tpyn in1986, representing an average annual growth rate of 14.1Z. Growth in nitrogenconsumption, which increased at an average annual rate of 14.1Z during1972-81, has slowed in recent years, mainly because the level of nitrogenapplication is relatively high, especially compared to the use of phosphateand potash fertilizers, whose supplies are limited. The consumption ofphosphate and potash showed average growth rates of 11.0? and 37.91respectively,l/ during 1972-86; this coincides with the Government'scontinued emphasis on increasing their application to improve the overallnutrient balance.
1/ Potash consumption has grown very quickiy from its low base in theearly 1970s, but it is still very low.

3.7 China also has a long history of using organic fertilizer. This willcontinue to be a valuable source of nutrients and will complement furtherincreases in the use of chemical fertilizer. Total nutrients supplied byorganic fertilizers in 1986 are estimated at about 15 million tons.
3.8 Based on its agricultural targets, the Government has projected thatthe demand for chemical fertilizer will reach 27.9 million tpyn in 1995, withimplied average annual growth rates of about 2.0X for nitrogen (N) 6.9% forphosphorous (P205) and 13.2X for potassium (K20). These projections appear tobe somewhat conservative, based on the limited supplies of phosphate andpotash fertilizers. According to MAAF, ths desirable long-term target for theratio of these nutrients is 100:50:20, compared with a current ratio of100:33:8. GOC plans to achieve the target by 1995 by rapidly expanding theconsumption of phosphate and potash fertilizers. However, it may be difficultto satisfy these requirements owing to domestic raw material constraints forpotash and limited financial resources for investments and imports.
3.9 Fertilizer Supply. China has about 1,900 operating fertilizer plantsof varying types and sizes and is the world's third largest producer of chem-ical fertilizers after the USSR and the US. Chemical fertilizer productionincreased from 3.7 million tpyn in 1972 to 14.6 million tpyn in 1984, and thenfell to 13.2 million tpyn in 1985. In 1986, production reached 14.0 milliontpyn. Juring 1972-86, phosphate fertilizer production increased at a modestrate of 4.6%, while nitrogenous fertilizer production increased at the muchfaster rate of 11.82 p.a. For potash the figure was 8.5Z.
3.10 The decline in domestic production of both nitrogenous and phosphatefertilizers in 1985 was mainly due to the Government's decision to close some200 of the small, inefficient plants. These plants produced low quality, lownutrient fertilizers such as ammonium bicarbonate (ABC), single superphosphate(SSP), and calcium magnesium phosphate (CMP). The Government took this stepin response to diminishing demand for these fertilizers. Despite the aggres-sive buildup of capacity for high-grade fertilizers in recent years, a signi-ficant portion of the fertilizer production in China still is low grade: in1985, only 30% of nitrogen production and 2X of phosphate production involvedhigh-grade products such as urea (46% N), MAP (522 P205) and TSP (46% P205).
3.11 China plans to continue expanding its production capacity for chem-ical fertilizer, particularly high-grade phosphate fertilizer, during theSeventh and Eighth Five-Year Plan periods (1986-95). It also intends torationalize existing low-grade fertilizer production facilities, by convertingtheir products to high-grade fertilizers. New large- ard medium-scalefertilizer plants to be completed during the Seventh Five-Year Plan period 2/are expected to increase China's high-grade fertilizer production capacity byapproximately 1.2 Mtpy of N, 0.6 Mtpy of P205, and 0.1 Mtpy of K20. Projectsunder the Eighth Five-Year Plan, which is currently being formulated, areexpected to include further expansion in capacity for chemical fertilizers of
2/ Two 1,740 tpd urea plants, three 800 tpd DAP plants, a 400 tpd DAPplant, a 2,970 tpd nitrophosphate plant, a 500 tpd nitrophosphateplant, an 1,800 tpd NPK plant, a 500 tpd NPK plant, and 200,000 tpypotassium-chloride plant.
2.0 Mtpy of N and 1.9 Mtpy of P205.3/ During 1986-95, all medium-size plantscurrently producing low-grade fertilizer will be converted to high-grade pro-duction.
3.12 Fertilizer Demand and Supply Balance. Despite the impressive build-up in production capacity during the last decade, and continued expeditiousexpansion of capacity planned under the Seventh and Eighth Five-Year Plans,China will need to continue importing fertilizers to meet expected domesticdemand. In 1986, about 16% of China's apparent total consumption (domesticproduction plus net imports) of chemical fertilizers was met by imports (122for nitrogen, 24% for phosphate and 96Z for potash), at a value of over US$1.1billion p.a., making China the world's largest net importer of fertilizers.As Table 3.A shows, the overall fertilizer deficit is projected to increasefrom 2.9 million tons of nutrients in 1986 to 8.0 million tons in 1990 and 9.9million tons in 1995. If the foreign exchange situation permics, this deficitwill be met by imports.
D. Structure of the Fertilizer Industry
3.13 Production. Except for 16 large-size urea plants (about 280,000 tpyof ammonia each), most of China's approximately 1,900 fertilizer plants (about1,200 producing nitrogenous and 700 phosphate nutrients) are using outdatedtechnology and do not conform to current irternational production norms. Thisis because most of China's fertilizer plants were built using indigenousdesign, technology and equipment reflecting the industry's early policy ofrelying on local technology and available raw materials as much as possible.Because of the outdated technology at the majority of these plants, the levelof energy consumption of fertilizer production has been high.
3.14 The reliance on local technology was modifiec, in the early 1970s.During that decade and the early 1980s, China built 15 large nitrogenous fer-tilizer plants using imported technology and equipment. Almost all plantscurrently under construction are based on internationally proven importedtechnologies.
3.15 Feedstock. China uses a variety of locally available feedstocks forfertilizer production. The large-size nitrogenous fertilizer plants usenatural gas, naphtha and fuel oil as feedstocks for ammonia production, whilethe small- and medium-size plants mainly use coal. The small-size phosphaticfertilizer plants use low-grade phosphate rock to produce SSP and CMP. Thelarge- and medium-size high-grade phosphatic fertilizer plants under construc-tion or consideration will be based on both domestic phosphate rock andimported phosphoric acid.
E. Fertilizer Marketing and Distribution
3.16 Fertilizer Allocation. In May 1985, the Government changed itsapproach to fertilizer allocation by introducing a new contract system for theprocurement of farm output (see para. 3.2). In the past, it allocated ferti-lizer according to a state allocation plan in exchange for agricultural
3/ Ten high-grade phosphate fertilizer plants with a capacity of240,000-480,000 tpy DAP or 400,000-800,000 tpy TSP, and five large-sizeurea plants.
- 10 -
products acquired through the state procurement system. The current contractsystem gives both farmers and the Government more flexibility in allocatingfertilizer by reducing the quantities covered by the state allocation plan.Fertilizer producers thus are able to sell an increasing portion of theirproduction outside the state plan, sometimes directly to farmers and acrossprovincial boundaries. However, the state procurement system still accountsfor about 60? of total fertilizer consumption and about 85Z of the high-gradefertilizers, including urea and DAP.
3.17 Fertilizer Marketing. About 90? of chemical fertilizer is marketedthrough the Agricultural Means of Production Corporation (AMPC), a state-ownedcompany under the Ministry of Commerce (MOC). AMPC handles all fertilizerunder the state allocation quota and a significant portion of the above-quotaproduction. Producers sell the balance directly to farmers. AMPC procuresfertilizer from the domestic plants and China Chemical Export and Import Cor-poration (SINOCHEM)--the agency responsible for all imports of chemical ferti-lizers under the Ministry of Foreign Economic Relations and Trade. AMPC hassome 2,500 offices at the national (accounting for about 202 of AKPC's totalpurchases), provincial (282), and county (52Z) levels. The county-leveloffices sell fertilizers to farmers through: (a) about 64,000 retail coopera-tive shops (about 50? of AMPC's total sales); (b) some 110,000 retail shops(32Z); and (c) direct sales (18Z).
3.18 Fertilizer Transportation. So far, the transportation system hasbeen able to move the large and growing quantity of fertilizer, about 94million product tons in 1986. The transport of fertilizer has been givenpriority to ensure its availability for farmers. Fertilizer is moved, mainlyin bagged form, from plants and ports directly to a network of county-levelAMPC warehouses located close to the consuming areas. While high-grade ferti-lizers such as urea and DAP are hauled long distances by rail, low-grade fer-tilizer such as ABC and SSP from small plants generally located near the con-suming areas is transported mainly by road. Ab6ut one-third of the totalfertilizer distributed in China moves by rail. River transportation alsoplays an important role.
3.19 Fertilizer Storage. Fertilizer storage capacity has not been ade-quate in recent years to meet the peak storage requirements. given the rise inconsumption. The AMPC operates storage facilities for fertilizers at variouslevels. Total capacity at these facilities is equivalent to three months ofnational fertilizer consumption. AMPC warehouses at the national, provincialand county levels account for half the total storage capacity; the rest of thewarehouses are located in the countryside at AMPC's retail shops. To reducethe storage burden and its carrying costs, AMPC is encouraging farmers to buyfertilizers during the off-season by offering rebates. The shortage of ware-housing capacity at periods of peak storage demand will be alleviated grad-ually as high-grade fertilizers replace low-grade ones, since the former havea lower volume.
F. Fertilizer Pricing
3.20 Trends under the Price Reforms. GOC has embarked on a major effortto reform the prevailing system of prices in the country (para. 2.4). Giventhe Government's concern for macroeconomic management and the obvious sensiti-

- 11 -
vities involved, the pace of reform inevitably will vary from sector to sectorand over time. Recently the Government has taken a cautious approach to over-all price reforms due to concerns about their inflationary implications (para.2.4). However, the overall direction of reform has been clearly set. Theongoing economic reforms involve expansion of the role of market forces infertilizer production and allocation. In the past, the Governmentadministered fertilizer prices strictly, as it did those of other essentialcommodities. The current strategy assigns a greater role to market forces infertilizer pricing and allocation so as to improve the efficiency of produc-tion and application. As a result, a two-tier pricing system has emerged.The State Pricing Bureau (SPB) and local (province, city and county) bureausset the prices for the production subject to the state plan quotas at both theex-factory and farm-gate levels. Market-influenced prices negotiated withinthe limits of guideline retail prices set by local pricing authorities prevailfor production outside the state plan quota.4/ Fertilizer producers marketthese products directly.
3.21 At present, about 402 of total consumption is sold at negotiatedprices, although the percentage varies significantly across products andlocalities and with the financial situation of individual manufacturers. Ingeneral, high-grade fertilizers are subject to stricter state allocation.About S5% of these products, including urea and DAP, are being sold at con-trolled prices under the state allocation plan.
3.22 The Government views the two-tier pricing system as an intermediatestep in the evolution of sectoral pricing policy, given its well-recognizedlimitations, including: (a) discrimination across producers and consumers;(b) administrative complexity; and (c) distortions and time lags in theadjustment of the prices of inputs and outputs. Despite these limitations,the Government expects to use this transitional system until it introduces abroader price reform package. The reason is partly the close inter-relationship between fertilizer and the agricultural sector and the potentialfor disruption if the allocation and pricing arrangements for fertilizers wereto be liberalized in isolation.
3.23 The Government's strategy is to continue gradually reducing itsadministrative control of fertilizer pricing in parallel with the gradualdismantling of annual production planning and allocation, so that the economycan "grow out of the plan." Guidelines for future policy reforms are beingdeveloped by an inter-agency working group that is carrying out a compre-hensive review of the fertilizer pricing and allocation policies according toa program discussed with the Bank. Through these reforms, GOC is committed toremoving the irrationalities in the price relationships between inputs, ferti-lizers and agricultural products. The working group is headed by the Directorof the Department for Heavy Industry and Communication and comprises repre-sentatives from related Government agencies, including the Ministry of Finance(MOF), MCI, MOC, MAAF and China Petrochemical Corporation (SINOPEC). However,
4/ At present, there is a ceiling on the negotiated prices of all high-grade fertilizers, such as urea and MAP, at the retail level. Thisceiling currently is set by the SPB, but in the future it will be setby provincial authorities following guidelines to be given by the SPB.

- 12 -
specific guidelines are expected to emerge only after the agenda for furtheroverall price reforms is firmly in place (para. 2.4).
3.24 Fertilizer Prices. The ex-factory prices of major high-grade fert-ilizers and ABC, the delivered prices of the main inputs, and farmers' pricesfor major grains, together with comparable international border prices in1988, are shown in Annex 3.3. Presently, the controlled ex-factory prices ofurea and DAP are below the border prices, while their negotiated prices areclose to the economic prices. In December 1988, the controlled bagged ureaprice--Y 428 (US$115)/ton--represented about 62% of the CIF import price ofUS$185/ton, while the ceiling for the nei iated price quota, which differsamong provinces and is set by respective provincial pricing authorities, was95-102Z of the economic value. For DAP, the figures are, for plan quota,Y 570 (US$153)/ton, equivalent to 67% of the current import parity price ofUS$229, and for the negotiated price, Y 700-860 (US$188-231), or 82-101Z. Atpresent, there is no local production of TSP and MAP, and controlled ex-factory prices therefore have not been established. The ceilings for nego-tiated prices for future TSP and MAP production are expected to be set in linewith those for DAP. The Government provides subsidies to make up the differ-ence between the import and sale prices for imported fertilizers. Actualnegotiated ex-factory prices have usually been equal or close to the ceiling;reflecting market conditions, these prices have frequently exceeded the ceil-ing, with approval from the pricing authorities, at least during the peakseason.
3.25 An average distribution margin of about Y 140 (US$38/ton of product)is added to the ex-factory price of high-grade fertilizer at the farm-gatelevel to cover AMPC's transport and storage costs.
3.26 During negotiations, an assurance was obtained from the Governmentthat the Project companies would be allowed to market their entire output (TSPand MAP) outside the state allocation plan at negotiated prices.
3.27 Prices of Fertilizer Inputs Relative to Fertilizers. The pricestructure of major inputs is also similar to that of fertilizers. However,there are no country-wide uniform prices for these inputs, and the controlledprices applied to individual suppliers are set by each supplier's respectivesupervisory pricing authority at the central, provincial and county levels.Although these prices vary to a large extent depending on the quality ofproduct and the location and geological condition of supply sources, on thewhole they are far below their border prices. The controlled price of naturalgas under the state allocation quota is around 55-65% of its fuel oil equiva-lent value, based on border prices. The controlled price of coal is 65-75Z ofits export value. The average ex-mine controlled price of domestic phosphaterock, the quality of which is usually too low to be tradeable in the inter-national market, is about 45% of the import parity price based on nutrientcontents. Negotiated prices above the quota are generally 15-25% higher thanthe controlled prices; although in some cases they have, subject to approvalby pricing authorities, approached border prices. The entire production ofphosphate concentrate from Wengfu mine, to be developed under the Bank-supported Phosphate Development Project (Loan 2958-CHA, FY88), will be allowedto be sold outside the state allocation plan at market influenced negotiatedprices.

- 13 -
3.28 Prices of Fertilizers Relative to Agricultural Products. The pricestructure of agcicultural products is similar to that of fertilizers. Agri-cultural products traded by the state procurement system are subject to con-trolledI prices. While some exceptions exist, the prices of these productsgenerally are below border prices, while the market-influenced negotiatedprices more closely approximate the border prices. For example, as of January1988, thR controlled price ef rice was Y 632 (UTS$167)/ton, about 65Z of itsexport value of US$258/ton, whereas its negotiated price was Y 840 (US$226)/ton (Annex 3.2). The controlled price of wheat was Y 328 (US$119)/ton, about682 of the CIF in.port price of US$1.75, the negotiated price, Y 500 (US$161)/ton.
G. Government SLrategy in the Fertilizer Sector
3.29 In view of its importance to agriculture, the fertilizer sector hasbeen, and will continue to be, a sector of high priority for the allocation ofinvestment resources. In recent years, the Government rei.erated thispriority on several occasions, including statements published by the StateCouncil, respectively, in September 1987 and September 1988.
3.30 The Government's main objectives in the fertilizer sector are tc:(a) achieve the desirable nutrient balance of 100(N): 5U (P205): 20 (K20) bythe end of the Eighth Five-Year Plan (1991-95) by rapidly expanding the pro-duction capacity for phosphate fertilizers based on domestic phosplhate rockand the development of domestic potash resources; and (b) move toward self-sufficiency in fertilizer production during the Ninth Five-Year Plan(1996-2000). Other priorities include the rationalization of low-gradefertilizer facilities through technical renovation, energy-saving measures andimprovement in product quality, and greater efficiency in enterpriseoperations through improvements in management efficiency.
3.31 The Government's strategy for sectoral investment during the SeventhFive-Year Plan envisages: (a) bringing on-line the newi fertilizer productioncapacity currently under constraction (see para. 3.11); (b) converting medium-size low-grade fertilizer plants to high-grade fertilizer proluction;(c) intensifying the exploitation and development of d3mestic phosphateresources, including seven large new phosphate mines and the expansion ofpyrite mining capacity; and (d) rationalization of many small-size low-gradefertilizer plants, including their conversion to high-grade operations usingadaptive technologies. At present, the Government does not contemplate anyinvestments in new small-size SSP or ABC plants.
3.32 During the Eigh-n and Ninth Five-Year Plans (1991-2000), Governmentstrategy will focus on further expanding phosphate fertilizer production capa-city. With the recent decentralization of project implementation responsi-bilities, State resources will be used mainly for phosphate fertilizer; thecentral Government will ntot initiate ary new nitrogenous fertilizer projectsand these will be implemented by the provincial authorities as necessary.This strategy is considered appropriate, given the nutrient imbalance in fert-ilizer use and China's endowment of phosphate rock.

- 14 -
IV. THE PHOSPHATE SUBSECTOR
A. World Phosphate Market
4.1 Consumption. World phosphate fertilizer consumption grew steadily inthe 1970s and 1980s except in 1985/86, when a decline of 2.62 from Zhe pre-vious year's consumption was registered. According to statistics published bvFAO, world consumption of phosphate fertilizers rose from 19.8 million tons ofP205 to 34.3 million tons during 1969/70 to 1984/85, at an annual average rateof 3.5Z. The decline in 1985/86 reflects the reduced application of ferti-lizers in several countries exporting agricultural products due to the record-low prices of grains and agricultural products in the international market.In 1986/87, world phosphate consumption rsbounded to 34.4 million tons ofP205, largely due to a rapid increase in consumption in the developing coun-tries. The 1987/88 consumption is estimated at 36.4 million tons of P205, oran increase of 5.82 from the previous year's consumption. World phosphateconsumption is projected by the Bank's International Economics Department toincrease at anL annual average rate of 2.7Z between 1987/88 and the year2000/2001. In 1986/87, the major consumers of phosphate fertilizers were theUSSR (24.3X of the world consumption), US (10.6Z), China (8.OZ), India (5.7z),Brazil (4.9Z), and France (3.9%).
4.2 Production. World production of phosphate fertilizers also grewsteadily, from 20.6 million tons of P205 in 1969/70 to 37.2 million tons in1984/85. In response to the trends in demand for phosphate fertilizers, worldphosphate production fell to 34.6 million tons in 1985/86, and rebounded to37.0 million toDs in 1986/87. In 1987/88, the world production level reachedan estimated peak of 38.3 million tons of P205. In 1986/87, the majorproducers of phosphate fertilizers were the USSR (22.9% of world production),US (22.0%), China (5.8%), India (4.62), Brazil (4.12), France (2.7Z), Tunisia(1.92) and Morocco (1.3Z). According to supply projections by theFAO/UNIDO/World Bank Fertilizer Working Group in May 1987, world phosphatefertilizer supply potential, which is derived from world nominal capacity inoperation and under constrution and country-specific operation rates, wasestimated at 36.8 million tons of P205 in 1986/87, and was expected to reach41.8 million tons by 1991/92, representing an annual average growth rate of2.4Z. A major increase in capacity is expected to ,take place in developingcountries, particularly in Morocco, Tunisia, Jordan, China and Egypt wheremajor raw materials are abundant. The recent worldwide trend is to locate newproduction facilities near phosphate rock mine sites.
4.3 International Trade and Market Prices. The international phosphatemarket is competitive; the two main exporting regions are North America andNorthern Africa and all other regions import. Phosphate fertilizer prices inthe world market, which fell sharply during the 1980-83 worldwide recessionand reached a record low in 1986, have increased steadily in recent years asworld demand particularly in developing countries recovered. While the worldmarket prices of phosphate fertilizers are not expected to increasesignificantly in the short run given the forecast movement in the agriculturalmarket and the industry's investment behavior, the recovery of these prices isexpected to continue gradually and steadily throughout the 19909. Fertilizer

- 15 -
production facilities to be established under the Project are expected to comeon stream in early 1994.
B. The Chinese Phosphate Industry
4.4 Although the domestic production and use of phosphate fertilizers hasincreased steadily over the last two decades, development of the phosphateindustry in China has been less spectacular than that of the nitrogenindustry. The main constraint has been technical difficulties in processingChinese rock, which has a high magnesium content, into concentrates suitablefor the production of high-grade fertilizers. Production of phosphate ferti-lizer therefore has been limited to low-grade products such as SSP and CMP atsmall provincial phosphate fertilizer plants. Accordingly, there was littleplanning or coordination of the development of the phosphate fertilizer indus-try at the state level. However, several years ago the Government shifted thepriority in the fertilizer .ector from nitrogenous to phosphate fertilizers,in order to correct the large imbalance in fertilizer use.
4.5 Domestic Phosphate Fertilizer Production. Recent trends in the pro-duction of phosphate fertilizers are summarized in Table 4.A below (furtherdetails are given in Annex 4.1). As of the end of 1987, almost all phosphatefertilizer production was low-grade, with SSP comprising more than 70Z and CMPmost of the balance. Domestic production of other phosphate fertilizers hasbeen insignificant--in 1985, ammonium phosphate production was only 7,000 tonsof P205, while the total capacity of the phosphoric acid plants was only about50,000 tpy of P205. About 400,000 tons of ground phosphate rock were alsobeing applied directly.
Table 4.A: PRODUCTION OF PHOSPHATE FERTILIZEPS, 1972-86('000 tons of P2 05 , Z)
SS? CMP Others /a TotalYear Volume I Volume Z Volume X Volume Z
1972 740 59.2 488 39.1 21 1.7 1,249 100.01981 1,780 71.0 692 27.6 36 1.4 2,508 100.01983 1,920 72.0 715 26.8 30 1.1 2,665 100.01984 1,683 71.3 644 27.3 32 1.4 2,359 100.01985 1,345 76.5 380 21.6 33 1.9 1,758 100.01986 1,713 73.7 558 24.0 54 2.3 2,325 100.0
Ja Ammonium phosphate productiont 3,000 tons in 1984, 7,000 tons in1985; the 1986 figure is not available.
Source: MCI
4.6 There are about 700 phosphate fertilizer plants in China, scatteredamong almost all the provinces (see Annex 4.2). The average output capacity

- 16 -
is 15,000-30,000 tpy, except for a few SSP plants that have capacities of morethan 100,000 tpy. Most of the production in each province is consumed withinits boundaries (Annex 4.3).
C. Supply of Raw Materials
4.7 The two main materials required for producing high-grade phosphatefertilizers are phosphate rock and sulfuric acid.
4.8 Phosphate Rock. China is well endowed with more than 3 billion tonsof phosphate rock (see Annex 4.4). The physical nature of the rock is similaracross deposits-- usually hard and with a high magnesium oxide (MgO) contentvarying from about 2.5-6.0Z. Until recently, when a new process for benefici-ating these rocks was developed in China, domestic rocks were not suitable forproducing high-grade phosphate fertilizers. Now, however, the Government isplanning several large new undertakings to exploit the major deposits of rock,particularly in Hubei, Guizhou and Yunnan Provinces. The Project will supportseveral such efforts. Recent exploration also indicates large rock resourcesin Sichuan Province.
4.9 Relative to the large size of the phosphate rock reserves, the cur-rent level of production is low, for the reasons given above. Annualproduction of phosphate rock in 1986 amounted to only 15 million tons of runof mine (ROM) rock, mainly in five provinces, as shown in Table 4.B. In 1986,most of this rock was used as ROM rock; only about 5X was beneficiated beforeuse.
Table 4.B: AVERAGE ANNUAL PHOSPHATE ROCK PRODUCTION BY PROVINCE, 1986('000 tons rock)
Yunnan Guizhou Hubei Hunan Sichuan Other Total
Production 3,264 2,484 5,460 1,090 2,953 294 14,957
Source: MCI.
4.10 Because the phosphate fertilizer plants are small and scatteredthroughout the country, phosphate rock is transported widely o-er China.Yunnan Province, for example, sends rock to 24 provinces, Guizhou to 18, andHubei to 19. The major importing provinces are Hubei, Liaoning, Jiangsu,Shandong and Guangxi. China imports a small quantity of rock (varying between0.2 to 0.3 Mtpy from year to year) for some plants near the coast. It alsoexports a small amount of phosphate rock under counter-trading arrangementswith other developing countries.
4.11 Sulfuric Acid. China's sulfuric acid consumption in 1986 was about7.6 million tons, of which about 5.0 million tons went for phosphate fertili-

- 17 -
zer production. China meets almost the entire demand for sulfuric acid domes-tically. About 1.5 million tons of acid comes from smelter gas, and almostall the remainder from pyrites; only a small amount comes from elementalsulfur.
4.12 The major deposits and mines of pyrites are located in Guangdong,Shanxi, Anhui, Liaoning, Hunan and Sichuan Provinces (Annex 4.5). The majorproducers of smelter acid are in Liaoning, Gansu and Hunan. China hasdiscovered sulfur deposits in Shandong Province, but attempts to exploit themhave not been successful. Little sulfur is recovered from the oil and gasindustry as most gas deposits are sweet.
4.13 The shortage of sulfur could inhibit development of the phosphateindustry unless new deposits of pyrites or sources of by-product sulfuric acid(e.g. phosphogypsum' are developed. GOC is avare of this possibility ancd. isestablishing a pilot plant in Yunnan to develop a process to recover sulfurfrom phosphogypsum.
D. Th? Phosphate Subsector Study
4.14 As mentioned earlier (para. 1.1 and 1.4), during Project preparationMCl and the World Bank carried out a joint Phosphate Subsector Study (theStudy) to help the Government identify appropriate strategies for developingan efficient domestic phosphate fertilizer industry. The main objective ofthe Study was to prepare an optimal investment program up to the year 2000that would allow China to meet its rapidly growing demand for phosphate fer-tilizers in the most economic wanner, given specified market requirements andtransport constraints.
4.15 The Phosphate Model. As part of the Study, the Bank designed acomputer-based mathematical programming model to facilitate review of theoptions, using data provided by MCI (see Annex 4.6 for the details). Themodel covers optimization of investment at the national level as well as ateach plant in terms of location, scale of operations, and level of productionin the context of the constraints associated with the transport of raw mate-rials, intermediates and final products. The selection of optimal strategieswas based on a comparison of different options and scenarios. The modelenabled the Government to review in a consistent and integrated manner themajor issues involved in developing the fertilizer industry, such as: (a)domestic fertilizer production versus importation; (b) optimal mode of trans-porting raw materials and finished products; (c) the location of new fert-ilizer production facilities; (d) the relative economics of producing dif-ferent types of phosphate fertilizers; and (e) priorities in developing thedifferent phosphate rock deposits. This model is being installed at MCI'sChemical Planning Institute (CPI) with technical and financial assistance fromthe Bank under the Phosphate Development Project (Loan 2958-CHA, FY88). Itwill be continuously updated to provide advice to planning and project imple-menting authorities on relevant subsector strategies.
4.16 The results of work with the model provided strong economic justifi-cation for development of China's domestic phosphate fertilizer industry,based on domestic raw materials. The analysis suggested that producing high-grade phosphate fertilizers such as TSP, DAP and MAP near the rock sources in

- 18 -
Yunnan, Guizhou and Hubei Provinces can be more economic than relying onimports. Construction of small DAP plants that use adaptive technology andlocal raw materials also will help China meet its phosphate requirements.
E. Investment Program for the Phosphate Subsector
4.17 To meet its agricultural production targets by the year 2000 withbalanced use of the three main fertilizer nutrients, China will have toincrease its phosphate consumption to about 9.1 million tons of P205 from itscurrent level of 4.5 million tons. 'f most of the presently known economicdeposits are fully developed by that time, China could increase domestic pro-duction from the 1986 level of 2.3 million tons of P205 to 9.0 million tons.This development would necessitate an increase in phosphate rock productionfrom about 11 to 35 million tpy of rock and in sulfuric acid from about 8 tomore than 20 million tons. Total related investment costs for the productionfacilities are estimated at about US$8-10 billion in 1988 prices, excludingthe large Investment required to upgrade the infrastructure to transport rawmaterials to the processing units and to distribute the final products to themarketplace.
4.18 During the Seventh Five-Year Plan, five large new phosphate rockmines and many small local mines are to be developed (the Wengfu mine inGuizhou, one mine in Yunnan, and three mines in Hubei). Output at the largepyrites mines in Guangdong, Meimonggol, Hunan and Anhui will be greatlyincreased to meet the demand for sulfuric acid. These local raw materialswill feed the new high-grade phosphate fertilizer plants to be implementedduring the Seventh and Eighth Five-Year Plan periods. Three DAP plants willbe implemented based on imported phosphoric acid. About 50 small SSP plantswill be revamped to produce DAP using adaptive technology, a move that willallow them to utilize relatively low-grade phosphate rock. During the Eighthand Ninth Five-Year Plans (1991-2000), the Government intends to fully expioitthe domestic phosphate resources to produce a total of 35 Mtpy of phosphaterock (30Z P205 basis) and 9.0 Mtpy of phosphate fertilizers (10O P205) by theyear 2000. Details of specific investments in the phosphate subsector up tothe year 2000, estimated on the above basis, are given in Annex 4.7.
F. Bank Role and Project Justification
4.19 In support of the Government's efforts to implement its stracegies inthe fertilizer sector (paras. 3.28-3.31), the Bank's main role is to providetechnical and financial assistance in: (a) strengthening GOC's capability forinvestment planning based on modern planning techniques, in order to optimizeinvestments in the sector, especially those for phosphate and potash fertili-zer; (b) assessing specific projects using suitable methodologies, includingthe selection of appropriate technologies; (c) building new fertilizer produc-tion capacity, as well as renovating existing facilities, particularly forphosphate and potash fertilizers; (d) enterprise-level restructuring andupgrading the efficiency of fertilizer distribution so as to reduce fertilizerlosses during distribution; and (e) improving the managerial efficiency ofsector companies through the introduction of modern enterprise-level manage-ment systems.

- 19 -
4.20 The two previous Bank-assisted nitrogenous fertilizer projectssupported China's priority objective during the early part of the SeventhFive-Year Plan (1986-90), which has been given to improving the technical andmanagerial efficiency of existing fertilizer plants. Most of the existinglarge- and medium-size fertilizer plants, including the large ones built withinternationally proven technologies in the 1970s, do not use up-to-date tech-nologies and require major investments to improve energy and production effi-ciencies. The first project (Fertilizer Rehabilitation and Energy SavingProject, Loan 2541-CHA, FY85), which was physically completed on schedule bythe end of 1988, provided financial assistance for improvements in efficiencyat one medium-size and four large nitrogenous fertilizer plants. The secondproject (Fertilizer Rationalizaton Project, Loan 2838-CHA, FY87) providesfinancial assistance both to upgrade the operations of five medium-size nitro-genous fertilizer plants, including conversion of their products to high-gradeones, and to introduce modern enterprise-level management systems in the fer-tilizer industry overall. Implementation of th.a project is proceeding welland on schedule. An IDA-financed technical credit also was provided tosupport project preparation, including tests of the phosphate rock and feasi-bility studies for the Project.
4.21 The Project, together with the third fertilizer project (the Phos-phate Development Project, Loan 2958-CHA, FY88), supports China's priority inthe fertilizer sector during tine Seventh and Eighth Five-Year Plans (1986-95),which is to reduce the nutrient imbalance in fertilizer use by rapidly expand-ing the production capacity for high-grade phosphate products. At the sametime, the process of project preparation has provided an opportunity to intro-duce modern subsector planning techniques and methodologies to the phosphateindustry and to help GOC articulate an optimal strategy for developing thesubsector. MCI's involvement in the joint phosphate subsector study hasstrengthened its subsector planning capability. The experience and metho-dologies learned from the Study also can be applied to other subsectors, aprocess in which the Chinese Government has already expressed an interest. Afurther innovation of this Project is the integrated development of phosphatemines and high-grade fertilizer complexes, the largest and most complex ofsuch operations in China to date. This effort will provide China with theexperience needed to implement similar other investments, which already havebeen identified in the Study. The technical assistance component is designedto ensure successful Project implementation.
V. PROJECT INSTITUTIONS
5.1 The Hubei Phosphate Project involves: (a) Jinxiang Phosphate Chemi-cal Company (JPCC), Hubei Province, which will carry out the Dayukou mine andfertilizer development component (paras. 6.3-6.4, 6.6); (b) Huangmailing Phos-phate Chemical Company (HPCC), Hubei Province, which will carry out the Huang-mailing mine and fertilizer development component (paras. 6.5-6.6); and (c)MCI, which will coordinate Project execution by the Project companies andimplement the technical assistance component (paras. 6.7-6.10). The opera-tional, managerial and organizational aspects of these institutions arereviewed in this chapter, while the financial aspects are reviewed in ChapterIX.

- 20 -
A. Background
5.2 Chinese chemical fertilizer companies and phosphate mines are state-onmed but operate as financially and administratively independent entities.In the past, the administrative, production, ma:ketiDg and financial opera-tions of these companies were under the direct supervision of the provincialgovernments. However, their autonomy in th'eir business decisions has beenexpanding, and is expected to continue doiag so, under the ongoing economicreforms. Large-size companies already enjoy wide autonomy in almost allaspects of their operations. The project companies have been registered withtheir respective provincial authorities to provide them with the status oflegal entities. Charters of the project companies describe the scope of theiractivities, responsibilities and authority in the conduct of business.
5.3 Organization and Management. The organization and management prac-tices of Chinese state-owned industrial enterprises reveal strong similar-ities. Their organization is basically flat--there are numerous unit work-shops and departments with their own management layers, all at the same organ-izational level. A general manager, appointed by the supervisory government,heads each company. Under the general manager are the second-layer managers,twho share functional responsibilities related to procurement and sales,administration, production, maintenance and construction. A chief engineer,also second-layer, is charged with all technical matters, including develop-ment and renovation. A chief accountant has a similar position in the area offinancial matters.
5.4 This structure has not promoted contemporary standards of organiza-tional and managerial efficiency, such as adequate scope of control,functional distribution of responsibilities among line managers, and adequatemanagerial and financial autonomy. The Government (SPC, MCI and the localGovernments) has been setting annual production targets, allocating inputs,distributing output, and allocating funds from budgets. Some managers, parti-cularly those responsible for production, have been overloaded with super-visory responsibilities. Horizontal coordination among various departmentsand workshops is not satisfactory. Because of insufficient autonomy, goodmanagement information and cost management systems do not exist.
5.5 Recent Management Reforms. Under the recent economic reforms,Chinese fertilizer companies have received increasing management autonomy.One result, however, is that there is now a two-tier planning and managementsystem. The state plan mandates a basic minimum level of activity, but beyondthat level each company is free to operate in response to market forces underits own flexible plan. Companies can make their own decisions regarding pro-duction levels, procurement of raw materials, sales of products above thequota, and utilization of funds generated by those sales, within the contextof the flexible plan. Although state planning for the fertilizer sector isexpected to continue in the near future, the scope for flexible planning andmanagement is to expand further, providing greater autonomy to management.
5.6 MCI recognizes the strong need to restructure the organization andmanagement of the chemical fertilizer companies so that they can effectivelycarry out their mandates for organizational change. This reatructuring can be

- 21 -
done tiirough the introduction of modern enterprise-level management systemsfor infomnation and costs, as well as investment and financial planning. MCI,with Bank assistance under the Fertilizer Rationalization Project (Loan2838-CHA, FY87), is sponsoring a management efficiency study, usinginternationally experienced consultants. The aim of the study is to raisemanagerial efficiency in fertilizer companies in the context of the changingbusiness environment. The study is expected to be completed by the end of1989. It also will provide practical recommendations for introducing suitablemodern systems. MCI plans to introduce these systems gradually in the entirechemical industry, including the project companies, following successfulintroduction of them at several companies on a pilot basis. The BeijingInstitute of Chemical Engineering and Management (BICEM), MCI's managementtraining arm for engineers and managers of chemical enterprises as well asMCI's own staff, is currently implementing a comprehensive program to upgradeits management training capabilities with Bank assistance under the sameproject.
B. The Jinxiang Phosphate Chemic'l Company (JPCC)
5.7 Background. JPCC is the new name of the JinxiRng Mining Bureau(JMB), which has been operating since 1958 at Huji City, about 400 km north-west of Wuhan, the capital of Hubei Province. Presently, JPCC operates threephosphate rock mines: (a) the Dayukou open-pit mine, with a capacity of 0.4million tpy; (b) the Liuchong underground mine, with a capacity of 0.6 milliontpy; and (c) the Wangji underground mine, the first phase of which was com-pleted in 1985 and which is currently being expanded to its final capacity of1.5 million tpy. The rock of Dayukou and Liuchong is currently being sold asfeedstock without beneficiation to low-grade phosphate fertilizer plants,mainly in Hubei Province. The total output of the Wangji mine will be bene-ficiated at the company's Wangji beneficiation plant, which was completed in1986. Phosphate rock concentrate from Wangji will be sold to the Luchengnitrophosphate plant in Shanxi Province.
5.8 Production Performance. Except in 1987, when they were faced withdifficulties in marketing low-grade rock, Dayukou and Liuchong mines haveoperated at relatively high levels of capacity utilizaton (around 92-99%) (seeAnnex 5.1 for details). The new Wangji mine and beneficiation plant, thephysical construction of which was completed in mid-1987, started up only inmid-1988 because of delays in completing the downstream Lucheng fertilizerplant. The existing Dayukou mine has suffered from defective design, mainlyin terms of undersized and poorly adapted main mining equipment. Expansion ofthe Dayukou mine under the Project is intended to eliminate the above defectsthrough the selection of well-adapted equipment.
5.9 Organization and Management. JPCC is headed by a general manager whois appointed by the Hubei provincial government. The general manager isassisted by six second-layer managers: (a) the chief engineer; (b) thedirector for production; (c) the director for administration: (d) the chiefeconomist; (e) the chief accountant; and (f) the legal advisor. No majorchanges in JPCC's organizational structure are currently envisaged afterproject completion, except as a result of the expansion of the Dayukou mineand fertilizer complex (see Annex 5.2). Management already has gained valu-able experience in constructing a large-scale mine and a beneficiation plantfrom the new and complex Wangji iacility. However, the addition of the new

- 22 -
large mine and a modern complex fertilizer production operation will requiremanagerial strengthening, including the recruitment of qualified second- andthird-layer managers.
5.10 Staffing and Training. JPCC's staff presently number 10,170, of whom3,220 have higher educations and 690 are engineers and managers. Aftercompletion of the Project, JPCC will have 12,670 staff, including 1,100 engi-neers. In addition to strengthening managerial capability, recruiting addi-tional experienced technical staff also is required. During loan negotia-tions, an assurance was obtained that JPCC would prepare, and furnish to theBank for comment by December 31, 1990, a comprehensive program to strengthenmanagement, recruit qualified staff, and provide training, and thereafter willcarry out the agreed program. JPCC will obtain assistance from internation-ally experienced consultants and local design institutes in preparing theprogram.
C. The Huangmailing Phosphate Chemical Company (HPCC)
5.11 Background. HPCC will be created by merging two companies--Huangmailing Mining Company (HMC) located at Huangmailing, about 160 km northof Wluhan, the capital of Hubei Province, and the Dawu ABC plant, located 15 kmfrom the Huangmailing mine. This merger is intended to facilitate the con-struction and operation of the TSP complex to be established under the Projectby putting the core facilities of the complex under one management. HMC,founded in 1973, currently operates an open-pit mine with a design capacity of300,000 tpy of ROM ore, an adjacent rock beneficiation plant of the same capa-city, and an SSP plant of 40,000 tpy capacity, together with a small pyrites-based sulfuric acid plant of 15,000 tpy capacity and a recently added small(10,000 tpy) bulk blending facility that produces N-P-K fertilizers. The DawuABC plant, with a capacity of 15,000 tpy of ammonia and 51,000 tpy of ABC, wasestablished in the early 1970s.
5.12 Production Performance. HMC's output of beneficiated rock has beensubstantially below design capacity in recent years (see Annex 5.1), mainlybecause of a delay in the construction of downstream high-grade fetilizerplants. The small scale low-grade phosphate fertilizer plants have beenoperating at relatively high capacities because of the general shortage ofphosphate fertilizers in the locality despite the gradual shift toward high-grade phosphate fertilizers. Integration of the new mine and the proposedHuangmailing MAP plant will help HPCC solve the problem of timing mismatch ofupstream and downstream facilities, since all the rock concentrate produced bythe existing beneficiation plant will be consumed by the MAP plant.
5.13 Organization and Management. HPCC will be headed by a generalmanager, assisted by four directors responsible for: (a) operations; (b)production; (c) personnel; and (d) administraticn. Some streamlining ofHPCC's organizational structure after project completion is being consideredto accommodate the major expansion of operations under the Project (see Annex5.3 for details). As HPCC's existing operations are of simple design, itsmanagers have not been exposed to the requirements of modern, complex facili-ties. Significant reinforcement of HPCC's management will be required toensure successful implementation and completion of the Project.

- 23 -
5.14 Staffing and Training. HPCC staff presently number 905, of whom 60are engineers and managers. After completion of the Project, total staff areexpected to increase to 1,750 and engineers to 120. Considering the inexper-ience of management and the low level of technical skills within the company,considerable external recruitment and intensive training will be required.During loan negotiations, HPCC provided the same commitment as that obtainedfrom JPCC with respect to management strengthening, and staff recruitment andtraining (para. 5.10).
D. The Ministry of Chemical Industry (MCI)
5.15 Background. The Ministry of Chemical Induetry (MCI) has nationalsupervisory responsibility for the chemical fertilizer sector, including phos-phate mining, and a number of refineries, rubber plants and several otherchemical industries. MCI prepares the five-year plans for these subsectors,works out annual production targets, coordinates the supply of raw materialsand sales of output, and monitors the activities of the chemical industry atthe provincial and county levels in coordination with the Chemical IndustryBureaus of local governments. MCI also coordinates the implementation oflarge-scale investment projects in the chemical sector which are supportedfinancially and managed by the national government agencies under the nationalinvestment plans.
5.16 Organization and Management. MCI is headed by a minister, who isassisted by four deputy ministers responsible for respectivelys (a) financeand foreign affairs; (b) production; (c) construction projects; and (d) educa-tion and research. MCI maintains a task force known as the "World BankProject Implementation Coordination Group" to coordinate with the Bank. It isheaded by the deputy minister for finance and foreign affairs. The World BankLoan Office, an executive arrr of the group headed by a director-levelofficial, maintains project coordination groups for Bank-supported projects,including this Project.
VI. THE PROJECT
A. Objectives
6.1 The specific objectives of the Project are to: (a) provide financialand technical assistance in implementing some of the first major projects ofthe investment program developed from the Phosphate Subsector Study undertakenduring Project preparation (paras. 1.1, 1.4 and 4.14)--these projects wouldprovide models for integrated development of phosphate mines and fertilizerplants; and (b) strengthen MCI's project management capabilities, particularlywith respect to reducing technical risks associated with the integrated devel-opment of large-scale phosphate mines and high-grade fertilizer complexes.
6.2 To achieve the objectives, the Project comprises three major com-ponents: (a) Dayukou phosphate mine and fertilizer pruduction developmentcomponent; (b) Huangmailing phosphate mine and fertilizer production develop-ment component; and (c) technical assistance component.

- 24 -
B. Dayukou Phosphate Mine and Fertilizer Development Component
6.3 This component, which will be carried out by JPCC, involves estab-lishment of: (a) a new open-pit mine of 1.5 million tpy ROM rock capacity, toreplace the existing ineffLcient Dayukou mine; (b) a beneficiation plant, toproduce 0.65 million tp, of phosphate rock concentrate (33Z P205); (c) a560,000 tpy TSP plant, together with a pyrites-based sulfuric acid plant of560,000 tpy capacity and a phosphoric acid plant of 200,000 tpy P205 capacity;(d) a 12,000 tpy aluminum fluoride plant; and (e) related infrastructure (seeAnnex 6.1 for details). After commissioning the new Dayukou mine and benefi-ciation plant, the existing Dayukou and Liuchong mines will be phased out.The mine and beneficiation plant have been designed by the China ChemicalMines Research and Design Institute (CMRDI), with assistance from JacobsEngineering, a US company, and the fertilizer plant by Nanjing Chemical DesignInstitute (NUDI), with guidance from Chemsystems, also a US company.
6.4 Because Dayukou rock alone is not suitable for the production of TSP,mainly due to its high magnesium content, about 220,000 tpy of phosphate con-centrate with good reactivity will be supplied from Yunnan Province by rail.During loan negotiations, an assurance was obtained from JPCC that it wouldprepare supply and transport arrangements satisfactory to the Bank for therequired quantity of this concentrate by December 31, 1991.
C. Huangmailing Phosphate Mine and Fertilizer Development Component
6.5 This component, which will be carried out by HPCC, involves theestablishment of: (a) a new open-pit mine of 1.0 million tpy ROM rock capa-city, to replace the existing mine; fb) a beneficiation plant to produce240,000 tpy of phosphate rock concentrate (332 P205); (c) an MAP plant of180,000 tpy capacity, together with a pyrites-based sulfuric acid plant of280,000 tpy capacity and a phosphoric acid plant of 93,000 tpy P205 capacity;and (d) rehabilitation of a small coal-based ABC plant at Dawu, about 15 kmfrom the project site, to produce 30,000 tpy of ammonia as feedstock for MAPproduction (see Annex 6.2 for details). After commissioning the new complex,HPCC's existing small SSP and NPK facilities will be phased out, and theexisting beneficiation plant will be operated to complement the new benefici-ation plant. Raw materials and products will be transported by truck betweenHuangmailing and a new railway siding to be built at Guangshui, about 40 kmfrom the Project site. The mine and the beneficiation plant were designed bythe China Chemical Mines Planning and Design Institute (CMPDI), the fertilizerplant by lWuhan Chemical Engineering Design Institute (WCEDI).
6.6 When the above two components are completed, the production of phos-phate fertilizer in Hubei Province will reach 450,000 tpy of P205, of which350,000 tpy, or about 782, are expected to be consumed within Hubei. Thebalance will be marketed in adjoining provinces, which are generally short ofphosphate fertilizers, particularly high-grade products.
D. Technical Assistance Component
6.7 The technical assistance component, to be carried out by MCI, has twocomponents: (a) the services of internationally experienced consultants forMCI's project coordination team to support project implementation, process and

- 25 -
technology selection, production start-up, and the maintenance of mine equip-ment; and (b) the services of internationally experienced consultants forlocal training in hazard and operability (HAZOP) analysis with respect tochemical plant design and operations.
6.8 Consultant Services for Project Implementation. The Project involvesrisks associated with the coordinated implementation and commissioning ofhigh-grade phosphate fertilizer plants and associated mines. As mentioned inparas. 5.8 and 5.12, JPCC's new Wangji mine and I)eneficiation plant remainedidle for one year after their physical completion, and HPCC's mines have beenunderutilized mai-:ly due to delays in the completion of downstream fertilizerplants.
6.9 To mitigate these technical risks, this technical assistance compo-nent will provide internationally experienced consultants for MCI's projectcoordination team, who will help the team and the project companies withs (a)selection and procurement of appropriate technologies and equipment; (b)timely identification and resolution of problems with project implementation;(c) training of project management team staff; (d) preparation of staffrecruitment and training programs; and (e) implementation of a preventive mineworkshop maintenance system. The scope of their work was discussed duringproject preparation, and the terms of reference (see Annex 6.3 for summary)will be finalized during loan negotiations.
6.10 Training in Hazard and OperabilitZ Analysis. To strengthen the capa-city of Chinese design institutes to identify and analyze potential safetyhazards in chemical plant design and operations and plant operability, MCIwill sponsor a workshop on modern methodologies for Hazard and Operability(HAZOP) analysis, with assistance from internationally experienced consultants(see Annex 6.4 for details).
VII. PROJECT MANAGEMENT AND ENVIRONMENTAL PROTECTION
A. Engineering Arrangements
7.1 Local design institutes will handle most of the basic and detailedengineering for the Project. The two local design institutes that preparedthe feasibility studies, CMRDI for Dayukou and CMPDI for Huangmailing, willcarry out the detailed engineering for the mines, beneficiation plants, andinfrastructure. These two design institutes have extensive experience in thedesign, engineeLing, construction and start-up of comparable mines and benefi-ciation plants. Overall responsibility for the basic and detailed engineeringfor the fertilizer plants also will lie with local design institutes--NCDI forthe TSP complex at Dayukou, and WCEDI for the MAP complex at Huangmailing.
7.2 However, these institutes will not handle any facilities for whichthey do not have sufficient experience and capability, namely, the sulfuricacid, phosphoric acid, and granulation plants. Internationally experiencedengineering firms will be invited to provide the design and know-how for thoseplants. Although NCDI has had considerable experience in designing of Sul-furic acid, phosphoric acid and DAP plants, including a DAP plant in Yunnan

- 26 -
supported under the ongoing Bank-financed Fertilizer Rationalization Project(Loan 2838-CRA, FY87), it has not been involved with plants of a size compar-able to the Dayukou project. The services to be obtained from the interna-tionally experienced engineering firms will include assistance in the procure-ment of critical equipment to ensure efficient selection and adequate qualitycontrol during manufacturing and prior to shipment. These firms will usetechnologies that are commercially proven and acceptable in terms of invest-ment, operating costs, efficiency, safety and environmental aspects, and willprovide process guarantees. They will involve local design institutes as muchas possible feasible for technology transfer.
7.3 Local input in the design of the fertilizer plant at Huangmailing isexpected to be larger than that for Dayukou, as the scope of the former iscompatible with locally available and commercially proven experience. Thelocal design institutes will conduct hazard and operability studies on allcritical processes, in collaboration with specialists. The respective localdesign institutes will also provide guarantees on processes designed locally.
B. Project Management
7.4 The arrangements for overall Project coordination are similar tothose under the three ongoing Bank-financed fertilizer projects, where theyhave proven satisfactory. MCI will have primary responsibility for supervis-ing implementation of all Project components and for coordinating the con-struction work with raw materials supply and downstream plants. The projectcoordination group set up within MCI (Annex 7.1) will regularly review prog-ress on project implementation and procurement and coordinate efforts toremove any constraints. The coordination group also will maintain liaisonwith the companies and the Bank, submitting to the latter quarterly financialand technical progress reports. During negotiations, an assurance wasobtained from the Government that the group would be maintained during projectimplementation.
7.5 Each of the two project companies has already set up its own projectmanagement team (Annex 7.2) charged with implementing its respective compo-nent. The key staff responsible for specific aspects of project implementa-tion have been appointed. JPCC, which has just completed the major Wangjimine and infrastructure project, is well prepared to carry out the Dayukoucomponent. Because HPCC has limited experience in managing projects of com-parable magnitude, its project management team will receive substantialsupport from CMRDI, which has experience in large mine and chemical projectsin China. Internationally experienced consultants to be hired by MCI underthe technical assistance component will also provide assistance (see para6.9). During negotiations, assurances were obtained from the companies thatthey would maintain their project management teams during project implementa-tion.
C. Implementation Schedule
7.6 Implementation of the Project is expected to take 54 months from thestart of the selection process, which is scheduled to take place in the fourthquarter of 1989. Construction under the two development components isexpected to be complete by March 1994. The mines and the beneficiation plants

- 27 -
will be finished before the fertilizer plants so that they can build up thenecessary intermediate stocks. The overall project is scheduled for comple-tion by September 30, 1994. The project implementation schedule, along withkey milestones for project implementation, is shown in Annex 7.3. In light ofexperience with previous Bank-financed fertilizer projects, the project sche-dule is reasonable.
D. Trainina
7.7 Substantial training is required for the companies to ensure success-ful project implementation. JPCC has some experience in implementing andrunning large mine operations, as noted. HPCC has experience with smallermines and fertilizer plants. However, their skills and experience still donot conform to what is required to ensure smooth start-up and operations.
7.8 MCI and the project companies are well aware of the need fortraining. Each company will prepare a comprehensive recruitment and trainingprogram, with assistance from internationally experienced consultants andlocal design institutes, and will implement it (paras. 5.10 and 5.14). Thetraining program will include early assignment of managers and key technicalstaff to their positions during project implementation but prior to start-upso that they can learn from the consultants, licensors and engineering firms.The program also allows for overseas training in new technologies for open-pitmining, beneficiation, medium/large capacity sulfuric acid production, andphosphoric acid/MAP/TSP manufacture. On-the-job training in the operation ofhigh-grade fertilizer plants will be provided at existing Chinese sulfuricacid plants and new phosphoric acid and DAP plants under construction. Overthe next two years, the design institutes will focus on training for key tech-nical staff and company trainers. MCI plans to make arrangements for inten-sive training of key managers of both companies at BICEM (see para. 5.6)before the production start-up.
E. Environmental Aspects
7.9 All the mines and chemical plants under the Project will be designedand constructed to meet locally and internationally acceptable environmentalstandards. The internationally experienced consultants involved in Projectpreparation have paid particular attention to appropriate emission levels atthe two phosphate fertilizer plants to ensure satisfactory process controls.The s4tes and configurations of the open-pit mines, beneficiation plants andfertilizer plants were selected to ensure the least environmental impact. Forexample, all mining operations are concentrated in one large open pit at eachProject site; beneficiation tailing ponds and phosphogypsum storage areas willbe designed to avoid any groundwater pollution; and water treatment plantswill be installed to process all liquid effluent from the beneficiation andfertilizer plants prior to discharge into public waters (the majority ofliquid effluents and process water from the processing units will be treatedand recirculated into the processes). Air pollution will be kept withininternational standards. The expected emission levels from each plant arecompared to local and international standards in Annex 7.4.
7.10 Assurances have been obtained from the two companies that they willbuild and operate the Project mines and plants with due regard to safety and

- 28 -
ecological and environmental factors and will comply with environmental stan-dards satisfactory to the Bank.
VIII. CAPITAL COSTS, FINANCING PLAN, PROCUREMENT AND DISBURSEMENT
A. Capital Cost Estimates
8.1 The total financing required for the Project, including interestduring construction (IDC) and incremental working capital, ic estimated atUS$510.6 million equivalent, of which US$162.3 million, or 31.8%, is inforeign exchange. The estimate includes all off-site facilities necessary forthe Project, such as water and power supply, facilities for transport, storageand handling of raw materials, intermediates and products, and social infra-structure. The capital cost estimates (detailed in Annex 8.1) are summarizedin Table 8.A.
Table 8.A: PROJECT CAPITAL COSTS
U ofLocal Foreign Total Local Foreign Total Total---- (Y mIllIons) ----- ----(US$ millions)---
Dayukou mine and ferti-lizer component 596.9 278.0 868.9 180.2 78.4 238.6 67.8
Huangmailing mine andfertilizer component 280.9 130.6 411.5 76.6 36.1 110.6 32.1
Technical assistance - 1.5 1.6 - 0.4 0.4 0.1
Base Cost is 876.8 406.1 1!281.9 236.7 108.9 344.6 100.0(January 1989 prices)
Physical contingencios 87.7 40.6 128.2 23.8 10.9 84.6 10.0Price contingencies 861.0 182.2 633.6 37.4 19.6 67.0 16.6
Installed cost 1.315.6 627.9 1,943.3 298.7 139.4 436.1
Incremental workingcapital 188.7 0.0 183.7 27.2 0.0 27.2
Interest duringconstruction lb 111.6 104.7 218.2 24.4 22.9 47.8
Total FinancinQRequired 1,660.7 732.6 2.293.8 348.8 162.8 610.6
La Local costs Include sales tax on locally purchased equipmont and matorials amounting to
USS8.0 milIIon.
Lb Based on an assumption of an onlonding rate oqual to 1065 of the Bank loan rate.
- 29 -
8.2 The base cost estimates, expressed in January 1989 prices, werederived from estimates prepared by the Project authorities and MCI in collab-oration with the domestic design institutes, after checking with internation-ally experienced engineering firms. Physical contingencies are calculated at1OZ of the base cost estimates. In calculating the base cost and physicalcontingencies, the prevailing exchange rate of Y 3.72 to US$1 was used. Theprice escalation for foreign costs was calculated on the basis of anticipatedannual international price movements of 5.32 for 1989-90 and 4.1 thereafter.Price escalation for costs expressed in local currency was calculated based onprojected annual local inflation rates of 15.OZ for 1989, 10.0% for 1990-91and 8.0% thereafter. Equipment and materials imported for the Project areexempt from import duties. The local companies will pay sales tax on locallyprocured equipment and materials.
B. Financing Plan
8.3 The proposed Bank loan of US$137.0 million will meet 84.5% of thetotal foreign exchange and 26.8% of the total financing required. The remain-ing financing will be met mainly by loans arranged by GOC (47.2%), loansarranged by the Hubei provincial -.overnment (HPG) (20.7Z), internal funds ofthe companies (3.7?), loans from the Industrial and Commercial Bank of China(ICBC) (1.6%), and bilateral aid (0.1%). The proposed financing plan for theProject is summarized in Table 8.B.

- 30 -
Table 8.B: FINANCING PLAN
Local Foreign Total Local Foreign Total Z(Y millions) - - ($ million) ----
A. Dayukou Mine and Fertilizer Component (JPCC)IBRD loan - 425.7 425.7 - 94.0 94.0 26.9GOC loans La 710.1 - 710.1 159.6 - 159.6 45.7HPG loans /a 260.3 69.1 329.4 58.6 15.4 74.0 21.2ICBC /b loans 28.7 - 28.7 5.8 - 5.8 1.7Internal funds 78.5 - 78.5 16.0 - 16.0 4.6
Subtotal 1,077.6 494.8 1,572.4 240.0 109.4 349.4 100.0
B. P.uangmailing Mine and Fertilizer Component (HPCC)IBRD loan - 200.9 200.9 - 42.7 42.7 26.6GOC loans /a 359.9 - 359.9 81.1 - 81.1 50.5HPG loans 96.7 35.4 132.1 21.8 9.8 31.6 19.5ICBC /b loans 12.5 - 12.5 2.5 - 2.5 1.6Internal funds 14.0 - 14.0 2.9 - 2.9 1.8
Subtotal 483.1 236.3 719.4 108.3 52.5 160.8 100.0
C. Technical AssistanceIBRD loan - 1.1 1.1 - 0.3 0.3 75.0Bilateral aid /b - 0.4 0.4 - 0.1 0.1 25.0
Subtotal - 1.5 1.5 - 0.4 0.4 100.0
D. Total ProjectIBRD loan - 627.1 627.1 - 137.0 137.0 26.9GOC loans /a 1,070.0 - 1,070.0 240.7 - 240.7 42.2HPG loans /a 357.0 105.1 462.1 80.4 25.2 105.6 20.7ICBC loans 41.2 - 41.2 8.3 - 8.3 1.6Internal funds 92.5 - 92.5 18.9 - 18.9 3.7Bilateral aid /b - 0.4 0.4 - 0.1 0.1 0.1
Total 1,560.7 732.6 2,292.6 348.3 162.3 510.6 100.0
/a GOC/HPG loans are channeled through the People's Construction Bank ofChina (PCBC) and its Hubei branch.
Lb During negotiations, an understanding was reached that GOC would cover theHAZOP workshop from its own funds if bilateral aid will not be availablein time.

- 31 -
8.4 IBRD Loan Financing. The proposed Bank loan will be made availableto GOC at the Bank's standard rate of interest for 20 years, including 5 yearsof grace, with a commitment charge of 0.75Z. The total amount of the loanwill be on-lent by GOC, through HPG, to the two companies at an on-lendingrate equal to 1052 of the Bank variable loan rate, with a commitment charge of0.752 and a repayment period of 20 years, including 5 years of grace asfollows: (a) JPCC, US$94.15 million; and (b) HPCC, US$42.85 million. Anamount of US$300,000 to cover consultant services for project implementationto be provided under the technical assistance component will be equally sharedby the two companies, and the loan amount for each company includes one halfof this amount. The foreign exchange risk will be passed on to the companies.During negotiations, assurances were obtained from the Government that subsi-diary loan agreements would be signed by GOC and HPG, and HPG and thecompanies on terms and conditions satisfactory to the Bank as a condition ofloan effectiveness. HPG will provide a foreign exchange denominated loan ofUS$2.3 million to cover some minor imported items, and the terms of the loanwill be the same as the on-lending terms of the Bank loan. An additionalforeign exchange requirement of US$22.9 million equivalent to cover interestduring construction (IDC) on the Bank loan will be covered by a local currencyloan to be arranged by HPG, and the required foreign exchange will be madeavailable from GOC's and HPG's own foreign exchange reserves.
8.5 Local Financing. GOC, through the People's Construction Bank ofChina (PCBC), will provide construction loans to cover 69Z of the localfinancing requirements for fixed assets at its prevailing rate for similarinvestments (currently 3.6Z p.a.), with a maturity of 15 years, including agrace period equal to the construction period as follows: (a) JPCC, Y 710.1million (US$159.6 million); and (b) HPCC, Y 359.9 million (US$81.1 million).HPG, through the provincial branch of PCBC, will provide the balance of thelocal financing requirements for fixed assets on the same terms; (a) JPCC,Y 322.2 million (US$72.7 million) and (b) HPCC, Y 128.1 million (US$30.6 mil-lion). Portions of the loans arranged by HPG will be used to cover IDC on theproposed Bank loan (para 8.4). Interest payments on these loans w'.ll bedeferred during the construction period and repaid in installments aftercompletion of the Project. The remaining local financing needs, includingincremental working capital, will be met either by internal funds or shortterm loans from local banks. Financial projections indicate that both projectcompanies will need short-term loans from local banks to cover a portion oftheir incremental working capital requirements. During negotiations, confir-mation was obtained from the Government on all necessary arrangements forproviding local funds to finance the local costs of the Project.
C. Procurement
8.6 The procurement arrangements are summarized in Table 8.C:

- 32 -
Table 8.C: PROCUREMENT ARRANGEMENTS /a(US$ million)
Procurement method TotalProject element ICB LIB Other cost
Equipment and materials 83.6 22.0 119.9 225.5(83.6) (22.0) (5.7) (111.3)
License, engineering and consultancyservices 30.4 30.4
(18.2) (18.2)Project management and commissioning 44.2 44.2
(5.7) (5.7)Land, civil works and construction 129.4 129.4
(0.0) (0.0)Training 3.0 3.0
(1.8) (1.8)Other La 78.1 78.1
(0.0) (0.0)
Total Financing 83.6 22.0 405.0 510.6(83.6) (22.0) (31.4) (137.0)
Ta Including incremental working capital and interest during construction.
Note: Figures in parentheses are the amounts to be financed by the Bank.
8.7 A major portion of the equipment and materials (752 of those financedby the Bank loan) will be procured through international competitive bidding(ICB) in accordance with Bank guidelines. Standard bidding documents to beapplied to all Chinese projects are currently being prepared to improve pro-curement efficiency in ICB. In ICB, domestic manufacturers will be given amargin of 152 or the prevailing customs duty, whichever is lower, for purposesof bid evaluation. International engineering and technical assistanceservices will be selected according to Bank guidelines for the use of consult-ants.
8.8 Specialized items with only a limited number of suppliers, such asagitators for the phosphoric acid reactor and gypsum filters, will be procuredthrough limited international bidding (LIB). Items for LIB are expected notto exceed US$22.0 million in aggregate. All qualified bidders would beinvited under LIB.
8.9 Orders for small or miscellaneous items with an estimated value of upto US$200,000 each will be procured through international shopping from atleast three qualified and eligible suppliers, up to an aggregate amount ofUS$5.7 million. No procurement through direct contracting is envisaged.
- 33 -
8.10 Packages with an estimated value of US$1.0 million or more, expectedto number about 20, would be subject to prior Bank review; packages belowUS$1.0 million each would be subject to post-review by the Bank. Contractswith consultants will be subject to Bank approval prior to signature. Inter-national procurement will be executed by the China National Chemical Con-struction Corporation (CNCCC),5/ in cooperation with MCI's Projectcoordination group. To avoid delays in Project execution, the Bank loan willretroactively finance up to US$2.0 million of eligible expenditures fordownpayments for engineering contracts and technical services andinternational travel, incurred between February 5, 1989 and the date of loansigning.
8.11 Procurewent Arrangements for Local Financing. Local procurement willbe carried out by the respective operating companies with assistance from thedesign institutes. Since SPC identifies the Project as a key nationalproject, the supply of major local construction materials, plant and equipment(about 90% of the total items required) is regulated by an allocation systemadministered by central and provincial government agencies. Applications forannual requirements have to be made in advance to SPC and the State MaterialsSupply Bureau. However, under recent provisions, buyers and suppliers ofequipment have seme scope for negotiation as to the type of equipment,delivery and price.
8.12 Most of the civil works, construction, a major part of theengineering work, and some equipment and materials will be procured locally.Contracts for civil works and ccnstruction will be awarded through assignmentto specialized construction bureaus or companies under negotiated contractsthat specify unit costs, terms of payment and incentives/penalties forearly/late completion or delivery. The capabilities of local contractorsproposed for the Project are satisfactory for timely and efficient executionof the proposed work.
D. Allocation and Disbursement of the Bank Loan
8.13 The proposed allocation of the Bank loan is summarized in Table 8.D.
5/ CNCCC is responsible for international procurement of the three on-going Bank-supported fertilizer projects.

- 34 -
Table 8.D: BANK LOAN ALLOCATION(US$ million equivalent)
JPCC HPCC MCI Total Bank loan financing
Equipment, materials 78.0 33.3 - 111.3 100X of foreign expendi-and spares tures, 100? of local
expenditures (ex-factory),and 75? of local expendi-tures for items procuredlocally.
Engineering, licenses 11.4 6.8 - 18.2 100? of expendituresand technical services
Training 1.1 0.7 - 1.8 100o
Project management 3.5 1.9 0.3/a 5.7 1002
Total 94.0 42.7 0.3 137.0
La Consultant fees for the technical assistance component will 1ie sharedequally by JPCC and HPCC.
The proposed Bank loan will cover: (a) 1002 of the foreign expenditures fordirectly imported goods, 100? of local expenditures (ex-factory) for domestic-ally manufactured goods, and 75? of local expenditures for items procuredlocally; (b) 100? of the expenditures for licenses, engineering and technicalservices for Project management; and (c) 100? of the cost for overseas travelb7 local staff for engineering, procurement and tzaining. To facilitate thedisbursement of funds, a special account will be established in US dollars ata commercial bank acceptable to the Bank, with an authorized allocation ofUS$10.0 million. Disbursement will be against full documentation except fortraining, overseas travel and contracts valued at less than US$200,000 equiva-lent each, which would be against statements of expenditure. Documentation ofstatements of expenditure will be maintained by MCI's project coordinationgroup, to be audited annually by independent auditors acceptable to the Bank,and to be made available for review by the Bank during Project supervision.
8.14 The Project completion date would be September 30, 1994; the closingdate is expected to be March 31, 1995. An estimated disbursement schedule forthe Project has been prepared based on Bank experience with previous com-parable projects in China; it is generally in line with the Bank's recommendedstandard disbursement profile for industrial projects in Asia Region. It isgiven in Annex 8.2.

- 35 -
IX. FINANCIAL ANALYSIS
A. Financial Management Practices in China
9.1 Financial Autonomy. In the past, the Government made all major fin-ancial decisions, including approval of new investments. Enterprises remittedalmost all internally generated funds to the Government, and funds for newinvestments were, in turn, provided as grants through budget allocations.Recent reforms have resulted in greater financial autonomy and accountabilityfor the managers of individual enterprises. Major changes include: (a)enterprises can retain 100Z of their depreciation allowances; (b) enterprisescan retain an increasing portion of their profits (this provision variesacross companies and provinces); (c) new funding requirements, including thosefor investments, are to be met out of a company's internally retained funds orinterest-bearing loans (long-term capital construction loans for fixed invest-ments and short-term borrowing for working capital); and (d) enterprises mayutilize an increasing portion of internally retained funds without prior gov-eranent approval. Given the increasing financial autonomy and accountabilityof companies, there is a growing need and opportunity for these enterprises toengage in longer term financial planning and to improve on the traditionalconcentration on one-year financial targets.
9.2 Financing of New Projects. The recent economic reforms have alsochanged dramatically the Government's policy on financing new investments. Inthe past, all new investments were, as noted, financed through budget alloca-tions in the form of grants. Recently, the Government introduced the conceptof interest-bearing loans as an incentive for industrial enterprises to econo-mize on the use of funds. While this was, in principle, a positive step, ithas been carried to the point that new government-financed investments forstate-owned enterprises must now be financed entirely through debt. As aresult, newly formed companies are entirely debt-based, a financial structurethat conflicts with the basic norm for prudent financial management andaccountability. In particular, many companies have been facing cash flowdifficulties during the initial years of operations because of their excessivedebt service burden, and they have had to enter into negotiations with respectto financing and bail-outs on a case-by-case basis. While the companies'existence has not been threatened because of the country's structure of stateownership, this situation undermines the autonomy of the enterprises and con-flicts with the basic thrust of China's economic reform, which is designed toplace greater responsibility on enterprise management.
9.3 The Government recognizes the need to allow for equity-type fundingand is currently moving toward the creation of instruments for such financing.However, it will take time for the new instruments of financing to developsufficiently to allow for large-scale equity financing, particularly in lightof the current ambiguities relating to enterprise ownership.
9.4 Financial Accounting and Audits. The Chinese accounting system isgoverned by several regulations issued by central and local governments.Special features of the system include: (a) maintenance of two separateaccounts--one for production operations, the other for construction projects--that are not consolidated; (b) the inclusion of interest charges in theproduction costs, so that operating income reflects the company's financial

- 36 -
structure; and (c) the matching of funding sources with specific types ofassets--fixed assets with fixed funds, current assets with current funds, andspecial assets with special funds.6/ The financial statements of Chineseenterpr'ses are subject to external audits by the State Audit Administration(SAM), which was established in 1983 to ensure efficient and prudent financialmanagement bv enterprises. The Bank has been supporting the Government'sefforts t3 improve its audit capability through training under a TechnicalCooperation Credit (Cr. 1412-CHA).
B. Financial Performance and Prolections
9.5 The financial projections for Project entities were carried out usingcurrent yuan. It was conservatively assumed (the key assumptions are detailedin Annex 9.1) that their output prices would be lower by 10-20Z than theirprojected CIF import prices. Their actual prices are expected to be deter-mined at levels close to import parity, since GOC would allow the entire out-put of the project companies to be sold at negotiated prices (para. 3.26); thecurrent ceiling for negotiated prices of high-grade phosphate fertilizers(DAP) is 98Z of its import parity price (para. 3.24). The real prices ofinputs and outputs (i.e., after allowing for inflation) were assumed to remainunchanged at their January 1988 levels over the life of the Project. Detailedhistorical and projected financial data, prepared in accordance with conven-tional accounting concepts adjusted for the Chinese accounting system, aregiven in Anrexes 9.2-9.3. The salient features of financial performan ' andthe projected future finances of the companies are shown in Table 9.A.
6/ Strict application of earmarking, or non-fungibility, is graduallybeing relaxed, as enterprises retain greater portions of theirinternally generated funds as special funds.
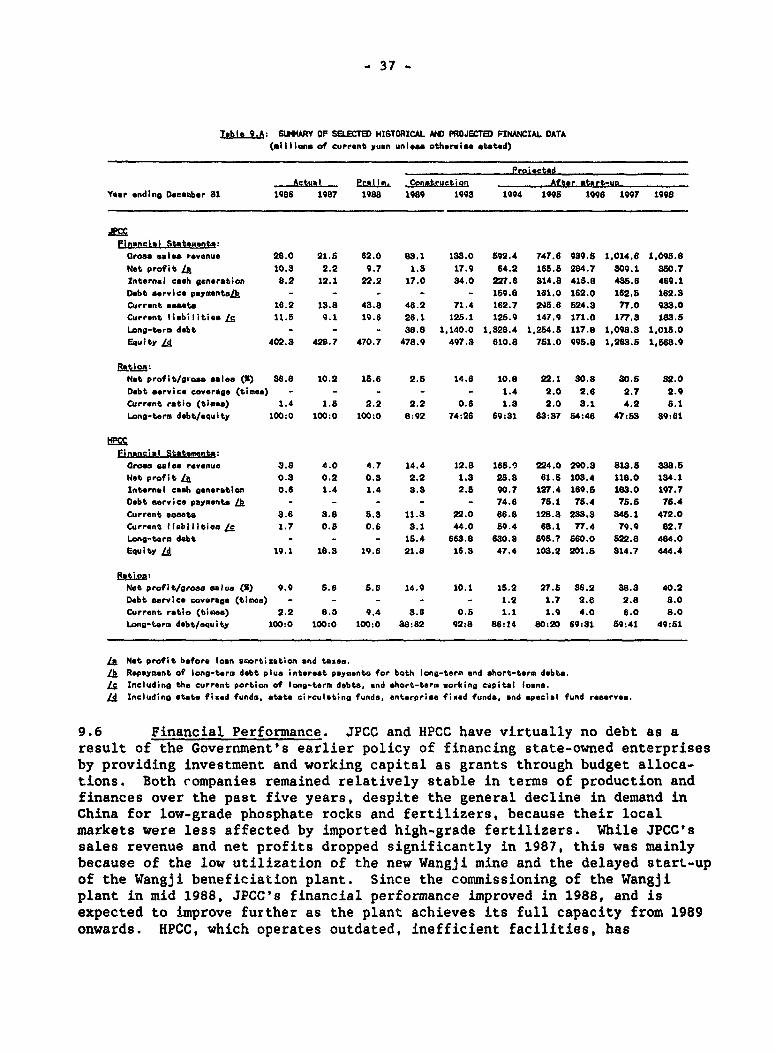
- 37 -
Tjble. .A: SIMMARY OF SiFELTED HISTORICAL AM PROJECTED FINANCIAL DATA(millions af current yuan unla" otherwise stated)
ProiactedAo.tul - PrElim. Construction After sjlrtuo
Year ending December 31 1Q88 1987 1Q88 1989 1993 1994 1996 1998 1997 1998
Financial StatementM:Gross sales revenue 28.0 21.S 62.0 83.1 133.0 S92.4 747.6 9O9.8 1,014.6 1,095.8Not profit /A 10.3 2.2 9.7 1.S 17.9 64.2 165.5 284.7 309.1 880.7Internal caeh generation 8.2 12.1 22.2 17.0 34.0 227.6 314.8 418.8 436.6 469.1Debt service payments14 - - - - - 189.8 181.0 162.0 162.5 162.3
Current as*ta 18.2 13.8 43.8 46.2 71.4 162.7 248.6 524.3 77.0 933.0Current liabilities1r 11.5 9.1 19.6 26.1 128.1 128.0 147.9 171.0 177.3 183.5Long-term debt - - - 88.8 1,140.0 1,828.4 1,284.8 117.8 1,098.8 1,018.0
Equity 1d 402.3 428.7 470.7 478.9 497.3 610.8 761.0 995.8 1,283.8 1,868.0
Not profit/groa &alee (S) 39.8 10.2 18.6 2.8 14.6 10.8 22.1 30.8 30.8 32.0Debt service coverage (times) - - - - - 1.4 2.0 2.6 2.7 2.9
Currant ratio (times) 1.4 1.8 2.2 2.2 0.6 1.3 2.0 3.1 4.2 6.1Long-term debt/equity 100:0 100:0 IOO:O 8:92 74:26 69:31 63:37 84:46 47:53 89:61
Financial Stttements:Oros" sales ravanuo 3.8 4.0 4.7 14.4 12.8 168.0 224.0 290.3 313.8 898.8Net profit & 0.3 0.2 0.3 2.2 1.3 28.8 61.S 103.4 118.0 134.1Internal cash generation 0.6 1.4 1.4 3.3 2.5 90.7 127.4 189.6 183.0 197.7
eobt service payments L - - - - - 74.6 78.1 78.4 78.6 75.4
Current eaosts 3.6 3.8 8.3 11.3 22.0 66.8 128.3 233.3 348.1 472.0Current (labiliti;e Lg 1.7 0.8 0.6 3.1 44.0 89.4 68.1 77.4 79.9 82.7Long-toerm debt - - - 16.4 663.8 630.3 S8S.7 860.0 622.8 484.0Equity L4 19.1 18.8 19.6 21.8 16.3 47.4 103.2 201.S 314.7 444.4
Net profit/gross ssl .e (3) 9.9 8.6 8.6 14.9 10.1 1.2 27.8 36.2 38.3 40.2Debt service coverage (times) - - - - - 1.2 1.7 2.6 2.8 3.0Current ratio (times) 2.2 8.0 0.4 3.6 0.5 1.1 1.9 4.0 6.0 8.0Long-term debt/equity 100:0 100:0 100:0 38:82 e2:8 86:24 80:20 69:31 69:41 49:61
LI Net profit before loan amortization end taxes.Lb Repayment of long-term debt plua interest paymento for both long-term end short-term debts.14 Including the current portion of long-term debto, and short-term working capital loane.L4 Including etate fixed funds, state circulating funds, enterprise fixed funds, and special fund reserves.
9.6 Financial Performance. JPCC and HPCC have virtually no debt as aresult of the Government's earlier policy of financing state-owned enterprisesby providing investment and working capital as grants through budget alloca-tions. Both companies remained relatively stable in terms of production andfinances over the past five years, despite the general decline in demand inChina for low-grade phosphate rocks and fertilizers, because their localmarkets were less affected by imported high-grade fertilizers. While JPCC'ssales revenue and net profits dropped significantly in 1987, this was mainlybecause of the low utilization of the new Wangji mine and the delayed start-upof the Wangji beneficiation plant. Since the commissioning of the Wangjiplant in mid 1988, JPCC's financial performance improved in 1988, and isexpected to improve further as the plant achieves its full capacity from 1989onwards. HPCC, which operates outdated, inefficient facilities, has

- 38 -
experienced low and declining profit margins, again mainly because of thedeclining demand and prices for low-grade fertilizer (paras. 5.8 and 5.12).
9.7 Financial Projections. Both companies are expected to achieve satis-factory profits, and their net profit margins on sales revenue will remainrelatively high at over 252--once their operations reach full capacity. In1994, the first year of operations, JPCC and HPCC are expected to achieve onlymarginal net profits because of low capacity utilization, a normal experiencefor new mines and fertilizer plants. With the build-up of capacity, thecombined net profits of the two companies are expected to increase from Y 89.5million in 1994, to Y 227.0 million in 1995, and Y 388.1 million in 1996.
9.8 The two companies nre not expected to have any serious cash flowdifficulties, and will generate sufficient cash internally to cover cashexpenditures. However, HPCC will not show a comfortable debt service ratio inits first year of operations. Because of the Government's current fundingpolicy (para. 9.2), HPCC, which does not have a significant capital base, willalso have high financial leverage until it accumulates retained earnings fromoperations. Given this background, the Government intends to take action toallow the companies to achieve sound financial positions rapidly in the eventthat it changes the funding policy, and a specific financial covenant has beendesigned to ensure that the companies will be able to cope with potentialcashflow difficulties during their start-up years (para. 9.10).
C. Financial Rate of Return and Sensitivity Analysis
9.9 The cost and revenue streams for the incremental financial rate ofreturn (FRR), expressed in January 1989 yuan, are presented in Annex 9.4. Theestimated base case FRRs (before taxes) for the companies are: 14.2Z for theDayukou component, and 13.1Z for the Huangmailing component. The FRRs for thecompanies are lower than their respective economic rates of return (ERRs),mainly because the assumed financial prices for fertilizers are below theireconomic value. The results of the sensitivity tests are shown in Table 9.B.
Table 9.B: SENSITIVITY TEST ON FINANCIAL RATES OF RETURN (BEFORE TAX)(in percentage)
Dayukou Huangmailing(JPCC) (HPCC)
Base case 14.2 13.1Capital cost up 202 12.0 10.8Capital cost down 20Z 17.2 15.0Sales revenue up 20Z 19.1 16.9Sales revenue down 20Z 8.2 8.8Variable cost up 202 12.7 11.9Variable cost down 20Z 15.8 14.32-year delay in completion 11.4 10.6

- 39 -
The FRRs for the Project are sensitive to changes in, in descending order,sales revenue, capital cost, and variable costs (input prices). Given thatadverse changes in the variables by a margin of 202 are not likely, satisfac-tory levels of FRR are likely to be realized.
D. Financial Covenants
9.10 During negotiations, agreement was reached that the companies would:(a) maintain a debt service coverage ratio of at least 1.2 and not incur anylong-term debt unless their projected internal cash retention for each fiscalyear during the term of the debt exceeds 1.2 times their projected debt ser-vice requirements in that year; (b) maintain a long-term debt/equity ratio of75:25 or better; and (c) maintain a current ratio of 1.2 or better, once suchcovenanted ratios are reached. Because of the current government financingpractice with respect to new investments (para. 9.2), HPCC will not be able toachieve these covenanted ratios in the initial years of operations, particu-larly the debt/equity ratio, until it builds up capacity utilization andretained earnings. The timeframe for achieving these ratios is as follows:debt service coverage ratio--1994 for JPCC and HPCC; long-term debt to equityratio--1994 for JPCC, and 1996 for HPCC; current ratio--1994 for JPCC, and1995 for HPCC. Therefore, an additional assurance has been obtained from theGovernment that it will cover any cash flow deficits, provided such deficitsare not the result of inefficient management and operation of the projectcompanies, during the initial three years of operations. Efficiency criteriawere agreed at negotiations. Moreover, if the Government adopts an alterna-tive funding policy to allow for equity-type funding (para. 9.3), it plans toallow the companies to convert a portion of local loans to the companies' ownfunds so that they can achieve a long-term debt/equxity ratio of 75:25 orbetter. An assurance has been obtained from the companies that they will pre-pare and furnish to the Bank for review. by October 31 of each year from 1990to 1998, their rolling five-year financial plans, including production, mar-keting and investment plans, in the form of projected financial statements.Such plans will be supported by: (a) a detailed analysis of production costtrends; (b) analysis of operational and financial budget variances for thecurrent fiscal year; and (c) financing arrangements for the investmentsproposed over the five-year period.
E. Auditing and Reporting Requirements
9.11 An assurance has been obtained that the companies will have theirannual financial statements and project accounts audited by independentauditors acceptable to the Bank. They will also submit the audit report forboth the production and capital construction accounts to the Bank within sixmonths after the close of each fiscal year. Based on project progress and thefinancial reports submitted by the project companies, MCI will provide theBank a quarterly summary of the project progress and procurement status, and asemi-annual summary of the companies' financial statements, within 45 daysafter the end of each period. An assurance was obtained that the Governmentwill have MCI's Project accounts for the technical assistance component, andthe accounts for the Special Account, audited by independent auditorsacceptable to the Bank. It will submit the audit report to the Bank withinsix months after the end of each fiscal year. Within six months after theclosing date for the project, the companies and MCI will prepare and provide

- 40 -
te the Bank a completion report for their respective components of theproject, to cover project implementation, initial operation, actual projectcosts and projected costs and benefits.
X. ECONOMIC ANALYSIS
10.1 Calculations of the economic rates of return (ERR) for the investmentcomponents were made on an incremental basis. The key assumptions in theeconomic analysis of the Project are detailed in Annex 10.1.
A. Economic Costs and Benefits
10.2 Economic Benefits. The quantifiable economic benefits of theProject, expressed in 1989 US dollars, come from two major sources: (a) phos-phate fertilizer (TSP and MAP) production utilizing phosphate rock from themines to be developed under the Project and other local raw materials such aspyrites, ammonia and high-quality rocks from Yunnan Province (Dayukou andHuangmailing); and (b) improved economic efficiency of production through therestructuring of existing inefficient operations, including the conversion ofproduction from low economic value fertilizers (ABC) into high economic valuefertilizers (MAP) (Huangmailing).
10.3 The economic prices of fertilizer products were derived from theirprojected international prices. The economic ex-factory prices of MAP and TSPwere derived from their CIF import prices by adding unloading, port handling,bagging and mixing charges, and inland freight from ports to the plant sites.
10.4 Economic Costs. The economic value of tradeable inputs was based ontheir estimated FOB export prices. The economic value of pyrites at eachplant was derived from their estimated long-term marginal production cost.Non-tradeable inputs were converted to their economic value by applying theirrespective specific conversion factors.
B. Economic Rate of Return and Sensitivity Analysis
10.5 The base-case ERRs in constant terms are 17.9% for the Dayukou com-ponent (JPCC) and 14.02 for the Huangmailing component (HPCC). The ERR forthe entire Project is 16.72. The streams of economic costs and benefits forthe ERR calculations are given in Annex 10.2.
10.6 The results of the sensitivity and switching-value analyses are sum-marized in Table 10.A.

- 41 -
Table 10.As SENSITIVITY ANALYSIS OF ERR(Z)
Dayukou Huangmailing Project as(JPCC) (HPCC) Whole
Cases
Base case 17.9 14.0 16.7Capital cost up 20% 15.5 11.8 14.4Capital cost down 202 21.2 17.0 19.8Sales benefits up 202 22.8 17.6 21.2Sales benefits down 202 12.1 9.7 11.5Variable cost up 202 16.5 12.9 15.4Variable cost down 202 19.3 15.1 19.02-year delay in completion 14.3 11.3 13.4
- Switching values of selected variables (Z) /a
Variables
Capital cost +99.5 +42.0Sales benefits -27.7 -18.8Variable cost +120.0 +68.0
/a A 102 discount rate is used.
The results of sensitivity tests indicate that the ERRs for the Project aresensitive to changes in, in descending order, sales benefits (which areclosely related to the international border prices of phosphate fertilizersand production volume), project capital costs, and variable costs. Evenassuming a 202 reduction in sales benefits, the Project would obtain a satis-factory ERR of 11.5Z. The switching-value analysis of the major variablesindicates that the Project would remain economically viable under variousconceivable adverse conditions, and confirms that the price of fertilizers isthe most critical variable determining the economic viability of the Project.
C. Other Benefits
10.7 Once full operating capacity is reached, the Project will lead to netimport substitution of high-grade phosphate fertilizers of 320,000 tpy of P205that will result in gross foreign exchange savings of about US$196 millionequivalent p.a. in 1989 prices. After netting out the annual service of theforeign debt (both principal repayment and interest payments), the net annualforeign exchange savings, as of 1996, are estimated at about US$180 millionequivalent (see Annex 10.3 for details).

- 42 -
D. Project Risks
10.8 No extraordinary commercial risks are foreseen, given the generalshortage of phosphate fertilizers, particularly high-grade products, and theapparently buoyant Chinese fertilizer market. The main technical risks lie incoordinating the implementation and commissioning of the high-grade fertilizerplants and associated mines. As observed in the cases of JPCC's new Wangjimine and HPCC's mines (paras. 5.8 and 5.12), poor coordination in implementingintegrated mine and fertilizer plant investments, executed by separateentities under separate budgets, has been a common cause of underutilizationof new mines in China, resulting in a significant loss of economic benefits.In order to reduce this risk, both mine development and fertilizer plant con-struction of the Dayukou and Huangmailing components will be implemented underthe same project management and budget. This risk will be further mitigatedby involving internationally experienced consultants in the technicalassistaace component. They will help MCI and the project companies withproject implementation and staff training.
AI. AGREEMENTS REACHED DURING LOAN NEGOTIATIONS AND RECOMMENDATION
11.1 During negotiations, confirmation was obtained from the Governmentthat:
(a) all necessary Arrangements for the provision of local funds will bemade to finance the local costs of the Project (para. 8.5); and
(b) if the Government adopts an alternative policy to allow for equity-type funding i'jr new investments of state-owned enterprises, it plansto allow the two project companies to convert a portion of localloans to the companies' own funds so that they can achieve a long-term debt/equity ratio of 75:25 or better (para. 9.10).
11.2 During negotiations, assurances were obtained that the Governmentwould:
(a) allow the project companies to market their entire output outside thestate allocation plan at negotiated prices (para. 3.26);
(b) maintain MCI's project coordination team during project implementa-tion (para. 7.4);
(c) on-lend the proceeds of the Bank loan to JPCC (US$94.15 million) andHPCC (US$42.85 million) under subsidiary loan agreements that willspecify terms and conditions acceptable to the Bank, including an on-lending rate equal to 105% of the Bank variable loan rate, with acommitment charge of 0.75Z p.a. and repayment over 20 years, includ-ing 5 years of grace (para. 8.4);

- 43 -
(d) cover any cash flow deficits of the project companies during theinitial three years of operations, provided such deficits are not theresult of inefficient management and operation of the companies(para. 9.10); and
(e) meet the auditing and reporting requirements (para. 9.11).
11.3 During negotiations, assurances were obtained from JPCC and HPCC thateach would:
(a) prepare and furnish to the Bank for comments by December 30, 1990, acomprehensive program to strengthen management, recruit qualifiedstaff and provide training, and thereafter carry out the agreed pro-gram (paras. 5.10 and 5.14);
(b) maintain their respective project management teams during pro4ectimplementation (para. 7.5);
(c) build and operate the project mines and plants with due regard tosafety, ecological and environmental factors and in accordance withenvironmental standards satisfactory to the Bank (para. 7.10);
(d) maintain a debt service coverage ratio of at least 1.2 once thatratio is reached, but no later than December 31, 1994. The companieswill not incur any long-term debt unless their projected internalcash retention for each fiscal year during the term of the debt to beincurred will exceed 1.2 times their pxojected debt service require-ments in that year (para. 9.10);
(e) maintain a long-term debt to equity ratio of 75:25 or better oncethat ratio is achieved, but no later than December 31, 1994 for JPCC,and December 31, 1996 for HPCC (para. 9.10);
(f) maintain a current ratio of at least 1.2 once such a ratio isachieved, but no later than December 31, 1994 for JPCC, and December31, 1995 for HPCC (para. 9.30);
(g) prepare and furnish to the Bank for review, by October 31 of eachyear from 1990 to 1998, their rolling five-year financial plans, tocover production, marketing and investment plans, to be presented inthe form of projected financial statements (para. 9.10); and
(h) comply with the auditing and reporting requirements (para. 9.11).
11.4 During negotiations, an assurance was obtained from JPCC that itwould prepare supply and transport arrangements satisfactory to the Bank forthe required quantity of Yunnan phosphate concentrate adequate for TSP produc-tion by December 31, 1991 (para. 6.4).
11.5 Conditions for loan effectiveness are:

- 44 -
(a) signing of subsidiary loan agreements between the Government and HPG,and HPG and JPCC and HPCC under terms and conditions satisfactory tothe Bank (para. 8.4); and
(b) approval of the loan agreement by China's State Council.
11.6 With the above assurances and arrangements, the Project is suitablefor a Bank loan of US$137.0 million equivalent to the People's Republic ofChina at the Bank's standard variable rate for 20 years, including 5 years ofgrace.

ANNEX 3.1
- 45 -
CHINA
HUBEI PHOSPHATE PROJECT
Fertilizer Application Rates for Various Countries, 1985 /a(kg per hectare of arable land)
Country Nitrogen Phosphate Potash Total Ratio
Japan 145.9 155.7 128.8 430.4 100:107:81
Korea 198.7 91.9 101.7 392.4 100:46:5l
France 127.2 77.5 95.2 300.9 100:61:76
China /b 135.6 27.4 4.4 167.4 100 20:9
USSR 47.2 32.8 29.4 109.4 100:69:6Z
Indonesia 62.2 23.9 8.5 94.6 100:37s13
US 49.9 19.9 24.0 93.3 100:40s48
India 33.7 11.5 5.1 50.3 100:35:15
Morocco 16.2 13.1 6.3 35.6 100:81:39
Brazil 11.2 17.3 14.0 42.5 100:154:125
/a Rates are based on apparent consumption figures obtained by adding netimports of fertilizers to domestic consumption.
Lb FAO'S apparent consumption figures are not consistent with the acutal con-sumption statistics published by MAAF text (Table 3.A) due to a differencein statisitical methods and bases.
Source: FAO Fertilizer Yearbook, 1986, Vol. 36.
China DepartmentMarch 1989

CHINA
HUBEI PHOSPHATE PROJECT
Consumption, Production and Imports of Chemical Fortilizers. 1972-86 /a('000 tons of nutrient)
Nitro gn Phosphate Potash All nutrientsYear Consumption Production Imports Consumption Produection Import. Consumption Production I1port. Consumption Production Imports
1972 3,108 2,444 1,842 1,038 1,249 11 12 8 2 4,219 3,701 1,3561978 8,048 2,996 1,230 4,468 1,689 72 1S 7 1S 6,864 4,692 1,3171974 3,490 2,827 928 1,890 1,390 82 57 6 57 4,916 4,222 1,0671975 4,020 3,709 964 1,531 1,531 34 40 7 39 5,407 5,247 1,0371976 4,468 3,816 928 1,360 1,418 20 18 11 6 5,844 6,244 9541977 6,065 6,609 1,147 1,416 1,708 161 a3 21 23 8,513 7,238 1,3211978 7,728 7,639 1,227 1,114 1,033 248 46 21 31 8,885 8,693 1,.041979 8,997 8,820 1,461 1,768 1,817 190 108 1S 108 10,8683 10,653 1,7491980 10,180 9,993 1,637 2,368 2,307 395 128 20 126 12,670 12,320 2,0581981 10,363 9,858 1,541 2,736 2,508 499 251 24 250 13,349 12,390 2,2901982 10,433 10,219 1,808 8,448 2,637 631 s58 25 489 14,449 12,781 2,9281983 11,923 11,094 2,365 3,945 2,666 1,028 728 29 684 16,696 13,789 4,0271984 18,378 12,211 2,828 3,S66 2,359 1,342 804 31 765 17,868 14,601 4,9251s8s 18,477 11,438 2,052 3,631 1,760 950 920 24 364 17,898 13,222 3,361986 18,728 11,592 1,700 4,602 2,340 645 1,075 26 600 19,305 13,957 2,946
is Nutrient composition of compound fertiliz r Is assumd to be 2:3:1 (nitrogWn, phosphate and potash).
Sources: Ministry of Chemical Industry; Ministry of Agriculturo, Animl Husbandry and Fishery; General Administration of Customs; and StateStatistical Bureau.
China DepartmsntMarch 1989
Ia

ANNEX 3.3
- 47 -
CHINA
HUBEI PHOSPHATE PROJECT
Comparison of Domestic and International Prices of Fertilizers,Main Energy Inputs, and Main Agricultural Products, December 1988
(US$/ton /a unless otherwise stated)
Domesticex-factory prices FOB inter-
Ceiling for national Economic Domestic price asControlled Negotiated price lb price /c Z of economic price
(A) (B) (C) (D) A/D B/D
ProductsUrea Ld 115 175-188 155 185 62.2 94.6-101.6DAP 153 188-231 196 229 66.8 82.1-100.9
InputsCoal Le 22 25 38 30 73.3 83.3Natural gas
(per mln Btu) 1.7-2.OjL 1.9-4.1/f -3.11& 54.8-64.5 61.3-132.3
Phosphate rock 25/h n.a. 36 56 44.6 n.a.
AgriculturalProductsRice 167 226 258 258 64.7 87.6Wheat 119 161 141 175 68.0 92.0
/a US$1 = Y 3.72./b Annual averages of January-December 1988./c For imported products, CIF China prices, and for exportable inputs, netback value from
exports./d Ba&ged urea./e Based on average anthracite price for medium-size fertilizer plants./f Average natural gas price for large-size urea plants under MCI./& Fuel oil equivalent economic value (netback from exports) in calorific terms./h Based on the low-quality rock after adjustments only in term3 of nutrients.
China DepartmentMarch 1989
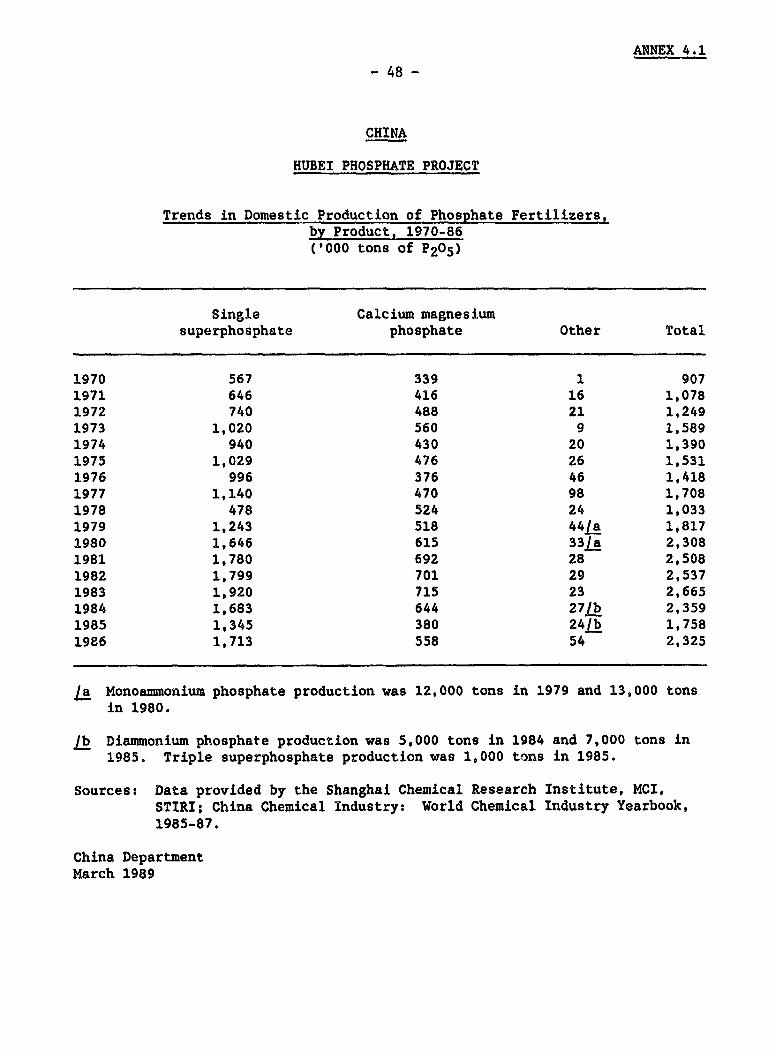
ANNEX 4.1
- 48 -
CHINA
HUBEI PHOSPHATE PROJECT
Trends in Domestic Production of Phosphate Fertilizers,by Product, 1970-86('000 tons of P205)
Single Calcium magnesiumsuperphosphate phosphate Other Total
1970 567 339 1 9071971 646 416 16 1,0781972 740 488 21 1,2491973 1,020 560 9 1,5891974 940 430 20 1,3901975 1,029 476 26 1,5311976 996 376 46 1,4181977 1,140 470 98 1,7081978 478 524 24 1,0331979 1,243 518 44/a 1,8171980 1,646 615 33/a 2,3081981 1,780 692 28 2,5081982 1,799 701 29 2,5371983 1,920 715 23 2,6651984 1,683 644 27lb 2,3591985 1,345 380 24/ 1,7581986 1,713 558 54 2,325
La Monoammonium phosphate production was 12,000 tons in 1979 and 13,000 tonsin 1980.
lb Diammonium phosphate production was 5,000 tons in 1984 and 7,000 tons in1985. Triple superphosphate production was 1,000 tons in 1985.
Sources: Data provided by the Shanghai Chemical Research Institute, MCI,STIRI; China Chemical Industry: World Chemical Industry Yearbook,1985-87.
China DepartmentMarch 1989

ANNEX 4.2- 49 -
CHINA
HUBEI PHOSPHATE PROJECT
Domestic Production of Phosphate Fertilizers,by Product and Province, 1985
('000 tons P205)
Single Calcium magnesiumProvince superphosphate phosphates Other Subtotal
NorthBeljing 1.1 - - 1.1Tianjin 3.6 - - 3.6Hebel 29.7 - - 29.7Shanxi 18.9 - - 18.9Neimonggol 1.1 - - 1.1
NortheastTa-tonIn9 m g14.0 - - 14.0Jilin 4.6 - - 4.6Heilong iang 7.2 - - 7.2Shanghai 24.3 - - 24.3Jiangsu 190.6 12.5 4.5 207.6Zhejiang 47.1 20.4 0.2 67.7Anhui 119.1 - 7.7 126.8Fujian 36.8 2.0 0.3 39.1
EastJ'angxi 13.7 40.4 - 54.1Shandong 35.6 7.8 0.1 43.5Henan 26.7 45.9 - 72.6Hubei 161.4 13.8 - 175.2
South Centralnunan 117.0 51.9 - 168.9Guangdong 143.2 - - 143.2Guangxi 55.8 26.3 0.1 82.2
Southwestbicnuan 150.1 32.7 4.3 187.1Guizhou 19.1 24.5 - 43.6Yunnan 61.0 102.0 15.6 178.6Tibet - - - -
NorthwestSnaanxV. 26.8 - 0.1 26.9Gansu 28.4 - - 28.4Qinghai 2.9 - - 2.9
5in$xia 5.0 -- 5.0Xinjiang 1.3 - - 1.3
Total 1,346.1 380.2 32.9 1,759.2
Source: MCI.
China DepartmentMarch 1989

ANNEX 4.3
- 50 -
CHINA
HUBEI PHOSPHATE PROJECT
Consumption of Chemical Fertilizers by Province, 1985('000 tons nutrient)
Nitrogen Phosphate Potash Total(N) (P205) (K20) nutrients
Northze Ting 67 15 0 82Tian;in 37 5 1 43Hebei 838 236 30 1,104Shanxi 302 81 15 398Neimonggol 143 31 6 199
NortheastiLaon-ng 551 144 14 709Jilin 425 77 19 521Heilongjiang 293 106 22 421Shanghai 107 18 1 126Jian su 1,214 326 40 1,579Zhejtang 586 103 22 711Anhui 810 289 37 1,136Fujian 323 93 75 491
EastJIanaxi 326 124 90 539Shandong 1,484 319 54 1,857Henan 1,044 351 42 1,436Hubei 672 194 51 917
South Centraliuunan 618 167 112 897Guangdong 783 174 147 1,104Guangxi 339 114 68 521
Southweststchuar. 1,115 211 21 1,347Guizhou 208 61 11 280Yunnan 277 112 15 404Tibet 6 2 0 8
NorthwestSfaanHxl 369 50 10 429Gansu 165 40 6 210Qinghai 156 9 4 168Ningxia 46 8 0 55Xingjiang 143 51 9 203
Total 13,447 3,531 920 17,898
Source: Agricultural Yearbook of China, 1985.
China DepartmentMarch 1989

- 51 - ANNEX 4.4
CHINA
HUBEI PHOSPHATE PROJECT
Major Phosphate Deposits in China
Resirves ore Ratio (orelProvince Deposit (million tons) concentrate)
Hubei Dayukou 162 2.14Wangji 90 2.14Fanmasheng n.a. n.a.Lungwaisheng n.a. n.a.Yichang 1,068 3.33Huangmailing 110 3.33
Guizhou Kaiyang 320 n.a.Wangjayuan 50 n.a.Chuanyondong 280 n.a.Datang 160 n.a.Yuhua n.a. n.a.Xingiao n.a. n.a.Xiaoba 104 n.a.Yingping 110 1.50Wofang 70 1.57Dazhai n.a. n.a.
Jiangsu Jingping 29 4.00
Sichuan Jinhe n.a. n.a.
Shaanxi Han Zhong n.a. n.a.
Jiangxi Cao Yang n.a. n.a.
Yunnan Haikou 152 n.a.Kunyang 105 n.a.Jinning 281 n.a.Anning n.a. n.a.Chengjaing n.a. n.a.Longshan n.a. n.a.
Hebei Fanshan 91 n.a.
Hunan Liyaing n.a. n.a.
Sources Various international handbooks.
China DepartmentMarch 1989

ANNEX 4.5
- 52 -
CHINA
HUBEI PHOSPHATE PROJECT
Major Pyrite Deposits and Mines in China /a(million tons)
SulfurProvince Mine name Reserves content (Z)
Guangdong Yunfu 206 32.1Yingde 37 23.2
Neimonggol Tanyaokou 72 23.3
Jiangsu Yuntaishan 9 22.8
Hunan Qibaoshan 6 39.6
Liaoning Zhangjiagon 5 22.2
Anhui Xingjiao 36 29.3Xiangsham 129 14.8
Sichuan Chuan Nan n.a. n.a.
Zhejiang Langyou 5 24.0
Shaanxi Yangguan 71 19.0-24.0
Other provinces /a n.a. n.a. n.a.
/a There are additional small pyrite mines in several provinces, usuallyassociated with coal mining.
Source: Various international handbooks.
China DepartmentMarch 1989

ANNEX 4.6Page 1 of 2
- 53 -
CHINA
HUBEI PHOSPHATE PROJECT
An Outline of the Phosphate SubsectorInvestment Optimization Model
A. The Transport Model
1. Objective. The objective is to optimize the transport of raw materi-als, intermediates and final products in meeting the demand for phosphatefertilizers.
2. A Mathematical Programming Formulation. To find the "cheapest" routebetween sets of origins and sets of destinations, a linear-programming modelwas developed, with four major networks--rail, river, ocean and road--repre-senting the transport system.
3. Results. The cheapest mode of transportation is derived from simul-taneous determination of the location size, timing and process of future fer-tilizer plants and importing ports, and distribution patterns.
B. The Industry Model
4. Objective. The objective is to assess alternative locations, sizes,products and distribution patterns associated with investment projects in thest.bsector.
5. A Mathematical Programming Model Formulation. A mixed-integer pro-gramminig model was designed to minimize the total costs of investments, pro-duction, transportation, and imports such that:
(a) demand for P205 is satisfied in each province through small-scaleproduction (for SSP, DAP and CMP), production in the modern sector orimports;
(b) mine and plant production at each location is limited by existingcapacity but can be expanded by new investments;
(c) phosphate rock and pyrites production in each region is limited byavailable domestic reserves;
(d) policies limit the percentage of P205 demand in each province thatcan be satisfied by certain products; and
(e) transport out of certain regions is severely constrained.
6. Results. The desired result is a national optimization giving ateach location:

ANNEX 4.6Page 2 of 2
- 54 -
(a) the production levels of raw materials, intermediates and final fer-tilizer products and the processes employed;
(b) the scale of the mines and production plants;
(c) the investments in the sector under economies of scale;
(d) the shipment patterns of raw materials to plants, of intermediatematerials between plants, and of final products to markets;
(e) the domestic purchase of raw materials, intermediates, labor andmiscellaneous inputs;
(f) the export of products to export regions; and
(g) the import of intermediates to plants and final products to markets.
China DepartmentMarch 1989

ANNEX 4.7-55 - Page 1 of 3
CHINA
HUBEI PHOSPHATE PROJECT
Planned Phosphate Investment Projects to the Year 2000
I. During the Seventh Five-Year Plan (1986-90)
A. Fertilizer Plants
Planned'000 tpy of year of
Project Province Product product (QO5 L completion
Jinchan Gansu SSP 400 (60) Completed
Lucheng Sharni NP 900 (120) Completed(26:13:0)
Kaifeng Henan NP 150 (20) Completed(26:13:0)
Jinan Shandong NP 150 (20) 1988(26:13:0)
Yicheng Hubei NPK 160 (30) 1992(15:20:15)
Guixi Jiangxi DAP 240 (110) 1990
Tonglin Anhui DAP 120 (55) Completed
Qin.huangdao Hebei NPK 600 (110)/a 1991(15:20:15)
Dalian Liaoning DAP 240 (110)/a 1989
Nanjing Jiangsu DAP 240 (110)/a 1989
Xuanwel Yunnan DAP 120 (55) 1992
Huangmalling Hubei MAP 180 (93) 1993
Hanghezhou Yunnan DAP 120 (55) -
Zhanjiang Guangdong DAP 60 (28) 1991
Huaxian Shaanxi DAP 60 (28) -
Small-sized MAP/ Various MAP/DAP 1,500 (650) -DAP plants (50) provinces
Dayukou Hubei TSP 560 (300) 1993
Wengfu Hubei TSP 800 (368) 1994
Total (2,322)/b
/a Based on imported phosphoric acid.Tb Exclusive of imported phosphoric acid.

ANNEX 4.7Page 2 of 3
- 56 -
B. Phosphate Mines
Estimated Planned Productionreserves Mining Rock quality year of ('000 tons/year)
Province Name of mine (mln tons) method P!OS Mg2 R203 completion ROM Concentrate
Yunnan Jining 110 Open 32 0.4 5.6 n.a. 700 700pit
Guizhou Wengfu 110 Open 29 3.7 1.13 1993 2.500 1,850pit
Hubei Yichang 1,060 Under- 21 2.6 3.6 n.a. 3,000 1,500ground
Dayukou 90 Open 19 3.9 2.6 1993 1,500 650pit
Huangmailing 110 Open 11 2.3 4.9 1993 1,000 300pit
C. Pyrite Mines
Proposedproduction ('000 tons)
Province Mine name Mining method ROM Concentrate
Guangdong Yunfu Open pit 3,000 2,400
Neimonggol /a Tanyaokou Underground 450 190
Hunnan Qibaoshan Underground 250 200
Neimonggol Lb Tanyaokou Underground 1,050 410
/a Expansion.lb New mine.

ANNEX 4.7Page 3 of 3
- 57 -
II. Durin. the Eighth and Ninth Five-Year Plans (1991-2000)
A. Fertilizer Plants
Phosphate fertilizerproduction
Type of fertilizer product (million tpy of P205)
Nitrophosphate (NP) 0.5Triple superphosphate (TSP) 2.8Ammonium phosphate (DAP/MAP) 1.7
Total 4.5
B. Phosphate Mines
New capacity Total output la(million tpy) (million tpy)
Province ROH ore/Product ROM ore/product
Yunnan 8.1/6.9 12.4110.8Guizhou 11.3/9.5 10.8/9.4Hubei 13.9/8.8 15.6/9.6Hunan 0.5/0.3 13./0.8Sichuan 1.5/1.3 3.4/2.9Jiangsu 0.21/0.1 1.0/0.3Hebei 0.41/0.1 1.6/0.5Other provinces -I- 1.5/0.4
Total 35.8/29.0 47.4/34.5
C. Pyrite Mines
New capacity(million tpy) Estimated production
Province crude ore/352 sulfur (million tpy)
Hebei 0.710.3 0.42Shanxi 2.0/1.0 2.07Neimonggol 4.8/2.1 2.45Anhui 4.4/2.0 3.12Guangdong 2.0/1.7 4.54Sichuan 5.0/1.8 2.38Other provinces 2.0/1.0 6.62
Total 20.9/9.9 21.60
/a Including output from existing mines after taking into account depletedmines.
China DepartmentMarch 1989

ANNEX 5.1
- 58 -
CHINA
HUBEI PHOSPHATE PROJECT
Production Performance of JPCC and HPCC
A. Design Capacity and Production('000 tpy)
DesignCompany and product capacity 1983 1984 1985 1986 1987 1988/a
JPCCLiuchong 600 420 500 550 570 484 490Dayukou 400 280 340 370 380 331 394Wangji 1,000 - - - - - 500
Total 2,000 700 840 920 950 815 1,384
HPCCConcentrate 100 44 64 - 20 51 60SSP 40 32 25 6 19 40 50NPK 10 - - 1 2 6 10Ammonia (Dawn) 15 14 16 14 12 14 15ABC (Dawn) 60 55 63 54 48 58 55
B. Capacity Utilization(Z of design capacity)
Company and product 1983 1984 1985 1986 1987 1988/a
JPCCLiuchong 70 83 92 95 81 82Dayukou 70 85 93 95 83 99Wangji - - - - - 50
HPCCConcentrate 44 64 0 20 51 60SSP 80 63 15 48 100 125NPK - - 13 15 60 100Ammonia 93 107 93 80 93 100ABC 92 105 90 80 97 100
/a Extrapolated based on actual production from January to September 1988.
China DepartmentMarch 1989

59 ANNEX 5.2
CHINA - HUBEI PHOSPHATE PROJECTOrganization Chart of JPCC
A. Existing
LiuchoPgdaucton Adngli &rItnnon
UUC Dayukou wangB & Statistics ae| Production i "~~Proucton
mine Mw|e Mae | Control Finc
Maintenance Maintenance oflto uc" Por8orWnBIPlant I I
GenwW Genera atnrce&Srieservices Services
Services
B. After Project Completion|Cliat Econonst|General Manager r t
ClUt EgMee r Corporatlor Offlc s hAdiior
Productlon |Administration
Fortzer Conix WanaP M <
C cAd lnt MaFtenWnee
. w I~~~~~~~~~~e413o
_ cdPantfi5Wbe .

- 60 - MNEX 5.3
CHINA - HUBEI PHOSPHATE PROJECTOrganization Chart of HPCC
A. Existing
Deneral Manager
ChEof Enginoer -.-
put eraaung enecatlon Planning & Flnarce Union RGlatlona
Operatin ProAfterPo jetCmnto
_ Planning _ Mlno | l Education
X Purchasing BenefilGateon enerallMnaer
I Chif EninSP & NPK rEIfZ]
4 Plant l H WLlta
. Mainteanance
.ti PrtonPrel
B. After Prolect Completion
MAP Plant~00f ccmtn
-E _ewncpt WSorag
Mai nutw nac Cld Peot
i C-MAoPer Supp
|~~ ~~~~~~~~~~~~~~~~~~~~e~ 1 2c|

ANNEX 6.1
- 61 - Page 1 of 3
CHINA
HUBEI PHOSPHATE PROJECT
Summary of the Dayukou Mine and Fertilizer Development Component
A. Geology
Rock reserves: 90 Mt at Dayukou, of which 28 Mt recoverable by openpit, 4.5 t/t average ratio overburden/rock; JPCCholds additional underground reserves at Liuchong andWangji
Rock quality: 19.0? P205, 3.9Z MgO average analysis of primary rock
B. Mining
Capacity: 1.5 Mtpy of ore and 6.8 Mtpy of overburden in 3shifts/day, 6 days/week operation
Mine layout: One single open pit, equipped with rotary drills,hydraulic excavators and trucks, primary crushing atmine site
C. Beneficiation
Capacity: 1.5 Mtpy ore feed, 0.65 Mtpy concentrate output
Product specificationd: Concentrate, 332 P2C5, 1.8? MgO
Process: Flotation, with heated pulp
D. Sulfuric Acid Plant
Capacity: 540,000 tpy (approximately 1,600 tpd), probably in 2parallel trainsStorage capacity for pyrites: 42,000 t (30 days)Storage capacity for product acid: 10,000 t (6 days)
Product specification: 932/982 H2 S04
Process: Pyrites drying; fluidized bed pyrites roasting;double contact/double absorption acid production withcogeneration of electricity; scrubbing of off-gasesto achieve SO2 emission levels below 450 ppm, typi-cally 300-350 ppm; plant design will be based onforeign technology

ANNEX 6.1Page 2 of 3
- 62 -
Pyrites supply: 535,000 tpy (38X S on dry basis) from Yunfu mine,Guangdong Province; supply and transportationconfirmed
Cinder disposal: By conveyor, total storage capacity 3 years, can beexpanded if cinder cannot be processed elsewhere
E. Phosphoric Acid Plant
Capacity: 200,000 tpy P205 (approximately 650 tpd)Storage capacity for product acid: 4,500 t (7 days)
Product specificationt 502 or lower P205 H3P04; the concentration andcomposition must be suitable for manufacturing TSPfrom Yunnan secondary phosphate rock
Process: Single-stage, dihydrate process with wet scrubbingand concentration of dilute acid; process will bereliable and flexible and allow possible future adap-tation for recycling of sulfur from phosphogypsum
Gypsum disposal: Slurry pipeline or conveyor (2.5 km) to disposalarea, whichever more feasible; total storage capacity12.9 million t (18-20 years); capacities and tech-niques for gypsum dumping cleared by environmentalpollution control authorities
F. Aluminum Fluoride Plant
Capacity: 12,000 tpy of AlF3 (dry basis)
Product specification: Minimum 96% AlF3; product must be suitable as make-upfor aluminum smelters
Process: Foreign technology proven for same application; con-version of Al(OH)3 with fluosilicic acid, H2SiF6,purification, drying and bagging
Supply of Al(OH3): 13,000 tpy of aluminum hydroxide from Zheng-Zhou,Henan .ovince
G. Triple Superphosphate Plant
Capacity: 560,000 tpy (approximately 1,900 tpd) of bagged curedgranular productStorage capacity for fulls curing--minimum 4 weeks(53,000 t)Storage capacity for secondary rock--minimum 14,000 t(20 days)Storage capacity for final product--minimum 57,000 t(30 days' production)

ANNEX 6.1Page 3 of 3
- 63 -
Product specification: Bagged granular TSP, 462 available P205, free H3PO4maximum 42 expressed as P205, H20 below 32, minimum95? within 1-4 mm
Process: Probably den-process with 3-4 weeks' curing, followedby drum granulation, intermediate final product stor-age (1-2 days) and bagging; technology still to beverified by pilot-scale tests; design will be carriedout in cooperation with f"reign consultant
Supply of secondaryrocks Jining mine, Yunnan Province, 34.1? P205, 222,000
tpy, supply and transportation have been confirmed
H. Infrastructure
Mine site: Workshop, store, equipment service facilities, office
Plant site: Workshops, stores, effluent treatment plant, labora-tories, offices
Power supply: 110 kV transmission line connecting with existingsubstation
Social infrastructure: Expansion of existing housing, dormitories and wel-fare facilities.
China DepartmentMarch 1989

ANNEX 6.2Page 1 of 3
- 64 -
CHINA
HUBEI PHOSPHATE PROJECT
Summary of the Huangmailing Mine and Fertilizer Development Component
A. Geology
Rock reserves: 110 Mt, of which 26 Mt recoverable by open pit,2.9 t/t average ratio overburden/ore
Rock quality: 11.6Z P205, 2.32 MgO and 2.9% S (recoverable) averageanalysis of primary ore
B. Mining
Capacity: 1.0 Mtpy of ore and 3.0 Mtpy of overburden in 3shifts/day, 6 days/week operation
Mine layout: One single open pit equipped with rotary drills,hydraulic excavators and trucks; primary crushing atmine site
C. Beneficiation
Capacity: 0.8 Mtpy ore feed for new plant and 0.2 Mtpy forexisting plant; 240,000 tpy concentrate output fromnew plant and 60,000 tpy from existing plant
Product specifications: Concentrate, 332 P205, 1.3? MgO
Process: Flotation, with heated pulp
D. Sulfuric Acid Plant
Capacity: 280,000 tpy (approximately 820 tpd)Storage capacity for pyrites--20,000 t (1.7 months)Storage capacity for product acid--4,900 t (6 days)
Product specification: 93Z/98Z H2SO4
Process: Pyrites drying; fluidized bed pyrites roasting;double contact/double absorption acid production withcogeneration of electricity; scrubbing of off-gasesto achieve SO2 emission levels below 450 ppm, typi-cally 300-350 ppm; plant wil'l be designed with assis-tance of foreign engineering firm

ANNEX 6.2Page 2 of 3
- 65 -
Pyrites supply: 145,000 tpy (38Z dry basis) from Yunfu mine,Guangdong Province; supply and transportationconfirmed
Cinder disposal: By conveyor, storage Capacity 1 Mt (10 years)
E. Phosph3ric Acid Plant
Capacityt 93,000 tpy P205 (approximately 300 tpd)Storage capacity for product acid--2,100 t (7 days)
Product specification: Approximately 50X P205 H3P04; the composition andconcentration must be suitable for the manufacture ofMAP/DAP
Process: Single-stage dihydrate process with wet scrubbing andconcentration of dilute acid; the process will bereliable and flexible and allow possible futureadaptation for the recycling of sulfur from phospho-gypsum
Gypsum disposal: Slurry pipeline (2 km) to final storage area withcapacity of 30 Mt (20 years); capacities andtechniques for gypsum dumping have been cleared bythe environmental pollution control authorities
P. Monoammonium Phosphate Plant
Capacity: 180,000 tpy (approximately 600 tpd) of bagged granu-lar productStorage capacity for final product--minimum 18,000 t(30 days' production)
Product specification: Bagged granular MAP, 12Z N, 52% available P205, mois-ture content less than 3%, minimum 952 within 1-4 mm
Process: Preneutralizer/pipe reactor process, also allowingproduction of DAP to utilize fully the ammonia outputfrom the Dawu ammonia plant; the granulation sectionwill be equipped with a dust extraction and scrubbingsystem to meet the emission standards for particu-lates, ammonia and fluorine, intermediate finalproduct storage (capacity 1-2 days' production) andbagging units; the plant will be designed incooperation with a foreign engineering firm

ANNEX 6.2Page 3 of 3
- 66 -
G. Dawu Ammonia Plant
Capacity: The capacity of the existing coal-based ammonia/ABCplant at Dawu will be expanded from 15,000 tpy ofgaseous to 30,000 tpy of anhydrous liquid NH3
Process: The Wuhan Chemical Design Institute (WCDI) has beeninvolved in similar revamps and will employ its expe-rience with local technology to expand the ammoniaplant
Supply of NH3 : Ammonia from the Dawu plant will be transferred toMAP plant by pipeline or road, whichever proves morefeasible; it is anticipated that ammonia plant willbe achieving design output rates soon after recommis-sioning; to facilitate full utilization of output,the design of the MAP plant will also allowproduction of DAP
H. Infrastructure
Mine site: Workshop, store, equipment service facilities
Plant site: Workshops, stores, effluent treatment plant, labora-tories, offices
Social infrastructure: Housing and welfare facilities at Dawu.
China DepartmentMarch 1989

ANNEX 6.3
- 67 -
CHINA
HUBEI PHOSPHATE PROJECT
Summary of the Terms of Reference for Consulting Services to SupportProject Implementation Under the Technical Assistance CoDironent
A. Objective
Internationally experienced consultants will provide advisoryservices to ensure the selection and procurement of appropriate technologiesand equipment, timely identification and resolution of Project implementationproblems, training of Project management team staff, and preparation of staffrecruitment and training programs.
B. Tasks
The consultants will provide the following services:
(1) for project implementation--(i) assistance in technologyselection; (ii) advice on the structure of Project teams andexecution of Project implementation for the coordinatedcommissioning of mines and fertilizer plants; and (iii)counseling on implementation issues to facilitate timelycorrective actions; and
(2) for maintenance of mobile mine equipment--(i) review of thedesign and layout of workshops; (ii) assistance in theselection and procurement of critical equipment; (iii) setting-up of a preventive maintenance system; (iv) review of the staffrecruitment and training programs; and (v) monitoring ofproject implementation.
C. Timing
The consultants are expected to commence field work by May/June 1989,and complete their tasks with the commissioning of the plants.
D. Estimated Budget
Consulting fees US$220,000Travel expenses 50,000Contingencies 30,000
Total US$300,000
China DepartmentApril 1989

ANNEX 6.4
- 68 -
CHINA
HUBEI PHOSPHATE PROJECT
Outline for Training on Hazard and Operability (HAZOP) AnalXsis
Objectives
1. Main objectives of the training on hazard and operability analysis(HAZOP/HAZAN), to be carried out by the Ministry of Chemical Industry as partof the technical assistance component, are tot (i) stimulate and improveawareness for safety and operability aspects among related Chinese governmentagencies, research and design institutes, and enterprises involved in thechemical processing industry; and (ii) strengthen the capabilities of Chinesedesign institutes for identifying and analyzing potential sources of safetyhazards and major production losses in chemical plant design and operation.
tlork Scope
2. A consultant will be appointed tos (i) present in China a seminar onHAZOP/HAZAN techniques; and (ii) conduct workshops to practice the applicationof those techniques in sector-specific case studies.
3. Presentation of HAZOP/HAZAN Seminar. The seminar will cover allmajor areas of basic and advanced HAZOP/HAZAN techniques and highlight generalaspects of other methodologies for technical risk analysis (e.g. hazard sur-veys and inventories; systems reliability/fault tree analysis; event treeanalysis; risk assessment and safety audits). Major topics to be covered bythe seminar are: (a) basic principles; (b) planning and timing; (c) selectionof study teams; (d) study procedures; (e) evaluation of potential problems;(f) recording of the study; and (g) processing of actions.
4. Presentation of Workshops with Sector-Specific Case Studies. Follow-ing the seminar, 2-3 workshops will be conducted to promote the practicalunderstanding and application of the HAZOP techniques explained. The numberof participants in each workshop will be about 20. Appropriate industry-specific case studies including typical Chinese conditions should be presen-ted. Each of the workshops will last about 5 days.
Work Plan
5. The consultant will prepare a work plan for the assignment which willbe reviewed by MCI and the World Bank. MCI will, in consultation with designinstitutes, prepare case studies for presentation during the workshops.
Timing
6. The seminar and workshops are planned to be held around April 1990.
China DepartmentApril 1989

CHINA: HUBEI PHOSPHATE PROJECTOrganization Chart of MCIs Project
Coordinatlon Unit
World Bank ProJectImp le m ent atlo n COo o rdcnat lon
Group
Deputy Mnlaiter of Finance
Project General Manager|
Chief World Bank LoanOffice
Vlce General Manager
Deputy Director, CNCCC
Project Officer
Design Technology Construction Procurement Traspration Finncig C ntCoordinator Coordfinator Coordinator Coordinao Coriao oriao
9kNw413O5D

- 70 - ANNEX 7.2
Page 1 of 2
CHINAHUBEI PHOSPHATE PROJECT
Organization Chart of JPCC Project Management Team
Generl Manager
F PMRDRoje Manager
Desdgn rInstHtMe 1Cocrdinotbon Unit
Beaato PhosporicAcid ||Maintenance | FlnKw Manacger | | Manog | Monoger || Mancoger |
| Maner | | Manager | | ag Manager Mo Mnager |M|oana | Manager | ong
World Bank-428Stt1

ANNEX 7.2- 71 - Page 2 of 2
CHINAHUBEI PHOSPHATE PROJECT
Organization Chort of HPCC Project Management Team
HPCCGeneral Manager
HPCCProject Manager
CMRDI _ - MCI Pr(ectDesign _r _itute Coordination Unit
BsrndcWon Ptwpa c Acid | Maintenance Fir nc
Manager | M| rNag | Manager | Manager !
Mlning Sulphuric Acid Map Infrastructure Planning ProcurementManager Manager Manager Manager Manager Manager
World Bank42840:2
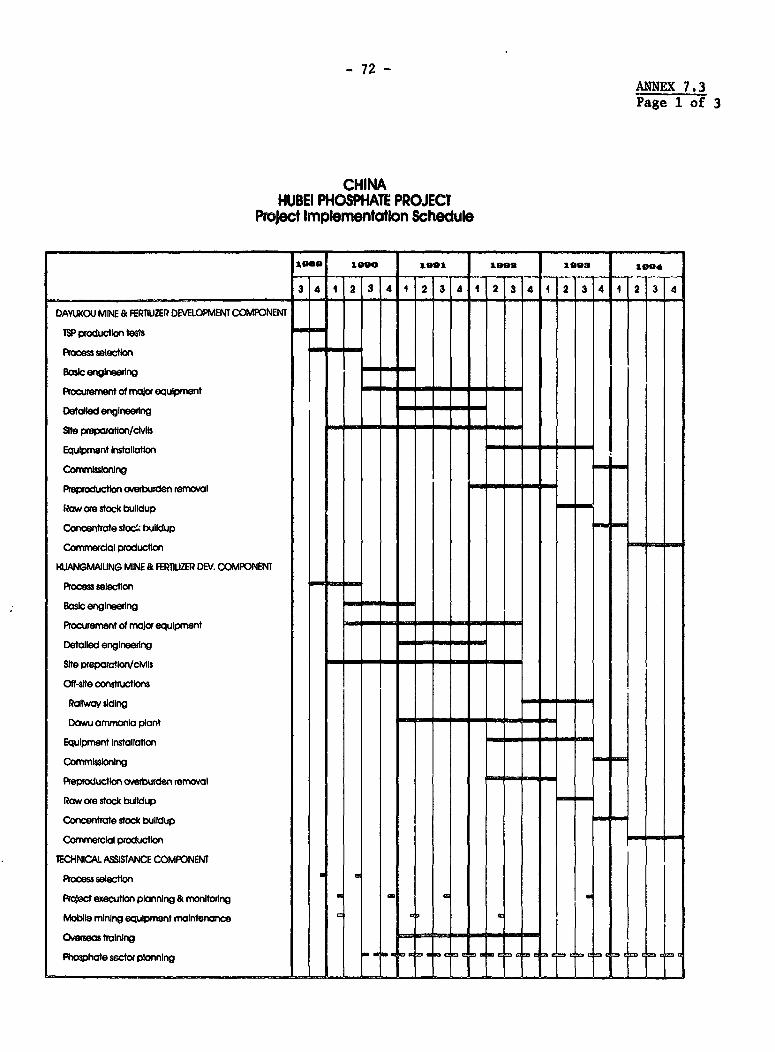
- 72 -
ANNEX 7.3Page 1 of 3
CHINAHUBEI PHOSPHATE PROJECT
Project Implmentation Schedule
314 1 213 4 1 231 4 1 2 3 4 4 2 3 4 1 2 3 4
DAyUKOU MINE & FEQIIUZER DEVLOPMENT COMPONENT
TSP produtctlon tests
PXe#m selection _
Basic englnwdrng __
Rocuement of ma,or equipment
Detalled enginsedng___________
site preparaHacvl s_______________
Equlpment IrnstallaHon_____ __
Commlnlng____ __ Reproduction ovedbren removal
Raw ore stock bulidup
Conoentrate stock buildup
Commerclal production
HUANGMALJNG MINE & FECaLIPEO DEV. T OMPONENT
ProcesseWctflon
Prsoc enreulnesr ln _ monItI
Pobient of mninog equipm ent mainten
Detolled traeinng
SNe preparateon/ctr plans
off-site constructions _
Ralhsay sldlng
Dawu ammonio plant _T- I__ I IIIEaulprnaent Installatlon T__ I
Cormissloning
P eprductibn ovebuwden remcvol _
Raw ore stock bufldup l lll_1
Concentrate stock buildup r LCommewclol production
lECHNICAL ASS9STANCE COMPONENTWll l
Procss sMectlon |e
Pro,Sc executlon planning & monNorlng 46 m
Moblis minlng eaulpment rnalntenance
OvEaas trailnlng IIIt_
Phoshae &estor plannln _g.., _ t t

ANNEX 7.3- 73 - Page 2 of 3
CHINA
HUBEI PHOSPHATE PROJECT
Key Milestones for Project Implementation
Milestone Target Date
A. Dayukou Mine and Fertilizer Development Component
Major Process Related Activities:TSP production tests Sep. 1989Process selection and contract awards forsulfuric acid, phosphoric acid and TSP plants Mar. 1990
Process selection and contract award foraluminum fluoride plant Jun. 1990
Commencement of local engineering Jan. 1990Completion of local engineering Mar. 1992Commencement of foreign engineering Apr. 1990Completion of foreign engineering Sep. 1991Commencement of international procurement Apr. 1990Completion of international procurement Sep. 1992
Site ActivitiestCommencement of site preparation Jan. 1989Completion of civil work Sep. 1992Commencement of equipment installation Apr. 1992Mechanical completion Sep. 1993Completion of commissioning Mar. 1994Commencement of commercial production Apr. 1994
B. Huangmailing Mine and Fertilizer Development Component
Major Process Related Activities:Process selection and contract awards forsulfuric acid, phosphuric acid and MAP plants Feb. 1990
Commencement of local engineering Jan. 1990Completion of local engineering Feb. 1992Commencement of foreign engineering Mar. 1990Completion of foreign engineering Sep. 1991Commencement of international procurement Apr. 1990Completion of international procurement Sep. 1992
Site Activities:Commencement of site preparatior. Jan. 1990Completion of civil work Sep. 1992Commencement of equipment installation Apr. 1992Mechanical completion Sep. 1993Completion of commissioning Mar. 1994Commencement of commercial production Apr. 1994

ANNEX 7.3Page 3 of 3
- 74 -
Off-site construction:Railway siding commencement Sep. 1992
completion Sep. 1993Dawu ammonia plant rehabiliation
commencement iApr. 1991completion Mar. 1993
C. Technical Assistance Component
Consultant Services for Project Implementation:Commencement Nov. 1989Completion Mar. 1994
Consultant Services for Mine EngineeringSelection and MaintenancesCommencement Jul. 1990Completion Mar. 1993
Hazard and Operability (HAZOP) Seminar Apr. 1990
China DepartmentMarch 1989

CHINA
HUBEI PHOSPHATE: PROJECT
Environmental Protection and Standards
StandardsProject Hazard Measures taken Bank
subcomponent or pollutant under project Local guidelines
Open-pit mines Overburden dumps Concentrated in few Must be safe, appropri-Ireas next to mine, no ate location to beinterference with other selectedinstallations
Beneficiation plants Tailings Pumped into safe ponds Same as overburden dumpson wasteland away frommine and other installa-tions
Waste water (from Wengfu Treated to Chinese stan- Solids-100 mg/l 100 mg/lfilter presses) dards for petroleum and BOD-60 mg/l
chemical industries COD-200 mg/il
Sulfuric acid plants Off-gas Wet scrubbing to maximum 500 ppm S02 220 ppm SO2 -
450 ppm S02, typically v300 ppm
Ammonia plant Waste water Treated to:-0.5 mg/l cyanogen -0.5 mg/l 0.5 mgIl-0.5 mg/l sulfide -1.0 mg/l 0.5 mg/l-30 mg71 solids -500 mg/l 50 mg/i
Phosphate acid plants Off-gas Wet scrgbbing to 50 mg/ml3 F 10 mg/m310 mg/rn3 P
Waste water Pumped into beneficia- n.a. n.a.tion tailings pond afterneutralization
MAP and TSP plants Off-gas Wet scrubbing to:10 mg/rmn F 50 mg/o 3 10 mg/m380 mg/m3 NH3 72 mgJm3100 mg/in particulate 170 mg/m3 100 mg/rn3
China DepartmentMarch 1989
1I

- 76 -
giftl4mEl PQFHATEK PROJECr
Capital Cot Eatimatee
bawukou iWuanmiing ICI lb TotalLocal Foreign total tocl Forsign Total Loal Foreign Yotal Locl IForeign Total
A. In Mi1lion
Lieane team 0.0 8.8 3.8 0.0 2.8 2.8 - - - 0.0 6.1 6.1Engineering 5.7 S.0 10.7 4.1 8.1 T.2 - - - 0.8 6.1 17.9Equipment A aterial- 61.8 82.9 104.7 26.7 24.5 61.2 - - - 78.8 77.4 168.9Spare parts 8.0 8.8 8.0 1.6 1.7 8.8 - - - 4.8 8.8 10.1FreiGht A insurance 8.6 4.0 9.6 1.8 1.8 8.8 - - * 7.1 5.e 12.9Civil& erection 70.2 0.0 70.2 88.7 0.0 88.7 - - - 103.0 0.0 10.0Project manageent 28.4 8 0 2S.4 7.8 1.2 8.7 - - - 80.9 4.2 85.1Training 0.5 0.9 1.4 0.4 0.5 0.9 - - - 0.9 1.4 2.8Technica! aessetanca 0.0 0.0 0.0 0.0 0.0 0.0 - 0.4 0.4 0.0 0.4 0.4
Bass Cost fJanuara1.i3u1 160.2 114 fI. i li ILL llO.S 24 24 2; 108.0 S44.
Phyaical contingencies 16.0 r.8 23.4 7.8 8.8 11.0 - - - 28.8 10.9 54.5Price contingencies 25.5 18.6 89.0 11.9 8.1 18.0 - 8 - 87.4 19.8 87.0
Insal l Coot 201. 20. 2J 9. M44. Ii G4 Q 04 2e6.7 llW4 IILL
Incemeental ortingcapital 21.0 0.0 21.6 5.4 0.0 8.4 - - - 27.2 0.0 27.2
Intareat during con-otruction k 16.6 15.2 01.6 7.9 7.7 15.6 - - - 24.4 22.9 47.8
Total i8nLninnR"cuired Le 2aAs 12t4 A&U 4 IQ EM 7 Q & Q ei il nuSh Am"
8. It Y MilioUn
License to" 0.0 14.1 14.1 0.0 8.6 8.8 - - - 0.0 22.7 22.7Engineerlng 21.8 18.6 89.9 15.4 11.6 27.0 - - - 86.7 80.2 68.9Equipment A eaterials 192.7 198.8 889.5 99.2 91.0 190.2 - - - 291.9 287.8 579.7Spare parts 11.2 14.1 25.8 5.5 6.4 11.9 - - - 16.7 20.8 87.2Freight A insurance 2.0 14.0 8.8 5.7 6.8 12.8 - - - 28.7 21.6 48.3Civil& A erection 261.0 0.0 281.0 12S.8 0.0 128.8 - - - S88.8 0.0 888.8Project aneagment 88.0 11.0 97.9 28.1 4.6 82.7 - _ _ 116.0 15.6 180.6Training 2.0 8.4 8.4 1.5 1.8 8.8 - - - 8.8 8.2 8.7Technical aesietance 0.0 0.0 0.0 0.0 0.0 0.0 - 1.8 1.8 0.0 1.6 1.5
Bass Coot (January19121 191.1 A 2I22 110.1 921.! 11 *11.1 LI L& 821.i 411. 1 21.9
Physical contingancle 89.6 27.8 68.9 2Z.1 18.1 41.2 - - - 87.7 40.8 128.0Price continenles 289.8 198.4 884.7 111.7 87.0 168.7 - - - 881.0 162.4 588.4
hM;,. ".4 1 IILI 21 L1 021 2. J L214 AA LI L.1 82. LU.UL
Incremntal morkingcapital 107.2 0.0 107.2 28.8 0.0 28.8 - - - 1s8.7 0.0 138.7
Interest during con-struction L/ 78.4 89.8 14.7 88.1 88.4 71.8 - - - 111.5 104.7 216.2
Total FinencinaReiI ed La LI7 494.1 11 24 2A 21.1 24 LI Li LII.! Z12.1 L2-2.2
Comitaent fe= ara Included.&i To cover tho technical asaistance comonent.
S Excluo % 11100.000 to cor the training coat an PAM analysis to be provided under tho technical asaistancocompon.
Chino DseprtoentMarch 1089
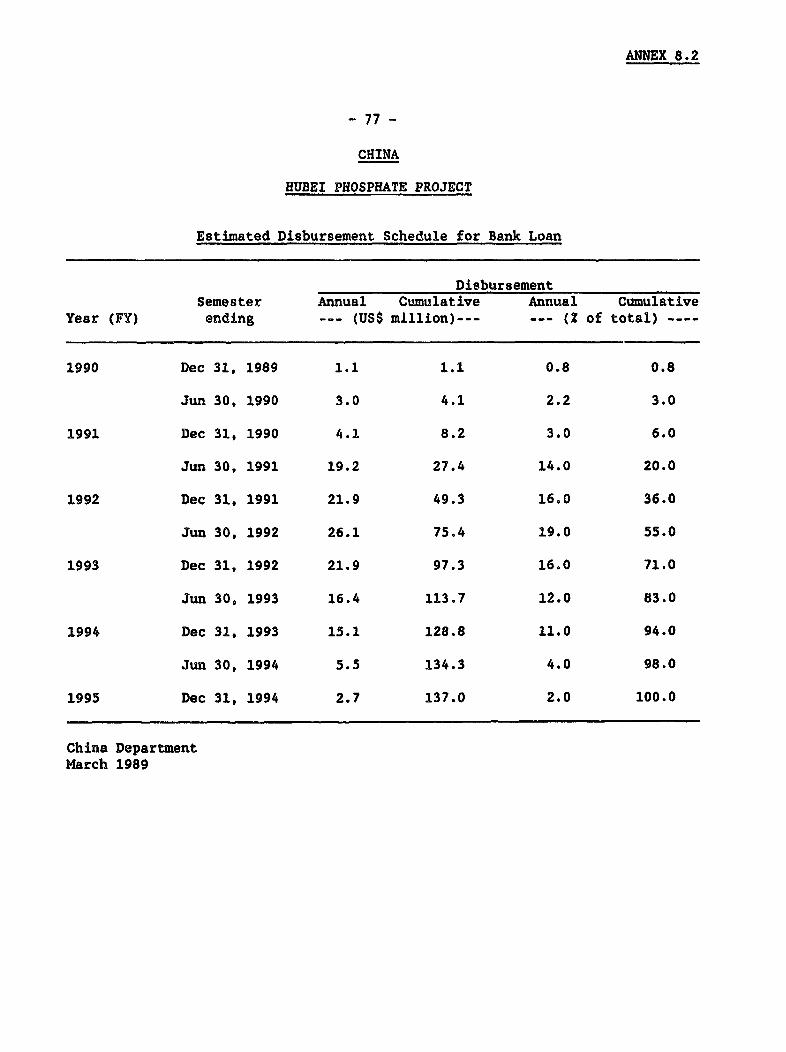
ANNEX 8.2
- 77 -
CHINA
HUBEI PHOSPHATE PROJECT
Estimated Disbursement Schedule for Bank Loan
DisbursementSemester Annual Cumulative Annual Cumulative
Year (FY) ending --- (US$ million)--- --- (2 of total) ----
1990 Dec 31, 1989 1.1 1.1 0.8 0.8
Jun 30, 1990 3.0 4.1 2.2 3.0
1991 Dec 31, 1990 4.1 8.2 3.0 6.0
Jun 30, 1991 19.2 27.4 14.0 20.0
1992 Dec 31, 1991 21.9 49.3 16.0 36.0
Jun 30, 1992 26.1 75.4 19.0 55.0
1993 Dec 31, 1992 21.9 97.3 16.0 71.0
Jun 30, 1993 16.4 113.7 12.0 83.0
1994 Dec 31, 1993 15.1 128.8 11.0 94.0
Jun 30, 1994 5.5 134.3 4.0 98.0
1995 Dec 31, 1994 2.7 137.0 2.0 100.0
China DepartmentMarch 1989

ANNEX 9.1Page 1 of 2
- 78 -
CHINA
HUBEI PHOSPHATE PROJECT
Assumptions Underlying the Financial Analysis
A. General
1. The financial projections were carried out in current yuan usingprojected domestic inflation rates for local inputs and outputs and interna-tional inflation rates for imported inputs as followss annual domestic infla-tion rates--15.0 for 1989, 10.02 for 1990, and 8.0% thereafter; and annualinternational inflation rates--5.3% for 1989/90, and 4.1% thereafter. The keyassumptions for financial projections were based on the actual annual perfor-mance of companies under Chinese regulations. To provide an overall view ofthe companies' financial performance in accordance with conventional account-ing concepts based on international accounting standards, the followingadjustments were made to the Chinese accounting systems (a) the two sets offinancial statements--production operations and capital construction wereconsolidated; (b) the accounts in the income statements and balance sheetswere reclassified as necessary in accordance with conventional concepts; and(c) the sources and applications of funds statements that do aot exist underthe current Chinese accounting system were prepared. For financial rate ofreturn (FRR) calculations, cost and benefit streams in constant yuan wereused. The assumed capacity utilization and production levels with and withoutthe Project are given in Table 1 of this Annex.
B. Income Statements
2. Sales Revenue. Sales prices are assumed to be maintained at levelsindicated by MCI and SPB as the expected sales prices for project output asthe following: Y 750/ton for TSP and Y 900/ton for MAP. Net sales revenuewere calculated after deducting the product tax. During Project implementa-tion, Project companies will not pay the product taxes under special arrange-ments. The rates of the product tax are as follows: 3% for TSP and MAP, and102 for aluminum fluoride.
3. Variable Production Costs. Annual consumption of inputs was obtainedfrom the material balance and estimated production levels with and without theProject. Materials balances for each company with and without the Project aregiven in Project File Ref. No. 2.
4. Depreciation. Fixed assets were depreciated using the straight-linemethod at rates agreed on between the companies and their respective supervis-ory authorities as followss (a) Dayukou--over 15 years; and (b) Huangmailing--over 12 years. In addition, a mining maintevence fee of Y 7/t of orecharged by all the companies was included.
5. Maintenance Costs. In the Chinese accounting system, maintenancecosts are divided into two categories--annual overhaul and other. Provisionsfor annual overhaul are provided as a percentage of the original acquisition

ANNEX 9.1- 79 - Page 2 of 2
value of the fixed assets and are managed separately within the special fundaccount. Other maintenance costs were covered as operating expenses. Therate of provision for annual overhaul for the companies is 62.
6. Interest Expenses. Interest on foreign exchange-denominated loanswere converted into local currency using projected foreign exchange rates,assumed to be adjusted to preserve the relative currency values between thetwo currencies.
7. Taxes. Taxable income is derived from net profits after deductingthe amortization of long-term loans, and is taxed at a uniform rate of 55?.The companies will not pay income and adjustment taxes on profits during Proj-ect implementation and the repayment period of the Bank loan.
C. Balance Sheets
8. Fixed Assets. Fixed assets are shown at their historical costs.
9. Equity. The following four items are considered as "equity,' giventheir equity "nature': (a) state fixed funds; (b) state circulating funds;*c) enterprise fixed funds allocated from internally generated funds; and(d) net special funds (special fund assets minus special loans) retained byenterprises.
D. Funds Flow Statements
10. Depreciation Fund. The current Government policy allows companies toretain 1002 of the fund.
11. ExDenditures from Special Funds. Provisions for annual overhaul wereused to cover annual overhaul expenses. Annually, 15? of the retained depre-ciation fund and profits are paid to the Energy Conservation Fund. The compa-nies will be exempt from this contribution during Project implementation. Aportion of internally generated funds (in the special fund account) is usedfor: (a) production technology development; (b) improvement of workers' liv-ing condition; (c) cash bonuses; and (d) new product test fund. The balanceis accumulated within the company as reserve funds.
China DepartmentMarch 1989

ANNEX 9.1
- 80 - Attachment 1
CHINA
HUBEI PHOSPHATE PROJECT
Production Levels and Capacity UtilizationWith and Without Project
Davukou HuanamailingTSP Aluminum fluoride HUP ABC
Without with Without With Without With Vithout Withproject project project project project project project project
Production('000 tpy)
1994 - 339 - 7 - 109 51
1995 - 424 - 9 - 137 51
1996 - 509 - 11 - 164 51
1997 - 509 - 11 - 164 51
2006 - 509 - 11 - 164 51
Capacity Uti-lization (Z)
1994 - 60 - 60 - 60 90
1995 - 75 - 75 - 75 90
1996 - 90 - 90 - 90 90
1997 - 90 - 90 - 90 90
2006 - 90 - 90 - 90 90
China DepartmentMarch 1989
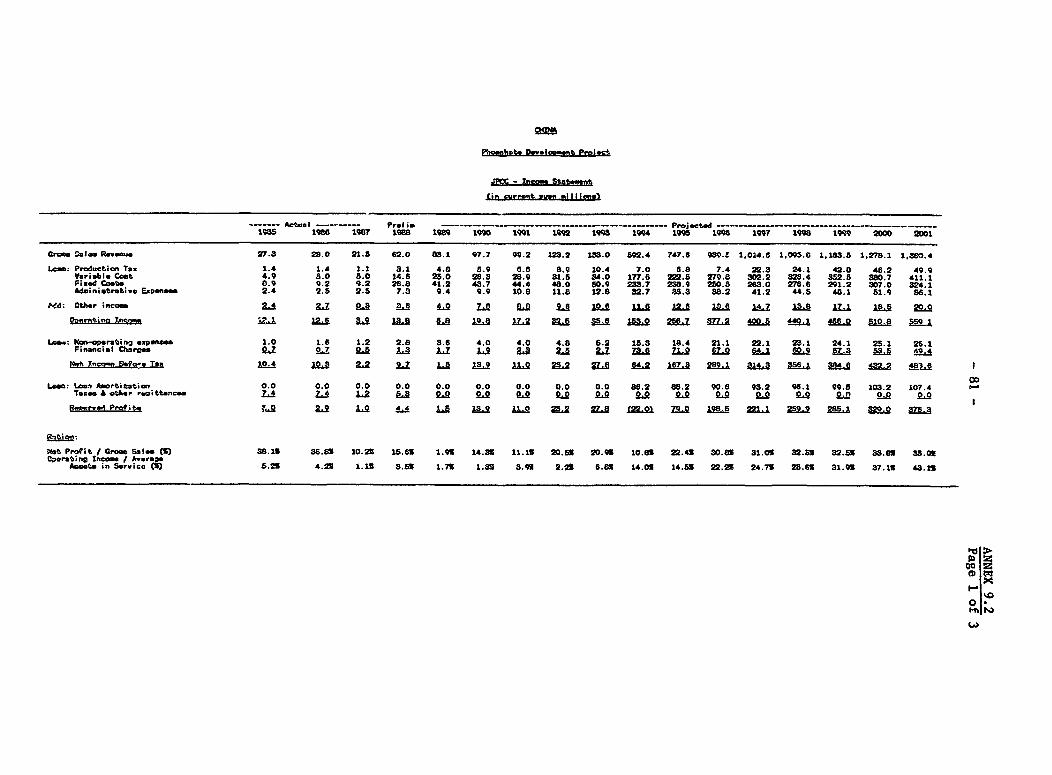
Pnehate D0oie."-lt Pmlrcl
- Incre Stat.nt
(in cUrrant M millions
_____ ^,cc., I _ _ pl ; __________ ______-- ------- --- Projected - - - - - - - - - - - - - -
1985 1928 198? 19E8 198 1990 1991 192 199S 1994 1995 lC96 1997 1998 1999 2000 20OI
Cro Sal_. R -eaue 27.3 28.0 21.5 62.0 83.1 97.7 99.2 12S.2 133.0 592.4 747.6 939.Z 1.04.6 1.095.8 1.1t83.5 1.278.1 1,3MO.4
Lem: Production To. 1.4 1.4 1.1 3.1 4.0 5.9 6.6 8.9 10.4 7.0 6.8 7.4 22.3 24.1 42.0 46.2 49.9Variablo Cost 4.9 5.0 6.0 14.6 25.0 26.3 28.9 81.8 84.0 177.6 22.5 279.8 302.2 82.4 36.2.5 380.7 411.1FiV Re Coa. 0.9 9.2 9.2 26.8 41.2 43.7 44.4 48.0 50.9 233.7 238.9 280. 263.0 276.6 291.2 307.0 324.1Adainistrative Expense 2.4 2.5 2.5 7.3 9.4 9.9 10.8 11.8 12.S 32.7 35.3 38.2 41.2 44.6 40.1 51.9 86.1
Add: Othr ineome 2_Z O S i 4 i La . LA L. iLl ILA AJu AmJ t4.z 15. 1L7 Ai E20
Chmrat'in Im"sJ t2.6 UA. Li B m 6. 1 B 172 35.eOAlSS.O 254.7 S77.2 48006 440.t 466.0 S10.0 559.
Lte.: Mon-operating expmam 1.0 1.6 1.2 2.8 3.6 4.0 4.0 4.8 6.2 15.3 18.4 21.1 22.1 23.1 24.1 25.1 26.1Financial Ca:rges 7 07 06 1.i Lz L L L LZ ZLI ZLS 71. 67.0 4.1i 60. 573 OA 49.
hIroosa D2atoe Tas 114 lO. L2 9.7 1.5 91S. 10 J VLA MA2 167.8 2f91 314.3 SaM. AS6 4S2: 48. I
03Lm: Loan AxortiZatiw 0.0 0.0 0.0 0.0 0.0 0.0 0.0 0.0 0.0 86.2 68.2 90.6 93.2 96.1 9.5 103.2 107.4
Taxs A other ,waiotence 74 7.4 L2 LA 0. Qf i 9Q L° ° °i ° ° ° 0.0 ° °i ° °i
R~Mrv*A Profite la &2 La 4.4 2L1. L1S 9 Ll 32 VA 8 £ZLQ1 73.1 1 21.1 ZA5. 2S6.1 M.. o 76
Not Profit / Groo_ Sales () 38.1is 36.63 10.21 15.6# 1.95 14.33 11.13 20.53 20.93 10.85 22.45 30.83 31.03 32.ss 32.s6 3S.83i 35.5 0perstina Inco_ / Average
Assets in Service 5) 6.2S 4.23 1.13 3.53 1.73 1.53 3.91 2.23 8.83 14.011 14.SS 22.23 24.73 28.63 31.93 37.13 43.13
Mi
0.

g41M
POPHTE DEeLOtO FRO=
------- ActAuI ---- Prel; ---- Procted----1988 1Q86 1987 1988 te 1990 1991 1992 1998 1994 199s 1996 1997 1998 1999 2000 2001
taV.rn sdFd"Its 3.0 2.9 1.0 4.4 1.5 13.9 11.0 25.2 27.8 (22.0) 79.0 198.5 221.1 259.9 285.1 829.0 876.3
Depreceation & Amortization 13.1 7.7 4.8 10.9 l8.0 14.1 11.9 12.8 12.6 92.5 98.6 93.6 98.8 98.6 98.6 98.6 93.6
Int~er.t Ezp.iaee 0.7 0.7 0.5 1.8 1.7 1.9 2.3 2.5 2.7 78.6 71.0 67.0 64.1 60.9 57.8 58.5 40.4
Repaynmt eol Lxx-t.'e Loan 0.0 0.0 0.0 0.0 0.0 0.0 0.0 0.0 0.0 8.2 68.2 90.6 98.2 96.1 99.5 103.2 107.4
Other odjuet_ent. (S.8) (3.1) 5.8 5.6 0.7 0.4 (0.8) (0.4) o.e (2.6) (17.1) (88.9) (86.4) (41.4) (44.8) (49.9) (86.0)
Internal CephCaneetCion VA A a1 12.1 z_ 17.0 AL94j ._ 4j1 4 a4.8 12.8 MJ -6e
Sourcqreex de frog Outmids,"Wrl Arf I ; 0.0 0.0 0.0 0.0 2.8 17.8 125.1 190.4 88.7 0.0 0.0 0.0 0.0 0.0 0.0 0.0 0.0
Oomseb;c long-temr loon 0.0 0.0 0.0 0.0 38.0 179.8 221.2 449. 1 158. 0.0 0.0 0.0 0.0 0.0 0.0 0.0 0.0
Dosxeic short-term loan 1.0 0 2 (2.4) 10.0 5.9 2.7 8.2 2.5 2.5 29.7 (28.7) 0.0 0.0 0.0 0.0 0.0 0.0
Cudgaot contribution 80.0 40.9 22.0 22.0 0.0 0.0 0.0 0.0 0 0 0,0 0.0 0 0 0.0 0.0 0.0 0.0 0.0
Toh^l Outeide Surcee fILQg 4 x .n 44 7 212. aso 5 Je ZoL. 245-ta2 QaIS ° . oo 2° -
T*mll Sorcen of Funds tS 49 3 ALI A Z fi.L 2JJ A N.U 2es 2es 2s 41S a 48As 469.1 49Aa $29.3 s706 1
A-R~~~~~~~~~~Lt=-ef 'g,_d, ~~~~~~~~~~~~~~~~~~~~~~~~~~~~~~~00. . ent seao Assets em.s 44.5 25.1 25.1 a8.8 197.1 847.3 6a9.5 242.6 0.0 0.0 0.0 0.0 0.0 0.0 0.0 0.0 9
In.etwmnt in long term Bonds 0.1 0.0 0.1 0.1 0.2 0.8 0.4 0.4 0.5 0.5 0.6 0.7 0.7 0.4 0.4 0.4 0.5
Principal repayment of long term loen 0.0 0.0 0.0 0.0 0.0 0.0 0.0 0.0 0.0 55.2 88.2 90.6 93.2 9d.1 99.5 103.2 107.4 1
Intoreot Expenses 0.7 0.7 0.5 1.8 1.7 1.9 2.8 2.5 2.7 75.8 71.0 87.0 64.1 60.9 57.3 53.5 49.4
Increae in Working Capital (O.S) (1.5) 0.4 0.2 0.0 0.2 0.4 3.8 o.s 28.7 17.4 e.8 1.5 1.6 1.8 1.9 2.0
Special Fund Expenditure 4.0 4.1 6.0 8.2 15.0 18.7 17.4 19.7 s6.0 48.8 48.4 56.2 68.7 185.6 38.4 415 44".
T7vtl Anvlicmtiona of Funds 8. 47-8 2LI Ait ALA 2P-1 ARA MU MU 2 26 238 a AMU 294-J 197.4 200. 201
Xncrwo" in C-oh 0.0 LA L.4J 1 1_ LA4 9 2_ iL LA 2 0 1e.IL 21 4 iI 2ss 8 a7 1L4 s
-If Samice C".reg.. (tim) 9.3 11.7 24.2 17.1 9.8 18.7 11.0 15.2 16.5 1.4 2.0 2.0 2.8 8.0 8.1 5.4 3.4
,0"
0*
~~~~~~~~~~~~~~~~~~~~~~~~~~~~~m "
LOQ

(in currant yun *ila iore)
--- Atual ------- Prelim - P1ess 198I 1987 1908 1w8 1990 1991 1992 1983 1994 1a99 199 1997 1998 1999 2000 2001
0.1 1.6 1.2 20.8 2s.9 42.8 8O.4 66.5 78.1 96.9 157.5 340.0 582.8 726.8 1,020.6 15.49. 1,715.8InvnCri_ a 6.6 6.3 5.3 13.0 18.7 21.0 23.6 20.9 o 1.8 97.0 218.6 143.0 184.5 166.8 180.2 194.6 210.1Acccunto Rocaivabla 13.9 8.3 7.3 10.8 11.6 12.6 14.1 15.6 16.9 18.8 25.1 82.6 35.2 88.0 41.0 44.3 47.8Tto,tl C,re nt Aesta 2J IL2 l 4S I AU ZLA MA UL1 i2LA =LA. L2 ANA 741.9 ss. 0 1.241J f1ti LZ a 2 1. 9. -
F s t wx_erAewt& 260.0 8.8 375.5 889.7 401.6 387.7 37S.8 363.2 SE0.6 1.723.3 1,629.7 1,886.1 1,442.5 1.348.9 1,255.4 1.161.8 1.068.2Uovk in progreos 83.8 44.5 28.1 28.1 88.8 238.9 863.1 1.222 1,485.2 0.0 a0. 00 00 00 00 00 00ta term -ands 0.3 0. 4 0.5 0.7 1.0 1.3 1 2 2 2 4 a 2 8.8 39 4. 5. 5. 5 8.4 0
Totl Fixetd Aa.ta 3SL.8 aRM -40o 416.S .S 624. 0602s LZ7J IS le. 1872o IJJ 1.5L0 1Mo447.2 LS54. 12WJ8 1.167.7 1.074.6Ot'as ameste 12.9 17.0 23.0 31.2 48.2 59.9 77.3 97.0 183.0 176.6 225.0 281.2 844.9 480.5 581.9 560.4 60s.2rToI Aevt aZL 41sXs &U? 4903 W 4.a ?60. I? 1L7956 L?.72. 2 115, 2 .lS9.1 2,.E B 2.5a4.0 2.766-1 3S01B 3,31s 3aWLieiliti ~ ~ ~ ~ ~ 15 dAL 8l I Z 1J fI 2ZJLLDL5ILMOLLDLU1Lt1 DIILAccownt. Payable 7.2 2.6 2.6 8.1 8.7 4.0 4.5 8.1 5.6 8.6 7.5 9.7 10.6 11.4 12.3 18.8 14.8tth r Puyables 0.0 0.0 0.0 0.0 0.0 0.0 0.0 0.0 0.0 8.4 8.6 8.9 4.3 4.6 8.0 5.4 8.8Sho,t term loan 8.7 8.9 6.8 16.8 22.4 23.1 2.8 50.8 6 8-.8 20.7 0.0 0.0 0.0 0.0 0.0 0.0 0.0 80Currant portion of long-tarm loan- 0.0 0.0 0.0 0.0 0.0 0.0 0.0 0.0 86.2 88.2 90.6 93.2 96.1 99.5 108.2 107.4 112.1 LiTotal Currant Lsbift;e. LAS 9115 .I 2L. 2. a au Ig. 12s =L 10AMJ9 auL mi Z6 S IM2*.Ld lor n 0.0 0.0 0.0 0.0 2.0 20.6 147.7 84S.0 420.7 427.5 422.9 415.7 405.3 891.8 878.2 380.4 822.1PCS A Covernent loans 0.0 0.0 0.0 0.0 86.0 215.8 436.8 8ss.6 970.2 900.9 813a.6 762.3 698.0 628.7 554.4 488.1 41s.8Totsl Loan Torn Lia;lA I ;ti ofl o2 o oL2 AM 1.s230.f 139 132S.4 2 1. 17sB Lo.mJ *1014.0 922ZL 8ass 7SIo
g >rpriae Fined FNo 851.2 392.1 414.1 414.1 414.1 414.1 414.1 414.1 414.1 500.8 568.5 679.1 772.8 6.5 968.0 1,071.2 1 178.5Special Fund Resr.ea 10.2 10.2 14.6 86.6 64.0 81.7 94.8 115.0 155.1 160.4 214.2 572.6 552.5 757.2 ,005.5 1,283. 7 1,606.0T*tAl EMUtv A 470.7 478. 49s.a Ai.6 S2-1 S47 2 m. 2W 1-051- 1,3248 13 1.M. LIL4.9 2.78M3Total Li&bi I iti*s A foultv mm7 9 40 497. 490.£t 1. Z 7S I75602L19J L38 2.fl 2L7La i _ 22.61 L J6.L3 S
brrwnC Ratio (tee.) 1.3 1.4 1.5 2.2 2.2 2.6 2.7 8.1 1.0 1.7 8.0 4.8 6.7 8.1 10.8 12.6 14.9 oldLong-tar. Debt/Eqpity 100:0 100:0 100:0 100O 0:72 3:3?7 S4:46 72:2g 74:26 69:31 6S:87 57:43 53.47 49:51 48:57 39:61 84:66 t
OQ1-h
LA)

Phlo.hat. D0a.lloaent Proiect
HPCC - Inecm Stat&a..t
(in current yuan milliorn)
------- Actual ----- Prals - ------- --------- ----- -- Proctd----------- --------- _ ----
1985 1986 1987 1986 1989 1990 1991 1992 1993 1994 1995 1996 1997 1998 1999 200 2001
Groom Sales Revnume 1.5 8.8 4.0 4.7 14.5 1.5.2 10.8 11.8 12.8 165.9 224.0 290.2 3135.5 338.5 365.6 394.9 426.5
Lose: Production 'ao 0.1 0.1 0.1 0.1 0.4 0.5 0.3 0.4 0.4 5.0 6.7 0.7 9.4 10.2 11.0 11.8 12.8
Variable Coat 0.6 1.5 1.6 1.9 7.8 8.2 8.6 7.2 7.8 51.3 69.3 89.0 97.0 104.8 113.2 122.2 122.0
Fixed Coat. 0.8 1.9 2.0 2.3 3.8 3.9 2.7 2.8 5.0 47.4 49.7 82.1 53.6 55.2 67.0 58.9 61.0
Administrative Expenn_ 0.0 0.1 0.1 0.1 0.8 0.3 0.2 0.3 0.3 2.4 2.6 2.8 8.1 8.3 3.6 8.9 4.2
Add: Other incone 0.2 0.2 0.0 0.0 0.0 0.0 0.0 0.0 0.0 0.0 0.0 0.0 0.0 0.0 0.0 0.0 0.0
Oxrntino Inco_. LA 0.4 0. ea . 2la 22 1 1.2 LA iLZ A. 22L& 150.4 1I.n 180.9 19l4 2lS
La..: Ncn-corating expenses 0.0 0.1 0.0 0.0 0.1 0.1 0.0 0.0 0.0 0.3 0.4 0.5 0.6 0.6 0.7 0.7 0.8
Financial OChrges 0.0 0.0 0.0 0.0 0.0 0.0 0.0 0.0 0.0 34.1 32.9 31.1 29.7 28.2 26.6 24.7 22.8
Not Incown SPr, Tax La 0.4 aa 9A , L.i 94 L s LA 21J Ik 1 0 .1 120.1 3La 13Z.7 172.8 102
La..: Loan Amortization 0.0 0.0 0.0 0.0 0.0 0.0 0.0 0.0 0.0 40.6 41.5 42.5 43.7 4t.1 48.6 48.3 50.2T
eaxe and othe,. remittences 0.0 0.0 0.0 0.0 0.0 0.0 0.0 0.0 0.0 0.0 0.0 0.0 0.0 O.D 0.0 0.0 0.0
Rr-nad ProtiO 0.4 0.2 0.3 2.2 2.8 0.9 1.1 1.3 -1S.3 20.8 62.6 76.4 91.2 107.1 124.3 142.8
Ratios:
CO
Hat Profit / Croec Sales (1) 16.71 9.91 6.61 5.6S 14.95 15.31 8.65 9.41 t0.11 L5.26 27.63 36.26 38.35 40.25 42.01 43.7% 46.26
Opearting Inca.s / AverageAcaate in Swicae (1) 1.81 2.41 1.31 1.6% 15.261 15.11 7.35 10.71 13.91 17.11 14.11 21.01 24.11 27.81 32.1% 37.25 43.0O
tD
0*
w

ICC - Fund. Flow State_nt
(in current umn a I Iliem)
Actual - Prelim --- - Projected198S 1986 197 1988 1989 1990 1991 1992 1998 1994 1998 1996 1997 1998 1999 2000 2001
Hetemned t rofat Onere. 0.S 0.4 0.2 0.8 2.2 2.8 0.9 1.1 1.8 (13.8) 20.8 62.6 76.4 91.2 107.1 124.S 142.8ODorecietion A ADortiztion 0.2 0.2 1.1 1.1 1.1 1.1 1.1 1.1 1.1 81.2 S2.2 83.2 83.2 53.2 8S.2 88.2 88.2Interest Expeane 0.0 0.0 0.0 0.0 0.0 0.0 0.0 0.0 0.0 34.1 82.9 S1.1 29.7 2S.2 28.8 24.7 22.8RhpsyV_nt of Longtetrm Loone 0.0 0.0 0.0 0.0 0.0 0.0 0.0 0.0 C.0 40.5 41.5 42.5 43.7 45.1 46.8 48.S 50.2UTer odjwat_nmto 0.0 0.0 0.0 0.0 0.0 0.0 0.1 0.1 0.1 0.1 (0.6) (1.7) (2.0) (2.0) (2.1) (2.1) (2.2)Internal Cwh Conermtian 0.4 _i LA La la LE i L L 2 9 126. I6.7Z 189 1953S Zi2 2M3 241.7
S§res g_ Fund fra Outsid-gorld canli len 0.0 0.0 0.0 0.0 1.7 12.0 67.0 97.9 22.4 0.0 0.0 0.0 0.0 0.0 0.0 0.0 0.0Domtic long-tere Ion 0.0 0.0 0.0 0.0 13.8 85.8 16.9 192.8 78.4 0.0 0.0 0.0 0.0 0.0 0.0 0.0 0.0Oe_tic ohort-ter loan 0.0 0.0 0.0 0.0 0.0 0.0 0.0 0.0 0.0 12.5 (12.5) 0.0 0.0 0.0 0.0 0.0 0.0DBdget contribution 0.8 0.4 0.0 0.0 0.0 0.0 0.0 0.0 0.0 0.0 0.0 0.0 0.0 0.0 0.0 0.0 0.0Talt Outide Sowr; L. 0 A 0. L. 1S 4 ALA . S f ism AN E2 =l 0.0& L_ PA Q_ L. 0 .
Total Snroce. of Rnd La L. la La IL lOD A2U =A EJ IU. U&2 1 lZZ W7.7 5. eZiLl 22a. 24.7. i -ixed A"oto 0.7 0.9 0.0 (0.0) 15.4 97.8 193.9 290.8 95.8 0.0 0.0 0.0 0.0 0.0 0.0 0.0 0.0Invetemtn in long tere Bond 0.0 0.0 (0.1) 0.0 0.0 0.0 0.0 0.0 0.0 0.0 00 00 0 0. .0 0.0 0.0 0Prineipal rwpny_nt of long trm Iowna 0.0 0.0 0 .0 0.0 0.0 0.0 0.0 0.0 40.8 41.5 42.5 48.7 45.1 46.8 48.8 60.2 UIntereat Expens 0.0 0.0 0.0 0.0 0.0 0.0 0.0 0.0 0.0 84.1 82.9 31.1 29.7 28.2 28.5 24.7 22.8Inere.. in Working Capitel 0.5 0.8 1.4 0.6 0.6 0.2 (4.2) 0.0 0.0 12.5 6.5 7.1 0.6 0.6 0.7 0.7 0.8Other wpphication 0.2 (0.0) 0.0 0.0 0.0 0.0 0.0 0.0 0.0 0.0 0.0 0.0 0.0 0.0 0.0 0.0 0.0
Total Avnlicntiatm of Funds LA 0 A 14 2i M.2 IL 1A 290.S IU- 23 U. ZLI ZLI ZLZ 7Z7 ZLZ
Ioverern in Cneh Q -° 5Q.Q2 L LQ LI 22 LA L4 LI gi aLl MA ILl 1l07 22S7 lIRA 31 17i9
DObt Service Coverao (time) 1.2 1.7 2.3 2.5 2.7 2.9 8.1 8.4
tDm
i00*
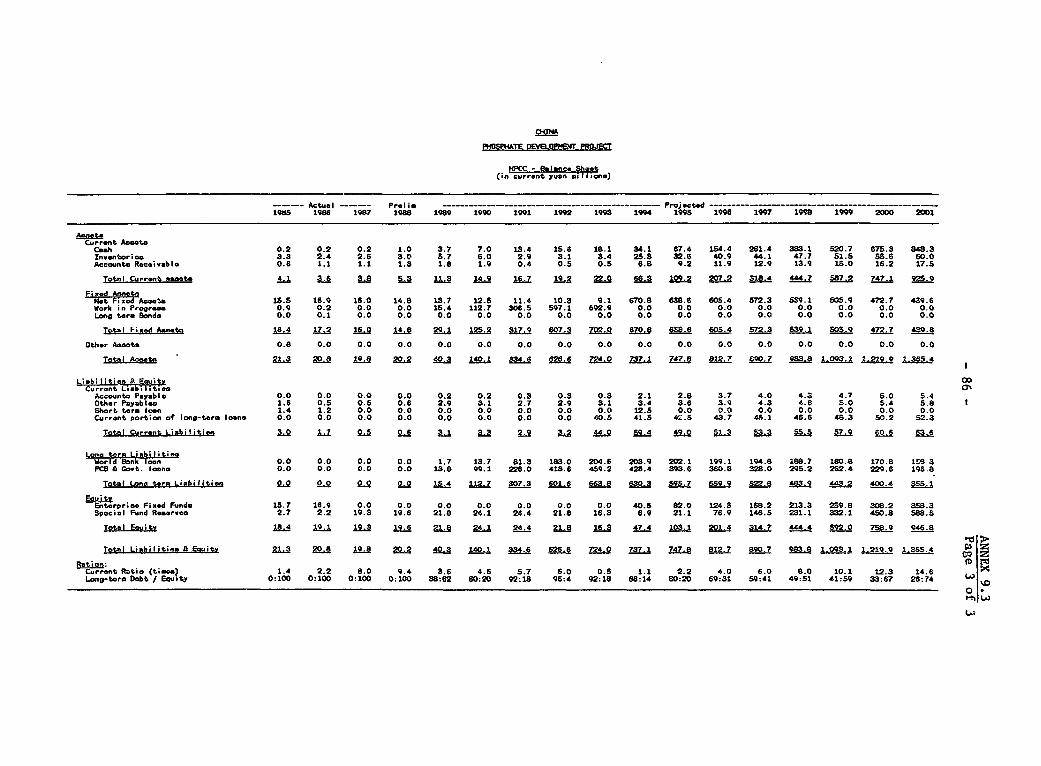
CHIN
PeOPTE DEVMJeLOdT PROJECT
-Actual-~~~~~~~~i curr-nt yunX eo-
19t5 1986 1987 1988 1989 1990 1991 1992 1993 1994 1995 1996 1997 1998 1999 2C00 2001
Current Ascotc.Cash 0.2 0.2 0.2 1.0 3.7 7.0 13.4 15.8 18.1 34.1 67.4 154.4 261.4 383.1 520.7 675.3 848.3Inventories 3.3 2.4 2.6 3.0 5.7 6.0 2.9 3.1 3.4 25.3 32.6 40.9 44.1 47.7 51.5 55.6 60.0Accounts Receivablo 0.6 1.1 1.1 1.3 1.8 1.9 0.4 0.5 0.5 6.8 9.2 11.9 12.9 13.9 15.0 16.2 17.5
Total Current aets A A AA 3. 53 1 14.9 16.7 19.2 207.2 318.4 4.7 587.2 747.1 92!i9
Fixeud AMNot Fixed AowS 15.5 16.9 16.0 14.8 13.7 12.5 11.4 10.3 9.1 670.8 638.6 605.4 572.3 539.1 505.9 472.7 439.6Work in Progress 0.9 0.2 0.0 0.0 15.4 112.7 306.5 597.1 692.9 0.0 0.0 0.0 0.0 0.0 0.0 0.0 0.0Long torn 8onda 0.0 0.1 0.0 0.0 0.0 0.0 0.0 0.0 0.0 0.0 0.0 0.0 0.0 0.0 0.0 0.0 0.0
TotaI F;xod Aaseto 18.44 17.2 16.0 14.8 i 125.2 317.9 607.3 702.0 f70.8 656 WS.i 4 57. 3 539L 05.0 472.7 439.6
Other Am..ts 0.8 0.0 0.0 0.0 0.0 0.0 0.0 0.0 0.0 0.0 0.0 0.0 0.0 0.0 0.0 0.0 0.0
Total O 21.3 20S 198 a20.2 40.3 1401 334.6 626.6 724.0 737.1 747.8 M. 6C90.7 9as.s 101 1 -219 X.365.4
LCrirbitioo A EauitiAccount.. Payable 0.0 0.0 0.0 0.0 0.2 0.2 0.3 0.3 0.3 2.1 2.8 3.7 4.0 4.3 4.7 5.0 5.4Other Payableo 1.6 0.5 0.5 0.6 2.9 3.1 2.7 2.9 3.1 3.4 3.6 3.9 4.3 4.6 5.0 5.4 5.6Short teorm loan 1.4 1.2 0.0 0.0 0.0 0.0 0.0 0.0 0.0 12.5 0.0 0.0 0.0 0.0 0.0 0.0 0.0Current portion of long-torm loans 0.0 0.0 0.0 0.0 0.0 0.0 0.0 0.0 40.5 41.5 42.5 43.7 45.1 46.6 48.3 50.2 52.3
Total Current Liabilitie 3.0 0 .6 3.2 44.0 59.4 49.0 51.3 53- S 5. 57.9 60.6 63.6
Lnt.rawLlibAilitio7Iilerld Tank;om.0.0 0.0 0.0 0.0 1.7 13.7 81.3 183.0 204.6 203.9 202.1 199.1 194.8 188.7 180.8 170.8 1S8 3eC8 a Goat. loan, 0.0 0.0 0.0 0.0 13.8 99.1 226.0 418.6 459.2 428.4 393.6 360.8 328.0 295.2 282.4 229.6 196.8
Total Lonc tart Limbiliti . 00 15.4 1t2.7 307.3 601.6 663.8 630.3 59b7 559.9 522.8 483.9 443. 400.4 355.
N8ntrprioo Fixed Funds 15.7 16.9 0.0 0.0 0.0 0.0 0.0 0.0 0.0 40.5 82.0 124.5 168.2 213.3 259.8 308.2 3S8.3Sp.cial Fund Reeervoo 2.7 2.2 19.3 19.8 21.8 24.1 24.4 21.8 16.3 6.9 21.1 76.9 146.5 231.1 332.1 450.8 588.5
TOtDI Ea, it 18.4 19.1 L9_ 1.I iL 241 24.4 6 47.4 103.1 201.4 314.7 444.4 592. 75.9 946.8
Total Liebilitie A Eouita 21.3 20.1 S 9. 20.2 40.3 140.1 334.6 626.6 724. 737.1 747.8 812.7 890.7 983.8 1. 09S 1 1.219.9 1 35.4
Ration:fD3C-urrnt Ratio (tiamo? 1.4 2.2 8.0 9.4 3.6 4.5 5.7 6.0 0.5 1.1 2.2 4.0 6.0 8.0 10.1 12.3 14.6Long-torm Debt / Equity 0:100 0:100 0:100 0:100 38:62 80:20 92:1S 96:4 92:18 86:14 80:20 69:31 59:41 49:51 41:59 33:67 26:74 W
O0

CHINA
HEtEI PUOSPH ATE PROJECT
Incremental Cost and Benefit StLieane for FRE Calculations
(millions of 1989 yuan)
______________________--- - - - -- - - --___- -- - - - -- - - ------ -- - ---- ----- --- ---- --- --- ---- --- --- ---- --- ---
DAYUKOU HUAN(MQ.ILING--- -- -- --- -- -- --- -- -- -- --- -- -- --- -- -- ------ --- --------- ------ ------ ----- ------ ------ ------ -----
CAPITAL WORKING PRODUCTION SALES NET CASH CAPITAL WORKING PRODUCTION SALES NET CASH
COSTS CAPITAL COSTS REVENUE FLOW COSTS CAPITAL COSTS REVENUE FLOW…_____________________-------_______________---- --------------------------------- _____-_____-------------------------------_______
1989 30.6 - - - (30.6) 11.9 - - - (11.9)
199C 156.3 - - - t156.3) 77.3 - - - (77.3)
1991 245.7 - - - (2A5.7) 138.0 - - - (138.0)
1992 410.9 - - - (410.9) 185.3 - - _ (185.3)
1993 112.5 - - - (112.5) 40.' - - - (40.7)1994 - 63.5 152.9 268.2 51.8 - 15.7 35.1 90.1 39.3
1995 - 9.5 173.0 335.3 152.8 - 3.6 42.7 114.7 68.4
1996 - 9.5 193.1 402.4 199.8 - 3.3 50.$ 139.3 ?5.3
1997 - - 193.1 602.4 209.3 - - 50.4 139.3 88.9
1998 - - 193.1 402.4 209.3 - - 50.4 139.3 se.9
i999 - - 193.1 402.4 209.3 - - 50.4 139.3 88.9
2000 - - 193r1 402.4 209.3 - - 5O.^ 132.3 88.9 co
2001 - - 153.1 402.4 209.3 - - 50.6 139.3 68.9
2002 - - 193.1 402.4 209.3 - - 50.4 139.3 88.9 1
2003 - - 193.1 402.4 209.3 - - 50.4 139.3 88.9
2004 - - 193.1 402.4 209.3 - - 50.4 139.3 88.9
2005 - - 193.1 402.4 209.3 - - 50.b 139.3 88.9
2006 - - 193.1 402.4 209.3 - - 50.4 139.3 88.9
2007 - - 19S.1 402.4 209.3 - - 50.4 139.3 88.9
2008 - - 193.1 402.4 209.3 - - 50.4 139.3 88.9
2009 - - 193.1 402.4 209.3 - - 50.4 139.3 88.9
2010 - - 193.1 402.4 209.3 - - 30.4 139.3 88.9
2011 - - 193.1 402.4 209.3 - . 50.4 139.3 88.9
2012 - - 193.1 402.4 209.3 - _ 50.4 139.3 88.9
2013 - (82.53 193.1 r02.4 201.8 (22.9) 50.4 139.3 111.8
Return on Investment-14.21 Return on Inveatment-13.1Z
…--------------______________---- - - _-__________ _____~~~~~~~~~~~~~~~~~~~~~~~~~~~~~~~~~~~~~~~~~~~~~~~~~~~~I.

ANNEX 10.1
- 88 - Page 1 of 3
CHINA
HUBEI PHOSPHATE PROJECT
Assumptions Underlying the Economic Analysis
A. General
1. The economic rates of return (ERRs) were calculated on an incrementalbasis for the three fertilizer plants. Prices were expressed in constantJanuary 1989 US dollars. The economic life of phosphate mines was assumed tobe 20 years based on the size of their proven exploitable phosphate reserves.The economic life of downstream fertilizer plants was also assumed to be 20years. The assumptions for the production levels of the plants with andwithout the Project are presented in Table 1 of Annex 8.1. The followingconversion factors, which were provided by Bank economic work, were applied tothe financial prices of nontradeable goods and services to derive theireconomic prices:
Nontradeable items Conversion factor
Unskilled labor 0.6Technical labor 2.0Electricity 3.4Local machinery 1.4Construction 1.3Rail transport 1.5Other 0.7
B. Capital Cost
2. The economic capital cost of each project element expressed inJanuary 1989 prices was obtained from the financial base capital cost after:(a) deducting the duties and taxes on equipment and other items; (b) deductingthe costs of those spare parts that are to be included in the operating costs;and (c) applying conversion factors to nontradeable goods and services foreconomic valuation.
C. Working Capital
3. Incremental economic working capital requirements for each projectelement were derived by comparing goods and services employed in productionwith and without the Project.
D. Economic Benefits
4. Economic benefits of the Project come mainly from two major sources:(a) phosphate fertilizer (MAP and TSP) production utilizing locally availablephosphate rock, pyrites and ammonia; and (b) improved economic efficiency ofproduction through the conversion of low economic-value fertilizers (SSP andABC) to high economic-value fertilizers (MAP and TSP). The economic prices of

AXI'NEX 10.1- 89 - Page 2 of 3
internationally traded products were derived from their latest projectedinternational prices, taking into accounit marine freight from the origin ofexport to China ports, unloading and port handling charges, and inland railfreight to plant sites. Marine freight, estimated from the latest statistics,were assumed to change in line with international energy costs.
5. The projections of the economic prices for each product are given inTable 1 of this Annex. The kev assumptions were:
(a) Monoammonium Phosphate (MAP). Since MAP is not actively traded inthe international market, its economic value was derived from theeconomic value of DAP, TSP and urea, taking into account their rela-tive nutrient contents (MAP 122 N; 52? P205; DAP 18% N: 462 P205; TSP46% P205; urea 462 N).
(b) Triple Superphosphate (TSP). The import rarity price of triplesuperphosphate (TSP) is derived from the price of imported TSP fromthe US Gulf coast, plus freight and bagging costs.
6. Savings in transportation costs are attributed mainly to thereduction of transportation volume because of the higher nutrient content ofMAP and TSP. Potential savings in terms of transportation distances were notconsidered because nf difficulties in measuring them.
E. Operating Costs
7. Tradeable Raw Materials. The economic cost of exportable inputs wasderived by adding to the netback prLces, from exports at the production sites,the inland transportation costs between the production and the plant sites.The netback value of inputs at the production sites was calculated by deduct-ing inland freight between the sites and exporting ports from the FOB exportprices. The economic cost of importable inputs was based on their projectedinternationa' Drices plus marine freight from the origin of export to ports inChina, plus inland i:reight to the plant sites. The economic values of themajor tradeable inputs are given in Table 2 of this Annex. The key assump-tions were:
(a) Coal. Coal is currently exported from China. The economic cost ofthe coal delivered at the plant sites was derived from the netbackfrom export prices.
(b) Fuel Oil. The economic value if fuel oil was based on the netbackprices of fuel oil exports to Singapore. The international price offuel oil was expected to move in line with international crude oilprices, as currently projected by the Bank.
(c) Diesel Oil. Since China is an importer of diesel oil, the economicvalue of diesel oil was derived from the import price from Singaporeplus transportation costs to the plant sites after adjusting forocean losses and insurance.
ANNEX 10.1- 90 - Page 3 of 3
8. Other Nontradeable Items. The economic value of nontradeable inputswas based on their long-term marginal production costs plus inland tranuporta-tion costs adjusted by specific conversion factors. The following assumptionswere made for major nontradeable inputs:
(a) Pyr'tes. Pyrites are not actively traded in the international mar-ket. The pyrites used for the Project cannot be exported economic-ally because of their grade and unfavorable location.
(b) Utilities, Chemicals and Bagging Materials. The economic costs ofother nontradeable items such as utilities and locally purchasedchemicals were derived from their financial costs by applying spe-cific conversion factors.
9. Fixed Costs. The economic coRts of various fixed cost items,including labor, general selling and administrative costs, were based onfinancial costs adjusted by specific conversion factors. Maintenance costswere conservatively assumed at over 8Z of the original acquisition coststhroughout the life of the project.
China DepartmentMarch 1989

CHINA
HUBEI PHOSPHATE PROJECT
Incremental Cost and Benefit StreinMe for ERR Calculations---------------------------- _------------------------------
(1989 U.S.$ million)
DAYUKOU UANGMAILING
CAPITAL WORKING PRODUCTION SALES NET CASH CAPITAL WORKING PRODUCTION SALES NET CASHCOSTS CAPITAL COSTS REVENUE FLOW COSTS CAPITAL COSTS REVENUE FLOW
1989 11.7 - - - (12.7) 4.5 - - - (4.5)1990 59.7 - - - (59.7) 28.8 - - - (28.8)19Si 84.9 - - - (84.9) '7.6 - - - (47.6)1992 145.3 - - - (145.3) 63.9 - - - (63.9)1993 37.2 - - - (37.2) 14.1 - - - (14.1)1994 - 20.5 57.1 98.7 21.1 - 4.6 12.4 30.0 12.81995 - 2.6 63.9 126.2 59.8 - 1.1 15.2 38.9 22.71996 - 2.6 70.6 155.0 81.8 - 1.1 17.9 48.3 29.41997 - - 70.7 158.7 88.0 - - 17.9 49.0 31.11998 - - 70.7 162.4 91.7 - - 17.9 50.0 31.91999 - - 70.8 166.3 95.5 - - 17.9 50.6 32.72000 - - 70.8 170.3 99.5 - - 18.0 51.4 33.52001 - - 70.9 173.5 103.6 - - 18.0 52.0 34.12002 - - 70.9 177.6 106.7 - - 18.0 52.7 34.72003 - - 71.0 180.8 109.8 - - 18.0 53.3 35.32004 - - 71.0 184.2 113 1 - - 18.0 54.0 36.02005 - - 71.1 187.6 116.4 - - 18.0 54.6 36.62006 - - 71.2 191.0 119.9 - - 18.0 55.2 37.22007 - - 71.2 194.6 123.4 - - 18.0 55.9 37.92008 - - 71.3 198.3 127.0 - - 18.0 56.6 38.52009 - - 71.4 202.1 130.7 - - 18.0 57.2 39.22010 - - 71.4 205.9 134.5 - - 18.0 57.9 39.92011 - - 71.5 209.9 138.4 - - 18.0 58.6 40.62v12 - - 71.6 214.0 142.4 - - 18.1 59.3 41.32013 - (25.6). 71.7 218.2 172.1 - (6.6) 18.1 60.0 48.6
Return on Investment-17.92 Return on Investment-14.0Z
…-------------
___ __ __ ___ __ __ ___ __ __ __ ___ __ __ ___ __ __ ___ __ __ __ ___ __ __ ___ __ __ ___ __ __ _,___ __ __ ___ __ __ ___ __ __ __

F4JSEI PHOSPHATE PRMJiT
Net Savinas of Foreion Exchange Over Proiect Life
CU.S.8 million)
1989 1990 1991 1992 1993 1994 1995 1996 1997 1998 1999 2000 2001-13
1989 U,S. 0o larn
Inf lowoWorld Bank loon 1.0 6.5 38.3 52.5 18.7 0.0 0.0 0.0 0.0 0.0 0.0 0.0 0.0Import oubetitution of fartilizers 0.0 0.0 0.0 0.0 0.0 121.4 157.6 196.3 198.8 201.3 203.8 206.4 2,717.9
Total inflow* 1.0 6.5 52.5 18.7 121.4 157.6 1°6.3 198.8 201.3 203.8 206.4 2.717.9
Outf logoForeign capital oxpandituro 1.0 6.5 38.3 52.5 18.7 0.0 0.0 0.0 0.C 0.0 0.0 0.0 0.0Intoerat during conztruction and
commitrant feo on World Bank loan 1.0 1.2 2.8 5.9 8.1 0.0 0.0 0.0 0.0 0.0 0.0 0.0 0.0Intoraot paymenta on Wo,ld Bank loan 0.0 0.0 0.0 0.0 0.0 8.2 7.6 7.0 6.4 5.8 5.2 4.6 17.1World Bank loan repayments 0.0 0.0 0.0 0.0 0.0 3.8 4.0 4.2 4.3 4.5 4.7 4.9 46.5Raw material imports 0.0 0.0 0.0 0.0 0.0 2.9 3.7 4.5 4.5 4.5 4.6 4.6 63.3
Total outflown 2.1 7.7 41.1 58.4 26.9 15.0 15.3 15.6 15.2 14.8 14.4 14.1 126.9
Not cavinga (1.0) (1.2) (2.8) (5.9) (8.1) 106.4 142.4 180.7 183.6 186. 189.4 192.3 2.591.
Cumulative not onvings (1.0) (2.3) (5.1) fi.0) (19.1) 87.3 229.7 410. 594.0( 7805 969.8 1,162.1 3.753.1
Current U.S. Dollar*
Inf IonsWorld Bank loan 1.1 7.2 44.2 63.1 23.4 0.0 0.0 0.0 0.0 0.0 0.0 0.0 0.0Import oubatitution of fortilizers 0.0 0.0 0.0 0.0 0.0 158.1 213.7 277.0 292.0 307.8 324.4 342.1 S,724.2
Total inflown 11 7.2 44.2 63.1 23.4 158.1 213.7 27.0 2.0 307.8 324.4 342.1 5.724.2
Outf l owaForeign capital exponditure 1.1 7.2 44.2 63.1 23.4 0.0 0.0 0.0 0.0 0.0 0.0 0.0 0.0Intareat during conatruction and
commitment fee on World Bank loan 1.1 1.4 3.2 7.1 10.1 0.0 0.0 0.0 0.0 0.0 0.0 0.0 0.0Intoroot payoant. on World Bank loan 0.0 0.0 0.0 0.0 0.0 10.7 10.3 9.9 9.4 8.9 8.3 7.7 S3Z.2World Bank loan repayments 0.0 0.0 0.0 0.0 0.0 5.0 5.4 5.9 6.3 6.9 7.4 8.1 93.6Raw material importo 0.0 0.0 0.0 0.0 0.0 3.8 5.0 6.3 6.6 6.9 7.3 7.6 133.7
Total outfloe 22 8.5 47.4 70.1 33.6 19.5 20.7 22_0 22.3 2.6 23.0 23.4 259.5
Not cavinge (1.1) (l.4 (3.2) (7.11 fl0.1) 138.5 193.0 25.0 269.7 285.1 301.4 318.7 5.464.
Cuoulative not aevingz (1.13 (2.5) (5.73 (12.a8 29 115.6 308.6 53.6 833.3 18.4 1.419.9 1.738.6 7.203.3
x
0>

_ _ _ _ _ _ _ _ _ _ _ _ _ _ _ _ _ _ _ _ _ _ _ _ _ _ _ _ _ _ _ _ _ _ _ _ _ _ _ _ _ _ _ _ _ _ _ _ _ _ _ _ _ _ _ _ _ _ _ _ _ _ _ _ _ _ _ _ _ _ _ _ _ _ _ _ _ _ _ _ _ _ _ _ _ _ _ _ _ _ _ _ _ _ _IIB R D 22 0 9 1 97D o0 100- 12M -,D-0
US S U~~~~~~~~~~~~~~~~~~~~~~~~~~~~~~~~~~~~~~~~~~~~~~~
_akND\FAs~~~~~~ s 5 of Z7 hoir 9( r . S1M n.
_ 5
.J-.. E -' m i Cldosa AM f 6 -S . /
I Iii ~ ~ ~ ~ ~ ~ ~ ~ M C
C ~ ~ ~~ ~"~~~~C'5
C -..-. A.... - / OB~~~~~~~~~~~~~~~~~~~~~~~~~~~~~~)MOCRAT IC 4
ARBBEUBLICJA NAGrOHANISTArI
* [] MerJium Size Nitrogen Plants > 7 20v-~~~~~~~~~~~m 9
~~~~~~~~~~~~~~-J' Z..- C ea~~~~~~~~~~~~~~~~~~~~~~~~~~~~~~~~~~~~~~~~~~~~~~~~~~~~~~~~~~~~~~~~~~~~~~e .
Sf50 ~ ~ ~ ~ ~ ~ ~ ~ ~ ~ ~ ~ ~ ~ ~ ~ ~ ~ ~ ~ ~ ~ ~ ~ ~ ALhOCO ~~~~~~~~~~~~~~~~~~~~~~~~~~~~REPUBLIC
*sOn.aSonoIfln.non Oae Large / Medium Size Phosphole PlSn . . . . . ;Ai
unsSCo SOit Mines u ChTo* CGRG.% lE
r~~ ~ ~ q - _______ . cor - ;B COEE
CHINA
HUBEI PHOSPHATE PROJECTTO BE
CONSTRUCTEDUNDER UNDER
EXISTING CONSeRU THFE PROJECTLarge ize Nitrogen, Plats 5
S i n g le a g Riri s M d iu S i a n- N i t ro g e n P l a n t s 1 20 7A A A Large / Mediam Size Phosphate Plants 0'A.. I4~ot. 2GMS 765 IOD
® ® ® ~~~~~~Phosphate Mines 460 /2 . onnn naS Py,ite Mines ,7a26 IE
Prajet Proinc-3 Major Parts BURM
Roods a Provinc Capitals*5n{ LA PE LS'.
=t== Doable Gauge Railroads Proinc Boudaries 2?., LDM CA C .0I. HLPIE-v-- Sin,gin Googe Railroads letn-aionl Boundaries THAILAND PHILIPPINES/An/A
1000 .-~1
. 120M 130'
OCT03ER 198R

IBRD 20504RCHINA
HUBEI PHOSPHATE PROJECTDAYUKOU PHOSPHATE MINE AND FERTILIZER DEVELOPMENT COMPONENT
PROJECT: EXISTING:( ) Mine Area El o Buildings
Tailing Pond and - RoadsWaste Dumping Areas Railroads
t] !-1 Buildings
Concentrate Slurry Pipeline Prefecture Boundaries
Roads Province Boundaries- - .- International Boundaries
/ 'ZHONG HU, (HO:.. C) To XMadnon/ AIj INlG POND
ADMINISTRATION
EXPLOSIVES STORAGE/ '''\
\ti X \RAIN~~~~~~~7AIING CETEA °e // ' AGIN~~EERS E;UltDING\ \
WASTE AND GYPSUM / x ITMA,NTENANC \\DUMPING AREA B S >I.Nt Y(\ /,' ( ( nSlitU l;WX \_ \3i_ > -\>rvt R ' HUJI RAILROAD STATION
EXISTING ~ ~ ~ ~ ~ ~ ~ ~ ~ ~ ~ ~ ~ ~~~~~FNM MUTI
>~~~~~~~~~~~~~~~~~~~~~~~~~~~~II M HuiiN
0 l 2 1 ) /. \ \ 1 /C-_g/t) \ \
KILOMETERS/ I\ _ /\ _
zc
To J Zaoyan 1 ' '/.
= _ _ . \ V / d~~~~~~~.O~
32' X;longfoy ; DWA99NNo JlRI:
(:ookang X I A N G jC ) Y A N4: NonzhongA techeng S YNGMA RAlt~~~~~~~~~~~~~~~~~~ROAD STATION
'~~~~~~~~~~~~~~~~~~~~~~~~~~~~~PJ '1988 ( 5
I- onz ng Yceg-\
, O~~~Xiooyon2^¢Hp / 1.\<
> e s Xrolecl A,, c (:~~~~~~~~~~~~~~~~~~~~~~~~/P Eu8... r_ ONGLl E , 'SX/J;EP PHOSPHATE MINE
. < \ ~~~~~Zongxiong > 3lig* tVE FKREP OF
Yuan'ng.' KOREA
YIC H E PG , ,5\UeX<;o-l-
Dongyo
\I Yicheng / \\ /- . . 114. .: . . .
Y'd H +h .. ... . .
APRIL 1 988

IBRD 20505R_ MONGOLIA _/ .. To Dawu
DEM
, N re~j~r7g J . tsc. 6FiKOREA..
\ : ',/ S a ! s.:#l -, REP OF/ /'7 ,., / KORFA
- v ^ /1a^; lr77A,, N.7 r, *.,yI
HBI. . P ject Areas
. . .I (qN Z , t 1 i
.~ WfO /. I'
/ /HUANGMAILINGHINE AND ELECTRIC
I/WORKSHOPS\ / I n /~~~~~~~~~~1 ,STING MINE AREA
I I U/ Q~~~~ OWATER TANK| | / I I~~~~ADMINISTRATIVE AND| | / k ~~~~~RESIDENTIAL AREA
I/ENEFICATI0 PLANT/ /A / \
MACNINE AND EECTMICAl PtANI>4>/ / v ~~COMPt[X \ ~
FX | ISUL~~~PHUJRIC AC-ID F"(05PIt ., . -WORKSHOANDS MAP HON"M
I / I GYPSUM STCJRAGE AND
|/ /WWASTE DUMPTN
To Pek,ng CH~5ADMN~RAINEANAILROAD SIDING HUBEI PHOSPHATE PROJECT
CERTILIER EEOMNxO P NN
AMn Area (-7 F: Buildings
1~~~~~~~~~~LN iTiln Pond and PC RoadsZ
WASTE DUMP - W D p Areas Rcil oadrfrrJI sr of r 4 h #7 7; .1^ r .7 .
flY 5 t vwlr ic4............. I I \ 7
Tine dinin ~ ~ ~ ~ ~ 1-0 -DEl uidigs rige
Yf5'.o3c7r. O',,5
-8d 5Qa sleinA of r BoAndaries.¢ewo Toe Huayua/n
TaPeR.,g MapHMIN
VDRAILROADKSIDING HUBEI PHOSPHATE PROJECTGua ngs ui 0 .
B \ ~~~KILOMETERS HUANGMAILING PHOSPHATE MINE AND? <9 < (: ~~~~~FERTILIZER DEVElOPMENT COMPON ENT
/ t \ \5APROJECT: EXISTING:
/ ~ ~ ~ ~ ~ MO~ Ct Da'1. Mine Area O C1 Buildings
A fS ~~~~~PLANT ( - ) Tailing Pond and - RoadsI \ r J} )\ ~~~~~~~~~Waste Dumping AreasRolod
3r30 -cl°313° n iI Buildings _ _ . Bridges
Yongjiozhai c( Rivers
) /t t\ Area of // ~~~~~~~~~~~~~~~~~ Province BoundariesX } § \ t/<EA -- ~~~~~~~~~~~~~~~~~--- International Boundaries
0 j ) Dengdea XU ' !~~~~~o 2
0@ f/ KILOMETERS
APRIL I1988