for distributors, strategic pricing is red · pdf file for distributors, strategic pricing...
TRANSCRIPT
www.advanceddistributionsoftware.com
For Distributors, Strategic Pricing is Red HotAn Advanced Distribution Partners Whitepaper
by Brent R. GroverEvergreen Consulting, LLC
As Paris Hilton might say about strategic pricing, “That’s hot!”. The current (August 2010) number of the prestigious McKinsey Quarterly features the article Build a Better Pricing Infrastructure. The article tagline reads, “Well-managed companies already recognize the critical role pricing plays in driving performance. A foundation that underpins excellence in pricing is the key to realizing its potential.”
For wholesale distributors, pricing is far more than a routine tactical process–the way distributors choose to handle pricing is deeply intertwined with their company’s selling function and with all business systems: purchasing, operations, finance and of course information processing.
Introduction
A comprehensive, fully-integrated business solution will help forward-thinking companies balance the demands of extended supply chains and move products more efficiently to increase sales, improve fill rates, and decrease costs.
Brent Grover is a Fellow of the NAW Institute for Distribution Excellence and has written six best-selling wholesale distribution management books for NAW, including Strategic Pricing for Distributors. Grover’s career includes working as a CPA at an international firm, teaching the entire accounting curriculum at a leading management school, and 20+ years leading an innovative and renowned wholesale distribution firm. He is a board member at several companies as well as HIDA (Health Industry Distribution Association) and the Paper and Plastics Education Research Foundation. Grover is a Past Chairman of the NPTA (National Paper Trade Association) board.
He founded Evergreen Consulting, LLC in 2001 to provide profitable growth advice exclusively to firms in the wholesale distribution channel. Grover’s firm conducts strategic pricing projects for high-profit companies in numerous trade lines. His personal practice areas are: strategic pricing, acquisitions assistance and strategic planning.
This whitepaper was commissioned by Advanced Distribution Partners (ADP), a group of six elite Microsoft partners who specialize in ultra-sophisticated distribution software products. ADP (www.advanceddistributionsoftware.com) is focused on delivering world class Advanced Distribution solutions built on software from Microsoft Dynamics and TVH Consulting.
The Advanced Distribution Partners support multi-channel distributors and retailers by offering industry expertise and sophisticated software solutions to help streamline processes, improve customer service and better manage the supply chain. As a powerful group of dedicated professionals, we are able to offer the distribution industry something different – results. We provide top-of-the-line software solutions, coupled with a deep understanding of multi-channel distribution to deliver valuable business transformations.
This paper is about why even highly profitable wholesale distributors often under-manage the critically important pricing function. Grover concludes that capable management teams that excel in growing sales, controlling costs and turning assets frequently fail to provide pricing leadership, resulting in inconsistent pricing and missed profit opportunities equaling 2% of sales or more. He demonstrates what makes strategic pricing projects meet their goals of sustained profit improvement.
ADP Whitepaper “Strategic Pricing for Wholesale Distributors: Optimize Your Margins” Page | 2© 2010 Evergreen Consulting, LLC www.advanceddistributionsoftware.com
How are distributors doing compared to last year (2009) and compared to their expectations for 2010?
For most wholesale distributors, the ‘great recession’ started in the third quarter of 2008. As I write this, 2010 is coming to its end and American and Canadian distributors have marked the second anniversary of the longest and deepest downturn their leaders and managers have ever experienced. Government economists noted recently that “the recession officially ended in July 2009.” Few or none of our distribution channel clients would agree.
Many distributors report that they are doing better than 2009, and that the results for 2010 are about as expected. Typically, 2009 was so bad that it would have been a disaster if 2010 didn’t at least bounce off the bottom. Meeting plan for 2010 has not been much of an achievement due to the low expectations for this year. Forget comparisons with 2009.
Looking back on the ‘salad days’ of 2003-2007, which many leaders seemed to think would never end, a good question might be “When will our company’s results get back to 2007? 2006? 2005?”
What does a high profit distributor look like?Why do some companies in our industry consistently make more money than others?
For most wholesale distributors, the ‘great recession’ started in the third quarter of 2008. As I write this, 2010 is coming to its end and American and Canadian distributors have marked the second anniversary of the longest and deepest downturn their leaders and managers have ever experienced. Government economists noted recently that “the recession officially ended in July 2009.” Few or none of our distribution channel clients would agree.
Wholesale distribution is a risky business: thin margins, low barriers of entry and exit, not much room for error. To attract capital from investors and lenders, the return on investment must be attractive relative to perceived risk.
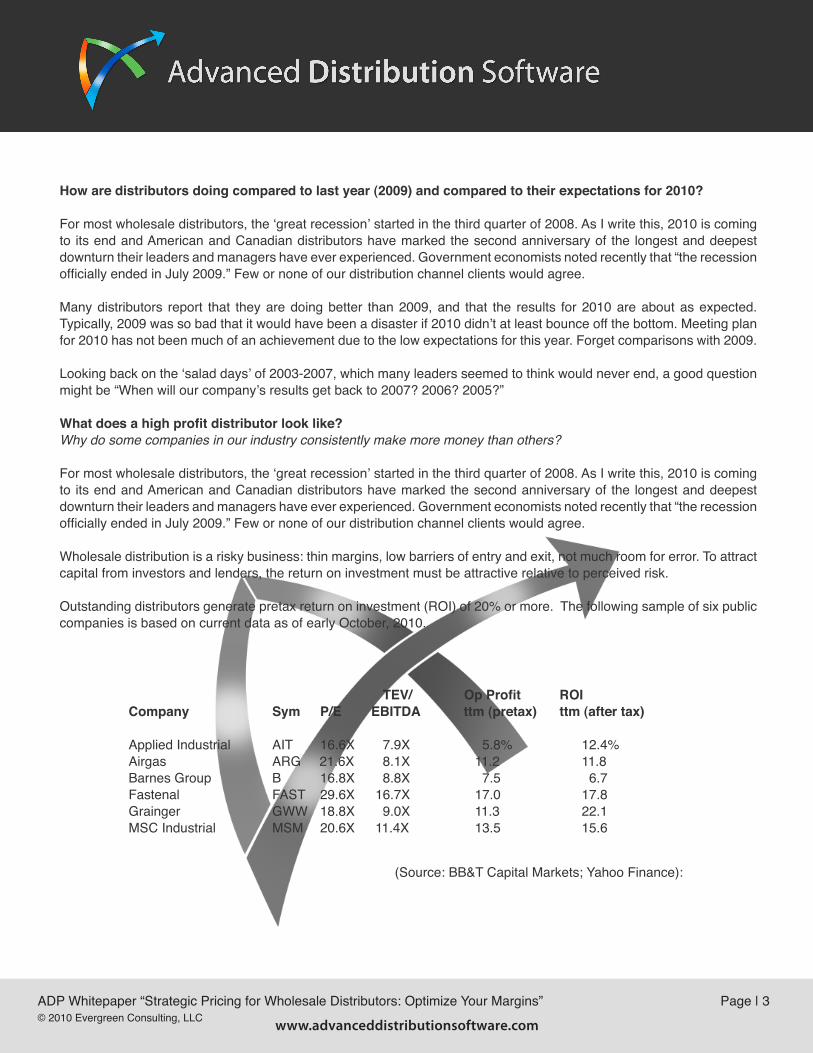
Outstanding distributors generate pretax return on investment (ROI) of 20% or more. The following sample of six public companies is based on current data as of early October, 2010.
(Source: BB&T Capital Markets; Yahoo Finance):
TEV/ Op Profit ROICompany Sym P/E EBITDA ttm (pretax) ttm (after tax)
Applied Industrial AIT 16.6X 7.9X 5.8% 12.4%Airgas ARG 21.6X 8.1X 11.2 11.8Barnes Group B 16.8X 8.8X 7.5 6.7Fastenal FAST 29.6X 16.7X 17.0 17.8Grainger GWW 18.8X 9.0X 11.3 22.1MSC Industrial MSM 20.6X 11.4X 13.5 15.6
ADP Whitepaper “Strategic Pricing for Wholesale Distributors: Optimize Your Margins” Page | 3© 2010 Evergreen Consulting, LLC www.advanceddistributionsoftware.com
The price-earnings (P/E) ratios shown for the large companies in this sample are the current price of the stock divided by analyst expectations for 2010 after-tax earnings. The total enterprise value (TEV) is the value of the company’s stock plus interest-bearing debt, divided by expected 2010 cash flow (EBITDA = earnings before taxes, interest, non-cash charges).
The operating profit is pretax return on sales (ROS) based on trailing 12 months earnings (ttm); after tax return on investment (ROI) is based on trailing 12 months earnings.
Lessons learned from these companies: well-managed distributors make money even in poor economic conditions. The four companies with pretax return on sales (ROS) percentages of 11.2% and higher all enjoy above-market P/E ratios. Even the two weaker performers, in terms of operating profit %, indicate a total enterprise value of at least 7.9 times EBITDA.
Note that the after tax return on investment of all but one of these companies range from about 12% to over 22%, during a period of great economic stress.
Comparing performance of privately-owned wholesale distributors is more difficult however good benchmarking information is available for many lines of trade. Most trade associations sponsor annual benchmarking performance reports, the most notable of which is the Performance Analysis Report (“PAR Report”) prepared by Performance Planning Group of Boulder, CO. Our firm regularly evaluates PAR reports for our clients in a variety of trade lines, carefully noting the results of the ‘top quartile performers’ (top 25% of companies as ranked by ROI) against the median company in each industry. We also compare the performance of companies in various lines of trade.
We are looking for the root causes of high performance, both on an individual company basis over time as well as across different industries. Why do some companies regularly outperform their peers in the same business? Why do other firms perform well only when economic conditions are strong but fall back to mediocre performance during lower points in the economic cycle?
Performance metrics such as Key Performance Indicators (KPIs) and “Balanced Scorecards” are wonderful tools. The great value of using the right performance metrics is to focus management on a small number of the most meaningful measures that are leading indicators of future performance – as opposed to merely being interesting observations about prior performance. A truly effective weekly management meeting should start with the performance metrics and a laser-beam discussion of what is being done to get or keep the company on track.
The KPIs also provide clues about the differences between high performance and mediocre performance. Is rapid revenue growth by itself a dependable profit indicator if the incremental sales are low margin small orders to demanding customers with weak credit and a poor record of vendor loyalty? Are high margin percentages alone a reliable profit indicator if they are a result of small orders of special stock items to slow-growth customers with a high cost to serve? Is low operating cost in isolation a valid profit indicator if it is the aftermath of careless cost cutting, poor retention of quality people, inadequate customer service, high customer turnover and failure to invest in needed staff and equipment? Is high asset turnover in isolation a true profit indicator if the company experiences low inventory fill rates, expensive emergency shipments and loses profitable business due to unrealistically tight credit policies?
ADP Whitepaper “Strategic Pricing for Wholesale Distributors: Optimize Your Margins” Page | 4© 2010 Evergreen Consulting, LLC www.advanceddistributionsoftware.com
Consistently outstanding financial performance requires a careful balance of the functions of the distribution business rather than a handful of silver bullets. Although it’s more fun to have the wind behind you, the toughest test of management skill is guiding a company through difficult economic conditions with good results. Observing and working with distributors makes it clear that some KPIs are more profound profitability indicators than others. For example, we do not see top quartile companies with weak Personnel Productivity Ratios (PPRs). Our work with Customer Profitability Analysis (CPA) demonstrates that order size is a prime determinant of customer profitability. Indeed, there is a positive correlation between order size and PPR. Although asset turnover is critical to cash flow, there is not necessarily a strong alignment between asset management and profitability. We don’t see an obvious correlation between sales compensation method and profitability.
What about pricing?
Why do even the top performers need to improve the way they do pricing? What is “strategic pricing” and how might it be different from what we are doing now?
Our annual surveys, management interviews, benchmarking reports and client projects often indicate that top-quartile firm managers are dissatisfied with their pricing processes and that there is much room for improvement in their pricing results.
Our surveys and research also indicate a strong positive correlation between profitability, management satisfaction with the pricing function and less pricing autonomy by the field sales and inside sales support functions. Companies with high or very high levels of pricing autonomy struggle with managing pricing in areas such as inability to pass along cost increases from vendors and difficulty in getting sales people to follow pricing guidelines including suggested resale prices.
Nearly all company leaders agree that their pricing processes do not take enough advantage of the tools in their ERP system’s pricing modules and that they have an excessive number of special price records. A frequently heard comment is that when the ERP system was set up originally the information systems experts were instructed to make sure the new system’s pricing function emulated the company’s traditional manual pricing methods.
A root cause of the high degree of sales pricing autonomy in distribution businesses is the traditional independence of sales people whose compensation is largely based on sales commissions. There are several reasons for the independence, not the least of which is management respect for the right of the commissioned sales rep to have some control over his or her income stream. The law of supply and demand is also at work. Excellent sales producers are few and need for them is high, giving sales people the upper hand in the quest for pricing autonomy.
ADP Whitepaper “Strategic Pricing for Wholesale Distributors: Optimize Your Margins” Page | 5© 2010 Evergreen Consulting, LLC www.advanceddistributionsoftware.com

Commission-based sales compensation is an obstacle for pricing optimization for several reasons. Management perceives that the interests of sales people and the company are closely aligned, and that sales people will work to get the best price to generate more commissions. Sales rep behavior does not necessarily follow this path; sales reps adapt to the fact that their income is maximized by generating the most gross margin dollars as opposed to squeezing out the highest possible gross margin percentage out of each order and customer. The lifetime value of the customer to the sales rep is generating the most sales dollars. In a distribution business driven by repeat sales, risking fragile customer relationships by haggling over prices is dangerous. The sales people learn that they are better off investing their time in looking for new business rather than risking antagonizing existing customers.
Sales rep interest in generating more commissions may be better met by negotiating with vendors or with their own purchasing department for a lower cost rather than pushing their customers for higher prices.
Highly successful commissioned sales people sometimes lose their thirst for more income in favor of seeking more control over their personal time, and they may not be willing to invest much effort in hard bargaining.
We find that sales people on commission are often lightly managed, as evidenced by the span of control of the sales managers (many sales reps assigned to each manager) and by the ways the sales managers use their time. The tendency is to spend the most time working with new sales reps and with people in turnaround situations, leaving the sales compensation plan to “manage” the more experienced reps. Sales managers charged with authority to monitor and approve exception pricing often admit that they rarely overturn or even challenge the staffs pricing decisions, and that they often don’t even look at the pricing exception and other management reports available for that purpose.
In extreme cases, sales people have access to the pricing database and are able (or even responsible for) entering exception pricing into the ERP system. We have observed companies where inside sales and/or customer service staff are instructed by sales reps not to quote pricing to the customers in the rep’s territory.
The way distributor price lists are used (or not used) indicates the functionality of the pricing system. Suggested prices, called a variety of names such as book price, bracket pricing, column pricing, are often defensive. Management determines pricing that is high enough to preclude ever leaving ‘money on the table’. New sales people quickly learn that quoting those prices is a good way to alienate prospective customers. They develop their own methods for setting prices, based on their success with their own accounts or what they learn from experienced sales reps. Typical anecdotal pricing information is “those are 20% items” or “always quote low against that competitor.”
Our analysis of pricing for the same item quoted to customers by various sales people indicates clustering of margins or discounts favored by individual reps for that group of products. The reps’ individual pricing tendencies can be observed by preparing a scatter plot, diagramming the margin for the most recent purchases against the customer’s total volume with the distributor. Using different colors for each sales territory shows the clustering effect.
Across-the-board discounting is another indication of dysfunctional pricing. Due to inadequate flexibility in the pricing module, or possibly just as a shortcut, a customer may be granted a % discount on all items in a given product class, brand or from a particular manufacturer. In extreme cases the customer is given an across-the-board % discount on every item in the catalog. When competitive situations occur on a specific item or group of items, the customer may demand (and receive) on additional discount on other items as well.
ADP Whitepaper “Strategic Pricing for Wholesale Distributors: Optimize Your Margins” Page | 6© 2010 Evergreen Consulting, LLC www.advanceddistributionsoftware.com
Distributors may use list price less discount, cost-plus, cost-margin or a combination of methods to set pricing. Although each method has its merits and disadvantages, we prefer pricing based on value received by the customer and not based on product cost to the distributor. One of the pitfalls of sales commissions based on percentage of gross margin dollars is the tendency of sales reps to focus on the cost of the product rather than the value of the product or service to the customer. Ideally the sales rep need not know the product cost at the time pricing is determined.
Better yet, sales reps need not waste so much of their time doing clerical pricing work. Clerical tasks are not the highest and best use of precious selling time. The pricing for smaller customers on less important items can be set automatically by reference to the default or bracket pricing (I hesitate to mention ‘price book pricing’ due to the negative connotation of that expression as being too high to quote to a customer). Properly done, default pricing is based on the customer’s segment, the volume of business the customer does with the distributor and the customer’s sensitivity to the item. The result is that the customer is quoted a price which is comparable to what similar customers pay for the same item or items like it. The customer receives the quote without delay. The customer receives an accurate invoice. The sales rep need not get involved.
When sales reps are truly integral to the pricing process, such as with major accounts and with items that are very important to their customer (sensitive items), the sales situation makes the transition from selling to negotiating. To be successful with price negotiations, sales professionals need to know true market pricing: what similar customers (segment and size) with comparable sensitivity to the item actually pay for the item or for items like it. The true market information provided by strategic pricing analysis is essential to a profitable outcome from the negotiation.
In other words, pricing is consistent. A strong pricing foundation and structure are the essence of strategic pricing. Pricing outliers (customers paying less than comparable others pay) are identified and gradually corrected, profit leaks are located and fixed, and profit opportunities are found and acted upon.
Strategic pricing at its best is a system of sustainable margins and continuous improvement, implemented and supported by the management and sales teams working together. What it is not is merely an academic analytical exercise or a “one-shot deal”.
Why does a small change in margin % cause such a large change in company profits?
The Distribution Strategic Profit Model is a simple but elegant framework for showing the interaction of the three levers of distributor ROI: return on sales, asset turnover and leverage. In turn, each of the three levers has its own components. Management performance can be evaluated on each of the three levers, and its components, but they aren’t equal in importance nor do they work independently.
Together, the three levers operate to multiply the profit power (ROI) of subtle improvements made by management, much as a system of gears multiplies mechanical advantage. For example, asset turnover (sales divided by assets) for most distributor lines of trade is in the range of 3:1 or 4:1. Asset turnover multiples return on sales (pretax income divided by sales) to determine return on assets (sometimes called ‘RONA’, this is pretax income divided by assets). If return on sales is 3%, and asset turnover is 4:1, return on assets is 12%.
ADP Whitepaper “Strategic Pricing for Wholesale Distributors: Optimize Your Margins” Page | 7© 2010 Evergreen Consulting, LLC www.advanceddistributionsoftware.com
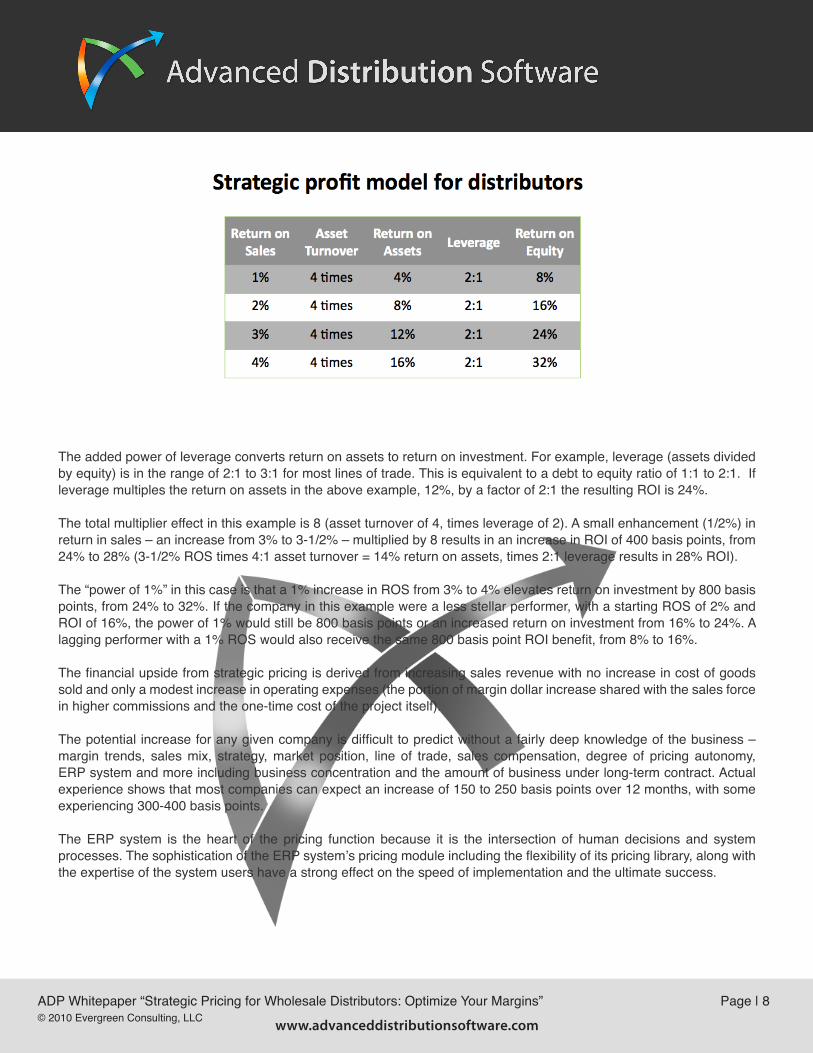
The added power of leverage converts return on assets to return on investment. For example, leverage (assets divided by equity) is in the range of 2:1 to 3:1 for most lines of trade. This is equivalent to a debt to equity ratio of 1:1 to 2:1. If leverage multiples the return on assets in the above example, 12%, by a factor of 2:1 the resulting ROI is 24%.
The total multiplier effect in this example is 8 (asset turnover of 4, times leverage of 2). A small enhancement (1/2%) in return in sales – an increase from 3% to 3-1/2% – multiplied by 8 results in an increase in ROI of 400 basis points, from 24% to 28% (3-1/2% ROS times 4:1 asset turnover = 14% return on assets, times 2:1 leverage results in 28% ROI).
The “power of 1%” in this case is that a 1% increase in ROS from 3% to 4% elevates return on investment by 800 basis points, from 24% to 32%. If the company in this example were a less stellar performer, with a starting ROS of 2% and ROI of 16%, the power of 1% would still be 800 basis points or an increased return on investment from 16% to 24%. A lagging performer with a 1% ROS would also receive the same 800 basis point ROI benefit, from 8% to 16%.
The financial upside from strategic pricing is derived from increasing sales revenue with no increase in cost of goods sold and only a modest increase in operating expenses (the portion of margin dollar increase shared with the sales force in higher commissions and the one-time cost of the project itself).
The potential increase for any given company is difficult to predict without a fairly deep knowledge of the business – margin trends, sales mix, strategy, market position, line of trade, sales compensation, degree of pricing autonomy, ERP system and more including business concentration and the amount of business under long-term contract. Actual experience shows that most companies can expect an increase of 150 to 250 basis points over 12 months, with some experiencing 300-400 basis points.
The ERP system is the heart of the pricing function because it is the intersection of human decisions and system processes. The sophistication of the ERP system’s pricing module including the flexibility of its pricing library, along with the expertise of the system users have a strong effect on the speed of implementation and the ultimate success.
ADP Whitepaper “Strategic Pricing for Wholesale Distributors: Optimize Your Margins” Page | 8© 2010 Evergreen Consulting, LLC www.advanceddistributionsoftware.com

What can I do to make my company’s pricing less chaotic and more consistent?
The chaotic nature of distribution pricing is a function of large number of customers, products, and transactions as well as the number of people involved in the pricing decision-making process. The richest opportunities for margin improvement from strategic pricing are in the companies with the greatest numbers of customers/products/transactions and the weakest systems. The more tightly managed businesses present less opportunity, however huge numbers of items, customers and transactions can overwhelm even the most disciplined management teams.
Consistency is a primary objective of strategic pricing. Companies that designate a strong manager as pricing coordinator achieve superior results. This may or not be a full-time responsibility depending on the company. This person should not be a new hire in most cases; it is best if the pricing coordinator has a working knowledge of all facets of the business, including being a power user of the information system. The pricing coordinator should be known and respected by the people in the sales organization but it is strongly preferred that this individual report to someone outside of the sales function, such as marketing if that is a discrete function at the company.
Another objective of strategic pricing is to establish a solid foundation and structure for routine pricing decisions. The McKinsey article referred to previously states, “...one distribution company, for example, didn’t even have the term “standard pricing” in its vocabulary–instead, it used “exception pricing” or “non-exception pricing” to describe all of its deals.” The strong foundation includes default pricing that is effective for the vast majority of routine pricing situations. The proper use of special price authorization records is for exception pricing, mostly for larger customers on their most important (sensitive) items. The well-designed pricing library contains only a fraction of the massive number of special price records found at typical distribution companies.
Training the sales staff to make highest and best use of their selling time helps to reduce the chaotic nature of distribution by limiting the number of people involved in routine pricing decisions. Fewer “touches” improves consistency, reduces errors and provides faster response to customers, resulting in higher customer satisfaction and fewer lost orders.
An investment in the information system pricing functionality can bring up-to-the-minute pricing information to the sales team in the field as well as the support staff. The capabilities can include accessing pricing for established customer / item combinations as well as look-ups for “on the fly” quotes to new customers or customers buying an item for the first time. Besides speed of response, a robust pricing process can enable the staff to quote the same (correct!) price to a multichannel commerce customer who buys different ways: outside sales, inside sales, web ordering, counter sales, direct contact, catalog or even at a kiosk.
The following exhibit is from the landmark article The Power of Pricing by Marn, Roegner and Zawada published in the McKinsey Quarterly in 2003. This article explains how “pocket pricing”, the ultimate price paid by the buyer, starts with the manufacturer’s list price which is reduced to a series of discounts. Most of these discounts are quite familiar to wholesale distributors.
ADP Whitepaper “Strategic Pricing for Wholesale Distributors: Optimize Your Margins” Page | 9© 2010 Evergreen Consulting, LLC www.advanceddistributionsoftware.com
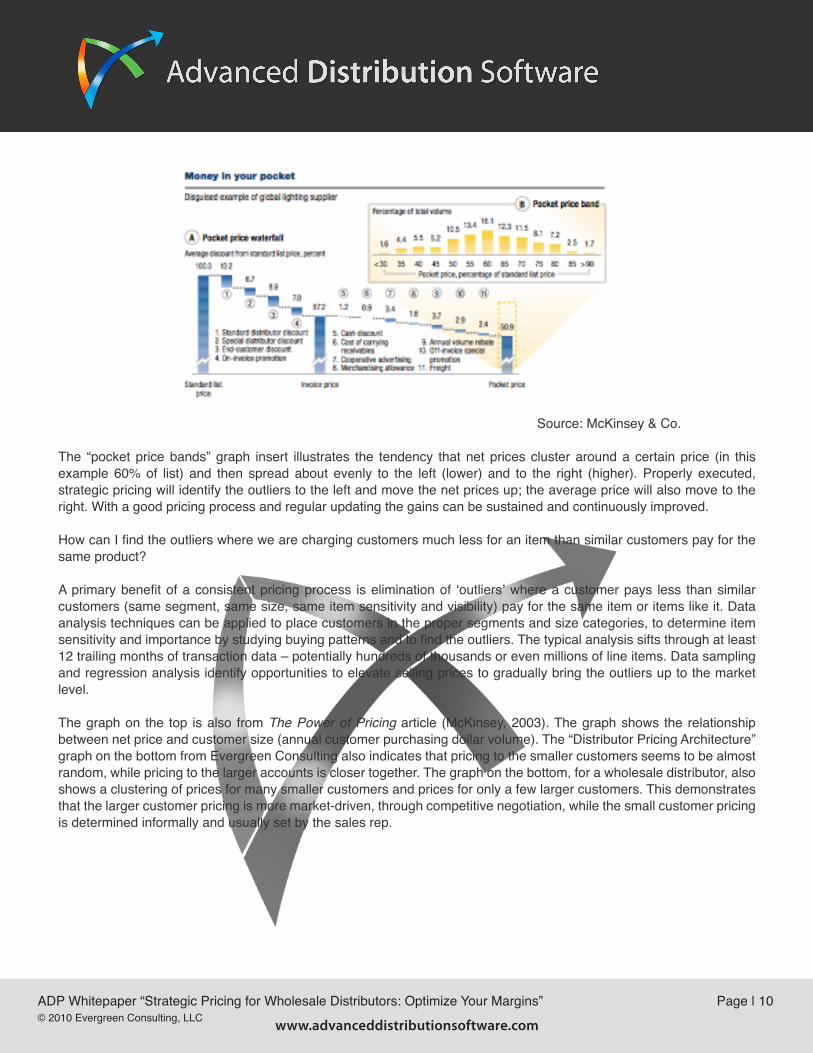
Source: McKinsey & Co.
The “pocket price bands” graph insert illustrates the tendency that net prices cluster around a certain price (in this example 60% of list) and then spread about evenly to the left (lower) and to the right (higher). Properly executed, strategic pricing will identify the outliers to the left and move the net prices up; the average price will also move to the right. With a good pricing process and regular updating the gains can be sustained and continuously improved.
How can I find the outliers where we are charging customers much less for an item than similar customers pay for the same product?
A primary benefit of a consistent pricing process is elimination of ‘outliers’ where a customer pays less than similar customers (same segment, same size, same item sensitivity and visibility) pay for the same item or items like it. Data analysis techniques can be applied to place customers in the proper segments and size categories, to determine item sensitivity and importance by studying buying patterns and to find the outliers. The typical analysis sifts through at least 12 trailing months of transaction data – potentially hundreds of thousands or even millions of line items. Data sampling and regression analysis identify opportunities to elevate selling prices to gradually bring the outliers up to the market level.
The graph on the top is also from The Power of Pricing article (McKinsey, 2003). The graph shows the relationship between net price and customer size (annual customer purchasing dollar volume). The “Distributor Pricing Architecture” graph on the bottom from Evergreen Consulting also indicates that pricing to the smaller customers seems to be almost random, while pricing to the larger accounts is closer together. The graph on the bottom, for a wholesale distributor, also shows a clustering of prices for many smaller customers and prices for only a few larger customers. This demonstrates that the larger customer pricing is more market-driven, through competitive negotiation, while the small customer pricing is determined informally and usually set by the sales rep.
ADP Whitepaper “Strategic Pricing for Wholesale Distributors: Optimize Your Margins” Page | 10© 2010 Evergreen Consulting, LLC www.advanceddistributionsoftware.com
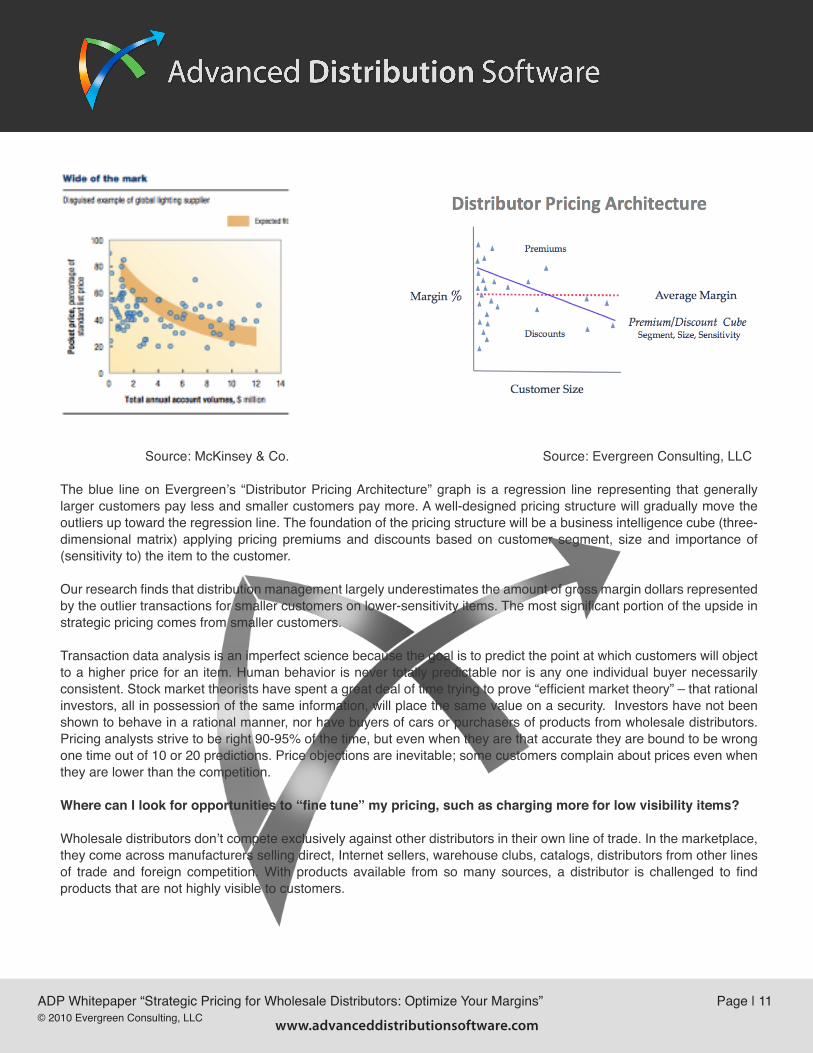
Source: McKinsey & Co. Source: Evergreen Consulting, LLC The blue line on Evergreen’s “Distributor Pricing Architecture” graph is a regression line representing that generally larger customers pay less and smaller customers pay more. A well-designed pricing structure will gradually move the outliers up toward the regression line. The foundation of the pricing structure will be a business intelligence cube (three-dimensional matrix) applying pricing premiums and discounts based on customer segment, size and importance of (sensitivity to) the item to the customer.
Our research finds that distribution management largely underestimates the amount of gross margin dollars represented by the outlier transactions for smaller customers on lower-sensitivity items. The most significant portion of the upside in strategic pricing comes from smaller customers.
Transaction data analysis is an imperfect science because the goal is to predict the point at which customers will object to a higher price for an item. Human behavior is never totally predictable nor is any one individual buyer necessarily consistent. Stock market theorists have spent a great deal of time trying to prove “efficient market theory” – that rational investors, all in possession of the same information, will place the same value on a security. Investors have not been shown to behave in a rational manner, nor have buyers of cars or purchasers of products from wholesale distributors. Pricing analysts strive to be right 90-95% of the time, but even when they are that accurate they are bound to be wrong one time out of 10 or 20 predictions. Price objections are inevitable; some customers complain about prices even when they are lower than the competition.
Where can I look for opportunities to “fine tune” my pricing, such as charging more for low visibility items?
Wholesale distributors don’t compete exclusively against other distributors in their own line of trade. In the marketplace, they come across manufacturers selling direct, Internet sellers, warehouse clubs, catalogs, distributors from other lines of trade and foreign competition. With products available from so many sources, a distributor is challenged to find products that are not highly visible to customers.
ADP Whitepaper “Strategic Pricing for Wholesale Distributors: Optimize Your Margins” Page | 11© 2010 Evergreen Consulting, LLC www.advanceddistributionsoftware.com
Customers are aware of the market pricing of items that are important to them, especially those products bought often and those that make up the largest portion of their total spend. Data analytics can review customer purchasing patterns, and the buying habits of similar customers, to identify the customer favorites and the most popular items for a customer segment.
Customers also know pricing for items that are heavily advertised, especially promotional items. Distribution managers who closely follow their line of trade monitor competition and can pinpoint the high visibility items.
Distributors often miss the chance to tweak the list prices of low visibility items. These fine adjustments to internally generated list prices, or even to manufacturers’ suggested list prices, can accumulate into surprisingly large margin increases.
What other sources of potential revenue am I overlooking? Can we recover more freight costs? Are we wasting money on unnecessary cash discounts or procurement card fees? Are we overlooking the advantages of add-on invoice charges?
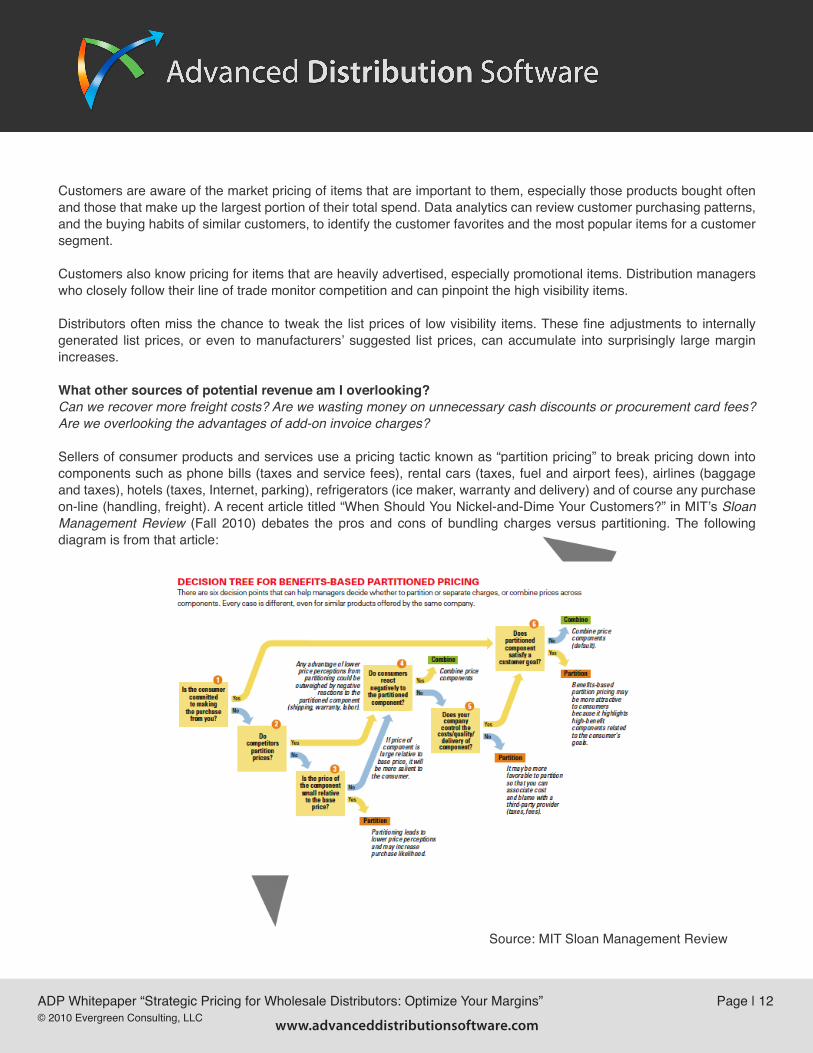
Sellers of consumer products and services use a pricing tactic known as “partition pricing” to break pricing down into components such as phone bills (taxes and service fees), rental cars (taxes, fuel and airport fees), airlines (baggage and taxes), hotels (taxes, Internet, parking), refrigerators (ice maker, warranty and delivery) and of course any purchase on-line (handling, freight). A recent article titled “When Should You Nickel-and-Dime Your Customers?” in MIT’s Sloan Management Review (Fall 2010) debates the pros and cons of bundling charges versus partitioning. The following diagram is from that article:
Source: MIT Sloan Management Review
ADP Whitepaper “Strategic Pricing for Wholesale Distributors: Optimize Your Margins” Page | 12© 2010 Evergreen Consulting, LLC www.advanceddistributionsoftware.com
Most wholesale distributors are not accustomed to the practice of price partitioning. Many fear that being the only distributor to invoice even small add-on charges will alarm customers and cause them to buy elsewhere. The energy crisis in the early ‘70s caused some distributors to tack on an “energy surcharge” for a few months. A few bold companies morphed that add-on into a “handling charge” that is still in place over 30 years later. Due to the enormous number of transactions each year, even a few dollars added to each invoice for most customers makes a huge difference in company profits.
Considerable study of cash discounts for prompt payment indicates that the discounts don’t cause much change in customer payment behavior, especially considering the annualized cost (giving a customer a 1% discount for paying 20 days faster is equivalent to borrowing money at an 18% annual rate). Cash discounts, generally poorly managed and expensive to account for, are another example of fear that customers will defect to competitors who offer better payment terms.
Credit card fees, averaging 2-3% of sales for most distributors, are an excellent example of tracking cost to serve customers. The merchant agreement between the distributor and the credit card issuers may preclude a specific up-charge to credit card users. However, distributors may take the card fees into account when setting the overall price level for customers who use credit cards. The bottom line effect is especially significant because many distributors earn less than 2% return on sales.
Freight cost recovery is a very large profit opportunity for many distributors, particularly those who make heavy use of parcel carriers and other common carriers for outbound shipments. The tactics to pass along both outbound and inbound freight to customers are many and could be the main subject of another whitepaper.
Are we making good use of the power of our ERP system’s pricing module? What can we do to take best advantage of what we already have?
There are many good ERP systems on the market for wholesale distributors of all sizes. Most of the enterprise systems have flexible pricing modules able to handle at least some of the demands of strategic pricing. Although the small number of remaining custom-written legacy systems from the 1970s have limited pricing options, most of the ERP packages for smaller distributors do have adequate pricing capabilities.
A line of trade specific ERP software package, such as a system designed to meet the particular needs of one type of distributor, may be so highly specialized that the pricing module is inflexible.
The newest enterprise systems, developed for general wholesale distribution use, as opposed to a specific line of trade, tend to be the most flexible. For example, some packages have independent design layers enabling customization of each layer. Another newer capability is the creation of “roles” for various types of knowledge workers, enabling access to specific functions for each worker.
As a rule, the popular ERP systems have pricing libraries arranged in a hierarchy starting with specific customers and gradually broadening to include all customers. The system searches for a pricing record for a specific customer-item combination, and then seeks pricing records for groups of customers and groups of items. The systems vary in their flexibility in creating price lists for default pricing, i.e., the price to be applied when there is no existing special pricing record. One of the objectives of strategic pricing is to reduce the large number of special pricing records found in most systems.
ADP Whitepaper “Strategic Pricing for Wholesale Distributors: Optimize Your Margins” Page | 13© 2010 Evergreen Consulting, LLC www.advanceddistributionsoftware.com
It is an easy task to download 12 or more trailing months of transaction records and other data needed for strategic pricing analysis. It is also fairly simple to write a small program to upload strategic pricing recommendations directly into the pricing module.
A ‘blue sky’ goal for strategic pricing is to make established pricing for active customers, as well as for ‘on the fly’ (new customers or customers buying an item for the first time) accessible to sales people at any time, no matter where they are.
How can we deploy 21st century technology to make our pricing function more strategic?
The convergence of information technology and telecommunications access into one seamless system is already upon us. Sales people will need to access pricing information no matter where they are using smart phones, tablets or laptops. The strategic pricing objectives of consistent pricing and making true market value pricing instantly available are within reach.
Another emerging technology, “Software As A Service” (SAAS) is enabling companies to run software applications hosted by outside providers. For example, a distributor’s customer profitability analysis (CPA) information can be hosted by a third party and made available to the distributor’s personnel on the Web. Another third party, the strategic pricing analyst, can utilize the customer profitability analysis data to provide pricing recommendations on the Web. Distributor personnel can obtain current pricing information for active and new customers on their smart phone, tablet or laptop from anywhere in the world.
How can we translate the value we deliver to our customers into profits for our company?
In conclusion, pricing is the last under-managed function remaining to be tackled by wholesale distribution leaders. The sustainable upside in gross margin percentages is enough to turn mediocre performers into top quartile companies, and to move top quartile firms into a new era of capital accumulation and profitable growth. Even struggling distributors have an opportunity to get back into the game.
Brent R. Grover can be contacted at the Evergreen Consulting, LLC (www.evergreen-consulting.com) office in Cleveland at (216) 360-4600 or at [email protected].
ADP Whitepaper “Strategic Pricing for Wholesale Distributors: Optimize Your Margins” Page | 14© 2010 Evergreen Consulting, LLC www.advanceddistributionsoftware.com