for lithium-ion batteries by raman and ir
TRANSCRIPT
Research Collection
Doctoral Thesis
In Situ Characterization of Electrode Materials for Lithium-IonBatteries by Raman and IR Microscopy
Author(s): Lanz, Patrick
Publication Date: 2014
Permanent Link: https://doi.org/10.3929/ethz-a-010346840
Rights / License: In Copyright - Non-Commercial Use Permitted
This page was generated automatically upon download from the ETH Zurich Research Collection. For moreinformation please consult the Terms of use.
ETH Library

DISS. ETH NO. 22294
IN SITU CHARACTERIZATION OF ELECTRODE MATERIALS FOR LITHIUM-ION BATTERIES BY RAMAN AND IR
MICROSCOPY
A thesis submitted to attain the degree of
DOCTOR OF SCIENCES of ETH ZURICH
(Dr. sc. ETH Zurich)
presented by
PATRICK LANZ
MSc ETH Chemistry, ETH Zurich
born on 23 November 1985
citizen of
Walterswil BE
accepted on the recommendation of
Prof. Dr. P. Novák
Prof. Dr. M. Kovalenko
2014

II

III
To my family

IV

V
Wenn eine Idee am Anfang nicht absurd klingt, dann gibt es keine Hoffnung für sie.
(If at first an idea does not sound absurd,
then there is no hope for it)
Albert Einstein

VI

VII
Acknowledgements
First and foremost I would like to thank my thesis supervisor Prof. Petr Novák for giving me the opportunity to work in his group. I especially appreciate the numerous stimulating and fruitful scientific discussions and I am very grateful that he always made time for me and constantly pro-vided valuable experimental insight and guidance. I was inspired by his enthusiasm and greatly profited from his detailed knowledge of electrochemistry.
I would also like to express my gratitude to all members, past and present, of the Electrochemical Energy Storage Section at Paul Scherrer Institute for their friendship, assistance and the great working atmosphere.
I am especially grateful to Dr. Claire Villevieille for many fruitful discussions on the subject of posi-tive electrode materials, which provided me with many new ideas, and for our excellent collabora-tion with regard to our common publications. I particularly appreciate the informal yet productive way in which we discussed our experimental data.
Furthermore, I would like to thank Dr. Sofía Pérez-Villar and Dr. Holger Schneider, my predeces-sors in terms of Raman and IR spectroscopy, for passing on their experience and detailed experi-mental know-how. I especially enjoyed our common investigation of GC by combined in situ Ra-man and IR microscopy, which led to a further publication.
I am also grateful to the members of the Materials Group of Prof. Thomas Lippert, with whom our group shares the Raman laboratory. Special thanks go to PD Dr. Christof Schneider for many stimu-lating discussions.
Dr. Annette Foelske-Schmitz and Dr. Rüdiger Kötz are gratefully acknowledged for interesting dis-cussions and for introducing me to the X-ray photoelectron and IR spectrometer, respectively.
Moreover, I would like to thank Dr. Erik Jämstorp Berg and Dr. Daniel Streich for sharing their ex-perience of IR and Raman spectroscopy. In addition, the former is acknowledged for introducing me to AutoHotkey.
Special thanks go to Dr. Heino Sommer, the supervisor of my Master’s project in the same group. It was with him that I cut my teeth in electrochemistry and wrote my first publication on lithium-ion batteries. He taught me several electrochemical standard methods that came in very handy during my doctoral studies.
In addition to the scientific contributions mentioned above, I would also like to acknowledge the invaluable technical support provided by Hermann Kaiser and Christoph Junker, especially their help in developing the in situ cells and designing the automation system for the combined meas-urements.
Furthermore, I am grateful to Peter Bleith and Dr. Michael Heß, with whom I shared most of my life as a doctoral student, for their friendship and support. Special thanks go to Peter Bleith for teaching me valuable word processing skills.
Dr. Sébastien Sallard and Lucien Boulet are gratefully acknowledged for helping me with the trans-lation of the abstract into French.

VIII
I would especially like to thank my family for their love, support and encouragement throughout my academic career. Special thanks go to my father, who aroused my enthusiasm for science and technology at an early age.
Finally, financial support of the group from BASF SE and the Swiss National Science Foundation is gratefully acknowledged. I had the pleasure of visiting the former company and greatly appreciate the acquaintances thus made.

IX
Abstract
Although lithium-ion batteries currently dominate the market for rechargeable batteries, im-provements in terms of energy density, cycling stability and safety are required. Many improve-ments may result from a deeper understanding of the surface reactions in lithium-ion batteries. In situ methods are particularly attractive since they allow the direct characterization of such pro-cesses during electrochemical cycling. Furthermore, the investigation of vibrational modes by Ra-man and IR microscopy provides information about structural and chemical changes, respectively, on a chosen spot of the working electrode. In a novel combined in situ approach, the complemen-tary nature of Raman and IR microscopy is exploited in order to simultaneously investigate struc-tural changes in the electrode materials and chemical reactions at the interfaces of the electrodes with the organic electrolyte.
In preliminary experiments it was demonstrated that stainless steel mesh is an excellent current collector for spectroscopic experiments under oxidative and reductive conditions, that manganese dissolves from high-energy nickel cobalt manganese oxide (HE-NCM) and deposits onto the graph-ite counter electrode during electrochemical cycling (X-ray photoelectron spectroscopy, XPS), that lithium intercalation and graphite exfoliation can be detected by the selected in situ Raman meth-od and that the IR reflectivity of polished single graphite particles is comparable to glassy carbon (GC) discs.
At the positive electrode, ageing of HE-NCM in a humid atmosphere was demonstrated to lead to the formation of a Li2CO3 surface film responsible for a deterioration in electrochemical perfor-mance. Ex situ Raman investigations of nickel cobalt manganese oxides (NCM) showed that the Raman spectrum of HE-NCM is a superposition of stoichiometric NCM and Li2MnO3, and that the Li2MnO3 disappears after the first cycle, demonstrating its irreversible electrochemical activation and confirming the domain model. A new band at ~545 cm-1 observed during in situ Raman exper-iments, which was stable over a wider potential window in HE-NCM than in stoichiometric NCM, was explained by the formation of Li2O during electrochemical activation. Finally, in situ Raman investigations of Li2MnO3 at 50 °C provided evidence of electrochemical activation positive to 4.4 V vs. Li+/Li, in excellent agreement with the potential plateau typically observed during initial charg-ing of Li2MnO3 and HE-NCM.
At the negative electrode, combined in situ Raman and IR microscopy was applied to the same spot on a GC electrode. Raman microscopy showed no significant lithium intercalation while IR microscopy demonstrated an increase in the concentration of free solvents and a decrease in the concentration of solvent molecules coordinated to lithium ions. Subsequently, the combined method was also applied to the same spot on a graphite electrode. Raman microscopy showed clear evidence of lithium intercalation negative to 0.4 V vs. Li+/Li and allowed the determination of the true local degree of lithium intercalation at the investigated spot despite the slow kinetics of the large, polished single graphite particle. IR microscopy demonstrated a decrease in the concen-tration of free solvents and solvent molecules coordinated to lithium ions during charge and an increase in both species during discharge. The decrease in the concentration of solvents and new IR signals at 1.0/0.7 V vs. Li+/Li during charge were explained by solid electrolyte interphase (SEI) formation. Finally, a jump in absorbance at 0.7/0.4 V vs. Li+/Li was attributed to lithium intercala-tion.

X
XI
Zusammenfassung
Obwohl Lithiumionen-Batterien zurzeit den Markt für wiederaufladbare Batterien dominieren, sind Verbesserungen hinsichtlich der Energiedichte, Zyklenfestigkeit und Sicherheit nötig. Viele Verbesserungen können aus einem vertieften Verständnis der Oberflächenreaktionen in Lithiumi-onen-Batterien resultieren. In situ Methoden sind besonders geeignet, da sie die direkte Charakte-risierung solcher Prozesse während des elektrochemischen Zyklisierens erlauben. Desweitern lie-fert die Untersuchung von Schwingungsmoden mittels Raman- und IR-Mikroskopie Informationen über die strukturellen beziehungsweise chemischen Veränderungen an einem ausgewählten Punkt der Arbeitselektrode. In einem neuen kombinierten in situ Ansatz wird die Komplementarität von Raman- und IR-Mikroskopie genutzt um gleichzeitig die strukturellen Veränderungen in den Elekt-rodenmaterialien und die chemischen Reaktionen an den Grenzflächen der Elektroden mit dem organischen Elektrolyten zu untersuchen.
In Vorversuchen wurde demonstriert, dass Edelstahlnetz ein hervorragender Stromsammler für spektroskopische Experimente unter oxidativen und reduktiven Bedingungen ist, dass sich Mangan während des elektrochemischen Zyklisierens aus Hoch-Energie-Nickel-Cobalt-Mangan-Oxid (HE-NCM) herauslöst und auf der Graphitgegenelektrode ablagert (Röntgenphotoelektronenspekt-roskopie, XPS), dass Lithiuminterkalation und Graphitexfoliation mittels der gewählten in situ Ra-man-Methode detektiert werden können und dass die IR-Reflektivität polierter einzelner Graphit-partikel vergleichbar mit Glaskohlenstoffscheiben (GC) ist.
An der positiven Elektrode wurde demonstriert, dass die Alterung von HE-NCM in feuchter Atmo-sphäre zur Bildung eines Oberflächenfilms aus Li2CO3 führt, der verantwortlich für eine verschlech-terte elektrochemische Leistungsfähigkeit ist. Ex situ Raman-Untersuchungen von Nickel-Cobalt-Mangan-Oxid (NCM) zeigten, dass das Raman-Spektrum von HE-NCM eine Überlagerung von stö-chiometrischem NCM und Li2MnO3 ist, und dass das Li2MnO3 nach dem ersten Zyklus verschwin-det, was dessen irreversible elektrochemische Aktivierung demonstriert und das Domänenmodell bestätigt. Eine während der in situ Raman-Experimente beobachtete neue Bande bei ~545 cm-1, die in HE-NCM über ein breiteres Potentialfenster stabil war als in stöchiometrischem NCM, wurde durch die Bildung von Li2O während der elektrochemischen Aktivierung erklärt. Schließlich wiesen in situ Raman-Untersuchungen von Li2MnO3 bei 50 °C elektrochemische Aktivierung positiv zu 4.4 V vs. Li+/Li nach, im Einklang mit dem typischerweise beobachteten Potentialplateau während des ursprünglichen Ladens von Li2MnO3 und HE-NCM.
An der negativen Elektrode wurde kombinierte in situ Raman- und IR-Mikroskopie auf den glei-chen Punkt einer GC-Elektrode angewandt. Raman-Mikroskopie zeigte keine signifikante Lithi-uminterkalation, während IR-Mikroskopie eine Zunahme der Konzentration freier Lösungsmittel und eine Abnahme der Konzentration an Lithiumionen koordinierter Lösungsmittelmoleküle de-monstrierte. Nachfolgend wurde die kombinierte Methode ebenfalls auf den gleichen Punkt einer Graphitelektrode angewandt. Raman-Mikroskopie wies klare Lithiuminterkalation negativ zu 0.4 V vs. Li+/Li nach und erlaubte die Bestimmung des tatsächlichen lokalen Grades der Lithiuminterkala-tion am untersuchten Punkt, trotz der langsamen Kinetik des großen, polierten einzelnen Graphit-partikels. IR-Mikroskopie demonstrierte eine Abnahme der Konzentration freier und an Lithium koordinierter Lösungsmittelmoleküle während des Ladens und eine Zunahme beider Spezies wäh-rend des Entladens. Die Abnahme der Konzentration der Lösungsmittel und neue IR-Signale bei 1.0/0.7 V vs. Li+/Li während des Ladens wurden durch die Bildung von Solid Electrolyte Interphase

XII
(SEI) erklärt. Schließlich wurde ein Sprung in der Absorbanz bei 0.7/0.4 V vs. Li+/Li der Lithiumin-terkalation zugeordnet.

XIII
Résumé
Bien qu’actuellement les batteries lithium-ion dominent le marché des batteries rechargeables, des améliorations en termes de densité énergétique, de stabilité et de sécurité sont nécessaires. Telles améliorations sont possibles avec une meilleure connaissance des réactions de surface des batteries lithium-ion. Les méthodes in situ sont particulièrement intéressantes, puisqu’elles per-mettent de caractériser les batteries directement durant le cyclage. De plus, l’étude des modes de vibrations par microscopie Raman et IR fournit, respectivement, des informations sur les change-ments structuraux et chimiques à l’endroit d’analyse sur l’électrode de travail. Une nouvelle ap-proche de méthodes in situ combinées permet de conjuguer la complémentarité des microscopies Raman et IR, avec le but d’étudier simultanément les changements structuraux dans les matériaux des électrodes et les réactions chimiques aux interfaces des électrodes avec l’électrolyte.
Des expériences préliminaires ont démontré que des grilles en acier inoxydable sont d’excellent collecteurs de courant pour les expériences spectroscopiques en conditions oxydantes ou réduc-trices, que le manganèse présent dans le matériau haute-énergie nickel cobalt manganèse oxyde (HE-NCM) se dissout et se dépose sur la contre électrode en graphite durant le cyclage électro-chimique (spectrométrie photoélectronique X, XPS) et que l’intercalation de lithium ainsi que l’exfoliation du graphite peuvent être détectées par la méthode Raman in situ. De plus, la réflecti-vité IR de particules polies uniques de graphite est comparable à celle de disques de carbone vi-treux (GC).
Il a été prouvé que le vieillissement en atmosphère humide du HE-NCM de l’électrode positive conduit à la formation d’un film de surface de Li2CO3, responsable d’une détérioration des perfor-mances électrochimiques du HE-NCM. Les études Raman ex situ des nickel cobalt manganèse oxydes (NCM) ont montré que le spectre Raman du HE-NCM est une superposition de ceux du NCM stœchiométrique et du Li2MnO3 et que le Li2MnO3 disparait après le premier cycle. Ces résul-tats s’accordent avec l’activation électrochimique irréversible du Li2MnO3 et le modèle des do-maines. Une nouvelle bande à ~545 cm-1 a été observée durant les analyses Raman in situ. Cette bande était stable sur une plage de potentiels plus large pour le HE-NCM que pour le NCM stœ-chiométrique. Elle a été attribuée à la formation de Li2O durant l’activation électrochimique. Fina-lement, les études Raman in situ du Li2MnO3 à 50 °C ont mis en évidence l’activation électrochi-mique à des potentiels supérieurs à 4,4 V vs. Li+/Li, en accord avec le plateau en potentiel typi-quement observé durant la charge initiale de Li2MnO3 et de HE-NCM.
La microscopie Raman et IR in situ combinée a été utilisées sur le même endroit de l’électrode négative en GC. La microscopie Raman n’a montré aucune intercalation significative de lithium alors que la microscopie IR a démontré une augmentation de la concentration en solvant libre et une diminution de la concentration en molécules de solvant coordonné aux ions lithiums. Par la suite, la méthode combinée a aussi été utilisée sur le même endroit d’une électrode en graphite. La microscopie Raman a clairement montré une intercalation de lithium à des potentiels inférieurs à 0,40 V vs. Li+/Li et elle a permis de déterminer le réel degré d’intercalation de lithium à l’endroit d’analyse, malgré les cinétiques lentes de la large particule polie unique de graphite. La microsco-pie IR a mis en évidence durant la charge une diminution de la concentration de solvant libre et de molécules de solvant coordonné aux ions lithium, le phénomène inverse ayant lieu durant la dé-charge. La diminution de la concentration en solvant et des nouveaux signaux à 1,0/0,7 V vs. Li+/Li

XIV
durant la charge ont été expliqués par la formation de la solid electrolyte interphase (SEI). Finale-ment, une chute de l’absorbance à 0,7/0,4 V vs. Li+/Li a été attribuée à l’intercalation de lithium.

XV
Table of contents
1 Introduction ....................................................................................................................... 1
1.1 Motivation ............................................................................................................................. 1
1.2 Lithium-ion batteries ............................................................................................................. 2
1.2.1 Overview ......................................................................................................................... 2
1.2.2 Principle .......................................................................................................................... 4
1.2.3 Positive electrode materials ........................................................................................... 6
1.2.4 Negative electrode materials ....................................................................................... 13
1.2.5 Electrolytes ................................................................................................................... 18
1.2.6 Solid electrolyte interphase .......................................................................................... 22
2 Experimental methods ..................................................................................................... 27
2.1 Materials .............................................................................................................................. 27
2.1.1 Commercially obtained chemicals ................................................................................ 27
2.1.2 Synthesized chemicals .................................................................................................. 27
2.1.3 Electrode preparation .................................................................................................. 29
2.2 Electrochemical techniques................................................................................................. 30
2.2.1 Electrochemical cells .................................................................................................... 30
2.2.2 Galvanostatic measurements....................................................................................... 33
2.2.3 Potentiostatic measurements ...................................................................................... 34
2.2.4 Cyclic voltammetry ....................................................................................................... 35
2.3 Vibrational techniques ........................................................................................................ 36
2.3.1 Raman microscopy ....................................................................................................... 37
2.3.2 IR spectroscopy/microscopy ......................................................................................... 40
2.3.3 Combined microscopy .................................................................................................. 44
2.4 Scanning electron microscopy ............................................................................................. 46
2.5 X-ray photoelectron spectroscopy ...................................................................................... 47

XVI
3 Results and discussion ...................................................................................................... 49
3.1 Preliminary experiments ..................................................................................................... 49
3.1.1 Electrochemical cycling of blank current collectors ..................................................... 49
3.1.2 X-ray photoelectron spectroscopy ............................................................................... 50
3.1.3 Raman microscopy ....................................................................................................... 55
3.1.4 IR microscopy ............................................................................................................... 57
3.2 Positive electrode materials ................................................................................................ 60
3.2.1 Ex situ IR investigation of the ageing of high-energy NCM ......................................... 61
3.2.2 Ex/in situ Raman comparison between stoichiometric and high-energy NCM ........... 64
3.2.3 Ex/in situ Raman investigation of the electrochemical activation of Li2MnO3 ............ 75
3.2.4 Conclusions for the positive electrode materials ......................................................... 84
3.3 Negative electrode materials .............................................................................................. 85
3.3.1 Combined in situ Raman and IR investigation of glassy carbon .................................. 86
3.3.2 Combined in situ Raman and IR investigation of graphite .......................................... 95
3.3.3 Conclusions for the negative electrode materials...................................................... 109
4 Summary and conclusions .............................................................................................. 111
5 Outlook .......................................................................................................................... 113
6 Appendix ........................................................................................................................ 115
6.1 Abbreviations and symbols ............................................................................................... 115
6.2 List of figures ..................................................................................................................... 118
6.3 List of tables ...................................................................................................................... 126
6.4 References ......................................................................................................................... 127
6.5 Nanotec and AutoHotkey programs for the automation system ..................................... 138
6.5.1 Control of the stepper motor by NanoPro ................................................................. 138
6.5.2 Control of the solenoid valve by NanoJEasy .............................................................. 139
6.5.3 Control of the spectroscopic program by AutoHotkey ............................................... 139
XVII
6.5.4 Automatic saving of the combined spectra by AutoHotkey ....................................... 140
6.6 Supplementary information .............................................................................................. 143
6.6.1 X-ray photoelectron spectroscopic analysis of Ni 2p ................................................. 143
6.6.2 Ex situ Raman analysis of pristine and surface-modified graphite ............................ 145
6.6.3 X-ray photoelectron spectroscopic analysis of aged high-energy NCM ..................... 146
6.6.4 Raman analysis of aged high-energy NCM ................................................................ 149
6.6.5 Deconvolution of the main Raman bands of uncycled NCMs .................................... 150
6.6.6 Ex situ Raman analysis of Li2MnO3 activation at room temperature ........................ 151
6.6.7 Optimization of the dimensions of polished single graphite particles ....................... 152
6.6.8 Combined in situ Raman and IR analysis of polished single graphite particles ......... 156
6.7 Publications and conferences ............................................................................................ 161
6.7.1 Peer-reviewed publications ........................................................................................ 161
6.7.2 Conference contributions ........................................................................................... 162

XVIII

Motivation 1
1 Introduction
1.1 Motivation
World energy consumption has increased dramatically due to global population growth and a sharp rise in per capita energy consumption since the industrial revolution. To date, most of the world’s energy demand is met by coal, oil and natural gas. These fossil fuels contribute to envi-ronmental problems, such as global warming, and will inevitably run out at some point [1]. There-fore, a shift to renewable energy sources is desperately needed. Investment in research and de-velopment has resulted in the commercialization and growth of several renewable energy tech-nologies, such as solar energy and wind power [2]. One of the main disadvantages of these tech-nologies is their inherent intermittency. As the market penetration of renewable technologies grows, the ability to store electrical energy (e.g. in batteries) will become increasingly important in order to guarantee grid reliability, stability and efficiency [3]. For ecological and practical reasons, secondary (rechargeable) batteries are preferable to primary (non-rechargeable) batteries. Lithi-um-ion batteries dominate today’s secondary battery market thanks to their high specific energy and good cycling stability. They have found widespread application in portable consumer electron-ics and are increasingly used in the electric vehicle industry [4, 5]. However, the electric vehicle industry would greatly benefit from further improvements.
To allow systematic and efficient optimization of lithium-ion batteries, a detailed understanding of the internal processes during electrochemical cycling is required. The interfaces between the elec-trodes and the electrolyte are particularly important since they influence the stability and kinetics of the cell and thus affect specific power, cycling stability and safety [6]. However, the complex interfacial reactions in lithium-ion batteries are still not fully understood, demonstrating the need for advanced surface characterization methods. In situ methods are particularly attractive because they provide continuous data during electrochemical cycling and avoid the problems of relaxation and contamination. Vibrational spectroscopy (Raman and IR) is a powerful analytical tool for the in situ investigation of surface processes occurring in lithium-ion batteries. The combination of Ra-man and IR spectroscopy offers additional advantages connected with their complementary na-ture. Whereas Raman spectroscopy is particularly sensitive to local structural changes in the elec-trode material, IR spectroscopy provides an excellent way of probing the interface with the organ-ic electrolyte. Microscopic methods and a specially adapted cell allow spatial resolution and the recording of in situ spectra, respectively. To provide an efficient way of collecting combined spec-troscopic data, an automation system enabling switching between the spectroscopic setups is de-veloped. Although the application of in situ Raman [7-23] and IR [24-36] spectroscopy to the char-acterization of various electrode materials and electrolytes has been treated extensively in the literature, there are as yet no reports of combined in situ Raman and IR microscopy.[37]
Lithium nickel cobalt manganese oxides (NCM) and carbons, two practically relevant classes of positive and negative electrode materials, respectively, are investigated by the developed in situ Raman and IR methods. Overlithiated NCM, also known as high-energy NCM (HE-NCM), is a prom-ising alternative to the commonly used LiCoO2. It is generally thought to contain Li2MnO3 domains that are activated during initial charging, leading to a characteristic potential plateau and irre-versible oxygen release [38, 39]. However, the exact reaction mechanisms involved in the electro-chemical activation of HE-NCM remain hotly debated. To contribute to the further elucidation of
2 Introduction
these reaction mechanisms, in situ Raman microscopy of NCMs [40] and the reference material Li2MnO3 [41] is employed. At the negative electrode, combined in situ Raman and IR microscopy is applied to GC, a model system for graphite with excellent IR reflectivity [42]. Since GC is unable to intercalate significant amounts of lithium (unless it is in powder form), the method is further de-veloped and applied to polished single graphite particles, allowing the correlation of information about the electronic state of the electrode with effects related to the interface with the organic electrolyte [37].
The goal of this work is the development of in situ Raman, in situ IR and combined in situ Raman and IR microscopic methods and their application to the characterization of electrode materials relevant to lithium-ion batteries. In particular, the electrochemical activation of HE-NCM and the interfacial processes occurring at carbon electrodes are investigated. The long-term goal is for these advanced in situ methods to provide an efficient tool for the systematic characterization and optimization of future lithium-ion battery systems and thus contribute to the further development of lithium-ion battery technology.
1.2 Lithium-ion batteries
1.2.1 Overview
Lithium, a member of the highly reactive alkali metal group, is the lightest (6.94 g/mol) and most electropositive (-3.04 V vs. SHE) metal in nature. It is therefore no coincidence that it has become the main focus of battery research. Primary lithium batteries were successfully commercialized in the 1960/70s and found application in watches, calculators and medical devices [5, 43]. However, the long-term goal of battery scientists has always been the construction of secondary batteries. In 1976, Whittingham proposed a secondary battery based on Li and the intercalation compound TiS2 as negative and positive electrode material, respectively [44]. Note that intercalation means inser-tion into a host material without major structural modification (insertion is the generic term). Alt-hough this demonstrated the possibility to produce secondary lithium-ion batteries, the use of metallic lithium raised serious safety concerns. During electrochemical charging, inhomogeneous current density distribution at the lithium electrode led to an increase in surface area and growth of needle-like lithium crystals (dendrites) that had the potential to penetrate the separator and cause a short circuit that may result in thermal runaway. Although several attempts were made to control dendrite formation in secondary lithium batteries, e.g. by changes in electrolyte formula-tion, these systems never caught on due to remaining safety concerns [43]. The first breakthrough came with the introduction of rocking-chair batteries in the 1980s, i.e. batteries that use intercala-tion compounds for both electrodes, resulting in improvements in safety and cycle life [45, 46]. However, the specific energies of these systems were limited due to the use of systems with low cell voltages. The final breakthrough came with the introduction of carbon based negative elec-trode materials and the successful commercialization of secondary lithium-ion batteries by Sony in 1991 [47]. These C/LiCoO2-based systems had several advantages over older systems, such as en-hanced specific energy owing to the low (negative) reduction potential of carbon and the possibil-ity to assemble the batteries in the discharged state (less air-sensitive). Since then, lithium-ion battery technology has rapidly expanded and, by 2000, already accounted for a share of more than 90% of the secondary battery market [43]. Today, lithium-ion batteries are ubiquitous thanks to
Lithium-ion batteries 3
their widespread application in portable consumer electronics, such as mobile phones and laptops. Furthermore, they are playing an increasingly important role in the electric vehicle industry.
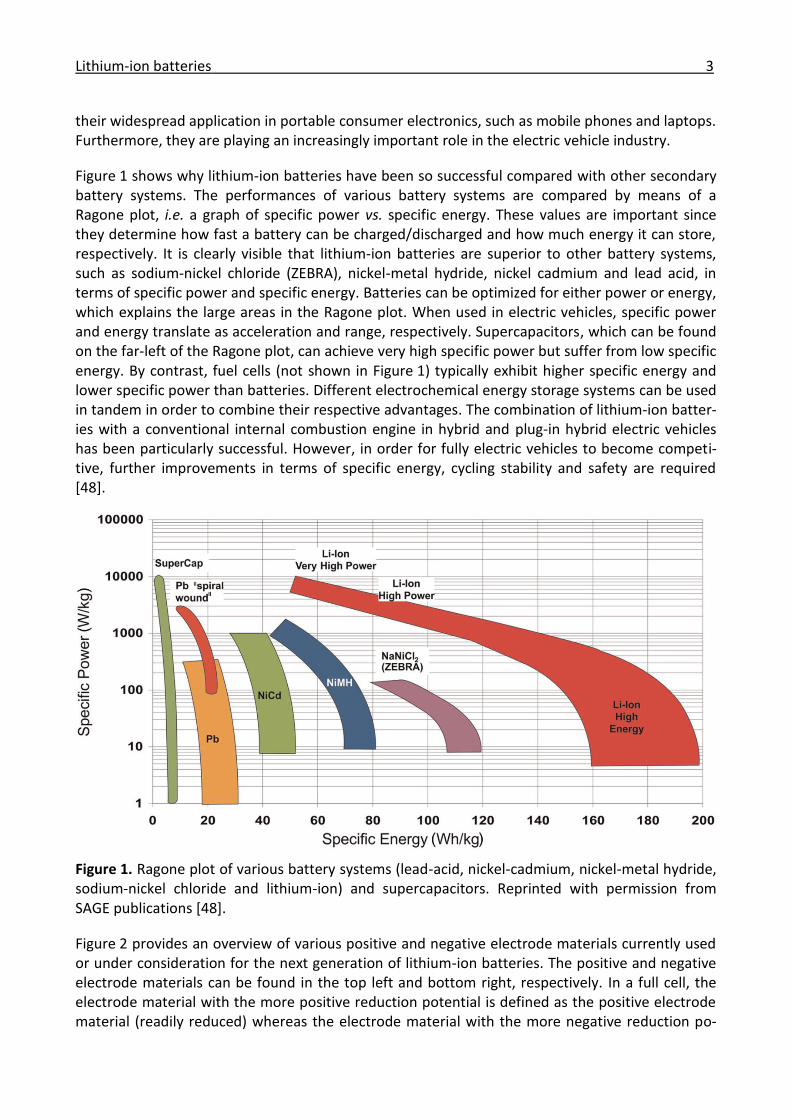
Figure 1 shows why lithium-ion batteries have been so successful compared with other secondary battery systems. The performances of various battery systems are compared by means of a Ragone plot, i.e. a graph of specific power vs. specific energy. These values are important since they determine how fast a battery can be charged/discharged and how much energy it can store, respectively. It is clearly visible that lithium-ion batteries are superior to other battery systems, such as sodium-nickel chloride (ZEBRA), nickel-metal hydride, nickel cadmium and lead acid, in terms of specific power and specific energy. Batteries can be optimized for either power or energy, which explains the large areas in the Ragone plot. When used in electric vehicles, specific power and energy translate as acceleration and range, respectively. Supercapacitors, which can be found on the far-left of the Ragone plot, can achieve very high specific power but suffer from low specific energy. By contrast, fuel cells (not shown in Figure 1) typically exhibit higher specific energy and lower specific power than batteries. Different electrochemical energy storage systems can be used in tandem in order to combine their respective advantages. The combination of lithium-ion batter-ies with a conventional internal combustion engine in hybrid and plug-in hybrid electric vehicles has been particularly successful. However, in order for fully electric vehicles to become competi-tive, further improvements in terms of specific energy, cycling stability and safety are required [48].
Figure 1. Ragone plot of various battery systems (lead-acid, nickel-cadmium, nickel-metal hydride, sodium-nickel chloride and lithium-ion) and supercapacitors. Reprinted with permission from SAGE publications [48].
Figure 2 provides an overview of various positive and negative electrode materials currently used or under consideration for the next generation of lithium-ion batteries. The positive and negative electrode materials can be found in the top left and bottom right, respectively. In a full cell, the electrode material with the more positive reduction potential is defined as the positive electrode material (readily reduced) whereas the electrode material with the more negative reduction po-

4 Introduction
tential is defined as the negative electrode material (readily oxidized). The difference in these po-tentials determines the cell voltage. Ideal electrode materials have a wide reversible lithiation range and a low molar mass (high specific charge), allow fast lithium-ion diffusion and good elec-tric conductivity (low overpotential), consist of cheap and easily synthesized materials (low cost), have low toxicity (low environmental impact), and are highly reversible (high cycling stability) [4]. The specific energy of a cell is obtained by multiplying the cell voltage by the specific charge. High reversibility is usually achieved for intercalation compounds (low mechanical strain). For a detailed discussion of various positive and negative electrode materials see chapters 1.2.3 and 1.2.4, re-spectively.
Figure 2. Plot of potential vs. specific charge for various positive and negative electrode materials. Reprinted with permission from Macmillan Publishers Ltd [5].
1.2.2 Principle
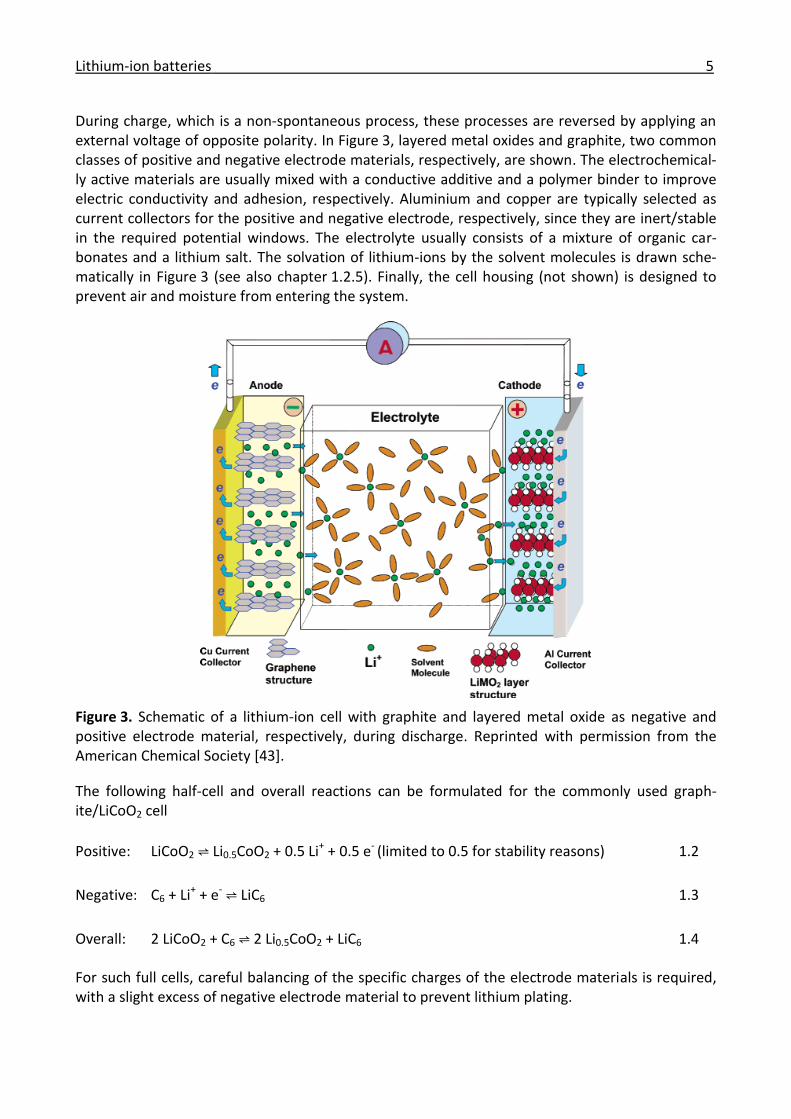
A state-of-the-art lithium-ion cell employing the rocking-chair principle is illustrated in Figure 3. This expression is derived from the fact that lithium-ions move (rock) back and forth between two intercalation compounds [49]. During discharge (shown here), which is a spontaneous process, lithium ions are deintercalated from the negative electrode material (anode) and reintercalated into the positive electrode material (cathode), with the electrolyte and the separator ensuring ionic conductivity and electrical insulation, respectively. Simultaneously, the negative electrode material is being oxidized while the positive electrode material is being reduced. The released electrons flow from the anode to the cathode via the external circuit and can be harnessed to pro-vide electrical energy according to
ΔG = -zFΔE 1.1
where ΔG is the change in Gibbs energy, z the number of electrons transferred and ΔE the poten-tial difference between the electrode materials.
Lithium-ion batteries 5
During charge, which is a non-spontaneous process, these processes are reversed by applying an external voltage of opposite polarity. In Figure 3, layered metal oxides and graphite, two common classes of positive and negative electrode materials, respectively, are shown. The electrochemical-ly active materials are usually mixed with a conductive additive and a polymer binder to improve electric conductivity and adhesion, respectively. Aluminium and copper are typically selected as current collectors for the positive and negative electrode, respectively, since they are inert/stable in the required potential windows. The electrolyte usually consists of a mixture of organic car-bonates and a lithium salt. The solvation of lithium-ions by the solvent molecules is drawn sche-matically in Figure 3 (see also chapter 1.2.5). Finally, the cell housing (not shown) is designed to prevent air and moisture from entering the system.
Figure 3. Schematic of a lithium-ion cell with graphite and layered metal oxide as negative and positive electrode material, respectively, during discharge. Reprinted with permission from the American Chemical Society [43].
The following half-cell and overall reactions can be formulated for the commonly used graph-ite/LiCoO2 cell
Positive: LiCoO2 ⇌ Li0.5CoO2 + 0.5 Li+ + 0.5 e- (limited to 0.5 for stability reasons) 1.2
Negative: C6 + Li+ + e- ⇌ LiC6 1.3
Overall: 2 LiCoO2 + C6 ⇌ 2 Li0.5CoO2 + LiC6 1.4
For such full cells, careful balancing of the specific charges of the electrode materials is required, with a slight excess of negative electrode material to prevent lithium plating.

6 Introduction
1.2.3 Positive electrode materials
Table 1 provides an overview of selected positive electrode materials for lithium-ion batteries, from layered dichalcogenides and vanadium oxides (1970s) to layered oxides (1980s), to spinels, olivines and mixed layered oxides (1990s), and finally to overlithiated mixed layered oxides (2000s). The positive electrode materials are given in their discharged (lithiated/reduced) and charged (delithiated/oxidized) forms. The reversible lithiation ranges are taken from the indicated references. Furthermore, the potentials (average or range, depending on availability) and the spe-cific charges (calculated or observed) are provided. All potentials given in this chapter are vs. Li+/Li.
Table 1. Selected positive electrode materials, their potentials and specific charges.
Discharged material Charged material Potential vs. Li+/Li / V Spec. charge / mAh/g
Layered dichalcogenides (MX2)
LiTiS2 [50] TiS2 2.1(a) [50] 225(b)
Li0.8MoS2 [50] MoS2 1.8(a) [50] 129(b)
Vanadium oxides (VxOy)
Li3V2O5 [50] V2O5 3.1(a) [50] 397(b)
Li3.6V6O13 [50] V6O13 2.3(a) [50] 179(b)
Layered oxides (LiMO2)
LiCoO2 Li0.5CoO2 [50] 3.7(a) [50] 137(b)
LiNiO2 Li0.3NiO2 [50] 3.5(a) [50] 192(b)
LiMnO2 Li0.5MnO2 [50] 2.8(a) [50] 143(b)
Spinels (LiM2O4) and olivines (LiMPO4)
LiMn2O4 Mn2O4 [50] 4.0-4.1(c) [51] 148(b)
LiFePO4 FePO4 [52] 3.5 [52] 170(b)
Nickel cobalt manganese oxides (NCM, Li(NiaCobMn1-a-b)O2)
LiNi0.33Co0.33Mn0.33O2 LixNi0.33Co0.33Mn0.33O2(d) 3.5-4.2 [53] 150(e) [53]
Overlithiated nickel cobalt manganese oxides (HE-NCM, Li1+δ(NiaCobMn1-a-b)1-δO2)
Li1+δ(NiaCobMn1-a-b)1-δO2 Lix(NiaCobMn1-a-b)1-δOy(f) 3.0-4.5(g) [38] >200(h) [38]
(a) Average discharge potential. (b) Calculated based on the mass of the discharged (lithiated) material. (c) The other potential plateau at 3 V is not usually used [54]. (d) For 0 < x < 1. (e) Observed value (for x = 0, a theoretical value of 278 mAh/g is calculated). (f) With x and y depending on the exact composition and on the charging conditions. (g) Up to 5.0 V can be applied to ensure complete electrochemical activation. (h) Depends on the exact composition and on the charging conditions (e.g. 260 mAh/g for 5.0 V)
In general, there are two types of positive electrode materials, depending on whether they already contain lithium after synthesis. Layered dichalcogenides and vanadium oxides are usually synthe-sized in the delithiated state whereas layered oxides, spinels, olivines, mixed layered oxides and overlithiated mixed layered oxides are typically obtained in the lithiated state. The latter type of-

Lithium-ion batteries 7
fers the advantage of allowing assembly with delithiated negative electrodes (usually carbon) in the discharged state (i.e. the construction of lithium-ion rather than lithium batteries).
Layered dichalcogenides (MX2)
Layered dichalcogenides (MX2) were among the first class of positive electrode materials used in secondary lithium batteries [4, 54]. They have the CdI2 structure consisting of hexagonally close-packed MX2 layers held together by weak bonds, providing readily available lithium intercalation sites between these layers [4]. Typical examples include TiS2 and MoS2 [50]. TiS2 is particularly at-tractive due to its low mass, good electric conductivity [55] and the fact that it forms a single phase with lithium over the entire compositional range [56]. One of the major disadvantages of these materials is their relatively low (negative) potentials, resulting in low cell voltages and low specific energies.
Vanadium oxides (VxOy)
High-valent vanadium oxides (VxOy) were among the earliest studied oxides [54]. Typical examples include V2O5, V6O13 and V3O8 [50]. V2O5 consists of layers of edge- and corner-sharing VO5 square pyramids held together by weak bonds (suitable for lithium intercalation) [4, 54]. The structural behaviour upon lithium insertion is quite complicated, with several reversible and irreversible phase changes occurring across the compositional range (0 to 3 Li) [4, 54]. Although it has a high specific charge and good cycling stability [4], V2O5 suffers from relatively low (negative) potential (sloping potential plateau between 4 and 2 V) [57]. The mixed-valent vanadium oxide V6O13 con-sists of alternating double and single layers of distorted VO6 octahedra and can reversibly store 3.6 lithium-ions per formula unit [50, 54]. However, this material suffers from poor cycling stability and, like V2O5, from relatively low (negative) potential [4].
Layered oxides (LiMO2)
Since their introduction, layered oxides (LiMO2) have been one of the most important classes of positive electrode materials. They have the α-NaFeO2 structure with the oxygen ions in a cubic close-packed arrangement [54]. The transition metal and lithium ions reside in the octahedral sites, forming MO2 layers of edge-sharing MO6 octahedra [4]. Typical examples include LiCoO2, LiNiO2 and LiMnO2. LiCoO2 has traditionally dominated the lithium-ion battery market thanks to the commercial success of the C/LiCoO2 cell introduced by Sony in 1991 [47]. Its advantages in-clude excellent cycling stability, high (positive) average potential and slow anodic electrolyte de-composition [58, 59]. However, one of its major disadvantages is the occurrence of irreversible structural changes upon deintercalation of more than 0.5 Li (conversion to the hexagonal close-packed structure of CoO2 positive to 4.5 V [54]), limiting the practical specific charge to ~140 mAh/g. Further reasons to look for alternatives to LiCoO2 are the relatively high price (low abundance) and toxicity (high environmental impact) of cobalt, which means that application of LiCoO2 may remain limited to small cells used in consumer electronics [54]. In principle, LiNiO2 constitutes a promising alternative to LiCoO2 owing to the lower price and higher abundance of nickel compared with cobalt [4, 54]. However, synthesis of layered LiNiO2 is rather difficult and typically results in a high degree of Li/Ni exchange (due to similar ionic radii of Li+ and Ni2+ [60, 61]), leading to contamination of the lithium layers by nickel, which, in turn, affects the rate capa-bility and the specific energy of the material [4, 54]. Furthermore, partially delithiated LiNiO2 is known to exhibit poor thermal stability, which raises serious safety concerns [62, 63]. Finally, LiM-
8 Introduction
nO2 is of high interest due to the low cost and low environmental impact of manganese. However, it cannot be synthesized in its layered form by conventional solid-state reactions at high tempera-tures due to thermodynamic instability [54]. Instead, it is prepared for example by ion exchange reactions of layered parent compounds [64, 65] or treatment of δ’-MnO2 with LiI [66]. Unfortu-nately, layered LiMnO2 ultimately undergoes conversion to the thermodynamically more stable spinel structure upon electrochemical cycling, which has prevented successful commercialization [54].
Spinels (LiM2O4) and olivines (LiMPO4)
In addition to the two-dimensional structures discussed so far, there has been a growing interest in three-dimensional structures, such as spinels (LiM2O4) and olivines (LiMPO4), which generally exhibit reduced volume expansion [4]. LiMn2O4 and LiFePO4 are particularly interesting owing to the low cost and low environmental impact of manganese and iron. The structure of the spinel LiMn2O4, which is closely related to α-NaFeO2, consists of oxygen ions in a cubic close-packed ar-rangement. However, unlike in α-NaFeO2, the cations occupy octahedral as well as tetrahedral sites [54]. Although there are two plateaus in the potential profile of LiMn2O4, one at 3 V and one at 4 V, only the latter (corresponding to Mn2O4/LiMn2O4) is used in practical lithium-ion batteries. The former (corresponding to LiMn2O4/Li2Mn2O4) is usually avoided due to the low oxidation state of manganese. Mn3+ is susceptible to Jahn-Teller distortion and disproportionation resulting in dissolution of Mn2+, which may affect the cycling stability upon deep discharge of LiMn2O4 [4, 54]. This dissolution is accelerated by acids, such as HF formed by reaction of the electrolyte salt LiPF6 with traces of water [67]. Further problems of LiMn2O4 include its relatively low specific charge and fast self-discharge [54]. LiFePO4, the most practically important and most studied olivine, is a polyanion compound with orthorhombic structure consisting of corner-shared FeO6 octahedra and edge-shared LiO6 octahedra, linked by PO4 tetrahedra [68]. It has some attractive features, such as a competitive specific charge of 170 mAh/g and excellent cycling stability [69]. Although LiFePO4 suffers from very low electric conductivity [70], this problem can be addressed by carbon coating [71], nanosizing [72] and/or doping (e.g. with Nb) [73]. However, further problems include its rela-tively low (negative) potential and low density, resulting in low energy and power density. The latter problem is compounded by the need to add substantial amounts of conductive additive [54].
Mixed layered oxides
Finally, mixed layered oxides, or, more specifically, lithium nickel cobalt manganese oxides (NCM), are presented. After several binary LiMO2 compounds of nickel, cobalt and manganese had been investigated (Ni/Co [74], Co/Mn [75] and Ni/Mn [76]), the logical next step was to move to these ternary compounds. This class of positive electrode materials has the general formula Li1+δ(NiaCobMn1-a-b)1-δO2. When overlithiated, i.e. when more than one equivalent of lithium is used (δ > 0), these materials are also known as high-energy NCM (HE-NCM). In addition to NCM and HE-NCM, Li2MnO3, which is structurally related to NCM, is also discussed. This compound is rele-vant since it is generally thought to occur as domains in HE-NCM and to be activated during initial charging [38]. As they constitute the main positive electrode materials used in this work, the rest of this chapter is dedicated mainly to stoichiometric NCM, HE-NCM and Li2MnO3 (in this context, stoichiometric means no overlithiation and equal amounts of transition metals).
Lithium-ion batteries 9
Lithium nickel cobalt manganese oxides (NCM)
Mixed layered oxides of the type LiNiaCobMn1-a-bO2 (NCM) were first introduced by Liu et al. [77] and Yoshio et al. [78]. Ohzuku et al. synthesized LiNi0.33Co0.33Mn0.33O2 (stoichiometric NCM), which has probably become the most studied NCM, and observed a specific charge of 150 mAh/g when cycling to 4.2 V and more than 220 mAh/g when cycling to 5.0 V [53]. Like layered oxides, such as LiCoO2, these materials crystallize in the α-NaFeO2 structure (R3̅m symmetry). In the literature, oxidation states of +II, +III and +IV are usually assigned to nickel, cobalt and manganese in stoichi-ometric NCM, respectively [54]. It was found that cobalt helps stabilize the two-dimensional struc-ture by reducing the amount of transition metal in the lithium layers [78]. Furthermore, cobalt was shown to improve the electric conductivity [79] and the rate capability of the material (the latter effect may be due to the reduction in the amount of nickel in the lithium layer) [80]. Manganese is typically considered electrochemically inactive, thus stabilizing the structure. In addition, it plays an important role in reducing the cost of the material. Finally, nickel is commonly assumed to change its oxidation state from +II to +IV, which makes it the main electrochemically active species in NCM (in contrast to cobalt, which only changes its oxidation state from +III to +IV, and manga-nese, which remains at +IV) [54]. Although one usually tries to minimize Ni/Li exchange, a certain amount of nickel in the lithium layers may be beneficial due to the fact that it may impede struc-tural reorganization at low lithium contents by pinning the lattice [81]. Thus, it is clear that all three transition metals play an important role in improving the electrochemical behaviour of NCM and that none of them can be easily replaced, justifying the use of ternary rather than simpler sys-tems. It is expected that optimization of the ratios of the three transition metals has the potential to further improve the properties of NCM.
Overlithiated lithium nickel cobalt manganese oxides (HE-NCM) and Li2MnO3
Building on the success of the NCM materials presented above, it has been possible to further im-prove this class of positive electrode materials by overlithiation (incorporation of excess lithium into the transition metal layers of LiMO2, with M = Ni, Co, Mn) [82], resulting in HE-NCM with the general formula Li1+δ(NiaCobMn1-a-b)1-δO2 (δ > 0). Overlithiation shifts the oxidation state of manga-nese from trivalent towards tetravalent, which minimizes problems associated with Jahn-Teller distortion and manganese dissolution [54]. Thackeray et al. extensively studied this new class of compounds and established the xLi2MnO3·(1-x)LiMO2 notation (Li2MnO3-stabilized NCM) based on the observation of domains exhibiting Li2MnO3 ordering by X-ray diffraction (XRD) [38, 83]. They proposed that these Li2MnO3 domains of C2/m symmetry can be incorporated into the overall LiMO2 structure of R3̅m symmetry thanks to the compatible spacing between the close-packed layers of 4.7 Å for both components, allowing the integration of Li2MnO3 with LiMO2 at the atomic level [38]. HE-NCM, which typically has a high content of cheap, abundant and non-toxic manga-nese, shows high specific charges in excess of 200 mAh/g, improved cycling stabilities and higher rate capabilities than stoichiometric NCM [39, 84-86]. The Li2MnO3 domains are essential for un-derstanding the electrochemical behaviour of HE-NCM and have a significant influence on its properties. Their activation and subsequent electrochemical cycling have been proposed to be responsible for the high specific charge and improved cycling stability of HE-NCM [83, 87]. The corresponding characteristic potential plateau observed at 4.5 V during the first charge has been explained by simultaneous extraction of lithium and oxygen (following the formal splitting of Li2MnO3 into Li2O and MnO2) [88-91]. Gan et al. employed X-ray diffraction (XRD) to further inves-tigate this potential plateau. It has been concluded that Li+ is extracted from the transition metal layer via oxygen release with subsequent electrochemical cycling between Mn4+ and Mn3+ [90].

10 Introduction
Tran et al. proposed a reaction mechanism for this activation of Li2MnO3 including extraction of Li2O and subsequent oxygen release [89]. The released oxygen has been detected by DEMS [39, 92]. Jiang and Dahn conducted electrochemical cycling experiments vs. graphite aimed at investi-gating the impact of oxygen release on the cycling stability of sealed cells [93]. They have conclud-ed that the release of oxygen does not significantly affect the electrochemical properties of lithi-um-ion cells. Yabuuchi et al. explained some of the extra specific charge by partially reversible re-dox activity of oxygen-containing surface species resulting from this oxygen release [91]. Bruce et al. assigned part of the electrochemical activity of pure Li2MnO3 to electrolyte oxidation followed by Li+/H+ exchange [94]. Based on diffraction measurements, Koga et al. have questioned the ex-istence of Li2MnO3 domains and suggested a solid-solution model [95]. The exact nature of the Li2MnO3 domains thus remains disputed, with possible descriptions ranging from pure Li2MnO3 to a perfect solid solution. However, it is commonly accepted that Li2MnO3, which can also be written as Li(Li0.33Mn0.66)O2 (emphasizing its similarity to LiMO2), is incorporated into the layered structure of LiMO2, resulting in a layered material. Thackeray et al. proposed Mn and M cation disorder be-tween Li2MnO3 and LiMO2 and, consequently, the formation of complex local structures of the type LiMn6-xMx that are intermediate in character between pure Li2MnO3 and LiMO2 [38, 83]. This model will be discussed in the next paragraph. In general, this paragraph has shown that, in addi-tion to the ratio of the three transition metals, the content of excess lithium is one more im-portant parameter that determines the properties of HE-NCM. In order to optimize this promising positive electrode material, the contents of all four components thus need to be carefully select-ed.[39-41]
Figure 4 illustrates the cation distribution in the transition metal layers of (a) Li2MnO3, (b) LiNi0.5Mn0.5O2, (c) Li1+δ(Ni0.5Mn0.5)1-δO2, (d) LiNi0.33Co0.33Mn0.33O2 and (e) Li1+δ(Ni0.33Co0.33Mn0.33)1-δO2. In Li2MnO3 (a), six manganese ions are clustered around every lith-ium ion, resulting in a hexagonal LiMn6 nearest-neighbour arrangement of C2/m symmetry with XRD peaks at 2θ = 21-25° (not shown). By contrast, LiMn0.5Ni0.5O2 (b) has a flower pattern with 8% of the lithium in the transition metal layers (Li/Ni exchange). To ensure local charge neutrality, the manganese ions are clustered around the lithium ions, giving rise to Li2MnO3-like structures with weak XRD peaks at 2θ = 21-25° (not shown) [96]. Overlithiation of this compound gives Li1+δ(Ni0.5Mn0.5)1-δO2 (c), which inevitably contains larger Li2MnO3-like domains if the manganese ions remain clustered around the lithium ions. Consequently, an increase in the XRD peaks at 2θ = 21-25° with x is observed (not shown). LiNi0.33Co0.33Mn0.33O2 (d) ideally exhibits an ordered trigonal arrangement of the three transition metals. The absence of XRD peaks at 2θ = 21-25° (not shown) indicates that there are no significant amounts of lithium in the transition metal layers. Finally, overlithiation of this compound gives Li1+δ(Ni0.33Co0.33Mn0.33)1-δO2 (e), in which it is signifi-cantly more difficult to cluster the manganese ions around the lithium ions than in (c) due to the presence of a significant amount of additional cobalt ions. Consequently, no clear increase in the XRD peaks at 2θ = 21-25° with x is observed (not shown).[38]

Lithium-ion batteries 11
Figure 4. Schematic structures of (a) Li2MnO3, (b) LiNi0.5Mn0.5O2, (c) Li1+δ(Ni0.5Mn0.5)1-δO2, (d) LiNi0.33Co0.33Mn0.33O2 and (e) Li1+δ(Ni0.33Co0.33Mn0.33)1-δO2. Adapted with permission from the Royal Society of Chemistry [38].
Activation mechanism of overlithiated lithium nickel cobalt manganese oxides (HE-NCM)
Figure 5 serves to illustrate our current understanding of the complex reaction mechanisms at play during the electrochemical activation and subsequent electrochemical cycling of a HE-NCM. Gal-vanostatic charge and discharge profiles (left column) as well as four-component compositional phase diagrams (right column) are provided. Rows one, two and three refer to the first charge, the first cycle and the second cycle, respectively. The first charge is divided into two regions separated by the inflection point at 4.4 V (a). In region I (OCP - 4.4 V), lithium is extracted from the lithium layer of LiMn0.42Ni0.42Co0.16O2, resulting in the oxidation of Ni2+ to Ni4+ and Co3+ to Co4+. This reac-tion is represented by a green dashed line (b) and the following equation

12 Introduction
0.5Li2MnO3·0.5LiMn0.42Ni0.42Co0.16O2 → 0.5Li2MnO3·0.5Mn0.42Ni0.42Co0.16O2 + 0.5Li+ + 0.5e- 1.5
In region II (4.4-4.8 V), Li2MnO3 is activated, resulting in the net loss of Li2O via simultaneous ex-traction of lithium and oxygen. This reaction is represented by a dashed blue line (b) and the fol-lowing equation, where ξ determines the degree of activation
0.5Li2MnO3·0.5Mn0.42Ni0.42Co0.16O2 →
(0.5-ξ)Li2MnO3·ξMnO2·0.5Mn0.42Ni0.42Co0.16O2 + 2ξLi+ + ξO2 + 2ξe- (0 < ξ <0.5) 1.6
Figure 5. Galvanostatic charge and discharge profiles (left column) and four-component composi-tional phase diagrams with reaction pathways (right column) of 0.5Li2MnO3·0.5LiMn0.42Ni0.42Co0.16O2 (HE-NCM). The vertices of the phase diagrams correspond to (A) Li2MnO3, (B) LiMn0.42Ni0.42Co0.16O2, (C) MO2 (M = Ni, Co, Mn) and (D) LiMnO2. (a) and (b) 1st charge, (c) and (d) 1st cycle, (e) and (f) 2nd cycle. Reprinted with permission from the Royal Society of Chemistry [85].

Lithium-ion batteries 13
During initial discharge (region III), 0.5 + ξ lithium ions are reintercalated, resulting in the reduction of Ni4+ back to Ni2+ and Co4+ back to Co3+ and an irreversible charge of ξ (c). This reaction is repre-sented by a dashed red line (d) and the following equation
(0.5-ξ)Li2MnO3·ξMnO2·0.5Mn0.42Ni0.42Co0.16O2 + (0.5 + ξ)Li+ + (0.5 + ξ)e- →
(0.5-ξ)Li2MnO3·ξLiMnO2·0.5LiMn0.42Ni0.42Co0.16O2 1.7
Finally, in the second and subsequent cycles (e), the system is oxidized and reduced reversibly ac-cording to equation 1.7 (right to left during charge and left to right during discharge). This reaction is represented by a purple and an orange line, respectively (f).[85]
This chapter has shown that HE-NCM is a highly promising and versatile positive electrode materi-al, which suggests that improvement in our understanding of its complicated activation mecha-nism may prove very rewarding.
1.2.4 Negative electrode materials
Table 2 provides an overview of selected negative electrode materials for lithium-ion batteries, from metallic lithium (1960s) to metal alloys and layered dichalcogenides (1970s), and finally to titanium oxides and carbons (1990s). The negative electrode materials are given in their dis-charged (delithiated/oxidized) and charged (lithiated/reduced) forms. The reversible lithiation ranges are taken from the indicated references. Furthermore, the potentials (average or range, depending on availability) and the specific charges (calculated or observed) are provided. All po-tentials given in this chapter are vs. Li+/Li.
In general there are two types of negative electrode materials, depending on whether they al-ready contain lithium after synthesis. With the exception of metallic lithium, all materials listed in Table 2 are typically obtained in the delithiated state, which offers the advantage of allowing as-sembly with lithiated positive electrodes in the discharged state.
Metallic lithium (Li)
The most obvious choice for the negative electrode is metallic lithium. Since the entire material is electrochemically active and possesses a low molecular mass, it has an impressive theoretical spe-cific charge of 3862 mAh/g. Together with the highly negative redox potential of lithium, this al-lows the construction of cells with excellent specific energies. However, a large lithium excess is usually required to avoid capacity fading due to poor reversibility. In practical secondary batteries, four equivalents of lithium are typically used, reducing the specific charge to 965 mAh/g. The poor reversibility can be explained by the formation of electrically isolated lithium and an increase in surface roughness during electrochemical cycling, which leads to an increase in electrolyte de-composition rate. Although the reversibility could be improved by applying mechanical pressure perpendicular to the electrode, using highly purified electrolytes and/or employing additives, re-maining safety concerns associated with the formation of lithium dendrites capable of penetrating the separator and short-circuiting the cell have prevented successful commercialization in second-ary batteries.[4, 50, 97]

14 Introduction
Metal alloys (M)
Lithium alloys have been proposed as possible alternatives to metallic lithium. Binary lithium alloys of Al, Si, Sn, Sb, Pb, In, Bi and Ag, as well as various ternary alloys, have been investigated. These materials offer attractive specific charges and current densities comparable to metallic lithium. Their potentials are typically a few 100 mV positive to lithium, which prevents lithium plating and results in moderate specific energy losses. However, these metals undergo major structural changes while alloying with lithium, which results in significant volume expansion of up to 300%. Since lithium alloys are usually quite brittle, the resulting mechanical stress typically leads to dete-rioration of the electrode (cracking / pulverization / loss of electrical contact) and a concomitant decrease in reversible charge. Various approaches to addressing the poor cycling stability, such as controlling the morphology (e.g. reducing the particle size), embedding the particles in ductile buffer matrices, applying thin films and limiting the depth of discharge, are described in the litera-ture.[4, 5, 97]
Table 2. Selected negative electrode materials, their potentials and specific charges.
Discharged material Charged material Potential vs. Li+/Li / V Spec. charge / mAh/g
Metallic lithium (Li)
Li Li 0.0(a) 3862(b)
Metal alloys (M)
Al LiAl [4] 0.3(c) [98] 993(d)
Si Li4.2Si [97] 0.3(c) [99] 4008(d, e)
Sn Li4.2Sn [97] 0.4(c) [98] 948(d)
Sb Li3Sb [98] 0.9(c) [98] 660(d)
Layered dichalcogenides (MX2)
TiS2 LiTiS2 [50] 2.1(c) [50] 239(d)
MoS2 Li0.8MoS2 [50] 1.8(c) [50] 134(d)
Titanium oxides (TixOy)
Anatase TiO2 Li0.5TiO2 [97] 1.8(c) [97] 168(d)
Spinel Li4Ti5O12 Li7Ti5O12 [100] 1.5(c) [100] 175(d)
Carbons (C)
Graphite LiC6 [101] 0.1(c) [4] 372(d)
Low specific charge(f) Lix<1C6 0.0-1.2(g) [4] 180-300 [4]
High specific charge(f) Lix>1C6 0.0-1.2(g) [4] 400-2000 [4]
GC(f, h) Li0.6C6 [102] 0.0-0.9(g) [102] 223(d)
(a) Zero by definition. (b) Calculated theoretical value. In practice, 4 eq. are typically used, resulting in 965 mAh/g [50]. (c) Average discharge potential. (d) Calculated based on the mass of the discharged (delithiated) material. (e) The fact that this is higher than the specific charge of Li is misleading (mass of Li is neglected). (f) Non-graphitic carbons. (g) Sloping potential (no well-defined potential plateaus). (h) In powder form (macroscopic GC inserts significantly less lithium).
Lithium-ion batteries 15
Layered dichalcogenides (MX2)
Layered dichalcogenides (MX2) have already been described in the context of positive electrode materials (chapter 1.2.3). Due to their intermediate potentials of ~2 V, they can also be used as negative electrode materials. Typical examples include TiS2, MoS2, WO2 and MoO2. The more posi-tive potentials compared with other negative electrode materials offer some advantages, such as slower reductive electrolyte decomposition and a reduced tendency for lithium plating (improved safety). However, the relatively low specific charges and high (positive) potentials result in low specific energies.[4]
Titanium oxides (TixOy)
Titanium oxides (TixOy) constitute a further important class of negative electrode materials. Typical examples include anatase TiO2 and spinel Li4Ti5O12, which insert lithium at 1.8 and 1.5 V, respec-tively. Unlike other polymorphs of TiO2, anatase TiO2 is capable of inserting up to 0.5 equivalents of lithium. Spinel Li4Ti5O12 has been proposed to allow the insertion of up to 3 equivalents of lithi-um into empty 16c sites, resulting in reduced strain and improved cycling stability. Furthermore, titanium oxides typically allow high rate capabilities and exhibit very stable potential plateaus. However, as discussed in the previous paragraph, the relatively low specific charges and high (pos-itive) potentials result in low specific energies.[97, 100]
Carbons (C)
Carbons are the most commonly used class of negative electrode materials in today’s commercial lithium-ion batteries [103]. Their advantages include relatively high specific charges (372 mAh/g for graphite) and low (negative) potentials (0.1 V for graphite), resulting in high specific energies. In addition, they are abundant, cheap, non-toxic and electrically conductive. The crystallinity and morphology of carbons have a strong influence on their electrochemical properties. The charge and discharge profiles as well as the tendency for solvent cointercalation (see also chapter 1.2.6) are thus determined by the exact nature of the carbons used. Consequently, there are a large number of different commercially available natural or synthetic carbons. As they constitute the main negative electrode materials used in this work, the rest of this chapter is dedicated mainly to graphite and GC.[4]
Structure of carbons
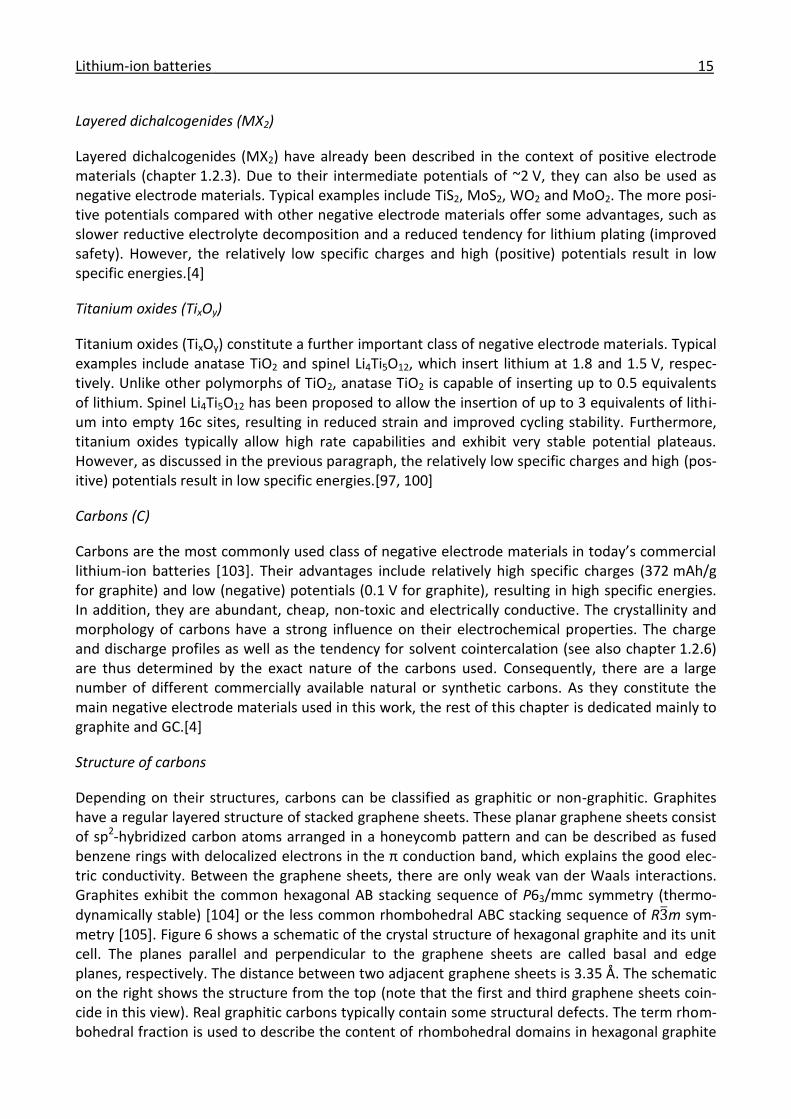
Depending on their structures, carbons can be classified as graphitic or non-graphitic. Graphites have a regular layered structure of stacked graphene sheets. These planar graphene sheets consist of sp2-hybridized carbon atoms arranged in a honeycomb pattern and can be described as fused benzene rings with delocalized electrons in the π conduction band, which explains the good elec-tric conductivity. Between the graphene sheets, there are only weak van der Waals interactions. Graphites exhibit the common hexagonal AB stacking sequence of P63/mmc symmetry (thermo-dynamically stable) [104] or the less common rhombohedral ABC stacking sequence of R3̅m sym-metry [105]. Figure 6 shows a schematic of the crystal structure of hexagonal graphite and its unit cell. The planes parallel and perpendicular to the graphene sheets are called basal and edge planes, respectively. The distance between two adjacent graphene sheets is 3.35 Å. The schematic on the right shows the structure from the top (note that the first and third graphene sheets coin-cide in this view). Real graphitic carbons typically contain some structural defects. The term rhom-bohedral fraction is used to describe the content of rhombohedral domains in hexagonal graphite
16 Introduction
(stacking faults). Furthermore, real samples usually consist of graphite crystallites of various sizes (typically a few nanometres) characterized by their La and Lc values, which indicate their dimen-sions parallel and perpendicular to the basal plane, respectively. These crystallites can be relatively large and free of defects (e.g. HOPG) or exhibit significant disorder (e.g. turbostratic graphite). Despite these defects, such materials are generally referred to as graphites.[4]
Figure 6. Left: schematic of the crystal structure of hexagonal graphite and its unit cell. Right: view perpendicular to the basal plane. Reprinted with permission from John Wiley and Sons [4].
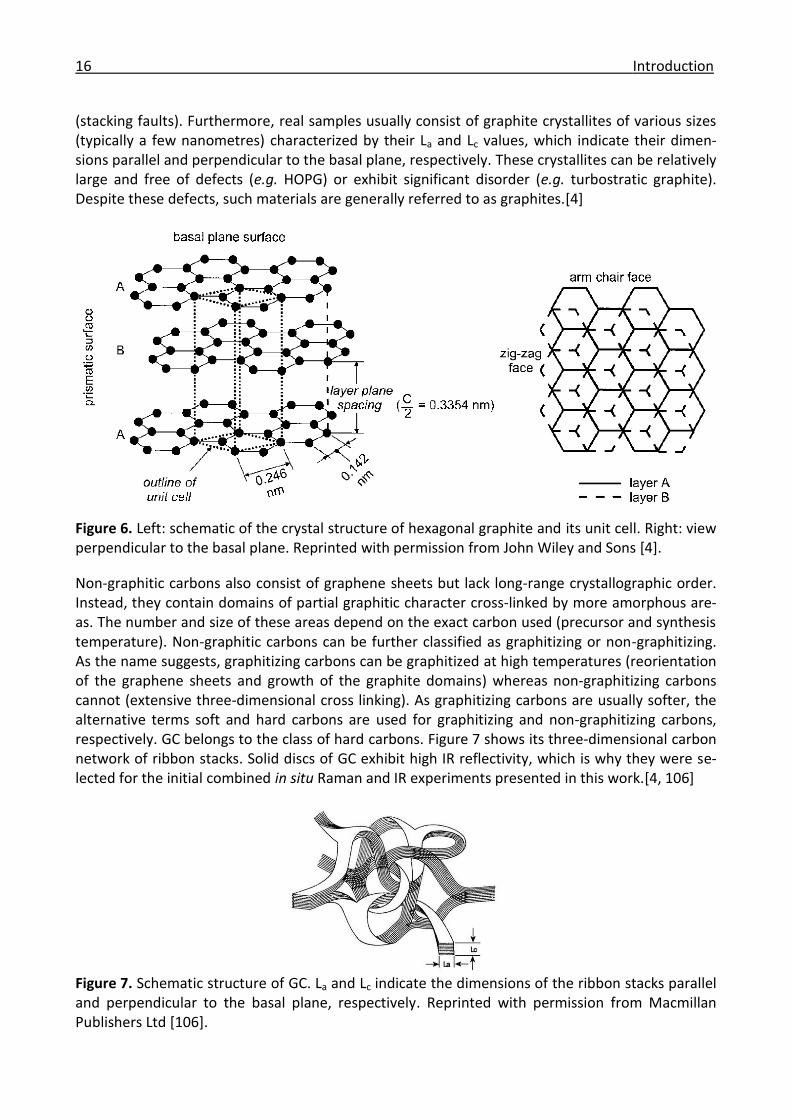
Non-graphitic carbons also consist of graphene sheets but lack long-range crystallographic order. Instead, they contain domains of partial graphitic character cross-linked by more amorphous are-as. The number and size of these areas depend on the exact carbon used (precursor and synthesis temperature). Non-graphitic carbons can be further classified as graphitizing or non-graphitizing. As the name suggests, graphitizing carbons can be graphitized at high temperatures (reorientation of the graphene sheets and growth of the graphite domains) whereas non-graphitizing carbons cannot (extensive three-dimensional cross linking). As graphitizing carbons are usually softer, the alternative terms soft and hard carbons are used for graphitizing and non-graphitizing carbons, respectively. GC belongs to the class of hard carbons. Figure 7 shows its three-dimensional carbon network of ribbon stacks. Solid discs of GC exhibit high IR reflectivity, which is why they were se-lected for the initial combined in situ Raman and IR experiments presented in this work.[4, 106]
Figure 7. Schematic structure of GC. La and Lc indicate the dimensions of the ribbon stacks parallel and perpendicular to the basal plane, respectively. Reprinted with permission from Macmillan Publishers Ltd [106].

Lithium-ion batteries 17
Lithium insertion into carbons
Lithium intercalation into graphite was first demonstrated in the 1950s [107]. Graphite is able to form intercalation compounds (GIC) with up to one lithium-ion (guest) per six carbon atoms (host), according to the following equation
C6 + Li+ + e- ⇌ LiC6 (charging/reduction from left to right) 1.8
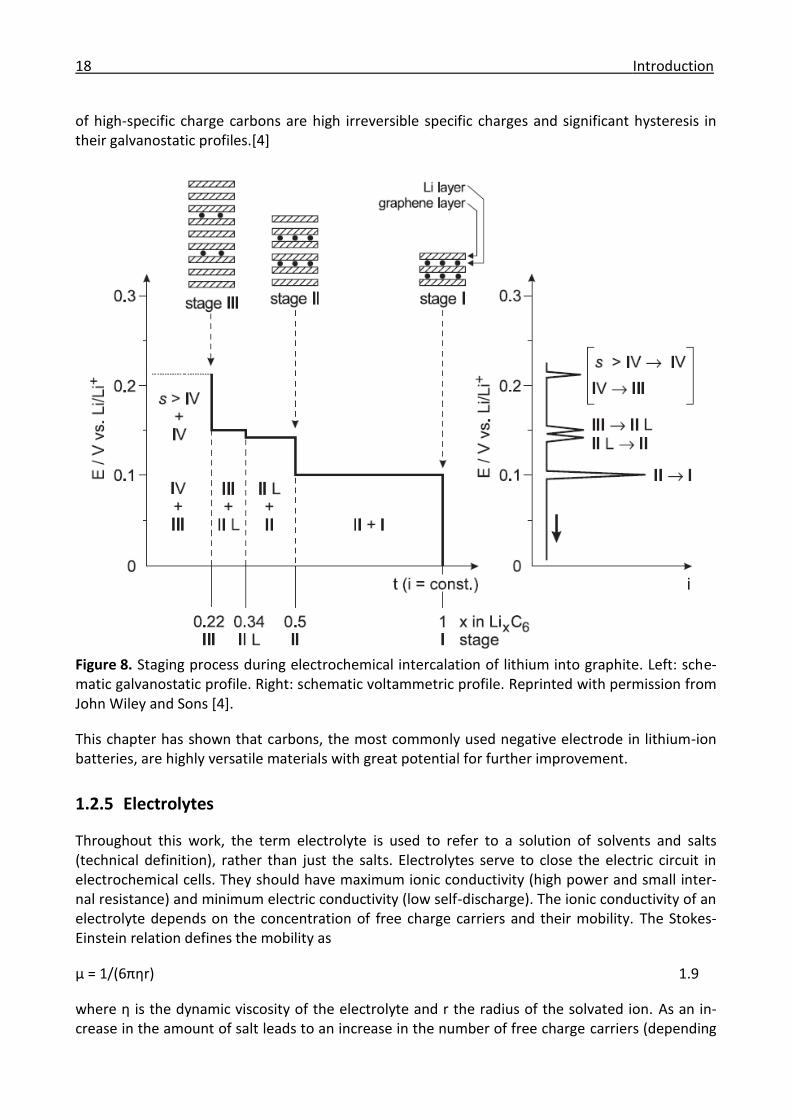
This electrochemical reaction is reversible and provides an attractive specific charge of 372 mAh/g. Intercalation occurs mainly at the edge planes whereas the basal planes are impermeable to lithi-um intercalation, unless they contain defects. The stacking sequence of graphite changes from AB (or ABC) to AA upon lithium intercalation, i.e. to a structure in which all graphene sheets coincide when viewed perpendicular to the base plane. In fully lithiated graphite (LiC6), all intercalation sites between the graphene sheets are occupied by lithium ions (located in the middle of the car-bon hexagons and avoiding nearest-neighbour sites). The resulting structure shows only a 10% increase in the interlayer distance between the graphene sheets [101], which explains the high cycling stability of graphite. The gradual intercalation of lithium into graphite leads to the distinc-tive stepwise formation of periodic arrays of occupied and unoccupied intercalation layers. This phenomenon is called staging and can be characterized by the stage index s, which represents the number of graphene sheets between two adjacent intercalation layers. Staging results from the competing influences of the energy required to overcome the van der Waals forces between the graphene sheets and the repulsive interactions between the intercalated species. Figure 8 illus-trate the staging process during electrochemical lithium intercalation into graphite. The graphs on the left and right show the schematic galvanostatic and voltammetric profiles, respectively. The potential plateaus in the galvanostatic profile and the peaks in the voltammetric profile at 0.22, 0.15, 0.13 and 0.09 V indicate two-phase regions. The discontinuities (drops) in the galvanostatic profile are attributed to stages IV, III (LiC27), II L (LiC18), II (LiC12) and I (LiC6). The splitting of the second stage is due to different lithium packing densities. Strikingly, the staging process is accom-panied by a change in colour from black (graphite) to red (LiC12) and finally to golden (LiC6). During electrochemical lithium deintercalation from graphite, these stages are observed in reverse order, demonstrating the reversibility of the staging process. Note that experimental galvanostatic curves of graphite do not show sharp discontinuities and perfectly flat potential plateaus due to slight variations in the packing densities and various types of overpotential. Nevertheless, the potential plateaus can usually be clearly distinguished.[4]
By contrast, non-graphitic carbons typically exhibit poorly defined galvanostatic profiles with slop-ing potentials, which can be explained by the existence of non-equivalent insertion sites resulting from disorder (note that the generic term insertion is used deliberately). Non-graphitic carbons can be classified as high- or low-specific charge carbons, depending on whether they are able to insert more or less than one lithium-ion per six carbon atoms. GC, coke and carbon black are ex-amples of low-specific charge carbons. Despite their reduced specific charges compared with graphite, some low-specific charge carbons have found practical application due to their reduced tendency for solvent cointercalation. Whereas macroscopic GC inserts only small amounts of lithi-um, a specific charge of 223 mAh/g has been reported for GC powder [102]. However, a high irre-versible specific charge was observed, which has been explained by irreversible insertion of lithi-um into nanopores [108]. Finally, the promising specific charges of high-specific charge carbons have been attributed to the formation of lithium multilayers [109], accommodation of lithium at edge planes [110] and doping of lithium into reactive cavities [111]. However, major disadvantages
18 Introduction
of high-specific charge carbons are high irreversible specific charges and significant hysteresis in their galvanostatic profiles.[4]
Figure 8. Staging process during electrochemical intercalation of lithium into graphite. Left: sche-matic galvanostatic profile. Right: schematic voltammetric profile. Reprinted with permission from John Wiley and Sons [4].
This chapter has shown that carbons, the most commonly used negative electrode in lithium-ion batteries, are highly versatile materials with great potential for further improvement.
1.2.5 Electrolytes
Throughout this work, the term electrolyte is used to refer to a solution of solvents and salts (technical definition), rather than just the salts. Electrolytes serve to close the electric circuit in electrochemical cells. They should have maximum ionic conductivity (high power and small inter-nal resistance) and minimum electric conductivity (low self-discharge). The ionic conductivity of an electrolyte depends on the concentration of free charge carriers and their mobility. The Stokes-Einstein relation defines the mobility as
µ = 1/(6πηr) 1.9
where η is the dynamic viscosity of the electrolyte and r the radius of the solvated ion. As an in-crease in the amount of salt leads to an increase in the number of free charge carriers (depending

Lithium-ion batteries 19
on the dissociation constant) and a decrease in their mobility (higher viscosity), there is an opti-mum salt concentration (usually ~1 M). The emphasis of this chapter is on the kind of electrolytes used in this work, i.e. liquid electrolytes consisting of organic carbonates and inorganic lithium salts. Table 3 provides an overview of the physical properties of selected organic carbonates (elec-trolyte solvents) and lithium salts (electrolyte solutes) for lithium-ion batteries. The melting (Tm) and boiling points (Tb) of the solvents determine the temperature range in which the electrolyte remains liquid whereas the viscosity (η) and relative permittivity (ε, measure of polarity) influence the ion mobility and the ability to dissolve lithium salts, respectively. The maximum usable tem-perature of the salts is determined by their decomposition temperatures (Td). In addition, the structures of the solvents, the toxicities and melting points of the salts and the ionic conductivities (σ) of PC- and EC/DMC-based electrolytes are provided. All potentials given in this chapter are vs. Li+/Li.[43]
Table 3. Physical properties of selected organic carbonates (electrolyte solvents) and lithium salts (electrolyte solutes) at 25°C [43].
Organic carbonates (electrolyte solvents)
Solvent Structure Tm / °C Tb / °C η / cP ε
EC
36 248 1.9 89.8
PC
-49 242 2.5 64.9
DMC
5 91 0.6 3.1
DEC
-74 126 0.8 2.8
EMC
-53 110 0.7 3.0
Lithium salts (electrolyte solutes)
Salt Toxic Tm / °C Td / °C σPC /
mS/cm σEC/DMC / mS/cm
LiBF4 No 293 [112] >100 3.4 [113] 4.9
LiPF6 No 200 [112] 80 5.8 [113] 10.7 [112]
LiAsF6 Yes 340 >100 5.7 [113] 11.1 [114]
LiClO4 No 236 >100 5.6 [113] 8.4 [112]
Electrolytes for lithium-ion batteries usually consist of a lithium salt dissolved in a mixture of or-ganic solvents. The combination of solvents allows the fulfilment of different (often contradictory) requirements that are difficult to meet by any single component. The most common approach is the mixture of a cyclic organic carbonate, such as EC or PC (high relative permittivity), with a linear organic carbonate, such as DMC, DEC or EMC (low viscosity). Ethers, which used to be commonly employed owing to their low viscosity and suppressed dendrite formation, have fallen out of fa-vour due to their poor capacity retention [115, 116] and low anodic stability (oxidation of THF at 4.0 V [117]). Solid inorganic, solid polymer, gel polymer and ionic liquid electrolytes are not dis-cussed in detail since they were not used in this work. In short, they are based on a solid inorganic material exhibiting lithium-ion mobility (lithium transference number of 1 but very poor conductiv-ity at room temperature), a fixed polar polymer with a dissolved lithium salt (flexibility and no

20 Introduction
leakage but poor conductivity), a polymer matrix swollen by liquid electrolyte (better conductivity but lower mechanical stability than solid polymer) and a salt liquid at or near room temperature with a dissolved lithium salt (low flammability and vapour pressure but high viscosity and cost), respectively [118, 119]. The rest of this chapter is dedicated mainly to the solvents and lithium salts used in this work.[4, 43]
Solvents
An ideal electrolyte solvent should meet the following criteria [5, 43]
(1) High solubility for lithium salts (high relative permittivity ε).
(2) High fluidity (low viscosity η).
(3) Wide liquid temperature range (low melting point Tm and high boiling point Tb).
(4) Electrochemical stability (stability window from 0 to 5 V).
(5) Chemical stability to all cell components.
(6) Thermal stability, non-toxicity and low cost.
The highly oxidizing and reducing nature of the charged positive and negative electrode, respec-tively, is particularly challenging. Any protic solvents, such as water, are immediately ruled out because of their limited stability windows (protons would immediately be reduced at the negative electrode). Of the possible aprotic organic solvents, only those with polar groups offer sufficient solubility for lithium salts. Organic carbonates are the most commonly used group of electrolyte solvents. In the following section, PC, EC and DMC, the three solvents used in this work, will be presented. Despite their widespread use, these organic solvents have a number of disadvantages compared with aqueous systems, such as lower ionic conductivity, flammability, exothermic reac-tions at elevated temperatures, and higher cost. Furthermore, the lithium transference number is typically only ~0.3 due to strong solvation of Li+ (reduced mobility).[4]
Propylene carbonate (PC)
After the discovery that lithium can be electrodeposited from a solution of LiClO4 in PC, it be-came the first organic carbonate to be used for lithium-based batteries. Its advantages include its high relative permittivity (owing to the geometric constraint imposed on the carbonyl group as a result of its cyclic structure), its static stability with lithium (owing to passivation) and par-ticularly its exceptionally wide temperature range. However, the use of electrolytes with PC as their only solvent fell out of favour with the introduction of lithium-ion batteries with carbon-based negative electrodes due to the problem of solvent cointercalation and exfoliation (see al-so chapter 1.2.6).[43]
Ethylene carbonate (EC)
As a result of its structural similarity, EC shares several characteristics with PC, such as a high relative permittivity and moderate viscosity. However, its limited temperature range (solid be-low 36°C) is a serious disadvantage. The high melting point of EC can be explained by its high symmetry, which may allow the formation of a more stable crystalline lattice. This problem can be partially overcome by combination with lower-melting solvents. Crucially, EC has become an indispensable component of modern electrolytes due to its unique ability to form a stable pas-
Lithium-ion batteries 21
sivation film on carbon electrodes that prevents solvent cointercalation and thus allows excel-lent reversibility [120] (see also chapter 1.2.6).[4, 5, 43]
Dimethyl carbonate (DMC)
As a linear carbonate, DMC has a low boiling point, low viscosity and low relative permittivity. Its use as a cosolvent with EC was first described in 1994 [121]. The main advantages of adding DMC to the electrolyte are an expansion of the temperature range (lower boiling point) and a decrease in the viscosity (improved ion mobility). Interestingly, the limited anodic stability of DMC (oxidation at 4.0 V [122]) does not appear to be an issue in solvent mixtures containing DMC.[43]
Lithium Salts
An ideal electrolyte solute should meet the following criteria [5, 43]
(1) Complete dissolution and dissociation in the electrolyte.
(2) Electrochemical stability of the anion (stability window from 0 to 5 V).
(3) Chemical stability of the anion to all cell components.
(4) Thermal stability (high decomposition temperature Td), non-toxicity and low cost.
The range of lithium salts used in electrolytes for lithium-based batteries is significantly smaller than the number of organic solvents. Typical examples include lithium tetrafluoroborate (LiBF4), lithium hexafluorophosphate (LiPF6), lithium hexafluoroarsenate (LiAsF6) and lithium perchlorate (LiClO4). Simple lithium salts, such as halides or oxides, do not show sufficient solubility in organic carbonates due to the small ionic radius of lithium-ions. Instead, the lithium salts are typically based on a Lewis acid core (LiXYz, with X = B, P, As, Sb or Cl, Y = F or O and z = 4-6) coordinated to a simple anion (F- or O2-), resulting in complex salts with well distributed negative charges. LiAsF6, which used to be commonly employed in combination with ethers, has fallen out of favour due to its toxicity. LiBF4, on the other hand, suffers from low ionic conductivity due to poor dissociation. In the following section, LiClO4 and LiPF6, the two lithium salts used in this work, will be present-ed.[43]
Lithium perchlorate (LiClO4)
LiClO4 was the first salt to be used in lithium-based batteries. Its advantages include high ionic conductivity (8.4 mScm-1 in EC/DMC), high anodic stability (5.1 V in EC/DMC [123]), chemical stability to air, low hygroscopicity and low cost. However, the high oxidation state of chlorine (VII) makes lithium perchlorate a strong oxidant that reacts violently with organic compounds at elevated temperatures. Therefore, it is usually not considered for large-scale industrial appli-cations. Nevertheless, it still plays an important role in research laboratories and may become increasingly important in combination with less combustible electrolytes. For most experiments shown in this work LiClO4 was selected due to less interference with the vibrational spectra compared with LiPF6.[43]
Lithium hexafluorophosphate (LiPF6)
LiPF6 has become the salt of choice for commercial lithium-ion batteries. Rather than exhibiting any single outstanding property, it offers a well-balanced combination of characteristics, such
22 Introduction
as high ionic conductivity (comparable to LiAsF6 and LiClO4), high anodic stability (comparable to LiClO4 [123]), reduced danger of electrolyte oxidation (compared with LiClO4) and low toxici-ty (compared with LiAsF6). Its disadvantages include relatively low thermal stability (decomposi-tion at 80°C) and lability to hydrolysis, which complicates the industrial production of pure LiPF6. The aggressive side products formed by this side reaction, such as HF, can cause a series of undesired reactions in the battery. Nevertheless, mixtures of EC, linear organic carbonates and LiPF6 remain the most commonly used electrolytes for lithium-ion batteries.[43]
In the next chapter, the passivation films formed on electrodes during electrochemical cycling, which are closely related to the electrolytes, will be discussed.
1.2.6 Solid electrolyte interphase
The main advantage of lithium-based batteries, i.e. their high voltage (>4 V), simultaneously con-stitutes a major challenge. Due to the highly reducing and oxidizing conditions encountered at the negative and positive electrodes, respectively, it is very difficult to find thermodynamically stable electrolytes. Therefore, kinetic passivation of the electrodes is essential to prevent continuous electrolyte decomposition and allow highly reversible electrochemical cycling. In order to enable efficient passivation, the initial decomposition products must form a film that protects the elec-trode surfaces. As the passivation films consist of decomposition products of the electrolytes, the properties of the passivation films strongly depend on the composition of the electrolytes. Fur-thermore, they are also affected by the electrodes, the temperature and the electrochemical cy-cling conditions. In turn, the passivation films significantly influence various indicators of battery performance, such as irreversible specific charge, cycling stability, rate capability, self-discharge, shelf life, ageing and safety [4, 6]. Due to the importance of passivation for lithium-based batter-ies, the electrolyte/electrode interface has attracted a lot of interest. In this chapter, the focus is on the passivation films formed on negative electrodes, particularly carbons, since this information will be relevant to the discussion of the spectroscopic data. All potentials given in this chapter are vs. Li+/Li.[43]
SEI on lithium
The concept of a protective interphase between the negative electrode and the electrolyte in a lithium battery was first proposed by Peled in 1979 [124]. He argued that the highly reducing na-ture of lithium results in the spontaneous decomposition of the electrolyte upon contact with the negative electrode and coined the term solid electrolyte interphase (SEI), which he based on the fact that, like an electrolyte, the resulting passivation film exhibited relatively high ionic and low electric conductivity. These two properties are important since they allow the passage of lithium ions while preventing further electrochemical reduction of the electrolyte. It is commonly accept-ed that the SEI formed on lithium consists of a thick, porous, electrolyte-permeable film of organic decomposition products (possibly polymeric) and a thin, compact, electrolyte-impermeable film of inorganic decomposition products [4, 6]. Aurbach et al. analysed the interface of lithium with PC and concluded that lithium alkyl carbonates (IR band at 1650 cm-1) are the main SEI products (the observation of Li2CO3 by previous groups was attributed to the reaction of the lithium alkyl car-bonates with contaminants, such as water) [125]. In addition to these degradation products of the solvents, the authors also found evidence of degradation products (halides) of the lithium salts (LiClO4 and LiAsF6), which demonstrated that all components of the electrolytes affect the SEI. The main organic SEI products formed on lithium in the presence of PC and EC were later identified as

Lithium-ion batteries 23
CH3CH(OCO2Li)CH2OCO2Li and (CH2OCO2Li)2, respectively [126, 127]. Although SEI formation on lithium is necessary to prevent complete decomposition of the electrolyte, its non-uniform mor-phology leads to inhomogeneous current distribution on the electrode, which can ultimately result in dendrite formation and catastrophic cell failure. However, the pioneering studies of SEI for-mation on lithium were important since some of this knowledge could be transferred to the inves-tigation of other negative electrode materials, such as carbons.[43]
SEI on carbon
Owing to the ultimate failure of primary lithium batteries and the success of secondary lithium-ion batteries, the focus of SEI investigations shifted from lithium to carbons. In 1990, Fong et al. (Dahn’s group) studied the undesired irreversible charge (consumption of lithium from the positive electrode material) occurring in the first cycle of carbon-based negative electrodes [120]. They observed that this irreversible charge, which was absent in subsequent cycles, is approximately proportional to the surface area of the carbons. By analogy with lithium, the authors proposed the formation of an SEI on carbon-based negative electrodes and attributed the increased reduction signal associated with SEI formation to the larger surface of carbons compared with lithium. Fur-thermore, they showed that the exfoliation of carbon-based negative electrodes (see below) can be prevented by adding EC to the electrolyte and concluded that EC enhances the stability of the SEI and thus improves the Coulombic efficiency. Fully lithiated carbons have potentials close to lithium, which suggests that the passivation films formed on carbons and lithium may indeed be similar. However, in contrast to lithium, which reacts spontaneously upon contact with the elec-trolyte, carbon electrodes need to be cathodically polarized before electrolyte reduction can take place, which makes the SEI formation process on carbon electrodes much more specific. According to the literature, the onset of SEI formation is usually observed at ~0.8 V [6, 128], although more positive values have also been reported (especially for the electrolyte salts) [129-132]. The thick-ness of the SEI has been estimated at a few to tens of nanometres [128, 133]. Due to the irreversi-bility of the first cycle (charge loss of 10-20% [4]), commercial lithium-ion batteries are typically subjected to a forming process at the manufacturing site in order to establish a stable SEI and en-sure high Coulombic efficiency in subsequent cycles. However, accidental abuse (overcharge, high temperature or mechanical impact) can damage the preformed SEI and thus initiate irreversible reactions.[43]
An ideal SEI should meet the following criteria [6, 43]
(1) Low electric conductivity (prevents continuous electrolyte decomposition).
(2) High ionic conductivity (Li+ migration required for intercalation and deintercalation).
(3) Uniform morphology and chemical composition (homogeneous current distribution).
(4) High mechanical strength, flexibility and adhesion to the carbon electrode.
(5) Low solubility in the electrolyte (dissolution would lead to continuous decomposition).
There are two main models describing the SEI formation mechanisms on graphite. The first was proposed by Besenhard et al., who argued that the reductive decomposition of the electrolyte may not be a simple surface process. The Besenhard model is shown schematically in Figure 9. Upon cathodic polarization, solvated lithium ions migrate to the negatively charged surface of the graphite electrode (a) and are intercalated between the graphene sheets (1.0-0.8 V), forming a ternary GIC of the type Lix(solv)yC6 (b), which is reductively decomposed near the edge planes at
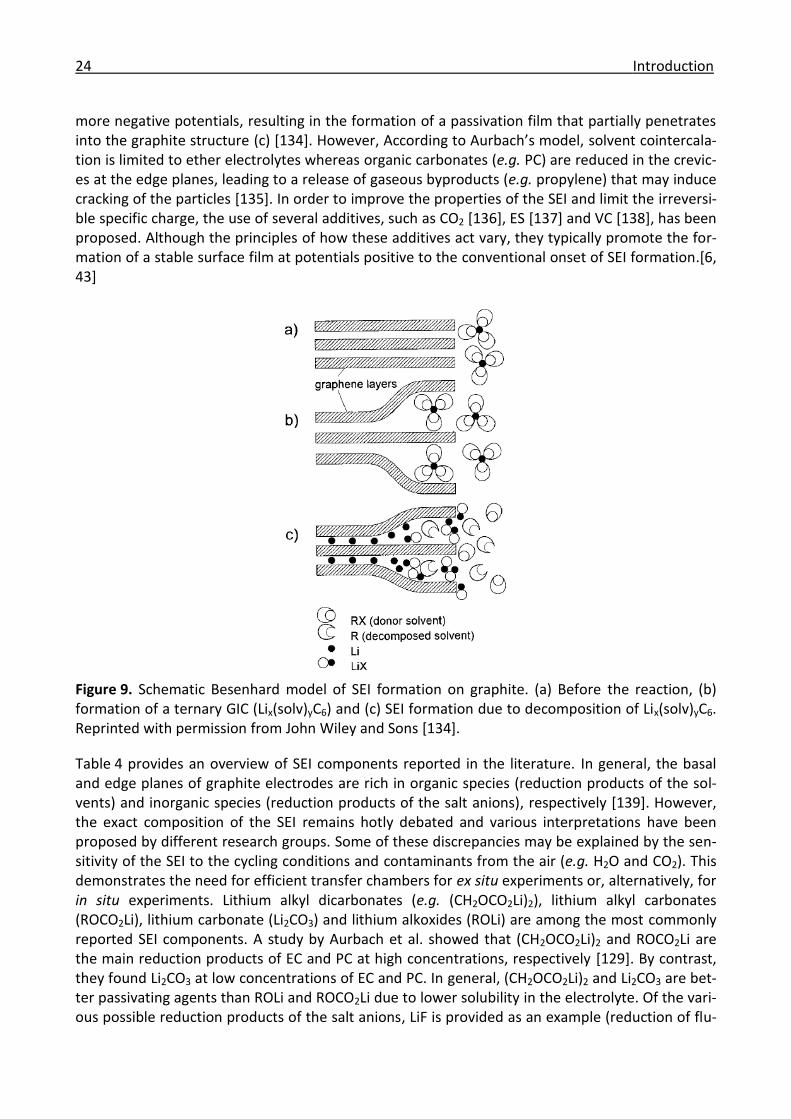
24 Introduction
more negative potentials, resulting in the formation of a passivation film that partially penetrates into the graphite structure (c) [134]. However, According to Aurbach’s model, solvent cointercala-tion is limited to ether electrolytes whereas organic carbonates (e.g. PC) are reduced in the crevic-es at the edge planes, leading to a release of gaseous byproducts (e.g. propylene) that may induce cracking of the particles [135]. In order to improve the properties of the SEI and limit the irreversi-ble specific charge, the use of several additives, such as CO2 [136], ES [137] and VC [138], has been proposed. Although the principles of how these additives act vary, they typically promote the for-mation of a stable surface film at potentials positive to the conventional onset of SEI formation.[6, 43]
Figure 9. Schematic Besenhard model of SEI formation on graphite. (a) Before the reaction, (b) formation of a ternary GIC (Lix(solv)yC6) and (c) SEI formation due to decomposition of Lix(solv)yC6. Reprinted with permission from John Wiley and Sons [134].
Table 4 provides an overview of SEI components reported in the literature. In general, the basal and edge planes of graphite electrodes are rich in organic species (reduction products of the sol-vents) and inorganic species (reduction products of the salt anions), respectively [139]. However, the exact composition of the SEI remains hotly debated and various interpretations have been proposed by different research groups. Some of these discrepancies may be explained by the sen-sitivity of the SEI to the cycling conditions and contaminants from the air (e.g. H2O and CO2). This demonstrates the need for efficient transfer chambers for ex situ experiments or, alternatively, for in situ experiments. Lithium alkyl dicarbonates (e.g. (CH2OCO2Li)2), lithium alkyl carbonates (ROCO2Li), lithium carbonate (Li2CO3) and lithium alkoxides (ROLi) are among the most commonly reported SEI components. A study by Aurbach et al. showed that (CH2OCO2Li)2 and ROCO2Li are the main reduction products of EC and PC at high concentrations, respectively [129]. By contrast, they found Li2CO3 at low concentrations of EC and PC. In general, (CH2OCO2Li)2 and Li2CO3 are bet-ter passivating agents than ROLi and ROCO2Li due to lower solubility in the electrolyte. Of the vari-ous possible reduction products of the salt anions, LiF is provided as an example (reduction of flu-
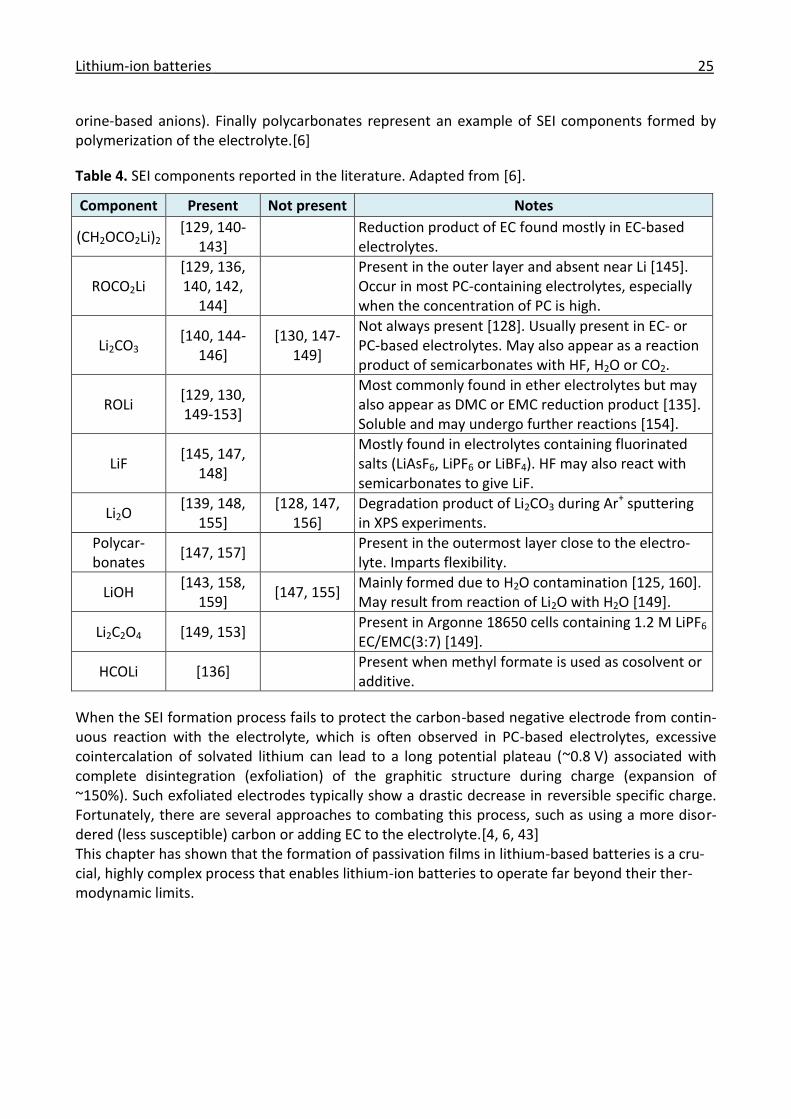
Lithium-ion batteries 25
orine-based anions). Finally polycarbonates represent an example of SEI components formed by polymerization of the electrolyte.[6]
Table 4. SEI components reported in the literature. Adapted from [6].
Component Present Not present Notes
(CH2OCO2Li)2 [129, 140-
143]
Reduction product of EC found mostly in EC-based electrolytes.
ROCO2Li [129, 136, 140, 142,
144]
Present in the outer layer and absent near Li [145]. Occur in most PC-containing electrolytes, especially when the concentration of PC is high.
Li2CO3 [140, 144-
146] [130, 147-
149]
Not always present [128]. Usually present in EC- or PC-based electrolytes. May also appear as a reaction product of semicarbonates with HF, H2O or CO2.
ROLi [129, 130, 149-153]
Most commonly found in ether electrolytes but may also appear as DMC or EMC reduction product [135]. Soluble and may undergo further reactions [154].
LiF [145, 147,
148]
Mostly found in electrolytes containing fluorinated salts (LiAsF6, LiPF6 or LiBF4). HF may also react with semicarbonates to give LiF.
Li2O [139, 148,
155] [128, 147,
156] Degradation product of Li2CO3 during Ar+ sputtering in XPS experiments.
Polycar-bonates
[147, 157] Present in the outermost layer close to the electro-lyte. Imparts flexibility.
LiOH [143, 158,
159] [147, 155]
Mainly formed due to H2O contamination [125, 160]. May result from reaction of Li2O with H2O [149].
Li2C2O4 [149, 153] Present in Argonne 18650 cells containing 1.2 M LiPF6 EC/EMC(3:7) [149].
HCOLi [136] Present when methyl formate is used as cosolvent or additive.
When the SEI formation process fails to protect the carbon-based negative electrode from contin-uous reaction with the electrolyte, which is often observed in PC-based electrolytes, excessive cointercalation of solvated lithium can lead to a long potential plateau (~0.8 V) associated with complete disintegration (exfoliation) of the graphitic structure during charge (expansion of ~150%). Such exfoliated electrodes typically show a drastic decrease in reversible specific charge. Fortunately, there are several approaches to combating this process, such as using a more disor-dered (less susceptible) carbon or adding EC to the electrolyte.[4, 6, 43] This chapter has shown that the formation of passivation films in lithium-based batteries is a cru-cial, highly complex process that enables lithium-ion batteries to operate far beyond their ther-modynamic limits.

26 Introduction
Materials 27
2 Experimental methods
This chapter provides an overview of the materials and analytical methods used. Some of the ex-perimental methods (e.g. the preparation of polished single graphite particles), the electrochemi-cal cells (for spectroscopic in situ experiments) and the automation system for combined in situ Raman and IR microscopy had to be developed/adapted specifically for this work.
2.1 Materials
NCM and carbons were selected as positive and negative electrode materials, respectively, due to their relevance to practical lithium-ion batteries. In particular, the positive electrode materials stoichiometric NCM, Li1.1(Ni0.33Co0.33Mn0.33)0.9O2, HE-NCM and Li2MnO3, and the negative electrode materials graphite powder, GC and polished single graphite particles were investigated. The men-tioned positive electrode materials were selected because they represent a series of NCM materi-als with increasing degrees of overlithiation, which allows the systematic study of the effect of overlithiation on the properties of NCM. The mentioned negative electrode materials were select-ed because they represent conventional graphite electrodes, a model system with high IR reflectiv-ity and a good compromise between IR reflectivity and lithium intercalation, respectively.
2.1.1 Commercially obtained chemicals
Table 5 provides an overview of the commercially obtained chemicals used in this work (including the manufacturers). The chemicals were used without further purification.
2.1.2 Synthesized chemicals
Due to limited commercial availability of suitable samples, stoichiometric NCM and Li2MnO3 were synthesized in-house.
Synthesis of stoichiometric NCM (LiNi0.33Co0.33Mn0.33O2) [40]
Stoichiometric NCM was synthesized in-house via the sol-gel method. In a 3 g batch, stoichio-metric amounts of metal nitrates (LiNO3, Ni(NO3)2·6H2O, Co(NO3)2·6H2O, Mn(NO3)2·4H2O, all Sig-ma-Aldrich) were dissolved in an aqueous solution (250 ml) of citric acid (4 equivalents, Sigma-Aldrich). The reaction mixture was continuously stirred and heated to 100 °C (1.5 h), 200 °C (2 h) and 300 °C (2.5 h), yielding a brown powder. The powder was ground with a mortar and pestle, transferred to a crucible and calcined under air (temperature ramp to 450 °C for 6 h, constant temperature for 12 h and natural cooling to room temperature). The calcination procedure was repeated at 850 °C. The product was obtained in 90% yield.
Synthesis of Li2MnO3 [41]
For the synthesis of Li2MnO3, a two-step solid-state process adapted from the literature was em-ployed [161]. KMnO4 (1.14 g, Sigma-Aldrich), EtOH (2.1 equivalents) and H2O (40 ml) were added to an autoclave. The reaction mixture was kept at 130 °C for 14 h under continuous stirring and then filtered and washed under reduced pressure (2 × 50 ml H2O and 1 × 30 ml EtOH). The ob-

28 Experimental methods
tained brown powder (1.15 g MnOOH) was dried under vacuum and subsequently mixed with Li-OH (2.1 equivalents, Sigma-Aldrich), ground with a mortar and pestle, transferred to a crucible and calcined (temperature ramp to 500 °C for 1 h, constant temperature for 4 h, temperature ramp to 800 °C for 4 h and natural cooling to room temperature). The obtained red powder was suspended in 200 ml H2O, filtered under reduced pressure and dried under vacuum (4 h at 70 °C). The product was obtained in an overall yield of 79%.
Table 5. Commercially obtained chemicals (electrode materials, conductive additives, polymer binders and electrolytes).
Chemical Manufacturer Comments
Positive electrode materials
Li1.1(Ni0.33Co0.33Mn0.33)0.9O2(a) BASF SE Slightly overlithiated NCM
HE-NCM(a) BASF SE xLi2MnO3·(1-x)LiMO2
with M = Ni, Co, Mn and x ≈ 0.5
Li2MnO3(a) BASF SE
More difficult to activate than the Li2MnO3 syn-thesized in-house
Negative electrode materials
SFG6 Imerys Graphite
& Carbon(b) TIMREX graphite powder with 90% of the parti-
cles smaller than 6 µm
SFG44 Imerys Graphite
& Carbon(b) TIMREX graphite powder with 90% of the parti-
cles smaller than 44 µm
GC HTW GmbH Glassy carbon discs (thickness: 150-180 µm)
T200-2000(a) Imerys Graphite
& Carbon(b)
Second coarsest TIMREX graphite powder avail-able from Imerys, used to prepare some polished
single graphite particles
T1000-8000(a) Imerys Graphite
& Carbon(b)
Coarsest TIMREX graphite powder available from Imerys, used to prepare most polished single
graphite particles
Counter and reference electrode materials
Li Alfa Aesar Lithium discs (thickness: 0.75 mm)
Conductive additives
Super P Imerys Graphite
& Carbon(b) Carbon black, not used for negative electrodes
(sufficient intrinsic electric conductivity)
Polymer binders
Solef 1015 Solvay Polyvinylidene difluoride (PVDF)
Electrolytes
1 M LiClO4 in 1:1 EC/DMC(c) (LC30)
BASF SE(d) Electrolyte for most experiments
1 M LiClO4 in PC (LCP) BASF SE(d) Electrolyte for the exfoliation experiments
1 M LiPF6 in 1:1 EC/DMC (LP30) BASF SE(d) Electrolyte for some preliminary experiments
(a) Special sample obtained via personal connections with the company. (b) Formerly Timcal Graphite & Carbon. (c) With 5 wt% VC or ES (additive) for some of the experiments presented in chapter 3.3.1. (d) Formerly provided by Novolyte.
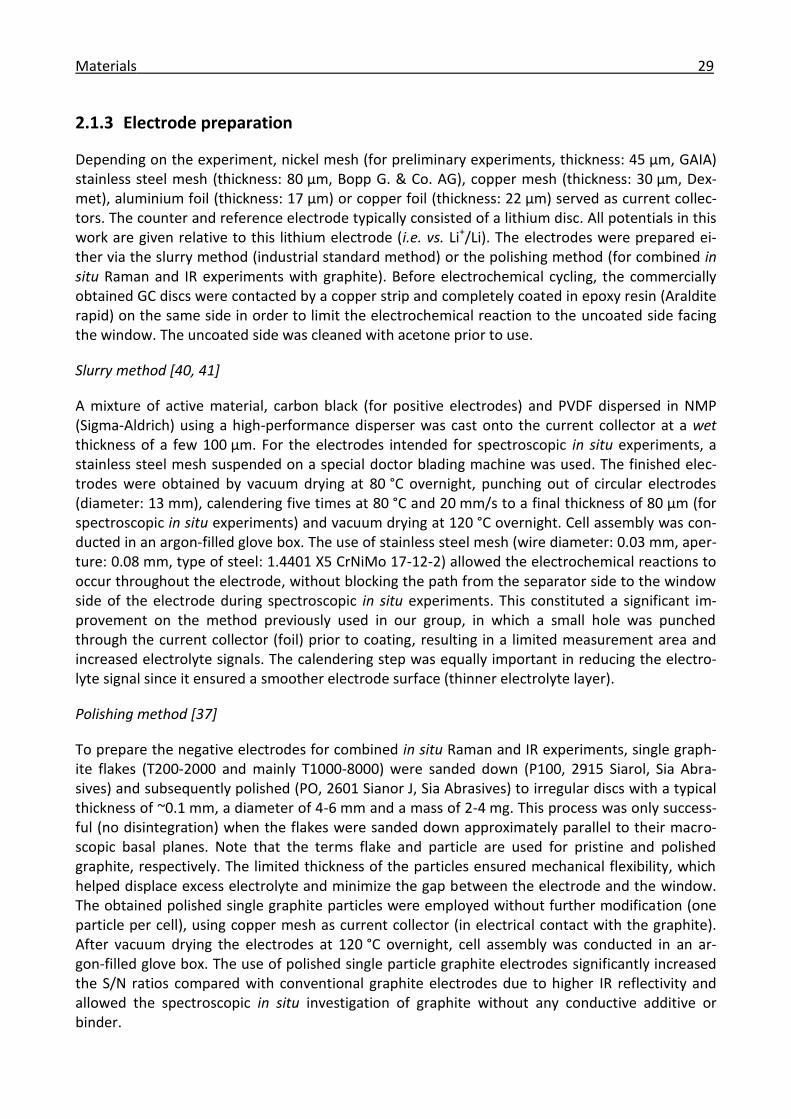
Materials 29
2.1.3 Electrode preparation
Depending on the experiment, nickel mesh (for preliminary experiments, thickness: 45 µm, GAIA) stainless steel mesh (thickness: 80 µm, Bopp G. & Co. AG), copper mesh (thickness: 30 µm, Dex-met), aluminium foil (thickness: 17 µm) or copper foil (thickness: 22 µm) served as current collec-tors. The counter and reference electrode typically consisted of a lithium disc. All potentials in this work are given relative to this lithium electrode (i.e. vs. Li+/Li). The electrodes were prepared ei-ther via the slurry method (industrial standard method) or the polishing method (for combined in situ Raman and IR experiments with graphite). Before electrochemical cycling, the commercially obtained GC discs were contacted by a copper strip and completely coated in epoxy resin (Araldite rapid) on the same side in order to limit the electrochemical reaction to the uncoated side facing the window. The uncoated side was cleaned with acetone prior to use.
Slurry method [40, 41]
A mixture of active material, carbon black (for positive electrodes) and PVDF dispersed in NMP (Sigma-Aldrich) using a high-performance disperser was cast onto the current collector at a wet thickness of a few 100 µm. For the electrodes intended for spectroscopic in situ experiments, a stainless steel mesh suspended on a special doctor blading machine was used. The finished elec-trodes were obtained by vacuum drying at 80 °C overnight, punching out of circular electrodes (diameter: 13 mm), calendering five times at 80 °C and 20 mm/s to a final thickness of 80 µm (for spectroscopic in situ experiments) and vacuum drying at 120 °C overnight. Cell assembly was con-ducted in an argon-filled glove box. The use of stainless steel mesh (wire diameter: 0.03 mm, aper-ture: 0.08 mm, type of steel: 1.4401 X5 CrNiMo 17-12-2) allowed the electrochemical reactions to occur throughout the electrode, without blocking the path from the separator side to the window side of the electrode during spectroscopic in situ experiments. This constituted a significant im-provement on the method previously used in our group, in which a small hole was punched through the current collector (foil) prior to coating, resulting in a limited measurement area and increased electrolyte signals. The calendering step was equally important in reducing the electro-lyte signal since it ensured a smoother electrode surface (thinner electrolyte layer).
Polishing method [37]
To prepare the negative electrodes for combined in situ Raman and IR experiments, single graph-ite flakes (T200-2000 and mainly T1000-8000) were sanded down (P100, 2915 Siarol, Sia Abra-sives) and subsequently polished (PO, 2601 Sianor J, Sia Abrasives) to irregular discs with a typical thickness of ~0.1 mm, a diameter of 4-6 mm and a mass of 2-4 mg. This process was only success-ful (no disintegration) when the flakes were sanded down approximately parallel to their macro-scopic basal planes. Note that the terms flake and particle are used for pristine and polished graphite, respectively. The limited thickness of the particles ensured mechanical flexibility, which helped displace excess electrolyte and minimize the gap between the electrode and the window. The obtained polished single graphite particles were employed without further modification (one particle per cell), using copper mesh as current collector (in electrical contact with the graphite). After vacuum drying the electrodes at 120 °C overnight, cell assembly was conducted in an ar-gon-filled glove box. The use of polished single particle graphite electrodes significantly increased the S/N ratios compared with conventional graphite electrodes due to higher IR reflectivity and allowed the spectroscopic in situ investigation of graphite without any conductive additive or binder.
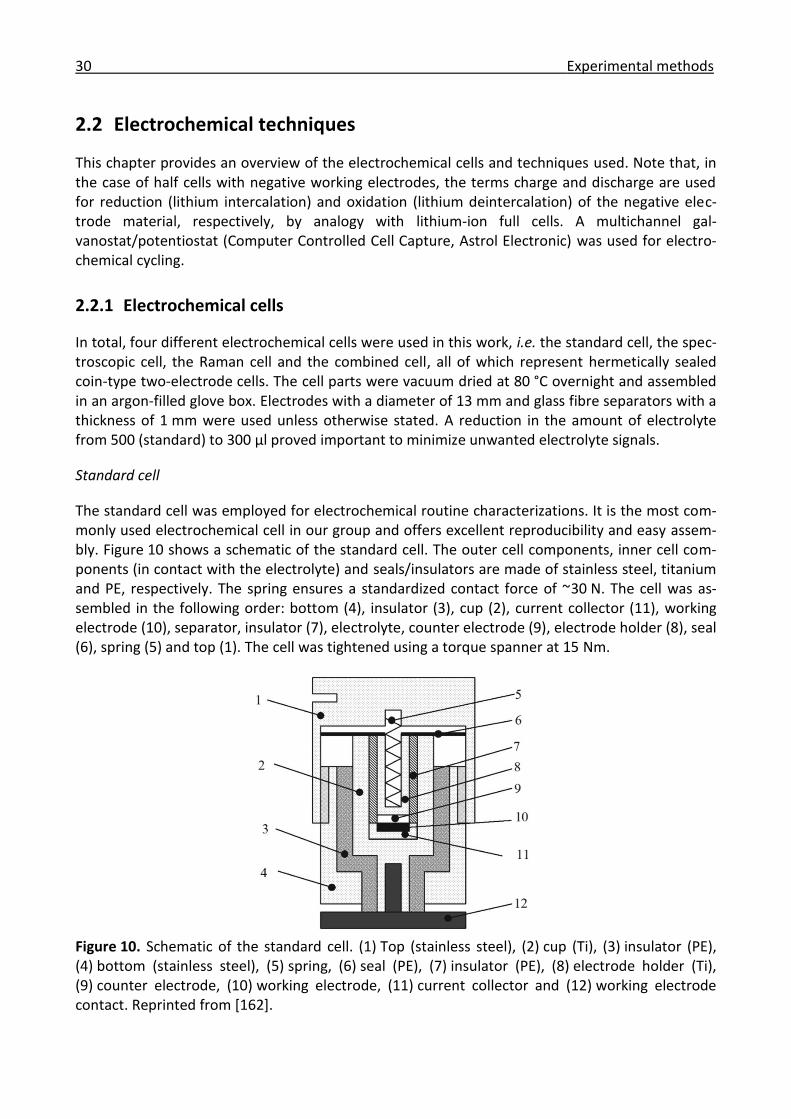
30 Experimental methods
2.2 Electrochemical techniques
This chapter provides an overview of the electrochemical cells and techniques used. Note that, in the case of half cells with negative working electrodes, the terms charge and discharge are used for reduction (lithium intercalation) and oxidation (lithium deintercalation) of the negative elec-trode material, respectively, by analogy with lithium-ion full cells. A multichannel gal-vanostat/potentiostat (Computer Controlled Cell Capture, Astrol Electronic) was used for electro-chemical cycling.
2.2.1 Electrochemical cells
In total, four different electrochemical cells were used in this work, i.e. the standard cell, the spec-troscopic cell, the Raman cell and the combined cell, all of which represent hermetically sealed coin-type two-electrode cells. The cell parts were vacuum dried at 80 °C overnight and assembled in an argon-filled glove box. Electrodes with a diameter of 13 mm and glass fibre separators with a thickness of 1 mm were used unless otherwise stated. A reduction in the amount of electrolyte from 500 (standard) to 300 µl proved important to minimize unwanted electrolyte signals.
Standard cell
The standard cell was employed for electrochemical routine characterizations. It is the most com-monly used electrochemical cell in our group and offers excellent reproducibility and easy assem-bly. Figure 10 shows a schematic of the standard cell. The outer cell components, inner cell com-ponents (in contact with the electrolyte) and seals/insulators are made of stainless steel, titanium and PE, respectively. The spring ensures a standardized contact force of ~30 N. The cell was as-sembled in the following order: bottom (4), insulator (3), cup (2), current collector (11), working electrode (10), separator, insulator (7), electrolyte, counter electrode (9), electrode holder (8), seal (6), spring (5) and top (1). The cell was tightened using a torque spanner at 15 Nm.
Figure 10. Schematic of the standard cell. (1) Top (stainless steel), (2) cup (Ti), (3) insulator (PE), (4) bottom (stainless steel), (5) spring, (6) seal (PE), (7) insulator (PE), (8) electrode holder (Ti), (9) counter electrode, (10) working electrode, (11) current collector and (12) working electrode contact. Reprinted from [162].
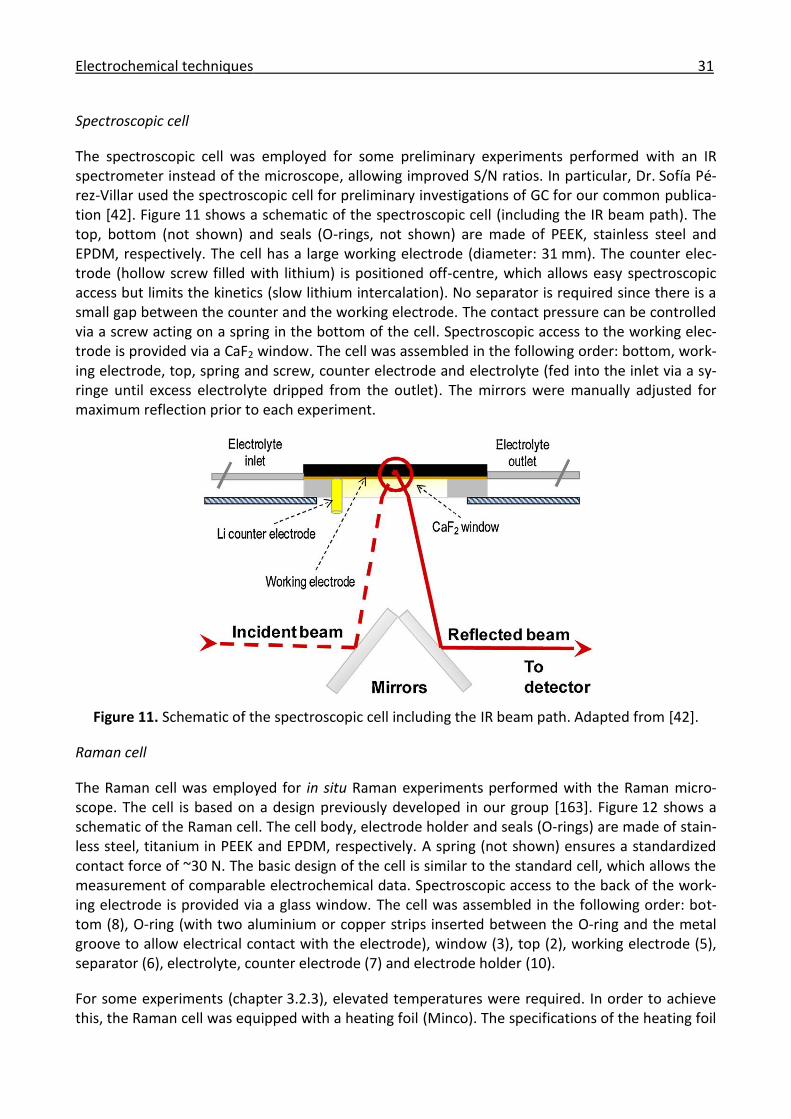
Electrochemical techniques 31
Spectroscopic cell
The spectroscopic cell was employed for some preliminary experiments performed with an IR spectrometer instead of the microscope, allowing improved S/N ratios. In particular, Dr. Sofía Pé-rez-Villar used the spectroscopic cell for preliminary investigations of GC for our common publica-tion [42]. Figure 11 shows a schematic of the spectroscopic cell (including the IR beam path). The top, bottom (not shown) and seals (O-rings, not shown) are made of PEEK, stainless steel and EPDM, respectively. The cell has a large working electrode (diameter: 31 mm). The counter elec-trode (hollow screw filled with lithium) is positioned off-centre, which allows easy spectroscopic access but limits the kinetics (slow lithium intercalation). No separator is required since there is a small gap between the counter and the working electrode. The contact pressure can be controlled via a screw acting on a spring in the bottom of the cell. Spectroscopic access to the working elec-trode is provided via a CaF2 window. The cell was assembled in the following order: bottom, work-ing electrode, top, spring and screw, counter electrode and electrolyte (fed into the inlet via a sy-ringe until excess electrolyte dripped from the outlet). The mirrors were manually adjusted for maximum reflection prior to each experiment.
Figure 11. Schematic of the spectroscopic cell including the IR beam path. Adapted from [42].
Raman cell
The Raman cell was employed for in situ Raman experiments performed with the Raman micro-scope. The cell is based on a design previously developed in our group [163]. Figure 12 shows a schematic of the Raman cell. The cell body, electrode holder and seals (O-rings) are made of stain-less steel, titanium in PEEK and EPDM, respectively. A spring (not shown) ensures a standardized contact force of ~30 N. The basic design of the cell is similar to the standard cell, which allows the measurement of comparable electrochemical data. Spectroscopic access to the back of the work-ing electrode is provided via a glass window. The cell was assembled in the following order: bot-tom (8), O-ring (with two aluminium or copper strips inserted between the O-ring and the metal groove to allow electrical contact with the electrode), window (3), top (2), working electrode (5), separator (6), electrolyte, counter electrode (7) and electrode holder (10).
For some experiments (chapter 3.2.3), elevated temperatures were required. In order to achieve this, the Raman cell was equipped with a heating foil (Minco). The specifications of the heating foil

32 Experimental methods
are 12.7 x 101.6 mm and 78.4 Ω. Using a 48 V power supply unit, this results in a heating power of ~30 W, which was more than sufficient. The heating foil was wrapped around the cell body and held in place by a heat shrink tube. The temperature was kept at 50 °C (±0.8 °C) using an Itron 16 control unit (Jumo) connected to a Pt100 resistance thermometer (Heraeus) attached to the cell top. Heat-conducting paste was employed to ensure good thermal contact. Prior to electrochemi-cal cycling, an idling step was implemented for 1 h.[41]
Figure 12. Schematic of the Raman cell. (1) Objective, (2) top (stainless steel), (3) window (glass), (4) current collector (stainless steel mesh), (5) working electrode, (6) separator, (7) counter elec-trode (Li), (8) bottom (stainless steel), (9) seals (EPDM) and (10) electrode holder (Ti in PEEK).
Combined cell
The combined cell was employed for all combined in situ Raman and IR experiments with the combined Raman and IR microscope. Figure 13 shows a schematic of the combined cell. The basic design of the cell is similar to the Raman cell, with the following modifications
(1) A pneumatic cylinder is used instead of a spring to control the contact pressure (application of an inlet pressure of 1 bar, resulting in a contact force of ~30 N)
(2) A CaF2 window is used instead of a glass window since it is transparent to both visible and IR radiation (down to ~950 cm-1) and chemically stable.
Cell assembly is also similar to the Raman cell, with the following modifications
(1) The polished single graphite particle is contacted by a copper mesh between the particle and the separator.
(2) At the end, the pneumatic cylinder is attached to the bottom of the cell.
Electrochemical techniques 33
Figure 13. Schematic of the combined cell including the pneumatic cylinder for contact pressure control. Adapted from [164].
2.2.2 Galvanostatic measurements
In galvanostatic measurements, a constant current is applied between the working and the coun-ter electrode until a certain limiting potential is reached (typically 3.00-4.80 and 1.50-0.05 V for the positive and negative electrode materials, respectively). Simultaneously, the applied current and the measured potential are recorded as a function of time. This technique is commonly used in battery research since it simulates real battery working conditions. The applied current is often expressed as a C-rate, which represents the inverse of the number of hours required to reach the total specific charge of a material during charge or discharge (throughout this work, the C-rates for NCM and graphite are calculated based on specific charges of 200 and 372 mAh/g, respectively). Alternatively, it can be expressed as a specific current (mA/g), which is normalized to the amount of active material. A complete electrochemical cycle consists of a charge and discharge half cycle. To achieve complete charge or discharge, potentiostatic steps (constant potentials) are sometimes employed at the end of the half cycles.
Figure 14 shows a typical galvanostatic profile. The complete first cycle of SFG44 graphite in the standard cell at a C-rate of C/37 in LC30 has been selected as an example. The blue curve (left axis) and the red curve (right axis) represent the measured potential profile and the applied current, respectively (note the short potentiostatic phase at the end of the charge). The potential profile matches the schematic staging profile of graphite provided in Figure 8.
The exact galvanostatic conditions applied in the experiments presented in this work will be speci-fied in the corresponding sections.

34 Experimental methods
Figure 14. Exemplary galvanostatic profile (1st cycle of SFG44 graphite vs. Li in the standard cell at a C-rate of C/37 in LC30). Left axis: potential. Right axis: current.
2.2.3 Potentiostatic measurements
In potentiostatic measurements, a constant potential is applied between the working and the ref-erence electrode (here: same as counter electrode) for a certain period of time. Simultaneously, the applied potential and the measured current are recorded as a function of time. For the transi-tions between different potentials, a maximum current is specified. Note that a relatively high cur-rent is typically selected to ensure that the transitions in potential occur rapidly. A complete elec-trochemical cycle consists of a charge and a discharge half cycle. Each half cycle comprises a se-lected number of potential steps. At each potential step, the current decays with time (e.g. ac-cording to the Cottrell equation for diffusion-limited systems).
Figure 15 shows a typical potentiostatic profile. The complete first cycle of a polished single graph-ite particle (T1000-8000) in the combined cell at a maximum current of ±2 mA in LC30 has been selected as an example. The blue curve (left axis) and the red curve (right axis) represent the ap-plied potential and the measured current profile, respectively. Note the overshoots immediately after the transitions in potential. In this example, six potential steps of 1 h each were selected for each half cycle.
The exact potentiostatic conditions applied in the experiments presented in this work will be spec-ified in the corresponding sections.
0.0
0.2
0.4
0.6
0.8
1.0
1.2
1.4
1.6
Po
tentia
l vs. L
i+/L
i / V
Time / h
Pote
ntiosta
tic p
hase
0 10 20 30 40 50 60 70 80
-0.2
-0.1
0.0
0.1
0.2
Cu
rre
nt
/ m
A
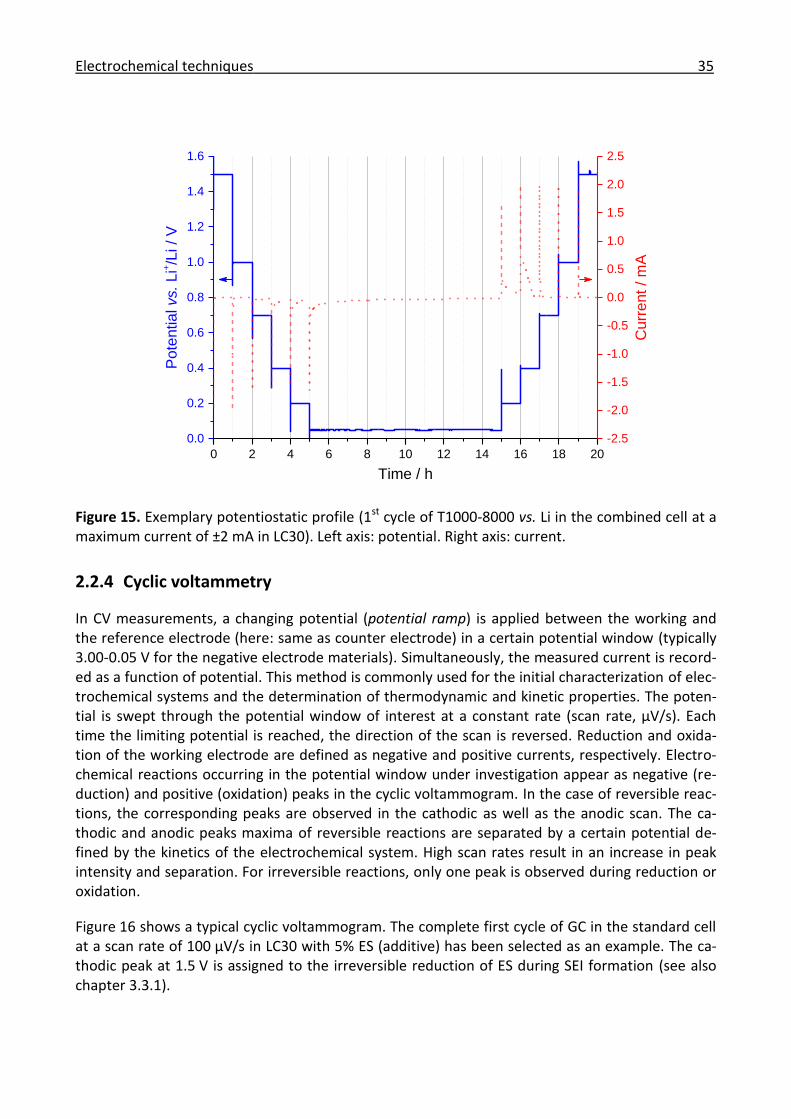
Electrochemical techniques 35
0 2 4 6 8 10 12 14 16 18 20
0.0
0.2
0.4
0.6
0.8
1.0
1.2
1.4
1.6
Po
tentia
l vs. L
i+/L
i / V
Time / h
-2.5
-2.0
-1.5
-1.0
-0.5
0.0
0.5
1.0
1.5
2.0
2.5
Cu
rre
nt
/ m
A
Figure 15. Exemplary potentiostatic profile (1st cycle of T1000-8000 vs. Li in the combined cell at a maximum current of ±2 mA in LC30). Left axis: potential. Right axis: current.
2.2.4 Cyclic voltammetry
In CV measurements, a changing potential (potential ramp) is applied between the working and the reference electrode (here: same as counter electrode) in a certain potential window (typically 3.00-0.05 V for the negative electrode materials). Simultaneously, the measured current is record-ed as a function of potential. This method is commonly used for the initial characterization of elec-trochemical systems and the determination of thermodynamic and kinetic properties. The poten-tial is swept through the potential window of interest at a constant rate (scan rate, µV/s). Each time the limiting potential is reached, the direction of the scan is reversed. Reduction and oxida-tion of the working electrode are defined as negative and positive currents, respectively. Electro-chemical reactions occurring in the potential window under investigation appear as negative (re-duction) and positive (oxidation) peaks in the cyclic voltammogram. In the case of reversible reac-tions, the corresponding peaks are observed in the cathodic as well as the anodic scan. The ca-thodic and anodic peaks maxima of reversible reactions are separated by a certain potential de-fined by the kinetics of the electrochemical system. High scan rates result in an increase in peak intensity and separation. For irreversible reactions, only one peak is observed during reduction or oxidation.
Figure 16 shows a typical cyclic voltammogram. The complete first cycle of GC in the standard cell at a scan rate of 100 µV/s in LC30 with 5% ES (additive) has been selected as an example. The ca-thodic peak at 1.5 V is assigned to the irreversible reduction of ES during SEI formation (see also chapter 3.3.1).

36 Experimental methods
Figure 16. Exemplary cyclic voltammogram (1st cycle of GC vs. Li in the standard cell at a scan rate of 100 µV/s in LC30 with 5% ES). Electrode area: 1.3 cm2.
2.3 Vibrational techniques
Vibrational spectroscopy is the generic term for spectroscopic techniques in which the structures of organic or inorganic materials are investigated by analysing their vibrational (and rotational) modes. Raman and IR spectroscopy, which are complementary thanks to their different selection rules (detection of changes in polarizability and polarization, respectively), are by far the most commonly used vibrational techniques.
For linear and non-linear molecules with N atoms, there are 3N-5 and 3N-6 normal vibrational modes, respectively. Several types of motion can contribute to these modes [165]
(1) Stretching (change in bond length).
(2) Bending or scissoring (change in the angle between two bonds).
(3) Rocking (change in the angle between a group of atoms and the rest of the molecule).
(4) Wagging (change in the angle between the plane of a group of atoms and a plane through the rest of the molecule).
(5) Twisting (change in the angle between the planes of two groups of atoms).
(6) Out-of-plane (movement of an atom in and out of the plane of the other atoms).
0.0 0.5 1.0 1.5 2.0 2.5 3.0
-0.7
-0.6
-0.5
-0.4
-0.3
-0.2
-0.1
0.0
0.1C
urr
ent
/ m
A
Potential vs. Li+/Li / V

Vibrational techniques 37
Using the harmonic oscillator approximation, the vibrational energy levels of any system can be calculated according to
𝐸𝑛𝑣𝑖𝑏 =
ℎ𝜔
2𝜋(𝑛 +
1
2) , 𝑤𝑖𝑡ℎ 𝜔 = √
𝑓
𝜇 2.1
where Envib is the nth vibrational energy level, h the Planck constant, ω the angular frequency, f the
force constant (bond strength) and µ the reduced mass.[166]
2.3.1 Raman microscopy
Theory
Raman spectroscopy is based on the measurement of inelastically scattered light (typically mono-chromatic laser light) to investigate the vibrational (and rotational) modes of organic or inorganic materials. When this technique is used in combination with an optical microscope, which allows lateral resolution of ~1 µm, it is known as Raman microscopy. In the context of batteries, Raman microscopy is a powerful local probe allowing the in situ detection of structural changes during electrochemical cycling. The Raman effect is named after Sir C. V. Raman, the Indian scientist who discovered it in 1928. When light interacts with matter, photons can be absorbed, transmitted or scattered. Absorption can only occur when the energy of the photons is equal to the energy dif-ference between two real vibrational states (IR spectroscopy). Scattering (see Figure 17), on the other hand, starts with the excitation to a virtual vibrational state. Most of the photons are scat-tered elastically, i.e. they retain the same energy (and frequency) and do not affect the vibrational state of the material. This effect is known as Rayleigh scattering. However, a small number of pho-tons (~1 in 107) are scattered inelastically, i.e. they exchange energy and affect the vibrational state of the material. If the photons lose energy, which is the case when the system gains vibra-tional energy, this effect is known as Stokes Raman scattering. Conversely, if the photons gain en-ergy, which is the case when the system loses vibrational energy, it is known as anti-Stokes Raman scattering. Since the lower vibrational modes are more populated than the upper ones, Stokes Raman scattering is typically significantly stronger than anti-Stokes Raman scattering. In order for a vibrational mode to be Raman-active, it needs to induce a change in polarizability. The Raman spectrum of a material is typically displayed as a plot of the Raman shift in wavenumbers (cm-1) vs. the intensity of the Stokes-Raman-scattered light. The Raman shift can be calculated according to
∆�̃�(𝑐𝑚−1) = (1
𝜆0(𝑛𝑚)−
1
𝜆1 (𝑛𝑚)) ×
107(𝑛𝑚)
(𝑐𝑚) 2.2
where �̃� is the wavenumber, λ0 the incident wavelength and λ1 the scattered wavelength. The Raman shift depends on several parameters, such as coordination geometry and oxidation states. However, note that the Raman shift, which represents differences in wavenumber corresponding to transitions between specific vibrational states, is theoretically independent of the frequency of the incident laser.[165]

38 Experimental methods
Figure 17. Energy level diagram illustrating anti-Stokes Raman, Rayleigh and Stokes Raman scatter-ing. Adapted with permission from the American Chemical Society [165].
Raman microscopy offers the following advantages (A) and disadvantages (D) [165]
(A1) Non-destructive (at low laser intensities).
(A2) No sample preparation required (e.g. powders and electrodes can be measured directly).
(A3) Relatively unaffected by common IR absorbers such as H2O, CO2 and glass.
(A4) High lateral resolution (>1 µm).
(A5) No long-range order required (amorphous samples can be analysed).
(D1) Not very quantitative (due to difficult calibration).
(D2) Impossible to measure metals (due to their high electric conductivities).
(D3) Fluorescence (may be more intense than the Raman signals).
(D4) Thermal degradation of the sample (solved by neutral filters or the use of a different laser).
Raman microscope
The following confocal Raman microscope was used for all Raman experiments presented in this work
Type: Labram HR800, Horiba Jobin Yvon.
Laser: Helium-Neon (632.8 nm), 20 mW, Horiba Jobin Yvon.
Objective: 10x MPlan N, NA = 0.25 or 50x ULWDMS Plan 50, NA = 0.55, Olympus.
Confocal pinhole: Adjustable between 0 and 1000 µm.
Slit: Adjustable between 0 and 100 µm.
Grating: 600 lines/mm (resulting in a spectral resolution of 1.3 cm-1).
Spectrometer: 800 mm focal length.
Detector: CCD Synapse, 1024x256 pixels of 26 microns, Horiba Jobin Yvon.
Vibrational techniques 39
Figure 18 shows a schematic of a confocal Raman microscope. The specifications provided in this section apply to the microscope used in this work. An interferential passband filter is used to block the secondary plasma lines of the helium-neon laser. At the entrance to the microscope, six differ-ent neutral filters (not shown) can be selected to attenuate the intensity of the laser beam (D0.3, D0.6, D1, D2, D3 or D4, where the number stands for the decadic logarithm of the attenuation factor). The laser beam is reflected towards the sample by the holographic notch filter. The laser beam is then focussed onto the sample (placed on a motorized x-y stage that enables automatic x-y-z mapping) by an objective and backscattered through the same objective. When the holo-graphic notch filter is reached again, it reflects (rejects) the intense Rayleigh line and transmits (selects) all other frequencies (Stokes and anti-Stokes signals). Note that the minimum practical wavenumber that can be measured by the Raman microscope (due to the bandwidth of the Ray-leigh line and the limitations of the notch filter) is ~120 cm-1. Subsequently, a lens images the Ra-man beam onto the adjustable confocal pinhole with a magnification factor of 1.4 between the sample and the confocal pinhole. This confocal setup allows improved spatial resolution and depth discrimination by rejecting signals from sections of the sample that are not in the focus plane. Fur-ther lenses project the confocal hole onto the adjustable slit (entrance to the spectrometer), re-ducing the size of the image of the hole at the slit by a factor of five. The Raman beam is dispersed into different wavelengths by the grating (600 lines/mm) and directed towards the CCD detector. This highly light-sensitive silicon-based integrated circuit chip allows fast, simultaneous measure-ment of a wide spectral range (~1200 cm-1 for the 600 lines/mm grating) at a spectral resolution of 1.3 cm-1. Finally, the spectrum is displayed and analysed by a computer. The removable mirror serves to choose between the eyepiece/camera for viewing the sample (selection of measurement points and focussing) and the spectrometer for measurement.[167]
Experimental details
To prevent thermal degradation, the laser power (20 mW) was typically reduced by a factor of 10 (D1) or 100 (D2). The diameters of the confocal pinhole and the slit were set to their maximum values of 1000 and 100 µm, respectively, in order to maximize the signal intensity, unless other-wise stated. Calibration was performed prior to each series of experiments, using the main bands of monocrystalline silicon (521 cm-1) and HOPG (1582 cm-1), which constituted an improvement on previous single-point calibration procedures. Depending on the experiment, the spectral range was set to ~0-1000 and ~1000-2000 cm-1 for the positive and negative electrode materials, respec-tively. Depending on detector saturation, typical acquisition times of 30-300 s were selected. Av-eraging of 1-10 spectra was applied to improve the S/N ratio and eliminate spikes. The ex situ ex-periments were performed at a minimum of three different positions to ensure reproducibility. For the in situ experiments, temporal and/or spatial mapping, i.e. measurement at different times and positions, respectively, was employed.[40, 41]
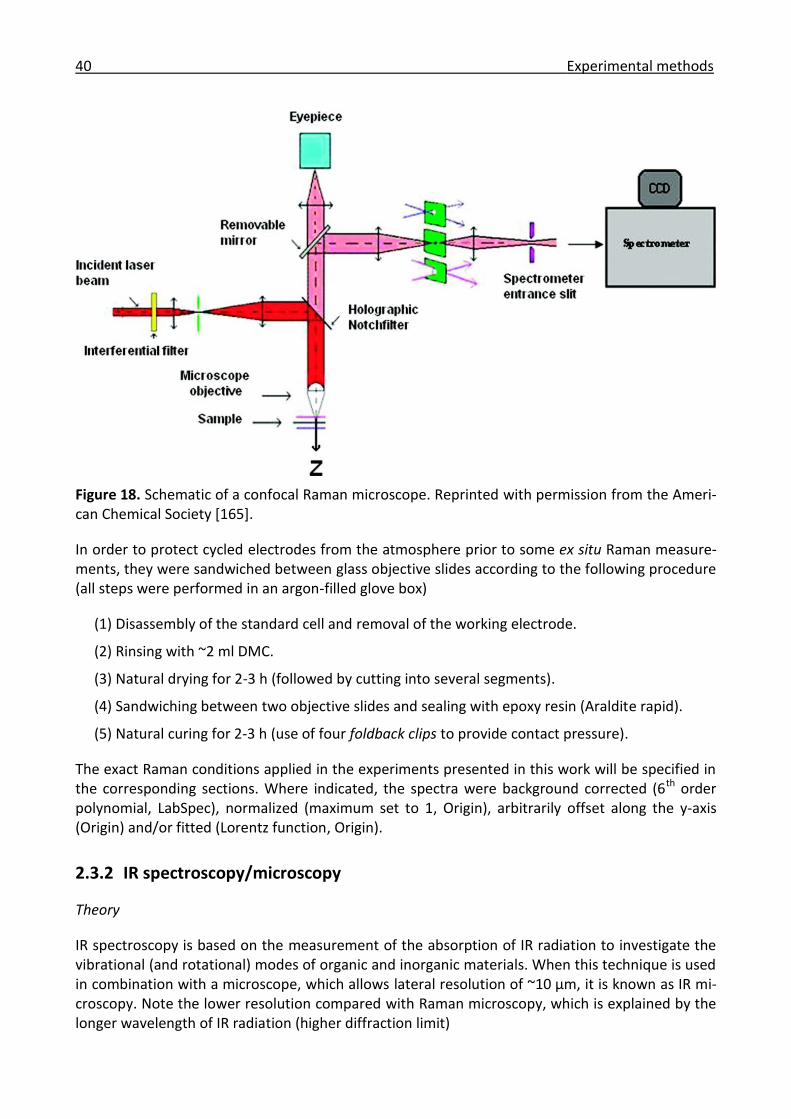
40 Experimental methods
Figure 18. Schematic of a confocal Raman microscope. Reprinted with permission from the Ameri-can Chemical Society [165].
In order to protect cycled electrodes from the atmosphere prior to some ex situ Raman measure-ments, they were sandwiched between glass objective slides according to the following procedure (all steps were performed in an argon-filled glove box)
(1) Disassembly of the standard cell and removal of the working electrode.
(2) Rinsing with ~2 ml DMC.
(3) Natural drying for 2-3 h (followed by cutting into several segments).
(4) Sandwiching between two objective slides and sealing with epoxy resin (Araldite rapid).
(5) Natural curing for 2-3 h (use of four foldback clips to provide contact pressure).
The exact Raman conditions applied in the experiments presented in this work will be specified in the corresponding sections. Where indicated, the spectra were background corrected (6th order polynomial, LabSpec), normalized (maximum set to 1, Origin), arbitrarily offset along the y-axis (Origin) and/or fitted (Lorentz function, Origin).
2.3.2 IR spectroscopy/microscopy
Theory
IR spectroscopy is based on the measurement of the absorption of IR radiation to investigate the vibrational (and rotational) modes of organic and inorganic materials. When this technique is used in combination with a microscope, which allows lateral resolution of ~10 µm, it is known as IR mi-croscopy. Note the lower resolution compared with Raman microscopy, which is explained by the longer wavelength of IR radiation (higher diffraction limit)

Vibrational techniques 41
Near IR: 0.8-2.5 µm 12500-4000 cm-1
Mid IR: 2.5-50 µm 4000-200 cm-1 (typically used in IR spectroscopy)
Far IR: 50-1000 µm 200-10 cm-1
In the context of batteries, IR spectroscopy is a powerful local probe allowing the in situ detection of chemical changes during electrochemical cycling. When IR radiation interacts with matter, pho-tons can be absorbed if their energy is equal to the energy difference between two vibrational states, which leads to the promotion of the system from the initial to an excited vibrational state. In order for a vibrational mode to be IR-active, it needs to induce a change in polarization (dipole moment). The IR spectrum of a material is typically displayed as a plot of the wavenumber (cm-1) vs. transmission (R1/R0) or absorbance (-log10(R1/R0)). Wavenumbers can be calculated from the wavelengths according to
∆�̃�(𝑐𝑚−1) =1
𝜆(𝜇𝑚)×
104(𝜇𝑚)
(𝑐𝑚) 2.3
where �̃� is the wavenumber and λ the wavelength. Note that IR signals represent the absolute wavenumbers of the absorbed photons (in contrast to Raman signals, which are displayed as shifts in wavenumber).[168]
IR spectroscopy/microscopy offers the following advantages (A) and disadvantages (D)
(A1) Non-destructive (at moderate source intensities).
(A2) Sample preparation not necessarily required (e.g. in ATR or external reflectance mode).
(A3) Very sensitive to various organic functional groups (e.g. carbonyls).
(A4) Less susceptible to fluorescence than Raman spectroscopy.
(A5) No long-range order required (amorphous samples can be analysed).
(D1) Strongly affected by common absorbers such as H2O, CO2 and glass.
(D2) Glass windows cannot be used due to strong IR absorption (e.g. replaced by CaF2).
(D3) Lower lateral resolution (~10 µm) than Raman microscopy.
(D4) Thin electrolyte layers (<10 µm) and highly reflective surfaces required (reflectance mode).
IR spectrometers
The following three IR spectrometers were used for the IR experiments presented in this work. The IlluminatIR II spectrometer is described in more detail since it was employed for the combined in situ Raman and IR experiments.
(1) Type: System 2000, PerkinElmer.
Detector: DTGS.
Comment: Compatible with the micro-ATR accessory.

42 Experimental methods
(2) Type: Vertex 70v, Bruker.
Detector: DTGS.
Comment: Compatible with the micro-ATR accessory.
(3) Type: IlluminatIR II, Smiths.
Objective: 15x ARO, NA = 0.88, Smiths.
Aperture: Adjustable between 10 and 137 µm at the specimen plane.
Spectrometer: 60° Michelson interferometer, KBr beam splitter, 4 cm-1 spectral resolution.
Detector: MCT.
Comment: Interfaces with the Raman microscope (mounted above the eyepiece).
IR spectrometers are based on dispersion or Fourier transformation. Dispersive IR spectrometers use a dispersive element (e.g. a glass or quartz grating) to split the IR beam into different wave-lengths and record the IR spectrum through a narrow slit by continuously turning the dispersive element. Unfortunately, this method is rather inefficient (high radiation loss) and slow. It is there-fore not commonly used anymore (unless very small frequency ranges are investigated). Instead, it has been largely replaced by Fourier transform IR (FTIR) spectrometers. Since all three spectrome-ters used in this work are FTIR spectrometers, this method is described in more detail in the next paragraph.[168]
Figure 19 shows a schematic of an FTIR spectrometer. The dispersive element is replaced by a Mi-chelson interferometer consisting of a fixed and a movable mirror. The IR beam from the source is split into two beams of equal intensity, one of which is modulated by the movable mirror (vibrat-ing at 160-1600 kHz). When the two beams recombine, they produce an interferogram via con-structive and destructive interference. Subsequently, the IR beam passes through (transmission mode) or is reflected from (reflectance mode, used here) the sample and is directed towards the detector. In this work, DTGS (deuterated triglycine sulfate photovoltaic detector) or MCT (mercury cadmium telluride pyroelectric bolometer, cooled by liquid nitrogen) were used. Finally, the inter-ferogram, which represents the vibrational spectrum in the time domain, is mathematically trans-formed into the frequency domain by Fourier transformation. This allows faster data acquisition (all frequencies are measured at the same time) and better S/N ratios compared with dispersive spectrometers.[168]
Experimental details
In this section, the experimental details of the ATR and external reflectance FTIR measurements are provided (ATR is based on total internal reflectance within an ATR crystal and measurement of substances on its surface via evanescent waves). All spectra were recorded over the full spectral range at a resolution of 4 cm-1. Averaging of 64-1000 scans was applied to improve the S/N ratio. Absorbances were calculated from the spectra measured at potential E (RE) and a background spectrum (R0) by calculating -log(RE/R0). This allowed the mathematical isolation of spectral chang-es that are hard to distinguish in the original spectra. In this representation, positive-going bands indicate an increase in the amount of the corresponding species (and vice versa for negative-going bands).

Vibrational techniques 43
Figure 19. Schematic of a Fourier transform IR spectrometer. Reprinted from [168].
For the ATR measurements with the System 2000 and Vertex 70v spectrometers, a micro-ATR ac-cessory (MKII Golden Gate Single Reflection ATR System, Specac) containing a diamond crystal (2 x 2 mm) was employed. A torque-limited screw was used to push the solid samples against the diamond crystal with a pressure of 1.78 kbar. No sample preparation was required. The ATR exper-iments were performed at a minimum of three different positions to ensure reproducibility.[37, 42]
For the external reflectance measurements with the System 2000 spectrometer, an external re-flectance accessory consisting of two mirrors, with the first one diverting the IR beam from the standard beam path to the working electrode and the second one directing the IR beam from the working electrode back to the standard beam path, was employed. The mirrors were manually adjusted for maximum intensity at the detector prior to each experiment. To control the contact pressure and minimize the strong absorbance from the electrolyte, the working electrode was pressed against the window by tightening the screw in the bottom of the cell until the strongest absorption band was at ~75%.[42]
For the external reflectance measurements with the IlluminatIR II spectrometer, the Raman micro-scope (see also Figure 18), which interfaces directly with this spectrometer, was employed. De-pending on the experiment, the aperture defining the illuminated area at the specimen plane was set to 100 or 137 µm. The ex situ experiments were performed at a minimum of three different positions to ensure reproducibility. For the in situ experiments, temporal mapping, i.e. measure-ment at different times, was employed.
The exact IR conditions applied in the experiments presented in this work will be specified in the corresponding sections.
44 Experimental methods
2.3.3 Combined microscopy
Theory
The combination of Raman and IR microscopy offers advantages connected with the complemen-tary nature of the two methods. As mentioned, Raman and IR measurements are sensitive to vi-brational modes that induce changes in polarizability and polarization (dipole moment), respec-tively. This difference in the selection rules implies that vibrational bands may be Raman-active, IR-active, both or neither (e.g. rule of mutual exclusion for molecules with a centre of symmetry). Furthermore, there may be significant differences in band intensities for modes that are theoreti-cally activated by both methods, with the consequence that, in practice, they are only detectable by either Raman or IR spectroscopy. From our previous experiments we know that in situ Raman spectra are particularly sensitive to structural changes in the electrode material itself (i.e. interca-lation of lithium into graphite) whereas in situ IR spectra are particularly sensitive to the interface between the electrode and the organic electrolyte (i.e. the interface between graphite and LC30). The combined in situ microscopic approach was thus selected to correlate information from the electrode with information from the interface during electrochemical cycling.[37]
Combined microscope
For the combined in situ Raman and IR experiments, the Raman microscope described in chap-ter 2.3.1 (see also Figure 18) equipped with the IlluminatIR II unit described in chapter 2.3.2 (spec-trometer (3)) was employed. A 10x objective (MPlan N, NA = 0.25, Olympus) or a 50x objective (ULWDMS Plan 50, NA = 0.55, Olympus) and a 15x objective (ARO, NA = 0.88, Smiths) mounted on the same nosepiece were used for the Raman and IR measurements, respectively. The automation system employed for the combined in situ Raman and IR investigation of graphite is described in the following section. [37, 42]
Automation system [37]
Automatic switching between the two spectroscopic setups (Raman and IR) was enabled by a cus-tom-made system allowing fully automatic acquisition of combined in situ spectra. This led to a significant increase in the efficiency and reproducibility of long-term experiments.
Figure 20 shows a photograph of the automation system. The optical slide, which sets the differ-ent beam paths (Raman or IR), is actuated by a pneumatic cylinder (DSN-10-100-P, Festo) operat-ed by a solenoid valve (CPE10-M1BH-5L-QS-6, Festo, not shown). A stepper motor (ST2818L1404-B, Nanotec) is used to turn the knurled nosepiece via a custom-made cogwheel (aluminium), thus selecting either the Raman or the IR objective. A stepper motor driver with integrated controller (SMCI33-1, Nanotec) is employed to drive the motor and trigger the solenoid valve via a relay (Sol-id state G3R, Omron). A capacitor (138 AML 4700 µF, Vishay) is used for surge suppression.
The controller was programmed using NanoPro 1.70 and NanoJEasy 1.04. The former software was employed to alternately turn the stepper motor clockwise and anticlockwise at regular inter-vals. The latter software served to acquire the current position of the stepper motor and use this information to induce the solenoid valve to switch to the corresponding beam path. In order to allow fully automatic operation (switching between the detectors and refocussing) of the spectro-scopic program LabSpec 5.45.09, AutoHotkey v.1.1.13.00, which can interact with any Microsoft Windows interface, was used (automatic acquisition of combined spectra is not supported by Lab-
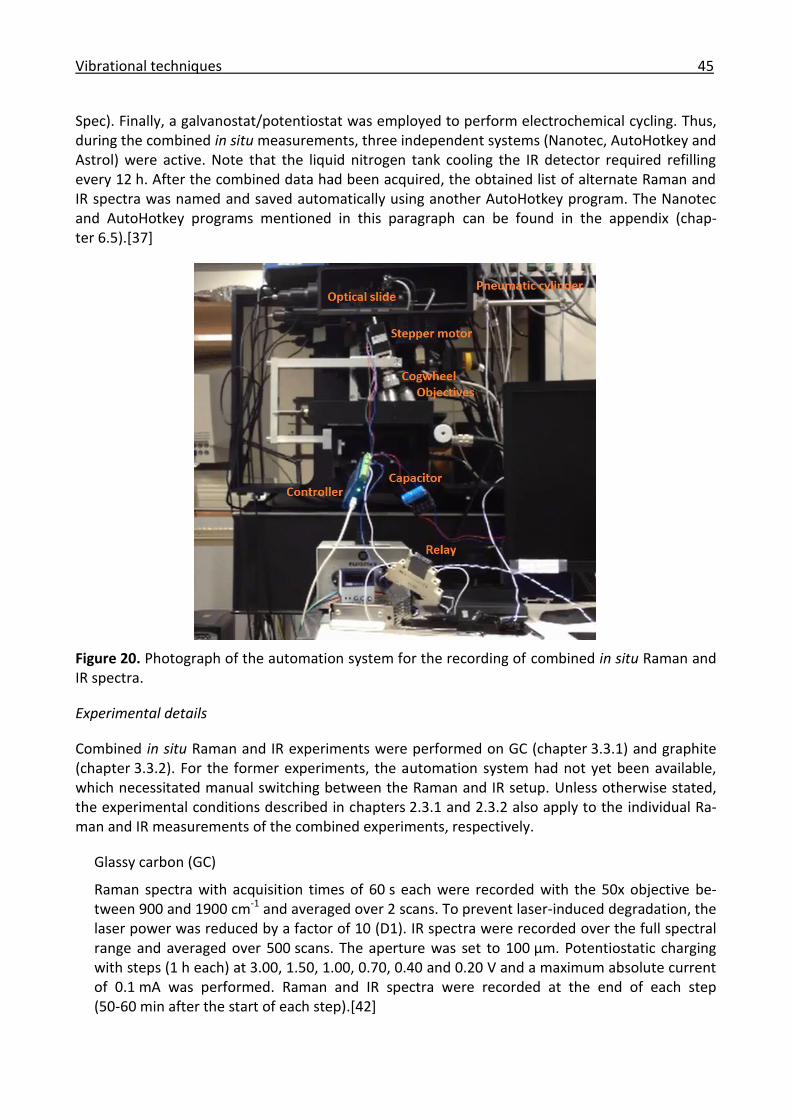
Vibrational techniques 45
Spec). Finally, a galvanostat/potentiostat was employed to perform electrochemical cycling. Thus, during the combined in situ measurements, three independent systems (Nanotec, AutoHotkey and Astrol) were active. Note that the liquid nitrogen tank cooling the IR detector required refilling every 12 h. After the combined data had been acquired, the obtained list of alternate Raman and IR spectra was named and saved automatically using another AutoHotkey program. The Nanotec and AutoHotkey programs mentioned in this paragraph can be found in the appendix (chap-ter 6.5).[37]
Figure 20. Photograph of the automation system for the recording of combined in situ Raman and IR spectra.
Experimental details
Combined in situ Raman and IR experiments were performed on GC (chapter 3.3.1) and graphite (chapter 3.3.2). For the former experiments, the automation system had not yet been available, which necessitated manual switching between the Raman and IR setup. Unless otherwise stated, the experimental conditions described in chapters 2.3.1 and 2.3.2 also apply to the individual Ra-man and IR measurements of the combined experiments, respectively.
Glassy carbon (GC)
Raman spectra with acquisition times of 60 s each were recorded with the 50x objective be-tween 900 and 1900 cm-1 and averaged over 2 scans. To prevent laser-induced degradation, the laser power was reduced by a factor of 10 (D1). IR spectra were recorded over the full spectral range and averaged over 500 scans. The aperture was set to 100 µm. Potentiostatic charging with steps (1 h each) at 3.00, 1.50, 1.00, 0.70, 0.40 and 0.20 V and a maximum absolute current of 0.1 mA was performed. Raman and IR spectra were recorded at the end of each step (50-60 min after the start of each step).[42]

46 Experimental methods
Graphite
Raman spectra with acquisition times of 60 s each were recorded with the 10x objective be-tween 1000 and 2000 cm-1 and averaged over 3 scans. To prevent laser-induced degradation, the laser power was reduced by a factor of 10 (D1). IR spectra were recorded over the full spec-tral range and averaged over 500 scans. The aperture was set to 137 µm. Potentiostatic cycling with steps (typically 1 h each) at 1.50, 1.00, 0.70, 0.40 and 0.05 V during charge and discharge and a maximum current of ±2mA was performed. Raman and IR spectra were recorded at in-tervals of 10 min between similar measurements, i.e. the spectroscopic setup was automatical-ly switched every 5 min.[37]
2.4 Scanning electron microscopy
SEM is a type of electron microscopy based on the imaging of samples via scanning with a fo-cussed electron beam. This method offers significantly improved magnification (resolution of ~1 nm) compared with light microscopy and is commonly used for surface characterizations in various fields (e.g. semiconductors, nanotechnology and biology). In the context of batteries, SEM is a powerful technique for the morphological investigation of electrode materials and their pas-sivation films before and after electrochemical cycling. When electrons interact with matter, vari-ous signals containing information about the sample are obtained. Two commonly used signals are the inelastically scattered secondary electrons and the elastically backscattered electrons. Sec-ondary electrons (from the sample) contain useful morphological information whereas backscat-tered electrons (from the primary electron beam) are more sensitive to differences in atomic number (mass contrast). In addition, detailed compositional information can be obtained from the characteristic X-rays emitted by different elements (energy-dispersive X-ray spectroscopy). In a typical scanning electron microscope, electrons are emitted from the electron gun, accelerated to a few kiloelectronvolts and focussed by a number of condenser lenses. The focussed electron beam then passes through pairs of scanning coils that allow deflection parallel to the x-y-plane and thus enable two-dimensional scanning of a rectangular raster. Subsequently, the electrons (or X-rays) are detected and amplified. Finally, the image is reconstructed (by correlating the position with the signal at each point of the raster) and stored on a computer. Scanning electron micro-scopes require high-vacuum conditions to minimize undesired interactions between the electrons and gas molecules. Consequently volatile and sensitive compounds cannot be measured and pos-sible effects of the high vacuum on the samples should be considered. Furthermore, the samples should be electrically conductive and earthed in order to avoid electrostatic charging that may result in image artefacts. To achieve this, insulators are routinely coated with noble metals or car-bon.
Morphological investigations of various uncycled and cycled electrode materials (powders and electrodes) were conducted using a scanning electron microscope (Ultra 55, Carl Zeiss) with SmartSEM operating software and a secondary electron detector (SE2) operated at an accelerating voltage of 3-5 kV. The samples were prepared by placing the materials onto adhesive conductive carbon tape fixed to SEM specimen stubs.[37, 40, 41]
The exact SEM conditions applied in the experiments presented in this work will be specified in the corresponding sections.

X-ray photoelectron spectroscopy 47
2.5 X-ray photoelectron spectroscopy
XPS, which is also known as electron spectroscopy for chemical analysis (ESCA), is a type of photo-electron spectroscopy based on the photoelectric effect observed when matter is irradiated with X-rays. This method offers high surface sensitivity (0-10 nm) and is commonly used for quantita-tive surface analysis in various fields (e.g. semiconductors, catalysts and polymers). All elements except hydrogen and helium can be detected (detection limit of ~0.1 %). In the context of batter-ies, XPS is a powerful technique for the chemical investigation of electrode materials and their passivation films before and after electrochemical cycling. When matter is irradiated with high-energy X-rays (typically Al Kα at 1486.6 eV or Mg Kα at 1253.6 eV), electrons are emitted from the core levels. The kinetic energy of these electrons depends on the X-ray source and the sample. The binding energy can be calculated according to
Ebind = ℎ𝑣 – Ekin – Φ 2.4
where Ebind is the binding energy of the electrons, ℎ𝑣 the energy of the incident X-rays, Ekin the kinetic energy of the emitted electrons and Φ the work function (instrument constant) [169]. The XPS spectrum of a material is typically displayed as a plot of the binding energy in electronvolts (eV) vs. the number of detected electrons and is therefore independent of the X-ray source. Known binding energies of specific elements and orbitals (e.g. C 1s) can be used to determine the chemical composition of a sample. Since these binding energies exhibit additional chemical shifts depending on the chemical state, it is possible to distinguish between different oxidation states of the same element. Auger peaks are a commonly observed secondary effect in XPS. Since their ki-netic energies are independent of the X-ray source, they exhibit apparent shifts in binding energy when the X-ray source is changed, which can be used to isolate them from the XPS peaks. X-ray photoelectron spectrometers usually require ultrahigh-vacuum conditions to minimize undesired interactions between the emitted electrons and gas molecules. Consequently volatile and sensitive compounds cannot be measured and possible effects of the ultrahigh vacuum on the samples should be considered. Furthermore, the samples should be electrically conductive and earthed in order to avoid electrostatic charging that may result in a shift in binding energy (recognized by the position of the adventitious hydrocarbon peak expected at 284.8 eV).[6, 168]
Surface analysis of uncycled and cycled electrodes was conducted using an X-ray photoelectron spectrometer (ESCALAB 220iXL, Thermo Scientific) with Avantage operating software equipped with a monochromatic Al Kα and a twin Al Kα/Mg Kα X-ray source with a spot diameter of 500 µm and 8 mm, respectively. Cycled electrodes were rinsed with ~5 ml DMC prior to use. The samples were prepared by clipping the electrodes onto XPS sample mounts. The survey spectra were rec-orded between -5 and 1100 eV at a pass energy of 50 eV and an energy step size of 0.5 eV, and averaged over 2 scans. The subsequent high-resolution spectra of individual elements/orbitals were recorded at a pass energy of 20 eV and an energy step size of 0.1 eV, and averaged over 20 scans. Finally, selected signals were quantified (integrated) and deconvoluted.

48 Experimental methods

Preliminary experiments 49
3 Results and discussion
3.1 Preliminary experiments
Before the main results are presented in chapters 3.2 and 3.3, preliminary experiments aimed at understanding the system under investigation and optimizing the experimental conditions will be discussed. These include electrochemical cycling of blank current collectors, XPS measurements of electrodes from full cells, Raman measurements of graphite and IR test measurements.
3.1.1 Electrochemical cycling of blank current collectors
Battery electrodes typically contain metal current collectors serving to collect and conduct elec-trons from/to the external circuit. In practical lithium-ion batteries, aluminium and copper foil are commonly used for the positive and negative electrodes, respectively. Consequently, they were also employed in some standard experiments described in this work. However, for the spectro-scopic in situ experiments the foil had to be replaced by a mesh to allow the electrochemical reac-tions to occur throughout the electrode. In preliminary in situ Raman experiments with NCM, the initially used nickel mesh was shown to be unsuitable. To address this issue, a series of electro-chemical reference experiments with various blank current collectors was performed. Nickel mesh, stainless steel mesh, aluminium foil and copper foil were cycled under oxidative (2.0 V - 4.8 V) and reductive (1.5 V - 5 mV) electrode conditions relevant to graphite and HE-NCM, respectively. The corresponding galvanostatic profiles, specific charges (to be minimized) and po-tential plateaus (to be avoided) of the blank current collectors for the first cycle in standard cells are shown in Figure 21 and Table 6. The specific charges were obtained by dividing the measured charges by the virtual amount of active material in a typical complete electrode (10 mg). The C-rates were also calculated based on this mass.
Under oxidative electrode conditions nickel mesh exhibited a continuous potential plateau at 4.6 V and was thus shown to be an unsuitable current collector for the high-potential positive electrode material HE-NCM (typically cycled up to 4.8 V). Under reductive electrode conditions, nickel mesh did not exhibit a potential plateau. However, it was still outperformed by stainless steel mesh and copper foil. By contrast, stainless steel mesh was shown to be an excellent current collector under both oxidative and reductive electrode conditions. For the first charge, its specific charge was only about three times higher than that of aluminium foil and comparable to that of copper foil under oxidative and reductive electrode conditions, respectively. As expected, aluminium and copper foil were thus shown to be excellent current collectors under oxidative and reductive electrode condi-tions, respectively. However, switching of the electrode conditions led to continuous potential plateaus at 0.3 and 3.6 V for aluminium and copper, respectively.
Consequently, stainless steel mesh was selected as the standard current collector for all spectro-scopic in situ experiments with graphite and NCM (the use of nickel mesh was stopped). Alumini-um and copper foil were used as current collectors for some standard experiments.

50 Results and discussion
0 1 2 3 4 5 6 7 8 9 10
0.0
0.5
1.0
1.5
2.0
2.5
3.0
3.5
4.0
4.5
5.0P
ote
ntia
l vs. L
i+/L
i / V
Specific charge / mAh/g
Ni mesh
Fe mesh
Al foil
Cu foil
Figure 21. Galvanostatic profiles of blank current collectors for the 1st cycle vs. Li in standard cells. Oxidative electrode conditions: 2.0 V - 4.8 V at C/12. Reductive electrode conditions: 1.5 V - 5 mV at C/37. The specific charges and C-rates are normalized to 10 mg of (virtual) active material. Elec-trolyte: 500 µl of LC30.
Table 6. Specific charges and potential plateaus of blank current collectors for the 1st charge vs. Li.
Conditions Ni mesh Steel mesh Al foil Cu foil
Oxidative 1st charge Plateau at 4.6 V 0.7 mAh/g 0.2 mAh/g Plateau at 3.6 V
Oxidative 1st discharge - 0.3 mAh/g 0.1 mAh/g -
Reductive 1st charge 8.5 mAh/g 4.9 mAh/g Plateau at 0.3 V 4.6 mAh/g
Reductive 1st discharge 1.5 mAh/g 1.2 mAh/g - 0.6 mAh/g
3.1.2 X-ray photoelectron spectroscopy
The XPS experiments presented in this chapter were performed to serve as an independent and complementary method and to provide a first overview of the system subsequently studied in more detail by Raman and IR spectroscopy. Uncycled HE-NCM and uncycled graphite were com-pared with HE-NCM and graphite cycled in a full cell. The use of a full cell (NCM vs. graphite) rather than half cells (NCM or graphite vs. lithium) reflected the situation encountered in practical lithi-um-ion batteries. In particular, SEI formation and the phenomenon of Mn dissolution at the posi-tive electrode followed by Mn deposition at the negative electrode upon electrochemical cycling were of interest. In a recent article, the latter process has been observed for Li1.05Mn2O4/graphite cells, where Mn deposits were detected on the graphite electrode by XPS [170]. Choi and Manthi-ram, who measured the metal ion dissolution from various positive electrode materials by AAS, found an increased susceptibility of materials containing Mn3+ to dissolution via disproportiona-tion and demonstrated an inverse relationship between the amount of dissolved Mn and cycling

Preliminary experiments 51
stability [171]. Finally, Zheng et al., who investigated the dissolution behaviour of stoichiometric NCM by ICP, observed an increase in dissolved transition metals (particularly Mn) at 4.5-4.6 V [172]. As possible explanations, they suggested the disproportionation of traces of Mn3+ or acid corrosion catalysed by HF [172]. Since LiClO4 was used instead of LiPF6 for the XPS experiments presented in this work, the latter reaction mechanism can be excluded. However, the dispropor-tionation of Mn3+ is plausible, especially in HE-NCM, which has been proposed to cycle between Mn3+ and Mn4+ after electrochemical activation [90].
The positive and negative electrodes used in this study consisted of 80:10:10 wt% HE-NCM/carbon black/PVDF on aluminium foil and 80:20 wt% SFG44/PVDF on copper foil, respec-tively. The cycled electrodes were obtained from a standard cell after 70 cycles between 3.0 and 4.7 V (initially 4.8 V) at a C-rate of 1 C in LC30. Figure 22 and Figure 23 show the XPS spectra of HE-NCM and SFG44 graphite, respectively. The green and red curves represent the uncycled and cycled electrodes, respectively. Finally, Table 7 provides a summary of the quantitative analysis of the corresponding signals. A deconvolution of the Ni 2p signal can be found in the appendix (chap-ter 6.6.1).
Based on the survey spectra of HE-NCM (Figure 22), the following signals were investigated in more detail: Li 1s, Al 2s, Cl 2p, C 1s, O 1s, Mn 2p, F 1s, Co 2p and Ni 2p. The following elements were found in uncycled HE-NCM: Li, C, O, Mn, F, Co and Ni. After electrochemical cycling, new sig-nals of Al and Cl were detected and the signal of Li disappeared. The appearance of Al and Cl may be explained by microscopic damage to the electrode coating and residues of the electrolyte salt LiClO4, respectively. The disappearance of Li, on the other hand, may be due to the formation of a passivation film deficient in Li. The change in the O 1s signal may be explained by a decrease in the amount of Li2CO3 on the surface (531.5 eV) and the formation of a carbonyl- and/or ether-based passivation film (533.5 eV). The main F 1s signal is assigned to the PVDF binder (688 eV). Table 7 indicates a ratio of 100 : 4 : 28 and 100 : 14 : 62 at% between Ni, Co and Mn for uncycled and cy-cled HE-NCM, respectively, which represents a significant overestimation of the Ni content. This can be explained by the fact that the strong background of the Ni 2p signal was also integrated. This issue was addressed by isolating the Ni 2p3/2 peak from the background (see appendix, chap-ter 6.6.1). Using the isolated Ni 2p3/2 peak, a more realistic ratio of 100 : 28 : 188 and 100 : 52 : 235 at% was calculated for uncycled and cycled HE-NCM, respectively. Finally, the de-crease in the amount of C and increase in the amount of O may be due to the formation of a pas-sivation film.
Based on the survey spectra of SFG44 graphite (Figure 23), the following signals were investigated in more detail: Li 1s, Si 2p, Cl 2p, C 1s, O 1s, Mn 2p, F 1s, Co 2p and Ni 2p. The following elements were found in uncycled SFG44 graphite: C, O and F. The Ni 2p signal was assumed to be entirely due to the background. After electrochemical cycling, new signals of Li, Si, Cl and Mn were detect-ed. The appearance of Si and Cl may be explained by the glass fibre separator and residues of the electrolyte salt LiClO4, respectively. The change in the O 1s signal may be explained by the for-mation of carbonyl- and/or ether-based SEI products (533.5 eV). The strong F 1s signal in uncycled SFG44 graphite is assigned to the PVDF binder (688 eV). The significant decrease in this signal after electrochemical cycling may be due to SEI formation. Finally, the decrease in the amount of C and increase in the amount of O may also be due to SEI formation. However, the main result of these experiments was certainly the detection of Mn on the cycled SFG44 electrode, which confirms Mn dissolution from HE-NCM during electrochemical cycling.

52 Results and discussion
1000 800 600 400 200 0 60 58 56 54 52 50
130 125 120 115 110 220 215 210 205 200 195
300 295 290 285 280 545 540 535 530 525
660 655 650 645 640 635 695 690 685 680
790 785 780 775 890 880 870 860 850
Ni 2pCo 2p
F 1sMn 2p
O 1sC 1s
Cl 2pAl 2s
Li 1sSurvey
Inte
nsity /
a.u
.
Binding energy / eV
Figure 22. Ex situ XPS spectra of uncycled (green) and cycled (red) HE-NCM. X-ray source: mono-chromatic Al Kα. Electrochemical conditions: 3.0-4.7 V (initially 4.8 V), 1 C, 70 cycles, 500 µl of LC30. The spectra are arbitrarily offset along the y-axis.

Preliminary experiments 53
1000 800 600 400 200 0 60 58 56 54 52 50
120 115 110 105 100 95 90 220 215 210 205 200 195
300 295 290 285 280 545 540 535 530 525
660 655 650 645 640 635 695 690 685 680
790 785 780 775 890 880 870 860 850
Inte
nsity /
a.u
.
Ni 2pCo 2p
F 1sMn 2p
O 1sC 1s
Si 2p Cl 2p
Li 1sSurvey
Binding energy / eV
Figure 23. Ex situ XPS spectra of uncycled (green) and cycled (red) SFG44 graphite. X-ray source: monochromatic Al Kα. Electrochemical conditions: 3.0-4.7 V (initially 4.8 V), 1 C, 70 cycles, 500 µl of LC30. The spectra are arbitrarily offset along the y-axis.
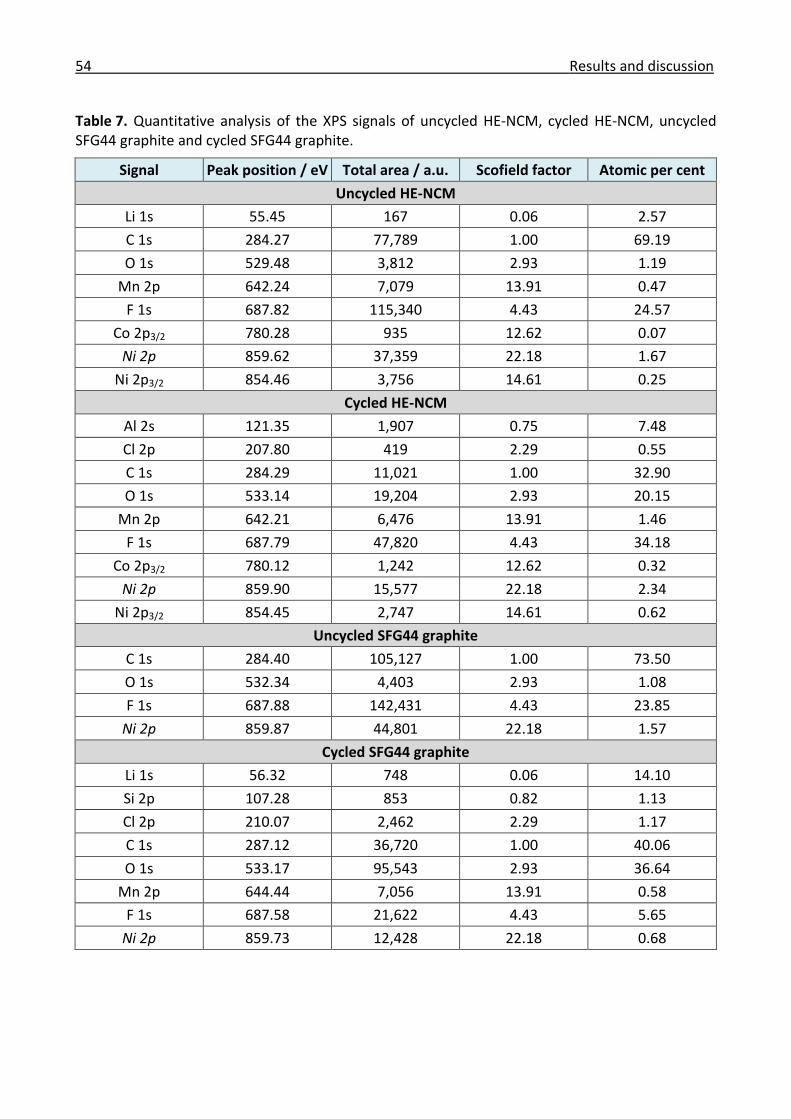
54 Results and discussion
Table 7. Quantitative analysis of the XPS signals of uncycled HE-NCM, cycled HE-NCM, uncycled SFG44 graphite and cycled SFG44 graphite.
Signal Peak position / eV Total area / a.u. Scofield factor Atomic per cent
Uncycled HE-NCM
Li 1s 55.45 167 0.06 2.57
C 1s 284.27 77,789 1.00 69.19
O 1s 529.48 3,812 2.93 1.19
Mn 2p 642.24 7,079 13.91 0.47
F 1s 687.82 115,340 4.43 24.57
Co 2p3/2 780.28 935 12.62 0.07
Ni 2p 859.62 37,359 22.18 1.67
Ni 2p3/2 854.46 3,756 14.61 0.25
Cycled HE-NCM
Al 2s 121.35 1,907 0.75 7.48
Cl 2p 207.80 419 2.29 0.55
C 1s 284.29 11,021 1.00 32.90
O 1s 533.14 19,204 2.93 20.15
Mn 2p 642.21 6,476 13.91 1.46
F 1s 687.79 47,820 4.43 34.18
Co 2p3/2 780.12 1,242 12.62 0.32
Ni 2p 859.90 15,577 22.18 2.34
Ni 2p3/2 854.45 2,747 14.61 0.62
Uncycled SFG44 graphite
C 1s 284.40 105,127 1.00 73.50
O 1s 532.34 4,403 2.93 1.08
F 1s 687.88 142,431 4.43 23.85
Ni 2p 859.87 44,801 22.18 1.57
Cycled SFG44 graphite
Li 1s 56.32 748 0.06 14.10
Si 2p 107.28 853 0.82 1.13
Cl 2p 210.07 2,462 2.29 1.17
C 1s 287.12 36,720 1.00 40.06
O 1s 533.17 95,543 2.93 36.64
Mn 2p 644.44 7,056 13.91 0.58
F 1s 687.58 21,622 4.43 5.65
Ni 2p 859.73 12,428 22.18 0.68

Preliminary experiments 55
3.1.3 Raman microscopy
The preliminary Raman experiments discussed in this chapter were performed in order to develop the method for the main experiments presented in chapters 3.2 and 3.3. Therefore, well-characterized reactions (lithium intercalation into graphite and graphite exfoliation [164]) were selected. The theory behind the Raman spectrum of graphite (D band at ~1350 cm-1 and G band at ~1600 cm-1) and a more detailed interpretation of the spectral changes are provided in chap-ter 3.3. In two series of in situ experiments, pristine graphite was cycled in LC30 (no exfoliation) and LCP (exfoliation). Further ex situ experiments with pristine and surface-modified graphite be-fore and after electrochemical cycling can be found in the appendix (chapter 6.6.2). All working electrodes used in this study consisted of 90:10 wt% graphite/PVDF on stainless steel mesh.
Figure 24 and Figure 25 show the in situ Raman spectra for first charge (bottom to top) and first discharge (top to bottom), respectively, of the first series of experiments aimed at investigating lithium intercalation into SFG44 graphite. In order to prevent exfoliation, the PC-free electrolyte LC30 was used. Note that no electrolyte bands are observed. Figure 24 shows clear evidence of lithium intercalation during charge. In good agreement with the literature, the G band shifts to higher wavenumbers (1588 cm-1 at OCP to 1599 cm-1 at 0.19 V) due to the formation of dilute stage I, splits (1578 and 1611 cm-1 from 0.19 to 0.10 V) due to the formation of stages IV-III and finally disappears (from 0.10 V to 5 mV) due to the formation of stages II and I [18, 164].
Figure 24. In situ Raman spectra for the 1st charge of SFG44 graphite vs. Li (lithium intercalation). Raman conditions: D2, 2 x 450 s, 2 spectra/h. Electrochemical conditions: OCP – 5 mV, C/20, 500 µl of LC30. The spectra are arbitrarily offset along the y-axis. From bottom to top: charge.
1100 1200 1300 1400 1500 1600 1700 1800
0.06 V, 277 mAh/g
0.07 V, 249 mAh/g
0.07 V, 222 mAh/g
0.11 V, 111 mAh/g
0.07 V, 194 mAh/g
0.10 V, 166 mAh/g
0.10 V, 138 mAh/g
0.11 V, 83 mAh/g
0.15 V, 55 mAh/g
0.19 V, 28 mAh/g
Inte
nsity /
a.u
.
Raman shift / cm-1
OCP, 0 mAh/g
16
11
15
78
15
99
15
88

56 Results and discussion
During discharge, the reverse process, i.e. lithium deintercalation, is observed (Figure 25). In agreement with the literature, the G band reappears (1611 cm-1 at 0.15 V), splits (1583 and 1611 cm-1 from 0.16 to 0.24 V) due to the formation of stages III-IV, merges and shifts back to low-er wavenumbers (1596 cm-1 at 0.23 V to 1589 cm-1 at 1.50 V) due to the formation of dilute stage I and lithium-free graphite [18, 164].
Figure 25. In situ Raman spectra for the 1st discharge of SFG44 graphite vs. Li (lithium deintercala-tion). Raman conditions: D2, 2 x 450 s, 2 spectra/h. Electrochemical conditions: 5 mV - 1.5 V, C/20, 500 µl of LC30. The spectra are arbitrarily offset along the y-axis. From top to bottom: discharge.
Having successfully measured lithium intercalation into graphite, attention was now turned to the investigation of graphite exfoliation. Figure 26 shows the in situ Raman spectra of the second se-ries of experiments aimed at investigating the exfoliation of SFG6 graphite. In order to induce ex-foliation, LCP (with PC as its only solvent) was used as electrolyte. Note that, as before, no electro-lyte bands are observed. Figure 26 shows clear evidence of graphite exfoliation during charge (bot-tom to top). In addition to the G band (1589 cm-1), a new band (E band) associated with graphite exfoliation was observed at higher wavenumbers (1609 cm-1 from 0.90 V to 5 mV), which is in good agreement with the literature [164, 173]. Due to the rather positive potential at which the E band appeared, it can be excluded that it is due to lithium intercalation.
From these two series of experiments it is finally concluded that the selected experimental ap-proach yields reproducible in situ Raman spectra that agree well with the results reported in the literature. The in situ Raman microscopic method was thus ready to be applied to various positive and negative electrode materials.
1100 1200 1300 1400 1500 1600 1700 1800
OCP, 359 mAh/g
1.40 V, 359 mAh/g
0.23 V, 322 mAh/g0.17 V, 286 mAh/g
0.16 V, 249 mAh/g
0.15 V, 212 mAh/gInte
nsity /
a.u
.
Raman shift / cm-1
0.11 V, 28 mAh/g
0.15 V, 175 mAh/g
5 mV, 0 mAh/g
0.11 V, 65 mAh/g
0.12 V, 102 mAh/g
0.14 V, 139 mAh/g
16
11
15
83
15
96
15
89
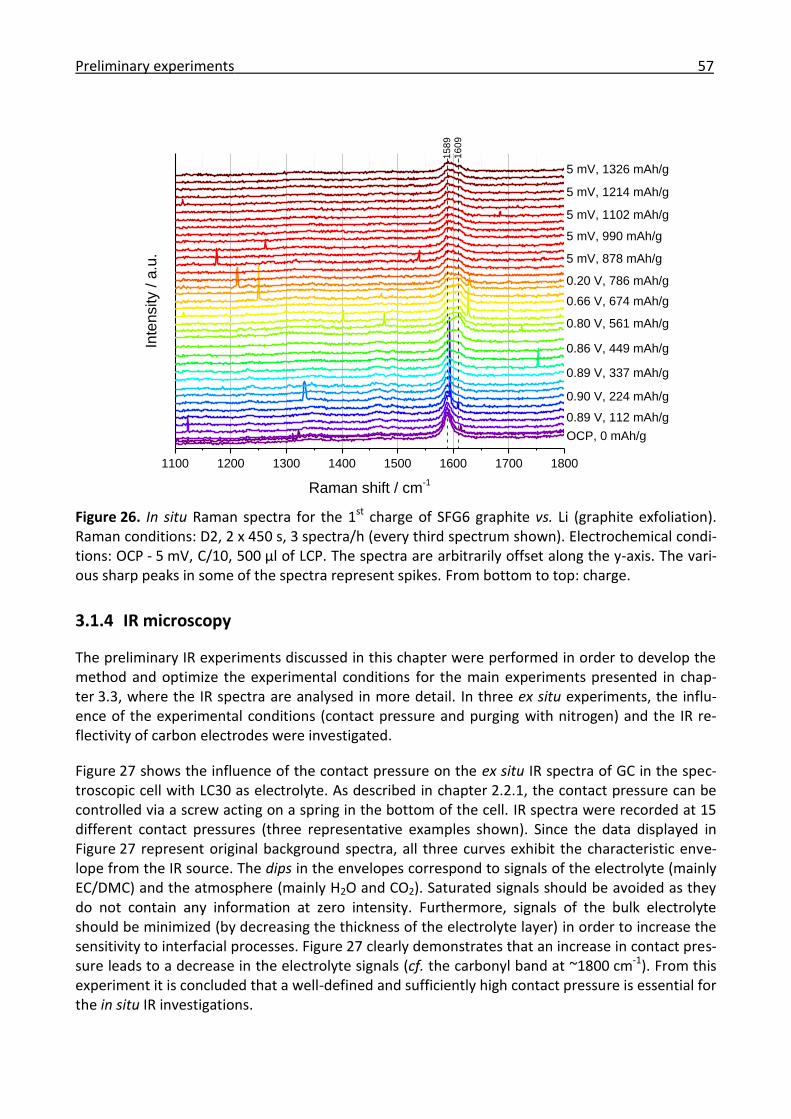
Preliminary experiments 57
Figure 26. In situ Raman spectra for the 1st charge of SFG6 graphite vs. Li (graphite exfoliation). Raman conditions: D2, 2 x 450 s, 3 spectra/h (every third spectrum shown). Electrochemical condi-tions: OCP - 5 mV, C/10, 500 µl of LCP. The spectra are arbitrarily offset along the y-axis. The vari-ous sharp peaks in some of the spectra represent spikes. From bottom to top: charge.
3.1.4 IR microscopy
The preliminary IR experiments discussed in this chapter were performed in order to develop the method and optimize the experimental conditions for the main experiments presented in chap-ter 3.3, where the IR spectra are analysed in more detail. In three ex situ experiments, the influ-ence of the experimental conditions (contact pressure and purging with nitrogen) and the IR re-flectivity of carbon electrodes were investigated.
Figure 27 shows the influence of the contact pressure on the ex situ IR spectra of GC in the spec-troscopic cell with LC30 as electrolyte. As described in chapter 2.2.1, the contact pressure can be controlled via a screw acting on a spring in the bottom of the cell. IR spectra were recorded at 15 different contact pressures (three representative examples shown). Since the data displayed in Figure 27 represent original background spectra, all three curves exhibit the characteristic enve-lope from the IR source. The dips in the envelopes correspond to signals of the electrolyte (mainly EC/DMC) and the atmosphere (mainly H2O and CO2). Saturated signals should be avoided as they do not contain any information at zero intensity. Furthermore, signals of the bulk electrolyte should be minimized (by decreasing the thickness of the electrolyte layer) in order to increase the sensitivity to interfacial processes. Figure 27 clearly demonstrates that an increase in contact pres-sure leads to a decrease in the electrolyte signals (cf. the carbonyl band at ~1800 cm-1). From this experiment it is concluded that a well-defined and sufficiently high contact pressure is essential for the in situ IR investigations.
1100 1200 1300 1400 1500 1600 1700 1800
5 mV, 1326 mAh/g
5 mV, 1214 mAh/g
5 mV, 1102 mAh/g
5 mV, 990 mAh/g
Inte
nsity /
a.u
.
Raman shift / cm-1
0.89 V, 112 mAh/g
0.90 V, 224 mAh/g
0.89 V, 337 mAh/g
5 mV, 878 mAh/g
0.66 V, 674 mAh/g
0.20 V, 786 mAh/g
0.80 V, 561 mAh/g
0.86 V, 449 mAh/g
OCP, 0 mAh/g
16
09
15
89

58 Results and discussion
4000 3500 3000 2500 2000 1500 1000
Inte
nsity /
a.u
.
Wavenumber / cm-1
High contact pressure
Medium contact pressure
Low contact pressure
Increasing
contact pressure
Figure 27. Influence of the contact pressure on the ex situ IR spectra of GC in the spectroscopic cell. IR conditions: System 2000, 50 scans. Electrolyte: LC30.
Figure 28 shows the influence of purging on the ex situ IR spectra of GC in the spectroscopic cell with LC30 as electrolyte. As expected, the spectrum recorded with an open sample chamber ex-hibits signals of H2O (1300-2100 and 3400-4000 cm-1) and CO2 (2300-2400 cm-1) from the atmos-phere. After closing the sample chamber and purging with nitrogen for 2 h, a significant decrease in the intensity of these signals was observed. This demonstrated the high intensity of the atmos-pheric signals and the strong influence of the purging conditions, which should be considered in future experiments.
Finally, the IR reflectivities of a gold film on glass, a GC disc, a polished single graphite particle, a conventional graphite electrode on copper and the objective slide are compared in Figure 29. Each sample was measured at three different points (one representative example shown for each sam-ple). The aim of this experiment was to provide reference spectra and to find a graphite electrode with sufficiently high IR reflectivity for the in situ IR investigations. Figure 29 shows that the IR re-flectivities decrease in the following order: Au > GC > T1000-8000 > SFG44 ≈ Glass. Gold film on glass is often used as a reflective surface for IR radiation and it is thus not surprising that it shows excellent IR reflectivity. The GC discs used in this work have very smooth surfaces and consequent-ly show the second highest IR reflectivity. Surprisingly, the signal of the polished single graphite particle was not significantly weaker than the signal of GC, indicating that such particles could yield in situ IR spectra with comparable S/N ratios, while maintaining the ability to intercalate lith-ium. As expected, the conventional graphite electrode containing SFG44 showed poor IR reflectivi-ty (comparable to glass) due to diffuse reflection at its rough surface. Based on this experiment, GC discs (proof of concept) and polished single T1000-8000 graphite particles (lithium intercala-tion) were selected as electrodes for the in situ IR investigations (the use of SFG6 and SFG44 was stopped).

Preliminary experiments 59
4000 3500 3000 2500 2000 1500 1000
Inte
nsity / a
.u.
Wavenumber / cm-1
Purged sample chamber
Open sample chamber
Figure 28. Influence of purging with N2 (2 h) on the ex situ IR spectra of GC in the spectroscopic cell. IR conditions: System 2000, 100 scans. Electrolyte: LC30.
4000 3500 3000 2500 2000 1500 1000
Inte
nsity /
a.u
.
Wavenumber / cm-1
Au
GC
T1000-8000
SFG44
Glass
Figure 29. Comparison of the IR reflectivities of an Au film on glass (Au), a GC disc (GC), a polished single graphite particle (T1000-8000), a conventional graphite electrode (SFG44) and the objective slide (glass). IR conditions: microscope, 137 µm aperture, 10 scans.

60 Results and discussion
3.2 Positive electrode materials
In this chapter, the main results of the experiments with HE-NCM, stoichiometric NCM and Li2MnO3 are presented. Raman microscopy proved to be the most suitable technique for the measurement of these positive electrode materials and was thus selected as the principal spectro-scopic method, although IR spectroscopy was also applied in some experiments. A general intro-duction to the positive electrode materials used in this chapter, demonstrating their relevance and describing the open questions, has been provided in chapter 1.2.3. In short, the highly promising positive electrode material HE-NCM has been proposed to contain Li2MnO3 domains that are acti-vated during initial charging, resulting in a characteristic potential plateau at 4.5 V and irreversible oxygen release. However, the exact reaction mechanisms involved remain hotly debated [38, 39]. The aim of the work described in this chapter was to contribute to the elucidation of these reac-tion mechanisms and to further characterize HE-NCM by investigating the ageing of HE-NCM, comparing stoichiometric with HE-NCM and investigating the electrochemical activation of Li2MnO3.
Before the main experimental results are presented, the theoretically expected Raman bands of NCMs and Li2MnO3 are discussed. First of all, it is important to understand the symmetry of NCMs in order to allow analysis of their Raman spectra. As described in detail in chapter 1.2.3, stoichio-metric NCMs crystallize in the α-NaFeO2 structure (R3̅m symmetry). HE-NCM crystallizes in the same overall structure but contains additional Li2MnO3 domains of C2/m symmetry, which is also the symmetry of pure Li2MnO3.[38]
Figure 30 shows the α-NaFeO2 crystal structure of NCM and the corresponding Raman-active vi-brational modes (note that, strictly speaking, only non-overlithiated NCMs have this crystal struc-ture). The space group R3̅m gives rise to the following vibrational modes
𝛤𝑣𝑖𝑏 = 𝐴1𝑔 ⨁ 2𝐴2𝑢 ⨁ 𝐸𝑔 ⨁ 2𝐸𝑢 3.1
where the gerade and ungerade modes are Raman- and IR-active, respectively. Eg and A1g repre-sent the O-M-O bending mode, in which the atoms move perpendicular to the c-axis, and the M-O stretching mode, in which the atoms move parallel to the c-axis, respectively. They are typically detected at ~500 and ~600 cm-1, respectively, with the exact wavenumbers depending on the ma-terial used.[165]
Finally, Li2MnO3 has been reported to exhibit Raman bands at 248, 308, 332, 369, 413, 438, 493, 568 and 612 cm-1, where the strongest band at 612 cm-1 has been assigned to the Ag mode. How-ever, note that, according to group theory, the space group C2/m should give rise to only six Ra-man-active modes (4Ag and 2Bg).[174]

Positive electrode materials 61
Figure 30. Left: α-NaFeO2-type crystal structure of NCM (M = Ni, Co, Mn). Right: Raman-active vi-brational modes (Eg = O-M-O bending at ~500 cm-1 and A1g = M-O stretching at ~600 cm-1). Adapted with permission from the American Chemical Society [165].
3.2.1 Ex situ IR investigation of the ageing of high-energy NCM
The results presented in this chapter are based on an article published in Journal of Materials Chemistry A [175]. All working electrodes used in this study consisted of 80:10:10 wt% HE-NCM/carbon black/PVDF on aluminium foil.
Although HE-NCM is a very promising alternative to LiCoO2 in secondary lithium-ion batteries, its long-term stability requires further investigation. Tolerance to air and humidity is an important factor in determining the shelf life of this material (most positive electrode materials for lithium-ion batteries are hygroscopic due to the high affinity of lithium for water). We thus investigated the ageing of HE-NCM in a humid atmosphere by electrochemical analysis, SEM, IR spectroscopy, neutron diffraction and XRD. Since the electrochemical, SEM and diffraction measurements were performed by Dr. Claire Villevieille, the focus of this chapter will be on the IR experiments.
In addition to the bulk properties of HE-NCM, the surface chemistry is another important parame-ter that affects the electrochemical performance of these materials. It is known that a certain amount of Li2CO3 is present on the surfaces of positive electrode materials of the type LiMO2 (M = Ni, Co, Mn) after exposure to air [176-178]. Zhuang et al. estimated the thickness of the Li2CO3 film on LiNi0.8Co0.15Al0.05O2 exposed to air for 2 years at 10 nm [179].
Figure 31 provides an overview of ageing mechanisms of positive electrodes during electrochemi-cal cycling. The main ageing mechanisms are ageing of the active material, degradation of elec-trode components (conductive additive, polymer binder and current collector), oxidation of elec-trolyte components (surface film formation) and interaction of ageing products with the negative electrode. These effects are highly interrelated and depend on the exact storage and cycling condi-tions.[180]
In this work, we concentrated on the ageing of HE-NCM due to surface film formation during stor-age in a humid atmosphere and its influence on the electrochemical performance. The humid at-mosphere was created by connecting a water container kept at 60 °C to the sealed sample flask.

62 Results and discussion
Figure 31. Overview of the ageing mechanisms of positive electrodes of the type LiMO2 (M = Ni, Co, Mn) during electrochemical cycling. Reprinted with permission from Elsevier [180].
Before the IR experiments are presented, a short summary of the electrochemical, SEM, neutron diffraction and XRD measurements is provided (for a more detailed discussion of these results the reader is referred to the original manuscript [175]). Whereas at C/10 about the same specific charges were obtained for pristine and HE-NCM aged for 1 year, at 1 C the aged sample delivered only ~70% of the specific charge of the pristine sample, which points towards kinetic limitation in the aged sample. Analysis of the galvanostatic charging profiles measured at 1 C showed a higher overpotential for aged HE-NCM, suggesting that the cut-off potential of 4.8 V is reached at a lower state of charge than in pristine HE-NCM. The potentials at which the ageing-related processes oc-cur were determined by analysing the derivative curves of the galvanostatic profiles. In addition to the commonly observed peaks associated with the charge and discharge of HE-NCM, there was a difference between the pristine and aged sample at 3.0-3.5 V. Whereas no reaction was detected for pristine HE-NCM, anodic peaks were clearly visible in this region for aged HE-NCM. To further investigate the reasons for the kinetic limitation observed in aged HE-NCM, the surfaces of both samples were examined by SEM. Although the SEM images of pristine and aged HE-NCM showed no clear evidence of surface films, the aged sample exhibited a thicker surface film after 30 cycles, which may be a consequence of differences already present in the uncycled electrodes. Neutron diffraction (high sensitivity to lithium) and XRD were employed to take a closer look at the bulk properties. The neutron diffraction pattern of HE-NCM could be indexed based on overall R3̅m symmetry with secondary C2/m ordering. Finally, in situ XRD measurements performed at C/10 during the first cycle demonstrated reversible changes in the lattice parameters and the evolution of an additional peak for aged HE-NCM, which was assigned to the formation of a spinel-like phase.
In addition to the IR experiments discussed in the rest of this chapter, XPS and Raman microscopy were also applied to the investigation of the surfaces of pristine and aged HE-NCM. These experi-ments showed no evidence of an increase in the amount of Li2CO3 on the surface of aged HE-NCM, which would have resulted in an increase in the XPS peaks at 55.12 (Li 1s), 289.55 (C 1s) and 531.40 eV (O 1s) [181] and the Raman band at 1088 cm-1 [182]. This may be explained by insuffi-cient sensitivity to small amounts of Li2CO3. However, as expected, Li, C and O, and the Eg and A1g bands of HE-NCM were detected by XPS and Raman microscopy, respectively. The corresponding XPS and Raman figures can be found in the appendix (chapters 6.6.3 and 6.6.4, respectively).
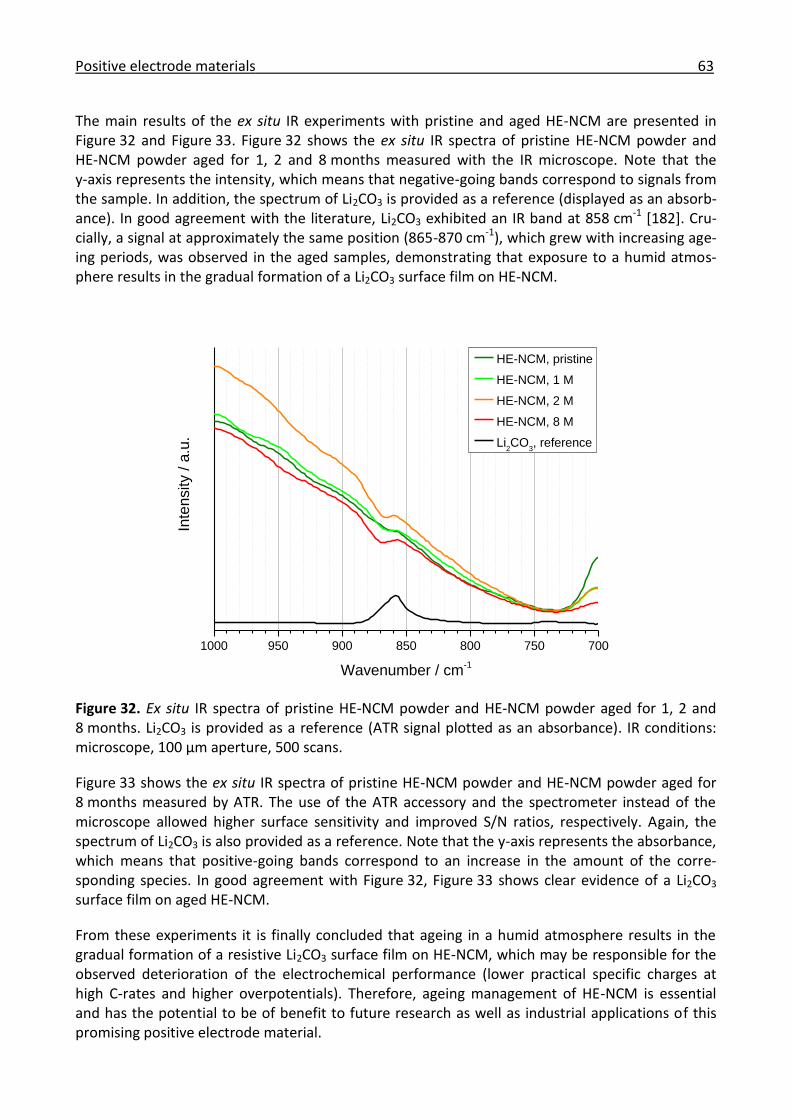
Positive electrode materials 63
The main results of the ex situ IR experiments with pristine and aged HE-NCM are presented in Figure 32 and Figure 33. Figure 32 shows the ex situ IR spectra of pristine HE-NCM powder and HE-NCM powder aged for 1, 2 and 8 months measured with the IR microscope. Note that the y-axis represents the intensity, which means that negative-going bands correspond to signals from the sample. In addition, the spectrum of Li2CO3 is provided as a reference (displayed as an absorb-ance). In good agreement with the literature, Li2CO3 exhibited an IR band at 858 cm-1 [182]. Cru-cially, a signal at approximately the same position (865-870 cm-1), which grew with increasing age-ing periods, was observed in the aged samples, demonstrating that exposure to a humid atmos-phere results in the gradual formation of a Li2CO3 surface film on HE-NCM.
1000 950 900 850 800 750 700
Inte
nsity / a
.u.
Wavenumber / cm-1
HE-NCM, pristine
HE-NCM, 1 M
HE-NCM, 2 M
HE-NCM, 8 M
Li2CO
3, reference
Figure 32. Ex situ IR spectra of pristine HE-NCM powder and HE-NCM powder aged for 1, 2 and 8 months. Li2CO3 is provided as a reference (ATR signal plotted as an absorbance). IR conditions: microscope, 100 µm aperture, 500 scans.
Figure 33 shows the ex situ IR spectra of pristine HE-NCM powder and HE-NCM powder aged for 8 months measured by ATR. The use of the ATR accessory and the spectrometer instead of the microscope allowed higher surface sensitivity and improved S/N ratios, respectively. Again, the spectrum of Li2CO3 is also provided as a reference. Note that the y-axis represents the absorbance, which means that positive-going bands correspond to an increase in the amount of the corre-sponding species. In good agreement with Figure 32, Figure 33 shows clear evidence of a Li2CO3 surface film on aged HE-NCM.
From these experiments it is finally concluded that ageing in a humid atmosphere results in the gradual formation of a resistive Li2CO3 surface film on HE-NCM, which may be responsible for the observed deterioration of the electrochemical performance (lower practical specific charges at high C-rates and higher overpotentials). Therefore, ageing management of HE-NCM is essential and has the potential to be of benefit to future research as well as industrial applications of this promising positive electrode material.

64 Results and discussion
1000 950 900 850 800 750 700
Absorb
ance / a
.u.
Wavenumber / cm-1
HE-NCM, pristine
HE-NCM, 8 M
Li2CO
3, reference
Figure 33. Ex situ ATR-IR spectra of pristine HE-NCM powder and HE-NCM powder aged for 8 months. Li2CO3 is provided as a reference. IR conditions: ATR, System 2000, 500 scans.
3.2.2 Ex/in situ Raman comparison between stoichiometric and high-energy NCM
The results presented in this chapter are based on an article published in Electrochimica Acta [40]. All working electrodes used in this study consisted of 80:10:10 wt% NCM/carbon black/PVDF on stainless steel mesh.
As described in chapter 1.2.3, the reaction mechanisms involved in the electrochemical activation of HE-NCM remain hotly debated. The aim of this study was thus to contribute to their further elucidation. Raman spectroscopy was chosen as a powerful tool for such studies due to the possi-bility of probing the short-range environment of transition metals, even in the absence of exten-sive long-range order, and due to its suitability for in situ experiments. By direct comparison be-tween the ex situ and in situ Raman spectra of stoichiometric and HE-NCM cycled under identical conditions, we intended to minimize the experimental variations and isolate the true differences between the Raman spectroscopic characteristics of the two compounds. Whereas ex situ Raman experiments are easier to implement, in situ Raman experiments offer the advantages of avoiding relaxation and allowing the determination of the exact potentials at which certain spectroscopic changes occur. In the literature, a limited number of ex situ Raman spectra of stoichiometric NCM have been presented [183-186]. Amalraj et al. recently reported ex situ Raman spectra of HE-NCM [187]. In corresponding in situ measurements, the emergence of a new band at 544 cm-1 during the first charge was observed at 4.1-4.3 V [22].
The SEM images shown in Figure 34 indicate that the morphologies of (a) the stoichiometric NCM powder and (b) the HE-NCM powder are quite similar. Both samples consist of relatively flat, hex-agonal crystallites in the range of a few hundred nanometres (slightly larger for HE-NCM). Fur-

Positive electrode materials 65
thermore, XRD measurements, which will not be discussed in detail since they were performed by Dr. Claire Villevieille, showed that the powders were pure and exhibited the expected R3̅m sym-metry for stoichiometric NCM and overall R3̅m symmetry with secondary C2/m ordering for HE-NCM.
Figure 34. SEM images of (a) stoichiometric NCM powder and (b) HE-NCM powder.
Two series of ex situ Raman experiments with NCMs with increasing degrees of overlithiation (stoichiometric NCM < Li1.1(Ni0.33Co0.33Mn0.33)0.9O2 < HE-NCM) were performed. In the first and second series of experiments, pristine electrodes and electrodes after a complete electrochemical cycle were characterized, respectively.
The galvanostatic profiles of stoichiometric NCM, Li1.1(Ni0.33Co0.33Mn0.33)0.9O2 and HE-NCM for the first cycle in standard cells are provided in Figure 35 (used in the ex situ Raman experiments). The curves show an increase in specific charge with increasing overlithiation (250/210, 295/230 and 320/280 mAh/g for charge and discharge, respectively). Part of the irreversible charge losses may be due to electrolyte decomposition at high potentials [188]. The HE-NCM clearly exhibits the po-tential plateau at 4.5 V associated with the electrochemical activation of Li2MnO3.
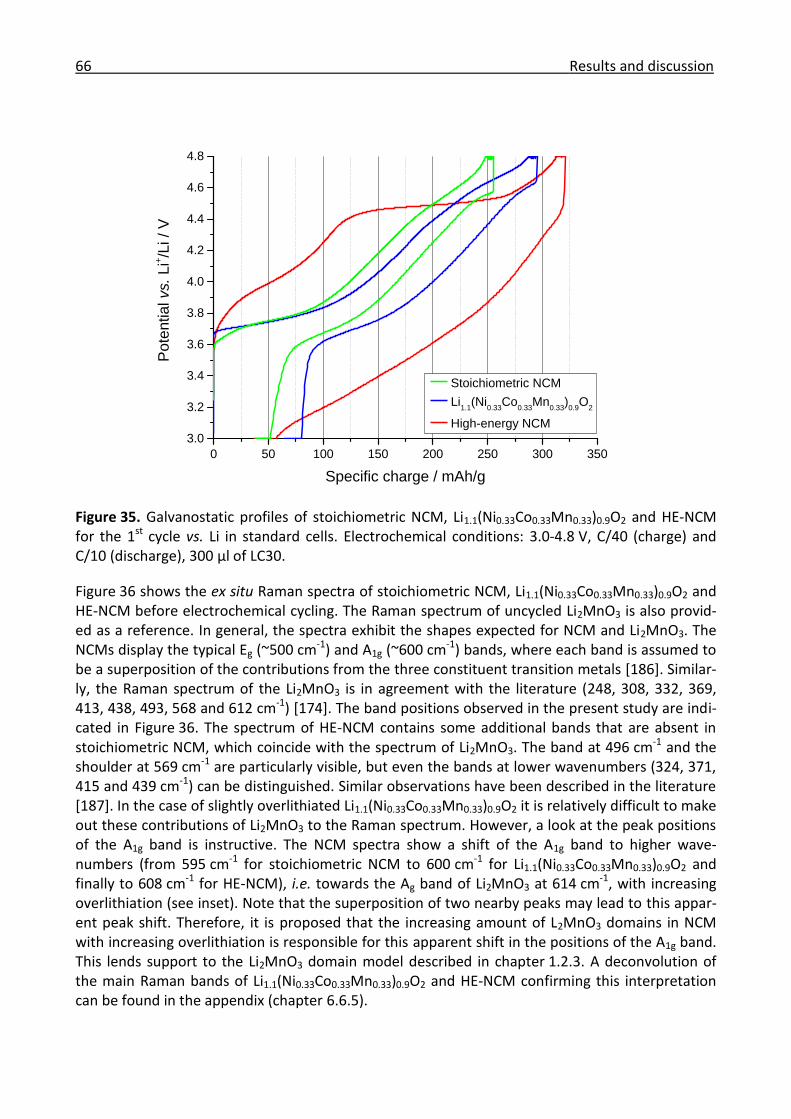
66 Results and discussion
0 50 100 150 200 250 300 350
3.0
3.2
3.4
3.6
3.8
4.0
4.2
4.4
4.6
4.8P
ote
ntia
l vs. L
i+/L
i / V
Specific charge / mAh/g
Stoichiometric NCM
Li1.1
(Ni0.33
Co0.33
Mn0.33
)0.9
O2
High-energy NCM
Figure 35. Galvanostatic profiles of stoichiometric NCM, Li1.1(Ni0.33Co0.33Mn0.33)0.9O2 and HE-NCM for the 1st cycle vs. Li in standard cells. Electrochemical conditions: 3.0-4.8 V, C/40 (charge) and C/10 (discharge), 300 µl of LC30.
Figure 36 shows the ex situ Raman spectra of stoichiometric NCM, Li1.1(Ni0.33Co0.33Mn0.33)0.9O2 and HE-NCM before electrochemical cycling. The Raman spectrum of uncycled Li2MnO3 is also provid-ed as a reference. In general, the spectra exhibit the shapes expected for NCM and Li2MnO3. The NCMs display the typical Eg (~500 cm-1) and A1g (~600 cm-1) bands, where each band is assumed to be a superposition of the contributions from the three constituent transition metals [186]. Similar-ly, the Raman spectrum of the Li2MnO3 is in agreement with the literature (248, 308, 332, 369, 413, 438, 493, 568 and 612 cm-1) [174]. The band positions observed in the present study are indi-cated in Figure 36. The spectrum of HE-NCM contains some additional bands that are absent in stoichiometric NCM, which coincide with the spectrum of Li2MnO3. The band at 496 cm-1 and the shoulder at 569 cm-1 are particularly visible, but even the bands at lower wavenumbers (324, 371, 415 and 439 cm-1) can be distinguished. Similar observations have been described in the literature [187]. In the case of slightly overlithiated Li1.1(Ni0.33Co0.33Mn0.33)0.9O2 it is relatively difficult to make out these contributions of Li2MnO3 to the Raman spectrum. However, a look at the peak positions of the A1g band is instructive. The NCM spectra show a shift of the A1g band to higher wave-numbers (from 595 cm-1 for stoichiometric NCM to 600 cm-1 for Li1.1(Ni0.33Co0.33Mn0.33)0.9O2 and finally to 608 cm-1 for HE-NCM), i.e. towards the Ag band of Li2MnO3 at 614 cm-1, with increasing overlithiation (see inset). Note that the superposition of two nearby peaks may lead to this appar-ent peak shift. Therefore, it is proposed that the increasing amount of L2MnO3 domains in NCM with increasing overlithiation is responsible for this apparent shift in the positions of the A1g band. This lends support to the Li2MnO3 domain model described in chapter 1.2.3. A deconvolution of the main Raman bands of Li1.1(Ni0.33Co0.33Mn0.33)0.9O2 and HE-NCM confirming this interpretation can be found in the appendix (chapter 6.6.5).

Positive electrode materials 67
300 350 400 450 500 550 600 650 700 750 800
60
8
60
0
59
5
61
4
56
9
49
6
43
9
41
5
37
1
Inte
nsity /
a.u
.
Raman shift / cm-1
Stoichiometric NCM
Li1.1
(Ni0.33
Co0.33
Mn0.33
)0.9
O2
High-energy NCM
Li2MnO
3 reference
32
4
590 600 610 620
Figure 36. Ex situ Raman spectra of stoichiometric NCM, Li1.1(Ni0.33Co0.33Mn0.33)0.9O2 and HE-NCM before electrochemical cycling. Li2MnO3 is given as a reference. Raman conditions: D1, 2 x 300 s. Inset: expanded view of the maxima. The spectra are normalized and background corrected.
300 350 400 450 500 550 600 650 700 750 800
Inte
nsity /
a.u
.
Raman shift / cm-1
Stoichiometric NCM
Li1.1
(Ni0.33
Co0.33
Mn0.33
)0.9
O2
High-energy NCM
Li2MnO
3 reference
56
9
49
6
43
9
41
5
37
1
32
4
590 600 610 620
59
65
99
60
1
61
4
Figure 37. Ex situ Raman spectra of stoichiometric NCM, Li1.1(Ni0.33Co0.33Mn0.33)0.9O2 and HE-NCM after electrochemical cycling. Li2MnO3 is given as a reference. Raman conditions: D1, 2 x 300 s. Electrochemical conditions: 3.0-4.8 V, C/40 (charge) and C/10 (discharge), 300 µl of LC30. Inset: expanded view of the maxima. The spectra are normalized and background corrected.

68 Results and discussion
Figure 37 shows the corresponding ex situ Raman spectra after electrochemical cycling. At first glance, they look quite similar to those presented in Figure 36, i.e. all NCMs display the typical Eg and A1g bands. This indicates that the layered structure of the NCMs remains intact. However, a closer look reveals some marked differences between the two figures. Whereas the A1g band of uncycled NCM shifted to higher wavenumbers with increasing overlithiation, hardly any such ef-fect was observed for the cycled samples (596, 599 and 601 cm-1 for stoichiometric NCM, Li1.1(Ni0.33Co0.33Mn0.33)0.9O2 and HE-NCM, respectively), i.e. the A1g bands of all NCMs were ob-served at approximately the same wavenumber (see inset). Since it has been proposed for Fig-ure 36 that the shift of the A1g band to higher wavenumbers with increasing overlithiation is due to the increasing contribution of the Li2MnO3 domains, it is, conversely, concluded that these do-mains are present in much lower quantities (or even absent) in cycled NCMs. The fact that the superimposed secondary Li2MnO3 bands of HE-NCM are significantly weaker after cycling also supports this conclusion. This suggests that the Li2MnO3 domains present in uncycled overlithiated NCMs had disappeared, which is in excellent agreement with the model of irreversible Li2MnO3 activation during initial charging.
Stoichiometric and HE-NCM were selected for the in situ Raman investigations as they span the entire range from no to heavy overlithiation. A series of experiments consisting of a complete electrochemical cycle was conducted for each compound.
The galvanostatic profiles of stoichiometric and HE-NCM for the first cycle in the Raman cell are provided in Figure 38 (used in the in situ Raman experiments). In general, the curves look similar to those presented in Figure 35. Specific charges of 265 (charge) and 190 mAh/g (discharge), and 330 (charge) and 215 mAh/g (discharge) were observed for stoichiometric and HE-NCM, respec-tively.
0 50 100 150 200 250 300 350
3.0
3.2
3.4
3.6
3.8
4.0
4.2
4.4
4.6
4.8
Po
tentia
l vs. L
i+/L
i / V
Specific charge / mAh/g
Stoichiometric NCM
High-energy NCM
Figure 38. Galvanostatic profiles of stoichiometric and HE-NCM for the 1st cycle vs. Li in the Raman cell. Electrochemical conditions: 3.0-4.8 V, C/40 (charge) and C/10 (discharge), 300 µl of LC30.
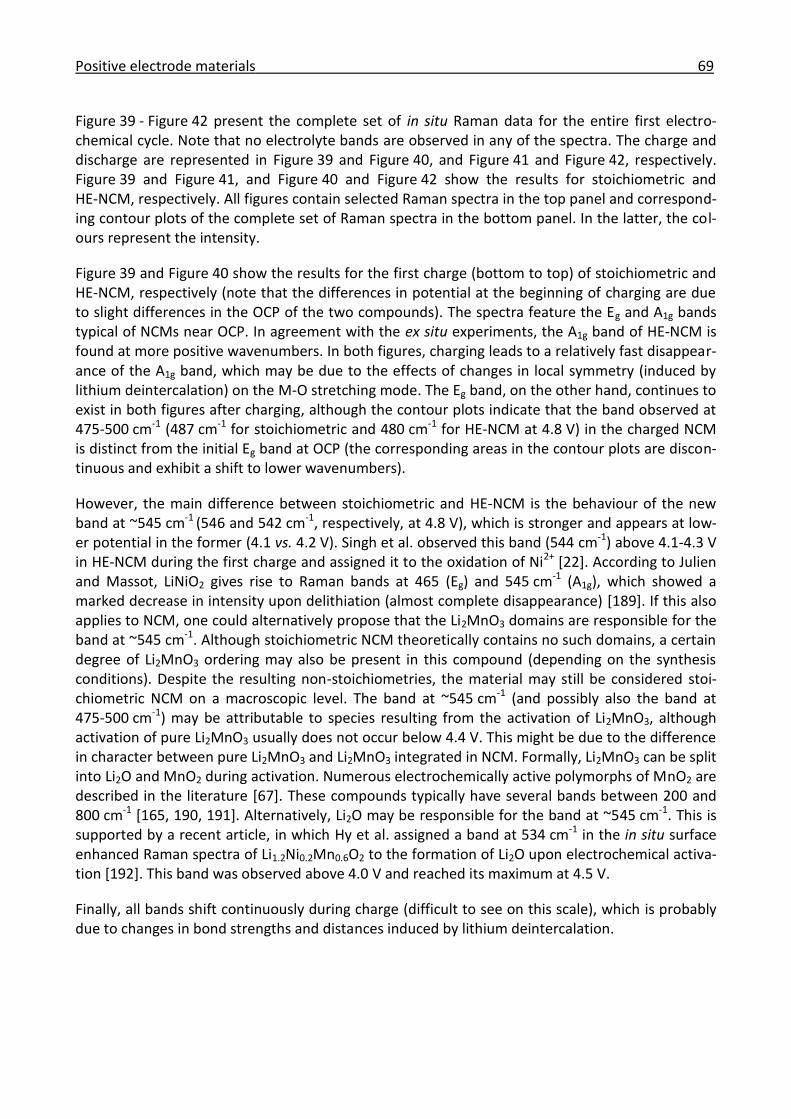
Positive electrode materials 69
Figure 39 - Figure 42 present the complete set of in situ Raman data for the entire first electro-chemical cycle. Note that no electrolyte bands are observed in any of the spectra. The charge and discharge are represented in Figure 39 and Figure 40, and Figure 41 and Figure 42, respectively. Figure 39 and Figure 41, and Figure 40 and Figure 42 show the results for stoichiometric and HE-NCM, respectively. All figures contain selected Raman spectra in the top panel and correspond-ing contour plots of the complete set of Raman spectra in the bottom panel. In the latter, the col-ours represent the intensity.
Figure 39 and Figure 40 show the results for the first charge (bottom to top) of stoichiometric and HE-NCM, respectively (note that the differences in potential at the beginning of charging are due to slight differences in the OCP of the two compounds). The spectra feature the Eg and A1g bands typical of NCMs near OCP. In agreement with the ex situ experiments, the A1g band of HE-NCM is found at more positive wavenumbers. In both figures, charging leads to a relatively fast disappear-ance of the A1g band, which may be due to the effects of changes in local symmetry (induced by lithium deintercalation) on the M-O stretching mode. The Eg band, on the other hand, continues to exist in both figures after charging, although the contour plots indicate that the band observed at 475-500 cm-1 (487 cm-1 for stoichiometric and 480 cm-1 for HE-NCM at 4.8 V) in the charged NCM is distinct from the initial Eg band at OCP (the corresponding areas in the contour plots are discon-tinuous and exhibit a shift to lower wavenumbers).
However, the main difference between stoichiometric and HE-NCM is the behaviour of the new band at ~545 cm-1
(546 and 542 cm-1, respectively, at 4.8 V), which is stronger and appears at low-er potential in the former (4.1 vs. 4.2 V). Singh et al. observed this band (544 cm-1) above 4.1-4.3 V in HE-NCM during the first charge and assigned it to the oxidation of Ni2+ [22]. According to Julien and Massot, LiNiO2 gives rise to Raman bands at 465 (Eg) and 545 cm-1 (A1g), which showed a marked decrease in intensity upon delithiation (almost complete disappearance) [189]. If this also applies to NCM, one could alternatively propose that the Li2MnO3 domains are responsible for the band at ~545 cm-1. Although stoichiometric NCM theoretically contains no such domains, a certain degree of Li2MnO3 ordering may also be present in this compound (depending on the synthesis conditions). Despite the resulting non-stoichiometries, the material may still be considered stoi-chiometric NCM on a macroscopic level. The band at ~545 cm-1 (and possibly also the band at 475-500 cm-1) may be attributable to species resulting from the activation of Li2MnO3, although activation of pure Li2MnO3 usually does not occur below 4.4 V. This might be due to the difference in character between pure Li2MnO3 and Li2MnO3 integrated in NCM. Formally, Li2MnO3 can be split into Li2O and MnO2 during activation. Numerous electrochemically active polymorphs of MnO2 are described in the literature [67]. These compounds typically have several bands between 200 and 800 cm-1 [165, 190, 191]. Alternatively, Li2O may be responsible for the band at ~545 cm-1. This is supported by a recent article, in which Hy et al. assigned a band at 534 cm-1 in the in situ surface enhanced Raman spectra of Li1.2Ni0.2Mn0.6O2 to the formation of Li2O upon electrochemical activa-tion [192]. This band was observed above 4.0 V and reached its maximum at 4.5 V.
Finally, all bands shift continuously during charge (difficult to see on this scale), which is probably due to changes in bond strengths and distances induced by lithium deintercalation.

70 Results and discussion
Figure 39. Top: in situ Raman spectra for the 1st charge of stoichiometric NCM vs. Li. Raman condi-tions: D2, 10 x 150 s, 2 spectra/h (every forth spectrum shown). Electrochemical conditions: 3.0-4.8 V, C/40, 300 µl of LC30. The spectra are arbitrarily offset along the y-axis. Bottom: corre-sponding contour plot. The intensities are indicated on the right. From bottom to top: charge.

Positive electrode materials 71
Figure 40. Top: in situ Raman spectra for the 1st charge of HE-NCM vs. Li. Raman conditions: D2, 10 x 150 s, 2 spectra/h (every forth spectrum shown). Electrochemical conditions: 3.0-4.8 V, C/40, 300 µl of LC30. The spectra are arbitrarily offset along the y-axis. Bottom: corresponding contour plot. The intensities are indicated on the right. From bottom to top: charge.

72 Results and discussion
Figure 41 and Figure 42 show the corresponding results for the first discharge (bottom to top) of stoichiometric and HE-NCM, respectively. In general, the figures show that the spectral changes resulting from electrochemical charging can be largely reversed by subsequent discharge. In par-ticular the typical NCM bands, Eg and A1g, re-emerge towards the end of discharge. This (partial) reversibility is assigned to the reversible intercalation of lithium. The fact that the overall intensi-ties are significantly lower at the end of discharge compared with the uncycled samples at OCP may be a consequence of increased electrical conductivity (resulting from incomplete reintercala-tion of lithium) [193], leading to a drop in optical skin depth [7]. By analogy with what has already been observed during the charge, the band at 475-500 cm-1 appears to be distinct from the band around 500 cm-1 observed in the fully discharged state of both samples (discontinuous and shifted areas in the contour plots). Finally, the band at ~545 cm-1 disappears again upon discharge of both samples. However, there seems to be a difference in behaviour between stoichiometric and HE-NCM. In the former, this band is only stable down to a potential of 3.9 V, whereas it continues to be detected down to a potential of 3.7 V in the latter. Combining the observations made with respect to the band at ~545 cm-1 during the entire first cycle, we note that the associated struc-ture is stable over a significantly larger potential range in high-energy than in stoichiometric NCM (4.1-4.8 and 4.8-3.7 vs. 4.2-4.8 and 4.8-3.9 V).
In conclusion, the Raman spectroscopic changes occurring in stoichiometric and HE-NCM upon electrochemical cycling under identical conditions were compared for the first time. Stoichio-metric NCM could be obtained via the sol-gel route. SEM measurements showed that both NCM samples consisted of relatively flat hexagonal crystallites in the range of a few hundred nanome-tres. A series of ex situ Raman experiments with NCMs with increasing degrees of overlithiation (stoichiometric NCM < Li1.1(Ni0.33Co0.33Mn0.33)0.9O2 < HE-NCM) and comparison to the spectrum of Li2MnO3 demonstrated a systematic shift of the A1g band observed in NCM towards the Ag band of Li2MnO3 at higher wavenumbers. This indicates that the Raman spectra of overlithiated NCMs may be described as superpositions of their constituent compounds stoichiometric NCM and Li2MnO3 proposed in the domain model, thus supporting this hypothesis. In a similar series of ex situ Ra-man experiments after a complete electrochemical cycle, the A1g bands of all NCMs were observed at approximately the same wavenumber. This allows the conclusion that the proposed activation of Li2MnO3 during the first charge of overlithiated NCM is indeed irreversible. In situ Raman exper-iments with stoichiometric and HE-NCM during a complete electrochemical cycle showed partial reversibility assigned to lithium intercalation, as well as the emergence of a new reversible band at ~545 cm-1 (due to Li2O or other activation products of Li2MnO3). Comparison of the two sets of in situ Raman spectra revealed that this band is stable over a larger potential range in HE-NCM than in stoichiometric NCM.
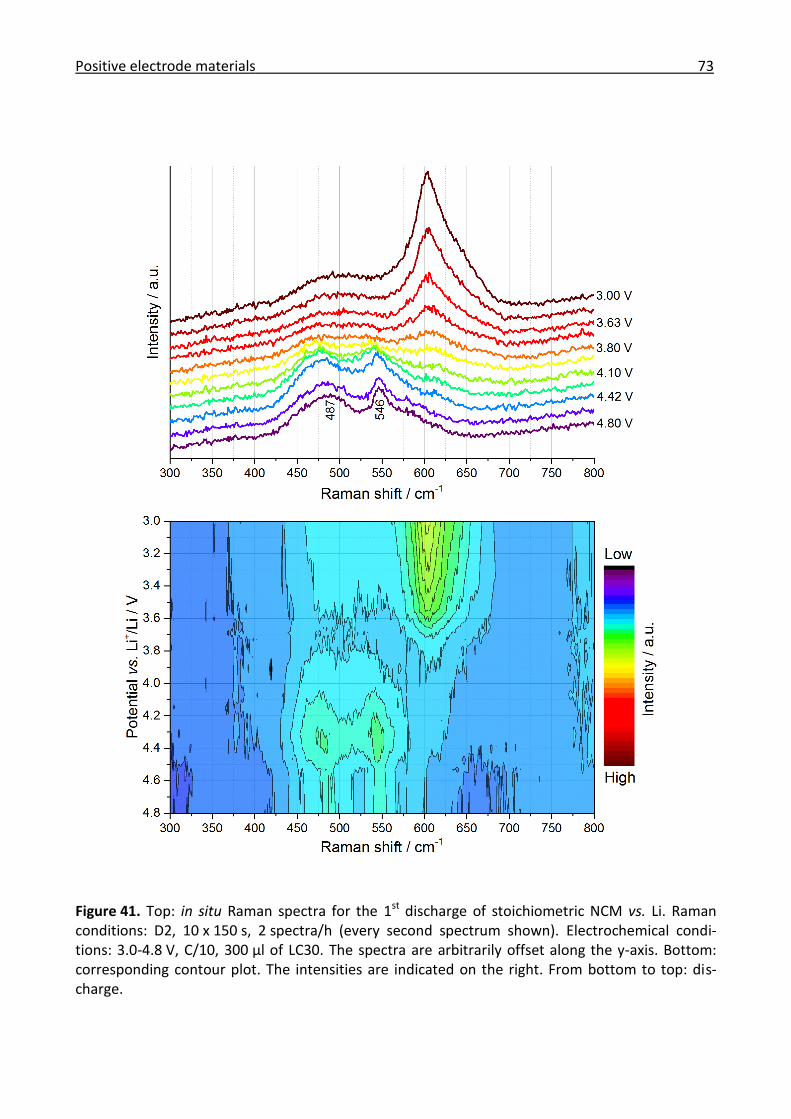
Positive electrode materials 73
Figure 41. Top: in situ Raman spectra for the 1st discharge of stoichiometric NCM vs. Li. Raman conditions: D2, 10 x 150 s, 2 spectra/h (every second spectrum shown). Electrochemical condi-tions: 3.0-4.8 V, C/10, 300 µl of LC30. The spectra are arbitrarily offset along the y-axis. Bottom: corresponding contour plot. The intensities are indicated on the right. From bottom to top: dis-charge.
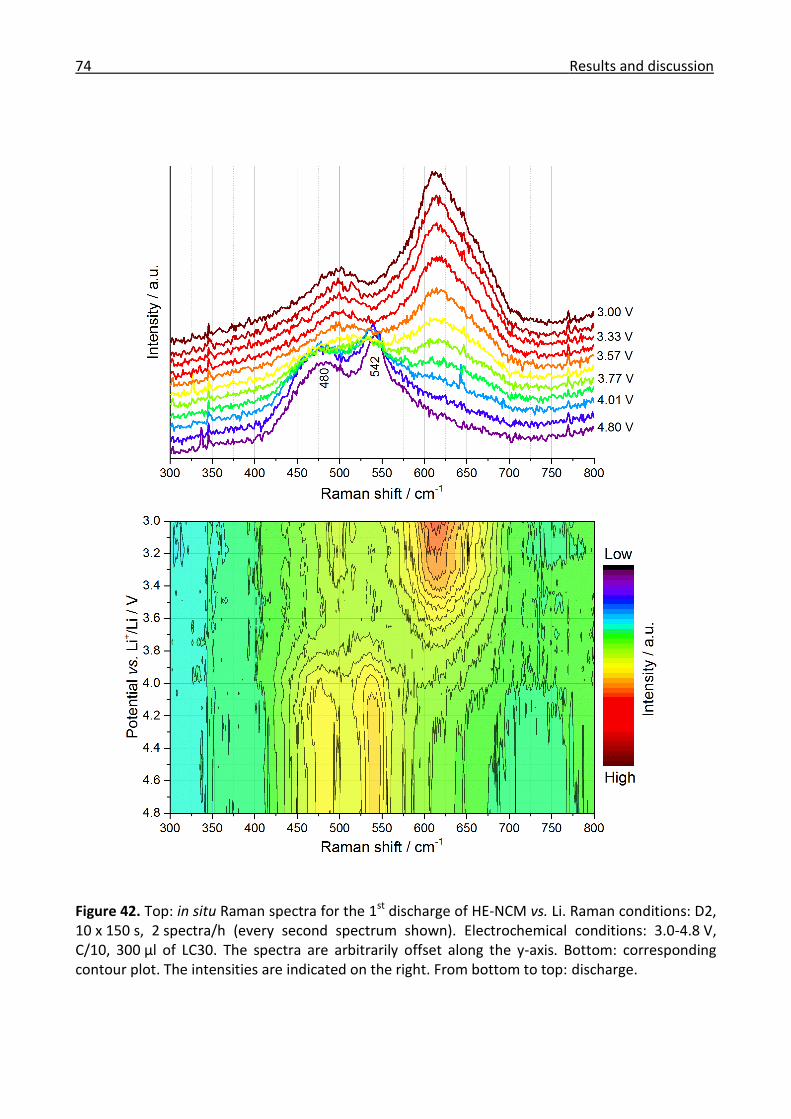
74 Results and discussion
Figure 42. Top: in situ Raman spectra for the 1st discharge of HE-NCM vs. Li. Raman conditions: D2, 10 x 150 s, 2 spectra/h (every second spectrum shown). Electrochemical conditions: 3.0-4.8 V, C/10, 300 µl of LC30. The spectra are arbitrarily offset along the y-axis. Bottom: corresponding contour plot. The intensities are indicated on the right. From bottom to top: discharge.

Positive electrode materials 75
3.2.3 Ex/in situ Raman investigation of the electrochemical activation of Li2MnO3
The results presented in this chapter are based on an article published in Electrochimica Acta [41]. All working electrodes used in this study consisted of 75:15:10 wt% Li2MnO3/carbon black/PVDF on stainless steel mesh.
As the alternative notation xLi2MnO3·(1-x)LiMO2 (M = Ni, Co, Mn) and the associated name Li2MnO3-stabilized NCM suggests, HE-NCM has been postulated to contain Li2MnO3 domains (see also chapter 1.2.3). Throughout the previous chapter, the importance of these Li2MnO3 domains in HE-NCM and their electrochemical activation, which gives rise to the characteristic potential plat-eau at 4.5 V during galvanostatic charging, has been stressed. The Li2MnO3 domains are essential for understanding the electrochemical properties of HE-NCM. They have been reported to stabilize the NCM structure and result in higher specific charges and improved cycling stability [38]. Recog-nizing the key role of Li2MnO3 domains in the complex reaction mechanisms at play in HE-NCM, we decided to investigate the simpler system of pure Li2MnO3. The sample was synthesized by a two-step solid-state reaction (chapter 2.1.2) and characterized by SEM and XRD. In a study on the reaction mechanism of electrochemical activity in Li2MnO3, Robertson and Bruce managed to acti-vate Li2MnO3 at elevated temperatures, obtaining specific charges of 50-300 mAh/g [94]. They proposed competing reaction mechanisms of oxygen loss and Li+/H+ exchange. As mentioned in the previous chapter, Raman spectroscopy offers a powerful additional tool for such studies since it allows the probing of the short-range environment of transition metals without the need for extensive long-range order. Amalraj et al. activated Li2MnO3 at elevated temperatures and charac-terized the changes by ex situ Raman spectroscopy [194]. After complete charging, the main signal of Li2MnO3 at 615 cm-1 was shown to shift to higher wavenumbers (~640 cm-1). Depending on the measurement, the degree of activation varied, i.e. the reaction was partially inhomogeneous. The shifted band at 640 cm-1 was attributed to the formation of a spinel-like phase [194]. In contrast to these ex situ Raman studies, our approach of performing the Raman experiments in situ offers the advantage of no relaxation and the ability to pinpoint the exact potential at which the activation sets in. This, in turn, allows comparison with the potentials of the plateaus observed in the gal-vanostatic profiles of Li2MnO3 and, ultimately, HE-NCM.
The Li2MnO3 powder was first characterized by SEM in order to determine the morphology of the particles. Figure 43 shows SEM images of as-synthesized Li2MnO3 powder. At first glance, one rec-ognizes that the sample consists of homogeneous needle-shaped crystals. The SEM image at lower magnification (a) shows that the crystals exhibit a certain degree of aggregation but in general remain relatively well separated, which is expected to be conducive to good reaction kinetics. The SEM image at higher magnification (b) indicates that the needle-shaped Li2MnO3 crystals are themselves made up of smaller crystallites in the nano range. From the latter SEM image it is esti-mated that the Li2MnO3 crystals are 2-3 µm in length and 100-200 nm in diameter. Furthermore, XRD measurements, which will not be discussed in detail since they were performed by Dr. Claire Villevieille, showed that the Li2MnO3 powder was pure and exhibited the expected C2/m sym-metry.
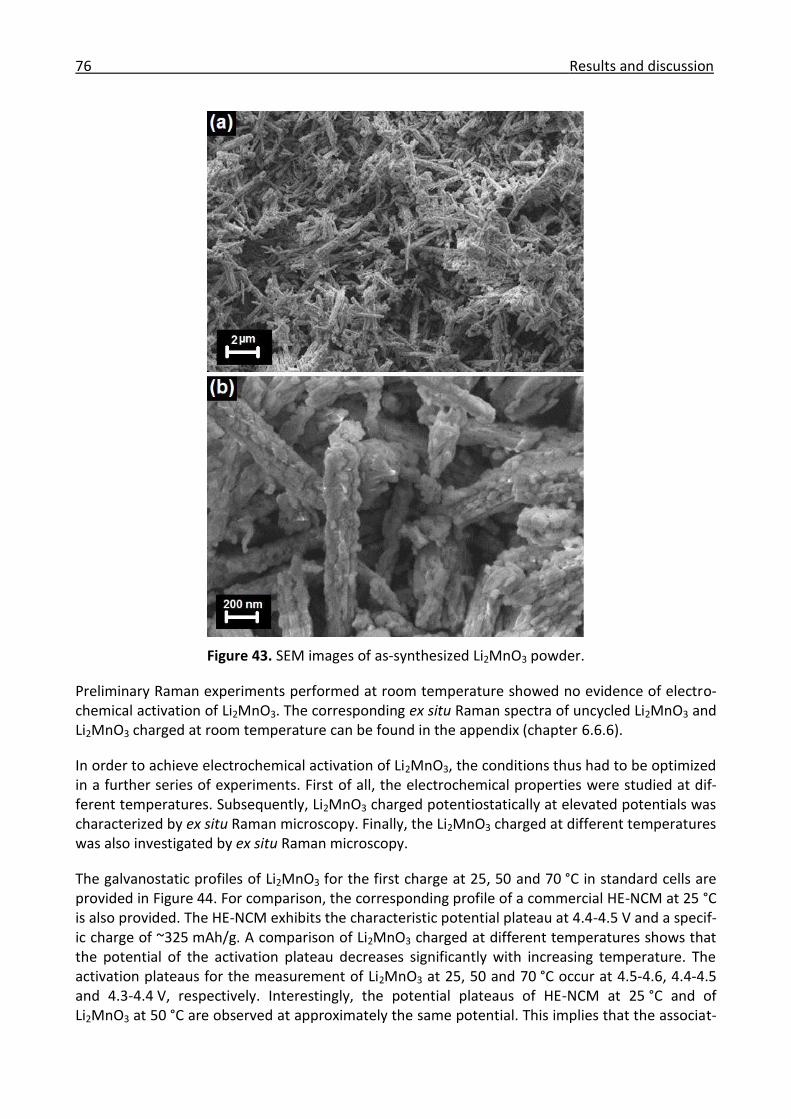
76 Results and discussion
Figure 43. SEM images of as-synthesized Li2MnO3 powder.
Preliminary Raman experiments performed at room temperature showed no evidence of electro-chemical activation of Li2MnO3. The corresponding ex situ Raman spectra of uncycled Li2MnO3 and Li2MnO3 charged at room temperature can be found in the appendix (chapter 6.6.6).
In order to achieve electrochemical activation of Li2MnO3, the conditions thus had to be optimized in a further series of experiments. First of all, the electrochemical properties were studied at dif-ferent temperatures. Subsequently, Li2MnO3 charged potentiostatically at elevated potentials was characterized by ex situ Raman microscopy. Finally, the Li2MnO3 charged at different temperatures was also investigated by ex situ Raman microscopy.
The galvanostatic profiles of Li2MnO3 for the first charge at 25, 50 and 70 °C in standard cells are provided in Figure 44. For comparison, the corresponding profile of a commercial HE-NCM at 25 °C is also provided. The HE-NCM exhibits the characteristic potential plateau at 4.4-4.5 V and a specif-ic charge of ~325 mAh/g. A comparison of Li2MnO3 charged at different temperatures shows that the potential of the activation plateau decreases significantly with increasing temperature. The activation plateaus for the measurement of Li2MnO3 at 25, 50 and 70 °C occur at 4.5-4.6, 4.4-4.5 and 4.3-4.4 V, respectively. Interestingly, the potential plateaus of HE-NCM at 25 °C and of Li2MnO3 at 50 °C are observed at approximately the same potential. This implies that the associat-
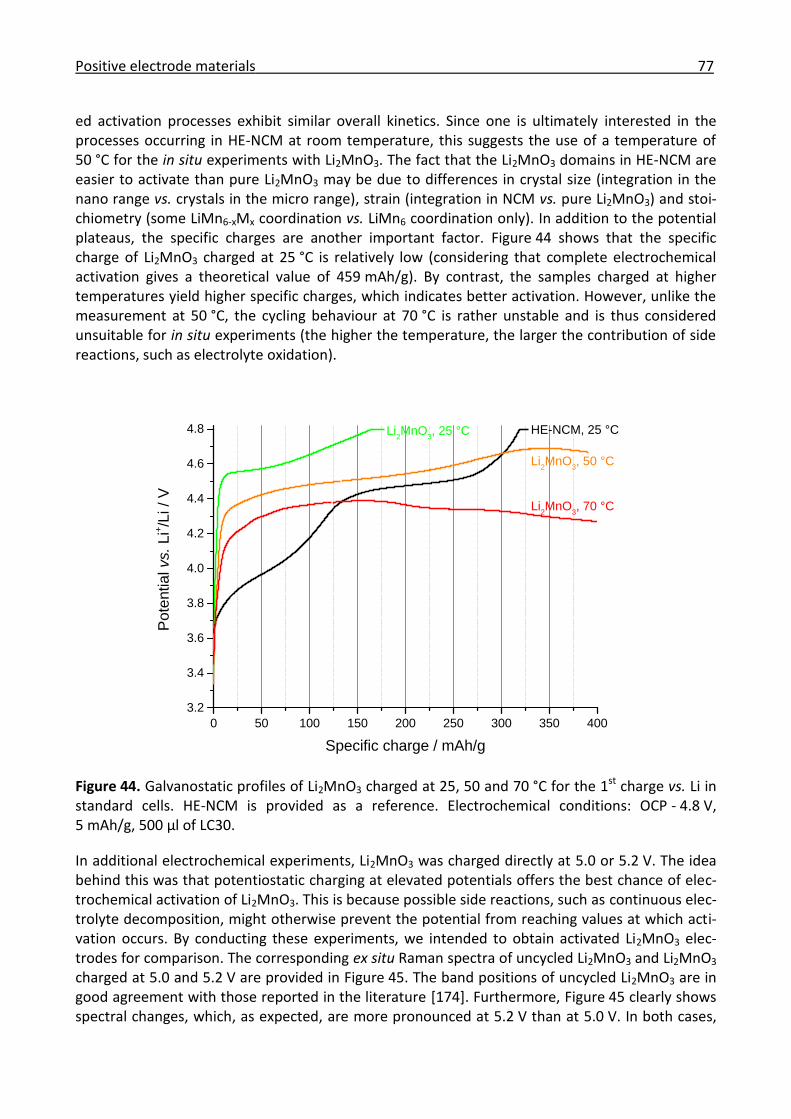
Positive electrode materials 77
ed activation processes exhibit similar overall kinetics. Since one is ultimately interested in the processes occurring in HE-NCM at room temperature, this suggests the use of a temperature of 50 °C for the in situ experiments with Li2MnO3. The fact that the Li2MnO3 domains in HE-NCM are easier to activate than pure Li2MnO3 may be due to differences in crystal size (integration in the nano range vs. crystals in the micro range), strain (integration in NCM vs. pure Li2MnO3) and stoi-chiometry (some LiMn6-xMx coordination vs. LiMn6 coordination only). In addition to the potential plateaus, the specific charges are another important factor. Figure 44 shows that the specific charge of Li2MnO3 charged at 25 °C is relatively low (considering that complete electrochemical activation gives a theoretical value of 459 mAh/g). By contrast, the samples charged at higher temperatures yield higher specific charges, which indicates better activation. However, unlike the measurement at 50 °C, the cycling behaviour at 70 °C is rather unstable and is thus considered unsuitable for in situ experiments (the higher the temperature, the larger the contribution of side reactions, such as electrolyte oxidation).
0 50 100 150 200 250 300 350 400
3.2
3.4
3.6
3.8
4.0
4.2
4.4
4.6
4.8
Po
tentia
l vs. L
i+/L
i / V
Specific charge / mAh/g
Li2MnO
3, 70 °C
Li2MnO
3, 50 °C
Li2MnO
3, 25 °C HE-NCM, 25 °C
Figure 44. Galvanostatic profiles of Li2MnO3 charged at 25, 50 and 70 °C for the 1st charge vs. Li in standard cells. HE-NCM is provided as a reference. Electrochemical conditions: OCP - 4.8 V, 5 mAh/g, 500 µl of LC30.
In additional electrochemical experiments, Li2MnO3 was charged directly at 5.0 or 5.2 V. The idea behind this was that potentiostatic charging at elevated potentials offers the best chance of elec-trochemical activation of Li2MnO3. This is because possible side reactions, such as continuous elec-trolyte decomposition, might otherwise prevent the potential from reaching values at which acti-vation occurs. By conducting these experiments, we intended to obtain activated Li2MnO3 elec-trodes for comparison. The corresponding ex situ Raman spectra of uncycled Li2MnO3 and Li2MnO3 charged at 5.0 and 5.2 V are provided in Figure 45. The band positions of uncycled Li2MnO3 are in good agreement with those reported in the literature [174]. Furthermore, Figure 45 clearly shows spectral changes, which, as expected, are more pronounced at 5.2 V than at 5.0 V. In both cases,

78 Results and discussion
the main difference compared with the uncycled sample is the appearance of a new shoulder at ~650 cm-1. In the literature, a new band at 630-640 cm-1 is considered an indication of activation of Li2MnO3 and is assigned to the partial formation of a spinel-like phase [194]. Interestingly, Amalraj et al. observed inhomogeneous reactions with completely inactivated, completely activated and partially activated spots on the sample [194], while we consistently recorded spectra indicating partial activation. This discrepancy might be a result of differences in morphology of the Li2MnO3 samples and, consequently, differences in reaction homogeneity.
Figure 45. Ex situ Raman spectra of uncycled Li2MnO3 and Li2MnO3 charged at 5.0 and 5.2 V. Ra-man conditions: D1, 2 x 60, 2 x 300 and 2 x 150 s, respectively. Electrochemical conditions: poten-tiostatic (100 h), 1300 µl of LC30. The spectra are normalized and background corrected.
Although the potentiostatic experiments at elevated potentials allowed successful electrochemical activation of the Li2MnO3, the usefulness of such experiments for purposes other than serving as a reference remains limited. This is because our goal was to assign the activation onset to a certain potential (and, ultimately, relate this potential to the plateau in HE-NCM). In order to achieve this, it is essential that the Li2MnO3 is activated galvanostatically. A standard procedure to accelerate a kinetically hindered activation process is to increase the temperature. Figure 46 shows the ex situ Raman spectra of uncycled Li2MnO3 and Li2MnO3 charged at 25, 50 and 70 °C. The evolution of the spectra is strikingly similar to that observed in the potentiostatic experiments (Figure 45). Since the new shoulder is observed at the same position (650 cm-1), we assume that the same activation process is at play. As expected, the activation is more pronounced at 70 °C than at 50 °C. Interest-ingly, the Li2MnO3 electrode charged at 25 °C is almost identical to the uncycled electrode, which implies that no significant activation occurs at room temperature.
We have thus succeeded in activating the Li2MnO3 under galvanostatic conditions at elevated temperatures. As already mentioned in the discussion of Figure 44, the cycling behaviour at 70 °C
300 350 400 450 500 550 600 650 700 750 800
Inte
nsity /
a.u
.
Raman shift / cm-1
Li2MnO
3, uncycled
Li2MnO
3, charged at 5.0 V
Li2MnO
3, charged at 5.2 V

Positive electrode materials 79
is rather unstable. Consequently, 50 °C is preferable. These findings were used in the development of the in situ Raman method presented in the following section.
Figure 46. Ex situ Raman spectra of uncycled Li2MnO3 and Li2MnO3 charged at 25, 50 and 70 °C. Raman conditions: D1, 2 x 60, 10 x 30, 5 x 120 and 2 x 300 s, respectively. Electrochemical condi-tions: OCP - 4.8 V, 5 mAh/g, 500 µl of LC30. The spectra are normalized and background corrected.
Since the ex situ experiments showed the need for elevated temperatures to achieve galvanostatic activation of the Li2MnO3, we now proceeded to conduct in situ Raman investigations at 50 °C. This temperature was selected as a compromise between sufficient electrochemical activation and acceptable electrochemical behaviour. In this series of experiments, three different points on the electrode were mapped (line scan with a point-to-point distance of 20 µm), of which one repre-sentative example (point 1) is shown in the in situ Raman diagrams.
First of all, the electrochemical profile of the in situ Raman experiment is discussed. Figure 47 shows the galvanostatic profile of Li2MnO3 for the first charge in the Raman cell at 50 °C. In gen-eral, the curve looks similar to the measurement at 50 °C shown in Figure 44. This demonstrates that the electrochemical behaviour of the in situ Raman cell is comparable to that of the standard cell used in the ex situ investigations. The jump in potential at a charging time of 36 h is the result of an increase in the specific current from 5 to 6.7 mA/g, which leads to a higher overpotential. This procedure was selected to allow sufficient time for galvanostatic activation at lower poten-tials and avoid an excessive contribution of electrolyte decomposition and accelerate the activa-tion at higher potentials. Finally, the potential profile shown in Figure 47 exhibits a maximum after a charging time of 75 h (which is also observed in Figure 44). The fact that the potential ceases to rise is probably due to continuous electrolyte decomposition. The maximum, on the other hand, might be attributable to changing properties of the Li2MnO3 during activation, such as an increase in electrical conductivity, catalytic activity towards electrolyte decomposition and/or volume (leading to improved electrical contact).
300 350 400 450 500 550 600 650 700 750 800
Inte
nsity /
a.u
.
Raman shift / cm-1
Li2MnO
3, uncycled
Li2MnO
3, charged at 25 °C
Li2MnO
3, charged at 50 °C
Li2MnO
3, charged at 70 °C

80 Results and discussion
Figure 47. Galvanostatic profile of Li2MnO3 for the 1st charge vs. Li in the Raman cell at 50 °C. Elec-trochemical conditions: OCP - 4.8 V, 5 mA/g (increased to 6.7 mA/g after 36 h), 500 µl of LC30.
The corresponding in situ Raman spectra are provided in Figure 48. The diagram shows the spectra for the first charge (bottom to top) of Li2MnO3 at 50 °C. Note that the first few spectra show a stronger background and thus overlap with some of the subsequent spectra. The initial bands of uncycled Li2MnO3, which are in good agreement with the literature [174], are labelled l and signals attributable to the electrolyte (LC30) are labelled *. A closer look reveals that most of the Li2MnO3 signals below 550 cm-1 become indiscernible upon charging. In the literature, a similar observation has been made in ex situ Raman experiments with Li2MnO3 [194]. Another prominent change in the spectra displayed in Figure 48 is the shift of the Ag band to higher wavenumbers upon charg-ing. However, due to the decreasing intensity of this band it is hard to clearly see this shift in Fig-ure 48. The decreasing signal intensity may be a consequence of increased electrical conductivity of activated Li2MnO3 [193], leading to a drop in optical skin depth [7].
Figure 49 shows an expanded view of the shifting Ag band of Li2MnO3. It is now clearly visible that the Ag band shifts to higher wavenumbers upon charging. This shift from 615 (Ag band of uncycled Li2MnO3) to ~630 cm-1 is quite similar to the previously mentioned new band at 630-640 cm-1 de-scribed in the literature and assigned to the partial formation of a spinel-like phase [194]. The fact that the new signal observed in our ex situ investigations was found at 650 cm-1 and was in the form of a shoulder rather than a shift (Figure 46) might be due to better activation as a result of the more drastic conditions and/or the use of the standard cell in these experiments. The decreas-ing S/N ratio of the spectra in Figure 49 upon charging is a result of the decreasing signal intensity due to increased conductivity combined with the normalization procedure.
0 10 20 30 40 50 60 70 80 90 100
3.2
3.4
3.6
3.8
4.0
4.2
4.4
4.6
4.8
Po
tentia
l vs. L
i+/L
i / V
Time / h
0
1
2
3
4
5
6
7
8
9
10
Sp
ecific
curr
ent
/ m
A/g
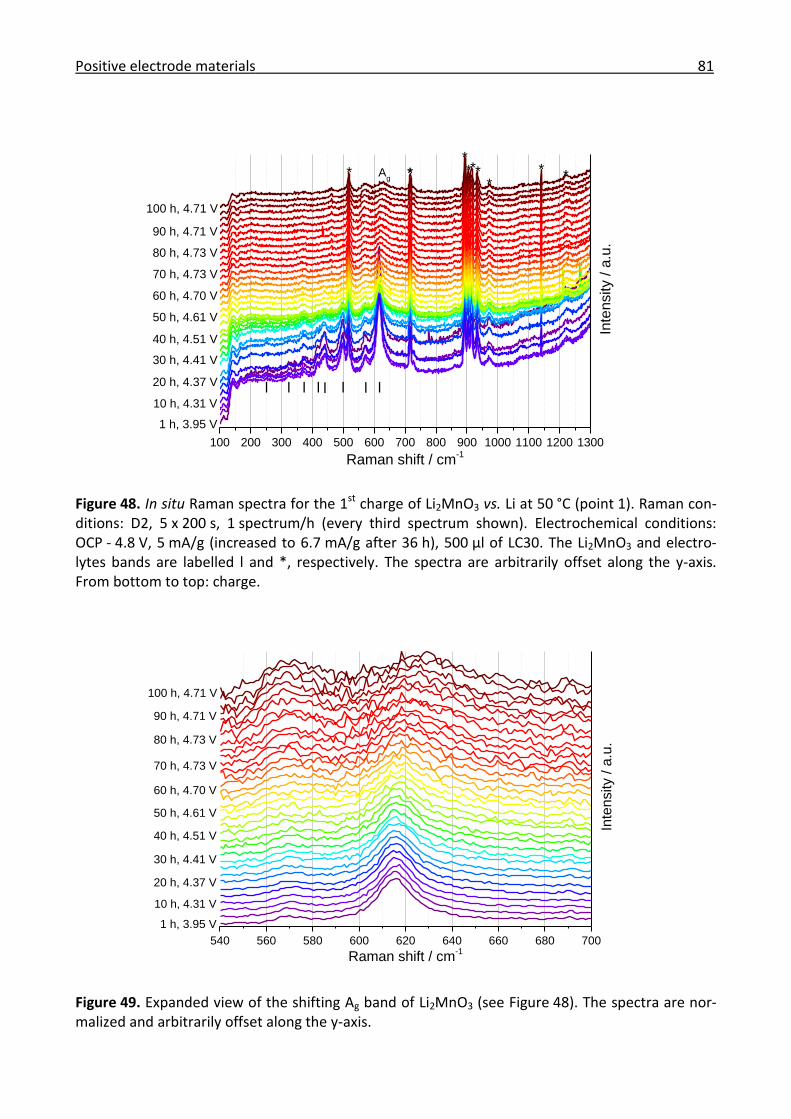
Positive electrode materials 81
Figure 48. In situ Raman spectra for the 1st charge of Li2MnO3 vs. Li at 50 °C (point 1). Raman con-ditions: D2, 5 x 200 s, 1 spectrum/h (every third spectrum shown). Electrochemical conditions: OCP - 4.8 V, 5 mA/g (increased to 6.7 mA/g after 36 h), 500 µl of LC30. The Li2MnO3 and electro-lytes bands are labelled l and *, respectively. The spectra are arbitrarily offset along the y-axis. From bottom to top: charge.
Figure 49. Expanded view of the shifting Ag band of Li2MnO3 (see Figure 48). The spectra are nor-malized and arbitrarily offset along the y-axis.
100 200 300 400 500 600 700 800 900 1000 1100 1200 1300
Inte
nsity / a
.u.
**
Raman shift / cm-1
* *****A
g
llllllll
**
100 h, 4.71 V
90 h, 4.71 V
80 h, 4.73 V
70 h, 4.73 V
60 h, 4.70 V
50 h, 4.61 V
40 h, 4.51 V
30 h, 4.41 V
20 h, 4.37 V
10 h, 4.31 V
1 h, 3.95 V
540 560 580 600 620 640 660 680 700
Inte
nsity / a
.u.
Raman shift / cm-1
100 h, 4.71 V
90 h, 4.71 V
80 h, 4.73 V
70 h, 4.73 V
60 h, 4.70 V
50 h, 4.61 V
40 h, 4.51 V
30 h, 4.41 V
20 h, 4.37 V
10 h, 4.31 V
1 h, 3.95 V

82 Results and discussion
Although Figure 49 clearly shows that the Ag band of Li2MnO3 shifts upon charging, it remains ra-ther difficult to estimate the onset potential of this shift. Furthermore, it is non-trivial to deter-mine the peak maxima, especially for the noisy spectra recorded at high potentials. For this rea-son, all Ag bands were fitted to Lorentz functions, which were shown to give the best results. Fig-ure 50 and Figure 51 represent plots of the corresponding peak maxima, where point 1 refers to the measurements shown in Figure 48 and Figure 49.
Figure 50 shows the Raman shift of the Ag peak maxima vs. the potential for all three points on the Li2MnO3 electrode. Data are shown for 0-75 h charging time, i.e. up to the maximum potential at 4.73 V in Figure 47. The last 25 h are omitted because, after the potential maximum, the potential started to decrease again, which would complicate the diagram by displaying Li2MnO3 with differ-ent degrees of activation at the same potential. The discontinuity in potential between 4.43 and 4.48 V is attributable to the increase in specific current after 36 h (see Figure 47). In general, the three points shown in Figure 50 exhibit very similar behaviour. However, if one tried to find a dif-ference, it would be that the final activation (shift of the Ag band) is lowest for point 1, intermedi-ate for point 2 and highest for point 3. The three points were chosen in such a way that point 1 exhibited the lowest electrolyte-to-Li2MnO3 Raman signal ratio while point 3 exhibited the highest such ratio. This is taken as an indication that the rate of ion transfer through the electrolyte is more limited in the former case, which might negatively affect the local activation rate. However, the most interesting feature of Figure 50 is certainly the pronounced kink at a potential of 4.4 V, which is observed at approximate the same position for all three points. The two lines represent linear regression fits of OCP - 4.4 and 4.4 V - 4.73 V for point 1. These fits show that the slope, which is interpreted as a measure of the activation rate, remains relatively low up to a potential of 4.4 V, after which it rises significantly. Note that the increase in specific current at 36 h was im-plemented after the kink at 4.4 V had already been observed and, thus, did not influence its onset potential. The kink at 4.4 V is in good agreement with the onset of the potential plateau in both Li2MnO3 at 50 °C and HE-NCM at 25 °C (see Figure 44).
Whereas the charging time shown in Figure 50 was limited to 75 h, Figure 51 shows the diagram for the full charging time (0-100 h) and, unlike Figure 50, uses the charging time rather than the potential as the x-axis. The potential of 4.4 V mentioned above corresponds to a charging time of 27 h. Plotting the Raman shift of the Ag band vs. the charging period avoids the problem intro-duced by the potential maximum in Figure 47 and, thus, provides a visualization of the increase in the Raman shift with time over the entire range. Figure 51 shows that all three points exhibit a monotonously increasing trend, which is in agreement with our expectations.
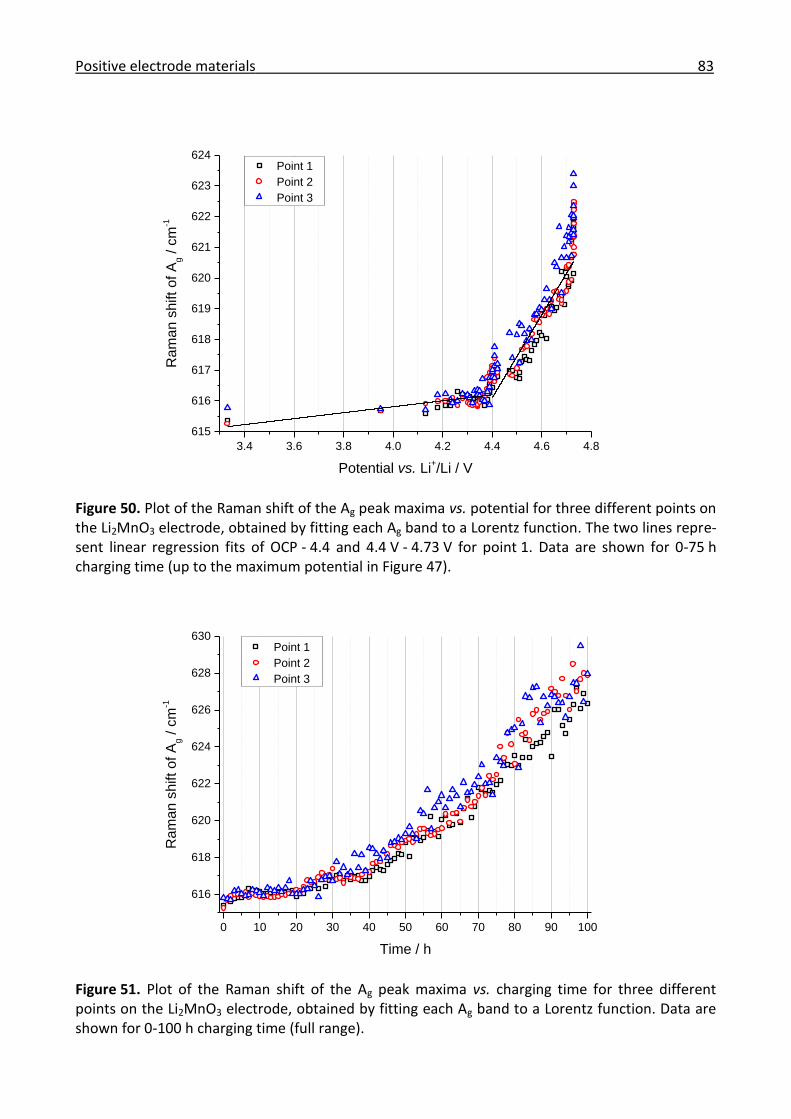
Positive electrode materials 83
Figure 50. Plot of the Raman shift of the Ag peak maxima vs. potential for three different points on the Li2MnO3 electrode, obtained by fitting each Ag band to a Lorentz function. The two lines repre-sent linear regression fits of OCP - 4.4 and 4.4 V - 4.73 V for point 1. Data are shown for 0-75 h charging time (up to the maximum potential in Figure 47).
Figure 51. Plot of the Raman shift of the Ag peak maxima vs. charging time for three different points on the Li2MnO3 electrode, obtained by fitting each Ag band to a Lorentz function. Data are shown for 0-100 h charging time (full range).
3.4 3.6 3.8 4.0 4.2 4.4 4.6 4.8
615
616
617
618
619
620
621
622
623
624 Point 1
Point 2
Point 3
Ram
an s
hift of A
g / c
m-1
Potential vs. Li+/Li / V
0 10 20 30 40 50 60 70 80 90 100
616
618
620
622
624
626
628
630 Point 1
Point 2
Point 3
Ram
an s
hift of A
g / c
m-1
Time / h

84 Results and discussion
In conclusion, Li2MnO3 could be obtained via a two-step solid-state reaction. SEM measurements revealed the presence of needle-shaped crystals 2-3 µm in length and 100-200 nm in diameter. Electrochemical tests and ex situ Raman microscopy showed the need for elevated temperatures to achieve activation. The ex situ Raman spectra of Li2MnO3 charged at elevated potentials (5.0 and 5.2 V) exhibited the same spectral changes (new shoulder at 650 cm-1) as those measured af-ter galvanostatic charging at elevated temperatures (50 and 70 °C). For the first time, this knowledge was used for in situ investigations of the electrochemical activation of Li2MnO3. The in situ Raman experiments at 50 °C demonstrated that the main signal at 615 cm-1 shifted to higher wavenumbers (up to ~630 cm-1) upon charging and that this shift was significantly accelerated once the cell had reached 4.4 V. This is in good agreement with the onset of the potential plateau in both Li2MnO3 and HE-NCM and, in accordance with the literature, was assigned to the partial formation of a spinel-like phase [194]. Our experiments thus suggest that the activation of Li2MnO3 plays a key role in the formation of the potential plateau of Li2MnO3, which implies that it also plays a role in the formation of the potential plateau observed when charging HE-NCM.
3.2.4 Conclusions for the positive electrode materials
In this chapter, the main conclusions from the three series of experiments (ageing of HE-NCM, comparison between stoichiometric and HE-NCM, and electrochemical activation of Li2MnO3) with the positive electrode materials stoichiometric NCM, HE-NCM and the reference material Li2MnO3 are summarized. The goal of these experiments was the validation of the Raman method, the in-vestigation of the ageing mechanism of HE-NCM and the elucidation of the electrochemical activa-tion mechanism of HE-NCM. Raman microscopy proved to be the most suitable technique for such investigations, although IR spectroscopy was also successfully applied to study the surface film on aged HE-NCM.
From the investigation of the ageing of HE-NCM it was concluded that ageing in a humid atmos-phere results in the formation of a resistive Li2CO3 surface film responsible for a deterioration of the electrochemical performance (lower rate capability). Ageing management of this promising positive electrode material is thus essential for future research and industrial applications. From ex situ Raman investigations of NCMs it was learnt that the Raman spectra of overlithiated NCMs are superpositions of their constituent compounds stoichiometric NCM and Li2MnO3, and that Li2MnO3 disappears after the first cycle. This confirms the domain model and irreversible electro-chemical activation of Li2MnO3 in the first cycle. Furthermore, observation of a new band at ~545 cm-1, which was stable over a wider potential window in HE-NCM than in stoichiometric NCM, was made by in situ Raman microscopy. It is proposed that this new band is due to the for-mation of Li2O (or possibly other activation products of Li2MnO3). In situ Raman investigations of Li2MnO3 at 50 °C showed evidence of spectral changes (shift of the Ag band from 615 to ~630 cm-1) starting at 4.4 V, which confirms the electrochemical activation of Li2MnO3 (partial formation of a spinel-like phase) at elevated temperature and is in excellent agreement with the onset of the potential plateau in both Li2MnO3 and HE-NCM. From this it is finally concluded that HE-NCM con-tains Li2MnO3 domains, the irreversible activation of which leads to the well-known potential plat-eau during initial charging. In short, the in situ Raman method was shown to be fully operational and successfully applied to the characterization of positive electrode materials.

Negative electrode materials 85
3.3 Negative electrode materials
In this chapter, the main results of the experiments with GC and graphite are presented. A com-bined Raman and IR approach proved to be the most suitable technique for the measurement of these negative electrode materials, allowing the simultaneous investigation of the structural changes in the electrode materials and the interface with the organic electrolyte, respectively. A general introduction to the negative electrode materials used in this chapter, demonstrating their relevance and describing the staging process of graphite, has been provided in chapter 1.2.4. In short, the intercalation of lithium into graphite results in the stepwise formation of periodic arrays of occupied and unoccupied intercalation layers [4]. Another crucial process, SEI formation on negative electrodes, has been discussed in chapter 1.2.6. In short, a passivation film derived from electrolyte reduction products is formed negative to 0.8 V at the interface of carbon-based nega-tive electrodes with the electrolyte during initial charging [6]. The aim of the work described in this chapter was to apply combined in situ Raman and IR microscopy to GC discs (investigation of the interface) and polished single graphite particles (investigation of lithium intercalation and the in-terface).
Before the main experimental results are presented, the theoretically expected Raman bands of carbon-based materials are discussed. First of all, it is important to understand the symmetry of carbon-based materials in order to allow analysis of their Raman spectra. As described in detail in chapter 1.2.4, graphite has a regular layered structure of stacked graphene sheets, which are mainly arranged in the thermodynamically favoured hexagonal AB stacking sequence of P63/mmc symmetry (the rhombohedral fraction usually present in industrial graphites is neglected) [104]. Non-graphitic carbons, such as GC, also consist of graphene sheets but lack long-range crystallo-graphic order [4].
Figure 52 shows the Raman-active vibrational modes of graphite. The space group P63/mmc gives rise to the following vibrational modes
𝛤𝑣𝑖𝑏 = 2(𝐴2𝑢 ⨁ 𝐵2𝑔 ⨁ 𝐸1𝑢 ⨁ 𝐸2𝑔) 3.2
where the two E2g modes are Raman-active and one A2u and one E1u mode are IR-active. The low-frequency E2g mode at 42 cm-1 (in-plane sliding of graphene sheets against each other [195]) is difficult to detect due to its proximity to the Rayleigh line. Therefore, the high-frequency E2g mode at 1582 cm-1 (in-plane C-C stretching [165]), which is usually called the graphite band (G band), is typically investigated in Raman experiments.[196]
Figure 52. Raman-active vibrational modes of graphite (low-frequency E2g band at 42 cm-1 and high-frequency E2g band at 1582 cm-1). Adapted with permission from the Royal Society [197].

86 Results and discussion
In highly crystalline graphite (e.g. HOPG) no other fundamental vibrational modes are observed. However, most polycrystalline graphites and non-graphitic carbons (such as GC) exhibit an addi-tional band at ~1350 cm-1. This band, which represents the A1g breathing mode, is activated by defects, impurities and grain boundaries (stronger for small particle sizes) and is thus usually called the disorder band (D band).[165, 196]
Electrochemical intercalation of lithium into graphite proceeds via the staging process described in chapter 1.2.4. The Raman spectra of the resulting GICs exhibit a G band doublet for s > 2. The low-er and higher frequency components of this doublet are known as E2g(i) (interior graphene sheets adjacent to other graphene sheets) and E2g(b) (bounding graphene sheets adjacent to intercalation layers), respectively [198]. Upon electrochemical cycling of graphite in LC30, Huang and Frech ob-served a shift of the G band to higher wavenumbers negative to ~0.5 V, splitting of the G band negative to ~0.2 V and finally disappearance of the G band negative to ~0.1 V, which they assigned to the formation of dilute stage I, stages IV-III and stages II-I, respectively.[11]
Finally, the effect of exfoliation on the Raman spectra is discussed. As mentioned in chapter 1.2.6, exfoliation occurs when the SEI fails to protect the carbon-based negative electrode from continu-ous reaction with the electrolyte (often observed in PC-based electrolytes), leading to excessive cointercalation of solvated lithium and complete disintegration of the graphitic structure. Upon electrochemical cycling of graphite in 1 M LiClO4 in EC/DME, Huang and Frech observed an addi-tional band at 1597 cm-1 (high-frequency shoulder of the G band) negative to 0.9 V, which they assigned to graphite exfoliation caused by solvent cointercalation (pure lithium intercalation was excluded due to the positive potential). This shoulder is often called the exfoliation band (E band).[11]
3.3.1 Combined in situ Raman and IR investigation of glassy carbon
The results presented in this chapter are partially based on an article published in Electrochimica Acta [42]. All working electrodes used in this study consisted of GC discs (thickness: 180 µm, diam-eter: 13 mm) contacted by a copper strip and coated in epoxy resin on the separator side (see also chapter 2.1.3).
As previously mentioned, the combined application of Raman and IR spectroscopy is especially rewarding thanks to the complementary nature of two methods. However, combined in situ Ra-man and IR microscopy is usually complicated by the experimental constraints imposed on the system. In particular, the thickness of the electrolyte layer between the window and the working electrode should be as small as possible in order to minimize the strong signal from the bulk elec-trolyte. Furthermore, the working electrode should be highly reflective in order to maximize the S/N ratio. The most obvious choice of negative electrode for combined Raman and IR investiga-tions would be the commonly used conventional graphite electrode (composite of active material, conductive additive and binder). However, as shown in Figure 29, conventional graphite electrodes exhibit rather low IR reflectivity (diffuse reflection due to their rough surfaces). Therefore, we de-cided to conduct experiments with highly reflective GC discs (specular reflection due to their flat surfaces) before moving on to the more complicated graphite electrodes used in practical applica-tions. Although GC is unable to intercalate significant amounts of lithium (different electrochemi-cal behaviour), it is an excellent model system for graphite thanks to its similar surface properties (similar IR-spectroscopic behaviour) [199, 200]. In addition to the experiments with the standard electrolyte LC30, the influence of the commonly used additives VC and ES, which have been re-

Negative electrode materials 87
ported to promote the formation of an improved SEI [201] (see also chapter 1.2.6), was investigat-ed.
As in chapter 3.2.1, the part of the work performed by others, in this case mainly ATR and prelimi-nary in situ IR experiments conducted by Dr. Sofía Pérez-Villar, will not be discussed in detail (for a detailed discussion of these results the reader is referred to the original manuscript [42]).
First of all, uncycled and charged GC discs were characterized by SEM in order to determine their surface morphologies. Figure 53 shows SEM images of (a) an uncycled GC disc, (b) a GC disc charged in LC30, (c) a GC disc charged in LC30 & 5wt% VC and (d) a GC disc charged in LC30 & 5wt% ES. The SEM image of the uncycled GC disc (a) shows a relatively flat and clean surface (with a couple of mechanical imperfections that are probably due to the manufacturing process). After charging in additive-free electrolyte (b) a very thin surface film is observed on the GC disc. By contrast, a thick surface film is formed after charging in VC-containing electrolyte (c). Finally, charging in ES-containing electrolye results in an even thicker surface film that completely covers the surface of the GC disc.
Figure 53. SEM images of GC discs. (a) Uncycled, (b) charged in LC30, (c) charged in LC30 & 5wt% VC and (d) charged in LC30 & 5wt% ES. Electrochemical conditions: potential steps at 3.0, 1.5, 1.0, 0.7, 0.4 and 0.2 V, maximum absolute current of 0.1 mA, 300 µl of LC30.
In order to study the processes occurring during electrochemical cycling of GC in the three differ-ent electrolytes in more detail, a series of CV measurements was performed. Figure 54 and Fig-ure 55 show the cyclic voltammograms of GC for the first and second cycle, respectively, in stand-ard cells. The curves of additive-free, VC-containing and ES-containing electrolyte are displayed in

88 Results and discussion
green, blue and red, respectively. In addition, expanded views of the potential window from 2.5 to 0.5 V are provided in the insets.
In general, the behaviour of the three systems is similar to that expected for noble metal elec-trodes in aprotic solvents [202]. The cyclic voltammograms show that small currents start to flow at about 2-1.5 V during charge, which is probably due to the reduction of traces of oxygen and water to lithium oxide and hydroxide species. By contrast, the increase in current negative to ~1.5 V is assigned to the onset of EC/DMC reduction, which has been proposed to result in the formation of various SEI products, such as lithium alkyl carbonates and lithium alkoxides [202].
In the VC-containing electrolyte, no striking reductive peaks are detected in the potential range where SEI formation is expected (see insets). This observation may be explained by the fact that the SEI formation mechanism in VC-based electrolyte (polymerization) is partially chemical (no significant charge consumption) [203]. However, a closer look at the cyclic voltammogram for the first charge in VC-containing electrolyte reveals a weak reductive peak at 1.2 V. Indeed, according to the literature, VC reduction on carbon-based negative electrodes starts at 1.2 V, i.e. before the reduction of EC (typically observed at ~0.8 V), which allows the formation of a stable surface film at potentials positive to the conventional onset of SEI formation in additive-free electrolyte [138]. The fact that the weak reductive peak at 1.2 V is absent during the second charge demonstrates that the formation of VC-based SEI is completed in the first cycle.
Finally, strong irreversible reductive peaks are observed at ~1.5 and ~1.1 V during the first and second cycle in ES-containing electrolyte, respectively. The fact that these peaks are significantly stronger than the peaks observed in additive-free and VC-containing electrolyte points towards the formation of a thicker SEI in the presence of ES and thus confirms the SEM measurements (Figure 53). According to the literature, the decomposition of ES does not, as may be assumed, result in the release of SO2, which would react reversibly and thus give rise to a reductive as well as an oxidative peak in the cyclic voltammogram [204]. The observed peaks are thus attributed to the direct irreversible reductive decomposition of ES associated with SEI formation. In contrast to the results obtained from the experiments with VC-containing electrolyte, the fact that the reduc-tive peak of ES is not limited to the first cycle demonstrates that the formation of ES-based SEI is not completed in the first cycle.
Although GC powder has been reported to insert lithium corresponding to up to 223 mAh/g [102] (see also chapter 1.2.4), the compact solid GC discs used in this study are not expected to insert significant amounts of lithium. Therefore, the large reductive currents observed negative to ~0.6 V are mainly assigned to electrolyte decomposition and SEI formation. Interesting, these currents are significantly reduced in the presence of VC or ES (strongest effect for ES), which confirms the formation of improved surface films that kinetically hinder further electrolyte decomposition.
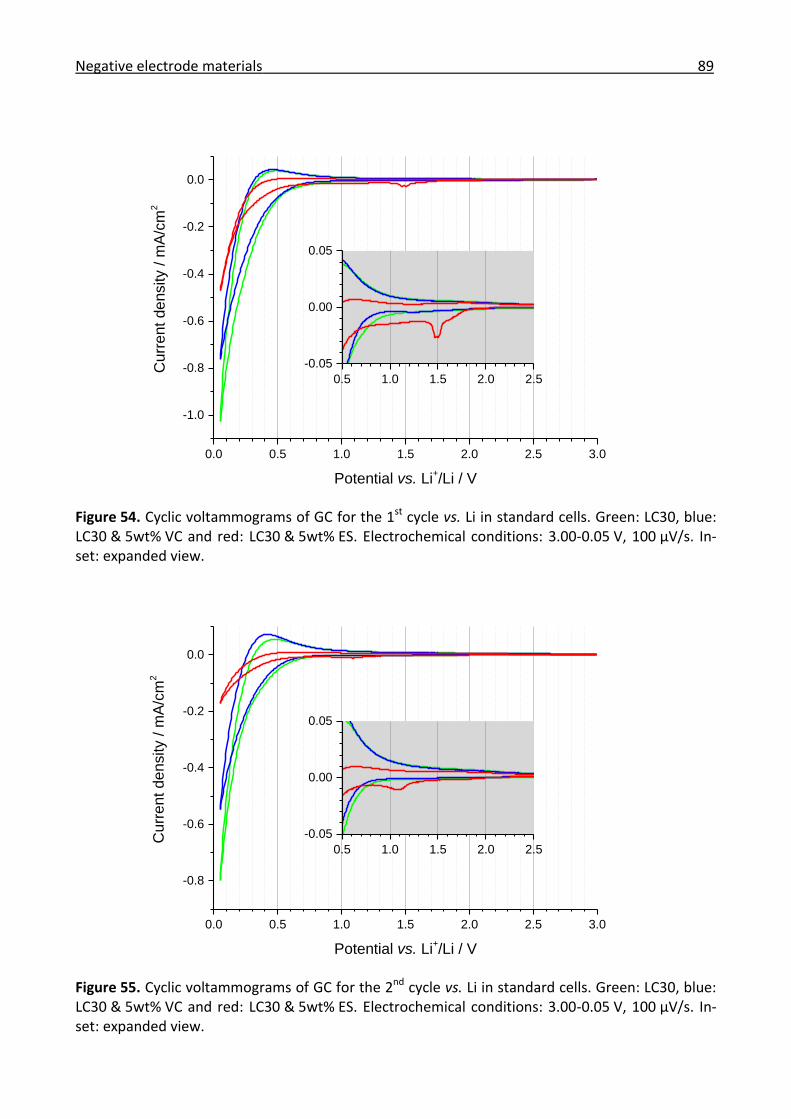
Negative electrode materials 89
0.0 0.5 1.0 1.5 2.0 2.5 3.0
-1.0
-0.8
-0.6
-0.4
-0.2
0.0
Cu
rre
nt
de
nsity /
mA
/cm
2
Potential vs. Li+/Li / V
0.5 1.0 1.5 2.0 2.5
-0.05
0.00
0.05
Figure 54. Cyclic voltammograms of GC for the 1st cycle vs. Li in standard cells. Green: LC30, blue: LC30 & 5wt% VC and red: LC30 & 5wt% ES. Electrochemical conditions: 3.00-0.05 V, 100 µV/s. In-set: expanded view.
0.0 0.5 1.0 1.5 2.0 2.5 3.0
-0.8
-0.6
-0.4
-0.2
0.0
Cu
rre
nt
de
nsity /
mA
/cm
2
Potential vs. Li+/Li / V
0.5 1.0 1.5 2.0 2.5
-0.05
0.00
0.05
Figure 55. Cyclic voltammograms of GC for the 2nd cycle vs. Li in standard cells. Green: LC30, blue: LC30 & 5wt% VC and red: LC30 & 5wt% ES. Electrochemical conditions: 3.00-0.05 V, 100 µV/s. In-set: expanded view.
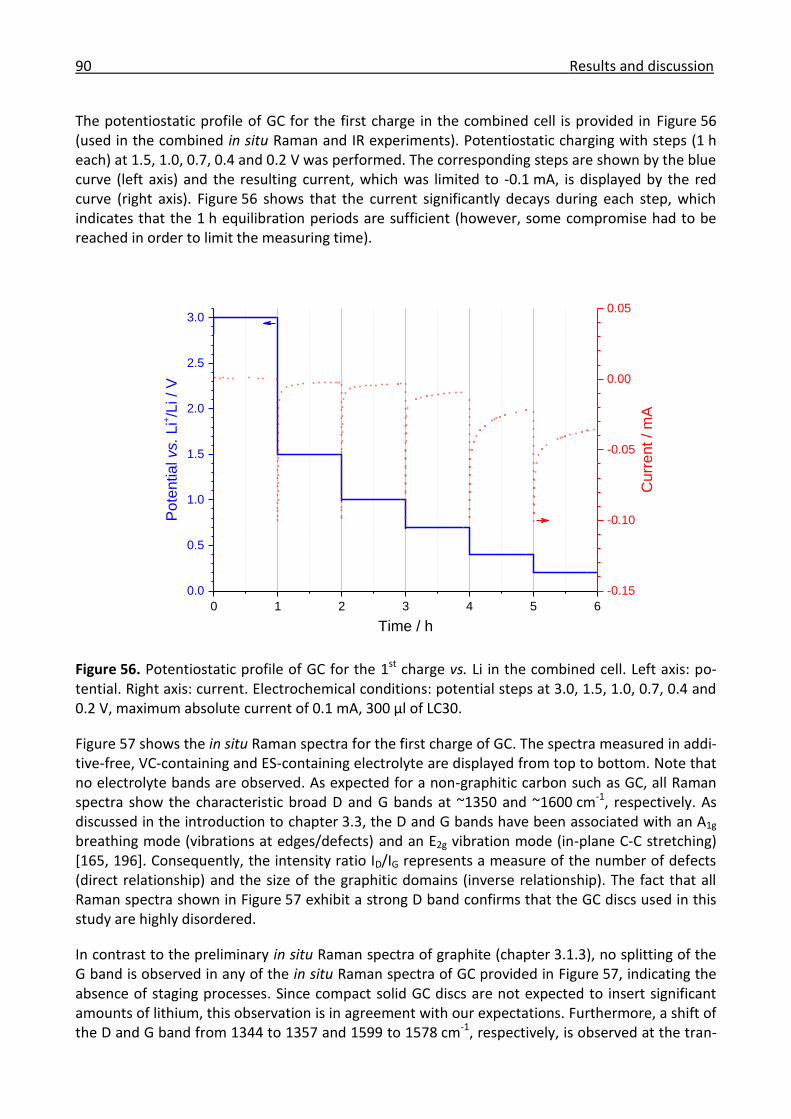
90 Results and discussion
The potentiostatic profile of GC for the first charge in the combined cell is provided in Figure 56 (used in the combined in situ Raman and IR experiments). Potentiostatic charging with steps (1 h each) at 1.5, 1.0, 0.7, 0.4 and 0.2 V was performed. The corresponding steps are shown by the blue curve (left axis) and the resulting current, which was limited to -0.1 mA, is displayed by the red curve (right axis). Figure 56 shows that the current significantly decays during each step, which indicates that the 1 h equilibration periods are sufficient (however, some compromise had to be reached in order to limit the measuring time).
Figure 56. Potentiostatic profile of GC for the 1st charge vs. Li in the combined cell. Left axis: po-tential. Right axis: current. Electrochemical conditions: potential steps at 3.0, 1.5, 1.0, 0.7, 0.4 and 0.2 V, maximum absolute current of 0.1 mA, 300 µl of LC30.
Figure 57 shows the in situ Raman spectra for the first charge of GC. The spectra measured in addi-tive-free, VC-containing and ES-containing electrolyte are displayed from top to bottom. Note that no electrolyte bands are observed. As expected for a non-graphitic carbon such as GC, all Raman spectra show the characteristic broad D and G bands at ~1350 and ~1600 cm-1, respectively. As discussed in the introduction to chapter 3.3, the D and G bands have been associated with an A1g breathing mode (vibrations at edges/defects) and an E2g vibration mode (in-plane C-C stretching) [165, 196]. Consequently, the intensity ratio ID/IG represents a measure of the number of defects (direct relationship) and the size of the graphitic domains (inverse relationship). The fact that all Raman spectra shown in Figure 57 exhibit a strong D band confirms that the GC discs used in this study are highly disordered.
In contrast to the preliminary in situ Raman spectra of graphite (chapter 3.1.3), no splitting of the G band is observed in any of the in situ Raman spectra of GC provided in Figure 57, indicating the absence of staging processes. Since compact solid GC discs are not expected to insert significant amounts of lithium, this observation is in agreement with our expectations. Furthermore, a shift of the D and G band from 1344 to 1357 and 1599 to 1578 cm-1, respectively, is observed at the tran-
0 1 2 3 4 5 6
0.0
0.5
1.0
1.5
2.0
2.5
3.0
Po
tentia
l vs. L
i+/L
i / V
Time / h
-0.15
-0.10
-0.05
0.00
0.05
Cu
rre
nt
/ m
A
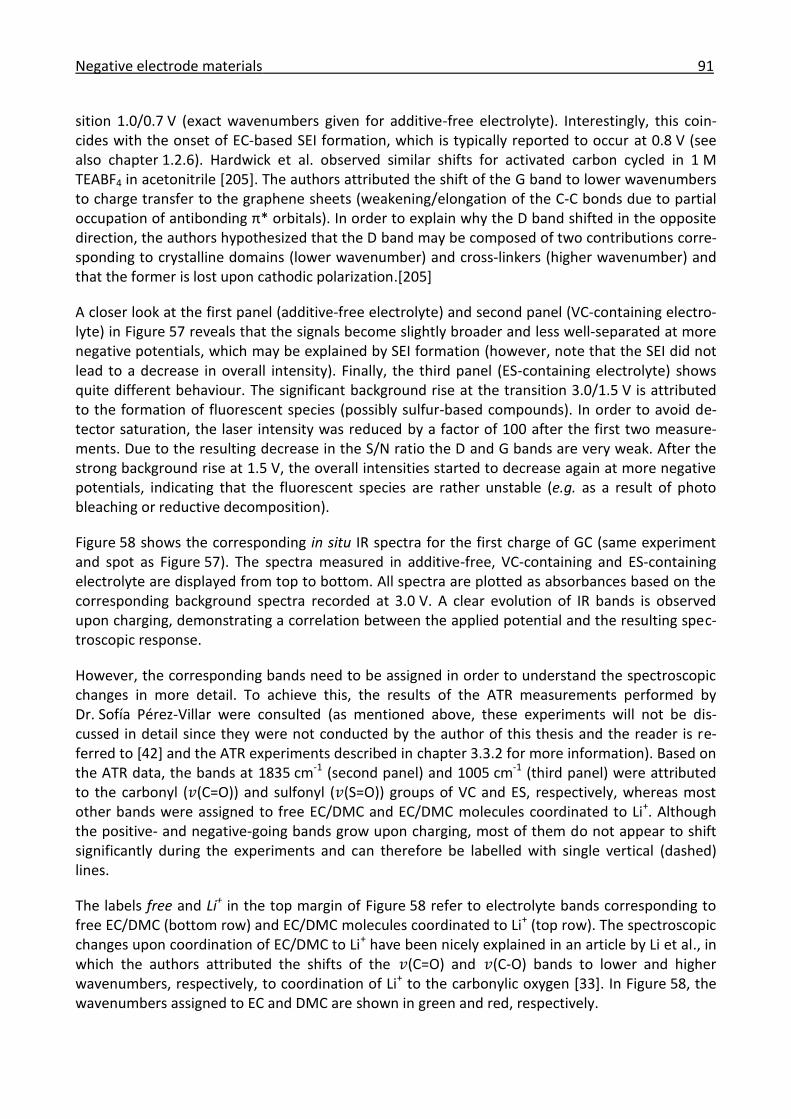
Negative electrode materials 91
sition 1.0/0.7 V (exact wavenumbers given for additive-free electrolyte). Interestingly, this coin-cides with the onset of EC-based SEI formation, which is typically reported to occur at 0.8 V (see also chapter 1.2.6). Hardwick et al. observed similar shifts for activated carbon cycled in 1 M TEABF4 in acetonitrile [205]. The authors attributed the shift of the G band to lower wavenumbers to charge transfer to the graphene sheets (weakening/elongation of the C-C bonds due to partial occupation of antibonding π* orbitals). In order to explain why the D band shifted in the opposite direction, the authors hypothesized that the D band may be composed of two contributions corre-sponding to crystalline domains (lower wavenumber) and cross-linkers (higher wavenumber) and that the former is lost upon cathodic polarization.[205]
A closer look at the first panel (additive-free electrolyte) and second panel (VC-containing electro-lyte) in Figure 57 reveals that the signals become slightly broader and less well-separated at more negative potentials, which may be explained by SEI formation (however, note that the SEI did not lead to a decrease in overall intensity). Finally, the third panel (ES-containing electrolyte) shows quite different behaviour. The significant background rise at the transition 3.0/1.5 V is attributed to the formation of fluorescent species (possibly sulfur-based compounds). In order to avoid de-tector saturation, the laser intensity was reduced by a factor of 100 after the first two measure-ments. Due to the resulting decrease in the S/N ratio the D and G bands are very weak. After the strong background rise at 1.5 V, the overall intensities started to decrease again at more negative potentials, indicating that the fluorescent species are rather unstable (e.g. as a result of photo bleaching or reductive decomposition).
Figure 58 shows the corresponding in situ IR spectra for the first charge of GC (same experiment and spot as Figure 57). The spectra measured in additive-free, VC-containing and ES-containing electrolyte are displayed from top to bottom. All spectra are plotted as absorbances based on the corresponding background spectra recorded at 3.0 V. A clear evolution of IR bands is observed upon charging, demonstrating a correlation between the applied potential and the resulting spec-troscopic response.
However, the corresponding bands need to be assigned in order to understand the spectroscopic changes in more detail. To achieve this, the results of the ATR measurements performed by Dr. Sofía Pérez-Villar were consulted (as mentioned above, these experiments will not be dis-cussed in detail since they were not conducted by the author of this thesis and the reader is re-ferred to [42] and the ATR experiments described in chapter 3.3.2 for more information). Based on the ATR data, the bands at 1835 cm-1 (second panel) and 1005 cm-1 (third panel) were attributed to the carbonyl (𝑣(C=O)) and sulfonyl (𝑣(S=O)) groups of VC and ES, respectively, whereas most other bands were assigned to free EC/DMC and EC/DMC molecules coordinated to Li+. Although the positive- and negative-going bands grow upon charging, most of them do not appear to shift significantly during the experiments and can therefore be labelled with single vertical (dashed) lines.
The labels free and Li+ in the top margin of Figure 58 refer to electrolyte bands corresponding to free EC/DMC (bottom row) and EC/DMC molecules coordinated to Li+ (top row). The spectroscopic changes upon coordination of EC/DMC to Li+ have been nicely explained in an article by Li et al., in which the authors attributed the shifts of the 𝑣(C=O) and 𝑣(C-O) bands to lower and higher wavenumbers, respectively, to coordination of Li+ to the carbonylic oxygen [33]. In Figure 58, the wavenumbers assigned to EC and DMC are shown in green and red, respectively.

92 Results and discussion
1000 1100 1200 1300 1400 1500 1600 1700 1800
0
1000
2000
3000
4000
5000
1000 1100 1200 1300 1400 1500 1600 1700 1800
0
1000
2000
3000
4000
5000
1000 1100 1200 1300 1400 1500 1600 1700 1800
0
10000
20000
30000
40000
50000
15
78
13
57 1
59
9
13
44
5 h, 0.2 V, D3
4 h, 0.4 V, D3
3 h, 0.7 V, D3
2 h, 1.0 V, D3
1 h, 1.5 V
0 h, 3.0 V
5 h, 0.2 V
4 h, 0.4 V
3 h, 0.7 V
2 h, 1.0 V
1 h, 1.5 V
0 h, 3.0 V
5 h, 0.2 V
4 h, 0.4 V
3 h, 0.7 V
2 h, 1.0 V
1 h, 1.5 V
0 h, 3.0 V
Inte
nsity / c
ounts
Raman shift / cm-1
Figure 57. In situ Raman spectra for the 1st charge of GC vs. Li. Top: LC30, middle: LC30 & 5wt% VC and bottom: LC30 & 5wt% ES (note the expanded y-axis). Raman conditions: D1 (unless indicated in the legend), 2 x 60 s, 1 spectrum/h. Electrochemical conditions: potential steps at 3.0, 1.5, 1.0, 0.7, 0.4 and 0.2 V, maximum absolute current of 0.1 mA, 300 µl of LC30.
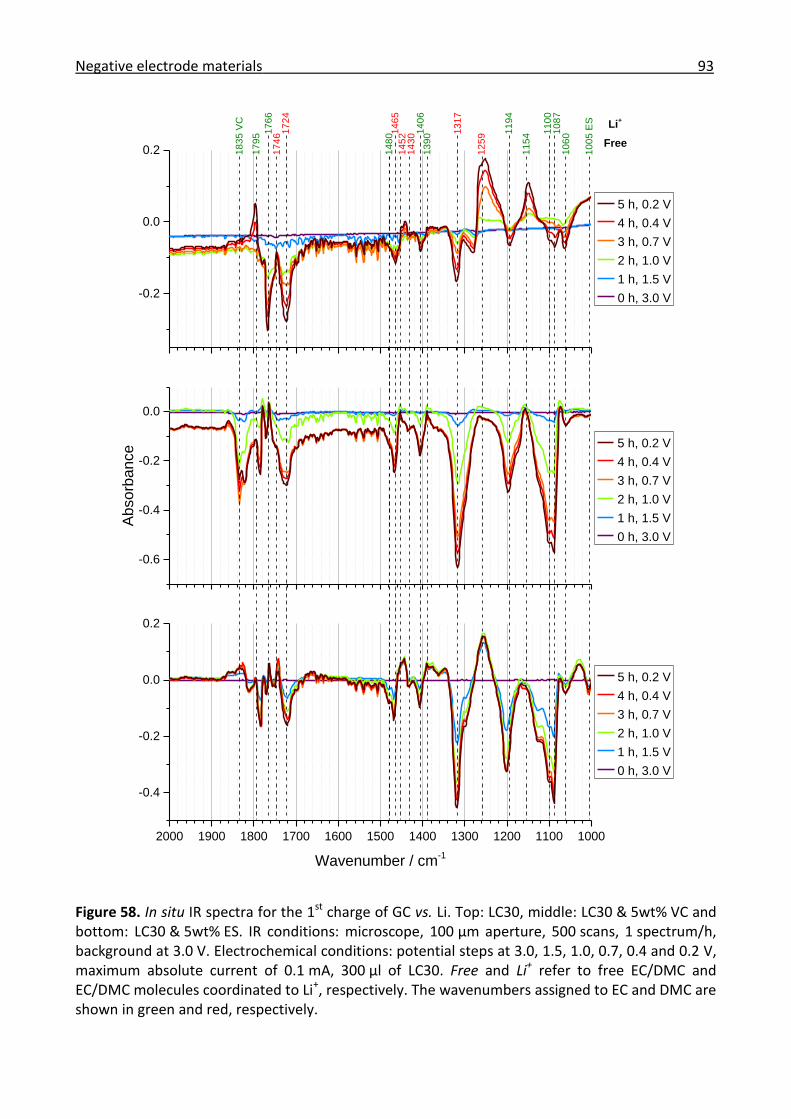
Negative electrode materials 93
-0.2
0.0
0.2
-0.6
-0.4
-0.2
0.0
2000 1900 1800 1700 1600 1500 1400 1300 1200 1100 1000
-0.4
-0.2
0.0
0.2
10
05
ES
Free
Li+
11
00
10
87
14
30 1
40
61
39
0 13
17
11
94
12
59
11
54
10
60
14
521
46
51
48
017
24
17
461
76
6
18
35
VC
5 h, 0.2 V
4 h, 0.4 V
3 h, 0.7 V
2 h, 1.0 V
1 h, 1.5 V
0 h, 3.0 V
5 h, 0.2 V
4 h, 0.4 V
3 h, 0.7 V
2 h, 1.0 V
1 h, 1.5 V
0 h, 3.0 V
5 h, 0.2 V
4 h, 0.4 V
3 h, 0.7 V
2 h, 1.0 V
1 h, 1.5 V
0 h, 3.0 V
17
95
Absorb
ance
Wavenumber / cm-1
Figure 58. In situ IR spectra for the 1st charge of GC vs. Li. Top: LC30, middle: LC30 & 5wt% VC and bottom: LC30 & 5wt% ES. IR conditions: microscope, 100 µm aperture, 500 scans, 1 spectrum/h, background at 3.0 V. Electrochemical conditions: potential steps at 3.0, 1.5, 1.0, 0.7, 0.4 and 0.2 V, maximum absolute current of 0.1 mA, 300 µl of LC30. Free and Li+ refer to free EC/DMC and EC/DMC molecules coordinated to Li+, respectively. The wavenumbers assigned to EC and DMC are shown in green and red, respectively.

94 Results and discussion
In agreement with the literature [32], the bands at 1795(1766) (𝑣 (C=O)), 1480 (δ(CH2)), 1390(1406) (δ(CH2)), 1154(1194) (𝑣(C-O)) and 1060(1100/1087) cm-1 (𝑣(C-O)) are assigned to ES, and the bands at 1746(1724) (𝑣(C=O)), 1452(1465) (δ(CH3)), 1430 (δ(CH3)) and 1259(1317) cm-1 (𝑣(C-O)) are assigned to DMC (where known, the wavenumbers of EC/DMC molecules coordinated to Li+ are given in parentheses). Based on these assignments, an increase in the amount of free EC/DMC (positive-going bands) and a decrease in the concentration of EC/DMC molecules coordi-nated to Li+ (negative-going bands) are observed for all three electrolytes.
In order to understand these observations, a look at the literature is very instructive. Ikezawa and Nishi assigned the spectral changes observed upon cathodic polarization of a copper electrode in LC30 to solvation effects [32]. In particular, they observed an increase in the concentration of free EC/DMC and a decrease in the concentration of EC/DMC molecules coordinated to Li+, which they attributed to a shift of the equilibrium from Li(solv)4
+ to Li(solv)3+ + solv for increasingly negative
potentials. The authors explained this shift in equilibrium by the influence of the potential gradient in the diffusion double layer on the stability of the solvation complexes (the polar trigonal planar complex is more stable than the apolar tetrahedral complex at increasingly negative potentials because its dipole moment can be oriented along the potential gradient). In agreement with the literature [32], we thus propose that the increase in the concentration of free and decrease in the concentration of coordinated EC/DMC observed in Figure 58 results from similar polarization-induced solvation effects. This similarity in mechanism may be explained by the fact that the cop-per electrodes used in [32] and GC discs used in the present study are both largely inactive to lithi-um intercalation.
The negative-going bands in the in situ IR spectra of VC-containing electrolyte (second panel) and ES-containing electrolyte (third panel) at 1835 and 1005 cm-1, respectively, are easily explained by a decrease in the amount of the corresponding electrolyte additive as it is being consumed during SEI formation. Interestingly, the most significant jumps in signal intensity are observed at the tran-sition 1.0/0.7 V for additive-free electrolyte (first panel), at the transition 1.5/1.0 V for VC-containing electrolyte (second panel) and at about 1.5 V for ES-containing electrolyte, which coin-cides with the onsets of SEI formation in the corresponding electrolytes derived from the CV measurements (Figure 54 and Figure 55). Finally, it is noted that no bands corresponding to the SEI products proposed in the literature (see chapter 1.2.6) are detected in Figure 58. In particular, the characteristic SEI band of alkyl (di)lithium carbonates at ~1650 cm-1 [206] is absent, which may be explained by the strong masking effect of the electrolyte.
In conclusion, SEM measurements of an uncycled GC disc and GC discs charged in additive-free, VC-containing and ES-containing electrolyte revealed a relatively clean surface, a very thin SEI, a thick SEI and an even thicker SEI, respectively. CV experiments showed reductive peaks at 1.2 and 1.5 V during initial charging in VC- and ES-containing electrolyte, respectively. Furthermore, com-pared with additive-free electrolyte, a decrease in cathodic current was observed for VC- and es-pecially for ES-containing electrolyte negative to ~0.6 V, confirming the formation of an improved surface film in the presence of VC and ES. In the main part of the study, the same spot on a GC disc was successfully investigated by combined in situ Raman and IR microscopy. As expected for com-pact solid GC discs, Raman microscopy showed no significant Li intercalation. However, a shift of the G band to lower wavenumber has been assigned to charge transfer to the graphene sheets. Finally, IR microscopy showed an increase in the concentration of free EC/DMC and a decrease in the concentration of EC/DMC molecules coordinated to Li+ during charge.

Negative electrode materials 95
3.3.2 Combined in situ Raman and IR investigation of graphite
The results presented in this chapter are based on an article published in Electrochimica Acta [37]. All working electrodes used in this study consisted of polished single graphite particles (contacted by a copper mesh current collector, unless otherwise stated).
As before, the combined in situ Raman and IR approach was employed to exploit the complemen-tary nature of the two methods. In particular, the combined technique was applied to graphite in order to investigate lithium intercalation into graphite (Raman) and the interface between graph-ite and the organic electrolyte (IR). Unlike the model system GC (chapter 3.3.1), graphite is able to intercalate significant amounts of lithium. Therefore, extending the combined in situ Raman and IR investigations to graphite was the logical next step. As previously mentioned, our initial attempts to study graphite were hampered by the low IR reflectivity of conventional graphite electrodes (see Figure 29), which invariably resulted in low S/N ratios. To address this issue while maintaining the material’s ability to intercalate lithium, we employed polished single graphite particles (prepa-ration described in chapter 2.1.3). HOPG was not used since it is expected to exhibit very slow lith-ium intercalation kinetics due to a lack of imperfections on the basal planes and since it is unsuita-ble for industrial applications. As shown in Figure 29, the IR reflectivity of polished single graphite particles is comparable to the IR reflectivity of GC discs. Consequently, polished single graphite particles offering a suitable compromise between acceptable lithium intercalation properties and sufficiently high IR reflectivity were selected. The aim of this study was to demonstrate the appli-cation of combined in situ Raman and IR spectroscopy to a material of practical relevance to lithi-um-ion batteries.
First of all, a relatively flat graphite flake (untreated T1000-8000) was characterized. SEM images of its edge (left column) and base (right column) are provided in Figure 59. It is clearly visible that the base is significantly smoother than the edge. Figure 59b shows a relatively featureless surface. However, Figure 59d reveals that this surface consists of platelets with diameters in the range of 1 µm. These individual crystallites are oriented approximately parallel to one another and to the base of the flake. Consequently, they form what can be interpreted as a macroscopic pseudo-basal plane. Conversely, the edge of the flake can be considered a pseudo-edge plane.
Although the graphite flake shown in Figure 59 offers a sufficiently reflective surface for the com-bined in situ Raman and IR experiments, it had to be treated mechanically to ensure that it was flat enough on a macroscopic level (avoidance of electrolyte pockets). SEM images of the polished surface of the graphite particle are provided in Figure 60. The uncycled electrode (Figure 60, left column) shows some similarities to the base of the graphite flake (Figure 59, right column). How-ever, the surface presented in Figure 60a is marked by grooves. Accordingly, Figure 60c appears to be more disordered than Figure 59d. Nevertheless, the basic features (i.e. the orientation of the crystallites parallel to one another and to the pseudo-basal plane) are preserved. Note that the roughness introduced during the mechanical treatment is not necessarily a disadvantage (im-proved overall kinetics). Finally, the electrode after charging to 5 mV at C/20 in LC30 is also shown in Figure 60 (right column). While the basic structure is maintained, there is clear evidence of a surface film (SEI) on the electrode. Figure 60b reveals a white precipitate, which appears as a sponge-like structure in Figure 60d.
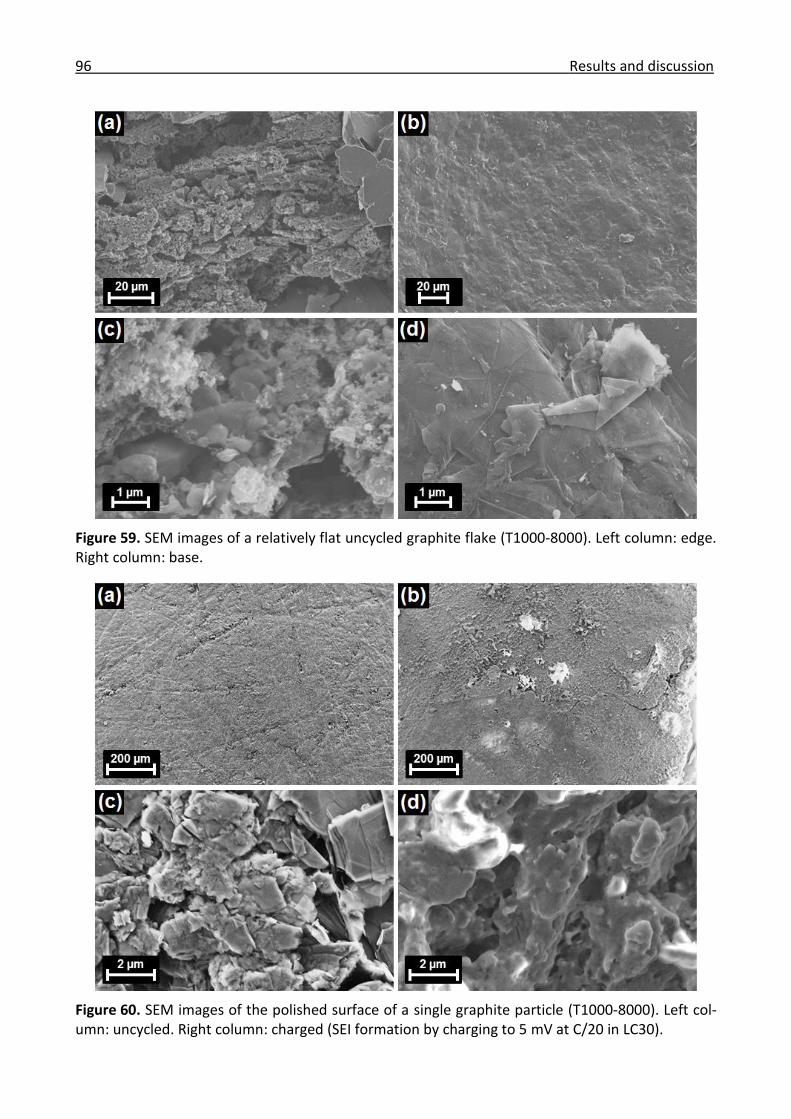
96 Results and discussion
Figure 59. SEM images of a relatively flat uncycled graphite flake (T1000-8000). Left column: edge. Right column: base.
Figure 60. SEM images of the polished surface of a single graphite particle (T1000-8000). Left col-umn: uncycled. Right column: charged (SEI formation by charging to 5 mV at C/20 in LC30).
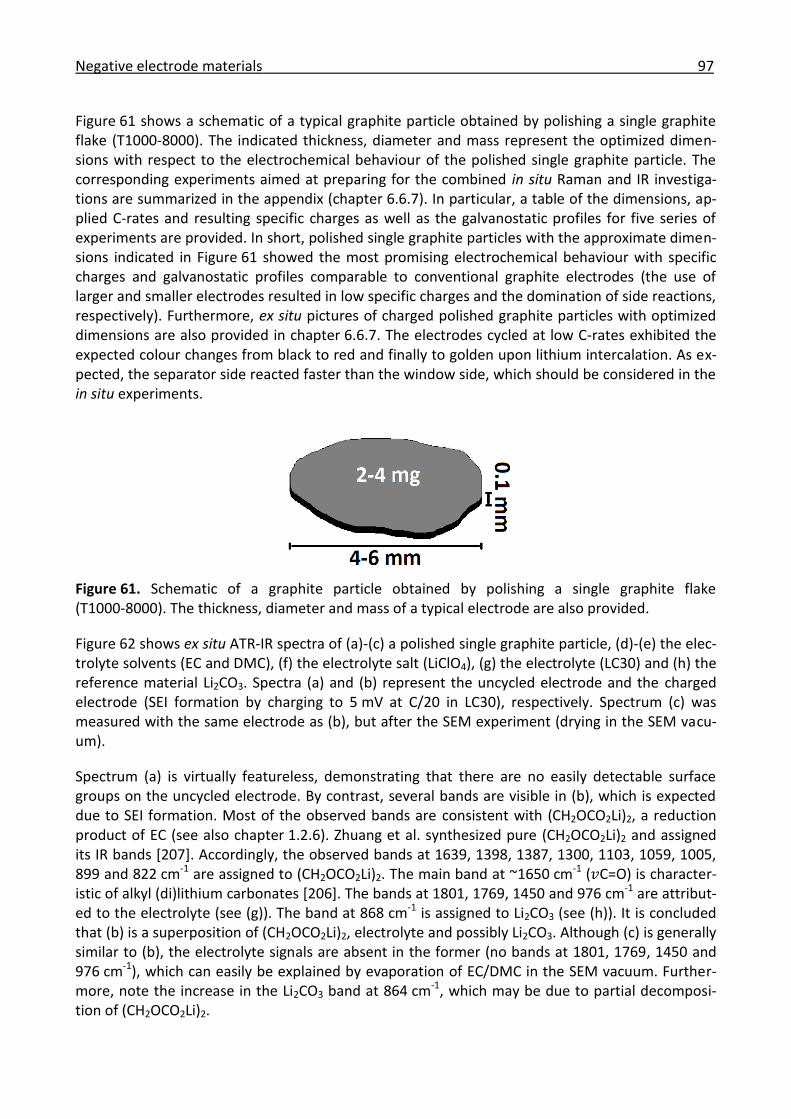
Negative electrode materials 97
Figure 61 shows a schematic of a typical graphite particle obtained by polishing a single graphite flake (T1000-8000). The indicated thickness, diameter and mass represent the optimized dimen-sions with respect to the electrochemical behaviour of the polished single graphite particle. The corresponding experiments aimed at preparing for the combined in situ Raman and IR investiga-tions are summarized in the appendix (chapter 6.6.7). In particular, a table of the dimensions, ap-plied C-rates and resulting specific charges as well as the galvanostatic profiles for five series of experiments are provided. In short, polished single graphite particles with the approximate dimen-sions indicated in Figure 61 showed the most promising electrochemical behaviour with specific charges and galvanostatic profiles comparable to conventional graphite electrodes (the use of larger and smaller electrodes resulted in low specific charges and the domination of side reactions, respectively). Furthermore, ex situ pictures of charged polished graphite particles with optimized dimensions are also provided in chapter 6.6.7. The electrodes cycled at low C-rates exhibited the expected colour changes from black to red and finally to golden upon lithium intercalation. As ex-pected, the separator side reacted faster than the window side, which should be considered in the in situ experiments.
Figure 61. Schematic of a graphite particle obtained by polishing a single graphite flake (T1000-8000). The thickness, diameter and mass of a typical electrode are also provided.
Figure 62 shows ex situ ATR-IR spectra of (a)-(c) a polished single graphite particle, (d)-(e) the elec-trolyte solvents (EC and DMC), (f) the electrolyte salt (LiClO4), (g) the electrolyte (LC30) and (h) the reference material Li2CO3. Spectra (a) and (b) represent the uncycled electrode and the charged electrode (SEI formation by charging to 5 mV at C/20 in LC30), respectively. Spectrum (c) was measured with the same electrode as (b), but after the SEM experiment (drying in the SEM vacu-um).
Spectrum (a) is virtually featureless, demonstrating that there are no easily detectable surface groups on the uncycled electrode. By contrast, several bands are visible in (b), which is expected due to SEI formation. Most of the observed bands are consistent with (CH2OCO2Li)2, a reduction product of EC (see also chapter 1.2.6). Zhuang et al. synthesized pure (CH2OCO2Li)2 and assigned its IR bands [207]. Accordingly, the observed bands at 1639, 1398, 1387, 1300, 1103, 1059, 1005, 899 and 822 cm-1 are assigned to (CH2OCO2Li)2. The main band at ~1650 cm-1 (𝑣C=O) is character-istic of alkyl (di)lithium carbonates [206]. The bands at 1801, 1769, 1450 and 976 cm-1 are attribut-ed to the electrolyte (see (g)). The band at 868 cm-1 is assigned to Li2CO3 (see (h)). It is concluded that (b) is a superposition of (CH2OCO2Li)2, electrolyte and possibly Li2CO3. Although (c) is generally similar to (b), the electrolyte signals are absent in the former (no bands at 1801, 1769, 1450 and 976 cm-1), which can easily be explained by evaporation of EC/DMC in the SEM vacuum. Further-more, note the increase in the Li2CO3 band at 864 cm-1, which may be due to partial decomposi-tion of (CH2OCO2Li)2.
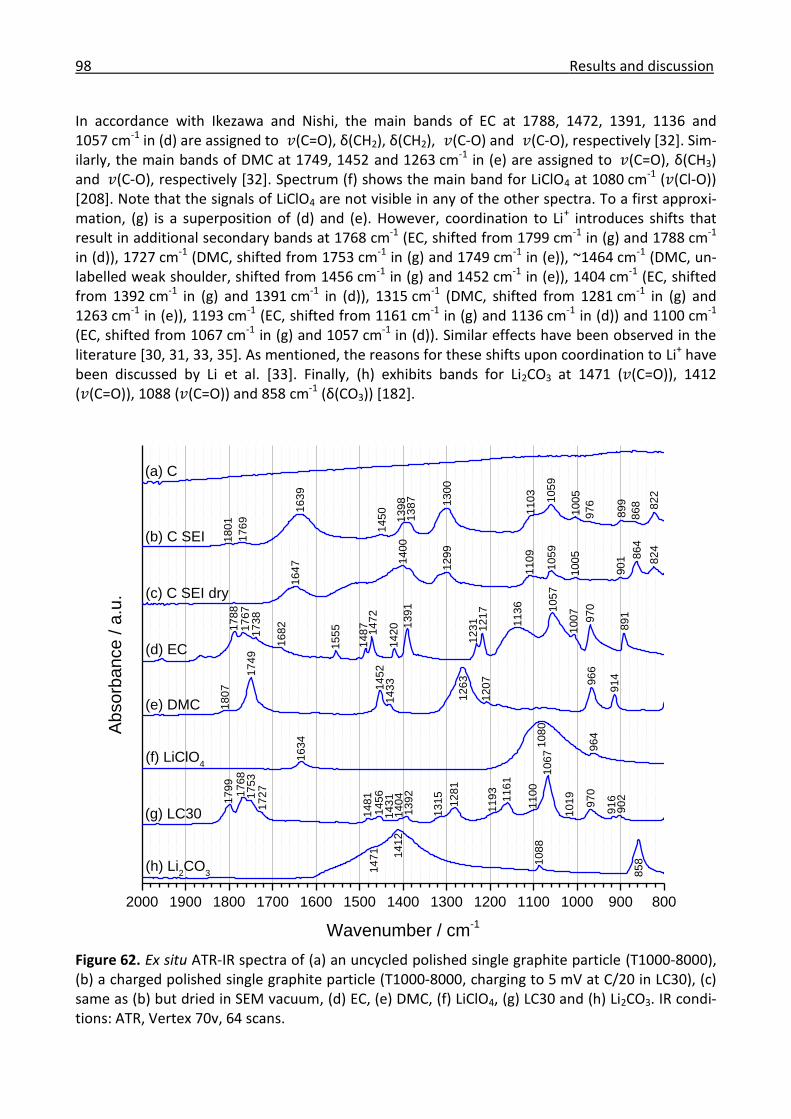
98 Results and discussion
In accordance with Ikezawa and Nishi, the main bands of EC at 1788, 1472, 1391, 1136 and 1057 cm-1 in (d) are assigned to 𝑣(C=O), δ(CH2), δ(CH2), 𝑣(C-O) and 𝑣(C-O), respectively [32]. Sim-ilarly, the main bands of DMC at 1749, 1452 and 1263 cm-1 in (e) are assigned to 𝑣(C=O), δ(CH3) and 𝑣(C-O), respectively [32]. Spectrum (f) shows the main band for LiClO4 at 1080 cm-1 (𝑣(Cl-O)) [208]. Note that the signals of LiClO4 are not visible in any of the other spectra. To a first approxi-mation, (g) is a superposition of (d) and (e). However, coordination to Li+ introduces shifts that result in additional secondary bands at 1768 cm-1 (EC, shifted from 1799 cm-1 in (g) and 1788 cm-1 in (d)), 1727 cm-1 (DMC, shifted from 1753 cm-1 in (g) and 1749 cm-1 in (e)), ~1464 cm-1 (DMC, un-labelled weak shoulder, shifted from 1456 cm-1 in (g) and 1452 cm-1 in (e)), 1404 cm-1 (EC, shifted from 1392 cm-1 in (g) and 1391 cm-1 in (d)), 1315 cm-1 (DMC, shifted from 1281 cm-1 in (g) and 1263 cm-1 in (e)), 1193 cm-1 (EC, shifted from 1161 cm-1 in (g) and 1136 cm-1 in (d)) and 1100 cm-1 (EC, shifted from 1067 cm-1 in (g) and 1057 cm-1 in (d)). Similar effects have been observed in the literature [30, 31, 33, 35]. As mentioned, the reasons for these shifts upon coordination to Li+ have been discussed by Li et al. [33]. Finally, (h) exhibits bands for Li2CO3 at 1471 (𝑣(C=O)), 1412 (𝑣(C=O)), 1088 (𝑣(C=O)) and 858 cm-1 (δ(CO3)) [182].
2000 1900 1800 1700 1600 1500 1400 1300 1200 1100 1000 900 800
85
810
88
14
12
14
71
90
29
16
97
0
10
19
10
67
11
00
11
61
11
93
12
81
13
15
13
92
14
04
14
31
14
56
14
81
17
27
17
53
17
68
17
99
96
4
10
80
16
34
91
4
96
6
12
07
12
63
14
33
14
5217
49
18
07
89
197
0
10
07
12
17
12
31
15
55
16
82
17
38
10
57
11
36
14
20
13
87
13
91
14
72
14
8717
67
17
88
82
4
86
4
90
1
10
05
10
59
11
09
1299
14
00
16
47
82
2
86
8
89
9
97
6
10
05
10
59
11
03
1300
13
98
14
501
63
9
17
69
(h) Li2CO
3
(g) LC30
(f) LiClO4
(e) DMC
(d) EC
(c) C SEI dry
(a) C
Absorb
ance / a
.u.
Wavenumber / cm-1
(b) C SEI 18
01
Figure 62. Ex situ ATR-IR spectra of (a) an uncycled polished single graphite particle (T1000-8000), (b) a charged polished single graphite particle (T1000-8000, charging to 5 mV at C/20 in LC30), (c) same as (b) but dried in SEM vacuum, (d) EC, (e) DMC, (f) LiClO4, (g) LC30 and (h) Li2CO3. IR condi-tions: ATR, Vertex 70v, 64 scans.

Negative electrode materials 99
Table 8 provides a summary of the ex situ ATR-IR bands shown in Figure 62. In particular, the bands of the free electrolyte solvents EC and DMC, the SEI product (CH2OCO2Li)2, the electrolyte salt LiClO4 and the reference material Li2CO3 are assigned. The assignment is based on the indicat-ed references.
Table 8. Assignment of the ex situ ATR-IR bands shown in Figure 62. The bands of EC and DMC are indicated in green and red, respectively.
Wavenumber / cm-1 Assignment Functional group Species Reference
1788 𝑣(C=O) O=C-O EC [32]
1749 𝑣(C=O) O=C-O DMC [32]
1639 𝑣(C=O) O=C-O ((CH2OCO2Li)2)2(a) [207]
1472 δ(CH2) CH2 EC [32]
1471 𝑣(C=O) CO3 Li2CO3 [182]
1452 δ(CH3) CH3 DMC [32]
1433 δ(CH3) CH3 DMC [42]
1412 𝑣(C=O) CO3 Li2CO3 [182]
1398 𝑣(C-O)&δ(CH2)(b) CH2-O-CO2 (CH2OCO2Li)2 [207]
1391 δ(CH2) CH2 EC [32]
1387 𝑣(C-O)&δ(CH2)(b) CH2-O-CO2 ((CH2OCO2Li)2)2(a) [207]
1300 δ(CH2) CH2 (CH2OCO2Li)2 [207]
1263 𝑣(C-O) O=C-O DMC [32]
1136 𝑣(C-O) O=C-O EC [32]
1103 𝑣(C-O-C) CH2-O-CO2 ((CH2OCO2Li)2)2(a) [207]
1088 𝑣(C=O) CO3 Li2CO3 [182]
1080 𝑣(Cl-O) ClO4 LiClO4 [208]
1059 𝑣(C-O-C)&𝑣(C=O)(b) CH2-O-CO2 (CH2OCO2Li)2 [207]
1057 𝑣(C-O) O=C-O EC [32]
1005 𝑣(C=O)&𝑣(C-O-C)(b) CH2-O-CO2 ((CH2OCO2Li)2)2(a) [207]
858 δ(CO3) CO3 Li2CO3 [182]
(a) Dimer of lithium ethylene dicarbonate. (b) Combination mode.
The potentiostatic profile of a polished single graphite particle (T1000-8000) for the first cycle in the combined cell is provided in Figure 63 (used in the combined in situ Raman and IR experi-ment). Potentiostatic cycling with steps (1 h each) at 1.50, 1.00, 0.70, 0.40, 0.20 and 0.05 V during charge and discharge was performed. After charging, the potential was held at 0.05 V for 10 h. The corresponding steps are shown by the blue curve (left axis). Note the overshoots immediately af-ter the transitions in potential. The resulting current, which was limited to ± 2mA, is displayed by the red curve (right axis). Note that a relatively high current was selected to ensure that the transi-tions in potential occurred rapidly. In agreement with Figure 56, Figure 63 shows that the current significantly decays during each step, which indicates that the 1 h equilibration periods are suffi-cient.

100 Results and discussion
0 2 4 6 8 10 12 14 16 18 20
0.0
0.2
0.4
0.6
0.8
1.0
1.2
1.4
1.6
Po
tentia
l vs. L
i+/L
i / V
Time / h
-2.5
-2.0
-1.5
-1.0
-0.5
0.0
0.5
1.0
1.5
2.0
2.5
Cu
rre
nt
/ m
A
Figure 63. Potentiostatic profile of a polished single graphite particle (T1000-8000) for the 1st cycle vs. Li in the combined cell. Left axis: potential. Right axis: current. Electrochemical conditions: po-tential steps at 1.50, 1.00, 0.70, 0.40, 0.20 and 0.05 V, maximum current of ±2 mA, 300 µl of LC30.
The discussion of the results of the combined in situ measurements will be divided into Raman and IR microscopy. Figure 64 shows the in situ Raman spectra for the first cycle of a polished single graphite particle (T1000-8000). For clarity, hourly averages (arithmetic means of six spectra each) are plotted. Note that no electrolyte bands are observed. The initial spectrum (0 h, 1.50 V) displays the typical G band of uncycled graphite at 1581 cm-1, which is in good agreement with the band at 1575 cm-1 reported by Tuinstra and Koenig [209]. The very low intensity of the D band at ~1340 cm-1 indicates good graphitic crystallinity throughout the experiment. Starting at 3 h (0.40 V), the G band shifts to higher wavenumbers upon charging (1581 to 1593 cm-1), which is in good agreement with the shift from 1580 to 1590 cm-1 starting at 0.39 or 0.46 V reported by Hardwick et al. [18]. Huang and Frech observed a similar shift starting at 0.50 V [11]. In the litera-ture, this shift has been assigned to the formation of dilute stage 1 [7]. From 6 h until the end of charging at 14 h, broadening followed by splitting of the G band into 1576 and 1602 cm-1 is ob-served. As discussed in the introduction to chapter 3.3, this doublet for stages s > 2 consists of an E2g(i) component attributed to interior graphene sheets (lower frequency) and an E2g(b) compo-nent attributed to bounding graphene sheets (higher frequency) [198]. Inaba et al. observed broadening and splitting of the G band into 1577 and 1601 cm-1 (0.207 to 0.191 V), which they assigned to the interior and bounding modes of stage 4, respectively [7]. Subsequently, the au-thors described a gradual disappearance of the E2g(i) band (0.189 to 0.092 V), which they ex-plained by phase transitions from stage 4 via stage 3 to stage 2, resulting in a single band at the end of charging [7]. Similar observations were made in the preliminary in situ Raman experiment shown in Figure 24.

Negative electrode materials 101
However, in Figure 64 the doublet is observed until the end of charging at 14 h (0.05 V), which may be easily explained by the slow kinetics of lithium intercalation into the relatively large, pol-ished single graphite particle, resulting in inhomogeneous lithium intercalation and a lower state of charge at the less accessible back of the electrode facing the window. Although this observation demonstrates the geometric limitations of the combined cell, it also highlights a major advantage of complementing in situ IR experiments with in situ Raman microscopy, i.e. the possibility to de-termine the true local degree of lithium intercalation at the investigated spot. This may be particu-larly important in spectroelectrochemical cells, which are often optimized for the spectroscopic method used rather than for their electrochemical properties. During discharge, the spectral changes observed during charge are reversed. In particular, the E2g(i) and E2g(b) bands merge back to a single G band (broad band at 0.40 V), which returns to its original position at 1581 cm-1 at the end of discharge, indicating that there are no problems with solvent cointercalation, in good agreement with the results reported by Inaba et al. [7].
1300 1350 1400 1450 1500 1550 1600 1650 1700
Dis
ch
arg
eC
harg
e
16
02
15
76
15
93
G
Inte
nsity / a
.u.
Raman shift / cm-1
19 h, 1.50 V
18 h, 1.00 V
17 h, 0.70 V
16 h, 0.40 V
15 h, 0.20 V
14 h, 0.05 V
13 h, 0.05 V
12 h, 0.05 V
11 h, 0.05 V
10 h, 0.05 V
9 h, 0.05 V
8 h, 0.05 V
7 h, 0.05 V
6 h, 0.05 V
5 h, 0.05 V
4 h, 0.20 V
3 h, 0.40 V
2 h, 0.70 V
1 h, 1.00 V
0 h, 1.50 V
D1
58
1
Figure 64. In situ Raman spectra (hourly averages) for the 1st cycle of a polished single graphite particle (T1000-8000) vs. Li. Raman conditions: D1, 3 x 60 s, 6 spectra/h. Electrochemical condi-tions: potential steps at 1.50, 1.00, 0.70, 0.40, 0.20 and 0.05 V, maximum current of ±2 mA, 300 µl of LC30. The spectra are arbitrarily offset along the y-axis.
Figure 65 shows the in situ IR spectra for the first cycle of a polished single graphite particle (T1000-8000) (same experiment and spot as Figure 64). As above, hourly averages (arithmetic means of six spectra each) are plotted. The absorbance spectra obtained during charge and dis-charge are displayed in the top panel (background at OCP) and bottom panel (background at 0.05 V), respectively. A clear evolution of IR bands is observed upon electrochemical cycling, demonstrating a correlation between the applied potential and the resulting spectroscopic re-sponse. There is a significant jump to more negative absorbances at the transition 0.70/0.40 V during charge and to more positive absorbances at the transition 0.40/0.70 V during discharge.
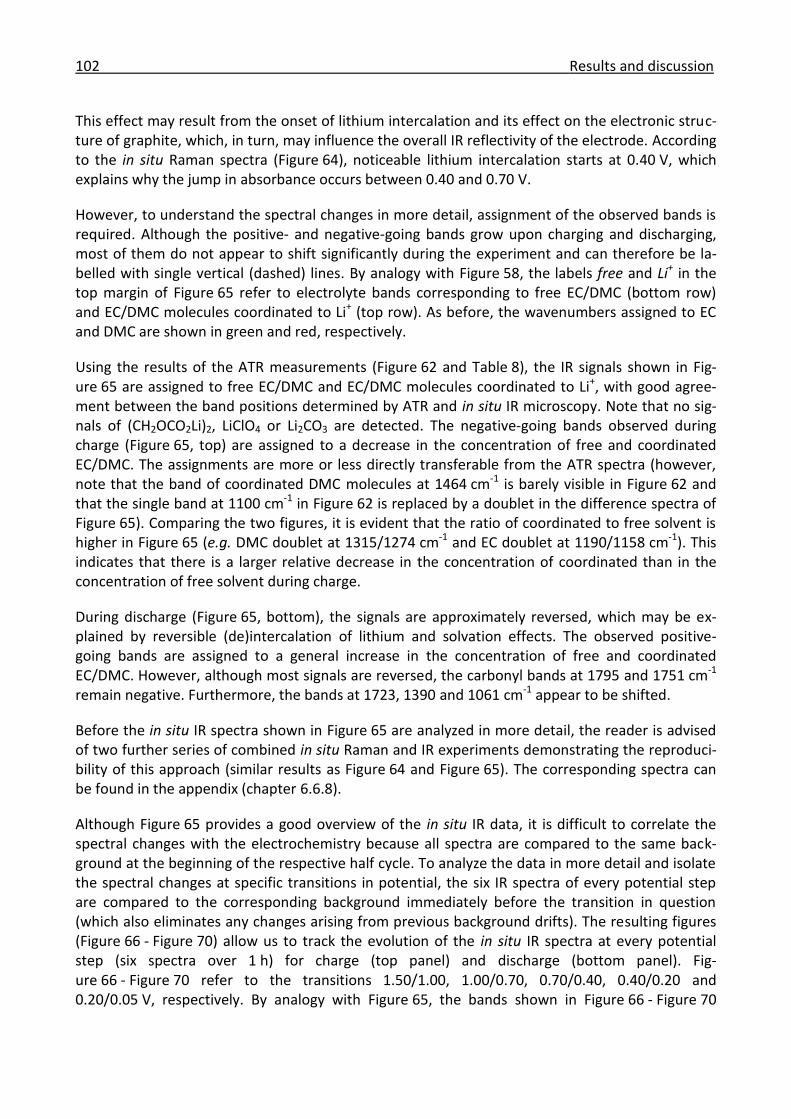
102 Results and discussion
This effect may result from the onset of lithium intercalation and its effect on the electronic struc-ture of graphite, which, in turn, may influence the overall IR reflectivity of the electrode. According to the in situ Raman spectra (Figure 64), noticeable lithium intercalation starts at 0.40 V, which explains why the jump in absorbance occurs between 0.40 and 0.70 V.
However, to understand the spectral changes in more detail, assignment of the observed bands is required. Although the positive- and negative-going bands grow upon charging and discharging, most of them do not appear to shift significantly during the experiment and can therefore be la-belled with single vertical (dashed) lines. By analogy with Figure 58, the labels free and Li+ in the top margin of Figure 65 refer to electrolyte bands corresponding to free EC/DMC (bottom row) and EC/DMC molecules coordinated to Li+ (top row). As before, the wavenumbers assigned to EC and DMC are shown in green and red, respectively.
Using the results of the ATR measurements (Figure 62 and Table 8), the IR signals shown in Fig-ure 65 are assigned to free EC/DMC and EC/DMC molecules coordinated to Li+, with good agree-ment between the band positions determined by ATR and in situ IR microscopy. Note that no sig-nals of (CH2OCO2Li)2, LiClO4 or Li2CO3 are detected. The negative-going bands observed during charge (Figure 65, top) are assigned to a decrease in the concentration of free and coordinated EC/DMC. The assignments are more or less directly transferable from the ATR spectra (however, note that the band of coordinated DMC molecules at 1464 cm-1 is barely visible in Figure 62 and that the single band at 1100 cm-1 in Figure 62 is replaced by a doublet in the difference spectra of Figure 65). Comparing the two figures, it is evident that the ratio of coordinated to free solvent is higher in Figure 65 (e.g. DMC doublet at 1315/1274 cm-1 and EC doublet at 1190/1158 cm-1). This indicates that there is a larger relative decrease in the concentration of coordinated than in the concentration of free solvent during charge.
During discharge (Figure 65, bottom), the signals are approximately reversed, which may be ex-plained by reversible (de)intercalation of lithium and solvation effects. The observed positive-going bands are assigned to a general increase in the concentration of free and coordinated EC/DMC. However, although most signals are reversed, the carbonyl bands at 1795 and 1751 cm-1 remain negative. Furthermore, the bands at 1723, 1390 and 1061 cm-1 appear to be shifted.
Before the in situ IR spectra shown in Figure 65 are analyzed in more detail, the reader is advised of two further series of combined in situ Raman and IR experiments demonstrating the reproduci-bility of this approach (similar results as Figure 64 and Figure 65). The corresponding spectra can be found in the appendix (chapter 6.6.8).
Although Figure 65 provides a good overview of the in situ IR data, it is difficult to correlate the spectral changes with the electrochemistry because all spectra are compared to the same back-ground at the beginning of the respective half cycle. To analyze the data in more detail and isolate the spectral changes at specific transitions in potential, the six IR spectra of every potential step are compared to the corresponding background immediately before the transition in question (which also eliminates any changes arising from previous background drifts). The resulting figures (Figure 66 - Figure 70) allow us to track the evolution of the in situ IR spectra at every potential step (six spectra over 1 h) for charge (top panel) and discharge (bottom panel). Fig-ure 66 - Figure 70 refer to the transitions 1.50/1.00, 1.00/0.70, 0.70/0.40, 0.40/0.20 and 0.20/0.05 V, respectively. By analogy with Figure 65, the bands shown in Figure 66 - Figure 70

Negative electrode materials 103
were labelled with single vertical (dashed) lines that deviated only slightly from the corresponding wavenumbers determined by ATR.
-0.3
-0.2
-0.1
0.0
0.1
2000 1900 1800 1700 1600 1500 1400 1300 1200 1100 1000 900 800
-0.1
0.0
0.1
0.2
0.3
Discharge
10
611
08
31
09
8
11
581
19
0
12
741
31
5
13
901
40
31
43
1
14
78
14
541
46
3
17
23
17
511
76
5
Ab
so
rban
ce
0 h, 1.50 V
1 h, 1.00 V
2 h, 0.70 V
3 h, 0.40 V
4 h, 0.20 V
5 h, 0.05 V
17
95
Charge
Wavenumber / cm-1
Free
Li+
19 h, 1.50 V
18 h, 1.00 V
17 h, 0.70 V
16 h, 0.40 V
15 h, 0.20 V
14 h, 0.05 V
Figure 65. In situ IR spectra (hourly averages) for the 1st cycle of a polished single graphite particle (T1000-8000) vs. Li. Top: charge (background at OCP). Bottom: discharge (background at 0.05 V). IR conditions: microscope, 137 µm aperture, 500 scans, 6 spectra/h. Electrochemical conditions: potential steps at 1.50, 1.00, 0.70, 0.40, 0.20 and 0.05 V, maximum current of ±2 mA, 300 µl of LC30. Free and Li+ refer to free EC/DMC and EC/DMC molecules coordinated to Li+, respectively. The wavenumbers assigned to EC and DMC are shown in green and red, respectively.
By analogy with Figure 65, the spectral changes observed in Figure 66 during charge are interpret-ed as a decrease in the concentration of free and coordinated EC/DMC. The bands already showed strong signals 10 min after the transition 1.50/1.00 V, after which they grew slightly until the end of the potential step. Sudden changes at transitions in potential may be due to double layer ef-fects (e.g. reorientation of adsorbed species) whereas gradual changes may be due to continuous (electro)chemical reactions (e.g. SEI formation) or diffusion. Although SEI formation is commonly assumed to occur at 0.80 V, it has been reported to start at potentials positive to 1.00 V [6]. The observed band growth may therefore result from depletion of free and coordinated EC/DMC due to SEI formation. During discharge, the magnitude of the spectral changes was significantly re-duced, which is consistent with irreversible SEI formation during charge. Due to a decrease in the S/N ratio, it is not possible to assign any bands above ~1350 cm-1. The bands below 1350 cm-1 seem to indicate that there is an increase in the concentration of free and coordinated EC/DMC (e.g. positive-going doublet at 1315/1274 cm-1). However, the other bands appear to be shifted and are thus not clearly attributable to either free or coordinated EC/DMC.

104 Results and discussion
-0.10
-0.05
0.00
0.05
2000 1900 1800 1700 1600 1500 1400 1300 1200 1100 1000 900 800
-0.02
0.00
0.02
10
88
10
661
10
0
11
561
19
3
12
741
31
5
13
901
40
51
43
11
45
314
63
14
781
72
31
74
917
70
17
98
Discharge 1.00/1.50 V
Free
Li+
Charge 1.50/1.00 V
10 min
20 min
30 min
40 min
50 min
Ab
so
rban
ce
Wavenumber / cm-1
10 min
20 min
30 min
40 min
50 min
60 min
Figure 66. In situ IR spectra (10 min interval) at the transition 1.50/1.00 V. Top: 1st charge at 1.00 V (background at 1.50 V). Bottom: 1st discharge at 1.50 V (background at 1.00 V). IR conditions: mi-croscope, 137 µm aperture, 500 scans, 6 spectra/h. Electrochemical conditions: potential steps at 1.50, 1.00, 0.70, 0.40, 0.20 and 0.05 V, maximum current of ±2 mA, 300 µl of LC30. Note that the charging spectrum at 60 min is missing (error). Free and Li+ refer to free EC/DMC and EC/DMC molecules coordinated to Li+, respectively. The wavenumbers assigned to EC and DMC are shown in green and red, respectively.
Figure 67 shows the in situ IR data for the transition 1.00/0.70 V, which covers 0.80 V, the most widely adopted practical value for the onset of SEI formation [6]. All bands exhibited gradual growth across the entire period, which is compatible with a continuous (electro)chemical reaction such as SEI formation (charge) or partial SEI stripping (discharge). In general, the bands associated with the former process are more intense, indicating incomplete SEI stripping. By analogy with Figure 65 and Figure 66, most negative-going bands observed during charge are assigned to a de-crease in the concentration of free EC/DMC and EC/DMC molecules coordinated to Li+ (e.g. nega-tive-going doublets at 1313/1278 and 1188/1161 cm-1). Conversely, the positive-going bands ob-served during discharge are assigned to an increase in both species. In addition to the bands asso-ciated with free and coordinated EC/DMC, there seem to be a number of new positive-going sig-nals located at 1791, 1774, 1227 (broad) and 1143 cm-1 (not labelled) during charge, with corre-sponding negative-going signals at approximately the same wavenumbers during discharge. The direction of these signals suggests formation and consumption of the corresponding species dur-ing charge and discharge, respectively, which is compatible with SEI products. However, these bands are not consistent with any of the signals shown in Figure 62 and listed in Table 8 ((CH2OCO2Li)2, LiClO4 and Li2CO3) and reported in the literature (ROCO2Li and Li2CO3) [25], indicat-

Negative electrode materials 105
ing that the associated species may be rather unstable. As a tentative interpretation, we propose the formation of oligomeric and/or polymeric species derived from EC/DMC, which would explain the new bands in the wavenumber ranges typical of 𝑣(C=O) and 𝑣(C-O).
-0.04
-0.02
0.00
0.02
2000 1900 1800 1700 1600 1500 1400 1300 1200 1100 1000 900 800
0.00
0.01
0.02
0.03
10
511
08
11
09
8
11
621
18
8
12
781
31
3
13
921
40
31
43
11
45
414
61
14
781
72
11
75
317
61
10 min
20 min
30 min
40 min
50 min
60 min
Free
Li+
18
06
Discharge 0.70/1.00 V
Charge 1.00/0.70 V
Ab
so
rban
ce
Wavenumber / cm-1
10 min
20 min
30 min
40 min
50 min
60 min
Figure 67. In situ IR spectra (10 min interval) at the transition 1.00/0.70 V. Top: 1st charge at 0.70 V (background at 1.00 V). Bottom: 1st discharge at 1.00 V (background at 0.70 V). IR conditions: mi-croscope, 137 µm aperture, 500 scans, 6 spectra/h. Electrochemical conditions: potential steps at 1.50, 1.00, 0.70, 0.40, 0.20 and 0.05 V, maximum current of ±2 mA, 300 µl of LC30. Free and Li+ refer to free EC/DMC and EC/DMC molecules coordinated to Li+, respectively. The wavenumbers assigned to EC and DMC are shown in green and red, respectively.
Figure 68 - Figure 70 (0.70/0.40, 0.40/0.20 and 0.20/0.05 V) seem to be significantly more difficult to interpret, which may be due to the influence of anisotropic volume changes in the polycrystal-line graphite particle resulting from the onset of lithium intercalation at 0.40 V and its influence on the IR spectra (significant background drift). However, the reversible jump at 0.70/0.40 V dis-cussed for Figure 65 is clearly visible in Figure 68. Furthermore, the signals shown for charge and discharge appear to be reversed in all figures except Figure 69. In addition, Figure 69 shows an unexplained increase in intensity during discharge. Finally, the bands in Figure 69 and especially Figure 70 exhibit gradual growth, indicating a continuous process (such as lithium intercalation).

106 Results and discussion
-0.15
-0.10
-0.05
0.00
2000 1900 1800 1700 1600 1500 1400 1300 1200 1100 1000 900 800
0.00
0.05
0.10
0.15
10
531
08
31
09
6
11
581
19
0
12
761
31
5
13
861
40
31
43
31
45
414
63
14
781
71
91
75
317
66
17
89
10 min
20 min
30 min
40 min
50 min
60 min
Discharge 0.40/0.70 V
Charge 0.70/0.40 V
Ab
so
rban
ce
Wavenumber / cm-1
10 min
20 min
30 min
40 min
50 min
60 min
Free
Li+
Figure 68. In situ IR spectra (10 min interval) at the transition 0.70/0.40 V. Top: 1st charge at 0.40 V (background at 0.70 V). Bottom: 1st discharge at 0.70 V (background at 0.40 V). IR conditions: mi-croscope, 137 µm aperture, 500 scans, 6 spectra/h. Electrochemical conditions: potential steps at 1.50, 1.00, 0.70, 0.40, 0.20 and 0.05 V, maximum current of ±2 mA, 300 µl of LC30. Free and Li+ refer to free EC/DMC and EC/DMC molecules coordinated to Li+, respectively. The wavenumbers assigned to EC and DMC are shown in green and red, respectively.
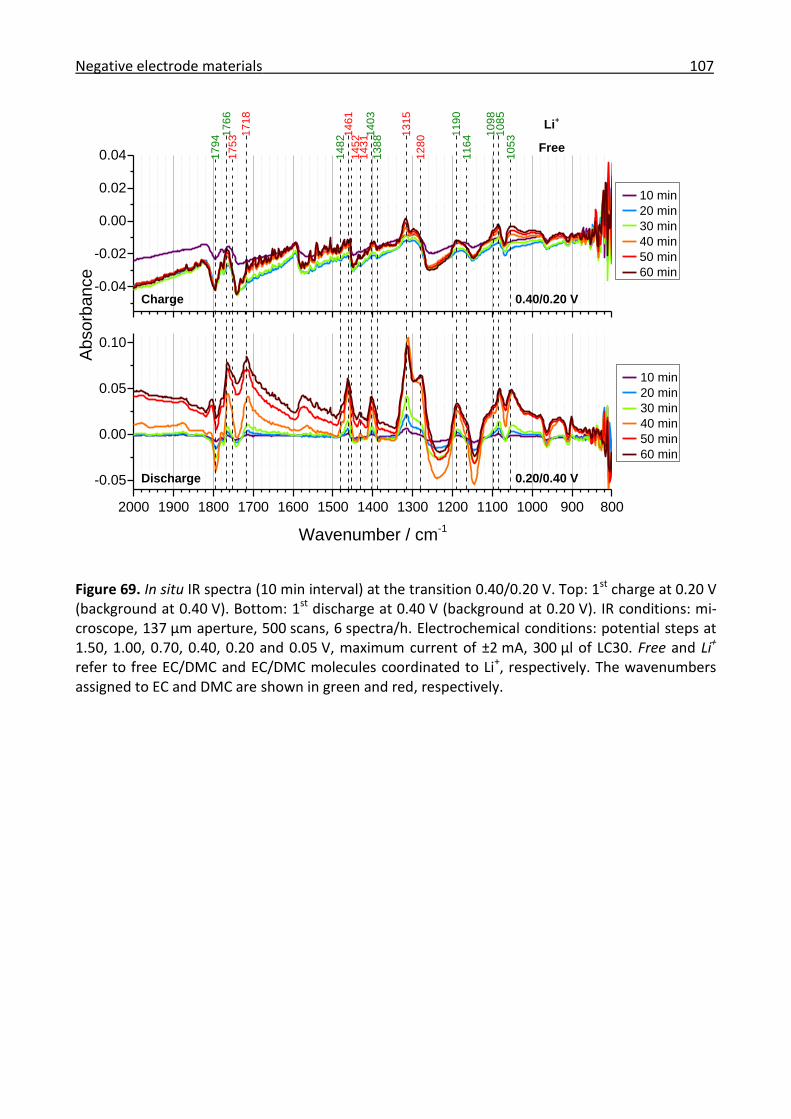
Negative electrode materials 107
-0.04
-0.02
0.00
0.02
0.04
2000 1900 1800 1700 1600 1500 1400 1300 1200 1100 1000 900 800
-0.05
0.00
0.05
0.10
10
531
08
51
09
8
11
641
19
0
12
801
31
5
13
881
40
31
43
11
45
214
61
14
821
71
8
17
531
76
61
79
4
10 min
20 min
30 min
40 min
50 min
60 min
Free
Li+
Discharge 0.20/0.40 V
Charge 0.40/0.20 V
Ab
so
rban
ce
Wavenumber / cm-1
10 min
20 min
30 min
40 min
50 min
60 min
Figure 69. In situ IR spectra (10 min interval) at the transition 0.40/0.20 V. Top: 1st charge at 0.20 V (background at 0.40 V). Bottom: 1st discharge at 0.40 V (background at 0.20 V). IR conditions: mi-croscope, 137 µm aperture, 500 scans, 6 spectra/h. Electrochemical conditions: potential steps at 1.50, 1.00, 0.70, 0.40, 0.20 and 0.05 V, maximum current of ±2 mA, 300 µl of LC30. Free and Li+ refer to free EC/DMC and EC/DMC molecules coordinated to Li+, respectively. The wavenumbers assigned to EC and DMC are shown in green and red, respectively.

108 Results and discussion
0.00
0.01
2000 1900 1800 1700 1600 1500 1400 1300 1200 1100 1000 900 800
-0.02
0.00
0.02
10
651
08
51
10
0
11
451
19
0
12
80
13
861
40
31
43
01
45
014
63
14
781
71
8
17
511
76
81
79
1
10 min
20 min
30 min
40 min
50 min
60 min
13
17
Discharge 0.05/0.20 V
Charge 0.20/0.05 V
Ab
so
rban
ce
Wavenumber / cm-1
10 min
20 min
30 min
40 min
50 min
60 min
Free
Li+
Figure 70. In situ IR spectra (10 min interval) at the transition 0.20/0.05 V. Top: 1st charge at 0.05 V (background at 0.20 V). Bottom: 1st discharge at 0.20 V (background at 0.05 V). IR conditions: mi-croscope, 137 µm aperture, 500 scans, 6 spectra/h. Electrochemical conditions: potential steps at 1.50, 1.00, 0.70, 0.40, 0.20 and 0.05 V, maximum current of ±2 mA, 300 µl of LC30. Free and Li+ refer to free EC/DMC and EC/DMC molecules coordinated to Li+, respectively. The wavenumbers assigned to EC and DMC are shown in green and red, respectively.
In conclusion, SEM measurements showed preferential orientation of the individual crystallites of polished single graphite particles as well as evidence of SEI formation after charging. ATR experi-ments provided useful reference spectra for free and coordinated solvent and SEI products. In the main part of the study, the same spot on a polished single graphite particle was successfully inves-tigated by combined in situ Raman and IR microscopy. The in situ Raman spectra indicated reversi-ble lithium intercalation negative to 0.40 V. The spectral delay associated with the slow kinetics of the relatively large, polished single graphite particle demonstrated a major advantage of in situ Raman microscopy, the determination of the true local degree of lithium intercalation at the in-vestigated spot. Since spectroelectrochemical cells are often optimized for the spectroscopic method used rather than for their electrochemical properties, such data, which are not commonly available in pure in situ IR experiments, can be very useful. Furthermore, Raman microscopy has shown that there are no problems with solvent cointercalation. The in situ IR spectra were domi-nated by solvation effects determined by the interactions between EC/DMC and Li+. Overall, a de-crease in the concentration of free EC/DMC and EC/DMC molecules coordinated to Li+ was ob-served during charge whereas an increase in both species was observed during discharge. The con-tinuous depletion of EC/DMC and growth of new signals at the transition 1.00/0.70 V during charge were assigned to SEI formation. The jump in absorbance at the transition 0.70/0.40 V was

Negative electrode materials 109
attributed to the effect of lithium intercalation on the electronic structure of graphite and its in-fluence on IR reflectivity (this transition coincides with the onset of lithium intercalation deter-mined by in situ Raman microscopy). Volume changes due to lithium intercalation presumably complicated the interpretation of the in situ IR spectra negative to 0.40 V. In short, the comple-mentary nature of Raman and IR microscopy proved essential in providing sensitivity to lithium intercalation into graphite as well as changes at the interface between graphite and the organic electrolyte.
3.3.3 Conclusions for the negative electrode materials
In this chapter, the main conclusions from the two series of experiments with GC and graphite are summarized. The goal of these experiments was the development and validation of combined in situ Raman and IR microscopy and its application to carbon-based negative electrode materials.
Combined investigations of GC demonstrated the successful application of in situ Raman and IR microscopy to the characterization of the same spot on a GC electrode and thus serve as a proof of concept. Raman microscopy showed no significant lithium intercalation and IR microscopy showed an increase in the concentration of free EC/DMC and a decrease in the concentration of EC/DMC molecules coordinated to Li+ during charge. Combined investigations of graphite demonstrated the successful application of in situ Raman and IR microscopy to the characterization of the same spot on a graphite electrode and thus constitute an application of the method to a system relevant to practical lithium-ion batteries. Raman microscopy showed clear evidence of lithium intercala-tion negative to 0.40 V. The slow kinetics of the large, polished single graphite particle led to a spectral delay which demonstrates a major advantage of Raman microscopy, the determination of the true local degree of lithium intercalation at the investigated spot. IR microscopy showed a de-crease in the concentration of free EC/DMC and EC/DMC molecules coordinated to Li+ during charge and an increase in both species during discharge. The continuous depletion of EC/DMC and the new IR signals at the transition 1.00/0.70 V were assigned to SEI formation. Finally, the jump in absorbance at the transition 0.70/0.40 V was attributed to lithium intercalation. In short, the new-ly developed fully automated combined in situ Raman and IR method was shown to be fully opera-tional and successfully applied to the complementary characterization of carbon-based negative electrode materials.

110 Results and discussion
Summary and conclusions 111
4 Summary and conclusions
In this chapter, a summary of the main conclusions from the four series of preliminary experi-ments (blank current collectors, XPS, Raman and IR), the three series of experiments with the posi-tive electrode materials stoichiometric NCM, HE-NCM and Li2MnO3 (ageing of HE-NCM, compari-son between stoichiometric and HE-NCM, and electrochemical activation of Li2MnO3), and the two series of experiments with the negative electrode materials GC and graphite (combined microsco-py of GC and graphite) is provided.
From the preliminary electrochemical experiments with blank current collectors it was learnt that stainless steel mesh is an excellent choice of current collector for the in situ Raman and IR experi-ments under both oxidative and reductive electrode conditions. The preliminary XPS experiments showed a decrease in the amount of carbon species and an increase in the amount of oxygen spe-cies on both electrodes after electrochemical cycling of HE-NCM vs. graphite, which was explained by the formation of passivation films. Furthermore, manganese was detected on the graphite elec-trode after electrochemical cycling, confirming manganese dissolution from HE-NCM. In the third series of preliminary experiments, lithium intercalation and graphite exfoliation were successfully detected by in situ Raman microscopy. Finally, the preliminary IR experiments demonstrated the importance of a well-defined and sufficiently high contact pressure, the strong effect of the at-mospheric signals on the spectra and the difference in IR reflectivity between various electrodes. In particular, it was shown that, unlike conventional composite graphite electrodes, polished single graphite particles exhibited IR reflectivities comparable to GC discs.
From the investigation of the ageing of HE-NCM it was concluded that ageing in a humid atmos-phere leads to the gradual formation of a resistive Li2CO3 surface film responsible for a deteriora-tion of the electrochemical performance, which suggests that ageing management is essential for future research and industrial applications of this promising positive electrode material. Ex situ Raman investigations of NCMs demonstrated that the Raman spectra of overlithiated NCMs (such as HE-NCM) are superpositions of their constituent compounds stoichiometric NCM and Li2MnO3, and that the Li2MnO3 disappears after the first cycle, which confirms the domain model proposed in the literature and irreversible electrochemical activation of Li2MnO3. The observation of a new band at ~545 cm-1, which was stable over a wider potential window in HE-NCM than in stoichio-metric NCM, by in situ Raman microscopy was explained by the formation of Li2O. In the third se-ries of experiments with positive electrode materials, in situ Raman investigations of Li2MnO3 at 50 °C provided evidence of electrochemical activation, i.e. the formation of a spinel-like phase, positive to 4.4 V, which is in excellent agreement with the onset of the potential plateau in Li2MnO3 and HE-NCM. From the experiments with the positive electrode materials it was finally concluded that HE-NCM contains Li2MnO3 domains that undergo irreversible activation, resulting in the well-known potential plateau during initial charging.
Combined investigations of GC demonstrated the successful application of in situ Raman and IR microscopy to the characterization of the same spot on a GC electrode, thus serving as a proof of concept. Whereas Raman microscopy showed no significant lithium intercalation, IR microscopy showed an increase in the concentration of free EC/DMC and a decrease in the concentration of EC/DMC molecules coordinated to Li+. Combined investigations of graphite demonstrated the suc-cessful application of in situ Raman and IR microscopy to the characterization of the same spot on a graphite electrode, thus constituting an application of the method to a system relevant to practi-

112 Summary and conclusions
cal lithium-ion batteries. Using Raman microscopy, the onset of lithium intercalation was shown to occur at 0.40 V. The Raman experiments allowed the determination of the true local degree of lithium intercalation at the investigated spot despite the slow kinetics of the large, polished single graphite particles. IR microscopy showed a decrease in the concentration of free EC/DMC and EC/DMC molecules coordinated to Li+ during charge and vice versa during discharge. Whereas the continuous depletion of EC/DMC and the new IR signals at the transition 1.00/0.70 V during charge were assigned to SEI formation, the vertical jump in absorbance at the transition 0.70/0.40 V was attributed to lithium intercalation.
Raman and IR microscopy were thus shown to be powerful methods for the investigation of both positive and negative electrode materials. In situ microscopy offered the advantages of avoiding relaxation and allowing the determination of the exact potentials of spectroscopic changes. The combination of Raman and IR microscopy offered further advantages connected with the com-plementary nature of the two methods. The newly developed combined in situ Raman and IR method, including the construction of an automation system enabling switching between the two spectroscopic setups, was shown to be fully operational and applied to the characterization of carbon-based negative electrode materials. With this approach, it was possible to correlate struc-tural information from the electrode (Raman) with chemical information from the interface with the organic electrolyte (IR). The fact that both sets of spectra were obtained from the same elec-trochemical experiment allowed direct comparison of the observed potentials, eliminating errors arising from experimental variation between different electrochemical measurements and/or cells. In the case of graphite, the complementary nature of Raman and IR microscopy proved es-sential in providing sensitivity to lithium intercalation into graphite and changes at the interface of the electrode with the organic electrolyte, respectively.
In short, a microscopic approach allowing fully automatic acquisition of combined in situ Raman and IR spectra from the same spot on a working electrode has been developed, validated and suc-cessfully applied to the characterization of various electrode materials for lithium-ion batteries.

Outlook 113
5 Outlook
The fully automated combined in situ Raman and IR microscopic approach developed in this work has been shown to be a powerful method for the complementary spectroscopic investigation of lithium-ion battery materials during electrochemical cycling. The combined method is thus ready to be employed in future experiments with any battery material with sufficient IR reflectivity and modest volume change.
The first condition, sufficient IR reflectivity, is required in order to allow the measurement of IR spectra with acceptable S/N ratios. Note that, according to our experiments, the reflectivity of the electrode is typically less of a problem in the Raman experiments. The second condition, modest volume change, is important in order to avoid excessive drifts of the IR background spectra that would significantly complicate the analysis. Consequently, the combined method is expected to be more suitable for intercalation compounds (small volume change), such as layered transition met-al oxides, than conversion compounds (large volume change), such as silicon.
The combined method is currently used by my successor Dr. Daniel Streich to study the electro-chemical cycling behaviour of polished single graphite particles in ionic liquids. In these experi-ments, in situ Raman microscopy allows the investigation of the intercalation of lithium and coin-tercalation of ionic liquids into graphite whereas in situ IR microscopy is employed to study SEI formation and electrolyte degradation.
In short, combined in situ Raman and IR microscopy has been developed and may now be applied to the investigation of various other electrode materials for lithium-ion batteries. In principle the combined method may also be used to characterize novel lithium-based battery systems, such as lithium-sulfur and lithium-oxygen batteries, or even non-lithium-based battery systems, such as sodium-ion batteries. Finally, combined in situ Raman and IR microscopy may also be applied in scientific research beyond the battery field.

114 Outlook

Abbreviations and symbols 115
6 Appendix
6.1 Abbreviations and symbols
AAS Atomic absorption spectroscopy
ARO All reflecting objective
at% Atomic per cent
ATR Attenuated total reflectance
a.u. Arbitrary units
C Cycling rate (1 C corresponds to complete charge or discharge in 1 h)
CCD Charge-coupled device
CV Cyclic voltammetry
DEC Diethyl carbonate
DEMS Differential electrochemical mass spectrometry
DMC Dimethyl carbonate
DME Dimethoxyethane
DTGS Deuterated triglycine sulfate
Ebind Binding energy
EC Ethylene carbonate
Ekin Kinetic Energy
EMC Ethyl methyl carbonate
Envib nth vibrational energy level
EPDM Ethylene propylene diene monomer
eq. Equivalent(s)
ES Ethylene sulfite
ESCA Electron spectroscopy for chemical analysis
et al. Et alii
F Faraday constant
f Force constant
FTIR Fourier transform infrared spectroscopy
GC Glassy carbon
GIC Graphite intercalation compound
h Planck constant
HE-NCM High-energy lithium nickel cobalt manganese oxide
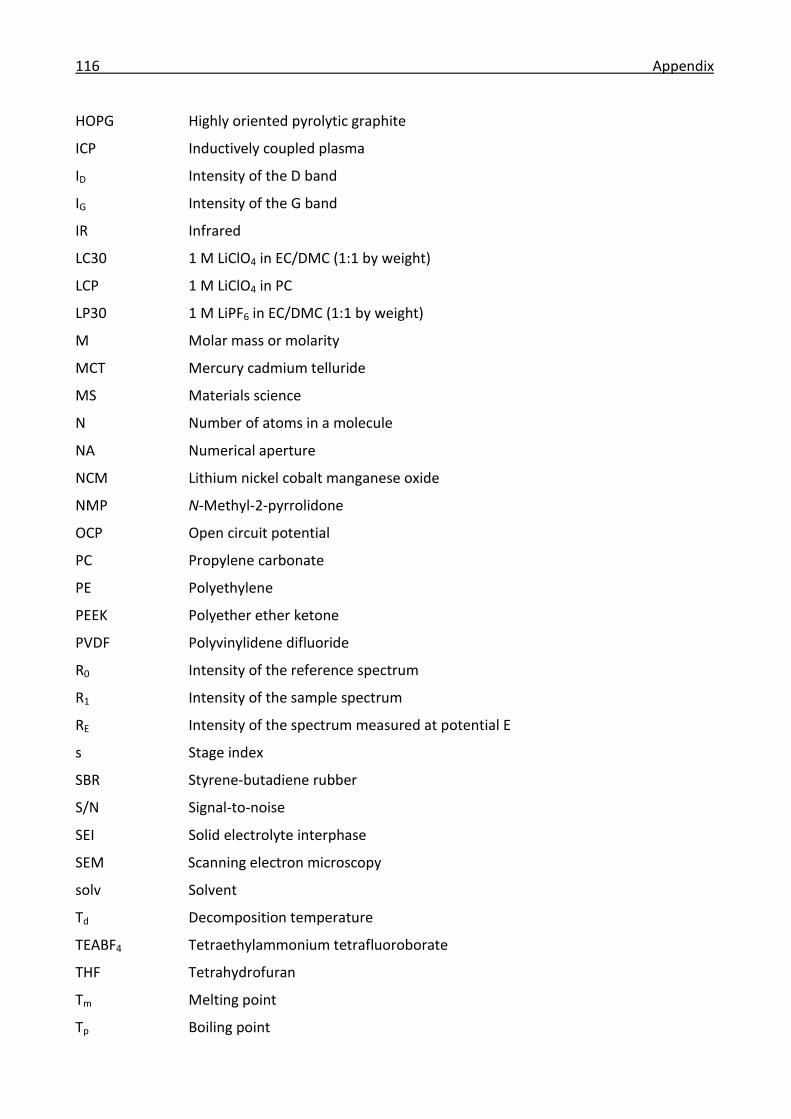
116 Appendix
HOPG Highly oriented pyrolytic graphite
ICP Inductively coupled plasma
ID Intensity of the D band
IG Intensity of the G band
IR Infrared
LC30 1 M LiClO4 in EC/DMC (1:1 by weight)
LCP 1 M LiClO4 in PC
LP30 1 M LiPF6 in EC/DMC (1:1 by weight)
M Molar mass or molarity
MCT Mercury cadmium telluride
MS Materials science
N Number of atoms in a molecule
NA Numerical aperture
NCM Lithium nickel cobalt manganese oxide
NMP N-Methyl-2-pyrrolidone
OCP Open circuit potential
PC Propylene carbonate
PE Polyethylene
PEEK Polyether ether ketone
PVDF Polyvinylidene difluoride
R0 Intensity of the reference spectrum
R1 Intensity of the sample spectrum
RE Intensity of the spectrum measured at potential E
s Stage index
SBR Styrene-butadiene rubber
S/N Signal-to-noise
SEI Solid electrolyte interphase
SEM Scanning electron microscopy
solv Solvent
Td Decomposition temperature
TEABF4 Tetraethylammonium tetrafluoroborate
THF Tetrahydrofuran
Tm Melting point
Tp Boiling point

Abbreviations and symbols 117
VC Vinylene carbonate
vs. Versus
wt% Weight per cent
XPS X-ray photoelectron spectroscopy
XRD X-ray diffraction
z Number of electrons transferred
ΔE Potential difference
ΔG Change in Gibbs energy
ε Relative permittivity (or dielectric constant)
η Dynamic viscosity
λ Wavelength
λ0 Incident wavelength
λ1 Scattered wavelength
�̃� Wavenumber
ξ Degree of activation
σ Conductivity
σPC Conductivity in 1 M PC
σEC/DMC Conductivity in 1 M EC/DMC
Φ Work function
ω Angular frequency
118 Appendix
6.2 List of figures
Figure 1. Ragone plot of various battery systems (lead-acid, nickel-cadmium, nickel-metal hydride, sodium-nickel chloride and lithium-ion) and supercapacitors. Reprinted from [48]. ......................... 3
Figure 2. Plot of potential vs. specific charge for various positive and negative electrode materials. Reprinted from [5]. .............................................................................................................................. 4
Figure 3. Schematic of a lithium-ion cell with graphite and layered metal oxide as negative and positive electrode material, respectively, during discharge. Reprinted from [43]. ............................ 5
Figure 4. Schematic structures of (a) Li2MnO3, (b) LiNi0.5Mn0.5O2, (c) Li1+δ(Ni0.5Mn0.5)1-δO2, (d) LiNi0.33Co0.33Mn0.33O2 and (e) Li1+δ(Ni0.33Co0.33Mn0.33)1-δO2. Adapted from [38]. .......................... 11
Figure 5. Galvanostatic charge and discharge profiles (left column) and four-component compositional phase diagrams with reaction pathways (right column) of 0.5Li2MnO3·0.5LiMn0.42Ni0.42Co0.16O2 (HE-NCM). The vertices of the phase diagrams correspond to (A) Li2MnO3, (B) LiMn0.42Ni0.42Co0.16O2, (C) MO2 (M = Ni, Co, Mn) and (D) LiMnO2. (a) and (b) 1st charge, (c) and (d) 1st cycle, (e) and (f) 2nd cycle. Reprinted from [85]. ............................................ 12
Figure 6. Left: schematic of the crystal structure of hexagonal graphite and its unit cell. Right: view perpendicular to the basal plane. Reprinted from [4]. ...................................................................... 16
Figure 7. Schematic structure of GC. La and Lc indicate the dimensions of the ribbon stacks parallel and perpendicular to the basal plane, respectively. Reprinted from [106]. ..................................... 16
Figure 8. Staging process during electrochemical intercalation of lithium into graphite. Left: schematic galvanostatic profile. Right: schematic voltammetric profile. Reprinted from [4]. ......... 18
Figure 9. Schematic Besenhard model of SEI formation on graphite. (a) Before the reaction, (b) formation of a ternary GIC (Lix(solv)yC6) and (c) SEI formation due to decomposition of Lix(solv)yC6. Reprinted from [134]. ........................................................................................................................ 24
Figure 10. Schematic of the standard cell. (1) Top (stainless steel), (2) cup (Ti), (3) insulator (PE), (4) bottom (stainless steel), (5) spring, (6) seal (PE), (7) insulator (PE), (8) electrode holder (Ti), (9) counter electrode, (10) working electrode, (11) current collector and (12) working electrode contact. Reprinted from [162]. .......................................................................................................... 30
Figure 11. Schematic of the spectroscopic cell including the IR beam path. Adapted from [42]. .... 31
Figure 12. Schematic of the Raman cell. (1) Objective, (2) top (stainless steel), (3) window (glass), (4) current collector (stainless steel mesh), (5) working electrode, (6) separator, (7) counter electrode (Li), (8) bottom (stainless steel), (9) seals (EPDM) and (10) electrode holder (Ti in PEEK). ............................................................................................................................................................ 32
Figure 13. Schematic of the combined cell including the pneumatic cylinder for contact pressure control. Adapted from [164]. ............................................................................................................. 33
Figure 14. Exemplary galvanostatic profile (1st cycle of SFG44 graphite vs. Li in the standard cell at a C-rate of C/37 in LC30). Left axis: potential. Right axis: current. .................................................... 34
List of figures 119
Figure 15. Exemplary potentiostatic profile (1st cycle of T1000-8000 vs. Li in the combined cell at a maximum current of ±2 mA in LC30). Left axis: potential. Right axis: current. ................................. 35
Figure 16. Exemplary cyclic voltammogram (1st cycle of GC vs. Li in the standard cell at a scan rate of 100 µV/s in LC30 with 5% ES). Electrode area: 1.3 cm2. ................................................................ 36
Figure 17. Energy level diagram illustrating anti-Stokes Raman, Rayleigh and Stokes Raman scattering. Adapted from [165]. ........................................................................................................ 38
Figure 18. Schematic of a confocal Raman microscope. Reprinted from [165]. ............................... 40
Figure 19. Schematic of a Fourier transform IR spectrometer. Reprinted from [168]. .................... 43
Figure 20. Photograph of the automation system for the recording of combined in situ Raman and IR spectra. ........................................................................................................................................... 45
Figure 21. Galvanostatic profiles of blank current collectors for the 1st cycle vs. Li in standard cells. Oxidative electrode conditions: 2.0 V - 4.8 V at C/12. Reductive electrode conditions: 1.5 V - 5 mV at C/37. The specific charges and C-rates are normalized to 10 mg of (virtual) active material. Electrolyte: 500 µl of LC30. ................................................................................................................ 50
Figure 22. Ex situ XPS spectra of uncycled (green) and cycled (red) HE-NCM. X-ray source: monochromatic Al Kα. Electrochemical conditions: 3.0-4.7 V (initially 4.8 V), 1 C, 70 cycles, 500 µl of LC30. The spectra are arbitrarily offset along the y-axis. .............................................................. 52
Figure 23. Ex situ XPS spectra of uncycled (green) and cycled (red) SFG44 graphite. X-ray source: monochromatic Al Kα. Electrochemical conditions: 3.0-4.7 V (initially 4.8 V), 1 C, 70 cycles, 500 µl of LC30. The spectra are arbitrarily offset along the y-axis. .............................................................. 53
Figure 24. In situ Raman spectra for the 1st charge of SFG44 graphite vs. Li (lithium intercalation). Raman conditions: D2, 2 x 450 s, 2 spectra/h. Electrochemical conditions: OCP – 5 mV, C/20, 500 µl of LC30. The spectra are arbitrarily offset along the y-axis. From bottom to top: charge. ............... 55
Figure 25. In situ Raman spectra for the 1st discharge of SFG44 graphite vs. Li (lithium deintercalation). Raman conditions: D2, 2 x 450 s, 2 spectra/h. Electrochemical conditions: 5 mV - 1.5 V, C/20, 500 µl of LC30. The spectra are arbitrarily offset along the y-axis. From top to bottom: discharge. ............................................................................................................................. 56
Figure 26. In situ Raman spectra for the 1st charge of SFG6 graphite vs. Li (graphite exfoliation). Raman conditions: D2, 2 x 450 s, 3 spectra/h (every third spectrum shown). Electrochemical conditions: OCP - 5 mV, C/10, 500 µl of LCP. The spectra are arbitrarily offset along the y-axis. The various sharp peaks in some of the spectra represent spikes. From bottom to top: charge. .......... 57
Figure 27. Influence of the contact pressure on the ex situ IR spectra of GC in the spectroscopic cell. IR conditions: System 2000, 50 scans. Electrolyte: LC30. .......................................................... 58
Figure 28. Influence of purging with N2 (2 h) on the ex situ IR spectra of GC in the spectroscopic cell. IR conditions: System 2000, 100 scans. Electrolyte: LC30. ........................................................ 59
120 Appendix
Figure 29. Comparison of the IR reflectivities of an Au film on glass (Au), a GC disc (GC), a polished single graphite particle (T1000-8000), a conventional graphite electrode (SFG44) and the objective slide (glass). IR conditions: microscope, 137 µm aperture, 10 scans. ............................................... 59
Figure 30. Left: α-NaFeO2-type crystal structure of NCM (M = Ni, Co, Mn). Right: Raman-active vibrational modes (Eg = O-M-O bending at ~500 cm-1 and A1g = M-O stretching at ~600 cm-1). Adapted from [165]. .......................................................................................................................... 61
Figure 31. Overview of the ageing mechanisms of positive electrodes of the type LiMO2 (M = Ni, Co, Mn) during electrochemical cycling. Reprinted from [180]. ....................................................... 62
Figure 32. Ex situ IR spectra of pristine HE-NCM powder and HE-NCM powder aged for 1, 2 and 8 months. Li2CO3 is provided as a reference (ATR signal plotted as an absorbance). IR conditions: microscope, 100 µm aperture, 500 scans. ......................................................................................... 63
Figure 33. Ex situ ATR-IR spectra of pristine HE-NCM powder and HE-NCM powder aged for 8 months. Li2CO3 is provided as a reference. IR conditions: ATR, System 2000, 500 scans. ............. 64
Figure 34. SEM images of (a) stoichiometric NCM powder and (b) HE-NCM powder. ..................... 65
Figure 35. Galvanostatic profiles of stoichiometric NCM, Li1.1(Ni0.33Co0.33Mn0.33)0.9O2 and HE-NCM for the 1st cycle vs. Li in standard cells. Electrochemical conditions: 3.0-4.8 V, C/40 (charge) and C/10 (discharge), 300 µl of LC30. ....................................................................................................... 66
Figure 36. Ex situ Raman spectra of stoichiometric NCM, Li1.1(Ni0.33Co0.33Mn0.33)0.9O2 and HE-NCM before electrochemical cycling. Li2MnO3 is given as a reference. Raman conditions: D1, 2 x 300 s. Inset: expanded view of the maxima. The spectra are normalized and background corrected. ...... 67
Figure 37. Ex situ Raman spectra of stoichiometric NCM, Li1.1(Ni0.33Co0.33Mn0.33)0.9O2 and HE-NCM after electrochemical cycling. Li2MnO3 is given as a reference. Raman conditions: D1, 2 x 300 s. Electrochemical conditions: 3.0-4.8 V, C/40 (charge) and C/10 (discharge), 300 µl of LC30. Inset: expanded view of the maxima. The spectra are normalized and background corrected. ................ 67
Figure 38. Galvanostatic profiles of stoichiometric and HE-NCM for the 1st cycle vs. Li in the Raman cell. Electrochemical conditions: 3.0-4.8 V, C/40 (charge) and C/10 (discharge), 300 µl of LC30. ... 68
Figure 39. Top: in situ Raman spectra for the 1st charge of stoichiometric NCM vs. Li. Raman conditions: D2, 10 x 150 s, 2 spectra/h (every forth spectrum shown). Electrochemical conditions: 3.0-4.8 V, C/40, 300 µl of LC30. The spectra are arbitrarily offset along the y-axis. Bottom: corresponding contour plot. The intensities are indicated on the right. From bottom to top: charge. ................................................................................................................................................ 70
Figure 40. Top: in situ Raman spectra for the 1st charge of HE-NCM vs. Li. Raman conditions: D2, 10 x 150 s, 2 spectra/h (every forth spectrum shown). Electrochemical conditions: 3.0-4.8 V, C/40, 300 µl of LC30. The spectra are arbitrarily offset along the y-axis. Bottom: corresponding contour plot. The intensities are indicated on the right. From bottom to top: charge. ................................. 71
Figure 41. Top: in situ Raman spectra for the 1st discharge of stoichiometric NCM vs. Li. Raman conditions: D2, 10 x 150 s, 2 spectra/h (every second spectrum shown). Electrochemical conditions: 3.0-4.8 V, C/10, 300 µl of LC30. The spectra are arbitrarily offset along the y-axis.
List of figures 121
Bottom: corresponding contour plot. The intensities are indicated on the right. From bottom to top: discharge. .................................................................................................................................... 73
Figure 42. Top: in situ Raman spectra for the 1st discharge of HE-NCM vs. Li. Raman conditions: D2, 10 x 150 s, 2 spectra/h (every second spectrum shown). Electrochemical conditions: 3.0-4.8 V, C/10, 300 µl of LC30. The spectra are arbitrarily offset along the y-axis. Bottom: corresponding contour plot. The intensities are indicated on the right. From bottom to top: discharge. ............... 74
Figure 43. SEM images of as-synthesized Li2MnO3 powder. ............................................................. 76
Figure 44. Galvanostatic profiles of Li2MnO3 charged at 25, 50 and 70 °C for the 1st charge vs. Li in standard cells. HE-NCM is provided as a reference. Electrochemical conditions: OCP - 4.8 V, 5 mAh/g, 500 µl of LC30. .................................................................................................................... 77
Figure 45. Ex situ Raman spectra of uncycled Li2MnO3 and Li2MnO3 charged at 5.0 and 5.2 V. Raman conditions: D1, 2 x 60, 2 x 300 and 2 x 150 s, respectively. Electrochemical conditions: potentiostatic (100 h), 1300 µl of LC30. The spectra are normalized and background corrected. .. 78
Figure 46. Ex situ Raman spectra of uncycled Li2MnO3 and Li2MnO3 charged at 25, 50 and 70 °C. Raman conditions: D1, 2 x 60, 10 x 30, 5 x 120 and 2 x 300 s, respectively. Electrochemical conditions: OCP - 4.8 V, 5 mAh/g, 500 µl of LC30. The spectra are normalized and background corrected. ........................................................................................................................................... 79
Figure 47. Galvanostatic profile of Li2MnO3 for the 1st charge vs. Li in the Raman cell at 50 °C. Electrochemical conditions: OCP - 4.8 V, 5 mA/g (increased to 6.7 mA/g after 36 h), 500 µl of LC30. ............................................................................................................................................................ 80
Figure 48. In situ Raman spectra for the 1st charge of Li2MnO3 vs. Li at 50 °C (point 1). Raman conditions: D2, 5 x 200 s, 1 spectrum/h (every third spectrum shown). Electrochemical conditions: OCP - 4.8 V, 5 mA/g (increased to 6.7 mA/g after 36 h), 500 µl of LC30. The Li2MnO3 and electrolytes bands are labelled l and *, respectively. The spectra are arbitrarily offset along the y-axis. From bottom to top: charge. .................................................................................................. 81
Figure 49. Expanded view of the shifting Ag band of Li2MnO3 (see Figure 48). The spectra are normalized and arbitrarily offset along the y-axis. ............................................................................ 81
Figure 50. Plot of the Raman shift of the Ag peak maxima vs. potential for three different points on the Li2MnO3 electrode, obtained by fitting each Ag band to a Lorentz function. The two lines represent linear regression fits of OCP - 4.4 and 4.4 V - 4.73 V for point 1. Data are shown for 0-75 h charging time (up to the maximum potential in Figure 47). .................................................. 83
Figure 51. Plot of the Raman shift of the Ag peak maxima vs. charging time for three different points on the Li2MnO3 electrode, obtained by fitting each Ag band to a Lorentz function. Data are shown for 0-100 h charging time (full range). ................................................................................... 83
Figure 52. Raman-active vibrational modes of graphite (low-frequency E2g band at 42 cm-1 and high-frequency E2g band at 1582 cm-1). Adapted from [197]. ........................................................... 85

122 Appendix
Figure 53. SEM images of GC discs. (a) Uncycled, (b) charged in LC30, (c) charged in LC30 & 5wt% VC and (d) charged in LC30 & 5wt% ES. Electrochemical conditions: potential steps at 3.0, 1.5, 1.0, 0.7, 0.4 and 0.2 V, maximum absolute current of 0.1 mA, 300 µl of LC30. .................. 87
Figure 54. Cyclic voltammograms of GC for the 1st cycle vs. Li in standard cells. Green: LC30, blue: LC30 & 5wt% VC and red: LC30 & 5wt% ES. Electrochemical conditions: 3.00-0.05 V, 100 µV/s. Inset: expanded view. ........................................................................................................................ 89
Figure 55. Cyclic voltammograms of GC for the 2nd cycle vs. Li in standard cells. Green: LC30, blue: LC30 & 5wt% VC and red: LC30 & 5wt% ES. Electrochemical conditions: 3.00-0.05 V, 100 µV/s. Inset: expanded view. ........................................................................................................................ 89
Figure 56. Potentiostatic profile of GC for the 1st charge vs. Li in the combined cell. Left axis: potential. Right axis: current. Electrochemical conditions: potential steps at 3.0, 1.5, 1.0, 0.7, 0.4 and 0.2 V, maximum absolute current of 0.1 mA, 300 µl of LC30. .................................................... 90
Figure 57. In situ Raman spectra for the 1st charge of GC vs. Li. Top: LC30, middle: LC30 & 5wt% VC and bottom: LC30 & 5wt% ES (note the expanded y-axis). Raman conditions: D1 (unless indicated in the legend), 2 x 60 s, 1 spectrum/h. Electrochemical conditions: potential steps at 3.0, 1.5, 1.0, 0.7, 0.4 and 0.2 V, maximum absolute current of 0.1 mA, 300 µl of LC30. ....................................... 92
Figure 58. In situ IR spectra for the 1st charge of GC vs. Li. Top: LC30, middle: LC30 & 5wt% VC and bottom: LC30 & 5wt% ES. IR conditions: microscope, 100 µm aperture, 500 scans, 1 spectrum/h, background at 3.0 V. Electrochemical conditions: potential steps at 3.0, 1.5, 1.0, 0.7, 0.4 and 0.2 V, maximum absolute current of 0.1 mA, 300 µl of LC30. Free and Li+ refer to free EC/DMC and EC/DMC molecules coordinated to Li+, respectively. The wavenumbers assigned to EC and DMC are shown in green and red, respectively. ............................................................................................... 93
Figure 59. SEM images of a relatively flat uncycled graphite flake (T1000-8000). Left column: edge. Right column: base. ............................................................................................................................ 96
Figure 60. SEM images of the polished surface of a single graphite particle (T1000-8000). Left column: uncycled. Right column: charged (SEI formation by charging to 5 mV at C/20 in LC30). .... 96
Figure 61. Schematic of a graphite particle obtained by polishing a single graphite flake (T1000-8000). The thickness, diameter and mass of a typical electrode are also provided. ............ 97
Figure 62. Ex situ ATR-IR spectra of (a) an uncycled polished single graphite particle (T1000-8000), (b) a charged polished single graphite particle (T1000-8000, charging to 5 mV at C/20 in LC30), (c) same as (b) but dried in SEM vacuum, (d) EC, (e) DMC, (f) LiClO4, (g) LC30 and (h) Li2CO3. IR conditions: ATR, Vertex 70v, 64 scans. .............................................................................................. 98
Figure 63. Potentiostatic profile of a polished single graphite particle (T1000-8000) for the 1st cycle vs. Li in the combined cell. Left axis: potential. Right axis: current. Electrochemical conditions: potential steps at 1.50, 1.00, 0.70, 0.40, 0.20 and 0.05 V, maximum current of ±2 mA, 300 µl of LC30. ................................................................................................................................................. 100
Figure 64. In situ Raman spectra (hourly averages) for the 1st cycle of a polished single graphite particle (T1000-8000) vs. Li. Raman conditions: D1, 3 x 60 s, 6 spectra/h. Electrochemical
List of figures 123
conditions: potential steps at 1.50, 1.00, 0.70, 0.40, 0.20 and 0.05 V, maximum current of ±2 mA, 300 µl of LC30. The spectra are arbitrarily offset along the y-axis. ................................................. 101
Figure 65. In situ IR spectra (hourly averages) for the 1st cycle of a polished single graphite particle (T1000-8000) vs. Li. Top: charge (background at OCP). Bottom: discharge (background at 0.05 V). IR conditions: microscope, 137 µm aperture, 500 scans, 6 spectra/h. Electrochemical conditions: potential steps at 1.50, 1.00, 0.70, 0.40, 0.20 and 0.05 V, maximum current of ±2 mA, 300 µl of LC30. Free and Li+ refer to free EC/DMC and EC/DMC molecules coordinated to Li+, respectively. The wavenumbers assigned to EC and DMC are shown in green and red, respectively................. 103
Figure 66. In situ IR spectra (10 min interval) at the transition 1.50/1.00 V. Top: 1st charge at 1.00 V (background at 1.50 V). Bottom: 1st discharge at 1.50 V (background at 1.00 V). IR conditions: microscope, 137 µm aperture, 500 scans, 6 spectra/h. Electrochemical conditions: potential steps at 1.50, 1.00, 0.70, 0.40, 0.20 and 0.05 V, maximum current of ±2 mA, 300 µl of LC30. Note that the charging spectrum at 60 min is missing (error). Free and Li+ refer to free EC/DMC and EC/DMC molecules coordinated to Li+, respectively. The wavenumbers assigned to EC and DMC are shown in green and red, respectively.......................................................................................................... 104
Figure 67. In situ IR spectra (10 min interval) at the transition 1.00/0.70 V. Top: 1st charge at 0.70 V (background at 1.00 V). Bottom: 1st discharge at 1.00 V (background at 0.70 V). IR conditions: microscope, 137 µm aperture, 500 scans, 6 spectra/h. Electrochemical conditions: potential steps at 1.50, 1.00, 0.70, 0.40, 0.20 and 0.05 V, maximum current of ±2 mA, 300 µl of LC30. Free and Li+ refer to free EC/DMC and EC/DMC molecules coordinated to Li+, respectively. The wavenumbers assigned to EC and DMC are shown in green and red, respectively. .............................................. 105
Figure 68. In situ IR spectra (10 min interval) at the transition 0.70/0.40 V. Top: 1st charge at 0.40 V (background at 0.70 V). Bottom: 1st discharge at 0.70 V (background at 0.40 V). IR conditions: microscope, 137 µm aperture, 500 scans, 6 spectra/h. Electrochemical conditions: potential steps at 1.50, 1.00, 0.70, 0.40, 0.20 and 0.05 V, maximum current of ±2 mA, 300 µl of LC30. Free and Li+ refer to free EC/DMC and EC/DMC molecules coordinated to Li+, respectively. The wavenumbers assigned to EC and DMC are shown in green and red, respectively. .............................................. 106
Figure 69. In situ IR spectra (10 min interval) at the transition 0.40/0.20 V. Top: 1st charge at 0.20 V (background at 0.40 V). Bottom: 1st discharge at 0.40 V (background at 0.20 V). IR conditions: microscope, 137 µm aperture, 500 scans, 6 spectra/h. Electrochemical conditions: potential steps at 1.50, 1.00, 0.70, 0.40, 0.20 and 0.05 V, maximum current of ±2 mA, 300 µl of LC30. Free and Li+ refer to free EC/DMC and EC/DMC molecules coordinated to Li+, respectively. The wavenumbers assigned to EC and DMC are shown in green and red, respectively. .............................................. 107
Figure 70. In situ IR spectra (10 min interval) at the transition 0.20/0.05 V. Top: 1st charge at 0.05 V (background at 0.20 V). Bottom: 1st discharge at 0.20 V (background at 0.05 V). IR conditions: microscope, 137 µm aperture, 500 scans, 6 spectra/h. Electrochemical conditions: potential steps at 1.50, 1.00, 0.70, 0.40, 0.20 and 0.05 V, maximum current of ±2 mA, 300 µl of LC30. Free and Li+ refer to free EC/DMC and EC/DMC molecules coordinated to Li+, respectively. The wavenumbers assigned to EC and DMC are shown in green and red, respectively. .............................................. 108
Figure 71. Comparison of the XPS Ni 2p region of uncycled HE-NCM (black) and uncycled SFG44 graphite (blue). X-ray source: monochromatic Al Kα. The unlabelled peaks are attributed to the background. ..................................................................................................................................... 143

124 Appendix
Figure 72. Deconvolution of the XPS Ni 2p signal of uncycled HE-NCM. X-ray source: monochromatic Al Kα. Green: measured spectrum, blue: individual peaks and grey: resulting envelope. .......................................................................................................................................... 144
Figure 73. Deconvolution of the XPS Ni 2p signal of cycled HE-NCM. X-ray source: monochromatic Al Kα. Electrochemical conditions: 3.0-4.7 V (initially 4.8 V), 1 C, 70 cycles, 500 µl of LC30. Red: measured spectrum, blue: individual peaks and grey: resulting envelope. .................................... 144
Figure 74. Ex situ Raman spectra of pristine and surface-modified SFG6 graphite (90:10 SFG6/SBR on Ti) cycled vs. Li. Raman conditions: D1, 2-3 x 60 s. Electrochemical conditions: 1.5 V - 5 mV, C/37, 50 cycles, 500 µl of 1 M LiPF6 in 15:85 EC/PC. From bottom to top: pristine and uncycled, pristine and cycled, electrochemically grafted and cycled, grafted under aqueous conditions and cycled, grafted under non-aqueous conditions and cycled, treated with BuLi and cycled. The spectra are arbitrarily offset along the y-axis. Reduced exfoliation of SFG6 graphite grafted under non-aqueous conditions and SFG6 graphite treated with BuLi (results compiled in [200]). .......... 145
Figure 75. XPS surveys of pristine HE-NCM powder (green) and HE-NCM powder aged for 8 months (red). X-ray source: twin Mg Kα. No obvious differences. ............................................................... 146
Figure 76. XPS spectra of the Li 1s signal of pristine HE-NCM powder (green) and HE-NCM powder aged for 8 months (red). X-ray source: twin Mg Kα. No obvious differences. ................................ 147
Figure 77. XPS spectra of the C 1s signal of pristine HE-NCM powder (green) and HE-NCM powder aged for 8 months (red). X-ray source: twin Mg Kα. No obvious differences. ................................ 147
Figure 78. XPS spectra of the O 1s signal of pristine HE-NCM powder (green) and HE-NCM powder aged for 8 months (red). X-ray source: twin Mg Kα. No obvious differences. ................................ 148
Figure 79. XPS spectra of the Mn 2p signal of pristine HE-NCM powder (green) and HE-NCM powder aged for 8 months (red). X-ray source: twin Mg Kα. No obvious differences.................... 148
Figure 80. Ex situ Raman spectra of pristine and aged HE-NCM powder. Raman conditions: D1, 2 x 120 s. From bottom to top: pristine, aged for 6 months and aged for 8 months. The spectra are normalized and arbitrarily offset along the y-axis. No obvious differences. ................................... 149
Figure 81. Deconvolution of the main Raman bands of uncycled Li1.1(Ni0.33Co0.33Mn0.33)0.9O2 and uncycled HE-NCM into Lorentzian peaks with fixed centres at 612 (Li2MnO3), 596 (LiMO2) and 568 cm-1 (Li2MnO3). .......................................................................................................................... 150
Figure 82. Ex situ Raman spectra of uncycled Li2MnO3 and Li2MnO3 charged at room temperature. Raman conditions: D2, 2 x 120 s. Electrochemical conditions: OCP - 4.8 V, 5 mA/g, 300 µl of LC30. The spectra are normalized and arbitrarily offset along the y-axis. No electrochemical activation. .......................................................................................................................................................... 151
Figure 83. Galvanostatic profiles of polished single graphite particles from Series A (Table 10) for the 1st charge vs. Li in standard cells. SFG44 graphite is provided as a reference. Electrochemical conditions: OCP - 5 mV, 500 µl of LC30. .......................................................................................... 153

List of figures 125
Figure 84. Galvanostatic profiles of polished single graphite particles from Series B (Table 10) for the 1st charge vs. Li in standard cells. SFG44 graphite is provided as a reference. Electrochemical conditions: OCP - 5 mV, 500 µl of LC30. .......................................................................................... 153
Figure 85. Galvanostatic profiles of polished single graphite particles from Series C (Table 10) for the 1st charge vs. Li in standard cells. SFG44 graphite is provided as a reference. Electrochemical conditions: OCP - 5 mV, 500 µl of LC30. .......................................................................................... 154
Figure 86. Galvanostatic profiles of polished single graphite particles from Series D (Table 10) for the 1st charge vs. Li in standard cells. SFG44 graphite is provided as a reference. Electrochemical conditions: OCP - 5 mV, 500 µl of LP30. .......................................................................................... 154
Figure 87. Galvanostatic profiles of polished single graphite particles from Series E (Table 10) for the 1st charge vs. Li in standard cells. SFG44 graphite is provided as a reference. Electrochemical conditions: OCP - 5 mV, 500 µl of LC30. .......................................................................................... 155
Figure 88. Ex situ pictures of the charged polished single graphite particles from Series E (Figure 87). Window side: facing the window during cycling. Separator side: facing the separator during cycling. Top margin: electrode (Table 10). Bottom margin: C-rate. ..................................... 155
Figure 89. In situ Raman spectra (hourly averages) for the 1st charge of a polished single graphite particle (T1000-8000) vs. Li (Series 1). Raman conditions: D1, 3 x 60 s, 6 spectra/h. Electrochemical conditions: potential steps at 1.50, 1.00, 0.70, 0.40, 0.20 and 0.05 V, maximum absolute current of 2 mA, 300 µl of LC30. The spectra are arbitrarily offset along the y-axis. ....................................... 156
Figure 90. In situ IR spectra (hourly averages) for the 1st charge of a polished single graphite particle (T1000-8000) vs. Li (Series 1). IR conditions: microscope, 137 µm aperture, 500 scans, 6 spectra/h, background at OCP. Electrochemical conditions: potential steps at 1.50, 1.00, 0.70, 0.40, 0.20 and 0.05 V, maximum absolute current of 2 mA, 300 µl of LC30. .................................. 157
Figure 91. In situ Raman spectra (hourly averages) for the first two cycles of a polished single graphite particle (T1000-8000) vs. Li (Series 2). Raman conditions: D1, 3 x 60 s, 6 spectra/h. Electrochemical conditions: potential steps at 1.50, 1.00, 0.70, 0.40, 0.20 and 0.05 V, maximum current of ±2 mA, 300 µl of LC30. The spectra are arbitrarily offset along the y-axis. ................... 158
Figure 92. In situ IR spectra (hourly averages) for the 1st cycle of a polished single graphite particle (T1000-8000) vs. Li (Series 2). Top: charge (background at OCP). Bottom: discharge (background at 0.05 V). IR conditions: microscope, 137 µm aperture, 500 scans, 6 spectra/h. Electrochemical conditions: potential steps at 1.50, 1.00, 0.70, 0.40, 0.20 and 0.05 V, maximum current of ±2 mA, 300 µl of LC30................................................................................................................................... 159
Figure 93. In situ IR spectra (hourly averages) for the 2nd cycle of a polished single graphite particle (T1000-8000) vs. Li (Series 2). Top: charge (background at 1.50 V after 1 cycle). Bottom: discharge (background at 0.05 V after 1.5 cycles). IR conditions: microscope, 137 µm aperture, 500 scans, 6 spectra/h. Electrochemical conditions: potential steps at 1.50, 1.00, 0.70, 0.40, 0.20 and 0.05 V, maximum current of ±2 mA, 300 µl of LC30. ................................................................................... 160
126 Appendix
6.3 List of tables
Table 1. Selected positive electrode materials, their potentials and specific charges. ...................... 6
Table 2. Selected negative electrode materials, their potentials and specific charges. ................... 14
Table 3. Physical properties of selected organic carbonates (electrolyte solvents) and lithium salts (electrolyte solutes) at 25°C [43]. ...................................................................................................... 19
Table 4. SEI components reported in the literature. Adapted from [6]. ........................................... 25
Table 5. Commercially obtained chemicals (electrode materials, conductive additives, polymer binders and electrolytes). .................................................................................................................. 28
Table 6. Specific charges and potential plateaus of blank current collectors for the 1st charge vs. Li. ............................................................................................................................................................ 50
Table 7. Quantitative analysis of the XPS signals of uncycled HE-NCM, cycled HE-NCM, uncycled SFG44 graphite and cycled SFG44 graphite. ...................................................................................... 54
Table 8. Assignment of the ex situ ATR-IR bands shown in Figure 62. The bands of EC and DMC are indicated in green and red, respectively............................................................................................ 99
Table 9. Peak parameters for the deconvolution of uncycled Li1.1(Ni0.33Co0.33Mn0.33)0.9O2 and uncycled HE-NCM (P1 = Li2MnO3, P2 = LiMO2, P3 = Li2MnO3, R2 = coefficient of determination, xc = peak centre, A = peak area). ...................................................................................................... 150
Table 10. Average thicknesses, maximum diameters, masses, applied C-rates and resulting specific charges for preliminary galvanostatic experiments with polished single graphite particles. ......... 152
References 127
6.4 References
[1] G.P. Beretta, International Journal of Environmental Technology and Management 7 (2007) 99.
[2] A. Izadian, N. Girrens, P. Khayyer, IEEE Industrial Electronics Magazine 7 (2013) 21.
[3] Y. Zhenguo, L. Jun, S. Baskaran, C.H. Imhoff, J.D. Holladay, JOM 62 (2010) 14.
[4] M. Winter, J.O. Besenhard, M.E. Spahr, P. Novák, Advanced Materials 10 (1998) 725.
[5] J.M. Tarascon, M. Armand, Nature 414 (2001) 359.
[6] P. Verma, P. Maire, P. Novák, Electrochimica Acta 55 (2010) 6332.
[7] M. Inaba, H. Yoshida, Z. Ogumi, T. Abe, Y. Mizutani, M. Asano, Journal of the Electrochemical Society 142 (1995) 20.
[8] I. Rey, J.C. Lassegues, P. Baudry, H. Majastre, Electrochimica Acta 43 (1998) 1539.
[9] X.L. Zhang, R. Frech, Journal of the Electrochemical Society 145 (1998) 847.
[10] M. Endo, C. Kim, T. Karaki, T. Fujino, M.J. Matthews, S.D.M. Brown, M.S. Dresslhaus, Synthetic Metals 98 (1998) 17.
[11] W.W. Huang, P. Frech, Journal of the Electrochemical Society 145 (1998) 765.
[12] J.C. Panitz, F. Joho, P. Novák, Applied Spectroscopy 53 (1999) 1188.
[13] L. Yu, W.B. Cai, D.A. Scherson, Electrochemical and Solid-State Letters 4 (2001) A101.
[14] K. Dokko, M. Mohamedi, N. Anzue, T. Itoh, I. Uchida, Journal of Materials Chemistry 12 (2002) 3688.
[15] N. Anzue, T. Itoh, M. Mohamedi, M. Umeda, I. Uchida, Solid State Ionics 156 (2003) 301.
[16] K. Dokko, N. Anzue, M. Mohamedi, T. Itoh, I. Uchida, Electrochemistry Communications 6 (2004) 384.
[17] J.L. Lei, F. McLarnon, R. Kostecki, Journal of Physical Chemistry B 109 (2005) 952.
[18] L.J. Hardwick, H. Buqa, P. Novák, Solid State Ionics 177 (2006) 2801.
[19] C.M. Burba, R. Frech, Applied Spectroscopy 60 (2006) 490.
[20] R. Baddour-Hadjean, C. Navone, J.P. Pereira-Ramos, Electrochimica Acta 54 (2009) 6674.
[21] J. Nanda, M.K. Datta, J.T. Remillard, A. O'Neill, P.N. Kumta, Electrochemistry Communications 11 (2009) 235.

128 Appendix
[22] G. Singh, W.C. West, J. Soler, R.S. Katiyar, Journal of Power Sources 218 (2012) 34.
[23] H. Nakagawa, Y. Domi, T. Doi, M. Ochida, S. Tsubouchi, T. Yamanaka, T. Abe, Z. Ogumi, Journal of Power Sources 236 (2013) 138.
[24] D. Aurbach, O. Chusid, Journal of the Electrochemical Society 140 (1993) L1.
[25] D. Aurbach, O. Chusid, Journal of Power Sources 68 (1997) 463.
[26] O. Chusid, Y. Gofer, D. Aurbach, M. Watanabe, T. Momma, T. Osaka, Journal of Power Sources 97-8 (2001) 632.
[27] H.J. Santner, C. Korepp, M. Winter, J.O. Besenhard, K.C. Moller, Analytical and Bioanalytical Chemistry 379 (2004) 266.
[28] T. Matsushita, K. Dokko, K. Kanamura, Journal of Power Sources 146 (2005) 360.
[29] C.M. Burba, R. Frech, Electrochimica Acta 52 (2006) 780.
[30] J.T. Li, S.R. Chen, X.Y. Fan, L. Huang, S.G. Sun, Langmuir 23 (2007) 13174.
[31] Y. Ikezawa, T. Ariga, Electrochimica Acta 52 (2007) 2710.
[32] Y. Ikezawa, H. Nishi, Electrochimica Acta 53 (2008) 3663.
[33] J.T. Li, S.R. Chen, F.S. Ke, G.Z. Wei, L. Huang, S.G. Sun, Journal of Electroanalytical Chemistry 649 (2010) 171.
[34] Y. Ikezawa, K. Atobe, Electrochimica Acta 56 (2011) 7078.
[35] Y. Akita, M. Segawa, H. Munakata, K. Kanamura, Journal of Power Sources 239 (2013) 175.
[36] K. Hongyou, T. Hattori, Y. Nagai, T. Tanaka, H. Nii, K. Shoda, Journal of Power Sources 243 (2013) 72.
[37] P. Lanz, P. Novák, Journal of the Electrochemical Society 161 (2014) A1555.
[38] M.M. Thackeray, S.H. Kang, C.S. Johnson, J.T. Vaughey, R. Benedek, S.A. Hackney, Journal of Materials Chemistry 17 (2007) 3112.
[39] P. Lanz, H. Sommer, M. Schulz-Dobrick, P. Novák, Electrochimica Acta 93 (2013) 114.
[40] P. Lanz, C. Villevieille, P. Novák, Electrochimica Acta 130 (2014) 206.
[41] P. Lanz, C. Villevieille, P. Novák, Electrochimica Acta 109 (2013) 426.
[42] S. Perez-Villar, P. Lanz, H. Schneider, P. Novák, Electrochimica Acta 106 (2013) 506.
[43] K. Xu, Chemical Reviews 104 (2004) 4303.
[44] M.S. Whittingham, Science 192 (1976) 1126.

References 129
[45] M. Lazzari, B. Scrosati, Journal of the Electrochemical Society 127 (1980) 773.
[46] J.J. Auborn, Y.L. Barberio, Journal of the Electrochemical Society 134 (1987) 638.
[47] M. Mohri, N. Yanagisawa, Y. Tajima, H. Tanaka, T. Mitate, S. Nakajima, M. Yoshida, Y. Yoshimoto, T. Suzuki, H. Wada, Journal of Power Sources 26 (1989) 545.
[48] H. Budde-Meiwes, J. Drillkens, B. Lunz, J. Muennix, S. Rothgang, J. Kowal, D.U. Sauer, Proceedings of the Institution of Mechanical Engineers Part D - Journal of Automobile Engineering 227 (2013) 761.
[49] D. Guyomard, J.M. Tarascon, Advanced Materials 6 (1994) 408.
[50] K. Brandt, Solid State Ionics 69 (1994) 173.
[51] Y. Gao, J.N. Reimers, J.R. Dahn, Physical Review B 54 (1996) 3878.
[52] A.K. Padhi, K.S. Nanjundaswamy, J.B. Goodenough, Journal of the Electrochemical Society 144 (1997) 1188.
[53] T. Ohzuku, Y. Makimura, Chemistry Letters (2001) 642.
[54] M.S. Whittingham, Chemical Reviews 104 (2004) 4271.
[55] A.H. Thompson, Physical Review Letters 35 (1975) 1786.
[56] M.S. Whittingham, Journal of the Electrochemical Society 123 (1976) 315.
[57] C. Delmas, H. Cognacauradou, J.M. Cocciantelli, M. Menetrier, J.P. Doumerc, Solid State Ionics 69 (1994) 257.
[58] K. Mizushima, P.C. Jones, P.J. Wiseman, J.B. Goodenough, Materials Research Bulletin 15 (1980) 783.
[59] R. Yazami, N. Lebrun, M. Bonneau, M. Molteni, Journal of Power Sources 54 (1995) 389.
[60] L. Croguennec, C. Pouillerie, C. Delmas, Solid State Ionics 135 (2000) 259.
[61] J.-M. Kim, N. Kumagai, Y. Kadoma, H. Yashiro, Journal of Power Sources 174 (2007) 473.
[62] M. Broussely, F. Perton, P. Biensan, J.M. Bodet, J. Labat, A. Lecerf, C. Delmas, A. Rougier, J.P. Peres, Journal of Power Sources 54 (1995) 109.
[63] J.R. Dahn, E.W. Fuller, M. Obrovac, U. Vonsacken, Solid State Ionics 69 (1994) 265.
[64] A.R. Armstrong, P.G. Bruce, Nature 381 (1996) 499.
[65] F. Capitaine, P. Gravereau, C. Delmas, Solid State Ionics 89 (1996) 197.
[66] M.H. Rossouw, D.C. Liles, M.M. Thackeray, Journal of Solid State Chemistry 104 (1993) 464.

130 Appendix
[67] M.M. Thackeray, Progress in Solid State Chemistry 25 (1997) 1.
[68] W.-J. Zhang, Journal of Power Sources 196 (2011) 2962.
[69] J. Liu, J. Wang, X. Yan, X. Zhang, G. Yang, A.F. Jalbout, R. Wang, Electrochimica Acta 54 (2009) 5656.
[70] P. Jozwiak, J.E. Garbarczyk, M. Wasiucionek, I. Gorzkowska, F. Gendron, A. Mauger, C.M. Julien, Solid State Ionics 179 (2008) 46.
[71] H. Huang, S.C. Yin, L.F. Nazar, Electrochemical and Solid State Letters 4 (2001) A170.
[72] A. Yamada, M. Yonemura, Y. Takei, N. Sonoyama, R. Kanno, Electrochemical and Solid State Letters 8 (2005) A55.
[73] S.Y. Chung, J.T. Bloking, Y.M. Chiang, Nature Materials 1 (2002) 123.
[74] E. Zhecheva, R. Stoyanova, Solid State Ionics 66 (1993) 143.
[75] A.R. Armstrong, R. Gitzendanner, A.D. Robertson, P.G. Bruce, Chemical Communications (1998) 1833.
[76] E. Rossen, C.D.W. Jones, J.R. Dahn, Solid State Ionics 57 (1992) 311.
[77] Z.L. Liu, A.S. Yu, J.Y. Lee, Journal of Power Sources 81 (1999) 416.
[78] M. Yoshio, H. Noguchi, J. Itoh, M. Okada, T. Mouri, Journal of Power Sources 90 (2000) 176.
[79] J.K. Ngala, N.A. Chernova, M.M. Ma, M. Mamak, P.Y. Zavalij, M.S. Whittingham, Journal of Materials Chemistry 14 (2004) 214.
[80] Y.C. Sun, C.Y. Ouyang, Z.X. Wang, X.J. Huang, L.Q. Chen, Journal of the Electrochemical Society 151 (2004) A504.
[81] M.S. Whittingham, M. Miaomiao, N.A. Chernova, B.H. Toby, P.Y. Zavalij, Journal of Power Sources 165 (2007) 517.
[82] J.M. Kim, H.T. Chung, Electrochimica Acta 49 (2004) 3573.
[83] M.M. Thackeray, S.H. Kang, C.S. Johnson, J.T. Vaughey, S.A. Hackney, Electrochemistry Communications 8 (2006) 1531.
[84] K. Jung-Min, N. Kumagai, C. Hoon-Taek, Electrochemical and Solid-State Letters 9 (2006) A494.
[85] H. Yu, H. Kim, Y. Wang, P. He, D. Asakura, Y. Nakamura, H. Zhou, Physical Chemistry Chemical Physics 14 (2012) 6584.
[86] S.-H. Yu, T. Yoon, J. Mun, S. Park, Y.-S. Kang, J.-H. Park, S.M. Oh, Y.-E. Sung, Journal of Materials Chemistry A 1 (2013) 2833.
References 131
[87] J.S. Kim, C.S. Johnson, J.T. Vaughey, M.M. Thackeray, S.A. Hackney, Chemistry of Materials 16 (2004) 1996.
[88] Z. Lu, J.R. Dahn, Journal of the Electrochemical Society 149 (2002) A815.
[89] N. Tran, L. Croguennec, M. Menetrier, F. Weill, P. Biensan, C. Jordy, C. Delmas, Chemistry of Materials 20 (2008) 4815.
[90] C.L. Gan, H. Zhan, X.H. Hu, Y.H. Zhou, Electrochemistry Communications 7 (2005) 1318.
[91] N. Yabuuchi, K. Yoshii, S.T. Myung, I. Nakai, S. Komaba, Journal of the American Chemical Society 133 (2011) 4404.
[92] A.R. Armstrong, M. Holzapfel, P. Novák, C.S. Johnson, S.-H. Kang, M.M. Thackeray, P.G. Bruce, Journal of the American Chemical Society 128 (2006) 8694.
[93] J. Jiang, J.R. Dahn, Electrochimica Acta 51 (2006) 3413.
[94] A.D. Robertson, P.G. Bruce, Chemistry of Materials 15 (2003) 1984.
[95] H. Koga, L. Croguennec, P. Mannessiez, M. Menetrier, F. Weill, L. Bourgeois, M. Duttine, E. Suard, C. Delmas, Journal of Physical Chemistry C 116 (2012) 13497.
[96] W.S. Yoon, S. Iannopollo, C.P. Grey, D. Carlier, J. Gorman, J. Reed, G. Ceder, Electrochemical and Solid State Letters 7 (2004) A167.
[97] J.L. Tirado, Materials Science & Engineering R - Reports 40 (2003) 103.
[98] J.O. Besenhard, J. Yang, M. Winter, Journal of Power Sources 68 (1997) 87.
[99] H. Kim, B. Han, J. Choo, J. Cho, Angewandte Chemie - International Edition 47 (2008) 10151.
[100] T. Ohzuku, A. Ueda, N. Yamamoto, Journal of the Electrochemical Society 142 (1995) 1431.
[101] D. Billaud, E. McRae, A. Herold, Materials Research Bulletin 14 (1979) 857.
[102] M. Kurihara, S. Maruyama, K. Oh'e, T. Ishigaki, Chemistry Letters (1998) 715.
[103] S. Flandrois, B. Simon, Carbon 37 (1999) 165.
[104] J.D. Bernal, Proceedings of the Royal Society of London Series A - Containing Papers of a Mathematical and Physical Character 106 (1924) 749.
[105] H. Lipson, A.R. Stokes, Proceedings of the Royal Society of London Series A - Mathematical and Physical Sciences 181 (1942) 0101.
[106] G.M. Jenkins, K. Kawamura, Nature 231 (1971) 175.
[107] A. Herold, Bulletin De La Societe Chimique De France (1955) 999.
132 Appendix
[108] J.M. Skowronski, K. Knofczynski, Journal of New Materials for Electrochemical Systems 9 (2006) 359.
[109] M. Deschamps, R. Yazami, Journal of Power Sources 68 (1997) 236.
[110] E. Peled, C. Menachem, D. BarTow, A. Melman, Journal of the Electrochemical Society 143 (1996) L4.
[111] H. Fujimoto, A. Mabuchi, K. Tokumitsu, T. Kasuh, Journal of Power Sources 54 (1995) 440.
[112] M. Schmidt, U. Heider, A. Kuehner, R. Oesten, M. Jungnitz, N. Ignat'ev, P. Sartori, Journal of Power Sources 97-8 (2001) 557.
[113] M. Ue, S. Mori, Journal of the Electrochemical Society 142 (1995) 2577.
[114] C.W. Walker, J.D. Cox, M. Salomon, Journal of the Electrochemical Society 143 (1996) L80.
[115] K.M. Abraham, J.L. Goldman, D.L. Natwig, Journal of the Electrochemical Society 129 (1982) 2404.
[116] K.M. Abraham, D.M. Pasquariello, F.J. Martin, Journal of the Electrochemical Society 133 (1986) 661.
[117] S.A. Campbell, C. Bowes, R.S. McMillan, Journal of Electroanalytical Chemistry 284 (1990) 195.
[118] D. Baril, C. Michot, M. Armand, Solid State Ionics 94 (1997) 35.
[119] R.D. Rogers, K.R. Seddon, Science 302 (2003) 792.
[120] R. Fong, U. Vonsacken, J.R. Dahn, Journal of the Electrochemical Society 137 (1990) 2009.
[121] D. Guyomard, J.M. Tarascon, Journal of the Electrochemical Society 140 (1993) 3071.
[122] K. Xu, S.P. Ding, T.R. Jow, Journal of the Electrochemical Society 146 (1999) 4172.
[123] J.M. Tarascon, D. Guyomard, Solid State Ionics 69 (1994) 293.
[124] E. Peled, Journal of the Electrochemical Society 126 (1979) 2047.
[125] D. Aurbach, M.L. Daroux, P.W. Faguy, E. Yeager, Journal of the Electrochemical Society 134 (1987) 1611.
[126] D. Aurbach, H. Gottlieb, Electrochimica Acta 34 (1989) 141.
[127] D. Aurbach, A. Zaban, A. Schechter, Y. Eineli, E. Zinigrad, B. Markovsky, Journal of the Electrochemical Society 142 (1995) 2873.
[128] K. Edstrom, M. Herstedt, D.P. Abraham, Journal of Power Sources 153 (2006) 380.

References 133
[129] D. Aurbach, M.D. Levi, E. Levi, A. Schechter, Journal of Physical Chemistry B 101 (1997) 2195.
[130] S.H. Kang, D.P. Abraham, A. Xiao, B.L. Lucht, Journal of Power Sources 175 (2008) 526.
[131] A.C. Chu, J.Y. Josefowicz, G.C. Farrington, Journal of the Electrochemical Society 144 (1997) 4161.
[132] K.A. Hirasawa, T. Sato, H. Asahina, S. Yamaguchi, S. Mori, Journal of the Electrochemical Society 144 (1997) L81.
[133] T. Yoshida, M. Takahashi, S. Morikawa, C. Ihara, H. Katsukawa, T. Shiratsuchi, J. Yamaki, Journal of the Electrochemical Society 153 (2006) A576.
[134] J.O. Besenhard, M. Winter, J. Yang, W. Biberacher, Journal of Power Sources 54 (1995) 228.
[135] D. Aurbach, Journal of Power Sources 119-121 (2003) 497.
[136] Y. Ein-Eli, B. Markovsky, D. Aurbach, Y. Carmeli, H. Yamin, S. Luski, Electrochimica Acta 39 (1994) 2559.
[137] Y.K. Han, S.U. Lee, J.H. Ok, J.J. Cho, H.J. Kim, Chemical Physics Letters 360 (2002) 359.
[138] D. Aurbach, K. Gamolsky, B. Markovsky, Y. Gofer, M. Schmidt, U. Heider, Electrochimica Acta 47 (2002) 1423.
[139] D. Bar-Tow, E. Peled, L. Burstein, Journal of the Electrochemical Society 146 (1999) 824.
[140] D. Aurbach, B. Markovsky, A. Shechter, Y. Ein-Eli, H. Cohen, Journal of the Electrochemical Society 143 (1996) 3809.
[141] D. Aurbach, Y. Eineli, B. Markovsky, A. Zaban, S. Luski, Y. Carmeli, H. Yamin, Journal of the Electrochemical Society 142 (1995) 2882.
[142] D. Aurbach, Y. Gofer, M. Benzion, P. Aped, Journal of Electroanalytical Chemistry 339 (1992) 451.
[143] A. Kominato, E. Yasukawa, N. Sato, T. Ijuuin, H. Asahina, S. Mori, Journal of Power Sources 68 (1997) 471.
[144] D. Aurbach, A. Zaban, Journal of Electroanalytical Chemistry 348 (1993) 155.
[145] E. Peled, D. Golodnitsky, C. Menachem, D. Bar-Tow, Journal of the Electrochemical Society 145 (1998) 3482.
[146] D. Aurbach, Y. Eineli, O. Chusid, Y. Carmeli, M. Babai, H. Yamin, Journal of the Electrochemical Society 141 (1994) 603.

134 Appendix
[147] A.M. Andersson, K. Edstrom, Journal of the Electrochemical Society 148 (2001) A1100.
[148] E. Peled, D. Bar Tow, A. Merson, A. Gladkich, L. Burstein, D. Golodnitsky, Journal of Power Sources 97-98 (2001) 52.
[149] G.R.V. Zhuang, P.N. Ross, Electrochemical and Solid State Letters 6 (2003) A136.
[150] S. Mori, H. Asahina, H. Suzuki, A. Yonei, K. Yokoto, Journal of Power Sources 68 (1997) 59.
[151] H.L. Zhang, F. Li, C. Liu, J. Tan, H.M. Cheng, Journal of Physical Chemistry B 109 (2005) 22205.
[152] D. Aurbach, M. Moshkovich, Journal of the Electrochemical Society 145 (1998) 2629.
[153] A. Augustsson, M. Herstedt, J.H. Guo, K. Edstrom, G.V. Zhuang, P.N. Ross, J.E. Rubensson, J. Nordgren, Physical Chemistry Chemical Physics 6 (2004) 4185.
[154] D. Aurbach, B. Markovsky, I. Weissman, E. Levi, Y. Ein-Eli, Electrochimica Acta 45 (1999) 67.
[155] K. Morigaki, A. Ohta, Journal of Power Sources 76 (1998) 159.
[156] A.M. Andersson, A. Henningson, H. Siegbahn, U. Jansson, K. Edstrom, Journal of Power Sources 119 (2003) 522.
[157] S. Genies, R. Yazami, J. Garden, J.C. Frison, Synthetic Metals 93 (1998) 77.
[158] K. Kanamura, H. Tamura, Z. Takehara, Journal of Electroanalytical Chemistry 333 (1992) 127.
[159] M. Odziemkowski, D.E. Irish, Journal of the Electrochemical Society 140 (1993) 1546.
[160] D. Aurbach, Y. Cohen, Journal of the Electrochemical Society 143 (1996) 3525.
[161] W.X. Zhang, Y. Liu, Z.H. Yang, S.P. Tang, M. Chen, Solid State Communications 131 (2004) 441.
[162] A. Wuersig, DISS. ETH NO. 16059, ETH Zurich, 2005.
[163] P. Novák, D. Goers, L.J. Hardwick, M. Holzapfel, W. Scheifele, J. Ufheil, A. Wuersig, Journal of Power Sources 146 (2005) 15.
[164] L.J. Hardwick, DISS. ETH NO. 16992, ETH Zurich, 2007.
[165] R. Baddour-Hadjean, J.P. Pereira-Ramos, Chemical Reviews 110 (2010) 1278.
[166] J.H. v.d.Maas, Basic Infrared Spectroscopy Second Edition, Heyden & Son Ltd., London, New York, Rheine, 1972.
[167] Horiba Jobin Yvon, HR800 User Manual.
References 135
[168] N.D. Spencer, Surfaces, Interfaces and their Applications (Lecture), ETH Zurich, 2012.
[169] C.D. Wagner, W.M. Riggs, L.E. Davis, J.F. Moulder, G.E. Muilenberg, Handbook of X-Ray Photoelectron Spectroscopy, Perkin-Elmer Corporation, Physical Electronics Division, 1979.
[170] X. Xiao, Z. Liu, L. Baggetto, G.M. Veith, K.L. More, R.R. Unocic, Physical Chemistry Chemical Physics 16 (2014) 10398.
[171] W. Choi, A. Manthiram, Journal of the Electrochemical Society 153 (2006) A1760.
[172] H. Zheng, Q. Sun, G. Liu, X. Song, V.S. Battaglia, Journal of Power Sources 207 (2012) 134.
[173] L.J. Hardwick, H. Buqa, M. Holzapfel, W. Scheifele, F. Krumeich, P. Novák, Electrochimica Acta 52 (2007) 4884.
[174] C.M. Julien, M. Massot, Materials Science and Engineering B - Solid State Materials for Advanced Technology 100 (2003) 69.
[175] C. Villevieille, P. Lanz, C. Buenzli, P. Novák, Journal of Materials Chemistry A 2 (2014) 6488.
[176] N. Dupre, J.-F. Martin, J. Oliveri, P. Soudan, D. Guyomard, A. Yamada, R. Kanno, Journal of the Electrochemical Society 156 (2009) C180.
[177] K. Matsumoto, R. Kuzuo, K. Takeya, A. Yamanaka, Journal of Power Sources 81 (1999) 558.
[178] H. Liu, Y. Yang, J. Zhang, Journal of Power Sources 162 (2006) 644.
[179] G.V. Zhuang, G.Y. Chen, J. Shim, X.Y. Song, P.N. Ross, T.J. Richardson, Journal of Power Sources 134 (2004) 293.
[180] J. Vetter, P. Novák, M.R. Wagner, C. Veit, K.C. Moller, J.O. Besenhard, M. Winter, M. Wohlfahrt-Mehrens, C. Vogler, A. Hammouche, Journal of Power Sources 147 (2005) 269.
[181] NIST, http://srdata.nist.gov/xps/main_search_menu.aspx, 2014.
[182] P. Pasierb, S. Komornicki, M. Rokita, M. Rekas, Journal of Molecular Structure 596 (2001) 151.
[183] X. Li, Y.J. Wei, H. Ehrenberg, F. Du, C.Z. Wang, G. Chen, Solid State Ionics 178 (2008) 1969.
[184] X. Zhang, A. Mauger, Q. Lu, H. Groult, L. Perrigaud, F. Gendron, C.M. Julien, Electrochimica Acta 55 (2010) 6440.
[185] F. Amalraj, D. Kovacheva, M. Talianker, L. Zeiri, J. Grinblat, N. Leifer, G. Goobes, B. Markovsky, D. Aurbach, Journal of the Electrochemical Society 157 (2010) S19.

136 Appendix
[186] K. Ben-Kamel, N. Amdouni, A. Mauger, C.M. Julien, Journal of Alloys and Compounds 528 (2012) 91.
[187] F. Amalraj, M. Talianker, B. Markovsky, D. Sharon, L. Burlaka, G. Shafir, E. Zinigrad, O. Haik, D. Aurbach, J. Lampert, M. Schulz-Dobrick, A. Garsuch, Journal of the Electrochemical Society 160 (2013) A324.
[188] M. Moshkovich, M. Cojocaru, H.E. Gottlieb, D. Aurbach, Journal of Electroanalytical Chemistry 497 (2001) 84.
[189] C. Julien, M. Massot, Solid State Ionics 148 (2002) 53.
[190] T. Gao, H. Fjellvag, P. Norby, Analytica Chimica Acta 648 (2009) 235.
[191] C. Julien, M. Massot, S. Rangan, M. Lemal, D. Guyomard, Journal of Raman Spectroscopy 33 (2002) 223.
[192] S. Hy, F. Felix, J. Rick, W.-N. Su, B.J. Hwang, Journal of the American Chemical Society 136 (2013) 999.
[193] M. Shibuya, T. Nishina, T. Matsue, I. Uchida, Journal of the Electrochemical Society 143 (1996) 3157.
[194] S.F. Amalraj, B. Markovsky, D. Sharon, M. Talianker, E. Zinigrad, R. Persky, O. Haik, J. Grinblat, J. Lampert, M. Schulz-Dobrick, A. Garsuch, L. Burlaka, D. Aurbach, Electrochimica Acta 78 (2012) 32.
[195] S. Reich, C. Thomsen, Philosophical transactions - Royal Society - B Biological sciences 362 (2004) 2271.
[196] A.C. Ferrari, D.M. Basko, Nature Nanotechnology 8 (2013) 235.
[197] D. Goers, DISS. ETH NO. 15344, ETH Zurich, 2003.
[198] C. Underhill, S.Y. Leung, G. Dresselhaus, M.S. Dresselhaus, Solid State Communications 29 (1979) 769.
[199] P. Novák, F. Joho, R. Imhof, J.C. Panitz, O. Haas, Journal of Power Sources 81 (1999) 212.
[200] P. Verma, DISS. ETH NO. 20006, ETH Zurich, 2011.
[201] S.S. Zhang, Journal of Power Sources 162 (2006) 1379.
[202] V. Etacheri, R. Marom, R. Elazari, G. Salitra, D. Aurbach, Energy & Environmental Science 4 (2011) 3243.
[203] H. Ota, Y. Sakata, A. Inoue, S. Yamaguchi, Journal of the Electrochemical Society 151 (2004) A1659.
[204] G.H. Wrodnigg, J.O. Besenhard, M. Winter, Journal of the Electrochemical Society 146 (1999) 470.

References 137
[205] L.J. Hardwick, P.W. Ruch, M. Hahn, W. Scheifele, R. Koetz, P. Novák, Journal of Physics and Chemistry of Solids 69 (2008) 1232.
[206] D. Aurbach, Y. Einely, A. Zaban, Journal of the Electrochemical Society 141 (1994) L1.
[207] G.R.V. Zhuang, K. Xu, H. Yang, T.R. Jow, P.N. Ross, Journal of Physical Chemistry B 109 (2005) 17567.
[208] Y. Chen, Y.H. Zhang, L.J. Zhao, Physical Chemistry Chemical Physics 6 (2004) 537.
[209] F. Tuinstra, J.L. Koenig, Journal of Chemical Physics 53 (1970) 1126.

138 Appendix
6.5 Nanotec and AutoHotkey programs for the automation system
6.5.1 Control of the stepper motor by NanoPro
//Sets the movements of the stepper motor. //01: Rotation to the left. 02: Delay. 03: Rotation to the right. 04: Delay. //Infinite loop since 04 goes back to 01. //All times are indicated in ms.
01 //Left Operation Type Positionmode – Relative Position Demand 2400 Direction Left Minimal Speed 200 Target Speed 1000 Ramp 25 Brake Ramp 0 Break 6600 Repetitions 1 Next Record 02 Ramp Type Trapezoid Ramp
02 //Delay Operation Type Positionmode – Relative Position Demand 0 Direction Left Minimal Speed 200 Target Speed 1000 Ramp 25 Brake Ramp 0 Break 29000 Repetitions 10 Next Record 03 Ramp Type Trapezoid Ramp
03 //Right Operation Type Positionmode – Relative Position Demand 2400 Direction Right Minimal Speed 200 Target Speed 1000 Ramp 25 Brake Ramp 0 Break 6600 Repetitions 1 Next Record 04 Ramp Type Trapezoid Ramp
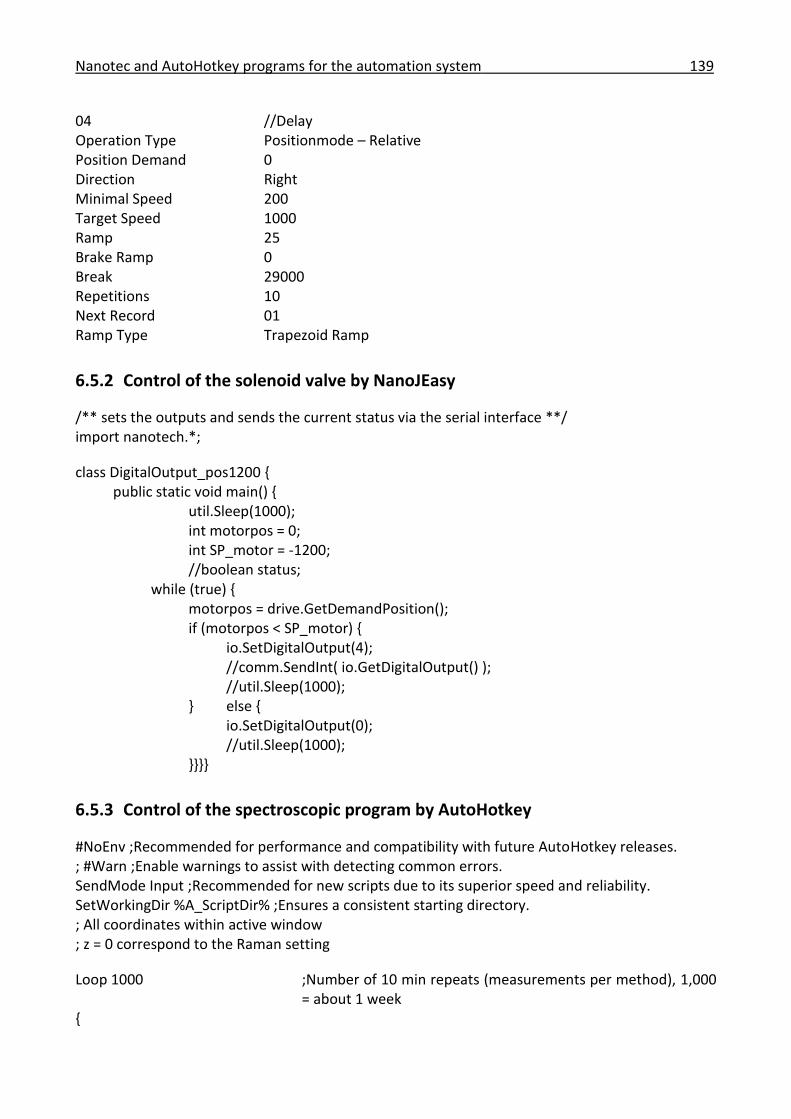
Nanotec and AutoHotkey programs for the automation system 139
04 //Delay Operation Type Positionmode – Relative Position Demand 0 Direction Right Minimal Speed 200 Target Speed 1000 Ramp 25 Brake Ramp 0 Break 29000 Repetitions 10 Next Record 01 Ramp Type Trapezoid Ramp
6.5.2 Control of the solenoid valve by NanoJEasy
/** sets the outputs and sends the current status via the serial interface **/ import nanotech.*;
class DigitalOutput_pos1200 { public static void main() { util.Sleep(1000); int motorpos = 0; int SP_motor = -1200; //boolean status; while (true) { motorpos = drive.GetDemandPosition(); if (motorpos < SP_motor) { io.SetDigitalOutput(4); //comm.SendInt( io.GetDigitalOutput() ); //util.Sleep(1000); } else { io.SetDigitalOutput(0); //util.Sleep(1000); }}}}
6.5.3 Control of the spectroscopic program by AutoHotkey
#NoEnv ;Recommended for performance and compatibility with future AutoHotkey releases. ; #Warn ;Enable warnings to assist with detecting common errors. SendMode Input ;Recommended for new scripts due to its superior speed and reliability. SetWorkingDir %A_ScriptDir% ;Ensures a consistent starting directory. ; All coordinates within active window ; z = 0 correspond to the Raman setting
Loop 1000 ;Number of 10 min repeats (measurements per method), 1,000 = about 1 week
{
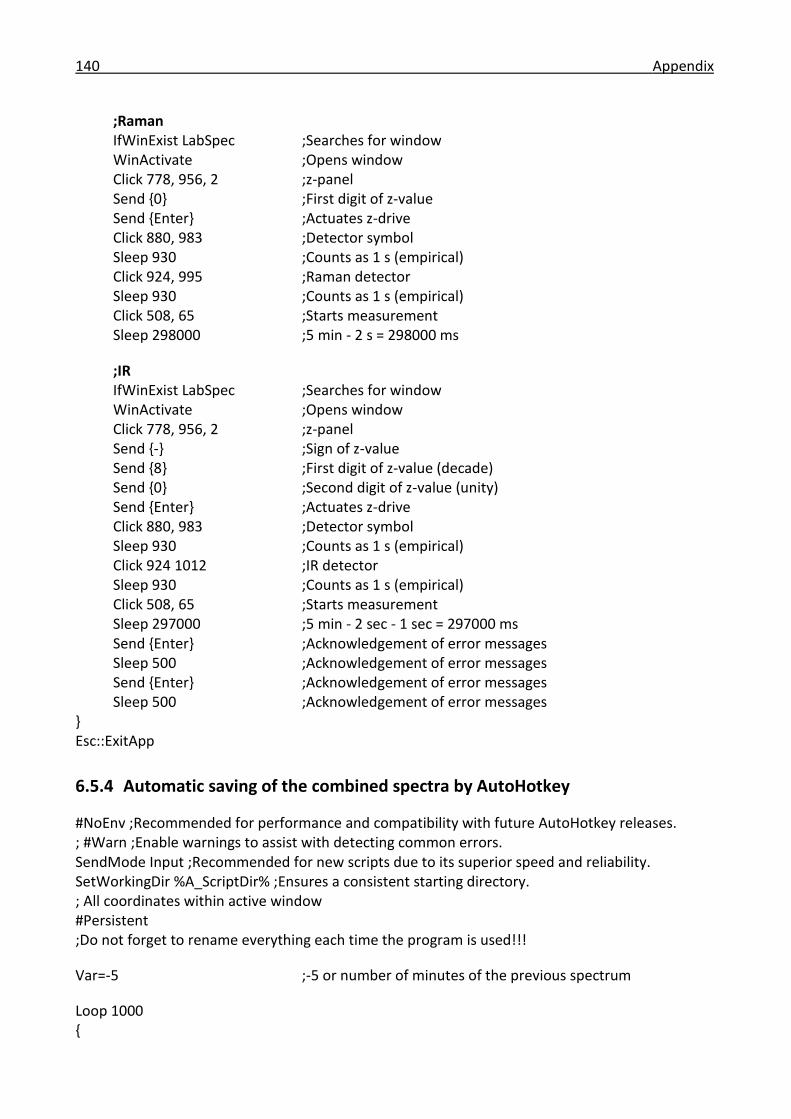
140 Appendix
;Raman IfWinExist LabSpec ;Searches for window WinActivate ;Opens window Click 778, 956, 2 ;z-panel Send {0} ;First digit of z-value Send {Enter} ;Actuates z-drive Click 880, 983 ;Detector symbol Sleep 930 ;Counts as 1 s (empirical) Click 924, 995 ;Raman detector Sleep 930 ;Counts as 1 s (empirical) Click 508, 65 ;Starts measurement Sleep 298000 ;5 min - 2 s = 298000 ms
;IR IfWinExist LabSpec ;Searches for window WinActivate ;Opens window Click 778, 956, 2 ;z-panel Send {-} ;Sign of z-value Send {8} ;First digit of z-value (decade) Send {0} ;Second digit of z-value (unity) Send {Enter} ;Actuates z-drive Click 880, 983 ;Detector symbol Sleep 930 ;Counts as 1 s (empirical) Click 924 1012 ;IR detector Sleep 930 ;Counts as 1 s (empirical) Click 508, 65 ;Starts measurement Sleep 297000 ;5 min - 2 sec - 1 sec = 297000 ms Send {Enter} ;Acknowledgement of error messages Sleep 500 ;Acknowledgement of error messages Send {Enter} ;Acknowledgement of error messages Sleep 500 ;Acknowledgement of error messages } Esc::ExitApp
6.5.4 Automatic saving of the combined spectra by AutoHotkey
#NoEnv ;Recommended for performance and compatibility with future AutoHotkey releases. ; #Warn ;Enable warnings to assist with detecting common errors. SendMode Input ;Recommended for new scripts due to its superior speed and reliability. SetWorkingDir %A_ScriptDir% ;Ensures a consistent starting directory. ; All coordinates within active window #Persistent ;Do not forget to rename everything each time the program is used!!!
Var=-5 ;-5 or number of minutes of the previous spectrum
Loop 1000 {

Nanotec and AutoHotkey programs for the automation system 141
;Raman IfWinExist LabSpec WinActivate Sleep 1000 Click 1271, 158 ;First spectrum selected Sleep 500 Click 110, 65 ;Save symbol Sleep 500 Loop 5 ;Keeps automatic spectrum number { Send {Left}
Sleep 200 } SendRaw PLXXX_Raman_ Var+=5 SendRaw %Var% SendRaw min Sleep 500 Click 306, 250 ;Data type selection Sleep 500 Click 200, 267 ;ngs Sleep 500 Send {Enter} ;Save Sleep 500 Click 110, 65 ;Save symbol Sleep 500 Click 306, 250 ;Data type selection Sleep 500 Click 200, 321 ;txt Sleep 500 Send {Enter} ;Save Sleep 500 Click 38, 39 ;File Sleep 500 Click 105, 76 ;Close
;IR IfWinExist LabSpec WinActivate Sleep 1000 Click 1271, 158 ;First spectrum selected Sleep 500 Click 110, 65 ;Save symbol Sleep 500 Loop 5 ;Keeps automatic spectrum number { Send {Left}
Sleep 200 } SendRaw PLXXX_IR_

142 Appendix
Var+=5 SendRaw %Var% SendRaw min Sleep 500 Click 306, 250 ;Data type selection Sleep 500 Click 200, 267 ;ngs Sleep 500 Send {Enter} ;Save Sleep 500 Click 110, 65 ;Save symbol Sleep 500 Click 306, 250 ;Data type selection Sleep 500 Click 200, 321 ;txt Sleep 500 Send {Enter} ;Save Sleep 500 Click 38, 39 ;File Sleep 500 Click 105, 76 ;Close Sleep 1000 } Esc::ExitApp
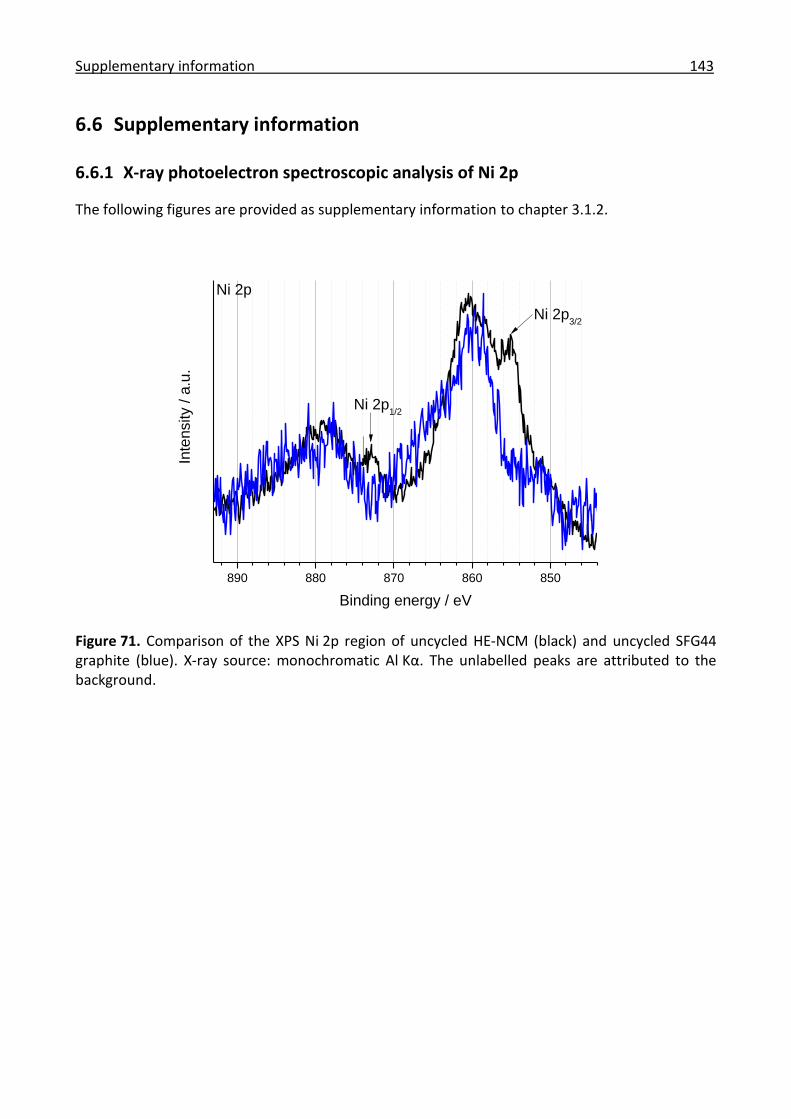
Supplementary information 143
6.6 Supplementary information
6.6.1 X-ray photoelectron spectroscopic analysis of Ni 2p
The following figures are provided as supplementary information to chapter 3.1.2.
Figure 71. Comparison of the XPS Ni 2p region of uncycled HE-NCM (black) and uncycled SFG44 graphite (blue). X-ray source: monochromatic Al Kα. The unlabelled peaks are attributed to the background.
890 880 870 860 850
Ni 2p1/2
Ni 2p3/2
Ni 2p
Inte
nsity /
a.u
.
Binding energy / eV

144 Appendix
890 880 870 860 850
Ni 2p
Ni 2p1/2
Inte
nsity /
a.u
.
Binding energy / eV
Ni 2p3/2
Figure 72. Deconvolution of the XPS Ni 2p signal of uncycled HE-NCM. X-ray source: monochro-matic Al Kα. Green: measured spectrum, blue: individual peaks and grey: resulting envelope.
890 880 870 860 850
Ni 2p
Ni 2p1/2
Ni 2p3/2
Inte
nsity /
a.u
.
Binding energy / eV
Figure 73. Deconvolution of the XPS Ni 2p signal of cycled HE-NCM. X-ray source: monochromatic Al Kα. Electrochemical conditions: 3.0-4.7 V (initially 4.8 V), 1 C, 70 cycles, 500 µl of LC30. Red: measured spectrum, blue: individual peaks and grey: resulting envelope.
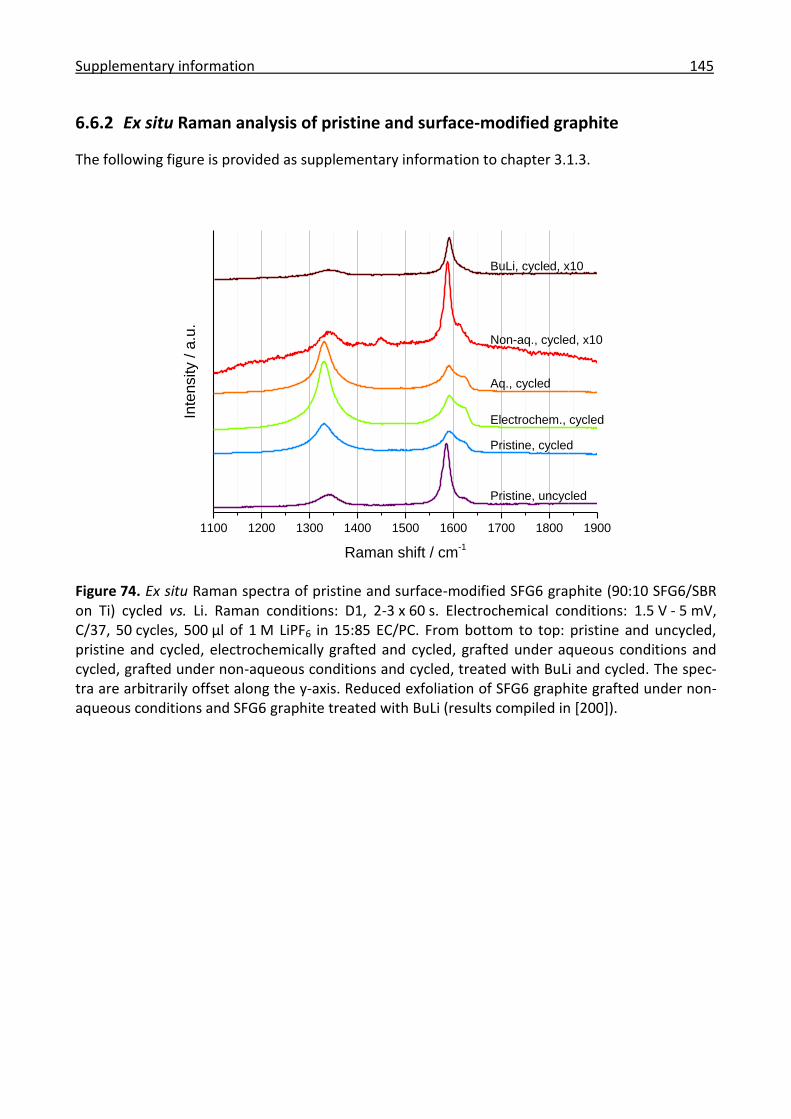
Supplementary information 145
6.6.2 Ex situ Raman analysis of pristine and surface-modified graphite
The following figure is provided as supplementary information to chapter 3.1.3.
Figure 74. Ex situ Raman spectra of pristine and surface-modified SFG6 graphite (90:10 SFG6/SBR on Ti) cycled vs. Li. Raman conditions: D1, 2-3 x 60 s. Electrochemical conditions: 1.5 V - 5 mV, C/37, 50 cycles, 500 µl of 1 M LiPF6 in 15:85 EC/PC. From bottom to top: pristine and uncycled, pristine and cycled, electrochemically grafted and cycled, grafted under aqueous conditions and cycled, grafted under non-aqueous conditions and cycled, treated with BuLi and cycled. The spec-tra are arbitrarily offset along the y-axis. Reduced exfoliation of SFG6 graphite grafted under non-aqueous conditions and SFG6 graphite treated with BuLi (results compiled in [200]).
1100 1200 1300 1400 1500 1600 1700 1800 1900
Pristine, uncycled
Pristine, cycled
Electrochem., cycled
Aq., cycled
Inte
nsity /
a.u
.
Raman shift / cm-1
BuLi, cycled, x10
Non-aq., cycled, x10
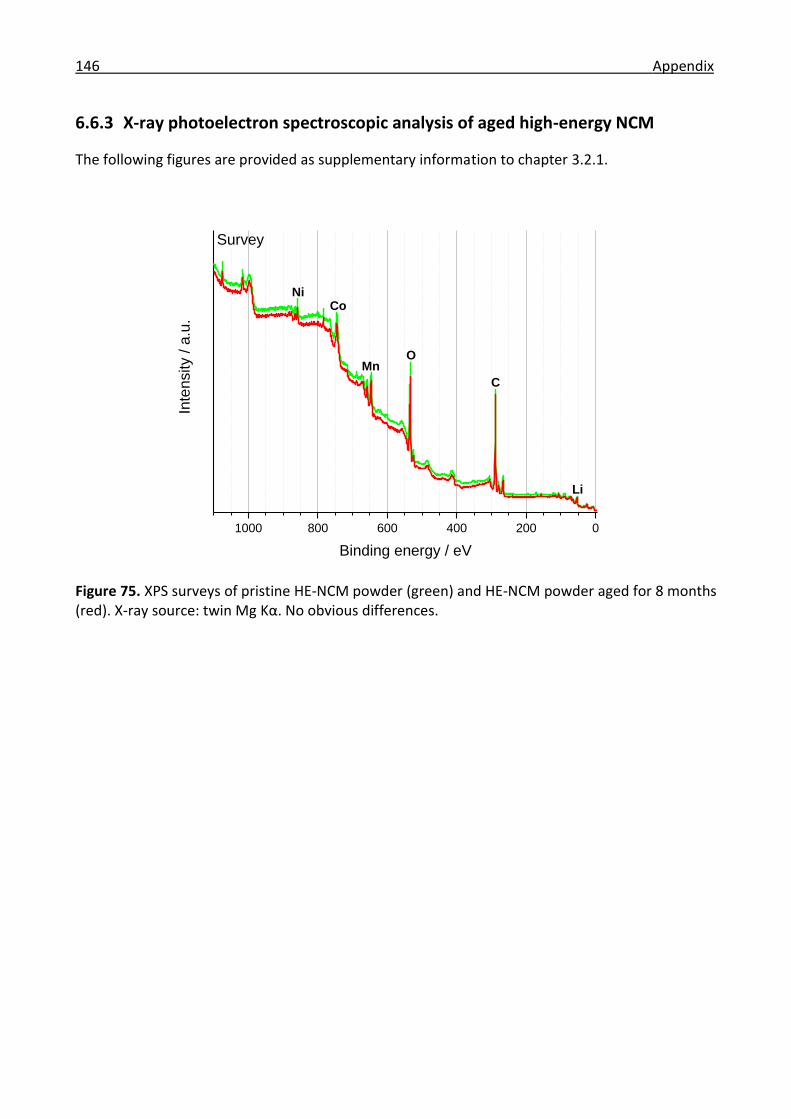
146 Appendix
6.6.3 X-ray photoelectron spectroscopic analysis of aged high-energy NCM
The following figures are provided as supplementary information to chapter 3.2.1.
1000 800 600 400 200 0
NiCo
MnO
C
Li
Inte
nsity /
a.u
.
Binding energy / eV
Survey
Figure 75. XPS surveys of pristine HE-NCM powder (green) and HE-NCM powder aged for 8 months (red). X-ray source: twin Mg Kα. No obvious differences.

Supplementary information 147
60 58 56 54 52 50
Li 1s
Inte
nsity /
a.u
.
Binding energy / eV
Figure 76. XPS spectra of the Li 1s signal of pristine HE-NCM powder (green) and HE-NCM powder aged for 8 months (red). X-ray source: twin Mg Kα. No obvious differences.
295 290 285 280
C 1s
Inte
nsity /
a.u
.
Binding energy / eV
Figure 77. XPS spectra of the C 1s signal of pristine HE-NCM powder (green) and HE-NCM powder aged for 8 months (red). X-ray source: twin Mg Kα. No obvious differences.

148 Appendix
545 540 535 530 525
O 1s
Inte
nsity /
a.u
.
Binding energy / eV
Figure 78. XPS spectra of the O 1s signal of pristine HE-NCM powder (green) and HE-NCM powder aged for 8 months (red). X-ray source: twin Mg Kα. No obvious differences.
665 660 655 650 645 640
Mn 2p
Inte
nsity /
a.u
.
Binding energy / eV
Figure 79. XPS spectra of the Mn 2p signal of pristine HE-NCM powder (green) and HE-NCM pow-der aged for 8 months (red). X-ray source: twin Mg Kα. No obvious differences.

Supplementary information 149
6.6.4 Raman analysis of aged high-energy NCM
The following figure is provided as supplementary information to chapter 3.2.1.
100 200 300 400 500 600 700 800 900 1000 1100 1200
Inte
nsity /
a.u
.
Raman shift / cm-1
HE-NCM, 8 M
HE-NCM, 6 M
HE-NCM, pristine
Figure 80. Ex situ Raman spectra of pristine and aged HE-NCM powder. Raman conditions: D1, 2 x 120 s. From bottom to top: pristine, aged for 6 months and aged for 8 months. The spectra are normalized and arbitrarily offset along the y-axis. No obvious differences.

150 Appendix
6.6.5 Deconvolution of the main Raman bands of uncycled NCMs
The following figure is provided as supplementary information to chapter 3.2.2. The ex situ Raman spectra of uncycled Li1.1(Ni0.33Co0.33Mn0.33)0.9O2 and uncycled HE-NCM are taken from Figure 36.
300 350 400 450 500 550 600 650 700 750 800
611
Inte
nsity / a
.u.
Raman shift / cm-1
Stoichiometric NCM
Li1.1
(Ni0.33
Co0.33
Mn0.33
)0.9
O2
High-energy NCM
Li2MnO
3 reference
Individual HE-NCM peaks
Cumulative HE-NCM peak
Individual Li1.1
NCM peaks
Cumulative Li1.1
NCM peak
603
Figure 81. Deconvolution of the main Raman bands of uncycled Li1.1(Ni0.33Co0.33Mn0.33)0.9O2 and uncycled HE-NCM into Lorentzian peaks with fixed centres at 612 (Li2MnO3), 596 (LiMO2) and 568 cm-1 (Li2MnO3).
Table 9. Peak parameters for the deconvolution of uncycled Li1.1(Ni0.33Co0.33Mn0.33)0.9O2 and uncycled HE-NCM (P1 = Li2MnO3, P2 = LiMO2, P3 = Li2MnO3, R2 = coefficient of determination, xc = peak centre, A = peak area).
Peak parameter R2 xc (P1) A (P1) xc (P2) A (P2) xc (P3) A (P3)
Li1.1(Ni0.33Co0.33Mn0.33)0.9O2 0.79 612 21 596 75 568 10
HE-NCM 0.79 612 70 596 75 568 8
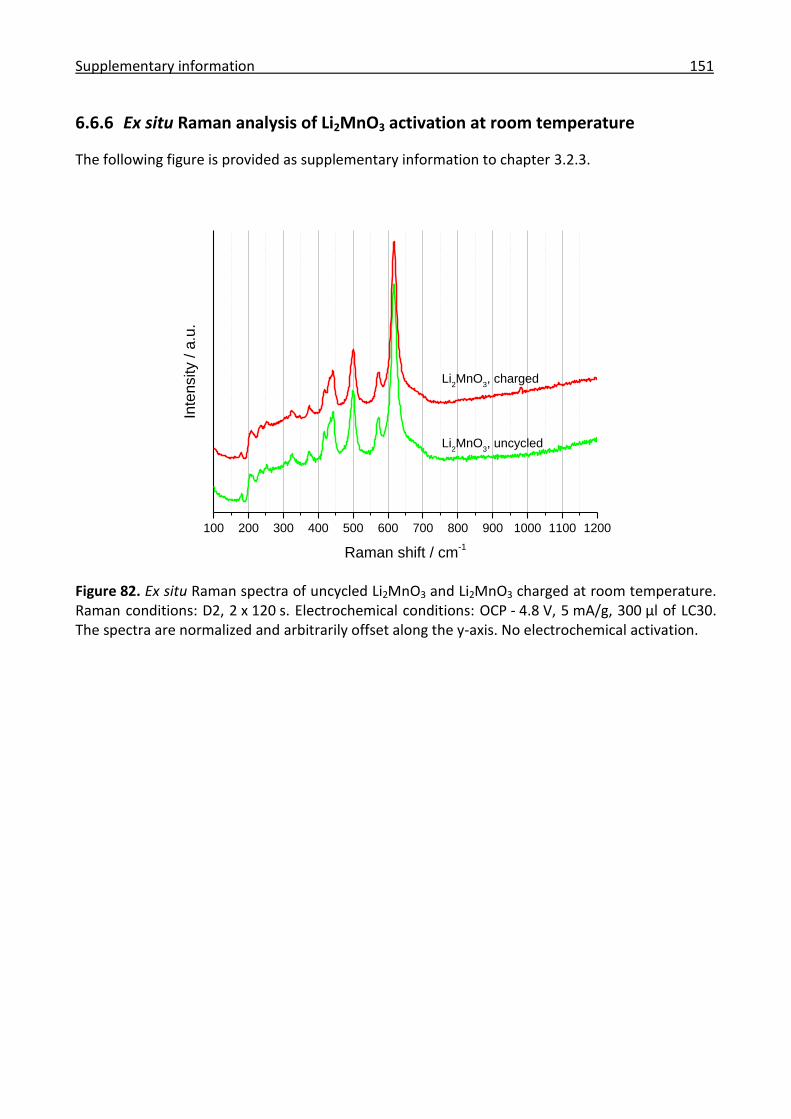
Supplementary information 151
6.6.6 Ex situ Raman analysis of Li2MnO3 activation at room temperature
The following figure is provided as supplementary information to chapter 3.2.3.
100 200 300 400 500 600 700 800 900 1000 1100 1200
Inte
nsity /
a.u
.
Raman shift / cm-1
Li2MnO
3, charged
Li2MnO
3, uncycled
Figure 82. Ex situ Raman spectra of uncycled Li2MnO3 and Li2MnO3 charged at room temperature. Raman conditions: D2, 2 x 120 s. Electrochemical conditions: OCP - 4.8 V, 5 mA/g, 300 µl of LC30. The spectra are normalized and arbitrarily offset along the y-axis. No electrochemical activation.
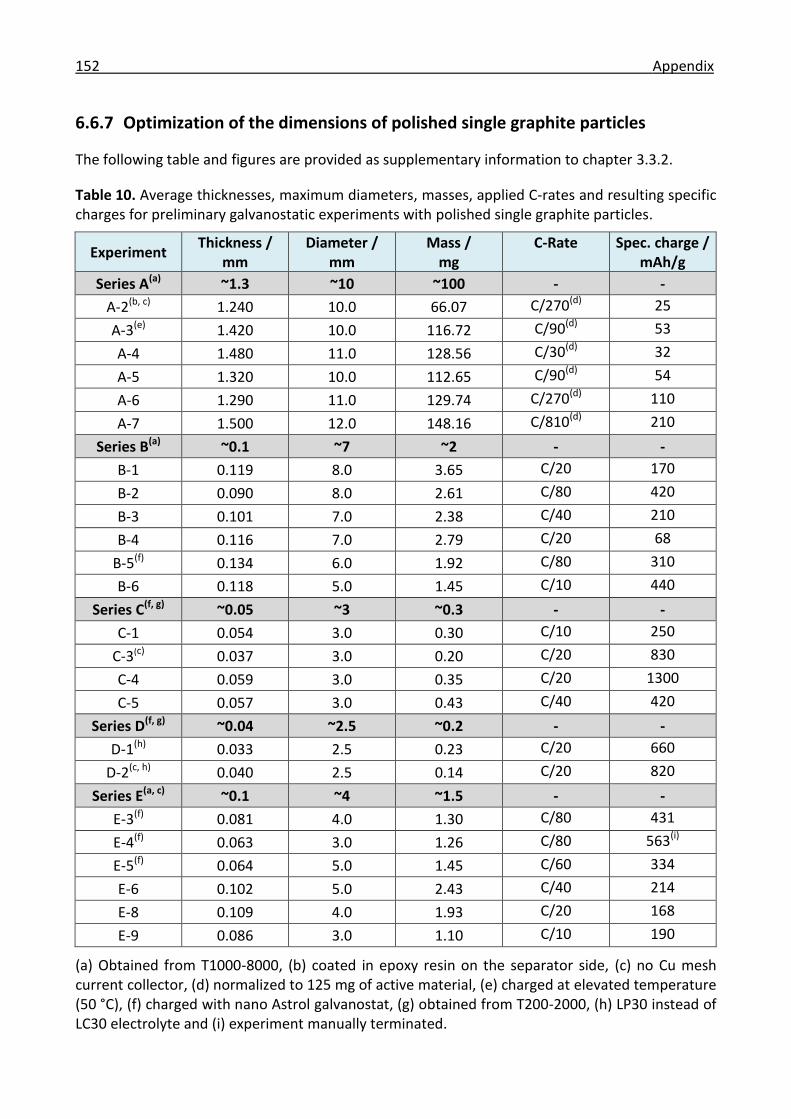
152 Appendix
6.6.7 Optimization of the dimensions of polished single graphite particles
The following table and figures are provided as supplementary information to chapter 3.3.2.
Table 10. Average thicknesses, maximum diameters, masses, applied C-rates and resulting specific charges for preliminary galvanostatic experiments with polished single graphite particles.
Experiment Thickness /
mm Diameter /
mm Mass /
mg C-Rate Spec. charge /
mAh/g
Series A(a) ~1.3 ~10 ~100 - -
A-2(b, c) 1.240 10.0 66.07 C/270(d) 25
A-3(e) 1.420 10.0 116.72 C/90(d) 53
A-4 1.480 11.0 128.56 C/30(d) 32
A-5 1.320 10.0 112.65 C/90(d) 54
A-6 1.290 11.0 129.74 C/270(d) 110
A-7 1.500 12.0 148.16 C/810(d) 210
Series B(a) ~0.1 ~7 ~2 - -
B-1 0.119 8.0 3.65 C/20 170
B-2 0.090 8.0 2.61 C/80 420
B-3 0.101 7.0 2.38 C/40 210
B-4 0.116 7.0 2.79 C/20 68
B-5(f) 0.134 6.0 1.92 C/80 310
B-6 0.118 5.0 1.45 C/10 440
Series C(f, g) ~0.05 ~3 ~0.3 - -
C-1 0.054 3.0 0.30 C/10 250
C-3(c) 0.037 3.0 0.20 C/20 830
C-4 0.059 3.0 0.35 C/20 1300
C-5 0.057 3.0 0.43 C/40 420
Series D(f, g) ~0.04 ~2.5 ~0.2 - -
D-1(h) 0.033 2.5 0.23 C/20 660
D-2(c, h) 0.040 2.5 0.14 C/20 820
Series E(a, c) ~0.1 ~4 ~1.5 - -
E-3(f) 0.081 4.0 1.30 C/80 431
E-4(f) 0.063 3.0 1.26 C/80 563(i)
E-5(f) 0.064 5.0 1.45 C/60 334
E-6 0.102 5.0 2.43 C/40 214
E-8 0.109 4.0 1.93 C/20 168
E-9 0.086 3.0 1.10 C/10 190
(a) Obtained from T1000-8000, (b) coated in epoxy resin on the separator side, (c) no Cu mesh current collector, (d) normalized to 125 mg of active material, (e) charged at elevated temperature (50 °C), (f) charged with nano Astrol galvanostat, (g) obtained from T200-2000, (h) LP30 instead of LC30 electrolyte and (i) experiment manually terminated.
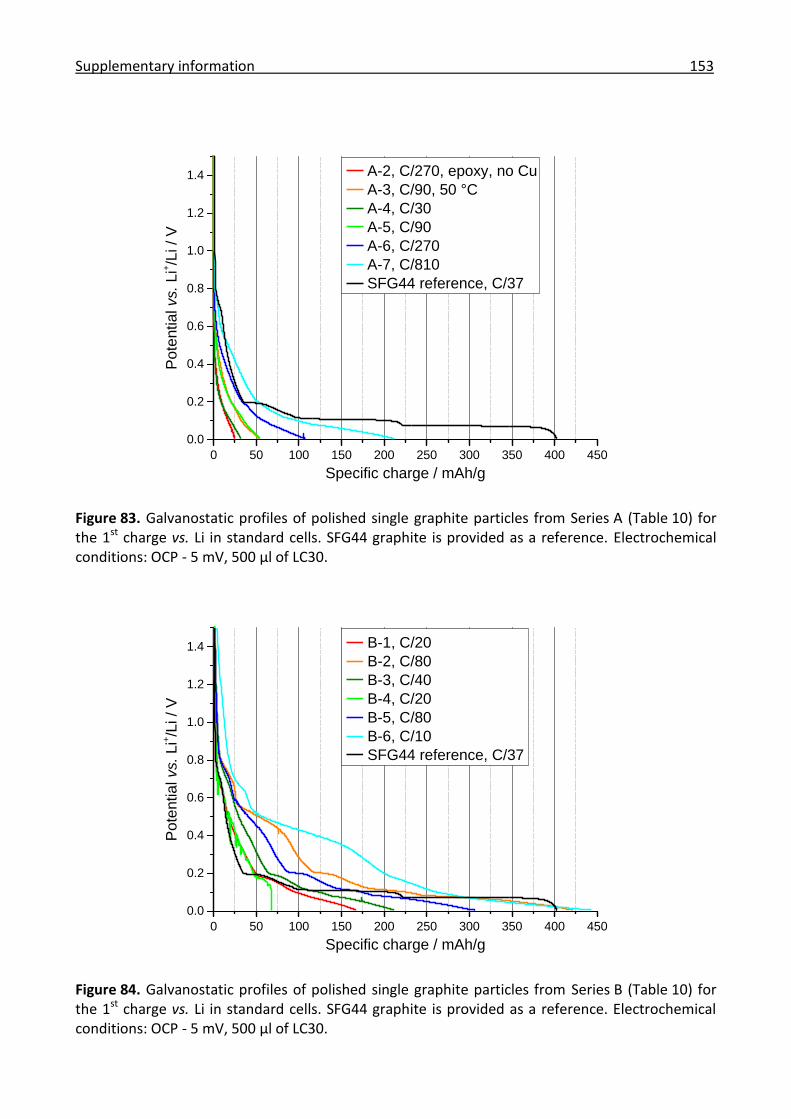
Supplementary information 153
0 50 100 150 200 250 300 350 400 450
0.0
0.2
0.4
0.6
0.8
1.0
1.2
1.4P
ote
ntia
l vs. L
i+/L
i / V
Specific charge / mAh/g
A-2, C/270, epoxy, no Cu
A-3, C/90, 50 °C
A-4, C/30
A-5, C/90
A-6, C/270
A-7, C/810
SFG44 reference, C/37
Figure 83. Galvanostatic profiles of polished single graphite particles from Series A (Table 10) for the 1st charge vs. Li in standard cells. SFG44 graphite is provided as a reference. Electrochemical conditions: OCP - 5 mV, 500 µl of LC30.
0 50 100 150 200 250 300 350 400 450
0.0
0.2
0.4
0.6
0.8
1.0
1.2
1.4
Po
tentia
l vs. L
i+/L
i / V
Specific charge / mAh/g
B-1, C/20
B-2, C/80
B-3, C/40
B-4, C/20
B-5, C/80
B-6, C/10
SFG44 reference, C/37
Figure 84. Galvanostatic profiles of polished single graphite particles from Series B (Table 10) for the 1st charge vs. Li in standard cells. SFG44 graphite is provided as a reference. Electrochemical conditions: OCP - 5 mV, 500 µl of LC30.

154 Appendix
0 200 400 600 800 1000 1200
0.0
0.2
0.4
0.6
0.8
1.0
1.2
1.4P
ote
ntia
l vs. L
i+/L
i / V
Specific charge / mAh/g
C-1, C/10
C-3, C/20, no Cu
C-4, C/20
C-5, C/40
SFG44 reference, C/37
Figure 85. Galvanostatic profiles of polished single graphite particles from Series C (Table 10) for the 1st charge vs. Li in standard cells. SFG44 graphite is provided as a reference. Electrochemical conditions: OCP - 5 mV, 500 µl of LC30.
0 100 200 300 400 500 600 700 800
0.0
0.2
0.4
0.6
0.8
1.0
1.2
1.4
Po
tentia
l vs. L
i+/L
i / V
Specific charge / mAh/g
D-1, C/20, LP30
D-2, C/20, LP30, no Cu
SFG44 reference, C/37
Figure 86. Galvanostatic profiles of polished single graphite particles from Series D (Table 10) for the 1st charge vs. Li in standard cells. SFG44 graphite is provided as a reference. Electrochemical conditions: OCP - 5 mV, 500 µl of LP30.

Supplementary information 155
0 100 200 300 400 500 600
0.0
0.2
0.4
0.6
0.8
1.0
1.2
1.4P
ote
ntia
l vs. L
i+/L
i / V
Specific charge / mAh/g
E-3, C/80
E-4, C/80
E-5, C/60
E-6, C/40
E-8, C/20
E-9, C/10
SFG44 reference, C/37
Figure 87. Galvanostatic profiles of polished single graphite particles from Series E (Table 10) for the 1st charge vs. Li in standard cells. SFG44 graphite is provided as a reference. Electrochemical conditions: OCP - 5 mV, 500 µl of LC30.
Figure 88. Ex situ pictures of the charged polished single graphite particles from Series E (Figure 87). Window side: facing the window during cycling. Separator side: facing the separator during cycling. Top margin: electrode (Table 10). Bottom margin: C-rate.
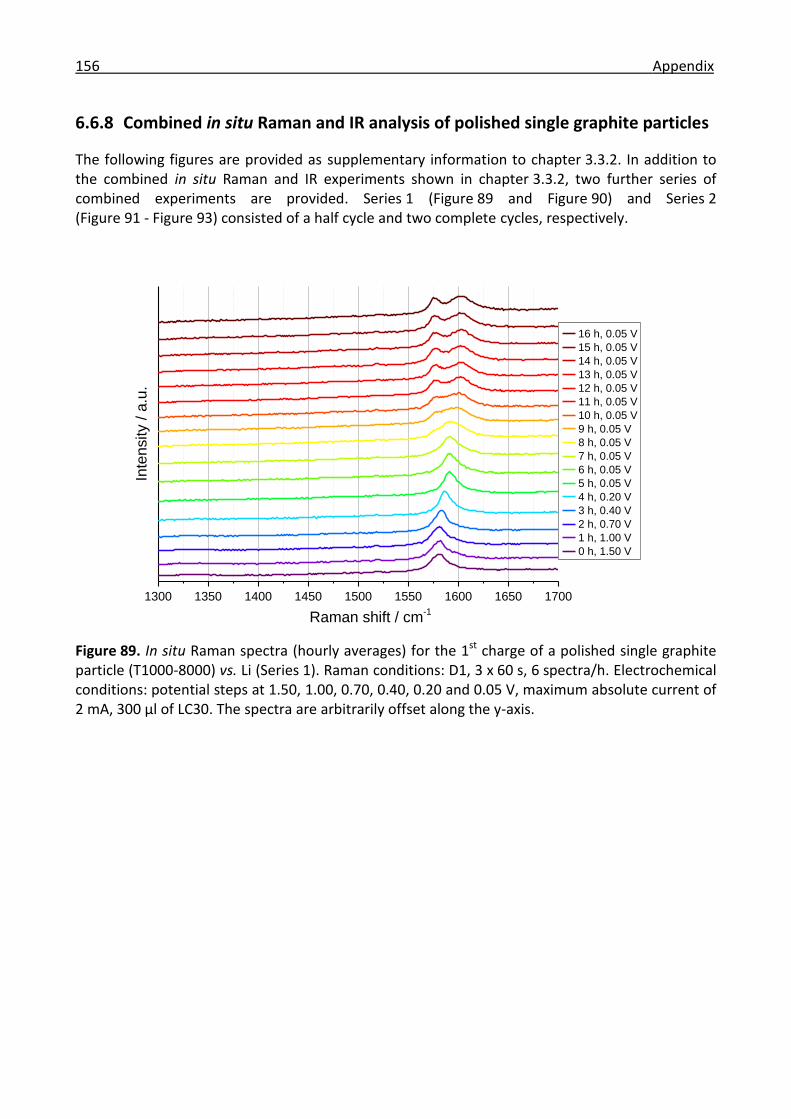
156 Appendix
6.6.8 Combined in situ Raman and IR analysis of polished single graphite particles
The following figures are provided as supplementary information to chapter 3.3.2. In addition to the combined in situ Raman and IR experiments shown in chapter 3.3.2, two further series of combined experiments are provided. Series 1 (Figure 89 and Figure 90) and Series 2 (Figure 91 - Figure 93) consisted of a half cycle and two complete cycles, respectively.
1300 1350 1400 1450 1500 1550 1600 1650 1700
Inte
nsity /
a.u
.
Raman shift / cm-1
16 h, 0.05 V
15 h, 0.05 V
14 h, 0.05 V
13 h, 0.05 V
12 h, 0.05 V
11 h, 0.05 V
10 h, 0.05 V
9 h, 0.05 V
8 h, 0.05 V
7 h, 0.05 V
6 h, 0.05 V
5 h, 0.05 V
4 h, 0.20 V
3 h, 0.40 V
2 h, 0.70 V
1 h, 1.00 V
0 h, 1.50 V
Figure 89. In situ Raman spectra (hourly averages) for the 1st charge of a polished single graphite particle (T1000-8000) vs. Li (Series 1). Raman conditions: D1, 3 x 60 s, 6 spectra/h. Electrochemical conditions: potential steps at 1.50, 1.00, 0.70, 0.40, 0.20 and 0.05 V, maximum absolute current of 2 mA, 300 µl of LC30. The spectra are arbitrarily offset along the y-axis.

Supplementary information 157
2000 1900 1800 1700 1600 1500 1400 1300 1200 1100 1000 900 800
-0.6
-0.4
-0.2
0.0
0.2
Ab
so
rban
ce
Wavenumber / cm-1
0 h, 1.50 V
1 h, 1.00 V
2 h, 0.70 V
3 h, 0.40 V
4 h, 0.20 V
5 h, 0.05 V
Figure 90. In situ IR spectra (hourly averages) for the 1st charge of a polished single graphite parti-cle (T1000-8000) vs. Li (Series 1). IR conditions: microscope, 137 µm aperture, 500 scans, 6 spectra/h, background at OCP. Electrochemical conditions: potential steps at 1.50, 1.00, 0.70, 0.40, 0.20 and 0.05 V, maximum absolute current of 2 mA, 300 µl of LC30.

158 Appendix
1300 1350 1400 1450 1500 1550 1600 1650 1700
Inte
nsity /
a.u
.
Raman shift / cm-1
46 h, 1.50 V
44 h, 1.00 V
42 h, 0.70 V
40 h, 0.40 V
38 h, 0.20 V
36 h, 0.05 V
34 h, 0.05 V
32 h, 0.20 V
30 h, 0.40 V
28 h, 0.70 V
26 h, 1.00 V
24 h, 1.50 V
22 h, 1.50 V
20 h, 1.00 V
18 h, 0.70 V
16 h, 0.40 V
14 h, 0.20 V
12 h, 0.05 V
10 h, 0.05 V
8 h, 0.20 V
6 h, 0.40 V
4 h, 0.70 V
2 h, 1.00 V
0 h, 1.50 V
Figure 91. In situ Raman spectra (hourly averages) for the first two cycles of a polished single graphite particle (T1000-8000) vs. Li (Series 2). Raman conditions: D1, 3 x 60 s, 6 spectra/h. Elec-trochemical conditions: potential steps at 1.50, 1.00, 0.70, 0.40, 0.20 and 0.05 V, maximum cur-rent of ±2 mA, 300 µl of LC30. The spectra are arbitrarily offset along the y-axis.
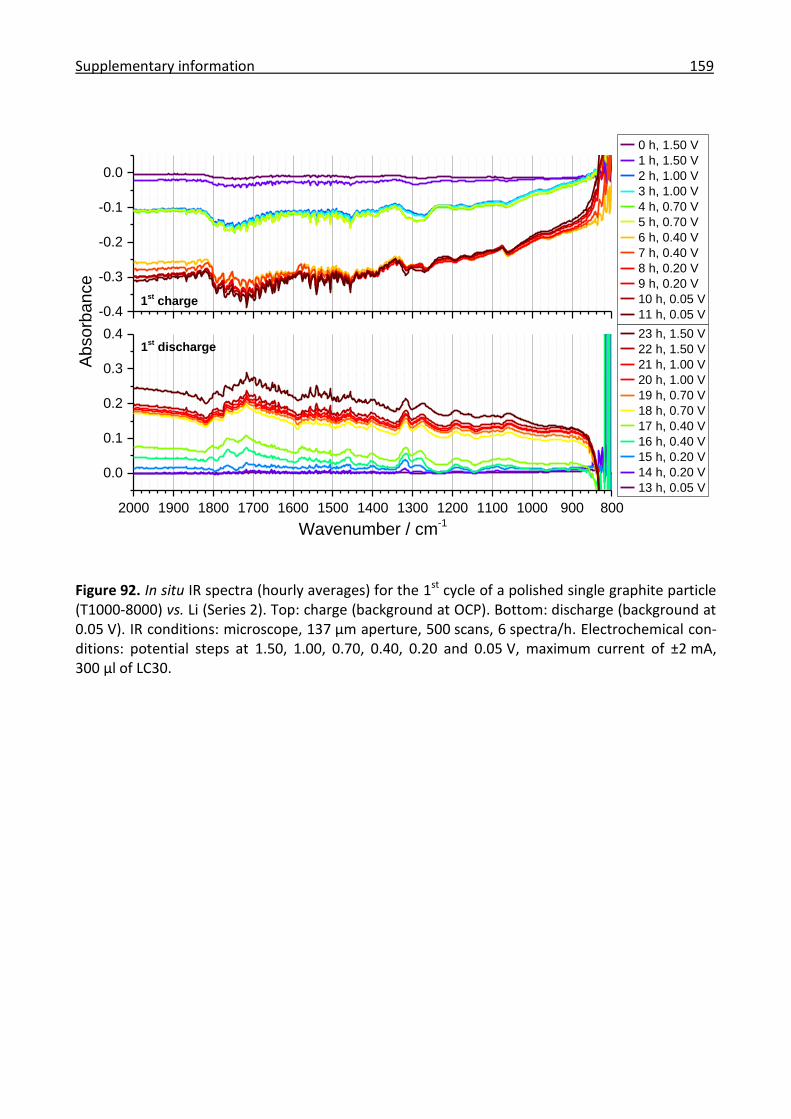
Supplementary information 159
-0.4
-0.3
-0.2
-0.1
0.0
2000 1900 1800 1700 1600 1500 1400 1300 1200 1100 1000 900 800
0.0
0.1
0.2
0.3
0.41
st discharge
Ab
so
rban
ce
0 h, 1.50 V
1 h, 1.50 V
2 h, 1.00 V
3 h, 1.00 V
4 h, 0.70 V
5 h, 0.70 V
6 h, 0.40 V
7 h, 0.40 V
8 h, 0.20 V
9 h, 0.20 V
10 h, 0.05 V
11 h, 0.05 V1
st charge
Wavenumber / cm-1
23 h, 1.50 V
22 h, 1.50 V
21 h, 1.00 V
20 h, 1.00 V
19 h, 0.70 V
18 h, 0.70 V
17 h, 0.40 V
16 h, 0.40 V
15 h, 0.20 V
14 h, 0.20 V
13 h, 0.05 V
Figure 92. In situ IR spectra (hourly averages) for the 1st cycle of a polished single graphite particle (T1000-8000) vs. Li (Series 2). Top: charge (background at OCP). Bottom: discharge (background at 0.05 V). IR conditions: microscope, 137 µm aperture, 500 scans, 6 spectra/h. Electrochemical con-ditions: potential steps at 1.50, 1.00, 0.70, 0.40, 0.20 and 0.05 V, maximum current of ±2 mA, 300 µl of LC30.

160 Appendix
-0.4
-0.3
-0.2
-0.1
0.0
2000 1900 1800 1700 1600 1500 1400 1300 1200 1100 1000 900 800
0.0
0.1
0.2
0.3
0.4
Ab
so
rban
ce
25 h, 1.50 V
26 h, 1.00 V
27 h, 1.00 V
28 h, 0.70 V
29 h, 0.70 V
30 h, 0.40 V
31 h, 0.40 V
32 h, 0.20 V
33 h, 0.20 V
34 h, 0.05 V
35 h, 0.05 V
Wavenumber / cm-1
47 h, 1.50 V
46 h, 1.50 V
45 h, 1.00 V
44 h, 1.00 V
43 h, 0.70 V
42 h, 0.70 V
41 h, 0.40 V
40 h, 0.40 V
39 h, 0.20 V
38 h, 0.20 V
37 h, 0.05 V
2nd
discharge
2nd
charge
Figure 93. In situ IR spectra (hourly averages) for the 2nd cycle of a polished single graphite particle (T1000-8000) vs. Li (Series 2). Top: charge (background at 1.50 V after 1 cycle). Bottom: discharge (background at 0.05 V after 1.5 cycles). IR conditions: microscope, 137 µm aperture, 500 scans, 6 spectra/h. Electrochemical conditions: potential steps at 1.50, 1.00, 0.70, 0.40, 0.20 and 0.05 V, maximum current of ±2 mA, 300 µl of LC30.

Publications and conferences 161
6.7 Publications and conferences
6.7.1 Peer-reviewed publications
Combined In Situ Raman and IR Microscopy at the Interface of a Single Graphite Particle with Ethylene Carbonate / Dimethyl Carbonate
P. Lanz, P. Novák
Journal of The Electrochemical Society 161 (2014), A1555-A1563
DOI: http://dx.doi.org/10.1149/2.0021410jes
Ex Situ and In Situ Raman Microscopic Investigation of the Differences Between Stoichiometric LiMO2 and High-Energy xLi2MnO3·(1-x)LiMO2 (M = Ni, Co, Mn)
P. Lanz, C. Villevieille, P. Novák
Electrochimica Acta 130 (2014) 206-212
DOI: http://dx.doi.org/10.1016/j.electacta.2014.03.004
Bulk and Surface Analyses of Ageing of a 5V-NCM Positive Electrode Material for Lithium-Ion Batteries
C. Villevieille, P. Lanz, C. Bünzli, P. Novák
Journal of Materials Chemistry A 2 (2014) 6488-6493
DOI: http://dx.doi.org/10.1039/C3TA13112B
Electrochemical Activation of Li2MnO3 at Elevated Temperature Investigated by In Situ Raman Microscopy
P. Lanz, C. Villevieille, P. Novák
Electrochimica Acta 109 (2013) 426-432
DOI: http://dx.doi.org/10.1016/j.electacta.2013.07.130
Characterization of a Model Solid Electrolyte Interphase/Carbon Interface by Combined In Situ Raman/Fourier Transform Infrared Microscopy
S. Pérez-Villar, P. Lanz, H. Schneider, P. Novák
Electrochimica Acta 106 (2013) 506-515
DOI: http://dx.doi.org/10.1016/j.electacta.2013.05.124
Oxygen Release from High-Energy xLi2MnO3·(1-x)LiMO2 (M = Mn, Ni, Co): Electrochemical, Dif-ferential Electrochemical Mass Spectrometric, In Situ Pressure, and In Situ Temperature Charac-terization
P. Lanz, H. Sommer, M. Schulz-Dobrick, P. Novák
Electrochimica Acta 93 (2013) 114-119
DOI: http://dx.doi.org/10.1016/j.electacta.2013.01.105
(Written during the PhD studies about experimental work performed during the Master’s studies)
162 Appendix
An Easy and Multigram-Scale Synthesis of Versatile AA- and AB-Type m-Terphenylenes as Build-ing Blocks for Kinked Polyphenylenes
P. Kissel, S. Breitler, V. Reinmüller, P. Lanz, L. Federer, A. Schlüter, J. Sakamoto
European Journal of Organic Chemistry 18 (2009) 2953-2955
DOI: http://dx.doi.org/10.1002/ejoc.200900263
(Written during the term project at ETH Zurich)
6.7.2 Conference contributions
65th Annual Meeting of the ISE, Lausanne Poster: Investigation of Electrode Materials for Lithium-Ion Cells by Combined In Situ Raman and IR Microscopy
IBA 2014, Brisbane Poster: Combined In Situ Raman and IR Microscopy of Electrode Materials for Lithium-Ion Bat-teries
LAC Christmas Symposium 2013, ETH Zurich Talk: In Situ Raman and IR Microscopy of Electrode Materials for Lithium-Ion Batteries
IinteR-La+b 2013, International Interdisciplinary Research Laboratory, Lugano Invited Panellist
GFECI 2013, Clermont-Ferrand Talk: In Situ and Ex Situ Raman and IR Spectroscopy Applied to the Characterization of Overlithi-ated NCM and Reference Materials
E-MRS 2012 Spring Meeting, Strasbourg Poster: In Situ Raman Microscopy of Li2MnO3·Li(NixCoyMnz)O2 Electrodes for Lithium-Ion Cells