for personal use only - asx2014/08/22 · 29 oct 1 3 9 dec 1 3 spk share price 28 june 2013 to 30...
TRANSCRIPT

Spark New Zealand Limited (formerly Telecom Corporation of New Zealand Limited) ARBN 050 611 277 Spark City, 167 Victoria Street West, Private Bag 92028, Auckland, New Zealand
ASX Market Announcements Australian Securities Exchange 4th Floor, 20 Bridge Street Sydney NSW 2000 Australia 22 August 2014 SPARK NEW ZEALAND LIMITED (formerly Telecom Corporation of New Zealand Limited) H2 FY14 RESULTS AND ANNUAL REPORT Dear Sir/Madam In accordance with ASX Listing Rules 4.3A and 4.7, I enclose the following for release to the market in relation to Spark New Zealand Limited’s H2 FY14 results:
1. Appendix 4E 2. Annual Report 3. Section 209 notice 4. Appendix 7 (NZX form)
The following information will follow:
5. Corporate Governance Statement 6. Appendix 4G 7. Media release 8. Investor presentation (containing FY15 earnings guidance) 9. Detailed financial information
Spark New Zealand’s Managing Director, Simon Moutter, and Chief Financial Officer, Jolie Hodson, will discuss the H2 FY14 Results at 10:00am New Zealand time today. Spark New Zealand’s 2014 Annual Report is now available at: investors.sparknz.co.nz. In accordance with the New Zealand Companies Act 1993 and NZSX Listing Rules, Spark New Zealand is no longer required to automatically mail shareholders a hard copy of the Annual Report. Shareholders may request a hard copy by responding to the section 209 notice that will be mailed to them. This announcement will also be released to the New Zealand Stock Exchange. Yours sincerely
Silvana Roest Company Secretary
For
per
sona
l use
onl
y
Spark New Zealand Limited (formerly Telecom Corporation of New Zealand Limited)
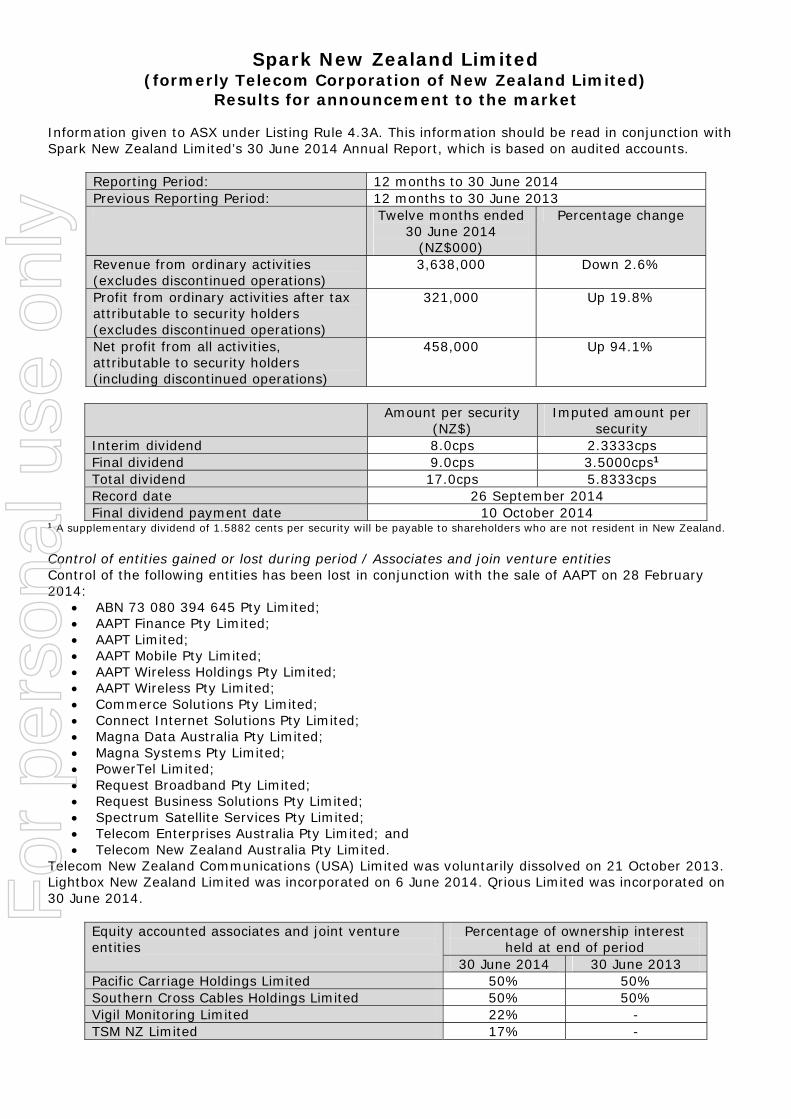
Results for announcement to the market Information given to ASX under Listing Rule 4.3A. This information should be read in conjunction with Spark New Zealand Limited’s 30 June 2014 Annual Report, which is based on audited accounts.
Reporting Period: 12 months to 30 June 2014 Previous Reporting Period: 12 months to 30 June 2013
Twelve months ended 30 June 2014
(NZ$000)
Percentage change
Revenue from ordinary activities (excludes discontinued operations)
3,638,000 Down 2.6%
Profit from ordinary activities after tax attributable to security holders (excludes discontinued operations)
321,000 Up 19.8%
Net profit from all activities, attributable to security holders (including discontinued operations)
458,000 Up 94.1%
Amount per security
(NZ$) Imputed amount per
security Interim dividend 8.0cps 2.3333cps Final dividend 9.0cps 3.5000cps1 Total dividend 17.0cps 5.8333cps Record date 26 September 2014 Final dividend payment date 10 October 2014
1 A supplementary dividend of 1.5882 cents per security will be payable to shareholders who are not resident in New Zealand. Control of entities gained or lost during period / Associates and join venture entities Control of the following entities has been lost in conjunction with the sale of AAPT on 28 February 2014:
ABN 73 080 394 645 Pty Limited; AAPT Finance Pty Limited; AAPT Limited; AAPT Mobile Pty Limited; AAPT Wireless Holdings Pty Limited; AAPT Wireless Pty Limited; Commerce Solutions Pty Limited; Connect Internet Solutions Pty Limited; Magna Data Australia Pty Limited; Magna Systems Pty Limited; PowerTel Limited; Request Broadband Pty Limited; Request Business Solutions Pty Limited; Spectrum Satellite Services Pty Limited; Telecom Enterprises Australia Pty Limited; and Telecom New Zealand Australia Pty Limited.
Telecom New Zealand Communications (USA) Limited was voluntarily dissolved on 21 October 2013. Lightbox New Zealand Limited was incorporated on 6 June 2014. Qrious Limited was incorporated on 30 June 2014.
Equity accounted associates and joint venture entities
Percentage of ownership interest held at end of period
30 June 2014 30 June 2013 Pacific Carriage Holdings Limited 50% 50% Southern Cross Cables Holdings Limited 50% 50% Vigil Monitoring Limited 22% - TSM NZ Limited 17% -
For
per
sona
l use
onl
y

Spark starts here.
Spark New Zealand | Annual Report 2014
For
per
sona
l use
onl
y

KEY DATES
Annual Meeting
7 November 2014
Half-year results announcement
19 February 2015
Financial year-end
30 June 2015
SECTION 1: SPARK NEW ZEALAND STARTS HERE
Spark New Zealand starts here 1
Spark New Zealand Performance 2014 8
Chairman and Managing Director report 10
Board of Directors 14
Leadership Team 18
SECTION 2: SPARK NEW ZEALAND PERFORMANCE
Key performance indicators 22
Group result 24
Spark Home, Mobile & Business 26
Spark Digital 28
Spark Connect 30
Spark Ventures 32
Capital management and dividends 34
Spark People 38
Spark Foundation 40
Environment 42
SECTION 3: FINANCIAL PERFORMANCE
Independent auditor’s report 45
Financial statements 46
Notes to the financial statements 52
SECTION 4: CORPORATE GOVERNANCE
Governance and disclosures 96
Glossary 106
Directory 107
The Company changed its name from Telecom Corporation of New Zealand Limited to Spark New Zealand Limited on 8 August 2014. ARBN 050 611 277
This report is dated 22 August 2014 and is signed on behalf of the Board of Spark New Zealand Limited by Mark Verbiest, Chairman, and Simon Moutter, Managing Director.
Mark VerbiestChairman
Simon MoutterManaging Director
For
per
sona
l use
onl
y

Page 1
Spark is more than a name change. It reflects enormous change for our customers and our business. At Spark, our ambition is to be a winning business, inspired by customers to unleash the potential in all New Zealanders.Join our journey.
For
per
sona
l use
onl
y

Page 2 Spark New Zealand Annual Report 2014 Spark starts here.
A winning business
For
per
sona
l use
onl
y

Page 3
Spark is a catalyst to an internal culture of winning.
Winning by being #1 in mobility, data, effortless service and cost.
Winning by ensuring we are growing our share in the markets that most matter and being business-savvy enough to invest in the areas that customers most value, now and in the future.
Winning by building big new businesses in digital services such as internet TV, Cloud computing services and big data.
Winning by our Turnaround programme enabling us to lower our prices and keep investing in the technologies that New Zealanders demand.
Winning by ensuring we attract and retain the very best Spark talent and investing in them to be their best.
Winning by ensuring we know New Zealanders better than anyone else and providing them with digital services they never thought possible.
Winning by building the best performing, lowest cost per GB data network in our country, built for the future.
For
per
sona
l use
onl
y

Page 4 Spark New Zealand Annual Report 2014 Spark starts here.
Inspiredby customers
For
per
sona
l use
onl
y

Page 5
Our customers’ worlds are getting faster and more demanding. Their lives are more diverse, more global and more exciting.
27 years ago when the Telecom brand was first created, mobile phones, the Internet, Google, Amazon and Facebook didn’t even exist.
There have been huge technology shifts in the last three decades and we expect rapid change to continue.
It’s up to us to keep up with the blistering pace of change, helping customers navigate the changes yet to come.
Customers rely on us for so much now. To be an individual, to fit in, to share cool stuff, to be in touch, to run their business, to do good, to be a family, to be the best they can be.
We know that the most inspired and customer-focused businesses in the world are also among the best performing.
So we want to truly understand our customers; understand their feelings, their frustrations, their aspirations and what drives them to succeed. We want to understand why they stay with us, why they are with others and what it would take to change their mind.
We want to know what customers will really value – and deliver it to them. We want to be inspired by them.
For
per
sona
l use
onl
y

Page 6 Spark New Zealand Annual Report 2014 Spark starts here.
For
per
sona
l use
onl
y

Page 7
In whatever way that New Zealanders want to unleash their potential, we know we can make a difference.
We believe in their potential as individuals, as families, as friends, as businesses and as organisations.
Our customers want to unleash their potential by learning, creating, enabling others, uniting, sharing, encouraging.
Our customers want to unleash their potential by inspiring, reshaping, being a success, doing good, being respected.
Our customers want to unleash their potential by launching a start-up, expanding globally or building an empire.
We are setting out to help them achieve all this through the amazing technology and digital services we provide.
And in doing so, Spark New Zealand will deliver long term value for our customers and our shareholders.
Unleashing the potential in all New Zealanders
For
per
sona
l use
onl
y

Page 8 Spark New Zealand Annual Report 2014 Spark New Zealand Performance 2014
Spark New Zealand Performance 2014
Operating revenue and other gains* NZ$
3,638M▼ 2.6%
EBITDA NZ$
936M▲ 7.1% NON-ADJUSTED ▼ 4.0% ADJUSTED
Dividends per share NZ$
17cents▲ 1 cent per share
Net earnings* NZ$
323M▲ 19.6% NON-ADJUSTED ▼ 7.7% ADJUSTED
Fixed revenue decline slowed from $98M in H1 to $54M in H2
CAPEX* NZ$
459M▲ 9.0%
Total shareholder returns
28%2.00
2.20
2.40
2.60
2.80
SHA
RE
PRIC
E $
28 J
UN
13
17 J
AN
14
27 F
EB 1
4
9 A
PR 1
4
20 M
AY
14
30 J
UN
14
8 A
UG
13
18 S
EP 1
3
29 O
CT
13
9 D
EC 1
3
SPK Share Price28 June 2013 to 30 June 2014
* From Continuing Operations
For
per
sona
l use
onl
y

Page 9
Mobile revenues up 6%
IT services EBITDA up 38.5% on the back of Cloud and Data Centre investments
Broadband connections 669,000 up 20,000
More than 175,000 Spark app users
Retail store foot traffic up 15%
Average monthly GB use per household doubled
Mobile connections up 191,000, now over 2M in total
Sold the AAPT business for $506M
Committed to purchase 4 lots of 700 MHz spectrum
Acquired Cloud computing business Appserv
Launched internet TV business Lightbox
Spark rebranding completed
2MOver
mobile connections in totalF
or p
erso
nal u
se o
nly

Page 10 Spark New Zealand Annual Report 2014 Chairman and Managing Director report
Welcome to our first annual report as Spark New Zealand. This year’s financial results show that the strategy the Company has been executing for the last two years is beginning to deliver.
We are executing relentlessly against that strategy, as demonstrated by our ongoing success in one of our major strategic priorities, mobile. We’ve added around 280,000 mobile connections since the closure of the CDMA network and we now have more than two million mobile connections.
The stronger performance in the second half of the year shows a significant slowing of the long-term decline in earnings. This is driven by ongoing decline in legacy fixed products being offset by growth in the mobile and data products and services that are our future.
Our centrally led Turnaround programme has helped increase business momentum and generated greater than expected cash flow benefits. In turn, this has allowed further room, alongside the funds freed by our divestment of AAPT in Australia, for strategic investment in selected growth areas.
These include the launch of an internet TV service called Lightbox, greater investment in Cloud computing through the acquisition of Appserv, further data centre development in the main centres around New Zealand and a number of exciting new businesses emerging out of our Spark Ventures incubator team.
We’ve also continued to invest in building an outstanding data network, upgrading our core transport network and information technology systems, acquiring more 700 MHz spectrum for 4G mobile data than anyone else and launching many fantastic new products and services. We believe this shows our commitment to delivering a better future for our New Zealand customers.
Mark VerbiestChairman
Simon MoutterManaging Director
The journey in changing our core brands reached a big milestone when we officially changed our Company and core brand names to Spark just a few weeks ago on August 8.
The transformation we are undergoing was also driven by the fundamental realisation that our customers wanted us to change, and that our future success depends on them.
We know that this change has generated a lot of interest. We believe this is an essential element of our future success. The timing is right, we have momentum in the market and we are following in the proven footsteps of telecommunications companies around the world such as Orange, O2, Verizon and Sprint, who each changed their name several years ago to reflect the very different world in which they now operate.
Operating expenses were down 5.6% largely due to continuing productivity focus through the Turnaround programme and cycling the FY13 restructure and asset impairment expenses.
Earnings before interest, tax, depreciation and amortisation (EBITDA) from continuing operations were up 7.1%. After excluding $101 million of restructuring related expenses in FY13, the EBITDA from continuing operations declined by 4.0%. Spark New Zealand’s net earnings after tax for FY14 was $460 million, an increase of $222 million, or 93.3%, from FY13. This included net earnings from discontinued operations of $137 million following the sale of the AAPT business.
We’ve taken steps to bring our total focus on the New Zealand market, selling AAPT for $506 million to TPG Telecom Limited and announcing our intention to sell our interest in Telecom Cook Islands, as well as winding down our IT business in Australia.
Spark Home, Mobile & Business (formerly Telecom Retail) has had an excellent year, performing particularly well in mobile and in lifting customer preference. Our share of mobile market revenue continued to improve to approximately 39.4%, while the number of mobile connections grew a net 191,000 during the financial year. Our share of the intensely competitive broadband market was stable at around 47%.
For
per
sona
l use
onl
y

Page 11
We have been introducing more and more initiatives designed to understand our customers better and respond to their needs. We’ve provided a lot of additional value for our customers through the addition of services such as free Spotify and free WiFi. We’ve accelerated the provision of digital customer services, with more than 90% of all customer interactions now self-service and with our digital sales doubling.
We’re helping more and more customers access online services. The Spark app is a key element of our digital self-serve future, with over 175,000 customers now using it. The extraordinary success of Tech in a Sec also demonstrates the appetite customers have for better understanding what technology can do for their lives.
Spark Digital (formerly Gen-i) has continued its rapid repositioning towards Cloud infrastructure, mobility, managed ICT and platform-as-a-service. The financial results reflect this repositioning, with IT services margin growth exceeding revenue growth and with a significant sales pipeline of new business.
The acquisition of Appserv in July 2014 adds to the significant investment across Spark New Zealand in Cloud services and provides a major new piece in the Cloud jigsaw. We see this as a strategic business move giving us a very strong New Zealand Cloud services portfolio. The combined capabilities of Spark Digital, Appserv and Revera mean we can now offer leading Cloud computing expertise to all New Zealand businesses including small and medium enterprises (SMEs).
In the IT services area, Revera is continuing to grow strongly and perform well. We have secured a number of significant new IT as-a-service contracts, including Ministry of Social Development and Transpower. We have added new or imminent data centre business totalling in excess of 250 data centre racks since the beginning of 2014.
Given that success, our investment in data centres has continued. In Wellington, a new Revera centre opened in September 2013 that is now 100% allocated, with a third centre due to open in
October 2014. In Christchurch a new green fields centre opened in August 2013 and is already over 30% full. In Auckland a new high resiliency data centre in Takanini is due to open in October 2014, with 38% of capacity already allocated.
Spark Ventures (formerly Digital Ventures) has developed some innovative new services, including Lightbox, a world-class internet TV service with thousands of hours of high-quality content on day one and the launch of a promising big data business, Qrious.
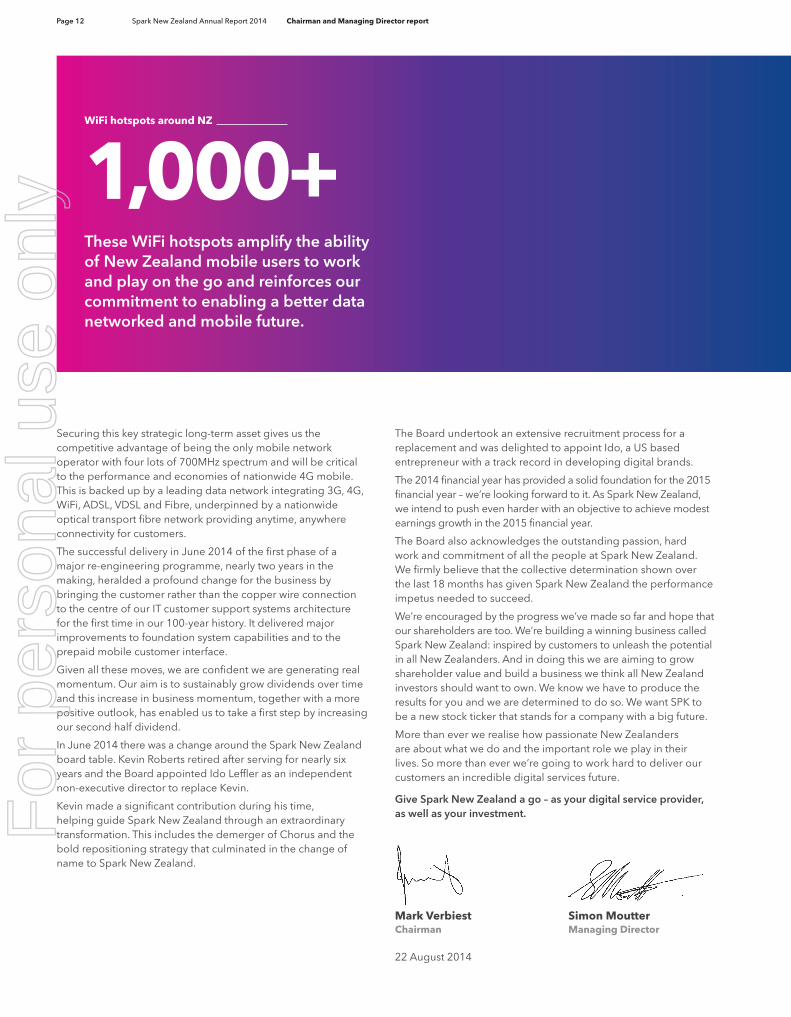
We have unveiled over 1,000 WiFi hot spots all around New Zealand, including a number of them at public transport locations through a strategic partnership with Auckland Transport. These WiFi hotspots amplify the ability of New Zealand mobile users to work and play on the go and reinforce our commitment to enabling a better data networked and mobile future.
During the year Spark New Zealand committed to invest $158 million in four lots of 700MHz spectrum and obtained its preferred location of those lots within the spectrum band.
“We’re helping more and more customers access online services. The Spark app is a key element of our digital self-serve future with over 175,000 customers now using it. The extraordinary success of Tech in a Sec also demonstrates the appetite customers have for better understanding what technology can do for their lives.“
For
per
sona
l use
onl
y
Page 12 Spark New Zealand Annual Report 2014 Chairman and Managing Director report
Securing this key strategic long-term asset gives us the competitive advantage of being the only mobile network operator with four lots of 700MHz spectrum and will be critical to the performance and economies of nationwide 4G mobile. This is backed up by a leading data network integrating 3G, 4G, WiFi, ADSL, VDSL and Fibre, underpinned by a nationwide optical transport fibre network providing anytime, anywhere connectivity for customers.
The successful delivery in June 2014 of the first phase of a major re-engineering programme, nearly two years in the making, heralded a profound change for the business by bringing the customer rather than the copper wire connection to the centre of our IT customer support systems architecture for the first time in our 100-year history. It delivered major improvements to foundation system capabilities and to the prepaid mobile customer interface.
Given all these moves, we are confident we are generating real momentum. Our aim is to sustainably grow dividends over time and this increase in business momentum, together with a more positive outlook, has enabled us to take a first step by increasing our second half dividend.
In June 2014 there was a change around the Spark New Zealand board table. Kevin Roberts retired after serving for nearly six years and the Board appointed Ido Leffler as an independent non-executive director to replace Kevin.
Kevin made a significant contribution during his time, helping guide Spark New Zealand through an extraordinary transformation. This includes the demerger of Chorus and the bold repositioning strategy that culminated in the change of name to Spark New Zealand.
Mark VerbiestChairman
Simon MoutterManaging Director
The Board undertook an extensive recruitment process for a replacement and was delighted to appoint Ido, a US based entrepreneur with a track record in developing digital brands.
The 2014 financial year has provided a solid foundation for the 2015 financial year – we’re looking forward to it. As Spark New Zealand, we intend to push even harder with an objective to achieve modest earnings growth in the 2015 financial year.
The Board also acknowledges the outstanding passion, hard work and commitment of all the people at Spark New Zealand. We firmly believe that the collective determination shown over the last 18 months has given Spark New Zealand the performance impetus needed to succeed.
We’re encouraged by the progress we’ve made so far and hope that our shareholders are too. We’re building a winning business called Spark New Zealand: inspired by customers to unleash the potential in all New Zealanders. And in doing this we are aiming to grow shareholder value and build a business we think all New Zealand investors should want to own. We know we have to produce the results for you and we are determined to do so. We want SPK to be a new stock ticker that stands for a company with a big future.
More than ever we realise how passionate New Zealanders are about what we do and the important role we play in their lives. So more than ever we’re going to work hard to deliver our customers an incredible digital services future.
Give Spark New Zealand a go – as your digital service provider, as well as your investment.
These WiFi hotspots amplify the ability of New Zealand mobile users to work and play on the go and reinforces our commitment to enabling a better data networked and mobile future.
WiFi hotspots around NZ
1,000+
22 August 2014
For
per
sona
l use
onl
y

Page 13
Spark Home, Mobile & Business provides access to technology in new and innovative ways to help
New Zealanders and New Zealand businesses move forward and
reach their goals.
Spark Digital is focussed on supporting the success of New Zealand businesses both
here and wherever they want to operate in today’s globally
connected world.
Spark Ventures will be accelerating the Company’s future focus and
pace of innovation, and delivering new services and businesses such as WiFi, internet TV and
Smart Data analytics.
Spark Connect will deliver the technology, products and processes to ensure great customer experiences and world-leading connectivity via the Spark Network.
S P E C I A LT Y A N D F L A N K I N G B R A N D S
The business of Spark New Zealand
For
per
sona
l use
onl
y

Page 14 Spark New Zealand Annual Report 2014 Board of Directors
Experienced.
“ I know how important technology is to the future of our country. I live in Wanaka, but with good internet and mobile connections I can stay connected to people and businesses around New Zealand and the world. In my role as a professional director, I’ve seen fantastic innovation coming out of businesses in this country. I want Spark New Zealand to enable that creative spirit and energy.”
nz.linkedin.com/pub/mark-verbiest/12/702/102
Mark Verbiest CHAIRMAN Non-executive Director
“ Existing traditional fixed and mobile access services are commoditised and even with a best in class organisation and cost benchmarks, Spark New Zealand could only, at best, hold its own. The new sources of revenue growth will come from Content, Applications and Transactional services. The competition has been eating our lunch for far too long now – it’s truly time for us to start eating theirs.”
hk.linkedin.com/pub/paul-berriman/48/7ab/a1a
Paul Berriman Non-executive Director
“ I live in the country and work around New Zealand and overseas, so I know how critical it is to have good internet and mobile connections everywhere, anytime. Spark New Zealand will help us to do more with those connections – at home, at work and at play.”
Murray Horn Non-executive Director
“ After hearing the vision of the Spark New Zealand Board and Leadership Team, I jumped at the chance to help reinvent a company which can truly help New Zealanders make a difference through technology and innovation.”
linkedin.com/pub/ido-leffler/b/320/5bb @idoleffler
Ido Leffler Non-executive Director
For
per
sona
l use
onl
y

Page 15
“ Spark New Zealand needs to be bold if we want to succeed in the modern interconnected world. This will require strength, focus and bravery from everyone involved. I want to help keep Spark New Zealand heading in the right direction, adjusting strategy where needed, mitigating risk and ensuring alignment of our goals across the whole company.”
linkedin.com/pub/maury-leyland/1/956/187
Maury Leyland Non-executive Director
“ The last decade has seen a revolution in communications technology. Things we take for granted now – WiFi, 4G, iPads, smartphones, ultrafast broadband – for all practical purposes didn’t even exist back then. The changes in the next 10 years will be no less daunting – we need to embrace them.”
Charles Sitch Non-executive Director
For more information on Director’s profiles and experience see page 16-17 or our website www.sparknz.co.nz/about/directors
“ We’ve simplified the business to concentrate on the key things that customers want – quality service, great value and the latest digital services. The technology sector is changing faster than almost any other industry in the country and Spark New Zealand needs to stay ahead of that change.”
Justine Smyth Non-executive Director
“We’ve dramatically lifted our operational performance over the past 18 months. This reflects a significant shift in our strategy and the pace of change that’s happening in social trends, technology and in our industry.”
@simonmoutter
Simon Moutter Managing Director
For
per
sona
l use
onl
y

Page 16 Spark New Zealand Annual Report 2014 Board of Directors
Mark Verbiest CHAIRMAN
Non-executive Director
TERM OF OFFICE: Appointed Director 1 December 2011 and last re-elected at the 2012 Annual Meeting.
BOARD COMMITTEES: Chair of the Nominations and Corporate Governance Committee and a member of the Human Resources and Compensation Committee.
Mark’s involvement in the transformation to Spark New Zealand runs a lot deeper than his role as Chairman during the past three years of significant change. His experience in the telecommunications sector extends over more than a decade, including 7½ years on the Company’s senior executive team from 2000. Mark’s experience in utilities, capital markets and infrastructure has been invaluable, given the massive structural changes that have occurred within the industry over recent years. Mark is an experienced company director, also serving as Chairman of Transpower New Zealand Limited, a Director of ANZ Bank New Zealand Limited and Freightways Limited, Chairman of Willis Bond Capital Partners Limited and Willis Bond General Partner Limited, a member of the Commercial Operations Advisory Board of the New Zealand Treasury and a former Board Member of the Financial Markets Authority. He is also a trustee of the Southern Lakes Arts Festival Trust. Mark has a law degree from Victoria University of Wellington.
Murray HornNon-executive Director
TERM OF OFFICE: Appointed Director 1 July 2007 and last re-elected at the 2011 Annual Meeting.
BOARD COMMITTEES: Chair of the Audit and Risk Management Committee and a member of the Nominations and Corporate Governance Committee.
Murray believes in high standards of transparency and financial reporting to build trust among investors. A Director since July 2007, Murray has played a key role in the Company’s successful transition from an infrastructure-focused business to a competitive retail provider. Murray’s extensive governance experience spans both the corporate and public sectors. He chairs the Wynyard Group Limited, the New Zealand Health Innovation Hub and Marisco Properties Limited and is a Director for the Beijing board of the China Construction Bank. Murray previously held a number of senior executive roles with ANZ Banking Group, including leading the group’s New Zealand operations. He was Secretary to the New Zealand Treasury and has served on a number of boards, including the Government’s National Health Board and the New Zealand Tourism Board. He has represented New Zealand at the OECD, as a Governor at the World Bank and as an Alternate Director at the International Monetary Fund. Murray received his doctorate from Harvard University in 1989 and has been awarded a number of academic honours in both New Zealand and the United States. Murray was awarded a Companion of the New Zealand Order of Merit (CNZM) in the 2013 Queen’s Birthday Honours.
Paul BerrimanNon-executive Director
TERM OF OFFICE: Appointed Director 1 December 2011 and last re-elected at the 2012 Annual Meeting.
BOARD COMMITTEES: Member of the Audit and Risk Management Committee and the Nominations and Corporate Governance Committee.
Paul joined the Board of Directors in December 2011, bringing over 25 years of international experience in telecommunications, media and convergence. Paul’s career with Hong Kong’s PCCW group has given him unique insights into the need for telcos to reinvent themselves. A decade ago PCCW was a traditional telco; the group is now Hong Kong’s biggest pay TV company, as well as being the largest integrated fixed broadband and mobile operator. Paul is the Group Chief Technology Officer of the HKT Trust, the listed telecommunications arm of PCCW. He is primarily responsible for leading the group’s product and technology roadmap and strategic development. In 2009 Paul was recognised by the IPTV World Forum with their Special Merit Award for Outstanding Industry Contribution and in 2008 he was listed as one of the Global Telecoms Business Magazine’s top 100 “most influential persons in telecoms”. Before joining PCCW in 2002, Paul was Managing Director of management consultancy Arthur D. Little in Hong Kong and also held roles in Reuters and several major Hong Kong service providers. Paul holds a Bachelor of Science degree in electro-acoustics from the University of Salford in the United Kingdom and a Master of Business Administration degree from the University of Hong Kong. A Chartered Engineer, he is a current or former member of a number of industry working groups and advisory boards.
Ido LefflerNon-executive Director
TERM OF OFFICE: Appointed a Director 9 June 2014
Encouraging more innovation and creativity at Spark New Zealand was the basis for Ido’s appointment in June 2014 to the Board of Directors. He’s a West Coast US based entrepreneur with experience in developing digital brands and has extensive networks in the start-up communities of Silicon Valley and Australasia. Ido is the Co-founder & CEO at Yoobi, a new school supplies company that engages kids through bright colours, cool designs, and most importantly, cause. For every Yoobi item purchased, Yoobi distributes an item to a classroom in need in the US. He is also Co-Founder of San Francisco based Yes To Inc., which markets a range of vegetable brands and also one of the world’s leading natural beauty brands - with distribution in over 25,000 stores in over 20 countries. Ido sits on numerous corporate/advisory boards including The United Nations Foundation Global Entrepreneur Council and The Dell Global EIR Advisory Board. Ido has been variously described as among the 1,000 most creative people in business, one of 30 top entrepreneurs under 30 and as one of the top 50 Achieving Australians outside of Australia. Ido attended the University of Technology Sydney where he earned his Bachelor of Business in Marketing & International Business.
For
per
sona
l use
onl
y

Page 17
Maury LeylandNon-executive Director
TERM OF OFFICE: Appointed Director 1 December 2011 and last re-elected at the 2013 Annual Meeting.
BOARD COMMITTEES: Member of the Human Resources and Compensation Committee and the Nominations and Corporate Governance Committee.
Maury joined the Board of Directors in December 2011 with a wealth of experience working on large, complex, and ultra-competitive challenges and a strong technical background in engineering. She has been a senior executive at Fonterra since 2005 and is currently Managing Director of People, Culture and Strategy. Prior to joining Fonterra, she spent nine years with the Boston Consulting Group as a strategy consultant working with large companies in New Zealand and Australia and she has previously been a director of Transpower New Zealand Limited. Earlier in her career, Maury honed her competitive edge as a member of both the design and sailing teams for Team New Zealand during the successful 1995 America’s Cup campaign in San Diego. Maury has a Bachelor of Engineering in Engineering Science with First Class Honours from Auckland University, is a Fellow of the Institution of Professional Engineers New Zealand and a Member of the Institute of Directors.
Justine SmythNon-executive Director
TERM OF OFFICE: Appointed Director 1 December 2011 and last re-elected at the 2013 Annual Meeting.
BOARD COMMITTEES: Chair of the Human Resources and Compensation Committee and a member of the Audit and Risk Management Committee and the Nominations and Corporate Governance Committee.
When Justine takes on a governance position it is important to her that she has a real passion for the company and the role it can play for New Zealand. That’s why she was delighted to join the Board of Spark New Zealand in December 2011. Her background is in finance and business management (with Deloitte and Lion Nathan), and she owns a retail clothing business with brands across Australasia. She is a Director of Auckland International Airport Limited, a Board Member of the Financial Markets Authority, and a former Deputy Chair of New Zealand Post Limited. She also chairs the New Zealand Breast Cancer Foundation. Justine’s experience in governance, mergers and acquisitions, taxation and financial performance of large corporate enterprises and the acquisition, ownership, management and sale of small and medium enterprises underpins her contribution as a Director. Her focus is on reshaping Spark New Zealand so it can make the bold decisions necessary to ensure the Company is fit for the future. Justine has a Bachelor of Commerce from Auckland University and is a Member of the New Zealand Institute of Chartered Accountants.
Charles SitchNon-executive Director
TERM OF OFFICE: Appointed Director 1 December 2011 and last re-elected at the 2013 Annual Meeting.
BOARD COMMITTEES: Member of the Audit and Risk Management Committee and the Nominations and Corporate Governance Committee.
Charles brings a deep international perspective across the telecommunications, consumer services and retail sectors gained during his 23-year career with international management consulting firm, McKinsey & Company. He joined McKinsey & Company in 1987 and in 2000 became a Senior Director, primarily working with CEOs and Boards on strategy and operations turnarounds, before retiring in 2010. Since 2006 he has been involved in various new business ventures. A Director since December 2011, Charles is focused on shareholder returns and embracing new communications technologies to create world-class customer experiences. Charles is a member of the Board of Trinity College at Melbourne University, the Robin Boyd Foundation, and a committee member of the Melbourne Cricket Club. He was previously an Advisory Director at Bkk Partners, an investment bank. Charles holds a MBA from Columbia Business School and a LLB, BCom from Melbourne University.
Simon MoutterExecutive Director, Non-independent
TERM OF OFFICE: Appointed Executive Director and Managing Director 13 August 2012 and elected at the 2012 Annual Meeting.
BOARD COMMITTEES: None.
As Managing Director, Simon is responsible for the overall leadership, strategic direction and management of Spark New Zealand, through its various business divisions and the brands that provide digital services to millions of New Zealanders and thousands of New Zealand businesses. Simon has led the reinvention of Telecom to Spark New Zealand, in order to better reflect the new world of digital services in which the business now operates. As a passionate and committed New Zealander, his ambition is for Spark New Zealand to be a winning business, inspired by customers to unleash the potential in all New Zealanders. Simon returned to the business in mid-2012. He has a deep understanding of the industry, having managed most parts of Telecom in previous roles, most recently as Chief Operating Officer during the years 2003–2008. In the intervening years, he led Auckland International Airport for a period of four years in which he invested in a successful growth strategy and transformed the customer experience to deliver a significant uplift in shareholder value. Simon spent 13 years in the electricity and gas industry including as chief executive of Powerco (1992 to 1999). Simon has a Master of Engineering from the University of Canterbury and a Bachelor of Science from Massey University.
For
per
sona
l use
onl
y
Page 18 Spark New Zealand Annual Report 2014 Leadership Team
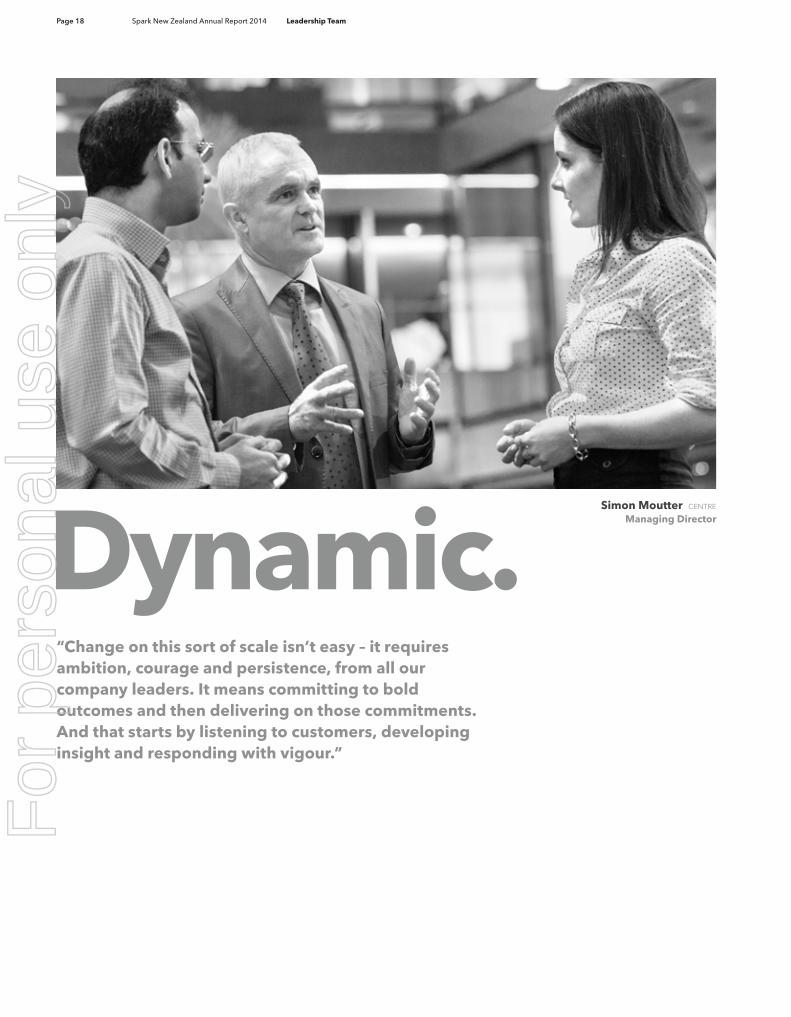
Dynamic.Simon Moutter CENTRE
Managing Director
“Change on this sort of scale isn’t easy – it requires ambition, courage and persistence, from all our company leaders. It means committing to bold outcomes and then delivering on those commitments. And that starts by listening to customers, developing insight and responding with vigour.”
For
per
sona
l use
onl
y

Page 19
Matt Crockett RIGHT
Chief Turnaround Officer
David Havercroft RIGHT
Chief Operating Officer Spark Connect
Jolie Hodson RIGHT
Chief Financial Officer
Joe McCollumGroup HR Director
Tim Miles CENTRE
Chief Executive Spark Digital
Chris Quin RIGHT
Chief Executive Spark Home, Mobile and Business
Rod Snodgrass RIGHT
Chief Executive Spark Ventures
For more information on the Leadership Team see page 20-24 or our website www.sparknz.co.nz/about/leadershipteam
For
per
sona
l use
onl
y

Page 20 Spark New Zealand Annual Report 2014 Leadership Team
Simon MoutterManaging Director, Spark New Zealand
See Board of Directors for information on Simon Moutter.
David HavercroftChief Operating Officer, Spark Connect
David Havercroft is the Chief Operating Officer of Spark Connect, the business unit responsible for delivering the technology, products and processes to ensure great customer experiences and world-leading connectivity via the Spark Network. David joined the Company in October 2009 and has over 25 years of international technology industry experience. He has held executive roles in business and technology functions in British Telecom, Cable & Wireless, IBM and PwC. David is responsible for building the best network experience for our customers, ensuring the lowest cost per gigabyte data network in the country that is built for the future. This involves optimising the huge investments being made in New Zealand’s digital future, including in data network capability, mobile spectrum and IT platforms, in order to set Spark New Zealand up for success and for further growth in the future. David has a proven track record in designing and leading large-scale, complex business and information technology transformation programmes with a particular focus on strategic partnerships. David has a Bachelor of Arts with Honours, majoring in Economics.
Matt CrockettChief Turnaround Officer, Spark New Zealand
Matt is leading Spark New Zealand’s cost and business improvement programme. Matt leads a team successfully identifying and delivering initiatives to improve the performance of business units and support functions. This includes strengthening the internal capabilities needed to maximise future cost and business improvement opportunities, with the ‘owner’s mind set’ at the core of that process. Matt re-joined the Company in June 2013 coming from senior roles with APN News and Media, a leading media company operating radio, outdoor, publishing and digital media businesses across Australia, New Zealand and Asia. Before joining APN Matt held a number of senior roles at Telecom, most recently as the Chief Executive Officer of Telecom Wholesale and International. Before his first stint with the Company, Matt was at global management consulting firm McKinsey & Company for seven years. He initially studied and worked as a mining engineer in Western Australia before being awarded a Rhodes Scholarship for postgraduate study at Oxford University, where he completed a Masters of Philosophy in Management.
Jolie HodsonChief Financial Officer, Spark New Zealand
Jolie is the Chief Financial Officer for Spark New Zealand. Jolie understands the critical role of the finance function in dynamic, competitive markets and during a massive organisational transformation. Jolie concentrates on developing clear insight into what customers value, what makes the business more competitive and what delivers value for Spark New Zealand. Prior to joining the Company, Jolie worked for 12 years with the Lion group, Australasia’s largest beverages group in a range of senior financial roles. Most recently she was Finance Director of the Beer, Spirits & Wine Australia division Lion’s largest business unit. Before joining Lion in 2000, Jolie spent eight years with Deloitte’s audit division based in Auckland, rising to Senior Audit Manager. She gained a Bachelor of Commerce from the University of Auckland and has attended the Strategic Management Program at Sydney’s Macquarie Graduate School of Management.
For
per
sona
l use
onl
y

Page 21
Joe McCollumGroup HR Director, Spark New Zealand
Joe McCollum joined Spark New Zealand in November 2012 as Group HR Director, bringing over 30 years of global experience in leading transformational HR initiatives at companies undergoing significant change and operating in rapidly changing markets. Joe understands the critical importance of organisational culture on success and is influencing the cultural shift underway within Spark New Zealand. Prior to joining the Company he worked in the music and media businesses – initially with EMI in 2004, managing the sale of EMI to a private equity company, before joining news media group DMGT in 2008. He remained with DMGT until returning to New Zealand in 2012, where he had previously worked in the hospitality industry as HR Director for Lion Nathan between 1989 and 1996. At the end of 1997 he returned to the UK to take up the role of worldwide HR Director for ICI, a global chemical company with 65,000 employees. He joined Misys in 1999 – a global software company recognised as a world leader in various segments. Joe also worked in Saudi Arabia for 5 years in the 1970s as the HR Director for a 4,500-staff hospital company before joining Pepsi initially in Cyprus and then in its headquarters in New York. He obtained his MSc in Business Studies from Columbia University.
Tim MilesChief Executive, Spark Digital
Tim leads Spark Digital, the business unit which provides converged ICT solutions for the rapidly evolving needs of business, enterprise and government customers, as they meet the demands of an increasingly globalised, connected and mobile customer base. Spark Digital’s unique capability in delivering the best ICT solutions in New Zealand, inspired and fully supported by the power of the Spark Network, makes it possible for its customers to contribute to the overall economic success of New Zealand. Tim joined Spark Digital (formerly Gen-i) as Chief Executive in February 2013 after previously being the Managing Director of PGG Wrightson, the Group Chief Technology Officer of Vodafone PLC and the CEO of Vodafone UK. Tim has spent much of his professional life working in New Zealand and offshore in senior leadership roles, including at IBM, Data General Corporation and Unisys. From 1994 until 2001 he was with Unisys Corporation in various senior executive roles, including Managing Director New Zealand and Vice President responsible for Unisys’ worldwide telecommunications business. Tim has also been involved in a number of industry and not-for-profit organisations in leadership roles. Tim has a Bachelor of Arts from Victoria University.
Chris QuinChief Executive, Spark Home, Mobile & Business
Chris leads the team at Spark Home, Mobile & Business, the business unit which provides New Zealanders with access to technology in new and innovative ways at home and to help their businesses succeed. Chris has always been inspired by customers’ desire for technology to drive change and opportunity and he is passionate about building a world-class Spark Home, Mobile & Business team to enable that for New Zealanders. For him, success is all about Spark becoming a world-class, truly customer inspired organisation with the business growing again due to new services and strong customer acquisition. Chris took on his current role in 2012, previously holding a number of roles in the Company, including managing the acquisition and expansion of Gen-i (now Spark Digital) and then serving as its CEO. Chris has been with the Company since 1991 following a stint at Mitel as Chief Financial Officer and Financial Accountant at Orica. In keeping with his passion for New Zealand’s future he is the Chair of business growth organisation The Icehouse and actively participates in the start-up industry. Chris has a BCA from Victoria University.
Rod SnodgrassChief Executive, Spark Ventures
Rod leads Spark Ventures, a business unit formed in early 2013 to lift the Company’s pace of innovation and to deliver connected digital experiences that customers love. It acts as an internal incubator and accelerator, adopting disruptive approaches and start-up methods, such as Lean and Agile for a portfolio of ventures that include Skinny mobile, Bigpipe broadband, Spark New Zealand’s WiFi hot spot network, Lightbox TV, Qrious smart data and investments in New Zealand start-ups Vigil and App La Carte. Rod has a huge amount of experience sitting on local and international boards and is involved in a number of innovation sector initiatives. Prior to joining the Company in 1998, Rod was the Financial Controller at Ericsson Cellular and before that Group Controller at Fletcher Energy. Originally part of the Xtra team, then rising to become its General Manager, Rod has also spent time since Xtra leading the Company’s fixed line division, leading Group Strategy and then as Chief Product Officer. Rod has a BCA from Victoria University and is a New Zealand Chartered Accountant.
For
per
sona
l use
onl
y

Page 22 Spark New Zealand Annual Report 2014 Spark New Zealand performance
Amounts are for Spark New Zealand’s continuing operations, representing the ongoing business.
CONTINUING OPERATIONS FY14 FY13 % CHANGE
Operating revenues and other gains $M 3,638 3,735 (2.6)%
Operating expenses $M 2,702 2,861 (5.6)%
EBITDA1 $M 936 874 7.1%
Adjusted EBITDA1 $M 936 975 (4.0)%
Depreciation and amortisation expense $M 451 459 (1.7)%
Net earnings $M 323 270 19.6%
Adjusted net earnings1 $M 323 350 (7.7)%
Capital expenditure2 $M 459 421 9.0%
Total mobile connections3, 4 (000)S 2,006 1,815 10.5%
Broadband connections3 (000)S 669 649 3.1%
Employee numbers5 (FTE including contractors) 5,565 5,902 (5.7)%
1 Spark New Zealand calculates EBITDA by adding back depreciation, amortisation, finance expenses and taxation expense to net earnings less finance income. EBITDA, adjusted EBITDA and adjusted net earnings are all non-Generally Accepted Accounting Principles (GAAP) measures and are not comparable to the New Zealand Equivalents to International Financial Reporting Standards (NZ IFRS) measure of performance. These measures are defined and reconciled in the discussion below.
2 Excludes capital expenditure related to discontinued operations of $35 million in FY14 and $44 million in FY13 and includes capital expenditure related to the rebranding of Spark in FY14.
3 Measure as at 30 June.
4 Measure relates to fixed access lines in the Home, Mobile & Business and Digital business units.
5 FTEs are full-time equivalents including contractors and are measured as at 30 June.
Key performance indicators
For
per
sona
l use
onl
y

Page 23
For
per
sona
l use
onl
y

Page 24 Spark New Zealand Annual Report 2014 Spark New Zealand performance
Group result overview
Spark New Zealand’s net earnings after tax for FY14 were $460 million, an increase of $222 million, or 93.3%, from FY13. This included net earnings from discontinued operations of $137 million related to the exit of the Australian operations following the sale of the AAPT business to TPG Telecom Limited.
Spark New Zealand’s FY14 financial results reflect the significant changes we have been making in the business and the relentless execution of our strategy.
In line with the strategy mobile revenues grew 6.0% with over 2.0 million customers choosing to be with Spark New Zealand, a growth of 10.5% from FY13.
IT services revenue grew by 5.8% in line with the growing trend towards Cloud computing and supported by our investment in data centres in the main centres of New Zealand.
The strong performance in mobile and IT services helped mitigate the decline in fixed revenue driven by the long-term industry trend away from fixed legacy products, which slowed from 10.0% in the second half of FY13 to 5.4% in the second half of FY14.
As a result of the fixed revenue declines, operating revenues from continuing operations declined by 2.6% to $3,368 million.
Operating expenses from continuing operations reduced by $159 million or 5.6% to $2,702 million. This included $101 million of non-recurring costs associated with the FY13 reset of the strategy. The remaining reduction has been delivered through our turnaround programme increasing business momentum with reductions in labour and procurement costs contributing to an improved second half earnings performance.
The depreciation and amortisation expense decreased by $8 million, or 1.7%, to $451 million in FY14. This reduction is a result of a combination of lower levels of capital spend in the last two financial years compared with historic levels, partly offset by the increased depreciation impact following the acquisition of Revera in May 2013.
Net finance expenses reduced by $11 million, or 26.2%, to $31 million in FY14 due to a combination of maturing debt being replaced by debt at lower interest rates and lower overall debt levels following the sale of the AAPT business in February 2014 for $506 million.
The income tax expense increased by $28 million, or 27.2%, to $131 million in FY14, in line with the increase in net earnings for the period.
Net earnings after tax from continuing operations of $323 million in FY14 were $53 million, or 19.6%, higher than $270 million in FY13. When the impact of the adjusting items of $80 million after tax in FY13 is removed, adjusted net earnings after tax from continuing operations declined by $27 million, or 7.7%, to $323 million.
Non-GAAP measuresSpark New Zealand uses EBITDA, adjusted EBITDA and adjusted net earnings when discussing financial performance. These are non-GAAP financial measures and are not prepared in accordance with NZ IFRS.
They are not uniformly defined or utilised by all companies in the telecommunications industry. Accordingly, these measures may not be comparable with similarly titled measures used by other companies. Non-GAAP financial measures should not be viewed in isolation nor considered as a substitute for measures reported in accordance with NZ IFRS. Management believes that these measures provide useful information as they are used internally to evaluate performance of business units, to analyse trends in cash-based expenses, to establish operational goals and allocate resources.
Reconciliations from the NZ IFRS measure of net earnings to Spark New Zealand’s adjusted net earnings, EBITDA and adjusted EBITDA are shown below.
For FY14 Spark New Zealand has altered its approach to reporting adjusting items in its financial results, removing only non-recurring or unusual items greater than $25 million from adjusted EBITDA and adjusted net earnings to ensure only material items are excluded. The FY13 comparative calculations of adjusted EBITDA and adjusted net earnings are re-presented to exclude the impact of insurance proceeds and natural disaster costs not considered to be material.
Adjusting items are taken from, and are consistent with, amounts presented in the audited financial statements.
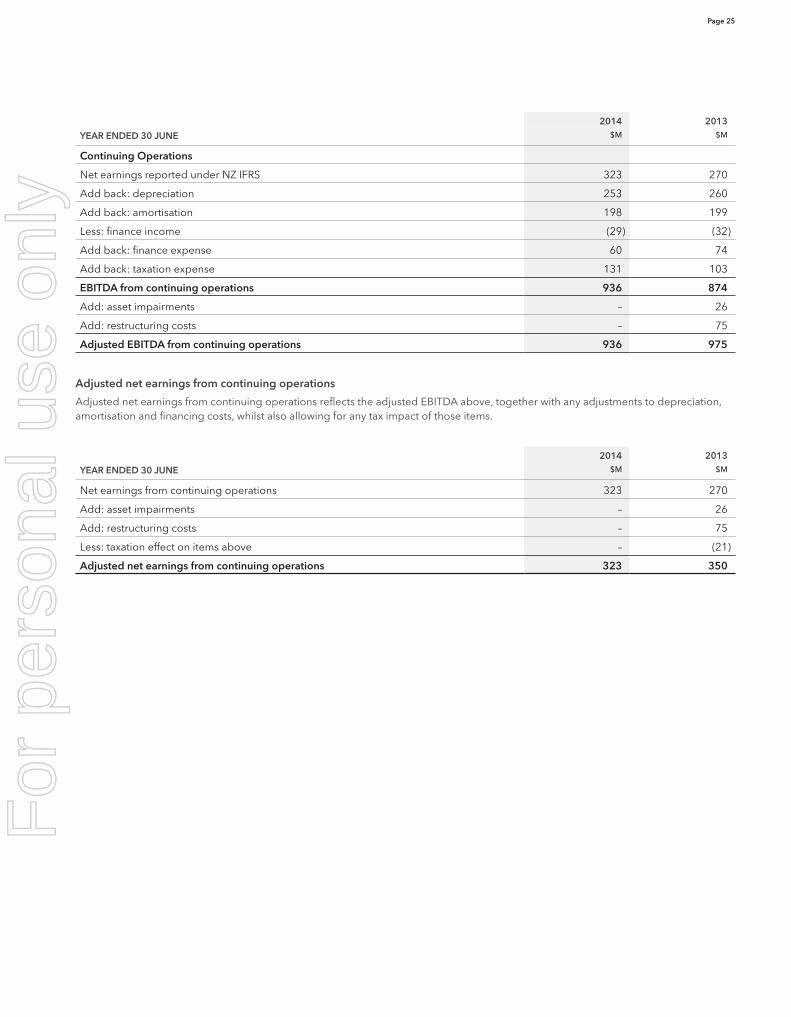
EBITDA and adjusted EBITDA from continuing operations
Spark New Zealand calculates EBITDA by adding back depreciation, amortisation, finance expenses and taxation expense to net earnings less finance income.
Adjusted EBITDA from continuing operations is the segment result reported, plus the net result of corporate revenue and expenses, in the financial statements. It excludes significant one-off gains, expenses and impairments that are also excluded from the segmental result to provide an indication of the underlying earnings of that segment. In FY13 there were two material groups of adjusting items to the continuing operations of the Group. These were $26 million of asset impairment expenses due to project closures as a direct result of the organisational strategy re-set in FY13 and $75 million of predominantly labour and surplus lease expenses directly related to the organisation restructuring programme undertaken in FY13. There were no adjusting items in FY14.
Segment results are reconciled to net earnings before income tax in note 3 to the financial statements.F
or p
erso
nal u
se o
nly
Page 25
2014 2013
YEAR ENDED 30 JUNE $M $M
Continuing Operations
Net earnings reported under NZ IFRS 323 270
Add back: depreciation 253 260
Add back: amortisation 198 199
Less: finance income (29) (32)
Add back: finance expense 60 74
Add back: taxation expense 131 103
EBITDA from continuing operations 936 874
Add: asset impairments – 26
Add: restructuring costs – 75
Adjusted EBITDA from continuing operations 936 975
Adjusted net earnings from continuing operations
Adjusted net earnings from continuing operations reflects the adjusted EBITDA above, together with any adjustments to depreciation, amortisation and financing costs, whilst also allowing for any tax impact of those items.
2014 2013
YEAR ENDED 30 JUNE $M $M
Net earnings from continuing operations 323 270
Add: asset impairments – 26
Add: restructuring costs – 75
Less: taxation effect on items above – (21)
Adjusted net earnings from continuing operations 323 350
For
per
sona
l use
onl
y

Page 26 Spark New Zealand Annual Report 2014 Spark New Zealand performance
Year-on-year mobile revenue growth of:
10.4%— Year-on-year revenue growth of 0.7%
— Held or improved market share across all segments
— 600k My Spark/Smartphone App digital users
— Brand refresh and Spark brand launch
Spark Home, Mobile & Business provides products, services and support to consumer and small business customers. It provides a full range of services and content, data and voice services across fibre and copper broadband, 3G & 4G mobile and nationwide WiFi zones.
The key priorities for Spark Home, Mobile & Business are to become #1 in the mobile market, to drive growth in the small business market and to hold connection share in the broadband market by creating differentiated products that customers value.
In FY14 we:>> Continued to be competitive across all products and segments;
>> Grew total revenue by $13 million, or 0.7%, with mobile revenue growth outweighing the slowing fixed revenue decline;
>> Created sustainable market differentiation through cool new services, such as Spotify, WiFi and English Premier League football;
>> Refreshed the brand to increase customer preference across all segments. Revamped retail store branding and performance, increasing foot traffic by 15% year on year;
>> Enhanced the broadband portfolio with fibre, VDSL, naked and unlimited broadband products;
>> Increased the percentage of broadband customers on new simple plans to 86% compared with 60% in FY13;
>> Increased the number of broadband customers on high-value plans to 42%. More than 50% of acquisitions are now on high-value plans, reflecting the continued demand for data and plan value;
>> Returned to growth in our New Zealand small business market with revenues increasing by 3.7%;
>> Transformed customer service transactions to 91% self-service, with 74% of transactions rated as effortless, and doubled digital sales; and
>> Slowed the rate of fixed revenue decline to 5.0% in FY14, compared with 8.2% in FY13.
Spark Home, Mobile & Business
For
per
sona
l use
onl
y
Page 27
Financials
2014 2013YEAR ENDED 30 JUNE $M $M CHANGE %
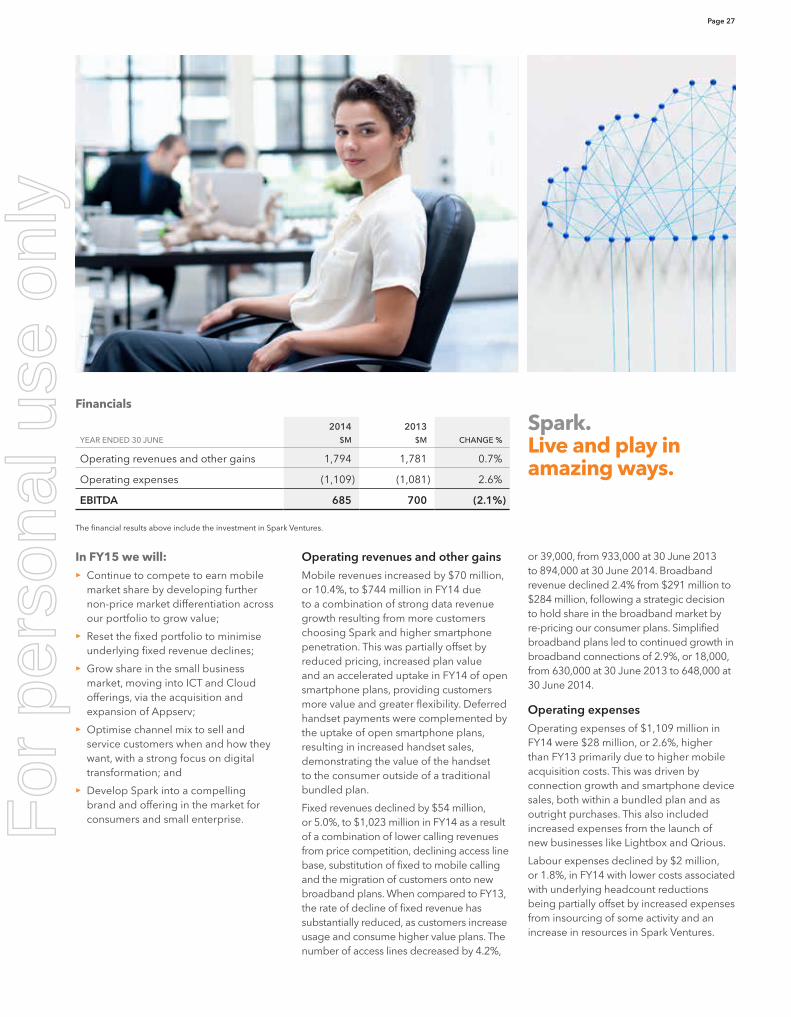
Operating revenues and other gains 1,794 1,781 0.7%
Operating expenses (1,109) (1,081) 2.6%
EBITDA 685 700 (2.1%)
The financial results above include the investment in Spark Ventures.
Spark. Live and play inamazing ways.
In FY15 we will:>> Continue to compete to earn mobile market share by developing further non-price market differentiation across our portfolio to grow value;
>> Reset the fixed portfolio to minimise underlying fixed revenue declines;
>> Grow share in the small business market, moving into ICT and Cloud offerings, via the acquisition and expansion of Appserv;
>> Optimise channel mix to sell and service customers when and how they want, with a strong focus on digital transformation; and
>> Develop Spark into a compelling brand and offering in the market for consumers and small enterprise.
Operating revenues and other gains
Mobile revenues increased by $70 million, or 10.4%, to $744 million in FY14 due to a combination of strong data revenue growth resulting from more customers choosing Spark and higher smartphone penetration. This was partially offset by reduced pricing, increased plan value and an accelerated uptake in FY14 of open smartphone plans, providing customers more value and greater flexibility. Deferred handset payments were complemented by the uptake of open smartphone plans, resulting in increased handset sales, demonstrating the value of the handset to the consumer outside of a traditional bundled plan.
Fixed revenues declined by $54 million, or 5.0%, to $1,023 million in FY14 as a result of a combination of lower calling revenues from price competition, declining access line base, substitution of fixed to mobile calling and the migration of customers onto new broadband plans. When compared to FY13, the rate of decline of fixed revenue has substantially reduced, as customers increase usage and consume higher value plans. The number of access lines decreased by 4.2%,
or 39,000, from 933,000 at 30 June 2013 to 894,000 at 30 June 2014. Broadband revenue declined 2.4% from $291 million to $284 million, following a strategic decision to hold share in the broadband market by re-pricing our consumer plans. Simplified broadband plans led to continued growth in broadband connections of 2.9%, or 18,000, from 630,000 at 30 June 2013 to 648,000 at 30 June 2014.
Operating expenses
Operating expenses of $1,109 million in FY14 were $28 million, or 2.6%, higher than FY13 primarily due to higher mobile acquisition costs. This was driven by connection growth and smartphone device sales, both within a bundled plan and as outright purchases. This also included increased expenses from the launch of new businesses like Lightbox and Qrious.
Labour expenses declined by $2 million, or 1.8%, in FY14 with lower costs associated with underlying headcount reductions being partially offset by increased expenses from insourcing of some activity and an increase in resources in Spark Ventures.
For
per
sona
l use
onl
y

Page 28 Spark New Zealand Annual Report 2014 Spark New Zealand performance
Spark Digital
IT services revenue growth of:
6.3%
Spark Digital is focussed on supporting the success of New Zealand businesses, both here and wherever they want to operate in today’s globally connected world.
Spark Digital provides solutions for the rapidly evolving needs of business, enterprise and government customers as they meet the demands of an increasingly globalised, connected and mobile customer base. We’re committed to helping our customers gain the competitive advantage that digital solutions can deliver.
In FY14 we:>> Continued to invest in data centre infrastructure, with new data centres opened in Wellington, Christchurch and Dunedin and new facilities under construction in Auckland and Wellington, due to open in October 2014;
>> Entered into an agreement with Telstra that will enable us to offer an expanded range of services in Australia by leveraging Telstra’s products and services across the Tasman, supporting the success of New Zealand businesses both in Australia and wherever they want to operate in a globally connected world;
>> Introduced a new way of delivering mobile customer services to meet the rapidly evolving mobility needs of clients in the new digital environment. This includes a new online service tool and in-house and partner expertise to provide hands-on support and advice; and
>> Developed partnerships with proven global providers (including Jasper Wireless, Samsung, Interactive Intelligence Group, International Telematics, Compuware and Emulex) to enable us to bring innovative network-centric products and solutions to market that increase the demand and usage of the Spark New Zealand networks.
>> Continued to deliver and perform for our customers. As Group Managing Director for Fastway Global, Brem Ellingham explains:
“With Spark Digital’s powerful ICT infrastructure we’ve been able to consistently provide a world-class delivery service that continues to win us business at home and abroad. Spark Digital knows and understands our business.”
— driven by Cloud and data centre investments
— Data centres opened in Wellington, Christchurch and Dunedin
For
per
sona
l use
onl
y

Page 29
In FY15 we will:>> Improve our ability to support New Zealand’s medium-sized businesses by bringing new, tailored propositions to market that will help them gain the competitive advantage that digital solutions can deliver;
>> Leverage our Cloud and data centre investments to further grow and improve the quality of our IT business;
>> Further reorient sales and service around the customer by introducing additional self-service channels that will provide clients with faster transaction times and greater visibility and control of their ICT assets; and
>> Amplify the thought leadership our customers value, by re-launching the FWD_Programme into a more in-depth framework of activities and ideas, designed to keep customers up to date in today’s rapidly changing marketplace.
Operating revenues and other gains
IT services revenue increased by $33 million, or 6.3%, to $556 million in FY14, with particularly strong growth of 10.1% in H2 FY14 as momentum built through new business wins, largely due to the full year impact of the Revera acquisition in May 2013 and growth in government and enterprise customers.
Fixed revenues declined by $43 million, or 8.7%, to $451 million in FY14. This can be attributed to customers continuing to consolidate lines and moving to IP-based services, substitution of legacy copper-based products with lower margin fibre and scaling back direct activity in Australia.
Mobile revenues of $221 million decreased by $15 million, or 6.4%, in FY14 primarily driven by competitive market pricing and a significant increase in smartphone connections accelerating the move away from voice and text usage to data.
Operating expenses
Labour costs decreased by $33 million, or 12.4%, to $233 million in FY14 through a range of productivity initiatives. Other operating expenses increased by $18 million, or 3.0%, to $618 million in FY14 primarily due to the full-year impact of the acquisition of Revera in May 2013, partially offset by reduced activity in the Australian operation.
Spark. Win the future.
‘We’re committed to providing leadership in the digital world, enabling customers to leverage their investment in legacy infrastructure, while transitioning safely to and thriving in the digital future.’
Financials
2014 2013YEAR ENDED 30 JUNE $M $M CHANGE %
Operating revenues and other gains 1,288 1,307 (1.5%)
Operating expenses (889) (905) (1.8%)
EBITDA 399 402 (0.7%)
For
per
sona
l use
onl
y

Page 30 Spark New Zealand Annual Report 2014 Spark New Zealand performance
Spark Connect is responsible for developing, maintaining and operating Spark New Zealand’s data and communication networks and IT support systems, as well as providing services directly to wholesale and international customers.
Spark Connect develops, maintains and operates Spark New Zealand’s key data and communications networks and products, including the fibre transport, mobile and broadband networks, as well as ensuring the Company’s IT support systems are aligned with the Group’s business objectives.
Spark Connect’s Wholesale and International business provides a range of regulated and commercial products to other retail service providers throughout New Zealand and the world.
In addition, Spark Connect also provides many critical support services to the Company, such as billing, credit collections, provisioning, procurement and the management of Spark Connect’s buildings and leasehold property.
In FY14 we:>> Delivered a brand new LTE/4G mobile network to all major centres and towns throughout New Zealand, as well as improved coverage and capacity to our existing mobile network;
>> Upgraded our national data transport network (or optical transport network) that will now support and enable New Zealanders’ rapid increase in demand for data. The new technology also allows us to increase capacity more efficiently into the future and offer new services to our customers;
>> Delivered the first major release of our three-year re-engineering programme on time and under budget. The programme will transform not just our current IT systems and tools but, more importantly, will transform the way we connect with our customers, making it easier to do business with Spark New Zealand in the future;
>> Delivered 3.5% EBITDA improvement through an $81 million reduction in operating expenses; and
>> Offered fibre-based services to more customers in more regions through enabling consumption of services from all but one of the UFB local fibre companies.
Spark Connect
FY14 EBITDA improvement
3.5%— New 4G mobile network
— New optical transport network
— New foundational IT capabilityFor
per
sona
l use
onl
y
Page 31
In FY15 we will:>> Continue to improve our customers’ speed of, and access to, mobile data by utilising the newly acquired 700MHz spectrum to progressively roll out 4G/LTE mobile to more customers in more places throughout New Zealand;
>> Complete the second major release of the re-engineering programme, which will provide key IT capability advancements to our frontline staff, enabling visible improvements to customer experience;
>> Continue Spark Connect’s leading role in cost efficiency for the Company and capitalise on new wholesale revenue opportunities already identified and in the early stages of development in FY14; and
>> Enhance our network and service capabilities through simplification and fibre-based products, including offering services to customers using all of the UFB local fibre companies.
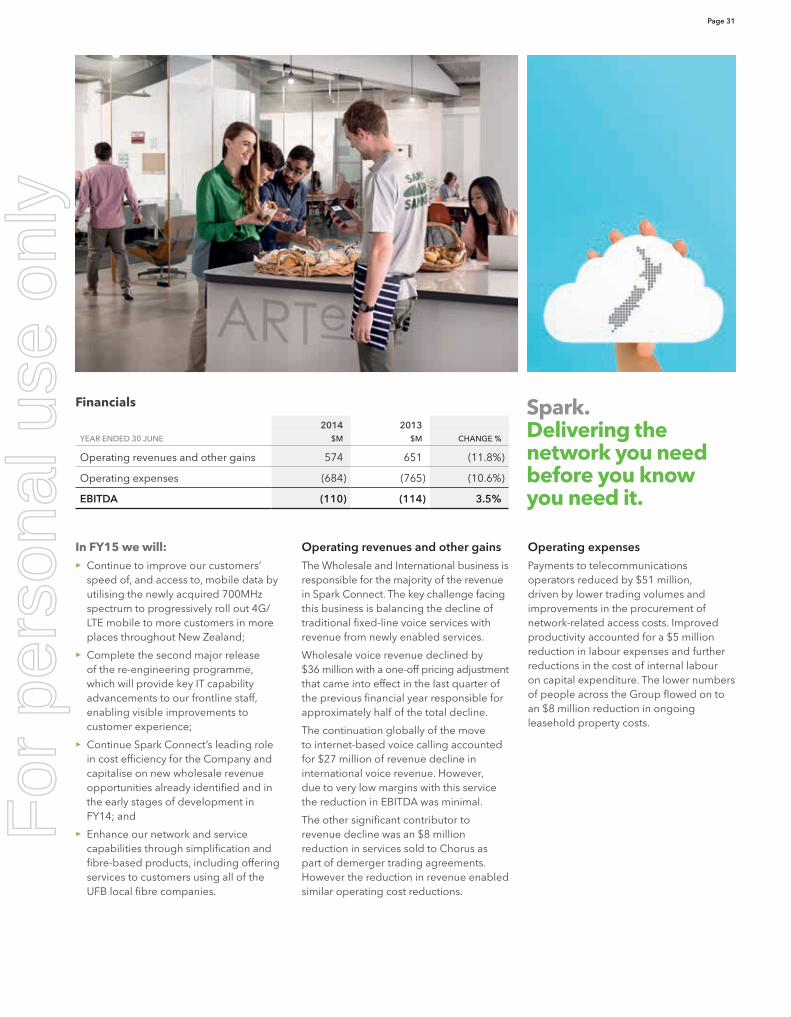
Operating revenues and other gains
The Wholesale and International business is responsible for the majority of the revenue in Spark Connect. The key challenge facing this business is balancing the decline of traditional fixed-line voice services with revenue from newly enabled services.
Wholesale voice revenue declined by $36 million with a one-off pricing adjustment that came into effect in the last quarter of the previous financial year responsible for approximately half of the total decline.
The continuation globally of the move to internet-based voice calling accounted for $27 million of revenue decline in international voice revenue. However, due to very low margins with this service the reduction in EBITDA was minimal.
The other significant contributor to revenue decline was an $8 million reduction in services sold to Chorus as part of demerger trading agreements. However the reduction in revenue enabled similar operating cost reductions.
Operating expenses
Payments to telecommunications operators reduced by $51 million, driven by lower trading volumes and improvements in the procurement of network-related access costs. Improved productivity accounted for a $5 million reduction in labour expenses and further reductions in the cost of internal labour on capital expenditure. The lower numbers of people across the Group flowed on to an $8 million reduction in ongoing leasehold property costs.
Financials
2014 2013YEAR ENDED 30 JUNE $M $M CHANGE %
Operating revenues and other gains 574 651 (11.8%)
Operating expenses (684) (765) (10.6%)
EBITDA (110) (114) 3.5%
Spark. Delivering the network you need before you know you need it.
For
per
sona
l use
onl
y

Page 32 Spark New Zealand Annual Report 2014 Spark New Zealand performance
Spark Ventures aims to develop a portfolio of new businesses and services that will create long-term value for Spark New Zealand by delivering connected digital experiences that consumers love. To achieve this outcome it is building out a portfolio of ventures by acting as an internal incubator and accelerator, adopting disruptive business models and approaches, using lean and agile methods and with a bias for partnering.
Spark Ventures
Expanded WiFi hotspot network to
1,100— hotspots in key locations nationwide
Built out a portfolio of
9— ventures in various life stages
Skinny Mobile net promoter score
+27— indicating an engaged customer base,
loving value for money and simplicity
For
per
sona
l use
onl
y

Spark. Tomorrow's solutions delivered.
Page 33
Spark Ventures is currently focused on six core and adjacent areas:
>> Connectivity – including Skinny mobile, Bigpipe broadband and WiFi
>> Content – including Lightbox TV and Cloud services
>> Commerce – including m-Wallet, m-Payments and m-Advertising
>> Data and applications – including Smart Data monetisation and applications enablement
>> Industry verticals – including health, rural and education
>> Smart Life – including smart living and smart business
In FY14 we:>> Re-established Skinny as the value leader in the mobile market for value focussed customers;
>> Launched Bigpipe, a new digitally centric broadband service provider utilising an industry-leading world-first online-only support model;
>> Expanded the WiFi hot-spot footprint to > 1,100 hotspots benefiting Spark New Zealand through improved acquisition and retention in mobile;
>> Developed and prepared for launch Lightbox TV, our internet TV business. This represents Spark Venture’s entry into entertainment and aims to change the way New Zealanders consume content, delivering TV, online, anytime;
>> Built and beta tested Qrious a data analytics business. Qrious will offer a purpose built data platform and services to help businesses better use data to drive decision-making and business value through the translation of insights into action; and
>> Commenced our investment in industry verticals and adjacencies, with investments in Vigil and App La Carte. These are complementary industry ventures that will leverage the assets and capabilities of Spark New Zealand in driving value.
In FY15 we will:>> Continue to grow the customer bases, revenues and margins of Skinny mobile and Bigpipe broadband to support Spark New Zealand’s objectives in winning key markets through the multi-brand strategy;
>> Continue to drive WiFi market leadership by building out the Spark WiFi network and services;
>> Launch and extend our internet TV business, Lightbox, focusing on continued content, device and feature expansion to deliver customer and revenue growth. Lightbox will be a major subscription video on demand (SVOD) service in New Zealand, offering both breadth and depth of content and using a ‘best in breed’, extensible and scalable technological platform for delivery;
>> Fully launch Qrious, offering services to New Zealand businesses, including data as a service, platform as a service, analytics and business insight as a service; and
>> Continue to explore and bring to market other business opportunities and services, including Smart Home services and business applications.
Spark Ventures financial results are included within the results of Spark Home, Mobile & Business as they are not currently material.
For
per
sona
l use
onl
y

Page 34 Spark New Zealand Annual Report 2014 Spark New Zealand performance
Cash flowsThe following table sets out information regarding Spark New Zealand’s cash flows from FY13 to FY14:
2014 2013 2014/2013YEAR ENDED 30 JUNE $M $M CHANGE %
Net cash flows from operating activities 614 885 (30.6)%
Net cash flows from investing activities 10 (462) NM
Net cash flows from financing activities (530) (488) (8.6)%
Foreign exchange movement (2) (2) –
Net increase/(decrease) in cash 92 (67) NM
Capital management and dividends
Net cash flows from operating activities
Net cash from operating activities decreased by $271 million, or 30.6%, in FY14 from FY13. The major drivers of this year-on-year change were:
> The sale of the AAPT business effective from 28 February 2014, resulting in a reduction in operating cash flows;
> Lower operating revenues, resulting in a reduction in cash receipts from customers;
> An increase in tax payments of $54 million, with the FY13 tax payments being reduced by refunds received dating back to FY11;
Partly offset by:
> Lower payments to suppliers and employees due to operating cost reductions resulting from procurement efficiencies and lower overall staff levels, partially offset by an additional month’s payment of $76 million to Chorus falling into FY14 that related to FY13;
> Lower interest expenses following a reduction in debt levels; and
> Increased dividend receipts of $40 million from Southern Cross.
Net cash flows from investing activities
Net cash from investing activities was an inflow of $10 million in FY14, compared with an outflow of $462 million in FY13. The major drivers of this year-on-year change were:
> The sale of the AAPT business generating a net cash receipt of $495 million in FY14, compared to a net investment of $91 million in FY13 for the purchase of Revera;
Partly offset by:
> Increased levels of investment on key capital projects in FY14; and
> Lower receipts from insurance proceeds in relation to the Canterbury earthquakes of $14 million.
Net cash flows from financing activities
The net cash outflow from financing activities was $530 million in FY14, compared with a net outflow of $488 million in FY13. The major drivers of this year-on-year change were:
> A net reduction in short and long-term debt of $294 million in FY14, compared with a reduction of $42 million in FY13;
> Dividend payments lower by $56 million in FY14; and
> $134 million outflow in FY13 for share buybacks. There was no share buyback in FY14.
For
per
sona
l use
onl
y
Page 35
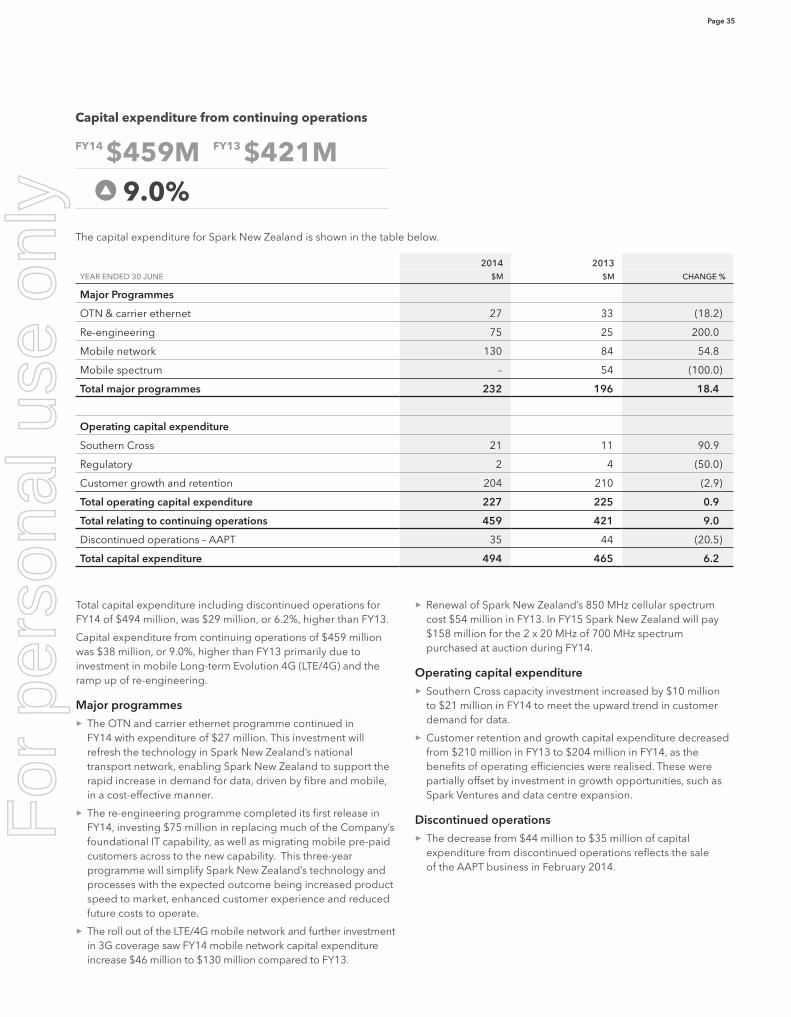
Capital expenditure from continuing operations
FY14 $459M FY13 $421M 9.0% The capital expenditure for Spark New Zealand is shown in the table below.
2014 2013YEAR ENDED 30 JUNE $M $M CHANGE %
Major Programmes
OTN & carrier ethernet 27 33 (18.2)
Re-engineering 75 25 200.0
Mobile network 130 84 54.8
Mobile spectrum – 54 (100.0)
Total major programmes 232 196 18.4
Operating capital expenditure
Southern Cross 21 11 90.9
Regulatory 2 4 (50.0)
Customer growth and retention 204 210 (2.9)
Total operating capital expenditure 227 225 0.9
Total relating to continuing operations 459 421 9.0
Discontinued operations – AAPT 35 44 (20.5)
Total capital expenditure 494 465 6.2
Total capital expenditure including discontinued operations for FY14 of $494 million, was $29 million, or 6.2%, higher than FY13.
Capital expenditure from continuing operations of $459 million was $38 million, or 9.0%, higher than FY13 primarily due to investment in mobile Long-term Evolution 4G (LTE/4G) and the ramp up of re-engineering.
Major programmes
> The OTN and carrier ethernet programme continued in FY14 with expenditure of $27 million. This investment will refresh the technology in Spark New Zealand’s national transport network, enabling Spark New Zealand to support the rapid increase in demand for data, driven by fibre and mobile, in a cost-effective manner.
> The re-engineering programme completed its first release in FY14, investing $75 million in replacing much of the Company’s foundational IT capability, as well as migrating mobile pre-paid customers across to the new capability. This three-year programme will simplify Spark New Zealand’s technology and processes with the expected outcome being increased product speed to market, enhanced customer experience and reduced future costs to operate.
> The roll out of the LTE/4G mobile network and further investment in 3G coverage saw FY14 mobile network capital expenditure increase $46 million to $130 million compared to FY13.
> Renewal of Spark New Zealand’s 850 MHz cellular spectrum cost $54 million in FY13. In FY15 Spark New Zealand will pay $158 million for the 2 x 20 MHz of 700 MHz spectrum purchased at auction during FY14.
Operating capital expenditure
> Southern Cross capacity investment increased by $10 million to $21 million in FY14 to meet the upward trend in customer demand for data.
> Customer retention and growth capital expenditure decreased from $210 million in FY13 to $204 million in FY14, as the benefits of operating efficiencies were realised. These were partially offset by investment in growth opportunities, such as Spark Ventures and data centre expansion.
Discontinued operations
> The decrease from $44 million to $35 million of capital expenditure from discontinued operations reflects the sale of the AAPT business in February 2014.
For
per
sona
l use
onl
y

Page 36 Spark New Zealand Annual Report 2014 Spark New Zealand performance
Liquidity and capital resources
S&P Credit Rating: A–
Moody’s Credit Rating: A3
Spark New Zealand’s principal sources of liquidity are operating cash flows and external borrowing from established debt programmes and bank facilities.
Credit ratings
Spark New Zealand continues to be committed to maintaining an ‘A Band’ credit rating and its capital management policies are designed to ensure this objective is met. Relevant factors include Spark New Zealand’s debt profile, operating outlook, cash flow and cost of capital.
As part of this commitment, Spark New Zealand intends to manage its debt levels to ensure that the ratio of net interest-bearing debt (inclusive of associated derivatives) to EBITDA does not materially exceed 1.0 times on a long-run basis, which for credit rating agency purposes equates approximately to net debt to EBITDA of 1.5 times. The difference between these two ratios is primarily due to the capitalisation of operating leases by credit rating agencies. Net debt includes long-term debt at the value of hedged cash flows due to arise on maturity, plus short-term debt, less any cash. Net debt is a non-GAAP measure and is not defined in accordance with NZ IFRS but is a measure used by management. A reconciliation of long-term debt at hedged rates to long-term debt at spot rates as reported under NZ IFRS is provided in note 22 to the financial statements.
As at 30 June 2014, Spark New Zealand had been assigned a long-term credit rating of A-/Stable by Standard & Poor’s and A3/Stable by Moody’s Investors Service.
Funding
As detailed in note 22 to the financial statements, Spark New Zealand evaluates its liquidity requirements on an ongoing basis. In general, Spark New Zealand has generated sufficient cash flows from its operating activities to meet its financial liabilities. In the event of any shortfalls, Spark New Zealand has the following short-term and long-term financing programmes in place:
> Short-term consisting of a $500 million note facility and an US$1 billion European Commercial Paper programme; and
> Long-term consisting of a domestic bond programme, an A$1 billion Australian Medium Term Note Programme and an US$2 billion Euro Medium Term Note Programme.
In addition, Spark New Zealand has a committed standby facility of $300 million with a number of creditworthy banks, committed revolving bank facilities totalling $400 million and committed overdraft facilities of $15 million with New Zealand banks. There are no compensating balance requirements associated with these facilities.
On-market buyback
There is currently no on-market share buyback of Spark New Zealand’s shares.
Dividends
Spark New Zealand pays dividends on a semi-annual basis. A dividend of 8 cents per share was declared for H1 FY14. The dividend was partially imputed at a rate of 2.3333 imputation credits per share (which equates to 75% imputation based on the current corporate tax rate). A supplementary dividend of 1.0588 cents per share was paid to non-resident shareholders.
A dividend of 9.0 cents per share has been declared for H2 FY14, bringing total dividends for FY14 to 17.0 cents per share.
The second half dividend will be fully imputed for New Zealand tax purposes at the rate of 3.5000 imputation credits per share. A supplementary dividend of 1.5882 cents per share will be paid to non-resident shareholders.
H1 FY14 H2 FY14ORDINARY DIVIDENDS ORDINARY DIVIDENDS
Ordinary shares 8 cents 9 cents
American Depositary Shares 33.32 US cents 38.16 US cents1
‘Ex’ dividend dates
New Zealand Stock Exchange 19 Mar 2014 24 Sep 2014
Australian Securities Exchange 17 Mar 2014 24 Sep 2014
American Depositary Shares 18 Mar 2014 23 Sep 2014
Record dates
New Zealand Stock Exchange 21 Mar 2014 26 Sep 2014
Australian Securities Exchange 21 Mar 2014 26 Sep 2014
American Depositary Shares 20 Mar 2014 25 Sep 2014
Payment dates
New Zealand and Australia 11 Apr 2014 10 Oct 2014
American Depositary Shares 18 Apr 2014 17 Oct 2014
1 Based on the exchange rate at 18 August 2014 of NZ$1 to US$0.8481 and a ratio of five ordinary shares per one American Depositary Share. The actual exchange rate used for conversion is determined in the week prior to payment when the Bank of New York performs the physical currency conversion.
For
per
sona
l use
onl
y

Page 37
For FY15, subject to there being no material adverse changes in circumstances or operating outlook, Spark New Zealand’s intention is to pay annual dividends of 18.0 cents per share. It is currently anticipated that the FY15 dividend will be fully imputed subject to there being no material adverse changes.
Dividend reinvestment plan
The dividend reinvestment plan has been retained for the H2 FY14 dividend. Shares issued under the dividend reinvestment plan are issued at or around the prevailing market price of ordinary shares. The last date for shareholders to elect to participate in the dividend reinvestment plan for the H2 FY14 dividend is 29 September 2014.
Working capital & net tangible assets
Working capital
Spark New Zealand defines its working capital as the difference between current assets and current liabilities, excluding assets and liabilities classified as held for sale. Spark New Zealand’s working capital position is shown in the table below. As at 30 June 2014 there was a surplus in working capital, with current assets exceeding current liabilities. As at 30 June 2013 current liabilities exceeded current assets. However, positive operating cash flows enabled working capital to be managed to meet short-term liabilities as they fell due.
2014 2013
AS AT 30 JUNE $M $M CHANGE %
Current assets 820 838 (2.1)%
Current liabilities (768) (1,086) 29.3%
Surplus/(deficit) in working capital 52 (248) NM
Net tangible assets
As at 30 June 2014 the consolidated net tangible assets per share was $0.39. Net tangible assets per share is a non-GAAP financial measure and is not prepared in accordance with NZ IFRS. It is required to be disclosed by NZX and ASX listing requirements.
The calculation of Spark New Zealand’s consolidated net tangible assets per share and its reconciliation to the consolidated statement of financial position is presented below:
AS AT 30 JUNE 2014 2013
Total assets ($M) 3,243 3,493
Less intangible assets ($M) (992) (1,071)
Less total liabilities ($M) (1,535) (2,080)
Net tangible assets ($M) 716 342
Number of shares outstanding (in millions) 1,829 1,817
Net tangible assets per share $0.39 $0.19
For
per
sona
l use
onl
y

Page 38 Spark New Zealand Annual Report 2014 Spark New Zealand performance
Whilst we have continued to streamline our workforce this past year under our turnaround programme, we have also been putting a clear focus on talent – we’ve introduced new company values and a code of behaviours that set out who we are and how we act. We’ve launched a new employee recognition programme to build a culture where we say ‘thanks’ every day and we continue to invest in leadership capability through management and financial capability development programmes.
Our valuesOur values are what define us – and with the change to Spark New Zealand it was the perfect opportunity to rethink what values mean and what they should be. We’ve embraced a new set of values – they’re simple, they’re clear and they lay the foundation for a strong, constructive culture. This will be a culture where our focus is on the customer and we can challenge each other to work better, every day.
Alongside our code of behaviours, which sets out the way we behave – to each other, to our customers and to the community – our values are the glue that brings us together.
Our people are what make Spark New Zealand. They design, build and market the networks and products that help New Zealanders unleash their potential and they deliver effortless customer service every day to New Zealanders over the phone and online. They’re our customer champions and each one of them brings special skills, experience and insights which add up to make us a customer-inspired company.
Spark People
For
per
sona
l use
onl
y

Page 39
Rewarding our peopleWe reward and recognise our people every day – with competitive salaries, appealing benefits, opportunities to grow and develop their skills and a range of recognition programmes that celebrate success.
We’re a performance-focused company, so for many of our people in sales and senior roles we link part of their remuneration to the delivery of customer or company outcomes. For our sales people, incentive and commission schemes give them the opportunity to be rewarded for retaining and winning customers, whilst for our senior people, our short and long-term incentive schemes link a large part of their remuneration to the overall performance of the company – and to the value we deliver to our shareholders.
Our newly launched employee recognition programme makes it easy for peer-to-peer and manager-led recognition – from a simple thanks, to cash rewards and right the way through to high profile annual awards events for top sales and service people.
Investing in our peopleWe are a big Company full of potential and operating in one of the most fast-paced and exciting industries around – it’s why people want to come to work for Spark New Zealand and why our people see endless opportunities to learn, to grow and to make a career with us.
We offer our people development in all sorts of ways, such as the opportunity to participate in exciting projects – like the build of our 4G and WiFi networks, the launch of free Spotify, the development of our exciting new internet TV service Lightbox, secondments to other roles and training and development through attending courses, seminars and conferences.
Diversity matters at Spark New Zealand. We are focused on ensuring that our organisation looks and feels more and more like our customers and New Zealand. Our focus areas continue to evolve each year. This year we have renewed our commitment to the First Foundation and Global Women. We have also sponsored staff onto the Best Pasifika Leaders Programme for the first time.
This year we also introduced two targeted leadership development programmes – our Building Management Fundamentals programme that equips our managers on how to manage and motivate people and our Commercial Acumen programme to give managers the skills to make commercially sound financial decisions.
Our work environmentOur state of the art working spaces and use of the latest and smartest technology create an innovative and productive environment for our people – allowing them to unleash their potential. Our Smart Meeting facilities mean we can connect with each other around the country in high definition – saving time, cost and reducing our carbon footprint.
Our successful ‘Agents @ Home’ programme now has over 150 of our call centre people operating from their homes. This balances their individual needs and our requirements and gives Spark New Zealand the flexibility to manage working hours that meet changing customer demands in a modern world.
We also take the safety of our people, our customers and suppliers and those visiting our places seriously. We are an Accredited Employer under the ACC Partnership Programme – this means we take responsibility for managing workplace injuries in return for bearing the costs. Our comprehensive and pragmatic approach to workplace health and safety, in conjunction with membership of the Partnership Programme has seen work-related injuries, lost-time injuries and injury-related absences continue to reduce year on year.F
or p
erso
nal u
se o
nly

Page 40 Spark New Zealand Annual Report 2014 Spark New Zealand performance
This year has been busy for the Foundation, moving ahead with key programmes and gearing up to transform into the Spark Foundation. The objectives of the Foundation are to encourage generosity and build better educational outcomes for New Zealand kids. Being a corporate foundation there is strong emphasis on building programmes to engage Spark New Zealand people and encourage their generosity and participation within their local communities. The Foundation has achieved some fantastic outcomes this year.
Spark Foundation
Donated to communities
$792kVolunteer days by Spark New Zealand employees this year
1,275
Donations made via Givealittle
$7.4m
Funding provided to enable Manaiakalani approach to be rolled out to a further four school clusters
For
per
sona
l use
onl
y

Page 41
Volunteering>> Spark New Zealand employees are given one paid volunteer day to use during the year and it’s completely their choice as to which organisation they would like to volunteer for.
>> Over the last year, 26% of Spark New Zealand people took a volunteer day.
>> Skilled volunteering and mentoring is something the Foundation is keen to encourage and, as one example, Managing Director Simon Moutter has been mentoring students in the Manaiakalani cluster this year.
Payroll giving>> This year we celebrated a milestone for payroll giving with $2 million donated through the programme since its inception in FY12, with $792,000 donated in FY14.
>> The Foundation operates a universal payroll giving programme; allowing Spark New Zealand’s employees to donate from a choice of 27,000 eligible charities, schools and community groups.
>> Donations are matched up to $1,000 for all charities an employee donates to and up to $1,000 for school donations, meaning recipients can receive doubled donations.
>> Internal communication and educating employees is a huge part of the programme’s success.
Growth of donations through Givealittle
H1 FY13 H2 FY13 H1 FY14 H2 FY14
$M
$1.0
$2.0
$3.0
$4.0
$5.0
Givealittle>> It’s almost two years since the Foundation acquired online fundraising platform Givealittle (www.givealittle.co.nz) and turned it into New Zealand’s only zero fees fundraising platform.
>> At acquisition, Givealittle had processed $2.8 million in donations over four years. By the end of FY14 a further $8.9 million of donations have been made through Givealittle, with the zero-based fees model ensuring beneficiaries have collectively received $445,000 more than they previously would have under a fee-charging model.
>> Donations have recently been tracking at an annualised rate of more than $12 million.
Manaiakalani Education Trust>> The Foundation supports the Manaiakalani Education Trust, a cluster of 12 low-decile schools showing extraordinary improvements in learning outcomes and student engagement in Tamaki, one of Auckland’s lowest income communities.
>> When the partnership launched, the Foundation pledged a contribution of $1 million over four years to fund e-learning, research and innovation.
>> Funding has enabled the establishment of the Manaiakalani Innovative Teacher Academy, where eight teachers from the cluster have been accepted to conduct independent research into particular issues that will advance e-learning education methods.
>> The Foundation has since pledged an additional $600,000 investment per year in the 2014 and 2015 school years to support new school clusters around the country.
>> The unique Manaiakalani model is now being piloted by clusters of schools in the communities of Kaikohe, Mt Roskill (Auckland), Otaki and Porirua (Wellington).
For
per
sona
l use
onl
y

Page 42 Spark New Zealand Annual Report 2014 Spark New Zealand performance
Spark New Zealand is committed to reducing our impact on the environment. This is because our customers want us to be a more sustainable company that plays its part in the world and because it is the right thing to do.
Reducing our impact on the environment
Greenhouse gas emissions
FY12 FY13 FY14
OtherTravel
RefrigerantFleet
DieselElectricity
0
10,000
20,000
30,000
40,000
50,000
60,000
Tonn
es-C
O2e
Spark New Zealand reduced greenhouse gas (GHG) emissions by 21% in FY14 as compared to FY13 levels. FY14 emissions were 29 kilotonnes of carbon dioxide equivalents (CO2e), representing a reduction of 8 kilotonnes.
Electricity consumption reduced by 6 kilotonnes, or 22% in FY14 compared with FY13, while the proportion of electricity from renewable sources increased to 78%. Significant ongoing investments in the fixed, mobile and data networks, along with power saving initiatives have enabled Spark New Zealand to reduce total electricity consumption. Spark New Zealand continuously seeks to improve energy efficiency and we regard this as vital to sustainability.
Air travel emissions reduced by 15% this year, due mainly to less domestic travel. Spark New Zealand has steadily reduced travel and in FY14 travel was 14 million passenger kilometres (PKM).
Reduction in Greenhouse gas emissions
21%
Environment
For
per
sona
l use
onl
y

Page 43
Other sources of GHG emissions include diesel, vehicle fuel, refrigerants and waste (and natural gas which is de minimis). Refrigerant leakage has reduced by three quarters, diesel consumption is down by 46,000 litres or 27% and fleet fuel consumption is down two-thirds saving 888,000 litres per year. Spark New Zealand continues to make steady progress in reducing emissions from these sources.
New Zealand environmental leadershipSpark New Zealand is playing its part in helping the country tackle the challenge of climate change. We are already a low-carbon business and are focused on reducing our emissions further still. The nature of our telecommunications services also help other New Zealanders transition to a low-carbon future. On many measures we have as much as halved our carbon intensity. Our world-class carbon performance demonstrates our climate commitment with our carbon emissions per connection reducing by 19% in FY14.
Encouraging sustainability in our day-to-day business
Spark New Zealand continues to integrate sustainability into our everyday business.
Key Activities>> The reduction of air and vehicle travel was encouraged through the promotion of smart meeting rooms and videoconference rooms as better alternatives to air travel between the Auckland, Hamilton, Wellington and Christchurch offices;
>> Accreditation by the Ministry for the Environment of the Spark New Zealand Telecommunications Forum Re:Mobile phone product stewardship scheme. Spark New Zealand encourages its customers and staff to recycle their phones by placing recycling bins in its stores and in Spark New Zealand’s offices. Working devices are then on-sold to emerging markets and unusable devices are recycled through the correct channels. The proceeds from these activities go to the Starship Children’s Hospital; and
>> Managing and coordinating the removal and recycling of waste through the OneSpark waste management strategy, which was approved in 2011.
Waste managementSpark New Zealand’s waste management strategy aims to ensure that all waste is managed and recycled in an efficient, cost-effective and environmentally friendly manner. Each business unit within Spark New Zealand manages and processes its own waste, overseen by a centralised recycling team. This strategy is an extension of the waste management processes already in place within Spark Connect, the spares management programme and Chorus.
The waste management programme utilises a concept of four ‘R’ priorities: recovering, reusing, reselling and recycling. Waste is allocated into different waste streams including mobile phones, line cards, steel cables and lead batteries, which are
then processed accordingly and appropriately. Some components are exported to the US and China for reuse and recycling. The centralised recycling team continues to cover both Spark New Zealand and Chorus, with waste being processed on this centralised basis. Spark New Zealand has constrained office waste to landfill and related emissions through a recycling programme. In FY14 the portion of office waste recycled was 30%.
Encouraging sustainability in New Zealand
Spark New Zealand is dedicated to helping our customers achieve their own sustainability goals. Telecommunications technology helps businesses and individuals to overcome the problem of distance. We are constantly inspired by the ways our customers use our technology to buy and sell products and services and to communicate with colleagues, customers, friends and family. Telecommunications is one way New Zealand can reduce the need for travel, better manage the country’s resources and increase productivity, which all help to reduce emissions.
To find out more about what Spark New Zealand is doing to protect the environment please visit www.sparknz.co.nz/what-matters/environment
For
per
sona
l use
onl
y
Page 44 Spark New Zealand Annual Report 2014 Financial performance
Financial statements
19%*5< 7
Independent auditor’s report 45
Financial statements 46
Notes to the financial statements 52
For
per
sona
l use
onl
y

Page 45
97
Independent auditor’s report
To the shareholders of Spark New Zealand Limited
Report on the company and group financial statementsWe have audited the accompanying financial statements of Spark New Zealand Limited (“the company”) (formerly Telecom Corporation of New Zealand Limited) and the group, comprising the company and its subsidiaries, on pages 46 to 95. The financial statements comprise the statements of financial position as at 30 June 2014, the income statements and statements of comprehensive income, changes in equity and cash flows for the year then ended, and a summary of significant accounting policies and other explanatory information, for both the company and the group.
Directors’ responsibility for the company and group financial statements
The directors are responsible for the preparation of company and group financial statements in accordance with generally accepted accounting practice in New Zealand and International Financial Reporting Standards that give a true and fair view of the matters to which they relate, and for such internal control as the directors determine is necessary to enable the preparation of company and group financial statements that are free from material misstatement whether due to fraud or error.
Auditor’s responsibility
Our responsibility is to express an opinion on these company and group financial statements based on our audit. We conducted our audit in accordance with International Standards on Auditing (New Zealand) and International Standards on Auditing. Those standards require that we comply with ethical requirements and plan and perform the audit to obtain reasonable assurance about whether the company and group financial statements are free from material misstatement.
An audit involves performing procedures to obtain audit evidence about the amounts and disclosures in the company and group financial statements. The procedures selected depend on the auditor’s judgement, including the assessment of the risks of material misstatement of the financial statements, whether due to fraud or error. In making those risk assessments, the auditor considers internal control relevant to the company and group’s preparation of the financial statements that give a true and fair view of the matters to which they relate in order to design audit procedures that are appropriate in the circumstances, but not for the purpose of expressing an opinion on the effectiveness of the company and group's internal control. An audit also includes evaluating the appropriateness of accounting policies used and the reasonableness of accounting estimates, as well as evaluating the presentation of the financial statements.
We believe that the audit evidence we have obtained is sufficient and appropriate to provide a basis for our audit opinion.
Our firm has also provided other services to the company and group in relation to other assurance related services. Subject to certain restrictions, partners and employees of our firm may also deal with the company and group on normal terms within the ordinary course of trading activities of the business of the company and group. These matters have not impaired our independence as auditor of the company and group. The firm has no other relationship with, or interest in, the company and group.
OpinionIn our opinion the financial statements on pages 46 to 95:
• comply with generally accepted accounting practice in New Zealand;
• comply with International Financial Reporting Standards;
• give a true and fair view of the financial position of the company and the group as at 30 June 2014 and of the financial performance and cash flows of the company and the group for the year then ended.
Report on other legal and regulatory requirementsIn accordance with the requirements of sections 16(1)(d) and 16(1)(e) of the Financial Reporting Act 1993, we report that:
• we have obtained all the information and explanations that we have required; and
• in our opinion, proper accounting records have been kept by Spark New Zealand Limited as far as appears from our examination of those records.
22 August 2014
Auckland
For
per
sona
l use
onl
y
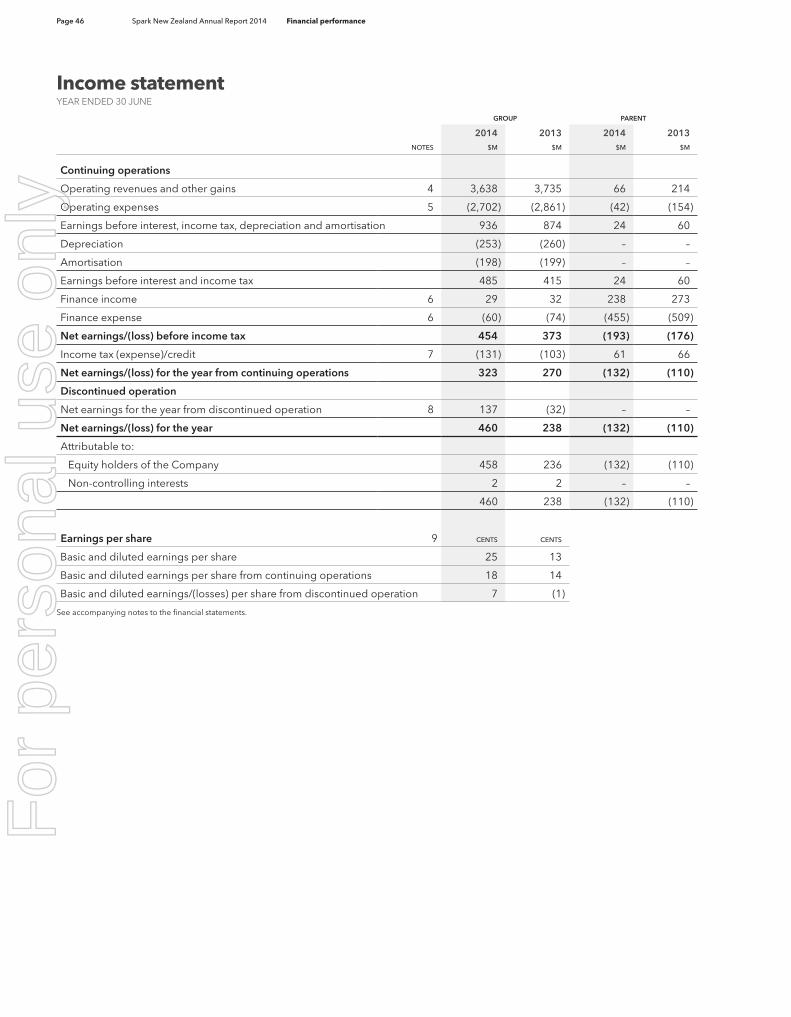
Page 46 Spark New Zealand Annual Report 2014 Financial performance
Income statementYEAR ENDED 30 JUNE
GROUP PARENT
2014 2013 2014 2013NOTES $M $M $M $M
Continuing operations
Operating revenues and other gains 4 3,638 3,735 66 214
Operating expenses 5 (2,702) (2,861) (42) (154)
Earnings before interest, income tax, depreciation and amortisation 936 874 24 60
Depreciation (253) (260) – –
Amortisation (198) (199) – –
Earnings before interest and income tax 485 415 24 60
Finance income 6 29 32 238 273
Finance expense 6 (60) (74) (455) (509)
Net earnings/(loss) before income tax 454 373 (193) (176)
Income tax (expense)/credit 7 (131) (103) 61 66
Net earnings/(loss) for the year from continuing operations 323 270 (132) (110)
Discontinued operation
Net earnings for the year from discontinued operation 8 137 (32) – –
Net earnings/(loss) for the year 460 238 (132) (110)
Attributable to:
Equity holders of the Company 458 236 (132) (110)
Non-controlling interests 2 2 – –
460 238 (132) (110)
Earnings per share 9 CENTS CENTS
Basic and diluted earnings per share 25 13
Basic and diluted earnings per share from continuing operations 18 14
Basic and diluted earnings/(losses) per share from discontinued operation 7 (1)
See accompanying notes to the financial statements.
For
per
sona
l use
onl
y
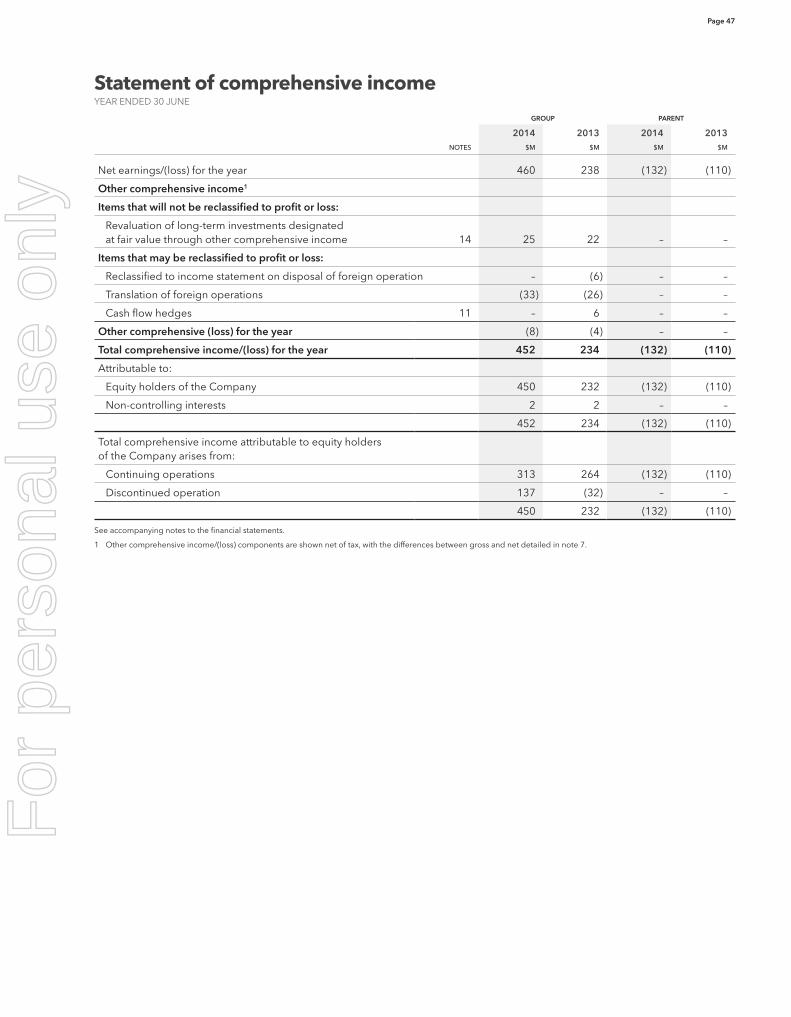
Page 47
Statement of comprehensive incomeYEAR ENDED 30 JUNE
GROUP PARENT
2014 2013 2014 2013NOTES $M $M $M $M
Net earnings/(loss) for the year 460 238 (132) (110)
Other comprehensive income1
Items that will not be reclassified to profit or loss:
Revaluation of long-term investments designated at fair value through other comprehensive income 14 25 22 – –
Items that may be reclassified to profit or loss:
Reclassified to income statement on disposal of foreign operation – (6) – –
Translation of foreign operations (33) (26) – –
Cash flow hedges 11 – 6 – –
Other comprehensive (loss) for the year (8) (4) – –
Total comprehensive income/(loss) for the year 452 234 (132) (110)
Attributable to:
Equity holders of the Company 450 232 (132) (110)
Non-controlling interests 2 2 – –
452 234 (132) (110)
Total comprehensive income attributable to equity holders of the Company arises from:
Continuing operations 313 264 (132) (110)
Discontinued operation 137 (32) – –
450 232 (132) (110)
See accompanying notes to the financial statements.
1 Other comprehensive income/(loss) components are shown net of tax, with the differences between gross and net detailed in note 7.
For
per
sona
l use
onl
y

Page 48 Spark New Zealand Annual Report 2014 Financial performance
Statement of financial positionAS AT 30 JUNE
GROUP PARENT
2014 2013 2014 2013NOTES $M $M $M $M
Current assets
Cash 208 118 – –
Short-term derivative assets 11 – 5 – –
Receivables and prepayments 12 560 658 1 1
Taxation recoverable 2 4 88 99
Inventories 13 50 53 – –
Assets classified as held for sale 8 21 – – –
Total current assets 841 838 89 100
Non-current assets
Long-term investments 14 105 77 7,077 7,155
Long-term receivables and prepayments 12 199 159 – –
Long-term derivative assets 11 5 1 – –
Property, plant and equipment 15 1,101 1,347 – –
Intangible assets 16 992 1,071 – –
Total non-current assets 2,402 2,655 7,077 7,155
Total assets 3,243 3,493 7,166 7,255
Current liabilities
Short-term payables and accruals 17 609 819 40 37
Taxation payable 23 6 – –
Short-term derivative liabilities 11 2 1 – –
Short-term provisions 18 21 35 2,093 –
Debt due within one year 19 113 225 3,981 3,715
Liabilities classified as held for sale 8 5 – – –
Total current liabilities 773 1,086 6,114 3,752
Non-current liabilities
Deferred tax liabilities 7 127 146 – –
Long-term derivative liabilities 11 26 22 – –
Long-term payables and accruals 17 19 30 – –
Long-term provisions 18 13 45 – 2,052
Long-term debt 19 577 751 – –
Total non-current liabilities 762 994 – 2,052
Total liabilities 1,535 2,080 6,114 5,804
Equity
Share capital 20 920 899 920 899
Reserves 20 (397) (504) 5 2
Retained earnings 1,179 1,012 127 550
Total equity attributable to equity holders of the Company 1,702 1,407 1,052 1,451
Non-controlling interests 6 6 – –
Total equity 1,708 1,413 1,052 1,451
Total liabilities and equity 3,243 3,493 7,166 7,255
See accompanying notes to the financial statements.
On behalf of the Board
Mark Verbiest, Chairman Simon Moutter, Managing DirectorAuthorised for issue on 22 August 2014
For
per
sona
l use
onl
y

Page 49
Statement of changes in equity – Group
SHARE CAPITAL
RETAINED EARNINGS
HEDGE RESERVE
SHARE-BASED
COMPEN-SATION
RESERVE
REVALU-ATION
RESERVE
FOREIGN CURRENCY
TRANS-LATION
RESERVE
TOTAL EQUITY
HOLDERS OF THE
COMPANY
NON-CON-TROLLING
INTERESTS TOTAL
YEAR ENDED 30 JUNE 2014 NOTES $M $M $M $M $M $M $M $M $M
Balance at 1 July 2013 899 1,012 – 2 (391) (115) 1,407 6 1,413
Net earnings for the year – 458 – – – – 458 2 460
Other comprehensive income/(loss) – – – – 25 (33) (8) – (8)
Total comprehensive income/(loss) for the year – 458 – – 25 (33) 450 2 452
Contributions by, and distributions to, owners:
Dividends 10 – (291) – – – – (291) (2) (293)
Supplementary dividends 10 – (27) – – – – (27) – (27)
Tax credit on supplementary dividends 10 – 27 – – – – 27 – 27
Dividend reinvestment plan 20 – – – – – 20 – 20
Issuance of shares under share scheme 1 – – 3 – – 4 – 4
Disposal of foreign operation 8 – – – – – 112 112 – 112
Total transactions with owners 21 (291) – 3 – 112 (155) (2) (157)
Balance at 30 June 2014 920 1,179 – 5 (366) (36) 1,702 6 1,708
SHARE CAPITAL
RETAINED EARNINGS
HEDGE RESERVE
SHARE-BASED
COMPEN-SATION
RESERVE
REVALU-ATION
RESERVE
FOREIGN CURRENCY
TRANS-LATION
RESERVE
TOTAL EQUITY
HOLDERS OF THE
COMPANY
NON-CON-TROLLING
INTERESTS TOTAL
YEAR ENDED 30 JUNE 2013 NOTE $M $M $M $M $M $M $M $M $M
Balance at 1 July 2012 990 1,126 (6) 7 (413) (83) 1,621 5 1,626
Net earnings for the year – 236 – – – – 236 2 238
Other comprehensive income/(loss) – – 6 – 22 (32) (4) – (4)
Total comprehensive income/(loss) for the year – 236 6 – 22 (32) 232 2 234
Contributions by, and distributions to, owners:
Dividends 10 – (350) – – – – (350) (1) (351)
Supplementary dividends 10 – (34) – – – – (34) – (34)
Tax credit on supplementary dividends 10 – 34 – – – – 34 – 34
Shares repurchased for dividend reinvestment plan (8) – – – – – (8) – (8)
Dividend reinvestment plan 23 – – – – – 23 – 23
Issuance of shares under share scheme 8 – – (5) – – 3 – 3
Shares repurchased (114) – – – – – (114) – (114)
Total transactions with owners (91) (350) – (5) – – (446) (1) (447)
Balance at 30 June 2013 899 1,012 – 2 (391) (115) 1,407 6 1,413
See accompanying notes to the financial statements.
For
per
sona
l use
onl
y
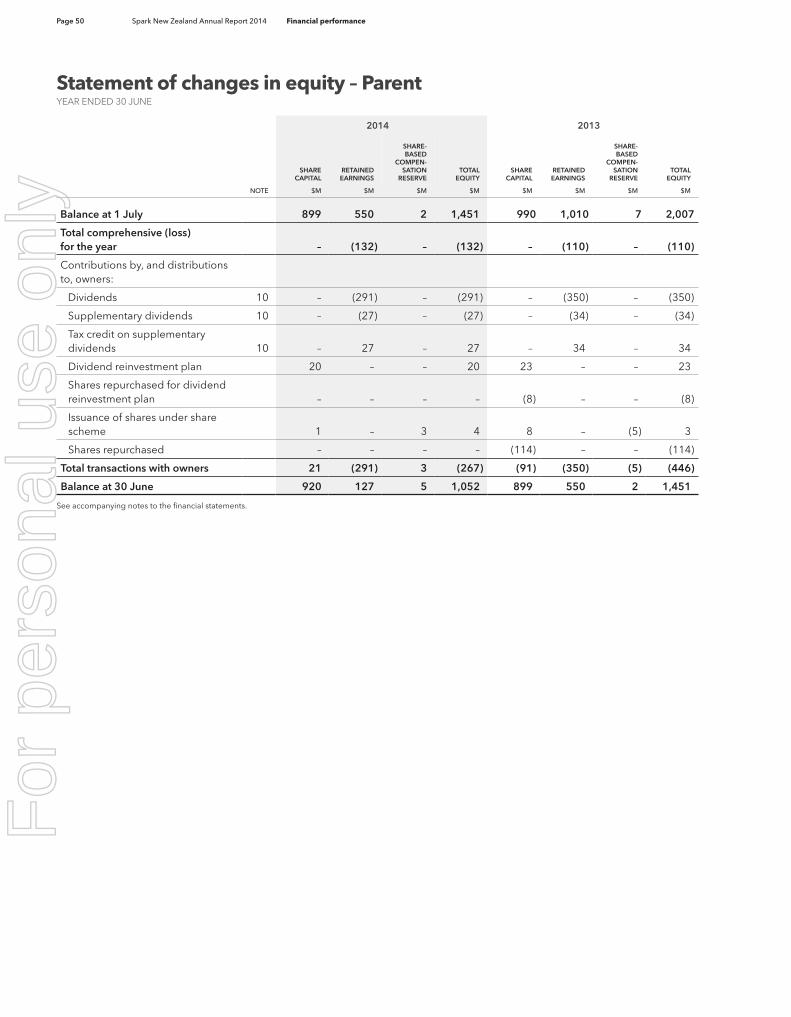
Page 50 Spark New Zealand Annual Report 2014 Financial performance
Statement of changes in equity – ParentYEAR ENDED 30 JUNE
2014 2013
SHARE CAPITAL
RETAINED EARNINGS
SHARE-BASED
COMPEN-SATION
RESERVETOTAL
EQUITYSHARE
CAPITALRETAINED EARNINGS
SHARE-BASED
COMPEN-SATION
RESERVETOTAL
EQUITY
NOTE $M $M $M $M $M $M $M $M
Balance at 1 July 899 550 2 1,451 990 1,010 7 2,007
Total comprehensive (loss) for the year – (132) – (132) – (110) – (110)
Contributions by, and distributions to, owners:
Dividends 10 – (291) – (291) – (350) – (350)
Supplementary dividends 10 – (27) – (27) – (34) – (34)
Tax credit on supplementary dividends 10 – 27 – 27 – 34 – 34
Dividend reinvestment plan 20 – – 20 23 – – 23
Shares repurchased for dividend reinvestment plan – – – – (8) – – (8)
Issuance of shares under share scheme 1 – 3 4 8 – (5) 3
Shares repurchased – – – – (114) – – (114)
Total transactions with owners 21 (291) 3 (267) (91) (350) (5) (446)
Balance at 30 June 920 127 5 1,052 899 550 2 1,451
See accompanying notes to the financial statements.
For
per
sona
l use
onl
y
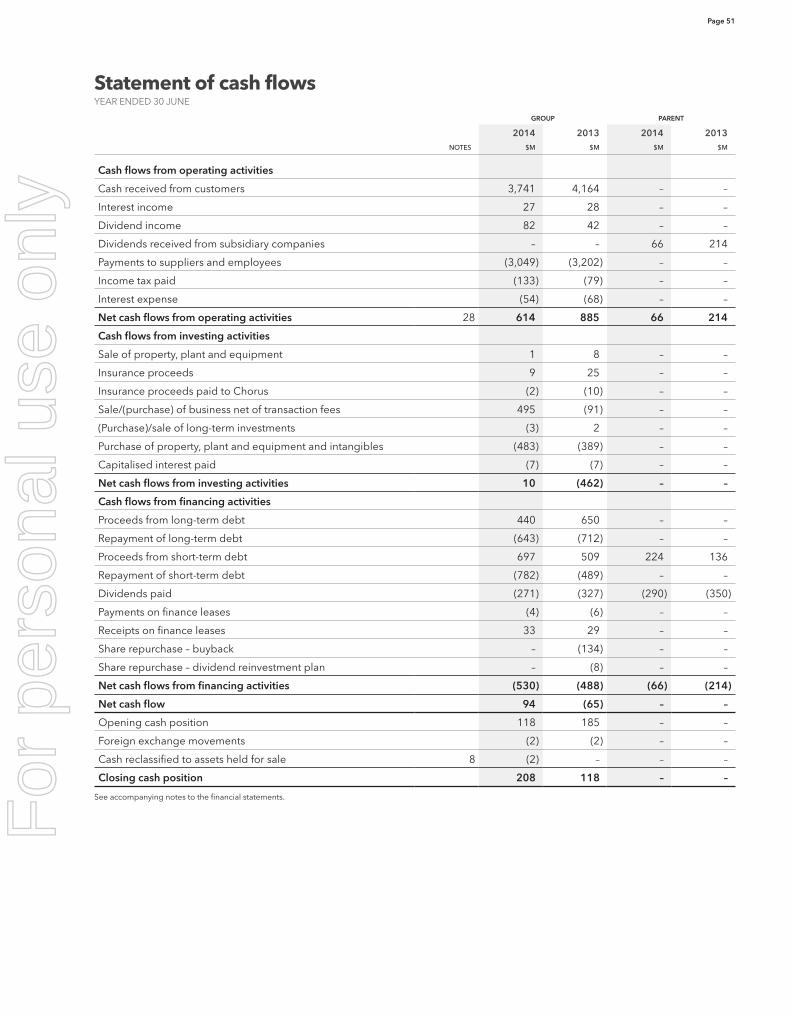
Page 51
Statement of cash flowsYEAR ENDED 30 JUNE
GROUP PARENT
2014 2013 2014 2013NOTES $M $M $M $M
Cash flows from operating activities
Cash received from customers 3,741 4,164 – –
Interest income 27 28 – –
Dividend income 82 42 – –
Dividends received from subsidiary companies – – 66 214
Payments to suppliers and employees (3,049) (3,202) – –
Income tax paid (133) (79) – –
Interest expense (54) (68) – –
Net cash flows from operating activities 28 614 885 66 214
Cash flows from investing activities
Sale of property, plant and equipment 1 8 – –
Insurance proceeds 9 25 – –
Insurance proceeds paid to Chorus (2) (10) – –
Sale/(purchase) of business net of transaction fees 495 (91) – –
(Purchase)/sale of long-term investments (3) 2 – –
Purchase of property, plant and equipment and intangibles (483) (389) – –
Capitalised interest paid (7) (7) – –
Net cash flows from investing activities 10 (462) – –
Cash flows from financing activities
Proceeds from long-term debt 440 650 – –
Repayment of long-term debt (643) (712) – –
Proceeds from short-term debt 697 509 224 136
Repayment of short-term debt (782) (489) – –
Dividends paid (271) (327) (290) (350)
Payments on finance leases (4) (6) – –
Receipts on finance leases 33 29 – –
Share repurchase – buyback – (134) – –
Share repurchase – dividend reinvestment plan – (8) – –
Net cash flows from financing activities (530) (488) (66) (214)
Net cash flow 94 (65) – –
Opening cash position 118 185 – –
Foreign exchange movements (2) (2) – –
Cash reclassified to assets held for sale 8 (2) – – –
Closing cash position 208 118 – –
See accompanying notes to the financial statements.
For
per
sona
l use
onl
y

Page 52 Spark New Zealand Annual Report 2014 Financial performance
Notes to the financial statements
Note 1 General informationThese financial statements are for Spark New Zealand Limited (formerly Telecom Corporation of New Zealand Limited) (the Company) and its subsidiaries (together the Group). The Company changed its name to Spark New Zealand Limited from Telecom Corporation of New Zealand Limited on 8 August 2014.
The Group is a major supplier of telecommunications and information and communications technology (ICT) services predominantly in New Zealand. The Group provides a full range of telecommunications and ICT products and services, including: local, national, international and value-added telephone services; mobile services, data, broadband services; IT consulting, implementation and procurement; equipment sales; and installation services.
The Company is incorporated and domiciled in New Zealand, registered under the Companies Act 1993 and listed on the New Zealand Main Board equity security market and the Australian Securities Exchange. The address of its registered office is Spark City, 167 Victoria Street West, Auckland, New Zealand, 1010.
From 1 April 2014, the new Financial Reporting Act 2013 came into force replacing the Financial Reporting Act 1993 and is effective for all for-profit entities with reporting periods beginning on or after 1 April 2014. This will be effective for the Group’s 30 June 2015 year end. The change in legislation is not expected to have a material impact on the Group’s obligation to prepare general purpose financial statements.
Note 2 Summary of significant accounting policiesThe principal accounting policies applied in the preparation of these financial statements are set out below and presented in the accompanying notes. These policies have been consistently applied to all years presented, unless otherwise stated.
Basis of preparationThe financial statements have been prepared in accordance with Generally Accepted Accounting Practice in New Zealand (‘NZ GAAP’). They comply with New Zealand equivalents to International Financial Reporting Standards (‘NZ IFRS’) and other applicable Financial Reporting Standards, as appropriate for profit-oriented entities. The financial statements also comply with International Financial Reporting Standards (‘IFRS’).
The measurement basis adopted in the preparation of these financial statements is historical cost, modified by the revaluation of certain investments and financial instruments as identified in the accompanying notes. These financial statements are expressed in New Zealand dollars, which is the Group’s functional and presentation currency. All financial information has been rounded to the nearest million, unless otherwise stated.
Transactions denominated in a foreign currency are converted at the functional currency exchange rate at the date of the transaction. Foreign currency receivables and payables at balance date are translated at exchange rates existing at the balance date. Exchange differences arising on the translation of monetary assets and liabilities, including foreign currency accounts payable and receivable, are recognised in the income statement. Non-monetary items that are measured in terms of historical cost in a foreign currency are translated using the exchange rate at the date of the initial transaction.
The financial statements of each of the Group’s subsidiaries are prepared in the functional currency of that entity. Functional currency is determined for each entity based on factors such as the principal trading or financing currency. Assets and liabilities of these entities are translated at exchange rates existing at balance date. Revenue and expenses are translated at rates approximating the exchange rates ruling at the dates of the transactions. The exchange gain or loss arising on translation is recorded in other comprehensive income and accumulated in the foreign currency translation reserve in equity.
Changes in accounting policy and disclosures
New and amended standards adopted by the Group
The Group has adopted External Reporting Board Standard A1, Accounting Standards Framework (For-profit Entities Update) (XRB A1). XRB A1 establishes a for-profit tier structure and outlines which suite of accounting standards entities in different tiers must follow. The Group is a Tier 1 entity. There was no impact on the current or prior year financial statements.
The Group has adopted NZ IFRS 10 Consolidated Financial Statements, NZ IFRS 11 Joint Arrangements, NZ IFRS 12 Disclosure of Interests in Other Entities and NZ IFRS 13 Fair Value Measurement for the first time for the year ended 30 June 2014. The adoption of these new and revised standards and amendments has not had a material impact on these financial statements and has not resulted in any restatements of prior period balances.
The Group early adopted Part 1 of NZ IFRS 9 (2009) Financial Instruments from the year ended 30 June 2010. NZ IFRS 9 specifies that financial assets should be measured at either amortised cost or fair value on the basis of both the business model for managing these assets and the nature of any contractual cash flows. The recognition and measurement of financial liabilities remains in accordance with NZ IAS 39 Financial Instruments.
New standards not yet adopted
There are no standards or amendments that have been issued but are not yet effective, that are expected to have a significant impact on the Group.F
or p
erso
nal u
se o
nly

Page 53
Note 2 Summary of significant accounting policies (continued)
Critical accounting estimates and judgementsThe preparation of these financial statements requires management to make estimates and assumptions that affect the reported amounts of assets and liabilities at the date of the financial statements and the reported amounts of revenues and expenses during the period. Actual results could differ from those estimates. The principal areas of judgement in preparing these financial statements are set out below.
Assessment of goodwill
The carrying value of goodwill is assessed at least annually to determine if it is impaired. Performing this assessment requires management to estimate future cash flows to be generated by the related cash-generating unit, which entails making judgements, including the expected rate of growth of revenues, margins expected to be achieved, the level of future capital expenditure required to support these outcomes and the appropriate discount rate to apply when valuing future cash flows.
Revenue recognition
All areas of revenue recognition are assessed as critical accounting policies as estimates and assumptions made can materially affect the financial statements. Examples of the key revenue lines subject to management’s judgement include:
• Mobile (including subsidy recognition), access, calling, data and broadband revenues – in revenue arrangements, including multiple deliverables, the deliverables are assigned to separate units of accounting and the consideration is allocated based on its relative fair value. Determining these fair values can be complex and is subject to judgement; and
• IT services and certain data revenues – the revenue recognition on contracts that span more than one accounting period may be impacted by estimates of the total costs, ultimate profitability or other appropriate inputs. Assessing contracts on a percentage of completion basis requires judgement to be exercised over future costs, profitability or other milestones. These revenues are also subject to ongoing profitability reviews of underlying contracts in order to determine whether the latest estimates applied remain appropriate.
Accounting for property, plant and equipment and finite-life intangible assets
In accounting for items of property, plant and equipment and finite-life intangible assets, judgements must be made about whether costs incurred relate to bringing an asset to working condition for its intended use and therefore are appropriate for capitalisation as part of the cost of the asset or whether they should be expensed as incurred. In capitalising costs for internally constructed assets, judgements must be made about the likelihood of project success. Such judgements can be difficult where the project involves the application of unproven technology. The determination of the appropriate useful life for a particular asset requires management to make judgements about the expected period of service potential of the asset, the likelihood of the asset becoming obsolete as a result of technological advances, the likelihood of the Group ceasing to use the asset in its business operations and the effect of government regulation.
The determination of any impairment of assets is based on a large number of factors, such as those referred to above, as well as changes in current competitive conditions, expectations of growth in the telecommunications industry, the discontinuance of services and other changes in circumstances that indicate an impairment exists. Assessing whether an asset is impaired may involve estimating the future cash flows that the asset is expected to generate. The key judgements include rates of expected revenue growth or decline, expected future margins and the selection of an appropriate discount rate for valuing future cash flows.
Provisions and contingent liabilities
Management consults with legal counsel on matters related to litigation, with respect to matters in the ordinary course of business. In respect of all claims and litigation, the Group provides for anticipated costs where an outflow of resources is considered probable and a reasonable estimate can be made of the likely outcome. The Group’s provisions principally relate to obligations arising from: property rationalisation programmes, restructuring programmes, claims and litigation. Estimates have been made of the cost of vacant properties and of any shortfall arising from any sub-lease income being lower than the lease cost and any such shortfall is recognised as a provision. Refer to note 18 for details on the Group’s provisions and note 25 for details of contingent liabilities.
For
per
sona
l use
onl
y

Page 54 Spark New Zealand Annual Report 2014 Financial performance
Notes to the financial statements
Note 3 Segment informationThe determination of the Group’s operating segments and the information reported for the operating segments is based on the management approach as set out in NZ IFRS 8 Operating Segments. The Managing Director has been identified as the Group’s chief operating decision-maker for the purpose of applying NZ IFRS 8.
The operating segments at 30 June 2014 consisted of the following:
• Spark Home, Mobile & Business – provider of fixed line, mobile and internet services to consumers and the small/medium business market and includes Spark Ventures;
• Spark Digital – integrates IT and telecommunications services to provide converged ICT solutions for clients; and
• Spark Connect – responsible for all of the Group’s network and IT operations, shared business operations and servicing of wholesale and international customers.
The Spark Connect business unit is comprised of what was previously reported as the Wholesale & International and Technology & Shared Services business units. Comparative amounts have been re-presented to reflect this change. In addition, reclassifications have been made to take into account customer transfers from Spark Home, Mobile & Business to Spark Digital, mobile cell site maintenance costs from Spark
Home, Mobile & Business and Spark Digital to Spark Connect and minor transfers to reflect the decentralisation of certain corporate functions to the business units.
AAPT was sold during the period and classified as a discontinued operation and has therefore been removed from all segmental information presented below, with comparative segmental results re-presented accordingly.
In addition to the Group’s operating segments, the Group has a Corporate Centre that contains income and costs not associated with the operating segments, such as dividends from investments and costs of providing corporate services, such as communications, legal, finance and human resources.
The segment results disclosed are based on those reported to the Managing Director and are how the Group analyses its business results. Segment results are an adjusted EBITDA and measured based on net earnings before depreciation, amortisation, finance income and expenses and income taxation expense and other gains and expenses not allocated to segments. None of these excluded items are assessed on a segment basis by the Managing Director.
The assets and liabilities of the Group are reported and reviewed by the Managing Director in total and are not allocated by operating segment. Operating segment assets and liabilities are therefore not disclosed.
The financial information of each segment is set out below:
YEAR ENDED 30 JUNE 2014
SPARK HOME, MOBILE & BUSINESS SPARK DIGITAL
SPARK CONNECT TOTAL
$M $M $M $M
Fixed 1,023 451 441 1,915
Mobile 744 221 11 976
IT Services 2 556 2 560
Other operating revenue 25 4 71 100
Other gains – 3 – 3
Internal revenue – 53 49 102
Total operating revenue and other gains 1,794 1,288 574 3,656
Segment result 685 399 (110) 974
YEAR ENDED 30 JUNE 2013
SPARK HOME, MOBILE & BUSINESS SPARK DIGITAL
SPARK CONNECT TOTAL
$M $M $M $M
Fixed 1,077 494 496 2,067
Mobile 674 236 11 921
IT Services 2 523 2 527
Other operating revenue 27 8 90 125
Other gains – 2 5 7
Internal revenue 1 44 47 92
Total operating revenue and other gains 1,781 1,307 651 3,739
Segment result 700 402 (114) 988
For
per
sona
l use
onl
y

Page 55
Note 3 Segment information (continued)Reconciliation from segment operating revenue and other gains to consolidated operating revenues and other gains
YEAR ENDED 30 JUNE2014 2013
NOTE $M $M
Segment operating revenue and other gains 3,656 3,739
Less operating revenue from internal customers (102) (92)
Other gains not allocated for segmental reporting 4 7 21
Dividend income 4 67 56
Other revenue not allocated for segmental reporting 10 11
Operating revenues and other gains (continuing operations) 3,638 3,735
Reconciliation from segment result to consolidated net earnings before income tax
YEAR ENDED 30 JUNE2014 2013
NOTES $M $M
Segment result 974 988
Net result of corporate revenue and expenses (38) (13)
Impairment and restructuring expenses not allocated to segments 5 – (101)
Depreciation (253) (260)
Amortisation (198) (199)
Finance income 6 29 32
Finance expense 6 (60) (74)
Net earnings before income tax (continuing operations) 454 373
Geographic information
The Group’s principal geographical region is New Zealand, with some international operations. The operating revenue by region is based on where services are provided and no other geographic region is considered to be material.
AS AT AND FOR THE YEAR ENDED 30 JUNE 2014
NEW ZEALAND INTERNATIONAL TOTAL
$M $M $M
Operating revenue from external customers 3,428 200 3,628
Property, plant and equipment 1,081 20 1,101
Intangible assets 987 5 992
AS AT AND FOR THE YEAR ENDED 30 JUNE 2013
NEW ZEALAND INTERNATIONAL TOTAL
$M $M $M
Operating revenue from external customers 3,494 213 3,707
Property, plant and equipment 1,058 24 1,082
Intangible assets 1,048 8 1,056
For
per
sona
l use
onl
y
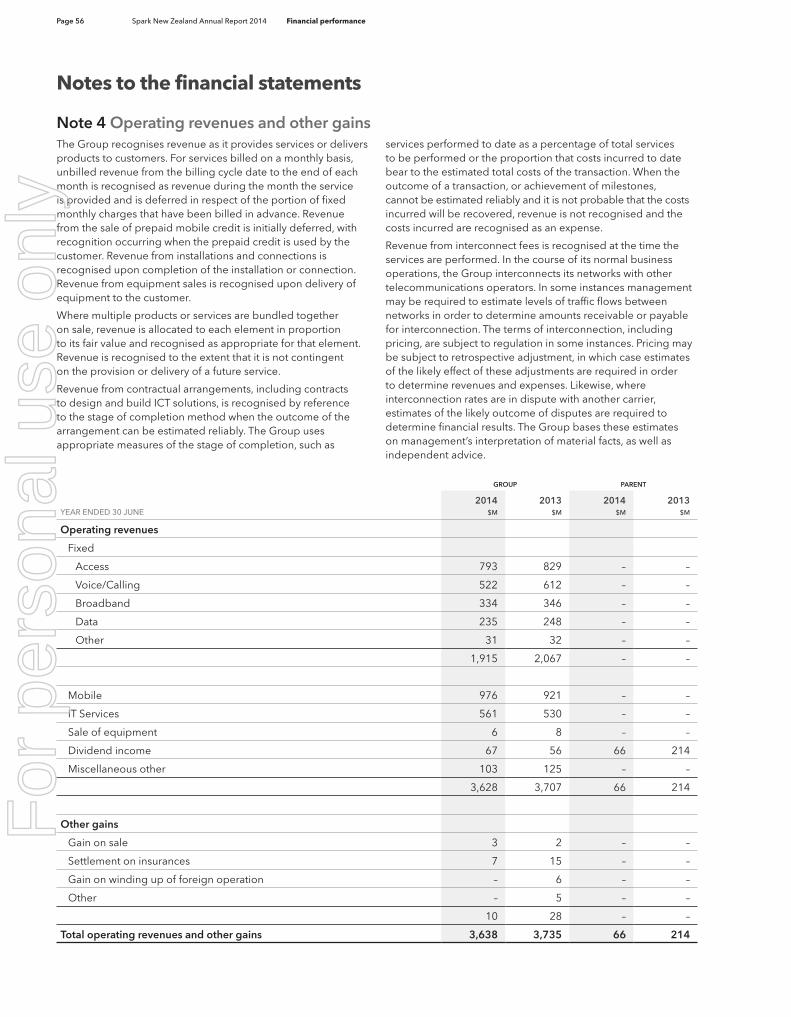
Page 56 Spark New Zealand Annual Report 2014 Financial performance
Notes to the financial statements
Note 4 Operating revenues and other gainsThe Group recognises revenue as it provides services or delivers products to customers. For services billed on a monthly basis, unbilled revenue from the billing cycle date to the end of each month is recognised as revenue during the month the service is provided and is deferred in respect of the portion of fixed monthly charges that have been billed in advance. Revenue from the sale of prepaid mobile credit is initially deferred, with recognition occurring when the prepaid credit is used by the customer. Revenue from installations and connections is recognised upon completion of the installation or connection. Revenue from equipment sales is recognised upon delivery of equipment to the customer.
Where multiple products or services are bundled together on sale, revenue is allocated to each element in proportion to its fair value and recognised as appropriate for that element. Revenue is recognised to the extent that it is not contingent on the provision or delivery of a future service.
Revenue from contractual arrangements, including contracts to design and build ICT solutions, is recognised by reference to the stage of completion method when the outcome of the arrangement can be estimated reliably. The Group uses appropriate measures of the stage of completion, such as
services performed to date as a percentage of total services to be performed or the proportion that costs incurred to date bear to the estimated total costs of the transaction. When the outcome of a transaction, or achievement of milestones, cannot be estimated reliably and it is not probable that the costs incurred will be recovered, revenue is not recognised and the costs incurred are recognised as an expense.
Revenue from interconnect fees is recognised at the time the services are performed. In the course of its normal business operations, the Group interconnects its networks with other telecommunications operators. In some instances management may be required to estimate levels of traffic flows between networks in order to determine amounts receivable or payable for interconnection. The terms of interconnection, including pricing, are subject to regulation in some instances. Pricing may be subject to retrospective adjustment, in which case estimates of the likely effect of these adjustments are required in order to determine revenues and expenses. Likewise, where interconnection rates are in dispute with another carrier, estimates of the likely outcome of disputes are required to determine financial results. The Group bases these estimates on management’s interpretation of material facts, as well as independent advice.
GROUP PARENT
YEAR ENDED 30 JUNE2014 2013 2014 2013
$M $M $M $M
Operating revenues
Fixed
Access 793 829 – –
Voice/Calling 522 612 – –
Broadband 334 346 – –
Data 235 248 – –
Other 31 32 – –
1,915 2,067 – –
Mobile 976 921 – –
IT Services 561 530 – –
Sale of equipment 6 8 – –
Dividend income 67 56 66 214
Miscellaneous other 103 125 – –
3,628 3,707 66 214
Other gains
Gain on sale 3 2 – –
Settlement on insurances 7 15 – –
Gain on winding up of foreign operation – 6 – –
Other – 5 – –
10 28 – –
Total operating revenues and other gains 3,638 3,735 66 214
For
per
sona
l use
onl
y

Page 57
Note 4 Operating revenues and other gains (continued)Operating revenues
Operating revenues includes $3,121 million from the rendering of services (30 June 2013: $3,262 million), $204 million from the sale of goods (30 June 2013: $159 million) and $236 million of IT procurement revenues (30 June 2013: $230 million).
Gain on sale
In the year ended 30 June 2014 the gain on sale of $3 million relates to the sale of Auldhouse. In the year ended 30 June 2013 the gain on sale of $2 million relates to the sale of Davanti Consulting.
Gain on winding up of foreign operation
In the year ended 30 June 2013 a gain of $6 million was recycled from the foreign currency translation reserve on the liquidation of Telecom Southern Cross Finance Limited.
Note 5 Operating expensesGROUP PARENT
YEAR ENDED 30 JUNE2014 2013 2014 2013
$M $M $M $M
Payments to telecommunications operators 955 991 – –
Mobile acquisition, procurement and IT services 701 657 – –
Labour 530 577 – –
Other operating expenses
Direct network costs 74 69 – –
Computer costs 71 74 – –
Accommodation and co-location 89 108 – –
Advertising, promotions and communication 69 71 – –
Bad debts 22 14 – –
Other 191 178 – –
516 514 – –
Other expenses
Restructuring costs – 75 – –
Natural disaster costs – 9 – –
Adjustment to provision for intercompany balances – – 42 154
– 84 42 154
Asset impairments
Related to restructure – 26 – –
Other – 12 – –
– 38 – –
Total operating expenses 2,702 2,861 42 154
For
per
sona
l use
onl
y

Page 58 Spark New Zealand Annual Report 2014 Financial performance
Notes to the financial statements
Note 5 Operating expenses (continued)Labour
Labour costs for the year ended 30 June 2014 include KiwiSaver employer contributions of $10 million (30 June 2013: $8 million) and pension contributions of $1 million on behalf of Australian employees as required by the Superannuation Guarantee (Administration) Act 1992 (30 June 2013: $2 million). The Group has no other significant obligations to provide pension benefits in respect of employees.
Donations
Donations for the year ended 30 June 2014 were $2,769,000 (30 June 2013: $2,979,000) which included the Group’s donation to the Spark Foundation of $2,591,000 (30 June 2013: $2,438,000) and payroll giving matching of $178,000 (30 June 2013: $398,000). No donations were made to political parties in New Zealand for the year ended 30 June 2014 (30 June 2013: nil).
Asset impairments
In the year ended 30 June 2014 there were no asset impairments. In the year ended 30 June 2013 there was a non-cash impairment charge totalling $38 million of the carrying value of certain property, plant and equipment and intangible assets. $26 million of these impairments were as a direct result of the Group re-setting its strategy as work on certain projects ceased. The remaining $12 million of impairments relates to assets whose future economic benefit was assessed as being lower than the assets’ carrying value.
Parent company – intercompany balances
The Company recognised a loss of $42 million (30 June 2013: loss of $154 million) representing the movement in the value of a provision reflecting intercompany obligations of subsidiary companies assumed by the Company. This loss arose due to an increase in obligations assumed by the Company under a letter of support over subsidiary intercompany debts.
Auditor remuneration
GROUP & PARENT 2014 2013YEAR ENDED 30 JUNE $’000 $’000
Audit of financial statements
Audit and review of financial statements 1 1,729 2,754
Other services
Regulatory audit work 2 147 188
Other assurance services 3 100 8
Total fees paid to auditor 1,975 2,950
1 The audit fee includes fees for both the annual audit of the financial statements and the review of the interim financial statements.
2 Regulatory audit work consists of the audit of telecommunications related regulatory disclosures.
3 Other assurance services relate to reporting on trust deed requirements, solvency returns and other assurance services. For the year ended 30 June 2014 other assurance services also comprise work performed in relation to the sale of AAPT.
For
per
sona
l use
onl
y

Page 59
Note 6 Finance income and expensesGROUP PARENT
YEAR ENDED 30 JUNE2014 2013 2014 2013
$M $M $M $M
Interest income from cash 6 10 – –
Finance lease income 23 21 – –
Other interest income – 1 – –
Interest income on loans to subsidiary companies – – 238 273
Finance income 29 32 238 273
Finance expense on long-term debt: 1
Euro Medium Term Notes (EMTN) 6 6 – –
TeleBonds 17 35 – –
Domestic notes 13 9 – –
Bank funding 13 12 – –
Revaluation of interest rate derivatives 1 – – –
Other interest and finance expenses 17 19 – –
Interest expense on loans from subsidiary companies – – 455 509
67 81 455 509
Less interest capitalised (7) (7) – –
Finance expense 60 74 455 509
1 Includes $2 million transferred from the cash flow hedge reserve for the year ended 30 June 2014 (30 June 2013: $2 million)
Interest is capitalised on property, plant and equipment and intangible assets under development at an annualised rate of 6.0% (30 June 2013: 6.0%).
For
per
sona
l use
onl
y
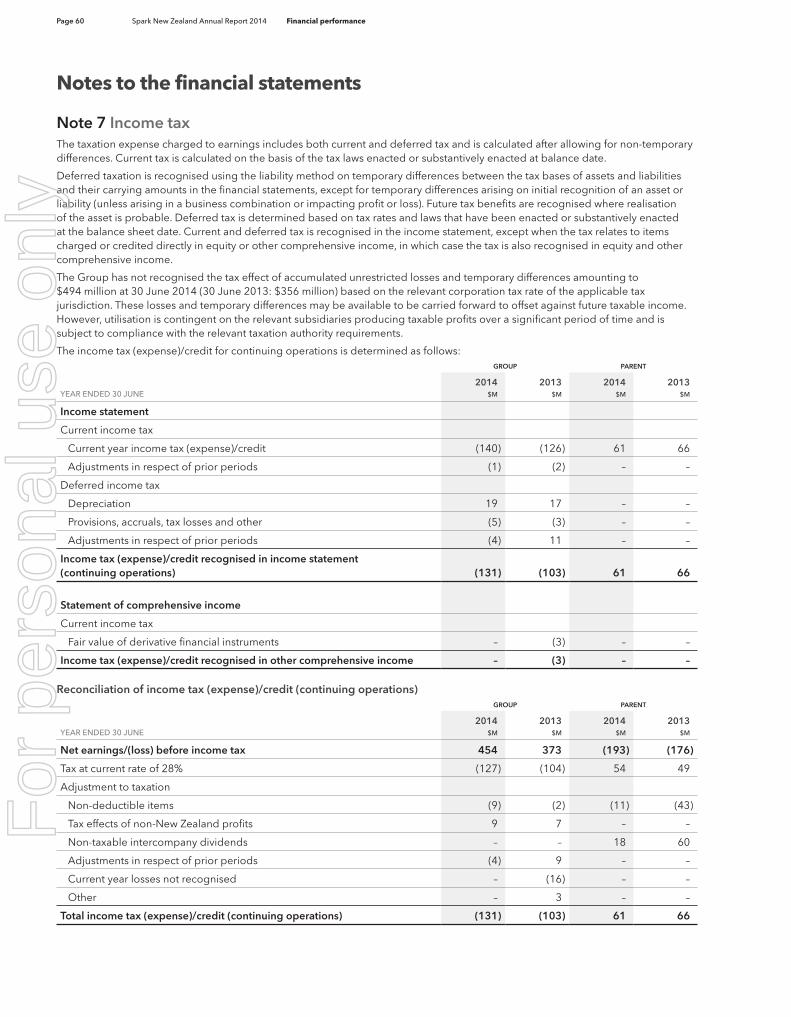
Page 60 Spark New Zealand Annual Report 2014 Financial performance
Notes to the financial statements
Note 7 Income taxThe taxation expense charged to earnings includes both current and deferred tax and is calculated after allowing for non-temporary differences. Current tax is calculated on the basis of the tax laws enacted or substantively enacted at balance date.
Deferred taxation is recognised using the liability method on temporary differences between the tax bases of assets and liabilities and their carrying amounts in the financial statements, except for temporary differences arising on initial recognition of an asset or liability (unless arising in a business combination or impacting profit or loss). Future tax benefits are recognised where realisation of the asset is probable. Deferred tax is determined based on tax rates and laws that have been enacted or substantively enacted at the balance sheet date. Current and deferred tax is recognised in the income statement, except when the tax relates to items charged or credited directly in equity or other comprehensive income, in which case the tax is also recognised in equity and other comprehensive income.
The Group has not recognised the tax effect of accumulated unrestricted losses and temporary differences amounting to $494 million at 30 June 2014 (30 June 2013: $356 million) based on the relevant corporation tax rate of the applicable tax jurisdiction. These losses and temporary differences may be available to be carried forward to offset against future taxable income. However, utilisation is contingent on the relevant subsidiaries producing taxable profits over a significant period of time and is subject to compliance with the relevant taxation authority requirements.
The income tax (expense)/credit for continuing operations is determined as follows:GROUP PARENT
YEAR ENDED 30 JUNE2014 2013 2014 2013
$M $M $M $M
Income statement
Current income tax
Current year income tax (expense)/credit (140) (126) 61 66
Adjustments in respect of prior periods (1) (2) – –
Deferred income tax
Depreciation 19 17 – –
Provisions, accruals, tax losses and other (5) (3) – –
Adjustments in respect of prior periods (4) 11 – –
Income tax (expense)/credit recognised in income statement (continuing operations) (131) (103) 61 66
Statement of comprehensive income
Current income tax
Fair value of derivative financial instruments – (3) – –
Income tax (expense)/credit recognised in other comprehensive income – (3) – –
Reconciliation of income tax (expense)/credit (continuing operations)GROUP PARENT
YEAR ENDED 30 JUNE2014 2013 2014 2013
$M $M $M $M
Net earnings/(loss) before income tax 454 373 (193) (176)
Tax at current rate of 28% (127) (104) 54 49
Adjustment to taxation
Non-deductible items (9) (2) (11) (43)
Tax effects of non-New Zealand profits 9 7 – –
Non-taxable intercompany dividends – – 18 60
Adjustments in respect of prior periods (4) 9 – –
Current year losses not recognised – (16) – –
Other – 3 – –
Total income tax (expense)/credit (continuing operations) (131) (103) 61 66
For
per
sona
l use
onl
y
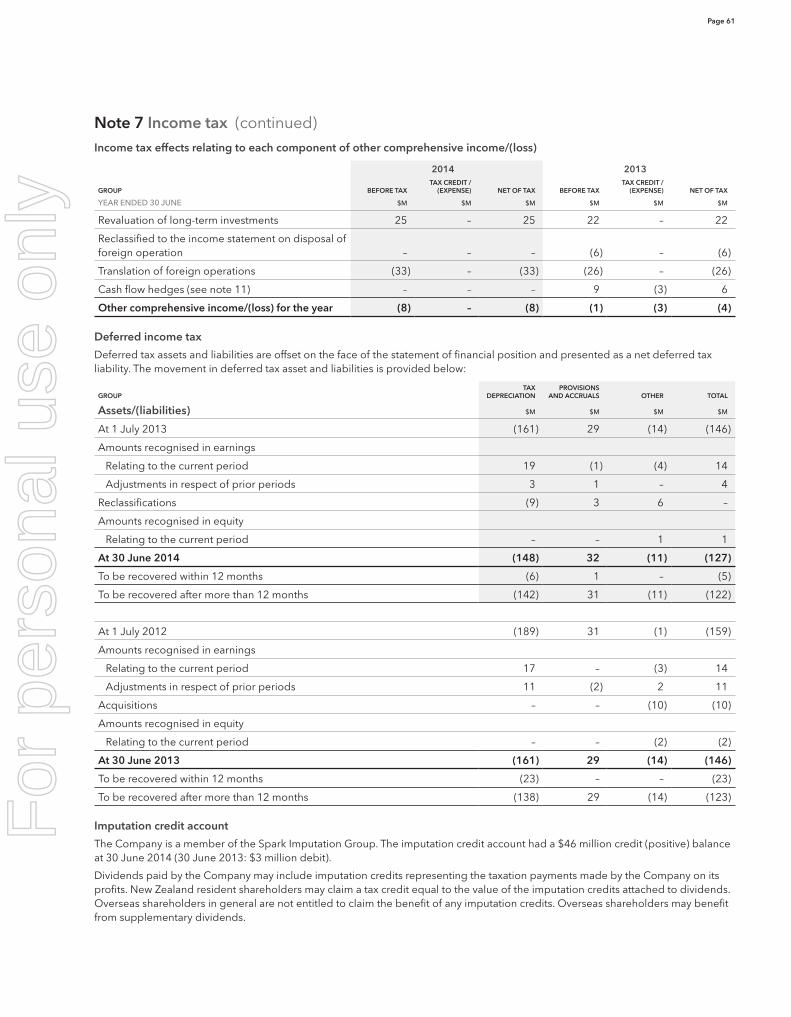
Page 61
Note 7 Income tax (continued)Income tax effects relating to each component of other comprehensive income/(loss)
2014 2013
GROUP BEFORE TAXTAX CREDIT /
(EXPENSE) NET OF TAX BEFORE TAXTAX CREDIT /
(EXPENSE) NET OF TAX
YEAR ENDED 30 JUNE $M $M $M $M $M $M
Revaluation of long-term investments 25 – 25 22 – 22
Reclassified to the income statement on disposal of foreign operation – – – (6) – (6)
Translation of foreign operations (33) – (33) (26) – (26)
Cash flow hedges (see note 11) – – – 9 (3) 6
Other comprehensive income/(loss) for the year (8) – (8) (1) (3) (4)
Deferred income tax
Deferred tax assets and liabilities are offset on the face of the statement of financial position and presented as a net deferred tax liability. The movement in deferred tax asset and liabilities is provided below:
GROUPTAX
DEPRECIATIONPROVISIONS
AND ACCRUALS OTHER TOTAL
Assets/(liabilities) $M $M $M $M
At 1 July 2013 (161) 29 (14) (146)
Amounts recognised in earnings
Relating to the current period 19 (1) (4) 14
Adjustments in respect of prior periods 3 1 – 4
Reclassifications (9) 3 6 –
Amounts recognised in equity
Relating to the current period – – 1 1
At 30 June 2014 (148) 32 (11) (127)
To be recovered within 12 months (6) 1 – (5)
To be recovered after more than 12 months (142) 31 (11) (122)
At 1 July 2012 (189) 31 (1) (159)
Amounts recognised in earnings
Relating to the current period 17 – (3) 14
Adjustments in respect of prior periods 11 (2) 2 11
Acquisitions – – (10) (10)
Amounts recognised in equity
Relating to the current period – – (2) (2)
At 30 June 2013 (161) 29 (14) (146)
To be recovered within 12 months (23) – – (23)
To be recovered after more than 12 months (138) 29 (14) (123)
Imputation credit account
The Company is a member of the Spark Imputation Group. The imputation credit account had a $46 million credit (positive) balance at 30 June 2014 (30 June 2013: $3 million debit).
Dividends paid by the Company may include imputation credits representing the taxation payments made by the Company on its profits. New Zealand resident shareholders may claim a tax credit equal to the value of the imputation credits attached to dividends. Overseas shareholders in general are not entitled to claim the benefit of any imputation credits. Overseas shareholders may benefit from supplementary dividends.
For
per
sona
l use
onl
y

Page 62 Spark New Zealand Annual Report 2014 Financial performance
Notes to the financial statements
Note 8 Discontinued operation and assets held for saleA discontinued operation is a component of the Group’s business that represents a separate major line of business or geographical area of operations that has been disposed of or is held for sale. Classification as a discontinued operation occurs upon disposal or when the operation meets the criteria to be classified as held for sale, if earlier. For an operation to be held for sale it must be available for sale in its current condition and its sale must be highly probable.
On 9 December 2013 the Group announced that it had entered into a binding agreement to sell AAPT to TPG Telecom Limited and the sale was completed on 28 February 2014. The Group’s income statement and comparatives have been re-presented to show the AAPT results to 28 February 2014 as a discontinued operation, separately from the Group’s continuing operations. The results of the discontinued operation for the periods presented in the income statement, including directly attributable gains and costs from the sale are as follows:
NET EARNINGS FROM DISCONTINUED OPERATION2014 2013
$M $M
Revenue 303 515
Expenses (263) (547)
Net earnings before income tax 40 (32)
Income tax expense – –
Net earnings for the period before directly attributable gains and costs 40 (32)
Directly attributable gains and costs
Gain on sale 238 –
Transaction and other costs (26) –
Foreign currency translation reserve transferred to profit or loss (112) –
Tax expense on sale-related items (3) –
Net earnings for the year from discontinued operation 137 (32)
Basic and diluted earnings/(losses) per share from discontinued operation (in dollars) $0.07 ($0.01)
The net earnings of the discontinued operation before directly attributable gains and costs for the period ended 28 February 2014 include the impact of the cessation of the recognition of depreciation and amortisation expense while held for sale from 9 December 2013 through to sale completion date on 28 February 2014 of $15 million.
The $238 million gain on sale relates to the difference between the sale proceeds received of $506 million and the carrying value of the net assets as at the date of sale. The carrying value of assets and liabilities at the date of sale were as follows:
$M
Cash 1
Receivables and prepayments 77
Inventories 4
Intangible assets 26
Property, plant and equipment 266
Total assets 374
Accounts payable and accruals 81
Long-term derivative liabilities 25
Total liabilities 106
Net assets 268
The cash flows of the discontinued operation for the periods presented in the cash flow statement are as follows:
CASH FLOWS FROM DISCONTINUED OPERATION2014 2013
$M $M
Net cash flows from operating activities 33 73
Net cash flows from investing activities (32) (49)
Net cash flows from financing activities (24) (35)
Net cash flows from discontinued operation (23) (11)
For
per
sona
l use
onl
y
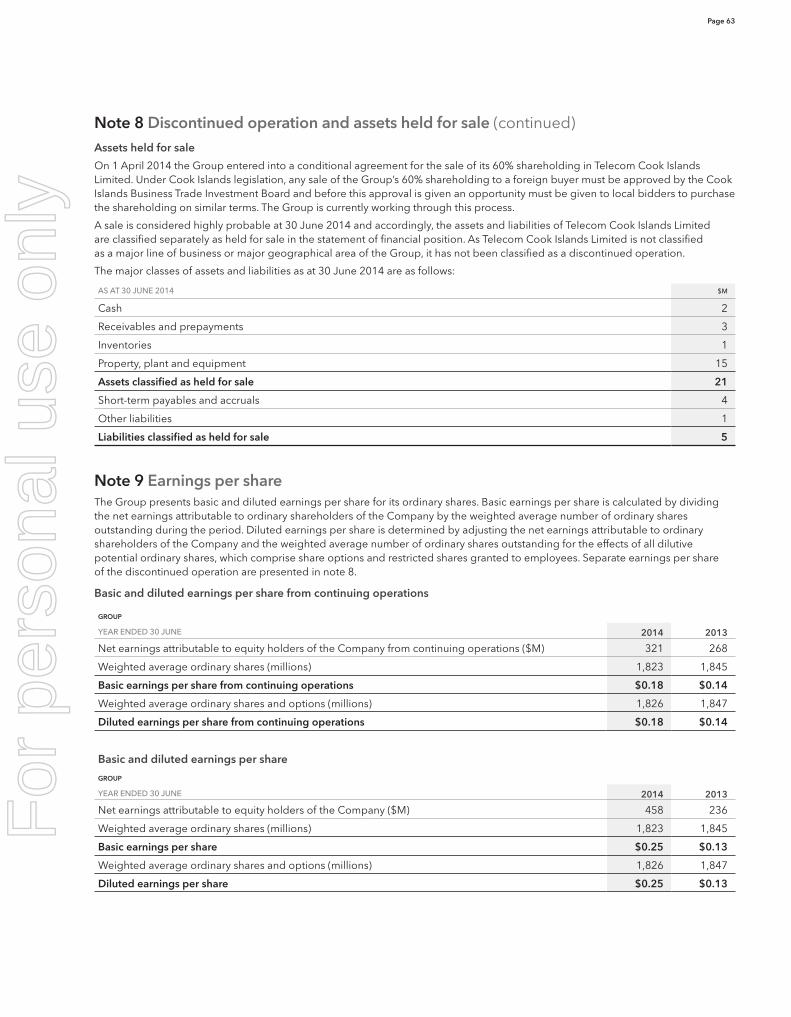
Page 63
Note 8 Discontinued operation and assets held for sale (continued)Assets held for sale
On 1 April 2014 the Group entered into a conditional agreement for the sale of its 60% shareholding in Telecom Cook Islands Limited. Under Cook Islands legislation, any sale of the Group’s 60% shareholding to a foreign buyer must be approved by the Cook Islands Business Trade Investment Board and before this approval is given an opportunity must be given to local bidders to purchase the shareholding on similar terms. The Group is currently working through this process.
A sale is considered highly probable at 30 June 2014 and accordingly, the assets and liabilities of Telecom Cook Islands Limited are classified separately as held for sale in the statement of financial position. As Telecom Cook Islands Limited is not classified as a major line of business or major geographical area of the Group, it has not been classified as a discontinued operation.
The major classes of assets and liabilities as at 30 June 2014 are as follows:
AS AT 30 JUNE 2014 $M
Cash 2
Receivables and prepayments 3
Inventories 1
Property, plant and equipment 15
Assets classified as held for sale 21
Short-term payables and accruals 4
Other liabilities 1
Liabilities classified as held for sale 5
Note 9 Earnings per shareThe Group presents basic and diluted earnings per share for its ordinary shares. Basic earnings per share is calculated by dividing the net earnings attributable to ordinary shareholders of the Company by the weighted average number of ordinary shares outstanding during the period. Diluted earnings per share is determined by adjusting the net earnings attributable to ordinary shareholders of the Company and the weighted average number of ordinary shares outstanding for the effects of all dilutive potential ordinary shares, which comprise share options and restricted shares granted to employees. Separate earnings per share of the discontinued operation are presented in note 8.
Basic and diluted earnings per share from continuing operations GROUP
YEAR ENDED 30 JUNE 2014 2013
Net earnings attributable to equity holders of the Company from continuing operations ($M) 321 268
Weighted average ordinary shares (millions) 1,823 1,845
Basic earnings per share from continuing operations $0.18 $0.14
Weighted average ordinary shares and options (millions) 1,826 1,847
Diluted earnings per share from continuing operations $0.18 $0.14
Basic and diluted earnings per share GROUP
YEAR ENDED 30 JUNE 2014 2013
Net earnings attributable to equity holders of the Company ($M) 458 236
Weighted average ordinary shares (millions) 1,823 1,845
Basic earnings per share $0.25 $0.13
Weighted average ordinary shares and options (millions) 1,826 1,847
Diluted earnings per share $0.25 $0.13
For
per
sona
l use
onl
y
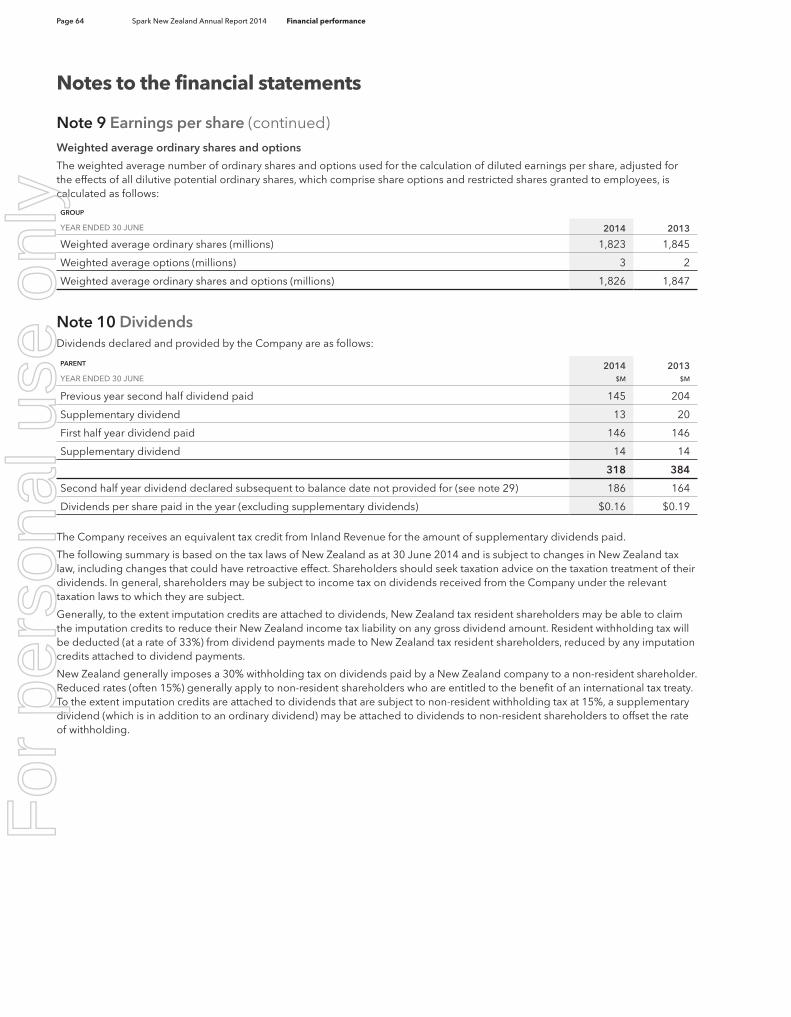
Page 64 Spark New Zealand Annual Report 2014 Financial performance
Notes to the financial statements
Note 9 Earnings per share (continued)Weighted average ordinary shares and options
The weighted average number of ordinary shares and options used for the calculation of diluted earnings per share, adjusted for the effects of all dilutive potential ordinary shares, which comprise share options and restricted shares granted to employees, is calculated as follows:
GROUP
YEAR ENDED 30 JUNE 2014 2013
Weighted average ordinary shares (millions) 1,823 1,845
Weighted average options (millions) 3 2
Weighted average ordinary shares and options (millions) 1,826 1,847
Note 10 DividendsDividends declared and provided by the Company are as follows:
PARENT 2014 2013YEAR ENDED 30 JUNE $M $M
Previous year second half dividend paid 145 204
Supplementary dividend 13 20
First half year dividend paid 146 146
Supplementary dividend 14 14
318 384
Second half year dividend declared subsequent to balance date not provided for (see note 29) 186 164
Dividends per share paid in the year (excluding supplementary dividends) $0.16 $0.19
The Company receives an equivalent tax credit from Inland Revenue for the amount of supplementary dividends paid.
The following summary is based on the tax laws of New Zealand as at 30 June 2014 and is subject to changes in New Zealand tax law, including changes that could have retroactive effect. Shareholders should seek taxation advice on the taxation treatment of their dividends. In general, shareholders may be subject to income tax on dividends received from the Company under the relevant taxation laws to which they are subject.
Generally, to the extent imputation credits are attached to dividends, New Zealand tax resident shareholders may be able to claim the imputation credits to reduce their New Zealand income tax liability on any gross dividend amount. Resident withholding tax will be deducted (at a rate of 33%) from dividend payments made to New Zealand tax resident shareholders, reduced by any imputation credits attached to dividend payments.
New Zealand generally imposes a 30% withholding tax on dividends paid by a New Zealand company to a non-resident shareholder. Reduced rates (often 15%) generally apply to non-resident shareholders who are entitled to the benefit of an international tax treaty. To the extent imputation credits are attached to dividends that are subject to non-resident withholding tax at 15%, a supplementary dividend (which is in addition to an ordinary dividend) may be attached to dividends to non-resident shareholders to offset the rate of withholding.
For
per
sona
l use
onl
y

Page 65
Note 11 DerivativesThe Group uses derivative financial instruments to reduce its exposure to fluctuations in foreign currency exchange rates and interest rates.
Derivative financial instruments are initially recognised at fair value on the date they are entered into and are subsequently re-measured at their fair value. The method of recognising the resulting gain or loss depends on whether the derivative is designated as a hedging instrument, and if so, the nature of the item being hedged.
The Group does not hold or issue derivative financial instruments for trading purposes, however derivatives that do not qualify for hedge accounting are accounted for as trading instruments and any changes in fair value are recognised in the income statement.
The Group designates certain derivatives as within a cash flow hedge, being hedges of a particular risk associated with a recognised asset or liability or a highly probable forecast transaction. The Group documents at the inception of the transaction the relationship between hedging instruments and hedged items, as well as its risk management objectives and strategy for undertaking various hedging transactions. The Group also documents its assessment, both at hedge inception and on an ongoing basis, whether the derivatives that are used in hedging transactions are highly effective in offsetting changes in cash flows of hedged items.
The effective portion of changes in the fair value of derivatives that are designated and qualify as cash flow hedges is recognised in other comprehensive income. The gain or loss relating to the ineffective portion is recognised immediately in the income statement.
Amounts accumulated in equity are reclassified to the income statement in the periods when the hedged transaction affects net earnings. When the forecast transaction that is hedged results in the recognition of a non-financial asset or liability, the gains and losses previously deferred in equity are transferred from equity and included in the initial carrying amount of the asset or liability.
When a hedging instrument expires or is sold, or when a hedge no longer meets the criteria for hedge accounting, any cumulative gain or loss existing in equity at that time remains in equity and is recognised when the forecast transaction is ultimately recognised in the income statement. When a forecast transaction is no longer expected to occur, the cumulative gain or loss that was reported in equity is immediately transferred to the income statement.
The fair values of derivatives in hedging relationships and derivatives not designated in hedging relationships are as follows:
GROUP 2014 2013AS AT 30 JUNE $M $M
Short-term derivative assets
Forward exchange contracts – cash flow hedges – 3
Forward exchange contracts – held for trading – 1
Currency options – cash flow hedge – 1
– 5
Long-term derivative assets
Interest rate swaps – cash flow hedge 5 1
5 1
Short-term derivative liabilities
Forward exchange contracts – cash flow hedges (2) (1)
(2) (1)
Long-term derivative liabilities
Interest rate swaps – cash flow hedges (1) (1)
Cross-currency interest rate swaps – cash flow hedges (25) (21)
(26) (22)
As at 30 June 2014 and 30 June 2013 no derivative financial assets or derivative financial liabilities have been offset in the statement of financial position. The potential for offsetting of any derivative financial instruments is immaterial.
For
per
sona
l use
onl
y

Page 66 Spark New Zealand Annual Report 2014 Financial performance
Notes to the financial statements
Note 11 Derivatives (continued)The notional values of contract amounts outstanding are as follows:
GROUP 2014 2013AS AT 30 JUNE CURRENCY MATURITIES $M $M
Cross-currency interest rate swaps NZD:GBP 2018 – 2020 110 110
Interest rate swaps NZD 2015 – 2023 330 210
Forward exchange contracts NZD:AUD 2014 21 27
NZD:USD 2014 – 2016 80 131
NZD:EUR 2014 – 2015 13 43
Other 2014 – 2015 23 25
Currency options NZD:EUR – 3
NZD:USD – 9
NZD:AUD – 1
Cash flow hedges
The Group uses cross-currency interest rate swaps and interest rate swaps to manage interest and foreign exchange risk on debt. These swaps are jointly designated as cash flow hedges of the forecast interest and principal cash flows of the debt. The changes in the fair values of interest rate derivatives accumulated in equity are expected to be reclassified to finance expense as interest payments occur over the remaining term of the derivatives.
At 30 June the fair value component of interest rate derivatives deferred in equity, by maturity, is as follows:
GROUP 2014 2013AS AT 30 JUNE $M $M
3 to 4 years 7 –
4 to 5 years – 6
Over 5 years 4 5
11 11
The Group enters into forward exchange contracts to hedge foreign currency purchases. The majority of the purchases are forecast to be made within 12 months of 30 June 2014 (30 June 2013: 12 months of 30 June 2013).
When in a hedging relationship, the fair value of foreign exchange forward contracts will be included in the income statement at the same time as the underlying purchase impacts the determination of income. If the purchase relates to an operating expense, the fair value will be recognised when the underlying expense is recognised. If the purchase relates to an item of property, plant and equipment or intangible assets, the fair value will be recognised in the income statement as the asset depreciates or is amortised. If the purchase relates to an inventory item, the fair value will be recognised in the income statement when the underlying inventory is expensed.
Other amounts deferred in equity will be transferred to the income statement over the next 6 years (30 June 2013: 7 years).
During the period all hedged forecast transactions occurred as expected and qualified for hedge accounting.
A reconciliation of movements in the cash flow hedge reserve follows:
2014 2013
GROUP BEFORE TAXTAX CREDIT /
EXPENSE NET OF TAX BEFORE TAXTAX CREDIT /
EXPENSE NET OF TAX
YEAR ENDED 30 JUNE $M $M $M $M $M $M
Balance at beginning of the year – (6)
Gain/(loss) recognised in other comprehensive income – – – 14 (4) 10
Amount reclassified from cash flow hedge reserve to finance expense 2 (1) 1 2 (1) 1
Amount reclassified from cash flow hedge reserve to property, plant and equipment/intangible assets (2) 1 (1) (6) 2 (4)
Amount reclassified from cash flow hedge reserve to inventory – – – (1) – (1)
Total movements to other comprehensive income – – – 9 (3) 6
Balance at the end of the year – –
For
per
sona
l use
onl
y

Page 67
Note 12 Receivables and prepaymentsGROUP PARENT
AS AT 30 JUNE2014 2013 2014 2013
$M $M $M $M
Short-term receivables and prepayments
Trade receivables 308 369 – –
Less allowance for doubtful accounts receivable (25) (21) – –
283 348 – –
Unbilled rentals and tolls 91 79 – –
Finance lease receivables (see note 23) 61 52 – –
Prepaid expenses and other receivables 125 179 – –
Due from subsidiaries – – 1 1
560 658 1 1
Long-term receivables and prepayments
Finance lease receivables (see note 23) 184 154 – –
Other receivables 15 5 – –
199 159 – –
The fair value of finance lease receivables is estimated to be $231million (30 June 2013: $194 million) using a discount rate based on the relevant swap rate given the tenure of the lease and adding a credit margin that reflects the credit quality of the receivables. The carrying amount of all other receivables are approximately equivalent to their fair value because of the short term to maturity.
The Group has $60 million (30 June 2013: $78 million) of financial assets that are overdue but not impaired. Trade receivables are aged as follows:
GROUP 2014 2013AS AT 30 JUNE $M $M
Current 223 270
0–30 days past due 51 37
30–60 days past due 11 32
60–90 days past due 10 17
90+ days past due 13 13
308 369
The Group maintains a provision for estimated losses expected to arise from customers being unable to make required payments. This provision takes into account known commercial factors impacting specific customer accounts, as well as the overall profile of the Group’s receivables portfolio. In assessing the provision, factors such as past collection history, the age of receivable balances, the level of activity in customer accounts, as well as general macro-economic trends, are taken into account. Significant changes in these factors would likely necessitate changes in the doubtful debts provision. At present, however, the Group considers the current level of its allowance for doubtful accounts to be adequate to cover credit losses on trade receivables. The provision balance is maintained at a Group-wide level and allocated against individual balances once non-collectability is highly probable.
Movements in the allowance for doubtful accounts are as follows:
GROUP 2014 2013YEAR ENDED 30 JUNE $M $M
Balance at beginning of the year 21 18
Charged to costs and expenses 25 21
Bad debts recovered (3) (5)
Utilised (18) (13)
Balance at end of the year 25 21
Bad debt expenses are reported as other operating expenses in the income statement and written off against the provision for doubtful debts in the period in which it is determined that the debts are uncollectable. If those debts are subsequently collected then a gain is recognised in the income statement. Bad debts of $18 million (30 June 2013: $13 million) were written off against the allowance for doubtful accounts during the year.
For
per
sona
l use
onl
y

Page 68 Spark New Zealand Annual Report 2014 Financial performance
Notes to the financial statements
Note 13 InventoriesInventories are stated at the lower of cost and net realisable value after consideration for excess and obsolete items. The cost is determined on a weighted average cost basis and amounts are removed from inventory on this basis. The cost of inventories includes the transfer from equity of any foreign exchange gains or losses on qualifying cash flow hedges related to inventories. Cash flows from the sale of inventories are included in amounts received from customers in the cash flow statement.
GROUP 2014 2013AS AT 30 JUNE $M $M
Maintenance materials and consumables 2 2
Goods held for resale 30 39
Work in progress 18 12
50 53
The allowance for inventory obsolescence as at 30 June 2014 was $6 million (30 June 2013: $5 million) with $1 million charged to the income statement during the period (30 June 2013: nil).
Note 14 Long-term investmentsGROUP PARENT
AS AT 30 JUNE2014 2013 2014 2013
$M $M $M $M
Shares in Hutchison 99 74 – –
Investment in TMT Ventures 2 2 – –
Government stock 1 1 – –
Investments in associates and joint ventures 3 – – –
Subsidiary companies (see note 27)
Shares – – 4,889 4,889
Term advances – – 2,188 2,266
105 77 7,077 7,155
Shares in Hutchison
The Group holds a 10% interest in Hutchison Telecommunications Australia Limited (Hutchison) which is quoted on the Australian Securities Exchange (ASX). The Group’s investment in Hutchison is classified at fair value through other comprehensive income. The increase in fair value for the year ended 30 June 2014 was $25 million (30 June 2013: $23 million). Fair value has been determined by reference to the closing bid price as quoted on the ASX. As at 30 June 2014 the quoted price of Hutchison’s shares on the ASX was A$0.068 (30 June 2013: A$0.046).
Investment in TMT Ventures
The Group holds an investment in TMT Ventures (TMT) a corporate venture capital programme, which is invested in a number of start-up companies. The Group has elected to classify this investment at fair value through other comprehensive income and further details of its fair value are provided in note 22. There was no change in fair value for the year ended 30 June 2014 (30 June 2013: $1 million decrease).
Associate companies
Associates are entities in which the Group has significant influence, but not control, over the operating and financial policies. Associates are accounted for in the consolidated financial statements using the equity method, whereby the Group’s share of the post-acquisition net earnings of associates is included in consolidated earnings before income tax.
Where the equity accounted carrying amount of an investment in an entity falls below zero, the equity method of accounting is suspended and the investment is recorded at zero, except where there is a legal or constructive obligation to fund those losses, in which case losses are recorded and a liability is recognised. If this occurs, the equity method of accounting is not resumed until such time as the Group’s share of losses and reserves not recognised during the financial years in which the equity method was suspended, are offset by the current share of earnings and reserves.
For
per
sona
l use
onl
y

Page 69
Note 14 Long-term investments (continued)The Group’s investment in associate companies consists of:
COUNTRY OWNERSHIP PRINCIPAL ACTIVITY
Pacific Carriage Holdings Limited Bermuda 50% A holding company
Southern Cross Cables Holdings Limited Bermuda 50% A holding company
Vigil Monitoring Limited New Zealand 22% Healthcare technology
Extract from associates’ financial statements:
GROUP 2014 2013AS AT AND FOR THE YEAR ENDED 30 JUNE $M $M
Total assets 773 1,145
Total liabilities 1,721 2,125
Total revenues 214 180
Net earnings 54 91
As at 30 June 2014 the Group has recognised cumulative dividend income of $746 million (30 June 2013: $679 million) from these associates and the share of the cumulative deficits of associates was $493 million (30 June 2013: $509 million). The Group has no obligation to fund these deficits or repay dividends. The Group’s share of profits not recognised for the year was $27 million (30 June 2013: $46 million).
Note 15 Property, plant and equipmentThe value of property, plant and equipment purchased from the Government was determined using deemed cost as at 1 April 1987. Subsequent additions are recognised at cost. The cost of additions to plant and equipment and other assets constructed by the Group consists of all appropriate costs of development, construction and installation, comprising material, labour, direct overhead and transport costs. For each qualifying asset, directly attributable interest costs incurred during the period required to complete and prepare the property, plant or equipment for its intended use are capitalised as part of the total cost.
On the statement of financial position, property, plant and equipment is stated at cost less accumulated depreciation and impairments. Depreciation is charged on a straight-line basis to write down the cost of property, plant and equipment to its estimated residual value over its estimated useful life. Estimated useful lives are outlined below.
Junctions and trunk transmission systems 10 – 50 years
Switching equipment 5 – 12 years
Customer premises equipment 3 – 5 years
Other network equipment 2 – 25 years
Buildings 9 – 50 years
Motor vehicles 6 years
Furniture and fittings 2 – 25 years
Computer equipment 3 – 5 years
Where the remaining useful lives or recoverable values have diminished due to technological, regulatory or market condition changes, depreciation is accelerated.
Land and capital work in progress are not depreciated. Where property, plant or equipment is disposed of the gain or loss recognised is calculated as the difference between the sale price and the carrying value of the asset and recorded within the operating revenues and other gains in the income statement. F
or p
erso
nal u
se o
nly

Page 70 Spark New Zealand Annual Report 2014 Financial performance
Notes to the financial statements
Note 15 Property, plant and equipment (continued)Impairment
At each reporting period date, management reviews the carrying amounts of property, plant and equipment to determine whether there is any indication that those assets have suffered an impairment loss. If any such indication exists, the recoverable amount of the asset is estimated in order to determine the extent, if any, of the impairment loss. Where it is not possible to estimate the recoverable amount of an individual asset, management estimates the recoverable amount of the cash-generating unit to which the asset belongs. If the recoverable amount of an asset or cash-generating unit is estimated to be less than its carrying amount, the carrying amount of the asset or cash-generating unit is reduced to its recoverable amount. An impairment loss is recognised immediately in the income statement within operating expenses.
Where an impairment loss subsequently reverses, the carrying amount of the asset or cash-generating unit is increased to the revised estimate of its recoverable amount, a level that will not exceed the carrying amount that would have been determined had no impairment loss been recognised. A reversal of an impairment loss is then recognised immediately in the income statement within operating expenses.
No impairment loss in respect of property, plant and equipment was identified in the current period (30 June 2013: $11 million).
GROUP
TELECOM-MUNICATIONS
EQUIPMENT AND PLANT
FREEHOLD LAND BUILDINGS OTHER ASSETS
WORK IN PROGRESS TOTAL
AS AT 30 JUNE 2014 $M $M $M $M $M $M
Cost
Balance as at 1 July 2013 5,362 62 494 624 21 6,563
Additions – 1 26 – 307 334
Transfers 272 – – 33 (305) –
Disposals (56) – (2) (9) – (67)
Disposal on sale of subsidiary (1,337) – (40) (53) (10) (1,440)
Transfers to assets held for sale (40) – (11) – (1) (52)
Currency movements (143) – (1) (5) – (149)
Balance as at 30 June 2014 4,058 63 466 590 12 5,189
Accumulated depreciation and impairment losses
Balance as at 1 July 2013 (4,412) – (278) (526) – (5,216)
Depreciation charge 1 (203) – (27) (52) – (282)
Disposals 53 – 2 8 – 63
Disposal on sale of subsidiary 1,083 – 40 51 – 1,174
Transfers to assets held for sale 30 – 7 – – 37
Currency movements 123 – 5 8 – 136
Balance as at 30 June 2014 (3,326) – (251) (511) – (4,088)
Net book value at 30 June 2014 732 63 215 79 12 1,101
1 The depreciation charge includes $29 million in relation to the discontinued operation prior to classification as held for sale.
For
per
sona
l use
onl
y

Page 71
Note 15 Property, plant and equipment (continued)
GROUP
TELECOM-MUNICATIONS
EQUIPMENT AND PLANT
FREEHOLD LAND BUILDINGS OTHER ASSETS
WORK IN PROGRESS TOTAL
AS AT 30 JUNE 2013 $M $M $M $M $M $M
Cost
Balance as at 1 July 2012 5,782 62 490 578 60 6,972
Additions – – – – 170 170
Acquisitions – – 14 46 – 60
Transfers 136 – 38 33 (207) –
Impairment (2) – (6) (1) (2) (11)
Disposals (464) – (39) (30) – (533)
Currency movements (90) – (3) (2) – (95)
Balance as at 30 June 2013 5,362 62 494 624 21 6,563
Accumulated depreciation and impairment losses
Balance as at 1 July 2012 (4,711) – (282) (464) – (5,457)
Depreciation charge (237) – (31) (64) – (332)
Acquisitions – – (5) (28) – (33)
Disposals 457 – 36 28 – 521
Currency movements 79 – 4 2 – 85
Balance as at 30 June 2013 (4,412) – (278) (526) – (5,216)
Net book value at 30 June 2013 950 62 216 98 21 1,347
Values ascribed to land and buildings
The Group’s properties consist primarily of special-purpose network buildings, which form an integral part of the telecommunications network.
Finance leases with Chorus
The Group has entered into leases to occupy space in exchanges owned by Chorus and to allow Chorus to occupy space in the Group’s exchanges. These leases are accounted for as finance leases with the lessor derecognising the leased proportion of the asset and the lessee recognising its share. As at 30 June 2014 $14 million (30 June 2013: $16 million) is included in buildings leased under finance leases.
For
per
sona
l use
onl
y
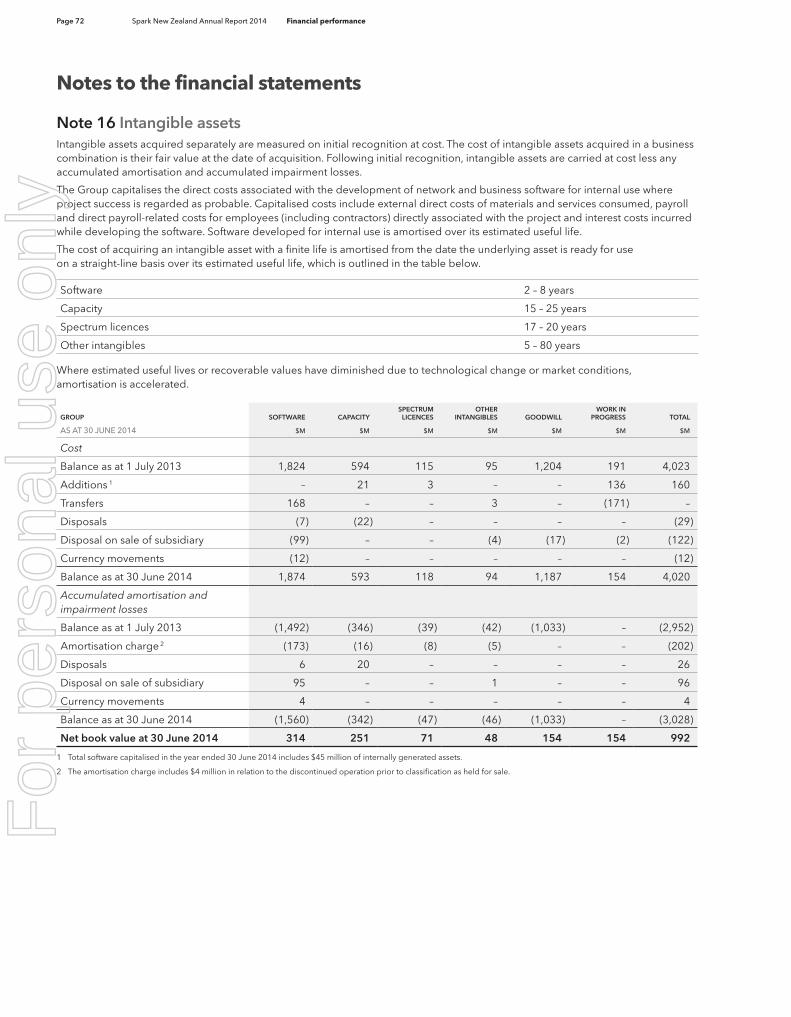
Page 72 Spark New Zealand Annual Report 2014 Financial performance
Notes to the financial statements
Note 16 Intangible assetsIntangible assets acquired separately are measured on initial recognition at cost. The cost of intangible assets acquired in a business combination is their fair value at the date of acquisition. Following initial recognition, intangible assets are carried at cost less any accumulated amortisation and accumulated impairment losses.
The Group capitalises the direct costs associated with the development of network and business software for internal use where project success is regarded as probable. Capitalised costs include external direct costs of materials and services consumed, payroll and direct payroll-related costs for employees (including contractors) directly associated with the project and interest costs incurred while developing the software. Software developed for internal use is amortised over its estimated useful life.
The cost of acquiring an intangible asset with a finite life is amortised from the date the underlying asset is ready for use on a straight-line basis over its estimated useful life, which is outlined in the table below.
Software 2 – 8 years
Capacity 15 – 25 years
Spectrum licences 17 – 20 years
Other intangibles 5 – 80 years
Where estimated useful lives or recoverable values have diminished due to technological change or market conditions, amortisation is accelerated.
GROUP SOFTWARE CAPACITYSPECTRUM
LICENCESOTHER
INTANGIBLES GOODWILLWORK IN
PROGRESS TOTAL
AS AT 30 JUNE 2014 $M $M $M $M $M $M $M
Cost
Balance as at 1 July 2013 1,824 594 115 95 1,204 191 4,023
Additions 1 – 21 3 – – 136 160
Transfers 168 – – 3 – (171) –
Disposals (7) (22) – – – – (29)
Disposal on sale of subsidiary (99) – – (4) (17) (2) (122)
Currency movements (12) – – – – – (12)
Balance as at 30 June 2014 1,874 593 118 94 1,187 154 4,020
Accumulated amortisation and impairment losses
Balance as at 1 July 2013 (1,492) (346) (39) (42) (1,033) – (2,952)
Amortisation charge 2 (173) (16) (8) (5) – – (202)
Disposals 6 20 – – – – 26
Disposal on sale of subsidiary 95 – – 1 – – 96
Currency movements 4 – – – – – 4
Balance as at 30 June 2014 (1,560) (342) (47) (46) (1,033) – (3,028)
Net book value at 30 June 2014 314 251 71 48 154 154 992
1 Total software capitalised in the year ended 30 June 2014 includes $45 million of internally generated assets.
2 The amortisation charge includes $4 million in relation to the discontinued operation prior to classification as held for sale.
For
per
sona
l use
onl
y

Page 73
Note 16 Intangible assets (continued)
GROUP SOFTWARE CAPACITYSPECTRUM
LICENCESOTHER
INTANGIBLES GOODWILLWORK IN
PROGRESS TOTAL
AS AT 30 JUNE 2013 $M $M $M $M $M $M $M
Cost
Balance as at 1 July 2012 1,720 583 60 56 1,139 146 3,704
Additions 1 – 11 55 – – 229 295
Acquisitions – – – 36 66 – 102
Transfers 172 – – 3 – (175) –
Disposals (55) – – – – – (55)
Impairments (4) – – – – (9) (13)
Currency movements (9) – – – (1) – (10)
Balance as at 30 June 2013 1,824 594 115 95 1,204 191 4,023
Accumulated amortisation and impairment losses
Balance as at 1 July 2012 (1,372) (327) (36) (36) (1,033) – (2,804)
Amortisation charge (179) (19) (3) (6) – – (207)
Disposals 51 – – – – – 51
Currency movements 8 – – – – – 8
Balance as at 30 June 2013 (1,492) (346) (39) (42) (1,033) – (2,952)
Net book value at 30 June 2013 332 248 76 53 171 191 1,071
1 Total software capitalised in the year ended 30 June 2013 includes $60 million of internally generated assets.
Jointly controlled assets
The Group shares a number of IT systems with Chorus, with some systems owned by the Group and some owned by Chorus. Due to the terms of the governance framework in place the arrangement is deemed to be a joint operation, as defined in NZ IFRS 11: Joint Arrangements. For assets that it does not own, the Group recognises its share of the assets held jointly, as well as a liability for the future payments due, akin to a finance lease. For assets that it does own, the Group derecognised the share of the asset used by Chorus and recognised a receivable for the future receipts due. As at 30 June 2014 the Group has recognised system assets held jointly owned by Chorus of $8 million (30 June 2013: $16 million).
Goodwill
Goodwill represents the excess of purchase consideration over the fair value of net assets acquired at the time of acquisition of a business or shares in a subsidiary. Goodwill is allocated to cash-generating units, which are the lowest level of assets for which separately identifiable cash flows can be attributed. Goodwill by cash-generating unit is presented below:
GROUP 2014 2013AS AT 30 JUNE $M $M
Spark Home, Mobile & Business (formerly Retail) 25 25
Spark Digital (formerly Gen-i) 122 122
Revera 7 7
AAPT 1 – 17
154 171
1 $17 million of goodwill associated with the AAPT cash-generating unit was derecognised during the period upon its sale. For
per
sona
l use
onl
y

Page 74 Spark New Zealand Annual Report 2014 Financial performance
Notes to the financial statements
Note 16 Intangible assets (continued)Impairment testing
Goodwill is not subject to amortisation but is tested for impairment annually or whenever there is an indication that the asset may be impaired. For the purpose of impairment testing, assets are grouped within the above cash-generating units (CGUs). If the recoverable amount of the CGU is less than the carrying amount of the unit, the impairment loss is allocated first to reduce the carrying amount of any goodwill allocated to the unit and then to the other assets. Impairment losses recognised for goodwill are not reversed in a subsequent period. The recoverable amount is the higher of fair value less costs to sell and value in use. In assessing value in use, the estimated future cash flows are discounted to their present value using a pre-tax discount rate.
The recoverable amount of each CGU was calculated on the basis of value in use using a discounted cash flow model. Future cash flows were projected for one year, based on Board-approved business plans, with key assumptions being earnings and capital expenditure for the CGU based on forecasts of expected future performance. The forecasted financial information is based on both past experience and future expectations of CGU performance. The major inputs and assumptions used in performing an impairment assessment that require judgement include revenue forecasts, operating cost projections, customer numbers and customer churn, discount rates, growth rates and future technology paths.
Nil terminal growth was applied and a pre-tax discount rate of 12% (30 June 2013: 11%) was utilised. The terminal growth rates are determined based on the long-term historical growth rates of the sectors in which the CGU operates. The growth rates have been benchmarked against external data for the relevant sectors. None of the growth rates applied exceed the observed long-term historical average growth rates for those markets/sectors.
During the years ended 30 June 2014 and 30 June 2013 no impairment arose as a result of the review of goodwill. Headroom currently exists in each CGU and, based on sensitivity analysis performed, no reasonably possible changes in the assumptions would cause the carrying amount of the CGUs to exceed their recoverable amount.
Note 17 Payables and accrualsGROUP PARENT
AS AT 30 JUNE2014 2013 2014 2013
$M $M $M $M
Short-term payables & accruals
Trade accounts payable 392 550 – –
Accrued personnel costs 81 92 – –
Revenue billed in advance 101 127 – –
Accrued interest 5 5 31 31
Finance lease payable (note 23) 3 6 – –
Other accrued expenses 27 39 9 6
609 819 40 37
Long-term payables & accruals
Finance lease payable (note 23) 1 5 – –
Other payables & accruals 18 25 – –
19 30 – –
For
per
sona
l use
onl
y
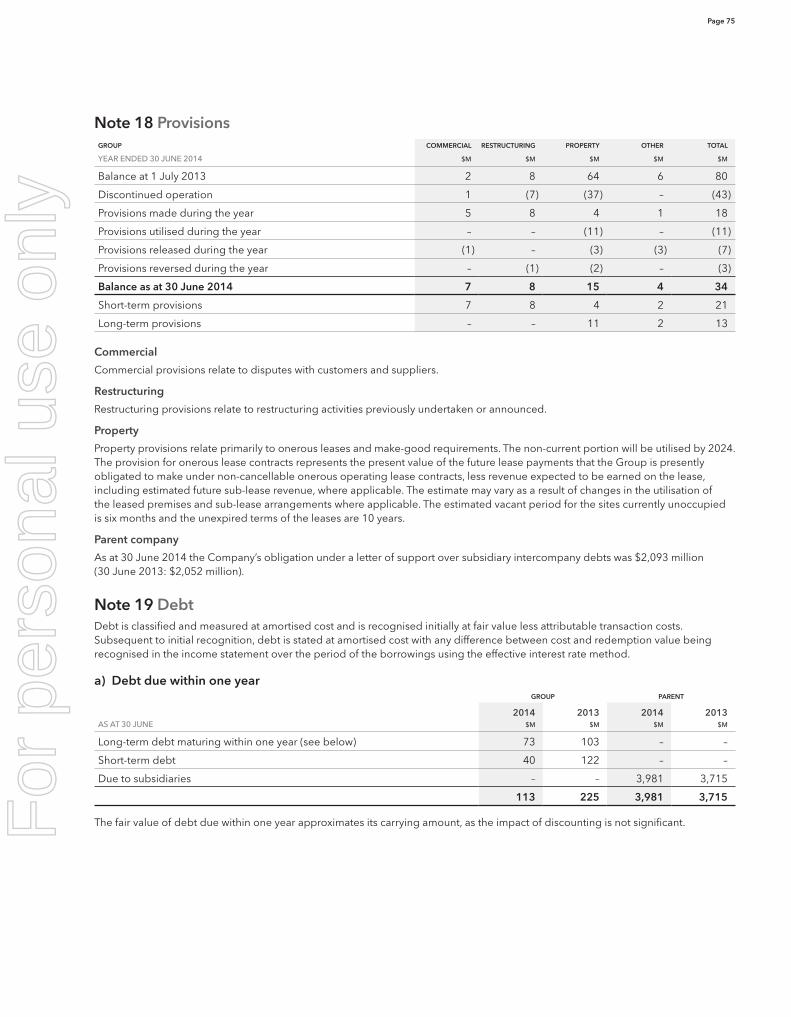
Page 75
Note 18 ProvisionsGROUP COMMERCIAL RESTRUCTURING PROPERTY OTHER TOTAL
YEAR ENDED 30 JUNE 2014 $M $M $M $M $M
Balance at 1 July 2013 2 8 64 6 80
Discontinued operation 1 (7) (37) – (43)
Provisions made during the year 5 8 4 1 18
Provisions utilised during the year – – (11) – (11)
Provisions released during the year (1) – (3) (3) (7)
Provisions reversed during the year – (1) (2) – (3)
Balance as at 30 June 2014 7 8 15 4 34
Short-term provisions 7 8 4 2 21
Long-term provisions – – 11 2 13
Commercial
Commercial provisions relate to disputes with customers and suppliers.
Restructuring
Restructuring provisions relate to restructuring activities previously undertaken or announced.
Property
Property provisions relate primarily to onerous leases and make-good requirements. The non-current portion will be utilised by 2024. The provision for onerous lease contracts represents the present value of the future lease payments that the Group is presently obligated to make under non-cancellable onerous operating lease contracts, less revenue expected to be earned on the lease, including estimated future sub-lease revenue, where applicable. The estimate may vary as a result of changes in the utilisation of the leased premises and sub-lease arrangements where applicable. The estimated vacant period for the sites currently unoccupied is six months and the unexpired terms of the leases are 10 years.
Parent company
As at 30 June 2014 the Company’s obligation under a letter of support over subsidiary intercompany debts was $2,093 million (30 June 2013: $2,052 million).
Note 19 DebtDebt is classified and measured at amortised cost and is recognised initially at fair value less attributable transaction costs. Subsequent to initial recognition, debt is stated at amortised cost with any difference between cost and redemption value being recognised in the income statement over the period of the borrowings using the effective interest rate method.
a) Debt due within one yearGROUP PARENT
AS AT 30 JUNE2014 2013 2014 2013
$M $M $M $M
Long-term debt maturing within one year (see below) 73 103 – –
Short-term debt 40 122 – –
Due to subsidiaries – – 3,981 3,715
113 225 3,981 3,715
The fair value of debt due within one year approximates its carrying amount, as the impact of discounting is not significant.For
per
sona
l use
onl
y

Page 76 Spark New Zealand Annual Report 2014 Financial performance
Notes to the financial statements
Note 19 Debt (continued)b) Long-term debt
GROUP PARENT
AS AT 30 JUNE2014 2013 2014 2013
$M $M $M $M
Euro Medium Term Notes 78 79 – –
TeleBonds 223 226 – –
Domestic notes 250 250 – –
Bank funding 100 300 – –
651 855 – –
Less unamortised discount (1) (1) – –
650 854 – –
Less long-term debt maturing within one year (see above) (73) (103) – –
577 751 – –
GROUP 2014 2013AS AT 30 JUNE $M $M
Schedule of maturities
Due 1 to 2 years 150 173
Due 2 to 3 years – 150
Due 3 to 4 years 143 –
Due 4 to 5 years – 144
Due over 5 years 284 284
Total due after one year 577 751
None of the Group’s debt is secured and all rank equally with other liabilities. There are no financial covenants over the Group’s debt, however, there are certain triggers in the event of default, as defined in the various debt agreements. There have been no events of default over the Group’s debt in the years ended 30 June 2014 and 30 June 2013.
The fair value of long-term debt (calculated based on the present value of future principal and interest cash flows, discounted at market interest rates at balance date) was $663 million compared to a carrying value of $651 million (30 June 2013: fair value of $891 million compared to a carrying value of $855 million).
Euro Medium Term Notes GROUP
AS AT 30 JUNE 2014 2013FACE VALUE DUE INTEREST RATE 1 $M $M
22m GBP 14 May 2018 5.6% 44 44
18m GBP 6 April 2020 5.8% 34 35
78 79
1 Before hedging instruments.
Cross-currency interest rate swaps and interest rate swaps have been entered into to hedge Euro Medium Term Notes currency and interest rate risk exposures (see note 11).
TeleBonds
The Group has issued bonds (TeleBonds) to institutional and retail investors. These have been issued as compounding, income or zero coupon bonds. TeleBonds have effective interest rates ranging from 7.0% to 8.7% and maturity dates between April 2015 and April 2016. During the year ended 30 June 2014 $3 million of TeleBonds matured and were repaid (30 June 2013: $313 million).
Domestic Notes
As at 30 June 2014 and 30 June 2013, the Group had $250 million of notes issued in New Zealand, maturing in October 2019. The notes are unsecured and pay a coupon of 5.25%.
For
per
sona
l use
onl
y

Page 77
Note 19 Debt (continued)Bank funding
The Group has a $100 million unsecured variable bank facility with Bank of Tokyo-Mitsubishi UFG, maturing in March 2018. The facility was fully drawn at 30 June 2014 and 30 June 2013.
The Group also has a $300 million unsecured variable bank facility with Westpac New Zealand Limited, maturing in June 2015. As at 30 June 2014 the facility was undrawn (30 June 2013: $400 million unsecured variable bank facility with Westpac New Zealand Limited and $200 million drawn down).
Note 20 Equity
Contributed equityMovements in the Company’s issued ordinary shares were as follows:
GROUP & PARENT 2014 2013YEAR ENDED 30 JUNE NUMBER $M NUMBER $M
Balance at the beginning of the year 1,817,088,869 899 1,856,745,213 990
Dividend reinvestment plan 8,495,999 20 6,493,301 15
Employee shares 2,945,976 1 3,750,025 8
Shares repurchased – – (49,899,670) (114)
Balance at the end of the year 1,828,530,844 920 1,817,088,869 899
All issued shares are fully paid and have no par value. Shareholders of ordinary shares have the right to vote at any general meeting of the Company.
Dividend reinvestment plan
The Company has a dividend reinvestment plan. Under the plan shareholders can elect to receive dividends in additional shares. For the year ended 30 June 2014, 8,495,999 shares with a total value of $20 million (30 June 2013: 9,793,591 shares with a total value of $23 million) were issued in lieu of dividends. During the year ended 30 June 2014 no shares were repurchased and cancelled to neutralise the dilution effect of the dividend reinvestment plan to non-participants (30 June 2013: 3,300,290 shares). Shares issued in lieu of dividends are excluded from dividends paid in the statement of cash flows.
Shares held in trust
As detailed in note 21, prior to vesting, shares are held in trust before they are allocated to employees under the Company’s restricted share scheme. As at 30 June 2014, 550,235 shares were held in trust (30 June 2013: 232,504).
Shares repurchased
In February 2012 the Company announced an on-market buyback of shares to return capital deemed surplus to existing requirements and to achieve a gearing ratio more consistent with the Group’s long-term capital management policies.
During the year ended 30 June 2014 there were no shares repurchased. During the year ended 30 June 2013 the Company repurchased 49,899,670 of its own shares at a cost of $114 million. This brought the total shares repurchased as part of the on market buyback to 118,577,138 at a cost of $283 million (representing an average buyback price of $2.39). Shares repurchased were cancelled immediately on acquisition.
Restricted share scheme, share rights scheme and exercise of options
See note 21 for details of the Group’s employee share schemes.
ReservesGROUP PARENT
AS AT 30 JUNE2014 2013 2014 2013
$M $M $M $M
Hedge reserve – – – –
Share-based compensation reserve 5 2 5 2
Revaluation reserve (366) (391) – –
Foreign currency translation reserve (36) (115) – –
(397) (504) 5 2
For
per
sona
l use
onl
y

Page 78 Spark New Zealand Annual Report 2014 Financial performance
Notes to the financial statements
Note 20 Equity (continued)Hedge reserve
Movements in the fair value of derivatives are recognised directly in the hedge reserve when the derivative is in an effective cash flow hedge relationship. Cash flow hedge relationships are established when the derivative is recognised and the hedge relationship is documented.
Share-based compensation reserve
Deferred compensation relating to restricted shares or share options is recognised over the related vesting period. Amounts are transferred from the share-based compensation reserve to share capital upon vesting of the share or the option.
Revaluation reserve
The revaluation reserve is used to record the cumulative fair value gains and losses recognised on financial assets that are recognised at fair value through other comprehensive income. In accordance with NZ IFRS 9 gains and losses are recorded in other comprehensive income.
Foreign currency translation reserve
Translation differences arising on the results and net assets of subsidiaries with functional currencies other than New Zealand dollars are recognised in the foreign currency translation reserve.
Non-controlling interestNon-controlling interest consists of the share of the net earnings less dividends of subsidiaries controlled by the Group but not attributable to the Group.
Note 21 Employee share schemesThe Group has operated a number of share-based compensation plans that are equity settled. These include a restricted share scheme, share rights schemes and a CEO performance rights scheme.
The fair value of the employee services received in exchange for the grant of equity instruments is recognised as an expense, with a corresponding entry in equity. The total amount to be expensed over the vesting period is determined by reference to the fair value of the equity instruments on grant date, excluding the impact of any non-market vesting conditions. Non-market vesting conditions are included in assumptions about the number of equity instruments that are expected to become exercisable. At each balance sheet date the Group revises its estimates of the number of equity instruments that are expected to vest. The Group recognises the impact of the revision of original estimates, if any, in the income statement. The proceeds received, net of any directly attributable transaction costs, are credited to contributed capital when equity instruments are exercised.
The total charge recognised for these schemes during the year ended 30 June 2014 was $5 million (30 June 2013: $3 million). The awards under the schemes are settled with or by issuing ordinary shares of the Company. There are no on-market purchases in relation to employee share schemes.
Restricted share scheme
The Company’s restricted share scheme (RSS) was introduced for selected employees in September 2001. Under the RSS ordinary shares in the Company are issued to Spark Trustee Limited (formerly Telecom Trustee Limited), a Company subsidiary. Participants purchase shares from Spark Trustee Limited with funds lent to them by the Company and which are held on their behalf by Spark Trustee Limited. Spark Trustee Limited cannot exercise any voting rights attached to the shares. However, once vested, the shares have the same voting rights as ordinary shares. Generally, the shares vest after a three-year period, although a reduced period may be used in some cases. If the individual is still employed by the Company at the end of the vesting period, the employee is provided a cash bonus which must be used to repay the loan and the shares are then transferred to the individual.
There were 2,577,607 restricted shares awarded during the year ended 30 June 2014, including one-off exceptional grants with substantially more challenging performance hurdles attached (30 June 2013: 1,128,767).
Information regarding shares awarded under the RSS is as follows:
NUMBER OF SHARES
Unvested shares as at 30 June 2012 1,083,652
Awarded pursuant to RSS 1,128,767
Forfeited (334,050)
Vested (1,002,513)
Unvested shares as at 30 June 2013 875,856
Awarded pursuant to RSS 2,577,607
Forfeited (257,569)
Vested (37,904)
Unvested shares as at 30 June 2014 3,157,990
Percentage of total ordinary shares 0.17%
The number of shares awarded pursuant to the RSS does not equal the number of shares created for the scheme as lapsed shares are held in trust and may be reissued. The expense relating to the RSS for the year ended 30 June 2014 was $2 million (30 June 2013: $1 million).
Share rights schemes
The Company’s share rights scheme (SRS) is used for selected Leadership Team members and senior employees. The Company also operates the CEO performance rights scheme (PRS). Under the share rights schemes participants are granted rights to purchase Company shares at a nil cost strike price.
Share rights have no voting rights until exercised and generally cannot be exercised for a three-year period. The share rights will be exercisable at the end of the vesting period only if the individual is still employed by the Company and, in the case of the Leadership Team and the Managing Director, a total shareholder return performance hurdle has been met (other than in relation to a one-off grant of share rights to the Managing Director in FY13, which had no performance criteria attached). In special circumstances early vesting may occur.
For
per
sona
l use
onl
y

Page 79
Note 21 Employee share schemes (continued)There were 1,835,546 options granted under the SRS and 868,006 options granted under the PRS during the year ended 30 June 2014, including one-off exceptional grants with substantially more challenging performance hurdles attached (30 June 2013: 722,400 under SRS and 698,576 under PRS). The intrinsic value of options exercised during the year was $1 million (30 June 2013: $6 million). Options with an intrinsic value of $9 million remain outstanding at the year end (30 June 2013: $3 million). Information regarding options granted under the SRS and PRS is as follows:
NUMBER OF OPTIONS
30 June 2012 2,817,968
Granted 1,420,976
Exercised (2,646,920)
Forfeited (188,811)
30 June 2013 1,403,213
Granted 2,703,552
Exercised (368,369)
Forfeited (197,558)
30 June 2014 3,540,838
The following table summarises SRS and PRS options outstanding:
OPTIONS OUTSTANDING AS AT 30 JUNE 2014
PERIOD GRANTEDOPTIONS
OUTSTANDINGREMAINING
LIFE1 (YEARS)
1 July 2012 – 30 June 2013 837,286 1.9
1 July 2013 – 30 June 2014 2,703,552 2.8
3,540,838
1 Weighted average
Fair value of share scheme awards
Options granted under the SRS and PRS are valued based on the volume weighted average price of 20 days prior to grant date.
The intrinsic value of options granted in the year ended 30 June 2014 was $6 million (30 June 2013: $4 million). The fair value is less than the intrinsic value.
In the year ended 30 June 2014 the Group has made awards under the SRS and PRS that are subject to performance conditions. The expense relating to all SRS and PRS awards in the year ended 30 June 2014 was $3 million (30 June 2013: $2 million).
$13 million of share scheme awards remain unvested and not expensed as at 30 June 2014 (30 June 2013: $4 million). This expense will be recognised over the vesting period of the awards.
Note 22 Financial instruments and risk managementThe Group has derivative and non-derivative financial instruments. The Group’s non-derivative financial instruments comprise equity securities, trade receivables and payables, other receivables and payables, cash, loans and borrowings and finance lease receivables and payables.
Classification
The Group classifies its financial assets as subsequently measured at fair value or amortised cost on the basis of the Group’s business model for managing the financial assets and its contractual cash flow characteristics. A financial asset is classified at amortised cost when the asset is held within a business model whose objective is to collect the contractual cash flows and those contractual cash flows consist solely of payments of principal and interest on specified dates. All equity investments are measured at fair value. Equity investments that are held for trading are measured at fair value through profit or loss. For all other equity investments, the Group can make an irrevocable election on an instrument by instrument basis at initial recognition to recognise changes in fair value through other comprehensive income rather than profit or loss.
The Group classifies its financial liabilities as subsequently measured at amortised cost or fair value through profit or loss.
Initial recognition and measurement
All financial assets and liabilities are recognised initially at fair value plus, in the case of a financial asset or liability not at fair value through profit or loss, directly attributable transaction costs. Transaction costs of financial assets and liabilities carried at fair value through profit or loss are expensed in the income statement. Regular way purchases and sales of financial assets are recognised on the trade-date — the date on which the Group commits to purchase or sell the asset. Financial assets are derecognised when the rights to receive cash flows have expired or have been transferred and the Group has transferred substantially all risks and rewards of ownership. Financial liabilities are derecognised if the Group’s obligations specified in the contract expire or are discharged or cancelled.
Subsequent fair value movements of equity investments classified at fair value through other comprehensive income are presented in other comprehensive income and accumulated in the revaluation reserve. Dividends from such investments are recognised in the income statement when the right to receive payment is established, unless the dividend represents a return of capital. If the investment is derecognised the cumulative gain or loss may be transferred within equity reserves.
A financial liability is classified at fair value through profit or loss if it is held for trading or is designated as such upon initial recognition. The Group’s financial liabilities measured at fair value through profit and loss are mandatorily measured as such. Derivatives are also categorised as held for trading unless they are designated as hedges. Financial liabilities not classified and measured at fair value through profit or loss are classified and measured at amortised cost using the effective interest method.
For
per
sona
l use
onl
y

Page 80 Spark New Zealand Annual Report 2014 Financial performance
Notes to the financial statements
Note 22 Financial instruments and risk management (continued)
Financial instrumentsThe Group’s financial instruments are classified as follows:
GROUP
FAIR VALUE THROUGH
PROFIT & LOSS
FAIR VALUE THROUGH
OTHER COMPREHEN-SIVE INCOME
DESIGNATED IN HEDGING
RELATIONSHIPSAMORTISED
COST TOTAL
AS AT 30 JUNE 2014 $M $M $M $M $M
Assets
Current assets
Cash – – – 208 208
Trade receivables – – – 283 283
Finance lease receivables 1 – – – 61 61
– – – 552 552
Non-current assets
Long-term derivative assets – – 5 – 5
Other receivables – – – 15 15
Finance lease receivables 1 – – – 184 184
Long-term investments – 101 – 1 102
– 101 5 200 306
Liabilities
Current liabilities
Short-term derivative liabilities – – (2) – (2)
Trade accounts payable – – – (392) (392)
Finance lease payables – – – (3) (3)
Short-term debt – – – (40) (40)
Long-term debt due within one year – – – (73) (73)
– – (2) (508) (510)
Non-current liabilities
Finance lease payables – – – (1) (1)
Long-term derivative liabilities – – (26) – (26)
Long-term debt due after one year – – – (577) (577)
– – (26) (578) (604)
1 Finance lease receivables are stated based on amounts set-off, as presented in note 23.
For
per
sona
l use
onl
y

Page 81
Note 22 Financial instruments and risk management (continued)
GROUP
FAIR VALUE THROUGH
PROFIT & LOSS
FAIR VALUE THROUGH
OTHER COMPREHEN-SIVE INCOME
DESIGNATED IN HEDGING
RELATIONSHIPSAMORTISED
COST TOTAL
AS AT 30 JUNE 2013 $M $M $M $M $M
Assets
Current assets
Cash – – – 118 118
Short-term derivative assets 1 – 4 – 5
Trade receivables – – – 348 348
Finance lease receivables 1 – – – 52 52
1 – 4 518 523
Non-current assets
Long-term derivative assets – – 1 – 1
Other receivables – – – 5 5
Finance lease receivables 1 – – – 154 154
Long-term investments – 76 – 1 77
– 76 1 160 237
Liabilities
Current liabilities
Short-term derivative liabilities – – (1) – (1)
Trade accounts payable – – – (550) (550)
Finance lease payables – – – (6) (6)
Short-term debt – – – (122) (122)
Long-term debt due within one year – – – (103) (103)
– – (1) (781) (782)
Non-current liabilities
Finance lease payables – – – (5) (5)
Long-term derivative liabilities – – (22) – (22)
Long-term debt due after one year – – – (751) (751)
– – (22) (756) (778)
1 Finance lease receivables are stated based on amounts set-off, as presented in note 23.
For
per
sona
l use
onl
y

Page 82 Spark New Zealand Annual Report 2014 Financial performance
Notes to the financial statements
Note 22 Financial instruments and risk management (continued)The table below categorises the Group’s financial assets and liabilities that are measured at fair value, by valuation method. The different levels are defined as follows:
• Level 1 – quoted prices (unadjusted) in active markets for identical assets or liabilities.
• Level 2 – inputs other than quoted prices included within Level 1 that are observable for the asset or liability, either directly (that is, as prices) or indirectly (that is, derived from prices).
• Level 3 – inputs for the asset or liability that are not based on observable market data (that is, unobservable inputs).
GROUP LEVEL 1 LEVEL 2 LEVEL 3 TOTAL
AS AT 30 JUNE 2014 $M $M $M $M
Financial assets
Long-term derivative assets – 5 – 5
Long-term investments 99 – 2 101
99 5 2 106
Financial liabilities
Short-term derivative liabilities – (2) – (2)
Long-term derivative liabilities – (26) – (26)
– (28) – (28)
There were no transfers between levels during the year ended 30 June 2014.
GROUP LEVEL 1 LEVEL 2 LEVEL 3 TOTAL
AS AT 30 JUNE 2013 $M $M $M $M
Financial assets
Short-term derivative assets – 5 – 5
Long-term derivative assets – 1 – 1
Long-term investments 74 – 2 76
74 6 2 82
Financial liabilities
Short-term derivative liabilities – (1) – (1)
Long-term derivative liabilities – (22) – (22)
– (23) – (23)
There were no transfers between levels during the year ended 30 June 2013.
Financial instruments in level 1The fair value of financial instruments traded in active markets is based on quoted market prices at balance date.
The Group measures its investment in Hutchison at fair value and due to its strategic nature has elected to designate it at fair value through other comprehensive income. The Group measures the fair value of Hutchison using its observable market share price at balance date.
Financial instruments in level 2The fair value of financial instruments that are not traded in an active market (for example, over the counter derivatives) is determined by using valuation techniques that maximise the use of observable market data where it is available.
The fair value of interest rate swaps is calculated as the present value of the estimated future cash flows based on observable yield curves. The fair value of forward foreign exchange contracts is determined using forward exchange rates at the balance sheet date, with the resulting value discounted back to present value. Other techniques, such as discounted cash flow analysis, are used to determine fair value for the remaining financial instruments.F
or p
erso
nal u
se o
nly

Page 83
Note 22 Financial instruments and risk management (continued)Financial instruments in level 3The fair value of the Group’s investment in TMT Ventures (TMT), a corporate venture capital programme, which is invested in a number of start-up companies, is determined based on the latest available fund manager’s report.
The following table presents the changes in level 3 instruments for the year ended 30 June:
GROUP 2014 2013AS AT 30 JUNE $M $M
Long-term investment in TMT
Balance at beginning of the year 2 5
Gain/(loss) recognised in other comprehensive income – (1)
Capital investment return – (2)
Balance at end of the year 2 2
Risk managementThe Group is exposed to market risk (including currency risk, interest rate risk and equity price risk), liquidity risk and credit risk. Each of these risks, the associated financial instruments and the management of those risks, are detailed in this note. The Group manages its treasury activities through a Board-approved treasury constitution consisting of treasury governance and policy frameworks.
Market riskThe Group is exposed to market risk primarily from changes in foreign currency exchange rates and interest rates. The Group employs risk management strategies, including the use of derivatives, such as interest rate swaps, forward exchange contracts, foreign currency options and cross-currency interest rate swaps, to manage these exposures.
The Group monitors the use of derivative financial instruments through the use of well defined market and credit risk limits and timely reports to senior management. All contracts have been entered into with major creditworthy financial institutions. The risk associated with these transactions is that the fair value or cash flows of financial instruments will change due to movements in market rates, coupled with the cost of replacing these agreements at the current market rates in the event of default by the counterparty. The Group is also subject to equity price risk in relation to long-term investments in listed and unlisted companies.
a) Currency riskThe Group’s primary objective in managing foreign currency risk is to protect against the risk that the eventual New Zealand dollar net cash flows will be adversely affected by changes in foreign currency exchange rates. To do this the Group enters into forward exchange contracts and foreign currency options to reduce its foreign currency exposures.
Capital and operational expenditure in foreign currencies that are highly probable may be hedged. Exposures with amounts and timing that are less than certain may be proportionately hedged, based on certain benchmarks.
A portion of the Group’s long-term debt has been issued in foreign currency under its Euro Medium Term Note programme. The Group enters into cross-currency interest rate swaps to convert the foreign currency borrowings into a floating rate New Zealand dollar exposure. All debt not denominated in New Zealand dollars is hedged. Debt denominated in foreign currencies is translated to New Zealand dollars, with currency translation recognised in the income statement. These movements are offset by the translation of the principal value of the related cross-currency interest rate swaps.
The Group uses forward exchange contracts and foreign currency options to hedge forecast transactions that have a high probability of occurrence and foreign exchange differences in foreign currency receivables and payables.
For
per
sona
l use
onl
y

Page 84 Spark New Zealand Annual Report 2014 Financial performance
Notes to the financial statements
Note 22 Financial instruments and risk management (continued)a) Currency risk (continued)The Group’s exposure to monetary foreign currency financial instruments is outlined below:
GROUP AUD USD EUR GBP OTHER TOTAL
AS AT 30 JUNE 2014 $M $M $M $M $M $M
Exposures
Cash 1 15 3 6 – 25
Trade receivables 6 19 1 – – 26
Trade accounts payable (12) (24) (2) (3) (48) (89)
Long-term debt – – – (78) – (78)
Total exposure from non-derivative financial instruments (5) 10 2 (75) (48) (116)
Hedging instruments
Forward exchange contracts (21) 77 24 6 4 90
Cross-currency interest rate swaps – – – 78 – 78
Total exposure from hedging instruments (21) 77 24 84 4 168
GROUP AUD USD EUR GBP OTHER TOTAL
AS AT 30 JUNE 2013 $M $M $M $M $M $M
Exposures
Cash 32 18 4 8 – 62
Trade receivables 79 25 1 6 – 111
Trade accounts payable (63) (31) (1) – (57) (152)
Long-term debt – – – (78) – (78)
Total exposure from non-derivative financial instruments 48 12 4 (64) (57) (57)
Hedging instruments
Forward exchange contracts (4) 91 53 6 11 157
Cross-currency interest rate swaps – – – 78 – 78
Total exposure from hedging instruments (4) 91 53 84 11 235
As at 30 June a movement of 10% in the New Zealand dollar would impact the income statement and statement of changes in equity (after hedging) as detailed in the table below:
10% DECREASE 10% INCREASE
GROUP 2014 2013 2014 2013AS AT 30 JUNE $M $M $M $M
Impact on:
Net earnings before income tax (3) (6) 3 5
Equity (before income tax) 7 21 (6) (16)
This analysis assumes a movement in the New Zealand dollar across all currencies and only includes the effect of foreign exchange movements on monetary financial instruments. All other variables remain constant.F
or p
erso
nal u
se o
nly
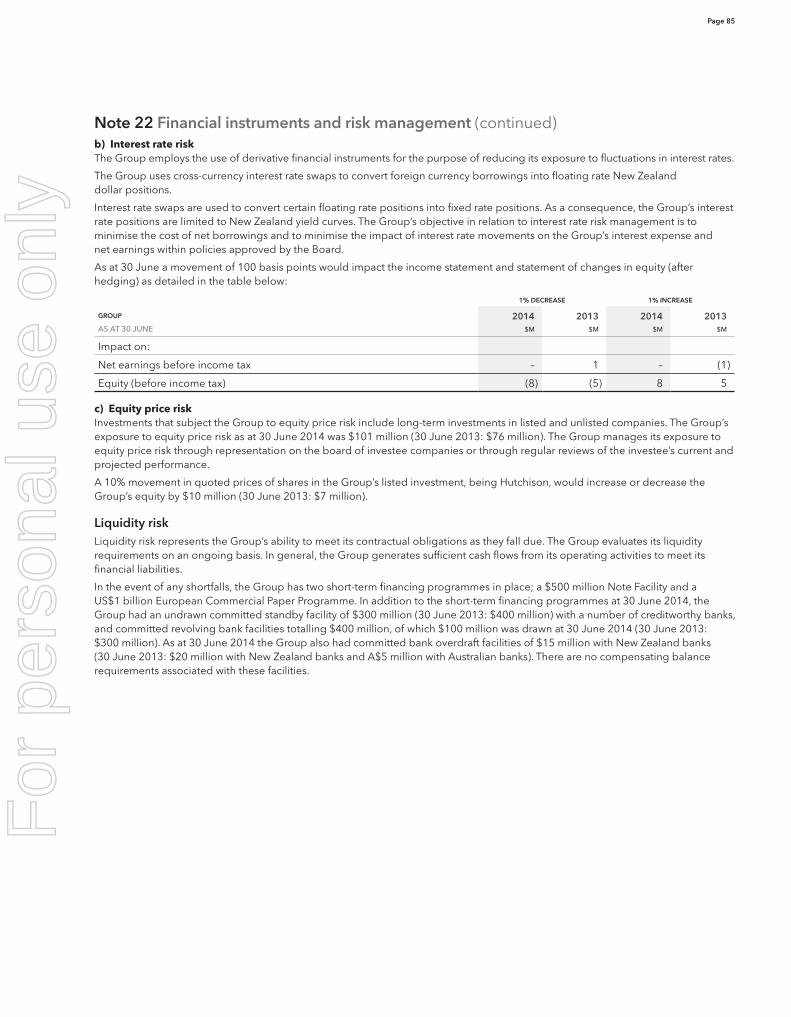
Page 85
Note 22 Financial instruments and risk management (continued)b) Interest rate riskThe Group employs the use of derivative financial instruments for the purpose of reducing its exposure to fluctuations in interest rates.
The Group uses cross-currency interest rate swaps to convert foreign currency borrowings into floating rate New Zealand dollar positions.
Interest rate swaps are used to convert certain floating rate positions into fixed rate positions. As a consequence, the Group’s interest rate positions are limited to New Zealand yield curves. The Group’s objective in relation to interest rate risk management is to minimise the cost of net borrowings and to minimise the impact of interest rate movements on the Group’s interest expense and net earnings within policies approved by the Board.
As at 30 June a movement of 100 basis points would impact the income statement and statement of changes in equity (after hedging) as detailed in the table below:
1% DECREASE 1% INCREASE
GROUP 2014 2013 2014 2013AS AT 30 JUNE $M $M $M $M
Impact on:
Net earnings before income tax – 1 – (1)
Equity (before income tax) (8) (5) 8 5
c) Equity price riskInvestments that subject the Group to equity price risk include long-term investments in listed and unlisted companies. The Group’s exposure to equity price risk as at 30 June 2014 was $101 million (30 June 2013: $76 million). The Group manages its exposure to equity price risk through representation on the board of investee companies or through regular reviews of the investee’s current and projected performance.
A 10% movement in quoted prices of shares in the Group’s listed investment, being Hutchison, would increase or decrease the Group’s equity by $10 million (30 June 2013: $7 million).
Liquidity riskLiquidity risk represents the Group’s ability to meet its contractual obligations as they fall due. The Group evaluates its liquidity requirements on an ongoing basis. In general, the Group generates sufficient cash flows from its operating activities to meet its financial liabilities.
In the event of any shortfalls, the Group has two short-term financing programmes in place; a $500 million Note Facility and a US$1 billion European Commercial Paper Programme. In addition to the short-term financing programmes at 30 June 2014, the Group had an undrawn committed standby facility of $300 million (30 June 2013: $400 million) with a number of creditworthy banks, and committed revolving bank facilities totalling $400 million, of which $100 million was drawn at 30 June 2014 (30 June 2013: $300 million). As at 30 June 2014 the Group also had committed bank overdraft facilities of $15 million with New Zealand banks (30 June 2013: $20 million with New Zealand banks and A$5 million with Australian banks). There are no compensating balance requirements associated with these facilities.
For
per
sona
l use
onl
y

Page 86 Spark New Zealand Annual Report 2014 Financial performance
Notes to the financial statements
Note 22 Financial instruments and risk management (continued)
Liquidity risk (continued)The Group’s liquidity policy is to maintain unutilised committed facilities of at least 110% of the next 12 months’ forecast peak net funding requirements. The policy also requires that the maximum amount of long-term debt maturing in any 12 month period is not to exceed $400 million. As at 30 June 2014 management considered that it was in compliance with its liquidity policy as reported to the Board. In addition to this assessment of compliance with the Group’s liquidity policy, the exposure to liquidity risk based on contractual cash flows relating to financial liabilities is summarised below:
GROUPCARRYING
AMOUNTCONTRACTUAL
CASH FLOWS 0–6 MONTHS 6–12 MONTHS 1–2 YEARS 2–5 YEARS 5+ YEARS
AS AT 30 JUNE 2014 $M $M $M $M $M $M $M
Non-derivative financial liabilities
Trade accounts payable 392 392 392 – – – –
Finance lease payable 4 4 2 1 1 – –
Short-term debt 40 40 40 – – – –
Long-term debt 651 773 16 93 178 194 292
Derivative financial liabilities
Interest rate swaps (net settled) 1 2 – – – 1 1
Cross-currency interest rate swaps (gross settled)
Inflows – (100) – (4) (5) (55) (36)
Outflows 25 140 3 3 6 80 48
Forward exchange contracts (gross settled)
Inflows – (101) (80) (14) (7) – –
Outflows 2 104 83 15 6 – –
1,115 1,254 456 94 179 220 305
GROUPCARRYING
AMOUNTCONTRACTUAL
CASH FLOWS 0–6 MONTHS 6–12 MONTHS 1–2 YEARS 2–5 YEARS 5+ YEARS
AS AT 30 JUNE 2013 $M $M $M $M $M $M $M
Non-derivative financial liabilities
Trade accounts payable 550 550 550 – – – –
Finance lease payable 11 12 4 3 3 2 –
Short-term debt 122 122 122 – – – –
Long-term debt 855 1,014 20 120 208 357 309
Derivative financial liabilities
Interest rate swaps (net settled) 1 1 1 1 1 (1) (1)
Cross-currency interest rate swaps (gross settled)
Inflows – (105) – (5) (4) (57) (39)
Outflows 21 143 2 2 5 82 52
Forward exchange contracts (gross settled)
Inflows – (83) (74) (9) – – –
Outflows 1 85 75 10 – – –
1,561 1,739 700 122 213 383 321
Contractual cash flows include contractual undiscounted principal and interest payments. The Group uses cash and derivative assets to manage liquidity.
For
per
sona
l use
onl
y

Page 87
Note 22 Financial instruments and risk management (continued)
Credit riskIn the normal course of its business, the Group incurs credit risk from financial instruments if a counterparty fails to meet its contractual obligations. Credit risk arises on cash, trade receivables, other receivables, finance lease receivables and derivative financial instruments.
The Group has a credit policy that is used to manage this exposure to credit risk. As part of this policy, limits on exposures with significant counterparties have been set and approved by the Board and are monitored on a regular basis. The Group places its cash and derivative financial instruments with high credit quality financial institutions and sovereign bodies. The Group’s financial instruments do not have significant concentration of risk with any single party.
The Group has certain derivative and debt agreements that are subject to bilateral credit support agreements that require the Group or the counterparty to post collateral funds to support the value of certain derivatives. As at 30 June 2014 no collateral was posted (30 June 2013: nil). In the event of a downgrade of the Company’s credit rating to either Baa1 (Moody’s Investors Service) or BBB+ (Standard & Poor’s) US$12 million (based on rates at 30 June 2014) of collateral would be required to be posted (30 June 2013: US$6 million).
$972 million of the Group’s assets are subject to credit risk (30 June 2013: $936 million). The Group holds various letters of credit and guarantees over some of these amounts. The Group does not hold any collateral over these amounts.
Finance lease receivables, other than those relating to asset and property usage agreements with Chorus, are secured over the underlying assets.
Capital risk management
The Group manages its capital considering shareholders’ interests, the value of the Group’s assets and the Company’s credit ratings. The following table summarises the Group’s capital:
GROUP 2014 2013AS AT 30 JUNE $M $M
Cash (208) (118)
Short-term debt (note 19) 40 122
Long-term debt at hedged rates 683 885
Net debt 515 889
Total Equity 1,708 1,413
Capital 2,223 2,302
The Board continues to be committed to the Company maintaining an ‘A Band’ credit rating and its capital management policies are designed to ensure this objective is met. As part of this commitment, the Group manages its debt levels to ensure that the ratio of net interest-bearing debt (inclusive of associated derivatives) to earnings before interest, tax, depreciation and amortisation does not materially exceed 1.0 times on a long-run basis, which for credit ratings agency purposes equates approximately to debt to earnings before interest, tax, depreciation and amortisation of 1.5 times. The difference between these two ratios is primarily due to the capitalisation of operating leases by credit ratings agencies.
At 30 June 2014 the Company’s credit rating for long-term and short-term debt with Moody’s Investors Service is A3 and P-2 respectively, with outlook stable (30 June 2013: same). The Company’s Standard & Poor’s credit ratings for long-term and short-term debt is A– and A–2 respectively, with outlook stable (30 June 2013: same).
Net debt includes long-term debt at the value of hedged cash flows due to arise on maturity, plus short-term debt, less any cash. Net debt is a non-GAAP measure and is not defined in accordance with NZ IFRS but is a measure used by management. The following table reconciles long-term debt at hedged rates to long-term debt at spot rates as reported under NZ IFRS:
GROUP 2014 2013AS AT 30 JUNE $M $M
Long-term debt (note 19) 650 854
Impact of hedged rates used 32 30
Unamortised discount 1 1
Long-term debt at hedged rates 683 885
For
per
sona
l use
onl
y

Page 88 Spark New Zealand Annual Report 2014 Financial performance
Notes to the financial statements
Note 22 Financial instruments and risk management (continued)
Parent companyThe classification of the Company’s financial instruments are as follows:
PARENT FAIR VALUEAMORTISED
COST TOTAL
AS AT 30 JUNE 2014 $M $M $M
Current assets Receivables due from subsidiaries – 1 1
Non-current assets Long-term investments – 2,188 2,188
Current liabilities Debt due within one year – (3,981) (3,981)
Current liabilities Short-term provisions (2,093) – (2,093)
PARENT FAIR VALUEAMORTISED
COST TOTAL
AS AT 30 JUNE 2013 $M $M $M
Current assets Receivables due from subsidiaries – 1 1
Non-current assets Long-term investments – 2,266 2,266
Current liabilities Debt due within one year – (3,715) (3,715)
Non-current liabilities Long-term provisions (2,052) – (2,052)
The Company has no derivative financial instruments and has no financial assets that are measured at fair value.
Market riskThe Company does not take any action to reduce its exposure to any resulting currency risk. The Company has interest rate exposures on some loans to and from subsidiary companies. The Company does not manage the associated risks.
Liquidity riskThe Company’s maximum exposure to liquidity risk relating to financial liabilities is summarised below:
CARRYING AMOUNT
CONTRACTUAL CASH FLOWS 0–6 MONTHS
PARENT $M $M $M
Debt due to subsidiaries as at 30 June 2014 (3,981) (3,981) (3,981)
Debt due to subsidiaries as at 30 June 2013 (3,715) (3,715) (3,715)
Credit riskThe Company has exposure to credit risk from balances owed from subsidiary companies. The maximum exposure to credit risk at 30 June 2014 is $2,189 million (30 June 2013: $2,267 million).
For
per
sona
l use
onl
y
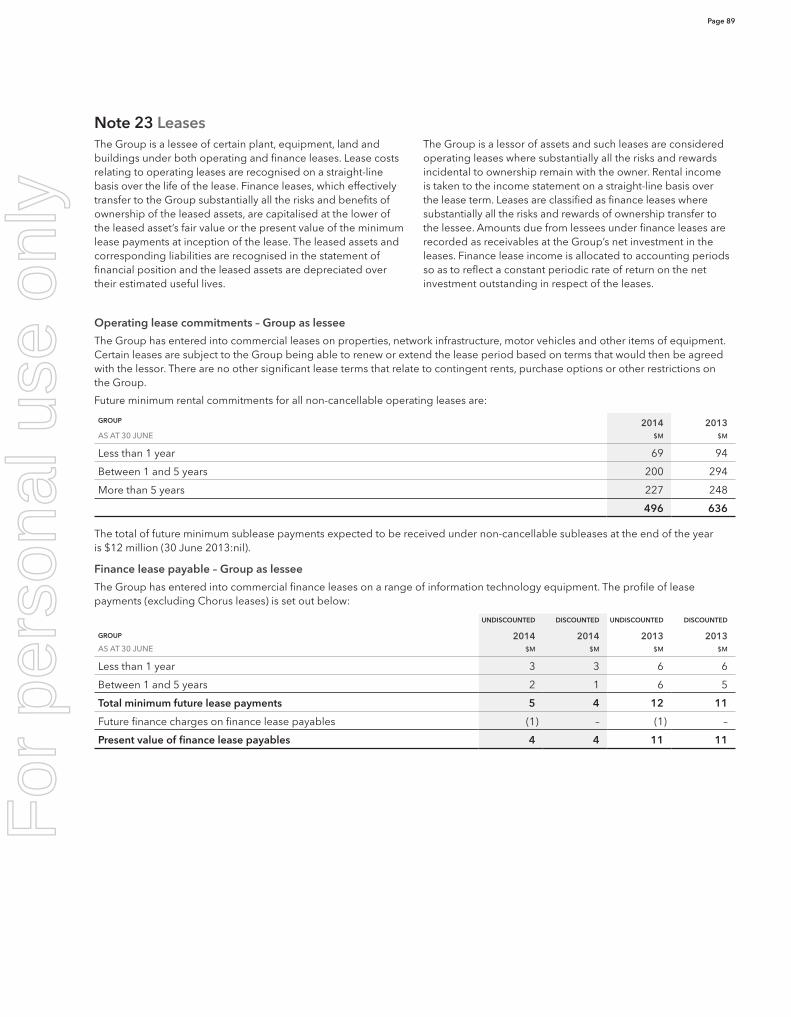
Page 89
Note 23 LeasesThe Group is a lessee of certain plant, equipment, land and buildings under both operating and finance leases. Lease costs relating to operating leases are recognised on a straight-line basis over the life of the lease. Finance leases, which effectively transfer to the Group substantially all the risks and benefits of ownership of the leased assets, are capitalised at the lower of the leased asset’s fair value or the present value of the minimum lease payments at inception of the lease. The leased assets and corresponding liabilities are recognised in the statement of financial position and the leased assets are depreciated over their estimated useful lives.
The Group is a lessor of assets and such leases are considered operating leases where substantially all the risks and rewards incidental to ownership remain with the owner. Rental income is taken to the income statement on a straight-line basis over the lease term. Leases are classified as finance leases where substantially all the risks and rewards of ownership transfer to the lessee. Amounts due from lessees under finance leases are recorded as receivables at the Group’s net investment in the leases. Finance lease income is allocated to accounting periods so as to reflect a constant periodic rate of return on the net investment outstanding in respect of the leases.
Operating lease commitments – Group as lessee
The Group has entered into commercial leases on properties, network infrastructure, motor vehicles and other items of equipment. Certain leases are subject to the Group being able to renew or extend the lease period based on terms that would then be agreed with the lessor. There are no other significant lease terms that relate to contingent rents, purchase options or other restrictions on the Group.
Future minimum rental commitments for all non-cancellable operating leases are:
GROUP 2014 2013AS AT 30 JUNE $M $M
Less than 1 year 69 94
Between 1 and 5 years 200 294
More than 5 years 227 248
496 636
The total of future minimum sublease payments expected to be received under non-cancellable subleases at the end of the year is $12 million (30 June 2013:nil).
Finance lease payable – Group as lessee
The Group has entered into commercial finance leases on a range of information technology equipment. The profile of lease payments (excluding Chorus leases) is set out below:
UNDISCOUNTED DISCOUNTED UNDISCOUNTED DISCOUNTED
GROUP 2014 2014 2013 2013AS AT 30 JUNE $M $M $M $M
Less than 1 year 3 3 6 6
Between 1 and 5 years 2 1 6 5
Total minimum future lease payments 5 4 12 11
Future finance charges on finance lease payables (1) – (1) –
Present value of finance lease payables 4 4 11 11
For
per
sona
l use
onl
y

Page 90 Spark New Zealand Annual Report 2014 Financial performance
Notes to the financial statements
Note 23 Leases (continued)Finance lease receivables – Group as lessor
The Group has entered into commercial finance leases on a range of information and communications technology equipment for the Group’s business customers. The profile of lease receipts (excluding Chorus leases) is set out below:
UNDISCOUNTED DISCOUNTED UNDISCOUNTED DISCOUNTED
GROUP 2014 2014 2013 2013AS AT 30 JUNE $M $M $M $M
Less than 1 year 55 53 47 44
Between 1 and 5 years 74 60 55 42
Total minimum future lease receipts 129 113 102 86
Unguaranteed residual value 8 8 – –
Gross finance lease receivables 137 121 102 86
Less unearned finance income (16) – (16) –
Present value of finance lease receivables 121 121 86 86
Short-term finance lease receivables 53 44
Long-term finance lease receivables 68 42
Allowance for uncollectable lease receivables 14 14 1 1
The interest rate inherent in the leases is fixed at the contract date for the entire lease term. The balances are secured over the equipment leased. The Group is not permitted to sell or repledge the collateral in the absence of a default by the lessee.
The maximum credit risk exposure for finance lease receivables is the carrying amount of the receivables. Other than the allowance for uncollectable lease payments noted above, the finance lease receivables at 30 June 2014 are neither past due nor impaired (30 June 2013: same).
Finance leases with Chorus
On demerger, the Group entered into a number of leases with Chorus for space in exchange buildings. Under these leases, the Group is:
• a lessor for space in the Group’s exchanges; and
• a lessee for space in Chorus exchanges.
These leases are generally accounted for as finance leases and include a legal right of offset as the Group and Chorus settle the payments on a net basis. As such the finance lease payable and finance lease receivable are shown as a net finance lease receivable on the statement of financial position. There are no contingent rents on the leases with Chorus.
The profile of lease net receipts is set out below:
GROUP AS LESSOR GROUP AS LESSEE NET
GROUP UNDISCOUNTED DISCOUNTED UNDISCOUNTED DISCOUNTED UNDISCOUNTED DISCOUNTED
AS AT 30 JUNE 2014 $M $M $M $M $M $M
Less than 1 year 14 14 (6) (6) 8 8
Between 1 and 3 years 28 24 (13) (11) 15 13
Between 3 and 5 years 28 20 (13) (9) 15 11
More than 5 years 388 98 (9) (6) 379 92
Finance lease receivable/(payable) 458 156 (41) (32) 417 124
Less unearned finance (income)/future finance charges (302) – 9 – (293) –
Present value of finance lease receivable/(payable) 156 156 (32) (32) 124 124
Short-term finance lease receivable/(payable) 14 (6) 8
Long-term finance lease receivable/(payable) 142 (26) 116
For
per
sona
l use
onl
y
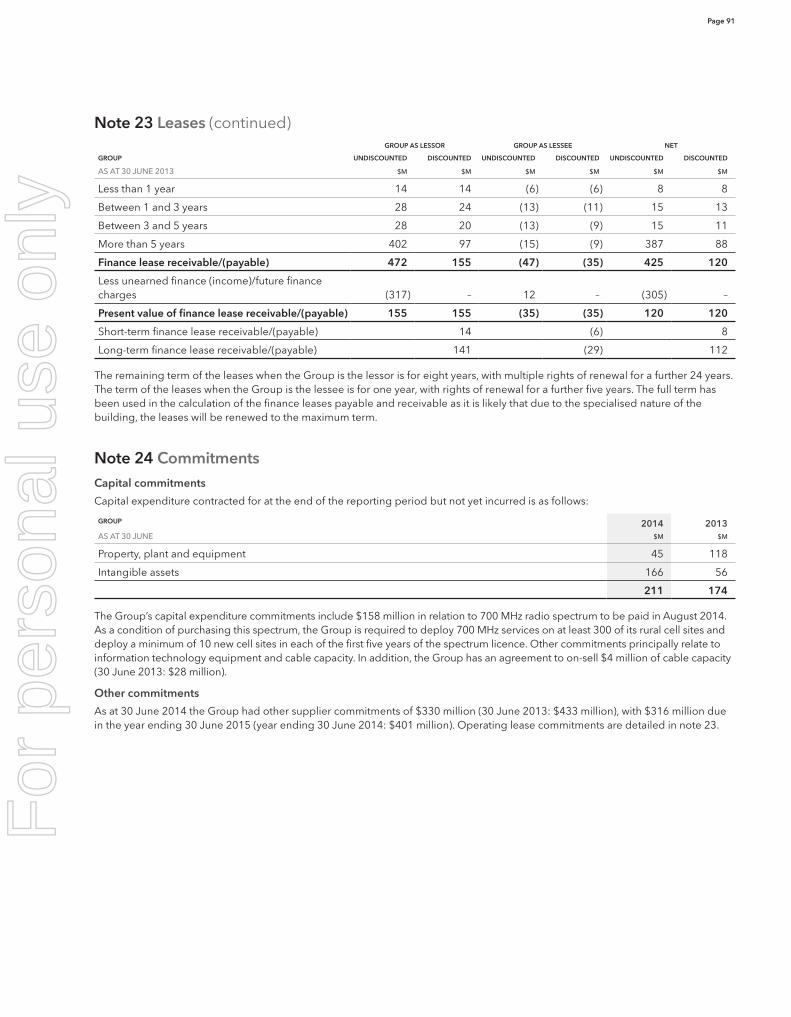
Page 91
Note 23 Leases (continued)GROUP AS LESSOR GROUP AS LESSEE NET
GROUP UNDISCOUNTED DISCOUNTED UNDISCOUNTED DISCOUNTED UNDISCOUNTED DISCOUNTED
AS AT 30 JUNE 2013 $M $M $M $M $M $M
Less than 1 year 14 14 (6) (6) 8 8
Between 1 and 3 years 28 24 (13) (11) 15 13
Between 3 and 5 years 28 20 (13) (9) 15 11
More than 5 years 402 97 (15) (9) 387 88
Finance lease receivable/(payable) 472 155 (47) (35) 425 120
Less unearned finance (income)/future finance charges (317) – 12 – (305) –
Present value of finance lease receivable/(payable) 155 155 (35) (35) 120 120
Short-term finance lease receivable/(payable) 14 (6) 8
Long-term finance lease receivable/(payable) 141 (29) 112
The remaining term of the leases when the Group is the lessor is for eight years, with multiple rights of renewal for a further 24 years. The term of the leases when the Group is the lessee is for one year, with rights of renewal for a further five years. The full term has been used in the calculation of the finance leases payable and receivable as it is likely that due to the specialised nature of the building, the leases will be renewed to the maximum term.
Note 24 CommitmentsCapital commitments
Capital expenditure contracted for at the end of the reporting period but not yet incurred is as follows:
GROUP 2014 2013AS AT 30 JUNE $M $M
Property, plant and equipment 45 118
Intangible assets 166 56
211 174
The Group’s capital expenditure commitments include $158 million in relation to 700 MHz radio spectrum to be paid in August 2014. As a condition of purchasing this spectrum, the Group is required to deploy 700 MHz services on at least 300 of its rural cell sites and deploy a minimum of 10 new cell sites in each of the first five years of the spectrum licence. Other commitments principally relate to information technology equipment and cable capacity. In addition, the Group has an agreement to on-sell $4 million of cable capacity (30 June 2013: $28 million).
Other commitments
As at 30 June 2014 the Group had other supplier commitments of $330 million (30 June 2013: $433 million), with $316 million due in the year ending 30 June 2015 (year ending 30 June 2014: $401 million). Operating lease commitments are detailed in note 23.
For
per
sona
l use
onl
y

Page 92 Spark New Zealand Annual Report 2014 Financial performance
Notes to the financial statements
Note 25 ContingenciesLawsuits and other claims
Where the Group concludes that its defence will more likely than not be successful, such lawsuits or claims are considered a contingent liability and no provision is recognised. When it is more likely than not that the Group will be liable and that there will be an outflow of resources to settle a lawsuit or claim, a provision is recognised, unless the amount cannot be measured reliably. There can be no assurance that such litigation will not have a material adverse effect on the Group’s business, financial condition or results of operations.
Other claims
Various other lawsuits, claims, investigations (including tax investigations) and inquiries have been brought, are pending or are in process against the Company and its subsidiaries, none of which are expected to have a significant effect on the financial position or profitability of the Group. However, the Group cannot reasonably estimate the adverse effect (if any) on the Group if any of the foregoing outstanding claims or inquiries are ultimately resolved against the Group’s interests. There can be no assurance that such cases will not have a significant effect on the Group’s business, financial condition, position, results of operations or profitability.
Land claims
Interests in land included in property, plant and equipment purchased from the Government may be subject to claims to the Waitangi Tribunal or deemed to be wāhi tapu and, in either case, may be resumed by the Government. Certain claims have been brought or are pending against the Government under the Treaty of Waitangi Act 1975. Some of these claims may affect land transferred to the Group by the Government. In the event that land is resumed by the Government, there is provision for compensation to the Group.
Unbundled Copper Local Loop final price review
The Group and other parties have applied to the Commerce Commission for a final price review for the Unbundled Copper Local Loop (UCLL) service. The Commerce Commission is currently seeking submissions on its proposed regulatory framework and key modelling decisions. Submissions and cross-submissions are due in August 2014 and the Commission’s indicative date for a decision is April 2015. An increase from the current price, if backdated, may have a material impact on the Group.
Guarantees
The Company has issued bank guarantees totalling A$2 million as at 30 June 2014 (30 June 2013: A$10 million) to guarantee rental payments of a subsidiary company. In the event of the subsidiary defaulting on these rental payments then the Company has guaranteed to pay these amounts. The likelihood of any payment being made under this guarantee is low.
Cross-border lease guarantees
The Group has cross-border leases in respect of certain telecommunications assets, which provide certain undertakings (including letters of credit) in accordance with guarantees entered into as part of the transactions. The maximum exposure under these guarantees is now assessed at $13 million (30 June 2013: $12 million) and the last guarantee expires in 2016.
Parent company
The Company has guaranteed, along with guaranteeing subsidiary companies, total indebtedness of Spark Finance Limited (formerly TCNZ Finance Limited, a Group company) amounting to $719 million (30 June 2013: $1,000 million).
The Company has also agreed to indemnify Spark Trustee Limited, a Company subsidiary, for any losses incurred on the sale of Company shares held by the Trust. Accordingly, where the revaluation of these shares results in a carrying value below historic cost, an equivalent receivable from the Company is recognised by Spark Trustee Limited.
For
per
sona
l use
onl
y

Page 93
Note 26 Related party transactionsInterest of directors in certain transactions
Certain directors of the Company have relevant interests in a number of companies with which the Group has transactions in the normal course of business and a number of the Company’s directors are also non-executive directors of other companies. Any transactions undertaken with these entities have been entered into on an arm’s length commercial basis.
Transactions with associate companies
The Group has the following transactions with associates:
• The Group provides network operations and management services to Southern Cross in respect of its operations in New Zealand; and
• The Group makes payments to Southern Cross in connection with capacity it has purchased on Southern Cross’ network.
Transactions undertaken with these entities have been entered into on an arm’s length commercial basis. Balances and amounts in respect of these transactions with associate companies are set out in the table below:
GROUP 2014 2013AS AT AND FOR THE YEAR ENDED 30 JUNE $M $M
Revenue received from associates 1 73 62
Expenses paid to associates 9 9
Capacity acquired from associates 2 21 11
Receivables from associates 3 –
1 Includes dividends received from Southern Cross of $67 million in the year ended 30 June 2014 (30 June 2013: $56 million).
2 At 30 June 2014 the Group has committed to purchases of $8 million for cable capacity from Southern Cross (30 June 2013: $56 million).
Parent company
Amounts due from subsidiary companies are for no fixed term and incur interest at interest rates that range from nil to 10%. Debts due to subsidiary companies within one year are for no fixed term and incur interest at a weighted average interest rate of 7.6% at 30 June 2014 (30 June 2013: 7.6%).
Key management personnel compensation
GROUP 2014 2013YEAR ENDED 30 JUNE $’000 $’000
Directors’ remuneration 1,239 1,239
Salary and other short-term benefits 1 11,830 8,274
Redundancy and termination payments 1,549 1,883
Long-term incentives and share-based compensation 2,830 2,644
17,448 14,040
1 Includes short-term benefits paid on termination.
The table above includes remuneration of the Managing Director and the other members of the Leadership Team, including amounts paid to members of the Leadership Team who left during the year ended 30 June or were in acting Leadership Team positions. As provided for other Group employees, members of the Leadership Team also receive telephone concessions. In addition, some members of the Leadership Team receive de minimus amounts by way of contributions to medical insurance premiums and membership to the Marram Trust.
For
per
sona
l use
onl
y
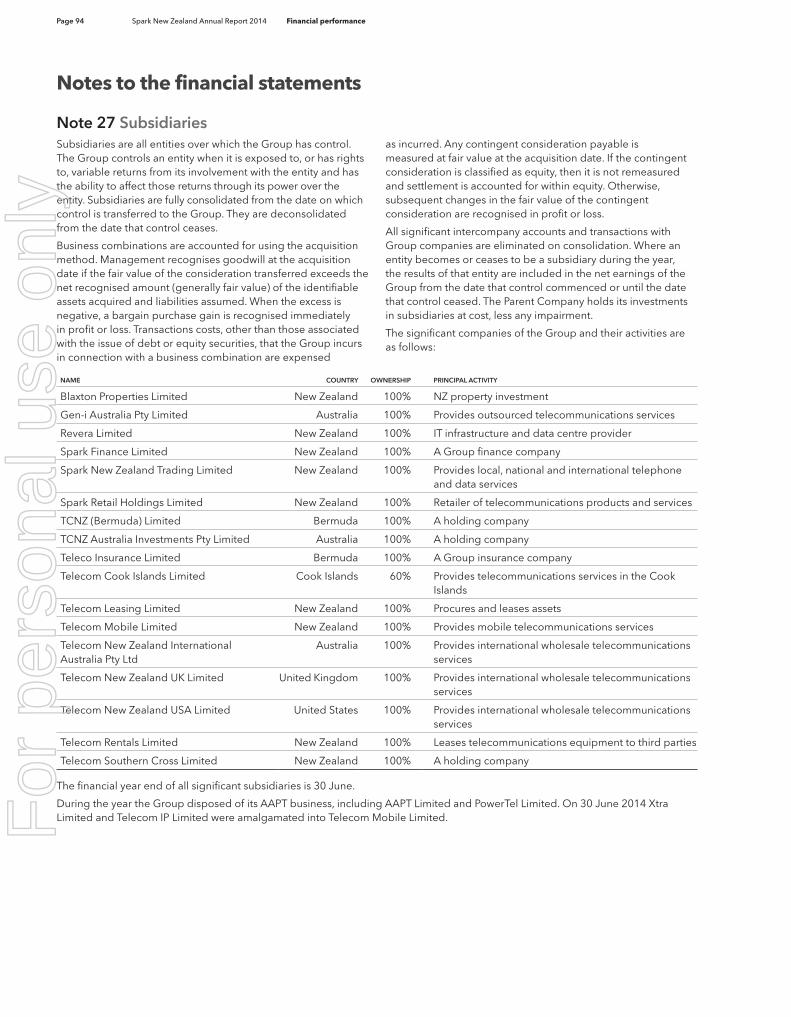
Page 94 Spark New Zealand Annual Report 2014 Financial performance
Notes to the financial statements
Note 27 SubsidiariesSubsidiaries are all entities over which the Group has control. The Group controls an entity when it is exposed to, or has rights to, variable returns from its involvement with the entity and has the ability to affect those returns through its power over the entity. Subsidiaries are fully consolidated from the date on which control is transferred to the Group. They are deconsolidated from the date that control ceases.
Business combinations are accounted for using the acquisition method. Management recognises goodwill at the acquisition date if the fair value of the consideration transferred exceeds the net recognised amount (generally fair value) of the identifiable assets acquired and liabilities assumed. When the excess is negative, a bargain purchase gain is recognised immediately in profit or loss. Transactions costs, other than those associated with the issue of debt or equity securities, that the Group incurs in connection with a business combination are expensed
as incurred. Any contingent consideration payable is measured at fair value at the acquisition date. If the contingent consideration is classified as equity, then it is not remeasured and settlement is accounted for within equity. Otherwise, subsequent changes in the fair value of the contingent consideration are recognised in profit or loss.
All significant intercompany accounts and transactions with Group companies are eliminated on consolidation. Where an entity becomes or ceases to be a subsidiary during the year, the results of that entity are included in the net earnings of the Group from the date that control commenced or until the date that control ceased. The Parent Company holds its investments in subsidiaries at cost, less any impairment.
The significant companies of the Group and their activities are as follows:
NAME COUNTRY OWNERSHIP PRINCIPAL ACTIVITY
Blaxton Properties Limited New Zealand 100% NZ property investment
Gen-i Australia Pty Limited Australia 100% Provides outsourced telecommunications services
Revera Limited New Zealand 100% IT infrastructure and data centre provider
Spark Finance Limited New Zealand 100% A Group finance company
Spark New Zealand Trading Limited New Zealand 100% Provides local, national and international telephone and data services
Spark Retail Holdings Limited New Zealand 100% Retailer of telecommunications products and services
TCNZ (Bermuda) Limited Bermuda 100% A holding company
TCNZ Australia Investments Pty Limited Australia 100% A holding company
Teleco Insurance Limited Bermuda 100% A Group insurance company
Telecom Cook Islands Limited Cook Islands 60% Provides telecommunications services in the Cook Islands
Telecom Leasing Limited New Zealand 100% Procures and leases assets
Telecom Mobile Limited New Zealand 100% Provides mobile telecommunications services
Telecom New Zealand International Australia Pty Ltd
Australia 100% Provides international wholesale telecommunications services
Telecom New Zealand UK Limited United Kingdom 100% Provides international wholesale telecommunications services
Telecom New Zealand USA Limited United States 100% Provides international wholesale telecommunications services
Telecom Rentals Limited New Zealand 100% Leases telecommunications equipment to third parties
Telecom Southern Cross Limited New Zealand 100% A holding company
The financial year end of all significant subsidiaries is 30 June.
During the year the Group disposed of its AAPT business, including AAPT Limited and PowerTel Limited. On 30 June 2014 Xtra Limited and Telecom IP Limited were amalgamated into Telecom Mobile Limited. F
or p
erso
nal u
se o
nly

Page 95
Note 28 Reconciliation of net earnings to net cash flows from operating activitiesGROUP PARENT
YEAR ENDED 30 JUNE2014 2013 2014 2013
$M $M $M $M
Net earnings/(loss) for the year 460 238 (132) (110)
Adjustments to reconcile net earnings to net cash flows from operating activities
Depreciation and amortisation 484 539 – –
Bad and doubtful accounts 26 21 – –
Deferred income tax (19) (26) – –
Net insurance proceeds (7) (15) – –
Gain on winding up foreign operations – (6) – –
Gain on sale of business (102) – – –
Asset impairments – 38 – –
Other 9 – 143 154
Changes in assets and liabilities net of effects of non-cash and investing and financing activities
Movement in accounts receivable and related items (77) 58 – –
Movement in inventories (1) (4) – –
Movement in current taxation 19 49 11 (15)
Movement in accounts payable and related items (178) (7) 44 185
Net cash flows from operating activities 614 885 66 214
Note 29 Significant events after balance dateDividends
On 22 August 2014 the Board approved the payment of a second half dividend of 9 cents per share, or approximately $165 million. The dividend will be fully imputed in line with the corporate income tax rate. In addition, supplementary dividends totalling approximately $21 million will be payable to shareholders who are not resident in New Zealand. In accordance with the Income Tax Act 2007, the Group will receive a tax credit from Inland Revenue equivalent to the amount of supplementary dividends paid.
Appserv Limited acquisition
The Group acquired 100% of the share capital of Appserv Limited, a business Cloud services specialist for cash consideration of $17 million on 1 July 2014.
Name change
The Company changed its name to Spark New Zealand Limited from Telecom Corporation of New Zealand Limited on 8 August 2014.
For
per
sona
l use
onl
y

Page 96 Spark New Zealand Annual Report 2014 Corporate governance and disclosures
Corporate governance and disclosures
Corporate governanceThe Board and management are committed to ensuring that Spark New Zealand maintains a high standard of corporate governance and adheres to high ethical standards. The Board regularly reviews and assesses Spark New Zealand’s governance structures and processes to ensure that they are consistent with international best practice, in both form and substance.
As encouraged by the ASX Corporate Governance Council, Spark New Zealand has adopted the 3rd Edition of the ASX Corporate Governance Council’s Principles and Recommendations for the financial year ending 30 June 2014. Spark New Zealand has taken the opportunity offered by these new recommendations to streamline this report by publishing certain corporate governance disclosures on its website: www.sparknz.co.nz/about/governance. This website includes further information on: the role and responsibilities of the Board and Board committees (including their charters); audit and independence; risks; remuneration; diversity; and ethics and other key Spark New Zealand policies.
The Board of Directors is elected by shareholders to govern Spark New Zealand in the interests of shareholders and to protect and enhance the value of the assets of Spark New Zealand. In carrying out its role, the Board works to enhance the value of Spark New Zealand in the interests of Spark New Zealand and its shareholders. The Board is the overall and final body responsible for all decision-making within the company. The role and responsibilities of the Board are set out in the Board Charter, which may be found at: www.sparknz.co.nz/about/governance.
Three Board committees assist in the execution of the Board’s responsibilities: the Human Resources and Compensation Committee; the Nominations and Corporate Governance Committee; and the Audit and Risk Management Committee. Each Board committee has a charter summarising the role, rights, responsibilities and membership requirements for that committee. Committee charters may be found at: www.sparknz.co.nz/about/governance.
Stock exchange listingsSpark New Zealand ordinary shares are listed on the NZSX and ASX. Spark New Zealand has adopted the governance practices prescribed in the NZX Corporate Governance Best Practice Code and the ASX Corporate Governance Council’s Principles and Recommendations (3rd Edition). As at 22 August 2014, the Board considers that Spark New Zealand has complied with these practices for the FY14 reporting period. Further detail regarding such compliance can be found at: www.sparknz.co.nz/about/governance.
Spark New Zealand has also adopted the requirements of the Financial Markets Authority handbook Corporate Governance in New Zealand Principles and Guidelines except to the extent certain of those requirements mandate information to be included in this annual report (in which case that information is included on the above website).
Spark New Zealand is incorporated in New Zealand and is not subject to Chapters 6, 6A, 6B and 6C of the Australian Corporations Act 2001. The acquisition of Spark New Zealand shares may be limited by the New Zealand Takeovers Code and the Overseas Investment Act 2005.
Spark New Zealand’s American Depositary Shares (ADSs), each representing five ordinary Spark New Zealand shares and evidenced by American Depositary Receipts (ADRs), are traded over-the-counter in the United States. On 3 June 2014 Spark New Zealand filed for deregistration of its ADRs and shares under the United States Securities Exchange Act of 1934 (Securities Exchange Act). Upon filing for deregistration, Spark New Zealand’s obligation to file certain reports with the United States Securities and Exchange Commission (SEC), including annual reports on Form 20-F, was immediately suspended. Spark New Zealand expects that the deregistration of its ADRs and ordinary shares will become effective on 1 September 2014, at which point its SEC reporting obligations under the Securities Exchange Act and the United States Sarbanes-Oxley Act of 2002 will permanently cease.
Risk factorsSpark New Zealand’s ability to achieve long-term profitability depends on its ability to successfully execute its business strategy. Risk factors associated with this include:
Growing core revenues with sustainable margins
Mature New Zealand mobile and broadband markets create intense competition, as operators compete for market share and scale to monetise their capital intensive network investments and fund their operating costs. Spark New Zealand may be unable to differentiate its offerings or service propositions sufficiently to avoid competing on price and reducing its margins.
Spark New Zealand may be unable to reduce its operating costs in line with falling revenues associated with migration to fibre-based access inputs and solutions. In particular, it must develop the capability to consume open market fibre inputs to restore agility to its operations and lower its input cost base.
Growing into adjacent markets
Spark New Zealand’s ability to participate in growth opportunities in adjacent markets, such as media content, data analytics and m-commerce may be limited by its lack of customer and market intimacy in these new areas. This may prevent it from successfully bringing products to market, challenging incumbents effectively or monetising these businesses within an efficient venture capitalist type business model.
Managing fixed legacy margin decline
Spark New Zealand has significant residual value remaining in legacy product portfolios. There are a number of risk factors, such as competitor activity and new network deployment, that may cause this value to decline at a faster rate than anticipated in Spark New Zealand’s business plans.
For
per
sona
l use
onl
y
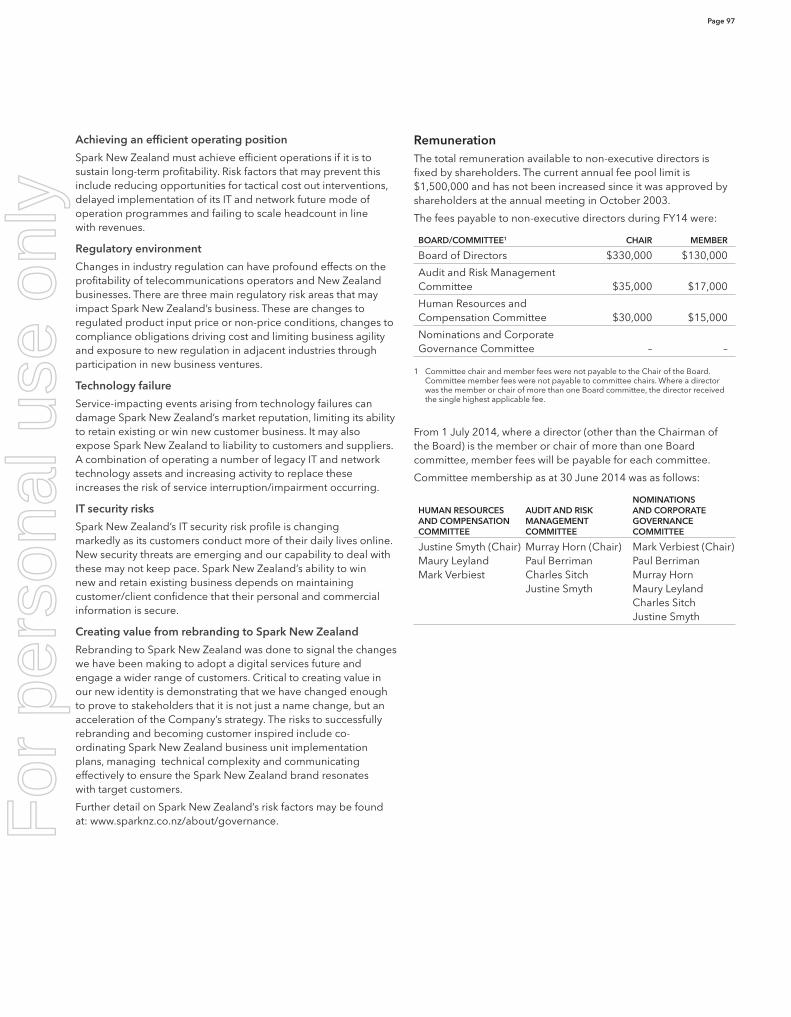
Page 97
Achieving an efficient operating position
Spark New Zealand must achieve efficient operations if it is to sustain long-term profitability. Risk factors that may prevent this include reducing opportunities for tactical cost out interventions, delayed implementation of its IT and network future mode of operation programmes and failing to scale headcount in line with revenues.
Regulatory environment
Changes in industry regulation can have profound effects on the profitability of telecommunications operators and New Zealand businesses. There are three main regulatory risk areas that may impact Spark New Zealand’s business. These are changes to regulated product input price or non-price conditions, changes to compliance obligations driving cost and limiting business agility and exposure to new regulation in adjacent industries through participation in new business ventures.
Technology failure
Service-impacting events arising from technology failures can damage Spark New Zealand’s market reputation, limiting its ability to retain existing or win new customer business. It may also expose Spark New Zealand to liability to customers and suppliers. A combination of operating a number of legacy IT and network technology assets and increasing activity to replace these increases the risk of service interruption/impairment occurring.
IT security risks
Spark New Zealand’s IT security risk profile is changing markedly as its customers conduct more of their daily lives online. New security threats are emerging and our capability to deal with these may not keep pace. Spark New Zealand’s ability to win new and retain existing business depends on maintaining customer/client confidence that their personal and commercial information is secure.
Creating value from rebranding to Spark New Zealand
Rebranding to Spark New Zealand was done to signal the changes we have been making to adopt a digital services future and engage a wider range of customers. Critical to creating value in our new identity is demonstrating that we have changed enough to prove to stakeholders that it is not just a name change, but an acceleration of the Company’s strategy. The risks to successfully rebranding and becoming customer inspired include co-ordinating Spark New Zealand business unit implementation plans, managing technical complexity and communicating effectively to ensure the Spark New Zealand brand resonates with target customers.
Further detail on Spark New Zealand’s risk factors may be found at: www.sparknz.co.nz/about/governance.
RemunerationThe total remuneration available to non-executive directors is fixed by shareholders. The current annual fee pool limit is $1,500,000 and has not been increased since it was approved by shareholders at the annual meeting in October 2003.
The fees payable to non-executive directors during FY14 were:
BOARD/COMMITTEE1 CHAIR MEMBER
Board of Directors $330,000 $130,000
Audit and Risk Management Committee $35,000 $17,000
Human Resources and Compensation Committee $30,000 $15,000
Nominations and Corporate Governance Committee – –
1 Committee chair and member fees were not payable to the Chair of the Board. Committee member fees were not payable to committee chairs. Where a director was the member or chair of more than one Board committee, the director received the single highest applicable fee.
From 1 July 2014, where a director (other than the Chairman of the Board) is the member or chair of more than one Board committee, member fees will be payable for each committee.
Committee membership as at 30 June 2014 was as follows:
HUMAN RESOURCES AND COMPENSATION COMMITTEE
AUDIT AND RISK MANAGEMENT COMMITTEE
NOMINATIONS AND CORPORATE GOVERNANCE COMMITTEE
Justine Smyth (Chair) Maury Leyland Mark Verbiest
Murray Horn (Chair) Paul Berriman Charles Sitch Justine Smyth
Mark Verbiest (Chair) Paul Berriman Murray Horn Maury Leyland Charles Sitch Justine Smyth
For
per
sona
l use
onl
y

Page 98 Spark New Zealand Annual Report 2014 Corporate governance and disclosures
The Board held eight formal meetings and two special meetings during FY14 and also attended a Board strategy day. The table below shows director attendance at these Board meetings and committee member attendance at committee meetings. Sub-committees of the Board also met regularly throughout the year to consider matters of special importance.
Board and committee meeting attendance for FY14
BOARD MEETINGS
SPECIAL BOARD MEETINGS ARMC HRCC
NOMS COMMITTEE
Total number of meetings held 8 2 4 5 3
Paul Berriman 8 2 4 – 3
Murray Horn 8 2 4 – 3
Ido Leffler1 1 1 – – –
Maury Leyland 7 2 – 4 3
Simon Moutter 8 2 – – –
Kevin Roberts2 5 1 – 4 1
Charles Sitch 8 2 4 - 3
Justine Smyth 8 2 4 5 3
Mark Verbiest3 8 2 43 5 3
1 Mr Leffler was appointed to the Board on 9 June 2014 (and was eligible to attend one Board meeting and one special Board meeting during FY14).2 Mr Roberts resigned from the Board on 9 June 2014 (and was eligible to attend all Board and applicable sub-committee meetings and one special Board meeting during FY14).3 Mr Verbiest attends ARMC meetings in an ex officio capacity.
The total remuneration and other benefits received by non-executive directors of Spark New Zealand during FY14 were as follows:
NAME TOTAL REMUNERATION (NZD)1
Paul Berriman $147,000
Murray Horn $165,000
Ido Leffler $8,000
Maury Leyland $145,000
Kevin Roberts $136,500
Charles Sitch $147,000
Justine Smyth $160,000
Mark Verbiest $330,000
Total $1,238,500
1 The figures shown are gross amounts and exclude GST (where applicable). In addition to these amounts, Spark New Zealand meets costs incurred by Directors that are incidental to the performance of their duties. This includes providing Directors with telephone concessions and paying the costs of Directors’ travel. As these costs are incurred by Spark New Zealand to enable Directors to perform their duties, no value is attributable to them as benefits to Directors for the purposes of the above table.
The total remuneration earned by, or paid to, the Managing Director, Mr Simon Moutter, for FY14 was as follows:
BASE SALARY1 SHORT-TERM INCENTIVE2 EQUITY INCENTIVE3 LONG-TERM INCENTIVE
NZ$1,358,736 NZ$1,132,500 NZ$906,000 NZ$1,000,000 in the form of 439,406 performance rights4
NZ$981,494 in the form of 428,600 performance rights5
1 Base salary includes employer contributions towards KiwiSaver. Mr Moutter does not receive any director fees. 2 Earned in FY14 and paid in FY15, as further described in CEO Annual Performance Incentive Scheme on www.sparknz.co.nz/about/governance.3 Earned in FY14 and awarded in FY15 in the form of redeemable ordinary shares that will reclassify as ordinary shares in September 2016, as further described in CEO Performance
Equity Scheme on www.sparknz.co.nz/about/governance.4 Granted in FY14 and, subject to specific performance hurdles, will vest in October 2016, as further described in CEO Performance Rights Scheme on
www.sparknz.co.nz/about/governance.5 Granted on 15 November 2013 (and valued using the share price on that day) as a one-off exceptional grant with substantially more challenging performance hurdles attached,
and, subject to those specific performance hurdles, will vest 60% in November 2016 and 40% in November 2017, as further described in CEO Performance Rights Scheme on www.sparknz.co.nz/about/governance.
For
per
sona
l use
onl
y

Page 99
The total remuneration earned by, or paid to, key management personnel, being the Directors and members of the Leadership Team, is set out in note 26 to the financial statements.
Employees do not receive any additional remuneration or other benefits from Spark New Zealand for acting as Directors of subsidiary companies. Mr Quince received a Director’s fee of NZ$10,000 (excluding GST) for acting as a Director of Teleco Insurance (NZ) Limited. Appleby Services (Bermuda) Limited received a Director’s fee of US$2,000 in relation to Mr Rees Davies acting as a Director of TCNZ (Bermuda) Limited.
The table below shows the number of employees and former employees, not being Directors of Spark New Zealand Limited, who, in their capacity as employees, received remuneration and other benefits during FY14 totalling NZ$100,000 or more.
REMUNERATION RANGE (NZD) CURRENT EMPLOYEES1 FORMER EMPLOYEES1 TOTAL EMPLOYEES1
$3810001 – $3820000 0 1 1
$720001 – $730000 0 1 1
$710001 – $720000 1 0 1
$700001 – $710000 2 0 2
$650001 – $660000 1 0 1
$580001 – $590000 1 0 1
$540001 – $550000 1 0 1
$500001 – $510000 1 0 1
$490001 – $500000 1 0 1
$480001 – $490000 1 0 1
$460001 – $470000 1 0 1
$450001 – $460000 0 1 1
$440001 – $450000 0 1 1
$430001 – $440000 1 1 2
$420001 – $430000 3 1 4
$410001 – $420000 1 0 1
$390001 – $400000 2 1 3
$380001 – $390000 1 0 1
$370001 – $380000 1 0 1
$350001 – $360000 2 0 2
$340001 – $350000 9 1 10
$330001 – $340000 6 2 8
$320001 – $330000 2 2 4
$310001 – $320000 4 1 5
$300001 – $310000 4 1 5
$290001 – $300000 5 0 5
$280001 – $290000 5 4 9
$270001 – $280000 2 1 3
$260001 – $270000 7 1 8
$250001 – $260000 4 2 6
$240001 – $250000 13 3 16
$230001 – $240000 12 3 15
$220001 – $230000 12 5 17
$210001 – $220000 19 0 19
$200001 – $210000 33 1 34
$190001 – $200000 42 8 50
For
per
sona
l use
onl
y
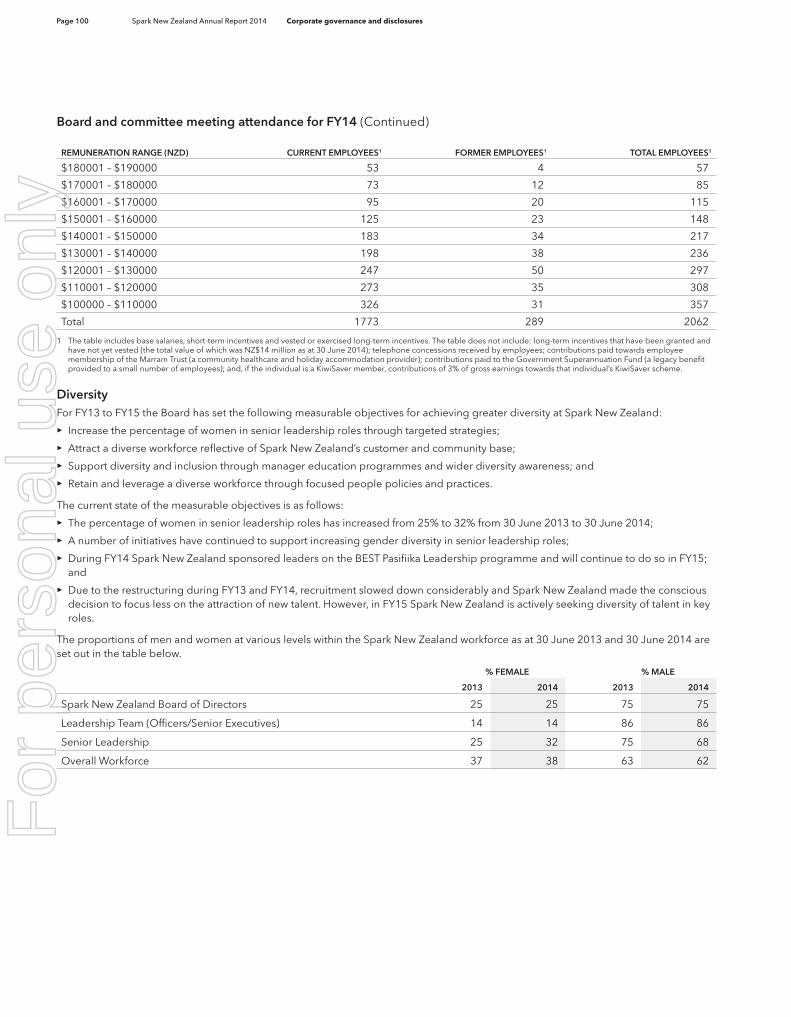
Page 100 Spark New Zealand Annual Report 2014 Corporate governance and disclosures
REMUNERATION RANGE (NZD) CURRENT EMPLOYEES1 FORMER EMPLOYEES1 TOTAL EMPLOYEES1
$180001 – $190000 53 4 57
$170001 – $180000 73 12 85
$160001 – $170000 95 20 115
$150001 – $160000 125 23 148
$140001 – $150000 183 34 217
$130001 – $140000 198 38 236
$120001 – $130000 247 50 297
$110001 – $120000 273 35 308
$100000 – $110000 326 31 357
Total 1773 289 2062
1 The table includes base salaries, short-term incentives and vested or exercised long-term incentives. The table does not include: long-term incentives that have been granted and have not yet vested (the total value of which was NZ$14 million as at 30 June 2014); telephone concessions received by employees; contributions paid towards employee membership of the Marram Trust (a community healthcare and holiday accommodation provider); contributions paid to the Government Superannuation Fund (a legacy benefit provided to a small number of employees); and, if the individual is a KiwiSaver member, contributions of 3% of gross earnings towards that individual’s KiwiSaver scheme.
Diversity For FY13 to FY15 the Board has set the following measurable objectives for achieving greater diversity at Spark New Zealand:
>> Increase the percentage of women in senior leadership roles through targeted strategies;
>> Attract a diverse workforce reflective of Spark New Zealand’s customer and community base;
>> Support diversity and inclusion through manager education programmes and wider diversity awareness; and
>> Retain and leverage a diverse workforce through focused people policies and practices.
The current state of the measurable objectives is as follows:
>> The percentage of women in senior leadership roles has increased from 25% to 32% from 30 June 2013 to 30 June 2014;
>> A number of initiatives have continued to support increasing gender diversity in senior leadership roles;
>> During FY14 Spark New Zealand sponsored leaders on the BEST Pasifiika Leadership programme and will continue to do so in FY15; and
>> Due to the restructuring during FY13 and FY14, recruitment slowed down considerably and Spark New Zealand made the conscious decision to focus less on the attraction of new talent. However, in FY15 Spark New Zealand is actively seeking diversity of talent in key roles.
The proportions of men and women at various levels within the Spark New Zealand workforce as at 30 June 2013 and 30 June 2014 are set out in the table below.
% FEMALE % MALE
2013 2014 2013 2014
Spark New Zealand Board of Directors 25 25 75 75
Leadership Team (Officers/Senior Executives) 14 14 86 86
Senior Leadership 25 32 75 68
Overall Workforce 37 38 63 62
Board and committee meeting attendance for FY14 (Continued)
For
per
sona
l use
onl
y

Page 101
Director independence and interestsThe Board has determined, based on information provided by Directors regarding their interests, that at 30 June 2014: Mr Berriman, Dr Horn, Mr Leffler, Ms Leyland, Mr Sitch, Ms Smyth and Mr Verbiest were independent. The Board also determined that Mr Moutter was not independent due to his position as Managing Director. Further information regarding Director independence may be found at: www.sparknz.co.nz/about/governance.
Directors made the following entries in the interests register for FY14:
>> Directors disclosed, pursuant to section 140 of the Companies Act 1993, interests in the following entities during FY14:
DIRECTOR ENTITY RELATIONSHIP
Murray Horn China Construction Bank Corporation Director
Ministry of Health Advisory Board Ceased to be Chairman
Ido Leffler Cheeky Co-founder/Director*
French Toast Products Co-founder/Director*
Joyus Non-executive Board Member*
Ruby Ribbon Non-executive Board Member*
Soma (Miko) Chairman*
Yes To, Inc. Co-founder/Board Member*
Yoobi Co-founder/CEO/Director*
Simon Moutter New Zealand Telecommunications Forum Appointed and ceased to be a Director
Mark Verbiest ANZ Bank New Zealand Limited Director
Aspiring Foundation Trust Chairman
Financial Markets Authority Ceased to be a Board Member
NZ International Festival of the Arts Trust Ceased to be Chairman
Southern Lakes Arts Festival Trust Trustee
*held on appointment at 9 June 2014.
>> Directors disclosed, pursuant to section 148 of the Companies Act 1993, the following acquisitions and disposals of relevant interests in Spark New Zealand shares during FY14:
NAMEDATE OF DISPOSAL/ACQUISITION CONSIDERATION PAID/RECEIVED
NUMBER OF SHARES ACQUIRED/DISPOSED OF CLASS OF SECURITIES
Simon Moutter 16 September 2013 Services to Spark New Zealand 149,695 Ordinary shares
4 October 2013 Services to Spark New Zealand 439,406 Performance rights
7 October 2013 Services to Spark New Zealand 428,600 Performance rights
Charles Sitch 26 August 2013 A$27,154.55 13,934 Ordinary shares
>> Directors disclosed, for the purposes of section 162 of the Companies Act 1993, insurance effected for Spark New Zealand’s Directors and officers for the 12-month period from 1 June 2014 and deeds of indemnity provided to all Directors and specified officers of Spark New Zealand.
For
per
sona
l use
onl
y

Page 102 Spark New Zealand Annual Report 2014 Corporate governance and disclosures
ShareholdingsAs at 25 July 2014 there were 1,828,530,844 Spark New Zealand ordinary shares on issue, each conferring to the registered holder the right to one vote on a poll at a meeting of shareholders on any resolution, held as follows:
SIZE OF HOLDING NUMBER OF HOLDERS1 % NUMBER OF SHARES %
1–1,000 12,701 31.85 6,600,002 0.36
1,001–5,000 17,244 43.24 44,263,754 2.42
5,001–10,000 5,105 12.80 38,121,525 2.08
10,001–100,000 4,624 11.59 105,590,853 5.77
100,001 and over 205 0.51 1,633,954,710 89.36
Total 39,879 100.00 1,828,530,844 100.00
1 Includes 3,764,119 restricted shares on issue held by Spark Trustee Limited on behalf of 48 beneficial holders and on trust for the Spark New Zealand Restricted Share Scheme (as further described in note 21 to the financial statements).
As at 25 July 2014 there were 3,540,838 share rights (including performance rights held by the Managing Director, Mr Moutter) on issue held by seven holders. Restricted shares and share rights are issued to Spark New Zealand employees as part of Spark New Zealand’s long-term incentive schemes. Further information on these schemes is contained in note 21 to the financial statements and at www.sparknz.co.nz/about/governance.
As at 25 July 2014 there were 1,209 shareholders holding between 1 and 99 ordinary shares (a minimum holding under the NZX listing rules) and 2,218 shareholders holding less than a marketable parcel of A$500 of shares (under the ASX listing rules).
The 20 largest holders of Spark New Zealand shares at 25 July 2014 were:
NAME1 NUMBER OF SHARES %
1. HSBC Nominees (New Zealand) Limited 452,342,809 24.74
2. National Nominees New Zealand Limited 371,996,986 20.34
3. JP Morgan Chase Bank 210,476,539 11.51
4. Citibank Nominees (NZ) Limited 116,629,794 6.38
5. Accident Compensation Corporation 55,005,505 3.01
6. HSBC Custody Nominees (Australia) Limited 54,464,746 2.98
7. Cogent Nominees Limited 52,410,340 2.87
8. National Nominees Limited 50,500,975 2.76
9. New Zealand Superannuation Fund Nominees Limited 36,477,886 1.99
10. JP Morgan Nominees Australia Limited 28,589,967 1.56
11. BNP Paribas Nominees NZ Limited 21,488,322 1.18
12. BNP Paribas Noms Pty Limited 19,398,088 1.06
13. Tea Custodians Limited 13,054,136 0.71
14. FNZ Custodians Limited 12,818,366 0.70
15. Premier Nominees Limited 10,448,527 0.57
16. Citicorp Nominess Pty Limited 10,268,641 0.56
17. AMP Life Limited 9,854,692 0.54
18. Guardian Nominees Limited 9,622,985 0.53
19. Private Nominees Limited 6,508,962 0.36
20. New Zealand Depositary Nominee Limited 4,972,058 0.27
1 The shareholding of New Zealand Central Securities Depository Limited (custodian for members trading through NZClear) has been re-allocated to the applicable members.For
per
sona
l use
onl
y
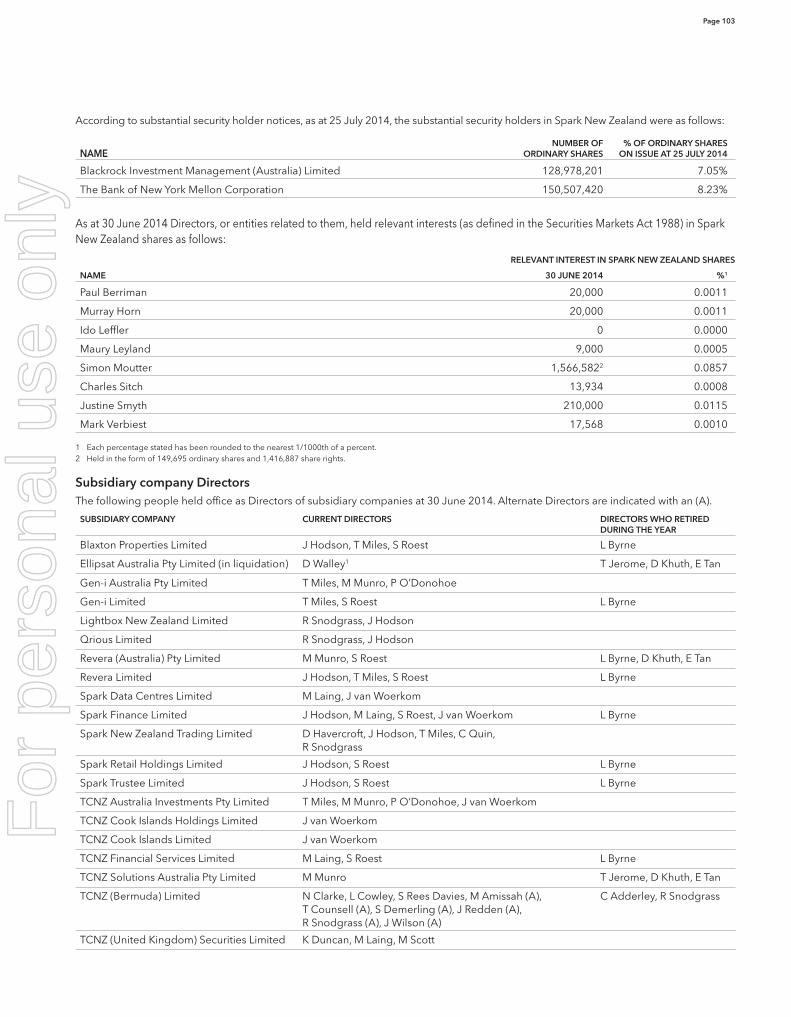
Page 103
According to substantial security holder notices, as at 25 July 2014, the substantial security holders in Spark New Zealand were as follows:
NAMENUMBER OF
ORDINARY SHARES% OF ORDINARY SHARES
ON ISSUE AT 25 JULY 2014
Blackrock Investment Management (Australia) Limited 128,978,201 7.05%
The Bank of New York Mellon Corporation 150,507,420 8.23%
As at 30 June 2014 Directors, or entities related to them, held relevant interests (as defined in the Securities Markets Act 1988) in Spark New Zealand shares as follows:
RELEVANT INTEREST IN SPARK NEW ZEALAND SHARES
NAME 30 JUNE 2014 %1
Paul Berriman 20,000 0.0011
Murray Horn 20,000 0.0011
Ido Leffler 0 0.0000
Maury Leyland 9,000 0.0005
Simon Moutter 1,566,5822 0.0857
Charles Sitch 13,934 0.0008
Justine Smyth 210,000 0.0115
Mark Verbiest 17,568 0.0010
1 Each percentage stated has been rounded to the nearest 1/1000th of a percent.2 Held in the form of 149,695 ordinary shares and 1,416,887 share rights.
Subsidiary company Directors The following people held office as Directors of subsidiary companies at 30 June 2014. Alternate Directors are indicated with an (A).
SUBSIDIARY COMPANY CURRENT DIRECTORS DIRECTORS WHO RETIRED DURING THE YEAR
Blaxton Properties Limited J Hodson, T Miles, S Roest L Byrne
Ellipsat Australia Pty Limited (in liquidation) D Walley1 T Jerome, D Khuth, E Tan
Gen-i Australia Pty Limited T Miles, M Munro, P O’Donohoe
Gen-i Limited T Miles, S Roest L Byrne
Lightbox New Zealand Limited R Snodgrass, J Hodson
Qrious Limited R Snodgrass, J Hodson
Revera (Australia) Pty Limited M Munro, S Roest L Byrne, D Khuth, E Tan
Revera Limited J Hodson, T Miles, S Roest L Byrne
Spark Data Centres Limited M Laing, J van Woerkom
Spark Finance Limited J Hodson, M Laing, S Roest, J van Woerkom L Byrne
Spark New Zealand Trading Limited D Havercroft, J Hodson, T Miles, C Quin, R Snodgrass
Spark Retail Holdings Limited J Hodson, S Roest L Byrne
Spark Trustee Limited J Hodson, S Roest L Byrne
TCNZ Australia Investments Pty Limited T Miles, M Munro, P O’Donohoe, J van Woerkom
TCNZ Cook Islands Holdings Limited J van Woerkom
TCNZ Cook Islands Limited J van Woerkom
TCNZ Financial Services Limited M Laing, S Roest L Byrne
TCNZ Solutions Australia Pty Limited M Munro T Jerome, D Khuth, E Tan
TCNZ (Bermuda) Limited N Clarke, L Cowley, S Rees Davies, M Amissah (A), T Counsell (A), S Demerling (A), J Redden (A), R Snodgrass (A), J Wilson (A)
C Adderley, R Snodgrass
TCNZ (United Kingdom) Securities Limited K Duncan, M Laing, M Scott
For
per
sona
l use
onl
y

Page 104 Spark New Zealand Annual Report 2014 Corporate governance and disclosures
SUBSIDIARY COMPANY CURRENT DIRECTORS DIRECTORS WHO RETIRED DURING THE YEAR
Teleco Insurance Limited D Havercroft, M Laing, S Rees Davies, M Amissah (A), J Burke (A), N Clarke (A), S Demerling (A), F Evett (A), T Richardson-Augustus (A), S Roest (A), R Snodgrass (A), T Woods (A)
J Redden, L Byrne (A)
Teleco Insurance (NZ) Limited M Laing, R Quince
Telecom 3G (Australia) Limited S Roest L Byrne
Telecom Capacity Limited D Havercroft R Snodgrass
Telecom Cook Islands Limited J van Woerkom, M Beder, M Sword, T Okotai J Maher
Telecom Enterprises Limited J Hodson, S Roest L Byrne
Telecom Leasing Limited J Hodson, M Laing, S Roest L Byrne
Telecom Mobile Leasing No.1 Limited M Laing, S Roest L Byrne
Telecom Mobile Leasing No.2 Limited M Laing, S Roest L Byrne
Telecom Mobile Limited2 J Hodson, S Roest L Byrne
Telecom New Zealand International Australia Pty Limited
C Walton, C Barnes
Telecom New Zealand International Limited S Roest, C Walton L Byrne
Telecom New Zealand Singapore Pte Limited L Seng, C Walton, A Tierney
Telecom New Zealand (UK) Enterprises Limited
J van Woerkom, M Laing
Telecom New Zealand UK Limited K Duncan, M Scott, C Walton
Telecom New Zealand USA Limited C Walton
Telecom Pacific Limited S Roest, J van Woerkom L Byrne
Telecom Rentals Limited M Laing, S Roest L Byrne
Telecom Southern Cross Limited J Hodson, S Roest L Byrne
Telecom Wellington Investments Limited M Laing, S Roest L Byrne
Telegistics Repair Limited S Roest, J van Woerkom L Byrne
1 Appointed as liquidator under members voluntary liquidation. The liquidation of Ellipsat Australia Pty Limited was finalised and the liquidator resigned on 29 July 2014 (and ASIC deregistration is pending).
2 Amalgamated into Spark New Zealand Trading Limited on 31 July 2014.
For
per
sona
l use
onl
y

Page 105
Forward-looking statementsThis annual report contains forward-looking statements within the meaning of section 27A of the United States Securities Act of 1933 and section 21E of the Securities Exchange Act. Such forward-looking statements are based on the beliefs of Spark New Zealand’s management, as well as on assumptions made by, and information currently available to, Spark New Zealand at the time such statements were made. These forward-looking statements include statements of Spark New Zealand’s present expectations, beliefs, future plans, strategies, other anticipated developments and matters that are not historical facts. Forward-looking statements can generally be identified by the use of forward-looking words such as ‘may’, ‘could’, ‘anticipate’, ‘estimate’, ‘expect’, ‘opportunity’, ‘plan’, ‘continue’, ‘objectives’, ‘outlook’, ‘guidance’, ‘intend’, ‘aim’, ‘seek’, ‘believe’, ‘should’, ‘will’ and similar expressions. These forward-looking statements include, without limitation, statements relating to:
>> Spark New Zealand’s operations and business prospects;
>> Capital expenditure and investment plans;
>> Spark New Zealand’s business and operating strategies, including reducing costs, simplifying Spark New Zealand’s business and improving customer experiences and operational performance;
>> Spark New Zealand’s expectations for its future financial performance generally;
>> The regulatory environment and the impact of regulatory initiatives on Spark New Zealand;
>> Spark New Zealand’s expected capital expenditure, working capital and investment requirements;
>> The performance of investments, including dividends from Southern Cross;
>> Growth of, and opportunities available in, the communications and IT services markets and Spark New Zealand’s positioning to take advantage of such opportunities;
>> The convergence of technologies, growth and opportunities to offer new products and services;
>> Plans for the launch of new products and services;
>> Spark New Zealand’s network and infrastructure development plans, including the deployment of 4G using 700 MHz spectrum;
>> Network performance, resilience and quality;
>> The impact of legal proceedings, investigations and inquiries involving Spark New Zealand;
>> Competition, market share, prices and growth; and
>> The operating environment and overall market conditions and trends.
Such forward-looking statements are not guarantees of future performance. Actual results, performance or achievements could differ materially from those projected in, or implied by, the forward-looking statements as a result of various assumptions, risks and uncertainties. See Risk factors in this annual report and risk factors described at www.sparknz.co.nz/about/governance. In addition to the risks described elsewhere in this annual report and on the above website, other factors and risks could cause actual results to differ materially from those described in the forward-looking statements.
Given the risks, uncertainties and other factors, undue reliance should not be placed on any forward-looking statement, which speaks only as of the date made. Except as required by the listing rules of the stock exchanges on which Spark New Zealand is listed, Spark New Zealand does not undertake any obligation to review or confirm analysts’ expectations or estimates or to release publicly any revisions to any forward-looking statements to reflect events or circumstances after the date of this report or to reflect the occurrence of unanticipated events. Further, the information contained in this document is a statement of Spark New Zealand’s intention as of 22 August 2014 and is based upon, among other things, the existing regulatory environment, industry conditions, market conditions and prices, the economy in general and Spark New Zealand management’s assumptions. Spark New Zealand’s management may change its intentions at any time and without notice based upon any changes in such factors, assumptions or otherwise.
For
per
sona
l use
onl
y
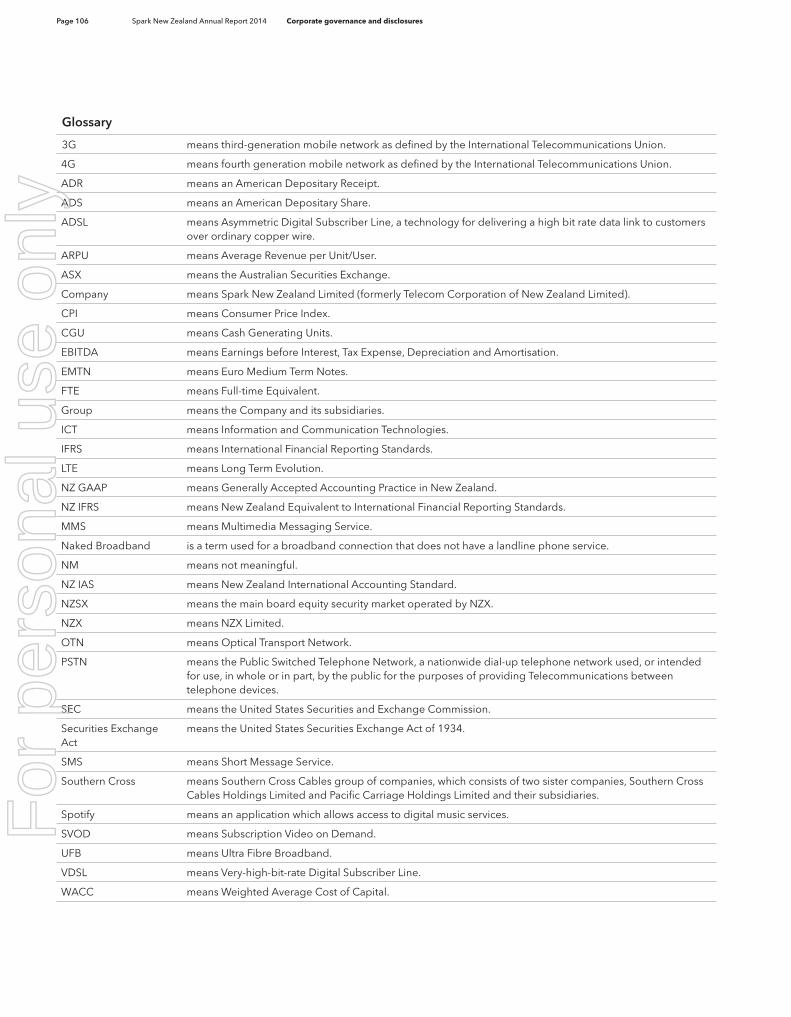
Page 106 Spark New Zealand Annual Report 2014 Corporate governance and disclosures
Glossary
3G means third-generation mobile network as defined by the International Telecommunications Union.
4G means fourth generation mobile network as defined by the International Telecommunications Union.
ADR means an American Depositary Receipt.
ADS means an American Depositary Share.
ADSL means Asymmetric Digital Subscriber Line, a technology for delivering a high bit rate data link to customers over ordinary copper wire.
ARPU means Average Revenue per Unit/User.
ASX means the Australian Securities Exchange.
Company means Spark New Zealand Limited (formerly Telecom Corporation of New Zealand Limited).
CPI means Consumer Price Index.
CGU means Cash Generating Units.
EBITDA means Earnings before Interest, Tax Expense, Depreciation and Amortisation.
EMTN means Euro Medium Term Notes.
FTE means Full-time Equivalent.
Group means the Company and its subsidiaries.
ICT means Information and Communication Technologies.
IFRS means International Financial Reporting Standards.
LTE means Long Term Evolution.
NZ GAAP means Generally Accepted Accounting Practice in New Zealand.
NZ IFRS means New Zealand Equivalent to International Financial Reporting Standards.
MMS means Multimedia Messaging Service.
Naked Broadband is a term used for a broadband connection that does not have a landline phone service.
NM means not meaningful.
NZ IAS means New Zealand International Accounting Standard.
NZSX means the main board equity security market operated by NZX.
NZX means NZX Limited.
OTN means Optical Transport Network.
PSTN means the Public Switched Telephone Network, a nationwide dial-up telephone network used, or intended for use, in whole or in part, by the public for the purposes of providing Telecommunications between telephone devices.
SEC means the United States Securities and Exchange Commission.
Securities Exchange Act
means the United States Securities Exchange Act of 1934.
SMS means Short Message Service.
Southern Cross means Southern Cross Cables group of companies, which consists of two sister companies, Southern Cross Cables Holdings Limited and Pacific Carriage Holdings Limited and their subsidiaries.
Spotify means an application which allows access to digital music services.
SVOD means Subscription Video on Demand.
UFB means Ultra Fibre Broadband.
VDSL means Very-high-bit-rate Digital Subscriber Line.
WACC means Weighted Average Cost of Capital.
For
per
sona
l use
onl
y

Page 107
Registered officeLevel 2Spark City167 Victoria Street WestAuckland 1010New ZealandPh +64 4 471 1638 or 0800 108 010
Principal administrative office in Australia Level 23 680 George StreetSydney NSW 2000AustraliaPh 1800 124 248
Company secretarySilvana Roest
New Zealand registry Link Market Services Limited Level 7 Zurich House PO Box 91976 21 Queen Street Auckland 1142 Ph +64 9 375 5998 (investor enquiries) or + 64 9 375 5999 Fax +64 9 375 5990 [email protected] www.linkmarketservices.co.nz
Australian registry Link Market Services Limited Level 12 680 George Street Sydney NSW 2000 Australia
Locked Bag A14 Sydney South NSW 1235 Australia
Ph +61 2 8280 7111 (investor enquiries) Fax +61 2 9287 0303 [email protected] www.linkmarketservices.com.au
United States registry BNY Mellon Depositary ReceiptsPO Box 43006Providence, RI 02940-3006United States Ph +1 888 BNY ADRS (+1 888 269 2377) or +1 201 680 6825 (from outside the United States)[email protected]
For more informationFor inquiries about transactions, changes of address or dividend payments contact the relevant share registries.
For inquiries about Spark New Zealand’s operating and financial performance contact:
GM Corporate FinanceSpark New Zealand LimitedPrivate Bag 92028Auckland 1142New Zealand
Australia 1800 123 350Canada 1800 280 0398Hong Kong 800 962 867New Zealand 0800 737 500Singapore 800 641 1013United Kingdom 0800 960 283United States 1800 208 2130
investors.sparknz.co.nz
Contact details
Spark New Zealand Limited (formerly Telecom Corporation of New Zealand Limited)ARBN 050 611 277
designedbyinsight.com
SPA
RK00
1 08
/14 F
or p
erso
nal u
se o
nly

investors.sparknz.co.nzARBN 050 611 277
For
per
sona
l use
onl
y
Spark New Zealand Limited (formerly Telecom Corporation of New Zealand Limited)
Dear Shareholder SPARK NEW ZEALAND ANNUAL REPORT 2014
We have the pleasure of informing you that our first annual report under our new brand “Spark New Zealand” for the year
ending 30 June 2014 is now available online at investors.sparknz.co.nz
Request for electronic communications
We encourage you to receive your Spark New Zealand shareholder communications electronically. This will enable you to
receive important shareholder and company information faster, reduce the impact on the environment, access all
documents conveniently, securely at any time and contribute to reducing the company’s costs associated with print and mail.
I/We wish to receive all Spark New Zealand shareholder communications electronically and my/our email address for this
purpose is:
_____________________________________________________________________________________________________
If you have any questions about changing how you receive shareholder communications as a Spark New Zealand shareholder
please contact Link Market Services on (NZ) 0800 737 100 or (AU) 1300 554 474 or by email at:
Request for printed copies of reports
Even though Spark New Zealand’s annual report is available electronically, you can request to be sent a printed copy by
ticking the box below and returning this notice to Link Market Services Limited. For your request to be valid it must be
received within 15 working days of your receipt of this notice. Every year we are obliged to give you the option of receiving a
hard copy of the annual report. If you request a hard copy we are obliged to send you hard copies of our annual report and
half‐year report each year until you request us not to. We do not produce a concise annual report.
I/We would like to receive a printed copy of Spark New Zealand’s
annual report and half‐year report (when available) each year.
Please tick only if you wish to receive a
printed copy of the reports.
Return this notice in the reply paid envelope provided, by fax to +64 9 375 5990 or by scanning and emailing it to:
[email protected] (please include “Spark New Zealand Annual Report” as the subject).
Substantial security holders According to substantial security holder notices, as at 25 July 2014, the substantial security holders in Spark New Zealand
were: Blackrock Investment Management (Australia) Limited, holding 128,978,201 ordinary shares (7.05% of ordinary shares
on issue at 25 July 2014); and The Bank of New York Mellon Corporation, holding 150,507,420 ordinary shares (8.23% of
ordinary shares on issue at 25 July 2014).
For
per
sona
l use
onl
y

APPENDIX 7 – NZSX Listing Rules
Number of pages including this one(Please provide any other relevant
NZSX Listing Rule 7.12.2. For rights, NZSX Listing Rules 7.10.9 and 7.10.10 details on additional pages)For change to allotment, NZSX Listing Rule 7.12.1, a separate advice is required
Full nameof Issuer
Name of officer authorised to Authority for event,make this notice e.g. Directors' resolution
Contact phone Contact faxnumber number Date
Nature of event Bonus If ticked, Rights IssueTick as appropriate Issue state whether: Taxable / Non Taxable Conversion Interest Renouncable
Rights Issue Capital Call Dividend If ticked, state Fullnon-renouncable change X whether: Interim Year X Special DRP Applies X
EXISTING securities affected by this If more than one security is affected by the event, use a separate form
Description of the ISINclass of securities
If unknown, contact NZX
Details of securities issued pursuant to this event If more than one class of security is to be issued, use a separate form for each class
Description of the ISINclass of securities
If unknown, contact NZX
Number of Securities to Minimum Ratio, e.gbe issued following event Entitlement 1 for 2 for
Conversion, Maturity, Call Treatment of FractionsPayable or Exercise Date
Tick if provide anpari passu OR explanation
Strike price per security for any issue in lieu or date of theStrike Price available. ranking
Monies Associated with Event Dividend payable, Call payable, Exercise price, Conversion price, Redemption price, Application money.
Source ofAmount per security Payment(does not include any excluded income)
Excluded income per security(only applicable to listed PIEs)
Supplementary Amount per securityCurrency dividend in dollars and cents
details -NZSX Listing Rule 7.12.7
Total monies
Taxation Amount per Security in Dollars and cents to six decimal places
In the case of a taxable bonus Resident Imputation Creditsissue state strike price Withholding Tax (Give details)
Foreign FWP CreditsWithholding Tax (Give details)
Timing (Refer Appendix 8 in the NZSX Listing Rules)
Record Date 5pm Application DateFor calculation of entitlements - Also, Call Payable, Dividend /
Interest Payable, Exercise Date,Conversion Date. In the caseof applications this must be thelast business day of the week.
Notice Date Allotment DateEntitlement letters, call notices, For the issue of new securitiesconversion notices mailed Must be within 5 business days
of application closing date.
OFFICE USE ONLYEx Date:Commence Quoting Rights: Security Code:Cease Quoting Rights 5pm:Commence Quoting New Securities: Security Code:Cease Quoting Old Security 5pm:
EMAIL: [email protected]
Notice of event affecting securities1
SPARK NEW ZEALAND LIMITED
JOLIE HODSON DIRECTORS' RESOLUTION
(09) 358 6932 (09) 357 0798 22 08 2014
ORDINARY SHARES NZ TELE0001S4
In dollars and cents
RETAINED EARNINGS$0.090
Enter N/A if not applicable
NZD $0.015882
$164,567,776 Date Payable 10 October, 2014
26/09/14 AUST & NZ; 25/09/14 USA 10/10/14 AUST & NZ; 17/10/14 USA
$ $0.006250 $0.035000
$
For
per
sona
l use
onl
y