for personal use only - capitaland · 2013 half year results briefing investor presentation 24 july...
TRANSCRIPT

Page Investor Presentation2012 Half Year Results Briefing26 June 2012
For
per
sona
l use
onl
y

1H13 Result 2013 first halfoverview.
Group CapitaLand strategic review concluded, Australand to remain a key investment
First half operating profit of $62m
O t k t d li th i ti i f FY13 On track to deliver growth in operating earnings for FY13
Interim distribution of 10.5 cents per security
Investment 10% EBIT growth in 1H13Investment Property
10% EBIT growth in 1H13
Occupancy of 95.3% and WALE of 5.4 years
141,000 sqm of leasing activity
Commercial & Industrial
Completed 7 projects with an end value of ~$225m
Secured ~75,000 sqm of new commitments from industrial tenants
Forward workload of 146,000 sqm, q
Residential Improved sales activity driven by strong pre-sales in Sydney
1,793 contracts on hand, 51% expected to settle in 2H13
Page Investor Presentation2012 Half Year Results Briefing26 June 2012
Page2013 Half Year Results Briefing Investor Presentation 24 July 2013 2
Top 12 projects – FY13 sales targets 76% secured
For
per
sona
l use
onl
y

1H13 Result Group pfinancial results.
1H13 1H121
Investment Property $96m $88m
Commercial & Industrial $10m $10m
Residential $22m $40m
Corporate $(9)m $(13)mCorporate $(9)m $(13)m
Operating EBIT $119m $125m
Operating profit after tax2 $62m $68m
Investment property revaluation gain $17m $34m
Unrealised gain/loss on interest rate derivatives $10m $(12)mUnrealised gain/loss on interest rate derivatives $10m $(12)m
Corporate activity expenses $(1)m -
Statutory profit after tax $88m $90m
Page Investor Presentation2012 Half Year Results Briefing26 June 2012
Page2013 Half Year Results Briefing Investor Presentation 24 July 2013 3
1. 1H12 EBIT restated for AASB112. Operating profit after tax is consistent with Property Council White Paper guidelines for disclosing FFO
For
per
sona
l use
onl
y

1H13 Result Key operatingy p gmetrics.
1H13 earnings lower with a stronger 2H13 expected
Key metrics 1H13 1H12
Operating EPS 10.8c 11.8c
S Distribution of 10.5 cents per security,
consistent with full year guidance
Gearing remains within target range
DPS 10.5c 10.5c
% recurrent earnings 81% 70%
Jun 13 Dec 12g g g(25-35%)
Improved average cost of debt to 7.5%
NTA increase driven by MTM of
Jun 13 Dec 12
Gearing1 33.0% 32.1%
Weighted average debt maturity 2.7 yrs 3.2 yrs
Weighted average cost of debt2 7 5% 7 7% NTA increase driven by MTM of derivatives ($0.04) and property revaluation gains ($0.03)
Weighted average cost of debt2 7.5% 7.7%
NTA per security $3.57 $3.49
Page Investor Presentation2012 Half Year Results Briefing26 June 2012
Page2013 Half Year Results Briefing Investor Presentation 24 July 2013 4
1. Interest bearing debt / total tangible assets (cash adjusted), based on the drawn amount of debt excluding fair value adjustments and associated derivative financial instruments. Dec 12 restated for AASB112. All in cost of debt excluding establishment fees and net of interest income
For
per
sona
l use
onl
y

Page Investor Presentation2012 Half Year Results Briefing26 June 2012
For
per
sona
l use
onl
y

InvestmentProperty
FinancialProperty performance.
Results 1H13 1H12
EBIT $96m $88m1 $ $
EBIT growth of 10% driven by:
− Comparable rental growth of 3.1%Revaluation gain1 $17m $34m
Metrics2 Jun 13 Dec 12
Portfolio value $2.3bn $2.3bn
− Income from internal development completions including 357 Collins St (VIC), Rhodes F (NSW) and Coles (QLD) Portfolio value $2.3bn $2.3bn
Occupancy (by income) 95.3% 97.6%
Industrial occupancy 98.6% 100.0%
Office occupancy 91 6% 94 9%
(QLD)
Revaluation gain of $17m driven primarily by rental growth
P tf li i il i ffi d Office occupancy 91.6% 94.9%
Comparable rental growth 3.1% 3.2%
WALE (by income) 5.4 yrs 5.5 yrs
Portfolio vacancy, primarily in office, due to unlet space at:
− 357 Collins St (74% leased)
Average cap rate 8.06% 8.09%1. Includes gains on internal developments of $3m (1H13) and $10m (1H12)2. Portfolio value includes properties under development, all other metrics exclude properties
under development and assets held for sale
− Rhodes F (63% leased)
Page Investor Presentation2012 Half Year Results Briefing26 June 2012
Page2013 Half Year Results Briefing Investor Presentation 24 July 2013 6
For
per
sona
l use
onl
y

InvestmentProperty
2013 leasing Property
gactivity.
Renewals and new leasing activity of 141,000 sqm
Major renewals Type Area (sqm) Expiry
Coles Industrial 61,300 2019
Amcor Industrial 15 200 2023− Represents 7% of portfolio income
− Rents on renewals were in line with in place rents
Amcor Industrial 15,200 2023
L&L Products Industrial 14,000 2024
Sumitomo Industrial 12,350 2017
Smith Lewis Industrial 3,800 2017
− WALE of 5.1 years
Tenant retention of 75% (by income)Major new leases
Holman Fresh Industrial 5,000 2016
Vanguard Office 1,400 2020
Leasing metricsArea
(sqm)Rent
changeAverage
incentiveAverage
WALE
Renewals 113,200 +1% 5% 5.6 yrs
New leases 27,800 N/A 14% 3.7 yrs
Total 141,000 +1% 7% 5.1 yrs
Page Investor Presentation2012 Half Year Results Briefing26 June 2012
Page2013 Half Year Results Briefing Investor Presentation 24 July 2013 7
For
per
sona
l use
onl
y

InvestmentProperty
Lease expiry Property
p yprofile.
50% Portfolio WALE remains strong at 5.4 years
− 1% expires in 2H13
Lease expiry profile1
83% expiring post FY14
5%1%
11% 11% 8%14%
− 11% expires in FY14 (down from 16% at Dec 12)
− 83% expires post FY14
p g p
Vacancy 2H13 FY14 FY15 FY16 FY17 FY18+
% p p
Strong focus on addressing near term expiries and portfolio vacancy
Portfolio income supported by quality Major 2H13 and FY14 l i i
Area ( )
% portfolio i E iPortfolio income supported by quality
tenant covenant
− 85% of income from government, ASX listed and multinational companies
lease expiries (sqm) income Expiry
LG, Eastern Creek (NSW) 29,045 2.3% 3Q14
Qantas, Mascot (NSW) 10,255 2.0% 2Q14
NAB, Rhodes (NSW) 7,490 1.7% 2Q14
Laminex, Murarrie (QLD) 21,530 0.8% 3Q14
Commonwealth Govt, Sydney (NSW) 5,675 0.7% 2Q14
Qantas, Mascot (NSW) 3,370 0.6% 3Q13
C t i P th Ai t (WA) 9 540 0 6% 2Q14
Page Investor Presentation2012 Half Year Results Briefing26 June 2012
Page2013 Half Year Results Briefing Investor Presentation 24 July 2013 8
1. By portfolio income, excludes properties under development
Centurion, Perth Airport (WA) 9,540 0.6% 2Q14
For
per
sona
l use
onl
y

InvestmentProperty
PositioningProperty
g& outlook.
EBIT growth expected in FY13
− 2H13 EBIT expected to be at least in line with 1H13
− Full year contributions from internal developments
− Embedded rental growth(Average ~3% pa fixed rent increases over 94% of portfolio income)
Mi i l l i i FY13− Minimal lease expiry in FY13
Leasing remains a key focus
− Progressively de-risking near term expiries
− Leasing up vacant space including 357 Collins St and Rhodes F
B ildi F
Page Investor Presentation2012 Half Year Results Briefing26 June 2012
Page2013 Half Year Results Briefing Investor Presentation 24 July 2013 9
357 Collins St, VIC
Building FRhodes, NSW
For
per
sona
l use
onl
y

Page Investor Presentation2012 Half Year Results Briefing26 June 2012
For
per
sona
l use
onl
y

Commercial& Industrial
Financial& Industrial performance.
EBIT in line with prior period
− Lower land sales offset by increased
Results1 1H13 1H12
Revenue $108m $65m
EBIT $10 $10third party built form activity
Total contribution (including NTA uplift) lower due to a reduced level of internal development
EBIT $10m $10m
NTA uplift $3m $10m
Total contribution $13m $20mdevelopment
Secured ~75,000 sqm of new commitments from industrial tenants
F tli VIC (22 000 )
Development activity
Built form - Third party (sqm) 90,200 28,400
Built form Internal (sqm) 8 900 38 500− Fastline, VIC (22,000 sqm)
− OfficeMax, NSW (19,300 sqm)
− Schenker, VIC (14,000 sqm)
Built form - Internal (sqm) 8,900 38,500
Land sales (sqm) 81,500 127,000
Metrics Jun 13 Dec 12
Two additional facilities committed to the GIC JV with an end value of $42m
Capital employed2 $377m $376m
Forward workload (sqm) 146,000 183,000
1. Includes ALZ share of joint arrangements. 1H12 revenue & EBIT restated for AASB11
Page Investor Presentation2012 Half Year Results Briefing26 June 2012
Page2013 Half Year Results Briefing Investor Presentation 24 July 2013 11
2. Total assets less non interest bearing liabilities at period end. Dec 12 restated for AASB11
For
per
sona
l use
onl
y

Commercial& Industrial
Forward& Industrial workload.
INTERNAL DEVELOPMENTArea Estimated end Timing
(sqm) value ($m) % to go 2H13 1H14
NSW Kangaroo Drive, Eastern Creek 15,750 22 65% Total forward workload of 146,000
sqm across 11 industrial projects, end value ~$280m
DEVELOPED FOR EXTERNAL SALEArea Estimated end Revenue Revenue timing
(sqm) value ($m) % to go 2H13 1H14
NSW Office Max, Eastern Creek (GIC) 19,300 26 100%
Kangaroo Drive, Eastern Creek 20,500 25 100%
CH2 Eastern Creek (GIC) 8 150 16 40%
end value $280m
10 projects developed for external sale with an estimated end value of ~$260m
CH2, Eastern Creek (GIC) 8,150 16 40%
QLD Ceva, Berrinba (GIC) 41,000 60 15%
Siltstone Place, Berrinba 9,450 13 100%
VIC Fastline & Spec, Westpark 46,850 42 24%
Kimpton Way Altona 25 700 24 100%
− 60% leased
− 72% sold
9 j t t t d f l ti Kimpton Way, Altona 25,700 24 100%
Rinnai, Keysborough 14,800 20 65%
Southern Court, Keysborough 17,850 18 100%
Symbion, Keysborough 12,800 17 100%
− 9 projects targeted for completion in 2H13
A detailed table outlining the forward workload is set out in the AppendicesA detailed table outlining the forward workload is set out in the Appendices
Page Investor Presentation2012 Half Year Results Briefing26 June 2012
Page2013 Half Year Results Briefing Investor Presentation 24 July 2013 12
For
per
sona
l use
onl
y

Commercial& Industrial
Industrial market & Industrial overview.
Prime grade vacancy remains relatively low
− High level of tenant renewal activity
Prime industrial vacancy Jun 13Melbourne 1.7%
Sydney 5 1%
− Supply remains constrained despite some speculative activity
Tenants remain selective and conversion of
Sydney 5.1%
Brisbane 5.3%Source: Savills
2,500
Industrial completions
enquiry is challenging
− Retail and logistics related users are most active
1,000
1,500
2,000
sqm
(000
's)
− Supply chain efficiencies key driver
− Sydney currently most active market
Some land markets showing early signs of
0
500
'03 '04 '05 '06 '07 '08 '09 '10 '11 '12 '13
S d M lb B i b
Some land markets showing early signs of improved enquiry
Increased focus on sustainability
Strong investor appetite remains for prime assets*
Page Investor Presentation2012 Half Year Results Briefing26 June 2012
Page2013 Half Year Results Briefing Investor Presentation 24 July 2013
Sydney Melbourne Brisbane
13
* Includes properties currently under constructionSource: Jones Lang LaSalle REIS 2Q13
Strong investor appetite remains for prime assets
For
per
sona
l use
onl
y

Commercial& Industrial
Positioning& Industrial
g& outlook.
Fully zoned landbank and strong operating platform with multiple revenue streams
− Industrial pre-leases and land sales
− Development for owner occupiers
− Selective speculative developmentp p
Expand capital partnering relationships
FY13 outlook
− Operating conditions to remain challenging
− Earnings skewed to 2H13, in line with delivery of forward workloaddelivery of forward workload
− FY13 EBIT expected to be similar to FY12
Capital expected to trend down
Page Investor Presentation2012 Half Year Results Briefing26 June 2012
Page2013 Half Year Results Briefing Investor Presentation 24 July 2013 14
GMEWinston Hills, NSW
− Capital expected to trend down
For
per
sona
l use
onl
y

Page Investor Presentation2012 Half Year Results Briefing26 June 2012
For
per
sona
l use
onl
y

Residential Financial performance.
Revenue and EBIT lower reflecting:
− Timing of built form settlements
Results1 1H13 1H12
Revenue $192m $260m
EBIT $22m $40m− Reduced contribution from high margin
land projects
Lot sales down slightly but activity up driven
EBIT $22m $40m
Lots sold 409 489
Contracts on hand (lots) 1,108 824
C t t h d ( l ) $558 $406g y y p
by strong pre-sales in Sydney
Strong growth in contracts on hand
− 51% expected to settle in 2H13
Contracts on hand (value) $558m $406m
Activity2
Sales activity3 1,244 1,03151% expected to settle in 2H13
− 33% expected to settle in 2014
− 16% expected to settle in 2015
Gross lots sold 620 654
Gross contracts on hand (lots) 1,793 1,316
Metrics Jun 13 Dec 12
1 I l d ALZ h f j i t t d PDA 1H12 & EBIT t t d f AASB11
Capital elevated reflecting construction of built form projects due to settle in 2H13 & 2014
Metrics Jun 13 Dec 12
Capital employed4 $920m $873m
Lots under management2 18,900 20,400
Pipeline end value2 $7 6bn $8 0bn
Page Investor Presentation2012 Half Year Results Briefing26 June 2012
Page2013 Half Year Results Briefing Investor Presentation 24 July 2013 16
1. Includes ALZ share of joint arrangements and PDAs. 1H12 revenue & EBIT restated for AASB112. Includes 100% of joint arrangements and PDAs3. Total new sales and contracts on hand for the 6 months to 30 Jun4. Total assets less non interest bearing liabilities at period end. Dec 12 restated for AASB11
Pipeline end value $7.6bn $8.0bn
For
per
sona
l use
onl
y

Residential VIC overview.
Market stabilising
− Activity levels for land sales improved in 1H13Land sales activity
(by lots)2VIC1
58% 350− Re-introduction of FHB incentives for new
dwellings and enhanced NRAS expected to assist recovery
Steady sales at medium density projects in 1H13
58%
50100150200250300
Contracts on hand (by lots)2
y y p j
− Carlton, 72 sales
− Parkville, 32 sales
Pi li i ll di ifi d b l ti
050
2H11 1H12 2H12 1H13
Pipeline remains well diversified: by location, product type, ownership structure and price point
− 4 out of 9 active projects are medium density
88% f i li i i j i t t PDA
283
513
346
508
− 88% of pipeline is in joint arrangements or PDAs
High level of contracts on hand underpinned by medium density pipeline
508 gross lots ith an end al e of $225mLandMedium Density
Dec 11 Jun 12 Dec 12 Jun 13
Page Investor Presentation2012 Half Year Results Briefing26 June 2012
Page2013 Half Year Results Briefing Investor Presentation 24 July 2013
− 508 gross lots with an end value of ~$225m
17
1. Pipeline by geography (by lots, includes 100% of joint arrangements and PDAs)
2. Includes 100% of joint arrangements and PDAs
For
per
sona
l use
onl
y

Residential NSW overview.
Solid 1H13 sales activity driven by demand for product priced around the median price point
− Wolli Creek, 179 sales
Pipeline typediversity (by lots)2
NSW1 ,− Clemton Park, 117 sales− The Ponds, 58 sales
77% of pipeline is built form, with strong pre-sales Built form
Land23%
NSW22%
− Wolli Creek (447 pre-sales, $266m)− Clemton Park (212 pre-sales, $111m)− Lidcombe (82 pre-sales, $56m) Contracts on hand
Built form 77%
Rezoning at Ashlar progressing with first sales expected in 2015
Greenhills Beach continues to deliver solid sales and the project is expected to be ~90% sold by
(by lots)2
389
572 543
905
40%FY14
26%FY15
and the project is expected to be ~90% sold by year end
Significant increase in contracts on hand securing revenues for FY13 to FY15
389
Dec 11 Jun 12 Dec 12 Jun 13
34%2H13
FY14
Page Investor Presentation2012 Half Year Results Briefing26 June 2012
Page2013 Half Year Results Briefing Investor Presentation 24 July 2013 18
− 905 gross lots with an end value of~$500m 1. Pipeline by geography (by lots, includes 100% of joint arrangements and PDAs)
2. Includes 100% of joint arrangements and PDAs
For
per
sona
l use
onl
y

Residential SE QLD overview.
Trading conditions in Brisbane have improved as affordability and interstate migration levels recover, although consumer sentiment remains fragile
More discretionary markets (Gold Coast & Sunshine Coast) remain challenging
QLD1
10%
y ( ) g g
Hamilton & Kangaroo Point generating enquiry and sales activity with $104m of pre-sales secured
− 79 contracts with an end value of ~$60m expected to settle in 2H13$ p
Net interstate migrationg
QLD102030405060
ing
sum
(000
s)
-40-30-20-10
0
'92 '94 '96 '98 '00 '02 '04 '06 '08 '10 '12
Annu
al ro
lli
NSW
VIC
WA
Page Investor Presentation2012 Half Year Results Briefing26 June 2012
Page2013 Half Year Results Briefing Investor Presentation 24 July 2013 19
Hamilton, QLD
Source: ANZ, Dec 2012
1. Pipeline by geography (by lots, includes 100% of joint arrangements and PDAs)
For
per
sona
l use
onl
y

Residential WA overview.
Activity levels improving as increasing rents drive conversion of tenants into owneroccupiers, particularly at the affordable end of the market
− Byford, 68 land sales at $170k average price
WA1
10%
y , $ g p
− Cockburn Central, Kingston (Stage 2) 95% pre-sold at $450k average price
− Port Coogee, 36 land sales at $520k average price
Y h t t ( 1 200 l t ) ld l b t WA G t t i ht t i d Yanchep estate (~1,200 lots) sold englobo to WA Government, management rights retained
197 gross contracts on hand with an end value of $71m
Dwelling values and rents
120130140150
g
Rents
exed
8090
100110120
'08 '09 '10 '11 '12 '13
Values
Ind
Page Investor Presentation2012 Half Year Results Briefing26 June 2012
Page2013 Half Year Results Briefing Investor Presentation 24 July 2013 20
1. Pipeline by geography (by lots, includes 100% of joint arrangements and PDAs) Cockburn Central, WA
Source: RP Data
For
per
sona
l use
onl
y
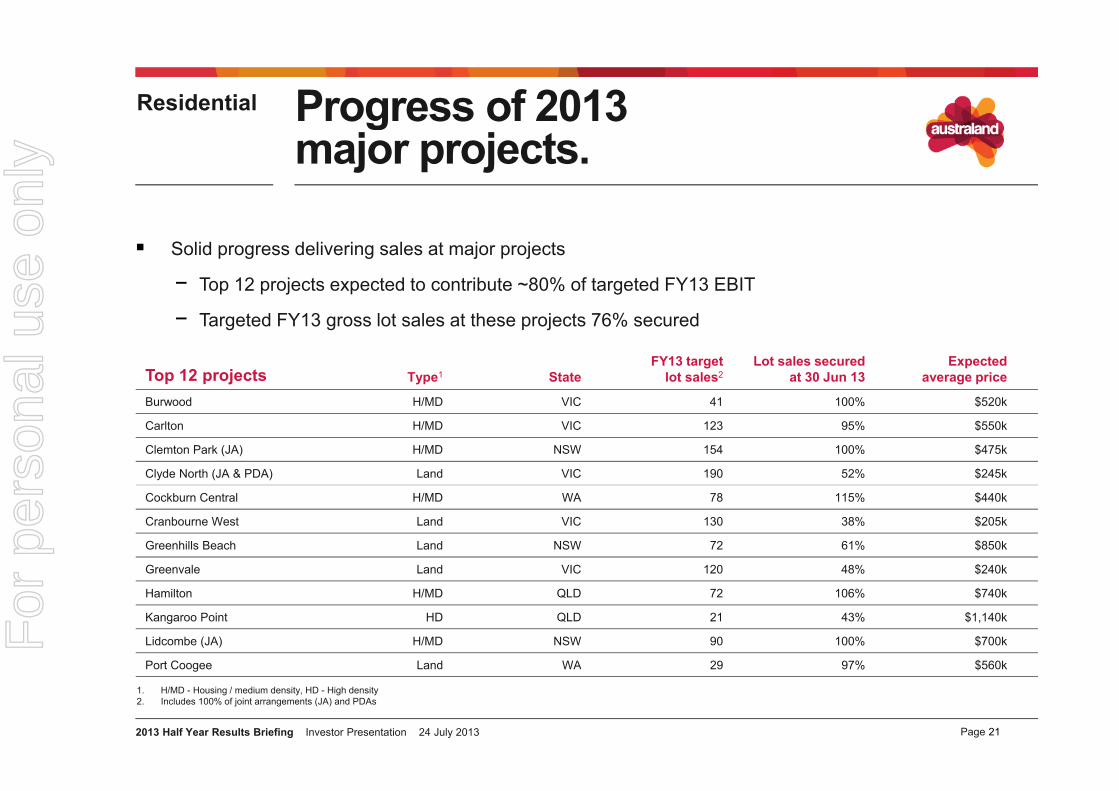
Residential Progress of 2013 gmajor projects.
Solid progress delivering sales at major projects
− Top 12 projects expected to contribute ~80% of targeted FY13 EBIT
− Targeted FY13 gross lot sales at these projects 76% secured
Top 12 projects Type1 StateFY13 target
lot sales2Lot sales secured
at 30 Jun 13Expected
average price
Burwood H/MD VIC 41 100% $520k
Carlton H/MD VIC 123 95% $550k
Clemton Park (JA) H/MD NSW 154 100% $475k
Clyde North (JA & PDA) Land VIC 190 52% $245k
Cockburn Central H/MD WA 78 115% $440k
Cranbourne West Land VIC 130 38% $205k
Greenhills Beach Land NSW 72 61% $850k
Greenvale Land VIC 120 48% $240k
Hamilton H/MD QLD 72 106% $740k
Kangaroo Point HD QLD 21 43% $1,140k
Lidcombe (JA) H/MD NSW 90 100% $700k
Port Coogee Land WA 29 97% $560k
Page Investor Presentation2012 Half Year Results Briefing26 June 2012
Page2013 Half Year Results Briefing Investor Presentation 24 July 2013 21
Port Coogee Land WA 29 97% $560k
1. H/MD - Housing / medium density, HD - High density2. Includes 100% of joint arrangements (JA) and PDAs
For
per
sona
l use
onl
y

Residential 2013 outlook.
FY13 EBIT expected to be similar to FY12
− ~$330m of built form product expected to settle in 2H131
− Solid sales progress at top 12 projects
− Strong level of contracts on hand with 51% expected to settle in 2013
2H13 Major built form settlements StateNumber of contracts
on hand secured1Value of contractson hand secured1 ALZ ownership
Carlton VIC 117 $65m 65%
Hamilton QLD 76 $56m 100%Hamilton QLD 76 $56m 100%
Lidcombe NSW 61 $43m 50% & 100%
The Ponds NSW 77 $41m 20%
Clemton Park NSW 80 $40m 50%
P k ill VIC 58 $29 50%Parkville VIC 58 $29m 50%
Burwood VIC 41 $21m 100%
Cockburn Central WA 42 $19m 100%
Page Investor Presentation2012 Half Year Results Briefing26 June 2012
Page2013 Half Year Results Briefing Investor Presentation 24 July 2013 22
1. Includes 100% of joint arrangements and PDAs
For
per
sona
l use
onl
y

Page Investor Presentation2012 Half Year Results Briefing26 June 2012
For
per
sona
l use
onl
y

Group outlook
2013 outlook.outlook
Outlook
While market conditions remain challenging, the Group continues to expect to deliver earnings growth in FY13 supported bygrowth in FY13 supported by
− Fixed increases in rental income from the Investment Property portfolio and full year contributions from internal developments
D li f C&I f d kl d k d t 2H13 ith t d l ti f 9 thi d t− Delivery of C&I forward workload skewed to 2H13 with expected completion of 9 third party projects
− Strong level of Residential contracts expected to settle in 2H13
Group earnings and distributions guidance
Group expects to deliver growth in FY13 operating earnings per security of 3-4%
FY13 di t ib ti id f 21 5 t it FY13 distribution guidance of 21.5 cents per security
Page Investor Presentation2012 Half Year Results Briefing26 June 2012
Page2013 Half Year Results Briefing Investor Presentation 24 July 2013 24
For
per
sona
l use
onl
y

Page Investor Presentation2012 Half Year Results Briefing26 June 2012
For
per
sona
l use
onl
y

Appendices Business model.
RECURRENT INCOME
INVESTMENT PORTFOLIO
GROWTH
DEVELOPMENT PIPELINE
RECURRENT INCOME(60-70% of Group EBIT)
GROWTH(30-40% of Group EBIT)
Commercial& Industrial
ResidentialOffice & Industrial & Industrial
$2.0bn1$2.3bn& Industrial
$7.6bn1
Page Investor Presentation2012 Half Year Results Briefing26 June 2012
Page2013 Half Year Results Briefing Investor Presentation 24 July 2013 26
1. Estimated pipeline end values
For
per
sona
l use
onl
y

Summary of profit Appendices y pand loss statement.Financial
1H13$m
1H121
$m
Investment Property 96 88
Commercial & Industrial 10 10
Residential 22 40
Corporate (9) (13)
Operating EBIT 119 125Net interest (46) (44)
Profit before tax 73 81
Tax - -
Non-controlling interest (ASSETS) (11) (12)
Operating profit after tax (FFO)2 62 68p g p ( )
Maintenance CAPEX (2) (2)
Cash incentives (3) (11)
Adjusted funds from operations (AFFO)2 58 55
Page Investor Presentation2012 Half Year Results Briefing26 June 2012
Page2013 Half Year Results Briefing Investor Presentation 24 July 2013
Adjusted funds from operations (AFFO) 58 55
27
1. 1H12 EBIT and net interest restated for AASB112. Consistent with Property Council White Paper guidelines for disclosing FFO & AFFO
For
per
sona
l use
onl
y

1H13 operating Appendices p gsegment.Financial
$m Residential Commercial & Industrial
Investment Property Corporate
1H13 Consolidated
1H12Consolidated1
Property development sales 135 101 - - 236 299Rent from investment properties - - 116 - 116 106Rent from investment properties 116 116 106Interest received or receivable - - - 1 1 3Management fees from joint arrangements 7 - 2 - 9 8Other income from joint arrangements 10 - - - 10 4Sundry income 13 - 2 4 19 10Revenue from continuing operations 165 102 121 4 392 430Property development sales from joint ventures 27 7 - - 34 9Revenue including sales from joint ventures 192 108 121 4 425 440Segment result before interest and equity accounted results 25 10 92 - 126 133Sh f t fit f i t d j i t t (2) 4 2 4Share of net profits of associates and joint ventures (2) - 4 - 2 4Unallocated corporate costs - - - (9) (9) (13)Earnings before interest and tax 22 10 96 (9) 119 125Capitalised interest in cost of goods sold & other interest (47) (46)Interest income 1 3Interest income 1 3Operating profit before tax 73 81Income tax (expense)/credit on operating activities - -Net profit attributable to ASSETS hybrid equity holders (11) (12)Net operating profit after tax 62 68
Page Investor Presentation2012 Half Year Results Briefing26 June 2012
Page2013 Half Year Results Briefing Investor Presentation 24 July 2013 28
1. 1H12 revenue, EBIT and interest restated for AASB11
For
per
sona
l use
onl
y

Interest Appendices
reconciliation.Financial
1H13$m
1H12$m
Gross finance costs 54 59
Less: capitalised interest – developer (23) (24)
Less: capitalised interest – investment property (0) (7)
Add: unrealised (gain)/loss on interest rate derivatives (10) 12
Finance costs in profit and loss 22 40
Less: unrealised gain/(loss) on interest rate derivatives 10 (12)g ( ) (12)
Add: capitalised interest expensed via COGS1 15 18
Finance costs included in operating profit1 47 46
Interest income 1 3
Net interest expense in operating profit1 46 44
Page Investor Presentation2012 Half Year Results Briefing26 June 2012
Page2013 Half Year Results Briefing Investor Presentation 24 July 2013 29
1. 1H12 restated for AASB11
For
per
sona
l use
onl
y

Balance sheet Appendices
by segment.Financial
$m ResidentialCommercial& Industrial
Investment Property Corporate
Jun 13 Consolidated
Dec 12Consolidated1
AssetsCash and cash equivalents 16 4 8 82 110 92Receivables 174 20 16 2 213 215Inventories 846 358 - - 1,204 1,151Investment properties - - 2,337 - 2,337 2,286Investment properties held for sale - - 49 - 49 114Equity accounted investments - 9 110 - 119 126Equity accounted investments - 9 110 - 119 126Derivative financial instruments2 - - - 38 38 22Deferred tax assets - - - 30 30 30Other assets 2 - 5 37 44 47
Total assets 1,038 391 2,526 189 4,143 4,084Liabilities
Payments 62 8 29 6 106 123Interest bearing liabilities 762 285 420 - 1,466 1,393Land vendor liabilities 48 - - - 48 62Provisions 7 6 69 12 94 99Derivative financial instruments2 - - - 96 96 122
Total liabilities 880 299 518 114 1,810 1,800Net assets 158 93 2,008 75 2,333 2,284ASSETS hybrid equity 269 269 269Net assets (after hybrid) 2 064 2 015
Page Investor Presentation2012 Half Year Results Briefing26 June 2012
Page2013 Half Year Results Briefing Investor Presentation 24 July 2013 30
Net assets (after hybrid) 2,064 2,015
1. Dec 12 restated for AASB112. Derivative financial instruments allocated to Corporate. Segment note in Appendix 4D allocates derivatives to Investment Property.
For
per
sona
l use
onl
y

NTA and securities on Appendices
issue reconciliation.Financial
Net tangible assets $m $ per security
As at 1 January 2013 2,015 3.49
Gains from property revaluations 17 0.03
Unrealised gain/(losses) on interest rate derivatives 26 0.04
Retained operating earnings/other 6 0.01p g g 0.01
As at 30 June 2013 2,064 3.57
Securities on issue No. of securities
As at 1 January 2013 576,846,597
Issue of securities for employee incentive scheme 4 March 2013 1,478,073
As at 30 June 2013 578,324,670
Weighted average number of securities 577,810,203
Page Investor Presentation2012 Half Year Results Briefing26 June 2012
Page2013 Half Year Results Briefing Investor Presentation 24 July 2013 31
For
per
sona
l use
onl
y

Appendices Capital Financial
pmanagement.
Jun 13 Dec 12
Gearing1 33.0% 32.1%
Look-through gearing2 33.4% 33.5%
Weighted average debt maturity 2.7 yrs 3.2 yrs
Undrawn facilities plus cash $420m $436m
Weighted average cost of debt3 7 5% 7 7%Weighted average cost of debt3 7.5% 7.7%
% of debt fixed by hedges 78% 81%
Debt maturity profile
$100
$504m
$371m$350m $394m
$200m
Debt maturity profile
Undrawn$100m $134m
$29m
2H13 2014 2015 2016 2017 2018 2019 2020 2021 2022 2023
$100m$200m
Drawn
1 Interest bearing debt / total tangible assets (cash adjusted) based on the drawn amount of debt excluding fair value adjustments and associated derivative financial instruments Dec 12 restated for AASB11
Page Investor Presentation2012 Half Year Results Briefing26 June 2012
Page2013 Half Year Results Briefing Investor Presentation 24 July 2013 32
1. Interest bearing debt / total tangible assets (cash adjusted), based on the drawn amount of debt excluding fair value adjustments and associated derivative financial instruments. Dec 12 restated for AASB112. Interest bearing debt plus share of off-balance sheet interest bearing debt / total tangible assets plus share of off-balance sheet assets (cash adjusted) based on the drawn amount of debt excluding fair value
adjustments and associated derivative financial instruments. Dec 12 restated for AASB113. All in cost of debt excluding establishment fees and net of interest income
For
per
sona
l use
onl
y

Reported gearing.Appendices p g gFinancial
$mStatutory balance
sheet Jun 13 Adjustments1Adjusted balance
sheet Jun 13
Cash 110 - 110
Other assets 4,033 (38) 3,995
Total tangible assets 4,143 (38) 4,105
Interest bearing liabilities 1,466 (38) 1,428
Gearing2 33.0%g 33.0%
Page Investor Presentation2012 Half Year Results Briefing26 June 2012
Page2013 Half Year Results Briefing Investor Presentation 24 July 2013 33
1. The adjustments reflect the restatement of the USPP notes at the foreign currency hedge rate for the purposes of the gearing calculation2. Interest bearing debt / total tangible assets (cash adjusted), based on the drawn amount of debt excluding fair value adjustments and associated derivative financial instruments
For
per
sona
l use
onl
y

Appendices ALZ share of joint Financial
jventure balance sheet.
$m ResidentialCommercial & Industrial
Investment Property Corporate
Jun 13 Consolidated
Dec 12Consolidated1
Assets
Cash and cash equivalents 4 1 2 - 7 14Cash and cash equivalents 4 1 2 7 14
Receivables 2 1 - - 3 6
Inventories 65 13 - - 77 87
Investment properties - - 126 - 126 127
Investment properties held for sale2 - - 10 - 10 -
Other assets 33 - 1 - 34 26
Total assets 103 15 138 - 257 260
LiabilitiesPayables 55 1 2 - 58 43
Interest bearing liabilities 48 5 26 - 80 90
Land vendor liabilities - - - - - -
Provisions - - - - 1 1
Total liabilities 104 6 28 - 138 134
Equity accounted investments (0) 9 110 - 119 126
Page Investor Presentation2012 Half Year Results Briefing26 June 2012
Page2013 Half Year Results Briefing Investor Presentation 24 July 2013 34
1. Dec 12 restated for AASB112. Healesville shopping centre (VIC) held for sale
For
per
sona
l use
onl
y

Liquidity and Appendices q ydebt facilities.Financial
Facility limit $m
Drawn amount $m Maturity date Security
Tranche A - syndicated 100 100 Sep 2013 Unsecured
Tranche B - syndicated 350 350 Jul 2014 Unsecured
Tranche 2015 - syndicated 304 304 Jan 2015 Unsecured
Tranche C - syndicated 200 90 Sep 2015 Unsecured
Tranche 2016 - syndicated 371 371 Sep 2016 Unsecured
Tranche D - syndicated 200 - May 2017 Unsecured
US private placement1 134 134 May 2021 Unsecured
US private placement1 29 29 May 2023 Unsecured
Total 1,688 1,378
Available facilities 310
Cash 110
Available liquidity 420
Page Investor Presentation2012 Half Year Results Briefing26 June 2012
Page2013 Half Year Results Briefing Investor Presentation 24 July 2013 35
1. US private placement at initial issuance amount (excludes fair value adjustments)
For
per
sona
l use
onl
y

Debt covenants. AppendicesFinancial
Measure Covenant 1H13
Interest cover ratio (cash basis) >2.0x 2.5xEBIT / cash interest paid
Investment Property interest cover ratio >1.3x 1.8xNet operating income of IP / cash interest paid
Covenant gearing (look-through) <55% 43.8%Total liabilities plus share of off-balance sheet liabilities / total tangibleassets plus share of off-balance sheet assets (cash adjusted)
Covenant gearing (contingent liabilities) <55% 45 7%Covenant gearing (contingent liabilities) <55% 45.7%Total liabilities plus contingent liabilities / total tangible assets (cash adjusted)
Priority debt <7.5% 0.1%Secured debt / total tangible assetsSecured debt / total tangible assets
Tangible net worth >$1.7bn $2.3bnTotal tangible assets less total liabilities
Page Investor Presentation2012 Half Year Results Briefing26 June 2012
Page2013 Half Year Results Briefing Investor Presentation 24 July 2013 36
For
per
sona
l use
onl
y

Interest rate Appendices
hedging profile.Financial
5.50%$1,200m
4 50%
5.00%
$800m
$1,000m
4.00%
4.50%
$400m
$600m
3.50%
$
$200m
3.00%$0m2013 2014 2015 2016 2017 2018 2019 2020
Hedge position (LHS)
Hedge rate at Dec 2012 (RHS)
Page Investor Presentation2012 Half Year Results Briefing26 June 2012
Page2013 Half Year Results Briefing Investor Presentation 24 July 2013 37
g ( )
Hedge rate at Jun 2013 (RHS)
For
per
sona
l use
onl
y
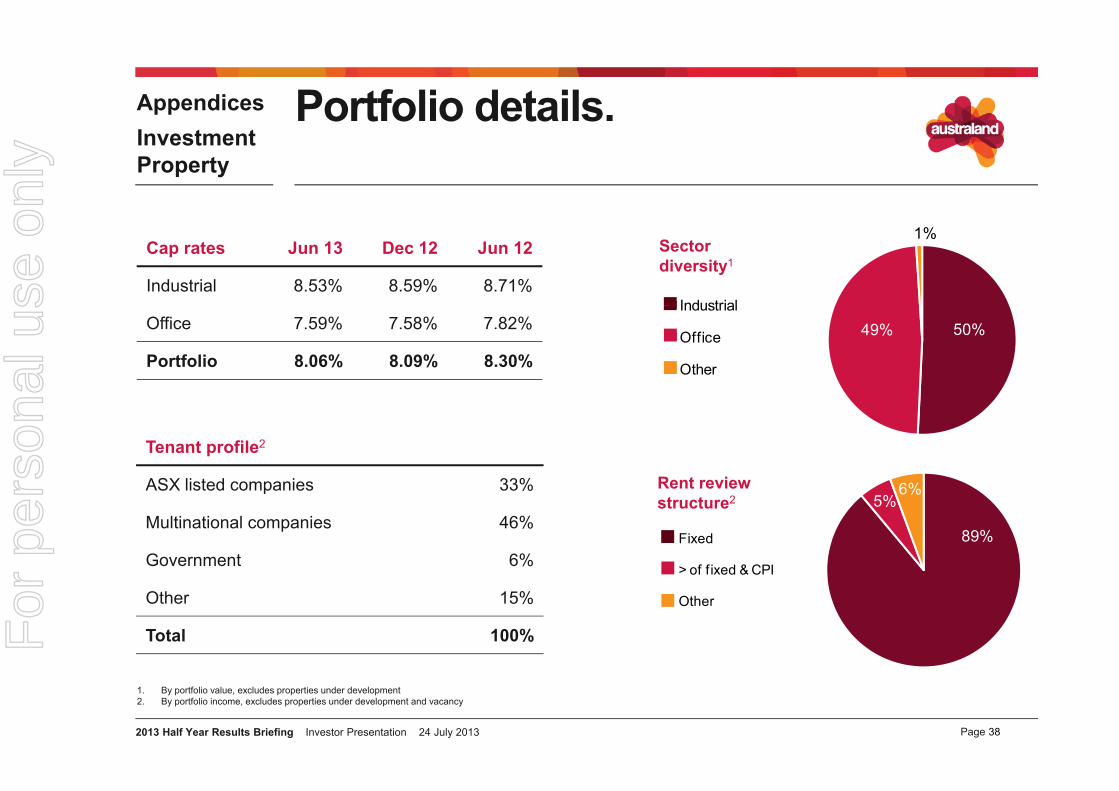
Portfolio details.AppendicesInvestment Property
Cap rates Jun 13 Dec 12 Jun 12
Industrial 8.53% 8.59% 8.71%Industrial
Sector diversity1
1%
Office 7.59% 7.58% 7.82%
Portfolio 8.06% 8.09% 8.30%
Industrial
Office
Other
50%49%
Tenant profile2
ASX listed companies 33% Rent review 6%
Fixed
> of fixed & CPI
ASX listed companies 33%
Multinational companies 46%
Government 6%
Rent review structure2
89%
5%6%
OtherOther 15%
Total 100%
Page Investor Presentation2012 Half Year Results Briefing26 June 2012
Page2013 Half Year Results Briefing Investor Presentation 24 July 2013
1. By portfolio value, excludes properties under development2. By portfolio income, excludes properties under development and vacancy
38
For
per
sona
l use
onl
y

Portfolio Appendices
OffiI d t i l
diversification.Investment Property
1%5%
VICVIC
Office geographic diversity
Industrial geographic diversity
55%44%34%28%
NSW
QLD
QLD
NSW
WA & SA33%
Industrial - Key metrics Jun 13
Portfolio value $1.16bn
N b f t 51
Office - Key metrics Jun 13
Portfolio value $1.15bn
N b f t 14Number of assets 51
GLA 926,914 sqm
Occupancy (by income) 98.6%
C bl t l th 2 9%
Number of assets 14
NLA 268,314 sqm
Occupancy (by income) 91.6%
C bl t l th 3 4%Comparable rental growth 2.9%
Cap rate 8.53%
WALE (by income) 6.1 years
Portfolio age 7 2 years
Comparable rental growth 3.4%
Cap rate 7.59%
WALE (by income) 4.7 years
P tf li 7 2
Page Investor Presentation2012 Half Year Results Briefing26 June 2012
Page2013 Half Year Results Briefing Investor Presentation 24 July 2013
Portfolio age 7.2 years Portfolio age 7.2 years
39
Note: Metrics exclude properties under development, except for portfolio value and number of assets
For
per
sona
l use
onl
y

Lease expiry profile Appendices p y p& rent review structure.Investment
Property
Industrial lease expiry1 Office lease expiry157%
41%
1% 1%
12% 15%7% 7% 8%
2%11%
7% 10%
21%
I d t i l Offi4%
Vacancy 2H13 FY14 FY15 FY16 FY17 FY18+ Vacancy 2H13 FY14 FY15 FY16 FY17 FY18+
Other
FixedFixed
> of fixed & CPI
Industrial rent reviews2
Office rent reviews2
86%
10%94%
6%
Other> of fixed & CPI
Other
Page Investor Presentation2012 Half Year Results Briefing26 June 2012
Page2013 Half Year Results Briefing Investor Presentation 24 July 2013 40
1. By portfolio income, excludes properties under development2. By portfolio income, excludes properties under development and vacancy
For
per
sona
l use
onl
y

Top 10 tenants Appendices pby income.Investment
Property
Portfolio Industrial Office
Wesfarmers - Coles & Kmart (11%) Wesfarmers - Coles & Kmart (16%) C’wealth Govt of Australia (9%)
Nestle Australia (4%) LG Electronics Australia (4%) Nestle Australia (9%)
C’wealth Govt of Australia (4%) H.J. Heinz Co. Australia (4%) PwC (7%)
PwC (3%) Toll Holdings (3%) CBA (6%)
CBA (3%) Schweppes Australia (3%) Wesfarmers - Coles (6%)
Qantas Airways (3%) DHL Global Forwarding (3%) Qantas Airways (5%)y ( ) g ( ) y ( )
LG Electronics Australia (2%) Inchcape Motors Australia (3%) TNT Australia (4%)
TNT Australia (2%) Retail Adventures (3%) State Govt of NSW (4%)
Toll Holdings (2%) Costco (3%) National Australia Bank (3%)
H.J. Heinz Co. Australia (2%) BJ Ball (2%) Service Stream (3%)
Page Investor Presentation2012 Half Year Results Briefing26 June 2012
Page2013 Half Year Results Briefing Investor Presentation 24 July 2013 41
Note: By portfolio income, excludes properties under development
For
per
sona
l use
onl
y

Equity accounted Appendices q yinvestments.Investment
Property
Australand Wholesale Property Fund No. 6 (ALZ 27.9% interest) State Type
Area(sqm) Major tenants
1A Homebush Bay Drive, Rhodes NSW Office 14,639 Link Market Services 1C Homebush Bay Drive, Rhodes NSW Office 10,647 Australand, National Australia Bank 5 Butler Boulevard, Adelaide Airport SA Industrial 12,257 Tyco Industries, Bayer Material Services 80-96 South Park Drive, Dandenong South VIC Industrial 20,245 Shiro Australia and Ausmart International 34 Australis Drive, Derrimut VIC Industrial 25,243 Mitre 1089 West Park Drive, Derrimut VIC Industrial 17,024 Dempsey Group32-40 Garden Street, Kilsyth VIC Industrial 10,647 Radio Frequency Systems140 Sharps Road Tullamarine VIC Industrial 10 508 Star Track Express140 Sharps Road, Tullamarine VIC Industrial 10,508 Star Track Express
Australand Logistics Joint Venture1
(ALZ 19.9% interest) State TypeArea
(sqm) Value($m) Cap rate Major tenants
Eucalyptus Place, Eastern Creek NSW Industrial 21,694 29.7 8.25% QLS & CEVALot 122, Wonderland Drive, Eastern Creek NSW Industrial 51,709 76.6 7.75% KMart1 & 7 -15 Kellet Close, Erskine Park NSW Industrial 23,267 31.8 8.25% Strandbags & Diageog gLot 14 Powers Road, Seven Hills NSW Industrial 13,555 18.3 8.50% Sigma62 Sandstone Place, Parkinson QLD Industrial 9,260 16.1 8.00% Salmat92 Sandstone Place, Parkinson QLD Industrial 13,738 20.9 8.00% Kimberly Clark81 - 89 Drake Boulevard, Altona VIC Industrial 14,099 13.7 8.13% Schenker2-34 Aylesbury Drive, Altona VIC Industrial 17,513 15.2 8.50% Toll Altona35 61 S th P k D i D d S th VIC I d t i l 32 167 29 2 8 25% P i li35-61 South Park Drive, Dandenong South VIC Industrial 32,167 29.2 8.25% Priceline162 Australis Drive, Derrimut VIC Industrial 23,252 20.5 8.50% Queensland CottonTotal 272.0
Australand Retail Trust(ALZ 50% interest) State Type
Area(sqm)
Value($m) Cap rate Major tenants
Berwick Southside Shopping Centre Berwick VIC Retail 3 081 7 9 8 50% IGA
Page Investor Presentation2012 Half Year Results Briefing26 June 2012
Page2013 Half Year Results Briefing Investor Presentation 24 July 2013 42
Berwick Southside Shopping Centre, Berwick VIC Retail 3,081 7.9 8.50% IGATotal 7.9
1. Excludes properties under development
For
per
sona
l use
onl
y

1H13 disposals.Appendices pInvestment Property
Property State TypeArea
(sqm)Sale price
($m) Major tenantsSettlement
date
111 Darlinghurst Road, Kings Cross NSW Other 13,811 65.0 Hotel (Accor Management) Jun 13
C f C J 139 Amcor Way, Campbellfield VIC Industrial 9,530 6.9 Amcor Jun 13
Sovereign Apartments, 138 Ferny Ave QLD Other N/A 0.1 N/A Jan & Jun 13
Total 72.0
Page Investor Presentation2012 Half Year Results Briefing26 June 2012
Page2013 Half Year Results Briefing Investor Presentation 24 July 2013 43
For
per
sona
l use
onl
y

Pipeline positioning.Appendices p p gCommercial & Industrial
Pipeline positioning($2.0bn estimated end value)
Industrial landbankpositioning (260ha)
62%38% West27%
6%51%16%
8%
East/South East
24%25%
Industrial VIC
QLDOffice QLD
NSW
SA
Page Investor Presentation2012 Half Year Results Briefing26 June 2012
Page2013 Half Year Results Briefing Investor Presentation 24 July 2013
Note: Includes 100% of joint arrangements
44
For
per
sona
l use
onl
y

Forward workload.AppendicesCommercial & Industrial
Type Ownership State
Estimated end value
($m) % to goArea
(sqm)
Forward workload
(sqm)
Estimated revenue
finish% leased(by area)
% sold(by area) % built
Kangaroo Drive, Eastern Creek Internal 100% NSW 22 65% 15,750 10,230 2H13 0% 100% 35%
Sub total - Internal development
Office Max, Eastern Creek (GIC)1 Third party 100% NSW 26 100% 19,300 19,300 2H13 100% 100% 0%
Kangaroo Drive, Eastern Creek2 Owner occupier 100% NSW 25 100% 20,500 20,500 1H14 100% 100% 0%
CH2, Eastern Creek (GIC)1 Third party 50% NSW 16 40% 8,150 3,255 2H13 100% 100% 60%
Ce a Berrinba (GIC)1 Third part 100% QLD 60 15% 41 000 6 150 2H13 100% 100% 85%Ceva, Berrinba (GIC)1 Third party 100% QLD 60 15% 41,000 6,150 2H13 100% 100% 85%
Siltstone Place, Berrinba Third party 100% QLD 13 100% 9,450 9,450 2H13 0% 0% 0%
Fastline, Westpark Third party 100% VIC 42 24% 46,850 11,250 2H13 47% 100% 76%
Kimpton Way, Altona Third party 100% VIC 24 100% 25,700 25,700 2H13 0% 0% 0%
Rinnai, Keysborough Owner occupier 100% VIC 20 65% 14,800 9,600 2H13 100% 100% 35%y g p
Southern Count, Keysborough Third party 100% VIC 18 100% 17,850 17,850 2H13 0% 0% 0%
Symbion, Keysborough Third party 100% VIC 17 100% 12,800 12,800 2H13 100% 0% 0%
Sub total - For external sale 261 216,400 135,855 60% 72%
Total 283 232,150 146,085Total 283 232,150 146,085
Page Investor Presentation2012 Half Year Results Briefing26 June 2012
Page2013 Half Year Results Briefing Investor Presentation 24 July 2013 45
1. Proposed for the Australand Logistics Joint Venture with GIC – ALZ interest 19.9%2. % leased under Heads of Agreement
For
per
sona
l use
onl
y

Pipeline overview.Appendices pCommercial & Industrial
Landbank OwnershipIndustrial pre-lease
Industrialland & build
Industrialspeculative
Industrialland sales Commercial
NSW Botany 100%Eastern Creek 100% & 50%Macquarie Park 50%Winston Hills 100%
QLD Berrinba 100%Northgate 100%Parkinson 50%Pinkenba 100% & 50%Richlands 100%Yatala 50%
VIC Altona 100%Dandenong 100%gFreshwater (Stage 3) 100%Keysborough 100%Laverton 100%Mulgrave 50%Rowville 100%West Park 100%
SA Beverley 100%Burbridge Business Park PDAGillman 50%
Page Investor Presentation2012 Half Year Results Briefing26 June 2012
Page2013 Half Year Results Briefing Investor Presentation 24 July 2013 46
For
per
sona
l use
onl
y

Pipeline positioning.Appendices p p gResidential
Pipeline by product type
Pipeline by geography
Pipeline by price point
1%
58%10%
10%
67%24%
9%
71%28%
1%
22%
24%
VIC
NSW
Affordable
Housing &
Land
NSW
WA
QLD
Medium range
Premium rangeHigh density
Housing & medium density
Page Investor Presentation2012 Half Year Results Briefing26 June 2012
Page2013 Half Year Results Briefing Investor Presentation 24 July 2013 47
Note: By number of lots, includes 100% of joint arrangements and PDAs
For
per
sona
l use
onl
y

Pipeline breakdown.Appendices pResidential
Land Housing & medium density High density
Projects 19 Projects 15 Projects 5
Lots 12,624 Lots 4,622 Lots 1,672
End value $3.8bn End value $2.7bn End value $1.1bn
1 1 1Average age1 7.1 yrs Average age1 5.4 yrs Average age1 10.8 yrs
Development life1 14.9 yrs Development life1 5.2 yrs Development life1 3.9 yrs
Elderslie NSW Carlton VIC Kangaroo Point QLD
Page Investor Presentation2012 Half Year Results Briefing26 June 2012
Page2013 Half Year Results Briefing Investor Presentation 24 July 2013
Elderslie, NSW Carlton, VIC Kangaroo Point, QLD
48
Note: Includes 100% of joint arrangements and PDAs1. Weighted average by lots remaining
For
per
sona
l use
onl
y

Pipeline detail.Appendices pMajor wholly owned projectsResidential
5,588 lots with an estimated on-completion value of $3.1bn
Project Type1Acquisition
dateTotal
lots Lots sold
Lots (to go)
End value to go ($m)
Contracts on hand Ownership
Revenue start
Estimated revenue
finish NSW Ashlar H/MD 2011 750 - 750 454 - 100% 2015 2019
Elderslie Land 2006 143 92 51 12 51 100% 2008 2013Greenhills Beach Land 1965 236 173 63 54 7 100% 2012 2014Lidcombe H/MD 2002 229 132 97 53 4 100% 2007 2015Wolli Creek2 HD 2002 707 707 402 100% 2014 2018Wolli Creek2 HD 2002 707 - 707 402 - 100% 2014 2018
QLD Hamilton H/MD 2010 652 12 640 522 135 100% 2012 2022Hope Island Land and H/MD 2003 516 59 457 221 5 100% 2010 2021Ivadale Lakes Land 2003 652 498 154 39 10 100% 2003 2017Kangaroo Point HD 2003 170 55 115 101 20 100% 2012 2017gPark Ridge Land 2008 319 - 319 69 - 100% 2014 2019Springfield Land 2008 279 139 140 35 13 100% 2010 2016
VIC Burwood H/MD 2008 241 200 41 21 41 100% 2011 2013Carlton H/MD 2009 675 185 490 295 176 65% 2011 2018Cranbourne West Land 2007 687 380 307 63 18 100% 2010 2015Greenvale Land 2007 659 197 462 126 36 100% 2011 2017
WA Cockburn Central H/MD 2006 795 272 523 277 61 100% 2008 2019Port Coogee Land 2005 378 130 248 324 15 100% 2007 2021
Page Investor Presentation2012 Half Year Results Briefing26 June 2012
Page2013 Half Year Results Briefing Investor Presentation 24 July 2013 49
1. H/MD – Housing / medium density, HD – High density2. Project was restructured in 2011
For
per
sona
l use
onl
y

Pipeline detail.Appendices pMajor joint arrangements and PDAs1Residential
13,330 lots with an estimated on-completion value of $4.5bn
Project Type2Acquisition
dateTotal
lots Lots sold
Lots (to go)
End value to go ($m)
Contracts on hand Ownership
Revenue start
Estimated revenue
finish NSW Clemton Park H/MD 2011 721 75 646 389 212 50% (JO) 2013 2017
Lidcombe H/MD 2006 461 383 78 54 78 50% (JO) 2007 2013Shell Cove Land 1993 2,512 1,662 850 401 29 50% (PDA) 1997 2025The Ponds Land and H/MD 2003 1,323 1,245 78 44 77 20% (PDA) 2007 2014Wolli Creek3 HD 2002 788 788 560 447 50% (JO) 2014 2016Wolli Creek3 HD 2002 788 - 788 560 447 50% (JO) 2014 2016
VIC Beveridge Land 2008 3,800 - 3,800 940 - 50% (PDA) 2016 2041Clyde North Land 2007 2,588 195 2,393 723 21 50% (JO & PDA) 2011 2028Croydon Land 2004 572 345 227 80 23 50% (JV) 2009 2015Parkville H/MD 2002 858 326 532 273 138 50% (JO) 2006 2019( )Point Cook Land 2001 601 - 601 212 - 50% (JV) 2015 2019Sunbury Land 2012 391 - 391 93 - 100% (PDA) 2015 2018Sunshine H/MD 2005 658 450 208 84 51 50% (JO) 2009 2015Wallan Land 2007 1,697 382 1,315 232 4 50% (JO) 2009 2023Westmeadows H/MD 2010 221 - 221 91 - 50% (PDA) 2014 2018
WA Baldivis Land 2008 837 - 837 181 - 50% (JO) 2014 2020Byford Land 2006 400 204 196 37 64 50% (JV) 2010 2015Port Coogee Land 2005 414 317 97 113 3 50% (JO) 2006 2015
Page Investor Presentation2012 Half Year Results Briefing26 June 2012
Page2013 Half Year Results Briefing Investor Presentation 24 July 2013 50
1. Includes 100% of joint arrangements (Joint operation-JO and Joint venture-JV) and PDAs2. H/MD – Housing / medium density, HD – High density3. Project was restructured in 2011
For
per
sona
l use
onl
y

Pipeline overview.Appendices pLots under management1Residential
Lots remaining End value ($m)
Housing & medium High
Housing& medium High
No. projects Land density density Total Land density density Total
NSW 11 964 1,667 1,495 4,126 466 1,011 961 2,438
VIC 14 9,502 1,492 - 10,994 2,471 766 - 3,237
QLD 7 773 937 132 1,842 200 686 117 1,003
WA 7 1385 526 45 1,956 656 278 24 958
Total 39 12,624 4,622 1,672 18,918 3,793 2,741 1,102 7,636ota 39 ,6 ,6 ,6 18,918 3, 93 , , 0 7,636
Wholly owned 19 1,910 2,856 822 5,588 780 1,805 503 3,088
JO 10 2,159 1,467 788 4,414 414 801 560 1,775
JV / PDAs 10 8,555 299 62 8,916 2,599 135 39 2,773
Total 39 12,624 4,622 1,672 18,918 3,793 2,741 1,102 7,636
Page Investor Presentation2012 Half Year Results Briefing26 June 2012
Page2013 Half Year Results Briefing Investor Presentation 24 July 2013 51
1. Includes 100% of joint arrangements and PDAs
For
per
sona
l use
onl
y

Pipeline overview.Appendices pALZ share1Residential
Lots remaining End value ($m)
Housing & medium High
Housing& medium High
No. projects Land density density Total Land density density Total
NSW 11 539 1,243 1,101 2,883 266 754 681 1,701
VIC 14 5,228 840 0 6,068 1,345 438 0 1,783
QLD 7 773 937 124 1,834 200 686 109 995
WA 7 817 524 22 1,363 490 278 12 780
Total 39 7,357 3,544 1,247 12,148 2,301 2,156 802 5,259ota 39 ,35 3,5 , 12,148 ,30 , 56 80 5,259
Wholly owned 19 1,910 2,685 822 5,417 780 1,701 503 2,984
JO 10 1,080 733 394 2,207 207 401 280 888
JV / PDAs 10 4,367 126 31 4,524 1,314 54 19 1,387
Total 39 7,357 3,544 1,247 12,148 2,301 2,156 802 5,259
Page Investor Presentation2012 Half Year Results Briefing26 June 2012
Page2013 Half Year Results Briefing Investor Presentation 24 July 2013
1. Includes ALZ share of joint arrangements and PDAs
52
For
per
sona
l use
onl
y

Appendices Pipeline emergence.Residential
p gMajor built form projects
Project Stage State 2H13 2014 2015Hamilton Watermarque QLD 78 lots (85% pre-sold)
Built form projects underpin earnings momentum in the medium term
qClemton Park Air NSW 78 lots (100% pre-sold)
Burwood 333 Burwood VIC 32 lots (100% pre-sold)
Carlton Local Carlton VIC 120 lots (98% pre-sold)
Parkville Hyde VIC 58 lots (100% pre-sold)
Cockburn Central Kingston (Stage 2) WA 44 lots (95% pre sold)Cockburn Central Kingston (Stage 2) WA 44 lots (95% pre-sold)
Hamilton Watermarque on the Park QLD 68 lots (72% pre-sold)
Wolli Creek Linc NSW 126 lots (99% pre-sold)
Wolli Creek Arc NSW 88 lots (100% pre-sold)
Wolli Creek Watervue NSW 74 lots (91% pre-sold)
Clemton Park Lime NSW 70 lots (89% pre-sold)
Carlton Zest Carlton VIC 105 lots (56% pre-sold)
Parkville The Green VIC 57 lots (100% pre-sold)
East Perth Bronte WA 48 lots (92% pre-sold)
Cockburn Central Kingston (Stage 3) WA 39 lots (49% pre-sold)g ( g )Kangaroo Point Linc QLD 45 lots (27% pre-sold)
Wolli Creek Summit NSW 200 lots (84% pre-sold)
Clemton Park Mint NSW 90 lots (13% pre-sold)
Clemton Park Olive NSW 64 lots (91% pre-sold)
Parkville Jardin VIC 68 Lots (34% pre-sold)
Page Investor Presentation2012 Half Year Results Briefing26 June 2012
Page2013 Half Year Results Briefing Investor Presentation 24 July 2013
Note: Includes 100% of joint arrangements and PDAs
53
Parkville Jardin VIC 68 Lots (34% pre-sold)
For
per
sona
l use
onl
y

1H13 lots sold.Appendices
ALZ share1Residential
VIC
Lot sales by geography
Land 1H13
Lots sold 279
R $119 32%
14%
VIC
NSW
WA
Revenue $119m
Average sale price2 $469k
Housing & medium density 1H13
32%
27%
27%
QLDHousing & medium density 1H13
Lots sold 116
Revenue $64m2 $
27%
4%
Land
Lot sales by segment
Average sale price2 $547k
High density 1H13
Lots sold 14 68%28%
4%
High density
Housing & medium density
LandLots sold 14
Revenue $9m
Average sale price $643k
68%8%
Page Investor Presentation2012 Half Year Results Briefing26 June 2012
Page2013 Half Year Results Briefing Investor Presentation 24 July 2013 54
1. Includes ALZ share of joint arrangements and PDAs2. Average sale price adjusted to exclude lots and revenue sold under PDA structures as sales from PDAs are not included in reported revenue
For
per
sona
l use
onl
y

1H13 lots sold by state.Appendices
L t ld NSW VIC WA QLD T t l
yALZ share1Residential
Lots sold NSW VIC WA QLD Total
Land 53 117 59 50 279
Housing & medium density 56 7 53 - 116
High density - 8 - 6 14
Total 109 132 112 56 409
Wholly owned 41 68 61 56 226
JO 44 41 21 - 106
JV / PDA 24 23 30 77JV / PDAs 24 23 30 - 77
Total 109 132 112 56 409
Revenue ($m) NSW VIC WA QLD Total
L d2 30 25 53 11 119Land2 30 25 53 11 119
Housing & medium density2 30 11 23 - 64
High density - 2 - 7 9
Total 60 38 76 18 192
Wholly owned 30 20 26 18 94
JO 24 12 24 - 60
JV / PDAs 6 6 26 - 38
Total 60 38 76 18 192
Page Investor Presentation2012 Half Year Results Briefing26 June 2012
Page2013 Half Year Results Briefing Investor Presentation 24 July 2013 55
Total 60 38 76 18 1921. Includes ALZ share of joint arrangements and PDAs2. Excludes revenue from projects under PDA structures
For
per
sona
l use
onl
y

Disclaimer.HY13ResultsResults Briefing
Australand Holdings Limited (ABN 12 008 443 696)Australand Property Limited (ABN 90 105 462 137; AFSLN 231 130) as the responsible entity of Australand Property Trust (ARSN 106 680 424) and Australand ASSETS Trust (ARSN 115 338 513)Trust (ARSN 106 680 424) and Australand ASSETS Trust (ARSN 115 338 513) Australand Investments Limited (ABN 12 086 673 092; AFSLN 228 837) as the responsible entity of Australand Property Trust No.4 (ARSN 108 254 413) and Australand Property Trust No.5 (ARSN 108 254 771)
Level 3, 1C Homebush Bay DriveRhodes NSW 2138Rhodes NSW 2138Ph: +61 2 9767 2000Fax: +61 2 9767 2900
Disclaimer of liabilityWhile every effort is made to provide accurate and complete information, Australand does not warrant or represent that the information in this presentation is free from errors or omissions or is suitable for the recipients’ intended use. Subject to any terms implied by law and which cannot be excluded, Australand accepts no responsibility for any loss, damage, cost or expense (whether direct or indirect) incurred by any recipient as a result of any error, omission or misrepresentation in information in this presentation. All information in this presentation is subject to change without notice.
Page Investor Presentation2012 Half Year Results Briefing26 June 2012
Page2013 Half Year Results Briefing Investor Presentation 24 July 2013 56
Note: All numbers subject to rounding
For
per
sona
l use
onl
y