for personal use only - .net framework
TRANSCRIPT

2011 AnnuAl RepoRt
For
per
sona
l use
onl
y
2011 highlights
FY08175.3
FY0861.8
FY1059.0
FY106.7
FY11(296.5)
FY11(30.9)
FY09(237.4)
FY09(77.9)
200–
150–
100–
50–
0–
-50–
-100–
-150–
-200–
-250–
-300–
100–
80–
60–
40–
20–
-0–
-20–
-40–
-60–
-80–
-100–
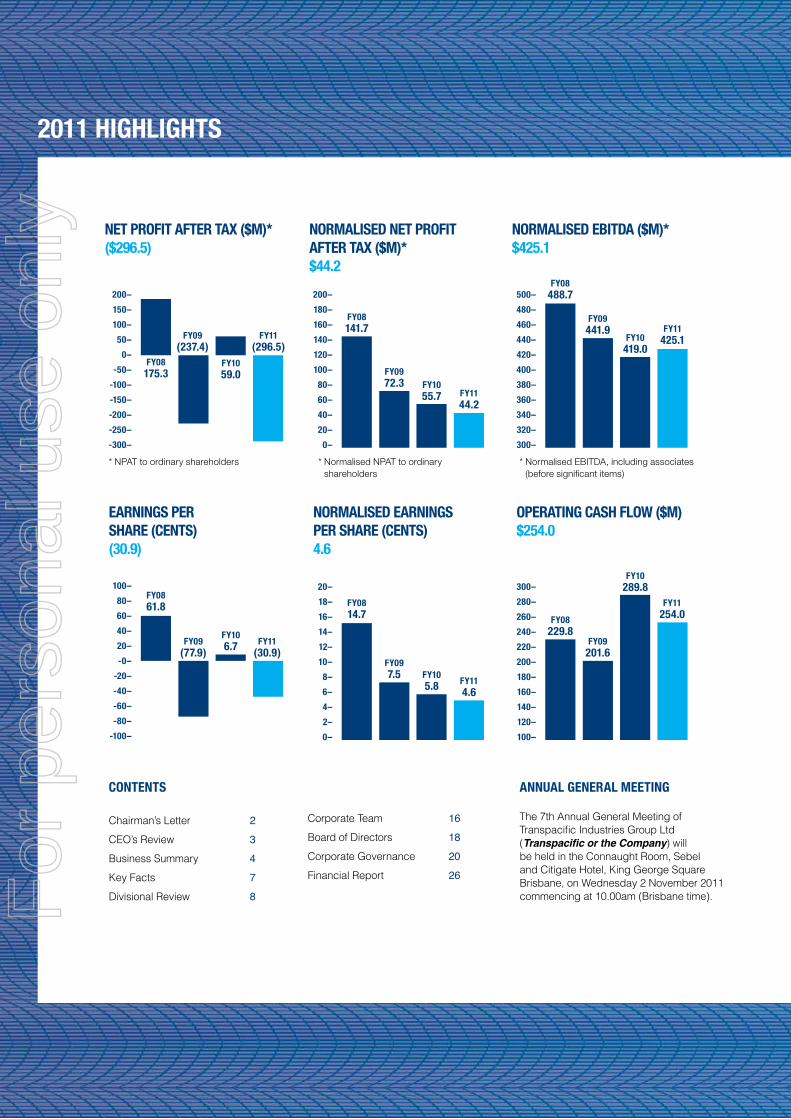
net pRoFit AFteR tAx ($m)* ($296.5)
eARnings peR shARe (cents) (30.9)
noRmAlised net pRoFit AFteR tAx ($m)* $44.2
noRmAlised eARnings peR shARe (cents) 4.6
contents
Chairman’s Letter 2CEO’s Review 3Business Summary 4Key Facts 7Divisional Review 8
Corporate Team 16Board of Directors 18Corporate Governance 20Financial Report 26
AnnuAl geneRAl meeting
The 7th Annual General Meeting of Transpacific Industries Group Ltd (Transpacific or the Company) will be held in the Connaught Room, Sebel and Citigate Hotel, King George Square Brisbane, on Wednesday 2 November 2011 commencing at 10.00am (Brisbane time).
noRmAlised eBitdA ($m)* $425.1
opeRAting cAsh Flow ($m) $254.0
FY08141.7
FY1055.7 FY11
44.2
FY0972.3
200–
180–
160–
140–
120–
100–
80–
60–
40–
20–
0–
FY08488.7
FY10419.0
FY11425.1
FY09441.9
500–
480–
460–
440–
420–
400–
380–
360–
340–
320–
300–
FY0814.7
FY105.8 FY11
4.6
FY097.5
20–
18–
16–
14–
12–
10–
8–
6–
4–
2–
0–
FY08229.8
FY10289.8
FY11254.0
FY09201.6
300–
280–
260–
240–
220–
200–
180–
160–
140–
120–
100–
* NPAT to ordinary shareholders * Normalised NPAT to ordinary shareholders
* Normalised EBITDA, including associates (before significant items)
For
per
sona
l use
onl
y

transpacific is Australia and new Zealand’s leading recycling, waste management and industrial services company.
our philosophy is that all waste is a resource and we aim to incorporate recovery, recycling and reuse throughout our operations and those of our clients.
tRAnspAciFic AnnuAl RepoRt 2011 1
Kabongo Mabandiro arrived in Adelaide in 2005 after living for three years as a refugee in Malawi. In 2011 he joined Transpacific and now works at our Largs North site.
For
per
sona
l use
onl
y

chAiRmAn’s letteR
2 tRAnspAciFic AnnuAl RepoRt 2011
Dear Shareholders,
Transpacific’s year to 30 June 2011 was one of significant challenges and change.
Group revenues increased by 5% to $2,179 million. While trading results were in line with last year, solid growth in the total waste management businesses was offset by the impact of a decline in the heavy duty truck market and a disappointing loss in the manufacturing division.
Impairment write-downs of $347 million led to an overall net loss after tax to ordinary shareholders of $296.5 million for the year. These write-downs related largely to the New Zealand business, due to weakening economic trends; the potential future sales value of Victorian landfill sites; and the manufacturing business.
A firm focus on cash generation enabled us to repay $125 million of debt.
Economic conditions were mixed, with firm demand from minerals sectors but a continuing decline from manufacturing.
The fundamentals of our total waste management businesses remain sound. The Cleanaway business won new work and successfully retained existing contracts.
Transpacific’s Industrials business consolidated its position in the industrial, mining, and oil and gas sectors for both recurrent contract and emergency response services, and maintained steady market share.
In 2011 there were several natural disasters and I would like to pay tribute to the efforts of our teams in the recoveries after the Christchurch earthquake and Queensland floods.
During the year we developed – and began delivering on – Transpacific’s new strategic direction. Our new Chief Executive Officer, Kevin Campbell, in his new role and Chief Financial Officer, Stewart Cummins, are leading the implementation.
Our divisional management structure has been streamlined and a refinancing program is planned. A turnaround plan for the underperforming manufacturing business is also well advanced. Our strategies are aimed at generating shareholder returns in a sustainable manner.
Transpacific is committed to continuously improving safety. I would like to acknowledge our Industrials site in Dandenong, Victoria, which has completed 2000 days lost time injury-free, contributing to a decrease in our lost time injury frequency rate. Our continuing programs aim to minimise workplace risk and facilitate the safety of our employees, customers and the community.
We maintain a strong environmental focus. Transpacific’s guiding philosophy that all waste is a resource has helped a
number of clients incorporate recovery, recycling and reuse strategies throughout their operations. The constant tightening of environmental standards that our customers must adhere to provides significant opportunities for us.
We are increasingly engaging with our communities through programs to minimise the impact of our operations, including community information and education about our landfill operations and how we manage waste.
I would like to acknowledge the efforts of two long-serving board members, Graham Mulligan and Bruce Allan, who left the board during the year.
We welcome to the board Ray Smith, who joined in April; and Emma Stein, in August 2011. The board now brings a broad range of experience to your company’s strategic directions and governance. I thank my colleagues for their efforts over a demanding year.
I thank also our previous Chief Executive Officer, Trevor Coonan, for his contribution over his six years with Transpacific.
Overall, we are cautiously optimistic about the economy and Transpacific’s positive market position in the total waste management business.
On behalf of the Board, I would like to thank Transpacific’s senior management team for their focus and drive to deliver business improvement, and all of our employees who are working hard to ensure results are achieved for our customers.
And finally, thanks to you, our shareholders, for your ongoing support of Transpacific.
I look forward to updating you on our progress.
gene tilBRooK Chairman
For
per
sona
l use
onl
y

ceo’s ReView
tRAnspAciFic AnnuAl RepoRt 2011 3
The highlight of Transpacific’s trading results for 2011 was the continued positive performance of our total waste management businesses, Cleanaway and Industrials in Australia, and Transpacific Waste Management and Industrials in New Zealand.
Overall, Transpacific’s EBITDA before one-off impairment write-downs was $425.1 million, up 0.2% on the prior year. Cleanaway’s EBITDA rose by 7.5% and Industrials Australia’s by 10.4% on the prior year. Transpacific’s New Zealand division increased EBITDA by a healthy 10.9% on a constant currency basis.
The Commercial Vehicles division’s EBITDA fell 28% due to a weak first half for sales, although heavy-duty truck market conditions improved in the second half.
The Manufacturing division made a loss of $8.4 million, and we have introduced a major turnaround plan to rationalise products, overhaul product costing and pricing models, explore location efficiencies, improve quality control and streamline management and overheads.
During the year we secured many new contract wins, assisted those in areas impacted by weather-related and other natural disasters, and improved our services to customers.
We have implemented a number of new systems to streamline our business. These included:
• The initial phase of an ERP system rollout, to be completed in 2013
• Establishing a single customer relationship management system to manage key accounts in the solid waste and industrials businesses
• A new payroll system in Australia
• A new incident management system to help support a ‘safety first’ culture.
The safety, health and wellbeing of our people and customers is an overriding imperative. As such, the implementation of ‘The Vault’ management system is an important step to ensure that safety issues across Transpacific can be reported and escalated in a systematic way.
We believe that all major incidents, occupational injuries and illnesses are preventable and we are fully committed to achieving our goal of “zero harm” and continually improving our occupational health and safety standards.
Our staff make important health and safety decisions every day, and we are pleased that major clients have recently acknowledged the work of several of our employees.
Transpacific’s Ken Underhill became the first contractor ever to be awarded a prestigious ‘Bravo!’ safety award from the Rio Tinto Alcan project in Gove, Northern Territory, and Velko Tavra and Geoff Marks were both presented with safety awards from OneSteel. These are wonderful achievements which recognise the importance our staff place on being safe.
2011 will be remembered for the natural disasters in Queensland, Victoria and New Zealand. These events provided significant challenges for Transpacific. Some of our employees suffered personally and it humbled me to see our staff rally behind their colleagues and provide assistance.
A number of fundraising events were organised to assist Transpacific victims of both the Queensland Floods and Christchurch earthquakes. The company provided initial donations and matched staff donations dollar-for-dollar. We also donated $100,000 to the Queensland Premier’s disaster relief appeal and $100,000 to the Red Cross Mayoral relief appeal in Christchurch.
Our outlook is positive. The fundamentals of our total waste management businesses remain sound, with good prospects for growth. Our Commercial Vehicles division has a solid order book and we anticipate improved results. A turnaround plan for the Manufacturing division is in place to return the business to profit as soon as possible.
We are committed to making tough decisions to improve business performance.
I am proud of what Transpacific has accomplished and the work that is taking place in our businesses every single day. I look forward to working with all our stakeholders as we continue to build on these foundations.
KeVin cAmpBell Chief Executive Officer
For
per
sona
l use
onl
y

Business summARY
4 tRAnspAciFic AnnuAl RepoRt 2011
cleAnAwAY
industRiAls AustRAliA
new ZeAlAnd
cApABilitiesCollectionsMunicipal, residential, commercial and industrial collection services for all types of solid waste streams, including general waste, recyclables, construction and demolition waste and medical and washroom services.
Post Collections Ownership and management of:• Waste transfer stations and material recovery facilities (MRFs). • Advanced waste treatment (AWT), resource recovery and recycling,
secure product destruction, quarantine treatment and landfill facilities.
Commodities Trading Sale of recovered paper, cardboard, metals and plastics to the domestic and international marketplace, ensuring the long-term sustainability of our limited natural resources.
cApABilitiesTechnical ServicesCollection, treatment, processing and recycling of liquid and hazardous waste, including industrial waste, grease trap waste, oily waters and used cooking oils.
Industrial Services Services include industrial cleaning, emergency spills response, vacuum loading, site remediation, sludge management, parts washing, concrete remediation, corrosion protection, asbestos removal, hydro excavation and catalyst services.
Hydrocarbons Collection, refining and recycling of used mineral oils to produce fuel oils and base oils. Manufacture of bituminous based applications and coatings.
cApABilitiesCollections Municipal, residential, commercial and industrial collection services for all types of solid waste streams, including general waste, recyclables, construction and demolition waste and electricity generation.
Post Collections Waste transfer stations and material recovery facilities (MRFs).
Technical Services Collection, treatment, processing and recycling of liquid and hazardous waste, including industrial waste, grease trap waste, oily waters and used cooking oils.
Industrial Services Services include industrial cleaning, vacuum loading, site remediation, sludge management, parts washing, concrete remediation, protective coatings, asbestos removal and catalyst services.
For
per
sona
l use
onl
y

tRAnspAciFic AnnuAl RepoRt 2011 5
540.7
183.6
195.0
Municipal
Commercial Industrial (C&I)
Post Collection
Revenue (A$ million)(pre inter-company eliminations)
Revenue (A$ million)
247.8
137.5161.8
Technical Services
Industrial Solutions
Hydrocarbons
Revenue (NZ$ million)
343.9
110.6
Transpacific Waste Management
NZ Industrials
YeAR in BRieF• Volumes and revenues in
key collection systems and post collection facilities showed solid growth year on year.
• Market share has been maintained during the period.
FutuRe outlooK• Several key Municipal and
C&I contract wins late in FY11 will benefit future periods.
• Pipeline of opportunities remains positive.
• Increasing number of AWT organics trials and tender opportunities presenting themselves in the market.
YeAR in BRieF• Focus on building our
Emergency Response capability has paid off as Transpacific is now recognised as the industry leader.
• Asset utilisation and labour productivity delivering margin benefits.
FutuRe outlooK• Growth in the resources
sector and tightening of environmental standards provide significant opportunities, despite difficult market conditions elsewhere particularly in the manufacturing sector.
YeAR in BRieF• Volumes and revenues in
key collection systems and post collection facilities showed solid growth year on year.
• Market share has been maintained during the period.
FutuRe outlooK• Several key Municipal and
C&I contract wins late in FY11 will benefit future periods.
• Pipeline of opportunities remains positive.
• Increasing number of AWT organics trials and tender opportunities presenting themselves in the market.F
or p
erso
nal u
se o
nly

Business summARY
6 tRAnspAciFic AnnuAl RepoRt 2011
mAnuFActuRing
cApABilities Manufacturing Manufacture and servicing of vehicle bodies, parts washers, plastic and steel bins, and waste compaction units to support our own and our clients’ operations.
YeAR in BRieF• Trading through FY11 was affected by an adverse
sales mix of fewer truck bodies and relatively more plastic and steel bins.
commeRciAl VehiclescApABilitiesImportation & Distribution Independent importer and distributor of Western Star, MAN, Foton and Dennis Eagle truck chassis, MAN bus chassis and associated parts.
Dealer Network Provides servicing, parts distribution, training, after sales support and warranty functions for an independent network of 65 dealerships.
Truck Centre The Brisbane and Tauranga (NZ) Truck Centres provide heavy vehicle sales, repairs and servicing for the Western Star, MAN, Foton and Dennis Eagle brands.
YeAR in BRieF• Commercial Vehicles (CVG) retains a strong position in the
Australian truck market with Western Star and MAN holding a combined market share of 11.5% (up 0.7% on pcp).
• 2H11 saw a more favourable result underpinned by improved demand for heavy duty trucks.
• New products launched – Dennis Eagle and Foton.
FutuRe outlooK• CVG order book and market intelligence suggests FY12
market size should equal or exceed FY11.
• Gross margin on the poorer sales mix was insufficient to cover fixed costs.
FutuRe outlooK• The Manufacturing Division is subject to a major
turnaround plan.
For
per
sona
l use
onl
y

tRAnspAciFic AnnuAl RepoRt 2011 7
KeY FActs
7,300 380
160 360
12 3.4
stAFFacross Australia and New Zealand
sites including landfills, resource recovery centres and liquid treatment and disposal facilities
millions oF litRes oF used mineRAl oil RecYcled every year, offsetting Australia and New Zealand’s requirements by 900,000 barrels per annum
olYmpic siZed swimming pools that could be filled with the 900 million litres of liquid wastes processed through treatment facilities annually
megAwAtts oF electRicitY geneRAted every year at Redvale Energy Park, north of Auckland, enough to power 14,000 homes
millions oF tRees sAVed every year by the 220,000 tonnes of paper and cardboard recycled annually
For
per
sona
l use
onl
y

diVisionAl ReView
A$200.4m
A$853.3m
rEVENUE iNclUdiNg lEViEs
EbitdA ANd mArgiNs*
0
100
200
300
400
500 490 Revenue (A$m)
386.5 380.6425.8 427.5
240
290
340
390
440
40
90
140
190
240
1H10 2H10 1H11 2H11
* Yellow shows the levy component
EDITABLE GRAPHS
1H10
386.5 380.6425.8 427.5
2H10 1H11 2H11
1H10
90.1
24.4%
26.5%
25.0% 25.4%
96.4 99.1 101.3
2H10 1H11 2H110
20
40
60
80
100
120
31%
21%
EBITDA and Margins (A$m)
90.196.4 99.1 101.3
24.4%
26.5%25.0% 25.4%
1H10 2H10 1H11 2H11
A$ M
ILLI
ONA$
MIL
LION
8 tRAnspAciFic AnnuAl RepoRt 2011
cleAnAwAYTranspacific’s Cleanaway division had a very pleasing year in 2011. Growth in both volumes and revenues in key collection systems and post collection facilities delivered EBITDA growth of 7.5% from the prior year.
Returns from productivity improvements and cost control programs continued to provide us with the ability to be highly competitive, despite numerous pressures within the sector.
In addition to our efforts in these areas, we have been working hard to ensure our Board approved strategic objectives are successfully implemented. By nature, these build year on year so it is pleasing that our baseline is now well established, with new business opportunities throughout FY11 achieved as a result of important tender wins which will benefit future periods.
This year has also seen success in a number of Advanced Waste Technology trials for the recycling of organic materials. Based on the success of these trials, we look forward to further growth with this technology and to developing it into an additional service available for our customers.
Significant resources have also been channelled into our post collection business of landfills, material recycling facilities and transfer stations. We have been working hard to not only further improve our compliance, but to also ensure we are well prepared for any impost from the proposed Carbon Tax.
During the year we opened a new Resource Recovery Centre and Transfer Station in Port Augusta, South Australia. In its first six months of operation the site received more than 6,620 tonnes of material – successfully diverting 45 per cent of this from ending up in landfill.
The Port Augusta Transfer Station has already been recognised for its performance, jointly awarded the Waste Management Association Australia (WMAA) National Transfer Station — Best Small Transfer Station Gold Award
at the recent WMAA National Landfill and Transfer Station conference.
The work of Transpacific staff in the design and construction phase of the Transfer Station, as well as the ongoing activities by the onsite team contributed to what the judges described as an exemplary award submission.
Although competition remains vigorous, the pipeline of opportunities for all service offerings is positive.
Overall, Cleanaway is well positioned to continue its growth and remain at the forefront of Australia’s solid waste industry.
nicK BAdYK Chief Operating Officer Cleanaway
0
100
200
300
400
500 490 Revenue (A$m)
386.5 380.6425.8 427.5
240
290
340
390
440
40
90
140
190
240
1H10 2H10 1H11 2H11
* Yellow shows the levy component
EDITABLE GRAPHS
1H10
386.5 380.6425.8 427.5
2H10 1H11 2H11
1H10
90.1
24.4%
26.5%
25.0% 25.4%
96.4 99.1 101.3
2H10 1H11 2H110
20
40
60
80
100
120
31%
21%
EBITDA and Margins (A$m)
90.196.4 99.1 101.3
24.4%
26.5%25.0% 25.4%
1H10 2H10 1H11 2H11
A$ M
ILLI
ONA$
MIL
LION
* EBITDA margin excludes levies
For
per
sona
l use
onl
y

tRAnspAciFic AnnuAl RepoRt 2011 9
Transpacific’s Stakeholder & Community Liaison Officer, Olga Ghiri, and CEO, Kevin Campbell, officially open the Community Information Centre in Victoria.
cAse studY communitY pARtneRships… KeY to doing Business
Transpacific’s Solid Waste and Recycling team continues to work closely with local communities in order to establish and foster these important relationships.
In Western Australia, Transpacific’s education program took to the roads with the Recycle Rover leading the charge.
The van was aptly named following a competition run by the Perth Education Team which attracted almost 1,000 entries from local school students.
Perth’s Education Manager has been driving the distinctive Recycle Rover van to visit schools in 14 Council areas across Perth, teaching students how to recycle correctly.
Up to 8,000 primary school children participate in Transpacific’s Perth based education program every year.
Across in New South Wales, the Transpacific Education Team has been spreading the word about the importance of waste management to students across the State.
Through sponsorship of the Hornsby Council’s recycled art competition, entrants were encouraged to think about other uses for their waste. More than 45 entries were received, with winners of the five individual categories presented with a $1000 prize. Photographs of all the artworks were then taken on a road show of Sydney.
The Sydney Municipal Branch Education Team has also continued to deliver the kNOw Waste Program.
Since its launch in 2005, the program has been delivered to over 25,000 preschool, primary and secondary students across seven local government areas in Sydney.
The kNOw Waste Program is a comprehensive service which in addition to lesson content, also includes all teaching resources; promotion of the program to local schools on behalf of a Council; and take-home education materials for participating students.
The kNOw Waste Program features unique lesson topics including:
• ‘Bin Wise’ – teaching about the specifics of waste services provided to them and how to use them most effectively;
• ‘Materials Matter’ – exploring the importance of conserving natural resources and the processes of recycling; and
• ‘Nature’s Recyclers’ – explaining composting and worm farming.
In Victoria, the Transpacific team have been working closely with local residents to provide detailed information about operations in their area.
Transpacific Chief Operating Officer – Cleanaway, Nick Badyk, said Transpacific had listened to residents who said they wanted more operational information from local industry.
“We have appointed a Stakeholder & Community Liaison Officer to work directly with local residents and have developed a Community Information Centre in Clayton.
“These resources provide local residents, businesses and school students with a central point to learn more about our local operations – what we do in managing and operating engineered landfills and essentially, what happens to their waste after they put it in their bin.
“This is the first facility of its type that Transpacific has launched and I believe it is a reflection of the seriousness of our commitment to the local community,” he said.
For
per
sona
l use
onl
y

diVisionAl ReView
A$129.0m
A$547.1m rEVENUE
EbitdA ANd mArgiNs
EDITABLE GRAPHS
1H10
252.7 262.4 272.7 274.4
2H10 1H11 2H11
1H10
56.7
22.4%
23.5% 23.6%
60.164.2 64.8
2H10 1H11 2H11
31%
21%
0
50
100
150
200
250
300
0
10
20
30
40
50
60
70
80
60 164.2 64.8
26%
27%EBITDA and Margins (A$m)
56.760.1
22.4% 22.9%23.5% 23.6%
22%
23%
24%
25%
26%
20%
21%
22%
1H10 2H10 1H11 2H11
22.9%
A$ M
ILLI
ONA$
MIL
LION
1H10
386.5 380.6425.8 427.5
2H10 1H11 2H11
A$ M
ILLI
ON
10 tRAnspAciFic AnnuAl RepoRt 2011
industRiAls AustRAliATranspacific’s Industrials Australia division performed well in 2011, delivering EBITDA growth of 10.4% over the prior year.
industRiAl seRVices
The Industrial Services business achieved significantly improved margins in 2011 from a relatively flat revenue profile through improved asset utilisation and penetration into growth markets outside the subdued manufacturing sector.
An increased focus on new and emerging markets, including the off shore oil and gas sector, allowed the business to capitalise on its strengthened core competencies and capabilities.
These capabilities were evident in our contract to provide the cleaning, waste recovery and disposal services for the salvage operation of the West Atlas Drilling Rig, in the Timor Sea north of Western Australia’s Kimberley region. The West Atlas Rig was a self elevating mobile offshore drilling unit (jack-up) rig, which suffered significant damage in a fire in November 2009.
A crew of approximately 70 staff – including project management, environmental specialists, safety professionals, supervisory crew and trained operators – successfully performed tasks including hydrocarbon clean up and removal from the damaged rig structure and ancillaries, and the containment and treatment of waste that was stored on the rig.
technicAl seRVices
The Technical Services business performed well, achieving growth in a subdued manufacturing environment. EBITDA margins increased through improved treatment efficiencies and implementing price increases.
While the overall volumes collected and processed increased (approaching 900 million litres for the year), there was a change in the volume mix. The volume of low level liquid waste increased, and the more hazardous industrial waste streams fell slightly.
A number of successes were achieved for the year including doubling capacity of the grease trap plant in Sydney; commissioning the oil recovery facility in Melbourne; and upgrading our Newcastle treatment plant. We have also been selected to build an onsite treatment plant at one of Australia’s largest oil and gas sites, which is a significant step in moving into the design and construction of onsite treatment plants in the future.
Overall, the Technical Services business continues to be recognised as a market leader in the liquid and hazardous waste area and a first choice service provider for emergencies such as fires, chemical spills or accidents and contaminated areas. By continuing to maintain our customer base, we have the capacity to capture growth when the industrial market starts to improve.
hYdRocARBons
The Queensland Floods presented both challenges and opportunities for the Hydrocarbons business in 2011. While virtually no bituminous products were sold in the months during and after the flooding in January 2011, damage to coal stockpiles created a huge demand for fuel oil.
We also provided assistance to the mining sector, delivering increased hydrocarbon waste management requirements and fuel oil demands as they increased production. Higher collection volumes and continuing high prices also boosted revenues.
The base oil hydrogenation facility at Rutherford, NSW, has performed exceptionally well throughout the year. In 2012 we will realise further technologies to bring utilisation of the facility to maximum capacity. Demand for both domestic and export base oil sales remains high and is expected to do so into the future.
tonY RodeRicK Chief Operating Officer Transpacific Industrials
For
per
sona
l use
onl
y

tRAnspAciFic AnnuAl RepoRt 2011 11
Transpacific’s Emergency Response Team clean up material left in Oxley Creek following the floods.
cAse studY 2011 QueenslAnd Floods
The 2011 Queensland flood crisis presented many challenges in the clean-up and recovery phase. Transpacific was at the forefront of this disaster and worked closely with rescue services and all levels of government to assist in a coordinated response.
In North Queensland, Transpacific staff were quick to respond, relocating equipment to higher ground to ensure continuity of service where possible. Transpacific also worked closely with Rockhampton Regional Council to set up front-lift bins on high ground for use by members of the public, as well as providing bins for those in the flood evacuation centre.
As the flood waters headed south, Transpacific’s focus moved to South-East Queensland. At the Brisbane Truck Centre in Rocklea, a crew of 15 drivers helped move more than 120 trucks to higher ground before the site was inundated with 3.2 metres of water. Transpacific staff in Brisbane also helped local councils and private customers by clearing and cleaning drains; removing building waste from flooded houses and offices; pumping water from flooded CBD basements; and removing contaminated oils and hazardous chemical sludge.
The clean up and recovery of waterways along the Brisbane River was a priority for the Department of Environment and Resource Management (DERM). Transpacific was engaged by the Department to recover chemical containers, check for contaminants and arrange appropriate disposal of materials.
Transpacific Chief Operating Officer – Industrials, Tony Roderick, said Transpacific quickly deployed a large amount of equipment and staff from business units all over the country.
“The Incident and Project Team inspected the Brisbane River and Oxley Creek areas in conjunction with government and emergency service personnel. Planning took place from the office as soon as calls were received and we worked in conjunction with teams on the ground to scope out the recovery scenarios,” Tony said.
A number of difficulties had to be taken into account including floating debris; tidal movements moving items; high bacteria and unknown biological hazards; drums and other items with damaged labels, making identification harder; and the retrieval of unusual-shaped large tanks and equipment from
river banks. The retrieval was further hampered by dense and waterlogged river banks and mangroves, and problems of vehicle access to river bank areas during rainy periods.
Transpacific used specialised waste storage drums and bins, with GPS and data logging details for recovered items, HAZMAT response gear and trained personnel, and set up a custom-made decontamination area for waste and equipment. The establishment of a web-based reporting process with live map viewing was a critical element to provide accurate and up to date information to both authorities and the public.
Tony said in total more than 3,000 items were recovered from the creek and surrounding environment, including pallets of paint tins, fridges, tyres, fuel trailers, pontoons, hazardous chemicals in drums, portaloos, cool rooms and food.
“Transpacific’s ability to respond in such a short time frame, implement the reporting process whilst commencing the recovery operations, and providing treatment facilities for recovered waste, was true testament to our capabilities,” he said.
For
per
sona
l use
onl
y
diVisionAl ReView
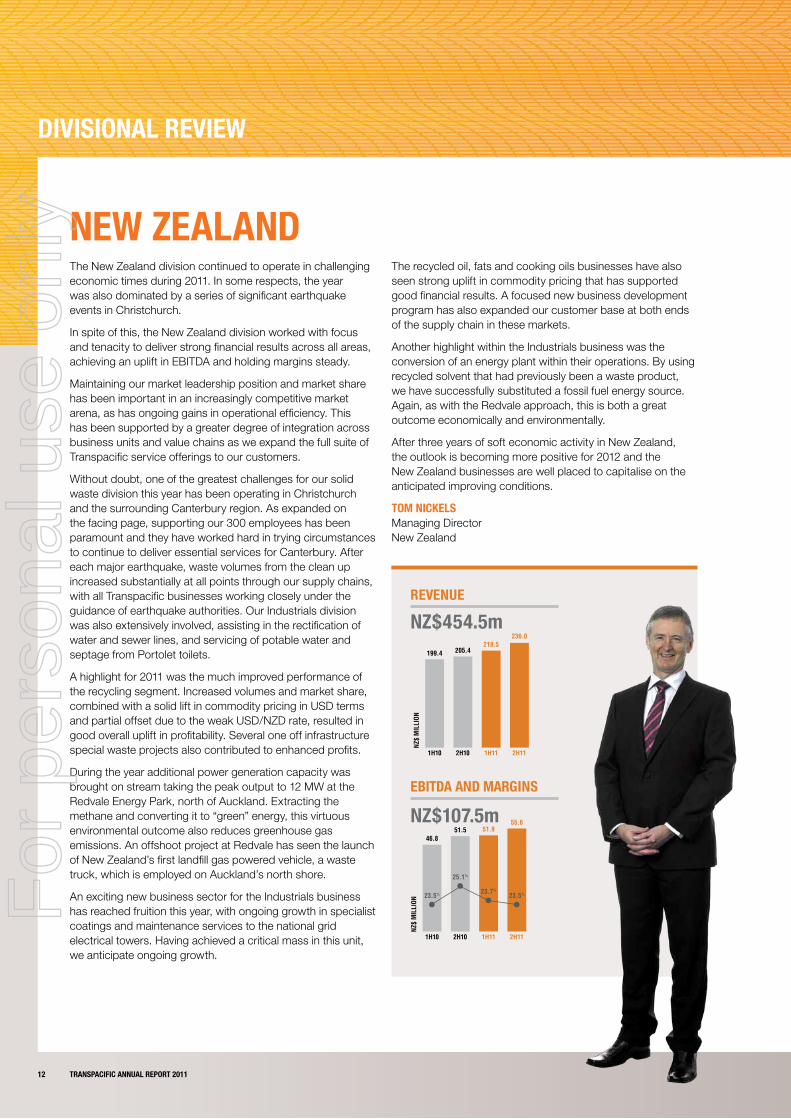
NZ$107.5m
NZ$454.5m rEVENUE
EbitdA ANd mArgiNs
12 tRAnspAciFic AnnuAl RepoRt 2011
new ZeAlAndThe New Zealand division continued to operate in challenging economic times during 2011. In some respects, the year was also dominated by a series of significant earthquake events in Christchurch.
In spite of this, the New Zealand division worked with focus and tenacity to deliver strong financial results across all areas, achieving an uplift in EBITDA and holding margins steady.
Maintaining our market leadership position and market share has been important in an increasingly competitive market arena, as has ongoing gains in operational efficiency. This has been supported by a greater degree of integration across business units and value chains as we expand the full suite of Transpacific service offerings to our customers.
Without doubt, one of the greatest challenges for our solid waste division this year has been operating in Christchurch and the surrounding Canterbury region. As expanded on the facing page, supporting our 300 employees has been paramount and they have worked hard in trying circumstances to continue to deliver essential services for Canterbury. After each major earthquake, waste volumes from the clean up increased substantially at all points through our supply chains, with all Transpacific businesses working closely under the guidance of earthquake authorities. Our Industrials division was also extensively involved, assisting in the rectification of water and sewer lines, and servicing of potable water and septage from Portolet toilets.
A highlight for 2011 was the much improved performance of the recycling segment. Increased volumes and market share, combined with a solid lift in commodity pricing in USD terms and partial offset due to the weak USD/NZD rate, resulted in good overall uplift in profitability. Several one off infrastructure special waste projects also contributed to enhanced profits.
During the year additional power generation capacity was brought on stream taking the peak output to 12 MW at the Redvale Energy Park, north of Auckland. Extracting the methane and converting it to “green” energy, this virtuous environmental outcome also reduces greenhouse gas emissions. An offshoot project at Redvale has seen the launch of New Zealand’s first landfill gas powered vehicle, a waste truck, which is employed on Auckland’s north shore.
An exciting new business sector for the Industrials business has reached fruition this year, with ongoing growth in specialist coatings and maintenance services to the national grid electrical towers. Having achieved a critical mass in this unit, we anticipate ongoing growth.
The recycled oil, fats and cooking oils businesses have also seen strong uplift in commodity pricing that has supported good financial results. A focused new business development program has also expanded our customer base at both ends of the supply chain in these markets.
Another highlight within the Industrials business was the conversion of an energy plant within their operations. By using recycled solvent that had previously been a waste product, we have successfully substituted a fossil fuel energy source. Again, as with the Redvale approach, this is both a great outcome economically and environmentally.
After three years of soft economic activity in New Zealand, the outlook is becoming more positive for 2012 and the New Zealand businesses are well placed to capitalise on the anticipated improving conditions.
tom nicKels Managing Director New Zealand
EDITABLE GRAPHS
1H10
199.4 205.4218.5
236.0
2H10 1H11 2H11
1H10
46.8
23.5% 23.7%
23.5%
51.5 51.955.6
2H10 1H11 2H11
25.1%
0
50
100
150
200
250
51.5 51.9
55.6 31%
EBITDA and Margins (NZ$m)
46.8
23 5%
25.1%23.7%23.5% 23.7%
23.5%
21%1H10 2H10 1H11 2H11
0
10
20
30
40
50
60
NZ$
MIL
LION
NZ$
MIL
LION
EDITABLE GRAPHS
1H10
199.4 205.4218.5
236.0
2H10 1H11 2H11
1H10
46.8
23.5% 23.7%
23.5%
51.5 51.955.6
2H10 1H11 2H11
25.1%
0
50
100
150
200
250
51.5 51.9
55.6 31%
EBITDA and Margins (NZ$m)
46.8
23 5%
25.1%23.7%23.5% 23.7%
23.5%
21%1H10 2H10 1H11 2H11
0
10
20
30
40
50
60
NZ$
MIL
LION
NZ$
MIL
LIONFor
per
sona
l use
onl
y

A Transpacific driver had a lucky escape from his truck after it was squashed in the collapse of a department store carpark.
tRAnspAciFic AnnuAl RepoRt 2011 13
cAse studY tRAnspAciFic At the FoReFRont oF chRistchuRch’s RecoVeRY
Transpacific has stood side by side with staff, local residents and customers in Christchurch, New Zealand as the city of 400,000 struggles to get back on its feet following three major earthquakes between September 2010 and June 2011.
The main quake in February destroyed the Central Business District and entire suburbs. Over 8,000 aftershocks have continued to destabilize an already fragile city. Many thousands of homes and up to 1500 commercial buildings will be demolished, with the Central Business District off limits under Army guard.
The clean up, repair and rebuild is the largest in New Zealand’s history and Transpacific has been at the forefront of this recovery.
Within a day of each of the major quakes, Transpacific resumed full service for Christchurch household kerbside collections. This provided a significant morale boost for residents who otherwise were without normal services including power, water or sewer.
Transpacific was able to provide an ongoing high level of service to our badly affected customers who needed help, whilst ensuring that the massive volumes of waste arising from the destruction were properly managed and disposed of.
Transpacific also played a vital role in supporting the region where roads, water and sewerage had suffered substantial damage, providing CCTV for pipeline inspection, as well as flushing, vacuum loading, Portolet hire and septage servicing. Tanker servicing for potable water distribution was also provided.
Transpacific’s Managing Director, New Zealand, Tom Nickels, said Transpacific’s 300 employees in the Canterbury region and their families had been incredible.
“Their resolve, support for one another and tremendous effort to continue to provide our wide range of essential services to the region, despite also dealing with individual personal challenges, has been nothing short of incredible.
“I am immensely proud of all our staff and we remain extremely appreciative of support from the wider Transpacific community, both those around New Zealand and also in Australia,” he said.
Throughout the crisis, Transpacific has worked to support both the region and staff in a variety of ways. These have included:
• A donation of $100,000 to the Red Cross Mayoral Relief Appeal;
• Establishing a Transpacific internal appeal to directly assist staff affected, and matching all contributions dollar for dollar;
• Distributing care packs containing emergency and life staple items to all Transpacific employees in Christchurch;
• Providing relief staff from outside the city when needed; and
• Establishing community centres for Transpacific employees to access shower and laundry facilities as well as potable water supplies.
For
per
sona
l use
onl
y

diVisionAl ReView
A$196.0m
A$353.2mrEVENUE
EbitdA ANd mArgiNs
EDITABLE GRAPHS
1H10
152.0
222.7
149.3
203.9
2H10
A$ M
ILLI
ON
1H11 2H11
1H10
7.9
5.2%
2.8%
7.6%
19.4
4.2
15.4
2H10
A$ M
ILLI
ON
1H11 2H11
8.7%
0
50
100
150
200
250
0
5
10
15
2019.4
EBITDA and Margins (A$m)
7.9
19.4
4.2
15.4
5 2%7.6%
5.2%
8.7% 2.8%
1H10 2H10 1H11 2H11
1H10
199.4 205.4218.5
236.0
2H10 1H11 2H11
NZ$
MIL
LION
14 tRAnspAciFic AnnuAl RepoRt 2011
commeRciAl VehiclesThe 2011 year saw a further contraction in the size of the Heavy Duty Truck Market in Australia, with the market decreasing a further 6% (following decreases of 11% and 26% in FY10 and FY09 respectively).
Despite these softer market conditions, the Commercial Vehicle division retains a strong position. Western Star increased its market share by 0.6% to 9.3%, and MAN market share remaining steady at 2.2%.
The New Zealand truck business has been transformed in 2011 by modelling a similar dealer network to that of Australia. As a result, significant fleet contracts have already been secured for 2012 with premium NZ Trucking Operators.
Bus volumes across Australia and New Zealand fell significantly in 2011, with MAN unable to secure any large long term contracts with Statutory Authorities in Australia, and a major bus body builder going into receivership in New Zealand. While the receivership process is underway, alternate body builder capacity for the New Zealand bus market has been sourced.
A highlight for the 2011 year was the delivery of the first 29 Dennis Eagle Trucks into service in Australia. This product, imported from the UK, continues to show significant promise for all refuse operators, with significant volumes expected to be utilised by the Cleanaway business in 2012.
The 4.5T GVM Foton product imported from China was also launched in Australia in the second half of 2011. Whilst sales to end users have started slowly for this new product, the brand is slowly gaining momentum and is on track to receive a significantly wider range of product by the end of the 2012 year.
There were a number of new MAN models (Portfolio Expansion) introduced during 2011, however the real model expansion opportunity still remains with Western Star, with both Transpacific and its supplier committed to various product engineering programs which will benefit the business in the coming year.
pAul glAVAc Managing Director Transpacific Commercial Vehicle Group
cAse studY dennis eAgle & supeRioR pAK – A winning solution FoR tRAnspAciFic
Transpacific’s Commercial Vehicles and Manufacturing divisions are working side by side to deliver superior solutions for municipal customers.
Following a comprehensive search that took the team across the globe, Commercial Vehicle’s newest recruit, ‘The Dennis Eagle Elite 2’, is the latest member to join the solid waste collection fleet.
Transpacific Commercial Vehicle Group Managing Director, Paul Glavac, said the new Dennis Eagle Elite 2 chassis represented a quantum shift in performance for refuse collections trucks from previous generation vehicles and was available in a wide variety of configurations.
For
per
sona
l use
onl
y

A$(8.4)m
A$67.7m rEVENUE
EbitdA ANd mArgiNs
EDITABLE GRAPHS
1H10
32.6
40.436.7
31.0
2H10
A$ M
ILLI
ON
1H11 2H11
1H10
3.5
10.7%
1.6%
-29.0%
3.3
0.6(9.0)
2H10
A$ M
ILLI
ON
2H11
8.2%
0
10
20
30
40
50
3.5 3.3
EBITDA and Margins (A$m)
0.610.7%
8.2%
1 6%
(9.0)
1.6%
-29.0%
-
-10
-8
-6
-4
-2
0
2
4
1H11
1H10
7.9
5.2%
2.8%
7.6%
19.4
4.2
15.4
2H10
A$ M
ILLI
ON
1H11 2H11
8.7%
The new Dennis Eagle Elite II fitted with a Superior Pak sideload compactor.
tRAnspAciFic AnnuAl RepoRt 2011 15
“Safety is paramount for operators and the Dennis Eagle Elite 2 delivers, with larger glass and mirror surface areas significantly improving visibility.
“The Dennis Eagle Elite 2 also offers a unique single low entry step, which, combined with large convenient grab handles, enables a safe and low effort entry and exit of the vehicle.
“A true walk-thru cab provides further protection by ensuring operators can avoid entering or exiting the vehicle from the traffic side,” he said.
The new Dennis Eagle Elite 2 is also a green option. Powered with the latest ADR 80/03 – Euro V emission compliant Cummins ISL engines with SCR technology, they provide more power, torque and improved fuel economy, while reducing emissions.
The demanding conditions Australia’s climate places on vehicles are not only met, but exceeded, in the new Dennis Eagle Elite 2. The vehicle is equipped with a unique side by side radiator/charge air cooler arrangement to ensure optimum cooling performance. An advanced six-channel ABS disc brake system with traction control delivers better control in difficult road and terrain conditions, and also offers extended service intervals.
Combined with a Superior Pak sideload compactor, the Dennis Eagle Elite 2 are already servicing a number of municipal contracts in Melbourne, Darwin and Perth.
The current Superior Pak sideload compactor has been very well received. However, the team has continued to fine tune the design and the newly released ‘Raptor SL Series III’ sets an even higher standard.
mAnuFActuRingThe Manufacturing division posted a disappointing result for 2011, hindered by an adverse sales mix of fewer waste vehicle bodies and relatively more plastic and steel bins, and many of its major customers delaying capital expenditure.
Despite the ongoing difficult market conditions, the business continued to improve its product offerings, with significant upgrades to Superior Pak’s mobile compactor products being launched. The new side lifter features a completely new design that will provide real advantages to its operators including significantly improved lifting cycle times and extended arm reach.
A five point turnaround plan is currently being implemented for this business to ensure it returns to a cash profit position as soon as possible.
For
per
sona
l use
onl
y

coRpoRAte
sAFetY
The business continued to have a strong focus on improving safety and environmental systems and performance throughout 2011. Changes within the Occupational Health Safety and Environment (OHSE) function have lead to an increased focus on business support and greater ownership of OHSE outcomes at an operational level. To reinforce operational ownership, we continued delivery of “Safety Leadership” training for supervisors and managers.
A key achievement during the year was the implementation of a new online incident reporting and management system “The Vault”. The system is accessible to all Transpacific businesses and enables timely, transparent and accurate management of incident reporting and associated corrective action information.
enViRonment
Transpacific remained focused on environmental compliance in 2011. Reducing the likelihood of odour emissions from landfills, as well as active engagement with the community and regulatory bodies in Victoria were a key focus. Internal and external review of our Energy Efficiency Opportunities (EEO) and National Greenhouse and Energy Report System (NGERS) programs was also undertaken to ensure our systems can provide accurate information with respect to energy use and CO2 emissions.
humAn ResouRces
The Human Resources Department implemented a fully integrated payroll, time and attendance and human resources information system in Australia, providing a consolidated technology platform for the management of personnel data. The system will be implemented in New Zealand in 2012. A new Positive Performance Management program was rolled-out to the company’s managers and the foundations were put in place for an executive succession planning and talent management platform. A review of key HR policies was undertaken and a paid parental leave policy was introduced. Our training team has revised the scope of training delivered to the company’s employees to include Nationally Recognised Training and also facilitated the sign-up of over 200 employees in government-funded traineeships.
continuous impRoVement
By reviewing national initiatives, the Continuous Improvement team has provided enhanced opportunities that have delivered a number of benefits to the Group. Commitment from businesses to continuous improvement has also grown, with a number of local advances made over the last financial year. Strategic partnerships with our key suppliers have also been strengthened through a number of contract reviews and renewals.
From left: Brenda Mello General Manager Human Resources Murray Floyd General Counsel Stewart Cummins Chief Financial Officer Kellie Smith Company Secretary Gordon Rettkowicz General Manager Strategic Procurement
16 tRAnspAciFic AnnuAl RepoRt 2011
For
per
sona
l use
onl
y

it
The group’s technology function has contributed to a number of business initiatives in 2011 including the deployment of the first stage of an ERP implementation, deployment of a new corporate website in Australia, and the development of a handheld mobile solution in New Zealand which allows for the automated work dispatch for our graffiti and bus shelter contracts. Enhancements have also been made to our route management solutions which will improve delivery to municipal contracts by reducing the number of vehicles needed on any given route and in doing so, further reducing our costs, fuel use and carbon footprint. Progress has also been made on the program to consolidate multiple systems.
pRopeRtY
Transpacific continues to review and assess its ongoing property and facilities needs across all of its 380 sites. In particular, we are focused on our valuable landfill properties and consolidation of sites.
The group is in the process of final submission of a rezoning proposal to Hume City Council for the 68 hectares of land adjacent to the Tullamarine Airport in Melbourne which includes the closed landfill site. This development will help to address a current shortage of quality industrial land in the area.
RisK
The group’s risk and assurance team began a process of reviewing and restructuring its internal audit and risk management activities. New appointments were made for lead OHSE audit positions and results from the audits undertaken are now directly reviewed and reported to executive management and the Board Committees. KPMG has also been engaged to run the internal audit process. Transpacific’s Enterprise Risk Management system has also been updated.
legAl
During 2011, the legal team’s work has centred on developing an in-depth understanding of the imperatives and drivers of Transpacific’s business. In doing so, we have addressed potential risks, and assisted the company in meeting both contractual obligations, and those in the regulatory framework. This year we have dealt with a variety of commercial, dispute resolution, occupational health and safety and environmental matters.
tRAnspAciFic AnnuAl RepoRt 2011 17
For
per
sona
l use
onl
y

BoARd oF diRectoRs
gene tilBRooK
• IndependentNon-ExecutiveChairman • MemberoftheAuditCommittee • MemberoftheRisk&ComplianceCommittee
Gene Tilbrook joined the Transpacific Board in September 2009. He was appointed Chairman in June 2010.
Gene has significant management experience in corporate strategy, finance, investments and capital management.
Gene was Finance Director at Wesfarmers Limited until his retirement in May 2009, having joined Wesfarmers in 1985 and holding a number of positions in its Finance and Business Development Departments during this time.
Gene is a Non-Executive Director of Fletcher Building Ltd (appointed September 2009), GPT Group (appointed May 2010), NBN Co Ltd (appointed August 2009) and QR National Limited (appointed April 2010).
Gene holds tertiary qualifications in science, computing science and business administration (MBA) and has completed the Advanced Management Program at the Harvard Business School. He is a Fellow of the Australian Institute of Company Directors.
KeVin cAmpBell
• ChiefExecutiveOfficer • ExecutiveDirector
Kevin Campbell joined Transpacific as CFO on 1 September 2010, and was appointed CEO and Executive Director on 27 January 2011.
Kevin has over 30 years of financial expertise and extensive strategic and operational leadership skills from his experiences with leading global and national organizations in the resources, retail, recycling and manufacturing industries.
Kevin was the former Global Director-Governance and Compliance, and Chief Financial Officer for Visy Industries Pty Ltd.
Kevin is a member of the Australian Institute of Company Directors and CPA Australia.
BRuce BRown
• IndependentNon-ExecutiveDirector • MemberoftheAuditCommittee • ActingChairmanoftheHumanResources
Committee
Bruce Brown joined the Transpacific Board in March 2005.
Bruce has significant financial expertise, and experience with global business operations.
Bruce was Chief Executive Officer of Campbell Brothers Limited until his retirement in 2005, having held finance and senior management positions with that company since 1976.
Bruce is currently a Non-Executive Director of Campbell Brothers Limited (appointed October 2005).
Bruce holds a tertiary qualification in Commerce. He is a Fellow of the Australian Institute of Company Directors.
RAjiV ghAtAliA
• Non-ExecutiveDirector • MemberoftheHumanResourcesCommittee
Rajiv Ghatalia joined the Transpacific Board in September 2009.
Rajiv is a Managing Director of Warburg Pincus Asia LLC. He focuses on the firm’s leveraged buy-out and special situations activities including financial services in Asia.
Rajiv is a director of Titan Group Investments Ltd (appointed June 2007).
Rajiv holds tertiary qualifications in economics and accounting from the University of Pennsylvania, and an MBA from Harvard Business School.
mARtin hudson
• IndependentNon-ExecutiveDirector • ChairmanoftheRiskandComplianceCommittee • MemberoftheAuditCommittee
Martin Hudson joined the Transpacific Board in September 2009.
Martin has significant board and commercial experience in risk management, executive leadership, regulatory matters and strategic direction derived from his varying roles at Fosters, Southcorp, Pacific Dunlop and Freehills.
Martin was Senior Vice President Commercial Affairs and Chief Legal Counsel at Foster’s Group Limited until his retirement in July 2009. Prior to that he held the Company Secretary and Chief General Counsel position with Southcorp
From left: Martin Hudson, Emma Stein, Rajiv Ghatalia, Ray Smith, Kevin Campbell, Gene Tilbrook, Bruce Brown
18 tRAnspAciFic AnnuAl RepoRt 2011
For
per
sona
l use
onl
y

Limited, was General Counsel to the Pacific Dunlop Group of Companies, and was also for over 20 years a partner of national law firm Freehills.
Martin is a non-executive Director of NM Superannuation Pty Ltd (the Trustee of Axa Asia Pacific Holdings Limited’s public superannuation funds).
Martin holds tertiary qualifications in Law. He is a Member of the Australian Institute of Company Directors
RAY smith
• IndependentNon-ExecutiveDirector • ChairmanoftheAuditCommittee • MemberoftheRiskandComplianceCommittee
Ray Smith joined the Transpacific Board on 1 April 2011.
Ray has significant corporate and financial experience in the areas of strategy, acquisitions, treasury and capital raisings.
Ray was Chief Financial Officer of Smorgon Steel Group for 11 years (1996-2007). During that period Smorgon Steel Group was at the forefront of the rationalisation of the Australian Steel Industry.
He is a Non-Executive Director of WHK Group Limited (appointed May 2009), and K&S Corporation Ltd (appointed February 2008). He is a former director of Willmott Forests Limited (resigned March 2011). Ray is also a Trustee of the Melbourne & Olympic Parks Trust.
Ray holds tertiary qualifications in commerce. He is a Fellow of CPA Australia and a Fellow of the Australian Institute of Company Directors.
emmA stein
• IndependentNon-ExecutiveDirector • MemberoftheHumanResourcesCommittee
Emma Stein joined the Transpacific Board on 1 August 2011.
Emma has significant corporate experience within industrial markets.
Emma was the UK Managing Director for French utility Gaz de France’s energy retailing operations. Since moving to Australia in 2003 she has held board roles in energy utility and oil and gas exploration.
She currently serves on the Boards of DUET Group (appointed June 2004), Programmed Maintenance Services Ltd (June 2010), Clough Limited (appointed July 2008) and Alumina Limited (appointed February 2011). She is a former director of Transfield Services Infrastructure Fund (resigned July 2011) and Arc Energy (resigned August 2008). She is also a member of the Board of Trustees for the University of Western Sydney.
Emma holds tertiary qualifications in science and business administration (MBA). She is a Fellow of the Australian Institute of Company Directors.
tRAnspAciFic AnnuAl RepoRt 2011 19
For
per
sona
l use
onl
y

coRpoRAte goVeRnAnce
Transpacific Industries Group Ltd (Transpacific or the Company) and its Board of Directors are committed to fulfilling their corporate governance obligations and responsibilities in the best interests of the Company and its stakeholders, and fully support the Australian Securities Exchange’s (ASX) Corporate Governance Principles and Recommendations (ASX guidelines).
This statement sets out Transpacific’s key governance principles and practices, together with details of how they are reviewed regularly and revised as appropriate to reflect changes in law and developments in corporate governance. Transpacific considers that throughout the 2011 financial year it has met all ASX guidelines in effect for that financial year, other than Recommendation 2.4 to the extent that the Board is currently acting as the Nomination Committee as set out under Principle 2 below.
Copies of the charters, codes and policies in respect of Transpacific’s corporate governance practices referred to in this Statement are available on the corporate governance section of the Transpacific website – www.transpacific.com.au/content/corporate-governance.aspx
pRinciple 1: lAY solid FoundAtions FoR mAnAgement And oVeRsight
The Transpacific Board operates under a Charter which sets out the role, powers and responsibilities of the Board. The Board is responsible for the overall corporate governance of the Company. The Board Charter sets out the following objectives of the Board:
• to provide strategic guidance for Transpacific and effective oversight of its management and its business activities;
• to optimise Transpacific’s performance so as to create and build sustainable value for shareholders within a framework of appropriate risk assessment and management; and
• to ensure Transpacific’s legal and other obligations to all legitimate stakeholders are being achieved.
The primary responsibilities of the Board towards achievement of these objectives are also set out in the Charter as follows:
• oversight of Transpacific, including its control and accountability systems;
• contribute to the development of, and final approval of, management’s corporate strategy and performance objectives;
• monitoring the implementation of the policies, strategies and objectives of Transpacific;
• appointing, and, where appropriate, removing the Chief Executive Officer, and approving his/her terms of engagement and termination benefits;
• ratifying the appointment and, where appropriate, the removal of members of the Executive Management team, approving their terms of engagement and termination benefits, and monitoring their performance;
• promulgating clear standards of ethical behaviour required of Directors and key executives and encourage observance
of those standards;
• reviewing, ratifying and monitoring systems of risk management, internal compliance and control, codes of conduct and legal compliance;
• protecting Transpacific’s financial position and its ability to meet its debts and other obligations as they fall due; and
• ensuring Transpacific’s financial report complies with relevant accounting standards and presents a true and fair view.
The Board Charter is regularly reviewed to ensure it remains consistent with the Board’s objectives and responsibilities.
The Chief Executive Officer is responsible to the Board for the day to day management of Transpacific. The delegation of Board authority to the Chief Executive Officer is reviewed regularly.
Evaluating the performance of Executive Management
The Board is responsible for conducting a formal review of the performance of the Chief Executive Officer on an annual basis. No formal review of the performance of the Chief Executive Officer was undertaken during the reporting period as Mr Kevin Campbell was appointed to the role in January 2011. Mr Campbell previously held the role of Chief Financial Officer (from 1 September 2010).
The Board is also responsible for monitoring and evaluating the performance of the members of the Executive Management team. The process for evaluating the performance of Executives is described in the Remuneration Report. Following Mr Campbell’s appointment as CEO, a review of the management structure of Transpacific was undertaken in consultation with the Board. This resulted in changes in reporting lines for a number of Executives.
pRinciple 2: stRuctuRe the BoARd to Add VAlue
Transpacific’s Constitution calls for at least three but not more than 10 Directors. The Board is currently comprised of six Non-Executive Directors (five of whom are independent), and one Executive Director (the CEO). Profiles of each Director, outlining their appointment dates, qualifications, directorships of other listed companies (including those held at any time in the three years immediately before the end of the financial year), experience and expertise, are set out on pages 18 to 19 of the Annual Report.
Director Independence
As required under the Board Charter and recommended by the ASX guidelines, the Board comprises a majority of independent Non-Executive Directors.
The Charter states that Transpacific will regard a Non-Executive Director as independent if he or she is not a member of management and is free of any business or other relationship that could materially interfere with, or could reasonably be perceived to materially interfere with, the independent exercise of their judgement.
When determining the independent status of a Non-Executive Director, the Board will take into account whether that Director:
20 tRAnspAciFic AnnuAl RepoRt 2011
For
per
sona
l use
onl
y

• is a substantial shareholder of Transpacific or an officer of, or otherwise associated directly with, a substantial shareholder of Transpacific;
• is employed, or has previously been employed in an executive capacity by the Transpacific group, and there has not been a period of at least three years between ceasing such employment and serving on the Board;
• has within the last 3 years been:
– a principal of a material professional advisor to the Transpacific group;
– a material consultant to the Transpacific group; or
– an employee materially associated with the service provided by such adviser or consultant to the Transpacific group.
• is a material supplier or customer of the Transpacific group, or an officer of or otherwise associated directly or indirectly with a material supplier or customer; or
• has a material contractual relationship with the Transpacific group other than as a Director of Transpacific.
Whether or not a material relationship exists is determined on a case-by-case basis, giving consideration to the nature of the relationship and the circumstances of the Director. Materiality is considered from the perspective of the company, the Director, and the person or entity with which the Director has a relationship.
The Board reviews the independence of directors before they are appointed, on an annual basis, and at any other time where the circumstances of a Director changes such as to require reassessment.
The Board has reviewed the independence of each of the Directors in office at the date of this report and has determined that all Directors are independent, with the exception of:
• Mr Kevin Campbell – Executive Director and Chief Executive Officer;
• Mr Rajiv Ghatalia – Non-Executive Director and Managing Director of Warburg Pincus Asia, an entity related to a substantial shareholder of Transpacific.
Certain Non-Executive Directors hold directorships in companies with which Transpacific has commercial relationships. Details of these other directorships are set out on pages 18 to 19.
The independent status of Directors standing for election or re-election is identified in the notice of AGM. If the Board’s assessment of a Director’s independence changes, the change is disclosed to the market.
The Board actively seeks to ensure that the Board continues to have the right balance of skills, knowledge, diversity, experience and expertise considered of benefit to the company, and necessary to adequately discharge its responsibilities and duties.
Chair of the Board
The Board Charter requires an independent Non-Executive Director to hold the position of Chairperson of the Board, unless the Board otherwise resolves. The Chairman of the Board, Mr Gene Tilbrook, is an independent Non-Executive Director.
The Chairman’s responsibilities are set out in the Board Charter.
The roles of the Chairperson and Chief Executive Officer are not exercised by the same person.
Conflicts of interest
Directors are required to keep the Board advised, on an ongoing basis, of any interest that could potentially conflict with those of Transpacific. A Director who has an actual or potential conflict of interest or a material personal interest in a matter is required to declare that potential or actual conflict of interest to the Board. If the Board determines that there is a material conflict of interest, the Board may require the relevant director to:
a) not receive the relevant papers;
b) not be present at the meeting while the matter is considered; and
c) not participate in any decision on the matter.
The Board may resolve to permit a Director to have an involvement in a matter involving a potential or actual conflict of interest. In such instances the Board will minute full details of the basis of the determination and the nature of the conflict, including a formal resolution concerning the matter.
Board committees
The Board has the ability under the company’s constitution to delegate its powers and responsibilities to committees of the Board. This enables the Board to spend additional and more focused time on specific issues. The Board has established the following standing committees to assist in the discharge of its responsibilities:
• Audit Committee;
• Risk and Compliance Committee;
• Nomination Committee; and
• Human Resources Committee.
In March 2011, the Board resolved that until further notice it would act as the Nomination Committee to enable the Board renewal process to be completed in the most effective and efficient manner.
The Charter of each Board Committee sets out the respective duties and responsibilities of that particular Committee.
Details of individual Director’s memberships of Board Committees are provided in the biographies included on pages 18 to 19 of the Annual Report.
All Directors are entitled to attend meetings of the standing committees. Papers considered by the standing committees are provided to all Directors. Minutes of the standing committee
tRAnspAciFic AnnuAl RepoRt 2011 21
For
per
sona
l use
onl
y

coRpoRAte goVeRnAnce
meetings are provided to all Directors and the proceedings of each meeting are reported at the next Board meeting by the Chairperson of the committee.
Directors’ attendance at Board and Board Committee meetings
The number of Board and Board Committee meetings held and attendance by Directors at these meetings is set out in the Directors’ Report on page 30.
The Non-Executive Directors receive regular briefings on Transpacific’s operations from the Senior Executive team, undertake site visits, and receive presentations from external parties in a range of fields.
The Non-Executive Directors meet without the presence of management during the course of regular Board meetings, and on other occasions as required outside regular Board meetings.
Independent advice
The Board and each of the Committees has the authority to seek any information it requires from any employee or external party, including the Internal and External Auditors. Any Director may take such independent legal, financial or other advice as they consider necessary to fulfil their duties, at the expense of the Company. Before the external advice is sought consent needs to be obtained from the Chairperson of the Board. The Chairperson may determine that any external advice received by an individual Director be circulated to the remainder of the Board.
Nomination Committee
As noted above, in March 2011 the Board resolved that until further notice it would act as the Nomination Committee.
The role of this Committee is to assist the Board to ensure that it is of an effective composition, size and commitment to adequately discharge its responsibilities and duties. Its duties include:
• reviewing, assessing and making recommendations to the Board on the necessary and desirable competencies of the directors and relevant Board committees;
• evaluating the Board’s performance;
• overseeing the selection and appointment practices for Non-Executive Directors of Transpacific; and
• reviewing Board succession plans.
Performance evaluation
Under its Charter, the Nomination Committee is responsible for undertaking regular reviews of the Board’s effectiveness, and the effectiveness of the Board Committees and individual Directors.
No formal performance evaluation of the Board was undertaken during the reporting period. A review is being undertaken in the second half of 2011.
pRinciple 3: pRomote ethicAl And ResponsiBle decision mAKing
Code of Conduct
Transpacific recognises that its reputation is an essential element to its success, and that its reputation is directly attributable to the ethical behaviour of those who represent it. Transpacific has developed a Corporate Code of Conduct (the Code) which sets out certain basic principles that all Directors, employees, contractors and consultants are expected to follow in all dealings related to Transpacific, to ensure that Transpacific’s business is conducted in accordance with the laws and regulations of the countries in which it operates.
The Code is fully endorsed by the Board and is regularly reviewed and updated as necessary to ensure it reflects the highest standards of behaviour and professionalism and the practices necessary to maintain confidence in Transpacific’s integrity.
Any breach of the Code is considered a serious matter which may result in disciplinary action, including termination of employment.
A copy of the Code is available on the Transpacific website – www.transpacific.com.au/content/corporate-governance.aspx
Whistleblower Policy
Transpacific’s Whistleblower policy further documents Transpacific’s commitment to ensuring high standards of conduct and ethical behaviour in all areas of business activity.
Transpacific employees who are aware of any serious misconduct or unethical behaviour that contravenes the Corporate Code of Conduct, or any Transpacific policies or the law, are encouraged to report this to their manager or make a report under the Transpacific FairCall program (Transpacific’s Whistleblower program).
The Whistleblower Policy provides that all reports will be investigated in an appropriate manner, and that feedback on the outcome of the investigation will be provided to the person making the report where appropriate.
The Company will not tolerate any reprisals, discrimination, harassment, intimidation or victimisation against any person suspected of making a report of unacceptable conduct.
Securities Trading Policy
Transpacific’s Securities Trading Policy reinforces the Corporations Act 2001 restrictions in relation to insider trading, and prohibits its Directors, Senior Executives and other employees from dealing in Transpacific shares at any time if that person is in possession of price sensitive information that has not been made public. The policy complies with the ASX listing rule requirements on trading policies.
Under the policy:
• Employees other than Directors and Senior Executives must not deal in TPI Securities, except during the following Trading Windows:
22 tRAnspAciFic AnnuAl RepoRt 2011
For
per
sona
l use
onl
y

– for a period of up to 6 weeks from the day after the release of Transpacific’s half-year and full-year results to the ASX;
– for a period of up to 6 weeks from the day after the Annual General Meeting has been held;
– at any time Transpacific has a prospectus open; or
– at any other time the Board declares trading permissible in a written note to all staff and the ASX.
• Before any Director or Senior Executive deals in any Transpacific securities at any time, including during Trading Windows, he or she must discuss the proposed dealing with, and obtain written approval from:
– The Chairman, in the case of Directors and Senior Executives; or
– In the case of the Chairman, the Chairman of the Risk and Compliance Committee.
• Directors, Senior Executives and other employees are prohibited from engaging in short-term or speculative trading in Transpacific securities, as well as trading in derivatives.
• No Director, Senior Executive or employee (in the case of employees, only to the extent their margin loan is considered material) may directly or indirectly enter into any margin loan facility against Transpacific securities unless the prior written consent of the Chairperson of the Board is obtained.
The Securities Trading Policy is available on the Transpacific website – www.transpacific.com.au/content/corporate-governance.aspx
Diversity
Transpacific has a workforce made up of people with diverse values, backgrounds, skills, experiences and needs. Transpacific values this diversity, and recognizes the benefits that it brings to the Company, its customers and other key stakeholders. On 30 June 2010, the ASX guidelines introduced a number of recommendations in respect of diversity. These changes apply to listed entities such as Transpacific for the financial year commencing 1 July 2011.
The Board is currently considering suitable diversity targets to work towards achieving greater diversity at Transpacific at all levels of the workforce and the Board. The Board will adopt measurable objectives for achieving gender diversity, and the progress towards achieving these objectives will be reported on in Transpacific’s 2012 annual report.
pRinciple 4: sAFeguARd integRitY in FinAnciAl RepoRting
Audit Committee
The function of the Audit Committee is to assist the Board to independently verify and safeguard the integrity of Transpacific’s financial reporting and review and evaluate all material capital management financing and treasury risk management proposals.
The Audit Committee consists entirely of independent Non-Executive Directors as follows:
• R M Smith (appointed Chairman 1 April 2011)
• M M Hudson (Acting Chairman from 1 June 2010 to 1 April 2011)
• B R Brown
• G T Tilbrook
• B S Allan (until 3 November 2010)
The Committee has appropriate financial expertise and all members are financially literate and have an appropriate understanding of the industries in which Transpacific operates. The Committee meets as required, normally at least four times per year – see page 30 for details of meetings. Under its Charter, the Chairperson of this Committee is also a member of the Risk and Compliance Committee. The Chairperson of the Board is not permitted to Chair this Committee.
The Committee’s primary responsibilities are to:
• assess whether the Company’s external reporting is legally compliant, consistent with Committee members’ information and knowledge and suitable for shareholder needs;
• assess the management processes supporting external reporting;
• liaise with the External Auditors and ensure that the annual statutory audit and half-year review are conducted in an effective manner;
• make recommendations for the appointment or removal of the External and the Internal Auditors;
• on an annual basis, assess the performance and independence of the External and Internal Auditors;
• monitor the coordination of the internal and external audits;
• approve the external audit plan; and
• in conjunction with the Risk and Compliance Committee, approve the internal audit plan.
The Committee has the authority to seek any information it requires from any employee or external party, including the Internal and External Auditors.
At each meeting the Committee meets with the Internal and External Auditors without management present.
tRAnspAciFic AnnuAl RepoRt 2011 23
For
per
sona
l use
onl
y

coRpoRAte goVeRnAnce
Certification under section 295A of the Corporations Act 2001
In accordance with section 295A of the Corporations Act 2001, the Chief Executive Officer and the Chief Financial Officer have provided a written statement to the Board (‘Declaration’) confirming that, in their opinion:
• the Company’s financial statements and notes present a true and fair view of the consolidated entity’s financial position and performance and are in accordance with applicable accounting standards; and
• the Company’s financial records for the financial year have been properly maintained in accordance with section 286 of the Corporations Act 2001.
This written statement also confirms to the Board that the Declaration is founded on a sound system of risk management and internal control and that the system was operating effectively and efficiently in all material respects in relation to the financial reporting risks.
Independence of the external auditor
Ernst & Young were appointed as the company’s External Auditors in November 2009. The lead external audit partner is required to rotate after a maximum of five years.
Ernst & Young have provided an independence declaration to the Board for the financial year ended 30 June 2011. The independence declaration forms part of the Directors’ Report and is provided on page 44 of this Annual Report.
pRinciple 5: mAKe timelY And BAlAnced disclosuRe
Transpacific has adopted a Continuous Disclosure Policy which sets out the procedures and requirements expected of all employees of the Company, including Directors and Senior Executives to ensure compliance with its continuous disclosure obligations under the ASX Listing Rules and the Corporations Act 2001.
The Continuous Disclosure Policy is available on the Transpacific website – www.transpacific.com.au/content/corporate-governance.aspx
pRinciple 6: Respect the Rights oF shAReholdeRs
Transpacific is committed to ensuring shareholders are provided with full, open and timely material information about its activities. In addition to compliance with its continuous disclosure obligations under the ASX Listing Rules, Transpacific achieves this through:
• ensuring that all communications with shareholders, including the annual report and notice of annual general meeting, satisfy statutory requirements and are easily understandable;
• ensuring that all shareholders have the opportunity to receive external communications issued by the Company. All Company announcements and information released are available via a link to the ASX website under the investor section of the Transpacific website;
• encouraging shareholders to attend annual general meetings to hear the Chairman’s address, and to use the
opportunity to ask questions. If shareholders are unable to attend in person, they are encouraged to participate through the appointment of a proxy, or proxies; and
• the Company’s External Auditor attends the annual general meeting to answer questions from shareholders about the conduct of the audit, the preparation and content of the Audit Report, the accounting policies adopted by the Company, and the independence of the Auditor in relation to the conduct of the audit. Shareholders attending the meeting are made aware that they may ask such questions of the Auditor, and are provided an opportunity to submit written questions prior to the meeting.
A copy of the Shareholder Communication Policy is available on the Transpacific website – www.transpacific.com.au/content/corporate-governance.aspx
pRinciple 7: Recognise And mAnAge RisK
The Board recognises that effective risk management processes are imperative to the Company achieving its business objectives and to the Board meeting its corporate governance responsibilities.
Risk and Compliance Committee
The function of the Risk and Compliance Committee is to assist the Board to:
• ensure Transpacific addresses all legal and other obligations to all legitimate stakeholders including employees, shareholders and other external counterparties;
• establish a sound system of risk oversight, management and internal control;
• ensure that Transpacific’s systems and processes are properly controlled and functioning effectively; and
• actively promote ethical and responsible decision making within Transpacific.
The Risk and Compliance Committee is also responsible, in conjunction with the Audit Committee, for approving the internal audit plan.
The Risk and Compliance Committee consists entirely of Non-Executive Directors. The members of the Committee are:
• M M Hudson (Chairman)
• G T Tilbrook
• R M Smith (from 1 April 2011)
• G D Mulligan (until 3 November 2010)
The Committee meets as required, normally at least four times per year – see page 30 for details. Under its Charter, the Chairperson of this Committee is also a member of the Audit Committee.
Detailed control procedures cover management accounting, financial reporting, project appraisal, environment, health and safety, IT security, compliance and other risk management issues. Numerous risk management controls are embedded in the Company’s risk management and reporting systems, including:
• guidelines and limits for approval of all expenditure inclusive of capital expenditure and investments;
24 tRAnspAciFic AnnuAl RepoRt 2011
For
per
sona
l use
onl
y

• policies and procedures for the management of financial risk and treasury operations, including hedging exposure to foreign currencies and interest rates;
• annual budgeting and monthly reporting systems for all divisions which enable monitoring of progress against performance targets, evaluation of trends and variances to be acted upon;
• preparation and ongoing review of five year strategic plans for all divisions;
• health and safety programs and targets; and
• due diligence procedures for acquisitions.
At a management level, Transpacific has a dedicated Risk department, which is responsible for updating and refining the existing risk management processes within Transpacific, and managing a detailed internal audit function across the group. To ensure a best practice approach to internal auditing, KPMG have been appointed to assist Transpacific with carrying out the work required in the annual internal audit plan.
At each meeting the Risk and Compliance Committee meets with the Internal Auditors without Management present.
Certification under section 295A of the Corporations Act 2001
The written statement provided to the Board under section 295A of the Corporations Act 2001, referred to above in respect of Principle 4, confirmed that the Declaration was founded on a sound system of risk management and internal control and that the system is operating effectively in all material respects in relation to financial reporting risks.
Occupational Health, Safety and Environment (OHSE)
Transpacific recognizes the importance of OHSE issues and is committed to a Zero Harm philosophy. Transpacific:
• monitors its compliance with all legislation;
• continually assesses and improves the impact of its operations on the environment;
• encourages employees to actively participate in the management of OHSE issues; and
• encourages management to drive performance in OHSE by including lead and lag indicators as measures in individual performance scorecards.
The Risk department conducts management systems, operational and licensing audits throughout the year as part of the Compliance Management Strategy. Transpacific has an externally certified Integrated Management System meeting the requirements of AS4801 (Occupational Health and Safety), ISO 14001 (Environment) and ISO 9001 (Quality).
A Greenhouse Policy has been implemented across the Group. The Policy is focused on improving our environmental footprint through the reduction of greenhouse gas emissions. Energy efficiency and emission reduction strategies will be assessed and implemented to help Transpacific achieve this goal. Information on compliance with significant environmental regulations is set out in the Directors’ Report.
pRinciple 8: RemuneRAte FAiRlY And ResponsiBlY
Human Resources Committee
The function of the Human Resources Committee is to assist the Board to ensure that Transpacific has in place appropriate Human Resources strategies and remuneration and employment policies that are consistent with best practices and business requirements, and that Transpacific adopts and complies with remuneration and employment policies that:
• attract, retain and motivate high calibre executives and directors so as to encourage enhanced performance of Transpacific;
• are consistent with the human resource needs of Transpacific;
• motivate management to pursue the long-term growth and success of Transpacific within an appropriate control framework; and
• demonstrate a clear relationship between executive performance and remuneration.
During the year, the Human Resources Committee Charter was amended to reflect that the committee will review and make recommendations to the Board on the company’s diversity policies and practices, including remuneration by gender.
The Human Resources Committee consists entirely of Non-Executive Directors, as follows:
• B R Brown (Acting Chairman from 3 November 2010)
• R A Ghatalia
• E R Stein (from 1 August 2011)
• G D Mulligan (Chairman until 3 November 2010)
The Committee meets as required and at least four times per year – see page 30 for more details.
Remuneration Report
The Remuneration Report, which has been included in the Directors’ Report, provides information on Transpacific’s remuneration policies and payment details for Directors and Senior Executives.
tRAnspAciFic AnnuAl RepoRt 2011 25
For
per
sona
l use
onl
y

26 tRAnspAciFic AnnuAl RepoRt 2011
FinAnciAl RepoRt for the financial year ended 30 June 2011
Transpacific Industries Group Ltd ABN 74 101 155 220
FINANCIAL REPORT Financial Year Ended 30 June 2011
Contents
Directors’ Report 27
Auditor’s Independence Declaration 44
Statement of Financial Position 45
Statement of Comprehensive Income 46
Statement of Changes in Equity 48
Statement of Cash Flows 49
Notes to the Financial Statements 50
Directors’ Declaration 117
Independent Audit Report to the Members 118
Shareholder Information 119
For
per
sona
l use
onl
y

diRectoRs’ RepoRt
27
26
Directors’ Report
The Directors present their report together with the financial report of Transpacific Industries Group Ltd (“Transpacific” or “the Company”) and of the Group, being the Company and its subsidiaries for the financial year ended 30 June 2011 and the auditor’s report thereon.
Directors
The names of Directors of the Company at any time during or since the end of the financial year are as follows. Directors were in office for this entire period unless otherwise stated. G T Tilbrook – Non-Executive Chairman K G Campbell – Executive Director and Chief Executive Officer (appointed 27 January 2011) B R Brown – Non-Executive Director and Deputy Chairman R A Ghatalia – Non-Executive Director M M Hudson – Non-Executive Director R M Smith – Non-Executive Director (appointed 1 April 2011) E R Stein – Non-Executive Director (appointed 1 August 2011) T J Coonan – Executive Director and Chief Executive Officer (resigned 27 January 2011) G D Mulligan – Non-Executive Director (retired 3 November 2010) B S Allan – Non-Executive Director (retired 3 November 2010)
The office of Company Secretary is held by K L Smith, B.Com (Hons), CA.
Particulars of Directors’ qualifications, experience and special responsibilities are detailed on pages 18 and 19 of the Annual Report.
Principal Activities
During the financial year the principal continuing activities of the Group consisted of:
• municipal, residential, commercial and industrial collection services for all types of solid waste streams, including general waste, recyclables, construction and demolition waste and medical and washroom services;
• ownership and management of waste transfer stations, resource recovery and recycling facilities, secure product destruction, quarantine treatment operations and landfills;
• sale of recovered paper, cardboard, metals and plastics to the domestic and international marketplace;
• the collection, treatment, processing and recycling of liquid and hazardous waste, including industrial waste, grease trap waste, oily waters and used mineral and cooking oils in packaged and bulk forms;
• refining and recycling of used mineral oils to produce fuel oils and base oils
• the manufacture of bituminous based applications and coatings;
• industrial solutions including industrial cleaning, vacuum tanker loading, site remediation, sludge management, parts washing, concrete remediation, CCTV, corrosion protection, asbestos removal and emergency response services;
• independent importer and distributor of Western Star, MAN, Foton and Dennis Eagle truck chassis and associated parts and MAN bus chassis and associated parts; and
• manufacturing and servicing of vehicle bodies, parts washers, plastic and steel bins and waste compaction units to support our own operations as well as our clients.
No significant changes in the nature of the activities of the Group occurred during the year.
For
per
sona
l use
onl
y

diRectoRs’ RepoRt continued
28 tRAnspAciFic AnnuAl RepoRt 2011
Transpacific Annual Report 2011 27
Dividends and Distributions
There were no dividends paid on ordinary shares during the 2011 or 2010 reporting years.
Details of distributions in respect of the financial year are as follows:
2011 $’000
2010 $’000
SPS PREFERENCE SECURITIES: Distribution of $2.87 per unit paid on 15 October 2010 (2010: $2.31) 7,175 5,775 Distribution of $3.00 per unit paid on 15 April 2011 (2010: $2.54) 7,500 6,350 TOTAL DISTRIBUTIONS PAID 14,675 12,125 TOTAL DIVIDENDS AND DISTRIBUTIONS PAID 14,675 12,125
In accordance with certain restrictions on payment of future dividends agreed with WPX Nominees B.V. (the Company’s major shareholder), syndicate banks and USPP noteholders, the Directors have decided not to declare a final dividend for 2011.
The payment of the SPS preference securities distribution for the period ending 30 September 2011 of $7,425,000 ($2.97 per unit) is to be paid on 14 October 2011. The financial effect of this distribution has not been brought to account in the financial statements for the year ended 30 June 2011 and will be recognised in subsequent financial reports. The proposed distribution is fully franked.
On 1 October 2011 the distribution on the SPS preference securities will be “stepped up”. As a result, the distribution margin will increase from 3.5% to 6.0% with effect from the distribution period ending 31 March 2012.
While the SPS have no fixed maturity date, the Trust retains the ability to redeem or convert the SPS at subsequent distribution payment dates.
Review of Operations, Financial Position, Business Strategies and Prospects
The Group net (loss)/profit after income tax attributable to ordinary equity holders of Transpacific Industries Group Ltd for the year ended 30 June 2011 was a ($296.5 million) loss (2010: $59.0 million profit).
The 2011 result was affected by a non-cash write-down on the carrying value of non-current assets of $346.8 million (before tax). The majority of this impairment charge relates to:
• New Zealand Division, $181.5 million – this impairment arises from a reduction in the expected future growth rate of the New Zealand division given the difficulties facing the New Zealand economy, both generally and as a consequence of its recent natural disasters. This write-down does not reflect on the New Zealand division’s current business performance, which continues to be strong.
• Victoria Landfill, $95.2 million – this impairment arises from lower than expected valuations on industrial properties which may affect future sales of Transpacific’s Victorian landfill sites and a change in realisation assumptions. This write-down does not reflect on the current performance of this business.
• Manufacturing Division, $60.4 million – this impairment is necessitated by the poor financial performance of this cash generating unit in 2011 and follows a three year history of declining profitability. This Division is being restructured to position itself for future growth and prosperity.
The 2010 results included a net positive mark to market for change in the fair value of derivative financial instruments and warrants of $11.7 million.
For
per
sona
l use
onl
y

29
28
Directors’ Report
The segment EBITDA results (before significant items) were as follows:
2011 $’000
2010 $’000
Cleanaway – Australia 200,432 186,468 Industrials – Australia 128,977 116,776 New Zealand 82,466 85,162 Share of Associates NPAT 5,018 1,373
Total Waste Management businesses 416,893 389,779 Commercial Vehicles – Australia and New Zealand 19,564 27,350 Manufacturing – Australia and New Zealand (8,363) 6,890 Corporate (2,959) 318 Total EBITDA (before significant items) 425,135 424,337
Divisional EBITDA rose by 7.5% and 10.4% respectively in Cleanaway and Industrials Australia, with revenues and volumes across all business streams having remained steady, or increasing on 2010.
On 1 July 2010 the Group deconsolidated Transwaste Canterbury Ltd from the New Zealand division and Group results, and is now equity accounting this entity as an associate. If the comparative was restated to reflect this change, and applying a constant currency basis, the New Zealand division EBITDA would show an increase from 2010 to 2011 of 10.9%.
A lower total heavy duty truck market resulted in the Commercial Vehicles division’s EBITDA decreasing by 28.5% for the year.
The fundamentals of the Group’s total waste management businesses remain sound, with good prospects for growth in the market place.
The Group continues to focus on debt reduction and positioning itself to meet upcoming debt maturities.
Significant Changes in the State of Affairs
Other than matters mentioned in this report, no other significant changes in the state of affairs of the Group occurred during the financial year under review.
Events Subsequent to Reporting Date
There has not arisen in the interval between the end of the financial year and the date of this report any item, transaction or event, not already disclosed, of a material and unusual nature likely, in the opinion of the Directors of the Company, to affect significantly the operations of the Group, the results of those operations, or the state of affairs of the Group, in future financial years.
For
per
sona
l use
onl
y

diRectoRs’ RepoRt continued
30 tRAnspAciFic AnnuAl RepoRt 2011
Transpacific Annual Report 2011 29
Likely Developments and Expected Results of Operations
The Group’s two key objectives during the next financial year are:
• maximising profitability and return on capital employed across all divisions; and
• debt reduction and positioning to meet upcoming debt maturities.
Further information about likely developments in the operations of the Group and the expected results of those operations in future financial years have not been included in this report because disclosure of the information would be likely to result in unreasonable prejudice to the Group.
Environmental Regulation
The Group’s operations are subject to significant environmental regulation.
The Group holds environmental licences for its sites throughout Australia and New Zealand.
The Group is committed to achieving the highest standards of environmental performance. There were no material breaches of environmental statutory requirements and no material prosecutions during the year. The aggregate fines paid during the year were $27,262 (2010: $95,023) but are not considered material.
Meetings of Directors
The number of Directors’ meetings (including circular resolutions) and Committee meetings, and the number of meetings attended by each of the Directors of the Company during the financial year were:
BOARD MEETINGS AUDIT
COMMITTEE
RISK AND COMPLIANCE COMMITTEE
DIRECTOR
MEETINGS HELD WHILE A DIRECTOR
NUMBER ATTENDED
MEETINGS HELD WHILE A MEMBER
NUMBER ATTENDED
MEETINGS HELD WHILE
A MEMBER NUMBER
ATTENDED
G T Tilbrook 27 27 5 4 5 4 K G Campbell 12 12 * * * *
B R Brown 27 26 5 5 * *
R A Ghatalia 27 25 * * * *
M M Hudson 27 27 5 5 5 5
R M Smith 6 6 1 1 1 1
T J Coonan 15 14^ * * * *
G D Mulligan 10 10 * * 2 2
B S Allan 10 10 2 2 * *
* Not a member of the relevant committee.
^ Mr Coonan did not attend one meeting due to a conflict of interest.
HUMAN RESOURCES
COMMITTEE
DIRECTOR
MEETINGS HELD WHILE
A MEMBER NUMBER
ATTENDED
G T Tilbrook * * K G Campbell * *
B R Brown 5 5
R A Ghatalia 5 5
M M Hudson * *
R M Smith * *
T J Coonan * *
G D Mulligan 2 2
B S Allan * *
* Not a member of the relevant committee.
For
per
sona
l use
onl
y

31
30
Directors’ Report (continued)
Directors’ Interests
The relevant interest of each Director in the shares and options over such instruments issued by the companies within the Group and other related body corporates, as notified by the Directors to the Australian Securities Exchange in accordance with section 205G(1) of the Corporations Act 2001, at the date of this report is as follows:
ORDINARY
SHARES
OPTIONS OVER UNISSUED
ORDINARY SHARES
PERFORMANCE RIGHTS
EXECUTIVE K G Campbell - - 1,120,088* NON-EXECUTIVE
G T Tilbrook 80,000 - -
B R Brown 200,000 - -
R A Ghatalia - - -
M M Hudson 7,000 - -
R M Smith - - -
E R Stein - - -
* 337,500 of these performance rights have been issued subject to shareholder approval at the 2011 Annual General Meeting.
REMUNERATION REPORT (AUDITED)
REMUNERATION POLICY
The key driver of the Company’s remuneration policy is to attract and retain top quality Directors and Executives to ensure the continued success of the Group for the benefit of all stakeholders.
This Remuneration Report outlines the Director and Executive remuneration arrangements of the Group in accordance with the requirements of the Corporations Act 2001 and its Regulations. This information has been audited as required by section 308(3C) of the Act. For the purposes of this report, key management personnel (KMP) of the Group are defined as those persons having authority and responsibility for planning, directing and controlling the major activities of the Group, directly or indirectly, including any Director (whether Executive or otherwise) of the parent company, and includes the five highest remunerated Executives of the Group.
A. Human Resources Committee
The Human Resources Committee assists the Board in ensuring the Group establishes appropriate human resources strategies and remuneration and employment policies consistent with best practices and business requirements, and adopts and complies with remuneration and employment policies that: • attract, retain and motivate high calibre Executives and Directors so as to encourage enhanced performance
of the Group; • are consistent with the human resources needs of the Group; • motivate management to pursue the long-term growth and success of the Group within an appropriate risk
and control framework; and • demonstrate a clear relationship between Executive performance and remuneration.
For
per
sona
l use
onl
y

diRectoRs’ RepoRt continued
32 tRAnspAciFic AnnuAl RepoRt 2011
Transpacific Annual Report 2011 31
B. Non-Executive Directors’ Remuneration
Non-Executive Directors are paid Directors’ fees which reflect the demands that are made on, and the responsibilities of, those Directors. Non-Executive Directors’ fees and payments are reviewed annually by the Board and are determined within an aggregate Directors’ fee pool limit, which is periodically recommended for approval by shareholders. The Board seeks to set aggregate remuneration at a level that provides the Group with the ability to attract and retain Directors of the highest calibre, whilst incurring a cost that is acceptable to shareholders. The maximum aggregate Director fee pool limit was voted upon by shareholders at the 2010 AGM, and was increased from $750,000 per annum to $1.2 million per annum (inclusive of superannuation), to be apportioned among the Non-Executive Directors as the Board determines in its absolute discretion.
The current fee structure is set out below:
BOARD
$
AUDIT COMMITTEE
$
RISK AND COMPLIANCE
COMMITTEE $
HUMAN RESOURCES COMMITTEE
$
NOMINATION COMMITTEE
$
Chairman 275,000 30,000 20,000 20,000 -
Non-Executive Director 125,000 - - - -
The remuneration Non-Executive Directors received for the years ended 30 June 2011 and 30 June 2010 are:
SHORT-TERM
SHARE-BASED PAYMENTS
POST EMPLOY-MENT
SALARY AND FEES
$
STI CASH BONUS
$
NON-MONETARY
BENEFITS $
OPTIONS6 $
SUPER-ANNUATION
BENEFITS $
TOTAL $
% OF REMUN-ERATION
PERFORMANCE RELATED
NON-EXECUTIVE IRECTORS
G T Tilbrook1 – 2011 259,796 - - - 15,200 274,996 -
– 2010 94,830 - - - 8,535 103,365 -
B R Brown – 2011 114,677 - - - 10,321 124,998 -
– 2010 109,399 - - - 9,846 119,245 -
R A Ghatalia2 – 2011 - - - - - - -
– 2010 - - - - - - -
M M Hudson3 – 2011 133,025 - - - 11,972 144,997 - – 2010 91,743 - - - 8,257 100,000 -
R M Smith4 – 2011 35,550 - - - 3,199 38,749 -
G D Mulligan 5 – 2011 45,877 - - - 4,129 50,006 -
– 2010 109,399 - - - 9,846 119,245 -
B S Allan 6 – 2011 39,549 - - - 3,559 43,108 -
– 2010 109,399 - - 1,493 9,846 120,738 1.2%
Total – 2011 628,474 - - - 48,380 676,854
Total – 2010 514,770 - - 1,493 46,330 562,593 1 Appointed as Non-Executive Director on 3 September 2009 and Non-Executive Chairman on 3 June 2010. 2 Appointed as Non-Executive Director on 1 September 2009. He has elected not to receive any Directors’ fees as the representative
Director of Warburg Pincus, a major shareholder. 3 Appointed as Non-Executive Director on 14 September 2009. 4 Appointed as Non-Executive Director on 1 April 2011. 5 Retired as Non-Executive Director on 3 November 2010. 6 Share based payment expense relates to options issued under the former Long Term Incentive Plan, which have now lapsed.
Non-Executive Directors do not participate in the new Long Term Incentive Plan.
For
per
sona
l use
onl
y

33
32
Directors’ Report (continued)
C. Executive Director and Senior Executive Remuneration Policy and Structure
The Group’s remuneration strategy is designed to attract, retain and motivate employees.
The Board ensures that Executive remuneration satisfies the following key criteria for good remuneration governance practices:
• aligned to the Group’s business strategy;
• competitiveness and reasonableness - as benchmarked against the external market;
• performance linked - to individual and financial performance; and
• aligned to shareholder value - through measuring Total Shareholder Return (TSR).
During the 2010 year, the Human Resources Committee sought independent advice in setting the structure and levels of Executive remuneration. The Board, upon the recommendation of the Human Resources Committee, has developed and adopted a structure driven by these key criteria which consists of:
• base pay (total fixed remuneration (TFR)); and
• incentive or “at-risk” components. These take the form of:
o annual incentives that represent between 10% and 75% of TFR; and
o long-term incentives that represent between 20% and 75% of TFR; and
o a one-off Executive engagement award issued in June 2010 (refer below for further details).
The proportion of remuneration that is at-risk (being the annual incentive and long-term incentive elements) increases for more senior positions to ensure that a significant part of an Executive’s reward is dependent on achieving business objectives and generating shareholder returns.
A detailed description of each of these elements is provided below.
Total Fixed Remuneration (TFR) Executives are offered a competitive base salary as part of TFR, which also includes statutory superannuation contributions, and other packaged allowances. The amount of TFR for each Executive Director and Senior Executive is approved annually by the Board, based on the recommendation of the Human Resources Committee, with consideration given to business and individual performance, responsibilities, qualifications and experience, as well as market relativity. There are no guaranteed base pay increases included in any Senior Executive contracts.
Annual Incentive Plan (AIP)
Actual incentive payments for the year ended 30 June 2011 are determined by achievement of clearly defined group earnings per share (EPS), divisional (earnings before interest and tax - EBIT) financial targets and a pre-determined scorecard of individual measurements and performance standards. The incentive is payable by a mix of cash and Performance Rights which entitle the employee to one share in the Company for each right granted after a period of two years from the grant date and subject to forfeiture if the employee resigns before the end of that period.
These performance measures were chosen primarily to align participant reward outcomes with the accomplishment of annual business plans and targets that drive divisional and Group performance.
The scorecard includes items such as:
• Financial measures - earnings and capital expenditure targets, achievement of Group strategic objectives;
• Customers - cross-selling opportunities and business growth targets;
• Process and Governance – continuous improvement targets, safety and environmental performance targets (including reductions in lost-time injury rates); and
• People – executive succession planning and talent development
Executives have the ability to earn up to 200% of their annual incentive where:
• 120% of the relevant financial targets are achieved; and
• the highest level of individual measures and performance standards are met.
For
per
sona
l use
onl
y

diRectoRs’ RepoRt continued
34 tRAnspAciFic AnnuAl RepoRt 2011
Transpacific Annual Report 2011 33
Annual Incentive Plan (AIP) (continued)
Annual incentive payments are determined after the preparation of the financial statements each year (in respect of the financial measures) and after a review of performance against individual measures. Payments of annual incentives are generally made in October each year.
For the 2011 financial year, no annual incentive bonuses were payable to Senior Executives as the Group and divisional financial targets were not met. However, the Board has discretion to award bonuses based on circumstances and other criteria. These have not yet been considered for the 2011 financial year.
For the 2010 financial year, divisional financial targets were not met; however, the board used its discretion to award bonuses to one KMP, and 219 employees. The total bonuses paid in cash were $2.7 million. 450,306 Performance Rights which vest on 30 June 2012 (subject to continued employment) were also issued under the terms of the Transpacific Industries Group Annual Inventive Plan.
Long-Term Incentive Plan
Shareholders approved the Transpacific Industries Group Long-term Incentive Plan (LTIP) at the 2010 Annual General Meeting. The LTIP is a key part of the longer term retention and incentive strategy of the Group, and is designed to reward Executives for delivering long-term shareholder return.
Under the LTIP, participants are issued performance rights which will entitle them to one ordinary share in the Group for each right granted at the end of a three year period if certain performance standards are met. Offers are made annually at the discretion of the Board, in conjunction with the salary review process for executives.
The LTIP performance standards are measured as follows:
• The Company achieving a total shareholder return (TSR) ranking of equal to or greater than the 50th percentile of the TSR of the S&P/ASX 200 Industrial Sector Index (excluding companies involved in resources or mining); and
• If the TSR ranking is achieved and the Group achieves certain statutory earnings per share (EPS) growth targets, the following percentages of performance rights vest:
PROPORTION OF PERFORMANCE RIGHTS THAT MAY BE EXERCISED IF TSR HURDLE IS MET EPS GROWTH HURDLE
2010 OFFER 2011 OFFER
< 15% annualised EPS growth
0% 0%
15% annualised EPS growth 50% 50%
20% annualised EPS growth
Straight line vesting between 50% and 75%
Straight line vesting between 50% and 75%
25% annualised EPS growth
Straight line vesting between 75% and 100%
Straight line vesting between 75% and 100%
PERFORMANCE PERIOD 1 July 2010 to 30 June 2012 1 July 2010 to 30 June 2013
Relative TSR performance provides an objective measure for rewarding Executives based on the extent to which shareholder returns are generated, relative to the performance of companies of a similar size. EPS is also used as it aligns directly with the increasing value of the business.
Fifty per cent of the ordinary shares allocated upon vesting of performance rights will be restricted shares, meaning that where the participant does not hold shares in the Company to the value of at least 12 months’ TFR at the vesting date, they will not be allowed to sell these restricted shares until they hold 12 months’ TFR in the Company’s shares. The Board has the right to waive any such restriction.
Where a participant ceases employment prior to the vesting of their award, the performance rights are forfeited unless the Board applies its discretion in appropriate circumstances.
For
per
sona
l use
onl
y

35
34
Directors’ Report (continued)
Long-Term Incentive Plan (continued)
The Board has discretion to determine the extent of vesting in the event of a change of control, or where a participant dies, becomes permanently disabled, retires or is made redundant.
All options granted to employees under the former Long-term Incentive Executive Share Option Plan have now lapsed and had an immaterial effect on the 2011 year.
Executive Engagement Award
In the 2010 year, the Board issued 9,945,265 performance rights to certain Executives, under a one-off Executive Engagement Award (EEA).
The purpose of this Award was to:
• provide one-off incentives to retain certain eligible Executives and senior managers;
• foster a responsible balance between short-term and long-term corporate results and long-term shareholder value creation; and
• build and maintain a strong spirit of performance and entrepreneurship.
The vesting of the performance rights issued under this Award is conditional upon the participant being employed at vesting date (30 June 2015), and will vest at various percentages based on the Company’s ordinary share price at that date as follows:
20 day VWAP
PERCENTAGE OF PERFORMANCE
RIGHTS VESTING
Less than $3.00 0%
$3.00 50%
$4.50 100%
$6.00 200%
$9.00 or more 300%
The award is subject to the same employment and early vesting clauses as the LTIP.
Shareholders approved the Transpacific Industries Group EEA at the 2010 Annual General Meeting.
Performance rights on issue The number of performance rights on issue at the date of this report is:
VESTING DATE NUMBER ON ISSUE
AIP
2010 offer 30 June 2012 405,098
LTIP
2010 offer 14 days after release of results
for year ending 30 June 2012 1,487,774
2011 offer 14 days after release of results
for year ending 30 June 2013 2,481,695
EEA
2010 offer 30 June 2015 7,236,348
The Board has not previously exercised its discretion to allow the early vesting of any performance rights under the incentive plans.
For
per
sona
l use
onl
y

diRectoRs’ RepoRt continued
36 tRAnspAciFic AnnuAl RepoRt 2011
Transpacific Annual Report 2011 35
Securities Trading Policy
The Company prohibits Executives from entering into any hedging arrangements or acquiring financial products (such as equity swaps, caps and collars or other hedging products) over unvested options or performance rights which have the effect of reducing or limiting exposure to risks associated with the market value of the Company’s securities.
No Directors or Senior Executives may directly or indirectly enter into any margin loan facility against the Company’s securities unless the prior written consent of the Chairperson of the Board is obtained.
The Group’s Performance
The following table summarises the Group’s performance over the five year period from 1 July 2006 to 30 June 2011:
2007 2008 2009 2010 2011
EPS 44.1c 61.8c (77.9)c 6.7c1 (30.9)c
Dividends per share 11.7c 18.1c - - -
Share price at 30 June $13.36 $6.00 $1.80 $1.00 $0.82 1 In August 2009, the Company completed a recapitalisation, issuing 649,657,609 fully paid ordinary shares.
Based on the Group’s performance, no annual incentives were paid to Senior Executives in respect of the 2011 financial year. However, the Board has discretion to award bonuses based on circumstances and other criteria. These have not yet been considered for the 2011 financial year.
An annual incentive was paid to one Key Management Personnel in respect of the 2010 year. No options issued under the former long-term incentive plan vested during the 2011 financial year.
D. Key Executive Contract Terms
The remuneration and other terms of employment for Executive Directors and Senior Executives are covered in formal employment contracts. A summary of the key terms of employment contracts for nominated Executives is outlined below.
TFR consists of cash salary, statutory superannuation contributions and packaged benefits such as motor vehicle allowances. There is no fixed term for key Executive contracts. Participation in the annual incentive plan and LTIP is at the Board’s discretion.
Performance appraisals are undertaken annually.
The Company may terminate service agreements immediately for cause, in which case the Executive is not entitled to any payment in lieu of notice or compensation.
For
per
sona
l use
onl
y

37
36
Directors’ Report (continued)
A summary of the key contract terms are below.
RESIGNATION TERMINATION BY TPI
(WITHOUT CAUSE) REDUNDANCY
K G Campbell,
N M Badyk,
A G Roderick,
S G Cummins*
12 months’ notice 12 months’ notice
12 months’ notice plus a severance payment of 2 weeks for every year of service. Payment not to exceed
average annual base salary over the previous 3 years.
P A Glavac,
K L Smith 6 months’ notice 6 months’ notice
6 months’ notice plus a severance payment of 2 weeks for every year of service. Payment not to exceed
average annual base salary over the previous 3 years.
T Nickels
3 months’ notice 1 months’ notice
6 months’ notice plus a severance payment of 4 weeks for the first year of service and 2 weeks for every year of service thereafter,
capped at 26 weeks.
* S G Cummins’ contract contains a six month notice period during his probation period (which ends 23 November 2011). E. Remuneration of Executive Directors and Key Management Personnel Details of the remuneration of the Executive Directors and the key management personnel (as defined in AASB 124 Related Party Disclosures) of the Group are set out in the following tables. These tables reflect the base fixed components and the “at-risk” performance-related components discussed above. The options and performance rights have been costed in accordance with methodology set out in F below.
A listing of all employees who were KMP during the 2011 and 2010 years is set out below.
NAME TITLE WHILST KMP PERIOD KMP (IF LESS THAN
FULL YEAR)
K G Campbell Executive Director and Chief Executive Officer From 1 September 2010 N M Badyk Chief Operating Officer, Transpacific Cleanaway
A G Roderick Chief Operating Officer, Transpacific Industrials
S G Cummins Chief Financial Officer From 23 May 2011
P A Glavac Managing Director, Commercial Vehicles
T Nickels Managing Director, New Zealand
K L Smith Company Secretary
T J Coonan Executive Director and Chief Executive Officer Until 27 January 2011
T E Peabody Executive Chairman Until 30 June 2010
H W Grundell Executive General Manager, New Zealand, Commercial Vehicles and Manufacturing
Until 6 June 2011
S T Barnard * General Manager, Group Projects
G R W Battershill Chief Financial Officer Until 5 March 2010
G S Campbell Managing Director, Solid Waste Australia and New Zealand
Until 13 November 2009
* S T Barnard ceased employment on 29 July 2011.
For
per
sona
l use
onl
y

diRectoRs’ RepoRt continued
38 tRAnspAciFic AnnuAl RepoRt 2011
Transpacific Annual Report 2011 37
REMUNERATION OF THE KEY MANAGEMENT PERSONNEL OF THE GROUP
SHORT-TERM
SHARE-BASED PAYMENTS
POST EMPLOY-MENT
SALARY AND FEES
$
OTHER CASH
$
STI CASH BONUS
$
NON-MONETARY
BENEFITS $
OPTIONS AND
RIGHTS $
SUPER-ANNUATION
BENEFITS $
TERM-INATION
PAY $
TOTAL $
EXECUTIVE DIRECTOR
K G Campbell1 – 2011 578,202 - - 2,755 172,936 28,846 - 782,739
FORMER EXECUTIVE DIRECTORS
T J Coonan 2 – 2011 537,471 - - 1,458 (33,590) 62,311 1,185,888 1,753,538
– 2010 874,017 - - 4,136 94,595 76,502 - 1,049,250
T E Peabody 3 – 2010 700,014 - - 8,340 - 63,001 1,222,184 1,993,539
KEY MANAGEMENT PERSONNEL
N M Badyk – 2011 575,000 - 56,4324 3,137 222,909 25,000 - 882,478
– 2010 479,341 - - 98 22,002 40,981 - 542,422
A G Roderick – 2011 552,441 60,9725 - 2,960 204,098 53,047 - 873,518
– 2010 482,342 - - 647 33,309 41,251 - 557,549
S G Cummins – 2011 53,451 30,0006 - 2,988 - 1,676 - 88,115
P A Glavac – 2011 460,697 - - 958 125,692 39,303 - 626,650
– 2010 399,007 - - 2,130 15,730 33,751 - 450,618
T Nickels – 2011 352,932 - - 19,148 146,842 7,059 - 525,981
– 2010 329,376 - - 31,138 11,430 6,588 - 378,532
K L Smith – 2011 331,927 - - 2,500 82,350 28,073 - 444,850
– 2010 245,004 - - 5,157 10,468 20,250 - 280,879
FORMER KEY MANAGEMENT PERSONNEL
H W Grundell – 20117 582,036 - - 5,250 (19,181) 55,753 943,526 1,567,384
– 2010 599,011 - - 2,652 43,027 51,751 - 696,441
S T Barnard – 20118 311,200 - 25,000 4,048 90,653 26,208 - 457,109
– 2010 303,011 - - 2,240 32,944 25,200 - 363,395
G R W Battershill - 20109 231,486 - - - - 19,544 29,422 280,452
G S Campbell – 201010 165,879 - - 488 - 12,578 343,625 522,570
Total – 2011 4,335,357 90,972 81,432 45,202 992,709 327,276 2,129,414 8,002,362
Total – 2010 4,808,488 - - 57,026 263,505 391,397 1,595,231 7,115,647
1 K G Campbell commenced employment as Chief Financial Officer on 1 September 2010. Mr Campbell was appointed as Executive Director and Chief Executive Officer on 27 January 2011. 2 T J Coonan resigned as Chief Executive Officer on 27 January 2011. Pursuant to his contract of employment Mr Coonan received a termination payment equivalent to the average of his annual base salary over the previous three years, and leave accrual payments. 3 T E Peabody ceased employment on 30 June 2010. Pursuant to his contract of employment dated 19 March 2005, Mr Peabody received a redundancy payment of $724,950, a payment in lieu of accrued long service leave of $359,172 and a payment in lieu of accrued annual leave of $138,082. Mr Peabody’s redundancy payment was less than the average of his annual base salary over the previous three years. 4 N M Badyk received an AIP bonus in 2011 in respect of the 2010 year. The Board used its discretion to award a bonus under the terms of the AIP after considering the performance and financial results of the Cleanaway business for that year. He received a cash bonus of $56,432, and 51,773 performance rights which vest 30 June 2012. His AIP bonus as a proportion of his total remuneration for 2011 is 8.5%. 5 A G Roderick received a cash payment of $60,972 in lieu of leave entitlements as entitled under legislation. 6 S G Cummins commenced employment as Chief Financial Officer on 23 May 2011. In 2011 he received a one-off $30,000 relocation allowance. 7 H W Grundell ceased employment on 6 June 2011. Pursuant to his contract of employment Mr Grundell received a redundancy payment equivalent to the average of his annual base salary over the previous three years, and leave accrual payments. 8 S T Barnard ceased employment subsequent to the end of the reporting period (29 July 2011). In 2011 Mr Barnard received a retention bonus of $25,000 for the ERP system implementation. His AIP bonus as a proportion of his total remuneration for 2011 is 5.5%. 9 G R W Battershill resigned as Chief Financial Officer on 5 March 2010. Mr Battershill received a termination payment which consisted of leave accrual payments. 10 G S Campbell resigned as Managing Director, Solid Waste Australia and New Zealand on 13 November 2009. Mr Campbell received a termination payment which consisted of 26 weeks’ severance pay in accordance with his contract, and leave accrual payments.
For
per
sona
l use
onl
y

39
38
Directors’ Report (continued)
F. Share Based Remuneration
Details of the aggregate AIP share opportunities in the Company that were granted as compensation to key management personnel during the reporting period and details on share opportunities that were vested during the reporting period are as follows.
NUMBER OF SHARE OPPORTUNITIES GRANTED
DURING THE YEAR
NUMBER OF SHARE OPPORTUNITIES VESTED DURING
THE YEAR
NUMBER OF SHARE OPPORTUNITIES
LAPSED/CANCELLED DURING THE YEAR
2011 2010 2011 2010 2011 2010
KEY MANAGEMENT PERSONNEL
N M Badyk 51,773 - - - - -
Details of the aggregate LTIP and EEA share opportunities in the Company that were granted as compensation to each key management personnel during the reporting period and details on share opportunities that were vested during the reporting period are as follows.
NUMBER OF SHARE OPPORTUNITIES GRANTED
DURING THE YEAR
NUMBER OF SHARE OPPORTUNITIES VESTED DURING
THE YEAR
NUMBER OF SHARE OPPORTUNITIES
LAPSED/CANCELLED DURING THE YEAR
2011 2010 2011 2010 2011 20101
EXECUTIVE DIRECTORS
K G Campbell 1,120,0882 - - - - -
FORMER EXECUTIVE DIRECTORS
T J Coonan 750,000 1,324,080 - - 2,507,413 200,000
KEY MANAGEMENT PERSONNEL
N M Badyk 300,000 653,604 - - - 100,000
A G Roderick 300,000 653,604 - - 500,000 -
S G Cummins - - - - - -
P A Glavac 175,000 401,532 - - - 100,000
T Nickels 187,729 456,455 - - - -
K L Smith 126,000 246,155 - - 75,000 -
FORMER KEY MANAGEMENT PERSONNEL
H W Grundell 337,910 785,109 - - 1,223,019 -
S T Barnard 118,093 301,740 - - 30,000 -
G R W Battershill - - - - - 200,000
G S Campbell - - - - - 650,000
1 Share opportunities lapsed/cancelled in 2010 are share options issued under the former long-term incentive plan. 2 337,500 of these performance rights have been issued subject to shareholder approval at the 2011 Annual General Meeting.
The assessed fair value at grant date of share opportunities granted to individuals is allocated equally over the period from grant date to vesting date, and the amount is included in the remuneration tables above. Details of the vesting conditions are set out earlier in the report.
Subsequent to year end, no performance rights have been issued to KMP.
No terms of equity-settled share-based payment transactions have been altered or modified by the issuing entity during the reporting period.
For
per
sona
l use
onl
y

diRectoRs’ RepoRt continued
40 tRAnspAciFic AnnuAl RepoRt 2011
Transpacific Annual Report 2011 39
There were no ordinary shares in the Company issued as a result of the exercise of remuneration share opportunities in 2011 or 2010 financial years.
Details of the vesting profile of the options and performance rights granted as remuneration to each Director of the Company and each of the key management personnel of the Group are set out below. No options or performance rights will vest if performance conditions detailed earlier are not satisfied, hence the minimum value of the option or performance rights to vest is nil. The maximum value of those yet to vest has been determined as the fair value amount of the options and performance rights at grant date that is yet to be expensed.
VALUE OF SHARE
OPPORTUNITIES AS PROPORTION
OF REMUN-ERATION
FINANCIAL YEAR
GRANTED NUMBER
% VESTED
AT 30 JUNE 2011
% LAPSED / CANCELLED
IN 2011
FINANCIAL YEARS IN
WHICH SHARE
OPPOR-TUNITIES
VEST
MINIMUM TOTAL
VALUE YET TO VEST
$
MAXIMUM TOTAL
VALUE YET TO VEST
$
OPTIONS ISSUED UNDER FORMER LONG-TERM INCENTIVE PLAN
FORMER EXECUTIVE DIRECTORS
T J Coonan - 2008 200,000 - 100% C - -
- 2008 100,000 - 100% A - -
FORMER NON-EXECUTIVE DIRECTORS
B S Allan - 2007 50,000 - 100% A - -
KEY MANAGEMENT PERSONNEL
A G Roderick - 2006 150,000 - 100% A - -
2006 150,000 - 100% A - -
2007 100,000 - 100% B - -
2007 100,000 - 100% C - -
T Nickels - 2008 150,000 - - D - -
2009 50,000 - - D - -
K L Smith - 2008 75,000 - 100% D - -
FORMER KEY MANAGEMENT PERSONNEL
H W Grundell - 2007 100,000 - 100% B - -
S T Barnard - 2008 30,000 - 100% A - -
2008 20,000 - - B - -
2008 100,000 - - C - -
For
per
sona
l use
onl
y

41
40
Directors’ Report (continued)
VALUE OF SHARE
OPPORTUNITIES AS PROPORTION
OF REMUN-ERATION
FINANCIAL YEAR
GRANTED NUMBER
% VESTED
AT 30 JUNE 2010
% LAPSED / CANCELLED
IN 2010
FINANCIAL YEARS IN
WHICH SHARE
OPPOR-TUNITIES
VEST
MINIMUM TOTAL
VALUE YET TO VEST
$
MAXIMUM TOTAL
VALUE YET TO VEST
$
PERFORMANCE RIGHTS ISSUED UNDER LONG-TERM INCENTIVE PLAN
EXECUTIVE DIRECTORS
K G Campbell 38% 2011 300,000* - - G - 255,000
2011 149,254 - - E - 132,836
2011 333,334 - - F - 446,668
FORMER EXECUTIVE DIRECTORS
T J Coonan - 2011 750,000 - 100% G - -
2010 531,996 - 100% E - -
2010 792,084 - 100% F - -
KEY MANAGEMENT PERSONNEL
N M Badyk 35% 2011 300,000 - - G - 225,000
2010 202,146 - - E - 179,910
2010 451,458 - - F - 604,954
A G Roderick 34% 2011 300,000 - - G - 225,000
2010 202,146 - - E - 179,910
2010 451,458 - - F - 604,954
P A Glavac 28% 2011 175,000 - - G - 148,750
2010 113,032 - - E - 100,598
2010 288,500 - - F - 386,590
T Nickels 36% 2011 187,729 - - G - 159,570
2010 123,121 - - E - 109,578
2010 355,000 - - F - 475,700
K L Smith 28% 2011 126,000 - - G - 107,100
2010 69,282 - - E - 61,661
2010 176,833 - - F - 236,956
FORMER KEY MANAGEMENT PERSONNEL
H W Grundell** - 2011 337,910 - 100% G - -
2010 242,817 - 100% E - -
2010 542,292 - 100% F - -
S T Barnard** 26% 2011 118,093 - - G - 100,379
2010 84,940 - - E - 75,597
2010 216,800 - - F - 290,512
A – Options vest in equal tranches over three years commencing financial year beginning 1 July 2007.
B – Options vest in equal tranches over two years commencing financial year beginning 1 July 2009.
C – Options vest in equal tranches over three years commencing financial year beginning 1 July 2008.
D – Options vest in equal tranches over three years commencing financial year beginning 1 July 2009.
E – Performance rights under the 2010 LTIP vest 14 days after the date on which the financial results for the year ending 30 June 2012 are released to the ASX.
F – Performance rights vest under the EEA on 30 June 2015.
G – Performance rights under the 2011 LTIP vest 14 days after the date on which the financial results for the year ending 20 June 2013 are released to the ASX.
* An additional 337,500 performance rights under the 2011 LTIP have also been issued to Mr Campbell on his appointment as CEO. These
performance rights have been issued subject to shareholder approval at the 2011 Annual General Meeting.
** These options have now lapsed.
END OF REMUNERATION REPORT
For
per
sona
l use
onl
y
diRectoRs’ RepoRt continued
42 tRAnspAciFic AnnuAl RepoRt 2011
Transpacific Annual Report 2011 41
Shares under Option
In the financial year ended 30 June 2011 and up to the date of this report, no options were granted over unissued shares.
As at the date of this report there are no unissued ordinary shares of the Company under option.
Details of performance rights granted under the AIP, LTIP and EEA in the 2011 and 2010 financial year are set out in a previous section of the Remuneration Report.
Shares Issued on the Exercise of Options
During or since the end of the financial year to the date of this report, the Company did not issue any ordinary shares as a result of the exercise of options.
Directors’ and Officers’ Insurance
During the financial year, the Company paid insurance premiums to insure the Directors and officers of the Company.
The liabilities insured are legal costs that may be incurred in defending civil or criminal proceedings that may be brought against the officers in their capacity as officers of Entities in the Group, and any other payments arising from liabilities incurred by the officers in connection with such proceedings. This does not include such liabilities that arise from conduct involving a wilful breach of duty by the officers or the improper use by the officers of their position or of information to gain advantage for themselves or someone else or to cause detriment to the Company. It is not possible to apportion the premium between amounts relating to the insurance against legal costs and those relating to other liabilities. Disclosure of the premium paid is not permitted under the terms of the insurance contract.
Non-audit Services
The Company may decide to employ the auditor on assignments additional to their statutory audit duties where the auditor’s expertise and experience with the Company and/or the Group are important. During financial years 2011 and 2010 non-audit services included taxation and other advisory services.
The Board of Directors has considered the position and in accordance with written advice provided by resolution of the Audit Committee, is satisfied that the provision of the non-audit services is compatible with, and did not compromise, the auditor independence requirements of the Corporations Act 2001 for the following reasons:
• all non-audit services were subject to the corporate governance procedures adopted by the Company to ensure they do not impact the integrity and objectivity of the auditor; and
• the non-audit services provided do not undermine the general principles relating to auditor independence as set out in APES 110 Code of Ethics for Professional Accountants, as they did not involve reviewing or auditing the auditor’s own work, acting in a management or decision-making capacity for the Company, acting as an advocate for the Company or jointly sharing risks and rewards.
For
per
sona
l use
onl
y

43
42
Directors’ Report (continued)
Details of the amounts paid or payable to the auditor, and its related practices for audit and non-audit services is set out below.
CONSOLIDATED
Ernst & Young: 2011 2010
1. Audit services 1,160,000 1,086,000
2. Non-audit services
Due diligence services - 612,335
Other advisory services 121,375 -
Taxation services 3,700 13,200
Total 1,285,075 1,711,535
A copy of the auditor’s independence declaration as required under section 307C of the Corporations Act 2001 is set out on page 44.
Rounding of Amounts
The Company is of a kind referred to in ASIC Class Order 98/100 issued by the Australian Securities and Investment Commission, relating to the “rounding off” of amounts in the Directors’ Report. Amounts in the Directors’ Report have been rounded off in accordance with that Class Order to the nearest thousand dollars or, in certain cases, to the nearest dollar.
This report is made in accordance with a resolution of the Directors.
G T Tilbrook
Chairman
Brisbane, 24 August 2011
For
per
sona
l use
onl
y

AuditoR’s independence declARAtion to the directors of transpacific industries Group ltd
44 tRAnspAciFic AnnuAl RepoRt 2011
20 Liability limited by a scheme approved under Professional Standards Legislation
Auditor’s Independence Declaration to the Directors of Transpacific Industries Group Limited In relation to our audit of the financial report Transpacific Industries Group Limited for the financial year ended 30 June 2011, to the best of my knowledge and belief, there have been no contraventions of the auditor independence requirements of the Corporations Act 2001 or any applicable code of professional conduct.
Ernst & Young
Mike Reid Partner 24 August 2011
For
per
sona
l use
onl
y

stAtement oF FinAnciAl position as at 30 June 2011
45
44
Statement of Financial Position As at 30 June 2011
CONSOLIDATED
NOTES 2011 $’000
2010 $’000
ASSETS Current assets
Cash and cash equivalents 9 88,726 140,954
Trade and other receivables 10 310,930 276,790
Current tax assets 11 707 14,520
Inventories 12 131,555 147,406
Derivative financial instruments 13 113 18,635
Other assets 15 13,680 12,298 TOTAL CURRENT ASSETS 545,711 610,603
Non-current assets Investments accounted for using the equity method 16 28,087 18,987
Other financial assets 14 6,840 23,942
Property, plant and equipment 17 1,029,443 1,128,009
Land held for sale 9,613 9,613
Intangible assets 18 2,061,933 2,412,865
Deferred tax assets 8 34,279 43,280 TOTAL NON-CURRENT ASSETS 3,170,195 3,636,696 TOTAL ASSETS 3,715,906 4,247,299 LIABILITIES Current liabilities
Trade and other payables 19 230,287 214,084
Borrowings 20 85,175 47,269
Employee benefits 46,853 42,791
Provisions 21 25,374 20,667
Derivative financial instruments 13 55,787 31,440
Other 22 21,275 19,659
TOTAL CURRENT LIABILITIES 464,751 375,910
Non-current liabilities Borrowings 20 1,405,534 1,654,924
Deferred tax liabilities 8 - 2,961
Employee benefits 8,282 9,774
Deferred government grants 954 1,136
TOTAL NON-CURRENT LIABILITIES 1,414,770 1,668,795 TOTAL LIABILITIES 1,879,521 2,044,705 NET ASSETS 1,836,385 2,202,594 EQUITY Issued capital 24 1,821,646 1,821,646
Reserves 24 (5,204) 56,823
Retained earnings 24 (231,728) 64,815
Parent entity interest 1,584,714 1,943,284
Non-controlling interest 24 1,825 9,464 Step-up preference security holders 24 249,846 249,846
TOTAL EQUITY 1,836,385 2,202,594
The above Statement of Financial Position should be read in conjunction with the accompanying Notes.
For
per
sona
l use
onl
y

stAtement oF compRehensiVe income for the financial year ended 30 June 2011
46 tRAnspAciFic AnnuAl RepoRt 2011
Transpacific Annual Report 2011 45
Statement of Comprehensive Income For the Financial Year Ended 30 June 2011
CONSOLIDATED
NOTES
2011 $’000
2010 $’000
CONTINUING OPERATIONS Revenue from continuing operations 4 2,181,985 2,073,996
Other income 5 9,214 2,474
Raw materials and inventory (414,917) (427,812)
Waste disposal and collection (297,203) )
(251,476)
Employee expenses (661,643) (616,174)
Depreciation and amortisation expenses (174,652) (168,571)
Finance costs 6 (179,762) (175,957)
Repairs and maintenance (108,621) (104,282)
Fuel purchases (58,295) (50,632)
Leasing charges (57,735) (60,059)
Freight costs (31,517) (28,090)
Other expenses (139,045) (114,449)
Results before associates and significant items 67,809 78,968
Share of net profits of associates accounted for using the equity method 26C 5,018 1,373
Impairment of available-for-sale financial assets 7 (5,179) -
Impairment of property, plant and equipment 7 (50,163) -
Impairment of intangible assets 7 (291,456) -
Change in fair value of derivative financial instruments 7 2,102 21,724
Change in fair value of warrants 7 - (10,029)
Profit/(loss) before income tax (271,869) 92,036
Income tax benefit/(expense) 8 (8,651) (19,300)
Profit/(loss) from continuing operations after income tax (280,520) 72,736
Attributable to:
Ordinary equity holders of the parent (296,543) 59,036
Non-controlling interest 1,348 1,575
Step-up preference security holders 14,675 12,125
Profit/(loss) from continuing operations after income tax (280,520) 72,736
The above Statement of Comprehensive Income should be read in conjunction with the accompanying Notes.
For
per
sona
l use
onl
y

stAtement oF compRehensiVe income for the financial year ended 30 June 2011 continued
47
46
Statement of Comprehensive Income (continued) For the Financial Year Ended 30 June 2011
CONSOLIDATED
NOTES 2011 $’000
2010 $’000
Profit/(loss) for the period (280,520) 72,736
Other comprehensive income
Cash flow hedges
Net gain/(loss) taken to equity (net of tax) 24 (2,839) 1,126
Translation of foreign operations
Exchange differences taken to equity 24 (57,702) 1,692
Revaluation of assets
Revaluation of non landfill land and buildings (net of tax) 24 (2,918) -
Revaluation of available-for-sale assets (net of tax) 24 (1,347) 2,747
Net income recognised directly in equity (64,806) 5,565
Total comprehensive income/(loss) for the period (345,326) 78,301
Attributable to:
Ordinary equity holders of the parent (361,349) 64,601
Non-controlling interest 1,348 1,575
Step-up preference security holders 14,675 12,125
Total comprehensive income/(loss) for the period (345,326) 78,301
Earnings per share for profit attributable to the ordinary equity holders of the Company:
Basic earnings per share 34 (30.9) 6.7
Diluted earnings per share 34 (30.9) 6.6
The above Statement of Comprehensive Income should be read in conjunction with the accompanying Notes.
For
per
sona
l use
onl
y
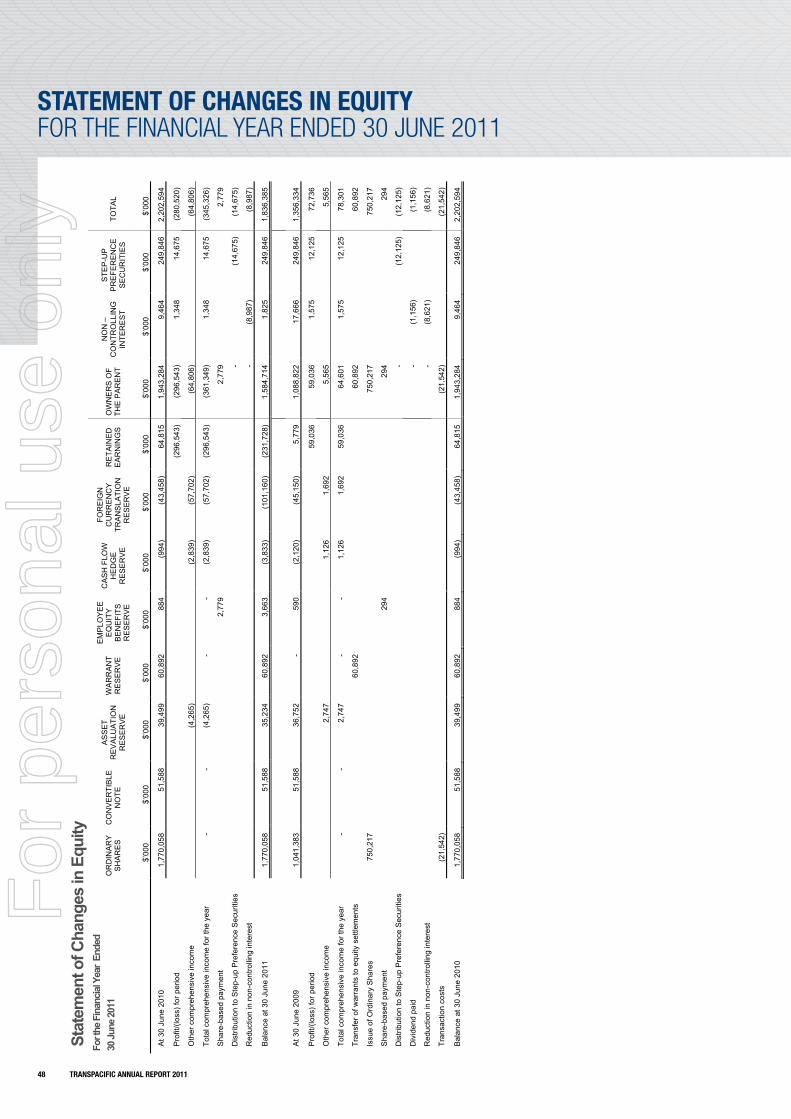
stAtement oF chAnges in eQuitY for the financial year ended 30 June 2011
48 tRAnspAciFic AnnuAl RepoRt 2011
Tran
spac
ific
Ann
ual R
epor
t 201
1 47
Stat
emen
t of C
hang
es in
Equ
ity
Fo
r the
Fin
ancia
l Yea
r En
ded
30
June
2011
O
RD
INA
RY
S
HA
RE
S
CO
NV
ER
TIB
LE
NO
TE
AS
SE
T R
EV
ALU
ATI
ON
R
ES
ER
VE
WA
RR
AN
T R
ES
ER
VE
EM
PLO
YE
E
EQ
UIT
Y
BE
NE
FITS
R
ES
ER
VE
CA
SH
FLO
W
HE
DG
E
RE
SE
RV
E
FOR
EIG
N
CU
RR
EN
CY
TR
AN
SLA
TIO
N
RE
SE
RV
E
RE
TAIN
ED
E
AR
NIN
GS
O
WN
ER
S O
F TH
E P
AR
EN
T
NO
N –
C
ON
TRO
LLIN
G
INTE
RE
ST
STE
P-U
P
PR
EFE
RE
NC
E
SE
CU
RIT
IES
TO
TAL
$’
000
$’00
0 $’
000
$’00
0 $’
000
$’00
0 $’
000
$’00
0 $’
000
$’00
0 $’
000
$’00
0
At 3
0 Ju
ne 2
010
1,77
0,05
8 51
,588
39
,499
60
,892
88
4 (9
94)
(43,
458)
64
,815
1,
943,
284
9,46
4 24
9,84
6 2,
202,
594
Pro
fit/(l
oss)
for p
erio
d
(296
,543
) (2
96,5
43)
1,34
8 14
,675
(2
80,5
20)
Oth
er c
ompr
ehen
sive
inco
me
(4,2
65)
(2,8
39)
(57,
702)
(64,
806)
(6
4,80
6)
Tota
l com
preh
ensi
ve in
com
e fo
r the
yea
r -
- (4
,265
) -
- (2
,839
) (5
7,70
2)
(296
,543
) (3
61,3
49)
1,34
8 14
,675
(3
45,3
26)
Sha
re-b
ased
pay
men
t
2,
779
2,
779
2,77
9
Dis
tribu
tion
to S
tep-
up P
refe
renc
e S
ecur
ities
-
(1
4,67
5)
(14,
675)
Red
uctio
n in
non
-con
trolli
ng in
tere
st
- (8
,987
)
(8,9
87)
Bal
ance
at 3
0 Ju
ne 2
011
1,77
0,05
8 51
,588
35
,234
60
,892
3,
663
(3,8
33)
(101
,160
) (2
31,7
28)
1,58
4,71
4 1,
825
249,
846
1,83
6,38
5
At 3
0 Ju
ne 2
009
1,0
41,3
83
51,5
88
36,7
52
-
5
90
(2,1
20)
(45,
150)
5,
779
1,
088,
822
17,6
66
249,
846
1,3
56,3
34
Pro
fit/(l
oss)
for p
erio
d
59,0
36
59,0
36
1,57
5 12
,125
72
,736
Oth
er c
ompr
ehen
sive
inco
me
2,74
7
1,
126
1,69
2
5,56
5
5,
565
Tota
l com
preh
ensi
ve in
com
e fo
r the
yea
r -
- 2,
747
- -
1,12
6 1,
692
59,0
36
64,6
01
1,57
5 12
,125
78
,301
Tran
sfer
of w
arra
nts
to e
quity
set
tlem
ents
60,8
92
60,8
92
60,8
92
Issu
e of
Ord
inar
y S
hare
s 75
0,21
7
750,
217
750,
217
Sha
re-b
ased
pay
men
t
29
4
294
294
Dis
tribu
tion
to S
tep-
up P
refe
renc
e S
ecur
ities
-
(1
2,12
5)
(12,
125)
Div
iden
d pa
id
- (1
,156
)
(1,1
56)
Red
uctio
n in
non
-con
trolli
ng in
tere
st
- (8
,621
)
(8,6
21)
Tran
sact
ion
cost
s (2
1,54
2)
(2
1,54
2)
(21,
542)
Bal
ance
at 3
0 Ju
ne 2
010
1,77
0,05
8 51
,588
39
,499
60
,892
88
4 (9
94)
(43,
458)
64
,815
1,
943,
284
9,46
4 24
9,84
6 2,
202,
594
For
per
sona
l use
onl
y

stAtement oF cAsh Flows for the financial year ended 30 June 2011
49
48
Statement of Cash Flows For the Financial Year Ended 30 June 2011
CONSOLIDATED
NOTES 2011 $’000
2010 $’000
CASH FLOWS FROM OPERATING ACTIVITIES Receipts from customers (inclusive of GST) 2,402,479 2,317,993
Payments to suppliers/employees (inclusive of GST) (2,017,248) (1,859,138)
Other revenue 14,812 8,391
Interest received 2,755 2,576
Interest paid (160,868) (158,227)
Income taxes benefits received/(paid) 12,061 (21,757) NET CASH FROM/(USED IN) OPERATING ACTIVITIES 27 253,991 289,838
CASH FLOWS FROM INVESTING ACTIVITIES Payments for purchase of businesses (4,241) (6,901)
Payments for property, plant and equipment (148,638) (134,416)
Proceeds from sale of business - 2,000
Proceeds from sale of listed securities 10,680 -
Proceeds from disposal of property, plant and equipment 9,775 11,883
NET CASH (USED IN) INVESTING ACTIVITIES (132,424) (127,434)
CASH FLOWS FROM FINANCING ACTIVITIES
Proceeds from issue of equity - 801,080
Payment of dividend to minority shareholders - (1,156)
Dividends received from associates 4,642 2,345
Payment of distribution on Step-up Preference Securities (14,675) (12,125)
Net movement in trade and vendor finance (806) (65,830)
Payment of equity raising costs - (23,272)
Payment of debt raising costs (1,175) (25,440)
Repayment of bank loans (124,154) (711,562)
Proceeds from bank loans - 2,371
Repayment of lease liabilities (36,410) (27,439)
Repayment of loans to related parties (380) (1,874)
Repayment of hedges - (29,169)
NET CASH (USED IN) FINANCING ACTIVITIES (172,958) (92,071)
1) NET INCREASE/(DECREASE) IN CASH HELD (51,391) 70,333 Cash at the beginning of the financial year 140,954 70,115
Net foreign exchange differences (837) 506 CASH AT THE END OF THE FINANCIAL YEAR 9 88,726 140,954
The above Statement of Cash Flows should be read in conjunction with the accompanying Notes.
For
per
sona
l use
onl
y

notes to the FinAnciAl stAtements for the financial year ended 30 June 2011
50 tRAnspAciFic AnnuAl RepoRt 2011
Transpacific Annual Report 2011 49
Notes to the Financial Statements For the Financial Year Ended 30 June 2011
1. Reporting Entity Transpacific Industries Group Ltd (the “Company”) is a listed public company, incorporated in Australia and operating in Australia, New Zealand and South East Asia. The consolidated financial statements of the Company as at and for the financial year ended 30 June 2011 comprise the Company and its subsidiaries (together referred to as the “Group”) and the Group’s interest in associates and jointly controlled entities.
2. Basis of Preparation
The financial report is a general purpose financial report which has been prepared in accordance with the Australian Accounting Standards (AAS) (including Australian Interpretations) adopted by the Australian Accounting Standards Board (AASB), the Corporations Act 2001, and complies with other requirements of the law.
The consolidated financial report of the Group complies with International Financial Reporting Standards (IFRSs) and interpretations adopted by the International Accounting Standards Board (IASB).
The financial report was authorised for issue by the Directors on 24 August 2011.
The financial report has been prepared on the basis of historical cost, except for the revaluation of certain non-current assets (non-landfill land and buildings and listed company investments) and financial instruments. Cost is based on the fair values of the consideration given in exchange for assets. All amounts are presented in Australian dollars, unless otherwise noted, which is the Group’s functional currency.
The Company is of a kind referred to in ASIC Class Order 98/100 dated 10 July 1998 and, in accordance with that Class Order amounts in the financial report have been rounded off to the nearest thousand dollars, unless otherwise stated.
The preparation of financial statements in accordance with International Financial Reporting Standards requires management to make judgements, estimates and assumptions that affect the application of accounting policies and reported amounts of assets, liabilities, income and expenses. The estimates and associated assumptions are based on historical experience and various other factors that are believed to be reasonable under the circumstances, the results of which form the basis of making the judgements about carrying values of assets and liabilities that are not readily apparent from other sources. Actual results may differ from these estimates. These accounting policies have been consistently applied by each entity in the Group.
The estimates and underlying assumptions are reviewed on an ongoing basis. Revisions to accounting estimates are recognised in the period in which the estimate is revised and in any future periods affected. Prior year comparatives have been adjusted to comply with current year presentation where appropriate.
3. Significant Accounting Policies
In the current year, the Group has adopted all of the new and revised Standards and Interpretations issued by the AASB that are relevant to its operations and effective for the current annual reporting period. Details of the impact of the adoption of these new accounting standards are set out in the individual accounting policy notes set out below.
Australian Accounting Standards and Interpretations that have recently been issued or amended but are not yet effective have not been adopted by the Group for the annual reporting period ended 30 June 2011. The impact of these not yet effective Standards and Interpretations has not yet been determined by management.
For
per
sona
l use
onl
y

51
50
3. Significant Accounting Policies (continued)
The following significant accounting policies have been adopted in the preparation and presentation of the financial report.
(A) BASIS OF CONSOLIDATION
(i) Subsidiaries The consolidated financial statements incorporate the assets and liabilities of all subsidiaries of Transpacific Industries Group Ltd (“Company” or “parent entity”) as at 30 June 2011 and the results of all subsidiaries for the year then ended. Transpacific Industries Group Ltd and its subsidiaries together are referred to in this financial report as the Group.
Subsidiaries are all those entities over which the Group has the power to govern the financial and operating policies, so as to obtain the benefits from their activities. In assessing control, potential voting rights that are presently exercisable or convertible are taken into account. Subsidiaries are fully consolidated from the date on which control is transferred to the Group. They are deconsolidated from the date that control ceases. The financial statements of the subsidiaries are prepared for the same reporting period as the parent company, using consistent accounting policies.
Intercompany transactions, balances, income and expenses and profit and losses resulting from intragroup transactions have been eliminated in full.
The acquisition of subsidiaries is accounted for using the acquisition method of accounting. The acquisition method of accounting involves recognising at acquisition date, separately from goodwill, the identifiable assets acquired, the liabilities assumed and any non-controlling interest in the acquiree. The identifiable assets acquired and the liabilities assumed are measured at their acquisition date fair values. The difference between these items and the fair value of the consideration is goodwill or a discount on acquisition.
A change in the ownership interest of a subsidiary that does not result in a loss of control is accounted for as an equity transaction.
Non-controlling interests (formerly known as minority interests) are allocated their share of net profit after tax in the statement of comprehensive income and are presented within equity in the consolidated statement of financial position separately from the equity of the owners of the parent. Losses are attributed to the non-controlling interest even if that results in a deficit balance.
If the Group loses control over a subsidiary it:
- derecognises the assets (including goodwill) and liabilities of the subsidiary;
- derecognises the carrying amount of any non-controlling interest;
- derecognises the cumulative translation differences, recorded in equity;
- recognises the fair value of the consideration received;
- recognises the fair value of any investment retained;
- recognises any surplus or deficit in profit or loss; and
- reclassifies the parent’s share of components previously recognised in other comprehensive income to profit or loss.
For
per
sona
l use
onl
y

notes to the FinAnciAl stAtements for the financial year ended 30 June 2011 continued
52 tRAnspAciFic AnnuAl RepoRt 2011
Transpacific Annual Report 2011 51
Notes to the Financial Statements For the Financial Year Ended 30 June 2011 (continued)
3. Significant Accounting Policies (continued)
(A) BASIS OF CONSOLIDATION (CONTINUED)
(ii) Associates Associates are all entities over which the Group has significant influence, but not control, over the financial and operating policies. Investments in associates are accounted for in the consolidated financial statements using the equity method of accounting, after initially being recognised at cost.
Under the equity method, investments in associates are carried in the consolidated statement of financial position at cost plus post-acquisition changes in the Group’s share of net assets of the associates. Goodwill relating to an associate is included in the carrying amount of the investment and is not amortised. After application of the equity method, the Group determines whether it is necessary to recognise any impairment loss with respect to the Group’s net investment in associates. Goodwill included in the carrying amount of the investment in associate is not tested separately, rather the entire carrying amount of the investment is tested for impairment as a single asset. If any impairment is recognised, the amount is not allocated to the goodwill of the associate.
The Group’s share of its associates’ post-acquisition profits or losses is recognised in the statement of comprehensive income, and its share of post-acquisition movements in reserves is recognised in reserves. The cumulative post-acquisition movements are adjusted against the carrying amount of the investment. Dividends receivable from associates are recognised in the parent entity’s statement of comprehensive income as a component of other income.
Where the Group’s share of losses in an associate equals or exceeds its interest in the associate, including any other unsecured long-term receivables, the Group does not recognise further losses, unless it has incurred obligations or made payments on behalf of the associate.
Unrealised gains on transactions with associates are eliminated to the extent of the Group’s interest in the associates. Unrealised losses are also eliminated unless the transaction provides evidence of an impairment of the asset transferred. Accounting policies have been changed where necessary to ensure consistency with the policies adopted by the Group.
(B) BUSINESS COMBINATIONS Business combinations are accounted for using the acquisition method. The consideration transferred in a business combination shall be measured at fair value, which shall be calculated as the sum of the acquisition date fair values of the assets transferred by the acquirer, the liabilities incurred by the acquirer to former owners of the acquiree and the equity issued by the acquirer, and the amount of any non-controlling interest in the acquiree. For each business combination, the acquirer measures the non-controlling interest in the acquiree either at fair value or at the proportionate share of the acquiree’s identifiable net assets. Acquisition related costs are expensed as incurred.
When the Group acquires a business, it assesses the financial assets and liabilities assumed for appropriate classification and designation in accordance with the contractual terms, economic conditions, the Group’s operating or accounting policies and other pertinent conditions as at the acquisition date. This includes the separation of embedded derivatives in host contracts by the acquiree.
If the business combination is achieved in stages, the acquisition date fair value of the acquirer’s previously held equity interest in the acquiree is remeasured at fair value as at the acquisition date through profit or loss.
Any contingent consideration to be transferred by the acquirer will be recognised at fair value at the acquisition date. Subsequent changes to the fair value of the contingent consideration which is deemed to be an asset or liability will be recognised in accordance with AASB 139 either in profit or loss or in other comprehensive income. If the contingent consideration is classified as equity, it shall not be remeasured until it is finally settled within equity. F
or p
erso
nal u
se o
nly

53
52
3. Significant Accounting Policies (continued)
(C) INCOME TAX The income tax expense or revenue for the period is the tax payable on the current period’s taxable income based on the national income tax rate for each jurisdiction adjusted by changes in deferred tax assets and liabilities attributable to temporary differences and to used tax losses.
Deferred income tax is provided in full, using the liability method, on temporary differences arising between the tax bases of assets and liabilities and their carrying amounts in the consolidated financial statements. However, the deferred income tax is not accounted for if it arises from initial recognition of an asset or liability in a transaction other than a business combination that at the time of the transaction affects neither accounting nor taxable profit or loss. Deferred income tax is determined using tax rates (and laws) that have been enacted or substantially enacted by the reporting date and are expected to apply when the related deferred income asset is realised or the deferred income tax liability is settled.
Deferred tax assets are recognised for deductible temporary differences and unused tax losses only if it is probable that future taxable amounts will be available to utilise those temporary differences and losses.
Deferred tax liabilities and assets are not recognised for temporary differences between the carrying amount and tax bases of investments in controlled entities where the parent entity is able to control the timing of the reversal of the temporary differences and it is probable that the differences will not reverse in the foreseeable future.
Deferred tax assets and liabilities are offset where there is a legally enforceable right to offset current tax assets and liabilities and they relate to income taxes levied by the same taxation authority on the same taxable entity, or on different tax entities, but they intend to settle current tax liabilities and assets on a new basis or their tax assets and liabilities will be realised simultaneously.
Current and deferred tax balances attributable to amounts recognised directly in equity are also recognised directly in equity.
Tax consolidation legislation
The Company and all its wholly-owned Australian resident entities are part of a tax-consolidated group under Australian taxation law. Transpacific Industries Group Ltd is the head entity in the tax-consolidated group. The tax-consolidated group has entered into a tax sharing and a tax funding agreement.
For
per
sona
l use
onl
y

notes to the FinAnciAl stAtements for the financial year ended 30 June 2011 continued
54 tRAnspAciFic AnnuAl RepoRt 2011
Transpacific Annual Report 2011 53
Notes to the Financial Statements For the Financial Year Ended 30 June 2011 (continued)
3. Significant Accounting Policies (continued)
(D) FOREIGN CURRENCY
(i) Foreign currency transactions and balances Foreign currency transactions are translated at the foreign exchange rate ruling at the date of the transaction. Monetary assets and liabilities denominated in foreign currencies at the reporting date are translated into Australian dollars at the foreign exchange rate ruling at that date. Foreign exchange differences arising on translation are recognised in the statement of comprehensive income and are reported on a net basis. Non-monetary assets and liabilities that are measured in terms of historical cost in a foreign currency are translated using the exchange rate at the date of the transaction. Non-monetary assets and liabilities denominated in foreign currencies that are stated at fair value are translated to Australian dollars at foreign exchange rates ruling at the dates the fair value was determined.
(ii) Financial statements of foreign operations The assets and liabilities of foreign operations, including goodwill and fair value adjustments arising on consolidation, are translated to Australian dollars at foreign exchange rates ruling at the reporting date. The revenues and expenses of foreign operations, excluding foreign operations in hyper-inflationary economies, are translated to Australian dollars at rates approximating to the foreign exchange rates ruling at the dates of the transactions. The revenues and expenses of foreign operations in hyper-inflationary economies are translated to Australian dollars at the foreign exchange rates ruling at the reporting date. Foreign exchange differences arising on re-translation are recognised directly in a separate component of equity. Foreign exchange gains and losses arising from a monetary item receivable from or payable to a foreign operation, the settlement of which is neither planned nor likely in the foreseeable future, are considered to form part of a net investment in a foreign operation and are recognised directly in equity.
(iii) Net investment in foreign operations On consolidation, exchange differences arising from the translation of any net investment in foreign entities, and of borrowings and other financial instruments designated as hedges of such investments, are taken to shareholders’ equity. When a foreign operation is sold or any borrowings forming part of the net investment are repaid, a proportionate share of such exchange differences are recognised in the statement of comprehensive income, as part of the gain or loss on sale where applicable.
Goodwill and fair value adjustments arising on the acquisition of a foreign entity are treated as assets and liabilities of the foreign entities and translated at the closing rate.
(E) DERIVATIVE FINANCIAL INSTRUMENTS The Group enters into a variety of derivative financial instruments to manage its exposure to foreign exchange and interest rate risk, including forward foreign exchange contracts and interest rate swaps.
Derivatives are initially recognised at fair value on the date a derivative contract is entered into and are subsequently remeasured to their fair value at each reporting date. The gain or loss on re-measurement to fair value is recognised immediately in profit or loss. However, where the derivatives qualify for hedge accounting, recognition of any resultant gain or loss depends on the nature of the item being hedged.
The fair value of interest rate swaps is the estimated amount that the Group would receive or pay to terminate the swap at the balance date, taking into account current interest rates and the current creditworthiness of the swap counterparties. The fair value of forward foreign exchange contracts is their quoted market price at the reporting date, being the present value of the quoted forward price. On entering into a hedging relationship, the Group designates certain derivatives as either hedges of the fair value of recognised assets or liabilities or firm commitments (fair value hedges), hedges of highly probable forecast transactions (cash flow hedges), or hedges of net investments in foreign operations.
For
per
sona
l use
onl
y

55
54
3. Significant Accounting Policies (continued)
(E) DERIVATIVE FINANCIAL INSTRUMENTS (CONTINUED)
(i) Fair value hedge Changes in the fair value of derivatives that are designated and qualify as fair value hedges are recorded in profit or loss immediately, together with any changes in the fair value of the hedged asset or liability that is attributable to the hedged risk.
If the hedge no longer meets the criteria for hedge accounting, the adjustment to the carrying amount of a hedge item for which the effective interest method is used is amortised to profit or loss over the period to maturity using a recalculated effective interest rate.
(ii) Cash flow hedge The effective portion of changes in the fair value of derivatives that are designated and qualify as cash flow hedges is recognised in equity in the hedging reserve. The gain or loss relating to the ineffective portion is recognised immediately in profit or loss.
Amounts accumulated in equity are recycled in profit or loss in the periods when the hedged item affects profit or loss. However, when the forecast transaction that is hedged results in the recognition of a non-financial asset or liability, the gains and losses previously deferred in equity are transferred from equity and included in the initial measurement of the cost of the asset or liability.
When the hedging instrument expires or is sold, or terminated, or when a hedge no longer qualifies for hedge accounting, any cumulative gain or loss existing in equity at that time remains in equity and is recognised when the forecast transaction is ultimately recognised in profit or loss. When a forecast transaction is no longer expected to occur, the cumulative gain or loss that was reported in equity is recognised immediately in profit or loss.
(iii) Net investment hedge Hedges of net investments in foreign operations are accounted for similarly to cash flow hedges. Any gain or loss on the hedging instrument relating to the effective portion of the hedge is recognised in the foreign currency translation reserve, the gain or loss relating to the ineffective portion is recognised immediately in profit or loss.
Gains and losses deferred in the foreign currency translation reserve are recognised immediately in profit or loss when the foreign operation is disposed of.
(iv) Compound financial instruments The component parts of compound instruments are classified separately as financial liabilities and equity in accordance with the substance of the contractual arrangement. At the date of issue, the fair value of the liability component is estimated using the prevailing market interest rate for a similar non-convertible instrument. This amount is recorded as a liability on an amortised cost basis until extinguished on conversion or upon the instruments reaching maturity. The equity component initially brought to account is determined by deducting the amount of the liability component from the fair value of the compound instrument as a whole. This is recognised and included in equity, net of income tax effects and is not subsequently remeasured.
(v) Derivatives that do not qualify for hedge accounting Certain derivative instruments do not qualify for hedge accounting. Changes in the fair value of any derivative instrument that does not qualify for hedge accounting are recognised immediately in profit or loss.
For
per
sona
l use
onl
y

notes to the FinAnciAl stAtements for the financial year ended 30 June 2011 continued
56 tRAnspAciFic AnnuAl RepoRt 2011
Transpacific Annual Report 2011 55
Notes to the Financial Statements For the Financial Year Ended 30 June 2011 (continued)
3. Significant Accounting Policies (continued)
(F) REVENUE Amounts disclosed as revenue are net of returns, trade allowances and duties and taxes paid. Revenue from the sale of goods is recognised when the significant risks and rewards of ownership of the goods have passed to the buyer and can be measured reliably. Risks and rewards are considered passed to the buyer at the time of delivery of goods to customers. Revenue from the rendering of services is recognised upon delivery of services to the customer. Revenue is recognised for the major business activities as follows:
(i) Technical Services Revenue from the collection and treatment of liquid waste is recognised when the waste has been collected and treated.
(ii) Hydrocarbons Revenue is recognised on the sale of oil and by-products to customers on shipment or passing of control of the goods.
(iii) Industrial solutions Contract revenue is measured by reference to labour hours incurred to date and actual costs incurred. Other revenue is recognised upon the delivery of goods or services to customers.
(iv) Commercial vehicles Revenue from the sale of goods is recognised when the significant risks and rewards of ownership of the goods have passed to the buyer and can be measured reliably. Risks and rewards are considered passed to the buyer at the time of delivery of goods to customers.
(v) Cleanaway Revenue is recognised when the service has been provided to customers.
(vi) Manufacturing Revenue from the sale of goods is recognised when the significant risks and rewards of ownership of the goods have passed to the buyer and can be measured reliably. Risks and rewards are considered passed to the buyer at the time of delivery of goods to customers.
(vii) Interest Interest revenue is recognised on an accruals basis, taking into account the interest rates applicable to the financial assets.
(viii) Dividends
Dividend revenue is recognised when the right to receive a dividend has been established. Dividends received from associates are accounted for in accordance with the equity method of accounting.
(ix) Government grants Grants from the government are recognised at their fair value when there is a reasonable assurance that the grant will be received and the Group will comply with all attached conditions. Grants relating to costs are deferred and recognised in the statement of comprehensive income over the period necessary to match them with the costs that they are intended to compensate. Grants relating to the purchase of property, plant and equipment are included in liabilities as deferred income and are credited to the statement of comprehensive income on a straight-line basis over the expected lives of the related assets.
(x) Other revenue Other revenue is recognised when the right to receive the revenue has been established.
(G) TRADE AND OTHER RECEIVABLES All trade debtors are recognised and carried at original invoice amount as they are due for settlement generally no more than 30 days from the date of invoice. Some divisions may give extended terms. Collectability of trade debtors is reviewed on an ongoing basis. Debts which are known to be uncollectable are written off when identified. A provision for impairment is raised when collection of an amount is no longer probable (shown in Note 33(G)).
For
per
sona
l use
onl
y

57
56
3. Significant Accounting Policies (continued)
(H) INVENTORIES Inventories are valued at the lower of cost and net realisable value. The cost of inventories is based on the method most appropriate to each particular class of inventory and includes expenditure incurred in acquiring the inventories, production or conversion costs and other costs incurred in bringing them to their existing location and condition. In the case of manufactured inventories and work in progress, cost includes an appropriate share of production overheads based on normal operating capacity. The cost of inventory may also include transfers from equity of any gain or loss on qualifying cash flow hedges of foreign currency purchases of inventory. Commercial vehicles are valued at actual cost, vehicle parts are valued at weighted average cost and the remainder of inventory is valued at standard cost. Landfill land held for sale may also be included in inventory in line with the Group’s accounting policy for landfills Note 3(J)(iv).
(I) IMPAIRMENT OF ASSETS A financial asset is assessed at each reporting date to determine whether there is any objective evidence that it is impaired. Impairment losses on financial assets are directly written off to the statement of comprehensive income. Impairment of equity investments classified as available-for-sale is recognised where a significant or prolonged decline in the fair value of the investment occurs. This is determined by reference to current market bid prices. Impairment of loans and receivables is recognised when it is probable that the carrying amount will not be recovered in full due to significant financial difficulty or other loss event of the debtor. Goodwill and intangible assets that have an indefinite useful life are not subject to amortisation and are tested annually for impairment, or more frequently if events or changes in circumstances indicate that they might be impaired. Other assets are reviewed for impairment whenever events or changes in circumstances indicate that the carrying amount may not be recoverable. An impairment loss is recognised for the amount by which the asset’s carrying amount exceeds its recoverable amount. The recoverable amount is the higher of an asset’s fair value less costs to sell and value-in-use. For the purposes of assessing impairment, assets are grouped at the lowest levels for which there are separately identifiable cash inflows which are largely independent of the cash inflows from other assets or groups of assets (cash-generating units). The goodwill acquired in a business combination, for the purpose of impairment testing, is allocated to cash-generating units that are expected to benefit from the synergies of the combination. Non-financial assets other than goodwill that suffer an impairment loss are reviewed for reversal of the impairment loss at each subsequent reporting date.
(J) PROPERTY, PLANT AND EQUIPMENT Landfills, cell development and provision for remediation
(i) Landfills
The Group owns landfill assets. A landfill may be either developed by the Group or purchased by the Group. The cost of developing a landfill includes the cost of land, permitting and overall site and infrastructure development to bring the asset to its condition necessary for its intended use, that is, to receive and dispose of waste. If the landfill is purchased, then an additional intangible (landfill airspace) cost may be recognised. The value composition of a landfill changes over time. Initially a landfill’s value is more of an intangible asset including location, permitting and airspace which generates future earnings. Landfill airspace and licences are both considered to be integral components of a landfill asset and as such have been combined with effect from 1 July 2008. As airspace is consumed and landfilling continues to completion, the landfill’s value shifts to a tangible asset, being the value of the land. It is the Group’s policy at time of development or acquisition and reporting dates to:
(a) capitalise the cost of a developed landfill to landfills; (b) capitalise the cost of purchased landfills to intangibles (landfill airspace) and landfills based on a split
of the intangible and tangible value paid for the landfill; (c) assess impairment of each landfill asset or group of landfill assets which work together as a unit by
reference to both intangible and tangible values. If impaired an impairment loss is recorded; (d) measure the intangible value by reference to remaining available airspace and the future earnings it
will generate;
For
per
sona
l use
onl
y

notes to the FinAnciAl stAtements for the financial year ended 30 June 2011 continued
58 tRAnspAciFic AnnuAl RepoRt 2011
Transpacific Annual Report 2011 57
Notes to the Financial Statements For the Financial Year Ended 30 June 2011 (continued)
3. Significant Accounting Policies (continued)
(J) PROPERTY, PLANT AND EQUIPMENT (CONTINUED) (e) measure the tangible land value by reference to fair value determined by Directors or an independent
valuation (carried out periodically every three years); and (f) transfer the consumption of landfill airspace to landfill land, over the life of the landfill in conjunction
with the measurement of intangible value in point (d) above. The portion of landfill airspace transferred from intangible assets to tangible assets in a reporting period is calculated as the tonnes of airspace consumed in the reporting period divided into the tonnes of airspace available at the beginning of the reporting period.
Discounted cash flows are used to test impairment (refer Note 3(I)). Landfill assets are carried at cost in the accounts which is based on cost increased for the amortisation of any landfill airspace. (ii) Cell development A landfill will normally be divided into parts, with each part (a cell) being developed one at a time to receive waste. When a cell is nearly full, a new cell is developed in readiness to receive waste from the time the former cell closes. The closed cell is then capped and may return a revenue stream, such as from the sale of landfill gas, to the Group for years to come. The cost of cell development includes earthworks, gas capture infrastructure and cell lining to bring the asset to its condition necessary for its intended use, that is, to receive and dispose of waste and generate revenue streams. Cell development costs also include the cost of capping on closure of the cell. Expenditure on cell development may be incurred in one reporting period but the airspace in the cell may last for more than that reporting period. In recognition of the above, it is the Group’s policy at time of cell development and reporting dates to:
(a) capitalise the cost of cell development in landfill assets; (b) amortise the cost of cell development over the useful life of the cell; and (c) recognise income streams in the reporting period earned.
The amortisation for a reporting period is calculated by the tonnes of airspace consumed during the reporting period divided into the total airspace available at the beginning of the reporting period. Future landfill site restoration and aftercare costs capitalised are depreciated at rates that match the pattern of benefits expected to be derived from use of the respective sites.
(iii) Landfill closure and provision for remediation
A landfill is deemed full when its permitted airspace is consumed and it cannot legally accept any more waste. Alternatively, a landfill may be deemed full earlier should other factors exist, for example, if it is not economically viable to continue accepting waste. At that point:
(a) the value of the landfill has fully shifted to tangible land asset and there is no intangible asset remaining; and
(b) the cost of cell development is fully amortised to nil.
Generally, a landfill must be maintained and left in a condition specified by the Environmental Protection Authority or government authorities. Therefore remediation occurs on an ongoing basis, at the time the landfill closes and also post-closure. Certain landfills will also have revenue streams from, for example, the supply of landfill gas into electricity grids for many years.
In recognition of the above, it is the Group’s policy at time of development and reporting dates to:
(a) in the case of developing a landfill, provide for the expected remediation at time of development;
(b) in the case of purchasing a landfill, account for the acquisition in accordance with AASB 3 Business Combinations at the time of acquisition;
(c) request environmental scientists to calculate the expected cost of remediation for each landfill asset or group of landfill assets working together; and
(d) assess the adequacy of the provision for remediation against (c) at each reporting date and either confirm its adequacy or increase or decrease the provision to the landfill asset or profit and loss account as required and account for the cost of remediation against the provision.
For
per
sona
l use
onl
y

59
58
3. Significant Accounting Policies (continued)
(J) PROPERTY, PLANT AND EQUIPMENT (CONTINUED)
Future landfill site restoration and aftercare costs provided for are initially capitalised in the statement of financial position. Any change in the provision for future landfill site restoration and aftercare costs arising from a change in estimate of those costs is also recognised in non-current assets in the statement of financial position and amortised.
The provision is stated at the present value of the future cash outflows expected to be incurred, which increases each period due to the passage of time. The annual change in the net present value of the provision due to the passage of time is recognised in the statement of comprehensive income as a time value adjustment.
(iv) Landfill sales
A landfill may be disposed of as an operating landfill or it may be retained until post-closure and then sold.
In accordance with the above, it is the Group’s policy at time of sale and reporting periods to:
(a) if the landfill is sold as an operating landfill, recognise the profit on sale of an asset; or
(b) if the completed landfill is intended to be sold in the future, transfer the landfill balance to inventory or non-current assets held for sale as applicable.
Other property, plant and equipment
Land and buildings are shown at fair value, based on periodic, but at least triennial, valuations by external independent valuers, less subsequent depreciation of buildings. The fair values are recognised in the financial statements of the Group, and are reviewed at the end of each reporting period to ensure that the carrying value of land and buildings is not materially different to their fair values.
Any revaluation increase arising on the revaluation of land and buildings is credited to the asset revaluation reserve, except to the extent that it reverses a revaluation decrease for the same asset previously recognised as an expense in profit or loss, in which case the increase is credited to the statement of comprehensive income to the extent of the decrease previously charged. A decrease in carrying amount arising on the revaluation of land and buildings is charged as an expense in profit or loss to the extent that it exceeds the balance, if any, held in the asset revaluation reserve relating to a previous revaluation of that asset.
Depreciation on revalued buildings is charged to profit or loss. On the subsequent sale or retirement of a revalued property, the attributable revaluation surplus remaining in the asset revaluation reserve, net of any related deferred taxes, is transferred directly to retained earnings.
Plant and equipment, and equipment under finance lease are stated at cost less accumulated depreciation and impairment. Cost includes expenditure that is directly attributable in bringing the asset to the location and condition necessary for its intended use. In the event that settlement of all or part of the purchase consideration is deferred, cost is determined by discounting the amounts payable in the future to their present value as at the date of acquisition. Cost also may include transfers from equity of any gain or loss on qualifying cash flow hedges of foreign currency purchases of property, plant and equipment. Purchased software that is integral to the functionality of the related equipment is capitalised as part of that equipment. Borrowing costs related to the acquisition or construction of qualifying assets are also capitalised as part of that asset.
Gains and losses on disposal of an item of other property, plant and equipment are determined by comparing the proceeds from disposal with the carrying amount of the other property, plant and equipment and are recognised net within “other income” in profit or loss. When revalued assets are sold, the amounts included in the revaluation reserve are transferred to retained earnings.
Depreciation is provided on other property, plant and equipment, including freehold buildings but excluding land. Depreciation of all other assets is calculated on a straight-line basis so as to write off the net cost or other revalued amount of each asset over its expected useful life to the Group. Leasehold improvements are depreciated over the period of the lease or estimated useful lives, whichever is the shorter, using the straight-line method.
For
per
sona
l use
onl
y

notes to the FinAnciAl stAtements for the financial year ended 30 June 2011 continued
60 tRAnspAciFic AnnuAl RepoRt 2011
Transpacific Annual Report 2011 59
Notes to the Financial Statements For the Financial Year Ended 30 June 2011 (continued)
3. Significant Accounting Policies (continued)
(J) PROPERTY, PLANT AND EQUIPMENT (CONTINUED) Estimates of remaining useful lives are made on a regular basis for all assets, with annual reassessments for major items. The expected useful lives are as follows: Buildings and site improvements 15 to 40 years Plant and equipment 2.5 to 20 years Leasehold improvements 5 to 10 years
(K) LEASES Leases are classified as finance leases whenever the terms of the lease transfer substantially all the risks and rewards of ownership to the lessee. All other leases are classified as operating leases.
(i) Finance leases Assets held under finance leases are initially recognised at their fair value or, if lower, at amounts equal to the present value of the minimum lease payments, each determined at the inception of the lease. The corresponding liability to the lessor is included in the statement of financial position as a finance lease obligation.
Lease payments are apportioned between finance charges and reduction of the lease obligation so as to achieve a constant rate of interest on the remaining balance of the liability. Finance charges are charged directly against income, unless they are directly attributable to qualifying assets, in which case they are capitalised in accordance with the Group’s general policy on finance costs. Refer to Note 3(O).
Finance leases are depreciated over the shorter of the estimated useful life of the asset or the lease term.
(ii) Operating leases Operating lease payments are recognised as an expense on a straight-line basis over the lease term, except where another systematic basis is more representative of the time pattern in which economic benefits from the leased asset are consumed.
(L) INTANGIBLES
(i) Goodwill Goodwill represents the excess of the cost of an acquisition over the fair value of the Group’s share of the net identifiable assets of the acquired business, subsidiary or associate at the date of acquisition. Goodwill on the acquisition of businesses or subsidiaries is included in intangible assets. Goodwill on acquisition of associates is included in investments in associates. Goodwill is not amortised. Instead goodwill is tested for impairment annually, or more frequently if events or changes in circumstances indicate that it might be impaired, and is carried at cost less accumulated impairment losses. Gains and losses on the disposal of an entity include the carrying amount of goodwill relating to the entity sold.
Goodwill is allocated to cash-generating units for the purpose of impairment testing.
(ii) Research and development Expenditure on research activities, undertaken with the prospect of gaining new technical knowledge and understanding, is recognised in the statement of comprehensive income as an expense as incurred.
Expenditure on development activities, whereby research findings are applied to a plan or design for the production of new or substantially improved products and processes, is capitalised if the product or process is technically and commercially feasible and the Group has sufficient resources to complete development. The expenditure capitalised includes the costs of materials, direct labour and overhead costs that are directly attributable to preparing the asset for its intended use. Borrowing costs related to the development of qualifying assets are also capitalised. Other development expenditure is recognised in the statement of comprehensive income as an expense as incurred. Capitalised development expenditure is stated at cost less accumulated amortisation and impairment losses (see Note 3(I)).
(iii) Landfill airspace Landfill airspace and its amortisation is addressed in Note 3(J).
For
per
sona
l use
onl
y

61
60
3. Significant Accounting Policies (continued)
(L) INTANGIBLES (CONTINUED)
(iv) Other intangible assets Other intangible assets include customer contracts recognised on business combinations and licences. Other intangible assets that are acquired by the Group are stated at cost less accumulated amortisation (see below) and impairment losses (see Note 3(I)).
(v) Amortisation (other than amortisation of landfill airspace) Amortisation is charged to net income on a straight-line basis over the estimated useful lives of intangible assets unless such lives are indefinite (e.g. brand names). Goodwill and intangible assets with an indefinite useful life are systematically tested for impairment at each reporting date. Other intangible assets are amortised from the date they are available for use. The estimated useful lives are as follows:
Licences 5 to 10 years
Other 3 to 20 years
(M) TRADE AND OTHER PAYABLES Trade and other payables are stated at their amortised cost.
Trade payables are non-interest bearing and are normally settled on 30 day terms.
(N) BORROWINGS Borrowings are initially recognised at fair value of the consideration received net of issue costs incurred. Subsequent to initial recognition, interest-bearing borrowings are stated at amortised cost with any difference between costs and redemption value being recognised in the statement of comprehensive income over the period of the borrowings on an effective interest basis.
Borrowings are derecognised when the obligation specified in the contract is discharged, cancelled or expired. The difference between the carrying amount of a financial liability that has been extinguished or transferred to another party and the consideration paid, including any non-cash assets transferred or liabilities assumed, is recognised in other income or other expenses.
(O) FINANCE COSTS Finance costs are recognised as expenses in the period in which they are incurred. Finance costs include:
• interest on bank overdrafts and short-term and long-term borrowings, including amounts paid or received on interest rate swaps;
• amortisation of discounts or premiums relating to borrowings;
• amortisation of ancillary costs incurred in connection with the arrangement of borrowings; and
• finance lease charges.
There have been no qualifying assets and related debt to which borrowing costs could have been applied, and as a result no borrowing costs have been capitalised to qualifying assets.
(P) REPAIRS AND MAINTENANCE Plant and equipment of the Group is required to be overhauled on a regular basis. This is managed as part of an ongoing major cyclical maintenance program. The costs of this maintenance are charged as expenses as incurred, except where they relate to the replacement of a component of an asset, in which case the costs are capitalised and depreciated in accordance with Note 3(J). Other routine operating maintenance, repair and minor renewal costs are also charged as expenses as incurred.
(Q) EMPLOYEE BENEFITS
(i) Wages and salaries, annual leave and sick leave Liabilities for wages and salaries, including non-monetary benefits, annual leave and vesting sick leave expected to be settled within 12 months of the reporting date are recognised in other creditors and provision for employee benefits in respect of employees' services up to the reporting date and are measured at the amounts expected to be paid when the liabilities are settled.
For
per
sona
l use
onl
y

notes to the FinAnciAl stAtements for the financial year ended 30 June 2011 continued
62 tRAnspAciFic AnnuAl RepoRt 2011
Transpacific Annual Report 2011 61
Notes to the Financial Statements For the Financial Year Ended 30 June 2011 (continued)
3. Significant Accounting Policies (continued)
(Q) EMPLOYEE BENEFITS (CONTINUED)
(ii) Long service leave The liability for long service leave expected to be settled within 12 months of the reporting date is recognised in the provision for employee benefits and is measured in accordance with (i) above. The liability for long service leave expected to be settled more than 12 months from the reporting date is recognised in the provision for employee benefits and measured as the present value of expected future payments to be made in respect of services provided by employees up to the reporting date. Consideration is given to expected future wage and salary levels, experience of employee departures and periods of service. Expected future payments are discounted using market yields at the reporting date on national government bonds with terms to maturity and currency that match, as closely as possible, the estimated future cash outflows.
(iii) Short-term incentive compensation (IC)/bonus plans A liability for employee benefits in the form of IC is recognised when the Human Resources Committee determines that IC criteria has been achieved and an amount is payable in accordance with the terms of the IC plan.
Liabilities for IC are expected to be settled within 12 months and are measured at the amounts expected to be paid when they are settled.
(iv) Employee benefit on-costs Employee benefit on-costs, including payroll tax, are recognised and included in employee benefit liabilities and costs when the employee benefits to which they relate are recognised as liabilities.
(v) Share-based payment transactions Share-based payments are provided to Directors and employees via the Transpacific Industries Group Executive Share Option Plan, Long Term Incentive Plan and an Executive Engagement Award.
Share-based compensation payments are measured at fair value at the date of grant and expensed to employee benefit expense with a corresponding increase in equity over the period during which the employees become unconditionally entitled to the options or performance rights. Fair value is measured by an external valuer using a binomial model that takes into account the exercise price, the term of the option or performance right, the impact of dilution, the share price at grant date and expected price volatility of the underlying share, the expected dividend yield and the risk free interest rate for the term of the option or performance right.
(R) PROVISIONS A provision is recognised in the statement of financial position when the Group has a present legal or constructive obligation as a result of a past event, it is probable that an outflow of economic benefits will be required to settle the obligation, and a reliable estimate can be made of the amount of the obligation. If the effect of the time value of money is material, provisions are determined by discounting the expected future cash flows at a pre-tax rate that reflects current market assessments of the time value of money and, where appropriate, the risks specific to the liability.
Warranties A provision for warranties is recognised when the underlying products are sold. The provision is based on historical warranty data and a weighting of all possible outcomes against their probabilities.
(S) CASH AND CASH EQUIVALENTS Cash and cash equivalents comprise cash balances, short-term bills and call deposits. Bank overdrafts that are repayable on demand and form an integral part of the Group’s cash management position are included as a component of cash and cash equivalents for the purpose of the statement of cash flows. F
or p
erso
nal u
se o
nly

63
62
3. Significant Accounting Policies (continued)
(T) INVESTMENTS AND OTHER FINANCIAL ASSETS Financial assets are recognised when the Group becomes a party to the contractual provisions of the instrument at trade date.
Financial assets are initially measured at fair value plus transaction costs where the instrument is not classified at fair value through profit and loss. Transaction costs related to financial assets classified as fair value through profit and loss are expensed immediately.
The Group’s non-derivative financial assets are currently measured after initial recognition as loans and receivables or available-for-sale financial assets. The Group has no non-derivative financial assets classified as fair value through the profit and loss or held-to-maturity under accounting standard AASB 139. Subsequent measurement of loans and receivables is disclosed in Note 3(G).
Available-for-sale financial assets are measured at fair value with any changes in the fair value recognised directly in equity until the investment is derecognised or until the investment is determined to be impaired, at which time the cumulative gain or loss previously reported in equity is recognised in profit or loss. The Group’s investments in equity securities, other than controlled entities and associates, are classified as available-for-sale. Fair value is determined by reference to official bid prices quoted on the relevant securities exchange, or where not listed and fair value cannot be reliably ascertained, at cost.
Controlled entities and associates are accounted for in the consolidated financial statements as set out in Note 3(A).
Financial assets are derecognised when the rights to receive cash flows from the financial assets have expired or have been transferred and the Group has transferred substantially all the risks and rewards of ownership.
(U) ISSUED CAPITAL Issued and paid up capital is recognised at the fair value of the consideration received by the Company. Any transaction costs incurred by the Company arising on the issue of capital are recognised directly in equity as a reduction of the share proceeds received.
(V) STEP-UP PREFERENCE SHARES The units are classified as equity according to AASB 132 Financial Instruments: Presentation due to the redemption and settlement features resulting in a fixed amount of equity instruments. AASB 132 states that if a contract is for the exchange of a fixed amount of cash for a fixed number of shares the contract is considered to represent a residual interest and to be classified as equity. The redemption of the shares is at the discretion of the Group rather than the unit holder, therefore the units are classified as equity.
(W) EARNINGS PER SHARE
(i) Basic earnings per share Basic earnings per share is determined by dividing net profit after income tax attributable to members of the Company, excluding any costs of servicing equity other than ordinary shares, by the weighted average number of ordinary shares outstanding during the financial year, adjusted for bonus elements in ordinary shares issued during the year.
(ii) Diluted earnings per share Diluted earnings per share adjusts the figures used in the determination of basic earnings per share to take into account the after income tax effect of interest and other financing costs associated with dilutive potential ordinary shares and the weighted average number of shares assumed to have been issued for no consideration in relation to dilutive potential ordinary shares.
For
per
sona
l use
onl
y

notes to the FinAnciAl stAtements for the financial year ended 30 June 2011 continued
64 tRAnspAciFic AnnuAl RepoRt 2011
Transpacific Annual Report 2011 63
Notes to the Financial Statements For the Financial Year Ended 30 June 2011 (continued)
3. Significant Accounting Policies (continued)
(X) GOODS AND SERVICES TAX Revenue, expenses and assets are recognised net of the amount of goods and services tax (GST), except where the amount of GST incurred is not recoverable from the taxation authority. In these circumstances, the GST is recognised as part of the cost of acquisition of the asset or as part of the expense.
Receivables and payables are stated with the amount of GST included. The net amount of GST recoverable from, or payable to, the Australian Taxation Office (ATO) is included as a current asset or liability in the statement of financial position.
Cash flows are included in the statement of cash flows on a gross basis. The GST component of cash flows arising from investing and financing activities which are recoverable from, or payable to, the ATO are classified as operating cash flows.
(Y) CRITICAL ACCOUNTING ESTIMATES AND JUDGEMENTS
The Directors evaluate estimates and judgements incorporated into the financial report based on historical knowledge and best available current information. Significant key estimates in the financial report are:
(i) Impairment: details of the key estimates used in assessing value-in-use calculations and impairment generally are disclosed in Notes 17 and 18.
(ii) Closure and post closure provisions: the Group assesses provisions for closure and post-closure costs in respect of its landfill sites by reference to external and internal sources to determine the best estimate of costs required to remediate the landfill sites. Further details are disclosed in Note 3(J)(iii). It should be noted that given the uncertainty surrounding the pricing of carbon and the effect on methane emissions from landfill sites, these variables have not been included in the measurement of these provisions and related impairment testing.
(iii) Land and property values: the Group assesses the fair value of all land and property assets held at fair value each reporting date. Fair value is established using recent market transactions between willing buyers and sellers in an arm’s length sale in the normal course of business. Movements in market prices and the level of transactions impact the ability to estimate fair value.
(iv) Accounting for landfills: details of the key estimates used in assessing landfill values are included in Notes 17 and 18.
(v) Workers compensation self-insurance provisions: independent actuarial valuations are used to estimate the provision required for workers compensation where the Group is self-insured.
(vi) Recovery of deferred tax assets: deferred tax assets are recognised for deductible temporary differences as management considers that it is probable that future taxable profits will be available to utilise those temporary differences. Significant management judgement is required to determine the amount of deferred tax assets that can be recognised, based upon the likely timing and the level of future profits over the next two years together with future tax planning strategies.
For
per
sona
l use
onl
y

65
64
3. Significant Accounting Policies (continued)
(Y) CRITICAL ACCOUNTING ESTIMATES AND JUDGEMENTS (CONTINUED) (vii) Taxation: the Group’s accounting policy for taxation requires management’s judgement as to the
types of arrangements considered to be a tax on income in contrast to an operating cost. Judgement is also required in assessing whether deferred tax assets and certain deferred tax liabilities are recognised in the statement of financial position. Deferred tax assets, including those arising from unrecouped tax losses, capital losses and temporary differences, are recognised only where it is considered more likely than not that they will be recovered, which is dependent on the generation of sufficient future taxable profits.
Deferred tax liabilities arising from temporary differences in investments, caused principally by retained earnings held in foreign tax jurisdictions, are recognised unless repatriation of retained earnings can be controlled and are not expected to occur in the foreseeable future. Assumptions about the generation of future taxable profits and repatriation of retained earnings depend on management’s estimates of future cash flows. These depend on estimates of future production and sales volumes, operating costs, restoration costs, capital expenditure, dividends and other capital management transactions. Judgements are also required about the application of income tax legislation.
These judgements and assumptions are subject to risk and uncertainty, hence there is a possibility that changes in circumstances will alter expectations, which may impact the amount of deferred tax assets and deferred tax liabilities recognised on the statement of financial position and the amount of other tax losses and temporary differences not yet recognised. In such circumstances, some or all of the carrying amounts of recognised deferred tax assets and liabilities may require adjustment, resulting in a corresponding credit or charge to the statement of comprehensive income.
(viii) Valuation of derivative financial instruments: the Group’s accounting policy for the valuation of derivatives requires an estimate of the fair value of interest rate swaps. See note 3(E).
(Z) RECLASSIFICATION WITHIN STATEMENT OF COMPREHENSIVE INCOME In the current year the classification of expenses in the Statement of Comprehensive was changed to better reflect the nature of the expenses rather than the previous year‘s format which was a combination of expenses by nature and function. These new classifications are thought to provide more relevant and reliable information to the users of the financial statements. The prior year comparatives have been reclassified to be consistent with the new current year format.
For
per
sona
l use
onl
y

notes to the FinAnciAl stAtements for the financial year ended 30 June 2011 continued
66 tRAnspAciFic AnnuAl RepoRt 2011
Transpacific Annual Report 2011 65
Notes to the Financial Statements For the Financial Year Ended 30 June 2011 (continued)
CONSOLIDATED
2011 $’000
2010 $’000
4. Revenue
Sale of goods and services 2,154,654 2,049,270
Product Stewardship Oil benefits 15,539 16,233
Interest revenue 2,755 2,576
Other revenue 9,037 5,917
2,181,985 2,073,996
5. Other Income
Profit on sale of business - 1,000
Profit on acquisition of business - 1,021
Proceeds from flood insurance claims 4,315 -
Foreign currency exchange gains (net) 603 143
Gain on disposal of property, plant and equipment 688 310
Other income 3,608 -
9,214 2,474
6. Finance Costs
Interest on bank overdrafts and loans 127,121 125,692
Interest on obligations under finance leases 12,093 11,795
Interest on convertible notes 20,864 20,864
Total interest 160,078 158,351
Amortisation of deferred borrowing costs 8,088 8,190
Amortisation of convertible bonds 6,601 6,601
Unwinding of discounts on provisions 4,995 2,815
179,762 175,957
7. Significant Items of Revenue and Expense
Expenses
Impairment of intangible assets 291,456 -
Impairment of property, plant and equipment 50,163 -
Change in fair value of derivative financial instruments (gain)/loss (2,102) (21,724)
Change in fair value of warrants - 10,029
Impairment of available-for-sale investment 5,179 -
The impairment of available-for-sale investments (investments in listed share equities) was due to uncertainty surrounding the recapitalisation of CMA Corporation Limited.
The details of impairments of intangible assets and property, plant and equipment are disclosed in Note 18.
For
per
sona
l use
onl
y

67
66
CONSOLIDATED
NOTES 2011 $’000
2010 $’000
8. Income Tax (A) RECOGNISED IN THE STATEMENT OF COMPREHENSIVE INCOME
Current tax expense
Current year 21,384 6,341
Adjustments for prior years (4,762) (9,337)
16,622 (2,996)
Deferred tax expense
Origination and reversal of temporary differences (7,971) 22,426
Benefit of tax losses recognised - (130)
(7,971) 22,296
Total income tax expense/(benefit) in statement of comprehensive income 8,651 19,300
(B) NUMERICAL RECONCILIATION BETWEEN TAX EXPENSE AND PRE-TAX NET PROFIT
Profit/(loss) before tax (271,869) 92,036
Income tax using the domestic corporation tax rate of 30% (2010: 30%) (81,561) 27,611
Increase/(decrease) in income tax expense due to:
Share of associates’ net profits (1,505) (412)
Non-deductible expenses/non-assessable income (3,853) (59)
Impairment writedowns 97,213 -
Effect of tax losses recognised - (130)
Under/(over) provision in prior years (4,762) (9,337)
Other 3,119 3,177
Change in overseas tax rate - (1,550)
Income tax expense/(benefit) 8,651 19,300
For
per
sona
l use
onl
y
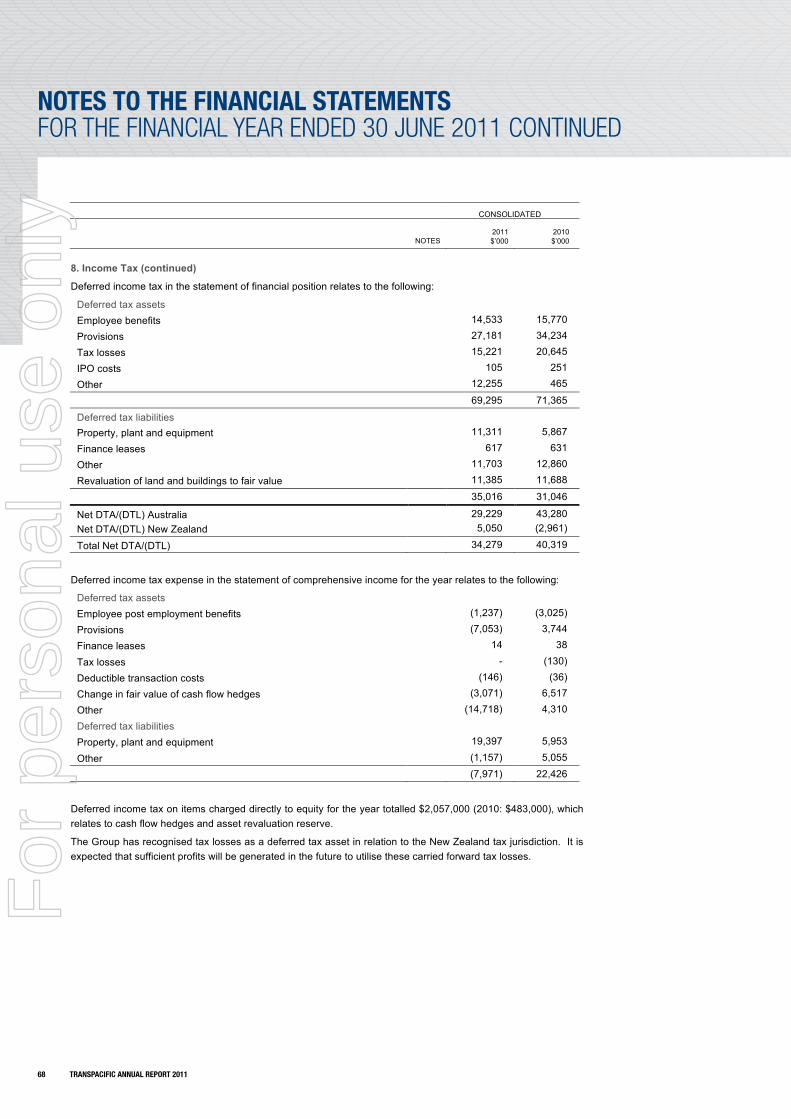
notes to the FinAnciAl stAtements for the financial year ended 30 June 2011 continued
68 tRAnspAciFic AnnuAl RepoRt 2011
Transpacific Annual Report 2011 67
Notes to the Financial Statements For the Financial Year Ended 30 June 2011 (continued)
CONSOLIDATED
NOTES 2011 $’000
2010 $’000
8. Income Tax (continued)
Deferred income tax in the statement of financial position relates to the following:
Deferred tax assets
Employee benefits 14,533 15,770
Provisions 27,181 34,234
Tax losses 15,221 20,645
IPO costs 105 251
Other 12,255 465
69,295 71,365
Deferred tax liabilities Property, plant and equipment 11,311 5,867
Finance leases 617 631
Other 11,703 12,860
Revaluation of land and buildings to fair value 11,385 11,688
35,016 31,046
Net DTA/(DTL) Australia 29,229 43,280 Net DTA/(DTL) New Zealand 5,050 (2,961)
Total Net DTA/(DTL) 34,279 40,319
Deferred income tax expense in the statement of comprehensive income for the year relates to the following:
Deferred tax assets
Employee post employment benefits (1,237) (3,025)
Provisions (7,053) 3,744
Finance leases 14 38
Tax losses - (130)
Deductible transaction costs (146) (36)
Change in fair value of cash flow hedges (3,071) 6,517
Other (14,718) 4,310
Deferred tax liabilities
Property, plant and equipment 19,397 5,953
Other (1,157) 5,055
(7,971) 22,426
Deferred income tax on items charged directly to equity for the year totalled $2,057,000 (2010: $483,000), which relates to cash flow hedges and asset revaluation reserve.
The Group has recognised tax losses as a deferred tax asset in relation to the New Zealand tax jurisdiction. It is expected that sufficient profits will be generated in the future to utilise these carried forward tax losses.
For
per
sona
l use
onl
y

69
68
CONSOLIDATED
NOTES 2011 $’000
2010 $’000
9. Cash and Cash Equivalents
Cash at bank and on hand 81,033 109,254
Short-term deposits 7,693 31,700
Cash and cash equivalents in the statement of cash flows 88,726 140,954
Cash at bank and on hand earns interest at floating rates based on daily bank deposit rates. Short-term deposits are at call, and earn interest at the respective short-term deposit rates. The Group’s exposure to interest rate risk and a sensitivity analysis for financial assets and liabilities are disclosed in Note 33.
10. Trade and Other Receivables
Current
Trade receivables 296,310 263,781
Less: impairment of trade receivables (4,169) (4,528)
292,141 259,253
Other receivables 18,752 17,444
Amounts owing: related parties and associates 37 93
310,930 276,790
The Group’s exposure to credit and currency risks and impairment losses related to trade and other receivables
are disclosed in Note 33.
11. Current Tax Assets
Income tax receivable 707 14,520
12. Inventories
Raw materials and consumables – at cost 10,939 21,056
Work in progress – at cost 9,352 8,100
Finished goods – at cost 117,116 120,603
137,407 149,759 Less: provision for obsolescence (5,852) (2,353)
131,555 147,406
For
per
sona
l use
onl
y

notes to the FinAnciAl stAtements for the financial year ended 30 June 2011 continued
70 tRAnspAciFic AnnuAl RepoRt 2011
Transpacific Annual Report 2011 69
Notes to the Financial Statements For the Financial Year Ended 30 June 2011 (continued)
CONSOLIDATED
NOTES 2011 $’000
2010 $’000
13. Derivative Financial Instruments
Current assets
Derivatives at fair value 113 18,635
113 18,635
Current liabilities Derivatives at fair value 55,787 31,440
55,787 31,440
14. Other Financial Assets
Non current
Other investments in listed companies at fair value 6,840 23,942
6,840 23,942
Other investments are classified as available-for-sale assets under AASB 139.
The Group’s exposure to credit, currency and interest rate risks related to other investments is disclosed in Note 33.
15. Other Assets
Prepayments 10,265 5,927
Other current assets 3,415 6,371
13,680 12,298
16. Investments Accounted for Using the Equity Method
Investment in associates 26A 28,087 18,987
28,087 18,987
For
per
sona
l use
onl
y

71
70
CONSOLIDATED
NOTES 2011 $’000
2010 $’000
17. Property, Plant and Equipment
LAND
Land at fair value 195,873 191,569
Net book value 195,873 191,569
Movements Opening written down value 191,569 180,731
Additions 9,379 16,077
Disposals - (2,753)
Transfer between categories 2,745 (2,785)
Revaluation (3,107) -
Deconsolidation of associate (3,568) -
Effect of movements in foreign exchange (1,145) 299
Closing written down value 195,873 191,569
LANDFILL, CELL DEVELOPMENT AND REMEDIATION
Landfill and cell development 311,495 316,574
Provision for remediation (106,058) (93,446)
Provision for depreciation (89,353) (62,864)
Net book value 116,084 160,264
Movements Opening written down value 160,264 140,730
Additions 54,490 33,504
Remediation provision provided during the year (27,198) (10,156)
Remediation work completed 19,598 10,530
Time value adjustment on remediation provision (5,012) (2,715)
Transfer from landfill airspace 6,563 15,608
Transfer between categories 2,673 (1,541)
Impairment of landfill land (32,587) -
Depreciation (26,489) (26,455)
Deconsolidation of associate (37,849) -
Effect of movements in foreign exchange 1,631 759
Closing written down value 116,084 160,264
The provision for remediation has been estimated using current expected costs and techniques applicable to the disturbed area. These costs have been adjusted forward to the total expected costs at the time of works being required. These costs have then been discounted to estimate the required provision at a rate of 5.2% (2010: 5.1%). Refer to Note 3(J).
The Group has a total of 16 landfills of which 13 are in Australia and 3 in New Zealand. Of the 13 Australian landfills 3 of these are closed. Those that are open are expected to close between 2013 and 2045. The Group’s remediation provisions are based on a 30 year post closure period. F
or p
erso
nal u
se o
nly

notes to the FinAnciAl stAtements for the financial year ended 30 June 2011 continued
72 tRAnspAciFic AnnuAl RepoRt 2011
Transpacific Annual Report 2011 71
Notes to the Financial Statements For the Financial Year Ended 30 June 2011 (continued)
CONSOLIDATED
NOTES 2011 $’000
2010 $’000
17. Property, Plant and Equipment (continued)
BUILDINGS
Buildings at fair value 78,458 95,319
Provision for depreciation - (14,783)
Net book value 78,458 80,536
Movements Opening written down value 80,536 71,003
Additions 6,839 5,791
Disposals - (663)
Transfer between categories - 8,454
Revaluation (1,814) -
Depreciation (5,475) (4,294)
Deconsolidation of associate (450) -
Effect of movements in foreign exchange (1,178) 245
Closing written down value 78,458 80,536
LEASEHOLD IMPROVEMENTS
Leasehold improvements 11,590 9,984
Provision for depreciation (2,976) (1,851)
Net book value 8,614 8,133
Movements Opening written down value 8,133 7,615
Additions through business combinations - 92
Additions 1,757 679
Disposals (43) (95)
Transfer between categories 107 300
Depreciation (1,129) (494)
Effect of movements in foreign exchange (211) 36
Closing written down value 8,614 8,133
For
per
sona
l use
onl
y

73
72
CONSOLIDATED
NOTES 2011 $’000
2010 $’000
17. Property, Plant and Equipment (continued)
PLANT AND EQUIPMENT
Plant and equipment 1,156,447 1,095,530
Provision for depreciation (596,271) (472,656)
Net book value 560,176 622,874
Movements Opening written down value 622,874 585,626
Additions through business combinations 333 4,939
Additions 92,707 127,732
Disposals (10,824) (7,258)
Impairment of assets (17,576) -
Transfer between categories 5,102 40,919
Depreciation (128,226) (129,754)
Deconsolidation of associate (934) -
Effect of movements in foreign exchange (3,280) 670
Closing written down value 560,176 622,874 CAPITAL WORK IN PROGRESS
Balance at beginning of year 64,633 94,202
Transfer (10,623) (45,347)
Net movement 16,228 15,778
Balance at end of year 70,238 64,633 TOTAL PROPERTY, PLANT AND EQUIPMENT Property, plant and equipment 1,824,101 1,773,609
Provision for remediation (106,058) (93,446)
Provision for depreciation (688,600) (552,154)
Net book value 1,029,443 1,128,009
Movements Opening written down value 1,128,009 1,079,907
Additions through business combinations 333 5,031
Additions 152,567 181,442
Revaluation of assets (4,920) -
Net movement in capital WIP 16,228 15,778
Disposals (10,874) (10,769)
Impairment of assets (50,163) -
Transfer from landfill airspace 6,563 15,608
Depreciation (161,320) (160,997)
Deconsolidation of associate (42,802) -
Effect of movements in foreign exchange (4,178) 2,009
Closing written down value 1,029,443 1,128,009
As at 1 July 2010 the Group deconsolidated Transwaste Canterbury Ltd from the group results and is now equity accounting the associate. F
or p
erso
nal u
se o
nly

notes to the FinAnciAl stAtements for the financial year ended 30 June 2011 continued
74 tRAnspAciFic AnnuAl RepoRt 2011
Transpacific Annual Report 2011 73
Notes to the Financial Statements For the Financial Year Ended 30 June 2011 (continued)
17. Property, Plant and Equipment (continued)
VALUATIONS
On 30 June 2011, an independent valuation was obtained to determine the fair value of non-landfill land and buildings which was determined by reference to an open market basis, being the amount for which the assets could be exchanged between a knowledgeable willing buyer and a knowledgeable willing seller in an arms length transaction at the valuation date. The revaluations of land and buildings were based on independent assessments by a member of the Australian Property Institute and the New Zealand Institute of Valuers. The 2011 valuations were broadly consistent with the previous valuations. The overall impact of these valuation increments and decrements is not considered material to the balance sheet. The decrements in land and buildings which could not be offset by prior revaluation increments resulted in an impairment loss of $1.7 million taken to the profit and loss.
Any revaluation increment (net of tax) is credited to the asset revaluation reserve included in the equity section of the statement of financial position. Any revaluation decrement directly offsetting a previous increment in the same asset is directly offset against the surplus in the asset revaluation reserve, otherwise it is charged to profit or loss. Revaluation movements are discussed in Note 24(G).
If land and buildings were measured using the cost model, the carrying amounts would be as follows:
CONSOLIDATED
NOTES 2011 $’000
2010 $’000
LAND (EXCLUDING LANDFILL)
Cost 116,326 116,324 BUILDINGS Cost 104,758 97,919
Accumulated depreciation (21,613) (16,138)
Net carrying amount 83,145 81,781
LEASED PLANT AND EQUIPMENT
The carrying amount of plant and equipment held under finance lease and hire purchase contracts at 30 June 2011 is $136,121,000 (2010: $158,581,000). Finance lease assets and assets under hire purchase contracts are pledged as security for the related finance lease and hire purchase liabilities.
18. Intangible Assets
CONSOLIDATED
NOTES 2011 $’000
2010 $’000
GOODWILL
Goodwill at cost 1,892,055 2,158,501
Net book value 1,892,055 2,158,501
Movements
Opening written down value 2,158,501 2,150,730
Additions through business combinations 231 2,038
Impairment of goodwill (227,348) -
Effect of movements in foreign exchange (39,329) 5,733
Closing written down value 1,892,055 2,158,501
For
per
sona
l use
onl
y

75
74
CONSOLIDATED
18. Intangible Assets (continued) 2011 $’000
2010 $’000
LANDFILL AIRSPACE Landfill airspace at cost 64,430 133,622
Net book value 64,430 133,622 Movements Opening written down value 133,622 149,230 Transfer to landfill land and cell development costs (6,563) (15,608) Impairment of landfill airspace (62,629) -
Closing written down value 64,430 133,622 PATENTS AND LICENCES Patents and licences at cost - 2,389 Provision for amortisation - (2,389)
Net book value - - Movements Opening written down value - 239 Amortisation - (239)
Closing written down value - - OTHER INTANGIBLES Other intangibles at cost 127,991 129,953 Provision for amortisation (22,543) (9,211)
Net book value 105,448 120,742 Movements Opening written down value 120,742 127,484 Additions - 577 Impairment of intangible assets (1,479) - Amortisation (13,332) (7,335) Effect of movement in foreign exchange (483) 16
Closing written down value 105,448 120,742 TOTAL INTANGIBLES Intangibles at cost 2,084,476 2,424,465 Provision for amortisation (22,543) (11,600)
Net book value 2,061,933 2,412,865 Movements Opening written down value 2,412,865 2,427,683 Acquisitions through business combinations 231 2,038 Additions - 577 Impairment of intangible assets (291,456) - Transfer to landfill land and cell development costs (6,563) (15,608) Amortisation (13,332) (7,574) Effect of movement in foreign exchange (39,812) 5,749
Closing written down value 2,061,933 2,412,865
For
per
sona
l use
onl
y

notes to the FinAnciAl stAtements for the financial year ended 30 June 2011 continued
76 tRAnspAciFic AnnuAl RepoRt 2011
Transpacific Annual Report 2011 75
Notes to the Financial Statements For the Financial Year Ended 30 June 2011 (continued)
18. Intangible Assets (continued)
After initial recognition, goodwill acquired in a business combination is measured at cost less any accumulated impairment losses. Goodwill is not amortised but is subject to impairment testing on an annual basis or whenever there is an indication of impairment.
Landfill airspace accounting and its nature is described in note 3(J).
Other intangibles include customer contracts valued at $25,490,000 (2010: $40,423,000) and brand names valued at $78,600,000 (2010: $78,600,000). Contracts are amortised over their useful life which on average is 3 years. Brand names are not amortised as they are assessed as having an indefinite useful life.
During the financial year ended 30 June 2011, all intangible assets were tested for impairment as required by AASB 136 ‘Impairment of Assets’. The following impairment losses were recognised in the profit and loss account (pre-tax). No amounts were recorded in equity. No impairment reversals were recognised.
CASH-GENERATING UNIT AMOUNT OF
IMPAIRMENT $’000 NATURE OF
IMPAIRMENT REASON FOR IMPAIRMENT
New Zealand
181,491 Goodwill Application of lower forecast long range growth rates
Manufacturing Australia 42,780 Goodwill Decline in business performance
Baxter Recycling (Cleanaway) 3,077 Goodwill
Decline in business performance
Victoria Landfill
62,629 Airspace Decline in landfill land values and change in realisation assumptions
New Zealand 1,479 Contracts Loss of contracts
291,456
There were no impairment losses or reversals recognised in the 2010 financial year.
The recoverable amounts of the cash-generating units have been based on value-in-use calculations. These calculations use cash flow projections based on actual operating results and financial budgets approved by the Board. The critical assumptions used in the testing of these cash generating units for both 2010 and 2011 financial years were as follows:
VARIABLE ASSUMPTION COMMENT
Nominal EBITDA growth – years 1 to 5
0.0% - 6.0% Based on 5 year plan numbers submitted to the Board (excluding strategic objectives)
Inflation
2.7% - 3.5% Represents forecast long term CPI growth in Australia and New Zealand
Nominal growth rate beyond five year financial plan (terminal growth rate)
2.7% - 4.0%
Based on forecast CPI, GDP and other macro economic factors
Discount rate
9.0% - 10.5%
Discount rate is post tax for assets with comparable risk profiles. The discount rate has been based on the assets WACC adjusted to remove gearing impacts
Landfill operations discount rate 9.0% Based on operations WACC
Land sales discount rate 10.5% Based on development WACC
Capex spend
Forecast Based on 5 year plan numbers submitted to the board (excluding strategic objectives
Growth and discount rate assumptions are deemed appropriate as there are no intentions to dispose of any businesses. F
or p
erso
nal u
se o
nly

77
76
18. Intangible Assets (continued)
The cash-generating units (“CGU”) with significant goodwill and indefinite life intangibles attributable to them are:
2011 2010
CASH-GENERATING UNIT
GOODWILL $’000
INDEFINITE LIFE
INTANGIBLES $’000
GOODWILL / AIRSPACE
$’000
INDEFINITE LIFE
INTANGIBLES $’000
New Zealand 577,497 - 765,670 - Victoria Landfill Division - - 62,629 -
Transpacific Cleanaway 1,082,566 78,600 1,082,566 78,600
1,660,063 78,600 1,910,865 78,600
There are no other individual CGUs with significant goodwill and indefinite life intangible attributable to them.
Cleanaway
2011 2010
Discount rate 9.0% 9.0% Nominal EBITDA growth – years 1 to 5 6.0% 6.0%
Nominal growth rate beyond five years plan
4.0% 6.0%
The recoverable amount of the Cleanaway CGU currently exceeds its carrying value by $282.5 million (2010: $738.1 million). This excess in recoverable amount could be reduced should changes in the following key assumptions occur:
1. Discount rate – an increase in the discount rate of over 1.0% (2010: 1.3%) would result in a reduction of the recoverable amount to below the carrying value.
2. Nominal growth rate beyond five year plan – a decrease in the growth rate beyond the five year plan of over 1.2% (2010: 1.1%) would result in a reduction of the recoverable amount to below the carrying value.
3. Nominal EBITDA growth – years 1 to 5 – a decrease in the nominal EBITDA growth rate of over 4.1% (2010: 6%) would result in a reduction of the recoverable amount to below the carrying value.
The potential impact of the proposed carbon tax has been excluded due to legislative uncertainty.
Victoria Landfill
2011 2010
Discount rate 9.0% to 10.5% 9.0% to 10.5% Nominal EBITDA growth – years 1 to 5 1.5% to 3.0% 3.25%
Nominal growth rate beyond five years n/a n/a
No terminal growth rate is used for the Victoria Landfill value in use calculation as operations have a defined life.
The impairment calculations were based on estimates around the present value of landfill land together with the uncertainty of the ultimate sell date. This resulted in a $62.6 million impairment of landfill airspace and a $32.6 million impairment of landfill land for the 2011 financial year. The potential impact of the proposed carbon tax has been excluded due to legislative uncertainty.
The key impairment calculation drivers above resulted in a current year impairment loss and as such any negative change in the underlying assumptions in the future would result in a further impairment.
For
per
sona
l use
onl
y

notes to the FinAnciAl stAtements for the financial year ended 30 June 2011 continued
78 tRAnspAciFic AnnuAl RepoRt 2011
Transpacific Annual Report 2011 77
Notes to the Financial Statements For the Financial Year Ended 30 June 2011 (continued)
18. Intangible Assets (continued)
New Zealand
2011 2010
Discount rate 9.0% 9.0% Nominal EBITDA growth – years 1 to 5 3.9% 4.8%
Nominal growth rate beyond five years 3.0% 4.7%
The key impairment calculation drivers above resulted in a current year impairment loss and as such any negative change in the underlying assumptions in the future would result in a further impairment.
Manufacturing
During the year ended 30 June 2011 all non-current assets attributable to the Manufacturing division were deemed to be impaired so no further impairment is possible.
CONSOLIDATED
NOTES 2011 $’000
2010 $’000
19. Trade and Other Payables
CURRENT
Trade payables 80,387 95,799
Other payables and accruals 149,100 113,919
Payables to related parties and associates 31C - 16
Deferred settlements 800 4,350
230,287 214,084
The Group’s exposure to currency and liquidity risk related to trade and other payables is disclosed in Note 33.
For
per
sona
l use
onl
y

79
78
CONSOLIDATED
NOTES 2011 $’000
2010 $’000
20. Borrowings
CURRENT
UNSECURED
Bank loans 50,000 4,663
Loans to related parties and associates 31C 3,329 7,131
Other 432 446 53,761 12,240 SECURED
Obligations under finance leases and hire purchase liabilities 29B 31,414 35,029 85,175 47,269
NON-CURRENT
UNSECURED
Bank loans 874,653 1,067,850
US Private Placement notes 139,658 174,605
6.75% Subordinated Convertible notes* 282,985 275,434
Other 1,170 1,192
1,298,466 1,519,081
SECURED
Obligations under finance leases and hire purchase liabilities 29B 107,068 135,843
1,405,534 1,654,924
Current unsecured bank loans of $50 million is for mandatory repayments required to be made in the 2012 financial year which the Group has the right to redraw in July 2012.
All borrowings are net of prepaid borrowing costs.
Within unsecured borrowings, the bank loans, US Private Placement and Convertible notes are currently in the process of having security granted over assets of the Group members who are party to these financing facilities.
* CONVERTIBLE NOTES
Opening balance 279,668 273,067
Amortisation 6,601 6,601
Closing balance 286,269 279,668
For
per
sona
l use
onl
y

notes to the FinAnciAl stAtements for the financial year ended 30 June 2011 continued
80 tRAnspAciFic AnnuAl RepoRt 2011
Transpacific Annual Report 2011 79
Notes to the Financial Statements For the Financial Year Ended 30 June 2011 (continued)
CONSOLIDATED
2011 $’000
2010 $’000
20. Borrowings (continued)
FINANCING FACILITIES
The facility limits and maturity profile of the Group’s main financing facilities are as follows:
FACILITY AMOUNT MATURITY Syndicated Facility Agreement 4 year tranche $601 million July 2013
5 year tranche $834 million July 2014
US Private Placement notes 5 year tenure $115 million December 2012*
10 year tenure $54 million December 2017*
6.75% Subordinated Convertible notes $309 million December 2014**
* The USPP lenders have the right to put the debt back to the Group as at September 2012. ** The Convertible note holders have the right to request redemption in December 2012.
The Group’s finance facilities are summarised below:
FACILITY AMOUNT Syndicated Facility Agreement 1,435,000 1,434,562
US Private Placement notes* 140,148 175,106
6.75% Subordinated Convertible notes 309,100 309,100
1,884,248 1,918,768
* This is translated at the spot rate at 30 June. Details of hedging are set out below.
Interest rates are variable under the Syndicated Facility Agreement. The Company manages its exposure to floating rate debt by economically hedging a proportion of its exposure with interest rate swaps.
The US Private Placement and has been swapped to A$ fixed rate debt to mitigate the foreign currency risk exposure arising for these borrowings.
In December 2007, the Company issued subordinated convertible notes due 7 December 2014. The notes carry a coupon of 6.75% per annum and will, unless previously converted, be redeemed at their principal amount on maturity. The conversion price of the notes has been set at A$14.8648 per ordinary share, subject to adjustment in accordance with the conditions. The convertible noteholders have the right to request redemption in December 2012. The notes are being amortised to 2014.
The Group and the Company can also borrow outside of the facilities detailed above.
DEBT FACILITIES Total facilities available 1,884,248 1,918,768
Facilities utilised at balance date (1,643,215) (1,833,750)
Facilities not utilised at balance date 241,033 85,018
Facilities used at balance date include $133.4 million (2010: $134.8 million) in guarantees and letters of credit which are not included in the statement of financial position. Refer Note 29.
For
per
sona
l use
onl
y

81
80
CONSOLIDATED
NOTES 2011 $’000
2010 $’000
21. Provisions
CURRENT
Provision for warranty Balance at beginning of year 5,322 5,382
Provisions acquired through business combinations - 1,286
Provisions made during the year 5,211 3,654
Provisions used during the year (4,786) (3,985)
Provisions reversed during the year - (1,015)
Balance at end of year 5,747 5,322 Provision – other Balance at beginning of year 15,345 11,693
Provisions made during the year 24,517 18,685
Provisions used during the year (16,924) (14,142)
Provisions reversed during the year (3,311) (891)
Balance at end of year 19,627 15,345 Total current provisions Balance at beginning of year 20,667 17,075
Provisions acquired through business combinations - 1,286
Provisions made during the year 29,728 22,339
Provisions used during the year (21,710) (18,127)
Provisions reversed during the year (3,311) (1,906)
Balance at end of year 25,374 20,667
WARRANTIES
The provision for warranties relates mainly to the commercial vehicle division warranties for vehicles. The provision is based on estimates made from historical warranty data associated with similar services.
OTHER PROVISIONS
Included in other provisions is an amount of $4.7 million (2010: $4.2 million) in relation to workers compensation self-insurance of the Group in Australia under the Comcare scheme. The workers compensation self-insurance provision is reassessed annually based on actuarial advice.
Other provisions also includes amounts for vehicle dealer support and floor plan interest and operating lease property make-good.
22. Other Liabilities
CONSOLIDATED
NOTES 2011 $’000
2010 $’000
Deferred income 21,275 19,659
21,275 19,659
Deferred income relates to prepaid waste collection amounts not yet serviced.For
per
sona
l use
onl
y

notes to the FinAnciAl stAtements for the financial year ended 30 June 2011 continued
82 tRAnspAciFic AnnuAl RepoRt 2011
Transpacific Annual Report 2011 81
Notes to the Financial Statements For the Financial Year Ended 30 June 2011 (continued)
23. Share Based Payments
On 1 June 2010 and 3 September 2010 the Group issued performance rights attached to a Long Term Incentive Plan. On 1 June 2010 the Group issued performance rights attached to an Executive Engagement Award. The Long Term Incentive Plan (“LTIP”) and the Executive Engagement Award (“EEA”) are exercisable in one tranche if certain performance standards are met.
The LTIP performance standards are measured by the Company achieving a total shareholder return (TSR) ranking of equal to or greater than the 50th percentile TSR of the S&P/ASX 200 Industrial Sector Index (excluding companies involved in resources or mining) and the Group achieves certain earnings per share growth targets.
The performance rights attached to the EEA will vest upon the condition that the participant is employed at vesting date and at various percentages based on the Company’s ordinary share price at that date.
During the year the Group issued performance rights which vest on 30 June 2012 (subject to continued employment) under the terms of the Transpacific Industries Group Annual Incentive Plan (AIP).
DATE GRANTED FIRST EXERCISE DATE ON OR AFTER EXPIRY DATE
NUMBER GRANTED
2011
NUMBER GRANTED
2010
(1) 1 June 2010 – LTIP
Release of results for year ending 30 June 2012
Six months following exercise date - 2,613,063
(2) 1 June 2010 – EEA
30 June 2015
Six months following exercise date - 9,945,265
(3) 3 September 2010
– LTIP
Release of results for year ending 30 June 2013
Six months following exercise date 3,968,010 -
(4) 23 December 2010 – AIP
30 June 2012
Six months following exercise date 450,306 -
The number and weighted average exercise prices of share options and performance rights are as follows:
WEIGHTED AVERAGE EXERCISE
PRICE 2011
NUMBER OF SHARE
OPPORTUNITIES 2011
WEIGHTED AVERAGE EXERCISE
PRICE 2010
NUMBER OF SHARE
OPPORTUNITIES 2010
Outstanding at the beginning of the period $8.81 18,663,163 $8.96 8,878,336 Granted during the period $0.00 4,418,316 $0.00 12,558,328
Exercised during the period - - - -
Cancelled/lapsed during the period (8,994,070) (2,773,501)
Outstanding at the end of the period 14,087,409 18,663,163 - Options 1,771,500 6,104,835
- Performance rights 12,315,909 12,558,328
Exercisable at the end of the period - $8.81 3,918,836
The options outstanding at 30 June 2011 have an exercise price in the range of $3.55 to $13.06 (2010: $3.55 to $13.06) and a weighted average contractual life of 0.2 years (2010: 2.1 years). Total share-based payment expense included in the statement of comprehensive income is set out in Note 24(G).
The performance rights granted as part of the AIP have been valued at share price on date of issue as they have a zero exercise price. All other parameters remain consistent to those below.
For
per
sona
l use
onl
y

83
82
23. Share Based Payments (continued)
All other performance rights granted during the year were fair valued by an external party using a Monte-Carlo simulation. The following table sets out the assumptions made in determining the value of these options:
LTIP 3,968,010
03/09/10
LTIP 2,613,063
01/06/10
EEA 9,945,265 01/06/10
Vesting period August 2013 August 2012 June 2015
Measurement period (years) 2.8 2.1 5.08
Risk free interest rate (%) 4.95% 4.92% 5.38%
Volatility (%) 64.51% 68.34% 54.94%
Fair value $0.85 $0.89 $1.34
The Company previously operated an Executive Share Option Plan (“the Option Plan”) approved by shareholders of the Company in March 2005. Under the option plan the Board of Directors may issue options to Non-Executive Directors and Executives of the Company. The Board determines the price, number, exercise price, expiry date and relevant performance hurdles of options to be issued. There are no voting or dividend rights attached to the options.
Upon exercise of the options and payment of the exercise price, the Executives are allotted one fully paid ordinary share in the Company for each option held.
On termination of employment of a participant, generally the option lapses. In certain circumstances, the Board may elect to allow the terminating participant to retain their options.
No options were granted during the reporting period.
New incentive schemes were introduced to replace the Option Plan during the 2010 financial year.
The following option arrangements were in existence during the current and comparative reporting periods:
DATE GRANTED FIRST EXERCISE DATE ON OR AFTER EXPIRY DATE
EXERCISE PRICE
NUMBER UNDER
OPTION 2011
NUMBER UNDER
OPTION 2010
OPTIONS (3) 17 February 2006 31 August 2007 31 July 2010 $5.40 - 333,334
(4) 24 April 2006 31 August 2007 31 July 2010 $8.53 - 450,000
(5) 13 September 2006 31 August 2007 31 July 2010 $7.25 - 386,667
(6) 20 September 2006 31 August 2007 31 July 2010 $7.28 - 175,000
(7) 23 October 2006 31 August 2007 31 July 2010 $8.20 - 40,000
(8) 10 November 2006 31 August 2008 31 July 2010 $8.09 - 50,000
(9) 14 December 2006 31 August 2008 31 July 2010 $8.81 - 53,334
(10) 12 March 2007 31 August 2008 31 July 2011 $9.98 70,000 695,000
(11) 12 March 2007 31 August 2008 31 July 2010 $9.98 - 900,000
(12) 3 May 2007 31 August 2008 31 July 2011 $12.51 50,000 50,000
(13) 16 May 2007 31 August 2008 31 July 2011 $13.06 425,000 885,000
(14) 22 October 2007 31 August 2008 31 July 2011 $11.15 145,000 145,000
(15) 11 February 2008 31 August 2009 31 July 2011 $7.96 801,500 911,500
(16) 23 September 2008 31 August 2009 31 July 2012 $6.13 - 200,000
(17) 6 November 2008 31 August 2009 31 July 2012 $3.55 280,000 830,000
Options issued under the Option Plan are exercisable in two or three equal tranches and will vest when the exercise conditions have been met up to the expiry date. Seventy five per cent of each tranche of options vest if total shareholder return (TPI share price increment over share price at grant date plus dividends paid) totals at least 15% per annum on a cumulative basis.
For
per
sona
l use
onl
y

notes to the FinAnciAl stAtements for the financial year ended 30 June 2011 continued
84 tRAnspAciFic AnnuAl RepoRt 2011
Transpacific Annual Report 2011 83
Notes to the Financial Statements For the Financial Year Ended 30 June 2011 (continued)
23. Share Based Payments (continued)
Twenty five per cent of each tranche of options vest if the volume weighted average price of TPI shares has outperformed the S&P/ASX 200 (less financials) by 5% on a cumulative basis. The fair value of the options are estimated at the date of grant using the binominal model incorporating a Monte-Carlo simulation. The fair value of the options range from $0.02 cents to $2.23.
The majority of options expense in relation to these options is in prior periods based on the contractual lives of the options.
Subsequent to the end of the reporting period all options on issue at 30 June 2011 have lapsed as the vesting conditions were not satisfied.
24. Equity
(A) ISSUED CAPITAL
CONSOLIDATED
2011 $’000
2010 $’000
Ordinary shares - issued and fully paid 1,770,058 1,770,058 Convertible notes equity component 51,588 51,588
1,821,646 1,821,646
(B) MOVEMENTS IN ORDINARY SHARES
2011 2010
NUMBER
OF SHARES $’000 NUMBER
OF SHARES $’000
Balance at the beginning of the year 960,638,735 1,770,058 310,981,126 1,041,383 Issued during the financial year:
- shares issued for equity raising - - 649,657,609 750,217 - transaction costs - - - (21,542)
BALANCE AT THE END OF THE YEAR 960,638,735 1,770,058 960,638,735 1,770,058
Ordinary shares participate in dividends and the proceeds on winding up of the Company in proportion to the number of shares held. Ordinary shares entitle their holder to one vote, either in person or by proxy, at a meeting of the Company. Ordinary shares have no par value.
(C) MOVEMENTS IN STEP-UP PREFERENCE SECURITIES
2011 2010
NUMBER
OF UNITS $’000 NUMBER
OF UNITS $’000
Balance at the beginning of the year 2,500,000 249,846 2,500,000 249,846 BALANCE AT THE END OF THE YEAR 2,500,000 249,846 2,500,000 249,846
The Group issued Step-up Preference Securities (SPS) via a prospectus dated 4 July 2006.
The rights of SPS holders to payments rank ahead of ordinary shareholders and have no fixed repayment date.
Distributions on the SPS are discretionary, payable semi-annually, non-cumulative and payable on the 180 day bank bill swap reference rate plus a margin. Distributions are expected to be fully franked.
For
per
sona
l use
onl
y
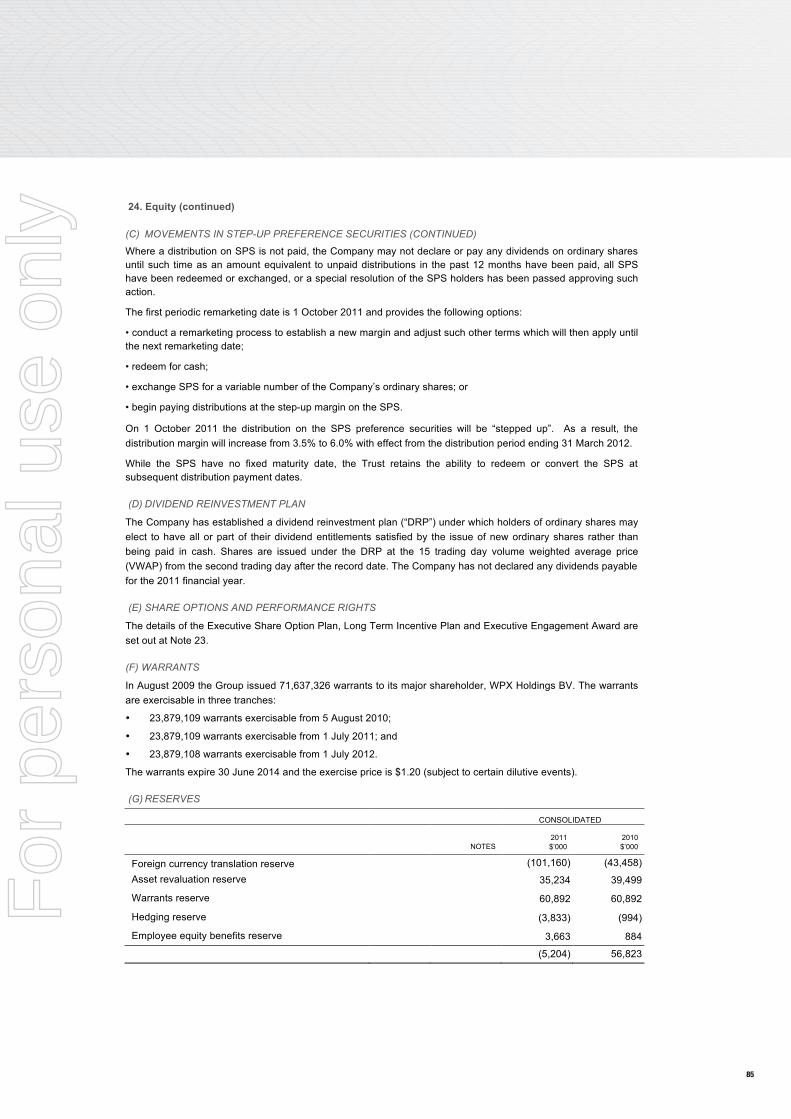
85
84
24. Equity (continued)
(C) MOVEMENTS IN STEP-UP PREFERENCE SECURITIES (CONTINUED)
Where a distribution on SPS is not paid, the Company may not declare or pay any dividends on ordinary shares until such time as an amount equivalent to unpaid distributions in the past 12 months have been paid, all SPS have been redeemed or exchanged, or a special resolution of the SPS holders has been passed approving such action.
The first periodic remarketing date is 1 October 2011 and provides the following options:
• conduct a remarketing process to establish a new margin and adjust such other terms which will then apply until the next remarketing date;
• redeem for cash;
• exchange SPS for a variable number of the Company’s ordinary shares; or
• begin paying distributions at the step-up margin on the SPS.
On 1 October 2011 the distribution on the SPS preference securities will be “stepped up”. As a result, the distribution margin will increase from 3.5% to 6.0% with effect from the distribution period ending 31 March 2012.
While the SPS have no fixed maturity date, the Trust retains the ability to redeem or convert the SPS at subsequent distribution payment dates.
(D) DIVIDEND REINVESTMENT PLAN
The Company has established a dividend reinvestment plan (“DRP”) under which holders of ordinary shares may elect to have all or part of their dividend entitlements satisfied by the issue of new ordinary shares rather than being paid in cash. Shares are issued under the DRP at the 15 trading day volume weighted average price (VWAP) from the second trading day after the record date. The Company has not declared any dividends payable for the 2011 financial year.
(E) SHARE OPTIONS AND PERFORMANCE RIGHTS
The details of the Executive Share Option Plan, Long Term Incentive Plan and Executive Engagement Award are set out at Note 23.
(F) WARRANTS
In August 2009 the Group issued 71,637,326 warrants to its major shareholder, WPX Holdings BV. The warrants are exercisable in three tranches:
• 23,879,109 warrants exercisable from 5 August 2010;
• 23,879,109 warrants exercisable from 1 July 2011; and
• 23,879,108 warrants exercisable from 1 July 2012.
The warrants expire 30 June 2014 and the exercise price is $1.20 (subject to certain dilutive events).
(G) RESERVES
CONSOLIDATED
NOTES 2011 $’000
2010 $’000
Foreign currency translation reserve (101,160) (43,458) Asset revaluation reserve 35,234 39,499
Warrants reserve 60,892 60,892
Hedging reserve (3,833) (994)
Employee equity benefits reserve 3,663 884
(5,204) 56,823
For
per
sona
l use
onl
y

notes to the FinAnciAl stAtements for the financial year ended 30 June 2011 continued
86 tRAnspAciFic AnnuAl RepoRt 2011
Transpacific Annual Report 2011 85
Notes to the Financial Statements For the Financial Year Ended 30 June 2011 (continued)
CONSOLIDATED
NOTES 2011 $’000
2010 $’000
24. Equity (continued)
(G) RESERVES (CONTINUED)
Foreign Currency Translation Reserve
Nature and purpose of reserve
The foreign currency translation reserve is used to record differences arising from the translation of the financial statements of foreign subsidiaries. It is also used to record the net investment hedged in these securities.
Movements
Foreign currency translation reserve:
Opening balance (43,458) (45,150)
Exchange differences taken to equity (57,702) 1,692
CLOSING BALANCE (101,160) (43,458)
Asset Revaluation Reserve
Nature and purpose of reserve
The asset revaluation reserve is used to record revaluations of non-current assets (including non landfill land and buildings and listed company investments).
Movements
Asset revaluation reserve:
Non Landfill Land and Buildings 36,752 36,752
Available-for-sale assets (listed company equity shares) 2,747 -
Opening balance 39,499 36,752
Revaluation of Non Landfill Land and Buildings (net of tax) (2,918) -
Revaluation of available-for-sale assets (net of tax) (1,347) 2,747
CLOSING BALANCE 35,234 39,499
Attributable to
Non Landfill Land and Buildings 33,834 36,752
Available-for-sale assets (listed company equity shares) 1,400 2,747
TOTAL 35,234 39,499
Warrants Reserve
Nature and purpose of reserve
The warrants reserve is used to record revaluations of warrants issued on recapitalisation.
Movements
Warrants reserve:
Opening balance 60,892 -
Warrants issued - 50,863
Revaluation* - 10,029
CLOSING BALANCE 60,892 60,892 * Revaluation was at the date that the cash settlement option of the warrants was removed.
For
per
sona
l use
onl
y

87
86
CONSOLIDATED
NOTES 2011 $’000
2010 $’000
24. Equity (continued)
(G) RESERVES (CONTINUED)
Hedging Reserve
Nature and purpose of reserve
The hedging reserve comprises the effective portion of the cumulative net change in the fair value of cash flow
hedging instruments related to hedge transactions that have not yet occurred.
Movements
Hedging reserve:
Opening balance (994) (2,120)
Transfer to net profit 42 (2,067)
Net gain taken to equity 6,226 6,508
Net (loss) taken to equity (9,107) (3,315)
CLOSING BALANCE (3,833) (994)
Employee Equity Benefits Reserve
Nature and purpose of reserve
The employee equity benefits reserve is used to record the value of equity benefits provided to employees and
Directors as part of their remuneration. Refer to Note 23 for further details of these plans.
Movements
Employee equity benefits reserve:
Opening balance 884 590
Share based payment expense 2,779 294
CLOSING BALANCE 3,663 884
(H) DIVIDENDS AND DISTRIBUTIONS
There were no dividends paid on ordinary shares during the 2011 or 2010 reporting years.
Details of distributions in respect of the financial year are as follows:
2011 2010
AMOUNT PER
SHARE/UNIT TOTAL $’000 AMOUNT PER
SHARE/UNIT TOTAL $’000
Step-up Preference Securities
Distribution period ended 30 September: fully franked at 30% tax rate $2.87 7,175 $2.31 5,775
Distribution period ended 31 March: fully franked at 30% tax rate $3.00 7,500 $2.54 6,350
TOTAL DISTRIBUTION PAID 14,675 12,125 For
per
sona
l use
onl
y

notes to the FinAnciAl stAtements for the financial year ended 30 June 2011 continued
88 tRAnspAciFic AnnuAl RepoRt 2011
Transpacific Annual Report 2011 87
Notes to the Financial Statements For the Financial Year Ended 30 June 2011 (continued)
24. Equity (continued)
(H) DIVIDENDS AND DISTRIBUTIONS (CONTINUED)
After the reporting date the following distribution was proposed by the Directors. The distribution has not been provided for. The declaration and subsequent payment of the distribution has no income tax consequences.
2011 2010
AMOUNT PER
SHARE/UNIT TOTAL $’000 AMOUNT PER
SHARE/UNIT TOTAL $’000
Proposed for :
Step-up Preference Securities
Distribution period ended 30 September: fully franked at 30% tax rate $2.97 7,425 $2.87 7,175
(I) FRANKING CREDIT BALANCE
CONSOLIDATED
2011 $’000
2010 $’000
30% franking credits available to subsequent financial years 44,258 62,797
The above available amounts are based on the balance of the franking account at year end, adjusted for:
(a) franking credits that will arise from the payment of current tax liabilities;
(b) franking debits that will arise from the payment of dividends recognised as a liability at the year end;
(c) franking credits that will arise from the receipt of dividends recognised as receivables by the tax consolidated group at the year end; and
(d) franking credits that the entity may be prevented from distributing in subsequent years.
(J ) RETAINED EARNINGS
Retained profits at beginning of year 64,815 5,779
Net profit attributable to members of the parent entity (296,543) 59,036
Retained profits at end of year (231,728) 64,815
(K) NON-CONTROLLING INTEREST
Contributed equity 1,426 7,771
Retained profits 399 1,693
1,825 9,464
As at 1 July 2010 the Group deconsolidated Transwaste Canterbury Ltd from the group results and is now equity accounting the associate.
For
per
sona
l use
onl
y

89
88
25. Consolidated Entities
2011 2010
ENTITY COUNTRY OF
INCORPORATION % %
Transpacific Industries Group Ltd – parent Australia
Transpacific Securities Pty Ltd Australia 100 100
Transpacific SPS Trust Australia 100 100
Transpacific Sustain Pty Ltd Australia 100 100
Transpacific Innovations Pty Ltd Australia 100 100
Transpacific Co Pty Ltd* Australia 100 100
Transpacific Resources Pty Ltd* Australia 100 100
Environmental Recovery Services Pty Ltd* Australia 100 100
ERS Australia Pty Ltd* Australia 100 100
Kleenparts Pty Ltd Australia 100 100
Transpacific Energy Pty Ltd Australia 100 100
Transpacific Oil Pty Ltd Australia 100 100
ERS Singapore Pte Ltd Singapore 100 100
ERS Taiwan Ltd Taiwan 100 100
Transpacific Industries Pty Ltd* Australia 100 100
Associated Oils Pty Ltd Australia 100 100
ATS Developments Pty Ltd Australia 100 100
Australian Pollution Engineering Pty Ltd Australia 100 100
Australian Resource Recovery Pty Ltd Australia 100 100
Australian Terminal Services Pty Ltd Australia 100 100
L V Rawlinson & Associates Pty Ltd Australia 100 100
Mann Waste Management Pty Ltd Australia 100 100
Nationwide Oil Pty Ltd* Australia 100 100
Oil & Fuel Salvaging (Qld) Pty Ltd Australia 100 100
NQ Resource Recovery Pty Ltd* Australia 100 100
Olmway Pty Ltd (i) Australia 50 50
QORS Pty Ltd Australia 100 100
Solidsep Pty Ltd Australia 100 100
Transpacific Biofuels Pty Ltd(i) Australia 50 50
Transpacific Bituminous Products Pty Ltd Australia 100 100
Transpacific Environmental Services Pty Ltd Australia 51 51
Transpacific Manufacturing Systems P/L Australia 100 100
Transpacific Refiners Pty Ltd (i) Australia 50 50
Transpacific Superior Pak Pty Ltd * Australia 100 100
Transwaste Technologies (1) Pty Ltd Australia 100 100
Transwaste Technologies Pty Ltd * Australia 100 100
Transpacific Baxter Pty Ltd* Australia 100 100
A J Baxter Pty Ltd Australia 100 100
Baxter Business Pty Ltd* Australia 100 100
Baxter Recyclers Pty Ltd Australia 100 100
For
per
sona
l use
onl
y

notes to the FinAnciAl stAtements for the financial year ended 30 June 2011 continued
90 tRAnspAciFic AnnuAl RepoRt 2011
Transpacific Annual Report 2011 89
25. Consolidated Entities (continued)
2011 2010
ENTITY COUNTRY OF
INCORPORATION % %
Transpacific Cleanaway Pty Ltd* Australia 100 100
Enviroguard Pty Ltd * Australia 100 100
Getabin Pty Ltd Australia 100 100
Transpacific Cleanaway Hygiene Pty Ltd Australia 70 70
Transpacific Collections Pty Ltd Australia 100 100
Transpacific Recycling Pty Ltd Australia 100 100
Transpacific Ventures Pty Ltd Australia 100 100
Transpacific Industrial Solutions Pty Ltd * Australia 100 100
ACN 122 808 324 Pty Ltd Australia 100 100
Transpacific Holdings Pty Ltd Australia 100 100
Transpacific Paramount Services Pty Ltd Australia 100 100
Transpacific Waste Management Pty Ltd* Australia 100 100
Ashrye Pty Ltd Australia 100 100
Clarinda Landfill Pty Ltd Australia 100 100
Max T Pty Ltd Australia 100 100
Rubus Holdings Pty Ltd* Australia 100 100
Rubus Intermediate One Pty Ltd* Australia 100 100
Rubus Intermediate Two Pty Ltd* Australia 100 100
Transpacific Cleanaway Holdings Pty Ltd* Australia 100 100
Transpacific Resource Recycling Pty Ltd Australia 100 100
Waste Management Pacific (SA) Pty Ltd Australia 100 100
Waste Management Pacific Pty Ltd* Australia 100 100
Western Star Trucks Australia Pty Ltd* Australia 100 100
MAN Automotive Imports (NZ) Ltd New Zealand 100 100
Man Automotive Imports Pty Ltd* Australia 100 100
Man Imports Pty Ltd Australia 100 100
Western Star Truck Centre Trust Australia 100 100
Transpacific Industries Group Finance (NZ) Ltd New Zealand 100 100
ERS New Zealand Ltd New Zealand 100 100
Healthcare Waste Ltd New Zealand 100 100
Transpacific Technical Services (NZ) Ltd New Zealand 100 100
Transpacific Industries Group (NZ) Ltd New Zealand 100 100
Burwood Resource Recovery Park Ltd New Zealand 100 -
Canterbury Material Recovery Facilities Ltd New Zealand 100 -
Canterbury Waste Services Ltd New Zealand 100 100
Eastern Bins Ltd New Zealand 100 100
Get-A-Bin Ltd New Zealand 100 100
Otago Waste Services Ltd New Zealand 100 100
Recycle New Zealand Ltd New Zealand 100 100
Superior Pak NZ New Zealand 100 100
For
per
sona
l use
onl
y

91
90
Notes to the Financial Statements For the Financial Year Ended 30 June 2011 (continued)
25. Consolidated Entities (continued)
2011 2010
ENTITY COUNTRY OF
INCORPORATION % %
Tartan Industries Ltd New Zealand 100 100
The Wheelibin Company Ltd New Zealand 100 100
Transpacific Collections Ltd New Zealand 100 -
Transpacific Industrial Solutions (NZ) Ltd New Zealand 100 100
Transpacific Recycling Ltd New Zealand 100 100
Transpacific Waste Management Ltd New Zealand 100 -
Waste Management Ltd New Zealand 100 100
Waste Care Ltd New Zealand 100 100
Waste Disposal Services Ltd New Zealand 100 100
Transpacific All-Brite Ltd New Zealand 100 100
Flexi-Bin Ltd New Zealand 100 100
General Rubbish Collection Ltd New Zealand 100 100
Budget Bins Ltd New Zealand 100 100
Sunshine Garden Bag & Bin Company Ltd New Zealand 100 100
(i) Wholly-owned subsidiaries of the Company have management control and the casting vote of Transpacific Refiners Pty Ltd, Olmway Pty Ltd,
and Transpacific Biofuels Pty Ltd and thus the Company has the capacity to dominate decision making in relation to the financial and operating
policies so as to enable those entities to operate as part of the Group in pursuing its objectives.
* These wholly owned subsidiaries have entered into a deed of cross guarantee with Transpacific Industries Group Ltd on 29 June 2007 pursuant
to ASIC Class Order 98/1418 and are relieved from the requirement to prepare and lodge an audited financial report.
The consolidated statement of comprehensive income and statement of financial position of the entities who are a party to the deed of cross guarantee are:
STATEMENT OF COMPREHENSIVE INCOME 2011 $’000
2010 $’000
Revenue from continuing activities 1,707,266 1,639,762 Other income 39,097 45,923
Raw materials and inventory (320,236) (348,316)
Waste disposal and collection (257,460) (209,674)
Employee expenses (531,064) (498,308)
Depreciation and amortisation expenses (125,174) (124,807)
Net finance costs (148,205) (126,817)
Repairs and maintenance (95,597) (92,071)
Fuel purchases (53,588) (47,233)
Leasing charges (56,405) (52,125)
Freight costs (18,884) (15,341)
Other expenses (103,883) (108,110)
Mark to market 2,102 11,695
Impairment (154,520) -
Share of net profits of associates accounted for using the equity method 535 (34)
Profit/(loss) before income tax (116,016) 74,544
Income tax expense/(benefit) (9,283) (33,918)
Profit/(loss) from continuing operations (125,299) 40,626
For
per
sona
l use
onl
y

notes to the FinAnciAl stAtements for the financial year ended 30 June 2011 continued
92 tRAnspAciFic AnnuAl RepoRt 2011
Transpacific Annual Report 2011 91
Notes to the Financial Statements For the Financial Year Ended 30 June 2011 (continued)
25. Consolidated Entities (continued)
OTHER COMPREHENSIVE INCOME 2011 $’000
2010 $’000
Cash flow hedges Net gain/(loss) taken to equity (2,906) 1,332
Translation of foreign operations
Exchange differences taken to equity - -
Net income/(loss) recognised directly in equity (2,906) 1,332
Profit/(loss) from continuing operations (128,205) 41,958
STATEMENT OF FINANCIAL POSITION 2011 $’000
2010 $’000
ASSETS Cash and cash equivalents 52,645 106,846
Trade and other receivables 597,602 601,844
Current tax assets - 9,739
Inventories 93,736 105,082
Other assets 13,545 14,142
TOTAL CURRENT ASSETS 757,528 837,653
Investments accounted for using the equity method 12,964 12,053 Investments 584,906 584,906
Property, plant and equipment 706,287 756,919
Intangible assets 1,430,780 1,547,726
Deferred tax assets 29,092 44,363
TOTAL NON-CURRENT ASSETS 2,764,029 2,945,967 TOTAL ASSETS 3,521,557 3,783,620 LIABILITIES Trade and other payables 209,379 203,202
Interest-bearing loans and borrowings 77,887 21,565
Income tax payable 2,701 -
Employee entitlements 42,563 36,191
Provisions 27,403 27,482
Other 68,194 35,991 TOTAL CURRENT LIABILITIES 428,127 324,431
Interest-bearing loans and borrowings 1,394,998 1,629,646 Employee entitlements 7,785 9,058
TOTAL NON-CURRENT LIABILITIES 1,402,783 1,638,704 TOTAL LIABILITIES 1,830,910 1,963,135 NET ASSETS 1,690,647 1,820,485 EQUITY Issued capital 1,821,646 1,821,646
Reserves 85,405 89,944
Retained earnings (216,404) (91,105) TOTAL EQUITY 1,690,647 1,820,485 F
or p
erso
nal u
se o
nly

93
92
26. Investments Accounted for Using the Equity Method
(A) DETAILS OF INTERESTS IN ASSOCIATES ARE AS FOLLOWS:
OWNERSHIP INTEREST
CARRYING VALUE OF INVESTMENT
ENTITY COUNTRY REPORTING
DATE 2011
% 2010
% 2011 $’000
2010 $’000
Technical services management:
Total Waste Management Pty Ltd Australia 31 December 50 50 4,946 5,203
Western Resource Recovery Pty Ltd Australia 31 December 50 50 7,236 6,210
Solid waste management:
Otago Southland Waste Services Ltd New
Zealand 30 June 50 50 208 675
Living Earth Ltd New
Zealand 30 June 50 50 2,136 1,887
Midwest Disposals Ltd New
Zealand 30 June 50 50 2,123 2,373
Pikes Point Transfer Station Ltd New
Zealand 30 June 50 50 820 943
Daniels Sharpsmart New Zealand Ltd New
Zealand 30 June 50 50 - -
Transwaste Canterbury Ltd (i) New
Zealand 30 June 50 50 9,162 -
Waste Disposal Services (unincorporated joint venture)
New Zealand 30 June 50 50 - -
Wellington Waste Disposal Pty Ltd Australia 30 June 50 50 - -
Wonthaggi Recyclers Pty Ltd Australia 30 June 50 50 1,313 1,695
Earthpower Technologies Sydney Pty Ltd Australia 30 June 50 50 (2) (17)
Garware Envionmental Services Private Limited (ii) India 30 June 50 - 127 -
Industrial management:
ERS Co Pty Ltd Australia 30 June 49 49 18 18
Hydrocarbon management:
Oil Stream Partners Pty Ltd Australia 30 June 50 50 - -
28,087 18,987
(i) Transwaste Canterbury Ltd was deconsolidated from the group results as at 1 July 2010. (ii) Waste Management Pacific Pty Ltd acquired 50% in December 2010.
The reporting dates for those entities noted as at 31 December is a result of that being the reporting date of the other 50% shareholder.
For
per
sona
l use
onl
y

notes to the FinAnciAl stAtements for the financial year ended 30 June 2011 continued
94 tRAnspAciFic AnnuAl RepoRt 2011
Transpacific Annual Report 2011 93
Notes to the Financial Statements For the Financial Year Ended 30 June 2011 (continued)
26. Investments Accounted for Using the Equity Method (continued)
(B) SHARE OF ASSOCIATES STATEMENT OF FINANCIAL POSITION
CONSOLIDATED
2011 $’000
2010 $’000
Total assets 103,238 53,588 Total liabilities (47,060) (15,614)
Net assets as reported by associates 56,178 37,974
Share of associates net assets equity accounted 28,087 18,987
(C) SHARE OF ASSOCIATES REVENUE AND PROFIT
Revenues (100%) 77,816 55,715
Profit before income tax (100%) 14,127 4,890
Share of associates profit before income tax 7,064 2,445 Share of income tax expense (2,046) (1,072)
Share of associates net profit/(loss) recognised 5,018 1,373
(D) IMPAIRMENT LOSSES AND COMMITMENTS
During the year the associates were tested for impairment and no adjustments were made as a result (2010: nil).
As at the reporting date the associates had capital commitments in relation to contracts of $815,000.
For
per
sona
l use
onl
y

95
94
CONSOLIDATED
2011 $’000
2010 $’000
27. Reconciliation of Cash Flows from Operating Activities
Cash flows from operating activities
Profit/(loss) for the period
(280,520) 72,736 ADJUSTMENTS FOR:
Performance rights expense 2,779 294
Other non-cash items 18,761 6,651
Impairment on available-for-sale financial assets 5,179 -
Impairment on non current assets and intangibles 341,619 -
Change in fair value of derivative financial instruments (1,180) (15,207)
Change in fair value of warrants - 10,029
Gain on acquisition of business - (1,021)
Gain on sale of business - (1,000)
Gain on sale of listed securities (261) -
Depreciation 161,320 160,997
Amortisation 13,332 7,574
Share of associates’ net profits (5,018) (1,373)
Net (gain)/loss on disposal of property, plant and equipment (688) (310)
Net cash flow from operating activities before changes in assets and liabilities 255,323 239,370
CHANGES IN ASSETS AND LIABILITIES ADJUSTED FOR EFFECTS OF PURCHASE OF CONTROLLED ENTITIES DURING THE FINANCIAL PERIOD
(Increase)/decrease in receivables (43,174) 43,227
(Increase)/decrease in other assets (2,326) 23,154
(Increase)/decrease in inventories 15,851 23,924
Increase/(decrease) in payables 16,190 (46,706)
Increase/(decrease) in income tax payable 13,813 (9,249)
Increase/(decrease) in deferred taxes 7,437 11,756
Increase/(decrease) in other liabilities 1,435 (838)
Increase/(decrease) in other provisions (10,558) 5,200
NET CASH FROM/(USED IN) OPERATING ACTIVITIES 253,991 289,838
During the 2011 financial year the Group acquired plant and equipment with an aggregate fair value of $5,076,000 (2010: $57,102,000) by means of finance lease. These acquisitions are not reflected in the statement of cash flows.
For
per
sona
l use
onl
y

notes to the FinAnciAl stAtements for the financial year ended 30 June 2011 continued
96 tRAnspAciFic AnnuAl RepoRt 2011
Transpacific Annual Report 2011 95
Notes to the Financial Statements For the Financial Year Ended 30 June 2011 (continued)
CONSOLIDATED
NOTES 2011 $’000
2010 $’000
28. Business Combinations
During the year the consolidated entity acquired a business and an interest in a joint venture at a cost of $0.7 million (2010: $11.5 million).
No ordinary shares were issued as part settlement of these business combinations.
29. Commitments and Contingencies
(A) OPERATING LEASE COMMITMENTS
The Group leases property, plant and equipment under operating leases expiring over terms of up to ten years. Leases generally provide the Group with a right of renewal at which time all terms are renegotiated.
Non-cancellable operating lease rentals are payable as follows:
Within one year 37,800 37,402
Between one and five years 70,299 96,177
More than five years 42,402 48,215
150,501 181,794
(B) FINANCE LEASE AND HIRE PURCHASE COMMITMENTS
The Group leases plant and equipment under finance leases and hire purchase agreements expiring over terms of up to seven years. At the end of the lease term the Group generally has the option to purchase the equipment at a percentage of market value.
Commitments in relation to finance leases are payable as follows:
Within one year 41,985 47,458
Between one and five years 112,320 123,044
More than five years 9,673 38,185
Minimum lease payments 163,978 208,687 Less:
Future finance charges (25,496) (37,815) TOTAL LIABILITIES 138,482 170,872
Representing: Current 20 31,414 35,029
Non-current 20 107,068 135,843 TOTAL LIABILITIES 138,482 170,872
(C) CAPITAL EXPENDITURE AND OTHER COMMITMENTS
Commitments in relation to capital expenditure and purchase commitments entered into:
Within one year 61,458 68,343
Other 1,996 - COMMITMENTS NOT RECOGNISED IN THE FINANCIAL STATEMENTS 63,454 68,343 F
or p
erso
nal u
se o
nly

97
96
CONSOLIDATED
NOTES 2011 $’000
2010 $’000
29. Commitments and Contingencies (continued)
(D) GUARANTEES
The Group is, in the normal course of business, required to provide guarantees and letters of credit on behalf of controlled entities and associates in respect of their contractual performance related obligations. These guarantees and indemnities only give rise to a liability where the entity concerned fails to perform its contractual obligations.
Letters of credit issued to suppliers 2,387 2,750
Bank guarantees outstanding at balance date in respect of financing facilities 1,229 12,075
Bank guarantees outstanding at balance date in respect of contractual performance 129,777 119,941
133,393 134,766
(E) CONTINGENT LIABILITIES
The Taxation authorities in Australia and New Zealand are currently undertaking reviews of the Group’s tax position in both countries. The reviews are ongoing and at this time it is too early to identify the adjustments that may arise, if any.
The Group has been invited to enter into discussions regarding a proposed class action by certain investors who acquired TPI shares in the period between 29 August 2007 and 16 February 2009. If any proceedings are commenced with respect to this matter the Company will vigorously defend them. The financial effect, if any, is unable to be quantified at this time.
There have been no other material changes to the commitments, contingent liabilities or contingent assets of the consolidated entity subsequent to the year ended 30 June 2011.
30. Auditor’s Remuneration
CONSOLIDATED
Ernst & Young: 2011 2010
1. Audit services 1,160,000 1,086,000
2. Non-audit services
Due diligence services - 612,335
Other advisory services 121,375 -
Taxation services 3,700 13,200
Total 1,285,075 1,711,535
For
per
sona
l use
onl
y

notes to the FinAnciAl stAtements for the financial year ended 30 June 2011 continued
98 tRAnspAciFic AnnuAl RepoRt 2011
Transpacific Annual Report 2011 97
Notes to the Financial Statements For the Financial Year Ended 30 June 2011 (continued)
31. Related Parties
(A) KEY MANAGEMENT PERSONNEL
Disclosures relating to key management personnel are set out in Note 35.
(B WHOLLY-OWNED GROUP TRANSACTIONS
The wholly-owned Group consists of Transpacific Industries Group Ltd and its wholly-owned entities listed at Note 25.
Transactions between Transpacific Industries Group Ltd and other entities in the wholly-owned Group during the years ended 30 June 2011 and 30 June 2010 consisted of:
(a) loans advanced by Transpacific Industries Group Ltd and other wholly-owned entities;
(b) loans repaid to Transpacific Industries Group Ltd and other wholly-owned entities;
(c) the payment of interest on the above loans;
(d) the payment of dividends to Transpacific Industries Group Ltd and other wholly-owned entities;
(e) management fees charged to wholly-owned entities; and
(f) sales between wholly-owned entities.
The above transactions are all eliminated on consolidation.
(C) OTHER RELATED PARTIES
CONSOLIDATED
2011 $’000
2010 $’000
Aggregate amounts included in the determination of profit before tax that resulted from transactions with each class of other related parties:
Interest expense Minority shareholders 112 230
Aggregate amounts brought to account in relation to other transactions with each class of other related parties:
Loans advanced to/(from):
Associates 650 261
Loan repayments to:
Associates 222 -
Minority shareholders - 448
Aggregate amounts receivable from, and payable to, each class of other related parties at balance date:
Current receivables:
Associates 37 93
37 93
Current payables:
Associates - 16
- 16
Current borrowings: Associates - 3,819
Minority shareholders 3,329 3,312
3,329 7,131
Transactions were made on normal commercial terms and conditions and at market rates, except that there are no fixed terms for the repayment of loans between the parties. Interest was charged at 10% (2010: 9%).
For
per
sona
l use
onl
y

99
98
31. Related Parties (continued)
(C) OTHER RELATED PARTIES (CONTINUED)
The Group trades on normal commercial terms and conditions on an arm’s-length basis with GPT Group Ltd, QR National Ltd and Fletcher Buildings Limited. Mr Gene Tilbrook, the Non-Executive Chairman of the Group, is a Non-Executive Director of these companies.
The Group trades on normal commercial terms and conditions on an arm’s length basis with K & S Corporation Ltd. Mr Ray Smith, a Non-Executive Director of the Group, is a Non-Executive Director of this company.
The Group trades on normal commercial terms and conditions on an arm’s length basis with Campbell Brothers Ltd. Mr Bruce Brown, Non-Executive Director of the Group, is a Non-Executive Director of this company.
The Group trades on normal commercial terms and conditions on an arm’s length basis with Centennial Coal Ltd. Mr Bruce Allan, a former Non-Executive Director of the Group, is a former Non-Executive Director of this company.
The Group trades on normal commercial terms and conditions on an arm’s length basis with Chalmers Ltd. Mr Graham Mulligan, a former Non-Executive Director of the Group, is a Non-Executive Director of this company. The Group also trades on normal commercial terms and conditions on an arm’s length basis with Stockland Corporation Ltd with whom Mr Graham Mulligan was a consultant during the 2010 financial year.
32. Segment Information
Under AASB 8, a condition for identifying an operating segment is that it is a component of the entity whose results are regularly reviewed by each entity’s chief operating decision maker to make decisions about resources to be allocated to the segment and to assess its performance (“the management approach”). The chief operating decision maker for the Group during the reporting period was considered to be the Chief Executive Officer.
Segment results, assets and liabilities include items directly attributable to a segment as well as those that can be allocated on a reasonable basis.
Segment capital expenditure is the total cost incurred during the period to acquire segment assets that are expected to be used for more than one period.
BUSINESS SEGMENTS
During the year the Group restructured the organisation to drive business profitability, efficiencies and synergies and to share information and resources. The comparative information has been updated to reflect this new structure.
As a result the Company has changed its segments and the consolidated entity now comprises the following business streams:
• Industrials
• Cleanaway
• Commercial Vehicles
• Manufacturing
• New Zealand
For
per
sona
l use
onl
y

notes to the FinAnciAl stAtements for the financial year ended 30 June 2011 continued
100 tRAnspAciFic AnnuAl RepoRt 2011
Transpacific Annual Report 2011 99
Notes to the Financial Statements For the Financial Year Ended 30 June 2011 (continued)
32. Segment Information (continued)
The above business streams comprise of the following activities:
Industrials – Australia
• Technical Services – collection, treatment, processing and recycling of liquid and hazardous waste, including industrial waste, grease trap waste, oily waters and used mineral and cooking oils in packaged and bulk forms.
• Industrial Services – services include industrial cleaning, vacuum tanker loading, site remediation, sludge management, parts washing, concrete remediation, CCTV, corrosion protection, asbestos removal and emergency response services.
• Hydrocarbons – refining and recycling of used mineral oils to produce fuel oils and base oils. Manufacture of bituminous based applications and coatings.
Cleanaway – Australia
• Collections – municipal, residential, commercial and industrial collection services for all types of solid waste streams, including general waste, recyclables, construction and demolition waste and medical and washroom services.
• Post collections – ownership and management of waste transfer stations, resource recovery and recycling facilities, secure product destruction, quarantine treatment operations and landfills.
• Commodities trading – sale of recovered paper, cardboard, metals and plastics to the domestic and international marketplace, ensuring the long-term sustainability of our limited natural resources.
Commercial Vehicles – Australia and New Zealand
• Importation and distribution – independent importer and distributor of Western Star, MAN, Foton and Dennis Eagle truck chassis and associated parts and MAN bus chassis and associated parts.
Manufacturing – Australia and New Zealand
• Manufacturing – manufacturing and servicing of vehicle bodies, parts washers, plastic and steel bins, and waste compaction units to support our own operations as well as our clients.
New Zealand
• New Zealand – business streams comprise the same activities as those noted above for Industrials and Cleanaway.
The Group has the following allocation policies: • Sales between segments are on normal commercial terms. • Corporate charges are allocated where possible based on estimated usage of corporate resources. • Interest charges are allocated based on the use of debt facilities and loan balances. • Income tax is not allocated to segments.
Items included in unallocated income and expenses in the following table relate to:
2011 $’000
2010 $’000
Interest charges not allocated out to divisions (44,809) (41,789) Change in fair value of hedges (2,108) 11,695
Other corporate costs not allocated (12,771) (2,955)
(59,688) (33,049) Segment assets and liabilities have not been disclosed as these are not provided to the chief operating decision maker. This information is provided at a Group level only.
For
per
sona
l use
onl
y

101
100
Note
s to
the
Fina
ncia
l Sta
tem
ents
Fo
r the
Fin
ancia
l Yea
r End
ed 30
June
2011
(con
tinue
d)
32. S
egm
ent I
nfor
mat
ion
(con
tinue
d)
2011
TRA
NS
PA
CIF
IC
CLE
AN
AW
AY
A
US
TRA
LIA
$
’000
TRA
NS
PA
CIF
IC
IND
US
TRIA
LS
$’0
00
NE
W Z
EA
LAN
D
$’0
00
CO
MM
ER
CIA
L V
EH
ICLE
S
$’0
00
MA
NU
FAC
TUR
ING
$’00
0 C
OR
PO
RA
TE
$’
000
CO
NS
OLI
DA
TED
$’
000
Rev
enue
Sal
es –
ext
erna
l 85
3,29
5 53
1,61
7 34
8,84
4 35
3,19
0 67
,708
-
2,15
4,65
4
Inte
r-se
gmen
t sal
es
65,9
78
99,3
14
1,44
2 5,
203
36,1
92
7,35
5 21
5,48
4
TOTA
L S
ALE
S R
EV
EN
UE
91
9,27
3 63
0,93
1 35
0,28
6 35
8,39
3 10
3,90
0 7,
355
2,37
0,13
8
Oth
er re
venu
e 4,
561
18,4
13
1,63
0 33
7 62
5 -
25,5
66
TOTA
L S
EG
ME
NT
RE
VE
NU
E
923,
834
649,
344
351,
916
358,
730
104,
525
7,35
5 2,
395,
704
Inte
r-se
gmen
t elim
inat
ion
(215
,484
)
Una
lloca
ted
reve
nue
1,76
5
TOTA
L C
ON
SO
LID
ATE
D R
EV
EN
UE
2,
181,
985
Res
ult
Seg
men
t res
ults
bef
ore
non
cash
, sig
nific
ant,
asso
ciat
es, i
nter
est a
nd ta
x 10
8,24
5 85
,837
52
,649
18
,222
(1
1,72
9)
(7,7
38)
245,
486
Seg
men
t res
ult b
efor
e ta
x (8
8,37
7)
54,1
45
(122
,137
) 15
,963
(7
6,79
3)
- (2
17,1
99)
Una
lloca
ted
reve
nue
and
expe
nses
(5
9,68
8)
Sha
re o
f pro
fit o
f ass
ocia
tes
(206
) 1,
168
4,05
6 -
- -
5,01
8
PR
OFI
T B
EFO
RE
INC
OM
E T
AX
(2
71,8
69)
Inco
me
tax
bene
fit
(8,6
51)
NE
T P
RO
FIT
(280
,520
)
Dep
reci
atio
n an
d am
ortis
atio
n ex
pens
e 92
,187
43
,141
29
,817
1,
342
3,36
7 -
169,
854
Una
lloca
ted
4,
798
Tota
l dep
reci
atio
n an
d am
ortis
atio
n
17
4,65
2
Impa
irmen
t of n
on-c
urre
nt a
sset
s (9
8,29
3)
- (1
82,9
70)
- (6
0,35
6)
- (3
41,6
19)
Acq
uisi
tion
prop
erty
, pla
nt a
nd e
quip
men
t 89
,097
21
,936
23
,061
96
6 4,
967
14,8
07
154,
834
For
per
sona
l use
onl
y

notes to the FinAnciAl stAtements for the financial year ended 30 June 2011 continued
102 tRAnspAciFic AnnuAl RepoRt 2011
Tran
spac
ific
Ann
ual R
epor
t 201
1 10
1
32. S
egm
ent I
nfor
mat
ion
(con
tinue
d)
2010
TRA
NS
PA
CIF
IC
CLE
AN
AW
AY
A
US
TRA
LIA
$’00
0
TRA
NS
PA
CIF
IC
IND
US
TRIA
LS
$’0
00
N
EW
ZE
ALA
ND
$
’000
CO
MM
ER
CIA
L V
EH
ICLE
S
$’0
00
MA
NU
FAC
TUR
ING
$’00
0 C
OR
PO
RA
TE
$’
000
CO
NS
OLI
DA
TED
$’
000
Rev
enue
Sal
es –
ext
erna
l 76
7,13
1 49
8,93
0
335,
505
374,
695
73,0
10
- 2,
049,
271
Inte
r-se
gmen
t sal
es
46,2
68
95,6
73
5,
886
7,75
4 49
,675
8,
007
213,
263
TOTA
L S
ALE
S R
EV
EN
UE
81
3,39
9 59
4,60
3
341,
391
382,
449
122,
685
8,00
7 2,
262,
534
Oth
er re
venu
e 3,
835
17,4
80
20
9 -
451
- 21
,975
TOTA
L S
EG
ME
NT
RE
VE
NU
E
817,
234
612,
083
34
1,60
0 38
2,44
9 12
3,13
6 8,
007
2,28
4,50
9
Inte
r-se
gmen
t elim
inat
ion
(2
13,2
64)
Una
lloca
ted
reve
nue
2,
751
TOTA
L C
ON
SO
LID
ATE
D R
EV
EN
UE
2,07
3,99
6
Res
ult
Seg
men
t res
ults
bef
ore
non
cash
, sig
nific
ant,
asso
ciat
es, i
nter
est a
nd ta
x 99
,944
79
,057
54
,464
25
,878
4,
549
(9,4
99)
254,
394
Seg
men
t res
ult
7,52
6 47
,264
48,6
66
21,0
59
(803
) -
123,
712
Una
lloca
ted
reve
nue
and
expe
nses
(33,
049)
Sha
re o
f pro
fit o
f ass
ocia
tes
(629
) 98
3
1,01
9 -
- -
1,37
3
PR
OFI
T B
EFO
RE
INC
OM
E T
AX
92,0
36
Inco
me
tax
bene
fit
(1
9,30
0)
NE
T P
RO
FIT
72
,736
Dep
reci
atio
n an
d am
ortis
atio
n ex
pens
e 87
,947
39
,312
31,8
75
1,47
2 2,
414
- 16
3,02
0
Una
lloca
ted
5,55
1
Tota
l dep
reci
atio
n an
d am
ortis
atio
n
168,
571
Impa
irmen
t of a
sset
s -
-
- -
- -
-
Acq
uisi
tion
prop
erty
, pla
nt a
nd e
quip
men
t 97
,802
24
,329
33,8
07
1,80
9 8,
734
31,3
37
197,
818
For
per
sona
l use
onl
y

103
102
Notes to the Financial Statements For the Financial Year Ended 30 June 2011 (continued)
32. Segment Information (continued)
REVENUE BY GEOGRAPHIC LOCATIONS
In presenting information on the basis of geographic locations, external customer revenue is based on the geographical location of business.
Australia All business segments have operations.
New Zealand All business segments have operations.
South East Asia Industrial services operations and commercial vehicles sales.
2011 AUSTRALIA
$’000
NEW ZEALAND
$’000
SOUTH EAST ASIA $’000
TOTAL $’000
Sales to external customers 1,777,089 377,565 - 2,154,654 Segment net assets 1,649,431 187,649 (695) 1,836,385
Acquisition of property, plant and equipment 130,886 23,948 - 154,834
2010 AUSTRALIA
$’000
NEW ZEALAND
$’000
SOUTH EAST ASIA $’000
TOTAL $’000
Sales to external customers 1,690,075 359,195 - 2,049,270 Segment net assets 1,785,150 418,407 (963) 2,202,594
Acquisition of property, plant and equipment 161,672 36,146 - 197,818
33. Financial Instruments
The Group’s principal financial instruments, other than derivatives, comprise bank loans, Convertible Notes, US Private Placement Notes, finance leases and hire purchase contracts, cash and short-term deposits.
The main purpose of these financial instruments is to raise finance for the Group’s operations.
The Group has various other financial instruments such as trade receivables, trade payables and equity investments.
The Group also enters into derivative transactions, principally interest rate swaps and forward currency contracts. The purpose is to manage the interest rate and currency risks arising from the Group’s operations and its sources of finance.
It is the Group’s policy that no trading in financial instruments shall be undertaken.
The main risks arising from the Group’s financial instruments are foreign currency risk, interest rate risk, liquidity risk and credit risk. The Board reviews and agrees on policies for managing each of these risks and they are summarised below.
For
per
sona
l use
onl
y

notes to the FinAnciAl stAtements for the financial year ended 30 June 2011 continued
104 tRAnspAciFic AnnuAl RepoRt 2011
Transpacific Annual Report 2011 103
33. Financial Instruments (continued)
(A) CURRENCY RISK
Hedging
The Commercial Vehicles division sells vehicles and parts purchased from China, United States, United Kingdom and Germany. The Cleanaway and Industrial divisions sell commodities, predominantly cardboard, paper and oil, to Asia in US dollars. In order to protect against exchange rate movements, the Group enters into forward exchange contracts to purchase US dollars, British pounds and New Zealand dollars.
The contracts are timed to mature when:
- major shipments are scheduled to arrive in Australia; and
- receipt of payment from customer is expected.
The Group classifies its forward exchange contracts as cash flow hedges and states them at fair value.
The Group’s exposure to foreign currency risk at balance date was as follows:
30 JUNE 2011
30 JUNE 2007
USD
$’000
GBP
$’000
NZD
$’000
EUR
$’000
Trade receivables 5,080 - 437 - Trade payables (15,448) - (92) (9)
Gross statement of financial position exposure (10,368) - 345 (9)
Estimated forecast sales 28,243 - 28,337 - Estimated forecast purchases (149,712) (3,652) - (2,620)
Gross exposure (131,837) (3,652) 28,682 (2,629)
Forward exchange contracts 61,253 443 9,417 -
Net exposure (70,584) (3,209) 38,099 (2,629)
30 JUNE 2010
30 JUNE 2007
USD
$’000
GBP
$’000
NZD
$’000
EUR
$’000
Trade receivables 5,017 - 33 - Trade payables (12,485) - - (702)
Gross statement of financial position exposure (7,468) - 33 (702)
Estimated forecast sales 27,496 - 12,292 - Estimated forecast purchases (152,065) (7,751) - (1,405)
Gross exposure (132,037) (7,751) 12,325 (2,107)
Forward exchange contracts 22,028 3,596 - -
Net exposure (110,009) (4,155) 12,325 (2,107)
The following significant exchange rates applied during the year:
AVERAGE RATE REPORTING DATE
SPOT RATE
2011 2010 2011 2010
NZD 1.3044 1.2552 1.2953 1.2308 USD 0.9881 0.8821 1.0739 0.8523
EUR 0.7245 0.6355 0.7405 0.6979
GBP 0.6208 0.5585 0.6667 0.5666 For
per
sona
l use
onl
y

105
104
Notes to the Financial Statements For the Financial Year Ended 30 June 2011 (continued)
33. Financial Instruments (continued)
(A) CURRENCY RISK (CONTINUED)
The Group is exposed to foreign currency risk on translation of its foreign controlled subsidiaries. The principal exposure arising from this risk is fluctuations in the NZD.
The USPP and foreign denominated Tranche D debt currency risk has been mitigated by a foreign currency swap which has been in place since inception and converts to A$ fixed rate debt. At balance date the Group held the following facilities denominated in foreign currency:
USD
$’000 AUD
$’000
30 June 2011 US Private Placement 150,000 140,148
150,000 140,148
30 June 2010
US Private Placement 150,000 175,106
Syndicated Facility 81,866 96,053
231,866 271,159
(B) PRICE RISK
Equity securities price risk arises from investments in listed equity securities. All investments are publicly traded on the ASX. The price risk for listed investments based on an increase of 10% for the Group is as follows. A corresponding decrease of 10% would result in the same amount reducing equity.
INCREASE TO EQUITY
$’000
DECREASE TO NPAT $’000
30 June 2011 Listed securities 653 -
30 June 2010 Listed securities 2,339 -
For
per
sona
l use
onl
y

notes to the FinAnciAl stAtements for the financial year ended 30 June 2011 continued
106 tRAnspAciFic AnnuAl RepoRt 2011
Transpacific Annual Report 2011 105
33. Financial Instruments (continued)
(C) CREDIT RISK EXPOSURES
Management has a credit policy in place and exposure to credit risk is monitored on an ongoing basis. Credit evaluations are performed on all customers requiring credit over a certain amount. The Group does not require collateral in respect of financial assets. For certain export sales the Group requires the vendor to provide a letter of credit.
The Group minimises concentrations of credit risk by undertaking transactions with a large number of customers. Credit risk on interest rate and foreign exchange contracts is minimal as counterparties are large Australian and international banks with acceptable credit ratings determined by a recognised ratings agency.
The maximum exposure to credit risk is represented by the carrying amount of each financial asset, including derivative financial instruments, in the statement of financial position. The Group’s maximum exposure to credit risk at the reporting date was:
CARRYING AMOUNT
NOTE 2011 $’000
2010 $’000
Loans and receivables 10 310,930 276,790
Cash and cash equivalents (excluding bank overdrafts) 9 88,726 140,954
Other forward exchange contracts (derivatives) 13 113 18,635
399,769 436,379
The Group’s maximum exposure to credit risk for trade receivables at reporting date by geographic region was:
CARRYING AMOUNT
2011 $’000
2010 $’000
Australia 248,302 215,046
New Zealand 43,839 44,207
292,141 259,253
For
per
sona
l use
onl
y

107
106
Notes to the Financial Statements For the Financial Year Ended 30 June 2011 (continued)
33. Financial Instruments (continued)
(D) INTEREST RATE RISK EXPOSURES
Hedging
The Group’s exposure to interest rate risk is predominantly cash flow interest rate risk. The Group adopts a policy of ensuring at least 40% of its exposure to changes in interest rates on borrowings is on a fixed rate basis. Accordingly, the Group has entered into interest rate swap contracts under which it is obliged to receive interest at variable rates and to pay interest at fixed rates. The contracts are settled on a net basis and require settlement of net interest receivable or payable each 30 days or 90 days.
Swaps in place at 30 June 2011 cover approximately 63% (2010: 51%) of term debt outstanding and expire April 2012, July 2013, June 2014, February 2015, June 2015 and July 2015. The fixed interest rates currently range between BBSY 5.03% and 7.25% (2010: 5.03% and 7.25%).
The Group is hedge accounting $300 million of the interest rate swaps.
The Group classifies interest rate swaps as derivatives and states them at fair value.
At the reporting date the interest rate profile of the Group’s interest bearing financial instruments was:
CONSOLIDATED CARRYING
AMOUNT
2011 $’000
2010 $’000
Fixed rate instruments Financial assets
88,876 159,682
Financial liabilities
(624,016) (668,084)
(535,140) (508,402)
Variable rate instruments
Financial liabilities (941,665) (1,091,647)
(1,476,805) (1,600,049)
Sensitivity analysis for variable rate instruments and derivatives
A change of 100 basis points in interest rates at the reporting date would have increased/(decreased) equity (excluding the movement in profit before tax) and profit or loss by the amounts shown below:
PROFIT BEFORE TAX EQUITY
100 BP INCREASE
$’000
100 BP DECREASE
$’000
100 BP INCREASE
$’000
100 BP DECREASE
$’000
30 June 2011
Variable rate instruments
(9,401) 9,401 - -
Interest rate swap
(22,992) 31,162 (3,000) 3,000
Cash flow sensitivity (net) (32,393) 40,563 (3,000) 3,000
30 June 2010
Variable rate instruments
(10,900) 10,900 - -
Interest rate swap
(28,119) 29,589 - -
Cash flow sensitivity (net) (39,019) 40,489 - -
For
per
sona
l use
onl
y

notes to the FinAnciAl stAtements for the financial year ended 30 June 2011 continued
108 tRAnspAciFic AnnuAl RepoRt 2011
Transpacific Annual Report 2011 107
33. Financial Instruments (continued)
Effective interest rates and repricing analysis
In respect of income-earning financial assets and interest-bearing financial liabilities of the Group, the following table indicates their effective interest rates at reporting date and the periods in which they reprice. No other financial assets or liabilities are exposed to any interest rate risk.
GROUP
EFFECTIVE INTEREST
RATE (%) TOTAL
1 YEAR OR LESS
$’000
1 – 2 YEARS
$’000
2 – 3 YEARS
$’000
3 – 4 YEARS
$’000
>4 YEARS
$’000
2011 FINANCIAL ASSETS
Cash and deposits 4.36 88,726 88,726 - - - -
Loans to related parties 9.00 37 37 - - - -
TOTAL FINANCIAL ASSETS 88,763 88,763 - - - -
FINANCIAL LIABILITIES
US Private Placement 10.84 140,148 - 95,451 - - 44,697
Convertible notes 6.75 286,270 - - - 286,270 -
Unsecured bank loans 9.14 940,063 50,000 12,500 526,667 350,896 -
Lease liabilities 8.37 138,482 31,414 44,119 28,551 26,229 8,169
Payable to related parties 9.00 3,329 3,329 - - - -
Interest rate swaps** 7.81 53,079 53,079 - - - -
Foreign currency swaps 2,709 2,709 - - - -
Other 6.0 1,602 1,602 - - - -
TOTAL FINANCIAL LIABILITIES 1,565,682 142,133 152,070 555,218 663,395 52,866
2010 FINANCIAL ASSETS
Cash and deposits 4.56 140,954 140,954 - - - -
Loans to related parties 9.00 93 93 - - - -
TOTAL FINANCIAL ASSETS 141,047 141,047 - - - -
FINANCIAL LIABILITIES
US Private Placement 10.84 175,106 - - - - 175,106
Convertible notes 6.75 279,668 - - - - 279,668
Unsecured bank loans 7.93 1,093,0700
- - 1,093,070 - -
Lease liabilities 8.28 170,872 38,858 35,024 38,319 27,405 31,266
Payable to related parties 9.00 7,131 7,131 - - - -
Interest rate swaps** 6.84 31,440 31,440 - - - -
Other 6.00 2,444 2,444 - - - -
TOTAL FINANCIAL LIABILITIES 1,759,731 79,873 35,024 1,131,389 27,405 486,040
** Interest rate swaps include the cross currency swaps for the USPP.
For
per
sona
l use
onl
y

109
108
Notes to the Financial Statements For the Financial Year Ended 30 June 2011 (continued)
33. Financial Instruments (continued)
(E) LIQUIDITY RISK
The following table discloses the contractual maturities of financial liabilities, including estimated interest payment and excluding the impact of netting agreements:
CONSOLIDATED
CARRYING AMOUNT
$’000
CONTRACT-UAL CASH
FLOWS $’000
LESS THAN 1 YEAR $’000
1 – 2 YEARS
$’000
2 – 5 YEARS
$’000
MORE THAN 5 YEARS
$’000
2011
Non-derivative financial liabilities
US Private Placement 140,148 (225,044) (18,321) (126,816) (17,478) (62,429)
Convertible notes 286,270 (382,125) (20,864) (20,864) (340,397) -
Loans from associates 3,329 (3,562) (3,562) - - -
Finance lease liabilities 138,482 (163,978) (41,985) (47,454) (64,866) (9,673)
Unsecured bank loans 940,063 (1,231,314) (136,015) (86,015) (1,009,284) -
Trade and other payables* 231,889 (231,889) (231,889) - - -
Derivative financial liabilities
Interest rate swaps** 53,079 (53,079) (53,079) - - -
Foreign currency swaps 2,708 (2,708) (2,708) - - -
1,795,968 (2,293,699) (508,423) (281,149) (1,432,025) (72,102)
2010
Non-derivative financial liabilities
US Private Placement 175,106 (243,365) (18,321) (18,321) (138,468) (68,255)
Convertible notes 279,668 (402,989) (20,864) (20,864) (361,261) -
Loans from associates 7,131 (7,773) (7,773) - - -
Finance lease liabilities 170,873 (208,686) (47,458) (42,775) (99,362) (19,091)
Unsecured bank loans 1,093,070 (1,287,201) (89,217) (62,114) (1,135,870) -
Trade and other payables* 218,003 (218,003) (218,003) - - -
Derivative financial liabilities
Interest rate swaps** 31,440 (31,440) (31,440) - - -
1,975,291 (2,399,457) (433,076) (144,074) (1,734,961) (87,346)
* Excludes derivatives shown separately.
** Interest rate swaps include the cross currency swaps for the USPP.
All non-derivative financial liabilities, excluding bank overdraft, are carried at amortised cost. The Group manages liquidity risk by monitoring forecast cash flows on a weekly basis and ensuring that adequate unutilised borrowing facilities are maintained.
For
per
sona
l use
onl
y

notes to the FinAnciAl stAtements for the financial year ended 30 June 2011 continued
110 tRAnspAciFic AnnuAl RepoRt 2011
Transpacific Annual Report 2011 109
33. Financial Instruments (continued)
(F) CAPITAL MANAGEMENT
The capital structure of the Group comprises debt, which includes the borrowings disclosed in Note 20, cash and cash equivalents and equity attributable to equity holders of the parent, such equity comprising issued capital, reserves and retained earnings as disclosed in the statement of financial position. The Company undertook a major review of its capital structure during 2009 which was finalised in August 2009. The Company is subject to externally imposed capital requirements, including restrictions on the payment of dividends on ordinary shares, and redeeming, repurchasing, retiring or repaying in cash any of the convertible notes, the USPP notes, the Transpacific Step-up Preference Securities or any other hybrid equity instrument issued by it prior to its stated maturity or expiry date (other than in circumstances where it is obliged to do so). The restrictions on dividends are consistent with the Company’s intention to adopt a dividend policy which is focused on cash flow management having regard to various factors including prevailing economic conditions, capital expenditure requirements and opportunities, acquisition opportunities and debt management. The Group has complied with all external requirements for capital management.
(G) IMPAIRMENT LOSSES
The ageing of the Group’s trade receivables at the reporting date was:
GROSS 2011 $’000
IMPAIRMENT 2011 $’000
GROSS 2010 $’000
IMPAIRMENT 2010 $’000
Not past due 166,901 132,165 - Past due 0-30 days
75,579 90,205 -
Past due 31-120 days
48,085 1,568 36,478 1,838
Past due 121 days to one year
5,495 2,351 4,850 2,607
More than one year
250 250 83 83
296,310 4,169 263,781 4,528
The movement in the allowance for impairment in respect of trade receivables during the year was as follows:
2011 $’000
2010 $’000
Balance at 1 July 4,528 4,537 Impairment loss/(reversed) recognised
(359) (9)
Balance 30 June 4,169 4,528
The impairment loss at 30 June 2011 of $250,000 > one year relates to several minor customers.
Based on historic default rates, the Group believes that no impairment allowance is necessary in respect of trade receivables not past due or past due by up to 30 days. No single customer’s annual revenue is greater than 2% of the Group’s total revenue. Trade and other debtors that are neither past due or impaired are considered to be of a high credit quality.
(H) FAIR VALUES
The Group uses various methods in estimating the fair value of a financial instrument. The methods comprise:
Level 1 – the fair value is calculated using quoted prices in active markets.
Level 2 – the fair value is estimated using inputs other than quoted prices included in Level 1 that are observable for the asset or liability, either directly (as prices) or indirectly (derived from prices).
Level 3 – the fair value is estimated using inputs for the asset or liability that are not based on observable market data. F
or p
erso
nal u
se o
nly

111
110
Notes to the Financial Statements For the Financial Year Ended 30 June 2011 (continued)
33. Financial Instruments (continued)
(H) FAIR VALUES (CONTINUED)
Quoted market price represents the fair value determined based on quoted prices on active markets as at the reporting date without any deduction for transaction costs. The fair value of the listed equity investments are based on quoted market prices.
For financial instruments not quoted in active markets, the Group uses valuation techniques such as present value techniques, comparison to similar instruments for which market observable prices exist and other relevant models used by market participants. These valuation techniques use both observable and unobservable market inputs.
The fair value of unlisted debt and equity securities, as well as other investments that do not have an active market, are based on valuation techniques using market data that is not observable.
Other than as disclosed on the following pages there are no differences between the carrying value and the fair value of financial assets and liabilities.
The fair value of the financial instruments as well as the methods used to estimate the fair value are summarised in the table below.
CONSOLIDATED
2011
QUOTED MARKET
PRICE (LEVEL 1)
VALUATION TECHNIQUE –
MARKET OBSERVABLE
INPUTS (LEVEL 2)
VALUATION TECHNIQUE – NON MARKET OBSERVABLE
INPUTS (LEVEL 3) TOTAL
Financial assets
Derivative financial instruments:
Currency rate swaps - 113 - 113
Available-for-sale investments:
Listed investments 6,840 - - 6,840
Financial liabilities
Derivative financial instruments:
Interest rate swaps - 53,079 - 53,079
Foreign currency swaps - 2,708 - 2,708
2010
Financial assets
Derivative financial instruments:
Currency rate swaps - 18,635 - 18,635
Available-for-sale investments:
Listed investments 23,942 - - 23,942
Financial liabilities
Derivative financial instruments:
Interest rate swaps - 31,440 - 31,440
Transfer between categories
There were no transfers between Level 1 and Level 2 during the year.
For
per
sona
l use
onl
y

notes to the FinAnciAl stAtements for the financial year ended 30 June 2011 continued
112 tRAnspAciFic AnnuAl RepoRt 2011
Transpacific Annual Report 2011 111
34. Earnings per Share
2011 2010
Calculated in accordance with AASB 133: Basic earnings per share (cents per share) (30.9) 6.7c
Diluted earnings per share (cents per share) (30.9) 6.6c
Weighted average number of ordinary shares used as the denominator in calculating basic earnings per share 960,638,735 883,487,199
Effect of share options, performance rights and warrants on issue
21,396,607 6,015,348
Weighted average number of ordinary shares used as the denominator in calculating diluted earnings per share 982,035,342 889,502,547
2011
$’000
2010
$000
Reconciliation of earnings used as the numerator in calculating basic and diluted earnings per share:
Profit/(loss) from continuing operations (280,520) 72,736
Net profit attributable to non-controlling interests (1,348) (1,575)
Distribution to Step-up Preference Security holders (14,675) (12,125)
(296,543) 59,036
For
per
sona
l use
onl
y

113
112
Notes to the Financial Statements For the Financial Year Ended 30 June 2011 (continued)
35. Key Management Personnel Disclosures
(A) DETAILS OF SPECIFIED DIRECTORS AND SPECIFIED EXECUTIVES
The following were key management personnel of the Group at any time during the reporting period and unless otherwise indicated were key management personnel for the entire period:
(i) Executive Directors K G Campbell – Executive Director and Chief Executive Officer (appointed 27 January 2011) T J Coonan – Executive Director and Chief Executive Officer (resigned 27 January 2011) (ii) Non-Executive Directors G T Tilbrook B R Brown R A Ghatalia M M Hudson
R Smith (appointed 1 April 2011) G D Mulligan (retired 3 November 2010) B S Allan (retired 3 November 2010) (iii) Key Executives H W Grundell – Executive General Manager, New Zealand, Commercial Vehicles and Manufacturing (ceased employment 6 June 2011)
N M Badyk – Chief Operating Officer, Cleanaway A G Roderick – Chief Operating Officer, Transpacific Industrials
S G Cummins – Chief Financial Officer (appointed 23 May 2011)
S T Barnard – General Manager, Group Projects
P A Glavac – Managing Director, Commercial Vehicles T Nickels – Managing Director, New Zealand K L Smith – Company Secretary
(B) KEY MANAGEMENT PERSONNEL COMPENSATION
The key management personnel compensation included in employee expenses are as follows:
CONSOLIDATED
2011 $’000
2010 $’000
Short-term employee benefits 5,179 5,380
Post-employment benefits 2,505 2,032
Equity compensation benefits 994 265
8,678 7,677
The disclosures relating to remuneration of specified Directors and Executives is set out in the Remuneration Report section of the Directors' Report on pages 31 to 41.
For
per
sona
l use
onl
y

notes to the FinAnciAl stAtements for the financial year ended 30 June 2011 continued
114 tRAnspAciFic AnnuAl RepoRt 2011
Transpacific Annual Report 2011 113
35. Key Management Personnel Disclosures (continued)
(C) OPTIONS AND PERFORMANCE RIGHTS OVER EQUITY INSTRUMENTS GRANTED
The movement during the reporting period in the number of opportunities over ordinary shares in the Company held, directly, indirectly or beneficially, by each key management person, including their related parties, is as follows. No options are exercisable at the end of the year.
2011
BALANCE AT THE START OF
THE YEAR
GRANTED DURING THE
YEAR AS REMUNERATION
EXERCISED DURING THE
YEAR
OTHER CHANGES
DURING THE YEAR
BALANCE AT THE END OF
THE YEAR
VESTED AND EXERCISABLE
AT THE END OF THE YEAR
Executive Directors: K G Campbell - 1,120,088* - - 1,120,088 - T J Coonan 1,757,413 750,000 - (2,507,413) - - Non-Executive Directors: G T Tilbrook - - - - - - B R Brown - - - - - - G D Mulligan - - - - - - B S Allan 50,000 - - (50,000) - - R A Ghatalia - - - - - - M M Hudson - - - - - - Key Executives: N M Badyk 653,604 351,773 - - 1,005,377 - A G Roderick 1,153,604 300,000 - (500,000) 953,604 - S G Cummins - - - - - - P A Glavac 401,532 175,000 - - 576,532 - T Nickels 656,455 187,729 - - 844,184 - K L Smith 321,155 126,000 - (75,000) 372,115 - H W Grundell 885,109 337,910 - (1,223,019) - - S T Barnard 451,740 118,093 - (30,000) 539,833 -
2010
BALANCE AT THE START OF
THE YEAR
GRANTED DURING THE
YEAR AS REMUNERATION
EXERCISED DURING THE
YEAR
OTHER CHANGES
DURING THE YEAR
BALANCE AT THE END OF
THE YEAR
VESTED AND EXERCISABLE
AT THE END OF THE YEAR
Executive Directors: T J Coonan 433,333 1,324,080 - - 1,757,413 - Non-Executive Directors: G T Tilbrook - - - - - - B R Brown - - - - - - G D Mulligan - - - - - - B S Allan 50,000 - - - 50,000 - R A Ghatalia - - - - - - M M Hudson - - - - - - Key Executives: H W Grundell 100,000 785,109 - - 885,109 - N M Badyk 100,000 653,604 - (100,000) 653,604 - A G Roderick 500,000 653,604 - - 1,153,604 - S T Barnard 150,000 301,740 - - 451,740 - P A Glavac 100,000 401,532 - (100,000) 401,532 - T Nickels 200,000 456,455 - - 656,455 - K L Smith 75,000 246,155 - - 321,155 - G R W Battershill 200,000 - - (200,000) - - G S Campbell 650,000 - - (650,000) - -
For
per
sona
l use
onl
y

115
114
* 337,500 of these performance rights have been issued subject to shareholder approval at the 2011 Annual General Meeting
Notes to the Financial Statements For the Financial Year Ended 30 June 2011 (continued)
35. Key Management Personnel Disclosures (continued)
(D) SHARE HOLDINGS
The movement during the reporting period in the number of ordinary shares in the Company held, directly or indirectly or beneficially, by each key management person, including their related parties, is as follows.
2011
NAME
BALANCE AT THE START OF THE
YEAR
RECEIVED DURING THE
YEAR ON THE EXERCISE OF
OPTIONS
OTHER CHANGES
DURING THE YEAR
BALANCE AT THE END OF THE
YEAR
Executive Directors: K G Campbell - - - -
Non-Executive Directors:
G T Tilbrook 30,000 - 50,000 80,000
B R Brown 200,000 - - 200,000
M M Hudson 7,000 - - 7,000
G D Mulligan 82,810 - - 82,810 B S Allan 25,653 - - 25,653
Key Executives:
N M Badyk 186,517 - - 186,517
S T Barnard 20,500 - - 20,500
P A Glavac 227,874 - - 227,874
K L Smith 76,465 - - 76,465
2010
NAME
BALANCE AT THE START OF THE
YEAR
RECEIVED DURING THE
YEAR ON THE EXERCISE OF
OPTIONS
OTHER CHANGES
DURING THE YEAR
BALANCE AT THE END OF THE
YEAR
Executive Directors: T E Peabody (including related parties) 118,158,430 - 58,129,450 176,287,880
T J Coonan 1,275,384 - (1,275,384) -
Non-Executive Directors:
G T Tilbrook - - 30,000 30,000
B R Brown 150,000 - 50,000 200,000
G D Mulligan 82,810 - - 82,810 B S Allan 9,261 - 16,392 25,653
M M Hudson - - 7,000 7,000
Key Executives:
H W Grundell 625,714 - (625,714) -
N M Badyk 186,517 - - 186,517
S T Barnard 20,500 - - 20,500
P A Glavac 455,749 - (227,875) 227,874
K L Smith 150,000 - (73,535) 76,465
For
per
sona
l use
onl
y

notes to the FinAnciAl stAtements for the financial year ended 30 June 2011 continued
116 tRAnspAciFic AnnuAl RepoRt 2011
Transpacific Annual Report 2011 115
35. Key Management Personnel Disclosures (continued)
(E) CHANGES IN KEY MANAGEMENT PERSONNEL IN THE PERIOD AFTER THE REPORTING DATE AND PRIOR TO THE DATE WHEN THE FINANCIAL REPORT IS AUTHORISED FOR ISSUE
Subsequent to year end S T Barnard ceased employment on 29 July 2011.
(F) LOANS TO DIRECTORS AND EXECUTIVES
There were no loans to directors or executives made during the period and no outstanding balances at reporting date.
36. Subsequent Events
There were no significant events subsequent to year end.
37. Parent Entity Disclosure
2011 $’000
2010 $’000
Current assets 6,520 60,923 Total assets 3,276,150 3,575,383
Current liabilities 54,854 161,346
Total liabilities 1,417,548 1,686,807
Issued capital 1,819,917 1,819,917
Retained earnings (24,738) 7,859
Reserves 63,423 60,800
Total shareholder equity 1,858,602 1,888,576
Profit or loss of the parent entity (32,597) 3,984
Total comprehensive income of the parent entity (32,597) 3,984
The parent entity guarantees the contractual commitments of its subsidiaries as requested. Refer to Note 25 and 29.
For
per
sona
l use
onl
y

diRectoRs’ declARAtion
117
116
Directors’ Declaration
In the Directors’ opinion:
(a) the financial statements and notes together with the additional disclosures included in the Directors report designated as audited, are in accordance with the Corporations Act 2001, including:
(i) giving a true and fair view of the consolidated entity’s financial position as at 30 June 2011 and of its performance for the financial year ended on that date; and
(ii) complying with Australian Accounting Standards (including the Australian Accounting Interpretations), and the Corporations Regulations 2001.
(b) the financial statements and notes also comply with International Financial Reporting Standards as disclosed in Note 2; and
(c) there are reasonable grounds to believe that the company will be able to pay its debts as and when they become due and payable.
(d) this declaration has been made after receiving the declarations required to be made to the Directors in accordance with section s295A of the Corporations Act 2001 for the financial year ended 30 June 2011; and
(e) as at the date of this declaration, there are reasonable grounds to believe that the members of the closed group identified in Note 25 will be able to meet any obligation or liabilities to which they are or may become subject to, by virtue of the deed of cross guarantee.
This declaration is made in accordance with a resolution of the Directors.
G T Tilbrook B R Brown Non-Executive Chairman Deputy Chairman
Brisbane, 24 August 2011
For
per
sona
l use
onl
y

independent Audit RepoRt to the members of transpacific industries Group ltd
118 tRAnspAciFic AnnuAl RepoRt 2011
118 Liability limited by a scheme approved under Professional Standards Legislation
Independent auditor's report to the members of Transpacific Industries Group Limited
Report on the financial report
We have audited the accompanying financial report of Transpacific Industries Group Limited, which comprises the consolidated statement of financial position as at 30 June 2011, the consolidated statement of comprehensive income, the consolidated statement of changes in equity and the consolidated statement of cash flows for the year then ended, notes comprising a summary of significant accounting policies and other explanatory information, and the directors' declaration of the consolidated entity comprising the company and the entities it controlled at the year's end or from time to time during the financial year.
Directors' responsibility for the financial report The directors of the company are responsible for the preparation of the financial report that gives a true and fair view in accordance with Australian Accounting Standards and the Corporations Act 2001 and for such internal controls as the directors determine are necessary to enable the preparation of the financial report that is free from material misstatement, whether due to fraud or error. In Note 2, the directors also state, in accordance with Accounting Standard AASB 101 Presentation of Financial Statements, that the financial statements comply with International Financial Reporting Standards.
Auditor's responsibility Our responsibility is to express an opinion on the financial report based on our audit. We conducted our audit in accordance with Australian Auditing Standards. Those standards require that we comply with relevant ethical requirements relating to audit engagements and plan and perform the audit to obtain reasonable assurance about whether the financial report is free from material misstatement.
An audit involves performing procedures to obtain audit evidence about the amounts and disclosures in the financial report. The procedures selected depend on the auditor's judgment, including the assessment of the risks of material misstatement of the financial report, whether due to fraud or error. In making those risk assessments, the auditor considers internal controls relevant to the entity's preparation and fair presentation of the financial report in order to design audit procedures that are appropriate in the circumstances, but not for the purpose of expressing an opinion on the effectiveness of the entity's internal controls. An audit also includes evaluating the appropriateness of accounting policies used and the reasonableness of accounting estimates made by the directors, as well as evaluating the overall presentation of the financial report.
We believe that the audit evidence we have obtained is sufficient and appropriate to provide a basis for our audit opinion.
Independence In conducting our audit we have complied with the independence requirements of the Corporations Act 2001. We have given to the directors of the company a written Auditor’s Independence Declaration, a copy of which is included in the directors’ report.
Opinion In our opinion:
a. the financial report of Transpacific Industries Group Limited is in accordance with the Corporations Act 2001, including:
i giving a true and fair view of the consolidated entity's financial position as at 30 June 2011 and of its performance for the year ended on that date; and
ii complying with Australian Accounting Standards and the Corporations Regulations 2001; and
b. the financial report also complies with International Financial Reporting Standards as disclosed in Note 2.
Report on the remuneration report We have audited the Remuneration Report included in pages 31 to 41 of the directors' report for the year ended 30 June 2011. The directors of the company are responsible for the preparation and presentation of the Remuneration Report in accordance with section 300A of the Corporations Act 2001. Our responsibility is to express an opinion on the Remuneration Report, based on our audit conducted in accordance with Australian Auditing Standards.
Opinion In our opinion, the Remuneration Report of Transpacific Industries Group Limited for the year ended 30 June 2011 complies with section 300A of the Corporations Act 2001.
Ernst & Young Mike Reid Partner
Brisbane 24 August 2011
For
per
sona
l use
onl
y
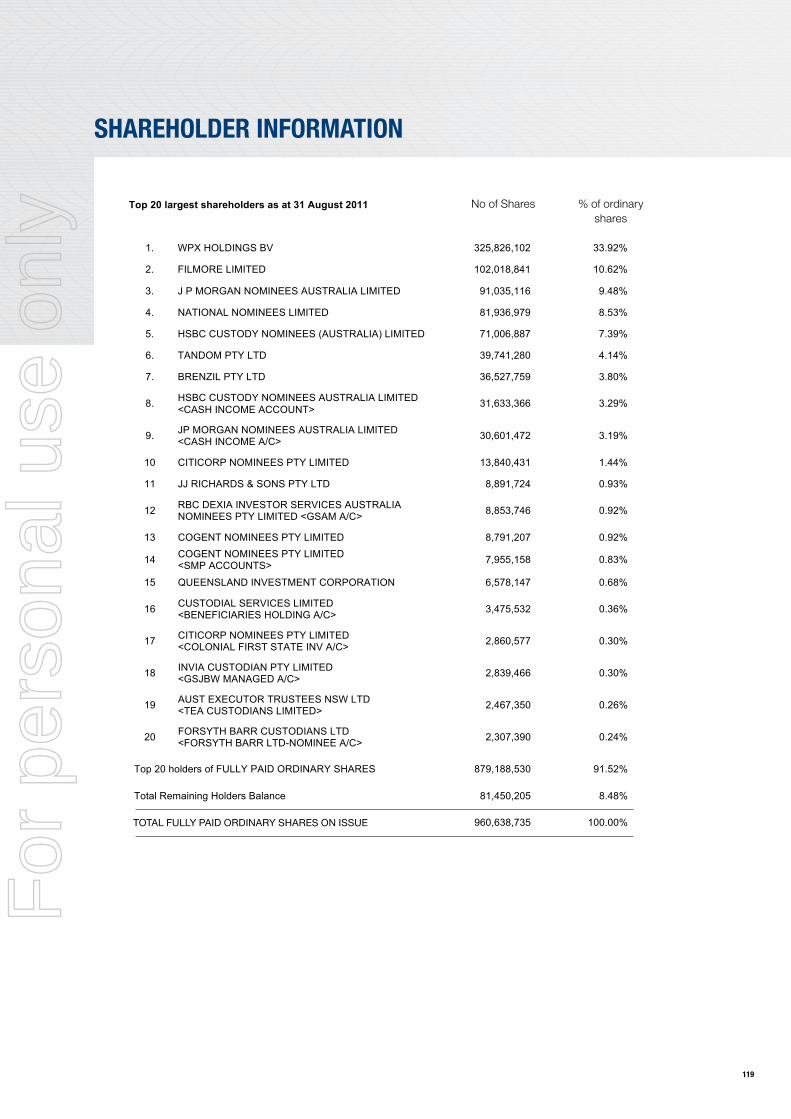
119
shAReholdeR inFoRmAtion
Top 20 largest shareholders as at 31 August 2011
1. WPX HOLDINGS BV 325,826,102 33.92%
2. FILMORE LIMITED 102,018,841 10.62%
3. J P MORGAN NOMINEES AUSTRALIA LIMITED 91,035,116 9.48%
4. NATIONAL NOMINEES LIMITED 81,936,979 8.53%
5. HSBC CUSTODY NOMINEES (AUSTRALIA) LIMITED 71,006,887 7.39%
6. TANDOM PTY LTD 39,741,280 4.14%
7. BRENZIL PTY LTD 36,527,759 3.80%
8. HSBC CUSTODY NOMINEES AUSTRALIA LIMITED <CASH INCOME ACCOUNT> 31,633,366 3.29%
9. JP MORGAN NOMINEES AUSTRALIA LIMITED <CASH INCOME A/C> 30,601,472 3.19%
10 CITICORP NOMINEES PTY LIMITED 13,840,431 1.44%
11 JJ RICHARDS & SONS PTY LTD 8,891,724 0.93%
12 RBC DEXIA INVESTOR SERVICES AUSTRALIA NOMINEES PTY LIMITED <GSAM A/C> 8,853,746 0.92%
13 COGENT NOMINEES PTY LIMITED 8,791,207 0.92%
14 COGENT NOMINEES PTY LIMITED <SMP ACCOUNTS> 7,955,158 0.83%
15 QUEENSLAND INVESTMENT CORPORATION 6,578,147 0.68%
16 CUSTODIAL SERVICES LIMITED <BENEFICIARIES HOLDING A/C> 3,475,532 0.36%
17 CITICORP NOMINEES PTY LIMITED <COLONIAL FIRST STATE INV A/C> 2,860,577 0.30%
18 INVIA CUSTODIAN PTY LIMITED <GSJBW MANAGED A/C> 2,839,466 0.30%
19 AUST EXECUTOR TRUSTEES NSW LTD <TEA CUSTODIANS LIMITED> 2,467,350 0.26%
20 FORSYTH BARR CUSTODIANS LTD <FORSYTH BARR LTD-NOMINEE A/C> 2,307,390 0.24%
Top 20 holders of FULLY PAID ORDINARY SHARES 879,188,530 91.52%
Total Remaining Holders Balance 81,450,205 8.48%
960,638,735 100.00%
An entity has a substantial shareholding if the total votes attaching to shares in which the entity and their associates have a relevant interest is 5% or more. The list of the 20 largest shareholders is based on the number of shares held in the name of each shareholder (not including their associates), even if the shareholder does not have a relevant interest in the shares for example, because the shareholder holds the share as a nominee. The list of the 20 largest shareholders of the Company and the list of substantial shareholders of the Company differ for this reason.
No of Shares % of ordinary shares
ToTal fully paid ordinary shares on issue
For
per
sona
l use
onl
y

120 tRAnspAciFic AnnuAl RepoRt 2011
shAReholdeR inFoRmAtion continued
Substantial shareholders
The number of shares held by substantial shareholders as dislcosed in the substantial shareholding notices
WPX Holdings BV 325,826,102 33.92%
Filmore Limited 101,137,147 10.53%
Total 426,963,249 44.45%
Statement of Quoted Securities
The Company's total number of shares on issue as at 31 August 2011 is 960,638,735 ordinary fully paid shares.
At 31 August 2011 the total number of shareholders owning these shares was 8,848 on the register of members maintained by Computershare Investor Services Pty Ltd.
91.52% of total issued capital is held by or on behalf of the 20 largest shareholders.
Voting rights
Under the Company's Constitution, every member entitled to vote who is present at a general meeting of the Company in person or by proxy or by attorney or, in the case of a corporations, by representative, shall, upon a show of hands, have one vote only.
Where a member is entitled to cast two or more votes it may appoint not more than two proxies or attorneys.
Poll – On a poll, every member entitled to vote shall, whether present in person or by proxy or attorney or, in the case of a corporation, by representative, have one vote for every share held by the member.
At 31 August 2011, there were 11, 610, 915 performance rights on issue to executives under incentive schemes. 71,636,326 warrants are held by WPX Holdings BV under an Equity Warrant Deed. Voting rights will be attached to the unissued ordinary shares when the performance rights and warrants have been exercised.
Distribution Schedule of Shareholders
No. of shares 1-1,000 1,001-5,000 5,001-10,000 10,001-100,000 100,000 and over
No. of shareholders 3115 3495 1100 1026 112
The number of shareholders each holding less than a marketable parcel of the Company's ordinary shares at 31 August 2011 was 2,000.
Securities Exchange listing
The shares of Transpacific Industries Group Ltd are listed on the Australian Securities Exchange under the trade symbol TPI, with Brisbane being the home exchange.
Top 20 largest shareholders as at 31 August 2011
1. WPX HOLDINGS BV 325,826,102 33.92%
2. FILMORE LIMITED 102,018,841 10.62%
3. J P MORGAN NOMINEES AUSTRALIA LIMITED 91,035,116 9.48%
4. NATIONAL NOMINEES LIMITED 81,936,979 8.53%
5. HSBC CUSTODY NOMINEES (AUSTRALIA) LIMITED 71,006,887 7.39%
6. TANDOM PTY LTD 39,741,280 4.14%
7. BRENZIL PTY LTD 36,527,759 3.80%
8. HSBC CUSTODY NOMINEES AUSTRALIA LIMITED <CASH INCOME ACCOUNT> 31,633,366 3.29%
9. JP MORGAN NOMINEES AUSTRALIA LIMITED <CASH INCOME A/C> 30,601,472 3.19%
10 CITICORP NOMINEES PTY LIMITED 13,840,431 1.44%
11 JJ RICHARDS & SONS PTY LTD 8,891,724 0.93%
12 RBC DEXIA INVESTOR SERVICES AUSTRALIA NOMINEES PTY LIMITED <GSAM A/C> 8,853,746 0.92%
13 COGENT NOMINEES PTY LIMITED 8,791,207 0.92%
14 COGENT NOMINEES PTY LIMITED <SMP ACCOUNTS> 7,955,158 0.83%
15 QUEENSLAND INVESTMENT CORPORATION 6,578,147 0.68%
16 CUSTODIAL SERVICES LIMITED <BENEFICIARIES HOLDING A/C> 3,475,532 0.36%
17 CITICORP NOMINEES PTY LIMITED <COLONIAL FIRST STATE INV A/C> 2,860,577 0.30%
18 INVIA CUSTODIAN PTY LIMITED <GSJBW MANAGED A/C> 2,839,466 0.30%
19 AUST EXECUTOR TRUSTEES NSW LTD <TEA CUSTODIANS LIMITED> 2,467,350 0.26%
20 FORSYTH BARR CUSTODIANS LTD <FORSYTH BARR LTD-NOMINEE A/C> 2,307,390 0.24%
Top 20 holders of FULLY PAID ORDINARY SHARES 879,188,530 91.52%
Total Remaining Holders Balance 81,450,205 8.48%
960,638,735 100.00%
An entity has a substantial shareholding if the total votes attaching to shares in which the entity and their associates have a relevant interest is 5% or more. The list of the 20 largest shareholders is based on the number of shares held in the name of each shareholder (not including their associates), even if the shareholder does not have a relevant interest in the shares for example, because the shareholder holds the share as a nominee. The list of the 20 largest shareholders of the Company and the list of substantial shareholders of the Company differ for this reason.
Substantial shareholders
The number of shares held by substantial shareholders as dislcosed in the substantial shareholding notices
WPX Holdings BV 325,826,102 33.92%
Filmore Limited 101,137,147 10.53%
Total 426,963,249 44.45%
Statement of Quoted Securities
The Company's total number of shares on issue as at 31 August 2011 is 960,638,735 ordinary fully paid shares.
At 31 August 2011 the total number of shareholders owning these shares was 8,848 on the register of members maintained by Computershare Investor Services Pty Ltd.
91.52% of total issued capital is held by or on behalf of the 20 largest shareholders.
Voting rights
Under the Company's Constitution, every member entitled to vote who is present at a general meeting of the Company in person or by proxy or by attorney or, in the case of a corporations, by representative, shall, upon a show of hands, have one vote only.
Where a member is entitled to cast two or more votes it may appoint not more than two proxies or attorneys.
Poll – On a poll, every member entitled to vote shall, whether present in person or by proxy or attorney or, in the case of a corporation, by representative, have one vote for every share held by the member.
At 31 August 2011, there were 11, 610, 915 performance rights on issue to executives under incentive schemes. 71,636,326 warrants are held by WPX Holdings BV under an Equity Warrant Deed. Voting rights will be attached to the unissued ordinary shares when the performance rights and warrants have been exercised.
Distribution Schedule of Shareholders
No. of shares 1-1,000 1,001-5,000 5,001-10,000 10,001-100,000 100,000 and over
No. of shareholders 3115 3495 1100 1026 112
The number of shareholders each holding less than a marketable parcel of the Company's ordinary shares at 31 August 2011 was 2,000.
Securities Exchange listing
The shares of Transpacific Industries Group Ltd are listed on the Australian Securities Exchange under the trade symbol TPI, with Brisbane being the home exchange.
3,115 3,495 1,100 1,026 112
.
given to the Company as at 15 september 2011 were:
For
per
sona
l use
onl
y

coRpoRAte diRectoRY
tRAnspAciFic industRies gRoup ltdABN 74 101 155 220
diRectoRsGene Tilbrook (Non-Executive Chairman)
Kevin Campbell (Chief Executive Officer and Executive Director)
Bruce Brown (Deputy Chairman and Non-Executive Director)
Rajiv Ghatalia (Non-Executive Director)
Martin Hudson (Non-Executive Director)
Ray Smith (Non-Executive Director)
Emma Stein (Non-Executive Director)
compAnY secRetARYKellie Smith
RegisteRed oFFiceLevel 1 159 Coronation Drive Milton QLD 4064
Designed and produced by FCR www.fcr.com.au
For
per
sona
l use
onl
y

www.transpacific.com.au
For
per
sona
l use
onl
y