for personal use only - asx · portfolio management identify prospectivity, add value, test...
TRANSCRIPT

North American RoadshowNovember 8-12, 2010
DisclaimerThis presentation includes certain forward-looking
statements that have been based on current expectations
about future acts, events and circumstances. These
forward-looking statements are, however, subject to risks,
uncertainties and assumptions that could cause those acts,
events and circumstances to differ materially from the
expectations described in such forward-looking statements.
These factors include, among other things, commercial and
other risks associated with estimation of potential
hydrocarbon resources, the meeting of objectives and other
investment considerations, as well as other matters not yet
known to the Company or not currently considered material
by the Company.
MEO Australia accepts no responsibility to update any
person regarding any error or omission or change in the
information in this presentation or any other information
made available to a person or any obligation to furnish the
person with further information.
For
per
sona
l use
onl
y

Corporate snapshotLeverage to growing export gas markets, strong cash position
MEO Australia Limited (ASX: MEO; OTC: MEOAY)
Issued ordinary sharesUnlisted options
477.2m8.9m
Market Cap (undiluted @ $0.50) A$239m
Cash @31st Oct (AUD/USD = $1.00) A$71m
Enterprise value A$168m
Avg daily liquidity (Rolling 3 months) 3.6m shares
Shareholders (31st October) 12,571
Top 20 hold (31st October) 17.4%
2
0
10
20
30
40
50
1965 1970 1975 1980 1985 1990 1995 2000 2005 2010
Mtpa
Rest of World
China
World Methanol Consumption
Source: ICI & MMSA
0
20
40
60
80
100
120
140
1970 1975 1980 1985 1990 1995 2000 2005
Mtpa
Asian Net Gas Imports (LNG)
Source: BP Statistical Review 2009
Japan
South Korea
Other
China
For
per
sona
l use
onl
y

Nick HeathNon-Executive Chairman
• Appointed May 2008• Engineer• >30 years with ExxonMobil• Past APPEA President
Greg ShortNon-Executive Director
• Appointed July 2008• Geologist• >33yrs with ExxonMobil• Retired 2006
Stephen HopleyNon-Executive Director
• Appointed October 2008• Financial Services• 14 years with Macquarie Bank• Retired 2003
Jürgen HendrichMD & CEO
• Appointed July 2008• Geologist, Investment Banking• 12 years at Esso Australia• 13 years financial markets
Michael SweeneyNon-Executive Director
• Appointed October 2008• Barrister, arbitrator & mediator• Practicing Barrister• 10 years MiMi (Mitsui/Mitsubishi)
3
Dave MaughanExploration Manager
• 35 years with ExxonMobil
Colin NaylorCFO/Company Secretary
• 30 years at Woodside, BHP, Rio
Ken HendrickImplementation Manager
• >40 years with large companies
Robert GardCommercial Manager
• 22 years with ExxonMobil
Errol JohnstoneChief Geoscientist
• 29 years with ExxonMobil
Experienced teamSound commercial decisions, underpinned by technical rigour
For
per
sona
l use
onl
y

Dampier
WA-361-P
WA-360-P
0 50 km
Jurassic (Structural-Stratigraphic)
Cretaceous (Structural)
Upper Triassic (Structural)
Upper Triassic (Structural - Stratigraphic)
Paleocene
Age of Main Gas Reservoir (Trap)
Oil Accumulation
Angel(2 Tcf)
East Spar
John BrookesHarriet et al
Barrow Island
Griffin
Pitcairn /Mutineer
Angel
Woollybutt
East Artemis Prospect(~12 Tcf)
Io/Jansz(20 Tcf)
Perseus(11 Tcf)
Gorgon
Strategically located acreageNear existing LNG projects hungry for gas to underpin expansion
Pluto Project (4.5 Tcf)Under Construction 4.3 Mtpa (1 train)
Expansion needs gasScarborough(8 - 10 Tcf)
Greater Gorgon Project (40 Tcf)Under Construction 10 Mtpa (2 trains)
Potential Expansion to 25 Mtpa (5 trains)
Wheatstone ProjectPlanned (FID 2011)8.6 Mtpa (2 trains)
Expansion needs gas
NWS Project (30 Tcf)Existing
16.3 Mtpa (5 trains)Extension needs gas
For
per
sona
l use
onl
y

5
• Petrobras farmed in for 50% interest (April 2010)
• Paying 100% of 1st well (to US$41m cap, MEO & Petrobras 50/50 above cap)
• MEO received US$31.5m cash, plus US$7.5m in seismic related back-costs
• Success case
• Paying 70% of 2 additional wells (MEO carried for 20% PI, to US$62m cap/well)
• MEO receives additional US$31.5m cash payment
• MEO has 25% participating interest & Operator
• All approvals in place to drill Artemis-1
• Rig handover expected +/- November 11th, 7 day tow to location
Petrobras farm-in to WA-360-P~12 Tcf prospect, multiple development options, drilling Nov/Dec 2010
For
per
sona
l use
onl
y

Base Calypso
Depth Map
Amplitude
Extract
Interpreted
gas-water contact
Interpreted
gas-water contact
East Artemis Prospect: WA-360-P (MEO 25%) Perseus Field – NWS JV (nearby analogue)Interpreted gas-water
contact
Published
outline of field
12 Tcf Artemis prospect revealed on MEO 3DAnalogous to Perseus field - DHI* termination = Gas Water Contact?
• * DHI = Direct Hydrocarbon Indicator
• Geological Chance of Success (GCOS) = 32%
• Gas quality expected to be similar to Pluto & Wheatstone (low CO2, low liquids)
• Multiple options to monetise discovered resources
6
For
per
sona
l use
onl
y

Poisson’s Ratio
Gas Probability
Acoustic Impedance
Simultaneous inversion was undertaken to
produce three datasets (Acoustic Impedance,
Poisson’s Ratio and Gas Probability*) that were
used to determine distribution of likely gas sands
* Note: Gas probability calculation is not calibrated to well data
in this 3D seismic data set. Artemis-1 will calibrate the data
80% Gas Sand probability envelope
Rigorous geophysical analysisUsed to identify & quantify probability* of gas sands occurring
For
per
sona
l use
onl
y

Formation P90 P50 Mean P10
Calypso
Gas-in-place TCF 7.7 10.6 10.8 14.0
Recoverable TCF 4.6 6.3 6.4 8.4
Legendre
Gas-in-place TCF 5.9 9.2 9.5 13.4
Recoverable TCF 3.5 5.5 5.6 8.0
Combined
Gas-in-place TCF 13.6 19.8 20.3 27.4
Recoverable TCF 8.1 11.8 12.0 16.4
Resource assessment (100% basis)Combined 12 Tcf mean prospective resources, 32% GCOS
Source: P. J. Cameron, Resource Invest Pty Ltd, August 2009
Parameter Distribution Calypso Fm Legendre Fm
GR Volume 10^6 m^3 20,650 23,769
Net to Gross Triangular 25%-45%-70% 25%-45%-70%
Porosity Triangular 17%-22%-25% 15%-20%-22%
Gas Saturatn Normal 70%, 4% std dev 70%, 4% std dev
Gas Expansn Normal 212, 5% std dev 212, 5% std dev
Gas Recovery Normal 60%, 3% std dev 60%, 3% std dev
Heating value Btu/scf 1,000 1,000
Inerts % Nil Nil
GWC mSS -3,275m -3,275m
Prospect Elements Probability
Reservoir - presence/quality 80%
Trap* (pre-2009 Artemis 3D estimate) 50%
Source – presence/quality 80%
Seal adequacy 70%
Maturation/Migration 90%
Timing 100%
Preservation 100%
Prospect Elements Probability
Overall Geological COS 20%
DHI de-risking multiplier 1.6x
Estimated Geological COS 32%
MEO participating interest 25%
For
per
sona
l use
onl
y

2007 2008 2009 2010
Permit awarded to Cue Energy and Gascorp (Feb ‘05)
MEO farms-in for 60% equity (Oct’07) on seismic option
MEO acquires 200 km2 3D over Artemis lead (Dec’07)
Interpretation confirms Artemis is substantial prospect
MEO negotiates drill/drop extension and option to increase equity to 70%
MEO acquires 250 km2 3D survey over Artemis extension
MEO commences farm-out process
Artemis 3D Survey supports extension, structural closure to north and DHI* conformable with structure
Petrobras selected as preferred farminee- negotiate & execute farmin documents
MEO exercises option to drill Artemis-1 well- secures 70% equity (20% post farm-out)
Purchased 5% equity, increasing interest to 25%
Regulatory approval of transfer to Petrobras
Artemis-1 drilling expected November/December(subject to current Operator operational progress)
WA-360-P case studyMEO’s technical skills and rapid evaluation identifies potential value
9
acquire/process
acquire/process
negotiate/execute
* DHI = Direct Hydrocarbon Indicator, an indication of high probability of gas based on seismic interpretation
negotiate/execute
negotiate/execute
FIRB DMP
interpret
For
per
sona
l use
onl
y

Bonaparte Basin – more challenging for LNGBest quality resource developed, other resources economically challenged
Heron-2 Frigate Sst
DST-1: 3.9 - 5 MMcfd
Darwin
Evans Shoal-2 DST-1: 25 MMcfd
DST-1A: 5.5 MMcfd
0 100 km
Tassie Shoal
Evans Shoal
Greater Sunrise
Indonesia
Australia
Joint Petroleum
Development
Area
Bayu-Undan
Timor-Leste
2500m
Blackwood
Heron
10 TcfAbadi
Caldita
Barossa
NT/P68(100% MEO)
13%
8%
28%
4%
4%
16%%
CO2
Evans Shoal-2
DST-1: 25 MMcfd
DST-1A: 5.5 MMcfd
Caldita-1
DST-1: 33 MMcfd
Barossa-1
DST-1: <1 MMcfd
DST-2: 30 MMcfd
Heron-2
DST-1: 3.9 - 5 MMcfd
Impediments to economic development:
• Gas quality – low liquids & high CO2 content
• Uncertain resource size & long term reservoir performance issues
• Capital cost uncertainty & technology (FLNG) risks
• Remoteness & geopolitical issues
For
per
sona
l use
onl
y

LNG Tank(170,000 m3)
Methanol Plant (5,000 tpd/1.75 Mtpa Stage 1 only)(For CO2 sequestration)MEO 50%, Air Products 50%
LNG Plant (3.0 Mtpa)MEO 100%
Accommodation and Control Platform (ACP)
Tassie Shoal Projects have environmental approvalsA modular hub ready for gas of any quality...
0 500m
ACP LNG Storage
LNG Plant
(3 mtpa)
Methanol
Plant (5,000
tpd stage 1)
Cooling
Water
Outlet
Gas
Supply
Pipelines
Methanol
Loading Buoy
LNG
Load out
N
For
per
sona
l use
onl
y

12
CO
2 C
on
ten
t (%
)
5
2
1 M
eth
ano
l Pla
nt
2 M
eth
ano
l Pla
nts
Uneconomic(unless blended)
CO2 sequestration
Recoverable Hydrocarbon (Tcf)
3 4 5 6 7 8 9 101
10
15
20
30
25
Conventional LNG Plants
Uneconomic(unless
combined)
3 Mtpa LNG + 1 Methanol Plants
3 Mtpa LNG + 2 Methanol Plants
Projects provide optionality & flexibilityMethanol plant has substantially lower reserves threshold than LNG
For
per
sona
l use
onl
y

Heron gas discovery – seeking farmineeBest estimate, prospective resource ~5 Tcf
Lowest Known Gas (LKG) = 4115m SS
GCA Mid Case = gas down to 4133m SS
MEO mapped structural spill point = 4325m SS
Heron-2
Well
Heron North Heron South
Heron-1
Well
Line of Cross Section
BlackwoodBlackwood East
Heron
NT/P68
= MEO Contingent Resource
= GCA Mid Case Contingent Resource
= MEO Prospective Resource
+
++
For
per
sona
l use
onl
y

2H2009 2010 1H2011
WA-360-P (25%, Carnarvon)• Complete data room process• Select preferred farminee• Farmout agreements• Regulatory approvals
Artemis-1 (WA-360-P)• Raise funds and commit to well• Rig contract• Drill well• Follow-up well decision
WA-361-P (50%, Carnarvon)• Acquire additional equity• Permit renewal• Prospect evaluation studies
NT/P68 (100%, Timor Sea)• MEO Technical studies• Schlumberger Reservoir Study• Gaffney Cline Resource Certify• Farmout
Tassie Shoal Projects (Timor Sea)• Technical enhancement studies• 3rd Party gas discussions
New Ventures• Reactively evaluate opportunities• Proactively pursue opportunities
Portfolio managementIdentify prospectivity, add value, test potential, replenish acreage
negotiate execute
FIRB Permit Tfr
negotiate execute
drill post well analysiswell prep
negotiate execute
negotiate & execute
renewal
14
Data room
For
per
sona
l use
onl
y

• Balanced board, experienced management team
• ~A$71m uncommitted cash (assumes AUD/USD = parity)
• Material gas projects near existing infrastructure
• 25% equity in ~12 Tcf Artemis prospect – drilling Nov 2010
• Proposed Tassie Shoal development hub
− Robust economic solution for all undeveloped gas
− TSMP sequesters CO2 into methanol derivatives
− LNG project approved for low CO2 gas
• 100% equity in two NT/P68 gas discoveries
− Seeking farminee to appraise Heron gas discovery
SummaryBalanced portfolio with considerable growth potential
15
Songa Venus
Base Calypso Depth Map Base Calypso amplitude extract
For
per
sona
l use
onl
y

Supplementary informationTechnical back-up
16
Dev
elo
ped
Dev
elo
ped
Dev
elo
ped
Dev
elo
ped
For
per
sona
l use
onl
y

CO2 emissions intensityProjects must deal with carbon to achieve Environmental Approvals
17Sources: Chevron Australia Pty Ltd – Wheatstone Project EIS, Inpex Corporation - Ichthys Project Draft EIS
Drivers:
• CO2 content in reservoir gas - (Prelude vs Wheatstone)
• LNG plant efficiency - (NWS trains 1-3 vs trains 4-5)
• Gas gathering/transportation - (Ichthys vs Prelude) (CSG gas gathering)
• Geo-sequestration - (Gorgon)
CSG gas gathering
Dev
elo
ped
Dev
elo
ped
Dev
elo
ped
Dev
elo
ped
Dev
elo
ped
Dev
elo
ped
Dev
elo
ped
Dev
el’d
Dev
el’d
875 km pipeline
to Darwin
Gas production emissions intensity
For
per
sona
l use
onl
y

18* Source = World Bank and Methanex
480 mmscfd LNG Plant
Methanol Plant
CO2
170 mmscfd
LNG3.0 Mtpa
Methanol1.75 Mtpa
4.5 Tcf,
9% CO2
(20 years supply)
74% of feed
26% of feed
Sequestration in companion Methanol plant9% CO2 Feed Gas Example
Gas
Field
67% of revenue
33% of revenue
US$0.67bn/yr(at average 2006-present Asian Contract Prices*)
US$1.36bn/yr(at average 2006-present Japan LNG import prices*)
$
$
3 2 41
Methane CO2 Steam Methanol
Effective Methanol Synthesis Reaction
= Hydrogen
= Oxygen
= Carbon
Legend
Methanol production sequesters CO2Enables gas with moderate CO2 content to be sanitised for LNG production
For
per
sona
l use
onl
y

Prelude and Greater Sunrise FLNG“Shell plans world’s biggest ship at Australian field”
19Source: http://royaldutchshellplc.com
For
per
sona
l use
onl
y

Air Products 3.0 Mtpa LNG Plant
Conventional Concrete and Steel LNG Tanks
Conventional Concrete Gravity Based Structure
Arup self-elevating platform (100m x 50m)
• One 3.0 Mtpa module• 170,000 m3 LNG storage• Arup, Air Products and Worley
Parsons designs and costings
Timor Sea LNG Plant (TSLNGP) – no floating risks
“MEO plans smallest footprint 3.0 Mtpa LNG plant”
For
per
sona
l use
onl
y
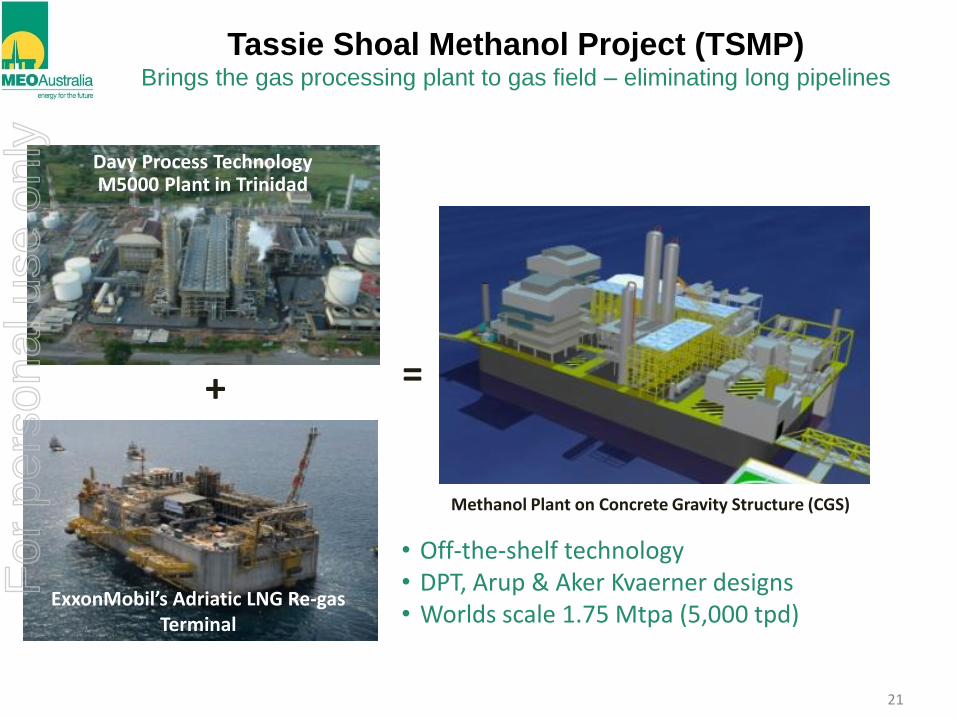
Tassie Shoal Methanol Project (TSMP)Brings the gas processing plant to gas field – eliminating long pipelines
21
+ =
Methanol Plant on Concrete Gravity Structure (CGS)
• Off-the-shelf technology• DPT, Arup & Aker Kvaerner designs• Worlds scale 1.75 Mtpa (5,000 tpd)
Davy Process TechnologyM5000 Plant in Trinidad
ExxonMobil’s Adriatic LNG Re-gas Terminal
For
per
sona
l use
onl
y

-
5
10
15
20
25
2004 2005 2006 2007 2008 2009 2010 2011 2012 2013 2014 2015
Methanol Demand – China OnlyHigh forecast demand growth
22
Chemicals & other
Fuels (direct use and additives)
11.8 x 1.75 Mtpa
Methanol Plantsforecast
Mill
ion
to
nn
es
pe
r a
nn
um
(M
tpa
)
• Strong growth averages more than one 1.75 Mtpa plant every year
• Coal based methanol production is currently swing producer
• Coal based methanol production emits 1.7 x CO2 of gas based plant
Source: MMSA 2010 forecast
For
per
sona
l use
onl
y