for spaces as noted in ltp3. (pg56, 5.32, sbc - ltp3) filethe central area car parks. these...
TRANSCRIPT

1
4.1
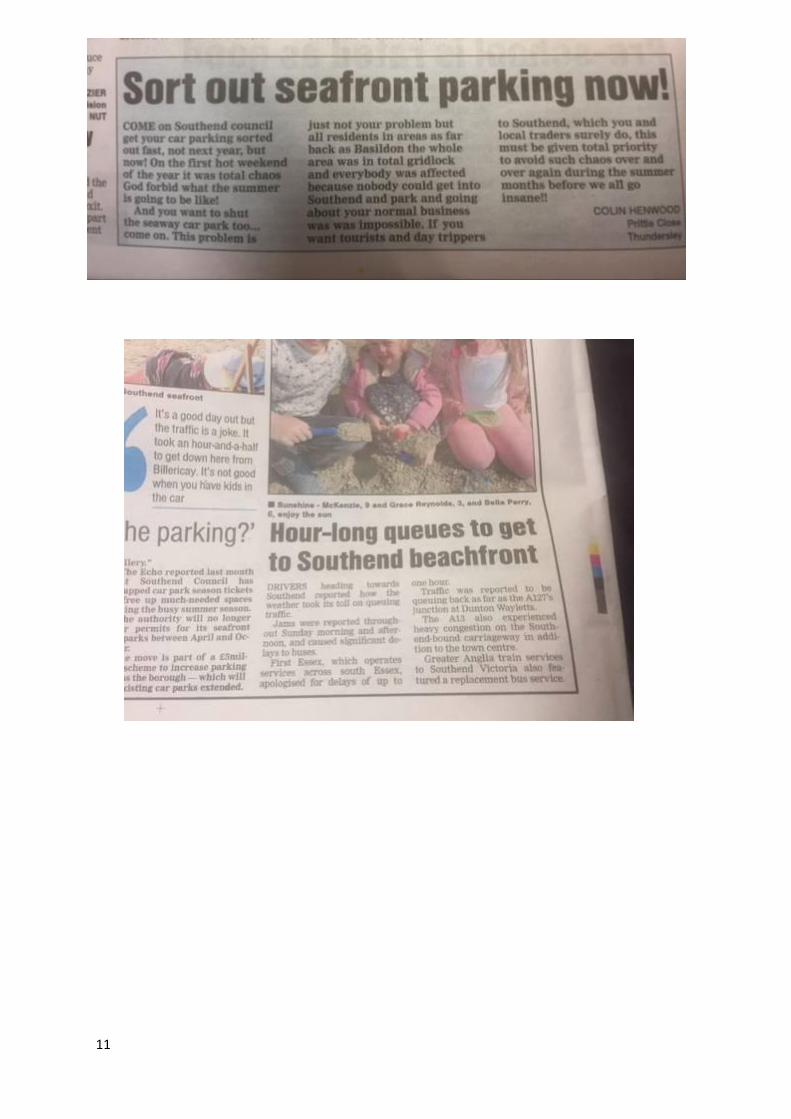
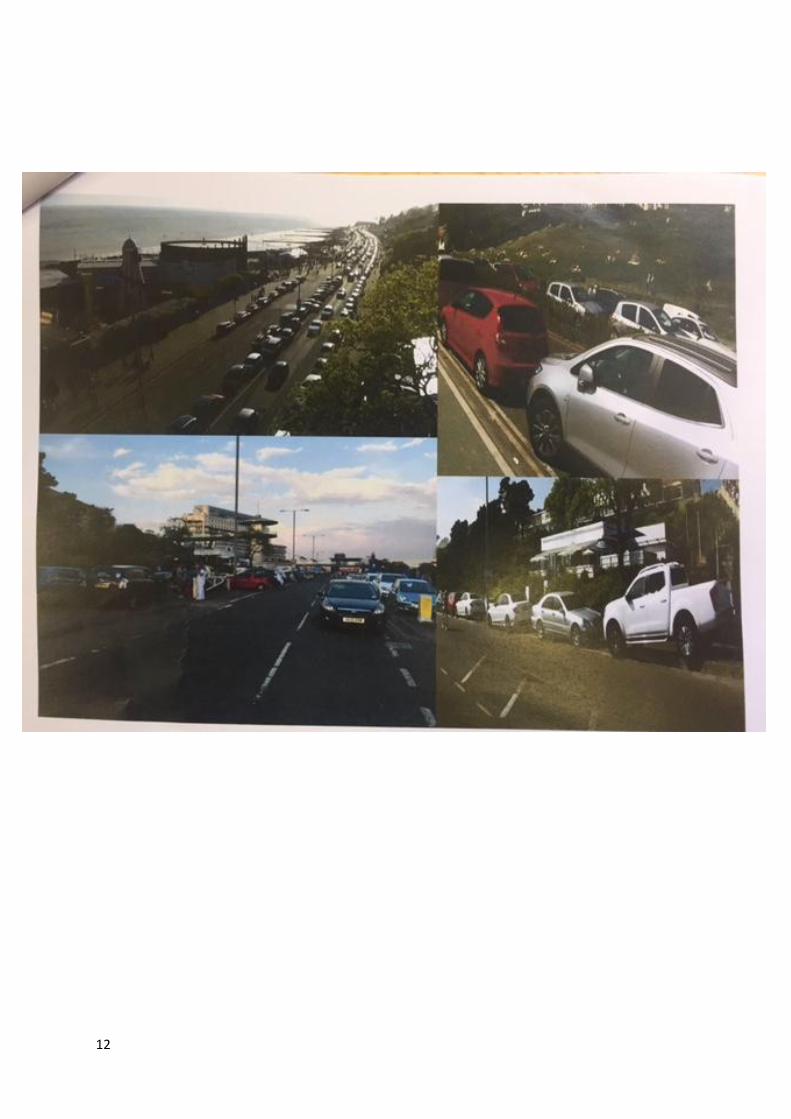
Heavy congestion and parking shortages exist already whenever the weather is good.(appendix1)
Proposed developments include 2166 new dwellings, 7250 new jobs and development on many of
the central area car parks.
These proposals will result in thousands more journeys, the majority by car, yet no increase in
parking spaces, no road improvements identified to increase the capacity of the road network.
Proposed Seaway car park development will see number of spaces reduced from 661 to c500. A 10
screen cinema, 12 restaurants and a 100 bed hotel are proposed, (SBC & turnstone Estates) on the
seafront’s main car park. A similar scheme at Basildon, festival leisure park, has over 2000 parking
spaces.
If these proposals progress, congestion and inconvenience will go through the roof. The central area
will become a no go area for cars, businesses and jobs will die out.
The SCAAP fails to include creating the extra spaces to cope with the forecast 25% demand increase
for spaces as noted in LTP3. (pg56, 5.32, SBC - LTP3)
4.2
DS5 sets out sustainable transport measures which have been, and will continue to be detrimental
to the central area, to residents, businesses and visitors.
SBC has been successful with road widening schemes and junction improvements outside of the
central area, on the A127.
Progress Rd Cuckoo Corner Kent Elms junction The Bell junction
These have improved traffic flow and capacity and dealt well with the increasing number of cars
coming into and out of Southend.
On one hand the council has and will continue to improve the road network efficiency for cars on the
main roads, outside of the central area. Then when you enter the central area the policy is the
opposite. The policy is all about sustainable transport schemes at the expense of the car. Pedestrian
priority routes/ junctions, bike lanes, road narrowing, reduction in parking spaces, bus lanes etc. The
result is huge traffic jams caused due to bottle necks etc. The 2 policies are the opposite of each
other and this is illogical. The policies should marry up so that the increased car traffic on the A127
can easily access the central area.
Victoria Gateway Junction has been a complete disaster. Long tailbacks exist as the junction gives
priority to pedestrians. (appendix2)
85% of seafront visitors come by car (appendix3). Visitors will not shift away from the car for day
trips to the seafront. When visitors come they bring pushchairs, beach kit such as towels, buckets
and spades, packed lunches and the children. It is impractical to do this via public transport.

2
To get to Southend by train many visitors would first have to get to their local station. Then take the
train to London, switch onto the underground to get to Fenchurch St station or Liverpool St station.
Then take the train to Southend Central Station or Southend Victoria Station, and then walk to the
seafront (10mins and 20 mins walk). This with the children, pushchairs and all the kit. They would
then have to do the reverse to get home.
Factor in the extra expense of train travel. Also as Southend’s railways are main line commuter
routes into London, the weekends are off-peak. Due to this engineering work is mainly done at
weekends, especially bank holiday weekends due to the extra day off, and buses are used as railway
replacement services at weekends.
This is why 85% of visitors to the seafront come by car. It is cheaper, more convenient and less time
consuming to come by car.
“ I live in Wittham and drive in to work everyday at the Civic Centre. I could
take the train but it takes too long and is expensive”. SBC Director of
Planning/Highways (appendix4)
“I live in Colchester, it is practically impossible to visit Southend with my
family by Bus or Train, we have to drive.” SBC Director of Tourism
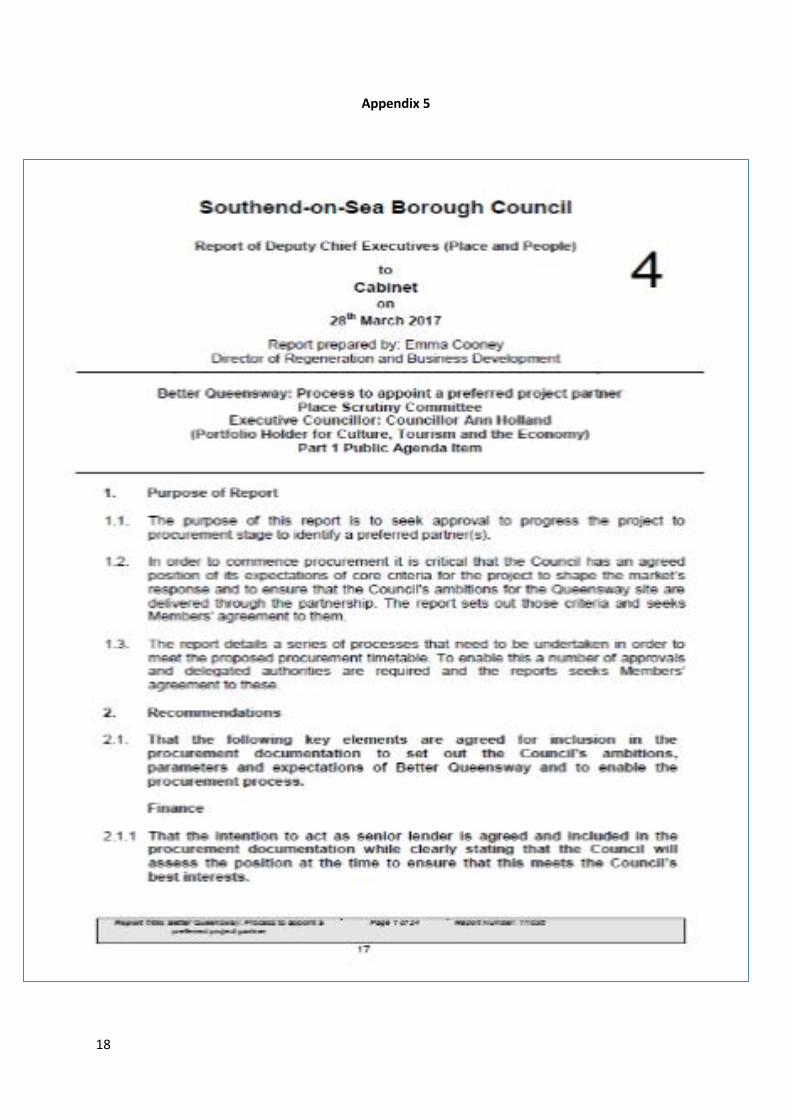
Better Queensway Project – SBC officers asked councillors to vote to approve their Queensway
development proposal on 20thApril17. The preferred road layout plan under this proposal involved
narrowing the Queensway underpass and dual carriageway to a single lane (appendix5). No
consultation had been carried out with residents, councillors or businesses over the narrowing of
this route. (BID chair email appendix6)
This is the main route to the seafront and southern end of the High Street. This anti-car proposal
would have had devastating effects on congestion and visitor’s ability to access the seafront & high
st. Fortunately, councillors voted to amend this road layout proposal and the highways portfolio
holder gave assurances that narrowing to 1 lane would not be allowed to happen.
SBC officers are trying to force cars out of the central area, by limiting the capacity of the road
network and reducing parking availability. Attempts to encourage a modal shift to sustainable
transport have failed and more drastic measures are trying to be implemented, all at the expense of
the car.
4.3i
The CPS neither provides an appropriate or robust evidence base to justify a realistic level of car
parking provision in the Central Area.
At this point it should be noted that transport strategy and policies DS5 of the SCAAP were written
prior to the CPS being carried out, and not the other way round.

3
This gives rise to the question were SDG appointed to carry out the CPS to provide an appropriate
and robust evidence base for the SCAAP? Or were SDG paid to defend and justify the planning
department’s policies and parking data, faced with ever growing concern and criticism over the
policies and accuracy of the parking data from the business community, local residents and
councillors?
Email exchanges between SBC Major Projects and SDG show how SBC suggested to SDG that an
amount of £15,000 should be tendered (appendix8)
Also a SBC senior planner sent several emails to SDG which contained ‘good examples of parking
strategies’. This poses the question as to who actually wrote the report? (appendix7)
RPS has provided a technical note on the CPS. I would like to add further points to their note that
cast doubt on the appropriateness and the robustness of SDG/SBC’s CPS. These can be categorised
under 4 main sections:
1 Weather – With an outdoor shopping High St and a large tourist industry based around the beach
and seafront one the biggest factors driving visitors to Southend is the weather. The CPS fails to
identify or consider prevailing weather conditions on the days surveys were done. Instead the survey
days have been classed as peak days simply as they were in August, or on a bank Holiday.
“The focus was on understanding how the parking network performs at peak periods of demand”
“For Southend these peak periods are in the holiday season including Bank Holidays” - SDG parking
Study overview of results (appendix11 )July 16
The weather conditions on each of the surveys were at best average on 2 days, but poor on the
other 4 days:
13thAugust15 : Rain & Thunderstorms (bad for Aug)
15thAugust15 : Cloudy with occasional sunny intervals, high 20c (poor for Aug)
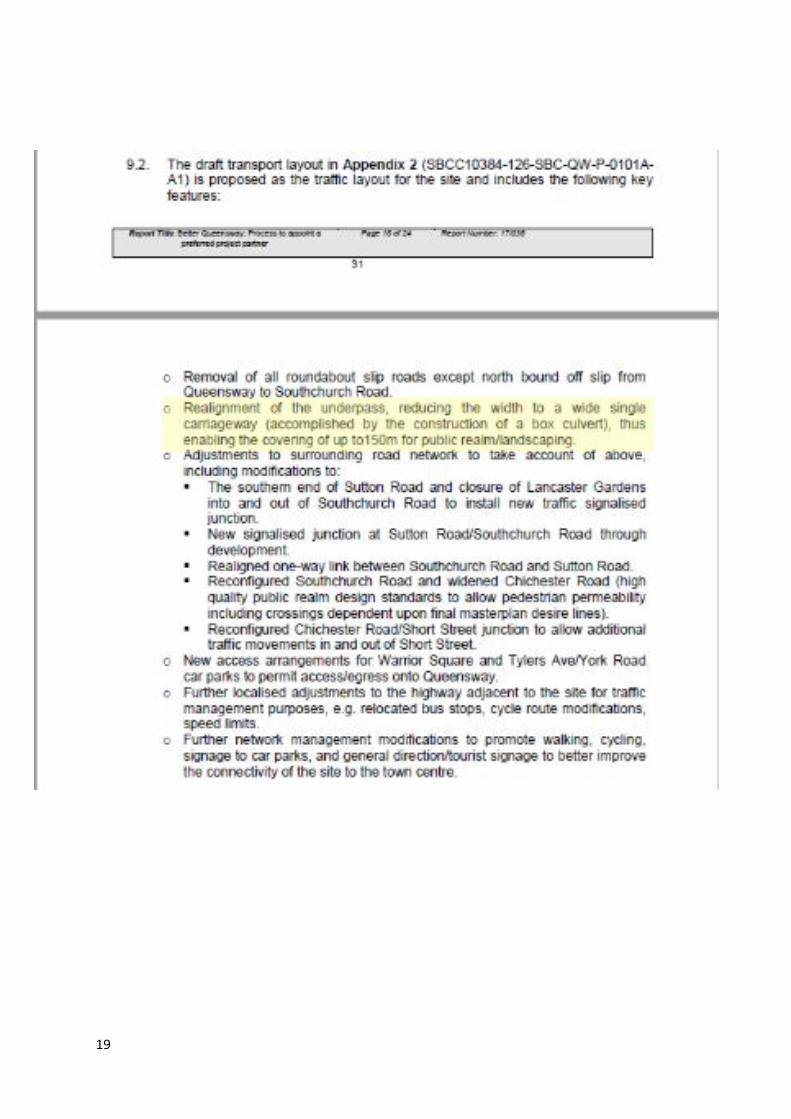
23rdMarch16 : Cloudy, av temp 7c (90% of seafront businesses closed)
25thMarch16 : Partly cloudy, av temp 11c (average March conditions) Good Friday
26thMarch16 : Cloudy, Rain, Wind, av temp 10c (Storm Katie weekend)
30t May16 : Mostly Cloudy, av temp 14c ( poor for end May) Bank Holiday Monday
Thus the surveys have been done on days where the weather was poor and at best average. Visitor
numbers on all of these days were considerably lower than you would see on a warm, sunny peak
day.
The CPS is therefore severely flawed as it has not carried out any surveys at ‘peak periods of
demand’.

4
Time and date stamped photographic evidence of Southend seafront demonstrates the differences
between visitor numbers on a warm sunny day, and those on the days the surveys were done.
(appendix12/13)
Survey Day Survey Day
PEAK DAY
5
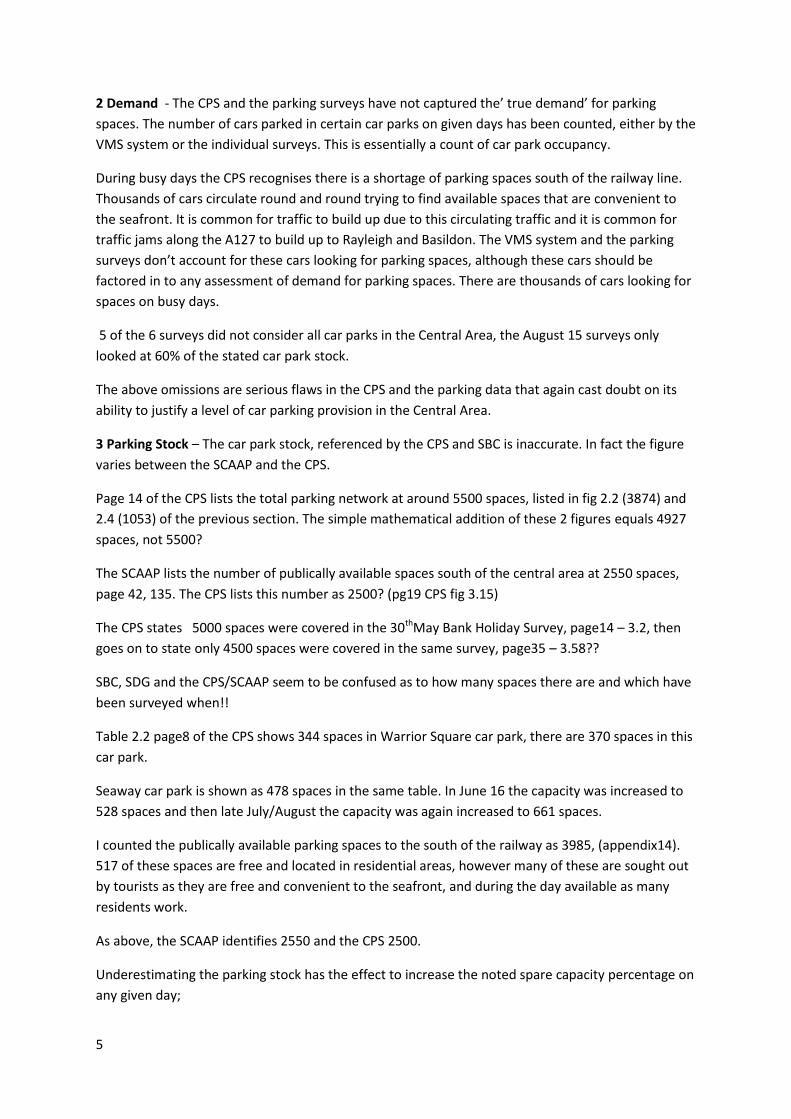
2 Demand - The CPS and the parking surveys have not captured the’ true demand’ for parking
spaces. The number of cars parked in certain car parks on given days has been counted, either by the
VMS system or the individual surveys. This is essentially a count of car park occupancy.
During busy days the CPS recognises there is a shortage of parking spaces south of the railway line.
Thousands of cars circulate round and round trying to find available spaces that are convenient to
the seafront. It is common for traffic to build up due to this circulating traffic and it is common for
traffic jams along the A127 to build up to Rayleigh and Basildon. The VMS system and the parking
surveys don’t account for these cars looking for parking spaces, although these cars should be
factored in to any assessment of demand for parking spaces. There are thousands of cars looking for
spaces on busy days.
5 of the 6 surveys did not consider all car parks in the Central Area, the August 15 surveys only
looked at 60% of the stated car park stock.
The above omissions are serious flaws in the CPS and the parking data that again cast doubt on its
ability to justify a level of car parking provision in the Central Area.
3 Parking Stock – The car park stock, referenced by the CPS and SBC is inaccurate. In fact the figure
varies between the SCAAP and the CPS.
Page 14 of the CPS lists the total parking network at around 5500 spaces, listed in fig 2.2 (3874) and
2.4 (1053) of the previous section. The simple mathematical addition of these 2 figures equals 4927
spaces, not 5500?
The SCAAP lists the number of publically available spaces south of the central area at 2550 spaces,
page 42, 135. The CPS lists this number as 2500? (pg19 CPS fig 3.15)
The CPS states 5000 spaces were covered in the 30thMay Bank Holiday Survey, page14 – 3.2, then
goes on to state only 4500 spaces were covered in the same survey, page35 – 3.58??
SBC, SDG and the CPS/SCAAP seem to be confused as to how many spaces there are and which have
been surveyed when!!
Table 2.2 page8 of the CPS shows 344 spaces in Warrior Square car park, there are 370 spaces in this
car park.
Seaway car park is shown as 478 spaces in the same table. In June 16 the capacity was increased to
528 spaces and then late July/August the capacity was again increased to 661 spaces.
I counted the publically available parking spaces to the south of the railway as 3985, (appendix14).
517 of these spaces are free and located in residential areas, however many of these are sought out
by tourists as they are free and convenient to the seafront, and during the day available as many
residents work.
As above, the SCAAP identifies 2550 and the CPS 2500.
Underestimating the parking stock has the effect to increase the noted spare capacity percentage on
any given day;

6
If the VMS identifies 100 available spaces across a network of 1000 spaces = 10% spare capacity
If the VMS identifies 100 available spaces across a network of 2500 spaces = 4% spare capacity
Thus by underestimating the parking stock, the available space % across the network is artificially
increased.
The parking surveys and CPS included car parks at The Civic Centre (underground 83 spaces) and
Southend College (215 spaces).
The College car park is closed on Sundays and Bank Holidays. The Civic Centre underground car park
is for permit holders only Monday to Friday, no exceptions for bank Holidays (appendix15).
Therefore c300 spaces have been incorrectly classed as spare capacity on the survey done on Friday
25thMarch and Monday 30thMay, as these were not publically available on these dates (circa 6% of
total parking stock using CPS figures).
CPS Table 2.7 page12 and Table 3.1 page15 show that The Leas and Chalkwell Esplanade have been
included in the surveys and CPS. Neither of these roads is in the Central Area and this poses
questions over the local knowledge of SBC’s planning/highways team and SDG’s consultants.
4 Data Accuracy -
The CPS covers a period of 365 days between May 2015 and May2016, on all but 6 days VMS data is
used as the sole source of occupancy data. On 5 survey days a mix of VMS and video survey data was
used, and on 1 survey day all the car parks were surveyed using video camera data. To summarise
Video camera data has been used on all the car parks on 1 day, and part used on 5 days. Even If the
video data had been used on all car parks on 6 days, this would still only represents 1.6% of days
over the year. Thus VMS data has been used for over 98% of the data set over the year.
A statement in the CPS reads “Comparison of VMS data with video survey data for the days surveyed
found these anomalies were rare: the VMS data is on the whole accurate giving us a high level of
confidence in the datasets”.
Such a small percentage of the dataset has been compared (just over 1%) that I believe this
statement cannot be justified.
The VMS data is inaccurate to an extent that no conclusions can be drawn from it. It is often
incorrect, suffers from many system anomalies, and doesn’t seem to work accurately during busy
days.
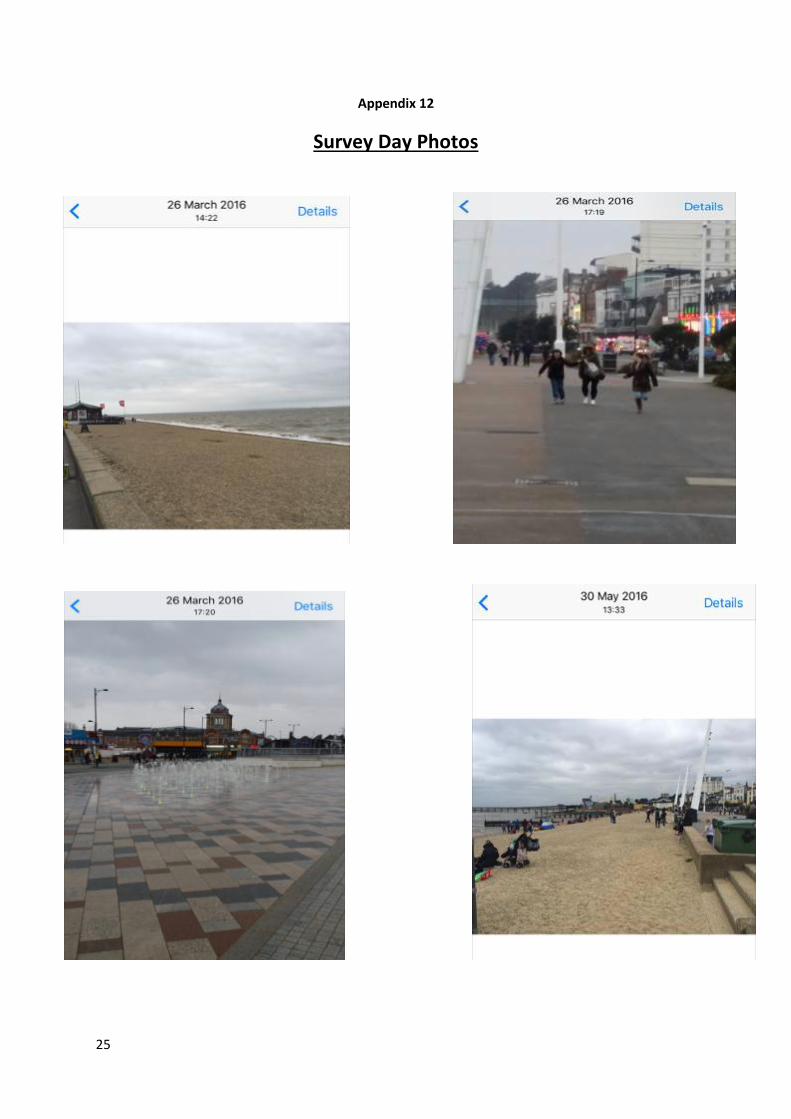
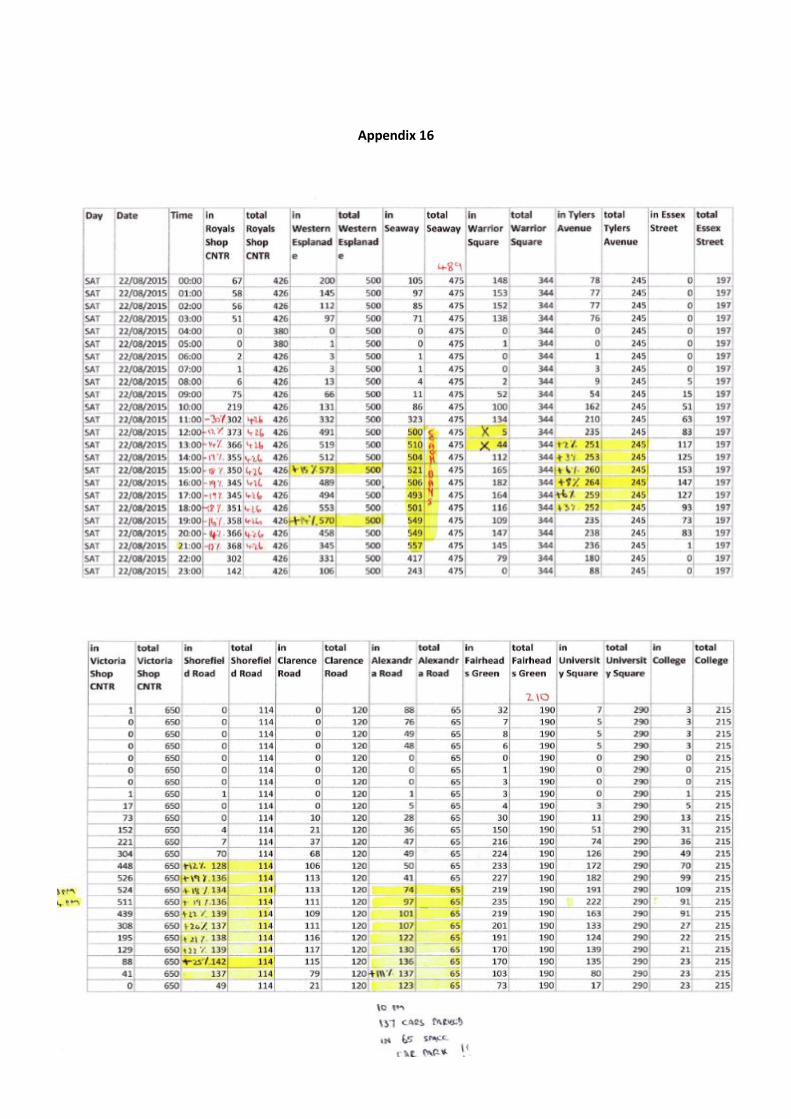
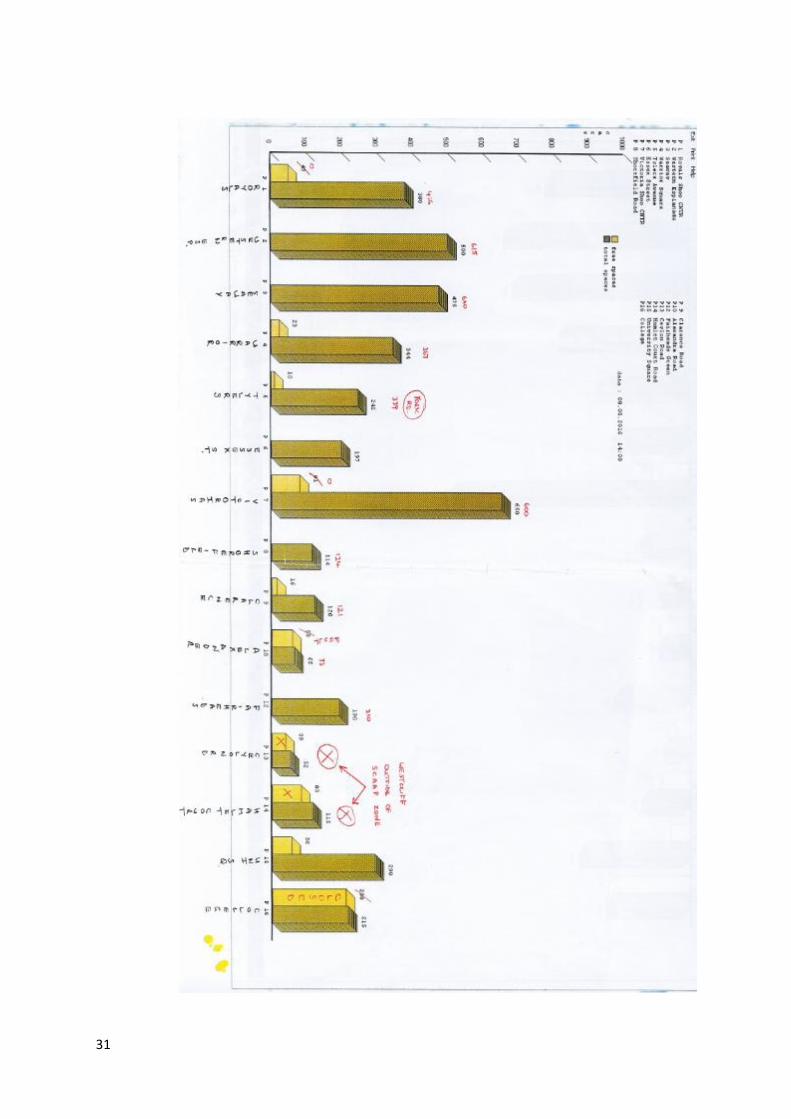
I will show 2 graphs provided by SBC (appendix16&17) which show VMS data for the 6thMay16 and
for 22ndAugust15 (busiest day of year) and also a sample of many photographs taken of the vms
system showing incorrect data.(appendix20)
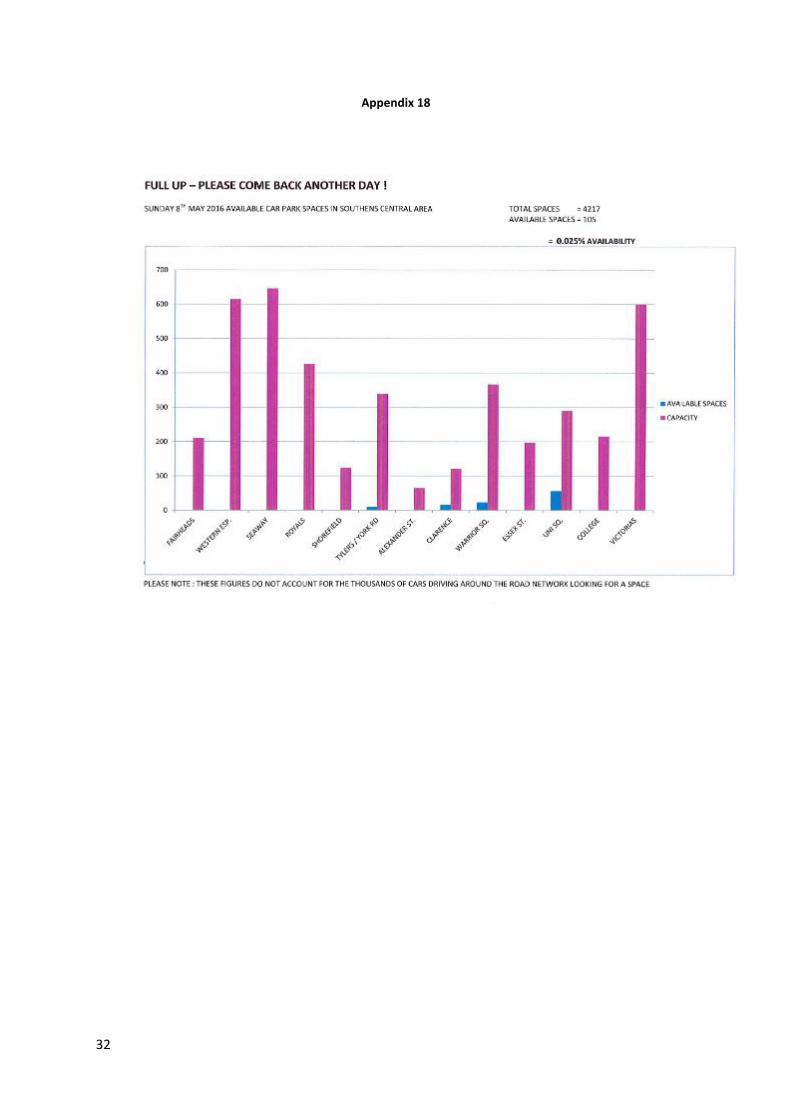
The 6thMay data was presented at a meeting to the Leader of the council, seafront business
representatives and SBC director of tourism, by SBC group manager of Major Projects. This was the
first time vms data has been produced by SBC. The graph shows that on the busiest day of 2016
there was 16% spare capacity over the network. I have examined this data and found approx 20

7
errors, ranging from incorrect car park capacities, incorrect occupancy counts, closed car parks etc.
Once the errors have been corrected the spare capacity figure drops to 0.025% spare capacity
(appendix18)
The CPS page29, 3.34, states the max occupancy on 22ndAugust (busiest day) was 87%. Again there
are many errors in the vms data, and once corrected I calculate the max occupancy to be 92%.
The CPS states there was 9% spare capacity at the Royals, however emails from the Royals confirm
they were full all day. (appendix19) The CPS states The Victoria had 19% spare capacity but it
actually had 12%.
The photos (appendix20) highlight more inaccuracies and reliability issues with the VMS data.
4.3ii
Page56, 5.32, LTP3 states car park demand is expected to increase by at least 25% by 2021. The CPS
also notes this on page5, 2.1.
As mentioned already visitors to the seafront want to and do come by car, it is therefore unlikely
that sustainable transport provision will fill much more than 2-3% of the 25% predicted growth in
demand.
Leigh rail station is difficult to get to from the A127 and therefore is not really a viable option for a
park and ride scheme as most visitors drive via the A127. (72% in Stockvale survey)
4.3iii
A ‘no net loss’ policy requires a baseline capacity figure from which no net loss can
occur(appendix26); otherwise it is a meaningless statement. A starting baseline figure provides a
number to which changes can be measured against. SBC has continually avoided establishing this
baseline capacity figure.
The policy should state that it would not permit any loss of parking spaces south of the railway line
through development, until an equivalent number of spaces has been provided south of the railway
line and within 10 minutes walk to the shoreline.
4.3iv
Spaces to the north of the railway are primarily used by shoppers and are located too far a walk from
the seafront to be used by tourists. Those to the south are used by visitors to the seafront and
shoppers. The needs and expectations of shoppers are different to those of tourists, thus it is
reasonable to argue there needs to be a separate parking policy, north and south of the railway.

8
4.3vi
The VMS system is unreliable, it is not monitored by SBC officers, and many visitors to the town
ignore the signs.
Bank Holiday Monday, 1stMay2017
4.3vii
The peak days are vital to the tourist industry in the same way that Christmas/December is vital to
the High Street and retailers. Through the winter and on quiet days businesses run at a loss and
these losses are funded by maximising sales on the busy days. For the industry to further invest and
grow extra parking capacity is needed so that the busy days can get busier. Thus these 40 or so days
are vital to the industry.
4.3viii
CPS page13, 2.29 refers to the SBC Southend Business Survey 2010. This study found that the most
important factors having a negative impact on businesses’ performance are; 1 high energy
costs(49%), 2 parking availability&cost (48%), 3 increasing competition(45%)etc.

9
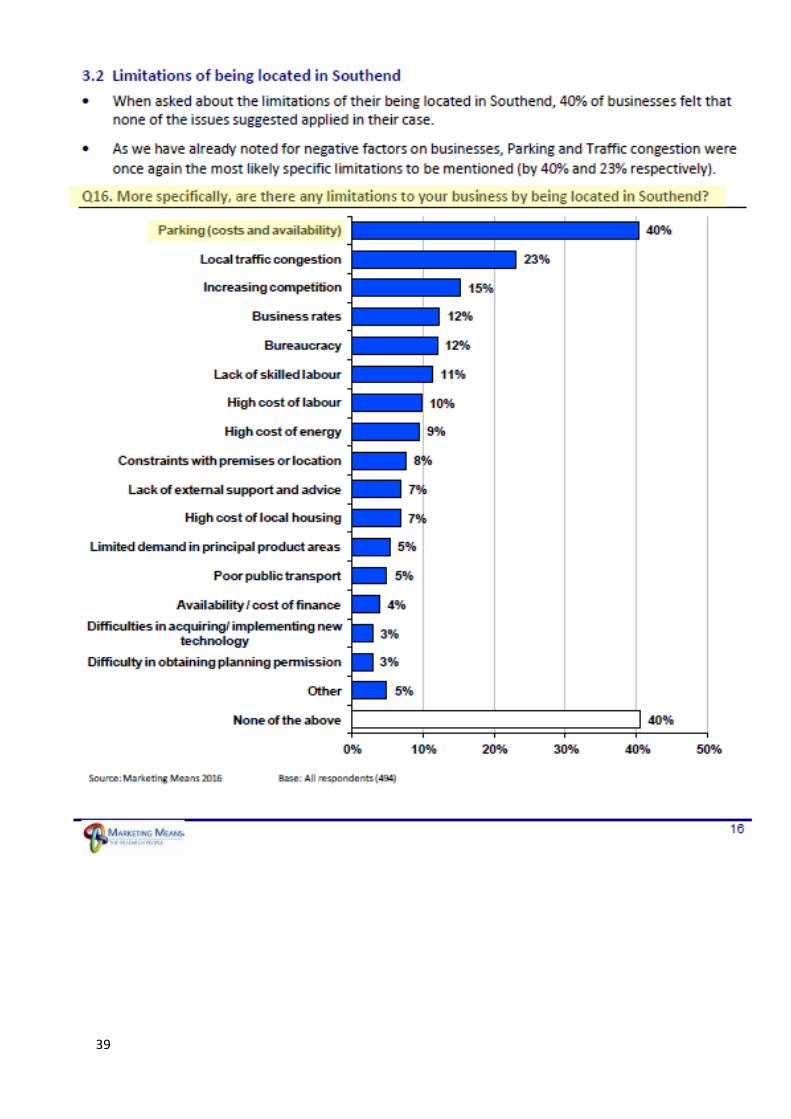
In the 2016 survey, the most important negative factor having an impact on businesses’
performances was parking availability&cost(56%) (appendix21). This means the majority of
businesses surveyed(56%), now feel that parking availability and cost are having a negative effect on
their business. Up 8% since2010.
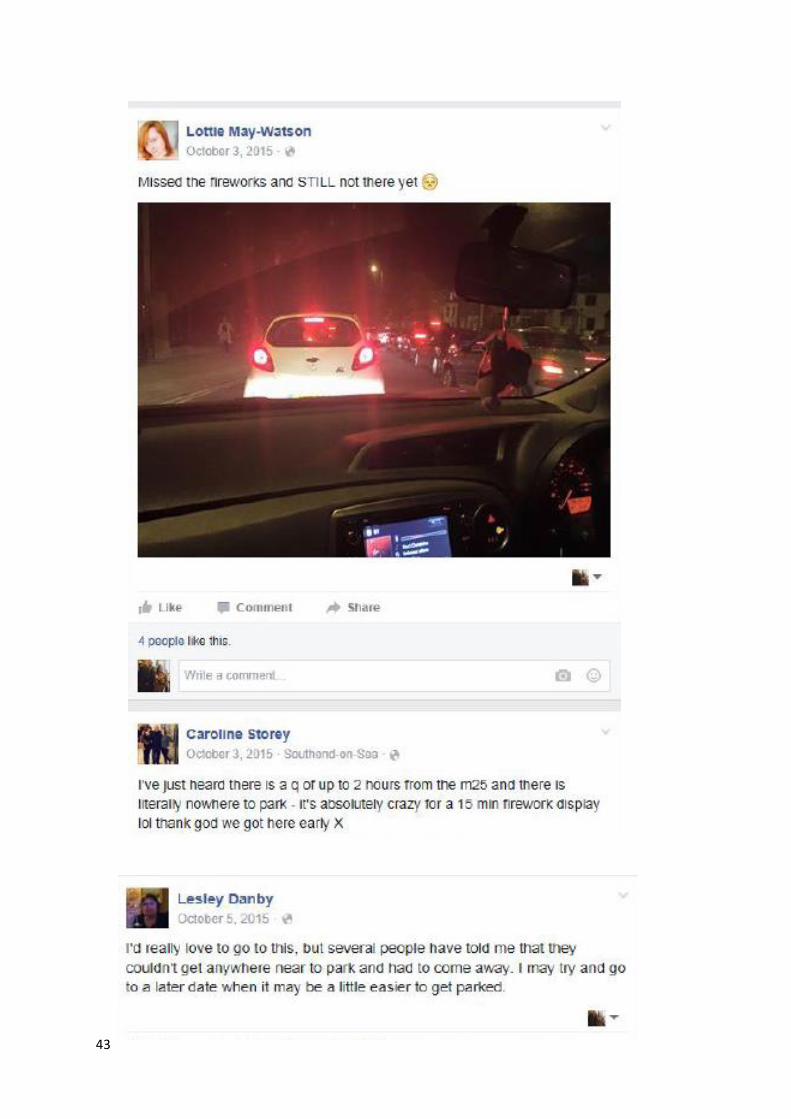
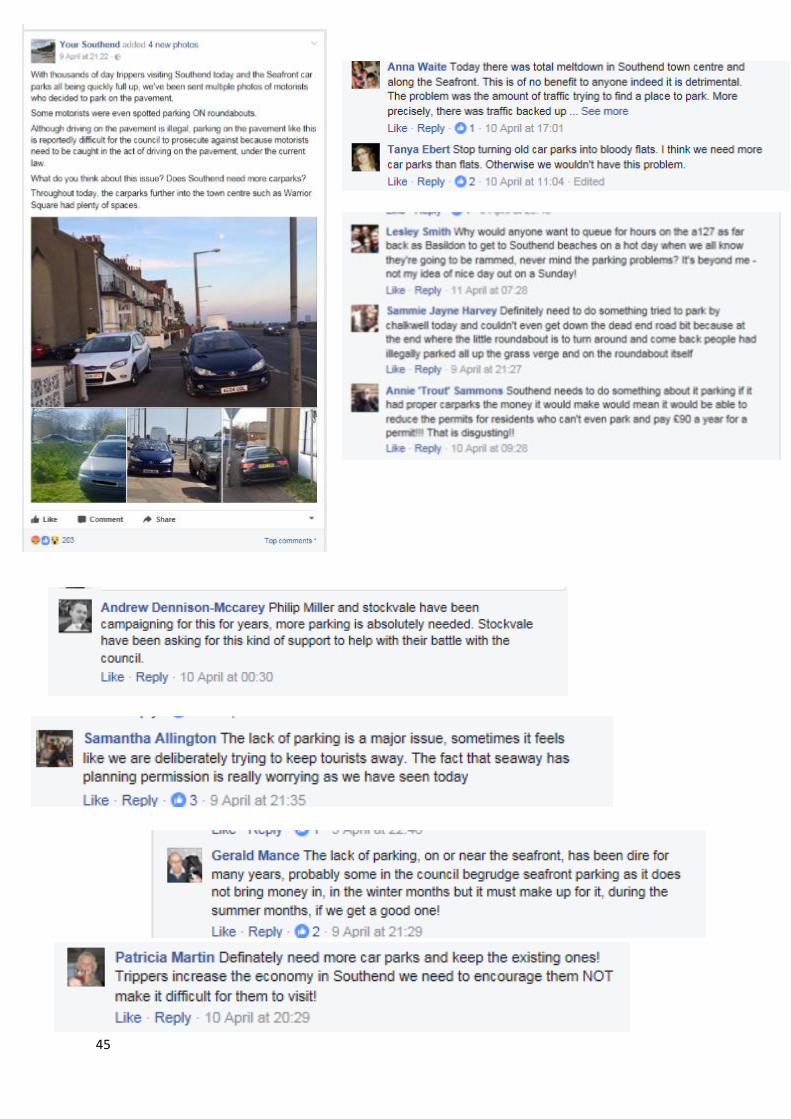
Appendix 23 shows social media comments on the parking experiences of seafront visitors coming to
one of the weekly evening fireworks displays on 2ndOct15. Many of the comments note visitors
turning around and going home as they can’t find a parking space.
Appendix 24 shows similar comments from Sunday 9thApril17. Both of these days are off-season.
These are just a sample of 2 days, in reality there are many more busy days that have similar
comments on line.

10
Appendix
Appendix 1
11
12

13

14

15
Appendix 2

16
Appendix 3
17
Appendix 4
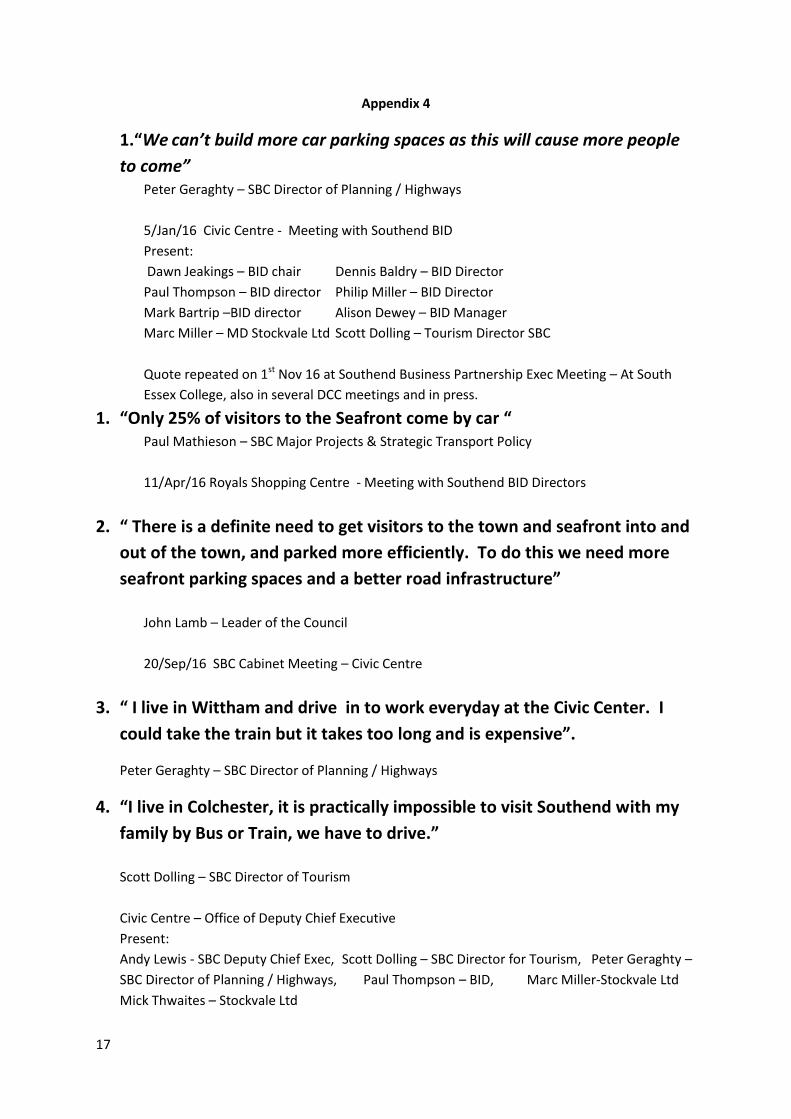
1.“We can’t build more car parking spaces as this will cause more people
to come”
Peter Geraghty – SBC Director of Planning / Highways
5/Jan/16 Civic Centre - Meeting with Southend BID
Present:
Dawn Jeakings – BID chair Dennis Baldry – BID Director
Paul Thompson – BID director Philip Miller – BID Director
Mark Bartrip –BID director Alison Dewey – BID Manager
Marc Miller – MD Stockvale Ltd Scott Dolling – Tourism Director SBC
Quote repeated on 1st Nov 16 at Southend Business Partnership Exec Meeting – At South
Essex College, also in several DCC meetings and in press.
1. “Only 25% of visitors to the Seafront come by car “ Paul Mathieson – SBC Major Projects & Strategic Transport Policy
11/Apr/16 Royals Shopping Centre - Meeting with Southend BID Directors
2. “ There is a definite need to get visitors to the town and seafront into and
out of the town, and parked more efficiently. To do this we need more
seafront parking spaces and a better road infrastructure”
John Lamb – Leader of the Council
20/Sep/16 SBC Cabinet Meeting – Civic Centre
3. “ I live in Wittham and drive in to work everyday at the Civic Center. I
could take the train but it takes too long and is expensive”.
Peter Geraghty – SBC Director of Planning / Highways
4. “I live in Colchester, it is practically impossible to visit Southend with my
family by Bus or Train, we have to drive.”
Scott Dolling – SBC Director of Tourism
Civic Centre – Office of Deputy Chief Executive
Present:
Andy Lewis - SBC Deputy Chief Exec, Scott Dolling – SBC Director for Tourism, Peter Geraghty –
SBC Director of Planning / Highways, Paul Thompson – BID, Marc Miller-Stockvale Ltd
Mick Thwaites – Stockvale Ltd
18
Appendix 5
19

20
Appendix 6
Appendix 7

21
Appendix 8

22
Appendix 9

23
Appendix 10

24
Appendix 11
25
Appendix 12
Survey Day Photos

26
Appendix 13
Peak Day Photos

27
Appendix 14

28
Appendix 15
29
Appendix 16

30
Appendix 17
31
32
Appendix 18

33
Appendix 19

34
Appendix 20
VMS car park app shows 104
available spaces out of a 500
capacity. This equates to 396 parked
cars, however photos show the car
park spaces are empty.
VMS sign shows 90 available spaces,
whereas the app shows 104.

35
VMS car park app shows 66
available spaces out of a 74
capacity. This equates to 8 parked
cars, however photos show the car
park is full.

36

37
Appendix 21

38
39

40
Appendix 22
Top photo shows VMS sign showing 197 available spaces in Tylers Avenue car park at 11:07
on the 26th October.
The bottom photo shows a different VMS sign at exactly the same date and time showing
76 available spaces for Tylers Avenue car park.

41
3rd May 2017 2nd May 2017

42
Appendix 23
43

44
45

46
Appendix 24
47

48
Appendix 25

49
Appendix 26

50