for the period ended june 30, 2014 - integra.com · for the period ended june 30, 2014 utf sare...
TRANSCRIPT
Semi-AnnuAl RepoRt
FOR THE PERIOD ENDED JUNE 30, 2014
UT
F S
AR
E 0
6/1
4
006027-UTF_SARE.CS6.indd 2 14-08-18 4:15 PM
NOTICE TO READER
The enclosed semi-annual financial statements have not been reviewed by the external auditors of the Funds.
August 2014
Dear Investor,
The first six months of 2014 presented an array of both potential sources of concern and reasons for optimism. Equity marketsseemed to embrace the latter more than the former, posting some fairly resilient positive results globally. This occurred despitenumerous macroeconomic and geopolitical tensions worldwide, including weaker-than-expected economic indicators from Europeand ongoing unrest and violence in Ukraine and Iraq.
In the case of Europe, concerns shifted towards a focus on avoiding deflation. Consumer price growth, one popular gauge ofinflation, was in positive territory but still below expectations (keep in mind that modest inflation is sometimes viewed as a positivesign of economic expansion). Employment figures in Europe were fairly soft as well; these indicators combined led to expectationsthat Europe’s central banks, the European Central Bank in particular, will need to take further steps to stimulate growth. This levelof uncertainty contrasted with more robust gains in the United States and Canada, with these markets reaching new highs.
The original contrarian investor
The lessons of the past six months, and of the years leading up to them, remind me of a sage quotation from one of the centralfigures who helped shape the company we know now as Franklin Templeton Investments: Sir John Templeton. In one of his morefamous pronouncements, he stated that, “The only investors who shouldn’t diversify are those who are right 100% of the time.”
The importance of diversification cannot be understated, no matter what type of investor you are, or what type of asset class orstrategy you are invested in. To take the last six months as an example, an equity investor who had concentrated only on Europe orAsia at the beginning of the year would have missed out on the impressive gains from the United States and Canada. Likewise, ifthat investor decided right now to avoid Europe entirely based on recent indicators, his or her portfolio might miss out onopportunities from stocks gaining back ground.
I had the honour of working with the late Sir John, whose life and times were the subject of Contrarian, a recently released USdocumentary film. Viewing the film earlier this year reminded me of how timeless Sir John’s wisdom was, and continues to be tothis day.
From a market perspective, Sir John always looked past headlines and popular sentiment. He did not believe investors should befocussed on just one type of security. He used diligent analysis to find what he viewed as the best possible opportunities for hisinvestors. Those are values shared by the diverse investment specialists across our global organization.
I feel privileged to play a role in bringing the strength and legacy of Franklin Templeton Investments to the service of you and all ourother investors across Canada. Thank you for your continued investment with us, and I wish you all the best for the remainder of2014.
Sincerely,
Donald F. ReedPresident and Chief Executive OfficerFranklin Templeton Investments Corp.
PS: For more information about Contrarian, please visit www.tennesseecontrarian.com.
Franklin Templeton Investments Funds
Table of Contents
Page
Financial StatementsTempleton Funds
Templeton Asian Growth Fund . . . . . . . . . . . . . . . 3Templeton Canadian Balanced Fund . . . . . . . . . . 9Templeton Canadian Stock Fund . . . . . . . . . . . . . 19Templeton EAFE Developed Markets Fund . . . . . 25Templeton Emerging Markets Fund . . . . . . . . . . . 32Templeton Frontier Markets Fund . . . . . . . . . . . . 39Templeton Global Balanced Fund . . . . . . . . . . . . . 47Templeton Global Bond Fund . . . . . . . . . . . . . . . . 64Templeton Global Bond Fund (Hedged) . . . . . . . . 80Templeton Global Smaller Companies Fund . . . . . 85Templeton International Stock Fund . . . . . . . . . . . 93
Franklin FundsFranklin Flex Cap Growth Fund . . . . . . . . . . . . . . 100Franklin High Income Fund . . . . . . . . . . . . . . . . . 110Franklin Income Fund . . . . . . . . . . . . . . . . . . . . . . 121Franklin Strategic Income Fund . . . . . . . . . . . . . . 130Franklin U.S. Core Equity Fund . . . . . . . . . . . . . . 157Franklin U.S. Rising Dividends Fund . . . . . . . . . . 163Franklin World Growth Fund . . . . . . . . . . . . . . . . . 170
Franklin Bissett FundsFranklin Bissett All Canadian Focus Fund . . . . . . 176Franklin Bissett Bond Fund . . . . . . . . . . . . . . . . . 182
Page
Franklin Bissett Canadian All Cap BalancedFund . . . . . . . . . . . . . . . . . . . . . . . . . . . . . . . . . 194
Franklin Bissett Canadian Balanced Fund . . . . . . 203Franklin Bissett Canadian Dividend Fund . . . . . . . 208Franklin Bissett Canadian Equity Fund . . . . . . . . . 214Franklin Bissett Canadian High Dividend Fund . . 220Franklin Bissett Canadian Short Term Bond
Fund . . . . . . . . . . . . . . . . . . . . . . . . . . . . . . . . . 226Franklin Bissett Corporate Bond Fund . . . . . . . . . 237Franklin Bissett Dividend Income Fund . . . . . . . . 248Franklin Bissett Microcap Fund . . . . . . . . . . . . . . 256Franklin Bissett Money Market Fund . . . . . . . . . . 262Franklin Bissett Small Cap Fund . . . . . . . . . . . . . . 271Franklin Bissett Strategic Income Fund . . . . . . . . 277Franklin Bissett Treasury Bill Fund . . . . . . . . . . . . 287Franklin Bissett U.S. Focus Fund . . . . . . . . . . . . . 294
Franklin Mutual Series FundsFranklin Mutual Global Discovery Fund . . . . . . . . 300Franklin Mutual U.S. Shares Fund . . . . . . . . . . . . 312
Franklin Templeton FundsFranklin Templeton Canadian Core Equity
Fund . . . . . . . . . . . . . . . . . . . . . . . . . . . . . . . . . 321Franklin Templeton Canadian Large Cap Fund . . 328
Notes to Financial Statements . . . . . . . . . . . . . . . . . . . 334
2 Franklin Templeton Investments Funds
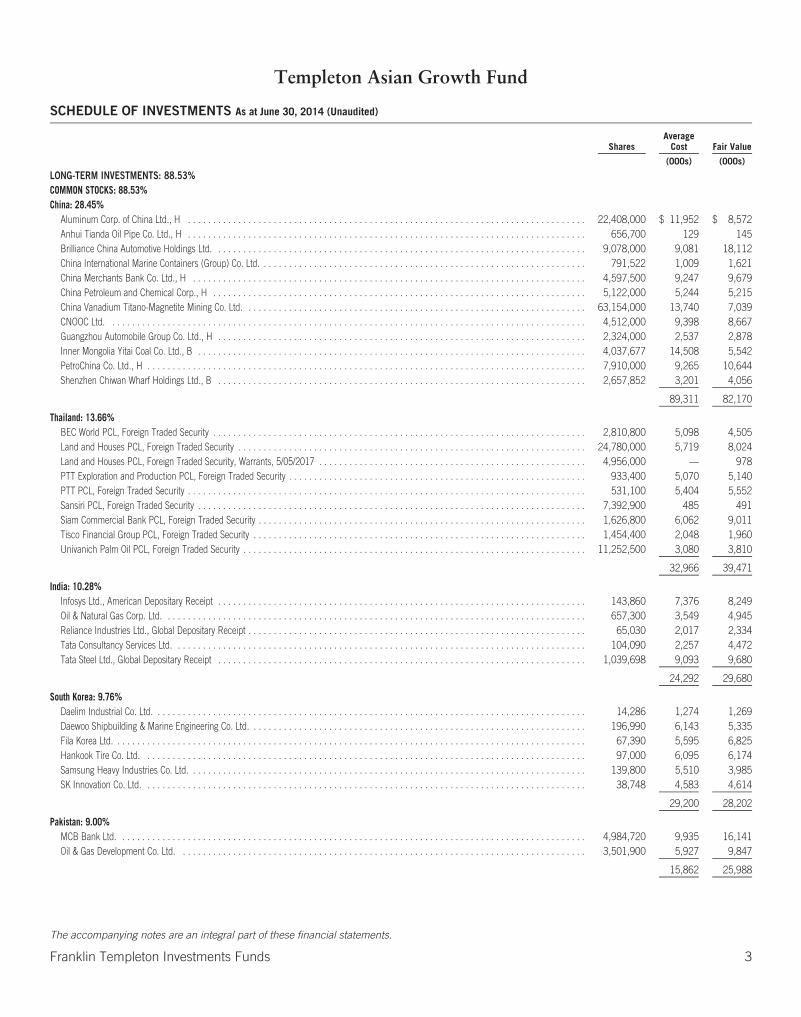
Templeton Asian Growth Fund
SCHEDULE OF INVESTMENTS As at June 30, 2014 (Unaudited)
SharesAverage
Cost Fair Value
(000s) (000s)
LONG-TERM INVESTMENTS: 88.53%COMMON STOCKS: 88.53%China: 28.45%
Aluminum Corp. of China Ltd., H . . . . . . . . . . . . . . . . . . . . . . . . . . . . . . . . . . . . . . . . . . . . . . . . . . . . . . . . . . . . . . . . . . . . . . . . . . . . . . . 22,408,000 $ 11,952 $ 8,572Anhui Tianda Oil Pipe Co. Ltd., H . . . . . . . . . . . . . . . . . . . . . . . . . . . . . . . . . . . . . . . . . . . . . . . . . . . . . . . . . . . . . . . . . . . . . . . . . . . . . . . 656,700 129 145Brilliance China Automotive Holdings Ltd. . . . . . . . . . . . . . . . . . . . . . . . . . . . . . . . . . . . . . . . . . . . . . . . . . . . . . . . . . . . . . . . . . . . . . . . . . 9,078,000 9,081 18,112China International Marine Containers (Group) Co. Ltd. . . . . . . . . . . . . . . . . . . . . . . . . . . . . . . . . . . . . . . . . . . . . . . . . . . . . . . . . . . . . . . . . 791,522 1,009 1,621China Merchants Bank Co. Ltd., H . . . . . . . . . . . . . . . . . . . . . . . . . . . . . . . . . . . . . . . . . . . . . . . . . . . . . . . . . . . . . . . . . . . . . . . . . . . . . . 4,597,500 9,247 9,679China Petroleum and Chemical Corp., H . . . . . . . . . . . . . . . . . . . . . . . . . . . . . . . . . . . . . . . . . . . . . . . . . . . . . . . . . . . . . . . . . . . . . . . . . . 5,122,000 5,244 5,215China Vanadium Titano-Magnetite Mining Co. Ltd. . . . . . . . . . . . . . . . . . . . . . . . . . . . . . . . . . . . . . . . . . . . . . . . . . . . . . . . . . . . . . . . . . . . 63,154,000 13,740 7,039CNOOC Ltd. . . . . . . . . . . . . . . . . . . . . . . . . . . . . . . . . . . . . . . . . . . . . . . . . . . . . . . . . . . . . . . . . . . . . . . . . . . . . . . . . . . . . . . . . . . . . . . 4,512,000 9,398 8,667Guangzhou Automobile Group Co. Ltd., H . . . . . . . . . . . . . . . . . . . . . . . . . . . . . . . . . . . . . . . . . . . . . . . . . . . . . . . . . . . . . . . . . . . . . . . . . 2,324,000 2,537 2,878Inner Mongolia Yitai Coal Co. Ltd., B . . . . . . . . . . . . . . . . . . . . . . . . . . . . . . . . . . . . . . . . . . . . . . . . . . . . . . . . . . . . . . . . . . . . . . . . . . . . . 4,037,677 14,508 5,542PetroChina Co. Ltd., H . . . . . . . . . . . . . . . . . . . . . . . . . . . . . . . . . . . . . . . . . . . . . . . . . . . . . . . . . . . . . . . . . . . . . . . . . . . . . . . . . . . . . . . 7,910,000 9,265 10,644Shenzhen Chiwan Wharf Holdings Ltd., B . . . . . . . . . . . . . . . . . . . . . . . . . . . . . . . . . . . . . . . . . . . . . . . . . . . . . . . . . . . . . . . . . . . . . . . . . 2,657,852 3,201 4,056
89,311 82,170
Thailand: 13.66%BEC World PCL, Foreign Traded Security . . . . . . . . . . . . . . . . . . . . . . . . . . . . . . . . . . . . . . . . . . . . . . . . . . . . . . . . . . . . . . . . . . . . . . . . . . 2,810,800 5,098 4,505Land and Houses PCL, Foreign Traded Security . . . . . . . . . . . . . . . . . . . . . . . . . . . . . . . . . . . . . . . . . . . . . . . . . . . . . . . . . . . . . . . . . . . . . 24,780,000 5,719 8,024Land and Houses PCL, Foreign Traded Security, Warrants, 5/05/2017 . . . . . . . . . . . . . . . . . . . . . . . . . . . . . . . . . . . . . . . . . . . . . . . . . . . . . 4,956,000 — 978PTT Exploration and Production PCL, Foreign Traded Security . . . . . . . . . . . . . . . . . . . . . . . . . . . . . . . . . . . . . . . . . . . . . . . . . . . . . . . . . . . 933,400 5,070 5,140PTT PCL, Foreign Traded Security . . . . . . . . . . . . . . . . . . . . . . . . . . . . . . . . . . . . . . . . . . . . . . . . . . . . . . . . . . . . . . . . . . . . . . . . . . . . . . . 531,100 5,404 5,552Sansiri PCL, Foreign Traded Security . . . . . . . . . . . . . . . . . . . . . . . . . . . . . . . . . . . . . . . . . . . . . . . . . . . . . . . . . . . . . . . . . . . . . . . . . . . . . 7,392,900 485 491Siam Commercial Bank PCL, Foreign Traded Security . . . . . . . . . . . . . . . . . . . . . . . . . . . . . . . . . . . . . . . . . . . . . . . . . . . . . . . . . . . . . . . . . 1,626,800 6,062 9,011Tisco Financial Group PCL, Foreign Traded Security . . . . . . . . . . . . . . . . . . . . . . . . . . . . . . . . . . . . . . . . . . . . . . . . . . . . . . . . . . . . . . . . . . 1,454,400 2,048 1,960Univanich Palm Oil PCL, Foreign Traded Security . . . . . . . . . . . . . . . . . . . . . . . . . . . . . . . . . . . . . . . . . . . . . . . . . . . . . . . . . . . . . . . . . . . . 11,252,500 3,080 3,810
32,966 39,471
India: 10.28%Infosys Ltd., American Depositary Receipt . . . . . . . . . . . . . . . . . . . . . . . . . . . . . . . . . . . . . . . . . . . . . . . . . . . . . . . . . . . . . . . . . . . . . . . . . 143,860 7,376 8,249Oil & Natural Gas Corp. Ltd. . . . . . . . . . . . . . . . . . . . . . . . . . . . . . . . . . . . . . . . . . . . . . . . . . . . . . . . . . . . . . . . . . . . . . . . . . . . . . . . . . . . 657,300 3,549 4,945Reliance Industries Ltd., Global Depositary Receipt . . . . . . . . . . . . . . . . . . . . . . . . . . . . . . . . . . . . . . . . . . . . . . . . . . . . . . . . . . . . . . . . . . . 65,030 2,017 2,334Tata Consultancy Services Ltd. . . . . . . . . . . . . . . . . . . . . . . . . . . . . . . . . . . . . . . . . . . . . . . . . . . . . . . . . . . . . . . . . . . . . . . . . . . . . . . . . . 104,090 2,257 4,472Tata Steel Ltd., Global Depositary Receipt . . . . . . . . . . . . . . . . . . . . . . . . . . . . . . . . . . . . . . . . . . . . . . . . . . . . . . . . . . . . . . . . . . . . . . . . . 1,039,698 9,093 9,680
24,292 29,680
South Korea: 9.76%Daelim Industrial Co. Ltd. . . . . . . . . . . . . . . . . . . . . . . . . . . . . . . . . . . . . . . . . . . . . . . . . . . . . . . . . . . . . . . . . . . . . . . . . . . . . . . . . . . . . . 14,286 1,274 1,269Daewoo Shipbuilding & Marine Engineering Co. Ltd. . . . . . . . . . . . . . . . . . . . . . . . . . . . . . . . . . . . . . . . . . . . . . . . . . . . . . . . . . . . . . . . . . . 196,990 6,143 5,335Fila Korea Ltd. . . . . . . . . . . . . . . . . . . . . . . . . . . . . . . . . . . . . . . . . . . . . . . . . . . . . . . . . . . . . . . . . . . . . . . . . . . . . . . . . . . . . . . . . . . . . . 67,390 5,595 6,825Hankook Tire Co. Ltd. . . . . . . . . . . . . . . . . . . . . . . . . . . . . . . . . . . . . . . . . . . . . . . . . . . . . . . . . . . . . . . . . . . . . . . . . . . . . . . . . . . . . . . . 97,000 6,095 6,174Samsung Heavy Industries Co. Ltd. . . . . . . . . . . . . . . . . . . . . . . . . . . . . . . . . . . . . . . . . . . . . . . . . . . . . . . . . . . . . . . . . . . . . . . . . . . . . . . 139,800 5,510 3,985SK Innovation Co. Ltd. . . . . . . . . . . . . . . . . . . . . . . . . . . . . . . . . . . . . . . . . . . . . . . . . . . . . . . . . . . . . . . . . . . . . . . . . . . . . . . . . . . . . . . . 38,748 4,583 4,614
29,200 28,202
Pakistan: 9.00%MCB Bank Ltd. . . . . . . . . . . . . . . . . . . . . . . . . . . . . . . . . . . . . . . . . . . . . . . . . . . . . . . . . . . . . . . . . . . . . . . . . . . . . . . . . . . . . . . . . . . . . 4,984,720 9,935 16,141Oil & Gas Development Co. Ltd. . . . . . . . . . . . . . . . . . . . . . . . . . . . . . . . . . . . . . . . . . . . . . . . . . . . . . . . . . . . . . . . . . . . . . . . . . . . . . . . . 3,501,900 5,927 9,847
15,862 25,988
The accompanying notes are an integral part of these financial statements.
Franklin Templeton Investments Funds 3
Templeton Asian Growth Fund
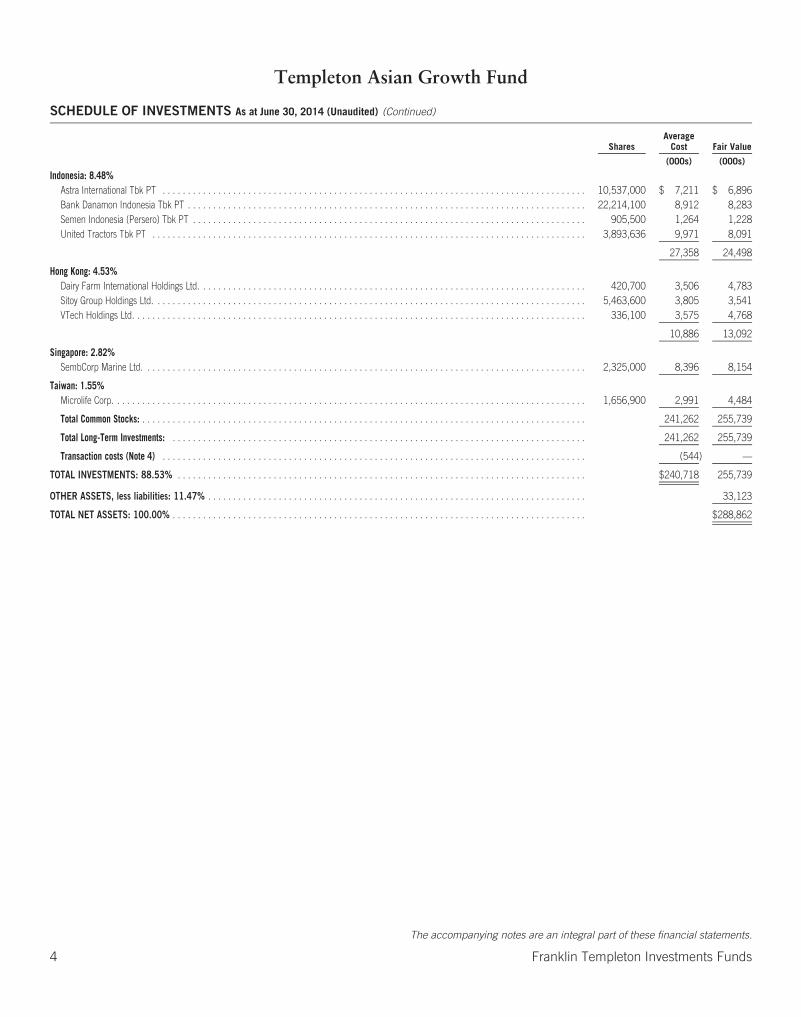
SCHEDULE OF INVESTMENTS As at June 30, 2014 (Unaudited) (Continued)
SharesAverage
Cost Fair Value
(000s) (000s)
Indonesia: 8.48%Astra International Tbk PT . . . . . . . . . . . . . . . . . . . . . . . . . . . . . . . . . . . . . . . . . . . . . . . . . . . . . . . . . . . . . . . . . . . . . . . . . . . . . . . . . . . . 10,537,000 $ 7,211 $ 6,896Bank Danamon Indonesia Tbk PT . . . . . . . . . . . . . . . . . . . . . . . . . . . . . . . . . . . . . . . . . . . . . . . . . . . . . . . . . . . . . . . . . . . . . . . . . . . . . . . 22,214,100 8,912 8,283Semen Indonesia (Persero) Tbk PT . . . . . . . . . . . . . . . . . . . . . . . . . . . . . . . . . . . . . . . . . . . . . . . . . . . . . . . . . . . . . . . . . . . . . . . . . . . . . . 905,500 1,264 1,228United Tractors Tbk PT . . . . . . . . . . . . . . . . . . . . . . . . . . . . . . . . . . . . . . . . . . . . . . . . . . . . . . . . . . . . . . . . . . . . . . . . . . . . . . . . . . . . . . 3,893,636 9,971 8,091
27,358 24,498
Hong Kong: 4.53%Dairy Farm International Holdings Ltd. . . . . . . . . . . . . . . . . . . . . . . . . . . . . . . . . . . . . . . . . . . . . . . . . . . . . . . . . . . . . . . . . . . . . . . . . . . . . 420,700 3,506 4,783Sitoy Group Holdings Ltd. . . . . . . . . . . . . . . . . . . . . . . . . . . . . . . . . . . . . . . . . . . . . . . . . . . . . . . . . . . . . . . . . . . . . . . . . . . . . . . . . . . . . . 5,463,600 3,805 3,541VTech Holdings Ltd. . . . . . . . . . . . . . . . . . . . . . . . . . . . . . . . . . . . . . . . . . . . . . . . . . . . . . . . . . . . . . . . . . . . . . . . . . . . . . . . . . . . . . . . . . 336,100 3,575 4,768
10,886 13,092
Singapore: 2.82%SembCorp Marine Ltd. . . . . . . . . . . . . . . . . . . . . . . . . . . . . . . . . . . . . . . . . . . . . . . . . . . . . . . . . . . . . . . . . . . . . . . . . . . . . . . . . . . . . . . . 2,325,000 8,396 8,154
Taiwan: 1.55%Microlife Corp. . . . . . . . . . . . . . . . . . . . . . . . . . . . . . . . . . . . . . . . . . . . . . . . . . . . . . . . . . . . . . . . . . . . . . . . . . . . . . . . . . . . . . . . . . . . . . 1,656,900 2,991 4,484
Total Common Stocks: . . . . . . . . . . . . . . . . . . . . . . . . . . . . . . . . . . . . . . . . . . . . . . . . . . . . . . . . . . . . . . . . . . . . . . . . . . . . . . . . . . . . . . . . 241,262 255,739
Total Long-Term Investments: . . . . . . . . . . . . . . . . . . . . . . . . . . . . . . . . . . . . . . . . . . . . . . . . . . . . . . . . . . . . . . . . . . . . . . . . . . . . . . . . . . 241,262 255,739
Transaction costs (Note 4) . . . . . . . . . . . . . . . . . . . . . . . . . . . . . . . . . . . . . . . . . . . . . . . . . . . . . . . . . . . . . . . . . . . . . . . . . . . . . . . . . . . . (544) —
TOTAL INVESTMENTS: 88.53% . . . . . . . . . . . . . . . . . . . . . . . . . . . . . . . . . . . . . . . . . . . . . . . . . . . . . . . . . . . . . . . . . . . . . . . . . . . . . . . . . $240,718 255,739
OTHER ASSETS, less liabilities: 11.47% . . . . . . . . . . . . . . . . . . . . . . . . . . . . . . . . . . . . . . . . . . . . . . . . . . . . . . . . . . . . . . . . . . . . . . . . . . . 33,123
TOTAL NET ASSETS: 100.00% . . . . . . . . . . . . . . . . . . . . . . . . . . . . . . . . . . . . . . . . . . . . . . . . . . . . . . . . . . . . . . . . . . . . . . . . . . . . . . . . . . $288,862
The accompanying notes are an integral part of these financial statements.
4 Franklin Templeton Investments Funds
Templeton Asian Growth Fund
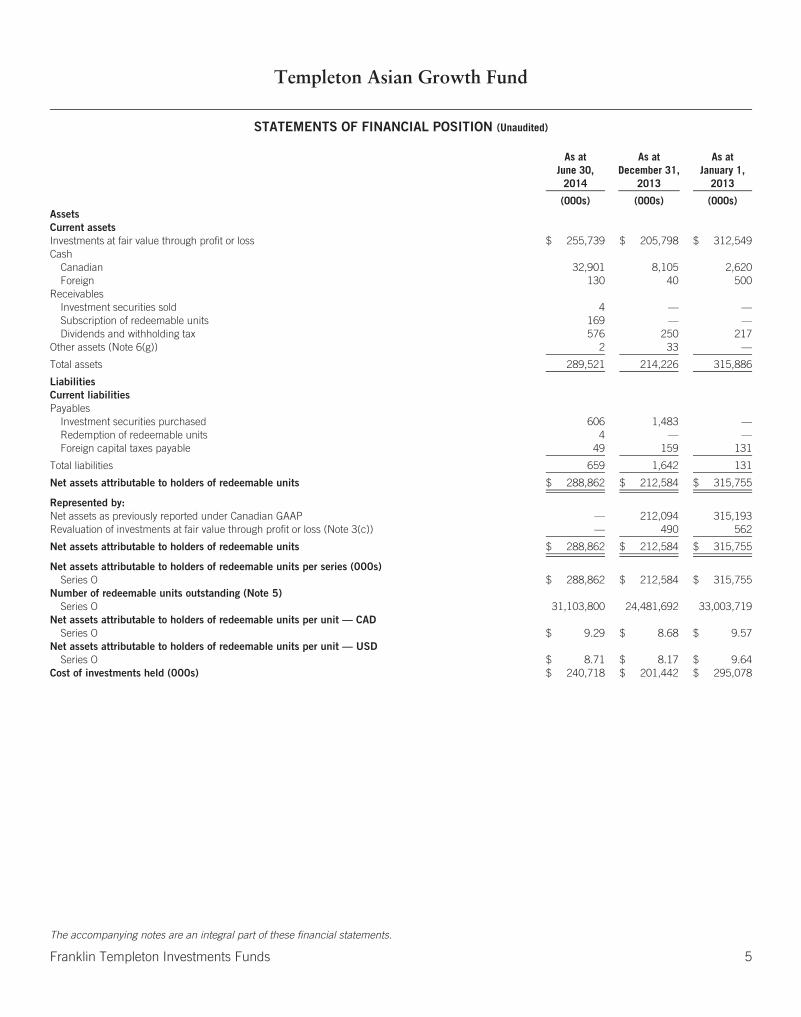
STATEMENTS OF FINANCIAL POSITION (Unaudited)
As atJune 30,
2014
As atDecember 31,
2013
As atJanuary 1,
2013
(000s) (000s) (000s)AssetsCurrent assetsInvestments at fair value through profit or loss $ 255,739 $ 205,798 $ 312,549Cash
Canadian 32,901 8,105 2,620Foreign 130 40 500
ReceivablesInvestment securities sold 4 — —Subscription of redeemable units 169 — —Dividends and withholding tax 576 250 217
Other assets (Note 6(g)) 2 33 —
Total assets 289,521 214,226 315,886
LiabilitiesCurrent liabilitiesPayables
Investment securities purchased 606 1,483 —Redemption of redeemable units 4 — —Foreign capital taxes payable 49 159 131
Total liabilities 659 1,642 131
Net assets attributable to holders of redeemable units $ 288,862 $ 212,584 $ 315,755
Represented by:Net assets as previously reported under Canadian GAAP — 212,094 315,193Revaluation of investments at fair value through profit or loss (Note 3(c)) — 490 562
Net assets attributable to holders of redeemable units $ 288,862 $ 212,584 $ 315,755
Net assets attributable to holders of redeemable units per series (000s)Series O $ 288,862 $ 212,584 $ 315,755
Number of redeemable units outstanding (Note 5)Series O 31,103,800 24,481,692 33,003,719
Net assets attributable to holders of redeemable units per unit — CADSeries O $ 9.29 $ 8.68 $ 9.57
Net assets attributable to holders of redeemable units per unit — USDSeries O $ 8.71 $ 8.17 $ 9.64
Cost of investments held (000s) $ 240,718 $ 201,442 $ 295,078
The accompanying notes are an integral part of these financial statements.
Franklin Templeton Investments Funds 5
Templeton Asian Growth Fund
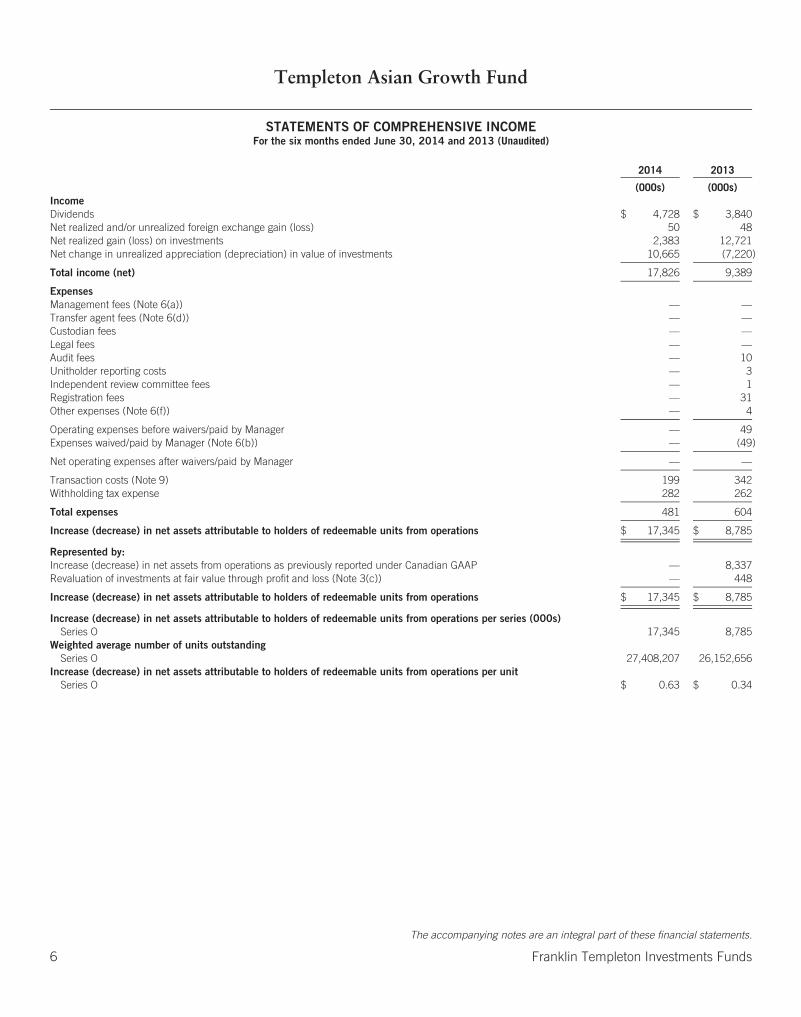
STATEMENTS OF COMPREHENSIVE INCOMEFor the six months ended June 30, 2014 and 2013 (Unaudited)
2014 2013
(000s) (000s)IncomeDividends $ 4,728 $ 3,840Net realized and/or unrealized foreign exchange gain (loss) 50 48Net realized gain (loss) on investments 2,383 12,721Net change in unrealized appreciation (depreciation) in value of investments 10,665 (7,220)
Total income (net) 17,826 9,389
ExpensesManagement fees (Note 6(a)) — —Transfer agent fees (Note 6(d)) — —Custodian fees — —Legal fees — —Audit fees — 10Unitholder reporting costs — 3Independent review committee fees — 1Registration fees — 31Other expenses (Note 6(f)) — 4
Operating expenses before waivers/paid by Manager — 49Expenses waived/paid by Manager (Note 6(b)) — (49)
Net operating expenses after waivers/paid by Manager — —
Transaction costs (Note 9) 199 342Withholding tax expense 282 262
Total expenses 481 604
Increase (decrease) in net assets attributable to holders of redeemable units from operations $ 17,345 $ 8,785
Represented by:Increase (decrease) in net assets from operations as previously reported under Canadian GAAP — 8,337Revaluation of investments at fair value through profit and loss (Note 3(c)) — 448
Increase (decrease) in net assets attributable to holders of redeemable units from operations $ 17,345 $ 8,785
Increase (decrease) in net assets attributable to holders of redeemable units from operations per series (000s)Series O 17,345 8,785
Weighted average number of units outstandingSeries O 27,408,207 26,152,656
Increase (decrease) in net assets attributable to holders of redeemable units from operations per unitSeries O $ 0.63 $ 0.34
The accompanying notes are an integral part of these financial statements.
6 Franklin Templeton Investments Funds
Templeton Asian Growth Fund
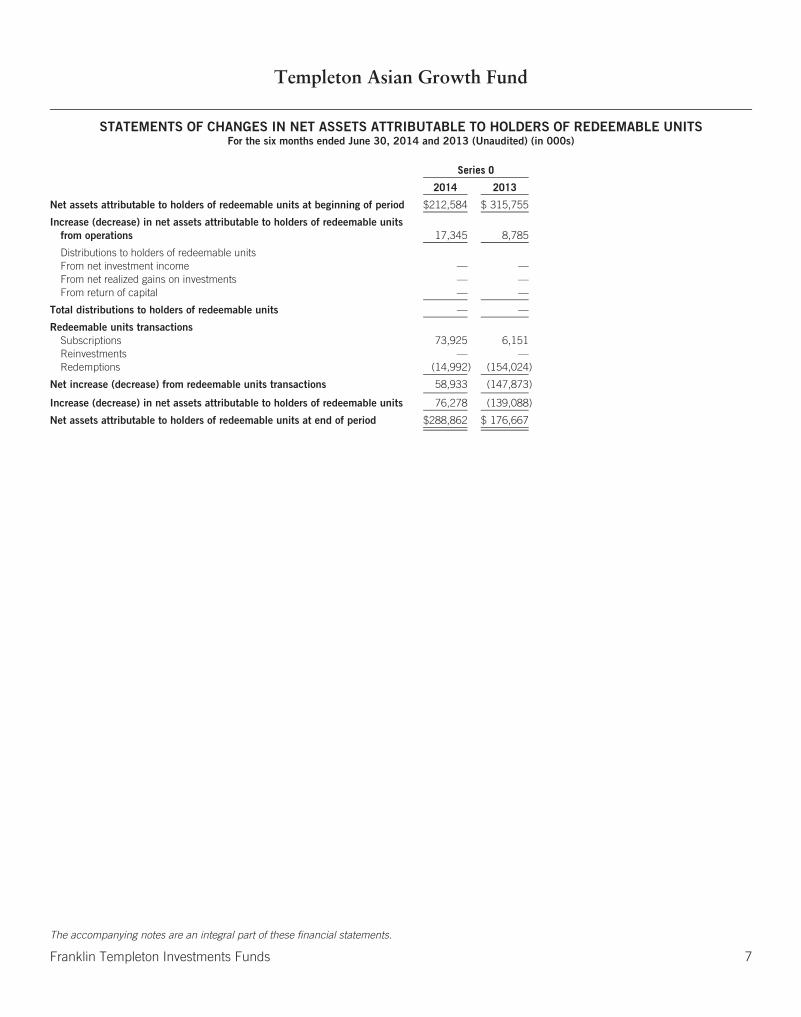
STATEMENTS OF CHANGES IN NET ASSETS ATTRIBUTABLE TO HOLDERS OF REDEEMABLE UNITSFor the six months ended June 30, 2014 and 2013 (Unaudited) (in 000s)
Series O
2014 2013
Net assets attributable to holders of redeemable units at beginning of period $212,584 $ 315,755
Increase (decrease) in net assets attributable to holders of redeemable unitsfrom operations 17,345 8,785
Distributions to holders of redeemable unitsFrom net investment income — —From net realized gains on investments — —From return of capital — —
Total distributions to holders of redeemable units — —
Redeemable units transactionsSubscriptions 73,925 6,151Reinvestments — —Redemptions (14,992) (154,024)
Net increase (decrease) from redeemable units transactions 58,933 (147,873)
Increase (decrease) in net assets attributable to holders of redeemable units 76,278 (139,088)
Net assets attributable to holders of redeemable units at end of period $288,862 $ 176,667
The accompanying notes are an integral part of these financial statements.
Franklin Templeton Investments Funds 7
Templeton Asian Growth Fund
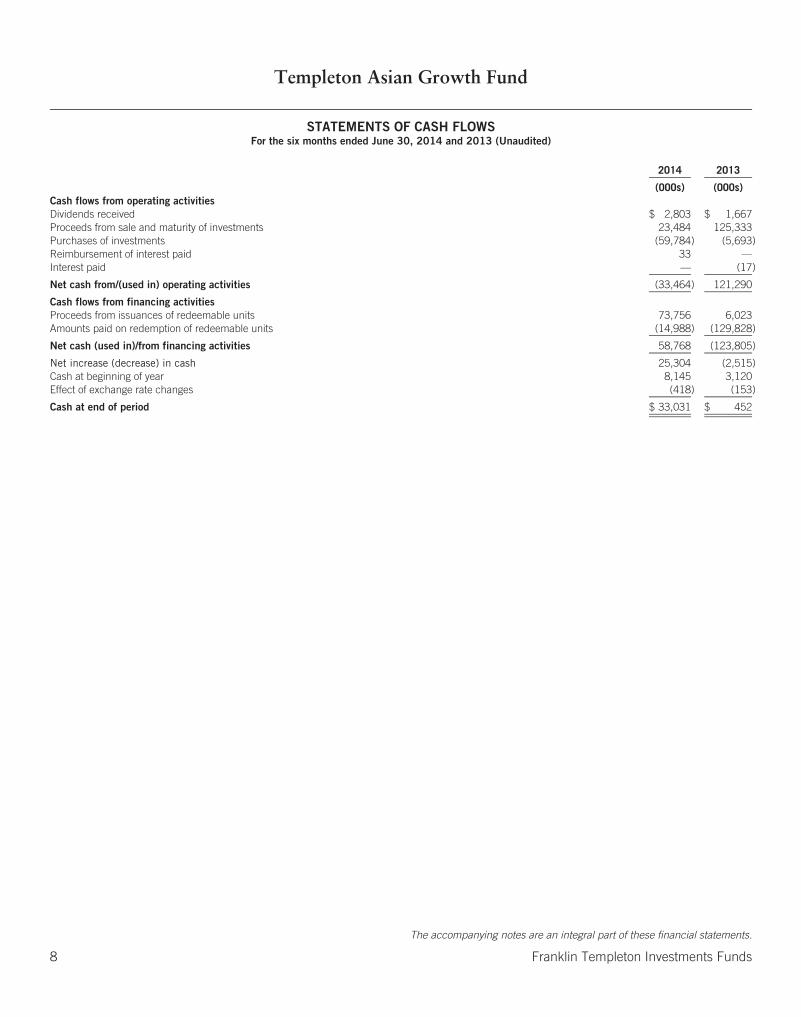
STATEMENTS OF CASH FLOWSFor the six months ended June 30, 2014 and 2013 (Unaudited)
2014 2013
(000s) (000s)Cash flows from operating activitiesDividends received $ 2,803 $ 1,667Proceeds from sale and maturity of investments 23,484 125,333Purchases of investments (59,784) (5,693)Reimbursement of interest paid 33 —Interest paid — (17)
Net cash from/(used in) operating activities (33,464) 121,290
Cash flows from financing activitiesProceeds from issuances of redeemable units 73,756 6,023Amounts paid on redemption of redeemable units (14,988) (129,828)
Net cash (used in)/from financing activities 58,768 (123,805)
Net increase (decrease) in cash 25,304 (2,515)Cash at beginning of year 8,145 3,120Effect of exchange rate changes (418) (153)
Cash at end of period $ 33,031 $ 452
The accompanying notes are an integral part of these financial statements.
8 Franklin Templeton Investments Funds

Templeton Canadian Balanced Fund
SCHEDULE OF INVESTMENTS As at June 30, 2014 (Unaudited)
SharesAverage
Cost Fair Value
(000s) (000s)
LONG-TERM INVESTMENTS: 99.07%COMMON STOCKS: 75.64%Canada: 73.99%
Bank of Montreal . . . . . . . . . . . . . . . . . . . . . . . . . . . . . . . . . . . . . . . . . . . . . . . . . . . . . . . . . . . . . . . . . . . . . . . . . . . . . . . . . . . . . . . . . . . . . . . 18,697 $ 767 $ 1,469Bank of Nova Scotia . . . . . . . . . . . . . . . . . . . . . . . . . . . . . . . . . . . . . . . . . . . . . . . . . . . . . . . . . . . . . . . . . . . . . . . . . . . . . . . . . . . . . . . . . . . . 43,603 1,239 3,102Barrick Gold Corp. . . . . . . . . . . . . . . . . . . . . . . . . . . . . . . . . . . . . . . . . . . . . . . . . . . . . . . . . . . . . . . . . . . . . . . . . . . . . . . . . . . . . . . . . . . . . . . 32,900 1,008 643BCE Inc. . . . . . . . . . . . . . . . . . . . . . . . . . . . . . . . . . . . . . . . . . . . . . . . . . . . . . . . . . . . . . . . . . . . . . . . . . . . . . . . . . . . . . . . . . . . . . . . . . . . . . 18,300 438 886Bell Aliant Inc. . . . . . . . . . . . . . . . . . . . . . . . . . . . . . . . . . . . . . . . . . . . . . . . . . . . . . . . . . . . . . . . . . . . . . . . . . . . . . . . . . . . . . . . . . . . . . . . . . 43,943 1,351 1,226Bombardier Inc., B . . . . . . . . . . . . . . . . . . . . . . . . . . . . . . . . . . . . . . . . . . . . . . . . . . . . . . . . . . . . . . . . . . . . . . . . . . . . . . . . . . . . . . . . . . . . . 556,500 2,520 2,098CAE Inc. . . . . . . . . . . . . . . . . . . . . . . . . . . . . . . . . . . . . . . . . . . . . . . . . . . . . . . . . . . . . . . . . . . . . . . . . . . . . . . . . . . . . . . . . . . . . . . . . . . . . . 56,818 500 793Calfrac Well Services Ltd. . . . . . . . . . . . . . . . . . . . . . . . . . . . . . . . . . . . . . . . . . . . . . . . . . . . . . . . . . . . . . . . . . . . . . . . . . . . . . . . . . . . . . . . . . 57,800 767 1,153Canadian Imperial Bank of Commerce . . . . . . . . . . . . . . . . . . . . . . . . . . . . . . . . . . . . . . . . . . . . . . . . . . . . . . . . . . . . . . . . . . . . . . . . . . . . . . . 15,389 770 1,494Canadian Natural Resources Ltd. . . . . . . . . . . . . . . . . . . . . . . . . . . . . . . . . . . . . . . . . . . . . . . . . . . . . . . . . . . . . . . . . . . . . . . . . . . . . . . . . . . . 65,420 1,428 3,207Cascades Inc. . . . . . . . . . . . . . . . . . . . . . . . . . . . . . . . . . . . . . . . . . . . . . . . . . . . . . . . . . . . . . . . . . . . . . . . . . . . . . . . . . . . . . . . . . . . . . . . . . 89,500 656 592Cenovus Energy Inc. . . . . . . . . . . . . . . . . . . . . . . . . . . . . . . . . . . . . . . . . . . . . . . . . . . . . . . . . . . . . . . . . . . . . . . . . . . . . . . . . . . . . . . . . . . . . 78,336 2,084 2,710Dorel Industries Inc., B . . . . . . . . . . . . . . . . . . . . . . . . . . . . . . . . . . . . . . . . . . . . . . . . . . . . . . . . . . . . . . . . . . . . . . . . . . . . . . . . . . . . . . . . . . 34,300 1,067 1,351EnCana Corp. . . . . . . . . . . . . . . . . . . . . . . . . . . . . . . . . . . . . . . . . . . . . . . . . . . . . . . . . . . . . . . . . . . . . . . . . . . . . . . . . . . . . . . . . . . . . . . . . . 59,436 1,689 1,502Genworth MI Canada Inc. . . . . . . . . . . . . . . . . . . . . . . . . . . . . . . . . . . . . . . . . . . . . . . . . . . . . . . . . . . . . . . . . . . . . . . . . . . . . . . . . . . . . . . . . . 58,400 1,110 2,220George Weston Ltd. . . . . . . . . . . . . . . . . . . . . . . . . . . . . . . . . . . . . . . . . . . . . . . . . . . . . . . . . . . . . . . . . . . . . . . . . . . . . . . . . . . . . . . . . . . . . . 31,600 2,067 2,487HudBay Minerals Inc. . . . . . . . . . . . . . . . . . . . . . . . . . . . . . . . . . . . . . . . . . . . . . . . . . . . . . . . . . . . . . . . . . . . . . . . . . . . . . . . . . . . . . . . . . . . 179,200 1,650 1,769Husky Energy Inc. . . . . . . . . . . . . . . . . . . . . . . . . . . . . . . . . . . . . . . . . . . . . . . . . . . . . . . . . . . . . . . . . . . . . . . . . . . . . . . . . . . . . . . . . . . . . . . 84,700 2,562 2,919Kingsway Financial Services Inc. . . . . . . . . . . . . . . . . . . . . . . . . . . . . . . . . . . . . . . . . . . . . . . . . . . . . . . . . . . . . . . . . . . . . . . . . . . . . . . . . . . . . 43,672 1,149 289Laurentian Bank of Canada . . . . . . . . . . . . . . . . . . . . . . . . . . . . . . . . . . . . . . . . . . . . . . . . . . . . . . . . . . . . . . . . . . . . . . . . . . . . . . . . . . . . . . . 26,900 811 1,341Loblaw Cos. Ltd. . . . . . . . . . . . . . . . . . . . . . . . . . . . . . . . . . . . . . . . . . . . . . . . . . . . . . . . . . . . . . . . . . . . . . . . . . . . . . . . . . . . . . . . . . . . . . . . 33,275 1,297 1,584Magellan Aerospace Corp. . . . . . . . . . . . . . . . . . . . . . . . . . . . . . . . . . . . . . . . . . . . . . . . . . . . . . . . . . . . . . . . . . . . . . . . . . . . . . . . . . . . . . . . . 258,388 3,346 3,044Major Drilling Group International Inc. . . . . . . . . . . . . . . . . . . . . . . . . . . . . . . . . . . . . . . . . . . . . . . . . . . . . . . . . . . . . . . . . . . . . . . . . . . . . . . . . 84,500 749 657National Bank of Canada . . . . . . . . . . . . . . . . . . . . . . . . . . . . . . . . . . . . . . . . . . . . . . . . . . . . . . . . . . . . . . . . . . . . . . . . . . . . . . . . . . . . . . . . . 25,644 434 1,161QLT Inc. . . . . . . . . . . . . . . . . . . . . . . . . . . . . . . . . . . . . . . . . . . . . . . . . . . . . . . . . . . . . . . . . . . . . . . . . . . . . . . . . . . . . . . . . . . . . . . . . . . . . . 63,032 254 405Rogers Communications Inc., B . . . . . . . . . . . . . . . . . . . . . . . . . . . . . . . . . . . . . . . . . . . . . . . . . . . . . . . . . . . . . . . . . . . . . . . . . . . . . . . . . . . . 19,496 836 837Royal Bank of Canada . . . . . . . . . . . . . . . . . . . . . . . . . . . . . . . . . . . . . . . . . . . . . . . . . . . . . . . . . . . . . . . . . . . . . . . . . . . . . . . . . . . . . . . . . . . 46,785 1,775 3,569Shawcor Ltd., A . . . . . . . . . . . . . . . . . . . . . . . . . . . . . . . . . . . . . . . . . . . . . . . . . . . . . . . . . . . . . . . . . . . . . . . . . . . . . . . . . . . . . . . . . . . . . . . . 21,470 365 1,274Sherritt International Corp. . . . . . . . . . . . . . . . . . . . . . . . . . . . . . . . . . . . . . . . . . . . . . . . . . . . . . . . . . . . . . . . . . . . . . . . . . . . . . . . . . . . . . . . . 309,300 1,605 1,336Sun Life Financial Inc. . . . . . . . . . . . . . . . . . . . . . . . . . . . . . . . . . . . . . . . . . . . . . . . . . . . . . . . . . . . . . . . . . . . . . . . . . . . . . . . . . . . . . . . . . . . 57,537 1,654 2,257Suncor Energy Inc. . . . . . . . . . . . . . . . . . . . . . . . . . . . . . . . . . . . . . . . . . . . . . . . . . . . . . . . . . . . . . . . . . . . . . . . . . . . . . . . . . . . . . . . . . . . . . 55,900 1,764 2,543Talisman Energy Inc. . . . . . . . . . . . . . . . . . . . . . . . . . . . . . . . . . . . . . . . . . . . . . . . . . . . . . . . . . . . . . . . . . . . . . . . . . . . . . . . . . . . . . . . . . . . . 261,990 3,359 2,955Teck Resources Ltd., B . . . . . . . . . . . . . . . . . . . . . . . . . . . . . . . . . . . . . . . . . . . . . . . . . . . . . . . . . . . . . . . . . . . . . . . . . . . . . . . . . . . . . . . . . . 54,300 1,760 1,323The Toronto-Dominion Bank . . . . . . . . . . . . . . . . . . . . . . . . . . . . . . . . . . . . . . . . . . . . . . . . . . . . . . . . . . . . . . . . . . . . . . . . . . . . . . . . . . . . . . . 65,772 1,343 3,613Valener Inc. . . . . . . . . . . . . . . . . . . . . . . . . . . . . . . . . . . . . . . . . . . . . . . . . . . . . . . . . . . . . . . . . . . . . . . . . . . . . . . . . . . . . . . . . . . . . . . . . . . 96,400 1,455 1,523
47,629 61,332
Zambia: 1.65%First Quantum Minerals Ltd. . . . . . . . . . . . . . . . . . . . . . . . . . . . . . . . . . . . . . . . . . . . . . . . . . . . . . . . . . . . . . . . . . . . . . . . . . . . . . . . . . . . . . . . 59,871 1,223 1,366
Total Common Stocks: . . . . . . . . . . . . . . . . . . . . . . . . . . . . . . . . . . . . . . . . . . . . . . . . . . . . . . . . . . . . . . . . . . . . . . . . . . . . . . . . . . . . . . . . . . . 48,852 62,698
PREFERRED STOCKS: 1.56%Vale SA, American Depositary Receipt, Preferred, A . . . . . . . . . . . . . . . . . . . . . . . . . . . . . . . . . . . . . . . . . . . . . . . . . . . . . . . . . . . . . . . . . . . . . . 102,227 2,125 1,297
Total Preferred Stocks: . . . . . . . . . . . . . . . . . . . . . . . . . . . . . . . . . . . . . . . . . . . . . . . . . . . . . . . . . . . . . . . . . . . . . . . . . . . . . . . . . . . . . . . . . . . 2,125 1,297
The accompanying notes are an integral part of these financial statements.
Franklin Templeton Investments Funds 9
Templeton Canadian Balanced Fund
SCHEDULE OF INVESTMENTS As at June 30, 2014 (Unaudited) (Continued)
Principal Amountin Currency
of IssueAverage
Cost Fair Value
(000s) (000s)
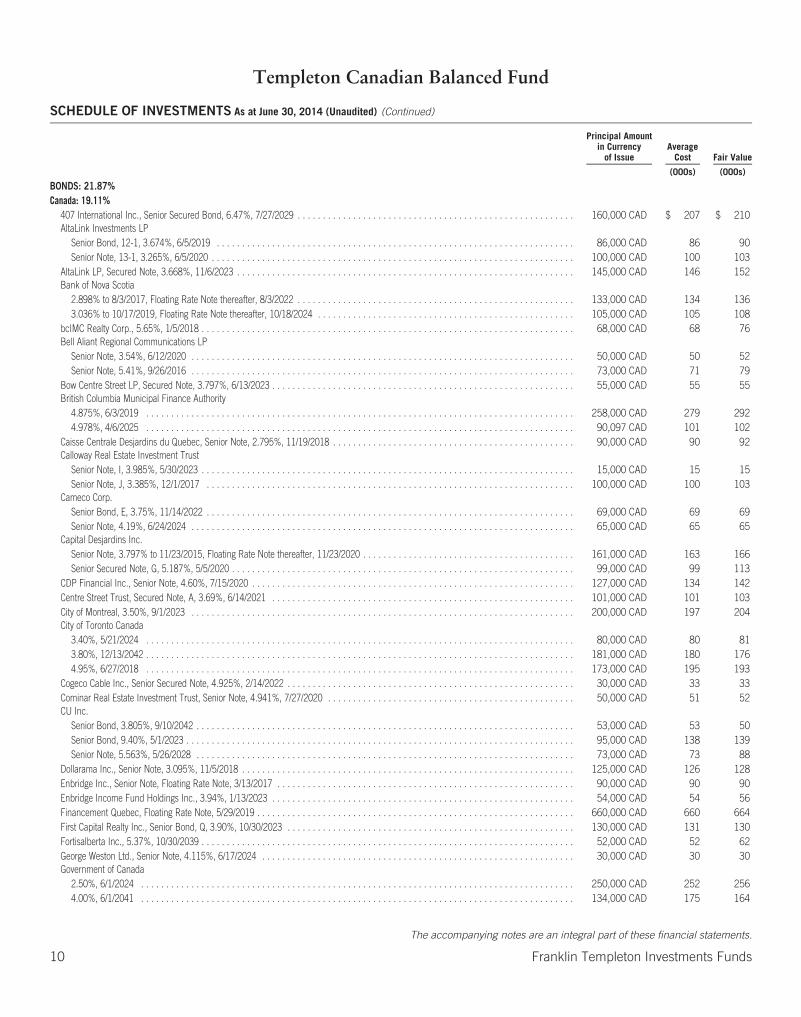
BONDS: 21.87%Canada: 19.11%
407 International Inc., Senior Secured Bond, 6.47%, 7/27/2029 . . . . . . . . . . . . . . . . . . . . . . . . . . . . . . . . . . . . . . . . . . . . . . . . . . . . . . . 160,000 CAD $ 207 $ 210AltaLink Investments LP
Senior Bond, 12-1, 3.674%, 6/5/2019 . . . . . . . . . . . . . . . . . . . . . . . . . . . . . . . . . . . . . . . . . . . . . . . . . . . . . . . . . . . . . . . . . . . . . . . 86,000 CAD 86 90Senior Note, 13-1, 3.265%, 6/5/2020 . . . . . . . . . . . . . . . . . . . . . . . . . . . . . . . . . . . . . . . . . . . . . . . . . . . . . . . . . . . . . . . . . . . . . . . . 100,000 CAD 100 103
AltaLink LP, Secured Note, 3.668%, 11/6/2023 . . . . . . . . . . . . . . . . . . . . . . . . . . . . . . . . . . . . . . . . . . . . . . . . . . . . . . . . . . . . . . . . . . . 145,000 CAD 146 152Bank of Nova Scotia
2.898% to 8/3/2017, Floating Rate Note thereafter, 8/3/2022 . . . . . . . . . . . . . . . . . . . . . . . . . . . . . . . . . . . . . . . . . . . . . . . . . . . . . . . 133,000 CAD 134 1363.036% to 10/17/2019, Floating Rate Note thereafter, 10/18/2024 . . . . . . . . . . . . . . . . . . . . . . . . . . . . . . . . . . . . . . . . . . . . . . . . . . . 105,000 CAD 105 108
bcIMC Realty Corp., 5.65%, 1/5/2018 . . . . . . . . . . . . . . . . . . . . . . . . . . . . . . . . . . . . . . . . . . . . . . . . . . . . . . . . . . . . . . . . . . . . . . . . . . 68,000 CAD 68 76Bell Aliant Regional Communications LP
Senior Note, 3.54%, 6/12/2020 . . . . . . . . . . . . . . . . . . . . . . . . . . . . . . . . . . . . . . . . . . . . . . . . . . . . . . . . . . . . . . . . . . . . . . . . . . . . 50,000 CAD 50 52Senior Note, 5.41%, 9/26/2016 . . . . . . . . . . . . . . . . . . . . . . . . . . . . . . . . . . . . . . . . . . . . . . . . . . . . . . . . . . . . . . . . . . . . . . . . . . . . 73,000 CAD 71 79
Bow Centre Street LP, Secured Note, 3.797%, 6/13/2023 . . . . . . . . . . . . . . . . . . . . . . . . . . . . . . . . . . . . . . . . . . . . . . . . . . . . . . . . . . . . 55,000 CAD 55 55British Columbia Municipal Finance Authority
4.875%, 6/3/2019 . . . . . . . . . . . . . . . . . . . . . . . . . . . . . . . . . . . . . . . . . . . . . . . . . . . . . . . . . . . . . . . . . . . . . . . . . . . . . . . . . . . . . 258,000 CAD 279 2924.978%, 4/6/2025 . . . . . . . . . . . . . . . . . . . . . . . . . . . . . . . . . . . . . . . . . . . . . . . . . . . . . . . . . . . . . . . . . . . . . . . . . . . . . . . . . . . . . 90,097 CAD 101 102
Caisse Centrale Desjardins du Quebec, Senior Note, 2.795%, 11/19/2018 . . . . . . . . . . . . . . . . . . . . . . . . . . . . . . . . . . . . . . . . . . . . . . . . 90,000 CAD 90 92Calloway Real Estate Investment Trust
Senior Note, I, 3.985%, 5/30/2023 . . . . . . . . . . . . . . . . . . . . . . . . . . . . . . . . . . . . . . . . . . . . . . . . . . . . . . . . . . . . . . . . . . . . . . . . . . 15,000 CAD 15 15Senior Note, J, 3.385%, 12/1/2017 . . . . . . . . . . . . . . . . . . . . . . . . . . . . . . . . . . . . . . . . . . . . . . . . . . . . . . . . . . . . . . . . . . . . . . . . . 100,000 CAD 100 103
Cameco Corp.Senior Bond, E, 3.75%, 11/14/2022 . . . . . . . . . . . . . . . . . . . . . . . . . . . . . . . . . . . . . . . . . . . . . . . . . . . . . . . . . . . . . . . . . . . . . . . . . 69,000 CAD 69 69Senior Note, 4.19%, 6/24/2024 . . . . . . . . . . . . . . . . . . . . . . . . . . . . . . . . . . . . . . . . . . . . . . . . . . . . . . . . . . . . . . . . . . . . . . . . . . . . 65,000 CAD 65 65
Capital Desjardins Inc.Senior Note, 3.797% to 11/23/2015, Floating Rate Note thereafter, 11/23/2020 . . . . . . . . . . . . . . . . . . . . . . . . . . . . . . . . . . . . . . . . . . 161,000 CAD 163 166Senior Secured Note, G, 5.187%, 5/5/2020 . . . . . . . . . . . . . . . . . . . . . . . . . . . . . . . . . . . . . . . . . . . . . . . . . . . . . . . . . . . . . . . . . . . . 99,000 CAD 99 113
CDP Financial Inc., Senior Note, 4.60%, 7/15/2020 . . . . . . . . . . . . . . . . . . . . . . . . . . . . . . . . . . . . . . . . . . . . . . . . . . . . . . . . . . . . . . . . 127,000 CAD 134 142Centre Street Trust, Secured Note, A, 3.69%, 6/14/2021 . . . . . . . . . . . . . . . . . . . . . . . . . . . . . . . . . . . . . . . . . . . . . . . . . . . . . . . . . . . . 101,000 CAD 101 103City of Montreal, 3.50%, 9/1/2023 . . . . . . . . . . . . . . . . . . . . . . . . . . . . . . . . . . . . . . . . . . . . . . . . . . . . . . . . . . . . . . . . . . . . . . . . . . . . 200,000 CAD 197 204City of Toronto Canada
3.40%, 5/21/2024 . . . . . . . . . . . . . . . . . . . . . . . . . . . . . . . . . . . . . . . . . . . . . . . . . . . . . . . . . . . . . . . . . . . . . . . . . . . . . . . . . . . . . 80,000 CAD 80 813.80%, 12/13/2042 . . . . . . . . . . . . . . . . . . . . . . . . . . . . . . . . . . . . . . . . . . . . . . . . . . . . . . . . . . . . . . . . . . . . . . . . . . . . . . . . . . . . . 181,000 CAD 180 1764.95%, 6/27/2018 . . . . . . . . . . . . . . . . . . . . . . . . . . . . . . . . . . . . . . . . . . . . . . . . . . . . . . . . . . . . . . . . . . . . . . . . . . . . . . . . . . . . . 173,000 CAD 195 193
Cogeco Cable Inc., Senior Secured Note, 4.925%, 2/14/2022 . . . . . . . . . . . . . . . . . . . . . . . . . . . . . . . . . . . . . . . . . . . . . . . . . . . . . . . . . 30,000 CAD 33 33Cominar Real Estate Investment Trust, Senior Note, 4.941%, 7/27/2020 . . . . . . . . . . . . . . . . . . . . . . . . . . . . . . . . . . . . . . . . . . . . . . . . . 50,000 CAD 51 52CU Inc.
Senior Bond, 3.805%, 9/10/2042 . . . . . . . . . . . . . . . . . . . . . . . . . . . . . . . . . . . . . . . . . . . . . . . . . . . . . . . . . . . . . . . . . . . . . . . . . . . 53,000 CAD 53 50Senior Bond, 9.40%, 5/1/2023 . . . . . . . . . . . . . . . . . . . . . . . . . . . . . . . . . . . . . . . . . . . . . . . . . . . . . . . . . . . . . . . . . . . . . . . . . . . . . 95,000 CAD 138 139Senior Note, 5.563%, 5/26/2028 . . . . . . . . . . . . . . . . . . . . . . . . . . . . . . . . . . . . . . . . . . . . . . . . . . . . . . . . . . . . . . . . . . . . . . . . . . . 73,000 CAD 73 88
Dollarama Inc., Senior Note, 3.095%, 11/5/2018 . . . . . . . . . . . . . . . . . . . . . . . . . . . . . . . . . . . . . . . . . . . . . . . . . . . . . . . . . . . . . . . . . . 125,000 CAD 126 128Enbridge Inc., Senior Note, Floating Rate Note, 3/13/2017 . . . . . . . . . . . . . . . . . . . . . . . . . . . . . . . . . . . . . . . . . . . . . . . . . . . . . . . . . . . 90,000 CAD 90 90Enbridge Income Fund Holdings Inc., 3.94%, 1/13/2023 . . . . . . . . . . . . . . . . . . . . . . . . . . . . . . . . . . . . . . . . . . . . . . . . . . . . . . . . . . . . 54,000 CAD 54 56Financement Quebec, Floating Rate Note, 5/29/2019 . . . . . . . . . . . . . . . . . . . . . . . . . . . . . . . . . . . . . . . . . . . . . . . . . . . . . . . . . . . . . . . 660,000 CAD 660 664First Capital Realty Inc., Senior Bond, Q, 3.90%, 10/30/2023 . . . . . . . . . . . . . . . . . . . . . . . . . . . . . . . . . . . . . . . . . . . . . . . . . . . . . . . . . 130,000 CAD 131 130Fortisalberta Inc., 5.37%, 10/30/2039 . . . . . . . . . . . . . . . . . . . . . . . . . . . . . . . . . . . . . . . . . . . . . . . . . . . . . . . . . . . . . . . . . . . . . . . . . . 52,000 CAD 52 62George Weston Ltd., Senior Note, 4.115%, 6/17/2024 . . . . . . . . . . . . . . . . . . . . . . . . . . . . . . . . . . . . . . . . . . . . . . . . . . . . . . . . . . . . . . 30,000 CAD 30 30Government of Canada
2.50%, 6/1/2024 . . . . . . . . . . . . . . . . . . . . . . . . . . . . . . . . . . . . . . . . . . . . . . . . . . . . . . . . . . . . . . . . . . . . . . . . . . . . . . . . . . . . . . 250,000 CAD 252 2564.00%, 6/1/2041 . . . . . . . . . . . . . . . . . . . . . . . . . . . . . . . . . . . . . . . . . . . . . . . . . . . . . . . . . . . . . . . . . . . . . . . . . . . . . . . . . . . . . . 134,000 CAD 175 164
The accompanying notes are an integral part of these financial statements.
10 Franklin Templeton Investments Funds
Templeton Canadian Balanced Fund
SCHEDULE OF INVESTMENTS As at June 30, 2014 (Unaudited) (Continued)
Principal Amountin Currency
of IssueAverage
Cost Fair Value
(000s) (000s)
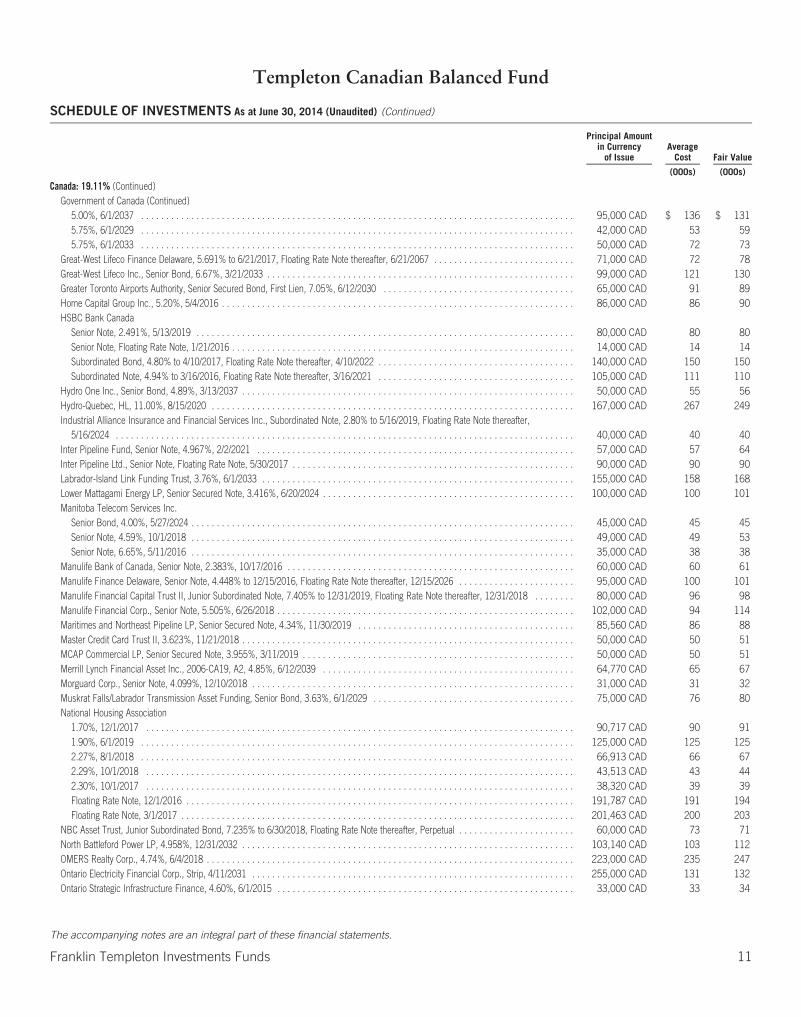
Canada: 19.11% (Continued)Government of Canada (Continued)
5.00%, 6/1/2037 . . . . . . . . . . . . . . . . . . . . . . . . . . . . . . . . . . . . . . . . . . . . . . . . . . . . . . . . . . . . . . . . . . . . . . . . . . . . . . . . . . . . . . 95,000 CAD $ 136 $ 1315.75%, 6/1/2029 . . . . . . . . . . . . . . . . . . . . . . . . . . . . . . . . . . . . . . . . . . . . . . . . . . . . . . . . . . . . . . . . . . . . . . . . . . . . . . . . . . . . . . 42,000 CAD 53 595.75%, 6/1/2033 . . . . . . . . . . . . . . . . . . . . . . . . . . . . . . . . . . . . . . . . . . . . . . . . . . . . . . . . . . . . . . . . . . . . . . . . . . . . . . . . . . . . . . 50,000 CAD 72 73
Great-West Lifeco Finance Delaware, 5.691% to 6/21/2017, Floating Rate Note thereafter, 6/21/2067 . . . . . . . . . . . . . . . . . . . . . . . . . . . . 71,000 CAD 72 78Great-West Lifeco Inc., Senior Bond, 6.67%, 3/21/2033 . . . . . . . . . . . . . . . . . . . . . . . . . . . . . . . . . . . . . . . . . . . . . . . . . . . . . . . . . . . . . 99,000 CAD 121 130Greater Toronto Airports Authority, Senior Secured Bond, First Lien, 7.05%, 6/12/2030 . . . . . . . . . . . . . . . . . . . . . . . . . . . . . . . . . . . . . . 65,000 CAD 91 89Home Capital Group Inc., 5.20%, 5/4/2016 . . . . . . . . . . . . . . . . . . . . . . . . . . . . . . . . . . . . . . . . . . . . . . . . . . . . . . . . . . . . . . . . . . . . . . 86,000 CAD 86 90HSBC Bank Canada
Senior Note, 2.491%, 5/13/2019 . . . . . . . . . . . . . . . . . . . . . . . . . . . . . . . . . . . . . . . . . . . . . . . . . . . . . . . . . . . . . . . . . . . . . . . . . . . 80,000 CAD 80 80Senior Note, Floating Rate Note, 1/21/2016 . . . . . . . . . . . . . . . . . . . . . . . . . . . . . . . . . . . . . . . . . . . . . . . . . . . . . . . . . . . . . . . . . . . . 14,000 CAD 14 14Subordinated Bond, 4.80% to 4/10/2017, Floating Rate Note thereafter, 4/10/2022 . . . . . . . . . . . . . . . . . . . . . . . . . . . . . . . . . . . . . . . 140,000 CAD 150 150Subordinated Note, 4.94% to 3/16/2016, Floating Rate Note thereafter, 3/16/2021 . . . . . . . . . . . . . . . . . . . . . . . . . . . . . . . . . . . . . . . 105,000 CAD 111 110
Hydro One Inc., Senior Bond, 4.89%, 3/13/2037 . . . . . . . . . . . . . . . . . . . . . . . . . . . . . . . . . . . . . . . . . . . . . . . . . . . . . . . . . . . . . . . . . . 50,000 CAD 55 56Hydro-Quebec, HL, 11.00%, 8/15/2020 . . . . . . . . . . . . . . . . . . . . . . . . . . . . . . . . . . . . . . . . . . . . . . . . . . . . . . . . . . . . . . . . . . . . . . . . 167,000 CAD 267 249Industrial Alliance Insurance and Financial Services Inc., Subordinated Note, 2.80% to 5/16/2019, Floating Rate Note thereafter,
5/16/2024 . . . . . . . . . . . . . . . . . . . . . . . . . . . . . . . . . . . . . . . . . . . . . . . . . . . . . . . . . . . . . . . . . . . . . . . . . . . . . . . . . . . . . . . . . . . 40,000 CAD 40 40Inter Pipeline Fund, Senior Note, 4.967%, 2/2/2021 . . . . . . . . . . . . . . . . . . . . . . . . . . . . . . . . . . . . . . . . . . . . . . . . . . . . . . . . . . . . . . . 57,000 CAD 57 64Inter Pipeline Ltd., Senior Note, Floating Rate Note, 5/30/2017 . . . . . . . . . . . . . . . . . . . . . . . . . . . . . . . . . . . . . . . . . . . . . . . . . . . . . . . . 90,000 CAD 90 90Labrador-Island Link Funding Trust, 3.76%, 6/1/2033 . . . . . . . . . . . . . . . . . . . . . . . . . . . . . . . . . . . . . . . . . . . . . . . . . . . . . . . . . . . . . . 155,000 CAD 158 168Lower Mattagami Energy LP, Senior Secured Note, 3.416%, 6/20/2024 . . . . . . . . . . . . . . . . . . . . . . . . . . . . . . . . . . . . . . . . . . . . . . . . . . 100,000 CAD 100 101Manitoba Telecom Services Inc.
Senior Bond, 4.00%, 5/27/2024 . . . . . . . . . . . . . . . . . . . . . . . . . . . . . . . . . . . . . . . . . . . . . . . . . . . . . . . . . . . . . . . . . . . . . . . . . . . . 45,000 CAD 45 45Senior Note, 4.59%, 10/1/2018 . . . . . . . . . . . . . . . . . . . . . . . . . . . . . . . . . . . . . . . . . . . . . . . . . . . . . . . . . . . . . . . . . . . . . . . . . . . . 49,000 CAD 49 53Senior Note, 6.65%, 5/11/2016 . . . . . . . . . . . . . . . . . . . . . . . . . . . . . . . . . . . . . . . . . . . . . . . . . . . . . . . . . . . . . . . . . . . . . . . . . . . . 35,000 CAD 38 38
Manulife Bank of Canada, Senior Note, 2.383%, 10/17/2016 . . . . . . . . . . . . . . . . . . . . . . . . . . . . . . . . . . . . . . . . . . . . . . . . . . . . . . . . . 60,000 CAD 60 61Manulife Finance Delaware, Senior Note, 4.448% to 12/15/2016, Floating Rate Note thereafter, 12/15/2026 . . . . . . . . . . . . . . . . . . . . . . . 95,000 CAD 100 101Manulife Financial Capital Trust II, Junior Subordinated Note, 7.405% to 12/31/2019, Floating Rate Note thereafter, 12/31/2018 . . . . . . . . 80,000 CAD 96 98Manulife Financial Corp., Senior Note, 5.505%, 6/26/2018 . . . . . . . . . . . . . . . . . . . . . . . . . . . . . . . . . . . . . . . . . . . . . . . . . . . . . . . . . . . 102,000 CAD 94 114Maritimes and Northeast Pipeline LP, Senior Secured Note, 4.34%, 11/30/2019 . . . . . . . . . . . . . . . . . . . . . . . . . . . . . . . . . . . . . . . . . . . 85,560 CAD 86 88Master Credit Card Trust II, 3.623%, 11/21/2018 . . . . . . . . . . . . . . . . . . . . . . . . . . . . . . . . . . . . . . . . . . . . . . . . . . . . . . . . . . . . . . . . . . 50,000 CAD 50 51MCAP Commercial LP, Senior Secured Note, 3.955%, 3/11/2019 . . . . . . . . . . . . . . . . . . . . . . . . . . . . . . . . . . . . . . . . . . . . . . . . . . . . . . 50,000 CAD 50 51Merrill Lynch Financial Asset Inc., 2006-CA19, A2, 4.85%, 6/12/2039 . . . . . . . . . . . . . . . . . . . . . . . . . . . . . . . . . . . . . . . . . . . . . . . . . . 64,770 CAD 65 67Morguard Corp., Senior Note, 4.099%, 12/10/2018 . . . . . . . . . . . . . . . . . . . . . . . . . . . . . . . . . . . . . . . . . . . . . . . . . . . . . . . . . . . . . . . . 31,000 CAD 31 32Muskrat Falls/Labrador Transmission Asset Funding, Senior Bond, 3.63%, 6/1/2029 . . . . . . . . . . . . . . . . . . . . . . . . . . . . . . . . . . . . . . . . 75,000 CAD 76 80National Housing Association
1.70%, 12/1/2017 . . . . . . . . . . . . . . . . . . . . . . . . . . . . . . . . . . . . . . . . . . . . . . . . . . . . . . . . . . . . . . . . . . . . . . . . . . . . . . . . . . . . . 90,717 CAD 90 911.90%, 6/1/2019 . . . . . . . . . . . . . . . . . . . . . . . . . . . . . . . . . . . . . . . . . . . . . . . . . . . . . . . . . . . . . . . . . . . . . . . . . . . . . . . . . . . . . . 125,000 CAD 125 1252.27%, 8/1/2018 . . . . . . . . . . . . . . . . . . . . . . . . . . . . . . . . . . . . . . . . . . . . . . . . . . . . . . . . . . . . . . . . . . . . . . . . . . . . . . . . . . . . . . 66,913 CAD 66 672.29%, 10/1/2018 . . . . . . . . . . . . . . . . . . . . . . . . . . . . . . . . . . . . . . . . . . . . . . . . . . . . . . . . . . . . . . . . . . . . . . . . . . . . . . . . . . . . . 43,513 CAD 43 442.30%, 10/1/2017 . . . . . . . . . . . . . . . . . . . . . . . . . . . . . . . . . . . . . . . . . . . . . . . . . . . . . . . . . . . . . . . . . . . . . . . . . . . . . . . . . . . . . 38,320 CAD 39 39Floating Rate Note, 12/1/2016 . . . . . . . . . . . . . . . . . . . . . . . . . . . . . . . . . . . . . . . . . . . . . . . . . . . . . . . . . . . . . . . . . . . . . . . . . . . . . 191,787 CAD 191 194Floating Rate Note, 3/1/2017 . . . . . . . . . . . . . . . . . . . . . . . . . . . . . . . . . . . . . . . . . . . . . . . . . . . . . . . . . . . . . . . . . . . . . . . . . . . . . . 201,463 CAD 200 203
NBC Asset Trust, Junior Subordinated Bond, 7.235% to 6/30/2018, Floating Rate Note thereafter, Perpetual . . . . . . . . . . . . . . . . . . . . . . . 60,000 CAD 73 71North Battleford Power LP, 4.958%, 12/31/2032 . . . . . . . . . . . . . . . . . . . . . . . . . . . . . . . . . . . . . . . . . . . . . . . . . . . . . . . . . . . . . . . . . . 103,140 CAD 103 112OMERS Realty Corp., 4.74%, 6/4/2018 . . . . . . . . . . . . . . . . . . . . . . . . . . . . . . . . . . . . . . . . . . . . . . . . . . . . . . . . . . . . . . . . . . . . . . . . . 223,000 CAD 235 247Ontario Electricity Financial Corp., Strip, 4/11/2031 . . . . . . . . . . . . . . . . . . . . . . . . . . . . . . . . . . . . . . . . . . . . . . . . . . . . . . . . . . . . . . . . 255,000 CAD 131 132Ontario Strategic Infrastructure Finance, 4.60%, 6/1/2015 . . . . . . . . . . . . . . . . . . . . . . . . . . . . . . . . . . . . . . . . . . . . . . . . . . . . . . . . . . . 33,000 CAD 33 34
The accompanying notes are an integral part of these financial statements.
Franklin Templeton Investments Funds 11
Templeton Canadian Balanced Fund
SCHEDULE OF INVESTMENTS As at June 30, 2014 (Unaudited) (Continued)
Principal Amountin Currency
of IssueAverage
Cost Fair Value
(000s) (000s)
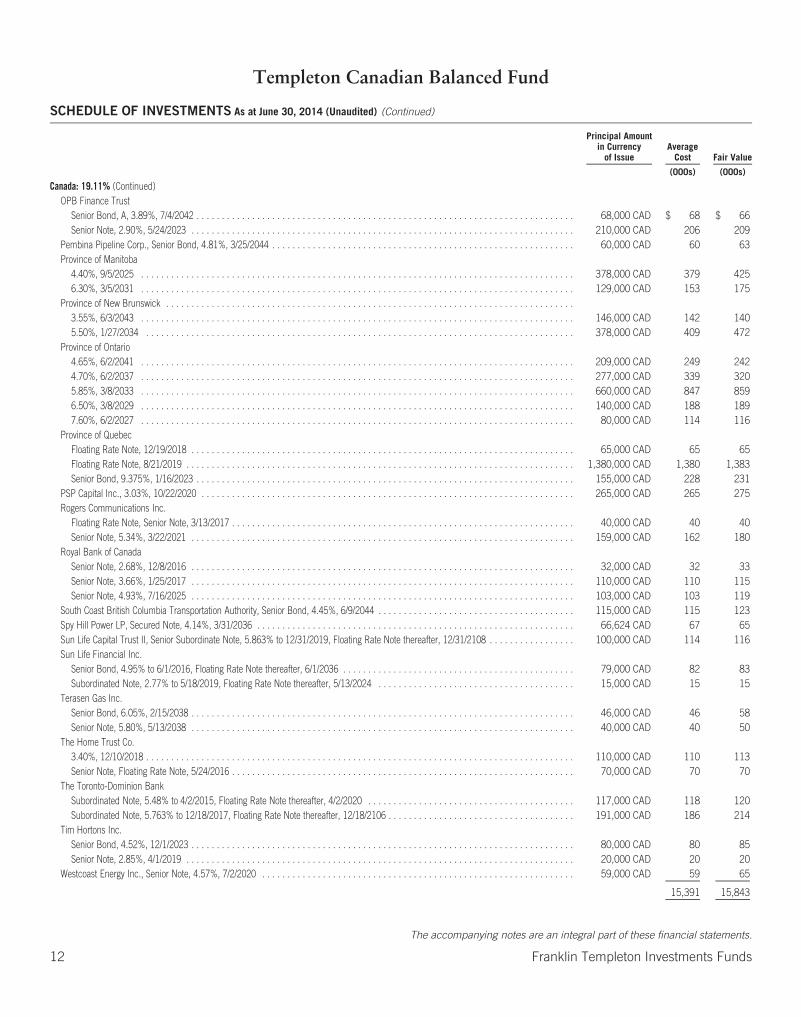
Canada: 19.11% (Continued)OPB Finance Trust
Senior Bond, A, 3.89%, 7/4/2042 . . . . . . . . . . . . . . . . . . . . . . . . . . . . . . . . . . . . . . . . . . . . . . . . . . . . . . . . . . . . . . . . . . . . . . . . . . . 68,000 CAD $ 68 $ 66Senior Note, 2.90%, 5/24/2023 . . . . . . . . . . . . . . . . . . . . . . . . . . . . . . . . . . . . . . . . . . . . . . . . . . . . . . . . . . . . . . . . . . . . . . . . . . . . 210,000 CAD 206 209
Pembina Pipeline Corp., Senior Bond, 4.81%, 3/25/2044 . . . . . . . . . . . . . . . . . . . . . . . . . . . . . . . . . . . . . . . . . . . . . . . . . . . . . . . . . . . . 60,000 CAD 60 63Province of Manitoba
4.40%, 9/5/2025 . . . . . . . . . . . . . . . . . . . . . . . . . . . . . . . . . . . . . . . . . . . . . . . . . . . . . . . . . . . . . . . . . . . . . . . . . . . . . . . . . . . . . . 378,000 CAD 379 4256.30%, 3/5/2031 . . . . . . . . . . . . . . . . . . . . . . . . . . . . . . . . . . . . . . . . . . . . . . . . . . . . . . . . . . . . . . . . . . . . . . . . . . . . . . . . . . . . . . 129,000 CAD 153 175
Province of New Brunswick . . . . . . . . . . . . . . . . . . . . . . . . . . . . . . . . . . . . . . . . . . . . . . . . . . . . . . . . . . . . . . . . . . . . . . . . . . . . . . . . .3.55%, 6/3/2043 . . . . . . . . . . . . . . . . . . . . . . . . . . . . . . . . . . . . . . . . . . . . . . . . . . . . . . . . . . . . . . . . . . . . . . . . . . . . . . . . . . . . . . 146,000 CAD 142 1405.50%, 1/27/2034 . . . . . . . . . . . . . . . . . . . . . . . . . . . . . . . . . . . . . . . . . . . . . . . . . . . . . . . . . . . . . . . . . . . . . . . . . . . . . . . . . . . . . 378,000 CAD 409 472
Province of Ontario4.65%, 6/2/2041 . . . . . . . . . . . . . . . . . . . . . . . . . . . . . . . . . . . . . . . . . . . . . . . . . . . . . . . . . . . . . . . . . . . . . . . . . . . . . . . . . . . . . . 209,000 CAD 249 2424.70%, 6/2/2037 . . . . . . . . . . . . . . . . . . . . . . . . . . . . . . . . . . . . . . . . . . . . . . . . . . . . . . . . . . . . . . . . . . . . . . . . . . . . . . . . . . . . . . 277,000 CAD 339 3205.85%, 3/8/2033 . . . . . . . . . . . . . . . . . . . . . . . . . . . . . . . . . . . . . . . . . . . . . . . . . . . . . . . . . . . . . . . . . . . . . . . . . . . . . . . . . . . . . . 660,000 CAD 847 8596.50%, 3/8/2029 . . . . . . . . . . . . . . . . . . . . . . . . . . . . . . . . . . . . . . . . . . . . . . . . . . . . . . . . . . . . . . . . . . . . . . . . . . . . . . . . . . . . . . 140,000 CAD 188 1897.60%, 6/2/2027 . . . . . . . . . . . . . . . . . . . . . . . . . . . . . . . . . . . . . . . . . . . . . . . . . . . . . . . . . . . . . . . . . . . . . . . . . . . . . . . . . . . . . . 80,000 CAD 114 116
Province of QuebecFloating Rate Note, 12/19/2018 . . . . . . . . . . . . . . . . . . . . . . . . . . . . . . . . . . . . . . . . . . . . . . . . . . . . . . . . . . . . . . . . . . . . . . . . . . . . 65,000 CAD 65 65Floating Rate Note, 8/21/2019 . . . . . . . . . . . . . . . . . . . . . . . . . . . . . . . . . . . . . . . . . . . . . . . . . . . . . . . . . . . . . . . . . . . . . . . . . . . . . 1,380,000 CAD 1,380 1,383Senior Bond, 9.375%, 1/16/2023 . . . . . . . . . . . . . . . . . . . . . . . . . . . . . . . . . . . . . . . . . . . . . . . . . . . . . . . . . . . . . . . . . . . . . . . . . . . 155,000 CAD 228 231
PSP Capital Inc., 3.03%, 10/22/2020 . . . . . . . . . . . . . . . . . . . . . . . . . . . . . . . . . . . . . . . . . . . . . . . . . . . . . . . . . . . . . . . . . . . . . . . . . . 265,000 CAD 265 275Rogers Communications Inc.
Floating Rate Note, Senior Note, 3/13/2017 . . . . . . . . . . . . . . . . . . . . . . . . . . . . . . . . . . . . . . . . . . . . . . . . . . . . . . . . . . . . . . . . . . . . 40,000 CAD 40 40Senior Note, 5.34%, 3/22/2021 . . . . . . . . . . . . . . . . . . . . . . . . . . . . . . . . . . . . . . . . . . . . . . . . . . . . . . . . . . . . . . . . . . . . . . . . . . . . 159,000 CAD 162 180
Royal Bank of CanadaSenior Note, 2.68%, 12/8/2016 . . . . . . . . . . . . . . . . . . . . . . . . . . . . . . . . . . . . . . . . . . . . . . . . . . . . . . . . . . . . . . . . . . . . . . . . . . . . 32,000 CAD 32 33Senior Note, 3.66%, 1/25/2017 . . . . . . . . . . . . . . . . . . . . . . . . . . . . . . . . . . . . . . . . . . . . . . . . . . . . . . . . . . . . . . . . . . . . . . . . . . . . 110,000 CAD 110 115Senior Note, 4.93%, 7/16/2025 . . . . . . . . . . . . . . . . . . . . . . . . . . . . . . . . . . . . . . . . . . . . . . . . . . . . . . . . . . . . . . . . . . . . . . . . . . . . 103,000 CAD 103 119
South Coast British Columbia Transportation Authority, Senior Bond, 4.45%, 6/9/2044 . . . . . . . . . . . . . . . . . . . . . . . . . . . . . . . . . . . . . . . 115,000 CAD 115 123Spy Hill Power LP, Secured Note, 4.14%, 3/31/2036 . . . . . . . . . . . . . . . . . . . . . . . . . . . . . . . . . . . . . . . . . . . . . . . . . . . . . . . . . . . . . . . 66,624 CAD 67 65Sun Life Capital Trust II, Senior Subordinate Note, 5.863% to 12/31/2019, Floating Rate Note thereafter, 12/31/2108 . . . . . . . . . . . . . . . . . 100,000 CAD 114 116Sun Life Financial Inc.
Senior Bond, 4.95% to 6/1/2016, Floating Rate Note thereafter, 6/1/2036 . . . . . . . . . . . . . . . . . . . . . . . . . . . . . . . . . . . . . . . . . . . . . . 79,000 CAD 82 83Subordinated Note, 2.77% to 5/18/2019, Floating Rate Note thereafter, 5/13/2024 . . . . . . . . . . . . . . . . . . . . . . . . . . . . . . . . . . . . . . . 15,000 CAD 15 15
Terasen Gas Inc.Senior Bond, 6.05%, 2/15/2038 . . . . . . . . . . . . . . . . . . . . . . . . . . . . . . . . . . . . . . . . . . . . . . . . . . . . . . . . . . . . . . . . . . . . . . . . . . . . 46,000 CAD 46 58Senior Note, 5.80%, 5/13/2038 . . . . . . . . . . . . . . . . . . . . . . . . . . . . . . . . . . . . . . . . . . . . . . . . . . . . . . . . . . . . . . . . . . . . . . . . . . . . 40,000 CAD 40 50
The Home Trust Co.3.40%, 12/10/2018 . . . . . . . . . . . . . . . . . . . . . . . . . . . . . . . . . . . . . . . . . . . . . . . . . . . . . . . . . . . . . . . . . . . . . . . . . . . . . . . . . . . . . 110,000 CAD 110 113Senior Note, Floating Rate Note, 5/24/2016 . . . . . . . . . . . . . . . . . . . . . . . . . . . . . . . . . . . . . . . . . . . . . . . . . . . . . . . . . . . . . . . . . . . . 70,000 CAD 70 70
The Toronto-Dominion BankSubordinated Note, 5.48% to 4/2/2015, Floating Rate Note thereafter, 4/2/2020 . . . . . . . . . . . . . . . . . . . . . . . . . . . . . . . . . . . . . . . . . 117,000 CAD 118 120Subordinated Note, 5.763% to 12/18/2017, Floating Rate Note thereafter, 12/18/2106 . . . . . . . . . . . . . . . . . . . . . . . . . . . . . . . . . . . . . 191,000 CAD 186 214
Tim Hortons Inc.Senior Bond, 4.52%, 12/1/2023 . . . . . . . . . . . . . . . . . . . . . . . . . . . . . . . . . . . . . . . . . . . . . . . . . . . . . . . . . . . . . . . . . . . . . . . . . . . . 80,000 CAD 80 85Senior Note, 2.85%, 4/1/2019 . . . . . . . . . . . . . . . . . . . . . . . . . . . . . . . . . . . . . . . . . . . . . . . . . . . . . . . . . . . . . . . . . . . . . . . . . . . . . 20,000 CAD 20 20
Westcoast Energy Inc., Senior Note, 4.57%, 7/2/2020 . . . . . . . . . . . . . . . . . . . . . . . . . . . . . . . . . . . . . . . . . . . . . . . . . . . . . . . . . . . . . . 59,000 CAD 59 65
15,391 15,843
The accompanying notes are an integral part of these financial statements.
12 Franklin Templeton Investments Funds
Templeton Canadian Balanced Fund
SCHEDULE OF INVESTMENTS As at June 30, 2014 (Unaudited) (Continued)
Principal Amountin Currency
of IssueAverage
Cost Fair Value
(000s) (000s)
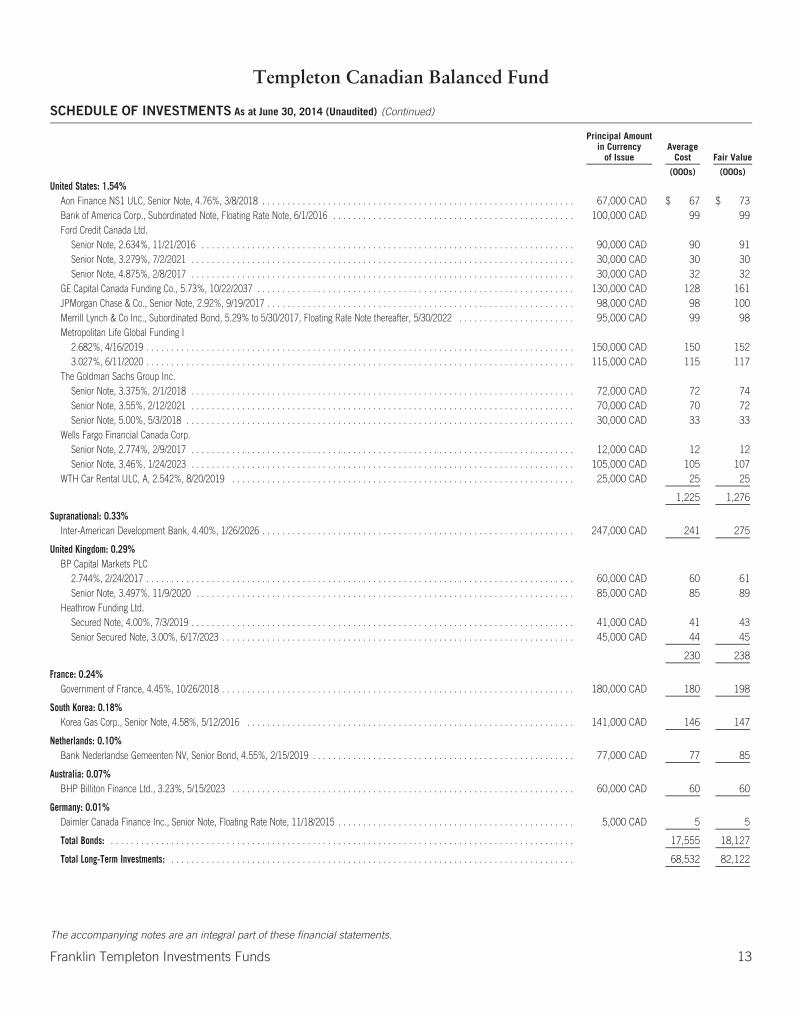
United States: 1.54%Aon Finance NS1 ULC, Senior Note, 4.76%, 3/8/2018 . . . . . . . . . . . . . . . . . . . . . . . . . . . . . . . . . . . . . . . . . . . . . . . . . . . . . . . . . . . . . . 67,000 CAD $ 67 $ 73Bank of America Corp., Subordinated Note, Floating Rate Note, 6/1/2016 . . . . . . . . . . . . . . . . . . . . . . . . . . . . . . . . . . . . . . . . . . . . . . . . 100,000 CAD 99 99Ford Credit Canada Ltd.
Senior Note, 2.634%, 11/21/2016 . . . . . . . . . . . . . . . . . . . . . . . . . . . . . . . . . . . . . . . . . . . . . . . . . . . . . . . . . . . . . . . . . . . . . . . . . . 90,000 CAD 90 91Senior Note, 3.279%, 7/2/2021 . . . . . . . . . . . . . . . . . . . . . . . . . . . . . . . . . . . . . . . . . . . . . . . . . . . . . . . . . . . . . . . . . . . . . . . . . . . . 30,000 CAD 30 30Senior Note, 4.875%, 2/8/2017 . . . . . . . . . . . . . . . . . . . . . . . . . . . . . . . . . . . . . . . . . . . . . . . . . . . . . . . . . . . . . . . . . . . . . . . . . . . . 30,000 CAD 32 32
GE Capital Canada Funding Co., 5.73%, 10/22/2037 . . . . . . . . . . . . . . . . . . . . . . . . . . . . . . . . . . . . . . . . . . . . . . . . . . . . . . . . . . . . . . . 130,000 CAD 128 161JPMorgan Chase & Co., Senior Note, 2.92%, 9/19/2017 . . . . . . . . . . . . . . . . . . . . . . . . . . . . . . . . . . . . . . . . . . . . . . . . . . . . . . . . . . . . . 98,000 CAD 98 100Merrill Lynch & Co Inc., Subordinated Bond, 5.29% to 5/30/2017, Floating Rate Note thereafter, 5/30/2022 . . . . . . . . . . . . . . . . . . . . . . . 95,000 CAD 99 98Metropolitan Life Global Funding I
2.682%, 4/16/2019 . . . . . . . . . . . . . . . . . . . . . . . . . . . . . . . . . . . . . . . . . . . . . . . . . . . . . . . . . . . . . . . . . . . . . . . . . . . . . . . . . . . . . 150,000 CAD 150 1523.027%, 6/11/2020 . . . . . . . . . . . . . . . . . . . . . . . . . . . . . . . . . . . . . . . . . . . . . . . . . . . . . . . . . . . . . . . . . . . . . . . . . . . . . . . . . . . . . 115,000 CAD 115 117
The Goldman Sachs Group Inc.Senior Note, 3.375%, 2/1/2018 . . . . . . . . . . . . . . . . . . . . . . . . . . . . . . . . . . . . . . . . . . . . . . . . . . . . . . . . . . . . . . . . . . . . . . . . . . . . 72,000 CAD 72 74Senior Note, 3.55%, 2/12/2021 . . . . . . . . . . . . . . . . . . . . . . . . . . . . . . . . . . . . . . . . . . . . . . . . . . . . . . . . . . . . . . . . . . . . . . . . . . . . 70,000 CAD 70 72Senior Note, 5.00%, 5/3/2018 . . . . . . . . . . . . . . . . . . . . . . . . . . . . . . . . . . . . . . . . . . . . . . . . . . . . . . . . . . . . . . . . . . . . . . . . . . . . . 30,000 CAD 33 33
Wells Fargo Financial Canada Corp.Senior Note, 2.774%, 2/9/2017 . . . . . . . . . . . . . . . . . . . . . . . . . . . . . . . . . . . . . . . . . . . . . . . . . . . . . . . . . . . . . . . . . . . . . . . . . . . . 12,000 CAD 12 12Senior Note, 3.46%, 1/24/2023 . . . . . . . . . . . . . . . . . . . . . . . . . . . . . . . . . . . . . . . . . . . . . . . . . . . . . . . . . . . . . . . . . . . . . . . . . . . . 105,000 CAD 105 107
WTH Car Rental ULC, A, 2.542%, 8/20/2019 . . . . . . . . . . . . . . . . . . . . . . . . . . . . . . . . . . . . . . . . . . . . . . . . . . . . . . . . . . . . . . . . . . . . 25,000 CAD 25 25
1,225 1,276
Supranational: 0.33%Inter-American Development Bank, 4.40%, 1/26/2026 . . . . . . . . . . . . . . . . . . . . . . . . . . . . . . . . . . . . . . . . . . . . . . . . . . . . . . . . . . . . . . 247,000 CAD 241 275
United Kingdom: 0.29%BP Capital Markets PLC
2.744%, 2/24/2017 . . . . . . . . . . . . . . . . . . . . . . . . . . . . . . . . . . . . . . . . . . . . . . . . . . . . . . . . . . . . . . . . . . . . . . . . . . . . . . . . . . . . . 60,000 CAD 60 61Senior Note, 3.497%, 11/9/2020 . . . . . . . . . . . . . . . . . . . . . . . . . . . . . . . . . . . . . . . . . . . . . . . . . . . . . . . . . . . . . . . . . . . . . . . . . . . 85,000 CAD 85 89
Heathrow Funding Ltd.Secured Note, 4.00%, 7/3/2019 . . . . . . . . . . . . . . . . . . . . . . . . . . . . . . . . . . . . . . . . . . . . . . . . . . . . . . . . . . . . . . . . . . . . . . . . . . . . 41,000 CAD 41 43Senior Secured Note, 3.00%, 6/17/2023 . . . . . . . . . . . . . . . . . . . . . . . . . . . . . . . . . . . . . . . . . . . . . . . . . . . . . . . . . . . . . . . . . . . . . . 45,000 CAD 44 45
230 238
France: 0.24%Government of France, 4.45%, 10/26/2018 . . . . . . . . . . . . . . . . . . . . . . . . . . . . . . . . . . . . . . . . . . . . . . . . . . . . . . . . . . . . . . . . . . . . . . 180,000 CAD 180 198
South Korea: 0.18%Korea Gas Corp., Senior Note, 4.58%, 5/12/2016 . . . . . . . . . . . . . . . . . . . . . . . . . . . . . . . . . . . . . . . . . . . . . . . . . . . . . . . . . . . . . . . . . 141,000 CAD 146 147
Netherlands: 0.10%Bank Nederlandse Gemeenten NV, Senior Bond, 4.55%, 2/15/2019 . . . . . . . . . . . . . . . . . . . . . . . . . . . . . . . . . . . . . . . . . . . . . . . . . . . . 77,000 CAD 77 85
Australia: 0.07%BHP Billiton Finance Ltd., 3.23%, 5/15/2023 . . . . . . . . . . . . . . . . . . . . . . . . . . . . . . . . . . . . . . . . . . . . . . . . . . . . . . . . . . . . . . . . . . . . 60,000 CAD 60 60
Germany: 0.01%Daimler Canada Finance Inc., Senior Note, Floating Rate Note, 11/18/2015 . . . . . . . . . . . . . . . . . . . . . . . . . . . . . . . . . . . . . . . . . . . . . . . 5,000 CAD 5 5
Total Bonds: . . . . . . . . . . . . . . . . . . . . . . . . . . . . . . . . . . . . . . . . . . . . . . . . . . . . . . . . . . . . . . . . . . . . . . . . . . . . . . . . . . . . . . . . . . . . 17,555 18,127
Total Long-Term Investments: . . . . . . . . . . . . . . . . . . . . . . . . . . . . . . . . . . . . . . . . . . . . . . . . . . . . . . . . . . . . . . . . . . . . . . . . . . . . . . . . 68,532 82,122
The accompanying notes are an integral part of these financial statements.
Franklin Templeton Investments Funds 13

Templeton Canadian Balanced Fund
SCHEDULE OF INVESTMENTS As at June 30, 2014 (Unaudited) (Continued)
Principal Amountin Currency
of IssueAverage
Cost Fair Value
(000s) (000s)
SHORT-TERM SECURITIES: 0.60%Royal Bank of Canada, Term Deposit, 0.97%, 7/2/2014 . . . . . . . . . . . . . . . . . . . . . . . . . . . . . . . . . . . . . . . . . . . . . . . . . . . . . . . . . . . . . 500,000 CAD $ 500 $ 500
Total Short-Term Securities: . . . . . . . . . . . . . . . . . . . . . . . . . . . . . . . . . . . . . . . . . . . . . . . . . . . . . . . . . . . . . . . . . . . . . . . . . . . . . . . . . 500 500
Transaction costs (Note 4) . . . . . . . . . . . . . . . . . . . . . . . . . . . . . . . . . . . . . . . . . . . . . . . . . . . . . . . . . . . . . . . . . . . . . . . . . . . . . . . . . . (25) —
TOTAL INVESTMENTS: 99.67% . . . . . . . . . . . . . . . . . . . . . . . . . . . . . . . . . . . . . . . . . . . . . . . . . . . . . . . . . . . . . . . . . . . . . . . . . . . . . . . $69,007 82,622
OTHER ASSETS, less liabilities: 0.33% . . . . . . . . . . . . . . . . . . . . . . . . . . . . . . . . . . . . . . . . . . . . . . . . . . . . . . . . . . . . . . . . . . . . . . . . . 272
TOTAL NET ASSETS: 100.00% . . . . . . . . . . . . . . . . . . . . . . . . . . . . . . . . . . . . . . . . . . . . . . . . . . . . . . . . . . . . . . . . . . . . . . . . . . . . . . . $82,894
June 30,2014
December 31,2013
January 1,2013
Bond Ratings*% of
Net Assets% of
Net Assets% of
Net AssetsAAA . . . . . . . . . . . . . . . . . . . 4.08 4.30 6.57AA . . . . . . . . . . . . . . . . . . . . . 4.99 6.04 8.44A . . . . . . . . . . . . . . . . . . . . . . 9.69 9.11 8.33BBB . . . . . . . . . . . . . . . . . . . 3.11 2.94 2.69
* Excluding cash and overnight term deposits.
Source: Standard & Poor’s, and/or composite of Moody’s, Standard & Poor’s andFitch ratings.
The accompanying notes are an integral part of these financial statements.
14 Franklin Templeton Investments Funds
Templeton Canadian Balanced Fund
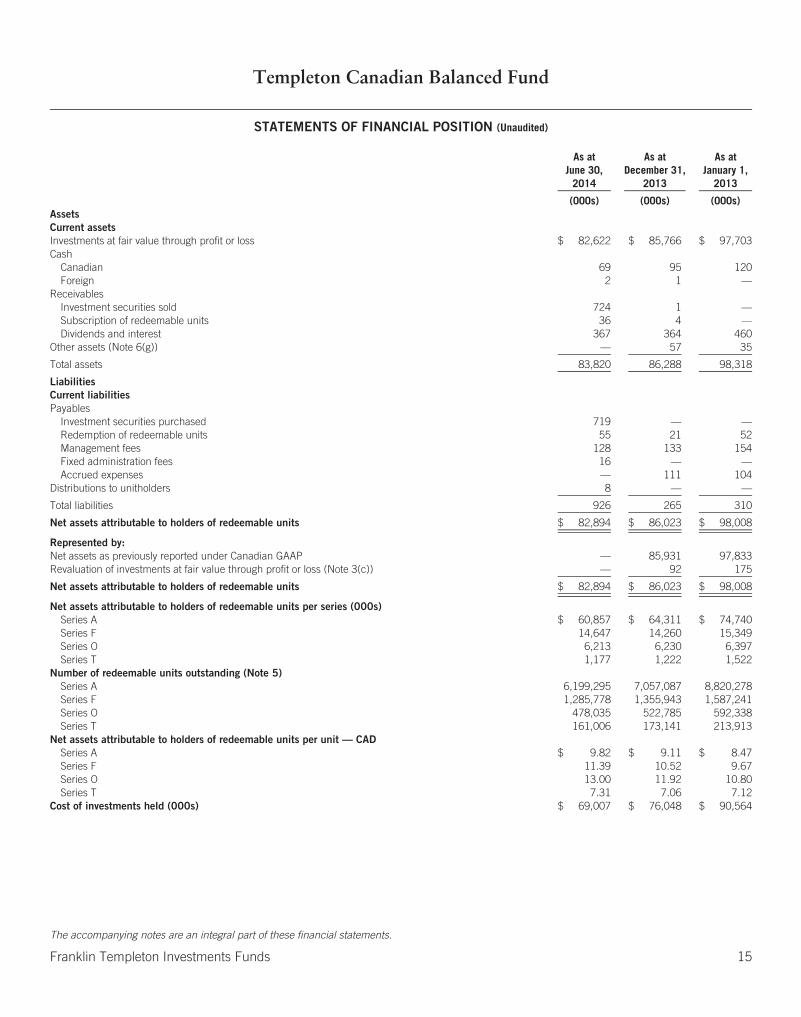
STATEMENTS OF FINANCIAL POSITION (Unaudited)
As atJune 30,
2014
As atDecember 31,
2013
As atJanuary 1,
2013
(000s) (000s) (000s)AssetsCurrent assetsInvestments at fair value through profit or loss $ 82,622 $ 85,766 $ 97,703Cash
Canadian 69 95 120Foreign 2 1 —
ReceivablesInvestment securities sold 724 1 —Subscription of redeemable units 36 4 —Dividends and interest 367 364 460
Other assets (Note 6(g)) — 57 35
Total assets 83,820 86,288 98,318
LiabilitiesCurrent liabilitiesPayables
Investment securities purchased 719 — —Redemption of redeemable units 55 21 52Management fees 128 133 154Fixed administration fees 16 — —Accrued expenses — 111 104
Distributions to unitholders 8 — —
Total liabilities 926 265 310
Net assets attributable to holders of redeemable units $ 82,894 $ 86,023 $ 98,008
Represented by:Net assets as previously reported under Canadian GAAP — 85,931 97,833Revaluation of investments at fair value through profit or loss (Note 3(c)) — 92 175
Net assets attributable to holders of redeemable units $ 82,894 $ 86,023 $ 98,008
Net assets attributable to holders of redeemable units per series (000s)Series A $ 60,857 $ 64,311 $ 74,740Series F 14,647 14,260 15,349Series O 6,213 6,230 6,397Series T 1,177 1,222 1,522
Number of redeemable units outstanding (Note 5)Series A 6,199,295 7,057,087 8,820,278Series F 1,285,778 1,355,943 1,587,241Series O 478,035 522,785 592,338Series T 161,006 173,141 213,913
Net assets attributable to holders of redeemable units per unit — CADSeries A $ 9.82 $ 9.11 $ 8.47Series F 11.39 10.52 9.67Series O 13.00 11.92 10.80Series T 7.31 7.06 7.12
Cost of investments held (000s) $ 69,007 $ 76,048 $ 90,564
The accompanying notes are an integral part of these financial statements.
Franklin Templeton Investments Funds 15
Templeton Canadian Balanced Fund
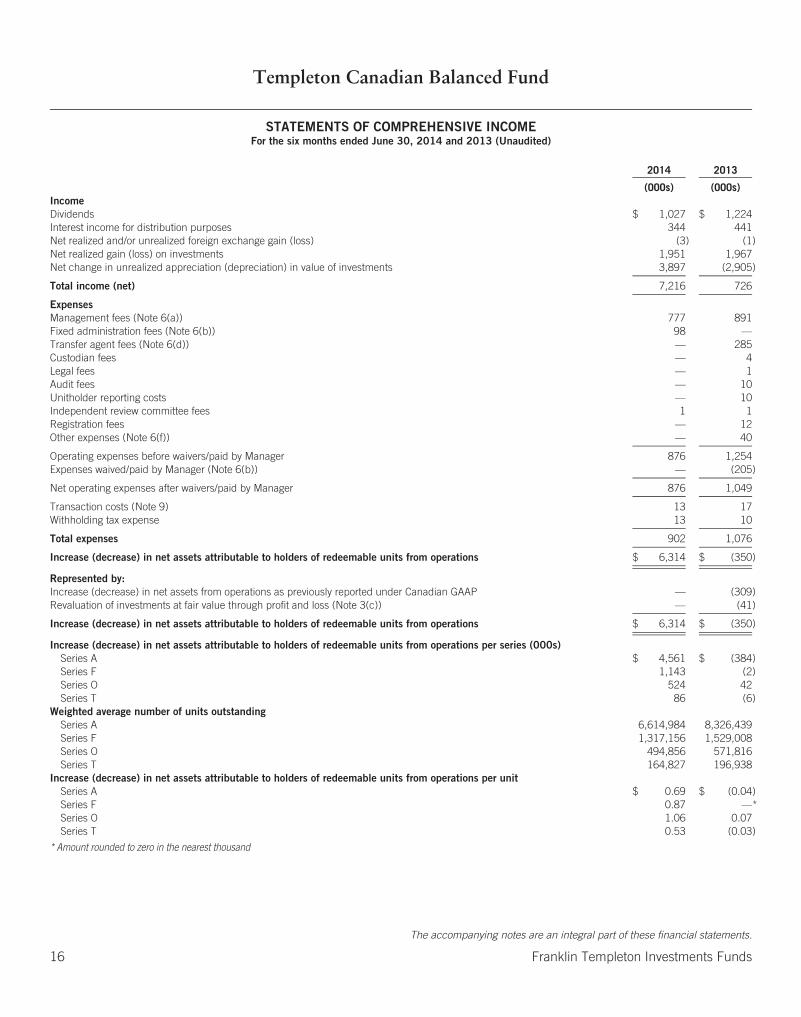
STATEMENTS OF COMPREHENSIVE INCOMEFor the six months ended June 30, 2014 and 2013 (Unaudited)
2014 2013
(000s) (000s)IncomeDividends $ 1,027 $ 1,224Interest income for distribution purposes 344 441Net realized and/or unrealized foreign exchange gain (loss) (3) (1)Net realized gain (loss) on investments 1,951 1,967Net change in unrealized appreciation (depreciation) in value of investments 3,897 (2,905)
Total income (net) 7,216 726
ExpensesManagement fees (Note 6(a)) 777 891Fixed administration fees (Note 6(b)) 98 —Transfer agent fees (Note 6(d)) — 285Custodian fees — 4Legal fees — 1Audit fees — 10Unitholder reporting costs — 10Independent review committee fees 1 1Registration fees — 12Other expenses (Note 6(f)) — 40
Operating expenses before waivers/paid by Manager 876 1,254Expenses waived/paid by Manager (Note 6(b)) — (205)
Net operating expenses after waivers/paid by Manager 876 1,049
Transaction costs (Note 9) 13 17Withholding tax expense 13 10
Total expenses 902 1,076
Increase (decrease) in net assets attributable to holders of redeemable units from operations $ 6,314 $ (350)
Represented by:Increase (decrease) in net assets from operations as previously reported under Canadian GAAP — (309)Revaluation of investments at fair value through profit and loss (Note 3(c)) — (41)
Increase (decrease) in net assets attributable to holders of redeemable units from operations $ 6,314 $ (350)
Increase (decrease) in net assets attributable to holders of redeemable units from operations per series (000s)Series A $ 4,561 $ (384)Series F 1,143 (2)Series O 524 42Series T 86 (6)
Weighted average number of units outstandingSeries A 6,614,984 8,326,439Series F 1,317,156 1,529,008Series O 494,856 571,816Series T 164,827 196,938
Increase (decrease) in net assets attributable to holders of redeemable units from operations per unitSeries A $ 0.69 $ (0.04)Series F 0.87 —*Series O 1.06 0.07Series T 0.53 (0.03)
* Amount rounded to zero in the nearest thousand
The accompanying notes are an integral part of these financial statements.
16 Franklin Templeton Investments Funds

Templeton Canadian Balanced Fund
STATEMENTS OF CHANGES IN NET ASSETS ATTRIBUTABLE TO HOLDERS OF REDEEMABLE UNITSFor the six months ended June 30, 2014 and 2013 (Unaudited) (in 000s)
All Series Series A Series F
2014 2013 2014 2013 2014 2013
Net assets attributable to holders of redeemable units at beginning of period $ 86,023 $ 98,008 $64,311 $ 74,740 $14,260 $15,349
Increase (decrease) in net assets attributable to holders of redeemable units fromoperations 6,314 (350) 4,561 (384) 1,143 (2)
Distributions to holders of redeemable unitsFrom net investment income — — — — — —From net realized gains on investments — — — — — —From return of capital (46) (55) — — — —
Total distributions to holders of redeemable units (46) (55) — — — —
Redeemable units transactionsSubscriptions 2,394 2,192 1,962 2,052 226 87Reinvestments 19 20 — — — —Redemptions (11,810) (12,440) (9,977) (10,306) (982) (1,438)
Net increase (decrease) from redeemable units transactions (9,397) (10,228) (8,015) (8,254) (756) (1,351)
Increase (decrease) in net assets attributable to holders of redeemable units (3,129) (10,633) (3,454) (8,638) 387 (1,353)
Net assets attributable to holders of redeemable units at end of period $ 82,894 $ 87,375 $60,857 $ 66,102 $14,647 $13,996
Series O Series T
2014 2013 2014 2013
Net assets attributable to holders of redeemable units at beginning of period $ 6,230 $ 6,397 $ 1,222 $ 1,522
Increase (decrease) in net assets attributable to holders of redeemable units fromoperations 524 42 86 (6)
Distributions to holders of redeemable unitsFrom net investment income — — — —From net realized gains on investments — — — —From return of capital — — (46) (55)
Total distributions to holders of redeemable units — — (46) (55)
Redeemable units transactionsSubscriptions 194 43 12 10Reinvestments — — 19 20Redemptions (735) (469) (116) (227)
Net increase (decrease) from redeemable units transactions (541) (426) (85) (197)
Increase (decrease) in net assets attributable to holders of redeemable units (17) (384) (45) (258)
Net assets attributable to holders of redeemable units at end of period $ 6,213 $ 6,013 $ 1,177 $ 1,264
The accompanying notes are an integral part of these financial statements.
Franklin Templeton Investments Funds 17
Templeton Canadian Balanced Fund
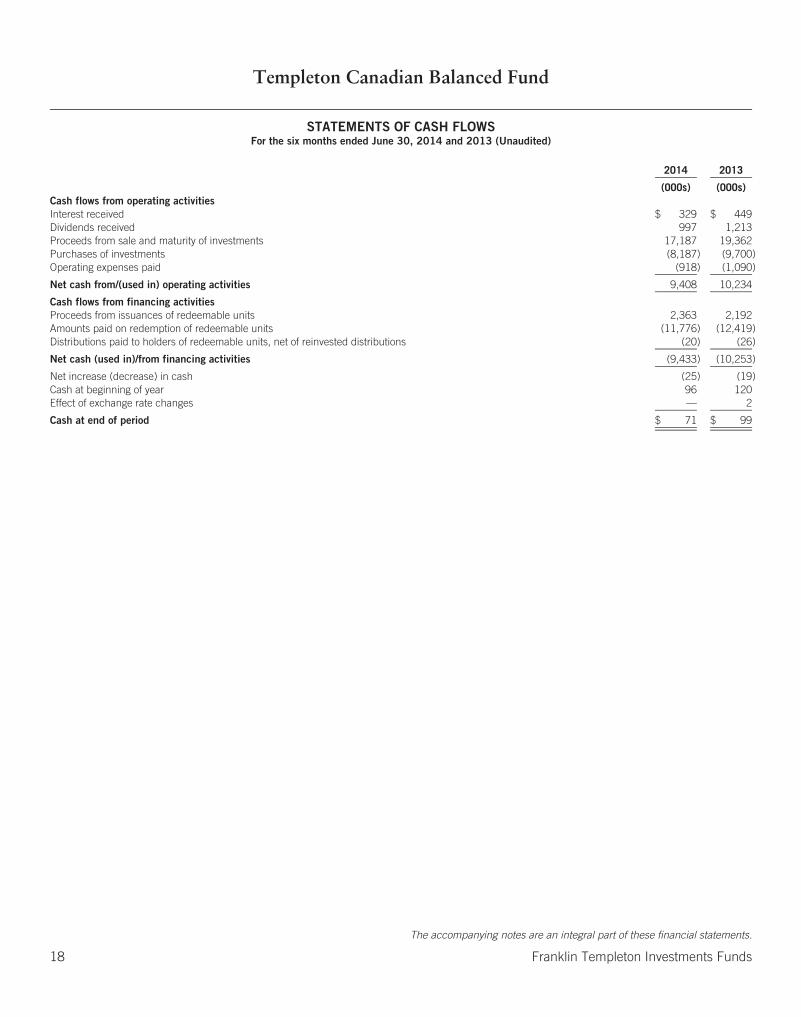
STATEMENTS OF CASH FLOWSFor the six months ended June 30, 2014 and 2013 (Unaudited)
2014 2013
(000s) (000s)Cash flows from operating activitiesInterest received $ 329 $ 449Dividends received 997 1,213Proceeds from sale and maturity of investments 17,187 19,362Purchases of investments (8,187) (9,700)Operating expenses paid (918) (1,090)
Net cash from/(used in) operating activities 9,408 10,234
Cash flows from financing activitiesProceeds from issuances of redeemable units 2,363 2,192Amounts paid on redemption of redeemable units (11,776) (12,419)Distributions paid to holders of redeemable units, net of reinvested distributions (20) (26)
Net cash (used in)/from financing activities (9,433) (10,253)
Net increase (decrease) in cash (25) (19)Cash at beginning of year 96 120Effect of exchange rate changes — 2
Cash at end of period $ 71 $ 99
The accompanying notes are an integral part of these financial statements.
18 Franklin Templeton Investments Funds
Templeton Canadian Stock Fund
SCHEDULE OF INVESTMENTS As at June 30, 2014 (Unaudited)
SharesAverage
Cost Fair Value
(000s) (000s)
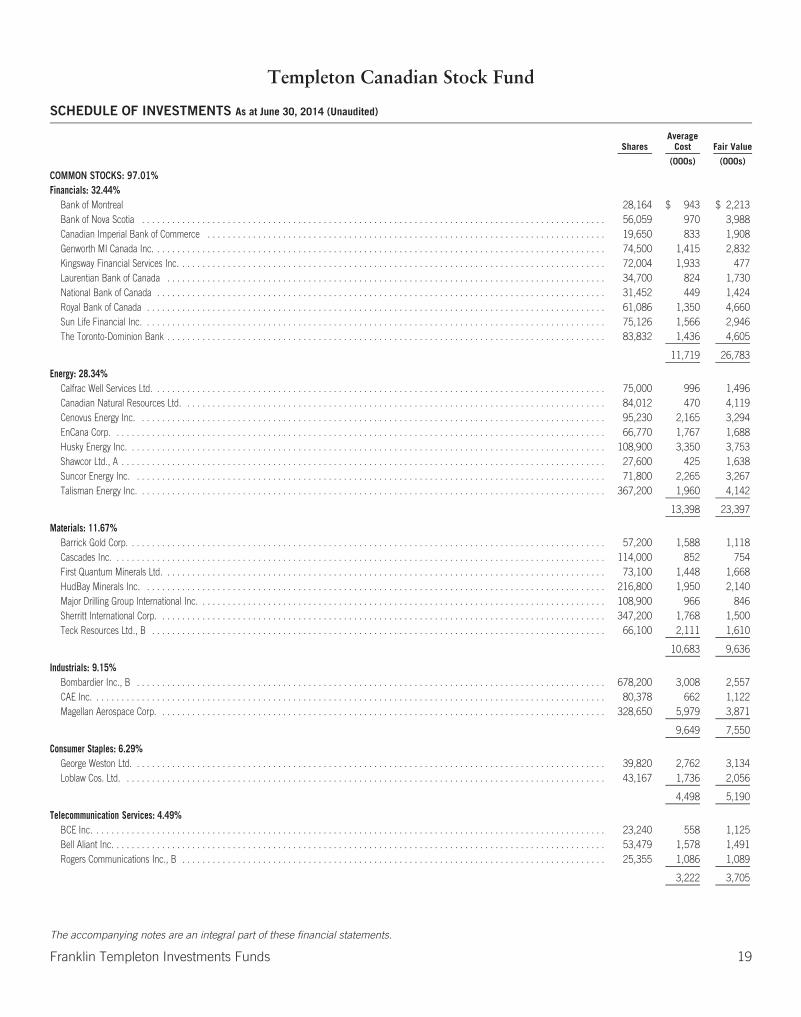
COMMON STOCKS: 97.01%Financials: 32.44%
Bank of Montreal 28,164 $ 943 $ 2,213Bank of Nova Scotia . . . . . . . . . . . . . . . . . . . . . . . . . . . . . . . . . . . . . . . . . . . . . . . . . . . . . . . . . . . . . . . . . . . . . . . . . . . . . . . . . . . . . . . . . . . . 56,059 970 3,988Canadian Imperial Bank of Commerce . . . . . . . . . . . . . . . . . . . . . . . . . . . . . . . . . . . . . . . . . . . . . . . . . . . . . . . . . . . . . . . . . . . . . . . . . . . . . . . 19,650 833 1,908Genworth MI Canada Inc. . . . . . . . . . . . . . . . . . . . . . . . . . . . . . . . . . . . . . . . . . . . . . . . . . . . . . . . . . . . . . . . . . . . . . . . . . . . . . . . . . . . . . . . . . 74,500 1,415 2,832Kingsway Financial Services Inc. . . . . . . . . . . . . . . . . . . . . . . . . . . . . . . . . . . . . . . . . . . . . . . . . . . . . . . . . . . . . . . . . . . . . . . . . . . . . . . . . . . . . 72,004 1,933 477Laurentian Bank of Canada . . . . . . . . . . . . . . . . . . . . . . . . . . . . . . . . . . . . . . . . . . . . . . . . . . . . . . . . . . . . . . . . . . . . . . . . . . . . . . . . . . . . . . . 34,700 824 1,730National Bank of Canada . . . . . . . . . . . . . . . . . . . . . . . . . . . . . . . . . . . . . . . . . . . . . . . . . . . . . . . . . . . . . . . . . . . . . . . . . . . . . . . . . . . . . . . . . 31,452 449 1,424Royal Bank of Canada . . . . . . . . . . . . . . . . . . . . . . . . . . . . . . . . . . . . . . . . . . . . . . . . . . . . . . . . . . . . . . . . . . . . . . . . . . . . . . . . . . . . . . . . . . . 61,086 1,350 4,660Sun Life Financial Inc. . . . . . . . . . . . . . . . . . . . . . . . . . . . . . . . . . . . . . . . . . . . . . . . . . . . . . . . . . . . . . . . . . . . . . . . . . . . . . . . . . . . . . . . . . . . 75,126 1,566 2,946The Toronto-Dominion Bank . . . . . . . . . . . . . . . . . . . . . . . . . . . . . . . . . . . . . . . . . . . . . . . . . . . . . . . . . . . . . . . . . . . . . . . . . . . . . . . . . . . . . . . 83,832 1,436 4,605
11,719 26,783
Energy: 28.34%Calfrac Well Services Ltd. . . . . . . . . . . . . . . . . . . . . . . . . . . . . . . . . . . . . . . . . . . . . . . . . . . . . . . . . . . . . . . . . . . . . . . . . . . . . . . . . . . . . . . . . . 75,000 996 1,496Canadian Natural Resources Ltd. . . . . . . . . . . . . . . . . . . . . . . . . . . . . . . . . . . . . . . . . . . . . . . . . . . . . . . . . . . . . . . . . . . . . . . . . . . . . . . . . . . . 84,012 470 4,119Cenovus Energy Inc. . . . . . . . . . . . . . . . . . . . . . . . . . . . . . . . . . . . . . . . . . . . . . . . . . . . . . . . . . . . . . . . . . . . . . . . . . . . . . . . . . . . . . . . . . . . . 95,230 2,165 3,294EnCana Corp. . . . . . . . . . . . . . . . . . . . . . . . . . . . . . . . . . . . . . . . . . . . . . . . . . . . . . . . . . . . . . . . . . . . . . . . . . . . . . . . . . . . . . . . . . . . . . . . . . 66,770 1,767 1,688Husky Energy Inc. . . . . . . . . . . . . . . . . . . . . . . . . . . . . . . . . . . . . . . . . . . . . . . . . . . . . . . . . . . . . . . . . . . . . . . . . . . . . . . . . . . . . . . . . . . . . . . 108,900 3,350 3,753Shawcor Ltd., A . . . . . . . . . . . . . . . . . . . . . . . . . . . . . . . . . . . . . . . . . . . . . . . . . . . . . . . . . . . . . . . . . . . . . . . . . . . . . . . . . . . . . . . . . . . . . . . . 27,600 425 1,638Suncor Energy Inc. . . . . . . . . . . . . . . . . . . . . . . . . . . . . . . . . . . . . . . . . . . . . . . . . . . . . . . . . . . . . . . . . . . . . . . . . . . . . . . . . . . . . . . . . . . . . . 71,800 2,265 3,267Talisman Energy Inc. . . . . . . . . . . . . . . . . . . . . . . . . . . . . . . . . . . . . . . . . . . . . . . . . . . . . . . . . . . . . . . . . . . . . . . . . . . . . . . . . . . . . . . . . . . . . 367,200 1,960 4,142
13,398 23,397
Materials: 11.67%Barrick Gold Corp. . . . . . . . . . . . . . . . . . . . . . . . . . . . . . . . . . . . . . . . . . . . . . . . . . . . . . . . . . . . . . . . . . . . . . . . . . . . . . . . . . . . . . . . . . . . . . . 57,200 1,588 1,118Cascades Inc. . . . . . . . . . . . . . . . . . . . . . . . . . . . . . . . . . . . . . . . . . . . . . . . . . . . . . . . . . . . . . . . . . . . . . . . . . . . . . . . . . . . . . . . . . . . . . . . . . 114,000 852 754First Quantum Minerals Ltd. . . . . . . . . . . . . . . . . . . . . . . . . . . . . . . . . . . . . . . . . . . . . . . . . . . . . . . . . . . . . . . . . . . . . . . . . . . . . . . . . . . . . . . . 73,100 1,448 1,668HudBay Minerals Inc. . . . . . . . . . . . . . . . . . . . . . . . . . . . . . . . . . . . . . . . . . . . . . . . . . . . . . . . . . . . . . . . . . . . . . . . . . . . . . . . . . . . . . . . . . . . 216,800 1,950 2,140Major Drilling Group International Inc. . . . . . . . . . . . . . . . . . . . . . . . . . . . . . . . . . . . . . . . . . . . . . . . . . . . . . . . . . . . . . . . . . . . . . . . . . . . . . . . . 108,900 966 846Sherritt International Corp. . . . . . . . . . . . . . . . . . . . . . . . . . . . . . . . . . . . . . . . . . . . . . . . . . . . . . . . . . . . . . . . . . . . . . . . . . . . . . . . . . . . . . . . . 347,200 1,768 1,500Teck Resources Ltd., B . . . . . . . . . . . . . . . . . . . . . . . . . . . . . . . . . . . . . . . . . . . . . . . . . . . . . . . . . . . . . . . . . . . . . . . . . . . . . . . . . . . . . . . . . . 66,100 2,111 1,610
10,683 9,636
Industrials: 9.15%Bombardier Inc., B . . . . . . . . . . . . . . . . . . . . . . . . . . . . . . . . . . . . . . . . . . . . . . . . . . . . . . . . . . . . . . . . . . . . . . . . . . . . . . . . . . . . . . . . . . . . . 678,200 3,008 2,557CAE Inc. . . . . . . . . . . . . . . . . . . . . . . . . . . . . . . . . . . . . . . . . . . . . . . . . . . . . . . . . . . . . . . . . . . . . . . . . . . . . . . . . . . . . . . . . . . . . . . . . . . . . . 80,378 662 1,122Magellan Aerospace Corp. . . . . . . . . . . . . . . . . . . . . . . . . . . . . . . . . . . . . . . . . . . . . . . . . . . . . . . . . . . . . . . . . . . . . . . . . . . . . . . . . . . . . . . . . 328,650 5,979 3,871
9,649 7,550
Consumer Staples: 6.29%George Weston Ltd. . . . . . . . . . . . . . . . . . . . . . . . . . . . . . . . . . . . . . . . . . . . . . . . . . . . . . . . . . . . . . . . . . . . . . . . . . . . . . . . . . . . . . . . . . . . . . 39,820 2,762 3,134Loblaw Cos. Ltd. . . . . . . . . . . . . . . . . . . . . . . . . . . . . . . . . . . . . . . . . . . . . . . . . . . . . . . . . . . . . . . . . . . . . . . . . . . . . . . . . . . . . . . . . . . . . . . . 43,167 1,736 2,056
4,498 5,190
Telecommunication Services: 4.49%BCE Inc. . . . . . . . . . . . . . . . . . . . . . . . . . . . . . . . . . . . . . . . . . . . . . . . . . . . . . . . . . . . . . . . . . . . . . . . . . . . . . . . . . . . . . . . . . . . . . . . . . . . . . 23,240 558 1,125Bell Aliant Inc. . . . . . . . . . . . . . . . . . . . . . . . . . . . . . . . . . . . . . . . . . . . . . . . . . . . . . . . . . . . . . . . . . . . . . . . . . . . . . . . . . . . . . . . . . . . . . . . . . 53,479 1,578 1,491Rogers Communications Inc., B . . . . . . . . . . . . . . . . . . . . . . . . . . . . . . . . . . . . . . . . . . . . . . . . . . . . . . . . . . . . . . . . . . . . . . . . . . . . . . . . . . . . 25,355 1,086 1,089
3,222 3,705
The accompanying notes are an integral part of these financial statements.
Franklin Templeton Investments Funds 19
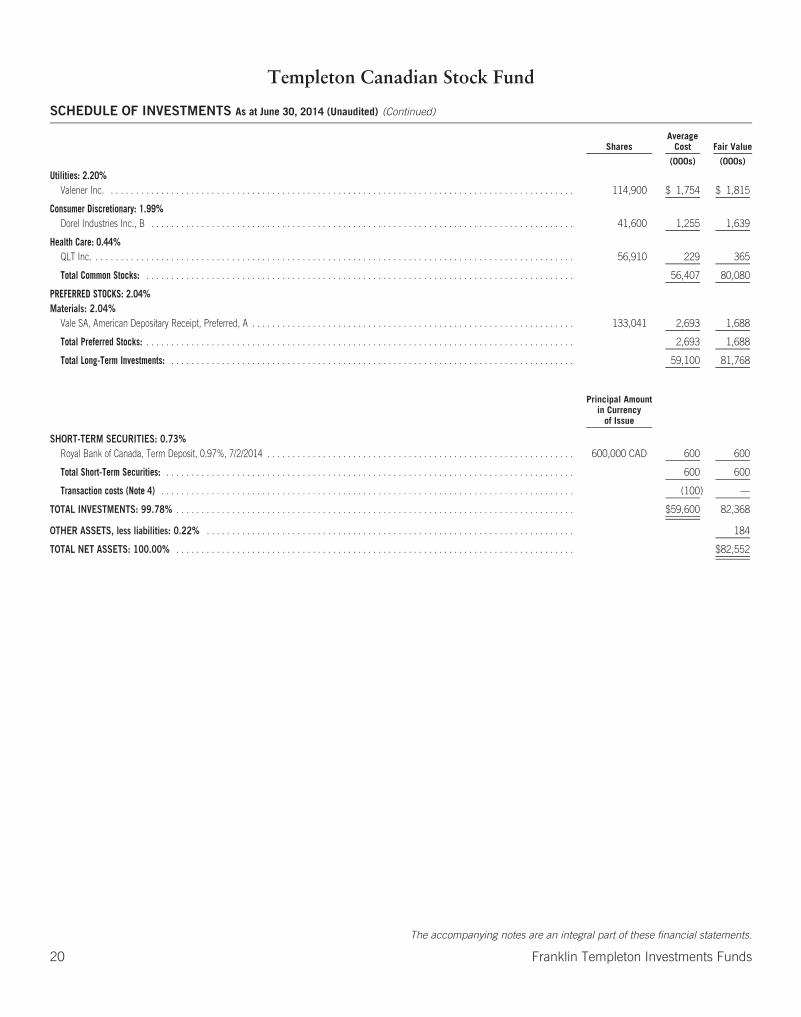
Templeton Canadian Stock Fund
SCHEDULE OF INVESTMENTS As at June 30, 2014 (Unaudited) (Continued)
SharesAverage
Cost Fair Value
(000s) (000s)
Utilities: 2.20%Valener Inc. . . . . . . . . . . . . . . . . . . . . . . . . . . . . . . . . . . . . . . . . . . . . . . . . . . . . . . . . . . . . . . . . . . . . . . . . . . . . . . . . . . . . . . . . . . . . 114,900 $ 1,754 $ 1,815
Consumer Discretionary: 1.99%Dorel Industries Inc., B . . . . . . . . . . . . . . . . . . . . . . . . . . . . . . . . . . . . . . . . . . . . . . . . . . . . . . . . . . . . . . . . . . . . . . . . . . . . . . . . . . . . 41,600 1,255 1,639
Health Care: 0.44%QLT Inc. . . . . . . . . . . . . . . . . . . . . . . . . . . . . . . . . . . . . . . . . . . . . . . . . . . . . . . . . . . . . . . . . . . . . . . . . . . . . . . . . . . . . . . . . . . . . . . . 56,910 229 365
Total Common Stocks: . . . . . . . . . . . . . . . . . . . . . . . . . . . . . . . . . . . . . . . . . . . . . . . . . . . . . . . . . . . . . . . . . . . . . . . . . . . . . . . . . . . . . 56,407 80,080
PREFERRED STOCKS: 2.04%Materials: 2.04%
Vale SA, American Depositary Receipt, Preferred, A . . . . . . . . . . . . . . . . . . . . . . . . . . . . . . . . . . . . . . . . . . . . . . . . . . . . . . . . . . . . . . . . 133,041 2,693 1,688
Total Preferred Stocks: . . . . . . . . . . . . . . . . . . . . . . . . . . . . . . . . . . . . . . . . . . . . . . . . . . . . . . . . . . . . . . . . . . . . . . . . . . . . . . . . . . . . . 2,693 1,688
Total Long-Term Investments: . . . . . . . . . . . . . . . . . . . . . . . . . . . . . . . . . . . . . . . . . . . . . . . . . . . . . . . . . . . . . . . . . . . . . . . . . . . . . . . . 59,100 81,768
Principal Amountin Currency
of Issue
SHORT-TERM SECURITIES: 0.73%Royal Bank of Canada, Term Deposit, 0.97%, 7/2/2014 . . . . . . . . . . . . . . . . . . . . . . . . . . . . . . . . . . . . . . . . . . . . . . . . . . . . . . . . . . . . . 600,000 CAD 600 600
Total Short-Term Securities: . . . . . . . . . . . . . . . . . . . . . . . . . . . . . . . . . . . . . . . . . . . . . . . . . . . . . . . . . . . . . . . . . . . . . . . . . . . . . . . . . 600 600
Transaction costs (Note 4) . . . . . . . . . . . . . . . . . . . . . . . . . . . . . . . . . . . . . . . . . . . . . . . . . . . . . . . . . . . . . . . . . . . . . . . . . . . . . . . . . . (100) —
TOTAL INVESTMENTS: 99.78% . . . . . . . . . . . . . . . . . . . . . . . . . . . . . . . . . . . . . . . . . . . . . . . . . . . . . . . . . . . . . . . . . . . . . . . . . . . . . . . $59,600 82,368
OTHER ASSETS, less liabilities: 0.22% . . . . . . . . . . . . . . . . . . . . . . . . . . . . . . . . . . . . . . . . . . . . . . . . . . . . . . . . . . . . . . . . . . . . . . . . . 184
TOTAL NET ASSETS: 100.00% . . . . . . . . . . . . . . . . . . . . . . . . . . . . . . . . . . . . . . . . . . . . . . . . . . . . . . . . . . . . . . . . . . . . . . . . . . . . . . . $82,552
The accompanying notes are an integral part of these financial statements.
20 Franklin Templeton Investments Funds
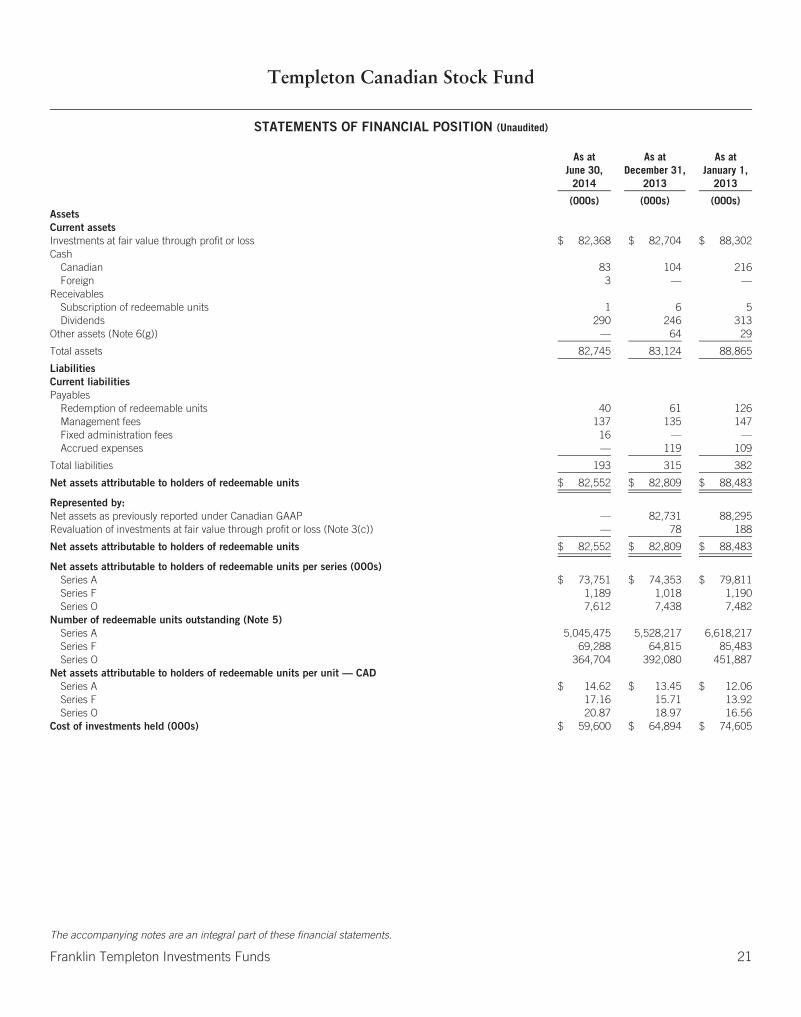
Templeton Canadian Stock Fund
STATEMENTS OF FINANCIAL POSITION (Unaudited)
As atJune 30,
2014
As atDecember 31,
2013
As atJanuary 1,
2013
(000s) (000s) (000s)AssetsCurrent assetsInvestments at fair value through profit or loss $ 82,368 $ 82,704 $ 88,302Cash
Canadian 83 104 216Foreign 3 — —
ReceivablesSubscription of redeemable units 1 6 5Dividends 290 246 313
Other assets (Note 6(g)) — 64 29
Total assets 82,745 83,124 88,865
LiabilitiesCurrent liabilitiesPayables
Redemption of redeemable units 40 61 126Management fees 137 135 147Fixed administration fees 16 — —Accrued expenses — 119 109
Total liabilities 193 315 382
Net assets attributable to holders of redeemable units $ 82,552 $ 82,809 $ 88,483
Represented by:Net assets as previously reported under Canadian GAAP — 82,731 88,295Revaluation of investments at fair value through profit or loss (Note 3(c)) — 78 188
Net assets attributable to holders of redeemable units $ 82,552 $ 82,809 $ 88,483
Net assets attributable to holders of redeemable units per series (000s)Series A $ 73,751 $ 74,353 $ 79,811Series F 1,189 1,018 1,190Series O 7,612 7,438 7,482
Number of redeemable units outstanding (Note 5)Series A 5,045,475 5,528,217 6,618,217Series F 69,288 64,815 85,483Series O 364,704 392,080 451,887
Net assets attributable to holders of redeemable units per unit — CADSeries A $ 14.62 $ 13.45 $ 12.06Series F 17.16 15.71 13.92Series O 20.87 18.97 16.56
Cost of investments held (000s) $ 59,600 $ 64,894 $ 74,605
The accompanying notes are an integral part of these financial statements.
Franklin Templeton Investments Funds 21
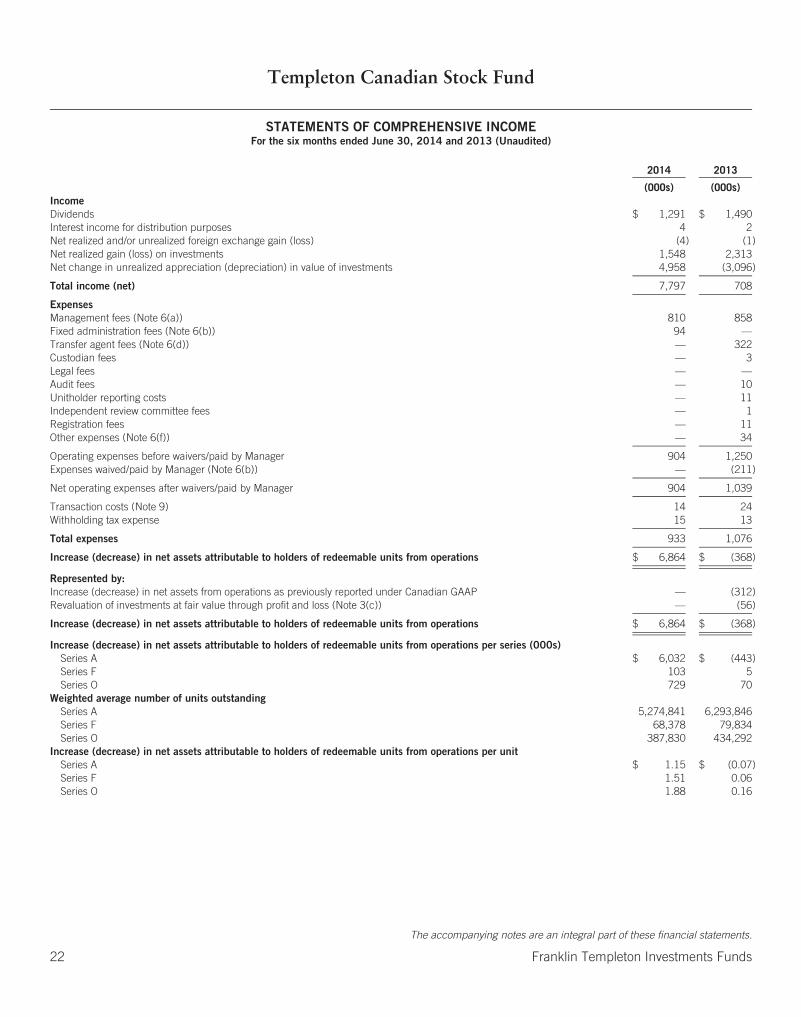
Templeton Canadian Stock Fund
STATEMENTS OF COMPREHENSIVE INCOMEFor the six months ended June 30, 2014 and 2013 (Unaudited)
2014 2013
(000s) (000s)IncomeDividends $ 1,291 $ 1,490Interest income for distribution purposes 4 2Net realized and/or unrealized foreign exchange gain (loss) (4) (1)Net realized gain (loss) on investments 1,548 2,313Net change in unrealized appreciation (depreciation) in value of investments 4,958 (3,096)
Total income (net) 7,797 708
ExpensesManagement fees (Note 6(a)) 810 858Fixed administration fees (Note 6(b)) 94 —Transfer agent fees (Note 6(d)) — 322Custodian fees — 3Legal fees — —Audit fees — 10Unitholder reporting costs — 11Independent review committee fees — 1Registration fees — 11Other expenses (Note 6(f)) — 34
Operating expenses before waivers/paid by Manager 904 1,250Expenses waived/paid by Manager (Note 6(b)) — (211)
Net operating expenses after waivers/paid by Manager 904 1,039
Transaction costs (Note 9) 14 24Withholding tax expense 15 13
Total expenses 933 1,076
Increase (decrease) in net assets attributable to holders of redeemable units from operations $ 6,864 $ (368)
Represented by:Increase (decrease) in net assets from operations as previously reported under Canadian GAAP — (312)Revaluation of investments at fair value through profit and loss (Note 3(c)) — (56)
Increase (decrease) in net assets attributable to holders of redeemable units from operations $ 6,864 $ (368)
Increase (decrease) in net assets attributable to holders of redeemable units from operations per series (000s)Series A $ 6,032 $ (443)Series F 103 5Series O 729 70
Weighted average number of units outstandingSeries A 5,274,841 6,293,846Series F 68,378 79,834Series O 387,830 434,292
Increase (decrease) in net assets attributable to holders of redeemable units from operations per unitSeries A $ 1.15 $ (0.07)Series F 1.51 0.06Series O 1.88 0.16
The accompanying notes are an integral part of these financial statements.
22 Franklin Templeton Investments Funds

Templeton Canadian Stock Fund
STATEMENTS OF CHANGES IN NET ASSETS ATTRIBUTABLE TO HOLDERS OF REDEEMABLE UNITSFor the six months ended June 30, 2014 and 2013 (Unaudited) (in 000s)
All Series Series A Series F
2014 2013 2014 2013 2014 2013
Net assets attributable to holders of redeemable units at beginning of period $82,809 $ 88,483 $74,353 $79,811 $1,018 $1,190
Increase (decrease) in net assets attributable to holders of redeemable units fromoperations 6,864 (368) 6,032 (443) 103 5
Distributions to holders of redeemable unitsFrom net investment income — — — — — —From net realized gains on investments — — — — — —From return of capital — — — — — —
Total distributions to holders of redeemable units — — — — — —
Redeemable units transactionsSubscriptions 2,199 1,489 909 1,017 126 17Reinvestments — — — — — —Redemptions (9,320) (10,187) (7,543) (8,785) (58) (288)
Net increase (decrease) from redeemable units transactions (7,121) (8,698) (6,634) (7,768) 68 (271)
Increase (decrease) in net assets attributable to holders of redeemable units (257) (9,066) (602) (8,211) 171 (266)
Net assets attributable to holders of redeemable units at end of period $82,552 $ 79,417 $73,751 $71,600 $1,189 $ 924
Series O
2014 2013
Net assets attributable to holders of redeemable units at beginning of period $ 7,438 $ 7,482
Increase (decrease) in net assets attributable to holders of redeemable units fromoperations 729 70
Distributions to holders of redeemable unitsFrom net investment income — —From net realized gains on investments — —From return of capital — —
Total distributions to holders of redeemable units — —
Redeemable units transactionsSubscriptions 1,164 455Reinvestments — —Redemptions (1,719) (1,114)
Net increase (decrease) from redeemable units transactions (555) (659)
Increase (decrease) in net assets attributable to holders of redeemable units 174 (589)
Net assets attributable to holders of redeemable units at end of period $ 7,612 $ 6,893
The accompanying notes are an integral part of these financial statements.
Franklin Templeton Investments Funds 23
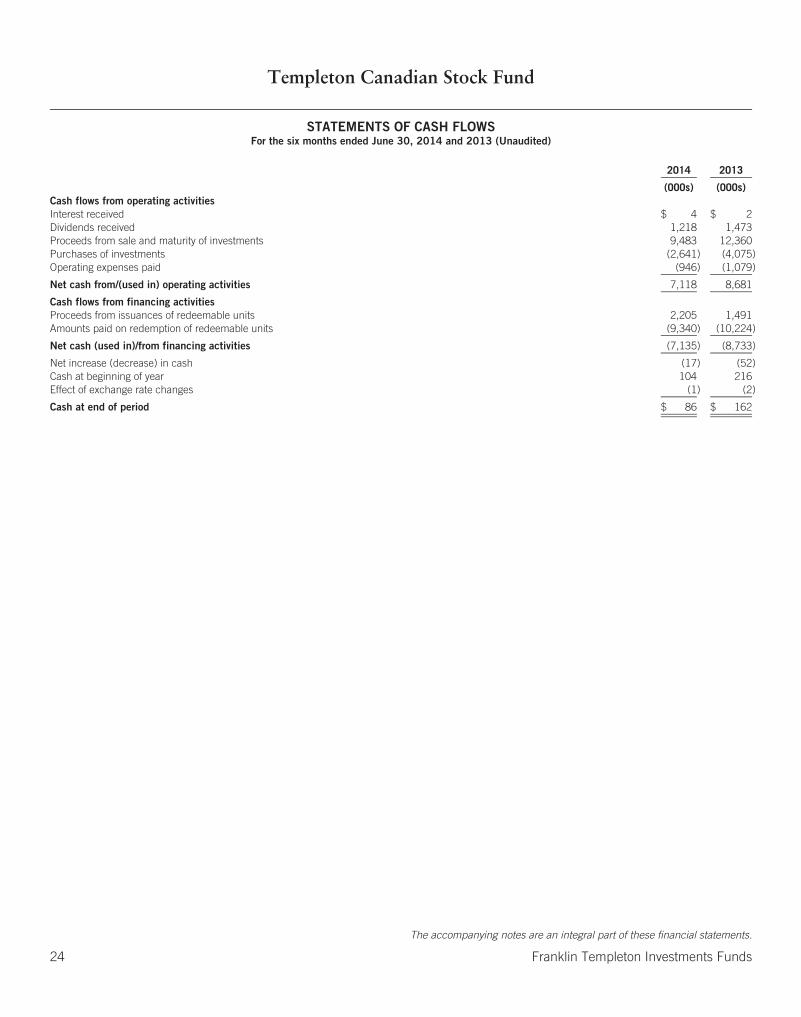
Templeton Canadian Stock Fund
STATEMENTS OF CASH FLOWSFor the six months ended June 30, 2014 and 2013 (Unaudited)
2014 2013
(000s) (000s)Cash flows from operating activitiesInterest received $ 4 $ 2Dividends received 1,218 1,473Proceeds from sale and maturity of investments 9,483 12,360Purchases of investments (2,641) (4,075)Operating expenses paid (946) (1,079)
Net cash from/(used in) operating activities 7,118 8,681
Cash flows from financing activitiesProceeds from issuances of redeemable units 2,205 1,491Amounts paid on redemption of redeemable units (9,340) (10,224)
Net cash (used in)/from financing activities (7,135) (8,733)
Net increase (decrease) in cash (17) (52)Cash at beginning of year 104 216Effect of exchange rate changes (1) (2)
Cash at end of period $ 86 $ 162
The accompanying notes are an integral part of these financial statements.
24 Franklin Templeton Investments Funds
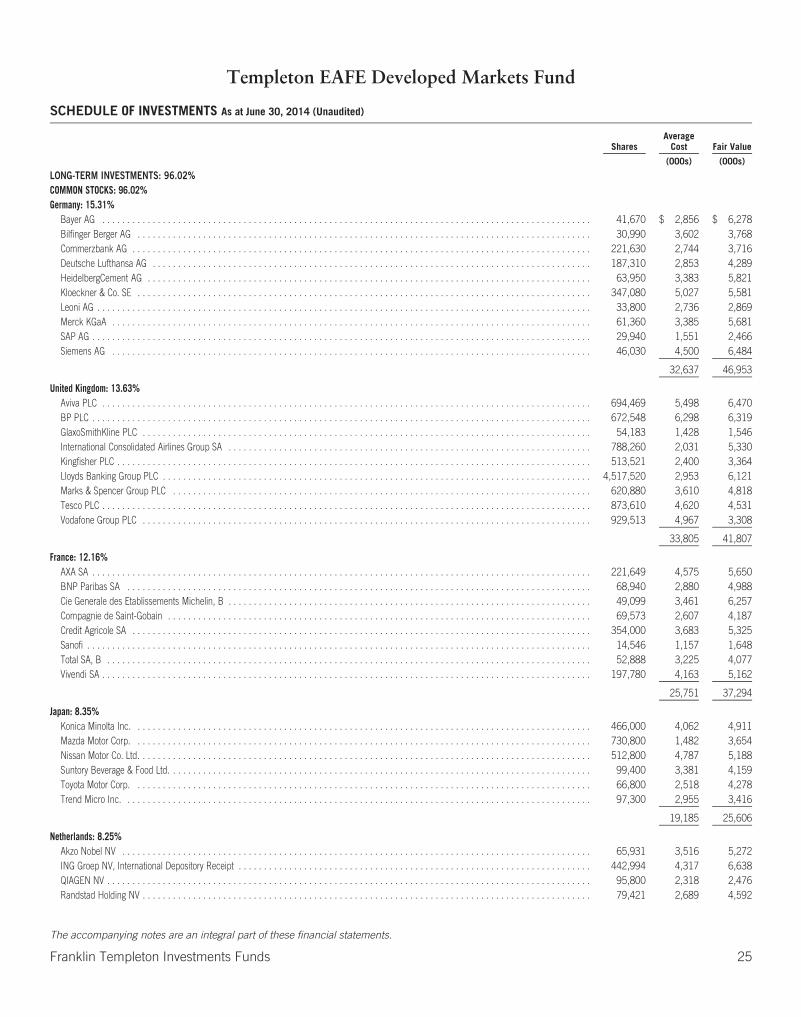
Templeton EAFE Developed Markets Fund
SCHEDULE OF INVESTMENTS As at June 30, 2014 (Unaudited)
SharesAverage
Cost Fair Value
(000s) (000s)
LONG-TERM INVESTMENTS: 96.02%COMMON STOCKS: 96.02%Germany: 15.31%
Bayer AG . . . . . . . . . . . . . . . . . . . . . . . . . . . . . . . . . . . . . . . . . . . . . . . . . . . . . . . . . . . . . . . . . . . . . . . . . . . . . . . . . . . . . . . . . . . . . . . . . 41,670 $ 2,856 $ 6,278Bilfinger Berger AG . . . . . . . . . . . . . . . . . . . . . . . . . . . . . . . . . . . . . . . . . . . . . . . . . . . . . . . . . . . . . . . . . . . . . . . . . . . . . . . . . . . . . . . . . . 30,990 3,602 3,768Commerzbank AG . . . . . . . . . . . . . . . . . . . . . . . . . . . . . . . . . . . . . . . . . . . . . . . . . . . . . . . . . . . . . . . . . . . . . . . . . . . . . . . . . . . . . . . . . . . 221,630 2,744 3,716Deutsche Lufthansa AG . . . . . . . . . . . . . . . . . . . . . . . . . . . . . . . . . . . . . . . . . . . . . . . . . . . . . . . . . . . . . . . . . . . . . . . . . . . . . . . . . . . . . . . 187,310 2,853 4,289HeidelbergCement AG . . . . . . . . . . . . . . . . . . . . . . . . . . . . . . . . . . . . . . . . . . . . . . . . . . . . . . . . . . . . . . . . . . . . . . . . . . . . . . . . . . . . . . . . 63,950 3,383 5,821Kloeckner & Co. SE . . . . . . . . . . . . . . . . . . . . . . . . . . . . . . . . . . . . . . . . . . . . . . . . . . . . . . . . . . . . . . . . . . . . . . . . . . . . . . . . . . . . . . . . . . 347,080 5,027 5,581Leoni AG . . . . . . . . . . . . . . . . . . . . . . . . . . . . . . . . . . . . . . . . . . . . . . . . . . . . . . . . . . . . . . . . . . . . . . . . . . . . . . . . . . . . . . . . . . . . . . . . . . 33,800 2,736 2,869Merck KGaA . . . . . . . . . . . . . . . . . . . . . . . . . . . . . . . . . . . . . . . . . . . . . . . . . . . . . . . . . . . . . . . . . . . . . . . . . . . . . . . . . . . . . . . . . . . . . . . 61,360 3,385 5,681SAP AG . . . . . . . . . . . . . . . . . . . . . . . . . . . . . . . . . . . . . . . . . . . . . . . . . . . . . . . . . . . . . . . . . . . . . . . . . . . . . . . . . . . . . . . . . . . . . . . . . . . 29,940 1,551 2,466Siemens AG . . . . . . . . . . . . . . . . . . . . . . . . . . . . . . . . . . . . . . . . . . . . . . . . . . . . . . . . . . . . . . . . . . . . . . . . . . . . . . . . . . . . . . . . . . . . . . . 46,030 4,500 6,484
32,637 46,953
United Kingdom: 13.63%Aviva PLC . . . . . . . . . . . . . . . . . . . . . . . . . . . . . . . . . . . . . . . . . . . . . . . . . . . . . . . . . . . . . . . . . . . . . . . . . . . . . . . . . . . . . . . . . . . . . . . . . 694,469 5,498 6,470BP PLC . . . . . . . . . . . . . . . . . . . . . . . . . . . . . . . . . . . . . . . . . . . . . . . . . . . . . . . . . . . . . . . . . . . . . . . . . . . . . . . . . . . . . . . . . . . . . . . . . . . 672,548 6,298 6,319GlaxoSmithKline PLC . . . . . . . . . . . . . . . . . . . . . . . . . . . . . . . . . . . . . . . . . . . . . . . . . . . . . . . . . . . . . . . . . . . . . . . . . . . . . . . . . . . . . . . . . 54,183 1,428 1,546International Consolidated Airlines Group SA . . . . . . . . . . . . . . . . . . . . . . . . . . . . . . . . . . . . . . . . . . . . . . . . . . . . . . . . . . . . . . . . . . . . . . . . 788,260 2,031 5,330Kingfisher PLC . . . . . . . . . . . . . . . . . . . . . . . . . . . . . . . . . . . . . . . . . . . . . . . . . . . . . . . . . . . . . . . . . . . . . . . . . . . . . . . . . . . . . . . . . . . . . . 513,521 2,400 3,364Lloyds Banking Group PLC . . . . . . . . . . . . . . . . . . . . . . . . . . . . . . . . . . . . . . . . . . . . . . . . . . . . . . . . . . . . . . . . . . . . . . . . . . . . . . . . . . . . . 4,517,520 2,953 6,121Marks & Spencer Group PLC . . . . . . . . . . . . . . . . . . . . . . . . . . . . . . . . . . . . . . . . . . . . . . . . . . . . . . . . . . . . . . . . . . . . . . . . . . . . . . . . . . . 620,880 3,610 4,818Tesco PLC . . . . . . . . . . . . . . . . . . . . . . . . . . . . . . . . . . . . . . . . . . . . . . . . . . . . . . . . . . . . . . . . . . . . . . . . . . . . . . . . . . . . . . . . . . . . . . . . . 873,610 4,620 4,531Vodafone Group PLC . . . . . . . . . . . . . . . . . . . . . . . . . . . . . . . . . . . . . . . . . . . . . . . . . . . . . . . . . . . . . . . . . . . . . . . . . . . . . . . . . . . . . . . . . 929,513 4,967 3,308
33,805 41,807
France: 12.16%AXA SA . . . . . . . . . . . . . . . . . . . . . . . . . . . . . . . . . . . . . . . . . . . . . . . . . . . . . . . . . . . . . . . . . . . . . . . . . . . . . . . . . . . . . . . . . . . . . . . . . . . 221,649 4,575 5,650BNP Paribas SA . . . . . . . . . . . . . . . . . . . . . . . . . . . . . . . . . . . . . . . . . . . . . . . . . . . . . . . . . . . . . . . . . . . . . . . . . . . . . . . . . . . . . . . . . . . . 68,940 2,880 4,988Cie Generale des Etablissements Michelin, B . . . . . . . . . . . . . . . . . . . . . . . . . . . . . . . . . . . . . . . . . . . . . . . . . . . . . . . . . . . . . . . . . . . . . . . . 49,099 3,461 6,257Compagnie de Saint-Gobain . . . . . . . . . . . . . . . . . . . . . . . . . . . . . . . . . . . . . . . . . . . . . . . . . . . . . . . . . . . . . . . . . . . . . . . . . . . . . . . . . . . . 69,573 2,607 4,187Credit Agricole SA . . . . . . . . . . . . . . . . . . . . . . . . . . . . . . . . . . . . . . . . . . . . . . . . . . . . . . . . . . . . . . . . . . . . . . . . . . . . . . . . . . . . . . . . . . . 354,000 3,683 5,325Sanofi . . . . . . . . . . . . . . . . . . . . . . . . . . . . . . . . . . . . . . . . . . . . . . . . . . . . . . . . . . . . . . . . . . . . . . . . . . . . . . . . . . . . . . . . . . . . . . . . . . . . 14,546 1,157 1,648Total SA, B . . . . . . . . . . . . . . . . . . . . . . . . . . . . . . . . . . . . . . . . . . . . . . . . . . . . . . . . . . . . . . . . . . . . . . . . . . . . . . . . . . . . . . . . . . . . . . . . 52,888 3,225 4,077Vivendi SA . . . . . . . . . . . . . . . . . . . . . . . . . . . . . . . . . . . . . . . . . . . . . . . . . . . . . . . . . . . . . . . . . . . . . . . . . . . . . . . . . . . . . . . . . . . . . . . . . 197,780 4,163 5,162
25,751 37,294
Japan: 8.35%Konica Minolta Inc. . . . . . . . . . . . . . . . . . . . . . . . . . . . . . . . . . . . . . . . . . . . . . . . . . . . . . . . . . . . . . . . . . . . . . . . . . . . . . . . . . . . . . . . . . . 466,000 4,062 4,911Mazda Motor Corp. . . . . . . . . . . . . . . . . . . . . . . . . . . . . . . . . . . . . . . . . . . . . . . . . . . . . . . . . . . . . . . . . . . . . . . . . . . . . . . . . . . . . . . . . . . 730,800 1,482 3,654Nissan Motor Co. Ltd. . . . . . . . . . . . . . . . . . . . . . . . . . . . . . . . . . . . . . . . . . . . . . . . . . . . . . . . . . . . . . . . . . . . . . . . . . . . . . . . . . . . . . . . . . 512,800 4,787 5,188Suntory Beverage & Food Ltd. . . . . . . . . . . . . . . . . . . . . . . . . . . . . . . . . . . . . . . . . . . . . . . . . . . . . . . . . . . . . . . . . . . . . . . . . . . . . . . . . . . . 99,400 3,381 4,159Toyota Motor Corp. . . . . . . . . . . . . . . . . . . . . . . . . . . . . . . . . . . . . . . . . . . . . . . . . . . . . . . . . . . . . . . . . . . . . . . . . . . . . . . . . . . . . . . . . . . 66,800 2,518 4,278Trend Micro Inc. . . . . . . . . . . . . . . . . . . . . . . . . . . . . . . . . . . . . . . . . . . . . . . . . . . . . . . . . . . . . . . . . . . . . . . . . . . . . . . . . . . . . . . . . . . . . 97,300 2,955 3,416
19,185 25,606
Netherlands: 8.25%Akzo Nobel NV . . . . . . . . . . . . . . . . . . . . . . . . . . . . . . . . . . . . . . . . . . . . . . . . . . . . . . . . . . . . . . . . . . . . . . . . . . . . . . . . . . . . . . . . . . . . . 65,931 3,516 5,272ING Groep NV, International Depository Receipt . . . . . . . . . . . . . . . . . . . . . . . . . . . . . . . . . . . . . . . . . . . . . . . . . . . . . . . . . . . . . . . . . . . . . . 442,994 4,317 6,638QIAGEN NV . . . . . . . . . . . . . . . . . . . . . . . . . . . . . . . . . . . . . . . . . . . . . . . . . . . . . . . . . . . . . . . . . . . . . . . . . . . . . . . . . . . . . . . . . . . . . . . . 95,800 2,318 2,476Randstad Holding NV . . . . . . . . . . . . . . . . . . . . . . . . . . . . . . . . . . . . . . . . . . . . . . . . . . . . . . . . . . . . . . . . . . . . . . . . . . . . . . . . . . . . . . . . . 79,421 2,689 4,592
The accompanying notes are an integral part of these financial statements.
Franklin Templeton Investments Funds 25
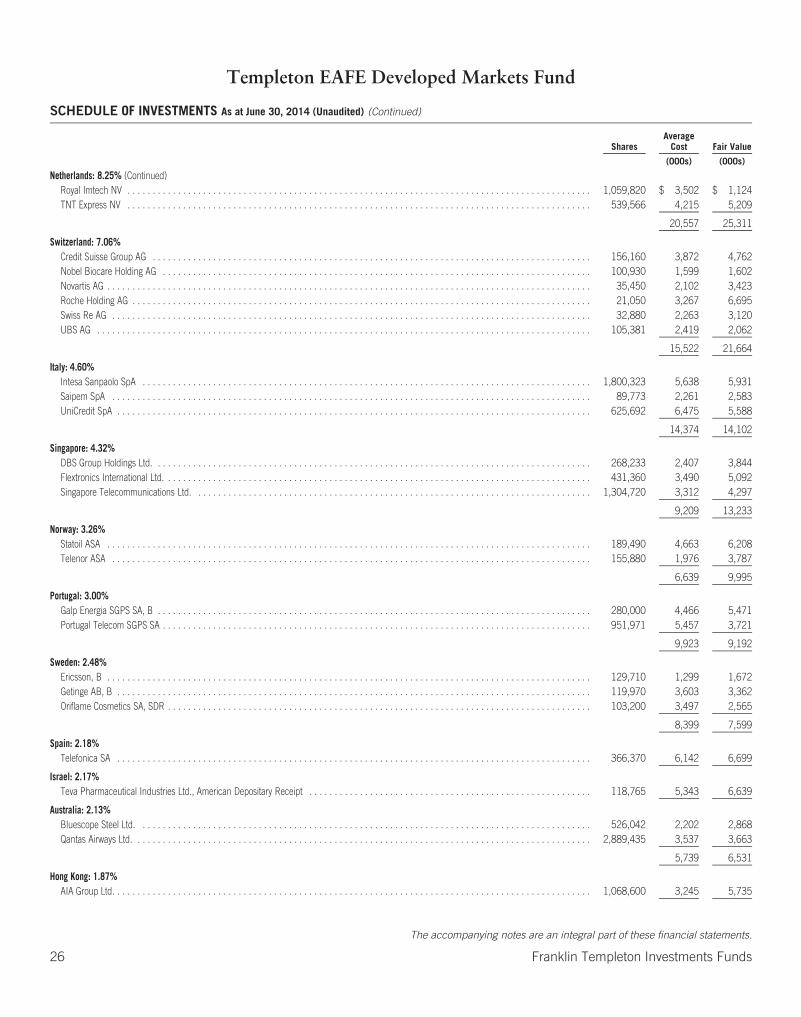
Templeton EAFE Developed Markets Fund
SCHEDULE OF INVESTMENTS As at June 30, 2014 (Unaudited) (Continued)
SharesAverage
Cost Fair Value
(000s) (000s)
Netherlands: 8.25% (Continued)Royal Imtech NV . . . . . . . . . . . . . . . . . . . . . . . . . . . . . . . . . . . . . . . . . . . . . . . . . . . . . . . . . . . . . . . . . . . . . . . . . . . . . . . . . . . . . . . . . . . . 1,059,820 $ 3,502 $ 1,124TNT Express NV . . . . . . . . . . . . . . . . . . . . . . . . . . . . . . . . . . . . . . . . . . . . . . . . . . . . . . . . . . . . . . . . . . . . . . . . . . . . . . . . . . . . . . . . . . . . 539,566 4,215 5,209
20,557 25,311
Switzerland: 7.06%Credit Suisse Group AG . . . . . . . . . . . . . . . . . . . . . . . . . . . . . . . . . . . . . . . . . . . . . . . . . . . . . . . . . . . . . . . . . . . . . . . . . . . . . . . . . . . . . . . 156,160 3,872 4,762Nobel Biocare Holding AG . . . . . . . . . . . . . . . . . . . . . . . . . . . . . . . . . . . . . . . . . . . . . . . . . . . . . . . . . . . . . . . . . . . . . . . . . . . . . . . . . . . . . 100,930 1,599 1,602Novartis AG . . . . . . . . . . . . . . . . . . . . . . . . . . . . . . . . . . . . . . . . . . . . . . . . . . . . . . . . . . . . . . . . . . . . . . . . . . . . . . . . . . . . . . . . . . . . . . . . 35,450 2,102 3,423Roche Holding AG . . . . . . . . . . . . . . . . . . . . . . . . . . . . . . . . . . . . . . . . . . . . . . . . . . . . . . . . . . . . . . . . . . . . . . . . . . . . . . . . . . . . . . . . . . . 21,050 3,267 6,695Swiss Re AG . . . . . . . . . . . . . . . . . . . . . . . . . . . . . . . . . . . . . . . . . . . . . . . . . . . . . . . . . . . . . . . . . . . . . . . . . . . . . . . . . . . . . . . . . . . . . . . 32,880 2,263 3,120UBS AG . . . . . . . . . . . . . . . . . . . . . . . . . . . . . . . . . . . . . . . . . . . . . . . . . . . . . . . . . . . . . . . . . . . . . . . . . . . . . . . . . . . . . . . . . . . . . . . . . . 105,381 2,419 2,062
15,522 21,664
Italy: 4.60%Intesa Sanpaolo SpA . . . . . . . . . . . . . . . . . . . . . . . . . . . . . . . . . . . . . . . . . . . . . . . . . . . . . . . . . . . . . . . . . . . . . . . . . . . . . . . . . . . . . . . . . 1,800,323 5,638 5,931Saipem SpA . . . . . . . . . . . . . . . . . . . . . . . . . . . . . . . . . . . . . . . . . . . . . . . . . . . . . . . . . . . . . . . . . . . . . . . . . . . . . . . . . . . . . . . . . . . . . . . 89,773 2,261 2,583UniCredit SpA . . . . . . . . . . . . . . . . . . . . . . . . . . . . . . . . . . . . . . . . . . . . . . . . . . . . . . . . . . . . . . . . . . . . . . . . . . . . . . . . . . . . . . . . . . . . . . 625,692 6,475 5,588
14,374 14,102
Singapore: 4.32%DBS Group Holdings Ltd. . . . . . . . . . . . . . . . . . . . . . . . . . . . . . . . . . . . . . . . . . . . . . . . . . . . . . . . . . . . . . . . . . . . . . . . . . . . . . . . . . . . . . . 268,233 2,407 3,844Flextronics International Ltd. . . . . . . . . . . . . . . . . . . . . . . . . . . . . . . . . . . . . . . . . . . . . . . . . . . . . . . . . . . . . . . . . . . . . . . . . . . . . . . . . . . . . 431,360 3,490 5,092Singapore Telecommunications Ltd. . . . . . . . . . . . . . . . . . . . . . . . . . . . . . . . . . . . . . . . . . . . . . . . . . . . . . . . . . . . . . . . . . . . . . . . . . . . . . . 1,304,720 3,312 4,297
9,209 13,233
Norway: 3.26%Statoil ASA . . . . . . . . . . . . . . . . . . . . . . . . . . . . . . . . . . . . . . . . . . . . . . . . . . . . . . . . . . . . . . . . . . . . . . . . . . . . . . . . . . . . . . . . . . . . . . . . 189,490 4,663 6,208Telenor ASA . . . . . . . . . . . . . . . . . . . . . . . . . . . . . . . . . . . . . . . . . . . . . . . . . . . . . . . . . . . . . . . . . . . . . . . . . . . . . . . . . . . . . . . . . . . . . . . 155,880 1,976 3,787
6,639 9,995
Portugal: 3.00%Galp Energia SGPS SA, B . . . . . . . . . . . . . . . . . . . . . . . . . . . . . . . . . . . . . . . . . . . . . . . . . . . . . . . . . . . . . . . . . . . . . . . . . . . . . . . . . . . . . . 280,000 4,466 5,471Portugal Telecom SGPS SA . . . . . . . . . . . . . . . . . . . . . . . . . . . . . . . . . . . . . . . . . . . . . . . . . . . . . . . . . . . . . . . . . . . . . . . . . . . . . . . . . . . . . 951,971 5,457 3,721
9,923 9,192
Sweden: 2.48%Ericsson, B . . . . . . . . . . . . . . . . . . . . . . . . . . . . . . . . . . . . . . . . . . . . . . . . . . . . . . . . . . . . . . . . . . . . . . . . . . . . . . . . . . . . . . . . . . . . . . . . 129,710 1,299 1,672Getinge AB, B . . . . . . . . . . . . . . . . . . . . . . . . . . . . . . . . . . . . . . . . . . . . . . . . . . . . . . . . . . . . . . . . . . . . . . . . . . . . . . . . . . . . . . . . . . . . . . 119,970 3,603 3,362Oriflame Cosmetics SA, SDR . . . . . . . . . . . . . . . . . . . . . . . . . . . . . . . . . . . . . . . . . . . . . . . . . . . . . . . . . . . . . . . . . . . . . . . . . . . . . . . . . . . . 103,200 3,497 2,565
8,399 7,599
Spain: 2.18%Telefonica SA . . . . . . . . . . . . . . . . . . . . . . . . . . . . . . . . . . . . . . . . . . . . . . . . . . . . . . . . . . . . . . . . . . . . . . . . . . . . . . . . . . . . . . . . . . . . . . 366,370 6,142 6,699
Israel: 2.17%Teva Pharmaceutical Industries Ltd., American Depositary Receipt . . . . . . . . . . . . . . . . . . . . . . . . . . . . . . . . . . . . . . . . . . . . . . . . . . . . . . . . 118,765 5,343 6,639
Australia: 2.13%Bluescope Steel Ltd. . . . . . . . . . . . . . . . . . . . . . . . . . . . . . . . . . . . . . . . . . . . . . . . . . . . . . . . . . . . . . . . . . . . . . . . . . . . . . . . . . . . . . . . . . 526,042 2,202 2,868Qantas Airways Ltd. . . . . . . . . . . . . . . . . . . . . . . . . . . . . . . . . . . . . . . . . . . . . . . . . . . . . . . . . . . . . . . . . . . . . . . . . . . . . . . . . . . . . . . . . . . 2,889,435 3,537 3,663
5,739 6,531
Hong Kong: 1.87%AIA Group Ltd. . . . . . . . . . . . . . . . . . . . . . . . . . . . . . . . . . . . . . . . . . . . . . . . . . . . . . . . . . . . . . . . . . . . . . . . . . . . . . . . . . . . . . . . . . . . . . . 1,068,600 3,245 5,735
The accompanying notes are an integral part of these financial statements.
26 Franklin Templeton Investments Funds
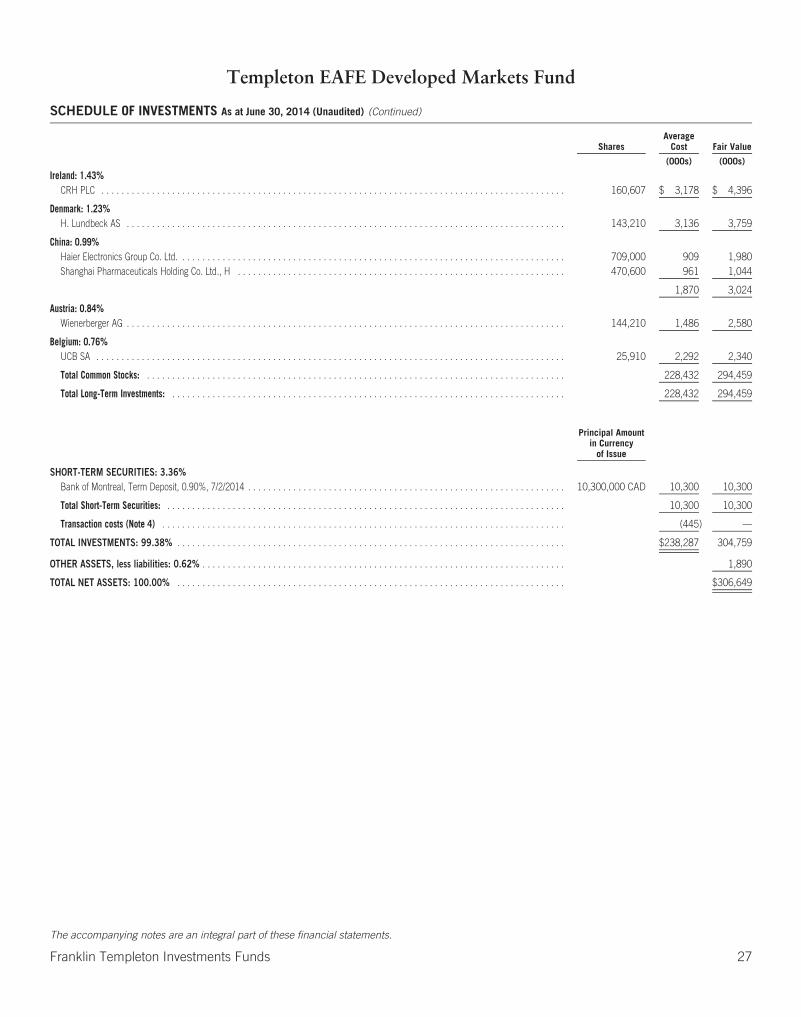
Templeton EAFE Developed Markets Fund
SCHEDULE OF INVESTMENTS As at June 30, 2014 (Unaudited) (Continued)
SharesAverage
Cost Fair Value
(000s) (000s)
Ireland: 1.43%CRH PLC . . . . . . . . . . . . . . . . . . . . . . . . . . . . . . . . . . . . . . . . . . . . . . . . . . . . . . . . . . . . . . . . . . . . . . . . . . . . . . . . . . . . . . . . . . . . 160,607 $ 3,178 $ 4,396
Denmark: 1.23%H. Lundbeck AS . . . . . . . . . . . . . . . . . . . . . . . . . . . . . . . . . . . . . . . . . . . . . . . . . . . . . . . . . . . . . . . . . . . . . . . . . . . . . . . . . . . . . . . 143,210 3,136 3,759
China: 0.99%Haier Electronics Group Co. Ltd. . . . . . . . . . . . . . . . . . . . . . . . . . . . . . . . . . . . . . . . . . . . . . . . . . . . . . . . . . . . . . . . . . . . . . . . . . . . . 709,000 909 1,980Shanghai Pharmaceuticals Holding Co. Ltd., H . . . . . . . . . . . . . . . . . . . . . . . . . . . . . . . . . . . . . . . . . . . . . . . . . . . . . . . . . . . . . . . . . 470,600 961 1,044
1,870 3,024
Austria: 0.84%Wienerberger AG . . . . . . . . . . . . . . . . . . . . . . . . . . . . . . . . . . . . . . . . . . . . . . . . . . . . . . . . . . . . . . . . . . . . . . . . . . . . . . . . . . . . . . . 144,210 1,486 2,580
Belgium: 0.76%UCB SA . . . . . . . . . . . . . . . . . . . . . . . . . . . . . . . . . . . . . . . . . . . . . . . . . . . . . . . . . . . . . . . . . . . . . . . . . . . . . . . . . . . . . . . . . . . . . 25,910 2,292 2,340
Total Common Stocks: . . . . . . . . . . . . . . . . . . . . . . . . . . . . . . . . . . . . . . . . . . . . . . . . . . . . . . . . . . . . . . . . . . . . . . . . . . . . . . . . . . . 228,432 294,459
Total Long-Term Investments: . . . . . . . . . . . . . . . . . . . . . . . . . . . . . . . . . . . . . . . . . . . . . . . . . . . . . . . . . . . . . . . . . . . . . . . . . . . . . . 228,432 294,459
Principal Amountin Currency
of Issue
SHORT-TERM SECURITIES: 3.36%Bank of Montreal, Term Deposit, 0.90%, 7/2/2014 . . . . . . . . . . . . . . . . . . . . . . . . . . . . . . . . . . . . . . . . . . . . . . . . . . . . . . . . . . . . . . . 10,300,000 CAD 10,300 10,300
Total Short-Term Securities: . . . . . . . . . . . . . . . . . . . . . . . . . . . . . . . . . . . . . . . . . . . . . . . . . . . . . . . . . . . . . . . . . . . . . . . . . . . . . . . 10,300 10,300
Transaction costs (Note 4) . . . . . . . . . . . . . . . . . . . . . . . . . . . . . . . . . . . . . . . . . . . . . . . . . . . . . . . . . . . . . . . . . . . . . . . . . . . . . . . . (445) —
TOTAL INVESTMENTS: 99.38% . . . . . . . . . . . . . . . . . . . . . . . . . . . . . . . . . . . . . . . . . . . . . . . . . . . . . . . . . . . . . . . . . . . . . . . . . . . . . $238,287 304,759
OTHER ASSETS, less liabilities: 0.62% . . . . . . . . . . . . . . . . . . . . . . . . . . . . . . . . . . . . . . . . . . . . . . . . . . . . . . . . . . . . . . . . . . . . . . . . 1,890
TOTAL NET ASSETS: 100.00% . . . . . . . . . . . . . . . . . . . . . . . . . . . . . . . . . . . . . . . . . . . . . . . . . . . . . . . . . . . . . . . . . . . . . . . . . . . . . $306,649
The accompanying notes are an integral part of these financial statements.
Franklin Templeton Investments Funds 27

Templeton EAFE Developed Markets Fund
STATEMENTS OF FINANCIAL POSITION (Unaudited)
As atJune 30,
2014
As atDecember 31,
2013
As atJanuary 1,
2013
(000s) (000s) (000s)AssetsCurrent assetsInvestments at fair value through profit or loss $ 304,759 $ 300,849 $ 313,139Cash
Canadian 71 — 90Foreign 305 — —
ReceivablesSubscription of redeemable units — 38 3Dividends and withholding tax 1,552 1,080 1,079
Other assets (Note 6(g)) — 48 21
Total assets 306,687 302,015 314,332
LiabilitiesCurrent liabilitiesPayables
Investment securities purchased 16 13 —Redemption of redeemable units 4 — 14Management fees 15 16 9Fixed administration fees 3 — —Accrued expenses — 83 60
Total liabilities 38 112 83
Net assets attributable to holders of redeemable units $ 306,649 $ 301,903 $ 314,249
Represented by:Net assets as previously reported under Canadian GAAP — 301,721 314,122Revaluation of investments at fair value through profit or loss (Note 3(c)) — 182 127
Net assets attributable to holders of redeemable units $ 306,649 $ 301,903 $ 314,249
Net assets attributable to holders of redeemable units per series (000s)Series A $ 6,587 $ 5,800 $ 4,173Series F 2,933 6,006 2,142Series O 297,129 290,097 307,934
Number of redeemable units outstanding (Note 5)Series A 754,320 678,151 641,431Series F 288,093 605,479 287,322Series O 23,491,019 23,724,604 34,037,926
Net assets attributable to holders of redeemable units per unit — CADSeries A $ 8.73 $ 8.55 $ 6.51Series F 10.18 9.92 7.45Series O 12.65 12.23 9.05
Net assets attributable to holders of redeemable units per unit — USDSeries A $ 8.19 $ 8.05 $ 6.55Series F 9.55 9.34 7.50Series O 11.86 11.51 9.11
Cost of investments held (000s) $ 238,287 $ 230,532 $ 318,866
The accompanying notes are an integral part of these financial statements.
28 Franklin Templeton Investments Funds

Templeton EAFE Developed Markets Fund
STATEMENTS OF COMPREHENSIVE INCOMEFor the six months ended June 30, 2014 and 2013 (Unaudited)
2014 2013
(000s) (000s)IncomeDividends $ 8,317 $ 5,858Interest income for distribution purposes 25 27Net realized and/or unrealized foreign exchange gain (loss) (30) 114Net realized gain (loss) on investments 6,692 430Net change in unrealized appreciation (depreciation) in value of investments (3,845) 28,897
Total income (net) 11,159 35,326
ExpensesManagement fees (Note 6(a)) 92 59Fixed administration fees (Note 6(b)) 20 —Transfer agent fees (Note 6(d)) — 31Custodian fees — 9Legal fees — —Audit fees — 10Unitholder reporting costs — 6Independent review committee fees — 1Registration fees — 10Other expenses (Note 6(f)) — 60
Operating expenses before waivers/paid by Manager 112 186Expenses waived/paid by Manager (Note 6(b)) — (109)
Net operating expenses after waivers/paid by Manager 112 77
Transaction costs (Note 9) 82 119Withholding tax expense 637 623
Total expenses 831 819
Increase (decrease) in net assets attributable to holders of redeemable units from operations $ 10,328 $ 34,507
Represented by:Increase (decrease) in net assets from operations as previously reported under Canadian GAAP — 34,246Revaluation of investments at fair value through profit and loss (Note 3(c)) — 261
Increase (decrease) in net assets attributable to holders of redeemable units from operations $ 10,328 $ 34,507
Increase (decrease) in net assets attributable to holders of redeemable units from operations per series (000s)Series A $ 98 $ 397Series F 229 227Series O 10,001 33,883
Weighted average number of units outstandingSeries A 706,736 599,259Series F 367,271 281,704Series O 23,437,908 31,166,882
Increase (decrease) in net assets attributable to holders of redeemable units from operations per unitSeries A $ 0.13 $ 0.66Series F 0.62 0.81Series O 0.43 1.09
The accompanying notes are an integral part of these financial statements.
Franklin Templeton Investments Funds 29
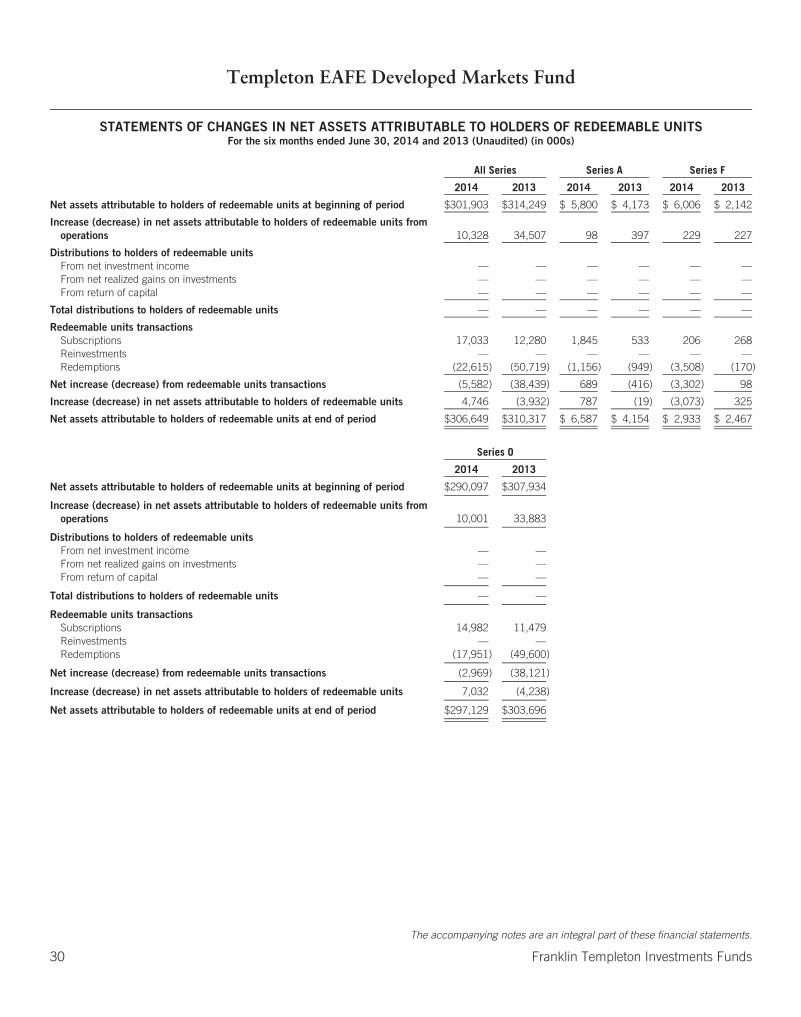
Templeton EAFE Developed Markets Fund
STATEMENTS OF CHANGES IN NET ASSETS ATTRIBUTABLE TO HOLDERS OF REDEEMABLE UNITSFor the six months ended June 30, 2014 and 2013 (Unaudited) (in 000s)
All Series Series A Series F
2014 2013 2014 2013 2014 2013
Net assets attributable to holders of redeemable units at beginning of period $301,903 $314,249 $ 5,800 $ 4,173 $ 6,006 $ 2,142
Increase (decrease) in net assets attributable to holders of redeemable units fromoperations 10,328 34,507 98 397 229 227
Distributions to holders of redeemable unitsFrom net investment income — — — — — —From net realized gains on investments — — — — — —From return of capital — — — — — —
Total distributions to holders of redeemable units — — — — — —
Redeemable units transactionsSubscriptions 17,033 12,280 1,845 533 206 268Reinvestments — — — — — —Redemptions (22,615) (50,719) (1,156) (949) (3,508) (170)
Net increase (decrease) from redeemable units transactions (5,582) (38,439) 689 (416) (3,302) 98
Increase (decrease) in net assets attributable to holders of redeemable units 4,746 (3,932) 787 (19) (3,073) 325
Net assets attributable to holders of redeemable units at end of period $306,649 $310,317 $ 6,587 $ 4,154 $ 2,933 $ 2,467
Series O
2014 2013
Net assets attributable to holders of redeemable units at beginning of period $290,097 $307,934
Increase (decrease) in net assets attributable to holders of redeemable units fromoperations 10,001 33,883
Distributions to holders of redeemable unitsFrom net investment income — —From net realized gains on investments — —From return of capital — —
Total distributions to holders of redeemable units — —
Redeemable units transactionsSubscriptions 14,982 11,479Reinvestments — —Redemptions (17,951) (49,600)
Net increase (decrease) from redeemable units transactions (2,969) (38,121)
Increase (decrease) in net assets attributable to holders of redeemable units 7,032 (4,238)
Net assets attributable to holders of redeemable units at end of period $297,129 $303,696
The accompanying notes are an integral part of these financial statements.
30 Franklin Templeton Investments Funds
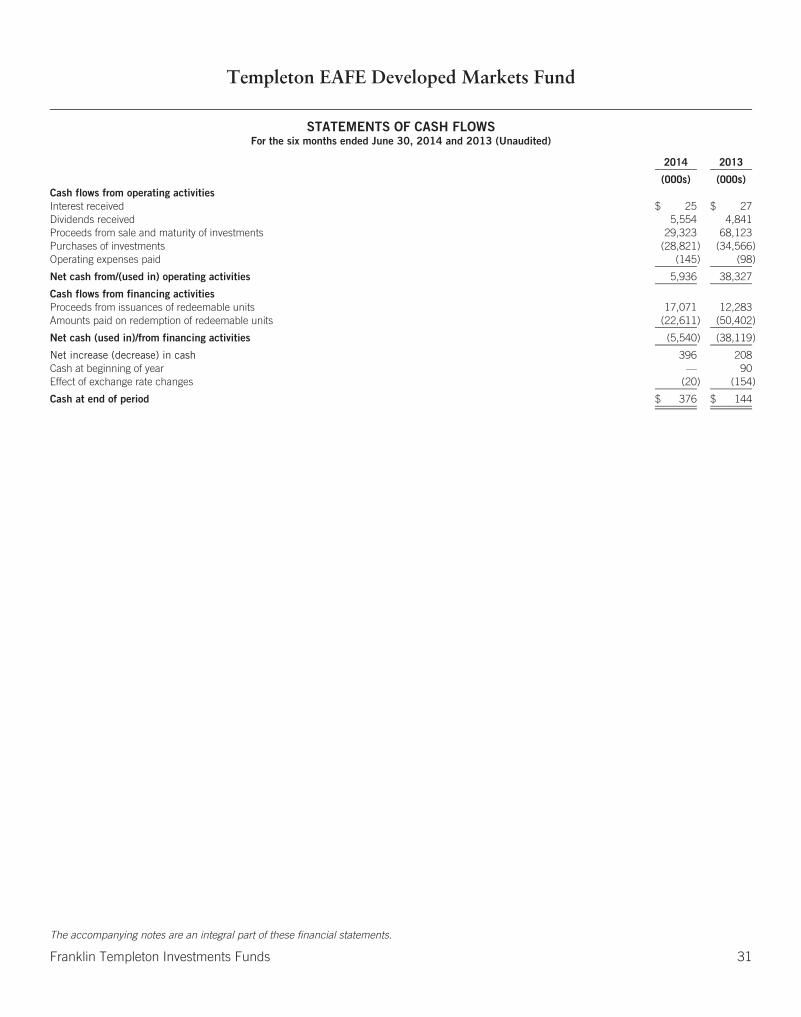
Templeton EAFE Developed Markets Fund
STATEMENTS OF CASH FLOWSFor the six months ended June 30, 2014 and 2013 (Unaudited)
2014 2013
(000s) (000s)Cash flows from operating activitiesInterest received $ 25 $ 27Dividends received 5,554 4,841Proceeds from sale and maturity of investments 29,323 68,123Purchases of investments (28,821) (34,566)Operating expenses paid (145) (98)
Net cash from/(used in) operating activities 5,936 38,327
Cash flows from financing activitiesProceeds from issuances of redeemable units 17,071 12,283Amounts paid on redemption of redeemable units (22,611) (50,402)
Net cash (used in)/from financing activities (5,540) (38,119)
Net increase (decrease) in cash 396 208Cash at beginning of year — 90Effect of exchange rate changes (20) (154)
Cash at end of period $ 376 $ 144
The accompanying notes are an integral part of these financial statements.
Franklin Templeton Investments Funds 31

Templeton Emerging Markets Fund
SCHEDULE OF INVESTMENTS As at June 30, 2014 (Unaudited)
SharesAverage
Cost Fair Value
(000s) (000s)
LONG-TERM INVESTMENTS: 97.20%COMMON STOCKS: 87.61%China: 16.30%
Bank of China Ltd., H . . . . . . . . . . . . . . . . . . . . . . . . . . . . . . . . . . . . . . . . . . . . . . . . . . . . . . . . . . . . . . . . . . . . . . . . . . . . . . . . . . . . . . . . 6,652,100 $ 3,514 $ 3,176Brilliance China Automotive Holdings Ltd. . . . . . . . . . . . . . . . . . . . . . . . . . . . . . . . . . . . . . . . . . . . . . . . . . . . . . . . . . . . . . . . . . . . . . . . . . 5,038,000 6,836 10,052China Mobile Ltd. . . . . . . . . . . . . . . . . . . . . . . . . . . . . . . . . . . . . . . . . . . . . . . . . . . . . . . . . . . . . . . . . . . . . . . . . . . . . . . . . . . . . . . . . . . 489,000 5,291 5,060China Petroleum and Chemical Corp., H . . . . . . . . . . . . . . . . . . . . . . . . . . . . . . . . . . . . . . . . . . . . . . . . . . . . . . . . . . . . . . . . . . . . . . . . . . 3,450,200 2,526 3,513CNOOC Ltd. . . . . . . . . . . . . . . . . . . . . . . . . . . . . . . . . . . . . . . . . . . . . . . . . . . . . . . . . . . . . . . . . . . . . . . . . . . . . . . . . . . . . . . . . . . . . . . 1,263,000 1,893 2,426COSCO Pacific Ltd. . . . . . . . . . . . . . . . . . . . . . . . . . . . . . . . . . . . . . . . . . . . . . . . . . . . . . . . . . . . . . . . . . . . . . . . . . . . . . . . . . . . . . . . . . 3,871,269 6,446 5,732Guangzhou Automobile Group Co. Ltd., H . . . . . . . . . . . . . . . . . . . . . . . . . . . . . . . . . . . . . . . . . . . . . . . . . . . . . . . . . . . . . . . . . . . . . . . . . 4,908,000 4,354 6,078NetEase Inc., American Depositary Receipt . . . . . . . . . . . . . . . . . . . . . . . . . . . . . . . . . . . . . . . . . . . . . . . . . . . . . . . . . . . . . . . . . . . . . . . . 31,041 2,364 2,594PetroChina Co. Ltd., H . . . . . . . . . . . . . . . . . . . . . . . . . . . . . . . . . . . . . . . . . . . . . . . . . . . . . . . . . . . . . . . . . . . . . . . . . . . . . . . . . . . . . . . 3,600,000 4,432 4,844Shanghai Prime Machinery Co. Ltd., H . . . . . . . . . . . . . . . . . . . . . . . . . . . . . . . . . . . . . . . . . . . . . . . . . . . . . . . . . . . . . . . . . . . . . . . . . . . 20,348,400 4,903 3,052Shenzhen Chiwan Wharf Holdings Ltd., B . . . . . . . . . . . . . . . . . . . . . . . . . . . . . . . . . . . . . . . . . . . . . . . . . . . . . . . . . . . . . . . . . . . . . . . . . 41,260 77 63Travelsky Technology Ltd., H . . . . . . . . . . . . . . . . . . . . . . . . . . . . . . . . . . . . . . . . . . . . . . . . . . . . . . . . . . . . . . . . . . . . . . . . . . . . . . . . . . 5,720,000 3,130 5,612Uni-President China Holdings Ltd. . . . . . . . . . . . . . . . . . . . . . . . . . . . . . . . . . . . . . . . . . . . . . . . . . . . . . . . . . . . . . . . . . . . . . . . . . . . . . . . 6,330,000 5,918 5,182
51,684 57,384
Indonesia: 8.38%Bank Danamon Indonesia Tbk PT . . . . . . . . . . . . . . . . . . . . . . . . . . . . . . . . . . . . . . . . . . . . . . . . . . . . . . . . . . . . . . . . . . . . . . . . . . . . . . . 15,886,387 7,724 5,924Bank Rakyat Indonesia Persero Tbk PT . . . . . . . . . . . . . . . . . . . . . . . . . . . . . . . . . . . . . . . . . . . . . . . . . . . . . . . . . . . . . . . . . . . . . . . . . . . 5,128,000 4,070 4,763Express Transindo Utama Tbk PT . . . . . . . . . . . . . . . . . . . . . . . . . . . . . . . . . . . . . . . . . . . . . . . . . . . . . . . . . . . . . . . . . . . . . . . . . . . . . . . 27,634,600 3,352 3,157Gudang Garam Tbk PT . . . . . . . . . . . . . . . . . . . . . . . . . . . . . . . . . . . . . . . . . . . . . . . . . . . . . . . . . . . . . . . . . . . . . . . . . . . . . . . . . . . . . . . 464,600 2,154 2,236Indo Tambangraya Megah Tbk PT . . . . . . . . . . . . . . . . . . . . . . . . . . . . . . . . . . . . . . . . . . . . . . . . . . . . . . . . . . . . . . . . . . . . . . . . . . . . . . . 1,159,500 3,582 2,816Indofood Sukses Makmur Tbk PT . . . . . . . . . . . . . . . . . . . . . . . . . . . . . . . . . . . . . . . . . . . . . . . . . . . . . . . . . . . . . . . . . . . . . . . . . . . . . . . 6,061,000 3,835 3,653Semen Indonesia (Persero) Tbk PT . . . . . . . . . . . . . . . . . . . . . . . . . . . . . . . . . . . . . . . . . . . . . . . . . . . . . . . . . . . . . . . . . . . . . . . . . . . . . . 2,508,500 3,081 3,402United Tractors Tbk PT . . . . . . . . . . . . . . . . . . . . . . . . . . . . . . . . . . . . . . . . . . . . . . . . . . . . . . . . . . . . . . . . . . . . . . . . . . . . . . . . . . . . . . 1,715,000 3,738 3,564
31,536 29,515
India: 8.07%Bajaj Holdings and Investment Ltd. . . . . . . . . . . . . . . . . . . . . . . . . . . . . . . . . . . . . . . . . . . . . . . . . . . . . . . . . . . . . . . . . . . . . . . . . . . . . . . 346,275 5,724 7,772ICICI Bank Ltd. . . . . . . . . . . . . . . . . . . . . . . . . . . . . . . . . . . . . . . . . . . . . . . . . . . . . . . . . . . . . . . . . . . . . . . . . . . . . . . . . . . . . . . . . . . . . 114,530 1,875 2,885Infosys Ltd. . . . . . . . . . . . . . . . . . . . . . . . . . . . . . . . . . . . . . . . . . . . . . . . . . . . . . . . . . . . . . . . . . . . . . . . . . . . . . . . . . . . . . . . . . . . . . . . 57,100 2,667 3,292Tata Chemicals Ltd. . . . . . . . . . . . . . . . . . . . . . . . . . . . . . . . . . . . . . . . . . . . . . . . . . . . . . . . . . . . . . . . . . . . . . . . . . . . . . . . . . . . . . . . . . 1,015,205 6,083 6,198Tata Consultancy Services Ltd. . . . . . . . . . . . . . . . . . . . . . . . . . . . . . . . . . . . . . . . . . . . . . . . . . . . . . . . . . . . . . . . . . . . . . . . . . . . . . . . . . 113,997 3,156 4,897Tata Investment Corp. Ltd. . . . . . . . . . . . . . . . . . . . . . . . . . . . . . . . . . . . . . . . . . . . . . . . . . . . . . . . . . . . . . . . . . . . . . . . . . . . . . . . . . . . . 328,750 3,053 3,383
22,558 28,427
South Korea: 7.55%Hite Jinro Co. Ltd. . . . . . . . . . . . . . . . . . . . . . . . . . . . . . . . . . . . . . . . . . . . . . . . . . . . . . . . . . . . . . . . . . . . . . . . . . . . . . . . . . . . . . . . . . . 159,716 4,051 3,694Hyundai Development Co. . . . . . . . . . . . . . . . . . . . . . . . . . . . . . . . . . . . . . . . . . . . . . . . . . . . . . . . . . . . . . . . . . . . . . . . . . . . . . . . . . . . . 82,330 2,212 2,789POSCO . . . . . . . . . . . . . . . . . . . . . . . . . . . . . . . . . . . . . . . . . . . . . . . . . . . . . . . . . . . . . . . . . . . . . . . . . . . . . . . . . . . . . . . . . . . . . . . . . . 11,002 4,042 3,525Samsung Electronics Co. Ltd. . . . . . . . . . . . . . . . . . . . . . . . . . . . . . . . . . . . . . . . . . . . . . . . . . . . . . . . . . . . . . . . . . . . . . . . . . . . . . . . . . . 10,265 8,477 14,301Samsung Heavy Industries Co. Ltd. . . . . . . . . . . . . . . . . . . . . . . . . . . . . . . . . . . . . . . . . . . . . . . . . . . . . . . . . . . . . . . . . . . . . . . . . . . . . . . 79,540 2,524 2,267
21,306 26,576
Brazil: 6.78%Ambev SA . . . . . . . . . . . . . . . . . . . . . . . . . . . . . . . . . . . . . . . . . . . . . . . . . . . . . . . . . . . . . . . . . . . . . . . . . . . . . . . . . . . . . . . . . . . . . . . . 998,010 5,641 7,589Ambev SA, International Depository Receipt . . . . . . . . . . . . . . . . . . . . . . . . . . . . . . . . . . . . . . . . . . . . . . . . . . . . . . . . . . . . . . . . . . . . . . . . 1,328 10 10Itau Unibanco Holding SA, American Depositary Receipt . . . . . . . . . . . . . . . . . . . . . . . . . . . . . . . . . . . . . . . . . . . . . . . . . . . . . . . . . . . . . . 685,412 10,828 10,511Lojas Americanas SA . . . . . . . . . . . . . . . . . . . . . . . . . . . . . . . . . . . . . . . . . . . . . . . . . . . . . . . . . . . . . . . . . . . . . . . . . . . . . . . . . . . . . . . . 984,375 4,992 5,757
21,471 23,867
The accompanying notes are an integral part of these financial statements.
32 Franklin Templeton Investments Funds
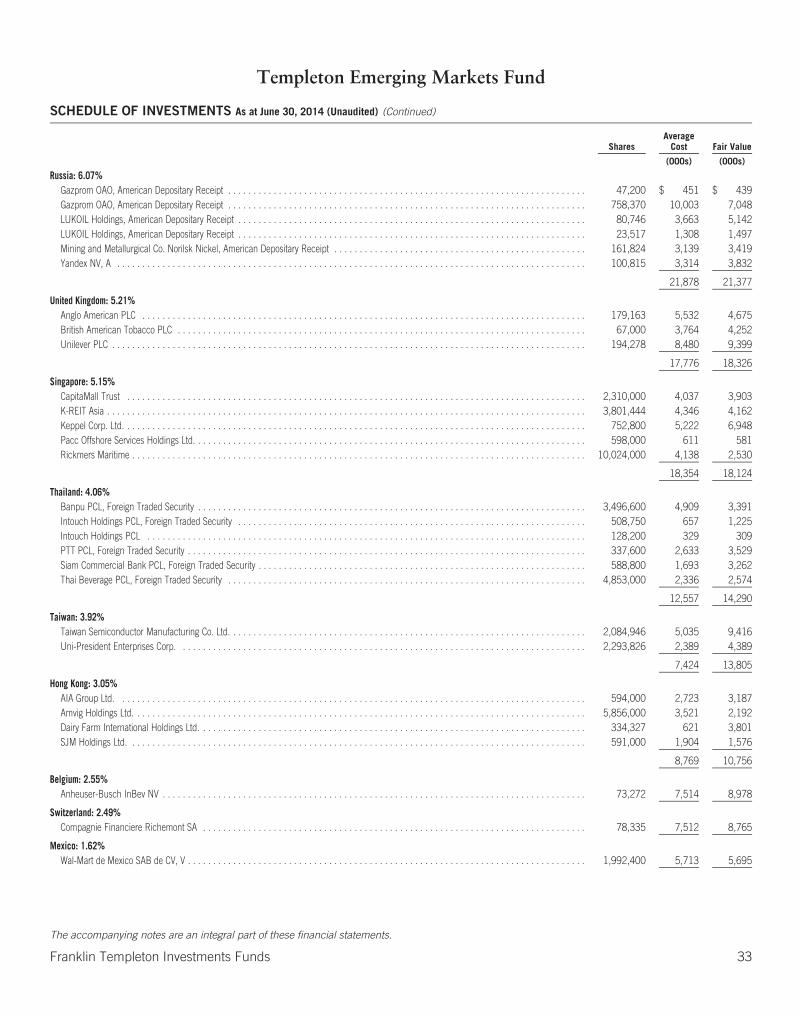
Templeton Emerging Markets Fund
SCHEDULE OF INVESTMENTS As at June 30, 2014 (Unaudited) (Continued)
SharesAverage
Cost Fair Value
(000s) (000s)
Russia: 6.07%Gazprom OAO, American Depositary Receipt . . . . . . . . . . . . . . . . . . . . . . . . . . . . . . . . . . . . . . . . . . . . . . . . . . . . . . . . . . . . . . . . . . . . . . . 47,200 $ 451 $ 439Gazprom OAO, American Depositary Receipt . . . . . . . . . . . . . . . . . . . . . . . . . . . . . . . . . . . . . . . . . . . . . . . . . . . . . . . . . . . . . . . . . . . . . . . 758,370 10,003 7,048LUKOIL Holdings, American Depositary Receipt . . . . . . . . . . . . . . . . . . . . . . . . . . . . . . . . . . . . . . . . . . . . . . . . . . . . . . . . . . . . . . . . . . . . . 80,746 3,663 5,142LUKOIL Holdings, American Depositary Receipt . . . . . . . . . . . . . . . . . . . . . . . . . . . . . . . . . . . . . . . . . . . . . . . . . . . . . . . . . . . . . . . . . . . . . 23,517 1,308 1,497Mining and Metallurgical Co. Norilsk Nickel, American Depositary Receipt . . . . . . . . . . . . . . . . . . . . . . . . . . . . . . . . . . . . . . . . . . . . . . . . . . 161,824 3,139 3,419Yandex NV, A . . . . . . . . . . . . . . . . . . . . . . . . . . . . . . . . . . . . . . . . . . . . . . . . . . . . . . . . . . . . . . . . . . . . . . . . . . . . . . . . . . . . . . . . . . . . . 100,815 3,314 3,832
21,878 21,377
United Kingdom: 5.21%Anglo American PLC . . . . . . . . . . . . . . . . . . . . . . . . . . . . . . . . . . . . . . . . . . . . . . . . . . . . . . . . . . . . . . . . . . . . . . . . . . . . . . . . . . . . . . . . 179,163 5,532 4,675British American Tobacco PLC . . . . . . . . . . . . . . . . . . . . . . . . . . . . . . . . . . . . . . . . . . . . . . . . . . . . . . . . . . . . . . . . . . . . . . . . . . . . . . . . . 67,000 3,764 4,252Unilever PLC . . . . . . . . . . . . . . . . . . . . . . . . . . . . . . . . . . . . . . . . . . . . . . . . . . . . . . . . . . . . . . . . . . . . . . . . . . . . . . . . . . . . . . . . . . . . . . 194,278 8,480 9,399
17,776 18,326
Singapore: 5.15%CapitaMall Trust . . . . . . . . . . . . . . . . . . . . . . . . . . . . . . . . . . . . . . . . . . . . . . . . . . . . . . . . . . . . . . . . . . . . . . . . . . . . . . . . . . . . . . . . . . . 2,310,000 4,037 3,903K-REIT Asia . . . . . . . . . . . . . . . . . . . . . . . . . . . . . . . . . . . . . . . . . . . . . . . . . . . . . . . . . . . . . . . . . . . . . . . . . . . . . . . . . . . . . . . . . . . . . . . 3,801,444 4,346 4,162Keppel Corp. Ltd. . . . . . . . . . . . . . . . . . . . . . . . . . . . . . . . . . . . . . . . . . . . . . . . . . . . . . . . . . . . . . . . . . . . . . . . . . . . . . . . . . . . . . . . . . . . 752,800 5,222 6,948Pacc Offshore Services Holdings Ltd. . . . . . . . . . . . . . . . . . . . . . . . . . . . . . . . . . . . . . . . . . . . . . . . . . . . . . . . . . . . . . . . . . . . . . . . . . . . . . 598,000 611 581Rickmers Maritime . . . . . . . . . . . . . . . . . . . . . . . . . . . . . . . . . . . . . . . . . . . . . . . . . . . . . . . . . . . . . . . . . . . . . . . . . . . . . . . . . . . . . . . . . . 10,024,000 4,138 2,530
18,354 18,124
Thailand: 4.06%Banpu PCL, Foreign Traded Security . . . . . . . . . . . . . . . . . . . . . . . . . . . . . . . . . . . . . . . . . . . . . . . . . . . . . . . . . . . . . . . . . . . . . . . . . . . . . 3,496,600 4,909 3,391Intouch Holdings PCL, Foreign Traded Security . . . . . . . . . . . . . . . . . . . . . . . . . . . . . . . . . . . . . . . . . . . . . . . . . . . . . . . . . . . . . . . . . . . . . 508,750 657 1,225Intouch Holdings PCL . . . . . . . . . . . . . . . . . . . . . . . . . . . . . . . . . . . . . . . . . . . . . . . . . . . . . . . . . . . . . . . . . . . . . . . . . . . . . . . . . . . . . . . 128,200 329 309PTT PCL, Foreign Traded Security . . . . . . . . . . . . . . . . . . . . . . . . . . . . . . . . . . . . . . . . . . . . . . . . . . . . . . . . . . . . . . . . . . . . . . . . . . . . . . . 337,600 2,633 3,529Siam Commercial Bank PCL, Foreign Traded Security . . . . . . . . . . . . . . . . . . . . . . . . . . . . . . . . . . . . . . . . . . . . . . . . . . . . . . . . . . . . . . . . . 588,800 1,693 3,262Thai Beverage PCL, Foreign Traded Security . . . . . . . . . . . . . . . . . . . . . . . . . . . . . . . . . . . . . . . . . . . . . . . . . . . . . . . . . . . . . . . . . . . . . . . 4,853,000 2,336 2,574
12,557 14,290
Taiwan: 3.92%Taiwan Semiconductor Manufacturing Co. Ltd. . . . . . . . . . . . . . . . . . . . . . . . . . . . . . . . . . . . . . . . . . . . . . . . . . . . . . . . . . . . . . . . . . . . . . . 2,084,946 5,035 9,416Uni-President Enterprises Corp. . . . . . . . . . . . . . . . . . . . . . . . . . . . . . . . . . . . . . . . . . . . . . . . . . . . . . . . . . . . . . . . . . . . . . . . . . . . . . . . . 2,293,826 2,389 4,389
7,424 13,805
Hong Kong: 3.05%AIA Group Ltd. . . . . . . . . . . . . . . . . . . . . . . . . . . . . . . . . . . . . . . . . . . . . . . . . . . . . . . . . . . . . . . . . . . . . . . . . . . . . . . . . . . . . . . . . . . . . 594,000 2,723 3,187Amvig Holdings Ltd. . . . . . . . . . . . . . . . . . . . . . . . . . . . . . . . . . . . . . . . . . . . . . . . . . . . . . . . . . . . . . . . . . . . . . . . . . . . . . . . . . . . . . . . . . 5,856,000 3,521 2,192Dairy Farm International Holdings Ltd. . . . . . . . . . . . . . . . . . . . . . . . . . . . . . . . . . . . . . . . . . . . . . . . . . . . . . . . . . . . . . . . . . . . . . . . . . . . . 334,327 621 3,801SJM Holdings Ltd. . . . . . . . . . . . . . . . . . . . . . . . . . . . . . . . . . . . . . . . . . . . . . . . . . . . . . . . . . . . . . . . . . . . . . . . . . . . . . . . . . . . . . . . . . . 591,000 1,904 1,576
8,769 10,756
Belgium: 2.55%Anheuser-Busch InBev NV . . . . . . . . . . . . . . . . . . . . . . . . . . . . . . . . . . . . . . . . . . . . . . . . . . . . . . . . . . . . . . . . . . . . . . . . . . . . . . . . . . . . 73,272 7,514 8,978
Switzerland: 2.49%Compagnie Financiere Richemont SA . . . . . . . . . . . . . . . . . . . . . . . . . . . . . . . . . . . . . . . . . . . . . . . . . . . . . . . . . . . . . . . . . . . . . . . . . . . . 78,335 7,512 8,765
Mexico: 1.62%Wal-Mart de Mexico SAB de CV, V . . . . . . . . . . . . . . . . . . . . . . . . . . . . . . . . . . . . . . . . . . . . . . . . . . . . . . . . . . . . . . . . . . . . . . . . . . . . . . . 1,992,400 5,713 5,695
The accompanying notes are an integral part of these financial statements.
Franklin Templeton Investments Funds 33
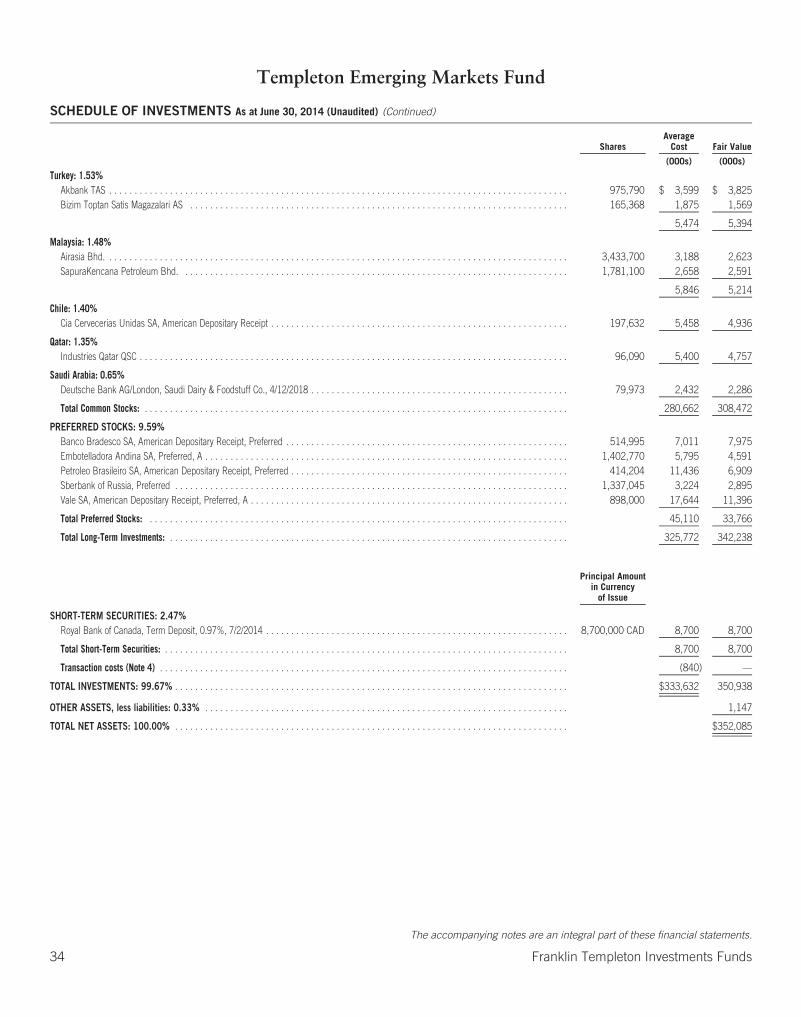
Templeton Emerging Markets Fund
SCHEDULE OF INVESTMENTS As at June 30, 2014 (Unaudited) (Continued)
SharesAverage
Cost Fair Value
(000s) (000s)
Turkey: 1.53%Akbank TAS . . . . . . . . . . . . . . . . . . . . . . . . . . . . . . . . . . . . . . . . . . . . . . . . . . . . . . . . . . . . . . . . . . . . . . . . . . . . . . . . . . . . . . . . . . . 975,790 $ 3,599 $ 3,825Bizim Toptan Satis Magazalari AS . . . . . . . . . . . . . . . . . . . . . . . . . . . . . . . . . . . . . . . . . . . . . . . . . . . . . . . . . . . . . . . . . . . . . . . . . . . 165,368 1,875 1,569
5,474 5,394
Malaysia: 1.48%Airasia Bhd. . . . . . . . . . . . . . . . . . . . . . . . . . . . . . . . . . . . . . . . . . . . . . . . . . . . . . . . . . . . . . . . . . . . . . . . . . . . . . . . . . . . . . . . . . . . 3,433,700 3,188 2,623SapuraKencana Petroleum Bhd. . . . . . . . . . . . . . . . . . . . . . . . . . . . . . . . . . . . . . . . . . . . . . . . . . . . . . . . . . . . . . . . . . . . . . . . . . . . . 1,781,100 2,658 2,591
5,846 5,214
Chile: 1.40%Cia Cervecerias Unidas SA, American Depositary Receipt . . . . . . . . . . . . . . . . . . . . . . . . . . . . . . . . . . . . . . . . . . . . . . . . . . . . . . . . . . . 197,632 5,458 4,936
Qatar: 1.35%Industries Qatar QSC . . . . . . . . . . . . . . . . . . . . . . . . . . . . . . . . . . . . . . . . . . . . . . . . . . . . . . . . . . . . . . . . . . . . . . . . . . . . . . . . . . . . . 96,090 5,400 4,757
Saudi Arabia: 0.65%Deutsche Bank AG/London, Saudi Dairy & Foodstuff Co., 4/12/2018 . . . . . . . . . . . . . . . . . . . . . . . . . . . . . . . . . . . . . . . . . . . . . . . . . . . 79,973 2,432 2,286
Total Common Stocks: . . . . . . . . . . . . . . . . . . . . . . . . . . . . . . . . . . . . . . . . . . . . . . . . . . . . . . . . . . . . . . . . . . . . . . . . . . . . . . . . . . . . 280,662 308,472
PREFERRED STOCKS: 9.59%Banco Bradesco SA, American Depositary Receipt, Preferred . . . . . . . . . . . . . . . . . . . . . . . . . . . . . . . . . . . . . . . . . . . . . . . . . . . . . . . . 514,995 7,011 7,975Embotelladora Andina SA, Preferred, A . . . . . . . . . . . . . . . . . . . . . . . . . . . . . . . . . . . . . . . . . . . . . . . . . . . . . . . . . . . . . . . . . . . . . . . . 1,402,770 5,795 4,591Petroleo Brasileiro SA, American Depositary Receipt, Preferred . . . . . . . . . . . . . . . . . . . . . . . . . . . . . . . . . . . . . . . . . . . . . . . . . . . . . . . 414,204 11,436 6,909Sberbank of Russia, Preferred . . . . . . . . . . . . . . . . . . . . . . . . . . . . . . . . . . . . . . . . . . . . . . . . . . . . . . . . . . . . . . . . . . . . . . . . . . . . . . 1,337,045 3,224 2,895Vale SA, American Depositary Receipt, Preferred, A . . . . . . . . . . . . . . . . . . . . . . . . . . . . . . . . . . . . . . . . . . . . . . . . . . . . . . . . . . . . . . . 898,000 17,644 11,396
Total Preferred Stocks: . . . . . . . . . . . . . . . . . . . . . . . . . . . . . . . . . . . . . . . . . . . . . . . . . . . . . . . . . . . . . . . . . . . . . . . . . . . . . . . . . . . 45,110 33,766
Total Long-Term Investments: . . . . . . . . . . . . . . . . . . . . . . . . . . . . . . . . . . . . . . . . . . . . . . . . . . . . . . . . . . . . . . . . . . . . . . . . . . . . . . . 325,772 342,238
Principal Amountin Currency
of Issue
SHORT-TERM SECURITIES: 2.47%Royal Bank of Canada, Term Deposit, 0.97%, 7/2/2014 . . . . . . . . . . . . . . . . . . . . . . . . . . . . . . . . . . . . . . . . . . . . . . . . . . . . . . . . . . . . 8,700,000 CAD 8,700 8,700
Total Short-Term Securities: . . . . . . . . . . . . . . . . . . . . . . . . . . . . . . . . . . . . . . . . . . . . . . . . . . . . . . . . . . . . . . . . . . . . . . . . . . . . . . . . 8,700 8,700
Transaction costs (Note 4) . . . . . . . . . . . . . . . . . . . . . . . . . . . . . . . . . . . . . . . . . . . . . . . . . . . . . . . . . . . . . . . . . . . . . . . . . . . . . . . . . (840) —
TOTAL INVESTMENTS: 99.67% . . . . . . . . . . . . . . . . . . . . . . . . . . . . . . . . . . . . . . . . . . . . . . . . . . . . . . . . . . . . . . . . . . . . . . . . . . . . . . $333,632 350,938
OTHER ASSETS, less liabilities: 0.33% . . . . . . . . . . . . . . . . . . . . . . . . . . . . . . . . . . . . . . . . . . . . . . . . . . . . . . . . . . . . . . . . . . . . . . . . 1,147
TOTAL NET ASSETS: 100.00% . . . . . . . . . . . . . . . . . . . . . . . . . . . . . . . . . . . . . . . . . . . . . . . . . . . . . . . . . . . . . . . . . . . . . . . . . . . . . . $352,085
The accompanying notes are an integral part of these financial statements.
34 Franklin Templeton Investments Funds

Templeton Emerging Markets Fund
STATEMENTS OF FINANCIAL POSITION (Unaudited)
As atJune 30,
2014
As atDecember 31,
2013
As atJanuary 1,
2013
(000s) (000s) (000s)AssetsCurrent assetsInvestments at fair value through profit or loss $ 350,938 $ 320,095 $ 370,860Cash
Canadian 88 45 32Foreign 13 6 —
ReceivablesInvestment securities sold 150 916 9Subscription of redeemable units 832 22 37Dividends, interest and withholding tax 1,059 414 632
Other assets (Note 6(g)) — 157 68
Total assets 353,080 321,655 371,638
LiabilitiesCurrent liabilitiesPayables
Investment securities purchased 3 371 5,329Redemption of redeemable units 237 100 239Management fees 372 421 602Fixed administration fees 50 — —Foreign capital taxes payable 287 121 5Accrued expenses — 251 213
Distributions to unitholders 46 — —
Total liabilities 995 1,264 6,388
Net assets attributable to holders of redeemable units $ 352,085 $ 320,391 $ 365,250
Represented by:Net assets as previously reported under Canadian GAAP — 319,529 364,501Revaluation of investments at fair value through profit or loss (Note 3(c)) — 862 749
Net assets attributable to holders of redeemable units $ 352,085 $ 320,391 $ 365,250
Net assets attributable to holders of redeemable units per series (000s)Series A $ 147,196 $ 154,312 $ 184,593Series F 7,476 7,230 7,667Series I 1,250 1,288 385Series O 196,163 157,561 172,605
Number of redeemable units outstanding (Note 5)Series A 15,490,124 17,362,915 19,414,729Series F 671,989 698,563 699,910Series I 118,624 131,012 36,835Series O 13,078,609 11,391,885 12,011,332
Net assets attributable to holders of redeemable units per unit — CADSeries A $ 9.50 $ 8.89 $ 9.51Series F 11.13 10.35 10.95Series I 10.54 9.83 10.47Series O 15.00 13.83 14.37
Net assets attributable to holders of redeemable units per unit — USDSeries A $ 8.91 $ 8.37 $ 9.57Series F 10.44 9.74 11.02Series I 9.88 9.25 10.54Series O 14.07 13.02 14.47
Cost of investments held (000s) $ 333,632 $ 317,681 $ 346,126
The accompanying notes are an integral part of these financial statements.
Franklin Templeton Investments Funds 35
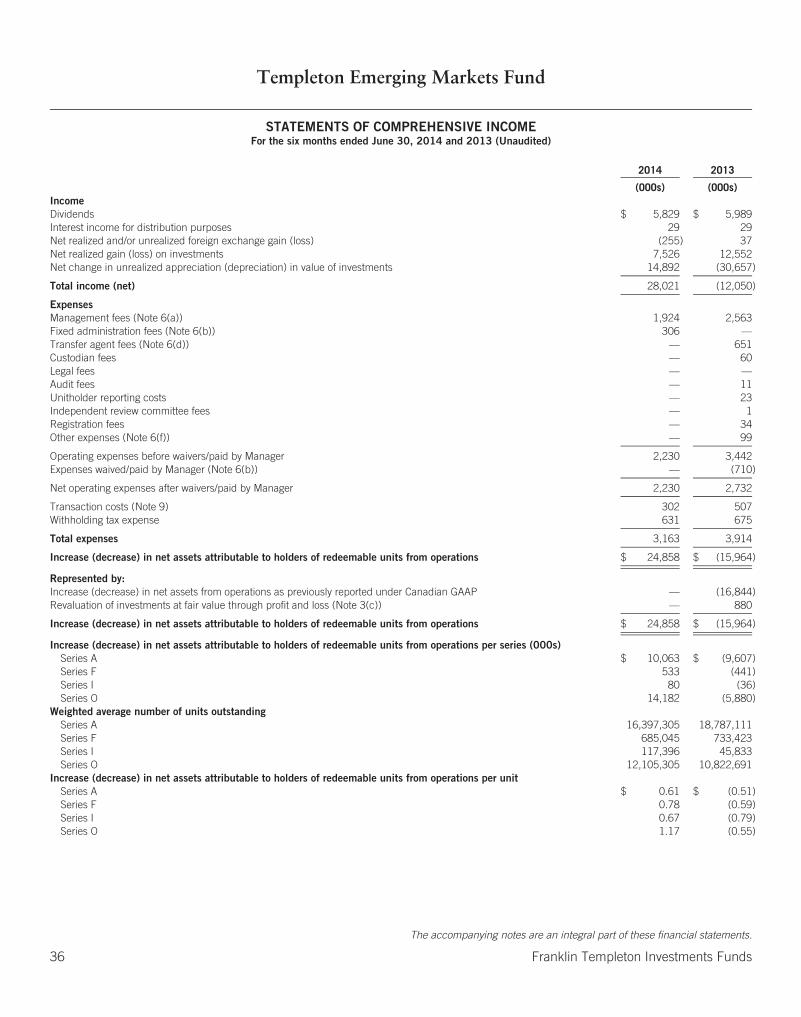
Templeton Emerging Markets Fund
STATEMENTS OF COMPREHENSIVE INCOMEFor the six months ended June 30, 2014 and 2013 (Unaudited)
2014 2013
(000s) (000s)IncomeDividends $ 5,829 $ 5,989Interest income for distribution purposes 29 29Net realized and/or unrealized foreign exchange gain (loss) (255) 37Net realized gain (loss) on investments 7,526 12,552Net change in unrealized appreciation (depreciation) in value of investments 14,892 (30,657)
Total income (net) 28,021 (12,050)
ExpensesManagement fees (Note 6(a)) 1,924 2,563Fixed administration fees (Note 6(b)) 306 —Transfer agent fees (Note 6(d)) — 651Custodian fees — 60Legal fees — —Audit fees — 11Unitholder reporting costs — 23Independent review committee fees — 1Registration fees — 34Other expenses (Note 6(f)) — 99
Operating expenses before waivers/paid by Manager 2,230 3,442Expenses waived/paid by Manager (Note 6(b)) — (710)
Net operating expenses after waivers/paid by Manager 2,230 2,732
Transaction costs (Note 9) 302 507Withholding tax expense 631 675
Total expenses 3,163 3,914
Increase (decrease) in net assets attributable to holders of redeemable units from operations $ 24,858 $ (15,964)
Represented by:Increase (decrease) in net assets from operations as previously reported under Canadian GAAP — (16,844)Revaluation of investments at fair value through profit and loss (Note 3(c)) — 880
Increase (decrease) in net assets attributable to holders of redeemable units from operations $ 24,858 $ (15,964)
Increase (decrease) in net assets attributable to holders of redeemable units from operations per series (000s)Series A $ 10,063 $ (9,607)Series F 533 (441)Series I 80 (36)Series O 14,182 (5,880)
Weighted average number of units outstandingSeries A 16,397,305 18,787,111Series F 685,045 733,423Series I 117,396 45,833Series O 12,105,305 10,822,691
Increase (decrease) in net assets attributable to holders of redeemable units from operations per unitSeries A $ 0.61 $ (0.51)Series F 0.78 (0.59)Series I 0.67 (0.79)Series O 1.17 (0.55)
The accompanying notes are an integral part of these financial statements.
36 Franklin Templeton Investments Funds
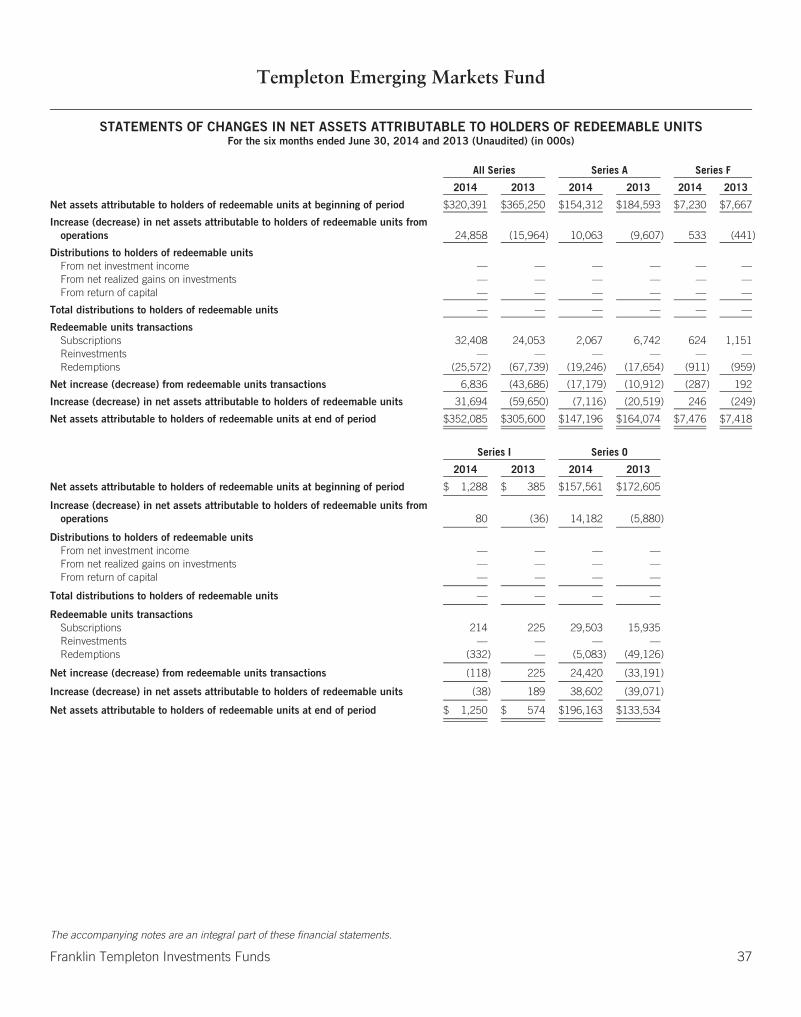
Templeton Emerging Markets Fund
STATEMENTS OF CHANGES IN NET ASSETS ATTRIBUTABLE TO HOLDERS OF REDEEMABLE UNITSFor the six months ended June 30, 2014 and 2013 (Unaudited) (in 000s)
All Series Series A Series F
2014 2013 2014 2013 2014 2013
Net assets attributable to holders of redeemable units at beginning of period $320,391 $365,250 $154,312 $184,593 $7,230 $7,667
Increase (decrease) in net assets attributable to holders of redeemable units fromoperations 24,858 (15,964) 10,063 (9,607) 533 (441)
Distributions to holders of redeemable unitsFrom net investment income — — — — — —From net realized gains on investments — — — — — —From return of capital — — — — — —
Total distributions to holders of redeemable units — — — — — —
Redeemable units transactionsSubscriptions 32,408 24,053 2,067 6,742 624 1,151Reinvestments — — — — — —Redemptions (25,572) (67,739) (19,246) (17,654) (911) (959)
Net increase (decrease) from redeemable units transactions 6,836 (43,686) (17,179) (10,912) (287) 192
Increase (decrease) in net assets attributable to holders of redeemable units 31,694 (59,650) (7,116) (20,519) 246 (249)
Net assets attributable to holders of redeemable units at end of period $352,085 $305,600 $147,196 $164,074 $7,476 $7,418
Series I Series O
2014 2013 2014 2013
Net assets attributable to holders of redeemable units at beginning of period $ 1,288 $ 385 $157,561 $172,605
Increase (decrease) in net assets attributable to holders of redeemable units fromoperations 80 (36) 14,182 (5,880)
Distributions to holders of redeemable unitsFrom net investment income — — — —From net realized gains on investments — — — —From return of capital — — — —
Total distributions to holders of redeemable units — — — —
Redeemable units transactionsSubscriptions 214 225 29,503 15,935Reinvestments — — — —Redemptions (332) — (5,083) (49,126)
Net increase (decrease) from redeemable units transactions (118) 225 24,420 (33,191)
Increase (decrease) in net assets attributable to holders of redeemable units (38) 189 38,602 (39,071)
Net assets attributable to holders of redeemable units at end of period $ 1,250 $ 574 $196,163 $133,534
The accompanying notes are an integral part of these financial statements.
Franklin Templeton Investments Funds 37

Templeton Emerging Markets Fund
STATEMENTS OF CASH FLOWSFor the six months ended June 30, 2014 and 2013 (Unaudited)
2014 2013
(000s) (000s)Cash flows from operating activitiesInterest received $ 29 $ 30Dividends received 4,560 3,754Proceeds from sale and maturity of investments 51,987 126,094Purchases of investments (60,368) (81,602)Net receipts/(payments) from derivative activities — (7)Operating expenses paid (2,322) (2,813)
Net cash from/(used in) operating activities (6,114) 45,456
Cash flows from financing activitiesProceeds from issuances of redeemable units 31,597 23,477Amounts paid on redemption of redeemable units (25,435) (67,693)Distributions paid to holders of redeemable units, net of reinvested distributions 45 —
Net cash (used in)/from financing activities 6,207 (44,216)
Net increase (decrease) in cash 93 1,240Cash at beginning of year 51 32Effect of exchange rate changes (43) (166)
Cash at end of period $ 101 $ 1,106
The accompanying notes are an integral part of these financial statements.
38 Franklin Templeton Investments Funds
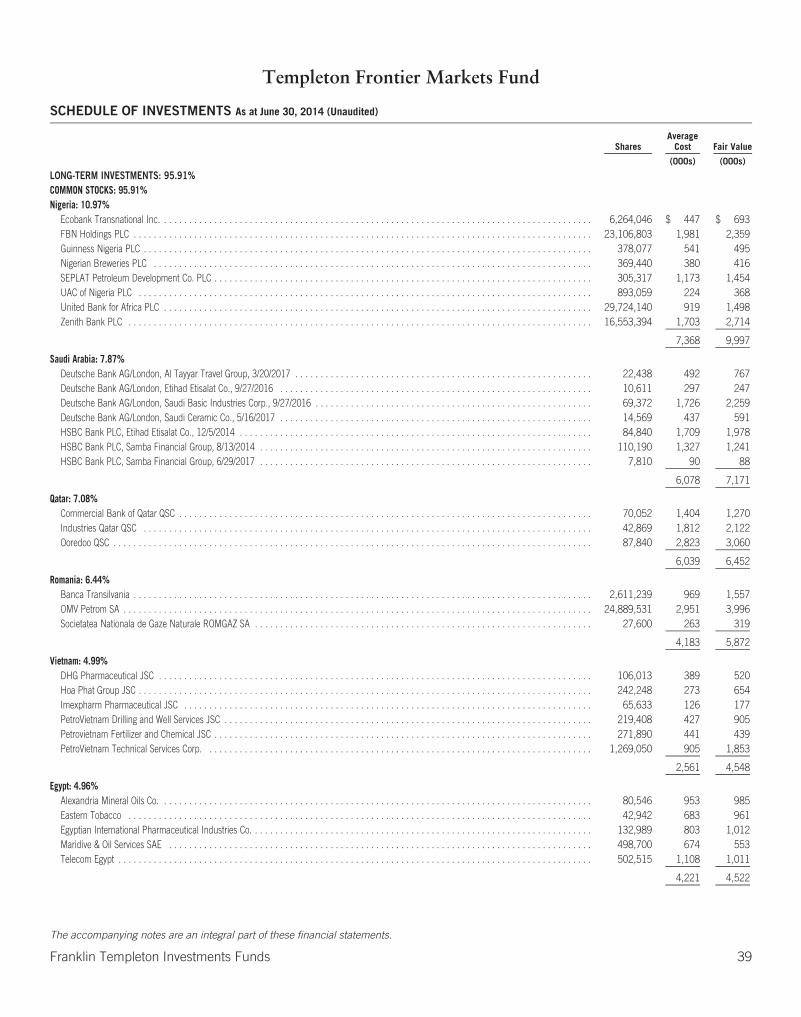
Templeton Frontier Markets Fund
SCHEDULE OF INVESTMENTS As at June 30, 2014 (Unaudited)
SharesAverage
Cost Fair Value
(000s) (000s)
LONG-TERM INVESTMENTS: 95.91%COMMON STOCKS: 95.91%Nigeria: 10.97%
Ecobank Transnational Inc. . . . . . . . . . . . . . . . . . . . . . . . . . . . . . . . . . . . . . . . . . . . . . . . . . . . . . . . . . . . . . . . . . . . . . . . . . . . . . . . . . . . . . 6,264,046 $ 447 $ 693FBN Holdings PLC . . . . . . . . . . . . . . . . . . . . . . . . . . . . . . . . . . . . . . . . . . . . . . . . . . . . . . . . . . . . . . . . . . . . . . . . . . . . . . . . . . . . . . . . . . . 23,106,803 1,981 2,359Guinness Nigeria PLC . . . . . . . . . . . . . . . . . . . . . . . . . . . . . . . . . . . . . . . . . . . . . . . . . . . . . . . . . . . . . . . . . . . . . . . . . . . . . . . . . . . . . . . . . 378,077 541 495Nigerian Breweries PLC . . . . . . . . . . . . . . . . . . . . . . . . . . . . . . . . . . . . . . . . . . . . . . . . . . . . . . . . . . . . . . . . . . . . . . . . . . . . . . . . . . . . . . . 369,440 380 416SEPLAT Petroleum Development Co. PLC . . . . . . . . . . . . . . . . . . . . . . . . . . . . . . . . . . . . . . . . . . . . . . . . . . . . . . . . . . . . . . . . . . . . . . . . . . . 305,317 1,173 1,454UAC of Nigeria PLC . . . . . . . . . . . . . . . . . . . . . . . . . . . . . . . . . . . . . . . . . . . . . . . . . . . . . . . . . . . . . . . . . . . . . . . . . . . . . . . . . . . . . . . . . . 893,059 224 368United Bank for Africa PLC . . . . . . . . . . . . . . . . . . . . . . . . . . . . . . . . . . . . . . . . . . . . . . . . . . . . . . . . . . . . . . . . . . . . . . . . . . . . . . . . . . . . . 29,724,140 919 1,498Zenith Bank PLC . . . . . . . . . . . . . . . . . . . . . . . . . . . . . . . . . . . . . . . . . . . . . . . . . . . . . . . . . . . . . . . . . . . . . . . . . . . . . . . . . . . . . . . . . . . . 16,553,394 1,703 2,714
7,368 9,997
Saudi Arabia: 7.87%Deutsche Bank AG/London, Al Tayyar Travel Group, 3/20/2017 . . . . . . . . . . . . . . . . . . . . . . . . . . . . . . . . . . . . . . . . . . . . . . . . . . . . . . . . . . . 22,438 492 767Deutsche Bank AG/London, Etihad Etisalat Co., 9/27/2016 . . . . . . . . . . . . . . . . . . . . . . . . . . . . . . . . . . . . . . . . . . . . . . . . . . . . . . . . . . . . . . 10,611 297 247Deutsche Bank AG/London, Saudi Basic Industries Corp., 9/27/2016 . . . . . . . . . . . . . . . . . . . . . . . . . . . . . . . . . . . . . . . . . . . . . . . . . . . . . . . 69,372 1,726 2,259Deutsche Bank AG/London, Saudi Ceramic Co., 5/16/2017 . . . . . . . . . . . . . . . . . . . . . . . . . . . . . . . . . . . . . . . . . . . . . . . . . . . . . . . . . . . . . . 14,569 437 591HSBC Bank PLC, Etihad Etisalat Co., 12/5/2014 . . . . . . . . . . . . . . . . . . . . . . . . . . . . . . . . . . . . . . . . . . . . . . . . . . . . . . . . . . . . . . . . . . . . . . 84,840 1,709 1,978HSBC Bank PLC, Samba Financial Group, 8/13/2014 . . . . . . . . . . . . . . . . . . . . . . . . . . . . . . . . . . . . . . . . . . . . . . . . . . . . . . . . . . . . . . . . . . 110,190 1,327 1,241HSBC Bank PLC, Samba Financial Group, 6/29/2017 . . . . . . . . . . . . . . . . . . . . . . . . . . . . . . . . . . . . . . . . . . . . . . . . . . . . . . . . . . . . . . . . . . 7,810 90 88
6,078 7,171
Qatar: 7.08%Commercial Bank of Qatar QSC . . . . . . . . . . . . . . . . . . . . . . . . . . . . . . . . . . . . . . . . . . . . . . . . . . . . . . . . . . . . . . . . . . . . . . . . . . . . . . . . . . 70,052 1,404 1,270Industries Qatar QSC . . . . . . . . . . . . . . . . . . . . . . . . . . . . . . . . . . . . . . . . . . . . . . . . . . . . . . . . . . . . . . . . . . . . . . . . . . . . . . . . . . . . . . . . . 42,869 1,812 2,122Ooredoo QSC . . . . . . . . . . . . . . . . . . . . . . . . . . . . . . . . . . . . . . . . . . . . . . . . . . . . . . . . . . . . . . . . . . . . . . . . . . . . . . . . . . . . . . . . . . . . . . . 87,840 2,823 3,060
6,039 6,452
Romania: 6.44%Banca Transilvania . . . . . . . . . . . . . . . . . . . . . . . . . . . . . . . . . . . . . . . . . . . . . . . . . . . . . . . . . . . . . . . . . . . . . . . . . . . . . . . . . . . . . . . . . . . 2,611,239 969 1,557OMV Petrom SA . . . . . . . . . . . . . . . . . . . . . . . . . . . . . . . . . . . . . . . . . . . . . . . . . . . . . . . . . . . . . . . . . . . . . . . . . . . . . . . . . . . . . . . . . . . . . 24,889,531 2,951 3,996Societatea Nationala de Gaze Naturale ROMGAZ SA . . . . . . . . . . . . . . . . . . . . . . . . . . . . . . . . . . . . . . . . . . . . . . . . . . . . . . . . . . . . . . . . . . . 27,600 263 319
4,183 5,872
Vietnam: 4.99%DHG Pharmaceutical JSC . . . . . . . . . . . . . . . . . . . . . . . . . . . . . . . . . . . . . . . . . . . . . . . . . . . . . . . . . . . . . . . . . . . . . . . . . . . . . . . . . . . . . . 106,013 389 520Hoa Phat Group JSC . . . . . . . . . . . . . . . . . . . . . . . . . . . . . . . . . . . . . . . . . . . . . . . . . . . . . . . . . . . . . . . . . . . . . . . . . . . . . . . . . . . . . . . . . . 242,248 273 654Imexpharm Pharmaceutical JSC . . . . . . . . . . . . . . . . . . . . . . . . . . . . . . . . . . . . . . . . . . . . . . . . . . . . . . . . . . . . . . . . . . . . . . . . . . . . . . . . . 65,633 126 177PetroVietnam Drilling and Well Services JSC . . . . . . . . . . . . . . . . . . . . . . . . . . . . . . . . . . . . . . . . . . . . . . . . . . . . . . . . . . . . . . . . . . . . . . . . . 219,408 427 905Petrovietnam Fertilizer and Chemical JSC . . . . . . . . . . . . . . . . . . . . . . . . . . . . . . . . . . . . . . . . . . . . . . . . . . . . . . . . . . . . . . . . . . . . . . . . . . . 271,890 441 439PetroVietnam Technical Services Corp. . . . . . . . . . . . . . . . . . . . . . . . . . . . . . . . . . . . . . . . . . . . . . . . . . . . . . . . . . . . . . . . . . . . . . . . . . . . . 1,269,050 905 1,853
2,561 4,548
Egypt: 4.96%Alexandria Mineral Oils Co. . . . . . . . . . . . . . . . . . . . . . . . . . . . . . . . . . . . . . . . . . . . . . . . . . . . . . . . . . . . . . . . . . . . . . . . . . . . . . . . . . . . . . 80,546 953 985Eastern Tobacco . . . . . . . . . . . . . . . . . . . . . . . . . . . . . . . . . . . . . . . . . . . . . . . . . . . . . . . . . . . . . . . . . . . . . . . . . . . . . . . . . . . . . . . . . . . . 42,942 683 961Egyptian International Pharmaceutical Industries Co. . . . . . . . . . . . . . . . . . . . . . . . . . . . . . . . . . . . . . . . . . . . . . . . . . . . . . . . . . . . . . . . . . . . 132,989 803 1,012Maridive & Oil Services SAE . . . . . . . . . . . . . . . . . . . . . . . . . . . . . . . . . . . . . . . . . . . . . . . . . . . . . . . . . . . . . . . . . . . . . . . . . . . . . . . . . . . . 498,700 674 553Telecom Egypt . . . . . . . . . . . . . . . . . . . . . . . . . . . . . . . . . . . . . . . . . . . . . . . . . . . . . . . . . . . . . . . . . . . . . . . . . . . . . . . . . . . . . . . . . . . . . . 502,515 1,108 1,011
4,221 4,522
The accompanying notes are an integral part of these financial statements.
Franklin Templeton Investments Funds 39
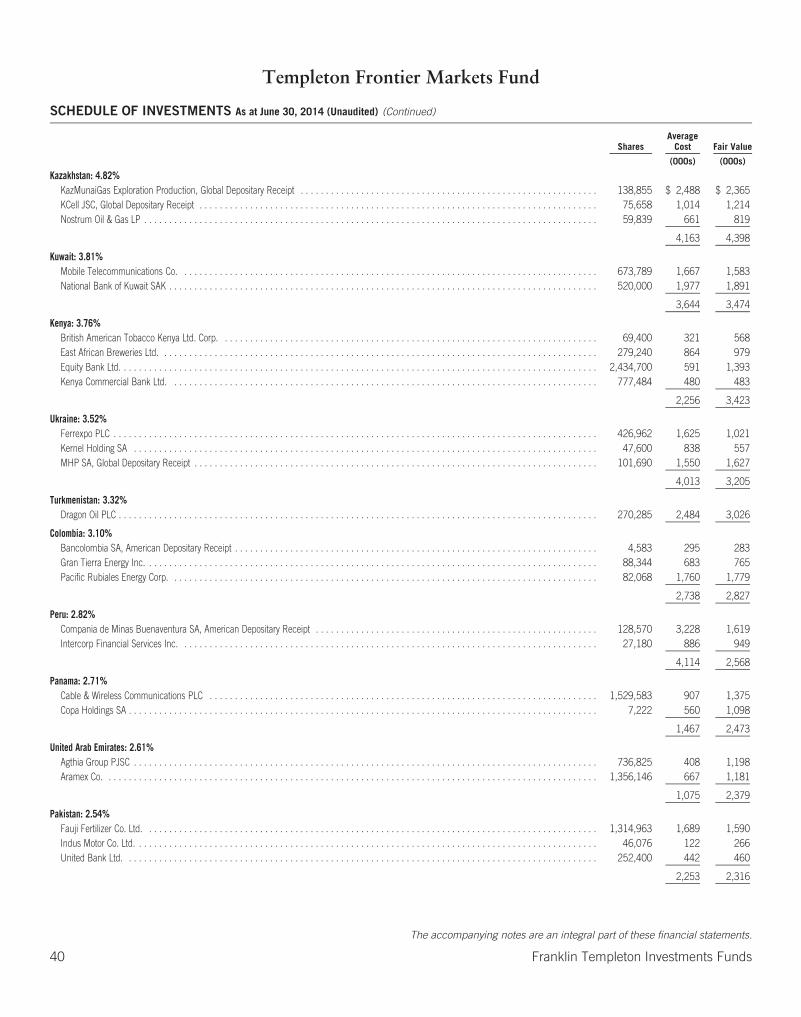
Templeton Frontier Markets Fund
SCHEDULE OF INVESTMENTS As at June 30, 2014 (Unaudited) (Continued)
SharesAverage
Cost Fair Value
(000s) (000s)
Kazakhstan: 4.82%KazMunaiGas Exploration Production, Global Depositary Receipt . . . . . . . . . . . . . . . . . . . . . . . . . . . . . . . . . . . . . . . . . . . . . . . . . . . . . . . . . . . 138,855 $ 2,488 $ 2,365KCell JSC, Global Depositary Receipt . . . . . . . . . . . . . . . . . . . . . . . . . . . . . . . . . . . . . . . . . . . . . . . . . . . . . . . . . . . . . . . . . . . . . . . . . . . . . . . 75,658 1,014 1,214Nostrum Oil & Gas LP . . . . . . . . . . . . . . . . . . . . . . . . . . . . . . . . . . . . . . . . . . . . . . . . . . . . . . . . . . . . . . . . . . . . . . . . . . . . . . . . . . . . . . . . . . 59,839 661 819
4,163 4,398
Kuwait: 3.81%Mobile Telecommunications Co. . . . . . . . . . . . . . . . . . . . . . . . . . . . . . . . . . . . . . . . . . . . . . . . . . . . . . . . . . . . . . . . . . . . . . . . . . . . . . . . . . . 673,789 1,667 1,583National Bank of Kuwait SAK . . . . . . . . . . . . . . . . . . . . . . . . . . . . . . . . . . . . . . . . . . . . . . . . . . . . . . . . . . . . . . . . . . . . . . . . . . . . . . . . . . . . . 520,000 1,977 1,891
3,644 3,474
Kenya: 3.76%British American Tobacco Kenya Ltd. Corp. . . . . . . . . . . . . . . . . . . . . . . . . . . . . . . . . . . . . . . . . . . . . . . . . . . . . . . . . . . . . . . . . . . . . . . . . . . 69,400 321 568East African Breweries Ltd. . . . . . . . . . . . . . . . . . . . . . . . . . . . . . . . . . . . . . . . . . . . . . . . . . . . . . . . . . . . . . . . . . . . . . . . . . . . . . . . . . . . . . . 279,240 864 979Equity Bank Ltd. . . . . . . . . . . . . . . . . . . . . . . . . . . . . . . . . . . . . . . . . . . . . . . . . . . . . . . . . . . . . . . . . . . . . . . . . . . . . . . . . . . . . . . . . . . . . . . 2,434,700 591 1,393Kenya Commercial Bank Ltd. . . . . . . . . . . . . . . . . . . . . . . . . . . . . . . . . . . . . . . . . . . . . . . . . . . . . . . . . . . . . . . . . . . . . . . . . . . . . . . . . . . . . 777,484 480 483
2,256 3,423
Ukraine: 3.52%Ferrexpo PLC . . . . . . . . . . . . . . . . . . . . . . . . . . . . . . . . . . . . . . . . . . . . . . . . . . . . . . . . . . . . . . . . . . . . . . . . . . . . . . . . . . . . . . . . . . . . . . . . 426,962 1,625 1,021Kernel Holding SA . . . . . . . . . . . . . . . . . . . . . . . . . . . . . . . . . . . . . . . . . . . . . . . . . . . . . . . . . . . . . . . . . . . . . . . . . . . . . . . . . . . . . . . . . . . . 47,600 838 557MHP SA, Global Depositary Receipt . . . . . . . . . . . . . . . . . . . . . . . . . . . . . . . . . . . . . . . . . . . . . . . . . . . . . . . . . . . . . . . . . . . . . . . . . . . . . . . . 101,690 1,550 1,627
4,013 3,205
Turkmenistan: 3.32%Dragon Oil PLC . . . . . . . . . . . . . . . . . . . . . . . . . . . . . . . . . . . . . . . . . . . . . . . . . . . . . . . . . . . . . . . . . . . . . . . . . . . . . . . . . . . . . . . . . . . . . . . 270,285 2,484 3,026
Colombia: 3.10%Bancolombia SA, American Depositary Receipt . . . . . . . . . . . . . . . . . . . . . . . . . . . . . . . . . . . . . . . . . . . . . . . . . . . . . . . . . . . . . . . . . . . . . . . . 4,583 295 283Gran Tierra Energy Inc. . . . . . . . . . . . . . . . . . . . . . . . . . . . . . . . . . . . . . . . . . . . . . . . . . . . . . . . . . . . . . . . . . . . . . . . . . . . . . . . . . . . . . . . . . 88,344 683 765Pacific Rubiales Energy Corp. . . . . . . . . . . . . . . . . . . . . . . . . . . . . . . . . . . . . . . . . . . . . . . . . . . . . . . . . . . . . . . . . . . . . . . . . . . . . . . . . . . . . 82,068 1,760 1,779
2,738 2,827
Peru: 2.82%Compania de Minas Buenaventura SA, American Depositary Receipt . . . . . . . . . . . . . . . . . . . . . . . . . . . . . . . . . . . . . . . . . . . . . . . . . . . . . . . . 128,570 3,228 1,619Intercorp Financial Services Inc. . . . . . . . . . . . . . . . . . . . . . . . . . . . . . . . . . . . . . . . . . . . . . . . . . . . . . . . . . . . . . . . . . . . . . . . . . . . . . . . . . . 27,180 886 949
4,114 2,568
Panama: 2.71%Cable & Wireless Communications PLC . . . . . . . . . . . . . . . . . . . . . . . . . . . . . . . . . . . . . . . . . . . . . . . . . . . . . . . . . . . . . . . . . . . . . . . . . . . . . 1,529,583 907 1,375Copa Holdings SA . . . . . . . . . . . . . . . . . . . . . . . . . . . . . . . . . . . . . . . . . . . . . . . . . . . . . . . . . . . . . . . . . . . . . . . . . . . . . . . . . . . . . . . . . . . . . 7,222 560 1,098
1,467 2,473
United Arab Emirates: 2.61%Agthia Group PJSC . . . . . . . . . . . . . . . . . . . . . . . . . . . . . . . . . . . . . . . . . . . . . . . . . . . . . . . . . . . . . . . . . . . . . . . . . . . . . . . . . . . . . . . . . . . . 736,825 408 1,198Aramex Co. . . . . . . . . . . . . . . . . . . . . . . . . . . . . . . . . . . . . . . . . . . . . . . . . . . . . . . . . . . . . . . . . . . . . . . . . . . . . . . . . . . . . . . . . . . . . . . . . . 1,356,146 667 1,181
1,075 2,379
Pakistan: 2.54%Fauji Fertilizer Co. Ltd. . . . . . . . . . . . . . . . . . . . . . . . . . . . . . . . . . . . . . . . . . . . . . . . . . . . . . . . . . . . . . . . . . . . . . . . . . . . . . . . . . . . . . . . . . 1,314,963 1,689 1,590Indus Motor Co. Ltd. . . . . . . . . . . . . . . . . . . . . . . . . . . . . . . . . . . . . . . . . . . . . . . . . . . . . . . . . . . . . . . . . . . . . . . . . . . . . . . . . . . . . . . . . . . . 46,076 122 266United Bank Ltd. . . . . . . . . . . . . . . . . . . . . . . . . . . . . . . . . . . . . . . . . . . . . . . . . . . . . . . . . . . . . . . . . . . . . . . . . . . . . . . . . . . . . . . . . . . . . . 252,400 442 460
2,253 2,316
The accompanying notes are an integral part of these financial statements.
40 Franklin Templeton Investments Funds
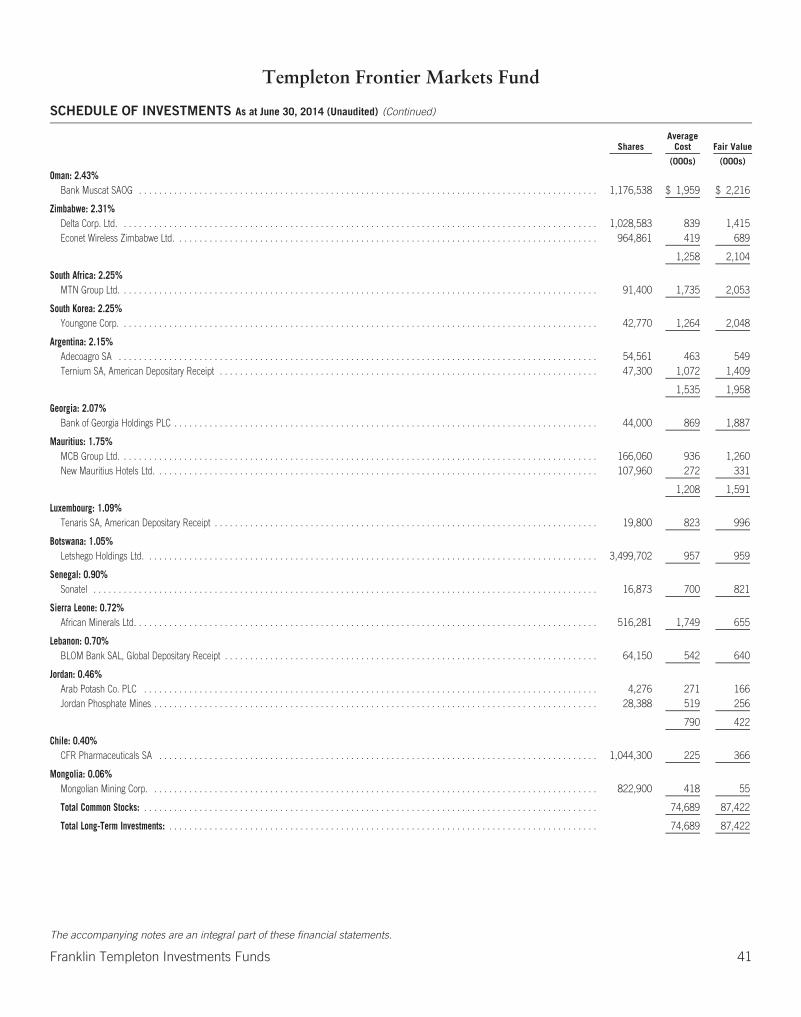
Templeton Frontier Markets Fund
SCHEDULE OF INVESTMENTS As at June 30, 2014 (Unaudited) (Continued)
SharesAverage
Cost Fair Value
(000s) (000s)
Oman: 2.43%Bank Muscat SAOG . . . . . . . . . . . . . . . . . . . . . . . . . . . . . . . . . . . . . . . . . . . . . . . . . . . . . . . . . . . . . . . . . . . . . . . . . . . . . . . . . . . . . . . . . . . 1,176,538 $ 1,959 $ 2,216
Zimbabwe: 2.31%Delta Corp. Ltd. . . . . . . . . . . . . . . . . . . . . . . . . . . . . . . . . . . . . . . . . . . . . . . . . . . . . . . . . . . . . . . . . . . . . . . . . . . . . . . . . . . . . . . . . . . . . . . 1,028,583 839 1,415Econet Wireless Zimbabwe Ltd. . . . . . . . . . . . . . . . . . . . . . . . . . . . . . . . . . . . . . . . . . . . . . . . . . . . . . . . . . . . . . . . . . . . . . . . . . . . . . . . . . . . 964,861 419 689
1,258 2,104
South Africa: 2.25%MTN Group Ltd. . . . . . . . . . . . . . . . . . . . . . . . . . . . . . . . . . . . . . . . . . . . . . . . . . . . . . . . . . . . . . . . . . . . . . . . . . . . . . . . . . . . . . . . . . . . . . . 91,400 1,735 2,053
South Korea: 2.25%Youngone Corp. . . . . . . . . . . . . . . . . . . . . . . . . . . . . . . . . . . . . . . . . . . . . . . . . . . . . . . . . . . . . . . . . . . . . . . . . . . . . . . . . . . . . . . . . . . . . . . 42,770 1,264 2,048
Argentina: 2.15%Adecoagro SA . . . . . . . . . . . . . . . . . . . . . . . . . . . . . . . . . . . . . . . . . . . . . . . . . . . . . . . . . . . . . . . . . . . . . . . . . . . . . . . . . . . . . . . . . . . . . . . 54,561 463 549Ternium SA, American Depositary Receipt . . . . . . . . . . . . . . . . . . . . . . . . . . . . . . . . . . . . . . . . . . . . . . . . . . . . . . . . . . . . . . . . . . . . . . . . . . . 47,300 1,072 1,409
1,535 1,958
Georgia: 2.07%Bank of Georgia Holdings PLC . . . . . . . . . . . . . . . . . . . . . . . . . . . . . . . . . . . . . . . . . . . . . . . . . . . . . . . . . . . . . . . . . . . . . . . . . . . . . . . . . . . . 44,000 869 1,887
Mauritius: 1.75%MCB Group Ltd. . . . . . . . . . . . . . . . . . . . . . . . . . . . . . . . . . . . . . . . . . . . . . . . . . . . . . . . . . . . . . . . . . . . . . . . . . . . . . . . . . . . . . . . . . . . . . . 166,060 936 1,260New Mauritius Hotels Ltd. . . . . . . . . . . . . . . . . . . . . . . . . . . . . . . . . . . . . . . . . . . . . . . . . . . . . . . . . . . . . . . . . . . . . . . . . . . . . . . . . . . . . . . . 107,960 272 331
1,208 1,591
Luxembourg: 1.09%Tenaris SA, American Depositary Receipt . . . . . . . . . . . . . . . . . . . . . . . . . . . . . . . . . . . . . . . . . . . . . . . . . . . . . . . . . . . . . . . . . . . . . . . . . . . . 19,800 823 996
Botswana: 1.05%Letshego Holdings Ltd. . . . . . . . . . . . . . . . . . . . . . . . . . . . . . . . . . . . . . . . . . . . . . . . . . . . . . . . . . . . . . . . . . . . . . . . . . . . . . . . . . . . . . . . . . 3,499,702 957 959
Senegal: 0.90%Sonatel . . . . . . . . . . . . . . . . . . . . . . . . . . . . . . . . . . . . . . . . . . . . . . . . . . . . . . . . . . . . . . . . . . . . . . . . . . . . . . . . . . . . . . . . . . . . . . . . . . . . 16,873 700 821
Sierra Leone: 0.72%African Minerals Ltd. . . . . . . . . . . . . . . . . . . . . . . . . . . . . . . . . . . . . . . . . . . . . . . . . . . . . . . . . . . . . . . . . . . . . . . . . . . . . . . . . . . . . . . . . . . . 516,281 1,749 655
Lebanon: 0.70%BLOM Bank SAL, Global Depositary Receipt . . . . . . . . . . . . . . . . . . . . . . . . . . . . . . . . . . . . . . . . . . . . . . . . . . . . . . . . . . . . . . . . . . . . . . . . . . 64,150 542 640
Jordan: 0.46%Arab Potash Co. PLC . . . . . . . . . . . . . . . . . . . . . . . . . . . . . . . . . . . . . . . . . . . . . . . . . . . . . . . . . . . . . . . . . . . . . . . . . . . . . . . . . . . . . . . . . . 4,276 271 166Jordan Phosphate Mines . . . . . . . . . . . . . . . . . . . . . . . . . . . . . . . . . . . . . . . . . . . . . . . . . . . . . . . . . . . . . . . . . . . . . . . . . . . . . . . . . . . . . . . . 28,388 519 256
790 422
Chile: 0.40%CFR Pharmaceuticals SA . . . . . . . . . . . . . . . . . . . . . . . . . . . . . . . . . . . . . . . . . . . . . . . . . . . . . . . . . . . . . . . . . . . . . . . . . . . . . . . . . . . . . . . 1,044,300 225 366
Mongolia: 0.06%Mongolian Mining Corp. . . . . . . . . . . . . . . . . . . . . . . . . . . . . . . . . . . . . . . . . . . . . . . . . . . . . . . . . . . . . . . . . . . . . . . . . . . . . . . . . . . . . . . . . 822,900 418 55
Total Common Stocks: . . . . . . . . . . . . . . . . . . . . . . . . . . . . . . . . . . . . . . . . . . . . . . . . . . . . . . . . . . . . . . . . . . . . . . . . . . . . . . . . . . . . . . . . . . 74,689 87,422
Total Long-Term Investments: . . . . . . . . . . . . . . . . . . . . . . . . . . . . . . . . . . . . . . . . . . . . . . . . . . . . . . . . . . . . . . . . . . . . . . . . . . . . . . . . . . . . . 74,689 87,422
The accompanying notes are an integral part of these financial statements.
Franklin Templeton Investments Funds 41
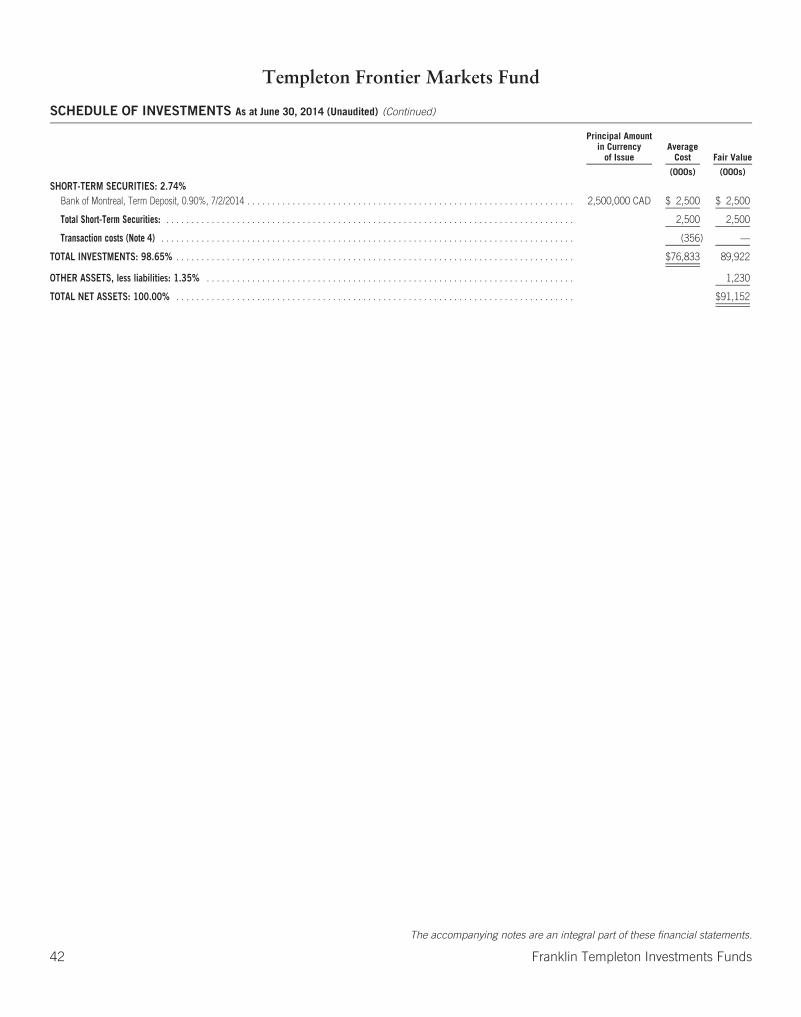
Templeton Frontier Markets Fund
SCHEDULE OF INVESTMENTS As at June 30, 2014 (Unaudited) (Continued)
Principal Amountin Currency
of IssueAverage
Cost Fair Value
(000s) (000s)
SHORT-TERM SECURITIES: 2.74%Bank of Montreal, Term Deposit, 0.90%, 7/2/2014 . . . . . . . . . . . . . . . . . . . . . . . . . . . . . . . . . . . . . . . . . . . . . . . . . . . . . . . . . . . . . . . . . 2,500,000 CAD $ 2,500 $ 2,500
Total Short-Term Securities: . . . . . . . . . . . . . . . . . . . . . . . . . . . . . . . . . . . . . . . . . . . . . . . . . . . . . . . . . . . . . . . . . . . . . . . . . . . . . . . . . 2,500 2,500
Transaction costs (Note 4) . . . . . . . . . . . . . . . . . . . . . . . . . . . . . . . . . . . . . . . . . . . . . . . . . . . . . . . . . . . . . . . . . . . . . . . . . . . . . . . . . . (356) —
TOTAL INVESTMENTS: 98.65% . . . . . . . . . . . . . . . . . . . . . . . . . . . . . . . . . . . . . . . . . . . . . . . . . . . . . . . . . . . . . . . . . . . . . . . . . . . . . . . $76,833 89,922
OTHER ASSETS, less liabilities: 1.35% . . . . . . . . . . . . . . . . . . . . . . . . . . . . . . . . . . . . . . . . . . . . . . . . . . . . . . . . . . . . . . . . . . . . . . . . . 1,230
TOTAL NET ASSETS: 100.00% . . . . . . . . . . . . . . . . . . . . . . . . . . . . . . . . . . . . . . . . . . . . . . . . . . . . . . . . . . . . . . . . . . . . . . . . . . . . . . . $91,152
The accompanying notes are an integral part of these financial statements.
42 Franklin Templeton Investments Funds

Templeton Frontier Markets Fund
STATEMENTS OF FINANCIAL POSITION (Unaudited)
As atJune 30,
2014
As atDecember 31,
2013
As atJanuary 1,
2013
(000s) (000s) (000s)AssetsCurrent assetsInvestments at fair value through profit or loss $ 89,922 $ 82,859 $ 87,455Cash
Canadian 33 55 6,230Foreign 286 333 202
ReceivablesInvestment securities sold 112 221 —Subscription of redeemable units 52 — —Dividends, interest and withholding tax 757 380 55
Total assets 91,162 83,848 93,942
LiabilitiesCurrent liabilitiesPayables
Investment securities purchased 1 3 1,077Redemption of redeemable units 2 — —Foreign capital taxes payable 7 — 25
Other liabilities — — 16
Total liabilities 10 3 1,118
Net assets attributable to holders of redeemable units $ 91,152 $ 83,845 $ 92,824
Represented by:Net assets as previously reported under Canadian GAAP — 82,950 92,250Revaluation of investments at fair value through profit or loss (Note 3(c)) — 895 574
Net assets attributable to holders of redeemable units $ 91,152 $ 83,845 $ 92,824
Net assets attributable to holders of redeemable units per series (000s)Series O $ 91,152 $ 83,845 $ 92,824
Number of redeemable units outstanding (Note 5)Series O 7,689,137 7,515,614 8,615,523
Net assets attributable to holders of redeemable units per unit — CADSeries O $ 11.85 $ 11.16 $ 10.77
Net assets attributable to holders of redeemable units per unit — USDSeries O $ 11.11 $ 10.51 $ 10.84
Cost of investments held (000s) $ 76,833 $ 69,679 $ 80,780
The accompanying notes are an integral part of these financial statements.
Franklin Templeton Investments Funds 43
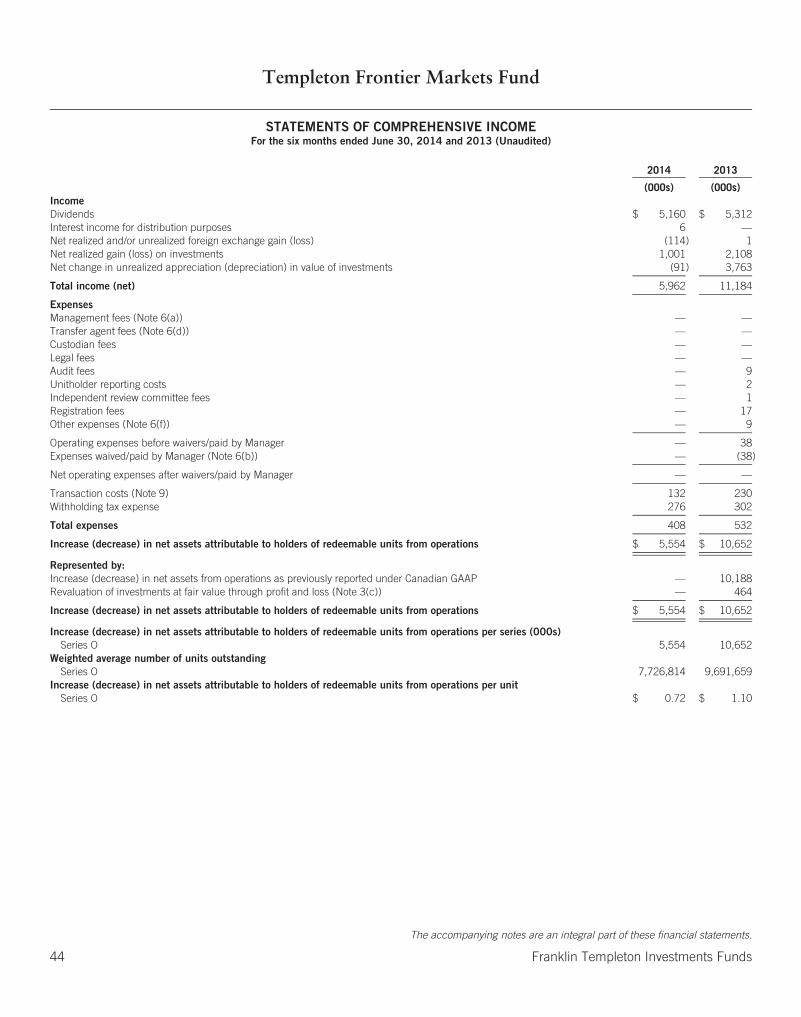
Templeton Frontier Markets Fund
STATEMENTS OF COMPREHENSIVE INCOMEFor the six months ended June 30, 2014 and 2013 (Unaudited)
2014 2013
(000s) (000s)IncomeDividends $ 5,160 $ 5,312Interest income for distribution purposes 6 —Net realized and/or unrealized foreign exchange gain (loss) (114) 1Net realized gain (loss) on investments 1,001 2,108Net change in unrealized appreciation (depreciation) in value of investments (91) 3,763
Total income (net) 5,962 11,184
ExpensesManagement fees (Note 6(a)) — —Transfer agent fees (Note 6(d)) — —Custodian fees — —Legal fees — —Audit fees — 9Unitholder reporting costs — 2Independent review committee fees — 1Registration fees — 17Other expenses (Note 6(f)) — 9
Operating expenses before waivers/paid by Manager — 38Expenses waived/paid by Manager (Note 6(b)) — (38)
Net operating expenses after waivers/paid by Manager — —
Transaction costs (Note 9) 132 230Withholding tax expense 276 302
Total expenses 408 532
Increase (decrease) in net assets attributable to holders of redeemable units from operations $ 5,554 $ 10,652
Represented by:Increase (decrease) in net assets from operations as previously reported under Canadian GAAP — 10,188Revaluation of investments at fair value through profit and loss (Note 3(c)) — 464
Increase (decrease) in net assets attributable to holders of redeemable units from operations $ 5,554 $ 10,652
Increase (decrease) in net assets attributable to holders of redeemable units from operations per series (000s)Series O 5,554 10,652
Weighted average number of units outstandingSeries O 7,726,814 9,691,659
Increase (decrease) in net assets attributable to holders of redeemable units from operations per unitSeries O $ 0.72 $ 1.10
The accompanying notes are an integral part of these financial statements.
44 Franklin Templeton Investments Funds

Templeton Frontier Markets Fund
STATEMENTS OF CHANGES IN NET ASSETS ATTRIBUTABLE TO HOLDERS OF REDEEMABLE UNITSFor the six months ended June 30, 2014 and 2013 (Unaudited) (in 000s)
Series O
2014 2013
Net assets attributable to holders of redeemable units at beginning of period $ 83,845 $ 92,824
Increase (decrease) in net assets attributable to holders of redeemable unitsfrom operations 5,554 10,652
Distributions to holders of redeemable unitsFrom net investment income — —From net realized gains on investments — —From return of capital — —
Total distributions to holders of redeemable units — —
Redeemable units transactionsSubscriptions 13,528 35,406Reinvestments — —Redemptions (11,775) (38,530)
Net increase (decrease) from redeemable units transactions 1,753 (3,124)
Increase (decrease) in net assets attributable to holders of redeemable units 7,307 7,528
Net assets attributable to holders of redeemable units at end of period $ 91,152 $100,352
The accompanying notes are an integral part of these financial statements.
Franklin Templeton Investments Funds 45
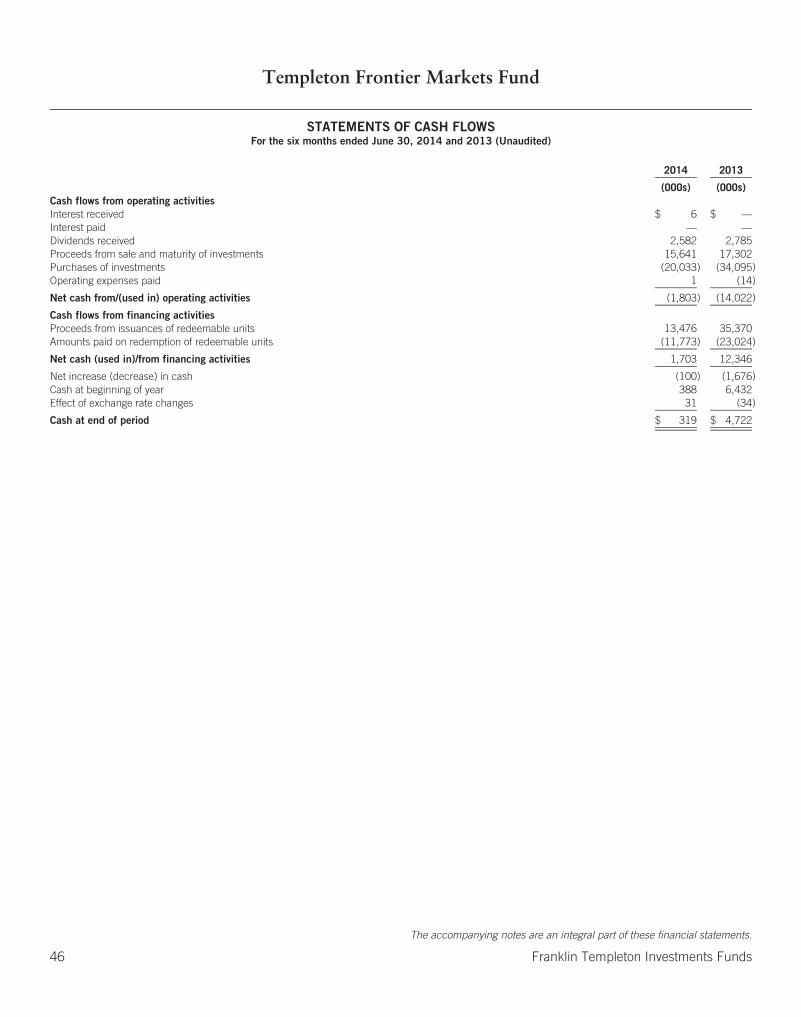
Templeton Frontier Markets Fund
STATEMENTS OF CASH FLOWSFor the six months ended June 30, 2014 and 2013 (Unaudited)
2014 2013
(000s) (000s)Cash flows from operating activitiesInterest received $ 6 $ —Interest paid — —Dividends received 2,582 2,785Proceeds from sale and maturity of investments 15,641 17,302Purchases of investments (20,033) (34,095)Operating expenses paid 1 (14)
Net cash from/(used in) operating activities (1,803) (14,022)
Cash flows from financing activitiesProceeds from issuances of redeemable units 13,476 35,370Amounts paid on redemption of redeemable units (11,773) (23,024)
Net cash (used in)/from financing activities 1,703 12,346
Net increase (decrease) in cash (100) (1,676)Cash at beginning of year 388 6,432Effect of exchange rate changes 31 (34)
Cash at end of period $ 319 $ 4,722
The accompanying notes are an integral part of these financial statements.
46 Franklin Templeton Investments Funds

Templeton Global Balanced Fund
SCHEDULE OF INVESTMENTS As at June 30, 2014 (Unaudited)
SharesAverage
Cost Fair Value
(000s) (000s)
LONG-TERM INVESTMENTS: 88.33%COMMON STOCKS: 63.30%United States: 19.98%
Abercrombie & Fitch Co., A . . . . . . . . . . . . . . . . . . . . . . . . . . . . . . . . . . . . . . . . . . . . . . . . . . . . . . . . . . . . . . . . . . . . . . . . . . . . . . . . . . . . . . 19,560 $ 750 $ 902Allegheny Technologies Inc. . . . . . . . . . . . . . . . . . . . . . . . . . . . . . . . . . . . . . . . . . . . . . . . . . . . . . . . . . . . . . . . . . . . . . . . . . . . . . . . . . . . . . . 36,750 1,561 1,768Amgen Inc. . . . . . . . . . . . . . . . . . . . . . . . . . . . . . . . . . . . . . . . . . . . . . . . . . . . . . . . . . . . . . . . . . . . . . . . . . . . . . . . . . . . . . . . . . . . . . . . . . 16,880 2,112 2,131Applied Materials Inc. . . . . . . . . . . . . . . . . . . . . . . . . . . . . . . . . . . . . . . . . . . . . . . . . . . . . . . . . . . . . . . . . . . . . . . . . . . . . . . . . . . . . . . . . . . 60,150 740 1,446Baker Hughes Inc. . . . . . . . . . . . . . . . . . . . . . . . . . . . . . . . . . . . . . . . . . . . . . . . . . . . . . . . . . . . . . . . . . . . . . . . . . . . . . . . . . . . . . . . . . . . . 24,286 1,270 1,928Best Buy Co. Inc. . . . . . . . . . . . . . . . . . . . . . . . . . . . . . . . . . . . . . . . . . . . . . . . . . . . . . . . . . . . . . . . . . . . . . . . . . . . . . . . . . . . . . . . . . . . . . 55,630 1,492 1,840Chesapeake Energy Corp. . . . . . . . . . . . . . . . . . . . . . . . . . . . . . . . . . . . . . . . . . . . . . . . . . . . . . . . . . . . . . . . . . . . . . . . . . . . . . . . . . . . . . . . 27,550 566 913Chevron Corp. . . . . . . . . . . . . . . . . . . . . . . . . . . . . . . . . . . . . . . . . . . . . . . . . . . . . . . . . . . . . . . . . . . . . . . . . . . . . . . . . . . . . . . . . . . . . . . . 6,130 539 853Cisco Systems Inc. . . . . . . . . . . . . . . . . . . . . . . . . . . . . . . . . . . . . . . . . . . . . . . . . . . . . . . . . . . . . . . . . . . . . . . . . . . . . . . . . . . . . . . . . . . . . 55,320 1,233 1,466Citigroup Inc. . . . . . . . . . . . . . . . . . . . . . . . . . . . . . . . . . . . . . . . . . . . . . . . . . . . . . . . . . . . . . . . . . . . . . . . . . . . . . . . . . . . . . . . . . . . . . . . . 26,580 1,043 1,335Comcast Corp., Special A . . . . . . . . . . . . . . . . . . . . . . . . . . . . . . . . . . . . . . . . . . . . . . . . . . . . . . . . . . . . . . . . . . . . . . . . . . . . . . . . . . . . . . . . 55,320 2,351 3,146CVS Caremark Corp. . . . . . . . . . . . . . . . . . . . . . . . . . . . . . . . . . . . . . . . . . . . . . . . . . . . . . . . . . . . . . . . . . . . . . . . . . . . . . . . . . . . . . . . . . . . 16,170 517 1,300Foot Locker Inc. . . . . . . . . . . . . . . . . . . . . . . . . . . . . . . . . . . . . . . . . . . . . . . . . . . . . . . . . . . . . . . . . . . . . . . . . . . . . . . . . . . . . . . . . . . . . . . 41,130 1,583 2,225Halliburton Co. . . . . . . . . . . . . . . . . . . . . . . . . . . . . . . . . . . . . . . . . . . . . . . . . . . . . . . . . . . . . . . . . . . . . . . . . . . . . . . . . . . . . . . . . . . . . . . . 29,944 1,584 2,268Hewlett-Packard Co. . . . . . . . . . . . . . . . . . . . . . . . . . . . . . . . . . . . . . . . . . . . . . . . . . . . . . . . . . . . . . . . . . . . . . . . . . . . . . . . . . . . . . . . . . . . 51,660 999 1,856JPMorgan Chase & Co. . . . . . . . . . . . . . . . . . . . . . . . . . . . . . . . . . . . . . . . . . . . . . . . . . . . . . . . . . . . . . . . . . . . . . . . . . . . . . . . . . . . . . . . . . 34,280 1,827 2,106LyondellBasell Industries NV, A . . . . . . . . . . . . . . . . . . . . . . . . . . . . . . . . . . . . . . . . . . . . . . . . . . . . . . . . . . . . . . . . . . . . . . . . . . . . . . . . . . . 8,940 398 931Macy’s Inc. . . . . . . . . . . . . . . . . . . . . . . . . . . . . . . . . . . . . . . . . . . . . . . . . . . . . . . . . . . . . . . . . . . . . . . . . . . . . . . . . . . . . . . . . . . . . . . . . . . 37,600 1,696 2,326Medtronic Inc. . . . . . . . . . . . . . . . . . . . . . . . . . . . . . . . . . . . . . . . . . . . . . . . . . . . . . . . . . . . . . . . . . . . . . . . . . . . . . . . . . . . . . . . . . . . . . . . 12,850 536 874Microsoft Corp. . . . . . . . . . . . . . . . . . . . . . . . . . . . . . . . . . . . . . . . . . . . . . . . . . . . . . . . . . . . . . . . . . . . . . . . . . . . . . . . . . . . . . . . . . . . . . . . 58,660 2,056 2,609Morgan Stanley . . . . . . . . . . . . . . . . . . . . . . . . . . . . . . . . . . . . . . . . . . . . . . . . . . . . . . . . . . . . . . . . . . . . . . . . . . . . . . . . . . . . . . . . . . . . . . . 61,610 1,991 2,124Navistar International Corp. . . . . . . . . . . . . . . . . . . . . . . . . . . . . . . . . . . . . . . . . . . . . . . . . . . . . . . . . . . . . . . . . . . . . . . . . . . . . . . . . . . . . . . 8,143 299 325NewPage Corp., Escrow Account . . . . . . . . . . . . . . . . . . . . . . . . . . . . . . . . . . . . . . . . . . . . . . . . . . . . . . . . . . . . . . . . . . . . . . . . . . . . . . . . . . 100,000 — —NewPage Holdings Inc. . . . . . . . . . . . . . . . . . . . . . . . . . . . . . . . . . . . . . . . . . . . . . . . . . . . . . . . . . . . . . . . . . . . . . . . . . . . . . . . . . . . . . . . . . 200 19 18News Corp., A . . . . . . . . . . . . . . . . . . . . . . . . . . . . . . . . . . . . . . . . . . . . . . . . . . . . . . . . . . . . . . . . . . . . . . . . . . . . . . . . . . . . . . . . . . . . . . . 88,630 1,669 1,696Noble Corp. PLC . . . . . . . . . . . . . . . . . . . . . . . . . . . . . . . . . . . . . . . . . . . . . . . . . . . . . . . . . . . . . . . . . . . . . . . . . . . . . . . . . . . . . . . . . . . . . . 53,270 1,844 1,907Oracle Corp. . . . . . . . . . . . . . . . . . . . . . . . . . . . . . . . . . . . . . . . . . . . . . . . . . . . . . . . . . . . . . . . . . . . . . . . . . . . . . . . . . . . . . . . . . . . . . . . . . 20,777 566 898Pfizer Inc. . . . . . . . . . . . . . . . . . . . . . . . . . . . . . . . . . . . . . . . . . . . . . . . . . . . . . . . . . . . . . . . . . . . . . . . . . . . . . . . . . . . . . . . . . . . . . . . . . . . 41,640 1,100 1,318PG&E Corp. . . . . . . . . . . . . . . . . . . . . . . . . . . . . . . . . . . . . . . . . . . . . . . . . . . . . . . . . . . . . . . . . . . . . . . . . . . . . . . . . . . . . . . . . . . . . . . . . . 24,990 1,096 1,280Service Corp. International . . . . . . . . . . . . . . . . . . . . . . . . . . . . . . . . . . . . . . . . . . . . . . . . . . . . . . . . . . . . . . . . . . . . . . . . . . . . . . . . . . . . . . . 36,020 397 796United Parcel Service Inc., B . . . . . . . . . . . . . . . . . . . . . . . . . . . . . . . . . . . . . . . . . . . . . . . . . . . . . . . . . . . . . . . . . . . . . . . . . . . . . . . . . . . . . 9,230 584 1,010Verizon Communications Inc. . . . . . . . . . . . . . . . . . . . . . . . . . . . . . . . . . . . . . . . . . . . . . . . . . . . . . . . . . . . . . . . . . . . . . . . . . . . . . . . . . . . . . 8,503 449 444Walgreen Co. . . . . . . . . . . . . . . . . . . . . . . . . . . . . . . . . . . . . . . . . . . . . . . . . . . . . . . . . . . . . . . . . . . . . . . . . . . . . . . . . . . . . . . . . . . . . . . . . 20,780 767 1,643
35,634 47,682
France: 6.10%AXA SA . . . . . . . . . . . . . . . . . . . . . . . . . . . . . . . . . . . . . . . . . . . . . . . . . . . . . . . . . . . . . . . . . . . . . . . . . . . . . . . . . . . . . . . . . . . . . . . . . . . . 73,407 1,613 1,871BNP Paribas SA . . . . . . . . . . . . . . . . . . . . . . . . . . . . . . . . . . . . . . . . . . . . . . . . . . . . . . . . . . . . . . . . . . . . . . . . . . . . . . . . . . . . . . . . . . . . . . 30,170 1,558 2,183Cie Generale des Etablissements Michelin, B . . . . . . . . . . . . . . . . . . . . . . . . . . . . . . . . . . . . . . . . . . . . . . . . . . . . . . . . . . . . . . . . . . . . . . . . . . 13,110 1,417 1,671Compagnie de Saint-Gobain . . . . . . . . . . . . . . . . . . . . . . . . . . . . . . . . . . . . . . . . . . . . . . . . . . . . . . . . . . . . . . . . . . . . . . . . . . . . . . . . . . . . . . 22,724 973 1,367GDF Suez . . . . . . . . . . . . . . . . . . . . . . . . . . . . . . . . . . . . . . . . . . . . . . . . . . . . . . . . . . . . . . . . . . . . . . . . . . . . . . . . . . . . . . . . . . . . . . . . . . . 21,060 586 618Sanofi . . . . . . . . . . . . . . . . . . . . . . . . . . . . . . . . . . . . . . . . . . . . . . . . . . . . . . . . . . . . . . . . . . . . . . . . . . . . . . . . . . . . . . . . . . . . . . . . . . . . . 17,316 1,698 1,962SEB SA . . . . . . . . . . . . . . . . . . . . . . . . . . . . . . . . . . . . . . . . . . . . . . . . . . . . . . . . . . . . . . . . . . . . . . . . . . . . . . . . . . . . . . . . . . . . . . . . . . . . 8,770 760 828Technip SA . . . . . . . . . . . . . . . . . . . . . . . . . . . . . . . . . . . . . . . . . . . . . . . . . . . . . . . . . . . . . . . . . . . . . . . . . . . . . . . . . . . . . . . . . . . . . . . . . 13,110 1,267 1,530Total SA, B . . . . . . . . . . . . . . . . . . . . . . . . . . . . . . . . . . . . . . . . . . . . . . . . . . . . . . . . . . . . . . . . . . . . . . . . . . . . . . . . . . . . . . . . . . . . . . . . . . 32,830 2,372 2,531
12,244 14,561
The accompanying notes are an integral part of these financial statements.
Franklin Templeton Investments Funds 47
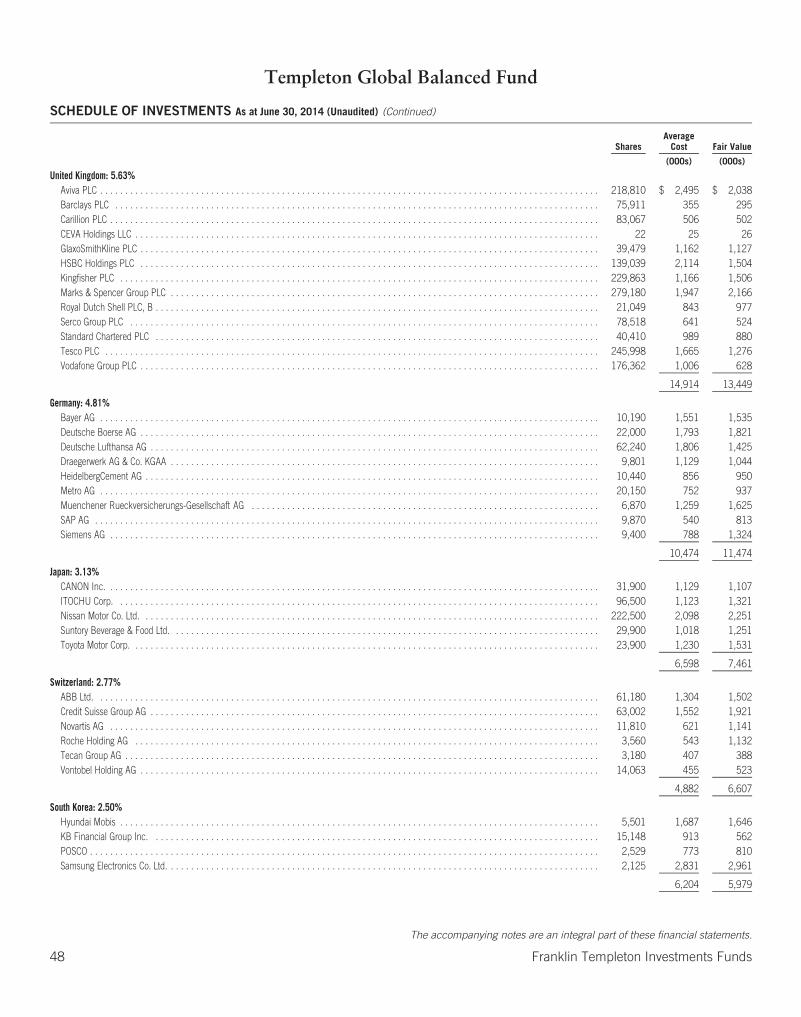
Templeton Global Balanced Fund
SCHEDULE OF INVESTMENTS As at June 30, 2014 (Unaudited) (Continued)
SharesAverage
Cost Fair Value
(000s) (000s)
United Kingdom: 5.63%Aviva PLC . . . . . . . . . . . . . . . . . . . . . . . . . . . . . . . . . . . . . . . . . . . . . . . . . . . . . . . . . . . . . . . . . . . . . . . . . . . . . . . . . . . . . . . . . . . . . . . . . . . 218,810 $ 2,495 $ 2,038Barclays PLC . . . . . . . . . . . . . . . . . . . . . . . . . . . . . . . . . . . . . . . . . . . . . . . . . . . . . . . . . . . . . . . . . . . . . . . . . . . . . . . . . . . . . . . . . . . . . . . . 75,911 355 295Carillion PLC . . . . . . . . . . . . . . . . . . . . . . . . . . . . . . . . . . . . . . . . . . . . . . . . . . . . . . . . . . . . . . . . . . . . . . . . . . . . . . . . . . . . . . . . . . . . . . . . . 83,067 506 502CEVA Holdings LLC . . . . . . . . . . . . . . . . . . . . . . . . . . . . . . . . . . . . . . . . . . . . . . . . . . . . . . . . . . . . . . . . . . . . . . . . . . . . . . . . . . . . . . . . . . . . 22 25 26GlaxoSmithKline PLC . . . . . . . . . . . . . . . . . . . . . . . . . . . . . . . . . . . . . . . . . . . . . . . . . . . . . . . . . . . . . . . . . . . . . . . . . . . . . . . . . . . . . . . . . . . 39,479 1,162 1,127HSBC Holdings PLC . . . . . . . . . . . . . . . . . . . . . . . . . . . . . . . . . . . . . . . . . . . . . . . . . . . . . . . . . . . . . . . . . . . . . . . . . . . . . . . . . . . . . . . . . . . 139,039 2,114 1,504Kingfisher PLC . . . . . . . . . . . . . . . . . . . . . . . . . . . . . . . . . . . . . . . . . . . . . . . . . . . . . . . . . . . . . . . . . . . . . . . . . . . . . . . . . . . . . . . . . . . . . . . 229,863 1,166 1,506Marks & Spencer Group PLC . . . . . . . . . . . . . . . . . . . . . . . . . . . . . . . . . . . . . . . . . . . . . . . . . . . . . . . . . . . . . . . . . . . . . . . . . . . . . . . . . . . . . 279,180 1,947 2,166Royal Dutch Shell PLC, B . . . . . . . . . . . . . . . . . . . . . . . . . . . . . . . . . . . . . . . . . . . . . . . . . . . . . . . . . . . . . . . . . . . . . . . . . . . . . . . . . . . . . . . . 21,049 843 977Serco Group PLC . . . . . . . . . . . . . . . . . . . . . . . . . . . . . . . . . . . . . . . . . . . . . . . . . . . . . . . . . . . . . . . . . . . . . . . . . . . . . . . . . . . . . . . . . . . . . 78,518 641 524Standard Chartered PLC . . . . . . . . . . . . . . . . . . . . . . . . . . . . . . . . . . . . . . . . . . . . . . . . . . . . . . . . . . . . . . . . . . . . . . . . . . . . . . . . . . . . . . . . 40,410 989 880Tesco PLC . . . . . . . . . . . . . . . . . . . . . . . . . . . . . . . . . . . . . . . . . . . . . . . . . . . . . . . . . . . . . . . . . . . . . . . . . . . . . . . . . . . . . . . . . . . . . . . . . . 245,998 1,665 1,276Vodafone Group PLC . . . . . . . . . . . . . . . . . . . . . . . . . . . . . . . . . . . . . . . . . . . . . . . . . . . . . . . . . . . . . . . . . . . . . . . . . . . . . . . . . . . . . . . . . . . 176,362 1,006 628
14,914 13,449
Germany: 4.81%Bayer AG . . . . . . . . . . . . . . . . . . . . . . . . . . . . . . . . . . . . . . . . . . . . . . . . . . . . . . . . . . . . . . . . . . . . . . . . . . . . . . . . . . . . . . . . . . . . . . . . . . . 10,190 1,551 1,535Deutsche Boerse AG . . . . . . . . . . . . . . . . . . . . . . . . . . . . . . . . . . . . . . . . . . . . . . . . . . . . . . . . . . . . . . . . . . . . . . . . . . . . . . . . . . . . . . . . . . . 22,000 1,793 1,821Deutsche Lufthansa AG . . . . . . . . . . . . . . . . . . . . . . . . . . . . . . . . . . . . . . . . . . . . . . . . . . . . . . . . . . . . . . . . . . . . . . . . . . . . . . . . . . . . . . . . . 62,240 1,806 1,425Draegerwerk AG & Co. KGAA . . . . . . . . . . . . . . . . . . . . . . . . . . . . . . . . . . . . . . . . . . . . . . . . . . . . . . . . . . . . . . . . . . . . . . . . . . . . . . . . . . . . . 9,801 1,129 1,044HeidelbergCement AG . . . . . . . . . . . . . . . . . . . . . . . . . . . . . . . . . . . . . . . . . . . . . . . . . . . . . . . . . . . . . . . . . . . . . . . . . . . . . . . . . . . . . . . . . . 10,440 856 950Metro AG . . . . . . . . . . . . . . . . . . . . . . . . . . . . . . . . . . . . . . . . . . . . . . . . . . . . . . . . . . . . . . . . . . . . . . . . . . . . . . . . . . . . . . . . . . . . . . . . . . . 20,150 752 937Muenchener Rueckversicherungs-Gesellschaft AG . . . . . . . . . . . . . . . . . . . . . . . . . . . . . . . . . . . . . . . . . . . . . . . . . . . . . . . . . . . . . . . . . . . . . 6,870 1,259 1,625SAP AG . . . . . . . . . . . . . . . . . . . . . . . . . . . . . . . . . . . . . . . . . . . . . . . . . . . . . . . . . . . . . . . . . . . . . . . . . . . . . . . . . . . . . . . . . . . . . . . . . . . . 9,870 540 813Siemens AG . . . . . . . . . . . . . . . . . . . . . . . . . . . . . . . . . . . . . . . . . . . . . . . . . . . . . . . . . . . . . . . . . . . . . . . . . . . . . . . . . . . . . . . . . . . . . . . . . 9,400 788 1,324
10,474 11,474
Japan: 3.13%CANON Inc. . . . . . . . . . . . . . . . . . . . . . . . . . . . . . . . . . . . . . . . . . . . . . . . . . . . . . . . . . . . . . . . . . . . . . . . . . . . . . . . . . . . . . . . . . . . . . . . . . 31,900 1,129 1,107ITOCHU Corp. . . . . . . . . . . . . . . . . . . . . . . . . . . . . . . . . . . . . . . . . . . . . . . . . . . . . . . . . . . . . . . . . . . . . . . . . . . . . . . . . . . . . . . . . . . . . . . . 96,500 1,123 1,321Nissan Motor Co. Ltd. . . . . . . . . . . . . . . . . . . . . . . . . . . . . . . . . . . . . . . . . . . . . . . . . . . . . . . . . . . . . . . . . . . . . . . . . . . . . . . . . . . . . . . . . . . 222,500 2,098 2,251Suntory Beverage & Food Ltd. . . . . . . . . . . . . . . . . . . . . . . . . . . . . . . . . . . . . . . . . . . . . . . . . . . . . . . . . . . . . . . . . . . . . . . . . . . . . . . . . . . . . 29,900 1,018 1,251Toyota Motor Corp. . . . . . . . . . . . . . . . . . . . . . . . . . . . . . . . . . . . . . . . . . . . . . . . . . . . . . . . . . . . . . . . . . . . . . . . . . . . . . . . . . . . . . . . . . . . . 23,900 1,230 1,531
6,598 7,461
Switzerland: 2.77%ABB Ltd. . . . . . . . . . . . . . . . . . . . . . . . . . . . . . . . . . . . . . . . . . . . . . . . . . . . . . . . . . . . . . . . . . . . . . . . . . . . . . . . . . . . . . . . . . . . . . . . . . . . 61,180 1,304 1,502Credit Suisse Group AG . . . . . . . . . . . . . . . . . . . . . . . . . . . . . . . . . . . . . . . . . . . . . . . . . . . . . . . . . . . . . . . . . . . . . . . . . . . . . . . . . . . . . . . . . 63,002 1,552 1,921Novartis AG . . . . . . . . . . . . . . . . . . . . . . . . . . . . . . . . . . . . . . . . . . . . . . . . . . . . . . . . . . . . . . . . . . . . . . . . . . . . . . . . . . . . . . . . . . . . . . . . . 11,810 621 1,141Roche Holding AG . . . . . . . . . . . . . . . . . . . . . . . . . . . . . . . . . . . . . . . . . . . . . . . . . . . . . . . . . . . . . . . . . . . . . . . . . . . . . . . . . . . . . . . . . . . . 3,560 543 1,132Tecan Group AG . . . . . . . . . . . . . . . . . . . . . . . . . . . . . . . . . . . . . . . . . . . . . . . . . . . . . . . . . . . . . . . . . . . . . . . . . . . . . . . . . . . . . . . . . . . . . . 3,180 407 388Vontobel Holding AG . . . . . . . . . . . . . . . . . . . . . . . . . . . . . . . . . . . . . . . . . . . . . . . . . . . . . . . . . . . . . . . . . . . . . . . . . . . . . . . . . . . . . . . . . . . 14,063 455 523
4,882 6,607
South Korea: 2.50%Hyundai Mobis . . . . . . . . . . . . . . . . . . . . . . . . . . . . . . . . . . . . . . . . . . . . . . . . . . . . . . . . . . . . . . . . . . . . . . . . . . . . . . . . . . . . . . . . . . . . . . . 5,501 1,687 1,646KB Financial Group Inc. . . . . . . . . . . . . . . . . . . . . . . . . . . . . . . . . . . . . . . . . . . . . . . . . . . . . . . . . . . . . . . . . . . . . . . . . . . . . . . . . . . . . . . . . 15,148 913 562POSCO . . . . . . . . . . . . . . . . . . . . . . . . . . . . . . . . . . . . . . . . . . . . . . . . . . . . . . . . . . . . . . . . . . . . . . . . . . . . . . . . . . . . . . . . . . . . . . . . . . . . . 2,529 773 810Samsung Electronics Co. Ltd. . . . . . . . . . . . . . . . . . . . . . . . . . . . . . . . . . . . . . . . . . . . . . . . . . . . . . . . . . . . . . . . . . . . . . . . . . . . . . . . . . . . . . 2,125 2,831 2,961
6,204 5,979
The accompanying notes are an integral part of these financial statements.
48 Franklin Templeton Investments Funds
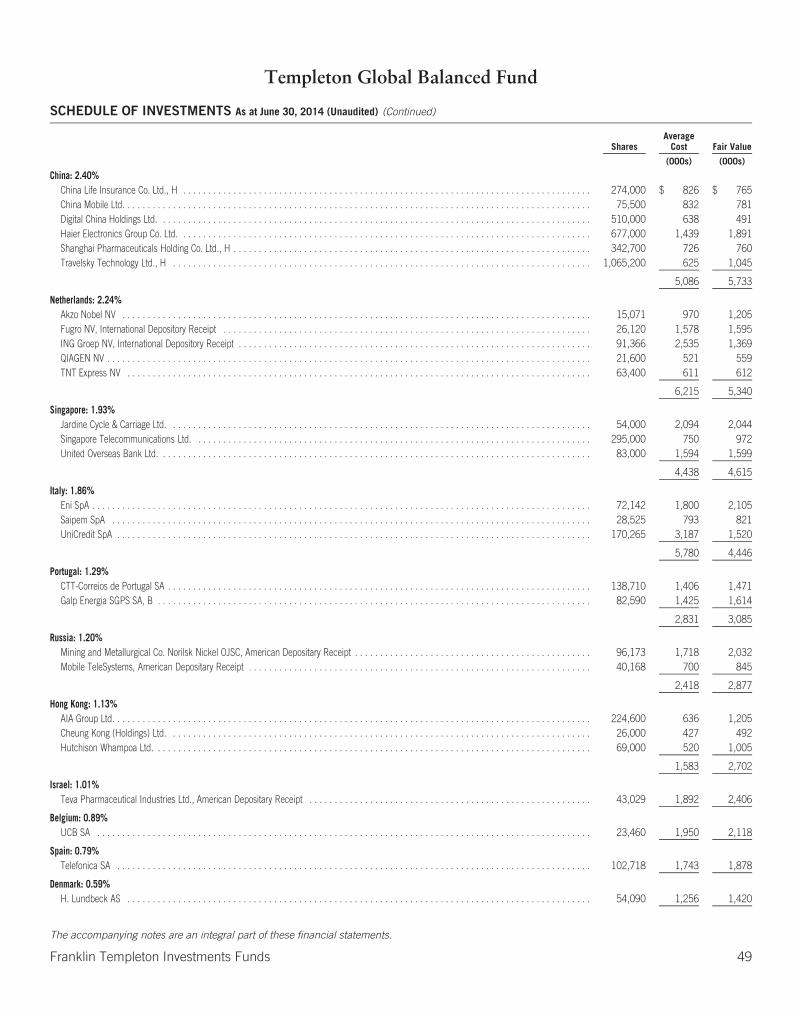
Templeton Global Balanced Fund
SCHEDULE OF INVESTMENTS As at June 30, 2014 (Unaudited) (Continued)
SharesAverage
Cost Fair Value
(000s) (000s)
China: 2.40%China Life Insurance Co. Ltd., H . . . . . . . . . . . . . . . . . . . . . . . . . . . . . . . . . . . . . . . . . . . . . . . . . . . . . . . . . . . . . . . . . . . . . . . . . . . . . . . . . 274,000 $ 826 $ 765China Mobile Ltd. . . . . . . . . . . . . . . . . . . . . . . . . . . . . . . . . . . . . . . . . . . . . . . . . . . . . . . . . . . . . . . . . . . . . . . . . . . . . . . . . . . . . . . . . . . . . 75,500 832 781Digital China Holdings Ltd. . . . . . . . . . . . . . . . . . . . . . . . . . . . . . . . . . . . . . . . . . . . . . . . . . . . . . . . . . . . . . . . . . . . . . . . . . . . . . . . . . . . . . 510,000 638 491Haier Electronics Group Co. Ltd. . . . . . . . . . . . . . . . . . . . . . . . . . . . . . . . . . . . . . . . . . . . . . . . . . . . . . . . . . . . . . . . . . . . . . . . . . . . . . . . . . 677,000 1,439 1,891Shanghai Pharmaceuticals Holding Co. Ltd., H . . . . . . . . . . . . . . . . . . . . . . . . . . . . . . . . . . . . . . . . . . . . . . . . . . . . . . . . . . . . . . . . . . . . . . . 342,700 726 760Travelsky Technology Ltd., H . . . . . . . . . . . . . . . . . . . . . . . . . . . . . . . . . . . . . . . . . . . . . . . . . . . . . . . . . . . . . . . . . . . . . . . . . . . . . . . . . . . 1,065,200 625 1,045
5,086 5,733
Netherlands: 2.24%Akzo Nobel NV . . . . . . . . . . . . . . . . . . . . . . . . . . . . . . . . . . . . . . . . . . . . . . . . . . . . . . . . . . . . . . . . . . . . . . . . . . . . . . . . . . . . . . . . . . . . . 15,071 970 1,205Fugro NV, International Depository Receipt . . . . . . . . . . . . . . . . . . . . . . . . . . . . . . . . . . . . . . . . . . . . . . . . . . . . . . . . . . . . . . . . . . . . . . . . . 26,120 1,578 1,595ING Groep NV, International Depository Receipt . . . . . . . . . . . . . . . . . . . . . . . . . . . . . . . . . . . . . . . . . . . . . . . . . . . . . . . . . . . . . . . . . . . . . . 91,366 2,535 1,369QIAGEN NV . . . . . . . . . . . . . . . . . . . . . . . . . . . . . . . . . . . . . . . . . . . . . . . . . . . . . . . . . . . . . . . . . . . . . . . . . . . . . . . . . . . . . . . . . . . . . . . . 21,600 521 559TNT Express NV . . . . . . . . . . . . . . . . . . . . . . . . . . . . . . . . . . . . . . . . . . . . . . . . . . . . . . . . . . . . . . . . . . . . . . . . . . . . . . . . . . . . . . . . . . . . 63,400 611 612
6,215 5,340
Singapore: 1.93%Jardine Cycle & Carriage Ltd. . . . . . . . . . . . . . . . . . . . . . . . . . . . . . . . . . . . . . . . . . . . . . . . . . . . . . . . . . . . . . . . . . . . . . . . . . . . . . . . . . . . 54,000 2,094 2,044Singapore Telecommunications Ltd. . . . . . . . . . . . . . . . . . . . . . . . . . . . . . . . . . . . . . . . . . . . . . . . . . . . . . . . . . . . . . . . . . . . . . . . . . . . . . . 295,000 750 972United Overseas Bank Ltd. . . . . . . . . . . . . . . . . . . . . . . . . . . . . . . . . . . . . . . . . . . . . . . . . . . . . . . . . . . . . . . . . . . . . . . . . . . . . . . . . . . . . . 83,000 1,594 1,599
4,438 4,615
Italy: 1.86%Eni SpA . . . . . . . . . . . . . . . . . . . . . . . . . . . . . . . . . . . . . . . . . . . . . . . . . . . . . . . . . . . . . . . . . . . . . . . . . . . . . . . . . . . . . . . . . . . . . . . . . . . 72,142 1,800 2,105Saipem SpA . . . . . . . . . . . . . . . . . . . . . . . . . . . . . . . . . . . . . . . . . . . . . . . . . . . . . . . . . . . . . . . . . . . . . . . . . . . . . . . . . . . . . . . . . . . . . . . 28,525 793 821UniCredit SpA . . . . . . . . . . . . . . . . . . . . . . . . . . . . . . . . . . . . . . . . . . . . . . . . . . . . . . . . . . . . . . . . . . . . . . . . . . . . . . . . . . . . . . . . . . . . . . 170,265 3,187 1,520
5,780 4,446
Portugal: 1.29%CTT-Correios de Portugal SA . . . . . . . . . . . . . . . . . . . . . . . . . . . . . . . . . . . . . . . . . . . . . . . . . . . . . . . . . . . . . . . . . . . . . . . . . . . . . . . . . . . . 138,710 1,406 1,471Galp Energia SGPS SA, B . . . . . . . . . . . . . . . . . . . . . . . . . . . . . . . . . . . . . . . . . . . . . . . . . . . . . . . . . . . . . . . . . . . . . . . . . . . . . . . . . . . . . . 82,590 1,425 1,614
2,831 3,085
Russia: 1.20%Mining and Metallurgical Co. Norilsk Nickel OJSC, American Depositary Receipt . . . . . . . . . . . . . . . . . . . . . . . . . . . . . . . . . . . . . . . . . . . . . . . 96,173 1,718 2,032Mobile TeleSystems, American Depositary Receipt . . . . . . . . . . . . . . . . . . . . . . . . . . . . . . . . . . . . . . . . . . . . . . . . . . . . . . . . . . . . . . . . . . . . 40,168 700 845
2,418 2,877
Hong Kong: 1.13%AIA Group Ltd. . . . . . . . . . . . . . . . . . . . . . . . . . . . . . . . . . . . . . . . . . . . . . . . . . . . . . . . . . . . . . . . . . . . . . . . . . . . . . . . . . . . . . . . . . . . . . . 224,600 636 1,205Cheung Kong (Holdings) Ltd. . . . . . . . . . . . . . . . . . . . . . . . . . . . . . . . . . . . . . . . . . . . . . . . . . . . . . . . . . . . . . . . . . . . . . . . . . . . . . . . . . . . 26,000 427 492Hutchison Whampoa Ltd. . . . . . . . . . . . . . . . . . . . . . . . . . . . . . . . . . . . . . . . . . . . . . . . . . . . . . . . . . . . . . . . . . . . . . . . . . . . . . . . . . . . . . . 69,000 520 1,005
1,583 2,702
Israel: 1.01%Teva Pharmaceutical Industries Ltd., American Depositary Receipt . . . . . . . . . . . . . . . . . . . . . . . . . . . . . . . . . . . . . . . . . . . . . . . . . . . . . . . . 43,029 1,892 2,406
Belgium: 0.89%UCB SA . . . . . . . . . . . . . . . . . . . . . . . . . . . . . . . . . . . . . . . . . . . . . . . . . . . . . . . . . . . . . . . . . . . . . . . . . . . . . . . . . . . . . . . . . . . . . . . . . . 23,460 1,950 2,118
Spain: 0.79%Telefonica SA . . . . . . . . . . . . . . . . . . . . . . . . . . . . . . . . . . . . . . . . . . . . . . . . . . . . . . . . . . . . . . . . . . . . . . . . . . . . . . . . . . . . . . . . . . . . . . 102,718 1,743 1,878
Denmark: 0.59%H. Lundbeck AS . . . . . . . . . . . . . . . . . . . . . . . . . . . . . . . . . . . . . . . . . . . . . . . . . . . . . . . . . . . . . . . . . . . . . . . . . . . . . . . . . . . . . . . . . . . . 54,090 1,256 1,420
The accompanying notes are an integral part of these financial statements.
Franklin Templeton Investments Funds 49

Templeton Global Balanced Fund
SCHEDULE OF INVESTMENTS As at June 30, 2014 (Unaudited) (Continued)
SharesAverage
Cost Fair Value
(000s) (000s)
Thailand: 0.57%Bangkok Bank PCL, Foreign Traded Security . . . . . . . . . . . . . . . . . . . . . . . . . . . . . . . . . . . . . . . . . . . . . . . . . . . . . . . . . . . . . . . . . . . 213,200 $ 1,275 $ 1,356
Sweden: 0.51%Getinge AB, B . . . . . . . . . . . . . . . . . . . . . . . . . . . . . . . . . . . . . . . . . . . . . . . . . . . . . . . . . . . . . . . . . . . . . . . . . . . . . . . . . . . . . . . . . 43,540 1,374 1,220
Turkmenistan: 0.47%Dragon Oil PLC . . . . . . . . . . . . . . . . . . . . . . . . . . . . . . . . . . . . . . . . . . . . . . . . . . . . . . . . . . . . . . . . . . . . . . . . . . . . . . . . . . . . . . . . . 99,250 1,081 1,111
Ireland: 0.45%CRH PLC . . . . . . . . . . . . . . . . . . . . . . . . . . . . . . . . . . . . . . . . . . . . . . . . . . . . . . . . . . . . . . . . . . . . . . . . . . . . . . . . . . . . . . . . . . . . . 38,896 1,043 1,065
Canada: 0.34%Talisman Energy Inc. . . . . . . . . . . . . . . . . . . . . . . . . . . . . . . . . . . . . . . . . . . . . . . . . . . . . . . . . . . . . . . . . . . . . . . . . . . . . . . . . . . . . 71,800 918 810
India: 0.27%ICICI Bank Ltd., American Depositary Receipt . . . . . . . . . . . . . . . . . . . . . . . . . . . . . . . . . . . . . . . . . . . . . . . . . . . . . . . . . . . . . . . . . . . 12,080 437 643
Austria: 0.25%UNIQA Insurance Group AG . . . . . . . . . . . . . . . . . . . . . . . . . . . . . . . . . . . . . . . . . . . . . . . . . . . . . . . . . . . . . . . . . . . . . . . . . . . . . . . 42,930 533 589
Brazil: 0.19%Centrais Eletricas Brasileiras SA . . . . . . . . . . . . . . . . . . . . . . . . . . . . . . . . . . . . . . . . . . . . . . . . . . . . . . . . . . . . . . . . . . . . . . . . . . . . . 144,900 437 447
Total Common Stocks: . . . . . . . . . . . . . . . . . . . . . . . . . . . . . . . . . . . . . . . . . . . . . . . . . . . . . . . . . . . . . . . . . . . . . . . . . . . . . . . . . . . . 133,240 151,074
EQUITY-LINKED SECURITIES: 1.42%United States: 0.96%
Bank of America Corp. into Microsoft Corp., 8/1/2014 . . . . . . . . . . . . . . . . . . . . . . . . . . . . . . . . . . . . . . . . . . . . . . . . . . . . . . . . . . . . . 13,862 456 615The Goldman Sachs Group Inc. into Gilead Sciences Inc., Convertible Preferred, 4/2/2015 . . . . . . . . . . . . . . . . . . . . . . . . . . . . . . . . . . . 18,688 1,581 1,663
2,037 2,278
Netherlands: 0.27%The Barclays Bank PLC into TNT Express NV, Convertible Preferred, 12/18/2014 . . . . . . . . . . . . . . . . . . . . . . . . . . . . . . . . . . . . . . . . . 88,993 593 646
Germany: 0.19%Barclays Bank PLC into Heidelbergcement AG, Convertible Preferred, 9/26/2014 . . . . . . . . . . . . . . . . . . . . . . . . . . . . . . . . . . . . . . . . . . 6,837 385 455
Total Equity-Linked Securities: . . . . . . . . . . . . . . . . . . . . . . . . . . . . . . . . . . . . . . . . . . . . . . . . . . . . . . . . . . . . . . . . . . . . . . . . . . . . . . 3,015 3,379
PREFERRED STOCKS: 0.22%Centrais Eletricas Brasileiras SA, Preferred, B . . . . . . . . . . . . . . . . . . . . . . . . . . . . . . . . . . . . . . . . . . . . . . . . . . . . . . . . . . . . . . . . . . . 87,700 445 444CEVA Holdings LLC, Convertible Preferred, A-2 . . . . . . . . . . . . . . . . . . . . . . . . . . . . . . . . . . . . . . . . . . . . . . . . . . . . . . . . . . . . . . . . . . 49 55 57GMAC Capital Trust I, Preferred . . . . . . . . . . . . . . . . . . . . . . . . . . . . . . . . . . . . . . . . . . . . . . . . . . . . . . . . . . . . . . . . . . . . . . . . . . . . . 800 19 23
Total Preferred Stocks: . . . . . . . . . . . . . . . . . . . . . . . . . . . . . . . . . . . . . . . . . . . . . . . . . . . . . . . . . . . . . . . . . . . . . . . . . . . . . . . . . . . 519 524
Principal Amountin Currency
of Issue
BONDS: 23.39%Mexico: 4.23%
Cemex Finance LLC, Senior Secured Note, 6.00%, 4/1/2024 . . . . . . . . . . . . . . . . . . . . . . . . . . . . . . . . . . . . . . . . . . . . . . . . . . . . . . . . 200,000 USD 224 223Government of Mexico(1)
9.50%, 12/18/2014 . . . . . . . . . . . . . . . . . . . . . . . . . . . . . . . . . . . . . . . . . . . . . . . . . . . . . . . . . . . . . . . . . . . . . . . . . . . . . . . . . . . 61,140 MXN 522 5176.00%, 6/18/2015 . . . . . . . . . . . . . . . . . . . . . . . . . . . . . . . . . . . . . . . . . . . . . . . . . . . . . . . . . . . . . . . . . . . . . . . . . . . . . . . . . . . . 650 MXN 6 58.00%, 12/17/2015 . . . . . . . . . . . . . . . . . . . . . . . . . . . . . . . . . . . . . . . . . . . . . . . . . . . . . . . . . . . . . . . . . . . . . . . . . . . . . . . . . . . 274,420 MXN 2,346 2,4116.25%, 6/16/2016 . . . . . . . . . . . . . . . . . . . . . . . . . . . . . . . . . . . . . . . . . . . . . . . . . . . . . . . . . . . . . . . . . . . . . . . . . . . . . . . . . . . . 6,770 MXN 59 597.25%, 12/15/2016 . . . . . . . . . . . . . . . . . . . . . . . . . . . . . . . . . . . . . . . . . . . . . . . . . . . . . . . . . . . . . . . . . . . . . . . . . . . . . . . . . . . 770,300 MXN 6,808 6,872
9,965 10,087
(1) Principal amount in 100 Mexican Peso units
The accompanying notes are an integral part of these financial statements.
50 Franklin Templeton Investments Funds
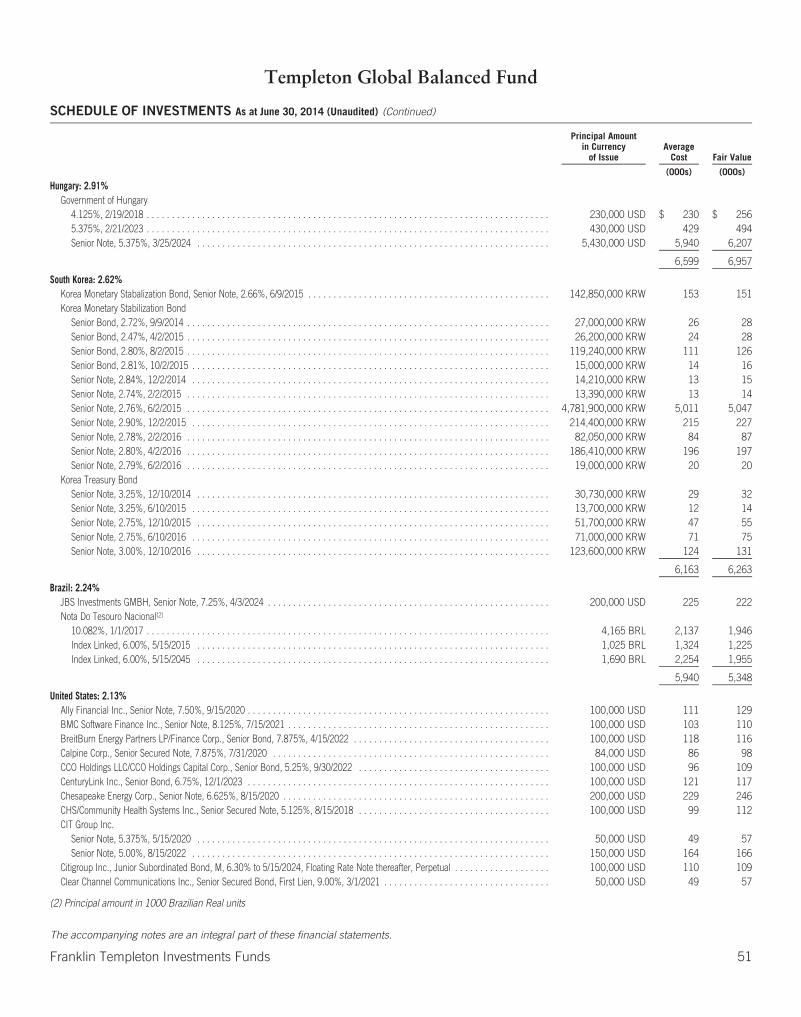
Templeton Global Balanced Fund
SCHEDULE OF INVESTMENTS As at June 30, 2014 (Unaudited) (Continued)
Principal Amountin Currency
of IssueAverage
Cost Fair Value
(000s) (000s)
Hungary: 2.91%Government of Hungary
4.125%, 2/19/2018 . . . . . . . . . . . . . . . . . . . . . . . . . . . . . . . . . . . . . . . . . . . . . . . . . . . . . . . . . . . . . . . . . . . . . . . . . . . . . . . . 230,000 USD $ 230 $ 2565.375%, 2/21/2023 . . . . . . . . . . . . . . . . . . . . . . . . . . . . . . . . . . . . . . . . . . . . . . . . . . . . . . . . . . . . . . . . . . . . . . . . . . . . . . . . 430,000 USD 429 494Senior Note, 5.375%, 3/25/2024 . . . . . . . . . . . . . . . . . . . . . . . . . . . . . . . . . . . . . . . . . . . . . . . . . . . . . . . . . . . . . . . . . . . . . . 5,430,000 USD 5,940 6,207
6,599 6,957
South Korea: 2.62%Korea Monetary Stabalization Bond, Senior Note, 2.66%, 6/9/2015 . . . . . . . . . . . . . . . . . . . . . . . . . . . . . . . . . . . . . . . . . . . . . . . . 142,850,000 KRW 153 151Korea Monetary Stabilization Bond
Senior Bond, 2.72%, 9/9/2014 . . . . . . . . . . . . . . . . . . . . . . . . . . . . . . . . . . . . . . . . . . . . . . . . . . . . . . . . . . . . . . . . . . . . . . . . 27,000,000 KRW 26 28Senior Bond, 2.47%, 4/2/2015 . . . . . . . . . . . . . . . . . . . . . . . . . . . . . . . . . . . . . . . . . . . . . . . . . . . . . . . . . . . . . . . . . . . . . . . . 26,200,000 KRW 24 28Senior Bond, 2.80%, 8/2/2015 . . . . . . . . . . . . . . . . . . . . . . . . . . . . . . . . . . . . . . . . . . . . . . . . . . . . . . . . . . . . . . . . . . . . . . . . 119,240,000 KRW 111 126Senior Bond, 2.81%, 10/2/2015 . . . . . . . . . . . . . . . . . . . . . . . . . . . . . . . . . . . . . . . . . . . . . . . . . . . . . . . . . . . . . . . . . . . . . . . 15,000,000 KRW 14 16Senior Note, 2.84%, 12/2/2014 . . . . . . . . . . . . . . . . . . . . . . . . . . . . . . . . . . . . . . . . . . . . . . . . . . . . . . . . . . . . . . . . . . . . . . . 14,210,000 KRW 13 15Senior Note, 2.74%, 2/2/2015 . . . . . . . . . . . . . . . . . . . . . . . . . . . . . . . . . . . . . . . . . . . . . . . . . . . . . . . . . . . . . . . . . . . . . . . . 13,390,000 KRW 13 14Senior Note, 2.76%, 6/2/2015 . . . . . . . . . . . . . . . . . . . . . . . . . . . . . . . . . . . . . . . . . . . . . . . . . . . . . . . . . . . . . . . . . . . . . . . . 4,781,900,000 KRW 5,011 5,047Senior Note, 2.90%, 12/2/2015 . . . . . . . . . . . . . . . . . . . . . . . . . . . . . . . . . . . . . . . . . . . . . . . . . . . . . . . . . . . . . . . . . . . . . . . 214,400,000 KRW 215 227Senior Note, 2.78%, 2/2/2016 . . . . . . . . . . . . . . . . . . . . . . . . . . . . . . . . . . . . . . . . . . . . . . . . . . . . . . . . . . . . . . . . . . . . . . . . 82,050,000 KRW 84 87Senior Note, 2.80%, 4/2/2016 . . . . . . . . . . . . . . . . . . . . . . . . . . . . . . . . . . . . . . . . . . . . . . . . . . . . . . . . . . . . . . . . . . . . . . . . 186,410,000 KRW 196 197Senior Note, 2.79%, 6/2/2016 . . . . . . . . . . . . . . . . . . . . . . . . . . . . . . . . . . . . . . . . . . . . . . . . . . . . . . . . . . . . . . . . . . . . . . . . 19,000,000 KRW 20 20
Korea Treasury BondSenior Note, 3.25%, 12/10/2014 . . . . . . . . . . . . . . . . . . . . . . . . . . . . . . . . . . . . . . . . . . . . . . . . . . . . . . . . . . . . . . . . . . . . . . 30,730,000 KRW 29 32Senior Note, 3.25%, 6/10/2015 . . . . . . . . . . . . . . . . . . . . . . . . . . . . . . . . . . . . . . . . . . . . . . . . . . . . . . . . . . . . . . . . . . . . . . . 13,700,000 KRW 12 14Senior Note, 2.75%, 12/10/2015 . . . . . . . . . . . . . . . . . . . . . . . . . . . . . . . . . . . . . . . . . . . . . . . . . . . . . . . . . . . . . . . . . . . . . . 51,700,000 KRW 47 55Senior Note, 2.75%, 6/10/2016 . . . . . . . . . . . . . . . . . . . . . . . . . . . . . . . . . . . . . . . . . . . . . . . . . . . . . . . . . . . . . . . . . . . . . . . 71,000,000 KRW 71 75Senior Note, 3.00%, 12/10/2016 . . . . . . . . . . . . . . . . . . . . . . . . . . . . . . . . . . . . . . . . . . . . . . . . . . . . . . . . . . . . . . . . . . . . . . 123,600,000 KRW 124 131
6,163 6,263
Brazil: 2.24%JBS Investments GMBH, Senior Note, 7.25%, 4/3/2024 . . . . . . . . . . . . . . . . . . . . . . . . . . . . . . . . . . . . . . . . . . . . . . . . . . . . . . . . 200,000 USD 225 222Nota Do Tesouro Nacional(2)
10.082%, 1/1/2017 . . . . . . . . . . . . . . . . . . . . . . . . . . . . . . . . . . . . . . . . . . . . . . . . . . . . . . . . . . . . . . . . . . . . . . . . . . . . . . . . 4,165 BRL 2,137 1,946Index Linked, 6.00%, 5/15/2015 . . . . . . . . . . . . . . . . . . . . . . . . . . . . . . . . . . . . . . . . . . . . . . . . . . . . . . . . . . . . . . . . . . . . . . 1,025 BRL 1,324 1,225Index Linked, 6.00%, 5/15/2045 . . . . . . . . . . . . . . . . . . . . . . . . . . . . . . . . . . . . . . . . . . . . . . . . . . . . . . . . . . . . . . . . . . . . . . 1,690 BRL 2,254 1,955
5,940 5,348
United States: 2.13%Ally Financial Inc., Senior Note, 7.50%, 9/15/2020 . . . . . . . . . . . . . . . . . . . . . . . . . . . . . . . . . . . . . . . . . . . . . . . . . . . . . . . . . . . . 100,000 USD 111 129BMC Software Finance Inc., Senior Note, 8.125%, 7/15/2021 . . . . . . . . . . . . . . . . . . . . . . . . . . . . . . . . . . . . . . . . . . . . . . . . . . . . 100,000 USD 103 110BreitBurn Energy Partners LP/Finance Corp., Senior Bond, 7.875%, 4/15/2022 . . . . . . . . . . . . . . . . . . . . . . . . . . . . . . . . . . . . . . . 100,000 USD 118 116Calpine Corp., Senior Secured Note, 7.875%, 7/31/2020 . . . . . . . . . . . . . . . . . . . . . . . . . . . . . . . . . . . . . . . . . . . . . . . . . . . . . . . 84,000 USD 86 98CCO Holdings LLC/CCO Holdings Capital Corp., Senior Bond, 5.25%, 9/30/2022 . . . . . . . . . . . . . . . . . . . . . . . . . . . . . . . . . . . . . . 100,000 USD 96 109CenturyLink Inc., Senior Bond, 6.75%, 12/1/2023 . . . . . . . . . . . . . . . . . . . . . . . . . . . . . . . . . . . . . . . . . . . . . . . . . . . . . . . . . . . . 100,000 USD 121 117Chesapeake Energy Corp., Senior Note, 6.625%, 8/15/2020 . . . . . . . . . . . . . . . . . . . . . . . . . . . . . . . . . . . . . . . . . . . . . . . . . . . . . 200,000 USD 229 246CHS/Community Health Systems Inc., Senior Secured Note, 5.125%, 8/15/2018 . . . . . . . . . . . . . . . . . . . . . . . . . . . . . . . . . . . . . . 100,000 USD 99 112CIT Group Inc.
Senior Note, 5.375%, 5/15/2020 . . . . . . . . . . . . . . . . . . . . . . . . . . . . . . . . . . . . . . . . . . . . . . . . . . . . . . . . . . . . . . . . . . . . . . 50,000 USD 49 57Senior Note, 5.00%, 8/15/2022 . . . . . . . . . . . . . . . . . . . . . . . . . . . . . . . . . . . . . . . . . . . . . . . . . . . . . . . . . . . . . . . . . . . . . . . 150,000 USD 164 166
Citigroup Inc., Junior Subordinated Bond, M, 6.30% to 5/15/2024, Floating Rate Note thereafter, Perpetual . . . . . . . . . . . . . . . . . . . 100,000 USD 110 109Clear Channel Communications Inc., Senior Secured Bond, First Lien, 9.00%, 3/1/2021 . . . . . . . . . . . . . . . . . . . . . . . . . . . . . . . . . 50,000 USD 49 57
(2) Principal amount in 1000 Brazilian Real units
The accompanying notes are an integral part of these financial statements.
Franklin Templeton Investments Funds 51

Templeton Global Balanced Fund
SCHEDULE OF INVESTMENTS As at June 30, 2014 (Unaudited) (Continued)
Principal Amountin Currency
of IssueAverage
Cost Fair Value
(000s) (000s)
United States: 2.13% (Continued)Clear Channel Worldwide Holdings Inc., Senior Subordinate Note, 7.625%, 3/15/2020 . . . . . . . . . . . . . . . . . . . . . . . . . . . . . . . . . . . . . . 50,000 USD $ 50 $ 58DaVita HealthCare Partners Inc., Senior Bond, 5.125%, 7/15/2024 . . . . . . . . . . . . . . . . . . . . . . . . . . . . . . . . . . . . . . . . . . . . . . . . . . . . 100,000 USD 109 108Energy Transfer Equity LP, Senior Bond, 5.875%, 1/15/2024 . . . . . . . . . . . . . . . . . . . . . . . . . . . . . . . . . . . . . . . . . . . . . . . . . . . . . . . . 100,000 USD 111 112Equinix Inc., Senior Bond, 5.375%, 4/1/2023 . . . . . . . . . . . . . . . . . . . . . . . . . . . . . . . . . . . . . . . . . . . . . . . . . . . . . . . . . . . . . . . . . . . 100,000 USD 111 110First Data Corp., Senior Note, 10.625%, 6/15/2021 . . . . . . . . . . . . . . . . . . . . . . . . . . . . . . . . . . . . . . . . . . . . . . . . . . . . . . . . . . . . . . . 100,000 USD 125 125Fontainebleau Las Vegas, Senior Secured Note, First Lien, 11.00%, 6/15/2015 . . . . . . . . . . . . . . . . . . . . . . . . . . . . . . . . . . . . . . . . . . . 100,000 USD 100 1Ford Motor Credit Co. LLC, Senior Note, 8.125%, 1/15/2020 . . . . . . . . . . . . . . . . . . . . . . . . . . . . . . . . . . . . . . . . . . . . . . . . . . . . . . . . 100,000 USD 102 136Frontier Communications Corp., Senior Note, 8.50%, 4/15/2020 . . . . . . . . . . . . . . . . . . . . . . . . . . . . . . . . . . . . . . . . . . . . . . . . . . . . . 100,000 USD 103 126Gannett Co. Inc., Senior Bond, 6.375%, 10/15/2023 . . . . . . . . . . . . . . . . . . . . . . . . . . . . . . . . . . . . . . . . . . . . . . . . . . . . . . . . . . . . . . 100,000 USD 116 114GMAC Inc., Subordinated Note, 8.00%, 12/31/2018 . . . . . . . . . . . . . . . . . . . . . . . . . . . . . . . . . . . . . . . . . . . . . . . . . . . . . . . . . . . . . . 25,000 USD 24 32Grifols Worldwide Operations Ltd., Senior Note, 5.25%, 4/1/2022 . . . . . . . . . . . . . . . . . . . . . . . . . . . . . . . . . . . . . . . . . . . . . . . . . . . . . 200,000 USD 219 222HCA Inc.
Senior Note, 6.50%, 2/15/2016 . . . . . . . . . . . . . . . . . . . . . . . . . . . . . . . . . . . . . . . . . . . . . . . . . . . . . . . . . . . . . . . . . . . . . . . . . . . 100,000 USD 100 115Senior Secured Note, 5.875%, 3/15/2022 . . . . . . . . . . . . . . . . . . . . . . . . . . . . . . . . . . . . . . . . . . . . . . . . . . . . . . . . . . . . . . . . . . . 100,000 USD 119 116
KB Home, Senior Bond, 7.50%, 9/15/2022 . . . . . . . . . . . . . . . . . . . . . . . . . . . . . . . . . . . . . . . . . . . . . . . . . . . . . . . . . . . . . . . . . . . . 100,000 USD 120 119Kinder Morgan Finance Co. LLC, Senior Secured Note, 6.00%, 1/15/2018 . . . . . . . . . . . . . . . . . . . . . . . . . . . . . . . . . . . . . . . . . . . . . . 100,000 USD 121 117MGM Resorts International, Senior Note, 7.75%, 3/15/2022 . . . . . . . . . . . . . . . . . . . . . . . . . . . . . . . . . . . . . . . . . . . . . . . . . . . . . . . . . 100,000 USD 99 125Peabody Energy Corp., Senior Note, 6.00%, 11/15/2018 . . . . . . . . . . . . . . . . . . . . . . . . . . . . . . . . . . . . . . . . . . . . . . . . . . . . . . . . . . . 100,000 USD 101 112Quicksilver Resources Inc., Secured Note, Second Lien, Floating Rate Note, 6/21/2019 . . . . . . . . . . . . . . . . . . . . . . . . . . . . . . . . . . . . . 100,000 USD 99 105Regency Energy Partners LP/Regency Energy Finance Corp, ., Senior Note, 5.875%, 3/1/2022 . . . . . . . . . . . . . . . . . . . . . . . . . . . . . . . . 100,000 USD 109 116Reynolds Group Issuer Inc./LLC/SA
Senior Note, 8.50%, 5/15/2018 . . . . . . . . . . . . . . . . . . . . . . . . . . . . . . . . . . . . . . . . . . . . . . . . . . . . . . . . . . . . . . . . . . . . . . . . . . . 100,000 USD 103 112Senior Note, 8.25%, 2/15/2021 . . . . . . . . . . . . . . . . . . . . . . . . . . . . . . . . . . . . . . . . . . . . . . . . . . . . . . . . . . . . . . . . . . . . . . . . . . . 100,000 USD 118 116
Sabine Pass Liquefaction LLC, Senior Secured Note, First Lien, 5.75%, 5/15/2024 . . . . . . . . . . . . . . . . . . . . . . . . . . . . . . . . . . . . . . . . . 100,000 USD 109 111Samson Investment Co., Senior Note, 9.75%, 2/15/2020 . . . . . . . . . . . . . . . . . . . . . . . . . . . . . . . . . . . . . . . . . . . . . . . . . . . . . . . . . . . 100,000 USD 100 113Sirius XM Radio Inc., Senior Bond, 6.00%, 7/15/2024 . . . . . . . . . . . . . . . . . . . . . . . . . . . . . . . . . . . . . . . . . . . . . . . . . . . . . . . . . . . . . 100,000 USD 110 111SLM Corp.
Senior Note, 8.45%, 6/15/2018 . . . . . . . . . . . . . . . . . . . . . . . . . . . . . . . . . . . . . . . . . . . . . . . . . . . . . . . . . . . . . . . . . . . . . . . . . . . 100,000 USD 117 126Senior Note, 5.50%, 1/15/2019 . . . . . . . . . . . . . . . . . . . . . . . . . . . . . . . . . . . . . . . . . . . . . . . . . . . . . . . . . . . . . . . . . . . . . . . . . . . 100,000 USD 117 114
Sprint Nextel Corp.Senior Note, 9.00%, 11/15/2018 . . . . . . . . . . . . . . . . . . . . . . . . . . . . . . . . . . . . . . . . . . . . . . . . . . . . . . . . . . . . . . . . . . . . . . . . . . 100,000 USD 102 130Senior Note, 6.00%, 11/15/2022 . . . . . . . . . . . . . . . . . . . . . . . . . . . . . . . . . . . . . . . . . . . . . . . . . . . . . . . . . . . . . . . . . . . . . . . . . . 100,000 USD 112 109
Taylor Morrison Communities Inc./Monarch Communities, Inc., Senior Note, 5.625%, 3/1/2024 . . . . . . . . . . . . . . . . . . . . . . . . . . . . . . . 100,000 USD 107 106Tenet Healthcare Corp., Senior Note, 8.125%, 4/1/2022 . . . . . . . . . . . . . . . . . . . . . . . . . . . . . . . . . . . . . . . . . . . . . . . . . . . . . . . . . . . 100,000 USD 103 124Texas Competitive Electric Holdings Co. LLC/Texas Competitive Electric Holdings Finance Inc., Senior Secured Note, 11.50%,
10/1/2020 . . . . . . . . . . . . . . . . . . . . . . . . . . . . . . . . . . . . . . . . . . . . . . . . . . . . . . . . . . . . . . . . . . . . . . . . . . . . . . . . . . . . . . . . . . 100,000 USD 76 98Univision Communications Inc., Senior Secured Note, 6.875%, 5/15/2019 . . . . . . . . . . . . . . . . . . . . . . . . . . . . . . . . . . . . . . . . . . . . . . 100,000 USD 95 114VPI Escrow Corp., Senior Note, 6.375%, 10/15/2020 . . . . . . . . . . . . . . . . . . . . . . . . . . . . . . . . . . . . . . . . . . . . . . . . . . . . . . . . . . . . . . 100,000 USD 98 114
4,840 5,093
Ukraine: 1.95%Government of Ukraine
9.25%, 7/24/2017 . . . . . . . . . . . . . . . . . . . . . . . . . . . . . . . . . . . . . . . . . . . . . . . . . . . . . . . . . . . . . . . . . . . . . . . . . . . . . . . . . . . . 400,000 USD 400 4337.75%, 9/23/2020 . . . . . . . . . . . . . . . . . . . . . . . . . . . . . . . . . . . . . . . . . . . . . . . . . . . . . . . . . . . . . . . . . . . . . . . . . . . . . . . . . . . . 200,000 USD 181 205Senior Note, 7.80%, 11/28/2022 . . . . . . . . . . . . . . . . . . . . . . . . . . . . . . . . . . . . . . . . . . . . . . . . . . . . . . . . . . . . . . . . . . . . . . . . . . 1,770,000 USD 1,695 1,793Senior Note, 7.50%, 4/17/2023 . . . . . . . . . . . . . . . . . . . . . . . . . . . . . . . . . . . . . . . . . . . . . . . . . . . . . . . . . . . . . . . . . . . . . . . . . . . 1,950,000 USD 1,738 1,966
State Export-Import Bank of Ukraine, (BIZ FIN), Loan Participation, 8.75%, 1/22/2018 . . . . . . . . . . . . . . . . . . . . . . . . . . . . . . . . . . . . . 265,000 USD 224 258
4,238 4,655
The accompanying notes are an integral part of these financial statements.
52 Franklin Templeton Investments Funds
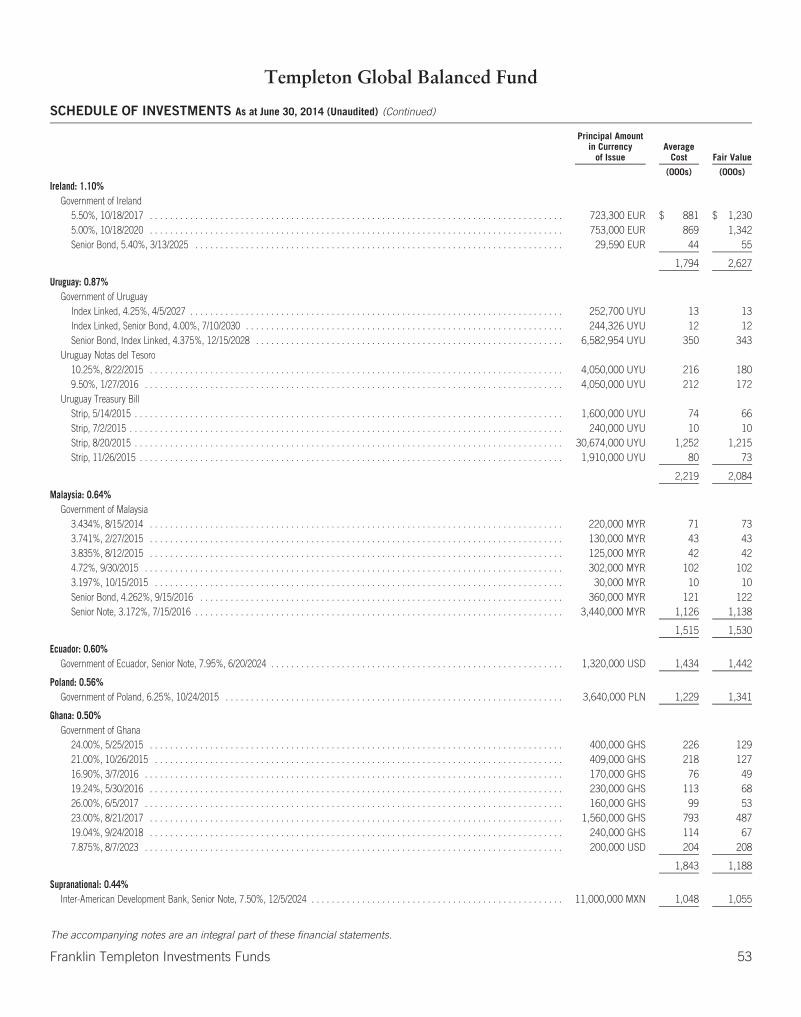
Templeton Global Balanced Fund
SCHEDULE OF INVESTMENTS As at June 30, 2014 (Unaudited) (Continued)
Principal Amountin Currency
of IssueAverage
Cost Fair Value
(000s) (000s)
Ireland: 1.10%Government of Ireland
5.50%, 10/18/2017 . . . . . . . . . . . . . . . . . . . . . . . . . . . . . . . . . . . . . . . . . . . . . . . . . . . . . . . . . . . . . . . . . . . . . . . . . . . . . . . . . . 723,300 EUR $ 881 $ 1,2305.00%, 10/18/2020 . . . . . . . . . . . . . . . . . . . . . . . . . . . . . . . . . . . . . . . . . . . . . . . . . . . . . . . . . . . . . . . . . . . . . . . . . . . . . . . . . . 753,000 EUR 869 1,342Senior Bond, 5.40%, 3/13/2025 . . . . . . . . . . . . . . . . . . . . . . . . . . . . . . . . . . . . . . . . . . . . . . . . . . . . . . . . . . . . . . . . . . . . . . . . . 29,590 EUR 44 55
1,794 2,627
Uruguay: 0.87%Government of Uruguay
Index Linked, 4.25%, 4/5/2027 . . . . . . . . . . . . . . . . . . . . . . . . . . . . . . . . . . . . . . . . . . . . . . . . . . . . . . . . . . . . . . . . . . . . . . . . . . 252,700 UYU 13 13Index Linked, Senior Bond, 4.00%, 7/10/2030 . . . . . . . . . . . . . . . . . . . . . . . . . . . . . . . . . . . . . . . . . . . . . . . . . . . . . . . . . . . . . . . 244,326 UYU 12 12Senior Bond, Index Linked, 4.375%, 12/15/2028 . . . . . . . . . . . . . . . . . . . . . . . . . . . . . . . . . . . . . . . . . . . . . . . . . . . . . . . . . . . . . 6,582,954 UYU 350 343
Uruguay Notas del Tesoro10.25%, 8/22/2015 . . . . . . . . . . . . . . . . . . . . . . . . . . . . . . . . . . . . . . . . . . . . . . . . . . . . . . . . . . . . . . . . . . . . . . . . . . . . . . . . . . 4,050,000 UYU 216 1809.50%, 1/27/2016 . . . . . . . . . . . . . . . . . . . . . . . . . . . . . . . . . . . . . . . . . . . . . . . . . . . . . . . . . . . . . . . . . . . . . . . . . . . . . . . . . . . 4,050,000 UYU 212 172
Uruguay Treasury BillStrip, 5/14/2015 . . . . . . . . . . . . . . . . . . . . . . . . . . . . . . . . . . . . . . . . . . . . . . . . . . . . . . . . . . . . . . . . . . . . . . . . . . . . . . . . . . . . . 1,600,000 UYU 74 66Strip, 7/2/2015 . . . . . . . . . . . . . . . . . . . . . . . . . . . . . . . . . . . . . . . . . . . . . . . . . . . . . . . . . . . . . . . . . . . . . . . . . . . . . . . . . . . . . . 240,000 UYU 10 10Strip, 8/20/2015 . . . . . . . . . . . . . . . . . . . . . . . . . . . . . . . . . . . . . . . . . . . . . . . . . . . . . . . . . . . . . . . . . . . . . . . . . . . . . . . . . . . . . 30,674,000 UYU 1,252 1,215Strip, 11/26/2015 . . . . . . . . . . . . . . . . . . . . . . . . . . . . . . . . . . . . . . . . . . . . . . . . . . . . . . . . . . . . . . . . . . . . . . . . . . . . . . . . . . . . 1,910,000 UYU 80 73
2,219 2,084
Malaysia: 0.64%Government of Malaysia
3.434%, 8/15/2014 . . . . . . . . . . . . . . . . . . . . . . . . . . . . . . . . . . . . . . . . . . . . . . . . . . . . . . . . . . . . . . . . . . . . . . . . . . . . . . . . . . 220,000 MYR 71 733.741%, 2/27/2015 . . . . . . . . . . . . . . . . . . . . . . . . . . . . . . . . . . . . . . . . . . . . . . . . . . . . . . . . . . . . . . . . . . . . . . . . . . . . . . . . . . 130,000 MYR 43 433.835%, 8/12/2015 . . . . . . . . . . . . . . . . . . . . . . . . . . . . . . . . . . . . . . . . . . . . . . . . . . . . . . . . . . . . . . . . . . . . . . . . . . . . . . . . . . 125,000 MYR 42 424.72%, 9/30/2015 . . . . . . . . . . . . . . . . . . . . . . . . . . . . . . . . . . . . . . . . . . . . . . . . . . . . . . . . . . . . . . . . . . . . . . . . . . . . . . . . . . . 302,000 MYR 102 1023.197%, 10/15/2015 . . . . . . . . . . . . . . . . . . . . . . . . . . . . . . . . . . . . . . . . . . . . . . . . . . . . . . . . . . . . . . . . . . . . . . . . . . . . . . . . . 30,000 MYR 10 10Senior Bond, 4.262%, 9/15/2016 . . . . . . . . . . . . . . . . . . . . . . . . . . . . . . . . . . . . . . . . . . . . . . . . . . . . . . . . . . . . . . . . . . . . . . . . 360,000 MYR 121 122Senior Note, 3.172%, 7/15/2016 . . . . . . . . . . . . . . . . . . . . . . . . . . . . . . . . . . . . . . . . . . . . . . . . . . . . . . . . . . . . . . . . . . . . . . . . . 3,440,000 MYR 1,126 1,138
1,515 1,530
Ecuador: 0.60%Government of Ecuador, Senior Note, 7.95%, 6/20/2024 . . . . . . . . . . . . . . . . . . . . . . . . . . . . . . . . . . . . . . . . . . . . . . . . . . . . . . . . . . 1,320,000 USD 1,434 1,442
Poland: 0.56%Government of Poland, 6.25%, 10/24/2015 . . . . . . . . . . . . . . . . . . . . . . . . . . . . . . . . . . . . . . . . . . . . . . . . . . . . . . . . . . . . . . . . . . . 3,640,000 PLN 1,229 1,341
Ghana: 0.50%Government of Ghana
24.00%, 5/25/2015 . . . . . . . . . . . . . . . . . . . . . . . . . . . . . . . . . . . . . . . . . . . . . . . . . . . . . . . . . . . . . . . . . . . . . . . . . . . . . . . . . . 400,000 GHS 226 12921.00%, 10/26/2015 . . . . . . . . . . . . . . . . . . . . . . . . . . . . . . . . . . . . . . . . . . . . . . . . . . . . . . . . . . . . . . . . . . . . . . . . . . . . . . . . . 409,000 GHS 218 12716.90%, 3/7/2016 . . . . . . . . . . . . . . . . . . . . . . . . . . . . . . . . . . . . . . . . . . . . . . . . . . . . . . . . . . . . . . . . . . . . . . . . . . . . . . . . . . . 170,000 GHS 76 4919.24%, 5/30/2016 . . . . . . . . . . . . . . . . . . . . . . . . . . . . . . . . . . . . . . . . . . . . . . . . . . . . . . . . . . . . . . . . . . . . . . . . . . . . . . . . . . 230,000 GHS 113 6826.00%, 6/5/2017 . . . . . . . . . . . . . . . . . . . . . . . . . . . . . . . . . . . . . . . . . . . . . . . . . . . . . . . . . . . . . . . . . . . . . . . . . . . . . . . . . . . 160,000 GHS 99 5323.00%, 8/21/2017 . . . . . . . . . . . . . . . . . . . . . . . . . . . . . . . . . . . . . . . . . . . . . . . . . . . . . . . . . . . . . . . . . . . . . . . . . . . . . . . . . . 1,560,000 GHS 793 48719.04%, 9/24/2018 . . . . . . . . . . . . . . . . . . . . . . . . . . . . . . . . . . . . . . . . . . . . . . . . . . . . . . . . . . . . . . . . . . . . . . . . . . . . . . . . . . 240,000 GHS 114 677.875%, 8/7/2023 . . . . . . . . . . . . . . . . . . . . . . . . . . . . . . . . . . . . . . . . . . . . . . . . . . . . . . . . . . . . . . . . . . . . . . . . . . . . . . . . . . . 200,000 USD 204 208
1,843 1,188
Supranational: 0.44%Inter-American Development Bank, Senior Note, 7.50%, 12/5/2024 . . . . . . . . . . . . . . . . . . . . . . . . . . . . . . . . . . . . . . . . . . . . . . . . . . 11,000,000 MXN 1,048 1,055
The accompanying notes are an integral part of these financial statements.
Franklin Templeton Investments Funds 53
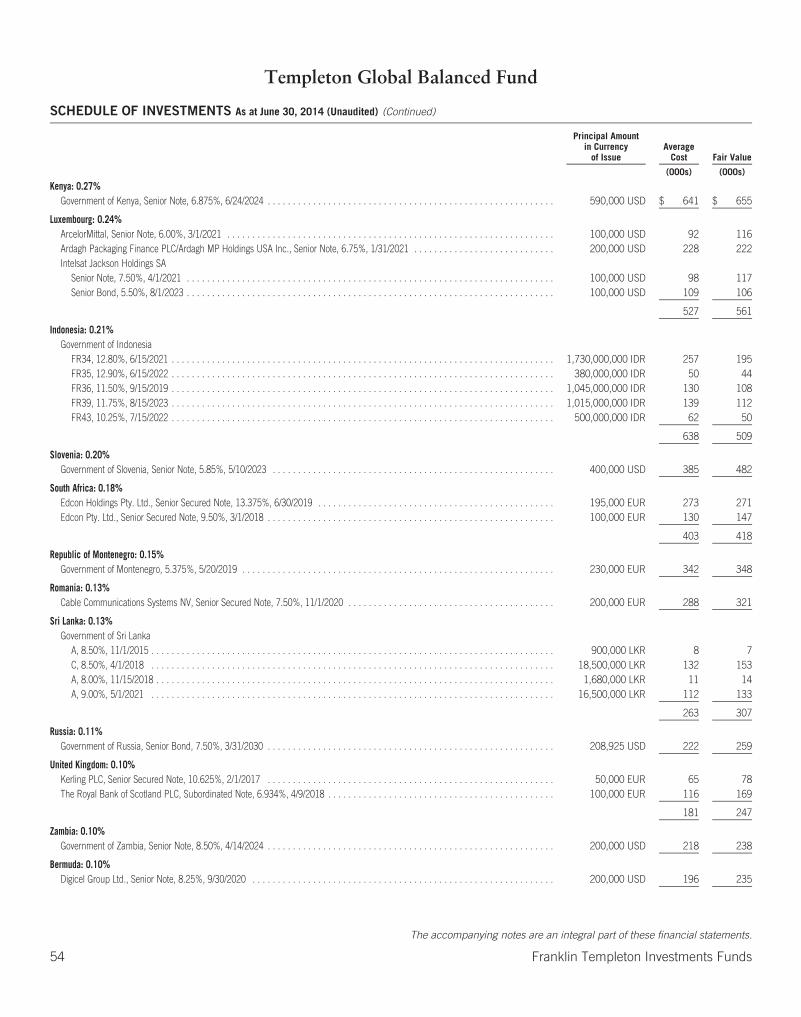
Templeton Global Balanced Fund
SCHEDULE OF INVESTMENTS As at June 30, 2014 (Unaudited) (Continued)
Principal Amountin Currency
of IssueAverage
Cost Fair Value
(000s) (000s)
Kenya: 0.27%Government of Kenya, Senior Note, 6.875%, 6/24/2024 . . . . . . . . . . . . . . . . . . . . . . . . . . . . . . . . . . . . . . . . . . . . . . . . . . . . . . . . . 590,000 USD $ 641 $ 655
Luxembourg: 0.24%ArcelorMittal, Senior Note, 6.00%, 3/1/2021 . . . . . . . . . . . . . . . . . . . . . . . . . . . . . . . . . . . . . . . . . . . . . . . . . . . . . . . . . . . . . . . . . 100,000 USD 92 116Ardagh Packaging Finance PLC/Ardagh MP Holdings USA Inc., Senior Note, 6.75%, 1/31/2021 . . . . . . . . . . . . . . . . . . . . . . . . . . . . 200,000 USD 228 222Intelsat Jackson Holdings SA
Senior Note, 7.50%, 4/1/2021 . . . . . . . . . . . . . . . . . . . . . . . . . . . . . . . . . . . . . . . . . . . . . . . . . . . . . . . . . . . . . . . . . . . . . . . . . 100,000 USD 98 117Senior Bond, 5.50%, 8/1/2023 . . . . . . . . . . . . . . . . . . . . . . . . . . . . . . . . . . . . . . . . . . . . . . . . . . . . . . . . . . . . . . . . . . . . . . . . . 100,000 USD 109 106
527 561
Indonesia: 0.21%Government of Indonesia
FR34, 12.80%, 6/15/2021 . . . . . . . . . . . . . . . . . . . . . . . . . . . . . . . . . . . . . . . . . . . . . . . . . . . . . . . . . . . . . . . . . . . . . . . . . . . . 1,730,000,000 IDR 257 195FR35, 12.90%, 6/15/2022 . . . . . . . . . . . . . . . . . . . . . . . . . . . . . . . . . . . . . . . . . . . . . . . . . . . . . . . . . . . . . . . . . . . . . . . . . . . . 380,000,000 IDR 50 44FR36, 11.50%, 9/15/2019 . . . . . . . . . . . . . . . . . . . . . . . . . . . . . . . . . . . . . . . . . . . . . . . . . . . . . . . . . . . . . . . . . . . . . . . . . . . . 1,045,000,000 IDR 130 108FR39, 11.75%, 8/15/2023 . . . . . . . . . . . . . . . . . . . . . . . . . . . . . . . . . . . . . . . . . . . . . . . . . . . . . . . . . . . . . . . . . . . . . . . . . . . . 1,015,000,000 IDR 139 112FR43, 10.25%, 7/15/2022 . . . . . . . . . . . . . . . . . . . . . . . . . . . . . . . . . . . . . . . . . . . . . . . . . . . . . . . . . . . . . . . . . . . . . . . . . . . . 500,000,000 IDR 62 50
638 509
Slovenia: 0.20%Government of Slovenia, Senior Note, 5.85%, 5/10/2023 . . . . . . . . . . . . . . . . . . . . . . . . . . . . . . . . . . . . . . . . . . . . . . . . . . . . . . . . 400,000 USD 385 482
South Africa: 0.18%Edcon Holdings Pty. Ltd., Senior Secured Note, 13.375%, 6/30/2019 . . . . . . . . . . . . . . . . . . . . . . . . . . . . . . . . . . . . . . . . . . . . . . . 195,000 EUR 273 271Edcon Pty. Ltd., Senior Secured Note, 9.50%, 3/1/2018 . . . . . . . . . . . . . . . . . . . . . . . . . . . . . . . . . . . . . . . . . . . . . . . . . . . . . . . . . 100,000 EUR 130 147
403 418
Republic of Montenegro: 0.15%Government of Montenegro, 5.375%, 5/20/2019 . . . . . . . . . . . . . . . . . . . . . . . . . . . . . . . . . . . . . . . . . . . . . . . . . . . . . . . . . . . . . . 230,000 EUR 342 348
Romania: 0.13%Cable Communications Systems NV, Senior Secured Note, 7.50%, 11/1/2020 . . . . . . . . . . . . . . . . . . . . . . . . . . . . . . . . . . . . . . . . . 200,000 EUR 288 321
Sri Lanka: 0.13%Government of Sri Lanka
A, 8.50%, 11/1/2015 . . . . . . . . . . . . . . . . . . . . . . . . . . . . . . . . . . . . . . . . . . . . . . . . . . . . . . . . . . . . . . . . . . . . . . . . . . . . . . . . 900,000 LKR 8 7C, 8.50%, 4/1/2018 . . . . . . . . . . . . . . . . . . . . . . . . . . . . . . . . . . . . . . . . . . . . . . . . . . . . . . . . . . . . . . . . . . . . . . . . . . . . . . . . 18,500,000 LKR 132 153A, 8.00%, 11/15/2018 . . . . . . . . . . . . . . . . . . . . . . . . . . . . . . . . . . . . . . . . . . . . . . . . . . . . . . . . . . . . . . . . . . . . . . . . . . . . . . . 1,680,000 LKR 11 14A, 9.00%, 5/1/2021 . . . . . . . . . . . . . . . . . . . . . . . . . . . . . . . . . . . . . . . . . . . . . . . . . . . . . . . . . . . . . . . . . . . . . . . . . . . . . . . . 16,500,000 LKR 112 133
263 307
Russia: 0.11%Government of Russia, Senior Bond, 7.50%, 3/31/2030 . . . . . . . . . . . . . . . . . . . . . . . . . . . . . . . . . . . . . . . . . . . . . . . . . . . . . . . . . 208,925 USD 222 259
United Kingdom: 0.10%Kerling PLC, Senior Secured Note, 10.625%, 2/1/2017 . . . . . . . . . . . . . . . . . . . . . . . . . . . . . . . . . . . . . . . . . . . . . . . . . . . . . . . . . 50,000 EUR 65 78The Royal Bank of Scotland PLC, Subordinated Note, 6.934%, 4/9/2018 . . . . . . . . . . . . . . . . . . . . . . . . . . . . . . . . . . . . . . . . . . . . . 100,000 EUR 116 169
181 247
Zambia: 0.10%Government of Zambia, Senior Note, 8.50%, 4/14/2024 . . . . . . . . . . . . . . . . . . . . . . . . . . . . . . . . . . . . . . . . . . . . . . . . . . . . . . . . . 200,000 USD 218 238
Bermuda: 0.10%Digicel Group Ltd., Senior Note, 8.25%, 9/30/2020 . . . . . . . . . . . . . . . . . . . . . . . . . . . . . . . . . . . . . . . . . . . . . . . . . . . . . . . . . . . . 200,000 USD 196 235
The accompanying notes are an integral part of these financial statements.
54 Franklin Templeton Investments Funds

Templeton Global Balanced Fund
SCHEDULE OF INVESTMENTS As at June 30, 2014 (Unaudited) (Continued)
Principal Amountin Currency
of IssueAverage
Cost Fair Value
(000s) (000s)
Italy: 0.10%Wind Acquisition Finance SA, Senior Secured Note, 7.375%, 4/23/2021 . . . . . . . . . . . . . . . . . . . . . . . . . . . . . . . . . . . . . . . . . . . . . . . . 200,000 USD $ 218 $ 229
Canada: 0.09%CHC Helicopter SA, Senior Secured Note, First Lien, 9.25%, 10/15/2020 . . . . . . . . . . . . . . . . . . . . . . . . . . . . . . . . . . . . . . . . . . . . . . . 90,000 USD 106 105First Quantum Minerals Ltd., Senior Note, 7.00%, 2/15/2021 . . . . . . . . . . . . . . . . . . . . . . . . . . . . . . . . . . . . . . . . . . . . . . . . . . . . . . . . 100,000 USD 113 110
219 215
Spain: 0.08%Abengoa Finance SAU, Senior Note, 7.75%, 2/1/2020 . . . . . . . . . . . . . . . . . . . . . . . . . . . . . . . . . . . . . . . . . . . . . . . . . . . . . . . . . . . . . 150,000 USD 182 178
Japan: 0.07%eAccess Ltd., Senior Note, 8.375%, 4/1/2018 . . . . . . . . . . . . . . . . . . . . . . . . . . . . . . . . . . . . . . . . . . . . . . . . . . . . . . . . . . . . . . . . . . . 100,000 EUR 123 159
Netherlands: 0.07%UPCB Finance II Ltd., Senior Secured Note, 6.375%, 7/1/2020 . . . . . . . . . . . . . . . . . . . . . . . . . . . . . . . . . . . . . . . . . . . . . . . . . . . . . . 100,000 EUR 135 155
Switzerland: 0.06%Ineos Group Holdings SA, Senior Note, 5.75%, 2/15/2019 . . . . . . . . . . . . . . . . . . . . . . . . . . . . . . . . . . . . . . . . . . . . . . . . . . . . . . . . . . 100,000 EUR 149 151
Kazakhstan: 0.05%HSBK ( EURope) BV, Senior Note, 7.25%, 5/3/2017 . . . . . . . . . . . . . . . . . . . . . . . . . . . . . . . . . . . . . . . . . . . . . . . . . . . . . . . . . . . . . . 100,000 USD 84 116
Australia: 0.05%FMG Resources (August 2006) Pty. Ltd., Senior Note, 6.875%, 4/1/2022 . . . . . . . . . . . . . . . . . . . . . . . . . . . . . . . . . . . . . . . . . . . . . . . 100,000 USD 119 115
Cyprus: 0.04%Ocean Rig UDW Inc., Senior Note, 7.25%, 4/1/2019 . . . . . . . . . . . . . . . . . . . . . . . . . . . . . . . . . . . . . . . . . . . . . . . . . . . . . . . . . . . . . . 100,000 USD 105 106
Philippines: 0.03%Government of the Philippines, Senior Note, 1.625%, 4/25/2016 . . . . . . . . . . . . . . . . . . . . . . . . . . . . . . . . . . . . . . . . . . . . . . . . . . . . . 3,220,000 PHP 78 78
Peru: 0.03%Government of Peru, Senior Bond, 7.84%, 8/12/2020 . . . . . . . . . . . . . . . . . . . . . . . . . . . . . . . . . . . . . . . . . . . . . . . . . . . . . . . . . . . . . 140,000 PEN 48 61
El Salvador: 0.01%Government of El Salvador, Senior Bond, 7.65%, 6/15/2035 . . . . . . . . . . . . . . . . . . . . . . . . . . . . . . . . . . . . . . . . . . . . . . . . . . . . . . . . 15,000 USD 17 17
Total Bonds: . . . . . . . . . . . . . . . . . . . . . . . . . . . . . . . . . . . . . . . . . . . . . . . . . . . . . . . . . . . . . . . . . . . . . . . . . . . . . . . . . . . . . . . . . . . 54,608 55,830
Total Long-Term Investments: . . . . . . . . . . . . . . . . . . . . . . . . . . . . . . . . . . . . . . . . . . . . . . . . . . . . . . . . . . . . . . . . . . . . . . . . . . . . . . . 191,382 210,807
SHORT-TERM SECURITIES: 7.47%Bank of Negara Malaysia Monetary Note, 3.12%, 6/16/2015 . . . . . . . . . . . . . . . . . . . . . . . . . . . . . . . . . . . . . . . . . . . . . . . . . . . . . . . . 10,000 MYR 3 3Bank of Negara Monetary Note
2.88%, 7/3/2014 . . . . . . . . . . . . . . . . . . . . . . . . . . . . . . . . . . . . . . . . . . . . . . . . . . . . . . . . . . . . . . . . . . . . . . . . . . . . . . . . . . . . . 10,000 MYR 3 32.86%, 7/8/2014 . . . . . . . . . . . . . . . . . . . . . . . . . . . . . . . . . . . . . . . . . . . . . . . . . . . . . . . . . . . . . . . . . . . . . . . . . . . . . . . . . . . . . 60,000 MYR 20 202.889%, 7/15/2014 . . . . . . . . . . . . . . . . . . . . . . . . . . . . . . . . . . . . . . . . . . . . . . . . . . . . . . . . . . . . . . . . . . . . . . . . . . . . . . . . . . . 40,000 MYR 13 132.952%, 7/17/2014 . . . . . . . . . . . . . . . . . . . . . . . . . . . . . . . . . . . . . . . . . . . . . . . . . . . . . . . . . . . . . . . . . . . . . . . . . . . . . . . . . . . 90,000 MYR 30 302.884%, 7/24/2014 . . . . . . . . . . . . . . . . . . . . . . . . . . . . . . . . . . . . . . . . . . . . . . . . . . . . . . . . . . . . . . . . . . . . . . . . . . . . . . . . . . . 60,000 MYR 19 202.889%, 8/5/2014 . . . . . . . . . . . . . . . . . . . . . . . . . . . . . . . . . . . . . . . . . . . . . . . . . . . . . . . . . . . . . . . . . . . . . . . . . . . . . . . . . . . . 300,000 MYR 96 992.861%, 8/14/2014 . . . . . . . . . . . . . . . . . . . . . . . . . . . . . . . . . . . . . . . . . . . . . . . . . . . . . . . . . . . . . . . . . . . . . . . . . . . . . . . . . . . 295,000 MYR 93 982.914%, 8/21/2014 . . . . . . . . . . . . . . . . . . . . . . . . . . . . . . . . . . . . . . . . . . . . . . . . . . . . . . . . . . . . . . . . . . . . . . . . . . . . . . . . . . . 110,000 MYR 35 362.888%, 9/18/2014 . . . . . . . . . . . . . . . . . . . . . . . . . . . . . . . . . . . . . . . . . . . . . . . . . . . . . . . . . . . . . . . . . . . . . . . . . . . . . . . . . . . 20,000 MYR 7 72.86%, 9/25/2014 . . . . . . . . . . . . . . . . . . . . . . . . . . . . . . . . . . . . . . . . . . . . . . . . . . . . . . . . . . . . . . . . . . . . . . . . . . . . . . . . . . . . 10,000 MYR 3 32.882%, 10/2/2014 . . . . . . . . . . . . . . . . . . . . . . . . . . . . . . . . . . . . . . . . . . . . . . . . . . . . . . . . . . . . . . . . . . . . . . . . . . . . . . . . . . . 100,000 MYR 33 332.888%, 10/16/2014 . . . . . . . . . . . . . . . . . . . . . . . . . . . . . . . . . . . . . . . . . . . . . . . . . . . . . . . . . . . . . . . . . . . . . . . . . . . . . . . . . . 150,000 MYR 49 492.95%, 10/28/2014 . . . . . . . . . . . . . . . . . . . . . . . . . . . . . . . . . . . . . . . . . . . . . . . . . . . . . . . . . . . . . . . . . . . . . . . . . . . . . . . . . . . 25,000 MYR 8 82.875%, 11/6/2014 . . . . . . . . . . . . . . . . . . . . . . . . . . . . . . . . . . . . . . . . . . . . . . . . . . . . . . . . . . . . . . . . . . . . . . . . . . . . . . . . . . . 45,000 MYR 15 152.876%, 11/18/2014 . . . . . . . . . . . . . . . . . . . . . . . . . . . . . . . . . . . . . . . . . . . . . . . . . . . . . . . . . . . . . . . . . . . . . . . . . . . . . . . . . . 10,000 MYR 3 3
The accompanying notes are an integral part of these financial statements.
Franklin Templeton Investments Funds 55

Templeton Global Balanced Fund
SCHEDULE OF INVESTMENTS As at June 30, 2014 (Unaudited) (Continued)
Principal Amountin Currency
of IssueAverage
Cost Fair Value
(000s) (000s)
Bank of Negara Monetary Note (Continued)2.869%, 12/2/2014 . . . . . . . . . . . . . . . . . . . . . . . . . . . . . . . . . . . . . . . . . . . . . . . . . . . . . . . . . . . . . . . . . . . . . . . . . . . . . . . . . . . 10,000 MYR $ 3 $ 32.886%, 12/16/2014 . . . . . . . . . . . . . . . . . . . . . . . . . . . . . . . . . . . . . . . . . . . . . . . . . . . . . . . . . . . . . . . . . . . . . . . . . . . . . . . . . . 20,000 MYR 6 72.88%, 1/8/2015 . . . . . . . . . . . . . . . . . . . . . . . . . . . . . . . . . . . . . . . . . . . . . . . . . . . . . . . . . . . . . . . . . . . . . . . . . . . . . . . . . . . . 20,000 MYR 7 72.87%, 2/17/2015 . . . . . . . . . . . . . . . . . . . . . . . . . . . . . . . . . . . . . . . . . . . . . . . . . . . . . . . . . . . . . . . . . . . . . . . . . . . . . . . . . . . . 10,000 MYR 3 33.015%, 3/5/2015 . . . . . . . . . . . . . . . . . . . . . . . . . . . . . . . . . . . . . . . . . . . . . . . . . . . . . . . . . . . . . . . . . . . . . . . . . . . . . . . . . . . . 100,000 MYR 33 332.908%, 3/24/2015 . . . . . . . . . . . . . . . . . . . . . . . . . . . . . . . . . . . . . . . . . . . . . . . . . . . . . . . . . . . . . . . . . . . . . . . . . . . . . . . . . . . 10,000 MYR 3 32.876%, 4/16/2015 . . . . . . . . . . . . . . . . . . . . . . . . . . . . . . . . . . . . . . . . . . . . . . . . . . . . . . . . . . . . . . . . . . . . . . . . . . . . . . . . . . . 30,000 MYR 10 103.076%, 4/28/2015 . . . . . . . . . . . . . . . . . . . . . . . . . . . . . . . . . . . . . . . . . . . . . . . . . . . . . . . . . . . . . . . . . . . . . . . . . . . . . . . . . . . 10,000 MYR 3 33.00%, 5/5/2015 . . . . . . . . . . . . . . . . . . . . . . . . . . . . . . . . . . . . . . . . . . . . . . . . . . . . . . . . . . . . . . . . . . . . . . . . . . . . . . . . . . . . 40,000 MYR 13 133.07%, 5/19/2015 . . . . . . . . . . . . . . . . . . . . . . . . . . . . . . . . . . . . . . . . . . . . . . . . . . . . . . . . . . . . . . . . . . . . . . . . . . . . . . . . . . . . 45,000 MYR 15 153.12%, 6/3/2015 . . . . . . . . . . . . . . . . . . . . . . . . . . . . . . . . . . . . . . . . . . . . . . . . . . . . . . . . . . . . . . . . . . . . . . . . . . . . . . . . . . . . 10,000 MYR 3 3
Federal Home Loan Bank Discount Notes, 7/1/2014 . . . . . . . . . . . . . . . . . . . . . . . . . . . . . . . . . . . . . . . . . . . . . . . . . . . . . . . . . . . . . 15,000,000 USD 15,977 15,977Mexico Treasury Bill
3.51%, 7/10/2014 . . . . . . . . . . . . . . . . . . . . . . . . . . . . . . . . . . . . . . . . . . . . . . . . . . . . . . . . . . . . . . . . . . . . . . . . . . . . . . . . . . . . 34,600 MXN 29 293.61%, 8/21/2014 . . . . . . . . . . . . . . . . . . . . . . . . . . . . . . . . . . . . . . . . . . . . . . . . . . . . . . . . . . . . . . . . . . . . . . . . . . . . . . . . . . . . 59,590 MXN 48 493.677%, 10/16/2014 . . . . . . . . . . . . . . . . . . . . . . . . . . . . . . . . . . . . . . . . . . . . . . . . . . . . . . . . . . . . . . . . . . . . . . . . . . . . . . . . . . 117,600 MXN 96 963.692%, 12/11/2014 . . . . . . . . . . . . . . . . . . . . . . . . . . . . . . . . . . . . . . . . . . . . . . . . . . . . . . . . . . . . . . . . . . . . . . . . . . . . . . . . . . 144,600 MXN 117 1173.634%, 4/1/2015 . . . . . . . . . . . . . . . . . . . . . . . . . . . . . . . . . . . . . . . . . . . . . . . . . . . . . . . . . . . . . . . . . . . . . . . . . . . . . . . . . . . . 373,200 MXN 306 300
Monetary Authority of Singapore Treasury Bill, 0.32%, 9/30/2014 . . . . . . . . . . . . . . . . . . . . . . . . . . . . . . . . . . . . . . . . . . . . . . . . . . . . 90,000 SGD 78 77Philippine Treasury Bill, 0.152%, 10/8/2014 . . . . . . . . . . . . . . . . . . . . . . . . . . . . . . . . . . . . . . . . . . . . . . . . . . . . . . . . . . . . . . . . . . . 26,830,000 PHP 643 654
Total Short-Term Securities: . . . . . . . . . . . . . . . . . . . . . . . . . . . . . . . . . . . . . . . . . . . . . . . . . . . . . . . . . . . . . . . . . . . . . . . . . . . . . . . 17,823 17,839
Transaction costs (Note 4) . . . . . . . . . . . . . . . . . . . . . . . . . . . . . . . . . . . . . . . . . . . . . . . . . . . . . . . . . . . . . . . . . . . . . . . . . . . . . . . . (273) —
TOTAL INVESTMENTS: 95.80% . . . . . . . . . . . . . . . . . . . . . . . . . . . . . . . . . . . . . . . . . . . . . . . . . . . . . . . . . . . . . . . . . . . . . . . . . . . . . $208,932 228,646
NET UNREALIZED GAIN ON DERIVATIVES: 0.14% . . . . . . . . . . . . . . . . . . . . . . . . . . . . . . . . . . . . . . . . . . . . . . . . . . . . . . . . . . . . . . 346OTHER ASSETS, less liabilities: 4.06% . . . . . . . . . . . . . . . . . . . . . . . . . . . . . . . . . . . . . . . . . . . . . . . . . . . . . . . . . . . . . . . . . . . . . . . 9,678
TOTAL NET ASSETS: 100.00% . . . . . . . . . . . . . . . . . . . . . . . . . . . . . . . . . . . . . . . . . . . . . . . . . . . . . . . . . . . . . . . . . . . . . . . . . . . . . $238,670
SCHEDULE OF DERIVATIVE INSTRUMENTS (As at June 30, 2014)FORWARD FOREIGN EXCHANGE CONTRACTS
CounterpartyCreditRating Settlement Date
Currencyto be Delivered
Par ValueIn Canadian Dollars
Currencyto be Received
Par ValueIn Canadian Dollars
ContractPrice
UnrealizedGain (Loss)
(000s) (000s) (000s) (000s) (000s)
BARCLAYS BANK PLC . . . . . . . . . . . A February 26, 2015 74 EUR $ 109 102 USD $ 109 1.3741 $ —
BARCLAYS BANK PLC . . . . . . . . . . . A May 5, 2015 147 EUR 217 204 USD 219 1.3859 2
DEUTSCHE BANK AG . . . . . . . . . . . A July 7, 2014 98 EUR 143 434 PLN 152 4.4326 9
DEUTSCHE BANK AG . . . . . . . . . . . A July 15, 2014 37 USD 39 2,247 INR 40 61.4018 1
DEUTSCHE BANK AG . . . . . . . . . . . A July 15, 2014 93 USD 100 300 MYR 100 3.2157 —
DEUTSCHE BANK AG . . . . . . . . . . . A July 17, 2014 78 USD 84 4,818 INR 86 61.4666 2
DEUTSCHE BANK AG . . . . . . . . . . . A July 18, 2014 772 USD 824 2,496 MYR 829 3.2330 5
DEUTSCHE BANK AG . . . . . . . . . . . A July 22, 2014 18 USD 19 1,117 INR 20 61.6752 1
DEUTSCHE BANK AG . . . . . . . . . . . A July 31, 2014 199 USD 212 12,269 INR 217 61.7292 5
DEUTSCHE BANK AG . . . . . . . . . . . A August 7, 2014 50 USD 53 3,057 INR 54 61.0826 1
DEUTSCHE BANK AG . . . . . . . . . . . A August 12, 2014 9 USD 10 557 INR 10 60.9609 —
DEUTSCHE BANK AG . . . . . . . . . . . A August 18, 2014 93 USD 100 52,530 CLP 101 563.1010 1
DEUTSCHE BANK AG . . . . . . . . . . . A August 27, 2014 70 USD 75 39,530 CLP 76 563.6032 1
DEUTSCHE BANK AG . . . . . . . . . . . A September 5, 2014 93 USD 99 52,610 CLP 101 567.4991 2
The accompanying notes are an integral part of these financial statements.
56 Franklin Templeton Investments Funds
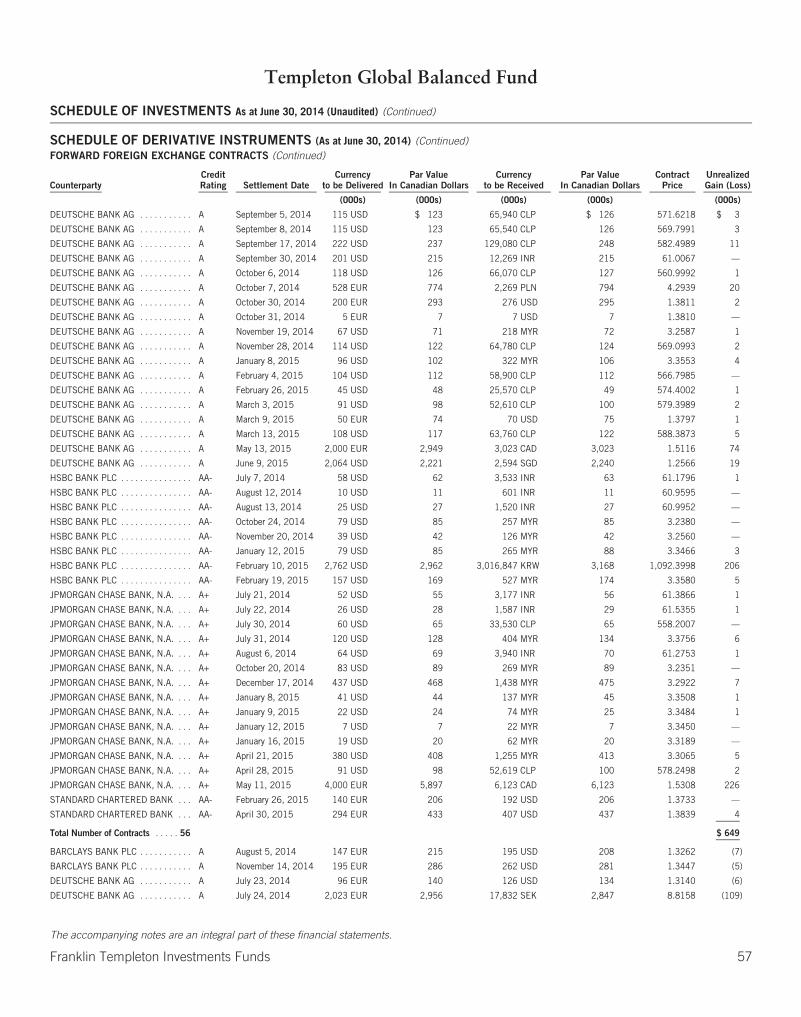
Templeton Global Balanced Fund
SCHEDULE OF INVESTMENTS As at June 30, 2014 (Unaudited) (Continued)
SCHEDULE OF DERIVATIVE INSTRUMENTS (As at June 30, 2014) (Continued)FORWARD FOREIGN EXCHANGE CONTRACTS (Continued)
CounterpartyCreditRating Settlement Date
Currencyto be Delivered
Par ValueIn Canadian Dollars
Currencyto be Received
Par ValueIn Canadian Dollars
ContractPrice
UnrealizedGain (Loss)
(000s) (000s) (000s) (000s) (000s)
DEUTSCHE BANK AG . . . . . . . . . . . A September 5, 2014 115 USD $ 123 65,940 CLP $ 126 571.6218 $ 3
DEUTSCHE BANK AG . . . . . . . . . . . A September 8, 2014 115 USD 123 65,540 CLP 126 569.7991 3
DEUTSCHE BANK AG . . . . . . . . . . . A September 17, 2014 222 USD 237 129,080 CLP 248 582.4989 11
DEUTSCHE BANK AG . . . . . . . . . . . A September 30, 2014 201 USD 215 12,269 INR 215 61.0067 —
DEUTSCHE BANK AG . . . . . . . . . . . A October 6, 2014 118 USD 126 66,070 CLP 127 560.9992 1
DEUTSCHE BANK AG . . . . . . . . . . . A October 7, 2014 528 EUR 774 2,269 PLN 794 4.2939 20
DEUTSCHE BANK AG . . . . . . . . . . . A October 30, 2014 200 EUR 293 276 USD 295 1.3811 2
DEUTSCHE BANK AG . . . . . . . . . . . A October 31, 2014 5 EUR 7 7 USD 7 1.3810 —
DEUTSCHE BANK AG . . . . . . . . . . . A November 19, 2014 67 USD 71 218 MYR 72 3.2587 1
DEUTSCHE BANK AG . . . . . . . . . . . A November 28, 2014 114 USD 122 64,780 CLP 124 569.0993 2
DEUTSCHE BANK AG . . . . . . . . . . . A January 8, 2015 96 USD 102 322 MYR 106 3.3553 4
DEUTSCHE BANK AG . . . . . . . . . . . A February 4, 2015 104 USD 112 58,900 CLP 112 566.7985 —
DEUTSCHE BANK AG . . . . . . . . . . . A February 26, 2015 45 USD 48 25,570 CLP 49 574.4002 1
DEUTSCHE BANK AG . . . . . . . . . . . A March 3, 2015 91 USD 98 52,610 CLP 100 579.3989 2
DEUTSCHE BANK AG . . . . . . . . . . . A March 9, 2015 50 EUR 74 70 USD 75 1.3797 1
DEUTSCHE BANK AG . . . . . . . . . . . A March 13, 2015 108 USD 117 63,760 CLP 122 588.3873 5
DEUTSCHE BANK AG . . . . . . . . . . . A May 13, 2015 2,000 EUR 2,949 3,023 CAD 3,023 1.5116 74
DEUTSCHE BANK AG . . . . . . . . . . . A June 9, 2015 2,064 USD 2,221 2,594 SGD 2,240 1.2566 19
HSBC BANK PLC . . . . . . . . . . . . . . . AA- July 7, 2014 58 USD 62 3,533 INR 63 61.1796 1
HSBC BANK PLC . . . . . . . . . . . . . . . AA- August 12, 2014 10 USD 11 601 INR 11 60.9595 —
HSBC BANK PLC . . . . . . . . . . . . . . . AA- August 13, 2014 25 USD 27 1,520 INR 27 60.9952 —
HSBC BANK PLC . . . . . . . . . . . . . . . AA- October 24, 2014 79 USD 85 257 MYR 85 3.2380 —
HSBC BANK PLC . . . . . . . . . . . . . . . AA- November 20, 2014 39 USD 42 126 MYR 42 3.2560 —
HSBC BANK PLC . . . . . . . . . . . . . . . AA- January 12, 2015 79 USD 85 265 MYR 88 3.3466 3
HSBC BANK PLC . . . . . . . . . . . . . . . AA- February 10, 2015 2,762 USD 2,962 3,016,847 KRW 3,168 1,092.3998 206
HSBC BANK PLC . . . . . . . . . . . . . . . AA- February 19, 2015 157 USD 169 527 MYR 174 3.3580 5
JPMORGAN CHASE BANK, N.A. . . . A+ July 21, 2014 52 USD 55 3,177 INR 56 61.3866 1
JPMORGAN CHASE BANK, N.A. . . . A+ July 22, 2014 26 USD 28 1,587 INR 29 61.5355 1
JPMORGAN CHASE BANK, N.A. . . . A+ July 30, 2014 60 USD 65 33,530 CLP 65 558.2007 —
JPMORGAN CHASE BANK, N.A. . . . A+ July 31, 2014 120 USD 128 404 MYR 134 3.3756 6
JPMORGAN CHASE BANK, N.A. . . . A+ August 6, 2014 64 USD 69 3,940 INR 70 61.2753 1
JPMORGAN CHASE BANK, N.A. . . . A+ October 20, 2014 83 USD 89 269 MYR 89 3.2351 —
JPMORGAN CHASE BANK, N.A. . . . A+ December 17, 2014 437 USD 468 1,438 MYR 475 3.2922 7
JPMORGAN CHASE BANK, N.A. . . . A+ January 8, 2015 41 USD 44 137 MYR 45 3.3508 1
JPMORGAN CHASE BANK, N.A. . . . A+ January 9, 2015 22 USD 24 74 MYR 25 3.3484 1
JPMORGAN CHASE BANK, N.A. . . . A+ January 12, 2015 7 USD 7 22 MYR 7 3.3450 —
JPMORGAN CHASE BANK, N.A. . . . A+ January 16, 2015 19 USD 20 62 MYR 20 3.3189 —
JPMORGAN CHASE BANK, N.A. . . . A+ April 21, 2015 380 USD 408 1,255 MYR 413 3.3065 5
JPMORGAN CHASE BANK, N.A. . . . A+ April 28, 2015 91 USD 98 52,619 CLP 100 578.2498 2
JPMORGAN CHASE BANK, N.A. . . . A+ May 11, 2015 4,000 EUR 5,897 6,123 CAD 6,123 1.5308 226
STANDARD CHARTERED BANK . . . AA- February 26, 2015 140 EUR 206 192 USD 206 1.3733 —
STANDARD CHARTERED BANK . . . AA- April 30, 2015 294 EUR 433 407 USD 437 1.3839 4
Total Number of Contracts . . . . . 56 $ 649
BARCLAYS BANK PLC . . . . . . . . . . . A August 5, 2014 147 EUR 215 195 USD 208 1.3262 (7)
BARCLAYS BANK PLC . . . . . . . . . . . A November 14, 2014 195 EUR 286 262 USD 281 1.3447 (5)
DEUTSCHE BANK AG . . . . . . . . . . . A July 23, 2014 96 EUR 140 126 USD 134 1.3140 (6)
DEUTSCHE BANK AG . . . . . . . . . . . A July 24, 2014 2,023 EUR 2,956 17,832 SEK 2,847 8.8158 (109)
The accompanying notes are an integral part of these financial statements.
Franklin Templeton Investments Funds 57

Templeton Global Balanced Fund
SCHEDULE OF INVESTMENTS As at June 30, 2014 (Unaudited) (Continued)
SCHEDULE OF DERIVATIVE INSTRUMENTS (As at June 30, 2014) (Continued)FORWARD FOREIGN EXCHANGE CONTRACTS (Continued)
CounterpartyCreditRating Settlement Date
Currencyto be Delivered
Par ValueIn Canadian Dollars
Currencyto be Received
Par ValueIn Canadian Dollars
ContractPrice
UnrealizedGain (Loss)
(000s) (000s) (000s) (000s) (000s)
DEUTSCHE BANK AG . . . . . . . . . . . A August 19, 2014 25 USD $ 27 1,526 INR $ 27 60.3544 $ —
DEUTSCHE BANK AG . . . . . . . . . . . A August 21, 2014 23 USD 26 1,390 INR 25 59.2953 (1)
DEUTSCHE BANK AG . . . . . . . . . . . A August 27, 2014 19 USD 20 1,128 INR 19 59.2842 (1)
DEUTSCHE BANK AG . . . . . . . . . . . A August 28, 2014 205 USD 219 12,269 INR 216 59.8149 (3)
DEUTSCHE BANK AG . . . . . . . . . . . A September 3, 2014 45 USD 49 2,706 INR 48 59.7734 (1)
DEUTSCHE BANK AG . . . . . . . . . . . A September 9, 2014 9 USD 10 569 INR 10 60.1289 —
DEUTSCHE BANK AG . . . . . . . . . . . A September 18, 2014 471 EUR 689 4,183 SEK 668 8.8863 (21)
DEUTSCHE BANK AG . . . . . . . . . . . A September 26, 2014 19 USD 20 1,128 INR 20 60.9499 —
DEUTSCHE BANK AG . . . . . . . . . . . A September 30, 2014 119 USD 127 62,190 CLP 119 523.4981 (8)
DEUTSCHE BANK AG . . . . . . . . . . . A October 24, 2014 120 USD 129 387 MYR 128 3.2205 (1)
DEUTSCHE BANK AG . . . . . . . . . . . A December 8, 2014 1,042 EUR 1,529 1,412 USD 1,513 1.3557 (16)
DEUTSCHE BANK AG . . . . . . . . . . . A January 9, 2015 97 EUR 142 130 USD 140 1.3512 (2)
DEUTSCHE BANK AG . . . . . . . . . . . A January 9, 2015 100 EUR 147 137 USD 147 1.3676 —
DEUTSCHE BANK AG . . . . . . . . . . . A June 5, 2015 42 USD 45 23,817 CLP 45 569.7983 —
DEUTSCHE BANK AG . . . . . . . . . . . A June 12, 2015 530 EUR 783 2,222 PLN 773 4.1886 (10)
HSBC BANK PLC . . . . . . . . . . . . . . . AA- August 4, 2014 294 EUR 430 390 USD 416 1.3254 (14)
HSBC BANK PLC . . . . . . . . . . . . . . . AA- October 20, 2014 652 EUR 955 885 USD 947 1.3580 (8)
HSBC BANK PLC . . . . . . . . . . . . . . . AA- October 22, 2014 158 USD 169 507 MYR 168 3.2072 (1)
HSBC BANK PLC . . . . . . . . . . . . . . . AA- December 9, 2014 220 EUR 323 300 USD 322 1.3650 (1)
JPMORGAN CHASE BANK, N.A. . . . A+ July 31, 2014 14 USD 15 853 INR 15 59.4964 —
JPMORGAN CHASE BANK, N.A. . . . A+ July 31, 2014 294 EUR 430 391 USD 417 1.3294 (13)
JPMORGAN CHASE BANK, N.A. . . . A+ August 19, 2014 54 USD 57 3,236 INR 57 60.3146 —
JPMORGAN CHASE BANK, N.A. . . . A+ August 27, 2014 213 EUR 311 284 USD 304 1.3372 (7)
JPMORGAN CHASE BANK, N.A. . . . A+ August 28, 2014 14 USD 15 853 INR 15 59.7883 —
JPMORGAN CHASE BANK, N.A. . . . A+ September 23, 2014 14 USD 15 853 INR 15 60.8894 —
JPMORGAN CHASE BANK, N.A. . . . A+ November 20, 2014 99 EUR 145 134 USD 143 1.3536 (2)
JPMORGAN CHASE BANK, N.A. . . . A+ May 20, 2015 229 EUR 337 313 USD 336 1.3669 (1)
STANDARD CHARTERED BANK . . . AA- January 13, 2015 73 EUR 108 99 USD 107 1.3590 (1)
UBS AG . . . . . . . . . . . . . . . . . . . . . . A August 1, 2014 294 EUR 430 391 USD 418 1.3309 (12)
UBS AG . . . . . . . . . . . . . . . . . . . . . . A August 26, 2014 57 EUR 83 500 SEK 79 8.7790 (4)
Total Number of Contracts . . . . . 34 $(255)
Net Unrealized Gain on forward
foreign exchange contracts . . . . $394
INTEREST RATE SWAP CONTRACTS
The Fund uses interest rate swap contracts to manage and or gain exposure to fluctuations in interest rates. An interest rate swap is anagreement between the Fund and a counterparty whereby the parties agree to exchange a fixed payment for a floating payment is linked to aninterest rate and an agreed upon notional amount. The details of the contracts are as follows:
CounterpartyCreditRating
Pay/ReceiveFloating Rate Fixed Rate Floating Rate
ExpirationDate
NotionalAmount
UnrealizedAppreciation/(Depreciation)
(000s) (000s)
JPMORGAN CHASE & CO. . . . . . . . . . . . . . . . . . . . . . . . . . . . . . . . . . . . . . . . A+ Receive 3.85% 3-Month USD-Libor-BBA 08/22/2043 $240 $ (29)
JPMORGAN CHASE & CO. . . . . . . . . . . . . . . . . . . . . . . . . . . . . . . . . . . . . . . . A+ Receive 3.02% 3-Month USD-Libor-BBA 08/22/2023 430 (19)
Net Unrealized Loss on interest rate swap contracts . . . . . . . . . . . . . . . . . . $ (48)
Net Unrealized Loss on Derivatives . . . . . . . . . . . . . . . . . . . . . . . . . . . . . . . . $(346)
The accompanying notes are an integral part of these financial statements.
58 Franklin Templeton Investments Funds
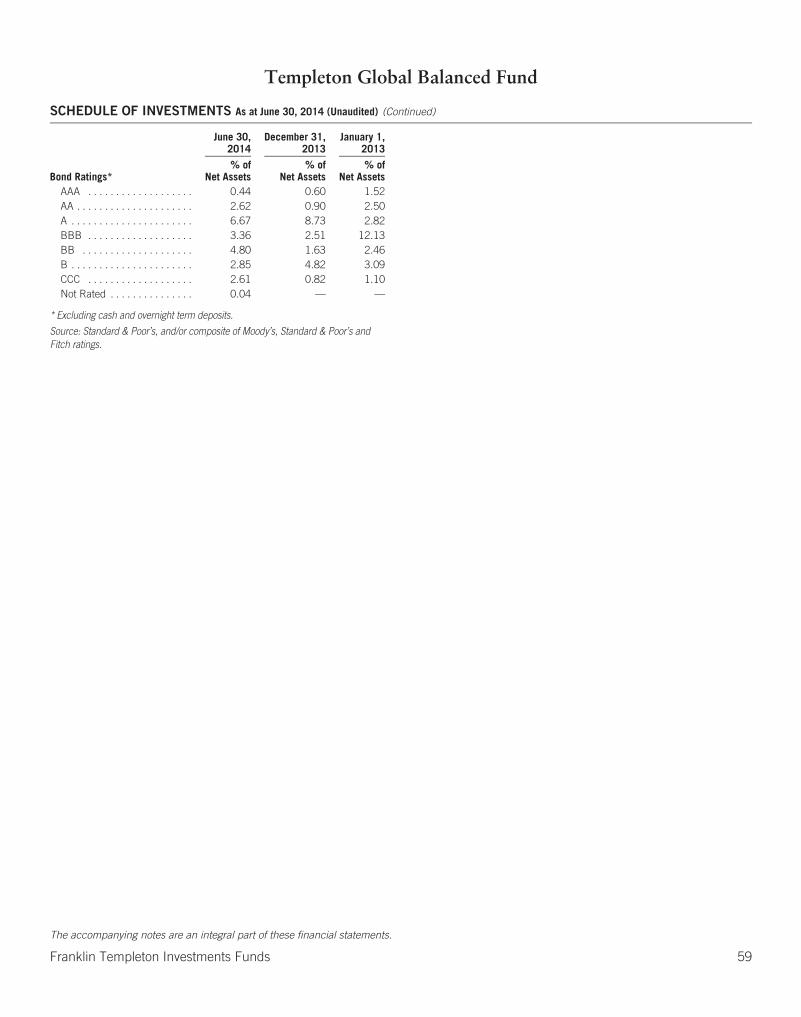
Templeton Global Balanced Fund
SCHEDULE OF INVESTMENTS As at June 30, 2014 (Unaudited) (Continued)
June 30,2014
December 31,2013
January 1,2013
Bond Ratings*% of
Net Assets% of
Net Assets% of
Net AssetsAAA . . . . . . . . . . . . . . . . . . . 0.44 0.60 1.52AA . . . . . . . . . . . . . . . . . . . . . 2.62 0.90 2.50A . . . . . . . . . . . . . . . . . . . . . . 6.67 8.73 2.82BBB . . . . . . . . . . . . . . . . . . . 3.36 2.51 12.13BB . . . . . . . . . . . . . . . . . . . . 4.80 1.63 2.46B . . . . . . . . . . . . . . . . . . . . . . 2.85 4.82 3.09CCC . . . . . . . . . . . . . . . . . . . 2.61 0.82 1.10Not Rated . . . . . . . . . . . . . . . 0.04 — —
* Excluding cash and overnight term deposits.
Source: Standard & Poor’s, and/or composite of Moody’s, Standard & Poor’s andFitch ratings.
The accompanying notes are an integral part of these financial statements.
Franklin Templeton Investments Funds 59
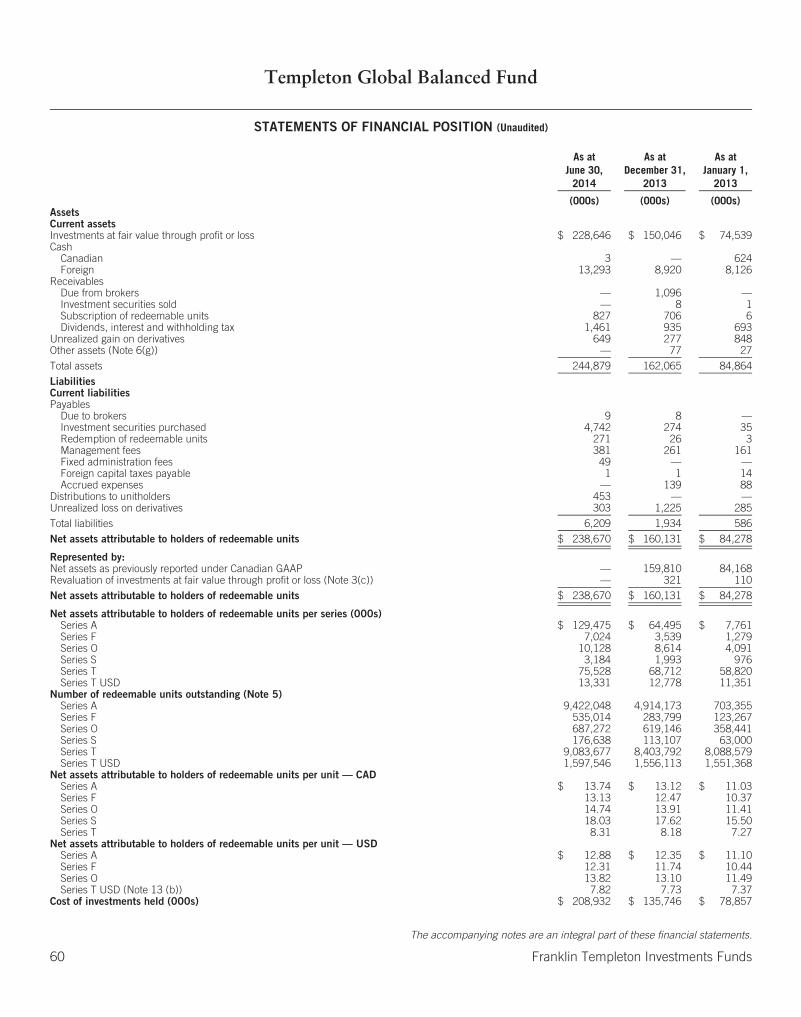
Templeton Global Balanced Fund
STATEMENTS OF FINANCIAL POSITION (Unaudited)
As atJune 30,
2014
As atDecember 31,
2013
As atJanuary 1,
2013
(000s) (000s) (000s)AssetsCurrent assetsInvestments at fair value through profit or loss $ 228,646 $ 150,046 $ 74,539Cash
Canadian 3 — 624Foreign 13,293 8,920 8,126
ReceivablesDue from brokers — 1,096 —Investment securities sold — 8 1Subscription of redeemable units 827 706 6Dividends, interest and withholding tax 1,461 935 693
Unrealized gain on derivatives 649 277 848Other assets (Note 6(g)) — 77 27
Total assets 244,879 162,065 84,864
LiabilitiesCurrent liabilitiesPayables
Due to brokers 9 8 —Investment securities purchased 4,742 274 35Redemption of redeemable units 271 26 3Management fees 381 261 161Fixed administration fees 49 — —Foreign capital taxes payable 1 1 14Accrued expenses — 139 88
Distributions to unitholders 453 — —Unrealized loss on derivatives 303 1,225 285
Total liabilities 6,209 1,934 586
Net assets attributable to holders of redeemable units $ 238,670 $ 160,131 $ 84,278
Represented by:Net assets as previously reported under Canadian GAAP — 159,810 84,168Revaluation of investments at fair value through profit or loss (Note 3(c)) — 321 110
Net assets attributable to holders of redeemable units $ 238,670 $ 160,131 $ 84,278
Net assets attributable to holders of redeemable units per series (000s)Series A $ 129,475 $ 64,495 $ 7,761Series F 7,024 3,539 1,279Series O 10,128 8,614 4,091Series S 3,184 1,993 976Series T 75,528 68,712 58,820Series T USD 13,331 12,778 11,351
Number of redeemable units outstanding (Note 5)Series A 9,422,048 4,914,173 703,355Series F 535,014 283,799 123,267Series O 687,272 619,146 358,441Series S 176,638 113,107 63,000Series T 9,083,677 8,403,792 8,088,579Series T USD 1,597,546 1,556,113 1,551,368
Net assets attributable to holders of redeemable units per unit — CADSeries A $ 13.74 $ 13.12 $ 11.03Series F 13.13 12.47 10.37Series O 14.74 13.91 11.41Series S 18.03 17.62 15.50Series T 8.31 8.18 7.27
Net assets attributable to holders of redeemable units per unit — USDSeries A $ 12.88 $ 12.35 $ 11.10Series F 12.31 11.74 10.44Series O 13.82 13.10 11.49Series T USD (Note 13 (b)) 7.82 7.73 7.37
Cost of investments held (000s) $ 208,932 $ 135,746 $ 78,857
The accompanying notes are an integral part of these financial statements.
60 Franklin Templeton Investments Funds

Templeton Global Balanced Fund
STATEMENTS OF COMPREHENSIVE INCOMEFor the six months ended June 30, 2014 and 2013 (Unaudited)
2014 2013
(000s) (000s)IncomeDividends $ 3,333 $ 1,444Interest income for distribution purposes 1,762 947Income (loss) on derivatives (11) —Net realized and/or unrealized foreign exchange gain (loss) (1,397) 714Net realized gain (loss) on investments and derivatives 340 266Net change in unrealized appreciation (depreciation) in value of investments and derivatives 6,708 4,148
Total income (net) 10,735 7,519
ExpensesManagement fees (Note 6(a)) 1,980 953Fixed administration fees (Note 6(b)) 252 —Transfer agent fees (Note 6(d)) — 172Custodian fees — 15Legal fees — 2Audit fees — 11Unitholder reporting costs — 7Independent review committee fees — 1Registration fees — 13Other expenses (Note 6(f)) — 39
Operating expenses before waivers/paid by Manager 2,232 1,213Expenses waived/paid by Manager (Note 6(b)) — (151)
Net operating expenses after waivers/paid by Manager 2,232 1,062
Transaction costs (Note 9) 103 43Withholding tax expense 302 141
Total expenses 2,637 1,246
Increase (decrease) in net assets attributable to holders of redeemable units from operations $ 8,098 $ 6,273
Represented by:Increase (decrease) in net assets from operations as previously reported under Canadian GAAP — 5,893Revaluation of investments at fair value through profit and loss (Note 3(c)) — 380
Increase (decrease) in net assets attributable to holders of redeemable units from operations $ 8,098 $ 6,273
Increase (decrease) in net assets attributable to holders of redeemable units from operations per series (000s)Series A $ 3,393 $ 550Series F 224 97Series O 514 412Series S 110 77Series T 3,254 4,305Series T USD 603 832
Weighted average number of units outstandingSeries A 7,414,595 1,014,578Series F 438,411 111,436Series O 654,851 451,224Series S 144,657 67,713Series T 8,718,305 7,954,548Series T USD 1,576,088 1,539,079
Increase (decrease) in net assets attributable to holders of redeemable units from operations per unitSeries A $ 0.46 $ 0.54Series F 0.51 0.86Series O 0.78 0.91Series S 0.76 1.13Series T 0.37 0.54Series T USD 0.37 0.55
The accompanying notes are an integral part of these financial statements.
Franklin Templeton Investments Funds 61
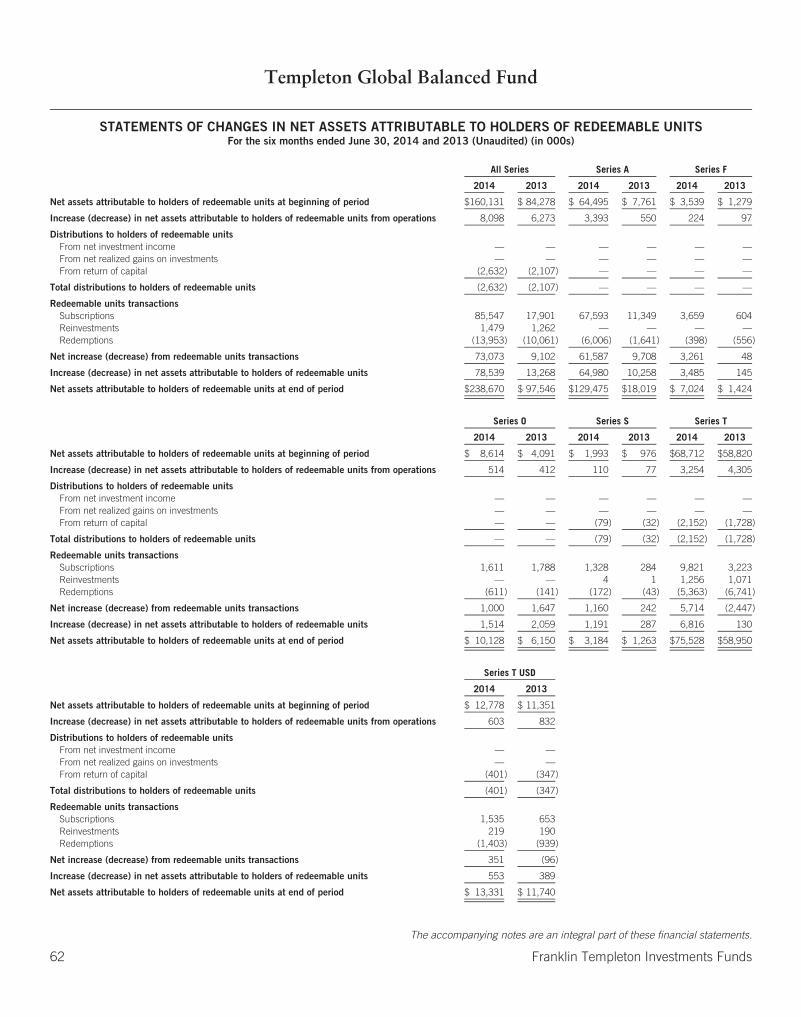
Templeton Global Balanced Fund
STATEMENTS OF CHANGES IN NET ASSETS ATTRIBUTABLE TO HOLDERS OF REDEEMABLE UNITSFor the six months ended June 30, 2014 and 2013 (Unaudited) (in 000s)
All Series Series A Series F
2014 2013 2014 2013 2014 2013
Net assets attributable to holders of redeemable units at beginning of period $160,131 $ 84,278 $ 64,495 $ 7,761 $ 3,539 $ 1,279
Increase (decrease) in net assets attributable to holders of redeemable units from operations 8,098 6,273 3,393 550 224 97
Distributions to holders of redeemable unitsFrom net investment income — — — — — —From net realized gains on investments — — — — — —From return of capital (2,632) (2,107) — — — —
Total distributions to holders of redeemable units (2,632) (2,107) — — — —
Redeemable units transactionsSubscriptions 85,547 17,901 67,593 11,349 3,659 604Reinvestments 1,479 1,262 — — — —Redemptions (13,953) (10,061) (6,006) (1,641) (398) (556)
Net increase (decrease) from redeemable units transactions 73,073 9,102 61,587 9,708 3,261 48
Increase (decrease) in net assets attributable to holders of redeemable units 78,539 13,268 64,980 10,258 3,485 145
Net assets attributable to holders of redeemable units at end of period $238,670 $ 97,546 $129,475 $18,019 $ 7,024 $ 1,424
Series O Series S Series T
2014 2013 2014 2013 2014 2013
Net assets attributable to holders of redeemable units at beginning of period $ 8,614 $ 4,091 $ 1,993 $ 976 $68,712 $58,820
Increase (decrease) in net assets attributable to holders of redeemable units from operations 514 412 110 77 3,254 4,305
Distributions to holders of redeemable unitsFrom net investment income — — — — — —From net realized gains on investments — — — — — —From return of capital — — (79) (32) (2,152) (1,728)
Total distributions to holders of redeemable units — — (79) (32) (2,152) (1,728)
Redeemable units transactionsSubscriptions 1,611 1,788 1,328 284 9,821 3,223Reinvestments — — 4 1 1,256 1,071Redemptions (611) (141) (172) (43) (5,363) (6,741)
Net increase (decrease) from redeemable units transactions 1,000 1,647 1,160 242 5,714 (2,447)
Increase (decrease) in net assets attributable to holders of redeemable units 1,514 2,059 1,191 287 6,816 130
Net assets attributable to holders of redeemable units at end of period $ 10,128 $ 6,150 $ 3,184 $ 1,263 $75,528 $58,950
Series T USD
2014 2013
Net assets attributable to holders of redeemable units at beginning of period $ 12,778 $ 11,351
Increase (decrease) in net assets attributable to holders of redeemable units from operations 603 832
Distributions to holders of redeemable unitsFrom net investment income — —From net realized gains on investments — —From return of capital (401) (347)
Total distributions to holders of redeemable units (401) (347)
Redeemable units transactionsSubscriptions 1,535 653Reinvestments 219 190Redemptions (1,403) (939)
Net increase (decrease) from redeemable units transactions 351 (96)
Increase (decrease) in net assets attributable to holders of redeemable units 553 389
Net assets attributable to holders of redeemable units at end of period $ 13,331 $ 11,740
The accompanying notes are an integral part of these financial statements.
62 Franklin Templeton Investments Funds
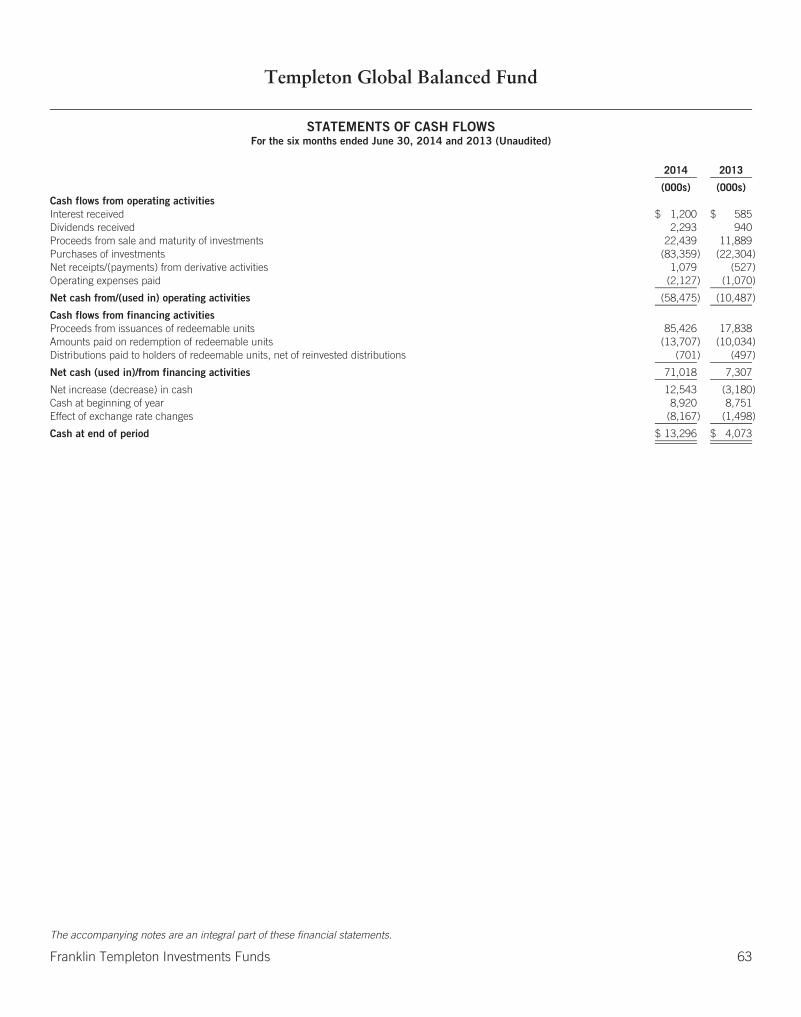
Templeton Global Balanced Fund
STATEMENTS OF CASH FLOWSFor the six months ended June 30, 2014 and 2013 (Unaudited)
2014 2013
(000s) (000s)Cash flows from operating activitiesInterest received $ 1,200 $ 585Dividends received 2,293 940Proceeds from sale and maturity of investments 22,439 11,889Purchases of investments (83,359) (22,304)Net receipts/(payments) from derivative activities 1,079 (527)Operating expenses paid (2,127) (1,070)
Net cash from/(used in) operating activities (58,475) (10,487)
Cash flows from financing activitiesProceeds from issuances of redeemable units 85,426 17,838Amounts paid on redemption of redeemable units (13,707) (10,034)Distributions paid to holders of redeemable units, net of reinvested distributions (701) (497)
Net cash (used in)/from financing activities 71,018 7,307
Net increase (decrease) in cash 12,543 (3,180)Cash at beginning of year 8,920 8,751Effect of exchange rate changes (8,167) (1,498)
Cash at end of period $ 13,296 $ 4,073
The accompanying notes are an integral part of these financial statements.
Franklin Templeton Investments Funds 63

Templeton Global Bond Fund
SCHEDULE OF INVESTMENTS As at June 30, 2014 (Unaudited)
Principal Amountin Currency
of IssueAverage
Cost Fair Value
(000s) (000s)
LONG-TERM INVESTMENTS: 62.43%BONDS: 62.43%South Korea: 9.66%
Korea Monetary Stabilization Bond, Senior Note, 2.66%, 6/9/2015 . . . . . . . . . . . . . . . . . . . . . . . . . . . . . . . . . . . . . . . . . . . 6,363,850,000 KRW $ 6,830 $ 6,710Korea Monetary Stabilization Bond
Senior Bond, 2.72%, 9/9/2014 . . . . . . . . . . . . . . . . . . . . . . . . . . . . . . . . . . . . . . . . . . . . . . . . . . . . . . . . . . . . . . . . . . 5,970,000,000 KRW 5,721 6,293Senior Bond, 2.47%, 4/2/2015 . . . . . . . . . . . . . . . . . . . . . . . . . . . . . . . . . . . . . . . . . . . . . . . . . . . . . . . . . . . . . . . . . . 2,456,200,000 KRW 2,201 2,586Senior Bond, 2.80%, 8/2/2015 . . . . . . . . . . . . . . . . . . . . . . . . . . . . . . . . . . . . . . . . . . . . . . . . . . . . . . . . . . . . . . . . . . 10,463,590,000 KRW 9,770 11,049Senior Bond, 2.81%, 10/2/2015 . . . . . . . . . . . . . . . . . . . . . . . . . . . . . . . . . . . . . . . . . . . . . . . . . . . . . . . . . . . . . . . . . 768,000,000 KRW 739 811Senior Note, 2.82%, 8/2/2014 . . . . . . . . . . . . . . . . . . . . . . . . . . . . . . . . . . . . . . . . . . . . . . . . . . . . . . . . . . . . . . . . . . . 2,789,710,000 KRW 2,419 2,940Senior Note, 2.78%, 10/2/2014 . . . . . . . . . . . . . . . . . . . . . . . . . . . . . . . . . . . . . . . . . . . . . . . . . . . . . . . . . . . . . . . . . . 614,400,000 KRW 562 648Senior Note, 2.84%, 12/2/2014 . . . . . . . . . . . . . . . . . . . . . . . . . . . . . . . . . . . . . . . . . . . . . . . . . . . . . . . . . . . . . . . . . . 360,940,000 KRW 334 381Senior Note, 2.74%, 2/2/2015 . . . . . . . . . . . . . . . . . . . . . . . . . . . . . . . . . . . . . . . . . . . . . . . . . . . . . . . . . . . . . . . . . . . 42,592,230,000 KRW 40,343 44,923Senior Note, 2.76%, 6/2/2015 . . . . . . . . . . . . . . . . . . . . . . . . . . . . . . . . . . . . . . . . . . . . . . . . . . . . . . . . . . . . . . . . . . . 5,804,900,000 KRW 5,375 6,126Senior Note, 2.90%, 12/2/2015 . . . . . . . . . . . . . . . . . . . . . . . . . . . . . . . . . . . . . . . . . . . . . . . . . . . . . . . . . . . . . . . . . . 45,981,300,000 KRW 46,186 48,642Senior Note, 2.78%, 2/2/2016 . . . . . . . . . . . . . . . . . . . . . . . . . . . . . . . . . . . . . . . . . . . . . . . . . . . . . . . . . . . . . . . . . . . 3,653,460,000 KRW 3,746 3,859Senior Note, 2.80%, 4/2/2016 . . . . . . . . . . . . . . . . . . . . . . . . . . . . . . . . . . . . . . . . . . . . . . . . . . . . . . . . . . . . . . . . . . . 4,287,800,000 KRW 4,569 4,531Senior Note, 2.79%, 6/2/2016 . . . . . . . . . . . . . . . . . . . . . . . . . . . . . . . . . . . . . . . . . . . . . . . . . . . . . . . . . . . . . . . . . . . 8,191,850,000 KRW 8,772 8,657
Korea Treasury BondSenior Bond, 4.00%, 3/10/2016 . . . . . . . . . . . . . . . . . . . . . . . . . . . . . . . . . . . . . . . . . . . . . . . . . . . . . . . . . . . . . . . . . 1,860,100,000 KRW 1,864 2,004Senior Bond, 5.00%, 9/10/2016 . . . . . . . . . . . . . . . . . . . . . . . . . . . . . . . . . . . . . . . . . . . . . . . . . . . . . . . . . . . . . . . . . 75,000,000 KRW 76 83Senior Note, 3.25%, 12/10/2014 . . . . . . . . . . . . . . . . . . . . . . . . . . . . . . . . . . . . . . . . . . . . . . . . . . . . . . . . . . . . . . . . . 13,800,600,000 KRW 12,801 14,585Senior Note, 4.50%, 3/10/2015 . . . . . . . . . . . . . . . . . . . . . . . . . . . . . . . . . . . . . . . . . . . . . . . . . . . . . . . . . . . . . . . . . . 930,100,000 KRW 929 993Senior Note, 3.25%, 6/10/2015 . . . . . . . . . . . . . . . . . . . . . . . . . . . . . . . . . . . . . . . . . . . . . . . . . . . . . . . . . . . . . . . . . . 1,708,900,000 KRW 1,545 1,812Senior Note, 4.00%, 9/10/2015 . . . . . . . . . . . . . . . . . . . . . . . . . . . . . . . . . . . . . . . . . . . . . . . . . . . . . . . . . . . . . . . . . . 4,919,300,000 KRW 4,909 5,268Senior Note, 2.75%, 12/10/2015 . . . . . . . . . . . . . . . . . . . . . . . . . . . . . . . . . . . . . . . . . . . . . . . . . . . . . . . . . . . . . . . . . 8,174,700,000 KRW 7,370 8,632Senior Note, 2.75%, 6/10/2016 . . . . . . . . . . . . . . . . . . . . . . . . . . . . . . . . . . . . . . . . . . . . . . . . . . . . . . . . . . . . . . . . . . 15,541,500,000 KRW 15,526 16,411Senior Note, 3.00%, 12/10/2016 . . . . . . . . . . . . . . . . . . . . . . . . . . . . . . . . . . . . . . . . . . . . . . . . . . . . . . . . . . . . . . . . . 16,591,500,000 KRW 16,663 17,622
199,250 215,566
Ireland: 9.18%Government of Ireland
5.50%, 10/18/2017 . . . . . . . . . . . . . . . . . . . . . . . . . . . . . . . . . . . . . . . . . . . . . . . . . . . . . . . . . . . . . . . . . . . . . . . . . . 12,588,800 EUR 15,343 21,4025.90%, 10/18/2019 . . . . . . . . . . . . . . . . . . . . . . . . . . . . . . . . . . . . . . . . . . . . . . . . . . . . . . . . . . . . . . . . . . . . . . . . . . 32,630,000 EUR 38,516 59,7644.50%, 4/18/2020 . . . . . . . . . . . . . . . . . . . . . . . . . . . . . . . . . . . . . . . . . . . . . . . . . . . . . . . . . . . . . . . . . . . . . . . . . . . 9,591,000 EUR 10,589 16,5865.00%, 10/18/2020 . . . . . . . . . . . . . . . . . . . . . . . . . . . . . . . . . . . . . . . . . . . . . . . . . . . . . . . . . . . . . . . . . . . . . . . . . . 28,656,000 EUR 32,760 51,0913.90%, 3/20/2023 . . . . . . . . . . . . . . . . . . . . . . . . . . . . . . . . . . . . . . . . . . . . . . . . . . . . . . . . . . . . . . . . . . . . . . . . . . . 3,908,000 EUR 5,094 6,529Senior Bond, 4.50%, 10/18/2018 . . . . . . . . . . . . . . . . . . . . . . . . . . . . . . . . . . . . . . . . . . . . . . . . . . . . . . . . . . . . . . . . . 4,638,000 EUR 5,249 7,869Senior Bond, 4.40%, 6/18/2019 . . . . . . . . . . . . . . . . . . . . . . . . . . . . . . . . . . . . . . . . . . . . . . . . . . . . . . . . . . . . . . . . . 11,467,000 EUR 12,623 19,589Senior Bond, 5.40%, 3/13/2025 . . . . . . . . . . . . . . . . . . . . . . . . . . . . . . . . . . . . . . . . . . . . . . . . . . . . . . . . . . . . . . . . . 11,898,530 EUR 13,268 22,038
133,442 204,868
Poland: 8.60%Government of Poland
5.50%, 4/25/2015 . . . . . . . . . . . . . . . . . . . . . . . . . . . . . . . . . . . . . . . . . . . . . . . . . . . . . . . . . . . . . . . . . . . . . . . . . . . 27,496,000 PLN 8,944 9,8976.25%, 10/24/2015 . . . . . . . . . . . . . . . . . . . . . . . . . . . . . . . . . . . . . . . . . . . . . . . . . . . . . . . . . . . . . . . . . . . . . . . . . . 27,441,000 PLN 9,121 10,1115.00%, 4/25/2016 . . . . . . . . . . . . . . . . . . . . . . . . . . . . . . . . . . . . . . . . . . . . . . . . . . . . . . . . . . . . . . . . . . . . . . . . . . . 45,490,000 PLN 16,541 16,6924.75%, 10/25/2016 . . . . . . . . . . . . . . . . . . . . . . . . . . . . . . . . . . . . . . . . . . . . . . . . . . . . . . . . . . . . . . . . . . . . . . . . . . 157,785,000 PLN 59,193 58,1865.75%, 9/23/2022 . . . . . . . . . . . . . . . . . . . . . . . . . . . . . . . . . . . . . . . . . . . . . . . . . . . . . . . . . . . . . . . . . . . . . . . . . . . 24,900,000 PLN 10,061 10,227Floating Rate Note, 1/25/2017 . . . . . . . . . . . . . . . . . . . . . . . . . . . . . . . . . . . . . . . . . . . . . . . . . . . . . . . . . . . . . . . . . . . 52,781,000 PLN 16,348 18,530Floating Rate Note, 1/25/2021 . . . . . . . . . . . . . . . . . . . . . . . . . . . . . . . . . . . . . . . . . . . . . . . . . . . . . . . . . . . . . . . . . . . 53,543,000 PLN 16,344 18,541
The accompanying notes are an integral part of these financial statements.
64 Franklin Templeton Investments Funds
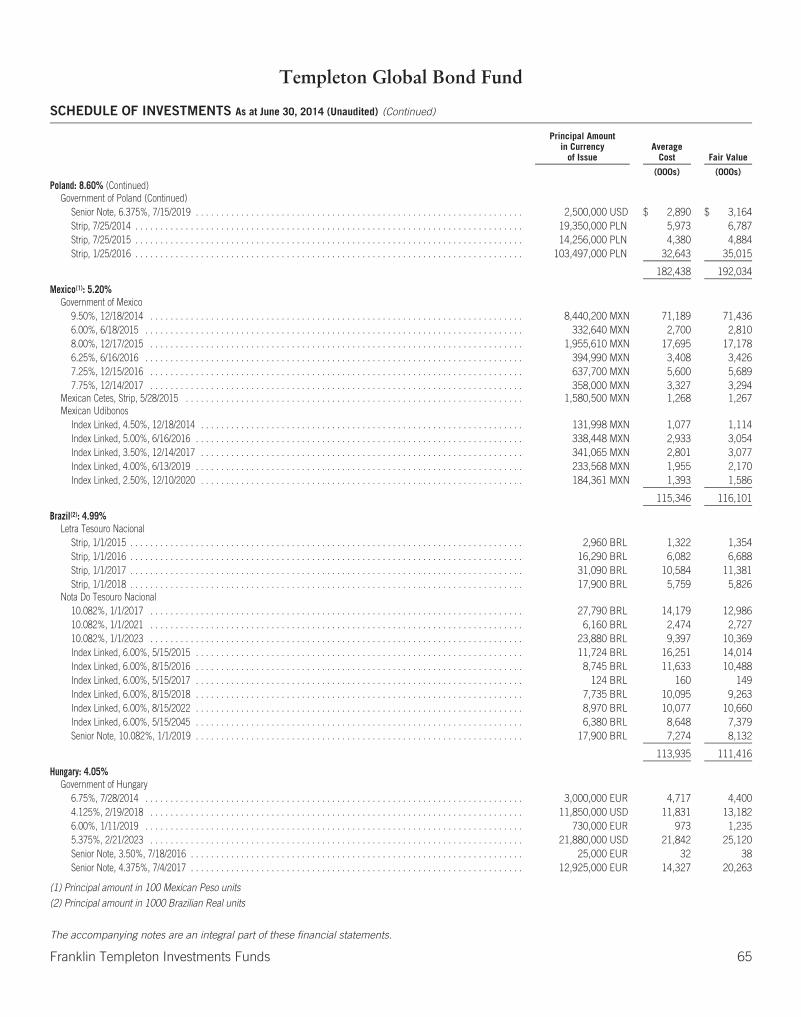
Templeton Global Bond Fund
SCHEDULE OF INVESTMENTS As at June 30, 2014 (Unaudited) (Continued)
Principal Amountin Currency
of IssueAverage
Cost Fair Value
(000s) (000s)Poland: 8.60% (Continued)
Government of Poland (Continued)Senior Note, 6.375%, 7/15/2019 . . . . . . . . . . . . . . . . . . . . . . . . . . . . . . . . . . . . . . . . . . . . . . . . . . . . . . . . . . . . . . . . . 2,500,000 USD $ 2,890 $ 3,164Strip, 7/25/2014 . . . . . . . . . . . . . . . . . . . . . . . . . . . . . . . . . . . . . . . . . . . . . . . . . . . . . . . . . . . . . . . . . . . . . . . . . . . . . 19,350,000 PLN 5,973 6,787Strip, 7/25/2015 . . . . . . . . . . . . . . . . . . . . . . . . . . . . . . . . . . . . . . . . . . . . . . . . . . . . . . . . . . . . . . . . . . . . . . . . . . . . . 14,256,000 PLN 4,380 4,884Strip, 1/25/2016 . . . . . . . . . . . . . . . . . . . . . . . . . . . . . . . . . . . . . . . . . . . . . . . . . . . . . . . . . . . . . . . . . . . . . . . . . . . . . 103,497,000 PLN 32,643 35,015
182,438 192,034
Mexico(1): 5.20%Government of Mexico
9.50%, 12/18/2014 . . . . . . . . . . . . . . . . . . . . . . . . . . . . . . . . . . . . . . . . . . . . . . . . . . . . . . . . . . . . . . . . . . . . . . . . . . 8,440,200 MXN 71,189 71,4366.00%, 6/18/2015 . . . . . . . . . . . . . . . . . . . . . . . . . . . . . . . . . . . . . . . . . . . . . . . . . . . . . . . . . . . . . . . . . . . . . . . . . . . 332,640 MXN 2,700 2,8108.00%, 12/17/2015 . . . . . . . . . . . . . . . . . . . . . . . . . . . . . . . . . . . . . . . . . . . . . . . . . . . . . . . . . . . . . . . . . . . . . . . . . . 1,955,610 MXN 17,695 17,1786.25%, 6/16/2016 . . . . . . . . . . . . . . . . . . . . . . . . . . . . . . . . . . . . . . . . . . . . . . . . . . . . . . . . . . . . . . . . . . . . . . . . . . . 394,990 MXN 3,408 3,4267.25%, 12/15/2016 . . . . . . . . . . . . . . . . . . . . . . . . . . . . . . . . . . . . . . . . . . . . . . . . . . . . . . . . . . . . . . . . . . . . . . . . . . 637,700 MXN 5,600 5,6897.75%, 12/14/2017 . . . . . . . . . . . . . . . . . . . . . . . . . . . . . . . . . . . . . . . . . . . . . . . . . . . . . . . . . . . . . . . . . . . . . . . . . . 358,000 MXN 3,327 3,294
Mexican Cetes, Strip, 5/28/2015 . . . . . . . . . . . . . . . . . . . . . . . . . . . . . . . . . . . . . . . . . . . . . . . . . . . . . . . . . . . . . . . . . . . 1,580,500 MXN 1,268 1,267Mexican Udibonos
Index Linked, 4.50%, 12/18/2014 . . . . . . . . . . . . . . . . . . . . . . . . . . . . . . . . . . . . . . . . . . . . . . . . . . . . . . . . . . . . . . . . 131,998 MXN 1,077 1,114Index Linked, 5.00%, 6/16/2016 . . . . . . . . . . . . . . . . . . . . . . . . . . . . . . . . . . . . . . . . . . . . . . . . . . . . . . . . . . . . . . . . . 338,448 MXN 2,933 3,054Index Linked, 3.50%, 12/14/2017 . . . . . . . . . . . . . . . . . . . . . . . . . . . . . . . . . . . . . . . . . . . . . . . . . . . . . . . . . . . . . . . . 341,065 MXN 2,801 3,077Index Linked, 4.00%, 6/13/2019 . . . . . . . . . . . . . . . . . . . . . . . . . . . . . . . . . . . . . . . . . . . . . . . . . . . . . . . . . . . . . . . . . 233,568 MXN 1,955 2,170Index Linked, 2.50%, 12/10/2020 . . . . . . . . . . . . . . . . . . . . . . . . . . . . . . . . . . . . . . . . . . . . . . . . . . . . . . . . . . . . . . . . 184,361 MXN 1,393 1,586
115,346 116,101
Brazil(2): 4.99%Letra Tesouro Nacional
Strip, 1/1/2015 . . . . . . . . . . . . . . . . . . . . . . . . . . . . . . . . . . . . . . . . . . . . . . . . . . . . . . . . . . . . . . . . . . . . . . . . . . . . . . 2,960 BRL 1,322 1,354Strip, 1/1/2016 . . . . . . . . . . . . . . . . . . . . . . . . . . . . . . . . . . . . . . . . . . . . . . . . . . . . . . . . . . . . . . . . . . . . . . . . . . . . . . 16,290 BRL 6,082 6,688Strip, 1/1/2017 . . . . . . . . . . . . . . . . . . . . . . . . . . . . . . . . . . . . . . . . . . . . . . . . . . . . . . . . . . . . . . . . . . . . . . . . . . . . . . 31,090 BRL 10,584 11,381Strip, 1/1/2018 . . . . . . . . . . . . . . . . . . . . . . . . . . . . . . . . . . . . . . . . . . . . . . . . . . . . . . . . . . . . . . . . . . . . . . . . . . . . . . 17,900 BRL 5,759 5,826
Nota Do Tesouro Nacional10.082%, 1/1/2017 . . . . . . . . . . . . . . . . . . . . . . . . . . . . . . . . . . . . . . . . . . . . . . . . . . . . . . . . . . . . . . . . . . . . . . . . . . 27,790 BRL 14,179 12,98610.082%, 1/1/2021 . . . . . . . . . . . . . . . . . . . . . . . . . . . . . . . . . . . . . . . . . . . . . . . . . . . . . . . . . . . . . . . . . . . . . . . . . . 6,160 BRL 2,474 2,72710.082%, 1/1/2023 . . . . . . . . . . . . . . . . . . . . . . . . . . . . . . . . . . . . . . . . . . . . . . . . . . . . . . . . . . . . . . . . . . . . . . . . . . 23,880 BRL 9,397 10,369Index Linked, 6.00%, 5/15/2015 . . . . . . . . . . . . . . . . . . . . . . . . . . . . . . . . . . . . . . . . . . . . . . . . . . . . . . . . . . . . . . . . . 11,724 BRL 16,251 14,014Index Linked, 6.00%, 8/15/2016 . . . . . . . . . . . . . . . . . . . . . . . . . . . . . . . . . . . . . . . . . . . . . . . . . . . . . . . . . . . . . . . . . 8,745 BRL 11,633 10,488Index Linked, 6.00%, 5/15/2017 . . . . . . . . . . . . . . . . . . . . . . . . . . . . . . . . . . . . . . . . . . . . . . . . . . . . . . . . . . . . . . . . . 124 BRL 160 149Index Linked, 6.00%, 8/15/2018 . . . . . . . . . . . . . . . . . . . . . . . . . . . . . . . . . . . . . . . . . . . . . . . . . . . . . . . . . . . . . . . . . 7,735 BRL 10,095 9,263Index Linked, 6.00%, 8/15/2022 . . . . . . . . . . . . . . . . . . . . . . . . . . . . . . . . . . . . . . . . . . . . . . . . . . . . . . . . . . . . . . . . . 8,970 BRL 10,077 10,660Index Linked, 6.00%, 5/15/2045 . . . . . . . . . . . . . . . . . . . . . . . . . . . . . . . . . . . . . . . . . . . . . . . . . . . . . . . . . . . . . . . . . 6,380 BRL 8,648 7,379Senior Note, 10.082%, 1/1/2019 . . . . . . . . . . . . . . . . . . . . . . . . . . . . . . . . . . . . . . . . . . . . . . . . . . . . . . . . . . . . . . . . . 17,900 BRL 7,274 8,132
113,935 111,416
Hungary: 4.05%Government of Hungary
6.75%, 7/28/2014 . . . . . . . . . . . . . . . . . . . . . . . . . . . . . . . . . . . . . . . . . . . . . . . . . . . . . . . . . . . . . . . . . . . . . . . . . . . 3,000,000 EUR 4,717 4,4004.125%, 2/19/2018 . . . . . . . . . . . . . . . . . . . . . . . . . . . . . . . . . . . . . . . . . . . . . . . . . . . . . . . . . . . . . . . . . . . . . . . . . . 11,850,000 USD 11,831 13,1826.00%, 1/11/2019 . . . . . . . . . . . . . . . . . . . . . . . . . . . . . . . . . . . . . . . . . . . . . . . . . . . . . . . . . . . . . . . . . . . . . . . . . . . 730,000 EUR 973 1,2355.375%, 2/21/2023 . . . . . . . . . . . . . . . . . . . . . . . . . . . . . . . . . . . . . . . . . . . . . . . . . . . . . . . . . . . . . . . . . . . . . . . . . . 21,880,000 USD 21,842 25,120Senior Note, 3.50%, 7/18/2016 . . . . . . . . . . . . . . . . . . . . . . . . . . . . . . . . . . . . . . . . . . . . . . . . . . . . . . . . . . . . . . . . . . 25,000 EUR 32 38Senior Note, 4.375%, 7/4/2017 . . . . . . . . . . . . . . . . . . . . . . . . . . . . . . . . . . . . . . . . . . . . . . . . . . . . . . . . . . . . . . . . . . 12,925,000 EUR 14,327 20,263
(1) Principal amount in 100 Mexican Peso units
(2) Principal amount in 1000 Brazilian Real units
The accompanying notes are an integral part of these financial statements.
Franklin Templeton Investments Funds 65
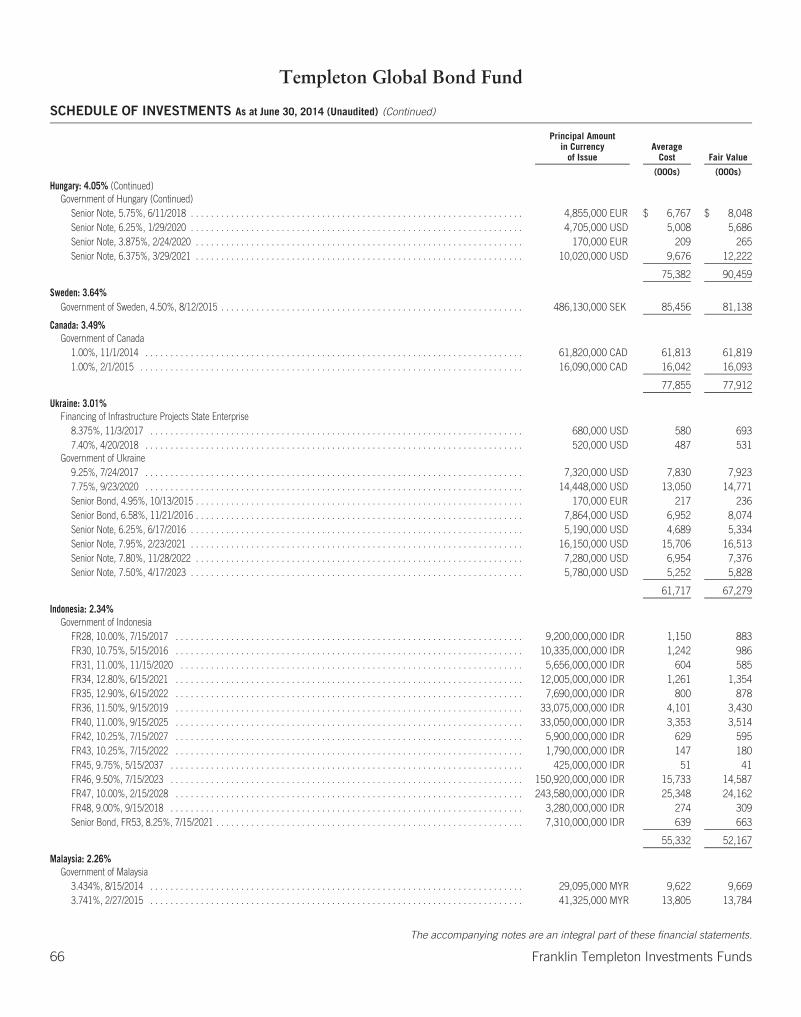
Templeton Global Bond Fund
SCHEDULE OF INVESTMENTS As at June 30, 2014 (Unaudited) (Continued)
Principal Amountin Currency
of IssueAverage
Cost Fair Value
(000s) (000s)
Hungary: 4.05% (Continued)Government of Hungary (Continued)
Senior Note, 5.75%, 6/11/2018 . . . . . . . . . . . . . . . . . . . . . . . . . . . . . . . . . . . . . . . . . . . . . . . . . . . . . . . . . . . . . . . . . . 4,855,000 EUR $ 6,767 $ 8,048Senior Note, 6.25%, 1/29/2020 . . . . . . . . . . . . . . . . . . . . . . . . . . . . . . . . . . . . . . . . . . . . . . . . . . . . . . . . . . . . . . . . . . 4,705,000 USD 5,008 5,686Senior Note, 3.875%, 2/24/2020 . . . . . . . . . . . . . . . . . . . . . . . . . . . . . . . . . . . . . . . . . . . . . . . . . . . . . . . . . . . . . . . . . 170,000 EUR 209 265Senior Note, 6.375%, 3/29/2021 . . . . . . . . . . . . . . . . . . . . . . . . . . . . . . . . . . . . . . . . . . . . . . . . . . . . . . . . . . . . . . . . . 10,020,000 USD 9,676 12,222
75,382 90,459
Sweden: 3.64%Government of Sweden, 4.50%, 8/12/2015 . . . . . . . . . . . . . . . . . . . . . . . . . . . . . . . . . . . . . . . . . . . . . . . . . . . . . . . . . . . . 486,130,000 SEK 85,456 81,138
Canada: 3.49%Government of Canada
1.00%, 11/1/2014 . . . . . . . . . . . . . . . . . . . . . . . . . . . . . . . . . . . . . . . . . . . . . . . . . . . . . . . . . . . . . . . . . . . . . . . . . . . 61,820,000 CAD 61,813 61,8191.00%, 2/1/2015 . . . . . . . . . . . . . . . . . . . . . . . . . . . . . . . . . . . . . . . . . . . . . . . . . . . . . . . . . . . . . . . . . . . . . . . . . . . . 16,090,000 CAD 16,042 16,093
77,855 77,912
Ukraine: 3.01%Financing of Infrastructure Projects State Enterprise
8.375%, 11/3/2017 . . . . . . . . . . . . . . . . . . . . . . . . . . . . . . . . . . . . . . . . . . . . . . . . . . . . . . . . . . . . . . . . . . . . . . . . . . 680,000 USD 580 6937.40%, 4/20/2018 . . . . . . . . . . . . . . . . . . . . . . . . . . . . . . . . . . . . . . . . . . . . . . . . . . . . . . . . . . . . . . . . . . . . . . . . . . . 520,000 USD 487 531
Government of Ukraine9.25%, 7/24/2017 . . . . . . . . . . . . . . . . . . . . . . . . . . . . . . . . . . . . . . . . . . . . . . . . . . . . . . . . . . . . . . . . . . . . . . . . . . . 7,320,000 USD 7,830 7,9237.75%, 9/23/2020 . . . . . . . . . . . . . . . . . . . . . . . . . . . . . . . . . . . . . . . . . . . . . . . . . . . . . . . . . . . . . . . . . . . . . . . . . . . 14,448,000 USD 13,050 14,771Senior Bond, 4.95%, 10/13/2015 . . . . . . . . . . . . . . . . . . . . . . . . . . . . . . . . . . . . . . . . . . . . . . . . . . . . . . . . . . . . . . . . . 170,000 EUR 217 236Senior Bond, 6.58%, 11/21/2016 . . . . . . . . . . . . . . . . . . . . . . . . . . . . . . . . . . . . . . . . . . . . . . . . . . . . . . . . . . . . . . . . . 7,864,000 USD 6,952 8,074Senior Note, 6.25%, 6/17/2016 . . . . . . . . . . . . . . . . . . . . . . . . . . . . . . . . . . . . . . . . . . . . . . . . . . . . . . . . . . . . . . . . . . 5,190,000 USD 4,689 5,334Senior Note, 7.95%, 2/23/2021 . . . . . . . . . . . . . . . . . . . . . . . . . . . . . . . . . . . . . . . . . . . . . . . . . . . . . . . . . . . . . . . . . . 16,150,000 USD 15,706 16,513Senior Note, 7.80%, 11/28/2022 . . . . . . . . . . . . . . . . . . . . . . . . . . . . . . . . . . . . . . . . . . . . . . . . . . . . . . . . . . . . . . . . . 7,280,000 USD 6,954 7,376Senior Note, 7.50%, 4/17/2023 . . . . . . . . . . . . . . . . . . . . . . . . . . . . . . . . . . . . . . . . . . . . . . . . . . . . . . . . . . . . . . . . . . 5,780,000 USD 5,252 5,828
61,717 67,279
Indonesia: 2.34%Government of Indonesia
FR28, 10.00%, 7/15/2017 . . . . . . . . . . . . . . . . . . . . . . . . . . . . . . . . . . . . . . . . . . . . . . . . . . . . . . . . . . . . . . . . . . . . . 9,200,000,000 IDR 1,150 883FR30, 10.75%, 5/15/2016 . . . . . . . . . . . . . . . . . . . . . . . . . . . . . . . . . . . . . . . . . . . . . . . . . . . . . . . . . . . . . . . . . . . . . 10,335,000,000 IDR 1,242 986FR31, 11.00%, 11/15/2020 . . . . . . . . . . . . . . . . . . . . . . . . . . . . . . . . . . . . . . . . . . . . . . . . . . . . . . . . . . . . . . . . . . . . 5,656,000,000 IDR 604 585FR34, 12.80%, 6/15/2021 . . . . . . . . . . . . . . . . . . . . . . . . . . . . . . . . . . . . . . . . . . . . . . . . . . . . . . . . . . . . . . . . . . . . . 12,005,000,000 IDR 1,261 1,354FR35, 12.90%, 6/15/2022 . . . . . . . . . . . . . . . . . . . . . . . . . . . . . . . . . . . . . . . . . . . . . . . . . . . . . . . . . . . . . . . . . . . . . 7,690,000,000 IDR 800 878FR36, 11.50%, 9/15/2019 . . . . . . . . . . . . . . . . . . . . . . . . . . . . . . . . . . . . . . . . . . . . . . . . . . . . . . . . . . . . . . . . . . . . . 33,075,000,000 IDR 4,101 3,430FR40, 11.00%, 9/15/2025 . . . . . . . . . . . . . . . . . . . . . . . . . . . . . . . . . . . . . . . . . . . . . . . . . . . . . . . . . . . . . . . . . . . . . 33,050,000,000 IDR 3,353 3,514FR42, 10.25%, 7/15/2027 . . . . . . . . . . . . . . . . . . . . . . . . . . . . . . . . . . . . . . . . . . . . . . . . . . . . . . . . . . . . . . . . . . . . . 5,900,000,000 IDR 629 595FR43, 10.25%, 7/15/2022 . . . . . . . . . . . . . . . . . . . . . . . . . . . . . . . . . . . . . . . . . . . . . . . . . . . . . . . . . . . . . . . . . . . . . 1,790,000,000 IDR 147 180FR45, 9.75%, 5/15/2037 . . . . . . . . . . . . . . . . . . . . . . . . . . . . . . . . . . . . . . . . . . . . . . . . . . . . . . . . . . . . . . . . . . . . . . 425,000,000 IDR 51 41FR46, 9.50%, 7/15/2023 . . . . . . . . . . . . . . . . . . . . . . . . . . . . . . . . . . . . . . . . . . . . . . . . . . . . . . . . . . . . . . . . . . . . . . 150,920,000,000 IDR 15,733 14,587FR47, 10.00%, 2/15/2028 . . . . . . . . . . . . . . . . . . . . . . . . . . . . . . . . . . . . . . . . . . . . . . . . . . . . . . . . . . . . . . . . . . . . . 243,580,000,000 IDR 25,348 24,162FR48, 9.00%, 9/15/2018 . . . . . . . . . . . . . . . . . . . . . . . . . . . . . . . . . . . . . . . . . . . . . . . . . . . . . . . . . . . . . . . . . . . . . . 3,280,000,000 IDR 274 309Senior Bond, FR53, 8.25%, 7/15/2021 . . . . . . . . . . . . . . . . . . . . . . . . . . . . . . . . . . . . . . . . . . . . . . . . . . . . . . . . . . . . . 7,310,000,000 IDR 639 663
55,332 52,167
Malaysia: 2.26%Government of Malaysia
3.434%, 8/15/2014 . . . . . . . . . . . . . . . . . . . . . . . . . . . . . . . . . . . . . . . . . . . . . . . . . . . . . . . . . . . . . . . . . . . . . . . . . . 29,095,000 MYR 9,622 9,6693.741%, 2/27/2015 . . . . . . . . . . . . . . . . . . . . . . . . . . . . . . . . . . . . . . . . . . . . . . . . . . . . . . . . . . . . . . . . . . . . . . . . . . 41,325,000 MYR 13,805 13,784
The accompanying notes are an integral part of these financial statements.
66 Franklin Templeton Investments Funds
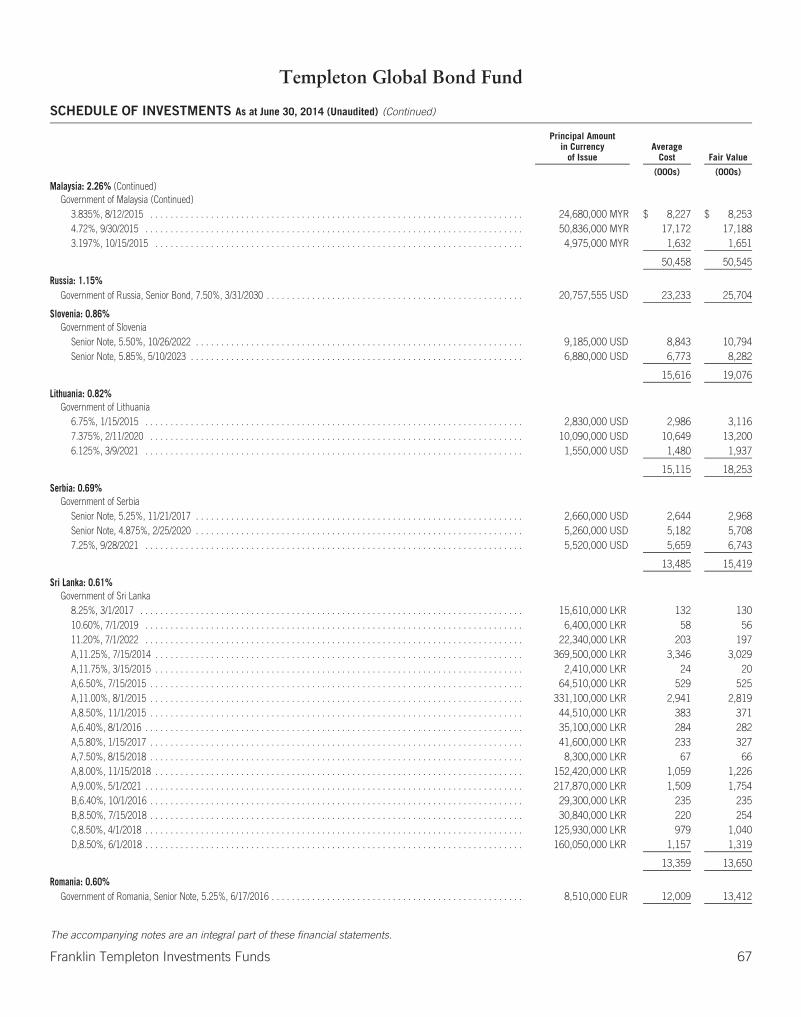
Templeton Global Bond Fund
SCHEDULE OF INVESTMENTS As at June 30, 2014 (Unaudited) (Continued)
Principal Amountin Currency
of IssueAverage
Cost Fair Value
(000s) (000s)
Malaysia: 2.26% (Continued)Government of Malaysia (Continued)
3.835%, 8/12/2015 . . . . . . . . . . . . . . . . . . . . . . . . . . . . . . . . . . . . . . . . . . . . . . . . . . . . . . . . . . . . . . . . . . . . . . . . . . 24,680,000 MYR $ 8,227 $ 8,2534.72%, 9/30/2015 . . . . . . . . . . . . . . . . . . . . . . . . . . . . . . . . . . . . . . . . . . . . . . . . . . . . . . . . . . . . . . . . . . . . . . . . . . . 50,836,000 MYR 17,172 17,1883.197%, 10/15/2015 . . . . . . . . . . . . . . . . . . . . . . . . . . . . . . . . . . . . . . . . . . . . . . . . . . . . . . . . . . . . . . . . . . . . . . . . . 4,975,000 MYR 1,632 1,651
50,458 50,545
Russia: 1.15%Government of Russia, Senior Bond, 7.50%, 3/31/2030 . . . . . . . . . . . . . . . . . . . . . . . . . . . . . . . . . . . . . . . . . . . . . . . . . . . 20,757,555 USD 23,233 25,704
Slovenia: 0.86%Government of Slovenia
Senior Note, 5.50%, 10/26/2022 . . . . . . . . . . . . . . . . . . . . . . . . . . . . . . . . . . . . . . . . . . . . . . . . . . . . . . . . . . . . . . . . . 9,185,000 USD 8,843 10,794Senior Note, 5.85%, 5/10/2023 . . . . . . . . . . . . . . . . . . . . . . . . . . . . . . . . . . . . . . . . . . . . . . . . . . . . . . . . . . . . . . . . . . 6,880,000 USD 6,773 8,282
15,616 19,076
Lithuania: 0.82%Government of Lithuania
6.75%, 1/15/2015 . . . . . . . . . . . . . . . . . . . . . . . . . . . . . . . . . . . . . . . . . . . . . . . . . . . . . . . . . . . . . . . . . . . . . . . . . . . 2,830,000 USD 2,986 3,1167.375%, 2/11/2020 . . . . . . . . . . . . . . . . . . . . . . . . . . . . . . . . . . . . . . . . . . . . . . . . . . . . . . . . . . . . . . . . . . . . . . . . . . 10,090,000 USD 10,649 13,2006.125%, 3/9/2021 . . . . . . . . . . . . . . . . . . . . . . . . . . . . . . . . . . . . . . . . . . . . . . . . . . . . . . . . . . . . . . . . . . . . . . . . . . . 1,550,000 USD 1,480 1,937
15,115 18,253
Serbia: 0.69%Government of Serbia
Senior Note, 5.25%, 11/21/2017 . . . . . . . . . . . . . . . . . . . . . . . . . . . . . . . . . . . . . . . . . . . . . . . . . . . . . . . . . . . . . . . . . 2,660,000 USD 2,644 2,968Senior Note, 4.875%, 2/25/2020 . . . . . . . . . . . . . . . . . . . . . . . . . . . . . . . . . . . . . . . . . . . . . . . . . . . . . . . . . . . . . . . . . 5,260,000 USD 5,182 5,7087.25%, 9/28/2021 . . . . . . . . . . . . . . . . . . . . . . . . . . . . . . . . . . . . . . . . . . . . . . . . . . . . . . . . . . . . . . . . . . . . . . . . . . . 5,520,000 USD 5,659 6,743
13,485 15,419
Sri Lanka: 0.61%Government of Sri Lanka
8.25%, 3/1/2017 . . . . . . . . . . . . . . . . . . . . . . . . . . . . . . . . . . . . . . . . . . . . . . . . . . . . . . . . . . . . . . . . . . . . . . . . . . . . 15,610,000 LKR 132 13010.60%, 7/1/2019 . . . . . . . . . . . . . . . . . . . . . . . . . . . . . . . . . . . . . . . . . . . . . . . . . . . . . . . . . . . . . . . . . . . . . . . . . . . 6,400,000 LKR 58 5611.20%, 7/1/2022 . . . . . . . . . . . . . . . . . . . . . . . . . . . . . . . . . . . . . . . . . . . . . . . . . . . . . . . . . . . . . . . . . . . . . . . . . . . 22,340,000 LKR 203 197A,11.25%, 7/15/2014 . . . . . . . . . . . . . . . . . . . . . . . . . . . . . . . . . . . . . . . . . . . . . . . . . . . . . . . . . . . . . . . . . . . . . . . . . 369,500,000 LKR 3,346 3,029A,11.75%, 3/15/2015 . . . . . . . . . . . . . . . . . . . . . . . . . . . . . . . . . . . . . . . . . . . . . . . . . . . . . . . . . . . . . . . . . . . . . . . . . 2,410,000 LKR 24 20A,6.50%, 7/15/2015 . . . . . . . . . . . . . . . . . . . . . . . . . . . . . . . . . . . . . . . . . . . . . . . . . . . . . . . . . . . . . . . . . . . . . . . . . . 64,510,000 LKR 529 525A,11.00%, 8/1/2015 . . . . . . . . . . . . . . . . . . . . . . . . . . . . . . . . . . . . . . . . . . . . . . . . . . . . . . . . . . . . . . . . . . . . . . . . . . 331,100,000 LKR 2,941 2,819A,8.50%, 11/1/2015 . . . . . . . . . . . . . . . . . . . . . . . . . . . . . . . . . . . . . . . . . . . . . . . . . . . . . . . . . . . . . . . . . . . . . . . . . . 44,510,000 LKR 383 371A,6.40%, 8/1/2016 . . . . . . . . . . . . . . . . . . . . . . . . . . . . . . . . . . . . . . . . . . . . . . . . . . . . . . . . . . . . . . . . . . . . . . . . . . . 35,100,000 LKR 284 282A,5.80%, 1/15/2017 . . . . . . . . . . . . . . . . . . . . . . . . . . . . . . . . . . . . . . . . . . . . . . . . . . . . . . . . . . . . . . . . . . . . . . . . . . 41,600,000 LKR 233 327A,7.50%, 8/15/2018 . . . . . . . . . . . . . . . . . . . . . . . . . . . . . . . . . . . . . . . . . . . . . . . . . . . . . . . . . . . . . . . . . . . . . . . . . . 8,300,000 LKR 67 66A,8.00%, 11/15/2018 . . . . . . . . . . . . . . . . . . . . . . . . . . . . . . . . . . . . . . . . . . . . . . . . . . . . . . . . . . . . . . . . . . . . . . . . . 152,420,000 LKR 1,059 1,226A,9.00%, 5/1/2021 . . . . . . . . . . . . . . . . . . . . . . . . . . . . . . . . . . . . . . . . . . . . . . . . . . . . . . . . . . . . . . . . . . . . . . . . . . . 217,870,000 LKR 1,509 1,754B,6.40%, 10/1/2016 . . . . . . . . . . . . . . . . . . . . . . . . . . . . . . . . . . . . . . . . . . . . . . . . . . . . . . . . . . . . . . . . . . . . . . . . . . 29,300,000 LKR 235 235B,8.50%, 7/15/2018 . . . . . . . . . . . . . . . . . . . . . . . . . . . . . . . . . . . . . . . . . . . . . . . . . . . . . . . . . . . . . . . . . . . . . . . . . . 30,840,000 LKR 220 254C,8.50%, 4/1/2018 . . . . . . . . . . . . . . . . . . . . . . . . . . . . . . . . . . . . . . . . . . . . . . . . . . . . . . . . . . . . . . . . . . . . . . . . . . . 125,930,000 LKR 979 1,040D,8.50%, 6/1/2018 . . . . . . . . . . . . . . . . . . . . . . . . . . . . . . . . . . . . . . . . . . . . . . . . . . . . . . . . . . . . . . . . . . . . . . . . . . . 160,050,000 LKR 1,157 1,319
13,359 13,650
Romania: 0.60%Government of Romania, Senior Note, 5.25%, 6/17/2016 . . . . . . . . . . . . . . . . . . . . . . . . . . . . . . . . . . . . . . . . . . . . . . . . . . 8,510,000 EUR 12,009 13,412
The accompanying notes are an integral part of these financial statements.
Franklin Templeton Investments Funds 67
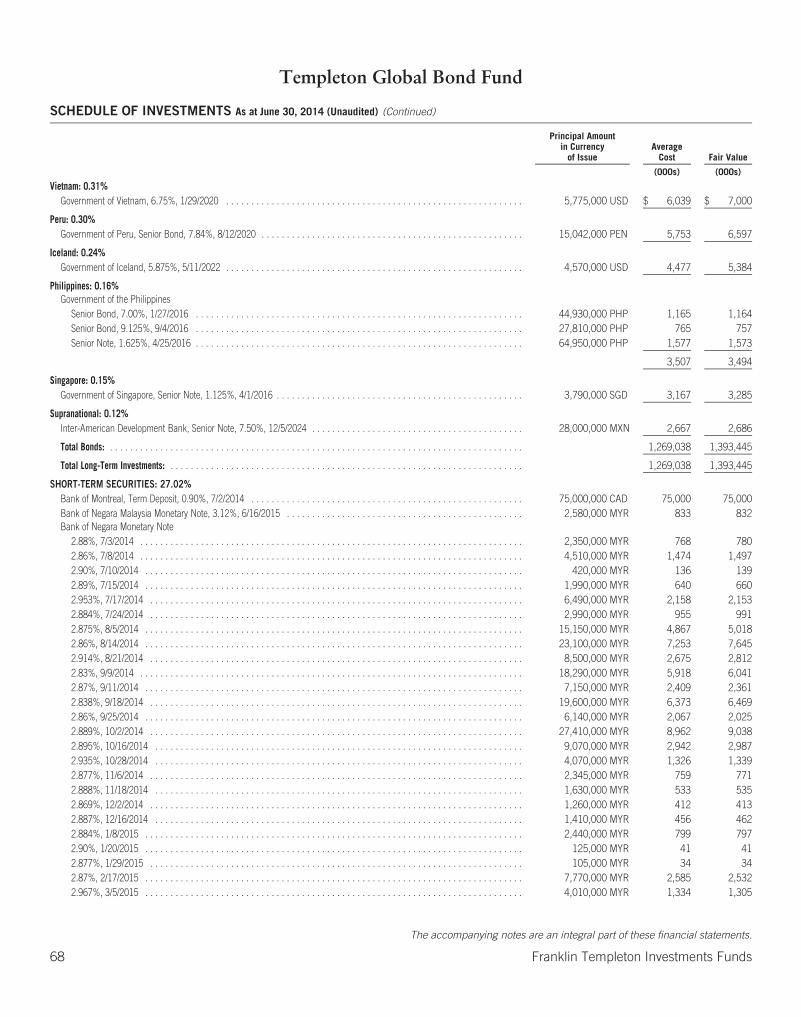
Templeton Global Bond Fund
SCHEDULE OF INVESTMENTS As at June 30, 2014 (Unaudited) (Continued)
Principal Amountin Currency
of IssueAverage
Cost Fair Value
(000s) (000s)
Vietnam: 0.31%Government of Vietnam, 6.75%, 1/29/2020 . . . . . . . . . . . . . . . . . . . . . . . . . . . . . . . . . . . . . . . . . . . . . . . . . . . . . . . . . . . 5,775,000 USD $ 6,039 $ 7,000
Peru: 0.30%Government of Peru, Senior Bond, 7.84%, 8/12/2020 . . . . . . . . . . . . . . . . . . . . . . . . . . . . . . . . . . . . . . . . . . . . . . . . . . . . 15,042,000 PEN 5,753 6,597
Iceland: 0.24%Government of Iceland, 5.875%, 5/11/2022 . . . . . . . . . . . . . . . . . . . . . . . . . . . . . . . . . . . . . . . . . . . . . . . . . . . . . . . . . . . 4,570,000 USD 4,477 5,384
Philippines: 0.16%Government of the Philippines
Senior Bond, 7.00%, 1/27/2016 . . . . . . . . . . . . . . . . . . . . . . . . . . . . . . . . . . . . . . . . . . . . . . . . . . . . . . . . . . . . . . . . . 44,930,000 PHP 1,165 1,164Senior Bond, 9.125%, 9/4/2016 . . . . . . . . . . . . . . . . . . . . . . . . . . . . . . . . . . . . . . . . . . . . . . . . . . . . . . . . . . . . . . . . . 27,810,000 PHP 765 757Senior Note, 1.625%, 4/25/2016 . . . . . . . . . . . . . . . . . . . . . . . . . . . . . . . . . . . . . . . . . . . . . . . . . . . . . . . . . . . . . . . . . 64,950,000 PHP 1,577 1,573
3,507 3,494
Singapore: 0.15%Government of Singapore, Senior Note, 1.125%, 4/1/2016 . . . . . . . . . . . . . . . . . . . . . . . . . . . . . . . . . . . . . . . . . . . . . . . . . 3,790,000 SGD 3,167 3,285
Supranational: 0.12%Inter-American Development Bank, Senior Note, 7.50%, 12/5/2024 . . . . . . . . . . . . . . . . . . . . . . . . . . . . . . . . . . . . . . . . . . 28,000,000 MXN 2,667 2,686
Total Bonds: . . . . . . . . . . . . . . . . . . . . . . . . . . . . . . . . . . . . . . . . . . . . . . . . . . . . . . . . . . . . . . . . . . . . . . . . . . . . . . . . . . 1,269,038 1,393,445
Total Long-Term Investments: . . . . . . . . . . . . . . . . . . . . . . . . . . . . . . . . . . . . . . . . . . . . . . . . . . . . . . . . . . . . . . . . . . . . . . 1,269,038 1,393,445
SHORT-TERM SECURITIES: 27.02%Bank of Montreal, Term Deposit, 0.90%, 7/2/2014 . . . . . . . . . . . . . . . . . . . . . . . . . . . . . . . . . . . . . . . . . . . . . . . . . . . . . . 75,000,000 CAD 75,000 75,000Bank of Negara Malaysia Monetary Note, 3.12%, 6/16/2015 . . . . . . . . . . . . . . . . . . . . . . . . . . . . . . . . . . . . . . . . . . . . . . . 2,580,000 MYR 833 832Bank of Negara Monetary Note
2.88%, 7/3/2014 . . . . . . . . . . . . . . . . . . . . . . . . . . . . . . . . . . . . . . . . . . . . . . . . . . . . . . . . . . . . . . . . . . . . . . . . . . . . 2,350,000 MYR 768 7802.86%, 7/8/2014 . . . . . . . . . . . . . . . . . . . . . . . . . . . . . . . . . . . . . . . . . . . . . . . . . . . . . . . . . . . . . . . . . . . . . . . . . . . . 4,510,000 MYR 1,474 1,4972.90%, 7/10/2014 . . . . . . . . . . . . . . . . . . . . . . . . . . . . . . . . . . . . . . . . . . . . . . . . . . . . . . . . . . . . . . . . . . . . . . . . . . . 420,000 MYR 136 1392.89%, 7/15/2014 . . . . . . . . . . . . . . . . . . . . . . . . . . . . . . . . . . . . . . . . . . . . . . . . . . . . . . . . . . . . . . . . . . . . . . . . . . . 1,990,000 MYR 640 6602.953%, 7/17/2014 . . . . . . . . . . . . . . . . . . . . . . . . . . . . . . . . . . . . . . . . . . . . . . . . . . . . . . . . . . . . . . . . . . . . . . . . . . 6,490,000 MYR 2,158 2,1532.884%, 7/24/2014 . . . . . . . . . . . . . . . . . . . . . . . . . . . . . . . . . . . . . . . . . . . . . . . . . . . . . . . . . . . . . . . . . . . . . . . . . . 2,990,000 MYR 955 9912.875%, 8/5/2014 . . . . . . . . . . . . . . . . . . . . . . . . . . . . . . . . . . . . . . . . . . . . . . . . . . . . . . . . . . . . . . . . . . . . . . . . . . . 15,150,000 MYR 4,867 5,0182.86%, 8/14/2014 . . . . . . . . . . . . . . . . . . . . . . . . . . . . . . . . . . . . . . . . . . . . . . . . . . . . . . . . . . . . . . . . . . . . . . . . . . . 23,100,000 MYR 7,253 7,6452.914%, 8/21/2014 . . . . . . . . . . . . . . . . . . . . . . . . . . . . . . . . . . . . . . . . . . . . . . . . . . . . . . . . . . . . . . . . . . . . . . . . . . 8,500,000 MYR 2,675 2,8122.83%, 9/9/2014 . . . . . . . . . . . . . . . . . . . . . . . . . . . . . . . . . . . . . . . . . . . . . . . . . . . . . . . . . . . . . . . . . . . . . . . . . . . . 18,290,000 MYR 5,918 6,0412.87%, 9/11/2014 . . . . . . . . . . . . . . . . . . . . . . . . . . . . . . . . . . . . . . . . . . . . . . . . . . . . . . . . . . . . . . . . . . . . . . . . . . . 7,150,000 MYR 2,409 2,3612.838%, 9/18/2014 . . . . . . . . . . . . . . . . . . . . . . . . . . . . . . . . . . . . . . . . . . . . . . . . . . . . . . . . . . . . . . . . . . . . . . . . . . 19,600,000 MYR 6,373 6,4692.86%, 9/25/2014 . . . . . . . . . . . . . . . . . . . . . . . . . . . . . . . . . . . . . . . . . . . . . . . . . . . . . . . . . . . . . . . . . . . . . . . . . . . 6,140,000 MYR 2,067 2,0252.889%, 10/2/2014 . . . . . . . . . . . . . . . . . . . . . . . . . . . . . . . . . . . . . . . . . . . . . . . . . . . . . . . . . . . . . . . . . . . . . . . . . . 27,410,000 MYR 8,962 9,0382.895%, 10/16/2014 . . . . . . . . . . . . . . . . . . . . . . . . . . . . . . . . . . . . . . . . . . . . . . . . . . . . . . . . . . . . . . . . . . . . . . . . . 9,070,000 MYR 2,942 2,9872.935%, 10/28/2014 . . . . . . . . . . . . . . . . . . . . . . . . . . . . . . . . . . . . . . . . . . . . . . . . . . . . . . . . . . . . . . . . . . . . . . . . . 4,070,000 MYR 1,326 1,3392.877%, 11/6/2014 . . . . . . . . . . . . . . . . . . . . . . . . . . . . . . . . . . . . . . . . . . . . . . . . . . . . . . . . . . . . . . . . . . . . . . . . . . 2,345,000 MYR 759 7712.888%, 11/18/2014 . . . . . . . . . . . . . . . . . . . . . . . . . . . . . . . . . . . . . . . . . . . . . . . . . . . . . . . . . . . . . . . . . . . . . . . . . 1,630,000 MYR 533 5352.869%, 12/2/2014 . . . . . . . . . . . . . . . . . . . . . . . . . . . . . . . . . . . . . . . . . . . . . . . . . . . . . . . . . . . . . . . . . . . . . . . . . . 1,260,000 MYR 412 4132.887%, 12/16/2014 . . . . . . . . . . . . . . . . . . . . . . . . . . . . . . . . . . . . . . . . . . . . . . . . . . . . . . . . . . . . . . . . . . . . . . . . . 1,410,000 MYR 456 4622.884%, 1/8/2015 . . . . . . . . . . . . . . . . . . . . . . . . . . . . . . . . . . . . . . . . . . . . . . . . . . . . . . . . . . . . . . . . . . . . . . . . . . . 2,440,000 MYR 799 7972.90%, 1/20/2015 . . . . . . . . . . . . . . . . . . . . . . . . . . . . . . . . . . . . . . . . . . . . . . . . . . . . . . . . . . . . . . . . . . . . . . . . . . . 125,000 MYR 41 412.877%, 1/29/2015 . . . . . . . . . . . . . . . . . . . . . . . . . . . . . . . . . . . . . . . . . . . . . . . . . . . . . . . . . . . . . . . . . . . . . . . . . . 105,000 MYR 34 342.87%, 2/17/2015 . . . . . . . . . . . . . . . . . . . . . . . . . . . . . . . . . . . . . . . . . . . . . . . . . . . . . . . . . . . . . . . . . . . . . . . . . . . 7,770,000 MYR 2,585 2,5322.967%, 3/5/2015 . . . . . . . . . . . . . . . . . . . . . . . . . . . . . . . . . . . . . . . . . . . . . . . . . . . . . . . . . . . . . . . . . . . . . . . . . . . 4,010,000 MYR 1,334 1,305
The accompanying notes are an integral part of these financial statements.
68 Franklin Templeton Investments Funds
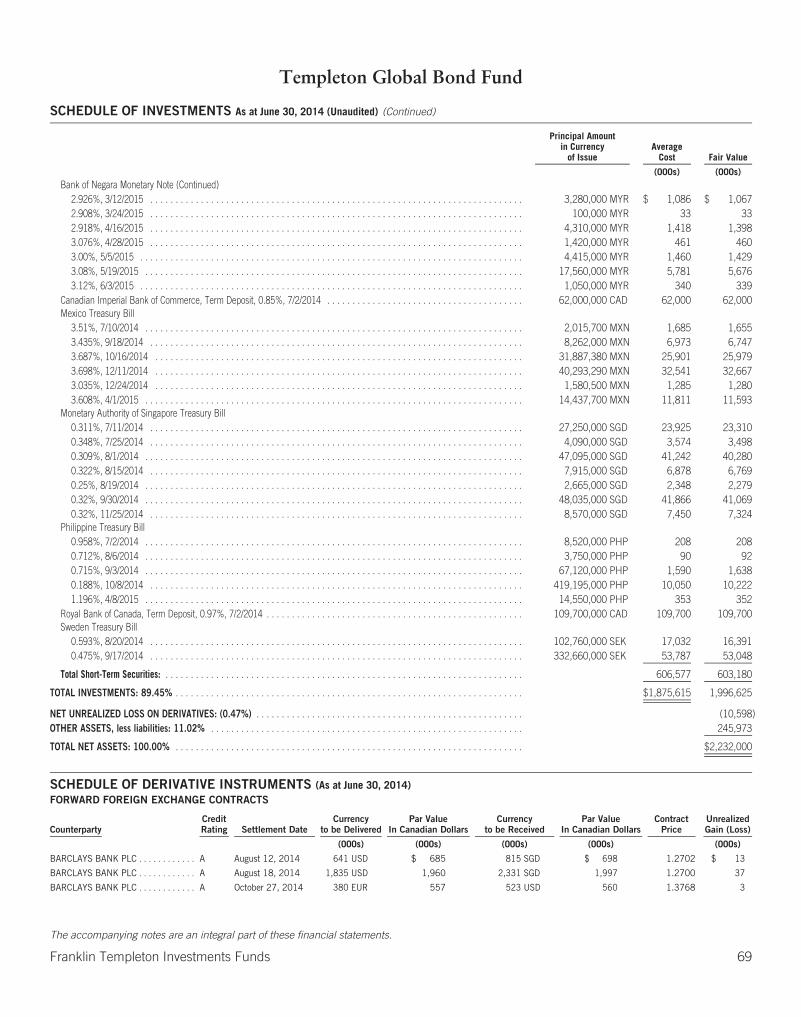
Templeton Global Bond Fund
SCHEDULE OF INVESTMENTS As at June 30, 2014 (Unaudited) (Continued)
Principal Amountin Currency
of IssueAverage
Cost Fair Value
(000s) (000s)Bank of Negara Monetary Note (Continued)
2.926%, 3/12/2015 . . . . . . . . . . . . . . . . . . . . . . . . . . . . . . . . . . . . . . . . . . . . . . . . . . . . . . . . . . . . . . . . . . . . . . . . . . 3,280,000 MYR $ 1,086 $ 1,0672.908%, 3/24/2015 . . . . . . . . . . . . . . . . . . . . . . . . . . . . . . . . . . . . . . . . . . . . . . . . . . . . . . . . . . . . . . . . . . . . . . . . . . 100,000 MYR 33 332.918%, 4/16/2015 . . . . . . . . . . . . . . . . . . . . . . . . . . . . . . . . . . . . . . . . . . . . . . . . . . . . . . . . . . . . . . . . . . . . . . . . . . 4,310,000 MYR 1,418 1,3983.076%, 4/28/2015 . . . . . . . . . . . . . . . . . . . . . . . . . . . . . . . . . . . . . . . . . . . . . . . . . . . . . . . . . . . . . . . . . . . . . . . . . . 1,420,000 MYR 461 4603.00%, 5/5/2015 . . . . . . . . . . . . . . . . . . . . . . . . . . . . . . . . . . . . . . . . . . . . . . . . . . . . . . . . . . . . . . . . . . . . . . . . . . . . 4,415,000 MYR 1,460 1,4293.08%, 5/19/2015 . . . . . . . . . . . . . . . . . . . . . . . . . . . . . . . . . . . . . . . . . . . . . . . . . . . . . . . . . . . . . . . . . . . . . . . . . . . 17,560,000 MYR 5,781 5,6763.12%, 6/3/2015 . . . . . . . . . . . . . . . . . . . . . . . . . . . . . . . . . . . . . . . . . . . . . . . . . . . . . . . . . . . . . . . . . . . . . . . . . . . . 1,050,000 MYR 340 339
Canadian Imperial Bank of Commerce, Term Deposit, 0.85%, 7/2/2014 . . . . . . . . . . . . . . . . . . . . . . . . . . . . . . . . . . . . . . . 62,000,000 CAD 62,000 62,000Mexico Treasury Bill
3.51%, 7/10/2014 . . . . . . . . . . . . . . . . . . . . . . . . . . . . . . . . . . . . . . . . . . . . . . . . . . . . . . . . . . . . . . . . . . . . . . . . . . . 2,015,700 MXN 1,685 1,6553.435%, 9/18/2014 . . . . . . . . . . . . . . . . . . . . . . . . . . . . . . . . . . . . . . . . . . . . . . . . . . . . . . . . . . . . . . . . . . . . . . . . . . 8,262,000 MXN 6,973 6,7473.687%, 10/16/2014 . . . . . . . . . . . . . . . . . . . . . . . . . . . . . . . . . . . . . . . . . . . . . . . . . . . . . . . . . . . . . . . . . . . . . . . . . 31,887,380 MXN 25,901 25,9793.698%, 12/11/2014 . . . . . . . . . . . . . . . . . . . . . . . . . . . . . . . . . . . . . . . . . . . . . . . . . . . . . . . . . . . . . . . . . . . . . . . . . 40,293,290 MXN 32,541 32,6673.035%, 12/24/2014 . . . . . . . . . . . . . . . . . . . . . . . . . . . . . . . . . . . . . . . . . . . . . . . . . . . . . . . . . . . . . . . . . . . . . . . . . 1,580,500 MXN 1,285 1,2803.608%, 4/1/2015 . . . . . . . . . . . . . . . . . . . . . . . . . . . . . . . . . . . . . . . . . . . . . . . . . . . . . . . . . . . . . . . . . . . . . . . . . . . 14,437,700 MXN 11,811 11,593
Monetary Authority of Singapore Treasury Bill0.311%, 7/11/2014 . . . . . . . . . . . . . . . . . . . . . . . . . . . . . . . . . . . . . . . . . . . . . . . . . . . . . . . . . . . . . . . . . . . . . . . . . . 27,250,000 SGD 23,925 23,3100.348%, 7/25/2014 . . . . . . . . . . . . . . . . . . . . . . . . . . . . . . . . . . . . . . . . . . . . . . . . . . . . . . . . . . . . . . . . . . . . . . . . . . 4,090,000 SGD 3,574 3,4980.309%, 8/1/2014 . . . . . . . . . . . . . . . . . . . . . . . . . . . . . . . . . . . . . . . . . . . . . . . . . . . . . . . . . . . . . . . . . . . . . . . . . . . 47,095,000 SGD 41,242 40,2800.322%, 8/15/2014 . . . . . . . . . . . . . . . . . . . . . . . . . . . . . . . . . . . . . . . . . . . . . . . . . . . . . . . . . . . . . . . . . . . . . . . . . . 7,915,000 SGD 6,878 6,7690.25%, 8/19/2014 . . . . . . . . . . . . . . . . . . . . . . . . . . . . . . . . . . . . . . . . . . . . . . . . . . . . . . . . . . . . . . . . . . . . . . . . . . . 2,665,000 SGD 2,348 2,2790.32%, 9/30/2014 . . . . . . . . . . . . . . . . . . . . . . . . . . . . . . . . . . . . . . . . . . . . . . . . . . . . . . . . . . . . . . . . . . . . . . . . . . . 48,035,000 SGD 41,866 41,0690.32%, 11/25/2014 . . . . . . . . . . . . . . . . . . . . . . . . . . . . . . . . . . . . . . . . . . . . . . . . . . . . . . . . . . . . . . . . . . . . . . . . . . 8,570,000 SGD 7,450 7,324
Philippine Treasury Bill0.958%, 7/2/2014 . . . . . . . . . . . . . . . . . . . . . . . . . . . . . . . . . . . . . . . . . . . . . . . . . . . . . . . . . . . . . . . . . . . . . . . . . . . 8,520,000 PHP 208 2080.712%, 8/6/2014 . . . . . . . . . . . . . . . . . . . . . . . . . . . . . . . . . . . . . . . . . . . . . . . . . . . . . . . . . . . . . . . . . . . . . . . . . . . 3,750,000 PHP 90 920.715%, 9/3/2014 . . . . . . . . . . . . . . . . . . . . . . . . . . . . . . . . . . . . . . . . . . . . . . . . . . . . . . . . . . . . . . . . . . . . . . . . . . . 67,120,000 PHP 1,590 1,6380.188%, 10/8/2014 . . . . . . . . . . . . . . . . . . . . . . . . . . . . . . . . . . . . . . . . . . . . . . . . . . . . . . . . . . . . . . . . . . . . . . . . . . 419,195,000 PHP 10,050 10,2221.196%, 4/8/2015 . . . . . . . . . . . . . . . . . . . . . . . . . . . . . . . . . . . . . . . . . . . . . . . . . . . . . . . . . . . . . . . . . . . . . . . . . . . 14,550,000 PHP 353 352
Royal Bank of Canada, Term Deposit, 0.97%, 7/2/2014 . . . . . . . . . . . . . . . . . . . . . . . . . . . . . . . . . . . . . . . . . . . . . . . . . . . 109,700,000 CAD 109,700 109,700Sweden Treasury Bill
0.593%, 8/20/2014 . . . . . . . . . . . . . . . . . . . . . . . . . . . . . . . . . . . . . . . . . . . . . . . . . . . . . . . . . . . . . . . . . . . . . . . . . . 102,760,000 SEK 17,032 16,3910.475%, 9/17/2014 . . . . . . . . . . . . . . . . . . . . . . . . . . . . . . . . . . . . . . . . . . . . . . . . . . . . . . . . . . . . . . . . . . . . . . . . . . 332,660,000 SEK 53,787 53,048
Total Short-Term Securities: . . . . . . . . . . . . . . . . . . . . . . . . . . . . . . . . . . . . . . . . . . . . . . . . . . . . . . . . . . . . . . . . . . . . . . . 606,577 603,180
TOTAL INVESTMENTS: 89.45% . . . . . . . . . . . . . . . . . . . . . . . . . . . . . . . . . . . . . . . . . . . . . . . . . . . . . . . . . . . . . . . . . . . . . $1,875,615 1,996,625
NET UNREALIZED LOSS ON DERIVATIVES: (0.47%) . . . . . . . . . . . . . . . . . . . . . . . . . . . . . . . . . . . . . . . . . . . . . . . . . . . . . (10,598)OTHER ASSETS, less liabilities: 11.02% . . . . . . . . . . . . . . . . . . . . . . . . . . . . . . . . . . . . . . . . . . . . . . . . . . . . . . . . . . . . . . 245,973
TOTAL NET ASSETS: 100.00% . . . . . . . . . . . . . . . . . . . . . . . . . . . . . . . . . . . . . . . . . . . . . . . . . . . . . . . . . . . . . . . . . . . . . $2,232,000
SCHEDULE OF DERIVATIVE INSTRUMENTS (As at June 30, 2014)FORWARD FOREIGN EXCHANGE CONTRACTS
CounterpartyCreditRating Settlement Date
Currencyto be Delivered
Par ValueIn Canadian Dollars
Currencyto be Received
Par ValueIn Canadian Dollars
ContractPrice
UnrealizedGain (Loss)
(000s) (000s) (000s) (000s) (000s)
BARCLAYS BANK PLC . . . . . . . . . . . . A August 12, 2014 641 USD $ 685 815 SGD $ 698 1.2702 $ 13
BARCLAYS BANK PLC . . . . . . . . . . . . A August 18, 2014 1,835 USD 1,960 2,331 SGD 1,997 1.2700 37
BARCLAYS BANK PLC . . . . . . . . . . . . A October 27, 2014 380 EUR 557 523 USD 560 1.3768 3
The accompanying notes are an integral part of these financial statements.
Franklin Templeton Investments Funds 69

Templeton Global Bond Fund
SCHEDULE OF INVESTMENTS As at June 30, 2014 (Unaudited) (Continued)
SCHEDULE OF DERIVATIVE INSTRUMENTS (As at June 30, 2014) (Continued)FORWARD FOREIGN EXCHANGE CONTRACTS (Continued)
CounterpartyCreditRating Settlement Date
Currencyto be Delivered
Par ValueIn Canadian Dollars
Currencyto be Received
Par ValueIn Canadian Dollars
ContractPrice
UnrealizedGain (Loss)
(000s) (000s) (000s) (000s) (000s)
BARCLAYS BANK PLC . . . . . . . . . A October 27, 2014 2,895 EUR $ 4,243 4,005 USD $ 4,284 1.3835 $ 41
BARCLAYS BANK PLC . . . . . . . . . A February 10, 2015 596 USD 640 346,700 CLP 658 581.2998 18
BARCLAYS BANK PLC . . . . . . . . . A February 11, 2015 520 EUR 765 2,224 PLN 776 4.2770 11
BARCLAYS BANK PLC . . . . . . . . . A February 26, 2015 2,263 EUR 3,329 3,107 USD 3,333 1.3726 4
BARCLAYS BANK PLC . . . . . . . . . A February 26, 2015 18,346 EUR 26,986 25,209 USD 27,048 1.3741 62
BARCLAYS BANK PLC . . . . . . . . . A March 9, 2015 2,007 EUR 2,954 2,756 USD 2,959 1.3733 5
BARCLAYS BANK PLC . . . . . . . . . A May 5, 2015 3,364 EUR 4,958 4,661 USD 5,010 1.3859 52
BARCLAYS BANK PLC . . . . . . . . . A May 7, 2015 3,885 EUR 5,727 5,392 USD 5,795 1.3878 68
BARCLAYS BANK PLC . . . . . . . . . A May 18, 2015 1,338 EUR 1,974 1,837 USD 1,976 1.3727 2
DEUTSCHE BANK AG . . . . . . . . . . A July 3, 2014 906 USD 966 2,919 MYR 969 3.2215 3
DEUTSCHE BANK AG . . . . . . . . . . A July 7, 2014 4,588 USD 4,894 14,780 MYR 4,908 3.2215 14
DEUTSCHE BANK AG . . . . . . . . . . A July 7, 2014 4,884 USD 5,209 6,198 SGD 5,303 1.2690 94
DEUTSCHE BANK AG . . . . . . . . . . A July 14, 2014 686 USD 731 2,224 MYR 738 3.2442 7
DEUTSCHE BANK AG . . . . . . . . . . A July 15, 2014 781 USD 833 2,510 MYR 834 3.2157 1
DEUTSCHE BANK AG . . . . . . . . . . A July 15, 2014 851 USD 907 52,224 INR 925 61.4015 18
DEUTSCHE BANK AG . . . . . . . . . . A July 17, 2014 1,073 USD 1,145 65,955 INR 1,168 61.4670 23
DEUTSCHE BANK AG . . . . . . . . . . A July 18, 2014 16 USD 18 53 MYR 18 3.2331 —
DEUTSCHE BANK AG . . . . . . . . . . A July 22, 2014 26 USD 28 84 MYR 28 3.2478 —
DEUTSCHE BANK AG . . . . . . . . . . A July 22, 2014 194 USD 207 11,968 INR 212 61.6751 5
DEUTSCHE BANK AG . . . . . . . . . . A July 25, 2014 32 USD 34 102 MYR 34 3.2207 —
DEUTSCHE BANK AG . . . . . . . . . . A July 30, 2014 197 USD 210 110,470 CLP 213 561.6995 3
DEUTSCHE BANK AG . . . . . . . . . . A July 31, 2014 1,182 USD 1,262 72,974 INR 1,290 61.7291 28
DEUTSCHE BANK AG . . . . . . . . . . A August 1, 2014 396 USD 423 220,930 CLP 425 557.8801 2
DEUTSCHE BANK AG . . . . . . . . . . A August 7, 2014 538 USD 574 32,847 INR 580 61.0825 6
DEUTSCHE BANK AG . . . . . . . . . . A August 7, 2014 2,453 USD 2,619 3,112 SGD 2,665 1.2684 46
DEUTSCHE BANK AG . . . . . . . . . . A August 12, 2014 615 USD 657 347,400 CLP 668 564.4504 11
DEUTSCHE BANK AG . . . . . . . . . . A August 12, 2014 2,395 USD 2,557 145,979 INR 2,577 60.9613 20
DEUTSCHE BANK AG . . . . . . . . . . A August 12, 2014 4,898 USD 5,229 6,199 SGD 5,309 1.2656 80
DEUTSCHE BANK AG . . . . . . . . . . A August 18, 2014 936 USD 999 526,890 CLP 1,012 563.1002 13
DEUTSCHE BANK AG . . . . . . . . . . A August 19, 2014 1,380 USD 1,473 1,749 SGD 1,498 1.2678 25
DEUTSCHE BANK AG . . . . . . . . . . A August 19, 2014 6,724 EUR 9,834 29,046 PLN 10,180 4.3200 346
DEUTSCHE BANK AG . . . . . . . . . . A August 27, 2014 589 USD 629 331,830 CLP 637 563.5996 8
DEUTSCHE BANK AG . . . . . . . . . . A August 27, 2014 2,939 USD 3,139 3,758 SGD 3,219 1.2783 80
DEUTSCHE BANK AG . . . . . . . . . . A August 27, 2014 2,978 USD 3,181 3,758 SGD 3,219 1.2616 38
DEUTSCHE BANK AG . . . . . . . . . . A September 5, 2014 404 USD 432 230,810 CLP 443 571.6203 11
DEUTSCHE BANK AG . . . . . . . . . . A September 5, 2014 422 USD 451 239,720 CLP 460 567.5001 9
DEUTSCHE BANK AG . . . . . . . . . . A September 8, 2014 403 USD 430 229,420 CLP 440 569.8007 10
DEUTSCHE BANK AG . . . . . . . . . . A September 17, 2014 776 USD 829 451,860 CLP 866 582.5002 37
DEUTSCHE BANK AG . . . . . . . . . . A September 30, 2014 1,279 USD 1,367 78,021 INR 1,367 61.0068 —
DEUTSCHE BANK AG . . . . . . . . . . A October 6, 2014 412 USD 441 231,280 CLP 443 560.9997 2
DEUTSCHE BANK AG . . . . . . . . . . A October 31, 2014 1,939 EUR 2,842 2,678 USD 2,865 1.3810 23
DEUTSCHE BANK AG . . . . . . . . . . A November 3, 2014 131 EUR 192 180 USD 193 1.3761 1
DEUTSCHE BANK AG . . . . . . . . . . A November 19, 2014 880 USD 942 2,867 MYR 948 3.2587 6
DEUTSCHE BANK AG . . . . . . . . . . A November 28, 2014 819 USD 877 465,910 CLP 889 569.0997 12
DEUTSCHE BANK AG . . . . . . . . . . A November 28, 2014 1,151 USD 1,232 1,445 SGD 1,241 1.2558 9
DEUTSCHE BANK AG . . . . . . . . . . A December 1, 2014 419 USD 449 239,150 CLP 456 570.0997 7
DEUTSCHE BANK AG . . . . . . . . . . A December 17, 2014 19,831 EUR 29,108 27,264 USD 29,201 1.3748 93
DEUTSCHE BANK AG . . . . . . . . . . A December 23, 2014 3,885 USD 4,162 4,854 SGD 4,171 1.2492 9
The accompanying notes are an integral part of these financial statements.
70 Franklin Templeton Investments Funds
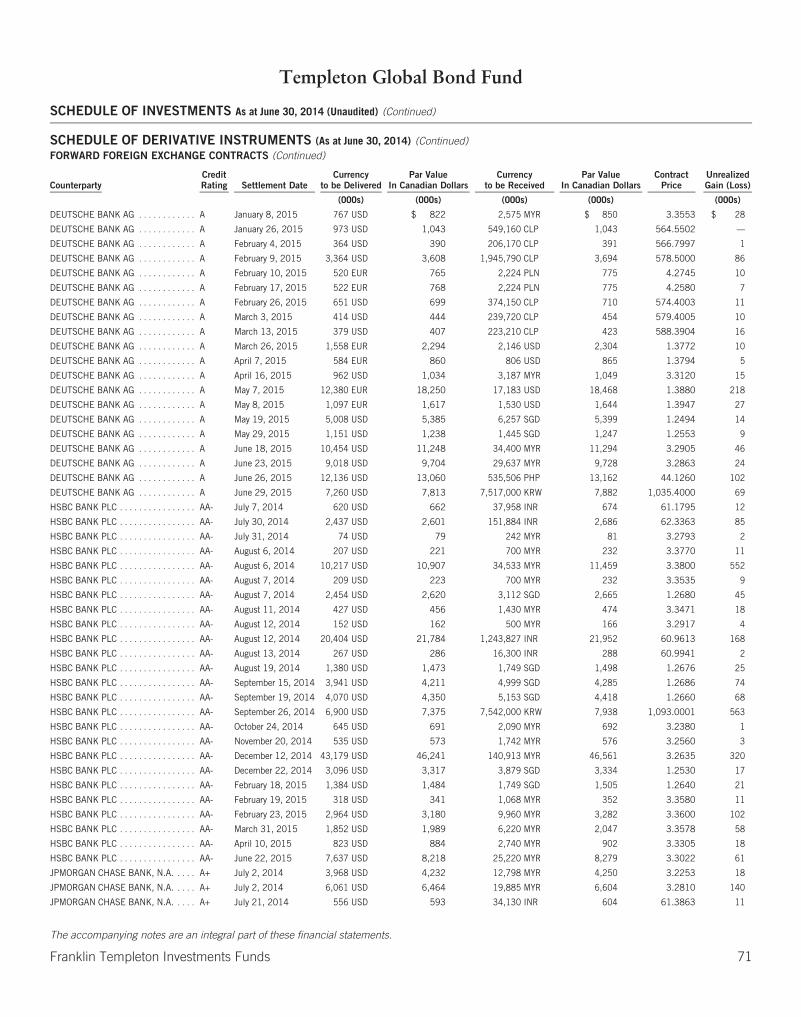
Templeton Global Bond Fund
SCHEDULE OF INVESTMENTS As at June 30, 2014 (Unaudited) (Continued)
SCHEDULE OF DERIVATIVE INSTRUMENTS (As at June 30, 2014) (Continued)FORWARD FOREIGN EXCHANGE CONTRACTS (Continued)
CounterpartyCreditRating Settlement Date
Currencyto be Delivered
Par ValueIn Canadian Dollars
Currencyto be Received
Par ValueIn Canadian Dollars
ContractPrice
UnrealizedGain (Loss)
(000s) (000s) (000s) (000s) (000s)
DEUTSCHE BANK AG . . . . . . . . . . . . A January 8, 2015 767 USD $ 822 2,575 MYR $ 850 3.3553 $ 28
DEUTSCHE BANK AG . . . . . . . . . . . . A January 26, 2015 973 USD 1,043 549,160 CLP 1,043 564.5502 —
DEUTSCHE BANK AG . . . . . . . . . . . . A February 4, 2015 364 USD 390 206,170 CLP 391 566.7997 1
DEUTSCHE BANK AG . . . . . . . . . . . . A February 9, 2015 3,364 USD 3,608 1,945,790 CLP 3,694 578.5000 86
DEUTSCHE BANK AG . . . . . . . . . . . . A February 10, 2015 520 EUR 765 2,224 PLN 775 4.2745 10
DEUTSCHE BANK AG . . . . . . . . . . . . A February 17, 2015 522 EUR 768 2,224 PLN 775 4.2580 7
DEUTSCHE BANK AG . . . . . . . . . . . . A February 26, 2015 651 USD 699 374,150 CLP 710 574.4003 11
DEUTSCHE BANK AG . . . . . . . . . . . . A March 3, 2015 414 USD 444 239,720 CLP 454 579.4005 10
DEUTSCHE BANK AG . . . . . . . . . . . . A March 13, 2015 379 USD 407 223,210 CLP 423 588.3904 16
DEUTSCHE BANK AG . . . . . . . . . . . . A March 26, 2015 1,558 EUR 2,294 2,146 USD 2,304 1.3772 10
DEUTSCHE BANK AG . . . . . . . . . . . . A April 7, 2015 584 EUR 860 806 USD 865 1.3794 5
DEUTSCHE BANK AG . . . . . . . . . . . . A April 16, 2015 962 USD 1,034 3,187 MYR 1,049 3.3120 15
DEUTSCHE BANK AG . . . . . . . . . . . . A May 7, 2015 12,380 EUR 18,250 17,183 USD 18,468 1.3880 218
DEUTSCHE BANK AG . . . . . . . . . . . . A May 8, 2015 1,097 EUR 1,617 1,530 USD 1,644 1.3947 27
DEUTSCHE BANK AG . . . . . . . . . . . . A May 19, 2015 5,008 USD 5,385 6,257 SGD 5,399 1.2494 14
DEUTSCHE BANK AG . . . . . . . . . . . . A May 29, 2015 1,151 USD 1,238 1,445 SGD 1,247 1.2553 9
DEUTSCHE BANK AG . . . . . . . . . . . . A June 18, 2015 10,454 USD 11,248 34,400 MYR 11,294 3.2905 46
DEUTSCHE BANK AG . . . . . . . . . . . . A June 23, 2015 9,018 USD 9,704 29,637 MYR 9,728 3.2863 24
DEUTSCHE BANK AG . . . . . . . . . . . . A June 26, 2015 12,136 USD 13,060 535,506 PHP 13,162 44.1260 102
DEUTSCHE BANK AG . . . . . . . . . . . . A June 29, 2015 7,260 USD 7,813 7,517,000 KRW 7,882 1,035.4000 69
HSBC BANK PLC . . . . . . . . . . . . . . . . AA- July 7, 2014 620 USD 662 37,958 INR 674 61.1795 12
HSBC BANK PLC . . . . . . . . . . . . . . . . AA- July 30, 2014 2,437 USD 2,601 151,884 INR 2,686 62.3363 85
HSBC BANK PLC . . . . . . . . . . . . . . . . AA- July 31, 2014 74 USD 79 242 MYR 81 3.2793 2
HSBC BANK PLC . . . . . . . . . . . . . . . . AA- August 6, 2014 207 USD 221 700 MYR 232 3.3770 11
HSBC BANK PLC . . . . . . . . . . . . . . . . AA- August 6, 2014 10,217 USD 10,907 34,533 MYR 11,459 3.3800 552
HSBC BANK PLC . . . . . . . . . . . . . . . . AA- August 7, 2014 209 USD 223 700 MYR 232 3.3535 9
HSBC BANK PLC . . . . . . . . . . . . . . . . AA- August 7, 2014 2,454 USD 2,620 3,112 SGD 2,665 1.2680 45
HSBC BANK PLC . . . . . . . . . . . . . . . . AA- August 11, 2014 427 USD 456 1,430 MYR 474 3.3471 18
HSBC BANK PLC . . . . . . . . . . . . . . . . AA- August 12, 2014 152 USD 162 500 MYR 166 3.2917 4
HSBC BANK PLC . . . . . . . . . . . . . . . . AA- August 12, 2014 20,404 USD 21,784 1,243,827 INR 21,952 60.9613 168
HSBC BANK PLC . . . . . . . . . . . . . . . . AA- August 13, 2014 267 USD 286 16,300 INR 288 60.9941 2
HSBC BANK PLC . . . . . . . . . . . . . . . . AA- August 19, 2014 1,380 USD 1,473 1,749 SGD 1,498 1.2676 25
HSBC BANK PLC . . . . . . . . . . . . . . . . AA- September 15, 2014 3,941 USD 4,211 4,999 SGD 4,285 1.2686 74
HSBC BANK PLC . . . . . . . . . . . . . . . . AA- September 19, 2014 4,070 USD 4,350 5,153 SGD 4,418 1.2660 68
HSBC BANK PLC . . . . . . . . . . . . . . . . AA- September 26, 2014 6,900 USD 7,375 7,542,000 KRW 7,938 1,093.0001 563
HSBC BANK PLC . . . . . . . . . . . . . . . . AA- October 24, 2014 645 USD 691 2,090 MYR 692 3.2380 1
HSBC BANK PLC . . . . . . . . . . . . . . . . AA- November 20, 2014 535 USD 573 1,742 MYR 576 3.2560 3
HSBC BANK PLC . . . . . . . . . . . . . . . . AA- December 12, 2014 43,179 USD 46,241 140,913 MYR 46,561 3.2635 320
HSBC BANK PLC . . . . . . . . . . . . . . . . AA- December 22, 2014 3,096 USD 3,317 3,879 SGD 3,334 1.2530 17
HSBC BANK PLC . . . . . . . . . . . . . . . . AA- February 18, 2015 1,384 USD 1,484 1,749 SGD 1,505 1.2640 21
HSBC BANK PLC . . . . . . . . . . . . . . . . AA- February 19, 2015 318 USD 341 1,068 MYR 352 3.3580 11
HSBC BANK PLC . . . . . . . . . . . . . . . . AA- February 23, 2015 2,964 USD 3,180 9,960 MYR 3,282 3.3600 102
HSBC BANK PLC . . . . . . . . . . . . . . . . AA- March 31, 2015 1,852 USD 1,989 6,220 MYR 2,047 3.3578 58
HSBC BANK PLC . . . . . . . . . . . . . . . . AA- April 10, 2015 823 USD 884 2,740 MYR 902 3.3305 18
HSBC BANK PLC . . . . . . . . . . . . . . . . AA- June 22, 2015 7,637 USD 8,218 25,220 MYR 8,279 3.3022 61
JPMORGAN CHASE BANK, N.A. . . . . A+ July 2, 2014 3,968 USD 4,232 12,798 MYR 4,250 3.2253 18
JPMORGAN CHASE BANK, N.A. . . . . A+ July 2, 2014 6,061 USD 6,464 19,885 MYR 6,604 3.2810 140
JPMORGAN CHASE BANK, N.A. . . . . A+ July 21, 2014 556 USD 593 34,130 INR 604 61.3863 11
The accompanying notes are an integral part of these financial statements.
Franklin Templeton Investments Funds 71
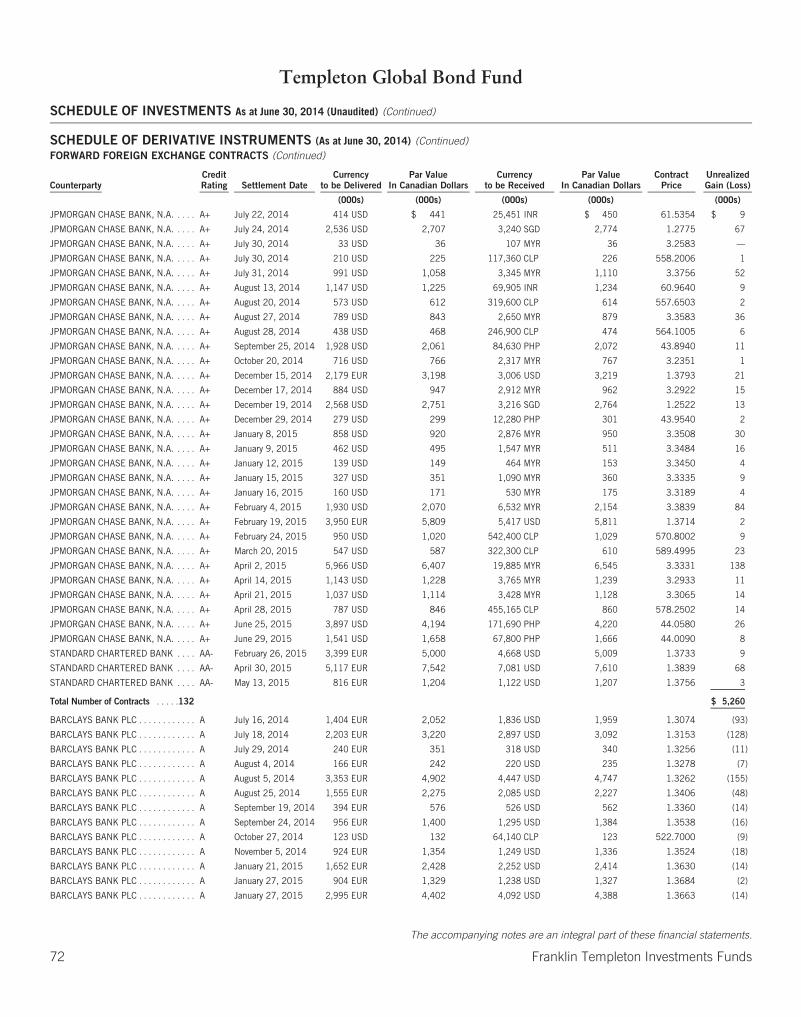
Templeton Global Bond Fund
SCHEDULE OF INVESTMENTS As at June 30, 2014 (Unaudited) (Continued)
SCHEDULE OF DERIVATIVE INSTRUMENTS (As at June 30, 2014) (Continued)FORWARD FOREIGN EXCHANGE CONTRACTS (Continued)
CounterpartyCreditRating Settlement Date
Currencyto be Delivered
Par ValueIn Canadian Dollars
Currencyto be Received
Par ValueIn Canadian Dollars
ContractPrice
UnrealizedGain (Loss)
(000s) (000s) (000s) (000s) (000s)
JPMORGAN CHASE BANK, N.A. . . . . A+ July 22, 2014 414 USD $ 441 25,451 INR $ 450 61.5354 $ 9
JPMORGAN CHASE BANK, N.A. . . . . A+ July 24, 2014 2,536 USD 2,707 3,240 SGD 2,774 1.2775 67
JPMORGAN CHASE BANK, N.A. . . . . A+ July 30, 2014 33 USD 36 107 MYR 36 3.2583 —
JPMORGAN CHASE BANK, N.A. . . . . A+ July 30, 2014 210 USD 225 117,360 CLP 226 558.2006 1
JPMORGAN CHASE BANK, N.A. . . . . A+ July 31, 2014 991 USD 1,058 3,345 MYR 1,110 3.3756 52
JPMORGAN CHASE BANK, N.A. . . . . A+ August 13, 2014 1,147 USD 1,225 69,905 INR 1,234 60.9640 9
JPMORGAN CHASE BANK, N.A. . . . . A+ August 20, 2014 573 USD 612 319,600 CLP 614 557.6503 2
JPMORGAN CHASE BANK, N.A. . . . . A+ August 27, 2014 789 USD 843 2,650 MYR 879 3.3583 36
JPMORGAN CHASE BANK, N.A. . . . . A+ August 28, 2014 438 USD 468 246,900 CLP 474 564.1005 6
JPMORGAN CHASE BANK, N.A. . . . . A+ September 25, 2014 1,928 USD 2,061 84,630 PHP 2,072 43.8940 11
JPMORGAN CHASE BANK, N.A. . . . . A+ October 20, 2014 716 USD 766 2,317 MYR 767 3.2351 1
JPMORGAN CHASE BANK, N.A. . . . . A+ December 15, 2014 2,179 EUR 3,198 3,006 USD 3,219 1.3793 21
JPMORGAN CHASE BANK, N.A. . . . . A+ December 17, 2014 884 USD 947 2,912 MYR 962 3.2922 15
JPMORGAN CHASE BANK, N.A. . . . . A+ December 19, 2014 2,568 USD 2,751 3,216 SGD 2,764 1.2522 13
JPMORGAN CHASE BANK, N.A. . . . . A+ December 29, 2014 279 USD 299 12,280 PHP 301 43.9540 2
JPMORGAN CHASE BANK, N.A. . . . . A+ January 8, 2015 858 USD 920 2,876 MYR 950 3.3508 30
JPMORGAN CHASE BANK, N.A. . . . . A+ January 9, 2015 462 USD 495 1,547 MYR 511 3.3484 16
JPMORGAN CHASE BANK, N.A. . . . . A+ January 12, 2015 139 USD 149 464 MYR 153 3.3450 4
JPMORGAN CHASE BANK, N.A. . . . . A+ January 15, 2015 327 USD 351 1,090 MYR 360 3.3335 9
JPMORGAN CHASE BANK, N.A. . . . . A+ January 16, 2015 160 USD 171 530 MYR 175 3.3189 4
JPMORGAN CHASE BANK, N.A. . . . . A+ February 4, 2015 1,930 USD 2,070 6,532 MYR 2,154 3.3839 84
JPMORGAN CHASE BANK, N.A. . . . . A+ February 19, 2015 3,950 EUR 5,809 5,417 USD 5,811 1.3714 2
JPMORGAN CHASE BANK, N.A. . . . . A+ February 24, 2015 950 USD 1,020 542,400 CLP 1,029 570.8002 9
JPMORGAN CHASE BANK, N.A. . . . . A+ March 20, 2015 547 USD 587 322,300 CLP 610 589.4995 23
JPMORGAN CHASE BANK, N.A. . . . . A+ April 2, 2015 5,966 USD 6,407 19,885 MYR 6,545 3.3331 138
JPMORGAN CHASE BANK, N.A. . . . . A+ April 14, 2015 1,143 USD 1,228 3,765 MYR 1,239 3.2933 11
JPMORGAN CHASE BANK, N.A. . . . . A+ April 21, 2015 1,037 USD 1,114 3,428 MYR 1,128 3.3065 14
JPMORGAN CHASE BANK, N.A. . . . . A+ April 28, 2015 787 USD 846 455,165 CLP 860 578.2502 14
JPMORGAN CHASE BANK, N.A. . . . . A+ June 25, 2015 3,897 USD 4,194 171,690 PHP 4,220 44.0580 26
JPMORGAN CHASE BANK, N.A. . . . . A+ June 29, 2015 1,541 USD 1,658 67,800 PHP 1,666 44.0090 8
STANDARD CHARTERED BANK . . . . AA- February 26, 2015 3,399 EUR 5,000 4,668 USD 5,009 1.3733 9
STANDARD CHARTERED BANK . . . . AA- April 30, 2015 5,117 EUR 7,542 7,081 USD 7,610 1.3839 68
STANDARD CHARTERED BANK . . . . AA- May 13, 2015 816 EUR 1,204 1,122 USD 1,207 1.3756 3
Total Number of Contracts . . . . .132 $ 5,260
BARCLAYS BANK PLC . . . . . . . . . . . . A July 16, 2014 1,404 EUR 2,052 1,836 USD 1,959 1.3074 (93)
BARCLAYS BANK PLC . . . . . . . . . . . . A July 18, 2014 2,203 EUR 3,220 2,897 USD 3,092 1.3153 (128)
BARCLAYS BANK PLC . . . . . . . . . . . . A July 29, 2014 240 EUR 351 318 USD 340 1.3256 (11)
BARCLAYS BANK PLC . . . . . . . . . . . . A August 4, 2014 166 EUR 242 220 USD 235 1.3278 (7)
BARCLAYS BANK PLC . . . . . . . . . . . . A August 5, 2014 3,353 EUR 4,902 4,447 USD 4,747 1.3262 (155)
BARCLAYS BANK PLC . . . . . . . . . . . . A August 25, 2014 1,555 EUR 2,275 2,085 USD 2,227 1.3406 (48)
BARCLAYS BANK PLC . . . . . . . . . . . . A September 19, 2014 394 EUR 576 526 USD 562 1.3360 (14)
BARCLAYS BANK PLC . . . . . . . . . . . . A September 24, 2014 956 EUR 1,400 1,295 USD 1,384 1.3538 (16)
BARCLAYS BANK PLC . . . . . . . . . . . . A October 27, 2014 123 USD 132 64,140 CLP 123 522.7000 (9)
BARCLAYS BANK PLC . . . . . . . . . . . . A November 5, 2014 924 EUR 1,354 1,249 USD 1,336 1.3524 (18)
BARCLAYS BANK PLC . . . . . . . . . . . . A January 21, 2015 1,652 EUR 2,428 2,252 USD 2,414 1.3630 (14)
BARCLAYS BANK PLC . . . . . . . . . . . . A January 27, 2015 904 EUR 1,329 1,238 USD 1,327 1.3684 (2)
BARCLAYS BANK PLC . . . . . . . . . . . . A January 27, 2015 2,995 EUR 4,402 4,092 USD 4,388 1.3663 (14)
The accompanying notes are an integral part of these financial statements.
72 Franklin Templeton Investments Funds

Templeton Global Bond Fund
SCHEDULE OF INVESTMENTS As at June 30, 2014 (Unaudited) (Continued)
SCHEDULE OF DERIVATIVE INSTRUMENTS (As at June 30, 2014) (Continued)FORWARD FOREIGN EXCHANGE CONTRACTS (Continued)
CounterpartyCreditRating Settlement Date
Currencyto be Delivered
Par ValueIn Canadian Dollars
Currencyto be Received
Par ValueIn Canadian Dollars
ContractPrice
UnrealizedGain (Loss)
(000s) (000s) (000s) (000s) (000s)
BARCLAYS BANK PLC . . . . . . . . . . . . A February 10, 2015 1,700 EUR $ 2,499 2,313 USD $ 2,480 1.3605 $ (19)
BARCLAYS BANK PLC . . . . . . . . . . . . A February 11, 2015 4,290 EUR 6,307 5,833 USD 6,256 1.3597 (51)
BARCLAYS BANK PLC . . . . . . . . . . . . A May 22, 2015 6,610 EUR 9,748 9,063 USD 9,744 1.3711 (4)
BARCLAYS BANK PLC . . . . . . . . . . . . A May 29, 2015 1,409 EUR 2,079 1,918 USD 2,063 1.3615 (16)
BARCLAYS BANK PLC . . . . . . . . . . . . A June 4, 2015 1,604 USD 1,725 911,700 CLP 1,717 568.3001 (8)
BARCLAYS BANK PLC . . . . . . . . . . . . A June 5, 2015 3,533 EUR 5,213 4,812 USD 5,175 1.3620 (38)
BARCLAYS BANK PLC . . . . . . . . . . . . A June 22, 2015 559 EUR 826 761 USD 819 1.3604 (7)
DEUTSCHE BANK AG . . . . . . . . . . . . A July 3, 2014 23,580 EUR 34,441 30,805 USD 32,855 1.3064 (1,586)
DEUTSCHE BANK AG . . . . . . . . . . . . A July 18, 2014 273 USD 292 11,840 PHP 290 43.3130 (2)
DEUTSCHE BANK AG . . . . . . . . . . . . A July 18, 2014 23,353 USD 24,917 12,225,039 CLP 23,543 523.5000 (1,374)
DEUTSCHE BANK AG . . . . . . . . . . . . A July 22, 2014 1,212 EUR 1,772 1,590 USD 1,697 1.3118 (75)
DEUTSCHE BANK AG . . . . . . . . . . . . A July 23, 2014 1,389 EUR 2,030 1,825 USD 1,948 1.3140 (82)
DEUTSCHE BANK AG . . . . . . . . . . . . A July 25, 2014 130 EUR 190 172 USD 184 1.3241 (6)
DEUTSCHE BANK AG . . . . . . . . . . . . A July 28, 2014 617 USD 659 341,940 CLP 658 554.0998 (1)
DEUTSCHE BANK AG . . . . . . . . . . . . A July 29, 2014 70 EUR 102 93 USD 99 1.3253 (3)
DEUTSCHE BANK AG . . . . . . . . . . . . A August 5, 2014 2,102 EUR 3,073 2,786 USD 2,974 1.3255 (99)
DEUTSCHE BANK AG . . . . . . . . . . . . A August 8, 2014 22,265 EUR 32,556 202,000 SEK 32,262 9.0725 (294)
DEUTSCHE BANK AG . . . . . . . . . . . . A August 11, 2014 1,505 EUR 2,201 2,007 USD 2,143 1.3334 (58)
DEUTSCHE BANK AG . . . . . . . . . . . . A August 19, 2014 272 USD 290 16,396 INR 289 60.3544 (1)
DEUTSCHE BANK AG . . . . . . . . . . . . A August 21, 2014 252 USD 269 14,935 INR 263 59.2960 (6)
DEUTSCHE BANK AG . . . . . . . . . . . . A August 27, 2014 375 USD 400 22,215 INR 391 59.2855 (9)
DEUTSCHE BANK AG . . . . . . . . . . . . A August 28, 2014 1,220 USD 1,303 72,974 INR 1,285 59.8150 (18)
DEUTSCHE BANK AG . . . . . . . . . . . . A August 29, 2014 614 EUR 899 820 USD 876 1.3354 (23)
DEUTSCHE BANK AG . . . . . . . . . . . . A August 29, 2014 19,646 USD 20,984 128,816 SEK 20,580 6.5567 (404)
DEUTSCHE BANK AG . . . . . . . . . . . . A September 3, 2014 845 USD 903 50,522 INR 889 59.7735 (14)
DEUTSCHE BANK AG . . . . . . . . . . . . A September 5, 2014 3,698 EUR 5,412 4,881 USD 5,214 1.3197 (198)
DEUTSCHE BANK AG . . . . . . . . . . . . A September 9, 2014 102 USD 109 6,118 INR 108 60.1272 (1)
DEUTSCHE BANK AG . . . . . . . . . . . . A September 23, 2014 27,260 EUR 39,909 36,987 USD 39,528 1.3568 (381)
DEUTSCHE BANK AG . . . . . . . . . . . . A September 26, 2014 364 USD 390 22,215 INR 390 60.9500 —
DEUTSCHE BANK AG . . . . . . . . . . . . A September 26, 2014 10,795 EUR 15,805 14,567 USD 15,569 1.3494 (236)
DEUTSCHE BANK AG . . . . . . . . . . . . A September 30, 2014 416 USD 445 217,700 CLP 417 523.4998 (28)
DEUTSCHE BANK AG . . . . . . . . . . . . A October 9, 2014 2,385 EUR 3,493 3,240 USD 3,464 1.3586 (29)
DEUTSCHE BANK AG . . . . . . . . . . . . A October 24, 2014 973 USD 1,041 3,133 MYR 1,037 3.2205 (4)
DEUTSCHE BANK AG . . . . . . . . . . . . A October 29, 2014 244 USD 261 128,218 CLP 245 525.1995 (16)
DEUTSCHE BANK AG . . . . . . . . . . . . A November 17, 2014 6,263 EUR 9,184 8,418 USD 9,010 1.3442 (174)
DEUTSCHE BANK AG . . . . . . . . . . . . A November 19, 2014 1,941 EUR 2,848 2,614 USD 2,799 1.3469 (49)
DEUTSCHE BANK AG . . . . . . . . . . . . A November 28, 2014 171 EUR 251 232 USD 248 1.3550 (3)
DEUTSCHE BANK AG . . . . . . . . . . . . A December 4, 2014 2,050 EUR 3,008 2,777 USD 2,974 1.3547 (34)
DEUTSCHE BANK AG . . . . . . . . . . . . A December 4, 2014 2,434 USD 2,606 1,340,820 CLP 2,556 550.9000 (50)
DEUTSCHE BANK AG . . . . . . . . . . . . A January 7, 2015 3,511 USD 3,762 1,926,470 CLP 3,664 548.7501 (98)
DEUTSCHE BANK AG . . . . . . . . . . . . A January 7, 2015 6,244 EUR 9,171 8,517 USD 9,127 1.3639 (44)
DEUTSCHE BANK AG . . . . . . . . . . . . A January 12, 2015 4,923 USD 5,277 2,706,900 CLP 5,148 549.8500 (129)
DEUTSCHE BANK AG . . . . . . . . . . . . A January 16, 2015 1,035 EUR 1,521 1,416 USD 1,518 1.3682 (3)
DEUTSCHE BANK AG . . . . . . . . . . . . A January 23, 2015 699 USD 750 387,160 CLP 736 553.5000 (14)
DEUTSCHE BANK AG . . . . . . . . . . . . A January 26, 2015 21,275 EUR 31,265 28,874 USD 30,957 1.3572 (308)
DEUTSCHE BANK AG . . . . . . . . . . . . A January 30, 2015 49 EUR 72 67 USD 72 1.3648 —
DEUTSCHE BANK AG . . . . . . . . . . . . A January 30, 2015 543 EUR 798 743 USD 796 1.3674 (2)
DEUTSCHE BANK AG . . . . . . . . . . . . A February 9, 2015 10,608 EUR 15,596 14,349 USD 15,390 1.3527 (206)
The accompanying notes are an integral part of these financial statements.
Franklin Templeton Investments Funds 73
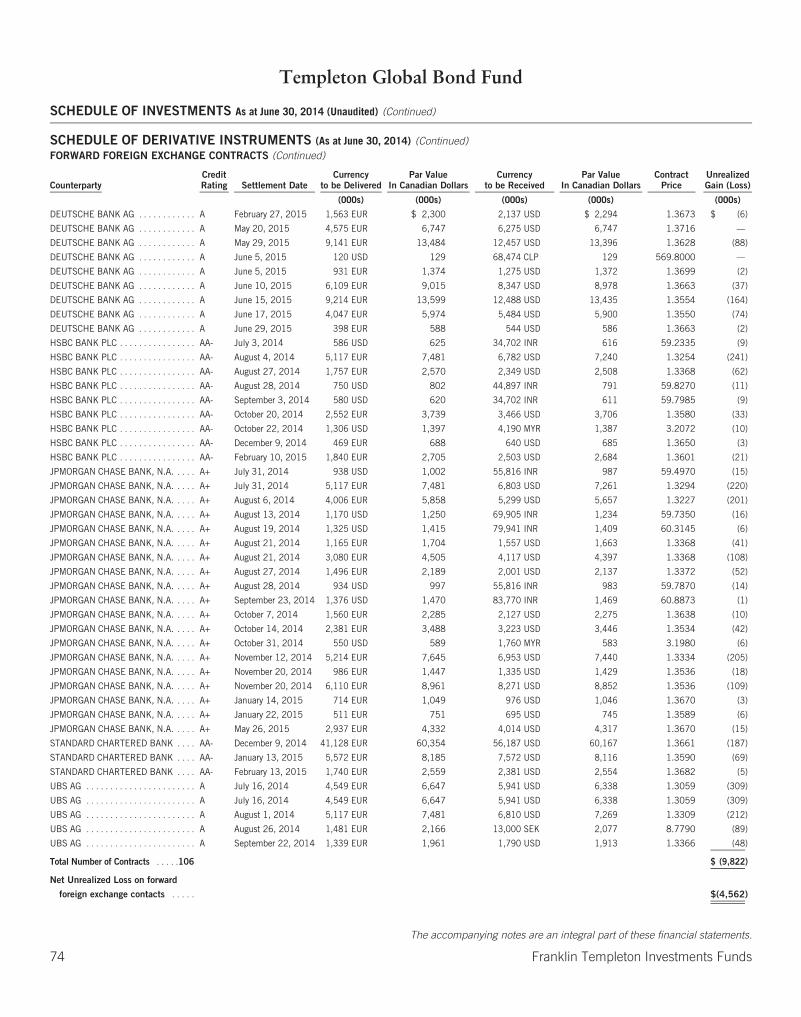
Templeton Global Bond Fund
SCHEDULE OF INVESTMENTS As at June 30, 2014 (Unaudited) (Continued)
SCHEDULE OF DERIVATIVE INSTRUMENTS (As at June 30, 2014) (Continued)FORWARD FOREIGN EXCHANGE CONTRACTS (Continued)
CounterpartyCreditRating Settlement Date
Currencyto be Delivered
Par ValueIn Canadian Dollars
Currencyto be Received
Par ValueIn Canadian Dollars
ContractPrice
UnrealizedGain (Loss)
(000s) (000s) (000s) (000s) (000s)
DEUTSCHE BANK AG . . . . . . . . . . . . A February 27, 2015 1,563 EUR $ 2,300 2,137 USD $ 2,294 1.3673 $ (6)
DEUTSCHE BANK AG . . . . . . . . . . . . A May 20, 2015 4,575 EUR 6,747 6,275 USD 6,747 1.3716 —
DEUTSCHE BANK AG . . . . . . . . . . . . A May 29, 2015 9,141 EUR 13,484 12,457 USD 13,396 1.3628 (88)
DEUTSCHE BANK AG . . . . . . . . . . . . A June 5, 2015 120 USD 129 68,474 CLP 129 569.8000 —
DEUTSCHE BANK AG . . . . . . . . . . . . A June 5, 2015 931 EUR 1,374 1,275 USD 1,372 1.3699 (2)
DEUTSCHE BANK AG . . . . . . . . . . . . A June 10, 2015 6,109 EUR 9,015 8,347 USD 8,978 1.3663 (37)
DEUTSCHE BANK AG . . . . . . . . . . . . A June 15, 2015 9,214 EUR 13,599 12,488 USD 13,435 1.3554 (164)
DEUTSCHE BANK AG . . . . . . . . . . . . A June 17, 2015 4,047 EUR 5,974 5,484 USD 5,900 1.3550 (74)
DEUTSCHE BANK AG . . . . . . . . . . . . A June 29, 2015 398 EUR 588 544 USD 586 1.3663 (2)
HSBC BANK PLC . . . . . . . . . . . . . . . . AA- July 3, 2014 586 USD 625 34,702 INR 616 59.2335 (9)
HSBC BANK PLC . . . . . . . . . . . . . . . . AA- August 4, 2014 5,117 EUR 7,481 6,782 USD 7,240 1.3254 (241)
HSBC BANK PLC . . . . . . . . . . . . . . . . AA- August 27, 2014 1,757 EUR 2,570 2,349 USD 2,508 1.3368 (62)
HSBC BANK PLC . . . . . . . . . . . . . . . . AA- August 28, 2014 750 USD 802 44,897 INR 791 59.8270 (11)
HSBC BANK PLC . . . . . . . . . . . . . . . . AA- September 3, 2014 580 USD 620 34,702 INR 611 59.7985 (9)
HSBC BANK PLC . . . . . . . . . . . . . . . . AA- October 20, 2014 2,552 EUR 3,739 3,466 USD 3,706 1.3580 (33)
HSBC BANK PLC . . . . . . . . . . . . . . . . AA- October 22, 2014 1,306 USD 1,397 4,190 MYR 1,387 3.2072 (10)
HSBC BANK PLC . . . . . . . . . . . . . . . . AA- December 9, 2014 469 EUR 688 640 USD 685 1.3650 (3)
HSBC BANK PLC . . . . . . . . . . . . . . . . AA- February 10, 2015 1,840 EUR 2,705 2,503 USD 2,684 1.3601 (21)
JPMORGAN CHASE BANK, N.A. . . . . A+ July 31, 2014 938 USD 1,002 55,816 INR 987 59.4970 (15)
JPMORGAN CHASE BANK, N.A. . . . . A+ July 31, 2014 5,117 EUR 7,481 6,803 USD 7,261 1.3294 (220)
JPMORGAN CHASE BANK, N.A. . . . . A+ August 6, 2014 4,006 EUR 5,858 5,299 USD 5,657 1.3227 (201)
JPMORGAN CHASE BANK, N.A. . . . . A+ August 13, 2014 1,170 USD 1,250 69,905 INR 1,234 59.7350 (16)
JPMORGAN CHASE BANK, N.A. . . . . A+ August 19, 2014 1,325 USD 1,415 79,941 INR 1,409 60.3145 (6)
JPMORGAN CHASE BANK, N.A. . . . . A+ August 21, 2014 1,165 EUR 1,704 1,557 USD 1,663 1.3368 (41)
JPMORGAN CHASE BANK, N.A. . . . . A+ August 21, 2014 3,080 EUR 4,505 4,117 USD 4,397 1.3368 (108)
JPMORGAN CHASE BANK, N.A. . . . . A+ August 27, 2014 1,496 EUR 2,189 2,001 USD 2,137 1.3372 (52)
JPMORGAN CHASE BANK, N.A. . . . . A+ August 28, 2014 934 USD 997 55,816 INR 983 59.7870 (14)
JPMORGAN CHASE BANK, N.A. . . . . A+ September 23, 2014 1,376 USD 1,470 83,770 INR 1,469 60.8873 (1)
JPMORGAN CHASE BANK, N.A. . . . . A+ October 7, 2014 1,560 EUR 2,285 2,127 USD 2,275 1.3638 (10)
JPMORGAN CHASE BANK, N.A. . . . . A+ October 14, 2014 2,381 EUR 3,488 3,223 USD 3,446 1.3534 (42)
JPMORGAN CHASE BANK, N.A. . . . . A+ October 31, 2014 550 USD 589 1,760 MYR 583 3.1980 (6)
JPMORGAN CHASE BANK, N.A. . . . . A+ November 12, 2014 5,214 EUR 7,645 6,953 USD 7,440 1.3334 (205)
JPMORGAN CHASE BANK, N.A. . . . . A+ November 20, 2014 986 EUR 1,447 1,335 USD 1,429 1.3536 (18)
JPMORGAN CHASE BANK, N.A. . . . . A+ November 20, 2014 6,110 EUR 8,961 8,271 USD 8,852 1.3536 (109)
JPMORGAN CHASE BANK, N.A. . . . . A+ January 14, 2015 714 EUR 1,049 976 USD 1,046 1.3670 (3)
JPMORGAN CHASE BANK, N.A. . . . . A+ January 22, 2015 511 EUR 751 695 USD 745 1.3589 (6)
JPMORGAN CHASE BANK, N.A. . . . . A+ May 26, 2015 2,937 EUR 4,332 4,014 USD 4,317 1.3670 (15)
STANDARD CHARTERED BANK . . . . AA- December 9, 2014 41,128 EUR 60,354 56,187 USD 60,167 1.3661 (187)
STANDARD CHARTERED BANK . . . . AA- January 13, 2015 5,572 EUR 8,185 7,572 USD 8,116 1.3590 (69)
STANDARD CHARTERED BANK . . . . AA- February 13, 2015 1,740 EUR 2,559 2,381 USD 2,554 1.3682 (5)
UBS AG . . . . . . . . . . . . . . . . . . . . . . . A July 16, 2014 4,549 EUR 6,647 5,941 USD 6,338 1.3059 (309)
UBS AG . . . . . . . . . . . . . . . . . . . . . . . A July 16, 2014 4,549 EUR 6,647 5,941 USD 6,338 1.3059 (309)
UBS AG . . . . . . . . . . . . . . . . . . . . . . . A August 1, 2014 5,117 EUR 7,481 6,810 USD 7,269 1.3309 (212)
UBS AG . . . . . . . . . . . . . . . . . . . . . . . A August 26, 2014 1,481 EUR 2,166 13,000 SEK 2,077 8.7790 (89)
UBS AG . . . . . . . . . . . . . . . . . . . . . . . A September 22, 2014 1,339 EUR 1,961 1,790 USD 1,913 1.3366 (48)
Total Number of Contracts . . . . .106 $ (9,822)
Net Unrealized Loss on forward
foreign exchange contacts . . . . . $(4,562)
The accompanying notes are an integral part of these financial statements.
74 Franklin Templeton Investments Funds
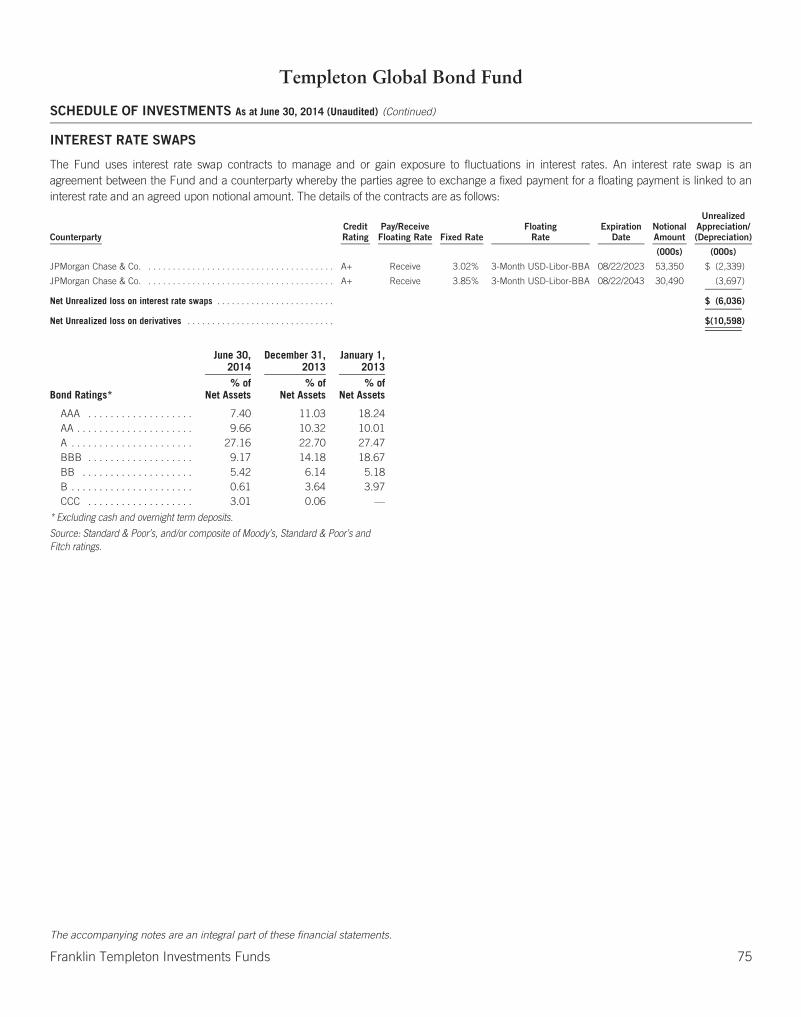
Templeton Global Bond Fund
SCHEDULE OF INVESTMENTS As at June 30, 2014 (Unaudited) (Continued)
INTEREST RATE SWAPS
The Fund uses interest rate swap contracts to manage and or gain exposure to fluctuations in interest rates. An interest rate swap is anagreement between the Fund and a counterparty whereby the parties agree to exchange a fixed payment for a floating payment is linked to aninterest rate and an agreed upon notional amount. The details of the contracts are as follows:
CounterpartyCreditRating
Pay/ReceiveFloating Rate Fixed Rate
FloatingRate
ExpirationDate
NotionalAmount
UnrealizedAppreciation/(Depreciation)
(000s) (000s)
JPMorgan Chase & Co. . . . . . . . . . . . . . . . . . . . . . . . . . . . . . . . . . . . . . . A+ Receive 3.02% 3-Month USD-Libor-BBA 08/22/2023 53,350 $ (2,339)
JPMorgan Chase & Co. . . . . . . . . . . . . . . . . . . . . . . . . . . . . . . . . . . . . . . A+ Receive 3.85% 3-Month USD-Libor-BBA 08/22/2043 30,490 (3,697)
Net Unrealized loss on interest rate swaps . . . . . . . . . . . . . . . . . . . . . . . . $ (6,036)
Net Unrealized loss on derivatives . . . . . . . . . . . . . . . . . . . . . . . . . . . . . . $(10,598)
June 30,2014
December 31,2013
January 1,2013
Bond Ratings*% of
Net Assets% of
Net Assets% of
Net Assets
AAA . . . . . . . . . . . . . . . . . . . 7.40 11.03 18.24AA . . . . . . . . . . . . . . . . . . . . . 9.66 10.32 10.01A . . . . . . . . . . . . . . . . . . . . . . 27.16 22.70 27.47BBB . . . . . . . . . . . . . . . . . . . 9.17 14.18 18.67BB . . . . . . . . . . . . . . . . . . . . 5.42 6.14 5.18B . . . . . . . . . . . . . . . . . . . . . . 0.61 3.64 3.97CCC . . . . . . . . . . . . . . . . . . . 3.01 0.06 —
* Excluding cash and overnight term deposits.
Source: Standard & Poor’s, and/or composite of Moody’s, Standard & Poor’s andFitch ratings.
The accompanying notes are an integral part of these financial statements.
Franklin Templeton Investments Funds 75
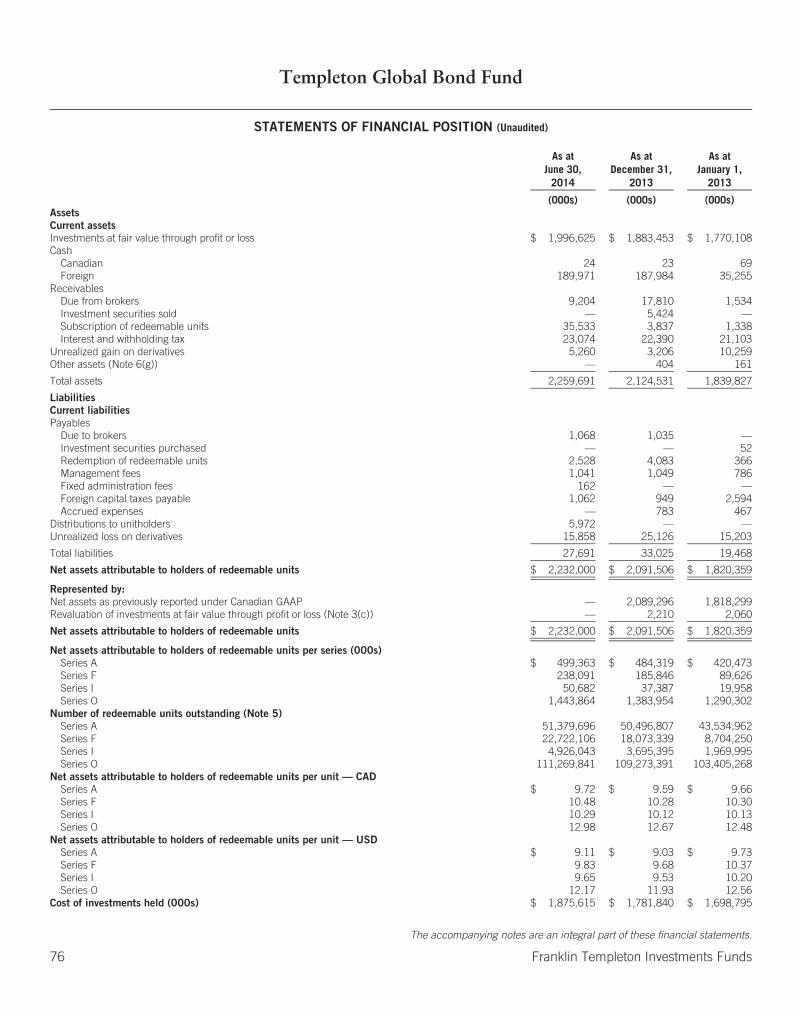
Templeton Global Bond Fund
STATEMENTS OF FINANCIAL POSITION (Unaudited)
As atJune 30,
2014
As atDecember 31,
2013
As atJanuary 1,
2013
(000s) (000s) (000s)AssetsCurrent assetsInvestments at fair value through profit or loss $ 1,996,625 $ 1,883,453 $ 1,770,108Cash
Canadian 24 23 69Foreign 189,971 187,984 35,255
ReceivablesDue from brokers 9,204 17,810 1,534Investment securities sold — 5,424 —Subscription of redeemable units 35,533 3,837 1,338Interest and withholding tax 23,074 22,390 21,103
Unrealized gain on derivatives 5,260 3,206 10,259Other assets (Note 6(g)) — 404 161
Total assets 2,259,691 2,124,531 1,839,827
LiabilitiesCurrent liabilitiesPayables
Due to brokers 1,068 1,035 —Investment securities purchased — — 52Redemption of redeemable units 2,528 4,083 366Management fees 1,041 1,049 786Fixed administration fees 162 — —Foreign capital taxes payable 1,062 949 2,594Accrued expenses — 783 467
Distributions to unitholders 5,972 — —Unrealized loss on derivatives 15,858 25,126 15,203
Total liabilities 27,691 33,025 19,468
Net assets attributable to holders of redeemable units $ 2,232,000 $ 2,091,506 $ 1,820,359
Represented by:Net assets as previously reported under Canadian GAAP — 2,089,296 1,818,299Revaluation of investments at fair value through profit or loss (Note 3(c)) — 2,210 2,060
Net assets attributable to holders of redeemable units $ 2,232,000 $ 2,091,506 $ 1,820,359
Net assets attributable to holders of redeemable units per series (000s)Series A $ 499,363 $ 484,319 $ 420,473Series F 238,091 185,846 89,626Series I 50,682 37,387 19,958Series O 1,443,864 1,383,954 1,290,302
Number of redeemable units outstanding (Note 5)Series A 51,379,696 50,496,807 43,534,962Series F 22,722,106 18,073,339 8,704,250Series I 4,926,043 3,695,395 1,969,995Series O 111,269,841 109,273,391 103,405,268
Net assets attributable to holders of redeemable units per unit — CADSeries A $ 9.72 $ 9.59 $ 9.66Series F 10.48 10.28 10.30Series I 10.29 10.12 10.13Series O 12.98 12.67 12.48
Net assets attributable to holders of redeemable units per unit — USDSeries A $ 9.11 $ 9.03 $ 9.73Series F 9.83 9.68 10.37Series I 9.65 9.53 10.20Series O 12.17 11.93 12.56
Cost of investments held (000s) $ 1,875,615 $ 1,781,840 $ 1,698,795
The accompanying notes are an integral part of these financial statements.
76 Franklin Templeton Investments Funds

Templeton Global Bond Fund
STATEMENTS OF COMPREHENSIVE INCOMEFor the six months ended June 30, 2014 and 2013 (Unaudited)
2014 2013
(000s) (000s)IncomeInterest income for distribution purposes $ 43,373 $ 41,039Income (loss) on derivatives (1,418) —Net realized and/or unrealized foreign exchange gain (loss) (13,132) 3,816Net realized gain (loss) on investments and derivatives 27,852 2,626Net change in unrealized appreciation (depreciation) in value of investments and derivatives 30,719 (12,550)
Total income (net) 87,394 34,931
ExpensesManagement fees (Note 6(a)) 6,065 5,610Fixed administration fees (Note 6(b)) 935 —Transfer agent fees (Note 6(d)) — 1,174Custodian fees — 234Legal fees — 2Audit fees — 15Unitholder reporting costs — 48Independent review committee fees — 1Registration fees — 17Other expenses (Note 6(f)) — 364
Operating expenses before waivers/paid by Manager 7,000 7,465Expenses waived/paid by Manager (Note 6(b)) — (1,151)
Net operating expenses after waivers/paid by Manager 7,000 6,314
Withholding tax expense 1,256 1,107
Total expenses 8,256 7,421
Increase (decrease) in net assets attributable to holders of redeemable units from operations $ 79,138 $ 27,510
Represented by:Increase (decrease) in net assets from operations as previously reported under Canadian GAAP — 27,450Revaluation of investments at fair value through profit and loss (Note 3(c)) — 60
Increase (decrease) in net assets attributable to holders of redeemable units from operations $ 79,138 $ 27,510
Increase (decrease) in net assets attributable to holders of redeemable units from operations per series (000s)Series A $ 14,197 $ 2,161Series F 6,623 205Series I 1,146 143Series O 57,172 25,001
Weighted average number of units outstandingSeries A 50,601,520 48,039,664Series F 20,790,488 11,642,161Series I 4,178,398 2,275,410Series O 110,022,752 108,443,386
Increase (decrease) in net assets attributable to holders of redeemable units from operations per unitSeries A $ 0.28 $ 0.04Series F 0.32 0.02Series I 0.27 0.07Series O 0.51 0.22
The accompanying notes are an integral part of these financial statements.
Franklin Templeton Investments Funds 77
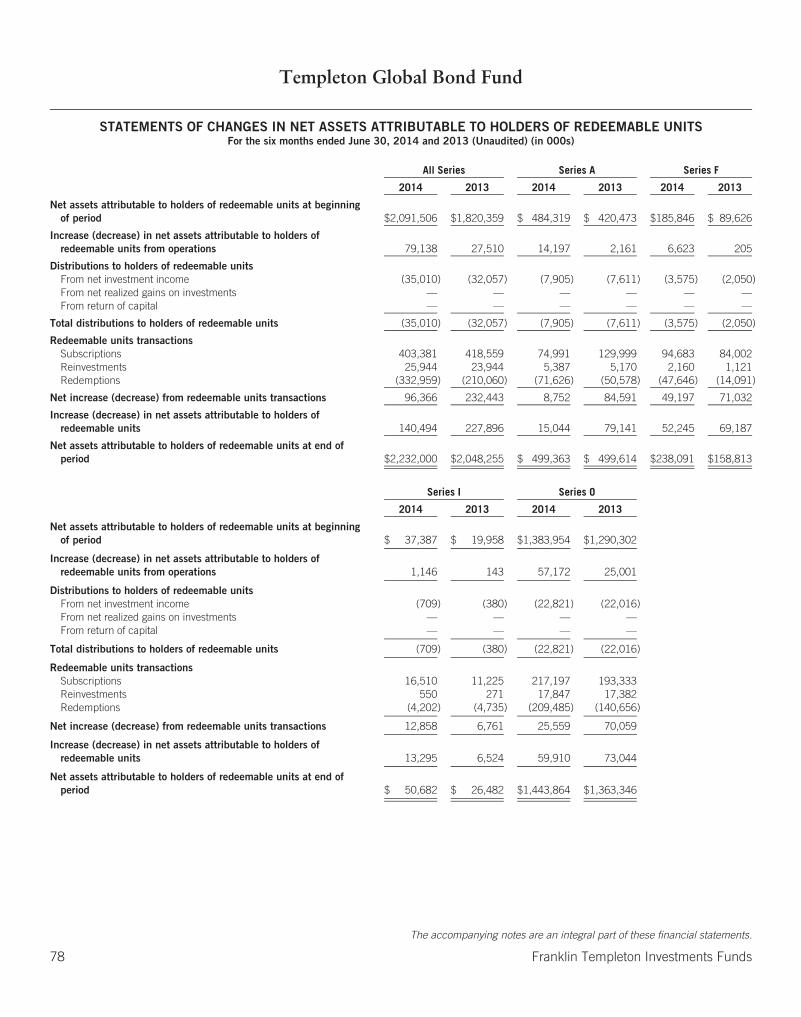
Templeton Global Bond Fund
STATEMENTS OF CHANGES IN NET ASSETS ATTRIBUTABLE TO HOLDERS OF REDEEMABLE UNITSFor the six months ended June 30, 2014 and 2013 (Unaudited) (in 000s)
All Series Series A Series F
2014 2013 2014 2013 2014 2013
Net assets attributable to holders of redeemable units at beginningof period $2,091,506 $1,820,359 $ 484,319 $ 420,473 $185,846 $ 89,626
Increase (decrease) in net assets attributable to holders ofredeemable units from operations 79,138 27,510 14,197 2,161 6,623 205
Distributions to holders of redeemable unitsFrom net investment income (35,010) (32,057) (7,905) (7,611) (3,575) (2,050)From net realized gains on investments — — — — — —From return of capital — — — — — —
Total distributions to holders of redeemable units (35,010) (32,057) (7,905) (7,611) (3,575) (2,050)
Redeemable units transactionsSubscriptions 403,381 418,559 74,991 129,999 94,683 84,002Reinvestments 25,944 23,944 5,387 5,170 2,160 1,121Redemptions (332,959) (210,060) (71,626) (50,578) (47,646) (14,091)
Net increase (decrease) from redeemable units transactions 96,366 232,443 8,752 84,591 49,197 71,032
Increase (decrease) in net assets attributable to holders ofredeemable units 140,494 227,896 15,044 79,141 52,245 69,187
Net assets attributable to holders of redeemable units at end ofperiod $2,232,000 $2,048,255 $ 499,363 $ 499,614 $238,091 $158,813
Series I Series O
2014 2013 2014 2013
Net assets attributable to holders of redeemable units at beginningof period $ 37,387 $ 19,958 $1,383,954 $1,290,302
Increase (decrease) in net assets attributable to holders ofredeemable units from operations 1,146 143 57,172 25,001
Distributions to holders of redeemable unitsFrom net investment income (709) (380) (22,821) (22,016)From net realized gains on investments — — — —From return of capital — — — —
Total distributions to holders of redeemable units (709) (380) (22,821) (22,016)
Redeemable units transactionsSubscriptions 16,510 11,225 217,197 193,333Reinvestments 550 271 17,847 17,382Redemptions (4,202) (4,735) (209,485) (140,656)
Net increase (decrease) from redeemable units transactions 12,858 6,761 25,559 70,059
Increase (decrease) in net assets attributable to holders ofredeemable units 13,295 6,524 59,910 73,044
Net assets attributable to holders of redeemable units at end ofperiod $ 50,682 $ 26,482 $1,443,864 $1,363,346
The accompanying notes are an integral part of these financial statements.
78 Franklin Templeton Investments Funds
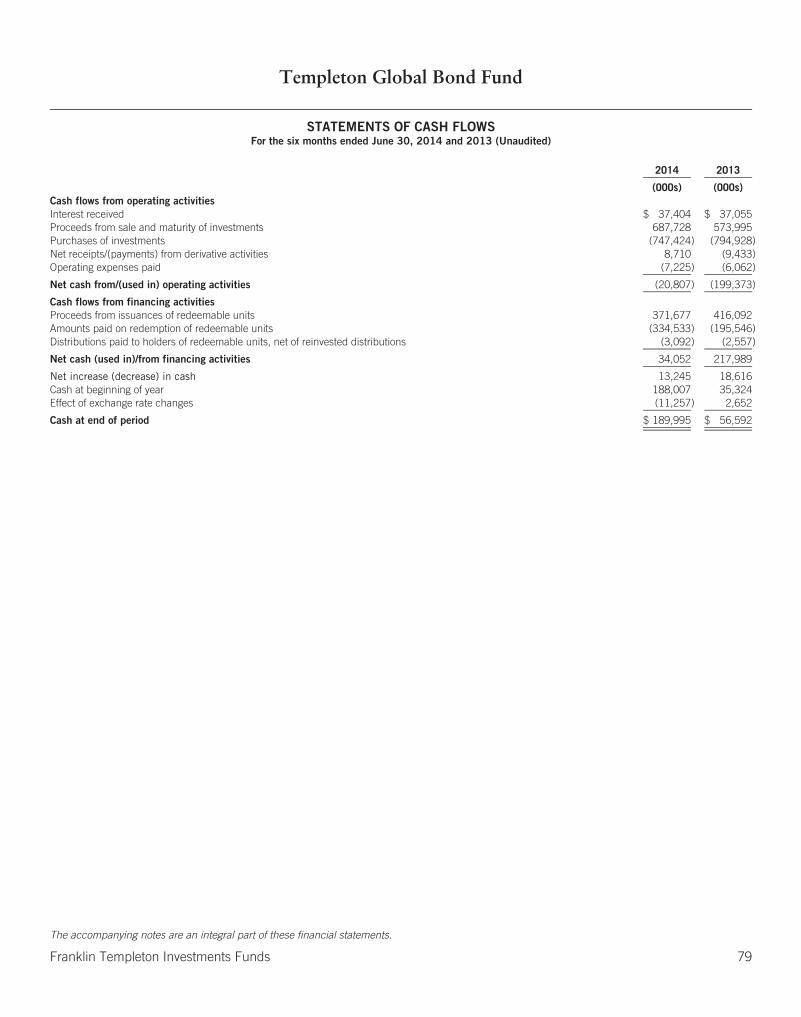
Templeton Global Bond Fund
STATEMENTS OF CASH FLOWSFor the six months ended June 30, 2014 and 2013 (Unaudited)
2014 2013
(000s) (000s)Cash flows from operating activitiesInterest received $ 37,404 $ 37,055Proceeds from sale and maturity of investments 687,728 573,995Purchases of investments (747,424) (794,928)Net receipts/(payments) from derivative activities 8,710 (9,433)Operating expenses paid (7,225) (6,062)
Net cash from/(used in) operating activities (20,807) (199,373)
Cash flows from financing activitiesProceeds from issuances of redeemable units 371,677 416,092Amounts paid on redemption of redeemable units (334,533) (195,546)Distributions paid to holders of redeemable units, net of reinvested distributions (3,092) (2,557)
Net cash (used in)/from financing activities 34,052 217,989
Net increase (decrease) in cash 13,245 18,616Cash at beginning of year 188,007 35,324Effect of exchange rate changes (11,257) 2,652
Cash at end of period $ 189,995 $ 56,592
The accompanying notes are an integral part of these financial statements.
Franklin Templeton Investments Funds 79
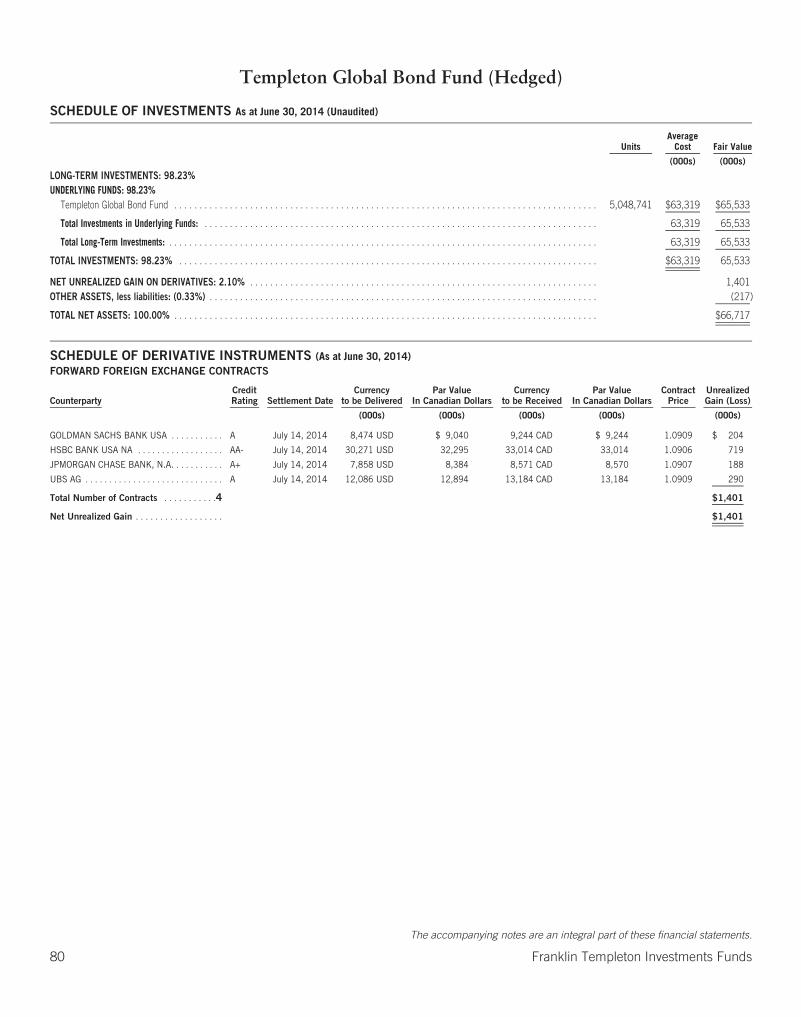
Templeton Global Bond Fund (Hedged)
SCHEDULE OF INVESTMENTS As at June 30, 2014 (Unaudited)
UnitsAverage
Cost Fair Value
(000s) (000s)
LONG-TERM INVESTMENTS: 98.23%UNDERLYING FUNDS: 98.23%
Templeton Global Bond Fund . . . . . . . . . . . . . . . . . . . . . . . . . . . . . . . . . . . . . . . . . . . . . . . . . . . . . . . . . . . . . . . . . . . . . . . . . . . . . . . . . . . . 5,048,741 $63,319 $65,533
Total Investments in Underlying Funds: . . . . . . . . . . . . . . . . . . . . . . . . . . . . . . . . . . . . . . . . . . . . . . . . . . . . . . . . . . . . . . . . . . . . . . . . . . . . . . 63,319 65,533
Total Long-Term Investments: . . . . . . . . . . . . . . . . . . . . . . . . . . . . . . . . . . . . . . . . . . . . . . . . . . . . . . . . . . . . . . . . . . . . . . . . . . . . . . . . . . . . . 63,319 65,533
TOTAL INVESTMENTS: 98.23% . . . . . . . . . . . . . . . . . . . . . . . . . . . . . . . . . . . . . . . . . . . . . . . . . . . . . . . . . . . . . . . . . . . . . . . . . . . . . . . . . . . $63,319 65,533
NET UNREALIZED GAIN ON DERIVATIVES: 2.10% . . . . . . . . . . . . . . . . . . . . . . . . . . . . . . . . . . . . . . . . . . . . . . . . . . . . . . . . . . . . . . . . . . . . . 1,401OTHER ASSETS, less liabilities: (0.33%) . . . . . . . . . . . . . . . . . . . . . . . . . . . . . . . . . . . . . . . . . . . . . . . . . . . . . . . . . . . . . . . . . . . . . . . . . . . . . (217)
TOTAL NET ASSETS: 100.00% . . . . . . . . . . . . . . . . . . . . . . . . . . . . . . . . . . . . . . . . . . . . . . . . . . . . . . . . . . . . . . . . . . . . . . . . . . . . . . . . . . . . $66,717
SCHEDULE OF DERIVATIVE INSTRUMENTS (As at June 30, 2014)FORWARD FOREIGN EXCHANGE CONTRACTS
CounterpartyCreditRating Settlement Date
Currencyto be Delivered
Par ValueIn Canadian Dollars
Currencyto be Received
Par ValueIn Canadian Dollars
ContractPrice
UnrealizedGain (Loss)
(000s) (000s) (000s) (000s) (000s)
GOLDMAN SACHS BANK USA . . . . . . . . . . . A July 14, 2014 8,474 USD $ 9,040 9,244 CAD $ 9,244 1.0909 $ 204
HSBC BANK USA NA . . . . . . . . . . . . . . . . . . AA- July 14, 2014 30,271 USD 32,295 33,014 CAD 33,014 1.0906 719
JPMORGAN CHASE BANK, N.A. . . . . . . . . . . A+ July 14, 2014 7,858 USD 8,384 8,571 CAD 8,570 1.0907 188
UBS AG . . . . . . . . . . . . . . . . . . . . . . . . . . . . . A July 14, 2014 12,086 USD 12,894 13,184 CAD 13,184 1.0909 290
Total Number of Contracts . . . . . . . . . . .4 $1,401
Net Unrealized Gain . . . . . . . . . . . . . . . . . . $1,401
The accompanying notes are an integral part of these financial statements.
80 Franklin Templeton Investments Funds
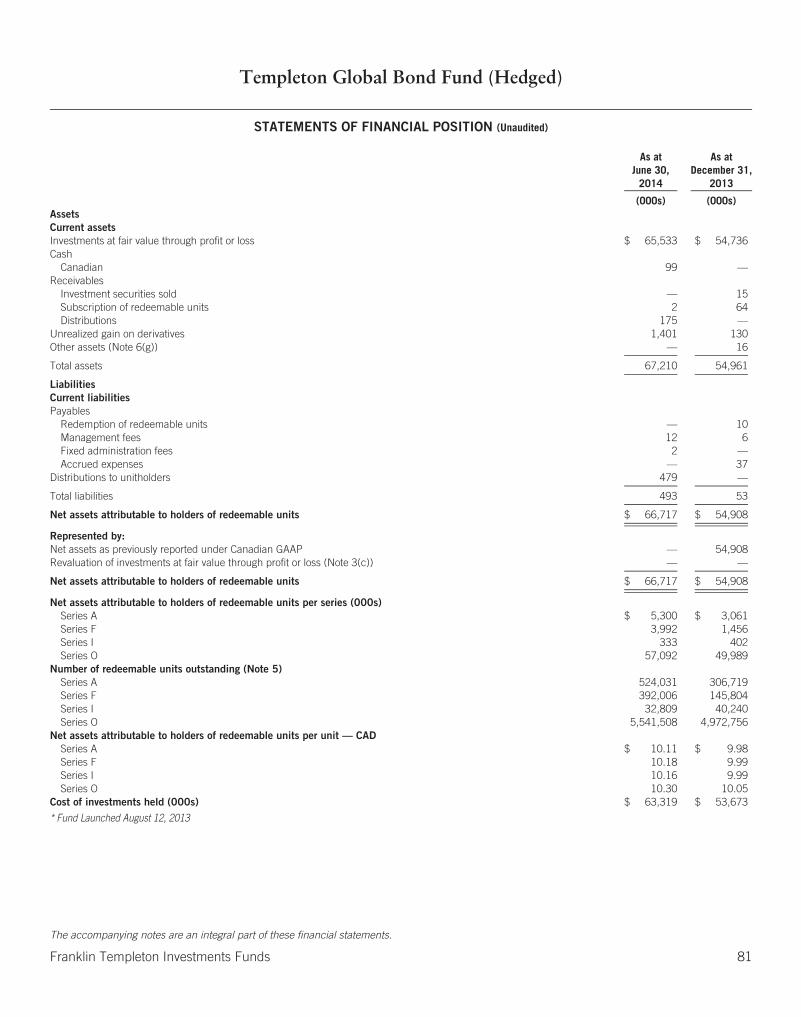
Templeton Global Bond Fund (Hedged)
STATEMENTS OF FINANCIAL POSITION (Unaudited)
As atJune 30,
2014
As atDecember 31,
2013
(000s) (000s)AssetsCurrent assetsInvestments at fair value through profit or loss $ 65,533 $ 54,736Cash
Canadian 99 —Receivables
Investment securities sold — 15Subscription of redeemable units 2 64Distributions 175 —
Unrealized gain on derivatives 1,401 130Other assets (Note 6(g)) — 16
Total assets 67,210 54,961
LiabilitiesCurrent liabilitiesPayables
Redemption of redeemable units — 10Management fees 12 6Fixed administration fees 2 —Accrued expenses — 37
Distributions to unitholders 479 —
Total liabilities 493 53
Net assets attributable to holders of redeemable units $ 66,717 $ 54,908
Represented by:Net assets as previously reported under Canadian GAAP — 54,908Revaluation of investments at fair value through profit or loss (Note 3(c)) — —
Net assets attributable to holders of redeemable units $ 66,717 $ 54,908
Net assets attributable to holders of redeemable units per series (000s)Series A $ 5,300 $ 3,061Series F 3,992 1,456Series I 333 402Series O 57,092 49,989
Number of redeemable units outstanding (Note 5)Series A 524,031 306,719Series F 392,006 145,804Series I 32,809 40,240Series O 5,541,508 4,972,756
Net assets attributable to holders of redeemable units per unit — CADSeries A $ 10.11 $ 9.98Series F 10.18 9.99Series I 10.16 9.99Series O 10.30 10.05
Cost of investments held (000s) $ 63,319 $ 53,673
* Fund Launched August 12, 2013
The accompanying notes are an integral part of these financial statements.
Franklin Templeton Investments Funds 81

Templeton Global Bond Fund (Hedged)
STATEMENT OF COMPREHENSIVE INCOMEFor the six months ended June 30, 2014 (Unaudited)
2014
(000s)IncomeDistributions received from underlying funds (Note 6(e)) $ 987Net realized and/or unrealized foreign exchange gain (loss) (943)Net realized gain (loss) on investments and derivatives 110Net change in unrealized appreciation (depreciation) in value of investments and derivatives 2,422
Total income (net) 2,576
ExpensesManagement fees (Note 6(a)) 61Fixed administration fees (Note 6(b)) 10Transfer agent fees (Note 6(d)) —Custodian fees —Legal fees —Audit fees —Unitholder reporting costs —Independent review committee fees —Registration fees —Other expenses (Note 6(f)) —
Operating expenses before waivers/paid by Manager 71Expenses waived/paid by Manager (Note 6(b)) —
Net operating expenses after waivers/paid by Manager 71
Total expenses 71
Increase (decrease) in net assets attributable to holders of redeemable units from operations $ 2,505
Increase (decrease) in net assets attributable to holders of redeemable units from operations per series (000s)Series A $ 163Series F 128Series I 7Series O 2,207
Weighted average number of units outstandingSeries A 467,101Series F 284,350Series I 30,813Series O 5,314,299
Increase (decrease) in net assets attributable to holders of redeemable units from operations per unitSeries A $ 0.35Series F 0.45Series I 0.22Series O 0.41
* Fund Launched August 12, 2013
The accompanying notes are an integral part of these financial statements.
82 Franklin Templeton Investments Funds

Templeton Global Bond Fund (Hedged)
STATEMENT OF CHANGES IN NET ASSETS ATTRIBUTABLE TO HOLDERS OF REDEEMABLE UNITSFor the six months ended June 30, 2014 (Unaudited) (in 000s)
All Series Series A Series F
2014 2014 2014
Net assets attributable to holders of redeemable units at beginning of period $54,908 $ 3,061 $1,456
Increase (decrease) in net assets attributable to holders of redeemable unitsfrom operations 2,505 163 128
Distributions to holders of redeemable unitsFrom net investment income (918) (74) (50)From net realized gains on investments — — —From return of capital — — —
Total distributions to holders of redeemable units (918) (74) (50)
Redeemable units transactionsSubscriptions 11,210 2,841 2,530Reinvestments 428 34 13Redemptions (1,416) (725) (85)
Net increase (decrease) from redeemable units transactions 10,222 2,150 2,458
Increase (decrease) in net assets attributable to holders of redeemable units 11,809 2,239 2,536
Net assets attributable to holders of redeemable units at end of period $66,717 $ 5,300 $3,992
Series I Series O
2014 2014
Net assets attributable to holders of redeemable units at beginning of period $ 402 $49,989
Increase (decrease) in net assets attributable to holders of redeemable unitsfrom operations 7 2,207
Distributions to holders of redeemable unitsFrom net investment income (4) (790)From net realized gains on investments — —From return of capital — —
Total distributions to holders of redeemable units (4) (790)
Redeemable units transactionsSubscriptions 74 5,765Reinvestments 1 380Redemptions (147) (459)
Net increase (decrease) from redeemable units transactions (72) 5,686
Increase (decrease) in net assets attributable to holders of redeemable units (69) 7,103
Net assets attributable to holders of redeemable units at end of period $ 333 $57,092
* Fund launched August 12, 2013
The accompanying notes are an integral part of these financial statements.
Franklin Templeton Investments Funds 83
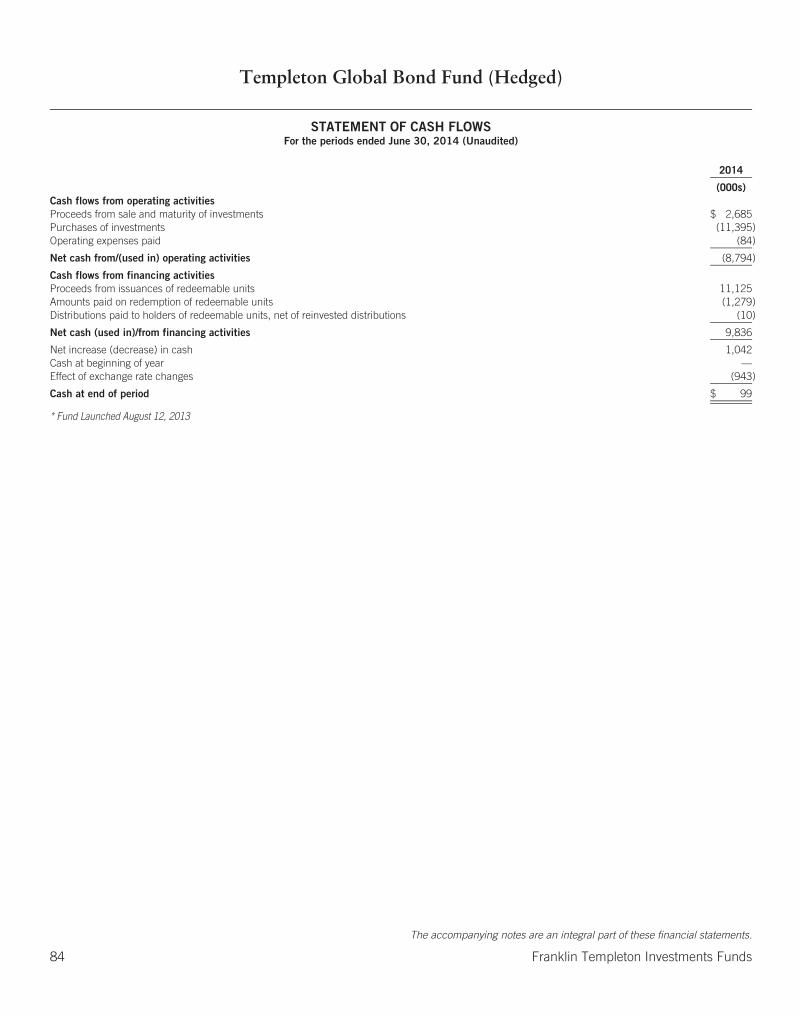
Templeton Global Bond Fund (Hedged)
STATEMENT OF CASH FLOWSFor the periods ended June 30, 2014 (Unaudited)
2014
(000s)Cash flows from operating activitiesProceeds from sale and maturity of investments $ 2,685Purchases of investments (11,395)Operating expenses paid (84)
Net cash from/(used in) operating activities (8,794)
Cash flows from financing activitiesProceeds from issuances of redeemable units 11,125Amounts paid on redemption of redeemable units (1,279)Distributions paid to holders of redeemable units, net of reinvested distributions (10)
Net cash (used in)/from financing activities 9,836
Net increase (decrease) in cash 1,042Cash at beginning of year —Effect of exchange rate changes (943)
Cash at end of period $ 99
* Fund Launched August 12, 2013
The accompanying notes are an integral part of these financial statements.
84 Franklin Templeton Investments Funds
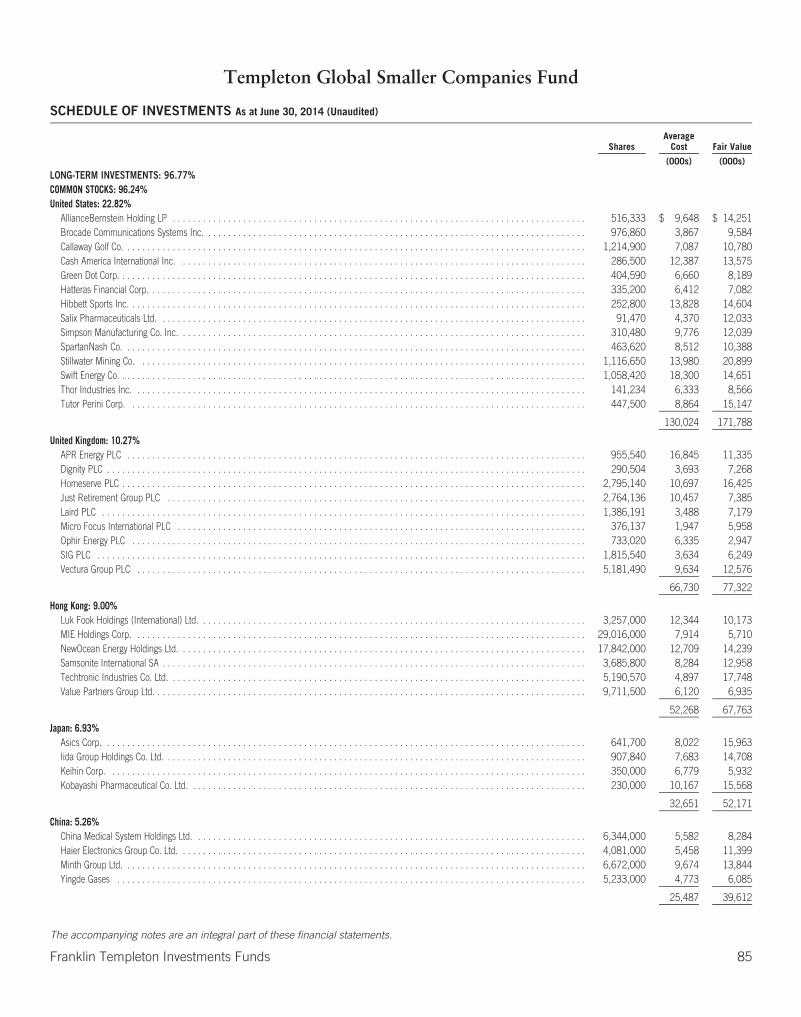
Templeton Global Smaller Companies Fund
SCHEDULE OF INVESTMENTS As at June 30, 2014 (Unaudited)
SharesAverage
Cost Fair Value
(000s) (000s)
LONG-TERM INVESTMENTS: 96.77%COMMON STOCKS: 96.24%United States: 22.82%
AllianceBernstein Holding LP . . . . . . . . . . . . . . . . . . . . . . . . . . . . . . . . . . . . . . . . . . . . . . . . . . . . . . . . . . . . . . . . . . . . . . . . . . . . . . . . . . 516,333 $ 9,648 $ 14,251Brocade Communications Systems Inc. . . . . . . . . . . . . . . . . . . . . . . . . . . . . . . . . . . . . . . . . . . . . . . . . . . . . . . . . . . . . . . . . . . . . . . . . . . . 976,860 3,867 9,584Callaway Golf Co. . . . . . . . . . . . . . . . . . . . . . . . . . . . . . . . . . . . . . . . . . . . . . . . . . . . . . . . . . . . . . . . . . . . . . . . . . . . . . . . . . . . . . . . . . . . 1,214,900 7,087 10,780Cash America International Inc. . . . . . . . . . . . . . . . . . . . . . . . . . . . . . . . . . . . . . . . . . . . . . . . . . . . . . . . . . . . . . . . . . . . . . . . . . . . . . . . . 286,500 12,387 13,575Green Dot Corp. . . . . . . . . . . . . . . . . . . . . . . . . . . . . . . . . . . . . . . . . . . . . . . . . . . . . . . . . . . . . . . . . . . . . . . . . . . . . . . . . . . . . . . . . . . . . 404,590 6,660 8,189Hatteras Financial Corp. . . . . . . . . . . . . . . . . . . . . . . . . . . . . . . . . . . . . . . . . . . . . . . . . . . . . . . . . . . . . . . . . . . . . . . . . . . . . . . . . . . . . . . 335,200 6,412 7,082Hibbett Sports Inc. . . . . . . . . . . . . . . . . . . . . . . . . . . . . . . . . . . . . . . . . . . . . . . . . . . . . . . . . . . . . . . . . . . . . . . . . . . . . . . . . . . . . . . . . . . 252,800 13,828 14,604Salix Pharmaceuticals Ltd. . . . . . . . . . . . . . . . . . . . . . . . . . . . . . . . . . . . . . . . . . . . . . . . . . . . . . . . . . . . . . . . . . . . . . . . . . . . . . . . . . . . . 91,470 4,370 12,033Simpson Manufacturing Co. Inc. . . . . . . . . . . . . . . . . . . . . . . . . . . . . . . . . . . . . . . . . . . . . . . . . . . . . . . . . . . . . . . . . . . . . . . . . . . . . . . . . 310,480 9,776 12,039SpartanNash Co. . . . . . . . . . . . . . . . . . . . . . . . . . . . . . . . . . . . . . . . . . . . . . . . . . . . . . . . . . . . . . . . . . . . . . . . . . . . . . . . . . . . . . . . . . . . 463,620 8,512 10,388Stillwater Mining Co. . . . . . . . . . . . . . . . . . . . . . . . . . . . . . . . . . . . . . . . . . . . . . . . . . . . . . . . . . . . . . . . . . . . . . . . . . . . . . . . . . . . . . . . . 1,116,650 13,980 20,899Swift Energy Co. . . . . . . . . . . . . . . . . . . . . . . . . . . . . . . . . . . . . . . . . . . . . . . . . . . . . . . . . . . . . . . . . . . . . . . . . . . . . . . . . . . . . . . . . . . . . 1,058,420 18,300 14,651Thor Industries Inc. . . . . . . . . . . . . . . . . . . . . . . . . . . . . . . . . . . . . . . . . . . . . . . . . . . . . . . . . . . . . . . . . . . . . . . . . . . . . . . . . . . . . . . . . . 141,234 6,333 8,566Tutor Perini Corp. . . . . . . . . . . . . . . . . . . . . . . . . . . . . . . . . . . . . . . . . . . . . . . . . . . . . . . . . . . . . . . . . . . . . . . . . . . . . . . . . . . . . . . . . . . 447,500 8,864 15,147
130,024 171,788
United Kingdom: 10.27%APR Energy PLC . . . . . . . . . . . . . . . . . . . . . . . . . . . . . . . . . . . . . . . . . . . . . . . . . . . . . . . . . . . . . . . . . . . . . . . . . . . . . . . . . . . . . . . . . . . 955,540 16,845 11,335Dignity PLC . . . . . . . . . . . . . . . . . . . . . . . . . . . . . . . . . . . . . . . . . . . . . . . . . . . . . . . . . . . . . . . . . . . . . . . . . . . . . . . . . . . . . . . . . . . . . . . 290,504 3,693 7,268Homeserve PLC . . . . . . . . . . . . . . . . . . . . . . . . . . . . . . . . . . . . . . . . . . . . . . . . . . . . . . . . . . . . . . . . . . . . . . . . . . . . . . . . . . . . . . . . . . . . 2,795,140 10,697 16,425Just Retirement Group PLC . . . . . . . . . . . . . . . . . . . . . . . . . . . . . . . . . . . . . . . . . . . . . . . . . . . . . . . . . . . . . . . . . . . . . . . . . . . . . . . . . . . 2,764,136 10,457 7,385Laird PLC . . . . . . . . . . . . . . . . . . . . . . . . . . . . . . . . . . . . . . . . . . . . . . . . . . . . . . . . . . . . . . . . . . . . . . . . . . . . . . . . . . . . . . . . . . . . . . . . 1,386,191 3,488 7,179Micro Focus International PLC . . . . . . . . . . . . . . . . . . . . . . . . . . . . . . . . . . . . . . . . . . . . . . . . . . . . . . . . . . . . . . . . . . . . . . . . . . . . . . . . . 376,137 1,947 5,958Ophir Energy PLC . . . . . . . . . . . . . . . . . . . . . . . . . . . . . . . . . . . . . . . . . . . . . . . . . . . . . . . . . . . . . . . . . . . . . . . . . . . . . . . . . . . . . . . . . . 733,020 6,335 2,947SIG PLC . . . . . . . . . . . . . . . . . . . . . . . . . . . . . . . . . . . . . . . . . . . . . . . . . . . . . . . . . . . . . . . . . . . . . . . . . . . . . . . . . . . . . . . . . . . . . . . . . 1,815,540 3,634 6,249Vectura Group PLC . . . . . . . . . . . . . . . . . . . . . . . . . . . . . . . . . . . . . . . . . . . . . . . . . . . . . . . . . . . . . . . . . . . . . . . . . . . . . . . . . . . . . . . . . 5,181,490 9,634 12,576
66,730 77,322
Hong Kong: 9.00%Luk Fook Holdings (International) Ltd. . . . . . . . . . . . . . . . . . . . . . . . . . . . . . . . . . . . . . . . . . . . . . . . . . . . . . . . . . . . . . . . . . . . . . . . . . . . . 3,257,000 12,344 10,173MIE Holdings Corp. . . . . . . . . . . . . . . . . . . . . . . . . . . . . . . . . . . . . . . . . . . . . . . . . . . . . . . . . . . . . . . . . . . . . . . . . . . . . . . . . . . . . . . . . . 29,016,000 7,914 5,710NewOcean Energy Holdings Ltd. . . . . . . . . . . . . . . . . . . . . . . . . . . . . . . . . . . . . . . . . . . . . . . . . . . . . . . . . . . . . . . . . . . . . . . . . . . . . . . . . 17,842,000 12,709 14,239Samsonite International SA . . . . . . . . . . . . . . . . . . . . . . . . . . . . . . . . . . . . . . . . . . . . . . . . . . . . . . . . . . . . . . . . . . . . . . . . . . . . . . . . . . . . 3,685,800 8,284 12,958Techtronic Industries Co. Ltd. . . . . . . . . . . . . . . . . . . . . . . . . . . . . . . . . . . . . . . . . . . . . . . . . . . . . . . . . . . . . . . . . . . . . . . . . . . . . . . . . . . 5,190,570 4,897 17,748Value Partners Group Ltd. . . . . . . . . . . . . . . . . . . . . . . . . . . . . . . . . . . . . . . . . . . . . . . . . . . . . . . . . . . . . . . . . . . . . . . . . . . . . . . . . . . . . . 9,711,500 6,120 6,935
52,268 67,763
Japan: 6.93%Asics Corp. . . . . . . . . . . . . . . . . . . . . . . . . . . . . . . . . . . . . . . . . . . . . . . . . . . . . . . . . . . . . . . . . . . . . . . . . . . . . . . . . . . . . . . . . . . . . . . . 641,700 8,022 15,963Iida Group Holdings Co. Ltd. . . . . . . . . . . . . . . . . . . . . . . . . . . . . . . . . . . . . . . . . . . . . . . . . . . . . . . . . . . . . . . . . . . . . . . . . . . . . . . . . . . . 907,840 7,683 14,708Keihin Corp. . . . . . . . . . . . . . . . . . . . . . . . . . . . . . . . . . . . . . . . . . . . . . . . . . . . . . . . . . . . . . . . . . . . . . . . . . . . . . . . . . . . . . . . . . . . . . . 350,000 6,779 5,932Kobayashi Pharmaceutical Co. Ltd. . . . . . . . . . . . . . . . . . . . . . . . . . . . . . . . . . . . . . . . . . . . . . . . . . . . . . . . . . . . . . . . . . . . . . . . . . . . . . . 230,000 10,167 15,568
32,651 52,171
China: 5.26%China Medical System Holdings Ltd. . . . . . . . . . . . . . . . . . . . . . . . . . . . . . . . . . . . . . . . . . . . . . . . . . . . . . . . . . . . . . . . . . . . . . . . . . . . . . 6,344,000 5,582 8,284Haier Electronics Group Co. Ltd. . . . . . . . . . . . . . . . . . . . . . . . . . . . . . . . . . . . . . . . . . . . . . . . . . . . . . . . . . . . . . . . . . . . . . . . . . . . . . . . . 4,081,000 5,458 11,399Minth Group Ltd. . . . . . . . . . . . . . . . . . . . . . . . . . . . . . . . . . . . . . . . . . . . . . . . . . . . . . . . . . . . . . . . . . . . . . . . . . . . . . . . . . . . . . . . . . . . 6,672,000 9,674 13,844Yingde Gases . . . . . . . . . . . . . . . . . . . . . . . . . . . . . . . . . . . . . . . . . . . . . . . . . . . . . . . . . . . . . . . . . . . . . . . . . . . . . . . . . . . . . . . . . . . . . 5,233,000 4,773 6,085
25,487 39,612
The accompanying notes are an integral part of these financial statements.
Franklin Templeton Investments Funds 85
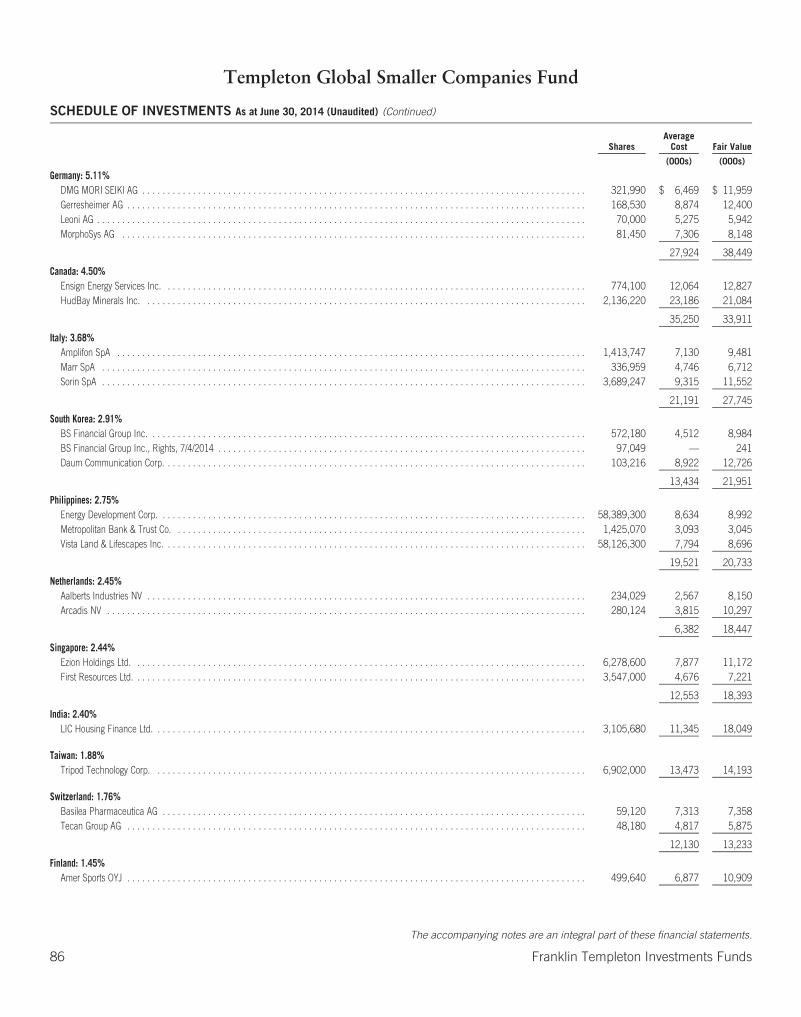
Templeton Global Smaller Companies Fund
SCHEDULE OF INVESTMENTS As at June 30, 2014 (Unaudited) (Continued)
SharesAverage
Cost Fair Value
(000s) (000s)
Germany: 5.11%DMG MORI SEIKI AG . . . . . . . . . . . . . . . . . . . . . . . . . . . . . . . . . . . . . . . . . . . . . . . . . . . . . . . . . . . . . . . . . . . . . . . . . . . . . . . . . . . . . . . . 321,990 $ 6,469 $ 11,959Gerresheimer AG . . . . . . . . . . . . . . . . . . . . . . . . . . . . . . . . . . . . . . . . . . . . . . . . . . . . . . . . . . . . . . . . . . . . . . . . . . . . . . . . . . . . . . . . . . . 168,530 8,874 12,400Leoni AG . . . . . . . . . . . . . . . . . . . . . . . . . . . . . . . . . . . . . . . . . . . . . . . . . . . . . . . . . . . . . . . . . . . . . . . . . . . . . . . . . . . . . . . . . . . . . . . . . 70,000 5,275 5,942MorphoSys AG . . . . . . . . . . . . . . . . . . . . . . . . . . . . . . . . . . . . . . . . . . . . . . . . . . . . . . . . . . . . . . . . . . . . . . . . . . . . . . . . . . . . . . . . . . . . 81,450 7,306 8,148
27,924 38,449
Canada: 4.50%Ensign Energy Services Inc. . . . . . . . . . . . . . . . . . . . . . . . . . . . . . . . . . . . . . . . . . . . . . . . . . . . . . . . . . . . . . . . . . . . . . . . . . . . . . . . . . . . 774,100 12,064 12,827HudBay Minerals Inc. . . . . . . . . . . . . . . . . . . . . . . . . . . . . . . . . . . . . . . . . . . . . . . . . . . . . . . . . . . . . . . . . . . . . . . . . . . . . . . . . . . . . . . . 2,136,220 23,186 21,084
35,250 33,911
Italy: 3.68%Amplifon SpA . . . . . . . . . . . . . . . . . . . . . . . . . . . . . . . . . . . . . . . . . . . . . . . . . . . . . . . . . . . . . . . . . . . . . . . . . . . . . . . . . . . . . . . . . . . . . 1,413,747 7,130 9,481Marr SpA . . . . . . . . . . . . . . . . . . . . . . . . . . . . . . . . . . . . . . . . . . . . . . . . . . . . . . . . . . . . . . . . . . . . . . . . . . . . . . . . . . . . . . . . . . . . . . . . 336,959 4,746 6,712Sorin SpA . . . . . . . . . . . . . . . . . . . . . . . . . . . . . . . . . . . . . . . . . . . . . . . . . . . . . . . . . . . . . . . . . . . . . . . . . . . . . . . . . . . . . . . . . . . . . . . . 3,689,247 9,315 11,552
21,191 27,745
South Korea: 2.91%BS Financial Group Inc. . . . . . . . . . . . . . . . . . . . . . . . . . . . . . . . . . . . . . . . . . . . . . . . . . . . . . . . . . . . . . . . . . . . . . . . . . . . . . . . . . . . . . . 572,180 4,512 8,984BS Financial Group Inc., Rights, 7/4/2014 . . . . . . . . . . . . . . . . . . . . . . . . . . . . . . . . . . . . . . . . . . . . . . . . . . . . . . . . . . . . . . . . . . . . . . . . . 97,049 — 241Daum Communication Corp. . . . . . . . . . . . . . . . . . . . . . . . . . . . . . . . . . . . . . . . . . . . . . . . . . . . . . . . . . . . . . . . . . . . . . . . . . . . . . . . . . . . 103,216 8,922 12,726
13,434 21,951
Philippines: 2.75%Energy Development Corp. . . . . . . . . . . . . . . . . . . . . . . . . . . . . . . . . . . . . . . . . . . . . . . . . . . . . . . . . . . . . . . . . . . . . . . . . . . . . . . . . . . . . 58,389,300 8,634 8,992Metropolitan Bank & Trust Co. . . . . . . . . . . . . . . . . . . . . . . . . . . . . . . . . . . . . . . . . . . . . . . . . . . . . . . . . . . . . . . . . . . . . . . . . . . . . . . . . . 1,425,070 3,093 3,045Vista Land & Lifescapes Inc. . . . . . . . . . . . . . . . . . . . . . . . . . . . . . . . . . . . . . . . . . . . . . . . . . . . . . . . . . . . . . . . . . . . . . . . . . . . . . . . . . . . 58,126,300 7,794 8,696
19,521 20,733
Netherlands: 2.45%Aalberts Industries NV . . . . . . . . . . . . . . . . . . . . . . . . . . . . . . . . . . . . . . . . . . . . . . . . . . . . . . . . . . . . . . . . . . . . . . . . . . . . . . . . . . . . . . . 234,029 2,567 8,150Arcadis NV . . . . . . . . . . . . . . . . . . . . . . . . . . . . . . . . . . . . . . . . . . . . . . . . . . . . . . . . . . . . . . . . . . . . . . . . . . . . . . . . . . . . . . . . . . . . . . . 280,124 3,815 10,297
6,382 18,447
Singapore: 2.44%Ezion Holdings Ltd. . . . . . . . . . . . . . . . . . . . . . . . . . . . . . . . . . . . . . . . . . . . . . . . . . . . . . . . . . . . . . . . . . . . . . . . . . . . . . . . . . . . . . . . . . 6,278,600 7,877 11,172First Resources Ltd. . . . . . . . . . . . . . . . . . . . . . . . . . . . . . . . . . . . . . . . . . . . . . . . . . . . . . . . . . . . . . . . . . . . . . . . . . . . . . . . . . . . . . . . . . 3,547,000 4,676 7,221
12,553 18,393
India: 2.40%LIC Housing Finance Ltd. . . . . . . . . . . . . . . . . . . . . . . . . . . . . . . . . . . . . . . . . . . . . . . . . . . . . . . . . . . . . . . . . . . . . . . . . . . . . . . . . . . . . . 3,105,680 11,345 18,049
Taiwan: 1.88%Tripod Technology Corp. . . . . . . . . . . . . . . . . . . . . . . . . . . . . . . . . . . . . . . . . . . . . . . . . . . . . . . . . . . . . . . . . . . . . . . . . . . . . . . . . . . . . . 6,902,000 13,473 14,193
Switzerland: 1.76%Basilea Pharmaceutica AG . . . . . . . . . . . . . . . . . . . . . . . . . . . . . . . . . . . . . . . . . . . . . . . . . . . . . . . . . . . . . . . . . . . . . . . . . . . . . . . . . . . . 59,120 7,313 7,358Tecan Group AG . . . . . . . . . . . . . . . . . . . . . . . . . . . . . . . . . . . . . . . . . . . . . . . . . . . . . . . . . . . . . . . . . . . . . . . . . . . . . . . . . . . . . . . . . . . 48,180 4,817 5,875
12,130 13,233
Finland: 1.45%Amer Sports OYJ . . . . . . . . . . . . . . . . . . . . . . . . . . . . . . . . . . . . . . . . . . . . . . . . . . . . . . . . . . . . . . . . . . . . . . . . . . . . . . . . . . . . . . . . . . . 499,640 6,877 10,909
The accompanying notes are an integral part of these financial statements.
86 Franklin Templeton Investments Funds
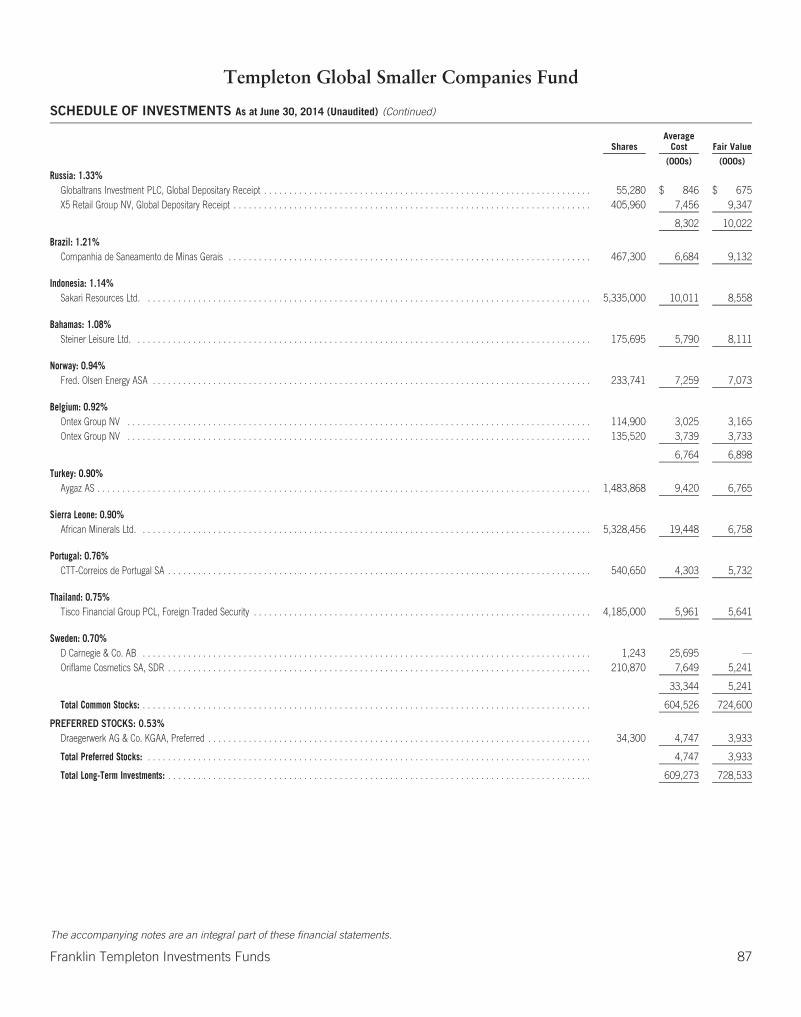
Templeton Global Smaller Companies Fund
SCHEDULE OF INVESTMENTS As at June 30, 2014 (Unaudited) (Continued)
SharesAverage
Cost Fair Value
(000s) (000s)
Russia: 1.33%Globaltrans Investment PLC, Global Depositary Receipt . . . . . . . . . . . . . . . . . . . . . . . . . . . . . . . . . . . . . . . . . . . . . . . . . . . . . . . . . . . . . . . . . 55,280 $ 846 $ 675X5 Retail Group NV, Global Depositary Receipt . . . . . . . . . . . . . . . . . . . . . . . . . . . . . . . . . . . . . . . . . . . . . . . . . . . . . . . . . . . . . . . . . . . . . . . 405,960 7,456 9,347
8,302 10,022
Brazil: 1.21%Companhia de Saneamento de Minas Gerais . . . . . . . . . . . . . . . . . . . . . . . . . . . . . . . . . . . . . . . . . . . . . . . . . . . . . . . . . . . . . . . . . . . . . . . . 467,300 6,684 9,132
Indonesia: 1.14%Sakari Resources Ltd. . . . . . . . . . . . . . . . . . . . . . . . . . . . . . . . . . . . . . . . . . . . . . . . . . . . . . . . . . . . . . . . . . . . . . . . . . . . . . . . . . . . . . . . . 5,335,000 10,011 8,558
Bahamas: 1.08%Steiner Leisure Ltd. . . . . . . . . . . . . . . . . . . . . . . . . . . . . . . . . . . . . . . . . . . . . . . . . . . . . . . . . . . . . . . . . . . . . . . . . . . . . . . . . . . . . . . . . . . 175,695 5,790 8,111
Norway: 0.94%Fred. Olsen Energy ASA . . . . . . . . . . . . . . . . . . . . . . . . . . . . . . . . . . . . . . . . . . . . . . . . . . . . . . . . . . . . . . . . . . . . . . . . . . . . . . . . . . . . . . . 233,741 7,259 7,073
Belgium: 0.92%Ontex Group NV . . . . . . . . . . . . . . . . . . . . . . . . . . . . . . . . . . . . . . . . . . . . . . . . . . . . . . . . . . . . . . . . . . . . . . . . . . . . . . . . . . . . . . . . . . . . 114,900 3,025 3,165Ontex Group NV . . . . . . . . . . . . . . . . . . . . . . . . . . . . . . . . . . . . . . . . . . . . . . . . . . . . . . . . . . . . . . . . . . . . . . . . . . . . . . . . . . . . . . . . . . . . 135,520 3,739 3,733
6,764 6,898
Turkey: 0.90%Aygaz AS . . . . . . . . . . . . . . . . . . . . . . . . . . . . . . . . . . . . . . . . . . . . . . . . . . . . . . . . . . . . . . . . . . . . . . . . . . . . . . . . . . . . . . . . . . . . . . . . . . 1,483,868 9,420 6,765
Sierra Leone: 0.90%African Minerals Ltd. . . . . . . . . . . . . . . . . . . . . . . . . . . . . . . . . . . . . . . . . . . . . . . . . . . . . . . . . . . . . . . . . . . . . . . . . . . . . . . . . . . . . . . . . . 5,328,456 19,448 6,758
Portugal: 0.76%CTT-Correios de Portugal SA . . . . . . . . . . . . . . . . . . . . . . . . . . . . . . . . . . . . . . . . . . . . . . . . . . . . . . . . . . . . . . . . . . . . . . . . . . . . . . . . . . . . 540,650 4,303 5,732
Thailand: 0.75%Tisco Financial Group PCL, Foreign Traded Security . . . . . . . . . . . . . . . . . . . . . . . . . . . . . . . . . . . . . . . . . . . . . . . . . . . . . . . . . . . . . . . . . . . 4,185,000 5,961 5,641
Sweden: 0.70%D Carnegie & Co. AB . . . . . . . . . . . . . . . . . . . . . . . . . . . . . . . . . . . . . . . . . . . . . . . . . . . . . . . . . . . . . . . . . . . . . . . . . . . . . . . . . . . . . . . . . 1,243 25,695 —Oriflame Cosmetics SA, SDR . . . . . . . . . . . . . . . . . . . . . . . . . . . . . . . . . . . . . . . . . . . . . . . . . . . . . . . . . . . . . . . . . . . . . . . . . . . . . . . . . . . . 210,870 7,649 5,241
33,344 5,241
Total Common Stocks: . . . . . . . . . . . . . . . . . . . . . . . . . . . . . . . . . . . . . . . . . . . . . . . . . . . . . . . . . . . . . . . . . . . . . . . . . . . . . . . . . . . . . . . . . 604,526 724,600
PREFERRED STOCKS: 0.53%Draegerwerk AG & Co. KGAA, Preferred . . . . . . . . . . . . . . . . . . . . . . . . . . . . . . . . . . . . . . . . . . . . . . . . . . . . . . . . . . . . . . . . . . . . . . . . . . . . 34,300 4,747 3,933
Total Preferred Stocks: . . . . . . . . . . . . . . . . . . . . . . . . . . . . . . . . . . . . . . . . . . . . . . . . . . . . . . . . . . . . . . . . . . . . . . . . . . . . . . . . . . . . . . . . 4,747 3,933
Total Long-Term Investments: . . . . . . . . . . . . . . . . . . . . . . . . . . . . . . . . . . . . . . . . . . . . . . . . . . . . . . . . . . . . . . . . . . . . . . . . . . . . . . . . . . . . 609,273 728,533
The accompanying notes are an integral part of these financial statements.
Franklin Templeton Investments Funds 87

Templeton Global Smaller Companies Fund
SCHEDULE OF INVESTMENTS As at June 30, 2014 (Unaudited) (Continued)
Principal Amountin Currency
of IssueAverage
Cost Fair Value
(000s) (000s)
SHORT-TERM SECURITIES: 3.08%Royal Bank of Canada, Term Deposit, 0.97%, 7/2/2014 . . . . . . . . . . . . . . . . . . . . . . . . . . . . . . . . . . . . . . . . . . . . . . . . . . . . . . . . . . . 23,200,000 CAD $ 23,200 $ 23,200
Total Short-Term Securities: . . . . . . . . . . . . . . . . . . . . . . . . . . . . . . . . . . . . . . . . . . . . . . . . . . . . . . . . . . . . . . . . . . . . . . . . . . . . . . . 23,200 23,200
Transaction costs (Note 4) . . . . . . . . . . . . . . . . . . . . . . . . . . . . . . . . . . . . . . . . . . . . . . . . . . . . . . . . . . . . . . . . . . . . . . . . . . . . . . . . (1,598) —
TOTAL INVESTMENTS: 99.85% . . . . . . . . . . . . . . . . . . . . . . . . . . . . . . . . . . . . . . . . . . . . . . . . . . . . . . . . . . . . . . . . . . . . . . . . . . . . . $630,875 751,733
OTHER ASSETS, less liabilities: 0.15% . . . . . . . . . . . . . . . . . . . . . . . . . . . . . . . . . . . . . . . . . . . . . . . . . . . . . . . . . . . . . . . . . . . . . . . . 1,166
TOTAL NET ASSETS: 100.00% . . . . . . . . . . . . . . . . . . . . . . . . . . . . . . . . . . . . . . . . . . . . . . . . . . . . . . . . . . . . . . . . . . . . . . . . . . . . . $752,899
The accompanying notes are an integral part of these financial statements.
88 Franklin Templeton Investments Funds
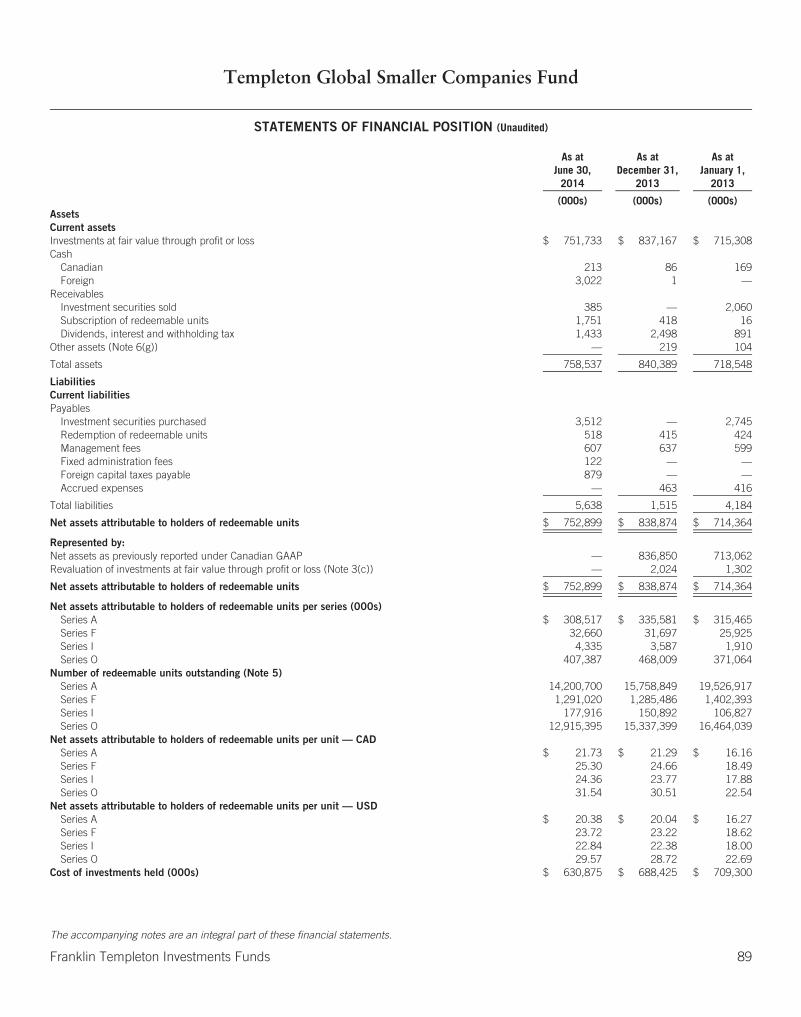
Templeton Global Smaller Companies Fund
STATEMENTS OF FINANCIAL POSITION (Unaudited)
As atJune 30,
2014
As atDecember 31,
2013
As atJanuary 1,
2013
(000s) (000s) (000s)AssetsCurrent assetsInvestments at fair value through profit or loss $ 751,733 $ 837,167 $ 715,308Cash
Canadian 213 86 169Foreign 3,022 1 —
ReceivablesInvestment securities sold 385 — 2,060Subscription of redeemable units 1,751 418 16Dividends, interest and withholding tax 1,433 2,498 891
Other assets (Note 6(g)) — 219 104
Total assets 758,537 840,389 718,548
LiabilitiesCurrent liabilitiesPayables
Investment securities purchased 3,512 — 2,745Redemption of redeemable units 518 415 424Management fees 607 637 599Fixed administration fees 122 — —Foreign capital taxes payable 879 — —Accrued expenses — 463 416
Total liabilities 5,638 1,515 4,184
Net assets attributable to holders of redeemable units $ 752,899 $ 838,874 $ 714,364
Represented by:Net assets as previously reported under Canadian GAAP — 836,850 713,062Revaluation of investments at fair value through profit or loss (Note 3(c)) — 2,024 1,302
Net assets attributable to holders of redeemable units $ 752,899 $ 838,874 $ 714,364
Net assets attributable to holders of redeemable units per series (000s)Series A $ 308,517 $ 335,581 $ 315,465Series F 32,660 31,697 25,925Series I 4,335 3,587 1,910Series O 407,387 468,009 371,064
Number of redeemable units outstanding (Note 5)Series A 14,200,700 15,758,849 19,526,917Series F 1,291,020 1,285,486 1,402,393Series I 177,916 150,892 106,827Series O 12,915,395 15,337,399 16,464,039
Net assets attributable to holders of redeemable units per unit — CADSeries A $ 21.73 $ 21.29 $ 16.16Series F 25.30 24.66 18.49Series I 24.36 23.77 17.88Series O 31.54 30.51 22.54
Net assets attributable to holders of redeemable units per unit — USDSeries A $ 20.38 $ 20.04 $ 16.27Series F 23.72 23.22 18.62Series I 22.84 22.38 18.00Series O 29.57 28.72 22.69
Cost of investments held (000s) $ 630,875 $ 688,425 $ 709,300
The accompanying notes are an integral part of these financial statements.
Franklin Templeton Investments Funds 89

Templeton Global Smaller Companies Fund
STATEMENTS OF COMPREHENSIVE INCOMEFor the six months ended June 30, 2014 and 2013 (Unaudited)
2014 2013
(000s) (000s)IncomeDividends $ 8,192 $ 9,894Interest income for distribution purposes 183 200Net realized and/or unrealized foreign exchange gain (loss) (825) (140)Net realized gain (loss) on investments 49,866 38,344Net change in unrealized appreciation (depreciation) in value of investments (27,884) 70,464
Total income (net) 29,532 118,762
ExpensesManagement fees (Note 6(a)) 3,788 3,808Fixed administration fees (Note 6(b)) 758 —Transfer agent fees (Note 6(d)) — 1,279Custodian fees — 38Legal fees — —Audit fees — 12Unitholder reporting costs — 40Independent review committee fees — 1Registration fees — 17Other expenses (Note 6(f)) — 210
Operating expenses before waivers/paid by Manager 4,546 5,405Management fees waived/paid by Manager (4) —Other expenses waived/paid by Manager — (778)
Net operating expenses after waivers/paid by Manager 4,542 4,627
Transaction costs (Note 9) 658 797Withholding tax expense 849 774
Total expenses 6,049 6,198
Increase (decrease) in net assets attributable to holders of redeemable units from operations $ 23,483 $ 112,564
Represented by:Increase (decrease) in net assets from operations as previously reported under Canadian GAAP — 111,247Revaluation of investments at fair value through profit and loss (Note 3(c)) — 1,317
Increase (decrease) in net assets attributable to holders of redeemable units from operations $ 23,483 $ 112,564
Increase (decrease) in net assets attributable to holders of redeemable units from operations per series (000s)Series A $ 6,822 $ 47,097Series F 836 4,161Series I 92 294Series O 15,733 61,012
Weighted average number of units outstandingSeries A 14,961,664 18,386,156Series F 1,301,549 1,375,251Series I 168,656 106,120Series O 14,483,220 15,499,074
Increase (decrease) in net assets attributable to holders of redeemable units from operations per unitSeries A $ 0.46 $ 2.56Series F 0.65 3.03Series I 0.55 2.77Series O 1.09 3.93
The accompanying notes are an integral part of these financial statements.
90 Franklin Templeton Investments Funds

Templeton Global Smaller Companies Fund
STATEMENTS OF CHANGES IN NET ASSETS ATTRIBUTABLE TO HOLDERS OF REDEEMABLE UNITSFor the six months ended June 30, 2014 and 2013 (Unaudited) (in 000s)
All Series Series A Series F
2014 2013 2014 2013 2014 2013
Net assets attributable to holders of redeemable units at beginning of period $ 838,874 $ 714,364 $335,581 $315,465 $31,697 $25,925
Increase (decrease) in net assets attributable to holders of redeemable unitsfrom operations 23,483 112,564 6,822 47,097 836 4,161
Distributions to holders of redeemable unitsFrom net investment income — — — — — —From net realized gains on investments — — — — — —From return of capital — — — — — —
Total distributions to holders of redeemable units — — — — — —
Redeemable units transactionsSubscriptions 32,951 26,635 9,356 8,999 3,427 2,149Reinvestments — — — — — —Redemptions (142,409) (105,993) (43,242) (49,355) (3,300) (4,007)
Net increase (decrease) from redeemable units transactions (109,458) (79,358) (33,886) (40,356) 127 (1,858)
Increase (decrease) in net assets attributable to holders of redeemable units (85,975) 33,206 (27,064) 6,741 963 2,303
Net assets attributable to holders of redeemable units at end of period $ 752,899 $ 747,570 $308,517 $322,206 $32,660 $28,228
Series I Series O
2014 2013 2014 2013
Net assets attributable to holders of redeemable units at beginning of period $ 3,587 $ 1,910 $468,009 $371,064
Increase (decrease) in net assets attributable to holders of redeemable unitsfrom operations 92 294 15,733 61,012
Distributions to holders of redeemable unitsFrom net investment income — — — —From net realized gains on investments — — — —From return of capital — — — —
Total distributions to holders of redeemable units — — — —
Redeemable units transactionsSubscriptions 1,036 54 19,132 15,433Reinvestments — — — —Redemptions (380) (371) (95,487) (52,260)
Net increase (decrease) from redeemable units transactions 656 (317) (76,355) (36,827)
Increase (decrease) in net assets attributable to holders of redeemable units 748 (23) (60,622) 24,185
Net assets attributable to holders of redeemable units at end of period $ 4,335 $ 1,887 $407,387 $395,249
The accompanying notes are an integral part of these financial statements.
Franklin Templeton Investments Funds 91
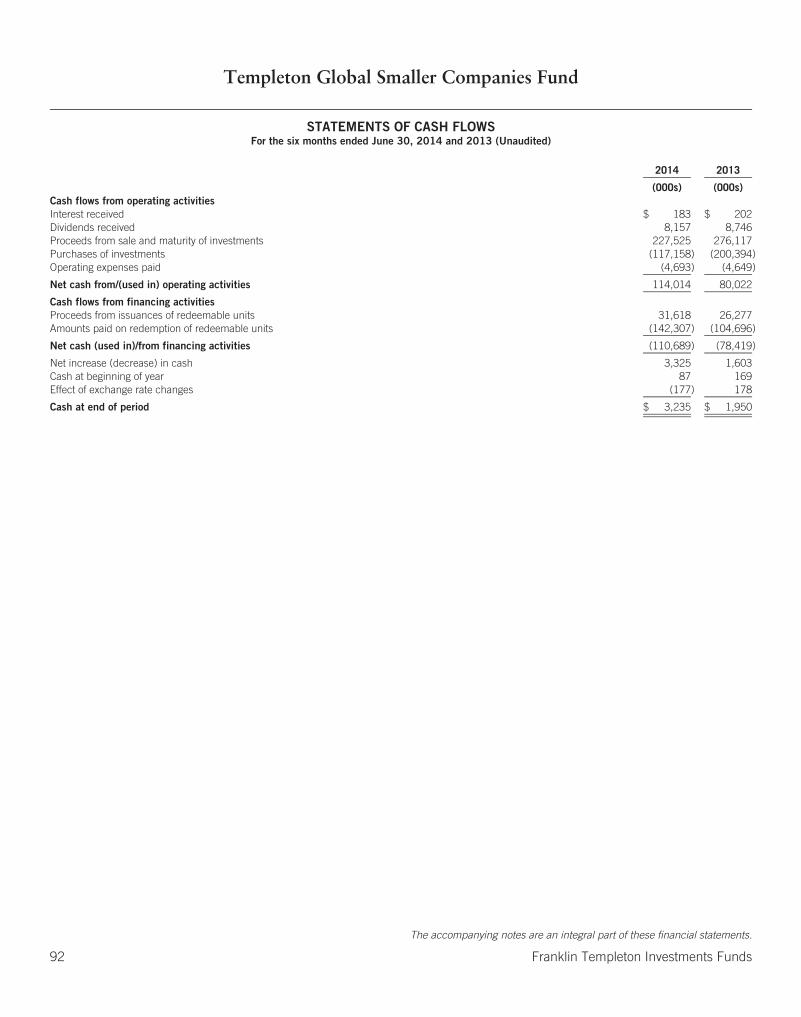
Templeton Global Smaller Companies Fund
STATEMENTS OF CASH FLOWSFor the six months ended June 30, 2014 and 2013 (Unaudited)
2014 2013
(000s) (000s)Cash flows from operating activitiesInterest received $ 183 $ 202Dividends received 8,157 8,746Proceeds from sale and maturity of investments 227,525 276,117Purchases of investments (117,158) (200,394)Operating expenses paid (4,693) (4,649)
Net cash from/(used in) operating activities 114,014 80,022
Cash flows from financing activitiesProceeds from issuances of redeemable units 31,618 26,277Amounts paid on redemption of redeemable units (142,307) (104,696)
Net cash (used in)/from financing activities (110,689) (78,419)
Net increase (decrease) in cash 3,325 1,603Cash at beginning of year 87 169Effect of exchange rate changes (177) 178
Cash at end of period $ 3,235 $ 1,950
The accompanying notes are an integral part of these financial statements.
92 Franklin Templeton Investments Funds
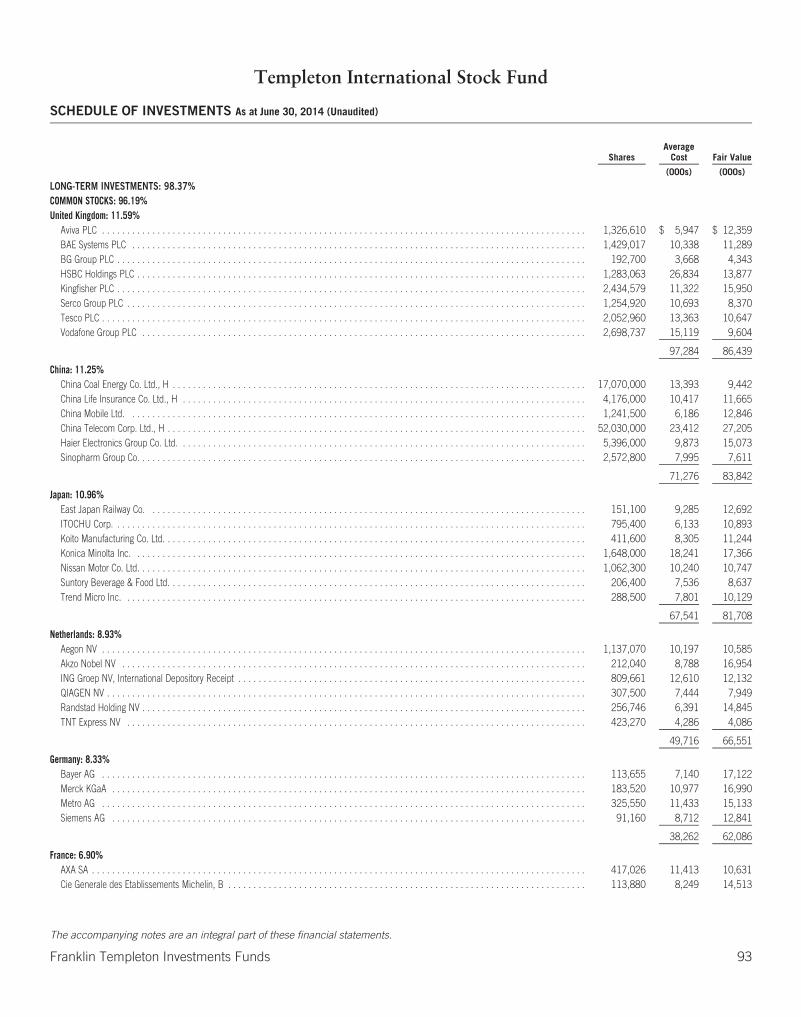
Templeton International Stock Fund
SCHEDULE OF INVESTMENTS As at June 30, 2014 (Unaudited)
SharesAverage
Cost Fair Value
(000s) (000s)
LONG-TERM INVESTMENTS: 98.37%COMMON STOCKS: 96.19%United Kingdom: 11.59%
Aviva PLC . . . . . . . . . . . . . . . . . . . . . . . . . . . . . . . . . . . . . . . . . . . . . . . . . . . . . . . . . . . . . . . . . . . . . . . . . . . . . . . . . . . . . . . . . . . . . . . . 1,326,610 $ 5,947 $ 12,359BAE Systems PLC . . . . . . . . . . . . . . . . . . . . . . . . . . . . . . . . . . . . . . . . . . . . . . . . . . . . . . . . . . . . . . . . . . . . . . . . . . . . . . . . . . . . . . . . . . 1,429,017 10,338 11,289BG Group PLC . . . . . . . . . . . . . . . . . . . . . . . . . . . . . . . . . . . . . . . . . . . . . . . . . . . . . . . . . . . . . . . . . . . . . . . . . . . . . . . . . . . . . . . . . . . . . 192,700 3,668 4,343HSBC Holdings PLC . . . . . . . . . . . . . . . . . . . . . . . . . . . . . . . . . . . . . . . . . . . . . . . . . . . . . . . . . . . . . . . . . . . . . . . . . . . . . . . . . . . . . . . . . 1,283,063 26,834 13,877Kingfisher PLC . . . . . . . . . . . . . . . . . . . . . . . . . . . . . . . . . . . . . . . . . . . . . . . . . . . . . . . . . . . . . . . . . . . . . . . . . . . . . . . . . . . . . . . . . . . . . 2,434,579 11,322 15,950Serco Group PLC . . . . . . . . . . . . . . . . . . . . . . . . . . . . . . . . . . . . . . . . . . . . . . . . . . . . . . . . . . . . . . . . . . . . . . . . . . . . . . . . . . . . . . . . . . . 1,254,920 10,693 8,370Tesco PLC . . . . . . . . . . . . . . . . . . . . . . . . . . . . . . . . . . . . . . . . . . . . . . . . . . . . . . . . . . . . . . . . . . . . . . . . . . . . . . . . . . . . . . . . . . . . . . . . 2,052,960 13,363 10,647Vodafone Group PLC . . . . . . . . . . . . . . . . . . . . . . . . . . . . . . . . . . . . . . . . . . . . . . . . . . . . . . . . . . . . . . . . . . . . . . . . . . . . . . . . . . . . . . . . 2,698,737 15,119 9,604
97,284 86,439
China: 11.25%China Coal Energy Co. Ltd., H . . . . . . . . . . . . . . . . . . . . . . . . . . . . . . . . . . . . . . . . . . . . . . . . . . . . . . . . . . . . . . . . . . . . . . . . . . . . . . . . . . 17,070,000 13,393 9,442China Life Insurance Co. Ltd., H . . . . . . . . . . . . . . . . . . . . . . . . . . . . . . . . . . . . . . . . . . . . . . . . . . . . . . . . . . . . . . . . . . . . . . . . . . . . . . . . 4,176,000 10,417 11,665China Mobile Ltd. . . . . . . . . . . . . . . . . . . . . . . . . . . . . . . . . . . . . . . . . . . . . . . . . . . . . . . . . . . . . . . . . . . . . . . . . . . . . . . . . . . . . . . . . . . 1,241,500 6,186 12,846China Telecom Corp. Ltd., H . . . . . . . . . . . . . . . . . . . . . . . . . . . . . . . . . . . . . . . . . . . . . . . . . . . . . . . . . . . . . . . . . . . . . . . . . . . . . . . . . . . 52,030,000 23,412 27,205Haier Electronics Group Co. Ltd. . . . . . . . . . . . . . . . . . . . . . . . . . . . . . . . . . . . . . . . . . . . . . . . . . . . . . . . . . . . . . . . . . . . . . . . . . . . . . . . . 5,396,000 9,873 15,073Sinopharm Group Co. . . . . . . . . . . . . . . . . . . . . . . . . . . . . . . . . . . . . . . . . . . . . . . . . . . . . . . . . . . . . . . . . . . . . . . . . . . . . . . . . . . . . . . . . 2,572,800 7,995 7,611
71,276 83,842
Japan: 10.96%East Japan Railway Co. . . . . . . . . . . . . . . . . . . . . . . . . . . . . . . . . . . . . . . . . . . . . . . . . . . . . . . . . . . . . . . . . . . . . . . . . . . . . . . . . . . . . . . 151,100 9,285 12,692ITOCHU Corp. . . . . . . . . . . . . . . . . . . . . . . . . . . . . . . . . . . . . . . . . . . . . . . . . . . . . . . . . . . . . . . . . . . . . . . . . . . . . . . . . . . . . . . . . . . . . . 795,400 6,133 10,893Koito Manufacturing Co. Ltd. . . . . . . . . . . . . . . . . . . . . . . . . . . . . . . . . . . . . . . . . . . . . . . . . . . . . . . . . . . . . . . . . . . . . . . . . . . . . . . . . . . . 411,600 8,305 11,244Konica Minolta Inc. . . . . . . . . . . . . . . . . . . . . . . . . . . . . . . . . . . . . . . . . . . . . . . . . . . . . . . . . . . . . . . . . . . . . . . . . . . . . . . . . . . . . . . . . . 1,648,000 18,241 17,366Nissan Motor Co. Ltd. . . . . . . . . . . . . . . . . . . . . . . . . . . . . . . . . . . . . . . . . . . . . . . . . . . . . . . . . . . . . . . . . . . . . . . . . . . . . . . . . . . . . . . . . 1,062,300 10,240 10,747Suntory Beverage & Food Ltd. . . . . . . . . . . . . . . . . . . . . . . . . . . . . . . . . . . . . . . . . . . . . . . . . . . . . . . . . . . . . . . . . . . . . . . . . . . . . . . . . . . 206,400 7,536 8,637Trend Micro Inc. . . . . . . . . . . . . . . . . . . . . . . . . . . . . . . . . . . . . . . . . . . . . . . . . . . . . . . . . . . . . . . . . . . . . . . . . . . . . . . . . . . . . . . . . . . . 288,500 7,801 10,129
67,541 81,708
Netherlands: 8.93%Aegon NV . . . . . . . . . . . . . . . . . . . . . . . . . . . . . . . . . . . . . . . . . . . . . . . . . . . . . . . . . . . . . . . . . . . . . . . . . . . . . . . . . . . . . . . . . . . . . . . . 1,137,070 10,197 10,585Akzo Nobel NV . . . . . . . . . . . . . . . . . . . . . . . . . . . . . . . . . . . . . . . . . . . . . . . . . . . . . . . . . . . . . . . . . . . . . . . . . . . . . . . . . . . . . . . . . . . . 212,040 8,788 16,954ING Groep NV, International Depository Receipt . . . . . . . . . . . . . . . . . . . . . . . . . . . . . . . . . . . . . . . . . . . . . . . . . . . . . . . . . . . . . . . . . . . . . 809,661 12,610 12,132QIAGEN NV . . . . . . . . . . . . . . . . . . . . . . . . . . . . . . . . . . . . . . . . . . . . . . . . . . . . . . . . . . . . . . . . . . . . . . . . . . . . . . . . . . . . . . . . . . . . . . . 307,500 7,444 7,949Randstad Holding NV . . . . . . . . . . . . . . . . . . . . . . . . . . . . . . . . . . . . . . . . . . . . . . . . . . . . . . . . . . . . . . . . . . . . . . . . . . . . . . . . . . . . . . . . 256,746 6,391 14,845TNT Express NV . . . . . . . . . . . . . . . . . . . . . . . . . . . . . . . . . . . . . . . . . . . . . . . . . . . . . . . . . . . . . . . . . . . . . . . . . . . . . . . . . . . . . . . . . . . 423,270 4,286 4,086
49,716 66,551
Germany: 8.33%Bayer AG . . . . . . . . . . . . . . . . . . . . . . . . . . . . . . . . . . . . . . . . . . . . . . . . . . . . . . . . . . . . . . . . . . . . . . . . . . . . . . . . . . . . . . . . . . . . . . . . 113,655 7,140 17,122Merck KGaA . . . . . . . . . . . . . . . . . . . . . . . . . . . . . . . . . . . . . . . . . . . . . . . . . . . . . . . . . . . . . . . . . . . . . . . . . . . . . . . . . . . . . . . . . . . . . . 183,520 10,977 16,990Metro AG . . . . . . . . . . . . . . . . . . . . . . . . . . . . . . . . . . . . . . . . . . . . . . . . . . . . . . . . . . . . . . . . . . . . . . . . . . . . . . . . . . . . . . . . . . . . . . . . 325,550 11,433 15,133Siemens AG . . . . . . . . . . . . . . . . . . . . . . . . . . . . . . . . . . . . . . . . . . . . . . . . . . . . . . . . . . . . . . . . . . . . . . . . . . . . . . . . . . . . . . . . . . . . . . 91,160 8,712 12,841
38,262 62,086
France: 6.90%AXA SA . . . . . . . . . . . . . . . . . . . . . . . . . . . . . . . . . . . . . . . . . . . . . . . . . . . . . . . . . . . . . . . . . . . . . . . . . . . . . . . . . . . . . . . . . . . . . . . . . . 417,026 11,413 10,631Cie Generale des Etablissements Michelin, B . . . . . . . . . . . . . . . . . . . . . . . . . . . . . . . . . . . . . . . . . . . . . . . . . . . . . . . . . . . . . . . . . . . . . . . 113,880 8,249 14,513
The accompanying notes are an integral part of these financial statements.
Franklin Templeton Investments Funds 93
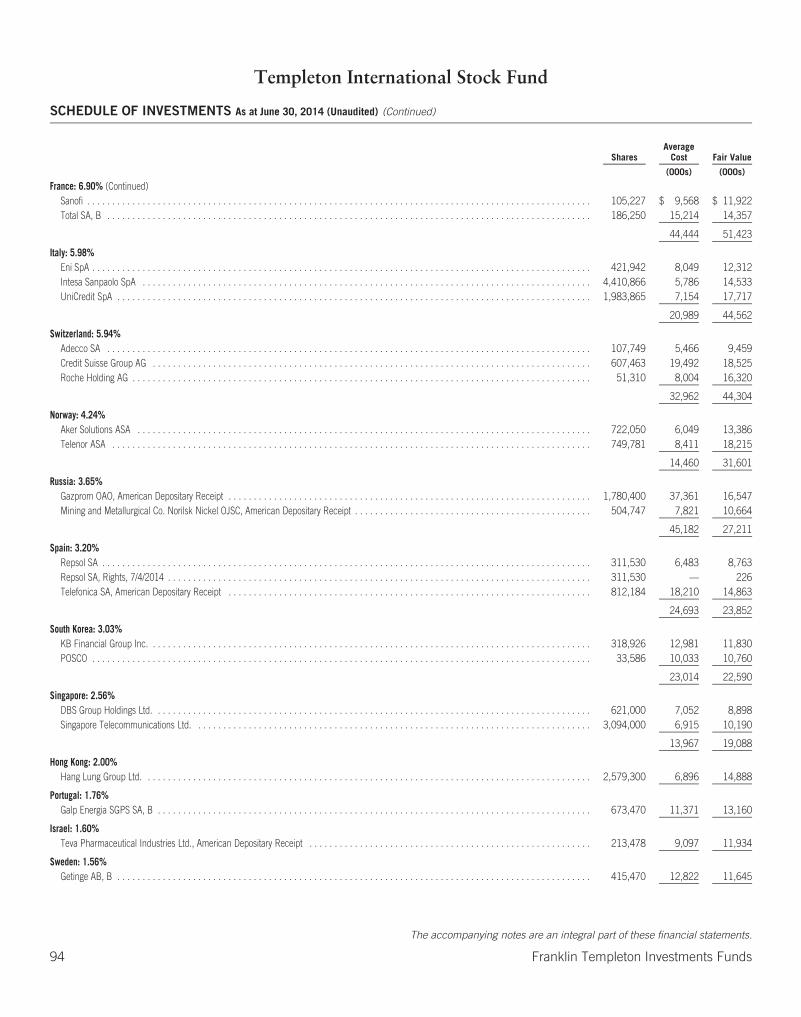
Templeton International Stock Fund
SCHEDULE OF INVESTMENTS As at June 30, 2014 (Unaudited) (Continued)
SharesAverage
Cost Fair Value
(000s) (000s)
France: 6.90% (Continued)Sanofi . . . . . . . . . . . . . . . . . . . . . . . . . . . . . . . . . . . . . . . . . . . . . . . . . . . . . . . . . . . . . . . . . . . . . . . . . . . . . . . . . . . . . . . . . . . . . . . . . . . . 105,227 $ 9,568 $ 11,922Total SA, B . . . . . . . . . . . . . . . . . . . . . . . . . . . . . . . . . . . . . . . . . . . . . . . . . . . . . . . . . . . . . . . . . . . . . . . . . . . . . . . . . . . . . . . . . . . . . . . . 186,250 15,214 14,357
44,444 51,423
Italy: 5.98%Eni SpA . . . . . . . . . . . . . . . . . . . . . . . . . . . . . . . . . . . . . . . . . . . . . . . . . . . . . . . . . . . . . . . . . . . . . . . . . . . . . . . . . . . . . . . . . . . . . . . . . . . 421,942 8,049 12,312Intesa Sanpaolo SpA . . . . . . . . . . . . . . . . . . . . . . . . . . . . . . . . . . . . . . . . . . . . . . . . . . . . . . . . . . . . . . . . . . . . . . . . . . . . . . . . . . . . . . . . . 4,410,866 5,786 14,533UniCredit SpA . . . . . . . . . . . . . . . . . . . . . . . . . . . . . . . . . . . . . . . . . . . . . . . . . . . . . . . . . . . . . . . . . . . . . . . . . . . . . . . . . . . . . . . . . . . . . . 1,983,865 7,154 17,717
20,989 44,562
Switzerland: 5.94%Adecco SA . . . . . . . . . . . . . . . . . . . . . . . . . . . . . . . . . . . . . . . . . . . . . . . . . . . . . . . . . . . . . . . . . . . . . . . . . . . . . . . . . . . . . . . . . . . . . . . . 107,749 5,466 9,459Credit Suisse Group AG . . . . . . . . . . . . . . . . . . . . . . . . . . . . . . . . . . . . . . . . . . . . . . . . . . . . . . . . . . . . . . . . . . . . . . . . . . . . . . . . . . . . . . . 607,463 19,492 18,525Roche Holding AG . . . . . . . . . . . . . . . . . . . . . . . . . . . . . . . . . . . . . . . . . . . . . . . . . . . . . . . . . . . . . . . . . . . . . . . . . . . . . . . . . . . . . . . . . . . 51,310 8,004 16,320
32,962 44,304
Norway: 4.24%Aker Solutions ASA . . . . . . . . . . . . . . . . . . . . . . . . . . . . . . . . . . . . . . . . . . . . . . . . . . . . . . . . . . . . . . . . . . . . . . . . . . . . . . . . . . . . . . . . . . 722,050 6,049 13,386Telenor ASA . . . . . . . . . . . . . . . . . . . . . . . . . . . . . . . . . . . . . . . . . . . . . . . . . . . . . . . . . . . . . . . . . . . . . . . . . . . . . . . . . . . . . . . . . . . . . . . 749,781 8,411 18,215
14,460 31,601
Russia: 3.65%Gazprom OAO, American Depositary Receipt . . . . . . . . . . . . . . . . . . . . . . . . . . . . . . . . . . . . . . . . . . . . . . . . . . . . . . . . . . . . . . . . . . . . . . . . 1,780,400 37,361 16,547Mining and Metallurgical Co. Norilsk Nickel OJSC, American Depositary Receipt . . . . . . . . . . . . . . . . . . . . . . . . . . . . . . . . . . . . . . . . . . . . . . . 504,747 7,821 10,664
45,182 27,211
Spain: 3.20%Repsol SA . . . . . . . . . . . . . . . . . . . . . . . . . . . . . . . . . . . . . . . . . . . . . . . . . . . . . . . . . . . . . . . . . . . . . . . . . . . . . . . . . . . . . . . . . . . . . . . . . 311,530 6,483 8,763Repsol SA, Rights, 7/4/2014 . . . . . . . . . . . . . . . . . . . . . . . . . . . . . . . . . . . . . . . . . . . . . . . . . . . . . . . . . . . . . . . . . . . . . . . . . . . . . . . . . . . . 311,530 — 226Telefonica SA, American Depositary Receipt . . . . . . . . . . . . . . . . . . . . . . . . . . . . . . . . . . . . . . . . . . . . . . . . . . . . . . . . . . . . . . . . . . . . . . . . 812,184 18,210 14,863
24,693 23,852
South Korea: 3.03%KB Financial Group Inc. . . . . . . . . . . . . . . . . . . . . . . . . . . . . . . . . . . . . . . . . . . . . . . . . . . . . . . . . . . . . . . . . . . . . . . . . . . . . . . . . . . . . . . . 318,926 12,981 11,830POSCO . . . . . . . . . . . . . . . . . . . . . . . . . . . . . . . . . . . . . . . . . . . . . . . . . . . . . . . . . . . . . . . . . . . . . . . . . . . . . . . . . . . . . . . . . . . . . . . . . . . 33,586 10,033 10,760
23,014 22,590
Singapore: 2.56%DBS Group Holdings Ltd. . . . . . . . . . . . . . . . . . . . . . . . . . . . . . . . . . . . . . . . . . . . . . . . . . . . . . . . . . . . . . . . . . . . . . . . . . . . . . . . . . . . . . . 621,000 7,052 8,898Singapore Telecommunications Ltd. . . . . . . . . . . . . . . . . . . . . . . . . . . . . . . . . . . . . . . . . . . . . . . . . . . . . . . . . . . . . . . . . . . . . . . . . . . . . . . 3,094,000 6,915 10,190
13,967 19,088
Hong Kong: 2.00%Hang Lung Group Ltd. . . . . . . . . . . . . . . . . . . . . . . . . . . . . . . . . . . . . . . . . . . . . . . . . . . . . . . . . . . . . . . . . . . . . . . . . . . . . . . . . . . . . . . . . 2,579,300 6,896 14,888
Portugal: 1.76%Galp Energia SGPS SA, B . . . . . . . . . . . . . . . . . . . . . . . . . . . . . . . . . . . . . . . . . . . . . . . . . . . . . . . . . . . . . . . . . . . . . . . . . . . . . . . . . . . . . . 673,470 11,371 13,160
Israel: 1.60%Teva Pharmaceutical Industries Ltd., American Depositary Receipt . . . . . . . . . . . . . . . . . . . . . . . . . . . . . . . . . . . . . . . . . . . . . . . . . . . . . . . . 213,478 9,097 11,934
Sweden: 1.56%Getinge AB, B . . . . . . . . . . . . . . . . . . . . . . . . . . . . . . . . . . . . . . . . . . . . . . . . . . . . . . . . . . . . . . . . . . . . . . . . . . . . . . . . . . . . . . . . . . . . . . 415,470 12,822 11,645
The accompanying notes are an integral part of these financial statements.
94 Franklin Templeton Investments Funds
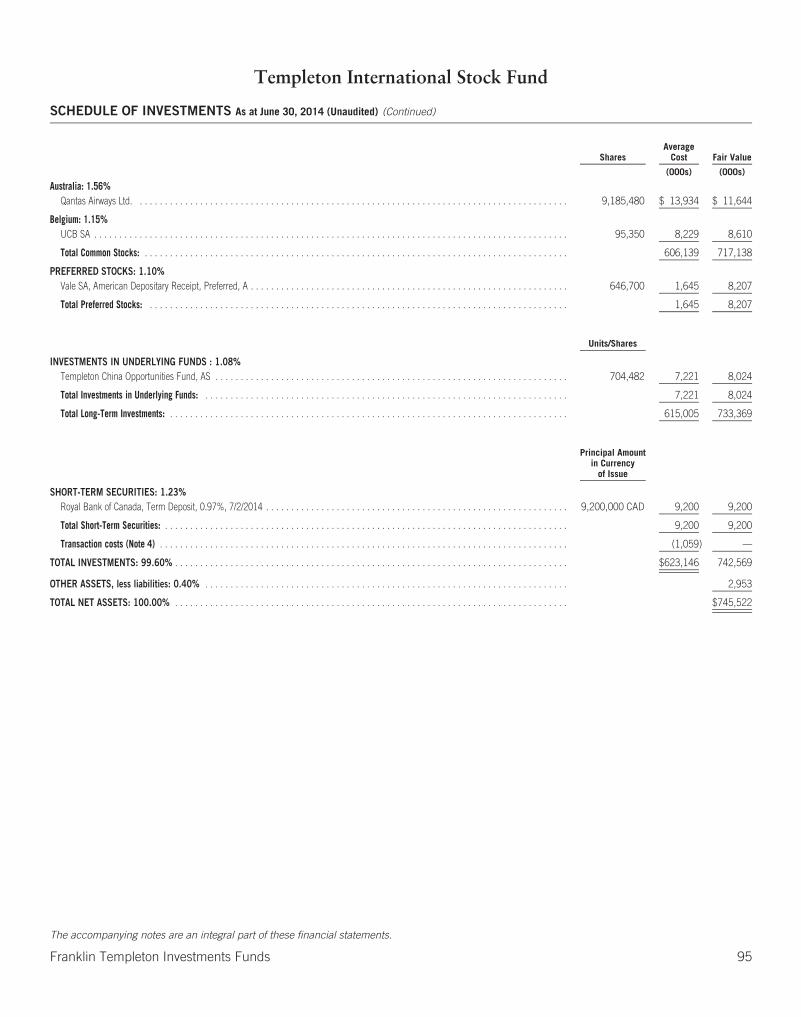
Templeton International Stock Fund
SCHEDULE OF INVESTMENTS As at June 30, 2014 (Unaudited) (Continued)
SharesAverage
Cost Fair Value
(000s) (000s)
Australia: 1.56%Qantas Airways Ltd. . . . . . . . . . . . . . . . . . . . . . . . . . . . . . . . . . . . . . . . . . . . . . . . . . . . . . . . . . . . . . . . . . . . . . . . . . . . . . . . . . . . . . 9,185,480 $ 13,934 $ 11,644
Belgium: 1.15%UCB SA . . . . . . . . . . . . . . . . . . . . . . . . . . . . . . . . . . . . . . . . . . . . . . . . . . . . . . . . . . . . . . . . . . . . . . . . . . . . . . . . . . . . . . . . . . . . . . 95,350 8,229 8,610
Total Common Stocks: . . . . . . . . . . . . . . . . . . . . . . . . . . . . . . . . . . . . . . . . . . . . . . . . . . . . . . . . . . . . . . . . . . . . . . . . . . . . . . . . . . . . 606,139 717,138
PREFERRED STOCKS: 1.10%Vale SA, American Depositary Receipt, Preferred, A . . . . . . . . . . . . . . . . . . . . . . . . . . . . . . . . . . . . . . . . . . . . . . . . . . . . . . . . . . . . . . . 646,700 1,645 8,207
Total Preferred Stocks: . . . . . . . . . . . . . . . . . . . . . . . . . . . . . . . . . . . . . . . . . . . . . . . . . . . . . . . . . . . . . . . . . . . . . . . . . . . . . . . . . . . 1,645 8,207
Units/Shares
INVESTMENTS IN UNDERLYING FUNDS : 1.08%Templeton China Opportunities Fund, AS . . . . . . . . . . . . . . . . . . . . . . . . . . . . . . . . . . . . . . . . . . . . . . . . . . . . . . . . . . . . . . . . . . . . . . 704,482 7,221 8,024
Total Investments in Underlying Funds: . . . . . . . . . . . . . . . . . . . . . . . . . . . . . . . . . . . . . . . . . . . . . . . . . . . . . . . . . . . . . . . . . . . . . . . . 7,221 8,024
Total Long-Term Investments: . . . . . . . . . . . . . . . . . . . . . . . . . . . . . . . . . . . . . . . . . . . . . . . . . . . . . . . . . . . . . . . . . . . . . . . . . . . . . . . 615,005 733,369
Principal Amountin Currency
of Issue
SHORT-TERM SECURITIES: 1.23%Royal Bank of Canada, Term Deposit, 0.97%, 7/2/2014 . . . . . . . . . . . . . . . . . . . . . . . . . . . . . . . . . . . . . . . . . . . . . . . . . . . . . . . . . . . . 9,200,000 CAD 9,200 9,200
Total Short-Term Securities: . . . . . . . . . . . . . . . . . . . . . . . . . . . . . . . . . . . . . . . . . . . . . . . . . . . . . . . . . . . . . . . . . . . . . . . . . . . . . . . . 9,200 9,200
Transaction costs (Note 4) . . . . . . . . . . . . . . . . . . . . . . . . . . . . . . . . . . . . . . . . . . . . . . . . . . . . . . . . . . . . . . . . . . . . . . . . . . . . . . . . . (1,059) —
TOTAL INVESTMENTS: 99.60% . . . . . . . . . . . . . . . . . . . . . . . . . . . . . . . . . . . . . . . . . . . . . . . . . . . . . . . . . . . . . . . . . . . . . . . . . . . . . . $623,146 742,569
OTHER ASSETS, less liabilities: 0.40% . . . . . . . . . . . . . . . . . . . . . . . . . . . . . . . . . . . . . . . . . . . . . . . . . . . . . . . . . . . . . . . . . . . . . . . . 2,953
TOTAL NET ASSETS: 100.00% . . . . . . . . . . . . . . . . . . . . . . . . . . . . . . . . . . . . . . . . . . . . . . . . . . . . . . . . . . . . . . . . . . . . . . . . . . . . . . $745,522
The accompanying notes are an integral part of these financial statements.
Franklin Templeton Investments Funds 95
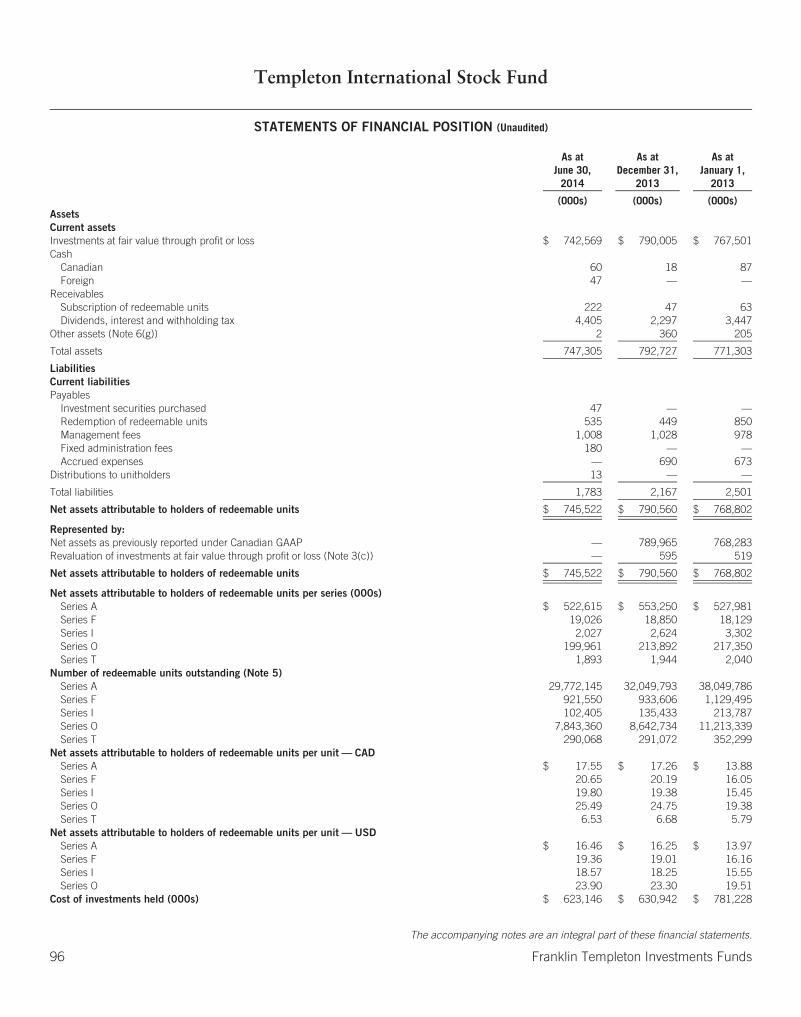
Templeton International Stock Fund
STATEMENTS OF FINANCIAL POSITION (Unaudited)
As atJune 30,
2014
As atDecember 31,
2013
As atJanuary 1,
2013
(000s) (000s) (000s)AssetsCurrent assetsInvestments at fair value through profit or loss $ 742,569 $ 790,005 $ 767,501Cash
Canadian 60 18 87Foreign 47 — —
ReceivablesSubscription of redeemable units 222 47 63Dividends, interest and withholding tax 4,405 2,297 3,447
Other assets (Note 6(g)) 2 360 205
Total assets 747,305 792,727 771,303
LiabilitiesCurrent liabilitiesPayables
Investment securities purchased 47 — —Redemption of redeemable units 535 449 850Management fees 1,008 1,028 978Fixed administration fees 180 — —Accrued expenses — 690 673
Distributions to unitholders 13 — —
Total liabilities 1,783 2,167 2,501
Net assets attributable to holders of redeemable units $ 745,522 $ 790,560 $ 768,802
Represented by:Net assets as previously reported under Canadian GAAP — 789,965 768,283Revaluation of investments at fair value through profit or loss (Note 3(c)) — 595 519
Net assets attributable to holders of redeemable units $ 745,522 $ 790,560 $ 768,802
Net assets attributable to holders of redeemable units per series (000s)Series A $ 522,615 $ 553,250 $ 527,981Series F 19,026 18,850 18,129Series I 2,027 2,624 3,302Series O 199,961 213,892 217,350Series T 1,893 1,944 2,040
Number of redeemable units outstanding (Note 5)Series A 29,772,145 32,049,793 38,049,786Series F 921,550 933,606 1,129,495Series I 102,405 135,433 213,787Series O 7,843,360 8,642,734 11,213,339Series T 290,068 291,072 352,299
Net assets attributable to holders of redeemable units per unit — CADSeries A $ 17.55 $ 17.26 $ 13.88Series F 20.65 20.19 16.05Series I 19.80 19.38 15.45Series O 25.49 24.75 19.38Series T 6.53 6.68 5.79
Net assets attributable to holders of redeemable units per unit — USDSeries A $ 16.46 $ 16.25 $ 13.97Series F 19.36 19.01 16.16Series I 18.57 18.25 15.55Series O 23.90 23.30 19.51
Cost of investments held (000s) $ 623,146 $ 630,942 $ 781,228
The accompanying notes are an integral part of these financial statements.
96 Franklin Templeton Investments Funds

Templeton International Stock Fund
STATEMENTS OF COMPREHENSIVE INCOMEFor the six months ended June 30, 2014 and 2013 (Unaudited)
2014 2013
(000s) (000s)IncomeDividends $ 24,873 $ 16,070Interest income for distribution purposes 40 31Net realized and/or unrealized foreign exchange gain (loss) (150) (42)Net realized gain (loss) on investments 40,812 (28,521)Net change in unrealized appreciation (depreciation) in value of investments (39,640) 50,438
Total income (net) 25,935 37,976
ExpensesManagement fees (Note 6(a)) 6,135 5,929Fixed administration fees (Note 6(b)) 1,094 —Transfer agent fees (Note 6(d)) — 2,163Custodian fees — 53Legal fees — —Audit fees — 13Unitholder reporting costs — 65Independent review committee fees — 1Registration fees — 21Other expenses (Note 6(f)) — 209
Operating expenses before waivers/paid by Manager 7,229 8,454Management fees waived/paid by Manager (10) —Expenses waived/paid by Manager (Note 6(b)) — (1,479)
Net operating expenses after waivers/paid by Manager 7,219 6,975
Transaction costs (Note 9) 327 320Withholding tax expense 1,796 1,409
Total expenses 9,342 8,704
Increase (decrease) in net assets attributable to holders of redeemable units from operations $ 16,593 $ 29,272
Represented by:Increase (decrease) in net assets from operations as previously reported under Canadian GAAP — 28,558Revaluation of investments at fair value through profit and loss (Note 3(c)) — 714
Increase (decrease) in net assets attributable to holders of redeemable units from operations $ 16,593 $ 29,272
Increase (decrease) in net assets attributable to holders of redeemable units from operations per series (000s)Series A $ 9,465 $ 18,154Series F 427 749Series I 60 126Series O 6,612 10,175Series T 29 68
Weighted average number of units outstandingSeries A 30,869,703 36,142,363Series F 937,113 1,086,745Series I 117,209 214,578Series O 8,239,939 10,848,171Series T 296,348 327,707
Increase (decrease) in net assets attributable to holders of redeemable units from operations per unitSeries A $ 0.31 $ 0.50Series F 0.46 0.68Series I 0.52 0.59Series O 0.80 0.94Series T 0.10 0.20
The accompanying notes are an integral part of these financial statements.
Franklin Templeton Investments Funds 97
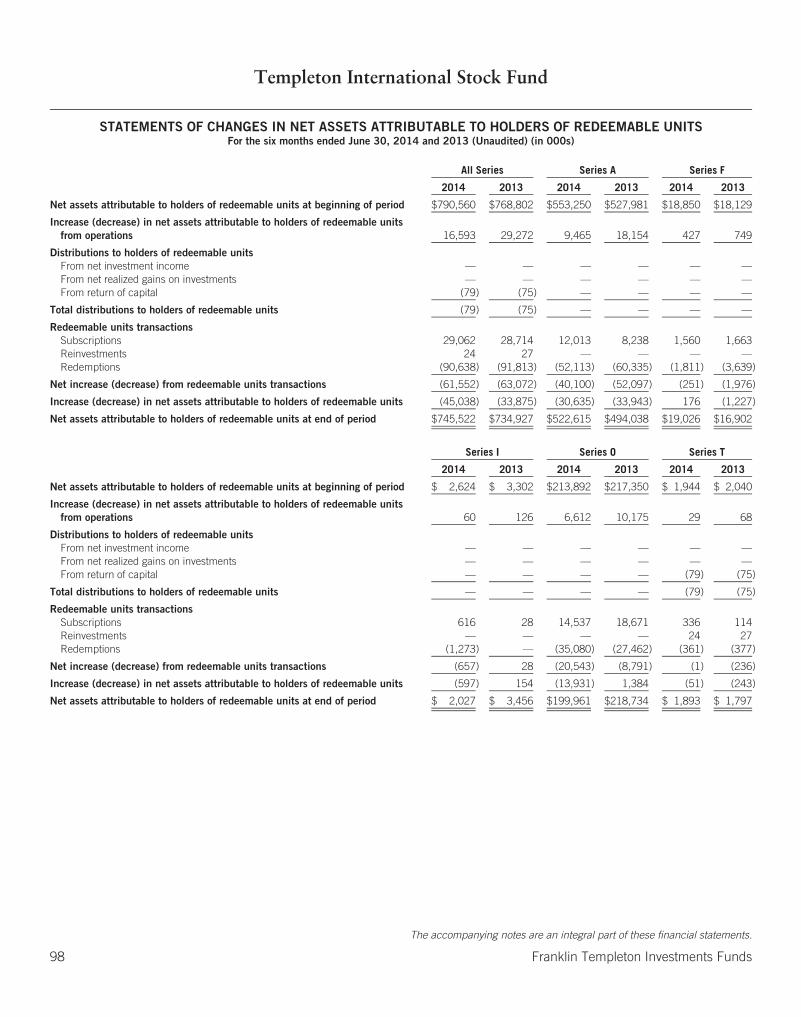
Templeton International Stock Fund
STATEMENTS OF CHANGES IN NET ASSETS ATTRIBUTABLE TO HOLDERS OF REDEEMABLE UNITSFor the six months ended June 30, 2014 and 2013 (Unaudited) (in 000s)
All Series Series A Series F
2014 2013 2014 2013 2014 2013
Net assets attributable to holders of redeemable units at beginning of period $790,560 $768,802 $553,250 $527,981 $18,850 $18,129
Increase (decrease) in net assets attributable to holders of redeemable unitsfrom operations 16,593 29,272 9,465 18,154 427 749
Distributions to holders of redeemable unitsFrom net investment income — — — — — —From net realized gains on investments — — — — — —From return of capital (79) (75) — — — —
Total distributions to holders of redeemable units (79) (75) — — — —
Redeemable units transactionsSubscriptions 29,062 28,714 12,013 8,238 1,560 1,663Reinvestments 24 27 — — — —Redemptions (90,638) (91,813) (52,113) (60,335) (1,811) (3,639)
Net increase (decrease) from redeemable units transactions (61,552) (63,072) (40,100) (52,097) (251) (1,976)
Increase (decrease) in net assets attributable to holders of redeemable units (45,038) (33,875) (30,635) (33,943) 176 (1,227)
Net assets attributable to holders of redeemable units at end of period $745,522 $734,927 $522,615 $494,038 $19,026 $16,902
Series I Series O Series T
2014 2013 2014 2013 2014 2013
Net assets attributable to holders of redeemable units at beginning of period $ 2,624 $ 3,302 $213,892 $217,350 $ 1,944 $ 2,040
Increase (decrease) in net assets attributable to holders of redeemable unitsfrom operations 60 126 6,612 10,175 29 68
Distributions to holders of redeemable unitsFrom net investment income — — — — — —From net realized gains on investments — — — — — —From return of capital — — — — (79) (75)
Total distributions to holders of redeemable units — — — — (79) (75)
Redeemable units transactionsSubscriptions 616 28 14,537 18,671 336 114Reinvestments — — — — 24 27Redemptions (1,273) — (35,080) (27,462) (361) (377)
Net increase (decrease) from redeemable units transactions (657) 28 (20,543) (8,791) (1) (236)
Increase (decrease) in net assets attributable to holders of redeemable units (597) 154 (13,931) 1,384 (51) (243)
Net assets attributable to holders of redeemable units at end of period $ 2,027 $ 3,456 $199,961 $218,734 $ 1,893 $ 1,797
The accompanying notes are an integral part of these financial statements.
98 Franklin Templeton Investments Funds

Templeton International Stock Fund
STATEMENTS OF CASH FLOWSFor the six months ended June 30, 2014 and 2013 (Unaudited)
2014 2013
(000s) (000s)Cash flows from operating activitiesInterest received $ 40 $ 31Dividends received 14,755 13,214Proceeds from sale and maturity of investments 121,277 131,266Purchases of investments (66,858) (73,281)Operating expenses paid (7,390) (7,113)
Net cash from/(used in) operating activities 61,824 64,117
Cash flows from financing activitiesProceeds from issuances of redeemable units 28,887 27,815Amounts paid on redemption of redeemable units (90,552) (91,679)Distributions paid to holders of redeemable units, net of reinvested distributions (43) (36)
Net cash (used in)/from financing activities (61,708) (63,900)
Net increase (decrease) in cash 116 217Cash at beginning of year 18 87Effect of exchange rate changes (27) (123)
Cash at end of period $ 107 $ 181
The accompanying notes are an integral part of these financial statements.
Franklin Templeton Investments Funds 99
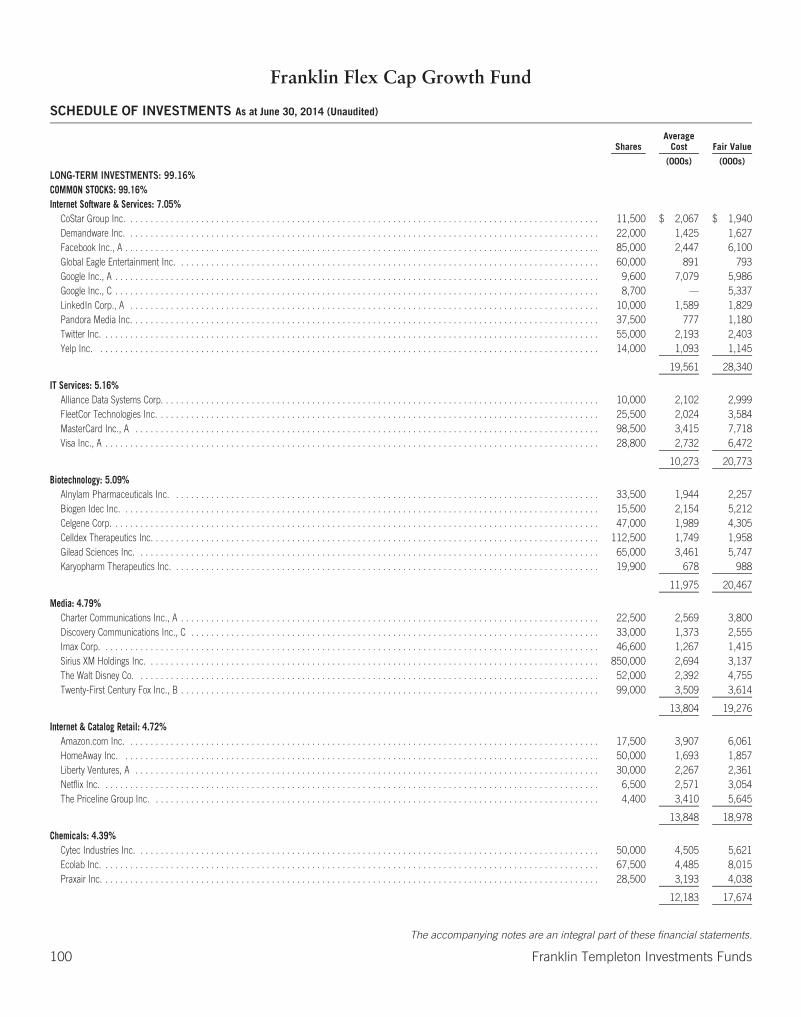
Franklin Flex Cap Growth Fund
SCHEDULE OF INVESTMENTS As at June 30, 2014 (Unaudited)
SharesAverage
Cost Fair Value
(000s) (000s)
LONG-TERM INVESTMENTS: 99.16%COMMON STOCKS: 99.16%Internet Software & Services: 7.05%
CoStar Group Inc. . . . . . . . . . . . . . . . . . . . . . . . . . . . . . . . . . . . . . . . . . . . . . . . . . . . . . . . . . . . . . . . . . . . . . . . . . . . . . . . . . . . . . . . . . . . . . 11,500 $ 2,067 $ 1,940Demandware Inc. . . . . . . . . . . . . . . . . . . . . . . . . . . . . . . . . . . . . . . . . . . . . . . . . . . . . . . . . . . . . . . . . . . . . . . . . . . . . . . . . . . . . . . . . . . . . . 22,000 1,425 1,627Facebook Inc., A . . . . . . . . . . . . . . . . . . . . . . . . . . . . . . . . . . . . . . . . . . . . . . . . . . . . . . . . . . . . . . . . . . . . . . . . . . . . . . . . . . . . . . . . . . . . . . 85,000 2,447 6,100Global Eagle Entertainment Inc. . . . . . . . . . . . . . . . . . . . . . . . . . . . . . . . . . . . . . . . . . . . . . . . . . . . . . . . . . . . . . . . . . . . . . . . . . . . . . . . . . . . 60,000 891 793Google Inc., A . . . . . . . . . . . . . . . . . . . . . . . . . . . . . . . . . . . . . . . . . . . . . . . . . . . . . . . . . . . . . . . . . . . . . . . . . . . . . . . . . . . . . . . . . . . . . . . . 9,600 7,079 5,986Google Inc., C . . . . . . . . . . . . . . . . . . . . . . . . . . . . . . . . . . . . . . . . . . . . . . . . . . . . . . . . . . . . . . . . . . . . . . . . . . . . . . . . . . . . . . . . . . . . . . . . 8,700 — 5,337LinkedIn Corp., A . . . . . . . . . . . . . . . . . . . . . . . . . . . . . . . . . . . . . . . . . . . . . . . . . . . . . . . . . . . . . . . . . . . . . . . . . . . . . . . . . . . . . . . . . . . . . 10,000 1,589 1,829Pandora Media Inc. . . . . . . . . . . . . . . . . . . . . . . . . . . . . . . . . . . . . . . . . . . . . . . . . . . . . . . . . . . . . . . . . . . . . . . . . . . . . . . . . . . . . . . . . . . . . 37,500 777 1,180Twitter Inc. . . . . . . . . . . . . . . . . . . . . . . . . . . . . . . . . . . . . . . . . . . . . . . . . . . . . . . . . . . . . . . . . . . . . . . . . . . . . . . . . . . . . . . . . . . . . . . . . . . 55,000 2,193 2,403Yelp Inc. . . . . . . . . . . . . . . . . . . . . . . . . . . . . . . . . . . . . . . . . . . . . . . . . . . . . . . . . . . . . . . . . . . . . . . . . . . . . . . . . . . . . . . . . . . . . . . . . . . . 14,000 1,093 1,145
19,561 28,340
IT Services: 5.16%Alliance Data Systems Corp. . . . . . . . . . . . . . . . . . . . . . . . . . . . . . . . . . . . . . . . . . . . . . . . . . . . . . . . . . . . . . . . . . . . . . . . . . . . . . . . . . . . . . . 10,000 2,102 2,999FleetCor Technologies Inc. . . . . . . . . . . . . . . . . . . . . . . . . . . . . . . . . . . . . . . . . . . . . . . . . . . . . . . . . . . . . . . . . . . . . . . . . . . . . . . . . . . . . . . . 25,500 2,024 3,584MasterCard Inc., A . . . . . . . . . . . . . . . . . . . . . . . . . . . . . . . . . . . . . . . . . . . . . . . . . . . . . . . . . . . . . . . . . . . . . . . . . . . . . . . . . . . . . . . . . . . . 98,500 3,415 7,718Visa Inc., A . . . . . . . . . . . . . . . . . . . . . . . . . . . . . . . . . . . . . . . . . . . . . . . . . . . . . . . . . . . . . . . . . . . . . . . . . . . . . . . . . . . . . . . . . . . . . . . . . . 28,800 2,732 6,472
10,273 20,773
Biotechnology: 5.09%Alnylam Pharmaceuticals Inc. . . . . . . . . . . . . . . . . . . . . . . . . . . . . . . . . . . . . . . . . . . . . . . . . . . . . . . . . . . . . . . . . . . . . . . . . . . . . . . . . . . . . 33,500 1,944 2,257Biogen Idec Inc. . . . . . . . . . . . . . . . . . . . . . . . . . . . . . . . . . . . . . . . . . . . . . . . . . . . . . . . . . . . . . . . . . . . . . . . . . . . . . . . . . . . . . . . . . . . . . . 15,500 2,154 5,212Celgene Corp. . . . . . . . . . . . . . . . . . . . . . . . . . . . . . . . . . . . . . . . . . . . . . . . . . . . . . . . . . . . . . . . . . . . . . . . . . . . . . . . . . . . . . . . . . . . . . . . . 47,000 1,989 4,305Celldex Therapeutics Inc. . . . . . . . . . . . . . . . . . . . . . . . . . . . . . . . . . . . . . . . . . . . . . . . . . . . . . . . . . . . . . . . . . . . . . . . . . . . . . . . . . . . . . . . . 112,500 1,749 1,958Gilead Sciences Inc. . . . . . . . . . . . . . . . . . . . . . . . . . . . . . . . . . . . . . . . . . . . . . . . . . . . . . . . . . . . . . . . . . . . . . . . . . . . . . . . . . . . . . . . . . . . 65,000 3,461 5,747Karyopharm Therapeutics Inc. . . . . . . . . . . . . . . . . . . . . . . . . . . . . . . . . . . . . . . . . . . . . . . . . . . . . . . . . . . . . . . . . . . . . . . . . . . . . . . . . . . . . 19,900 678 988
11,975 20,467
Media: 4.79%Charter Communications Inc., A . . . . . . . . . . . . . . . . . . . . . . . . . . . . . . . . . . . . . . . . . . . . . . . . . . . . . . . . . . . . . . . . . . . . . . . . . . . . . . . . . . . 22,500 2,569 3,800Discovery Communications Inc., C . . . . . . . . . . . . . . . . . . . . . . . . . . . . . . . . . . . . . . . . . . . . . . . . . . . . . . . . . . . . . . . . . . . . . . . . . . . . . . . . . 33,000 1,373 2,555Imax Corp. . . . . . . . . . . . . . . . . . . . . . . . . . . . . . . . . . . . . . . . . . . . . . . . . . . . . . . . . . . . . . . . . . . . . . . . . . . . . . . . . . . . . . . . . . . . . . . . . . . 46,600 1,267 1,415Sirius XM Holdings Inc. . . . . . . . . . . . . . . . . . . . . . . . . . . . . . . . . . . . . . . . . . . . . . . . . . . . . . . . . . . . . . . . . . . . . . . . . . . . . . . . . . . . . . . . . . 850,000 2,694 3,137The Walt Disney Co. . . . . . . . . . . . . . . . . . . . . . . . . . . . . . . . . . . . . . . . . . . . . . . . . . . . . . . . . . . . . . . . . . . . . . . . . . . . . . . . . . . . . . . . . . . . 52,000 2,392 4,755Twenty-First Century Fox Inc., B . . . . . . . . . . . . . . . . . . . . . . . . . . . . . . . . . . . . . . . . . . . . . . . . . . . . . . . . . . . . . . . . . . . . . . . . . . . . . . . . . . . 99,000 3,509 3,614
13,804 19,276
Internet & Catalog Retail: 4.72%Amazon.com Inc. . . . . . . . . . . . . . . . . . . . . . . . . . . . . . . . . . . . . . . . . . . . . . . . . . . . . . . . . . . . . . . . . . . . . . . . . . . . . . . . . . . . . . . . . . . . . . 17,500 3,907 6,061HomeAway Inc. . . . . . . . . . . . . . . . . . . . . . . . . . . . . . . . . . . . . . . . . . . . . . . . . . . . . . . . . . . . . . . . . . . . . . . . . . . . . . . . . . . . . . . . . . . . . . . 50,000 1,693 1,857Liberty Ventures, A . . . . . . . . . . . . . . . . . . . . . . . . . . . . . . . . . . . . . . . . . . . . . . . . . . . . . . . . . . . . . . . . . . . . . . . . . . . . . . . . . . . . . . . . . . . . 30,000 2,267 2,361Netflix Inc. . . . . . . . . . . . . . . . . . . . . . . . . . . . . . . . . . . . . . . . . . . . . . . . . . . . . . . . . . . . . . . . . . . . . . . . . . . . . . . . . . . . . . . . . . . . . . . . . . . 6,500 2,571 3,054The Priceline Group Inc. . . . . . . . . . . . . . . . . . . . . . . . . . . . . . . . . . . . . . . . . . . . . . . . . . . . . . . . . . . . . . . . . . . . . . . . . . . . . . . . . . . . . . . . . 4,400 3,410 5,645
13,848 18,978
Chemicals: 4.39%Cytec Industries Inc. . . . . . . . . . . . . . . . . . . . . . . . . . . . . . . . . . . . . . . . . . . . . . . . . . . . . . . . . . . . . . . . . . . . . . . . . . . . . . . . . . . . . . . . . . . . 50,000 4,505 5,621Ecolab Inc. . . . . . . . . . . . . . . . . . . . . . . . . . . . . . . . . . . . . . . . . . . . . . . . . . . . . . . . . . . . . . . . . . . . . . . . . . . . . . . . . . . . . . . . . . . . . . . . . . . 67,500 4,485 8,015Praxair Inc. . . . . . . . . . . . . . . . . . . . . . . . . . . . . . . . . . . . . . . . . . . . . . . . . . . . . . . . . . . . . . . . . . . . . . . . . . . . . . . . . . . . . . . . . . . . . . . . . . . 28,500 3,193 4,038
12,183 17,674
The accompanying notes are an integral part of these financial statements.
100 Franklin Templeton Investments Funds
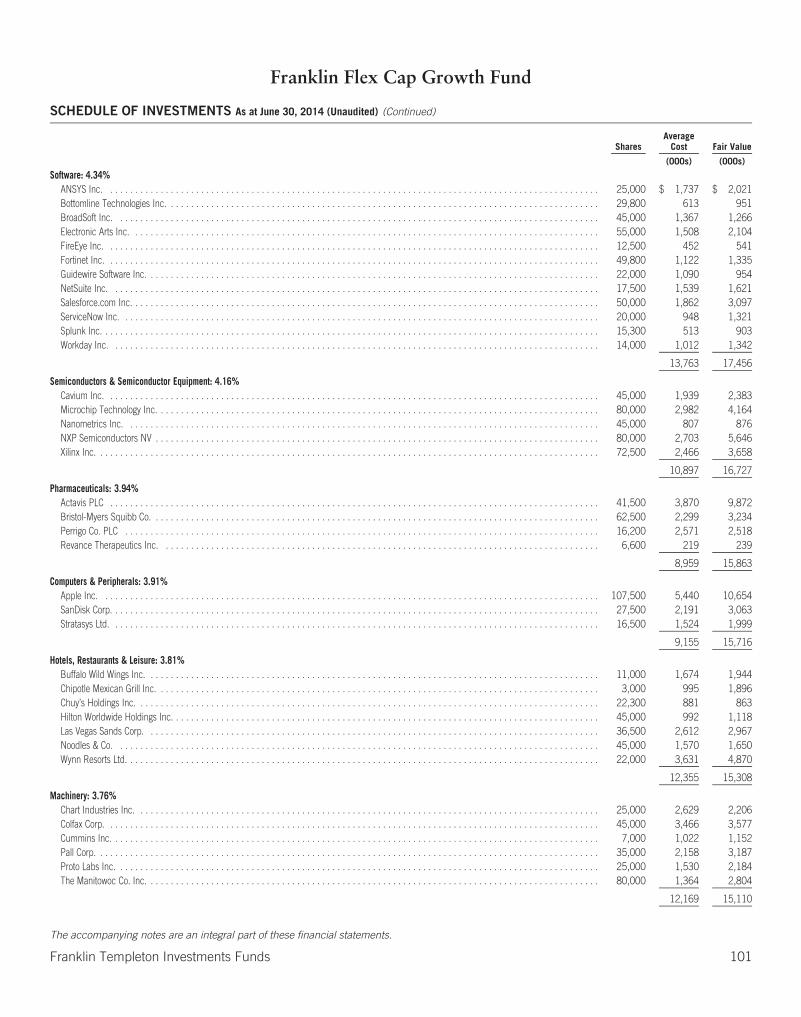
Franklin Flex Cap Growth Fund
SCHEDULE OF INVESTMENTS As at June 30, 2014 (Unaudited) (Continued)
SharesAverage
Cost Fair Value
(000s) (000s)
Software: 4.34%ANSYS Inc. . . . . . . . . . . . . . . . . . . . . . . . . . . . . . . . . . . . . . . . . . . . . . . . . . . . . . . . . . . . . . . . . . . . . . . . . . . . . . . . . . . . . . . . . . . . . . . . . . 25,000 $ 1,737 $ 2,021Bottomline Technologies Inc. . . . . . . . . . . . . . . . . . . . . . . . . . . . . . . . . . . . . . . . . . . . . . . . . . . . . . . . . . . . . . . . . . . . . . . . . . . . . . . . . . . . . . 29,800 613 951BroadSoft Inc. . . . . . . . . . . . . . . . . . . . . . . . . . . . . . . . . . . . . . . . . . . . . . . . . . . . . . . . . . . . . . . . . . . . . . . . . . . . . . . . . . . . . . . . . . . . . . . . 45,000 1,367 1,266Electronic Arts Inc. . . . . . . . . . . . . . . . . . . . . . . . . . . . . . . . . . . . . . . . . . . . . . . . . . . . . . . . . . . . . . . . . . . . . . . . . . . . . . . . . . . . . . . . . . . . . 55,000 1,508 2,104FireEye Inc. . . . . . . . . . . . . . . . . . . . . . . . . . . . . . . . . . . . . . . . . . . . . . . . . . . . . . . . . . . . . . . . . . . . . . . . . . . . . . . . . . . . . . . . . . . . . . . . . . 12,500 452 541Fortinet Inc. . . . . . . . . . . . . . . . . . . . . . . . . . . . . . . . . . . . . . . . . . . . . . . . . . . . . . . . . . . . . . . . . . . . . . . . . . . . . . . . . . . . . . . . . . . . . . . . . . 49,800 1,122 1,335Guidewire Software Inc. . . . . . . . . . . . . . . . . . . . . . . . . . . . . . . . . . . . . . . . . . . . . . . . . . . . . . . . . . . . . . . . . . . . . . . . . . . . . . . . . . . . . . . . . . 22,000 1,090 954NetSuite Inc. . . . . . . . . . . . . . . . . . . . . . . . . . . . . . . . . . . . . . . . . . . . . . . . . . . . . . . . . . . . . . . . . . . . . . . . . . . . . . . . . . . . . . . . . . . . . . . . . 17,500 1,539 1,621Salesforce.com Inc. . . . . . . . . . . . . . . . . . . . . . . . . . . . . . . . . . . . . . . . . . . . . . . . . . . . . . . . . . . . . . . . . . . . . . . . . . . . . . . . . . . . . . . . . . . . . 50,000 1,862 3,097ServiceNow Inc. . . . . . . . . . . . . . . . . . . . . . . . . . . . . . . . . . . . . . . . . . . . . . . . . . . . . . . . . . . . . . . . . . . . . . . . . . . . . . . . . . . . . . . . . . . . . . . 20,000 948 1,321Splunk Inc. . . . . . . . . . . . . . . . . . . . . . . . . . . . . . . . . . . . . . . . . . . . . . . . . . . . . . . . . . . . . . . . . . . . . . . . . . . . . . . . . . . . . . . . . . . . . . . . . . . 15,300 513 903Workday Inc. . . . . . . . . . . . . . . . . . . . . . . . . . . . . . . . . . . . . . . . . . . . . . . . . . . . . . . . . . . . . . . . . . . . . . . . . . . . . . . . . . . . . . . . . . . . . . . . . 14,000 1,012 1,342
13,763 17,456
Semiconductors & Semiconductor Equipment: 4.16%Cavium Inc. . . . . . . . . . . . . . . . . . . . . . . . . . . . . . . . . . . . . . . . . . . . . . . . . . . . . . . . . . . . . . . . . . . . . . . . . . . . . . . . . . . . . . . . . . . . . . . . . . 45,000 1,939 2,383Microchip Technology Inc. . . . . . . . . . . . . . . . . . . . . . . . . . . . . . . . . . . . . . . . . . . . . . . . . . . . . . . . . . . . . . . . . . . . . . . . . . . . . . . . . . . . . . . . 80,000 2,982 4,164Nanometrics Inc. . . . . . . . . . . . . . . . . . . . . . . . . . . . . . . . . . . . . . . . . . . . . . . . . . . . . . . . . . . . . . . . . . . . . . . . . . . . . . . . . . . . . . . . . . . . . . 45,000 807 876NXP Semiconductors NV . . . . . . . . . . . . . . . . . . . . . . . . . . . . . . . . . . . . . . . . . . . . . . . . . . . . . . . . . . . . . . . . . . . . . . . . . . . . . . . . . . . . . . . . 80,000 2,703 5,646Xilinx Inc. . . . . . . . . . . . . . . . . . . . . . . . . . . . . . . . . . . . . . . . . . . . . . . . . . . . . . . . . . . . . . . . . . . . . . . . . . . . . . . . . . . . . . . . . . . . . . . . . . . . 72,500 2,466 3,658
10,897 16,727
Pharmaceuticals: 3.94%Actavis PLC . . . . . . . . . . . . . . . . . . . . . . . . . . . . . . . . . . . . . . . . . . . . . . . . . . . . . . . . . . . . . . . . . . . . . . . . . . . . . . . . . . . . . . . . . . . . . . . . . 41,500 3,870 9,872Bristol-Myers Squibb Co. . . . . . . . . . . . . . . . . . . . . . . . . . . . . . . . . . . . . . . . . . . . . . . . . . . . . . . . . . . . . . . . . . . . . . . . . . . . . . . . . . . . . . . . . 62,500 2,299 3,234Perrigo Co. PLC . . . . . . . . . . . . . . . . . . . . . . . . . . . . . . . . . . . . . . . . . . . . . . . . . . . . . . . . . . . . . . . . . . . . . . . . . . . . . . . . . . . . . . . . . . . . . . 16,200 2,571 2,518Revance Therapeutics Inc. . . . . . . . . . . . . . . . . . . . . . . . . . . . . . . . . . . . . . . . . . . . . . . . . . . . . . . . . . . . . . . . . . . . . . . . . . . . . . . . . . . . . . . 6,600 219 239
8,959 15,863
Computers & Peripherals: 3.91%Apple Inc. . . . . . . . . . . . . . . . . . . . . . . . . . . . . . . . . . . . . . . . . . . . . . . . . . . . . . . . . . . . . . . . . . . . . . . . . . . . . . . . . . . . . . . . . . . . . . . . . . . 107,500 5,440 10,654SanDisk Corp. . . . . . . . . . . . . . . . . . . . . . . . . . . . . . . . . . . . . . . . . . . . . . . . . . . . . . . . . . . . . . . . . . . . . . . . . . . . . . . . . . . . . . . . . . . . . . . . . 27,500 2,191 3,063Stratasys Ltd. . . . . . . . . . . . . . . . . . . . . . . . . . . . . . . . . . . . . . . . . . . . . . . . . . . . . . . . . . . . . . . . . . . . . . . . . . . . . . . . . . . . . . . . . . . . . . . . . 16,500 1,524 1,999
9,155 15,716
Hotels, Restaurants & Leisure: 3.81%Buffalo Wild Wings Inc. . . . . . . . . . . . . . . . . . . . . . . . . . . . . . . . . . . . . . . . . . . . . . . . . . . . . . . . . . . . . . . . . . . . . . . . . . . . . . . . . . . . . . . . . . 11,000 1,674 1,944Chipotle Mexican Grill Inc. . . . . . . . . . . . . . . . . . . . . . . . . . . . . . . . . . . . . . . . . . . . . . . . . . . . . . . . . . . . . . . . . . . . . . . . . . . . . . . . . . . . . . . . 3,000 995 1,896Chuy’s Holdings Inc. . . . . . . . . . . . . . . . . . . . . . . . . . . . . . . . . . . . . . . . . . . . . . . . . . . . . . . . . . . . . . . . . . . . . . . . . . . . . . . . . . . . . . . . . . . . 22,300 881 863Hilton Worldwide Holdings Inc. . . . . . . . . . . . . . . . . . . . . . . . . . . . . . . . . . . . . . . . . . . . . . . . . . . . . . . . . . . . . . . . . . . . . . . . . . . . . . . . . . . . . 45,000 992 1,118Las Vegas Sands Corp. . . . . . . . . . . . . . . . . . . . . . . . . . . . . . . . . . . . . . . . . . . . . . . . . . . . . . . . . . . . . . . . . . . . . . . . . . . . . . . . . . . . . . . . . . 36,500 2,612 2,967Noodles & Co. . . . . . . . . . . . . . . . . . . . . . . . . . . . . . . . . . . . . . . . . . . . . . . . . . . . . . . . . . . . . . . . . . . . . . . . . . . . . . . . . . . . . . . . . . . . . . . . 45,000 1,570 1,650Wynn Resorts Ltd. . . . . . . . . . . . . . . . . . . . . . . . . . . . . . . . . . . . . . . . . . . . . . . . . . . . . . . . . . . . . . . . . . . . . . . . . . . . . . . . . . . . . . . . . . . . . . 22,000 3,631 4,870
12,355 15,308
Machinery: 3.76%Chart Industries Inc. . . . . . . . . . . . . . . . . . . . . . . . . . . . . . . . . . . . . . . . . . . . . . . . . . . . . . . . . . . . . . . . . . . . . . . . . . . . . . . . . . . . . . . . . . . . 25,000 2,629 2,206Colfax Corp. . . . . . . . . . . . . . . . . . . . . . . . . . . . . . . . . . . . . . . . . . . . . . . . . . . . . . . . . . . . . . . . . . . . . . . . . . . . . . . . . . . . . . . . . . . . . . . . . . 45,000 3,466 3,577Cummins Inc. . . . . . . . . . . . . . . . . . . . . . . . . . . . . . . . . . . . . . . . . . . . . . . . . . . . . . . . . . . . . . . . . . . . . . . . . . . . . . . . . . . . . . . . . . . . . . . . . 7,000 1,022 1,152Pall Corp. . . . . . . . . . . . . . . . . . . . . . . . . . . . . . . . . . . . . . . . . . . . . . . . . . . . . . . . . . . . . . . . . . . . . . . . . . . . . . . . . . . . . . . . . . . . . . . . . . . . 35,000 2,158 3,187Proto Labs Inc. . . . . . . . . . . . . . . . . . . . . . . . . . . . . . . . . . . . . . . . . . . . . . . . . . . . . . . . . . . . . . . . . . . . . . . . . . . . . . . . . . . . . . . . . . . . . . . . 25,000 1,530 2,184The Manitowoc Co. Inc. . . . . . . . . . . . . . . . . . . . . . . . . . . . . . . . . . . . . . . . . . . . . . . . . . . . . . . . . . . . . . . . . . . . . . . . . . . . . . . . . . . . . . . . . . 80,000 1,364 2,804
12,169 15,110
The accompanying notes are an integral part of these financial statements.
Franklin Templeton Investments Funds 101

Franklin Flex Cap Growth Fund
SCHEDULE OF INVESTMENTS As at June 30, 2014 (Unaudited) (Continued)
SharesAverage
Cost Fair Value
(000s) (000s)
Oil, Gas & Consumable Fuels: 3.60%Anadarko Petroleum Corp. . . . . . . . . . . . . . . . . . . . . . . . . . . . . . . . . . . . . . . . . . . . . . . . . . . . . . . . . . . . . . . . . . . . . . . . . . . . . . . . . . . . . . . . . 35,000 $ 3,355 $ 4,086Diamondback Energy Inc. . . . . . . . . . . . . . . . . . . . . . . . . . . . . . . . . . . . . . . . . . . . . . . . . . . . . . . . . . . . . . . . . . . . . . . . . . . . . . . . . . . . . . . . . 24,500 1,422 2,320Eclipse Resources Corp. . . . . . . . . . . . . . . . . . . . . . . . . . . . . . . . . . . . . . . . . . . . . . . . . . . . . . . . . . . . . . . . . . . . . . . . . . . . . . . . . . . . . . . . . . 43,100 1,241 1,155Noble Energy Inc. . . . . . . . . . . . . . . . . . . . . . . . . . . . . . . . . . . . . . . . . . . . . . . . . . . . . . . . . . . . . . . . . . . . . . . . . . . . . . . . . . . . . . . . . . . . . . . 25,000 1,452 2,065Oasis Petroleum Inc. . . . . . . . . . . . . . . . . . . . . . . . . . . . . . . . . . . . . . . . . . . . . . . . . . . . . . . . . . . . . . . . . . . . . . . . . . . . . . . . . . . . . . . . . . . . . 50,000 2,369 2,980Rice Energy Inc. . . . . . . . . . . . . . . . . . . . . . . . . . . . . . . . . . . . . . . . . . . . . . . . . . . . . . . . . . . . . . . . . . . . . . . . . . . . . . . . . . . . . . . . . . . . . . . . 58,000 1,377 1,884
11,216 14,490
Textiles, Apparel & Luxury Goods: 3.56%Kate Spade & Co. . . . . . . . . . . . . . . . . . . . . . . . . . . . . . . . . . . . . . . . . . . . . . . . . . . . . . . . . . . . . . . . . . . . . . . . . . . . . . . . . . . . . . . . . . . . . . . 27,500 1,115 1,118Lululemon Athletica Inc. . . . . . . . . . . . . . . . . . . . . . . . . . . . . . . . . . . . . . . . . . . . . . . . . . . . . . . . . . . . . . . . . . . . . . . . . . . . . . . . . . . . . . . . . . 25,000 1,725 1,079Michael Kors Holdings Ltd. . . . . . . . . . . . . . . . . . . . . . . . . . . . . . . . . . . . . . . . . . . . . . . . . . . . . . . . . . . . . . . . . . . . . . . . . . . . . . . . . . . . . . . . 40,000 2,712 3,782NIKE Inc., B . . . . . . . . . . . . . . . . . . . . . . . . . . . . . . . . . . . . . . . . . . . . . . . . . . . . . . . . . . . . . . . . . . . . . . . . . . . . . . . . . . . . . . . . . . . . . . . . . . 47,200 2,528 3,904Under Armour Inc., A . . . . . . . . . . . . . . . . . . . . . . . . . . . . . . . . . . . . . . . . . . . . . . . . . . . . . . . . . . . . . . . . . . . . . . . . . . . . . . . . . . . . . . . . . . . 70,000 1,583 4,441
9,663 14,324
Road & Rail: 3.06%Canadian Pacific Railway Ltd. . . . . . . . . . . . . . . . . . . . . . . . . . . . . . . . . . . . . . . . . . . . . . . . . . . . . . . . . . . . . . . . . . . . . . . . . . . . . . . . . . . . . . . 17,500 2,564 3,381Genesee & Wyoming Inc. . . . . . . . . . . . . . . . . . . . . . . . . . . . . . . . . . . . . . . . . . . . . . . . . . . . . . . . . . . . . . . . . . . . . . . . . . . . . . . . . . . . . . . . . . 28,800 2,195 3,225Kansas City Southern . . . . . . . . . . . . . . . . . . . . . . . . . . . . . . . . . . . . . . . . . . . . . . . . . . . . . . . . . . . . . . . . . . . . . . . . . . . . . . . . . . . . . . . . . . . . 20,000 1,546 2,293Union Pacific Corp. . . . . . . . . . . . . . . . . . . . . . . . . . . . . . . . . . . . . . . . . . . . . . . . . . . . . . . . . . . . . . . . . . . . . . . . . . . . . . . . . . . . . . . . . . . . . . 32,000 2,159 3,404
8,464 12,303
Aerospace & Defense: 2.87%DigitalGlobe Inc. . . . . . . . . . . . . . . . . . . . . . . . . . . . . . . . . . . . . . . . . . . . . . . . . . . . . . . . . . . . . . . . . . . . . . . . . . . . . . . . . . . . . . . . . . . . . . . . 60,000 2,142 1,779Honeywell International Inc. . . . . . . . . . . . . . . . . . . . . . . . . . . . . . . . . . . . . . . . . . . . . . . . . . . . . . . . . . . . . . . . . . . . . . . . . . . . . . . . . . . . . . . . 41,000 3,417 4,064Precision Castparts Corp. . . . . . . . . . . . . . . . . . . . . . . . . . . . . . . . . . . . . . . . . . . . . . . . . . . . . . . . . . . . . . . . . . . . . . . . . . . . . . . . . . . . . . . . . . 17,500 2,889 4,710The Keyw Holding Corp. . . . . . . . . . . . . . . . . . . . . . . . . . . . . . . . . . . . . . . . . . . . . . . . . . . . . . . . . . . . . . . . . . . . . . . . . . . . . . . . . . . . . . . . . . 72,500 1,048 972
9,496 11,525
Commercial Banks: 2.72%Signature Bank/New York NY . . . . . . . . . . . . . . . . . . . . . . . . . . . . . . . . . . . . . . . . . . . . . . . . . . . . . . . . . . . . . . . . . . . . . . . . . . . . . . . . . . . . . . 32,500 2,094 4,373SVB Financial Group . . . . . . . . . . . . . . . . . . . . . . . . . . . . . . . . . . . . . . . . . . . . . . . . . . . . . . . . . . . . . . . . . . . . . . . . . . . . . . . . . . . . . . . . . . . . 32,500 4,335 4,042Talmer Bank Corporation Inc., A . . . . . . . . . . . . . . . . . . . . . . . . . . . . . . . . . . . . . . . . . . . . . . . . . . . . . . . . . . . . . . . . . . . . . . . . . . . . . . . . . . . . 75,000 1,102 1,103Texas Capital Bancshares Inc. . . . . . . . . . . . . . . . . . . . . . . . . . . . . . . . . . . . . . . . . . . . . . . . . . . . . . . . . . . . . . . . . . . . . . . . . . . . . . . . . . . . . . 25,000 1,744 1,439
9,275 10,957
Energy Equipment & Services: 2.47%FMC Technologies Inc. . . . . . . . . . . . . . . . . . . . . . . . . . . . . . . . . . . . . . . . . . . . . . . . . . . . . . . . . . . . . . . . . . . . . . . . . . . . . . . . . . . . . . . . . . . 32,500 1,461 2,117National Oilwell Varco Inc. . . . . . . . . . . . . . . . . . . . . . . . . . . . . . . . . . . . . . . . . . . . . . . . . . . . . . . . . . . . . . . . . . . . . . . . . . . . . . . . . . . . . . . . . 17,500 1,308 1,537Oceaneering International Inc. . . . . . . . . . . . . . . . . . . . . . . . . . . . . . . . . . . . . . . . . . . . . . . . . . . . . . . . . . . . . . . . . . . . . . . . . . . . . . . . . . . . . . 22,500 1,842 1,875Schlumberger Ltd. . . . . . . . . . . . . . . . . . . . . . . . . . . . . . . . . . . . . . . . . . . . . . . . . . . . . . . . . . . . . . . . . . . . . . . . . . . . . . . . . . . . . . . . . . . . . . . 35,000 2,841 4,402
7,452 9,931
Health Care Providers & Services: 2.30%DaVita HealthCare Partners Inc. . . . . . . . . . . . . . . . . . . . . . . . . . . . . . . . . . . . . . . . . . . . . . . . . . . . . . . . . . . . . . . . . . . . . . . . . . . . . . . . . . . . . 32,500 1,318 2,507Envision Healthcare Holdings Inc. . . . . . . . . . . . . . . . . . . . . . . . . . . . . . . . . . . . . . . . . . . . . . . . . . . . . . . . . . . . . . . . . . . . . . . . . . . . . . . . . . . 85,000 2,863 3,255McKesson Corp. . . . . . . . . . . . . . . . . . . . . . . . . . . . . . . . . . . . . . . . . . . . . . . . . . . . . . . . . . . . . . . . . . . . . . . . . . . . . . . . . . . . . . . . . . . . . . . . 17,500 2,015 3,475
6,196 9,237
Communications Equipment: 2.26%Palo Alto Networks Inc. . . . . . . . . . . . . . . . . . . . . . . . . . . . . . . . . . . . . . . . . . . . . . . . . . . . . . . . . . . . . . . . . . . . . . . . . . . . . . . . . . . . . . . . . . . 17,000 852 1,520QUALCOMM Inc. . . . . . . . . . . . . . . . . . . . . . . . . . . . . . . . . . . . . . . . . . . . . . . . . . . . . . . . . . . . . . . . . . . . . . . . . . . . . . . . . . . . . . . . . . . . . . . 62,500 3,704 5,279
The accompanying notes are an integral part of these financial statements.
102 Franklin Templeton Investments Funds
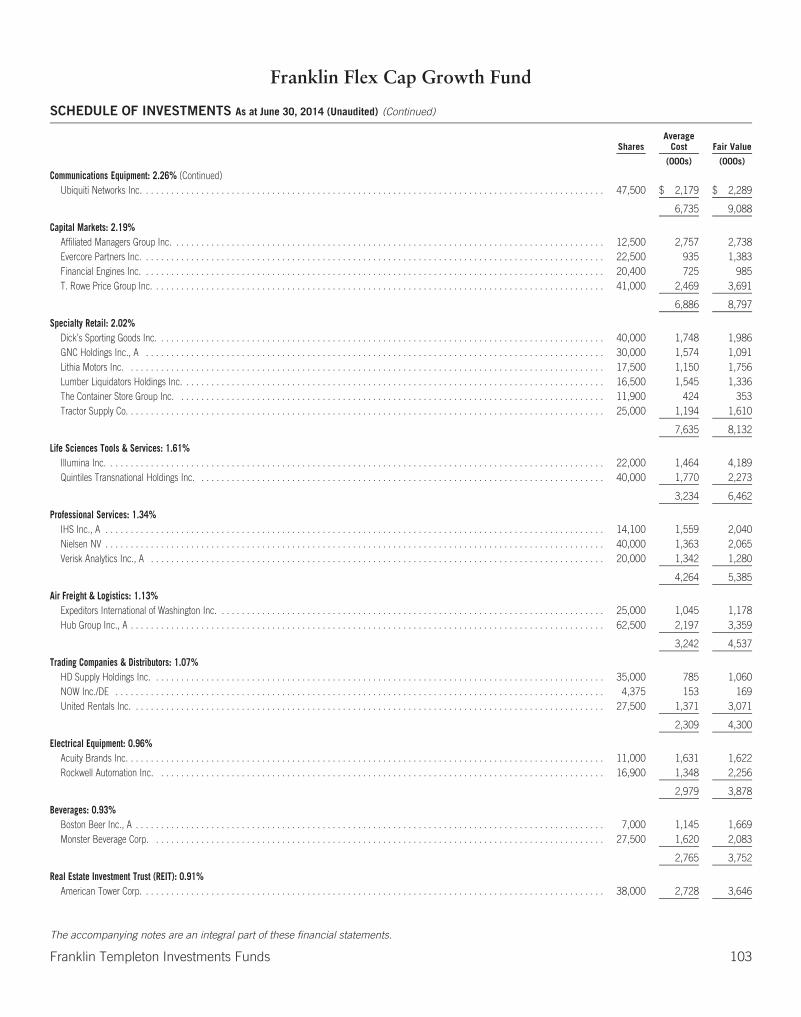
Franklin Flex Cap Growth Fund
SCHEDULE OF INVESTMENTS As at June 30, 2014 (Unaudited) (Continued)
SharesAverage
Cost Fair Value
(000s) (000s)
Communications Equipment: 2.26% (Continued)Ubiquiti Networks Inc. . . . . . . . . . . . . . . . . . . . . . . . . . . . . . . . . . . . . . . . . . . . . . . . . . . . . . . . . . . . . . . . . . . . . . . . . . . . . . . . . . . . . . . . . . . . 47,500 $ 2,179 $ 2,289
6,735 9,088
Capital Markets: 2.19%Affiliated Managers Group Inc. . . . . . . . . . . . . . . . . . . . . . . . . . . . . . . . . . . . . . . . . . . . . . . . . . . . . . . . . . . . . . . . . . . . . . . . . . . . . . . . . . . . . . 12,500 2,757 2,738Evercore Partners Inc. . . . . . . . . . . . . . . . . . . . . . . . . . . . . . . . . . . . . . . . . . . . . . . . . . . . . . . . . . . . . . . . . . . . . . . . . . . . . . . . . . . . . . . . . . . . 22,500 935 1,383Financial Engines Inc. . . . . . . . . . . . . . . . . . . . . . . . . . . . . . . . . . . . . . . . . . . . . . . . . . . . . . . . . . . . . . . . . . . . . . . . . . . . . . . . . . . . . . . . . . . . 20,400 725 985T. Rowe Price Group Inc. . . . . . . . . . . . . . . . . . . . . . . . . . . . . . . . . . . . . . . . . . . . . . . . . . . . . . . . . . . . . . . . . . . . . . . . . . . . . . . . . . . . . . . . . . 41,000 2,469 3,691
6,886 8,797
Specialty Retail: 2.02%Dick’s Sporting Goods Inc. . . . . . . . . . . . . . . . . . . . . . . . . . . . . . . . . . . . . . . . . . . . . . . . . . . . . . . . . . . . . . . . . . . . . . . . . . . . . . . . . . . . . . . . . 40,000 1,748 1,986GNC Holdings Inc., A . . . . . . . . . . . . . . . . . . . . . . . . . . . . . . . . . . . . . . . . . . . . . . . . . . . . . . . . . . . . . . . . . . . . . . . . . . . . . . . . . . . . . . . . . . . 30,000 1,574 1,091Lithia Motors Inc. . . . . . . . . . . . . . . . . . . . . . . . . . . . . . . . . . . . . . . . . . . . . . . . . . . . . . . . . . . . . . . . . . . . . . . . . . . . . . . . . . . . . . . . . . . . . . . 17,500 1,150 1,756Lumber Liquidators Holdings Inc. . . . . . . . . . . . . . . . . . . . . . . . . . . . . . . . . . . . . . . . . . . . . . . . . . . . . . . . . . . . . . . . . . . . . . . . . . . . . . . . . . . . 16,500 1,545 1,336The Container Store Group Inc. . . . . . . . . . . . . . . . . . . . . . . . . . . . . . . . . . . . . . . . . . . . . . . . . . . . . . . . . . . . . . . . . . . . . . . . . . . . . . . . . . . . . 11,900 424 353Tractor Supply Co. . . . . . . . . . . . . . . . . . . . . . . . . . . . . . . . . . . . . . . . . . . . . . . . . . . . . . . . . . . . . . . . . . . . . . . . . . . . . . . . . . . . . . . . . . . . . . . 25,000 1,194 1,610
7,635 8,132
Life Sciences Tools & Services: 1.61%Illumina Inc. . . . . . . . . . . . . . . . . . . . . . . . . . . . . . . . . . . . . . . . . . . . . . . . . . . . . . . . . . . . . . . . . . . . . . . . . . . . . . . . . . . . . . . . . . . . . . . . . . . 22,000 1,464 4,189Quintiles Transnational Holdings Inc. . . . . . . . . . . . . . . . . . . . . . . . . . . . . . . . . . . . . . . . . . . . . . . . . . . . . . . . . . . . . . . . . . . . . . . . . . . . . . . . . 40,000 1,770 2,273
3,234 6,462
Professional Services: 1.34%IHS Inc., A . . . . . . . . . . . . . . . . . . . . . . . . . . . . . . . . . . . . . . . . . . . . . . . . . . . . . . . . . . . . . . . . . . . . . . . . . . . . . . . . . . . . . . . . . . . . . . . . . . . 14,100 1,559 2,040Nielsen NV . . . . . . . . . . . . . . . . . . . . . . . . . . . . . . . . . . . . . . . . . . . . . . . . . . . . . . . . . . . . . . . . . . . . . . . . . . . . . . . . . . . . . . . . . . . . . . . . . . . 40,000 1,363 2,065Verisk Analytics Inc., A . . . . . . . . . . . . . . . . . . . . . . . . . . . . . . . . . . . . . . . . . . . . . . . . . . . . . . . . . . . . . . . . . . . . . . . . . . . . . . . . . . . . . . . . . . 20,000 1,342 1,280
4,264 5,385
Air Freight & Logistics: 1.13%Expeditors International of Washington Inc. . . . . . . . . . . . . . . . . . . . . . . . . . . . . . . . . . . . . . . . . . . . . . . . . . . . . . . . . . . . . . . . . . . . . . . . . . . . . 25,000 1,045 1,178Hub Group Inc., A . . . . . . . . . . . . . . . . . . . . . . . . . . . . . . . . . . . . . . . . . . . . . . . . . . . . . . . . . . . . . . . . . . . . . . . . . . . . . . . . . . . . . . . . . . . . . . 62,500 2,197 3,359
3,242 4,537
Trading Companies & Distributors: 1.07%HD Supply Holdings Inc. . . . . . . . . . . . . . . . . . . . . . . . . . . . . . . . . . . . . . . . . . . . . . . . . . . . . . . . . . . . . . . . . . . . . . . . . . . . . . . . . . . . . . . . . . 35,000 785 1,060NOW Inc./DE . . . . . . . . . . . . . . . . . . . . . . . . . . . . . . . . . . . . . . . . . . . . . . . . . . . . . . . . . . . . . . . . . . . . . . . . . . . . . . . . . . . . . . . . . . . . . . . . . 4,375 153 169United Rentals Inc. . . . . . . . . . . . . . . . . . . . . . . . . . . . . . . . . . . . . . . . . . . . . . . . . . . . . . . . . . . . . . . . . . . . . . . . . . . . . . . . . . . . . . . . . . . . . . 27,500 1,371 3,071
2,309 4,300
Electrical Equipment: 0.96%Acuity Brands Inc. . . . . . . . . . . . . . . . . . . . . . . . . . . . . . . . . . . . . . . . . . . . . . . . . . . . . . . . . . . . . . . . . . . . . . . . . . . . . . . . . . . . . . . . . . . . . . . 11,000 1,631 1,622Rockwell Automation Inc. . . . . . . . . . . . . . . . . . . . . . . . . . . . . . . . . . . . . . . . . . . . . . . . . . . . . . . . . . . . . . . . . . . . . . . . . . . . . . . . . . . . . . . . . 16,900 1,348 2,256
2,979 3,878
Beverages: 0.93%Boston Beer Inc., A . . . . . . . . . . . . . . . . . . . . . . . . . . . . . . . . . . . . . . . . . . . . . . . . . . . . . . . . . . . . . . . . . . . . . . . . . . . . . . . . . . . . . . . . . . . . . 7,000 1,145 1,669Monster Beverage Corp. . . . . . . . . . . . . . . . . . . . . . . . . . . . . . . . . . . . . . . . . . . . . . . . . . . . . . . . . . . . . . . . . . . . . . . . . . . . . . . . . . . . . . . . . . 27,500 1,620 2,083
2,765 3,752
Real Estate Investment Trust (REIT): 0.91%American Tower Corp. . . . . . . . . . . . . . . . . . . . . . . . . . . . . . . . . . . . . . . . . . . . . . . . . . . . . . . . . . . . . . . . . . . . . . . . . . . . . . . . . . . . . . . . . . . . 38,000 2,728 3,646
The accompanying notes are an integral part of these financial statements.
Franklin Templeton Investments Funds 103
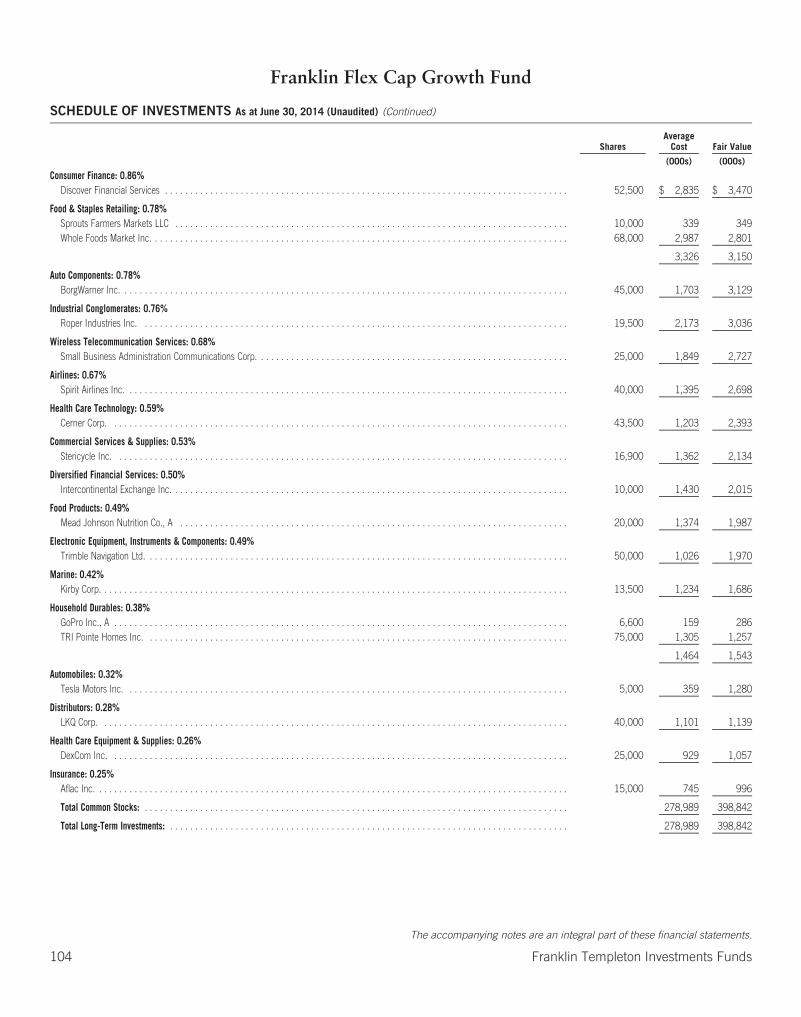
Franklin Flex Cap Growth Fund
SCHEDULE OF INVESTMENTS As at June 30, 2014 (Unaudited) (Continued)
SharesAverage
Cost Fair Value
(000s) (000s)
Consumer Finance: 0.86%Discover Financial Services . . . . . . . . . . . . . . . . . . . . . . . . . . . . . . . . . . . . . . . . . . . . . . . . . . . . . . . . . . . . . . . . . . . . . . . . . . . . . . . . 52,500 $ 2,835 $ 3,470
Food & Staples Retailing: 0.78%Sprouts Farmers Markets LLC . . . . . . . . . . . . . . . . . . . . . . . . . . . . . . . . . . . . . . . . . . . . . . . . . . . . . . . . . . . . . . . . . . . . . . . . . . . . . . 10,000 339 349Whole Foods Market Inc. . . . . . . . . . . . . . . . . . . . . . . . . . . . . . . . . . . . . . . . . . . . . . . . . . . . . . . . . . . . . . . . . . . . . . . . . . . . . . . . . . . 68,000 2,987 2,801
3,326 3,150
Auto Components: 0.78%BorgWarner Inc. . . . . . . . . . . . . . . . . . . . . . . . . . . . . . . . . . . . . . . . . . . . . . . . . . . . . . . . . . . . . . . . . . . . . . . . . . . . . . . . . . . . . . . . . 45,000 1,703 3,129
Industrial Conglomerates: 0.76%Roper Industries Inc. . . . . . . . . . . . . . . . . . . . . . . . . . . . . . . . . . . . . . . . . . . . . . . . . . . . . . . . . . . . . . . . . . . . . . . . . . . . . . . . . . . . . 19,500 2,173 3,036
Wireless Telecommunication Services: 0.68%Small Business Administration Communications Corp. . . . . . . . . . . . . . . . . . . . . . . . . . . . . . . . . . . . . . . . . . . . . . . . . . . . . . . . . . . . . . 25,000 1,849 2,727
Airlines: 0.67%Spirit Airlines Inc. . . . . . . . . . . . . . . . . . . . . . . . . . . . . . . . . . . . . . . . . . . . . . . . . . . . . . . . . . . . . . . . . . . . . . . . . . . . . . . . . . . . . . . . 40,000 1,395 2,698
Health Care Technology: 0.59%Cerner Corp. . . . . . . . . . . . . . . . . . . . . . . . . . . . . . . . . . . . . . . . . . . . . . . . . . . . . . . . . . . . . . . . . . . . . . . . . . . . . . . . . . . . . . . . . . . 43,500 1,203 2,393
Commercial Services & Supplies: 0.53%Stericycle Inc. . . . . . . . . . . . . . . . . . . . . . . . . . . . . . . . . . . . . . . . . . . . . . . . . . . . . . . . . . . . . . . . . . . . . . . . . . . . . . . . . . . . . . . . . . 16,900 1,362 2,134
Diversified Financial Services: 0.50%Intercontinental Exchange Inc. . . . . . . . . . . . . . . . . . . . . . . . . . . . . . . . . . . . . . . . . . . . . . . . . . . . . . . . . . . . . . . . . . . . . . . . . . . . . . . 10,000 1,430 2,015
Food Products: 0.49%Mead Johnson Nutrition Co., A . . . . . . . . . . . . . . . . . . . . . . . . . . . . . . . . . . . . . . . . . . . . . . . . . . . . . . . . . . . . . . . . . . . . . . . . . . . . . 20,000 1,374 1,987
Electronic Equipment, Instruments & Components: 0.49%Trimble Navigation Ltd. . . . . . . . . . . . . . . . . . . . . . . . . . . . . . . . . . . . . . . . . . . . . . . . . . . . . . . . . . . . . . . . . . . . . . . . . . . . . . . . . . . . 50,000 1,026 1,970
Marine: 0.42%Kirby Corp. . . . . . . . . . . . . . . . . . . . . . . . . . . . . . . . . . . . . . . . . . . . . . . . . . . . . . . . . . . . . . . . . . . . . . . . . . . . . . . . . . . . . . . . . . . . . 13,500 1,234 1,686
Household Durables: 0.38%GoPro Inc., A . . . . . . . . . . . . . . . . . . . . . . . . . . . . . . . . . . . . . . . . . . . . . . . . . . . . . . . . . . . . . . . . . . . . . . . . . . . . . . . . . . . . . . . . . . 6,600 159 286TRI Pointe Homes Inc. . . . . . . . . . . . . . . . . . . . . . . . . . . . . . . . . . . . . . . . . . . . . . . . . . . . . . . . . . . . . . . . . . . . . . . . . . . . . . . . . . . . 75,000 1,305 1,257
1,464 1,543
Automobiles: 0.32%Tesla Motors Inc. . . . . . . . . . . . . . . . . . . . . . . . . . . . . . . . . . . . . . . . . . . . . . . . . . . . . . . . . . . . . . . . . . . . . . . . . . . . . . . . . . . . . . . . 5,000 359 1,280
Distributors: 0.28%LKQ Corp. . . . . . . . . . . . . . . . . . . . . . . . . . . . . . . . . . . . . . . . . . . . . . . . . . . . . . . . . . . . . . . . . . . . . . . . . . . . . . . . . . . . . . . . . . . . . 40,000 1,101 1,139
Health Care Equipment & Supplies: 0.26%DexCom Inc. . . . . . . . . . . . . . . . . . . . . . . . . . . . . . . . . . . . . . . . . . . . . . . . . . . . . . . . . . . . . . . . . . . . . . . . . . . . . . . . . . . . . . . . . . . 25,000 929 1,057
Insurance: 0.25%Aflac Inc. . . . . . . . . . . . . . . . . . . . . . . . . . . . . . . . . . . . . . . . . . . . . . . . . . . . . . . . . . . . . . . . . . . . . . . . . . . . . . . . . . . . . . . . . . . . . . 15,000 745 996
Total Common Stocks: . . . . . . . . . . . . . . . . . . . . . . . . . . . . . . . . . . . . . . . . . . . . . . . . . . . . . . . . . . . . . . . . . . . . . . . . . . . . . . . . . . . . 278,989 398,842
Total Long-Term Investments: . . . . . . . . . . . . . . . . . . . . . . . . . . . . . . . . . . . . . . . . . . . . . . . . . . . . . . . . . . . . . . . . . . . . . . . . . . . . . . . 278,989 398,842
The accompanying notes are an integral part of these financial statements.
104 Franklin Templeton Investments Funds

Franklin Flex Cap Growth Fund
SCHEDULE OF INVESTMENTS As at June 30, 2014 (Unaudited) (Continued)
Principal Amountin Currency
of IssueAverage
Cost Fair Value
(000s) (000s)
SHORT-TERM SECURITIES: 0.94%Federal Home Loan Bank Discount Notes, 7/1/2014 . . . . . . . . . . . . . . . . . . . . . . . . . . . . . . . . . . . . . . . . . . . . . . . . . . . . . . . . . . . . . . 3,550,000 USD $ 3,781 $ 3,781
Total Short-Term Securities: . . . . . . . . . . . . . . . . . . . . . . . . . . . . . . . . . . . . . . . . . . . . . . . . . . . . . . . . . . . . . . . . . . . . . . . . . . . . . . . . 3,781 3,781
Transaction costs (Note 4) . . . . . . . . . . . . . . . . . . . . . . . . . . . . . . . . . . . . . . . . . . . . . . . . . . . . . . . . . . . . . . . . . . . . . . . . . . . . . . . . . (407) —
TOTAL INVESTMENTS: 100.10% . . . . . . . . . . . . . . . . . . . . . . . . . . . . . . . . . . . . . . . . . . . . . . . . . . . . . . . . . . . . . . . . . . . . . . . . . . . . $282,363 402,623
OTHER ASSETS, less liabilities: (0.10%) . . . . . . . . . . . . . . . . . . . . . . . . . . . . . . . . . . . . . . . . . . . . . . . . . . . . . . . . . . . . . . . . . . . . . . . (413)
TOTAL NET ASSETS: 100.00% . . . . . . . . . . . . . . . . . . . . . . . . . . . . . . . . . . . . . . . . . . . . . . . . . . . . . . . . . . . . . . . . . . . . . . . . . . . . . . $402,210
The accompanying notes are an integral part of these financial statements.
Franklin Templeton Investments Funds 105
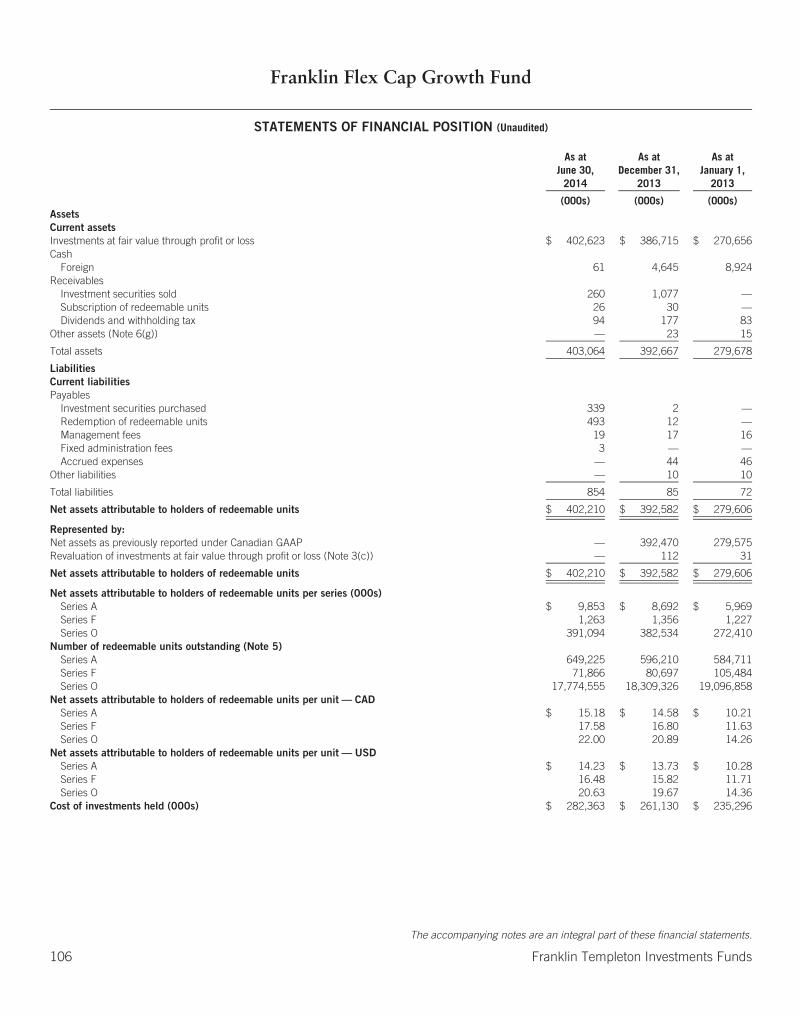
Franklin Flex Cap Growth Fund
STATEMENTS OF FINANCIAL POSITION (Unaudited)
As atJune 30,
2014
As atDecember 31,
2013
As atJanuary 1,
2013
(000s) (000s) (000s)AssetsCurrent assetsInvestments at fair value through profit or loss $ 402,623 $ 386,715 $ 270,656Cash
Foreign 61 4,645 8,924Receivables
Investment securities sold 260 1,077 —Subscription of redeemable units 26 30 —Dividends and withholding tax 94 177 83
Other assets (Note 6(g)) — 23 15
Total assets 403,064 392,667 279,678
LiabilitiesCurrent liabilitiesPayables
Investment securities purchased 339 2 —Redemption of redeemable units 493 12 —Management fees 19 17 16Fixed administration fees 3 — —Accrued expenses — 44 46
Other liabilities — 10 10
Total liabilities 854 85 72
Net assets attributable to holders of redeemable units $ 402,210 $ 392,582 $ 279,606
Represented by:Net assets as previously reported under Canadian GAAP — 392,470 279,575Revaluation of investments at fair value through profit or loss (Note 3(c)) — 112 31
Net assets attributable to holders of redeemable units $ 402,210 $ 392,582 $ 279,606
Net assets attributable to holders of redeemable units per series (000s)Series A $ 9,853 $ 8,692 $ 5,969Series F 1,263 1,356 1,227Series O 391,094 382,534 272,410
Number of redeemable units outstanding (Note 5)Series A 649,225 596,210 584,711Series F 71,866 80,697 105,484Series O 17,774,555 18,309,326 19,096,858
Net assets attributable to holders of redeemable units per unit — CADSeries A $ 15.18 $ 14.58 $ 10.21Series F 17.58 16.80 11.63Series O 22.00 20.89 14.26
Net assets attributable to holders of redeemable units per unit — USDSeries A $ 14.23 $ 13.73 $ 10.28Series F 16.48 15.82 11.71Series O 20.63 19.67 14.36
Cost of investments held (000s) $ 282,363 $ 261,130 $ 235,296
The accompanying notes are an integral part of these financial statements.
106 Franklin Templeton Investments Funds
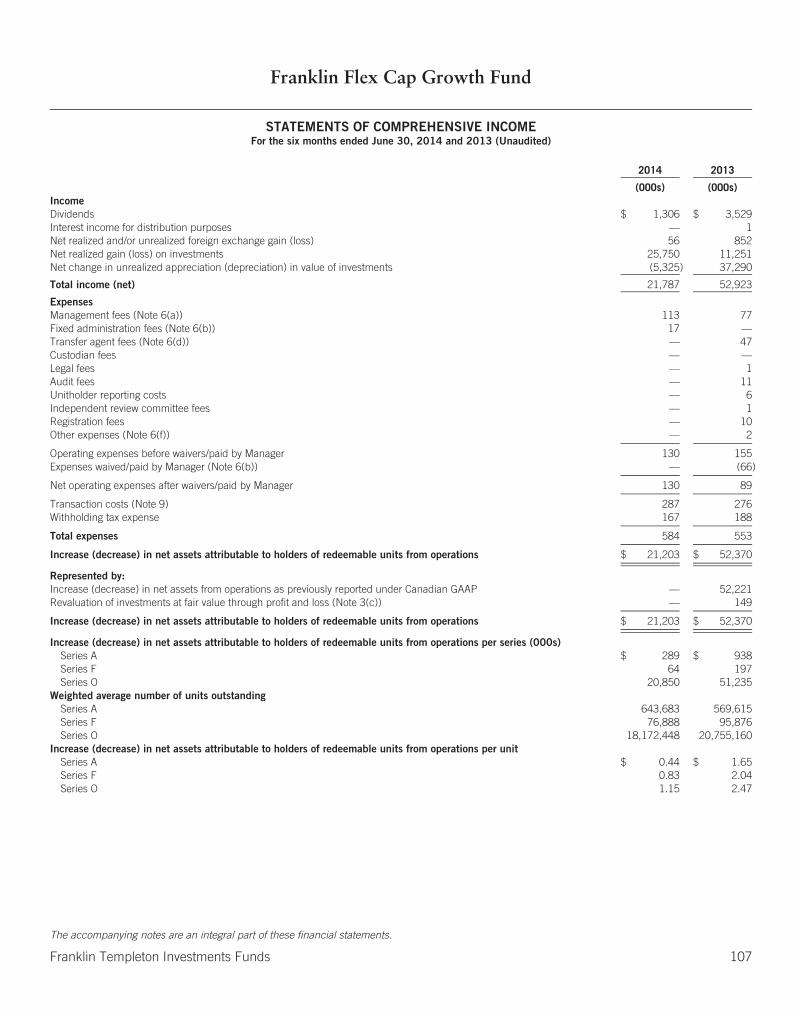
Franklin Flex Cap Growth Fund
STATEMENTS OF COMPREHENSIVE INCOMEFor the six months ended June 30, 2014 and 2013 (Unaudited)
2014 2013
(000s) (000s)IncomeDividends $ 1,306 $ 3,529Interest income for distribution purposes — 1Net realized and/or unrealized foreign exchange gain (loss) 56 852Net realized gain (loss) on investments 25,750 11,251Net change in unrealized appreciation (depreciation) in value of investments (5,325) 37,290
Total income (net) 21,787 52,923
ExpensesManagement fees (Note 6(a)) 113 77Fixed administration fees (Note 6(b)) 17 —Transfer agent fees (Note 6(d)) — 47Custodian fees — —Legal fees — 1Audit fees — 11Unitholder reporting costs — 6Independent review committee fees — 1Registration fees — 10Other expenses (Note 6(f)) — 2
Operating expenses before waivers/paid by Manager 130 155Expenses waived/paid by Manager (Note 6(b)) — (66)
Net operating expenses after waivers/paid by Manager 130 89
Transaction costs (Note 9) 287 276Withholding tax expense 167 188
Total expenses 584 553
Increase (decrease) in net assets attributable to holders of redeemable units from operations $ 21,203 $ 52,370
Represented by:Increase (decrease) in net assets from operations as previously reported under Canadian GAAP — 52,221Revaluation of investments at fair value through profit and loss (Note 3(c)) — 149
Increase (decrease) in net assets attributable to holders of redeemable units from operations $ 21,203 $ 52,370
Increase (decrease) in net assets attributable to holders of redeemable units from operations per series (000s)Series A $ 289 $ 938Series F 64 197Series O 20,850 51,235
Weighted average number of units outstandingSeries A 643,683 569,615Series F 76,888 95,876Series O 18,172,448 20,755,160
Increase (decrease) in net assets attributable to holders of redeemable units from operations per unitSeries A $ 0.44 $ 1.65Series F 0.83 2.04Series O 1.15 2.47
The accompanying notes are an integral part of these financial statements.
Franklin Templeton Investments Funds 107

Franklin Flex Cap Growth Fund
STATEMENTS OF CHANGES IN NET ASSETS ATTRIBUTABLE TO HOLDERS OF REDEEMABLE UNITSFor the six months ended June 30, 2014 and 2013 (Unaudited) (in 000s)
All Series Series A Series F
2014 2013 2014 2013 2014 2013
Net assets attributable to holders of redeemable units at beginning of period $392,582 $279,606 $ 8,692 $5,969 $1,356 $1,227
Increase (decrease) in net assets attributable to holders of redeemable units fromoperations 21,203 52,370 289 938 64 197
Distributions to holders of redeemable unitsFrom net investment income — — — — — —From net realized gains on investments — — — — — —From return of capital — — — — — —
Total distributions to holders of redeemable units — — — — — —
Redeemable units transactionsSubscriptions 26,654 86,965 2,216 267 155 331Reinvestments — — — — — —Redemptions (38,229) (28,714) (1,344) (644) (312) (462)
Net increase (decrease) from redeemable units transactions (11,575) 58,251 872 (377) (157) (131)
Increase (decrease) in net assets attributable to holders of redeemable units 9,628 110,621 1,161 561 (93) 66
Net assets attributable to holders of redeemable units at end of period $402,210 $390,227 $ 9,853 $6,530 $1,263 $1,293
Series O
2014 2013
Net assets attributable to holders of redeemable units at beginning of period $382,534 $272,410
Increase (decrease) in net assets attributable to holders of redeemable units fromoperations 20,850 51,235
Distributions to holders of redeemable unitsFrom net investment income — —From net realized gains on investments — —From return of capital — —
Total distributions to holders of redeemable units — —
Redeemable units transactionsSubscriptions 24,283 86,367Reinvestments — —Redemptions (36,573) (27,608)
Net increase (decrease) from redeemable units transactions (12,290) 58,759
Increase (decrease) in net assets attributable to holders of redeemable units 8,560 109,994
Net assets attributable to holders of redeemable units at end of period $391,094 $382,404
The accompanying notes are an integral part of these financial statements.
108 Franklin Templeton Investments Funds
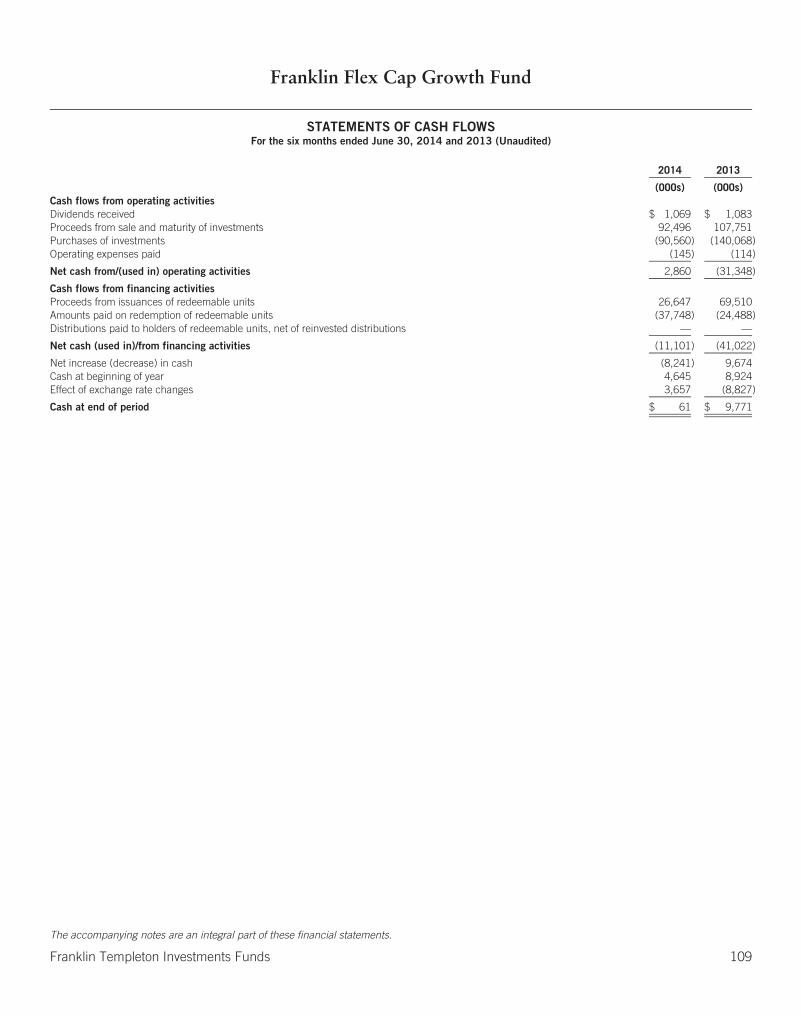
Franklin Flex Cap Growth Fund
STATEMENTS OF CASH FLOWSFor the six months ended June 30, 2014 and 2013 (Unaudited)
2014 2013
(000s) (000s)Cash flows from operating activitiesDividends received $ 1,069 $ 1,083Proceeds from sale and maturity of investments 92,496 107,751Purchases of investments (90,560) (140,068)Operating expenses paid (145) (114)
Net cash from/(used in) operating activities 2,860 (31,348)
Cash flows from financing activitiesProceeds from issuances of redeemable units 26,647 69,510Amounts paid on redemption of redeemable units (37,748) (24,488)Distributions paid to holders of redeemable units, net of reinvested distributions — —
Net cash (used in)/from financing activities (11,101) (41,022)
Net increase (decrease) in cash (8,241) 9,674Cash at beginning of year 4,645 8,924Effect of exchange rate changes 3,657 (8,827)
Cash at end of period $ 61 $ 9,771
The accompanying notes are an integral part of these financial statements.
Franklin Templeton Investments Funds 109
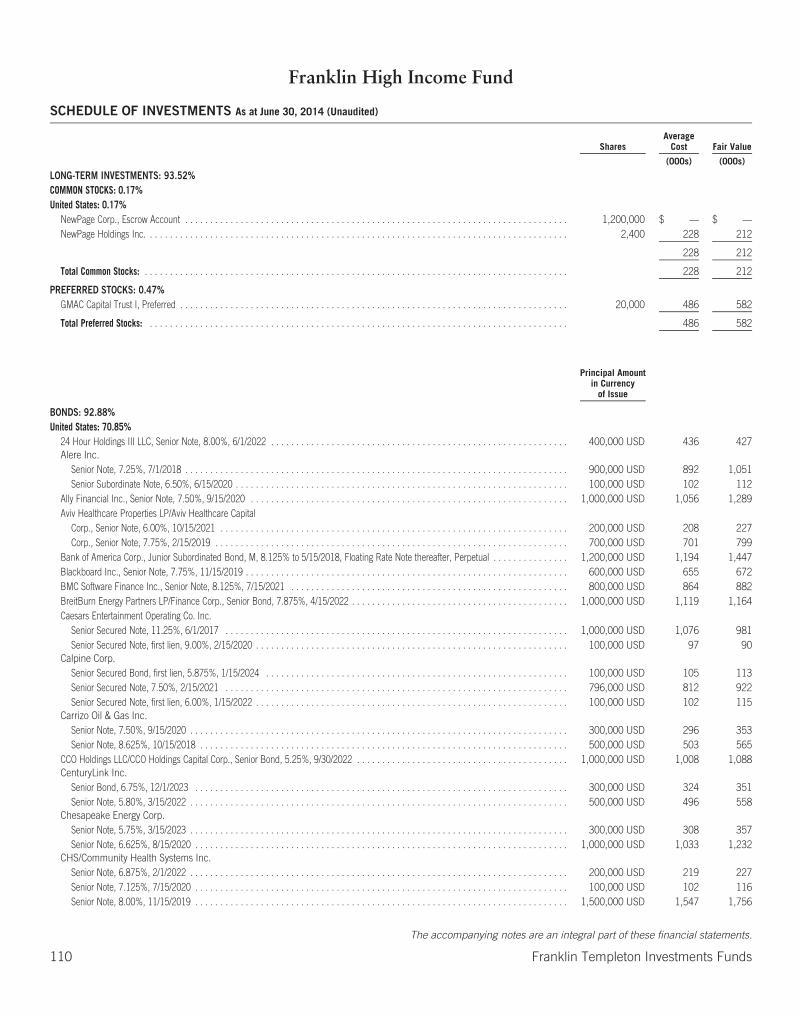
Franklin High Income Fund
SCHEDULE OF INVESTMENTS As at June 30, 2014 (Unaudited)
SharesAverage
Cost Fair Value
(000s) (000s)
LONG-TERM INVESTMENTS: 93.52%COMMON STOCKS: 0.17%United States: 0.17%
NewPage Corp., Escrow Account . . . . . . . . . . . . . . . . . . . . . . . . . . . . . . . . . . . . . . . . . . . . . . . . . . . . . . . . . . . . . . . . . . . . . . . . . . . . 1,200,000 $ — $ —NewPage Holdings Inc. . . . . . . . . . . . . . . . . . . . . . . . . . . . . . . . . . . . . . . . . . . . . . . . . . . . . . . . . . . . . . . . . . . . . . . . . . . . . . . . . . . . 2,400 228 212
228 212
Total Common Stocks: . . . . . . . . . . . . . . . . . . . . . . . . . . . . . . . . . . . . . . . . . . . . . . . . . . . . . . . . . . . . . . . . . . . . . . . . . . . . . . . . . . . . 228 212
PREFERRED STOCKS: 0.47%GMAC Capital Trust I, Preferred . . . . . . . . . . . . . . . . . . . . . . . . . . . . . . . . . . . . . . . . . . . . . . . . . . . . . . . . . . . . . . . . . . . . . . . . . . . . . 20,000 486 582
Total Preferred Stocks: . . . . . . . . . . . . . . . . . . . . . . . . . . . . . . . . . . . . . . . . . . . . . . . . . . . . . . . . . . . . . . . . . . . . . . . . . . . . . . . . . . . 486 582
Principal Amountin Currency
of Issue
BONDS: 92.88%United States: 70.85%
24 Hour Holdings III LLC, Senior Note, 8.00%, 6/1/2022 . . . . . . . . . . . . . . . . . . . . . . . . . . . . . . . . . . . . . . . . . . . . . . . . . . . . . . . . . . . 400,000 USD 436 427Alere Inc.
Senior Note, 7.25%, 7/1/2018 . . . . . . . . . . . . . . . . . . . . . . . . . . . . . . . . . . . . . . . . . . . . . . . . . . . . . . . . . . . . . . . . . . . . . . . . . . . . 900,000 USD 892 1,051Senior Subordinate Note, 6.50%, 6/15/2020 . . . . . . . . . . . . . . . . . . . . . . . . . . . . . . . . . . . . . . . . . . . . . . . . . . . . . . . . . . . . . . . . . . 100,000 USD 102 112
Ally Financial Inc., Senior Note, 7.50%, 9/15/2020 . . . . . . . . . . . . . . . . . . . . . . . . . . . . . . . . . . . . . . . . . . . . . . . . . . . . . . . . . . . . . . . 1,000,000 USD 1,056 1,289Aviv Healthcare Properties LP/Aviv Healthcare Capital
Corp., Senior Note, 6.00%, 10/15/2021 . . . . . . . . . . . . . . . . . . . . . . . . . . . . . . . . . . . . . . . . . . . . . . . . . . . . . . . . . . . . . . . . . . . . . 200,000 USD 208 227Corp., Senior Note, 7.75%, 2/15/2019 . . . . . . . . . . . . . . . . . . . . . . . . . . . . . . . . . . . . . . . . . . . . . . . . . . . . . . . . . . . . . . . . . . . . . . 700,000 USD 701 799
Bank of America Corp., Junior Subordinated Bond, M, 8.125% to 5/15/2018, Floating Rate Note thereafter, Perpetual . . . . . . . . . . . . . . . 1,200,000 USD 1,194 1,447Blackboard Inc., Senior Note, 7.75%, 11/15/2019 . . . . . . . . . . . . . . . . . . . . . . . . . . . . . . . . . . . . . . . . . . . . . . . . . . . . . . . . . . . . . . . . 600,000 USD 655 672BMC Software Finance Inc., Senior Note, 8.125%, 7/15/2021 . . . . . . . . . . . . . . . . . . . . . . . . . . . . . . . . . . . . . . . . . . . . . . . . . . . . . . . 800,000 USD 864 882BreitBurn Energy Partners LP/Finance Corp., Senior Bond, 7.875%, 4/15/2022 . . . . . . . . . . . . . . . . . . . . . . . . . . . . . . . . . . . . . . . . . . . 1,000,000 USD 1,119 1,164Caesars Entertainment Operating Co. Inc.
Senior Secured Note, 11.25%, 6/1/2017 . . . . . . . . . . . . . . . . . . . . . . . . . . . . . . . . . . . . . . . . . . . . . . . . . . . . . . . . . . . . . . . . . . . . 1,000,000 USD 1,076 981Senior Secured Note, first lien, 9.00%, 2/15/2020 . . . . . . . . . . . . . . . . . . . . . . . . . . . . . . . . . . . . . . . . . . . . . . . . . . . . . . . . . . . . . . 100,000 USD 97 90
Calpine Corp.Senior Secured Bond, first lien, 5.875%, 1/15/2024 . . . . . . . . . . . . . . . . . . . . . . . . . . . . . . . . . . . . . . . . . . . . . . . . . . . . . . . . . . . . 100,000 USD 105 113Senior Secured Note, 7.50%, 2/15/2021 . . . . . . . . . . . . . . . . . . . . . . . . . . . . . . . . . . . . . . . . . . . . . . . . . . . . . . . . . . . . . . . . . . . . 796,000 USD 812 922Senior Secured Note, first lien, 6.00%, 1/15/2022 . . . . . . . . . . . . . . . . . . . . . . . . . . . . . . . . . . . . . . . . . . . . . . . . . . . . . . . . . . . . . . 100,000 USD 102 115
Carrizo Oil & Gas Inc.Senior Note, 7.50%, 9/15/2020 . . . . . . . . . . . . . . . . . . . . . . . . . . . . . . . . . . . . . . . . . . . . . . . . . . . . . . . . . . . . . . . . . . . . . . . . . . . 300,000 USD 296 353Senior Note, 8.625%, 10/15/2018 . . . . . . . . . . . . . . . . . . . . . . . . . . . . . . . . . . . . . . . . . . . . . . . . . . . . . . . . . . . . . . . . . . . . . . . . . 500,000 USD 503 565
CCO Holdings LLC/CCO Holdings Capital Corp., Senior Bond, 5.25%, 9/30/2022 . . . . . . . . . . . . . . . . . . . . . . . . . . . . . . . . . . . . . . . . . . 1,000,000 USD 1,008 1,088CenturyLink Inc.
Senior Bond, 6.75%, 12/1/2023 . . . . . . . . . . . . . . . . . . . . . . . . . . . . . . . . . . . . . . . . . . . . . . . . . . . . . . . . . . . . . . . . . . . . . . . . . . 300,000 USD 324 351Senior Note, 5.80%, 3/15/2022 . . . . . . . . . . . . . . . . . . . . . . . . . . . . . . . . . . . . . . . . . . . . . . . . . . . . . . . . . . . . . . . . . . . . . . . . . . . 500,000 USD 496 558
Chesapeake Energy Corp.Senior Note, 5.75%, 3/15/2023 . . . . . . . . . . . . . . . . . . . . . . . . . . . . . . . . . . . . . . . . . . . . . . . . . . . . . . . . . . . . . . . . . . . . . . . . . . . 300,000 USD 308 357Senior Note, 6.625%, 8/15/2020 . . . . . . . . . . . . . . . . . . . . . . . . . . . . . . . . . . . . . . . . . . . . . . . . . . . . . . . . . . . . . . . . . . . . . . . . . . 1,000,000 USD 1,033 1,232
CHS/Community Health Systems Inc.Senior Note, 6.875%, 2/1/2022 . . . . . . . . . . . . . . . . . . . . . . . . . . . . . . . . . . . . . . . . . . . . . . . . . . . . . . . . . . . . . . . . . . . . . . . . . . . 200,000 USD 219 227Senior Note, 7.125%, 7/15/2020 . . . . . . . . . . . . . . . . . . . . . . . . . . . . . . . . . . . . . . . . . . . . . . . . . . . . . . . . . . . . . . . . . . . . . . . . . . 100,000 USD 102 116Senior Note, 8.00%, 11/15/2019 . . . . . . . . . . . . . . . . . . . . . . . . . . . . . . . . . . . . . . . . . . . . . . . . . . . . . . . . . . . . . . . . . . . . . . . . . . 1,500,000 USD 1,547 1,756
The accompanying notes are an integral part of these financial statements.
110 Franklin Templeton Investments Funds
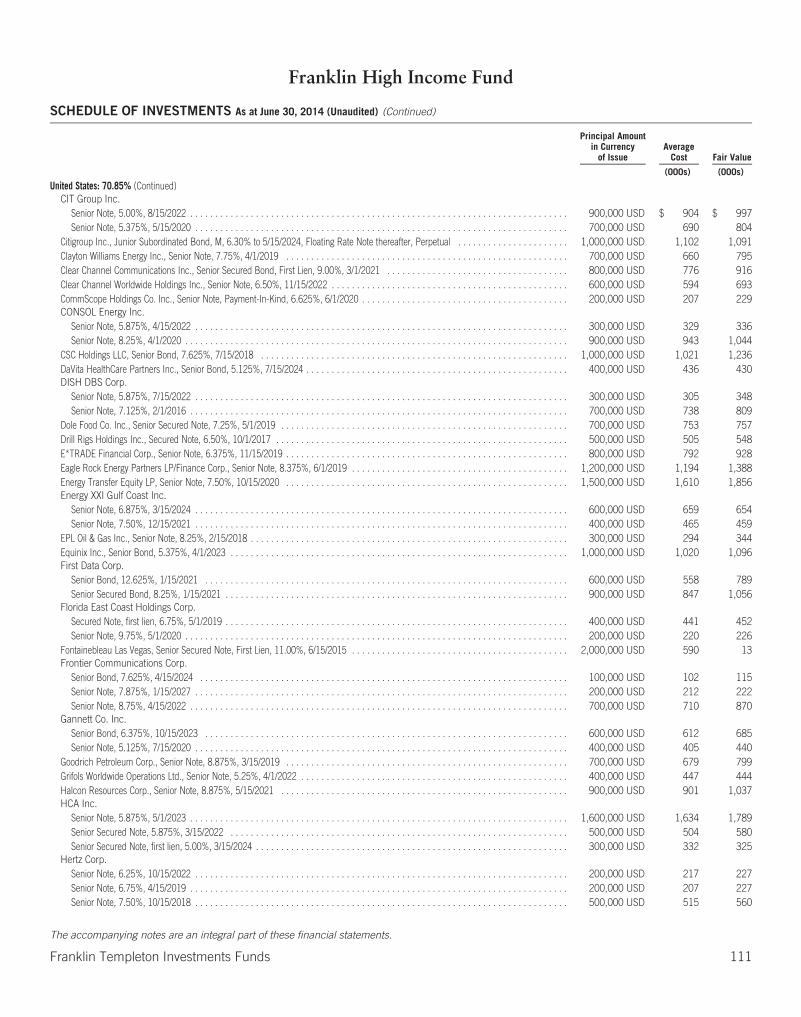
Franklin High Income Fund
SCHEDULE OF INVESTMENTS As at June 30, 2014 (Unaudited) (Continued)
Principal Amountin Currency
of IssueAverage
Cost Fair Value
(000s) (000s)
United States: 70.85% (Continued)CIT Group Inc.
Senior Note, 5.00%, 8/15/2022 . . . . . . . . . . . . . . . . . . . . . . . . . . . . . . . . . . . . . . . . . . . . . . . . . . . . . . . . . . . . . . . . . . . . . . . . . . . 900,000 USD $ 904 $ 997Senior Note, 5.375%, 5/15/2020 . . . . . . . . . . . . . . . . . . . . . . . . . . . . . . . . . . . . . . . . . . . . . . . . . . . . . . . . . . . . . . . . . . . . . . . . . . 700,000 USD 690 804
Citigroup Inc., Junior Subordinated Bond, M, 6.30% to 5/15/2024, Floating Rate Note thereafter, Perpetual . . . . . . . . . . . . . . . . . . . . . . 1,000,000 USD 1,102 1,091Clayton Williams Energy Inc., Senior Note, 7.75%, 4/1/2019 . . . . . . . . . . . . . . . . . . . . . . . . . . . . . . . . . . . . . . . . . . . . . . . . . . . . . . . . 700,000 USD 660 795Clear Channel Communications Inc., Senior Secured Bond, First Lien, 9.00%, 3/1/2021 . . . . . . . . . . . . . . . . . . . . . . . . . . . . . . . . . . . . 800,000 USD 776 916Clear Channel Worldwide Holdings Inc., Senior Note, 6.50%, 11/15/2022 . . . . . . . . . . . . . . . . . . . . . . . . . . . . . . . . . . . . . . . . . . . . . . . 600,000 USD 594 693CommScope Holdings Co. Inc., Senior Note, Payment-In-Kind, 6.625%, 6/1/2020 . . . . . . . . . . . . . . . . . . . . . . . . . . . . . . . . . . . . . . . . . 200,000 USD 207 229CONSOL Energy Inc.
Senior Note, 5.875%, 4/15/2022 . . . . . . . . . . . . . . . . . . . . . . . . . . . . . . . . . . . . . . . . . . . . . . . . . . . . . . . . . . . . . . . . . . . . . . . . . . 300,000 USD 329 336Senior Note, 8.25%, 4/1/2020 . . . . . . . . . . . . . . . . . . . . . . . . . . . . . . . . . . . . . . . . . . . . . . . . . . . . . . . . . . . . . . . . . . . . . . . . . . . . 900,000 USD 943 1,044
CSC Holdings LLC, Senior Bond, 7.625%, 7/15/2018 . . . . . . . . . . . . . . . . . . . . . . . . . . . . . . . . . . . . . . . . . . . . . . . . . . . . . . . . . . . . . 1,000,000 USD 1,021 1,236DaVita HealthCare Partners Inc., Senior Bond, 5.125%, 7/15/2024 . . . . . . . . . . . . . . . . . . . . . . . . . . . . . . . . . . . . . . . . . . . . . . . . . . . . 400,000 USD 436 430DISH DBS Corp.
Senior Note, 5.875%, 7/15/2022 . . . . . . . . . . . . . . . . . . . . . . . . . . . . . . . . . . . . . . . . . . . . . . . . . . . . . . . . . . . . . . . . . . . . . . . . . . 300,000 USD 305 348Senior Note, 7.125%, 2/1/2016 . . . . . . . . . . . . . . . . . . . . . . . . . . . . . . . . . . . . . . . . . . . . . . . . . . . . . . . . . . . . . . . . . . . . . . . . . . . 700,000 USD 738 809
Dole Food Co. Inc., Senior Secured Note, 7.25%, 5/1/2019 . . . . . . . . . . . . . . . . . . . . . . . . . . . . . . . . . . . . . . . . . . . . . . . . . . . . . . . . . 700,000 USD 753 757Drill Rigs Holdings Inc., Secured Note, 6.50%, 10/1/2017 . . . . . . . . . . . . . . . . . . . . . . . . . . . . . . . . . . . . . . . . . . . . . . . . . . . . . . . . . . 500,000 USD 505 548E*TRADE Financial Corp., Senior Note, 6.375%, 11/15/2019 . . . . . . . . . . . . . . . . . . . . . . . . . . . . . . . . . . . . . . . . . . . . . . . . . . . . . . . . 800,000 USD 792 928Eagle Rock Energy Partners LP/Finance Corp., Senior Note, 8.375%, 6/1/2019 . . . . . . . . . . . . . . . . . . . . . . . . . . . . . . . . . . . . . . . . . . . 1,200,000 USD 1,194 1,388Energy Transfer Equity LP, Senior Note, 7.50%, 10/15/2020 . . . . . . . . . . . . . . . . . . . . . . . . . . . . . . . . . . . . . . . . . . . . . . . . . . . . . . . . 1,500,000 USD 1,610 1,856Energy XXI Gulf Coast Inc.
Senior Note, 6.875%, 3/15/2024 . . . . . . . . . . . . . . . . . . . . . . . . . . . . . . . . . . . . . . . . . . . . . . . . . . . . . . . . . . . . . . . . . . . . . . . . . . 600,000 USD 659 654Senior Note, 7.50%, 12/15/2021 . . . . . . . . . . . . . . . . . . . . . . . . . . . . . . . . . . . . . . . . . . . . . . . . . . . . . . . . . . . . . . . . . . . . . . . . . . 400,000 USD 465 459
EPL Oil & Gas Inc., Senior Note, 8.25%, 2/15/2018 . . . . . . . . . . . . . . . . . . . . . . . . . . . . . . . . . . . . . . . . . . . . . . . . . . . . . . . . . . . . . . . 300,000 USD 294 344Equinix Inc., Senior Bond, 5.375%, 4/1/2023 . . . . . . . . . . . . . . . . . . . . . . . . . . . . . . . . . . . . . . . . . . . . . . . . . . . . . . . . . . . . . . . . . . . 1,000,000 USD 1,020 1,096First Data Corp.
Senior Bond, 12.625%, 1/15/2021 . . . . . . . . . . . . . . . . . . . . . . . . . . . . . . . . . . . . . . . . . . . . . . . . . . . . . . . . . . . . . . . . . . . . . . . . 600,000 USD 558 789Senior Secured Bond, 8.25%, 1/15/2021 . . . . . . . . . . . . . . . . . . . . . . . . . . . . . . . . . . . . . . . . . . . . . . . . . . . . . . . . . . . . . . . . . . . . 900,000 USD 847 1,056
Florida East Coast Holdings Corp.Secured Note, first lien, 6.75%, 5/1/2019 . . . . . . . . . . . . . . . . . . . . . . . . . . . . . . . . . . . . . . . . . . . . . . . . . . . . . . . . . . . . . . . . . . . . 400,000 USD 441 452Senior Note, 9.75%, 5/1/2020 . . . . . . . . . . . . . . . . . . . . . . . . . . . . . . . . . . . . . . . . . . . . . . . . . . . . . . . . . . . . . . . . . . . . . . . . . . . . 200,000 USD 220 226
Fontainebleau Las Vegas, Senior Secured Note, First Lien, 11.00%, 6/15/2015 . . . . . . . . . . . . . . . . . . . . . . . . . . . . . . . . . . . . . . . . . . . 2,000,000 USD 590 13Frontier Communications Corp.
Senior Bond, 7.625%, 4/15/2024 . . . . . . . . . . . . . . . . . . . . . . . . . . . . . . . . . . . . . . . . . . . . . . . . . . . . . . . . . . . . . . . . . . . . . . . . . 100,000 USD 102 115Senior Note, 7.875%, 1/15/2027 . . . . . . . . . . . . . . . . . . . . . . . . . . . . . . . . . . . . . . . . . . . . . . . . . . . . . . . . . . . . . . . . . . . . . . . . . . 200,000 USD 212 222Senior Note, 8.75%, 4/15/2022 . . . . . . . . . . . . . . . . . . . . . . . . . . . . . . . . . . . . . . . . . . . . . . . . . . . . . . . . . . . . . . . . . . . . . . . . . . . 700,000 USD 710 870
Gannett Co. Inc.Senior Bond, 6.375%, 10/15/2023 . . . . . . . . . . . . . . . . . . . . . . . . . . . . . . . . . . . . . . . . . . . . . . . . . . . . . . . . . . . . . . . . . . . . . . . . 600,000 USD 612 685Senior Note, 5.125%, 7/15/2020 . . . . . . . . . . . . . . . . . . . . . . . . . . . . . . . . . . . . . . . . . . . . . . . . . . . . . . . . . . . . . . . . . . . . . . . . . . 400,000 USD 405 440
Goodrich Petroleum Corp., Senior Note, 8.875%, 3/15/2019 . . . . . . . . . . . . . . . . . . . . . . . . . . . . . . . . . . . . . . . . . . . . . . . . . . . . . . . . 700,000 USD 679 799Grifols Worldwide Operations Ltd., Senior Note, 5.25%, 4/1/2022 . . . . . . . . . . . . . . . . . . . . . . . . . . . . . . . . . . . . . . . . . . . . . . . . . . . . . 400,000 USD 447 444Halcon Resources Corp., Senior Note, 8.875%, 5/15/2021 . . . . . . . . . . . . . . . . . . . . . . . . . . . . . . . . . . . . . . . . . . . . . . . . . . . . . . . . . 900,000 USD 901 1,037HCA Inc.
Senior Note, 5.875%, 5/1/2023 . . . . . . . . . . . . . . . . . . . . . . . . . . . . . . . . . . . . . . . . . . . . . . . . . . . . . . . . . . . . . . . . . . . . . . . . . . . 1,600,000 USD 1,634 1,789Senior Secured Note, 5.875%, 3/15/2022 . . . . . . . . . . . . . . . . . . . . . . . . . . . . . . . . . . . . . . . . . . . . . . . . . . . . . . . . . . . . . . . . . . . 500,000 USD 504 580Senior Secured Note, first lien, 5.00%, 3/15/2024 . . . . . . . . . . . . . . . . . . . . . . . . . . . . . . . . . . . . . . . . . . . . . . . . . . . . . . . . . . . . . . 300,000 USD 332 325
Hertz Corp.Senior Note, 6.25%, 10/15/2022 . . . . . . . . . . . . . . . . . . . . . . . . . . . . . . . . . . . . . . . . . . . . . . . . . . . . . . . . . . . . . . . . . . . . . . . . . . 200,000 USD 217 227Senior Note, 6.75%, 4/15/2019 . . . . . . . . . . . . . . . . . . . . . . . . . . . . . . . . . . . . . . . . . . . . . . . . . . . . . . . . . . . . . . . . . . . . . . . . . . . 200,000 USD 207 227Senior Note, 7.50%, 10/15/2018 . . . . . . . . . . . . . . . . . . . . . . . . . . . . . . . . . . . . . . . . . . . . . . . . . . . . . . . . . . . . . . . . . . . . . . . . . . 500,000 USD 515 560
The accompanying notes are an integral part of these financial statements.
Franklin Templeton Investments Funds 111
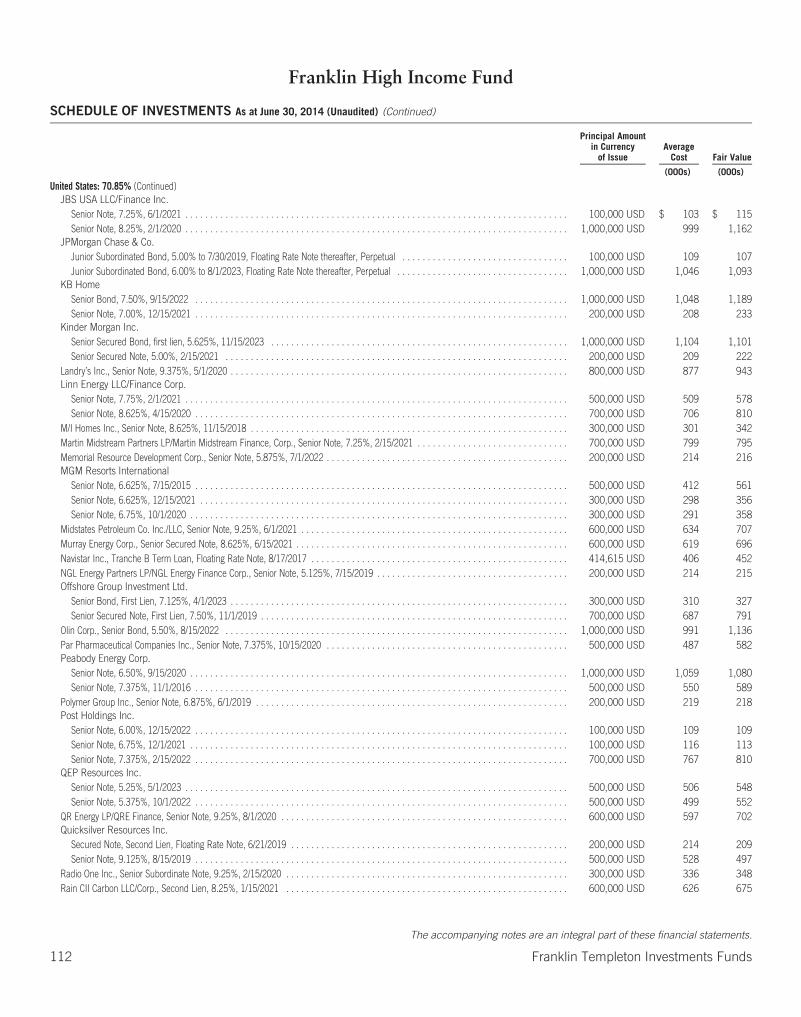
Franklin High Income Fund
SCHEDULE OF INVESTMENTS As at June 30, 2014 (Unaudited) (Continued)
Principal Amountin Currency
of IssueAverage
Cost Fair Value
(000s) (000s)
United States: 70.85% (Continued)JBS USA LLC/Finance Inc.
Senior Note, 7.25%, 6/1/2021 . . . . . . . . . . . . . . . . . . . . . . . . . . . . . . . . . . . . . . . . . . . . . . . . . . . . . . . . . . . . . . . . . . . . . . . . . . . . 100,000 USD $ 103 $ 115Senior Note, 8.25%, 2/1/2020 . . . . . . . . . . . . . . . . . . . . . . . . . . . . . . . . . . . . . . . . . . . . . . . . . . . . . . . . . . . . . . . . . . . . . . . . . . . . 1,000,000 USD 999 1,162
JPMorgan Chase & Co.Junior Subordinated Bond, 5.00% to 7/30/2019, Floating Rate Note thereafter, Perpetual . . . . . . . . . . . . . . . . . . . . . . . . . . . . . . . . . 100,000 USD 109 107Junior Subordinated Bond, 6.00% to 8/1/2023, Floating Rate Note thereafter, Perpetual . . . . . . . . . . . . . . . . . . . . . . . . . . . . . . . . . . 1,000,000 USD 1,046 1,093
KB HomeSenior Bond, 7.50%, 9/15/2022 . . . . . . . . . . . . . . . . . . . . . . . . . . . . . . . . . . . . . . . . . . . . . . . . . . . . . . . . . . . . . . . . . . . . . . . . . . 1,000,000 USD 1,048 1,189Senior Note, 7.00%, 12/15/2021 . . . . . . . . . . . . . . . . . . . . . . . . . . . . . . . . . . . . . . . . . . . . . . . . . . . . . . . . . . . . . . . . . . . . . . . . . . 200,000 USD 208 233
Kinder Morgan Inc.Senior Secured Bond, first lien, 5.625%, 11/15/2023 . . . . . . . . . . . . . . . . . . . . . . . . . . . . . . . . . . . . . . . . . . . . . . . . . . . . . . . . . . . 1,000,000 USD 1,104 1,101Senior Secured Note, 5.00%, 2/15/2021 . . . . . . . . . . . . . . . . . . . . . . . . . . . . . . . . . . . . . . . . . . . . . . . . . . . . . . . . . . . . . . . . . . . . 200,000 USD 209 222
Landry’s Inc., Senior Note, 9.375%, 5/1/2020 . . . . . . . . . . . . . . . . . . . . . . . . . . . . . . . . . . . . . . . . . . . . . . . . . . . . . . . . . . . . . . . . . . . 800,000 USD 877 943Linn Energy LLC/Finance Corp.
Senior Note, 7.75%, 2/1/2021 . . . . . . . . . . . . . . . . . . . . . . . . . . . . . . . . . . . . . . . . . . . . . . . . . . . . . . . . . . . . . . . . . . . . . . . . . . . . 500,000 USD 509 578Senior Note, 8.625%, 4/15/2020 . . . . . . . . . . . . . . . . . . . . . . . . . . . . . . . . . . . . . . . . . . . . . . . . . . . . . . . . . . . . . . . . . . . . . . . . . . 700,000 USD 706 810
M/I Homes Inc., Senior Note, 8.625%, 11/15/2018 . . . . . . . . . . . . . . . . . . . . . . . . . . . . . . . . . . . . . . . . . . . . . . . . . . . . . . . . . . . . . . . 300,000 USD 301 342Martin Midstream Partners LP/Martin Midstream Finance, Corp., Senior Note, 7.25%, 2/15/2021 . . . . . . . . . . . . . . . . . . . . . . . . . . . . . . 700,000 USD 799 795Memorial Resource Development Corp., Senior Note, 5.875%, 7/1/2022 . . . . . . . . . . . . . . . . . . . . . . . . . . . . . . . . . . . . . . . . . . . . . . . . 200,000 USD 214 216MGM Resorts International
Senior Note, 6.625%, 7/15/2015 . . . . . . . . . . . . . . . . . . . . . . . . . . . . . . . . . . . . . . . . . . . . . . . . . . . . . . . . . . . . . . . . . . . . . . . . . . 500,000 USD 412 561Senior Note, 6.625%, 12/15/2021 . . . . . . . . . . . . . . . . . . . . . . . . . . . . . . . . . . . . . . . . . . . . . . . . . . . . . . . . . . . . . . . . . . . . . . . . . 300,000 USD 298 356Senior Note, 6.75%, 10/1/2020 . . . . . . . . . . . . . . . . . . . . . . . . . . . . . . . . . . . . . . . . . . . . . . . . . . . . . . . . . . . . . . . . . . . . . . . . . . . 300,000 USD 291 358
Midstates Petroleum Co. Inc./LLC, Senior Note, 9.25%, 6/1/2021 . . . . . . . . . . . . . . . . . . . . . . . . . . . . . . . . . . . . . . . . . . . . . . . . . . . . . 600,000 USD 634 707Murray Energy Corp., Senior Secured Note, 8.625%, 6/15/2021 . . . . . . . . . . . . . . . . . . . . . . . . . . . . . . . . . . . . . . . . . . . . . . . . . . . . . . 600,000 USD 619 696Navistar Inc., Tranche B Term Loan, Floating Rate Note, 8/17/2017 . . . . . . . . . . . . . . . . . . . . . . . . . . . . . . . . . . . . . . . . . . . . . . . . . . . 414,615 USD 406 452NGL Energy Partners LP/NGL Energy Finance Corp., Senior Note, 5.125%, 7/15/2019 . . . . . . . . . . . . . . . . . . . . . . . . . . . . . . . . . . . . . . 200,000 USD 214 215Offshore Group Investment Ltd.
Senior Bond, First Lien, 7.125%, 4/1/2023 . . . . . . . . . . . . . . . . . . . . . . . . . . . . . . . . . . . . . . . . . . . . . . . . . . . . . . . . . . . . . . . . . . . 300,000 USD 310 327Senior Secured Note, First Lien, 7.50%, 11/1/2019 . . . . . . . . . . . . . . . . . . . . . . . . . . . . . . . . . . . . . . . . . . . . . . . . . . . . . . . . . . . . . 700,000 USD 687 791
Olin Corp., Senior Bond, 5.50%, 8/15/2022 . . . . . . . . . . . . . . . . . . . . . . . . . . . . . . . . . . . . . . . . . . . . . . . . . . . . . . . . . . . . . . . . . . . . 1,000,000 USD 991 1,136Par Pharmaceutical Companies Inc., Senior Note, 7.375%, 10/15/2020 . . . . . . . . . . . . . . . . . . . . . . . . . . . . . . . . . . . . . . . . . . . . . . . . 500,000 USD 487 582Peabody Energy Corp.
Senior Note, 6.50%, 9/15/2020 . . . . . . . . . . . . . . . . . . . . . . . . . . . . . . . . . . . . . . . . . . . . . . . . . . . . . . . . . . . . . . . . . . . . . . . . . . . 1,000,000 USD 1,059 1,080Senior Note, 7.375%, 11/1/2016 . . . . . . . . . . . . . . . . . . . . . . . . . . . . . . . . . . . . . . . . . . . . . . . . . . . . . . . . . . . . . . . . . . . . . . . . . . 500,000 USD 550 589
Polymer Group Inc., Senior Note, 6.875%, 6/1/2019 . . . . . . . . . . . . . . . . . . . . . . . . . . . . . . . . . . . . . . . . . . . . . . . . . . . . . . . . . . . . . . 200,000 USD 219 218Post Holdings Inc.
Senior Note, 6.00%, 12/15/2022 . . . . . . . . . . . . . . . . . . . . . . . . . . . . . . . . . . . . . . . . . . . . . . . . . . . . . . . . . . . . . . . . . . . . . . . . . . 100,000 USD 109 109Senior Note, 6.75%, 12/1/2021 . . . . . . . . . . . . . . . . . . . . . . . . . . . . . . . . . . . . . . . . . . . . . . . . . . . . . . . . . . . . . . . . . . . . . . . . . . . 100,000 USD 116 113Senior Note, 7.375%, 2/15/2022 . . . . . . . . . . . . . . . . . . . . . . . . . . . . . . . . . . . . . . . . . . . . . . . . . . . . . . . . . . . . . . . . . . . . . . . . . . 700,000 USD 767 810
QEP Resources Inc.Senior Note, 5.25%, 5/1/2023 . . . . . . . . . . . . . . . . . . . . . . . . . . . . . . . . . . . . . . . . . . . . . . . . . . . . . . . . . . . . . . . . . . . . . . . . . . . . 500,000 USD 506 548Senior Note, 5.375%, 10/1/2022 . . . . . . . . . . . . . . . . . . . . . . . . . . . . . . . . . . . . . . . . . . . . . . . . . . . . . . . . . . . . . . . . . . . . . . . . . . 500,000 USD 499 552
QR Energy LP/QRE Finance, Senior Note, 9.25%, 8/1/2020 . . . . . . . . . . . . . . . . . . . . . . . . . . . . . . . . . . . . . . . . . . . . . . . . . . . . . . . . . 600,000 USD 597 702Quicksilver Resources Inc.
Secured Note, Second Lien, Floating Rate Note, 6/21/2019 . . . . . . . . . . . . . . . . . . . . . . . . . . . . . . . . . . . . . . . . . . . . . . . . . . . . . . . 200,000 USD 214 209Senior Note, 9.125%, 8/15/2019 . . . . . . . . . . . . . . . . . . . . . . . . . . . . . . . . . . . . . . . . . . . . . . . . . . . . . . . . . . . . . . . . . . . . . . . . . . 500,000 USD 528 497
Radio One Inc., Senior Subordinate Note, 9.25%, 2/15/2020 . . . . . . . . . . . . . . . . . . . . . . . . . . . . . . . . . . . . . . . . . . . . . . . . . . . . . . . . 300,000 USD 336 348Rain CII Carbon LLC/Corp., Second Lien, 8.25%, 1/15/2021 . . . . . . . . . . . . . . . . . . . . . . . . . . . . . . . . . . . . . . . . . . . . . . . . . . . . . . . . 600,000 USD 626 675
The accompanying notes are an integral part of these financial statements.
112 Franklin Templeton Investments Funds
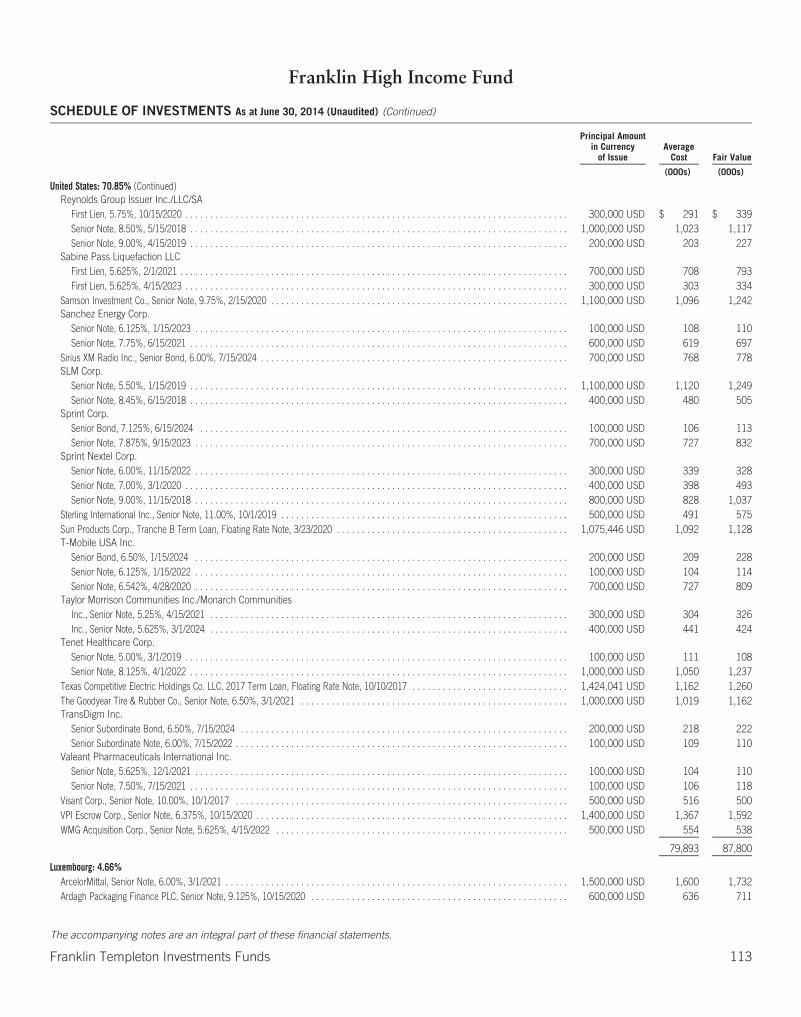
Franklin High Income Fund
SCHEDULE OF INVESTMENTS As at June 30, 2014 (Unaudited) (Continued)
Principal Amountin Currency
of IssueAverage
Cost Fair Value
(000s) (000s)
United States: 70.85% (Continued)Reynolds Group Issuer Inc./LLC/SA
First Lien, 5.75%, 10/15/2020 . . . . . . . . . . . . . . . . . . . . . . . . . . . . . . . . . . . . . . . . . . . . . . . . . . . . . . . . . . . . . . . . . . . . . . . . . . . . 300,000 USD $ 291 $ 339Senior Note, 8.50%, 5/15/2018 . . . . . . . . . . . . . . . . . . . . . . . . . . . . . . . . . . . . . . . . . . . . . . . . . . . . . . . . . . . . . . . . . . . . . . . . . . . 1,000,000 USD 1,023 1,117Senior Note, 9.00%, 4/15/2019 . . . . . . . . . . . . . . . . . . . . . . . . . . . . . . . . . . . . . . . . . . . . . . . . . . . . . . . . . . . . . . . . . . . . . . . . . . . 200,000 USD 203 227
Sabine Pass Liquefaction LLCFirst Lien, 5.625%, 2/1/2021 . . . . . . . . . . . . . . . . . . . . . . . . . . . . . . . . . . . . . . . . . . . . . . . . . . . . . . . . . . . . . . . . . . . . . . . . . . . . . 700,000 USD 708 793First Lien, 5.625%, 4/15/2023 . . . . . . . . . . . . . . . . . . . . . . . . . . . . . . . . . . . . . . . . . . . . . . . . . . . . . . . . . . . . . . . . . . . . . . . . . . . . 300,000 USD 303 334
Samson Investment Co., Senior Note, 9.75%, 2/15/2020 . . . . . . . . . . . . . . . . . . . . . . . . . . . . . . . . . . . . . . . . . . . . . . . . . . . . . . . . . . . 1,100,000 USD 1,096 1,242Sanchez Energy Corp.
Senior Note, 6.125%, 1/15/2023 . . . . . . . . . . . . . . . . . . . . . . . . . . . . . . . . . . . . . . . . . . . . . . . . . . . . . . . . . . . . . . . . . . . . . . . . . . 100,000 USD 108 110Senior Note, 7.75%, 6/15/2021 . . . . . . . . . . . . . . . . . . . . . . . . . . . . . . . . . . . . . . . . . . . . . . . . . . . . . . . . . . . . . . . . . . . . . . . . . . . 600,000 USD 619 697
Sirius XM Radio Inc., Senior Bond, 6.00%, 7/15/2024 . . . . . . . . . . . . . . . . . . . . . . . . . . . . . . . . . . . . . . . . . . . . . . . . . . . . . . . . . . . . . 700,000 USD 768 778SLM Corp.
Senior Note, 5.50%, 1/15/2019 . . . . . . . . . . . . . . . . . . . . . . . . . . . . . . . . . . . . . . . . . . . . . . . . . . . . . . . . . . . . . . . . . . . . . . . . . . . 1,100,000 USD 1,120 1,249Senior Note, 8.45%, 6/15/2018 . . . . . . . . . . . . . . . . . . . . . . . . . . . . . . . . . . . . . . . . . . . . . . . . . . . . . . . . . . . . . . . . . . . . . . . . . . . 400,000 USD 480 505
Sprint Corp.Senior Bond, 7.125%, 6/15/2024 . . . . . . . . . . . . . . . . . . . . . . . . . . . . . . . . . . . . . . . . . . . . . . . . . . . . . . . . . . . . . . . . . . . . . . . . . 100,000 USD 106 113Senior Note, 7.875%, 9/15/2023 . . . . . . . . . . . . . . . . . . . . . . . . . . . . . . . . . . . . . . . . . . . . . . . . . . . . . . . . . . . . . . . . . . . . . . . . . . 700,000 USD 727 832
Sprint Nextel Corp.Senior Note, 6.00%, 11/15/2022 . . . . . . . . . . . . . . . . . . . . . . . . . . . . . . . . . . . . . . . . . . . . . . . . . . . . . . . . . . . . . . . . . . . . . . . . . . 300,000 USD 339 328Senior Note, 7.00%, 3/1/2020 . . . . . . . . . . . . . . . . . . . . . . . . . . . . . . . . . . . . . . . . . . . . . . . . . . . . . . . . . . . . . . . . . . . . . . . . . . . . 400,000 USD 398 493Senior Note, 9.00%, 11/15/2018 . . . . . . . . . . . . . . . . . . . . . . . . . . . . . . . . . . . . . . . . . . . . . . . . . . . . . . . . . . . . . . . . . . . . . . . . . . 800,000 USD 828 1,037
Sterling International Inc., Senior Note, 11.00%, 10/1/2019 . . . . . . . . . . . . . . . . . . . . . . . . . . . . . . . . . . . . . . . . . . . . . . . . . . . . . . . . . 500,000 USD 491 575Sun Products Corp., Tranche B Term Loan, Floating Rate Note, 3/23/2020 . . . . . . . . . . . . . . . . . . . . . . . . . . . . . . . . . . . . . . . . . . . . . . 1,075,446 USD 1,092 1,128T-Mobile USA Inc.
Senior Bond, 6.50%, 1/15/2024 . . . . . . . . . . . . . . . . . . . . . . . . . . . . . . . . . . . . . . . . . . . . . . . . . . . . . . . . . . . . . . . . . . . . . . . . . . 200,000 USD 209 228Senior Note, 6.125%, 1/15/2022 . . . . . . . . . . . . . . . . . . . . . . . . . . . . . . . . . . . . . . . . . . . . . . . . . . . . . . . . . . . . . . . . . . . . . . . . . . 100,000 USD 104 114Senior Note, 6.542%, 4/28/2020 . . . . . . . . . . . . . . . . . . . . . . . . . . . . . . . . . . . . . . . . . . . . . . . . . . . . . . . . . . . . . . . . . . . . . . . . . . 700,000 USD 727 809
Taylor Morrison Communities Inc./Monarch CommunitiesInc., Senior Note, 5.25%, 4/15/2021 . . . . . . . . . . . . . . . . . . . . . . . . . . . . . . . . . . . . . . . . . . . . . . . . . . . . . . . . . . . . . . . . . . . . . . . 300,000 USD 304 326Inc., Senior Note, 5.625%, 3/1/2024 . . . . . . . . . . . . . . . . . . . . . . . . . . . . . . . . . . . . . . . . . . . . . . . . . . . . . . . . . . . . . . . . . . . . . . . 400,000 USD 441 424
Tenet Healthcare Corp.Senior Note, 5.00%, 3/1/2019 . . . . . . . . . . . . . . . . . . . . . . . . . . . . . . . . . . . . . . . . . . . . . . . . . . . . . . . . . . . . . . . . . . . . . . . . . . . . 100,000 USD 111 108Senior Note, 8.125%, 4/1/2022 . . . . . . . . . . . . . . . . . . . . . . . . . . . . . . . . . . . . . . . . . . . . . . . . . . . . . . . . . . . . . . . . . . . . . . . . . . . 1,000,000 USD 1,050 1,237
Texas Competitive Electric Holdings Co. LLC, 2017 Term Loan, Floating Rate Note, 10/10/2017 . . . . . . . . . . . . . . . . . . . . . . . . . . . . . . . 1,424,041 USD 1,162 1,260The Goodyear Tire & Rubber Co., Senior Note, 6.50%, 3/1/2021 . . . . . . . . . . . . . . . . . . . . . . . . . . . . . . . . . . . . . . . . . . . . . . . . . . . . . 1,000,000 USD 1,019 1,162TransDigm Inc.
Senior Subordinate Bond, 6.50%, 7/15/2024 . . . . . . . . . . . . . . . . . . . . . . . . . . . . . . . . . . . . . . . . . . . . . . . . . . . . . . . . . . . . . . . . . 200,000 USD 218 222Senior Subordinate Note, 6.00%, 7/15/2022 . . . . . . . . . . . . . . . . . . . . . . . . . . . . . . . . . . . . . . . . . . . . . . . . . . . . . . . . . . . . . . . . . . 100,000 USD 109 110
Valeant Pharmaceuticals International Inc.Senior Note, 5.625%, 12/1/2021 . . . . . . . . . . . . . . . . . . . . . . . . . . . . . . . . . . . . . . . . . . . . . . . . . . . . . . . . . . . . . . . . . . . . . . . . . . 100,000 USD 104 110Senior Note, 7.50%, 7/15/2021 . . . . . . . . . . . . . . . . . . . . . . . . . . . . . . . . . . . . . . . . . . . . . . . . . . . . . . . . . . . . . . . . . . . . . . . . . . . 100,000 USD 106 118
Visant Corp., Senior Note, 10.00%, 10/1/2017 . . . . . . . . . . . . . . . . . . . . . . . . . . . . . . . . . . . . . . . . . . . . . . . . . . . . . . . . . . . . . . . . . . 500,000 USD 516 500VPI Escrow Corp., Senior Note, 6.375%, 10/15/2020 . . . . . . . . . . . . . . . . . . . . . . . . . . . . . . . . . . . . . . . . . . . . . . . . . . . . . . . . . . . . . . 1,400,000 USD 1,367 1,592WMG Acquisition Corp., Senior Note, 5.625%, 4/15/2022 . . . . . . . . . . . . . . . . . . . . . . . . . . . . . . . . . . . . . . . . . . . . . . . . . . . . . . . . . . 500,000 USD 554 538
79,893 87,800
Luxembourg: 4.66%ArcelorMittal, Senior Note, 6.00%, 3/1/2021 . . . . . . . . . . . . . . . . . . . . . . . . . . . . . . . . . . . . . . . . . . . . . . . . . . . . . . . . . . . . . . . . . . . . 1,500,000 USD 1,600 1,732Ardagh Packaging Finance PLC, Senior Note, 9.125%, 10/15/2020 . . . . . . . . . . . . . . . . . . . . . . . . . . . . . . . . . . . . . . . . . . . . . . . . . . . 600,000 USD 636 711
The accompanying notes are an integral part of these financial statements.
Franklin Templeton Investments Funds 113
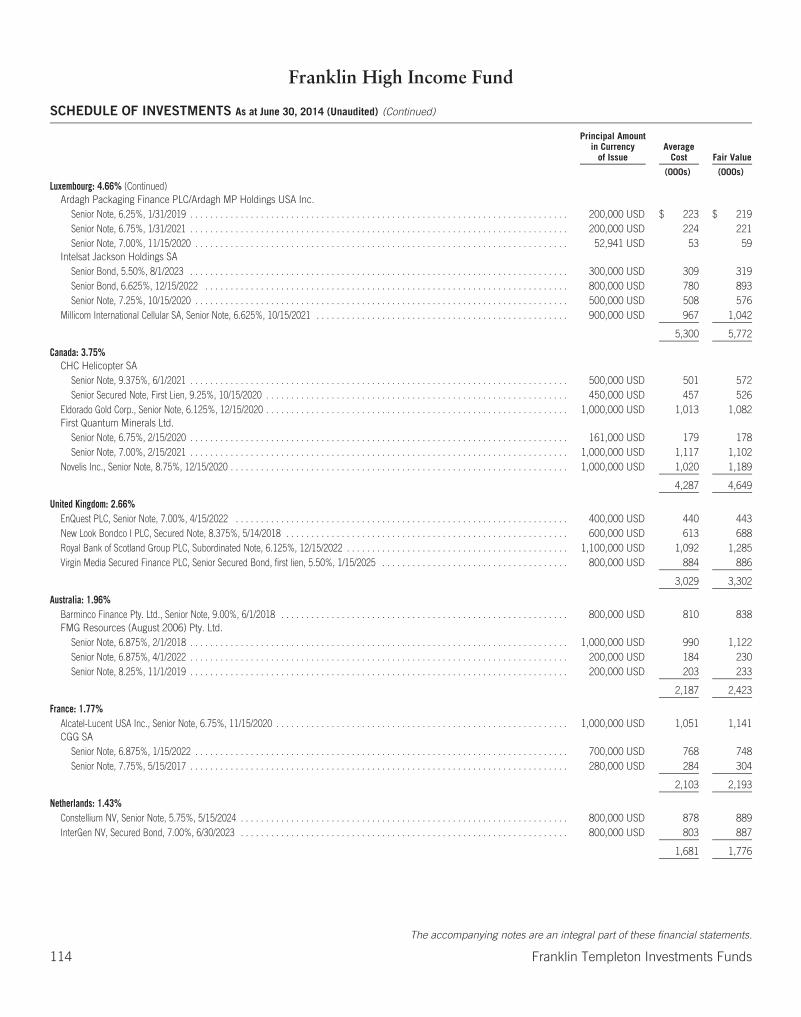
Franklin High Income Fund
SCHEDULE OF INVESTMENTS As at June 30, 2014 (Unaudited) (Continued)
Principal Amountin Currency
of IssueAverage
Cost Fair Value
(000s) (000s)
Luxembourg: 4.66% (Continued)Ardagh Packaging Finance PLC/Ardagh MP Holdings USA Inc.
Senior Note, 6.25%, 1/31/2019 . . . . . . . . . . . . . . . . . . . . . . . . . . . . . . . . . . . . . . . . . . . . . . . . . . . . . . . . . . . . . . . . . . . . . . . . . . . 200,000 USD $ 223 $ 219Senior Note, 6.75%, 1/31/2021 . . . . . . . . . . . . . . . . . . . . . . . . . . . . . . . . . . . . . . . . . . . . . . . . . . . . . . . . . . . . . . . . . . . . . . . . . . . 200,000 USD 224 221Senior Note, 7.00%, 11/15/2020 . . . . . . . . . . . . . . . . . . . . . . . . . . . . . . . . . . . . . . . . . . . . . . . . . . . . . . . . . . . . . . . . . . . . . . . . . . 52,941 USD 53 59
Intelsat Jackson Holdings SASenior Bond, 5.50%, 8/1/2023 . . . . . . . . . . . . . . . . . . . . . . . . . . . . . . . . . . . . . . . . . . . . . . . . . . . . . . . . . . . . . . . . . . . . . . . . . . . 300,000 USD 309 319Senior Bond, 6.625%, 12/15/2022 . . . . . . . . . . . . . . . . . . . . . . . . . . . . . . . . . . . . . . . . . . . . . . . . . . . . . . . . . . . . . . . . . . . . . . . . 800,000 USD 780 893Senior Note, 7.25%, 10/15/2020 . . . . . . . . . . . . . . . . . . . . . . . . . . . . . . . . . . . . . . . . . . . . . . . . . . . . . . . . . . . . . . . . . . . . . . . . . . 500,000 USD 508 576
Millicom International Cellular SA, Senior Note, 6.625%, 10/15/2021 . . . . . . . . . . . . . . . . . . . . . . . . . . . . . . . . . . . . . . . . . . . . . . . . . . 900,000 USD 967 1,042
5,300 5,772
Canada: 3.75%CHC Helicopter SA
Senior Note, 9.375%, 6/1/2021 . . . . . . . . . . . . . . . . . . . . . . . . . . . . . . . . . . . . . . . . . . . . . . . . . . . . . . . . . . . . . . . . . . . . . . . . . . . 500,000 USD 501 572Senior Secured Note, First Lien, 9.25%, 10/15/2020 . . . . . . . . . . . . . . . . . . . . . . . . . . . . . . . . . . . . . . . . . . . . . . . . . . . . . . . . . . . . 450,000 USD 457 526
Eldorado Gold Corp., Senior Note, 6.125%, 12/15/2020 . . . . . . . . . . . . . . . . . . . . . . . . . . . . . . . . . . . . . . . . . . . . . . . . . . . . . . . . . . . . 1,000,000 USD 1,013 1,082First Quantum Minerals Ltd.
Senior Note, 6.75%, 2/15/2020 . . . . . . . . . . . . . . . . . . . . . . . . . . . . . . . . . . . . . . . . . . . . . . . . . . . . . . . . . . . . . . . . . . . . . . . . . . . 161,000 USD 179 178Senior Note, 7.00%, 2/15/2021 . . . . . . . . . . . . . . . . . . . . . . . . . . . . . . . . . . . . . . . . . . . . . . . . . . . . . . . . . . . . . . . . . . . . . . . . . . . 1,000,000 USD 1,117 1,102
Novelis Inc., Senior Note, 8.75%, 12/15/2020 . . . . . . . . . . . . . . . . . . . . . . . . . . . . . . . . . . . . . . . . . . . . . . . . . . . . . . . . . . . . . . . . . . . 1,000,000 USD 1,020 1,189
4,287 4,649
United Kingdom: 2.66%EnQuest PLC, Senior Note, 7.00%, 4/15/2022 . . . . . . . . . . . . . . . . . . . . . . . . . . . . . . . . . . . . . . . . . . . . . . . . . . . . . . . . . . . . . . . . . . 400,000 USD 440 443New Look Bondco I PLC, Secured Note, 8.375%, 5/14/2018 . . . . . . . . . . . . . . . . . . . . . . . . . . . . . . . . . . . . . . . . . . . . . . . . . . . . . . . . 600,000 USD 613 688Royal Bank of Scotland Group PLC, Subordinated Note, 6.125%, 12/15/2022 . . . . . . . . . . . . . . . . . . . . . . . . . . . . . . . . . . . . . . . . . . . . 1,100,000 USD 1,092 1,285Virgin Media Secured Finance PLC, Senior Secured Bond, first lien, 5.50%, 1/15/2025 . . . . . . . . . . . . . . . . . . . . . . . . . . . . . . . . . . . . . 800,000 USD 884 886
3,029 3,302
Australia: 1.96%Barminco Finance Pty. Ltd., Senior Note, 9.00%, 6/1/2018 . . . . . . . . . . . . . . . . . . . . . . . . . . . . . . . . . . . . . . . . . . . . . . . . . . . . . . . . . 800,000 USD 810 838FMG Resources (August 2006) Pty. Ltd.
Senior Note, 6.875%, 2/1/2018 . . . . . . . . . . . . . . . . . . . . . . . . . . . . . . . . . . . . . . . . . . . . . . . . . . . . . . . . . . . . . . . . . . . . . . . . . . . 1,000,000 USD 990 1,122Senior Note, 6.875%, 4/1/2022 . . . . . . . . . . . . . . . . . . . . . . . . . . . . . . . . . . . . . . . . . . . . . . . . . . . . . . . . . . . . . . . . . . . . . . . . . . . 200,000 USD 184 230Senior Note, 8.25%, 11/1/2019 . . . . . . . . . . . . . . . . . . . . . . . . . . . . . . . . . . . . . . . . . . . . . . . . . . . . . . . . . . . . . . . . . . . . . . . . . . . 200,000 USD 203 233
2,187 2,423
France: 1.77%Alcatel-Lucent USA Inc., Senior Note, 6.75%, 11/15/2020 . . . . . . . . . . . . . . . . . . . . . . . . . . . . . . . . . . . . . . . . . . . . . . . . . . . . . . . . . . 1,000,000 USD 1,051 1,141CGG SA
Senior Note, 6.875%, 1/15/2022 . . . . . . . . . . . . . . . . . . . . . . . . . . . . . . . . . . . . . . . . . . . . . . . . . . . . . . . . . . . . . . . . . . . . . . . . . . 700,000 USD 768 748Senior Note, 7.75%, 5/15/2017 . . . . . . . . . . . . . . . . . . . . . . . . . . . . . . . . . . . . . . . . . . . . . . . . . . . . . . . . . . . . . . . . . . . . . . . . . . . 280,000 USD 284 304
2,103 2,193
Netherlands: 1.43%Constellium NV, Senior Note, 5.75%, 5/15/2024 . . . . . . . . . . . . . . . . . . . . . . . . . . . . . . . . . . . . . . . . . . . . . . . . . . . . . . . . . . . . . . . . . 800,000 USD 878 889InterGen NV, Secured Bond, 7.00%, 6/30/2023 . . . . . . . . . . . . . . . . . . . . . . . . . . . . . . . . . . . . . . . . . . . . . . . . . . . . . . . . . . . . . . . . . 800,000 USD 803 887
1,681 1,776
The accompanying notes are an integral part of these financial statements.
114 Franklin Templeton Investments Funds
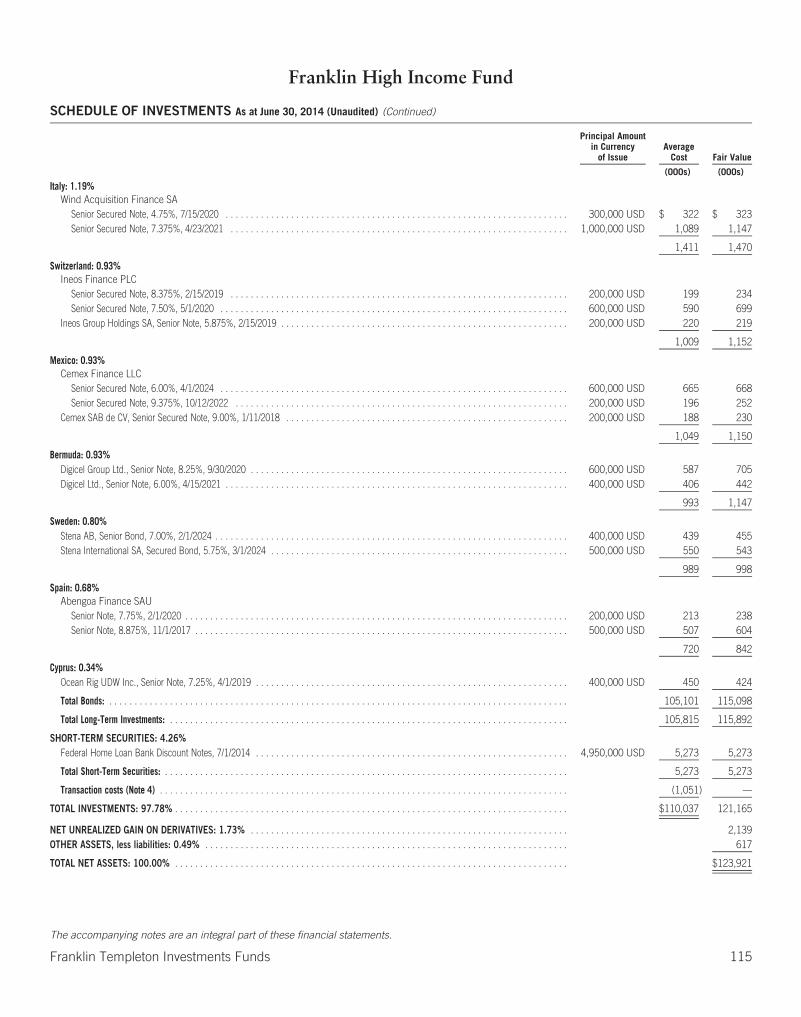
Franklin High Income Fund
SCHEDULE OF INVESTMENTS As at June 30, 2014 (Unaudited) (Continued)
Principal Amountin Currency
of IssueAverage
Cost Fair Value
(000s) (000s)
Italy: 1.19%Wind Acquisition Finance SA
Senior Secured Note, 4.75%, 7/15/2020 . . . . . . . . . . . . . . . . . . . . . . . . . . . . . . . . . . . . . . . . . . . . . . . . . . . . . . . . . . . . . . . . . . . . 300,000 USD $ 322 $ 323Senior Secured Note, 7.375%, 4/23/2021 . . . . . . . . . . . . . . . . . . . . . . . . . . . . . . . . . . . . . . . . . . . . . . . . . . . . . . . . . . . . . . . . . . . 1,000,000 USD 1,089 1,147
1,411 1,470
Switzerland: 0.93%Ineos Finance PLC
Senior Secured Note, 8.375%, 2/15/2019 . . . . . . . . . . . . . . . . . . . . . . . . . . . . . . . . . . . . . . . . . . . . . . . . . . . . . . . . . . . . . . . . . . . 200,000 USD 199 234Senior Secured Note, 7.50%, 5/1/2020 . . . . . . . . . . . . . . . . . . . . . . . . . . . . . . . . . . . . . . . . . . . . . . . . . . . . . . . . . . . . . . . . . . . . . 600,000 USD 590 699
Ineos Group Holdings SA, Senior Note, 5.875%, 2/15/2019 . . . . . . . . . . . . . . . . . . . . . . . . . . . . . . . . . . . . . . . . . . . . . . . . . . . . . . . . . 200,000 USD 220 219
1,009 1,152
Mexico: 0.93%Cemex Finance LLC
Senior Secured Note, 6.00%, 4/1/2024 . . . . . . . . . . . . . . . . . . . . . . . . . . . . . . . . . . . . . . . . . . . . . . . . . . . . . . . . . . . . . . . . . . . . . 600,000 USD 665 668Senior Secured Note, 9.375%, 10/12/2022 . . . . . . . . . . . . . . . . . . . . . . . . . . . . . . . . . . . . . . . . . . . . . . . . . . . . . . . . . . . . . . . . . . 200,000 USD 196 252
Cemex SAB de CV, Senior Secured Note, 9.00%, 1/11/2018 . . . . . . . . . . . . . . . . . . . . . . . . . . . . . . . . . . . . . . . . . . . . . . . . . . . . . . . . 200,000 USD 188 230
1,049 1,150
Bermuda: 0.93%Digicel Group Ltd., Senior Note, 8.25%, 9/30/2020 . . . . . . . . . . . . . . . . . . . . . . . . . . . . . . . . . . . . . . . . . . . . . . . . . . . . . . . . . . . . . . . 600,000 USD 587 705Digicel Ltd., Senior Note, 6.00%, 4/15/2021 . . . . . . . . . . . . . . . . . . . . . . . . . . . . . . . . . . . . . . . . . . . . . . . . . . . . . . . . . . . . . . . . . . . . 400,000 USD 406 442
993 1,147
Sweden: 0.80%Stena AB, Senior Bond, 7.00%, 2/1/2024 . . . . . . . . . . . . . . . . . . . . . . . . . . . . . . . . . . . . . . . . . . . . . . . . . . . . . . . . . . . . . . . . . . . . . . 400,000 USD 439 455Stena International SA, Secured Bond, 5.75%, 3/1/2024 . . . . . . . . . . . . . . . . . . . . . . . . . . . . . . . . . . . . . . . . . . . . . . . . . . . . . . . . . . . 500,000 USD 550 543
989 998
Spain: 0.68%Abengoa Finance SAU
Senior Note, 7.75%, 2/1/2020 . . . . . . . . . . . . . . . . . . . . . . . . . . . . . . . . . . . . . . . . . . . . . . . . . . . . . . . . . . . . . . . . . . . . . . . . . . . . 200,000 USD 213 238Senior Note, 8.875%, 11/1/2017 . . . . . . . . . . . . . . . . . . . . . . . . . . . . . . . . . . . . . . . . . . . . . . . . . . . . . . . . . . . . . . . . . . . . . . . . . . 500,000 USD 507 604
720 842
Cyprus: 0.34%Ocean Rig UDW Inc., Senior Note, 7.25%, 4/1/2019 . . . . . . . . . . . . . . . . . . . . . . . . . . . . . . . . . . . . . . . . . . . . . . . . . . . . . . . . . . . . . . 400,000 USD 450 424
Total Bonds: . . . . . . . . . . . . . . . . . . . . . . . . . . . . . . . . . . . . . . . . . . . . . . . . . . . . . . . . . . . . . . . . . . . . . . . . . . . . . . . . . . . . . . . . . . . 105,101 115,098
Total Long-Term Investments: . . . . . . . . . . . . . . . . . . . . . . . . . . . . . . . . . . . . . . . . . . . . . . . . . . . . . . . . . . . . . . . . . . . . . . . . . . . . . . . 105,815 115,892
SHORT-TERM SECURITIES: 4.26%Federal Home Loan Bank Discount Notes, 7/1/2014 . . . . . . . . . . . . . . . . . . . . . . . . . . . . . . . . . . . . . . . . . . . . . . . . . . . . . . . . . . . . . . 4,950,000 USD 5,273 5,273
Total Short-Term Securities: . . . . . . . . . . . . . . . . . . . . . . . . . . . . . . . . . . . . . . . . . . . . . . . . . . . . . . . . . . . . . . . . . . . . . . . . . . . . . . . . 5,273 5,273
Transaction costs (Note 4) . . . . . . . . . . . . . . . . . . . . . . . . . . . . . . . . . . . . . . . . . . . . . . . . . . . . . . . . . . . . . . . . . . . . . . . . . . . . . . . . . (1,051) —
TOTAL INVESTMENTS: 97.78% . . . . . . . . . . . . . . . . . . . . . . . . . . . . . . . . . . . . . . . . . . . . . . . . . . . . . . . . . . . . . . . . . . . . . . . . . . . . . . $110,037 121,165
NET UNREALIZED GAIN ON DERIVATIVES: 1.73% . . . . . . . . . . . . . . . . . . . . . . . . . . . . . . . . . . . . . . . . . . . . . . . . . . . . . . . . . . . . . . . 2,139OTHER ASSETS, less liabilities: 0.49% . . . . . . . . . . . . . . . . . . . . . . . . . . . . . . . . . . . . . . . . . . . . . . . . . . . . . . . . . . . . . . . . . . . . . . . . 617
TOTAL NET ASSETS: 100.00% . . . . . . . . . . . . . . . . . . . . . . . . . . . . . . . . . . . . . . . . . . . . . . . . . . . . . . . . . . . . . . . . . . . . . . . . . . . . . . $123,921
The accompanying notes are an integral part of these financial statements.
Franklin Templeton Investments Funds 115
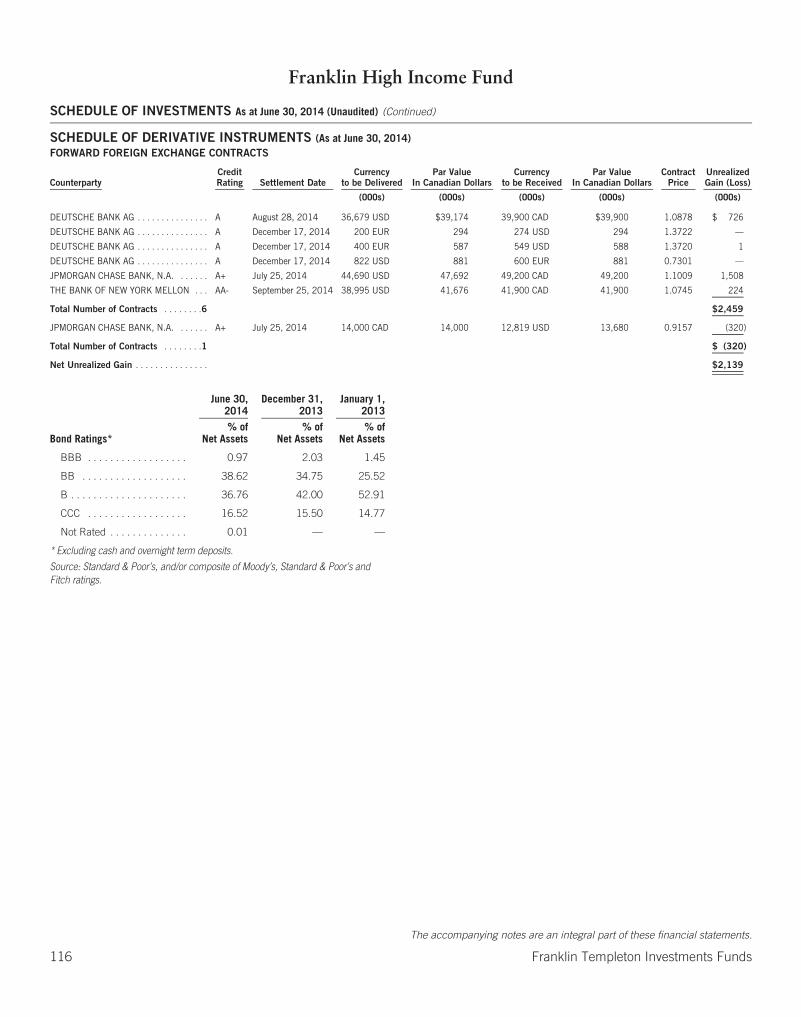
Franklin High Income Fund
SCHEDULE OF INVESTMENTS As at June 30, 2014 (Unaudited) (Continued)
SCHEDULE OF DERIVATIVE INSTRUMENTS (As at June 30, 2014)FORWARD FOREIGN EXCHANGE CONTRACTS
CounterpartyCreditRating Settlement Date
Currencyto be Delivered
Par ValueIn Canadian Dollars
Currencyto be Received
Par ValueIn Canadian Dollars
ContractPrice
UnrealizedGain (Loss)
(000s) (000s) (000s) (000s) (000s)
DEUTSCHE BANK AG . . . . . . . . . . . . . . . A August 28, 2014 36,679 USD $39,174 39,900 CAD $39,900 1.0878 $ 726
DEUTSCHE BANK AG . . . . . . . . . . . . . . . A December 17, 2014 200 EUR 294 274 USD 294 1.3722 —
DEUTSCHE BANK AG . . . . . . . . . . . . . . . A December 17, 2014 400 EUR 587 549 USD 588 1.3720 1
DEUTSCHE BANK AG . . . . . . . . . . . . . . . A December 17, 2014 822 USD 881 600 EUR 881 0.7301 —
JPMORGAN CHASE BANK, N.A. . . . . . . A+ July 25, 2014 44,690 USD 47,692 49,200 CAD 49,200 1.1009 1,508
THE BANK OF NEW YORK MELLON . . . AA- September 25, 2014 38,995 USD 41,676 41,900 CAD 41,900 1.0745 224
Total Number of Contracts . . . . . . . .6 $2,459
JPMORGAN CHASE BANK, N.A. . . . . . . A+ July 25, 2014 14,000 CAD 14,000 12,819 USD 13,680 0.9157 (320)
Total Number of Contracts . . . . . . . .1 $ (320)
Net Unrealized Gain . . . . . . . . . . . . . . . $2,139
June 30,2014
December 31,2013
January 1,2013
Bond Ratings*% of
Net Assets% of
Net Assets% of
Net Assets
BBB . . . . . . . . . . . . . . . . . . 0.97 2.03 1.45
BB . . . . . . . . . . . . . . . . . . . 38.62 34.75 25.52
B . . . . . . . . . . . . . . . . . . . . . 36.76 42.00 52.91
CCC . . . . . . . . . . . . . . . . . . 16.52 15.50 14.77
Not Rated . . . . . . . . . . . . . . 0.01 — —
* Excluding cash and overnight term deposits.
Source: Standard & Poor’s, and/or composite of Moody’s, Standard & Poor’s andFitch ratings.
The accompanying notes are an integral part of these financial statements.
116 Franklin Templeton Investments Funds
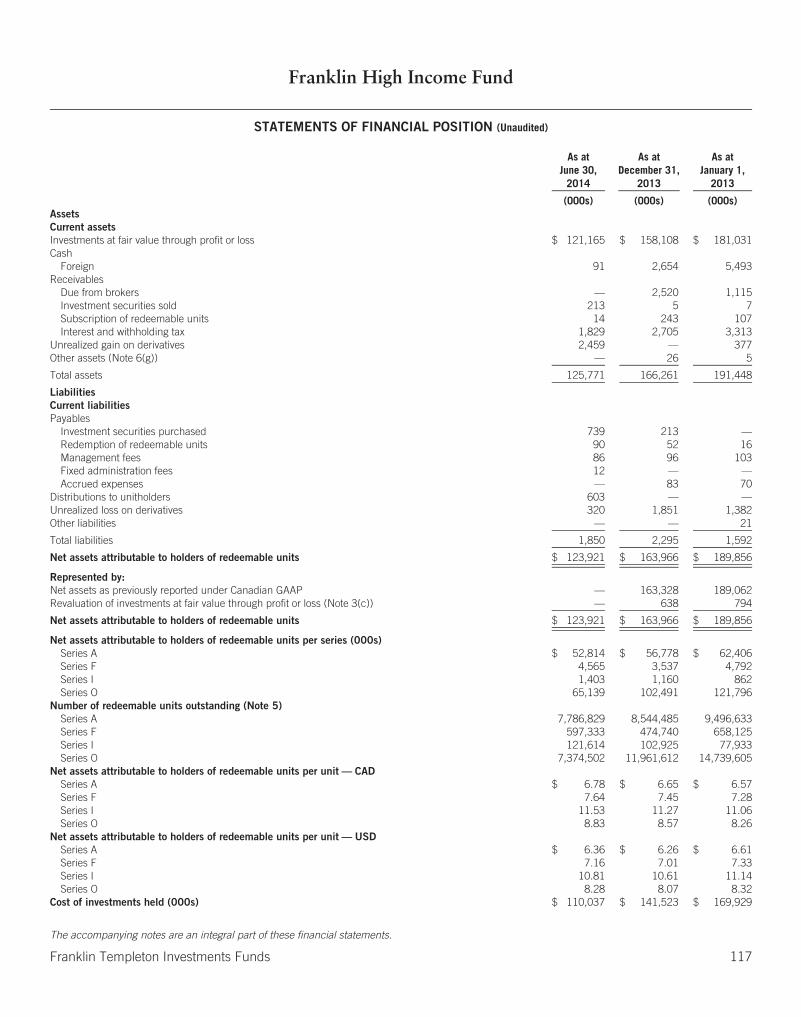
Franklin High Income Fund
STATEMENTS OF FINANCIAL POSITION (Unaudited)
As atJune 30,
2014
As atDecember 31,
2013
As atJanuary 1,
2013
(000s) (000s) (000s)AssetsCurrent assetsInvestments at fair value through profit or loss $ 121,165 $ 158,108 $ 181,031Cash
Foreign 91 2,654 5,493Receivables
Due from brokers — 2,520 1,115Investment securities sold 213 5 7Subscription of redeemable units 14 243 107Interest and withholding tax 1,829 2,705 3,313
Unrealized gain on derivatives 2,459 — 377Other assets (Note 6(g)) — 26 5
Total assets 125,771 166,261 191,448
LiabilitiesCurrent liabilitiesPayables
Investment securities purchased 739 213 —Redemption of redeemable units 90 52 16Management fees 86 96 103Fixed administration fees 12 — —Accrued expenses — 83 70
Distributions to unitholders 603 — —Unrealized loss on derivatives 320 1,851 1,382Other liabilities — — 21
Total liabilities 1,850 2,295 1,592
Net assets attributable to holders of redeemable units $ 123,921 $ 163,966 $ 189,856
Represented by:Net assets as previously reported under Canadian GAAP — 163,328 189,062Revaluation of investments at fair value through profit or loss (Note 3(c)) — 638 794
Net assets attributable to holders of redeemable units $ 123,921 $ 163,966 $ 189,856
Net assets attributable to holders of redeemable units per series (000s)Series A $ 52,814 $ 56,778 $ 62,406Series F 4,565 3,537 4,792Series I 1,403 1,160 862Series O 65,139 102,491 121,796
Number of redeemable units outstanding (Note 5)Series A 7,786,829 8,544,485 9,496,633Series F 597,333 474,740 658,125Series I 121,614 102,925 77,933Series O 7,374,502 11,961,612 14,739,605
Net assets attributable to holders of redeemable units per unit — CADSeries A $ 6.78 $ 6.65 $ 6.57Series F 7.64 7.45 7.28Series I 11.53 11.27 11.06Series O 8.83 8.57 8.26
Net assets attributable to holders of redeemable units per unit — USDSeries A $ 6.36 $ 6.26 $ 6.61Series F 7.16 7.01 7.33Series I 10.81 10.61 11.14Series O 8.28 8.07 8.32
Cost of investments held (000s) $ 110,037 $ 141,523 $ 169,929
The accompanying notes are an integral part of these financial statements.
Franklin Templeton Investments Funds 117
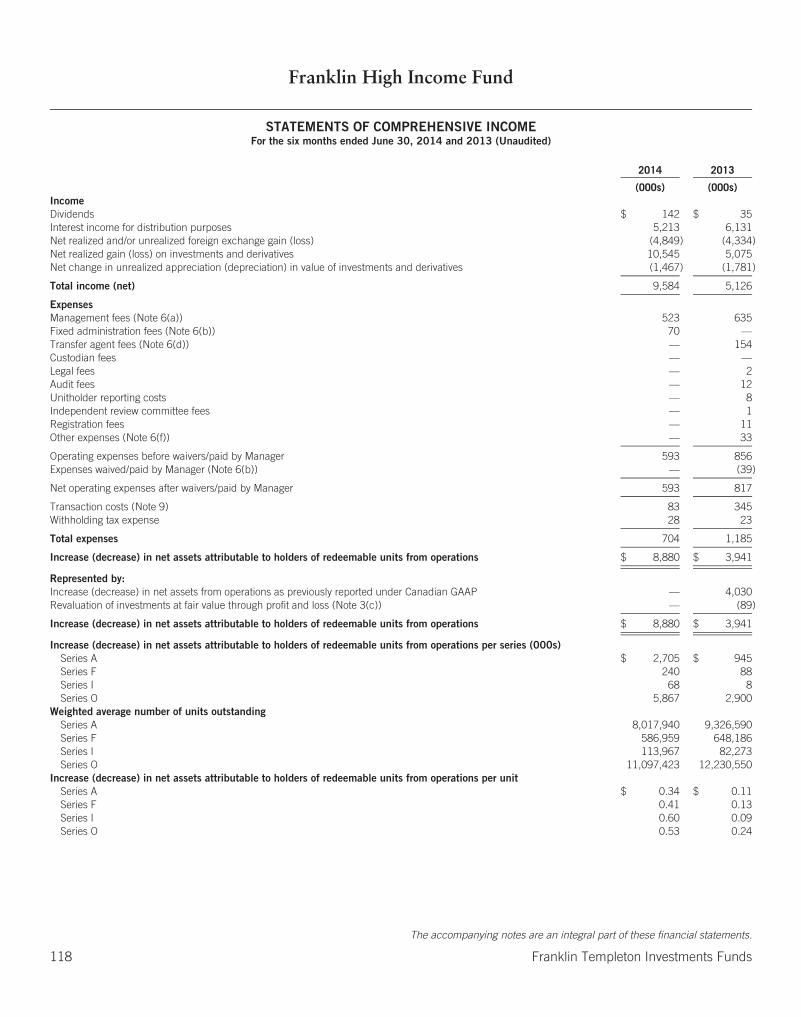
Franklin High Income Fund
STATEMENTS OF COMPREHENSIVE INCOMEFor the six months ended June 30, 2014 and 2013 (Unaudited)
2014 2013
(000s) (000s)IncomeDividends $ 142 $ 35Interest income for distribution purposes 5,213 6,131Net realized and/or unrealized foreign exchange gain (loss) (4,849) (4,334)Net realized gain (loss) on investments and derivatives 10,545 5,075Net change in unrealized appreciation (depreciation) in value of investments and derivatives (1,467) (1,781)
Total income (net) 9,584 5,126
ExpensesManagement fees (Note 6(a)) 523 635Fixed administration fees (Note 6(b)) 70 —Transfer agent fees (Note 6(d)) — 154Custodian fees — —Legal fees — 2Audit fees — 12Unitholder reporting costs — 8Independent review committee fees — 1Registration fees — 11Other expenses (Note 6(f)) — 33
Operating expenses before waivers/paid by Manager 593 856Expenses waived/paid by Manager (Note 6(b)) — (39)
Net operating expenses after waivers/paid by Manager 593 817
Transaction costs (Note 9) 83 345Withholding tax expense 28 23
Total expenses 704 1,185
Increase (decrease) in net assets attributable to holders of redeemable units from operations $ 8,880 $ 3,941
Represented by:Increase (decrease) in net assets from operations as previously reported under Canadian GAAP — 4,030Revaluation of investments at fair value through profit and loss (Note 3(c)) — (89)
Increase (decrease) in net assets attributable to holders of redeemable units from operations $ 8,880 $ 3,941
Increase (decrease) in net assets attributable to holders of redeemable units from operations per series (000s)Series A $ 2,705 $ 945Series F 240 88Series I 68 8Series O 5,867 2,900
Weighted average number of units outstandingSeries A 8,017,940 9,326,590Series F 586,959 648,186Series I 113,967 82,273Series O 11,097,423 12,230,550
Increase (decrease) in net assets attributable to holders of redeemable units from operations per unitSeries A $ 0.34 $ 0.11Series F 0.41 0.13Series I 0.60 0.09Series O 0.53 0.24
The accompanying notes are an integral part of these financial statements.
118 Franklin Templeton Investments Funds

Franklin High Income Fund
STATEMENTS OF CHANGES IN NET ASSETS ATTRIBUTABLE TO HOLDERS OF REDEEMABLE UNITSFor the six months ended June 30, 2014 and 2013 (Unaudited) (in 000s)
All Series Series A Series F
2014 2013 2014 2013 2014 2013
Net assets attributable to holders of redeemable units at beginning of period $163,966 $189,856 $ 56,778 $ 62,406 $ 3,537 $ 4,792
Increase (decrease) in net assets attributable to holders of redeemable unitsfrom operations 8,880 3,941 2,705 945 240 88
Distributions to holders of redeemable unitsFrom net investment income (4,457) (5,517) (1,571) (2,001) (132) (153)From net realized gains on investments — — — — — —From return of capital — — — — — —
Total distributions to holders of redeemable units (4,457) (5,517) (1,571) (2,001) (132) (153)
Redeemable units transactionsSubscriptions 9,194 17,628 5,041 8,705 1,848 1,202Reinvestments 3,494 4,103 977 1,209 87 100Redemptions (57,156) (46,700) (11,116) (13,550) (1,015) (2,067)
Net increase (decrease) from redeemable units transactions (44,468) (24,969) (5,098) (3,636) 920 (765)
Increase (decrease) in net assets attributable to holders of redeemable units (40,045) (26,545) (3,964) (4,692) 1,028 (830)
Net assets attributable to holders of redeemable units at end of period $123,921 $163,311 $ 52,814 $ 57,714 $ 4,565 $ 3,962
Series I Series O
2014 2013 2014 2013
Net assets attributable to holders of redeemable units at beginning of period $ 1,160 $ 862 $102,491 $121,796
Increase (decrease) in net assets attributable to holders of redeemable unitsfrom operations 68 8 5,867 2,900
Distributions to holders of redeemable unitsFrom net investment income (39) (31) (2,715) (3,332)From net realized gains on investments — — — —From return of capital — — — —
Total distributions to holders of redeemable units (39) (31) (2,715) (3,332)
Redeemable units transactionsSubscriptions 185 258 2,120 7,463Reinvestments 32 25 2,398 2,769Redemptions (3) (37) (45,022) (31,046)
Net increase (decrease) from redeemable units transactions 214 246 (40,504) (20,814)
Increase (decrease) in net assets attributable to holders of redeemable units 243 223 (37,352) (21,246)
Net assets attributable to holders of redeemable units at end of period $ 1,403 $ 1,085 $ 65,139 $100,550
The accompanying notes are an integral part of these financial statements.
Franklin Templeton Investments Funds 119

Franklin High Income Fund
STATEMENTS OF CASH FLOWSFor the six months ended June 30, 2014 and 2013 (Unaudited)
2014 2013
(000s) (000s)Cash flows from operating activitiesInterest received $ 5,032 $ 5,611Dividends received 169 36Proceeds from sale and maturity of investments 69,972 60,557Purchases of investments (35,180) (27,169)Net receipts/(payments) from derivative activities 2,508 (1,824)Operating expenses paid (649) (866)
Net cash from/(used in) operating activities 41,852 36,345
Cash flows from financing activitiesProceeds from issuances of redeemable units 9,423 13,632Amounts paid on redemption of redeemable units (57,117) (46,653)Distributions paid to holders of redeemable units, net of reinvested distributions (360) (503)
Net cash (used in)/from financing activities (48,054) (33,524)
Net increase (decrease) in cash (6,202) 2,821Cash at beginning of year 2,654 5,493Effect of exchange rate changes 3,639 (6,629)
Cash at end of period $ 91 $ 1,685
The accompanying notes are an integral part of these financial statements.
120 Franklin Templeton Investments Funds

Franklin Income Fund
SCHEDULE OF INVESTMENTS As at June 30, 2014 (Unaudited)
SharesAverage
Cost Fair Value
(000s) (000s)
LONG-TERM INVESTMENTS: 87.39%COMMON STOCKS: 59.16%Electric Utilities: 7.73%
American Electric Power Co. Inc. . . . . . . . . . . . . . . . . . . . . . . . . . . . . . . . . . . . . . . . . . . . . . . . . . . . . . . . . . . . . . . . . . . . . . . . . . . . . . . . . . . . 5,000 $ 242 $ 297Duke Energy Corp. . . . . . . . . . . . . . . . . . . . . . . . . . . . . . . . . . . . . . . . . . . . . . . . . . . . . . . . . . . . . . . . . . . . . . . . . . . . . . . . . . . . . . . . . . . . . . . 8,860 637 701Edison International . . . . . . . . . . . . . . . . . . . . . . . . . . . . . . . . . . . . . . . . . . . . . . . . . . . . . . . . . . . . . . . . . . . . . . . . . . . . . . . . . . . . . . . . . . . . . 7,000 365 434Entergy Corp. . . . . . . . . . . . . . . . . . . . . . . . . . . . . . . . . . . . . . . . . . . . . . . . . . . . . . . . . . . . . . . . . . . . . . . . . . . . . . . . . . . . . . . . . . . . . . . . . . 2,000 142 175Exelon Corp. . . . . . . . . . . . . . . . . . . . . . . . . . . . . . . . . . . . . . . . . . . . . . . . . . . . . . . . . . . . . . . . . . . . . . . . . . . . . . . . . . . . . . . . . . . . . . . . . . . 30,000 1,108 1,167FirstEnergy Corp. . . . . . . . . . . . . . . . . . . . . . . . . . . . . . . . . . . . . . . . . . . . . . . . . . . . . . . . . . . . . . . . . . . . . . . . . . . . . . . . . . . . . . . . . . . . . . . . 5,000 199 185HK Electric Investments/HK Electric Investments Ltd. . . . . . . . . . . . . . . . . . . . . . . . . . . . . . . . . . . . . . . . . . . . . . . . . . . . . . . . . . . . . . . . . . . . . . 200,000 157 145NextEra Energy Inc. . . . . . . . . . . . . . . . . . . . . . . . . . . . . . . . . . . . . . . . . . . . . . . . . . . . . . . . . . . . . . . . . . . . . . . . . . . . . . . . . . . . . . . . . . . . . . 2,500 211 273Pinnacle West Capital Corp. . . . . . . . . . . . . . . . . . . . . . . . . . . . . . . . . . . . . . . . . . . . . . . . . . . . . . . . . . . . . . . . . . . . . . . . . . . . . . . . . . . . . . . . 6,000 358 370PPL Corp. . . . . . . . . . . . . . . . . . . . . . . . . . . . . . . . . . . . . . . . . . . . . . . . . . . . . . . . . . . . . . . . . . . . . . . . . . . . . . . . . . . . . . . . . . . . . . . . . . . . . 15,000 515 568The Southern Co. . . . . . . . . . . . . . . . . . . . . . . . . . . . . . . . . . . . . . . . . . . . . . . . . . . . . . . . . . . . . . . . . . . . . . . . . . . . . . . . . . . . . . . . . . . . . . . 19,980 915 967Xcel Energy Inc. . . . . . . . . . . . . . . . . . . . . . . . . . . . . . . . . . . . . . . . . . . . . . . . . . . . . . . . . . . . . . . . . . . . . . . . . . . . . . . . . . . . . . . . . . . . . . . . 20,000 614 688
5,463 5,970
Pharmaceuticals: 5.79%Bristol-Myers Squibb Co. . . . . . . . . . . . . . . . . . . . . . . . . . . . . . . . . . . . . . . . . . . . . . . . . . . . . . . . . . . . . . . . . . . . . . . . . . . . . . . . . . . . . . . . . . 10,000 491 517Eli Lilly & Co. . . . . . . . . . . . . . . . . . . . . . . . . . . . . . . . . . . . . . . . . . . . . . . . . . . . . . . . . . . . . . . . . . . . . . . . . . . . . . . . . . . . . . . . . . . . . . . . . . . 9,050 485 600Johnson & Johnson . . . . . . . . . . . . . . . . . . . . . . . . . . . . . . . . . . . . . . . . . . . . . . . . . . . . . . . . . . . . . . . . . . . . . . . . . . . . . . . . . . . . . . . . . . . . . 7,000 687 781Merck & Co. Inc. . . . . . . . . . . . . . . . . . . . . . . . . . . . . . . . . . . . . . . . . . . . . . . . . . . . . . . . . . . . . . . . . . . . . . . . . . . . . . . . . . . . . . . . . . . . . . . . 13,000 741 802Pfizer Inc. . . . . . . . . . . . . . . . . . . . . . . . . . . . . . . . . . . . . . . . . . . . . . . . . . . . . . . . . . . . . . . . . . . . . . . . . . . . . . . . . . . . . . . . . . . . . . . . . . . . . 30,000 955 950Roche Holding AG . . . . . . . . . . . . . . . . . . . . . . . . . . . . . . . . . . . . . . . . . . . . . . . . . . . . . . . . . . . . . . . . . . . . . . . . . . . . . . . . . . . . . . . . . . . . . . 1,690 464 538Sanofi, American Depositary Receipt . . . . . . . . . . . . . . . . . . . . . . . . . . . . . . . . . . . . . . . . . . . . . . . . . . . . . . . . . . . . . . . . . . . . . . . . . . . . . . . . . 5,000 282 283
4,105 4,471
Oil, Gas & Consumable Fuels: 5.36%BP PLC, American Depositary Receipt . . . . . . . . . . . . . . . . . . . . . . . . . . . . . . . . . . . . . . . . . . . . . . . . . . . . . . . . . . . . . . . . . . . . . . . . . . . . . . . . 7,500 348 422Chevron Corp. . . . . . . . . . . . . . . . . . . . . . . . . . . . . . . . . . . . . . . . . . . . . . . . . . . . . . . . . . . . . . . . . . . . . . . . . . . . . . . . . . . . . . . . . . . . . . . . . . 7,000 888 975Exxon Mobil Corp. . . . . . . . . . . . . . . . . . . . . . . . . . . . . . . . . . . . . . . . . . . . . . . . . . . . . . . . . . . . . . . . . . . . . . . . . . . . . . . . . . . . . . . . . . . . . . . 10,610 1,022 1,139Royal Dutch Shell PLC, A, American Depositary Receipt . . . . . . . . . . . . . . . . . . . . . . . . . . . . . . . . . . . . . . . . . . . . . . . . . . . . . . . . . . . . . . . . . . . 3,000 223 263Spectra Energy Corp. . . . . . . . . . . . . . . . . . . . . . . . . . . . . . . . . . . . . . . . . . . . . . . . . . . . . . . . . . . . . . . . . . . . . . . . . . . . . . . . . . . . . . . . . . . . . 6,000 215 272The Williams Companies Inc. . . . . . . . . . . . . . . . . . . . . . . . . . . . . . . . . . . . . . . . . . . . . . . . . . . . . . . . . . . . . . . . . . . . . . . . . . . . . . . . . . . . . . . 10,000 378 621Total SA, B, American Depositary Receipt . . . . . . . . . . . . . . . . . . . . . . . . . . . . . . . . . . . . . . . . . . . . . . . . . . . . . . . . . . . . . . . . . . . . . . . . . . . . . 5,818 345 448
3,419 4,140
Chemicals: 4.40%Agrium Inc. . . . . . . . . . . . . . . . . . . . . . . . . . . . . . . . . . . . . . . . . . . . . . . . . . . . . . . . . . . . . . . . . . . . . . . . . . . . . . . . . . . . . . . . . . . . . . . . . . . . 7,000 667 684E. I. du Pont de Nemours and Co. . . . . . . . . . . . . . . . . . . . . . . . . . . . . . . . . . . . . . . . . . . . . . . . . . . . . . . . . . . . . . . . . . . . . . . . . . . . . . . . . . . . 7,500 479 523LyondellBasell Industries NV, A . . . . . . . . . . . . . . . . . . . . . . . . . . . . . . . . . . . . . . . . . . . . . . . . . . . . . . . . . . . . . . . . . . . . . . . . . . . . . . . . . . . . 5,000 389 521The Dow Chemical Co. . . . . . . . . . . . . . . . . . . . . . . . . . . . . . . . . . . . . . . . . . . . . . . . . . . . . . . . . . . . . . . . . . . . . . . . . . . . . . . . . . . . . . . . . . . . 16,020 689 879The Mosaic Co. . . . . . . . . . . . . . . . . . . . . . . . . . . . . . . . . . . . . . . . . . . . . . . . . . . . . . . . . . . . . . . . . . . . . . . . . . . . . . . . . . . . . . . . . . . . . . . . . 15,000 742 791
2,966 3,398
Multi-Utilities: 4.22%Ameren Corp. . . . . . . . . . . . . . . . . . . . . . . . . . . . . . . . . . . . . . . . . . . . . . . . . . . . . . . . . . . . . . . . . . . . . . . . . . . . . . . . . . . . . . . . . . . . . . . . . . 15,000 607 654Dominion Resources Inc. . . . . . . . . . . . . . . . . . . . . . . . . . . . . . . . . . . . . . . . . . . . . . . . . . . . . . . . . . . . . . . . . . . . . . . . . . . . . . . . . . . . . . . . . . 7,500 511 572DTE Energy Co. . . . . . . . . . . . . . . . . . . . . . . . . . . . . . . . . . . . . . . . . . . . . . . . . . . . . . . . . . . . . . . . . . . . . . . . . . . . . . . . . . . . . . . . . . . . . . . . . 6,500 466 540PG&E Corp. . . . . . . . . . . . . . . . . . . . . . . . . . . . . . . . . . . . . . . . . . . . . . . . . . . . . . . . . . . . . . . . . . . . . . . . . . . . . . . . . . . . . . . . . . . . . . . . . . . 18,000 820 922Public Service Enterprise Group Inc. . . . . . . . . . . . . . . . . . . . . . . . . . . . . . . . . . . . . . . . . . . . . . . . . . . . . . . . . . . . . . . . . . . . . . . . . . . . . . . . . . 8,000 303 348Sempra Energy . . . . . . . . . . . . . . . . . . . . . . . . . . . . . . . . . . . . . . . . . . . . . . . . . . . . . . . . . . . . . . . . . . . . . . . . . . . . . . . . . . . . . . . . . . . . . . . . 2,000 189 223
2,896 3,259
The accompanying notes are an integral part of these financial statements.
Franklin Templeton Investments Funds 121
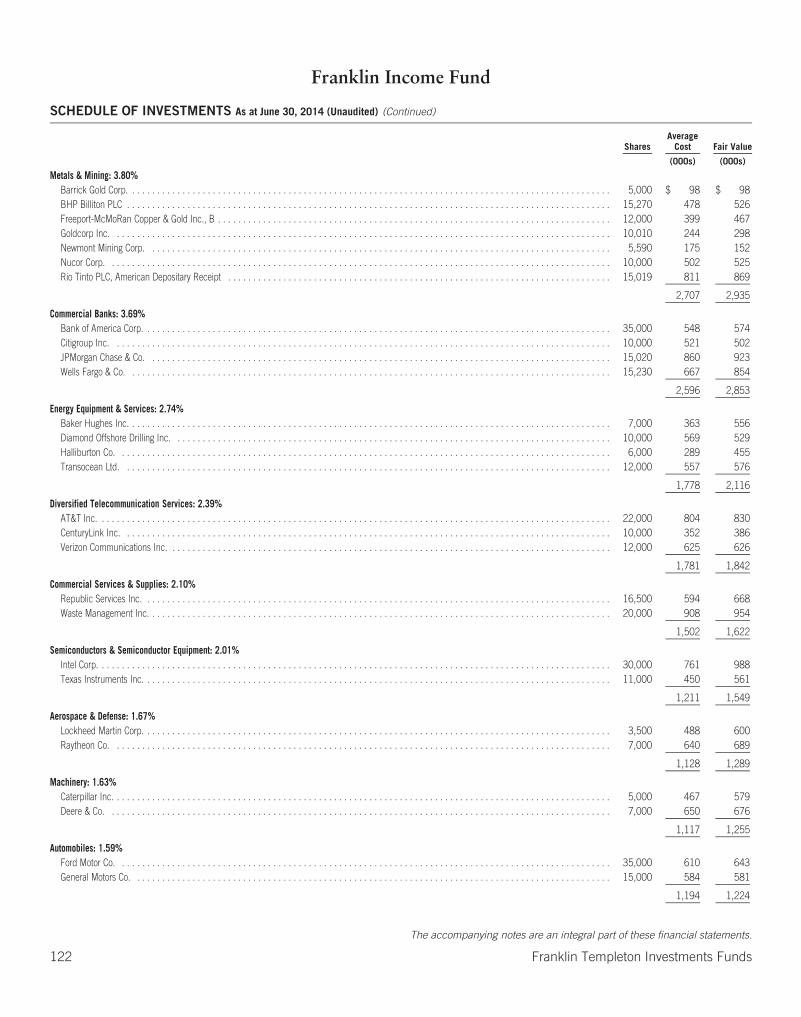
Franklin Income Fund
SCHEDULE OF INVESTMENTS As at June 30, 2014 (Unaudited) (Continued)
SharesAverage
Cost Fair Value
(000s) (000s)
Metals & Mining: 3.80%Barrick Gold Corp. . . . . . . . . . . . . . . . . . . . . . . . . . . . . . . . . . . . . . . . . . . . . . . . . . . . . . . . . . . . . . . . . . . . . . . . . . . . . . . . . . . . . . . . . . . . . . . . 5,000 $ 98 $ 98BHP Billiton PLC . . . . . . . . . . . . . . . . . . . . . . . . . . . . . . . . . . . . . . . . . . . . . . . . . . . . . . . . . . . . . . . . . . . . . . . . . . . . . . . . . . . . . . . . . . . . . . . . 15,270 478 526Freeport-McMoRan Copper & Gold Inc., B . . . . . . . . . . . . . . . . . . . . . . . . . . . . . . . . . . . . . . . . . . . . . . . . . . . . . . . . . . . . . . . . . . . . . . . . . . . . . . 12,000 399 467Goldcorp Inc. . . . . . . . . . . . . . . . . . . . . . . . . . . . . . . . . . . . . . . . . . . . . . . . . . . . . . . . . . . . . . . . . . . . . . . . . . . . . . . . . . . . . . . . . . . . . . . . . . . 10,010 244 298Newmont Mining Corp. . . . . . . . . . . . . . . . . . . . . . . . . . . . . . . . . . . . . . . . . . . . . . . . . . . . . . . . . . . . . . . . . . . . . . . . . . . . . . . . . . . . . . . . . . . . 5,590 175 152Nucor Corp. . . . . . . . . . . . . . . . . . . . . . . . . . . . . . . . . . . . . . . . . . . . . . . . . . . . . . . . . . . . . . . . . . . . . . . . . . . . . . . . . . . . . . . . . . . . . . . . . . . . 10,000 502 525Rio Tinto PLC, American Depositary Receipt . . . . . . . . . . . . . . . . . . . . . . . . . . . . . . . . . . . . . . . . . . . . . . . . . . . . . . . . . . . . . . . . . . . . . . . . . . . . 15,019 811 869
2,707 2,935
Commercial Banks: 3.69%Bank of America Corp. . . . . . . . . . . . . . . . . . . . . . . . . . . . . . . . . . . . . . . . . . . . . . . . . . . . . . . . . . . . . . . . . . . . . . . . . . . . . . . . . . . . . . . . . . . . . 35,000 548 574Citigroup Inc. . . . . . . . . . . . . . . . . . . . . . . . . . . . . . . . . . . . . . . . . . . . . . . . . . . . . . . . . . . . . . . . . . . . . . . . . . . . . . . . . . . . . . . . . . . . . . . . . . . 10,000 521 502JPMorgan Chase & Co. . . . . . . . . . . . . . . . . . . . . . . . . . . . . . . . . . . . . . . . . . . . . . . . . . . . . . . . . . . . . . . . . . . . . . . . . . . . . . . . . . . . . . . . . . . . 15,020 860 923Wells Fargo & Co. . . . . . . . . . . . . . . . . . . . . . . . . . . . . . . . . . . . . . . . . . . . . . . . . . . . . . . . . . . . . . . . . . . . . . . . . . . . . . . . . . . . . . . . . . . . . . . . 15,230 667 854
2,596 2,853
Energy Equipment & Services: 2.74%Baker Hughes Inc. . . . . . . . . . . . . . . . . . . . . . . . . . . . . . . . . . . . . . . . . . . . . . . . . . . . . . . . . . . . . . . . . . . . . . . . . . . . . . . . . . . . . . . . . . . . . . . . 7,000 363 556Diamond Offshore Drilling Inc. . . . . . . . . . . . . . . . . . . . . . . . . . . . . . . . . . . . . . . . . . . . . . . . . . . . . . . . . . . . . . . . . . . . . . . . . . . . . . . . . . . . . . . 10,000 569 529Halliburton Co. . . . . . . . . . . . . . . . . . . . . . . . . . . . . . . . . . . . . . . . . . . . . . . . . . . . . . . . . . . . . . . . . . . . . . . . . . . . . . . . . . . . . . . . . . . . . . . . . . 6,000 289 455Transocean Ltd. . . . . . . . . . . . . . . . . . . . . . . . . . . . . . . . . . . . . . . . . . . . . . . . . . . . . . . . . . . . . . . . . . . . . . . . . . . . . . . . . . . . . . . . . . . . . . . . . 12,000 557 576
1,778 2,116
Diversified Telecommunication Services: 2.39%AT&T Inc. . . . . . . . . . . . . . . . . . . . . . . . . . . . . . . . . . . . . . . . . . . . . . . . . . . . . . . . . . . . . . . . . . . . . . . . . . . . . . . . . . . . . . . . . . . . . . . . . . . . . . 22,000 804 830CenturyLink Inc. . . . . . . . . . . . . . . . . . . . . . . . . . . . . . . . . . . . . . . . . . . . . . . . . . . . . . . . . . . . . . . . . . . . . . . . . . . . . . . . . . . . . . . . . . . . . . . . . 10,000 352 386Verizon Communications Inc. . . . . . . . . . . . . . . . . . . . . . . . . . . . . . . . . . . . . . . . . . . . . . . . . . . . . . . . . . . . . . . . . . . . . . . . . . . . . . . . . . . . . . . . 12,000 625 626
1,781 1,842
Commercial Services & Supplies: 2.10%Republic Services Inc. . . . . . . . . . . . . . . . . . . . . . . . . . . . . . . . . . . . . . . . . . . . . . . . . . . . . . . . . . . . . . . . . . . . . . . . . . . . . . . . . . . . . . . . . . . . . 16,500 594 668Waste Management Inc. . . . . . . . . . . . . . . . . . . . . . . . . . . . . . . . . . . . . . . . . . . . . . . . . . . . . . . . . . . . . . . . . . . . . . . . . . . . . . . . . . . . . . . . . . . . 20,000 908 954
1,502 1,622
Semiconductors & Semiconductor Equipment: 2.01%Intel Corp. . . . . . . . . . . . . . . . . . . . . . . . . . . . . . . . . . . . . . . . . . . . . . . . . . . . . . . . . . . . . . . . . . . . . . . . . . . . . . . . . . . . . . . . . . . . . . . . . . . . . . 30,000 761 988Texas Instruments Inc. . . . . . . . . . . . . . . . . . . . . . . . . . . . . . . . . . . . . . . . . . . . . . . . . . . . . . . . . . . . . . . . . . . . . . . . . . . . . . . . . . . . . . . . . . . . . 11,000 450 561
1,211 1,549
Aerospace & Defense: 1.67%Lockheed Martin Corp. . . . . . . . . . . . . . . . . . . . . . . . . . . . . . . . . . . . . . . . . . . . . . . . . . . . . . . . . . . . . . . . . . . . . . . . . . . . . . . . . . . . . . . . . . . . . 3,500 488 600Raytheon Co. . . . . . . . . . . . . . . . . . . . . . . . . . . . . . . . . . . . . . . . . . . . . . . . . . . . . . . . . . . . . . . . . . . . . . . . . . . . . . . . . . . . . . . . . . . . . . . . . . . 7,000 640 689
1,128 1,289
Machinery: 1.63%Caterpillar Inc. . . . . . . . . . . . . . . . . . . . . . . . . . . . . . . . . . . . . . . . . . . . . . . . . . . . . . . . . . . . . . . . . . . . . . . . . . . . . . . . . . . . . . . . . . . . . . . . . . . 5,000 467 579Deere & Co. . . . . . . . . . . . . . . . . . . . . . . . . . . . . . . . . . . . . . . . . . . . . . . . . . . . . . . . . . . . . . . . . . . . . . . . . . . . . . . . . . . . . . . . . . . . . . . . . . . . 7,000 650 676
1,117 1,255
Automobiles: 1.59%Ford Motor Co. . . . . . . . . . . . . . . . . . . . . . . . . . . . . . . . . . . . . . . . . . . . . . . . . . . . . . . . . . . . . . . . . . . . . . . . . . . . . . . . . . . . . . . . . . . . . . . . . . 35,000 610 643General Motors Co. . . . . . . . . . . . . . . . . . . . . . . . . . . . . . . . . . . . . . . . . . . . . . . . . . . . . . . . . . . . . . . . . . . . . . . . . . . . . . . . . . . . . . . . . . . . . . . 15,000 584 581
1,194 1,224
The accompanying notes are an integral part of these financial statements.
122 Franklin Templeton Investments Funds
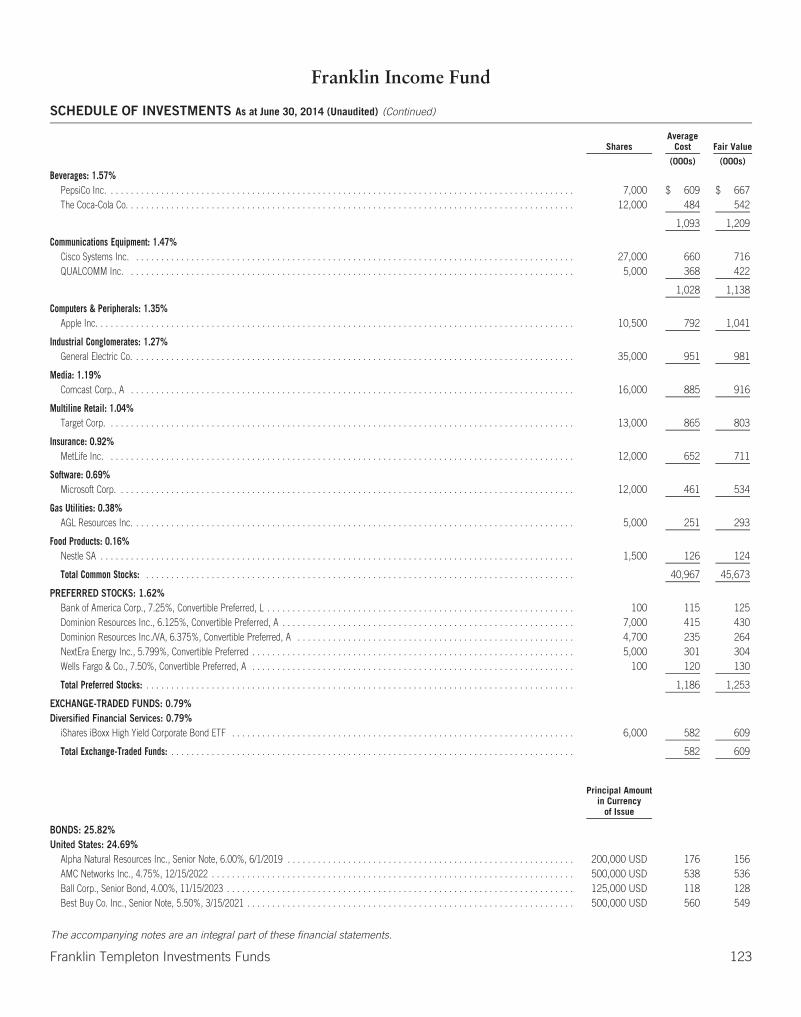
Franklin Income Fund
SCHEDULE OF INVESTMENTS As at June 30, 2014 (Unaudited) (Continued)
SharesAverage
Cost Fair Value
(000s) (000s)
Beverages: 1.57%PepsiCo Inc. . . . . . . . . . . . . . . . . . . . . . . . . . . . . . . . . . . . . . . . . . . . . . . . . . . . . . . . . . . . . . . . . . . . . . . . . . . . . . . . . . . . . . . . . . . . . 7,000 $ 609 $ 667The Coca-Cola Co. . . . . . . . . . . . . . . . . . . . . . . . . . . . . . . . . . . . . . . . . . . . . . . . . . . . . . . . . . . . . . . . . . . . . . . . . . . . . . . . . . . . . . . . . 12,000 484 542
1,093 1,209
Communications Equipment: 1.47%Cisco Systems Inc. . . . . . . . . . . . . . . . . . . . . . . . . . . . . . . . . . . . . . . . . . . . . . . . . . . . . . . . . . . . . . . . . . . . . . . . . . . . . . . . . . . . . . . . 27,000 660 716QUALCOMM Inc. . . . . . . . . . . . . . . . . . . . . . . . . . . . . . . . . . . . . . . . . . . . . . . . . . . . . . . . . . . . . . . . . . . . . . . . . . . . . . . . . . . . . . . . . 5,000 368 422
1,028 1,138
Computers & Peripherals: 1.35%Apple Inc. . . . . . . . . . . . . . . . . . . . . . . . . . . . . . . . . . . . . . . . . . . . . . . . . . . . . . . . . . . . . . . . . . . . . . . . . . . . . . . . . . . . . . . . . . . . . . . 10,500 792 1,041
Industrial Conglomerates: 1.27%General Electric Co. . . . . . . . . . . . . . . . . . . . . . . . . . . . . . . . . . . . . . . . . . . . . . . . . . . . . . . . . . . . . . . . . . . . . . . . . . . . . . . . . . . . . . . . 35,000 951 981
Media: 1.19%Comcast Corp., A . . . . . . . . . . . . . . . . . . . . . . . . . . . . . . . . . . . . . . . . . . . . . . . . . . . . . . . . . . . . . . . . . . . . . . . . . . . . . . . . . . . . . . . . 16,000 885 916
Multiline Retail: 1.04%Target Corp. . . . . . . . . . . . . . . . . . . . . . . . . . . . . . . . . . . . . . . . . . . . . . . . . . . . . . . . . . . . . . . . . . . . . . . . . . . . . . . . . . . . . . . . . . . . . 13,000 865 803
Insurance: 0.92%MetLife Inc. . . . . . . . . . . . . . . . . . . . . . . . . . . . . . . . . . . . . . . . . . . . . . . . . . . . . . . . . . . . . . . . . . . . . . . . . . . . . . . . . . . . . . . . . . . . . 12,000 652 711
Software: 0.69%Microsoft Corp. . . . . . . . . . . . . . . . . . . . . . . . . . . . . . . . . . . . . . . . . . . . . . . . . . . . . . . . . . . . . . . . . . . . . . . . . . . . . . . . . . . . . . . . . . . 12,000 461 534
Gas Utilities: 0.38%AGL Resources Inc. . . . . . . . . . . . . . . . . . . . . . . . . . . . . . . . . . . . . . . . . . . . . . . . . . . . . . . . . . . . . . . . . . . . . . . . . . . . . . . . . . . . . . . . 5,000 251 293
Food Products: 0.16%Nestle SA . . . . . . . . . . . . . . . . . . . . . . . . . . . . . . . . . . . . . . . . . . . . . . . . . . . . . . . . . . . . . . . . . . . . . . . . . . . . . . . . . . . . . . . . . . . . . . 1,500 126 124
Total Common Stocks: . . . . . . . . . . . . . . . . . . . . . . . . . . . . . . . . . . . . . . . . . . . . . . . . . . . . . . . . . . . . . . . . . . . . . . . . . . . . . . . . . . . . . 40,967 45,673
PREFERRED STOCKS: 1.62%Bank of America Corp., 7.25%, Convertible Preferred, L . . . . . . . . . . . . . . . . . . . . . . . . . . . . . . . . . . . . . . . . . . . . . . . . . . . . . . . . . . . . . 100 115 125Dominion Resources Inc., 6.125%, Convertible Preferred, A . . . . . . . . . . . . . . . . . . . . . . . . . . . . . . . . . . . . . . . . . . . . . . . . . . . . . . . . . . 7,000 415 430Dominion Resources Inc./VA, 6.375%, Convertible Preferred, A . . . . . . . . . . . . . . . . . . . . . . . . . . . . . . . . . . . . . . . . . . . . . . . . . . . . . . . 4,700 235 264NextEra Energy Inc., 5.799%, Convertible Preferred . . . . . . . . . . . . . . . . . . . . . . . . . . . . . . . . . . . . . . . . . . . . . . . . . . . . . . . . . . . . . . . . 5,000 301 304Wells Fargo & Co., 7.50%, Convertible Preferred, A . . . . . . . . . . . . . . . . . . . . . . . . . . . . . . . . . . . . . . . . . . . . . . . . . . . . . . . . . . . . . . . . 100 120 130
Total Preferred Stocks: . . . . . . . . . . . . . . . . . . . . . . . . . . . . . . . . . . . . . . . . . . . . . . . . . . . . . . . . . . . . . . . . . . . . . . . . . . . . . . . . . . . . . 1,186 1,253
EXCHANGE-TRADED FUNDS: 0.79%Diversified Financial Services: 0.79%
iShares iBoxx High Yield Corporate Bond ETF . . . . . . . . . . . . . . . . . . . . . . . . . . . . . . . . . . . . . . . . . . . . . . . . . . . . . . . . . . . . . . . . . . . . 6,000 582 609
Total Exchange-Traded Funds: . . . . . . . . . . . . . . . . . . . . . . . . . . . . . . . . . . . . . . . . . . . . . . . . . . . . . . . . . . . . . . . . . . . . . . . . . . . . . . . . 582 609
Principal Amountin Currency
of Issue
BONDS: 25.82%United States: 24.69%
Alpha Natural Resources Inc., Senior Note, 6.00%, 6/1/2019 . . . . . . . . . . . . . . . . . . . . . . . . . . . . . . . . . . . . . . . . . . . . . . . . . . . . . . . . . 200,000 USD 176 156AMC Networks Inc., 4.75%, 12/15/2022 . . . . . . . . . . . . . . . . . . . . . . . . . . . . . . . . . . . . . . . . . . . . . . . . . . . . . . . . . . . . . . . . . . . . . . . . 500,000 USD 538 536Ball Corp., Senior Bond, 4.00%, 11/15/2023 . . . . . . . . . . . . . . . . . . . . . . . . . . . . . . . . . . . . . . . . . . . . . . . . . . . . . . . . . . . . . . . . . . . . . 125,000 USD 118 128Best Buy Co. Inc., Senior Note, 5.50%, 3/15/2021 . . . . . . . . . . . . . . . . . . . . . . . . . . . . . . . . . . . . . . . . . . . . . . . . . . . . . . . . . . . . . . . . . 500,000 USD 560 549
The accompanying notes are an integral part of these financial statements.
Franklin Templeton Investments Funds 123
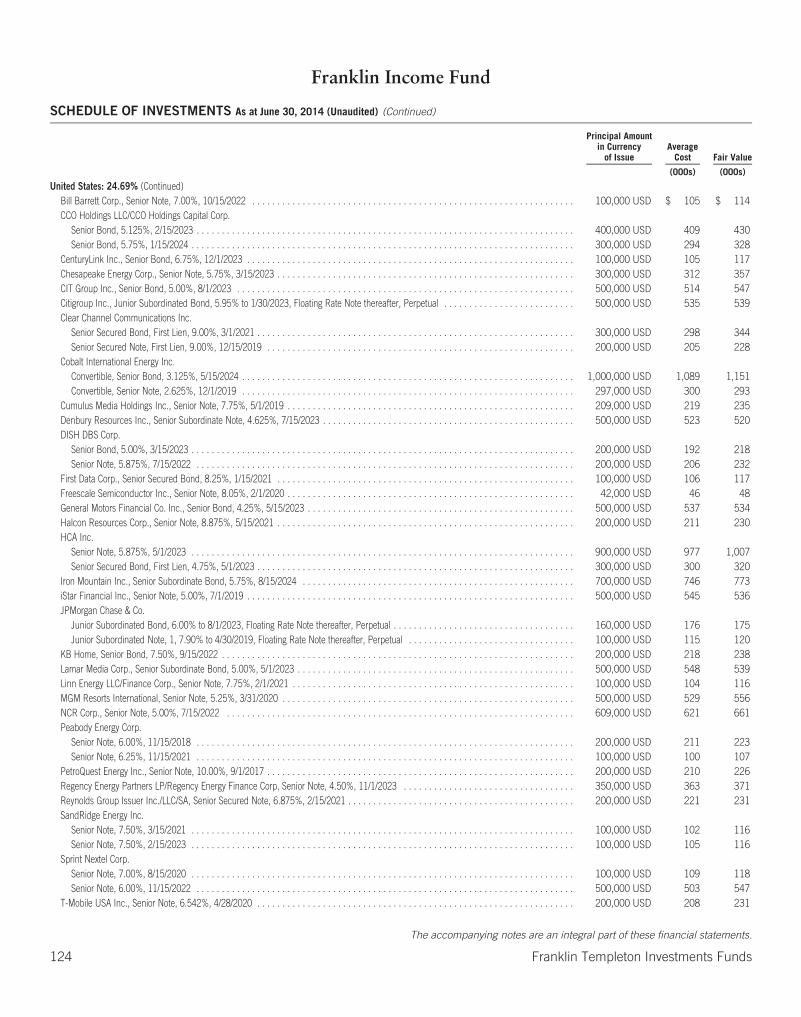
Franklin Income Fund
SCHEDULE OF INVESTMENTS As at June 30, 2014 (Unaudited) (Continued)
Principal Amountin Currency
of IssueAverage
Cost Fair Value
(000s) (000s)
United States: 24.69% (Continued)Bill Barrett Corp., Senior Note, 7.00%, 10/15/2022 . . . . . . . . . . . . . . . . . . . . . . . . . . . . . . . . . . . . . . . . . . . . . . . . . . . . . . . . . . . . . . . . 100,000 USD $ 105 $ 114CCO Holdings LLC/CCO Holdings Capital Corp.
Senior Bond, 5.125%, 2/15/2023 . . . . . . . . . . . . . . . . . . . . . . . . . . . . . . . . . . . . . . . . . . . . . . . . . . . . . . . . . . . . . . . . . . . . . . . . . . . 400,000 USD 409 430Senior Bond, 5.75%, 1/15/2024 . . . . . . . . . . . . . . . . . . . . . . . . . . . . . . . . . . . . . . . . . . . . . . . . . . . . . . . . . . . . . . . . . . . . . . . . . . . . 300,000 USD 294 328
CenturyLink Inc., Senior Bond, 6.75%, 12/1/2023 . . . . . . . . . . . . . . . . . . . . . . . . . . . . . . . . . . . . . . . . . . . . . . . . . . . . . . . . . . . . . . . . . 100,000 USD 105 117Chesapeake Energy Corp., Senior Note, 5.75%, 3/15/2023 . . . . . . . . . . . . . . . . . . . . . . . . . . . . . . . . . . . . . . . . . . . . . . . . . . . . . . . . . . . 300,000 USD 312 357CIT Group Inc., Senior Bond, 5.00%, 8/1/2023 . . . . . . . . . . . . . . . . . . . . . . . . . . . . . . . . . . . . . . . . . . . . . . . . . . . . . . . . . . . . . . . . . . . 500,000 USD 514 547Citigroup Inc., Junior Subordinated Bond, 5.95% to 1/30/2023, Floating Rate Note thereafter, Perpetual . . . . . . . . . . . . . . . . . . . . . . . . . . 500,000 USD 535 539Clear Channel Communications Inc.
Senior Secured Bond, First Lien, 9.00%, 3/1/2021 . . . . . . . . . . . . . . . . . . . . . . . . . . . . . . . . . . . . . . . . . . . . . . . . . . . . . . . . . . . . . . . 300,000 USD 298 344Senior Secured Note, First Lien, 9.00%, 12/15/2019 . . . . . . . . . . . . . . . . . . . . . . . . . . . . . . . . . . . . . . . . . . . . . . . . . . . . . . . . . . . . . 200,000 USD 205 228
Cobalt International Energy Inc.Convertible, Senior Bond, 3.125%, 5/15/2024 . . . . . . . . . . . . . . . . . . . . . . . . . . . . . . . . . . . . . . . . . . . . . . . . . . . . . . . . . . . . . . . . . . 1,000,000 USD 1,089 1,151Convertible, Senior Note, 2.625%, 12/1/2019 . . . . . . . . . . . . . . . . . . . . . . . . . . . . . . . . . . . . . . . . . . . . . . . . . . . . . . . . . . . . . . . . . . 297,000 USD 300 293
Cumulus Media Holdings Inc., Senior Note, 7.75%, 5/1/2019 . . . . . . . . . . . . . . . . . . . . . . . . . . . . . . . . . . . . . . . . . . . . . . . . . . . . . . . . . 209,000 USD 219 235Denbury Resources Inc., Senior Subordinate Note, 4.625%, 7/15/2023 . . . . . . . . . . . . . . . . . . . . . . . . . . . . . . . . . . . . . . . . . . . . . . . . . . 500,000 USD 523 520DISH DBS Corp.
Senior Bond, 5.00%, 3/15/2023 . . . . . . . . . . . . . . . . . . . . . . . . . . . . . . . . . . . . . . . . . . . . . . . . . . . . . . . . . . . . . . . . . . . . . . . . . . . . 200,000 USD 192 218Senior Note, 5.875%, 7/15/2022 . . . . . . . . . . . . . . . . . . . . . . . . . . . . . . . . . . . . . . . . . . . . . . . . . . . . . . . . . . . . . . . . . . . . . . . . . . . 200,000 USD 206 232
First Data Corp., Senior Secured Bond, 8.25%, 1/15/2021 . . . . . . . . . . . . . . . . . . . . . . . . . . . . . . . . . . . . . . . . . . . . . . . . . . . . . . . . . . . 100,000 USD 106 117Freescale Semiconductor Inc., Senior Note, 8.05%, 2/1/2020 . . . . . . . . . . . . . . . . . . . . . . . . . . . . . . . . . . . . . . . . . . . . . . . . . . . . . . . . . 42,000 USD 46 48General Motors Financial Co. Inc., Senior Bond, 4.25%, 5/15/2023 . . . . . . . . . . . . . . . . . . . . . . . . . . . . . . . . . . . . . . . . . . . . . . . . . . . . . 500,000 USD 537 534Halcon Resources Corp., Senior Note, 8.875%, 5/15/2021 . . . . . . . . . . . . . . . . . . . . . . . . . . . . . . . . . . . . . . . . . . . . . . . . . . . . . . . . . . . 200,000 USD 211 230HCA Inc.
Senior Note, 5.875%, 5/1/2023 . . . . . . . . . . . . . . . . . . . . . . . . . . . . . . . . . . . . . . . . . . . . . . . . . . . . . . . . . . . . . . . . . . . . . . . . . . . . 900,000 USD 977 1,007Senior Secured Bond, First Lien, 4.75%, 5/1/2023 . . . . . . . . . . . . . . . . . . . . . . . . . . . . . . . . . . . . . . . . . . . . . . . . . . . . . . . . . . . . . . . 300,000 USD 300 320
Iron Mountain Inc., Senior Subordinate Bond, 5.75%, 8/15/2024 . . . . . . . . . . . . . . . . . . . . . . . . . . . . . . . . . . . . . . . . . . . . . . . . . . . . . . 700,000 USD 746 773iStar Financial Inc., Senior Note, 5.00%, 7/1/2019 . . . . . . . . . . . . . . . . . . . . . . . . . . . . . . . . . . . . . . . . . . . . . . . . . . . . . . . . . . . . . . . . . 500,000 USD 545 536JPMorgan Chase & Co.
Junior Subordinated Bond, 6.00% to 8/1/2023, Floating Rate Note thereafter, Perpetual . . . . . . . . . . . . . . . . . . . . . . . . . . . . . . . . . . . . 160,000 USD 176 175Junior Subordinated Note, 1, 7.90% to 4/30/2019, Floating Rate Note thereafter, Perpetual . . . . . . . . . . . . . . . . . . . . . . . . . . . . . . . . . 100,000 USD 115 120
KB Home, Senior Bond, 7.50%, 9/15/2022 . . . . . . . . . . . . . . . . . . . . . . . . . . . . . . . . . . . . . . . . . . . . . . . . . . . . . . . . . . . . . . . . . . . . . . 200,000 USD 218 238Lamar Media Corp., Senior Subordinate Bond, 5.00%, 5/1/2023 . . . . . . . . . . . . . . . . . . . . . . . . . . . . . . . . . . . . . . . . . . . . . . . . . . . . . . . 500,000 USD 548 539Linn Energy LLC/Finance Corp., Senior Note, 7.75%, 2/1/2021 . . . . . . . . . . . . . . . . . . . . . . . . . . . . . . . . . . . . . . . . . . . . . . . . . . . . . . . . 100,000 USD 104 116MGM Resorts International, Senior Note, 5.25%, 3/31/2020 . . . . . . . . . . . . . . . . . . . . . . . . . . . . . . . . . . . . . . . . . . . . . . . . . . . . . . . . . . 500,000 USD 529 556NCR Corp., Senior Note, 5.00%, 7/15/2022 . . . . . . . . . . . . . . . . . . . . . . . . . . . . . . . . . . . . . . . . . . . . . . . . . . . . . . . . . . . . . . . . . . . . . 609,000 USD 621 661Peabody Energy Corp.
Senior Note, 6.00%, 11/15/2018 . . . . . . . . . . . . . . . . . . . . . . . . . . . . . . . . . . . . . . . . . . . . . . . . . . . . . . . . . . . . . . . . . . . . . . . . . . . 200,000 USD 211 223Senior Note, 6.25%, 11/15/2021 . . . . . . . . . . . . . . . . . . . . . . . . . . . . . . . . . . . . . . . . . . . . . . . . . . . . . . . . . . . . . . . . . . . . . . . . . . . 100,000 USD 100 107
PetroQuest Energy Inc., Senior Note, 10.00%, 9/1/2017 . . . . . . . . . . . . . . . . . . . . . . . . . . . . . . . . . . . . . . . . . . . . . . . . . . . . . . . . . . . . . 200,000 USD 210 226Regency Energy Partners LP/Regency Energy Finance Corp, Senior Note, 4.50%, 11/1/2023 . . . . . . . . . . . . . . . . . . . . . . . . . . . . . . . . . . 350,000 USD 363 371Reynolds Group Issuer Inc./LLC/SA, Senior Secured Note, 6.875%, 2/15/2021 . . . . . . . . . . . . . . . . . . . . . . . . . . . . . . . . . . . . . . . . . . . . . 200,000 USD 221 231SandRidge Energy Inc.
Senior Note, 7.50%, 3/15/2021 . . . . . . . . . . . . . . . . . . . . . . . . . . . . . . . . . . . . . . . . . . . . . . . . . . . . . . . . . . . . . . . . . . . . . . . . . . . . 100,000 USD 102 116Senior Note, 7.50%, 2/15/2023 . . . . . . . . . . . . . . . . . . . . . . . . . . . . . . . . . . . . . . . . . . . . . . . . . . . . . . . . . . . . . . . . . . . . . . . . . . . . 100,000 USD 105 116
Sprint Nextel Corp.Senior Note, 7.00%, 8/15/2020 . . . . . . . . . . . . . . . . . . . . . . . . . . . . . . . . . . . . . . . . . . . . . . . . . . . . . . . . . . . . . . . . . . . . . . . . . . . . 100,000 USD 109 118Senior Note, 6.00%, 11/15/2022 . . . . . . . . . . . . . . . . . . . . . . . . . . . . . . . . . . . . . . . . . . . . . . . . . . . . . . . . . . . . . . . . . . . . . . . . . . . 500,000 USD 503 547
T-Mobile USA Inc., Senior Note, 6.542%, 4/28/2020 . . . . . . . . . . . . . . . . . . . . . . . . . . . . . . . . . . . . . . . . . . . . . . . . . . . . . . . . . . . . . . . 200,000 USD 208 231
The accompanying notes are an integral part of these financial statements.
124 Franklin Templeton Investments Funds
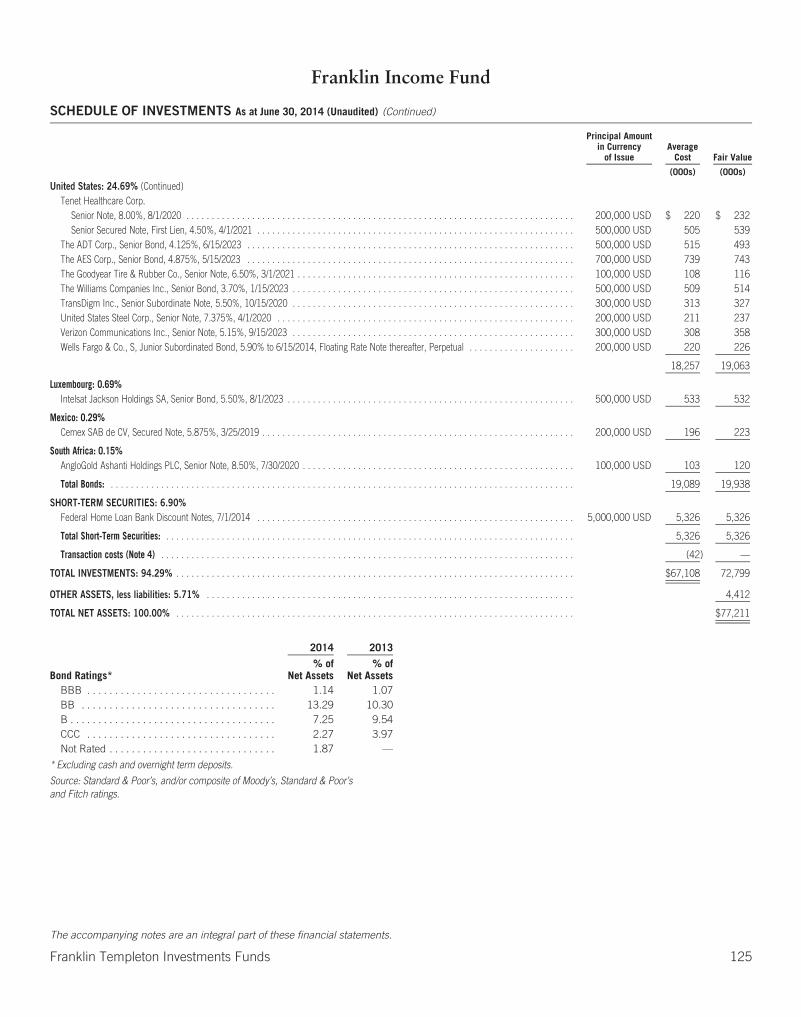
Franklin Income Fund
SCHEDULE OF INVESTMENTS As at June 30, 2014 (Unaudited) (Continued)
Principal Amountin Currency
of IssueAverage
Cost Fair Value
(000s) (000s)
United States: 24.69% (Continued)Tenet Healthcare Corp.
Senior Note, 8.00%, 8/1/2020 . . . . . . . . . . . . . . . . . . . . . . . . . . . . . . . . . . . . . . . . . . . . . . . . . . . . . . . . . . . . . . . . . . . . . . . . . . . . . 200,000 USD $ 220 $ 232Senior Secured Note, First Lien, 4.50%, 4/1/2021 . . . . . . . . . . . . . . . . . . . . . . . . . . . . . . . . . . . . . . . . . . . . . . . . . . . . . . . . . . . . . . . 500,000 USD 505 539
The ADT Corp., Senior Bond, 4.125%, 6/15/2023 . . . . . . . . . . . . . . . . . . . . . . . . . . . . . . . . . . . . . . . . . . . . . . . . . . . . . . . . . . . . . . . . . 500,000 USD 515 493The AES Corp., Senior Bond, 4.875%, 5/15/2023 . . . . . . . . . . . . . . . . . . . . . . . . . . . . . . . . . . . . . . . . . . . . . . . . . . . . . . . . . . . . . . . . . 700,000 USD 739 743The Goodyear Tire & Rubber Co., Senior Note, 6.50%, 3/1/2021 . . . . . . . . . . . . . . . . . . . . . . . . . . . . . . . . . . . . . . . . . . . . . . . . . . . . . . . 100,000 USD 108 116The Williams Companies Inc., Senior Bond, 3.70%, 1/15/2023 . . . . . . . . . . . . . . . . . . . . . . . . . . . . . . . . . . . . . . . . . . . . . . . . . . . . . . . . 500,000 USD 509 514TransDigm Inc., Senior Subordinate Note, 5.50%, 10/15/2020 . . . . . . . . . . . . . . . . . . . . . . . . . . . . . . . . . . . . . . . . . . . . . . . . . . . . . . . . 300,000 USD 313 327United States Steel Corp., Senior Note, 7.375%, 4/1/2020 . . . . . . . . . . . . . . . . . . . . . . . . . . . . . . . . . . . . . . . . . . . . . . . . . . . . . . . . . . . 200,000 USD 211 237Verizon Communications Inc., Senior Note, 5.15%, 9/15/2023 . . . . . . . . . . . . . . . . . . . . . . . . . . . . . . . . . . . . . . . . . . . . . . . . . . . . . . . . 300,000 USD 308 358Wells Fargo & Co., S, Junior Subordinated Bond, 5.90% to 6/15/2014, Floating Rate Note thereafter, Perpetual . . . . . . . . . . . . . . . . . . . . . 200,000 USD 220 226
18,257 19,063
Luxembourg: 0.69%Intelsat Jackson Holdings SA, Senior Bond, 5.50%, 8/1/2023 . . . . . . . . . . . . . . . . . . . . . . . . . . . . . . . . . . . . . . . . . . . . . . . . . . . . . . . . . 500,000 USD 533 532
Mexico: 0.29%Cemex SAB de CV, Secured Note, 5.875%, 3/25/2019 . . . . . . . . . . . . . . . . . . . . . . . . . . . . . . . . . . . . . . . . . . . . . . . . . . . . . . . . . . . . . . 200,000 USD 196 223
South Africa: 0.15%AngloGold Ashanti Holdings PLC, Senior Note, 8.50%, 7/30/2020 . . . . . . . . . . . . . . . . . . . . . . . . . . . . . . . . . . . . . . . . . . . . . . . . . . . . . . 100,000 USD 103 120
Total Bonds: . . . . . . . . . . . . . . . . . . . . . . . . . . . . . . . . . . . . . . . . . . . . . . . . . . . . . . . . . . . . . . . . . . . . . . . . . . . . . . . . . . . . . . . . . . . . 19,089 19,938
SHORT-TERM SECURITIES: 6.90%Federal Home Loan Bank Discount Notes, 7/1/2014 . . . . . . . . . . . . . . . . . . . . . . . . . . . . . . . . . . . . . . . . . . . . . . . . . . . . . . . . . . . . . . . 5,000,000 USD 5,326 5,326
Total Short-Term Securities: . . . . . . . . . . . . . . . . . . . . . . . . . . . . . . . . . . . . . . . . . . . . . . . . . . . . . . . . . . . . . . . . . . . . . . . . . . . . . . . . . 5,326 5,326
Transaction costs (Note 4) . . . . . . . . . . . . . . . . . . . . . . . . . . . . . . . . . . . . . . . . . . . . . . . . . . . . . . . . . . . . . . . . . . . . . . . . . . . . . . . . . . (42) —
TOTAL INVESTMENTS: 94.29% . . . . . . . . . . . . . . . . . . . . . . . . . . . . . . . . . . . . . . . . . . . . . . . . . . . . . . . . . . . . . . . . . . . . . . . . . . . . . . . $67,108 72,799
OTHER ASSETS, less liabilities: 5.71% . . . . . . . . . . . . . . . . . . . . . . . . . . . . . . . . . . . . . . . . . . . . . . . . . . . . . . . . . . . . . . . . . . . . . . . . . 4,412
TOTAL NET ASSETS: 100.00% . . . . . . . . . . . . . . . . . . . . . . . . . . . . . . . . . . . . . . . . . . . . . . . . . . . . . . . . . . . . . . . . . . . . . . . . . . . . . . . $77,211
2014 2013
Bond Ratings*% of
Net Assets% of
Net AssetsBBB . . . . . . . . . . . . . . . . . . . . . . . . . . . . . . . . . . 1.14 1.07BB . . . . . . . . . . . . . . . . . . . . . . . . . . . . . . . . . . . 13.29 10.30B . . . . . . . . . . . . . . . . . . . . . . . . . . . . . . . . . . . . . 7.25 9.54CCC . . . . . . . . . . . . . . . . . . . . . . . . . . . . . . . . . . 2.27 3.97Not Rated . . . . . . . . . . . . . . . . . . . . . . . . . . . . . . 1.87 —
* Excluding cash and overnight term deposits.
Source: Standard & Poor’s, and/or composite of Moody’s, Standard & Poor’sand Fitch ratings.
The accompanying notes are an integral part of these financial statements.
Franklin Templeton Investments Funds 125
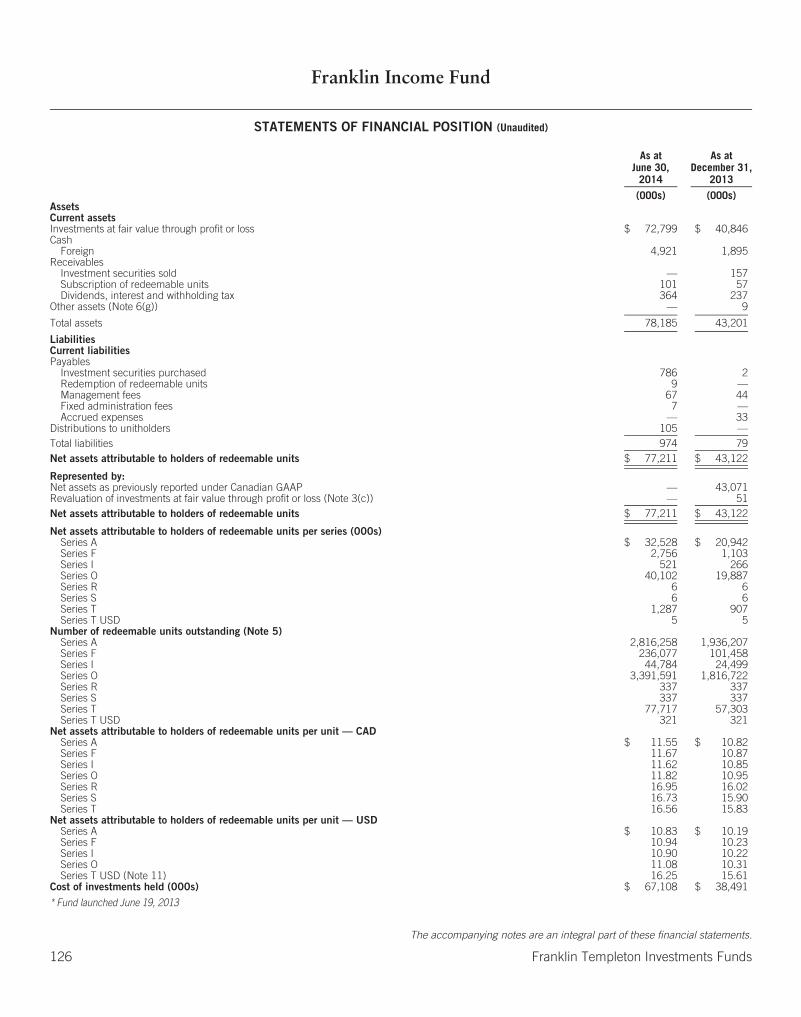
Franklin Income Fund
STATEMENTS OF FINANCIAL POSITION (Unaudited)
As atJune 30,
2014
As atDecember 31,
2013
(000s) (000s)AssetsCurrent assetsInvestments at fair value through profit or loss $ 72,799 $ 40,846Cash
Foreign 4,921 1,895Receivables
Investment securities sold — 157Subscription of redeemable units 101 57Dividends, interest and withholding tax 364 237
Other assets (Note 6(g)) — 9
Total assets 78,185 43,201
LiabilitiesCurrent liabilitiesPayables
Investment securities purchased 786 2Redemption of redeemable units 9 —Management fees 67 44Fixed administration fees 7 —Accrued expenses — 33
Distributions to unitholders 105 —Total liabilities 974 79Net assets attributable to holders of redeemable units $ 77,211 $ 43,122
Represented by:Net assets as previously reported under Canadian GAAP — 43,071Revaluation of investments at fair value through profit or loss (Note 3(c)) — 51Net assets attributable to holders of redeemable units $ 77,211 $ 43,122
Net assets attributable to holders of redeemable units per series (000s)Series A $ 32,528 $ 20,942Series F 2,756 1,103Series I 521 266Series O 40,102 19,887Series R 6 6Series S 6 6Series T 1,287 907Series T USD 5 5
Number of redeemable units outstanding (Note 5)Series A 2,816,258 1,936,207Series F 236,077 101,458Series I 44,784 24,499Series O 3,391,591 1,816,722Series R 337 337Series S 337 337Series T 77,717 57,303Series T USD 321 321
Net assets attributable to holders of redeemable units per unit — CADSeries A $ 11.55 $ 10.82Series F 11.67 10.87Series I 11.62 10.85Series O 11.82 10.95Series R 16.95 16.02Series S 16.73 15.90Series T 16.56 15.83
Net assets attributable to holders of redeemable units per unit — USDSeries A $ 10.83 $ 10.19Series F 10.94 10.23Series I 10.90 10.22Series O 11.08 10.31Series T USD (Note 11) 16.25 15.61
Cost of investments held (000s) $ 67,108 $ 38,491
* Fund launched June 19, 2013
The accompanying notes are an integral part of these financial statements.
126 Franklin Templeton Investments Funds
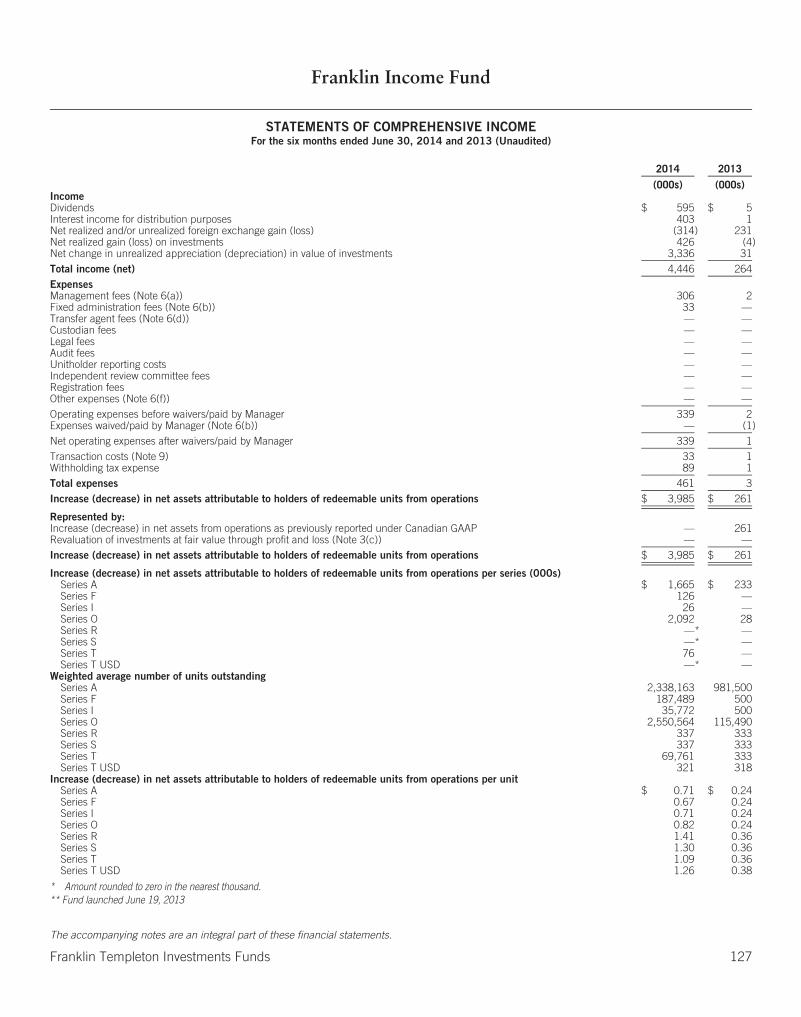
Franklin Income Fund
STATEMENTS OF COMPREHENSIVE INCOMEFor the six months ended June 30, 2014 and 2013 (Unaudited)
2014 2013
(000s) (000s)IncomeDividends $ 595 $ 5Interest income for distribution purposes 403 1Net realized and/or unrealized foreign exchange gain (loss) (314) 231Net realized gain (loss) on investments 426 (4)Net change in unrealized appreciation (depreciation) in value of investments 3,336 31Total income (net) 4,446 264ExpensesManagement fees (Note 6(a)) 306 2Fixed administration fees (Note 6(b)) 33 —Transfer agent fees (Note 6(d)) — —Custodian fees — —Legal fees — —Audit fees — —Unitholder reporting costs — —Independent review committee fees — —Registration fees — —Other expenses (Note 6(f)) — —Operating expenses before waivers/paid by Manager 339 2Expenses waived/paid by Manager (Note 6(b)) — (1)Net operating expenses after waivers/paid by Manager 339 1Transaction costs (Note 9) 33 1Withholding tax expense 89 1Total expenses 461 3Increase (decrease) in net assets attributable to holders of redeemable units from operations $ 3,985 $ 261
Represented by:Increase (decrease) in net assets from operations as previously reported under Canadian GAAP — 261Revaluation of investments at fair value through profit and loss (Note 3(c)) — —Increase (decrease) in net assets attributable to holders of redeemable units from operations $ 3,985 $ 261
Increase (decrease) in net assets attributable to holders of redeemable units from operations per series (000s)Series A $ 1,665 $ 233Series F 126 —Series I 26 —Series O 2,092 28Series R —* —Series S —* —Series T 76 —Series T USD —* —
Weighted average number of units outstandingSeries A 2,338,163 981,500Series F 187,489 500Series I 35,772 500Series O 2,550,564 115,490Series R 337 333Series S 337 333Series T 69,761 333Series T USD 321 318
Increase (decrease) in net assets attributable to holders of redeemable units from operations per unitSeries A $ 0.71 $ 0.24Series F 0.67 0.24Series I 0.71 0.24Series O 0.82 0.24Series R 1.41 0.36Series S 1.30 0.36Series T 1.09 0.36Series T USD 1.26 0.38
* Amount rounded to zero in the nearest thousand.** Fund launched June 19, 2013
The accompanying notes are an integral part of these financial statements.
Franklin Templeton Investments Funds 127
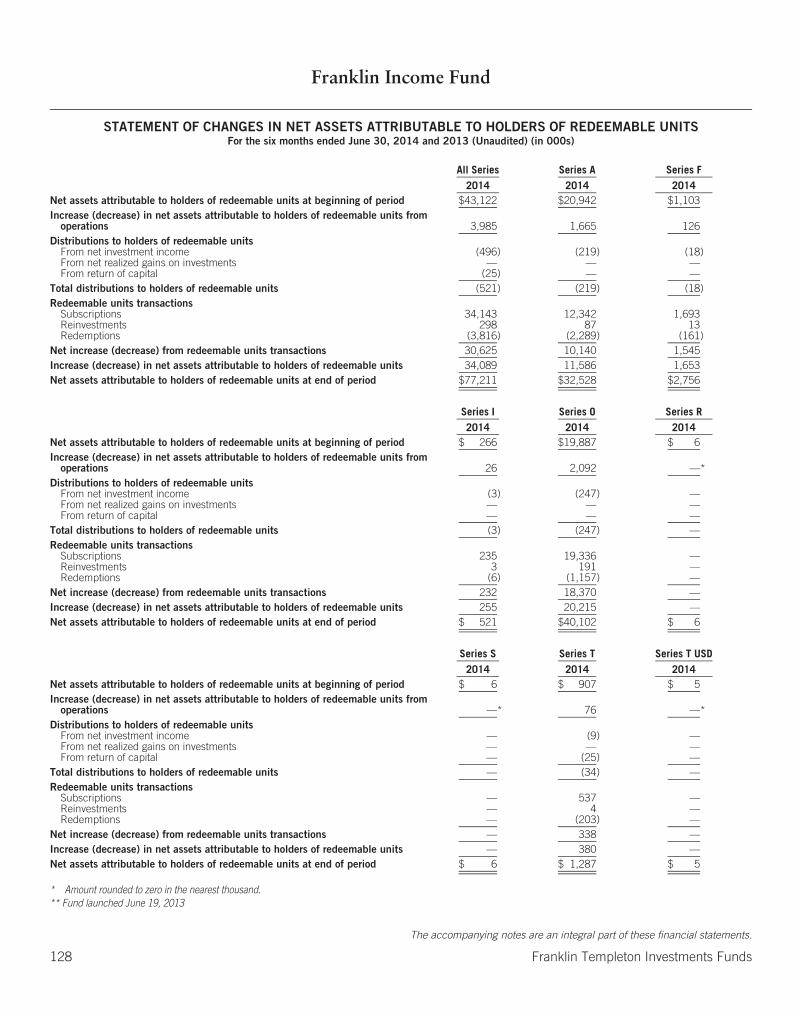
Franklin Income Fund
STATEMENT OF CHANGES IN NET ASSETS ATTRIBUTABLE TO HOLDERS OF REDEEMABLE UNITSFor the six months ended June 30, 2014 and 2013 (Unaudited) (in 000s)
All Series Series A Series F2014 2014 2014
Net assets attributable to holders of redeemable units at beginning of period $43,122 $20,942 $1,103Increase (decrease) in net assets attributable to holders of redeemable units from
operations 3,985 1,665 126Distributions to holders of redeemable units
From net investment income (496) (219) (18)From net realized gains on investments — — —From return of capital (25) — —
Total distributions to holders of redeemable units (521) (219) (18)Redeemable units transactions
Subscriptions 34,143 12,342 1,693Reinvestments 298 87 13Redemptions (3,816) (2,289) (161)
Net increase (decrease) from redeemable units transactions 30,625 10,140 1,545Increase (decrease) in net assets attributable to holders of redeemable units 34,089 11,586 1,653Net assets attributable to holders of redeemable units at end of period $77,211 $32,528 $2,756
Series I Series O Series R2014 2014 2014
Net assets attributable to holders of redeemable units at beginning of period $ 266 $19,887 $ 6Increase (decrease) in net assets attributable to holders of redeemable units from
operations 26 2,092 —*Distributions to holders of redeemable units
From net investment income (3) (247) —From net realized gains on investments — — —From return of capital — — —
Total distributions to holders of redeemable units (3) (247) —Redeemable units transactions
Subscriptions 235 19,336 —Reinvestments 3 191 —Redemptions (6) (1,157) —
Net increase (decrease) from redeemable units transactions 232 18,370 —Increase (decrease) in net assets attributable to holders of redeemable units 255 20,215 —Net assets attributable to holders of redeemable units at end of period $ 521 $40,102 $ 6
Series S Series T Series T USD2014 2014 2014
Net assets attributable to holders of redeemable units at beginning of period $ 6 $ 907 $ 5Increase (decrease) in net assets attributable to holders of redeemable units from
operations —* 76 —*Distributions to holders of redeemable units
From net investment income — (9) —From net realized gains on investments — — —From return of capital — (25) —
Total distributions to holders of redeemable units — (34) —Redeemable units transactions
Subscriptions — 537 —Reinvestments — 4 —Redemptions — (203) —
Net increase (decrease) from redeemable units transactions — 338 —Increase (decrease) in net assets attributable to holders of redeemable units — 380 —Net assets attributable to holders of redeemable units at end of period $ 6 $ 1,287 $ 5
* Amount rounded to zero in the nearest thousand.** Fund launched June 19, 2013
The accompanying notes are an integral part of these financial statements.
128 Franklin Templeton Investments Funds

Franklin Income Fund
STATEMENT OF CASH FLOWSFor the periods ended June 30, 2014 (Unaudited)
2014
(000s)Cash flows from operating activitiesInterest received $ 359Dividends received 473Proceeds from sale and maturity of investments 3,495Purchases of investments (35,622)Operating expenses paid (332)
Net cash from/(used in) operating activities (31,627)
Cash flows from financing activitiesProceeds from issuances of redeemable units 34,099Amounts paid on redemption of redeemable units (3,807)Distributions paid to holders of redeemable units, net of reinvested distributions (119)
Net cash (used in)/from financing activities 30,173
Net increase (decrease) in cash (1,454)Cash at beginning of year 1,895Effect of exchange rate changes 4,480
Cash at end of period $ 4,921
* Fund launched June 19, 2013
The accompanying notes are an integral part of these financial statements.
Franklin Templeton Investments Funds 129
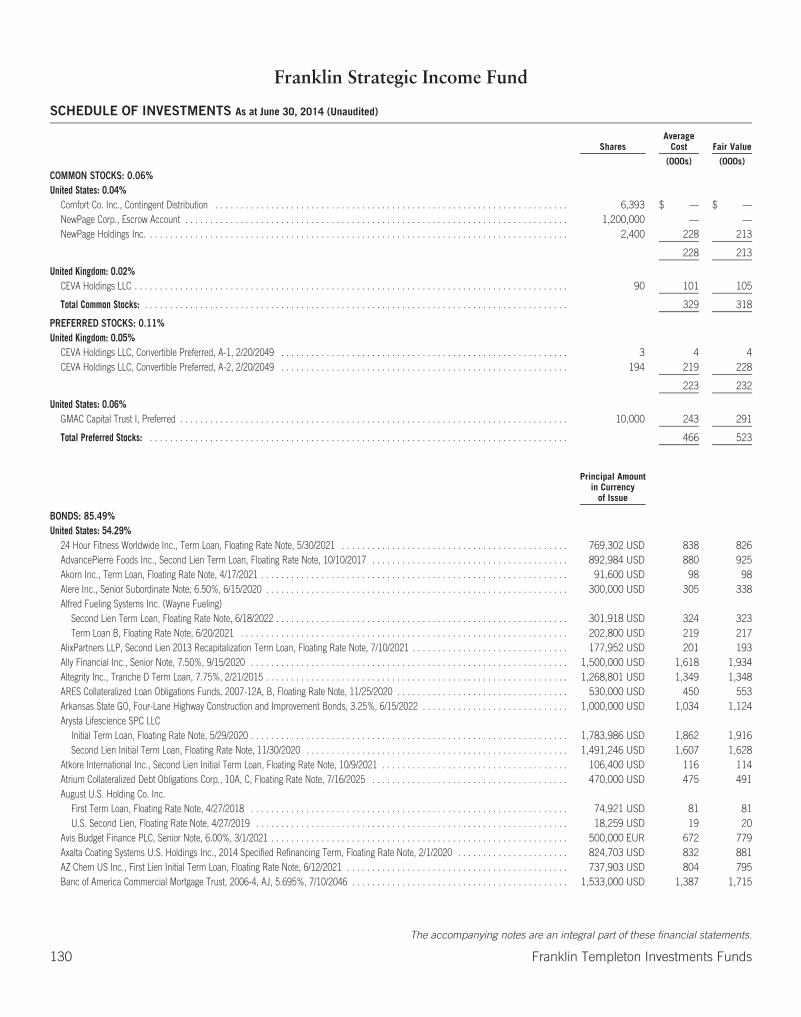
Franklin Strategic Income Fund
SCHEDULE OF INVESTMENTS As at June 30, 2014 (Unaudited)
SharesAverage
Cost Fair Value
(000s) (000s)
COMMON STOCKS: 0.06%United States: 0.04%
Comfort Co. Inc., Contingent Distribution . . . . . . . . . . . . . . . . . . . . . . . . . . . . . . . . . . . . . . . . . . . . . . . . . . . . . . . . . . . . . . . . . . . . . . 6,393 $ — $ —NewPage Corp., Escrow Account . . . . . . . . . . . . . . . . . . . . . . . . . . . . . . . . . . . . . . . . . . . . . . . . . . . . . . . . . . . . . . . . . . . . . . . . . . . . 1,200,000 — —NewPage Holdings Inc. . . . . . . . . . . . . . . . . . . . . . . . . . . . . . . . . . . . . . . . . . . . . . . . . . . . . . . . . . . . . . . . . . . . . . . . . . . . . . . . . . . . 2,400 228 213
228 213
United Kingdom: 0.02%CEVA Holdings LLC . . . . . . . . . . . . . . . . . . . . . . . . . . . . . . . . . . . . . . . . . . . . . . . . . . . . . . . . . . . . . . . . . . . . . . . . . . . . . . . . . . . . . . 90 101 105
Total Common Stocks: . . . . . . . . . . . . . . . . . . . . . . . . . . . . . . . . . . . . . . . . . . . . . . . . . . . . . . . . . . . . . . . . . . . . . . . . . . . . . . . . . . . . 329 318
PREFERRED STOCKS: 0.11%United Kingdom: 0.05%
CEVA Holdings LLC, Convertible Preferred, A-1, 2/20/2049 . . . . . . . . . . . . . . . . . . . . . . . . . . . . . . . . . . . . . . . . . . . . . . . . . . . . . . . . . 3 4 4CEVA Holdings LLC, Convertible Preferred, A-2, 2/20/2049 . . . . . . . . . . . . . . . . . . . . . . . . . . . . . . . . . . . . . . . . . . . . . . . . . . . . . . . . . 194 219 228
223 232
United States: 0.06%GMAC Capital Trust I, Preferred . . . . . . . . . . . . . . . . . . . . . . . . . . . . . . . . . . . . . . . . . . . . . . . . . . . . . . . . . . . . . . . . . . . . . . . . . . . . . 10,000 243 291
Total Preferred Stocks: . . . . . . . . . . . . . . . . . . . . . . . . . . . . . . . . . . . . . . . . . . . . . . . . . . . . . . . . . . . . . . . . . . . . . . . . . . . . . . . . . . . 466 523
Principal Amountin Currency
of Issue
BONDS: 85.49%United States: 54.29%
24 Hour Fitness Worldwide Inc., Term Loan, Floating Rate Note, 5/30/2021 . . . . . . . . . . . . . . . . . . . . . . . . . . . . . . . . . . . . . . . . . . . . . 769,302 USD 838 826AdvancePierre Foods Inc., Second Lien Term Loan, Floating Rate Note, 10/10/2017 . . . . . . . . . . . . . . . . . . . . . . . . . . . . . . . . . . . . . . . 892,984 USD 880 925Akorn Inc., Term Loan, Floating Rate Note, 4/17/2021 . . . . . . . . . . . . . . . . . . . . . . . . . . . . . . . . . . . . . . . . . . . . . . . . . . . . . . . . . . . . . 91,600 USD 98 98Alere Inc., Senior Subordinate Note, 6.50%, 6/15/2020 . . . . . . . . . . . . . . . . . . . . . . . . . . . . . . . . . . . . . . . . . . . . . . . . . . . . . . . . . . . . 300,000 USD 305 338Alfred Fueling Systems Inc. (Wayne Fueling)
Second Lien Term Loan, Floating Rate Note, 6/18/2022 . . . . . . . . . . . . . . . . . . . . . . . . . . . . . . . . . . . . . . . . . . . . . . . . . . . . . . . . . . 301,918 USD 324 323Term Loan B, Floating Rate Note, 6/20/2021 . . . . . . . . . . . . . . . . . . . . . . . . . . . . . . . . . . . . . . . . . . . . . . . . . . . . . . . . . . . . . . . . . 202,800 USD 219 217
AlixPartners LLP, Second Lien 2013 Recapitalization Term Loan, Floating Rate Note, 7/10/2021 . . . . . . . . . . . . . . . . . . . . . . . . . . . . . . . 177,952 USD 201 193Ally Financial Inc., Senior Note, 7.50%, 9/15/2020 . . . . . . . . . . . . . . . . . . . . . . . . . . . . . . . . . . . . . . . . . . . . . . . . . . . . . . . . . . . . . . . 1,500,000 USD 1,618 1,934Altegrity Inc., Tranche D Term Loan, 7.75%, 2/21/2015 . . . . . . . . . . . . . . . . . . . . . . . . . . . . . . . . . . . . . . . . . . . . . . . . . . . . . . . . . . . . 1,268,801 USD 1,349 1,348ARES Collateralized Loan Obligations Funds, 2007-12A, B, Floating Rate Note, 11/25/2020 . . . . . . . . . . . . . . . . . . . . . . . . . . . . . . . . . . 530,000 USD 450 553Arkansas State GO, Four-Lane Highway Construction and Improvement Bonds, 3.25%, 6/15/2022 . . . . . . . . . . . . . . . . . . . . . . . . . . . . . 1,000,000 USD 1,034 1,124Arysta Lifescience SPC LLC
Initial Term Loan, Floating Rate Note, 5/29/2020 . . . . . . . . . . . . . . . . . . . . . . . . . . . . . . . . . . . . . . . . . . . . . . . . . . . . . . . . . . . . . . . 1,783,986 USD 1,862 1,916Second Lien Initial Term Loan, Floating Rate Note, 11/30/2020 . . . . . . . . . . . . . . . . . . . . . . . . . . . . . . . . . . . . . . . . . . . . . . . . . . . . 1,491,246 USD 1,607 1,628
Atkore International Inc., Second Lien Initial Term Loan, Floating Rate Note, 10/9/2021 . . . . . . . . . . . . . . . . . . . . . . . . . . . . . . . . . . . . . 106,400 USD 116 114Atrium Collateralized Debt Obligations Corp., 10A, C, Floating Rate Note, 7/16/2025 . . . . . . . . . . . . . . . . . . . . . . . . . . . . . . . . . . . . . . . 470,000 USD 475 491August U.S. Holding Co. Inc.
First Term Loan, Floating Rate Note, 4/27/2018 . . . . . . . . . . . . . . . . . . . . . . . . . . . . . . . . . . . . . . . . . . . . . . . . . . . . . . . . . . . . . . . 74,921 USD 81 81U.S. Second Lien, Floating Rate Note, 4/27/2019 . . . . . . . . . . . . . . . . . . . . . . . . . . . . . . . . . . . . . . . . . . . . . . . . . . . . . . . . . . . . . . 18,259 USD 19 20
Avis Budget Finance PLC, Senior Note, 6.00%, 3/1/2021 . . . . . . . . . . . . . . . . . . . . . . . . . . . . . . . . . . . . . . . . . . . . . . . . . . . . . . . . . . . 500,000 EUR 672 779Axalta Coating Systems U.S. Holdings Inc., 2014 Specified Refinancing Term, Floating Rate Note, 2/1/2020 . . . . . . . . . . . . . . . . . . . . . . 824,703 USD 832 881AZ Chem US Inc., First Lien Initial Term Loan, Floating Rate Note, 6/12/2021 . . . . . . . . . . . . . . . . . . . . . . . . . . . . . . . . . . . . . . . . . . . . 737,903 USD 804 795Banc of America Commercial Mortgage Trust, 2006-4, AJ, 5.695%, 7/10/2046 . . . . . . . . . . . . . . . . . . . . . . . . . . . . . . . . . . . . . . . . . . . 1,533,000 USD 1,387 1,715
The accompanying notes are an integral part of these financial statements.
130 Franklin Templeton Investments Funds

Franklin Strategic Income Fund
SCHEDULE OF INVESTMENTS As at June 30, 2014 (Unaudited) (Continued)
Principal Amountin Currency
of IssueAverage
Cost Fair Value
(000s) (000s)
United States: 54.29% (Continued)Bank of America Corp.
Junior Subordinated Bond, M, 8.125% to 5/15/2018, Floating Rate Note thereafter, Perpetual . . . . . . . . . . . . . . . . . . . . . . . . . . . . . . 1,300,000 USD $ 1,253 $ 1,567Senior Note, 5.65%, 5/1/2018 . . . . . . . . . . . . . . . . . . . . . . . . . . . . . . . . . . . . . . . . . . . . . . . . . . . . . . . . . . . . . . . . . . . . . . . . . . . . 1,000,000 USD 1,048 1,209
Bear Stearns Commercial Mortgage Securities Inc.2006-PW11, AJ, Floating Rate Note, 3/11/2039 . . . . . . . . . . . . . . . . . . . . . . . . . . . . . . . . . . . . . . . . . . . . . . . . . . . . . . . . . . . . . . . 750,000 USD 760 8372006-PW12, AJ, Floating Rate Note, 9/11/2038 . . . . . . . . . . . . . . . . . . . . . . . . . . . . . . . . . . . . . . . . . . . . . . . . . . . . . . . . . . . . . . . 500,000 USD 506 5622006-PW13, AJ, 5.611%, 9/11/2041 . . . . . . . . . . . . . . . . . . . . . . . . . . . . . . . . . . . . . . . . . . . . . . . . . . . . . . . . . . . . . . . . . . . . . . . 1,600,000 USD 1,559 1,7872007-PW16, AM, Floating Rate Note, 6/11/2040 . . . . . . . . . . . . . . . . . . . . . . . . . . . . . . . . . . . . . . . . . . . . . . . . . . . . . . . . . . . . . . . 260,000 USD 319 308
Bear Stearns Commercial Mortgage Securities Trust, 2007-PW15, A4, 5.331%, 2/11/2044 . . . . . . . . . . . . . . . . . . . . . . . . . . . . . . . . . . . 96,315 USD 108 111Big Heart Pet Brands (Del Monte Pet), Initial Term Loans, Floating Rate Note, 2/24/2020 . . . . . . . . . . . . . . . . . . . . . . . . . . . . . . . . . . . . 927,563 USD 907 984BJ’s Wholesale Club Inc.
2013 (Nov) Replacement Loans, Floating Rate Note, 9/26/2019 . . . . . . . . . . . . . . . . . . . . . . . . . . . . . . . . . . . . . . . . . . . . . . . . . . . . 2,231,973 USD 2,160 2,387Second Lien 2013 (Nov) Replacment Loans, Floating Rate Note, 3/26/2020 . . . . . . . . . . . . . . . . . . . . . . . . . . . . . . . . . . . . . . . . . . . 1,306,714 USD 1,424 1,432
BMC Software Finance Inc.Initial U.S. Term Loans, Floating Rate Note, 9/10/2020 . . . . . . . . . . . . . . . . . . . . . . . . . . . . . . . . . . . . . . . . . . . . . . . . . . . . . . . . . . 2,137,303 USD 2,245 2,279Senior Note, 8.125%, 7/15/2021 . . . . . . . . . . . . . . . . . . . . . . . . . . . . . . . . . . . . . . . . . . . . . . . . . . . . . . . . . . . . . . . . . . . . . . . . . . 1,000,000 USD 1,093 1,102
Bowie Resource Holdings LLC, 2nd Lien Initial Term Loan, Floating Rate Note, 2/16/2021 . . . . . . . . . . . . . . . . . . . . . . . . . . . . . . . . . . . 370,068 USD 384 404BreitBurn Energy Partners LP/Finance Corp., Senior Bond, 7.875%, 4/15/2022 . . . . . . . . . . . . . . . . . . . . . . . . . . . . . . . . . . . . . . . . . . . 400,000 USD 419 465Caesars Entertainment Operating Co. Inc., Senior Secured Note, 11.25%, 6/1/2017 . . . . . . . . . . . . . . . . . . . . . . . . . . . . . . . . . . . . . . . . 1,000,000 USD 1,088 981Caesars Entertainment Resort Properties LLC, Term B Loans, Floating Rate Note, 10/11/2020 . . . . . . . . . . . . . . . . . . . . . . . . . . . . . . . . 1,619,687 USD 1,765 1,739California State GO
Various Purpose, 6.00%, 11/1/2039 . . . . . . . . . . . . . . . . . . . . . . . . . . . . . . . . . . . . . . . . . . . . . . . . . . . . . . . . . . . . . . . . . . . . . . . 130,000 USD 129 166Various Purpose, 5.25%, 11/1/2040 . . . . . . . . . . . . . . . . . . . . . . . . . . . . . . . . . . . . . . . . . . . . . . . . . . . . . . . . . . . . . . . . . . . . . . . 450,000 USD 402 541Various Purpose, 7.60%, 11/1/2040 . . . . . . . . . . . . . . . . . . . . . . . . . . . . . . . . . . . . . . . . . . . . . . . . . . . . . . . . . . . . . . . . . . . . . . . 800,000 USD 825 1,291Various Purpose, Refunding, 5.00%, 4/1/2038 . . . . . . . . . . . . . . . . . . . . . . . . . . . . . . . . . . . . . . . . . . . . . . . . . . . . . . . . . . . . . . . . 1,500,000 USD 1,537 1,736Various Purpose, Refunding, NATL Insured, 4.50%, 12/1/2032 . . . . . . . . . . . . . . . . . . . . . . . . . . . . . . . . . . . . . . . . . . . . . . . . . . . . 240,000 USD 192 266Various Purpose, Refunding, Series 1, AGMC Insured, 4.75%, 9/1/2031 . . . . . . . . . . . . . . . . . . . . . . . . . . . . . . . . . . . . . . . . . . . . . . 235,000 USD 197 261
Calpine Corp.Senior Secured Bond, First Lien, 5.875%, 1/15/2024 . . . . . . . . . . . . . . . . . . . . . . . . . . . . . . . . . . . . . . . . . . . . . . . . . . . . . . . . . . . 200,000 USD 207 226Senior Secured Note, 7.50%, 2/15/2021 . . . . . . . . . . . . . . . . . . . . . . . . . . . . . . . . . . . . . . . . . . . . . . . . . . . . . . . . . . . . . . . . . . . . 574,000 USD 598 665Senior Secured Note, 7.875%, 1/15/2023 . . . . . . . . . . . . . . . . . . . . . . . . . . . . . . . . . . . . . . . . . . . . . . . . . . . . . . . . . . . . . . . . . . . 438,000 USD 504 523Senior Secured Note, First Lien, 6.00%, 1/15/2022 . . . . . . . . . . . . . . . . . . . . . . . . . . . . . . . . . . . . . . . . . . . . . . . . . . . . . . . . . . . . . 100,000 USD 102 115
Caraustar Industries Inc., Initial Term Loan, Floating Rate Note, 5/1/2019 . . . . . . . . . . . . . . . . . . . . . . . . . . . . . . . . . . . . . . . . . . . . . . . 170,649 USD 191 185Carestream Health Inc., Second Lien Loan, Floating Rate Note, 12/7/2019 . . . . . . . . . . . . . . . . . . . . . . . . . . . . . . . . . . . . . . . . . . . . . . 865,652 USD 877 945CCO Holdings LLC/CCO Holdings Capital Corp., Senior Bond, 5.25%, 9/30/2022 . . . . . . . . . . . . . . . . . . . . . . . . . . . . . . . . . . . . . . . . . . 700,000 USD 692 761Cengage Learning Acquisitions Inc., Original Term Loans, Floating Rate Note, 3/31/2020 . . . . . . . . . . . . . . . . . . . . . . . . . . . . . . . . . . . . 1,605,589 USD 1,807 1,737Cent Collateralized Debt Obligations Ltd., 2007-15A, A2B, Floating Rate Note, 3/11/2021 . . . . . . . . . . . . . . . . . . . . . . . . . . . . . . . . . . . . 203,000 USD 165 204CenturyLink Inc.
Senior Bond, 6.75%, 12/1/2023 . . . . . . . . . . . . . . . . . . . . . . . . . . . . . . . . . . . . . . . . . . . . . . . . . . . . . . . . . . . . . . . . . . . . . . . . . . 100,000 USD 105 117Senior Note, 6.00%, 4/1/2017 . . . . . . . . . . . . . . . . . . . . . . . . . . . . . . . . . . . . . . . . . . . . . . . . . . . . . . . . . . . . . . . . . . . . . . . . . . . . 800,000 USD 813 946Senior Note, 5.80%, 3/15/2022 . . . . . . . . . . . . . . . . . . . . . . . . . . . . . . . . . . . . . . . . . . . . . . . . . . . . . . . . . . . . . . . . . . . . . . . . . . . 200,000 USD 216 223
Chesapeake Energy Corp.Senior Note, 6.625%, 8/15/2020 . . . . . . . . . . . . . . . . . . . . . . . . . . . . . . . . . . . . . . . . . . . . . . . . . . . . . . . . . . . . . . . . . . . . . . . . . . 300,000 USD 308 369Senior Note, 6.125%, 2/15/2021 . . . . . . . . . . . . . . . . . . . . . . . . . . . . . . . . . . . . . . . . . . . . . . . . . . . . . . . . . . . . . . . . . . . . . . . . . . 800,000 USD 796 960Senior Note, 5.75%, 3/15/2023 . . . . . . . . . . . . . . . . . . . . . . . . . . . . . . . . . . . . . . . . . . . . . . . . . . . . . . . . . . . . . . . . . . . . . . . . . . . 500,000 USD 529 595
CHS/Community Health Systems Inc.Senior Note, 8.00%, 11/15/2019 . . . . . . . . . . . . . . . . . . . . . . . . . . . . . . . . . . . . . . . . . . . . . . . . . . . . . . . . . . . . . . . . . . . . . . . . . . 900,000 USD 918 1,053Senior Note, 7.125%, 7/15/2020 . . . . . . . . . . . . . . . . . . . . . . . . . . . . . . . . . . . . . . . . . . . . . . . . . . . . . . . . . . . . . . . . . . . . . . . . . . 300,000 USD 305 348Senior Note, 6.875%, 2/1/2022 . . . . . . . . . . . . . . . . . . . . . . . . . . . . . . . . . . . . . . . . . . . . . . . . . . . . . . . . . . . . . . . . . . . . . . . . . . . 200,000 USD 219 227
The accompanying notes are an integral part of these financial statements.
Franklin Templeton Investments Funds 131
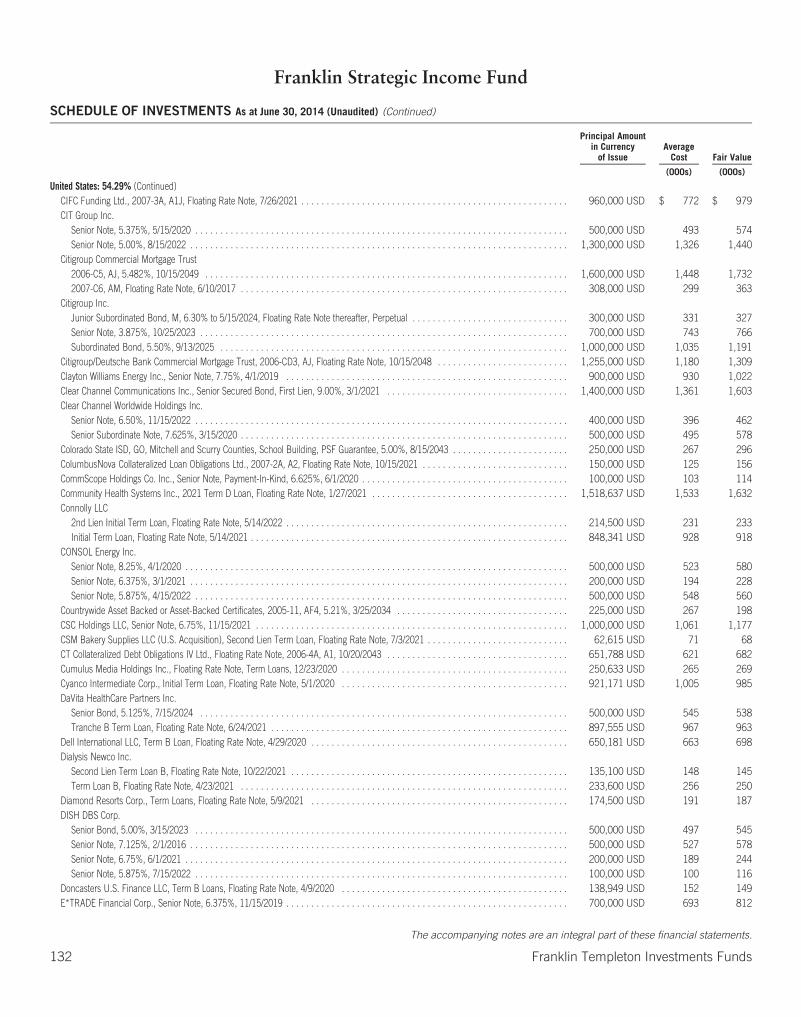
Franklin Strategic Income Fund
SCHEDULE OF INVESTMENTS As at June 30, 2014 (Unaudited) (Continued)
Principal Amountin Currency
of IssueAverage
Cost Fair Value
(000s) (000s)
United States: 54.29% (Continued)CIFC Funding Ltd., 2007-3A, A1J, Floating Rate Note, 7/26/2021 . . . . . . . . . . . . . . . . . . . . . . . . . . . . . . . . . . . . . . . . . . . . . . . . . . . . . 960,000 USD $ 772 $ 979CIT Group Inc.
Senior Note, 5.375%, 5/15/2020 . . . . . . . . . . . . . . . . . . . . . . . . . . . . . . . . . . . . . . . . . . . . . . . . . . . . . . . . . . . . . . . . . . . . . . . . . . 500,000 USD 493 574Senior Note, 5.00%, 8/15/2022 . . . . . . . . . . . . . . . . . . . . . . . . . . . . . . . . . . . . . . . . . . . . . . . . . . . . . . . . . . . . . . . . . . . . . . . . . . . 1,300,000 USD 1,326 1,440
Citigroup Commercial Mortgage Trust2006-C5, AJ, 5.482%, 10/15/2049 . . . . . . . . . . . . . . . . . . . . . . . . . . . . . . . . . . . . . . . . . . . . . . . . . . . . . . . . . . . . . . . . . . . . . . . . 1,600,000 USD 1,448 1,7322007-C6, AM, Floating Rate Note, 6/10/2017 . . . . . . . . . . . . . . . . . . . . . . . . . . . . . . . . . . . . . . . . . . . . . . . . . . . . . . . . . . . . . . . . . 308,000 USD 299 363
Citigroup Inc.Junior Subordinated Bond, M, 6.30% to 5/15/2024, Floating Rate Note thereafter, Perpetual . . . . . . . . . . . . . . . . . . . . . . . . . . . . . . . 300,000 USD 331 327Senior Note, 3.875%, 10/25/2023 . . . . . . . . . . . . . . . . . . . . . . . . . . . . . . . . . . . . . . . . . . . . . . . . . . . . . . . . . . . . . . . . . . . . . . . . . 700,000 USD 743 766Subordinated Bond, 5.50%, 9/13/2025 . . . . . . . . . . . . . . . . . . . . . . . . . . . . . . . . . . . . . . . . . . . . . . . . . . . . . . . . . . . . . . . . . . . . . 1,000,000 USD 1,035 1,191
Citigroup/Deutsche Bank Commercial Mortgage Trust, 2006-CD3, AJ, Floating Rate Note, 10/15/2048 . . . . . . . . . . . . . . . . . . . . . . . . . . 1,255,000 USD 1,180 1,309Clayton Williams Energy Inc., Senior Note, 7.75%, 4/1/2019 . . . . . . . . . . . . . . . . . . . . . . . . . . . . . . . . . . . . . . . . . . . . . . . . . . . . . . . . 900,000 USD 930 1,022Clear Channel Communications Inc., Senior Secured Bond, First Lien, 9.00%, 3/1/2021 . . . . . . . . . . . . . . . . . . . . . . . . . . . . . . . . . . . . 1,400,000 USD 1,361 1,603Clear Channel Worldwide Holdings Inc.
Senior Note, 6.50%, 11/15/2022 . . . . . . . . . . . . . . . . . . . . . . . . . . . . . . . . . . . . . . . . . . . . . . . . . . . . . . . . . . . . . . . . . . . . . . . . . . 400,000 USD 396 462Senior Subordinate Note, 7.625%, 3/15/2020 . . . . . . . . . . . . . . . . . . . . . . . . . . . . . . . . . . . . . . . . . . . . . . . . . . . . . . . . . . . . . . . . . 500,000 USD 495 578
Colorado State ISD, GO, Mitchell and Scurry Counties, School Building, PSF Guarantee, 5.00%, 8/15/2043 . . . . . . . . . . . . . . . . . . . . . . . 250,000 USD 267 296ColumbusNova Collateralized Loan Obligations Ltd., 2007-2A, A2, Floating Rate Note, 10/15/2021 . . . . . . . . . . . . . . . . . . . . . . . . . . . . . 150,000 USD 125 156CommScope Holdings Co. Inc., Senior Note, Payment-In-Kind, 6.625%, 6/1/2020 . . . . . . . . . . . . . . . . . . . . . . . . . . . . . . . . . . . . . . . . . 100,000 USD 103 114Community Health Systems Inc., 2021 Term D Loan, Floating Rate Note, 1/27/2021 . . . . . . . . . . . . . . . . . . . . . . . . . . . . . . . . . . . . . . . 1,518,637 USD 1,533 1,632Connolly LLC
2nd Lien Initial Term Loan, Floating Rate Note, 5/14/2022 . . . . . . . . . . . . . . . . . . . . . . . . . . . . . . . . . . . . . . . . . . . . . . . . . . . . . . . . 214,500 USD 231 233Initial Term Loan, Floating Rate Note, 5/14/2021 . . . . . . . . . . . . . . . . . . . . . . . . . . . . . . . . . . . . . . . . . . . . . . . . . . . . . . . . . . . . . . . 848,341 USD 928 918
CONSOL Energy Inc.Senior Note, 8.25%, 4/1/2020 . . . . . . . . . . . . . . . . . . . . . . . . . . . . . . . . . . . . . . . . . . . . . . . . . . . . . . . . . . . . . . . . . . . . . . . . . . . . 500,000 USD 523 580Senior Note, 6.375%, 3/1/2021 . . . . . . . . . . . . . . . . . . . . . . . . . . . . . . . . . . . . . . . . . . . . . . . . . . . . . . . . . . . . . . . . . . . . . . . . . . . 200,000 USD 194 228Senior Note, 5.875%, 4/15/2022 . . . . . . . . . . . . . . . . . . . . . . . . . . . . . . . . . . . . . . . . . . . . . . . . . . . . . . . . . . . . . . . . . . . . . . . . . . 500,000 USD 548 560
Countrywide Asset Backed or Asset-Backed Certificates, 2005-11, AF4, 5.21%, 3/25/2034 . . . . . . . . . . . . . . . . . . . . . . . . . . . . . . . . . . 225,000 USD 267 198CSC Holdings LLC, Senior Note, 6.75%, 11/15/2021 . . . . . . . . . . . . . . . . . . . . . . . . . . . . . . . . . . . . . . . . . . . . . . . . . . . . . . . . . . . . . . 1,000,000 USD 1,061 1,177CSM Bakery Supplies LLC (U.S. Acquisition), Second Lien Term Loan, Floating Rate Note, 7/3/2021 . . . . . . . . . . . . . . . . . . . . . . . . . . . . 62,615 USD 71 68CT Collateralized Debt Obligations IV Ltd., Floating Rate Note, 2006-4A, A1, 10/20/2043 . . . . . . . . . . . . . . . . . . . . . . . . . . . . . . . . . . . . 651,788 USD 621 682Cumulus Media Holdings Inc., Floating Rate Note, Term Loans, 12/23/2020 . . . . . . . . . . . . . . . . . . . . . . . . . . . . . . . . . . . . . . . . . . . . . 250,633 USD 265 269Cyanco Intermediate Corp., Initial Term Loan, Floating Rate Note, 5/1/2020 . . . . . . . . . . . . . . . . . . . . . . . . . . . . . . . . . . . . . . . . . . . . . 921,171 USD 1,005 985DaVita HealthCare Partners Inc.
Senior Bond, 5.125%, 7/15/2024 . . . . . . . . . . . . . . . . . . . . . . . . . . . . . . . . . . . . . . . . . . . . . . . . . . . . . . . . . . . . . . . . . . . . . . . . . 500,000 USD 545 538Tranche B Term Loan, Floating Rate Note, 6/24/2021 . . . . . . . . . . . . . . . . . . . . . . . . . . . . . . . . . . . . . . . . . . . . . . . . . . . . . . . . . . . 897,555 USD 967 963
Dell International LLC, Term B Loan, Floating Rate Note, 4/29/2020 . . . . . . . . . . . . . . . . . . . . . . . . . . . . . . . . . . . . . . . . . . . . . . . . . . . 650,181 USD 663 698Dialysis Newco Inc.
Second Lien Term Loan B, Floating Rate Note, 10/22/2021 . . . . . . . . . . . . . . . . . . . . . . . . . . . . . . . . . . . . . . . . . . . . . . . . . . . . . . . 135,100 USD 148 145Term Loan B, Floating Rate Note, 4/23/2021 . . . . . . . . . . . . . . . . . . . . . . . . . . . . . . . . . . . . . . . . . . . . . . . . . . . . . . . . . . . . . . . . . 233,600 USD 256 250
Diamond Resorts Corp., Term Loans, Floating Rate Note, 5/9/2021 . . . . . . . . . . . . . . . . . . . . . . . . . . . . . . . . . . . . . . . . . . . . . . . . . . . 174,500 USD 191 187DISH DBS Corp.
Senior Bond, 5.00%, 3/15/2023 . . . . . . . . . . . . . . . . . . . . . . . . . . . . . . . . . . . . . . . . . . . . . . . . . . . . . . . . . . . . . . . . . . . . . . . . . . 500,000 USD 497 545Senior Note, 7.125%, 2/1/2016 . . . . . . . . . . . . . . . . . . . . . . . . . . . . . . . . . . . . . . . . . . . . . . . . . . . . . . . . . . . . . . . . . . . . . . . . . . . 500,000 USD 527 578Senior Note, 6.75%, 6/1/2021 . . . . . . . . . . . . . . . . . . . . . . . . . . . . . . . . . . . . . . . . . . . . . . . . . . . . . . . . . . . . . . . . . . . . . . . . . . . . 200,000 USD 189 244Senior Note, 5.875%, 7/15/2022 . . . . . . . . . . . . . . . . . . . . . . . . . . . . . . . . . . . . . . . . . . . . . . . . . . . . . . . . . . . . . . . . . . . . . . . . . . 100,000 USD 100 116
Doncasters U.S. Finance LLC, Term B Loans, Floating Rate Note, 4/9/2020 . . . . . . . . . . . . . . . . . . . . . . . . . . . . . . . . . . . . . . . . . . . . . 138,949 USD 152 149E*TRADE Financial Corp., Senior Note, 6.375%, 11/15/2019 . . . . . . . . . . . . . . . . . . . . . . . . . . . . . . . . . . . . . . . . . . . . . . . . . . . . . . . . 700,000 USD 693 812
The accompanying notes are an integral part of these financial statements.
132 Franklin Templeton Investments Funds
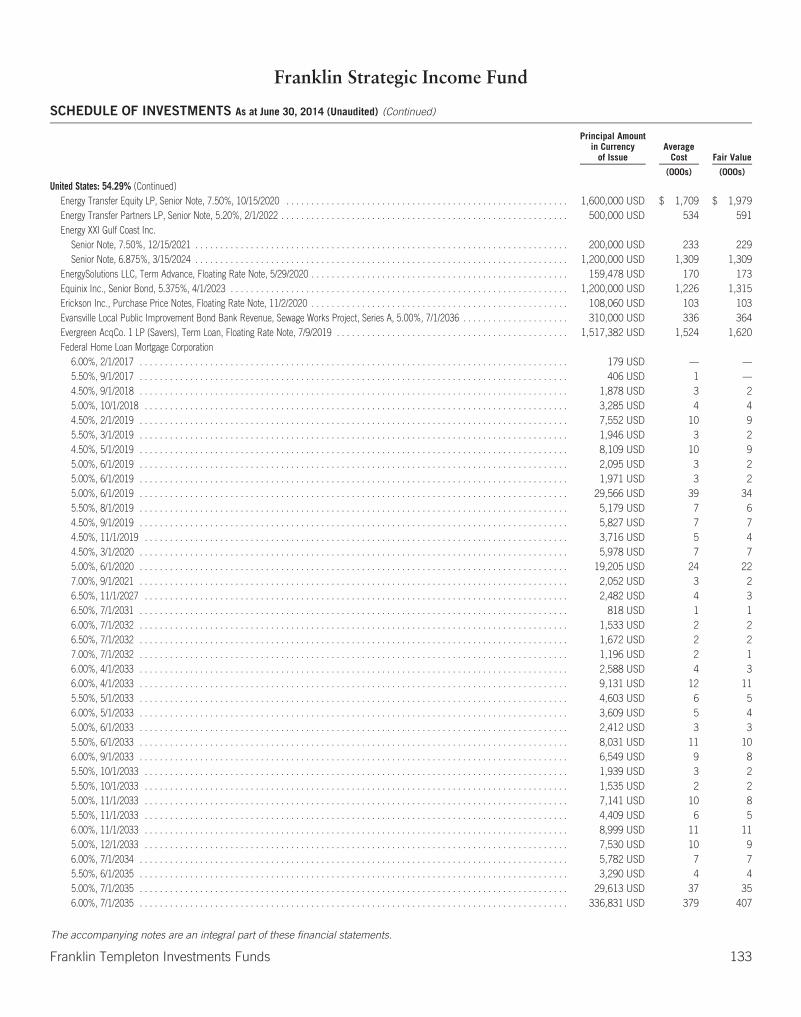
Franklin Strategic Income Fund
SCHEDULE OF INVESTMENTS As at June 30, 2014 (Unaudited) (Continued)
Principal Amountin Currency
of IssueAverage
Cost Fair Value
(000s) (000s)
United States: 54.29% (Continued)Energy Transfer Equity LP, Senior Note, 7.50%, 10/15/2020 . . . . . . . . . . . . . . . . . . . . . . . . . . . . . . . . . . . . . . . . . . . . . . . . . . . . . . . . 1,600,000 USD $ 1,709 $ 1,979Energy Transfer Partners LP, Senior Note, 5.20%, 2/1/2022 . . . . . . . . . . . . . . . . . . . . . . . . . . . . . . . . . . . . . . . . . . . . . . . . . . . . . . . . . 500,000 USD 534 591Energy XXI Gulf Coast Inc.
Senior Note, 7.50%, 12/15/2021 . . . . . . . . . . . . . . . . . . . . . . . . . . . . . . . . . . . . . . . . . . . . . . . . . . . . . . . . . . . . . . . . . . . . . . . . . . 200,000 USD 233 229Senior Note, 6.875%, 3/15/2024 . . . . . . . . . . . . . . . . . . . . . . . . . . . . . . . . . . . . . . . . . . . . . . . . . . . . . . . . . . . . . . . . . . . . . . . . . . 1,200,000 USD 1,309 1,309
EnergySolutions LLC, Term Advance, Floating Rate Note, 5/29/2020 . . . . . . . . . . . . . . . . . . . . . . . . . . . . . . . . . . . . . . . . . . . . . . . . . . . 159,478 USD 170 173Equinix Inc., Senior Bond, 5.375%, 4/1/2023 . . . . . . . . . . . . . . . . . . . . . . . . . . . . . . . . . . . . . . . . . . . . . . . . . . . . . . . . . . . . . . . . . . . 1,200,000 USD 1,226 1,315Erickson Inc., Purchase Price Notes, Floating Rate Note, 11/2/2020 . . . . . . . . . . . . . . . . . . . . . . . . . . . . . . . . . . . . . . . . . . . . . . . . . . . 108,060 USD 103 103Evansville Local Public Improvement Bond Bank Revenue, Sewage Works Project, Series A, 5.00%, 7/1/2036 . . . . . . . . . . . . . . . . . . . . . 310,000 USD 336 364Evergreen AcqCo. 1 LP (Savers), Term Loan, Floating Rate Note, 7/9/2019 . . . . . . . . . . . . . . . . . . . . . . . . . . . . . . . . . . . . . . . . . . . . . . 1,517,382 USD 1,524 1,620Federal Home Loan Mortgage Corporation
6.00%, 2/1/2017 . . . . . . . . . . . . . . . . . . . . . . . . . . . . . . . . . . . . . . . . . . . . . . . . . . . . . . . . . . . . . . . . . . . . . . . . . . . . . . . . . . . . . 179 USD — —5.50%, 9/1/2017 . . . . . . . . . . . . . . . . . . . . . . . . . . . . . . . . . . . . . . . . . . . . . . . . . . . . . . . . . . . . . . . . . . . . . . . . . . . . . . . . . . . . . 406 USD 1 —4.50%, 9/1/2018 . . . . . . . . . . . . . . . . . . . . . . . . . . . . . . . . . . . . . . . . . . . . . . . . . . . . . . . . . . . . . . . . . . . . . . . . . . . . . . . . . . . . . 1,878 USD 3 25.00%, 10/1/2018 . . . . . . . . . . . . . . . . . . . . . . . . . . . . . . . . . . . . . . . . . . . . . . . . . . . . . . . . . . . . . . . . . . . . . . . . . . . . . . . . . . . . 3,285 USD 4 44.50%, 2/1/2019 . . . . . . . . . . . . . . . . . . . . . . . . . . . . . . . . . . . . . . . . . . . . . . . . . . . . . . . . . . . . . . . . . . . . . . . . . . . . . . . . . . . . . 7,552 USD 10 95.50%, 3/1/2019 . . . . . . . . . . . . . . . . . . . . . . . . . . . . . . . . . . . . . . . . . . . . . . . . . . . . . . . . . . . . . . . . . . . . . . . . . . . . . . . . . . . . . 1,946 USD 3 24.50%, 5/1/2019 . . . . . . . . . . . . . . . . . . . . . . . . . . . . . . . . . . . . . . . . . . . . . . . . . . . . . . . . . . . . . . . . . . . . . . . . . . . . . . . . . . . . . 8,109 USD 10 95.00%, 6/1/2019 . . . . . . . . . . . . . . . . . . . . . . . . . . . . . . . . . . . . . . . . . . . . . . . . . . . . . . . . . . . . . . . . . . . . . . . . . . . . . . . . . . . . . 2,095 USD 3 25.00%, 6/1/2019 . . . . . . . . . . . . . . . . . . . . . . . . . . . . . . . . . . . . . . . . . . . . . . . . . . . . . . . . . . . . . . . . . . . . . . . . . . . . . . . . . . . . . 1,971 USD 3 25.00%, 6/1/2019 . . . . . . . . . . . . . . . . . . . . . . . . . . . . . . . . . . . . . . . . . . . . . . . . . . . . . . . . . . . . . . . . . . . . . . . . . . . . . . . . . . . . . 29,566 USD 39 345.50%, 8/1/2019 . . . . . . . . . . . . . . . . . . . . . . . . . . . . . . . . . . . . . . . . . . . . . . . . . . . . . . . . . . . . . . . . . . . . . . . . . . . . . . . . . . . . . 5,179 USD 7 64.50%, 9/1/2019 . . . . . . . . . . . . . . . . . . . . . . . . . . . . . . . . . . . . . . . . . . . . . . . . . . . . . . . . . . . . . . . . . . . . . . . . . . . . . . . . . . . . . 5,827 USD 7 74.50%, 11/1/2019 . . . . . . . . . . . . . . . . . . . . . . . . . . . . . . . . . . . . . . . . . . . . . . . . . . . . . . . . . . . . . . . . . . . . . . . . . . . . . . . . . . . . 3,716 USD 5 44.50%, 3/1/2020 . . . . . . . . . . . . . . . . . . . . . . . . . . . . . . . . . . . . . . . . . . . . . . . . . . . . . . . . . . . . . . . . . . . . . . . . . . . . . . . . . . . . . 5,978 USD 7 75.00%, 6/1/2020 . . . . . . . . . . . . . . . . . . . . . . . . . . . . . . . . . . . . . . . . . . . . . . . . . . . . . . . . . . . . . . . . . . . . . . . . . . . . . . . . . . . . . 19,205 USD 24 227.00%, 9/1/2021 . . . . . . . . . . . . . . . . . . . . . . . . . . . . . . . . . . . . . . . . . . . . . . . . . . . . . . . . . . . . . . . . . . . . . . . . . . . . . . . . . . . . . 2,052 USD 3 26.50%, 11/1/2027 . . . . . . . . . . . . . . . . . . . . . . . . . . . . . . . . . . . . . . . . . . . . . . . . . . . . . . . . . . . . . . . . . . . . . . . . . . . . . . . . . . . . 2,482 USD 4 36.50%, 7/1/2031 . . . . . . . . . . . . . . . . . . . . . . . . . . . . . . . . . . . . . . . . . . . . . . . . . . . . . . . . . . . . . . . . . . . . . . . . . . . . . . . . . . . . . 818 USD 1 16.00%, 7/1/2032 . . . . . . . . . . . . . . . . . . . . . . . . . . . . . . . . . . . . . . . . . . . . . . . . . . . . . . . . . . . . . . . . . . . . . . . . . . . . . . . . . . . . . 1,533 USD 2 26.50%, 7/1/2032 . . . . . . . . . . . . . . . . . . . . . . . . . . . . . . . . . . . . . . . . . . . . . . . . . . . . . . . . . . . . . . . . . . . . . . . . . . . . . . . . . . . . . 1,672 USD 2 27.00%, 7/1/2032 . . . . . . . . . . . . . . . . . . . . . . . . . . . . . . . . . . . . . . . . . . . . . . . . . . . . . . . . . . . . . . . . . . . . . . . . . . . . . . . . . . . . . 1,196 USD 2 16.00%, 4/1/2033 . . . . . . . . . . . . . . . . . . . . . . . . . . . . . . . . . . . . . . . . . . . . . . . . . . . . . . . . . . . . . . . . . . . . . . . . . . . . . . . . . . . . . 2,588 USD 4 36.00%, 4/1/2033 . . . . . . . . . . . . . . . . . . . . . . . . . . . . . . . . . . . . . . . . . . . . . . . . . . . . . . . . . . . . . . . . . . . . . . . . . . . . . . . . . . . . . 9,131 USD 12 115.50%, 5/1/2033 . . . . . . . . . . . . . . . . . . . . . . . . . . . . . . . . . . . . . . . . . . . . . . . . . . . . . . . . . . . . . . . . . . . . . . . . . . . . . . . . . . . . . 4,603 USD 6 56.00%, 5/1/2033 . . . . . . . . . . . . . . . . . . . . . . . . . . . . . . . . . . . . . . . . . . . . . . . . . . . . . . . . . . . . . . . . . . . . . . . . . . . . . . . . . . . . . 3,609 USD 5 45.00%, 6/1/2033 . . . . . . . . . . . . . . . . . . . . . . . . . . . . . . . . . . . . . . . . . . . . . . . . . . . . . . . . . . . . . . . . . . . . . . . . . . . . . . . . . . . . . 2,412 USD 3 35.50%, 6/1/2033 . . . . . . . . . . . . . . . . . . . . . . . . . . . . . . . . . . . . . . . . . . . . . . . . . . . . . . . . . . . . . . . . . . . . . . . . . . . . . . . . . . . . . 8,031 USD 11 106.00%, 9/1/2033 . . . . . . . . . . . . . . . . . . . . . . . . . . . . . . . . . . . . . . . . . . . . . . . . . . . . . . . . . . . . . . . . . . . . . . . . . . . . . . . . . . . . . 6,549 USD 9 85.50%, 10/1/2033 . . . . . . . . . . . . . . . . . . . . . . . . . . . . . . . . . . . . . . . . . . . . . . . . . . . . . . . . . . . . . . . . . . . . . . . . . . . . . . . . . . . . 1,939 USD 3 25.50%, 10/1/2033 . . . . . . . . . . . . . . . . . . . . . . . . . . . . . . . . . . . . . . . . . . . . . . . . . . . . . . . . . . . . . . . . . . . . . . . . . . . . . . . . . . . . 1,535 USD 2 25.00%, 11/1/2033 . . . . . . . . . . . . . . . . . . . . . . . . . . . . . . . . . . . . . . . . . . . . . . . . . . . . . . . . . . . . . . . . . . . . . . . . . . . . . . . . . . . . 7,141 USD 10 85.50%, 11/1/2033 . . . . . . . . . . . . . . . . . . . . . . . . . . . . . . . . . . . . . . . . . . . . . . . . . . . . . . . . . . . . . . . . . . . . . . . . . . . . . . . . . . . . 4,409 USD 6 56.00%, 11/1/2033 . . . . . . . . . . . . . . . . . . . . . . . . . . . . . . . . . . . . . . . . . . . . . . . . . . . . . . . . . . . . . . . . . . . . . . . . . . . . . . . . . . . . 8,999 USD 11 115.00%, 12/1/2033 . . . . . . . . . . . . . . . . . . . . . . . . . . . . . . . . . . . . . . . . . . . . . . . . . . . . . . . . . . . . . . . . . . . . . . . . . . . . . . . . . . . . 7,530 USD 10 96.00%, 7/1/2034 . . . . . . . . . . . . . . . . . . . . . . . . . . . . . . . . . . . . . . . . . . . . . . . . . . . . . . . . . . . . . . . . . . . . . . . . . . . . . . . . . . . . . 5,782 USD 7 75.50%, 6/1/2035 . . . . . . . . . . . . . . . . . . . . . . . . . . . . . . . . . . . . . . . . . . . . . . . . . . . . . . . . . . . . . . . . . . . . . . . . . . . . . . . . . . . . . 3,290 USD 4 45.00%, 7/1/2035 . . . . . . . . . . . . . . . . . . . . . . . . . . . . . . . . . . . . . . . . . . . . . . . . . . . . . . . . . . . . . . . . . . . . . . . . . . . . . . . . . . . . . 29,613 USD 37 356.00%, 7/1/2035 . . . . . . . . . . . . . . . . . . . . . . . . . . . . . . . . . . . . . . . . . . . . . . . . . . . . . . . . . . . . . . . . . . . . . . . . . . . . . . . . . . . . . 336,831 USD 379 407
The accompanying notes are an integral part of these financial statements.
Franklin Templeton Investments Funds 133
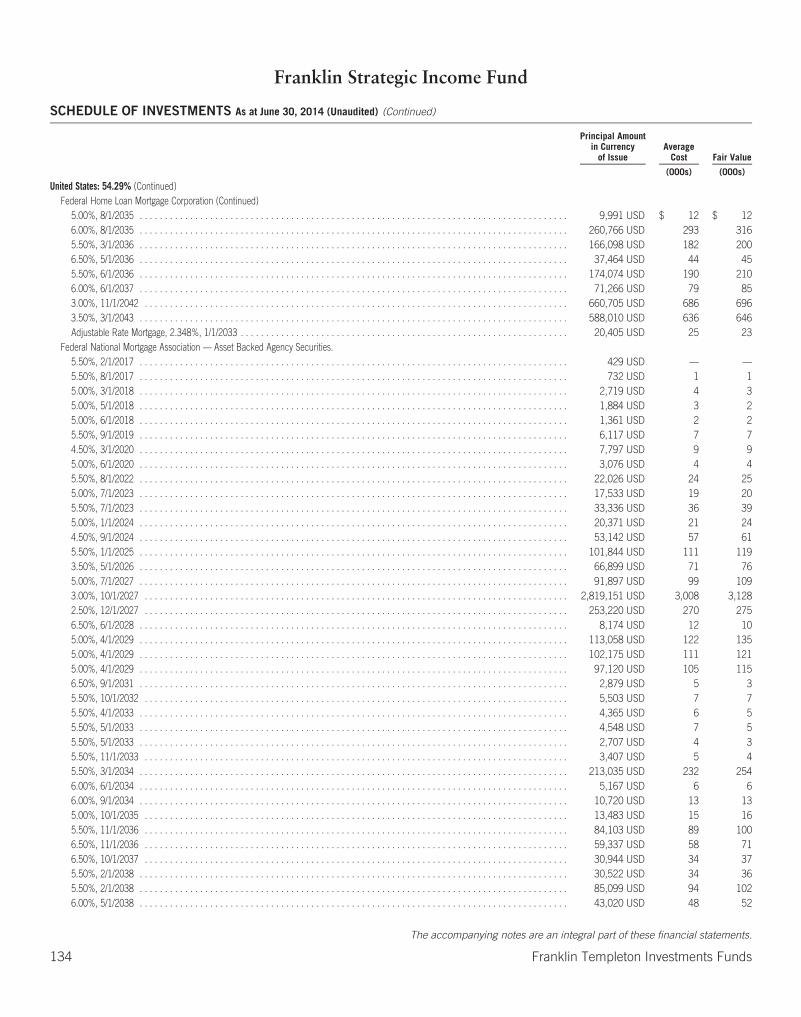
Franklin Strategic Income Fund
SCHEDULE OF INVESTMENTS As at June 30, 2014 (Unaudited) (Continued)
Principal Amountin Currency
of IssueAverage
Cost Fair Value
(000s) (000s)
United States: 54.29% (Continued)Federal Home Loan Mortgage Corporation (Continued)
5.00%, 8/1/2035 . . . . . . . . . . . . . . . . . . . . . . . . . . . . . . . . . . . . . . . . . . . . . . . . . . . . . . . . . . . . . . . . . . . . . . . . . . . . . . . . . . . . . 9,991 USD $ 12 $ 126.00%, 8/1/2035 . . . . . . . . . . . . . . . . . . . . . . . . . . . . . . . . . . . . . . . . . . . . . . . . . . . . . . . . . . . . . . . . . . . . . . . . . . . . . . . . . . . . . 260,766 USD 293 3165.50%, 3/1/2036 . . . . . . . . . . . . . . . . . . . . . . . . . . . . . . . . . . . . . . . . . . . . . . . . . . . . . . . . . . . . . . . . . . . . . . . . . . . . . . . . . . . . . 166,098 USD 182 2006.50%, 5/1/2036 . . . . . . . . . . . . . . . . . . . . . . . . . . . . . . . . . . . . . . . . . . . . . . . . . . . . . . . . . . . . . . . . . . . . . . . . . . . . . . . . . . . . . 37,464 USD 44 455.50%, 6/1/2036 . . . . . . . . . . . . . . . . . . . . . . . . . . . . . . . . . . . . . . . . . . . . . . . . . . . . . . . . . . . . . . . . . . . . . . . . . . . . . . . . . . . . . 174,074 USD 190 2106.00%, 6/1/2037 . . . . . . . . . . . . . . . . . . . . . . . . . . . . . . . . . . . . . . . . . . . . . . . . . . . . . . . . . . . . . . . . . . . . . . . . . . . . . . . . . . . . . 71,266 USD 79 853.00%, 11/1/2042 . . . . . . . . . . . . . . . . . . . . . . . . . . . . . . . . . . . . . . . . . . . . . . . . . . . . . . . . . . . . . . . . . . . . . . . . . . . . . . . . . . . . 660,705 USD 686 6963.50%, 3/1/2043 . . . . . . . . . . . . . . . . . . . . . . . . . . . . . . . . . . . . . . . . . . . . . . . . . . . . . . . . . . . . . . . . . . . . . . . . . . . . . . . . . . . . . 588,010 USD 636 646Adjustable Rate Mortgage, 2.348%, 1/1/2033 . . . . . . . . . . . . . . . . . . . . . . . . . . . . . . . . . . . . . . . . . . . . . . . . . . . . . . . . . . . . . . . . . 20,405 USD 25 23
Federal National Mortgage Association — Asset Backed Agency Securities.5.50%, 2/1/2017 . . . . . . . . . . . . . . . . . . . . . . . . . . . . . . . . . . . . . . . . . . . . . . . . . . . . . . . . . . . . . . . . . . . . . . . . . . . . . . . . . . . . . 429 USD — —5.50%, 8/1/2017 . . . . . . . . . . . . . . . . . . . . . . . . . . . . . . . . . . . . . . . . . . . . . . . . . . . . . . . . . . . . . . . . . . . . . . . . . . . . . . . . . . . . . 732 USD 1 15.00%, 3/1/2018 . . . . . . . . . . . . . . . . . . . . . . . . . . . . . . . . . . . . . . . . . . . . . . . . . . . . . . . . . . . . . . . . . . . . . . . . . . . . . . . . . . . . . 2,719 USD 4 35.00%, 5/1/2018 . . . . . . . . . . . . . . . . . . . . . . . . . . . . . . . . . . . . . . . . . . . . . . . . . . . . . . . . . . . . . . . . . . . . . . . . . . . . . . . . . . . . . 1,884 USD 3 25.00%, 6/1/2018 . . . . . . . . . . . . . . . . . . . . . . . . . . . . . . . . . . . . . . . . . . . . . . . . . . . . . . . . . . . . . . . . . . . . . . . . . . . . . . . . . . . . . 1,361 USD 2 25.50%, 9/1/2019 . . . . . . . . . . . . . . . . . . . . . . . . . . . . . . . . . . . . . . . . . . . . . . . . . . . . . . . . . . . . . . . . . . . . . . . . . . . . . . . . . . . . . 6,117 USD 7 74.50%, 3/1/2020 . . . . . . . . . . . . . . . . . . . . . . . . . . . . . . . . . . . . . . . . . . . . . . . . . . . . . . . . . . . . . . . . . . . . . . . . . . . . . . . . . . . . . 7,797 USD 9 95.00%, 6/1/2020 . . . . . . . . . . . . . . . . . . . . . . . . . . . . . . . . . . . . . . . . . . . . . . . . . . . . . . . . . . . . . . . . . . . . . . . . . . . . . . . . . . . . . 3,076 USD 4 45.50%, 8/1/2022 . . . . . . . . . . . . . . . . . . . . . . . . . . . . . . . . . . . . . . . . . . . . . . . . . . . . . . . . . . . . . . . . . . . . . . . . . . . . . . . . . . . . . 22,026 USD 24 255.00%, 7/1/2023 . . . . . . . . . . . . . . . . . . . . . . . . . . . . . . . . . . . . . . . . . . . . . . . . . . . . . . . . . . . . . . . . . . . . . . . . . . . . . . . . . . . . . 17,533 USD 19 205.50%, 7/1/2023 . . . . . . . . . . . . . . . . . . . . . . . . . . . . . . . . . . . . . . . . . . . . . . . . . . . . . . . . . . . . . . . . . . . . . . . . . . . . . . . . . . . . . 33,336 USD 36 395.00%, 1/1/2024 . . . . . . . . . . . . . . . . . . . . . . . . . . . . . . . . . . . . . . . . . . . . . . . . . . . . . . . . . . . . . . . . . . . . . . . . . . . . . . . . . . . . . 20,371 USD 21 244.50%, 9/1/2024 . . . . . . . . . . . . . . . . . . . . . . . . . . . . . . . . . . . . . . . . . . . . . . . . . . . . . . . . . . . . . . . . . . . . . . . . . . . . . . . . . . . . . 53,142 USD 57 615.50%, 1/1/2025 . . . . . . . . . . . . . . . . . . . . . . . . . . . . . . . . . . . . . . . . . . . . . . . . . . . . . . . . . . . . . . . . . . . . . . . . . . . . . . . . . . . . . 101,844 USD 111 1193.50%, 5/1/2026 . . . . . . . . . . . . . . . . . . . . . . . . . . . . . . . . . . . . . . . . . . . . . . . . . . . . . . . . . . . . . . . . . . . . . . . . . . . . . . . . . . . . . 66,899 USD 71 765.00%, 7/1/2027 . . . . . . . . . . . . . . . . . . . . . . . . . . . . . . . . . . . . . . . . . . . . . . . . . . . . . . . . . . . . . . . . . . . . . . . . . . . . . . . . . . . . . 91,897 USD 99 1093.00%, 10/1/2027 . . . . . . . . . . . . . . . . . . . . . . . . . . . . . . . . . . . . . . . . . . . . . . . . . . . . . . . . . . . . . . . . . . . . . . . . . . . . . . . . . . . . 2,819,151 USD 3,008 3,1282.50%, 12/1/2027 . . . . . . . . . . . . . . . . . . . . . . . . . . . . . . . . . . . . . . . . . . . . . . . . . . . . . . . . . . . . . . . . . . . . . . . . . . . . . . . . . . . . 253,220 USD 270 2756.50%, 6/1/2028 . . . . . . . . . . . . . . . . . . . . . . . . . . . . . . . . . . . . . . . . . . . . . . . . . . . . . . . . . . . . . . . . . . . . . . . . . . . . . . . . . . . . . 8,174 USD 12 105.00%, 4/1/2029 . . . . . . . . . . . . . . . . . . . . . . . . . . . . . . . . . . . . . . . . . . . . . . . . . . . . . . . . . . . . . . . . . . . . . . . . . . . . . . . . . . . . . 113,058 USD 122 1355.00%, 4/1/2029 . . . . . . . . . . . . . . . . . . . . . . . . . . . . . . . . . . . . . . . . . . . . . . . . . . . . . . . . . . . . . . . . . . . . . . . . . . . . . . . . . . . . . 102,175 USD 111 1215.00%, 4/1/2029 . . . . . . . . . . . . . . . . . . . . . . . . . . . . . . . . . . . . . . . . . . . . . . . . . . . . . . . . . . . . . . . . . . . . . . . . . . . . . . . . . . . . . 97,120 USD 105 1156.50%, 9/1/2031 . . . . . . . . . . . . . . . . . . . . . . . . . . . . . . . . . . . . . . . . . . . . . . . . . . . . . . . . . . . . . . . . . . . . . . . . . . . . . . . . . . . . . 2,879 USD 5 35.50%, 10/1/2032 . . . . . . . . . . . . . . . . . . . . . . . . . . . . . . . . . . . . . . . . . . . . . . . . . . . . . . . . . . . . . . . . . . . . . . . . . . . . . . . . . . . . 5,503 USD 7 75.50%, 4/1/2033 . . . . . . . . . . . . . . . . . . . . . . . . . . . . . . . . . . . . . . . . . . . . . . . . . . . . . . . . . . . . . . . . . . . . . . . . . . . . . . . . . . . . . 4,365 USD 6 55.50%, 5/1/2033 . . . . . . . . . . . . . . . . . . . . . . . . . . . . . . . . . . . . . . . . . . . . . . . . . . . . . . . . . . . . . . . . . . . . . . . . . . . . . . . . . . . . . 4,548 USD 7 55.50%, 5/1/2033 . . . . . . . . . . . . . . . . . . . . . . . . . . . . . . . . . . . . . . . . . . . . . . . . . . . . . . . . . . . . . . . . . . . . . . . . . . . . . . . . . . . . . 2,707 USD 4 35.50%, 11/1/2033 . . . . . . . . . . . . . . . . . . . . . . . . . . . . . . . . . . . . . . . . . . . . . . . . . . . . . . . . . . . . . . . . . . . . . . . . . . . . . . . . . . . . 3,407 USD 5 45.50%, 3/1/2034 . . . . . . . . . . . . . . . . . . . . . . . . . . . . . . . . . . . . . . . . . . . . . . . . . . . . . . . . . . . . . . . . . . . . . . . . . . . . . . . . . . . . . 213,035 USD 232 2546.00%, 6/1/2034 . . . . . . . . . . . . . . . . . . . . . . . . . . . . . . . . . . . . . . . . . . . . . . . . . . . . . . . . . . . . . . . . . . . . . . . . . . . . . . . . . . . . . 5,167 USD 6 66.00%, 9/1/2034 . . . . . . . . . . . . . . . . . . . . . . . . . . . . . . . . . . . . . . . . . . . . . . . . . . . . . . . . . . . . . . . . . . . . . . . . . . . . . . . . . . . . . 10,720 USD 13 135.00%, 10/1/2035 . . . . . . . . . . . . . . . . . . . . . . . . . . . . . . . . . . . . . . . . . . . . . . . . . . . . . . . . . . . . . . . . . . . . . . . . . . . . . . . . . . . . 13,483 USD 15 165.50%, 11/1/2036 . . . . . . . . . . . . . . . . . . . . . . . . . . . . . . . . . . . . . . . . . . . . . . . . . . . . . . . . . . . . . . . . . . . . . . . . . . . . . . . . . . . . 84,103 USD 89 1006.50%, 11/1/2036 . . . . . . . . . . . . . . . . . . . . . . . . . . . . . . . . . . . . . . . . . . . . . . . . . . . . . . . . . . . . . . . . . . . . . . . . . . . . . . . . . . . . 59,337 USD 58 716.50%, 10/1/2037 . . . . . . . . . . . . . . . . . . . . . . . . . . . . . . . . . . . . . . . . . . . . . . . . . . . . . . . . . . . . . . . . . . . . . . . . . . . . . . . . . . . . 30,944 USD 34 375.50%, 2/1/2038 . . . . . . . . . . . . . . . . . . . . . . . . . . . . . . . . . . . . . . . . . . . . . . . . . . . . . . . . . . . . . . . . . . . . . . . . . . . . . . . . . . . . . 30,522 USD 34 365.50%, 2/1/2038 . . . . . . . . . . . . . . . . . . . . . . . . . . . . . . . . . . . . . . . . . . . . . . . . . . . . . . . . . . . . . . . . . . . . . . . . . . . . . . . . . . . . . 85,099 USD 94 1026.00%, 5/1/2038 . . . . . . . . . . . . . . . . . . . . . . . . . . . . . . . . . . . . . . . . . . . . . . . . . . . . . . . . . . . . . . . . . . . . . . . . . . . . . . . . . . . . . 43,020 USD 48 52
The accompanying notes are an integral part of these financial statements.
134 Franklin Templeton Investments Funds

Franklin Strategic Income Fund
SCHEDULE OF INVESTMENTS As at June 30, 2014 (Unaudited) (Continued)
Principal Amountin Currency
of IssueAverage
Cost Fair Value
(000s) (000s)
United States: 54.29% (Continued)Federal National Mortgage Association — Asset Backed Agency Securities. (Continued)
4.00%, 1/1/2041 . . . . . . . . . . . . . . . . . . . . . . . . . . . . . . . . . . . . . . . . . . . . . . . . . . . . . . . . . . . . . . . . . . . . . . . . . . . . . . . . . . . . 471,055 USD $ 505 $ 5344.00%, 2/1/2041 . . . . . . . . . . . . . . . . . . . . . . . . . . . . . . . . . . . . . . . . . . . . . . . . . . . . . . . . . . . . . . . . . . . . . . . . . . . . . . . . . . . . 4,103,987 USD 4,421 4,6533.00%, 5/1/2043 . . . . . . . . . . . . . . . . . . . . . . . . . . . . . . . . . . . . . . . . . . . . . . . . . . . . . . . . . . . . . . . . . . . . . . . . . . . . . . . . . . . . 3,002,336 USD 3,180 3,168Adjustable Rate Mortgage, 2.33%, 4/1/2020 . . . . . . . . . . . . . . . . . . . . . . . . . . . . . . . . . . . . . . . . . . . . . . . . . . . . . . . . . . . . . . . . . 13,396 USD 17 14
FGI Operating Co. LLC (Freedom Group), Term B Loans, Floating Rate Note, 4/19/2019 . . . . . . . . . . . . . . . . . . . . . . . . . . . . . . . . . . . . 1,733,748 USD 1,855 1,867First Data Corp.
Senior Bond, 12.625%, 1/15/2021 . . . . . . . . . . . . . . . . . . . . . . . . . . . . . . . . . . . . . . . . . . . . . . . . . . . . . . . . . . . . . . . . . . . . . . . 200,000 USD 194 263Senior Secured Bond, 8.25%, 1/15/2021 . . . . . . . . . . . . . . . . . . . . . . . . . . . . . . . . . . . . . . . . . . . . . . . . . . . . . . . . . . . . . . . . . . . 1,500,000 USD 1,430 1,760
Fitness International LLC, Term Loan B, Floating Rate Note, 6/30/2020 . . . . . . . . . . . . . . . . . . . . . . . . . . . . . . . . . . . . . . . . . . . . . . . . 667,000 USD 709 710Florida East Coast Holdings Corp.
Secured Note, first lien, 6.75%, 5/1/2019 . . . . . . . . . . . . . . . . . . . . . . . . . . . . . . . . . . . . . . . . . . . . . . . . . . . . . . . . . . . . . . . . . . . 400,000 USD 441 452Senior Note, 9.75%, 5/1/2020 . . . . . . . . . . . . . . . . . . . . . . . . . . . . . . . . . . . . . . . . . . . . . . . . . . . . . . . . . . . . . . . . . . . . . . . . . . . 200,000 USD 220 226
Florida Hurricane Catastrophe Fund Finance Corp. Revenue, Series A, 2.995%, 7/1/2020 . . . . . . . . . . . . . . . . . . . . . . . . . . . . . . . . . . 1,000,000 USD 1,015 1,064FMG America Finance Inc. (Fortescue Metals Group), Loans, Floating Rate Note, 6/30/2019 . . . . . . . . . . . . . . . . . . . . . . . . . . . . . . . . 640,246 USD 651 684Fontainebleau Las Vegas, Senior Secured Note, First Lien, 11.00%, 6/15/2015 . . . . . . . . . . . . . . . . . . . . . . . . . . . . . . . . . . . . . . . . . . 1,300,000 USD 1,214 9FRAM Group Holdings Inc. (Autoparts Holdings)
Second Lien Term Loan, Floating Rate Note, 1/29/2018 . . . . . . . . . . . . . . . . . . . . . . . . . . . . . . . . . . . . . . . . . . . . . . . . . . . . . . . . . 820,657 USD 819 831Term Loan, Floating Rate Note, 7/29/2017 . . . . . . . . . . . . . . . . . . . . . . . . . . . . . . . . . . . . . . . . . . . . . . . . . . . . . . . . . . . . . . . . . . 779,166 USD 860 833
Frontier Communications Corp.Senior Bond, 7.625%, 4/15/2024 . . . . . . . . . . . . . . . . . . . . . . . . . . . . . . . . . . . . . . . . . . . . . . . . . . . . . . . . . . . . . . . . . . . . . . . . 300,000 USD 311 346Senior Note, 8.50%, 4/15/2020 . . . . . . . . . . . . . . . . . . . . . . . . . . . . . . . . . . . . . . . . . . . . . . . . . . . . . . . . . . . . . . . . . . . . . . . . . . 500,000 USD 514 632Senior Note, 8.75%, 4/15/2022 . . . . . . . . . . . . . . . . . . . . . . . . . . . . . . . . . . . . . . . . . . . . . . . . . . . . . . . . . . . . . . . . . . . . . . . . . . 300,000 USD 319 373Senior Note, 7.125%, 1/15/2023 . . . . . . . . . . . . . . . . . . . . . . . . . . . . . . . . . . . . . . . . . . . . . . . . . . . . . . . . . . . . . . . . . . . . . . . . . 100,000 USD 102 114Senior Note, 7.875%, 1/15/2027 . . . . . . . . . . . . . . . . . . . . . . . . . . . . . . . . . . . . . . . . . . . . . . . . . . . . . . . . . . . . . . . . . . . . . . . . . 200,000 USD 201 222
G-Force LLC, 2005-RRA, C, 5.20%, 8/22/2036 . . . . . . . . . . . . . . . . . . . . . . . . . . . . . . . . . . . . . . . . . . . . . . . . . . . . . . . . . . . . . . . . . 700,000 USD 655 694Gannett Co. Inc.
Senior Bond, 6.375%, 10/15/2023 . . . . . . . . . . . . . . . . . . . . . . . . . . . . . . . . . . . . . . . . . . . . . . . . . . . . . . . . . . . . . . . . . . . . . . . 1,100,000 USD 1,136 1,255Senior Note, 5.125%, 7/15/2020 . . . . . . . . . . . . . . . . . . . . . . . . . . . . . . . . . . . . . . . . . . . . . . . . . . . . . . . . . . . . . . . . . . . . . . . . . 300,000 USD 304 330
Gates Global LLC, Term Loan B, Floating Rate Note, 7/20/2021 . . . . . . . . . . . . . . . . . . . . . . . . . . . . . . . . . . . . . . . . . . . . . . . . . . . . . 178,800 USD 192 190General Electric Capital Corp., Senior Note, A, 8.50%, 4/6/2018 . . . . . . . . . . . . . . . . . . . . . . . . . . . . . . . . . . . . . . . . . . . . . . . . . . . . . 13,000,000 MXN 1,247 1,210General Motors Financial Co. Inc., Senior Note, 3.25%, 5/15/2018 . . . . . . . . . . . . . . . . . . . . . . . . . . . . . . . . . . . . . . . . . . . . . . . . . . . 400,000 USD 405 433Gleneagles Collateralized Loan Obligations Ltd., 2005-1A, A2, Floating Rate Note, 11/1/2017 . . . . . . . . . . . . . . . . . . . . . . . . . . . . . . . . 1,000,000 USD 804 1,048Global Tip Finance BV/Finance America LLC, Facility C Commitment, Floating Rate Note, 10/16/2020 . . . . . . . . . . . . . . . . . . . . . . . . . . 1,114,930 USD 1,151 1,196Government National Mortgage Association
6.50%, 2/20/2034 . . . . . . . . . . . . . . . . . . . . . . . . . . . . . . . . . . . . . . . . . . . . . . . . . . . . . . . . . . . . . . . . . . . . . . . . . . . . . . . . . . . 1,348 USD 2 2Single Family, 5.50%, 12/15/2032 . . . . . . . . . . . . . . . . . . . . . . . . . . . . . . . . . . . . . . . . . . . . . . . . . . . . . . . . . . . . . . . . . . . . . . . . 11,019 USD 15 13Single Family, 6.00%, 12/15/2032 . . . . . . . . . . . . . . . . . . . . . . . . . . . . . . . . . . . . . . . . . . . . . . . . . . . . . . . . . . . . . . . . . . . . . . . . 4,027 USD 6 5Single Family, 6.00%, 2/15/2033 . . . . . . . . . . . . . . . . . . . . . . . . . . . . . . . . . . . . . . . . . . . . . . . . . . . . . . . . . . . . . . . . . . . . . . . . . 1,662 USD 2 2Single Family, 5.50%, 3/15/2033 . . . . . . . . . . . . . . . . . . . . . . . . . . . . . . . . . . . . . . . . . . . . . . . . . . . . . . . . . . . . . . . . . . . . . . . . . 1,141 USD 2 1Single Family, 5.50%, 4/15/2033 . . . . . . . . . . . . . . . . . . . . . . . . . . . . . . . . . . . . . . . . . . . . . . . . . . . . . . . . . . . . . . . . . . . . . . . . . 1,885 USD 3 2Single Family, 5.50%, 9/15/2033 . . . . . . . . . . . . . . . . . . . . . . . . . . . . . . . . . . . . . . . . . . . . . . . . . . . . . . . . . . . . . . . . . . . . . . . . . 1,744 USD 2 2Single Family, 5.00%, 12/15/2033 . . . . . . . . . . . . . . . . . . . . . . . . . . . . . . . . . . . . . . . . . . . . . . . . . . . . . . . . . . . . . . . . . . . . . . . . 15,364 USD 21 18Single Family, 5.00%, 4/15/2034 . . . . . . . . . . . . . . . . . . . . . . . . . . . . . . . . . . . . . . . . . . . . . . . . . . . . . . . . . . . . . . . . . . . . . . . . . 2,906 USD 4 3Single Family, 5.50%, 9/15/2034 . . . . . . . . . . . . . . . . . . . . . . . . . . . . . . . . . . . . . . . . . . . . . . . . . . . . . . . . . . . . . . . . . . . . . . . . . 10,866 USD 13 13Single Family, 5.50%, 6/15/2036 . . . . . . . . . . . . . . . . . . . . . . . . . . . . . . . . . . . . . . . . . . . . . . . . . . . . . . . . . . . . . . . . . . . . . . . . . 10,737 USD 12 13Single Family, 6.00%, 8/15/2036 . . . . . . . . . . . . . . . . . . . . . . . . . . . . . . . . . . . . . . . . . . . . . . . . . . . . . . . . . . . . . . . . . . . . . . . . . 69,236 USD 77 85
The accompanying notes are an integral part of these financial statements.
Franklin Templeton Investments Funds 135
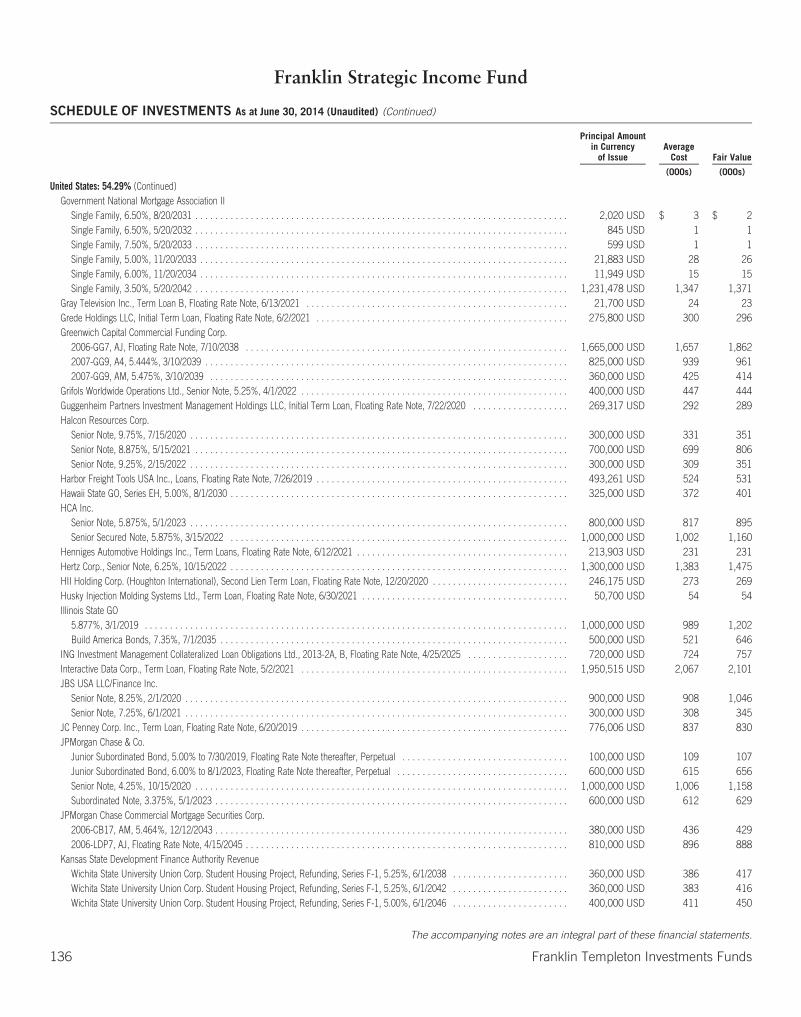
Franklin Strategic Income Fund
SCHEDULE OF INVESTMENTS As at June 30, 2014 (Unaudited) (Continued)
Principal Amountin Currency
of IssueAverage
Cost Fair Value
(000s) (000s)
United States: 54.29% (Continued)Government National Mortgage Association II
Single Family, 6.50%, 8/20/2031 . . . . . . . . . . . . . . . . . . . . . . . . . . . . . . . . . . . . . . . . . . . . . . . . . . . . . . . . . . . . . . . . . . . . . . . . . . 2,020 USD $ 3 $ 2Single Family, 6.50%, 5/20/2032 . . . . . . . . . . . . . . . . . . . . . . . . . . . . . . . . . . . . . . . . . . . . . . . . . . . . . . . . . . . . . . . . . . . . . . . . . . 845 USD 1 1Single Family, 7.50%, 5/20/2033 . . . . . . . . . . . . . . . . . . . . . . . . . . . . . . . . . . . . . . . . . . . . . . . . . . . . . . . . . . . . . . . . . . . . . . . . . . 599 USD 1 1Single Family, 5.00%, 11/20/2033 . . . . . . . . . . . . . . . . . . . . . . . . . . . . . . . . . . . . . . . . . . . . . . . . . . . . . . . . . . . . . . . . . . . . . . . . . 21,883 USD 28 26Single Family, 6.00%, 11/20/2034 . . . . . . . . . . . . . . . . . . . . . . . . . . . . . . . . . . . . . . . . . . . . . . . . . . . . . . . . . . . . . . . . . . . . . . . . . 11,949 USD 15 15Single Family, 3.50%, 5/20/2042 . . . . . . . . . . . . . . . . . . . . . . . . . . . . . . . . . . . . . . . . . . . . . . . . . . . . . . . . . . . . . . . . . . . . . . . . . . 1,231,478 USD 1,347 1,371
Gray Television Inc., Term Loan B, Floating Rate Note, 6/13/2021 . . . . . . . . . . . . . . . . . . . . . . . . . . . . . . . . . . . . . . . . . . . . . . . . . . . . 21,700 USD 24 23Grede Holdings LLC, Initial Term Loan, Floating Rate Note, 6/2/2021 . . . . . . . . . . . . . . . . . . . . . . . . . . . . . . . . . . . . . . . . . . . . . . . . . . 275,800 USD 300 296Greenwich Capital Commercial Funding Corp.
2006-GG7, AJ, Floating Rate Note, 7/10/2038 . . . . . . . . . . . . . . . . . . . . . . . . . . . . . . . . . . . . . . . . . . . . . . . . . . . . . . . . . . . . . . . . 1,665,000 USD 1,657 1,8622007-GG9, A4, 5.444%, 3/10/2039 . . . . . . . . . . . . . . . . . . . . . . . . . . . . . . . . . . . . . . . . . . . . . . . . . . . . . . . . . . . . . . . . . . . . . . . . 825,000 USD 939 9612007-GG9, AM, 5.475%, 3/10/2039 . . . . . . . . . . . . . . . . . . . . . . . . . . . . . . . . . . . . . . . . . . . . . . . . . . . . . . . . . . . . . . . . . . . . . . . 360,000 USD 425 414
Grifols Worldwide Operations Ltd., Senior Note, 5.25%, 4/1/2022 . . . . . . . . . . . . . . . . . . . . . . . . . . . . . . . . . . . . . . . . . . . . . . . . . . . . . 400,000 USD 447 444Guggenheim Partners Investment Management Holdings LLC, Initial Term Loan, Floating Rate Note, 7/22/2020 . . . . . . . . . . . . . . . . . . . 269,317 USD 292 289Halcon Resources Corp.
Senior Note, 9.75%, 7/15/2020 . . . . . . . . . . . . . . . . . . . . . . . . . . . . . . . . . . . . . . . . . . . . . . . . . . . . . . . . . . . . . . . . . . . . . . . . . . . 300,000 USD 331 351Senior Note, 8.875%, 5/15/2021 . . . . . . . . . . . . . . . . . . . . . . . . . . . . . . . . . . . . . . . . . . . . . . . . . . . . . . . . . . . . . . . . . . . . . . . . . . 700,000 USD 699 806Senior Note, 9.25%, 2/15/2022 . . . . . . . . . . . . . . . . . . . . . . . . . . . . . . . . . . . . . . . . . . . . . . . . . . . . . . . . . . . . . . . . . . . . . . . . . . . 300,000 USD 309 351
Harbor Freight Tools USA Inc., Loans, Floating Rate Note, 7/26/2019 . . . . . . . . . . . . . . . . . . . . . . . . . . . . . . . . . . . . . . . . . . . . . . . . . . 493,261 USD 524 531Hawaii State GO, Series EH, 5.00%, 8/1/2030 . . . . . . . . . . . . . . . . . . . . . . . . . . . . . . . . . . . . . . . . . . . . . . . . . . . . . . . . . . . . . . . . . . . 325,000 USD 372 401HCA Inc.
Senior Note, 5.875%, 5/1/2023 . . . . . . . . . . . . . . . . . . . . . . . . . . . . . . . . . . . . . . . . . . . . . . . . . . . . . . . . . . . . . . . . . . . . . . . . . . . 800,000 USD 817 895Senior Secured Note, 5.875%, 3/15/2022 . . . . . . . . . . . . . . . . . . . . . . . . . . . . . . . . . . . . . . . . . . . . . . . . . . . . . . . . . . . . . . . . . . . 1,000,000 USD 1,002 1,160
Henniges Automotive Holdings Inc., Term Loans, Floating Rate Note, 6/12/2021 . . . . . . . . . . . . . . . . . . . . . . . . . . . . . . . . . . . . . . . . . . 213,903 USD 231 231Hertz Corp., Senior Note, 6.25%, 10/15/2022 . . . . . . . . . . . . . . . . . . . . . . . . . . . . . . . . . . . . . . . . . . . . . . . . . . . . . . . . . . . . . . . . . . . 1,300,000 USD 1,383 1,475HII Holding Corp. (Houghton International), Second Lien Term Loan, Floating Rate Note, 12/20/2020 . . . . . . . . . . . . . . . . . . . . . . . . . . . 246,175 USD 273 269Husky Injection Molding Systems Ltd., Term Loan, Floating Rate Note, 6/30/2021 . . . . . . . . . . . . . . . . . . . . . . . . . . . . . . . . . . . . . . . . . 50,700 USD 54 54Illinois State GO
5.877%, 3/1/2019 . . . . . . . . . . . . . . . . . . . . . . . . . . . . . . . . . . . . . . . . . . . . . . . . . . . . . . . . . . . . . . . . . . . . . . . . . . . . . . . . . . . . 1,000,000 USD 989 1,202Build America Bonds, 7.35%, 7/1/2035 . . . . . . . . . . . . . . . . . . . . . . . . . . . . . . . . . . . . . . . . . . . . . . . . . . . . . . . . . . . . . . . . . . . . . 500,000 USD 521 646
ING Investment Management Collateralized Loan Obligations Ltd., 2013-2A, B, Floating Rate Note, 4/25/2025 . . . . . . . . . . . . . . . . . . . . 720,000 USD 724 757Interactive Data Corp., Term Loan, Floating Rate Note, 5/2/2021 . . . . . . . . . . . . . . . . . . . . . . . . . . . . . . . . . . . . . . . . . . . . . . . . . . . . . 1,950,515 USD 2,067 2,101JBS USA LLC/Finance Inc.
Senior Note, 8.25%, 2/1/2020 . . . . . . . . . . . . . . . . . . . . . . . . . . . . . . . . . . . . . . . . . . . . . . . . . . . . . . . . . . . . . . . . . . . . . . . . . . . . 900,000 USD 908 1,046Senior Note, 7.25%, 6/1/2021 . . . . . . . . . . . . . . . . . . . . . . . . . . . . . . . . . . . . . . . . . . . . . . . . . . . . . . . . . . . . . . . . . . . . . . . . . . . . 300,000 USD 308 345
JC Penney Corp. Inc., Term Loan, Floating Rate Note, 6/20/2019 . . . . . . . . . . . . . . . . . . . . . . . . . . . . . . . . . . . . . . . . . . . . . . . . . . . . . 776,006 USD 837 830JPMorgan Chase & Co.
Junior Subordinated Bond, 5.00% to 7/30/2019, Floating Rate Note thereafter, Perpetual . . . . . . . . . . . . . . . . . . . . . . . . . . . . . . . . . 100,000 USD 109 107Junior Subordinated Bond, 6.00% to 8/1/2023, Floating Rate Note thereafter, Perpetual . . . . . . . . . . . . . . . . . . . . . . . . . . . . . . . . . . 600,000 USD 615 656Senior Note, 4.25%, 10/15/2020 . . . . . . . . . . . . . . . . . . . . . . . . . . . . . . . . . . . . . . . . . . . . . . . . . . . . . . . . . . . . . . . . . . . . . . . . . . 1,000,000 USD 1,006 1,158Subordinated Note, 3.375%, 5/1/2023 . . . . . . . . . . . . . . . . . . . . . . . . . . . . . . . . . . . . . . . . . . . . . . . . . . . . . . . . . . . . . . . . . . . . . . 600,000 USD 612 629
JPMorgan Chase Commercial Mortgage Securities Corp.2006-CB17, AM, 5.464%, 12/12/2043 . . . . . . . . . . . . . . . . . . . . . . . . . . . . . . . . . . . . . . . . . . . . . . . . . . . . . . . . . . . . . . . . . . . . . . 380,000 USD 436 4292006-LDP7, AJ, Floating Rate Note, 4/15/2045 . . . . . . . . . . . . . . . . . . . . . . . . . . . . . . . . . . . . . . . . . . . . . . . . . . . . . . . . . . . . . . . . 810,000 USD 896 888
Kansas State Development Finance Authority RevenueWichita State University Union Corp. Student Housing Project, Refunding, Series F-1, 5.25%, 6/1/2038 . . . . . . . . . . . . . . . . . . . . . . . 360,000 USD 386 417Wichita State University Union Corp. Student Housing Project, Refunding, Series F-1, 5.25%, 6/1/2042 . . . . . . . . . . . . . . . . . . . . . . . 360,000 USD 383 416Wichita State University Union Corp. Student Housing Project, Refunding, Series F-1, 5.00%, 6/1/2046 . . . . . . . . . . . . . . . . . . . . . . . 400,000 USD 411 450
The accompanying notes are an integral part of these financial statements.
136 Franklin Templeton Investments Funds

Franklin Strategic Income Fund
SCHEDULE OF INVESTMENTS As at June 30, 2014 (Unaudited) (Continued)
Principal Amountin Currency
of IssueAverage
Cost Fair Value
(000s) (000s)
United States: 54.29% (Continued)KB Home
Senior Note, 4.75%, 5/15/2019 . . . . . . . . . . . . . . . . . . . . . . . . . . . . . . . . . . . . . . . . . . . . . . . . . . . . . . . . . . . . . . . . . . . . . . . . . . . 500,000 USD $ 562 $ 539Senior Note, 7.00%, 12/15/2021 . . . . . . . . . . . . . . . . . . . . . . . . . . . . . . . . . . . . . . . . . . . . . . . . . . . . . . . . . . . . . . . . . . . . . . . . . . 800,000 USD 830 932
Kinder Morgan Finance Co. LLC, Senior Secured Note, 6.00%, 1/15/2018 . . . . . . . . . . . . . . . . . . . . . . . . . . . . . . . . . . . . . . . . . . . . . . 1,500,000 USD 1,572 1,756KKR Group Finance Co., Senior Note, 6.375%, 9/29/2020 . . . . . . . . . . . . . . . . . . . . . . . . . . . . . . . . . . . . . . . . . . . . . . . . . . . . . . . . . . 1,200,000 USD 1,239 1,511Kraft Foods Group Inc., Senior Bond, 3.50%, 6/6/2022 . . . . . . . . . . . . . . . . . . . . . . . . . . . . . . . . . . . . . . . . . . . . . . . . . . . . . . . . . . . . 1,200,000 USD 1,224 1,316LB-UBS Commercial Mortgage Trust, 2006-C4, AM, Floating Rate Note, 6/15/2038 . . . . . . . . . . . . . . . . . . . . . . . . . . . . . . . . . . . . . . . . 550,000 USD 663 637Linn Energy LLC/Finance Corp.
Senior Note, 8.625%, 4/15/2020 . . . . . . . . . . . . . . . . . . . . . . . . . . . . . . . . . . . . . . . . . . . . . . . . . . . . . . . . . . . . . . . . . . . . . . . . . . 500,000 USD 503 579Senior Note, 7.75%, 2/1/2021 . . . . . . . . . . . . . . . . . . . . . . . . . . . . . . . . . . . . . . . . . . . . . . . . . . . . . . . . . . . . . . . . . . . . . . . . . . . . 1,300,000 USD 1,356 1,502
M/A-COM Technology Solutions Holdings Inc., Initial Term Loan, Floating Rate Note, 5/7/2021 . . . . . . . . . . . . . . . . . . . . . . . . . . . . . . . . 261,800 USD 285 281M/I Homes Inc., Senior Note, 8.625%, 11/15/2018 . . . . . . . . . . . . . . . . . . . . . . . . . . . . . . . . . . . . . . . . . . . . . . . . . . . . . . . . . . . . . . . 400,000 USD 402 456MacDermid Holdings LLC, First Lien Tranche B Term Loan, Floating Rate Note, 6/7/2020 . . . . . . . . . . . . . . . . . . . . . . . . . . . . . . . . . . . 1,046,168 USD 1,103 1,118Marco Island Utility System Revenue
Refunding, 4.625%, 10/1/2030 . . . . . . . . . . . . . . . . . . . . . . . . . . . . . . . . . . . . . . . . . . . . . . . . . . . . . . . . . . . . . . . . . . . . . . . . . . . 250,000 USD 257 291Refunding, 4.625%, 10/1/2031 . . . . . . . . . . . . . . . . . . . . . . . . . . . . . . . . . . . . . . . . . . . . . . . . . . . . . . . . . . . . . . . . . . . . . . . . . . . 175,000 USD 179 202
Martin Midstream Partners LP/Martin Midstream Finance, Corp., Senior Note, 7.25%, 2/15/2021 . . . . . . . . . . . . . . . . . . . . . . . . . . . . . . 1,000,000 USD 1,103 1,136Massachusetts State GO, Consolidated Loan of 2014, Series A, 4.50%, 12/1/2043 . . . . . . . . . . . . . . . . . . . . . . . . . . . . . . . . . . . . . . . . . 930,000 USD 958 1,047McJunkin Red Man Corp., 2013 Term Loan, Floating Rate Note, 11/11/2019 . . . . . . . . . . . . . . . . . . . . . . . . . . . . . . . . . . . . . . . . . . . . 364,645 USD 407 392MetLife Inc., Junior Subordinated Note, 6.40% to 12/15/2036, Floating Rate Note thereafter, 12/15/2066 . . . . . . . . . . . . . . . . . . . . . . . . 1,200,000 USD 1,131 1,436Metropolitan Boston Transit Parking Corp. Systemwide Parking Revenue, Senior Lien, 5.00%, 7/1/2041 . . . . . . . . . . . . . . . . . . . . . . . . . 250,000 USD 263 289MGM Resorts International
Senior Note, 6.625%, 7/15/2015 . . . . . . . . . . . . . . . . . . . . . . . . . . . . . . . . . . . . . . . . . . . . . . . . . . . . . . . . . . . . . . . . . . . . . . . . . . 300,000 USD 301 337Senior Note, 8.625%, 2/1/2019 . . . . . . . . . . . . . . . . . . . . . . . . . . . . . . . . . . . . . . . . . . . . . . . . . . . . . . . . . . . . . . . . . . . . . . . . . . . 100,000 USD 102 128Senior Note, 6.75%, 10/1/2020 . . . . . . . . . . . . . . . . . . . . . . . . . . . . . . . . . . . . . . . . . . . . . . . . . . . . . . . . . . . . . . . . . . . . . . . . . . . 100,000 USD 97 119Senior Note, 6.625%, 12/15/2021 . . . . . . . . . . . . . . . . . . . . . . . . . . . . . . . . . . . . . . . . . . . . . . . . . . . . . . . . . . . . . . . . . . . . . . . . . 800,000 USD 838 950Senior Note, 7.75%, 3/15/2022 . . . . . . . . . . . . . . . . . . . . . . . . . . . . . . . . . . . . . . . . . . . . . . . . . . . . . . . . . . . . . . . . . . . . . . . . . . . 100,000 USD 99 125
Midstates Petroleum Co. Inc./LLC, Senior Note, 9.25%, 6/1/2021 . . . . . . . . . . . . . . . . . . . . . . . . . . . . . . . . . . . . . . . . . . . . . . . . . . . . . 600,000 USD 617 707Millennium Laboratories LLC, Tranche B Term Loan, Floating Rate Note, 4/16/2021 . . . . . . . . . . . . . . . . . . . . . . . . . . . . . . . . . . . . . . . 2,037,100 USD 2,214 2,195Minnesota State GO, Various Purpose, Refunding, Series F, 4.00%, 10/1/2024 . . . . . . . . . . . . . . . . . . . . . . . . . . . . . . . . . . . . . . . . . . . 1,070,000 USD 1,223 1,286Mississippi State GO, Series B, 5.00%, 12/1/2031 . . . . . . . . . . . . . . . . . . . . . . . . . . . . . . . . . . . . . . . . . . . . . . . . . . . . . . . . . . . . . . . . 365,000 USD 415 450MoneyGram International Inc., Term Loan, Floating Rate Note, 3/28/2020 . . . . . . . . . . . . . . . . . . . . . . . . . . . . . . . . . . . . . . . . . . . . . . . 2,042,800 USD 2,170 2,152Morgan Stanley, Senior Note, 5.50%, 7/24/2020 . . . . . . . . . . . . . . . . . . . . . . . . . . . . . . . . . . . . . . . . . . . . . . . . . . . . . . . . . . . . . . . . . 1,200,000 USD 1,191 1,472Morgan Stanley Capital I Trust
2006-HQ8, AJ, Floating Rate Note, 3/12/2044 . . . . . . . . . . . . . . . . . . . . . . . . . . . . . . . . . . . . . . . . . . . . . . . . . . . . . . . . . . . . . . . . 250,000 USD 235 2732007-IQ16, AM, Floating Rate Note, 12/12/2049 . . . . . . . . . . . . . . . . . . . . . . . . . . . . . . . . . . . . . . . . . . . . . . . . . . . . . . . . . . . . . . 710,000 USD 864 8552007-IQ16, AMA, Floating Rate Note, 12/12/2049 . . . . . . . . . . . . . . . . . . . . . . . . . . . . . . . . . . . . . . . . . . . . . . . . . . . . . . . . . . . . . 725,000 USD 892 866
Nassau County GOGeneral Improvement Bonds, Series B, 5.00%, 4/1/2039 . . . . . . . . . . . . . . . . . . . . . . . . . . . . . . . . . . . . . . . . . . . . . . . . . . . . . . . . . 930,000 USD 953 1,065General Improvement Bonds, Series B, 5.00%, 4/1/2043 . . . . . . . . . . . . . . . . . . . . . . . . . . . . . . . . . . . . . . . . . . . . . . . . . . . . . . . . . 1,000,000 USD 1,020 1,142
NEP/NCP Holdco Inc., Second Lien Term Loan, Floating Rate Note, 7/22/2020 . . . . . . . . . . . . . . . . . . . . . . . . . . . . . . . . . . . . . . . . . . . 374,307 USD 407 411Neuberger Berman Group LLC/Finance Corp., Senior Note, 5.875%, 3/15/2022 . . . . . . . . . . . . . . . . . . . . . . . . . . . . . . . . . . . . . . . . . . 900,000 USD 920 1,029New Jersey EDA Revenue, School Facilities Construction, Refunding, Series NN, 5.00%, 3/1/2030 . . . . . . . . . . . . . . . . . . . . . . . . . . . . . 325,000 USD 346 379New York City HDC Revenue, Series B1, 5.00%, 7/1/2033 . . . . . . . . . . . . . . . . . . . . . . . . . . . . . . . . . . . . . . . . . . . . . . . . . . . . . . . . . . 250,000 USD 262 292New York City Municipal Water Finance Authority Water and Sewer System Revenue, Second General Resolution, Fiscal 2014, Refunding,
Series BB, 5.00%, 6/15/2046 . . . . . . . . . . . . . . . . . . . . . . . . . . . . . . . . . . . . . . . . . . . . . . . . . . . . . . . . . . . . . . . . . . . . . . . . . . . . 1,135,000 USD 1,215 1,325New York GO, Sub. Series G-1, 5.00%, 4/1/2027 . . . . . . . . . . . . . . . . . . . . . . . . . . . . . . . . . . . . . . . . . . . . . . . . . . . . . . . . . . . . . . . . 1,030,000 USD 1,135 1,252Newcastle Collateralized Debt Obligations Ltd., 2004-5A, 1, Floating Rate Note, 12/24/2039 . . . . . . . . . . . . . . . . . . . . . . . . . . . . . . . . . . 270,693 USD 256 278Nielsen Finance LLC/Co., Senior Note, 5.00%, 4/15/2022 . . . . . . . . . . . . . . . . . . . . . . . . . . . . . . . . . . . . . . . . . . . . . . . . . . . . . . . . . . 800,000 USD 878 862
The accompanying notes are an integral part of these financial statements.
Franklin Templeton Investments Funds 137
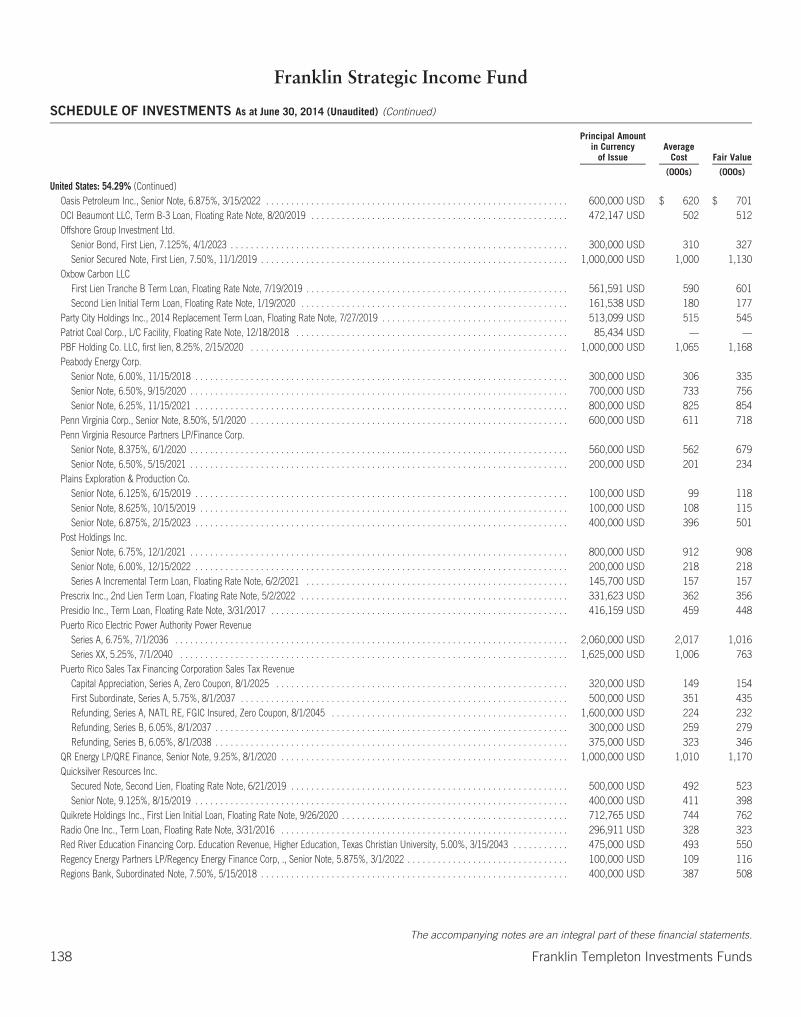
Franklin Strategic Income Fund
SCHEDULE OF INVESTMENTS As at June 30, 2014 (Unaudited) (Continued)
Principal Amountin Currency
of IssueAverage
Cost Fair Value
(000s) (000s)
United States: 54.29% (Continued)Oasis Petroleum Inc., Senior Note, 6.875%, 3/15/2022 . . . . . . . . . . . . . . . . . . . . . . . . . . . . . . . . . . . . . . . . . . . . . . . . . . . . . . . . . . . . 600,000 USD $ 620 $ 701OCI Beaumont LLC, Term B-3 Loan, Floating Rate Note, 8/20/2019 . . . . . . . . . . . . . . . . . . . . . . . . . . . . . . . . . . . . . . . . . . . . . . . . . . . 472,147 USD 502 512Offshore Group Investment Ltd.
Senior Bond, First Lien, 7.125%, 4/1/2023 . . . . . . . . . . . . . . . . . . . . . . . . . . . . . . . . . . . . . . . . . . . . . . . . . . . . . . . . . . . . . . . . . . . 300,000 USD 310 327Senior Secured Note, First Lien, 7.50%, 11/1/2019 . . . . . . . . . . . . . . . . . . . . . . . . . . . . . . . . . . . . . . . . . . . . . . . . . . . . . . . . . . . . . 1,000,000 USD 1,000 1,130
Oxbow Carbon LLCFirst Lien Tranche B Term Loan, Floating Rate Note, 7/19/2019 . . . . . . . . . . . . . . . . . . . . . . . . . . . . . . . . . . . . . . . . . . . . . . . . . . . . 561,591 USD 590 601Second Lien Initial Term Loan, Floating Rate Note, 1/19/2020 . . . . . . . . . . . . . . . . . . . . . . . . . . . . . . . . . . . . . . . . . . . . . . . . . . . . . 161,538 USD 180 177
Party City Holdings Inc., 2014 Replacement Term Loan, Floating Rate Note, 7/27/2019 . . . . . . . . . . . . . . . . . . . . . . . . . . . . . . . . . . . . . 513,099 USD 515 545Patriot Coal Corp., L/C Facility, Floating Rate Note, 12/18/2018 . . . . . . . . . . . . . . . . . . . . . . . . . . . . . . . . . . . . . . . . . . . . . . . . . . . . . . 85,434 USD — —PBF Holding Co. LLC, first lien, 8.25%, 2/15/2020 . . . . . . . . . . . . . . . . . . . . . . . . . . . . . . . . . . . . . . . . . . . . . . . . . . . . . . . . . . . . . . . 1,000,000 USD 1,065 1,168Peabody Energy Corp.
Senior Note, 6.00%, 11/15/2018 . . . . . . . . . . . . . . . . . . . . . . . . . . . . . . . . . . . . . . . . . . . . . . . . . . . . . . . . . . . . . . . . . . . . . . . . . . 300,000 USD 306 335Senior Note, 6.50%, 9/15/2020 . . . . . . . . . . . . . . . . . . . . . . . . . . . . . . . . . . . . . . . . . . . . . . . . . . . . . . . . . . . . . . . . . . . . . . . . . . . 700,000 USD 733 756Senior Note, 6.25%, 11/15/2021 . . . . . . . . . . . . . . . . . . . . . . . . . . . . . . . . . . . . . . . . . . . . . . . . . . . . . . . . . . . . . . . . . . . . . . . . . . 800,000 USD 825 854
Penn Virginia Corp., Senior Note, 8.50%, 5/1/2020 . . . . . . . . . . . . . . . . . . . . . . . . . . . . . . . . . . . . . . . . . . . . . . . . . . . . . . . . . . . . . . . 600,000 USD 611 718Penn Virginia Resource Partners LP/Finance Corp.
Senior Note, 8.375%, 6/1/2020 . . . . . . . . . . . . . . . . . . . . . . . . . . . . . . . . . . . . . . . . . . . . . . . . . . . . . . . . . . . . . . . . . . . . . . . . . . . 560,000 USD 562 679Senior Note, 6.50%, 5/15/2021 . . . . . . . . . . . . . . . . . . . . . . . . . . . . . . . . . . . . . . . . . . . . . . . . . . . . . . . . . . . . . . . . . . . . . . . . . . . 200,000 USD 201 234
Plains Exploration & Production Co.Senior Note, 6.125%, 6/15/2019 . . . . . . . . . . . . . . . . . . . . . . . . . . . . . . . . . . . . . . . . . . . . . . . . . . . . . . . . . . . . . . . . . . . . . . . . . . 100,000 USD 99 118Senior Note, 8.625%, 10/15/2019 . . . . . . . . . . . . . . . . . . . . . . . . . . . . . . . . . . . . . . . . . . . . . . . . . . . . . . . . . . . . . . . . . . . . . . . . . 100,000 USD 108 115Senior Note, 6.875%, 2/15/2023 . . . . . . . . . . . . . . . . . . . . . . . . . . . . . . . . . . . . . . . . . . . . . . . . . . . . . . . . . . . . . . . . . . . . . . . . . . 400,000 USD 396 501
Post Holdings Inc.Senior Note, 6.75%, 12/1/2021 . . . . . . . . . . . . . . . . . . . . . . . . . . . . . . . . . . . . . . . . . . . . . . . . . . . . . . . . . . . . . . . . . . . . . . . . . . . 800,000 USD 912 908Senior Note, 6.00%, 12/15/2022 . . . . . . . . . . . . . . . . . . . . . . . . . . . . . . . . . . . . . . . . . . . . . . . . . . . . . . . . . . . . . . . . . . . . . . . . . . 200,000 USD 218 218Series A Incremental Term Loan, Floating Rate Note, 6/2/2021 . . . . . . . . . . . . . . . . . . . . . . . . . . . . . . . . . . . . . . . . . . . . . . . . . . . . 145,700 USD 157 157
Prescrix Inc., 2nd Lien Term Loan, Floating Rate Note, 5/2/2022 . . . . . . . . . . . . . . . . . . . . . . . . . . . . . . . . . . . . . . . . . . . . . . . . . . . . . 331,623 USD 362 356Presidio Inc., Term Loan, Floating Rate Note, 3/31/2017 . . . . . . . . . . . . . . . . . . . . . . . . . . . . . . . . . . . . . . . . . . . . . . . . . . . . . . . . . . . 416,159 USD 459 448Puerto Rico Electric Power Authority Power Revenue
Series A, 6.75%, 7/1/2036 . . . . . . . . . . . . . . . . . . . . . . . . . . . . . . . . . . . . . . . . . . . . . . . . . . . . . . . . . . . . . . . . . . . . . . . . . . . . . . 2,060,000 USD 2,017 1,016Series XX, 5.25%, 7/1/2040 . . . . . . . . . . . . . . . . . . . . . . . . . . . . . . . . . . . . . . . . . . . . . . . . . . . . . . . . . . . . . . . . . . . . . . . . . . . . . 1,625,000 USD 1,006 763
Puerto Rico Sales Tax Financing Corporation Sales Tax RevenueCapital Appreciation, Series A, Zero Coupon, 8/1/2025 . . . . . . . . . . . . . . . . . . . . . . . . . . . . . . . . . . . . . . . . . . . . . . . . . . . . . . . . . . 320,000 USD 149 154First Subordinate, Series A, 5.75%, 8/1/2037 . . . . . . . . . . . . . . . . . . . . . . . . . . . . . . . . . . . . . . . . . . . . . . . . . . . . . . . . . . . . . . . . . 500,000 USD 351 435Refunding, Series A, NATL RE, FGIC Insured, Zero Coupon, 8/1/2045 . . . . . . . . . . . . . . . . . . . . . . . . . . . . . . . . . . . . . . . . . . . . . . . 1,600,000 USD 224 232Refunding, Series B, 6.05%, 8/1/2037 . . . . . . . . . . . . . . . . . . . . . . . . . . . . . . . . . . . . . . . . . . . . . . . . . . . . . . . . . . . . . . . . . . . . . . 300,000 USD 259 279Refunding, Series B, 6.05%, 8/1/2038 . . . . . . . . . . . . . . . . . . . . . . . . . . . . . . . . . . . . . . . . . . . . . . . . . . . . . . . . . . . . . . . . . . . . . . 375,000 USD 323 346
QR Energy LP/QRE Finance, Senior Note, 9.25%, 8/1/2020 . . . . . . . . . . . . . . . . . . . . . . . . . . . . . . . . . . . . . . . . . . . . . . . . . . . . . . . . . 1,000,000 USD 1,010 1,170Quicksilver Resources Inc.
Secured Note, Second Lien, Floating Rate Note, 6/21/2019 . . . . . . . . . . . . . . . . . . . . . . . . . . . . . . . . . . . . . . . . . . . . . . . . . . . . . . . 500,000 USD 492 523Senior Note, 9.125%, 8/15/2019 . . . . . . . . . . . . . . . . . . . . . . . . . . . . . . . . . . . . . . . . . . . . . . . . . . . . . . . . . . . . . . . . . . . . . . . . . . 400,000 USD 411 398
Quikrete Holdings Inc., First Lien Initial Loan, Floating Rate Note, 9/26/2020 . . . . . . . . . . . . . . . . . . . . . . . . . . . . . . . . . . . . . . . . . . . . . 712,765 USD 744 762Radio One Inc., Term Loan, Floating Rate Note, 3/31/2016 . . . . . . . . . . . . . . . . . . . . . . . . . . . . . . . . . . . . . . . . . . . . . . . . . . . . . . . . . 296,911 USD 328 323Red River Education Financing Corp. Education Revenue, Higher Education, Texas Christian University, 5.00%, 3/15/2043 . . . . . . . . . . . 475,000 USD 493 550Regency Energy Partners LP/Regency Energy Finance Corp, ., Senior Note, 5.875%, 3/1/2022 . . . . . . . . . . . . . . . . . . . . . . . . . . . . . . . . 100,000 USD 109 116Regions Bank, Subordinated Note, 7.50%, 5/15/2018 . . . . . . . . . . . . . . . . . . . . . . . . . . . . . . . . . . . . . . . . . . . . . . . . . . . . . . . . . . . . . 400,000 USD 387 508
The accompanying notes are an integral part of these financial statements.
138 Franklin Templeton Investments Funds
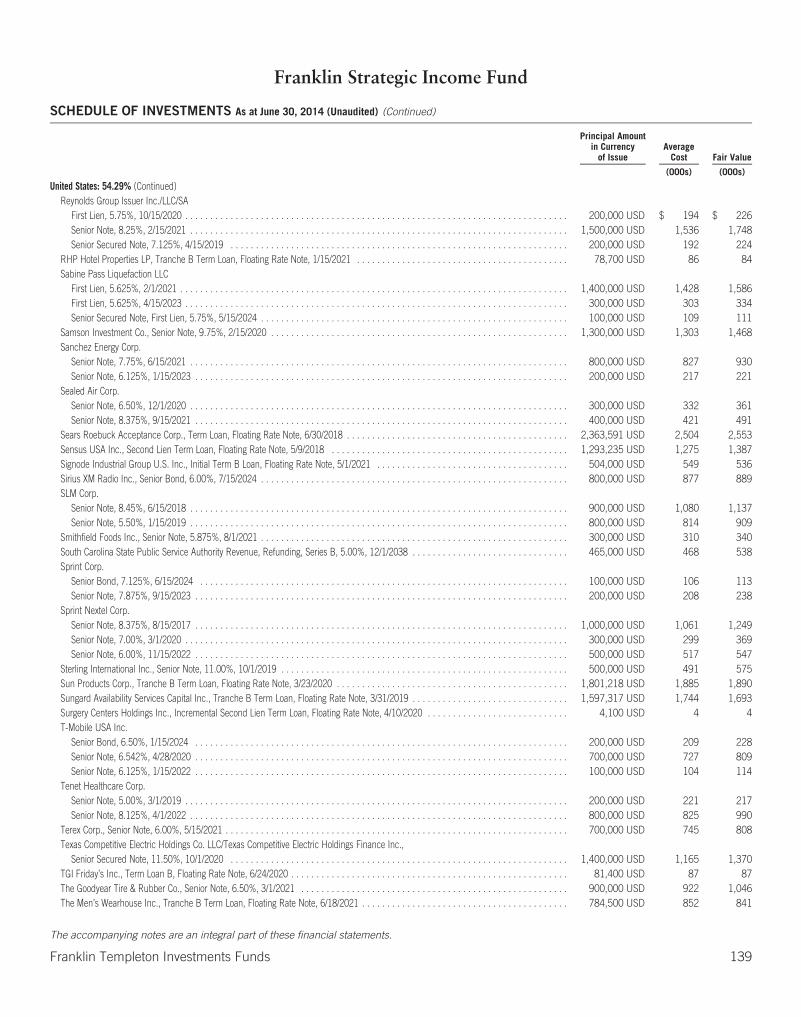
Franklin Strategic Income Fund
SCHEDULE OF INVESTMENTS As at June 30, 2014 (Unaudited) (Continued)
Principal Amountin Currency
of IssueAverage
Cost Fair Value
(000s) (000s)
United States: 54.29% (Continued)Reynolds Group Issuer Inc./LLC/SA
First Lien, 5.75%, 10/15/2020 . . . . . . . . . . . . . . . . . . . . . . . . . . . . . . . . . . . . . . . . . . . . . . . . . . . . . . . . . . . . . . . . . . . . . . . . . . . . 200,000 USD $ 194 $ 226Senior Note, 8.25%, 2/15/2021 . . . . . . . . . . . . . . . . . . . . . . . . . . . . . . . . . . . . . . . . . . . . . . . . . . . . . . . . . . . . . . . . . . . . . . . . . . . 1,500,000 USD 1,536 1,748Senior Secured Note, 7.125%, 4/15/2019 . . . . . . . . . . . . . . . . . . . . . . . . . . . . . . . . . . . . . . . . . . . . . . . . . . . . . . . . . . . . . . . . . . . 200,000 USD 192 224
RHP Hotel Properties LP, Tranche B Term Loan, Floating Rate Note, 1/15/2021 . . . . . . . . . . . . . . . . . . . . . . . . . . . . . . . . . . . . . . . . . . 78,700 USD 86 84Sabine Pass Liquefaction LLC
First Lien, 5.625%, 2/1/2021 . . . . . . . . . . . . . . . . . . . . . . . . . . . . . . . . . . . . . . . . . . . . . . . . . . . . . . . . . . . . . . . . . . . . . . . . . . . . . 1,400,000 USD 1,428 1,586First Lien, 5.625%, 4/15/2023 . . . . . . . . . . . . . . . . . . . . . . . . . . . . . . . . . . . . . . . . . . . . . . . . . . . . . . . . . . . . . . . . . . . . . . . . . . . . 300,000 USD 303 334Senior Secured Note, First Lien, 5.75%, 5/15/2024 . . . . . . . . . . . . . . . . . . . . . . . . . . . . . . . . . . . . . . . . . . . . . . . . . . . . . . . . . . . . . 100,000 USD 109 111
Samson Investment Co., Senior Note, 9.75%, 2/15/2020 . . . . . . . . . . . . . . . . . . . . . . . . . . . . . . . . . . . . . . . . . . . . . . . . . . . . . . . . . . . 1,300,000 USD 1,303 1,468Sanchez Energy Corp.
Senior Note, 7.75%, 6/15/2021 . . . . . . . . . . . . . . . . . . . . . . . . . . . . . . . . . . . . . . . . . . . . . . . . . . . . . . . . . . . . . . . . . . . . . . . . . . . 800,000 USD 827 930Senior Note, 6.125%, 1/15/2023 . . . . . . . . . . . . . . . . . . . . . . . . . . . . . . . . . . . . . . . . . . . . . . . . . . . . . . . . . . . . . . . . . . . . . . . . . . 200,000 USD 217 221
Sealed Air Corp.Senior Note, 6.50%, 12/1/2020 . . . . . . . . . . . . . . . . . . . . . . . . . . . . . . . . . . . . . . . . . . . . . . . . . . . . . . . . . . . . . . . . . . . . . . . . . . . 300,000 USD 332 361Senior Note, 8.375%, 9/15/2021 . . . . . . . . . . . . . . . . . . . . . . . . . . . . . . . . . . . . . . . . . . . . . . . . . . . . . . . . . . . . . . . . . . . . . . . . . . 400,000 USD 421 491
Sears Roebuck Acceptance Corp., Term Loan, Floating Rate Note, 6/30/2018 . . . . . . . . . . . . . . . . . . . . . . . . . . . . . . . . . . . . . . . . . . . . 2,363,591 USD 2,504 2,553Sensus USA Inc., Second Lien Term Loan, Floating Rate Note, 5/9/2018 . . . . . . . . . . . . . . . . . . . . . . . . . . . . . . . . . . . . . . . . . . . . . . . 1,293,235 USD 1,275 1,387Signode Industrial Group U.S. Inc., Initial Term B Loan, Floating Rate Note, 5/1/2021 . . . . . . . . . . . . . . . . . . . . . . . . . . . . . . . . . . . . . . 504,000 USD 549 536Sirius XM Radio Inc., Senior Bond, 6.00%, 7/15/2024 . . . . . . . . . . . . . . . . . . . . . . . . . . . . . . . . . . . . . . . . . . . . . . . . . . . . . . . . . . . . . 800,000 USD 877 889SLM Corp.
Senior Note, 8.45%, 6/15/2018 . . . . . . . . . . . . . . . . . . . . . . . . . . . . . . . . . . . . . . . . . . . . . . . . . . . . . . . . . . . . . . . . . . . . . . . . . . . 900,000 USD 1,080 1,137Senior Note, 5.50%, 1/15/2019 . . . . . . . . . . . . . . . . . . . . . . . . . . . . . . . . . . . . . . . . . . . . . . . . . . . . . . . . . . . . . . . . . . . . . . . . . . . 800,000 USD 814 909
Smithfield Foods Inc., Senior Note, 5.875%, 8/1/2021 . . . . . . . . . . . . . . . . . . . . . . . . . . . . . . . . . . . . . . . . . . . . . . . . . . . . . . . . . . . . . 300,000 USD 310 340South Carolina State Public Service Authority Revenue, Refunding, Series B, 5.00%, 12/1/2038 . . . . . . . . . . . . . . . . . . . . . . . . . . . . . . . 465,000 USD 468 538Sprint Corp.
Senior Bond, 7.125%, 6/15/2024 . . . . . . . . . . . . . . . . . . . . . . . . . . . . . . . . . . . . . . . . . . . . . . . . . . . . . . . . . . . . . . . . . . . . . . . . . 100,000 USD 106 113Senior Note, 7.875%, 9/15/2023 . . . . . . . . . . . . . . . . . . . . . . . . . . . . . . . . . . . . . . . . . . . . . . . . . . . . . . . . . . . . . . . . . . . . . . . . . . 200,000 USD 208 238
Sprint Nextel Corp.Senior Note, 8.375%, 8/15/2017 . . . . . . . . . . . . . . . . . . . . . . . . . . . . . . . . . . . . . . . . . . . . . . . . . . . . . . . . . . . . . . . . . . . . . . . . . . 1,000,000 USD 1,061 1,249Senior Note, 7.00%, 3/1/2020 . . . . . . . . . . . . . . . . . . . . . . . . . . . . . . . . . . . . . . . . . . . . . . . . . . . . . . . . . . . . . . . . . . . . . . . . . . . . 300,000 USD 299 369Senior Note, 6.00%, 11/15/2022 . . . . . . . . . . . . . . . . . . . . . . . . . . . . . . . . . . . . . . . . . . . . . . . . . . . . . . . . . . . . . . . . . . . . . . . . . . 500,000 USD 517 547
Sterling International Inc., Senior Note, 11.00%, 10/1/2019 . . . . . . . . . . . . . . . . . . . . . . . . . . . . . . . . . . . . . . . . . . . . . . . . . . . . . . . . . 500,000 USD 491 575Sun Products Corp., Tranche B Term Loan, Floating Rate Note, 3/23/2020 . . . . . . . . . . . . . . . . . . . . . . . . . . . . . . . . . . . . . . . . . . . . . . 1,801,218 USD 1,885 1,890Sungard Availability Services Capital Inc., Tranche B Term Loan, Floating Rate Note, 3/31/2019 . . . . . . . . . . . . . . . . . . . . . . . . . . . . . . . 1,597,317 USD 1,744 1,693Surgery Centers Holdings Inc., Incremental Second Lien Term Loan, Floating Rate Note, 4/10/2020 . . . . . . . . . . . . . . . . . . . . . . . . . . . . 4,100 USD 4 4T-Mobile USA Inc.
Senior Bond, 6.50%, 1/15/2024 . . . . . . . . . . . . . . . . . . . . . . . . . . . . . . . . . . . . . . . . . . . . . . . . . . . . . . . . . . . . . . . . . . . . . . . . . . 200,000 USD 209 228Senior Note, 6.542%, 4/28/2020 . . . . . . . . . . . . . . . . . . . . . . . . . . . . . . . . . . . . . . . . . . . . . . . . . . . . . . . . . . . . . . . . . . . . . . . . . . 700,000 USD 727 809Senior Note, 6.125%, 1/15/2022 . . . . . . . . . . . . . . . . . . . . . . . . . . . . . . . . . . . . . . . . . . . . . . . . . . . . . . . . . . . . . . . . . . . . . . . . . . 100,000 USD 104 114
Tenet Healthcare Corp.Senior Note, 5.00%, 3/1/2019 . . . . . . . . . . . . . . . . . . . . . . . . . . . . . . . . . . . . . . . . . . . . . . . . . . . . . . . . . . . . . . . . . . . . . . . . . . . . 200,000 USD 221 217Senior Note, 8.125%, 4/1/2022 . . . . . . . . . . . . . . . . . . . . . . . . . . . . . . . . . . . . . . . . . . . . . . . . . . . . . . . . . . . . . . . . . . . . . . . . . . . 800,000 USD 825 990
Terex Corp., Senior Note, 6.00%, 5/15/2021 . . . . . . . . . . . . . . . . . . . . . . . . . . . . . . . . . . . . . . . . . . . . . . . . . . . . . . . . . . . . . . . . . . . . 700,000 USD 745 808Texas Competitive Electric Holdings Co. LLC/Texas Competitive Electric Holdings Finance Inc.,
Senior Secured Note, 11.50%, 10/1/2020 . . . . . . . . . . . . . . . . . . . . . . . . . . . . . . . . . . . . . . . . . . . . . . . . . . . . . . . . . . . . . . . . . . . 1,400,000 USD 1,165 1,370TGI Friday’s Inc., Term Loan B, Floating Rate Note, 6/24/2020 . . . . . . . . . . . . . . . . . . . . . . . . . . . . . . . . . . . . . . . . . . . . . . . . . . . . . . . 81,400 USD 87 87The Goodyear Tire & Rubber Co., Senior Note, 6.50%, 3/1/2021 . . . . . . . . . . . . . . . . . . . . . . . . . . . . . . . . . . . . . . . . . . . . . . . . . . . . . 900,000 USD 922 1,046The Men’s Wearhouse Inc., Tranche B Term Loan, Floating Rate Note, 6/18/2021 . . . . . . . . . . . . . . . . . . . . . . . . . . . . . . . . . . . . . . . . . 784,500 USD 852 841
The accompanying notes are an integral part of these financial statements.
Franklin Templeton Investments Funds 139

Franklin Strategic Income Fund
SCHEDULE OF INVESTMENTS As at June 30, 2014 (Unaudited) (Continued)
Principal Amountin Currency
of IssueAverage
Cost Fair Value
(000s) (000s)
United States: 54.29% (Continued)Time Warner Inc., 7.625%, 4/15/2031 . . . . . . . . . . . . . . . . . . . . . . . . . . . . . . . . . . . . . . . . . . . . . . . . . . . . . . . . . . . . . . . . . . . . . . . . 800,000 USD $ 911 $ 1,174Toll Brothers Finance Corp., Senior Bond, 5.625%, 1/15/2024 . . . . . . . . . . . . . . . . . . . . . . . . . . . . . . . . . . . . . . . . . . . . . . . . . . . . . . . 700,000 USD 747 799Trans Union LLC, 2014 Replacement Term Loan, Floating Rate Note, 4/9/2021 . . . . . . . . . . . . . . . . . . . . . . . . . . . . . . . . . . . . . . . . . . . 2,582,356 USD 2,851 2,759TransDigm Inc.
Senior Subordinate Bond, 6.50%, 7/15/2024 . . . . . . . . . . . . . . . . . . . . . . . . . . . . . . . . . . . . . . . . . . . . . . . . . . . . . . . . . . . . . . . . . 200,000 USD 218 222Senior Subordinate Note, 6.00%, 7/15/2022 . . . . . . . . . . . . . . . . . . . . . . . . . . . . . . . . . . . . . . . . . . . . . . . . . . . . . . . . . . . . . . . . . . 200,000 USD 218 219Tranche C Term Loan, Floating Rate Note, 2/28/2020 . . . . . . . . . . . . . . . . . . . . . . . . . . . . . . . . . . . . . . . . . . . . . . . . . . . . . . . . . . . 230,271 USD 244 245Tranche D Term Loan, Floating Rate Note, 6/4/2021 . . . . . . . . . . . . . . . . . . . . . . . . . . . . . . . . . . . . . . . . . . . . . . . . . . . . . . . . . . . . 321,200 USD 348 341
Truven Health Analytics Inc., New Tranche B Term Loan, Floating Rate Note, 6/6/2019 . . . . . . . . . . . . . . . . . . . . . . . . . . . . . . . . . . . . . 559,313 USD 607 592Turtle Bay Holdings LLC, Term Loan B, Payment-In-Kind, Floating Rate Note, 6/30/2016 . . . . . . . . . . . . . . . . . . . . . . . . . . . . . . . . . . . . 723,398 USD 695 735U.S. Coatings Acquisition Inc./Flash Dutch 2 BV, Secured Note, 5.75%, 2/1/2021 . . . . . . . . . . . . . . . . . . . . . . . . . . . . . . . . . . . . . . . . . 300,000 EUR 395 470U.S. Renal Care Inc., Tranche B-2 Term Loan, Floating Rate Note, 7/3/2019 . . . . . . . . . . . . . . . . . . . . . . . . . . . . . . . . . . . . . . . . . . . . . 1,632,984 USD 1,814 1,750U.S. Treasury Bond
7.125%, 2/15/2023 . . . . . . . . . . . . . . . . . . . . . . . . . . . . . . . . . . . . . . . . . . . . . . . . . . . . . . . . . . . . . . . . . . . . . . . . . . . . . . . . . . . 100,000 USD 141 1476.875%, 8/15/2025 . . . . . . . . . . . . . . . . . . . . . . . . . . . . . . . . . . . . . . . . . . . . . . . . . . . . . . . . . . . . . . . . . . . . . . . . . . . . . . . . . . . 730,000 USD 1,088 1,102
U.S. Treasury Note2.375%, 3/31/2016* . . . . . . . . . . . . . . . . . . . . . . . . . . . . . . . . . . . . . . . . . . . . . . . . . . . . . . . . . . . . . . . . . . . . . . . . . . . . . . . . . . 2,000,000 USD 2,102 2,2093.75%, 11/15/2018 . . . . . . . . . . . . . . . . . . . . . . . . . . . . . . . . . . . . . . . . . . . . . . . . . . . . . . . . . . . . . . . . . . . . . . . . . . . . . . . . . . . 3,500,000 USD 3,920 4,106Index Linked, 0.625%, 7/15/2021 . . . . . . . . . . . . . . . . . . . . . . . . . . . . . . . . . . . . . . . . . . . . . . . . . . . . . . . . . . . . . . . . . . . . . . . . . 1,472,441 USD 1,485 1,654
University of California Revenues, General, Series AK, 5.00%, 5/15/2048 . . . . . . . . . . . . . . . . . . . . . . . . . . . . . . . . . . . . . . . . . . . . . . . 1,505,000 USD 1,821 1,951Univision Communications Inc.
Senior Secured Bond, 6.75%, 9/15/2022 . . . . . . . . . . . . . . . . . . . . . . . . . . . . . . . . . . . . . . . . . . . . . . . . . . . . . . . . . . . . . . . . . . . . 98,000 USD 97 116Senior Secured Note, 7.875%, 11/1/2020 . . . . . . . . . . . . . . . . . . . . . . . . . . . . . . . . . . . . . . . . . . . . . . . . . . . . . . . . . . . . . . . . . . . 1,000,000 USD 1,024 1,178Senior Secured Note, 5.125%, 5/15/2023 . . . . . . . . . . . . . . . . . . . . . . . . . . . . . . . . . . . . . . . . . . . . . . . . . . . . . . . . . . . . . . . . . . . 200,000 USD 205 227
Utex Industries Inc., First Lien Initial Term Loan, Floating Rate Note, 5/22/2021 . . . . . . . . . . . . . . . . . . . . . . . . . . . . . . . . . . . . . . . . . . 171,924 USD 189 185Valeant Pharmaceuticals International Inc., Senior Note, 7.50%, 7/15/2021 . . . . . . . . . . . . . . . . . . . . . . . . . . . . . . . . . . . . . . . . . . . . . 500,000 USD 528 593Verizon Communications Inc., Senior Note, 5.15%, 9/15/2023 . . . . . . . . . . . . . . . . . . . . . . . . . . . . . . . . . . . . . . . . . . . . . . . . . . . . . . . 1,500,000 USD 1,542 1,793Vertafore Inc., Floating Rate Note, Second Lien Term Loan, 10/27/2017 . . . . . . . . . . . . . . . . . . . . . . . . . . . . . . . . . . . . . . . . . . . . . . . . 1,157,959 USD 1,202 1,260Visant Corp., Senior Note, 10.00%, 10/1/2017 . . . . . . . . . . . . . . . . . . . . . . . . . . . . . . . . . . . . . . . . . . . . . . . . . . . . . . . . . . . . . . . . . . 700,000 USD 731 700Visant Corp. (Jostens), New Loan, Floating Rate Note, 12/22/2016 . . . . . . . . . . . . . . . . . . . . . . . . . . . . . . . . . . . . . . . . . . . . . . . . . . . . 1,349,723 USD 1,453 1,434VPI Escrow Corp., Senior Note, 6.375%, 10/15/2020 . . . . . . . . . . . . . . . . . . . . . . . . . . . . . . . . . . . . . . . . . . . . . . . . . . . . . . . . . . . . . . 1,200,000 USD 1,171 1,364W&T Offshore Inc., Senior Note, 8.50%, 6/15/2019 . . . . . . . . . . . . . . . . . . . . . . . . . . . . . . . . . . . . . . . . . . . . . . . . . . . . . . . . . . . . . . . 1,100,000 USD 1,147 1,273Walter Energy Inc., Floating Rate Note, B Term Loan, 4/1/2018 . . . . . . . . . . . . . . . . . . . . . . . . . . . . . . . . . . . . . . . . . . . . . . . . . . . . . . 394,625 USD 418 408Washington State GO
Various Purpose, Refunding, Series R-C, 5.00%, 7/1/2024 . . . . . . . . . . . . . . . . . . . . . . . . . . . . . . . . . . . . . . . . . . . . . . . . . . . . . . . 400,000 USD 489 514Various Purpose, Series D, 5.00%, 2/1/2023 . . . . . . . . . . . . . . . . . . . . . . . . . . . . . . . . . . . . . . . . . . . . . . . . . . . . . . . . . . . . . . . . . . 375,000 USD 458 476
Wells Fargo & Co., S, Junior Subordinated Bond, 5.90% to 6/15/2014, Floating Rate Note thereafter, Perpetual . . . . . . . . . . . . . . . . . . . . 1,600,000 USD 1,757 1,811Wells Fargo Mortgage Backed Securities Trust
04-W, A9, Floating Rate Note, 11/25/2034 . . . . . . . . . . . . . . . . . . . . . . . . . . . . . . . . . . . . . . . . . . . . . . . . . . . . . . . . . . . . . . . . . . . 396,233 USD 369 4382007-3, 3A1, 5.50%, 4/25/2037 . . . . . . . . . . . . . . . . . . . . . . . . . . . . . . . . . . . . . . . . . . . . . . . . . . . . . . . . . . . . . . . . . . . . . . . . . . 138,396 USD 145 153
Wesco Distribution Inc., Tranche B-1 Loan, Floating Rate Note, 12/12/2019 . . . . . . . . . . . . . . . . . . . . . . . . . . . . . . . . . . . . . . . . . . . . . 655,803 USD 702 701William Morris Endeavor Entertainment LLC
Term Loans First Lien, Floating Rate Note, 3/21/2021 . . . . . . . . . . . . . . . . . . . . . . . . . . . . . . . . . . . . . . . . . . . . . . . . . . . . . . . . . . . 2,513,129 USD 2,784 2,704Term Loans Second Lien, Floating Rate Note, 3/21/2022 . . . . . . . . . . . . . . . . . . . . . . . . . . . . . . . . . . . . . . . . . . . . . . . . . . . . . . . . . 1,144,899 USD 1,280 1,242
WireCo Worldgroup Inc., Term Loan, Floating Rate Note, 2/15/2017 . . . . . . . . . . . . . . . . . . . . . . . . . . . . . . . . . . . . . . . . . . . . . . . . . . . 22,886 USD 25 25Zoetis Inc., Senior Bond, 3.25%, 2/1/2023 . . . . . . . . . . . . . . . . . . . . . . . . . . . . . . . . . . . . . . . . . . . . . . . . . . . . . . . . . . . . . . . . . . . . . 1,000,000 USD 990 1,056Zuffa LLC, Initial Term Loan, Floating Rate Note, 2/25/2020 . . . . . . . . . . . . . . . . . . . . . . . . . . . . . . . . . . . . . . . . . . . . . . . . . . . . . . . . . 116,231 USD 122 124
247,889 263,740
* Principal amount of $260,000 pledged as at June 30, 2014
The accompanying notes are an integral part of these financial statements.
140 Franklin Templeton Investments Funds
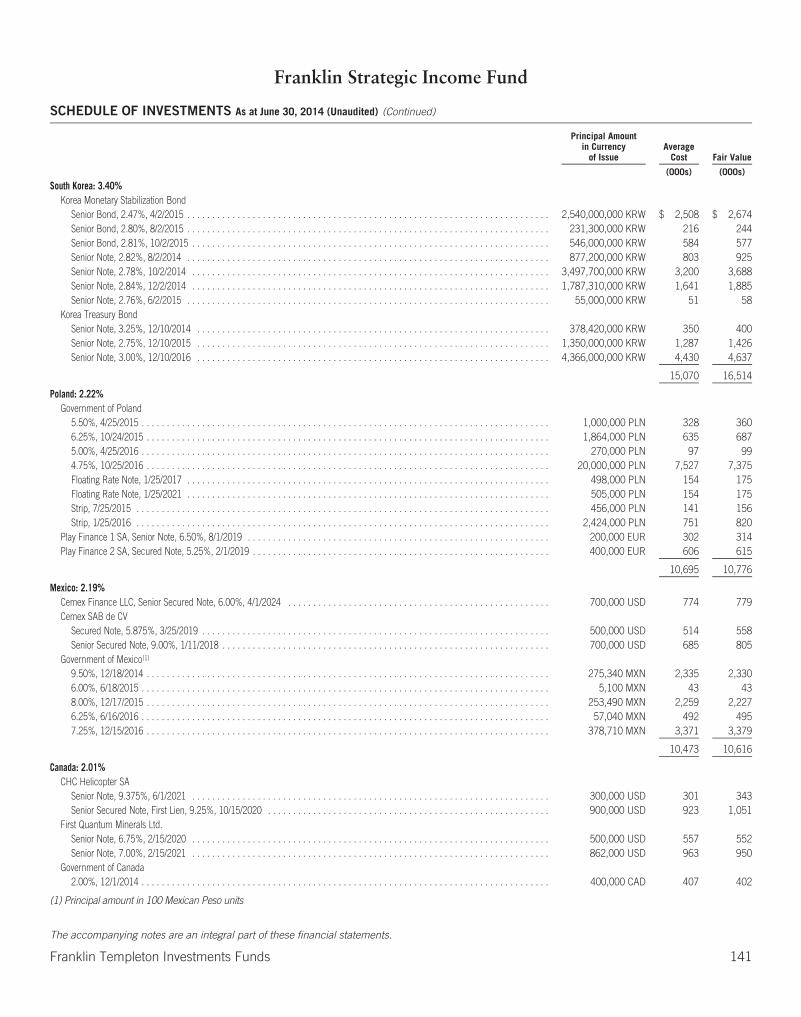
Franklin Strategic Income Fund
SCHEDULE OF INVESTMENTS As at June 30, 2014 (Unaudited) (Continued)
Principal Amountin Currency
of IssueAverage
Cost Fair Value
(000s) (000s)
South Korea: 3.40%Korea Monetary Stabilization Bond
Senior Bond, 2.47%, 4/2/2015 . . . . . . . . . . . . . . . . . . . . . . . . . . . . . . . . . . . . . . . . . . . . . . . . . . . . . . . . . . . . . . . . . . . . . . . . 2,540,000,000 KRW $ 2,508 $ 2,674Senior Bond, 2.80%, 8/2/2015 . . . . . . . . . . . . . . . . . . . . . . . . . . . . . . . . . . . . . . . . . . . . . . . . . . . . . . . . . . . . . . . . . . . . . . . . 231,300,000 KRW 216 244Senior Bond, 2.81%, 10/2/2015 . . . . . . . . . . . . . . . . . . . . . . . . . . . . . . . . . . . . . . . . . . . . . . . . . . . . . . . . . . . . . . . . . . . . . . . 546,000,000 KRW 584 577Senior Note, 2.82%, 8/2/2014 . . . . . . . . . . . . . . . . . . . . . . . . . . . . . . . . . . . . . . . . . . . . . . . . . . . . . . . . . . . . . . . . . . . . . . . . 877,200,000 KRW 803 925Senior Note, 2.78%, 10/2/2014 . . . . . . . . . . . . . . . . . . . . . . . . . . . . . . . . . . . . . . . . . . . . . . . . . . . . . . . . . . . . . . . . . . . . . . . 3,497,700,000 KRW 3,200 3,688Senior Note, 2.84%, 12/2/2014 . . . . . . . . . . . . . . . . . . . . . . . . . . . . . . . . . . . . . . . . . . . . . . . . . . . . . . . . . . . . . . . . . . . . . . . 1,787,310,000 KRW 1,641 1,885Senior Note, 2.76%, 6/2/2015 . . . . . . . . . . . . . . . . . . . . . . . . . . . . . . . . . . . . . . . . . . . . . . . . . . . . . . . . . . . . . . . . . . . . . . . . 55,000,000 KRW 51 58
Korea Treasury BondSenior Note, 3.25%, 12/10/2014 . . . . . . . . . . . . . . . . . . . . . . . . . . . . . . . . . . . . . . . . . . . . . . . . . . . . . . . . . . . . . . . . . . . . . . 378,420,000 KRW 350 400Senior Note, 2.75%, 12/10/2015 . . . . . . . . . . . . . . . . . . . . . . . . . . . . . . . . . . . . . . . . . . . . . . . . . . . . . . . . . . . . . . . . . . . . . . 1,350,000,000 KRW 1,287 1,426Senior Note, 3.00%, 12/10/2016 . . . . . . . . . . . . . . . . . . . . . . . . . . . . . . . . . . . . . . . . . . . . . . . . . . . . . . . . . . . . . . . . . . . . . . 4,366,000,000 KRW 4,430 4,637
15,070 16,514
Poland: 2.22%Government of Poland
5.50%, 4/25/2015 . . . . . . . . . . . . . . . . . . . . . . . . . . . . . . . . . . . . . . . . . . . . . . . . . . . . . . . . . . . . . . . . . . . . . . . . . . . . . . . . . 1,000,000 PLN 328 3606.25%, 10/24/2015 . . . . . . . . . . . . . . . . . . . . . . . . . . . . . . . . . . . . . . . . . . . . . . . . . . . . . . . . . . . . . . . . . . . . . . . . . . . . . . . . 1,864,000 PLN 635 6875.00%, 4/25/2016 . . . . . . . . . . . . . . . . . . . . . . . . . . . . . . . . . . . . . . . . . . . . . . . . . . . . . . . . . . . . . . . . . . . . . . . . . . . . . . . . . 270,000 PLN 97 994.75%, 10/25/2016 . . . . . . . . . . . . . . . . . . . . . . . . . . . . . . . . . . . . . . . . . . . . . . . . . . . . . . . . . . . . . . . . . . . . . . . . . . . . . . . . 20,000,000 PLN 7,527 7,375Floating Rate Note, 1/25/2017 . . . . . . . . . . . . . . . . . . . . . . . . . . . . . . . . . . . . . . . . . . . . . . . . . . . . . . . . . . . . . . . . . . . . . . . . 498,000 PLN 154 175Floating Rate Note, 1/25/2021 . . . . . . . . . . . . . . . . . . . . . . . . . . . . . . . . . . . . . . . . . . . . . . . . . . . . . . . . . . . . . . . . . . . . . . . . 505,000 PLN 154 175Strip, 7/25/2015 . . . . . . . . . . . . . . . . . . . . . . . . . . . . . . . . . . . . . . . . . . . . . . . . . . . . . . . . . . . . . . . . . . . . . . . . . . . . . . . . . . 456,000 PLN 141 156Strip, 1/25/2016 . . . . . . . . . . . . . . . . . . . . . . . . . . . . . . . . . . . . . . . . . . . . . . . . . . . . . . . . . . . . . . . . . . . . . . . . . . . . . . . . . . 2,424,000 PLN 751 820
Play Finance 1 SA, Senior Note, 6.50%, 8/1/2019 . . . . . . . . . . . . . . . . . . . . . . . . . . . . . . . . . . . . . . . . . . . . . . . . . . . . . . . . . . . . 200,000 EUR 302 314Play Finance 2 SA, Secured Note, 5.25%, 2/1/2019 . . . . . . . . . . . . . . . . . . . . . . . . . . . . . . . . . . . . . . . . . . . . . . . . . . . . . . . . . . . 400,000 EUR 606 615
10,695 10,776
Mexico: 2.19%Cemex Finance LLC, Senior Secured Note, 6.00%, 4/1/2024 . . . . . . . . . . . . . . . . . . . . . . . . . . . . . . . . . . . . . . . . . . . . . . . . . . . . 700,000 USD 774 779Cemex SAB de CV
Secured Note, 5.875%, 3/25/2019 . . . . . . . . . . . . . . . . . . . . . . . . . . . . . . . . . . . . . . . . . . . . . . . . . . . . . . . . . . . . . . . . . . . . . 500,000 USD 514 558Senior Secured Note, 9.00%, 1/11/2018 . . . . . . . . . . . . . . . . . . . . . . . . . . . . . . . . . . . . . . . . . . . . . . . . . . . . . . . . . . . . . . . . . 700,000 USD 685 805
Government of Mexico(1)
9.50%, 12/18/2014 . . . . . . . . . . . . . . . . . . . . . . . . . . . . . . . . . . . . . . . . . . . . . . . . . . . . . . . . . . . . . . . . . . . . . . . . . . . . . . . . 275,340 MXN 2,335 2,3306.00%, 6/18/2015 . . . . . . . . . . . . . . . . . . . . . . . . . . . . . . . . . . . . . . . . . . . . . . . . . . . . . . . . . . . . . . . . . . . . . . . . . . . . . . . . . 5,100 MXN 43 438.00%, 12/17/2015 . . . . . . . . . . . . . . . . . . . . . . . . . . . . . . . . . . . . . . . . . . . . . . . . . . . . . . . . . . . . . . . . . . . . . . . . . . . . . . . . 253,490 MXN 2,259 2,2276.25%, 6/16/2016 . . . . . . . . . . . . . . . . . . . . . . . . . . . . . . . . . . . . . . . . . . . . . . . . . . . . . . . . . . . . . . . . . . . . . . . . . . . . . . . . . 57,040 MXN 492 4957.25%, 12/15/2016 . . . . . . . . . . . . . . . . . . . . . . . . . . . . . . . . . . . . . . . . . . . . . . . . . . . . . . . . . . . . . . . . . . . . . . . . . . . . . . . . 378,710 MXN 3,371 3,379
10,473 10,616
Canada: 2.01%CHC Helicopter SA
Senior Note, 9.375%, 6/1/2021 . . . . . . . . . . . . . . . . . . . . . . . . . . . . . . . . . . . . . . . . . . . . . . . . . . . . . . . . . . . . . . . . . . . . . . . 300,000 USD 301 343Senior Secured Note, First Lien, 9.25%, 10/15/2020 . . . . . . . . . . . . . . . . . . . . . . . . . . . . . . . . . . . . . . . . . . . . . . . . . . . . . . . . 900,000 USD 923 1,051
First Quantum Minerals Ltd.Senior Note, 6.75%, 2/15/2020 . . . . . . . . . . . . . . . . . . . . . . . . . . . . . . . . . . . . . . . . . . . . . . . . . . . . . . . . . . . . . . . . . . . . . . . 500,000 USD 557 552Senior Note, 7.00%, 2/15/2021 . . . . . . . . . . . . . . . . . . . . . . . . . . . . . . . . . . . . . . . . . . . . . . . . . . . . . . . . . . . . . . . . . . . . . . . 862,000 USD 963 950
Government of Canada2.00%, 12/1/2014 . . . . . . . . . . . . . . . . . . . . . . . . . . . . . . . . . . . . . . . . . . . . . . . . . . . . . . . . . . . . . . . . . . . . . . . . . . . . . . . . . 400,000 CAD 407 402
(1) Principal amount in 100 Mexican Peso units
The accompanying notes are an integral part of these financial statements.
Franklin Templeton Investments Funds 141

Franklin Strategic Income Fund
SCHEDULE OF INVESTMENTS As at June 30, 2014 (Unaudited) (Continued)
Principal Amountin Currency
of IssueAverage
Cost Fair Value
(000s) (000s)
Canada: 2.01% (Continued)Government of Canada (Continued)
1.00%, 2/1/2015 . . . . . . . . . . . . . . . . . . . . . . . . . . . . . . . . . . . . . . . . . . . . . . . . . . . . . . . . . . . . . . . . . . . . . . . . . . . . . . . . . . . 600,000 CAD $ 600 $ 6001.00%, 5/1/2015 . . . . . . . . . . . . . . . . . . . . . . . . . . . . . . . . . . . . . . . . . . . . . . . . . . . . . . . . . . . . . . . . . . . . . . . . . . . . . . . . . . . 2,032,000 CAD 2,032 2,032
Novelis Inc.Senior Note, 8.375%, 12/15/2017 . . . . . . . . . . . . . . . . . . . . . . . . . . . . . . . . . . . . . . . . . . . . . . . . . . . . . . . . . . . . . . . . . . . . . . . 400,000 USD 407 455Senior Note, 8.75%, 12/15/2020 . . . . . . . . . . . . . . . . . . . . . . . . . . . . . . . . . . . . . . . . . . . . . . . . . . . . . . . . . . . . . . . . . . . . . . . . 600,000 USD 603 714
Valeant Pharmaceuticals International Inc., Series E-1 Tranche B Term Loan, Floating Rate Note, 8/5/2020 . . . . . . . . . . . . . . . . . . . . . 996,675 USD 1,102 1,063Videotron Ltd., Senior Bond, 5.375%, 6/15/2024 . . . . . . . . . . . . . . . . . . . . . . . . . . . . . . . . . . . . . . . . . . . . . . . . . . . . . . . . . . . . . . . 400,000 USD 444 438Xstrata Finance Canada Ltd., Senior Note, 4.95%, 11/15/2021 . . . . . . . . . . . . . . . . . . . . . . . . . . . . . . . . . . . . . . . . . . . . . . . . . . . . . 1,000,000 USD 1,024 1,152
9,363 9,752
Luxembourg: 1.98%ArcelorMittal
Senior Note, 6.00%, 3/1/2021 . . . . . . . . . . . . . . . . . . . . . . . . . . . . . . . . . . . . . . . . . . . . . . . . . . . . . . . . . . . . . . . . . . . . . . . . . . 1,500,000 USD 1,469 1,732Senior Note, 6.75%, 2/25/2022 . . . . . . . . . . . . . . . . . . . . . . . . . . . . . . . . . . . . . . . . . . . . . . . . . . . . . . . . . . . . . . . . . . . . . . . . . 500,000 USD 540 599
Ardagh Packaging Finance PLC, Senior Note, 9.125%, 10/15/2020 . . . . . . . . . . . . . . . . . . . . . . . . . . . . . . . . . . . . . . . . . . . . . . . . . 800,000 USD 846 948Ardagh Packaging Finance PLC/Ardagh MP Holdings USA Inc.
Senior Note, 6.25%, 1/31/2019 . . . . . . . . . . . . . . . . . . . . . . . . . . . . . . . . . . . . . . . . . . . . . . . . . . . . . . . . . . . . . . . . . . . . . . . . . 200,000 USD 224 219Senior Note, 7.00%, 11/15/2020 . . . . . . . . . . . . . . . . . . . . . . . . . . . . . . . . . . . . . . . . . . . . . . . . . . . . . . . . . . . . . . . . . . . . . . . . 35,294 USD 35 39Senior Note, 6.75%, 1/31/2021 . . . . . . . . . . . . . . . . . . . . . . . . . . . . . . . . . . . . . . . . . . . . . . . . . . . . . . . . . . . . . . . . . . . . . . . . . 200,000 USD 224 221Senior Note, 6.00%, 6/30/2021 . . . . . . . . . . . . . . . . . . . . . . . . . . . . . . . . . . . . . . . . . . . . . . . . . . . . . . . . . . . . . . . . . . . . . . . . . 200,000 USD 215 213
August LuxUK Holding Co.First Lien Term Loan, Floating Rate Note, 4/27/2018 . . . . . . . . . . . . . . . . . . . . . . . . . . . . . . . . . . . . . . . . . . . . . . . . . . . . . . . . . . 249,062 USD 271 269Lux Second Lien, Floating Rate Note, 4/27/2019 . . . . . . . . . . . . . . . . . . . . . . . . . . . . . . . . . . . . . . . . . . . . . . . . . . . . . . . . . . . . . 55,764 USD 57 60
Exopack Holdings SA, USD Term Loan, Floating Rate Note, 5/8/2019 . . . . . . . . . . . . . . . . . . . . . . . . . . . . . . . . . . . . . . . . . . . . . . . . 1,404,222 USD 1,531 1,523Intelsat Jackson Holdings SA
Senior Bond, 6.625%, 12/15/2022 . . . . . . . . . . . . . . . . . . . . . . . . . . . . . . . . . . . . . . . . . . . . . . . . . . . . . . . . . . . . . . . . . . . . . . . 800,000 USD 781 893Senior Bond, 5.50%, 8/1/2023 . . . . . . . . . . . . . . . . . . . . . . . . . . . . . . . . . . . . . . . . . . . . . . . . . . . . . . . . . . . . . . . . . . . . . . . . . 100,000 USD 103 106Senior Note, 7.25%, 10/15/2020 . . . . . . . . . . . . . . . . . . . . . . . . . . . . . . . . . . . . . . . . . . . . . . . . . . . . . . . . . . . . . . . . . . . . . . . . 500,000 USD 527 576Senior Note, 7.50%, 4/1/2021 . . . . . . . . . . . . . . . . . . . . . . . . . . . . . . . . . . . . . . . . . . . . . . . . . . . . . . . . . . . . . . . . . . . . . . . . . . 200,000 USD 199 235Tranche B-2 Term Loan, Floating Rate Note, 6/30/2019 . . . . . . . . . . . . . . . . . . . . . . . . . . . . . . . . . . . . . . . . . . . . . . . . . . . . . . . . 218,417 USD 218 234
Millicom International Cellular SA, Senior Note, 6.625%, 10/15/2021 . . . . . . . . . . . . . . . . . . . . . . . . . . . . . . . . . . . . . . . . . . . . . . . . 900,000 USD 972 1,043OXEA GmbH, Second Lien Term Loan, Floating Rate Note, 7/15/2020 . . . . . . . . . . . . . . . . . . . . . . . . . . . . . . . . . . . . . . . . . . . . . . . . 669,125 USD 715 723
8,927 9,633
Hungary: 1.90%Government of Hungary
7.75%, 8/24/2015 . . . . . . . . . . . . . . . . . . . . . . . . . . . . . . . . . . . . . . . . . . . . . . . . . . . . . . . . . . . . . . . . . . . . . . . . . . . . . . . . . . 1,700,000 HUF 8 85.50%, 2/12/2016 . . . . . . . . . . . . . . . . . . . . . . . . . . . . . . . . . . . . . . . . . . . . . . . . . . . . . . . . . . . . . . . . . . . . . . . . . . . . . . . . . . 733,200,000 HUF 3,359 3,6385.50%, 12/22/2016 . . . . . . . . . . . . . . . . . . . . . . . . . . . . . . . . . . . . . . . . . . . . . . . . . . . . . . . . . . . . . . . . . . . . . . . . . . . . . . . . . 17,480,000 HUF 82 887.50%, 11/12/2020 . . . . . . . . . . . . . . . . . . . . . . . . . . . . . . . . . . . . . . . . . . . . . . . . . . . . . . . . . . . . . . . . . . . . . . . . . . . . . . . . . 230,660,000 HUF 1,255 1,315A, 8.00%, 2/12/2015 . . . . . . . . . . . . . . . . . . . . . . . . . . . . . . . . . . . . . . . . . . . . . . . . . . . . . . . . . . . . . . . . . . . . . . . . . . . . . . . . 5,510,000 HUF 25 27A, 6.75%, 11/24/2017 . . . . . . . . . . . . . . . . . . . . . . . . . . . . . . . . . . . . . . . . . . . . . . . . . . . . . . . . . . . . . . . . . . . . . . . . . . . . . . . 101,680,000 HUF 550 539A, 5.50%, 12/20/2018 . . . . . . . . . . . . . . . . . . . . . . . . . . . . . . . . . . . . . . . . . . . . . . . . . . . . . . . . . . . . . . . . . . . . . . . . . . . . . . . 12,800,000 HUF 64 66A, 7.00%, 6/24/2022 . . . . . . . . . . . . . . . . . . . . . . . . . . . . . . . . . . . . . . . . . . . . . . . . . . . . . . . . . . . . . . . . . . . . . . . . . . . . . . . . 340,000 HUF 2 2A, 6.00%, 11/24/2023 . . . . . . . . . . . . . . . . . . . . . . . . . . . . . . . . . . . . . . . . . . . . . . . . . . . . . . . . . . . . . . . . . . . . . . . . . . . . . . . 480,000 HUF 2 3Senior Note, 6.25%, 1/29/2020 . . . . . . . . . . . . . . . . . . . . . . . . . . . . . . . . . . . . . . . . . . . . . . . . . . . . . . . . . . . . . . . . . . . . . . . . . 2,200,000 USD 2,297 2,659Senior Note, 6.375%, 3/29/2021 . . . . . . . . . . . . . . . . . . . . . . . . . . . . . . . . . . . . . . . . . . . . . . . . . . . . . . . . . . . . . . . . . . . . . . . . 724,000 USD 675 883
8,319 9,228
The accompanying notes are an integral part of these financial statements.
142 Franklin Templeton Investments Funds
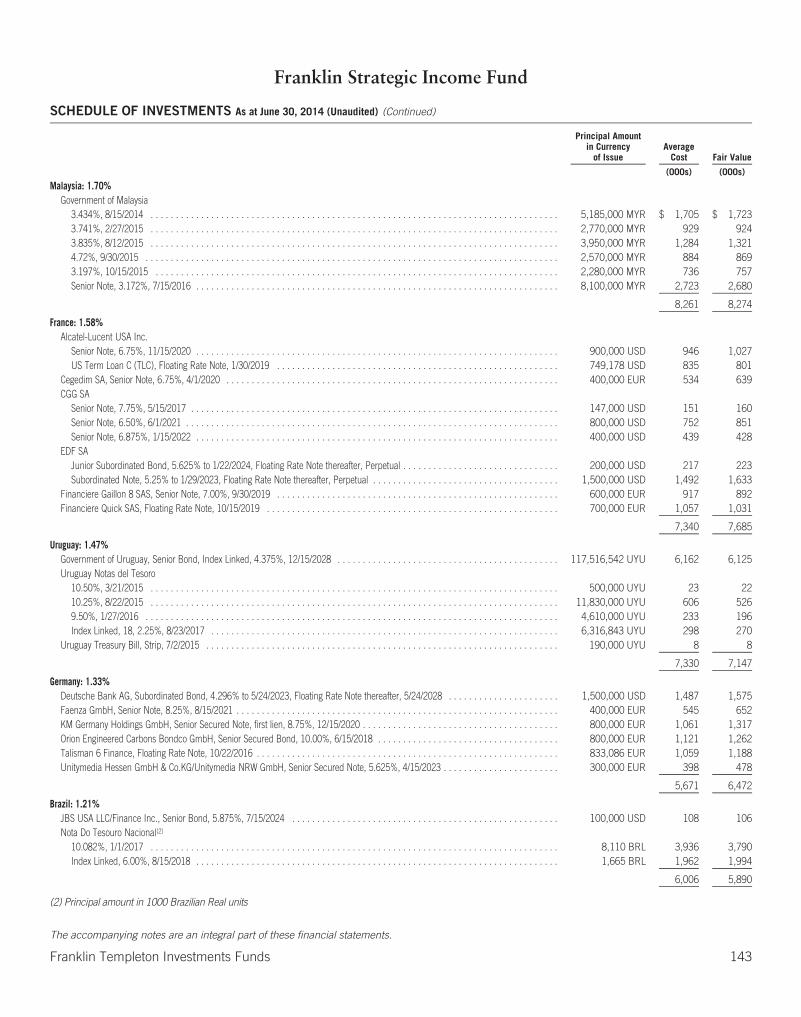
Franklin Strategic Income Fund
SCHEDULE OF INVESTMENTS As at June 30, 2014 (Unaudited) (Continued)
Principal Amountin Currency
of IssueAverage
Cost Fair Value
(000s) (000s)
Malaysia: 1.70%Government of Malaysia
3.434%, 8/15/2014 . . . . . . . . . . . . . . . . . . . . . . . . . . . . . . . . . . . . . . . . . . . . . . . . . . . . . . . . . . . . . . . . . . . . . . . . . . . . . . . . . 5,185,000 MYR $ 1,705 $ 1,7233.741%, 2/27/2015 . . . . . . . . . . . . . . . . . . . . . . . . . . . . . . . . . . . . . . . . . . . . . . . . . . . . . . . . . . . . . . . . . . . . . . . . . . . . . . . . . 2,770,000 MYR 929 9243.835%, 8/12/2015 . . . . . . . . . . . . . . . . . . . . . . . . . . . . . . . . . . . . . . . . . . . . . . . . . . . . . . . . . . . . . . . . . . . . . . . . . . . . . . . . . 3,950,000 MYR 1,284 1,3214.72%, 9/30/2015 . . . . . . . . . . . . . . . . . . . . . . . . . . . . . . . . . . . . . . . . . . . . . . . . . . . . . . . . . . . . . . . . . . . . . . . . . . . . . . . . . . 2,570,000 MYR 884 8693.197%, 10/15/2015 . . . . . . . . . . . . . . . . . . . . . . . . . . . . . . . . . . . . . . . . . . . . . . . . . . . . . . . . . . . . . . . . . . . . . . . . . . . . . . . . 2,280,000 MYR 736 757Senior Note, 3.172%, 7/15/2016 . . . . . . . . . . . . . . . . . . . . . . . . . . . . . . . . . . . . . . . . . . . . . . . . . . . . . . . . . . . . . . . . . . . . . . . . 8,100,000 MYR 2,723 2,680
8,261 8,274
France: 1.58%Alcatel-Lucent USA Inc.
Senior Note, 6.75%, 11/15/2020 . . . . . . . . . . . . . . . . . . . . . . . . . . . . . . . . . . . . . . . . . . . . . . . . . . . . . . . . . . . . . . . . . . . . . . . . 900,000 USD 946 1,027US Term Loan C (TLC), Floating Rate Note, 1/30/2019 . . . . . . . . . . . . . . . . . . . . . . . . . . . . . . . . . . . . . . . . . . . . . . . . . . . . . . . . 749,178 USD 835 801
Cegedim SA, Senior Note, 6.75%, 4/1/2020 . . . . . . . . . . . . . . . . . . . . . . . . . . . . . . . . . . . . . . . . . . . . . . . . . . . . . . . . . . . . . . . . . . 400,000 EUR 534 639CGG SA
Senior Note, 7.75%, 5/15/2017 . . . . . . . . . . . . . . . . . . . . . . . . . . . . . . . . . . . . . . . . . . . . . . . . . . . . . . . . . . . . . . . . . . . . . . . . . 147,000 USD 151 160Senior Note, 6.50%, 6/1/2021 . . . . . . . . . . . . . . . . . . . . . . . . . . . . . . . . . . . . . . . . . . . . . . . . . . . . . . . . . . . . . . . . . . . . . . . . . . 800,000 USD 752 851Senior Note, 6.875%, 1/15/2022 . . . . . . . . . . . . . . . . . . . . . . . . . . . . . . . . . . . . . . . . . . . . . . . . . . . . . . . . . . . . . . . . . . . . . . . . 400,000 USD 439 428
EDF SAJunior Subordinated Bond, 5.625% to 1/22/2024, Floating Rate Note thereafter, Perpetual . . . . . . . . . . . . . . . . . . . . . . . . . . . . . . . 200,000 USD 217 223Subordinated Note, 5.25% to 1/29/2023, Floating Rate Note thereafter, Perpetual . . . . . . . . . . . . . . . . . . . . . . . . . . . . . . . . . . . . . 1,500,000 USD 1,492 1,633
Financiere Gaillon 8 SAS, Senior Note, 7.00%, 9/30/2019 . . . . . . . . . . . . . . . . . . . . . . . . . . . . . . . . . . . . . . . . . . . . . . . . . . . . . . . . 600,000 EUR 917 892Financiere Quick SAS, Floating Rate Note, 10/15/2019 . . . . . . . . . . . . . . . . . . . . . . . . . . . . . . . . . . . . . . . . . . . . . . . . . . . . . . . . . . 700,000 EUR 1,057 1,031
7,340 7,685
Uruguay: 1.47%Government of Uruguay, Senior Bond, Index Linked, 4.375%, 12/15/2028 . . . . . . . . . . . . . . . . . . . . . . . . . . . . . . . . . . . . . . . . . . . . 117,516,542 UYU 6,162 6,125Uruguay Notas del Tesoro
10.50%, 3/21/2015 . . . . . . . . . . . . . . . . . . . . . . . . . . . . . . . . . . . . . . . . . . . . . . . . . . . . . . . . . . . . . . . . . . . . . . . . . . . . . . . . . 500,000 UYU 23 2210.25%, 8/22/2015 . . . . . . . . . . . . . . . . . . . . . . . . . . . . . . . . . . . . . . . . . . . . . . . . . . . . . . . . . . . . . . . . . . . . . . . . . . . . . . . . . 11,830,000 UYU 606 5269.50%, 1/27/2016 . . . . . . . . . . . . . . . . . . . . . . . . . . . . . . . . . . . . . . . . . . . . . . . . . . . . . . . . . . . . . . . . . . . . . . . . . . . . . . . . . . 4,610,000 UYU 233 196Index Linked, 18, 2.25%, 8/23/2017 . . . . . . . . . . . . . . . . . . . . . . . . . . . . . . . . . . . . . . . . . . . . . . . . . . . . . . . . . . . . . . . . . . . . . 6,316,843 UYU 298 270
Uruguay Treasury Bill, Strip, 7/2/2015 . . . . . . . . . . . . . . . . . . . . . . . . . . . . . . . . . . . . . . . . . . . . . . . . . . . . . . . . . . . . . . . . . . . . . . 190,000 UYU 8 8
7,330 7,147
Germany: 1.33%Deutsche Bank AG, Subordinated Bond, 4.296% to 5/24/2023, Floating Rate Note thereafter, 5/24/2028 . . . . . . . . . . . . . . . . . . . . . . 1,500,000 USD 1,487 1,575Faenza GmbH, Senior Note, 8.25%, 8/15/2021 . . . . . . . . . . . . . . . . . . . . . . . . . . . . . . . . . . . . . . . . . . . . . . . . . . . . . . . . . . . . . . . . 400,000 EUR 545 652KM Germany Holdings GmbH, Senior Secured Note, first lien, 8.75%, 12/15/2020 . . . . . . . . . . . . . . . . . . . . . . . . . . . . . . . . . . . . . . . 800,000 EUR 1,061 1,317Orion Engineered Carbons Bondco GmbH, Senior Secured Bond, 10.00%, 6/15/2018 . . . . . . . . . . . . . . . . . . . . . . . . . . . . . . . . . . . . 800,000 EUR 1,121 1,262Talisman 6 Finance, Floating Rate Note, 10/22/2016 . . . . . . . . . . . . . . . . . . . . . . . . . . . . . . . . . . . . . . . . . . . . . . . . . . . . . . . . . . . . 833,086 EUR 1,059 1,188Unitymedia Hessen GmbH & Co.KG/Unitymedia NRW GmbH, Senior Secured Note, 5.625%, 4/15/2023 . . . . . . . . . . . . . . . . . . . . . . . 300,000 EUR 398 478
5,671 6,472
Brazil: 1.21%JBS USA LLC/Finance Inc., Senior Bond, 5.875%, 7/15/2024 . . . . . . . . . . . . . . . . . . . . . . . . . . . . . . . . . . . . . . . . . . . . . . . . . . . . . 100,000 USD 108 106Nota Do Tesouro Nacional(2)
10.082%, 1/1/2017 . . . . . . . . . . . . . . . . . . . . . . . . . . . . . . . . . . . . . . . . . . . . . . . . . . . . . . . . . . . . . . . . . . . . . . . . . . . . . . . . . 8,110 BRL 3,936 3,790Index Linked, 6.00%, 8/15/2018 . . . . . . . . . . . . . . . . . . . . . . . . . . . . . . . . . . . . . . . . . . . . . . . . . . . . . . . . . . . . . . . . . . . . . . . . 1,665 BRL 1,962 1,994
6,006 5,890
(2) Principal amount in 1000 Brazilian Real units
The accompanying notes are an integral part of these financial statements.
Franklin Templeton Investments Funds 143
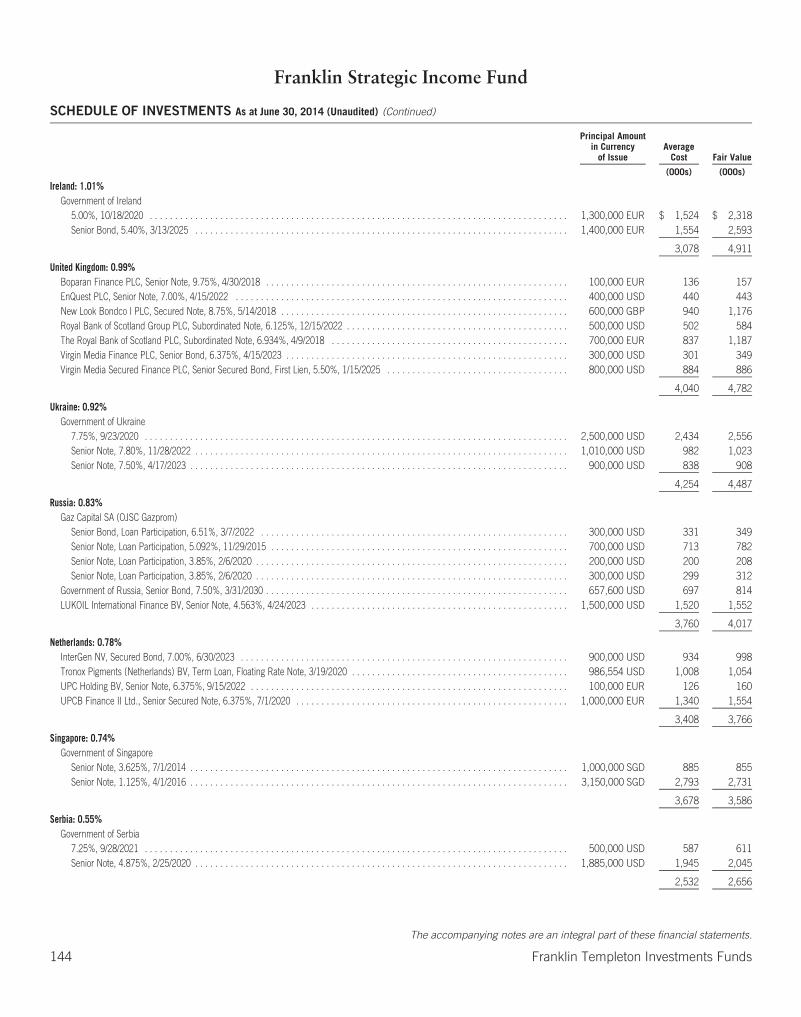
Franklin Strategic Income Fund
SCHEDULE OF INVESTMENTS As at June 30, 2014 (Unaudited) (Continued)
Principal Amountin Currency
of IssueAverage
Cost Fair Value
(000s) (000s)
Ireland: 1.01%Government of Ireland
5.00%, 10/18/2020 . . . . . . . . . . . . . . . . . . . . . . . . . . . . . . . . . . . . . . . . . . . . . . . . . . . . . . . . . . . . . . . . . . . . . . . . . . . . . . . . . . . 1,300,000 EUR $ 1,524 $ 2,318Senior Bond, 5.40%, 3/13/2025 . . . . . . . . . . . . . . . . . . . . . . . . . . . . . . . . . . . . . . . . . . . . . . . . . . . . . . . . . . . . . . . . . . . . . . . . . . 1,400,000 EUR 1,554 2,593
3,078 4,911
United Kingdom: 0.99%Boparan Finance PLC, Senior Note, 9.75%, 4/30/2018 . . . . . . . . . . . . . . . . . . . . . . . . . . . . . . . . . . . . . . . . . . . . . . . . . . . . . . . . . . . . 100,000 EUR 136 157EnQuest PLC, Senior Note, 7.00%, 4/15/2022 . . . . . . . . . . . . . . . . . . . . . . . . . . . . . . . . . . . . . . . . . . . . . . . . . . . . . . . . . . . . . . . . . . 400,000 USD 440 443New Look Bondco I PLC, Secured Note, 8.75%, 5/14/2018 . . . . . . . . . . . . . . . . . . . . . . . . . . . . . . . . . . . . . . . . . . . . . . . . . . . . . . . . . 600,000 GBP 940 1,176Royal Bank of Scotland Group PLC, Subordinated Note, 6.125%, 12/15/2022 . . . . . . . . . . . . . . . . . . . . . . . . . . . . . . . . . . . . . . . . . . . . 500,000 USD 502 584The Royal Bank of Scotland PLC, Subordinated Note, 6.934%, 4/9/2018 . . . . . . . . . . . . . . . . . . . . . . . . . . . . . . . . . . . . . . . . . . . . . . . 700,000 EUR 837 1,187Virgin Media Finance PLC, Senior Bond, 6.375%, 4/15/2023 . . . . . . . . . . . . . . . . . . . . . . . . . . . . . . . . . . . . . . . . . . . . . . . . . . . . . . . . 300,000 USD 301 349Virgin Media Secured Finance PLC, Senior Secured Bond, First Lien, 5.50%, 1/15/2025 . . . . . . . . . . . . . . . . . . . . . . . . . . . . . . . . . . . . 800,000 USD 884 886
4,040 4,782
Ukraine: 0.92%Government of Ukraine
7.75%, 9/23/2020 . . . . . . . . . . . . . . . . . . . . . . . . . . . . . . . . . . . . . . . . . . . . . . . . . . . . . . . . . . . . . . . . . . . . . . . . . . . . . . . . . . . . 2,500,000 USD 2,434 2,556Senior Note, 7.80%, 11/28/2022 . . . . . . . . . . . . . . . . . . . . . . . . . . . . . . . . . . . . . . . . . . . . . . . . . . . . . . . . . . . . . . . . . . . . . . . . . . 1,010,000 USD 982 1,023Senior Note, 7.50%, 4/17/2023 . . . . . . . . . . . . . . . . . . . . . . . . . . . . . . . . . . . . . . . . . . . . . . . . . . . . . . . . . . . . . . . . . . . . . . . . . . . 900,000 USD 838 908
4,254 4,487
Russia: 0.83%Gaz Capital SA (OJSC Gazprom)
Senior Bond, Loan Participation, 6.51%, 3/7/2022 . . . . . . . . . . . . . . . . . . . . . . . . . . . . . . . . . . . . . . . . . . . . . . . . . . . . . . . . . . . . . 300,000 USD 331 349Senior Note, Loan Participation, 5.092%, 11/29/2015 . . . . . . . . . . . . . . . . . . . . . . . . . . . . . . . . . . . . . . . . . . . . . . . . . . . . . . . . . . . 700,000 USD 713 782Senior Note, Loan Participation, 3.85%, 2/6/2020 . . . . . . . . . . . . . . . . . . . . . . . . . . . . . . . . . . . . . . . . . . . . . . . . . . . . . . . . . . . . . . 200,000 USD 200 208Senior Note, Loan Participation, 3.85%, 2/6/2020 . . . . . . . . . . . . . . . . . . . . . . . . . . . . . . . . . . . . . . . . . . . . . . . . . . . . . . . . . . . . . . 300,000 USD 299 312
Government of Russia, Senior Bond, 7.50%, 3/31/2030 . . . . . . . . . . . . . . . . . . . . . . . . . . . . . . . . . . . . . . . . . . . . . . . . . . . . . . . . . . . . 657,600 USD 697 814LUKOIL International Finance BV, Senior Note, 4.563%, 4/24/2023 . . . . . . . . . . . . . . . . . . . . . . . . . . . . . . . . . . . . . . . . . . . . . . . . . . . 1,500,000 USD 1,520 1,552
3,760 4,017
Netherlands: 0.78%InterGen NV, Secured Bond, 7.00%, 6/30/2023 . . . . . . . . . . . . . . . . . . . . . . . . . . . . . . . . . . . . . . . . . . . . . . . . . . . . . . . . . . . . . . . . . 900,000 USD 934 998Tronox Pigments (Netherlands) BV, Term Loan, Floating Rate Note, 3/19/2020 . . . . . . . . . . . . . . . . . . . . . . . . . . . . . . . . . . . . . . . . . . . 986,554 USD 1,008 1,054UPC Holding BV, Senior Note, 6.375%, 9/15/2022 . . . . . . . . . . . . . . . . . . . . . . . . . . . . . . . . . . . . . . . . . . . . . . . . . . . . . . . . . . . . . . . 100,000 EUR 126 160UPCB Finance II Ltd., Senior Secured Note, 6.375%, 7/1/2020 . . . . . . . . . . . . . . . . . . . . . . . . . . . . . . . . . . . . . . . . . . . . . . . . . . . . . . 1,000,000 EUR 1,340 1,554
3,408 3,766
Singapore: 0.74%Government of Singapore
Senior Note, 3.625%, 7/1/2014 . . . . . . . . . . . . . . . . . . . . . . . . . . . . . . . . . . . . . . . . . . . . . . . . . . . . . . . . . . . . . . . . . . . . . . . . . . . 1,000,000 SGD 885 855Senior Note, 1.125%, 4/1/2016 . . . . . . . . . . . . . . . . . . . . . . . . . . . . . . . . . . . . . . . . . . . . . . . . . . . . . . . . . . . . . . . . . . . . . . . . . . . 3,150,000 SGD 2,793 2,731
3,678 3,586
Serbia: 0.55%Government of Serbia
7.25%, 9/28/2021 . . . . . . . . . . . . . . . . . . . . . . . . . . . . . . . . . . . . . . . . . . . . . . . . . . . . . . . . . . . . . . . . . . . . . . . . . . . . . . . . . . . . 500,000 USD 587 611Senior Note, 4.875%, 2/25/2020 . . . . . . . . . . . . . . . . . . . . . . . . . . . . . . . . . . . . . . . . . . . . . . . . . . . . . . . . . . . . . . . . . . . . . . . . . . 1,885,000 USD 1,945 2,045
2,532 2,656
The accompanying notes are an integral part of these financial statements.
144 Franklin Templeton Investments Funds
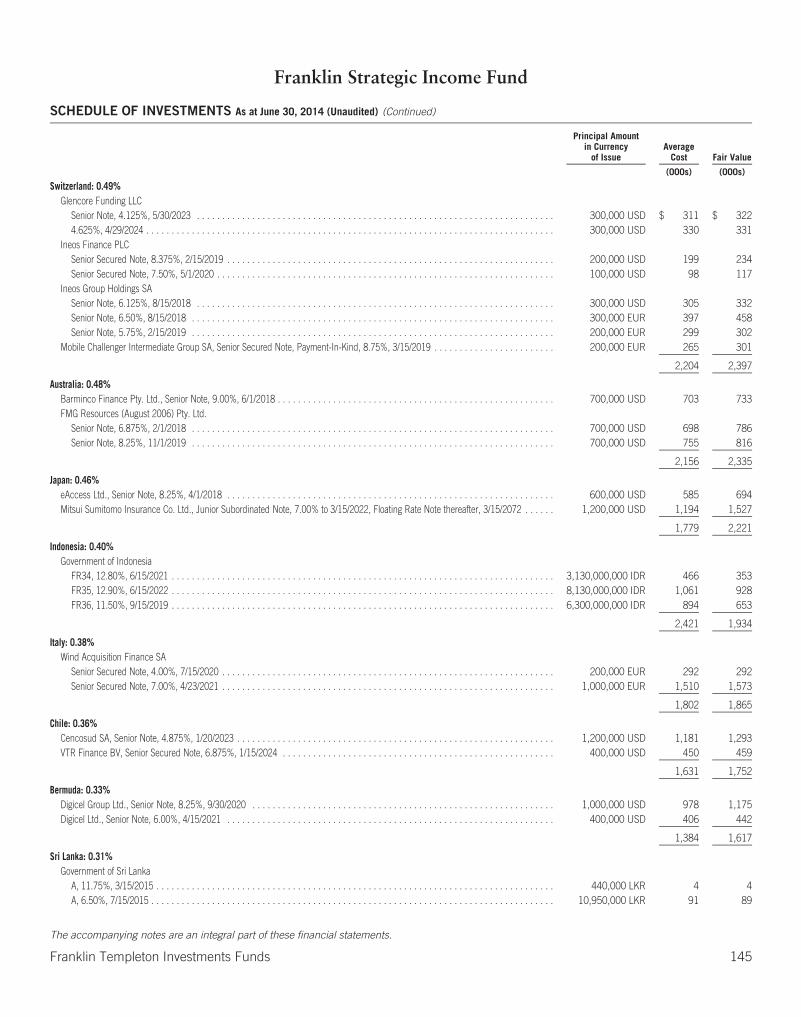
Franklin Strategic Income Fund
SCHEDULE OF INVESTMENTS As at June 30, 2014 (Unaudited) (Continued)
Principal Amountin Currency
of IssueAverage
Cost Fair Value
(000s) (000s)
Switzerland: 0.49%Glencore Funding LLC
Senior Note, 4.125%, 5/30/2023 . . . . . . . . . . . . . . . . . . . . . . . . . . . . . . . . . . . . . . . . . . . . . . . . . . . . . . . . . . . . . . . . . . . . . . . 300,000 USD $ 311 $ 3224.625%, 4/29/2024 . . . . . . . . . . . . . . . . . . . . . . . . . . . . . . . . . . . . . . . . . . . . . . . . . . . . . . . . . . . . . . . . . . . . . . . . . . . . . . . . . 300,000 USD 330 331
Ineos Finance PLCSenior Secured Note, 8.375%, 2/15/2019 . . . . . . . . . . . . . . . . . . . . . . . . . . . . . . . . . . . . . . . . . . . . . . . . . . . . . . . . . . . . . . . . . 200,000 USD 199 234Senior Secured Note, 7.50%, 5/1/2020 . . . . . . . . . . . . . . . . . . . . . . . . . . . . . . . . . . . . . . . . . . . . . . . . . . . . . . . . . . . . . . . . . . . 100,000 USD 98 117
Ineos Group Holdings SASenior Note, 6.125%, 8/15/2018 . . . . . . . . . . . . . . . . . . . . . . . . . . . . . . . . . . . . . . . . . . . . . . . . . . . . . . . . . . . . . . . . . . . . . . . 300,000 USD 305 332Senior Note, 6.50%, 8/15/2018 . . . . . . . . . . . . . . . . . . . . . . . . . . . . . . . . . . . . . . . . . . . . . . . . . . . . . . . . . . . . . . . . . . . . . . . . 300,000 EUR 397 458Senior Note, 5.75%, 2/15/2019 . . . . . . . . . . . . . . . . . . . . . . . . . . . . . . . . . . . . . . . . . . . . . . . . . . . . . . . . . . . . . . . . . . . . . . . . 200,000 EUR 299 302
Mobile Challenger Intermediate Group SA, Senior Secured Note, Payment-In-Kind, 8.75%, 3/15/2019 . . . . . . . . . . . . . . . . . . . . . . . . 200,000 EUR 265 301
2,204 2,397
Australia: 0.48%Barminco Finance Pty. Ltd., Senior Note, 9.00%, 6/1/2018 . . . . . . . . . . . . . . . . . . . . . . . . . . . . . . . . . . . . . . . . . . . . . . . . . . . . . . . 700,000 USD 703 733FMG Resources (August 2006) Pty. Ltd.
Senior Note, 6.875%, 2/1/2018 . . . . . . . . . . . . . . . . . . . . . . . . . . . . . . . . . . . . . . . . . . . . . . . . . . . . . . . . . . . . . . . . . . . . . . . . 700,000 USD 698 786Senior Note, 8.25%, 11/1/2019 . . . . . . . . . . . . . . . . . . . . . . . . . . . . . . . . . . . . . . . . . . . . . . . . . . . . . . . . . . . . . . . . . . . . . . . . 700,000 USD 755 816
2,156 2,335
Japan: 0.46%eAccess Ltd., Senior Note, 8.25%, 4/1/2018 . . . . . . . . . . . . . . . . . . . . . . . . . . . . . . . . . . . . . . . . . . . . . . . . . . . . . . . . . . . . . . . . . 600,000 USD 585 694Mitsui Sumitomo Insurance Co. Ltd., Junior Subordinated Note, 7.00% to 3/15/2022, Floating Rate Note thereafter, 3/15/2072 . . . . . . 1,200,000 USD 1,194 1,527
1,779 2,221
Indonesia: 0.40%Government of Indonesia
FR34, 12.80%, 6/15/2021 . . . . . . . . . . . . . . . . . . . . . . . . . . . . . . . . . . . . . . . . . . . . . . . . . . . . . . . . . . . . . . . . . . . . . . . . . . . . 3,130,000,000 IDR 466 353FR35, 12.90%, 6/15/2022 . . . . . . . . . . . . . . . . . . . . . . . . . . . . . . . . . . . . . . . . . . . . . . . . . . . . . . . . . . . . . . . . . . . . . . . . . . . . 8,130,000,000 IDR 1,061 928FR36, 11.50%, 9/15/2019 . . . . . . . . . . . . . . . . . . . . . . . . . . . . . . . . . . . . . . . . . . . . . . . . . . . . . . . . . . . . . . . . . . . . . . . . . . . . 6,300,000,000 IDR 894 653
2,421 1,934
Italy: 0.38%Wind Acquisition Finance SA
Senior Secured Note, 4.00%, 7/15/2020 . . . . . . . . . . . . . . . . . . . . . . . . . . . . . . . . . . . . . . . . . . . . . . . . . . . . . . . . . . . . . . . . . . 200,000 EUR 292 292Senior Secured Note, 7.00%, 4/23/2021 . . . . . . . . . . . . . . . . . . . . . . . . . . . . . . . . . . . . . . . . . . . . . . . . . . . . . . . . . . . . . . . . . . 1,000,000 EUR 1,510 1,573
1,802 1,865
Chile: 0.36%Cencosud SA, Senior Note, 4.875%, 1/20/2023 . . . . . . . . . . . . . . . . . . . . . . . . . . . . . . . . . . . . . . . . . . . . . . . . . . . . . . . . . . . . . . . 1,200,000 USD 1,181 1,293VTR Finance BV, Senior Secured Note, 6.875%, 1/15/2024 . . . . . . . . . . . . . . . . . . . . . . . . . . . . . . . . . . . . . . . . . . . . . . . . . . . . . . 400,000 USD 450 459
1,631 1,752
Bermuda: 0.33%Digicel Group Ltd., Senior Note, 8.25%, 9/30/2020 . . . . . . . . . . . . . . . . . . . . . . . . . . . . . . . . . . . . . . . . . . . . . . . . . . . . . . . . . . . . 1,000,000 USD 978 1,175Digicel Ltd., Senior Note, 6.00%, 4/15/2021 . . . . . . . . . . . . . . . . . . . . . . . . . . . . . . . . . . . . . . . . . . . . . . . . . . . . . . . . . . . . . . . . . 400,000 USD 406 442
1,384 1,617
Sri Lanka: 0.31%Government of Sri Lanka
A, 11.75%, 3/15/2015 . . . . . . . . . . . . . . . . . . . . . . . . . . . . . . . . . . . . . . . . . . . . . . . . . . . . . . . . . . . . . . . . . . . . . . . . . . . . . . . 440,000 LKR 4 4A, 6.50%, 7/15/2015 . . . . . . . . . . . . . . . . . . . . . . . . . . . . . . . . . . . . . . . . . . . . . . . . . . . . . . . . . . . . . . . . . . . . . . . . . . . . . . . . 10,950,000 LKR 91 89
The accompanying notes are an integral part of these financial statements.
Franklin Templeton Investments Funds 145
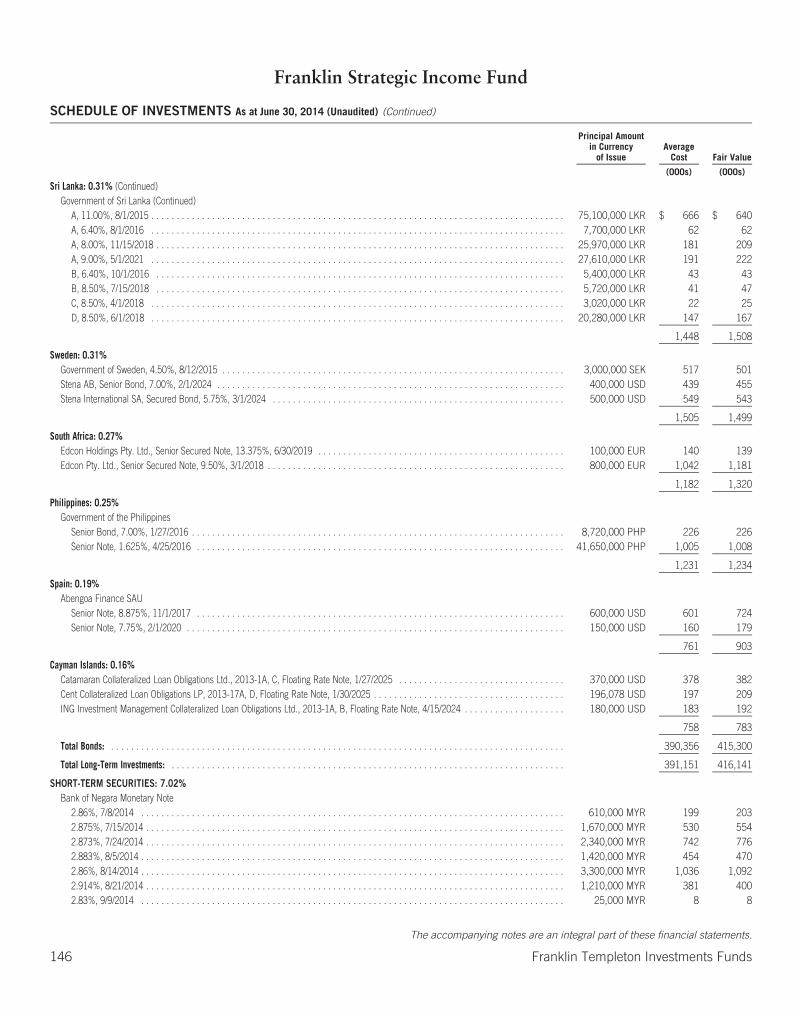
Franklin Strategic Income Fund
SCHEDULE OF INVESTMENTS As at June 30, 2014 (Unaudited) (Continued)
Principal Amountin Currency
of IssueAverage
Cost Fair Value
(000s) (000s)
Sri Lanka: 0.31% (Continued)Government of Sri Lanka (Continued)
A, 11.00%, 8/1/2015 . . . . . . . . . . . . . . . . . . . . . . . . . . . . . . . . . . . . . . . . . . . . . . . . . . . . . . . . . . . . . . . . . . . . . . . . . . . . . . . . . . 75,100,000 LKR $ 666 $ 640A, 6.40%, 8/1/2016 . . . . . . . . . . . . . . . . . . . . . . . . . . . . . . . . . . . . . . . . . . . . . . . . . . . . . . . . . . . . . . . . . . . . . . . . . . . . . . . . . . 7,700,000 LKR 62 62A, 8.00%, 11/15/2018 . . . . . . . . . . . . . . . . . . . . . . . . . . . . . . . . . . . . . . . . . . . . . . . . . . . . . . . . . . . . . . . . . . . . . . . . . . . . . . . . . 25,970,000 LKR 181 209A, 9.00%, 5/1/2021 . . . . . . . . . . . . . . . . . . . . . . . . . . . . . . . . . . . . . . . . . . . . . . . . . . . . . . . . . . . . . . . . . . . . . . . . . . . . . . . . . . 27,610,000 LKR 191 222B, 6.40%, 10/1/2016 . . . . . . . . . . . . . . . . . . . . . . . . . . . . . . . . . . . . . . . . . . . . . . . . . . . . . . . . . . . . . . . . . . . . . . . . . . . . . . . . . 5,400,000 LKR 43 43B, 8.50%, 7/15/2018 . . . . . . . . . . . . . . . . . . . . . . . . . . . . . . . . . . . . . . . . . . . . . . . . . . . . . . . . . . . . . . . . . . . . . . . . . . . . . . . . . 5,720,000 LKR 41 47C, 8.50%, 4/1/2018 . . . . . . . . . . . . . . . . . . . . . . . . . . . . . . . . . . . . . . . . . . . . . . . . . . . . . . . . . . . . . . . . . . . . . . . . . . . . . . . . . . 3,020,000 LKR 22 25D, 8.50%, 6/1/2018 . . . . . . . . . . . . . . . . . . . . . . . . . . . . . . . . . . . . . . . . . . . . . . . . . . . . . . . . . . . . . . . . . . . . . . . . . . . . . . . . . . 20,280,000 LKR 147 167
1,448 1,508
Sweden: 0.31%Government of Sweden, 4.50%, 8/12/2015 . . . . . . . . . . . . . . . . . . . . . . . . . . . . . . . . . . . . . . . . . . . . . . . . . . . . . . . . . . . . . . . . . . . . 3,000,000 SEK 517 501Stena AB, Senior Bond, 7.00%, 2/1/2024 . . . . . . . . . . . . . . . . . . . . . . . . . . . . . . . . . . . . . . . . . . . . . . . . . . . . . . . . . . . . . . . . . . . . . 400,000 USD 439 455Stena International SA, Secured Bond, 5.75%, 3/1/2024 . . . . . . . . . . . . . . . . . . . . . . . . . . . . . . . . . . . . . . . . . . . . . . . . . . . . . . . . . . 500,000 USD 549 543
1,505 1,499
South Africa: 0.27%Edcon Holdings Pty. Ltd., Senior Secured Note, 13.375%, 6/30/2019 . . . . . . . . . . . . . . . . . . . . . . . . . . . . . . . . . . . . . . . . . . . . . . . . . 100,000 EUR 140 139Edcon Pty. Ltd., Senior Secured Note, 9.50%, 3/1/2018 . . . . . . . . . . . . . . . . . . . . . . . . . . . . . . . . . . . . . . . . . . . . . . . . . . . . . . . . . . . 800,000 EUR 1,042 1,181
1,182 1,320
Philippines: 0.25%Government of the Philippines
Senior Bond, 7.00%, 1/27/2016 . . . . . . . . . . . . . . . . . . . . . . . . . . . . . . . . . . . . . . . . . . . . . . . . . . . . . . . . . . . . . . . . . . . . . . . . . . 8,720,000 PHP 226 226Senior Note, 1.625%, 4/25/2016 . . . . . . . . . . . . . . . . . . . . . . . . . . . . . . . . . . . . . . . . . . . . . . . . . . . . . . . . . . . . . . . . . . . . . . . . . 41,650,000 PHP 1,005 1,008
1,231 1,234
Spain: 0.19%Abengoa Finance SAU
Senior Note, 8.875%, 11/1/2017 . . . . . . . . . . . . . . . . . . . . . . . . . . . . . . . . . . . . . . . . . . . . . . . . . . . . . . . . . . . . . . . . . . . . . . . . . 600,000 USD 601 724Senior Note, 7.75%, 2/1/2020 . . . . . . . . . . . . . . . . . . . . . . . . . . . . . . . . . . . . . . . . . . . . . . . . . . . . . . . . . . . . . . . . . . . . . . . . . . . 150,000 USD 160 179
761 903
Cayman Islands: 0.16%Catamaran Collateralized Loan Obligations Ltd., 2013-1A, C, Floating Rate Note, 1/27/2025 . . . . . . . . . . . . . . . . . . . . . . . . . . . . . . . . . 370,000 USD 378 382Cent Collateralized Loan Obligations LP, 2013-17A, D, Floating Rate Note, 1/30/2025 . . . . . . . . . . . . . . . . . . . . . . . . . . . . . . . . . . . . . . 196,078 USD 197 209ING Investment Management Collateralized Loan Obligations Ltd., 2013-1A, B, Floating Rate Note, 4/15/2024 . . . . . . . . . . . . . . . . . . . . 180,000 USD 183 192
758 783
Total Bonds: . . . . . . . . . . . . . . . . . . . . . . . . . . . . . . . . . . . . . . . . . . . . . . . . . . . . . . . . . . . . . . . . . . . . . . . . . . . . . . . . . . . . . . . . . . 390,356 415,300
Total Long-Term Investments: . . . . . . . . . . . . . . . . . . . . . . . . . . . . . . . . . . . . . . . . . . . . . . . . . . . . . . . . . . . . . . . . . . . . . . . . . . . . . . 391,151 416,141
SHORT-TERM SECURITIES: 7.02%Bank of Negara Monetary Note
2.86%, 7/8/2014 . . . . . . . . . . . . . . . . . . . . . . . . . . . . . . . . . . . . . . . . . . . . . . . . . . . . . . . . . . . . . . . . . . . . . . . . . . . . . . . . . . . . 610,000 MYR 199 2032.875%, 7/15/2014 . . . . . . . . . . . . . . . . . . . . . . . . . . . . . . . . . . . . . . . . . . . . . . . . . . . . . . . . . . . . . . . . . . . . . . . . . . . . . . . . . . . 1,670,000 MYR 530 5542.873%, 7/24/2014 . . . . . . . . . . . . . . . . . . . . . . . . . . . . . . . . . . . . . . . . . . . . . . . . . . . . . . . . . . . . . . . . . . . . . . . . . . . . . . . . . . . 2,340,000 MYR 742 7762.883%, 8/5/2014 . . . . . . . . . . . . . . . . . . . . . . . . . . . . . . . . . . . . . . . . . . . . . . . . . . . . . . . . . . . . . . . . . . . . . . . . . . . . . . . . . . . . 1,420,000 MYR 454 4702.86%, 8/14/2014 . . . . . . . . . . . . . . . . . . . . . . . . . . . . . . . . . . . . . . . . . . . . . . . . . . . . . . . . . . . . . . . . . . . . . . . . . . . . . . . . . . . . 3,300,000 MYR 1,036 1,0922.914%, 8/21/2014 . . . . . . . . . . . . . . . . . . . . . . . . . . . . . . . . . . . . . . . . . . . . . . . . . . . . . . . . . . . . . . . . . . . . . . . . . . . . . . . . . . . 1,210,000 MYR 381 4002.83%, 9/9/2014 . . . . . . . . . . . . . . . . . . . . . . . . . . . . . . . . . . . . . . . . . . . . . . . . . . . . . . . . . . . . . . . . . . . . . . . . . . . . . . . . . . . . 25,000 MYR 8 8
The accompanying notes are an integral part of these financial statements.
146 Franklin Templeton Investments Funds
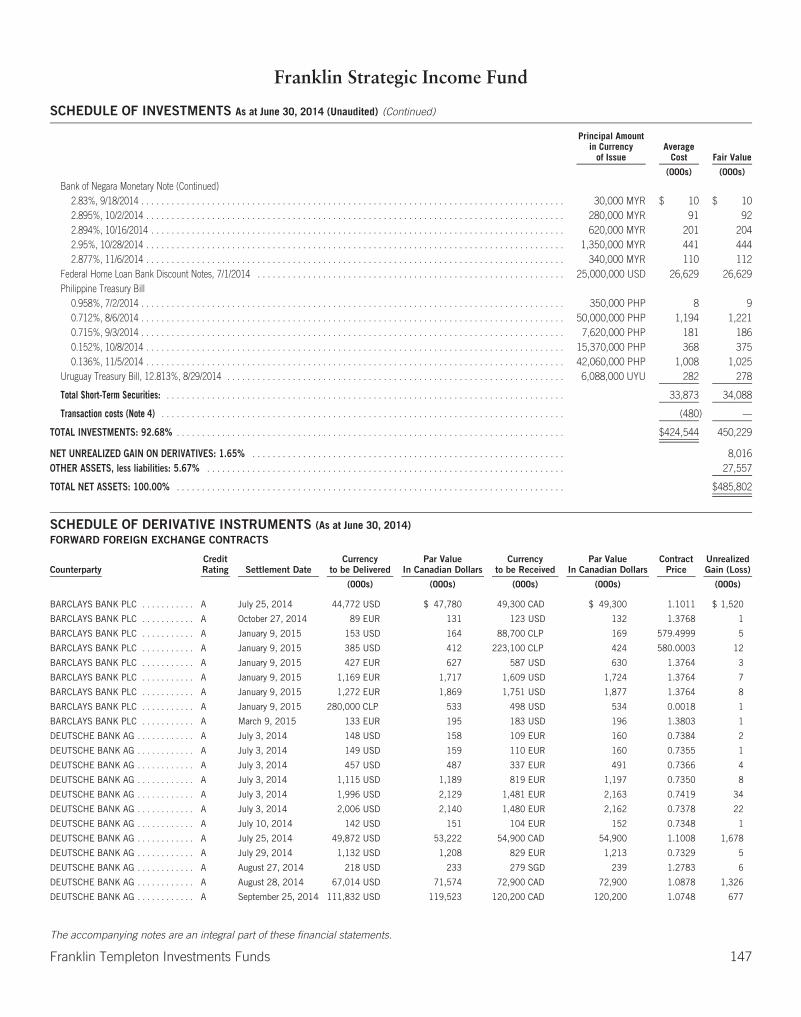
Franklin Strategic Income Fund
SCHEDULE OF INVESTMENTS As at June 30, 2014 (Unaudited) (Continued)
Principal Amountin Currency
of IssueAverage
Cost Fair Value
(000s) (000s)
Bank of Negara Monetary Note (Continued)2.83%, 9/18/2014 . . . . . . . . . . . . . . . . . . . . . . . . . . . . . . . . . . . . . . . . . . . . . . . . . . . . . . . . . . . . . . . . . . . . . . . . . . . . . . . . . . . . 30,000 MYR $ 10 $ 102.895%, 10/2/2014 . . . . . . . . . . . . . . . . . . . . . . . . . . . . . . . . . . . . . . . . . . . . . . . . . . . . . . . . . . . . . . . . . . . . . . . . . . . . . . . . . . . 280,000 MYR 91 922.894%, 10/16/2014 . . . . . . . . . . . . . . . . . . . . . . . . . . . . . . . . . . . . . . . . . . . . . . . . . . . . . . . . . . . . . . . . . . . . . . . . . . . . . . . . . . 620,000 MYR 201 2042.95%, 10/28/2014 . . . . . . . . . . . . . . . . . . . . . . . . . . . . . . . . . . . . . . . . . . . . . . . . . . . . . . . . . . . . . . . . . . . . . . . . . . . . . . . . . . . 1,350,000 MYR 441 4442.877%, 11/6/2014 . . . . . . . . . . . . . . . . . . . . . . . . . . . . . . . . . . . . . . . . . . . . . . . . . . . . . . . . . . . . . . . . . . . . . . . . . . . . . . . . . . . 340,000 MYR 110 112
Federal Home Loan Bank Discount Notes, 7/1/2014 . . . . . . . . . . . . . . . . . . . . . . . . . . . . . . . . . . . . . . . . . . . . . . . . . . . . . . . . . . . . . 25,000,000 USD 26,629 26,629Philippine Treasury Bill
0.958%, 7/2/2014 . . . . . . . . . . . . . . . . . . . . . . . . . . . . . . . . . . . . . . . . . . . . . . . . . . . . . . . . . . . . . . . . . . . . . . . . . . . . . . . . . . . . 350,000 PHP 8 90.712%, 8/6/2014 . . . . . . . . . . . . . . . . . . . . . . . . . . . . . . . . . . . . . . . . . . . . . . . . . . . . . . . . . . . . . . . . . . . . . . . . . . . . . . . . . . . . 50,000,000 PHP 1,194 1,2210.715%, 9/3/2014 . . . . . . . . . . . . . . . . . . . . . . . . . . . . . . . . . . . . . . . . . . . . . . . . . . . . . . . . . . . . . . . . . . . . . . . . . . . . . . . . . . . . 7,620,000 PHP 181 1860.152%, 10/8/2014 . . . . . . . . . . . . . . . . . . . . . . . . . . . . . . . . . . . . . . . . . . . . . . . . . . . . . . . . . . . . . . . . . . . . . . . . . . . . . . . . . . . 15,370,000 PHP 368 3750.136%, 11/5/2014 . . . . . . . . . . . . . . . . . . . . . . . . . . . . . . . . . . . . . . . . . . . . . . . . . . . . . . . . . . . . . . . . . . . . . . . . . . . . . . . . . . . 42,060,000 PHP 1,008 1,025
Uruguay Treasury Bill, 12.813%, 8/29/2014 . . . . . . . . . . . . . . . . . . . . . . . . . . . . . . . . . . . . . . . . . . . . . . . . . . . . . . . . . . . . . . . . . . . 6,088,000 UYU 282 278
Total Short-Term Securities: . . . . . . . . . . . . . . . . . . . . . . . . . . . . . . . . . . . . . . . . . . . . . . . . . . . . . . . . . . . . . . . . . . . . . . . . . . . . . . . 33,873 34,088
Transaction costs (Note 4) . . . . . . . . . . . . . . . . . . . . . . . . . . . . . . . . . . . . . . . . . . . . . . . . . . . . . . . . . . . . . . . . . . . . . . . . . . . . . . . . (480) —
TOTAL INVESTMENTS: 92.68% . . . . . . . . . . . . . . . . . . . . . . . . . . . . . . . . . . . . . . . . . . . . . . . . . . . . . . . . . . . . . . . . . . . . . . . . . . . . . $424,544 450,229
NET UNREALIZED GAIN ON DERIVATIVES: 1.65% . . . . . . . . . . . . . . . . . . . . . . . . . . . . . . . . . . . . . . . . . . . . . . . . . . . . . . . . . . . . . . 8,016OTHER ASSETS, less liabilities: 5.67% . . . . . . . . . . . . . . . . . . . . . . . . . . . . . . . . . . . . . . . . . . . . . . . . . . . . . . . . . . . . . . . . . . . . . . . 27,557
TOTAL NET ASSETS: 100.00% . . . . . . . . . . . . . . . . . . . . . . . . . . . . . . . . . . . . . . . . . . . . . . . . . . . . . . . . . . . . . . . . . . . . . . . . . . . . . $485,802
SCHEDULE OF DERIVATIVE INSTRUMENTS (As at June 30, 2014)FORWARD FOREIGN EXCHANGE CONTRACTS
CounterpartyCreditRating Settlement Date
Currencyto be Delivered
Par ValueIn Canadian Dollars
Currencyto be Received
Par ValueIn Canadian Dollars
ContractPrice
UnrealizedGain (Loss)
(000s) (000s) (000s) (000s) (000s)
BARCLAYS BANK PLC . . . . . . . . . . . A July 25, 2014 44,772 USD $ 47,780 49,300 CAD $ 49,300 1.1011 $ 1,520
BARCLAYS BANK PLC . . . . . . . . . . . A October 27, 2014 89 EUR 131 123 USD 132 1.3768 1
BARCLAYS BANK PLC . . . . . . . . . . . A January 9, 2015 153 USD 164 88,700 CLP 169 579.4999 5
BARCLAYS BANK PLC . . . . . . . . . . . A January 9, 2015 385 USD 412 223,100 CLP 424 580.0003 12
BARCLAYS BANK PLC . . . . . . . . . . . A January 9, 2015 427 EUR 627 587 USD 630 1.3764 3
BARCLAYS BANK PLC . . . . . . . . . . . A January 9, 2015 1,169 EUR 1,717 1,609 USD 1,724 1.3764 7
BARCLAYS BANK PLC . . . . . . . . . . . A January 9, 2015 1,272 EUR 1,869 1,751 USD 1,877 1.3764 8
BARCLAYS BANK PLC . . . . . . . . . . . A January 9, 2015 280,000 CLP 533 498 USD 534 0.0018 1
BARCLAYS BANK PLC . . . . . . . . . . . A March 9, 2015 133 EUR 195 183 USD 196 1.3803 1
DEUTSCHE BANK AG . . . . . . . . . . . . A July 3, 2014 148 USD 158 109 EUR 160 0.7384 2
DEUTSCHE BANK AG . . . . . . . . . . . . A July 3, 2014 149 USD 159 110 EUR 160 0.7355 1
DEUTSCHE BANK AG . . . . . . . . . . . . A July 3, 2014 457 USD 487 337 EUR 491 0.7366 4
DEUTSCHE BANK AG . . . . . . . . . . . . A July 3, 2014 1,115 USD 1,189 819 EUR 1,197 0.7350 8
DEUTSCHE BANK AG . . . . . . . . . . . . A July 3, 2014 1,996 USD 2,129 1,481 EUR 2,163 0.7419 34
DEUTSCHE BANK AG . . . . . . . . . . . . A July 3, 2014 2,006 USD 2,140 1,480 EUR 2,162 0.7378 22
DEUTSCHE BANK AG . . . . . . . . . . . . A July 10, 2014 142 USD 151 104 EUR 152 0.7348 1
DEUTSCHE BANK AG . . . . . . . . . . . . A July 25, 2014 49,872 USD 53,222 54,900 CAD 54,900 1.1008 1,678
DEUTSCHE BANK AG . . . . . . . . . . . . A July 29, 2014 1,132 USD 1,208 829 EUR 1,213 0.7329 5
DEUTSCHE BANK AG . . . . . . . . . . . . A August 27, 2014 218 USD 233 279 SGD 239 1.2783 6
DEUTSCHE BANK AG . . . . . . . . . . . . A August 28, 2014 67,014 USD 71,574 72,900 CAD 72,900 1.0878 1,326
DEUTSCHE BANK AG . . . . . . . . . . . . A September 25, 2014 111,832 USD 119,523 120,200 CAD 120,200 1.0748 677
The accompanying notes are an integral part of these financial statements.
Franklin Templeton Investments Funds 147
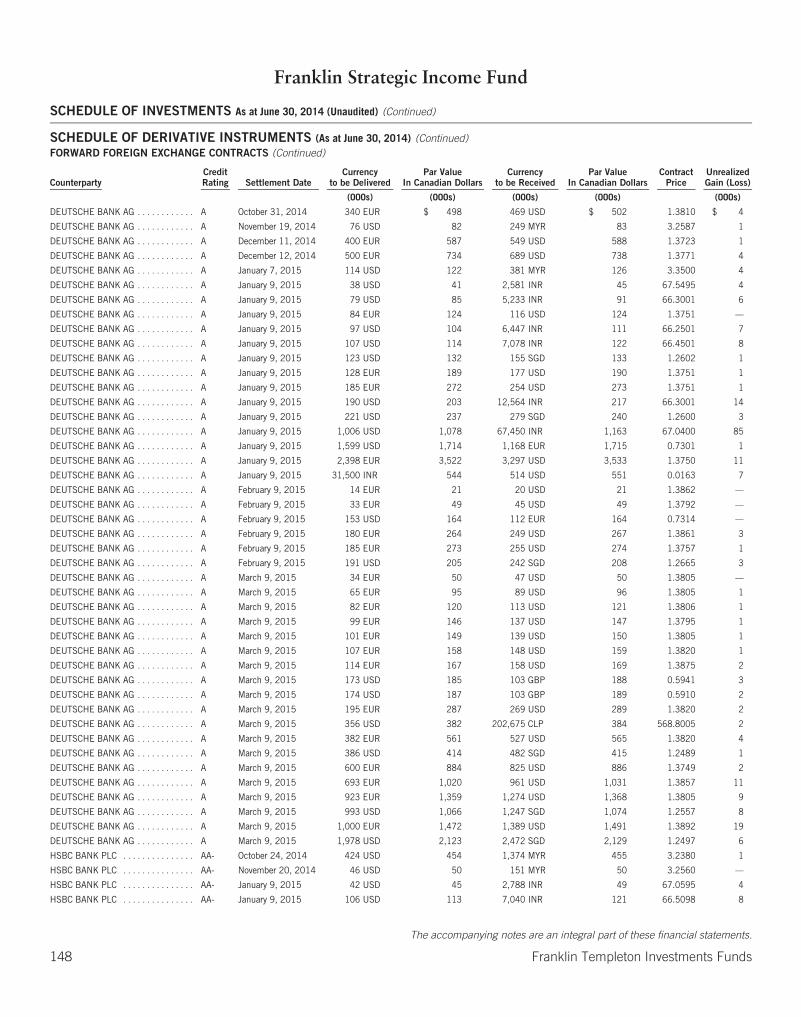
Franklin Strategic Income Fund
SCHEDULE OF INVESTMENTS As at June 30, 2014 (Unaudited) (Continued)
SCHEDULE OF DERIVATIVE INSTRUMENTS (As at June 30, 2014) (Continued)FORWARD FOREIGN EXCHANGE CONTRACTS (Continued)
CounterpartyCreditRating Settlement Date
Currencyto be Delivered
Par ValueIn Canadian Dollars
Currencyto be Received
Par ValueIn Canadian Dollars
ContractPrice
UnrealizedGain (Loss)
(000s) (000s) (000s) (000s) (000s)
DEUTSCHE BANK AG . . . . . . . . . . . . A October 31, 2014 340 EUR $ 498 469 USD $ 502 1.3810 $ 4
DEUTSCHE BANK AG . . . . . . . . . . . . A November 19, 2014 76 USD 82 249 MYR 83 3.2587 1
DEUTSCHE BANK AG . . . . . . . . . . . . A December 11, 2014 400 EUR 587 549 USD 588 1.3723 1
DEUTSCHE BANK AG . . . . . . . . . . . . A December 12, 2014 500 EUR 734 689 USD 738 1.3771 4
DEUTSCHE BANK AG . . . . . . . . . . . . A January 7, 2015 114 USD 122 381 MYR 126 3.3500 4
DEUTSCHE BANK AG . . . . . . . . . . . . A January 9, 2015 38 USD 41 2,581 INR 45 67.5495 4
DEUTSCHE BANK AG . . . . . . . . . . . . A January 9, 2015 79 USD 85 5,233 INR 91 66.3001 6
DEUTSCHE BANK AG . . . . . . . . . . . . A January 9, 2015 84 EUR 124 116 USD 124 1.3751 —
DEUTSCHE BANK AG . . . . . . . . . . . . A January 9, 2015 97 USD 104 6,447 INR 111 66.2501 7
DEUTSCHE BANK AG . . . . . . . . . . . . A January 9, 2015 107 USD 114 7,078 INR 122 66.4501 8
DEUTSCHE BANK AG . . . . . . . . . . . . A January 9, 2015 123 USD 132 155 SGD 133 1.2602 1
DEUTSCHE BANK AG . . . . . . . . . . . . A January 9, 2015 128 EUR 189 177 USD 190 1.3751 1
DEUTSCHE BANK AG . . . . . . . . . . . . A January 9, 2015 185 EUR 272 254 USD 273 1.3751 1
DEUTSCHE BANK AG . . . . . . . . . . . . A January 9, 2015 190 USD 203 12,564 INR 217 66.3001 14
DEUTSCHE BANK AG . . . . . . . . . . . . A January 9, 2015 221 USD 237 279 SGD 240 1.2600 3
DEUTSCHE BANK AG . . . . . . . . . . . . A January 9, 2015 1,006 USD 1,078 67,450 INR 1,163 67.0400 85
DEUTSCHE BANK AG . . . . . . . . . . . . A January 9, 2015 1,599 USD 1,714 1,168 EUR 1,715 0.7301 1
DEUTSCHE BANK AG . . . . . . . . . . . . A January 9, 2015 2,398 EUR 3,522 3,297 USD 3,533 1.3750 11
DEUTSCHE BANK AG . . . . . . . . . . . . A January 9, 2015 31,500 INR 544 514 USD 551 0.0163 7
DEUTSCHE BANK AG . . . . . . . . . . . . A February 9, 2015 14 EUR 21 20 USD 21 1.3862 —
DEUTSCHE BANK AG . . . . . . . . . . . . A February 9, 2015 33 EUR 49 45 USD 49 1.3792 —
DEUTSCHE BANK AG . . . . . . . . . . . . A February 9, 2015 153 USD 164 112 EUR 164 0.7314 —
DEUTSCHE BANK AG . . . . . . . . . . . . A February 9, 2015 180 EUR 264 249 USD 267 1.3861 3
DEUTSCHE BANK AG . . . . . . . . . . . . A February 9, 2015 185 EUR 273 255 USD 274 1.3757 1
DEUTSCHE BANK AG . . . . . . . . . . . . A February 9, 2015 191 USD 205 242 SGD 208 1.2665 3
DEUTSCHE BANK AG . . . . . . . . . . . . A March 9, 2015 34 EUR 50 47 USD 50 1.3805 —
DEUTSCHE BANK AG . . . . . . . . . . . . A March 9, 2015 65 EUR 95 89 USD 96 1.3805 1
DEUTSCHE BANK AG . . . . . . . . . . . . A March 9, 2015 82 EUR 120 113 USD 121 1.3806 1
DEUTSCHE BANK AG . . . . . . . . . . . . A March 9, 2015 99 EUR 146 137 USD 147 1.3795 1
DEUTSCHE BANK AG . . . . . . . . . . . . A March 9, 2015 101 EUR 149 139 USD 150 1.3805 1
DEUTSCHE BANK AG . . . . . . . . . . . . A March 9, 2015 107 EUR 158 148 USD 159 1.3820 1
DEUTSCHE BANK AG . . . . . . . . . . . . A March 9, 2015 114 EUR 167 158 USD 169 1.3875 2
DEUTSCHE BANK AG . . . . . . . . . . . . A March 9, 2015 173 USD 185 103 GBP 188 0.5941 3
DEUTSCHE BANK AG . . . . . . . . . . . . A March 9, 2015 174 USD 187 103 GBP 189 0.5910 2
DEUTSCHE BANK AG . . . . . . . . . . . . A March 9, 2015 195 EUR 287 269 USD 289 1.3820 2
DEUTSCHE BANK AG . . . . . . . . . . . . A March 9, 2015 356 USD 382 202,675 CLP 384 568.8005 2
DEUTSCHE BANK AG . . . . . . . . . . . . A March 9, 2015 382 EUR 561 527 USD 565 1.3820 4
DEUTSCHE BANK AG . . . . . . . . . . . . A March 9, 2015 386 USD 414 482 SGD 415 1.2489 1
DEUTSCHE BANK AG . . . . . . . . . . . . A March 9, 2015 600 EUR 884 825 USD 886 1.3749 2
DEUTSCHE BANK AG . . . . . . . . . . . . A March 9, 2015 693 EUR 1,020 961 USD 1,031 1.3857 11
DEUTSCHE BANK AG . . . . . . . . . . . . A March 9, 2015 923 EUR 1,359 1,274 USD 1,368 1.3805 9
DEUTSCHE BANK AG . . . . . . . . . . . . A March 9, 2015 993 USD 1,066 1,247 SGD 1,074 1.2557 8
DEUTSCHE BANK AG . . . . . . . . . . . . A March 9, 2015 1,000 EUR 1,472 1,389 USD 1,491 1.3892 19
DEUTSCHE BANK AG . . . . . . . . . . . . A March 9, 2015 1,978 USD 2,123 2,472 SGD 2,129 1.2497 6
HSBC BANK PLC . . . . . . . . . . . . . . . AA- October 24, 2014 424 USD 454 1,374 MYR 455 3.2380 1
HSBC BANK PLC . . . . . . . . . . . . . . . AA- November 20, 2014 46 USD 50 151 MYR 50 3.2560 —
HSBC BANK PLC . . . . . . . . . . . . . . . AA- January 9, 2015 42 USD 45 2,788 INR 49 67.0595 4
HSBC BANK PLC . . . . . . . . . . . . . . . AA- January 9, 2015 106 USD 113 7,040 INR 121 66.5098 8
The accompanying notes are an integral part of these financial statements.
148 Franklin Templeton Investments Funds
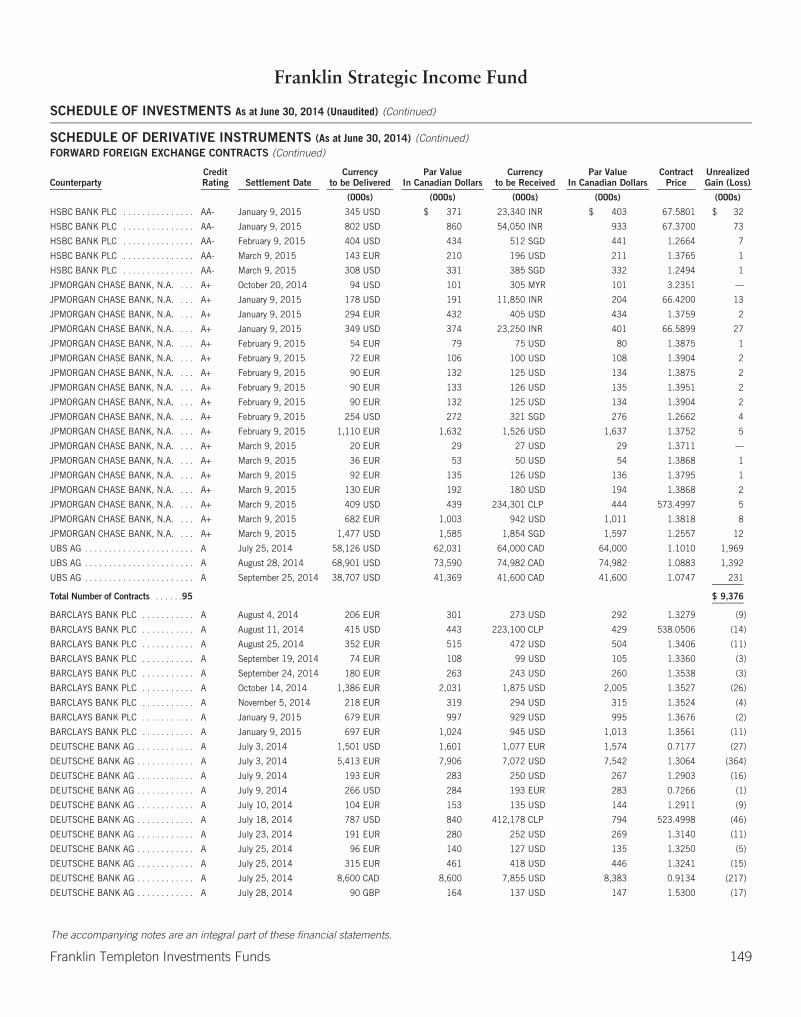
Franklin Strategic Income Fund
SCHEDULE OF INVESTMENTS As at June 30, 2014 (Unaudited) (Continued)
SCHEDULE OF DERIVATIVE INSTRUMENTS (As at June 30, 2014) (Continued)FORWARD FOREIGN EXCHANGE CONTRACTS (Continued)
CounterpartyCreditRating Settlement Date
Currencyto be Delivered
Par ValueIn Canadian Dollars
Currencyto be Received
Par ValueIn Canadian Dollars
ContractPrice
UnrealizedGain (Loss)
(000s) (000s) (000s) (000s) (000s)
HSBC BANK PLC . . . . . . . . . . . . . . . AA- January 9, 2015 345 USD $ 371 23,340 INR $ 403 67.5801 $ 32
HSBC BANK PLC . . . . . . . . . . . . . . . AA- January 9, 2015 802 USD 860 54,050 INR 933 67.3700 73
HSBC BANK PLC . . . . . . . . . . . . . . . AA- February 9, 2015 404 USD 434 512 SGD 441 1.2664 7
HSBC BANK PLC . . . . . . . . . . . . . . . AA- March 9, 2015 143 EUR 210 196 USD 211 1.3765 1
HSBC BANK PLC . . . . . . . . . . . . . . . AA- March 9, 2015 308 USD 331 385 SGD 332 1.2494 1
JPMORGAN CHASE BANK, N.A. . . . A+ October 20, 2014 94 USD 101 305 MYR 101 3.2351 —
JPMORGAN CHASE BANK, N.A. . . . A+ January 9, 2015 178 USD 191 11,850 INR 204 66.4200 13
JPMORGAN CHASE BANK, N.A. . . . A+ January 9, 2015 294 EUR 432 405 USD 434 1.3759 2
JPMORGAN CHASE BANK, N.A. . . . A+ January 9, 2015 349 USD 374 23,250 INR 401 66.5899 27
JPMORGAN CHASE BANK, N.A. . . . A+ February 9, 2015 54 EUR 79 75 USD 80 1.3875 1
JPMORGAN CHASE BANK, N.A. . . . A+ February 9, 2015 72 EUR 106 100 USD 108 1.3904 2
JPMORGAN CHASE BANK, N.A. . . . A+ February 9, 2015 90 EUR 132 125 USD 134 1.3875 2
JPMORGAN CHASE BANK, N.A. . . . A+ February 9, 2015 90 EUR 133 126 USD 135 1.3951 2
JPMORGAN CHASE BANK, N.A. . . . A+ February 9, 2015 90 EUR 132 125 USD 134 1.3904 2
JPMORGAN CHASE BANK, N.A. . . . A+ February 9, 2015 254 USD 272 321 SGD 276 1.2662 4
JPMORGAN CHASE BANK, N.A. . . . A+ February 9, 2015 1,110 EUR 1,632 1,526 USD 1,637 1.3752 5
JPMORGAN CHASE BANK, N.A. . . . A+ March 9, 2015 20 EUR 29 27 USD 29 1.3711 —
JPMORGAN CHASE BANK, N.A. . . . A+ March 9, 2015 36 EUR 53 50 USD 54 1.3868 1
JPMORGAN CHASE BANK, N.A. . . . A+ March 9, 2015 92 EUR 135 126 USD 136 1.3795 1
JPMORGAN CHASE BANK, N.A. . . . A+ March 9, 2015 130 EUR 192 180 USD 194 1.3868 2
JPMORGAN CHASE BANK, N.A. . . . A+ March 9, 2015 409 USD 439 234,301 CLP 444 573.4997 5
JPMORGAN CHASE BANK, N.A. . . . A+ March 9, 2015 682 EUR 1,003 942 USD 1,011 1.3818 8
JPMORGAN CHASE BANK, N.A. . . . A+ March 9, 2015 1,477 USD 1,585 1,854 SGD 1,597 1.2557 12
UBS AG . . . . . . . . . . . . . . . . . . . . . . . A July 25, 2014 58,126 USD 62,031 64,000 CAD 64,000 1.1010 1,969
UBS AG . . . . . . . . . . . . . . . . . . . . . . . A August 28, 2014 68,901 USD 73,590 74,982 CAD 74,982 1.0883 1,392
UBS AG . . . . . . . . . . . . . . . . . . . . . . . A September 25, 2014 38,707 USD 41,369 41,600 CAD 41,600 1.0747 231
Total Number of Contracts . . . . . .95 $ 9,376
BARCLAYS BANK PLC . . . . . . . . . . . A August 4, 2014 206 EUR 301 273 USD 292 1.3279 (9)
BARCLAYS BANK PLC . . . . . . . . . . . A August 11, 2014 415 USD 443 223,100 CLP 429 538.0506 (14)
BARCLAYS BANK PLC . . . . . . . . . . . A August 25, 2014 352 EUR 515 472 USD 504 1.3406 (11)
BARCLAYS BANK PLC . . . . . . . . . . . A September 19, 2014 74 EUR 108 99 USD 105 1.3360 (3)
BARCLAYS BANK PLC . . . . . . . . . . . A September 24, 2014 180 EUR 263 243 USD 260 1.3538 (3)
BARCLAYS BANK PLC . . . . . . . . . . . A October 14, 2014 1,386 EUR 2,031 1,875 USD 2,005 1.3527 (26)
BARCLAYS BANK PLC . . . . . . . . . . . A November 5, 2014 218 EUR 319 294 USD 315 1.3524 (4)
BARCLAYS BANK PLC . . . . . . . . . . . A January 9, 2015 679 EUR 997 929 USD 995 1.3676 (2)
BARCLAYS BANK PLC . . . . . . . . . . . A January 9, 2015 697 EUR 1,024 945 USD 1,013 1.3561 (11)
DEUTSCHE BANK AG . . . . . . . . . . . . A July 3, 2014 1,501 USD 1,601 1,077 EUR 1,574 0.7177 (27)
DEUTSCHE BANK AG . . . . . . . . . . . . A July 3, 2014 5,413 EUR 7,906 7,072 USD 7,542 1.3064 (364)
DEUTSCHE BANK AG . . . . . . . . . . . . A July 9, 2014 193 EUR 283 250 USD 267 1.2903 (16)
DEUTSCHE BANK AG . . . . . . . . . . . . A July 9, 2014 266 USD 284 193 EUR 283 0.7266 (1)
DEUTSCHE BANK AG . . . . . . . . . . . . A July 10, 2014 104 EUR 153 135 USD 144 1.2911 (9)
DEUTSCHE BANK AG . . . . . . . . . . . . A July 18, 2014 787 USD 840 412,178 CLP 794 523.4998 (46)
DEUTSCHE BANK AG . . . . . . . . . . . . A July 23, 2014 191 EUR 280 252 USD 269 1.3140 (11)
DEUTSCHE BANK AG . . . . . . . . . . . . A July 25, 2014 96 EUR 140 127 USD 135 1.3250 (5)
DEUTSCHE BANK AG . . . . . . . . . . . . A July 25, 2014 315 EUR 461 418 USD 446 1.3241 (15)
DEUTSCHE BANK AG . . . . . . . . . . . . A July 25, 2014 8,600 CAD 8,600 7,855 USD 8,383 0.9134 (217)
DEUTSCHE BANK AG . . . . . . . . . . . . A July 28, 2014 90 GBP 164 137 USD 147 1.5300 (17)
The accompanying notes are an integral part of these financial statements.
Franklin Templeton Investments Funds 149
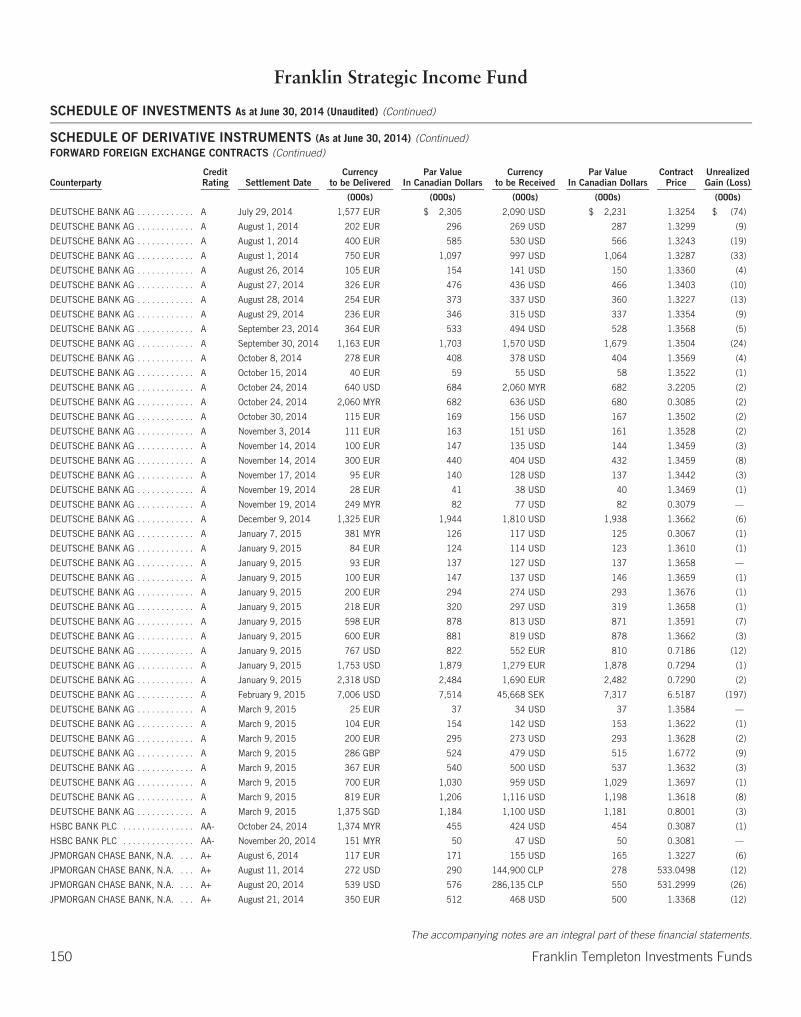
Franklin Strategic Income Fund
SCHEDULE OF INVESTMENTS As at June 30, 2014 (Unaudited) (Continued)
SCHEDULE OF DERIVATIVE INSTRUMENTS (As at June 30, 2014) (Continued)FORWARD FOREIGN EXCHANGE CONTRACTS (Continued)
CounterpartyCreditRating Settlement Date
Currencyto be Delivered
Par ValueIn Canadian Dollars
Currencyto be Received
Par ValueIn Canadian Dollars
ContractPrice
UnrealizedGain (Loss)
(000s) (000s) (000s) (000s) (000s)
DEUTSCHE BANK AG . . . . . . . . . . . . A July 29, 2014 1,577 EUR $ 2,305 2,090 USD $ 2,231 1.3254 $ (74)
DEUTSCHE BANK AG . . . . . . . . . . . . A August 1, 2014 202 EUR 296 269 USD 287 1.3299 (9)
DEUTSCHE BANK AG . . . . . . . . . . . . A August 1, 2014 400 EUR 585 530 USD 566 1.3243 (19)
DEUTSCHE BANK AG . . . . . . . . . . . . A August 1, 2014 750 EUR 1,097 997 USD 1,064 1.3287 (33)
DEUTSCHE BANK AG . . . . . . . . . . . . A August 26, 2014 105 EUR 154 141 USD 150 1.3360 (4)
DEUTSCHE BANK AG . . . . . . . . . . . . A August 27, 2014 326 EUR 476 436 USD 466 1.3403 (10)
DEUTSCHE BANK AG . . . . . . . . . . . . A August 28, 2014 254 EUR 373 337 USD 360 1.3227 (13)
DEUTSCHE BANK AG . . . . . . . . . . . . A August 29, 2014 236 EUR 346 315 USD 337 1.3354 (9)
DEUTSCHE BANK AG . . . . . . . . . . . . A September 23, 2014 364 EUR 533 494 USD 528 1.3568 (5)
DEUTSCHE BANK AG . . . . . . . . . . . . A September 30, 2014 1,163 EUR 1,703 1,570 USD 1,679 1.3504 (24)
DEUTSCHE BANK AG . . . . . . . . . . . . A October 8, 2014 278 EUR 408 378 USD 404 1.3569 (4)
DEUTSCHE BANK AG . . . . . . . . . . . . A October 15, 2014 40 EUR 59 55 USD 58 1.3522 (1)
DEUTSCHE BANK AG . . . . . . . . . . . . A October 24, 2014 640 USD 684 2,060 MYR 682 3.2205 (2)
DEUTSCHE BANK AG . . . . . . . . . . . . A October 24, 2014 2,060 MYR 682 636 USD 680 0.3085 (2)
DEUTSCHE BANK AG . . . . . . . . . . . . A October 30, 2014 115 EUR 169 156 USD 167 1.3502 (2)
DEUTSCHE BANK AG . . . . . . . . . . . . A November 3, 2014 111 EUR 163 151 USD 161 1.3528 (2)
DEUTSCHE BANK AG . . . . . . . . . . . . A November 14, 2014 100 EUR 147 135 USD 144 1.3459 (3)
DEUTSCHE BANK AG . . . . . . . . . . . . A November 14, 2014 300 EUR 440 404 USD 432 1.3459 (8)
DEUTSCHE BANK AG . . . . . . . . . . . . A November 17, 2014 95 EUR 140 128 USD 137 1.3442 (3)
DEUTSCHE BANK AG . . . . . . . . . . . . A November 19, 2014 28 EUR 41 38 USD 40 1.3469 (1)
DEUTSCHE BANK AG . . . . . . . . . . . . A November 19, 2014 249 MYR 82 77 USD 82 0.3079 —
DEUTSCHE BANK AG . . . . . . . . . . . . A December 9, 2014 1,325 EUR 1,944 1,810 USD 1,938 1.3662 (6)
DEUTSCHE BANK AG . . . . . . . . . . . . A January 7, 2015 381 MYR 126 117 USD 125 0.3067 (1)
DEUTSCHE BANK AG . . . . . . . . . . . . A January 9, 2015 84 EUR 124 114 USD 123 1.3610 (1)
DEUTSCHE BANK AG . . . . . . . . . . . . A January 9, 2015 93 EUR 137 127 USD 137 1.3658 —
DEUTSCHE BANK AG . . . . . . . . . . . . A January 9, 2015 100 EUR 147 137 USD 146 1.3659 (1)
DEUTSCHE BANK AG . . . . . . . . . . . . A January 9, 2015 200 EUR 294 274 USD 293 1.3676 (1)
DEUTSCHE BANK AG . . . . . . . . . . . . A January 9, 2015 218 EUR 320 297 USD 319 1.3658 (1)
DEUTSCHE BANK AG . . . . . . . . . . . . A January 9, 2015 598 EUR 878 813 USD 871 1.3591 (7)
DEUTSCHE BANK AG . . . . . . . . . . . . A January 9, 2015 600 EUR 881 819 USD 878 1.3662 (3)
DEUTSCHE BANK AG . . . . . . . . . . . . A January 9, 2015 767 USD 822 552 EUR 810 0.7186 (12)
DEUTSCHE BANK AG . . . . . . . . . . . . A January 9, 2015 1,753 USD 1,879 1,279 EUR 1,878 0.7294 (1)
DEUTSCHE BANK AG . . . . . . . . . . . . A January 9, 2015 2,318 USD 2,484 1,690 EUR 2,482 0.7290 (2)
DEUTSCHE BANK AG . . . . . . . . . . . . A February 9, 2015 7,006 USD 7,514 45,668 SEK 7,317 6.5187 (197)
DEUTSCHE BANK AG . . . . . . . . . . . . A March 9, 2015 25 EUR 37 34 USD 37 1.3584 —
DEUTSCHE BANK AG . . . . . . . . . . . . A March 9, 2015 104 EUR 154 142 USD 153 1.3622 (1)
DEUTSCHE BANK AG . . . . . . . . . . . . A March 9, 2015 200 EUR 295 273 USD 293 1.3628 (2)
DEUTSCHE BANK AG . . . . . . . . . . . . A March 9, 2015 286 GBP 524 479 USD 515 1.6772 (9)
DEUTSCHE BANK AG . . . . . . . . . . . . A March 9, 2015 367 EUR 540 500 USD 537 1.3632 (3)
DEUTSCHE BANK AG . . . . . . . . . . . . A March 9, 2015 700 EUR 1,030 959 USD 1,029 1.3697 (1)
DEUTSCHE BANK AG . . . . . . . . . . . . A March 9, 2015 819 EUR 1,206 1,116 USD 1,198 1.3618 (8)
DEUTSCHE BANK AG . . . . . . . . . . . . A March 9, 2015 1,375 SGD 1,184 1,100 USD 1,181 0.8001 (3)
HSBC BANK PLC . . . . . . . . . . . . . . . AA- October 24, 2014 1,374 MYR 455 424 USD 454 0.3087 (1)
HSBC BANK PLC . . . . . . . . . . . . . . . AA- November 20, 2014 151 MYR 50 47 USD 50 0.3081 —
JPMORGAN CHASE BANK, N.A. . . . A+ August 6, 2014 117 EUR 171 155 USD 165 1.3227 (6)
JPMORGAN CHASE BANK, N.A. . . . A+ August 11, 2014 272 USD 290 144,900 CLP 278 533.0498 (12)
JPMORGAN CHASE BANK, N.A. . . . A+ August 20, 2014 539 USD 576 286,135 CLP 550 531.2999 (26)
JPMORGAN CHASE BANK, N.A. . . . A+ August 21, 2014 350 EUR 512 468 USD 500 1.3368 (12)
The accompanying notes are an integral part of these financial statements.
150 Franklin Templeton Investments Funds
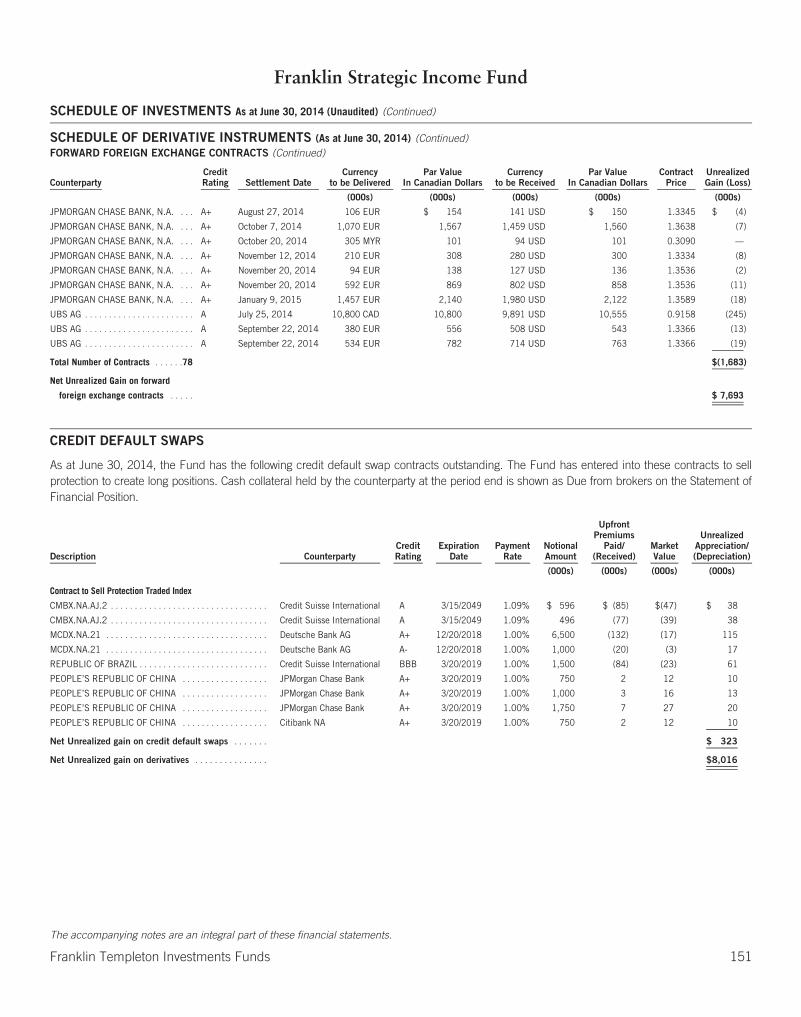
Franklin Strategic Income Fund
SCHEDULE OF INVESTMENTS As at June 30, 2014 (Unaudited) (Continued)
SCHEDULE OF DERIVATIVE INSTRUMENTS (As at June 30, 2014) (Continued)FORWARD FOREIGN EXCHANGE CONTRACTS (Continued)
CounterpartyCreditRating Settlement Date
Currencyto be Delivered
Par ValueIn Canadian Dollars
Currencyto be Received
Par ValueIn Canadian Dollars
ContractPrice
UnrealizedGain (Loss)
(000s) (000s) (000s) (000s) (000s)
JPMORGAN CHASE BANK, N.A. . . . A+ August 27, 2014 106 EUR $ 154 141 USD $ 150 1.3345 $ (4)
JPMORGAN CHASE BANK, N.A. . . . A+ October 7, 2014 1,070 EUR 1,567 1,459 USD 1,560 1.3638 (7)
JPMORGAN CHASE BANK, N.A. . . . A+ October 20, 2014 305 MYR 101 94 USD 101 0.3090 —
JPMORGAN CHASE BANK, N.A. . . . A+ November 12, 2014 210 EUR 308 280 USD 300 1.3334 (8)
JPMORGAN CHASE BANK, N.A. . . . A+ November 20, 2014 94 EUR 138 127 USD 136 1.3536 (2)
JPMORGAN CHASE BANK, N.A. . . . A+ November 20, 2014 592 EUR 869 802 USD 858 1.3536 (11)
JPMORGAN CHASE BANK, N.A. . . . A+ January 9, 2015 1,457 EUR 2,140 1,980 USD 2,122 1.3589 (18)
UBS AG . . . . . . . . . . . . . . . . . . . . . . . A July 25, 2014 10,800 CAD 10,800 9,891 USD 10,555 0.9158 (245)
UBS AG . . . . . . . . . . . . . . . . . . . . . . . A September 22, 2014 380 EUR 556 508 USD 543 1.3366 (13)
UBS AG . . . . . . . . . . . . . . . . . . . . . . . A September 22, 2014 534 EUR 782 714 USD 763 1.3366 (19)
Total Number of Contracts . . . . . .78 $(1,683)
Net Unrealized Gain on forward
foreign exchange contracts . . . . . $ 7,693
CREDIT DEFAULT SWAPS
As at June 30, 2014, the Fund has the following credit default swap contracts outstanding. The Fund has entered into these contracts to sellprotection to create long positions. Cash collateral held by the counterparty at the period end is shown as Due from brokers on the Statement ofFinancial Position.
Description CounterpartyCreditRating
ExpirationDate
PaymentRate
NotionalAmount
UpfrontPremiums
Paid/(Received)
MarketValue
UnrealizedAppreciation/(Depreciation)
(000s) (000s) (000s) (000s)
Contract to Sell Protection Traded Index
CMBX.NA.AJ.2 . . . . . . . . . . . . . . . . . . . . . . . . . . . . . . . . . Credit Suisse International A 3/15/2049 1.09% $ 596 $ (85) $(47) $ 38
CMBX.NA.AJ.2 . . . . . . . . . . . . . . . . . . . . . . . . . . . . . . . . . Credit Suisse International A 3/15/2049 1.09% 496 (77) (39) 38
MCDX.NA.21 . . . . . . . . . . . . . . . . . . . . . . . . . . . . . . . . . . Deutsche Bank AG A+ 12/20/2018 1.00% 6,500 (132) (17) 115
MCDX.NA.21 . . . . . . . . . . . . . . . . . . . . . . . . . . . . . . . . . . Deutsche Bank AG A- 12/20/2018 1.00% 1,000 (20) (3) 17
REPUBLIC OF BRAZIL . . . . . . . . . . . . . . . . . . . . . . . . . . . Credit Suisse International BBB 3/20/2019 1.00% 1,500 (84) (23) 61
PEOPLE’S REPUBLIC OF CHINA . . . . . . . . . . . . . . . . . . JPMorgan Chase Bank A+ 3/20/2019 1.00% 750 2 12 10
PEOPLE’S REPUBLIC OF CHINA . . . . . . . . . . . . . . . . . . JPMorgan Chase Bank A+ 3/20/2019 1.00% 1,000 3 16 13
PEOPLE’S REPUBLIC OF CHINA . . . . . . . . . . . . . . . . . . JPMorgan Chase Bank A+ 3/20/2019 1.00% 1,750 7 27 20
PEOPLE’S REPUBLIC OF CHINA . . . . . . . . . . . . . . . . . . Citibank NA A+ 3/20/2019 1.00% 750 2 12 10
Net Unrealized gain on credit default swaps . . . . . . . $ 323
Net Unrealized gain on derivatives . . . . . . . . . . . . . . . $8,016
The accompanying notes are an integral part of these financial statements.
Franklin Templeton Investments Funds 151
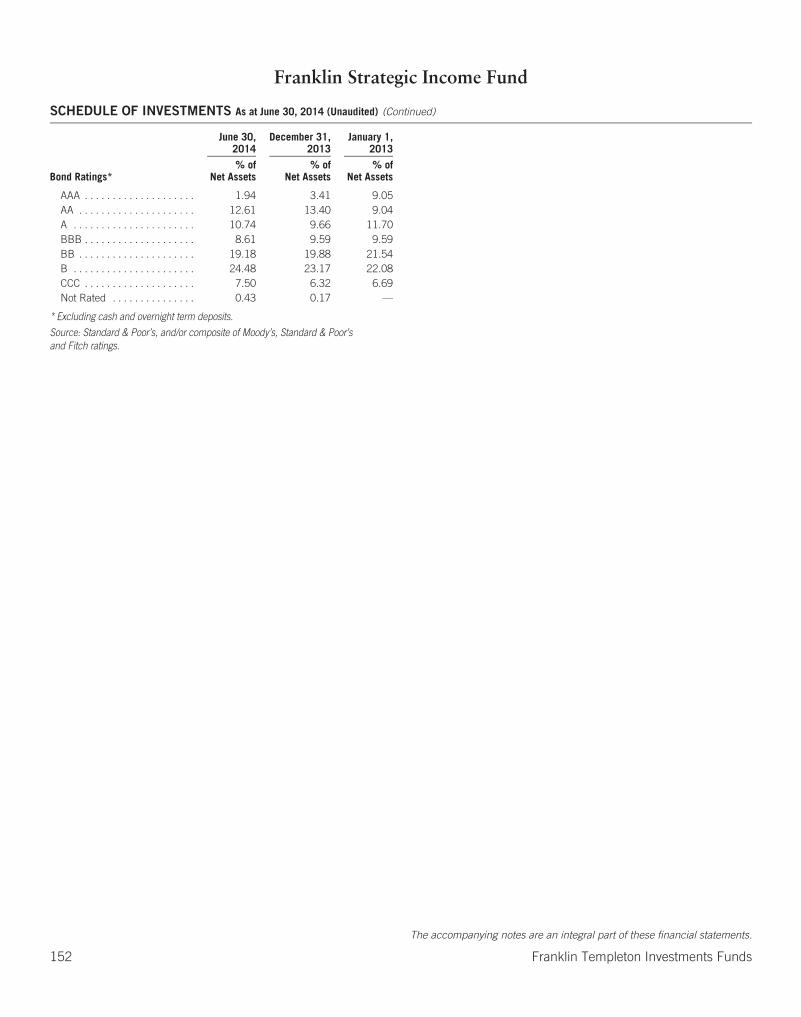
Franklin Strategic Income Fund
SCHEDULE OF INVESTMENTS As at June 30, 2014 (Unaudited) (Continued)
June 30,2014
December 31,2013
January 1,2013
Bond Ratings*% of
Net Assets% of
Net Assets% of
Net Assets
AAA . . . . . . . . . . . . . . . . . . . . 1.94 3.41 9.05AA . . . . . . . . . . . . . . . . . . . . . 12.61 13.40 9.04A . . . . . . . . . . . . . . . . . . . . . . 10.74 9.66 11.70BBB . . . . . . . . . . . . . . . . . . . . 8.61 9.59 9.59BB . . . . . . . . . . . . . . . . . . . . . 19.18 19.88 21.54B . . . . . . . . . . . . . . . . . . . . . . 24.48 23.17 22.08CCC . . . . . . . . . . . . . . . . . . . . 7.50 6.32 6.69Not Rated . . . . . . . . . . . . . . . 0.43 0.17 —
* Excluding cash and overnight term deposits.
Source: Standard & Poor’s, and/or composite of Moody’s, Standard & Poor’sand Fitch ratings.
The accompanying notes are an integral part of these financial statements.
152 Franklin Templeton Investments Funds
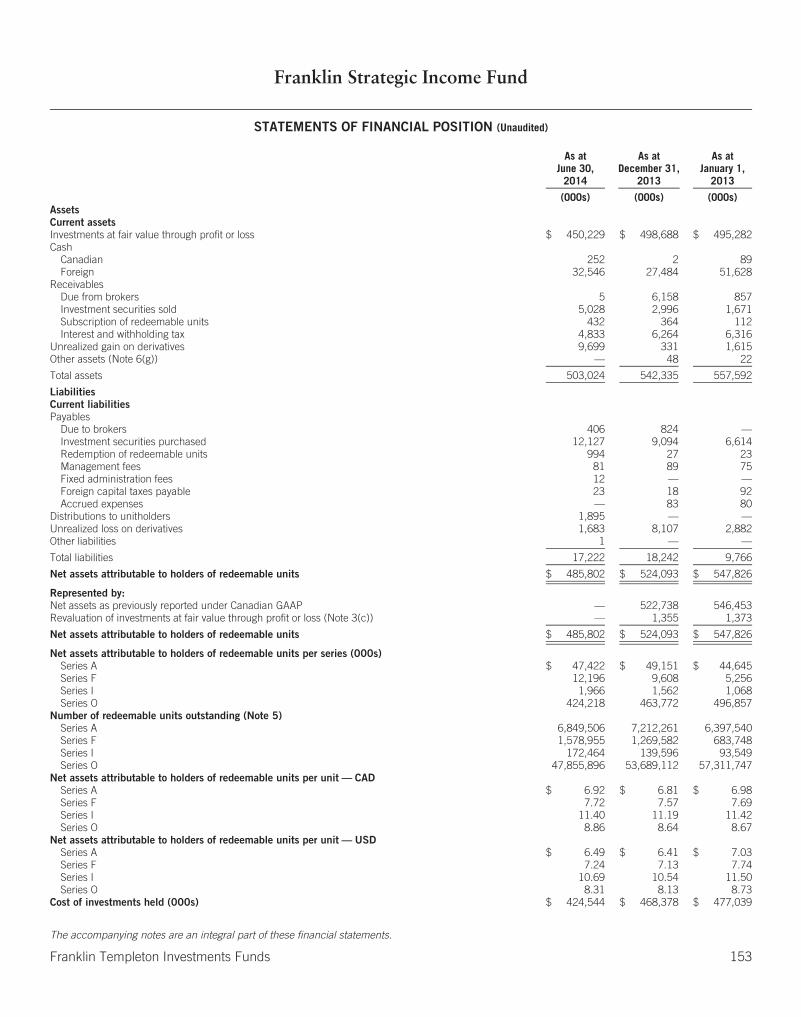
Franklin Strategic Income Fund
STATEMENTS OF FINANCIAL POSITION (Unaudited)
As atJune 30,
2014
As atDecember 31,
2013
As atJanuary 1,
2013
(000s) (000s) (000s)AssetsCurrent assetsInvestments at fair value through profit or loss $ 450,229 $ 498,688 $ 495,282Cash
Canadian 252 2 89Foreign 32,546 27,484 51,628
ReceivablesDue from brokers 5 6,158 857Investment securities sold 5,028 2,996 1,671Subscription of redeemable units 432 364 112Interest and withholding tax 4,833 6,264 6,316
Unrealized gain on derivatives 9,699 331 1,615Other assets (Note 6(g)) — 48 22
Total assets 503,024 542,335 557,592
LiabilitiesCurrent liabilitiesPayables
Due to brokers 406 824 —Investment securities purchased 12,127 9,094 6,614Redemption of redeemable units 994 27 23Management fees 81 89 75Fixed administration fees 12 — —Foreign capital taxes payable 23 18 92Accrued expenses — 83 80
Distributions to unitholders 1,895 — —Unrealized loss on derivatives 1,683 8,107 2,882Other liabilities 1 — —
Total liabilities 17,222 18,242 9,766
Net assets attributable to holders of redeemable units $ 485,802 $ 524,093 $ 547,826
Represented by:Net assets as previously reported under Canadian GAAP — 522,738 546,453Revaluation of investments at fair value through profit or loss (Note 3(c)) — 1,355 1,373
Net assets attributable to holders of redeemable units $ 485,802 $ 524,093 $ 547,826
Net assets attributable to holders of redeemable units per series (000s)Series A $ 47,422 $ 49,151 $ 44,645Series F 12,196 9,608 5,256Series I 1,966 1,562 1,068Series O 424,218 463,772 496,857
Number of redeemable units outstanding (Note 5)Series A 6,849,506 7,212,261 6,397,540Series F 1,578,955 1,269,582 683,748Series I 172,464 139,596 93,549Series O 47,855,896 53,689,112 57,311,747
Net assets attributable to holders of redeemable units per unit — CADSeries A $ 6.92 $ 6.81 $ 6.98Series F 7.72 7.57 7.69Series I 11.40 11.19 11.42Series O 8.86 8.64 8.67
Net assets attributable to holders of redeemable units per unit — USDSeries A $ 6.49 $ 6.41 $ 7.03Series F 7.24 7.13 7.74Series I 10.69 10.54 11.50Series O 8.31 8.13 8.73
Cost of investments held (000s) $ 424,544 $ 468,378 $ 477,039
The accompanying notes are an integral part of these financial statements.
Franklin Templeton Investments Funds 153
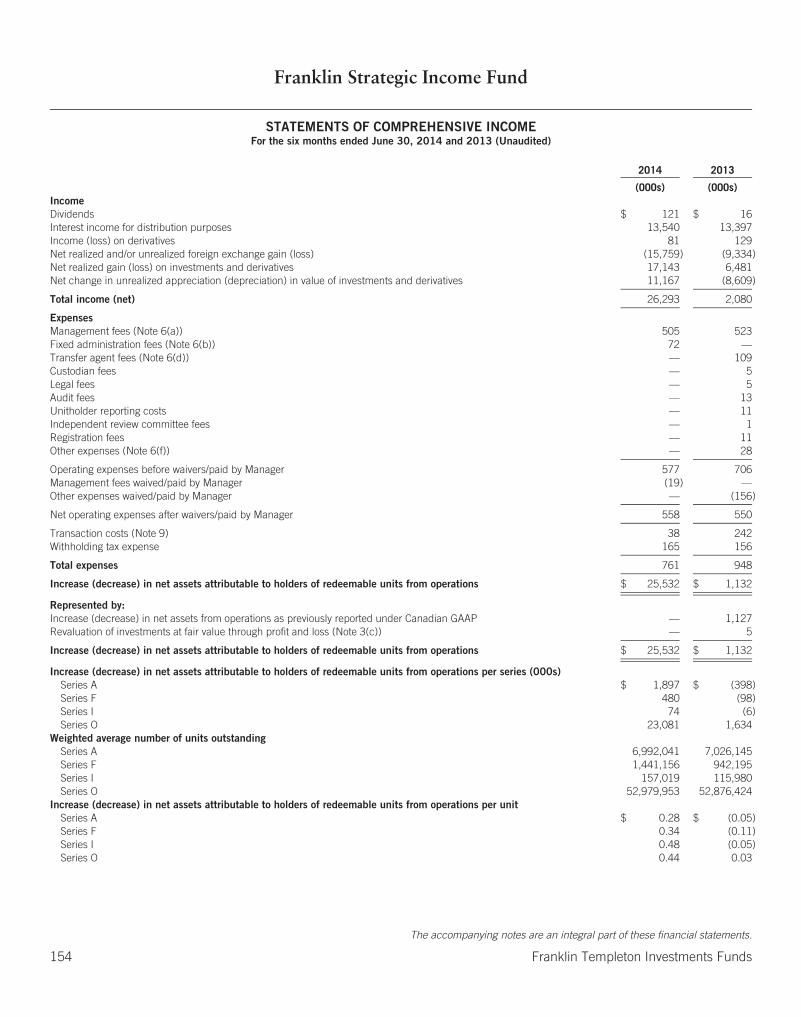
Franklin Strategic Income Fund
STATEMENTS OF COMPREHENSIVE INCOMEFor the six months ended June 30, 2014 and 2013 (Unaudited)
2014 2013
(000s) (000s)IncomeDividends $ 121 $ 16Interest income for distribution purposes 13,540 13,397Income (loss) on derivatives 81 129Net realized and/or unrealized foreign exchange gain (loss) (15,759) (9,334)Net realized gain (loss) on investments and derivatives 17,143 6,481Net change in unrealized appreciation (depreciation) in value of investments and derivatives 11,167 (8,609)
Total income (net) 26,293 2,080
ExpensesManagement fees (Note 6(a)) 505 523Fixed administration fees (Note 6(b)) 72 —Transfer agent fees (Note 6(d)) — 109Custodian fees — 5Legal fees — 5Audit fees — 13Unitholder reporting costs — 11Independent review committee fees — 1Registration fees — 11Other expenses (Note 6(f)) — 28
Operating expenses before waivers/paid by Manager 577 706Management fees waived/paid by Manager (19) —Other expenses waived/paid by Manager — (156)
Net operating expenses after waivers/paid by Manager 558 550
Transaction costs (Note 9) 38 242Withholding tax expense 165 156
Total expenses 761 948
Increase (decrease) in net assets attributable to holders of redeemable units from operations $ 25,532 $ 1,132
Represented by:Increase (decrease) in net assets from operations as previously reported under Canadian GAAP — 1,127Revaluation of investments at fair value through profit and loss (Note 3(c)) — 5
Increase (decrease) in net assets attributable to holders of redeemable units from operations $ 25,532 $ 1,132
Increase (decrease) in net assets attributable to holders of redeemable units from operations per series (000s)Series A $ 1,897 $ (398)Series F 480 (98)Series I 74 (6)Series O 23,081 1,634
Weighted average number of units outstandingSeries A 6,992,041 7,026,145Series F 1,441,156 942,195Series I 157,019 115,980Series O 52,979,953 52,876,424
Increase (decrease) in net assets attributable to holders of redeemable units from operations per unitSeries A $ 0.28 $ (0.05)Series F 0.34 (0.11)Series I 0.48 (0.05)Series O 0.44 0.03
The accompanying notes are an integral part of these financial statements.
154 Franklin Templeton Investments Funds

Franklin Strategic Income Fund
STATEMENTS OF CHANGES IN NET ASSETS ATTRIBUTABLE TO HOLDERS OF REDEEMABLE UNITSFor the six months ended June 30, 2014 and 2013 (Unaudited) (in 000s)
All Series Series A Series F
2014 2013 2014 2013 2014 2013
Net assets attributable to holders of redeemable units at beginning of period $524,093 $547,826 $ 49,151 $ 44,645 $ 9,608 $ 5,256
Increase (decrease) in net assets attributable to holders of redeemable unitsfrom operations 25,532 1,132 1,897 (398) 480 (98)
Distributions to holders of redeemable unitsFrom net investment income (12,210) (12,932) (1,128) (1,235) (264) (191)From net realized gains on investments — — — — — —From return of capital — — — — — —
Total distributions to holders of redeemable units (12,210) (12,932) (1,128) (1,235) (264) (191)
Redeemable units transactionsSubscriptions 24,508 67,350 5,998 12,767 3,805 5,665Reinvestments 10,062 10,414 729 753 179 136Redemptions (86,183) (93,104) (9,225) (6,601) (1,612) (1,441)
Net increase (decrease) from redeemable units transactions (51,613) (15,340) (2,498) 6,919 2,372 4,360
Increase (decrease) in net assets attributable to holders of redeemable units (38,291) (27,140) (1,729) 5,286 2,588 4,072
Net assets attributable to holders of redeemable units at end of period $485,802 $520,686 $ 47,422 $ 49,931 $12,196 $ 9,327
Series I Series O
2014 2013 2014 2013
Net assets attributable to holders of redeemable units at beginning of period $ 1,562 $ 1,068 $463,772 $496,857
Increase (decrease) in net assets attributable to holders of redeemable unitsfrom operations 74 (6) 23,081 1,634
Distributions to holders of redeemable unitsFrom net investment income (43) (34) (10,775) (11,472)From net realized gains on investments — — — —From return of capital — — — —
Total distributions to holders of redeemable units (43) (34) (10,775) (11,472)
Redeemable units transactionsSubscriptions 425 490 14,280 48,428Reinvestments 34 28 9,120 9,497Redemptions (86) (251) (75,260) (84,811)
Net increase (decrease) from redeemable units transactions 373 267 (51,860) (26,886)
Increase (decrease) in net assets attributable to holders of redeemable units 404 227 (39,554) (36,725)
Net assets attributable to holders of redeemable units at end of period $ 1,966 $ 1,295 $424,218 $460,133
The accompanying notes are an integral part of these financial statements.
Franklin Templeton Investments Funds 155
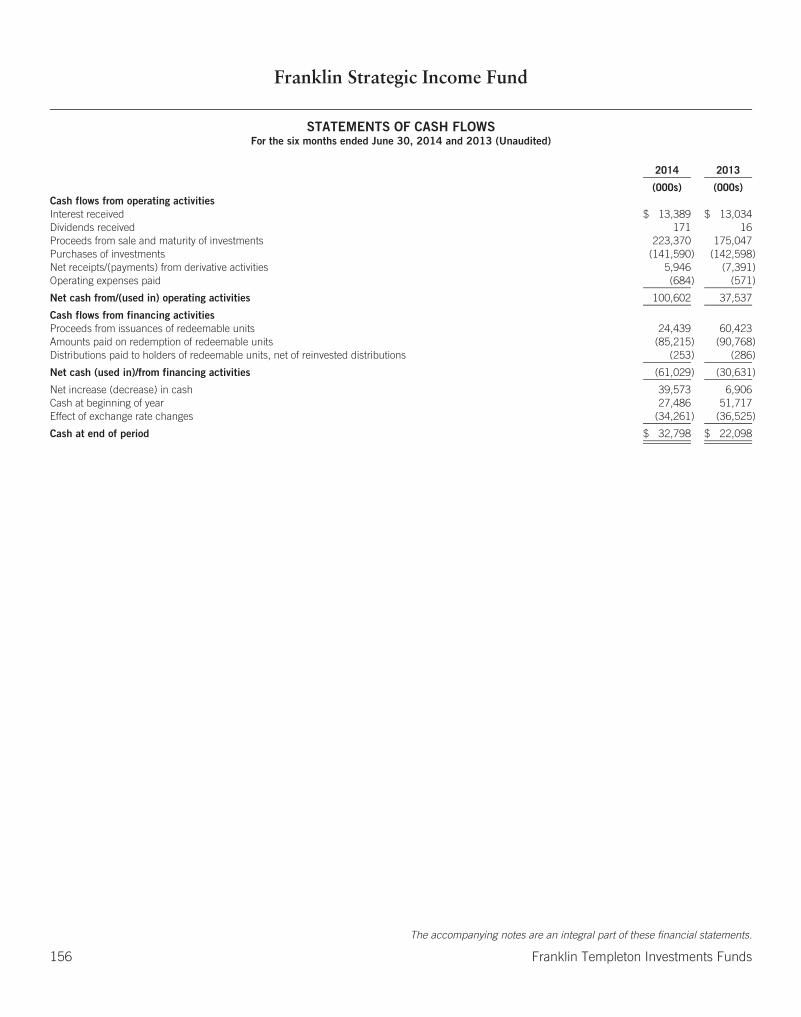
Franklin Strategic Income Fund
STATEMENTS OF CASH FLOWSFor the six months ended June 30, 2014 and 2013 (Unaudited)
2014 2013
(000s) (000s)Cash flows from operating activitiesInterest received $ 13,389 $ 13,034Dividends received 171 16Proceeds from sale and maturity of investments 223,370 175,047Purchases of investments (141,590) (142,598)Net receipts/(payments) from derivative activities 5,946 (7,391)Operating expenses paid (684) (571)
Net cash from/(used in) operating activities 100,602 37,537
Cash flows from financing activitiesProceeds from issuances of redeemable units 24,439 60,423Amounts paid on redemption of redeemable units (85,215) (90,768)Distributions paid to holders of redeemable units, net of reinvested distributions (253) (286)
Net cash (used in)/from financing activities (61,029) (30,631)
Net increase (decrease) in cash 39,573 6,906Cash at beginning of year 27,486 51,717Effect of exchange rate changes (34,261) (36,525)
Cash at end of period $ 32,798 $ 22,098
The accompanying notes are an integral part of these financial statements.
156 Franklin Templeton Investments Funds
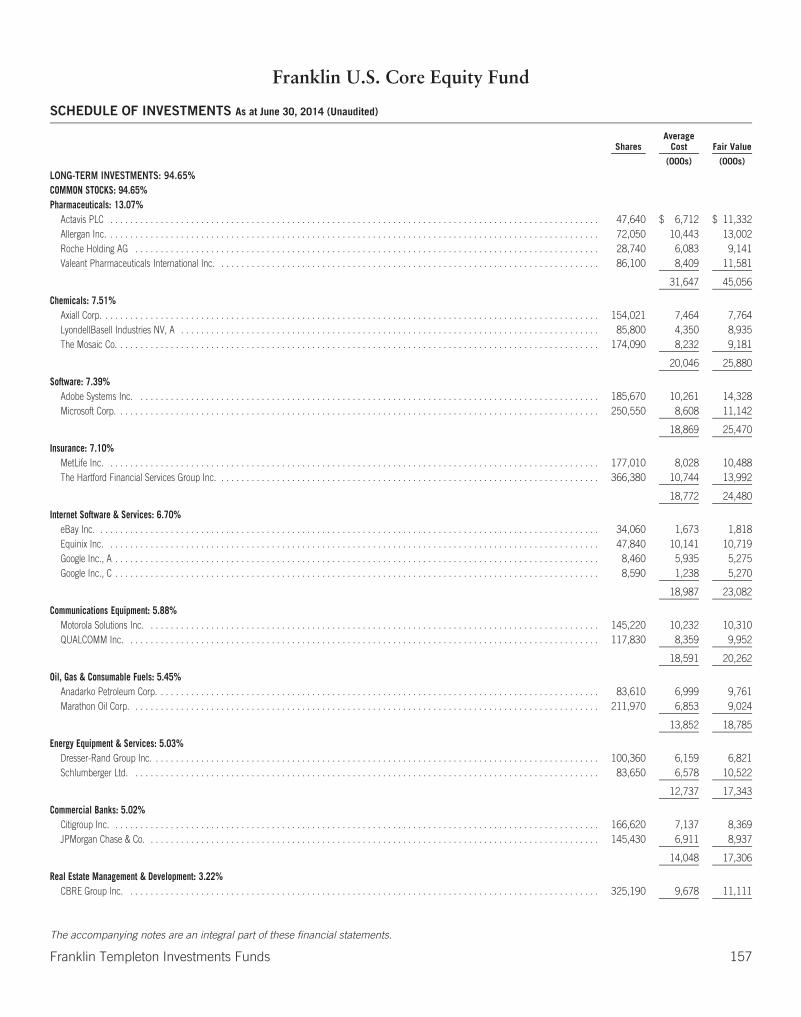
Franklin U.S. Core Equity Fund
SCHEDULE OF INVESTMENTS As at June 30, 2014 (Unaudited)
SharesAverage
Cost Fair Value
(000s) (000s)
LONG-TERM INVESTMENTS: 94.65%COMMON STOCKS: 94.65%Pharmaceuticals: 13.07%
Actavis PLC . . . . . . . . . . . . . . . . . . . . . . . . . . . . . . . . . . . . . . . . . . . . . . . . . . . . . . . . . . . . . . . . . . . . . . . . . . . . . . . . . . . . . . . . . . . . . . . . . 47,640 $ 6,712 $ 11,332Allergan Inc. . . . . . . . . . . . . . . . . . . . . . . . . . . . . . . . . . . . . . . . . . . . . . . . . . . . . . . . . . . . . . . . . . . . . . . . . . . . . . . . . . . . . . . . . . . . . . . . . . 72,050 10,443 13,002Roche Holding AG . . . . . . . . . . . . . . . . . . . . . . . . . . . . . . . . . . . . . . . . . . . . . . . . . . . . . . . . . . . . . . . . . . . . . . . . . . . . . . . . . . . . . . . . . . . . 28,740 6,083 9,141Valeant Pharmaceuticals International Inc. . . . . . . . . . . . . . . . . . . . . . . . . . . . . . . . . . . . . . . . . . . . . . . . . . . . . . . . . . . . . . . . . . . . . . . . . . . . 86,100 8,409 11,581
31,647 45,056
Chemicals: 7.51%Axiall Corp. . . . . . . . . . . . . . . . . . . . . . . . . . . . . . . . . . . . . . . . . . . . . . . . . . . . . . . . . . . . . . . . . . . . . . . . . . . . . . . . . . . . . . . . . . . . . . . . . . . 154,021 7,464 7,764LyondellBasell Industries NV, A . . . . . . . . . . . . . . . . . . . . . . . . . . . . . . . . . . . . . . . . . . . . . . . . . . . . . . . . . . . . . . . . . . . . . . . . . . . . . . . . . . . 85,800 4,350 8,935The Mosaic Co. . . . . . . . . . . . . . . . . . . . . . . . . . . . . . . . . . . . . . . . . . . . . . . . . . . . . . . . . . . . . . . . . . . . . . . . . . . . . . . . . . . . . . . . . . . . . . . . 174,090 8,232 9,181
20,046 25,880
Software: 7.39%Adobe Systems Inc. . . . . . . . . . . . . . . . . . . . . . . . . . . . . . . . . . . . . . . . . . . . . . . . . . . . . . . . . . . . . . . . . . . . . . . . . . . . . . . . . . . . . . . . . . . . 185,670 10,261 14,328Microsoft Corp. . . . . . . . . . . . . . . . . . . . . . . . . . . . . . . . . . . . . . . . . . . . . . . . . . . . . . . . . . . . . . . . . . . . . . . . . . . . . . . . . . . . . . . . . . . . . . . . 250,550 8,608 11,142
18,869 25,470
Insurance: 7.10%MetLife Inc. . . . . . . . . . . . . . . . . . . . . . . . . . . . . . . . . . . . . . . . . . . . . . . . . . . . . . . . . . . . . . . . . . . . . . . . . . . . . . . . . . . . . . . . . . . . . . . . . . 177,010 8,028 10,488The Hartford Financial Services Group Inc. . . . . . . . . . . . . . . . . . . . . . . . . . . . . . . . . . . . . . . . . . . . . . . . . . . . . . . . . . . . . . . . . . . . . . . . . . . . 366,380 10,744 13,992
18,772 24,480
Internet Software & Services: 6.70%eBay Inc. . . . . . . . . . . . . . . . . . . . . . . . . . . . . . . . . . . . . . . . . . . . . . . . . . . . . . . . . . . . . . . . . . . . . . . . . . . . . . . . . . . . . . . . . . . . . . . . . . . . 34,060 1,673 1,818Equinix Inc. . . . . . . . . . . . . . . . . . . . . . . . . . . . . . . . . . . . . . . . . . . . . . . . . . . . . . . . . . . . . . . . . . . . . . . . . . . . . . . . . . . . . . . . . . . . . . . . . . 47,840 10,141 10,719Google Inc., A . . . . . . . . . . . . . . . . . . . . . . . . . . . . . . . . . . . . . . . . . . . . . . . . . . . . . . . . . . . . . . . . . . . . . . . . . . . . . . . . . . . . . . . . . . . . . . . . 8,460 5,935 5,275Google Inc., C . . . . . . . . . . . . . . . . . . . . . . . . . . . . . . . . . . . . . . . . . . . . . . . . . . . . . . . . . . . . . . . . . . . . . . . . . . . . . . . . . . . . . . . . . . . . . . . . 8,590 1,238 5,270
18,987 23,082
Communications Equipment: 5.88%Motorola Solutions Inc. . . . . . . . . . . . . . . . . . . . . . . . . . . . . . . . . . . . . . . . . . . . . . . . . . . . . . . . . . . . . . . . . . . . . . . . . . . . . . . . . . . . . . . . . . 145,220 10,232 10,310QUALCOMM Inc. . . . . . . . . . . . . . . . . . . . . . . . . . . . . . . . . . . . . . . . . . . . . . . . . . . . . . . . . . . . . . . . . . . . . . . . . . . . . . . . . . . . . . . . . . . . . . 117,830 8,359 9,952
18,591 20,262
Oil, Gas & Consumable Fuels: 5.45%Anadarko Petroleum Corp. . . . . . . . . . . . . . . . . . . . . . . . . . . . . . . . . . . . . . . . . . . . . . . . . . . . . . . . . . . . . . . . . . . . . . . . . . . . . . . . . . . . . . . . 83,610 6,999 9,761Marathon Oil Corp. . . . . . . . . . . . . . . . . . . . . . . . . . . . . . . . . . . . . . . . . . . . . . . . . . . . . . . . . . . . . . . . . . . . . . . . . . . . . . . . . . . . . . . . . . . . . 211,970 6,853 9,024
13,852 18,785
Energy Equipment & Services: 5.03%Dresser-Rand Group Inc. . . . . . . . . . . . . . . . . . . . . . . . . . . . . . . . . . . . . . . . . . . . . . . . . . . . . . . . . . . . . . . . . . . . . . . . . . . . . . . . . . . . . . . . . 100,360 6,159 6,821Schlumberger Ltd. . . . . . . . . . . . . . . . . . . . . . . . . . . . . . . . . . . . . . . . . . . . . . . . . . . . . . . . . . . . . . . . . . . . . . . . . . . . . . . . . . . . . . . . . . . . . 83,650 6,578 10,522
12,737 17,343
Commercial Banks: 5.02%Citigroup Inc. . . . . . . . . . . . . . . . . . . . . . . . . . . . . . . . . . . . . . . . . . . . . . . . . . . . . . . . . . . . . . . . . . . . . . . . . . . . . . . . . . . . . . . . . . . . . . . . . 166,620 7,137 8,369JPMorgan Chase & Co. . . . . . . . . . . . . . . . . . . . . . . . . . . . . . . . . . . . . . . . . . . . . . . . . . . . . . . . . . . . . . . . . . . . . . . . . . . . . . . . . . . . . . . . . . 145,430 6,911 8,937
14,048 17,306
Real Estate Management & Development: 3.22%CBRE Group Inc. . . . . . . . . . . . . . . . . . . . . . . . . . . . . . . . . . . . . . . . . . . . . . . . . . . . . . . . . . . . . . . . . . . . . . . . . . . . . . . . . . . . . . . . . . . . . . 325,190 9,678 11,111
The accompanying notes are an integral part of these financial statements.
Franklin Templeton Investments Funds 157

Franklin U.S. Core Equity Fund
SCHEDULE OF INVESTMENTS As at June 30, 2014 (Unaudited) (Continued)
SharesAverage
Cost Fair Value
(000s) (000s)
IT Services: 3.17%MasterCard Inc., A . . . . . . . . . . . . . . . . . . . . . . . . . . . . . . . . . . . . . . . . . . . . . . . . . . . . . . . . . . . . . . . . . . . . . . . . . . . . . . . . . . . . . 139,250 $ 9,819 $ 10,911
Road & Rail: 3.01%Genesee & Wyoming Inc. . . . . . . . . . . . . . . . . . . . . . . . . . . . . . . . . . . . . . . . . . . . . . . . . . . . . . . . . . . . . . . . . . . . . . . . . . . . . . . . . . 92,590 8,926 10,368
Textiles, Apparel & Luxury Goods: 2.76%NIKE Inc., B . . . . . . . . . . . . . . . . . . . . . . . . . . . . . . . . . . . . . . . . . . . . . . . . . . . . . . . . . . . . . . . . . . . . . . . . . . . . . . . . . . . . . . . . . . 115,176 6,708 9,525
Media: 2.55%The Walt Disney Co. . . . . . . . . . . . . . . . . . . . . . . . . . . . . . . . . . . . . . . . . . . . . . . . . . . . . . . . . . . . . . . . . . . . . . . . . . . . . . . . . . . . . 95,970 7,063 8,775
Consumer Finance: 2.51%Discover Financial Services . . . . . . . . . . . . . . . . . . . . . . . . . . . . . . . . . . . . . . . . . . . . . . . . . . . . . . . . . . . . . . . . . . . . . . . . . . . . . . . 131,020 7,289 8,660
Food & Staples Retailing: 2.31%CVS Caremark Corp. . . . . . . . . . . . . . . . . . . . . . . . . . . . . . . . . . . . . . . . . . . . . . . . . . . . . . . . . . . . . . . . . . . . . . . . . . . . . . . . . . . . . 99,220 4,791 7,975
Health Care Providers & Services: 2.31%Aetna Inc. . . . . . . . . . . . . . . . . . . . . . . . . . . . . . . . . . . . . . . . . . . . . . . . . . . . . . . . . . . . . . . . . . . . . . . . . . . . . . . . . . . . . . . . . . . . . 92,190 4,829 7,972
Semiconductors & Semiconductor Equipment: 2.15%Maxim Integrated Products Inc. . . . . . . . . . . . . . . . . . . . . . . . . . . . . . . . . . . . . . . . . . . . . . . . . . . . . . . . . . . . . . . . . . . . . . . . . . . . . 205,620 5,765 7,414
Capital Markets: 1.89%BlackRock Inc. . . . . . . . . . . . . . . . . . . . . . . . . . . . . . . . . . . . . . . . . . . . . . . . . . . . . . . . . . . . . . . . . . . . . . . . . . . . . . . . . . . . . . . . . 19,140 4,110 6,524
Commercial Services & Supplies: 1.71%The ADT Corp. . . . . . . . . . . . . . . . . . . . . . . . . . . . . . . . . . . . . . . . . . . . . . . . . . . . . . . . . . . . . . . . . . . . . . . . . . . . . . . . . . . . . . . . . 158,250 5,491 5,897
Air Freight & Logistics: 1.59%FedEx Corp. . . . . . . . . . . . . . . . . . . . . . . . . . . . . . . . . . . . . . . . . . . . . . . . . . . . . . . . . . . . . . . . . . . . . . . . . . . . . . . . . . . . . . . . . . . 33,940 3,451 5,479
Food Products: 1.24%Mead Johnson Nutrition Co., A . . . . . . . . . . . . . . . . . . . . . . . . . . . . . . . . . . . . . . . . . . . . . . . . . . . . . . . . . . . . . . . . . . . . . . . . . . . . . 42,870 3,159 4,260
Auto Components: 1.08%BorgWarner Inc. . . . . . . . . . . . . . . . . . . . . . . . . . . . . . . . . . . . . . . . . . . . . . . . . . . . . . . . . . . . . . . . . . . . . . . . . . . . . . . . . . . . . . . . 53,550 2,032 3,723
Total Common Stocks: . . . . . . . . . . . . . . . . . . . . . . . . . . . . . . . . . . . . . . . . . . . . . . . . . . . . . . . . . . . . . . . . . . . . . . . . . . . . . . . . . . . 250,660 326,258
Total Long-Term Investments: . . . . . . . . . . . . . . . . . . . . . . . . . . . . . . . . . . . . . . . . . . . . . . . . . . . . . . . . . . . . . . . . . . . . . . . . . . . . . . 250,660 326,258
Principal Amountin Currency
of Issue
SHORT-TERM SECURITIES: 3.09%Federal Home Loan Bank Discount Notes, 7/1/2014 . . . . . . . . . . . . . . . . . . . . . . . . . . . . . . . . . . . . . . . . . . . . . . . . . . . . . . . . . . . . . 10,000,000 USD 10,652 10,652
Total Short-Term Securities: . . . . . . . . . . . . . . . . . . . . . . . . . . . . . . . . . . . . . . . . . . . . . . . . . . . . . . . . . . . . . . . . . . . . . . . . . . . . . . . 10,652 10,652
Transaction costs (Note 4) . . . . . . . . . . . . . . . . . . . . . . . . . . . . . . . . . . . . . . . . . . . . . . . . . . . . . . . . . . . . . . . . . . . . . . . . . . . . . . . . (243) —
TOTAL INVESTMENTS: 97.74% . . . . . . . . . . . . . . . . . . . . . . . . . . . . . . . . . . . . . . . . . . . . . . . . . . . . . . . . . . . . . . . . . . . . . . . . . . . . . $261,069 336,910
OTHER ASSETS, less liabilities: 2.26% . . . . . . . . . . . . . . . . . . . . . . . . . . . . . . . . . . . . . . . . . . . . . . . . . . . . . . . . . . . . . . . . . . . . . . . 7,779
TOTAL NET ASSETS: 100.00% . . . . . . . . . . . . . . . . . . . . . . . . . . . . . . . . . . . . . . . . . . . . . . . . . . . . . . . . . . . . . . . . . . . . . . . . . . . . . $344,689
The accompanying notes are an integral part of these financial statements.
158 Franklin Templeton Investments Funds
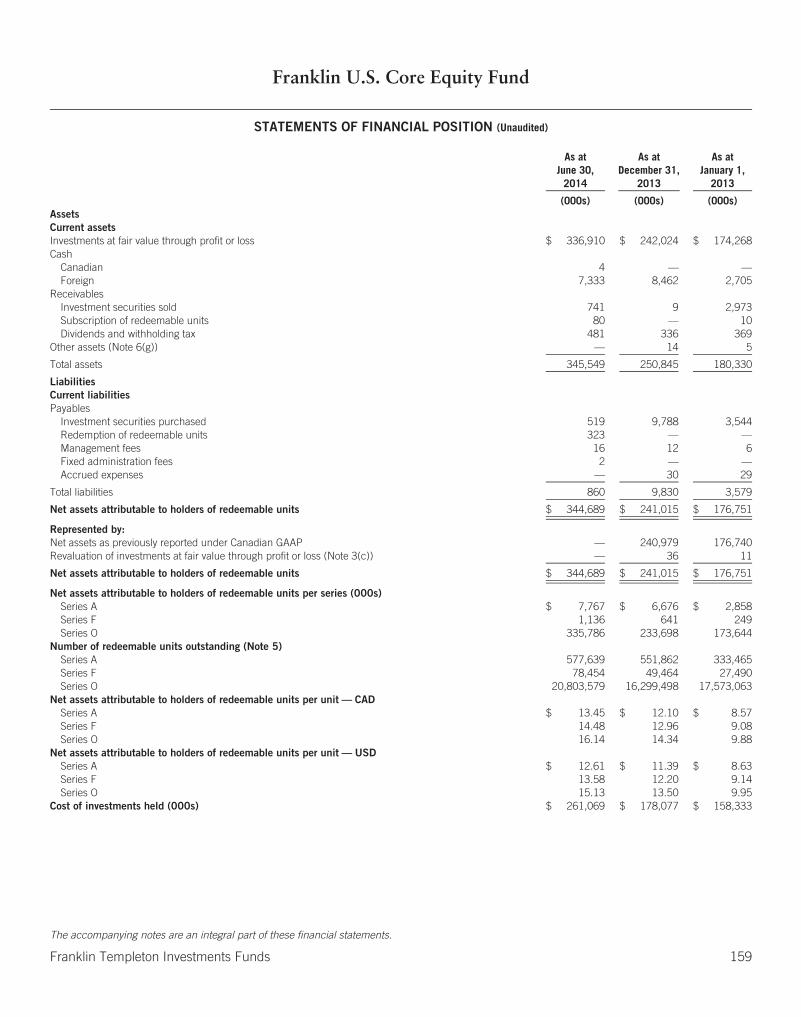
Franklin U.S. Core Equity Fund
STATEMENTS OF FINANCIAL POSITION (Unaudited)
As atJune 30,
2014
As atDecember 31,
2013
As atJanuary 1,
2013
(000s) (000s) (000s)AssetsCurrent assetsInvestments at fair value through profit or loss $ 336,910 $ 242,024 $ 174,268Cash
Canadian 4 — —Foreign 7,333 8,462 2,705
ReceivablesInvestment securities sold 741 9 2,973Subscription of redeemable units 80 — 10Dividends and withholding tax 481 336 369
Other assets (Note 6(g)) — 14 5
Total assets 345,549 250,845 180,330
LiabilitiesCurrent liabilitiesPayables
Investment securities purchased 519 9,788 3,544Redemption of redeemable units 323 — —Management fees 16 12 6Fixed administration fees 2 — —Accrued expenses — 30 29
Total liabilities 860 9,830 3,579
Net assets attributable to holders of redeemable units $ 344,689 $ 241,015 $ 176,751
Represented by:Net assets as previously reported under Canadian GAAP — 240,979 176,740Revaluation of investments at fair value through profit or loss (Note 3(c)) — 36 11
Net assets attributable to holders of redeemable units $ 344,689 $ 241,015 $ 176,751
Net assets attributable to holders of redeemable units per series (000s)Series A $ 7,767 $ 6,676 $ 2,858Series F 1,136 641 249Series O 335,786 233,698 173,644
Number of redeemable units outstanding (Note 5)Series A 577,639 551,862 333,465Series F 78,454 49,464 27,490Series O 20,803,579 16,299,498 17,573,063
Net assets attributable to holders of redeemable units per unit — CADSeries A $ 13.45 $ 12.10 $ 8.57Series F 14.48 12.96 9.08Series O 16.14 14.34 9.88
Net assets attributable to holders of redeemable units per unit — USDSeries A $ 12.61 $ 11.39 $ 8.63Series F 13.58 12.20 9.14Series O 15.13 13.50 9.95
Cost of investments held (000s) $ 261,069 $ 178,077 $ 158,333
The accompanying notes are an integral part of these financial statements.
Franklin Templeton Investments Funds 159
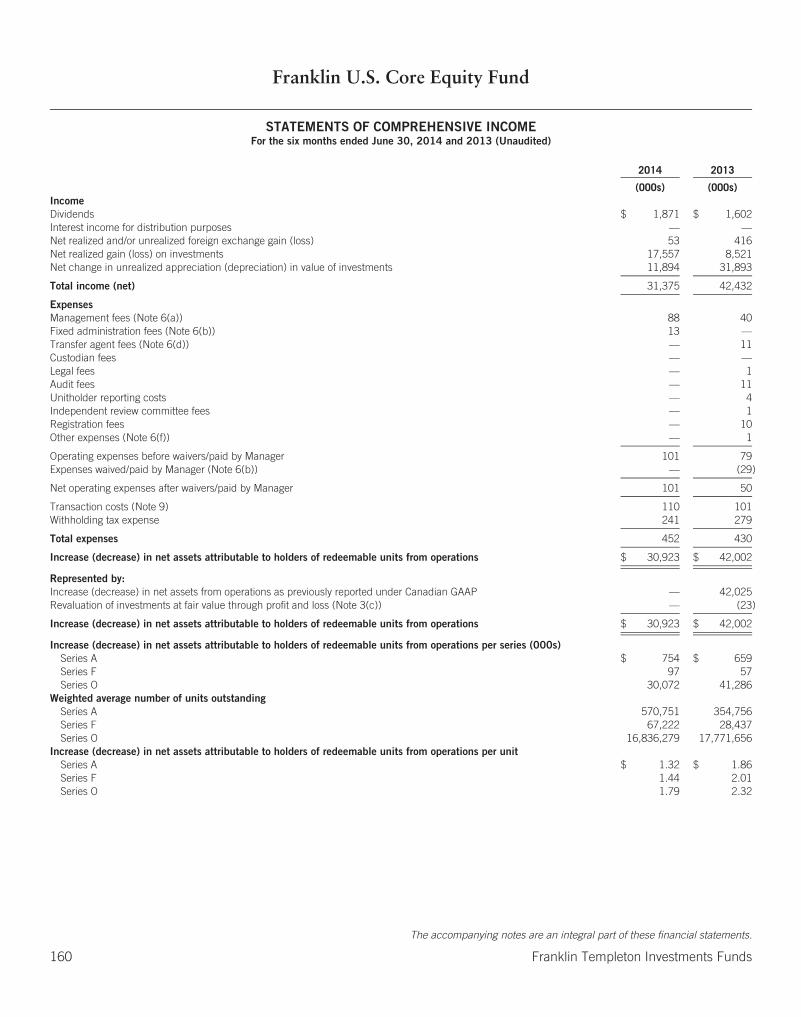
Franklin U.S. Core Equity Fund
STATEMENTS OF COMPREHENSIVE INCOMEFor the six months ended June 30, 2014 and 2013 (Unaudited)
2014 2013
(000s) (000s)IncomeDividends $ 1,871 $ 1,602Interest income for distribution purposes — —Net realized and/or unrealized foreign exchange gain (loss) 53 416Net realized gain (loss) on investments 17,557 8,521Net change in unrealized appreciation (depreciation) in value of investments 11,894 31,893
Total income (net) 31,375 42,432
ExpensesManagement fees (Note 6(a)) 88 40Fixed administration fees (Note 6(b)) 13 —Transfer agent fees (Note 6(d)) — 11Custodian fees — —Legal fees — 1Audit fees — 11Unitholder reporting costs — 4Independent review committee fees — 1Registration fees — 10Other expenses (Note 6(f)) — 1
Operating expenses before waivers/paid by Manager 101 79Expenses waived/paid by Manager (Note 6(b)) — (29)
Net operating expenses after waivers/paid by Manager 101 50
Transaction costs (Note 9) 110 101Withholding tax expense 241 279
Total expenses 452 430
Increase (decrease) in net assets attributable to holders of redeemable units from operations $ 30,923 $ 42,002
Represented by:Increase (decrease) in net assets from operations as previously reported under Canadian GAAP — 42,025Revaluation of investments at fair value through profit and loss (Note 3(c)) — (23)
Increase (decrease) in net assets attributable to holders of redeemable units from operations $ 30,923 $ 42,002
Increase (decrease) in net assets attributable to holders of redeemable units from operations per series (000s)Series A $ 754 $ 659Series F 97 57Series O 30,072 41,286
Weighted average number of units outstandingSeries A 570,751 354,756Series F 67,222 28,437Series O 16,836,279 17,771,656
Increase (decrease) in net assets attributable to holders of redeemable units from operations per unitSeries A $ 1.32 $ 1.86Series F 1.44 2.01Series O 1.79 2.32
The accompanying notes are an integral part of these financial statements.
160 Franklin Templeton Investments Funds
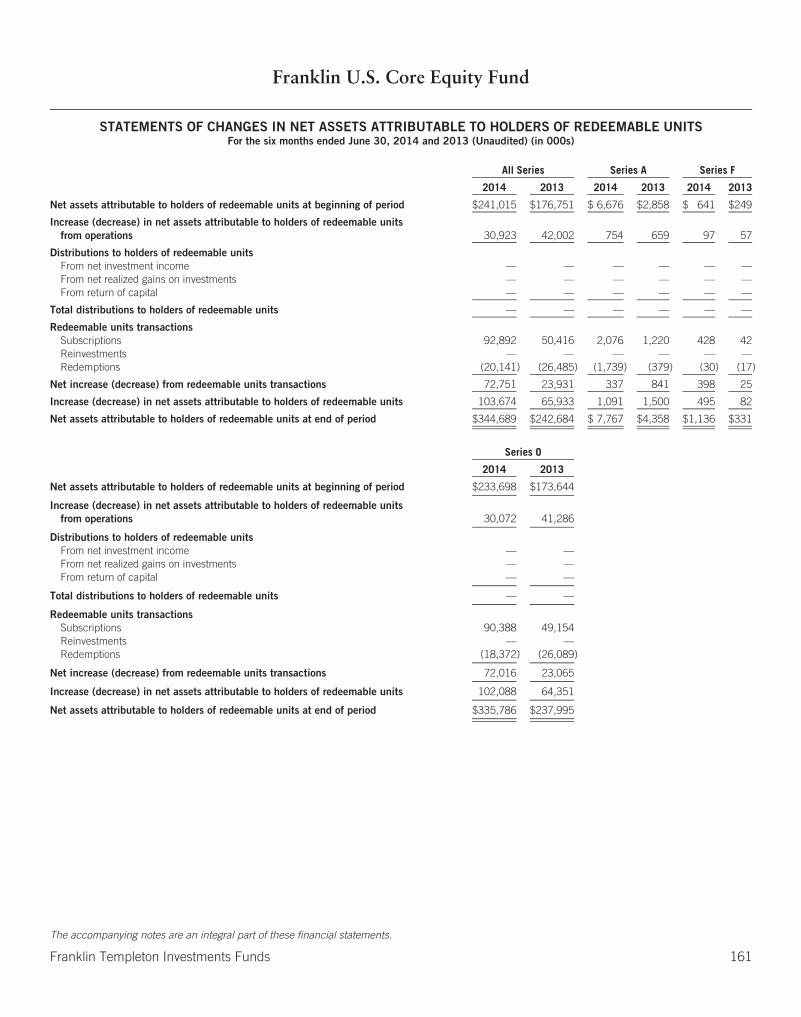
Franklin U.S. Core Equity Fund
STATEMENTS OF CHANGES IN NET ASSETS ATTRIBUTABLE TO HOLDERS OF REDEEMABLE UNITSFor the six months ended June 30, 2014 and 2013 (Unaudited) (in 000s)
All Series Series A Series F
2014 2013 2014 2013 2014 2013
Net assets attributable to holders of redeemable units at beginning of period $241,015 $176,751 $ 6,676 $2,858 $ 641 $249
Increase (decrease) in net assets attributable to holders of redeemable unitsfrom operations 30,923 42,002 754 659 97 57
Distributions to holders of redeemable unitsFrom net investment income — — — — — —From net realized gains on investments — — — — — —From return of capital — — — — — —
Total distributions to holders of redeemable units — — — — — —
Redeemable units transactionsSubscriptions 92,892 50,416 2,076 1,220 428 42Reinvestments — — — — — —Redemptions (20,141) (26,485) (1,739) (379) (30) (17)
Net increase (decrease) from redeemable units transactions 72,751 23,931 337 841 398 25
Increase (decrease) in net assets attributable to holders of redeemable units 103,674 65,933 1,091 1,500 495 82
Net assets attributable to holders of redeemable units at end of period $344,689 $242,684 $ 7,767 $4,358 $1,136 $331
Series O
2014 2013
Net assets attributable to holders of redeemable units at beginning of period $233,698 $173,644
Increase (decrease) in net assets attributable to holders of redeemable unitsfrom operations 30,072 41,286
Distributions to holders of redeemable unitsFrom net investment income — —From net realized gains on investments — —From return of capital — —
Total distributions to holders of redeemable units — —
Redeemable units transactionsSubscriptions 90,388 49,154Reinvestments — —Redemptions (18,372) (26,089)
Net increase (decrease) from redeemable units transactions 72,016 23,065
Increase (decrease) in net assets attributable to holders of redeemable units 102,088 64,351
Net assets attributable to holders of redeemable units at end of period $335,786 $237,995
The accompanying notes are an integral part of these financial statements.
Franklin Templeton Investments Funds 161
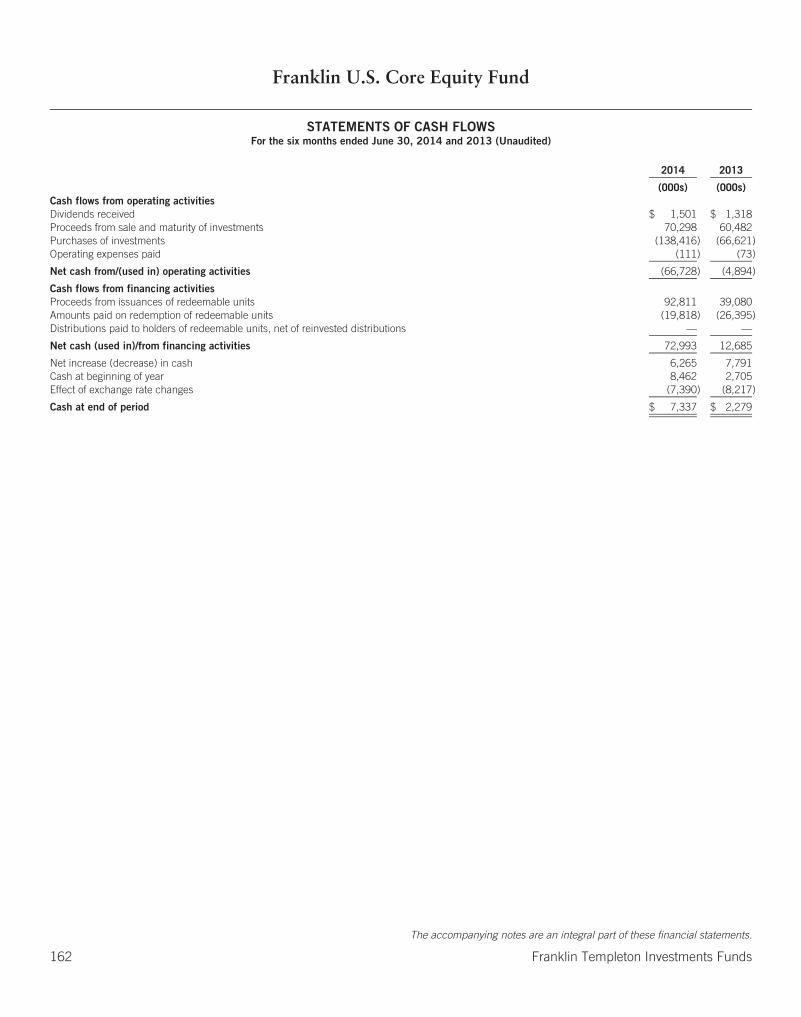
Franklin U.S. Core Equity Fund
STATEMENTS OF CASH FLOWSFor the six months ended June 30, 2014 and 2013 (Unaudited)
2014 2013
(000s) (000s)Cash flows from operating activitiesDividends received $ 1,501 $ 1,318Proceeds from sale and maturity of investments 70,298 60,482Purchases of investments (138,416) (66,621)Operating expenses paid (111) (73)
Net cash from/(used in) operating activities (66,728) (4,894)
Cash flows from financing activitiesProceeds from issuances of redeemable units 92,811 39,080Amounts paid on redemption of redeemable units (19,818) (26,395)Distributions paid to holders of redeemable units, net of reinvested distributions — —
Net cash (used in)/from financing activities 72,993 12,685
Net increase (decrease) in cash 6,265 7,791Cash at beginning of year 8,462 2,705Effect of exchange rate changes (7,390) (8,217)
Cash at end of period $ 7,337 $ 2,279
The accompanying notes are an integral part of these financial statements.
162 Franklin Templeton Investments Funds
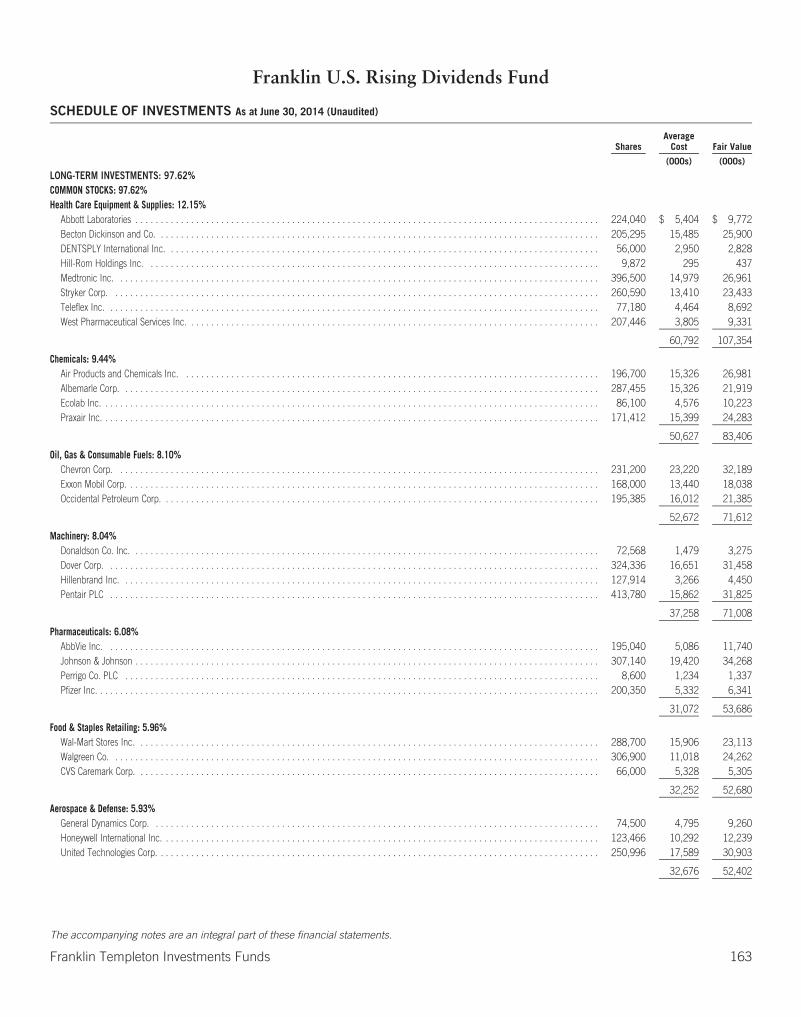
Franklin U.S. Rising Dividends Fund
SCHEDULE OF INVESTMENTS As at June 30, 2014 (Unaudited)
SharesAverage
Cost Fair Value
(000s) (000s)
LONG-TERM INVESTMENTS: 97.62%COMMON STOCKS: 97.62%Health Care Equipment & Supplies: 12.15%
Abbott Laboratories . . . . . . . . . . . . . . . . . . . . . . . . . . . . . . . . . . . . . . . . . . . . . . . . . . . . . . . . . . . . . . . . . . . . . . . . . . . . . . . . . . . . . . . . . . . . 224,040 $ 5,404 $ 9,772Becton Dickinson and Co. . . . . . . . . . . . . . . . . . . . . . . . . . . . . . . . . . . . . . . . . . . . . . . . . . . . . . . . . . . . . . . . . . . . . . . . . . . . . . . . . . . . . . . . 205,295 15,485 25,900DENTSPLY International Inc. . . . . . . . . . . . . . . . . . . . . . . . . . . . . . . . . . . . . . . . . . . . . . . . . . . . . . . . . . . . . . . . . . . . . . . . . . . . . . . . . . . . . . 56,000 2,950 2,828Hill-Rom Holdings Inc. . . . . . . . . . . . . . . . . . . . . . . . . . . . . . . . . . . . . . . . . . . . . . . . . . . . . . . . . . . . . . . . . . . . . . . . . . . . . . . . . . . . . . . . . . 9,872 295 437Medtronic Inc. . . . . . . . . . . . . . . . . . . . . . . . . . . . . . . . . . . . . . . . . . . . . . . . . . . . . . . . . . . . . . . . . . . . . . . . . . . . . . . . . . . . . . . . . . . . . . . . 396,500 14,979 26,961Stryker Corp. . . . . . . . . . . . . . . . . . . . . . . . . . . . . . . . . . . . . . . . . . . . . . . . . . . . . . . . . . . . . . . . . . . . . . . . . . . . . . . . . . . . . . . . . . . . . . . . . 260,590 13,410 23,433Teleflex Inc. . . . . . . . . . . . . . . . . . . . . . . . . . . . . . . . . . . . . . . . . . . . . . . . . . . . . . . . . . . . . . . . . . . . . . . . . . . . . . . . . . . . . . . . . . . . . . . . . . 77,180 4,464 8,692West Pharmaceutical Services Inc. . . . . . . . . . . . . . . . . . . . . . . . . . . . . . . . . . . . . . . . . . . . . . . . . . . . . . . . . . . . . . . . . . . . . . . . . . . . . . . . . . 207,446 3,805 9,331
60,792 107,354
Chemicals: 9.44%Air Products and Chemicals Inc. . . . . . . . . . . . . . . . . . . . . . . . . . . . . . . . . . . . . . . . . . . . . . . . . . . . . . . . . . . . . . . . . . . . . . . . . . . . . . . . . . . 196,700 15,326 26,981Albemarle Corp. . . . . . . . . . . . . . . . . . . . . . . . . . . . . . . . . . . . . . . . . . . . . . . . . . . . . . . . . . . . . . . . . . . . . . . . . . . . . . . . . . . . . . . . . . . . . . . 287,455 15,326 21,919Ecolab Inc. . . . . . . . . . . . . . . . . . . . . . . . . . . . . . . . . . . . . . . . . . . . . . . . . . . . . . . . . . . . . . . . . . . . . . . . . . . . . . . . . . . . . . . . . . . . . . . . . . . 86,100 4,576 10,223Praxair Inc. . . . . . . . . . . . . . . . . . . . . . . . . . . . . . . . . . . . . . . . . . . . . . . . . . . . . . . . . . . . . . . . . . . . . . . . . . . . . . . . . . . . . . . . . . . . . . . . . . . 171,412 15,399 24,283
50,627 83,406
Oil, Gas & Consumable Fuels: 8.10%Chevron Corp. . . . . . . . . . . . . . . . . . . . . . . . . . . . . . . . . . . . . . . . . . . . . . . . . . . . . . . . . . . . . . . . . . . . . . . . . . . . . . . . . . . . . . . . . . . . . . . . 231,200 23,220 32,189Exxon Mobil Corp. . . . . . . . . . . . . . . . . . . . . . . . . . . . . . . . . . . . . . . . . . . . . . . . . . . . . . . . . . . . . . . . . . . . . . . . . . . . . . . . . . . . . . . . . . . . . . 168,000 13,440 18,038Occidental Petroleum Corp. . . . . . . . . . . . . . . . . . . . . . . . . . . . . . . . . . . . . . . . . . . . . . . . . . . . . . . . . . . . . . . . . . . . . . . . . . . . . . . . . . . . . . . 195,385 16,012 21,385
52,672 71,612
Machinery: 8.04%Donaldson Co. Inc. . . . . . . . . . . . . . . . . . . . . . . . . . . . . . . . . . . . . . . . . . . . . . . . . . . . . . . . . . . . . . . . . . . . . . . . . . . . . . . . . . . . . . . . . . . . . 72,568 1,479 3,275Dover Corp. . . . . . . . . . . . . . . . . . . . . . . . . . . . . . . . . . . . . . . . . . . . . . . . . . . . . . . . . . . . . . . . . . . . . . . . . . . . . . . . . . . . . . . . . . . . . . . . . . 324,336 16,651 31,458Hillenbrand Inc. . . . . . . . . . . . . . . . . . . . . . . . . . . . . . . . . . . . . . . . . . . . . . . . . . . . . . . . . . . . . . . . . . . . . . . . . . . . . . . . . . . . . . . . . . . . . . . 127,914 3,266 4,450Pentair PLC . . . . . . . . . . . . . . . . . . . . . . . . . . . . . . . . . . . . . . . . . . . . . . . . . . . . . . . . . . . . . . . . . . . . . . . . . . . . . . . . . . . . . . . . . . . . . . . . . 413,780 15,862 31,825
37,258 71,008
Pharmaceuticals: 6.08%AbbVie Inc. . . . . . . . . . . . . . . . . . . . . . . . . . . . . . . . . . . . . . . . . . . . . . . . . . . . . . . . . . . . . . . . . . . . . . . . . . . . . . . . . . . . . . . . . . . . . . . . . . 195,040 5,086 11,740Johnson & Johnson . . . . . . . . . . . . . . . . . . . . . . . . . . . . . . . . . . . . . . . . . . . . . . . . . . . . . . . . . . . . . . . . . . . . . . . . . . . . . . . . . . . . . . . . . . . . 307,140 19,420 34,268Perrigo Co. PLC . . . . . . . . . . . . . . . . . . . . . . . . . . . . . . . . . . . . . . . . . . . . . . . . . . . . . . . . . . . . . . . . . . . . . . . . . . . . . . . . . . . . . . . . . . . . . . 8,600 1,234 1,337Pfizer Inc. . . . . . . . . . . . . . . . . . . . . . . . . . . . . . . . . . . . . . . . . . . . . . . . . . . . . . . . . . . . . . . . . . . . . . . . . . . . . . . . . . . . . . . . . . . . . . . . . . . . 200,350 5,332 6,341
31,072 53,686
Food & Staples Retailing: 5.96%Wal-Mart Stores Inc. . . . . . . . . . . . . . . . . . . . . . . . . . . . . . . . . . . . . . . . . . . . . . . . . . . . . . . . . . . . . . . . . . . . . . . . . . . . . . . . . . . . . . . . . . . . 288,700 15,906 23,113Walgreen Co. . . . . . . . . . . . . . . . . . . . . . . . . . . . . . . . . . . . . . . . . . . . . . . . . . . . . . . . . . . . . . . . . . . . . . . . . . . . . . . . . . . . . . . . . . . . . . . . . 306,900 11,018 24,262CVS Caremark Corp. . . . . . . . . . . . . . . . . . . . . . . . . . . . . . . . . . . . . . . . . . . . . . . . . . . . . . . . . . . . . . . . . . . . . . . . . . . . . . . . . . . . . . . . . . . . 66,000 5,328 5,305
32,252 52,680
Aerospace & Defense: 5.93%General Dynamics Corp. . . . . . . . . . . . . . . . . . . . . . . . . . . . . . . . . . . . . . . . . . . . . . . . . . . . . . . . . . . . . . . . . . . . . . . . . . . . . . . . . . . . . . . . . 74,500 4,795 9,260Honeywell International Inc. . . . . . . . . . . . . . . . . . . . . . . . . . . . . . . . . . . . . . . . . . . . . . . . . . . . . . . . . . . . . . . . . . . . . . . . . . . . . . . . . . . . . . . 123,466 10,292 12,239United Technologies Corp. . . . . . . . . . . . . . . . . . . . . . . . . . . . . . . . . . . . . . . . . . . . . . . . . . . . . . . . . . . . . . . . . . . . . . . . . . . . . . . . . . . . . . . . 250,996 17,589 30,903
32,676 52,402
The accompanying notes are an integral part of these financial statements.
Franklin Templeton Investments Funds 163
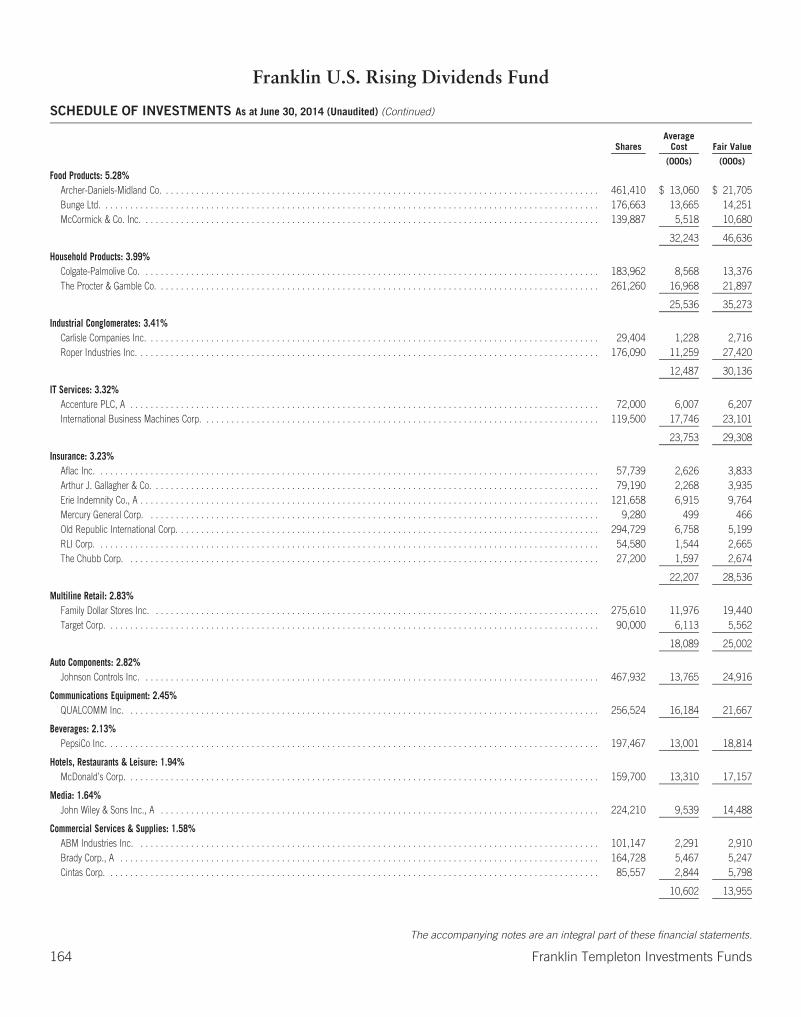
Franklin U.S. Rising Dividends Fund
SCHEDULE OF INVESTMENTS As at June 30, 2014 (Unaudited) (Continued)
SharesAverage
Cost Fair Value
(000s) (000s)
Food Products: 5.28%Archer-Daniels-Midland Co. . . . . . . . . . . . . . . . . . . . . . . . . . . . . . . . . . . . . . . . . . . . . . . . . . . . . . . . . . . . . . . . . . . . . . . . . . . . . . . . . . . . . . . 461,410 $ 13,060 $ 21,705Bunge Ltd. . . . . . . . . . . . . . . . . . . . . . . . . . . . . . . . . . . . . . . . . . . . . . . . . . . . . . . . . . . . . . . . . . . . . . . . . . . . . . . . . . . . . . . . . . . . . . . . . . . 176,663 13,665 14,251McCormick & Co. Inc. . . . . . . . . . . . . . . . . . . . . . . . . . . . . . . . . . . . . . . . . . . . . . . . . . . . . . . . . . . . . . . . . . . . . . . . . . . . . . . . . . . . . . . . . . . 139,887 5,518 10,680
32,243 46,636
Household Products: 3.99%Colgate-Palmolive Co. . . . . . . . . . . . . . . . . . . . . . . . . . . . . . . . . . . . . . . . . . . . . . . . . . . . . . . . . . . . . . . . . . . . . . . . . . . . . . . . . . . . . . . . . . . 183,962 8,568 13,376The Procter & Gamble Co. . . . . . . . . . . . . . . . . . . . . . . . . . . . . . . . . . . . . . . . . . . . . . . . . . . . . . . . . . . . . . . . . . . . . . . . . . . . . . . . . . . . . . . . 261,260 16,968 21,897
25,536 35,273
Industrial Conglomerates: 3.41%Carlisle Companies Inc. . . . . . . . . . . . . . . . . . . . . . . . . . . . . . . . . . . . . . . . . . . . . . . . . . . . . . . . . . . . . . . . . . . . . . . . . . . . . . . . . . . . . . . . . . 29,404 1,228 2,716Roper Industries Inc. . . . . . . . . . . . . . . . . . . . . . . . . . . . . . . . . . . . . . . . . . . . . . . . . . . . . . . . . . . . . . . . . . . . . . . . . . . . . . . . . . . . . . . . . . . . 176,090 11,259 27,420
12,487 30,136
IT Services: 3.32%Accenture PLC, A . . . . . . . . . . . . . . . . . . . . . . . . . . . . . . . . . . . . . . . . . . . . . . . . . . . . . . . . . . . . . . . . . . . . . . . . . . . . . . . . . . . . . . . . . . . . . 72,000 6,007 6,207International Business Machines Corp. . . . . . . . . . . . . . . . . . . . . . . . . . . . . . . . . . . . . . . . . . . . . . . . . . . . . . . . . . . . . . . . . . . . . . . . . . . . . . . 119,500 17,746 23,101
23,753 29,308
Insurance: 3.23%Aflac Inc. . . . . . . . . . . . . . . . . . . . . . . . . . . . . . . . . . . . . . . . . . . . . . . . . . . . . . . . . . . . . . . . . . . . . . . . . . . . . . . . . . . . . . . . . . . . . . . . . . . . 57,739 2,626 3,833Arthur J. Gallagher & Co. . . . . . . . . . . . . . . . . . . . . . . . . . . . . . . . . . . . . . . . . . . . . . . . . . . . . . . . . . . . . . . . . . . . . . . . . . . . . . . . . . . . . . . . . 79,190 2,268 3,935Erie Indemnity Co., A . . . . . . . . . . . . . . . . . . . . . . . . . . . . . . . . . . . . . . . . . . . . . . . . . . . . . . . . . . . . . . . . . . . . . . . . . . . . . . . . . . . . . . . . . . . 121,658 6,915 9,764Mercury General Corp. . . . . . . . . . . . . . . . . . . . . . . . . . . . . . . . . . . . . . . . . . . . . . . . . . . . . . . . . . . . . . . . . . . . . . . . . . . . . . . . . . . . . . . . . . 9,280 499 466Old Republic International Corp. . . . . . . . . . . . . . . . . . . . . . . . . . . . . . . . . . . . . . . . . . . . . . . . . . . . . . . . . . . . . . . . . . . . . . . . . . . . . . . . . . . . 294,729 6,758 5,199RLI Corp. . . . . . . . . . . . . . . . . . . . . . . . . . . . . . . . . . . . . . . . . . . . . . . . . . . . . . . . . . . . . . . . . . . . . . . . . . . . . . . . . . . . . . . . . . . . . . . . . . . . 54,580 1,544 2,665The Chubb Corp. . . . . . . . . . . . . . . . . . . . . . . . . . . . . . . . . . . . . . . . . . . . . . . . . . . . . . . . . . . . . . . . . . . . . . . . . . . . . . . . . . . . . . . . . . . . . . 27,200 1,597 2,674
22,207 28,536
Multiline Retail: 2.83%Family Dollar Stores Inc. . . . . . . . . . . . . . . . . . . . . . . . . . . . . . . . . . . . . . . . . . . . . . . . . . . . . . . . . . . . . . . . . . . . . . . . . . . . . . . . . . . . . . . . . 275,610 11,976 19,440Target Corp. . . . . . . . . . . . . . . . . . . . . . . . . . . . . . . . . . . . . . . . . . . . . . . . . . . . . . . . . . . . . . . . . . . . . . . . . . . . . . . . . . . . . . . . . . . . . . . . . . 90,000 6,113 5,562
18,089 25,002
Auto Components: 2.82%Johnson Controls Inc. . . . . . . . . . . . . . . . . . . . . . . . . . . . . . . . . . . . . . . . . . . . . . . . . . . . . . . . . . . . . . . . . . . . . . . . . . . . . . . . . . . . . . . . . . . 467,932 13,765 24,916
Communications Equipment: 2.45%QUALCOMM Inc. . . . . . . . . . . . . . . . . . . . . . . . . . . . . . . . . . . . . . . . . . . . . . . . . . . . . . . . . . . . . . . . . . . . . . . . . . . . . . . . . . . . . . . . . . . . . . 256,524 16,184 21,667
Beverages: 2.13%PepsiCo Inc. . . . . . . . . . . . . . . . . . . . . . . . . . . . . . . . . . . . . . . . . . . . . . . . . . . . . . . . . . . . . . . . . . . . . . . . . . . . . . . . . . . . . . . . . . . . . . . . . . 197,467 13,001 18,814
Hotels, Restaurants & Leisure: 1.94%McDonald’s Corp. . . . . . . . . . . . . . . . . . . . . . . . . . . . . . . . . . . . . . . . . . . . . . . . . . . . . . . . . . . . . . . . . . . . . . . . . . . . . . . . . . . . . . . . . . . . . . 159,700 13,310 17,157
Media: 1.64%John Wiley & Sons Inc., A . . . . . . . . . . . . . . . . . . . . . . . . . . . . . . . . . . . . . . . . . . . . . . . . . . . . . . . . . . . . . . . . . . . . . . . . . . . . . . . . . . . . . . . 224,210 9,539 14,488
Commercial Services & Supplies: 1.58%ABM Industries Inc. . . . . . . . . . . . . . . . . . . . . . . . . . . . . . . . . . . . . . . . . . . . . . . . . . . . . . . . . . . . . . . . . . . . . . . . . . . . . . . . . . . . . . . . . . . . 101,147 2,291 2,910Brady Corp., A . . . . . . . . . . . . . . . . . . . . . . . . . . . . . . . . . . . . . . . . . . . . . . . . . . . . . . . . . . . . . . . . . . . . . . . . . . . . . . . . . . . . . . . . . . . . . . . 164,728 5,467 5,247Cintas Corp. . . . . . . . . . . . . . . . . . . . . . . . . . . . . . . . . . . . . . . . . . . . . . . . . . . . . . . . . . . . . . . . . . . . . . . . . . . . . . . . . . . . . . . . . . . . . . . . . . 85,557 2,844 5,798
10,602 13,955
The accompanying notes are an integral part of these financial statements.
164 Franklin Templeton Investments Funds
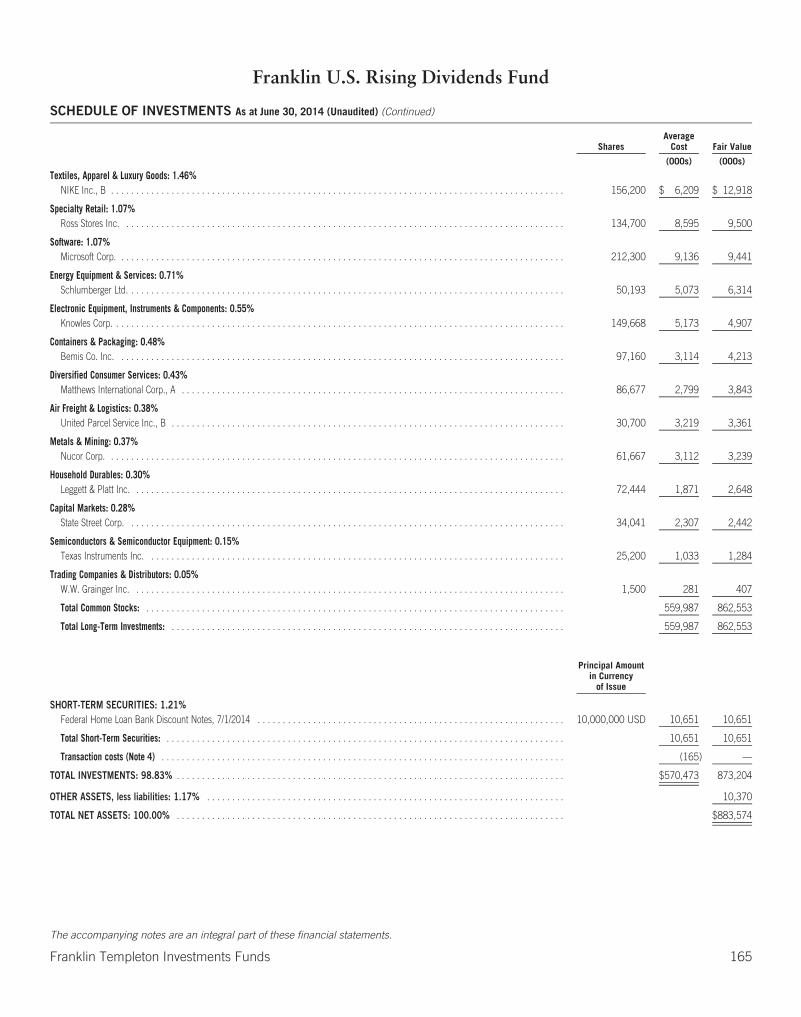
Franklin U.S. Rising Dividends Fund
SCHEDULE OF INVESTMENTS As at June 30, 2014 (Unaudited) (Continued)
SharesAverage
Cost Fair Value
(000s) (000s)
Textiles, Apparel & Luxury Goods: 1.46%NIKE Inc., B . . . . . . . . . . . . . . . . . . . . . . . . . . . . . . . . . . . . . . . . . . . . . . . . . . . . . . . . . . . . . . . . . . . . . . . . . . . . . . . . . . . . . . . . . . 156,200 $ 6,209 $ 12,918
Specialty Retail: 1.07%Ross Stores Inc. . . . . . . . . . . . . . . . . . . . . . . . . . . . . . . . . . . . . . . . . . . . . . . . . . . . . . . . . . . . . . . . . . . . . . . . . . . . . . . . . . . . . . . . 134,700 8,595 9,500
Software: 1.07%Microsoft Corp. . . . . . . . . . . . . . . . . . . . . . . . . . . . . . . . . . . . . . . . . . . . . . . . . . . . . . . . . . . . . . . . . . . . . . . . . . . . . . . . . . . . . . . . . 212,300 9,136 9,441
Energy Equipment & Services: 0.71%Schlumberger Ltd. . . . . . . . . . . . . . . . . . . . . . . . . . . . . . . . . . . . . . . . . . . . . . . . . . . . . . . . . . . . . . . . . . . . . . . . . . . . . . . . . . . . . . . 50,193 5,073 6,314
Electronic Equipment, Instruments & Components: 0.55%Knowles Corp. . . . . . . . . . . . . . . . . . . . . . . . . . . . . . . . . . . . . . . . . . . . . . . . . . . . . . . . . . . . . . . . . . . . . . . . . . . . . . . . . . . . . . . . . . 149,668 5,173 4,907
Containers & Packaging: 0.48%Bemis Co. Inc. . . . . . . . . . . . . . . . . . . . . . . . . . . . . . . . . . . . . . . . . . . . . . . . . . . . . . . . . . . . . . . . . . . . . . . . . . . . . . . . . . . . . . . . . 97,160 3,114 4,213
Diversified Consumer Services: 0.43%Matthews International Corp., A . . . . . . . . . . . . . . . . . . . . . . . . . . . . . . . . . . . . . . . . . . . . . . . . . . . . . . . . . . . . . . . . . . . . . . . . . . . . 86,677 2,799 3,843
Air Freight & Logistics: 0.38%United Parcel Service Inc., B . . . . . . . . . . . . . . . . . . . . . . . . . . . . . . . . . . . . . . . . . . . . . . . . . . . . . . . . . . . . . . . . . . . . . . . . . . . . . . 30,700 3,219 3,361
Metals & Mining: 0.37%Nucor Corp. . . . . . . . . . . . . . . . . . . . . . . . . . . . . . . . . . . . . . . . . . . . . . . . . . . . . . . . . . . . . . . . . . . . . . . . . . . . . . . . . . . . . . . . . . . 61,667 3,112 3,239
Household Durables: 0.30%Leggett & Platt Inc. . . . . . . . . . . . . . . . . . . . . . . . . . . . . . . . . . . . . . . . . . . . . . . . . . . . . . . . . . . . . . . . . . . . . . . . . . . . . . . . . . . . . . 72,444 1,871 2,648
Capital Markets: 0.28%State Street Corp. . . . . . . . . . . . . . . . . . . . . . . . . . . . . . . . . . . . . . . . . . . . . . . . . . . . . . . . . . . . . . . . . . . . . . . . . . . . . . . . . . . . . . . 34,041 2,307 2,442
Semiconductors & Semiconductor Equipment: 0.15%Texas Instruments Inc. . . . . . . . . . . . . . . . . . . . . . . . . . . . . . . . . . . . . . . . . . . . . . . . . . . . . . . . . . . . . . . . . . . . . . . . . . . . . . . . . . . 25,200 1,033 1,284
Trading Companies & Distributors: 0.05%W.W. Grainger Inc. . . . . . . . . . . . . . . . . . . . . . . . . . . . . . . . . . . . . . . . . . . . . . . . . . . . . . . . . . . . . . . . . . . . . . . . . . . . . . . . . . . . . . 1,500 281 407
Total Common Stocks: . . . . . . . . . . . . . . . . . . . . . . . . . . . . . . . . . . . . . . . . . . . . . . . . . . . . . . . . . . . . . . . . . . . . . . . . . . . . . . . . . . . 559,987 862,553
Total Long-Term Investments: . . . . . . . . . . . . . . . . . . . . . . . . . . . . . . . . . . . . . . . . . . . . . . . . . . . . . . . . . . . . . . . . . . . . . . . . . . . . . . 559,987 862,553
Principal Amountin Currency
of Issue
SHORT-TERM SECURITIES: 1.21%Federal Home Loan Bank Discount Notes, 7/1/2014 . . . . . . . . . . . . . . . . . . . . . . . . . . . . . . . . . . . . . . . . . . . . . . . . . . . . . . . . . . . . . 10,000,000 USD 10,651 10,651
Total Short-Term Securities: . . . . . . . . . . . . . . . . . . . . . . . . . . . . . . . . . . . . . . . . . . . . . . . . . . . . . . . . . . . . . . . . . . . . . . . . . . . . . . . 10,651 10,651
Transaction costs (Note 4) . . . . . . . . . . . . . . . . . . . . . . . . . . . . . . . . . . . . . . . . . . . . . . . . . . . . . . . . . . . . . . . . . . . . . . . . . . . . . . . . (165) —
TOTAL INVESTMENTS: 98.83% . . . . . . . . . . . . . . . . . . . . . . . . . . . . . . . . . . . . . . . . . . . . . . . . . . . . . . . . . . . . . . . . . . . . . . . . . . . . . $570,473 873,204
OTHER ASSETS, less liabilities: 1.17% . . . . . . . . . . . . . . . . . . . . . . . . . . . . . . . . . . . . . . . . . . . . . . . . . . . . . . . . . . . . . . . . . . . . . . . 10,370
TOTAL NET ASSETS: 100.00% . . . . . . . . . . . . . . . . . . . . . . . . . . . . . . . . . . . . . . . . . . . . . . . . . . . . . . . . . . . . . . . . . . . . . . . . . . . . . $883,574
The accompanying notes are an integral part of these financial statements.
Franklin Templeton Investments Funds 165
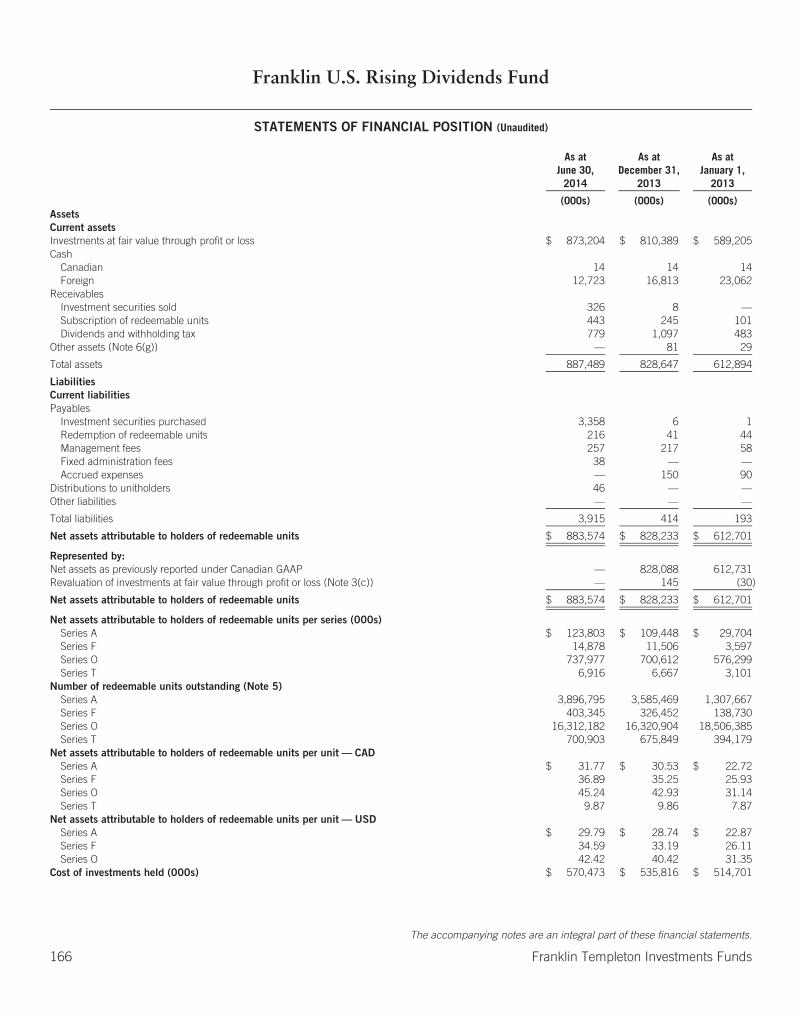
Franklin U.S. Rising Dividends Fund
STATEMENTS OF FINANCIAL POSITION (Unaudited)
As atJune 30,
2014
As atDecember 31,
2013
As atJanuary 1,
2013
(000s) (000s) (000s)AssetsCurrent assetsInvestments at fair value through profit or loss $ 873,204 $ 810,389 $ 589,205Cash
Canadian 14 14 14Foreign 12,723 16,813 23,062
ReceivablesInvestment securities sold 326 8 —Subscription of redeemable units 443 245 101Dividends and withholding tax 779 1,097 483
Other assets (Note 6(g)) — 81 29
Total assets 887,489 828,647 612,894
LiabilitiesCurrent liabilitiesPayables
Investment securities purchased 3,358 6 1Redemption of redeemable units 216 41 44Management fees 257 217 58Fixed administration fees 38 — —Accrued expenses — 150 90
Distributions to unitholders 46 — —Other liabilities — — —
Total liabilities 3,915 414 193
Net assets attributable to holders of redeemable units $ 883,574 $ 828,233 $ 612,701
Represented by:Net assets as previously reported under Canadian GAAP — 828,088 612,731Revaluation of investments at fair value through profit or loss (Note 3(c)) — 145 (30)
Net assets attributable to holders of redeemable units $ 883,574 $ 828,233 $ 612,701
Net assets attributable to holders of redeemable units per series (000s)Series A $ 123,803 $ 109,448 $ 29,704Series F 14,878 11,506 3,597Series O 737,977 700,612 576,299Series T 6,916 6,667 3,101
Number of redeemable units outstanding (Note 5)Series A 3,896,795 3,585,469 1,307,667Series F 403,345 326,452 138,730Series O 16,312,182 16,320,904 18,506,385Series T 700,903 675,849 394,179
Net assets attributable to holders of redeemable units per unit — CADSeries A $ 31.77 $ 30.53 $ 22.72Series F 36.89 35.25 25.93Series O 45.24 42.93 31.14Series T 9.87 9.86 7.87
Net assets attributable to holders of redeemable units per unit — USDSeries A $ 29.79 $ 28.74 $ 22.87Series F 34.59 33.19 26.11Series O 42.42 40.42 31.35
Cost of investments held (000s) $ 570,473 $ 535,816 $ 514,701
The accompanying notes are an integral part of these financial statements.
166 Franklin Templeton Investments Funds

Franklin U.S. Rising Dividends Fund
STATEMENTS OF COMPREHENSIVE INCOMEFor the six months ended June 30, 2014 and 2013 (Unaudited)
2014 2013
(000s) (000s)IncomeDividends $ 14,376 $ 15,515Interest income for distribution purposes 1 2Net realized and/or unrealized foreign exchange gain (loss) 70 2,879Net realized gain (loss) on investments 4,130 5,696Net change in unrealized appreciation (depreciation) in value of investments 28,158 101,917
Total income (net) 46,735 126,009
ExpensesManagement fees (Note 6(a)) 1,466 597Fixed administration fees (Note 6(b)) 216 —Transfer agent fees (Note 6(d)) — 140Custodian fees — 1Legal fees — —Audit fees — 11Unitholder reporting costs — 11Independent review committee fees — 1Registration fees — 10Other expenses (Note 6(f)) — 72
Operating expenses before waivers/paid by Manager 1,682 843Expenses waived/paid by Manager (Note 6(b)) — (151)
Net operating expenses after waivers/paid by Manager 1,682 692
Transaction costs (Note 9) 18 28Withholding tax expense 1,260 1,059
Total expenses 2,960 1,779
Increase (decrease) in net assets attributable to holders of redeemable units from operations $ 43,775 $ 124,230
Represented by:Increase (decrease) in net assets from operations as previously reported under Canadian GAAP — 123,818Revaluation of investments at fair value through profit and loss (Note 3(c)) — 412
Increase (decrease) in net assets attributable to holders of redeemable units from operations $ 43,775 $ 124,230
Increase (decrease) in net assets attributable to holders of redeemable units from operations per series (000s)Series A $ 4,587 $ 7,192Series F 573 858Series O 38,347 115,536Series T 268 644
Weighted average number of units outstandingSeries A 3,792,186 1,837,576Series F 364,985 182,431Series O 16,322,326 18,282,694Series T 679,405 463,499
Increase (decrease) in net assets attributable to holders of redeemable units from operations per unitSeries A $ 1.21 $ 3.91Series F 1.57 4.69Series O 2.35 6.32Series T 0.39 1.39
The accompanying notes are an integral part of these financial statements.
Franklin Templeton Investments Funds 167

Franklin U.S. Rising Dividends Fund
STATEMENTS OF CHANGES IN NET ASSETS ATTRIBUTABLE TO HOLDERS OF REDEEMABLE UNITSFor the six months ended June 30, 2014 and 2013 (Unaudited) (in 000s)
All Series Series A Series F
2014 2013 2014 2013 2014 2013
Net assets attributable to holders of redeemable units at beginning of period $828,233 $ 612,701 $109,448 $29,704 $11,506 $3,597
Increase (decrease) in net assets attributable to holders of redeemable unitsfrom operations 43,775 124,230 4,587 7,192 573 858
Distributions to holders of redeemable unitsFrom net investment income — — — — — —From net realized gains on investments — — — — — —From return of capital (268) (150) — — — —
Total distributions to holders of redeemable units (268) (150) — — — —
Redeemable units transactionsSubscriptions 101,573 167,428 22,917 35,350 4,624 3,534Reinvestments 68 32 — — — —Redemptions (89,807) (106,511) (13,149) (2,161) (1,825) (399)
Net increase (decrease) from redeemable units transactions 11,834 60,949 9,768 33,189 2,799 3,135
Increase (decrease) in net assets attributable to holders of redeemable units 55,341 185,029 14,355 40,381 3,372 3,992
Net assets attributable to holders of redeemable units at end of period $883,574 $ 797,730 $123,803 $70,085 $14,878 $7,590
Series O Series T
2014 2013 2014 2013
Net assets attributable to holders of redeemable units at beginning of period $700,612 $ 576,299 $ 6,667 $ 3,101
Increase (decrease) in net assets attributable to holders of redeemable unitsfrom operations 38,347 115,536 268 644
Distributions to holders of redeemable unitsFrom net investment income — — — —From net realized gains on investments — — — —From return of capital — — (268) (150)
Total distributions to holders of redeemable units — — (268) (150)
Redeemable units transactionsSubscriptions 73,293 126,553 739 1,991Reinvestments — — 68 32Redemptions (74,275) (103,179) (558) (772)
Net increase (decrease) from redeemable units transactions (982) 23,374 249 1,251
Increase (decrease) in net assets attributable to holders of redeemable units 37,365 138,911 249 1,745
Net assets attributable to holders of redeemable units at end of period $737,977 $ 715,209 $ 6,916 $ 4,846
The accompanying notes are an integral part of these financial statements.
168 Franklin Templeton Investments Funds
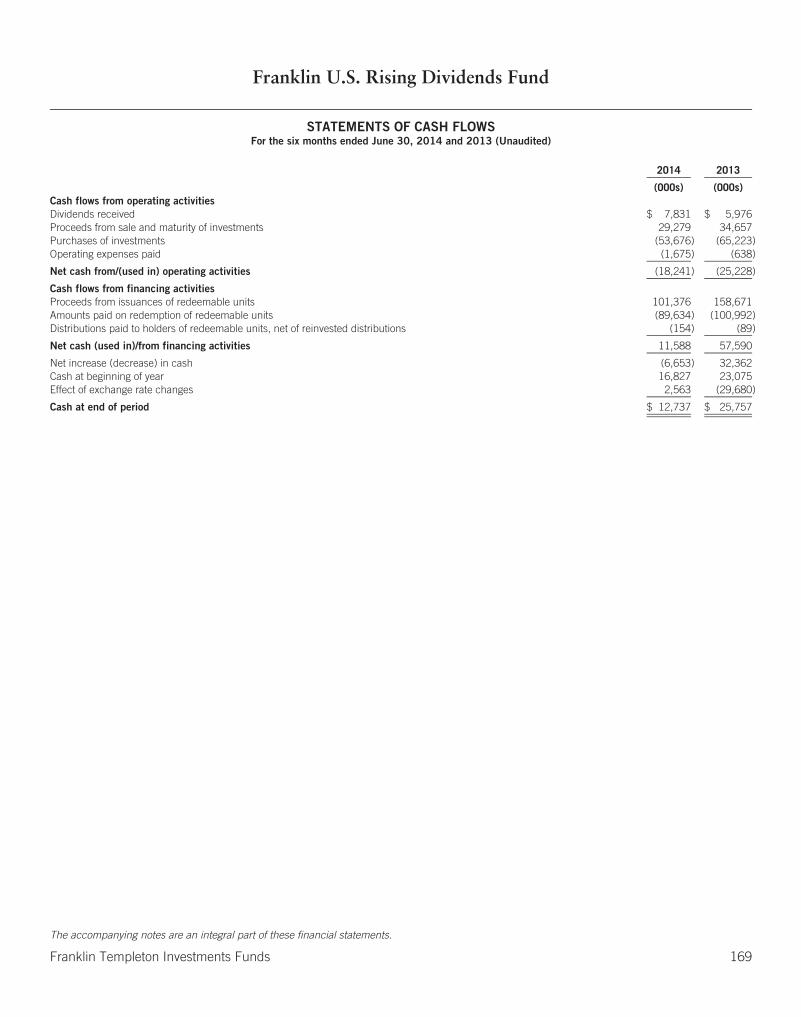
Franklin U.S. Rising Dividends Fund
STATEMENTS OF CASH FLOWSFor the six months ended June 30, 2014 and 2013 (Unaudited)
2014 2013
(000s) (000s)Cash flows from operating activitiesDividends received $ 7,831 $ 5,976Proceeds from sale and maturity of investments 29,279 34,657Purchases of investments (53,676) (65,223)Operating expenses paid (1,675) (638)
Net cash from/(used in) operating activities (18,241) (25,228)
Cash flows from financing activitiesProceeds from issuances of redeemable units 101,376 158,671Amounts paid on redemption of redeemable units (89,634) (100,992)Distributions paid to holders of redeemable units, net of reinvested distributions (154) (89)
Net cash (used in)/from financing activities 11,588 57,590
Net increase (decrease) in cash (6,653) 32,362Cash at beginning of year 16,827 23,075Effect of exchange rate changes 2,563 (29,680)
Cash at end of period $ 12,737 $ 25,757
The accompanying notes are an integral part of these financial statements.
Franklin Templeton Investments Funds 169

Franklin World Growth Fund
SCHEDULE OF INVESTMENTS As at June 30, 2014 (Unaudited)
SharesAverage
Cost Fair Value
(000s) (000s)
COMMON STOCKS: 97.40%United States: 52.57%
Adobe Systems Inc. . . . . . . . . . . . . . . . . . . . . . . . . . . . . . . . . . . . . . . . . . . . . . . . . . . . . . . . . . . . . . . . . . . . . . . . . . . . . . . . . . . . . . . . . . . 58,000 $ 3,900 $ 4,476Alkermes PLC . . . . . . . . . . . . . . . . . . . . . . . . . . . . . . . . . . . . . . . . . . . . . . . . . . . . . . . . . . . . . . . . . . . . . . . . . . . . . . . . . . . . . . . . . . . . . . 85,000 3,728 4,562Amazon.com Inc. . . . . . . . . . . . . . . . . . . . . . . . . . . . . . . . . . . . . . . . . . . . . . . . . . . . . . . . . . . . . . . . . . . . . . . . . . . . . . . . . . . . . . . . . . . . . 12,500 2,789 4,330Apple Inc. . . . . . . . . . . . . . . . . . . . . . . . . . . . . . . . . . . . . . . . . . . . . . . . . . . . . . . . . . . . . . . . . . . . . . . . . . . . . . . . . . . . . . . . . . . . . . . . . . 42,000 2,385 4,162athenahealth Inc. . . . . . . . . . . . . . . . . . . . . . . . . . . . . . . . . . . . . . . . . . . . . . . . . . . . . . . . . . . . . . . . . . . . . . . . . . . . . . . . . . . . . . . . . . . . . 37,000 4,630 4,937Catamaran Corp. . . . . . . . . . . . . . . . . . . . . . . . . . . . . . . . . . . . . . . . . . . . . . . . . . . . . . . . . . . . . . . . . . . . . . . . . . . . . . . . . . . . . . . . . . . . . 110,000 5,116 5,180Chipotle Mexican Grill Inc. . . . . . . . . . . . . . . . . . . . . . . . . . . . . . . . . . . . . . . . . . . . . . . . . . . . . . . . . . . . . . . . . . . . . . . . . . . . . . . . . . . . . . 7,200 4,363 4,550Danaher Corp. . . . . . . . . . . . . . . . . . . . . . . . . . . . . . . . . . . . . . . . . . . . . . . . . . . . . . . . . . . . . . . . . . . . . . . . . . . . . . . . . . . . . . . . . . . . . . . 58,000 3,048 4,870Discover Financial Services . . . . . . . . . . . . . . . . . . . . . . . . . . . . . . . . . . . . . . . . . . . . . . . . . . . . . . . . . . . . . . . . . . . . . . . . . . . . . . . . . . . . . 71,000 3,671 4,693Discovery Communications Inc., A . . . . . . . . . . . . . . . . . . . . . . . . . . . . . . . . . . . . . . . . . . . . . . . . . . . . . . . . . . . . . . . . . . . . . . . . . . . . . . . 67,000 5,662 5,307FMC Technologies Inc. . . . . . . . . . . . . . . . . . . . . . . . . . . . . . . . . . . . . . . . . . . . . . . . . . . . . . . . . . . . . . . . . . . . . . . . . . . . . . . . . . . . . . . . . 60,000 3,484 3,908Incyte Corp. . . . . . . . . . . . . . . . . . . . . . . . . . . . . . . . . . . . . . . . . . . . . . . . . . . . . . . . . . . . . . . . . . . . . . . . . . . . . . . . . . . . . . . . . . . . . . . . . 30,000 1,146 1,806Intercontinental Exchange Inc. . . . . . . . . . . . . . . . . . . . . . . . . . . . . . . . . . . . . . . . . . . . . . . . . . . . . . . . . . . . . . . . . . . . . . . . . . . . . . . . . . . 25,000 3,631 5,036Level 3 Communications Inc. . . . . . . . . . . . . . . . . . . . . . . . . . . . . . . . . . . . . . . . . . . . . . . . . . . . . . . . . . . . . . . . . . . . . . . . . . . . . . . . . . . . 90,000 3,863 4,214Polaris Industries Inc. . . . . . . . . . . . . . . . . . . . . . . . . . . . . . . . . . . . . . . . . . . . . . . . . . . . . . . . . . . . . . . . . . . . . . . . . . . . . . . . . . . . . . . . . . 37,000 4,413 5,139Praxair Inc. . . . . . . . . . . . . . . . . . . . . . . . . . . . . . . . . . . . . . . . . . . . . . . . . . . . . . . . . . . . . . . . . . . . . . . . . . . . . . . . . . . . . . . . . . . . . . . . . 27,000 2,685 3,825Rockwell Automation Inc. . . . . . . . . . . . . . . . . . . . . . . . . . . . . . . . . . . . . . . . . . . . . . . . . . . . . . . . . . . . . . . . . . . . . . . . . . . . . . . . . . . . . . . 28,000 2,858 3,737Schlumberger Ltd. . . . . . . . . . . . . . . . . . . . . . . . . . . . . . . . . . . . . . . . . . . . . . . . . . . . . . . . . . . . . . . . . . . . . . . . . . . . . . . . . . . . . . . . . . . . 35,000 2,583 4,403Signature Bank/New York NY . . . . . . . . . . . . . . . . . . . . . . . . . . . . . . . . . . . . . . . . . . . . . . . . . . . . . . . . . . . . . . . . . . . . . . . . . . . . . . . . . . . 42,000 5,598 5,652The Priceline Group Inc. . . . . . . . . . . . . . . . . . . . . . . . . . . . . . . . . . . . . . . . . . . . . . . . . . . . . . . . . . . . . . . . . . . . . . . . . . . . . . . . . . . . . . . . 4,000 2,847 5,132Verisk Analytics Inc., A . . . . . . . . . . . . . . . . . . . . . . . . . . . . . . . . . . . . . . . . . . . . . . . . . . . . . . . . . . . . . . . . . . . . . . . . . . . . . . . . . . . . . . . . 75,000 5,088 4,801Visa Inc., A . . . . . . . . . . . . . . . . . . . . . . . . . . . . . . . . . . . . . . . . . . . . . . . . . . . . . . . . . . . . . . . . . . . . . . . . . . . . . . . . . . . . . . . . . . . . . . . . 25,000 3,086 5,618
80,574 100,338
United Kingdom: 10.07%Aberdeen Asset Management PLC . . . . . . . . . . . . . . . . . . . . . . . . . . . . . . . . . . . . . . . . . . . . . . . . . . . . . . . . . . . . . . . . . . . . . . . . . . . . . . . 650,000 4,644 5,384ARM Holdings PLC . . . . . . . . . . . . . . . . . . . . . . . . . . . . . . . . . . . . . . . . . . . . . . . . . . . . . . . . . . . . . . . . . . . . . . . . . . . . . . . . . . . . . . . . . . 310,000 3,693 4,984Burberry Group PLC . . . . . . . . . . . . . . . . . . . . . . . . . . . . . . . . . . . . . . . . . . . . . . . . . . . . . . . . . . . . . . . . . . . . . . . . . . . . . . . . . . . . . . . . . . 155,000 3,553 4,195Reckitt Benckiser Group PLC . . . . . . . . . . . . . . . . . . . . . . . . . . . . . . . . . . . . . . . . . . . . . . . . . . . . . . . . . . . . . . . . . . . . . . . . . . . . . . . . . . . 50,000 2,836 4,653
14,726 19,216
Switzerland: 7.79%Partners Group Holding AG . . . . . . . . . . . . . . . . . . . . . . . . . . . . . . . . . . . . . . . . . . . . . . . . . . . . . . . . . . . . . . . . . . . . . . . . . . . . . . . . . . . . . 15,000 4,085 4,372Roche Holding AG . . . . . . . . . . . . . . . . . . . . . . . . . . . . . . . . . . . . . . . . . . . . . . . . . . . . . . . . . . . . . . . . . . . . . . . . . . . . . . . . . . . . . . . . . . . 17,000 4,433 5,407Syngenta AG . . . . . . . . . . . . . . . . . . . . . . . . . . . . . . . . . . . . . . . . . . . . . . . . . . . . . . . . . . . . . . . . . . . . . . . . . . . . . . . . . . . . . . . . . . . . . . . 12,800 4,176 5,084
12,694 14,863
Australia: 4.71%Cochlear Ltd. . . . . . . . . . . . . . . . . . . . . . . . . . . . . . . . . . . . . . . . . . . . . . . . . . . . . . . . . . . . . . . . . . . . . . . . . . . . . . . . . . . . . . . . . . . . . . . . 77,000 4,586 4,780CSL Ltd. . . . . . . . . . . . . . . . . . . . . . . . . . . . . . . . . . . . . . . . . . . . . . . . . . . . . . . . . . . . . . . . . . . . . . . . . . . . . . . . . . . . . . . . . . . . . . . . . . . 63,000 2,692 4,218
7,278 8,998
Hong Kong: 2.89%Noble Group Ltd. . . . . . . . . . . . . . . . . . . . . . . . . . . . . . . . . . . . . . . . . . . . . . . . . . . . . . . . . . . . . . . . . . . . . . . . . . . . . . . . . . . . . . . . . . . . . 4,700,000 4,859 5,508
Belgium: 2.86%Umicore SA . . . . . . . . . . . . . . . . . . . . . . . . . . . . . . . . . . . . . . . . . . . . . . . . . . . . . . . . . . . . . . . . . . . . . . . . . . . . . . . . . . . . . . . . . . . . . . . . 110,000 5,466 5,451
Argentina: 2.66%MercadoLibre Inc. . . . . . . . . . . . . . . . . . . . . . . . . . . . . . . . . . . . . . . . . . . . . . . . . . . . . . . . . . . . . . . . . . . . . . . . . . . . . . . . . . . . . . . . . . . . 50,000 4,853 5,087
The accompanying notes are an integral part of these financial statements.
170 Franklin Templeton Investments Funds
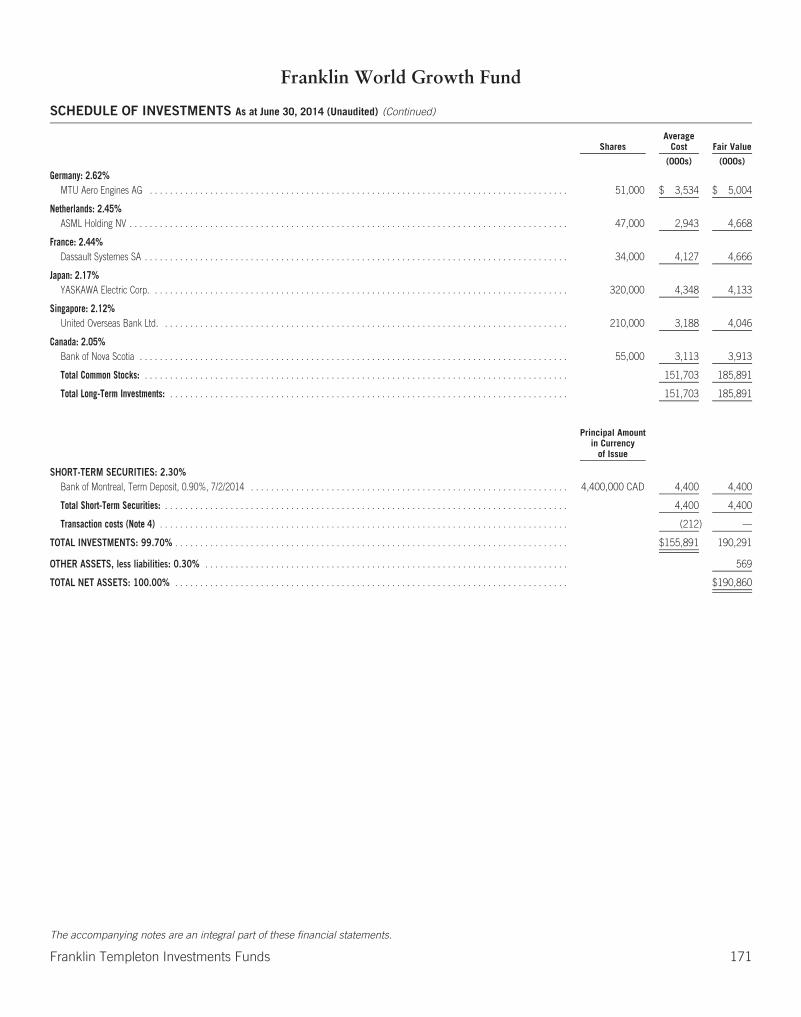
Franklin World Growth Fund
SCHEDULE OF INVESTMENTS As at June 30, 2014 (Unaudited) (Continued)
SharesAverage
Cost Fair Value
(000s) (000s)
Germany: 2.62%MTU Aero Engines AG . . . . . . . . . . . . . . . . . . . . . . . . . . . . . . . . . . . . . . . . . . . . . . . . . . . . . . . . . . . . . . . . . . . . . . . . . . . . . . . . . . . 51,000 $ 3,534 $ 5,004
Netherlands: 2.45%ASML Holding NV . . . . . . . . . . . . . . . . . . . . . . . . . . . . . . . . . . . . . . . . . . . . . . . . . . . . . . . . . . . . . . . . . . . . . . . . . . . . . . . . . . . . . . . 47,000 2,943 4,668
France: 2.44%Dassault Systemes SA . . . . . . . . . . . . . . . . . . . . . . . . . . . . . . . . . . . . . . . . . . . . . . . . . . . . . . . . . . . . . . . . . . . . . . . . . . . . . . . . . . . . 34,000 4,127 4,666
Japan: 2.17%YASKAWA Electric Corp. . . . . . . . . . . . . . . . . . . . . . . . . . . . . . . . . . . . . . . . . . . . . . . . . . . . . . . . . . . . . . . . . . . . . . . . . . . . . . . . . . . 320,000 4,348 4,133
Singapore: 2.12%United Overseas Bank Ltd. . . . . . . . . . . . . . . . . . . . . . . . . . . . . . . . . . . . . . . . . . . . . . . . . . . . . . . . . . . . . . . . . . . . . . . . . . . . . . . . . 210,000 3,188 4,046
Canada: 2.05%Bank of Nova Scotia . . . . . . . . . . . . . . . . . . . . . . . . . . . . . . . . . . . . . . . . . . . . . . . . . . . . . . . . . . . . . . . . . . . . . . . . . . . . . . . . . . . . . 55,000 3,113 3,913
Total Common Stocks: . . . . . . . . . . . . . . . . . . . . . . . . . . . . . . . . . . . . . . . . . . . . . . . . . . . . . . . . . . . . . . . . . . . . . . . . . . . . . . . . . . . . 151,703 185,891
Total Long-Term Investments: . . . . . . . . . . . . . . . . . . . . . . . . . . . . . . . . . . . . . . . . . . . . . . . . . . . . . . . . . . . . . . . . . . . . . . . . . . . . . . . 151,703 185,891
Principal Amountin Currency
of Issue
SHORT-TERM SECURITIES: 2.30%Bank of Montreal, Term Deposit, 0.90%, 7/2/2014 . . . . . . . . . . . . . . . . . . . . . . . . . . . . . . . . . . . . . . . . . . . . . . . . . . . . . . . . . . . . . . . 4,400,000 CAD 4,400 4,400
Total Short-Term Securities: . . . . . . . . . . . . . . . . . . . . . . . . . . . . . . . . . . . . . . . . . . . . . . . . . . . . . . . . . . . . . . . . . . . . . . . . . . . . . . . . 4,400 4,400
Transaction costs (Note 4) . . . . . . . . . . . . . . . . . . . . . . . . . . . . . . . . . . . . . . . . . . . . . . . . . . . . . . . . . . . . . . . . . . . . . . . . . . . . . . . . . (212) —
TOTAL INVESTMENTS: 99.70% . . . . . . . . . . . . . . . . . . . . . . . . . . . . . . . . . . . . . . . . . . . . . . . . . . . . . . . . . . . . . . . . . . . . . . . . . . . . . . $155,891 190,291
OTHER ASSETS, less liabilities: 0.30% . . . . . . . . . . . . . . . . . . . . . . . . . . . . . . . . . . . . . . . . . . . . . . . . . . . . . . . . . . . . . . . . . . . . . . . . 569
TOTAL NET ASSETS: 100.00% . . . . . . . . . . . . . . . . . . . . . . . . . . . . . . . . . . . . . . . . . . . . . . . . . . . . . . . . . . . . . . . . . . . . . . . . . . . . . . $190,860
The accompanying notes are an integral part of these financial statements.
Franklin Templeton Investments Funds 171
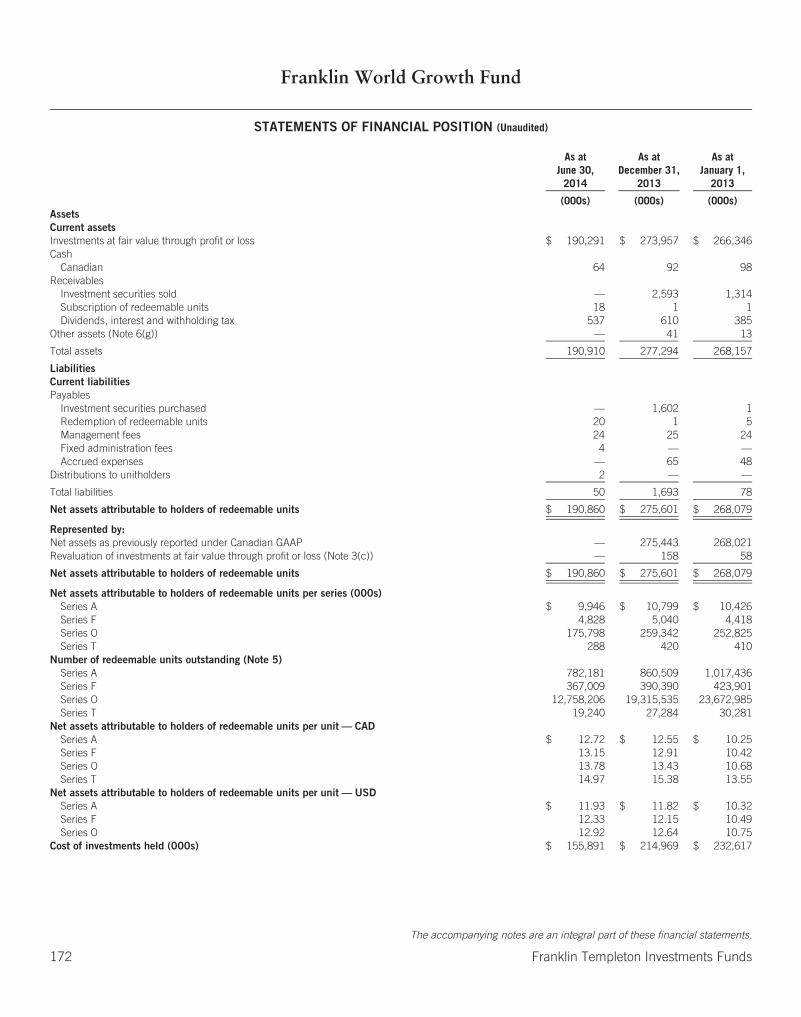
Franklin World Growth Fund
STATEMENTS OF FINANCIAL POSITION (Unaudited)
As atJune 30,
2014
As atDecember 31,
2013
As atJanuary 1,
2013
(000s) (000s) (000s)AssetsCurrent assetsInvestments at fair value through profit or loss $ 190,291 $ 273,957 $ 266,346Cash
Canadian 64 92 98Receivables
Investment securities sold — 2,593 1,314Subscription of redeemable units 18 1 1Dividends, interest and withholding tax 537 610 385
Other assets (Note 6(g)) — 41 13
Total assets 190,910 277,294 268,157
LiabilitiesCurrent liabilitiesPayables
Investment securities purchased — 1,602 1Redemption of redeemable units 20 1 5Management fees 24 25 24Fixed administration fees 4 — —Accrued expenses — 65 48
Distributions to unitholders 2 — —
Total liabilities 50 1,693 78
Net assets attributable to holders of redeemable units $ 190,860 $ 275,601 $ 268,079
Represented by:Net assets as previously reported under Canadian GAAP — 275,443 268,021Revaluation of investments at fair value through profit or loss (Note 3(c)) — 158 58
Net assets attributable to holders of redeemable units $ 190,860 $ 275,601 $ 268,079
Net assets attributable to holders of redeemable units per series (000s)Series A $ 9,946 $ 10,799 $ 10,426Series F 4,828 5,040 4,418Series O 175,798 259,342 252,825Series T 288 420 410
Number of redeemable units outstanding (Note 5)Series A 782,181 860,509 1,017,436Series F 367,009 390,390 423,901Series O 12,758,206 19,315,535 23,672,985Series T 19,240 27,284 30,281
Net assets attributable to holders of redeemable units per unit — CADSeries A $ 12.72 $ 12.55 $ 10.25Series F 13.15 12.91 10.42Series O 13.78 13.43 10.68Series T 14.97 15.38 13.55
Net assets attributable to holders of redeemable units per unit — USDSeries A $ 11.93 $ 11.82 $ 10.32Series F 12.33 12.15 10.49Series O 12.92 12.64 10.75
Cost of investments held (000s) $ 155,891 $ 214,969 $ 232,617
The accompanying notes are an integral part of these financial statements.
172 Franklin Templeton Investments Funds
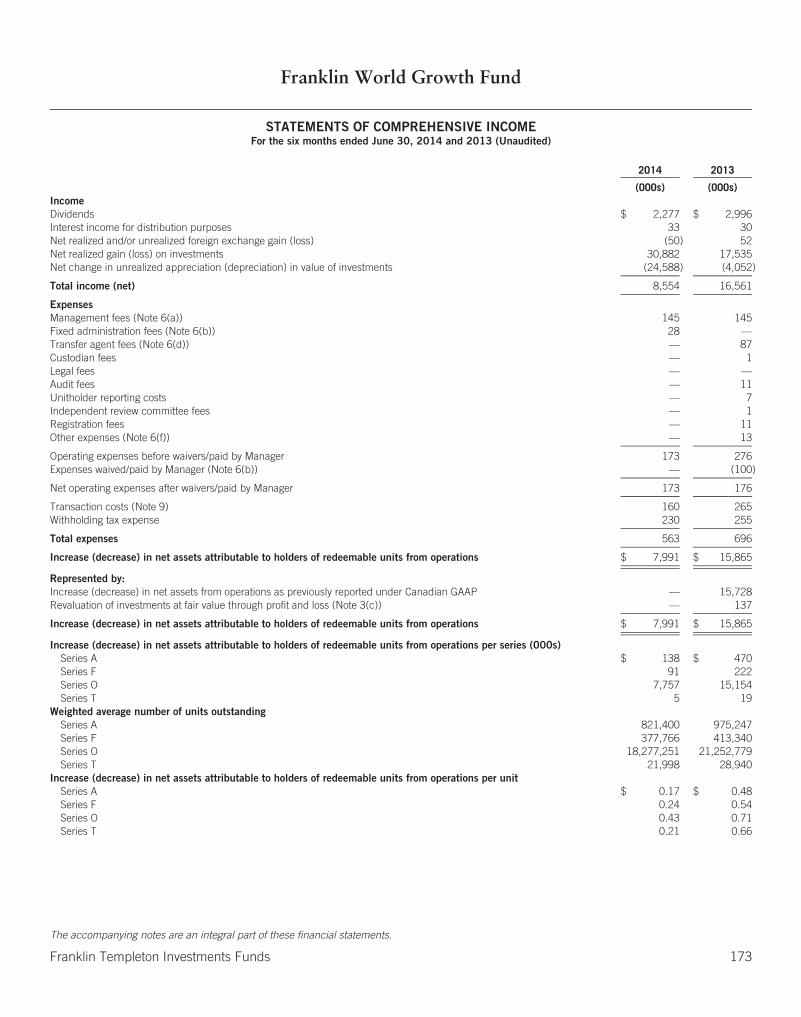
Franklin World Growth Fund
STATEMENTS OF COMPREHENSIVE INCOMEFor the six months ended June 30, 2014 and 2013 (Unaudited)
2014 2013
(000s) (000s)IncomeDividends $ 2,277 $ 2,996Interest income for distribution purposes 33 30Net realized and/or unrealized foreign exchange gain (loss) (50) 52Net realized gain (loss) on investments 30,882 17,535Net change in unrealized appreciation (depreciation) in value of investments (24,588) (4,052)
Total income (net) 8,554 16,561
ExpensesManagement fees (Note 6(a)) 145 145Fixed administration fees (Note 6(b)) 28 —Transfer agent fees (Note 6(d)) — 87Custodian fees — 1Legal fees — —Audit fees — 11Unitholder reporting costs — 7Independent review committee fees — 1Registration fees — 11Other expenses (Note 6(f)) — 13
Operating expenses before waivers/paid by Manager 173 276Expenses waived/paid by Manager (Note 6(b)) — (100)
Net operating expenses after waivers/paid by Manager 173 176
Transaction costs (Note 9) 160 265Withholding tax expense 230 255
Total expenses 563 696
Increase (decrease) in net assets attributable to holders of redeemable units from operations $ 7,991 $ 15,865
Represented by:Increase (decrease) in net assets from operations as previously reported under Canadian GAAP — 15,728Revaluation of investments at fair value through profit and loss (Note 3(c)) — 137
Increase (decrease) in net assets attributable to holders of redeemable units from operations $ 7,991 $ 15,865
Increase (decrease) in net assets attributable to holders of redeemable units from operations per series (000s)Series A $ 138 $ 470Series F 91 222Series O 7,757 15,154Series T 5 19
Weighted average number of units outstandingSeries A 821,400 975,247Series F 377,766 413,340Series O 18,277,251 21,252,779Series T 21,998 28,940
Increase (decrease) in net assets attributable to holders of redeemable units from operations per unitSeries A $ 0.17 $ 0.48Series F 0.24 0.54Series O 0.43 0.71Series T 0.21 0.66
The accompanying notes are an integral part of these financial statements.
Franklin Templeton Investments Funds 173
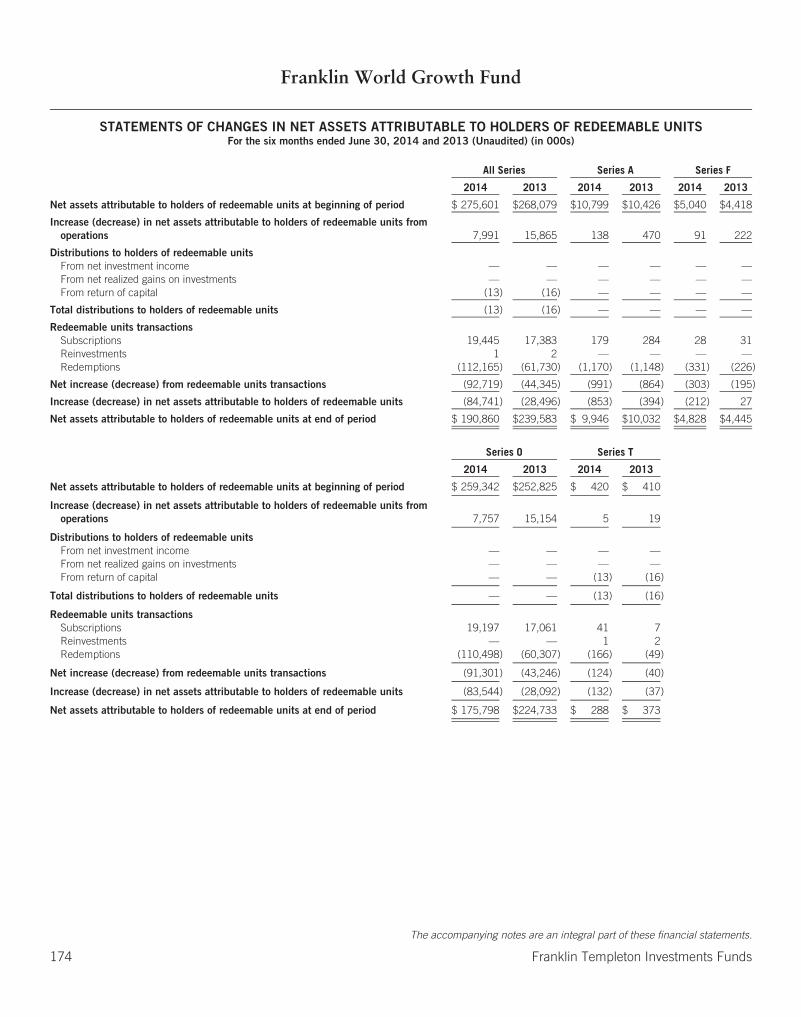
Franklin World Growth Fund
STATEMENTS OF CHANGES IN NET ASSETS ATTRIBUTABLE TO HOLDERS OF REDEEMABLE UNITSFor the six months ended June 30, 2014 and 2013 (Unaudited) (in 000s)
All Series Series A Series F
2014 2013 2014 2013 2014 2013
Net assets attributable to holders of redeemable units at beginning of period $ 275,601 $268,079 $10,799 $10,426 $5,040 $4,418
Increase (decrease) in net assets attributable to holders of redeemable units fromoperations 7,991 15,865 138 470 91 222
Distributions to holders of redeemable unitsFrom net investment income — — — — — —From net realized gains on investments — — — — — —From return of capital (13) (16) — — — —
Total distributions to holders of redeemable units (13) (16) — — — —
Redeemable units transactionsSubscriptions 19,445 17,383 179 284 28 31Reinvestments 1 2 — — — —Redemptions (112,165) (61,730) (1,170) (1,148) (331) (226)
Net increase (decrease) from redeemable units transactions (92,719) (44,345) (991) (864) (303) (195)
Increase (decrease) in net assets attributable to holders of redeemable units (84,741) (28,496) (853) (394) (212) 27
Net assets attributable to holders of redeemable units at end of period $ 190,860 $239,583 $ 9,946 $10,032 $4,828 $4,445
Series O Series T
2014 2013 2014 2013
Net assets attributable to holders of redeemable units at beginning of period $ 259,342 $252,825 $ 420 $ 410
Increase (decrease) in net assets attributable to holders of redeemable units fromoperations 7,757 15,154 5 19
Distributions to holders of redeemable unitsFrom net investment income — — — —From net realized gains on investments — — — —From return of capital — — (13) (16)
Total distributions to holders of redeemable units — — (13) (16)
Redeemable units transactionsSubscriptions 19,197 17,061 41 7Reinvestments — — 1 2Redemptions (110,498) (60,307) (166) (49)
Net increase (decrease) from redeemable units transactions (91,301) (43,246) (124) (40)
Increase (decrease) in net assets attributable to holders of redeemable units (83,544) (28,092) (132) (37)
Net assets attributable to holders of redeemable units at end of period $ 175,798 $224,733 $ 288 $ 373
The accompanying notes are an integral part of these financial statements.
174 Franklin Templeton Investments Funds

Franklin World Growth Fund
STATEMENTS OF CASH FLOWSFor the six months ended June 30, 2014 and 2013 (Unaudited)
2014 2013
(000s) (000s)Cash flows from operating activitiesInterest received $ 28 $ 30Dividends received 2,135 2,445Proceeds from sale and maturity of investments 159,050 199,321Purchases of investments (68,127) (156,435)Operating expenses paid (194) (201)
Net cash from/(used in) operating activities 92,892 45,160
Cash flows from financing activitiesProceeds from issuances of redeemable units 19,429 16,473Amounts paid on redemption of redeemable units (112,147) (61,097)Distributions paid to holders of redeemable units, net of reinvested distributions (10) (11)
Net cash (used in)/from financing activities (92,728) (44,635)
Net increase (decrease) in cash 164 525Cash at beginning of year 92 99Effect of exchange rate changes (192) (69)
Cash at end of period $ 64 $ 555
The accompanying notes are an integral part of these financial statements.
Franklin Templeton Investments Funds 175
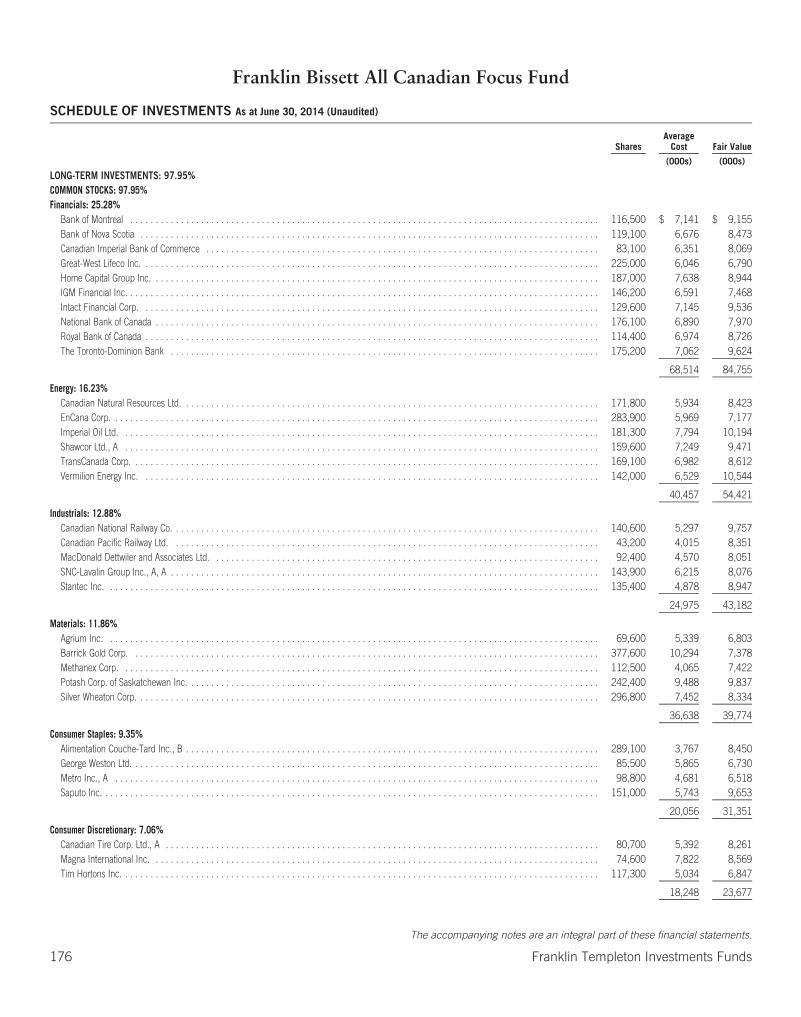
Franklin Bissett All Canadian Focus Fund
SCHEDULE OF INVESTMENTS As at June 30, 2014 (Unaudited)
SharesAverage
Cost Fair Value
(000s) (000s)
LONG-TERM INVESTMENTS: 97.95%COMMON STOCKS: 97.95%Financials: 25.28%
Bank of Montreal . . . . . . . . . . . . . . . . . . . . . . . . . . . . . . . . . . . . . . . . . . . . . . . . . . . . . . . . . . . . . . . . . . . . . . . . . . . . . . . . . . . . . . . . . . . . . 116,500 $ 7,141 $ 9,155Bank of Nova Scotia . . . . . . . . . . . . . . . . . . . . . . . . . . . . . . . . . . . . . . . . . . . . . . . . . . . . . . . . . . . . . . . . . . . . . . . . . . . . . . . . . . . . . . . . . . . 119,100 6,676 8,473Canadian Imperial Bank of Commerce . . . . . . . . . . . . . . . . . . . . . . . . . . . . . . . . . . . . . . . . . . . . . . . . . . . . . . . . . . . . . . . . . . . . . . . . . . . . . . 83,100 6,351 8,069Great-West Lifeco Inc. . . . . . . . . . . . . . . . . . . . . . . . . . . . . . . . . . . . . . . . . . . . . . . . . . . . . . . . . . . . . . . . . . . . . . . . . . . . . . . . . . . . . . . . . . . 225,000 6,046 6,790Home Capital Group Inc. . . . . . . . . . . . . . . . . . . . . . . . . . . . . . . . . . . . . . . . . . . . . . . . . . . . . . . . . . . . . . . . . . . . . . . . . . . . . . . . . . . . . . . . . 187,000 7,638 8,944IGM Financial Inc. . . . . . . . . . . . . . . . . . . . . . . . . . . . . . . . . . . . . . . . . . . . . . . . . . . . . . . . . . . . . . . . . . . . . . . . . . . . . . . . . . . . . . . . . . . . . . 146,200 6,591 7,468Intact Financial Corp. . . . . . . . . . . . . . . . . . . . . . . . . . . . . . . . . . . . . . . . . . . . . . . . . . . . . . . . . . . . . . . . . . . . . . . . . . . . . . . . . . . . . . . . . . . 129,600 7,145 9,536National Bank of Canada . . . . . . . . . . . . . . . . . . . . . . . . . . . . . . . . . . . . . . . . . . . . . . . . . . . . . . . . . . . . . . . . . . . . . . . . . . . . . . . . . . . . . . . . 176,100 6,890 7,970Royal Bank of Canada . . . . . . . . . . . . . . . . . . . . . . . . . . . . . . . . . . . . . . . . . . . . . . . . . . . . . . . . . . . . . . . . . . . . . . . . . . . . . . . . . . . . . . . . . . 114,400 6,974 8,726The Toronto-Dominion Bank . . . . . . . . . . . . . . . . . . . . . . . . . . . . . . . . . . . . . . . . . . . . . . . . . . . . . . . . . . . . . . . . . . . . . . . . . . . . . . . . . . . . . 175,200 7,062 9,624
68,514 84,755
Energy: 16.23%Canadian Natural Resources Ltd. . . . . . . . . . . . . . . . . . . . . . . . . . . . . . . . . . . . . . . . . . . . . . . . . . . . . . . . . . . . . . . . . . . . . . . . . . . . . . . . . . . 171,800 5,934 8,423EnCana Corp. . . . . . . . . . . . . . . . . . . . . . . . . . . . . . . . . . . . . . . . . . . . . . . . . . . . . . . . . . . . . . . . . . . . . . . . . . . . . . . . . . . . . . . . . . . . . . . . . 283,900 5,969 7,177Imperial Oil Ltd. . . . . . . . . . . . . . . . . . . . . . . . . . . . . . . . . . . . . . . . . . . . . . . . . . . . . . . . . . . . . . . . . . . . . . . . . . . . . . . . . . . . . . . . . . . . . . . 181,300 7,794 10,194Shawcor Ltd., A . . . . . . . . . . . . . . . . . . . . . . . . . . . . . . . . . . . . . . . . . . . . . . . . . . . . . . . . . . . . . . . . . . . . . . . . . . . . . . . . . . . . . . . . . . . . . . 159,600 7,249 9,471TransCanada Corp. . . . . . . . . . . . . . . . . . . . . . . . . . . . . . . . . . . . . . . . . . . . . . . . . . . . . . . . . . . . . . . . . . . . . . . . . . . . . . . . . . . . . . . . . . . . . 169,100 6,982 8,612Vermilion Energy Inc. . . . . . . . . . . . . . . . . . . . . . . . . . . . . . . . . . . . . . . . . . . . . . . . . . . . . . . . . . . . . . . . . . . . . . . . . . . . . . . . . . . . . . . . . . . 142,000 6,529 10,544
40,457 54,421
Industrials: 12.88%Canadian National Railway Co. . . . . . . . . . . . . . . . . . . . . . . . . . . . . . . . . . . . . . . . . . . . . . . . . . . . . . . . . . . . . . . . . . . . . . . . . . . . . . . . . . . . . 140,600 5,297 9,757Canadian Pacific Railway Ltd. . . . . . . . . . . . . . . . . . . . . . . . . . . . . . . . . . . . . . . . . . . . . . . . . . . . . . . . . . . . . . . . . . . . . . . . . . . . . . . . . . . . . 43,200 4,015 8,351MacDonald Dettwiler and Associates Ltd. . . . . . . . . . . . . . . . . . . . . . . . . . . . . . . . . . . . . . . . . . . . . . . . . . . . . . . . . . . . . . . . . . . . . . . . . . . . . 92,400 4,570 8,051SNC-Lavalin Group Inc., A, A . . . . . . . . . . . . . . . . . . . . . . . . . . . . . . . . . . . . . . . . . . . . . . . . . . . . . . . . . . . . . . . . . . . . . . . . . . . . . . . . . . . . . 143,900 6,215 8,076Stantec Inc. . . . . . . . . . . . . . . . . . . . . . . . . . . . . . . . . . . . . . . . . . . . . . . . . . . . . . . . . . . . . . . . . . . . . . . . . . . . . . . . . . . . . . . . . . . . . . . . . . 135,400 4,878 8,947
24,975 43,182
Materials: 11.86%Agrium Inc. . . . . . . . . . . . . . . . . . . . . . . . . . . . . . . . . . . . . . . . . . . . . . . . . . . . . . . . . . . . . . . . . . . . . . . . . . . . . . . . . . . . . . . . . . . . . . . . . . 69,600 5,339 6,803Barrick Gold Corp. . . . . . . . . . . . . . . . . . . . . . . . . . . . . . . . . . . . . . . . . . . . . . . . . . . . . . . . . . . . . . . . . . . . . . . . . . . . . . . . . . . . . . . . . . . . . 377,600 10,294 7,378Methanex Corp. . . . . . . . . . . . . . . . . . . . . . . . . . . . . . . . . . . . . . . . . . . . . . . . . . . . . . . . . . . . . . . . . . . . . . . . . . . . . . . . . . . . . . . . . . . . . . . 112,500 4,065 7,422Potash Corp. of Saskatchewan Inc. . . . . . . . . . . . . . . . . . . . . . . . . . . . . . . . . . . . . . . . . . . . . . . . . . . . . . . . . . . . . . . . . . . . . . . . . . . . . . . . . . 242,400 9,488 9,837Silver Wheaton Corp. . . . . . . . . . . . . . . . . . . . . . . . . . . . . . . . . . . . . . . . . . . . . . . . . . . . . . . . . . . . . . . . . . . . . . . . . . . . . . . . . . . . . . . . . . . . 296,800 7,452 8,334
36,638 39,774
Consumer Staples: 9.35%Alimentation Couche-Tard Inc., B . . . . . . . . . . . . . . . . . . . . . . . . . . . . . . . . . . . . . . . . . . . . . . . . . . . . . . . . . . . . . . . . . . . . . . . . . . . . . . . . . . 289,100 3,767 8,450George Weston Ltd. . . . . . . . . . . . . . . . . . . . . . . . . . . . . . . . . . . . . . . . . . . . . . . . . . . . . . . . . . . . . . . . . . . . . . . . . . . . . . . . . . . . . . . . . . . . . 85,500 5,865 6,730Metro Inc., A . . . . . . . . . . . . . . . . . . . . . . . . . . . . . . . . . . . . . . . . . . . . . . . . . . . . . . . . . . . . . . . . . . . . . . . . . . . . . . . . . . . . . . . . . . . . . . . . 98,800 4,681 6,518Saputo Inc. . . . . . . . . . . . . . . . . . . . . . . . . . . . . . . . . . . . . . . . . . . . . . . . . . . . . . . . . . . . . . . . . . . . . . . . . . . . . . . . . . . . . . . . . . . . . . . . . . . 151,000 5,743 9,653
20,056 31,351
Consumer Discretionary: 7.06%Canadian Tire Corp. Ltd., A . . . . . . . . . . . . . . . . . . . . . . . . . . . . . . . . . . . . . . . . . . . . . . . . . . . . . . . . . . . . . . . . . . . . . . . . . . . . . . . . . . . . . . 80,700 5,392 8,261Magna International Inc. . . . . . . . . . . . . . . . . . . . . . . . . . . . . . . . . . . . . . . . . . . . . . . . . . . . . . . . . . . . . . . . . . . . . . . . . . . . . . . . . . . . . . . . . 74,600 7,822 8,569Tim Hortons Inc. . . . . . . . . . . . . . . . . . . . . . . . . . . . . . . . . . . . . . . . . . . . . . . . . . . . . . . . . . . . . . . . . . . . . . . . . . . . . . . . . . . . . . . . . . . . . . . 117,300 5,034 6,847
18,248 23,677
The accompanying notes are an integral part of these financial statements.
176 Franklin Templeton Investments Funds

Franklin Bissett All Canadian Focus Fund
SCHEDULE OF INVESTMENTS As at June 30, 2014 (Unaudited) (Continued)
SharesAverage
Cost Fair Value
(000s) (000s)
Information Technology: 7.02%CGI Group Inc., A . . . . . . . . . . . . . . . . . . . . . . . . . . . . . . . . . . . . . . . . . . . . . . . . . . . . . . . . . . . . . . . . . . . . . . . . . . . . . . . . . . . . . . . 197,100 $ 3,982 $ 7,454Constellation Software Inc./Canada . . . . . . . . . . . . . . . . . . . . . . . . . . . . . . . . . . . . . . . . . . . . . . . . . . . . . . . . . . . . . . . . . . . . . . . . . . . 30,100 8,220 8,186Open Text Corp. . . . . . . . . . . . . . . . . . . . . . . . . . . . . . . . . . . . . . . . . . . . . . . . . . . . . . . . . . . . . . . . . . . . . . . . . . . . . . . . . . . . . . . . . 153,900 3,995 7,880
16,197 23,520
Utilities: 4.45%ATCO Ltd., I . . . . . . . . . . . . . . . . . . . . . . . . . . . . . . . . . . . . . . . . . . . . . . . . . . . . . . . . . . . . . . . . . . . . . . . . . . . . . . . . . . . . . . . . . . . 151,000 5,206 7,810Canadian Utilities Ltd., A . . . . . . . . . . . . . . . . . . . . . . . . . . . . . . . . . . . . . . . . . . . . . . . . . . . . . . . . . . . . . . . . . . . . . . . . . . . . . . . . . . 177,600 4,962 7,104
10,168 14,914
Health Care: 1.95%Valeant Pharmaceuticals International Inc. . . . . . . . . . . . . . . . . . . . . . . . . . . . . . . . . . . . . . . . . . . . . . . . . . . . . . . . . . . . . . . . . . . . . . 48,300 3,248 6,518
Telecommunication Services: 1.87%Rogers Communications Inc., B . . . . . . . . . . . . . . . . . . . . . . . . . . . . . . . . . . . . . . . . . . . . . . . . . . . . . . . . . . . . . . . . . . . . . . . . . . . . . 146,300 5,876 6,282
Total Common Stocks: . . . . . . . . . . . . . . . . . . . . . . . . . . . . . . . . . . . . . . . . . . . . . . . . . . . . . . . . . . . . . . . . . . . . . . . . . . . . . . . . . . . . 244,377 328,394
Total Long-Term Investments: . . . . . . . . . . . . . . . . . . . . . . . . . . . . . . . . . . . . . . . . . . . . . . . . . . . . . . . . . . . . . . . . . . . . . . . . . . . . . . . 244,377 328,394
Principal Amountin Currency
of Issue
SHORT-TERM SECURITIES: 1.73%Royal Bank of Canada, Term Deposit, 0.97%, 7/2/2014 . . . . . . . . . . . . . . . . . . . . . . . . . . . . . . . . . . . . . . . . . . . . . . . . . . . . . . . . . . . . 5,800,000 CAD 5,800 5,800
Total Short-Term Securities: . . . . . . . . . . . . . . . . . . . . . . . . . . . . . . . . . . . . . . . . . . . . . . . . . . . . . . . . . . . . . . . . . . . . . . . . . . . . . . . . 5,800 5,800
Transaction costs (Note 4) . . . . . . . . . . . . . . . . . . . . . . . . . . . . . . . . . . . . . . . . . . . . . . . . . . . . . . . . . . . . . . . . . . . . . . . . . . . . . . . . . (106) —
TOTAL INVESTMENTS: 99.68% . . . . . . . . . . . . . . . . . . . . . . . . . . . . . . . . . . . . . . . . . . . . . . . . . . . . . . . . . . . . . . . . . . . . . . . . . . . . . . $250,071 334,194
OTHER ASSETS, less liabilities: 0.32% . . . . . . . . . . . . . . . . . . . . . . . . . . . . . . . . . . . . . . . . . . . . . . . . . . . . . . . . . . . . . . . . . . . . . . . . 1,076
TOTAL NET ASSETS: 100.00% . . . . . . . . . . . . . . . . . . . . . . . . . . . . . . . . . . . . . . . . . . . . . . . . . . . . . . . . . . . . . . . . . . . . . . . . . . . . . . $335,270
The accompanying notes are an integral part of these financial statements.
Franklin Templeton Investments Funds 177
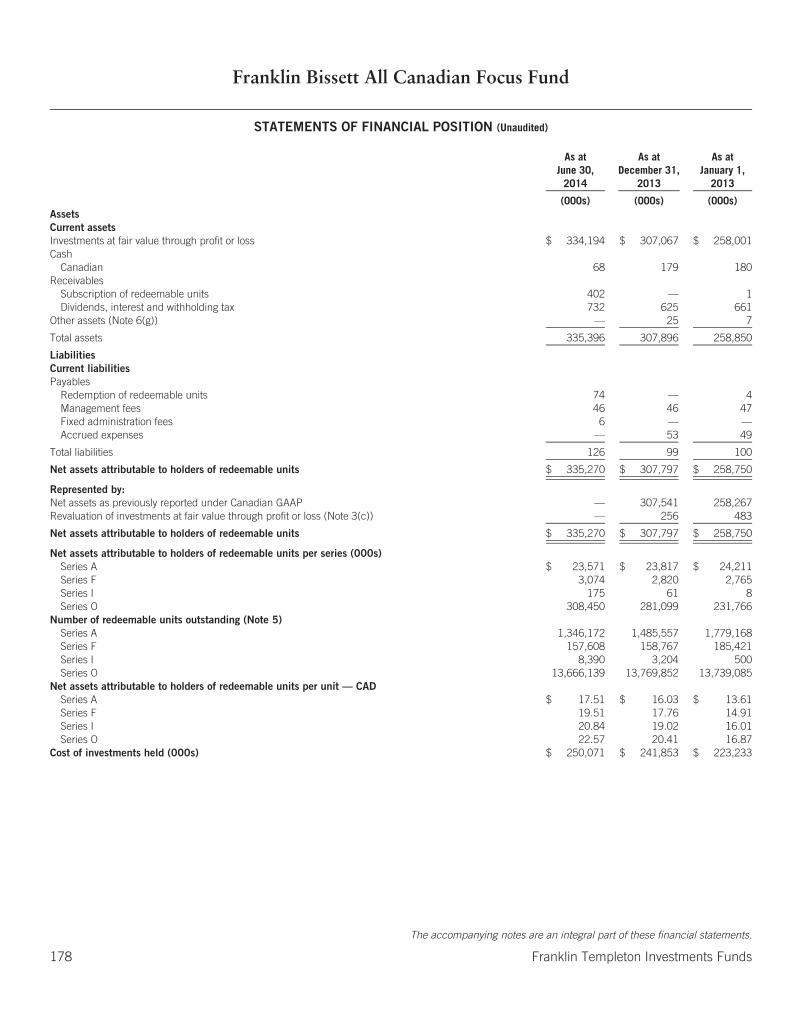
Franklin Bissett All Canadian Focus Fund
STATEMENTS OF FINANCIAL POSITION (Unaudited)
As atJune 30,
2014
As atDecember 31,
2013
As atJanuary 1,
2013
(000s) (000s) (000s)AssetsCurrent assetsInvestments at fair value through profit or loss $ 334,194 $ 307,067 $ 258,001Cash
Canadian 68 179 180Receivables
Subscription of redeemable units 402 — 1Dividends, interest and withholding tax 732 625 661
Other assets (Note 6(g)) — 25 7
Total assets 335,396 307,896 258,850
LiabilitiesCurrent liabilitiesPayables
Redemption of redeemable units 74 — 4Management fees 46 46 47Fixed administration fees 6 — —Accrued expenses — 53 49
Total liabilities 126 99 100
Net assets attributable to holders of redeemable units $ 335,270 $ 307,797 $ 258,750
Represented by:Net assets as previously reported under Canadian GAAP — 307,541 258,267Revaluation of investments at fair value through profit or loss (Note 3(c)) — 256 483
Net assets attributable to holders of redeemable units $ 335,270 $ 307,797 $ 258,750
Net assets attributable to holders of redeemable units per series (000s)Series A $ 23,571 $ 23,817 $ 24,211Series F 3,074 2,820 2,765Series I 175 61 8Series O 308,450 281,099 231,766
Number of redeemable units outstanding (Note 5)Series A 1,346,172 1,485,557 1,779,168Series F 157,608 158,767 185,421Series I 8,390 3,204 500Series O 13,666,139 13,769,852 13,739,085
Net assets attributable to holders of redeemable units per unit — CADSeries A $ 17.51 $ 16.03 $ 13.61Series F 19.51 17.76 14.91Series I 20.84 19.02 16.01Series O 22.57 20.41 16.87
Cost of investments held (000s) $ 250,071 $ 241,853 $ 223,233
The accompanying notes are an integral part of these financial statements.
178 Franklin Templeton Investments Funds

Franklin Bissett All Canadian Focus Fund
STATEMENTS OF COMPREHENSIVE INCOMEFor the six months ended June 30, 2014 and 2013 (Unaudited)
2014 2013
(000s) (000s)IncomeDividends $ 3,652 $ 3,383Interest income for distribution purposes 24 17Net realized and/or unrealized foreign exchange gain (loss) (1) —Net realized gain (loss) on investments 10,539 8,635Net change in unrealized appreciation (depreciation) in value of investments 18,909 1,092
Total income (net) 33,123 13,127
ExpensesManagement fees (Note 6(a)) 277 275Fixed administration fees (Note 6(b)) 34 —Transfer agent fees (Note 6(d)) — 90Custodian fees — 1Legal fees — —Audit fees — 11Unitholder reporting costs — 7Independent review committee fees — 1Registration fees — 11Other expenses (Note 6(f)) — 14
Operating expenses before waivers/paid by Manager 311 410Expenses waived/paid by Manager (Note 6(b)) — (73)
Net operating expenses after waivers/paid by Manager 311 337
Transaction costs (Note 9) 43 24
Total expenses 354 361
Increase (decrease) in net assets attributable to holders of redeemable units from operations $ 32,769 $ 12,766
Represented by:Increase (decrease) in net assets from operations as previously reported under Canadian GAAP — 12,495Revaluation of investments at fair value through profit and loss (Note 3(c)) — 271
Increase (decrease) in net assets attributable to holders of redeemable units from operations $ 32,769 $ 12,766
Increase (decrease) in net assets attributable to holders of redeemable units from operations per series (000s)Series A $ 2,081 $ 1,025Series F 280 127Series I 11 —*Series O 30,397 11,614
Weighted average number of units outstandingSeries A 1,413,478 1,668,685Series F 160,496 164,402Series I 6,044 500Series O 14,041,446 14,063,756
Increase (decrease) in net assets attributable to holders of redeemable units from operations per unitSeries A $ 1.47 $ 0.61Series F 1.76 0.76Series I 1.76 0.72Series O 2.17 0.81
* Amount rounded to zero in the nearest thousand.
The accompanying notes are an integral part of these financial statements.
Franklin Templeton Investments Funds 179
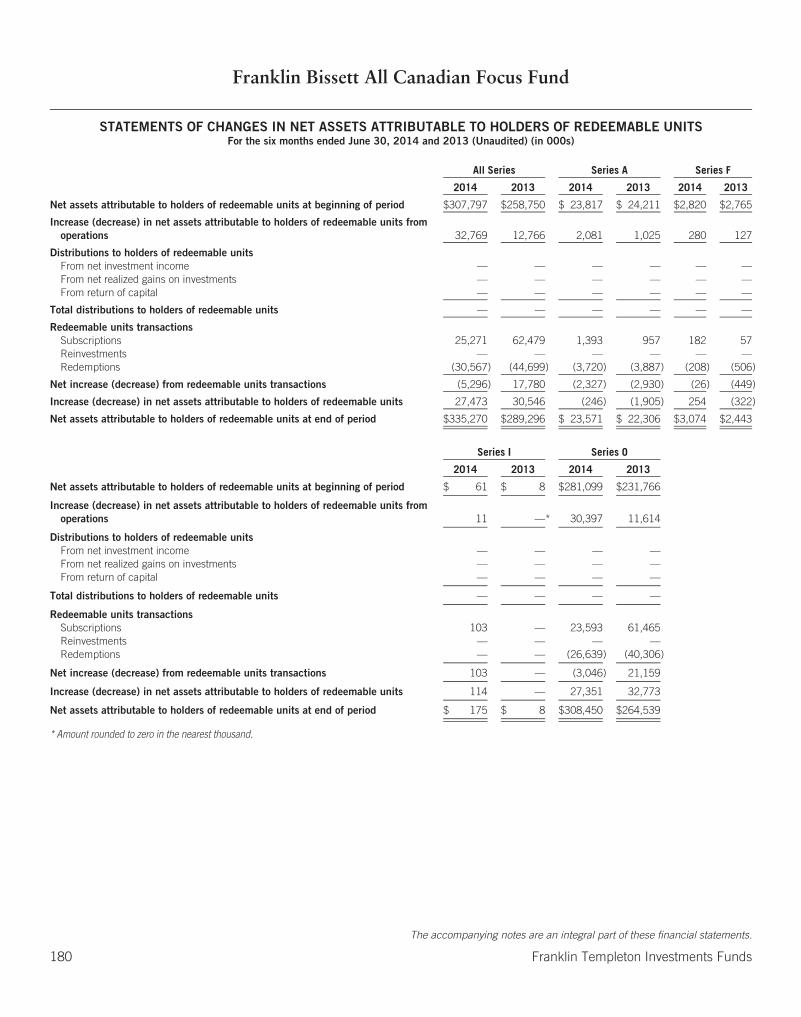
Franklin Bissett All Canadian Focus Fund
STATEMENTS OF CHANGES IN NET ASSETS ATTRIBUTABLE TO HOLDERS OF REDEEMABLE UNITSFor the six months ended June 30, 2014 and 2013 (Unaudited) (in 000s)
All Series Series A Series F
2014 2013 2014 2013 2014 2013
Net assets attributable to holders of redeemable units at beginning of period $307,797 $258,750 $ 23,817 $ 24,211 $2,820 $2,765
Increase (decrease) in net assets attributable to holders of redeemable units fromoperations 32,769 12,766 2,081 1,025 280 127
Distributions to holders of redeemable unitsFrom net investment income — — — — — —From net realized gains on investments — — — — — —From return of capital — — — — — —
Total distributions to holders of redeemable units — — — — — —
Redeemable units transactionsSubscriptions 25,271 62,479 1,393 957 182 57Reinvestments — — — — — —Redemptions (30,567) (44,699) (3,720) (3,887) (208) (506)
Net increase (decrease) from redeemable units transactions (5,296) 17,780 (2,327) (2,930) (26) (449)
Increase (decrease) in net assets attributable to holders of redeemable units 27,473 30,546 (246) (1,905) 254 (322)
Net assets attributable to holders of redeemable units at end of period $335,270 $289,296 $ 23,571 $ 22,306 $3,074 $2,443
Series I Series O
2014 2013 2014 2013
Net assets attributable to holders of redeemable units at beginning of period $ 61 $ 8 $281,099 $231,766
Increase (decrease) in net assets attributable to holders of redeemable units fromoperations 11 —* 30,397 11,614
Distributions to holders of redeemable unitsFrom net investment income — — — —From net realized gains on investments — — — —From return of capital — — — —
Total distributions to holders of redeemable units — — — —
Redeemable units transactionsSubscriptions 103 — 23,593 61,465Reinvestments — — — —Redemptions — — (26,639) (40,306)
Net increase (decrease) from redeemable units transactions 103 — (3,046) 21,159
Increase (decrease) in net assets attributable to holders of redeemable units 114 — 27,351 32,773
Net assets attributable to holders of redeemable units at end of period $ 175 $ 8 $308,450 $264,539
* Amount rounded to zero in the nearest thousand.
The accompanying notes are an integral part of these financial statements.
180 Franklin Templeton Investments Funds

Franklin Bissett All Canadian Focus Fund
STATEMENTS OF CASH FLOWSFor the six months ended June 30, 2014 and 2013 (Unaudited)
2014 2013
(000s) (000s)Cash flows from operating activitiesInterest received $ 24 $ 17Dividends received 3,543 3,202Proceeds from sale and maturity of investments 50,502 46,370Purchases of investments (48,224) (66,165)Operating expenses paid (333) (367)
Net cash from/(used in) operating activities 5,512 (16,943)
Cash flows from financing activitiesProceeds from issuances of redeemable units 24,869 60,527Amounts paid on redemption of redeemable units (30,492) (43,600)Distributions paid to holders of redeemable units, net of reinvested distributions — —
Net cash (used in)/from financing activities (5,623) 16,927
Net increase (decrease) in cash (111) (16)Cash at beginning of year 179 180Effect of exchange rate changes — —
Cash at end of period $ 68 $ 164
The accompanying notes are an integral part of these financial statements.
Franklin Templeton Investments Funds 181
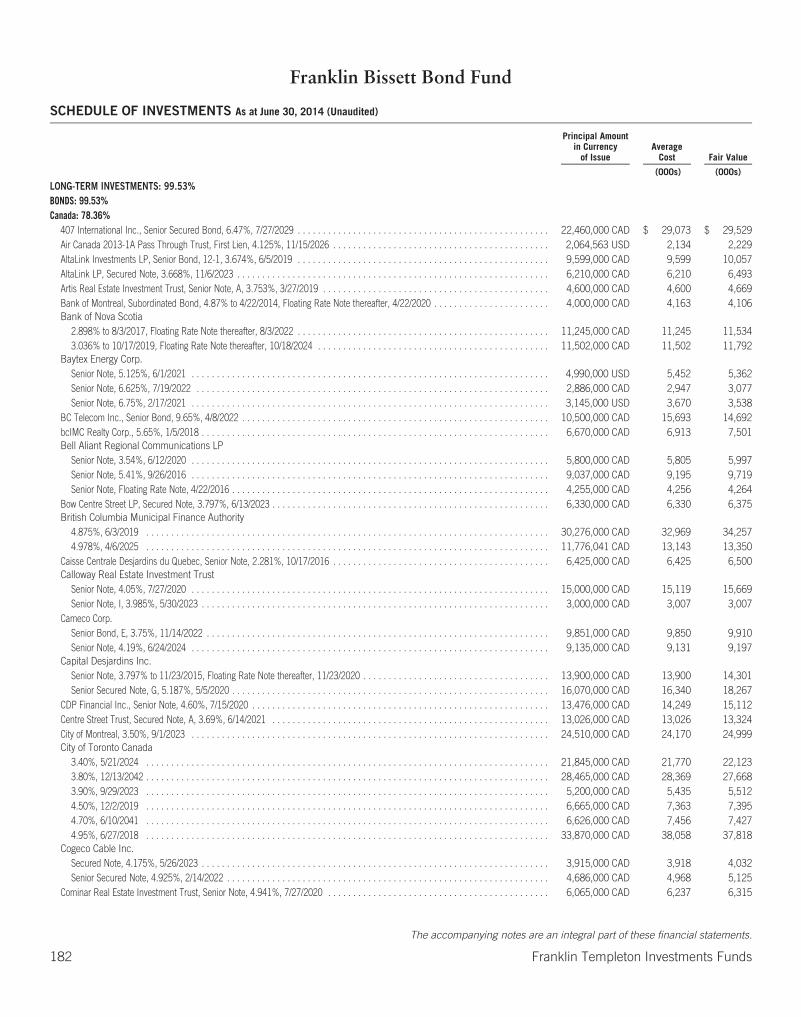
Franklin Bissett Bond Fund
SCHEDULE OF INVESTMENTS As at June 30, 2014 (Unaudited)
Principal Amountin Currency
of IssueAverage
Cost Fair Value
(000s) (000s)
LONG-TERM INVESTMENTS: 99.53%BONDS: 99.53%Canada: 78.36%
407 International Inc., Senior Secured Bond, 6.47%, 7/27/2029 . . . . . . . . . . . . . . . . . . . . . . . . . . . . . . . . . . . . . . . . . . . . . . . . . . 22,460,000 CAD $ 29,073 $ 29,529Air Canada 2013-1A Pass Through Trust, First Lien, 4.125%, 11/15/2026 . . . . . . . . . . . . . . . . . . . . . . . . . . . . . . . . . . . . . . . . . . . 2,064,563 USD 2,134 2,229AltaLink Investments LP, Senior Bond, 12-1, 3.674%, 6/5/2019 . . . . . . . . . . . . . . . . . . . . . . . . . . . . . . . . . . . . . . . . . . . . . . . . . . 9,599,000 CAD 9,599 10,057AltaLink LP, Secured Note, 3.668%, 11/6/2023 . . . . . . . . . . . . . . . . . . . . . . . . . . . . . . . . . . . . . . . . . . . . . . . . . . . . . . . . . . . . . . 6,210,000 CAD 6,210 6,493Artis Real Estate Investment Trust, Senior Note, A, 3.753%, 3/27/2019 . . . . . . . . . . . . . . . . . . . . . . . . . . . . . . . . . . . . . . . . . . . . . 4,600,000 CAD 4,600 4,669Bank of Montreal, Subordinated Bond, 4.87% to 4/22/2014, Floating Rate Note thereafter, 4/22/2020 . . . . . . . . . . . . . . . . . . . . . . . 4,000,000 CAD 4,163 4,106Bank of Nova Scotia
2.898% to 8/3/2017, Floating Rate Note thereafter, 8/3/2022 . . . . . . . . . . . . . . . . . . . . . . . . . . . . . . . . . . . . . . . . . . . . . . . . . . 11,245,000 CAD 11,245 11,5343.036% to 10/17/2019, Floating Rate Note thereafter, 10/18/2024 . . . . . . . . . . . . . . . . . . . . . . . . . . . . . . . . . . . . . . . . . . . . . . 11,502,000 CAD 11,502 11,792
Baytex Energy Corp.Senior Note, 5.125%, 6/1/2021 . . . . . . . . . . . . . . . . . . . . . . . . . . . . . . . . . . . . . . . . . . . . . . . . . . . . . . . . . . . . . . . . . . . . . . . 4,990,000 USD 5,452 5,362Senior Note, 6.625%, 7/19/2022 . . . . . . . . . . . . . . . . . . . . . . . . . . . . . . . . . . . . . . . . . . . . . . . . . . . . . . . . . . . . . . . . . . . . . . 2,886,000 CAD 2,947 3,077Senior Note, 6.75%, 2/17/2021 . . . . . . . . . . . . . . . . . . . . . . . . . . . . . . . . . . . . . . . . . . . . . . . . . . . . . . . . . . . . . . . . . . . . . . . 3,145,000 USD 3,670 3,538
BC Telecom Inc., Senior Bond, 9.65%, 4/8/2022 . . . . . . . . . . . . . . . . . . . . . . . . . . . . . . . . . . . . . . . . . . . . . . . . . . . . . . . . . . . . . 10,500,000 CAD 15,693 14,692bcIMC Realty Corp., 5.65%, 1/5/2018 . . . . . . . . . . . . . . . . . . . . . . . . . . . . . . . . . . . . . . . . . . . . . . . . . . . . . . . . . . . . . . . . . . . . . 6,670,000 CAD 6,913 7,501Bell Aliant Regional Communications LP
Senior Note, 3.54%, 6/12/2020 . . . . . . . . . . . . . . . . . . . . . . . . . . . . . . . . . . . . . . . . . . . . . . . . . . . . . . . . . . . . . . . . . . . . . . . 5,800,000 CAD 5,805 5,997Senior Note, 5.41%, 9/26/2016 . . . . . . . . . . . . . . . . . . . . . . . . . . . . . . . . . . . . . . . . . . . . . . . . . . . . . . . . . . . . . . . . . . . . . . . 9,037,000 CAD 9,195 9,719Senior Note, Floating Rate Note, 4/22/2016 . . . . . . . . . . . . . . . . . . . . . . . . . . . . . . . . . . . . . . . . . . . . . . . . . . . . . . . . . . . . . . . 4,255,000 CAD 4,256 4,264
Bow Centre Street LP, Secured Note, 3.797%, 6/13/2023 . . . . . . . . . . . . . . . . . . . . . . . . . . . . . . . . . . . . . . . . . . . . . . . . . . . . . . . 6,330,000 CAD 6,330 6,375British Columbia Municipal Finance Authority
4.875%, 6/3/2019 . . . . . . . . . . . . . . . . . . . . . . . . . . . . . . . . . . . . . . . . . . . . . . . . . . . . . . . . . . . . . . . . . . . . . . . . . . . . . . . . 30,276,000 CAD 32,969 34,2574.978%, 4/6/2025 . . . . . . . . . . . . . . . . . . . . . . . . . . . . . . . . . . . . . . . . . . . . . . . . . . . . . . . . . . . . . . . . . . . . . . . . . . . . . . . . 11,776,041 CAD 13,143 13,350
Caisse Centrale Desjardins du Quebec, Senior Note, 2.281%, 10/17/2016 . . . . . . . . . . . . . . . . . . . . . . . . . . . . . . . . . . . . . . . . . . . 6,425,000 CAD 6,425 6,500Calloway Real Estate Investment Trust
Senior Note, 4.05%, 7/27/2020 . . . . . . . . . . . . . . . . . . . . . . . . . . . . . . . . . . . . . . . . . . . . . . . . . . . . . . . . . . . . . . . . . . . . . . . 15,000,000 CAD 15,119 15,669Senior Note, I, 3.985%, 5/30/2023 . . . . . . . . . . . . . . . . . . . . . . . . . . . . . . . . . . . . . . . . . . . . . . . . . . . . . . . . . . . . . . . . . . . . . 3,000,000 CAD 3,007 3,007
Cameco Corp.Senior Bond, E, 3.75%, 11/14/2022 . . . . . . . . . . . . . . . . . . . . . . . . . . . . . . . . . . . . . . . . . . . . . . . . . . . . . . . . . . . . . . . . . . . . 9,851,000 CAD 9,850 9,910Senior Note, 4.19%, 6/24/2024 . . . . . . . . . . . . . . . . . . . . . . . . . . . . . . . . . . . . . . . . . . . . . . . . . . . . . . . . . . . . . . . . . . . . . . . 9,135,000 CAD 9,131 9,197
Capital Desjardins Inc.Senior Note, 3.797% to 11/23/2015, Floating Rate Note thereafter, 11/23/2020 . . . . . . . . . . . . . . . . . . . . . . . . . . . . . . . . . . . . . 13,900,000 CAD 13,900 14,301Senior Secured Note, G, 5.187%, 5/5/2020 . . . . . . . . . . . . . . . . . . . . . . . . . . . . . . . . . . . . . . . . . . . . . . . . . . . . . . . . . . . . . . . 16,070,000 CAD 16,340 18,267
CDP Financial Inc., Senior Note, 4.60%, 7/15/2020 . . . . . . . . . . . . . . . . . . . . . . . . . . . . . . . . . . . . . . . . . . . . . . . . . . . . . . . . . . . 13,476,000 CAD 14,249 15,112Centre Street Trust, Secured Note, A, 3.69%, 6/14/2021 . . . . . . . . . . . . . . . . . . . . . . . . . . . . . . . . . . . . . . . . . . . . . . . . . . . . . . . 13,026,000 CAD 13,026 13,324City of Montreal, 3.50%, 9/1/2023 . . . . . . . . . . . . . . . . . . . . . . . . . . . . . . . . . . . . . . . . . . . . . . . . . . . . . . . . . . . . . . . . . . . . . . . 24,510,000 CAD 24,170 24,999City of Toronto Canada
3.40%, 5/21/2024 . . . . . . . . . . . . . . . . . . . . . . . . . . . . . . . . . . . . . . . . . . . . . . . . . . . . . . . . . . . . . . . . . . . . . . . . . . . . . . . . 21,845,000 CAD 21,770 22,1233.80%, 12/13/2042 . . . . . . . . . . . . . . . . . . . . . . . . . . . . . . . . . . . . . . . . . . . . . . . . . . . . . . . . . . . . . . . . . . . . . . . . . . . . . . . . 28,465,000 CAD 28,369 27,6683.90%, 9/29/2023 . . . . . . . . . . . . . . . . . . . . . . . . . . . . . . . . . . . . . . . . . . . . . . . . . . . . . . . . . . . . . . . . . . . . . . . . . . . . . . . . 5,200,000 CAD 5,435 5,5124.50%, 12/2/2019 . . . . . . . . . . . . . . . . . . . . . . . . . . . . . . . . . . . . . . . . . . . . . . . . . . . . . . . . . . . . . . . . . . . . . . . . . . . . . . . . 6,665,000 CAD 7,363 7,3954.70%, 6/10/2041 . . . . . . . . . . . . . . . . . . . . . . . . . . . . . . . . . . . . . . . . . . . . . . . . . . . . . . . . . . . . . . . . . . . . . . . . . . . . . . . . 6,626,000 CAD 7,456 7,4274.95%, 6/27/2018 . . . . . . . . . . . . . . . . . . . . . . . . . . . . . . . . . . . . . . . . . . . . . . . . . . . . . . . . . . . . . . . . . . . . . . . . . . . . . . . . 33,870,000 CAD 38,058 37,818
Cogeco Cable Inc.Secured Note, 4.175%, 5/26/2023 . . . . . . . . . . . . . . . . . . . . . . . . . . . . . . . . . . . . . . . . . . . . . . . . . . . . . . . . . . . . . . . . . . . . . 3,915,000 CAD 3,918 4,032Senior Secured Note, 4.925%, 2/14/2022 . . . . . . . . . . . . . . . . . . . . . . . . . . . . . . . . . . . . . . . . . . . . . . . . . . . . . . . . . . . . . . . . 4,686,000 CAD 4,968 5,125
Cominar Real Estate Investment Trust, Senior Note, 4.941%, 7/27/2020 . . . . . . . . . . . . . . . . . . . . . . . . . . . . . . . . . . . . . . . . . . . . 6,065,000 CAD 6,237 6,315
The accompanying notes are an integral part of these financial statements.
182 Franklin Templeton Investments Funds
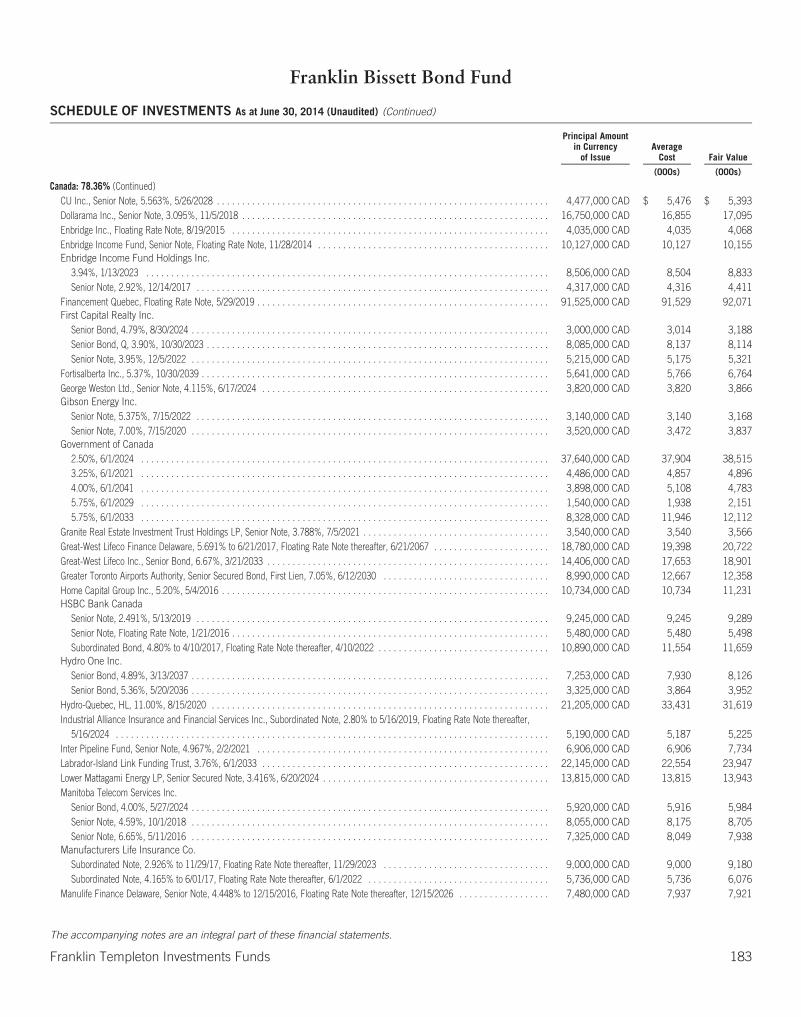
Franklin Bissett Bond Fund
SCHEDULE OF INVESTMENTS As at June 30, 2014 (Unaudited) (Continued)
Principal Amountin Currency
of IssueAverage
Cost Fair Value
(000s) (000s)
Canada: 78.36% (Continued)CU Inc., Senior Note, 5.563%, 5/26/2028 . . . . . . . . . . . . . . . . . . . . . . . . . . . . . . . . . . . . . . . . . . . . . . . . . . . . . . . . . . . . . . . . . . 4,477,000 CAD $ 5,476 $ 5,393Dollarama Inc., Senior Note, 3.095%, 11/5/2018 . . . . . . . . . . . . . . . . . . . . . . . . . . . . . . . . . . . . . . . . . . . . . . . . . . . . . . . . . . . . . 16,750,000 CAD 16,855 17,095Enbridge Inc., Floating Rate Note, 8/19/2015 . . . . . . . . . . . . . . . . . . . . . . . . . . . . . . . . . . . . . . . . . . . . . . . . . . . . . . . . . . . . . . . 4,035,000 CAD 4,035 4,068Enbridge Income Fund, Senior Note, Floating Rate Note, 11/28/2014 . . . . . . . . . . . . . . . . . . . . . . . . . . . . . . . . . . . . . . . . . . . . . . 10,127,000 CAD 10,127 10,155Enbridge Income Fund Holdings Inc.
3.94%, 1/13/2023 . . . . . . . . . . . . . . . . . . . . . . . . . . . . . . . . . . . . . . . . . . . . . . . . . . . . . . . . . . . . . . . . . . . . . . . . . . . . . . . . 8,506,000 CAD 8,504 8,833Senior Note, 2.92%, 12/14/2017 . . . . . . . . . . . . . . . . . . . . . . . . . . . . . . . . . . . . . . . . . . . . . . . . . . . . . . . . . . . . . . . . . . . . . . 4,317,000 CAD 4,316 4,411
Financement Quebec, Floating Rate Note, 5/29/2019 . . . . . . . . . . . . . . . . . . . . . . . . . . . . . . . . . . . . . . . . . . . . . . . . . . . . . . . . . . 91,525,000 CAD 91,529 92,071First Capital Realty Inc.
Senior Bond, 4.79%, 8/30/2024 . . . . . . . . . . . . . . . . . . . . . . . . . . . . . . . . . . . . . . . . . . . . . . . . . . . . . . . . . . . . . . . . . . . . . . . 3,000,000 CAD 3,014 3,188Senior Bond, Q, 3.90%, 10/30/2023 . . . . . . . . . . . . . . . . . . . . . . . . . . . . . . . . . . . . . . . . . . . . . . . . . . . . . . . . . . . . . . . . . . . . 8,085,000 CAD 8,137 8,114Senior Note, 3.95%, 12/5/2022 . . . . . . . . . . . . . . . . . . . . . . . . . . . . . . . . . . . . . . . . . . . . . . . . . . . . . . . . . . . . . . . . . . . . . . . 5,215,000 CAD 5,175 5,321
Fortisalberta Inc., 5.37%, 10/30/2039 . . . . . . . . . . . . . . . . . . . . . . . . . . . . . . . . . . . . . . . . . . . . . . . . . . . . . . . . . . . . . . . . . . . . . 5,641,000 CAD 5,766 6,764George Weston Ltd., Senior Note, 4.115%, 6/17/2024 . . . . . . . . . . . . . . . . . . . . . . . . . . . . . . . . . . . . . . . . . . . . . . . . . . . . . . . . . 3,820,000 CAD 3,820 3,866Gibson Energy Inc.
Senior Note, 5.375%, 7/15/2022 . . . . . . . . . . . . . . . . . . . . . . . . . . . . . . . . . . . . . . . . . . . . . . . . . . . . . . . . . . . . . . . . . . . . . . 3,140,000 CAD 3,140 3,168Senior Note, 7.00%, 7/15/2020 . . . . . . . . . . . . . . . . . . . . . . . . . . . . . . . . . . . . . . . . . . . . . . . . . . . . . . . . . . . . . . . . . . . . . . . 3,520,000 CAD 3,472 3,837
Government of Canada2.50%, 6/1/2024 . . . . . . . . . . . . . . . . . . . . . . . . . . . . . . . . . . . . . . . . . . . . . . . . . . . . . . . . . . . . . . . . . . . . . . . . . . . . . . . . . 37,640,000 CAD 37,904 38,5153.25%, 6/1/2021 . . . . . . . . . . . . . . . . . . . . . . . . . . . . . . . . . . . . . . . . . . . . . . . . . . . . . . . . . . . . . . . . . . . . . . . . . . . . . . . . . 4,486,000 CAD 4,857 4,8964.00%, 6/1/2041 . . . . . . . . . . . . . . . . . . . . . . . . . . . . . . . . . . . . . . . . . . . . . . . . . . . . . . . . . . . . . . . . . . . . . . . . . . . . . . . . . 3,898,000 CAD 5,108 4,7835.75%, 6/1/2029 . . . . . . . . . . . . . . . . . . . . . . . . . . . . . . . . . . . . . . . . . . . . . . . . . . . . . . . . . . . . . . . . . . . . . . . . . . . . . . . . . 1,540,000 CAD 1,938 2,1515.75%, 6/1/2033 . . . . . . . . . . . . . . . . . . . . . . . . . . . . . . . . . . . . . . . . . . . . . . . . . . . . . . . . . . . . . . . . . . . . . . . . . . . . . . . . . 8,328,000 CAD 11,946 12,112
Granite Real Estate Investment Trust Holdings LP, Senior Note, 3.788%, 7/5/2021 . . . . . . . . . . . . . . . . . . . . . . . . . . . . . . . . . . . . . 3,540,000 CAD 3,540 3,566Great-West Lifeco Finance Delaware, 5.691% to 6/21/2017, Floating Rate Note thereafter, 6/21/2067 . . . . . . . . . . . . . . . . . . . . . . . 18,780,000 CAD 19,398 20,722Great-West Lifeco Inc., Senior Bond, 6.67%, 3/21/2033 . . . . . . . . . . . . . . . . . . . . . . . . . . . . . . . . . . . . . . . . . . . . . . . . . . . . . . . . 14,406,000 CAD 17,653 18,901Greater Toronto Airports Authority, Senior Secured Bond, First Lien, 7.05%, 6/12/2030 . . . . . . . . . . . . . . . . . . . . . . . . . . . . . . . . . 8,990,000 CAD 12,667 12,358Home Capital Group Inc., 5.20%, 5/4/2016 . . . . . . . . . . . . . . . . . . . . . . . . . . . . . . . . . . . . . . . . . . . . . . . . . . . . . . . . . . . . . . . . . 10,734,000 CAD 10,734 11,231HSBC Bank Canada
Senior Note, 2.491%, 5/13/2019 . . . . . . . . . . . . . . . . . . . . . . . . . . . . . . . . . . . . . . . . . . . . . . . . . . . . . . . . . . . . . . . . . . . . . . 9,245,000 CAD 9,245 9,289Senior Note, Floating Rate Note, 1/21/2016 . . . . . . . . . . . . . . . . . . . . . . . . . . . . . . . . . . . . . . . . . . . . . . . . . . . . . . . . . . . . . . . 5,480,000 CAD 5,480 5,498Subordinated Bond, 4.80% to 4/10/2017, Floating Rate Note thereafter, 4/10/2022 . . . . . . . . . . . . . . . . . . . . . . . . . . . . . . . . . . 10,890,000 CAD 11,554 11,659
Hydro One Inc.Senior Bond, 4.89%, 3/13/2037 . . . . . . . . . . . . . . . . . . . . . . . . . . . . . . . . . . . . . . . . . . . . . . . . . . . . . . . . . . . . . . . . . . . . . . . 7,253,000 CAD 7,930 8,126Senior Bond, 5.36%, 5/20/2036 . . . . . . . . . . . . . . . . . . . . . . . . . . . . . . . . . . . . . . . . . . . . . . . . . . . . . . . . . . . . . . . . . . . . . . . 3,325,000 CAD 3,864 3,952
Hydro-Quebec, HL, 11.00%, 8/15/2020 . . . . . . . . . . . . . . . . . . . . . . . . . . . . . . . . . . . . . . . . . . . . . . . . . . . . . . . . . . . . . . . . . . . 21,205,000 CAD 33,431 31,619Industrial Alliance Insurance and Financial Services Inc., Subordinated Note, 2.80% to 5/16/2019, Floating Rate Note thereafter,
5/16/2024 . . . . . . . . . . . . . . . . . . . . . . . . . . . . . . . . . . . . . . . . . . . . . . . . . . . . . . . . . . . . . . . . . . . . . . . . . . . . . . . . . . . . . . 5,190,000 CAD 5,187 5,225Inter Pipeline Fund, Senior Note, 4.967%, 2/2/2021 . . . . . . . . . . . . . . . . . . . . . . . . . . . . . . . . . . . . . . . . . . . . . . . . . . . . . . . . . . 6,906,000 CAD 6,906 7,734Labrador-Island Link Funding Trust, 3.76%, 6/1/2033 . . . . . . . . . . . . . . . . . . . . . . . . . . . . . . . . . . . . . . . . . . . . . . . . . . . . . . . . . 22,145,000 CAD 22,554 23,947Lower Mattagami Energy LP, Senior Secured Note, 3.416%, 6/20/2024 . . . . . . . . . . . . . . . . . . . . . . . . . . . . . . . . . . . . . . . . . . . . . 13,815,000 CAD 13,815 13,943Manitoba Telecom Services Inc.
Senior Bond, 4.00%, 5/27/2024 . . . . . . . . . . . . . . . . . . . . . . . . . . . . . . . . . . . . . . . . . . . . . . . . . . . . . . . . . . . . . . . . . . . . . . . 5,920,000 CAD 5,916 5,984Senior Note, 4.59%, 10/1/2018 . . . . . . . . . . . . . . . . . . . . . . . . . . . . . . . . . . . . . . . . . . . . . . . . . . . . . . . . . . . . . . . . . . . . . . . 8,055,000 CAD 8,175 8,705Senior Note, 6.65%, 5/11/2016 . . . . . . . . . . . . . . . . . . . . . . . . . . . . . . . . . . . . . . . . . . . . . . . . . . . . . . . . . . . . . . . . . . . . . . . 7,325,000 CAD 8,049 7,938
Manufacturers Life Insurance Co.Subordinated Note, 2.926% to 11/29/17, Floating Rate Note thereafter, 11/29/2023 . . . . . . . . . . . . . . . . . . . . . . . . . . . . . . . . . 9,000,000 CAD 9,000 9,180Subordinated Note, 4.165% to 6/01/17, Floating Rate Note thereafter, 6/1/2022 . . . . . . . . . . . . . . . . . . . . . . . . . . . . . . . . . . . . 5,736,000 CAD 5,736 6,076
Manulife Finance Delaware, Senior Note, 4.448% to 12/15/2016, Floating Rate Note thereafter, 12/15/2026 . . . . . . . . . . . . . . . . . . 7,480,000 CAD 7,937 7,921
The accompanying notes are an integral part of these financial statements.
Franklin Templeton Investments Funds 183

Franklin Bissett Bond Fund
SCHEDULE OF INVESTMENTS As at June 30, 2014 (Unaudited) (Continued)
Principal Amountin Currency
of IssueAverage
Cost Fair Value
(000s) (000s)
Canada: 78.36% (Continued)Manulife Financial Capital Trust II, Junior Subordinated Note, 7.405% to 12/31/2019, Floating Rate Note thereafter, 12/31/2018 . . . 9,911,000 CAD $ 12,175 $ 12,202Manulife Financial Corp., Senior Note, 5.505%, 6/26/2018 . . . . . . . . . . . . . . . . . . . . . . . . . . . . . . . . . . . . . . . . . . . . . . . . . . . . . . 5,196,000 CAD 5,321 5,819Maritimes and Northeast Pipeline LP, Senior Secured Note, 4.34%, 11/30/2019 . . . . . . . . . . . . . . . . . . . . . . . . . . . . . . . . . . . . . . 6,115,680 CAD 6,129 6,300Master Credit Card Trust, Secured Note, 3.876%, 1/21/2017 . . . . . . . . . . . . . . . . . . . . . . . . . . . . . . . . . . . . . . . . . . . . . . . . . . . . 8,215,000 CAD 8,077 8,268Master Credit Card Trust II, 3.623%, 11/21/2018 . . . . . . . . . . . . . . . . . . . . . . . . . . . . . . . . . . . . . . . . . . . . . . . . . . . . . . . . . . . . . 5,635,000 CAD 5,635 5,722MCAP Commercial LP, Senior Secured Note, 3.955%, 3/11/2019 . . . . . . . . . . . . . . . . . . . . . . . . . . . . . . . . . . . . . . . . . . . . . . . . . 6,390,000 CAD 6,390 6,470Merrill Lynch Financial Asset Inc., 2006-CA20, A2, 4.659%, 10/12/2039 . . . . . . . . . . . . . . . . . . . . . . . . . . . . . . . . . . . . . . . . . . . . 2,538,321 CAD 2,538 2,639Morguard Corp., Senior Note, 4.099%, 12/10/2018 . . . . . . . . . . . . . . . . . . . . . . . . . . . . . . . . . . . . . . . . . . . . . . . . . . . . . . . . . . . 3,686,000 CAD 3,686 3,796Muskrat Falls/Labrador Transmission Asset Funding, Senior Bond, 3.63%, 6/1/2029 . . . . . . . . . . . . . . . . . . . . . . . . . . . . . . . . . . . 8,855,000 CAD 9,005 9,489National Housing Association
1.70%, 12/1/2017 . . . . . . . . . . . . . . . . . . . . . . . . . . . . . . . . . . . . . . . . . . . . . . . . . . . . . . . . . . . . . . . . . . . . . . . . . . . . . . . . 12,878,313 CAD 12,717 12,9061.90%, 6/1/2019 . . . . . . . . . . . . . . . . . . . . . . . . . . . . . . . . . . . . . . . . . . . . . . . . . . . . . . . . . . . . . . . . . . . . . . . . . . . . . . . . . 17,304,523 CAD 17,244 17,2722.27%, 8/1/2018 . . . . . . . . . . . . . . . . . . . . . . . . . . . . . . . . . . . . . . . . . . . . . . . . . . . . . . . . . . . . . . . . . . . . . . . . . . . . . . . . . 7,895,736 CAD 7,827 7,9382.29%, 10/1/2018 . . . . . . . . . . . . . . . . . . . . . . . . . . . . . . . . . . . . . . . . . . . . . . . . . . . . . . . . . . . . . . . . . . . . . . . . . . . . . . . . 4,346,507 CAD 4,327 4,3502.30%, 10/1/2017 . . . . . . . . . . . . . . . . . . . . . . . . . . . . . . . . . . . . . . . . . . . . . . . . . . . . . . . . . . . . . . . . . . . . . . . . . . . . . . . . 9,009,542 CAD 9,151 9,080Floating Rate Note, 12/1/2016 . . . . . . . . . . . . . . . . . . . . . . . . . . . . . . . . . . . . . . . . . . . . . . . . . . . . . . . . . . . . . . . . . . . . . . . . 28,742,033 CAD 28,666 29,044Floating Rate Note, 3/1/2017 . . . . . . . . . . . . . . . . . . . . . . . . . . . . . . . . . . . . . . . . . . . . . . . . . . . . . . . . . . . . . . . . . . . . . . . . . 21,116,037 CAD 20,999 21,312
NBC Asset Trust, Junior Subordinated Bond, 7.235% to 6/30/2018, Floating Rate Note thereafter, Perpetual . . . . . . . . . . . . . . . . . . 17,000,000 CAD 20,379 20,088North Battleford Power LP, 4.958%, 12/31/2032 . . . . . . . . . . . . . . . . . . . . . . . . . . . . . . . . . . . . . . . . . . . . . . . . . . . . . . . . . . . . . 12,489,820 CAD 12,491 13,535OMERS Realty Corp., 4.74%, 6/4/2018 . . . . . . . . . . . . . . . . . . . . . . . . . . . . . . . . . . . . . . . . . . . . . . . . . . . . . . . . . . . . . . . . . . . . 13,551,000 CAD 14,645 15,005Ontario Electricity Financial Corp., Strip, 4/11/2031 . . . . . . . . . . . . . . . . . . . . . . . . . . . . . . . . . . . . . . . . . . . . . . . . . . . . . . . . . . . 35,000,000 CAD 17,981 18,148Ontario School Boards Finance, 06A1, 5.07%, 4/18/2031 . . . . . . . . . . . . . . . . . . . . . . . . . . . . . . . . . . . . . . . . . . . . . . . . . . . . . . 18,785,948 CAD 18,786 20,641OPB Finance Trust
Senior Bond, A, 3.89%, 7/4/2042 . . . . . . . . . . . . . . . . . . . . . . . . . . . . . . . . . . . . . . . . . . . . . . . . . . . . . . . . . . . . . . . . . . . . . . 11,748,000 CAD 11,685 11,480Senior Note, 2.90%, 5/24/2023 . . . . . . . . . . . . . . . . . . . . . . . . . . . . . . . . . . . . . . . . . . . . . . . . . . . . . . . . . . . . . . . . . . . . . . . 29,940,000 CAD 29,132 29,748
Parkland Fuel Corp., Senior Note, 5.50%, 5/28/2021 . . . . . . . . . . . . . . . . . . . . . . . . . . . . . . . . . . . . . . . . . . . . . . . . . . . . . . . . . . 2,830,000 CAD 2,830 2,888Pembina Pipeline Corp.
Senior Bond, 4.75%, 4/30/2043 . . . . . . . . . . . . . . . . . . . . . . . . . . . . . . . . . . . . . . . . . . . . . . . . . . . . . . . . . . . . . . . . . . . . . . . 3,000,000 CAD 2,993 3,102Senior Bond, 4.81%, 3/25/2044 . . . . . . . . . . . . . . . . . . . . . . . . . . . . . . . . . . . . . . . . . . . . . . . . . . . . . . . . . . . . . . . . . . . . . . . 8,230,000 CAD 8,222 8,593
Precision Drilling Corp.Senior Bond, 5.25%, 11/15/2024 . . . . . . . . . . . . . . . . . . . . . . . . . . . . . . . . . . . . . . . . . . . . . . . . . . . . . . . . . . . . . . . . . . . . . . 1,440,000 USD 1,560 1,552Senior Note, 6.50%, 3/15/2019 . . . . . . . . . . . . . . . . . . . . . . . . . . . . . . . . . . . . . . . . . . . . . . . . . . . . . . . . . . . . . . . . . . . . . . . 1,657,625 CAD 1,687 1,755
Province of Manitoba4.40%, 9/5/2025 . . . . . . . . . . . . . . . . . . . . . . . . . . . . . . . . . . . . . . . . . . . . . . . . . . . . . . . . . . . . . . . . . . . . . . . . . . . . . . . . . 39,179,000 CAD 40,245 44,0156.30%, 3/5/2031 . . . . . . . . . . . . . . . . . . . . . . . . . . . . . . . . . . . . . . . . . . . . . . . . . . . . . . . . . . . . . . . . . . . . . . . . . . . . . . . . . 17,573,000 CAD 21,609 23,850
Province of New Brunswick3.55%, 6/3/2043 . . . . . . . . . . . . . . . . . . . . . . . . . . . . . . . . . . . . . . . . . . . . . . . . . . . . . . . . . . . . . . . . . . . . . . . . . . . . . . . . . 14,335,000 CAD 13,820 13,7325.50%, 1/27/2034 . . . . . . . . . . . . . . . . . . . . . . . . . . . . . . . . . . . . . . . . . . . . . . . . . . . . . . . . . . . . . . . . . . . . . . . . . . . . . . . . 51,863,000 CAD 59,609 64,698
Province of Ontario2.85%, 6/2/2023 . . . . . . . . . . . . . . . . . . . . . . . . . . . . . . . . . . . . . . . . . . . . . . . . . . . . . . . . . . . . . . . . . . . . . . . . . . . . . . . . . 2,800,000 CAD 2,782 2,7864.00%, 6/2/2021 . . . . . . . . . . . . . . . . . . . . . . . . . . . . . . . . . . . . . . . . . . . . . . . . . . . . . . . . . . . . . . . . . . . . . . . . . . . . . . . . . 2,320,000 CAD 2,539 2,5354.65%, 6/2/2041 . . . . . . . . . . . . . . . . . . . . . . . . . . . . . . . . . . . . . . . . . . . . . . . . . . . . . . . . . . . . . . . . . . . . . . . . . . . . . . . . . 21,408,000 CAD 25,499 24,8024.70%, 6/2/2037 . . . . . . . . . . . . . . . . . . . . . . . . . . . . . . . . . . . . . . . . . . . . . . . . . . . . . . . . . . . . . . . . . . . . . . . . . . . . . . . . . 31,342,000 CAD 38,228 36,1585.85%, 3/8/2033 . . . . . . . . . . . . . . . . . . . . . . . . . . . . . . . . . . . . . . . . . . . . . . . . . . . . . . . . . . . . . . . . . . . . . . . . . . . . . . . . . 70,748,000 CAD 91,038 92,0956.50%, 3/8/2029 . . . . . . . . . . . . . . . . . . . . . . . . . . . . . . . . . . . . . . . . . . . . . . . . . . . . . . . . . . . . . . . . . . . . . . . . . . . . . . . . . 20,895,000 CAD 28,008 28,236KJ, 7.60%, 6/2/2027 . . . . . . . . . . . . . . . . . . . . . . . . . . . . . . . . . . . . . . . . . . . . . . . . . . . . . . . . . . . . . . . . . . . . . . . . . . . . . . . 8,865,000 CAD 12,605 12,867Strip, 6/2/2030 . . . . . . . . . . . . . . . . . . . . . . . . . . . . . . . . . . . . . . . . . . . . . . . . . . . . . . . . . . . . . . . . . . . . . . . . . . . . . . . . . . . 6,850,000 CAD 3,649 3,731
The accompanying notes are an integral part of these financial statements.
184 Franklin Templeton Investments Funds
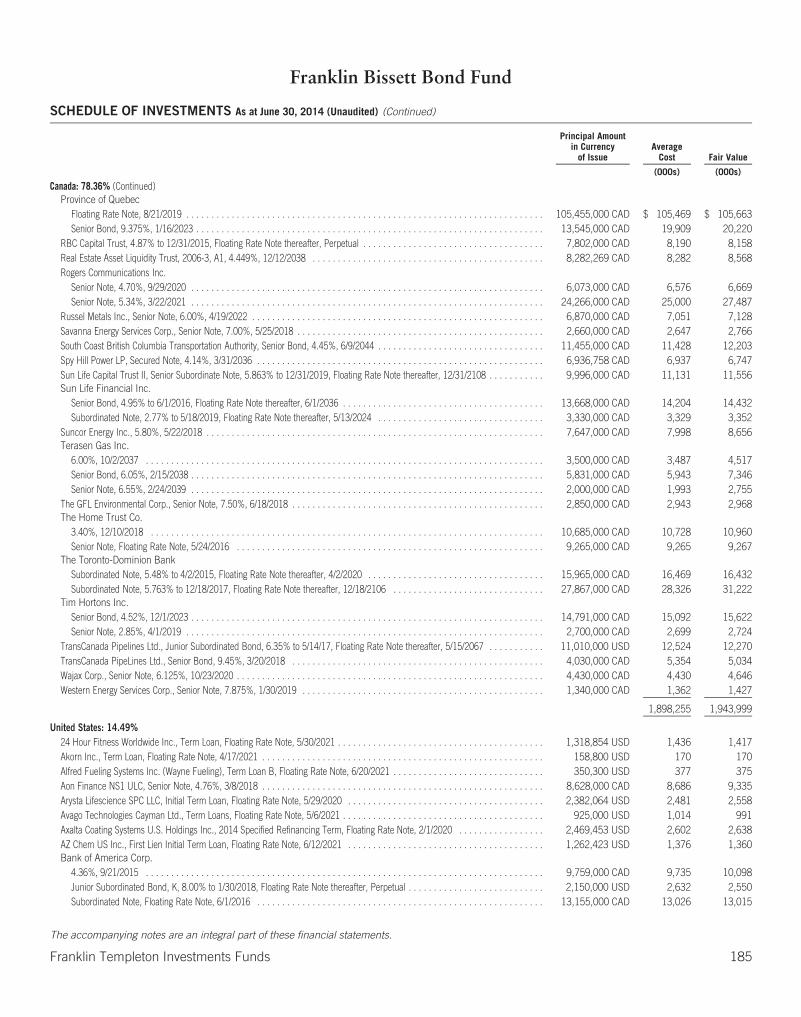
Franklin Bissett Bond Fund
SCHEDULE OF INVESTMENTS As at June 30, 2014 (Unaudited) (Continued)
Principal Amountin Currency
of IssueAverage
Cost Fair Value
(000s) (000s)
Canada: 78.36% (Continued)Province of Quebec
Floating Rate Note, 8/21/2019 . . . . . . . . . . . . . . . . . . . . . . . . . . . . . . . . . . . . . . . . . . . . . . . . . . . . . . . . . . . . . . . . . . . . . . . 105,455,000 CAD $ 105,469 $ 105,663Senior Bond, 9.375%, 1/16/2023 . . . . . . . . . . . . . . . . . . . . . . . . . . . . . . . . . . . . . . . . . . . . . . . . . . . . . . . . . . . . . . . . . . . . . 13,545,000 CAD 19,909 20,220
RBC Capital Trust, 4.87% to 12/31/2015, Floating Rate Note thereafter, Perpetual . . . . . . . . . . . . . . . . . . . . . . . . . . . . . . . . . . . . 7,802,000 CAD 8,190 8,158Real Estate Asset Liquidity Trust, 2006-3, A1, 4.449%, 12/12/2038 . . . . . . . . . . . . . . . . . . . . . . . . . . . . . . . . . . . . . . . . . . . . . . 8,282,269 CAD 8,282 8,568Rogers Communications Inc.
Senior Note, 4.70%, 9/29/2020 . . . . . . . . . . . . . . . . . . . . . . . . . . . . . . . . . . . . . . . . . . . . . . . . . . . . . . . . . . . . . . . . . . . . . . 6,073,000 CAD 6,576 6,669Senior Note, 5.34%, 3/22/2021 . . . . . . . . . . . . . . . . . . . . . . . . . . . . . . . . . . . . . . . . . . . . . . . . . . . . . . . . . . . . . . . . . . . . . . 24,266,000 CAD 25,000 27,487
Russel Metals Inc., Senior Note, 6.00%, 4/19/2022 . . . . . . . . . . . . . . . . . . . . . . . . . . . . . . . . . . . . . . . . . . . . . . . . . . . . . . . . . . 6,870,000 CAD 7,051 7,128Savanna Energy Services Corp., Senior Note, 7.00%, 5/25/2018 . . . . . . . . . . . . . . . . . . . . . . . . . . . . . . . . . . . . . . . . . . . . . . . . . 2,660,000 CAD 2,647 2,766South Coast British Columbia Transportation Authority, Senior Bond, 4.45%, 6/9/2044 . . . . . . . . . . . . . . . . . . . . . . . . . . . . . . . . . 11,455,000 CAD 11,428 12,203Spy Hill Power LP, Secured Note, 4.14%, 3/31/2036 . . . . . . . . . . . . . . . . . . . . . . . . . . . . . . . . . . . . . . . . . . . . . . . . . . . . . . . . . 6,936,758 CAD 6,937 6,747Sun Life Capital Trust II, Senior Subordinate Note, 5.863% to 12/31/2019, Floating Rate Note thereafter, 12/31/2108 . . . . . . . . . . . 9,996,000 CAD 11,131 11,556Sun Life Financial Inc.
Senior Bond, 4.95% to 6/1/2016, Floating Rate Note thereafter, 6/1/2036 . . . . . . . . . . . . . . . . . . . . . . . . . . . . . . . . . . . . . . . . 13,668,000 CAD 14,204 14,432Subordinated Note, 2.77% to 5/18/2019, Floating Rate Note thereafter, 5/13/2024 . . . . . . . . . . . . . . . . . . . . . . . . . . . . . . . . . 3,330,000 CAD 3,329 3,352
Suncor Energy Inc., 5.80%, 5/22/2018 . . . . . . . . . . . . . . . . . . . . . . . . . . . . . . . . . . . . . . . . . . . . . . . . . . . . . . . . . . . . . . . . . . . 7,647,000 CAD 7,998 8,656Terasen Gas Inc.
6.00%, 10/2/2037 . . . . . . . . . . . . . . . . . . . . . . . . . . . . . . . . . . . . . . . . . . . . . . . . . . . . . . . . . . . . . . . . . . . . . . . . . . . . . . . 3,500,000 CAD 3,487 4,517Senior Bond, 6.05%, 2/15/2038 . . . . . . . . . . . . . . . . . . . . . . . . . . . . . . . . . . . . . . . . . . . . . . . . . . . . . . . . . . . . . . . . . . . . . . 5,831,000 CAD 5,943 7,346Senior Note, 6.55%, 2/24/2039 . . . . . . . . . . . . . . . . . . . . . . . . . . . . . . . . . . . . . . . . . . . . . . . . . . . . . . . . . . . . . . . . . . . . . . 2,000,000 CAD 1,993 2,755
The GFL Environmental Corp., Senior Note, 7.50%, 6/18/2018 . . . . . . . . . . . . . . . . . . . . . . . . . . . . . . . . . . . . . . . . . . . . . . . . . . 2,850,000 CAD 2,943 2,968The Home Trust Co.
3.40%, 12/10/2018 . . . . . . . . . . . . . . . . . . . . . . . . . . . . . . . . . . . . . . . . . . . . . . . . . . . . . . . . . . . . . . . . . . . . . . . . . . . . . . 10,685,000 CAD 10,728 10,960Senior Note, Floating Rate Note, 5/24/2016 . . . . . . . . . . . . . . . . . . . . . . . . . . . . . . . . . . . . . . . . . . . . . . . . . . . . . . . . . . . . . 9,265,000 CAD 9,265 9,267
The Toronto-Dominion BankSubordinated Note, 5.48% to 4/2/2015, Floating Rate Note thereafter, 4/2/2020 . . . . . . . . . . . . . . . . . . . . . . . . . . . . . . . . . . . 15,965,000 CAD 16,469 16,432Subordinated Note, 5.763% to 12/18/2017, Floating Rate Note thereafter, 12/18/2106 . . . . . . . . . . . . . . . . . . . . . . . . . . . . . . 27,867,000 CAD 28,326 31,222
Tim Hortons Inc.Senior Bond, 4.52%, 12/1/2023 . . . . . . . . . . . . . . . . . . . . . . . . . . . . . . . . . . . . . . . . . . . . . . . . . . . . . . . . . . . . . . . . . . . . . . 14,791,000 CAD 15,092 15,622Senior Note, 2.85%, 4/1/2019 . . . . . . . . . . . . . . . . . . . . . . . . . . . . . . . . . . . . . . . . . . . . . . . . . . . . . . . . . . . . . . . . . . . . . . . 2,700,000 CAD 2,699 2,724
TransCanada Pipelines Ltd., Junior Subordinated Bond, 6.35% to 5/14/17, Floating Rate Note thereafter, 5/15/2067 . . . . . . . . . . . 11,010,000 USD 12,524 12,270TransCanada PipeLines Ltd., Senior Bond, 9.45%, 3/20/2018 . . . . . . . . . . . . . . . . . . . . . . . . . . . . . . . . . . . . . . . . . . . . . . . . . . 4,030,000 CAD 5,354 5,034Wajax Corp., Senior Note, 6.125%, 10/23/2020 . . . . . . . . . . . . . . . . . . . . . . . . . . . . . . . . . . . . . . . . . . . . . . . . . . . . . . . . . . . . . 4,430,000 CAD 4,430 4,646Western Energy Services Corp., Senior Note, 7.875%, 1/30/2019 . . . . . . . . . . . . . . . . . . . . . . . . . . . . . . . . . . . . . . . . . . . . . . . . 1,340,000 CAD 1,362 1,427
1,898,255 1,943,999
United States: 14.49%24 Hour Fitness Worldwide Inc., Term Loan, Floating Rate Note, 5/30/2021 . . . . . . . . . . . . . . . . . . . . . . . . . . . . . . . . . . . . . . . . . 1,318,854 USD 1,436 1,417Akorn Inc., Term Loan, Floating Rate Note, 4/17/2021 . . . . . . . . . . . . . . . . . . . . . . . . . . . . . . . . . . . . . . . . . . . . . . . . . . . . . . . . 158,800 USD 170 170Alfred Fueling Systems Inc. (Wayne Fueling), Term Loan B, Floating Rate Note, 6/20/2021 . . . . . . . . . . . . . . . . . . . . . . . . . . . . . . 350,300 USD 377 375Aon Finance NS1 ULC, Senior Note, 4.76%, 3/8/2018 . . . . . . . . . . . . . . . . . . . . . . . . . . . . . . . . . . . . . . . . . . . . . . . . . . . . . . . . 8,628,000 CAD 8,686 9,335Arysta Lifescience SPC LLC, Initial Term Loan, Floating Rate Note, 5/29/2020 . . . . . . . . . . . . . . . . . . . . . . . . . . . . . . . . . . . . . . . 2,382,064 USD 2,481 2,558Avago Technologies Cayman Ltd., Term Loans, Floating Rate Note, 5/6/2021 . . . . . . . . . . . . . . . . . . . . . . . . . . . . . . . . . . . . . . . . 925,000 USD 1,014 991Axalta Coating Systems U.S. Holdings Inc., 2014 Specified Refinancing Term, Floating Rate Note, 2/1/2020 . . . . . . . . . . . . . . . . . 2,469,453 USD 2,602 2,638AZ Chem US Inc., First Lien Initial Term Loan, Floating Rate Note, 6/12/2021 . . . . . . . . . . . . . . . . . . . . . . . . . . . . . . . . . . . . . . . 1,262,423 USD 1,376 1,360Bank of America Corp.
4.36%, 9/21/2015 . . . . . . . . . . . . . . . . . . . . . . . . . . . . . . . . . . . . . . . . . . . . . . . . . . . . . . . . . . . . . . . . . . . . . . . . . . . . . . . 9,759,000 CAD 9,735 10,098Junior Subordinated Bond, K, 8.00% to 1/30/2018, Floating Rate Note thereafter, Perpetual . . . . . . . . . . . . . . . . . . . . . . . . . . . 2,150,000 USD 2,632 2,550Subordinated Note, Floating Rate Note, 6/1/2016 . . . . . . . . . . . . . . . . . . . . . . . . . . . . . . . . . . . . . . . . . . . . . . . . . . . . . . . . . 13,155,000 CAD 13,026 13,015
The accompanying notes are an integral part of these financial statements.
Franklin Templeton Investments Funds 185
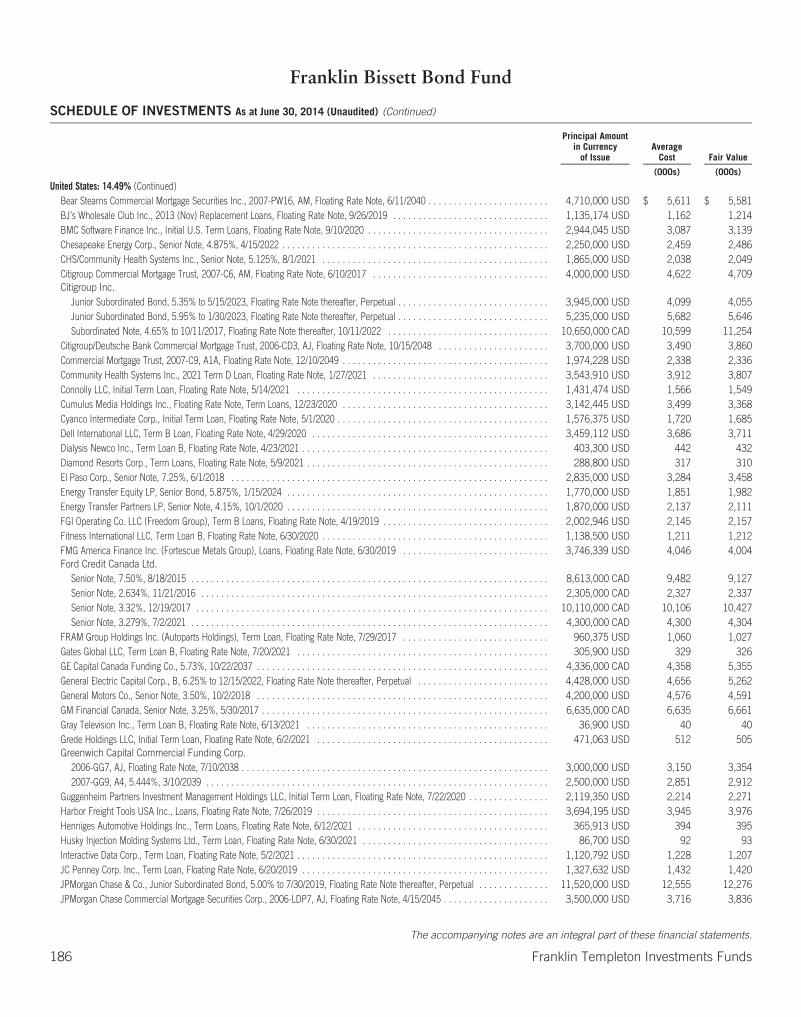
Franklin Bissett Bond Fund
SCHEDULE OF INVESTMENTS As at June 30, 2014 (Unaudited) (Continued)
Principal Amountin Currency
of IssueAverage
Cost Fair Value
(000s) (000s)
United States: 14.49% (Continued)Bear Stearns Commercial Mortgage Securities Inc., 2007-PW16, AM, Floating Rate Note, 6/11/2040 . . . . . . . . . . . . . . . . . . . . . . . . 4,710,000 USD $ 5,611 $ 5,581BJ’s Wholesale Club Inc., 2013 (Nov) Replacement Loans, Floating Rate Note, 9/26/2019 . . . . . . . . . . . . . . . . . . . . . . . . . . . . . . . 1,135,174 USD 1,162 1,214BMC Software Finance Inc., Initial U.S. Term Loans, Floating Rate Note, 9/10/2020 . . . . . . . . . . . . . . . . . . . . . . . . . . . . . . . . . . . . 2,944,045 USD 3,087 3,139Chesapeake Energy Corp., Senior Note, 4.875%, 4/15/2022 . . . . . . . . . . . . . . . . . . . . . . . . . . . . . . . . . . . . . . . . . . . . . . . . . . . . . 2,250,000 USD 2,459 2,486CHS/Community Health Systems Inc., Senior Note, 5.125%, 8/1/2021 . . . . . . . . . . . . . . . . . . . . . . . . . . . . . . . . . . . . . . . . . . . . . 1,865,000 USD 2,038 2,049Citigroup Commercial Mortgage Trust, 2007-C6, AM, Floating Rate Note, 6/10/2017 . . . . . . . . . . . . . . . . . . . . . . . . . . . . . . . . . . . 4,000,000 USD 4,622 4,709Citigroup Inc.
Junior Subordinated Bond, 5.35% to 5/15/2023, Floating Rate Note thereafter, Perpetual . . . . . . . . . . . . . . . . . . . . . . . . . . . . . . 3,945,000 USD 4,099 4,055Junior Subordinated Bond, 5.95% to 1/30/2023, Floating Rate Note thereafter, Perpetual . . . . . . . . . . . . . . . . . . . . . . . . . . . . . . 5,235,000 USD 5,682 5,646Subordinated Note, 4.65% to 10/11/2017, Floating Rate Note thereafter, 10/11/2022 . . . . . . . . . . . . . . . . . . . . . . . . . . . . . . . . 10,650,000 CAD 10,599 11,254
Citigroup/Deutsche Bank Commercial Mortgage Trust, 2006-CD3, AJ, Floating Rate Note, 10/15/2048 . . . . . . . . . . . . . . . . . . . . . . 3,700,000 USD 3,490 3,860Commercial Mortgage Trust, 2007-C9, A1A, Floating Rate Note, 12/10/2049 . . . . . . . . . . . . . . . . . . . . . . . . . . . . . . . . . . . . . . . . . 1,974,228 USD 2,338 2,336Community Health Systems Inc., 2021 Term D Loan, Floating Rate Note, 1/27/2021 . . . . . . . . . . . . . . . . . . . . . . . . . . . . . . . . . . . 3,543,910 USD 3,912 3,807Connolly LLC, Initial Term Loan, Floating Rate Note, 5/14/2021 . . . . . . . . . . . . . . . . . . . . . . . . . . . . . . . . . . . . . . . . . . . . . . . . . . 1,431,474 USD 1,566 1,549Cumulus Media Holdings Inc., Floating Rate Note, Term Loans, 12/23/2020 . . . . . . . . . . . . . . . . . . . . . . . . . . . . . . . . . . . . . . . . . 3,142,445 USD 3,499 3,368Cyanco Intermediate Corp., Initial Term Loan, Floating Rate Note, 5/1/2020 . . . . . . . . . . . . . . . . . . . . . . . . . . . . . . . . . . . . . . . . . . 1,576,375 USD 1,720 1,685Dell International LLC, Term B Loan, Floating Rate Note, 4/29/2020 . . . . . . . . . . . . . . . . . . . . . . . . . . . . . . . . . . . . . . . . . . . . . . . 3,459,112 USD 3,686 3,711Dialysis Newco Inc., Term Loan B, Floating Rate Note, 4/23/2021 . . . . . . . . . . . . . . . . . . . . . . . . . . . . . . . . . . . . . . . . . . . . . . . . . 403,300 USD 442 432Diamond Resorts Corp., Term Loans, Floating Rate Note, 5/9/2021 . . . . . . . . . . . . . . . . . . . . . . . . . . . . . . . . . . . . . . . . . . . . . . . . 288,800 USD 317 310El Paso Corp., Senior Note, 7.25%, 6/1/2018 . . . . . . . . . . . . . . . . . . . . . . . . . . . . . . . . . . . . . . . . . . . . . . . . . . . . . . . . . . . . . . . 2,835,000 USD 3,284 3,458Energy Transfer Equity LP, Senior Bond, 5.875%, 1/15/2024 . . . . . . . . . . . . . . . . . . . . . . . . . . . . . . . . . . . . . . . . . . . . . . . . . . . . 1,770,000 USD 1,851 1,982Energy Transfer Partners LP, Senior Note, 4.15%, 10/1/2020 . . . . . . . . . . . . . . . . . . . . . . . . . . . . . . . . . . . . . . . . . . . . . . . . . . . . 1,870,000 USD 2,137 2,111FGI Operating Co. LLC (Freedom Group), Term B Loans, Floating Rate Note, 4/19/2019 . . . . . . . . . . . . . . . . . . . . . . . . . . . . . . . . . 2,002,946 USD 2,145 2,157Fitness International LLC, Term Loan B, Floating Rate Note, 6/30/2020 . . . . . . . . . . . . . . . . . . . . . . . . . . . . . . . . . . . . . . . . . . . . . 1,138,500 USD 1,211 1,212FMG America Finance Inc. (Fortescue Metals Group), Loans, Floating Rate Note, 6/30/2019 . . . . . . . . . . . . . . . . . . . . . . . . . . . . . 3,746,339 USD 4,046 4,004Ford Credit Canada Ltd.
Senior Note, 7.50%, 8/18/2015 . . . . . . . . . . . . . . . . . . . . . . . . . . . . . . . . . . . . . . . . . . . . . . . . . . . . . . . . . . . . . . . . . . . . . . . 8,613,000 CAD 9,482 9,127Senior Note, 2.634%, 11/21/2016 . . . . . . . . . . . . . . . . . . . . . . . . . . . . . . . . . . . . . . . . . . . . . . . . . . . . . . . . . . . . . . . . . . . . . 2,305,000 CAD 2,327 2,337Senior Note, 3.32%, 12/19/2017 . . . . . . . . . . . . . . . . . . . . . . . . . . . . . . . . . . . . . . . . . . . . . . . . . . . . . . . . . . . . . . . . . . . . . . 10,110,000 CAD 10,106 10,427Senior Note, 3.279%, 7/2/2021 . . . . . . . . . . . . . . . . . . . . . . . . . . . . . . . . . . . . . . . . . . . . . . . . . . . . . . . . . . . . . . . . . . . . . . . 4,300,000 CAD 4,300 4,304
FRAM Group Holdings Inc. (Autoparts Holdings), Term Loan, Floating Rate Note, 7/29/2017 . . . . . . . . . . . . . . . . . . . . . . . . . . . . . 960,375 USD 1,060 1,027Gates Global LLC, Term Loan B, Floating Rate Note, 7/20/2021 . . . . . . . . . . . . . . . . . . . . . . . . . . . . . . . . . . . . . . . . . . . . . . . . . . 305,900 USD 329 326GE Capital Canada Funding Co., 5.73%, 10/22/2037 . . . . . . . . . . . . . . . . . . . . . . . . . . . . . . . . . . . . . . . . . . . . . . . . . . . . . . . . . . 4,336,000 CAD 4,358 5,355General Electric Capital Corp., B, 6.25% to 12/15/2022, Floating Rate Note thereafter, Perpetual . . . . . . . . . . . . . . . . . . . . . . . . . . 4,428,000 USD 4,656 5,262General Motors Co., Senior Note, 3.50%, 10/2/2018 . . . . . . . . . . . . . . . . . . . . . . . . . . . . . . . . . . . . . . . . . . . . . . . . . . . . . . . . . . 4,200,000 USD 4,576 4,591GM Financial Canada, Senior Note, 3.25%, 5/30/2017 . . . . . . . . . . . . . . . . . . . . . . . . . . . . . . . . . . . . . . . . . . . . . . . . . . . . . . . . . 6,635,000 CAD 6,635 6,661Gray Television Inc., Term Loan B, Floating Rate Note, 6/13/2021 . . . . . . . . . . . . . . . . . . . . . . . . . . . . . . . . . . . . . . . . . . . . . . . . 36,900 USD 40 40Grede Holdings LLC, Initial Term Loan, Floating Rate Note, 6/2/2021 . . . . . . . . . . . . . . . . . . . . . . . . . . . . . . . . . . . . . . . . . . . . . . 471,063 USD 512 505Greenwich Capital Commercial Funding Corp.
2006-GG7, AJ, Floating Rate Note, 7/10/2038 . . . . . . . . . . . . . . . . . . . . . . . . . . . . . . . . . . . . . . . . . . . . . . . . . . . . . . . . . . . . . 3,000,000 USD 3,150 3,3542007-GG9, A4, 5.444%, 3/10/2039 . . . . . . . . . . . . . . . . . . . . . . . . . . . . . . . . . . . . . . . . . . . . . . . . . . . . . . . . . . . . . . . . . . . . 2,500,000 USD 2,851 2,912
Guggenheim Partners Investment Management Holdings LLC, Initial Term Loan, Floating Rate Note, 7/22/2020 . . . . . . . . . . . . . . . . 2,119,350 USD 2,214 2,271Harbor Freight Tools USA Inc., Loans, Floating Rate Note, 7/26/2019 . . . . . . . . . . . . . . . . . . . . . . . . . . . . . . . . . . . . . . . . . . . . . . 3,694,195 USD 3,945 3,976Henniges Automotive Holdings Inc., Term Loans, Floating Rate Note, 6/12/2021 . . . . . . . . . . . . . . . . . . . . . . . . . . . . . . . . . . . . . . 365,913 USD 394 395Husky Injection Molding Systems Ltd., Term Loan, Floating Rate Note, 6/30/2021 . . . . . . . . . . . . . . . . . . . . . . . . . . . . . . . . . . . . . 86,700 USD 92 93Interactive Data Corp., Term Loan, Floating Rate Note, 5/2/2021 . . . . . . . . . . . . . . . . . . . . . . . . . . . . . . . . . . . . . . . . . . . . . . . . . . 1,120,792 USD 1,228 1,207JC Penney Corp. Inc., Term Loan, Floating Rate Note, 6/20/2019 . . . . . . . . . . . . . . . . . . . . . . . . . . . . . . . . . . . . . . . . . . . . . . . . . 1,327,632 USD 1,432 1,420JPMorgan Chase & Co., Junior Subordinated Bond, 5.00% to 7/30/2019, Floating Rate Note thereafter, Perpetual . . . . . . . . . . . . . . 11,520,000 USD 12,555 12,276JPMorgan Chase Commercial Mortgage Securities Corp., 2006-LDP7, AJ, Floating Rate Note, 4/15/2045 . . . . . . . . . . . . . . . . . . . . . 3,500,000 USD 3,716 3,836
The accompanying notes are an integral part of these financial statements.
186 Franklin Templeton Investments Funds
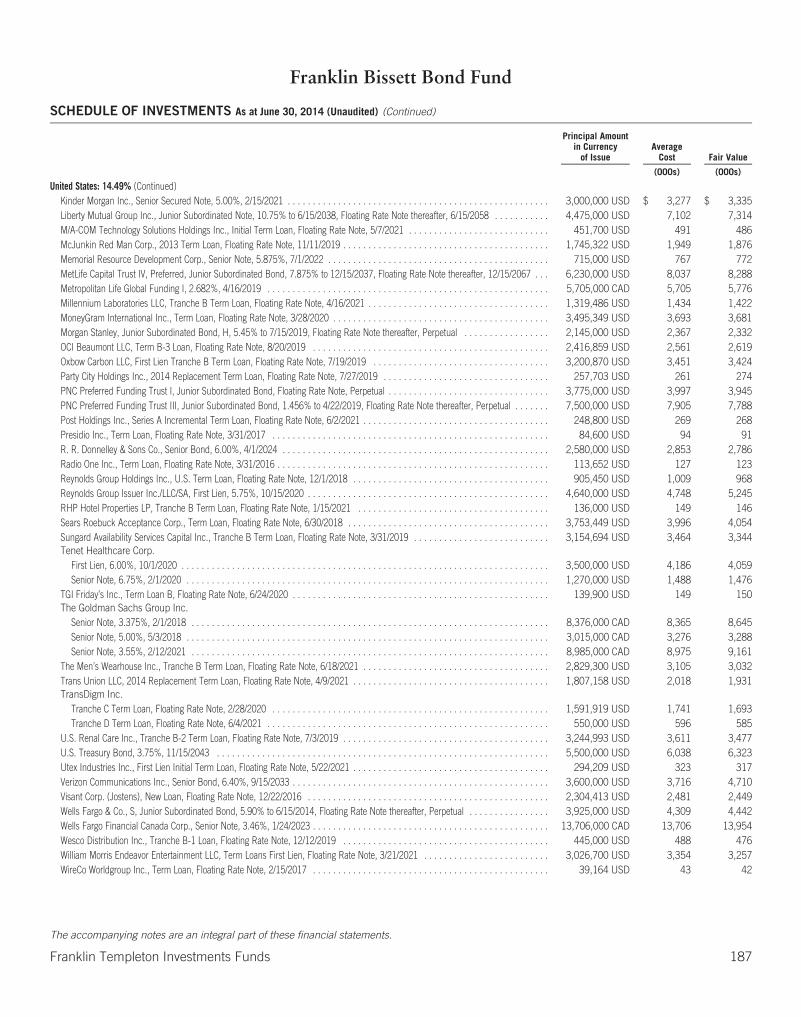
Franklin Bissett Bond Fund
SCHEDULE OF INVESTMENTS As at June 30, 2014 (Unaudited) (Continued)
Principal Amountin Currency
of IssueAverage
Cost Fair Value
(000s) (000s)
United States: 14.49% (Continued)Kinder Morgan Inc., Senior Secured Note, 5.00%, 2/15/2021 . . . . . . . . . . . . . . . . . . . . . . . . . . . . . . . . . . . . . . . . . . . . . . . . . . . . 3,000,000 USD $ 3,277 $ 3,335Liberty Mutual Group Inc., Junior Subordinated Note, 10.75% to 6/15/2038, Floating Rate Note thereafter, 6/15/2058 . . . . . . . . . . . 4,475,000 USD 7,102 7,314M/A-COM Technology Solutions Holdings Inc., Initial Term Loan, Floating Rate Note, 5/7/2021 . . . . . . . . . . . . . . . . . . . . . . . . . . . . 451,700 USD 491 486McJunkin Red Man Corp., 2013 Term Loan, Floating Rate Note, 11/11/2019 . . . . . . . . . . . . . . . . . . . . . . . . . . . . . . . . . . . . . . . . . 1,745,322 USD 1,949 1,876Memorial Resource Development Corp., Senior Note, 5.875%, 7/1/2022 . . . . . . . . . . . . . . . . . . . . . . . . . . . . . . . . . . . . . . . . . . . . 715,000 USD 767 772MetLife Capital Trust IV, Preferred, Junior Subordinated Bond, 7.875% to 12/15/2037, Floating Rate Note thereafter, 12/15/2067 . . . 6,230,000 USD 8,037 8,288Metropolitan Life Global Funding I, 2.682%, 4/16/2019 . . . . . . . . . . . . . . . . . . . . . . . . . . . . . . . . . . . . . . . . . . . . . . . . . . . . . . . . 5,705,000 CAD 5,705 5,776Millennium Laboratories LLC, Tranche B Term Loan, Floating Rate Note, 4/16/2021 . . . . . . . . . . . . . . . . . . . . . . . . . . . . . . . . . . . . 1,319,486 USD 1,434 1,422MoneyGram International Inc., Term Loan, Floating Rate Note, 3/28/2020 . . . . . . . . . . . . . . . . . . . . . . . . . . . . . . . . . . . . . . . . . . . 3,495,349 USD 3,693 3,681Morgan Stanley, Junior Subordinated Bond, H, 5.45% to 7/15/2019, Floating Rate Note thereafter, Perpetual . . . . . . . . . . . . . . . . . 2,145,000 USD 2,367 2,332OCI Beaumont LLC, Term B-3 Loan, Floating Rate Note, 8/20/2019 . . . . . . . . . . . . . . . . . . . . . . . . . . . . . . . . . . . . . . . . . . . . . . . 2,416,859 USD 2,561 2,619Oxbow Carbon LLC, First Lien Tranche B Term Loan, Floating Rate Note, 7/19/2019 . . . . . . . . . . . . . . . . . . . . . . . . . . . . . . . . . . . 3,200,870 USD 3,451 3,424Party City Holdings Inc., 2014 Replacement Term Loan, Floating Rate Note, 7/27/2019 . . . . . . . . . . . . . . . . . . . . . . . . . . . . . . . . . 257,703 USD 261 274PNC Preferred Funding Trust I, Junior Subordinated Bond, Floating Rate Note, Perpetual . . . . . . . . . . . . . . . . . . . . . . . . . . . . . . . . 3,775,000 USD 3,997 3,945PNC Preferred Funding Trust III, Junior Subordinated Bond, 1.456% to 4/22/2019, Floating Rate Note thereafter, Perpetual . . . . . . . 7,500,000 USD 7,905 7,788Post Holdings Inc., Series A Incremental Term Loan, Floating Rate Note, 6/2/2021 . . . . . . . . . . . . . . . . . . . . . . . . . . . . . . . . . . . . . 248,800 USD 269 268Presidio Inc., Term Loan, Floating Rate Note, 3/31/2017 . . . . . . . . . . . . . . . . . . . . . . . . . . . . . . . . . . . . . . . . . . . . . . . . . . . . . . . 84,600 USD 94 91R. R. Donnelley & Sons Co., Senior Bond, 6.00%, 4/1/2024 . . . . . . . . . . . . . . . . . . . . . . . . . . . . . . . . . . . . . . . . . . . . . . . . . . . . . 2,580,000 USD 2,853 2,786Radio One Inc., Term Loan, Floating Rate Note, 3/31/2016 . . . . . . . . . . . . . . . . . . . . . . . . . . . . . . . . . . . . . . . . . . . . . . . . . . . . . . 113,652 USD 127 123Reynolds Group Holdings Inc., U.S. Term Loan, Floating Rate Note, 12/1/2018 . . . . . . . . . . . . . . . . . . . . . . . . . . . . . . . . . . . . . . . 905,450 USD 1,009 968Reynolds Group Issuer Inc./LLC/SA, First Lien, 5.75%, 10/15/2020 . . . . . . . . . . . . . . . . . . . . . . . . . . . . . . . . . . . . . . . . . . . . . . . . 4,640,000 USD 4,748 5,245RHP Hotel Properties LP, Tranche B Term Loan, Floating Rate Note, 1/15/2021 . . . . . . . . . . . . . . . . . . . . . . . . . . . . . . . . . . . . . . 136,000 USD 149 146Sears Roebuck Acceptance Corp., Term Loan, Floating Rate Note, 6/30/2018 . . . . . . . . . . . . . . . . . . . . . . . . . . . . . . . . . . . . . . . . 3,753,449 USD 3,996 4,054Sungard Availability Services Capital Inc., Tranche B Term Loan, Floating Rate Note, 3/31/2019 . . . . . . . . . . . . . . . . . . . . . . . . . . . 3,154,694 USD 3,464 3,344Tenet Healthcare Corp.
First Lien, 6.00%, 10/1/2020 . . . . . . . . . . . . . . . . . . . . . . . . . . . . . . . . . . . . . . . . . . . . . . . . . . . . . . . . . . . . . . . . . . . . . . . . . 3,500,000 USD 4,186 4,059Senior Note, 6.75%, 2/1/2020 . . . . . . . . . . . . . . . . . . . . . . . . . . . . . . . . . . . . . . . . . . . . . . . . . . . . . . . . . . . . . . . . . . . . . . . . 1,270,000 USD 1,488 1,476
TGI Friday’s Inc., Term Loan B, Floating Rate Note, 6/24/2020 . . . . . . . . . . . . . . . . . . . . . . . . . . . . . . . . . . . . . . . . . . . . . . . . . . . 139,900 USD 149 150The Goldman Sachs Group Inc.
Senior Note, 3.375%, 2/1/2018 . . . . . . . . . . . . . . . . . . . . . . . . . . . . . . . . . . . . . . . . . . . . . . . . . . . . . . . . . . . . . . . . . . . . . . . 8,376,000 CAD 8,365 8,645Senior Note, 5.00%, 5/3/2018 . . . . . . . . . . . . . . . . . . . . . . . . . . . . . . . . . . . . . . . . . . . . . . . . . . . . . . . . . . . . . . . . . . . . . . . . 3,015,000 CAD 3,276 3,288Senior Note, 3.55%, 2/12/2021 . . . . . . . . . . . . . . . . . . . . . . . . . . . . . . . . . . . . . . . . . . . . . . . . . . . . . . . . . . . . . . . . . . . . . . . 8,985,000 CAD 8,975 9,161
The Men’s Wearhouse Inc., Tranche B Term Loan, Floating Rate Note, 6/18/2021 . . . . . . . . . . . . . . . . . . . . . . . . . . . . . . . . . . . . . 2,829,300 USD 3,105 3,032Trans Union LLC, 2014 Replacement Term Loan, Floating Rate Note, 4/9/2021 . . . . . . . . . . . . . . . . . . . . . . . . . . . . . . . . . . . . . . . 1,807,158 USD 2,018 1,931TransDigm Inc.
Tranche C Term Loan, Floating Rate Note, 2/28/2020 . . . . . . . . . . . . . . . . . . . . . . . . . . . . . . . . . . . . . . . . . . . . . . . . . . . . . . . 1,591,919 USD 1,741 1,693Tranche D Term Loan, Floating Rate Note, 6/4/2021 . . . . . . . . . . . . . . . . . . . . . . . . . . . . . . . . . . . . . . . . . . . . . . . . . . . . . . . . 550,000 USD 596 585
U.S. Renal Care Inc., Tranche B-2 Term Loan, Floating Rate Note, 7/3/2019 . . . . . . . . . . . . . . . . . . . . . . . . . . . . . . . . . . . . . . . . . 3,244,993 USD 3,611 3,477U.S. Treasury Bond, 3.75%, 11/15/2043 . . . . . . . . . . . . . . . . . . . . . . . . . . . . . . . . . . . . . . . . . . . . . . . . . . . . . . . . . . . . . . . . . . 5,500,000 USD 6,038 6,323Utex Industries Inc., First Lien Initial Term Loan, Floating Rate Note, 5/22/2021 . . . . . . . . . . . . . . . . . . . . . . . . . . . . . . . . . . . . . . . 294,209 USD 323 317Verizon Communications Inc., Senior Bond, 6.40%, 9/15/2033 . . . . . . . . . . . . . . . . . . . . . . . . . . . . . . . . . . . . . . . . . . . . . . . . . . . 3,600,000 USD 3,716 4,710Visant Corp. (Jostens), New Loan, Floating Rate Note, 12/22/2016 . . . . . . . . . . . . . . . . . . . . . . . . . . . . . . . . . . . . . . . . . . . . . . . . 2,304,413 USD 2,481 2,449Wells Fargo & Co., S, Junior Subordinated Bond, 5.90% to 6/15/2014, Floating Rate Note thereafter, Perpetual . . . . . . . . . . . . . . . . 3,925,000 USD 4,309 4,442Wells Fargo Financial Canada Corp., Senior Note, 3.46%, 1/24/2023 . . . . . . . . . . . . . . . . . . . . . . . . . . . . . . . . . . . . . . . . . . . . . . . 13,706,000 CAD 13,706 13,954Wesco Distribution Inc., Tranche B-1 Loan, Floating Rate Note, 12/12/2019 . . . . . . . . . . . . . . . . . . . . . . . . . . . . . . . . . . . . . . . . . 445,000 USD 488 476William Morris Endeavor Entertainment LLC, Term Loans First Lien, Floating Rate Note, 3/21/2021 . . . . . . . . . . . . . . . . . . . . . . . . . 3,026,700 USD 3,354 3,257WireCo Worldgroup Inc., Term Loan, Floating Rate Note, 2/15/2017 . . . . . . . . . . . . . . . . . . . . . . . . . . . . . . . . . . . . . . . . . . . . . . . 39,164 USD 43 42
The accompanying notes are an integral part of these financial statements.
Franklin Templeton Investments Funds 187
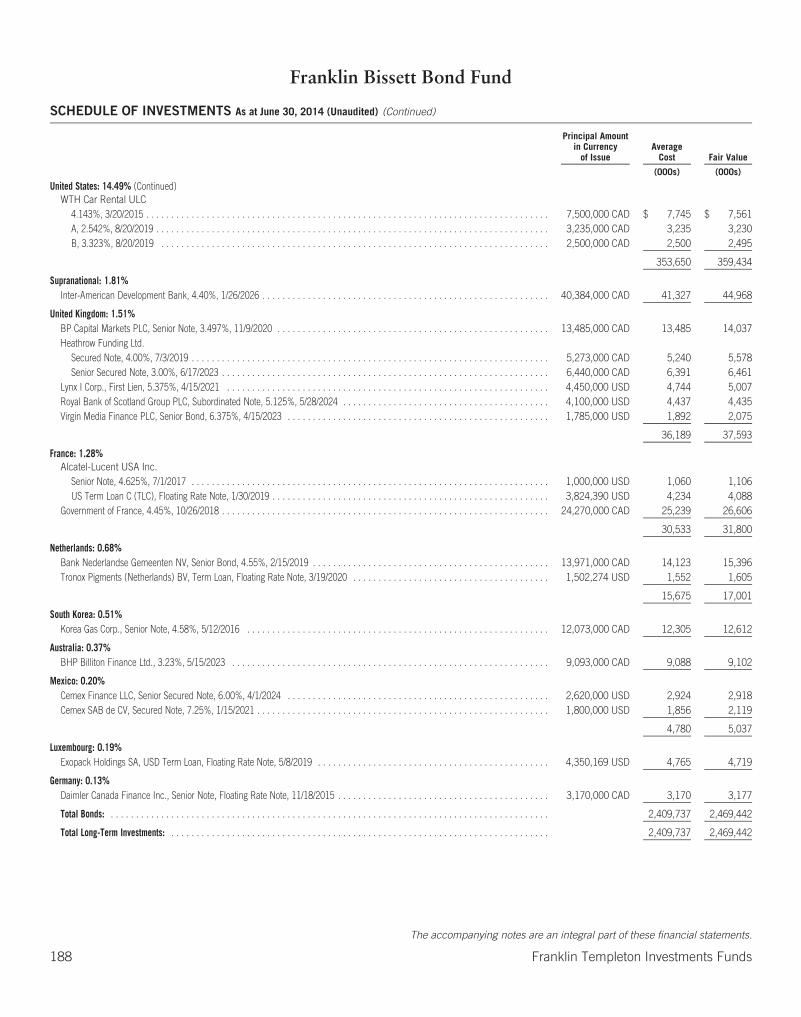
Franklin Bissett Bond Fund
SCHEDULE OF INVESTMENTS As at June 30, 2014 (Unaudited) (Continued)
Principal Amountin Currency
of IssueAverage
Cost Fair Value
(000s) (000s)
United States: 14.49% (Continued)WTH Car Rental ULC
4.143%, 3/20/2015 . . . . . . . . . . . . . . . . . . . . . . . . . . . . . . . . . . . . . . . . . . . . . . . . . . . . . . . . . . . . . . . . . . . . . . . . . . . . . . . . 7,500,000 CAD $ 7,745 $ 7,561A, 2.542%, 8/20/2019 . . . . . . . . . . . . . . . . . . . . . . . . . . . . . . . . . . . . . . . . . . . . . . . . . . . . . . . . . . . . . . . . . . . . . . . . . . . . . . 3,235,000 CAD 3,235 3,230B, 3.323%, 8/20/2019 . . . . . . . . . . . . . . . . . . . . . . . . . . . . . . . . . . . . . . . . . . . . . . . . . . . . . . . . . . . . . . . . . . . . . . . . . . . . . 2,500,000 CAD 2,500 2,495
353,650 359,434
Supranational: 1.81%Inter-American Development Bank, 4.40%, 1/26/2026 . . . . . . . . . . . . . . . . . . . . . . . . . . . . . . . . . . . . . . . . . . . . . . . . . . . . . . . . . 40,384,000 CAD 41,327 44,968
United Kingdom: 1.51%BP Capital Markets PLC, Senior Note, 3.497%, 11/9/2020 . . . . . . . . . . . . . . . . . . . . . . . . . . . . . . . . . . . . . . . . . . . . . . . . . . . . . . 13,485,000 CAD 13,485 14,037Heathrow Funding Ltd.
Secured Note, 4.00%, 7/3/2019 . . . . . . . . . . . . . . . . . . . . . . . . . . . . . . . . . . . . . . . . . . . . . . . . . . . . . . . . . . . . . . . . . . . . . . . 5,273,000 CAD 5,240 5,578Senior Secured Note, 3.00%, 6/17/2023 . . . . . . . . . . . . . . . . . . . . . . . . . . . . . . . . . . . . . . . . . . . . . . . . . . . . . . . . . . . . . . . . . 6,440,000 CAD 6,391 6,461
Lynx I Corp., First Lien, 5.375%, 4/15/2021 . . . . . . . . . . . . . . . . . . . . . . . . . . . . . . . . . . . . . . . . . . . . . . . . . . . . . . . . . . . . . . . . 4,450,000 USD 4,744 5,007Royal Bank of Scotland Group PLC, Subordinated Note, 5.125%, 5/28/2024 . . . . . . . . . . . . . . . . . . . . . . . . . . . . . . . . . . . . . . . . . 4,100,000 USD 4,437 4,435Virgin Media Finance PLC, Senior Bond, 6.375%, 4/15/2023 . . . . . . . . . . . . . . . . . . . . . . . . . . . . . . . . . . . . . . . . . . . . . . . . . . . . 1,785,000 USD 1,892 2,075
36,189 37,593
France: 1.28%Alcatel-Lucent USA Inc.
Senior Note, 4.625%, 7/1/2017 . . . . . . . . . . . . . . . . . . . . . . . . . . . . . . . . . . . . . . . . . . . . . . . . . . . . . . . . . . . . . . . . . . . . . . . 1,000,000 USD 1,060 1,106US Term Loan C (TLC), Floating Rate Note, 1/30/2019 . . . . . . . . . . . . . . . . . . . . . . . . . . . . . . . . . . . . . . . . . . . . . . . . . . . . . . . 3,824,390 USD 4,234 4,088
Government of France, 4.45%, 10/26/2018 . . . . . . . . . . . . . . . . . . . . . . . . . . . . . . . . . . . . . . . . . . . . . . . . . . . . . . . . . . . . . . . . . 24,270,000 CAD 25,239 26,606
30,533 31,800
Netherlands: 0.68%Bank Nederlandse Gemeenten NV, Senior Bond, 4.55%, 2/15/2019 . . . . . . . . . . . . . . . . . . . . . . . . . . . . . . . . . . . . . . . . . . . . . . . 13,971,000 CAD 14,123 15,396Tronox Pigments (Netherlands) BV, Term Loan, Floating Rate Note, 3/19/2020 . . . . . . . . . . . . . . . . . . . . . . . . . . . . . . . . . . . . . . . 1,502,274 USD 1,552 1,605
15,675 17,001
South Korea: 0.51%Korea Gas Corp., Senior Note, 4.58%, 5/12/2016 . . . . . . . . . . . . . . . . . . . . . . . . . . . . . . . . . . . . . . . . . . . . . . . . . . . . . . . . . . . . 12,073,000 CAD 12,305 12,612
Australia: 0.37%BHP Billiton Finance Ltd., 3.23%, 5/15/2023 . . . . . . . . . . . . . . . . . . . . . . . . . . . . . . . . . . . . . . . . . . . . . . . . . . . . . . . . . . . . . . . 9,093,000 CAD 9,088 9,102
Mexico: 0.20%Cemex Finance LLC, Senior Secured Note, 6.00%, 4/1/2024 . . . . . . . . . . . . . . . . . . . . . . . . . . . . . . . . . . . . . . . . . . . . . . . . . . . . 2,620,000 USD 2,924 2,918Cemex SAB de CV, Secured Note, 7.25%, 1/15/2021 . . . . . . . . . . . . . . . . . . . . . . . . . . . . . . . . . . . . . . . . . . . . . . . . . . . . . . . . . . 1,800,000 USD 1,856 2,119
4,780 5,037
Luxembourg: 0.19%Exopack Holdings SA, USD Term Loan, Floating Rate Note, 5/8/2019 . . . . . . . . . . . . . . . . . . . . . . . . . . . . . . . . . . . . . . . . . . . . . . 4,350,169 USD 4,765 4,719
Germany: 0.13%Daimler Canada Finance Inc., Senior Note, Floating Rate Note, 11/18/2015 . . . . . . . . . . . . . . . . . . . . . . . . . . . . . . . . . . . . . . . . . . 3,170,000 CAD 3,170 3,177
Total Bonds: . . . . . . . . . . . . . . . . . . . . . . . . . . . . . . . . . . . . . . . . . . . . . . . . . . . . . . . . . . . . . . . . . . . . . . . . . . . . . . . . . . . . . . . 2,409,737 2,469,442
Total Long-Term Investments: . . . . . . . . . . . . . . . . . . . . . . . . . . . . . . . . . . . . . . . . . . . . . . . . . . . . . . . . . . . . . . . . . . . . . . . . . . . 2,409,737 2,469,442
The accompanying notes are an integral part of these financial statements.
188 Franklin Templeton Investments Funds

Franklin Bissett Bond Fund
SCHEDULE OF INVESTMENTS As at June 30, 2014 (Unaudited) (Continued)
Principal Amountin Currency
of IssueAverage
Cost Fair Value
(000s) (000s)
SHORT-TERM SECURITIES: 0.29%Mexico Treasury Bill, 3.065%, 4/1/2015 . . . . . . . . . . . . . . . . . . . . . . . . . . . . . . . . . . . . . . . . . . . . . . . . . . . . . . . . . . . . . . . . . . . 7,728,500 MXN $ 6,217 $ 6,206Royal Bank of Canada, Term Deposit, 0.97%, 7/2/2014 . . . . . . . . . . . . . . . . . . . . . . . . . . . . . . . . . . . . . . . . . . . . . . . . . . . . . . . . 900,000 CAD 900 900
Total Short-Term Securities: . . . . . . . . . . . . . . . . . . . . . . . . . . . . . . . . . . . . . . . . . . . . . . . . . . . . . . . . . . . . . . . . . . . . . . . . . . . . 7,117 7,106
TOTAL INVESTMENTS: 99.82% . . . . . . . . . . . . . . . . . . . . . . . . . . . . . . . . . . . . . . . . . . . . . . . . . . . . . . . . . . . . . . . . . . . . . . . . . . $2,416,854 2,476,548
NET UNREALIZED GAIN ON DERIVATIVES: 0.12% . . . . . . . . . . . . . . . . . . . . . . . . . . . . . . . . . . . . . . . . . . . . . . . . . . . . . . . . . . . . 3,035OTHER ASSETS, less liabilities: 0.06% . . . . . . . . . . . . . . . . . . . . . . . . . . . . . . . . . . . . . . . . . . . . . . . . . . . . . . . . . . . . . . . . . . . . . 1,375
TOTAL NET ASSETS: 100.00% . . . . . . . . . . . . . . . . . . . . . . . . . . . . . . . . . . . . . . . . . . . . . . . . . . . . . . . . . . . . . . . . . . . . . . . . . . $2,480,958
SCHEDULE OF DERIVATIVE INSTRUMENTS (As at June 30, 2014)FORWARD FOREIGN EXCHANGE CONTRACTS
CounterpartyCreditRating Settlement Date
Currencyto be Delivered
Par ValueIn Canadian Dollars
Currencyto be Received
Par ValueIn Canadian Dollars
ContractPrice
UnrealizedGain (Loss)
(000s) (000s) (000s) (000s) (000s)
BANK OF MONTREAL . . . . . . . . . . . . . . . . . . . . . A+ July 22, 2014 40,560 USD $ 43,282 43,937 CAD $ 43,937 1.0833 $ 655
CIBC WORLDMARKETS CORPORATION . . . . . . . AA July 22, 2014 8,000 USD 8,537 8,662 CAD 8,662 1.0827 125
CITIBANK NA . . . . . . . . . . . . . . . . . . . . . . . . . . . . A July 22, 2014 33,395 USD 35,635 36,155 CAD 36,155 1.0826 520
CREDIT SUISSE INTERNATIONAL . . . . . . . . . . . A July 22, 2014 118,210 USD 126,142 128,016 CAD 128,016 1.0830 1,874
Total Number of Contracts . . . . . . . . . . . . . . .4 $3,174
CREDIT SUISSE INTERNATIONAL . . . . . . . . . . . A July 22, 2014 10,999 CAD 10,999 10,177 USD 10,860 0.9253 (139)
Total Number of Contracts . . . . . . . . . . . . . . .1 $ (139)
Net Unrealized Gain . . . . . . . . . . . . . . . . . . . . . $3,035
June 30,2014
December 31,2013
January 1,2013
Bond Ratings*% of
Net Assets% of
Net Assets% of
Net Assets
AAA . . . . . . . . . . . . . . . . . . . . 15.73 16.63 22.24AA . . . . . . . . . . . . . . . . . . . . . . 20.46 19.85 32.24A . . . . . . . . . . . . . . . . . . . . . . . 35.43 38.89 31.47BBB . . . . . . . . . . . . . . . . . . . . 18.65 15.82 11.24BB . . . . . . . . . . . . . . . . . . . . . 5.04 4.49 1.11B . . . . . . . . . . . . . . . . . . . . . . . 4.12 2.62 0.28CCC . . . . . . . . . . . . . . . . . . . . 0.10 0.04 —
* Excluding cash and overnight term deposits.
Source: Standard & Poor’s, and/or composite of Moody’s, Standard & Poor’sand Fitch ratings
The accompanying notes are an integral part of these financial statements.
Franklin Templeton Investments Funds 189
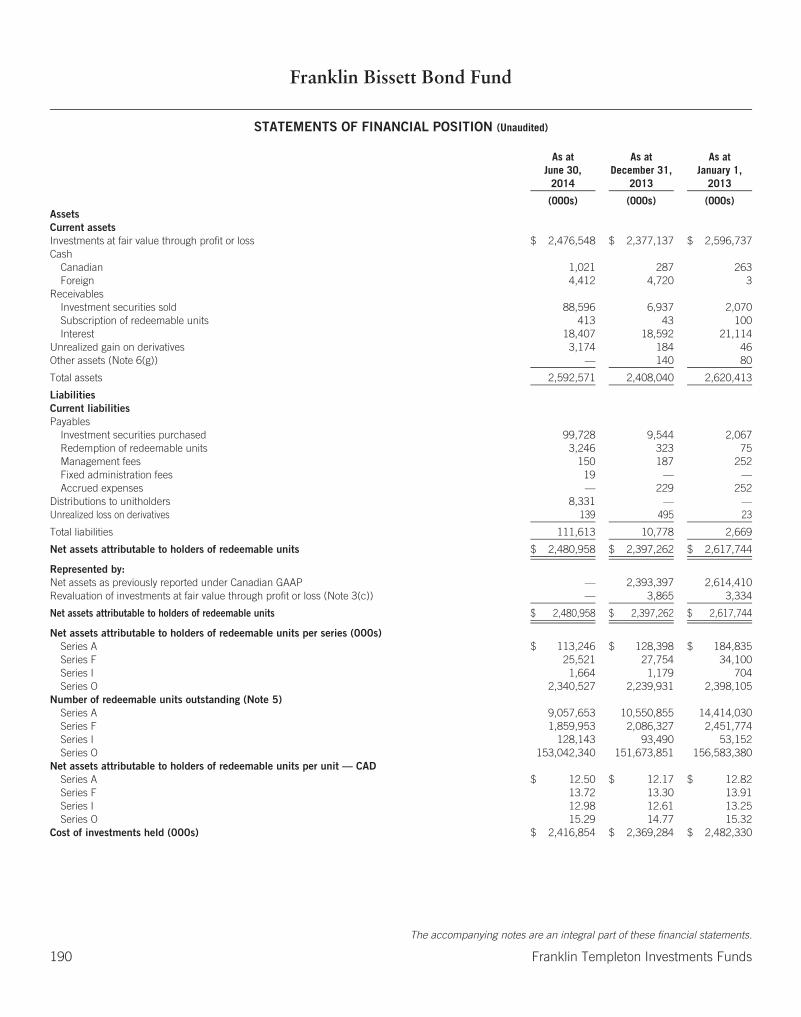
Franklin Bissett Bond Fund
STATEMENTS OF FINANCIAL POSITION (Unaudited)
As atJune 30,
2014
As atDecember 31,
2013
As atJanuary 1,
2013
(000s) (000s) (000s)AssetsCurrent assetsInvestments at fair value through profit or loss $ 2,476,548 $ 2,377,137 $ 2,596,737Cash
Canadian 1,021 287 263Foreign 4,412 4,720 3
ReceivablesInvestment securities sold 88,596 6,937 2,070Subscription of redeemable units 413 43 100Interest 18,407 18,592 21,114
Unrealized gain on derivatives 3,174 184 46Other assets (Note 6(g)) — 140 80
Total assets 2,592,571 2,408,040 2,620,413
LiabilitiesCurrent liabilitiesPayables
Investment securities purchased 99,728 9,544 2,067Redemption of redeemable units 3,246 323 75Management fees 150 187 252Fixed administration fees 19 — —Accrued expenses — 229 252
Distributions to unitholders 8,331 — —Unrealized loss on derivatives 139 495 23
Total liabilities 111,613 10,778 2,669
Net assets attributable to holders of redeemable units $ 2,480,958 $ 2,397,262 $ 2,617,744
Represented by:Net assets as previously reported under Canadian GAAP — 2,393,397 2,614,410Revaluation of investments at fair value through profit or loss (Note 3(c)) — 3,865 3,334
Net assets attributable to holders of redeemable units $ 2,480,958 $ 2,397,262 $ 2,617,744
Net assets attributable to holders of redeemable units per series (000s)Series A $ 113,246 $ 128,398 $ 184,835Series F 25,521 27,754 34,100Series I 1,664 1,179 704Series O 2,340,527 2,239,931 2,398,105
Number of redeemable units outstanding (Note 5)Series A 9,057,653 10,550,855 14,414,030Series F 1,859,953 2,086,327 2,451,774Series I 128,143 93,490 53,152Series O 153,042,340 151,673,851 156,583,380
Net assets attributable to holders of redeemable units per unit — CADSeries A $ 12.50 $ 12.17 $ 12.82Series F 13.72 13.30 13.91Series I 12.98 12.61 13.25Series O 15.29 14.77 15.32
Cost of investments held (000s) $ 2,416,854 $ 2,369,284 $ 2,482,330
The accompanying notes are an integral part of these financial statements.
190 Franklin Templeton Investments Funds
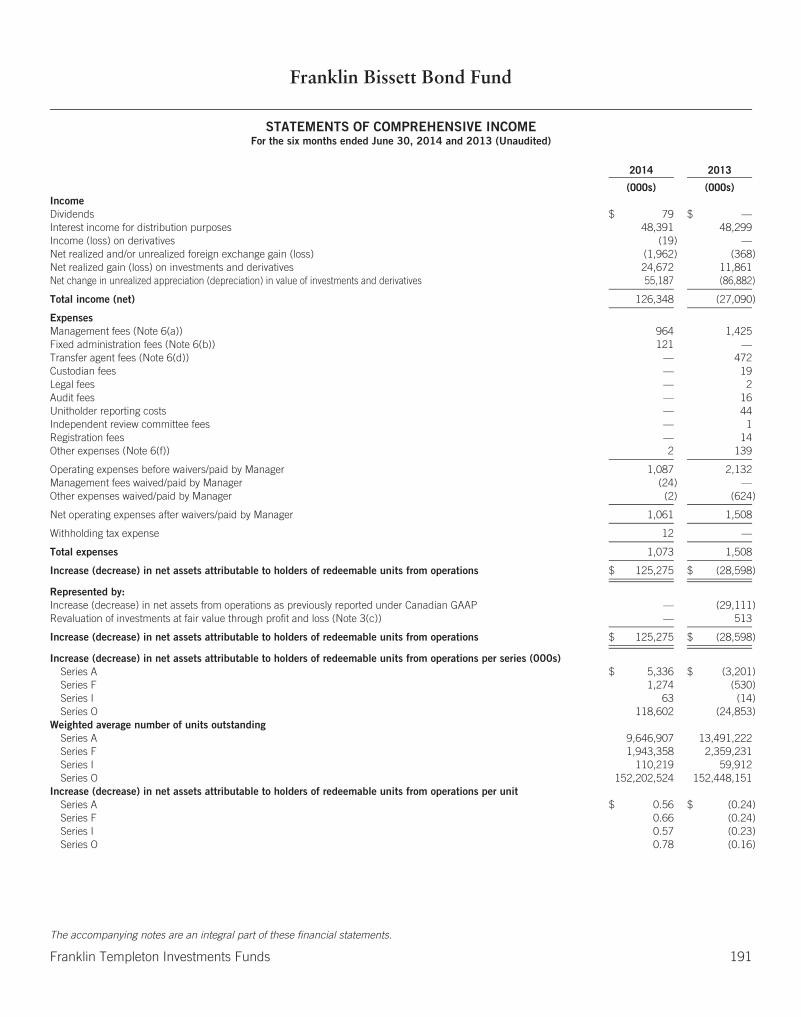
Franklin Bissett Bond Fund
STATEMENTS OF COMPREHENSIVE INCOMEFor the six months ended June 30, 2014 and 2013 (Unaudited)
2014 2013
(000s) (000s)IncomeDividends $ 79 $ —Interest income for distribution purposes 48,391 48,299Income (loss) on derivatives (19) —Net realized and/or unrealized foreign exchange gain (loss) (1,962) (368)Net realized gain (loss) on investments and derivatives 24,672 11,861Net change in unrealized appreciation (depreciation) in value of investments and derivatives 55,187 (86,882)
Total income (net) 126,348 (27,090)
ExpensesManagement fees (Note 6(a)) 964 1,425Fixed administration fees (Note 6(b)) 121 —Transfer agent fees (Note 6(d)) — 472Custodian fees — 19Legal fees — 2Audit fees — 16Unitholder reporting costs — 44Independent review committee fees — 1Registration fees — 14Other expenses (Note 6(f)) 2 139
Operating expenses before waivers/paid by Manager 1,087 2,132Management fees waived/paid by Manager (24) —Other expenses waived/paid by Manager (2) (624)
Net operating expenses after waivers/paid by Manager 1,061 1,508
Withholding tax expense 12 —
Total expenses 1,073 1,508
Increase (decrease) in net assets attributable to holders of redeemable units from operations $ 125,275 $ (28,598)
Represented by:Increase (decrease) in net assets from operations as previously reported under Canadian GAAP — (29,111)Revaluation of investments at fair value through profit and loss (Note 3(c)) — 513
Increase (decrease) in net assets attributable to holders of redeemable units from operations $ 125,275 $ (28,598)
Increase (decrease) in net assets attributable to holders of redeemable units from operations per series (000s)Series A $ 5,336 $ (3,201)Series F 1,274 (530)Series I 63 (14)Series O 118,602 (24,853)
Weighted average number of units outstandingSeries A 9,646,907 13,491,222Series F 1,943,358 2,359,231Series I 110,219 59,912Series O 152,202,524 152,448,151
Increase (decrease) in net assets attributable to holders of redeemable units from operations per unitSeries A $ 0.56 $ (0.24)Series F 0.66 (0.24)Series I 0.57 (0.23)Series O 0.78 (0.16)
The accompanying notes are an integral part of these financial statements.
Franklin Templeton Investments Funds 191

Franklin Bissett Bond Fund
STATEMENTS OF CHANGES IN NET ASSETS ATTRIBUTABLE TO HOLDERS OF REDEEMABLE UNITSFor the six months ended June 30, 2014 and 2013 (Unaudited) (in 000s)
All Series Series A Series F
2014 2013 2014 2013 2014 2013
Net assets attributable to holders of redeemable units at beginning ofperiod $2,397,262 $2,617,744 $ 128,398 $ 184,835 $27,754 $34,100
Increase (decrease) in net assets attributable to holders of redeemableunits from operations 125,275 (28,598) 5,336 (3,201) 1,274 (530)
Distributions to holders of redeemable unitsFrom net investment income (40,830) (40,692) (1,961) (2,726) (434) (524)From net realized gains on investments — — — — — —From return of capital — — — — — —
Total distributions to holders of redeemable units (40,830) (40,692) (1,961) (2,726) (434) (524)
Redeemable units transactionsSubscriptions 173,229 216,950 6,550 12,360 1,333 2,363Reinvestments 32,316 32,545 1,459 2,032 325 395Redemptions (206,294) (354,553) (26,536) (36,337) (4,731) (4,143)
Net increase (decrease) from redeemable units transactions (749) (105,058) (18,527) (21,945) (3,073) (1,385)
Increase (decrease) in net assets attributable to holders of redeemableunits 83,696 (174,348) (15,152) (27,872) (2,233) (2,439)
Net assets attributable to holders of redeemable units at end of period $2,480,958 $2,443,396 $ 113,246 $ 156,963 $25,521 $31,661
Series I Series O
2014 2013 2014 2013
Net assets attributable to holders of redeemable units at beginning ofperiod $ 1,179 $ 704 $2,239,931 $2,398,105
Increase (decrease) in net assets attributable to holders of redeemableunits from operations 63 (14) 118,602 (24,853)
Distributions to holders of redeemable unitsFrom net investment income (24) (13) (38,411) (37,429)From net realized gains on investments — — — —From return of capital — — — —
Total distributions to holders of redeemable units (24) (13) (38,411) (37,429)
Redeemable units transactionsSubscriptions 513 153 164,833 202,074Reinvestments 19 10 30,513 30,108Redemptions (86) (54) (174,941) (314,019)
Net increase (decrease) from redeemable units transactions 446 109 20,405 (81,837)
Increase (decrease) in net assets attributable to holders of redeemableunits 485 82 100,596 (144,119)
Net assets attributable to holders of redeemable units at end of period $ 1,664 $ 786 $2,340,527 $2,253,986
The accompanying notes are an integral part of these financial statements.
192 Franklin Templeton Investments Funds
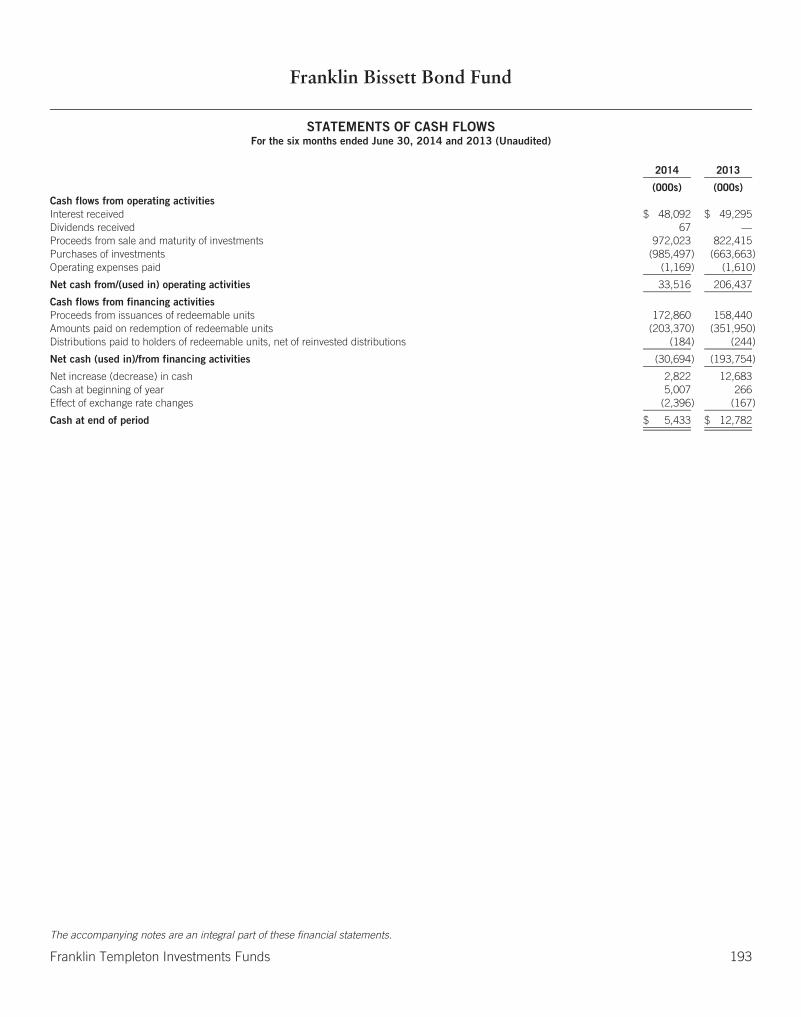
Franklin Bissett Bond Fund
STATEMENTS OF CASH FLOWSFor the six months ended June 30, 2014 and 2013 (Unaudited)
2014 2013
(000s) (000s)Cash flows from operating activitiesInterest received $ 48,092 $ 49,295Dividends received 67 —Proceeds from sale and maturity of investments 972,023 822,415Purchases of investments (985,497) (663,663)Operating expenses paid (1,169) (1,610)
Net cash from/(used in) operating activities 33,516 206,437
Cash flows from financing activitiesProceeds from issuances of redeemable units 172,860 158,440Amounts paid on redemption of redeemable units (203,370) (351,950)Distributions paid to holders of redeemable units, net of reinvested distributions (184) (244)
Net cash (used in)/from financing activities (30,694) (193,754)
Net increase (decrease) in cash 2,822 12,683Cash at beginning of year 5,007 266Effect of exchange rate changes (2,396) (167)
Cash at end of period $ 5,433 $ 12,782
The accompanying notes are an integral part of these financial statements.
Franklin Templeton Investments Funds 193
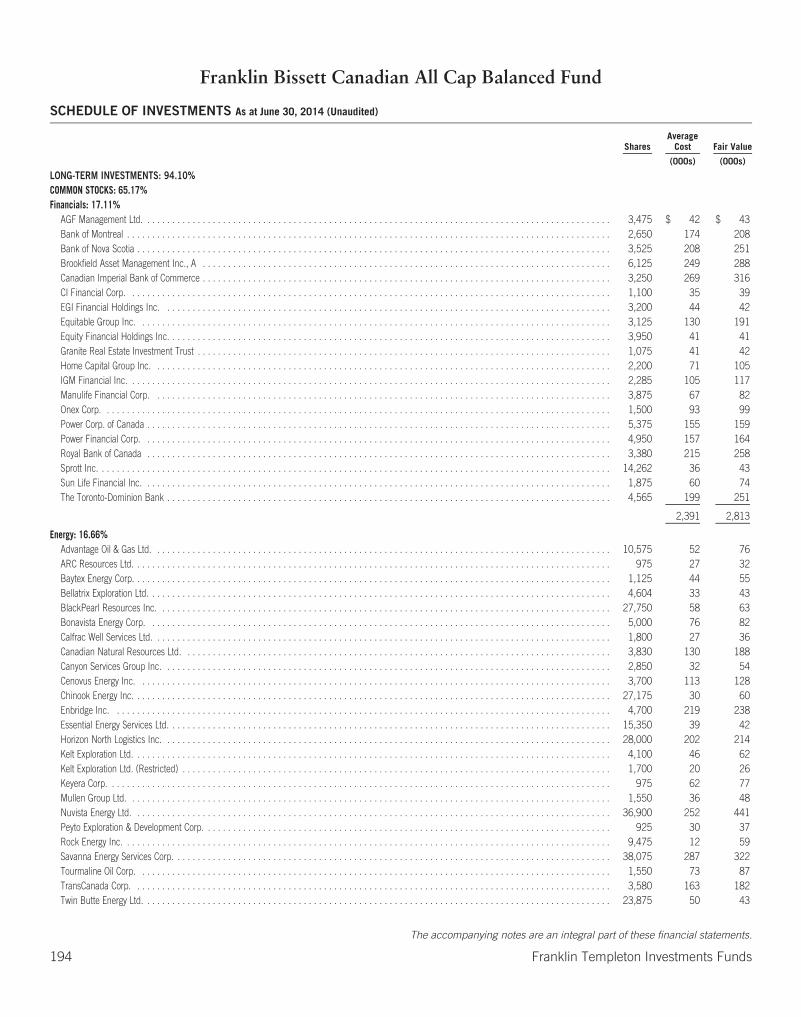
Franklin Bissett Canadian All Cap Balanced Fund
SCHEDULE OF INVESTMENTS As at June 30, 2014 (Unaudited)
SharesAverage
Cost Fair Value
(000s) (000s)
LONG-TERM INVESTMENTS: 94.10%COMMON STOCKS: 65.17%Financials: 17.11%
AGF Management Ltd. . . . . . . . . . . . . . . . . . . . . . . . . . . . . . . . . . . . . . . . . . . . . . . . . . . . . . . . . . . . . . . . . . . . . . . . . . . . . . . . . . . . . . . . . . . . . 3,475 $ 42 $ 43Bank of Montreal . . . . . . . . . . . . . . . . . . . . . . . . . . . . . . . . . . . . . . . . . . . . . . . . . . . . . . . . . . . . . . . . . . . . . . . . . . . . . . . . . . . . . . . . . . . . . . . . 2,650 174 208Bank of Nova Scotia . . . . . . . . . . . . . . . . . . . . . . . . . . . . . . . . . . . . . . . . . . . . . . . . . . . . . . . . . . . . . . . . . . . . . . . . . . . . . . . . . . . . . . . . . . . . . . 3,525 208 251Brookfield Asset Management Inc., A . . . . . . . . . . . . . . . . . . . . . . . . . . . . . . . . . . . . . . . . . . . . . . . . . . . . . . . . . . . . . . . . . . . . . . . . . . . . . . . . . 6,125 249 288Canadian Imperial Bank of Commerce . . . . . . . . . . . . . . . . . . . . . . . . . . . . . . . . . . . . . . . . . . . . . . . . . . . . . . . . . . . . . . . . . . . . . . . . . . . . . . . . . 3,250 269 316CI Financial Corp. . . . . . . . . . . . . . . . . . . . . . . . . . . . . . . . . . . . . . . . . . . . . . . . . . . . . . . . . . . . . . . . . . . . . . . . . . . . . . . . . . . . . . . . . . . . . . . . 1,100 35 39EGI Financial Holdings Inc. . . . . . . . . . . . . . . . . . . . . . . . . . . . . . . . . . . . . . . . . . . . . . . . . . . . . . . . . . . . . . . . . . . . . . . . . . . . . . . . . . . . . . . . . 3,200 44 42Equitable Group Inc. . . . . . . . . . . . . . . . . . . . . . . . . . . . . . . . . . . . . . . . . . . . . . . . . . . . . . . . . . . . . . . . . . . . . . . . . . . . . . . . . . . . . . . . . . . . . . 3,125 130 191Equity Financial Holdings Inc. . . . . . . . . . . . . . . . . . . . . . . . . . . . . . . . . . . . . . . . . . . . . . . . . . . . . . . . . . . . . . . . . . . . . . . . . . . . . . . . . . . . . . . . 3,950 41 41Granite Real Estate Investment Trust . . . . . . . . . . . . . . . . . . . . . . . . . . . . . . . . . . . . . . . . . . . . . . . . . . . . . . . . . . . . . . . . . . . . . . . . . . . . . . . . . . 1,075 41 42Home Capital Group Inc. . . . . . . . . . . . . . . . . . . . . . . . . . . . . . . . . . . . . . . . . . . . . . . . . . . . . . . . . . . . . . . . . . . . . . . . . . . . . . . . . . . . . . . . . . . 2,200 71 105IGM Financial Inc. . . . . . . . . . . . . . . . . . . . . . . . . . . . . . . . . . . . . . . . . . . . . . . . . . . . . . . . . . . . . . . . . . . . . . . . . . . . . . . . . . . . . . . . . . . . . . . . 2,285 105 117Manulife Financial Corp. . . . . . . . . . . . . . . . . . . . . . . . . . . . . . . . . . . . . . . . . . . . . . . . . . . . . . . . . . . . . . . . . . . . . . . . . . . . . . . . . . . . . . . . . . . 3,875 67 82Onex Corp. . . . . . . . . . . . . . . . . . . . . . . . . . . . . . . . . . . . . . . . . . . . . . . . . . . . . . . . . . . . . . . . . . . . . . . . . . . . . . . . . . . . . . . . . . . . . . . . . . . . . 1,500 93 99Power Corp. of Canada . . . . . . . . . . . . . . . . . . . . . . . . . . . . . . . . . . . . . . . . . . . . . . . . . . . . . . . . . . . . . . . . . . . . . . . . . . . . . . . . . . . . . . . . . . . . 5,375 155 159Power Financial Corp. . . . . . . . . . . . . . . . . . . . . . . . . . . . . . . . . . . . . . . . . . . . . . . . . . . . . . . . . . . . . . . . . . . . . . . . . . . . . . . . . . . . . . . . . . . . . 4,950 157 164Royal Bank of Canada . . . . . . . . . . . . . . . . . . . . . . . . . . . . . . . . . . . . . . . . . . . . . . . . . . . . . . . . . . . . . . . . . . . . . . . . . . . . . . . . . . . . . . . . . . . . 3,380 215 258Sprott Inc. . . . . . . . . . . . . . . . . . . . . . . . . . . . . . . . . . . . . . . . . . . . . . . . . . . . . . . . . . . . . . . . . . . . . . . . . . . . . . . . . . . . . . . . . . . . . . . . . . . . . . 14,262 36 43Sun Life Financial Inc. . . . . . . . . . . . . . . . . . . . . . . . . . . . . . . . . . . . . . . . . . . . . . . . . . . . . . . . . . . . . . . . . . . . . . . . . . . . . . . . . . . . . . . . . . . . . 1,875 60 74The Toronto-Dominion Bank . . . . . . . . . . . . . . . . . . . . . . . . . . . . . . . . . . . . . . . . . . . . . . . . . . . . . . . . . . . . . . . . . . . . . . . . . . . . . . . . . . . . . . . . 4,565 199 251
2,391 2,813
Energy: 16.66%Advantage Oil & Gas Ltd. . . . . . . . . . . . . . . . . . . . . . . . . . . . . . . . . . . . . . . . . . . . . . . . . . . . . . . . . . . . . . . . . . . . . . . . . . . . . . . . . . . . . . . . . . . 10,575 52 76ARC Resources Ltd. . . . . . . . . . . . . . . . . . . . . . . . . . . . . . . . . . . . . . . . . . . . . . . . . . . . . . . . . . . . . . . . . . . . . . . . . . . . . . . . . . . . . . . . . . . . . . . 975 27 32Baytex Energy Corp. . . . . . . . . . . . . . . . . . . . . . . . . . . . . . . . . . . . . . . . . . . . . . . . . . . . . . . . . . . . . . . . . . . . . . . . . . . . . . . . . . . . . . . . . . . . . . . 1,125 44 55Bellatrix Exploration Ltd. . . . . . . . . . . . . . . . . . . . . . . . . . . . . . . . . . . . . . . . . . . . . . . . . . . . . . . . . . . . . . . . . . . . . . . . . . . . . . . . . . . . . . . . . . . . 4,604 33 43BlackPearl Resources Inc. . . . . . . . . . . . . . . . . . . . . . . . . . . . . . . . . . . . . . . . . . . . . . . . . . . . . . . . . . . . . . . . . . . . . . . . . . . . . . . . . . . . . . . . . . 27,750 58 63Bonavista Energy Corp. . . . . . . . . . . . . . . . . . . . . . . . . . . . . . . . . . . . . . . . . . . . . . . . . . . . . . . . . . . . . . . . . . . . . . . . . . . . . . . . . . . . . . . . . . . . 5,000 76 82Calfrac Well Services Ltd. . . . . . . . . . . . . . . . . . . . . . . . . . . . . . . . . . . . . . . . . . . . . . . . . . . . . . . . . . . . . . . . . . . . . . . . . . . . . . . . . . . . . . . . . . . 1,800 27 36Canadian Natural Resources Ltd. . . . . . . . . . . . . . . . . . . . . . . . . . . . . . . . . . . . . . . . . . . . . . . . . . . . . . . . . . . . . . . . . . . . . . . . . . . . . . . . . . . . . 3,830 130 188Canyon Services Group Inc. . . . . . . . . . . . . . . . . . . . . . . . . . . . . . . . . . . . . . . . . . . . . . . . . . . . . . . . . . . . . . . . . . . . . . . . . . . . . . . . . . . . . . . . . 2,850 32 54Cenovus Energy Inc. . . . . . . . . . . . . . . . . . . . . . . . . . . . . . . . . . . . . . . . . . . . . . . . . . . . . . . . . . . . . . . . . . . . . . . . . . . . . . . . . . . . . . . . . . . . . . 3,700 113 128Chinook Energy Inc. . . . . . . . . . . . . . . . . . . . . . . . . . . . . . . . . . . . . . . . . . . . . . . . . . . . . . . . . . . . . . . . . . . . . . . . . . . . . . . . . . . . . . . . . . . . . . . 27,175 30 60Enbridge Inc. . . . . . . . . . . . . . . . . . . . . . . . . . . . . . . . . . . . . . . . . . . . . . . . . . . . . . . . . . . . . . . . . . . . . . . . . . . . . . . . . . . . . . . . . . . . . . . . . . . 4,700 219 238Essential Energy Services Ltd. . . . . . . . . . . . . . . . . . . . . . . . . . . . . . . . . . . . . . . . . . . . . . . . . . . . . . . . . . . . . . . . . . . . . . . . . . . . . . . . . . . . . . . . 15,350 39 42Horizon North Logistics Inc. . . . . . . . . . . . . . . . . . . . . . . . . . . . . . . . . . . . . . . . . . . . . . . . . . . . . . . . . . . . . . . . . . . . . . . . . . . . . . . . . . . . . . . . . 28,000 202 214Kelt Exploration Ltd. . . . . . . . . . . . . . . . . . . . . . . . . . . . . . . . . . . . . . . . . . . . . . . . . . . . . . . . . . . . . . . . . . . . . . . . . . . . . . . . . . . . . . . . . . . . . . . 4,100 46 62Kelt Exploration Ltd. (Restricted) . . . . . . . . . . . . . . . . . . . . . . . . . . . . . . . . . . . . . . . . . . . . . . . . . . . . . . . . . . . . . . . . . . . . . . . . . . . . . . . . . . . . . 1,700 20 26Keyera Corp. . . . . . . . . . . . . . . . . . . . . . . . . . . . . . . . . . . . . . . . . . . . . . . . . . . . . . . . . . . . . . . . . . . . . . . . . . . . . . . . . . . . . . . . . . . . . . . . . . . . 975 62 77Mullen Group Ltd. . . . . . . . . . . . . . . . . . . . . . . . . . . . . . . . . . . . . . . . . . . . . . . . . . . . . . . . . . . . . . . . . . . . . . . . . . . . . . . . . . . . . . . . . . . . . . . . 1,550 36 48Nuvista Energy Ltd. . . . . . . . . . . . . . . . . . . . . . . . . . . . . . . . . . . . . . . . . . . . . . . . . . . . . . . . . . . . . . . . . . . . . . . . . . . . . . . . . . . . . . . . . . . . . . . 36,900 252 441Peyto Exploration & Development Corp. . . . . . . . . . . . . . . . . . . . . . . . . . . . . . . . . . . . . . . . . . . . . . . . . . . . . . . . . . . . . . . . . . . . . . . . . . . . . . . . . 925 30 37Rock Energy Inc. . . . . . . . . . . . . . . . . . . . . . . . . . . . . . . . . . . . . . . . . . . . . . . . . . . . . . . . . . . . . . . . . . . . . . . . . . . . . . . . . . . . . . . . . . . . . . . . . 9,475 12 59Savanna Energy Services Corp. . . . . . . . . . . . . . . . . . . . . . . . . . . . . . . . . . . . . . . . . . . . . . . . . . . . . . . . . . . . . . . . . . . . . . . . . . . . . . . . . . . . . . . 38,075 287 322Tourmaline Oil Corp. . . . . . . . . . . . . . . . . . . . . . . . . . . . . . . . . . . . . . . . . . . . . . . . . . . . . . . . . . . . . . . . . . . . . . . . . . . . . . . . . . . . . . . . . . . . . . 1,550 73 87TransCanada Corp. . . . . . . . . . . . . . . . . . . . . . . . . . . . . . . . . . . . . . . . . . . . . . . . . . . . . . . . . . . . . . . . . . . . . . . . . . . . . . . . . . . . . . . . . . . . . . . 3,580 163 182Twin Butte Energy Ltd. . . . . . . . . . . . . . . . . . . . . . . . . . . . . . . . . . . . . . . . . . . . . . . . . . . . . . . . . . . . . . . . . . . . . . . . . . . . . . . . . . . . . . . . . . . . . 23,875 50 43
The accompanying notes are an integral part of these financial statements.
194 Franklin Templeton Investments Funds

Franklin Bissett Canadian All Cap Balanced Fund
SCHEDULE OF INVESTMENTS As at June 30, 2014 (Unaudited) (Continued)
SharesAverage
Cost Fair Value
(000s) (000s)
Energy: 16.66% (Continued)Xtreme Drilling and Coil Services Corp. . . . . . . . . . . . . . . . . . . . . . . . . . . . . . . . . . . . . . . . . . . . . . . . . . . . . . . . . . . . . . . . . . . . . . . . . . . . . . . . . 8,400 $ 22 $ 44
2,135 2,739
Industrials: 12.11%ADF Group Inc. . . . . . . . . . . . . . . . . . . . . . . . . . . . . . . . . . . . . . . . . . . . . . . . . . . . . . . . . . . . . . . . . . . . . . . . . . . . . . . . . . . . . . . . . . . . . . . . . . 15,250 28 42Calian Technologies Ltd. . . . . . . . . . . . . . . . . . . . . . . . . . . . . . . . . . . . . . . . . . . . . . . . . . . . . . . . . . . . . . . . . . . . . . . . . . . . . . . . . . . . . . . . . . . 2,250 45 44Canadian National Railway Co. . . . . . . . . . . . . . . . . . . . . . . . . . . . . . . . . . . . . . . . . . . . . . . . . . . . . . . . . . . . . . . . . . . . . . . . . . . . . . . . . . . . . . . 4,435 225 308Canadian Pacific Railway Ltd. . . . . . . . . . . . . . . . . . . . . . . . . . . . . . . . . . . . . . . . . . . . . . . . . . . . . . . . . . . . . . . . . . . . . . . . . . . . . . . . . . . . . . . . 855 114 165Canam Group Inc., A . . . . . . . . . . . . . . . . . . . . . . . . . . . . . . . . . . . . . . . . . . . . . . . . . . . . . . . . . . . . . . . . . . . . . . . . . . . . . . . . . . . . . . . . . . . . . 15,650 166 210Cervus Equipment Corp. . . . . . . . . . . . . . . . . . . . . . . . . . . . . . . . . . . . . . . . . . . . . . . . . . . . . . . . . . . . . . . . . . . . . . . . . . . . . . . . . . . . . . . . . . . . 2,025 41 43Clarke Inc. . . . . . . . . . . . . . . . . . . . . . . . . . . . . . . . . . . . . . . . . . . . . . . . . . . . . . . . . . . . . . . . . . . . . . . . . . . . . . . . . . . . . . . . . . . . . . . . . . . . . 6,550 42 70Contrans Group Inc., A . . . . . . . . . . . . . . . . . . . . . . . . . . . . . . . . . . . . . . . . . . . . . . . . . . . . . . . . . . . . . . . . . . . . . . . . . . . . . . . . . . . . . . . . . . . . 2,875 35 41Exco Technologies Ltd. . . . . . . . . . . . . . . . . . . . . . . . . . . . . . . . . . . . . . . . . . . . . . . . . . . . . . . . . . . . . . . . . . . . . . . . . . . . . . . . . . . . . . . . . . . . . 4,125 26 45HNZ Group Inc. . . . . . . . . . . . . . . . . . . . . . . . . . . . . . . . . . . . . . . . . . . . . . . . . . . . . . . . . . . . . . . . . . . . . . . . . . . . . . . . . . . . . . . . . . . . . . . . . . 1,800 39 41MacDonald Dettwiler and Associates Ltd. . . . . . . . . . . . . . . . . . . . . . . . . . . . . . . . . . . . . . . . . . . . . . . . . . . . . . . . . . . . . . . . . . . . . . . . . . . . . . . . 2,120 138 185Richelieu Hardware Ltd. . . . . . . . . . . . . . . . . . . . . . . . . . . . . . . . . . . . . . . . . . . . . . . . . . . . . . . . . . . . . . . . . . . . . . . . . . . . . . . . . . . . . . . . . . . . 3,950 168 192Russel Metals Inc. . . . . . . . . . . . . . . . . . . . . . . . . . . . . . . . . . . . . . . . . . . . . . . . . . . . . . . . . . . . . . . . . . . . . . . . . . . . . . . . . . . . . . . . . . . . . . . . 2,100 58 72SNC-Lavalin Group Inc., A, A . . . . . . . . . . . . . . . . . . . . . . . . . . . . . . . . . . . . . . . . . . . . . . . . . . . . . . . . . . . . . . . . . . . . . . . . . . . . . . . . . . . . . . . 2,985 133 168Toromont Industries Ltd. . . . . . . . . . . . . . . . . . . . . . . . . . . . . . . . . . . . . . . . . . . . . . . . . . . . . . . . . . . . . . . . . . . . . . . . . . . . . . . . . . . . . . . . . . . 1,825 46 48Transcontinental Inc., A . . . . . . . . . . . . . . . . . . . . . . . . . . . . . . . . . . . . . . . . . . . . . . . . . . . . . . . . . . . . . . . . . . . . . . . . . . . . . . . . . . . . . . . . . . . 14,175 194 212ZCL Composites Inc. . . . . . . . . . . . . . . . . . . . . . . . . . . . . . . . . . . . . . . . . . . . . . . . . . . . . . . . . . . . . . . . . . . . . . . . . . . . . . . . . . . . . . . . . . . . . . 15,525 87 105
1,585 1,991
Consumer Discretionary: 8.17%Automodular Corp. . . . . . . . . . . . . . . . . . . . . . . . . . . . . . . . . . . . . . . . . . . . . . . . . . . . . . . . . . . . . . . . . . . . . . . . . . . . . . . . . . . . . . . . . . . . . . . 17,175 28 38Danier Leather Inc. . . . . . . . . . . . . . . . . . . . . . . . . . . . . . . . . . . . . . . . . . . . . . . . . . . . . . . . . . . . . . . . . . . . . . . . . . . . . . . . . . . . . . . . . . . . . . . 3,800 43 35Dollarama Inc. . . . . . . . . . . . . . . . . . . . . . . . . . . . . . . . . . . . . . . . . . . . . . . . . . . . . . . . . . . . . . . . . . . . . . . . . . . . . . . . . . . . . . . . . . . . . . . . . . . 825 64 73easyhome Ltd. . . . . . . . . . . . . . . . . . . . . . . . . . . . . . . . . . . . . . . . . . . . . . . . . . . . . . . . . . . . . . . . . . . . . . . . . . . . . . . . . . . . . . . . . . . . . . . . . . . 2,050 22 41Gildan Activewear Inc. . . . . . . . . . . . . . . . . . . . . . . . . . . . . . . . . . . . . . . . . . . . . . . . . . . . . . . . . . . . . . . . . . . . . . . . . . . . . . . . . . . . . . . . . . . . . 1,050 50 66Glacier Media Inc. . . . . . . . . . . . . . . . . . . . . . . . . . . . . . . . . . . . . . . . . . . . . . . . . . . . . . . . . . . . . . . . . . . . . . . . . . . . . . . . . . . . . . . . . . . . . . . . 33,275 48 46Indigo Books & Music Inc. . . . . . . . . . . . . . . . . . . . . . . . . . . . . . . . . . . . . . . . . . . . . . . . . . . . . . . . . . . . . . . . . . . . . . . . . . . . . . . . . . . . . . . . . . 20,375 197 215Leon’s Furniture Ltd. . . . . . . . . . . . . . . . . . . . . . . . . . . . . . . . . . . . . . . . . . . . . . . . . . . . . . . . . . . . . . . . . . . . . . . . . . . . . . . . . . . . . . . . . . . . . . 14,375 197 208Reitmans (Canada) Ltd., A . . . . . . . . . . . . . . . . . . . . . . . . . . . . . . . . . . . . . . . . . . . . . . . . . . . . . . . . . . . . . . . . . . . . . . . . . . . . . . . . . . . . . . . . . 14,250 99 86RONA Inc. . . . . . . . . . . . . . . . . . . . . . . . . . . . . . . . . . . . . . . . . . . . . . . . . . . . . . . . . . . . . . . . . . . . . . . . . . . . . . . . . . . . . . . . . . . . . . . . . . . . . 18,500 199 212Sears Canada Inc. . . . . . . . . . . . . . . . . . . . . . . . . . . . . . . . . . . . . . . . . . . . . . . . . . . . . . . . . . . . . . . . . . . . . . . . . . . . . . . . . . . . . . . . . . . . . . . . 2,975 33 44Thomson Reuters Corp. . . . . . . . . . . . . . . . . . . . . . . . . . . . . . . . . . . . . . . . . . . . . . . . . . . . . . . . . . . . . . . . . . . . . . . . . . . . . . . . . . . . . . . . . . . . 6,125 222 238Transat A.T. Inc., B . . . . . . . . . . . . . . . . . . . . . . . . . . . . . . . . . . . . . . . . . . . . . . . . . . . . . . . . . . . . . . . . . . . . . . . . . . . . . . . . . . . . . . . . . . . . . . 4,425 32 42
1,234 1,344
Materials: 5.03%Agrium Inc. . . . . . . . . . . . . . . . . . . . . . . . . . . . . . . . . . . . . . . . . . . . . . . . . . . . . . . . . . . . . . . . . . . . . . . . . . . . . . . . . . . . . . . . . . . . . . . . . . . . . 920 84 90Brampton Brick Ltd., A . . . . . . . . . . . . . . . . . . . . . . . . . . . . . . . . . . . . . . . . . . . . . . . . . . . . . . . . . . . . . . . . . . . . . . . . . . . . . . . . . . . . . . . . . . . 6,475 34 38Capstone Mining Corp. . . . . . . . . . . . . . . . . . . . . . . . . . . . . . . . . . . . . . . . . . . . . . . . . . . . . . . . . . . . . . . . . . . . . . . . . . . . . . . . . . . . . . . . . . . . . 16,550 39 42Energold Drilling Corp. . . . . . . . . . . . . . . . . . . . . . . . . . . . . . . . . . . . . . . . . . . . . . . . . . . . . . . . . . . . . . . . . . . . . . . . . . . . . . . . . . . . . . . . . . . . . 24,550 40 45Fortress Paper Ltd. . . . . . . . . . . . . . . . . . . . . . . . . . . . . . . . . . . . . . . . . . . . . . . . . . . . . . . . . . . . . . . . . . . . . . . . . . . . . . . . . . . . . . . . . . . . . . . 6,425 28 20Franco-Nevada Corp. . . . . . . . . . . . . . . . . . . . . . . . . . . . . . . . . . . . . . . . . . . . . . . . . . . . . . . . . . . . . . . . . . . . . . . . . . . . . . . . . . . . . . . . . . . . . . 1,375 58 84Major Drilling Group International Inc. . . . . . . . . . . . . . . . . . . . . . . . . . . . . . . . . . . . . . . . . . . . . . . . . . . . . . . . . . . . . . . . . . . . . . . . . . . . . . . . . . 19,750 146 153Orbit Garant Drilling Inc. . . . . . . . . . . . . . . . . . . . . . . . . . . . . . . . . . . . . . . . . . . . . . . . . . . . . . . . . . . . . . . . . . . . . . . . . . . . . . . . . . . . . . . . . . . . 41,400 56 60Potash Corp. of Saskatchewan Inc. . . . . . . . . . . . . . . . . . . . . . . . . . . . . . . . . . . . . . . . . . . . . . . . . . . . . . . . . . . . . . . . . . . . . . . . . . . . . . . . . . . . 3,100 124 126Silver Wheaton Corp. . . . . . . . . . . . . . . . . . . . . . . . . . . . . . . . . . . . . . . . . . . . . . . . . . . . . . . . . . . . . . . . . . . . . . . . . . . . . . . . . . . . . . . . . . . . . . 2,300 58 65
The accompanying notes are an integral part of these financial statements.
Franklin Templeton Investments Funds 195
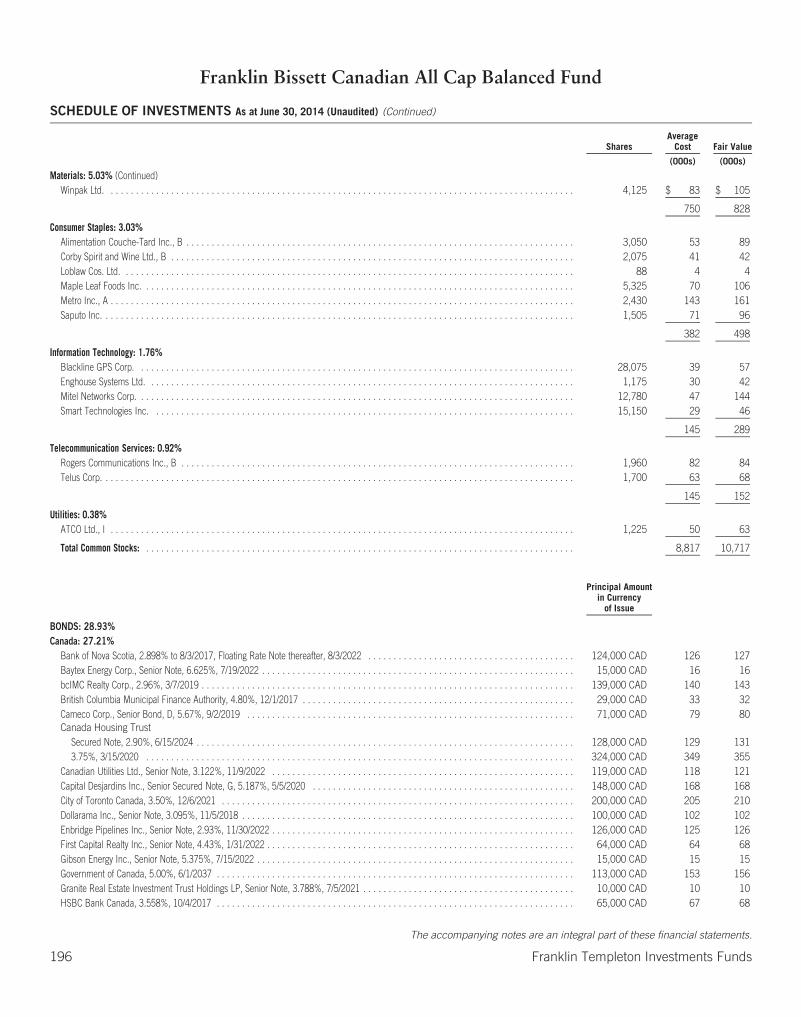
Franklin Bissett Canadian All Cap Balanced Fund
SCHEDULE OF INVESTMENTS As at June 30, 2014 (Unaudited) (Continued)
SharesAverage
Cost Fair Value
(000s) (000s)
Materials: 5.03% (Continued)Winpak Ltd. . . . . . . . . . . . . . . . . . . . . . . . . . . . . . . . . . . . . . . . . . . . . . . . . . . . . . . . . . . . . . . . . . . . . . . . . . . . . . . . . . . . . . . . . . . . . 4,125 $ 83 $ 105
750 828
Consumer Staples: 3.03%Alimentation Couche-Tard Inc., B . . . . . . . . . . . . . . . . . . . . . . . . . . . . . . . . . . . . . . . . . . . . . . . . . . . . . . . . . . . . . . . . . . . . . . . . . . . . . 3,050 53 89Corby Spirit and Wine Ltd., B . . . . . . . . . . . . . . . . . . . . . . . . . . . . . . . . . . . . . . . . . . . . . . . . . . . . . . . . . . . . . . . . . . . . . . . . . . . . . . . . 2,075 41 42Loblaw Cos. Ltd. . . . . . . . . . . . . . . . . . . . . . . . . . . . . . . . . . . . . . . . . . . . . . . . . . . . . . . . . . . . . . . . . . . . . . . . . . . . . . . . . . . . . . . . . . 88 4 4Maple Leaf Foods Inc. . . . . . . . . . . . . . . . . . . . . . . . . . . . . . . . . . . . . . . . . . . . . . . . . . . . . . . . . . . . . . . . . . . . . . . . . . . . . . . . . . . . . . 5,325 70 106Metro Inc., A . . . . . . . . . . . . . . . . . . . . . . . . . . . . . . . . . . . . . . . . . . . . . . . . . . . . . . . . . . . . . . . . . . . . . . . . . . . . . . . . . . . . . . . . . . . . 2,430 143 161Saputo Inc. . . . . . . . . . . . . . . . . . . . . . . . . . . . . . . . . . . . . . . . . . . . . . . . . . . . . . . . . . . . . . . . . . . . . . . . . . . . . . . . . . . . . . . . . . . . . . 1,505 71 96
382 498
Information Technology: 1.76%Blackline GPS Corp. . . . . . . . . . . . . . . . . . . . . . . . . . . . . . . . . . . . . . . . . . . . . . . . . . . . . . . . . . . . . . . . . . . . . . . . . . . . . . . . . . . . . . . 28,075 39 57Enghouse Systems Ltd. . . . . . . . . . . . . . . . . . . . . . . . . . . . . . . . . . . . . . . . . . . . . . . . . . . . . . . . . . . . . . . . . . . . . . . . . . . . . . . . . . . . . 1,175 30 42Mitel Networks Corp. . . . . . . . . . . . . . . . . . . . . . . . . . . . . . . . . . . . . . . . . . . . . . . . . . . . . . . . . . . . . . . . . . . . . . . . . . . . . . . . . . . . . . . 12,780 47 144Smart Technologies Inc. . . . . . . . . . . . . . . . . . . . . . . . . . . . . . . . . . . . . . . . . . . . . . . . . . . . . . . . . . . . . . . . . . . . . . . . . . . . . . . . . . . . 15,150 29 46
145 289
Telecommunication Services: 0.92%Rogers Communications Inc., B . . . . . . . . . . . . . . . . . . . . . . . . . . . . . . . . . . . . . . . . . . . . . . . . . . . . . . . . . . . . . . . . . . . . . . . . . . . . . . 1,960 82 84Telus Corp. . . . . . . . . . . . . . . . . . . . . . . . . . . . . . . . . . . . . . . . . . . . . . . . . . . . . . . . . . . . . . . . . . . . . . . . . . . . . . . . . . . . . . . . . . . . . . 1,700 63 68
145 152
Utilities: 0.38%ATCO Ltd., I . . . . . . . . . . . . . . . . . . . . . . . . . . . . . . . . . . . . . . . . . . . . . . . . . . . . . . . . . . . . . . . . . . . . . . . . . . . . . . . . . . . . . . . . . . . . 1,225 50 63
Total Common Stocks: . . . . . . . . . . . . . . . . . . . . . . . . . . . . . . . . . . . . . . . . . . . . . . . . . . . . . . . . . . . . . . . . . . . . . . . . . . . . . . . . . . . . . 8,817 10,717
Principal Amountin Currency
of Issue
BONDS: 28.93%Canada: 27.21%
Bank of Nova Scotia, 2.898% to 8/3/2017, Floating Rate Note thereafter, 8/3/2022 . . . . . . . . . . . . . . . . . . . . . . . . . . . . . . . . . . . . . . . . . 124,000 CAD 126 127Baytex Energy Corp., Senior Note, 6.625%, 7/19/2022 . . . . . . . . . . . . . . . . . . . . . . . . . . . . . . . . . . . . . . . . . . . . . . . . . . . . . . . . . . . . . . 15,000 CAD 16 16bcIMC Realty Corp., 2.96%, 3/7/2019 . . . . . . . . . . . . . . . . . . . . . . . . . . . . . . . . . . . . . . . . . . . . . . . . . . . . . . . . . . . . . . . . . . . . . . . . . . 139,000 CAD 140 143British Columbia Municipal Finance Authority, 4.80%, 12/1/2017 . . . . . . . . . . . . . . . . . . . . . . . . . . . . . . . . . . . . . . . . . . . . . . . . . . . . . . 29,000 CAD 33 32Cameco Corp., Senior Bond, D, 5.67%, 9/2/2019 . . . . . . . . . . . . . . . . . . . . . . . . . . . . . . . . . . . . . . . . . . . . . . . . . . . . . . . . . . . . . . . . . 71,000 CAD 79 80Canada Housing Trust
Secured Note, 2.90%, 6/15/2024 . . . . . . . . . . . . . . . . . . . . . . . . . . . . . . . . . . . . . . . . . . . . . . . . . . . . . . . . . . . . . . . . . . . . . . . . . . . 128,000 CAD 129 1313.75%, 3/15/2020 . . . . . . . . . . . . . . . . . . . . . . . . . . . . . . . . . . . . . . . . . . . . . . . . . . . . . . . . . . . . . . . . . . . . . . . . . . . . . . . . . . . . . 324,000 CAD 349 355
Canadian Utilities Ltd., Senior Note, 3.122%, 11/9/2022 . . . . . . . . . . . . . . . . . . . . . . . . . . . . . . . . . . . . . . . . . . . . . . . . . . . . . . . . . . . . 119,000 CAD 118 121Capital Desjardins Inc., Senior Secured Note, G, 5.187%, 5/5/2020 . . . . . . . . . . . . . . . . . . . . . . . . . . . . . . . . . . . . . . . . . . . . . . . . . . . . 148,000 CAD 168 168City of Toronto Canada, 3.50%, 12/6/2021 . . . . . . . . . . . . . . . . . . . . . . . . . . . . . . . . . . . . . . . . . . . . . . . . . . . . . . . . . . . . . . . . . . . . . . 200,000 CAD 205 210Dollarama Inc., Senior Note, 3.095%, 11/5/2018 . . . . . . . . . . . . . . . . . . . . . . . . . . . . . . . . . . . . . . . . . . . . . . . . . . . . . . . . . . . . . . . . . . 100,000 CAD 102 102Enbridge Pipelines Inc., Senior Note, 2.93%, 11/30/2022 . . . . . . . . . . . . . . . . . . . . . . . . . . . . . . . . . . . . . . . . . . . . . . . . . . . . . . . . . . . . 126,000 CAD 125 126First Capital Realty Inc., Senior Note, 4.43%, 1/31/2022 . . . . . . . . . . . . . . . . . . . . . . . . . . . . . . . . . . . . . . . . . . . . . . . . . . . . . . . . . . . . . 64,000 CAD 64 68Gibson Energy Inc., Senior Note, 5.375%, 7/15/2022 . . . . . . . . . . . . . . . . . . . . . . . . . . . . . . . . . . . . . . . . . . . . . . . . . . . . . . . . . . . . . . . 15,000 CAD 15 15Government of Canada, 5.00%, 6/1/2037 . . . . . . . . . . . . . . . . . . . . . . . . . . . . . . . . . . . . . . . . . . . . . . . . . . . . . . . . . . . . . . . . . . . . . . . 113,000 CAD 153 156Granite Real Estate Investment Trust Holdings LP, Senior Note, 3.788%, 7/5/2021 . . . . . . . . . . . . . . . . . . . . . . . . . . . . . . . . . . . . . . . . . . 10,000 CAD 10 10HSBC Bank Canada, 3.558%, 10/4/2017 . . . . . . . . . . . . . . . . . . . . . . . . . . . . . . . . . . . . . . . . . . . . . . . . . . . . . . . . . . . . . . . . . . . . . . . 65,000 CAD 67 68
The accompanying notes are an integral part of these financial statements.
196 Franklin Templeton Investments Funds
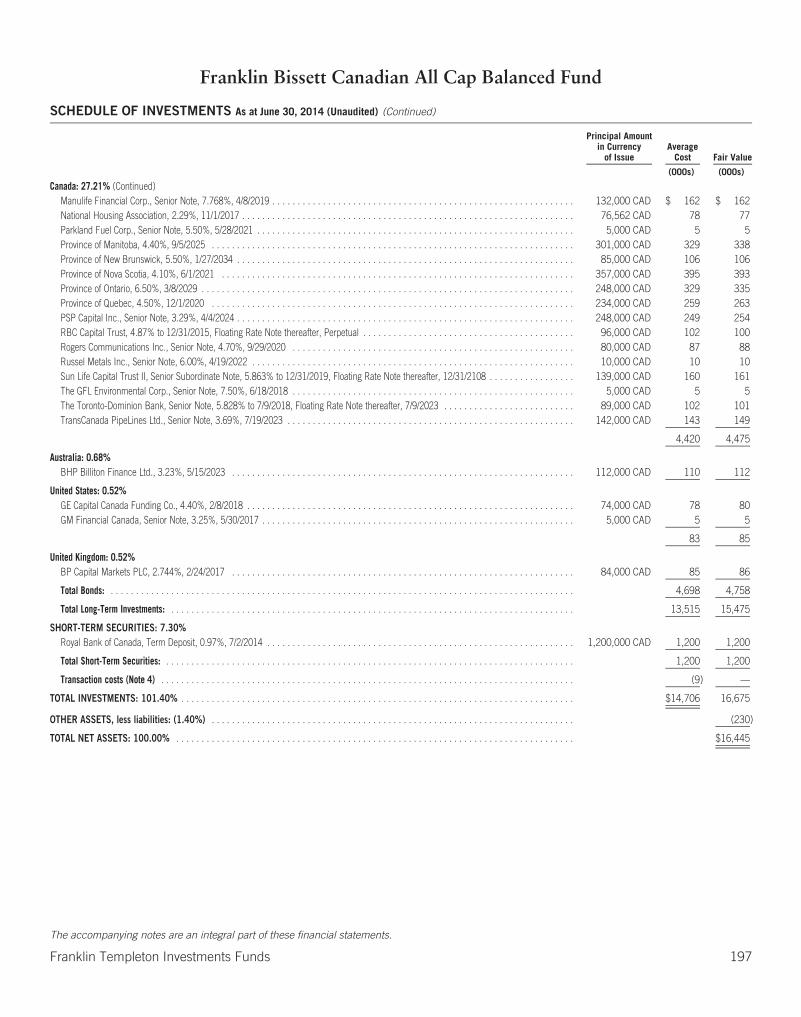
Franklin Bissett Canadian All Cap Balanced Fund
SCHEDULE OF INVESTMENTS As at June 30, 2014 (Unaudited) (Continued)
Principal Amountin Currency
of IssueAverage
Cost Fair Value
(000s) (000s)
Canada: 27.21% (Continued)Manulife Financial Corp., Senior Note, 7.768%, 4/8/2019 . . . . . . . . . . . . . . . . . . . . . . . . . . . . . . . . . . . . . . . . . . . . . . . . . . . . . . . . . . . . 132,000 CAD $ 162 $ 162National Housing Association, 2.29%, 11/1/2017 . . . . . . . . . . . . . . . . . . . . . . . . . . . . . . . . . . . . . . . . . . . . . . . . . . . . . . . . . . . . . . . . . . 76,562 CAD 78 77Parkland Fuel Corp., Senior Note, 5.50%, 5/28/2021 . . . . . . . . . . . . . . . . . . . . . . . . . . . . . . . . . . . . . . . . . . . . . . . . . . . . . . . . . . . . . . . 5,000 CAD 5 5Province of Manitoba, 4.40%, 9/5/2025 . . . . . . . . . . . . . . . . . . . . . . . . . . . . . . . . . . . . . . . . . . . . . . . . . . . . . . . . . . . . . . . . . . . . . . . . 301,000 CAD 329 338Province of New Brunswick, 5.50%, 1/27/2034 . . . . . . . . . . . . . . . . . . . . . . . . . . . . . . . . . . . . . . . . . . . . . . . . . . . . . . . . . . . . . . . . . . . 85,000 CAD 106 106Province of Nova Scotia, 4.10%, 6/1/2021 . . . . . . . . . . . . . . . . . . . . . . . . . . . . . . . . . . . . . . . . . . . . . . . . . . . . . . . . . . . . . . . . . . . . . . 357,000 CAD 395 393Province of Ontario, 6.50%, 3/8/2029 . . . . . . . . . . . . . . . . . . . . . . . . . . . . . . . . . . . . . . . . . . . . . . . . . . . . . . . . . . . . . . . . . . . . . . . . . . 248,000 CAD 329 335Province of Quebec, 4.50%, 12/1/2020 . . . . . . . . . . . . . . . . . . . . . . . . . . . . . . . . . . . . . . . . . . . . . . . . . . . . . . . . . . . . . . . . . . . . . . . . 234,000 CAD 259 263PSP Capital Inc., Senior Note, 3.29%, 4/4/2024 . . . . . . . . . . . . . . . . . . . . . . . . . . . . . . . . . . . . . . . . . . . . . . . . . . . . . . . . . . . . . . . . . . . 248,000 CAD 249 254RBC Capital Trust, 4.87% to 12/31/2015, Floating Rate Note thereafter, Perpetual . . . . . . . . . . . . . . . . . . . . . . . . . . . . . . . . . . . . . . . . . . 96,000 CAD 102 100Rogers Communications Inc., Senior Note, 4.70%, 9/29/2020 . . . . . . . . . . . . . . . . . . . . . . . . . . . . . . . . . . . . . . . . . . . . . . . . . . . . . . . . 80,000 CAD 87 88Russel Metals Inc., Senior Note, 6.00%, 4/19/2022 . . . . . . . . . . . . . . . . . . . . . . . . . . . . . . . . . . . . . . . . . . . . . . . . . . . . . . . . . . . . . . . . 10,000 CAD 10 10Sun Life Capital Trust II, Senior Subordinate Note, 5.863% to 12/31/2019, Floating Rate Note thereafter, 12/31/2108 . . . . . . . . . . . . . . . . . 139,000 CAD 160 161The GFL Environmental Corp., Senior Note, 7.50%, 6/18/2018 . . . . . . . . . . . . . . . . . . . . . . . . . . . . . . . . . . . . . . . . . . . . . . . . . . . . . . . . 5,000 CAD 5 5The Toronto-Dominion Bank, Senior Note, 5.828% to 7/9/2018, Floating Rate Note thereafter, 7/9/2023 . . . . . . . . . . . . . . . . . . . . . . . . . . 89,000 CAD 102 101TransCanada PipeLines Ltd., Senior Note, 3.69%, 7/19/2023 . . . . . . . . . . . . . . . . . . . . . . . . . . . . . . . . . . . . . . . . . . . . . . . . . . . . . . . . . 142,000 CAD 143 149
4,420 4,475
Australia: 0.68%BHP Billiton Finance Ltd., 3.23%, 5/15/2023 . . . . . . . . . . . . . . . . . . . . . . . . . . . . . . . . . . . . . . . . . . . . . . . . . . . . . . . . . . . . . . . . . . . . 112,000 CAD 110 112
United States: 0.52%GE Capital Canada Funding Co., 4.40%, 2/8/2018 . . . . . . . . . . . . . . . . . . . . . . . . . . . . . . . . . . . . . . . . . . . . . . . . . . . . . . . . . . . . . . . . . 74,000 CAD 78 80GM Financial Canada, Senior Note, 3.25%, 5/30/2017 . . . . . . . . . . . . . . . . . . . . . . . . . . . . . . . . . . . . . . . . . . . . . . . . . . . . . . . . . . . . . . 5,000 CAD 5 5
83 85
United Kingdom: 0.52%BP Capital Markets PLC, 2.744%, 2/24/2017 . . . . . . . . . . . . . . . . . . . . . . . . . . . . . . . . . . . . . . . . . . . . . . . . . . . . . . . . . . . . . . . . . . . . 84,000 CAD 85 86
Total Bonds: . . . . . . . . . . . . . . . . . . . . . . . . . . . . . . . . . . . . . . . . . . . . . . . . . . . . . . . . . . . . . . . . . . . . . . . . . . . . . . . . . . . . . . . . . . . . 4,698 4,758
Total Long-Term Investments: . . . . . . . . . . . . . . . . . . . . . . . . . . . . . . . . . . . . . . . . . . . . . . . . . . . . . . . . . . . . . . . . . . . . . . . . . . . . . . . . 13,515 15,475
SHORT-TERM SECURITIES: 7.30%Royal Bank of Canada, Term Deposit, 0.97%, 7/2/2014 . . . . . . . . . . . . . . . . . . . . . . . . . . . . . . . . . . . . . . . . . . . . . . . . . . . . . . . . . . . . . 1,200,000 CAD 1,200 1,200
Total Short-Term Securities: . . . . . . . . . . . . . . . . . . . . . . . . . . . . . . . . . . . . . . . . . . . . . . . . . . . . . . . . . . . . . . . . . . . . . . . . . . . . . . . . . 1,200 1,200
Transaction costs (Note 4) . . . . . . . . . . . . . . . . . . . . . . . . . . . . . . . . . . . . . . . . . . . . . . . . . . . . . . . . . . . . . . . . . . . . . . . . . . . . . . . . . . (9) —
TOTAL INVESTMENTS: 101.40% . . . . . . . . . . . . . . . . . . . . . . . . . . . . . . . . . . . . . . . . . . . . . . . . . . . . . . . . . . . . . . . . . . . . . . . . . . . . . . $14,706 16,675
OTHER ASSETS, less liabilities: (1.40%) . . . . . . . . . . . . . . . . . . . . . . . . . . . . . . . . . . . . . . . . . . . . . . . . . . . . . . . . . . . . . . . . . . . . . . . . (230)
TOTAL NET ASSETS: 100.00% . . . . . . . . . . . . . . . . . . . . . . . . . . . . . . . . . . . . . . . . . . . . . . . . . . . . . . . . . . . . . . . . . . . . . . . . . . . . . . . $16,445
The accompanying notes are an integral part of these financial statements.
Franklin Templeton Investments Funds 197

Franklin Bissett Canadian All Cap Balanced Fund
SCHEDULE OF INVESTMENTS As at June 30, 2014 (Unaudited) (Continued)
June 30,2014
December 31,2013
January 1,2013
Bond Ratings*% of
Net Assets% of
Net Assets% of
Net AssetsAAA . . . . . . . . . . . . . . . . . . . . 6.10 6.94 10.39AA . . . . . . . . . . . . . . . . . . . . . . 6.28 5.76 10.64A . . . . . . . . . . . . . . . . . . . . . . . 14.09 13.39 18.47BBB . . . . . . . . . . . . . . . . . . . . 2.12 1.37 —BB . . . . . . . . . . . . . . . . . . . . . 0.31 — —B . . . . . . . . . . . . . . . . . . . . . . . 0.03 — —
* Excluding cash and overnight term deposits.
Source: Standard & Poor’s, and/or composite of Moody’s, Standard & Poor’sand Fitch ratings
The accompanying notes are an integral part of these financial statements.
198 Franklin Templeton Investments Funds
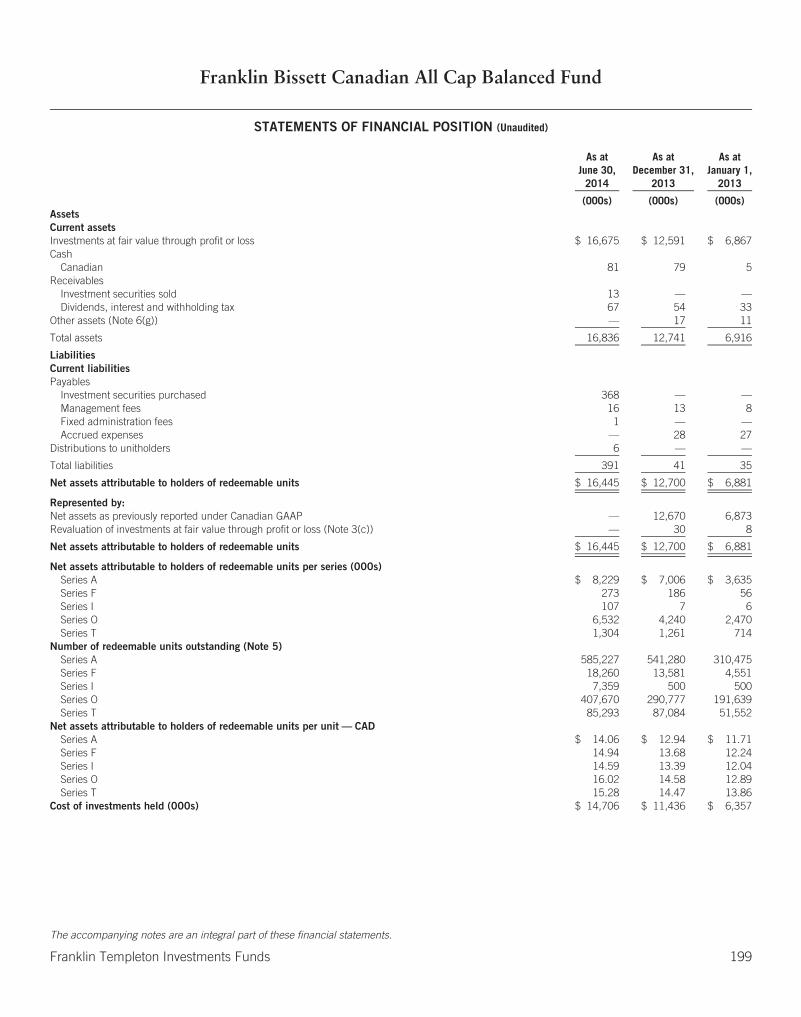
Franklin Bissett Canadian All Cap Balanced Fund
STATEMENTS OF FINANCIAL POSITION (Unaudited)
As atJune 30,
2014
As atDecember 31,
2013
As atJanuary 1,
2013
(000s) (000s) (000s)AssetsCurrent assetsInvestments at fair value through profit or loss $ 16,675 $ 12,591 $ 6,867Cash
Canadian 81 79 5Receivables
Investment securities sold 13 — —Dividends, interest and withholding tax 67 54 33
Other assets (Note 6(g)) — 17 11
Total assets 16,836 12,741 6,916
LiabilitiesCurrent liabilitiesPayables
Investment securities purchased 368 — —Management fees 16 13 8Fixed administration fees 1 — —Accrued expenses — 28 27
Distributions to unitholders 6 — —
Total liabilities 391 41 35
Net assets attributable to holders of redeemable units $ 16,445 $ 12,700 $ 6,881
Represented by:Net assets as previously reported under Canadian GAAP — 12,670 6,873Revaluation of investments at fair value through profit or loss (Note 3(c)) — 30 8
Net assets attributable to holders of redeemable units $ 16,445 $ 12,700 $ 6,881
Net assets attributable to holders of redeemable units per series (000s)Series A $ 8,229 $ 7,006 $ 3,635Series F 273 186 56Series I 107 7 6Series O 6,532 4,240 2,470Series T 1,304 1,261 714
Number of redeemable units outstanding (Note 5)Series A 585,227 541,280 310,475Series F 18,260 13,581 4,551Series I 7,359 500 500Series O 407,670 290,777 191,639Series T 85,293 87,084 51,552
Net assets attributable to holders of redeemable units per unit — CADSeries A $ 14.06 $ 12.94 $ 11.71Series F 14.94 13.68 12.24Series I 14.59 13.39 12.04Series O 16.02 14.58 12.89Series T 15.28 14.47 13.86
Cost of investments held (000s) $ 14,706 $ 11,436 $ 6,357
The accompanying notes are an integral part of these financial statements.
Franklin Templeton Investments Funds 199

Franklin Bissett Canadian All Cap Balanced Fund
STATEMENTS OF COMPREHENSIVE INCOMEFor the six months ended June 30, 2014 and 2013 (Unaudited)
2014 2013
(000s) (000s)IncomeDividends $ 116 $ 87Interest income for distribution purposes 78 58Net realized and/or unrealized foreign exchange gain (loss) — 4Net realized gain (loss) on investments 227 701Net change in unrealized appreciation (depreciation) in value of investments 814 (428)
Total income (net) 1,235 422
ExpensesManagement fees (Note 6(a)) 88 54Fixed administration fees (Note 6(b)) 8 —Transfer agent fees (Note 6(d)) — 10Custodian fees — —Legal fees — 1Audit fees — 10Unitholder reporting costs — 2Independent review committee fees — 1Registration fees — 13Other expenses (Note 6(f)) — 5
Operating expenses before waivers/paid by Manager 96 96Expenses waived/paid by Manager (Note 6(b)) — (38)
Net operating expenses after waivers/paid by Manager 96 58
Transaction costs (Note 9) 3 7Withholding tax expense — 3
Total expenses 99 68
Increase (decrease) in net assets attributable to holders of redeemable units from operations $ 1,136 $ 354
Represented by:Increase (decrease) in net assets from operations as previously reported under Canadian GAAP — 336Revaluation of investments at fair value through profit and loss (Note 3(c)) — 18
Increase (decrease) in net assets attributable to holders of redeemable units from operations $ 1,136 $ 354
Increase (decrease) in net assets attributable to holders of redeemable units from operations per series (000s)Series A $ 577 $ 166Series F 19 3Series I 3 —*Series O 429 150Series T 108 35
Weighted average number of units outstandingSeries A 523,395 327,026Series F 15,354 5,162Series I 3,058 500Series O 305,756 204,908Series T 86,442 65,161
Increase (decrease) in net assets attributable to holders of redeemable units from operations per unitSeries A $ 1.11 $ 0.51Series F 1.27 0.61Series I 1.11 0.61Series O 1.41 0.73Series T 1.25 0.55
*Amount rounded to zero in the nearest thousand.
The accompanying notes are an integral part of these financial statements.
200 Franklin Templeton Investments Funds
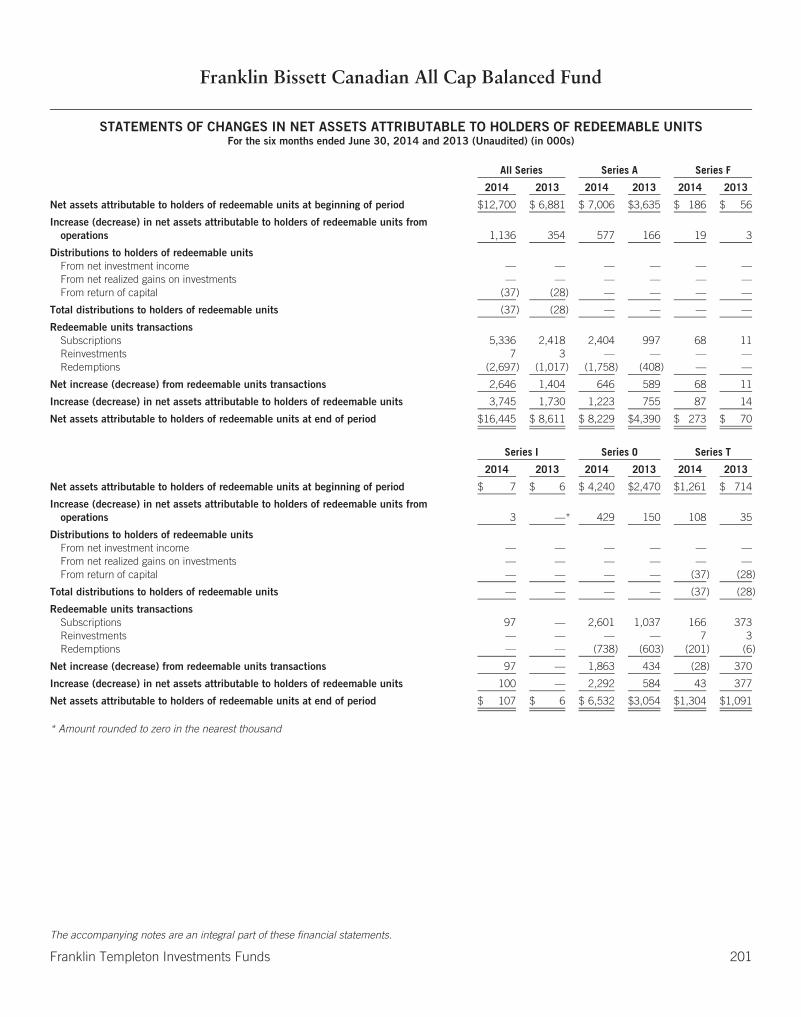
Franklin Bissett Canadian All Cap Balanced Fund
STATEMENTS OF CHANGES IN NET ASSETS ATTRIBUTABLE TO HOLDERS OF REDEEMABLE UNITSFor the six months ended June 30, 2014 and 2013 (Unaudited) (in 000s)
All Series Series A Series F
2014 2013 2014 2013 2014 2013
Net assets attributable to holders of redeemable units at beginning of period $12,700 $ 6,881 $ 7,006 $3,635 $ 186 $ 56
Increase (decrease) in net assets attributable to holders of redeemable units fromoperations 1,136 354 577 166 19 3
Distributions to holders of redeemable unitsFrom net investment income — — — — — —From net realized gains on investments — — — — — —From return of capital (37) (28) — — — —
Total distributions to holders of redeemable units (37) (28) — — — —
Redeemable units transactionsSubscriptions 5,336 2,418 2,404 997 68 11Reinvestments 7 3 — — — —Redemptions (2,697) (1,017) (1,758) (408) — —
Net increase (decrease) from redeemable units transactions 2,646 1,404 646 589 68 11
Increase (decrease) in net assets attributable to holders of redeemable units 3,745 1,730 1,223 755 87 14
Net assets attributable to holders of redeemable units at end of period $16,445 $ 8,611 $ 8,229 $4,390 $ 273 $ 70
Series I Series O Series T
2014 2013 2014 2013 2014 2013
Net assets attributable to holders of redeemable units at beginning of period $ 7 $ 6 $ 4,240 $2,470 $1,261 $ 714
Increase (decrease) in net assets attributable to holders of redeemable units fromoperations 3 —* 429 150 108 35
Distributions to holders of redeemable unitsFrom net investment income — — — — — —From net realized gains on investments — — — — — —From return of capital — — — — (37) (28)
Total distributions to holders of redeemable units — — — — (37) (28)
Redeemable units transactionsSubscriptions 97 — 2,601 1,037 166 373Reinvestments — — — — 7 3Redemptions — — (738) (603) (201) (6)
Net increase (decrease) from redeemable units transactions 97 — 1,863 434 (28) 370
Increase (decrease) in net assets attributable to holders of redeemable units 100 — 2,292 584 43 377
Net assets attributable to holders of redeemable units at end of period $ 107 $ 6 $ 6,532 $3,054 $1,304 $1,091
* Amount rounded to zero in the nearest thousand
The accompanying notes are an integral part of these financial statements.
Franklin Templeton Investments Funds 201
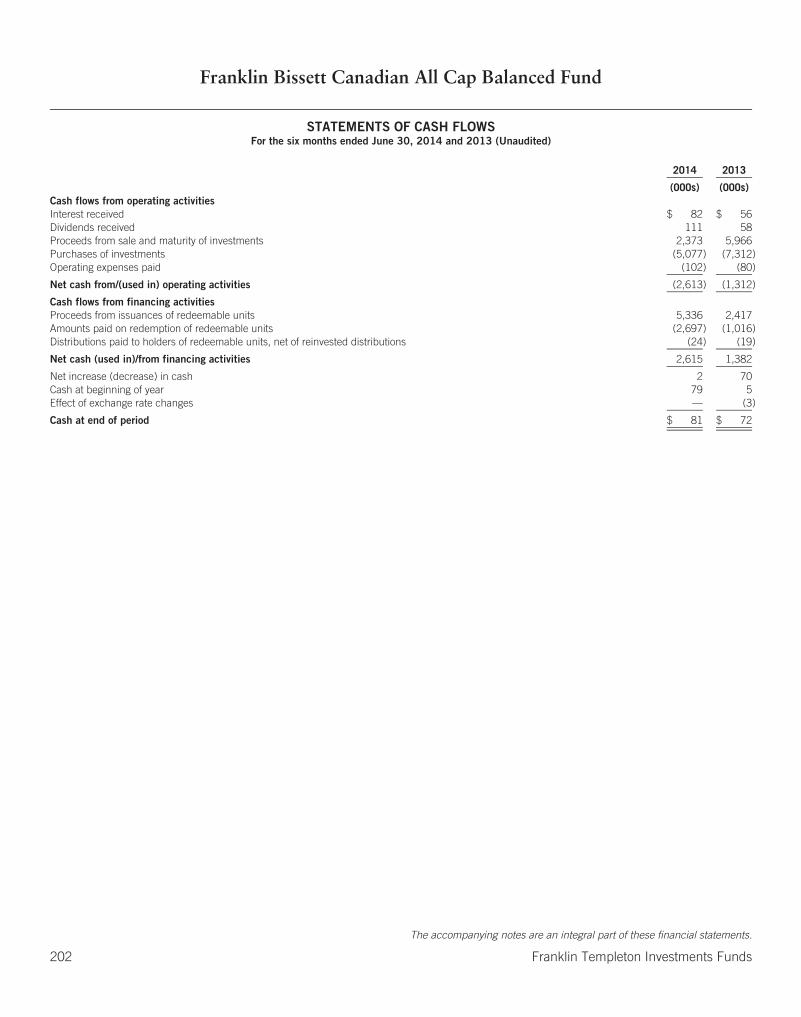
Franklin Bissett Canadian All Cap Balanced Fund
STATEMENTS OF CASH FLOWSFor the six months ended June 30, 2014 and 2013 (Unaudited)
2014 2013
(000s) (000s)Cash flows from operating activitiesInterest received $ 82 $ 56Dividends received 111 58Proceeds from sale and maturity of investments 2,373 5,966Purchases of investments (5,077) (7,312)Operating expenses paid (102) (80)
Net cash from/(used in) operating activities (2,613) (1,312)
Cash flows from financing activitiesProceeds from issuances of redeemable units 5,336 2,417Amounts paid on redemption of redeemable units (2,697) (1,016)Distributions paid to holders of redeemable units, net of reinvested distributions (24) (19)
Net cash (used in)/from financing activities 2,615 1,382
Net increase (decrease) in cash 2 70Cash at beginning of year 79 5Effect of exchange rate changes — (3)
Cash at end of period $ 81 $ 72
The accompanying notes are an integral part of these financial statements.
202 Franklin Templeton Investments Funds

Franklin Bissett Canadian Balanced Fund
SCHEDULE OF INVESTMENTS As at June 30, 2014 (Unaudited)
UnitsAverage
Cost Fair Value
(000s) (000s)
LONG-TERM INVESTMENTS: 99.52%UNDERLYING FUNDS : 99.52%
Franklin Bissett All Canadian Focus Fund . . . . . . . . . . . . . . . . . . . . . . . . . . . . . . . . . . . . . . . . . . . . . . . . . . . . . . . . . . . . . . . . . . . . 1,722,009 $ 22,451 $ 38,866Franklin Bissett Bond Fund . . . . . . . . . . . . . . . . . . . . . . . . . . . . . . . . . . . . . . . . . . . . . . . . . . . . . . . . . . . . . . . . . . . . . . . . . . . . . . 12,508,911 179,786 191,261Franklin Bissett Canadian Dividend Fund . . . . . . . . . . . . . . . . . . . . . . . . . . . . . . . . . . . . . . . . . . . . . . . . . . . . . . . . . . . . . . . . . . . . 1,229,552 20,833 26,681Franklin Bissett Canadian Equity Fund . . . . . . . . . . . . . . . . . . . . . . . . . . . . . . . . . . . . . . . . . . . . . . . . . . . . . . . . . . . . . . . . . . . . . . 1,574,116 124,240 217,275Franklin Bissett Canadian High Dividend Fund . . . . . . . . . . . . . . . . . . . . . . . . . . . . . . . . . . . . . . . . . . . . . . . . . . . . . . . . . . . . . . . . . 1,225,818 24,064 27,103Franklin Bissett Canadian Short Term Bond Fund . . . . . . . . . . . . . . . . . . . . . . . . . . . . . . . . . . . . . . . . . . . . . . . . . . . . . . . . . . . . . . 5,566,433 60,048 60,472Franklin Bissett Corporate Bond Fund . . . . . . . . . . . . . . . . . . . . . . . . . . . . . . . . . . . . . . . . . . . . . . . . . . . . . . . . . . . . . . . . . . . . . . . 9,045,648 98,124 102,306Franklin Bissett Microcap Fund . . . . . . . . . . . . . . . . . . . . . . . . . . . . . . . . . . . . . . . . . . . . . . . . . . . . . . . . . . . . . . . . . . . . . . . . . . . 986,329 28,606 54,248Franklin Bissett Small Cap Fund . . . . . . . . . . . . . . . . . . . . . . . . . . . . . . . . . . . . . . . . . . . . . . . . . . . . . . . . . . . . . . . . . . . . . . . . . . . 551,357 37,949 54,121Franklin Bissett U.S. Focus Fund . . . . . . . . . . . . . . . . . . . . . . . . . . . . . . . . . . . . . . . . . . . . . . . . . . . . . . . . . . . . . . . . . . . . . . . . . . 3,097,231 25,751 45,684Franklin Mutual Global Discovery Fund . . . . . . . . . . . . . . . . . . . . . . . . . . . . . . . . . . . . . . . . . . . . . . . . . . . . . . . . . . . . . . . . . . . . . . 2,097,538 36,188 50,677Franklin Strategic Income Fund . . . . . . . . . . . . . . . . . . . . . . . . . . . . . . . . . . . . . . . . . . . . . . . . . . . . . . . . . . . . . . . . . . . . . . . . . . . 3,936,438 33,436 34,877Franklin U.S. Rising Dividends Fund . . . . . . . . . . . . . . . . . . . . . . . . . . . . . . . . . . . . . . . . . . . . . . . . . . . . . . . . . . . . . . . . . . . . . . . . 1,073,214 32,029 48,552Templeton EAFE Developed Markets Fund . . . . . . . . . . . . . . . . . . . . . . . . . . . . . . . . . . . . . . . . . . . . . . . . . . . . . . . . . . . . . . . . . . . 3,717,786 37,708 47,030Templeton Emerging Markets Fund . . . . . . . . . . . . . . . . . . . . . . . . . . . . . . . . . . . . . . . . . . . . . . . . . . . . . . . . . . . . . . . . . . . . . . . . . 1,701,266 24,636 25,519Templeton Global Bond Fund . . . . . . . . . . . . . . . . . . . . . . . . . . . . . . . . . . . . . . . . . . . . . . . . . . . . . . . . . . . . . . . . . . . . . . . . . . . . . 2,657,698 32,826 34,497Templeton Global Smaller Companies Fund . . . . . . . . . . . . . . . . . . . . . . . . . . . . . . . . . . . . . . . . . . . . . . . . . . . . . . . . . . . . . . . . . . . 1,020,740 25,572 32,194
Total Underlying Funds: . . . . . . . . . . . . . . . . . . . . . . . . . . . . . . . . . . . . . . . . . . . . . . . . . . . . . . . . . . . . . . . . . . . . . . . . . . . . . . . . . 844,247 1,091,363
Total Long-Term Investments: . . . . . . . . . . . . . . . . . . . . . . . . . . . . . . . . . . . . . . . . . . . . . . . . . . . . . . . . . . . . . . . . . . . . . . . . . . . . . 844,247 1,091,363
Principal Amountin Currency
of Issue
SHORT-TERM SECURITIES: 0.37%Royal Bank of Canada, Term Deposit, 0.97%, 7/2/2014 . . . . . . . . . . . . . . . . . . . . . . . . . . . . . . . . . . . . . . . . . . . . . . . . . . . . . . . . . . 4,000,000 CAD 4,000 4,000
Total Short-Term Securities: . . . . . . . . . . . . . . . . . . . . . . . . . . . . . . . . . . . . . . . . . . . . . . . . . . . . . . . . . . . . . . . . . . . . . . . . . . . . . . 4,000 4,000
TOTAL INVESTMENTS: 99.89% . . . . . . . . . . . . . . . . . . . . . . . . . . . . . . . . . . . . . . . . . . . . . . . . . . . . . . . . . . . . . . . . . . . . . . . . . . . . $848,247 1,095,363
OTHER ASSETS, less liabilities: 0.11% . . . . . . . . . . . . . . . . . . . . . . . . . . . . . . . . . . . . . . . . . . . . . . . . . . . . . . . . . . . . . . . . . . . . . . . 1,213
TOTAL NET ASSETS: 100.00% . . . . . . . . . . . . . . . . . . . . . . . . . . . . . . . . . . . . . . . . . . . . . . . . . . . . . . . . . . . . . . . . . . . . . . . . . . . . $1,096,576
The accompanying notes are an integral part of these financial statements.
Franklin Templeton Investments Funds 203
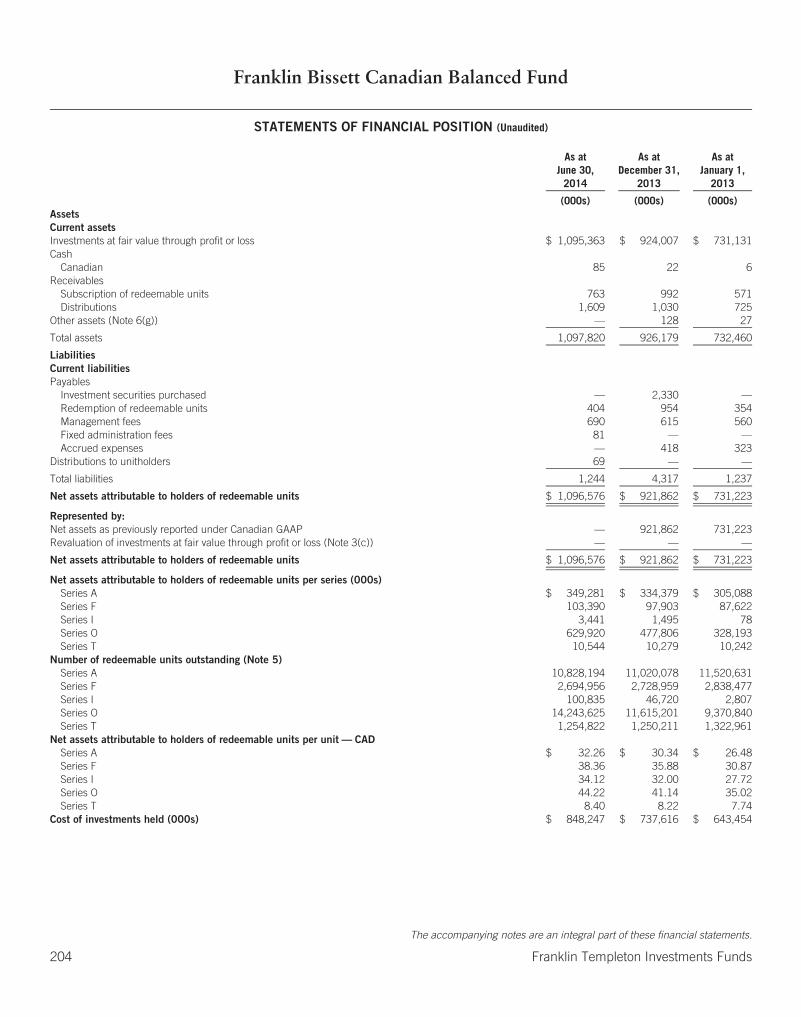
Franklin Bissett Canadian Balanced Fund
STATEMENTS OF FINANCIAL POSITION (Unaudited)
As atJune 30,
2014
As atDecember 31,
2013
As atJanuary 1,
2013
(000s) (000s) (000s)AssetsCurrent assetsInvestments at fair value through profit or loss $ 1,095,363 $ 924,007 $ 731,131Cash
Canadian 85 22 6Receivables
Subscription of redeemable units 763 992 571Distributions 1,609 1,030 725
Other assets (Note 6(g)) — 128 27
Total assets 1,097,820 926,179 732,460
LiabilitiesCurrent liabilitiesPayables
Investment securities purchased — 2,330 —Redemption of redeemable units 404 954 354Management fees 690 615 560Fixed administration fees 81 — —Accrued expenses — 418 323
Distributions to unitholders 69 — —
Total liabilities 1,244 4,317 1,237
Net assets attributable to holders of redeemable units $ 1,096,576 $ 921,862 $ 731,223
Represented by:Net assets as previously reported under Canadian GAAP — 921,862 731,223Revaluation of investments at fair value through profit or loss (Note 3(c)) — — —
Net assets attributable to holders of redeemable units $ 1,096,576 $ 921,862 $ 731,223
Net assets attributable to holders of redeemable units per series (000s)Series A $ 349,281 $ 334,379 $ 305,088Series F 103,390 97,903 87,622Series I 3,441 1,495 78Series O 629,920 477,806 328,193Series T 10,544 10,279 10,242
Number of redeemable units outstanding (Note 5)Series A 10,828,194 11,020,078 11,520,631Series F 2,694,956 2,728,959 2,838,477Series I 100,835 46,720 2,807Series O 14,243,625 11,615,201 9,370,840Series T 1,254,822 1,250,211 1,322,961
Net assets attributable to holders of redeemable units per unit — CADSeries A $ 32.26 $ 30.34 $ 26.48Series F 38.36 35.88 30.87Series I 34.12 32.00 27.72Series O 44.22 41.14 35.02Series T 8.40 8.22 7.74
Cost of investments held (000s) $ 848,247 $ 737,616 $ 643,454
The accompanying notes are an integral part of these financial statements.
204 Franklin Templeton Investments Funds
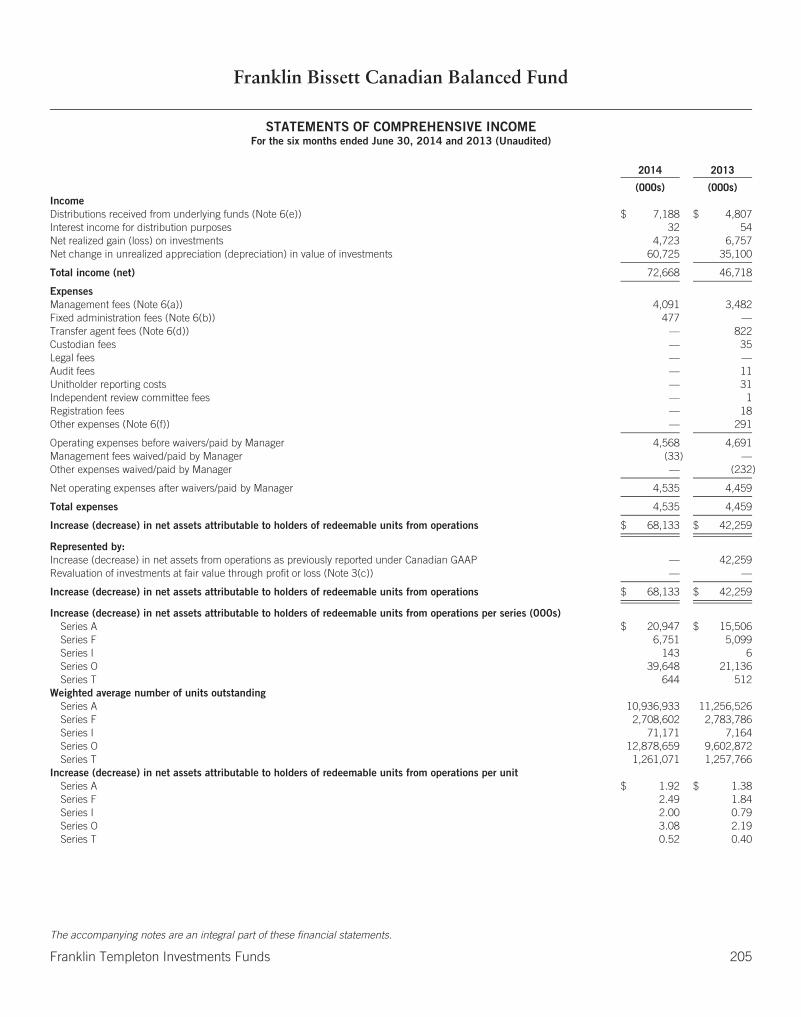
Franklin Bissett Canadian Balanced Fund
STATEMENTS OF COMPREHENSIVE INCOMEFor the six months ended June 30, 2014 and 2013 (Unaudited)
2014 2013
(000s) (000s)IncomeDistributions received from underlying funds (Note 6(e)) $ 7,188 $ 4,807Interest income for distribution purposes 32 54Net realized gain (loss) on investments 4,723 6,757Net change in unrealized appreciation (depreciation) in value of investments 60,725 35,100
Total income (net) 72,668 46,718
ExpensesManagement fees (Note 6(a)) 4,091 3,482Fixed administration fees (Note 6(b)) 477 —Transfer agent fees (Note 6(d)) — 822Custodian fees — 35Legal fees — —Audit fees — 11Unitholder reporting costs — 31Independent review committee fees — 1Registration fees — 18Other expenses (Note 6(f)) — 291
Operating expenses before waivers/paid by Manager 4,568 4,691Management fees waived/paid by Manager (33) —Other expenses waived/paid by Manager — (232)
Net operating expenses after waivers/paid by Manager 4,535 4,459
Total expenses 4,535 4,459
Increase (decrease) in net assets attributable to holders of redeemable units from operations $ 68,133 $ 42,259
Represented by:Increase (decrease) in net assets from operations as previously reported under Canadian GAAP — 42,259Revaluation of investments at fair value through profit or loss (Note 3(c)) — —
Increase (decrease) in net assets attributable to holders of redeemable units from operations $ 68,133 $ 42,259
Increase (decrease) in net assets attributable to holders of redeemable units from operations per series (000s)Series A $ 20,947 $ 15,506Series F 6,751 5,099Series I 143 6Series O 39,648 21,136Series T 644 512
Weighted average number of units outstandingSeries A 10,936,933 11,256,526Series F 2,708,602 2,783,786Series I 71,171 7,164Series O 12,878,659 9,602,872Series T 1,261,071 1,257,766
Increase (decrease) in net assets attributable to holders of redeemable units from operations per unitSeries A $ 1.92 $ 1.38Series F 2.49 1.84Series I 2.00 0.79Series O 3.08 2.19Series T 0.52 0.40
The accompanying notes are an integral part of these financial statements.
Franklin Templeton Investments Funds 205

Franklin Bissett Canadian Balanced Fund
STATEMENTS OF CHANGES IN NET ASSETS ATTRIBUTABLE TO HOLDERS OF REDEEMABLE UNITSFor the six months ended June 30, 2014 and 2013 (Unaudited) (in 000s)
All Series Series A Series F
2014 2013 2014 2013 2014 2013
Net assets attributable to holders of redeemable units at beginning ofperiod $ 921,862 $731,223 $334,379 $305,088 $ 97,903 $87,622
Increase (decrease) in net assets attributable to holders of redeemable unitsfrom operations 68,133 42,259 20,947 15,506 6,751 5,099
Distributions to holders of redeemable unitsFrom net investment income — — — — — —From net realized gains on investments — — — — — —From return of capital (415) (386) — — — —
Total distributions to holders of redeemable units (415) (386) — — — —
Redeemable units transactionsSubscriptions 161,573 80,595 28,775 20,039 4,349 1,729Reinvestments 140 120 — — — —Redemptions (54,717) (70,448) (34,820) (34,242) (5,613) (5,148)
Net increase (decrease) from redeemable units transactions 106,996 10,267 (6,045) (14,203) (1,264) (3,419)
Increase (decrease) in net assets attributable to holders of redeemable units 174,714 52,140 14,902 1,303 5,487 1,680
Net assets attributable to holders of redeemable units at end of period $1,096,576 $783,363 $349,281 $306,391 $103,390 $89,302
Series I Series O Series T
2014 2013 2014 2013 2014 2013
Net assets attributable to holders of redeemable units at beginning ofperiod $ 1,495 $ 78 $477,806 $328,193 $ 10,279 $10,242
Increase (decrease) in net assets attributable to holders of redeemable unitsfrom operations 143 6 39,648 21,136 644 512
Distributions to holders of redeemable unitsFrom net investment income — — — — — —From net realized gains on investments — — — — — —From return of capital — — — — (415) (386)
Total distributions to holders of redeemable units — — — — (415) (386)
Redeemable units transactionsSubscriptions 1,859 261 125,509 58,062 1,081 504Reinvestments — — — — 140 120Redemptions (56) (6) (13,043) (29,634) (1,185) (1,418)
Net increase (decrease) from redeemable units transactions 1,803 255 112,466 28,428 36 (794)
Increase (decrease) in net assets attributable to holders of redeemable units 1,946 261 152,114 49,564 265 (668)
Net assets attributable to holders of redeemable units at end of period $ 3,441 $ 339 $629,920 $377,757 $ 10,544 $ 9,574
The accompanying notes are an integral part of these financial statements.
206 Franklin Templeton Investments Funds
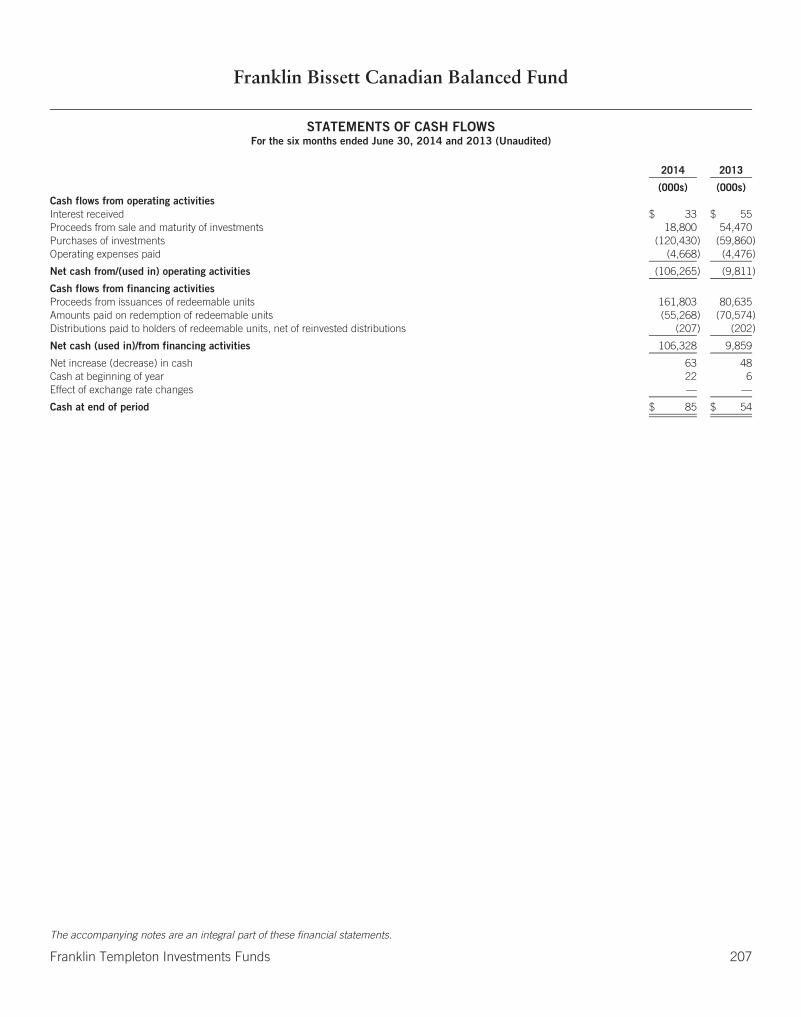
Franklin Bissett Canadian Balanced Fund
STATEMENTS OF CASH FLOWSFor the six months ended June 30, 2014 and 2013 (Unaudited)
2014 2013
(000s) (000s)Cash flows from operating activitiesInterest received $ 33 $ 55Proceeds from sale and maturity of investments 18,800 54,470Purchases of investments (120,430) (59,860)Operating expenses paid (4,668) (4,476)
Net cash from/(used in) operating activities (106,265) (9,811)
Cash flows from financing activitiesProceeds from issuances of redeemable units 161,803 80,635Amounts paid on redemption of redeemable units (55,268) (70,574)Distributions paid to holders of redeemable units, net of reinvested distributions (207) (202)
Net cash (used in)/from financing activities 106,328 9,859
Net increase (decrease) in cash 63 48Cash at beginning of year 22 6Effect of exchange rate changes — —
Cash at end of period $ 85 $ 54
The accompanying notes are an integral part of these financial statements.
Franklin Templeton Investments Funds 207
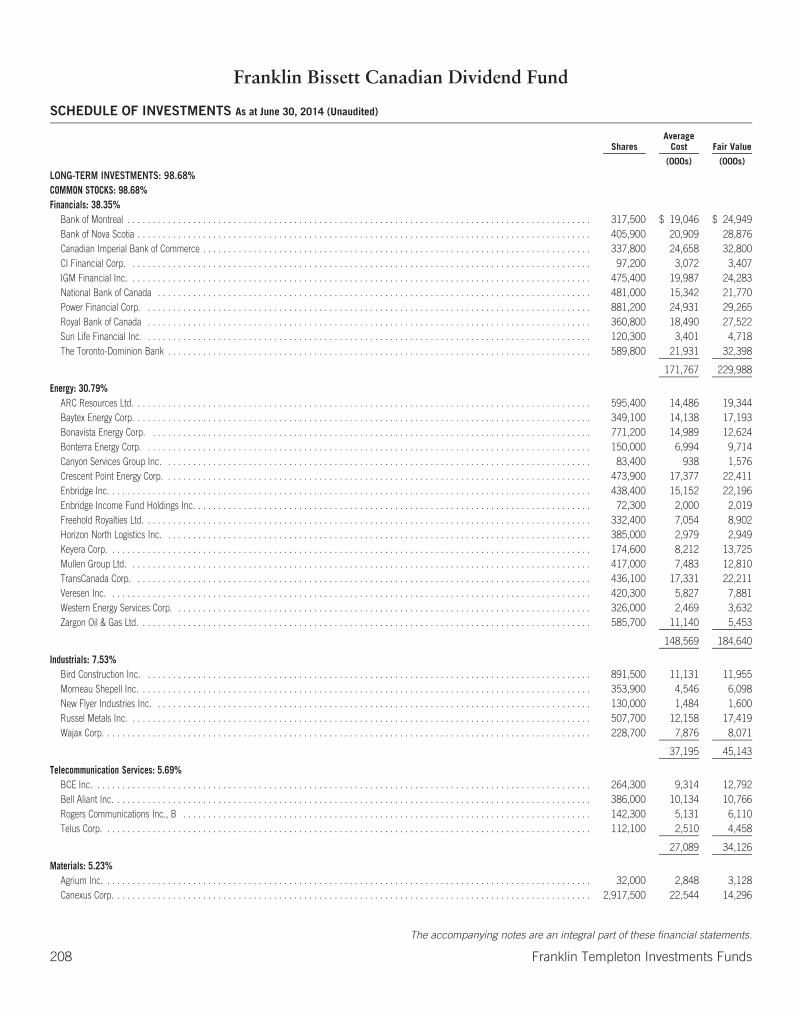
Franklin Bissett Canadian Dividend Fund
SCHEDULE OF INVESTMENTS As at June 30, 2014 (Unaudited)
SharesAverage
Cost Fair Value
(000s) (000s)
LONG-TERM INVESTMENTS: 98.68%COMMON STOCKS: 98.68%Financials: 38.35%
Bank of Montreal . . . . . . . . . . . . . . . . . . . . . . . . . . . . . . . . . . . . . . . . . . . . . . . . . . . . . . . . . . . . . . . . . . . . . . . . . . . . . . . . . . . . . . . . . . . . 317,500 $ 19,046 $ 24,949Bank of Nova Scotia . . . . . . . . . . . . . . . . . . . . . . . . . . . . . . . . . . . . . . . . . . . . . . . . . . . . . . . . . . . . . . . . . . . . . . . . . . . . . . . . . . . . . . . . . . 405,900 20,909 28,876Canadian Imperial Bank of Commerce . . . . . . . . . . . . . . . . . . . . . . . . . . . . . . . . . . . . . . . . . . . . . . . . . . . . . . . . . . . . . . . . . . . . . . . . . . . . . 337,800 24,658 32,800CI Financial Corp. . . . . . . . . . . . . . . . . . . . . . . . . . . . . . . . . . . . . . . . . . . . . . . . . . . . . . . . . . . . . . . . . . . . . . . . . . . . . . . . . . . . . . . . . . . . 97,200 3,072 3,407IGM Financial Inc. . . . . . . . . . . . . . . . . . . . . . . . . . . . . . . . . . . . . . . . . . . . . . . . . . . . . . . . . . . . . . . . . . . . . . . . . . . . . . . . . . . . . . . . . . . . 475,400 19,987 24,283National Bank of Canada . . . . . . . . . . . . . . . . . . . . . . . . . . . . . . . . . . . . . . . . . . . . . . . . . . . . . . . . . . . . . . . . . . . . . . . . . . . . . . . . . . . . . . 481,000 15,342 21,770Power Financial Corp. . . . . . . . . . . . . . . . . . . . . . . . . . . . . . . . . . . . . . . . . . . . . . . . . . . . . . . . . . . . . . . . . . . . . . . . . . . . . . . . . . . . . . . . . 881,200 24,931 29,265Royal Bank of Canada . . . . . . . . . . . . . . . . . . . . . . . . . . . . . . . . . . . . . . . . . . . . . . . . . . . . . . . . . . . . . . . . . . . . . . . . . . . . . . . . . . . . . . . . 360,800 18,490 27,522Sun Life Financial Inc. . . . . . . . . . . . . . . . . . . . . . . . . . . . . . . . . . . . . . . . . . . . . . . . . . . . . . . . . . . . . . . . . . . . . . . . . . . . . . . . . . . . . . . . . 120,300 3,401 4,718The Toronto-Dominion Bank . . . . . . . . . . . . . . . . . . . . . . . . . . . . . . . . . . . . . . . . . . . . . . . . . . . . . . . . . . . . . . . . . . . . . . . . . . . . . . . . . . . . 589,800 21,931 32,398
171,767 229,988
Energy: 30.79%ARC Resources Ltd. . . . . . . . . . . . . . . . . . . . . . . . . . . . . . . . . . . . . . . . . . . . . . . . . . . . . . . . . . . . . . . . . . . . . . . . . . . . . . . . . . . . . . . . . . . 595,400 14,486 19,344Baytex Energy Corp. . . . . . . . . . . . . . . . . . . . . . . . . . . . . . . . . . . . . . . . . . . . . . . . . . . . . . . . . . . . . . . . . . . . . . . . . . . . . . . . . . . . . . . . . . . 349,100 14,138 17,193Bonavista Energy Corp. . . . . . . . . . . . . . . . . . . . . . . . . . . . . . . . . . . . . . . . . . . . . . . . . . . . . . . . . . . . . . . . . . . . . . . . . . . . . . . . . . . . . . . . 771,200 14,989 12,624Bonterra Energy Corp. . . . . . . . . . . . . . . . . . . . . . . . . . . . . . . . . . . . . . . . . . . . . . . . . . . . . . . . . . . . . . . . . . . . . . . . . . . . . . . . . . . . . . . . . 150,000 6,994 9,714Canyon Services Group Inc. . . . . . . . . . . . . . . . . . . . . . . . . . . . . . . . . . . . . . . . . . . . . . . . . . . . . . . . . . . . . . . . . . . . . . . . . . . . . . . . . . . . . 83,400 938 1,576Crescent Point Energy Corp. . . . . . . . . . . . . . . . . . . . . . . . . . . . . . . . . . . . . . . . . . . . . . . . . . . . . . . . . . . . . . . . . . . . . . . . . . . . . . . . . . . . . 473,900 17,377 22,411Enbridge Inc. . . . . . . . . . . . . . . . . . . . . . . . . . . . . . . . . . . . . . . . . . . . . . . . . . . . . . . . . . . . . . . . . . . . . . . . . . . . . . . . . . . . . . . . . . . . . . . . 438,400 15,152 22,196Enbridge Income Fund Holdings Inc. . . . . . . . . . . . . . . . . . . . . . . . . . . . . . . . . . . . . . . . . . . . . . . . . . . . . . . . . . . . . . . . . . . . . . . . . . . . . . . 72,300 2,000 2,019Freehold Royalties Ltd. . . . . . . . . . . . . . . . . . . . . . . . . . . . . . . . . . . . . . . . . . . . . . . . . . . . . . . . . . . . . . . . . . . . . . . . . . . . . . . . . . . . . . . . . 332,400 7,054 8,902Horizon North Logistics Inc. . . . . . . . . . . . . . . . . . . . . . . . . . . . . . . . . . . . . . . . . . . . . . . . . . . . . . . . . . . . . . . . . . . . . . . . . . . . . . . . . . . . . 385,000 2,979 2,949Keyera Corp. . . . . . . . . . . . . . . . . . . . . . . . . . . . . . . . . . . . . . . . . . . . . . . . . . . . . . . . . . . . . . . . . . . . . . . . . . . . . . . . . . . . . . . . . . . . . . . . 174,600 8,212 13,725Mullen Group Ltd. . . . . . . . . . . . . . . . . . . . . . . . . . . . . . . . . . . . . . . . . . . . . . . . . . . . . . . . . . . . . . . . . . . . . . . . . . . . . . . . . . . . . . . . . . . . 417,000 7,483 12,810TransCanada Corp. . . . . . . . . . . . . . . . . . . . . . . . . . . . . . . . . . . . . . . . . . . . . . . . . . . . . . . . . . . . . . . . . . . . . . . . . . . . . . . . . . . . . . . . . . . 436,100 17,331 22,211Veresen Inc. . . . . . . . . . . . . . . . . . . . . . . . . . . . . . . . . . . . . . . . . . . . . . . . . . . . . . . . . . . . . . . . . . . . . . . . . . . . . . . . . . . . . . . . . . . . . . . . 420,300 5,827 7,881Western Energy Services Corp. . . . . . . . . . . . . . . . . . . . . . . . . . . . . . . . . . . . . . . . . . . . . . . . . . . . . . . . . . . . . . . . . . . . . . . . . . . . . . . . . . . 326,000 2,469 3,632Zargon Oil & Gas Ltd. . . . . . . . . . . . . . . . . . . . . . . . . . . . . . . . . . . . . . . . . . . . . . . . . . . . . . . . . . . . . . . . . . . . . . . . . . . . . . . . . . . . . . . . . . 585,700 11,140 5,453
148,569 184,640
Industrials: 7.53%Bird Construction Inc. . . . . . . . . . . . . . . . . . . . . . . . . . . . . . . . . . . . . . . . . . . . . . . . . . . . . . . . . . . . . . . . . . . . . . . . . . . . . . . . . . . . . . . . . 891,500 11,131 11,955Morneau Shepell Inc. . . . . . . . . . . . . . . . . . . . . . . . . . . . . . . . . . . . . . . . . . . . . . . . . . . . . . . . . . . . . . . . . . . . . . . . . . . . . . . . . . . . . . . . . . 353,900 4,546 6,098New Flyer Industries Inc. . . . . . . . . . . . . . . . . . . . . . . . . . . . . . . . . . . . . . . . . . . . . . . . . . . . . . . . . . . . . . . . . . . . . . . . . . . . . . . . . . . . . . . 130,000 1,484 1,600Russel Metals Inc. . . . . . . . . . . . . . . . . . . . . . . . . . . . . . . . . . . . . . . . . . . . . . . . . . . . . . . . . . . . . . . . . . . . . . . . . . . . . . . . . . . . . . . . . . . . 507,700 12,158 17,419Wajax Corp. . . . . . . . . . . . . . . . . . . . . . . . . . . . . . . . . . . . . . . . . . . . . . . . . . . . . . . . . . . . . . . . . . . . . . . . . . . . . . . . . . . . . . . . . . . . . . . . . 228,700 7,876 8,071
37,195 45,143
Telecommunication Services: 5.69%BCE Inc. . . . . . . . . . . . . . . . . . . . . . . . . . . . . . . . . . . . . . . . . . . . . . . . . . . . . . . . . . . . . . . . . . . . . . . . . . . . . . . . . . . . . . . . . . . . . . . . . . . 264,300 9,314 12,792Bell Aliant Inc. . . . . . . . . . . . . . . . . . . . . . . . . . . . . . . . . . . . . . . . . . . . . . . . . . . . . . . . . . . . . . . . . . . . . . . . . . . . . . . . . . . . . . . . . . . . . . . 386,000 10,134 10,766Rogers Communications Inc., B . . . . . . . . . . . . . . . . . . . . . . . . . . . . . . . . . . . . . . . . . . . . . . . . . . . . . . . . . . . . . . . . . . . . . . . . . . . . . . . . . 142,300 5,131 6,110Telus Corp. . . . . . . . . . . . . . . . . . . . . . . . . . . . . . . . . . . . . . . . . . . . . . . . . . . . . . . . . . . . . . . . . . . . . . . . . . . . . . . . . . . . . . . . . . . . . . . . . 112,100 2,510 4,458
27,089 34,126
Materials: 5.23%Agrium Inc. . . . . . . . . . . . . . . . . . . . . . . . . . . . . . . . . . . . . . . . . . . . . . . . . . . . . . . . . . . . . . . . . . . . . . . . . . . . . . . . . . . . . . . . . . . . . . . . . 32,000 2,848 3,128Canexus Corp. . . . . . . . . . . . . . . . . . . . . . . . . . . . . . . . . . . . . . . . . . . . . . . . . . . . . . . . . . . . . . . . . . . . . . . . . . . . . . . . . . . . . . . . . . . . . . . 2,917,500 22,544 14,296
The accompanying notes are an integral part of these financial statements.
208 Franklin Templeton Investments Funds
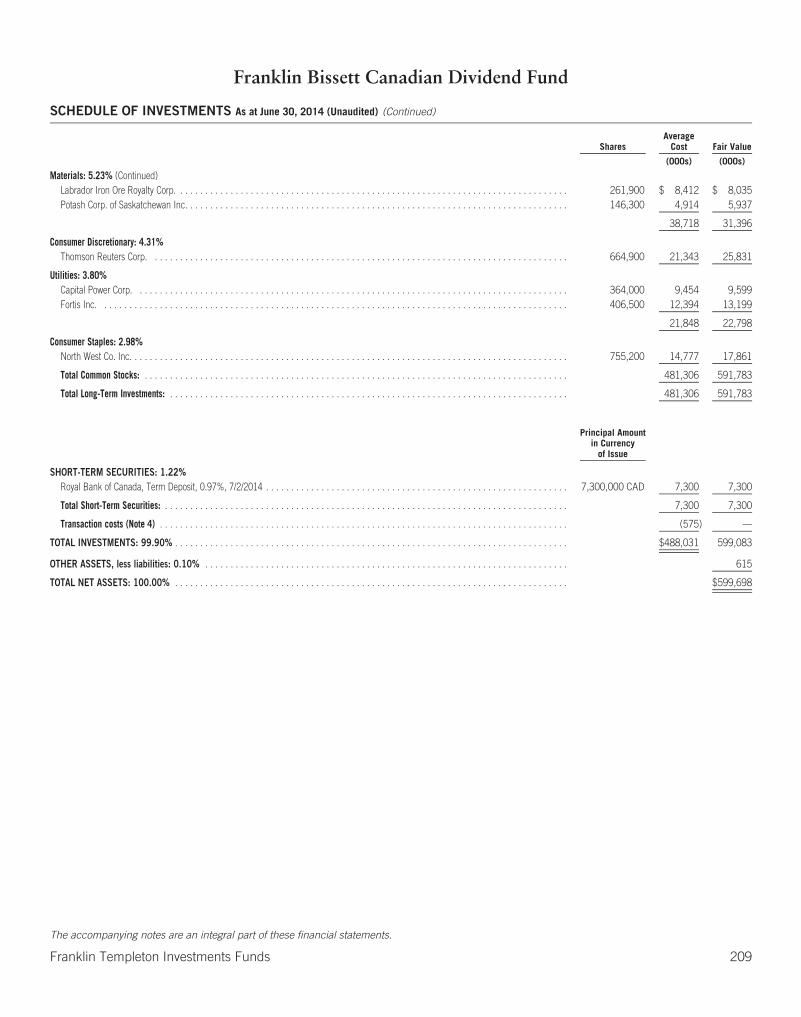
Franklin Bissett Canadian Dividend Fund
SCHEDULE OF INVESTMENTS As at June 30, 2014 (Unaudited) (Continued)
SharesAverage
Cost Fair Value
(000s) (000s)
Materials: 5.23% (Continued)Labrador Iron Ore Royalty Corp. . . . . . . . . . . . . . . . . . . . . . . . . . . . . . . . . . . . . . . . . . . . . . . . . . . . . . . . . . . . . . . . . . . . . . . . . . . . . . 261,900 $ 8,412 $ 8,035Potash Corp. of Saskatchewan Inc. . . . . . . . . . . . . . . . . . . . . . . . . . . . . . . . . . . . . . . . . . . . . . . . . . . . . . . . . . . . . . . . . . . . . . . . . . . . 146,300 4,914 5,937
38,718 31,396
Consumer Discretionary: 4.31%Thomson Reuters Corp. . . . . . . . . . . . . . . . . . . . . . . . . . . . . . . . . . . . . . . . . . . . . . . . . . . . . . . . . . . . . . . . . . . . . . . . . . . . . . . . . . . 664,900 21,343 25,831
Utilities: 3.80%Capital Power Corp. . . . . . . . . . . . . . . . . . . . . . . . . . . . . . . . . . . . . . . . . . . . . . . . . . . . . . . . . . . . . . . . . . . . . . . . . . . . . . . . . . . . . . 364,000 9,454 9,599Fortis Inc. . . . . . . . . . . . . . . . . . . . . . . . . . . . . . . . . . . . . . . . . . . . . . . . . . . . . . . . . . . . . . . . . . . . . . . . . . . . . . . . . . . . . . . . . . . . . 406,500 12,394 13,199
21,848 22,798
Consumer Staples: 2.98%North West Co. Inc. . . . . . . . . . . . . . . . . . . . . . . . . . . . . . . . . . . . . . . . . . . . . . . . . . . . . . . . . . . . . . . . . . . . . . . . . . . . . . . . . . . . . . . 755,200 14,777 17,861
Total Common Stocks: . . . . . . . . . . . . . . . . . . . . . . . . . . . . . . . . . . . . . . . . . . . . . . . . . . . . . . . . . . . . . . . . . . . . . . . . . . . . . . . . . . . . 481,306 591,783
Total Long-Term Investments: . . . . . . . . . . . . . . . . . . . . . . . . . . . . . . . . . . . . . . . . . . . . . . . . . . . . . . . . . . . . . . . . . . . . . . . . . . . . . . . 481,306 591,783
Principal Amountin Currency
of Issue
SHORT-TERM SECURITIES: 1.22%Royal Bank of Canada, Term Deposit, 0.97%, 7/2/2014 . . . . . . . . . . . . . . . . . . . . . . . . . . . . . . . . . . . . . . . . . . . . . . . . . . . . . . . . . . . . 7,300,000 CAD 7,300 7,300
Total Short-Term Securities: . . . . . . . . . . . . . . . . . . . . . . . . . . . . . . . . . . . . . . . . . . . . . . . . . . . . . . . . . . . . . . . . . . . . . . . . . . . . . . . . 7,300 7,300
Transaction costs (Note 4) . . . . . . . . . . . . . . . . . . . . . . . . . . . . . . . . . . . . . . . . . . . . . . . . . . . . . . . . . . . . . . . . . . . . . . . . . . . . . . . . . (575) —
TOTAL INVESTMENTS: 99.90% . . . . . . . . . . . . . . . . . . . . . . . . . . . . . . . . . . . . . . . . . . . . . . . . . . . . . . . . . . . . . . . . . . . . . . . . . . . . . . $488,031 599,083
OTHER ASSETS, less liabilities: 0.10% . . . . . . . . . . . . . . . . . . . . . . . . . . . . . . . . . . . . . . . . . . . . . . . . . . . . . . . . . . . . . . . . . . . . . . . . 615
TOTAL NET ASSETS: 100.00% . . . . . . . . . . . . . . . . . . . . . . . . . . . . . . . . . . . . . . . . . . . . . . . . . . . . . . . . . . . . . . . . . . . . . . . . . . . . . . $599,698
The accompanying notes are an integral part of these financial statements.
Franklin Templeton Investments Funds 209
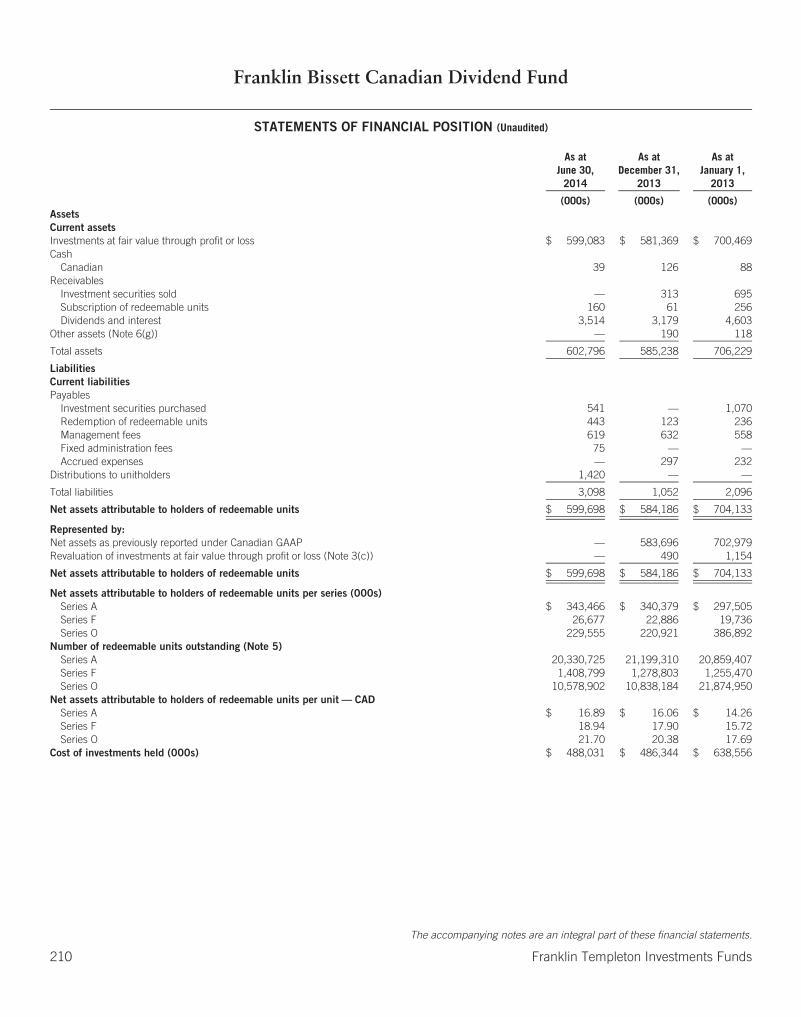
Franklin Bissett Canadian Dividend Fund
STATEMENTS OF FINANCIAL POSITION (Unaudited)
As atJune 30,
2014
As atDecember 31,
2013
As atJanuary 1,
2013
(000s) (000s) (000s)AssetsCurrent assetsInvestments at fair value through profit or loss $ 599,083 $ 581,369 $ 700,469Cash
Canadian 39 126 88Receivables
Investment securities sold — 313 695Subscription of redeemable units 160 61 256Dividends and interest 3,514 3,179 4,603
Other assets (Note 6(g)) — 190 118
Total assets 602,796 585,238 706,229
LiabilitiesCurrent liabilitiesPayables
Investment securities purchased 541 — 1,070Redemption of redeemable units 443 123 236Management fees 619 632 558Fixed administration fees 75 — —Accrued expenses — 297 232
Distributions to unitholders 1,420 — —
Total liabilities 3,098 1,052 2,096
Net assets attributable to holders of redeemable units $ 599,698 $ 584,186 $ 704,133
Represented by:Net assets as previously reported under Canadian GAAP — 583,696 702,979Revaluation of investments at fair value through profit or loss (Note 3(c)) — 490 1,154
Net assets attributable to holders of redeemable units $ 599,698 $ 584,186 $ 704,133
Net assets attributable to holders of redeemable units per series (000s)Series A $ 343,466 $ 340,379 $ 297,505Series F 26,677 22,886 19,736Series O 229,555 220,921 386,892
Number of redeemable units outstanding (Note 5)Series A 20,330,725 21,199,310 20,859,407Series F 1,408,799 1,278,803 1,255,470Series O 10,578,902 10,838,184 21,874,950
Net assets attributable to holders of redeemable units per unit — CADSeries A $ 16.89 $ 16.06 $ 14.26Series F 18.94 17.90 15.72Series O 21.70 20.38 17.69
Cost of investments held (000s) $ 488,031 $ 486,344 $ 638,556
The accompanying notes are an integral part of these financial statements.
210 Franklin Templeton Investments Funds
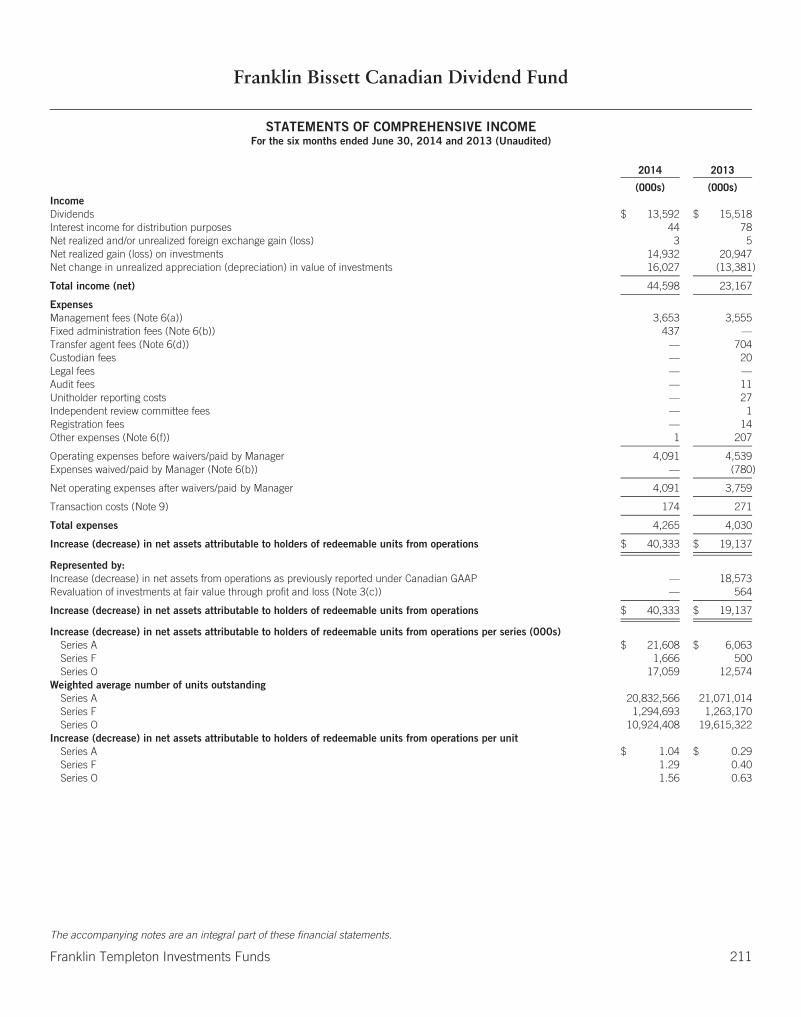
Franklin Bissett Canadian Dividend Fund
STATEMENTS OF COMPREHENSIVE INCOMEFor the six months ended June 30, 2014 and 2013 (Unaudited)
2014 2013
(000s) (000s)IncomeDividends $ 13,592 $ 15,518Interest income for distribution purposes 44 78Net realized and/or unrealized foreign exchange gain (loss) 3 5Net realized gain (loss) on investments 14,932 20,947Net change in unrealized appreciation (depreciation) in value of investments 16,027 (13,381)
Total income (net) 44,598 23,167
ExpensesManagement fees (Note 6(a)) 3,653 3,555Fixed administration fees (Note 6(b)) 437 —Transfer agent fees (Note 6(d)) — 704Custodian fees — 20Legal fees — —Audit fees — 11Unitholder reporting costs — 27Independent review committee fees — 1Registration fees — 14Other expenses (Note 6(f)) 1 207
Operating expenses before waivers/paid by Manager 4,091 4,539Expenses waived/paid by Manager (Note 6(b)) — (780)
Net operating expenses after waivers/paid by Manager 4,091 3,759
Transaction costs (Note 9) 174 271
Total expenses 4,265 4,030
Increase (decrease) in net assets attributable to holders of redeemable units from operations $ 40,333 $ 19,137
Represented by:Increase (decrease) in net assets from operations as previously reported under Canadian GAAP — 18,573Revaluation of investments at fair value through profit and loss (Note 3(c)) — 564
Increase (decrease) in net assets attributable to holders of redeemable units from operations $ 40,333 $ 19,137
Increase (decrease) in net assets attributable to holders of redeemable units from operations per series (000s)Series A $ 21,608 $ 6,063Series F 1,666 500Series O 17,059 12,574
Weighted average number of units outstandingSeries A 20,832,566 21,071,014Series F 1,294,693 1,263,170Series O 10,924,408 19,615,322
Increase (decrease) in net assets attributable to holders of redeemable units from operations per unitSeries A $ 1.04 $ 0.29Series F 1.29 0.40Series O 1.56 0.63
The accompanying notes are an integral part of these financial statements.
Franklin Templeton Investments Funds 211

Franklin Bissett Canadian Dividend Fund
STATEMENTS OF CHANGES IN NET ASSETS ATTRIBUTABLE TO HOLDERS OF REDEEMABLE UNITSFor the six months ended June 30, 2014 and 2013 (Unaudited) (in 000s)
All Series Series A Series F
2014 2013 2014 2013 2014 2013
Net assets attributable to holders of redeemable units at beginning of period $584,186 $ 704,133 $340,379 $297,505 $22,886 $19,736
Increase (decrease) in net assets attributable to holders of redeemable unitsfrom operations 40,333 19,137 21,608 6,063 1,666 500
Distributions to holders of redeemable unitsFrom net investment income (7,588) (7,949) (4,351) (3,588) (309) (240)From net realized gains on investments — — — — — —From return of capital — — — — — —
Total distributions to holders of redeemable units (7,588) (7,949) (4,351) (3,588) (309) (240)
Redeemable units transactionsSubscriptions 44,436 95,907 23,140 34,439 4,612 2,934Reinvestments 5,807 5,525 3,231 2,419 199 147Redemptions (67,476) (118,886) (40,541) (31,646) (2,377) (1,874)
Net increase (decrease) from redeemable units transactions (17,233) (17,454) (14,170) 5,212 2,434 1,207
Increase (decrease) in net assets attributable to holders of redeemable units 15,512 (6,266) 3,087 7,687 3,791 1,467
Net assets attributable to holders of redeemable units at end of period $599,698 $ 697,867 $343,466 $305,192 $26,677 $21,203
Series O
2014 2013
Net assets attributable to holders of redeemable units at beginning of period $220,921 $ 386,892
Increase (decrease) in net assets attributable to holders of redeemable unitsfrom operations 17,059 12,574
Distributions to holders of redeemable unitsFrom net investment income (2,928) (4,121)From net realized gains on investments — —From return of capital — —
Total distributions to holders of redeemable units (2,928) (4,121)
Redeemable units transactionsSubscriptions 16,684 58,534Reinvestments 2,377 2,959Redemptions (24,558) (85,366)
Net increase (decrease) from redeemable units transactions (5,497) (23,873)
Increase (decrease) in net assets attributable to holders of redeemable units 8,634 (15,420)
Net assets attributable to holders of redeemable units at end of period $229,555 $ 371,472
The accompanying notes are an integral part of these financial statements.
212 Franklin Templeton Investments Funds
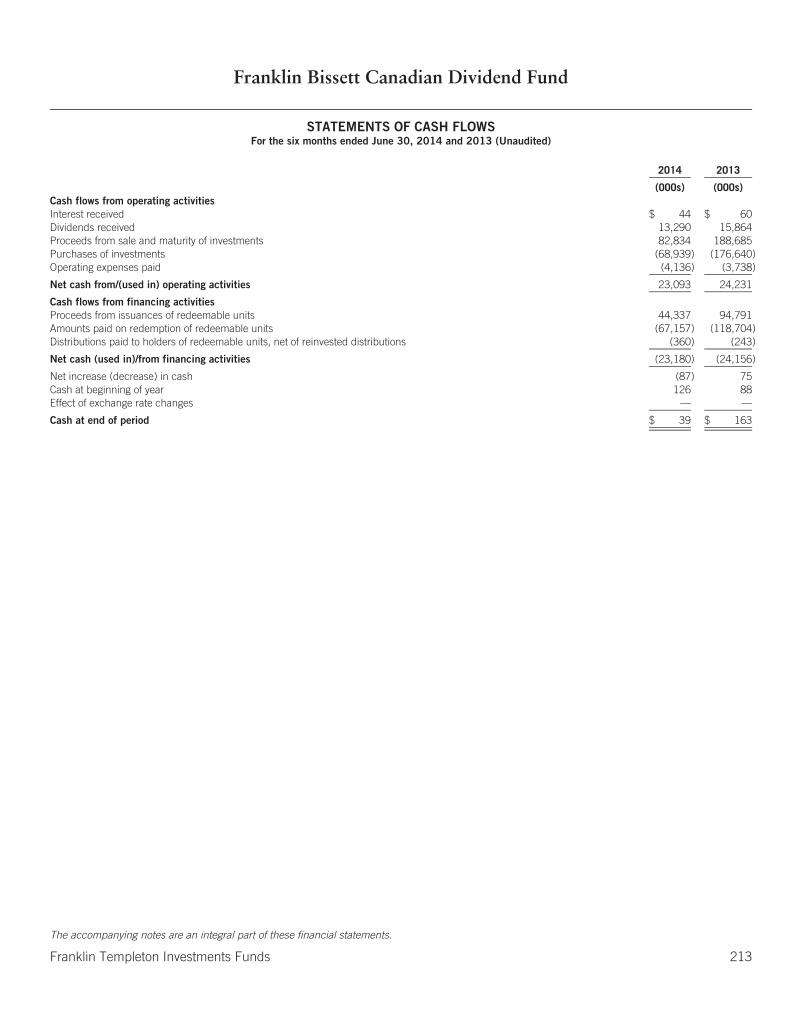
Franklin Bissett Canadian Dividend Fund
STATEMENTS OF CASH FLOWSFor the six months ended June 30, 2014 and 2013 (Unaudited)
2014 2013
(000s) (000s)Cash flows from operating activitiesInterest received $ 44 $ 60Dividends received 13,290 15,864Proceeds from sale and maturity of investments 82,834 188,685Purchases of investments (68,939) (176,640)Operating expenses paid (4,136) (3,738)
Net cash from/(used in) operating activities 23,093 24,231
Cash flows from financing activitiesProceeds from issuances of redeemable units 44,337 94,791Amounts paid on redemption of redeemable units (67,157) (118,704)Distributions paid to holders of redeemable units, net of reinvested distributions (360) (243)
Net cash (used in)/from financing activities (23,180) (24,156)
Net increase (decrease) in cash (87) 75Cash at beginning of year 126 88Effect of exchange rate changes — —
Cash at end of period $ 39 $ 163
The accompanying notes are an integral part of these financial statements.
Franklin Templeton Investments Funds 213
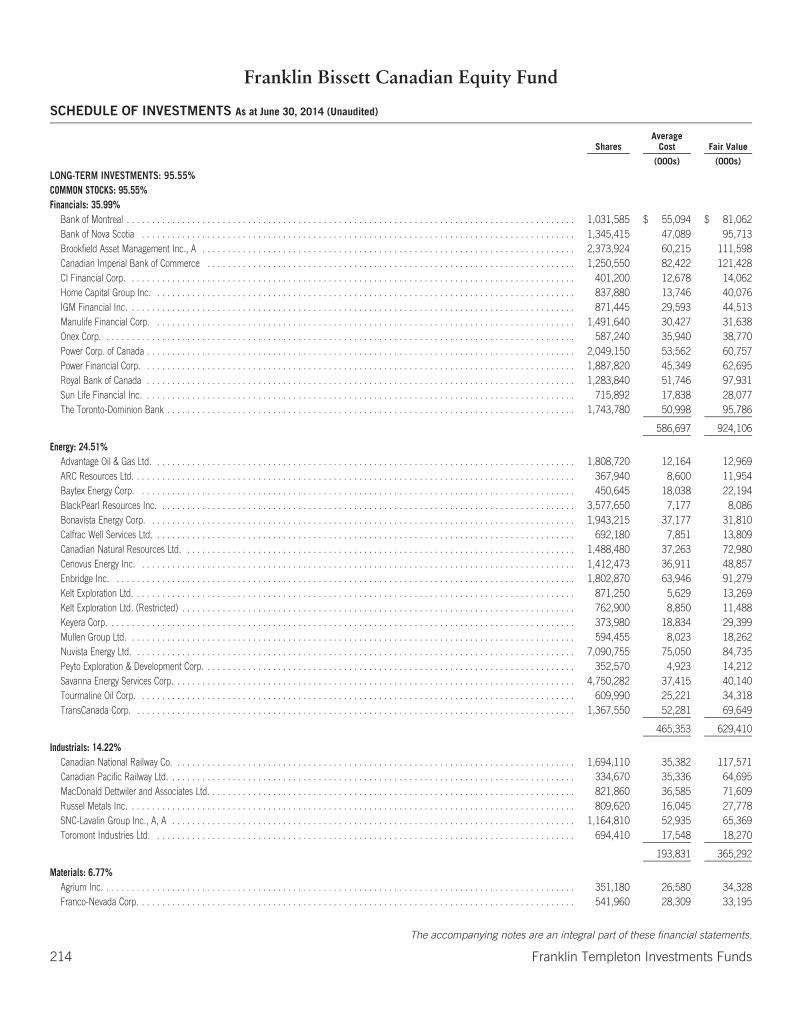
Franklin Bissett Canadian Equity Fund
SCHEDULE OF INVESTMENTS As at June 30, 2014 (Unaudited)
SharesAverage
Cost Fair Value
(000s) (000s)
LONG-TERM INVESTMENTS: 95.55%COMMON STOCKS: 95.55%Financials: 35.99%
Bank of Montreal . . . . . . . . . . . . . . . . . . . . . . . . . . . . . . . . . . . . . . . . . . . . . . . . . . . . . . . . . . . . . . . . . . . . . . . . . . . . . . . . . . . . . . . . . 1,031,585 $ 55,094 $ 81,062Bank of Nova Scotia . . . . . . . . . . . . . . . . . . . . . . . . . . . . . . . . . . . . . . . . . . . . . . . . . . . . . . . . . . . . . . . . . . . . . . . . . . . . . . . . . . . . . . 1,345,415 47,089 95,713Brookfield Asset Management Inc., A . . . . . . . . . . . . . . . . . . . . . . . . . . . . . . . . . . . . . . . . . . . . . . . . . . . . . . . . . . . . . . . . . . . . . . . . . . 2,373,924 60,215 111,598Canadian Imperial Bank of Commerce . . . . . . . . . . . . . . . . . . . . . . . . . . . . . . . . . . . . . . . . . . . . . . . . . . . . . . . . . . . . . . . . . . . . . . . . . 1,250,550 82,422 121,428CI Financial Corp. . . . . . . . . . . . . . . . . . . . . . . . . . . . . . . . . . . . . . . . . . . . . . . . . . . . . . . . . . . . . . . . . . . . . . . . . . . . . . . . . . . . . . . . . 401,200 12,678 14,062Home Capital Group Inc. . . . . . . . . . . . . . . . . . . . . . . . . . . . . . . . . . . . . . . . . . . . . . . . . . . . . . . . . . . . . . . . . . . . . . . . . . . . . . . . . . . . 837,880 13,746 40,076IGM Financial Inc. . . . . . . . . . . . . . . . . . . . . . . . . . . . . . . . . . . . . . . . . . . . . . . . . . . . . . . . . . . . . . . . . . . . . . . . . . . . . . . . . . . . . . . . . 871,445 29,593 44,513Manulife Financial Corp. . . . . . . . . . . . . . . . . . . . . . . . . . . . . . . . . . . . . . . . . . . . . . . . . . . . . . . . . . . . . . . . . . . . . . . . . . . . . . . . . . . . 1,491,640 30,427 31,638Onex Corp. . . . . . . . . . . . . . . . . . . . . . . . . . . . . . . . . . . . . . . . . . . . . . . . . . . . . . . . . . . . . . . . . . . . . . . . . . . . . . . . . . . . . . . . . . . . . . 587,240 35,940 38,770Power Corp. of Canada . . . . . . . . . . . . . . . . . . . . . . . . . . . . . . . . . . . . . . . . . . . . . . . . . . . . . . . . . . . . . . . . . . . . . . . . . . . . . . . . . . . . . 2,049,150 53,562 60,757Power Financial Corp. . . . . . . . . . . . . . . . . . . . . . . . . . . . . . . . . . . . . . . . . . . . . . . . . . . . . . . . . . . . . . . . . . . . . . . . . . . . . . . . . . . . . . 1,887,820 45,349 62,695Royal Bank of Canada . . . . . . . . . . . . . . . . . . . . . . . . . . . . . . . . . . . . . . . . . . . . . . . . . . . . . . . . . . . . . . . . . . . . . . . . . . . . . . . . . . . . . 1,283,840 51,746 97,931Sun Life Financial Inc. . . . . . . . . . . . . . . . . . . . . . . . . . . . . . . . . . . . . . . . . . . . . . . . . . . . . . . . . . . . . . . . . . . . . . . . . . . . . . . . . . . . . . 715,892 17,838 28,077The Toronto-Dominion Bank . . . . . . . . . . . . . . . . . . . . . . . . . . . . . . . . . . . . . . . . . . . . . . . . . . . . . . . . . . . . . . . . . . . . . . . . . . . . . . . . . 1,743,780 50,998 95,786
586,697 924,106
Energy: 24.51%Advantage Oil & Gas Ltd. . . . . . . . . . . . . . . . . . . . . . . . . . . . . . . . . . . . . . . . . . . . . . . . . . . . . . . . . . . . . . . . . . . . . . . . . . . . . . . . . . . . 1,808,720 12,164 12,969ARC Resources Ltd. . . . . . . . . . . . . . . . . . . . . . . . . . . . . . . . . . . . . . . . . . . . . . . . . . . . . . . . . . . . . . . . . . . . . . . . . . . . . . . . . . . . . . . . 367,940 8,600 11,954Baytex Energy Corp. . . . . . . . . . . . . . . . . . . . . . . . . . . . . . . . . . . . . . . . . . . . . . . . . . . . . . . . . . . . . . . . . . . . . . . . . . . . . . . . . . . . . . . 450,645 18,038 22,194BlackPearl Resources Inc. . . . . . . . . . . . . . . . . . . . . . . . . . . . . . . . . . . . . . . . . . . . . . . . . . . . . . . . . . . . . . . . . . . . . . . . . . . . . . . . . . . 3,577,650 7,177 8,086Bonavista Energy Corp. . . . . . . . . . . . . . . . . . . . . . . . . . . . . . . . . . . . . . . . . . . . . . . . . . . . . . . . . . . . . . . . . . . . . . . . . . . . . . . . . . . . . 1,943,215 37,177 31,810Calfrac Well Services Ltd. . . . . . . . . . . . . . . . . . . . . . . . . . . . . . . . . . . . . . . . . . . . . . . . . . . . . . . . . . . . . . . . . . . . . . . . . . . . . . . . . . . . 692,180 7,851 13,809Canadian Natural Resources Ltd. . . . . . . . . . . . . . . . . . . . . . . . . . . . . . . . . . . . . . . . . . . . . . . . . . . . . . . . . . . . . . . . . . . . . . . . . . . . . . 1,488,480 37,263 72,980Cenovus Energy Inc. . . . . . . . . . . . . . . . . . . . . . . . . . . . . . . . . . . . . . . . . . . . . . . . . . . . . . . . . . . . . . . . . . . . . . . . . . . . . . . . . . . . . . . 1,412,473 36,911 48,857Enbridge Inc. . . . . . . . . . . . . . . . . . . . . . . . . . . . . . . . . . . . . . . . . . . . . . . . . . . . . . . . . . . . . . . . . . . . . . . . . . . . . . . . . . . . . . . . . . . . 1,802,870 63,946 91,279Kelt Exploration Ltd. . . . . . . . . . . . . . . . . . . . . . . . . . . . . . . . . . . . . . . . . . . . . . . . . . . . . . . . . . . . . . . . . . . . . . . . . . . . . . . . . . . . . . . . 871,250 5,629 13,269Kelt Exploration Ltd. (Restricted) . . . . . . . . . . . . . . . . . . . . . . . . . . . . . . . . . . . . . . . . . . . . . . . . . . . . . . . . . . . . . . . . . . . . . . . . . . . . . . 762,900 8,850 11,488Keyera Corp. . . . . . . . . . . . . . . . . . . . . . . . . . . . . . . . . . . . . . . . . . . . . . . . . . . . . . . . . . . . . . . . . . . . . . . . . . . . . . . . . . . . . . . . . . . . . 373,980 18,834 29,399Mullen Group Ltd. . . . . . . . . . . . . . . . . . . . . . . . . . . . . . . . . . . . . . . . . . . . . . . . . . . . . . . . . . . . . . . . . . . . . . . . . . . . . . . . . . . . . . . . . 594,455 8,023 18,262Nuvista Energy Ltd. . . . . . . . . . . . . . . . . . . . . . . . . . . . . . . . . . . . . . . . . . . . . . . . . . . . . . . . . . . . . . . . . . . . . . . . . . . . . . . . . . . . . . . . 7,090,755 75,050 84,735Peyto Exploration & Development Corp. . . . . . . . . . . . . . . . . . . . . . . . . . . . . . . . . . . . . . . . . . . . . . . . . . . . . . . . . . . . . . . . . . . . . . . . . . 352,570 4,923 14,212Savanna Energy Services Corp. . . . . . . . . . . . . . . . . . . . . . . . . . . . . . . . . . . . . . . . . . . . . . . . . . . . . . . . . . . . . . . . . . . . . . . . . . . . . . . . 4,750,282 37,415 40,140Tourmaline Oil Corp. . . . . . . . . . . . . . . . . . . . . . . . . . . . . . . . . . . . . . . . . . . . . . . . . . . . . . . . . . . . . . . . . . . . . . . . . . . . . . . . . . . . . . . 609,990 25,221 34,318TransCanada Corp. . . . . . . . . . . . . . . . . . . . . . . . . . . . . . . . . . . . . . . . . . . . . . . . . . . . . . . . . . . . . . . . . . . . . . . . . . . . . . . . . . . . . . . . 1,367,550 52,281 69,649
465,353 629,410
Industrials: 14.22%Canadian National Railway Co. . . . . . . . . . . . . . . . . . . . . . . . . . . . . . . . . . . . . . . . . . . . . . . . . . . . . . . . . . . . . . . . . . . . . . . . . . . . . . . . 1,694,110 35,382 117,571Canadian Pacific Railway Ltd. . . . . . . . . . . . . . . . . . . . . . . . . . . . . . . . . . . . . . . . . . . . . . . . . . . . . . . . . . . . . . . . . . . . . . . . . . . . . . . . . 334,670 35,336 64,695MacDonald Dettwiler and Associates Ltd. . . . . . . . . . . . . . . . . . . . . . . . . . . . . . . . . . . . . . . . . . . . . . . . . . . . . . . . . . . . . . . . . . . . . . . . . 821,860 36,585 71,609Russel Metals Inc. . . . . . . . . . . . . . . . . . . . . . . . . . . . . . . . . . . . . . . . . . . . . . . . . . . . . . . . . . . . . . . . . . . . . . . . . . . . . . . . . . . . . . . . . 809,620 16,045 27,778SNC-Lavalin Group Inc., A, A . . . . . . . . . . . . . . . . . . . . . . . . . . . . . . . . . . . . . . . . . . . . . . . . . . . . . . . . . . . . . . . . . . . . . . . . . . . . . . . . 1,164,810 52,935 65,369Toromont Industries Ltd. . . . . . . . . . . . . . . . . . . . . . . . . . . . . . . . . . . . . . . . . . . . . . . . . . . . . . . . . . . . . . . . . . . . . . . . . . . . . . . . . . . . 694,410 17,548 18,270
193,831 365,292
Materials: 6.77%Agrium Inc. . . . . . . . . . . . . . . . . . . . . . . . . . . . . . . . . . . . . . . . . . . . . . . . . . . . . . . . . . . . . . . . . . . . . . . . . . . . . . . . . . . . . . . . . . . . . . 351,180 26,580 34,328Franco-Nevada Corp. . . . . . . . . . . . . . . . . . . . . . . . . . . . . . . . . . . . . . . . . . . . . . . . . . . . . . . . . . . . . . . . . . . . . . . . . . . . . . . . . . . . . . . 541,960 28,309 33,195
The accompanying notes are an integral part of these financial statements.
214 Franklin Templeton Investments Funds
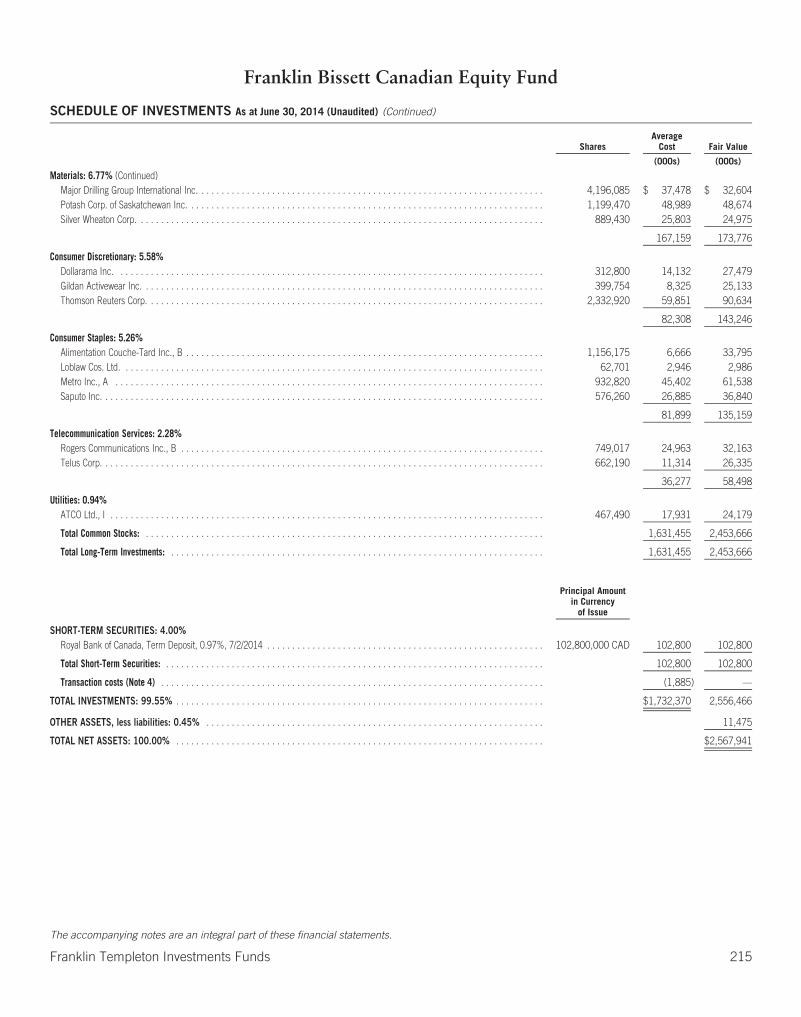
Franklin Bissett Canadian Equity Fund
SCHEDULE OF INVESTMENTS As at June 30, 2014 (Unaudited) (Continued)
SharesAverage
Cost Fair Value
(000s) (000s)
Materials: 6.77% (Continued)Major Drilling Group International Inc. . . . . . . . . . . . . . . . . . . . . . . . . . . . . . . . . . . . . . . . . . . . . . . . . . . . . . . . . . . . . . . . . . . . . 4,196,085 $ 37,478 $ 32,604Potash Corp. of Saskatchewan Inc. . . . . . . . . . . . . . . . . . . . . . . . . . . . . . . . . . . . . . . . . . . . . . . . . . . . . . . . . . . . . . . . . . . . . . . 1,199,470 48,989 48,674Silver Wheaton Corp. . . . . . . . . . . . . . . . . . . . . . . . . . . . . . . . . . . . . . . . . . . . . . . . . . . . . . . . . . . . . . . . . . . . . . . . . . . . . . . . . 889,430 25,803 24,975
167,159 173,776
Consumer Discretionary: 5.58%Dollarama Inc. . . . . . . . . . . . . . . . . . . . . . . . . . . . . . . . . . . . . . . . . . . . . . . . . . . . . . . . . . . . . . . . . . . . . . . . . . . . . . . . . . . . . 312,800 14,132 27,479Gildan Activewear Inc. . . . . . . . . . . . . . . . . . . . . . . . . . . . . . . . . . . . . . . . . . . . . . . . . . . . . . . . . . . . . . . . . . . . . . . . . . . . . . . . 399,754 8,325 25,133Thomson Reuters Corp. . . . . . . . . . . . . . . . . . . . . . . . . . . . . . . . . . . . . . . . . . . . . . . . . . . . . . . . . . . . . . . . . . . . . . . . . . . . . . . 2,332,920 59,851 90,634
82,308 143,246
Consumer Staples: 5.26%Alimentation Couche-Tard Inc., B . . . . . . . . . . . . . . . . . . . . . . . . . . . . . . . . . . . . . . . . . . . . . . . . . . . . . . . . . . . . . . . . . . . . . . . 1,156,175 6,666 33,795Loblaw Cos. Ltd. . . . . . . . . . . . . . . . . . . . . . . . . . . . . . . . . . . . . . . . . . . . . . . . . . . . . . . . . . . . . . . . . . . . . . . . . . . . . . . . . . . . 62,701 2,946 2,986Metro Inc., A . . . . . . . . . . . . . . . . . . . . . . . . . . . . . . . . . . . . . . . . . . . . . . . . . . . . . . . . . . . . . . . . . . . . . . . . . . . . . . . . . . . . . 932,820 45,402 61,538Saputo Inc. . . . . . . . . . . . . . . . . . . . . . . . . . . . . . . . . . . . . . . . . . . . . . . . . . . . . . . . . . . . . . . . . . . . . . . . . . . . . . . . . . . . . . . . 576,260 26,885 36,840
81,899 135,159
Telecommunication Services: 2.28%Rogers Communications Inc., B . . . . . . . . . . . . . . . . . . . . . . . . . . . . . . . . . . . . . . . . . . . . . . . . . . . . . . . . . . . . . . . . . . . . . . . . 749,017 24,963 32,163Telus Corp. . . . . . . . . . . . . . . . . . . . . . . . . . . . . . . . . . . . . . . . . . . . . . . . . . . . . . . . . . . . . . . . . . . . . . . . . . . . . . . . . . . . . . . . 662,190 11,314 26,335
36,277 58,498
Utilities: 0.94%ATCO Ltd., I . . . . . . . . . . . . . . . . . . . . . . . . . . . . . . . . . . . . . . . . . . . . . . . . . . . . . . . . . . . . . . . . . . . . . . . . . . . . . . . . . . . . . . 467,490 17,931 24,179
Total Common Stocks: . . . . . . . . . . . . . . . . . . . . . . . . . . . . . . . . . . . . . . . . . . . . . . . . . . . . . . . . . . . . . . . . . . . . . . . . . . . . . . . 1,631,455 2,453,666
Total Long-Term Investments: . . . . . . . . . . . . . . . . . . . . . . . . . . . . . . . . . . . . . . . . . . . . . . . . . . . . . . . . . . . . . . . . . . . . . . . . . . 1,631,455 2,453,666
Principal Amountin Currency
of Issue
SHORT-TERM SECURITIES: 4.00%Royal Bank of Canada, Term Deposit, 0.97%, 7/2/2014 . . . . . . . . . . . . . . . . . . . . . . . . . . . . . . . . . . . . . . . . . . . . . . . . . . . . . . . 102,800,000 CAD 102,800 102,800
Total Short-Term Securities: . . . . . . . . . . . . . . . . . . . . . . . . . . . . . . . . . . . . . . . . . . . . . . . . . . . . . . . . . . . . . . . . . . . . . . . . . . . 102,800 102,800
Transaction costs (Note 4) . . . . . . . . . . . . . . . . . . . . . . . . . . . . . . . . . . . . . . . . . . . . . . . . . . . . . . . . . . . . . . . . . . . . . . . . . . . . (1,885) —
TOTAL INVESTMENTS: 99.55% . . . . . . . . . . . . . . . . . . . . . . . . . . . . . . . . . . . . . . . . . . . . . . . . . . . . . . . . . . . . . . . . . . . . . . . . . $1,732,370 2,556,466
OTHER ASSETS, less liabilities: 0.45% . . . . . . . . . . . . . . . . . . . . . . . . . . . . . . . . . . . . . . . . . . . . . . . . . . . . . . . . . . . . . . . . . . . 11,475
TOTAL NET ASSETS: 100.00% . . . . . . . . . . . . . . . . . . . . . . . . . . . . . . . . . . . . . . . . . . . . . . . . . . . . . . . . . . . . . . . . . . . . . . . . . $2,567,941
The accompanying notes are an integral part of these financial statements.
Franklin Templeton Investments Funds 215

Franklin Bissett Canadian Equity Fund
STATEMENTS OF FINANCIAL POSITION (Unaudited)
As atJune 30,
2014
As atDecember 31,
2013
As atJanuary 1,
2013
(000s) (000s) (000s)AssetsCurrent assetsInvestments at fair value through profit or loss $ 2,556,466 $ 2,220,917 $ 1,858,492Cash
Canadian 58 1,037 999Receivables
Investment securities sold 6,914 1,630 —Subscription of redeemable units 2,210 2,816 447Dividends and interest 6,131 5,191 5,845
Other assets (Note 6(g)) — 368 154
Total assets 2,571,779 2,231,959 1,865,937
LiabilitiesCurrent liabilitiesPayables
Investment securities purchased 688 — 85Redemption of redeemable units 1,769 886 359Management fees 1,205 1,145 971Fixed administration fees 176 — —Accrued expenses — 677 496
Total liabilities 3,838 2,708 1,911
Net assets attributable to holders of redeemable units $ 2,567,941 $ 2,229,251 $ 1,864,026
Represented by:Net assets as previously reported under Canadian GAAP — 2,226,743 1,861,157Revaluation of investments at fair value through profit or loss (Note 3(c)) — 2,508 2,869
Net assets attributable to holders of redeemable units $ 2,567,941 $ 2,229,251 $ 1,864,026
Net assets attributable to holders of redeemable units per series (000s)Series A $ 534,331 $ 496,358 $ 416,864Series F 297,010 267,349 234,799Series I 10,367 5,473 1,073Series O 1,726,233 1,460,071 1,211,290
Number of redeemable units outstanding (Note 5)Series A 5,439,401 5,631,541 5,568,276Series F 2,558,121 2,583,253 2,705,621Series I 96,648 57,120 13,269Series O 12,506,195 11,935,178 11,948,525
Net assets attributable to holders of redeemable units per unit — CADSeries A $ 98.23 $ 88.14 $ 74.86Series F 116.10 103.49 86.78Series I 107.27 95.82 80.86Series O 138.03 122.33 101.38
Cost of investments held (000s) $ 1,732,370 $ 1,595,224 $ 1,470,721
The accompanying notes are an integral part of these financial statements.
216 Franklin Templeton Investments Funds
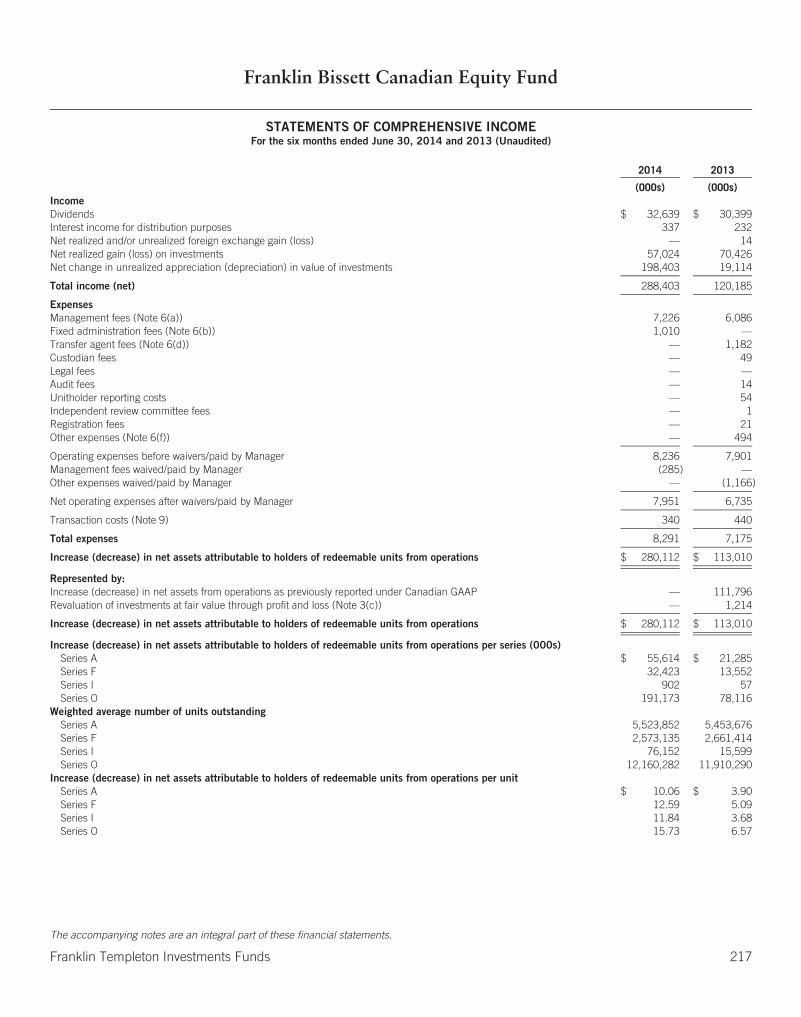
Franklin Bissett Canadian Equity Fund
STATEMENTS OF COMPREHENSIVE INCOMEFor the six months ended June 30, 2014 and 2013 (Unaudited)
2014 2013
(000s) (000s)IncomeDividends $ 32,639 $ 30,399Interest income for distribution purposes 337 232Net realized and/or unrealized foreign exchange gain (loss) — 14Net realized gain (loss) on investments 57,024 70,426Net change in unrealized appreciation (depreciation) in value of investments 198,403 19,114
Total income (net) 288,403 120,185
ExpensesManagement fees (Note 6(a)) 7,226 6,086Fixed administration fees (Note 6(b)) 1,010 —Transfer agent fees (Note 6(d)) — 1,182Custodian fees — 49Legal fees — —Audit fees — 14Unitholder reporting costs — 54Independent review committee fees — 1Registration fees — 21Other expenses (Note 6(f)) — 494
Operating expenses before waivers/paid by Manager 8,236 7,901Management fees waived/paid by Manager (285) —Other expenses waived/paid by Manager — (1,166)
Net operating expenses after waivers/paid by Manager 7,951 6,735
Transaction costs (Note 9) 340 440
Total expenses 8,291 7,175
Increase (decrease) in net assets attributable to holders of redeemable units from operations $ 280,112 $ 113,010
Represented by:Increase (decrease) in net assets from operations as previously reported under Canadian GAAP — 111,796Revaluation of investments at fair value through profit and loss (Note 3(c)) — 1,214
Increase (decrease) in net assets attributable to holders of redeemable units from operations $ 280,112 $ 113,010
Increase (decrease) in net assets attributable to holders of redeemable units from operations per series (000s)Series A $ 55,614 $ 21,285Series F 32,423 13,552Series I 902 57Series O 191,173 78,116
Weighted average number of units outstandingSeries A 5,523,852 5,453,676Series F 2,573,135 2,661,414Series I 76,152 15,599Series O 12,160,282 11,910,290
Increase (decrease) in net assets attributable to holders of redeemable units from operations per unitSeries A $ 10.06 $ 3.90Series F 12.59 5.09Series I 11.84 3.68Series O 15.73 6.57
The accompanying notes are an integral part of these financial statements.
Franklin Templeton Investments Funds 217
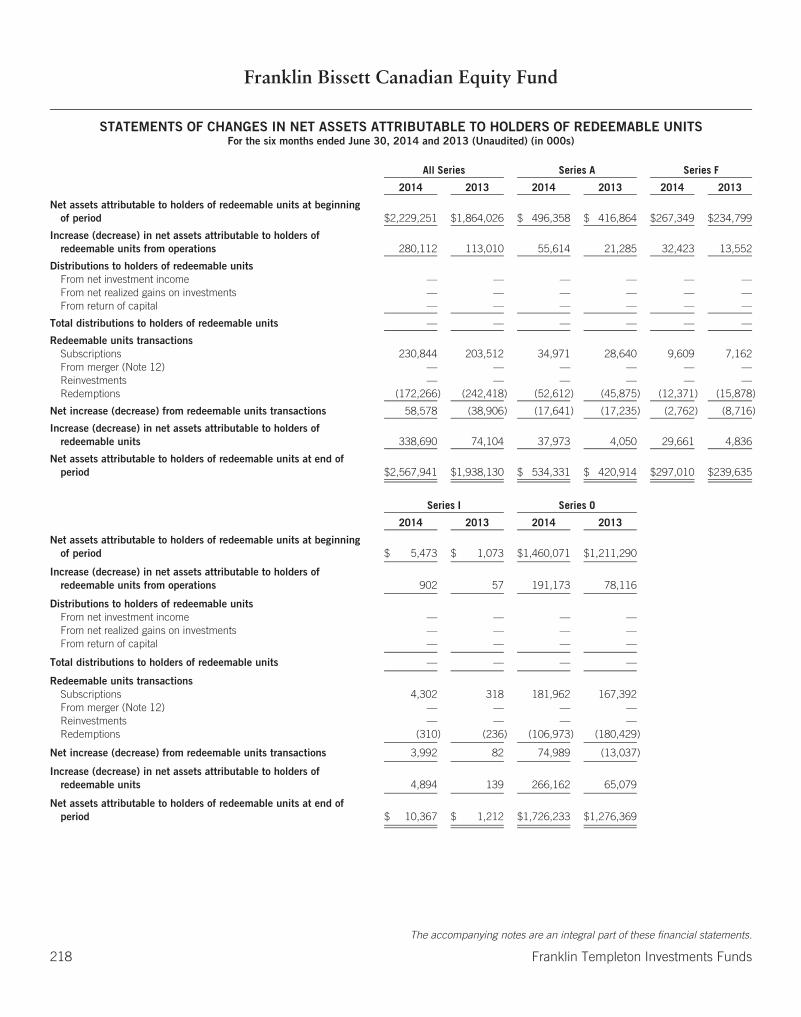
Franklin Bissett Canadian Equity Fund
STATEMENTS OF CHANGES IN NET ASSETS ATTRIBUTABLE TO HOLDERS OF REDEEMABLE UNITSFor the six months ended June 30, 2014 and 2013 (Unaudited) (in 000s)
All Series Series A Series F
2014 2013 2014 2013 2014 2013
Net assets attributable to holders of redeemable units at beginningof period $2,229,251 $1,864,026 $ 496,358 $ 416,864 $267,349 $234,799
Increase (decrease) in net assets attributable to holders ofredeemable units from operations 280,112 113,010 55,614 21,285 32,423 13,552
Distributions to holders of redeemable unitsFrom net investment income — — — — — —From net realized gains on investments — — — — — —From return of capital — — — — — —
Total distributions to holders of redeemable units — — — — — —
Redeemable units transactionsSubscriptions 230,844 203,512 34,971 28,640 9,609 7,162From merger (Note 12) — — — — — —Reinvestments — — — — — —Redemptions (172,266) (242,418) (52,612) (45,875) (12,371) (15,878)
Net increase (decrease) from redeemable units transactions 58,578 (38,906) (17,641) (17,235) (2,762) (8,716)
Increase (decrease) in net assets attributable to holders ofredeemable units 338,690 74,104 37,973 4,050 29,661 4,836
Net assets attributable to holders of redeemable units at end ofperiod $2,567,941 $1,938,130 $ 534,331 $ 420,914 $297,010 $239,635
Series I Series O
2014 2013 2014 2013
Net assets attributable to holders of redeemable units at beginningof period $ 5,473 $ 1,073 $1,460,071 $1,211,290
Increase (decrease) in net assets attributable to holders ofredeemable units from operations 902 57 191,173 78,116
Distributions to holders of redeemable unitsFrom net investment income — — — —From net realized gains on investments — — — —From return of capital — — — —
Total distributions to holders of redeemable units — — — —
Redeemable units transactionsSubscriptions 4,302 318 181,962 167,392From merger (Note 12) — — — —Reinvestments — — — —Redemptions (310) (236) (106,973) (180,429)
Net increase (decrease) from redeemable units transactions 3,992 82 74,989 (13,037)
Increase (decrease) in net assets attributable to holders ofredeemable units 4,894 139 266,162 65,079
Net assets attributable to holders of redeemable units at end ofperiod $ 10,367 $ 1,212 $1,726,233 $1,276,369
The accompanying notes are an integral part of these financial statements.
218 Franklin Templeton Investments Funds

Franklin Bissett Canadian Equity Fund
STATEMENTS OF CASH FLOWSFor the six months ended June 30, 2014 and 2013 (Unaudited)
2014 2013
(000s) (000s)Cash flows from operating activitiesInterest received $ 337 $ 235Dividends received 31,941 28,247Proceeds from sale and maturity of investments 235,747 266,931Purchases of investments (321,047) (252,312)Operating expenses paid (8,024) (6,758)
Net cash from/(used in) operating activities (61,046) 36,343
Cash flows from financing activitiesProceeds from issuances of redeemable units 231,451 202,480Amounts paid on redemption of redeemable units (171,384) (238,823)
Net cash (used in)/from financing activities 60,067 (36,343)
Net increase (decrease) in cash (979) —Cash at beginning of year 1,037 999Effect of exchange rate changes — —
Cash at end of period $ 58 $ 999
The accompanying notes are an integral part of these financial statements.
Franklin Templeton Investments Funds 219
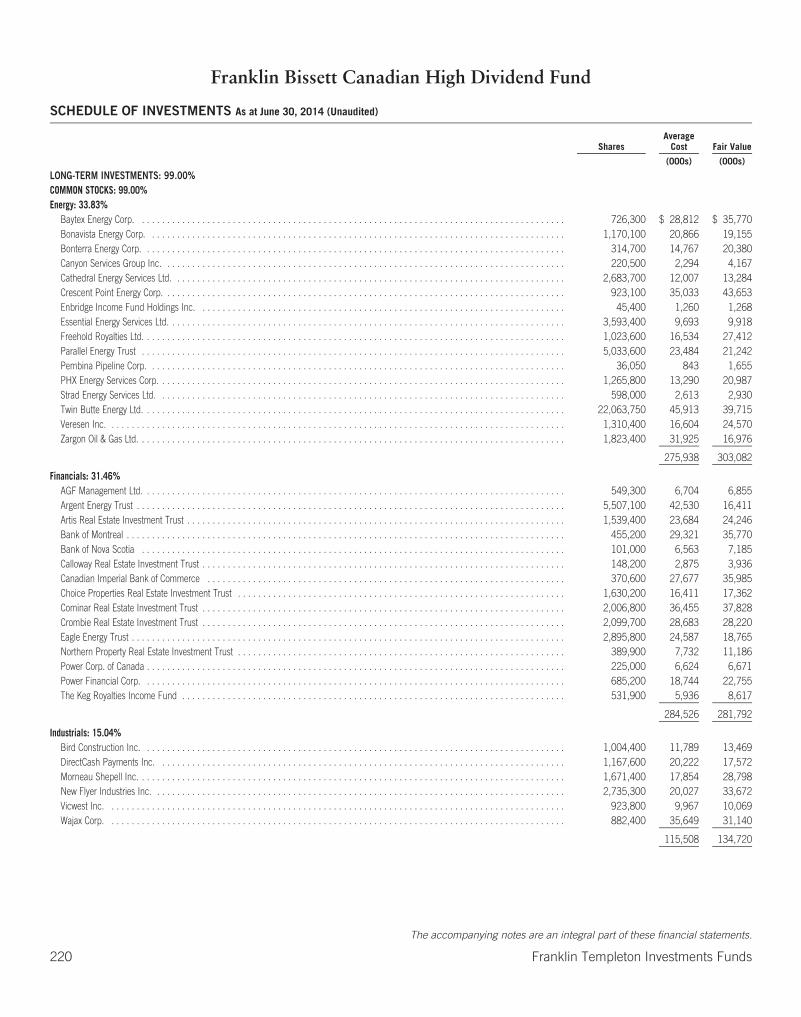
Franklin Bissett Canadian High Dividend Fund
SCHEDULE OF INVESTMENTS As at June 30, 2014 (Unaudited)
SharesAverage
Cost Fair Value
(000s) (000s)
LONG-TERM INVESTMENTS: 99.00%COMMON STOCKS: 99.00%Energy: 33.83%
Baytex Energy Corp. . . . . . . . . . . . . . . . . . . . . . . . . . . . . . . . . . . . . . . . . . . . . . . . . . . . . . . . . . . . . . . . . . . . . . . . . . . . . . . . . . . . . 726,300 $ 28,812 $ 35,770Bonavista Energy Corp. . . . . . . . . . . . . . . . . . . . . . . . . . . . . . . . . . . . . . . . . . . . . . . . . . . . . . . . . . . . . . . . . . . . . . . . . . . . . . . . . . . 1,170,100 20,866 19,155Bonterra Energy Corp. . . . . . . . . . . . . . . . . . . . . . . . . . . . . . . . . . . . . . . . . . . . . . . . . . . . . . . . . . . . . . . . . . . . . . . . . . . . . . . . . . . . 314,700 14,767 20,380Canyon Services Group Inc. . . . . . . . . . . . . . . . . . . . . . . . . . . . . . . . . . . . . . . . . . . . . . . . . . . . . . . . . . . . . . . . . . . . . . . . . . . . . . . . 220,500 2,294 4,167Cathedral Energy Services Ltd. . . . . . . . . . . . . . . . . . . . . . . . . . . . . . . . . . . . . . . . . . . . . . . . . . . . . . . . . . . . . . . . . . . . . . . . . . . . . . 2,683,700 12,007 13,284Crescent Point Energy Corp. . . . . . . . . . . . . . . . . . . . . . . . . . . . . . . . . . . . . . . . . . . . . . . . . . . . . . . . . . . . . . . . . . . . . . . . . . . . . . . . 923,100 35,033 43,653Enbridge Income Fund Holdings Inc. . . . . . . . . . . . . . . . . . . . . . . . . . . . . . . . . . . . . . . . . . . . . . . . . . . . . . . . . . . . . . . . . . . . . . . . . 45,400 1,260 1,268Essential Energy Services Ltd. . . . . . . . . . . . . . . . . . . . . . . . . . . . . . . . . . . . . . . . . . . . . . . . . . . . . . . . . . . . . . . . . . . . . . . . . . . . . . . 3,593,400 9,693 9,918Freehold Royalties Ltd. . . . . . . . . . . . . . . . . . . . . . . . . . . . . . . . . . . . . . . . . . . . . . . . . . . . . . . . . . . . . . . . . . . . . . . . . . . . . . . . . . . . 1,023,600 16,534 27,412Parallel Energy Trust . . . . . . . . . . . . . . . . . . . . . . . . . . . . . . . . . . . . . . . . . . . . . . . . . . . . . . . . . . . . . . . . . . . . . . . . . . . . . . . . . . . . 5,033,600 23,484 21,242Pembina Pipeline Corp. . . . . . . . . . . . . . . . . . . . . . . . . . . . . . . . . . . . . . . . . . . . . . . . . . . . . . . . . . . . . . . . . . . . . . . . . . . . . . . . . . . 36,050 843 1,655PHX Energy Services Corp. . . . . . . . . . . . . . . . . . . . . . . . . . . . . . . . . . . . . . . . . . . . . . . . . . . . . . . . . . . . . . . . . . . . . . . . . . . . . . . . . 1,265,800 13,290 20,987Strad Energy Services Ltd. . . . . . . . . . . . . . . . . . . . . . . . . . . . . . . . . . . . . . . . . . . . . . . . . . . . . . . . . . . . . . . . . . . . . . . . . . . . . . . . . 598,000 2,613 2,930Twin Butte Energy Ltd. . . . . . . . . . . . . . . . . . . . . . . . . . . . . . . . . . . . . . . . . . . . . . . . . . . . . . . . . . . . . . . . . . . . . . . . . . . . . . . . . . . . 22,063,750 45,913 39,715Veresen Inc. . . . . . . . . . . . . . . . . . . . . . . . . . . . . . . . . . . . . . . . . . . . . . . . . . . . . . . . . . . . . . . . . . . . . . . . . . . . . . . . . . . . . . . . . . . 1,310,400 16,604 24,570Zargon Oil & Gas Ltd. . . . . . . . . . . . . . . . . . . . . . . . . . . . . . . . . . . . . . . . . . . . . . . . . . . . . . . . . . . . . . . . . . . . . . . . . . . . . . . . . . . . . 1,823,400 31,925 16,976
275,938 303,082
Financials: 31.46%AGF Management Ltd. . . . . . . . . . . . . . . . . . . . . . . . . . . . . . . . . . . . . . . . . . . . . . . . . . . . . . . . . . . . . . . . . . . . . . . . . . . . . . . . . . . . 549,300 6,704 6,855Argent Energy Trust . . . . . . . . . . . . . . . . . . . . . . . . . . . . . . . . . . . . . . . . . . . . . . . . . . . . . . . . . . . . . . . . . . . . . . . . . . . . . . . . . . . . . 5,507,100 42,530 16,411Artis Real Estate Investment Trust . . . . . . . . . . . . . . . . . . . . . . . . . . . . . . . . . . . . . . . . . . . . . . . . . . . . . . . . . . . . . . . . . . . . . . . . . . . 1,539,400 23,684 24,246Bank of Montreal . . . . . . . . . . . . . . . . . . . . . . . . . . . . . . . . . . . . . . . . . . . . . . . . . . . . . . . . . . . . . . . . . . . . . . . . . . . . . . . . . . . . . . . 455,200 29,321 35,770Bank of Nova Scotia . . . . . . . . . . . . . . . . . . . . . . . . . . . . . . . . . . . . . . . . . . . . . . . . . . . . . . . . . . . . . . . . . . . . . . . . . . . . . . . . . . . . 101,000 6,563 7,185Calloway Real Estate Investment Trust . . . . . . . . . . . . . . . . . . . . . . . . . . . . . . . . . . . . . . . . . . . . . . . . . . . . . . . . . . . . . . . . . . . . . . . . 148,200 2,875 3,936Canadian Imperial Bank of Commerce . . . . . . . . . . . . . . . . . . . . . . . . . . . . . . . . . . . . . . . . . . . . . . . . . . . . . . . . . . . . . . . . . . . . . . . 370,600 27,677 35,985Choice Properties Real Estate Investment Trust . . . . . . . . . . . . . . . . . . . . . . . . . . . . . . . . . . . . . . . . . . . . . . . . . . . . . . . . . . . . . . . . . 1,630,200 16,411 17,362Cominar Real Estate Investment Trust . . . . . . . . . . . . . . . . . . . . . . . . . . . . . . . . . . . . . . . . . . . . . . . . . . . . . . . . . . . . . . . . . . . . . . . . 2,006,800 36,455 37,828Crombie Real Estate Investment Trust . . . . . . . . . . . . . . . . . . . . . . . . . . . . . . . . . . . . . . . . . . . . . . . . . . . . . . . . . . . . . . . . . . . . . . . . 2,099,700 28,683 28,220Eagle Energy Trust . . . . . . . . . . . . . . . . . . . . . . . . . . . . . . . . . . . . . . . . . . . . . . . . . . . . . . . . . . . . . . . . . . . . . . . . . . . . . . . . . . . . . . 2,895,800 24,587 18,765Northern Property Real Estate Investment Trust . . . . . . . . . . . . . . . . . . . . . . . . . . . . . . . . . . . . . . . . . . . . . . . . . . . . . . . . . . . . . . . . . 389,900 7,732 11,186Power Corp. of Canada . . . . . . . . . . . . . . . . . . . . . . . . . . . . . . . . . . . . . . . . . . . . . . . . . . . . . . . . . . . . . . . . . . . . . . . . . . . . . . . . . . . 225,000 6,624 6,671Power Financial Corp. . . . . . . . . . . . . . . . . . . . . . . . . . . . . . . . . . . . . . . . . . . . . . . . . . . . . . . . . . . . . . . . . . . . . . . . . . . . . . . . . . . . 685,200 18,744 22,755The Keg Royalties Income Fund . . . . . . . . . . . . . . . . . . . . . . . . . . . . . . . . . . . . . . . . . . . . . . . . . . . . . . . . . . . . . . . . . . . . . . . . . . . . 531,900 5,936 8,617
284,526 281,792
Industrials: 15.04%Bird Construction Inc. . . . . . . . . . . . . . . . . . . . . . . . . . . . . . . . . . . . . . . . . . . . . . . . . . . . . . . . . . . . . . . . . . . . . . . . . . . . . . . . . . . . 1,004,400 11,789 13,469DirectCash Payments Inc. . . . . . . . . . . . . . . . . . . . . . . . . . . . . . . . . . . . . . . . . . . . . . . . . . . . . . . . . . . . . . . . . . . . . . . . . . . . . . . . . 1,167,600 20,222 17,572Morneau Shepell Inc. . . . . . . . . . . . . . . . . . . . . . . . . . . . . . . . . . . . . . . . . . . . . . . . . . . . . . . . . . . . . . . . . . . . . . . . . . . . . . . . . . . . . 1,671,400 17,854 28,798New Flyer Industries Inc. . . . . . . . . . . . . . . . . . . . . . . . . . . . . . . . . . . . . . . . . . . . . . . . . . . . . . . . . . . . . . . . . . . . . . . . . . . . . . . . . . 2,735,300 20,027 33,672Vicwest Inc. . . . . . . . . . . . . . . . . . . . . . . . . . . . . . . . . . . . . . . . . . . . . . . . . . . . . . . . . . . . . . . . . . . . . . . . . . . . . . . . . . . . . . . . . . . 923,800 9,967 10,069Wajax Corp. . . . . . . . . . . . . . . . . . . . . . . . . . . . . . . . . . . . . . . . . . . . . . . . . . . . . . . . . . . . . . . . . . . . . . . . . . . . . . . . . . . . . . . . . . . 882,400 35,649 31,140
115,508 134,720
The accompanying notes are an integral part of these financial statements.
220 Franklin Templeton Investments Funds
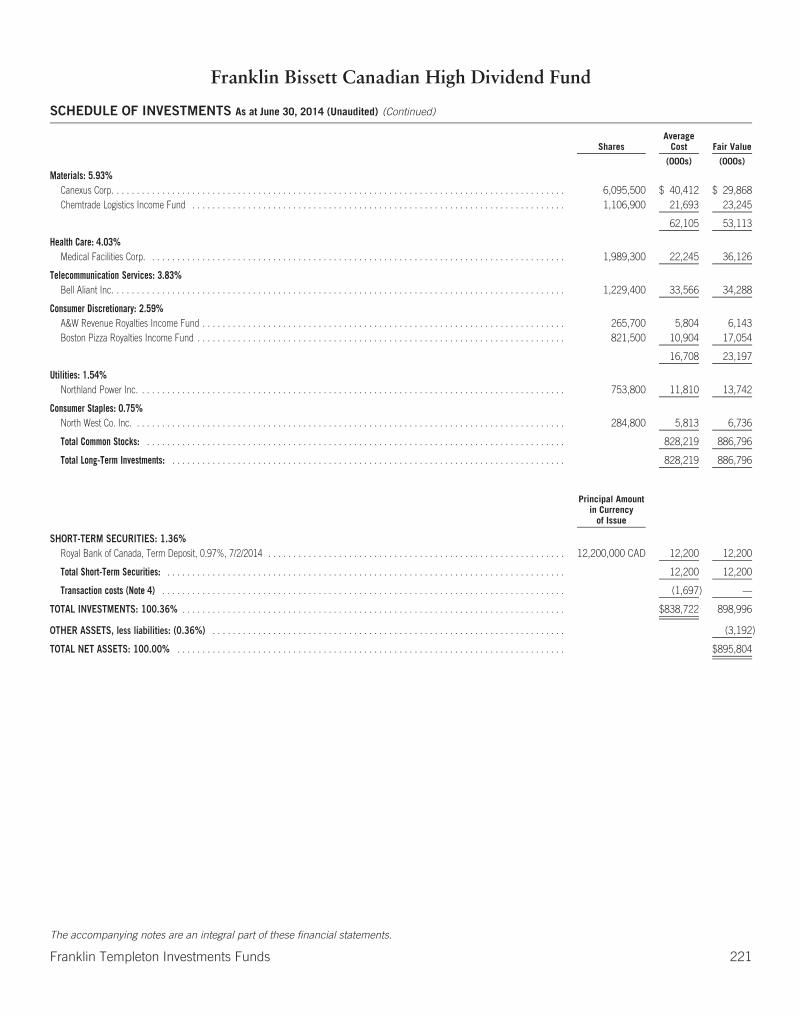
Franklin Bissett Canadian High Dividend Fund
SCHEDULE OF INVESTMENTS As at June 30, 2014 (Unaudited) (Continued)
SharesAverage
Cost Fair Value
(000s) (000s)
Materials: 5.93%Canexus Corp. . . . . . . . . . . . . . . . . . . . . . . . . . . . . . . . . . . . . . . . . . . . . . . . . . . . . . . . . . . . . . . . . . . . . . . . . . . . . . . . . . . . . . . . . . 6,095,500 $ 40,412 $ 29,868Chemtrade Logistics Income Fund . . . . . . . . . . . . . . . . . . . . . . . . . . . . . . . . . . . . . . . . . . . . . . . . . . . . . . . . . . . . . . . . . . . . . . . . . . 1,106,900 21,693 23,245
62,105 53,113
Health Care: 4.03%Medical Facilities Corp. . . . . . . . . . . . . . . . . . . . . . . . . . . . . . . . . . . . . . . . . . . . . . . . . . . . . . . . . . . . . . . . . . . . . . . . . . . . . . . . . . . 1,989,300 22,245 36,126
Telecommunication Services: 3.83%Bell Aliant Inc. . . . . . . . . . . . . . . . . . . . . . . . . . . . . . . . . . . . . . . . . . . . . . . . . . . . . . . . . . . . . . . . . . . . . . . . . . . . . . . . . . . . . . . . . . 1,229,400 33,566 34,288
Consumer Discretionary: 2.59%A&W Revenue Royalties Income Fund . . . . . . . . . . . . . . . . . . . . . . . . . . . . . . . . . . . . . . . . . . . . . . . . . . . . . . . . . . . . . . . . . . . . . . . . 265,700 5,804 6,143Boston Pizza Royalties Income Fund . . . . . . . . . . . . . . . . . . . . . . . . . . . . . . . . . . . . . . . . . . . . . . . . . . . . . . . . . . . . . . . . . . . . . . . . . 821,500 10,904 17,054
16,708 23,197
Utilities: 1.54%Northland Power Inc. . . . . . . . . . . . . . . . . . . . . . . . . . . . . . . . . . . . . . . . . . . . . . . . . . . . . . . . . . . . . . . . . . . . . . . . . . . . . . . . . . . . . 753,800 11,810 13,742
Consumer Staples: 0.75%North West Co. Inc. . . . . . . . . . . . . . . . . . . . . . . . . . . . . . . . . . . . . . . . . . . . . . . . . . . . . . . . . . . . . . . . . . . . . . . . . . . . . . . . . . . . . . 284,800 5,813 6,736
Total Common Stocks: . . . . . . . . . . . . . . . . . . . . . . . . . . . . . . . . . . . . . . . . . . . . . . . . . . . . . . . . . . . . . . . . . . . . . . . . . . . . . . . . . . . 828,219 886,796
Total Long-Term Investments: . . . . . . . . . . . . . . . . . . . . . . . . . . . . . . . . . . . . . . . . . . . . . . . . . . . . . . . . . . . . . . . . . . . . . . . . . . . . . . 828,219 886,796
Principal Amountin Currency
of Issue
SHORT-TERM SECURITIES: 1.36%Royal Bank of Canada, Term Deposit, 0.97%, 7/2/2014 . . . . . . . . . . . . . . . . . . . . . . . . . . . . . . . . . . . . . . . . . . . . . . . . . . . . . . . . . . . 12,200,000 CAD 12,200 12,200
Total Short-Term Securities: . . . . . . . . . . . . . . . . . . . . . . . . . . . . . . . . . . . . . . . . . . . . . . . . . . . . . . . . . . . . . . . . . . . . . . . . . . . . . . . 12,200 12,200
Transaction costs (Note 4) . . . . . . . . . . . . . . . . . . . . . . . . . . . . . . . . . . . . . . . . . . . . . . . . . . . . . . . . . . . . . . . . . . . . . . . . . . . . . . . . (1,697) —
TOTAL INVESTMENTS: 100.36% . . . . . . . . . . . . . . . . . . . . . . . . . . . . . . . . . . . . . . . . . . . . . . . . . . . . . . . . . . . . . . . . . . . . . . . . . . . . $838,722 898,996
OTHER ASSETS, less liabilities: (0.36%) . . . . . . . . . . . . . . . . . . . . . . . . . . . . . . . . . . . . . . . . . . . . . . . . . . . . . . . . . . . . . . . . . . . . . . (3,192)
TOTAL NET ASSETS: 100.00% . . . . . . . . . . . . . . . . . . . . . . . . . . . . . . . . . . . . . . . . . . . . . . . . . . . . . . . . . . . . . . . . . . . . . . . . . . . . . $895,804
The accompanying notes are an integral part of these financial statements.
Franklin Templeton Investments Funds 221

Franklin Bissett Canadian High Dividend Fund
STATEMENTS OF FINANCIAL POSITION (Unaudited)
As atJune 30,
2014
As atDecember 31,
2013
As atJanuary 1,
2013
(000s) (000s) (000s)AssetsCurrent assetsInvestments at fair value through profit or loss $ 898,996 $ 872,033 $ 703,509Cash
Canadian 169 805 89Receivables
Investment securities sold — 729 —Subscription of redeemable units 355 350 687Dividends and interest 6,007 5,434 4,987
Other assets (Note 6(g)) — 210 87
Total assets 905,527 879,561 709,359
LiabilitiesCurrent liabilitiesPayables
Investment securities purchased 3,329 473 159Redemption of redeemable units 923 337 239Management fees 1,100 1,103 872Fixed administration fees 148 — —Accrued expenses — 430 292
Distributions to unitholders 4,223 — —
Total liabilities 9,723 2,343 1,562
Net assets attributable to holders of redeemable units $ 895,804 $ 877,218 $ 707,797
Represented by:Net assets as previously reported under Canadian GAAP — 875,087 705,404Revaluation of investments at fair value through profit or loss (Note 3(c)) — 2,131 2,393
Net assets attributable to holders of redeemable units $ 895,804 $ 877,218 $ 707,797
Net assets attributable to holders of redeemable units per series (000s)Series A $ 552,297 $ 555,774 $ 438,976Series F 90,945 83,567 67,218Series I 6,787 4,515 2,240Series O 245,775 233,362 199,363
Number of redeemable units outstanding (Note 5)Series A 34,722,832 35,621,592 30,078,889Series F 4,936,604 4,650,383 4,043,314Series I 395,633 268,962 143,610Series O 11,116,227 10,894,332 10,202,434
Net assets attributable to holders of redeemable units per unit — CADSeries A $ 15.91 $ 15.60 $ 14.59Series F 18.42 17.97 16.62Series I 17.15 16.78 15.60Series O 22.11 21.42 19.54
Cost of investments held (000s) $ 838,722 $ 802,953 $ 675,952
The accompanying notes are an integral part of these financial statements.
222 Franklin Templeton Investments Funds
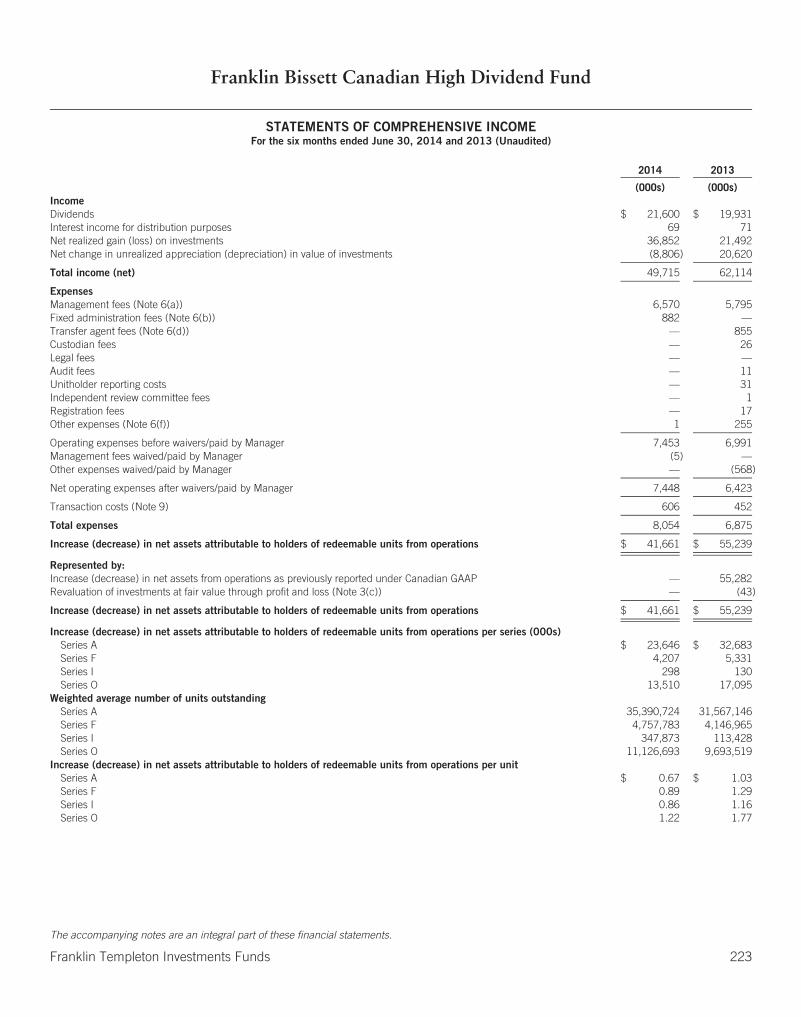
Franklin Bissett Canadian High Dividend Fund
STATEMENTS OF COMPREHENSIVE INCOMEFor the six months ended June 30, 2014 and 2013 (Unaudited)
2014 2013
(000s) (000s)IncomeDividends $ 21,600 $ 19,931Interest income for distribution purposes 69 71Net realized gain (loss) on investments 36,852 21,492Net change in unrealized appreciation (depreciation) in value of investments (8,806) 20,620
Total income (net) 49,715 62,114
ExpensesManagement fees (Note 6(a)) 6,570 5,795Fixed administration fees (Note 6(b)) 882 —Transfer agent fees (Note 6(d)) — 855Custodian fees — 26Legal fees — —Audit fees — 11Unitholder reporting costs — 31Independent review committee fees — 1Registration fees — 17Other expenses (Note 6(f)) 1 255
Operating expenses before waivers/paid by Manager 7,453 6,991Management fees waived/paid by Manager (5) —Other expenses waived/paid by Manager — (568)
Net operating expenses after waivers/paid by Manager 7,448 6,423
Transaction costs (Note 9) 606 452
Total expenses 8,054 6,875
Increase (decrease) in net assets attributable to holders of redeemable units from operations $ 41,661 $ 55,239
Represented by:Increase (decrease) in net assets from operations as previously reported under Canadian GAAP — 55,282Revaluation of investments at fair value through profit and loss (Note 3(c)) — (43)
Increase (decrease) in net assets attributable to holders of redeemable units from operations $ 41,661 $ 55,239
Increase (decrease) in net assets attributable to holders of redeemable units from operations per series (000s)Series A $ 23,646 $ 32,683Series F 4,207 5,331Series I 298 130Series O 13,510 17,095
Weighted average number of units outstandingSeries A 35,390,724 31,567,146Series F 4,757,783 4,146,965Series I 347,873 113,428Series O 11,126,693 9,693,519
Increase (decrease) in net assets attributable to holders of redeemable units from operations per unitSeries A $ 0.67 $ 1.03Series F 0.89 1.29Series I 0.86 1.16Series O 1.22 1.77
The accompanying notes are an integral part of these financial statements.
Franklin Templeton Investments Funds 223

Franklin Bissett Canadian High Dividend Fund
STATEMENTS OF CHANGES IN NET ASSETS ATTRIBUTABLE TO HOLDERS OF REDEEMABLE UNITSFor the six months ended June 30, 2014 and 2013 (Unaudited) (in 000s)
All Series Series A Series F
2014 2013 2014 2013 2014 2013
Net assets attributable to holders of redeemable units at beginning of period $877,218 $707,797 $555,774 $438,976 $83,567 $67,218
Increase (decrease) in net assets attributable to holders of redeemable unitsfrom operations 41,661 55,239 23,646 32,683 4,207 5,331
Distributions to holders of redeemable unitsFrom net investment income (16,568) (16,841) (10,334) (10,785) (1,623) (1,613)From net realized gains on investments — — — — — —From return of capital (4,359) (1,520) (2,705) (972) (430) (144)
Total distributions to holders of redeemable units (20,927) (18,361) (13,039) (11,757) (2,053) (1,757)
Redeemable units transactionsSubscriptions 77,767 116,857 45,703 69,633 12,030 6,608Reinvestments 13,826 11,666 8,219 7,132 1,200 1,014Redemptions (93,741) (98,902) (68,006) (41,807) (8,006) (4,842)
Net increase (decrease) from redeemable units transactions (2,148) 29,621 (14,084) 34,958 5,224 2,780
Increase (decrease) in net assets attributable to holders of redeemable units 18,586 66,499 (3,477) 55,884 7,378 6,354
Net assets attributable to holders of redeemable units at end of period $895,804 $774,296 $552,297 $494,860 $90,945 $73,572
Series I Series O
2014 2013 2014 2013
Net assets attributable to holders of redeemable units at beginning of period $ 4,515 $ 2,240 $233,362 $199,363
Increase (decrease) in net assets attributable to holders of redeemable unitsfrom operations 298 130 13,510 17,095
Distributions to holders of redeemable unitsFrom net investment income (113) (42) (4,498) (4,401)From net realized gains on investments — — — —From return of capital (31) (3) (1,193) (401)
Total distributions to holders of redeemable units (144) (45) (5,691) (4,802)
Redeemable units transactionsSubscriptions 2,975 647 17,059 39,969Reinvestments 96 32 4,311 3,488Redemptions (953) (1,643) (16,776) (50,610)
Net increase (decrease) from redeemable units transactions 2,118 (964) 4,594 (7,153)
Increase (decrease) in net assets attributable to holders of redeemable units 2,272 (879) 12,413 5,140
Net assets attributable to holders of redeemable units at end of period $ 6,787 $ 1,361 $245,775 $204,503
The accompanying notes are an integral part of these financial statements.
224 Franklin Templeton Investments Funds

Franklin Bissett Canadian High Dividend Fund
STATEMENTS OF CASH FLOWSFor the six months ended June 30, 2014 and 2013 (Unaudited)
2014 2013
(000s) (000s)Cash flows from operating activitiesInterest received $ 70 $ 72Dividends received 29,431 24,627Proceeds from sale and maturity of investments 172,663 124,987Purchases of investments (177,008) (160,731)Operating expenses paid (7,522) (6,317)
Net cash from/(used in) operating activities 17,634 (17,362)
Cash flows from financing activitiesProceeds from issuances of redeemable units 77,763 116,758Amounts paid on redemption of redeemable units (93,154) (96,468)Distributions paid to holders of redeemable units, net of reinvested distributions (2,879) (2,895)
Net cash (used in)/from financing activities (18,270) 17,395
Net increase (decrease) in cash (636) 33Cash at beginning of year 805 89Effect of exchange rate changes — —
Cash at end of period $ 169 $ 122
The accompanying notes are an integral part of these financial statements.
Franklin Templeton Investments Funds 225
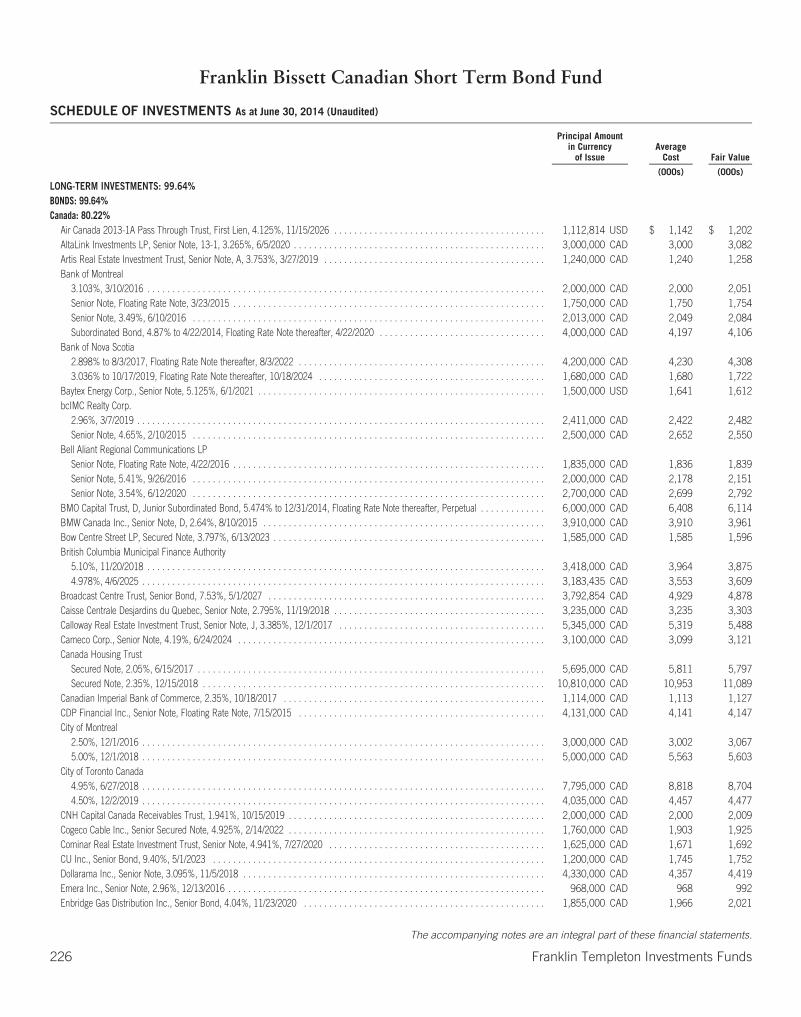
Franklin Bissett Canadian Short Term Bond Fund
SCHEDULE OF INVESTMENTS As at June 30, 2014 (Unaudited)
Principal Amountin Currency
of IssueAverage
Cost Fair Value
(000s) (000s)
LONG-TERM INVESTMENTS: 99.64%BONDS: 99.64%Canada: 80.22%
Air Canada 2013-1A Pass Through Trust, First Lien, 4.125%, 11/15/2026 . . . . . . . . . . . . . . . . . . . . . . . . . . . . . . . . . . . . . . . . . . 1,112,814 USD $ 1,142 $ 1,202AltaLink Investments LP, Senior Note, 13-1, 3.265%, 6/5/2020 . . . . . . . . . . . . . . . . . . . . . . . . . . . . . . . . . . . . . . . . . . . . . . . . . . 3,000,000 CAD 3,000 3,082Artis Real Estate Investment Trust, Senior Note, A, 3.753%, 3/27/2019 . . . . . . . . . . . . . . . . . . . . . . . . . . . . . . . . . . . . . . . . . . . . 1,240,000 CAD 1,240 1,258Bank of Montreal
3.103%, 3/10/2016 . . . . . . . . . . . . . . . . . . . . . . . . . . . . . . . . . . . . . . . . . . . . . . . . . . . . . . . . . . . . . . . . . . . . . . . . . . . . . . . 2,000,000 CAD 2,000 2,051Senior Note, Floating Rate Note, 3/23/2015 . . . . . . . . . . . . . . . . . . . . . . . . . . . . . . . . . . . . . . . . . . . . . . . . . . . . . . . . . . . . . . 1,750,000 CAD 1,750 1,754Senior Note, 3.49%, 6/10/2016 . . . . . . . . . . . . . . . . . . . . . . . . . . . . . . . . . . . . . . . . . . . . . . . . . . . . . . . . . . . . . . . . . . . . . . 2,013,000 CAD 2,049 2,084Subordinated Bond, 4.87% to 4/22/2014, Floating Rate Note thereafter, 4/22/2020 . . . . . . . . . . . . . . . . . . . . . . . . . . . . . . . . . 4,000,000 CAD 4,197 4,106
Bank of Nova Scotia2.898% to 8/3/2017, Floating Rate Note thereafter, 8/3/2022 . . . . . . . . . . . . . . . . . . . . . . . . . . . . . . . . . . . . . . . . . . . . . . . . . 4,200,000 CAD 4,230 4,3083.036% to 10/17/2019, Floating Rate Note thereafter, 10/18/2024 . . . . . . . . . . . . . . . . . . . . . . . . . . . . . . . . . . . . . . . . . . . . . 1,680,000 CAD 1,680 1,722
Baytex Energy Corp., Senior Note, 5.125%, 6/1/2021 . . . . . . . . . . . . . . . . . . . . . . . . . . . . . . . . . . . . . . . . . . . . . . . . . . . . . . . . . 1,500,000 USD 1,641 1,612bcIMC Realty Corp.
2.96%, 3/7/2019 . . . . . . . . . . . . . . . . . . . . . . . . . . . . . . . . . . . . . . . . . . . . . . . . . . . . . . . . . . . . . . . . . . . . . . . . . . . . . . . . . 2,411,000 CAD 2,422 2,482Senior Note, 4.65%, 2/10/2015 . . . . . . . . . . . . . . . . . . . . . . . . . . . . . . . . . . . . . . . . . . . . . . . . . . . . . . . . . . . . . . . . . . . . . . 2,500,000 CAD 2,652 2,550
Bell Aliant Regional Communications LPSenior Note, Floating Rate Note, 4/22/2016 . . . . . . . . . . . . . . . . . . . . . . . . . . . . . . . . . . . . . . . . . . . . . . . . . . . . . . . . . . . . . . 1,835,000 CAD 1,836 1,839Senior Note, 5.41%, 9/26/2016 . . . . . . . . . . . . . . . . . . . . . . . . . . . . . . . . . . . . . . . . . . . . . . . . . . . . . . . . . . . . . . . . . . . . . . 2,000,000 CAD 2,178 2,151Senior Note, 3.54%, 6/12/2020 . . . . . . . . . . . . . . . . . . . . . . . . . . . . . . . . . . . . . . . . . . . . . . . . . . . . . . . . . . . . . . . . . . . . . . 2,700,000 CAD 2,699 2,792
BMO Capital Trust, D, Junior Subordinated Bond, 5.474% to 12/31/2014, Floating Rate Note thereafter, Perpetual . . . . . . . . . . . . . 6,000,000 CAD 6,408 6,114BMW Canada Inc., Senior Note, D, 2.64%, 8/10/2015 . . . . . . . . . . . . . . . . . . . . . . . . . . . . . . . . . . . . . . . . . . . . . . . . . . . . . . . . 3,910,000 CAD 3,910 3,961Bow Centre Street LP, Secured Note, 3.797%, 6/13/2023 . . . . . . . . . . . . . . . . . . . . . . . . . . . . . . . . . . . . . . . . . . . . . . . . . . . . . . 1,585,000 CAD 1,585 1,596British Columbia Municipal Finance Authority
5.10%, 11/20/2018 . . . . . . . . . . . . . . . . . . . . . . . . . . . . . . . . . . . . . . . . . . . . . . . . . . . . . . . . . . . . . . . . . . . . . . . . . . . . . . . 3,418,000 CAD 3,964 3,8754.978%, 4/6/2025 . . . . . . . . . . . . . . . . . . . . . . . . . . . . . . . . . . . . . . . . . . . . . . . . . . . . . . . . . . . . . . . . . . . . . . . . . . . . . . . . 3,183,435 CAD 3,553 3,609
Broadcast Centre Trust, Senior Bond, 7.53%, 5/1/2027 . . . . . . . . . . . . . . . . . . . . . . . . . . . . . . . . . . . . . . . . . . . . . . . . . . . . . . . 3,792,854 CAD 4,929 4,878Caisse Centrale Desjardins du Quebec, Senior Note, 2.795%, 11/19/2018 . . . . . . . . . . . . . . . . . . . . . . . . . . . . . . . . . . . . . . . . . . 3,235,000 CAD 3,235 3,303Calloway Real Estate Investment Trust, Senior Note, J, 3.385%, 12/1/2017 . . . . . . . . . . . . . . . . . . . . . . . . . . . . . . . . . . . . . . . . . 5,345,000 CAD 5,319 5,488Cameco Corp., Senior Note, 4.19%, 6/24/2024 . . . . . . . . . . . . . . . . . . . . . . . . . . . . . . . . . . . . . . . . . . . . . . . . . . . . . . . . . . . . . 3,100,000 CAD 3,099 3,121Canada Housing Trust
Secured Note, 2.05%, 6/15/2017 . . . . . . . . . . . . . . . . . . . . . . . . . . . . . . . . . . . . . . . . . . . . . . . . . . . . . . . . . . . . . . . . . . . . . 5,695,000 CAD 5,811 5,797Secured Note, 2.35%, 12/15/2018 . . . . . . . . . . . . . . . . . . . . . . . . . . . . . . . . . . . . . . . . . . . . . . . . . . . . . . . . . . . . . . . . . . . . 10,810,000 CAD 10,953 11,089
Canadian Imperial Bank of Commerce, 2.35%, 10/18/2017 . . . . . . . . . . . . . . . . . . . . . . . . . . . . . . . . . . . . . . . . . . . . . . . . . . . . 1,114,000 CAD 1,113 1,127CDP Financial Inc., Senior Note, Floating Rate Note, 7/15/2015 . . . . . . . . . . . . . . . . . . . . . . . . . . . . . . . . . . . . . . . . . . . . . . . . . 4,131,000 CAD 4,141 4,147City of Montreal
2.50%, 12/1/2016 . . . . . . . . . . . . . . . . . . . . . . . . . . . . . . . . . . . . . . . . . . . . . . . . . . . . . . . . . . . . . . . . . . . . . . . . . . . . . . . . 3,000,000 CAD 3,002 3,0675.00%, 12/1/2018 . . . . . . . . . . . . . . . . . . . . . . . . . . . . . . . . . . . . . . . . . . . . . . . . . . . . . . . . . . . . . . . . . . . . . . . . . . . . . . . . 5,000,000 CAD 5,563 5,603
City of Toronto Canada4.95%, 6/27/2018 . . . . . . . . . . . . . . . . . . . . . . . . . . . . . . . . . . . . . . . . . . . . . . . . . . . . . . . . . . . . . . . . . . . . . . . . . . . . . . . . 7,795,000 CAD 8,818 8,7044.50%, 12/2/2019 . . . . . . . . . . . . . . . . . . . . . . . . . . . . . . . . . . . . . . . . . . . . . . . . . . . . . . . . . . . . . . . . . . . . . . . . . . . . . . . . 4,035,000 CAD 4,457 4,477
CNH Capital Canada Receivables Trust, 1.941%, 10/15/2019 . . . . . . . . . . . . . . . . . . . . . . . . . . . . . . . . . . . . . . . . . . . . . . . . . . . 2,000,000 CAD 2,000 2,009Cogeco Cable Inc., Senior Secured Note, 4.925%, 2/14/2022 . . . . . . . . . . . . . . . . . . . . . . . . . . . . . . . . . . . . . . . . . . . . . . . . . . . 1,760,000 CAD 1,903 1,925Cominar Real Estate Investment Trust, Senior Note, 4.941%, 7/27/2020 . . . . . . . . . . . . . . . . . . . . . . . . . . . . . . . . . . . . . . . . . . . 1,625,000 CAD 1,671 1,692CU Inc., Senior Bond, 9.40%, 5/1/2023 . . . . . . . . . . . . . . . . . . . . . . . . . . . . . . . . . . . . . . . . . . . . . . . . . . . . . . . . . . . . . . . . . . 1,200,000 CAD 1,745 1,752Dollarama Inc., Senior Note, 3.095%, 11/5/2018 . . . . . . . . . . . . . . . . . . . . . . . . . . . . . . . . . . . . . . . . . . . . . . . . . . . . . . . . . . . . 4,330,000 CAD 4,357 4,419Emera Inc., Senior Note, 2.96%, 12/13/2016 . . . . . . . . . . . . . . . . . . . . . . . . . . . . . . . . . . . . . . . . . . . . . . . . . . . . . . . . . . . . . . . 968,000 CAD 968 992Enbridge Gas Distribution Inc., Senior Bond, 4.04%, 11/23/2020 . . . . . . . . . . . . . . . . . . . . . . . . . . . . . . . . . . . . . . . . . . . . . . . . 1,855,000 CAD 1,966 2,021
The accompanying notes are an integral part of these financial statements.
226 Franklin Templeton Investments Funds

Franklin Bissett Canadian Short Term Bond Fund
SCHEDULE OF INVESTMENTS As at June 30, 2014 (Unaudited) (Continued)
Principal Amountin Currency
of IssueAverage
Cost Fair Value
(000s) (000s)
Canada: 80.22% (Continued)Enbridge Inc.
Floating Rate Note, 8/19/2015 . . . . . . . . . . . . . . . . . . . . . . . . . . . . . . . . . . . . . . . . . . . . . . . . . . . . . . . . . . . . . . . . . . . . . . . 6,890,000 CAD $ 6,942 $ 6,946Senior Note, Floating Rate Note, 3/13/2017 . . . . . . . . . . . . . . . . . . . . . . . . . . . . . . . . . . . . . . . . . . . . . . . . . . . . . . . . . . . . . . 1,500,000 CAD 1,500 1,502
Enbridge Income Fund4.00%, 12/20/2018 . . . . . . . . . . . . . . . . . . . . . . . . . . . . . . . . . . . . . . . . . . . . . . . . . . . . . . . . . . . . . . . . . . . . . . . . . . . . . . . 2,000,000 CAD 2,091 2,120Senior Note, Floating Rate Note, 11/28/2014 . . . . . . . . . . . . . . . . . . . . . . . . . . . . . . . . . . . . . . . . . . . . . . . . . . . . . . . . . . . . . 1,540,000 CAD 1,545 1,544
Enbridge Income Fund Holdings Inc.3.94%, 1/13/2023 . . . . . . . . . . . . . . . . . . . . . . . . . . . . . . . . . . . . . . . . . . . . . . . . . . . . . . . . . . . . . . . . . . . . . . . . . . . . . . . . 695,000 CAD 695 722Senior Note, 2.92%, 12/14/2017 . . . . . . . . . . . . . . . . . . . . . . . . . . . . . . . . . . . . . . . . . . . . . . . . . . . . . . . . . . . . . . . . . . . . . 977,000 CAD 977 998
Financement Quebec, Floating Rate Note, 5/29/2019 . . . . . . . . . . . . . . . . . . . . . . . . . . . . . . . . . . . . . . . . . . . . . . . . . . . . . . . . . 36,290,000 CAD 36,330 36,506Finning International Inc., 3.232%, 7/3/2020 . . . . . . . . . . . . . . . . . . . . . . . . . . . . . . . . . . . . . . . . . . . . . . . . . . . . . . . . . . . . . . . 1,200,000 CAD 1,200 1,227First Capital Realty Inc.
Senior Note, 5.95%, 6/1/2015 . . . . . . . . . . . . . . . . . . . . . . . . . . . . . . . . . . . . . . . . . . . . . . . . . . . . . . . . . . . . . . . . . . . . . . . 1,700,000 CAD 1,801 1,766Senior Note, 5.85%, 1/31/2017 . . . . . . . . . . . . . . . . . . . . . . . . . . . . . . . . . . . . . . . . . . . . . . . . . . . . . . . . . . . . . . . . . . . . . . 2,000,000 CAD 2,236 2,183Senior Note, 5.48%, 7/30/2019 . . . . . . . . . . . . . . . . . . . . . . . . . . . . . . . . . . . . . . . . . . . . . . . . . . . . . . . . . . . . . . . . . . . . . . 1,435,000 CAD 1,604 1,610
Ford Auto Securitization Trust, 2014-R2, A3, 1.972%, 3/15/2019 . . . . . . . . . . . . . . . . . . . . . . . . . . . . . . . . . . . . . . . . . . . . . . . . 2,000,000 CAD 2,000 2,009Ford Floorplan Auto Securitization Trust, 2.063%, 6/15/2016 . . . . . . . . . . . . . . . . . . . . . . . . . . . . . . . . . . . . . . . . . . . . . . . . . . . 3,000,000 CAD 3,000 3,025Genesis Trust II, 1, 2.433%, 5/15/2019 . . . . . . . . . . . . . . . . . . . . . . . . . . . . . . . . . . . . . . . . . . . . . . . . . . . . . . . . . . . . . . . . . . . 5,000,000 CAD 5,000 5,035George Weston Ltd., Senior Note, 4.115%, 6/17/2024 . . . . . . . . . . . . . . . . . . . . . . . . . . . . . . . . . . . . . . . . . . . . . . . . . . . . . . . . 960,000 CAD 960 972Gibson Energy Inc., Senior Note, 5.375%, 7/15/2022 . . . . . . . . . . . . . . . . . . . . . . . . . . . . . . . . . . . . . . . . . . . . . . . . . . . . . . . . . 1,900,000 CAD 1,900 1,917Glacier Credit Card Trust, 4.128%, 11/20/2015 . . . . . . . . . . . . . . . . . . . . . . . . . . . . . . . . . . . . . . . . . . . . . . . . . . . . . . . . . . . . . 1,000,000 CAD 1,035 1,028Granite Real Estate Investment Trust Holdings LP, Senior Note, 3.788%, 7/5/2021 . . . . . . . . . . . . . . . . . . . . . . . . . . . . . . . . . . . . 895,000 CAD 895 902Great-West Lifeco Finance Delaware, 5.691% to 6/21/2017, Floating Rate Note thereafter, 6/21/2067 . . . . . . . . . . . . . . . . . . . . . . 7,785,000 CAD 8,272 8,590Home Capital Group Inc., 5.20%, 5/4/2016 . . . . . . . . . . . . . . . . . . . . . . . . . . . . . . . . . . . . . . . . . . . . . . . . . . . . . . . . . . . . . . . . 1,133,000 CAD 1,135 1,185Honda Canada Finance Inc., Senior Note, Floating Rate Note, 2/23/2015 . . . . . . . . . . . . . . . . . . . . . . . . . . . . . . . . . . . . . . . . . . . 225,000 CAD 226 226HSBC Bank Canada
Senior Note, Floating Rate Note, 1/21/2016 . . . . . . . . . . . . . . . . . . . . . . . . . . . . . . . . . . . . . . . . . . . . . . . . . . . . . . . . . . . . . . 1,000,000 CAD 1,001 1,003Senior Note, 2.491%, 5/13/2019 . . . . . . . . . . . . . . . . . . . . . . . . . . . . . . . . . . . . . . . . . . . . . . . . . . . . . . . . . . . . . . . . . . . . . 3,010,000 CAD 3,010 3,024Subordinated Bond, 4.80% to 4/10/2017, Floating Rate Note thereafter, 4/10/2022 . . . . . . . . . . . . . . . . . . . . . . . . . . . . . . . . . 4,760,000 CAD 5,078 5,096Subordinated Note, 4.94% to 3/16/2016, Floating Rate Note thereafter, 3/16/2021 . . . . . . . . . . . . . . . . . . . . . . . . . . . . . . . . . . 3,500,000 CAD 3,753 3,675
Industrial Alliance Insurance and Financial Services Inc., Subordinated Note, 2.80% to 5/16/2019, Floating Rate Note thereafter,5/16/2024 . . . . . . . . . . . . . . . . . . . . . . . . . . . . . . . . . . . . . . . . . . . . . . . . . . . . . . . . . . . . . . . . . . . . . . . . . . . . . . . . . . . . . 1,340,000 CAD 1,339 1,349
Inter Pipeline Fund, Senior Note, 3.839%, 7/30/2018 . . . . . . . . . . . . . . . . . . . . . . . . . . . . . . . . . . . . . . . . . . . . . . . . . . . . . . . . . 1,235,000 CAD 1,235 1,304Inter Pipeline Ltd., Senior Note, Floating Rate Note, 5/30/2017 . . . . . . . . . . . . . . . . . . . . . . . . . . . . . . . . . . . . . . . . . . . . . . . . . . 4,545,000 CAD 4,545 4,547Loblaw Companies Ltd., Senior Note, 3.748%, 3/12/2019 . . . . . . . . . . . . . . . . . . . . . . . . . . . . . . . . . . . . . . . . . . . . . . . . . . . . . . 4,095,000 CAD 4,192 4,307Manitoba Telecom Services Inc.
Senior Bond, 4.00%, 5/27/2024 . . . . . . . . . . . . . . . . . . . . . . . . . . . . . . . . . . . . . . . . . . . . . . . . . . . . . . . . . . . . . . . . . . . . . . 1,515,000 CAD 1,514 1,531Senior Note, 6.65%, 5/11/2016 . . . . . . . . . . . . . . . . . . . . . . . . . . . . . . . . . . . . . . . . . . . . . . . . . . . . . . . . . . . . . . . . . . . . . . 4,000,000 CAD 4,450 4,335Senior Note, 4.59%, 10/1/2018 . . . . . . . . . . . . . . . . . . . . . . . . . . . . . . . . . . . . . . . . . . . . . . . . . . . . . . . . . . . . . . . . . . . . . . 1,974,000 CAD 2,089 2,133
Manufacturers Life Insurance Co.Subordinated Note, 4.165% to 6/01/17, Floating Rate Note thereafter, 6/1/2022 . . . . . . . . . . . . . . . . . . . . . . . . . . . . . . . . . . . 1,516,000 CAD 1,533 1,606Subordinated Note, 2.819% to 2/26/18, Floating Rate Note thereafter, 2/26/2023 . . . . . . . . . . . . . . . . . . . . . . . . . . . . . . . . . . . 3,000,000 CAD 3,000 3,059
Manulife Bank of CanadaSenior Note, Floating Rate Note, 12/3/2014 . . . . . . . . . . . . . . . . . . . . . . . . . . . . . . . . . . . . . . . . . . . . . . . . . . . . . . . . . . . . . . 2,150,000 CAD 2,150 2,154Senior Note, Floating Rate Note, 3/14/2016 . . . . . . . . . . . . . . . . . . . . . . . . . . . . . . . . . . . . . . . . . . . . . . . . . . . . . . . . . . . . . . 3,000,000 CAD 3,000 3,012Senior Note, 2.383%, 10/17/2016 . . . . . . . . . . . . . . . . . . . . . . . . . . . . . . . . . . . . . . . . . . . . . . . . . . . . . . . . . . . . . . . . . . . . 3,185,000 CAD 3,185 3,223
Manulife Finance Delaware, Senior Note, 4.448% to 12/15/2016, Floating Rate Note thereafter, 12/15/2026 . . . . . . . . . . . . . . . . . 2,385,000 CAD 2,518 2,525Manulife Financial Capital Trust II, Junior Subordinated Note, 7.405% to 12/31/2019, Floating Rate Note thereafter, 12/31/2018 . . . 3,500,000 CAD 4,105 4,309Manulife Financial Corp., Senior Note, 4.079%, 8/20/2015 . . . . . . . . . . . . . . . . . . . . . . . . . . . . . . . . . . . . . . . . . . . . . . . . . . . . . 3,000,000 CAD 3,113 3,084
The accompanying notes are an integral part of these financial statements.
Franklin Templeton Investments Funds 227
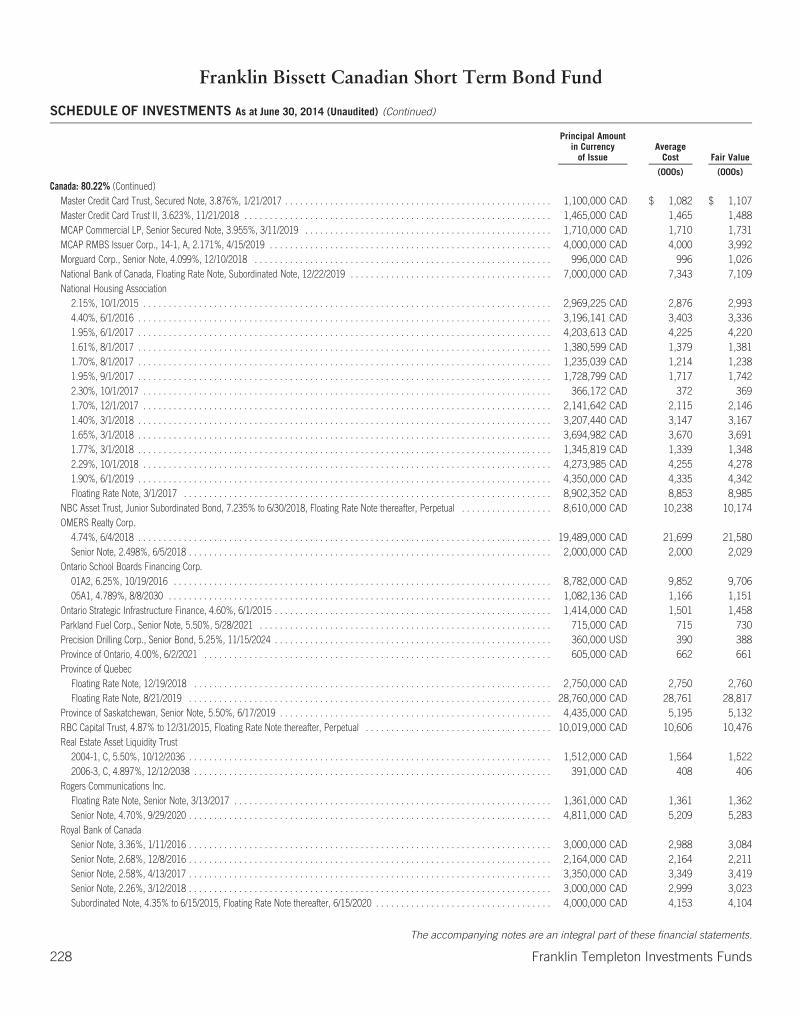
Franklin Bissett Canadian Short Term Bond Fund
SCHEDULE OF INVESTMENTS As at June 30, 2014 (Unaudited) (Continued)
Principal Amountin Currency
of IssueAverage
Cost Fair Value
(000s) (000s)
Canada: 80.22% (Continued)Master Credit Card Trust, Secured Note, 3.876%, 1/21/2017 . . . . . . . . . . . . . . . . . . . . . . . . . . . . . . . . . . . . . . . . . . . . . . . . . . . . . 1,100,000 CAD $ 1,082 $ 1,107Master Credit Card Trust II, 3.623%, 11/21/2018 . . . . . . . . . . . . . . . . . . . . . . . . . . . . . . . . . . . . . . . . . . . . . . . . . . . . . . . . . . . . . 1,465,000 CAD 1,465 1,488MCAP Commercial LP, Senior Secured Note, 3.955%, 3/11/2019 . . . . . . . . . . . . . . . . . . . . . . . . . . . . . . . . . . . . . . . . . . . . . . . . . 1,710,000 CAD 1,710 1,731MCAP RMBS Issuer Corp., 14-1, A, 2.171%, 4/15/2019 . . . . . . . . . . . . . . . . . . . . . . . . . . . . . . . . . . . . . . . . . . . . . . . . . . . . . . . . 4,000,000 CAD 4,000 3,992Morguard Corp., Senior Note, 4.099%, 12/10/2018 . . . . . . . . . . . . . . . . . . . . . . . . . . . . . . . . . . . . . . . . . . . . . . . . . . . . . . . . . . . 996,000 CAD 996 1,026National Bank of Canada, Floating Rate Note, Subordinated Note, 12/22/2019 . . . . . . . . . . . . . . . . . . . . . . . . . . . . . . . . . . . . . . . . 7,000,000 CAD 7,343 7,109National Housing Association
2.15%, 10/1/2015 . . . . . . . . . . . . . . . . . . . . . . . . . . . . . . . . . . . . . . . . . . . . . . . . . . . . . . . . . . . . . . . . . . . . . . . . . . . . . . . . . 2,969,225 CAD 2,876 2,9934.40%, 6/1/2016 . . . . . . . . . . . . . . . . . . . . . . . . . . . . . . . . . . . . . . . . . . . . . . . . . . . . . . . . . . . . . . . . . . . . . . . . . . . . . . . . . . 3,196,141 CAD 3,403 3,3361.95%, 6/1/2017 . . . . . . . . . . . . . . . . . . . . . . . . . . . . . . . . . . . . . . . . . . . . . . . . . . . . . . . . . . . . . . . . . . . . . . . . . . . . . . . . . . 4,203,613 CAD 4,225 4,2201.61%, 8/1/2017 . . . . . . . . . . . . . . . . . . . . . . . . . . . . . . . . . . . . . . . . . . . . . . . . . . . . . . . . . . . . . . . . . . . . . . . . . . . . . . . . . . 1,380,599 CAD 1,379 1,3811.70%, 8/1/2017 . . . . . . . . . . . . . . . . . . . . . . . . . . . . . . . . . . . . . . . . . . . . . . . . . . . . . . . . . . . . . . . . . . . . . . . . . . . . . . . . . . 1,235,039 CAD 1,214 1,2381.95%, 9/1/2017 . . . . . . . . . . . . . . . . . . . . . . . . . . . . . . . . . . . . . . . . . . . . . . . . . . . . . . . . . . . . . . . . . . . . . . . . . . . . . . . . . . 1,728,799 CAD 1,717 1,7422.30%, 10/1/2017 . . . . . . . . . . . . . . . . . . . . . . . . . . . . . . . . . . . . . . . . . . . . . . . . . . . . . . . . . . . . . . . . . . . . . . . . . . . . . . . . . 366,172 CAD 372 3691.70%, 12/1/2017 . . . . . . . . . . . . . . . . . . . . . . . . . . . . . . . . . . . . . . . . . . . . . . . . . . . . . . . . . . . . . . . . . . . . . . . . . . . . . . . . . 2,141,642 CAD 2,115 2,1461.40%, 3/1/2018 . . . . . . . . . . . . . . . . . . . . . . . . . . . . . . . . . . . . . . . . . . . . . . . . . . . . . . . . . . . . . . . . . . . . . . . . . . . . . . . . . . 3,207,440 CAD 3,147 3,1671.65%, 3/1/2018 . . . . . . . . . . . . . . . . . . . . . . . . . . . . . . . . . . . . . . . . . . . . . . . . . . . . . . . . . . . . . . . . . . . . . . . . . . . . . . . . . . 3,694,982 CAD 3,670 3,6911.77%, 3/1/2018 . . . . . . . . . . . . . . . . . . . . . . . . . . . . . . . . . . . . . . . . . . . . . . . . . . . . . . . . . . . . . . . . . . . . . . . . . . . . . . . . . . 1,345,819 CAD 1,339 1,3482.29%, 10/1/2018 . . . . . . . . . . . . . . . . . . . . . . . . . . . . . . . . . . . . . . . . . . . . . . . . . . . . . . . . . . . . . . . . . . . . . . . . . . . . . . . . . 4,273,985 CAD 4,255 4,2781.90%, 6/1/2019 . . . . . . . . . . . . . . . . . . . . . . . . . . . . . . . . . . . . . . . . . . . . . . . . . . . . . . . . . . . . . . . . . . . . . . . . . . . . . . . . . . 4,350,000 CAD 4,335 4,342Floating Rate Note, 3/1/2017 . . . . . . . . . . . . . . . . . . . . . . . . . . . . . . . . . . . . . . . . . . . . . . . . . . . . . . . . . . . . . . . . . . . . . . . . . 8,902,352 CAD 8,853 8,985
NBC Asset Trust, Junior Subordinated Bond, 7.235% to 6/30/2018, Floating Rate Note thereafter, Perpetual . . . . . . . . . . . . . . . . . . 8,610,000 CAD 10,238 10,174OMERS Realty Corp.
4.74%, 6/4/2018 . . . . . . . . . . . . . . . . . . . . . . . . . . . . . . . . . . . . . . . . . . . . . . . . . . . . . . . . . . . . . . . . . . . . . . . . . . . . . . . . . . 19,489,000 CAD 21,699 21,580Senior Note, 2.498%, 6/5/2018 . . . . . . . . . . . . . . . . . . . . . . . . . . . . . . . . . . . . . . . . . . . . . . . . . . . . . . . . . . . . . . . . . . . . . . . . 2,000,000 CAD 2,000 2,029
Ontario School Boards Financing Corp.01A2, 6.25%, 10/19/2016 . . . . . . . . . . . . . . . . . . . . . . . . . . . . . . . . . . . . . . . . . . . . . . . . . . . . . . . . . . . . . . . . . . . . . . . . . . . 8,782,000 CAD 9,852 9,70605A1, 4.789%, 8/8/2030 . . . . . . . . . . . . . . . . . . . . . . . . . . . . . . . . . . . . . . . . . . . . . . . . . . . . . . . . . . . . . . . . . . . . . . . . . . . . 1,082,136 CAD 1,166 1,151
Ontario Strategic Infrastructure Finance, 4.60%, 6/1/2015 . . . . . . . . . . . . . . . . . . . . . . . . . . . . . . . . . . . . . . . . . . . . . . . . . . . . . . . 1,414,000 CAD 1,501 1,458Parkland Fuel Corp., Senior Note, 5.50%, 5/28/2021 . . . . . . . . . . . . . . . . . . . . . . . . . . . . . . . . . . . . . . . . . . . . . . . . . . . . . . . . . . 715,000 CAD 715 730Precision Drilling Corp., Senior Bond, 5.25%, 11/15/2024 . . . . . . . . . . . . . . . . . . . . . . . . . . . . . . . . . . . . . . . . . . . . . . . . . . . . . . . 360,000 USD 390 388Province of Ontario, 4.00%, 6/2/2021 . . . . . . . . . . . . . . . . . . . . . . . . . . . . . . . . . . . . . . . . . . . . . . . . . . . . . . . . . . . . . . . . . . . . . 605,000 CAD 662 661Province of Quebec
Floating Rate Note, 12/19/2018 . . . . . . . . . . . . . . . . . . . . . . . . . . . . . . . . . . . . . . . . . . . . . . . . . . . . . . . . . . . . . . . . . . . . . . . 2,750,000 CAD 2,750 2,760Floating Rate Note, 8/21/2019 . . . . . . . . . . . . . . . . . . . . . . . . . . . . . . . . . . . . . . . . . . . . . . . . . . . . . . . . . . . . . . . . . . . . . . . . 28,760,000 CAD 28,761 28,817
Province of Saskatchewan, Senior Note, 5.50%, 6/17/2019 . . . . . . . . . . . . . . . . . . . . . . . . . . . . . . . . . . . . . . . . . . . . . . . . . . . . . . 4,435,000 CAD 5,195 5,132RBC Capital Trust, 4.87% to 12/31/2015, Floating Rate Note thereafter, Perpetual . . . . . . . . . . . . . . . . . . . . . . . . . . . . . . . . . . . . . 10,019,000 CAD 10,606 10,476Real Estate Asset Liquidity Trust
2004-1, C, 5.50%, 10/12/2036 . . . . . . . . . . . . . . . . . . . . . . . . . . . . . . . . . . . . . . . . . . . . . . . . . . . . . . . . . . . . . . . . . . . . . . . . 1,512,000 CAD 1,564 1,5222006-3, C, 4.897%, 12/12/2038 . . . . . . . . . . . . . . . . . . . . . . . . . . . . . . . . . . . . . . . . . . . . . . . . . . . . . . . . . . . . . . . . . . . . . . . 391,000 CAD 408 406
Rogers Communications Inc.Floating Rate Note, Senior Note, 3/13/2017 . . . . . . . . . . . . . . . . . . . . . . . . . . . . . . . . . . . . . . . . . . . . . . . . . . . . . . . . . . . . . . . 1,361,000 CAD 1,361 1,362Senior Note, 4.70%, 9/29/2020 . . . . . . . . . . . . . . . . . . . . . . . . . . . . . . . . . . . . . . . . . . . . . . . . . . . . . . . . . . . . . . . . . . . . . . . . 4,811,000 CAD 5,209 5,283
Royal Bank of CanadaSenior Note, 3.36%, 1/11/2016 . . . . . . . . . . . . . . . . . . . . . . . . . . . . . . . . . . . . . . . . . . . . . . . . . . . . . . . . . . . . . . . . . . . . . . . . 3,000,000 CAD 2,988 3,084Senior Note, 2.68%, 12/8/2016 . . . . . . . . . . . . . . . . . . . . . . . . . . . . . . . . . . . . . . . . . . . . . . . . . . . . . . . . . . . . . . . . . . . . . . . . 2,164,000 CAD 2,164 2,211Senior Note, 2.58%, 4/13/2017 . . . . . . . . . . . . . . . . . . . . . . . . . . . . . . . . . . . . . . . . . . . . . . . . . . . . . . . . . . . . . . . . . . . . . . . . 3,350,000 CAD 3,349 3,419Senior Note, 2.26%, 3/12/2018 . . . . . . . . . . . . . . . . . . . . . . . . . . . . . . . . . . . . . . . . . . . . . . . . . . . . . . . . . . . . . . . . . . . . . . . . 3,000,000 CAD 2,999 3,023Subordinated Note, 4.35% to 6/15/2015, Floating Rate Note thereafter, 6/15/2020 . . . . . . . . . . . . . . . . . . . . . . . . . . . . . . . . . . . 4,000,000 CAD 4,153 4,104
The accompanying notes are an integral part of these financial statements.
228 Franklin Templeton Investments Funds
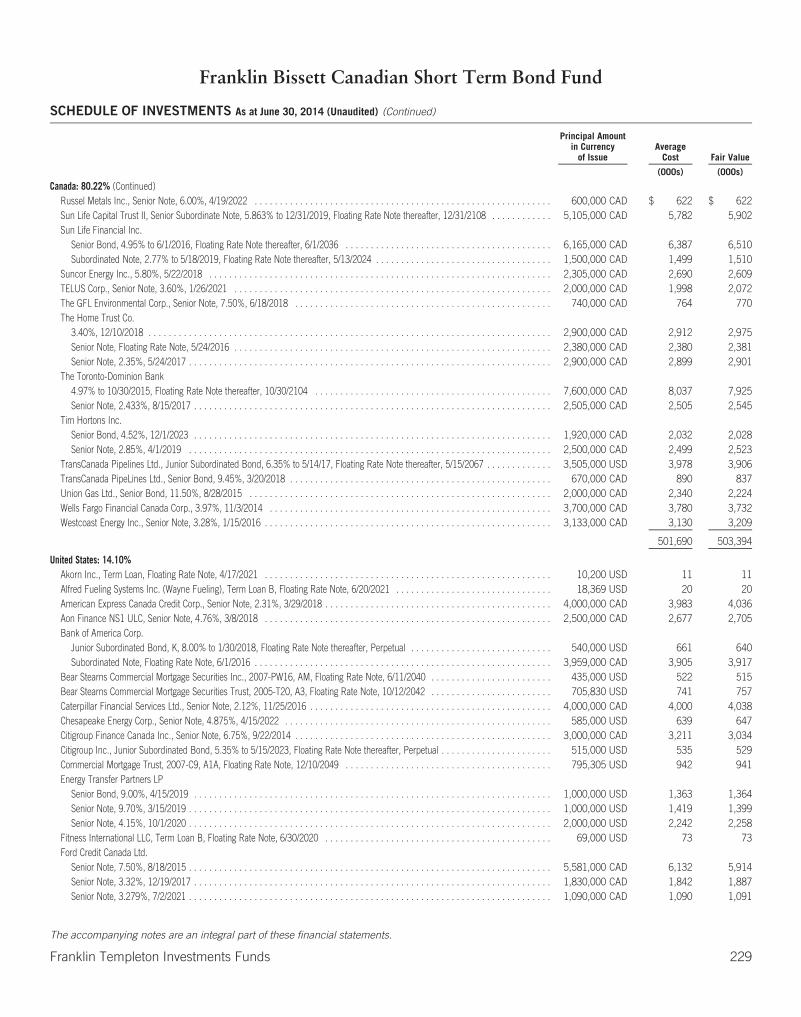
Franklin Bissett Canadian Short Term Bond Fund
SCHEDULE OF INVESTMENTS As at June 30, 2014 (Unaudited) (Continued)
Principal Amountin Currency
of IssueAverage
Cost Fair Value
(000s) (000s)
Canada: 80.22% (Continued)Russel Metals Inc., Senior Note, 6.00%, 4/19/2022 . . . . . . . . . . . . . . . . . . . . . . . . . . . . . . . . . . . . . . . . . . . . . . . . . . . . . . . . . . . 600,000 CAD $ 622 $ 622Sun Life Capital Trust II, Senior Subordinate Note, 5.863% to 12/31/2019, Floating Rate Note thereafter, 12/31/2108 . . . . . . . . . . . . 5,105,000 CAD 5,782 5,902Sun Life Financial Inc.
Senior Bond, 4.95% to 6/1/2016, Floating Rate Note thereafter, 6/1/2036 . . . . . . . . . . . . . . . . . . . . . . . . . . . . . . . . . . . . . . . . . 6,165,000 CAD 6,387 6,510Subordinated Note, 2.77% to 5/18/2019, Floating Rate Note thereafter, 5/13/2024 . . . . . . . . . . . . . . . . . . . . . . . . . . . . . . . . . . . 1,500,000 CAD 1,499 1,510
Suncor Energy Inc., 5.80%, 5/22/2018 . . . . . . . . . . . . . . . . . . . . . . . . . . . . . . . . . . . . . . . . . . . . . . . . . . . . . . . . . . . . . . . . . . . . 2,305,000 CAD 2,690 2,609TELUS Corp., Senior Note, 3.60%, 1/26/2021 . . . . . . . . . . . . . . . . . . . . . . . . . . . . . . . . . . . . . . . . . . . . . . . . . . . . . . . . . . . . . . . 2,000,000 CAD 1,998 2,072The GFL Environmental Corp., Senior Note, 7.50%, 6/18/2018 . . . . . . . . . . . . . . . . . . . . . . . . . . . . . . . . . . . . . . . . . . . . . . . . . . . 740,000 CAD 764 770The Home Trust Co.
3.40%, 12/10/2018 . . . . . . . . . . . . . . . . . . . . . . . . . . . . . . . . . . . . . . . . . . . . . . . . . . . . . . . . . . . . . . . . . . . . . . . . . . . . . . . . 2,900,000 CAD 2,912 2,975Senior Note, Floating Rate Note, 5/24/2016 . . . . . . . . . . . . . . . . . . . . . . . . . . . . . . . . . . . . . . . . . . . . . . . . . . . . . . . . . . . . . . . 2,380,000 CAD 2,380 2,381Senior Note, 2.35%, 5/24/2017 . . . . . . . . . . . . . . . . . . . . . . . . . . . . . . . . . . . . . . . . . . . . . . . . . . . . . . . . . . . . . . . . . . . . . . . . 2,900,000 CAD 2,899 2,901
The Toronto-Dominion Bank4.97% to 10/30/2015, Floating Rate Note thereafter, 10/30/2104 . . . . . . . . . . . . . . . . . . . . . . . . . . . . . . . . . . . . . . . . . . . . . . . 7,600,000 CAD 8,037 7,925Senior Note, 2.433%, 8/15/2017 . . . . . . . . . . . . . . . . . . . . . . . . . . . . . . . . . . . . . . . . . . . . . . . . . . . . . . . . . . . . . . . . . . . . . . . 2,505,000 CAD 2,505 2,545
Tim Hortons Inc.Senior Bond, 4.52%, 12/1/2023 . . . . . . . . . . . . . . . . . . . . . . . . . . . . . . . . . . . . . . . . . . . . . . . . . . . . . . . . . . . . . . . . . . . . . . . 1,920,000 CAD 2,032 2,028Senior Note, 2.85%, 4/1/2019 . . . . . . . . . . . . . . . . . . . . . . . . . . . . . . . . . . . . . . . . . . . . . . . . . . . . . . . . . . . . . . . . . . . . . . . . 2,500,000 CAD 2,499 2,523
TransCanada Pipelines Ltd., Junior Subordinated Bond, 6.35% to 5/14/17, Floating Rate Note thereafter, 5/15/2067 . . . . . . . . . . . . . 3,505,000 USD 3,978 3,906TransCanada PipeLines Ltd., Senior Bond, 9.45%, 3/20/2018 . . . . . . . . . . . . . . . . . . . . . . . . . . . . . . . . . . . . . . . . . . . . . . . . . . . . 670,000 CAD 890 837Union Gas Ltd., Senior Bond, 11.50%, 8/28/2015 . . . . . . . . . . . . . . . . . . . . . . . . . . . . . . . . . . . . . . . . . . . . . . . . . . . . . . . . . . . . 2,000,000 CAD 2,340 2,224Wells Fargo Financial Canada Corp., 3.97%, 11/3/2014 . . . . . . . . . . . . . . . . . . . . . . . . . . . . . . . . . . . . . . . . . . . . . . . . . . . . . . . . 3,700,000 CAD 3,780 3,732Westcoast Energy Inc., Senior Note, 3.28%, 1/15/2016 . . . . . . . . . . . . . . . . . . . . . . . . . . . . . . . . . . . . . . . . . . . . . . . . . . . . . . . . . 3,133,000 CAD 3,130 3,209
501,690 503,394
United States: 14.10%Akorn Inc., Term Loan, Floating Rate Note, 4/17/2021 . . . . . . . . . . . . . . . . . . . . . . . . . . . . . . . . . . . . . . . . . . . . . . . . . . . . . . . . . 10,200 USD 11 11Alfred Fueling Systems Inc. (Wayne Fueling), Term Loan B, Floating Rate Note, 6/20/2021 . . . . . . . . . . . . . . . . . . . . . . . . . . . . . . . 18,369 USD 20 20American Express Canada Credit Corp., Senior Note, 2.31%, 3/29/2018 . . . . . . . . . . . . . . . . . . . . . . . . . . . . . . . . . . . . . . . . . . . . . 4,000,000 CAD 3,983 4,036Aon Finance NS1 ULC, Senior Note, 4.76%, 3/8/2018 . . . . . . . . . . . . . . . . . . . . . . . . . . . . . . . . . . . . . . . . . . . . . . . . . . . . . . . . . 2,500,000 CAD 2,677 2,705Bank of America Corp.
Junior Subordinated Bond, K, 8.00% to 1/30/2018, Floating Rate Note thereafter, Perpetual . . . . . . . . . . . . . . . . . . . . . . . . . . . . 540,000 USD 661 640Subordinated Note, Floating Rate Note, 6/1/2016 . . . . . . . . . . . . . . . . . . . . . . . . . . . . . . . . . . . . . . . . . . . . . . . . . . . . . . . . . . . 3,959,000 CAD 3,905 3,917
Bear Stearns Commercial Mortgage Securities Inc., 2007-PW16, AM, Floating Rate Note, 6/11/2040 . . . . . . . . . . . . . . . . . . . . . . . . 435,000 USD 522 515Bear Stearns Commercial Mortgage Securities Trust, 2005-T20, A3, Floating Rate Note, 10/12/2042 . . . . . . . . . . . . . . . . . . . . . . . . 705,830 USD 741 757Caterpillar Financial Services Ltd., Senior Note, 2.12%, 11/25/2016 . . . . . . . . . . . . . . . . . . . . . . . . . . . . . . . . . . . . . . . . . . . . . . . . 4,000,000 CAD 4,000 4,038Chesapeake Energy Corp., Senior Note, 4.875%, 4/15/2022 . . . . . . . . . . . . . . . . . . . . . . . . . . . . . . . . . . . . . . . . . . . . . . . . . . . . . 585,000 USD 639 647Citigroup Finance Canada Inc., Senior Note, 6.75%, 9/22/2014 . . . . . . . . . . . . . . . . . . . . . . . . . . . . . . . . . . . . . . . . . . . . . . . . . . . 3,000,000 CAD 3,211 3,034Citigroup Inc., Junior Subordinated Bond, 5.35% to 5/15/2023, Floating Rate Note thereafter, Perpetual . . . . . . . . . . . . . . . . . . . . . . 515,000 USD 535 529Commercial Mortgage Trust, 2007-C9, A1A, Floating Rate Note, 12/10/2049 . . . . . . . . . . . . . . . . . . . . . . . . . . . . . . . . . . . . . . . . . 795,305 USD 942 941Energy Transfer Partners LP
Senior Bond, 9.00%, 4/15/2019 . . . . . . . . . . . . . . . . . . . . . . . . . . . . . . . . . . . . . . . . . . . . . . . . . . . . . . . . . . . . . . . . . . . . . . . 1,000,000 USD 1,363 1,364Senior Note, 9.70%, 3/15/2019 . . . . . . . . . . . . . . . . . . . . . . . . . . . . . . . . . . . . . . . . . . . . . . . . . . . . . . . . . . . . . . . . . . . . . . . . 1,000,000 USD 1,419 1,399Senior Note, 4.15%, 10/1/2020 . . . . . . . . . . . . . . . . . . . . . . . . . . . . . . . . . . . . . . . . . . . . . . . . . . . . . . . . . . . . . . . . . . . . . . . . 2,000,000 USD 2,242 2,258
Fitness International LLC, Term Loan B, Floating Rate Note, 6/30/2020 . . . . . . . . . . . . . . . . . . . . . . . . . . . . . . . . . . . . . . . . . . . . . 69,000 USD 73 73Ford Credit Canada Ltd.
Senior Note, 7.50%, 8/18/2015 . . . . . . . . . . . . . . . . . . . . . . . . . . . . . . . . . . . . . . . . . . . . . . . . . . . . . . . . . . . . . . . . . . . . . . . . 5,581,000 CAD 6,132 5,914Senior Note, 3.32%, 12/19/2017 . . . . . . . . . . . . . . . . . . . . . . . . . . . . . . . . . . . . . . . . . . . . . . . . . . . . . . . . . . . . . . . . . . . . . . . 1,830,000 CAD 1,842 1,887Senior Note, 3.279%, 7/2/2021 . . . . . . . . . . . . . . . . . . . . . . . . . . . . . . . . . . . . . . . . . . . . . . . . . . . . . . . . . . . . . . . . . . . . . . . . 1,090,000 CAD 1,090 1,091
The accompanying notes are an integral part of these financial statements.
Franklin Templeton Investments Funds 229

Franklin Bissett Canadian Short Term Bond Fund
SCHEDULE OF INVESTMENTS As at June 30, 2014 (Unaudited) (Continued)
Principal Amountin Currency
of IssueAverage
Cost Fair Value
(000s) (000s)
United States: 14.10% (Continued)GE Capital Canada Funding Co.
4.40%, 2/8/2018 . . . . . . . . . . . . . . . . . . . . . . . . . . . . . . . . . . . . . . . . . . . . . . . . . . . . . . . . . . . . . . . . . . . . . . . . . . . . . . . . . . . . 4,000,000 CAD $ 4,249 $ 4,328Senior Note, 5.53%, 8/17/2017 . . . . . . . . . . . . . . . . . . . . . . . . . . . . . . . . . . . . . . . . . . . . . . . . . . . . . . . . . . . . . . . . . . . . . . . . . . 2,320,000 CAD 2,643 2,573
General Electric Capital Corp., B, 6.25% to 12/15/2022, Floating Rate Note thereafter, Perpetual . . . . . . . . . . . . . . . . . . . . . . . . . . . . . 662,000 USD 696 787GM Financial Canada, Senior Note, 3.25%, 5/30/2017 . . . . . . . . . . . . . . . . . . . . . . . . . . . . . . . . . . . . . . . . . . . . . . . . . . . . . . . . . . . 1,685,000 CAD 1,685 1,692Greenwich Capital Commercial Funding Corp., 2007-GG9, A4, 5.444%, 3/10/2039 . . . . . . . . . . . . . . . . . . . . . . . . . . . . . . . . . . . . . . . 1,250,000 USD 1,425 1,456Husky Injection Molding Systems Ltd., Term Loan, Floating Rate Note, 6/30/2021 . . . . . . . . . . . . . . . . . . . . . . . . . . . . . . . . . . . . . . . . 5,400 USD 6 6JC Penney Corp. Inc., Term Loan, Floating Rate Note, 6/20/2019 . . . . . . . . . . . . . . . . . . . . . . . . . . . . . . . . . . . . . . . . . . . . . . . . . . . . 66,854 USD 72 72JPMorgan Chase & Co.
Junior Subordinated Bond, 5.00% to 7/30/2019, Floating Rate Note thereafter, Perpetual . . . . . . . . . . . . . . . . . . . . . . . . . . . . . . . . 2,880,000 USD 3,139 3,069Senior Note, 2.92%, 9/19/2017 . . . . . . . . . . . . . . . . . . . . . . . . . . . . . . . . . . . . . . . . . . . . . . . . . . . . . . . . . . . . . . . . . . . . . . . . . . 1,322,000 CAD 1,323 1,354
Memorial Resource Development Corp., Senior Note, 5.875%, 7/1/2022 . . . . . . . . . . . . . . . . . . . . . . . . . . . . . . . . . . . . . . . . . . . . . . . 180,000 USD 193 194Merrill Lynch & Co Inc., Subordinated Bond, 5.29% to 5/30/2017, Floating Rate Note thereafter, 5/30/2022 . . . . . . . . . . . . . . . . . . . . . 2,976,000 CAD 3,106 3,076Metropolitan Life Global Funding I
2.682%, 4/16/2019 . . . . . . . . . . . . . . . . . . . . . . . . . . . . . . . . . . . . . . . . . . . . . . . . . . . . . . . . . . . . . . . . . . . . . . . . . . . . . . . . . . 2,970,000 CAD 2,970 3,007Floating Rate Note, 9/25/2017 . . . . . . . . . . . . . . . . . . . . . . . . . . . . . . . . . . . . . . . . . . . . . . . . . . . . . . . . . . . . . . . . . . . . . . . . . . . 3,000,000 CAD 3,000 3,053
Morgan Stanley, Junior Subordinated Bond, H, 5.45% to 7/15/2019, Floating Rate Note thereafter, Perpetual . . . . . . . . . . . . . . . . . . . . 555,000 USD 613 603Morgan Stanley Capital I Trust, 2007-IQ16, AM, Floating Rate Note, 12/12/2049 . . . . . . . . . . . . . . . . . . . . . . . . . . . . . . . . . . . . . . . . . 1,190,000 USD 1,433 1,433PNC Preferred Funding Trust I, Junior Subordinated Bond, Floating Rate Note, Perpetual . . . . . . . . . . . . . . . . . . . . . . . . . . . . . . . . . . 950,000 USD 1,006 993PNC Preferred Funding Trust III, Junior Subordinated Bond, 1.456% to 4/22/2019, Floating Rate Note thereafter, Perpetual . . . . . . . . . . 1,950,000 USD 2,055 2,025TGI Friday’s Inc., Term Loan B, Floating Rate Note, 6/24/2020 . . . . . . . . . . . . . . . . . . . . . . . . . . . . . . . . . . . . . . . . . . . . . . . . . . . . . . 8,900 USD 10 10The Goldman Sachs Group Inc.
Senior Note, 4.10%, 11/3/2015 . . . . . . . . . . . . . . . . . . . . . . . . . . . . . . . . . . . . . . . . . . . . . . . . . . . . . . . . . . . . . . . . . . . . . . . . . . 1,000,000 CAD 1,044 1,031Senior Note, 3.375%, 2/1/2018 . . . . . . . . . . . . . . . . . . . . . . . . . . . . . . . . . . . . . . . . . . . . . . . . . . . . . . . . . . . . . . . . . . . . . . . . . . 2,053,000 CAD 2,063 2,119Senior Note, 5.00%, 5/3/2018 . . . . . . . . . . . . . . . . . . . . . . . . . . . . . . . . . . . . . . . . . . . . . . . . . . . . . . . . . . . . . . . . . . . . . . . . . . . 4,040,000 CAD 4,389 4,406
Wells Fargo & Co., S, Junior Subordinated Bond, 5.90% to 6/15/2014, Floating Rate Note thereafter, Perpetual . . . . . . . . . . . . . . . . . . . 505,000 USD 554 572Wells Fargo Financial Canada Corp.
Senior Note, 2.78%, 11/15/2018 . . . . . . . . . . . . . . . . . . . . . . . . . . . . . . . . . . . . . . . . . . . . . . . . . . . . . . . . . . . . . . . . . . . . . . . . . 2,800,000 CAD 2,799 2,862Senior Note, 2.944%, 7/25/2019 . . . . . . . . . . . . . . . . . . . . . . . . . . . . . . . . . . . . . . . . . . . . . . . . . . . . . . . . . . . . . . . . . . . . . . . . . 1,553,000 CAD 1,549 1,592
WTH Car Rental ULC4.143%, 3/20/2015 . . . . . . . . . . . . . . . . . . . . . . . . . . . . . . . . . . . . . . . . . . . . . . . . . . . . . . . . . . . . . . . . . . . . . . . . . . . . . . . . . . 6,675,000 CAD 6,804 6,7292.619%, 12/20/2016 . . . . . . . . . . . . . . . . . . . . . . . . . . . . . . . . . . . . . . . . . . . . . . . . . . . . . . . . . . . . . . . . . . . . . . . . . . . . . . . . . 3,000,000 CAD 3,003 3,046B, 3.323%, 8/20/2019 . . . . . . . . . . . . . . . . . . . . . . . . . . . . . . . . . . . . . . . . . . . . . . . . . . . . . . . . . . . . . . . . . . . . . . . . . . . . . . . . 630,000 CAD 630 629
88,467 88,493
Germany: 1.80%Daimler Canada Finance Inc., Senior Note, Floating Rate Note, 9/12/2014 . . . . . . . . . . . . . . . . . . . . . . . . . . . . . . . . . . . . . . . . . . . . . 3,250,000 CAD 3,267 3,253VW Credit Canada Inc.
Senior Note, Floating Rate Note, 8/19/2015 . . . . . . . . . . . . . . . . . . . . . . . . . . . . . . . . . . . . . . . . . . . . . . . . . . . . . . . . . . . . . . . . . 3,000,000 CAD 3,000 3,005Senior Note, 2.20%, 10/11/2016 . . . . . . . . . . . . . . . . . . . . . . . . . . . . . . . . . . . . . . . . . . . . . . . . . . . . . . . . . . . . . . . . . . . . . . . . . 5,000,000 CAD 4,995 5,052
11,262 11,310
United Kingdom: 1.52%BP Capital Markets PLC
2.744%, 2/24/2017 . . . . . . . . . . . . . . . . . . . . . . . . . . . . . . . . . . . . . . . . . . . . . . . . . . . . . . . . . . . . . . . . . . . . . . . . . . . . . . . . . . 2,689,000 CAD 2,718 2,747Senior Note, 3.497%, 11/9/2020 . . . . . . . . . . . . . . . . . . . . . . . . . . . . . . . . . . . . . . . . . . . . . . . . . . . . . . . . . . . . . . . . . . . . . . . . . 3,555,000 CAD 3,555 3,701
Heathrow Funding Ltd.Secured Note, 4.00%, 7/3/2019 . . . . . . . . . . . . . . . . . . . . . . . . . . . . . . . . . . . . . . . . . . . . . . . . . . . . . . . . . . . . . . . . . . . . . . . . . 851,000 CAD 846 900Senior Secured Note, 3.00%, 6/17/2023 . . . . . . . . . . . . . . . . . . . . . . . . . . . . . . . . . . . . . . . . . . . . . . . . . . . . . . . . . . . . . . . . . . . 1,625,000 CAD 1,613 1,630
The accompanying notes are an integral part of these financial statements.
230 Franklin Templeton Investments Funds
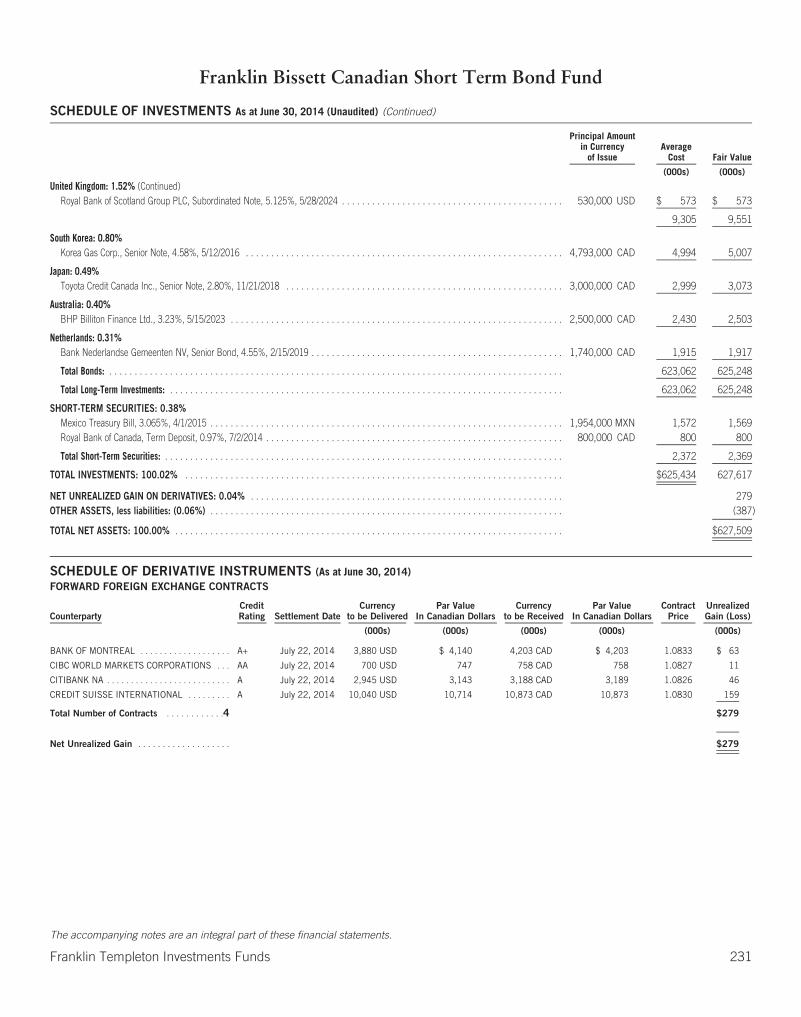
Franklin Bissett Canadian Short Term Bond Fund
SCHEDULE OF INVESTMENTS As at June 30, 2014 (Unaudited) (Continued)
Principal Amountin Currency
of IssueAverage
Cost Fair Value
(000s) (000s)
United Kingdom: 1.52% (Continued)Royal Bank of Scotland Group PLC, Subordinated Note, 5.125%, 5/28/2024 . . . . . . . . . . . . . . . . . . . . . . . . . . . . . . . . . . . . . . . . . . . . 530,000 USD $ 573 $ 573
9,305 9,551
South Korea: 0.80%Korea Gas Corp., Senior Note, 4.58%, 5/12/2016 . . . . . . . . . . . . . . . . . . . . . . . . . . . . . . . . . . . . . . . . . . . . . . . . . . . . . . . . . . . . . . . 4,793,000 CAD 4,994 5,007
Japan: 0.49%Toyota Credit Canada Inc., Senior Note, 2.80%, 11/21/2018 . . . . . . . . . . . . . . . . . . . . . . . . . . . . . . . . . . . . . . . . . . . . . . . . . . . . . . . 3,000,000 CAD 2,999 3,073
Australia: 0.40%BHP Billiton Finance Ltd., 3.23%, 5/15/2023 . . . . . . . . . . . . . . . . . . . . . . . . . . . . . . . . . . . . . . . . . . . . . . . . . . . . . . . . . . . . . . . . . . 2,500,000 CAD 2,430 2,503
Netherlands: 0.31%Bank Nederlandse Gemeenten NV, Senior Bond, 4.55%, 2/15/2019 . . . . . . . . . . . . . . . . . . . . . . . . . . . . . . . . . . . . . . . . . . . . . . . . . . 1,740,000 CAD 1,915 1,917
Total Bonds: . . . . . . . . . . . . . . . . . . . . . . . . . . . . . . . . . . . . . . . . . . . . . . . . . . . . . . . . . . . . . . . . . . . . . . . . . . . . . . . . . . . . . . . . . . 623,062 625,248
Total Long-Term Investments: . . . . . . . . . . . . . . . . . . . . . . . . . . . . . . . . . . . . . . . . . . . . . . . . . . . . . . . . . . . . . . . . . . . . . . . . . . . . . . 623,062 625,248
SHORT-TERM SECURITIES: 0.38%Mexico Treasury Bill, 3.065%, 4/1/2015 . . . . . . . . . . . . . . . . . . . . . . . . . . . . . . . . . . . . . . . . . . . . . . . . . . . . . . . . . . . . . . . . . . . . . . 1,954,000 MXN 1,572 1,569Royal Bank of Canada, Term Deposit, 0.97%, 7/2/2014 . . . . . . . . . . . . . . . . . . . . . . . . . . . . . . . . . . . . . . . . . . . . . . . . . . . . . . . . . . . 800,000 CAD 800 800
Total Short-Term Securities: . . . . . . . . . . . . . . . . . . . . . . . . . . . . . . . . . . . . . . . . . . . . . . . . . . . . . . . . . . . . . . . . . . . . . . . . . . . . . . . 2,372 2,369
TOTAL INVESTMENTS: 100.02% . . . . . . . . . . . . . . . . . . . . . . . . . . . . . . . . . . . . . . . . . . . . . . . . . . . . . . . . . . . . . . . . . . . . . . . . . . . $625,434 627,617
NET UNREALIZED GAIN ON DERIVATIVES: 0.04% . . . . . . . . . . . . . . . . . . . . . . . . . . . . . . . . . . . . . . . . . . . . . . . . . . . . . . . . . . . . . . 279OTHER ASSETS, less liabilities: (0.06%) . . . . . . . . . . . . . . . . . . . . . . . . . . . . . . . . . . . . . . . . . . . . . . . . . . . . . . . . . . . . . . . . . . . . . . (387)
TOTAL NET ASSETS: 100.00% . . . . . . . . . . . . . . . . . . . . . . . . . . . . . . . . . . . . . . . . . . . . . . . . . . . . . . . . . . . . . . . . . . . . . . . . . . . . . $627,509
SCHEDULE OF DERIVATIVE INSTRUMENTS (As at June 30, 2014)FORWARD FOREIGN EXCHANGE CONTRACTS
CounterpartyCreditRating Settlement Date
Currencyto be Delivered
Par ValueIn Canadian Dollars
Currencyto be Received
Par ValueIn Canadian Dollars
ContractPrice
UnrealizedGain (Loss)
(000s) (000s) (000s) (000s) (000s)
BANK OF MONTREAL . . . . . . . . . . . . . . . . . . . A+ July 22, 2014 3,880 USD $ 4,140 4,203 CAD $ 4,203 1.0833 $ 63
CIBC WORLD MARKETS CORPORATIONS . . . AA July 22, 2014 700 USD 747 758 CAD 758 1.0827 11
CITIBANK NA . . . . . . . . . . . . . . . . . . . . . . . . . . A July 22, 2014 2,945 USD 3,143 3,188 CAD 3,189 1.0826 46
CREDIT SUISSE INTERNATIONAL . . . . . . . . . A July 22, 2014 10,040 USD 10,714 10,873 CAD 10,873 1.0830 159
Total Number of Contracts . . . . . . . . . . . .4 $279
Net Unrealized Gain . . . . . . . . . . . . . . . . . . . $279
The accompanying notes are an integral part of these financial statements.
Franklin Templeton Investments Funds 231
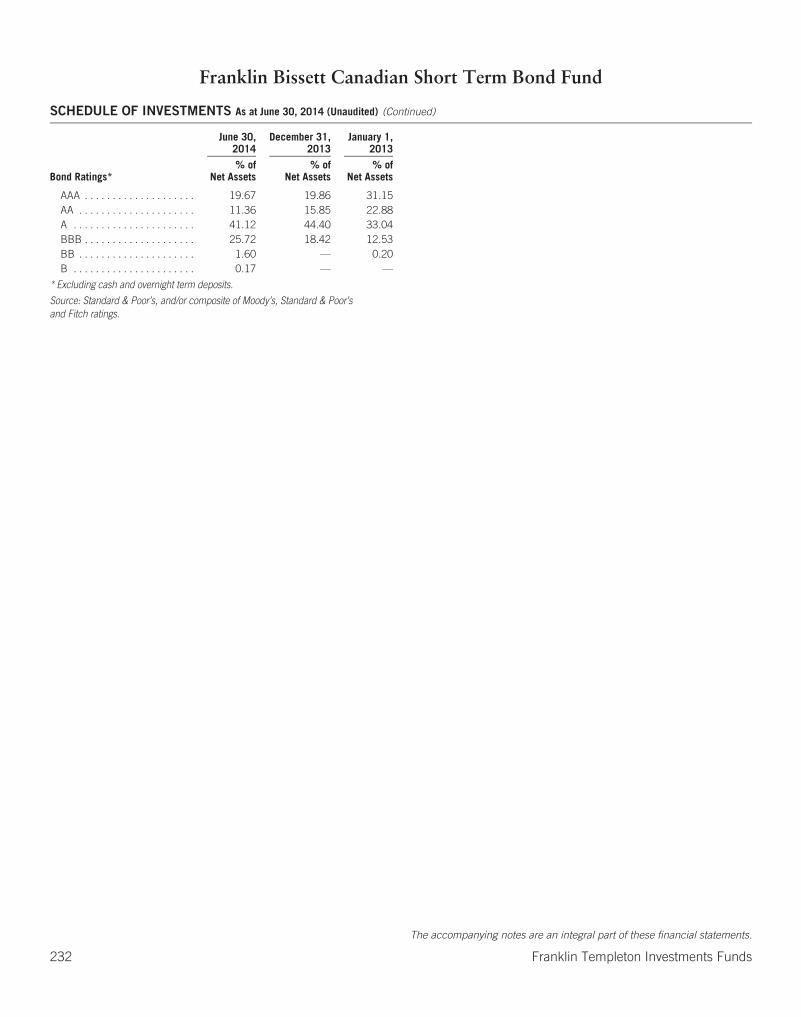
Franklin Bissett Canadian Short Term Bond Fund
SCHEDULE OF INVESTMENTS As at June 30, 2014 (Unaudited) (Continued)
June 30,2014
December 31,2013
January 1,2013
Bond Ratings*% of
Net Assets% of
Net Assets% of
Net Assets
AAA . . . . . . . . . . . . . . . . . . . . 19.67 19.86 31.15AA . . . . . . . . . . . . . . . . . . . . . 11.36 15.85 22.88A . . . . . . . . . . . . . . . . . . . . . . 41.12 44.40 33.04BBB . . . . . . . . . . . . . . . . . . . . 25.72 18.42 12.53BB . . . . . . . . . . . . . . . . . . . . . 1.60 — 0.20B . . . . . . . . . . . . . . . . . . . . . . 0.17 — —
* Excluding cash and overnight term deposits.
Source: Standard & Poor’s, and/or composite of Moody’s, Standard & Poor’sand Fitch ratings.
The accompanying notes are an integral part of these financial statements.
232 Franklin Templeton Investments Funds

Franklin Bissett Canadian Short Term Bond Fund
STATEMENTS OF FINANCIAL POSITION (Unaudited)
As atJune 30,
2014
As atDecember 31,
2013
As atJanuary 1,
2013
(000s) (000s) (000s)AssetsCurrent assetsInvestments at fair value through profit or loss $ 627,617 $ 634,868 $ 423,059Cash
Canadian 326 324 429Foreign — 1,250 5
ReceivablesInvestment securities sold 3,009 3,373 2,042Subscription of redeemable units 202 1,294 94Interest 3,090 3,272 2,393
Unrealized gain on derivatives 279 33 4
Total assets 634,523 644,414 428,026
LiabilitiesCurrent liabilitiesPayables
Investment securities purchased 2,366 524 4,326Redemption of redeemable units 2,576 291 110Management fees 67 90 120Fixed administration fees 10 — —
Distributions to unitholders 1,995 — —Unrealized loss on derivatives — 45 2
Total liabilities 7,014 950 4,558
Net assets attributable to holders of redeemable units $ 627,509 $ 643,464 $ 423,468
Represented by:Net assets as previously reported under Canadian GAAP — 642,888 423,077Revaluation of investments at fair value through profit or loss (Note 3(c)) — 576 391
Net assets attributable to holders of redeemable units $ 627,509 $ 643,464 $ 423,468
Net assets attributable to holders of redeemable units per series (000s)Series A $ 64,720 $ 72,664 $ 100,702Series F 6,795 6,489 5,873Series O 555,994 564,311 316,893
Number of redeemable units outstanding (Note 5)Series A 6,859,340 7,733,593 10,476,755Series F 681,090 654,957 582,772Series O 51,179,107 52,509,297 29,226,110
Net assets attributable to holders of redeemable units per unit — CADSeries A $ 9.44 $ 9.40 $ 9.61Series F 9.98 9.91 10.08Series O 10.86 10.75 10.84
Cost of investments held (000s) $ 625,434 $ 636,981 $ 420,118
The accompanying notes are an integral part of these financial statements.
Franklin Templeton Investments Funds 233
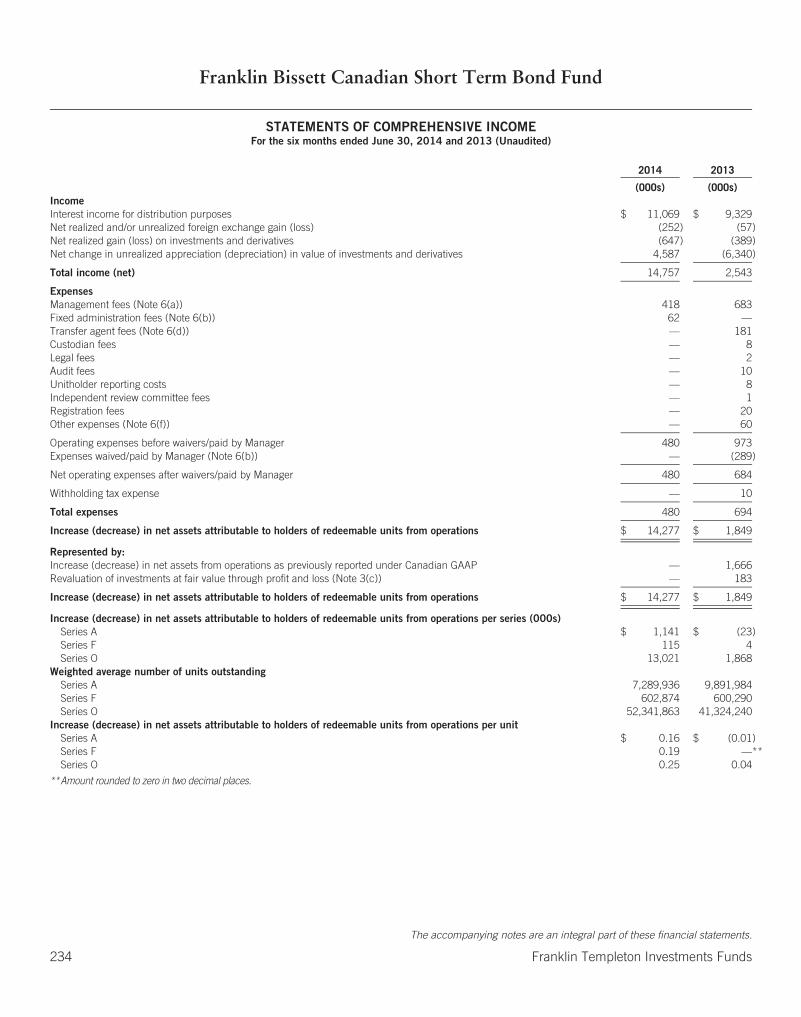
Franklin Bissett Canadian Short Term Bond Fund
STATEMENTS OF COMPREHENSIVE INCOMEFor the six months ended June 30, 2014 and 2013 (Unaudited)
2014 2013
(000s) (000s)IncomeInterest income for distribution purposes $ 11,069 $ 9,329Net realized and/or unrealized foreign exchange gain (loss) (252) (57)Net realized gain (loss) on investments and derivatives (647) (389)Net change in unrealized appreciation (depreciation) in value of investments and derivatives 4,587 (6,340)
Total income (net) 14,757 2,543
ExpensesManagement fees (Note 6(a)) 418 683Fixed administration fees (Note 6(b)) 62 —Transfer agent fees (Note 6(d)) — 181Custodian fees — 8Legal fees — 2Audit fees — 10Unitholder reporting costs — 8Independent review committee fees — 1Registration fees — 20Other expenses (Note 6(f)) — 60
Operating expenses before waivers/paid by Manager 480 973Expenses waived/paid by Manager (Note 6(b)) — (289)
Net operating expenses after waivers/paid by Manager 480 684
Withholding tax expense — 10
Total expenses 480 694
Increase (decrease) in net assets attributable to holders of redeemable units from operations $ 14,277 $ 1,849
Represented by:Increase (decrease) in net assets from operations as previously reported under Canadian GAAP — 1,666Revaluation of investments at fair value through profit and loss (Note 3(c)) — 183
Increase (decrease) in net assets attributable to holders of redeemable units from operations $ 14,277 $ 1,849
Increase (decrease) in net assets attributable to holders of redeemable units from operations per series (000s)Series A $ 1,141 $ (23)Series F 115 4Series O 13,021 1,868
Weighted average number of units outstandingSeries A 7,289,936 9,891,984Series F 602,874 600,290Series O 52,341,863 41,324,240
Increase (decrease) in net assets attributable to holders of redeemable units from operations per unitSeries A $ 0.16 $ (0.01)Series F 0.19 —**Series O 0.25 0.04
**Amount rounded to zero in two decimal places.
The accompanying notes are an integral part of these financial statements.
234 Franklin Templeton Investments Funds
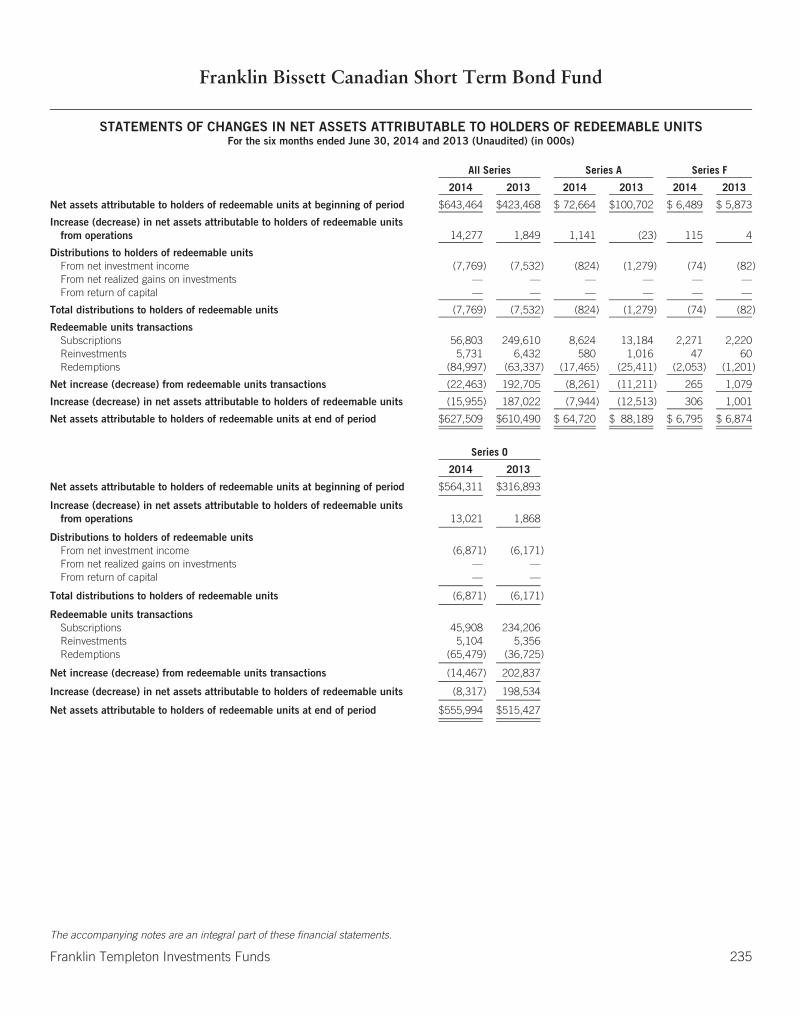
Franklin Bissett Canadian Short Term Bond Fund
STATEMENTS OF CHANGES IN NET ASSETS ATTRIBUTABLE TO HOLDERS OF REDEEMABLE UNITSFor the six months ended June 30, 2014 and 2013 (Unaudited) (in 000s)
All Series Series A Series F
2014 2013 2014 2013 2014 2013
Net assets attributable to holders of redeemable units at beginning of period $643,464 $423,468 $ 72,664 $100,702 $ 6,489 $ 5,873
Increase (decrease) in net assets attributable to holders of redeemable unitsfrom operations 14,277 1,849 1,141 (23) 115 4
Distributions to holders of redeemable unitsFrom net investment income (7,769) (7,532) (824) (1,279) (74) (82)From net realized gains on investments — — — — — —From return of capital — — — — — —
Total distributions to holders of redeemable units (7,769) (7,532) (824) (1,279) (74) (82)
Redeemable units transactionsSubscriptions 56,803 249,610 8,624 13,184 2,271 2,220Reinvestments 5,731 6,432 580 1,016 47 60Redemptions (84,997) (63,337) (17,465) (25,411) (2,053) (1,201)
Net increase (decrease) from redeemable units transactions (22,463) 192,705 (8,261) (11,211) 265 1,079
Increase (decrease) in net assets attributable to holders of redeemable units (15,955) 187,022 (7,944) (12,513) 306 1,001
Net assets attributable to holders of redeemable units at end of period $627,509 $610,490 $ 64,720 $ 88,189 $ 6,795 $ 6,874
Series O
2014 2013
Net assets attributable to holders of redeemable units at beginning of period $564,311 $316,893
Increase (decrease) in net assets attributable to holders of redeemable unitsfrom operations 13,021 1,868
Distributions to holders of redeemable unitsFrom net investment income (6,871) (6,171)From net realized gains on investments — —From return of capital — —
Total distributions to holders of redeemable units (6,871) (6,171)
Redeemable units transactionsSubscriptions 45,908 234,206Reinvestments 5,104 5,356Redemptions (65,479) (36,725)
Net increase (decrease) from redeemable units transactions (14,467) 202,837
Increase (decrease) in net assets attributable to holders of redeemable units (8,317) 198,534
Net assets attributable to holders of redeemable units at end of period $555,994 $515,427
The accompanying notes are an integral part of these financial statements.
Franklin Templeton Investments Funds 235
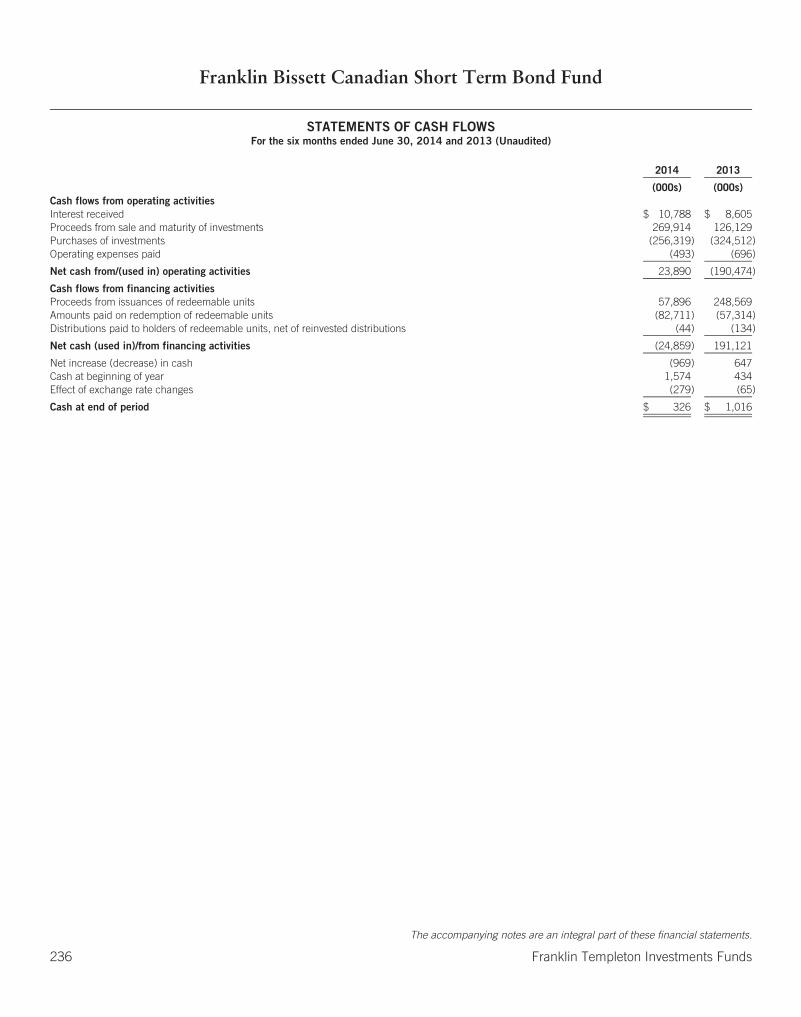
Franklin Bissett Canadian Short Term Bond Fund
STATEMENTS OF CASH FLOWSFor the six months ended June 30, 2014 and 2013 (Unaudited)
2014 2013
(000s) (000s)Cash flows from operating activitiesInterest received $ 10,788 $ 8,605Proceeds from sale and maturity of investments 269,914 126,129Purchases of investments (256,319) (324,512)Operating expenses paid (493) (696)
Net cash from/(used in) operating activities 23,890 (190,474)
Cash flows from financing activitiesProceeds from issuances of redeemable units 57,896 248,569Amounts paid on redemption of redeemable units (82,711) (57,314)Distributions paid to holders of redeemable units, net of reinvested distributions (44) (134)
Net cash (used in)/from financing activities (24,859) 191,121
Net increase (decrease) in cash (969) 647Cash at beginning of year 1,574 434Effect of exchange rate changes (279) (65)
Cash at end of period $ 326 $ 1,016
The accompanying notes are an integral part of these financial statements.
236 Franklin Templeton Investments Funds
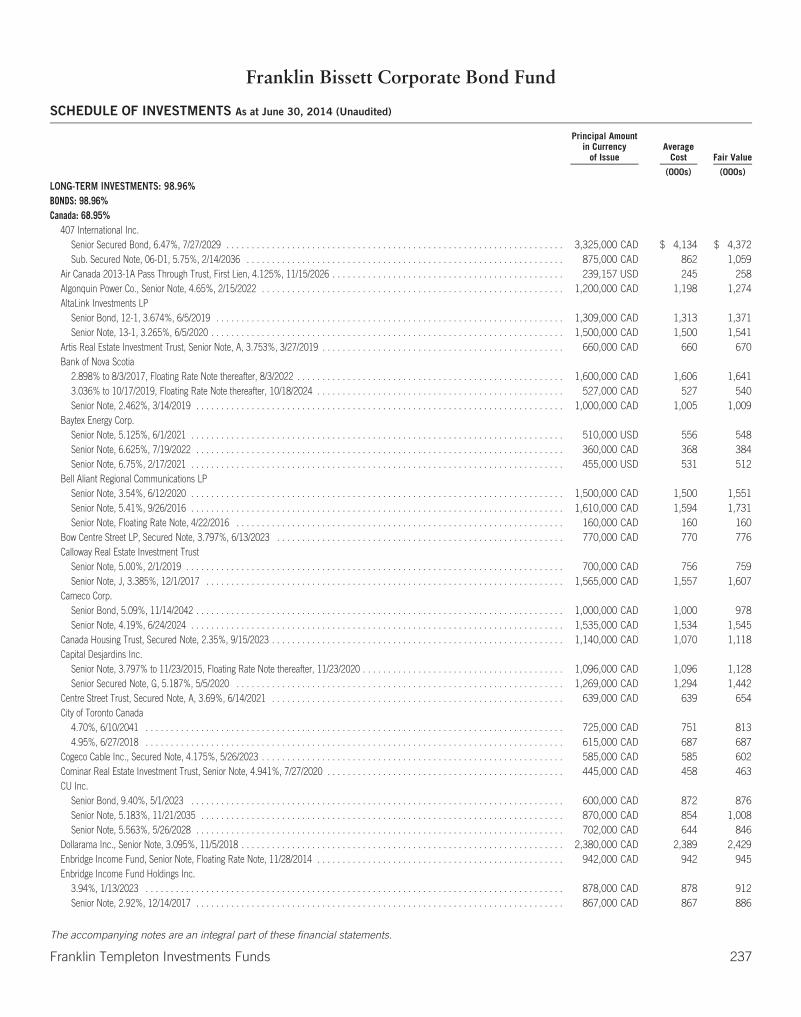
Franklin Bissett Corporate Bond Fund
SCHEDULE OF INVESTMENTS As at June 30, 2014 (Unaudited)
Principal Amountin Currency
of IssueAverage
Cost Fair Value
(000s) (000s)
LONG-TERM INVESTMENTS: 98.96%BONDS: 98.96%Canada: 68.95%
407 International Inc.Senior Secured Bond, 6.47%, 7/27/2029 . . . . . . . . . . . . . . . . . . . . . . . . . . . . . . . . . . . . . . . . . . . . . . . . . . . . . . . . . . . . . . . . . . . 3,325,000 CAD $ 4,134 $ 4,372Sub. Secured Note, 06-D1, 5.75%, 2/14/2036 . . . . . . . . . . . . . . . . . . . . . . . . . . . . . . . . . . . . . . . . . . . . . . . . . . . . . . . . . . . . . . . 875,000 CAD 862 1,059
Air Canada 2013-1A Pass Through Trust, First Lien, 4.125%, 11/15/2026 . . . . . . . . . . . . . . . . . . . . . . . . . . . . . . . . . . . . . . . . . . . . . . 239,157 USD 245 258Algonquin Power Co., Senior Note, 4.65%, 2/15/2022 . . . . . . . . . . . . . . . . . . . . . . . . . . . . . . . . . . . . . . . . . . . . . . . . . . . . . . . . . . . . 1,200,000 CAD 1,198 1,274AltaLink Investments LP
Senior Bond, 12-1, 3.674%, 6/5/2019 . . . . . . . . . . . . . . . . . . . . . . . . . . . . . . . . . . . . . . . . . . . . . . . . . . . . . . . . . . . . . . . . . . . . . 1,309,000 CAD 1,313 1,371Senior Note, 13-1, 3.265%, 6/5/2020 . . . . . . . . . . . . . . . . . . . . . . . . . . . . . . . . . . . . . . . . . . . . . . . . . . . . . . . . . . . . . . . . . . . . . . 1,500,000 CAD 1,500 1,541
Artis Real Estate Investment Trust, Senior Note, A, 3.753%, 3/27/2019 . . . . . . . . . . . . . . . . . . . . . . . . . . . . . . . . . . . . . . . . . . . . . . . . 660,000 CAD 660 670Bank of Nova Scotia
2.898% to 8/3/2017, Floating Rate Note thereafter, 8/3/2022 . . . . . . . . . . . . . . . . . . . . . . . . . . . . . . . . . . . . . . . . . . . . . . . . . . . . . 1,600,000 CAD 1,606 1,6413.036% to 10/17/2019, Floating Rate Note thereafter, 10/18/2024 . . . . . . . . . . . . . . . . . . . . . . . . . . . . . . . . . . . . . . . . . . . . . . . . . 527,000 CAD 527 540Senior Note, 2.462%, 3/14/2019 . . . . . . . . . . . . . . . . . . . . . . . . . . . . . . . . . . . . . . . . . . . . . . . . . . . . . . . . . . . . . . . . . . . . . . . . . 1,000,000 CAD 1,005 1,009
Baytex Energy Corp.Senior Note, 5.125%, 6/1/2021 . . . . . . . . . . . . . . . . . . . . . . . . . . . . . . . . . . . . . . . . . . . . . . . . . . . . . . . . . . . . . . . . . . . . . . . . . . 510,000 USD 556 548Senior Note, 6.625%, 7/19/2022 . . . . . . . . . . . . . . . . . . . . . . . . . . . . . . . . . . . . . . . . . . . . . . . . . . . . . . . . . . . . . . . . . . . . . . . . . 360,000 CAD 368 384Senior Note, 6.75%, 2/17/2021 . . . . . . . . . . . . . . . . . . . . . . . . . . . . . . . . . . . . . . . . . . . . . . . . . . . . . . . . . . . . . . . . . . . . . . . . . . 455,000 USD 531 512
Bell Aliant Regional Communications LPSenior Note, 3.54%, 6/12/2020 . . . . . . . . . . . . . . . . . . . . . . . . . . . . . . . . . . . . . . . . . . . . . . . . . . . . . . . . . . . . . . . . . . . . . . . . . . 1,500,000 CAD 1,500 1,551Senior Note, 5.41%, 9/26/2016 . . . . . . . . . . . . . . . . . . . . . . . . . . . . . . . . . . . . . . . . . . . . . . . . . . . . . . . . . . . . . . . . . . . . . . . . . . 1,610,000 CAD 1,594 1,731Senior Note, Floating Rate Note, 4/22/2016 . . . . . . . . . . . . . . . . . . . . . . . . . . . . . . . . . . . . . . . . . . . . . . . . . . . . . . . . . . . . . . . . . 160,000 CAD 160 160
Bow Centre Street LP, Secured Note, 3.797%, 6/13/2023 . . . . . . . . . . . . . . . . . . . . . . . . . . . . . . . . . . . . . . . . . . . . . . . . . . . . . . . . . 770,000 CAD 770 776Calloway Real Estate Investment Trust
Senior Note, 5.00%, 2/1/2019 . . . . . . . . . . . . . . . . . . . . . . . . . . . . . . . . . . . . . . . . . . . . . . . . . . . . . . . . . . . . . . . . . . . . . . . . . . . 700,000 CAD 756 759Senior Note, J, 3.385%, 12/1/2017 . . . . . . . . . . . . . . . . . . . . . . . . . . . . . . . . . . . . . . . . . . . . . . . . . . . . . . . . . . . . . . . . . . . . . . . 1,565,000 CAD 1,557 1,607
Cameco Corp.Senior Bond, 5.09%, 11/14/2042 . . . . . . . . . . . . . . . . . . . . . . . . . . . . . . . . . . . . . . . . . . . . . . . . . . . . . . . . . . . . . . . . . . . . . . . . . 1,000,000 CAD 1,000 978Senior Note, 4.19%, 6/24/2024 . . . . . . . . . . . . . . . . . . . . . . . . . . . . . . . . . . . . . . . . . . . . . . . . . . . . . . . . . . . . . . . . . . . . . . . . . . 1,535,000 CAD 1,534 1,545
Canada Housing Trust, Secured Note, 2.35%, 9/15/2023 . . . . . . . . . . . . . . . . . . . . . . . . . . . . . . . . . . . . . . . . . . . . . . . . . . . . . . . . . . 1,140,000 CAD 1,070 1,118Capital Desjardins Inc.
Senior Note, 3.797% to 11/23/2015, Floating Rate Note thereafter, 11/23/2020 . . . . . . . . . . . . . . . . . . . . . . . . . . . . . . . . . . . . . . . . 1,096,000 CAD 1,096 1,128Senior Secured Note, G, 5.187%, 5/5/2020 . . . . . . . . . . . . . . . . . . . . . . . . . . . . . . . . . . . . . . . . . . . . . . . . . . . . . . . . . . . . . . . . . 1,269,000 CAD 1,294 1,442
Centre Street Trust, Secured Note, A, 3.69%, 6/14/2021 . . . . . . . . . . . . . . . . . . . . . . . . . . . . . . . . . . . . . . . . . . . . . . . . . . . . . . . . . . 639,000 CAD 639 654City of Toronto Canada
4.70%, 6/10/2041 . . . . . . . . . . . . . . . . . . . . . . . . . . . . . . . . . . . . . . . . . . . . . . . . . . . . . . . . . . . . . . . . . . . . . . . . . . . . . . . . . . . 725,000 CAD 751 8134.95%, 6/27/2018 . . . . . . . . . . . . . . . . . . . . . . . . . . . . . . . . . . . . . . . . . . . . . . . . . . . . . . . . . . . . . . . . . . . . . . . . . . . . . . . . . . . 615,000 CAD 687 687
Cogeco Cable Inc., Secured Note, 4.175%, 5/26/2023 . . . . . . . . . . . . . . . . . . . . . . . . . . . . . . . . . . . . . . . . . . . . . . . . . . . . . . . . . . . . 585,000 CAD 585 602Cominar Real Estate Investment Trust, Senior Note, 4.941%, 7/27/2020 . . . . . . . . . . . . . . . . . . . . . . . . . . . . . . . . . . . . . . . . . . . . . . . 445,000 CAD 458 463CU Inc.
Senior Bond, 9.40%, 5/1/2023 . . . . . . . . . . . . . . . . . . . . . . . . . . . . . . . . . . . . . . . . . . . . . . . . . . . . . . . . . . . . . . . . . . . . . . . . . . 600,000 CAD 872 876Senior Note, 5.183%, 11/21/2035 . . . . . . . . . . . . . . . . . . . . . . . . . . . . . . . . . . . . . . . . . . . . . . . . . . . . . . . . . . . . . . . . . . . . . . . . 870,000 CAD 854 1,008Senior Note, 5.563%, 5/26/2028 . . . . . . . . . . . . . . . . . . . . . . . . . . . . . . . . . . . . . . . . . . . . . . . . . . . . . . . . . . . . . . . . . . . . . . . . . 702,000 CAD 644 846
Dollarama Inc., Senior Note, 3.095%, 11/5/2018 . . . . . . . . . . . . . . . . . . . . . . . . . . . . . . . . . . . . . . . . . . . . . . . . . . . . . . . . . . . . . . . . 2,380,000 CAD 2,389 2,429Enbridge Income Fund, Senior Note, Floating Rate Note, 11/28/2014 . . . . . . . . . . . . . . . . . . . . . . . . . . . . . . . . . . . . . . . . . . . . . . . . . 942,000 CAD 942 945Enbridge Income Fund Holdings Inc.
3.94%, 1/13/2023 . . . . . . . . . . . . . . . . . . . . . . . . . . . . . . . . . . . . . . . . . . . . . . . . . . . . . . . . . . . . . . . . . . . . . . . . . . . . . . . . . . . 878,000 CAD 878 912Senior Note, 2.92%, 12/14/2017 . . . . . . . . . . . . . . . . . . . . . . . . . . . . . . . . . . . . . . . . . . . . . . . . . . . . . . . . . . . . . . . . . . . . . . . . . 867,000 CAD 867 886
The accompanying notes are an integral part of these financial statements.
Franklin Templeton Investments Funds 237
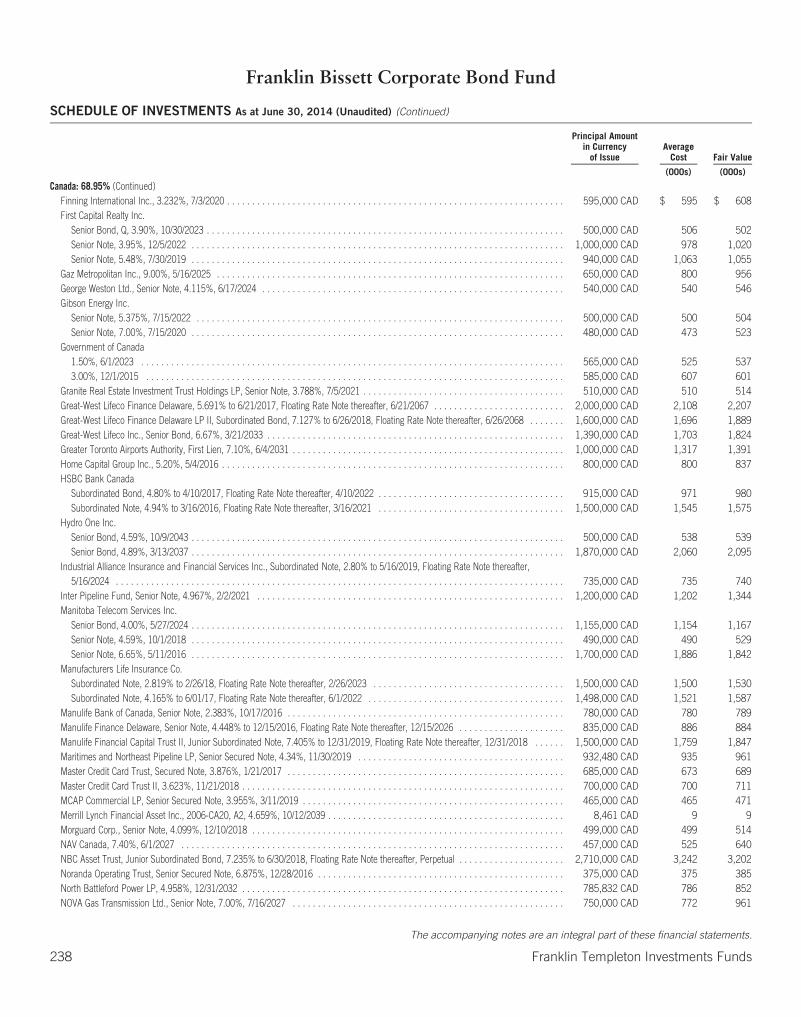
Franklin Bissett Corporate Bond Fund
SCHEDULE OF INVESTMENTS As at June 30, 2014 (Unaudited) (Continued)
Principal Amountin Currency
of IssueAverage
Cost Fair Value
(000s) (000s)
Canada: 68.95% (Continued)Finning International Inc., 3.232%, 7/3/2020 . . . . . . . . . . . . . . . . . . . . . . . . . . . . . . . . . . . . . . . . . . . . . . . . . . . . . . . . . . . . . . . . . . . 595,000 CAD $ 595 $ 608First Capital Realty Inc.
Senior Bond, Q, 3.90%, 10/30/2023 . . . . . . . . . . . . . . . . . . . . . . . . . . . . . . . . . . . . . . . . . . . . . . . . . . . . . . . . . . . . . . . . . . . . . . . 500,000 CAD 506 502Senior Note, 3.95%, 12/5/2022 . . . . . . . . . . . . . . . . . . . . . . . . . . . . . . . . . . . . . . . . . . . . . . . . . . . . . . . . . . . . . . . . . . . . . . . . . . 1,000,000 CAD 978 1,020Senior Note, 5.48%, 7/30/2019 . . . . . . . . . . . . . . . . . . . . . . . . . . . . . . . . . . . . . . . . . . . . . . . . . . . . . . . . . . . . . . . . . . . . . . . . . . 940,000 CAD 1,063 1,055
Gaz Metropolitan Inc., 9.00%, 5/16/2025 . . . . . . . . . . . . . . . . . . . . . . . . . . . . . . . . . . . . . . . . . . . . . . . . . . . . . . . . . . . . . . . . . . . . . 650,000 CAD 800 956George Weston Ltd., Senior Note, 4.115%, 6/17/2024 . . . . . . . . . . . . . . . . . . . . . . . . . . . . . . . . . . . . . . . . . . . . . . . . . . . . . . . . . . . . 540,000 CAD 540 546Gibson Energy Inc.
Senior Note, 5.375%, 7/15/2022 . . . . . . . . . . . . . . . . . . . . . . . . . . . . . . . . . . . . . . . . . . . . . . . . . . . . . . . . . . . . . . . . . . . . . . . . . 500,000 CAD 500 504Senior Note, 7.00%, 7/15/2020 . . . . . . . . . . . . . . . . . . . . . . . . . . . . . . . . . . . . . . . . . . . . . . . . . . . . . . . . . . . . . . . . . . . . . . . . . . 480,000 CAD 473 523
Government of Canada1.50%, 6/1/2023 . . . . . . . . . . . . . . . . . . . . . . . . . . . . . . . . . . . . . . . . . . . . . . . . . . . . . . . . . . . . . . . . . . . . . . . . . . . . . . . . . . . . 565,000 CAD 525 5373.00%, 12/1/2015 . . . . . . . . . . . . . . . . . . . . . . . . . . . . . . . . . . . . . . . . . . . . . . . . . . . . . . . . . . . . . . . . . . . . . . . . . . . . . . . . . . . 585,000 CAD 607 601
Granite Real Estate Investment Trust Holdings LP, Senior Note, 3.788%, 7/5/2021 . . . . . . . . . . . . . . . . . . . . . . . . . . . . . . . . . . . . . . . . 510,000 CAD 510 514Great-West Lifeco Finance Delaware, 5.691% to 6/21/2017, Floating Rate Note thereafter, 6/21/2067 . . . . . . . . . . . . . . . . . . . . . . . . . . 2,000,000 CAD 2,108 2,207Great-West Lifeco Finance Delaware LP II, Subordinated Bond, 7.127% to 6/26/2018, Floating Rate Note thereafter, 6/26/2068 . . . . . . . 1,600,000 CAD 1,696 1,889Great-West Lifeco Inc., Senior Bond, 6.67%, 3/21/2033 . . . . . . . . . . . . . . . . . . . . . . . . . . . . . . . . . . . . . . . . . . . . . . . . . . . . . . . . . . . 1,390,000 CAD 1,703 1,824Greater Toronto Airports Authority, First Lien, 7.10%, 6/4/2031 . . . . . . . . . . . . . . . . . . . . . . . . . . . . . . . . . . . . . . . . . . . . . . . . . . . . . . 1,000,000 CAD 1,317 1,391Home Capital Group Inc., 5.20%, 5/4/2016 . . . . . . . . . . . . . . . . . . . . . . . . . . . . . . . . . . . . . . . . . . . . . . . . . . . . . . . . . . . . . . . . . . . . 800,000 CAD 800 837HSBC Bank Canada
Subordinated Bond, 4.80% to 4/10/2017, Floating Rate Note thereafter, 4/10/2022 . . . . . . . . . . . . . . . . . . . . . . . . . . . . . . . . . . . . . 915,000 CAD 971 980Subordinated Note, 4.94% to 3/16/2016, Floating Rate Note thereafter, 3/16/2021 . . . . . . . . . . . . . . . . . . . . . . . . . . . . . . . . . . . . . 1,500,000 CAD 1,545 1,575
Hydro One Inc.Senior Bond, 4.59%, 10/9/2043 . . . . . . . . . . . . . . . . . . . . . . . . . . . . . . . . . . . . . . . . . . . . . . . . . . . . . . . . . . . . . . . . . . . . . . . . . . 500,000 CAD 538 539Senior Bond, 4.89%, 3/13/2037 . . . . . . . . . . . . . . . . . . . . . . . . . . . . . . . . . . . . . . . . . . . . . . . . . . . . . . . . . . . . . . . . . . . . . . . . . . 1,870,000 CAD 2,060 2,095
Industrial Alliance Insurance and Financial Services Inc., Subordinated Note, 2.80% to 5/16/2019, Floating Rate Note thereafter,5/16/2024 . . . . . . . . . . . . . . . . . . . . . . . . . . . . . . . . . . . . . . . . . . . . . . . . . . . . . . . . . . . . . . . . . . . . . . . . . . . . . . . . . . . . . . . . . 735,000 CAD 735 740
Inter Pipeline Fund, Senior Note, 4.967%, 2/2/2021 . . . . . . . . . . . . . . . . . . . . . . . . . . . . . . . . . . . . . . . . . . . . . . . . . . . . . . . . . . . . . 1,200,000 CAD 1,202 1,344Manitoba Telecom Services Inc.
Senior Bond, 4.00%, 5/27/2024 . . . . . . . . . . . . . . . . . . . . . . . . . . . . . . . . . . . . . . . . . . . . . . . . . . . . . . . . . . . . . . . . . . . . . . . . . . 1,155,000 CAD 1,154 1,167Senior Note, 4.59%, 10/1/2018 . . . . . . . . . . . . . . . . . . . . . . . . . . . . . . . . . . . . . . . . . . . . . . . . . . . . . . . . . . . . . . . . . . . . . . . . . . 490,000 CAD 490 529Senior Note, 6.65%, 5/11/2016 . . . . . . . . . . . . . . . . . . . . . . . . . . . . . . . . . . . . . . . . . . . . . . . . . . . . . . . . . . . . . . . . . . . . . . . . . . 1,700,000 CAD 1,886 1,842
Manufacturers Life Insurance Co.Subordinated Note, 2.819% to 2/26/18, Floating Rate Note thereafter, 2/26/2023 . . . . . . . . . . . . . . . . . . . . . . . . . . . . . . . . . . . . . . 1,500,000 CAD 1,500 1,530Subordinated Note, 4.165% to 6/01/17, Floating Rate Note thereafter, 6/1/2022 . . . . . . . . . . . . . . . . . . . . . . . . . . . . . . . . . . . . . . . 1,498,000 CAD 1,521 1,587
Manulife Bank of Canada, Senior Note, 2.383%, 10/17/2016 . . . . . . . . . . . . . . . . . . . . . . . . . . . . . . . . . . . . . . . . . . . . . . . . . . . . . . . 780,000 CAD 780 789Manulife Finance Delaware, Senior Note, 4.448% to 12/15/2016, Floating Rate Note thereafter, 12/15/2026 . . . . . . . . . . . . . . . . . . . . . 835,000 CAD 886 884Manulife Financial Capital Trust II, Junior Subordinated Note, 7.405% to 12/31/2019, Floating Rate Note thereafter, 12/31/2018 . . . . . . 1,500,000 CAD 1,759 1,847Maritimes and Northeast Pipeline LP, Senior Secured Note, 4.34%, 11/30/2019 . . . . . . . . . . . . . . . . . . . . . . . . . . . . . . . . . . . . . . . . . 932,480 CAD 935 961Master Credit Card Trust, Secured Note, 3.876%, 1/21/2017 . . . . . . . . . . . . . . . . . . . . . . . . . . . . . . . . . . . . . . . . . . . . . . . . . . . . . . . 685,000 CAD 673 689Master Credit Card Trust II, 3.623%, 11/21/2018 . . . . . . . . . . . . . . . . . . . . . . . . . . . . . . . . . . . . . . . . . . . . . . . . . . . . . . . . . . . . . . . . 700,000 CAD 700 711MCAP Commercial LP, Senior Secured Note, 3.955%, 3/11/2019 . . . . . . . . . . . . . . . . . . . . . . . . . . . . . . . . . . . . . . . . . . . . . . . . . . . . 465,000 CAD 465 471Merrill Lynch Financial Asset Inc., 2006-CA20, A2, 4.659%, 10/12/2039 . . . . . . . . . . . . . . . . . . . . . . . . . . . . . . . . . . . . . . . . . . . . . . . 8,461 CAD 9 9Morguard Corp., Senior Note, 4.099%, 12/10/2018 . . . . . . . . . . . . . . . . . . . . . . . . . . . . . . . . . . . . . . . . . . . . . . . . . . . . . . . . . . . . . . 499,000 CAD 499 514NAV Canada, 7.40%, 6/1/2027 . . . . . . . . . . . . . . . . . . . . . . . . . . . . . . . . . . . . . . . . . . . . . . . . . . . . . . . . . . . . . . . . . . . . . . . . . . . . 457,000 CAD 525 640NBC Asset Trust, Junior Subordinated Bond, 7.235% to 6/30/2018, Floating Rate Note thereafter, Perpetual . . . . . . . . . . . . . . . . . . . . . 2,710,000 CAD 3,242 3,202Noranda Operating Trust, Senior Secured Note, 6.875%, 12/28/2016 . . . . . . . . . . . . . . . . . . . . . . . . . . . . . . . . . . . . . . . . . . . . . . . . . 375,000 CAD 375 385North Battleford Power LP, 4.958%, 12/31/2032 . . . . . . . . . . . . . . . . . . . . . . . . . . . . . . . . . . . . . . . . . . . . . . . . . . . . . . . . . . . . . . . . 785,832 CAD 786 852NOVA Gas Transmission Ltd., Senior Note, 7.00%, 7/16/2027 . . . . . . . . . . . . . . . . . . . . . . . . . . . . . . . . . . . . . . . . . . . . . . . . . . . . . . 750,000 CAD 772 961
The accompanying notes are an integral part of these financial statements.
238 Franklin Templeton Investments Funds
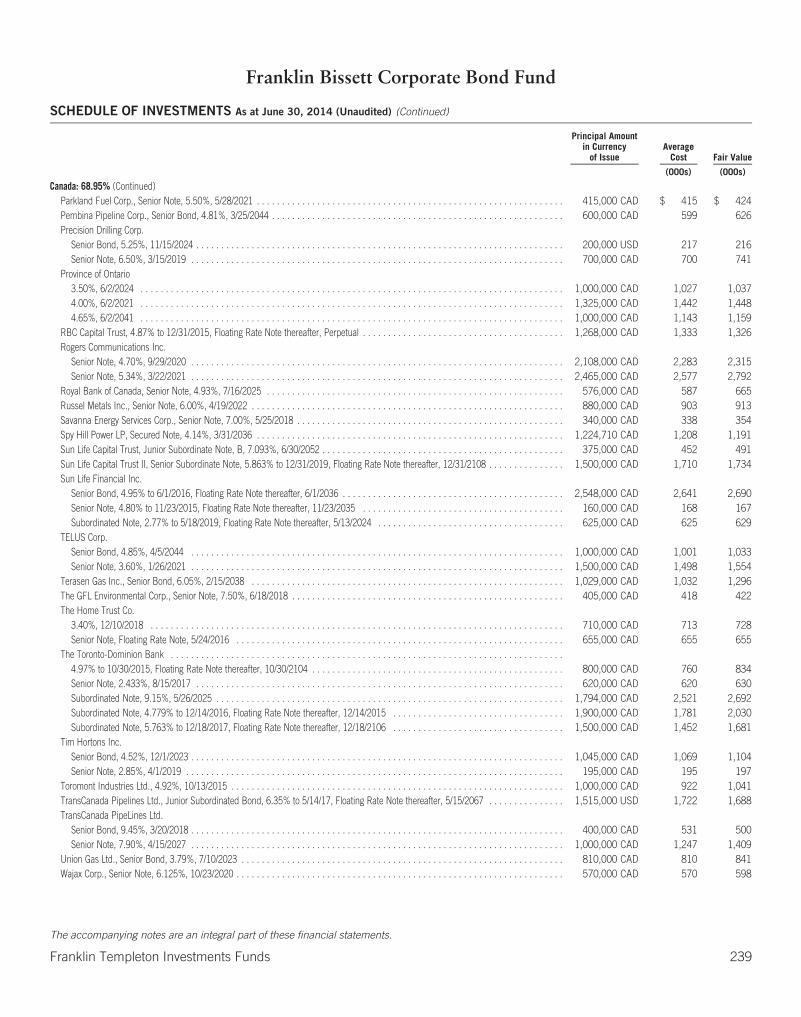
Franklin Bissett Corporate Bond Fund
SCHEDULE OF INVESTMENTS As at June 30, 2014 (Unaudited) (Continued)
Principal Amountin Currency
of IssueAverage
Cost Fair Value
(000s) (000s)
Canada: 68.95% (Continued)Parkland Fuel Corp., Senior Note, 5.50%, 5/28/2021 . . . . . . . . . . . . . . . . . . . . . . . . . . . . . . . . . . . . . . . . . . . . . . . . . . . . . . . . . . . . . 415,000 CAD $ 415 $ 424Pembina Pipeline Corp., Senior Bond, 4.81%, 3/25/2044 . . . . . . . . . . . . . . . . . . . . . . . . . . . . . . . . . . . . . . . . . . . . . . . . . . . . . . . . . . 600,000 CAD 599 626Precision Drilling Corp.
Senior Bond, 5.25%, 11/15/2024 . . . . . . . . . . . . . . . . . . . . . . . . . . . . . . . . . . . . . . . . . . . . . . . . . . . . . . . . . . . . . . . . . . . . . . . . . 200,000 USD 217 216Senior Note, 6.50%, 3/15/2019 . . . . . . . . . . . . . . . . . . . . . . . . . . . . . . . . . . . . . . . . . . . . . . . . . . . . . . . . . . . . . . . . . . . . . . . . . . 700,000 CAD 700 741
Province of Ontario3.50%, 6/2/2024 . . . . . . . . . . . . . . . . . . . . . . . . . . . . . . . . . . . . . . . . . . . . . . . . . . . . . . . . . . . . . . . . . . . . . . . . . . . . . . . . . . . . 1,000,000 CAD 1,027 1,0374.00%, 6/2/2021 . . . . . . . . . . . . . . . . . . . . . . . . . . . . . . . . . . . . . . . . . . . . . . . . . . . . . . . . . . . . . . . . . . . . . . . . . . . . . . . . . . . . 1,325,000 CAD 1,442 1,4484.65%, 6/2/2041 . . . . . . . . . . . . . . . . . . . . . . . . . . . . . . . . . . . . . . . . . . . . . . . . . . . . . . . . . . . . . . . . . . . . . . . . . . . . . . . . . . . . 1,000,000 CAD 1,143 1,159
RBC Capital Trust, 4.87% to 12/31/2015, Floating Rate Note thereafter, Perpetual . . . . . . . . . . . . . . . . . . . . . . . . . . . . . . . . . . . . . . . . 1,268,000 CAD 1,333 1,326Rogers Communications Inc.
Senior Note, 4.70%, 9/29/2020 . . . . . . . . . . . . . . . . . . . . . . . . . . . . . . . . . . . . . . . . . . . . . . . . . . . . . . . . . . . . . . . . . . . . . . . . . . 2,108,000 CAD 2,283 2,315Senior Note, 5.34%, 3/22/2021 . . . . . . . . . . . . . . . . . . . . . . . . . . . . . . . . . . . . . . . . . . . . . . . . . . . . . . . . . . . . . . . . . . . . . . . . . . 2,465,000 CAD 2,577 2,792
Royal Bank of Canada, Senior Note, 4.93%, 7/16/2025 . . . . . . . . . . . . . . . . . . . . . . . . . . . . . . . . . . . . . . . . . . . . . . . . . . . . . . . . . . . 576,000 CAD 587 665Russel Metals Inc., Senior Note, 6.00%, 4/19/2022 . . . . . . . . . . . . . . . . . . . . . . . . . . . . . . . . . . . . . . . . . . . . . . . . . . . . . . . . . . . . . . 880,000 CAD 903 913Savanna Energy Services Corp., Senior Note, 7.00%, 5/25/2018 . . . . . . . . . . . . . . . . . . . . . . . . . . . . . . . . . . . . . . . . . . . . . . . . . . . . . 340,000 CAD 338 354Spy Hill Power LP, Secured Note, 4.14%, 3/31/2036 . . . . . . . . . . . . . . . . . . . . . . . . . . . . . . . . . . . . . . . . . . . . . . . . . . . . . . . . . . . . . 1,224,710 CAD 1,208 1,191Sun Life Capital Trust, Junior Subordinate Note, B, 7.093%, 6/30/2052 . . . . . . . . . . . . . . . . . . . . . . . . . . . . . . . . . . . . . . . . . . . . . . . . 375,000 CAD 452 491Sun Life Capital Trust II, Senior Subordinate Note, 5.863% to 12/31/2019, Floating Rate Note thereafter, 12/31/2108 . . . . . . . . . . . . . . . 1,500,000 CAD 1,710 1,734Sun Life Financial Inc.
Senior Bond, 4.95% to 6/1/2016, Floating Rate Note thereafter, 6/1/2036 . . . . . . . . . . . . . . . . . . . . . . . . . . . . . . . . . . . . . . . . . . . . 2,548,000 CAD 2,641 2,690Senior Note, 4.80% to 11/23/2015, Floating Rate Note thereafter, 11/23/2035 . . . . . . . . . . . . . . . . . . . . . . . . . . . . . . . . . . . . . . . . 160,000 CAD 168 167Subordinated Note, 2.77% to 5/18/2019, Floating Rate Note thereafter, 5/13/2024 . . . . . . . . . . . . . . . . . . . . . . . . . . . . . . . . . . . . . 625,000 CAD 625 629
TELUS Corp.Senior Bond, 4.85%, 4/5/2044 . . . . . . . . . . . . . . . . . . . . . . . . . . . . . . . . . . . . . . . . . . . . . . . . . . . . . . . . . . . . . . . . . . . . . . . . . . 1,000,000 CAD 1,001 1,033Senior Note, 3.60%, 1/26/2021 . . . . . . . . . . . . . . . . . . . . . . . . . . . . . . . . . . . . . . . . . . . . . . . . . . . . . . . . . . . . . . . . . . . . . . . . . . 1,500,000 CAD 1,498 1,554
Terasen Gas Inc., Senior Bond, 6.05%, 2/15/2038 . . . . . . . . . . . . . . . . . . . . . . . . . . . . . . . . . . . . . . . . . . . . . . . . . . . . . . . . . . . . . . 1,029,000 CAD 1,032 1,296The GFL Environmental Corp., Senior Note, 7.50%, 6/18/2018 . . . . . . . . . . . . . . . . . . . . . . . . . . . . . . . . . . . . . . . . . . . . . . . . . . . . . . 405,000 CAD 418 422The Home Trust Co.
3.40%, 12/10/2018 . . . . . . . . . . . . . . . . . . . . . . . . . . . . . . . . . . . . . . . . . . . . . . . . . . . . . . . . . . . . . . . . . . . . . . . . . . . . . . . . . . 710,000 CAD 713 728Senior Note, Floating Rate Note, 5/24/2016 . . . . . . . . . . . . . . . . . . . . . . . . . . . . . . . . . . . . . . . . . . . . . . . . . . . . . . . . . . . . . . . . . 655,000 CAD 655 655
The Toronto-Dominion Bank . . . . . . . . . . . . . . . . . . . . . . . . . . . . . . . . . . . . . . . . . . . . . . . . . . . . . . . . . . . . . . . . . . . . . . . . . . . . . .4.97% to 10/30/2015, Floating Rate Note thereafter, 10/30/2104 . . . . . . . . . . . . . . . . . . . . . . . . . . . . . . . . . . . . . . . . . . . . . . . . . . 800,000 CAD 760 834Senior Note, 2.433%, 8/15/2017 . . . . . . . . . . . . . . . . . . . . . . . . . . . . . . . . . . . . . . . . . . . . . . . . . . . . . . . . . . . . . . . . . . . . . . . . . 620,000 CAD 620 630Subordinated Note, 9.15%, 5/26/2025 . . . . . . . . . . . . . . . . . . . . . . . . . . . . . . . . . . . . . . . . . . . . . . . . . . . . . . . . . . . . . . . . . . . . . 1,794,000 CAD 2,521 2,692Subordinated Note, 4.779% to 12/14/2016, Floating Rate Note thereafter, 12/14/2015 . . . . . . . . . . . . . . . . . . . . . . . . . . . . . . . . . . 1,900,000 CAD 1,781 2,030Subordinated Note, 5.763% to 12/18/2017, Floating Rate Note thereafter, 12/18/2106 . . . . . . . . . . . . . . . . . . . . . . . . . . . . . . . . . . 1,500,000 CAD 1,452 1,681
Tim Hortons Inc.Senior Bond, 4.52%, 12/1/2023 . . . . . . . . . . . . . . . . . . . . . . . . . . . . . . . . . . . . . . . . . . . . . . . . . . . . . . . . . . . . . . . . . . . . . . . . . . 1,045,000 CAD 1,069 1,104Senior Note, 2.85%, 4/1/2019 . . . . . . . . . . . . . . . . . . . . . . . . . . . . . . . . . . . . . . . . . . . . . . . . . . . . . . . . . . . . . . . . . . . . . . . . . . . 195,000 CAD 195 197
Toromont Industries Ltd., 4.92%, 10/13/2015 . . . . . . . . . . . . . . . . . . . . . . . . . . . . . . . . . . . . . . . . . . . . . . . . . . . . . . . . . . . . . . . . . . 1,000,000 CAD 922 1,041TransCanada Pipelines Ltd., Junior Subordinated Bond, 6.35% to 5/14/17, Floating Rate Note thereafter, 5/15/2067 . . . . . . . . . . . . . . . 1,515,000 USD 1,722 1,688TransCanada PipeLines Ltd.
Senior Bond, 9.45%, 3/20/2018 . . . . . . . . . . . . . . . . . . . . . . . . . . . . . . . . . . . . . . . . . . . . . . . . . . . . . . . . . . . . . . . . . . . . . . . . . . 400,000 CAD 531 500Senior Note, 7.90%, 4/15/2027 . . . . . . . . . . . . . . . . . . . . . . . . . . . . . . . . . . . . . . . . . . . . . . . . . . . . . . . . . . . . . . . . . . . . . . . . . . 1,000,000 CAD 1,247 1,409
Union Gas Ltd., Senior Bond, 3.79%, 7/10/2023 . . . . . . . . . . . . . . . . . . . . . . . . . . . . . . . . . . . . . . . . . . . . . . . . . . . . . . . . . . . . . . . . 810,000 CAD 810 841Wajax Corp., Senior Note, 6.125%, 10/23/2020 . . . . . . . . . . . . . . . . . . . . . . . . . . . . . . . . . . . . . . . . . . . . . . . . . . . . . . . . . . . . . . . . . 570,000 CAD 570 598
The accompanying notes are an integral part of these financial statements.
Franklin Templeton Investments Funds 239
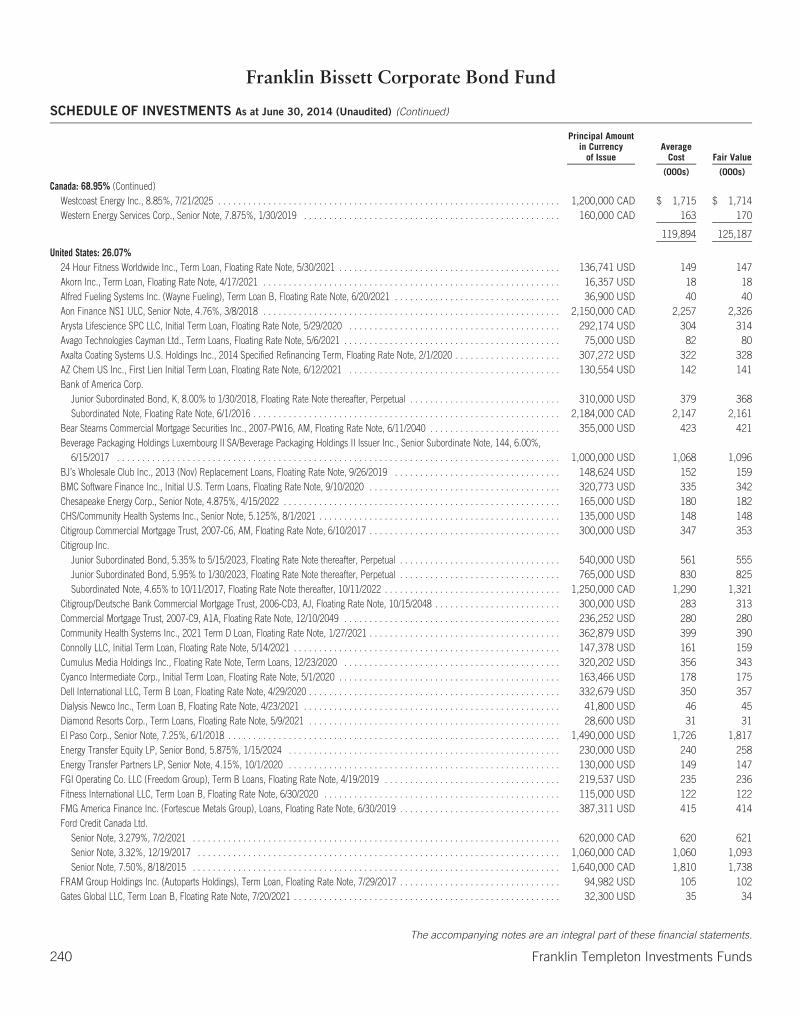
Franklin Bissett Corporate Bond Fund
SCHEDULE OF INVESTMENTS As at June 30, 2014 (Unaudited) (Continued)
Principal Amountin Currency
of IssueAverage
Cost Fair Value
(000s) (000s)
Canada: 68.95% (Continued)Westcoast Energy Inc., 8.85%, 7/21/2025 . . . . . . . . . . . . . . . . . . . . . . . . . . . . . . . . . . . . . . . . . . . . . . . . . . . . . . . . . . . . . . . . . . . . 1,200,000 CAD $ 1,715 $ 1,714Western Energy Services Corp., Senior Note, 7.875%, 1/30/2019 . . . . . . . . . . . . . . . . . . . . . . . . . . . . . . . . . . . . . . . . . . . . . . . . . . . 160,000 CAD 163 170
119,894 125,187
United States: 26.07%24 Hour Fitness Worldwide Inc., Term Loan, Floating Rate Note, 5/30/2021 . . . . . . . . . . . . . . . . . . . . . . . . . . . . . . . . . . . . . . . . . . . . 136,741 USD 149 147Akorn Inc., Term Loan, Floating Rate Note, 4/17/2021 . . . . . . . . . . . . . . . . . . . . . . . . . . . . . . . . . . . . . . . . . . . . . . . . . . . . . . . . . . . 16,357 USD 18 18Alfred Fueling Systems Inc. (Wayne Fueling), Term Loan B, Floating Rate Note, 6/20/2021 . . . . . . . . . . . . . . . . . . . . . . . . . . . . . . . . . 36,900 USD 40 40Aon Finance NS1 ULC, Senior Note, 4.76%, 3/8/2018 . . . . . . . . . . . . . . . . . . . . . . . . . . . . . . . . . . . . . . . . . . . . . . . . . . . . . . . . . . . 2,150,000 CAD 2,257 2,326Arysta Lifescience SPC LLC, Initial Term Loan, Floating Rate Note, 5/29/2020 . . . . . . . . . . . . . . . . . . . . . . . . . . . . . . . . . . . . . . . . . . 292,174 USD 304 314Avago Technologies Cayman Ltd., Term Loans, Floating Rate Note, 5/6/2021 . . . . . . . . . . . . . . . . . . . . . . . . . . . . . . . . . . . . . . . . . . . 75,000 USD 82 80Axalta Coating Systems U.S. Holdings Inc., 2014 Specified Refinancing Term, Floating Rate Note, 2/1/2020 . . . . . . . . . . . . . . . . . . . . . 307,272 USD 322 328AZ Chem US Inc., First Lien Initial Term Loan, Floating Rate Note, 6/12/2021 . . . . . . . . . . . . . . . . . . . . . . . . . . . . . . . . . . . . . . . . . . 130,554 USD 142 141Bank of America Corp.
Junior Subordinated Bond, K, 8.00% to 1/30/2018, Floating Rate Note thereafter, Perpetual . . . . . . . . . . . . . . . . . . . . . . . . . . . . . . 310,000 USD 379 368Subordinated Note, Floating Rate Note, 6/1/2016 . . . . . . . . . . . . . . . . . . . . . . . . . . . . . . . . . . . . . . . . . . . . . . . . . . . . . . . . . . . . . 2,184,000 CAD 2,147 2,161
Bear Stearns Commercial Mortgage Securities Inc., 2007-PW16, AM, Floating Rate Note, 6/11/2040 . . . . . . . . . . . . . . . . . . . . . . . . . . 355,000 USD 423 421Beverage Packaging Holdings Luxembourg II SA/Beverage Packaging Holdings II Issuer Inc., Senior Subordinate Note, 144, 6.00%,
6/15/2017 . . . . . . . . . . . . . . . . . . . . . . . . . . . . . . . . . . . . . . . . . . . . . . . . . . . . . . . . . . . . . . . . . . . . . . . . . . . . . . . . . . . . . . . . 1,000,000 USD 1,068 1,096BJ’s Wholesale Club Inc., 2013 (Nov) Replacement Loans, Floating Rate Note, 9/26/2019 . . . . . . . . . . . . . . . . . . . . . . . . . . . . . . . . . 148,624 USD 152 159BMC Software Finance Inc., Initial U.S. Term Loans, Floating Rate Note, 9/10/2020 . . . . . . . . . . . . . . . . . . . . . . . . . . . . . . . . . . . . . . 320,773 USD 335 342Chesapeake Energy Corp., Senior Note, 4.875%, 4/15/2022 . . . . . . . . . . . . . . . . . . . . . . . . . . . . . . . . . . . . . . . . . . . . . . . . . . . . . . . 165,000 USD 180 182CHS/Community Health Systems Inc., Senior Note, 5.125%, 8/1/2021 . . . . . . . . . . . . . . . . . . . . . . . . . . . . . . . . . . . . . . . . . . . . . . . . 135,000 USD 148 148Citigroup Commercial Mortgage Trust, 2007-C6, AM, Floating Rate Note, 6/10/2017 . . . . . . . . . . . . . . . . . . . . . . . . . . . . . . . . . . . . . . 300,000 USD 347 353Citigroup Inc.
Junior Subordinated Bond, 5.35% to 5/15/2023, Floating Rate Note thereafter, Perpetual . . . . . . . . . . . . . . . . . . . . . . . . . . . . . . . . 540,000 USD 561 555Junior Subordinated Bond, 5.95% to 1/30/2023, Floating Rate Note thereafter, Perpetual . . . . . . . . . . . . . . . . . . . . . . . . . . . . . . . . 765,000 USD 830 825Subordinated Note, 4.65% to 10/11/2017, Floating Rate Note thereafter, 10/11/2022 . . . . . . . . . . . . . . . . . . . . . . . . . . . . . . . . . . . 1,250,000 CAD 1,290 1,321
Citigroup/Deutsche Bank Commercial Mortgage Trust, 2006-CD3, AJ, Floating Rate Note, 10/15/2048 . . . . . . . . . . . . . . . . . . . . . . . . . 300,000 USD 283 313Commercial Mortgage Trust, 2007-C9, A1A, Floating Rate Note, 12/10/2049 . . . . . . . . . . . . . . . . . . . . . . . . . . . . . . . . . . . . . . . . . . . 236,252 USD 280 280Community Health Systems Inc., 2021 Term D Loan, Floating Rate Note, 1/27/2021 . . . . . . . . . . . . . . . . . . . . . . . . . . . . . . . . . . . . . . 362,879 USD 399 390Connolly LLC, Initial Term Loan, Floating Rate Note, 5/14/2021 . . . . . . . . . . . . . . . . . . . . . . . . . . . . . . . . . . . . . . . . . . . . . . . . . . . . . 147,378 USD 161 159Cumulus Media Holdings Inc., Floating Rate Note, Term Loans, 12/23/2020 . . . . . . . . . . . . . . . . . . . . . . . . . . . . . . . . . . . . . . . . . . . 320,202 USD 356 343Cyanco Intermediate Corp., Initial Term Loan, Floating Rate Note, 5/1/2020 . . . . . . . . . . . . . . . . . . . . . . . . . . . . . . . . . . . . . . . . . . . . 163,466 USD 178 175Dell International LLC, Term B Loan, Floating Rate Note, 4/29/2020 . . . . . . . . . . . . . . . . . . . . . . . . . . . . . . . . . . . . . . . . . . . . . . . . . . 332,679 USD 350 357Dialysis Newco Inc., Term Loan B, Floating Rate Note, 4/23/2021 . . . . . . . . . . . . . . . . . . . . . . . . . . . . . . . . . . . . . . . . . . . . . . . . . . . 41,800 USD 46 45Diamond Resorts Corp., Term Loans, Floating Rate Note, 5/9/2021 . . . . . . . . . . . . . . . . . . . . . . . . . . . . . . . . . . . . . . . . . . . . . . . . . . 28,600 USD 31 31El Paso Corp., Senior Note, 7.25%, 6/1/2018 . . . . . . . . . . . . . . . . . . . . . . . . . . . . . . . . . . . . . . . . . . . . . . . . . . . . . . . . . . . . . . . . . . 1,490,000 USD 1,726 1,817Energy Transfer Equity LP, Senior Bond, 5.875%, 1/15/2024 . . . . . . . . . . . . . . . . . . . . . . . . . . . . . . . . . . . . . . . . . . . . . . . . . . . . . . 230,000 USD 240 258Energy Transfer Partners LP, Senior Note, 4.15%, 10/1/2020 . . . . . . . . . . . . . . . . . . . . . . . . . . . . . . . . . . . . . . . . . . . . . . . . . . . . . . 130,000 USD 149 147FGI Operating Co. LLC (Freedom Group), Term B Loans, Floating Rate Note, 4/19/2019 . . . . . . . . . . . . . . . . . . . . . . . . . . . . . . . . . . . 219,537 USD 235 236Fitness International LLC, Term Loan B, Floating Rate Note, 6/30/2020 . . . . . . . . . . . . . . . . . . . . . . . . . . . . . . . . . . . . . . . . . . . . . . . 115,000 USD 122 122FMG America Finance Inc. (Fortescue Metals Group), Loans, Floating Rate Note, 6/30/2019 . . . . . . . . . . . . . . . . . . . . . . . . . . . . . . . . 387,311 USD 415 414Ford Credit Canada Ltd.
Senior Note, 3.279%, 7/2/2021 . . . . . . . . . . . . . . . . . . . . . . . . . . . . . . . . . . . . . . . . . . . . . . . . . . . . . . . . . . . . . . . . . . . . . . . . . 620,000 CAD 620 621Senior Note, 3.32%, 12/19/2017 . . . . . . . . . . . . . . . . . . . . . . . . . . . . . . . . . . . . . . . . . . . . . . . . . . . . . . . . . . . . . . . . . . . . . . . . 1,060,000 CAD 1,060 1,093Senior Note, 7.50%, 8/18/2015 . . . . . . . . . . . . . . . . . . . . . . . . . . . . . . . . . . . . . . . . . . . . . . . . . . . . . . . . . . . . . . . . . . . . . . . . . 1,640,000 CAD 1,810 1,738
FRAM Group Holdings Inc. (Autoparts Holdings), Term Loan, Floating Rate Note, 7/29/2017 . . . . . . . . . . . . . . . . . . . . . . . . . . . . . . . . 94,982 USD 105 102Gates Global LLC, Term Loan B, Floating Rate Note, 7/20/2021 . . . . . . . . . . . . . . . . . . . . . . . . . . . . . . . . . . . . . . . . . . . . . . . . . . . . . 32,300 USD 35 34
The accompanying notes are an integral part of these financial statements.
240 Franklin Templeton Investments Funds
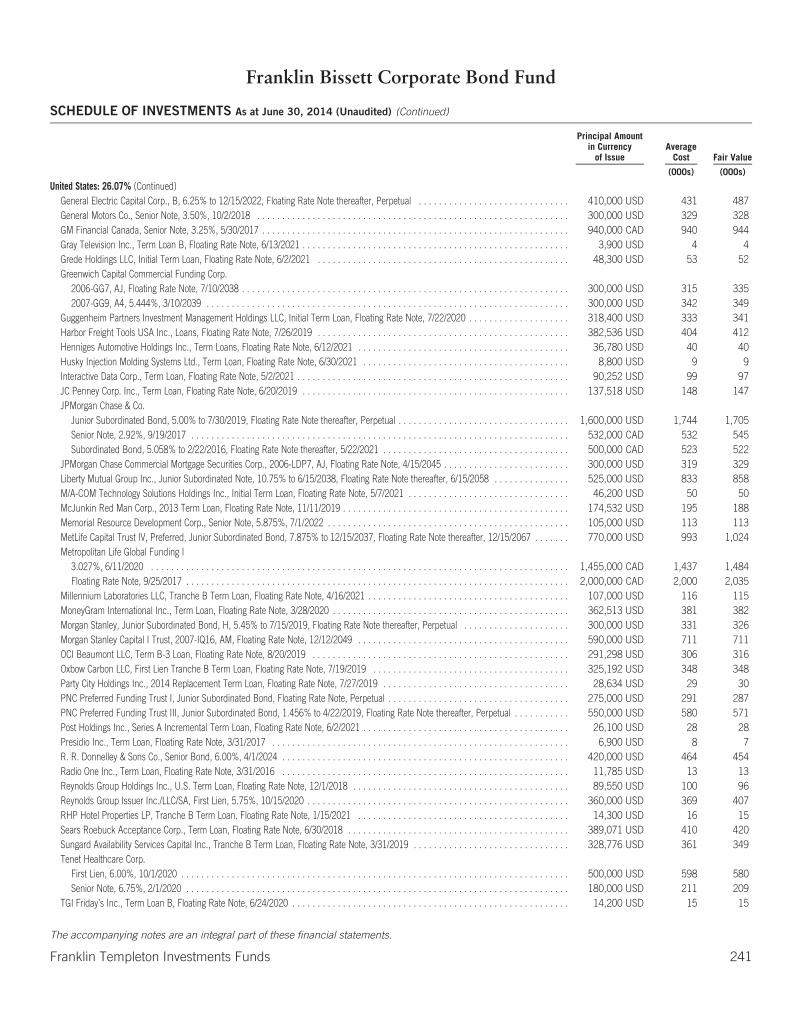
Franklin Bissett Corporate Bond Fund
SCHEDULE OF INVESTMENTS As at June 30, 2014 (Unaudited) (Continued)
Principal Amountin Currency
of IssueAverage
Cost Fair Value
(000s) (000s)
United States: 26.07% (Continued)General Electric Capital Corp., B, 6.25% to 12/15/2022, Floating Rate Note thereafter, Perpetual . . . . . . . . . . . . . . . . . . . . . . . . . . . . . . 410,000 USD 431 487General Motors Co., Senior Note, 3.50%, 10/2/2018 . . . . . . . . . . . . . . . . . . . . . . . . . . . . . . . . . . . . . . . . . . . . . . . . . . . . . . . . . . . . . . 300,000 USD 329 328GM Financial Canada, Senior Note, 3.25%, 5/30/2017 . . . . . . . . . . . . . . . . . . . . . . . . . . . . . . . . . . . . . . . . . . . . . . . . . . . . . . . . . . . . . 940,000 CAD 940 944Gray Television Inc., Term Loan B, Floating Rate Note, 6/13/2021 . . . . . . . . . . . . . . . . . . . . . . . . . . . . . . . . . . . . . . . . . . . . . . . . . . . . . 3,900 USD 4 4Grede Holdings LLC, Initial Term Loan, Floating Rate Note, 6/2/2021 . . . . . . . . . . . . . . . . . . . . . . . . . . . . . . . . . . . . . . . . . . . . . . . . . . 48,300 USD 53 52Greenwich Capital Commercial Funding Corp.
2006-GG7, AJ, Floating Rate Note, 7/10/2038 . . . . . . . . . . . . . . . . . . . . . . . . . . . . . . . . . . . . . . . . . . . . . . . . . . . . . . . . . . . . . . . . . 300,000 USD 315 3352007-GG9, A4, 5.444%, 3/10/2039 . . . . . . . . . . . . . . . . . . . . . . . . . . . . . . . . . . . . . . . . . . . . . . . . . . . . . . . . . . . . . . . . . . . . . . . . 300,000 USD 342 349
Guggenheim Partners Investment Management Holdings LLC, Initial Term Loan, Floating Rate Note, 7/22/2020 . . . . . . . . . . . . . . . . . . . . 318,400 USD 333 341Harbor Freight Tools USA Inc., Loans, Floating Rate Note, 7/26/2019 . . . . . . . . . . . . . . . . . . . . . . . . . . . . . . . . . . . . . . . . . . . . . . . . . . 382,536 USD 404 412Henniges Automotive Holdings Inc., Term Loans, Floating Rate Note, 6/12/2021 . . . . . . . . . . . . . . . . . . . . . . . . . . . . . . . . . . . . . . . . . . 36,780 USD 40 40Husky Injection Molding Systems Ltd., Term Loan, Floating Rate Note, 6/30/2021 . . . . . . . . . . . . . . . . . . . . . . . . . . . . . . . . . . . . . . . . . 8,800 USD 9 9Interactive Data Corp., Term Loan, Floating Rate Note, 5/2/2021 . . . . . . . . . . . . . . . . . . . . . . . . . . . . . . . . . . . . . . . . . . . . . . . . . . . . . . 90,252 USD 99 97JC Penney Corp. Inc., Term Loan, Floating Rate Note, 6/20/2019 . . . . . . . . . . . . . . . . . . . . . . . . . . . . . . . . . . . . . . . . . . . . . . . . . . . . . 137,518 USD 148 147JPMorgan Chase & Co.
Junior Subordinated Bond, 5.00% to 7/30/2019, Floating Rate Note thereafter, Perpetual . . . . . . . . . . . . . . . . . . . . . . . . . . . . . . . . . . 1,600,000 USD 1,744 1,705Senior Note, 2.92%, 9/19/2017 . . . . . . . . . . . . . . . . . . . . . . . . . . . . . . . . . . . . . . . . . . . . . . . . . . . . . . . . . . . . . . . . . . . . . . . . . . . 532,000 CAD 532 545Subordinated Bond, 5.058% to 2/22/2016, Floating Rate Note thereafter, 5/22/2021 . . . . . . . . . . . . . . . . . . . . . . . . . . . . . . . . . . . . . 500,000 CAD 523 522
JPMorgan Chase Commercial Mortgage Securities Corp., 2006-LDP7, AJ, Floating Rate Note, 4/15/2045 . . . . . . . . . . . . . . . . . . . . . . . . . 300,000 USD 319 329Liberty Mutual Group Inc., Junior Subordinated Note, 10.75% to 6/15/2038, Floating Rate Note thereafter, 6/15/2058 . . . . . . . . . . . . . . . 525,000 USD 833 858M/A-COM Technology Solutions Holdings Inc., Initial Term Loan, Floating Rate Note, 5/7/2021 . . . . . . . . . . . . . . . . . . . . . . . . . . . . . . . . 46,200 USD 50 50McJunkin Red Man Corp., 2013 Term Loan, Floating Rate Note, 11/11/2019 . . . . . . . . . . . . . . . . . . . . . . . . . . . . . . . . . . . . . . . . . . . . . 174,532 USD 195 188Memorial Resource Development Corp., Senior Note, 5.875%, 7/1/2022 . . . . . . . . . . . . . . . . . . . . . . . . . . . . . . . . . . . . . . . . . . . . . . . . 105,000 USD 113 113MetLife Capital Trust IV, Preferred, Junior Subordinated Bond, 7.875% to 12/15/2037, Floating Rate Note thereafter, 12/15/2067 . . . . . . . 770,000 USD 993 1,024Metropolitan Life Global Funding I
3.027%, 6/11/2020 . . . . . . . . . . . . . . . . . . . . . . . . . . . . . . . . . . . . . . . . . . . . . . . . . . . . . . . . . . . . . . . . . . . . . . . . . . . . . . . . . . . 1,455,000 CAD 1,437 1,484Floating Rate Note, 9/25/2017 . . . . . . . . . . . . . . . . . . . . . . . . . . . . . . . . . . . . . . . . . . . . . . . . . . . . . . . . . . . . . . . . . . . . . . . . . . . . 2,000,000 CAD 2,000 2,035
Millennium Laboratories LLC, Tranche B Term Loan, Floating Rate Note, 4/16/2021 . . . . . . . . . . . . . . . . . . . . . . . . . . . . . . . . . . . . . . . . 107,000 USD 116 115MoneyGram International Inc., Term Loan, Floating Rate Note, 3/28/2020 . . . . . . . . . . . . . . . . . . . . . . . . . . . . . . . . . . . . . . . . . . . . . . . 362,513 USD 381 382Morgan Stanley, Junior Subordinated Bond, H, 5.45% to 7/15/2019, Floating Rate Note thereafter, Perpetual . . . . . . . . . . . . . . . . . . . . . 300,000 USD 331 326Morgan Stanley Capital I Trust, 2007-IQ16, AM, Floating Rate Note, 12/12/2049 . . . . . . . . . . . . . . . . . . . . . . . . . . . . . . . . . . . . . . . . . . 590,000 USD 711 711OCI Beaumont LLC, Term B-3 Loan, Floating Rate Note, 8/20/2019 . . . . . . . . . . . . . . . . . . . . . . . . . . . . . . . . . . . . . . . . . . . . . . . . . . . 291,298 USD 306 316Oxbow Carbon LLC, First Lien Tranche B Term Loan, Floating Rate Note, 7/19/2019 . . . . . . . . . . . . . . . . . . . . . . . . . . . . . . . . . . . . . . . 325,192 USD 348 348Party City Holdings Inc., 2014 Replacement Term Loan, Floating Rate Note, 7/27/2019 . . . . . . . . . . . . . . . . . . . . . . . . . . . . . . . . . . . . . 28,634 USD 29 30PNC Preferred Funding Trust I, Junior Subordinated Bond, Floating Rate Note, Perpetual . . . . . . . . . . . . . . . . . . . . . . . . . . . . . . . . . . . . 275,000 USD 291 287PNC Preferred Funding Trust III, Junior Subordinated Bond, 1.456% to 4/22/2019, Floating Rate Note thereafter, Perpetual . . . . . . . . . . . 550,000 USD 580 571Post Holdings Inc., Series A Incremental Term Loan, Floating Rate Note, 6/2/2021 . . . . . . . . . . . . . . . . . . . . . . . . . . . . . . . . . . . . . . . . . 26,100 USD 28 28Presidio Inc., Term Loan, Floating Rate Note, 3/31/2017 . . . . . . . . . . . . . . . . . . . . . . . . . . . . . . . . . . . . . . . . . . . . . . . . . . . . . . . . . . . 6,900 USD 8 7R. R. Donnelley & Sons Co., Senior Bond, 6.00%, 4/1/2024 . . . . . . . . . . . . . . . . . . . . . . . . . . . . . . . . . . . . . . . . . . . . . . . . . . . . . . . . . 420,000 USD 464 454Radio One Inc., Term Loan, Floating Rate Note, 3/31/2016 . . . . . . . . . . . . . . . . . . . . . . . . . . . . . . . . . . . . . . . . . . . . . . . . . . . . . . . . . 11,785 USD 13 13Reynolds Group Holdings Inc., U.S. Term Loan, Floating Rate Note, 12/1/2018 . . . . . . . . . . . . . . . . . . . . . . . . . . . . . . . . . . . . . . . . . . . 89,550 USD 100 96Reynolds Group Issuer Inc./LLC/SA, First Lien, 5.75%, 10/15/2020 . . . . . . . . . . . . . . . . . . . . . . . . . . . . . . . . . . . . . . . . . . . . . . . . . . . . 360,000 USD 369 407RHP Hotel Properties LP, Tranche B Term Loan, Floating Rate Note, 1/15/2021 . . . . . . . . . . . . . . . . . . . . . . . . . . . . . . . . . . . . . . . . . . 14,300 USD 16 15Sears Roebuck Acceptance Corp., Term Loan, Floating Rate Note, 6/30/2018 . . . . . . . . . . . . . . . . . . . . . . . . . . . . . . . . . . . . . . . . . . . . 389,071 USD 410 420Sungard Availability Services Capital Inc., Tranche B Term Loan, Floating Rate Note, 3/31/2019 . . . . . . . . . . . . . . . . . . . . . . . . . . . . . . . 328,776 USD 361 349Tenet Healthcare Corp.
First Lien, 6.00%, 10/1/2020 . . . . . . . . . . . . . . . . . . . . . . . . . . . . . . . . . . . . . . . . . . . . . . . . . . . . . . . . . . . . . . . . . . . . . . . . . . . . . 500,000 USD 598 580Senior Note, 6.75%, 2/1/2020 . . . . . . . . . . . . . . . . . . . . . . . . . . . . . . . . . . . . . . . . . . . . . . . . . . . . . . . . . . . . . . . . . . . . . . . . . . . . 180,000 USD 211 209
TGI Friday’s Inc., Term Loan B, Floating Rate Note, 6/24/2020 . . . . . . . . . . . . . . . . . . . . . . . . . . . . . . . . . . . . . . . . . . . . . . . . . . . . . . . 14,200 USD 15 15
The accompanying notes are an integral part of these financial statements.
Franklin Templeton Investments Funds 241
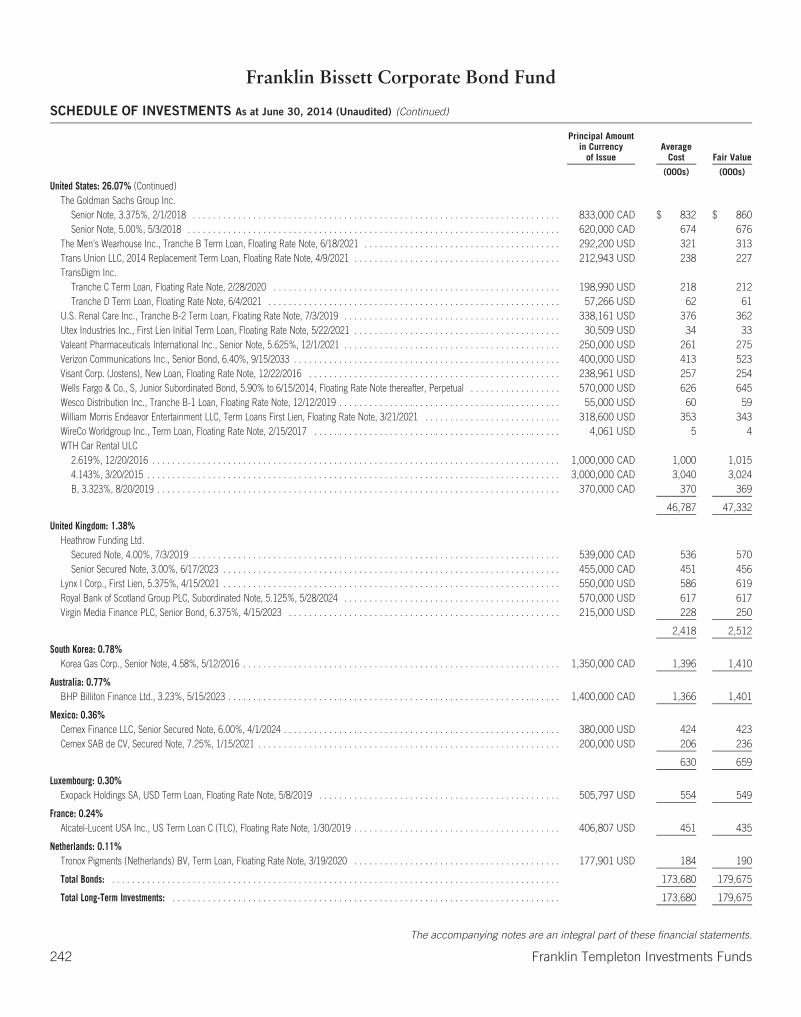
Franklin Bissett Corporate Bond Fund
SCHEDULE OF INVESTMENTS As at June 30, 2014 (Unaudited) (Continued)
Principal Amountin Currency
of IssueAverage
Cost Fair Value
(000s) (000s)
United States: 26.07% (Continued)The Goldman Sachs Group Inc.
Senior Note, 3.375%, 2/1/2018 . . . . . . . . . . . . . . . . . . . . . . . . . . . . . . . . . . . . . . . . . . . . . . . . . . . . . . . . . . . . . . . . . . . . . . . . . 833,000 CAD $ 832 $ 860Senior Note, 5.00%, 5/3/2018 . . . . . . . . . . . . . . . . . . . . . . . . . . . . . . . . . . . . . . . . . . . . . . . . . . . . . . . . . . . . . . . . . . . . . . . . . . 620,000 CAD 674 676
The Men’s Wearhouse Inc., Tranche B Term Loan, Floating Rate Note, 6/18/2021 . . . . . . . . . . . . . . . . . . . . . . . . . . . . . . . . . . . . . . . 292,200 USD 321 313Trans Union LLC, 2014 Replacement Term Loan, Floating Rate Note, 4/9/2021 . . . . . . . . . . . . . . . . . . . . . . . . . . . . . . . . . . . . . . . . . 212,943 USD 238 227TransDigm Inc.
Tranche C Term Loan, Floating Rate Note, 2/28/2020 . . . . . . . . . . . . . . . . . . . . . . . . . . . . . . . . . . . . . . . . . . . . . . . . . . . . . . . . . 198,990 USD 218 212Tranche D Term Loan, Floating Rate Note, 6/4/2021 . . . . . . . . . . . . . . . . . . . . . . . . . . . . . . . . . . . . . . . . . . . . . . . . . . . . . . . . . . 57,266 USD 62 61
U.S. Renal Care Inc., Tranche B-2 Term Loan, Floating Rate Note, 7/3/2019 . . . . . . . . . . . . . . . . . . . . . . . . . . . . . . . . . . . . . . . . . . . 338,161 USD 376 362Utex Industries Inc., First Lien Initial Term Loan, Floating Rate Note, 5/22/2021 . . . . . . . . . . . . . . . . . . . . . . . . . . . . . . . . . . . . . . . . . 30,509 USD 34 33Valeant Pharmaceuticals International Inc., Senior Note, 5.625%, 12/1/2021 . . . . . . . . . . . . . . . . . . . . . . . . . . . . . . . . . . . . . . . . . . . 250,000 USD 261 275Verizon Communications Inc., Senior Bond, 6.40%, 9/15/2033 . . . . . . . . . . . . . . . . . . . . . . . . . . . . . . . . . . . . . . . . . . . . . . . . . . . . . 400,000 USD 413 523Visant Corp. (Jostens), New Loan, Floating Rate Note, 12/22/2016 . . . . . . . . . . . . . . . . . . . . . . . . . . . . . . . . . . . . . . . . . . . . . . . . . . 238,961 USD 257 254Wells Fargo & Co., S, Junior Subordinated Bond, 5.90% to 6/15/2014, Floating Rate Note thereafter, Perpetual . . . . . . . . . . . . . . . . . . 570,000 USD 626 645Wesco Distribution Inc., Tranche B-1 Loan, Floating Rate Note, 12/12/2019 . . . . . . . . . . . . . . . . . . . . . . . . . . . . . . . . . . . . . . . . . . . . 55,000 USD 60 59William Morris Endeavor Entertainment LLC, Term Loans First Lien, Floating Rate Note, 3/21/2021 . . . . . . . . . . . . . . . . . . . . . . . . . . . 318,600 USD 353 343WireCo Worldgroup Inc., Term Loan, Floating Rate Note, 2/15/2017 . . . . . . . . . . . . . . . . . . . . . . . . . . . . . . . . . . . . . . . . . . . . . . . . . 4,061 USD 5 4WTH Car Rental ULC
2.619%, 12/20/2016 . . . . . . . . . . . . . . . . . . . . . . . . . . . . . . . . . . . . . . . . . . . . . . . . . . . . . . . . . . . . . . . . . . . . . . . . . . . . . . . . . 1,000,000 CAD 1,000 1,0154.143%, 3/20/2015 . . . . . . . . . . . . . . . . . . . . . . . . . . . . . . . . . . . . . . . . . . . . . . . . . . . . . . . . . . . . . . . . . . . . . . . . . . . . . . . . . . 3,000,000 CAD 3,040 3,024B, 3.323%, 8/20/2019 . . . . . . . . . . . . . . . . . . . . . . . . . . . . . . . . . . . . . . . . . . . . . . . . . . . . . . . . . . . . . . . . . . . . . . . . . . . . . . . . 370,000 CAD 370 369
46,787 47,332
United Kingdom: 1.38%Heathrow Funding Ltd.
Secured Note, 4.00%, 7/3/2019 . . . . . . . . . . . . . . . . . . . . . . . . . . . . . . . . . . . . . . . . . . . . . . . . . . . . . . . . . . . . . . . . . . . . . . . . . 539,000 CAD 536 570Senior Secured Note, 3.00%, 6/17/2023 . . . . . . . . . . . . . . . . . . . . . . . . . . . . . . . . . . . . . . . . . . . . . . . . . . . . . . . . . . . . . . . . . . . 455,000 CAD 451 456
Lynx I Corp., First Lien, 5.375%, 4/15/2021 . . . . . . . . . . . . . . . . . . . . . . . . . . . . . . . . . . . . . . . . . . . . . . . . . . . . . . . . . . . . . . . . . . . 550,000 USD 586 619Royal Bank of Scotland Group PLC, Subordinated Note, 5.125%, 5/28/2024 . . . . . . . . . . . . . . . . . . . . . . . . . . . . . . . . . . . . . . . . . . . 570,000 USD 617 617Virgin Media Finance PLC, Senior Bond, 6.375%, 4/15/2023 . . . . . . . . . . . . . . . . . . . . . . . . . . . . . . . . . . . . . . . . . . . . . . . . . . . . . . 215,000 USD 228 250
2,418 2,512
South Korea: 0.78%Korea Gas Corp., Senior Note, 4.58%, 5/12/2016 . . . . . . . . . . . . . . . . . . . . . . . . . . . . . . . . . . . . . . . . . . . . . . . . . . . . . . . . . . . . . . . 1,350,000 CAD 1,396 1,410
Australia: 0.77%BHP Billiton Finance Ltd., 3.23%, 5/15/2023 . . . . . . . . . . . . . . . . . . . . . . . . . . . . . . . . . . . . . . . . . . . . . . . . . . . . . . . . . . . . . . . . . . 1,400,000 CAD 1,366 1,401
Mexico: 0.36%Cemex Finance LLC, Senior Secured Note, 6.00%, 4/1/2024 . . . . . . . . . . . . . . . . . . . . . . . . . . . . . . . . . . . . . . . . . . . . . . . . . . . . . . . 380,000 USD 424 423Cemex SAB de CV, Secured Note, 7.25%, 1/15/2021 . . . . . . . . . . . . . . . . . . . . . . . . . . . . . . . . . . . . . . . . . . . . . . . . . . . . . . . . . . . . 200,000 USD 206 236
630 659
Luxembourg: 0.30%Exopack Holdings SA, USD Term Loan, Floating Rate Note, 5/8/2019 . . . . . . . . . . . . . . . . . . . . . . . . . . . . . . . . . . . . . . . . . . . . . . . . 505,797 USD 554 549
France: 0.24%Alcatel-Lucent USA Inc., US Term Loan C (TLC), Floating Rate Note, 1/30/2019 . . . . . . . . . . . . . . . . . . . . . . . . . . . . . . . . . . . . . . . . . 406,807 USD 451 435
Netherlands: 0.11%Tronox Pigments (Netherlands) BV, Term Loan, Floating Rate Note, 3/19/2020 . . . . . . . . . . . . . . . . . . . . . . . . . . . . . . . . . . . . . . . . . 177,901 USD 184 190
Total Bonds: . . . . . . . . . . . . . . . . . . . . . . . . . . . . . . . . . . . . . . . . . . . . . . . . . . . . . . . . . . . . . . . . . . . . . . . . . . . . . . . . . . . . . . . . . 173,680 179,675
Total Long-Term Investments: . . . . . . . . . . . . . . . . . . . . . . . . . . . . . . . . . . . . . . . . . . . . . . . . . . . . . . . . . . . . . . . . . . . . . . . . . . . . . 173,680 179,675
The accompanying notes are an integral part of these financial statements.
242 Franklin Templeton Investments Funds
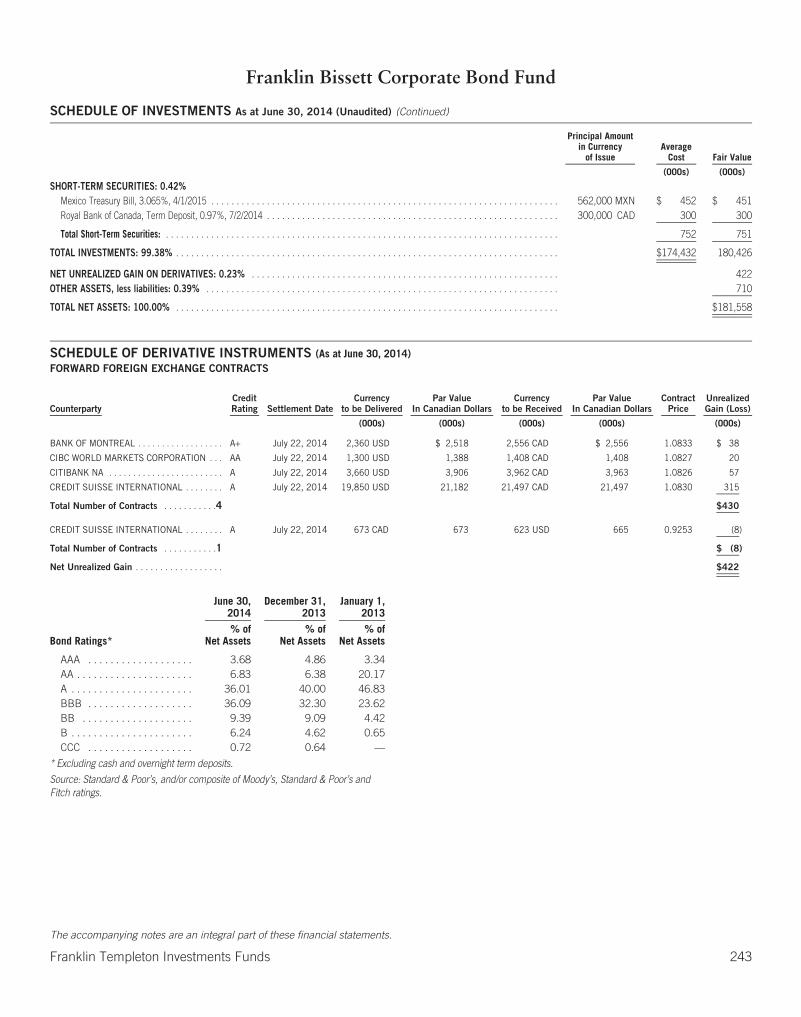
Franklin Bissett Corporate Bond Fund
SCHEDULE OF INVESTMENTS As at June 30, 2014 (Unaudited) (Continued)
Principal Amountin Currency
of IssueAverage
Cost Fair Value
(000s) (000s)
SHORT-TERM SECURITIES: 0.42%Mexico Treasury Bill, 3.065%, 4/1/2015 . . . . . . . . . . . . . . . . . . . . . . . . . . . . . . . . . . . . . . . . . . . . . . . . . . . . . . . . . . . . . . . . . . . . . 562,000 MXN $ 452 $ 451Royal Bank of Canada, Term Deposit, 0.97%, 7/2/2014 . . . . . . . . . . . . . . . . . . . . . . . . . . . . . . . . . . . . . . . . . . . . . . . . . . . . . . . . . . 300,000 CAD 300 300
Total Short-Term Securities: . . . . . . . . . . . . . . . . . . . . . . . . . . . . . . . . . . . . . . . . . . . . . . . . . . . . . . . . . . . . . . . . . . . . . . . . . . . . . . 752 751
TOTAL INVESTMENTS: 99.38% . . . . . . . . . . . . . . . . . . . . . . . . . . . . . . . . . . . . . . . . . . . . . . . . . . . . . . . . . . . . . . . . . . . . . . . . . . . . $174,432 180,426
NET UNREALIZED GAIN ON DERIVATIVES: 0.23% . . . . . . . . . . . . . . . . . . . . . . . . . . . . . . . . . . . . . . . . . . . . . . . . . . . . . . . . . . . . . 422OTHER ASSETS, less liabilities: 0.39% . . . . . . . . . . . . . . . . . . . . . . . . . . . . . . . . . . . . . . . . . . . . . . . . . . . . . . . . . . . . . . . . . . . . . . 710
TOTAL NET ASSETS: 100.00% . . . . . . . . . . . . . . . . . . . . . . . . . . . . . . . . . . . . . . . . . . . . . . . . . . . . . . . . . . . . . . . . . . . . . . . . . . . . $181,558
SCHEDULE OF DERIVATIVE INSTRUMENTS (As at June 30, 2014)FORWARD FOREIGN EXCHANGE CONTRACTS
CounterpartyCreditRating Settlement Date
Currencyto be Delivered
Par ValueIn Canadian Dollars
Currencyto be Received
Par ValueIn Canadian Dollars
ContractPrice
UnrealizedGain (Loss)
(000s) (000s) (000s) (000s) (000s)
BANK OF MONTREAL . . . . . . . . . . . . . . . . . . A+ July 22, 2014 2,360 USD $ 2,518 2,556 CAD $ 2,556 1.0833 $ 38
CIBC WORLD MARKETS CORPORATION . . . AA July 22, 2014 1,300 USD 1,388 1,408 CAD 1,408 1.0827 20
CITIBANK NA . . . . . . . . . . . . . . . . . . . . . . . . A July 22, 2014 3,660 USD 3,906 3,962 CAD 3,963 1.0826 57
CREDIT SUISSE INTERNATIONAL . . . . . . . . A July 22, 2014 19,850 USD 21,182 21,497 CAD 21,497 1.0830 315
Total Number of Contracts . . . . . . . . . . .4 $430
CREDIT SUISSE INTERNATIONAL . . . . . . . . A July 22, 2014 673 CAD 673 623 USD 665 0.9253 (8)
Total Number of Contracts . . . . . . . . . . .1 $ (8)
Net Unrealized Gain . . . . . . . . . . . . . . . . . . $422
June 30,2014
December 31,2013
January 1,2013
Bond Ratings*% of
Net Assets% of
Net Assets% of
Net Assets
AAA . . . . . . . . . . . . . . . . . . . 3.68 4.86 3.34AA . . . . . . . . . . . . . . . . . . . . . 6.83 6.38 20.17A . . . . . . . . . . . . . . . . . . . . . . 36.01 40.00 46.83BBB . . . . . . . . . . . . . . . . . . . 36.09 32.30 23.62BB . . . . . . . . . . . . . . . . . . . . 9.39 9.09 4.42B . . . . . . . . . . . . . . . . . . . . . . 6.24 4.62 0.65CCC . . . . . . . . . . . . . . . . . . . 0.72 0.64 —
* Excluding cash and overnight term deposits.
Source: Standard & Poor’s, and/or composite of Moody’s, Standard & Poor’s andFitch ratings.
The accompanying notes are an integral part of these financial statements.
Franklin Templeton Investments Funds 243
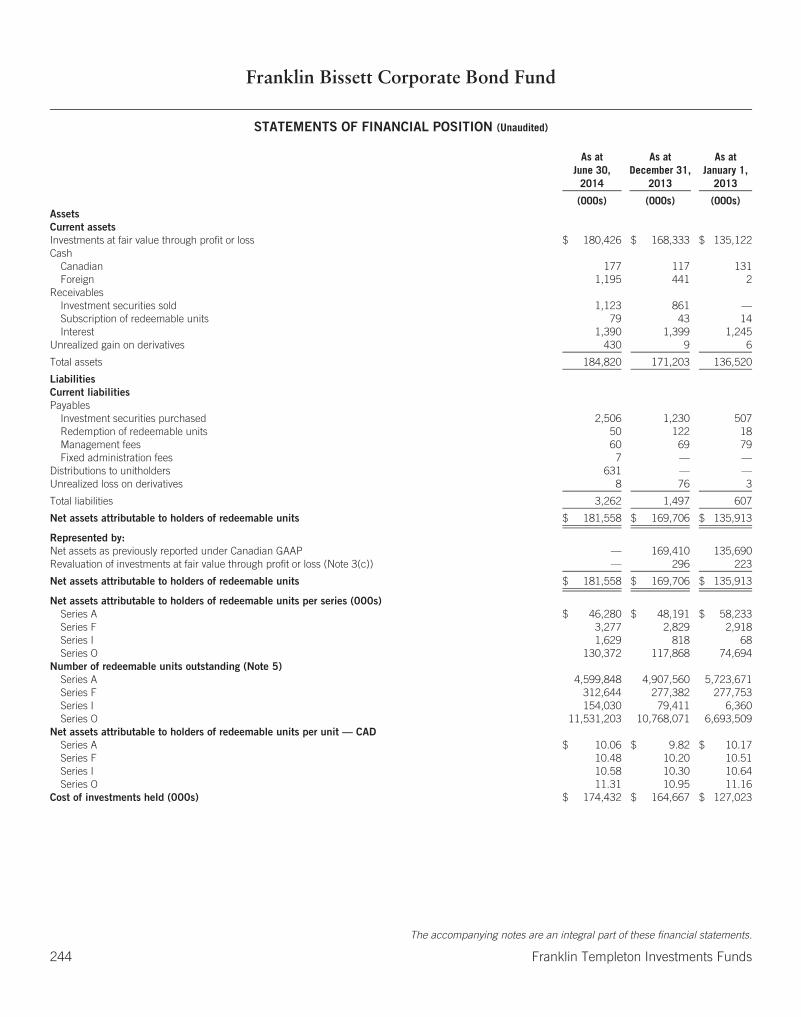
Franklin Bissett Corporate Bond Fund
STATEMENTS OF FINANCIAL POSITION (Unaudited)
As atJune 30,
2014
As atDecember 31,
2013
As atJanuary 1,
2013
(000s) (000s) (000s)AssetsCurrent assetsInvestments at fair value through profit or loss $ 180,426 $ 168,333 $ 135,122Cash
Canadian 177 117 131Foreign 1,195 441 2
ReceivablesInvestment securities sold 1,123 861 —Subscription of redeemable units 79 43 14Interest 1,390 1,399 1,245
Unrealized gain on derivatives 430 9 6
Total assets 184,820 171,203 136,520
LiabilitiesCurrent liabilitiesPayables
Investment securities purchased 2,506 1,230 507Redemption of redeemable units 50 122 18Management fees 60 69 79Fixed administration fees 7 — —
Distributions to unitholders 631 — —Unrealized loss on derivatives 8 76 3
Total liabilities 3,262 1,497 607
Net assets attributable to holders of redeemable units $ 181,558 $ 169,706 $ 135,913
Represented by:Net assets as previously reported under Canadian GAAP — 169,410 135,690Revaluation of investments at fair value through profit or loss (Note 3(c)) — 296 223
Net assets attributable to holders of redeemable units $ 181,558 $ 169,706 $ 135,913
Net assets attributable to holders of redeemable units per series (000s)Series A $ 46,280 $ 48,191 $ 58,233Series F 3,277 2,829 2,918Series I 1,629 818 68Series O 130,372 117,868 74,694
Number of redeemable units outstanding (Note 5)Series A 4,599,848 4,907,560 5,723,671Series F 312,644 277,382 277,753Series I 154,030 79,411 6,360Series O 11,531,203 10,768,071 6,693,509
Net assets attributable to holders of redeemable units per unit — CADSeries A $ 10.06 $ 9.82 $ 10.17Series F 10.48 10.20 10.51Series I 10.58 10.30 10.64Series O 11.31 10.95 11.16
Cost of investments held (000s) $ 174,432 $ 164,667 $ 127,023
The accompanying notes are an integral part of these financial statements.
244 Franklin Templeton Investments Funds
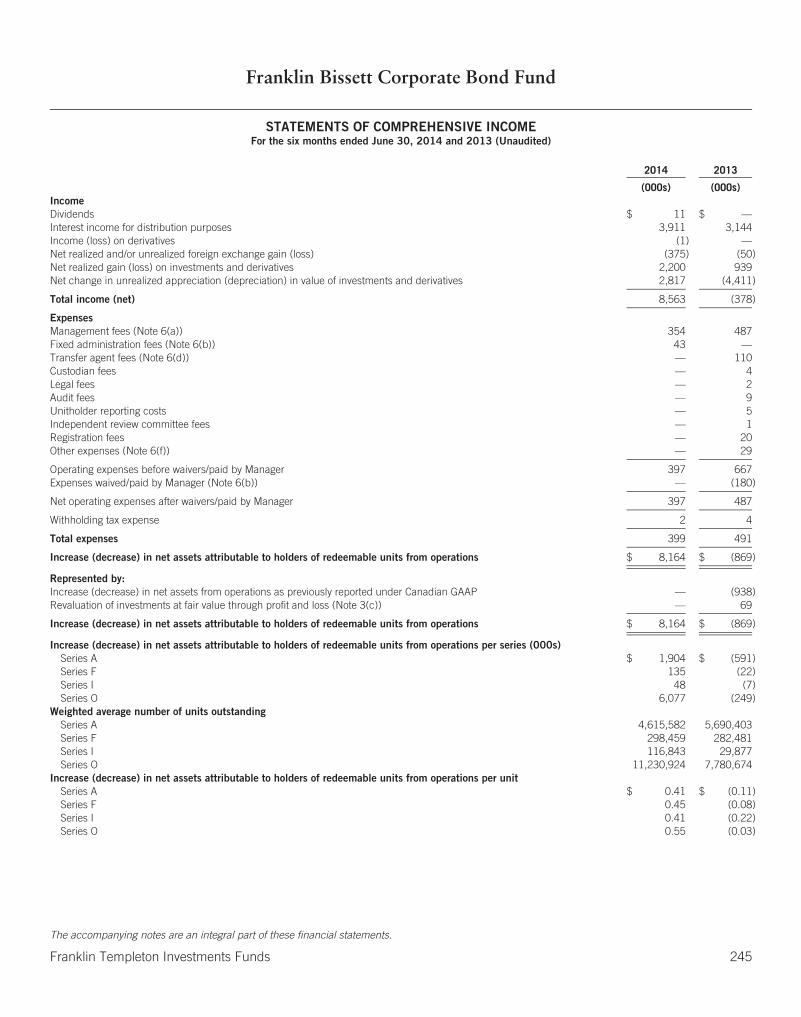
Franklin Bissett Corporate Bond Fund
STATEMENTS OF COMPREHENSIVE INCOMEFor the six months ended June 30, 2014 and 2013 (Unaudited)
2014 2013
(000s) (000s)IncomeDividends $ 11 $ —Interest income for distribution purposes 3,911 3,144Income (loss) on derivatives (1) —Net realized and/or unrealized foreign exchange gain (loss) (375) (50)Net realized gain (loss) on investments and derivatives 2,200 939Net change in unrealized appreciation (depreciation) in value of investments and derivatives 2,817 (4,411)
Total income (net) 8,563 (378)
ExpensesManagement fees (Note 6(a)) 354 487Fixed administration fees (Note 6(b)) 43 —Transfer agent fees (Note 6(d)) — 110Custodian fees — 4Legal fees — 2Audit fees — 9Unitholder reporting costs — 5Independent review committee fees — 1Registration fees — 20Other expenses (Note 6(f)) — 29
Operating expenses before waivers/paid by Manager 397 667Expenses waived/paid by Manager (Note 6(b)) — (180)
Net operating expenses after waivers/paid by Manager 397 487
Withholding tax expense 2 4
Total expenses 399 491
Increase (decrease) in net assets attributable to holders of redeemable units from operations $ 8,164 $ (869)
Represented by:Increase (decrease) in net assets from operations as previously reported under Canadian GAAP — (938)Revaluation of investments at fair value through profit and loss (Note 3(c)) — 69
Increase (decrease) in net assets attributable to holders of redeemable units from operations $ 8,164 $ (869)
Increase (decrease) in net assets attributable to holders of redeemable units from operations per series (000s)Series A $ 1,904 $ (591)Series F 135 (22)Series I 48 (7)Series O 6,077 (249)
Weighted average number of units outstandingSeries A 4,615,582 5,690,403Series F 298,459 282,481Series I 116,843 29,877Series O 11,230,924 7,780,674
Increase (decrease) in net assets attributable to holders of redeemable units from operations per unitSeries A $ 0.41 $ (0.11)Series F 0.45 (0.08)Series I 0.41 (0.22)Series O 0.55 (0.03)
The accompanying notes are an integral part of these financial statements.
Franklin Templeton Investments Funds 245
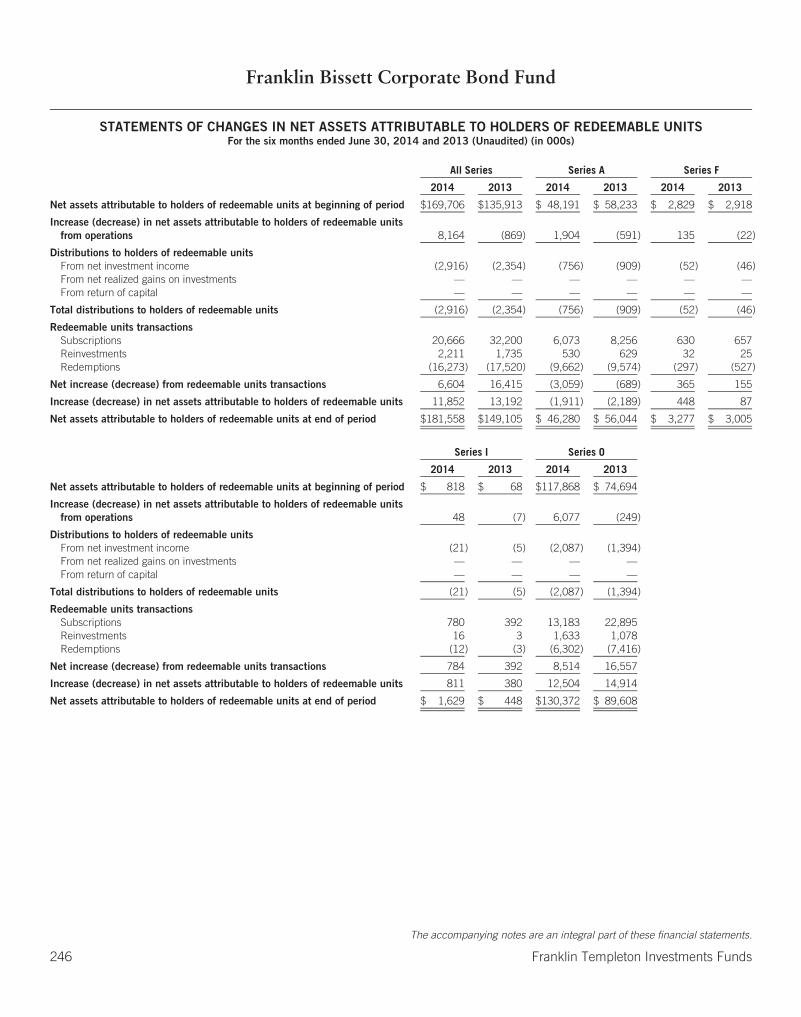
Franklin Bissett Corporate Bond Fund
STATEMENTS OF CHANGES IN NET ASSETS ATTRIBUTABLE TO HOLDERS OF REDEEMABLE UNITSFor the six months ended June 30, 2014 and 2013 (Unaudited) (in 000s)
All Series Series A Series F
2014 2013 2014 2013 2014 2013
Net assets attributable to holders of redeemable units at beginning of period $169,706 $135,913 $ 48,191 $ 58,233 $ 2,829 $ 2,918
Increase (decrease) in net assets attributable to holders of redeemable unitsfrom operations 8,164 (869) 1,904 (591) 135 (22)
Distributions to holders of redeemable unitsFrom net investment income (2,916) (2,354) (756) (909) (52) (46)From net realized gains on investments — — — — — —From return of capital — — — — — —
Total distributions to holders of redeemable units (2,916) (2,354) (756) (909) (52) (46)
Redeemable units transactionsSubscriptions 20,666 32,200 6,073 8,256 630 657Reinvestments 2,211 1,735 530 629 32 25Redemptions (16,273) (17,520) (9,662) (9,574) (297) (527)
Net increase (decrease) from redeemable units transactions 6,604 16,415 (3,059) (689) 365 155
Increase (decrease) in net assets attributable to holders of redeemable units 11,852 13,192 (1,911) (2,189) 448 87
Net assets attributable to holders of redeemable units at end of period $181,558 $149,105 $ 46,280 $ 56,044 $ 3,277 $ 3,005
Series I Series O
2014 2013 2014 2013
Net assets attributable to holders of redeemable units at beginning of period $ 818 $ 68 $117,868 $ 74,694
Increase (decrease) in net assets attributable to holders of redeemable unitsfrom operations 48 (7) 6,077 (249)
Distributions to holders of redeemable unitsFrom net investment income (21) (5) (2,087) (1,394)From net realized gains on investments — — — —From return of capital — — — —
Total distributions to holders of redeemable units (21) (5) (2,087) (1,394)
Redeemable units transactionsSubscriptions 780 392 13,183 22,895Reinvestments 16 3 1,633 1,078Redemptions (12) (3) (6,302) (7,416)
Net increase (decrease) from redeemable units transactions 784 392 8,514 16,557
Increase (decrease) in net assets attributable to holders of redeemable units 811 380 12,504 14,914
Net assets attributable to holders of redeemable units at end of period $ 1,629 $ 448 $130,372 $ 89,608
The accompanying notes are an integral part of these financial statements.
246 Franklin Templeton Investments Funds

Franklin Bissett Corporate Bond Fund
STATEMENTS OF CASH FLOWSFor the six months ended June 30, 2014 and 2013 (Unaudited)
2014 2013
(000s) (000s)Cash flows from operating activitiesInterest received $ 3,688 $ 3,035Dividends received 9 —Proceeds from sale and maturity of investments 63,127 45,736Purchases of investments (69,412) (60,725)Operating expenses paid (398) (486)
Net cash from/(used in) operating activities (2,986) (12,440)
Cash flows from financing activitiesProceeds from issuances of redeemable units 20,629 32,210Amounts paid on redemption of redeemable units (16,345) (17,464)Distributions paid to holders of redeemable units, net of reinvested distributions (73) (93)
Net cash (used in)/from financing activities 4,211 14,653
Net increase (decrease) in cash 1,225 2,213Cash at beginning of year 558 133Effect of exchange rate changes (411) (52)
Cash at end of period $ 1,372 $ 2,294
The accompanying notes are an integral part of these financial statements.
Franklin Templeton Investments Funds 247

Franklin Bissett Dividend Income Fund
SCHEDULE OF INVESTMENTS As at June 30, 2014 (Unaudited)
SharesAverage
Cost Fair Value
(000s) (000s)
LONG-TERM INVESTMENTS: 97.26%COMMON STOCKS: 80.11%Financials: 26.33%
Bank of Montreal . . . . . . . . . . . . . . . . . . . . . . . . . . . . . . . . . . . . . . . . . . . . . . . . . . . . . . . . . . . . . . . . . . . . . . . . . . . . . . . . . . . . . . . . . . . . . 276,500 $ 16,627 $ 21,728Bank of Nova Scotia . . . . . . . . . . . . . . . . . . . . . . . . . . . . . . . . . . . . . . . . . . . . . . . . . . . . . . . . . . . . . . . . . . . . . . . . . . . . . . . . . . . . . . . . . . . 353,100 15,521 25,120Canadian Imperial Bank of Commerce . . . . . . . . . . . . . . . . . . . . . . . . . . . . . . . . . . . . . . . . . . . . . . . . . . . . . . . . . . . . . . . . . . . . . . . . . . . . . . 294,800 18,244 28,625CI Financial Corp. . . . . . . . . . . . . . . . . . . . . . . . . . . . . . . . . . . . . . . . . . . . . . . . . . . . . . . . . . . . . . . . . . . . . . . . . . . . . . . . . . . . . . . . . . . . . . 83,200 2,629 2,916IGM Financial Inc. . . . . . . . . . . . . . . . . . . . . . . . . . . . . . . . . . . . . . . . . . . . . . . . . . . . . . . . . . . . . . . . . . . . . . . . . . . . . . . . . . . . . . . . . . . . . . 412,900 15,866 21,091JPMorgan Chase & Co. . . . . . . . . . . . . . . . . . . . . . . . . . . . . . . . . . . . . . . . . . . . . . . . . . . . . . . . . . . . . . . . . . . . . . . . . . . . . . . . . . . . . . . . . . 148,600 9,308 9,131National Bank of Canada . . . . . . . . . . . . . . . . . . . . . . . . . . . . . . . . . . . . . . . . . . . . . . . . . . . . . . . . . . . . . . . . . . . . . . . . . . . . . . . . . . . . . . . . 420,100 16,279 19,014Power Financial Corp. . . . . . . . . . . . . . . . . . . . . . . . . . . . . . . . . . . . . . . . . . . . . . . . . . . . . . . . . . . . . . . . . . . . . . . . . . . . . . . . . . . . . . . . . . . 761,100 21,379 25,276Royal Bank of Canada . . . . . . . . . . . . . . . . . . . . . . . . . . . . . . . . . . . . . . . . . . . . . . . . . . . . . . . . . . . . . . . . . . . . . . . . . . . . . . . . . . . . . . . . . . 314,700 11,513 24,005Sun Life Financial Inc. . . . . . . . . . . . . . . . . . . . . . . . . . . . . . . . . . . . . . . . . . . . . . . . . . . . . . . . . . . . . . . . . . . . . . . . . . . . . . . . . . . . . . . . . . . 112,700 3,928 4,420The Toronto-Dominion Bank . . . . . . . . . . . . . . . . . . . . . . . . . . . . . . . . . . . . . . . . . . . . . . . . . . . . . . . . . . . . . . . . . . . . . . . . . . . . . . . . . . . . . 514,400 16,348 28,256Wells Fargo & Co. . . . . . . . . . . . . . . . . . . . . . . . . . . . . . . . . . . . . . . . . . . . . . . . . . . . . . . . . . . . . . . . . . . . . . . . . . . . . . . . . . . . . . . . . . . . . . 180,100 9,772 10,095
157,414 219,677
Energy: 21.50%ARC Resources Ltd. . . . . . . . . . . . . . . . . . . . . . . . . . . . . . . . . . . . . . . . . . . . . . . . . . . . . . . . . . . . . . . . . . . . . . . . . . . . . . . . . . . . . . . . . . . . 518,500 12,663 16,846Baytex Energy Corp. . . . . . . . . . . . . . . . . . . . . . . . . . . . . . . . . . . . . . . . . . . . . . . . . . . . . . . . . . . . . . . . . . . . . . . . . . . . . . . . . . . . . . . . . . . . 303,700 12,314 14,957Bonavista Energy Corp. . . . . . . . . . . . . . . . . . . . . . . . . . . . . . . . . . . . . . . . . . . . . . . . . . . . . . . . . . . . . . . . . . . . . . . . . . . . . . . . . . . . . . . . . . 675,000 11,085 11,050Bonterra Energy Corp. . . . . . . . . . . . . . . . . . . . . . . . . . . . . . . . . . . . . . . . . . . . . . . . . . . . . . . . . . . . . . . . . . . . . . . . . . . . . . . . . . . . . . . . . . . 130,900 6,231 8,477Canyon Services Group Inc. . . . . . . . . . . . . . . . . . . . . . . . . . . . . . . . . . . . . . . . . . . . . . . . . . . . . . . . . . . . . . . . . . . . . . . . . . . . . . . . . . . . . . . 75,000 843 1,418Chevron Corp. . . . . . . . . . . . . . . . . . . . . . . . . . . . . . . . . . . . . . . . . . . . . . . . . . . . . . . . . . . . . . . . . . . . . . . . . . . . . . . . . . . . . . . . . . . . . . . . 77,400 5,174 10,776Crescent Point Energy Corp. . . . . . . . . . . . . . . . . . . . . . . . . . . . . . . . . . . . . . . . . . . . . . . . . . . . . . . . . . . . . . . . . . . . . . . . . . . . . . . . . . . . . . . 412,200 13,354 19,493Enbridge Inc. . . . . . . . . . . . . . . . . . . . . . . . . . . . . . . . . . . . . . . . . . . . . . . . . . . . . . . . . . . . . . . . . . . . . . . . . . . . . . . . . . . . . . . . . . . . . . . . . 381,800 10,339 19,331Enbridge Income Fund Holdings Inc. . . . . . . . . . . . . . . . . . . . . . . . . . . . . . . . . . . . . . . . . . . . . . . . . . . . . . . . . . . . . . . . . . . . . . . . . . . . . . . . 61,700 1,707 1,723Exxon Mobil Corp. . . . . . . . . . . . . . . . . . . . . . . . . . . . . . . . . . . . . . . . . . . . . . . . . . . . . . . . . . . . . . . . . . . . . . . . . . . . . . . . . . . . . . . . . . . . . . 68,200 5,790 7,323Freehold Royalties Ltd. . . . . . . . . . . . . . . . . . . . . . . . . . . . . . . . . . . . . . . . . . . . . . . . . . . . . . . . . . . . . . . . . . . . . . . . . . . . . . . . . . . . . . . . . . 291,300 6,306 7,801Horizon North Logistics Inc. . . . . . . . . . . . . . . . . . . . . . . . . . . . . . . . . . . . . . . . . . . . . . . . . . . . . . . . . . . . . . . . . . . . . . . . . . . . . . . . . . . . . . . 329,000 2,546 2,520Keyera Corp. . . . . . . . . . . . . . . . . . . . . . . . . . . . . . . . . . . . . . . . . . . . . . . . . . . . . . . . . . . . . . . . . . . . . . . . . . . . . . . . . . . . . . . . . . . . . . . . . . 152,200 7,624 11,964Mullen Group Ltd. . . . . . . . . . . . . . . . . . . . . . . . . . . . . . . . . . . . . . . . . . . . . . . . . . . . . . . . . . . . . . . . . . . . . . . . . . . . . . . . . . . . . . . . . . . . . . 404,700 6,683 12,432TransCanada Corp. . . . . . . . . . . . . . . . . . . . . . . . . . . . . . . . . . . . . . . . . . . . . . . . . . . . . . . . . . . . . . . . . . . . . . . . . . . . . . . . . . . . . . . . . . . . . 380,700 12,931 19,389Veresen Inc. . . . . . . . . . . . . . . . . . . . . . . . . . . . . . . . . . . . . . . . . . . . . . . . . . . . . . . . . . . . . . . . . . . . . . . . . . . . . . . . . . . . . . . . . . . . . . . . . . 369,300 5,174 6,924Western Energy Services Corp. . . . . . . . . . . . . . . . . . . . . . . . . . . . . . . . . . . . . . . . . . . . . . . . . . . . . . . . . . . . . . . . . . . . . . . . . . . . . . . . . . . . . 291,900 2,211 3,252Zargon Oil & Gas Ltd. . . . . . . . . . . . . . . . . . . . . . . . . . . . . . . . . . . . . . . . . . . . . . . . . . . . . . . . . . . . . . . . . . . . . . . . . . . . . . . . . . . . . . . . . . . 401,000 6,719 3,733
129,694 179,409
Consumer Staples: 7.04%Diageo PLC, American Depositary Receipt . . . . . . . . . . . . . . . . . . . . . . . . . . . . . . . . . . . . . . . . . . . . . . . . . . . . . . . . . . . . . . . . . . . . . . . . . . . . 58,000 5,483 7,872General Mills Inc. . . . . . . . . . . . . . . . . . . . . . . . . . . . . . . . . . . . . . . . . . . . . . . . . . . . . . . . . . . . . . . . . . . . . . . . . . . . . . . . . . . . . . . . . . . . . . 151,300 4,986 8,477Kraft Foods Group Inc. . . . . . . . . . . . . . . . . . . . . . . . . . . . . . . . . . . . . . . . . . . . . . . . . . . . . . . . . . . . . . . . . . . . . . . . . . . . . . . . . . . . . . . . . . 140,366 6,396 8,974North West Co. Inc. . . . . . . . . . . . . . . . . . . . . . . . . . . . . . . . . . . . . . . . . . . . . . . . . . . . . . . . . . . . . . . . . . . . . . . . . . . . . . . . . . . . . . . . . . . . . 646,700 11,256 15,294The Coca-Cola Co. . . . . . . . . . . . . . . . . . . . . . . . . . . . . . . . . . . . . . . . . . . . . . . . . . . . . . . . . . . . . . . . . . . . . . . . . . . . . . . . . . . . . . . . . . . . . 217,700 9,289 9,835The Procter & Gamble Co. . . . . . . . . . . . . . . . . . . . . . . . . . . . . . . . . . . . . . . . . . . . . . . . . . . . . . . . . . . . . . . . . . . . . . . . . . . . . . . . . . . . . . . . 98,800 6,574 8,281
43,984 58,733
Industrials: 5.70%Bird Construction Inc. . . . . . . . . . . . . . . . . . . . . . . . . . . . . . . . . . . . . . . . . . . . . . . . . . . . . . . . . . . . . . . . . . . . . . . . . . . . . . . . . . . . . . . . . . . 681,240 8,434 9,135General Electric Co. . . . . . . . . . . . . . . . . . . . . . . . . . . . . . . . . . . . . . . . . . . . . . . . . . . . . . . . . . . . . . . . . . . . . . . . . . . . . . . . . . . . . . . . . . . . . 360,800 9,968 10,112Morneau Shepell Inc. . . . . . . . . . . . . . . . . . . . . . . . . . . . . . . . . . . . . . . . . . . . . . . . . . . . . . . . . . . . . . . . . . . . . . . . . . . . . . . . . . . . . . . . . . . 308,000 4,045 5,307
The accompanying notes are an integral part of these financial statements.
248 Franklin Templeton Investments Funds

Franklin Bissett Dividend Income Fund
SCHEDULE OF INVESTMENTS As at June 30, 2014 (Unaudited) (Continued)
SharesAverage
Cost Fair Value
(000s) (000s)
Industrials: 5.70% (Continued)New Flyer Industries Inc. . . . . . . . . . . . . . . . . . . . . . . . . . . . . . . . . . . . . . . . . . . . . . . . . . . . . . . . . . . . . . . . . . . . . . . . . . . . . . . . . . . . . . . 119,000 $ 1,360 $ 1,465Russel Metals Inc. . . . . . . . . . . . . . . . . . . . . . . . . . . . . . . . . . . . . . . . . . . . . . . . . . . . . . . . . . . . . . . . . . . . . . . . . . . . . . . . . . . . . . . . . . . . 448,600 7,890 15,391Wajax Corp. . . . . . . . . . . . . . . . . . . . . . . . . . . . . . . . . . . . . . . . . . . . . . . . . . . . . . . . . . . . . . . . . . . . . . . . . . . . . . . . . . . . . . . . . . . . . . . . . 174,400 4,100 6,155
35,797 47,565
Consumer Discretionary: 3.84%McDonald’s Corp. . . . . . . . . . . . . . . . . . . . . . . . . . . . . . . . . . . . . . . . . . . . . . . . . . . . . . . . . . . . . . . . . . . . . . . . . . . . . . . . . . . . . . . . . . . . 88,700 6,684 9,529Thomson Reuters Corp. . . . . . . . . . . . . . . . . . . . . . . . . . . . . . . . . . . . . . . . . . . . . . . . . . . . . . . . . . . . . . . . . . . . . . . . . . . . . . . . . . . . . . . . 579,900 17,123 22,529
23,807 32,058
Telecommunication Services: 3.56%BCE Inc. . . . . . . . . . . . . . . . . . . . . . . . . . . . . . . . . . . . . . . . . . . . . . . . . . . . . . . . . . . . . . . . . . . . . . . . . . . . . . . . . . . . . . . . . . . . . . . . . . . 228,200 7,548 11,045Bell Aliant Inc. . . . . . . . . . . . . . . . . . . . . . . . . . . . . . . . . . . . . . . . . . . . . . . . . . . . . . . . . . . . . . . . . . . . . . . . . . . . . . . . . . . . . . . . . . . . . . . 336,100 8,840 9,374Rogers Communications Inc., B . . . . . . . . . . . . . . . . . . . . . . . . . . . . . . . . . . . . . . . . . . . . . . . . . . . . . . . . . . . . . . . . . . . . . . . . . . . . . . . . . 125,700 4,309 5,398Telus Corp. . . . . . . . . . . . . . . . . . . . . . . . . . . . . . . . . . . . . . . . . . . . . . . . . . . . . . . . . . . . . . . . . . . . . . . . . . . . . . . . . . . . . . . . . . . . . . . . . 98,700 1,956 3,925
22,653 29,742
Utilities: 3.56%Capital Power Corp. . . . . . . . . . . . . . . . . . . . . . . . . . . . . . . . . . . . . . . . . . . . . . . . . . . . . . . . . . . . . . . . . . . . . . . . . . . . . . . . . . . . . . . . . . . 314,500 8,170 8,293Duke Energy Corp. . . . . . . . . . . . . . . . . . . . . . . . . . . . . . . . . . . . . . . . . . . . . . . . . . . . . . . . . . . . . . . . . . . . . . . . . . . . . . . . . . . . . . . . . . . . 125,000 9,058 9,890Fortis Inc. . . . . . . . . . . . . . . . . . . . . . . . . . . . . . . . . . . . . . . . . . . . . . . . . . . . . . . . . . . . . . . . . . . . . . . . . . . . . . . . . . . . . . . . . . . . . . . . . . 353,500 7,795 11,478
25,023 29,661
Health Care: 3.46%Johnson & Johnson . . . . . . . . . . . . . . . . . . . . . . . . . . . . . . . . . . . . . . . . . . . . . . . . . . . . . . . . . . . . . . . . . . . . . . . . . . . . . . . . . . . . . . . . . . 96,700 7,172 10,789Merck & Co. Inc. . . . . . . . . . . . . . . . . . . . . . . . . . . . . . . . . . . . . . . . . . . . . . . . . . . . . . . . . . . . . . . . . . . . . . . . . . . . . . . . . . . . . . . . . . . . . 152,000 7,727 9,378Pfizer Inc. . . . . . . . . . . . . . . . . . . . . . . . . . . . . . . . . . . . . . . . . . . . . . . . . . . . . . . . . . . . . . . . . . . . . . . . . . . . . . . . . . . . . . . . . . . . . . . . . . 274,900 6,928 8,701
21,827 28,868
Materials: 3.33%Agrium Inc. . . . . . . . . . . . . . . . . . . . . . . . . . . . . . . . . . . . . . . . . . . . . . . . . . . . . . . . . . . . . . . . . . . . . . . . . . . . . . . . . . . . . . . . . . . . . . . . . 28,800 2,581 2,815Canexus Corp. . . . . . . . . . . . . . . . . . . . . . . . . . . . . . . . . . . . . . . . . . . . . . . . . . . . . . . . . . . . . . . . . . . . . . . . . . . . . . . . . . . . . . . . . . . . . . . 2,607,300 19,563 12,776Labrador Iron Ore Royalty Corp. . . . . . . . . . . . . . . . . . . . . . . . . . . . . . . . . . . . . . . . . . . . . . . . . . . . . . . . . . . . . . . . . . . . . . . . . . . . . . . . . . 226,600 7,370 6,952Potash Corp. of Saskatchewan Inc. . . . . . . . . . . . . . . . . . . . . . . . . . . . . . . . . . . . . . . . . . . . . . . . . . . . . . . . . . . . . . . . . . . . . . . . . . . . . . . . 128,400 4,333 5,211
33,847 27,754
Information Technology: 1.79%Intel Corp. . . . . . . . . . . . . . . . . . . . . . . . . . . . . . . . . . . . . . . . . . . . . . . . . . . . . . . . . . . . . . . . . . . . . . . . . . . . . . . . . . . . . . . . . . . . . . . . . . 235,500 5,478 7,761Microsoft Corp. . . . . . . . . . . . . . . . . . . . . . . . . . . . . . . . . . . . . . . . . . . . . . . . . . . . . . . . . . . . . . . . . . . . . . . . . . . . . . . . . . . . . . . . . . . . . . 161,100 4,422 7,164
9,900 14,925
Total Common Stocks: . . . . . . . . . . . . . . . . . . . . . . . . . . . . . . . . . . . . . . . . . . . . . . . . . . . . . . . . . . . . . . . . . . . . . . . . . . . . . . . . . . . . . . . . . 503,946 668,392
PREFERRED STOCKS: 1.92%Financials: 0.73%
Brookfield Asset Management Inc., Preferred, 17 . . . . . . . . . . . . . . . . . . . . . . . . . . . . . . . . . . . . . . . . . . . . . . . . . . . . . . . . . . . . . . . . . . . . . 103,200 2,333 2,196Brookfield Asset Management Inc., Preferred, 4, A . . . . . . . . . . . . . . . . . . . . . . . . . . . . . . . . . . . . . . . . . . . . . . . . . . . . . . . . . . . . . . . . . . . . 85,800 1,686 1,512Great West Lifeco Inc., Preferred . . . . . . . . . . . . . . . . . . . . . . . . . . . . . . . . . . . . . . . . . . . . . . . . . . . . . . . . . . . . . . . . . . . . . . . . . . . . . . . . . 41,300 1,054 1,046Power Financial Corp., Preferred, H . . . . . . . . . . . . . . . . . . . . . . . . . . . . . . . . . . . . . . . . . . . . . . . . . . . . . . . . . . . . . . . . . . . . . . . . . . . . . . . 51,600 1,296 1,320
6,369 6,074
The accompanying notes are an integral part of these financial statements.
Franklin Templeton Investments Funds 249

Franklin Bissett Dividend Income Fund
SCHEDULE OF INVESTMENTS As at June 30, 2014 (Unaudited) (Continued)
SharesAverage
Cost Fair Value
(000s) (000s)
Energy: 0.46%Enbridge Inc., Preferred, F . . . . . . . . . . . . . . . . . . . . . . . . . . . . . . . . . . . . . . . . . . . . . . . . . . . . . . . . . . . . . . . . . . . . . . . . . . . . . . . . 105,500 $ 2,676 $ 2,632Husky Energy Inc., Preferred, 1 . . . . . . . . . . . . . . . . . . . . . . . . . . . . . . . . . . . . . . . . . . . . . . . . . . . . . . . . . . . . . . . . . . . . . . . . . . . . . 54,000 1,349 1,245
4,025 3,877
Telecommunication Services: 0.43%BCE Inc., Preferred, AJ . . . . . . . . . . . . . . . . . . . . . . . . . . . . . . . . . . . . . . . . . . . . . . . . . . . . . . . . . . . . . . . . . . . . . . . . . . . . . . . . . . . 87,700 2,232 1,960BCE Inc., Preferred, AA . . . . . . . . . . . . . . . . . . . . . . . . . . . . . . . . . . . . . . . . . . . . . . . . . . . . . . . . . . . . . . . . . . . . . . . . . . . . . . . . . . . 75,700 1,918 1,616
4,150 3,576
Consumer Staples: 0.30%George Weston Ltd., Preferred, IV . . . . . . . . . . . . . . . . . . . . . . . . . . . . . . . . . . . . . . . . . . . . . . . . . . . . . . . . . . . . . . . . . . . . . . . . . . . 103,200 1,736 2,512
Total Preferred Stocks: . . . . . . . . . . . . . . . . . . . . . . . . . . . . . . . . . . . . . . . . . . . . . . . . . . . . . . . . . . . . . . . . . . . . . . . . . . . . . . . . . . . 16,280 16,039
Principal Amountin Currency
of Issue
BONDS: 15.23%Canada: 14.77%
407 International Inc., Senior Secured Bond, 6.47%, 7/27/2029 . . . . . . . . . . . . . . . . . . . . . . . . . . . . . . . . . . . . . . . . . . . . . . . . . . . . . 5,000,000 CAD 6,206 6,574Baytex Energy Corp., Senior Note, 6.625%, 7/19/2022 . . . . . . . . . . . . . . . . . . . . . . . . . . . . . . . . . . . . . . . . . . . . . . . . . . . . . . . . . . . . 2,000,000 CAD 2,142 2,133Bell Aliant Regional Communications LP, Senior Note, 4.88%, 4/26/2018 . . . . . . . . . . . . . . . . . . . . . . . . . . . . . . . . . . . . . . . . . . . . . . . 5,000,000 CAD 5,379 5,446Cameco Corp., Senior Bond, D, 5.67%, 9/2/2019 . . . . . . . . . . . . . . . . . . . . . . . . . . . . . . . . . . . . . . . . . . . . . . . . . . . . . . . . . . . . . . . . 5,000,000 CAD 5,252 5,646Canada Housing Trust, 3.75%, 3/15/2020 . . . . . . . . . . . . . . . . . . . . . . . . . . . . . . . . . . . . . . . . . . . . . . . . . . . . . . . . . . . . . . . . . . . . . 2,170,000 CAD 2,357 2,374Canadian Natural Resources Ltd., 2.89%, 8/14/2020 . . . . . . . . . . . . . . . . . . . . . . . . . . . . . . . . . . . . . . . . . . . . . . . . . . . . . . . . . . . . . 5,628,000 CAD 5,638 5,677Capital Desjardins Inc., Senior Secured Note, G, 5.187%, 5/5/2020 . . . . . . . . . . . . . . . . . . . . . . . . . . . . . . . . . . . . . . . . . . . . . . . . . . . 8,000,000 CAD 8,000 9,094Cogeco Cable Inc.
Senior Secured Bond, First Lien, 5.15%, 11/16/2020 . . . . . . . . . . . . . . . . . . . . . . . . . . . . . . . . . . . . . . . . . . . . . . . . . . . . . . . . . . . 3,000,000 CAD 3,272 3,350Senior Secured Note, 4.925%, 2/14/2022 . . . . . . . . . . . . . . . . . . . . . . . . . . . . . . . . . . . . . . . . . . . . . . . . . . . . . . . . . . . . . . . . . . . 1,840,000 CAD 1,999 2,013
Cominar Real Estate Investment Trust, Senior Note, 4.941%, 7/27/2020 . . . . . . . . . . . . . . . . . . . . . . . . . . . . . . . . . . . . . . . . . . . . . . . . 5,000,000 CAD 5,143 5,206Dollarama Inc., Senior Note, 3.095%, 11/5/2018 . . . . . . . . . . . . . . . . . . . . . . . . . . . . . . . . . . . . . . . . . . . . . . . . . . . . . . . . . . . . . . . . 5,300,000 CAD 5,403 5,409Enbridge Income Fund, Senior Note, 4.85%, 11/12/2020 . . . . . . . . . . . . . . . . . . . . . . . . . . . . . . . . . . . . . . . . . . . . . . . . . . . . . . . . . . 5,000,000 CAD 5,395 5,558EnCana Corp., 5.80%, 1/18/2018 . . . . . . . . . . . . . . . . . . . . . . . . . . . . . . . . . . . . . . . . . . . . . . . . . . . . . . . . . . . . . . . . . . . . . . . . . . . 5,000,000 CAD 4,581 5,623Fairfax Financial Holdings Ltd., Senior Note, 6.40%, 5/25/2021 . . . . . . . . . . . . . . . . . . . . . . . . . . . . . . . . . . . . . . . . . . . . . . . . . . . . . . 4,500,000 CAD 4,536 5,127First Capital Realty Inc., Senior Bond, Q, 3.90%, 10/30/2023 . . . . . . . . . . . . . . . . . . . . . . . . . . . . . . . . . . . . . . . . . . . . . . . . . . . . . . . . 5,000,000 CAD 5,000 5,018Gibson Energy Inc., Senior Note, 5.375%, 7/15/2022 . . . . . . . . . . . . . . . . . . . . . . . . . . . . . . . . . . . . . . . . . . . . . . . . . . . . . . . . . . . . . 1,350,000 CAD 1,350 1,362NAV Canada, 4.713%, 2/24/2016 . . . . . . . . . . . . . . . . . . . . . . . . . . . . . . . . . . . . . . . . . . . . . . . . . . . . . . . . . . . . . . . . . . . . . . . . . . . 2,340,000 CAD 2,376 2,463Pembina Pipeline Corp., Senior Bond, 4.75%, 4/30/2043 . . . . . . . . . . . . . . . . . . . . . . . . . . . . . . . . . . . . . . . . . . . . . . . . . . . . . . . . . . 3,000,000 CAD 3,043 3,102Province of Manitoba, 3.85%, 12/1/2021 . . . . . . . . . . . . . . . . . . . . . . . . . . . . . . . . . . . . . . . . . . . . . . . . . . . . . . . . . . . . . . . . . . . . . . 5,000,000 CAD 5,523 5,440Province of New Brunswick, 5.50%, 1/27/2034 . . . . . . . . . . . . . . . . . . . . . . . . . . . . . . . . . . . . . . . . . . . . . . . . . . . . . . . . . . . . . . . . . . 2,510,000 CAD 3,176 3,131Rogers Communications Inc., Senior Note, 4.70%, 9/29/2020 . . . . . . . . . . . . . . . . . . . . . . . . . . . . . . . . . . . . . . . . . . . . . . . . . . . . . . . 5,619,000 CAD 6,091 6,171Russel Metals Inc., Senior Note, 6.00%, 4/19/2022 . . . . . . . . . . . . . . . . . . . . . . . . . . . . . . . . . . . . . . . . . . . . . . . . . . . . . . . . . . . . . . . 1,295,000 CAD 1,344 1,344Sun Life Financial Inc., Senior Note, 4.80% to 11/23/2015, Floating Rate Note thereafter, 11/23/2035 . . . . . . . . . . . . . . . . . . . . . . . . . . 9,500,000 CAD 9,520 9,891Terasen Gas Inc., Senior Bond, 6.05%, 2/15/2038 . . . . . . . . . . . . . . . . . . . . . . . . . . . . . . . . . . . . . . . . . . . . . . . . . . . . . . . . . . . . . . . 3,500,000 CAD 3,947 4,409Thomson Reuters Corp., Senior Note, 3.369%, 5/23/2019 . . . . . . . . . . . . . . . . . . . . . . . . . . . . . . . . . . . . . . . . . . . . . . . . . . . . . . . . . . 8,000,000 CAD 8,000 8,262Tim Hortons Inc., Senior Bond, 4.52%, 12/1/2023 . . . . . . . . . . . . . . . . . . . . . . . . . . . . . . . . . . . . . . . . . . . . . . . . . . . . . . . . . . . . . . . 2,500,000 CAD 2,645 2,640Wajax Corp., Senior Note, 6.125%, 10/23/2020 . . . . . . . . . . . . . . . . . . . . . . . . . . . . . . . . . . . . . . . . . . . . . . . . . . . . . . . . . . . . . . . . . 715,000 CAD 749 750
118,067 123,213
The accompanying notes are an integral part of these financial statements.
250 Franklin Templeton Investments Funds
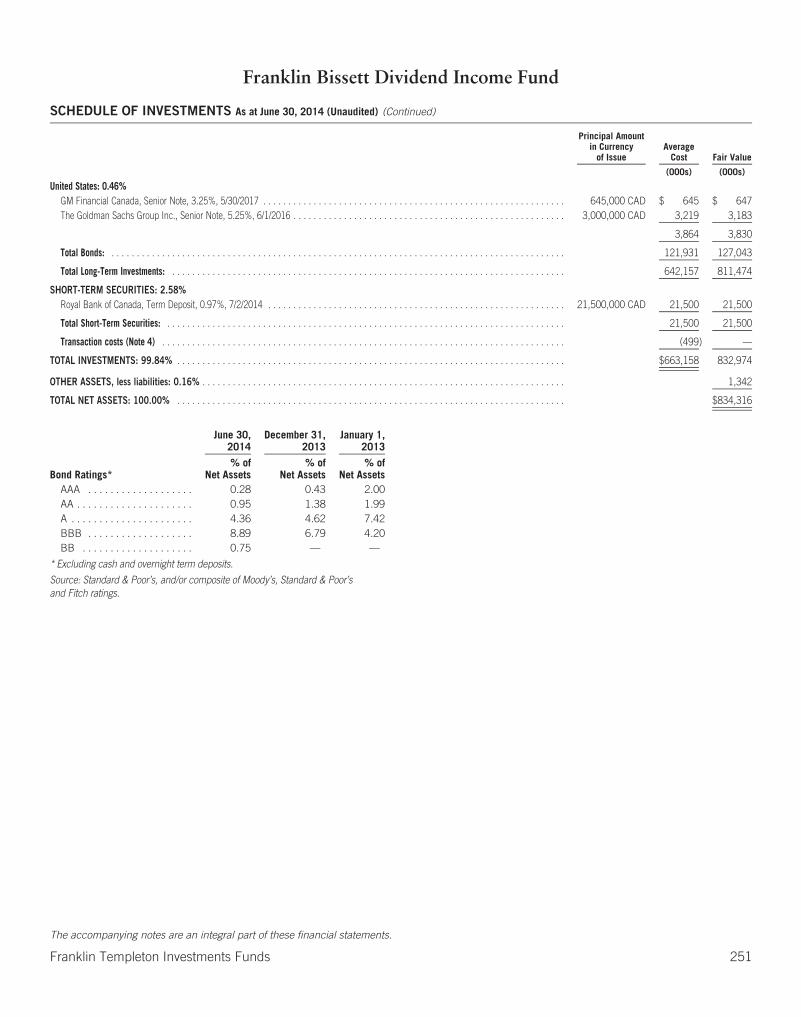
Franklin Bissett Dividend Income Fund
SCHEDULE OF INVESTMENTS As at June 30, 2014 (Unaudited) (Continued)
Principal Amountin Currency
of IssueAverage
Cost Fair Value
(000s) (000s)
United States: 0.46%GM Financial Canada, Senior Note, 3.25%, 5/30/2017 . . . . . . . . . . . . . . . . . . . . . . . . . . . . . . . . . . . . . . . . . . . . . . . . . . . . . . . . . . . . 645,000 CAD $ 645 $ 647The Goldman Sachs Group Inc., Senior Note, 5.25%, 6/1/2016 . . . . . . . . . . . . . . . . . . . . . . . . . . . . . . . . . . . . . . . . . . . . . . . . . . . . . . 3,000,000 CAD 3,219 3,183
3,864 3,830
Total Bonds: . . . . . . . . . . . . . . . . . . . . . . . . . . . . . . . . . . . . . . . . . . . . . . . . . . . . . . . . . . . . . . . . . . . . . . . . . . . . . . . . . . . . . . . . . . 121,931 127,043
Total Long-Term Investments: . . . . . . . . . . . . . . . . . . . . . . . . . . . . . . . . . . . . . . . . . . . . . . . . . . . . . . . . . . . . . . . . . . . . . . . . . . . . . . 642,157 811,474
SHORT-TERM SECURITIES: 2.58%Royal Bank of Canada, Term Deposit, 0.97%, 7/2/2014 . . . . . . . . . . . . . . . . . . . . . . . . . . . . . . . . . . . . . . . . . . . . . . . . . . . . . . . . . . . 21,500,000 CAD 21,500 21,500
Total Short-Term Securities: . . . . . . . . . . . . . . . . . . . . . . . . . . . . . . . . . . . . . . . . . . . . . . . . . . . . . . . . . . . . . . . . . . . . . . . . . . . . . . . 21,500 21,500
Transaction costs (Note 4) . . . . . . . . . . . . . . . . . . . . . . . . . . . . . . . . . . . . . . . . . . . . . . . . . . . . . . . . . . . . . . . . . . . . . . . . . . . . . . . . (499) —
TOTAL INVESTMENTS: 99.84% . . . . . . . . . . . . . . . . . . . . . . . . . . . . . . . . . . . . . . . . . . . . . . . . . . . . . . . . . . . . . . . . . . . . . . . . . . . . . $663,158 832,974
OTHER ASSETS, less liabilities: 0.16% . . . . . . . . . . . . . . . . . . . . . . . . . . . . . . . . . . . . . . . . . . . . . . . . . . . . . . . . . . . . . . . . . . . . . . . . 1,342
TOTAL NET ASSETS: 100.00% . . . . . . . . . . . . . . . . . . . . . . . . . . . . . . . . . . . . . . . . . . . . . . . . . . . . . . . . . . . . . . . . . . . . . . . . . . . . . $834,316
June 30,2014
December 31,2013
January 1,2013
Bond Ratings*% of
Net Assets% of
Net Assets% of
Net AssetsAAA . . . . . . . . . . . . . . . . . . . 0.28 0.43 2.00AA . . . . . . . . . . . . . . . . . . . . . 0.95 1.38 1.99A . . . . . . . . . . . . . . . . . . . . . . 4.36 4.62 7.42BBB . . . . . . . . . . . . . . . . . . . 8.89 6.79 4.20BB . . . . . . . . . . . . . . . . . . . . 0.75 — —
* Excluding cash and overnight term deposits.
Source: Standard & Poor’s, and/or composite of Moody’s, Standard & Poor’sand Fitch ratings.
The accompanying notes are an integral part of these financial statements.
Franklin Templeton Investments Funds 251

Franklin Bissett Dividend Income Fund
STATEMENTS OF FINANCIAL POSITION (Unaudited)
As atJune 30,
2014
As atDecember 31,
2013
As atJanuary 1,
2013
(000s) (000s) (000s)AssetsCurrent assetsInvestments at fair value through profit or loss $ 832,974 $ 773,814 $ 610,549Cash
Canadian 76 83 88Receivables
Investment securities sold — 263 474Subscription of redeemable units 399 334 485Dividends and interest 4,573 4,069 3,508
Other assets (Note 6(g)) — 235 119
Total assets 838,022 778,798 615,223
LiabilitiesCurrent liabilitiesPayables
Investment securities purchased 472 — 1,047Redemption of redeemable units 500 352 269Management fees 831 810 707Fixed administration fees 73 — —Accrued expenses — 396 293
Distributions to unitholders 1,830 — —
Total liabilities 3,706 1,558 2,316
Net assets attributable to holders of redeemable units $ 834,316 $ 777,240 $ 612,907
Represented by:Net assets as previously reported under Canadian GAAP — 776,562 611,834Revaluation of investments at fair value through profit or loss (Note 3(c)) — 678 1,073
Net assets attributable to holders of redeemable units $ 834,316 $ 777,240 $ 612,907
Net assets attributable to holders of redeemable units per series (000s)Series A $ 410,756 $ 396,129 $ 342,010Series F 50,621 45,342 39,460Series I 6,297 3,478 1,445Series O 338,639 305,021 204,598Series T 28,003 27,270 25,394
Number of redeemable units outstanding (Note 5)Series A 12,899,981 13,035,886 12,343,509Series F 1,350,254 1,274,765 1,231,818Series I 181,058 105,059 48,123Series O 7,574,009 7,231,857 5,448,486Series T 2,558,043 2,537,075 2,450,289
Net assets attributable to holders of redeemable units per unit — CADSeries A $ 31.84 $ 30.39 $ 27.71Series F 37.49 35.57 32.03Series I 34.78 33.10 30.02Series O 44.71 42.18 37.55Series T 10.95 10.75 10.36
Cost of investments held (000s) $ 663,158 $ 609,957 $ 483,931
The accompanying notes are an integral part of these financial statements.
252 Franklin Templeton Investments Funds

Franklin Bissett Dividend Income Fund
STATEMENTS OF COMPREHENSIVE INCOMEFor the six months ended June 30, 2014 and 2013 (Unaudited)
2014 2013
(000s) (000s)IncomeDividends $ 14,363 $ 15,734Interest income for distribution purposes 2,597 2,278Net realized and/or unrealized foreign exchange gain (loss) (72) 20Net realized gain (loss) on investments 33,932 25,129Net change in unrealized appreciation (depreciation) in value of investments 5,959 (9,393)
Total income (net) 56,779 33,768
ExpensesManagement fees (Note 6(a)) 4,873 4,529Fixed administration fees (Note 6(b)) 423 —Transfer agent fees (Note 6(d)) — 823Custodian fees — 21Legal fees — —Audit fees — 11Unitholder reporting costs — 29Independent review committee fees — 1Registration fees — 17Other expenses (Note 6(f)) — 256
Operating expenses before waivers/paid by Manager 5,296 5,687Management fees waived/paid by Manager (16) —Other expenses waived/paid by Manager — (800)
Net operating expenses after waivers/paid by Manager 5,280 4,887
Transaction costs (Note 9) 177 246Withholding tax expense 342 255
Total expenses 5,799 5,388
Increase (decrease) in net assets attributable to holders of redeemable units from operations $ 50,980 $ 28,380
Represented by:Increase (decrease) in net assets from operations as previously reported under Canadian GAAP — 28,130Revaluation of investments at fair value through profit and loss (Note 3(c)) — 250
Increase (decrease) in net assets attributable to holders of redeemable units from operations $ 50,980 $ 28,380
Increase (decrease) in net assets attributable to holders of redeemable units from operations per series (000s)Series A $ 23,366 $ 14,261Series F 3,124 1,935Series I 335 60Series O 22,559 11,042Series T 1,596 1,082
Weighted average number of units outstandingSeries A 12,970,568 12,488,443Series F 1,328,730 1,275,769Series I 150,239 50,584Series O 7,412,972 5,832,472Series T 2,546,808 2,512,524
Increase (decrease) in net assets attributable to holders of redeemable units from operations per unitSeries A $ 1.80 $ 1.15Series F 2.35 1.52Series I 2.22 1.20Series O 3.05 1.88Series T 0.63 0.43
The accompanying notes are an integral part of these financial statements.
Franklin Templeton Investments Funds 253
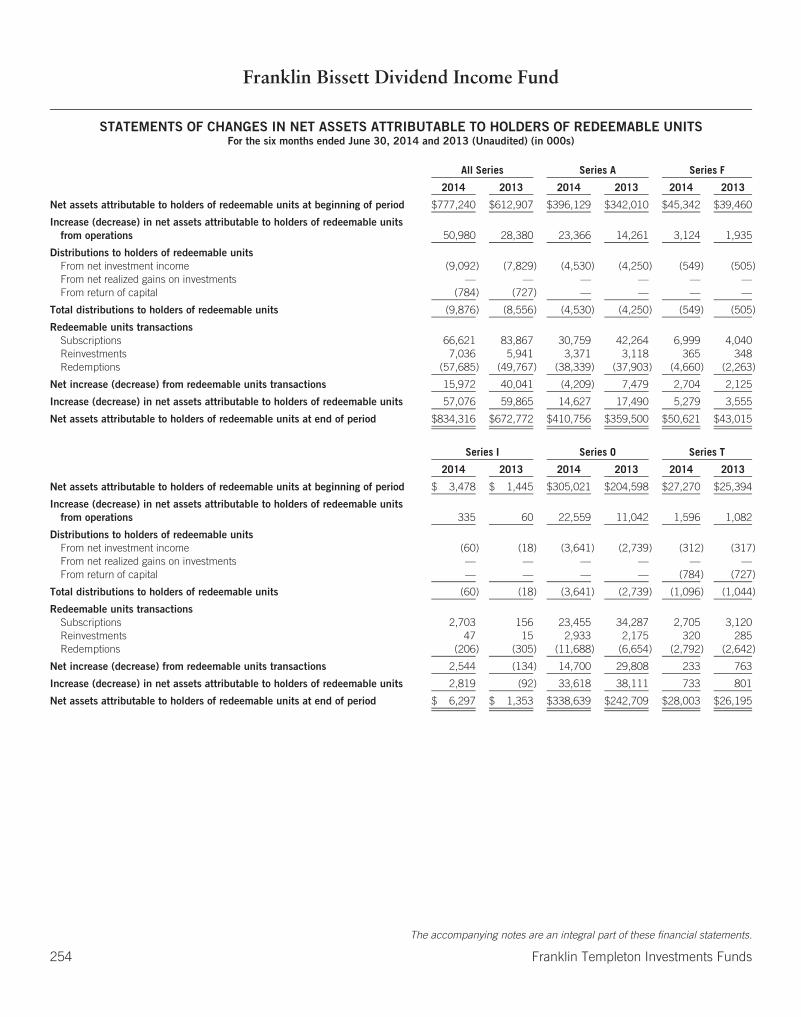
Franklin Bissett Dividend Income Fund
STATEMENTS OF CHANGES IN NET ASSETS ATTRIBUTABLE TO HOLDERS OF REDEEMABLE UNITSFor the six months ended June 30, 2014 and 2013 (Unaudited) (in 000s)
All Series Series A Series F
2014 2013 2014 2013 2014 2013
Net assets attributable to holders of redeemable units at beginning of period $777,240 $612,907 $396,129 $342,010 $45,342 $39,460
Increase (decrease) in net assets attributable to holders of redeemable unitsfrom operations 50,980 28,380 23,366 14,261 3,124 1,935
Distributions to holders of redeemable unitsFrom net investment income (9,092) (7,829) (4,530) (4,250) (549) (505)From net realized gains on investments — — — — — —From return of capital (784) (727) — — — —
Total distributions to holders of redeemable units (9,876) (8,556) (4,530) (4,250) (549) (505)
Redeemable units transactionsSubscriptions 66,621 83,867 30,759 42,264 6,999 4,040Reinvestments 7,036 5,941 3,371 3,118 365 348Redemptions (57,685) (49,767) (38,339) (37,903) (4,660) (2,263)
Net increase (decrease) from redeemable units transactions 15,972 40,041 (4,209) 7,479 2,704 2,125
Increase (decrease) in net assets attributable to holders of redeemable units 57,076 59,865 14,627 17,490 5,279 3,555
Net assets attributable to holders of redeemable units at end of period $834,316 $672,772 $410,756 $359,500 $50,621 $43,015
Series I Series O Series T
2014 2013 2014 2013 2014 2013
Net assets attributable to holders of redeemable units at beginning of period $ 3,478 $ 1,445 $305,021 $204,598 $27,270 $25,394
Increase (decrease) in net assets attributable to holders of redeemable unitsfrom operations 335 60 22,559 11,042 1,596 1,082
Distributions to holders of redeemable unitsFrom net investment income (60) (18) (3,641) (2,739) (312) (317)From net realized gains on investments — — — — — —From return of capital — — — — (784) (727)
Total distributions to holders of redeemable units (60) (18) (3,641) (2,739) (1,096) (1,044)
Redeemable units transactionsSubscriptions 2,703 156 23,455 34,287 2,705 3,120Reinvestments 47 15 2,933 2,175 320 285Redemptions (206) (305) (11,688) (6,654) (2,792) (2,642)
Net increase (decrease) from redeemable units transactions 2,544 (134) 14,700 29,808 233 763
Increase (decrease) in net assets attributable to holders of redeemable units 2,819 (92) 33,618 38,111 733 801
Net assets attributable to holders of redeemable units at end of period $ 6,297 $ 1,353 $338,639 $242,709 $28,003 $26,195
The accompanying notes are an integral part of these financial statements.
254 Franklin Templeton Investments Funds

Franklin Bissett Dividend Income Fund
STATEMENTS OF CASH FLOWSFor the six months ended June 30, 2014 and 2013 (Unaudited)
2014 2013
(000s) (000s)Cash flows from operating activitiesInterest received $ 2,502 $ 2,130Dividends received 13,771 11,089Proceeds from sale and maturity of investments 108,735 136,016Purchases of investments (127,630) (177,420)Operating expenses paid (5,347) (4,864)
Net cash from/(used in) operating activities (7,969) (33,049)
Cash flows from financing activitiesProceeds from issuances of redeemable units 66,556 83,667Amounts paid on redemption of redeemable units (57,538) (49,593)Distributions paid to holders of redeemable units, net of reinvested distributions (1,010) (967)
Net cash (used in)/from financing activities 8,008 33,107
Net increase (decrease) in cash 39 58Cash at beginning of year 83 88Effect of exchange rate changes (46) (13)
Cash at end of period $ 76 $ 133
The accompanying notes are an integral part of these financial statements.
Franklin Templeton Investments Funds 255
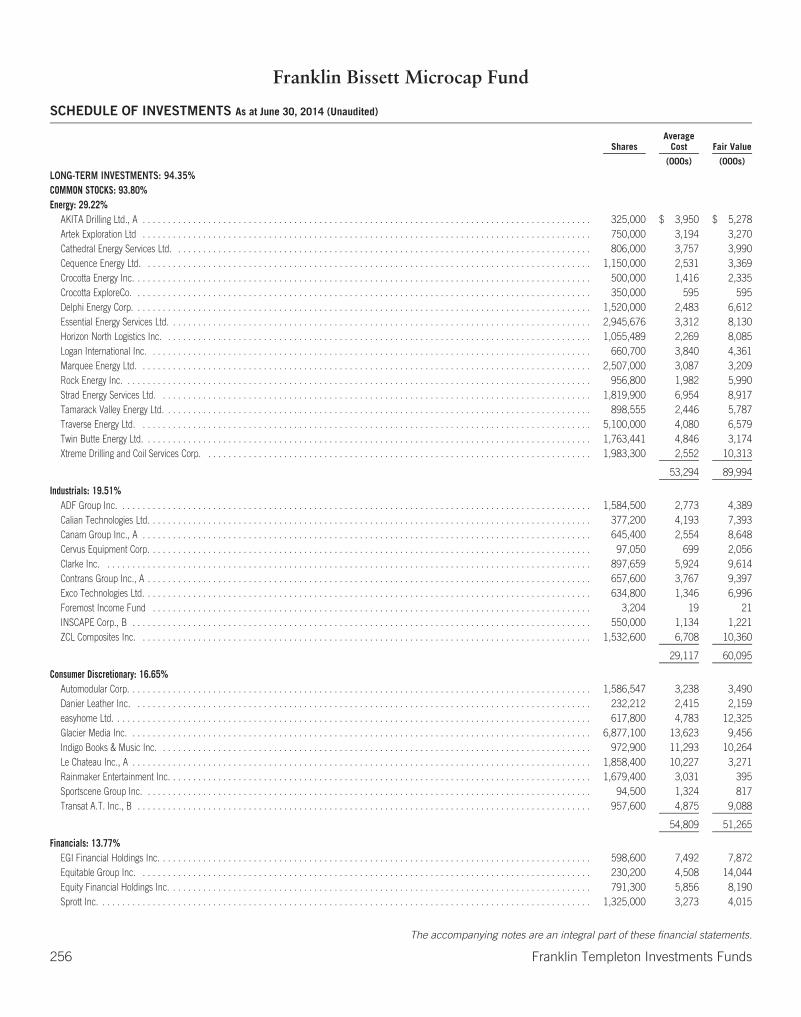
Franklin Bissett Microcap Fund
SCHEDULE OF INVESTMENTS As at June 30, 2014 (Unaudited)
SharesAverage
Cost Fair Value
(000s) (000s)
LONG-TERM INVESTMENTS: 94.35%COMMON STOCKS: 93.80%Energy: 29.22%
AKITA Drilling Ltd., A . . . . . . . . . . . . . . . . . . . . . . . . . . . . . . . . . . . . . . . . . . . . . . . . . . . . . . . . . . . . . . . . . . . . . . . . . . . . . . . . . . . . . . . . . 325,000 $ 3,950 $ 5,278Artek Exploration Ltd . . . . . . . . . . . . . . . . . . . . . . . . . . . . . . . . . . . . . . . . . . . . . . . . . . . . . . . . . . . . . . . . . . . . . . . . . . . . . . . . . . . . . . . . . 750,000 3,194 3,270Cathedral Energy Services Ltd. . . . . . . . . . . . . . . . . . . . . . . . . . . . . . . . . . . . . . . . . . . . . . . . . . . . . . . . . . . . . . . . . . . . . . . . . . . . . . . . . . . 806,000 3,757 3,990Cequence Energy Ltd. . . . . . . . . . . . . . . . . . . . . . . . . . . . . . . . . . . . . . . . . . . . . . . . . . . . . . . . . . . . . . . . . . . . . . . . . . . . . . . . . . . . . . . . . 1,150,000 2,531 3,369Crocotta Energy Inc. . . . . . . . . . . . . . . . . . . . . . . . . . . . . . . . . . . . . . . . . . . . . . . . . . . . . . . . . . . . . . . . . . . . . . . . . . . . . . . . . . . . . . . . . . . 500,000 1,416 2,335Crocotta ExploreCo. . . . . . . . . . . . . . . . . . . . . . . . . . . . . . . . . . . . . . . . . . . . . . . . . . . . . . . . . . . . . . . . . . . . . . . . . . . . . . . . . . . . . . . . . . . 350,000 595 595Delphi Energy Corp. . . . . . . . . . . . . . . . . . . . . . . . . . . . . . . . . . . . . . . . . . . . . . . . . . . . . . . . . . . . . . . . . . . . . . . . . . . . . . . . . . . . . . . . . . . 1,520,000 2,483 6,612Essential Energy Services Ltd. . . . . . . . . . . . . . . . . . . . . . . . . . . . . . . . . . . . . . . . . . . . . . . . . . . . . . . . . . . . . . . . . . . . . . . . . . . . . . . . . . . . 2,945,676 3,312 8,130Horizon North Logistics Inc. . . . . . . . . . . . . . . . . . . . . . . . . . . . . . . . . . . . . . . . . . . . . . . . . . . . . . . . . . . . . . . . . . . . . . . . . . . . . . . . . . . . . 1,055,489 2,269 8,085Logan International Inc. . . . . . . . . . . . . . . . . . . . . . . . . . . . . . . . . . . . . . . . . . . . . . . . . . . . . . . . . . . . . . . . . . . . . . . . . . . . . . . . . . . . . . . . 660,700 3,840 4,361Marquee Energy Ltd. . . . . . . . . . . . . . . . . . . . . . . . . . . . . . . . . . . . . . . . . . . . . . . . . . . . . . . . . . . . . . . . . . . . . . . . . . . . . . . . . . . . . . . . . . 2,507,000 3,087 3,209Rock Energy Inc. . . . . . . . . . . . . . . . . . . . . . . . . . . . . . . . . . . . . . . . . . . . . . . . . . . . . . . . . . . . . . . . . . . . . . . . . . . . . . . . . . . . . . . . . . . . . 956,800 1,982 5,990Strad Energy Services Ltd. . . . . . . . . . . . . . . . . . . . . . . . . . . . . . . . . . . . . . . . . . . . . . . . . . . . . . . . . . . . . . . . . . . . . . . . . . . . . . . . . . . . . . 1,819,900 6,954 8,917Tamarack Valley Energy Ltd. . . . . . . . . . . . . . . . . . . . . . . . . . . . . . . . . . . . . . . . . . . . . . . . . . . . . . . . . . . . . . . . . . . . . . . . . . . . . . . . . . . . . 898,555 2,446 5,787Traverse Energy Ltd. . . . . . . . . . . . . . . . . . . . . . . . . . . . . . . . . . . . . . . . . . . . . . . . . . . . . . . . . . . . . . . . . . . . . . . . . . . . . . . . . . . . . . . . . . 5,100,000 4,080 6,579Twin Butte Energy Ltd. . . . . . . . . . . . . . . . . . . . . . . . . . . . . . . . . . . . . . . . . . . . . . . . . . . . . . . . . . . . . . . . . . . . . . . . . . . . . . . . . . . . . . . . . 1,763,441 4,846 3,174Xtreme Drilling and Coil Services Corp. . . . . . . . . . . . . . . . . . . . . . . . . . . . . . . . . . . . . . . . . . . . . . . . . . . . . . . . . . . . . . . . . . . . . . . . . . . . . 1,983,300 2,552 10,313
53,294 89,994
Industrials: 19.51%ADF Group Inc. . . . . . . . . . . . . . . . . . . . . . . . . . . . . . . . . . . . . . . . . . . . . . . . . . . . . . . . . . . . . . . . . . . . . . . . . . . . . . . . . . . . . . . . . . . . . . 1,584,500 2,773 4,389Calian Technologies Ltd. . . . . . . . . . . . . . . . . . . . . . . . . . . . . . . . . . . . . . . . . . . . . . . . . . . . . . . . . . . . . . . . . . . . . . . . . . . . . . . . . . . . . . . . 377,200 4,193 7,393Canam Group Inc., A . . . . . . . . . . . . . . . . . . . . . . . . . . . . . . . . . . . . . . . . . . . . . . . . . . . . . . . . . . . . . . . . . . . . . . . . . . . . . . . . . . . . . . . . . 645,400 2,554 8,648Cervus Equipment Corp. . . . . . . . . . . . . . . . . . . . . . . . . . . . . . . . . . . . . . . . . . . . . . . . . . . . . . . . . . . . . . . . . . . . . . . . . . . . . . . . . . . . . . . . 97,050 699 2,056Clarke Inc. . . . . . . . . . . . . . . . . . . . . . . . . . . . . . . . . . . . . . . . . . . . . . . . . . . . . . . . . . . . . . . . . . . . . . . . . . . . . . . . . . . . . . . . . . . . . . . . . 897,659 5,924 9,614Contrans Group Inc., A . . . . . . . . . . . . . . . . . . . . . . . . . . . . . . . . . . . . . . . . . . . . . . . . . . . . . . . . . . . . . . . . . . . . . . . . . . . . . . . . . . . . . . . . 657,600 3,767 9,397Exco Technologies Ltd. . . . . . . . . . . . . . . . . . . . . . . . . . . . . . . . . . . . . . . . . . . . . . . . . . . . . . . . . . . . . . . . . . . . . . . . . . . . . . . . . . . . . . . . . 634,800 1,346 6,996Foremost Income Fund . . . . . . . . . . . . . . . . . . . . . . . . . . . . . . . . . . . . . . . . . . . . . . . . . . . . . . . . . . . . . . . . . . . . . . . . . . . . . . . . . . . . . . . 3,204 19 21INSCAPE Corp., B . . . . . . . . . . . . . . . . . . . . . . . . . . . . . . . . . . . . . . . . . . . . . . . . . . . . . . . . . . . . . . . . . . . . . . . . . . . . . . . . . . . . . . . . . . . 550,000 1,134 1,221ZCL Composites Inc. . . . . . . . . . . . . . . . . . . . . . . . . . . . . . . . . . . . . . . . . . . . . . . . . . . . . . . . . . . . . . . . . . . . . . . . . . . . . . . . . . . . . . . . . . 1,532,600 6,708 10,360
29,117 60,095
Consumer Discretionary: 16.65%Automodular Corp. . . . . . . . . . . . . . . . . . . . . . . . . . . . . . . . . . . . . . . . . . . . . . . . . . . . . . . . . . . . . . . . . . . . . . . . . . . . . . . . . . . . . . . . . . . . 1,586,547 3,238 3,490Danier Leather Inc. . . . . . . . . . . . . . . . . . . . . . . . . . . . . . . . . . . . . . . . . . . . . . . . . . . . . . . . . . . . . . . . . . . . . . . . . . . . . . . . . . . . . . . . . . . 232,212 2,415 2,159easyhome Ltd. . . . . . . . . . . . . . . . . . . . . . . . . . . . . . . . . . . . . . . . . . . . . . . . . . . . . . . . . . . . . . . . . . . . . . . . . . . . . . . . . . . . . . . . . . . . . . . 617,800 4,783 12,325Glacier Media Inc. . . . . . . . . . . . . . . . . . . . . . . . . . . . . . . . . . . . . . . . . . . . . . . . . . . . . . . . . . . . . . . . . . . . . . . . . . . . . . . . . . . . . . . . . . . . 6,877,100 13,623 9,456Indigo Books & Music Inc. . . . . . . . . . . . . . . . . . . . . . . . . . . . . . . . . . . . . . . . . . . . . . . . . . . . . . . . . . . . . . . . . . . . . . . . . . . . . . . . . . . . . . 972,900 11,293 10,264Le Chateau Inc., A . . . . . . . . . . . . . . . . . . . . . . . . . . . . . . . . . . . . . . . . . . . . . . . . . . . . . . . . . . . . . . . . . . . . . . . . . . . . . . . . . . . . . . . . . . . 1,858,400 10,227 3,271Rainmaker Entertainment Inc. . . . . . . . . . . . . . . . . . . . . . . . . . . . . . . . . . . . . . . . . . . . . . . . . . . . . . . . . . . . . . . . . . . . . . . . . . . . . . . . . . . . 1,679,400 3,031 395Sportscene Group Inc. . . . . . . . . . . . . . . . . . . . . . . . . . . . . . . . . . . . . . . . . . . . . . . . . . . . . . . . . . . . . . . . . . . . . . . . . . . . . . . . . . . . . . . . . 94,500 1,324 817Transat A.T. Inc., B . . . . . . . . . . . . . . . . . . . . . . . . . . . . . . . . . . . . . . . . . . . . . . . . . . . . . . . . . . . . . . . . . . . . . . . . . . . . . . . . . . . . . . . . . . 957,600 4,875 9,088
54,809 51,265
Financials: 13.77%EGI Financial Holdings Inc. . . . . . . . . . . . . . . . . . . . . . . . . . . . . . . . . . . . . . . . . . . . . . . . . . . . . . . . . . . . . . . . . . . . . . . . . . . . . . . . . . . . . . 598,600 7,492 7,872Equitable Group Inc. . . . . . . . . . . . . . . . . . . . . . . . . . . . . . . . . . . . . . . . . . . . . . . . . . . . . . . . . . . . . . . . . . . . . . . . . . . . . . . . . . . . . . . . . . 230,200 4,508 14,044Equity Financial Holdings Inc. . . . . . . . . . . . . . . . . . . . . . . . . . . . . . . . . . . . . . . . . . . . . . . . . . . . . . . . . . . . . . . . . . . . . . . . . . . . . . . . . . . . 791,300 5,856 8,190Sprott Inc. . . . . . . . . . . . . . . . . . . . . . . . . . . . . . . . . . . . . . . . . . . . . . . . . . . . . . . . . . . . . . . . . . . . . . . . . . . . . . . . . . . . . . . . . . . . . . . . . . 1,325,000 3,273 4,015
The accompanying notes are an integral part of these financial statements.
256 Franklin Templeton Investments Funds
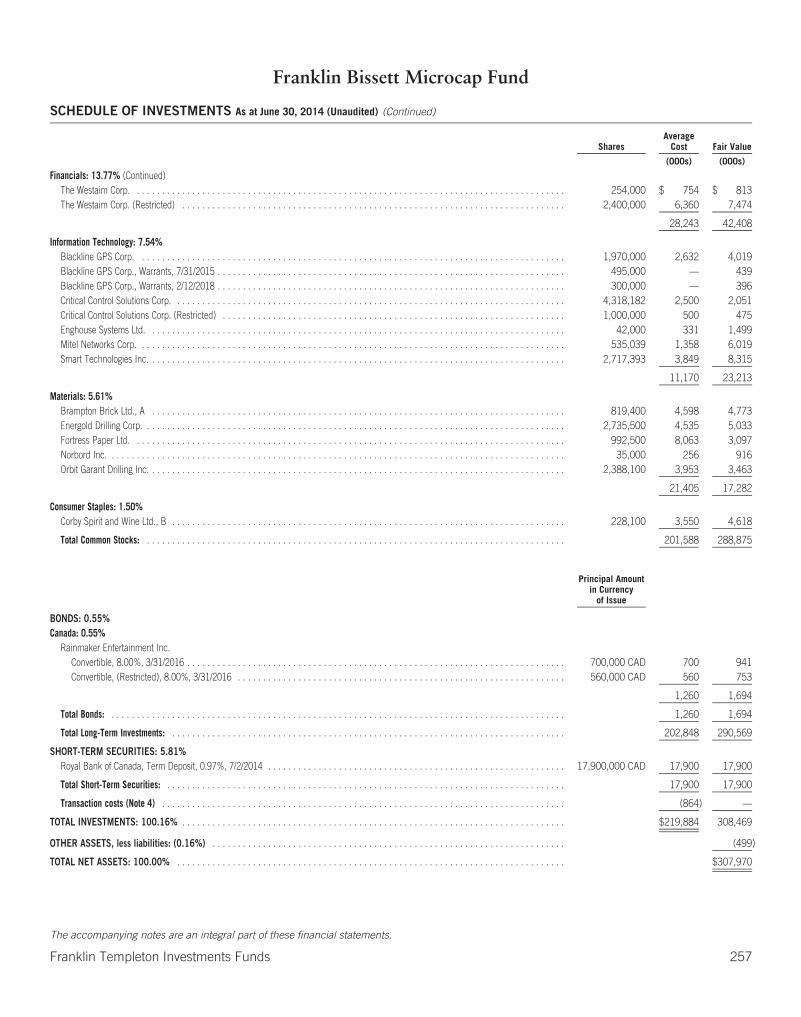
Franklin Bissett Microcap Fund
SCHEDULE OF INVESTMENTS As at June 30, 2014 (Unaudited) (Continued)
SharesAverage
Cost Fair Value
(000s) (000s)
Financials: 13.77% (Continued)The Westaim Corp. . . . . . . . . . . . . . . . . . . . . . . . . . . . . . . . . . . . . . . . . . . . . . . . . . . . . . . . . . . . . . . . . . . . . . . . . . . . . . . . . . . . . . 254,000 $ 754 $ 813The Westaim Corp. (Restricted) . . . . . . . . . . . . . . . . . . . . . . . . . . . . . . . . . . . . . . . . . . . . . . . . . . . . . . . . . . . . . . . . . . . . . . . . . . . . 2,400,000 6,360 7,474
28,243 42,408
Information Technology: 7.54%Blackline GPS Corp. . . . . . . . . . . . . . . . . . . . . . . . . . . . . . . . . . . . . . . . . . . . . . . . . . . . . . . . . . . . . . . . . . . . . . . . . . . . . . . . . . . . . 1,970,000 2,632 4,019Blackline GPS Corp., Warrants, 7/31/2015 . . . . . . . . . . . . . . . . . . . . . . . . . . . . . . . . . . . . . . . . . . . . . . . . . . . . . . . . . . . . . . . . . . . . . 495,000 — 439Blackline GPS Corp., Warrants, 2/12/2018 . . . . . . . . . . . . . . . . . . . . . . . . . . . . . . . . . . . . . . . . . . . . . . . . . . . . . . . . . . . . . . . . . . . . . 300,000 — 396Critical Control Solutions Corp. . . . . . . . . . . . . . . . . . . . . . . . . . . . . . . . . . . . . . . . . . . . . . . . . . . . . . . . . . . . . . . . . . . . . . . . . . . . . . 4,318,182 2,500 2,051Critical Control Solutions Corp. (Restricted) . . . . . . . . . . . . . . . . . . . . . . . . . . . . . . . . . . . . . . . . . . . . . . . . . . . . . . . . . . . . . . . . . . . . 1,000,000 500 475Enghouse Systems Ltd. . . . . . . . . . . . . . . . . . . . . . . . . . . . . . . . . . . . . . . . . . . . . . . . . . . . . . . . . . . . . . . . . . . . . . . . . . . . . . . . . . . 42,000 331 1,499Mitel Networks Corp. . . . . . . . . . . . . . . . . . . . . . . . . . . . . . . . . . . . . . . . . . . . . . . . . . . . . . . . . . . . . . . . . . . . . . . . . . . . . . . . . . . . . 535,039 1,358 6,019Smart Technologies Inc. . . . . . . . . . . . . . . . . . . . . . . . . . . . . . . . . . . . . . . . . . . . . . . . . . . . . . . . . . . . . . . . . . . . . . . . . . . . . . . . . . . 2,717,393 3,849 8,315
11,170 23,213
Materials: 5.61%Brampton Brick Ltd., A . . . . . . . . . . . . . . . . . . . . . . . . . . . . . . . . . . . . . . . . . . . . . . . . . . . . . . . . . . . . . . . . . . . . . . . . . . . . . . . . . . 819,400 4,598 4,773Energold Drilling Corp. . . . . . . . . . . . . . . . . . . . . . . . . . . . . . . . . . . . . . . . . . . . . . . . . . . . . . . . . . . . . . . . . . . . . . . . . . . . . . . . . . . . 2,735,500 4,535 5,033Fortress Paper Ltd. . . . . . . . . . . . . . . . . . . . . . . . . . . . . . . . . . . . . . . . . . . . . . . . . . . . . . . . . . . . . . . . . . . . . . . . . . . . . . . . . . . . . . 992,500 8,063 3,097Norbord Inc. . . . . . . . . . . . . . . . . . . . . . . . . . . . . . . . . . . . . . . . . . . . . . . . . . . . . . . . . . . . . . . . . . . . . . . . . . . . . . . . . . . . . . . . . . . 35,000 256 916Orbit Garant Drilling Inc. . . . . . . . . . . . . . . . . . . . . . . . . . . . . . . . . . . . . . . . . . . . . . . . . . . . . . . . . . . . . . . . . . . . . . . . . . . . . . . . . . . 2,388,100 3,953 3,463
21,405 17,282
Consumer Staples: 1.50%Corby Spirit and Wine Ltd., B . . . . . . . . . . . . . . . . . . . . . . . . . . . . . . . . . . . . . . . . . . . . . . . . . . . . . . . . . . . . . . . . . . . . . . . . . . . . . . 228,100 3,550 4,618
Total Common Stocks: . . . . . . . . . . . . . . . . . . . . . . . . . . . . . . . . . . . . . . . . . . . . . . . . . . . . . . . . . . . . . . . . . . . . . . . . . . . . . . . . . . . 201,588 288,875
Principal Amountin Currency
of Issue
BONDS: 0.55%Canada: 0.55%
Rainmaker Entertainment Inc.Convertible, 8.00%, 3/31/2016 . . . . . . . . . . . . . . . . . . . . . . . . . . . . . . . . . . . . . . . . . . . . . . . . . . . . . . . . . . . . . . . . . . . . . . . . . . . 700,000 CAD 700 941Convertible, (Restricted), 8.00%, 3/31/2016 . . . . . . . . . . . . . . . . . . . . . . . . . . . . . . . . . . . . . . . . . . . . . . . . . . . . . . . . . . . . . . . . . 560,000 CAD 560 753
1,260 1,694
Total Bonds: . . . . . . . . . . . . . . . . . . . . . . . . . . . . . . . . . . . . . . . . . . . . . . . . . . . . . . . . . . . . . . . . . . . . . . . . . . . . . . . . . . . . . . . . . . 1,260 1,694
Total Long-Term Investments: . . . . . . . . . . . . . . . . . . . . . . . . . . . . . . . . . . . . . . . . . . . . . . . . . . . . . . . . . . . . . . . . . . . . . . . . . . . . . . 202,848 290,569
SHORT-TERM SECURITIES: 5.81%Royal Bank of Canada, Term Deposit, 0.97%, 7/2/2014 . . . . . . . . . . . . . . . . . . . . . . . . . . . . . . . . . . . . . . . . . . . . . . . . . . . . . . . . . . . 17,900,000 CAD 17,900 17,900
Total Short-Term Securities: . . . . . . . . . . . . . . . . . . . . . . . . . . . . . . . . . . . . . . . . . . . . . . . . . . . . . . . . . . . . . . . . . . . . . . . . . . . . . . . 17,900 17,900
Transaction costs (Note 4) . . . . . . . . . . . . . . . . . . . . . . . . . . . . . . . . . . . . . . . . . . . . . . . . . . . . . . . . . . . . . . . . . . . . . . . . . . . . . . . . (864) —
TOTAL INVESTMENTS: 100.16% . . . . . . . . . . . . . . . . . . . . . . . . . . . . . . . . . . . . . . . . . . . . . . . . . . . . . . . . . . . . . . . . . . . . . . . . . . . . $219,884 308,469
OTHER ASSETS, less liabilities: (0.16%) . . . . . . . . . . . . . . . . . . . . . . . . . . . . . . . . . . . . . . . . . . . . . . . . . . . . . . . . . . . . . . . . . . . . . . (499)
TOTAL NET ASSETS: 100.00% . . . . . . . . . . . . . . . . . . . . . . . . . . . . . . . . . . . . . . . . . . . . . . . . . . . . . . . . . . . . . . . . . . . . . . . . . . . . . $307,970
The accompanying notes are an integral part of these financial statements.
Franklin Templeton Investments Funds 257
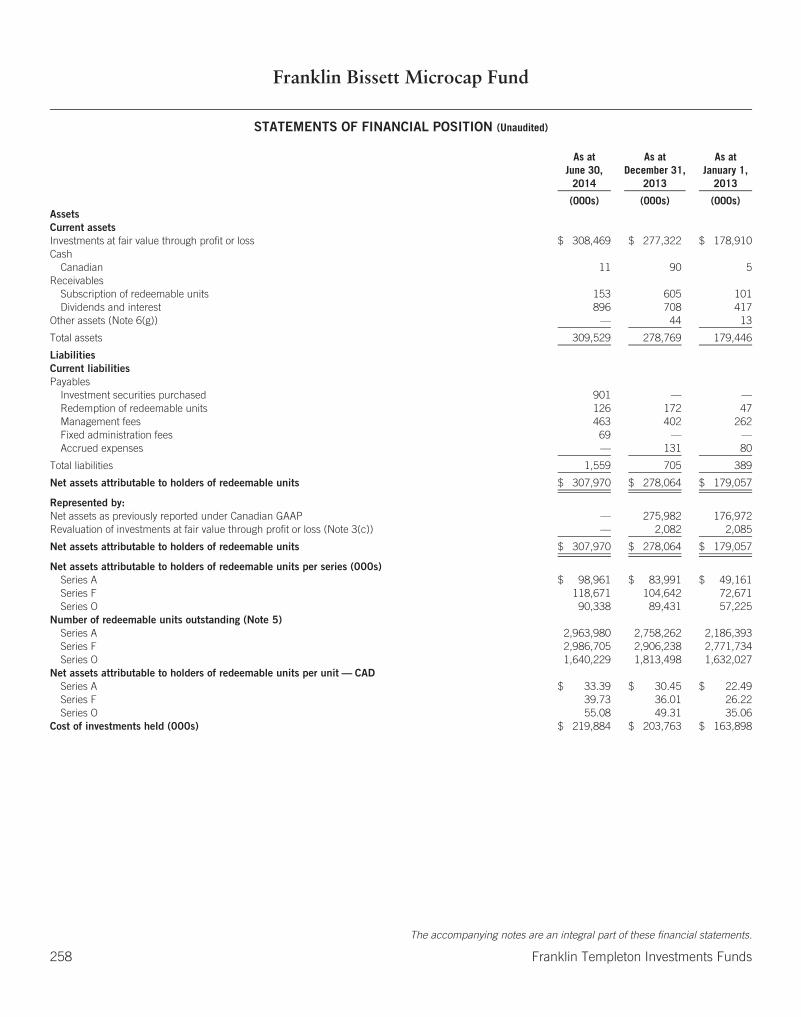
Franklin Bissett Microcap Fund
STATEMENTS OF FINANCIAL POSITION (Unaudited)
As atJune 30,
2014
As atDecember 31,
2013
As atJanuary 1,
2013
(000s) (000s) (000s)AssetsCurrent assetsInvestments at fair value through profit or loss $ 308,469 $ 277,322 $ 178,910Cash
Canadian 11 90 5Receivables
Subscription of redeemable units 153 605 101Dividends and interest 896 708 417
Other assets (Note 6(g)) — 44 13
Total assets 309,529 278,769 179,446
LiabilitiesCurrent liabilitiesPayables
Investment securities purchased 901 — —Redemption of redeemable units 126 172 47Management fees 463 402 262Fixed administration fees 69 — —Accrued expenses — 131 80
Total liabilities 1,559 705 389
Net assets attributable to holders of redeemable units $ 307,970 $ 278,064 $ 179,057
Represented by:Net assets as previously reported under Canadian GAAP — 275,982 176,972Revaluation of investments at fair value through profit or loss (Note 3(c)) — 2,082 2,085
Net assets attributable to holders of redeemable units $ 307,970 $ 278,064 $ 179,057
Net assets attributable to holders of redeemable units per series (000s)Series A $ 98,961 $ 83,991 $ 49,161Series F 118,671 104,642 72,671Series O 90,338 89,431 57,225
Number of redeemable units outstanding (Note 5)Series A 2,963,980 2,758,262 2,186,393Series F 2,986,705 2,906,238 2,771,734Series O 1,640,229 1,813,498 1,632,027
Net assets attributable to holders of redeemable units per unit — CADSeries A $ 33.39 $ 30.45 $ 22.49Series F 39.73 36.01 26.22Series O 55.08 49.31 35.06
Cost of investments held (000s) $ 219,884 $ 203,763 $ 163,898
The accompanying notes are an integral part of these financial statements.
258 Franklin Templeton Investments Funds
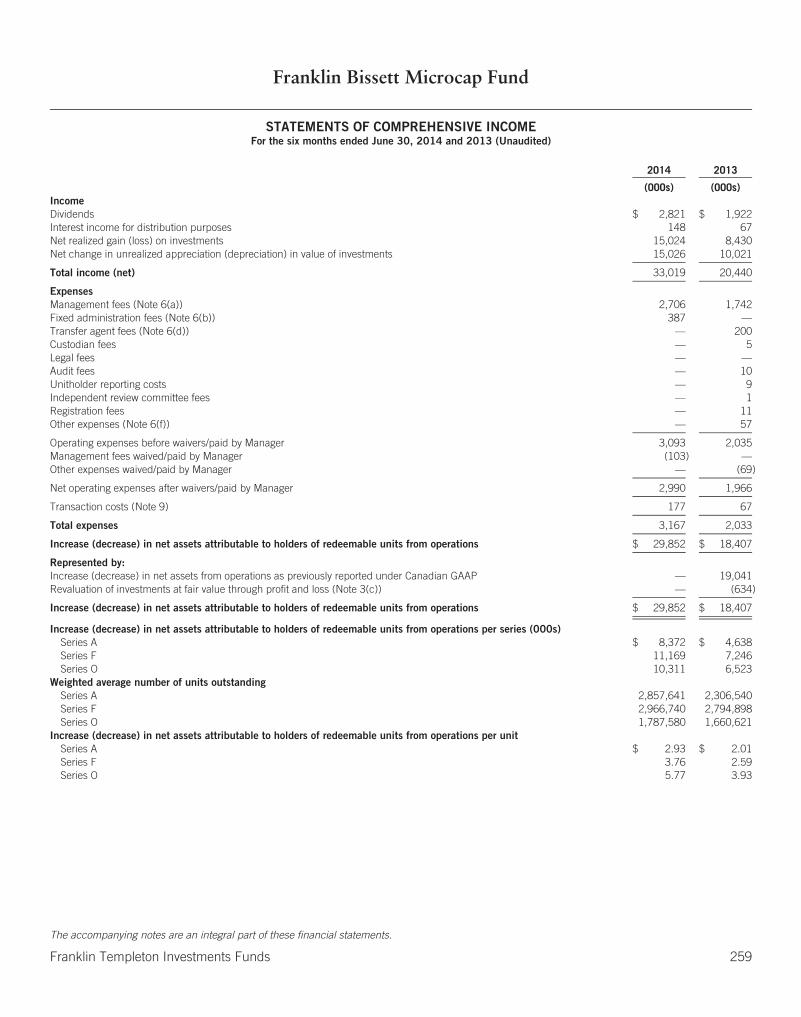
Franklin Bissett Microcap Fund
STATEMENTS OF COMPREHENSIVE INCOMEFor the six months ended June 30, 2014 and 2013 (Unaudited)
2014 2013
(000s) (000s)IncomeDividends $ 2,821 $ 1,922Interest income for distribution purposes 148 67Net realized gain (loss) on investments 15,024 8,430Net change in unrealized appreciation (depreciation) in value of investments 15,026 10,021
Total income (net) 33,019 20,440
ExpensesManagement fees (Note 6(a)) 2,706 1,742Fixed administration fees (Note 6(b)) 387 —Transfer agent fees (Note 6(d)) — 200Custodian fees — 5Legal fees — —Audit fees — 10Unitholder reporting costs — 9Independent review committee fees — 1Registration fees — 11Other expenses (Note 6(f)) — 57
Operating expenses before waivers/paid by Manager 3,093 2,035Management fees waived/paid by Manager (103) —Other expenses waived/paid by Manager — (69)
Net operating expenses after waivers/paid by Manager 2,990 1,966
Transaction costs (Note 9) 177 67
Total expenses 3,167 2,033
Increase (decrease) in net assets attributable to holders of redeemable units from operations $ 29,852 $ 18,407
Represented by:Increase (decrease) in net assets from operations as previously reported under Canadian GAAP — 19,041Revaluation of investments at fair value through profit and loss (Note 3(c)) — (634)
Increase (decrease) in net assets attributable to holders of redeemable units from operations $ 29,852 $ 18,407
Increase (decrease) in net assets attributable to holders of redeemable units from operations per series (000s)Series A $ 8,372 $ 4,638Series F 11,169 7,246Series O 10,311 6,523
Weighted average number of units outstandingSeries A 2,857,641 2,306,540Series F 2,966,740 2,794,898Series O 1,787,580 1,660,621
Increase (decrease) in net assets attributable to holders of redeemable units from operations per unitSeries A $ 2.93 $ 2.01Series F 3.76 2.59Series O 5.77 3.93
The accompanying notes are an integral part of these financial statements.
Franklin Templeton Investments Funds 259
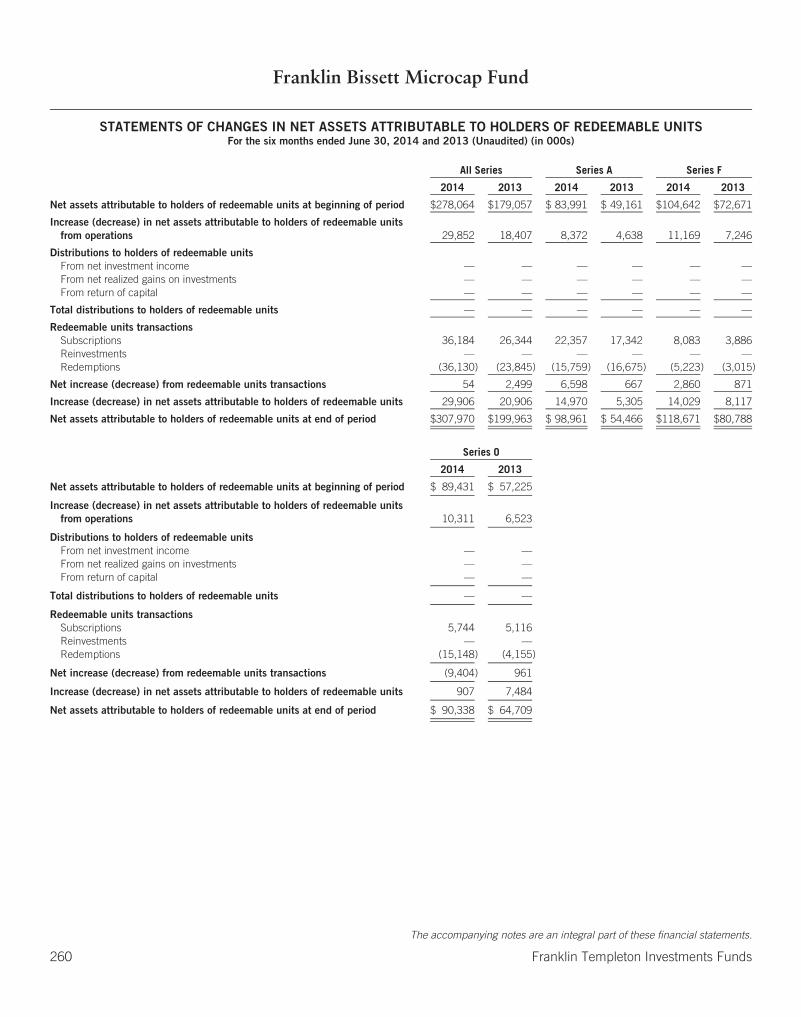
Franklin Bissett Microcap Fund
STATEMENTS OF CHANGES IN NET ASSETS ATTRIBUTABLE TO HOLDERS OF REDEEMABLE UNITSFor the six months ended June 30, 2014 and 2013 (Unaudited) (in 000s)
All Series Series A Series F
2014 2013 2014 2013 2014 2013
Net assets attributable to holders of redeemable units at beginning of period $278,064 $179,057 $ 83,991 $ 49,161 $104,642 $72,671
Increase (decrease) in net assets attributable to holders of redeemable unitsfrom operations 29,852 18,407 8,372 4,638 11,169 7,246
Distributions to holders of redeemable unitsFrom net investment income — — — — — —From net realized gains on investments — — — — — —From return of capital — — — — — —
Total distributions to holders of redeemable units — — — — — —
Redeemable units transactionsSubscriptions 36,184 26,344 22,357 17,342 8,083 3,886Reinvestments — — — — — —Redemptions (36,130) (23,845) (15,759) (16,675) (5,223) (3,015)
Net increase (decrease) from redeemable units transactions 54 2,499 6,598 667 2,860 871
Increase (decrease) in net assets attributable to holders of redeemable units 29,906 20,906 14,970 5,305 14,029 8,117
Net assets attributable to holders of redeemable units at end of period $307,970 $199,963 $ 98,961 $ 54,466 $118,671 $80,788
Series O
2014 2013
Net assets attributable to holders of redeemable units at beginning of period $ 89,431 $ 57,225
Increase (decrease) in net assets attributable to holders of redeemable unitsfrom operations 10,311 6,523
Distributions to holders of redeemable unitsFrom net investment income — —From net realized gains on investments — —From return of capital — —
Total distributions to holders of redeemable units — —
Redeemable units transactionsSubscriptions 5,744 5,116Reinvestments — —Redemptions (15,148) (4,155)
Net increase (decrease) from redeemable units transactions (9,404) 961
Increase (decrease) in net assets attributable to holders of redeemable units 907 7,484
Net assets attributable to holders of redeemable units at end of period $ 90,338 $ 64,709
The accompanying notes are an integral part of these financial statements.
260 Franklin Templeton Investments Funds

Franklin Bissett Microcap Fund
STATEMENTS OF CASH FLOWSFor the six months ended June 30, 2014 and 2013 (Unaudited)
2014 2013
(000s) (000s)Cash flows from operating activitiesInterest received $ 136 $ 68Dividends received 2,644 1,924Proceeds from sale and maturity of investments 54,859 28,571Purchases of investments (55,231) (30,663)Net receipts/(payments) from derivative activities — (560)Operating expenses paid (2,947) (1,950)
Net cash from/(used in) operating activities (539) (2,610)
Cash flows from financing activitiesProceeds from issuances of redeemable units 36,635 26,308Amounts paid on redemption of redeemable units (36,175) (23,680)Distributions paid to holders of redeemable units, net of reinvested distributions — (2)
Net cash (used in)/from financing activities 460 2,626
Net increase (decrease) in cash (79) 16Cash at beginning of year 90 5Effect of exchange rate changes — —
Cash at end of period $ 11 $ 21
The accompanying notes are an integral part of these financial statements.
Franklin Templeton Investments Funds 261

Franklin Bissett Money Market Fund
SCHEDULE OF INVESTMENTS As at June 30, 2014 (Unaudited)
PrincipalAmount
Cost andValue
(CAD) (CAD 000s)
TREASURY BILLS: 4.47%Canada Treasury Bill: 4.47%
0.95%, November 20, 2014 . . . . . . . . . . . . . . . . . . . . . . . . . . . . . . . . . . . . . . . . . . . . . . . . . . . . . . . . . . . . . . . . . . . . . . . . . . . . . . . . . . . . . . . . . . $ 2,000,000 $ 1,9930.956%, December 4, 2014 . . . . . . . . . . . . . . . . . . . . . . . . . . . . . . . . . . . . . . . . . . . . . . . . . . . . . . . . . . . . . . . . . . . . . . . . . . . . . . . . . . . . . . . . . . 2,000,000 1,9920.967%, January 15, 2015 . . . . . . . . . . . . . . . . . . . . . . . . . . . . . . . . . . . . . . . . . . . . . . . . . . . . . . . . . . . . . . . . . . . . . . . . . . . . . . . . . . . . . . . . . . . 3,000,000 2,9840.96%, February 12, 2015 . . . . . . . . . . . . . . . . . . . . . . . . . . . . . . . . . . . . . . . . . . . . . . . . . . . . . . . . . . . . . . . . . . . . . . . . . . . . . . . . . . . . . . . . . . . 1,000,000 9940.975%, March 12, 2015 . . . . . . . . . . . . . . . . . . . . . . . . . . . . . . . . . . . . . . . . . . . . . . . . . . . . . . . . . . . . . . . . . . . . . . . . . . . . . . . . . . . . . . . . . . . . 1,000,000 9931.01%, June 4, 2015 . . . . . . . . . . . . . . . . . . . . . . . . . . . . . . . . . . . . . . . . . . . . . . . . . . . . . . . . . . . . . . . . . . . . . . . . . . . . . . . . . . . . . . . . . . . . . . . 700,000 694
Total Treasury Bills . . . . . . . . . . . . . . . . . . . . . . . . . . . . . . . . . . . . . . . . . . . . . . . . . . . . . . . . . . . . . . . . . . . . . . . . . . . . . . . . . . . . . . . . . . . . . . . . . 9,700,000 9,650
BANKER’S ACCEPTANCES: 26.72%Canadian Imperial Bank of Commerce: 1.27%
1.15%, July 25, 2014 . . . . . . . . . . . . . . . . . . . . . . . . . . . . . . . . . . . . . . . . . . . . . . . . . . . . . . . . . . . . . . . . . . . . . . . . . . . . . . . . . . . . . . . . . . . . . . . 250,000 2501.131%, August 7, 2014 . . . . . . . . . . . . . . . . . . . . . . . . . . . . . . . . . . . . . . . . . . . . . . . . . . . . . . . . . . . . . . . . . . . . . . . . . . . . . . . . . . . . . . . . . . . . . 500,000 4991.179%, September 22, 2014 . . . . . . . . . . . . . . . . . . . . . . . . . . . . . . . . . . . . . . . . . . . . . . . . . . . . . . . . . . . . . . . . . . . . . . . . . . . . . . . . . . . . . . . . . 1,000,000 9971.20%, November 14, 2014 . . . . . . . . . . . . . . . . . . . . . . . . . . . . . . . . . . . . . . . . . . . . . . . . . . . . . . . . . . . . . . . . . . . . . . . . . . . . . . . . . . . . . . . . . . 1,000,000 995
2,750,000 2,741
HSBC Bank Canada: 6.08%1.172%, July 9, 2014 . . . . . . . . . . . . . . . . . . . . . . . . . . . . . . . . . . . . . . . . . . . . . . . . . . . . . . . . . . . . . . . . . . . . . . . . . . . . . . . . . . . . . . . . . . . . . . . 1,170,000 1,1701.172%, July 10, 2014 . . . . . . . . . . . . . . . . . . . . . . . . . . . . . . . . . . . . . . . . . . . . . . . . . . . . . . . . . . . . . . . . . . . . . . . . . . . . . . . . . . . . . . . . . . . . . . 1,000,000 1,0001.174%, July 11, 2014 . . . . . . . . . . . . . . . . . . . . . . . . . . . . . . . . . . . . . . . . . . . . . . . . . . . . . . . . . . . . . . . . . . . . . . . . . . . . . . . . . . . . . . . . . . . . . . 500,000 5001.206%, July 16, 2014 . . . . . . . . . . . . . . . . . . . . . . . . . . . . . . . . . . . . . . . . . . . . . . . . . . . . . . . . . . . . . . . . . . . . . . . . . . . . . . . . . . . . . . . . . . . . . . 5,300,000 5,2971.191%, July 25, 2014 . . . . . . . . . . . . . . . . . . . . . . . . . . . . . . . . . . . . . . . . . . . . . . . . . . . . . . . . . . . . . . . . . . . . . . . . . . . . . . . . . . . . . . . . . . . . . . 1,000,000 9991.178%, July 28, 2014 . . . . . . . . . . . . . . . . . . . . . . . . . . . . . . . . . . . . . . . . . . . . . . . . . . . . . . . . . . . . . . . . . . . . . . . . . . . . . . . . . . . . . . . . . . . . . . 500,000 5001.182%, August 11, 2014 . . . . . . . . . . . . . . . . . . . . . . . . . . . . . . . . . . . . . . . . . . . . . . . . . . . . . . . . . . . . . . . . . . . . . . . . . . . . . . . . . . . . . . . . . . . . 1,000,000 9991.20%, August 19, 2014 . . . . . . . . . . . . . . . . . . . . . . . . . . . . . . . . . . . . . . . . . . . . . . . . . . . . . . . . . . . . . . . . . . . . . . . . . . . . . . . . . . . . . . . . . . . . . 500,000 4991.20%, August 25, 2014 . . . . . . . . . . . . . . . . . . . . . . . . . . . . . . . . . . . . . . . . . . . . . . . . . . . . . . . . . . . . . . . . . . . . . . . . . . . . . . . . . . . . . . . . . . . . . 550,000 5491.201%, September 15, 2014 . . . . . . . . . . . . . . . . . . . . . . . . . . . . . . . . . . . . . . . . . . . . . . . . . . . . . . . . . . . . . . . . . . . . . . . . . . . . . . . . . . . . . . . . . 1,115,000 1,1121.18%, September 22, 2014 . . . . . . . . . . . . . . . . . . . . . . . . . . . . . . . . . . . . . . . . . . . . . . . . . . . . . . . . . . . . . . . . . . . . . . . . . . . . . . . . . . . . . . . . . . 500,000 499
13,135,000 13,124
JPMorgan Chase Bank NA: 0.86%1.209%, October 15, 2014 . . . . . . . . . . . . . . . . . . . . . . . . . . . . . . . . . . . . . . . . . . . . . . . . . . . . . . . . . . . . . . . . . . . . . . . . . . . . . . . . . . . . . . . . . . . 750,000 7471.22%, December 8, 2014 . . . . . . . . . . . . . . . . . . . . . . . . . . . . . . . . . . . . . . . . . . . . . . . . . . . . . . . . . . . . . . . . . . . . . . . . . . . . . . . . . . . . . . . . . . . 1,100,000 1,094
1,850,000 1,841
Manulife Bank of Canada: 3.21%1.241%, July 7, 2014 . . . . . . . . . . . . . . . . . . . . . . . . . . . . . . . . . . . . . . . . . . . . . . . . . . . . . . . . . . . . . . . . . . . . . . . . . . . . . . . . . . . . . . . . . . . . . . . 534,000 5341.282%, July 10, 2014 . . . . . . . . . . . . . . . . . . . . . . . . . . . . . . . . . . . . . . . . . . . . . . . . . . . . . . . . . . . . . . . . . . . . . . . . . . . . . . . . . . . . . . . . . . . . . . 1,424,000 1,4231.31%, October 1, 2014 . . . . . . . . . . . . . . . . . . . . . . . . . . . . . . . . . . . . . . . . . . . . . . . . . . . . . . . . . . . . . . . . . . . . . . . . . . . . . . . . . . . . . . . . . . . . . 500,000 4981.291%, October 3, 2014 . . . . . . . . . . . . . . . . . . . . . . . . . . . . . . . . . . . . . . . . . . . . . . . . . . . . . . . . . . . . . . . . . . . . . . . . . . . . . . . . . . . . . . . . . . . . 500,000 4981.44%, October 23, 2014 . . . . . . . . . . . . . . . . . . . . . . . . . . . . . . . . . . . . . . . . . . . . . . . . . . . . . . . . . . . . . . . . . . . . . . . . . . . . . . . . . . . . . . . . . . . . 1,000,000 9951.43%, October 29, 2014 . . . . . . . . . . . . . . . . . . . . . . . . . . . . . . . . . . . . . . . . . . . . . . . . . . . . . . . . . . . . . . . . . . . . . . . . . . . . . . . . . . . . . . . . . . . . 500,000 4981.411%, November 4, 2014 . . . . . . . . . . . . . . . . . . . . . . . . . . . . . . . . . . . . . . . . . . . . . . . . . . . . . . . . . . . . . . . . . . . . . . . . . . . . . . . . . . . . . . . . . . 2,000,000 1,9901.291%, November 24, 2014 . . . . . . . . . . . . . . . . . . . . . . . . . . . . . . . . . . . . . . . . . . . . . . . . . . . . . . . . . . . . . . . . . . . . . . . . . . . . . . . . . . . . . . . . . 500,000 497
6,958,000 6,933
National Bank of Canada: 5.13%1.137%, July 8, 2014 . . . . . . . . . . . . . . . . . . . . . . . . . . . . . . . . . . . . . . . . . . . . . . . . . . . . . . . . . . . . . . . . . . . . . . . . . . . . . . . . . . . . . . . . . . . . . . . 1,075,000 1,0751.146%, July 16, 2014 . . . . . . . . . . . . . . . . . . . . . . . . . . . . . . . . . . . . . . . . . . . . . . . . . . . . . . . . . . . . . . . . . . . . . . . . . . . . . . . . . . . . . . . . . . . . . . 3,850,000 3,8481.141%, July 31, 2014 . . . . . . . . . . . . . . . . . . . . . . . . . . . . . . . . . . . . . . . . . . . . . . . . . . . . . . . . . . . . . . . . . . . . . . . . . . . . . . . . . . . . . . . . . . . . . . 2,125,000 2,1231.149%, August 8, 2014 . . . . . . . . . . . . . . . . . . . . . . . . . . . . . . . . . . . . . . . . . . . . . . . . . . . . . . . . . . . . . . . . . . . . . . . . . . . . . . . . . . . . . . . . . . . . . 525,000 524
The accompanying notes are an integral part of these financial statements.
262 Franklin Templeton Investments Funds
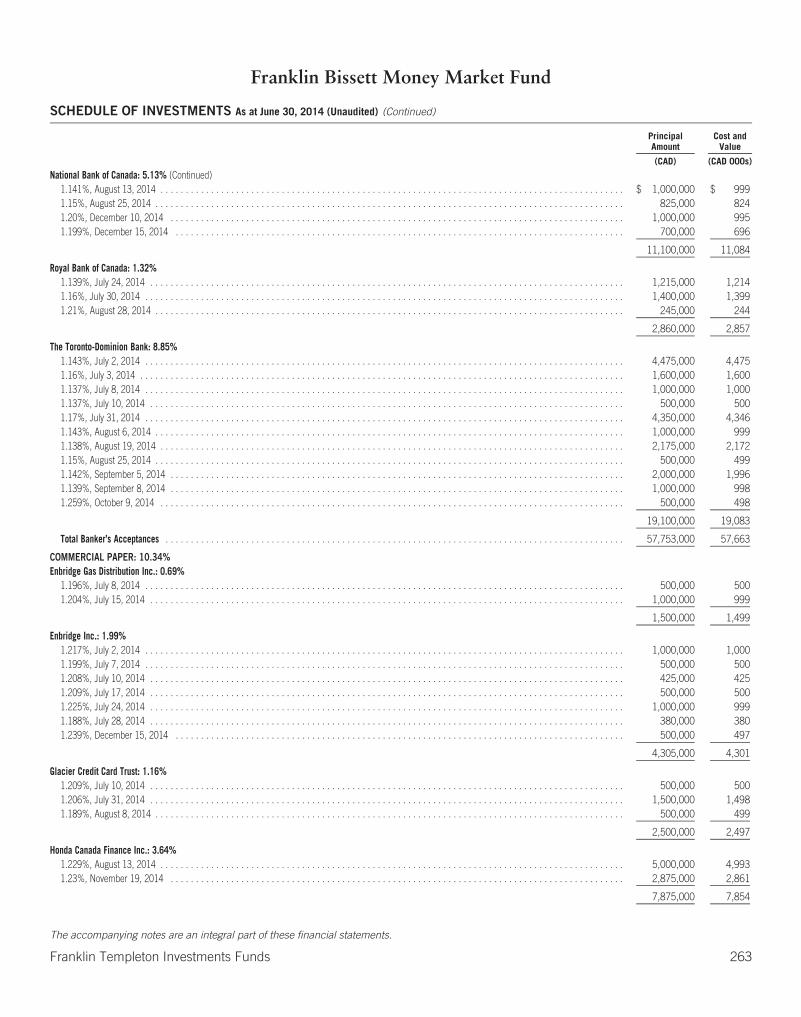
Franklin Bissett Money Market Fund
SCHEDULE OF INVESTMENTS As at June 30, 2014 (Unaudited) (Continued)
PrincipalAmount
Cost andValue
(CAD) (CAD 000s)
National Bank of Canada: 5.13% (Continued)1.141%, August 13, 2014 . . . . . . . . . . . . . . . . . . . . . . . . . . . . . . . . . . . . . . . . . . . . . . . . . . . . . . . . . . . . . . . . . . . . . . . . . . . . . . . . . . . . . . . . . . . . $ 1,000,000 $ 9991.15%, August 25, 2014 . . . . . . . . . . . . . . . . . . . . . . . . . . . . . . . . . . . . . . . . . . . . . . . . . . . . . . . . . . . . . . . . . . . . . . . . . . . . . . . . . . . . . . . . . . . . . 825,000 8241.20%, December 10, 2014 . . . . . . . . . . . . . . . . . . . . . . . . . . . . . . . . . . . . . . . . . . . . . . . . . . . . . . . . . . . . . . . . . . . . . . . . . . . . . . . . . . . . . . . . . . 1,000,000 9951.199%, December 15, 2014 . . . . . . . . . . . . . . . . . . . . . . . . . . . . . . . . . . . . . . . . . . . . . . . . . . . . . . . . . . . . . . . . . . . . . . . . . . . . . . . . . . . . . . . . . 700,000 696
11,100,000 11,084
Royal Bank of Canada: 1.32%1.139%, July 24, 2014 . . . . . . . . . . . . . . . . . . . . . . . . . . . . . . . . . . . . . . . . . . . . . . . . . . . . . . . . . . . . . . . . . . . . . . . . . . . . . . . . . . . . . . . . . . . . . . 1,215,000 1,2141.16%, July 30, 2014 . . . . . . . . . . . . . . . . . . . . . . . . . . . . . . . . . . . . . . . . . . . . . . . . . . . . . . . . . . . . . . . . . . . . . . . . . . . . . . . . . . . . . . . . . . . . . . . 1,400,000 1,3991.21%, August 28, 2014 . . . . . . . . . . . . . . . . . . . . . . . . . . . . . . . . . . . . . . . . . . . . . . . . . . . . . . . . . . . . . . . . . . . . . . . . . . . . . . . . . . . . . . . . . . . . . 245,000 244
2,860,000 2,857
The Toronto-Dominion Bank: 8.85%1.143%, July 2, 2014 . . . . . . . . . . . . . . . . . . . . . . . . . . . . . . . . . . . . . . . . . . . . . . . . . . . . . . . . . . . . . . . . . . . . . . . . . . . . . . . . . . . . . . . . . . . . . . . 4,475,000 4,4751.16%, July 3, 2014 . . . . . . . . . . . . . . . . . . . . . . . . . . . . . . . . . . . . . . . . . . . . . . . . . . . . . . . . . . . . . . . . . . . . . . . . . . . . . . . . . . . . . . . . . . . . . . . . 1,600,000 1,6001.137%, July 8, 2014 . . . . . . . . . . . . . . . . . . . . . . . . . . . . . . . . . . . . . . . . . . . . . . . . . . . . . . . . . . . . . . . . . . . . . . . . . . . . . . . . . . . . . . . . . . . . . . . 1,000,000 1,0001.137%, July 10, 2014 . . . . . . . . . . . . . . . . . . . . . . . . . . . . . . . . . . . . . . . . . . . . . . . . . . . . . . . . . . . . . . . . . . . . . . . . . . . . . . . . . . . . . . . . . . . . . . 500,000 5001.17%, July 31, 2014 . . . . . . . . . . . . . . . . . . . . . . . . . . . . . . . . . . . . . . . . . . . . . . . . . . . . . . . . . . . . . . . . . . . . . . . . . . . . . . . . . . . . . . . . . . . . . . . 4,350,000 4,3461.143%, August 6, 2014 . . . . . . . . . . . . . . . . . . . . . . . . . . . . . . . . . . . . . . . . . . . . . . . . . . . . . . . . . . . . . . . . . . . . . . . . . . . . . . . . . . . . . . . . . . . . . 1,000,000 9991.138%, August 19, 2014 . . . . . . . . . . . . . . . . . . . . . . . . . . . . . . . . . . . . . . . . . . . . . . . . . . . . . . . . . . . . . . . . . . . . . . . . . . . . . . . . . . . . . . . . . . . . 2,175,000 2,1721.15%, August 25, 2014 . . . . . . . . . . . . . . . . . . . . . . . . . . . . . . . . . . . . . . . . . . . . . . . . . . . . . . . . . . . . . . . . . . . . . . . . . . . . . . . . . . . . . . . . . . . . . 500,000 4991.142%, September 5, 2014 . . . . . . . . . . . . . . . . . . . . . . . . . . . . . . . . . . . . . . . . . . . . . . . . . . . . . . . . . . . . . . . . . . . . . . . . . . . . . . . . . . . . . . . . . . 2,000,000 1,9961.139%, September 8, 2014 . . . . . . . . . . . . . . . . . . . . . . . . . . . . . . . . . . . . . . . . . . . . . . . . . . . . . . . . . . . . . . . . . . . . . . . . . . . . . . . . . . . . . . . . . . 1,000,000 9981.259%, October 9, 2014 . . . . . . . . . . . . . . . . . . . . . . . . . . . . . . . . . . . . . . . . . . . . . . . . . . . . . . . . . . . . . . . . . . . . . . . . . . . . . . . . . . . . . . . . . . . . 500,000 498
19,100,000 19,083
Total Banker’s Acceptances . . . . . . . . . . . . . . . . . . . . . . . . . . . . . . . . . . . . . . . . . . . . . . . . . . . . . . . . . . . . . . . . . . . . . . . . . . . . . . . . . . . . . . . . . . . 57,753,000 57,663
COMMERCIAL PAPER: 10.34%Enbridge Gas Distribution Inc.: 0.69%
1.196%, July 8, 2014 . . . . . . . . . . . . . . . . . . . . . . . . . . . . . . . . . . . . . . . . . . . . . . . . . . . . . . . . . . . . . . . . . . . . . . . . . . . . . . . . . . . . . . . . . . . . . . . 500,000 5001.204%, July 15, 2014 . . . . . . . . . . . . . . . . . . . . . . . . . . . . . . . . . . . . . . . . . . . . . . . . . . . . . . . . . . . . . . . . . . . . . . . . . . . . . . . . . . . . . . . . . . . . . . 1,000,000 999
1,500,000 1,499
Enbridge Inc.: 1.99%1.217%, July 2, 2014 . . . . . . . . . . . . . . . . . . . . . . . . . . . . . . . . . . . . . . . . . . . . . . . . . . . . . . . . . . . . . . . . . . . . . . . . . . . . . . . . . . . . . . . . . . . . . . . 1,000,000 1,0001.199%, July 7, 2014 . . . . . . . . . . . . . . . . . . . . . . . . . . . . . . . . . . . . . . . . . . . . . . . . . . . . . . . . . . . . . . . . . . . . . . . . . . . . . . . . . . . . . . . . . . . . . . . 500,000 5001.208%, July 10, 2014 . . . . . . . . . . . . . . . . . . . . . . . . . . . . . . . . . . . . . . . . . . . . . . . . . . . . . . . . . . . . . . . . . . . . . . . . . . . . . . . . . . . . . . . . . . . . . . 425,000 4251.209%, July 17, 2014 . . . . . . . . . . . . . . . . . . . . . . . . . . . . . . . . . . . . . . . . . . . . . . . . . . . . . . . . . . . . . . . . . . . . . . . . . . . . . . . . . . . . . . . . . . . . . . 500,000 5001.225%, July 24, 2014 . . . . . . . . . . . . . . . . . . . . . . . . . . . . . . . . . . . . . . . . . . . . . . . . . . . . . . . . . . . . . . . . . . . . . . . . . . . . . . . . . . . . . . . . . . . . . . 1,000,000 9991.188%, July 28, 2014 . . . . . . . . . . . . . . . . . . . . . . . . . . . . . . . . . . . . . . . . . . . . . . . . . . . . . . . . . . . . . . . . . . . . . . . . . . . . . . . . . . . . . . . . . . . . . . 380,000 3801.239%, December 15, 2014 . . . . . . . . . . . . . . . . . . . . . . . . . . . . . . . . . . . . . . . . . . . . . . . . . . . . . . . . . . . . . . . . . . . . . . . . . . . . . . . . . . . . . . . . . 500,000 497
4,305,000 4,301
Glacier Credit Card Trust: 1.16%1.209%, July 10, 2014 . . . . . . . . . . . . . . . . . . . . . . . . . . . . . . . . . . . . . . . . . . . . . . . . . . . . . . . . . . . . . . . . . . . . . . . . . . . . . . . . . . . . . . . . . . . . . . 500,000 5001.206%, July 31, 2014 . . . . . . . . . . . . . . . . . . . . . . . . . . . . . . . . . . . . . . . . . . . . . . . . . . . . . . . . . . . . . . . . . . . . . . . . . . . . . . . . . . . . . . . . . . . . . . 1,500,000 1,4981.189%, August 8, 2014 . . . . . . . . . . . . . . . . . . . . . . . . . . . . . . . . . . . . . . . . . . . . . . . . . . . . . . . . . . . . . . . . . . . . . . . . . . . . . . . . . . . . . . . . . . . . . 500,000 499
2,500,000 2,497
Honda Canada Finance Inc.: 3.64%1.229%, August 13, 2014 . . . . . . . . . . . . . . . . . . . . . . . . . . . . . . . . . . . . . . . . . . . . . . . . . . . . . . . . . . . . . . . . . . . . . . . . . . . . . . . . . . . . . . . . . . . . 5,000,000 4,9931.23%, November 19, 2014 . . . . . . . . . . . . . . . . . . . . . . . . . . . . . . . . . . . . . . . . . . . . . . . . . . . . . . . . . . . . . . . . . . . . . . . . . . . . . . . . . . . . . . . . . . 2,875,000 2,861
7,875,000 7,854
The accompanying notes are an integral part of these financial statements.
Franklin Templeton Investments Funds 263

Franklin Bissett Money Market Fund
SCHEDULE OF INVESTMENTS As at June 30, 2014 (Unaudited) (Continued)
PrincipalAmount
Cost andValue
(CAD) (CAD 000s)
Inter Pipeline Corridor Inc.: 2.45%1.20%, July 10, 2014 . . . . . . . . . . . . . . . . . . . . . . . . . . . . . . . . . . . . . . . . . . . . . . . . . . . . . . . . . . . . . . . . . . . . . . . . . . . . . . . . . . . . . . . . . . . . . . . $ 500,000 $ 5001.191%, July 31, 2014 . . . . . . . . . . . . . . . . . . . . . . . . . . . . . . . . . . . . . . . . . . . . . . . . . . . . . . . . . . . . . . . . . . . . . . . . . . . . . . . . . . . . . . . . . . . . . . 1,100,000 1,0991.206%, August 6, 2014 . . . . . . . . . . . . . . . . . . . . . . . . . . . . . . . . . . . . . . . . . . . . . . . . . . . . . . . . . . . . . . . . . . . . . . . . . . . . . . . . . . . . . . . . . . . . . 1,000,000 9991.188%, August 13, 2014 . . . . . . . . . . . . . . . . . . . . . . . . . . . . . . . . . . . . . . . . . . . . . . . . . . . . . . . . . . . . . . . . . . . . . . . . . . . . . . . . . . . . . . . . . . . . 500,000 4991.188%, August 25, 2014 . . . . . . . . . . . . . . . . . . . . . . . . . . . . . . . . . . . . . . . . . . . . . . . . . . . . . . . . . . . . . . . . . . . . . . . . . . . . . . . . . . . . . . . . . . . . 650,000 6491.187%, August 29, 2014 . . . . . . . . . . . . . . . . . . . . . . . . . . . . . . . . . . . . . . . . . . . . . . . . . . . . . . . . . . . . . . . . . . . . . . . . . . . . . . . . . . . . . . . . . . . . 1,000,000 9981.192%, September 8, 2014 . . . . . . . . . . . . . . . . . . . . . . . . . . . . . . . . . . . . . . . . . . . . . . . . . . . . . . . . . . . . . . . . . . . . . . . . . . . . . . . . . . . . . . . . . . 550,000 549
5,300,000 5,293
Transcanada Pipelines Ltd.: 0.41%1.175%, September 2, 2014 . . . . . . . . . . . . . . . . . . . . . . . . . . . . . . . . . . . . . . . . . . . . . . . . . . . . . . . . . . . . . . . . . . . . . . . . . . . . . . . . . . . . . . . . . . 875,000 873
Total Commercial Paper . . . . . . . . . . . . . . . . . . . . . . . . . . . . . . . . . . . . . . . . . . . . . . . . . . . . . . . . . . . . . . . . . . . . . . . . . . . . . . . . . . . . . . . . . . . . . . 22,355,000 22,317
CORPORATE BONDS: 53.73%Bank of Montreal, Senior Note, Floating Rate Note: 8.23%
September 12, 2014 . . . . . . . . . . . . . . . . . . . . . . . . . . . . . . . . . . . . . . . . . . . . . . . . . . . . . . . . . . . . . . . . . . . . . . . . . . . . . . . . . . . . . . . . . . . . . . . . 5,000,000 5,003October 10, 2014 . . . . . . . . . . . . . . . . . . . . . . . . . . . . . . . . . . . . . . . . . . . . . . . . . . . . . . . . . . . . . . . . . . . . . . . . . . . . . . . . . . . . . . . . . . . . . . . . . . 1,000,000 1,001January 9, 2015 . . . . . . . . . . . . . . . . . . . . . . . . . . . . . . . . . . . . . . . . . . . . . . . . . . . . . . . . . . . . . . . . . . . . . . . . . . . . . . . . . . . . . . . . . . . . . . . . . . . 5,000,000 5,007March 23, 2015 . . . . . . . . . . . . . . . . . . . . . . . . . . . . . . . . . . . . . . . . . . . . . . . . . . . . . . . . . . . . . . . . . . . . . . . . . . . . . . . . . . . . . . . . . . . . . . . . . . . 5,750,000 5,751June 19, 2015 . . . . . . . . . . . . . . . . . . . . . . . . . . . . . . . . . . . . . . . . . . . . . . . . . . . . . . . . . . . . . . . . . . . . . . . . . . . . . . . . . . . . . . . . . . . . . . . . . . . . 1,000,000 1,000
17,750,000 17,762
Bank of Nova Scotia, Floating Rate Note: 1.39%January 9, 2015 . . . . . . . . . . . . . . . . . . . . . . . . . . . . . . . . . . . . . . . . . . . . . . . . . . . . . . . . . . . . . . . . . . . . . . . . . . . . . . . . . . . . . . . . . . . . . . . . . . . 3,000,000 3,000
Bank of Nova Scotia, Floating Rate Note, Senior Note: 1.85%September 10, 2014 . . . . . . . . . . . . . . . . . . . . . . . . . . . . . . . . . . . . . . . . . . . . . . . . . . . . . . . . . . . . . . . . . . . . . . . . . . . . . . . . . . . . . . . . . . . . . . . . 4,000,000 4,000
Bank of Nova Scotia, Senior Note: 4.18%1.28%, July 16, 2014 . . . . . . . . . . . . . . . . . . . . . . . . . . . . . . . . . . . . . . . . . . . . . . . . . . . . . . . . . . . . . . . . . . . . . . . . . . . . . . . . . . . . . . . . . . . . . . . 7,000,000 7,0071.38%, May 8, 2015 . . . . . . . . . . . . . . . . . . . . . . . . . . . . . . . . . . . . . . . . . . . . . . . . . . . . . . . . . . . . . . . . . . . . . . . . . . . . . . . . . . . . . . . . . . . . . . . . 2,000,000 2,015
9,000,000 9,022
Bank of Nova Scotia, Senior Note, Floating Rate Note: 2.32%November 7, 2014 . . . . . . . . . . . . . . . . . . . . . . . . . . . . . . . . . . . . . . . . . . . . . . . . . . . . . . . . . . . . . . . . . . . . . . . . . . . . . . . . . . . . . . . . . . . . . . . . . 3,000,000 3,000March 10, 2015 . . . . . . . . . . . . . . . . . . . . . . . . . . . . . . . . . . . . . . . . . . . . . . . . . . . . . . . . . . . . . . . . . . . . . . . . . . . . . . . . . . . . . . . . . . . . . . . . . . . 2,000,000 2,000
5,000,000 5,000
BMW Canada Inc., Senior Note, H, Floating Rate Note: 2.32%November 24, 2014 . . . . . . . . . . . . . . . . . . . . . . . . . . . . . . . . . . . . . . . . . . . . . . . . . . . . . . . . . . . . . . . . . . . . . . . . . . . . . . . . . . . . . . . . . . . . . . . . 5,000,000 5,000
Caisse Centrale Desjardins du Quebec, Senior Note, Floating Rate Note: 0.93%October 16, 2015 . . . . . . . . . . . . . . . . . . . . . . . . . . . . . . . . . . . . . . . . . . . . . . . . . . . . . . . . . . . . . . . . . . . . . . . . . . . . . . . . . . . . . . . . . . . . . . . . . . 2,000,000 2,000
Canadian Imperial Bank of Commerce: 2.22%1.284%, November 19, 2014 . . . . . . . . . . . . . . . . . . . . . . . . . . . . . . . . . . . . . . . . . . . . . . . . . . . . . . . . . . . . . . . . . . . . . . . . . . . . . . . . . . . . . . . . . 4,758,000 4,795
Canadian Imperial Bank of Commerce, Floating Rate Note: 4.73%July 11, 2014 . . . . . . . . . . . . . . . . . . . . . . . . . . . . . . . . . . . . . . . . . . . . . . . . . . . . . . . . . . . . . . . . . . . . . . . . . . . . . . . . . . . . . . . . . . . . . . . . . . . . . 2,000,000 2,000August 8, 2014 . . . . . . . . . . . . . . . . . . . . . . . . . . . . . . . . . . . . . . . . . . . . . . . . . . . . . . . . . . . . . . . . . . . . . . . . . . . . . . . . . . . . . . . . . . . . . . . . . . . . 8,200,000 8,201
10,200,000 10,201
Canadian Imperial Bank of Commerce, Senior Note: 1.41%1.294%, December 22, 2014 . . . . . . . . . . . . . . . . . . . . . . . . . . . . . . . . . . . . . . . . . . . . . . . . . . . . . . . . . . . . . . . . . . . . . . . . . . . . . . . . . . . . . . . . . 1,000,000 1,0161.355%, March 2, 2015 . . . . . . . . . . . . . . . . . . . . . . . . . . . . . . . . . . . . . . . . . . . . . . . . . . . . . . . . . . . . . . . . . . . . . . . . . . . . . . . . . . . . . . . . . . . . . 2,005,000 2,028
3,005,000 3,044
The accompanying notes are an integral part of these financial statements.
264 Franklin Templeton Investments Funds
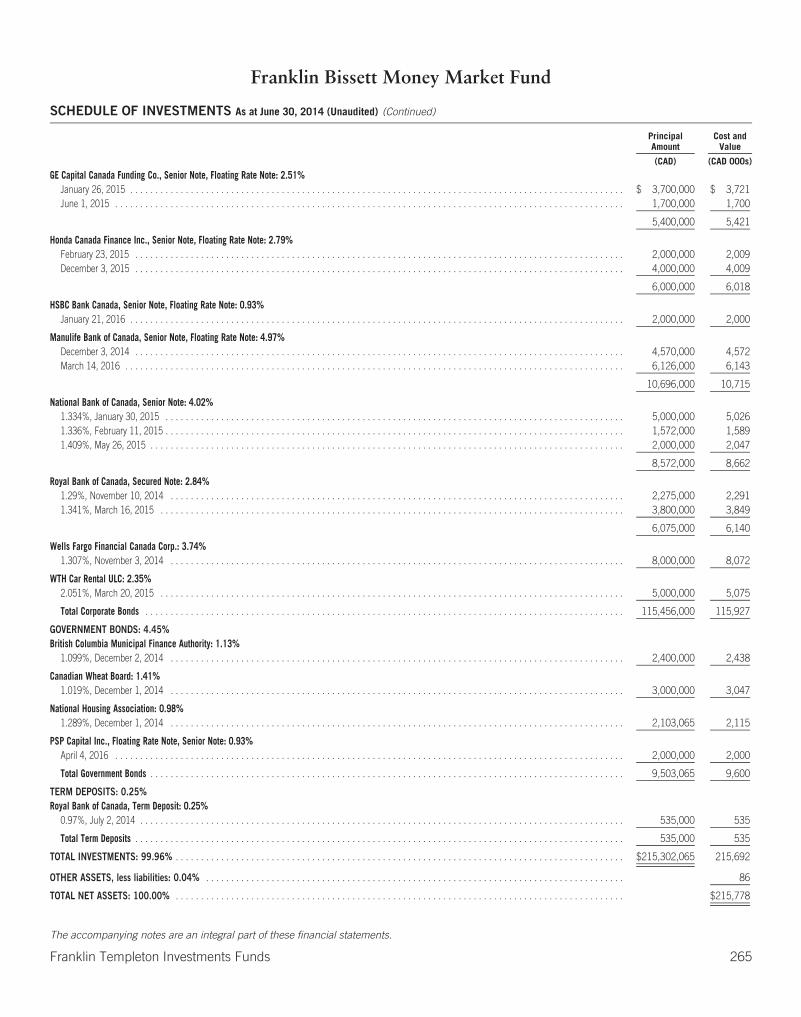
Franklin Bissett Money Market Fund
SCHEDULE OF INVESTMENTS As at June 30, 2014 (Unaudited) (Continued)
PrincipalAmount
Cost andValue
(CAD) (CAD 000s)
GE Capital Canada Funding Co., Senior Note, Floating Rate Note: 2.51%January 26, 2015 . . . . . . . . . . . . . . . . . . . . . . . . . . . . . . . . . . . . . . . . . . . . . . . . . . . . . . . . . . . . . . . . . . . . . . . . . . . . . . . . . . . . . . . . . . . . . . . . . . $ 3,700,000 $ 3,721June 1, 2015 . . . . . . . . . . . . . . . . . . . . . . . . . . . . . . . . . . . . . . . . . . . . . . . . . . . . . . . . . . . . . . . . . . . . . . . . . . . . . . . . . . . . . . . . . . . . . . . . . . . . . 1,700,000 1,700
5,400,000 5,421
Honda Canada Finance Inc., Senior Note, Floating Rate Note: 2.79%February 23, 2015 . . . . . . . . . . . . . . . . . . . . . . . . . . . . . . . . . . . . . . . . . . . . . . . . . . . . . . . . . . . . . . . . . . . . . . . . . . . . . . . . . . . . . . . . . . . . . . . . . 2,000,000 2,009December 3, 2015 . . . . . . . . . . . . . . . . . . . . . . . . . . . . . . . . . . . . . . . . . . . . . . . . . . . . . . . . . . . . . . . . . . . . . . . . . . . . . . . . . . . . . . . . . . . . . . . . . 4,000,000 4,009
6,000,000 6,018
HSBC Bank Canada, Senior Note, Floating Rate Note: 0.93%January 21, 2016 . . . . . . . . . . . . . . . . . . . . . . . . . . . . . . . . . . . . . . . . . . . . . . . . . . . . . . . . . . . . . . . . . . . . . . . . . . . . . . . . . . . . . . . . . . . . . . . . . . 2,000,000 2,000
Manulife Bank of Canada, Senior Note, Floating Rate Note: 4.97%December 3, 2014 . . . . . . . . . . . . . . . . . . . . . . . . . . . . . . . . . . . . . . . . . . . . . . . . . . . . . . . . . . . . . . . . . . . . . . . . . . . . . . . . . . . . . . . . . . . . . . . . . 4,570,000 4,572March 14, 2016 . . . . . . . . . . . . . . . . . . . . . . . . . . . . . . . . . . . . . . . . . . . . . . . . . . . . . . . . . . . . . . . . . . . . . . . . . . . . . . . . . . . . . . . . . . . . . . . . . . . 6,126,000 6,143
10,696,000 10,715
National Bank of Canada, Senior Note: 4.02%1.334%, January 30, 2015 . . . . . . . . . . . . . . . . . . . . . . . . . . . . . . . . . . . . . . . . . . . . . . . . . . . . . . . . . . . . . . . . . . . . . . . . . . . . . . . . . . . . . . . . . . . 5,000,000 5,0261.336%, February 11, 2015 . . . . . . . . . . . . . . . . . . . . . . . . . . . . . . . . . . . . . . . . . . . . . . . . . . . . . . . . . . . . . . . . . . . . . . . . . . . . . . . . . . . . . . . . . . . 1,572,000 1,5891.409%, May 26, 2015 . . . . . . . . . . . . . . . . . . . . . . . . . . . . . . . . . . . . . . . . . . . . . . . . . . . . . . . . . . . . . . . . . . . . . . . . . . . . . . . . . . . . . . . . . . . . . . 2,000,000 2,047
8,572,000 8,662
Royal Bank of Canada, Secured Note: 2.84%1.29%, November 10, 2014 . . . . . . . . . . . . . . . . . . . . . . . . . . . . . . . . . . . . . . . . . . . . . . . . . . . . . . . . . . . . . . . . . . . . . . . . . . . . . . . . . . . . . . . . . . 2,275,000 2,2911.341%, March 16, 2015 . . . . . . . . . . . . . . . . . . . . . . . . . . . . . . . . . . . . . . . . . . . . . . . . . . . . . . . . . . . . . . . . . . . . . . . . . . . . . . . . . . . . . . . . . . . . 3,800,000 3,849
6,075,000 6,140
Wells Fargo Financial Canada Corp.: 3.74%1.307%, November 3, 2014 . . . . . . . . . . . . . . . . . . . . . . . . . . . . . . . . . . . . . . . . . . . . . . . . . . . . . . . . . . . . . . . . . . . . . . . . . . . . . . . . . . . . . . . . . . 8,000,000 8,072
WTH Car Rental ULC: 2.35%2.051%, March 20, 2015 . . . . . . . . . . . . . . . . . . . . . . . . . . . . . . . . . . . . . . . . . . . . . . . . . . . . . . . . . . . . . . . . . . . . . . . . . . . . . . . . . . . . . . . . . . . . 5,000,000 5,075
Total Corporate Bonds . . . . . . . . . . . . . . . . . . . . . . . . . . . . . . . . . . . . . . . . . . . . . . . . . . . . . . . . . . . . . . . . . . . . . . . . . . . . . . . . . . . . . . . . . . . . . . . 115,456,000 115,927
GOVERNMENT BONDS: 4.45%British Columbia Municipal Finance Authority: 1.13%
1.099%, December 2, 2014 . . . . . . . . . . . . . . . . . . . . . . . . . . . . . . . . . . . . . . . . . . . . . . . . . . . . . . . . . . . . . . . . . . . . . . . . . . . . . . . . . . . . . . . . . . 2,400,000 2,438
Canadian Wheat Board: 1.41%1.019%, December 1, 2014 . . . . . . . . . . . . . . . . . . . . . . . . . . . . . . . . . . . . . . . . . . . . . . . . . . . . . . . . . . . . . . . . . . . . . . . . . . . . . . . . . . . . . . . . . . 3,000,000 3,047
National Housing Association: 0.98%1.289%, December 1, 2014 . . . . . . . . . . . . . . . . . . . . . . . . . . . . . . . . . . . . . . . . . . . . . . . . . . . . . . . . . . . . . . . . . . . . . . . . . . . . . . . . . . . . . . . . . . 2,103,065 2,115
PSP Capital Inc., Floating Rate Note, Senior Note: 0.93%April 4, 2016 . . . . . . . . . . . . . . . . . . . . . . . . . . . . . . . . . . . . . . . . . . . . . . . . . . . . . . . . . . . . . . . . . . . . . . . . . . . . . . . . . . . . . . . . . . . . . . . . . . . . . 2,000,000 2,000
Total Government Bonds . . . . . . . . . . . . . . . . . . . . . . . . . . . . . . . . . . . . . . . . . . . . . . . . . . . . . . . . . . . . . . . . . . . . . . . . . . . . . . . . . . . . . . . . . . . . . . 9,503,065 9,600
TERM DEPOSITS: 0.25%Royal Bank of Canada, Term Deposit: 0.25%
0.97%, July 2, 2014 . . . . . . . . . . . . . . . . . . . . . . . . . . . . . . . . . . . . . . . . . . . . . . . . . . . . . . . . . . . . . . . . . . . . . . . . . . . . . . . . . . . . . . . . . . . . . . . . 535,000 535
Total Term Deposits . . . . . . . . . . . . . . . . . . . . . . . . . . . . . . . . . . . . . . . . . . . . . . . . . . . . . . . . . . . . . . . . . . . . . . . . . . . . . . . . . . . . . . . . . . . . . . . . . 535,000 535
TOTAL INVESTMENTS: 99.96% . . . . . . . . . . . . . . . . . . . . . . . . . . . . . . . . . . . . . . . . . . . . . . . . . . . . . . . . . . . . . . . . . . . . . . . . . . . . . . . . . . . . . . . . . $215,302,065 215,692
OTHER ASSETS, less liabilities: 0.04% . . . . . . . . . . . . . . . . . . . . . . . . . . . . . . . . . . . . . . . . . . . . . . . . . . . . . . . . . . . . . . . . . . . . . . . . . . . . . . . . . . . 86
TOTAL NET ASSETS: 100.00% . . . . . . . . . . . . . . . . . . . . . . . . . . . . . . . . . . . . . . . . . . . . . . . . . . . . . . . . . . . . . . . . . . . . . . . . . . . . . . . . . . . . . . . . . $215,778
The accompanying notes are an integral part of these financial statements.
Franklin Templeton Investments Funds 265
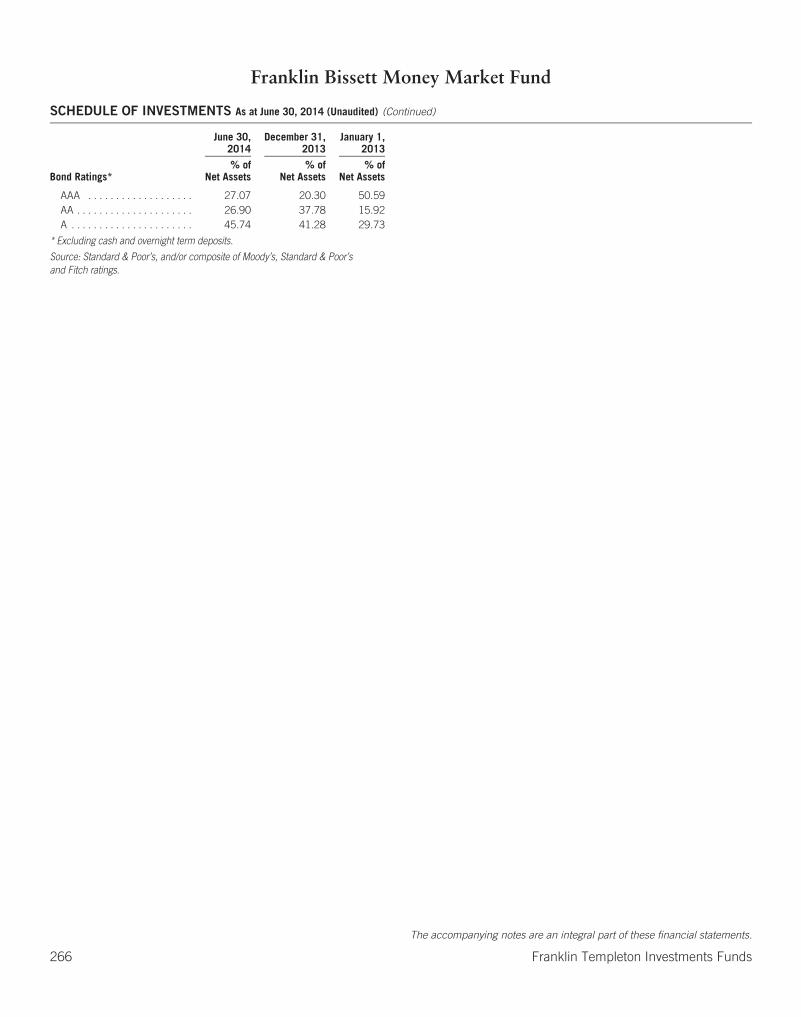
Franklin Bissett Money Market Fund
SCHEDULE OF INVESTMENTS As at June 30, 2014 (Unaudited) (Continued)
June 30,2014
December 31,2013
January 1,2013
Bond Ratings*% of
Net Assets% of
Net Assets% of
Net Assets
AAA . . . . . . . . . . . . . . . . . . . 27.07 20.30 50.59AA . . . . . . . . . . . . . . . . . . . . . 26.90 37.78 15.92A . . . . . . . . . . . . . . . . . . . . . . 45.74 41.28 29.73
* Excluding cash and overnight term deposits.
Source: Standard & Poor’s, and/or composite of Moody’s, Standard & Poor’sand Fitch ratings.
The accompanying notes are an integral part of these financial statements.
266 Franklin Templeton Investments Funds
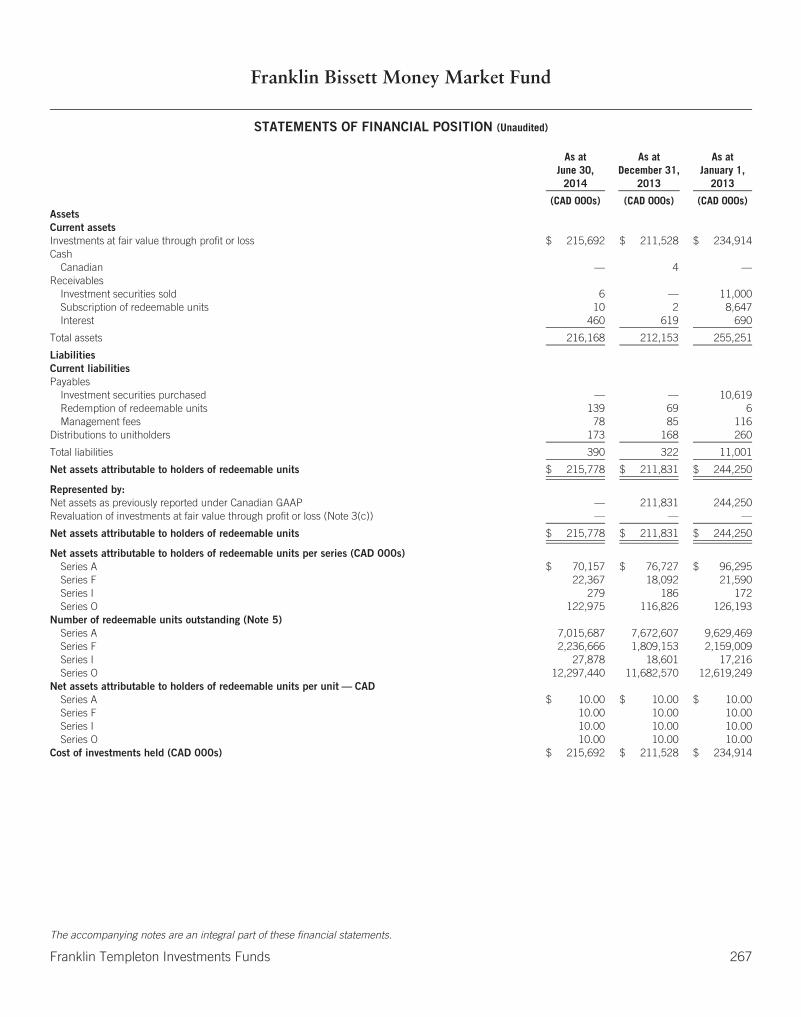
Franklin Bissett Money Market Fund
STATEMENTS OF FINANCIAL POSITION (Unaudited)
As atJune 30,
2014
As atDecember 31,
2013
As atJanuary 1,
2013
(CAD 000s) (CAD 000s) (CAD 000s)AssetsCurrent assetsInvestments at fair value through profit or loss $ 215,692 $ 211,528 $ 234,914Cash
Canadian — 4 —Receivables
Investment securities sold 6 — 11,000Subscription of redeemable units 10 2 8,647Interest 460 619 690
Total assets 216,168 212,153 255,251
LiabilitiesCurrent liabilitiesPayables
Investment securities purchased — — 10,619Redemption of redeemable units 139 69 6Management fees 78 85 116
Distributions to unitholders 173 168 260
Total liabilities 390 322 11,001
Net assets attributable to holders of redeemable units $ 215,778 $ 211,831 $ 244,250
Represented by:Net assets as previously reported under Canadian GAAP — 211,831 244,250Revaluation of investments at fair value through profit or loss (Note 3(c)) — — —
Net assets attributable to holders of redeemable units $ 215,778 $ 211,831 $ 244,250
Net assets attributable to holders of redeemable units per series (CAD 000s)Series A $ 70,157 $ 76,727 $ 96,295Series F 22,367 18,092 21,590Series I 279 186 172Series O 122,975 116,826 126,193
Number of redeemable units outstanding (Note 5)Series A 7,015,687 7,672,607 9,629,469Series F 2,236,666 1,809,153 2,159,009Series I 27,878 18,601 17,216Series O 12,297,440 11,682,570 12,619,249
Net assets attributable to holders of redeemable units per unit — CADSeries A $ 10.00 $ 10.00 $ 10.00Series F 10.00 10.00 10.00Series I 10.00 10.00 10.00Series O 10.00 10.00 10.00
Cost of investments held (CAD 000s) $ 215,692 $ 211,528 $ 234,914
The accompanying notes are an integral part of these financial statements.
Franklin Templeton Investments Funds 267

Franklin Bissett Money Market Fund
STATEMENTS OF COMPREHENSIVE INCOMEFor the six months ended June 30, 2014 and 2013 (Unaudited)
2014 2013
(CAD 000s) (CAD 000s)IncomeInterest income for distribution purposes $ 1,486 $ 1,524
Total income (net) 1,486 1,524
ExpensesManagement fees (Note 6(a)) 465 534Transfer agent fees (Note 6(d)) — 312Custodian fees — 8Legal fees — —Audit fees — 11Unitholder reporting costs — 9Independent review committee fees — 1Registration fees — 26Other expenses (Note 6(f)) — 69
Operating expenses before waivers/paid by Manager 465 970Expenses waived/paid by Manager (Note 6(b)) — (436)
Net operating expenses after waivers/paid by Manager 465 534
Total expenses 465 534
Increase (decrease) in net assets attributable to holders of redeemable units from operations $ 1,021 $ 990
Represented by:Increase (decrease) in net assets from operations as previously reported under Canadian GAAP — 990Revaluation of investments at fair value through profit and loss (Note 3(c)) — —
Increase (decrease) in net assets attributable to holders of redeemable units from operations $ 1,021 $ 990
Increase (decrease) in net assets attributable to holders of redeemable units from operations per series (CAD 000s)Series A $ 89 $ 123Series F 89 83Series I —* —*Series O 843 784
Weighted average number of units outstandingSeries A 7,415,032 8,831,669Series F 2,234,861 1,996,924Series I 25,506 7,185Series O 12,637,052 11,485,518
Increase (decrease) in net assets attributable to holders of redeemable units from operations per unitSeries A $ 0.02 $ 0.02Series F 0.04 0.04Series I 0.02 0.02Series O 0.07 0.07
* Amount rounded to zero in the nearest thousand.
The accompanying notes are an integral part of these financial statements.
268 Franklin Templeton Investments Funds

Franklin Bissett Money Market Fund
STATEMENTS OF CHANGES IN NET ASSETS ATTRIBUTABLE TO HOLDERS OF REDEEMABLE UNITSFor the six months ended June 30, 2014 and 2013 (Unaudited) (in CAD 000s)
All Series Series A Series F
2014 2013 2014 2013 2014 2013
Net assets attributable to holders of redeemable units at beginning of period $211,831 $244,250 $ 76,727 $ 96,295 $18,092 $21,590
Increase (decrease) in net assets attributable to holders of redeemable unitsfrom operations 1,021 990 89 123 89 83
Distributions to holders of redeemable unitsFrom net investment income (1,021) (990) (89) (123) (89) (83)From net realized gains on investments — — — — — —From return of capital — — — — — —
Total distributions to holders of redeemable units (1,021) (990) (89) (123) (89) (83)
Redeemable units transactionsSubscriptions 100,094 72,215 26,905 29,709 10,412 4,916Reinvestments 1,012 1,089 90 159 85 92Redemptions (97,159) (91,925) (33,565) (39,782) (6,222) (7,360)
Net increase (decrease) from redeemable units transactions 3,947 (18,621) (6,570) (9,914) 4,275 (2,352)
Increase (decrease) in net assets attributable to holders of redeemable units 3,947 (18,621) (6,570) (9,914) 4,275 (2,352)
Net assets attributable to holders of redeemable units at end of period $215,778 $225,629 $ 70,157 $ 86,381 $22,367 $19,238
Series I Series O
2014 2013 2014 2013
Net assets attributable to holders of redeemable units at beginning of period $ 186 $ 172 $116,826 $126,193
Increase (decrease) in net assets attributable to holders of redeemable unitsfrom operations —* —* 843 784
Distributions to holders of redeemable unitsFrom net investment income — — (843) (784)From net realized gains on investments — — — —From return of capital — — — —
Total distributions to holders of redeemable units — — (843) (784)
Redeemable units transactionsSubscriptions 375 — 62,402 37,590Reinvestments — — 837 838Redemptions (282) (167) (57,090) (44,616)
Net increase (decrease) from redeemable units transactions 93 (167) 6,149 (6,188)
Increase (decrease) in net assets attributable to holders of redeemable units 93 (167) 6,149 (6,188)
Net assets attributable to holders of redeemable units at end of period $ 279 $ 5 $122,975 $120,005
* Amount rounded to zero in the nearest thousand.
The accompanying notes are an integral part of these financial statements.
Franklin Templeton Investments Funds 269
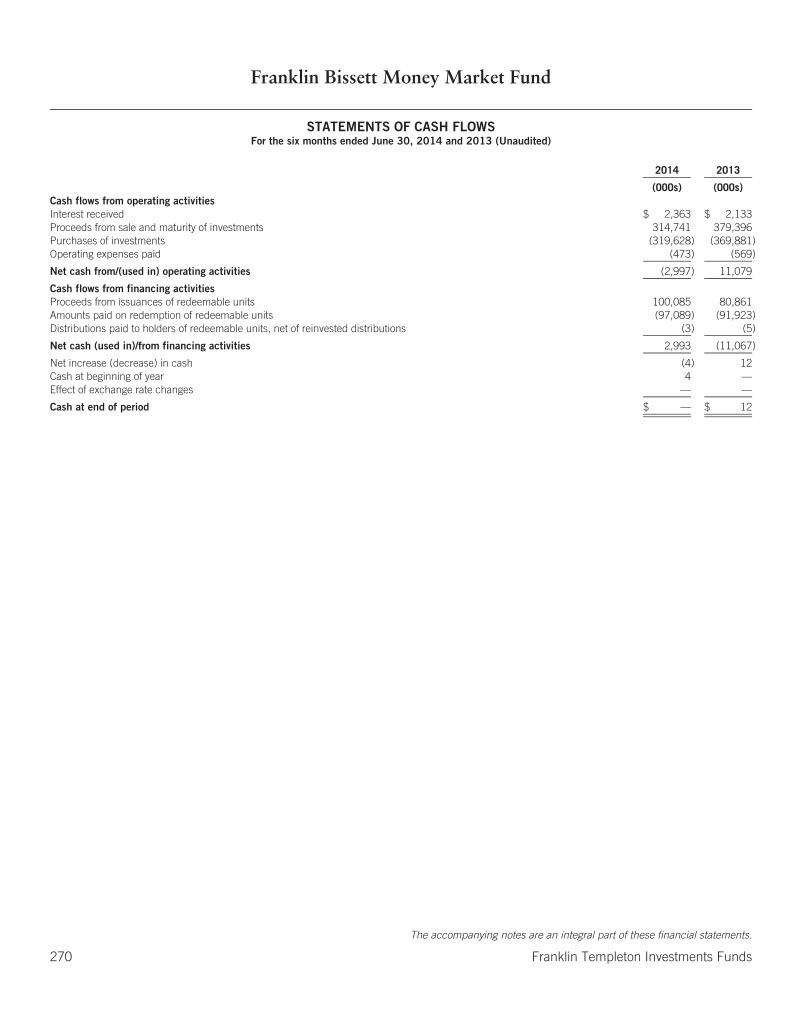
Franklin Bissett Money Market Fund
STATEMENTS OF CASH FLOWSFor the six months ended June 30, 2014 and 2013 (Unaudited)
2014 2013
(000s) (000s)Cash flows from operating activitiesInterest received $ 2,363 $ 2,133Proceeds from sale and maturity of investments 314,741 379,396Purchases of investments (319,628) (369,881)Operating expenses paid (473) (569)
Net cash from/(used in) operating activities (2,997) 11,079
Cash flows from financing activitiesProceeds from issuances of redeemable units 100,085 80,861Amounts paid on redemption of redeemable units (97,089) (91,923)Distributions paid to holders of redeemable units, net of reinvested distributions (3) (5)
Net cash (used in)/from financing activities 2,993 (11,067)
Net increase (decrease) in cash (4) 12Cash at beginning of year 4 —Effect of exchange rate changes — —
Cash at end of period $ — $ 12
The accompanying notes are an integral part of these financial statements.
270 Franklin Templeton Investments Funds
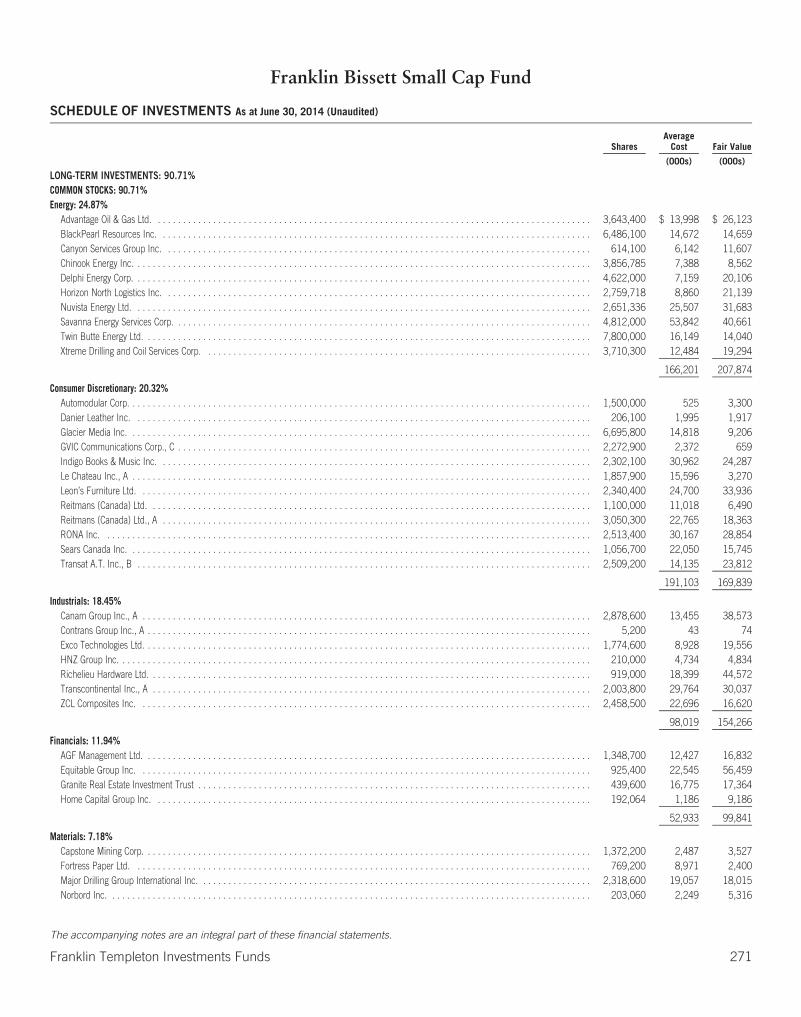
Franklin Bissett Small Cap Fund
SCHEDULE OF INVESTMENTS As at June 30, 2014 (Unaudited)
SharesAverage
Cost Fair Value
(000s) (000s)
LONG-TERM INVESTMENTS: 90.71%COMMON STOCKS: 90.71%Energy: 24.87%
Advantage Oil & Gas Ltd. . . . . . . . . . . . . . . . . . . . . . . . . . . . . . . . . . . . . . . . . . . . . . . . . . . . . . . . . . . . . . . . . . . . . . . . . . . . . . . . . . . . . . . 3,643,400 $ 13,998 $ 26,123BlackPearl Resources Inc. . . . . . . . . . . . . . . . . . . . . . . . . . . . . . . . . . . . . . . . . . . . . . . . . . . . . . . . . . . . . . . . . . . . . . . . . . . . . . . . . . . . . . 6,486,100 14,672 14,659Canyon Services Group Inc. . . . . . . . . . . . . . . . . . . . . . . . . . . . . . . . . . . . . . . . . . . . . . . . . . . . . . . . . . . . . . . . . . . . . . . . . . . . . . . . . . . . . 614,100 6,142 11,607Chinook Energy Inc. . . . . . . . . . . . . . . . . . . . . . . . . . . . . . . . . . . . . . . . . . . . . . . . . . . . . . . . . . . . . . . . . . . . . . . . . . . . . . . . . . . . . . . . . . . 3,856,785 7,388 8,562Delphi Energy Corp. . . . . . . . . . . . . . . . . . . . . . . . . . . . . . . . . . . . . . . . . . . . . . . . . . . . . . . . . . . . . . . . . . . . . . . . . . . . . . . . . . . . . . . . . . . 4,622,000 7,159 20,106Horizon North Logistics Inc. . . . . . . . . . . . . . . . . . . . . . . . . . . . . . . . . . . . . . . . . . . . . . . . . . . . . . . . . . . . . . . . . . . . . . . . . . . . . . . . . . . . . 2,759,718 8,860 21,139Nuvista Energy Ltd. . . . . . . . . . . . . . . . . . . . . . . . . . . . . . . . . . . . . . . . . . . . . . . . . . . . . . . . . . . . . . . . . . . . . . . . . . . . . . . . . . . . . . . . . . . 2,651,336 25,507 31,683Savanna Energy Services Corp. . . . . . . . . . . . . . . . . . . . . . . . . . . . . . . . . . . . . . . . . . . . . . . . . . . . . . . . . . . . . . . . . . . . . . . . . . . . . . . . . . . 4,812,000 53,842 40,661Twin Butte Energy Ltd. . . . . . . . . . . . . . . . . . . . . . . . . . . . . . . . . . . . . . . . . . . . . . . . . . . . . . . . . . . . . . . . . . . . . . . . . . . . . . . . . . . . . . . . . 7,800,000 16,149 14,040Xtreme Drilling and Coil Services Corp. . . . . . . . . . . . . . . . . . . . . . . . . . . . . . . . . . . . . . . . . . . . . . . . . . . . . . . . . . . . . . . . . . . . . . . . . . . . . 3,710,300 12,484 19,294
166,201 207,874
Consumer Discretionary: 20.32%Automodular Corp. . . . . . . . . . . . . . . . . . . . . . . . . . . . . . . . . . . . . . . . . . . . . . . . . . . . . . . . . . . . . . . . . . . . . . . . . . . . . . . . . . . . . . . . . . . . 1,500,000 525 3,300Danier Leather Inc. . . . . . . . . . . . . . . . . . . . . . . . . . . . . . . . . . . . . . . . . . . . . . . . . . . . . . . . . . . . . . . . . . . . . . . . . . . . . . . . . . . . . . . . . . . 206,100 1,995 1,917Glacier Media Inc. . . . . . . . . . . . . . . . . . . . . . . . . . . . . . . . . . . . . . . . . . . . . . . . . . . . . . . . . . . . . . . . . . . . . . . . . . . . . . . . . . . . . . . . . . . . 6,695,800 14,818 9,206GVIC Communications Corp., C . . . . . . . . . . . . . . . . . . . . . . . . . . . . . . . . . . . . . . . . . . . . . . . . . . . . . . . . . . . . . . . . . . . . . . . . . . . . . . . . . . 2,272,900 2,372 659Indigo Books & Music Inc. . . . . . . . . . . . . . . . . . . . . . . . . . . . . . . . . . . . . . . . . . . . . . . . . . . . . . . . . . . . . . . . . . . . . . . . . . . . . . . . . . . . . . 2,302,100 30,962 24,287Le Chateau Inc., A . . . . . . . . . . . . . . . . . . . . . . . . . . . . . . . . . . . . . . . . . . . . . . . . . . . . . . . . . . . . . . . . . . . . . . . . . . . . . . . . . . . . . . . . . . . 1,857,900 15,596 3,270Leon’s Furniture Ltd. . . . . . . . . . . . . . . . . . . . . . . . . . . . . . . . . . . . . . . . . . . . . . . . . . . . . . . . . . . . . . . . . . . . . . . . . . . . . . . . . . . . . . . . . . 2,340,400 24,700 33,936Reitmans (Canada) Ltd. . . . . . . . . . . . . . . . . . . . . . . . . . . . . . . . . . . . . . . . . . . . . . . . . . . . . . . . . . . . . . . . . . . . . . . . . . . . . . . . . . . . . . . . 1,100,000 11,018 6,490Reitmans (Canada) Ltd., A . . . . . . . . . . . . . . . . . . . . . . . . . . . . . . . . . . . . . . . . . . . . . . . . . . . . . . . . . . . . . . . . . . . . . . . . . . . . . . . . . . . . . 3,050,300 22,765 18,363RONA Inc. . . . . . . . . . . . . . . . . . . . . . . . . . . . . . . . . . . . . . . . . . . . . . . . . . . . . . . . . . . . . . . . . . . . . . . . . . . . . . . . . . . . . . . . . . . . . . . . . 2,513,400 30,167 28,854Sears Canada Inc. . . . . . . . . . . . . . . . . . . . . . . . . . . . . . . . . . . . . . . . . . . . . . . . . . . . . . . . . . . . . . . . . . . . . . . . . . . . . . . . . . . . . . . . . . . . 1,056,700 22,050 15,745Transat A.T. Inc., B . . . . . . . . . . . . . . . . . . . . . . . . . . . . . . . . . . . . . . . . . . . . . . . . . . . . . . . . . . . . . . . . . . . . . . . . . . . . . . . . . . . . . . . . . . 2,509,200 14,135 23,812
191,103 169,839
Industrials: 18.45%Canam Group Inc., A . . . . . . . . . . . . . . . . . . . . . . . . . . . . . . . . . . . . . . . . . . . . . . . . . . . . . . . . . . . . . . . . . . . . . . . . . . . . . . . . . . . . . . . . . 2,878,600 13,455 38,573Contrans Group Inc., A . . . . . . . . . . . . . . . . . . . . . . . . . . . . . . . . . . . . . . . . . . . . . . . . . . . . . . . . . . . . . . . . . . . . . . . . . . . . . . . . . . . . . . . . 5,200 43 74Exco Technologies Ltd. . . . . . . . . . . . . . . . . . . . . . . . . . . . . . . . . . . . . . . . . . . . . . . . . . . . . . . . . . . . . . . . . . . . . . . . . . . . . . . . . . . . . . . . . 1,774,600 8,928 19,556HNZ Group Inc. . . . . . . . . . . . . . . . . . . . . . . . . . . . . . . . . . . . . . . . . . . . . . . . . . . . . . . . . . . . . . . . . . . . . . . . . . . . . . . . . . . . . . . . . . . . . . 210,000 4,734 4,834Richelieu Hardware Ltd. . . . . . . . . . . . . . . . . . . . . . . . . . . . . . . . . . . . . . . . . . . . . . . . . . . . . . . . . . . . . . . . . . . . . . . . . . . . . . . . . . . . . . . . 919,000 18,399 44,572Transcontinental Inc., A . . . . . . . . . . . . . . . . . . . . . . . . . . . . . . . . . . . . . . . . . . . . . . . . . . . . . . . . . . . . . . . . . . . . . . . . . . . . . . . . . . . . . . . 2,003,800 29,764 30,037ZCL Composites Inc. . . . . . . . . . . . . . . . . . . . . . . . . . . . . . . . . . . . . . . . . . . . . . . . . . . . . . . . . . . . . . . . . . . . . . . . . . . . . . . . . . . . . . . . . . 2,458,500 22,696 16,620
98,019 154,266
Financials: 11.94%AGF Management Ltd. . . . . . . . . . . . . . . . . . . . . . . . . . . . . . . . . . . . . . . . . . . . . . . . . . . . . . . . . . . . . . . . . . . . . . . . . . . . . . . . . . . . . . . . . 1,348,700 12,427 16,832Equitable Group Inc. . . . . . . . . . . . . . . . . . . . . . . . . . . . . . . . . . . . . . . . . . . . . . . . . . . . . . . . . . . . . . . . . . . . . . . . . . . . . . . . . . . . . . . . . . 925,400 22,545 56,459Granite Real Estate Investment Trust . . . . . . . . . . . . . . . . . . . . . . . . . . . . . . . . . . . . . . . . . . . . . . . . . . . . . . . . . . . . . . . . . . . . . . . . . . . . . . 439,600 16,775 17,364Home Capital Group Inc. . . . . . . . . . . . . . . . . . . . . . . . . . . . . . . . . . . . . . . . . . . . . . . . . . . . . . . . . . . . . . . . . . . . . . . . . . . . . . . . . . . . . . . 192,064 1,186 9,186
52,933 99,841
Materials: 7.18%Capstone Mining Corp. . . . . . . . . . . . . . . . . . . . . . . . . . . . . . . . . . . . . . . . . . . . . . . . . . . . . . . . . . . . . . . . . . . . . . . . . . . . . . . . . . . . . . . . . 1,372,200 2,487 3,527Fortress Paper Ltd. . . . . . . . . . . . . . . . . . . . . . . . . . . . . . . . . . . . . . . . . . . . . . . . . . . . . . . . . . . . . . . . . . . . . . . . . . . . . . . . . . . . . . . . . . . 769,200 8,971 2,400Major Drilling Group International Inc. . . . . . . . . . . . . . . . . . . . . . . . . . . . . . . . . . . . . . . . . . . . . . . . . . . . . . . . . . . . . . . . . . . . . . . . . . . . . . 2,318,600 19,057 18,015Norbord Inc. . . . . . . . . . . . . . . . . . . . . . . . . . . . . . . . . . . . . . . . . . . . . . . . . . . . . . . . . . . . . . . . . . . . . . . . . . . . . . . . . . . . . . . . . . . . . . . . 203,060 2,249 5,316
The accompanying notes are an integral part of these financial statements.
Franklin Templeton Investments Funds 271
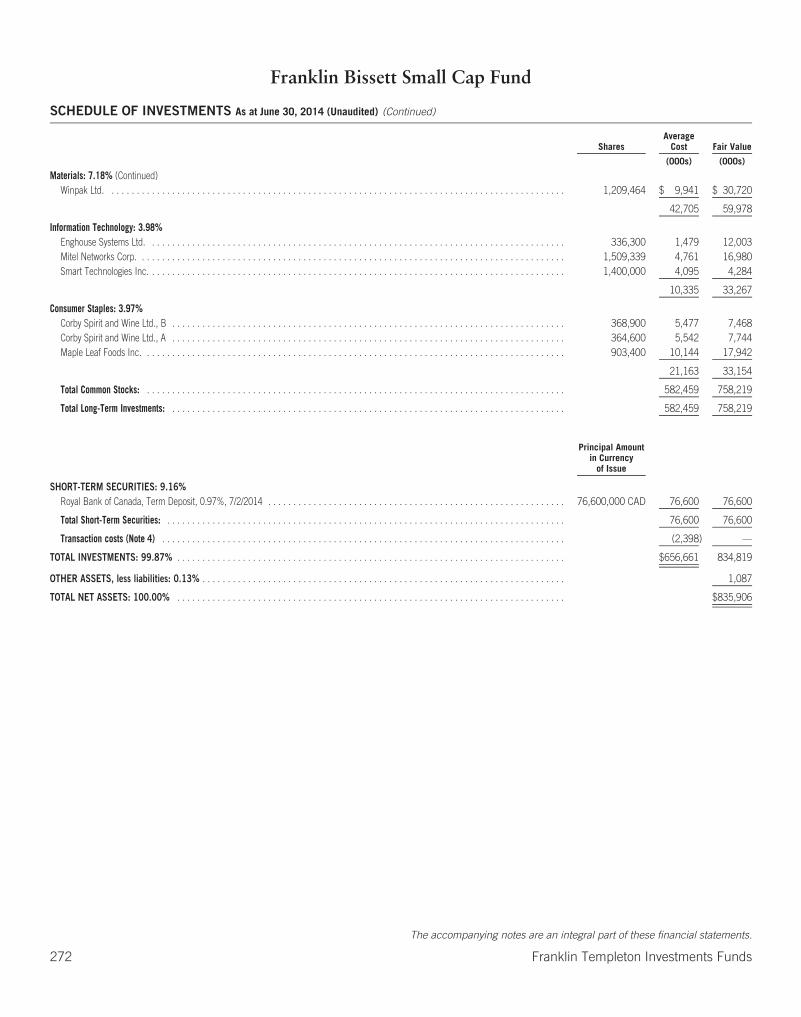
Franklin Bissett Small Cap Fund
SCHEDULE OF INVESTMENTS As at June 30, 2014 (Unaudited) (Continued)
SharesAverage
Cost Fair Value
(000s) (000s)
Materials: 7.18% (Continued)Winpak Ltd. . . . . . . . . . . . . . . . . . . . . . . . . . . . . . . . . . . . . . . . . . . . . . . . . . . . . . . . . . . . . . . . . . . . . . . . . . . . . . . . . . . . . . . . . . . 1,209,464 $ 9,941 $ 30,720
42,705 59,978
Information Technology: 3.98%Enghouse Systems Ltd. . . . . . . . . . . . . . . . . . . . . . . . . . . . . . . . . . . . . . . . . . . . . . . . . . . . . . . . . . . . . . . . . . . . . . . . . . . . . . . . . . . 336,300 1,479 12,003Mitel Networks Corp. . . . . . . . . . . . . . . . . . . . . . . . . . . . . . . . . . . . . . . . . . . . . . . . . . . . . . . . . . . . . . . . . . . . . . . . . . . . . . . . . . . . . 1,509,339 4,761 16,980Smart Technologies Inc. . . . . . . . . . . . . . . . . . . . . . . . . . . . . . . . . . . . . . . . . . . . . . . . . . . . . . . . . . . . . . . . . . . . . . . . . . . . . . . . . . . 1,400,000 4,095 4,284
10,335 33,267
Consumer Staples: 3.97%Corby Spirit and Wine Ltd., B . . . . . . . . . . . . . . . . . . . . . . . . . . . . . . . . . . . . . . . . . . . . . . . . . . . . . . . . . . . . . . . . . . . . . . . . . . . . . . 368,900 5,477 7,468Corby Spirit and Wine Ltd., A . . . . . . . . . . . . . . . . . . . . . . . . . . . . . . . . . . . . . . . . . . . . . . . . . . . . . . . . . . . . . . . . . . . . . . . . . . . . . . 364,600 5,542 7,744Maple Leaf Foods Inc. . . . . . . . . . . . . . . . . . . . . . . . . . . . . . . . . . . . . . . . . . . . . . . . . . . . . . . . . . . . . . . . . . . . . . . . . . . . . . . . . . . . 903,400 10,144 17,942
21,163 33,154
Total Common Stocks: . . . . . . . . . . . . . . . . . . . . . . . . . . . . . . . . . . . . . . . . . . . . . . . . . . . . . . . . . . . . . . . . . . . . . . . . . . . . . . . . . . . 582,459 758,219
Total Long-Term Investments: . . . . . . . . . . . . . . . . . . . . . . . . . . . . . . . . . . . . . . . . . . . . . . . . . . . . . . . . . . . . . . . . . . . . . . . . . . . . . . 582,459 758,219
Principal Amountin Currency
of Issue
SHORT-TERM SECURITIES: 9.16%Royal Bank of Canada, Term Deposit, 0.97%, 7/2/2014 . . . . . . . . . . . . . . . . . . . . . . . . . . . . . . . . . . . . . . . . . . . . . . . . . . . . . . . . . . . 76,600,000 CAD 76,600 76,600
Total Short-Term Securities: . . . . . . . . . . . . . . . . . . . . . . . . . . . . . . . . . . . . . . . . . . . . . . . . . . . . . . . . . . . . . . . . . . . . . . . . . . . . . . . 76,600 76,600
Transaction costs (Note 4) . . . . . . . . . . . . . . . . . . . . . . . . . . . . . . . . . . . . . . . . . . . . . . . . . . . . . . . . . . . . . . . . . . . . . . . . . . . . . . . . (2,398) —
TOTAL INVESTMENTS: 99.87% . . . . . . . . . . . . . . . . . . . . . . . . . . . . . . . . . . . . . . . . . . . . . . . . . . . . . . . . . . . . . . . . . . . . . . . . . . . . . $656,661 834,819
OTHER ASSETS, less liabilities: 0.13% . . . . . . . . . . . . . . . . . . . . . . . . . . . . . . . . . . . . . . . . . . . . . . . . . . . . . . . . . . . . . . . . . . . . . . . . 1,087
TOTAL NET ASSETS: 100.00% . . . . . . . . . . . . . . . . . . . . . . . . . . . . . . . . . . . . . . . . . . . . . . . . . . . . . . . . . . . . . . . . . . . . . . . . . . . . . $835,906
The accompanying notes are an integral part of these financial statements.
272 Franklin Templeton Investments Funds

Franklin Bissett Small Cap Fund
STATEMENTS OF FINANCIAL POSITION (Unaudited)
As atJune 30,
2014
As atDecember 31,
2013
As atJanuary 1,
2013
(000s) (000s) (000s)AssetsCurrent assetsInvestments at fair value through profit or loss $ 834,819 $ 795,140 $ 573,361Cash
Canadian 54 11 3Receivables
Investment securities sold — — 2,480Subscription of redeemable units 114 435 335Dividends and interest 1,572 1,560 1,473
Other assets (Note 6(g)) — 127 61
Total assets 836,559 797,273 577,713
LiabilitiesCurrent liabilitiesPayables
Investment securities purchased — 973 —Redemption of redeemable units 421 125 830Management fees 204 224 166Fixed administration fees 28 — —Accrued expenses — 202 153
Total liabilities 653 1,524 1,149
Net assets attributable to holders of redeemable units $ 835,906 $ 795,749 $ 576,564
Represented by:Net assets as previously reported under Canadian GAAP — 793,163 570,473Revaluation of investments at fair value through profit or loss (Note 3(c)) — 2,586 6,091
Net assets attributable to holders of redeemable units $ 835,906 $ 795,749 $ 576,564
Net assets attributable to holders of redeemable units per series (000s)Series A $ 59,181 $ 65,884 $ 47,393Series F 61,595 58,075 45,106Series O 715,130 671,790 484,065
Number of redeemable units outstanding (Note 5)Series A 887,800 1,066,093 941,265Series F 799,868 818,064 788,664Series O 7,285,063 7,488,165 6,817,994
Net assets attributable to holders of redeemable units per unit — CADSeries A $ 66.66 $ 61.80 $ 50.35Series F 77.01 70.99 57.19Series O 98.16 89.71 71.00
Cost of investments held (000s) $ 656,661 $ 660,026 $ 575,992
The accompanying notes are an integral part of these financial statements.
Franklin Templeton Investments Funds 273
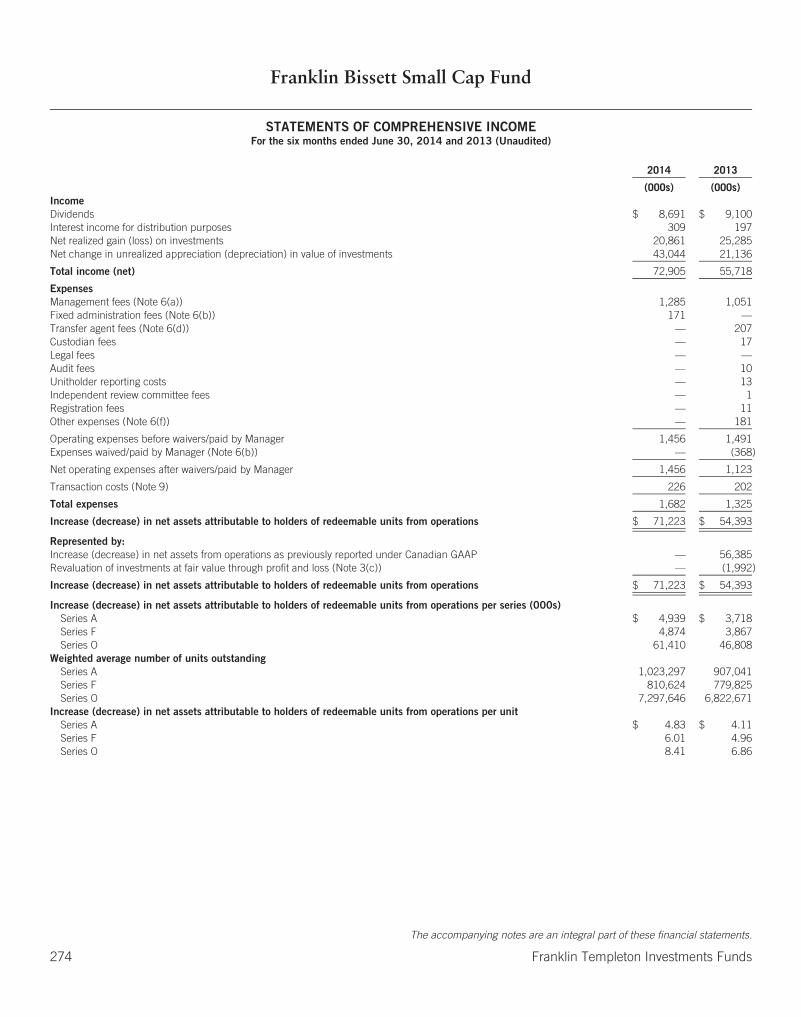
Franklin Bissett Small Cap Fund
STATEMENTS OF COMPREHENSIVE INCOMEFor the six months ended June 30, 2014 and 2013 (Unaudited)
2014 2013
(000s) (000s)IncomeDividends $ 8,691 $ 9,100Interest income for distribution purposes 309 197Net realized gain (loss) on investments 20,861 25,285Net change in unrealized appreciation (depreciation) in value of investments 43,044 21,136
Total income (net) 72,905 55,718
ExpensesManagement fees (Note 6(a)) 1,285 1,051Fixed administration fees (Note 6(b)) 171 —Transfer agent fees (Note 6(d)) — 207Custodian fees — 17Legal fees — —Audit fees — 10Unitholder reporting costs — 13Independent review committee fees — 1Registration fees — 11Other expenses (Note 6(f)) — 181
Operating expenses before waivers/paid by Manager 1,456 1,491Expenses waived/paid by Manager (Note 6(b)) — (368)
Net operating expenses after waivers/paid by Manager 1,456 1,123
Transaction costs (Note 9) 226 202
Total expenses 1,682 1,325
Increase (decrease) in net assets attributable to holders of redeemable units from operations $ 71,223 $ 54,393
Represented by:Increase (decrease) in net assets from operations as previously reported under Canadian GAAP — 56,385Revaluation of investments at fair value through profit and loss (Note 3(c)) — (1,992)
Increase (decrease) in net assets attributable to holders of redeemable units from operations $ 71,223 $ 54,393
Increase (decrease) in net assets attributable to holders of redeemable units from operations per series (000s)Series A $ 4,939 $ 3,718Series F 4,874 3,867Series O 61,410 46,808
Weighted average number of units outstandingSeries A 1,023,297 907,041Series F 810,624 779,825Series O 7,297,646 6,822,671
Increase (decrease) in net assets attributable to holders of redeemable units from operations per unitSeries A $ 4.83 $ 4.11Series F 6.01 4.96Series O 8.41 6.86
The accompanying notes are an integral part of these financial statements.
274 Franklin Templeton Investments Funds
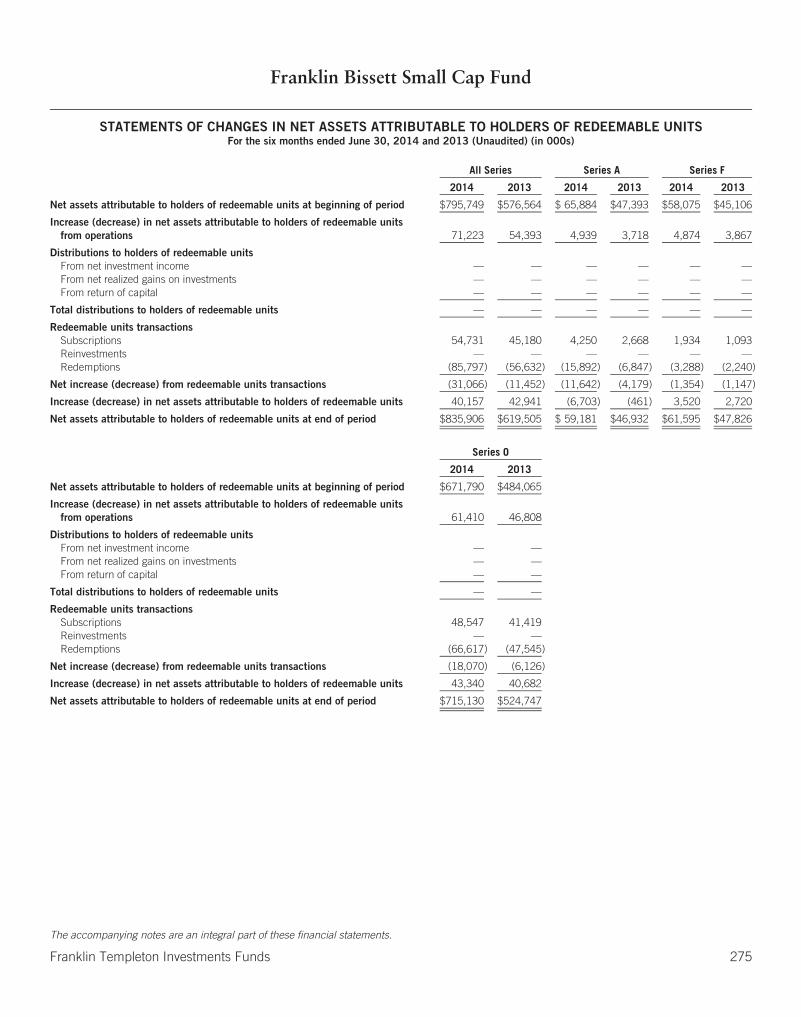
Franklin Bissett Small Cap Fund
STATEMENTS OF CHANGES IN NET ASSETS ATTRIBUTABLE TO HOLDERS OF REDEEMABLE UNITSFor the six months ended June 30, 2014 and 2013 (Unaudited) (in 000s)
All Series Series A Series F
2014 2013 2014 2013 2014 2013
Net assets attributable to holders of redeemable units at beginning of period $795,749 $576,564 $ 65,884 $47,393 $58,075 $45,106
Increase (decrease) in net assets attributable to holders of redeemable unitsfrom operations 71,223 54,393 4,939 3,718 4,874 3,867
Distributions to holders of redeemable unitsFrom net investment income — — — — — —From net realized gains on investments — — — — — —From return of capital — — — — — —
Total distributions to holders of redeemable units — — — — — —
Redeemable units transactionsSubscriptions 54,731 45,180 4,250 2,668 1,934 1,093Reinvestments — — — — — —Redemptions (85,797) (56,632) (15,892) (6,847) (3,288) (2,240)
Net increase (decrease) from redeemable units transactions (31,066) (11,452) (11,642) (4,179) (1,354) (1,147)
Increase (decrease) in net assets attributable to holders of redeemable units 40,157 42,941 (6,703) (461) 3,520 2,720
Net assets attributable to holders of redeemable units at end of period $835,906 $619,505 $ 59,181 $46,932 $61,595 $47,826
Series O
2014 2013
Net assets attributable to holders of redeemable units at beginning of period $671,790 $484,065
Increase (decrease) in net assets attributable to holders of redeemable unitsfrom operations 61,410 46,808
Distributions to holders of redeemable unitsFrom net investment income — —From net realized gains on investments — —From return of capital — —
Total distributions to holders of redeemable units — —
Redeemable units transactionsSubscriptions 48,547 41,419Reinvestments — —Redemptions (66,617) (47,545)
Net increase (decrease) from redeemable units transactions (18,070) (6,126)
Increase (decrease) in net assets attributable to holders of redeemable units 43,340 40,682
Net assets attributable to holders of redeemable units at end of period $715,130 $524,747
The accompanying notes are an integral part of these financial statements.
Franklin Templeton Investments Funds 275
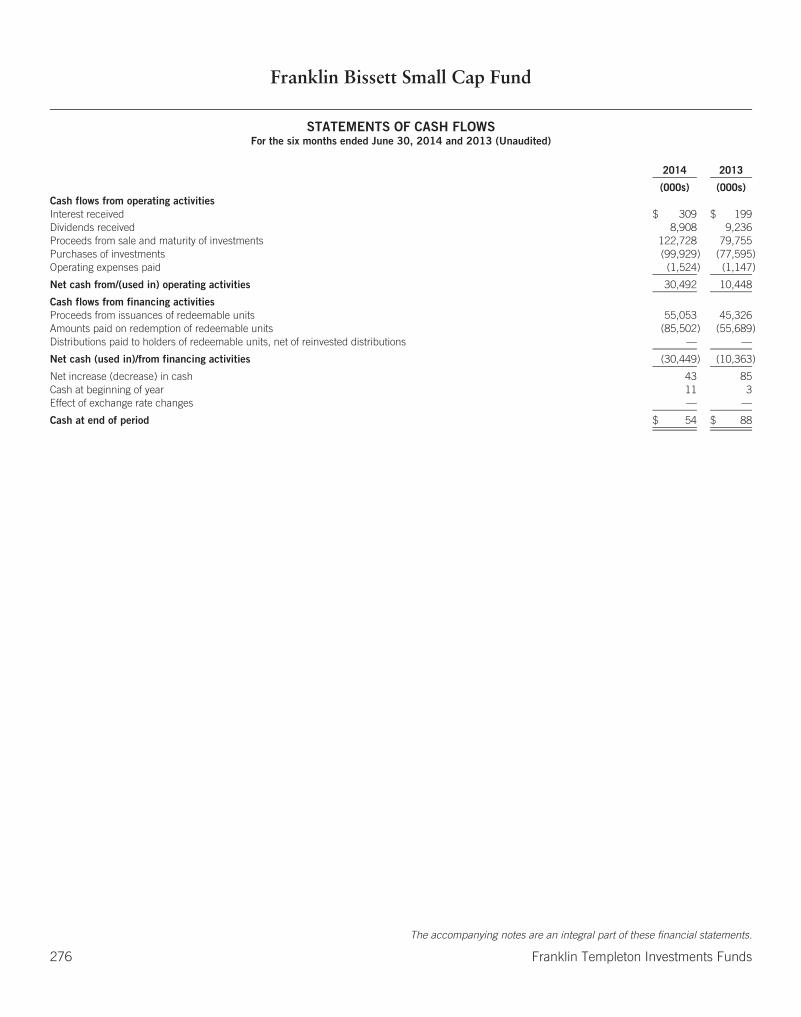
Franklin Bissett Small Cap Fund
STATEMENTS OF CASH FLOWSFor the six months ended June 30, 2014 and 2013 (Unaudited)
2014 2013
(000s) (000s)Cash flows from operating activitiesInterest received $ 309 $ 199Dividends received 8,908 9,236Proceeds from sale and maturity of investments 122,728 79,755Purchases of investments (99,929) (77,595)Operating expenses paid (1,524) (1,147)
Net cash from/(used in) operating activities 30,492 10,448
Cash flows from financing activitiesProceeds from issuances of redeemable units 55,053 45,326Amounts paid on redemption of redeemable units (85,502) (55,689)Distributions paid to holders of redeemable units, net of reinvested distributions — —
Net cash (used in)/from financing activities (30,449) (10,363)
Net increase (decrease) in cash 43 85Cash at beginning of year 11 3Effect of exchange rate changes — —
Cash at end of period $ 54 $ 88
The accompanying notes are an integral part of these financial statements.
276 Franklin Templeton Investments Funds
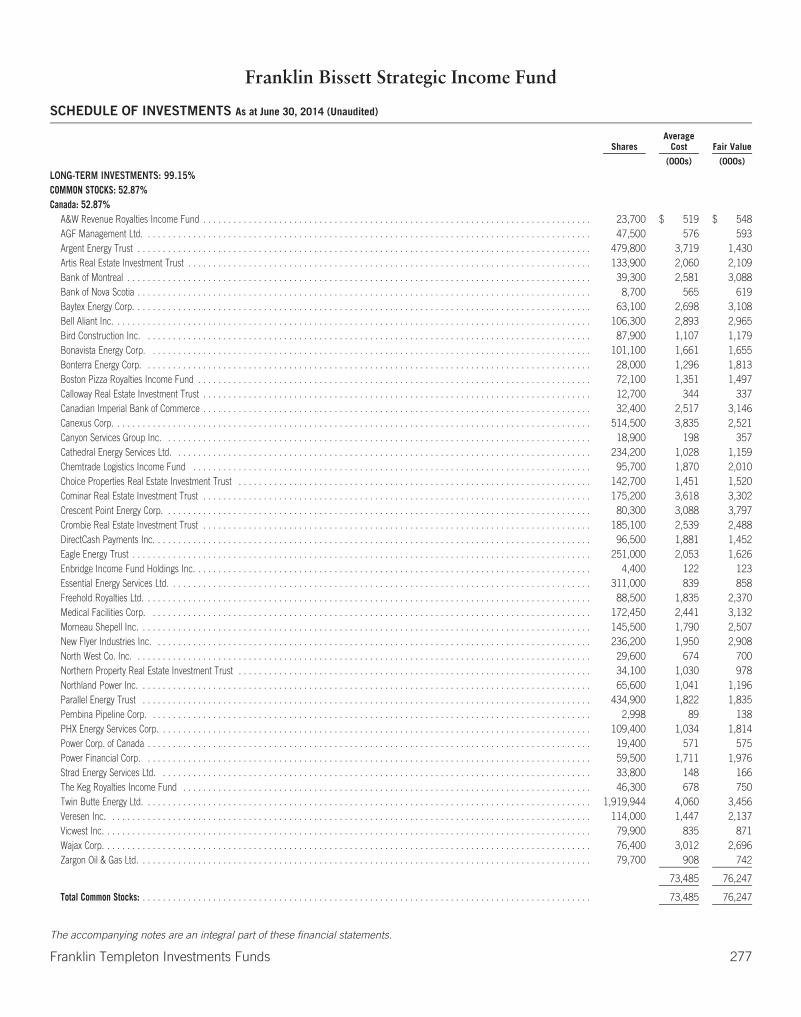
Franklin Bissett Strategic Income Fund
SCHEDULE OF INVESTMENTS As at June 30, 2014 (Unaudited)
SharesAverage
Cost Fair Value
(000s) (000s)
LONG-TERM INVESTMENTS: 99.15%COMMON STOCKS: 52.87%Canada: 52.87%
A&W Revenue Royalties Income Fund . . . . . . . . . . . . . . . . . . . . . . . . . . . . . . . . . . . . . . . . . . . . . . . . . . . . . . . . . . . . . . . . . . . . . . . . . . . . . 23,700 $ 519 $ 548AGF Management Ltd. . . . . . . . . . . . . . . . . . . . . . . . . . . . . . . . . . . . . . . . . . . . . . . . . . . . . . . . . . . . . . . . . . . . . . . . . . . . . . . . . . . . . . . . . 47,500 576 593Argent Energy Trust . . . . . . . . . . . . . . . . . . . . . . . . . . . . . . . . . . . . . . . . . . . . . . . . . . . . . . . . . . . . . . . . . . . . . . . . . . . . . . . . . . . . . . . . . . 479,800 3,719 1,430Artis Real Estate Investment Trust . . . . . . . . . . . . . . . . . . . . . . . . . . . . . . . . . . . . . . . . . . . . . . . . . . . . . . . . . . . . . . . . . . . . . . . . . . . . . . . . 133,900 2,060 2,109Bank of Montreal . . . . . . . . . . . . . . . . . . . . . . . . . . . . . . . . . . . . . . . . . . . . . . . . . . . . . . . . . . . . . . . . . . . . . . . . . . . . . . . . . . . . . . . . . . . . 39,300 2,581 3,088Bank of Nova Scotia . . . . . . . . . . . . . . . . . . . . . . . . . . . . . . . . . . . . . . . . . . . . . . . . . . . . . . . . . . . . . . . . . . . . . . . . . . . . . . . . . . . . . . . . . . 8,700 565 619Baytex Energy Corp. . . . . . . . . . . . . . . . . . . . . . . . . . . . . . . . . . . . . . . . . . . . . . . . . . . . . . . . . . . . . . . . . . . . . . . . . . . . . . . . . . . . . . . . . . . 63,100 2,698 3,108Bell Aliant Inc. . . . . . . . . . . . . . . . . . . . . . . . . . . . . . . . . . . . . . . . . . . . . . . . . . . . . . . . . . . . . . . . . . . . . . . . . . . . . . . . . . . . . . . . . . . . . . . 106,300 2,893 2,965Bird Construction Inc. . . . . . . . . . . . . . . . . . . . . . . . . . . . . . . . . . . . . . . . . . . . . . . . . . . . . . . . . . . . . . . . . . . . . . . . . . . . . . . . . . . . . . . . . 87,900 1,107 1,179Bonavista Energy Corp. . . . . . . . . . . . . . . . . . . . . . . . . . . . . . . . . . . . . . . . . . . . . . . . . . . . . . . . . . . . . . . . . . . . . . . . . . . . . . . . . . . . . . . . 101,100 1,661 1,655Bonterra Energy Corp. . . . . . . . . . . . . . . . . . . . . . . . . . . . . . . . . . . . . . . . . . . . . . . . . . . . . . . . . . . . . . . . . . . . . . . . . . . . . . . . . . . . . . . . . 28,000 1,296 1,813Boston Pizza Royalties Income Fund . . . . . . . . . . . . . . . . . . . . . . . . . . . . . . . . . . . . . . . . . . . . . . . . . . . . . . . . . . . . . . . . . . . . . . . . . . . . . . 72,100 1,351 1,497Calloway Real Estate Investment Trust . . . . . . . . . . . . . . . . . . . . . . . . . . . . . . . . . . . . . . . . . . . . . . . . . . . . . . . . . . . . . . . . . . . . . . . . . . . . . 12,700 344 337Canadian Imperial Bank of Commerce . . . . . . . . . . . . . . . . . . . . . . . . . . . . . . . . . . . . . . . . . . . . . . . . . . . . . . . . . . . . . . . . . . . . . . . . . . . . . 32,400 2,517 3,146Canexus Corp. . . . . . . . . . . . . . . . . . . . . . . . . . . . . . . . . . . . . . . . . . . . . . . . . . . . . . . . . . . . . . . . . . . . . . . . . . . . . . . . . . . . . . . . . . . . . . . 514,500 3,835 2,521Canyon Services Group Inc. . . . . . . . . . . . . . . . . . . . . . . . . . . . . . . . . . . . . . . . . . . . . . . . . . . . . . . . . . . . . . . . . . . . . . . . . . . . . . . . . . . . . 18,900 198 357Cathedral Energy Services Ltd. . . . . . . . . . . . . . . . . . . . . . . . . . . . . . . . . . . . . . . . . . . . . . . . . . . . . . . . . . . . . . . . . . . . . . . . . . . . . . . . . . . 234,200 1,028 1,159Chemtrade Logistics Income Fund . . . . . . . . . . . . . . . . . . . . . . . . . . . . . . . . . . . . . . . . . . . . . . . . . . . . . . . . . . . . . . . . . . . . . . . . . . . . . . . 95,700 1,870 2,010Choice Properties Real Estate Investment Trust . . . . . . . . . . . . . . . . . . . . . . . . . . . . . . . . . . . . . . . . . . . . . . . . . . . . . . . . . . . . . . . . . . . . . . 142,700 1,451 1,520Cominar Real Estate Investment Trust . . . . . . . . . . . . . . . . . . . . . . . . . . . . . . . . . . . . . . . . . . . . . . . . . . . . . . . . . . . . . . . . . . . . . . . . . . . . . 175,200 3,618 3,302Crescent Point Energy Corp. . . . . . . . . . . . . . . . . . . . . . . . . . . . . . . . . . . . . . . . . . . . . . . . . . . . . . . . . . . . . . . . . . . . . . . . . . . . . . . . . . . . . 80,300 3,088 3,797Crombie Real Estate Investment Trust . . . . . . . . . . . . . . . . . . . . . . . . . . . . . . . . . . . . . . . . . . . . . . . . . . . . . . . . . . . . . . . . . . . . . . . . . . . . . 185,100 2,539 2,488DirectCash Payments Inc. . . . . . . . . . . . . . . . . . . . . . . . . . . . . . . . . . . . . . . . . . . . . . . . . . . . . . . . . . . . . . . . . . . . . . . . . . . . . . . . . . . . . . . 96,500 1,881 1,452Eagle Energy Trust . . . . . . . . . . . . . . . . . . . . . . . . . . . . . . . . . . . . . . . . . . . . . . . . . . . . . . . . . . . . . . . . . . . . . . . . . . . . . . . . . . . . . . . . . . . 251,000 2,053 1,626Enbridge Income Fund Holdings Inc. . . . . . . . . . . . . . . . . . . . . . . . . . . . . . . . . . . . . . . . . . . . . . . . . . . . . . . . . . . . . . . . . . . . . . . . . . . . . . . 4,400 122 123Essential Energy Services Ltd. . . . . . . . . . . . . . . . . . . . . . . . . . . . . . . . . . . . . . . . . . . . . . . . . . . . . . . . . . . . . . . . . . . . . . . . . . . . . . . . . . . . 311,000 839 858Freehold Royalties Ltd. . . . . . . . . . . . . . . . . . . . . . . . . . . . . . . . . . . . . . . . . . . . . . . . . . . . . . . . . . . . . . . . . . . . . . . . . . . . . . . . . . . . . . . . . 88,500 1,835 2,370Medical Facilities Corp. . . . . . . . . . . . . . . . . . . . . . . . . . . . . . . . . . . . . . . . . . . . . . . . . . . . . . . . . . . . . . . . . . . . . . . . . . . . . . . . . . . . . . . . 172,450 2,441 3,132Morneau Shepell Inc. . . . . . . . . . . . . . . . . . . . . . . . . . . . . . . . . . . . . . . . . . . . . . . . . . . . . . . . . . . . . . . . . . . . . . . . . . . . . . . . . . . . . . . . . . 145,500 1,790 2,507New Flyer Industries Inc. . . . . . . . . . . . . . . . . . . . . . . . . . . . . . . . . . . . . . . . . . . . . . . . . . . . . . . . . . . . . . . . . . . . . . . . . . . . . . . . . . . . . . . 236,200 1,950 2,908North West Co. Inc. . . . . . . . . . . . . . . . . . . . . . . . . . . . . . . . . . . . . . . . . . . . . . . . . . . . . . . . . . . . . . . . . . . . . . . . . . . . . . . . . . . . . . . . . . . 29,600 674 700Northern Property Real Estate Investment Trust . . . . . . . . . . . . . . . . . . . . . . . . . . . . . . . . . . . . . . . . . . . . . . . . . . . . . . . . . . . . . . . . . . . . . . 34,100 1,030 978Northland Power Inc. . . . . . . . . . . . . . . . . . . . . . . . . . . . . . . . . . . . . . . . . . . . . . . . . . . . . . . . . . . . . . . . . . . . . . . . . . . . . . . . . . . . . . . . . . 65,600 1,041 1,196Parallel Energy Trust . . . . . . . . . . . . . . . . . . . . . . . . . . . . . . . . . . . . . . . . . . . . . . . . . . . . . . . . . . . . . . . . . . . . . . . . . . . . . . . . . . . . . . . . . 434,900 1,822 1,835Pembina Pipeline Corp. . . . . . . . . . . . . . . . . . . . . . . . . . . . . . . . . . . . . . . . . . . . . . . . . . . . . . . . . . . . . . . . . . . . . . . . . . . . . . . . . . . . . . . . 2,998 89 138PHX Energy Services Corp. . . . . . . . . . . . . . . . . . . . . . . . . . . . . . . . . . . . . . . . . . . . . . . . . . . . . . . . . . . . . . . . . . . . . . . . . . . . . . . . . . . . . . 109,400 1,034 1,814Power Corp. of Canada . . . . . . . . . . . . . . . . . . . . . . . . . . . . . . . . . . . . . . . . . . . . . . . . . . . . . . . . . . . . . . . . . . . . . . . . . . . . . . . . . . . . . . . . 19,400 571 575Power Financial Corp. . . . . . . . . . . . . . . . . . . . . . . . . . . . . . . . . . . . . . . . . . . . . . . . . . . . . . . . . . . . . . . . . . . . . . . . . . . . . . . . . . . . . . . . . 59,500 1,711 1,976Strad Energy Services Ltd. . . . . . . . . . . . . . . . . . . . . . . . . . . . . . . . . . . . . . . . . . . . . . . . . . . . . . . . . . . . . . . . . . . . . . . . . . . . . . . . . . . . . . 33,800 148 166The Keg Royalties Income Fund . . . . . . . . . . . . . . . . . . . . . . . . . . . . . . . . . . . . . . . . . . . . . . . . . . . . . . . . . . . . . . . . . . . . . . . . . . . . . . . . . 46,300 678 750Twin Butte Energy Ltd. . . . . . . . . . . . . . . . . . . . . . . . . . . . . . . . . . . . . . . . . . . . . . . . . . . . . . . . . . . . . . . . . . . . . . . . . . . . . . . . . . . . . . . . . 1,919,944 4,060 3,456Veresen Inc. . . . . . . . . . . . . . . . . . . . . . . . . . . . . . . . . . . . . . . . . . . . . . . . . . . . . . . . . . . . . . . . . . . . . . . . . . . . . . . . . . . . . . . . . . . . . . . . 114,000 1,447 2,137Vicwest Inc. . . . . . . . . . . . . . . . . . . . . . . . . . . . . . . . . . . . . . . . . . . . . . . . . . . . . . . . . . . . . . . . . . . . . . . . . . . . . . . . . . . . . . . . . . . . . . . . . 79,900 835 871Wajax Corp. . . . . . . . . . . . . . . . . . . . . . . . . . . . . . . . . . . . . . . . . . . . . . . . . . . . . . . . . . . . . . . . . . . . . . . . . . . . . . . . . . . . . . . . . . . . . . . . . 76,400 3,012 2,696Zargon Oil & Gas Ltd. . . . . . . . . . . . . . . . . . . . . . . . . . . . . . . . . . . . . . . . . . . . . . . . . . . . . . . . . . . . . . . . . . . . . . . . . . . . . . . . . . . . . . . . . . 79,700 908 742
73,485 76,247
Total Common Stocks: . . . . . . . . . . . . . . . . . . . . . . . . . . . . . . . . . . . . . . . . . . . . . . . . . . . . . . . . . . . . . . . . . . . . . . . . . . . . . . . . . . . . . . . . . 73,485 76,247
The accompanying notes are an integral part of these financial statements.
Franklin Templeton Investments Funds 277
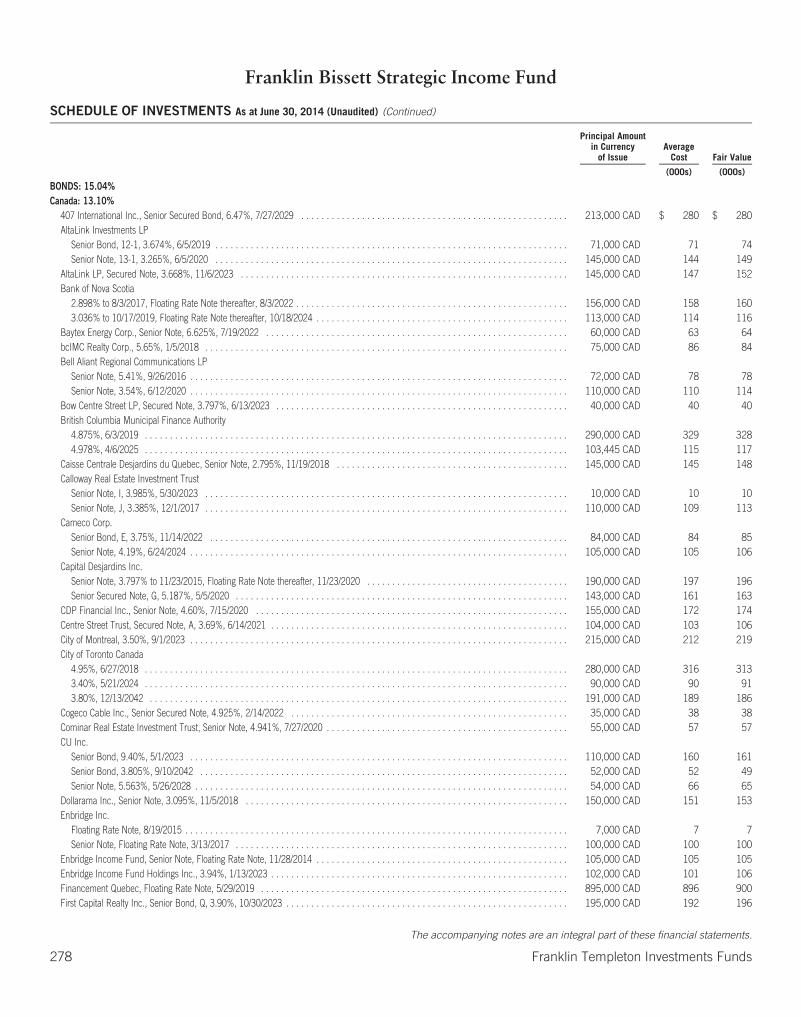
Franklin Bissett Strategic Income Fund
SCHEDULE OF INVESTMENTS As at June 30, 2014 (Unaudited) (Continued)
Principal Amountin Currency
of IssueAverage
Cost Fair Value
(000s) (000s)
BONDS: 15.04%Canada: 13.10%
407 International Inc., Senior Secured Bond, 6.47%, 7/27/2029 . . . . . . . . . . . . . . . . . . . . . . . . . . . . . . . . . . . . . . . . . . . . . . . . . . . . . 213,000 CAD $ 280 $ 280AltaLink Investments LP
Senior Bond, 12-1, 3.674%, 6/5/2019 . . . . . . . . . . . . . . . . . . . . . . . . . . . . . . . . . . . . . . . . . . . . . . . . . . . . . . . . . . . . . . . . . . . . . . 71,000 CAD 71 74Senior Note, 13-1, 3.265%, 6/5/2020 . . . . . . . . . . . . . . . . . . . . . . . . . . . . . . . . . . . . . . . . . . . . . . . . . . . . . . . . . . . . . . . . . . . . . . 145,000 CAD 144 149
AltaLink LP, Secured Note, 3.668%, 11/6/2023 . . . . . . . . . . . . . . . . . . . . . . . . . . . . . . . . . . . . . . . . . . . . . . . . . . . . . . . . . . . . . . . . . 145,000 CAD 147 152Bank of Nova Scotia
2.898% to 8/3/2017, Floating Rate Note thereafter, 8/3/2022 . . . . . . . . . . . . . . . . . . . . . . . . . . . . . . . . . . . . . . . . . . . . . . . . . . . . . . 156,000 CAD 158 1603.036% to 10/17/2019, Floating Rate Note thereafter, 10/18/2024 . . . . . . . . . . . . . . . . . . . . . . . . . . . . . . . . . . . . . . . . . . . . . . . . . . 113,000 CAD 114 116
Baytex Energy Corp., Senior Note, 6.625%, 7/19/2022 . . . . . . . . . . . . . . . . . . . . . . . . . . . . . . . . . . . . . . . . . . . . . . . . . . . . . . . . . . . . 60,000 CAD 63 64bcIMC Realty Corp., 5.65%, 1/5/2018 . . . . . . . . . . . . . . . . . . . . . . . . . . . . . . . . . . . . . . . . . . . . . . . . . . . . . . . . . . . . . . . . . . . . . . . . 75,000 CAD 86 84Bell Aliant Regional Communications LP
Senior Note, 5.41%, 9/26/2016 . . . . . . . . . . . . . . . . . . . . . . . . . . . . . . . . . . . . . . . . . . . . . . . . . . . . . . . . . . . . . . . . . . . . . . . . . . . 72,000 CAD 78 78Senior Note, 3.54%, 6/12/2020 . . . . . . . . . . . . . . . . . . . . . . . . . . . . . . . . . . . . . . . . . . . . . . . . . . . . . . . . . . . . . . . . . . . . . . . . . . . 110,000 CAD 110 114
Bow Centre Street LP, Secured Note, 3.797%, 6/13/2023 . . . . . . . . . . . . . . . . . . . . . . . . . . . . . . . . . . . . . . . . . . . . . . . . . . . . . . . . . . 40,000 CAD 40 40British Columbia Municipal Finance Authority
4.875%, 6/3/2019 . . . . . . . . . . . . . . . . . . . . . . . . . . . . . . . . . . . . . . . . . . . . . . . . . . . . . . . . . . . . . . . . . . . . . . . . . . . . . . . . . . . . 290,000 CAD 329 3284.978%, 4/6/2025 . . . . . . . . . . . . . . . . . . . . . . . . . . . . . . . . . . . . . . . . . . . . . . . . . . . . . . . . . . . . . . . . . . . . . . . . . . . . . . . . . . . . 103,445 CAD 115 117
Caisse Centrale Desjardins du Quebec, Senior Note, 2.795%, 11/19/2018 . . . . . . . . . . . . . . . . . . . . . . . . . . . . . . . . . . . . . . . . . . . . . . 145,000 CAD 145 148Calloway Real Estate Investment Trust
Senior Note, I, 3.985%, 5/30/2023 . . . . . . . . . . . . . . . . . . . . . . . . . . . . . . . . . . . . . . . . . . . . . . . . . . . . . . . . . . . . . . . . . . . . . . . . 10,000 CAD 10 10Senior Note, J, 3.385%, 12/1/2017 . . . . . . . . . . . . . . . . . . . . . . . . . . . . . . . . . . . . . . . . . . . . . . . . . . . . . . . . . . . . . . . . . . . . . . . . 110,000 CAD 109 113
Cameco Corp.Senior Bond, E, 3.75%, 11/14/2022 . . . . . . . . . . . . . . . . . . . . . . . . . . . . . . . . . . . . . . . . . . . . . . . . . . . . . . . . . . . . . . . . . . . . . . . 84,000 CAD 84 85Senior Note, 4.19%, 6/24/2024 . . . . . . . . . . . . . . . . . . . . . . . . . . . . . . . . . . . . . . . . . . . . . . . . . . . . . . . . . . . . . . . . . . . . . . . . . . . 105,000 CAD 105 106
Capital Desjardins Inc.Senior Note, 3.797% to 11/23/2015, Floating Rate Note thereafter, 11/23/2020 . . . . . . . . . . . . . . . . . . . . . . . . . . . . . . . . . . . . . . . . 190,000 CAD 197 196Senior Secured Note, G, 5.187%, 5/5/2020 . . . . . . . . . . . . . . . . . . . . . . . . . . . . . . . . . . . . . . . . . . . . . . . . . . . . . . . . . . . . . . . . . . 143,000 CAD 161 163
CDP Financial Inc., Senior Note, 4.60%, 7/15/2020 . . . . . . . . . . . . . . . . . . . . . . . . . . . . . . . . . . . . . . . . . . . . . . . . . . . . . . . . . . . . . . 155,000 CAD 172 174Centre Street Trust, Secured Note, A, 3.69%, 6/14/2021 . . . . . . . . . . . . . . . . . . . . . . . . . . . . . . . . . . . . . . . . . . . . . . . . . . . . . . . . . . . 104,000 CAD 103 106City of Montreal, 3.50%, 9/1/2023 . . . . . . . . . . . . . . . . . . . . . . . . . . . . . . . . . . . . . . . . . . . . . . . . . . . . . . . . . . . . . . . . . . . . . . . . . . . 215,000 CAD 212 219City of Toronto Canada
4.95%, 6/27/2018 . . . . . . . . . . . . . . . . . . . . . . . . . . . . . . . . . . . . . . . . . . . . . . . . . . . . . . . . . . . . . . . . . . . . . . . . . . . . . . . . . . . . 280,000 CAD 316 3133.40%, 5/21/2024 . . . . . . . . . . . . . . . . . . . . . . . . . . . . . . . . . . . . . . . . . . . . . . . . . . . . . . . . . . . . . . . . . . . . . . . . . . . . . . . . . . . . 90,000 CAD 90 913.80%, 12/13/2042 . . . . . . . . . . . . . . . . . . . . . . . . . . . . . . . . . . . . . . . . . . . . . . . . . . . . . . . . . . . . . . . . . . . . . . . . . . . . . . . . . . . 191,000 CAD 189 186
Cogeco Cable Inc., Senior Secured Note, 4.925%, 2/14/2022 . . . . . . . . . . . . . . . . . . . . . . . . . . . . . . . . . . . . . . . . . . . . . . . . . . . . . . . 35,000 CAD 38 38Cominar Real Estate Investment Trust, Senior Note, 4.941%, 7/27/2020 . . . . . . . . . . . . . . . . . . . . . . . . . . . . . . . . . . . . . . . . . . . . . . . . 55,000 CAD 57 57CU Inc.
Senior Bond, 9.40%, 5/1/2023 . . . . . . . . . . . . . . . . . . . . . . . . . . . . . . . . . . . . . . . . . . . . . . . . . . . . . . . . . . . . . . . . . . . . . . . . . . . 110,000 CAD 160 161Senior Bond, 3.805%, 9/10/2042 . . . . . . . . . . . . . . . . . . . . . . . . . . . . . . . . . . . . . . . . . . . . . . . . . . . . . . . . . . . . . . . . . . . . . . . . . 52,000 CAD 52 49Senior Note, 5.563%, 5/26/2028 . . . . . . . . . . . . . . . . . . . . . . . . . . . . . . . . . . . . . . . . . . . . . . . . . . . . . . . . . . . . . . . . . . . . . . . . . . 54,000 CAD 66 65
Dollarama Inc., Senior Note, 3.095%, 11/5/2018 . . . . . . . . . . . . . . . . . . . . . . . . . . . . . . . . . . . . . . . . . . . . . . . . . . . . . . . . . . . . . . . . 150,000 CAD 151 153Enbridge Inc.
Floating Rate Note, 8/19/2015 . . . . . . . . . . . . . . . . . . . . . . . . . . . . . . . . . . . . . . . . . . . . . . . . . . . . . . . . . . . . . . . . . . . . . . . . . . . . 7,000 CAD 7 7Senior Note, Floating Rate Note, 3/13/2017 . . . . . . . . . . . . . . . . . . . . . . . . . . . . . . . . . . . . . . . . . . . . . . . . . . . . . . . . . . . . . . . . . . 100,000 CAD 100 100
Enbridge Income Fund, Senior Note, Floating Rate Note, 11/28/2014 . . . . . . . . . . . . . . . . . . . . . . . . . . . . . . . . . . . . . . . . . . . . . . . . . . 105,000 CAD 105 105Enbridge Income Fund Holdings Inc., 3.94%, 1/13/2023 . . . . . . . . . . . . . . . . . . . . . . . . . . . . . . . . . . . . . . . . . . . . . . . . . . . . . . . . . . . 102,000 CAD 101 106Financement Quebec, Floating Rate Note, 5/29/2019 . . . . . . . . . . . . . . . . . . . . . . . . . . . . . . . . . . . . . . . . . . . . . . . . . . . . . . . . . . . . . 895,000 CAD 896 900First Capital Realty Inc., Senior Bond, Q, 3.90%, 10/30/2023 . . . . . . . . . . . . . . . . . . . . . . . . . . . . . . . . . . . . . . . . . . . . . . . . . . . . . . . . 195,000 CAD 192 196
The accompanying notes are an integral part of these financial statements.
278 Franklin Templeton Investments Funds
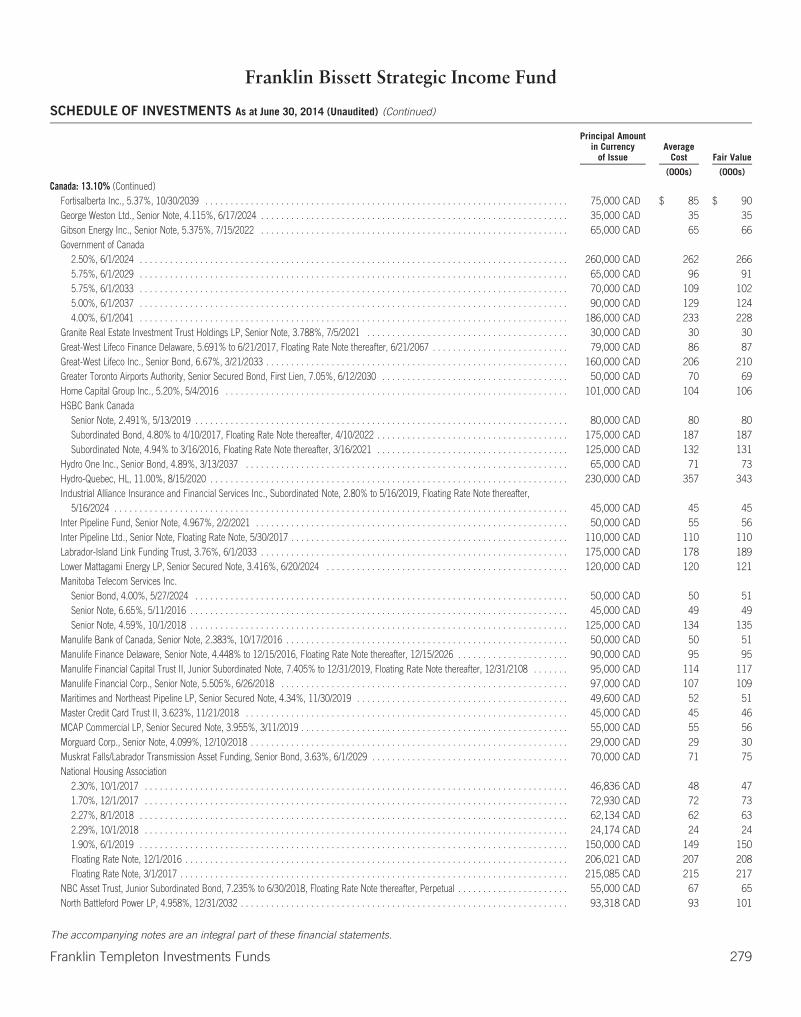
Franklin Bissett Strategic Income Fund
SCHEDULE OF INVESTMENTS As at June 30, 2014 (Unaudited) (Continued)
Principal Amountin Currency
of IssueAverage
Cost Fair Value
(000s) (000s)
Canada: 13.10% (Continued)Fortisalberta Inc., 5.37%, 10/30/2039 . . . . . . . . . . . . . . . . . . . . . . . . . . . . . . . . . . . . . . . . . . . . . . . . . . . . . . . . . . . . . . . . . . . . . . . . 75,000 CAD $ 85 $ 90George Weston Ltd., Senior Note, 4.115%, 6/17/2024 . . . . . . . . . . . . . . . . . . . . . . . . . . . . . . . . . . . . . . . . . . . . . . . . . . . . . . . . . . . . . 35,000 CAD 35 35Gibson Energy Inc., Senior Note, 5.375%, 7/15/2022 . . . . . . . . . . . . . . . . . . . . . . . . . . . . . . . . . . . . . . . . . . . . . . . . . . . . . . . . . . . . . 65,000 CAD 65 66Government of Canada
2.50%, 6/1/2024 . . . . . . . . . . . . . . . . . . . . . . . . . . . . . . . . . . . . . . . . . . . . . . . . . . . . . . . . . . . . . . . . . . . . . . . . . . . . . . . . . . . . . 260,000 CAD 262 2665.75%, 6/1/2029 . . . . . . . . . . . . . . . . . . . . . . . . . . . . . . . . . . . . . . . . . . . . . . . . . . . . . . . . . . . . . . . . . . . . . . . . . . . . . . . . . . . . . 65,000 CAD 96 915.75%, 6/1/2033 . . . . . . . . . . . . . . . . . . . . . . . . . . . . . . . . . . . . . . . . . . . . . . . . . . . . . . . . . . . . . . . . . . . . . . . . . . . . . . . . . . . . . 70,000 CAD 109 1025.00%, 6/1/2037 . . . . . . . . . . . . . . . . . . . . . . . . . . . . . . . . . . . . . . . . . . . . . . . . . . . . . . . . . . . . . . . . . . . . . . . . . . . . . . . . . . . . . 90,000 CAD 129 1244.00%, 6/1/2041 . . . . . . . . . . . . . . . . . . . . . . . . . . . . . . . . . . . . . . . . . . . . . . . . . . . . . . . . . . . . . . . . . . . . . . . . . . . . . . . . . . . . . 186,000 CAD 233 228
Granite Real Estate Investment Trust Holdings LP, Senior Note, 3.788%, 7/5/2021 . . . . . . . . . . . . . . . . . . . . . . . . . . . . . . . . . . . . . . . . 30,000 CAD 30 30Great-West Lifeco Finance Delaware, 5.691% to 6/21/2017, Floating Rate Note thereafter, 6/21/2067 . . . . . . . . . . . . . . . . . . . . . . . . . . . 79,000 CAD 86 87Great-West Lifeco Inc., Senior Bond, 6.67%, 3/21/2033 . . . . . . . . . . . . . . . . . . . . . . . . . . . . . . . . . . . . . . . . . . . . . . . . . . . . . . . . . . . . 160,000 CAD 206 210Greater Toronto Airports Authority, Senior Secured Bond, First Lien, 7.05%, 6/12/2030 . . . . . . . . . . . . . . . . . . . . . . . . . . . . . . . . . . . . . 50,000 CAD 70 69Home Capital Group Inc., 5.20%, 5/4/2016 . . . . . . . . . . . . . . . . . . . . . . . . . . . . . . . . . . . . . . . . . . . . . . . . . . . . . . . . . . . . . . . . . . . . 101,000 CAD 104 106HSBC Bank Canada
Senior Note, 2.491%, 5/13/2019 . . . . . . . . . . . . . . . . . . . . . . . . . . . . . . . . . . . . . . . . . . . . . . . . . . . . . . . . . . . . . . . . . . . . . . . . . . 80,000 CAD 80 80Subordinated Bond, 4.80% to 4/10/2017, Floating Rate Note thereafter, 4/10/2022 . . . . . . . . . . . . . . . . . . . . . . . . . . . . . . . . . . . . . . 175,000 CAD 187 187Subordinated Note, 4.94% to 3/16/2016, Floating Rate Note thereafter, 3/16/2021 . . . . . . . . . . . . . . . . . . . . . . . . . . . . . . . . . . . . . . 125,000 CAD 132 131
Hydro One Inc., Senior Bond, 4.89%, 3/13/2037 . . . . . . . . . . . . . . . . . . . . . . . . . . . . . . . . . . . . . . . . . . . . . . . . . . . . . . . . . . . . . . . . 65,000 CAD 71 73Hydro-Quebec, HL, 11.00%, 8/15/2020 . . . . . . . . . . . . . . . . . . . . . . . . . . . . . . . . . . . . . . . . . . . . . . . . . . . . . . . . . . . . . . . . . . . . . . . 230,000 CAD 357 343Industrial Alliance Insurance and Financial Services Inc., Subordinated Note, 2.80% to 5/16/2019, Floating Rate Note thereafter,
5/16/2024 . . . . . . . . . . . . . . . . . . . . . . . . . . . . . . . . . . . . . . . . . . . . . . . . . . . . . . . . . . . . . . . . . . . . . . . . . . . . . . . . . . . . . . . . . . 45,000 CAD 45 45Inter Pipeline Fund, Senior Note, 4.967%, 2/2/2021 . . . . . . . . . . . . . . . . . . . . . . . . . . . . . . . . . . . . . . . . . . . . . . . . . . . . . . . . . . . . . . 50,000 CAD 55 56Inter Pipeline Ltd., Senior Note, Floating Rate Note, 5/30/2017 . . . . . . . . . . . . . . . . . . . . . . . . . . . . . . . . . . . . . . . . . . . . . . . . . . . . . . . 110,000 CAD 110 110Labrador-Island Link Funding Trust, 3.76%, 6/1/2033 . . . . . . . . . . . . . . . . . . . . . . . . . . . . . . . . . . . . . . . . . . . . . . . . . . . . . . . . . . . . . 175,000 CAD 178 189Lower Mattagami Energy LP, Senior Secured Note, 3.416%, 6/20/2024 . . . . . . . . . . . . . . . . . . . . . . . . . . . . . . . . . . . . . . . . . . . . . . . . 120,000 CAD 120 121Manitoba Telecom Services Inc.
Senior Bond, 4.00%, 5/27/2024 . . . . . . . . . . . . . . . . . . . . . . . . . . . . . . . . . . . . . . . . . . . . . . . . . . . . . . . . . . . . . . . . . . . . . . . . . . 50,000 CAD 50 51Senior Note, 6.65%, 5/11/2016 . . . . . . . . . . . . . . . . . . . . . . . . . . . . . . . . . . . . . . . . . . . . . . . . . . . . . . . . . . . . . . . . . . . . . . . . . . . 45,000 CAD 49 49Senior Note, 4.59%, 10/1/2018 . . . . . . . . . . . . . . . . . . . . . . . . . . . . . . . . . . . . . . . . . . . . . . . . . . . . . . . . . . . . . . . . . . . . . . . . . . . 125,000 CAD 134 135
Manulife Bank of Canada, Senior Note, 2.383%, 10/17/2016 . . . . . . . . . . . . . . . . . . . . . . . . . . . . . . . . . . . . . . . . . . . . . . . . . . . . . . . . 50,000 CAD 50 51Manulife Finance Delaware, Senior Note, 4.448% to 12/15/2016, Floating Rate Note thereafter, 12/15/2026 . . . . . . . . . . . . . . . . . . . . . . 90,000 CAD 95 95Manulife Financial Capital Trust II, Junior Subordinated Note, 7.405% to 12/31/2019, Floating Rate Note thereafter, 12/31/2108 . . . . . . . 95,000 CAD 114 117Manulife Financial Corp., Senior Note, 5.505%, 6/26/2018 . . . . . . . . . . . . . . . . . . . . . . . . . . . . . . . . . . . . . . . . . . . . . . . . . . . . . . . . . 97,000 CAD 107 109Maritimes and Northeast Pipeline LP, Senior Secured Note, 4.34%, 11/30/2019 . . . . . . . . . . . . . . . . . . . . . . . . . . . . . . . . . . . . . . . . . . 49,600 CAD 52 51Master Credit Card Trust II, 3.623%, 11/21/2018 . . . . . . . . . . . . . . . . . . . . . . . . . . . . . . . . . . . . . . . . . . . . . . . . . . . . . . . . . . . . . . . . 45,000 CAD 45 46MCAP Commercial LP, Senior Secured Note, 3.955%, 3/11/2019 . . . . . . . . . . . . . . . . . . . . . . . . . . . . . . . . . . . . . . . . . . . . . . . . . . . . . 55,000 CAD 55 56Morguard Corp., Senior Note, 4.099%, 12/10/2018 . . . . . . . . . . . . . . . . . . . . . . . . . . . . . . . . . . . . . . . . . . . . . . . . . . . . . . . . . . . . . . . 29,000 CAD 29 30Muskrat Falls/Labrador Transmission Asset Funding, Senior Bond, 3.63%, 6/1/2029 . . . . . . . . . . . . . . . . . . . . . . . . . . . . . . . . . . . . . . . 70,000 CAD 71 75National Housing Association
2.30%, 10/1/2017 . . . . . . . . . . . . . . . . . . . . . . . . . . . . . . . . . . . . . . . . . . . . . . . . . . . . . . . . . . . . . . . . . . . . . . . . . . . . . . . . . . . . 46,836 CAD 48 471.70%, 12/1/2017 . . . . . . . . . . . . . . . . . . . . . . . . . . . . . . . . . . . . . . . . . . . . . . . . . . . . . . . . . . . . . . . . . . . . . . . . . . . . . . . . . . . . 72,930 CAD 72 732.27%, 8/1/2018 . . . . . . . . . . . . . . . . . . . . . . . . . . . . . . . . . . . . . . . . . . . . . . . . . . . . . . . . . . . . . . . . . . . . . . . . . . . . . . . . . . . . . 62,134 CAD 62 632.29%, 10/1/2018 . . . . . . . . . . . . . . . . . . . . . . . . . . . . . . . . . . . . . . . . . . . . . . . . . . . . . . . . . . . . . . . . . . . . . . . . . . . . . . . . . . . . 24,174 CAD 24 241.90%, 6/1/2019 . . . . . . . . . . . . . . . . . . . . . . . . . . . . . . . . . . . . . . . . . . . . . . . . . . . . . . . . . . . . . . . . . . . . . . . . . . . . . . . . . . . . . 150,000 CAD 149 150Floating Rate Note, 12/1/2016 . . . . . . . . . . . . . . . . . . . . . . . . . . . . . . . . . . . . . . . . . . . . . . . . . . . . . . . . . . . . . . . . . . . . . . . . . . . . 206,021 CAD 207 208Floating Rate Note, 3/1/2017 . . . . . . . . . . . . . . . . . . . . . . . . . . . . . . . . . . . . . . . . . . . . . . . . . . . . . . . . . . . . . . . . . . . . . . . . . . . . . 215,085 CAD 215 217
NBC Asset Trust, Junior Subordinated Bond, 7.235% to 6/30/2018, Floating Rate Note thereafter, Perpetual . . . . . . . . . . . . . . . . . . . . . . 55,000 CAD 67 65North Battleford Power LP, 4.958%, 12/31/2032 . . . . . . . . . . . . . . . . . . . . . . . . . . . . . . . . . . . . . . . . . . . . . . . . . . . . . . . . . . . . . . . . . 93,318 CAD 93 101
The accompanying notes are an integral part of these financial statements.
Franklin Templeton Investments Funds 279
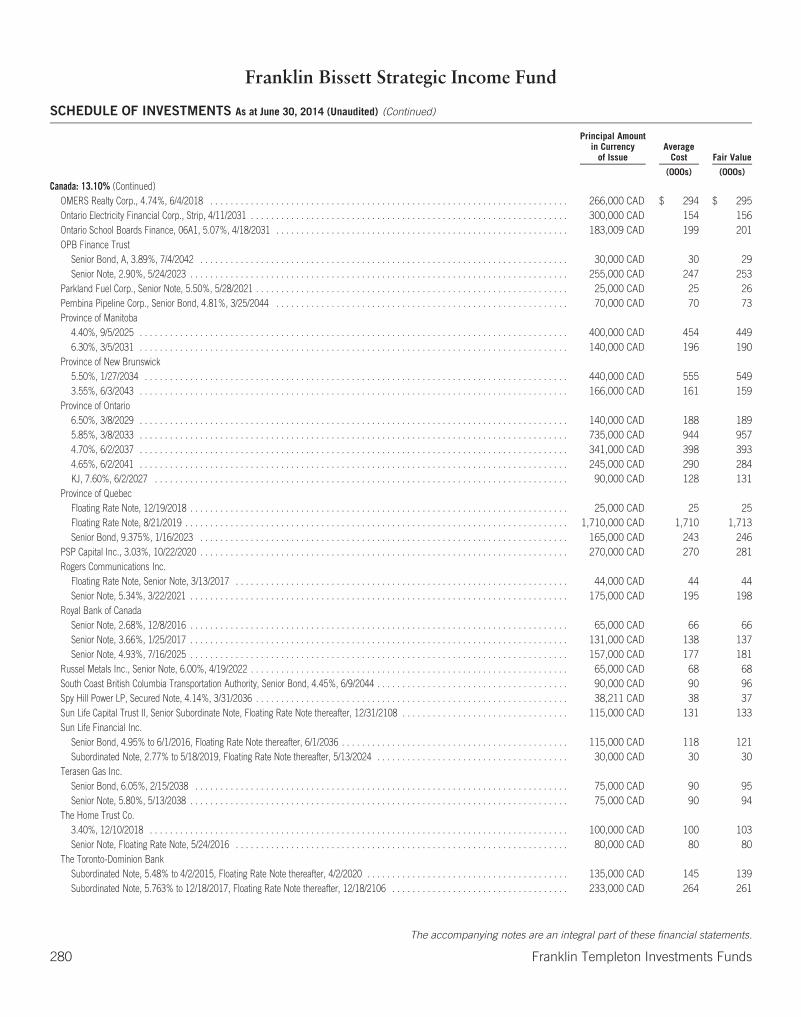
Franklin Bissett Strategic Income Fund
SCHEDULE OF INVESTMENTS As at June 30, 2014 (Unaudited) (Continued)
Principal Amountin Currency
of IssueAverage
Cost Fair Value
(000s) (000s)
Canada: 13.10% (Continued)OMERS Realty Corp., 4.74%, 6/4/2018 . . . . . . . . . . . . . . . . . . . . . . . . . . . . . . . . . . . . . . . . . . . . . . . . . . . . . . . . . . . . . . . . . . . . . . . 266,000 CAD $ 294 $ 295Ontario Electricity Financial Corp., Strip, 4/11/2031 . . . . . . . . . . . . . . . . . . . . . . . . . . . . . . . . . . . . . . . . . . . . . . . . . . . . . . . . . . . . . . . 300,000 CAD 154 156Ontario School Boards Finance, 06A1, 5.07%, 4/18/2031 . . . . . . . . . . . . . . . . . . . . . . . . . . . . . . . . . . . . . . . . . . . . . . . . . . . . . . . . . . 183,009 CAD 199 201OPB Finance Trust
Senior Bond, A, 3.89%, 7/4/2042 . . . . . . . . . . . . . . . . . . . . . . . . . . . . . . . . . . . . . . . . . . . . . . . . . . . . . . . . . . . . . . . . . . . . . . . . . 30,000 CAD 30 29Senior Note, 2.90%, 5/24/2023 . . . . . . . . . . . . . . . . . . . . . . . . . . . . . . . . . . . . . . . . . . . . . . . . . . . . . . . . . . . . . . . . . . . . . . . . . . . 255,000 CAD 247 253
Parkland Fuel Corp., Senior Note, 5.50%, 5/28/2021 . . . . . . . . . . . . . . . . . . . . . . . . . . . . . . . . . . . . . . . . . . . . . . . . . . . . . . . . . . . . . . 25,000 CAD 25 26Pembina Pipeline Corp., Senior Bond, 4.81%, 3/25/2044 . . . . . . . . . . . . . . . . . . . . . . . . . . . . . . . . . . . . . . . . . . . . . . . . . . . . . . . . . . 70,000 CAD 70 73Province of Manitoba
4.40%, 9/5/2025 . . . . . . . . . . . . . . . . . . . . . . . . . . . . . . . . . . . . . . . . . . . . . . . . . . . . . . . . . . . . . . . . . . . . . . . . . . . . . . . . . . . . . 400,000 CAD 454 4496.30%, 3/5/2031 . . . . . . . . . . . . . . . . . . . . . . . . . . . . . . . . . . . . . . . . . . . . . . . . . . . . . . . . . . . . . . . . . . . . . . . . . . . . . . . . . . . . . 140,000 CAD 196 190
Province of New Brunswick5.50%, 1/27/2034 . . . . . . . . . . . . . . . . . . . . . . . . . . . . . . . . . . . . . . . . . . . . . . . . . . . . . . . . . . . . . . . . . . . . . . . . . . . . . . . . . . . . 440,000 CAD 555 5493.55%, 6/3/2043 . . . . . . . . . . . . . . . . . . . . . . . . . . . . . . . . . . . . . . . . . . . . . . . . . . . . . . . . . . . . . . . . . . . . . . . . . . . . . . . . . . . . . 166,000 CAD 161 159
Province of Ontario6.50%, 3/8/2029 . . . . . . . . . . . . . . . . . . . . . . . . . . . . . . . . . . . . . . . . . . . . . . . . . . . . . . . . . . . . . . . . . . . . . . . . . . . . . . . . . . . . . 140,000 CAD 188 1895.85%, 3/8/2033 . . . . . . . . . . . . . . . . . . . . . . . . . . . . . . . . . . . . . . . . . . . . . . . . . . . . . . . . . . . . . . . . . . . . . . . . . . . . . . . . . . . . . 735,000 CAD 944 9574.70%, 6/2/2037 . . . . . . . . . . . . . . . . . . . . . . . . . . . . . . . . . . . . . . . . . . . . . . . . . . . . . . . . . . . . . . . . . . . . . . . . . . . . . . . . . . . . . 341,000 CAD 398 3934.65%, 6/2/2041 . . . . . . . . . . . . . . . . . . . . . . . . . . . . . . . . . . . . . . . . . . . . . . . . . . . . . . . . . . . . . . . . . . . . . . . . . . . . . . . . . . . . . 245,000 CAD 290 284KJ, 7.60%, 6/2/2027 . . . . . . . . . . . . . . . . . . . . . . . . . . . . . . . . . . . . . . . . . . . . . . . . . . . . . . . . . . . . . . . . . . . . . . . . . . . . . . . . . . 90,000 CAD 128 131
Province of QuebecFloating Rate Note, 12/19/2018 . . . . . . . . . . . . . . . . . . . . . . . . . . . . . . . . . . . . . . . . . . . . . . . . . . . . . . . . . . . . . . . . . . . . . . . . . . . 25,000 CAD 25 25Floating Rate Note, 8/21/2019 . . . . . . . . . . . . . . . . . . . . . . . . . . . . . . . . . . . . . . . . . . . . . . . . . . . . . . . . . . . . . . . . . . . . . . . . . . . . 1,710,000 CAD 1,710 1,713Senior Bond, 9.375%, 1/16/2023 . . . . . . . . . . . . . . . . . . . . . . . . . . . . . . . . . . . . . . . . . . . . . . . . . . . . . . . . . . . . . . . . . . . . . . . . . 165,000 CAD 243 246
PSP Capital Inc., 3.03%, 10/22/2020 . . . . . . . . . . . . . . . . . . . . . . . . . . . . . . . . . . . . . . . . . . . . . . . . . . . . . . . . . . . . . . . . . . . . . . . . . 270,000 CAD 270 281Rogers Communications Inc.
Floating Rate Note, Senior Note, 3/13/2017 . . . . . . . . . . . . . . . . . . . . . . . . . . . . . . . . . . . . . . . . . . . . . . . . . . . . . . . . . . . . . . . . . . 44,000 CAD 44 44Senior Note, 5.34%, 3/22/2021 . . . . . . . . . . . . . . . . . . . . . . . . . . . . . . . . . . . . . . . . . . . . . . . . . . . . . . . . . . . . . . . . . . . . . . . . . . . 175,000 CAD 195 198
Royal Bank of CanadaSenior Note, 2.68%, 12/8/2016 . . . . . . . . . . . . . . . . . . . . . . . . . . . . . . . . . . . . . . . . . . . . . . . . . . . . . . . . . . . . . . . . . . . . . . . . . . . 65,000 CAD 66 66Senior Note, 3.66%, 1/25/2017 . . . . . . . . . . . . . . . . . . . . . . . . . . . . . . . . . . . . . . . . . . . . . . . . . . . . . . . . . . . . . . . . . . . . . . . . . . . 131,000 CAD 138 137Senior Note, 4.93%, 7/16/2025 . . . . . . . . . . . . . . . . . . . . . . . . . . . . . . . . . . . . . . . . . . . . . . . . . . . . . . . . . . . . . . . . . . . . . . . . . . . 157,000 CAD 177 181
Russel Metals Inc., Senior Note, 6.00%, 4/19/2022 . . . . . . . . . . . . . . . . . . . . . . . . . . . . . . . . . . . . . . . . . . . . . . . . . . . . . . . . . . . . . . . 65,000 CAD 68 68South Coast British Columbia Transportation Authority, Senior Bond, 4.45%, 6/9/2044 . . . . . . . . . . . . . . . . . . . . . . . . . . . . . . . . . . . . . . 90,000 CAD 90 96Spy Hill Power LP, Secured Note, 4.14%, 3/31/2036 . . . . . . . . . . . . . . . . . . . . . . . . . . . . . . . . . . . . . . . . . . . . . . . . . . . . . . . . . . . . . . 38,211 CAD 38 37Sun Life Capital Trust II, Senior Subordinate Note, Floating Rate Note thereafter, 12/31/2108 . . . . . . . . . . . . . . . . . . . . . . . . . . . . . . . . . 115,000 CAD 131 133Sun Life Financial Inc.
Senior Bond, 4.95% to 6/1/2016, Floating Rate Note thereafter, 6/1/2036 . . . . . . . . . . . . . . . . . . . . . . . . . . . . . . . . . . . . . . . . . . . . . 115,000 CAD 118 121Subordinated Note, 2.77% to 5/18/2019, Floating Rate Note thereafter, 5/13/2024 . . . . . . . . . . . . . . . . . . . . . . . . . . . . . . . . . . . . . . 30,000 CAD 30 30
Terasen Gas Inc.Senior Bond, 6.05%, 2/15/2038 . . . . . . . . . . . . . . . . . . . . . . . . . . . . . . . . . . . . . . . . . . . . . . . . . . . . . . . . . . . . . . . . . . . . . . . . . . 75,000 CAD 90 95Senior Note, 5.80%, 5/13/2038 . . . . . . . . . . . . . . . . . . . . . . . . . . . . . . . . . . . . . . . . . . . . . . . . . . . . . . . . . . . . . . . . . . . . . . . . . . . 75,000 CAD 90 94
The Home Trust Co.3.40%, 12/10/2018 . . . . . . . . . . . . . . . . . . . . . . . . . . . . . . . . . . . . . . . . . . . . . . . . . . . . . . . . . . . . . . . . . . . . . . . . . . . . . . . . . . . 100,000 CAD 100 103Senior Note, Floating Rate Note, 5/24/2016 . . . . . . . . . . . . . . . . . . . . . . . . . . . . . . . . . . . . . . . . . . . . . . . . . . . . . . . . . . . . . . . . . . 80,000 CAD 80 80
The Toronto-Dominion BankSubordinated Note, 5.48% to 4/2/2015, Floating Rate Note thereafter, 4/2/2020 . . . . . . . . . . . . . . . . . . . . . . . . . . . . . . . . . . . . . . . . 135,000 CAD 145 139Subordinated Note, 5.763% to 12/18/2017, Floating Rate Note thereafter, 12/18/2106 . . . . . . . . . . . . . . . . . . . . . . . . . . . . . . . . . . . 233,000 CAD 264 261
The accompanying notes are an integral part of these financial statements.
280 Franklin Templeton Investments Funds
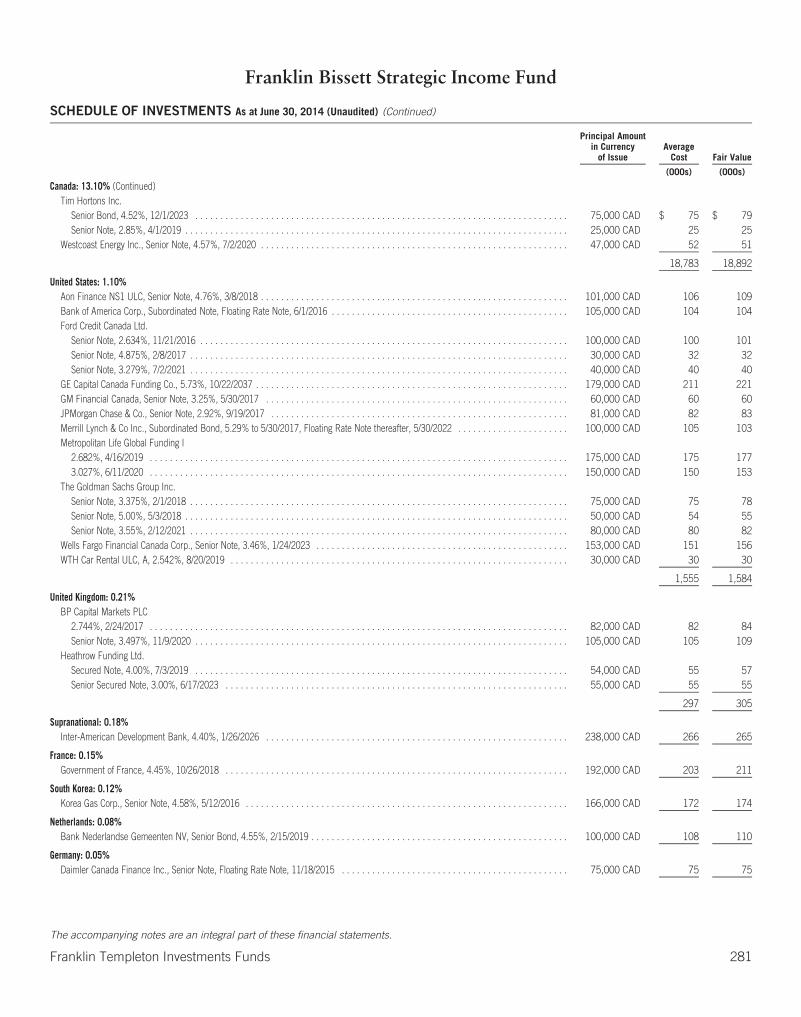
Franklin Bissett Strategic Income Fund
SCHEDULE OF INVESTMENTS As at June 30, 2014 (Unaudited) (Continued)
Principal Amountin Currency
of IssueAverage
Cost Fair Value
(000s) (000s)
Canada: 13.10% (Continued)Tim Hortons Inc.
Senior Bond, 4.52%, 12/1/2023 . . . . . . . . . . . . . . . . . . . . . . . . . . . . . . . . . . . . . . . . . . . . . . . . . . . . . . . . . . . . . . . . . . . . . . . . . . 75,000 CAD $ 75 $ 79Senior Note, 2.85%, 4/1/2019 . . . . . . . . . . . . . . . . . . . . . . . . . . . . . . . . . . . . . . . . . . . . . . . . . . . . . . . . . . . . . . . . . . . . . . . . . . . . 25,000 CAD 25 25
Westcoast Energy Inc., Senior Note, 4.57%, 7/2/2020 . . . . . . . . . . . . . . . . . . . . . . . . . . . . . . . . . . . . . . . . . . . . . . . . . . . . . . . . . . . . . 47,000 CAD 52 51
18,783 18,892
United States: 1.10%Aon Finance NS1 ULC, Senior Note, 4.76%, 3/8/2018 . . . . . . . . . . . . . . . . . . . . . . . . . . . . . . . . . . . . . . . . . . . . . . . . . . . . . . . . . . . . . 101,000 CAD 106 109Bank of America Corp., Subordinated Note, Floating Rate Note, 6/1/2016 . . . . . . . . . . . . . . . . . . . . . . . . . . . . . . . . . . . . . . . . . . . . . . . 105,000 CAD 104 104Ford Credit Canada Ltd.
Senior Note, 2.634%, 11/21/2016 . . . . . . . . . . . . . . . . . . . . . . . . . . . . . . . . . . . . . . . . . . . . . . . . . . . . . . . . . . . . . . . . . . . . . . . . . 100,000 CAD 100 101Senior Note, 4.875%, 2/8/2017 . . . . . . . . . . . . . . . . . . . . . . . . . . . . . . . . . . . . . . . . . . . . . . . . . . . . . . . . . . . . . . . . . . . . . . . . . . . 30,000 CAD 32 32Senior Note, 3.279%, 7/2/2021 . . . . . . . . . . . . . . . . . . . . . . . . . . . . . . . . . . . . . . . . . . . . . . . . . . . . . . . . . . . . . . . . . . . . . . . . . . . 40,000 CAD 40 40
GE Capital Canada Funding Co., 5.73%, 10/22/2037 . . . . . . . . . . . . . . . . . . . . . . . . . . . . . . . . . . . . . . . . . . . . . . . . . . . . . . . . . . . . . . 179,000 CAD 211 221GM Financial Canada, Senior Note, 3.25%, 5/30/2017 . . . . . . . . . . . . . . . . . . . . . . . . . . . . . . . . . . . . . . . . . . . . . . . . . . . . . . . . . . . . 60,000 CAD 60 60JPMorgan Chase & Co., Senior Note, 2.92%, 9/19/2017 . . . . . . . . . . . . . . . . . . . . . . . . . . . . . . . . . . . . . . . . . . . . . . . . . . . . . . . . . . . 81,000 CAD 82 83Merrill Lynch & Co Inc., Subordinated Bond, 5.29% to 5/30/2017, Floating Rate Note thereafter, 5/30/2022 . . . . . . . . . . . . . . . . . . . . . . 100,000 CAD 105 103Metropolitan Life Global Funding I
2.682%, 4/16/2019 . . . . . . . . . . . . . . . . . . . . . . . . . . . . . . . . . . . . . . . . . . . . . . . . . . . . . . . . . . . . . . . . . . . . . . . . . . . . . . . . . . . 175,000 CAD 175 1773.027%, 6/11/2020 . . . . . . . . . . . . . . . . . . . . . . . . . . . . . . . . . . . . . . . . . . . . . . . . . . . . . . . . . . . . . . . . . . . . . . . . . . . . . . . . . . . 150,000 CAD 150 153
The Goldman Sachs Group Inc.Senior Note, 3.375%, 2/1/2018 . . . . . . . . . . . . . . . . . . . . . . . . . . . . . . . . . . . . . . . . . . . . . . . . . . . . . . . . . . . . . . . . . . . . . . . . . . . 75,000 CAD 75 78Senior Note, 5.00%, 5/3/2018 . . . . . . . . . . . . . . . . . . . . . . . . . . . . . . . . . . . . . . . . . . . . . . . . . . . . . . . . . . . . . . . . . . . . . . . . . . . . 50,000 CAD 54 55Senior Note, 3.55%, 2/12/2021 . . . . . . . . . . . . . . . . . . . . . . . . . . . . . . . . . . . . . . . . . . . . . . . . . . . . . . . . . . . . . . . . . . . . . . . . . . . 80,000 CAD 80 82
Wells Fargo Financial Canada Corp., Senior Note, 3.46%, 1/24/2023 . . . . . . . . . . . . . . . . . . . . . . . . . . . . . . . . . . . . . . . . . . . . . . . . . . 153,000 CAD 151 156WTH Car Rental ULC, A, 2.542%, 8/20/2019 . . . . . . . . . . . . . . . . . . . . . . . . . . . . . . . . . . . . . . . . . . . . . . . . . . . . . . . . . . . . . . . . . . . 30,000 CAD 30 30
1,555 1,584
United Kingdom: 0.21%BP Capital Markets PLC
2.744%, 2/24/2017 . . . . . . . . . . . . . . . . . . . . . . . . . . . . . . . . . . . . . . . . . . . . . . . . . . . . . . . . . . . . . . . . . . . . . . . . . . . . . . . . . . . 82,000 CAD 82 84Senior Note, 3.497%, 11/9/2020 . . . . . . . . . . . . . . . . . . . . . . . . . . . . . . . . . . . . . . . . . . . . . . . . . . . . . . . . . . . . . . . . . . . . . . . . . . 105,000 CAD 105 109
Heathrow Funding Ltd.Secured Note, 4.00%, 7/3/2019 . . . . . . . . . . . . . . . . . . . . . . . . . . . . . . . . . . . . . . . . . . . . . . . . . . . . . . . . . . . . . . . . . . . . . . . . . . 54,000 CAD 55 57Senior Secured Note, 3.00%, 6/17/2023 . . . . . . . . . . . . . . . . . . . . . . . . . . . . . . . . . . . . . . . . . . . . . . . . . . . . . . . . . . . . . . . . . . . . 55,000 CAD 55 55
297 305
Supranational: 0.18%Inter-American Development Bank, 4.40%, 1/26/2026 . . . . . . . . . . . . . . . . . . . . . . . . . . . . . . . . . . . . . . . . . . . . . . . . . . . . . . . . . . . . 238,000 CAD 266 265
France: 0.15%Government of France, 4.45%, 10/26/2018 . . . . . . . . . . . . . . . . . . . . . . . . . . . . . . . . . . . . . . . . . . . . . . . . . . . . . . . . . . . . . . . . . . . . 192,000 CAD 203 211
South Korea: 0.12%Korea Gas Corp., Senior Note, 4.58%, 5/12/2016 . . . . . . . . . . . . . . . . . . . . . . . . . . . . . . . . . . . . . . . . . . . . . . . . . . . . . . . . . . . . . . . . 166,000 CAD 172 174
Netherlands: 0.08%Bank Nederlandse Gemeenten NV, Senior Bond, 4.55%, 2/15/2019 . . . . . . . . . . . . . . . . . . . . . . . . . . . . . . . . . . . . . . . . . . . . . . . . . . . 100,000 CAD 108 110
Germany: 0.05%Daimler Canada Finance Inc., Senior Note, Floating Rate Note, 11/18/2015 . . . . . . . . . . . . . . . . . . . . . . . . . . . . . . . . . . . . . . . . . . . . . 75,000 CAD 75 75
The accompanying notes are an integral part of these financial statements.
Franklin Templeton Investments Funds 281
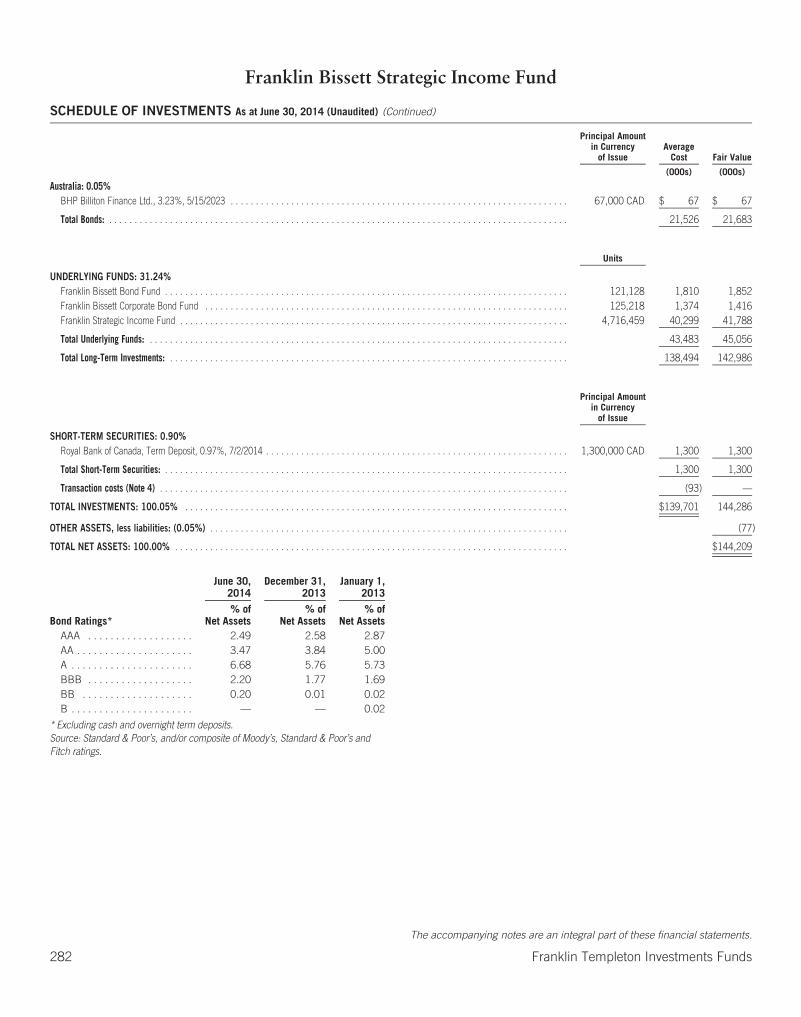
Franklin Bissett Strategic Income Fund
SCHEDULE OF INVESTMENTS As at June 30, 2014 (Unaudited) (Continued)
Principal Amountin Currency
of IssueAverage
Cost Fair Value
(000s) (000s)
Australia: 0.05%BHP Billiton Finance Ltd., 3.23%, 5/15/2023 . . . . . . . . . . . . . . . . . . . . . . . . . . . . . . . . . . . . . . . . . . . . . . . . . . . . . . . . . . . . . . . . . . . 67,000 CAD $ 67 $ 67
Total Bonds: . . . . . . . . . . . . . . . . . . . . . . . . . . . . . . . . . . . . . . . . . . . . . . . . . . . . . . . . . . . . . . . . . . . . . . . . . . . . . . . . . . . . . . . . . . . 21,526 21,683
Units
UNDERLYING FUNDS: 31.24%Franklin Bissett Bond Fund . . . . . . . . . . . . . . . . . . . . . . . . . . . . . . . . . . . . . . . . . . . . . . . . . . . . . . . . . . . . . . . . . . . . . . . . . . . . . . . . 121,128 1,810 1,852Franklin Bissett Corporate Bond Fund . . . . . . . . . . . . . . . . . . . . . . . . . . . . . . . . . . . . . . . . . . . . . . . . . . . . . . . . . . . . . . . . . . . . . . . . 125,218 1,374 1,416Franklin Strategic Income Fund . . . . . . . . . . . . . . . . . . . . . . . . . . . . . . . . . . . . . . . . . . . . . . . . . . . . . . . . . . . . . . . . . . . . . . . . . . . . . 4,716,459 40,299 41,788
Total Underlying Funds: . . . . . . . . . . . . . . . . . . . . . . . . . . . . . . . . . . . . . . . . . . . . . . . . . . . . . . . . . . . . . . . . . . . . . . . . . . . . . . . . . . . 43,483 45,056
Total Long-Term Investments: . . . . . . . . . . . . . . . . . . . . . . . . . . . . . . . . . . . . . . . . . . . . . . . . . . . . . . . . . . . . . . . . . . . . . . . . . . . . . . . 138,494 142,986
Principal Amountin Currency
of Issue
SHORT-TERM SECURITIES: 0.90%Royal Bank of Canada, Term Deposit, 0.97%, 7/2/2014 . . . . . . . . . . . . . . . . . . . . . . . . . . . . . . . . . . . . . . . . . . . . . . . . . . . . . . . . . . . . 1,300,000 CAD 1,300 1,300
Total Short-Term Securities: . . . . . . . . . . . . . . . . . . . . . . . . . . . . . . . . . . . . . . . . . . . . . . . . . . . . . . . . . . . . . . . . . . . . . . . . . . . . . . . . 1,300 1,300
Transaction costs (Note 4) . . . . . . . . . . . . . . . . . . . . . . . . . . . . . . . . . . . . . . . . . . . . . . . . . . . . . . . . . . . . . . . . . . . . . . . . . . . . . . . . . (93) —
TOTAL INVESTMENTS: 100.05% . . . . . . . . . . . . . . . . . . . . . . . . . . . . . . . . . . . . . . . . . . . . . . . . . . . . . . . . . . . . . . . . . . . . . . . . . . . . $139,701 144,286
OTHER ASSETS, less liabilities: (0.05%) . . . . . . . . . . . . . . . . . . . . . . . . . . . . . . . . . . . . . . . . . . . . . . . . . . . . . . . . . . . . . . . . . . . . . . . (77)
TOTAL NET ASSETS: 100.00% . . . . . . . . . . . . . . . . . . . . . . . . . . . . . . . . . . . . . . . . . . . . . . . . . . . . . . . . . . . . . . . . . . . . . . . . . . . . . . $144,209
June 30,2014
December 31,2013
January 1,2013
Bond Ratings*% of
Net Assets% of
Net Assets% of
Net AssetsAAA . . . . . . . . . . . . . . . . . . . 2.49 2.58 2.87AA . . . . . . . . . . . . . . . . . . . . . 3.47 3.84 5.00A . . . . . . . . . . . . . . . . . . . . . . 6.68 5.76 5.73BBB . . . . . . . . . . . . . . . . . . . 2.20 1.77 1.69BB . . . . . . . . . . . . . . . . . . . . 0.20 0.01 0.02B . . . . . . . . . . . . . . . . . . . . . . — — 0.02
* Excluding cash and overnight term deposits.Source: Standard & Poor’s, and/or composite of Moody’s, Standard & Poor’s andFitch ratings.
The accompanying notes are an integral part of these financial statements.
282 Franklin Templeton Investments Funds

Franklin Bissett Strategic Income Fund
STATEMENTS OF FINANCIAL POSITION (Unaudited)
As atJune 30,
2014
As atDecember 31,
2013
As atJanuary 1,
2013
(000s) (000s) (000s)AssetsCurrent assetsInvestments at fair value through profit or loss $ 144,286 $ 136,023 $ 80,523Cash
Canadian 114 77 2Receivables
Investment securities sold 772 51 —Subscription of redeemable units 83 13 180Dividends and interest 853 589 387
Other assets (Note 6(g)) — 56 26
Total assets 146,108 136,809 81,118
LiabilitiesCurrent liabilitiesPayables
Investment securities purchased 1,067 236 41Redemption of redeemable units 98 41 1Management fees 231 223 129Fixed administration fees 24 — —Accrued expenses — 112 57
Distributions to unitholders 479 — —
Total liabilities 1,899 612 228
Net assets attributable to holders of redeemable units $ 144,209 $ 136,197 $ 80,890
Represented by:Net assets as previously reported under Canadian GAAP — 135,987 80,737Revaluation of investments at fair value through profit or loss (Note 3(c)) — 210 153
Net assets attributable to holders of redeemable units $ 144,209 $ 136,197 $ 80,890
Net assets attributable to holders of redeemable units per series (000s)Series A $ 131,755 $ 128,869 $ 76,784Series F 4,075 3,692 2,328Series I 3,673 1,859 907Series O 4,706 1,777 871
Number of redeemable units outstanding (Note 5)Series A 11,660,737 11,688,249 7,202,478Series F 350,688 327,409 215,915Series I 320,459 166,632 84,564Series O 393,411 153,980 79,849
Net assets attributable to holders of redeemable units per unit — CADSeries A $ 11.30 $ 11.03 $ 10.66Series F 11.62 11.28 10.78Series I 11.46 11.16 10.72Series O 11.96 11.54 10.91
Net assets attributable to holders of redeemable units per unit — USDSeries A $ 10.60 $ 10.38 $ 10.73Series F 10.90 10.62 10.85Series I 10.75 10.51 10.79Series O 11.21 10.86 10.98
Cost of investments held (000s) $ 139,701 $ 132,620 $ 79,985
The accompanying notes are an integral part of these financial statements.
Franklin Templeton Investments Funds 283
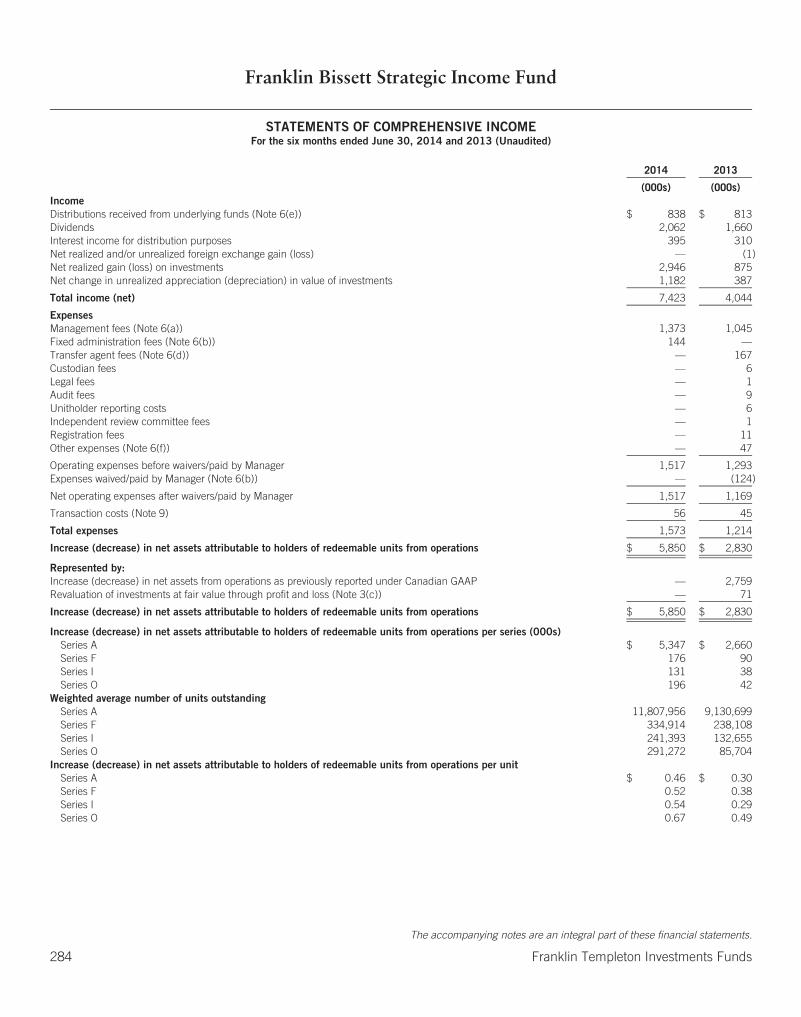
Franklin Bissett Strategic Income Fund
STATEMENTS OF COMPREHENSIVE INCOMEFor the six months ended June 30, 2014 and 2013 (Unaudited)
2014 2013
(000s) (000s)IncomeDistributions received from underlying funds (Note 6(e)) $ 838 $ 813Dividends 2,062 1,660Interest income for distribution purposes 395 310Net realized and/or unrealized foreign exchange gain (loss) — (1)Net realized gain (loss) on investments 2,946 875Net change in unrealized appreciation (depreciation) in value of investments 1,182 387
Total income (net) 7,423 4,044
ExpensesManagement fees (Note 6(a)) 1,373 1,045Fixed administration fees (Note 6(b)) 144 —Transfer agent fees (Note 6(d)) — 167Custodian fees — 6Legal fees — 1Audit fees — 9Unitholder reporting costs — 6Independent review committee fees — 1Registration fees — 11Other expenses (Note 6(f)) — 47
Operating expenses before waivers/paid by Manager 1,517 1,293Expenses waived/paid by Manager (Note 6(b)) — (124)
Net operating expenses after waivers/paid by Manager 1,517 1,169
Transaction costs (Note 9) 56 45
Total expenses 1,573 1,214
Increase (decrease) in net assets attributable to holders of redeemable units from operations $ 5,850 $ 2,830
Represented by:Increase (decrease) in net assets from operations as previously reported under Canadian GAAP — 2,759Revaluation of investments at fair value through profit and loss (Note 3(c)) — 71
Increase (decrease) in net assets attributable to holders of redeemable units from operations $ 5,850 $ 2,830
Increase (decrease) in net assets attributable to holders of redeemable units from operations per series (000s)Series A $ 5,347 $ 2,660Series F 176 90Series I 131 38Series O 196 42
Weighted average number of units outstandingSeries A 11,807,956 9,130,699Series F 334,914 238,108Series I 241,393 132,655Series O 291,272 85,704
Increase (decrease) in net assets attributable to holders of redeemable units from operations per unitSeries A $ 0.46 $ 0.30Series F 0.52 0.38Series I 0.54 0.29Series O 0.67 0.49
The accompanying notes are an integral part of these financial statements.
284 Franklin Templeton Investments Funds
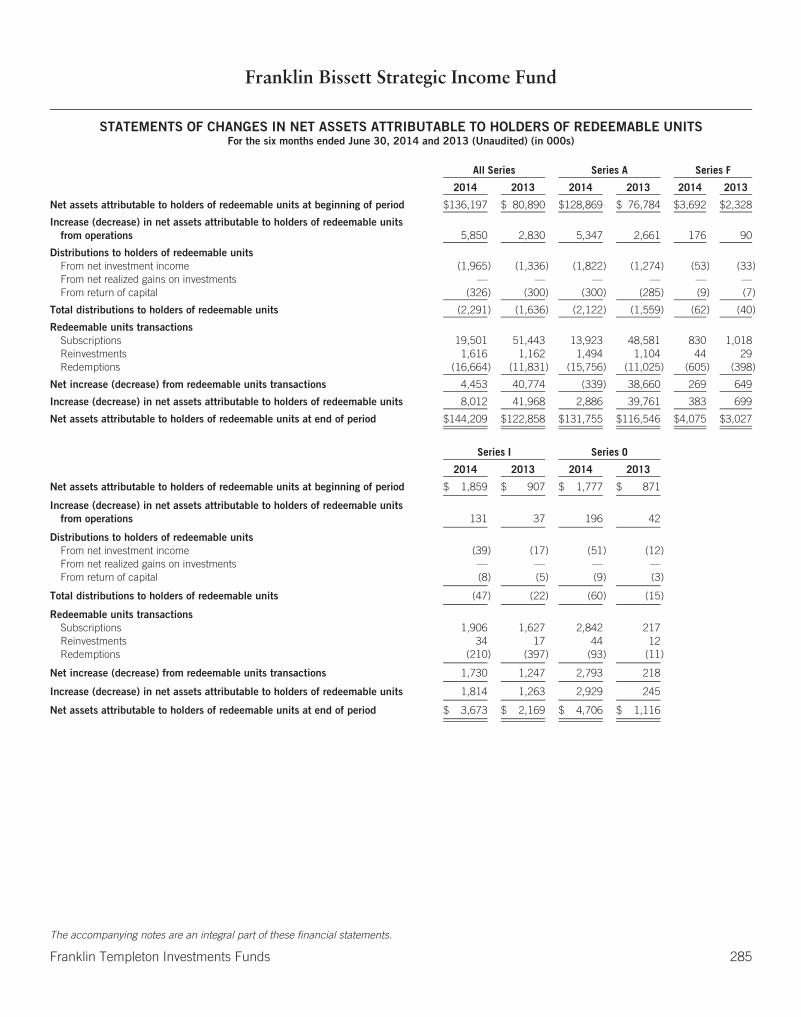
Franklin Bissett Strategic Income Fund
STATEMENTS OF CHANGES IN NET ASSETS ATTRIBUTABLE TO HOLDERS OF REDEEMABLE UNITSFor the six months ended June 30, 2014 and 2013 (Unaudited) (in 000s)
All Series Series A Series F
2014 2013 2014 2013 2014 2013
Net assets attributable to holders of redeemable units at beginning of period $136,197 $ 80,890 $128,869 $ 76,784 $3,692 $2,328
Increase (decrease) in net assets attributable to holders of redeemable unitsfrom operations 5,850 2,830 5,347 2,661 176 90
Distributions to holders of redeemable unitsFrom net investment income (1,965) (1,336) (1,822) (1,274) (53) (33)From net realized gains on investments — — — — — —From return of capital (326) (300) (300) (285) (9) (7)
Total distributions to holders of redeemable units (2,291) (1,636) (2,122) (1,559) (62) (40)
Redeemable units transactionsSubscriptions 19,501 51,443 13,923 48,581 830 1,018Reinvestments 1,616 1,162 1,494 1,104 44 29Redemptions (16,664) (11,831) (15,756) (11,025) (605) (398)
Net increase (decrease) from redeemable units transactions 4,453 40,774 (339) 38,660 269 649
Increase (decrease) in net assets attributable to holders of redeemable units 8,012 41,968 2,886 39,761 383 699
Net assets attributable to holders of redeemable units at end of period $144,209 $122,858 $131,755 $116,546 $4,075 $3,027
Series I Series O
2014 2013 2014 2013
Net assets attributable to holders of redeemable units at beginning of period $ 1,859 $ 907 $ 1,777 $ 871
Increase (decrease) in net assets attributable to holders of redeemable unitsfrom operations 131 37 196 42
Distributions to holders of redeemable unitsFrom net investment income (39) (17) (51) (12)From net realized gains on investments — — — —From return of capital (8) (5) (9) (3)
Total distributions to holders of redeemable units (47) (22) (60) (15)
Redeemable units transactionsSubscriptions 1,906 1,627 2,842 217Reinvestments 34 17 44 12Redemptions (210) (397) (93) (11)
Net increase (decrease) from redeemable units transactions 1,730 1,247 2,793 218
Increase (decrease) in net assets attributable to holders of redeemable units 1,814 1,263 2,929 245
Net assets attributable to holders of redeemable units at end of period $ 3,673 $ 2,169 $ 4,706 $ 1,116
The accompanying notes are an integral part of these financial statements.
Franklin Templeton Investments Funds 285

Franklin Bissett Strategic Income Fund
STATEMENTS OF CASH FLOWSFor the six months ended June 30, 2014 and 2013 (Unaudited)
2014 2013
(000s) (000s)Cash flows from operating activitiesInterest received $ 375 $ 336Dividends received 2,507 1,686Proceeds from sale and maturity of investments 25,382 19,609Purchases of investments (29,313) (60,032)Operating expenses paid (1,541) (1,100)
Net cash from/(used in) operating activities (2,590) (39,501)
Cash flows from financing activitiesProceeds from issuances of redeemable units 19,430 51,436Amounts paid on redemption of redeemable units (16,607) (11,748)Distributions paid to holders of redeemable units, net of reinvested distributions (196) (163)
Net cash (used in)/from financing activities 2,627 39,525
Net increase (decrease) in cash 37 24Cash at beginning of year 77 2Effect of exchange rate changes — (1)
Cash at end of period $ 114 $ 25
The accompanying notes are an integral part of these financial statements.
286 Franklin Templeton Investments Funds
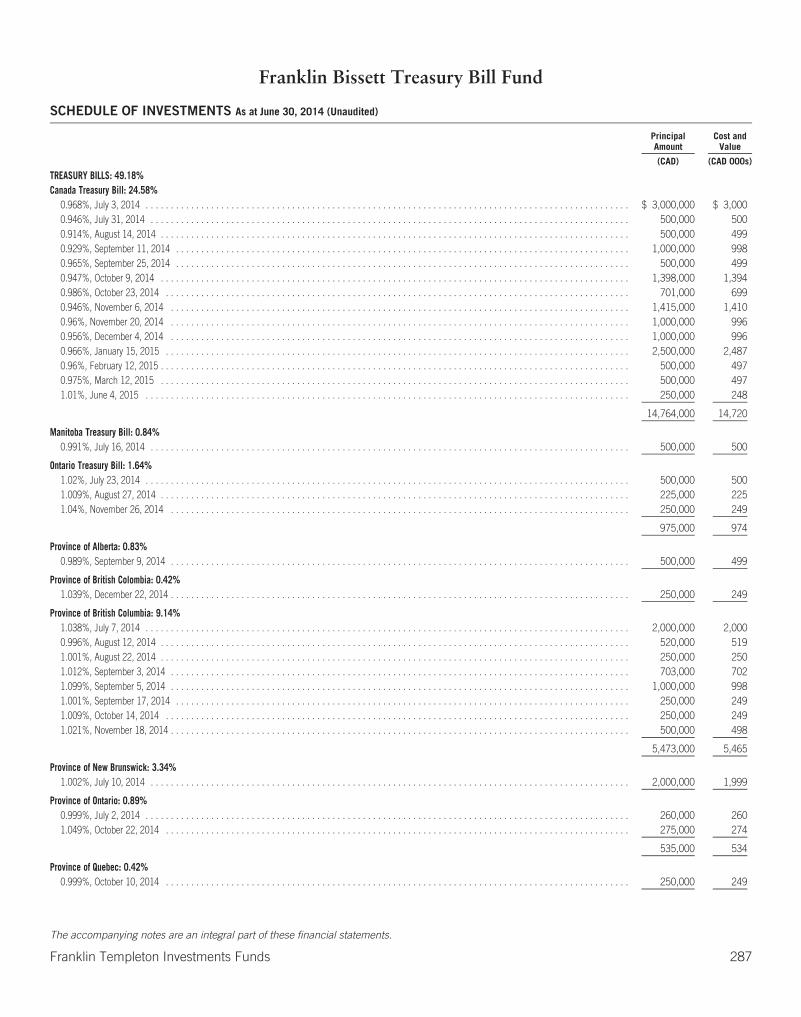
Franklin Bissett Treasury Bill Fund
SCHEDULE OF INVESTMENTS As at June 30, 2014 (Unaudited)
PrincipalAmount
Cost andValue
(CAD) (CAD 000s)
TREASURY BILLS: 49.18%Canada Treasury Bill: 24.58%
0.968%, July 3, 2014 . . . . . . . . . . . . . . . . . . . . . . . . . . . . . . . . . . . . . . . . . . . . . . . . . . . . . . . . . . . . . . . . . . . . . . . . . . . . . . . . . . . . . . . . . . . . . . . . $ 3,000,000 $ 3,0000.946%, July 31, 2014 . . . . . . . . . . . . . . . . . . . . . . . . . . . . . . . . . . . . . . . . . . . . . . . . . . . . . . . . . . . . . . . . . . . . . . . . . . . . . . . . . . . . . . . . . . . . . . . 500,000 5000.914%, August 14, 2014 . . . . . . . . . . . . . . . . . . . . . . . . . . . . . . . . . . . . . . . . . . . . . . . . . . . . . . . . . . . . . . . . . . . . . . . . . . . . . . . . . . . . . . . . . . . . . 500,000 4990.929%, September 11, 2014 . . . . . . . . . . . . . . . . . . . . . . . . . . . . . . . . . . . . . . . . . . . . . . . . . . . . . . . . . . . . . . . . . . . . . . . . . . . . . . . . . . . . . . . . . . 1,000,000 9980.965%, September 25, 2014 . . . . . . . . . . . . . . . . . . . . . . . . . . . . . . . . . . . . . . . . . . . . . . . . . . . . . . . . . . . . . . . . . . . . . . . . . . . . . . . . . . . . . . . . . . 500,000 4990.947%, October 9, 2014 . . . . . . . . . . . . . . . . . . . . . . . . . . . . . . . . . . . . . . . . . . . . . . . . . . . . . . . . . . . . . . . . . . . . . . . . . . . . . . . . . . . . . . . . . . . . . 1,398,000 1,3940.986%, October 23, 2014 . . . . . . . . . . . . . . . . . . . . . . . . . . . . . . . . . . . . . . . . . . . . . . . . . . . . . . . . . . . . . . . . . . . . . . . . . . . . . . . . . . . . . . . . . . . . 701,000 6990.946%, November 6, 2014 . . . . . . . . . . . . . . . . . . . . . . . . . . . . . . . . . . . . . . . . . . . . . . . . . . . . . . . . . . . . . . . . . . . . . . . . . . . . . . . . . . . . . . . . . . . 1,415,000 1,4100.96%, November 20, 2014 . . . . . . . . . . . . . . . . . . . . . . . . . . . . . . . . . . . . . . . . . . . . . . . . . . . . . . . . . . . . . . . . . . . . . . . . . . . . . . . . . . . . . . . . . . . 1,000,000 9960.956%, December 4, 2014 . . . . . . . . . . . . . . . . . . . . . . . . . . . . . . . . . . . . . . . . . . . . . . . . . . . . . . . . . . . . . . . . . . . . . . . . . . . . . . . . . . . . . . . . . . . 1,000,000 9960.966%, January 15, 2015 . . . . . . . . . . . . . . . . . . . . . . . . . . . . . . . . . . . . . . . . . . . . . . . . . . . . . . . . . . . . . . . . . . . . . . . . . . . . . . . . . . . . . . . . . . . . 2,500,000 2,4870.96%, February 12, 2015 . . . . . . . . . . . . . . . . . . . . . . . . . . . . . . . . . . . . . . . . . . . . . . . . . . . . . . . . . . . . . . . . . . . . . . . . . . . . . . . . . . . . . . . . . . . . . 500,000 4970.975%, March 12, 2015 . . . . . . . . . . . . . . . . . . . . . . . . . . . . . . . . . . . . . . . . . . . . . . . . . . . . . . . . . . . . . . . . . . . . . . . . . . . . . . . . . . . . . . . . . . . . . 500,000 4971.01%, June 4, 2015 . . . . . . . . . . . . . . . . . . . . . . . . . . . . . . . . . . . . . . . . . . . . . . . . . . . . . . . . . . . . . . . . . . . . . . . . . . . . . . . . . . . . . . . . . . . . . . . . 250,000 248
14,764,000 14,720
Manitoba Treasury Bill: 0.84%0.991%, July 16, 2014 . . . . . . . . . . . . . . . . . . . . . . . . . . . . . . . . . . . . . . . . . . . . . . . . . . . . . . . . . . . . . . . . . . . . . . . . . . . . . . . . . . . . . . . . . . . . . . . 500,000 500
Ontario Treasury Bill: 1.64%1.02%, July 23, 2014 . . . . . . . . . . . . . . . . . . . . . . . . . . . . . . . . . . . . . . . . . . . . . . . . . . . . . . . . . . . . . . . . . . . . . . . . . . . . . . . . . . . . . . . . . . . . . . . . 500,000 5001.009%, August 27, 2014 . . . . . . . . . . . . . . . . . . . . . . . . . . . . . . . . . . . . . . . . . . . . . . . . . . . . . . . . . . . . . . . . . . . . . . . . . . . . . . . . . . . . . . . . . . . . . 225,000 2251.04%, November 26, 2014 . . . . . . . . . . . . . . . . . . . . . . . . . . . . . . . . . . . . . . . . . . . . . . . . . . . . . . . . . . . . . . . . . . . . . . . . . . . . . . . . . . . . . . . . . . . 250,000 249
975,000 974
Province of Alberta: 0.83%0.989%, September 9, 2014 . . . . . . . . . . . . . . . . . . . . . . . . . . . . . . . . . . . . . . . . . . . . . . . . . . . . . . . . . . . . . . . . . . . . . . . . . . . . . . . . . . . . . . . . . . . 500,000 499
Province of British Colombia: 0.42%1.039%, December 22, 2014 . . . . . . . . . . . . . . . . . . . . . . . . . . . . . . . . . . . . . . . . . . . . . . . . . . . . . . . . . . . . . . . . . . . . . . . . . . . . . . . . . . . . . . . . . . . 250,000 249
Province of British Columbia: 9.14%1.038%, July 7, 2014 . . . . . . . . . . . . . . . . . . . . . . . . . . . . . . . . . . . . . . . . . . . . . . . . . . . . . . . . . . . . . . . . . . . . . . . . . . . . . . . . . . . . . . . . . . . . . . . . 2,000,000 2,0000.996%, August 12, 2014 . . . . . . . . . . . . . . . . . . . . . . . . . . . . . . . . . . . . . . . . . . . . . . . . . . . . . . . . . . . . . . . . . . . . . . . . . . . . . . . . . . . . . . . . . . . . . 520,000 5191.001%, August 22, 2014 . . . . . . . . . . . . . . . . . . . . . . . . . . . . . . . . . . . . . . . . . . . . . . . . . . . . . . . . . . . . . . . . . . . . . . . . . . . . . . . . . . . . . . . . . . . . . 250,000 2501.012%, September 3, 2014 . . . . . . . . . . . . . . . . . . . . . . . . . . . . . . . . . . . . . . . . . . . . . . . . . . . . . . . . . . . . . . . . . . . . . . . . . . . . . . . . . . . . . . . . . . . 703,000 7021.099%, September 5, 2014 . . . . . . . . . . . . . . . . . . . . . . . . . . . . . . . . . . . . . . . . . . . . . . . . . . . . . . . . . . . . . . . . . . . . . . . . . . . . . . . . . . . . . . . . . . . 1,000,000 9981.001%, September 17, 2014 . . . . . . . . . . . . . . . . . . . . . . . . . . . . . . . . . . . . . . . . . . . . . . . . . . . . . . . . . . . . . . . . . . . . . . . . . . . . . . . . . . . . . . . . . . 250,000 2491.009%, October 14, 2014 . . . . . . . . . . . . . . . . . . . . . . . . . . . . . . . . . . . . . . . . . . . . . . . . . . . . . . . . . . . . . . . . . . . . . . . . . . . . . . . . . . . . . . . . . . . . 250,000 2491.021%, November 18, 2014 . . . . . . . . . . . . . . . . . . . . . . . . . . . . . . . . . . . . . . . . . . . . . . . . . . . . . . . . . . . . . . . . . . . . . . . . . . . . . . . . . . . . . . . . . . . 500,000 498
5,473,000 5,465
Province of New Brunswick: 3.34%1.002%, July 10, 2014 . . . . . . . . . . . . . . . . . . . . . . . . . . . . . . . . . . . . . . . . . . . . . . . . . . . . . . . . . . . . . . . . . . . . . . . . . . . . . . . . . . . . . . . . . . . . . . . 2,000,000 1,999
Province of Ontario: 0.89%0.999%, July 2, 2014 . . . . . . . . . . . . . . . . . . . . . . . . . . . . . . . . . . . . . . . . . . . . . . . . . . . . . . . . . . . . . . . . . . . . . . . . . . . . . . . . . . . . . . . . . . . . . . . . 260,000 2601.049%, October 22, 2014 . . . . . . . . . . . . . . . . . . . . . . . . . . . . . . . . . . . . . . . . . . . . . . . . . . . . . . . . . . . . . . . . . . . . . . . . . . . . . . . . . . . . . . . . . . . . 275,000 274
535,000 534
Province of Quebec: 0.42%0.999%, October 10, 2014 . . . . . . . . . . . . . . . . . . . . . . . . . . . . . . . . . . . . . . . . . . . . . . . . . . . . . . . . . . . . . . . . . . . . . . . . . . . . . . . . . . . . . . . . . . . . 250,000 249
The accompanying notes are an integral part of these financial statements.
Franklin Templeton Investments Funds 287
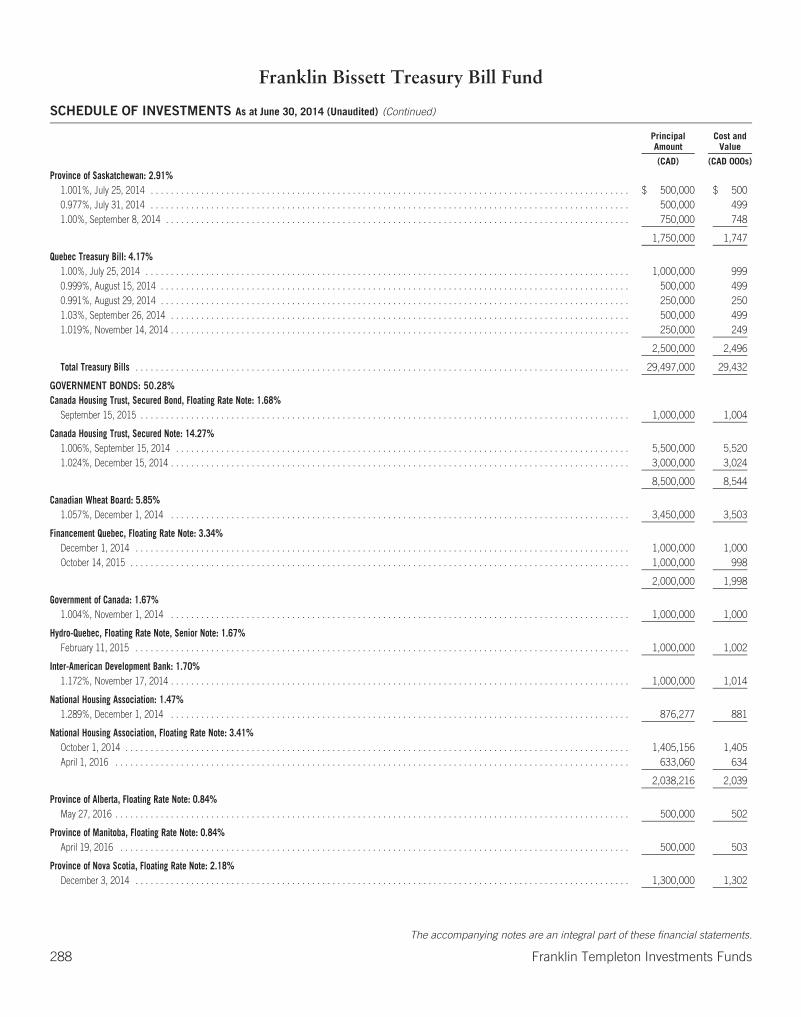
Franklin Bissett Treasury Bill Fund
SCHEDULE OF INVESTMENTS As at June 30, 2014 (Unaudited) (Continued)
PrincipalAmount
Cost andValue
(CAD) (CAD 000s)
Province of Saskatchewan: 2.91%1.001%, July 25, 2014 . . . . . . . . . . . . . . . . . . . . . . . . . . . . . . . . . . . . . . . . . . . . . . . . . . . . . . . . . . . . . . . . . . . . . . . . . . . . . . . . . . . . . . . . . . . . . . . $ 500,000 $ 5000.977%, July 31, 2014 . . . . . . . . . . . . . . . . . . . . . . . . . . . . . . . . . . . . . . . . . . . . . . . . . . . . . . . . . . . . . . . . . . . . . . . . . . . . . . . . . . . . . . . . . . . . . . . 500,000 4991.00%, September 8, 2014 . . . . . . . . . . . . . . . . . . . . . . . . . . . . . . . . . . . . . . . . . . . . . . . . . . . . . . . . . . . . . . . . . . . . . . . . . . . . . . . . . . . . . . . . . . . . 750,000 748
1,750,000 1,747
Quebec Treasury Bill: 4.17%1.00%, July 25, 2014 . . . . . . . . . . . . . . . . . . . . . . . . . . . . . . . . . . . . . . . . . . . . . . . . . . . . . . . . . . . . . . . . . . . . . . . . . . . . . . . . . . . . . . . . . . . . . . . . 1,000,000 9990.999%, August 15, 2014 . . . . . . . . . . . . . . . . . . . . . . . . . . . . . . . . . . . . . . . . . . . . . . . . . . . . . . . . . . . . . . . . . . . . . . . . . . . . . . . . . . . . . . . . . . . . . 500,000 4990.991%, August 29, 2014 . . . . . . . . . . . . . . . . . . . . . . . . . . . . . . . . . . . . . . . . . . . . . . . . . . . . . . . . . . . . . . . . . . . . . . . . . . . . . . . . . . . . . . . . . . . . . 250,000 2501.03%, September 26, 2014 . . . . . . . . . . . . . . . . . . . . . . . . . . . . . . . . . . . . . . . . . . . . . . . . . . . . . . . . . . . . . . . . . . . . . . . . . . . . . . . . . . . . . . . . . . . 500,000 4991.019%, November 14, 2014 . . . . . . . . . . . . . . . . . . . . . . . . . . . . . . . . . . . . . . . . . . . . . . . . . . . . . . . . . . . . . . . . . . . . . . . . . . . . . . . . . . . . . . . . . . . 250,000 249
2,500,000 2,496
Total Treasury Bills . . . . . . . . . . . . . . . . . . . . . . . . . . . . . . . . . . . . . . . . . . . . . . . . . . . . . . . . . . . . . . . . . . . . . . . . . . . . . . . . . . . . . . . . . . . . . . . . . . 29,497,000 29,432
GOVERNMENT BONDS: 50.28%Canada Housing Trust, Secured Bond, Floating Rate Note: 1.68%
September 15, 2015 . . . . . . . . . . . . . . . . . . . . . . . . . . . . . . . . . . . . . . . . . . . . . . . . . . . . . . . . . . . . . . . . . . . . . . . . . . . . . . . . . . . . . . . . . . . . . . . . . 1,000,000 1,004
Canada Housing Trust, Secured Note: 14.27%1.006%, September 15, 2014 . . . . . . . . . . . . . . . . . . . . . . . . . . . . . . . . . . . . . . . . . . . . . . . . . . . . . . . . . . . . . . . . . . . . . . . . . . . . . . . . . . . . . . . . . . 5,500,000 5,5201.024%, December 15, 2014 . . . . . . . . . . . . . . . . . . . . . . . . . . . . . . . . . . . . . . . . . . . . . . . . . . . . . . . . . . . . . . . . . . . . . . . . . . . . . . . . . . . . . . . . . . . 3,000,000 3,024
8,500,000 8,544
Canadian Wheat Board: 5.85%1.057%, December 1, 2014 . . . . . . . . . . . . . . . . . . . . . . . . . . . . . . . . . . . . . . . . . . . . . . . . . . . . . . . . . . . . . . . . . . . . . . . . . . . . . . . . . . . . . . . . . . . 3,450,000 3,503
Financement Quebec, Floating Rate Note: 3.34%December 1, 2014 . . . . . . . . . . . . . . . . . . . . . . . . . . . . . . . . . . . . . . . . . . . . . . . . . . . . . . . . . . . . . . . . . . . . . . . . . . . . . . . . . . . . . . . . . . . . . . . . . . 1,000,000 1,000October 14, 2015 . . . . . . . . . . . . . . . . . . . . . . . . . . . . . . . . . . . . . . . . . . . . . . . . . . . . . . . . . . . . . . . . . . . . . . . . . . . . . . . . . . . . . . . . . . . . . . . . . . . 1,000,000 998
2,000,000 1,998
Government of Canada: 1.67%1.004%, November 1, 2014 . . . . . . . . . . . . . . . . . . . . . . . . . . . . . . . . . . . . . . . . . . . . . . . . . . . . . . . . . . . . . . . . . . . . . . . . . . . . . . . . . . . . . . . . . . . 1,000,000 1,000
Hydro-Quebec, Floating Rate Note, Senior Note: 1.67%February 11, 2015 . . . . . . . . . . . . . . . . . . . . . . . . . . . . . . . . . . . . . . . . . . . . . . . . . . . . . . . . . . . . . . . . . . . . . . . . . . . . . . . . . . . . . . . . . . . . . . . . . . 1,000,000 1,002
Inter-American Development Bank: 1.70%1.172%, November 17, 2014 . . . . . . . . . . . . . . . . . . . . . . . . . . . . . . . . . . . . . . . . . . . . . . . . . . . . . . . . . . . . . . . . . . . . . . . . . . . . . . . . . . . . . . . . . . . 1,000,000 1,014
National Housing Association: 1.47%1.289%, December 1, 2014 . . . . . . . . . . . . . . . . . . . . . . . . . . . . . . . . . . . . . . . . . . . . . . . . . . . . . . . . . . . . . . . . . . . . . . . . . . . . . . . . . . . . . . . . . . . 876,277 881
National Housing Association, Floating Rate Note: 3.41%October 1, 2014 . . . . . . . . . . . . . . . . . . . . . . . . . . . . . . . . . . . . . . . . . . . . . . . . . . . . . . . . . . . . . . . . . . . . . . . . . . . . . . . . . . . . . . . . . . . . . . . . . . . . 1,405,156 1,405April 1, 2016 . . . . . . . . . . . . . . . . . . . . . . . . . . . . . . . . . . . . . . . . . . . . . . . . . . . . . . . . . . . . . . . . . . . . . . . . . . . . . . . . . . . . . . . . . . . . . . . . . . . . . . 633,060 634
2,038,216 2,039
Province of Alberta, Floating Rate Note: 0.84%May 27, 2016 . . . . . . . . . . . . . . . . . . . . . . . . . . . . . . . . . . . . . . . . . . . . . . . . . . . . . . . . . . . . . . . . . . . . . . . . . . . . . . . . . . . . . . . . . . . . . . . . . . . . . . 500,000 502
Province of Manitoba, Floating Rate Note: 0.84%April 19, 2016 . . . . . . . . . . . . . . . . . . . . . . . . . . . . . . . . . . . . . . . . . . . . . . . . . . . . . . . . . . . . . . . . . . . . . . . . . . . . . . . . . . . . . . . . . . . . . . . . . . . . . 500,000 503
Province of Nova Scotia, Floating Rate Note: 2.18%December 3, 2014 . . . . . . . . . . . . . . . . . . . . . . . . . . . . . . . . . . . . . . . . . . . . . . . . . . . . . . . . . . . . . . . . . . . . . . . . . . . . . . . . . . . . . . . . . . . . . . . . . . 1,300,000 1,302
The accompanying notes are an integral part of these financial statements.
288 Franklin Templeton Investments Funds
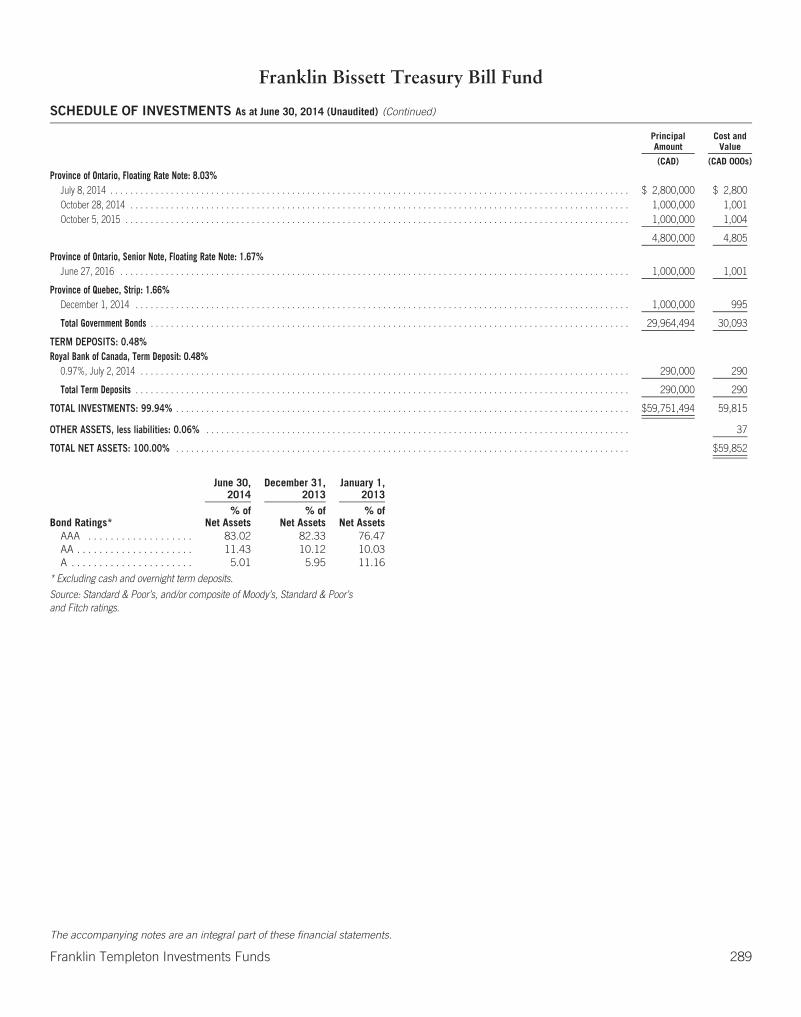
Franklin Bissett Treasury Bill Fund
SCHEDULE OF INVESTMENTS As at June 30, 2014 (Unaudited) (Continued)
PrincipalAmount
Cost andValue
(CAD) (CAD 000s)
Province of Ontario, Floating Rate Note: 8.03%July 8, 2014 . . . . . . . . . . . . . . . . . . . . . . . . . . . . . . . . . . . . . . . . . . . . . . . . . . . . . . . . . . . . . . . . . . . . . . . . . . . . . . . . . . . . . . . . . . . . . . . . . . . . . . . $ 2,800,000 $ 2,800October 28, 2014 . . . . . . . . . . . . . . . . . . . . . . . . . . . . . . . . . . . . . . . . . . . . . . . . . . . . . . . . . . . . . . . . . . . . . . . . . . . . . . . . . . . . . . . . . . . . . . . . . . . 1,000,000 1,001October 5, 2015 . . . . . . . . . . . . . . . . . . . . . . . . . . . . . . . . . . . . . . . . . . . . . . . . . . . . . . . . . . . . . . . . . . . . . . . . . . . . . . . . . . . . . . . . . . . . . . . . . . . . 1,000,000 1,004
4,800,000 4,805
Province of Ontario, Senior Note, Floating Rate Note: 1.67%June 27, 2016 . . . . . . . . . . . . . . . . . . . . . . . . . . . . . . . . . . . . . . . . . . . . . . . . . . . . . . . . . . . . . . . . . . . . . . . . . . . . . . . . . . . . . . . . . . . . . . . . . . . . . 1,000,000 1,001
Province of Quebec, Strip: 1.66%December 1, 2014 . . . . . . . . . . . . . . . . . . . . . . . . . . . . . . . . . . . . . . . . . . . . . . . . . . . . . . . . . . . . . . . . . . . . . . . . . . . . . . . . . . . . . . . . . . . . . . . . . . 1,000,000 995
Total Government Bonds . . . . . . . . . . . . . . . . . . . . . . . . . . . . . . . . . . . . . . . . . . . . . . . . . . . . . . . . . . . . . . . . . . . . . . . . . . . . . . . . . . . . . . . . . . . . . . . 29,964,494 30,093
TERM DEPOSITS: 0.48%Royal Bank of Canada, Term Deposit: 0.48%
0.97%, July 2, 2014 . . . . . . . . . . . . . . . . . . . . . . . . . . . . . . . . . . . . . . . . . . . . . . . . . . . . . . . . . . . . . . . . . . . . . . . . . . . . . . . . . . . . . . . . . . . . . . . . . 290,000 290
Total Term Deposits . . . . . . . . . . . . . . . . . . . . . . . . . . . . . . . . . . . . . . . . . . . . . . . . . . . . . . . . . . . . . . . . . . . . . . . . . . . . . . . . . . . . . . . . . . . . . . . . . . 290,000 290
TOTAL INVESTMENTS: 99.94% . . . . . . . . . . . . . . . . . . . . . . . . . . . . . . . . . . . . . . . . . . . . . . . . . . . . . . . . . . . . . . . . . . . . . . . . . . . . . . . . . . . . . . . . . . $59,751,494 59,815
OTHER ASSETS, less liabilities: 0.06% . . . . . . . . . . . . . . . . . . . . . . . . . . . . . . . . . . . . . . . . . . . . . . . . . . . . . . . . . . . . . . . . . . . . . . . . . . . . . . . . . . . . 37
TOTAL NET ASSETS: 100.00% . . . . . . . . . . . . . . . . . . . . . . . . . . . . . . . . . . . . . . . . . . . . . . . . . . . . . . . . . . . . . . . . . . . . . . . . . . . . . . . . . . . . . . . . . . $59,852
June 30,2014
December 31,2013
January 1,2013
Bond Ratings*% of
Net Assets% of
Net Assets% of
Net AssetsAAA . . . . . . . . . . . . . . . . . . . 83.02 82.33 76.47AA . . . . . . . . . . . . . . . . . . . . . 11.43 10.12 10.03A . . . . . . . . . . . . . . . . . . . . . . 5.01 5.95 11.16
* Excluding cash and overnight term deposits.
Source: Standard & Poor’s, and/or composite of Moody’s, Standard & Poor’sand Fitch ratings.
The accompanying notes are an integral part of these financial statements.
Franklin Templeton Investments Funds 289

Franklin Bissett Treasury Bill Fund
STATEMENTS OF FINANCIAL POSITION (Unaudited)
As atJune 30,
2014
As atDecember 31,
2013
As atJanuary 1,
2013
(CAD 000s) (CAD 000s) (CAD 000s)AssetsCurrent assetsInvestments at fair value through profit or loss $ 59,815 $ 67,182 $ 90,032Cash
Canadian — 2 6Receivables
Investment securities sold 2 — —Interest 98 138 157
Total assets 59,915 67,322 90,195
LiabilitiesCurrent liabilitiesPayables
Redemption of redeemable units 4 — —Management fees 35 40 52
Distributions to unitholders 24 29 47
Total liabilities 63 69 99
Net assets attributable to holders of redeemable units $ 59,852 $ 67,253 $ 90,096
Represented by:Net assets as previously reported under Canadian GAAP — 67,253 90,096Revaluation of investments at fair value through profit or loss (Note 3(c)) — — —
Net assets attributable to holders of redeemable units $ 59,852 $ 67,253 $ 90,096
Net assets attributable to holders of redeemable units per series (CAD 000s)Series A $ 47,796 $ 53,330 $ 70,882Series F 1,765 2,257 4,607Series I 452 322 417Series O 9,839 11,344 14,190
Number of redeemable units outstanding (Note 5)Series A 4,779,600 5,332,977 7,088,126Series F 176,462 225,681 460,715Series I 45,271 32,238 41,732Series O 983,879 1,134,402 1,419,026
Net assets attributable to holders of redeemable units per unit — CADSeries A $ 10.00 $ 10.00 $ 10.00Series F 10.00 10.00 10.00Series I 10.00 10.00 10.00Series O 10.00 10.00 10.00
Cost of investments held (CAD 000s) $ 59,815 $ 67,182 $ 90,032
The accompanying notes are an integral part of these financial statements.
290 Franklin Templeton Investments Funds
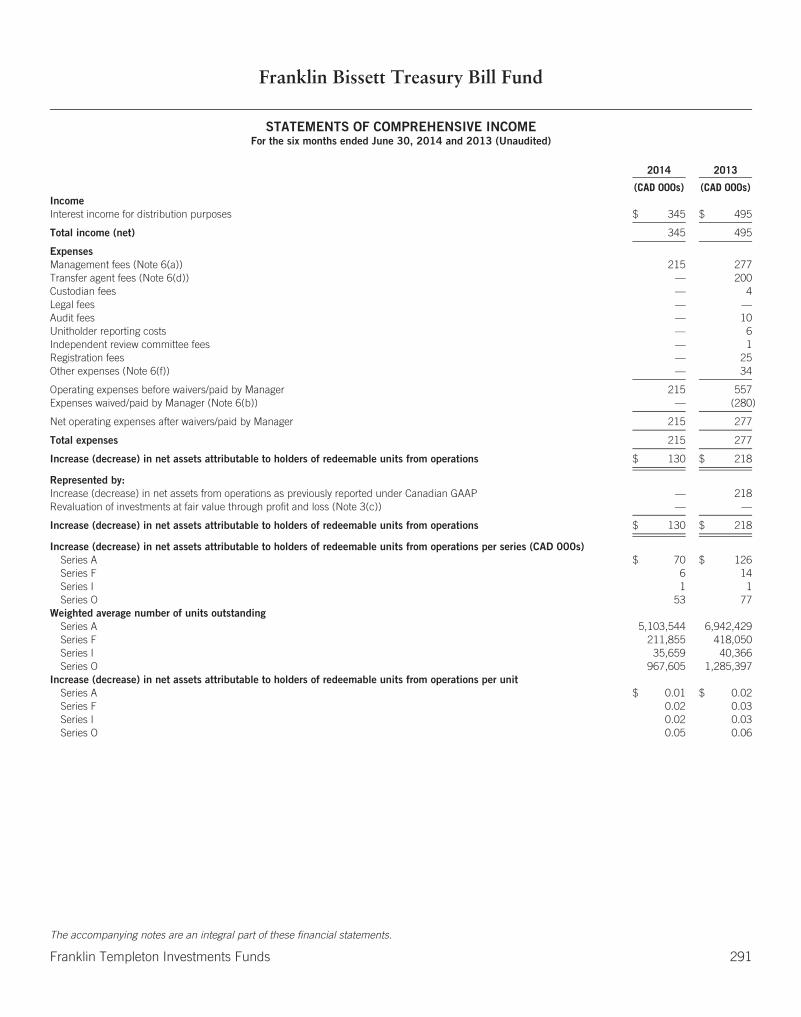
Franklin Bissett Treasury Bill Fund
STATEMENTS OF COMPREHENSIVE INCOMEFor the six months ended June 30, 2014 and 2013 (Unaudited)
2014 2013
(CAD 000s) (CAD 000s)IncomeInterest income for distribution purposes $ 345 $ 495
Total income (net) 345 495
ExpensesManagement fees (Note 6(a)) 215 277Transfer agent fees (Note 6(d)) — 200Custodian fees — 4Legal fees — —Audit fees — 10Unitholder reporting costs — 6Independent review committee fees — 1Registration fees — 25Other expenses (Note 6(f)) — 34
Operating expenses before waivers/paid by Manager 215 557Expenses waived/paid by Manager (Note 6(b)) — (280)
Net operating expenses after waivers/paid by Manager 215 277
Total expenses 215 277
Increase (decrease) in net assets attributable to holders of redeemable units from operations $ 130 $ 218
Represented by:Increase (decrease) in net assets from operations as previously reported under Canadian GAAP — 218Revaluation of investments at fair value through profit and loss (Note 3(c)) — —
Increase (decrease) in net assets attributable to holders of redeemable units from operations $ 130 $ 218
Increase (decrease) in net assets attributable to holders of redeemable units from operations per series (CAD 000s)Series A $ 70 $ 126Series F 6 14Series I 1 1Series O 53 77
Weighted average number of units outstandingSeries A 5,103,544 6,942,429Series F 211,855 418,050Series I 35,659 40,366Series O 967,605 1,285,397
Increase (decrease) in net assets attributable to holders of redeemable units from operations per unitSeries A $ 0.01 $ 0.02Series F 0.02 0.03Series I 0.02 0.03Series O 0.05 0.06
The accompanying notes are an integral part of these financial statements.
Franklin Templeton Investments Funds 291

Franklin Bissett Treasury Bill Fund
STATEMENTS OF CHANGES IN NET ASSETS ATTRIBUTABLE TO HOLDERS OF REDEEMABLE UNITSFor the six months ended June 30, 2014 and 2013 (Unaudited) (in CAD 000s)
All Series Series A Series F
2014 2013 2014 2013 2014 2013
Net assets attributable to holders of redeemable units at beginning of period $ 67,253 $ 90,096 $ 53,330 $ 70,882 $2,257 $ 4,607
Increase (decrease) in net assets attributable to holders of redeemable unitsfrom operations 130 218 70 126 6 14
Distributions to holders of redeemable unitsFrom net investment income (130) (218) (70) (126) (6) (14)From net realized gains on investments — — — — — —From return of capital — — — — — —
Total distributions to holders of redeemable units (130) (218) (70) (126) (6) (14)
Redeemable units transactionsSubscriptions 8,779 11,372 6,762 8,549 406 236Reinvestments 133 234 71 134 6 16Redemptions (16,313) (26,057) (12,367) (17,941) (904) (2,785)
Net increase (decrease) from redeemable units transactions (7,401) (14,451) (5,534) (9,258) (492) (2,533)
Increase (decrease) in net assets attributable to holders of redeemable units (7,401) (14,451) (5,534) (9,258) (492) (2,533)
Net assets attributable to holders of redeemable units at end of period $ 59,852 $ 75,645 $ 47,796 $ 61,624 $1,765 $ 2,074
Series I Series O
2014 2013 2014 2013
Net assets attributable to holders of redeemable units at beginning of period $ 322 $ 417 $ 11,344 $ 14,190
Increase (decrease) in net assets attributable to holders of redeemable unitsfrom operations 1 1 53 77
Distributions to holders of redeemable unitsFrom net investment income (1) (1) (53) (77)From net realized gains on investments — — — —From return of capital — — — —
Total distributions to holders of redeemable units (1) (1) (53) (77)
Redeemable units transactionsSubscriptions 301 295 1,310 2,292Reinvestments 1 1 55 83Redemptions (172) (542) (2,870) (4,789)
Net increase (decrease) from redeemable units transactions 130 (246) (1,505) (2,414)
Increase (decrease) in net assets attributable to holders of redeemable units 130 (246) (1,505) (2,414)
Net assets attributable to holders of redeemable units at end of period $ 452 $ 171 $ 9,839 $ 11,776
The accompanying notes are an integral part of these financial statements.
292 Franklin Templeton Investments Funds

Franklin Bissett Treasury Bill Fund
STATEMENTS OF CASH FLOWSFor the six months ended June 30, 2014 and 2013 (Unaudited)
2014 2013
(CAD 000s) (CAD 000s)Cash flows from operating activitiesInterest received $ 353 $ 481Proceeds from sale and maturity of investments 86,424 131,987Purchases of investments (79,027) (117,493)Operating expenses paid (220) (288)
Net cash from/(used in) operating activities 7,530 14,687
Cash flows from financing activitiesProceeds from issuances of redeemable units 8,779 11,373Amounts paid on redemption of redeemable units (16,309) (26,057)Distributions paid to holders of redeemable units, net of reinvested distributions (2) (2)
Net cash (used in)/from financing activities (7,532) (14,686)
Net increase (decrease) in cash (2) 1Cash at beginning of year 2 6Effect of exchange rate changes — —
Cash at end of period $ — $ 7
The accompanying notes are an integral part of these financial statements.
Franklin Templeton Investments Funds 293
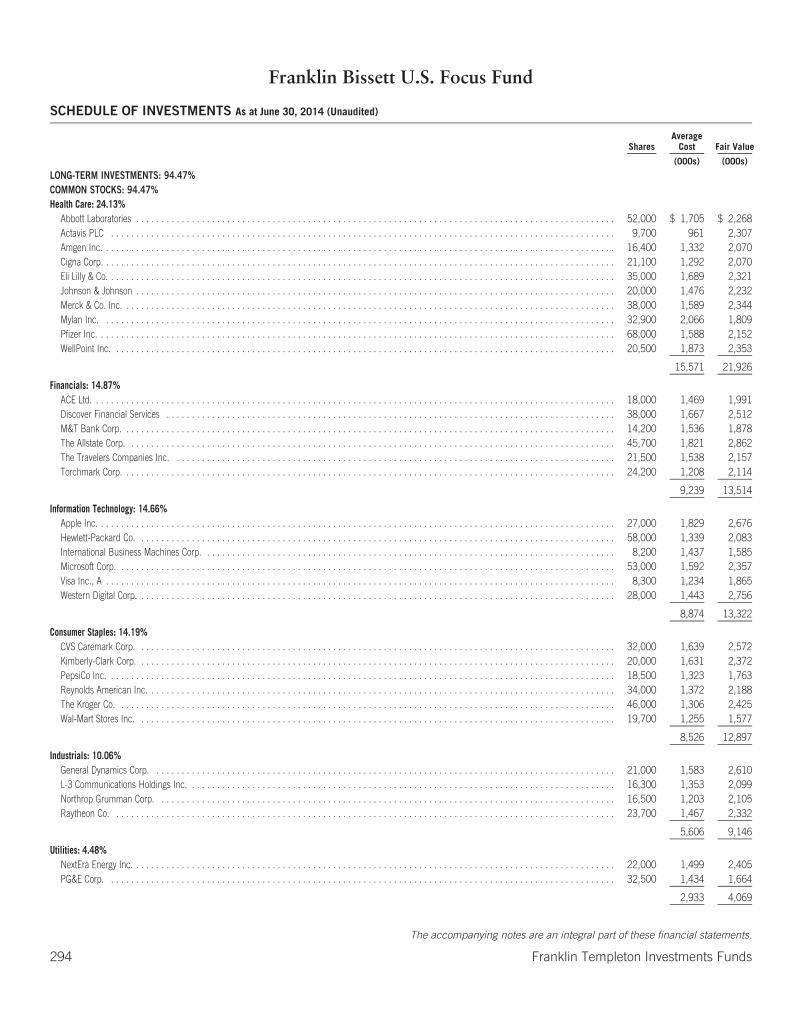
Franklin Bissett U.S. Focus Fund
SCHEDULE OF INVESTMENTS As at June 30, 2014 (Unaudited)
SharesAverage
Cost Fair Value
(000s) (000s)
LONG-TERM INVESTMENTS: 94.47%COMMON STOCKS: 94.47%Health Care: 24.13%
Abbott Laboratories . . . . . . . . . . . . . . . . . . . . . . . . . . . . . . . . . . . . . . . . . . . . . . . . . . . . . . . . . . . . . . . . . . . . . . . . . . . . . . . . . . . . . . . . . . . . . . . 52,000 $ 1,705 $ 2,268Actavis PLC . . . . . . . . . . . . . . . . . . . . . . . . . . . . . . . . . . . . . . . . . . . . . . . . . . . . . . . . . . . . . . . . . . . . . . . . . . . . . . . . . . . . . . . . . . . . . . . . . . . . 9,700 961 2,307Amgen Inc. . . . . . . . . . . . . . . . . . . . . . . . . . . . . . . . . . . . . . . . . . . . . . . . . . . . . . . . . . . . . . . . . . . . . . . . . . . . . . . . . . . . . . . . . . . . . . . . . . . . . . 16,400 1,332 2,070Cigna Corp. . . . . . . . . . . . . . . . . . . . . . . . . . . . . . . . . . . . . . . . . . . . . . . . . . . . . . . . . . . . . . . . . . . . . . . . . . . . . . . . . . . . . . . . . . . . . . . . . . . . . . 21,100 1,292 2,070Eli Lilly & Co. . . . . . . . . . . . . . . . . . . . . . . . . . . . . . . . . . . . . . . . . . . . . . . . . . . . . . . . . . . . . . . . . . . . . . . . . . . . . . . . . . . . . . . . . . . . . . . . . . . . . 35,000 1,689 2,321Johnson & Johnson . . . . . . . . . . . . . . . . . . . . . . . . . . . . . . . . . . . . . . . . . . . . . . . . . . . . . . . . . . . . . . . . . . . . . . . . . . . . . . . . . . . . . . . . . . . . . . . 20,000 1,476 2,232Merck & Co. Inc. . . . . . . . . . . . . . . . . . . . . . . . . . . . . . . . . . . . . . . . . . . . . . . . . . . . . . . . . . . . . . . . . . . . . . . . . . . . . . . . . . . . . . . . . . . . . . . . . . 38,000 1,589 2,344Mylan Inc. . . . . . . . . . . . . . . . . . . . . . . . . . . . . . . . . . . . . . . . . . . . . . . . . . . . . . . . . . . . . . . . . . . . . . . . . . . . . . . . . . . . . . . . . . . . . . . . . . . . . . 32,900 2,066 1,809Pfizer Inc. . . . . . . . . . . . . . . . . . . . . . . . . . . . . . . . . . . . . . . . . . . . . . . . . . . . . . . . . . . . . . . . . . . . . . . . . . . . . . . . . . . . . . . . . . . . . . . . . . . . . . . 68,000 1,588 2,152WellPoint Inc. . . . . . . . . . . . . . . . . . . . . . . . . . . . . . . . . . . . . . . . . . . . . . . . . . . . . . . . . . . . . . . . . . . . . . . . . . . . . . . . . . . . . . . . . . . . . . . . . . . . 20,500 1,873 2,353
15,571 21,926
Financials: 14.87%ACE Ltd. . . . . . . . . . . . . . . . . . . . . . . . . . . . . . . . . . . . . . . . . . . . . . . . . . . . . . . . . . . . . . . . . . . . . . . . . . . . . . . . . . . . . . . . . . . . . . . . . . . . . . . . 18,000 1,469 1,991Discover Financial Services . . . . . . . . . . . . . . . . . . . . . . . . . . . . . . . . . . . . . . . . . . . . . . . . . . . . . . . . . . . . . . . . . . . . . . . . . . . . . . . . . . . . . . . . . 38,000 1,667 2,512M&T Bank Corp. . . . . . . . . . . . . . . . . . . . . . . . . . . . . . . . . . . . . . . . . . . . . . . . . . . . . . . . . . . . . . . . . . . . . . . . . . . . . . . . . . . . . . . . . . . . . . . . . . 14,200 1,536 1,878The Allstate Corp. . . . . . . . . . . . . . . . . . . . . . . . . . . . . . . . . . . . . . . . . . . . . . . . . . . . . . . . . . . . . . . . . . . . . . . . . . . . . . . . . . . . . . . . . . . . . . . . . 45,700 1,821 2,862The Travelers Companies Inc. . . . . . . . . . . . . . . . . . . . . . . . . . . . . . . . . . . . . . . . . . . . . . . . . . . . . . . . . . . . . . . . . . . . . . . . . . . . . . . . . . . . . . . . 21,500 1,538 2,157Torchmark Corp. . . . . . . . . . . . . . . . . . . . . . . . . . . . . . . . . . . . . . . . . . . . . . . . . . . . . . . . . . . . . . . . . . . . . . . . . . . . . . . . . . . . . . . . . . . . . . . . . . 24,200 1,208 2,114
9,239 13,514
Information Technology: 14.66%Apple Inc. . . . . . . . . . . . . . . . . . . . . . . . . . . . . . . . . . . . . . . . . . . . . . . . . . . . . . . . . . . . . . . . . . . . . . . . . . . . . . . . . . . . . . . . . . . . . . . . . . . . . . . 27,000 1,829 2,676Hewlett-Packard Co. . . . . . . . . . . . . . . . . . . . . . . . . . . . . . . . . . . . . . . . . . . . . . . . . . . . . . . . . . . . . . . . . . . . . . . . . . . . . . . . . . . . . . . . . . . . . . . 58,000 1,339 2,083International Business Machines Corp. . . . . . . . . . . . . . . . . . . . . . . . . . . . . . . . . . . . . . . . . . . . . . . . . . . . . . . . . . . . . . . . . . . . . . . . . . . . . . . . . . 8,200 1,437 1,585Microsoft Corp. . . . . . . . . . . . . . . . . . . . . . . . . . . . . . . . . . . . . . . . . . . . . . . . . . . . . . . . . . . . . . . . . . . . . . . . . . . . . . . . . . . . . . . . . . . . . . . . . . . 53,000 1,592 2,357Visa Inc., A . . . . . . . . . . . . . . . . . . . . . . . . . . . . . . . . . . . . . . . . . . . . . . . . . . . . . . . . . . . . . . . . . . . . . . . . . . . . . . . . . . . . . . . . . . . . . . . . . . . . . 8,300 1,234 1,865Western Digital Corp. . . . . . . . . . . . . . . . . . . . . . . . . . . . . . . . . . . . . . . . . . . . . . . . . . . . . . . . . . . . . . . . . . . . . . . . . . . . . . . . . . . . . . . . . . . . . . . 28,000 1,443 2,756
8,874 13,322
Consumer Staples: 14.19%CVS Caremark Corp. . . . . . . . . . . . . . . . . . . . . . . . . . . . . . . . . . . . . . . . . . . . . . . . . . . . . . . . . . . . . . . . . . . . . . . . . . . . . . . . . . . . . . . . . . . . . . . 32,000 1,639 2,572Kimberly-Clark Corp. . . . . . . . . . . . . . . . . . . . . . . . . . . . . . . . . . . . . . . . . . . . . . . . . . . . . . . . . . . . . . . . . . . . . . . . . . . . . . . . . . . . . . . . . . . . . . . 20,000 1,631 2,372PepsiCo Inc. . . . . . . . . . . . . . . . . . . . . . . . . . . . . . . . . . . . . . . . . . . . . . . . . . . . . . . . . . . . . . . . . . . . . . . . . . . . . . . . . . . . . . . . . . . . . . . . . . . . . 18,500 1,323 1,763Reynolds American Inc. . . . . . . . . . . . . . . . . . . . . . . . . . . . . . . . . . . . . . . . . . . . . . . . . . . . . . . . . . . . . . . . . . . . . . . . . . . . . . . . . . . . . . . . . . . . . 34,000 1,372 2,188The Kroger Co. . . . . . . . . . . . . . . . . . . . . . . . . . . . . . . . . . . . . . . . . . . . . . . . . . . . . . . . . . . . . . . . . . . . . . . . . . . . . . . . . . . . . . . . . . . . . . . . . . . 46,000 1,306 2,425Wal-Mart Stores Inc. . . . . . . . . . . . . . . . . . . . . . . . . . . . . . . . . . . . . . . . . . . . . . . . . . . . . . . . . . . . . . . . . . . . . . . . . . . . . . . . . . . . . . . . . . . . . . . 19,700 1,255 1,577
8,526 12,897
Industrials: 10.06%General Dynamics Corp. . . . . . . . . . . . . . . . . . . . . . . . . . . . . . . . . . . . . . . . . . . . . . . . . . . . . . . . . . . . . . . . . . . . . . . . . . . . . . . . . . . . . . . . . . . . 21,000 1,583 2,610L-3 Communications Holdings Inc. . . . . . . . . . . . . . . . . . . . . . . . . . . . . . . . . . . . . . . . . . . . . . . . . . . . . . . . . . . . . . . . . . . . . . . . . . . . . . . . . . . . . 16,300 1,353 2,099Northrop Grumman Corp. . . . . . . . . . . . . . . . . . . . . . . . . . . . . . . . . . . . . . . . . . . . . . . . . . . . . . . . . . . . . . . . . . . . . . . . . . . . . . . . . . . . . . . . . . . 16,500 1,203 2,105Raytheon Co. . . . . . . . . . . . . . . . . . . . . . . . . . . . . . . . . . . . . . . . . . . . . . . . . . . . . . . . . . . . . . . . . . . . . . . . . . . . . . . . . . . . . . . . . . . . . . . . . . . . 23,700 1,467 2,332
5,606 9,146
Utilities: 4.48%NextEra Energy Inc. . . . . . . . . . . . . . . . . . . . . . . . . . . . . . . . . . . . . . . . . . . . . . . . . . . . . . . . . . . . . . . . . . . . . . . . . . . . . . . . . . . . . . . . . . . . . . . . 22,000 1,499 2,405PG&E Corp. . . . . . . . . . . . . . . . . . . . . . . . . . . . . . . . . . . . . . . . . . . . . . . . . . . . . . . . . . . . . . . . . . . . . . . . . . . . . . . . . . . . . . . . . . . . . . . . . . . . . 32,500 1,434 1,664
2,933 4,069
The accompanying notes are an integral part of these financial statements.
294 Franklin Templeton Investments Funds
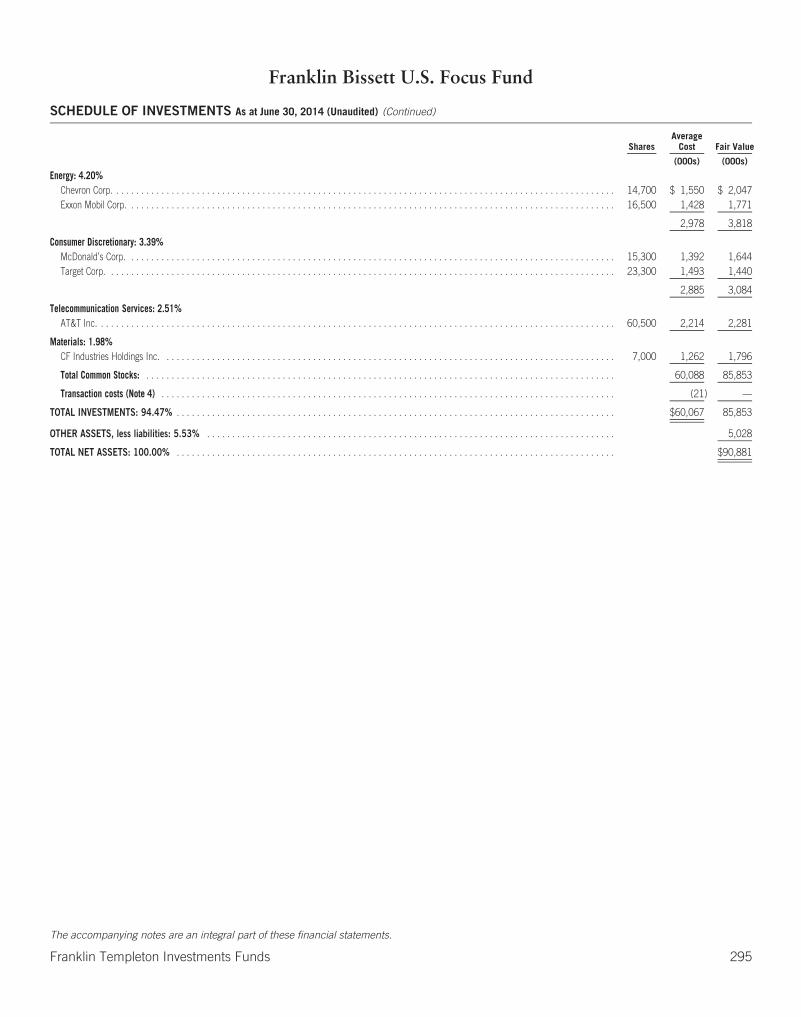
Franklin Bissett U.S. Focus Fund
SCHEDULE OF INVESTMENTS As at June 30, 2014 (Unaudited) (Continued)
SharesAverage
Cost Fair Value
(000s) (000s)
Energy: 4.20%Chevron Corp. . . . . . . . . . . . . . . . . . . . . . . . . . . . . . . . . . . . . . . . . . . . . . . . . . . . . . . . . . . . . . . . . . . . . . . . . . . . . . . . . . . . . . . . . . . . . . . . . . . . 14,700 $ 1,550 $ 2,047Exxon Mobil Corp. . . . . . . . . . . . . . . . . . . . . . . . . . . . . . . . . . . . . . . . . . . . . . . . . . . . . . . . . . . . . . . . . . . . . . . . . . . . . . . . . . . . . . . . . . . . . . . . . 16,500 1,428 1,771
2,978 3,818
Consumer Discretionary: 3.39%McDonald’s Corp. . . . . . . . . . . . . . . . . . . . . . . . . . . . . . . . . . . . . . . . . . . . . . . . . . . . . . . . . . . . . . . . . . . . . . . . . . . . . . . . . . . . . . . . . . . . . . . . . 15,300 1,392 1,644Target Corp. . . . . . . . . . . . . . . . . . . . . . . . . . . . . . . . . . . . . . . . . . . . . . . . . . . . . . . . . . . . . . . . . . . . . . . . . . . . . . . . . . . . . . . . . . . . . . . . . . . . . 23,300 1,493 1,440
2,885 3,084
Telecommunication Services: 2.51%AT&T Inc. . . . . . . . . . . . . . . . . . . . . . . . . . . . . . . . . . . . . . . . . . . . . . . . . . . . . . . . . . . . . . . . . . . . . . . . . . . . . . . . . . . . . . . . . . . . . . . . . . . . . . . 60,500 2,214 2,281
Materials: 1.98%CF Industries Holdings Inc. . . . . . . . . . . . . . . . . . . . . . . . . . . . . . . . . . . . . . . . . . . . . . . . . . . . . . . . . . . . . . . . . . . . . . . . . . . . . . . . . . . . . . . . . . 7,000 1,262 1,796
Total Common Stocks: . . . . . . . . . . . . . . . . . . . . . . . . . . . . . . . . . . . . . . . . . . . . . . . . . . . . . . . . . . . . . . . . . . . . . . . . . . . . . . . . . . . . . . . . . . . . . 60,088 85,853
Transaction costs (Note 4) . . . . . . . . . . . . . . . . . . . . . . . . . . . . . . . . . . . . . . . . . . . . . . . . . . . . . . . . . . . . . . . . . . . . . . . . . . . . . . . . . . . . . . . . . . (21) —
TOTAL INVESTMENTS: 94.47% . . . . . . . . . . . . . . . . . . . . . . . . . . . . . . . . . . . . . . . . . . . . . . . . . . . . . . . . . . . . . . . . . . . . . . . . . . . . . . . . . . . . . . . $60,067 85,853
OTHER ASSETS, less liabilities: 5.53% . . . . . . . . . . . . . . . . . . . . . . . . . . . . . . . . . . . . . . . . . . . . . . . . . . . . . . . . . . . . . . . . . . . . . . . . . . . . . . . . . 5,028
TOTAL NET ASSETS: 100.00% . . . . . . . . . . . . . . . . . . . . . . . . . . . . . . . . . . . . . . . . . . . . . . . . . . . . . . . . . . . . . . . . . . . . . . . . . . . . . . . . . . . . . . . $90,881
The accompanying notes are an integral part of these financial statements.
Franklin Templeton Investments Funds 295
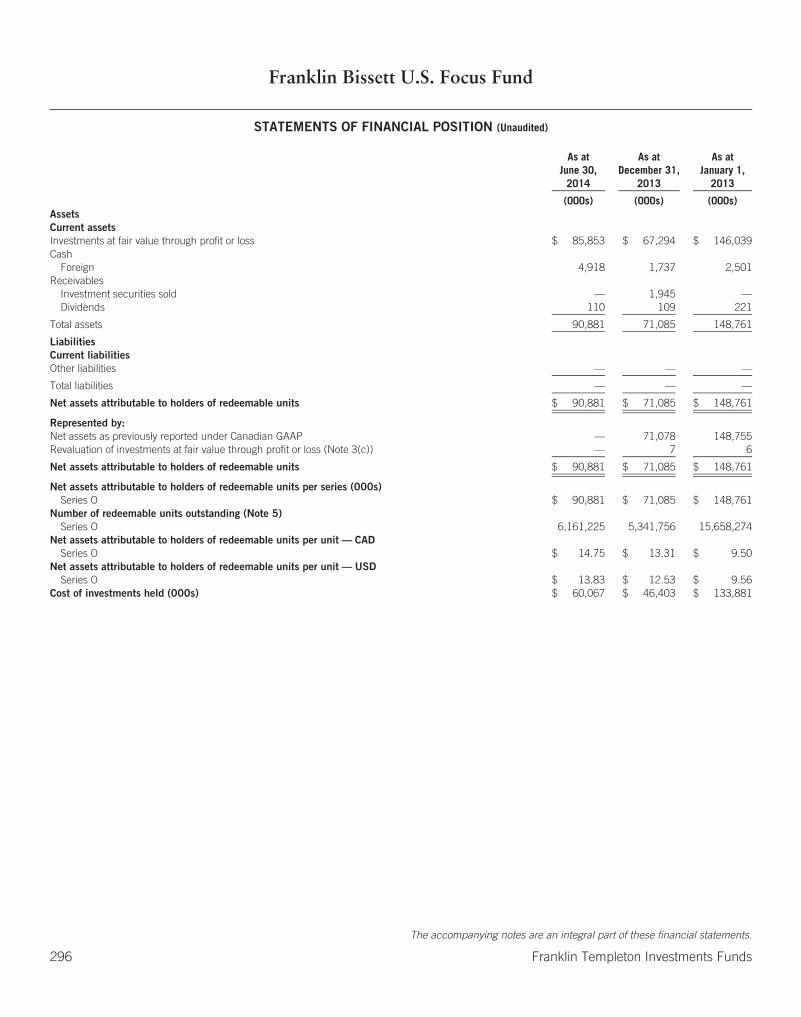
Franklin Bissett U.S. Focus Fund
STATEMENTS OF FINANCIAL POSITION (Unaudited)
As atJune 30,
2014
As atDecember 31,
2013
As atJanuary 1,
2013
(000s) (000s) (000s)AssetsCurrent assetsInvestments at fair value through profit or loss $ 85,853 $ 67,294 $ 146,039Cash
Foreign 4,918 1,737 2,501Receivables
Investment securities sold — 1,945 —Dividends 110 109 221
Total assets 90,881 71,085 148,761
LiabilitiesCurrent liabilitiesOther liabilities — — —
Total liabilities — — —
Net assets attributable to holders of redeemable units $ 90,881 $ 71,085 $ 148,761
Represented by:Net assets as previously reported under Canadian GAAP — 71,078 148,755Revaluation of investments at fair value through profit or loss (Note 3(c)) — 7 6
Net assets attributable to holders of redeemable units $ 90,881 $ 71,085 $ 148,761
Net assets attributable to holders of redeemable units per series (000s)Series O $ 90,881 $ 71,085 $ 148,761
Number of redeemable units outstanding (Note 5)Series O 6,161,225 5,341,756 15,658,274
Net assets attributable to holders of redeemable units per unit — CADSeries O $ 14.75 $ 13.31 $ 9.50
Net assets attributable to holders of redeemable units per unit — USDSeries O $ 13.83 $ 12.53 $ 9.56
Cost of investments held (000s) $ 60,067 $ 46,403 $ 133,881
The accompanying notes are an integral part of these financial statements.
296 Franklin Templeton Investments Funds
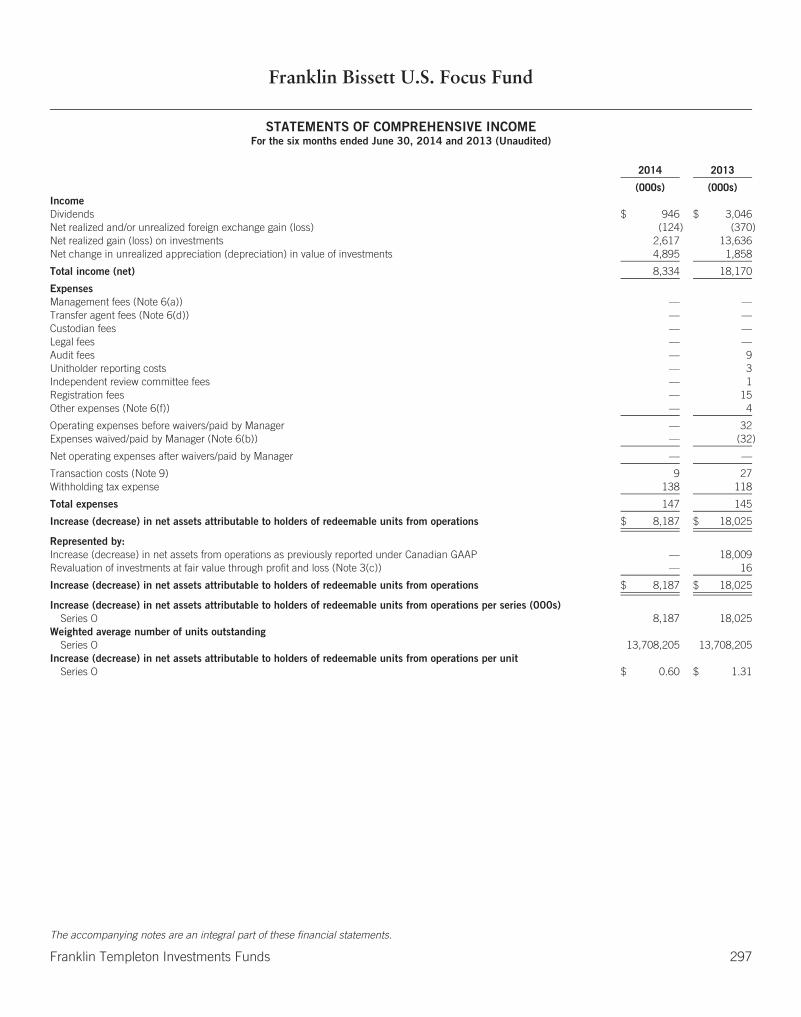
Franklin Bissett U.S. Focus Fund
STATEMENTS OF COMPREHENSIVE INCOMEFor the six months ended June 30, 2014 and 2013 (Unaudited)
2014 2013
(000s) (000s)IncomeDividends $ 946 $ 3,046Net realized and/or unrealized foreign exchange gain (loss) (124) (370)Net realized gain (loss) on investments 2,617 13,636Net change in unrealized appreciation (depreciation) in value of investments 4,895 1,858
Total income (net) 8,334 18,170
ExpensesManagement fees (Note 6(a)) — —Transfer agent fees (Note 6(d)) — —Custodian fees — —Legal fees — —Audit fees — 9Unitholder reporting costs — 3Independent review committee fees — 1Registration fees — 15Other expenses (Note 6(f)) — 4
Operating expenses before waivers/paid by Manager — 32Expenses waived/paid by Manager (Note 6(b)) — (32)
Net operating expenses after waivers/paid by Manager — —
Transaction costs (Note 9) 9 27Withholding tax expense 138 118
Total expenses 147 145
Increase (decrease) in net assets attributable to holders of redeemable units from operations $ 8,187 $ 18,025
Represented by:Increase (decrease) in net assets from operations as previously reported under Canadian GAAP — 18,009Revaluation of investments at fair value through profit and loss (Note 3(c)) — 16
Increase (decrease) in net assets attributable to holders of redeemable units from operations $ 8,187 $ 18,025
Increase (decrease) in net assets attributable to holders of redeemable units from operations per series (000s)Series O 8,187 18,025
Weighted average number of units outstandingSeries O 13,708,205 13,708,205
Increase (decrease) in net assets attributable to holders of redeemable units from operations per unitSeries O $ 0.60 $ 1.31
The accompanying notes are an integral part of these financial statements.
Franklin Templeton Investments Funds 297
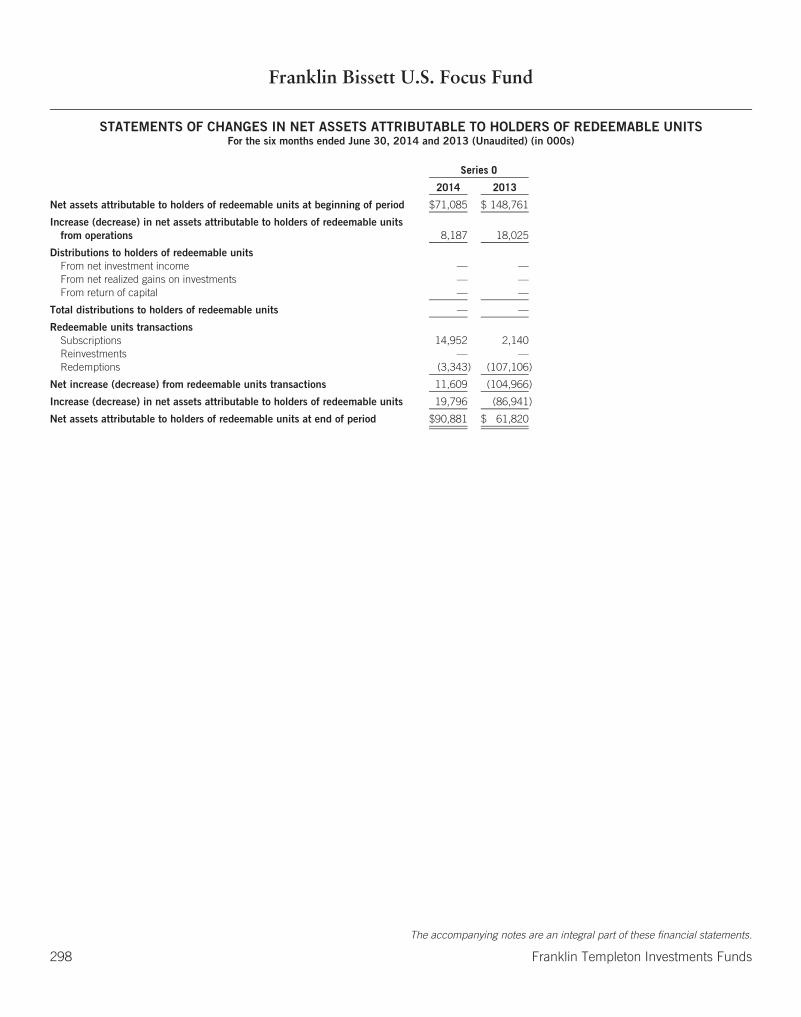
Franklin Bissett U.S. Focus Fund
STATEMENTS OF CHANGES IN NET ASSETS ATTRIBUTABLE TO HOLDERS OF REDEEMABLE UNITSFor the six months ended June 30, 2014 and 2013 (Unaudited) (in 000s)
Series O
2014 2013
Net assets attributable to holders of redeemable units at beginning of period $71,085 $ 148,761
Increase (decrease) in net assets attributable to holders of redeemable unitsfrom operations 8,187 18,025
Distributions to holders of redeemable unitsFrom net investment income — —From net realized gains on investments — —From return of capital — —
Total distributions to holders of redeemable units — —
Redeemable units transactionsSubscriptions 14,952 2,140Reinvestments — —Redemptions (3,343) (107,106)
Net increase (decrease) from redeemable units transactions 11,609 (104,966)
Increase (decrease) in net assets attributable to holders of redeemable units 19,796 (86,941)
Net assets attributable to holders of redeemable units at end of period $90,881 $ 61,820
The accompanying notes are an integral part of these financial statements.
298 Franklin Templeton Investments Funds

Franklin Bissett U.S. Focus Fund
STATEMENTS OF CASH FLOWSFor the six months ended June 30, 2014 and 2013 (Unaudited)
2014 2013
(000s) (000s)Cash flows from operating activitiesDividends received $ 807 $ 829Proceeds from sale and maturity of investments 10,179 108,577Purchases of investments (19,454) (5,619)
Net cash from/(used in) operating activities (8,468) 103,787
Cash flows from financing activitiesProceeds from issuances of redeemable units 14,951 2,140Amounts paid on redemption of redeemable units (3,343) (107,105)
Net cash (used in)/from financing activities 11,608 (104,965)
Net increase (decrease) in cash 3,140 (1,178)Cash at beginning of year 1,737 2,501Effect of exchange rate changes 41 178
Cash at end of period $ 4,918 $ 1,501
The accompanying notes are an integral part of these financial statements.
Franklin Templeton Investments Funds 299

Franklin Mutual Global Discovery Fund
SCHEDULE OF INVESTMENTS As at June 30, 2014 (Unaudited)
SharesAverage
Cost Fair Value
(000s) (000s)
LONG-TERM INVESTMENTS: 88.41%COMMON STOCKS: 80.68%United States: 44.81%
ACE Ltd. . . . . . . . . . . . . . . . . . . . . . . . . . . . . . . . . . . . . . . . . . . . . . . . . . . . . . . . . . . . . . . . . . . . . . . . . . . . . . . . . . . . . . . . . . . . . . . . 226,610 $ 11,844 $ 25,061Adelphia Recovery Trust, Arahova, Contingent Distribution . . . . . . . . . . . . . . . . . . . . . . . . . . . . . . . . . . . . . . . . . . . . . . . . . . . . . . . . . . . . 41,197 17 1Adelphia Recovery Trust, ACC-1, Contingent Distribution . . . . . . . . . . . . . . . . . . . . . . . . . . . . . . . . . . . . . . . . . . . . . . . . . . . . . . . . . . . . . 496,717 35 5Alleghany Corp. . . . . . . . . . . . . . . . . . . . . . . . . . . . . . . . . . . . . . . . . . . . . . . . . . . . . . . . . . . . . . . . . . . . . . . . . . . . . . . . . . . . . . . . . . . 2,084 758 974Ally Financial Inc. . . . . . . . . . . . . . . . . . . . . . . . . . . . . . . . . . . . . . . . . . . . . . . . . . . . . . . . . . . . . . . . . . . . . . . . . . . . . . . . . . . . . . . . . . 237,300 6,342 6,051Altria Group Inc. . . . . . . . . . . . . . . . . . . . . . . . . . . . . . . . . . . . . . . . . . . . . . . . . . . . . . . . . . . . . . . . . . . . . . . . . . . . . . . . . . . . . . . . . . . 166,768 3,299 7,459American International Group Inc. . . . . . . . . . . . . . . . . . . . . . . . . . . . . . . . . . . . . . . . . . . . . . . . . . . . . . . . . . . . . . . . . . . . . . . . . . . . . . 239,842 6,950 13,960Apache Corp. . . . . . . . . . . . . . . . . . . . . . . . . . . . . . . . . . . . . . . . . . . . . . . . . . . . . . . . . . . . . . . . . . . . . . . . . . . . . . . . . . . . . . . . . . . . . 187,340 16,726 20,103Apple Inc. . . . . . . . . . . . . . . . . . . . . . . . . . . . . . . . . . . . . . . . . . . . . . . . . . . . . . . . . . . . . . . . . . . . . . . . . . . . . . . . . . . . . . . . . . . . . . . 314,160 20,336 31,135Avon Products Inc. . . . . . . . . . . . . . . . . . . . . . . . . . . . . . . . . . . . . . . . . . . . . . . . . . . . . . . . . . . . . . . . . . . . . . . . . . . . . . . . . . . . . . . . . 460,440 7,409 7,174B/E Aerospace Inc. . . . . . . . . . . . . . . . . . . . . . . . . . . . . . . . . . . . . . . . . . . . . . . . . . . . . . . . . . . . . . . . . . . . . . . . . . . . . . . . . . . . . . . . . 81,600 8,533 8,049Baker Hughes Inc. . . . . . . . . . . . . . . . . . . . . . . . . . . . . . . . . . . . . . . . . . . . . . . . . . . . . . . . . . . . . . . . . . . . . . . . . . . . . . . . . . . . . . . . . 86,988 3,760 6,907Brookfield Property Partners LP . . . . . . . . . . . . . . . . . . . . . . . . . . . . . . . . . . . . . . . . . . . . . . . . . . . . . . . . . . . . . . . . . . . . . . . . . . . . . . . 2,004 42 45Caterpillar Inc. . . . . . . . . . . . . . . . . . . . . . . . . . . . . . . . . . . . . . . . . . . . . . . . . . . . . . . . . . . . . . . . . . . . . . . . . . . . . . . . . . . . . . . . . . . . 72,127 6,136 8,359CBS Corp., B . . . . . . . . . . . . . . . . . . . . . . . . . . . . . . . . . . . . . . . . . . . . . . . . . . . . . . . . . . . . . . . . . . . . . . . . . . . . . . . . . . . . . . . . . . . . 214,972 13,194 14,246Cengage Learning Holdings II LP . . . . . . . . . . . . . . . . . . . . . . . . . . . . . . . . . . . . . . . . . . . . . . . . . . . . . . . . . . . . . . . . . . . . . . . . . . . . . . 56,211 2,098 2,113Century Communications Corp., Contingent Distribution . . . . . . . . . . . . . . . . . . . . . . . . . . . . . . . . . . . . . . . . . . . . . . . . . . . . . . . . . . . . . . 48,000 — —Century Communications Corp., Contingent Distribution . . . . . . . . . . . . . . . . . . . . . . . . . . . . . . . . . . . . . . . . . . . . . . . . . . . . . . . . . . . . . . 29,000 — —Century Communications Corp., Contingent Distribution . . . . . . . . . . . . . . . . . . . . . . . . . . . . . . . . . . . . . . . . . . . . . . . . . . . . . . . . . . . . . . 33,000 — —Century Communications Corp., Contingent Distribution . . . . . . . . . . . . . . . . . . . . . . . . . . . . . . . . . . . . . . . . . . . . . . . . . . . . . . . . . . . . . . 3,000 — —Cigna Corp. . . . . . . . . . . . . . . . . . . . . . . . . . . . . . . . . . . . . . . . . . . . . . . . . . . . . . . . . . . . . . . . . . . . . . . . . . . . . . . . . . . . . . . . . . . . . . 67,915 3,077 6,661Cisco Systems Inc. . . . . . . . . . . . . . . . . . . . . . . . . . . . . . . . . . . . . . . . . . . . . . . . . . . . . . . . . . . . . . . . . . . . . . . . . . . . . . . . . . . . . . . . . 430,570 8,562 11,411CIT Group Inc. . . . . . . . . . . . . . . . . . . . . . . . . . . . . . . . . . . . . . . . . . . . . . . . . . . . . . . . . . . . . . . . . . . . . . . . . . . . . . . . . . . . . . . . . . . . 152,916 6,305 7,462Citigroup Inc. . . . . . . . . . . . . . . . . . . . . . . . . . . . . . . . . . . . . . . . . . . . . . . . . . . . . . . . . . . . . . . . . . . . . . . . . . . . . . . . . . . . . . . . . . . . . 318,781 8,607 16,012Comcast Corp., Special A . . . . . . . . . . . . . . . . . . . . . . . . . . . . . . . . . . . . . . . . . . . . . . . . . . . . . . . . . . . . . . . . . . . . . . . . . . . . . . . . . . . 59,591 1,513 3,389CVS Caremark Corp. . . . . . . . . . . . . . . . . . . . . . . . . . . . . . . . . . . . . . . . . . . . . . . . . . . . . . . . . . . . . . . . . . . . . . . . . . . . . . . . . . . . . . . . 75,302 2,503 6,053Eli Lilly & Co. . . . . . . . . . . . . . . . . . . . . . . . . . . . . . . . . . . . . . . . . . . . . . . . . . . . . . . . . . . . . . . . . . . . . . . . . . . . . . . . . . . . . . . . . . . . . 210,160 11,419 13,934Ensco PLC, A . . . . . . . . . . . . . . . . . . . . . . . . . . . . . . . . . . . . . . . . . . . . . . . . . . . . . . . . . . . . . . . . . . . . . . . . . . . . . . . . . . . . . . . . . . . . 71,746 3,724 4,252FIM Coinvestor Holdings I, LLC . . . . . . . . . . . . . . . . . . . . . . . . . . . . . . . . . . . . . . . . . . . . . . . . . . . . . . . . . . . . . . . . . . . . . . . . . . . . . . . 941,517 — —Freeport-McMoRan Copper & Gold Inc., B . . . . . . . . . . . . . . . . . . . . . . . . . . . . . . . . . . . . . . . . . . . . . . . . . . . . . . . . . . . . . . . . . . . . . . . 178,170 5,548 6,935General Motors Co. . . . . . . . . . . . . . . . . . . . . . . . . . . . . . . . . . . . . . . . . . . . . . . . . . . . . . . . . . . . . . . . . . . . . . . . . . . . . . . . . . . . . . . . . 300,580 9,445 11,636Hewlett-Packard Co. . . . . . . . . . . . . . . . . . . . . . . . . . . . . . . . . . . . . . . . . . . . . . . . . . . . . . . . . . . . . . . . . . . . . . . . . . . . . . . . . . . . . . . . 216,409 4,458 7,773Hospira Inc. . . . . . . . . . . . . . . . . . . . . . . . . . . . . . . . . . . . . . . . . . . . . . . . . . . . . . . . . . . . . . . . . . . . . . . . . . . . . . . . . . . . . . . . . . . . . . 186,743 6,805 10,230International Automotive Components Group North America, LLC . . . . . . . . . . . . . . . . . . . . . . . . . . . . . . . . . . . . . . . . . . . . . . . . . . . . . . . 1,201,447 1,229 1,182International Paper Co. . . . . . . . . . . . . . . . . . . . . . . . . . . . . . . . . . . . . . . . . . . . . . . . . . . . . . . . . . . . . . . . . . . . . . . . . . . . . . . . . . . . . . 119,900 6,132 6,453JPMorgan Chase & Co. . . . . . . . . . . . . . . . . . . . . . . . . . . . . . . . . . . . . . . . . . . . . . . . . . . . . . . . . . . . . . . . . . . . . . . . . . . . . . . . . . . . . . 252,330 10,829 15,505Kohl’s Corp. . . . . . . . . . . . . . . . . . . . . . . . . . . . . . . . . . . . . . . . . . . . . . . . . . . . . . . . . . . . . . . . . . . . . . . . . . . . . . . . . . . . . . . . . . . . . . 125,520 6,203 7,052Lehman Brothers Holdings Inc. . . . . . . . . . . . . . . . . . . . . . . . . . . . . . . . . . . . . . . . . . . . . . . . . . . . . . . . . . . . . . . . . . . . . . . . . . . . . . . . 28,962,636 13,117 14,169Lorillard Inc. . . . . . . . . . . . . . . . . . . . . . . . . . . . . . . . . . . . . . . . . . . . . . . . . . . . . . . . . . . . . . . . . . . . . . . . . . . . . . . . . . . . . . . . . . . . . . 231,675 5,668 15,064Marathon Oil Corp. . . . . . . . . . . . . . . . . . . . . . . . . . . . . . . . . . . . . . . . . . . . . . . . . . . . . . . . . . . . . . . . . . . . . . . . . . . . . . . . . . . . . . . . . 317,704 8,208 13,526Medtronic Inc. . . . . . . . . . . . . . . . . . . . . . . . . . . . . . . . . . . . . . . . . . . . . . . . . . . . . . . . . . . . . . . . . . . . . . . . . . . . . . . . . . . . . . . . . . . . 359,302 13,206 24,431Merck & Co. Inc. . . . . . . . . . . . . . . . . . . . . . . . . . . . . . . . . . . . . . . . . . . . . . . . . . . . . . . . . . . . . . . . . . . . . . . . . . . . . . . . . . . . . . . . . . 244,900 8,135 15,109MetLife Inc. . . . . . . . . . . . . . . . . . . . . . . . . . . . . . . . . . . . . . . . . . . . . . . . . . . . . . . . . . . . . . . . . . . . . . . . . . . . . . . . . . . . . . . . . . . . . . 187,920 7,720 11,135Microsoft Corp. . . . . . . . . . . . . . . . . . . . . . . . . . . . . . . . . . . . . . . . . . . . . . . . . . . . . . . . . . . . . . . . . . . . . . . . . . . . . . . . . . . . . . . . . . . . 585,220 16,729 26,025Murphy Oil Corp. . . . . . . . . . . . . . . . . . . . . . . . . . . . . . . . . . . . . . . . . . . . . . . . . . . . . . . . . . . . . . . . . . . . . . . . . . . . . . . . . . . . . . . . . . 81,660 4,697 5,789NewPage Corp., Escrow Account . . . . . . . . . . . . . . . . . . . . . . . . . . . . . . . . . . . . . . . . . . . . . . . . . . . . . . . . . . . . . . . . . . . . . . . . . . . . . . 8,279,000 — —NewPage Holdings Inc. . . . . . . . . . . . . . . . . . . . . . . . . . . . . . . . . . . . . . . . . . . . . . . . . . . . . . . . . . . . . . . . . . . . . . . . . . . . . . . . . . . . . . 33,116 3,151 2,931
The accompanying notes are an integral part of these financial statements.
300 Franklin Templeton Investments Funds
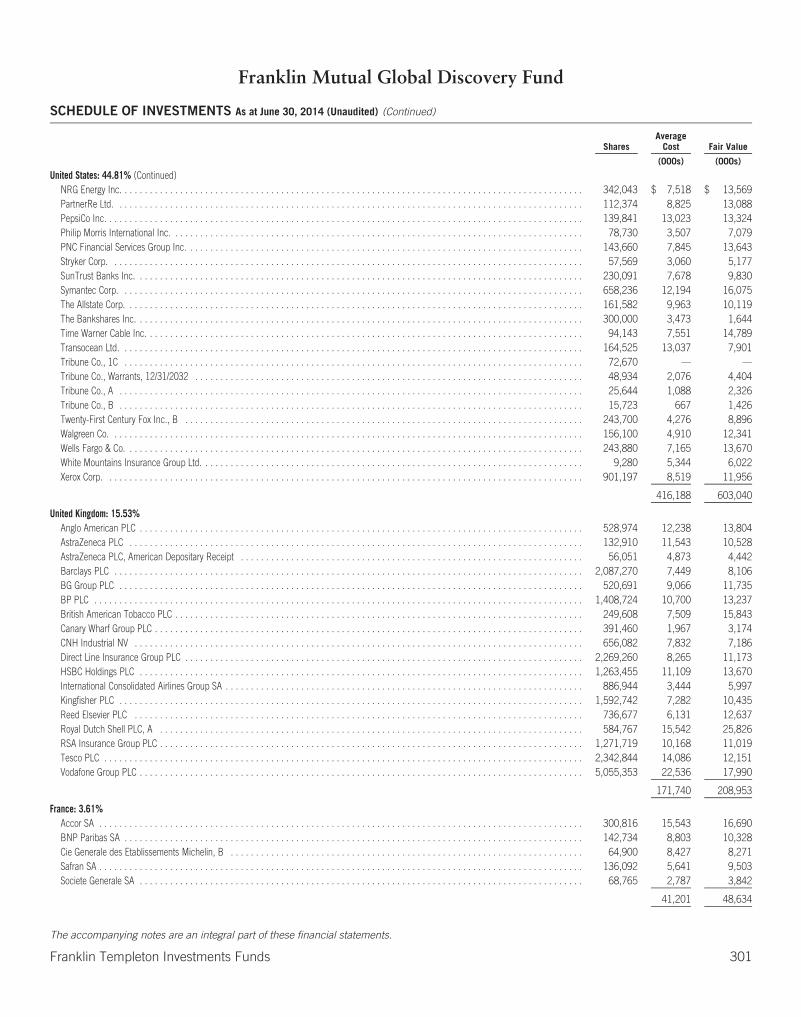
Franklin Mutual Global Discovery Fund
SCHEDULE OF INVESTMENTS As at June 30, 2014 (Unaudited) (Continued)
SharesAverage
Cost Fair Value
(000s) (000s)
United States: 44.81% (Continued)NRG Energy Inc. . . . . . . . . . . . . . . . . . . . . . . . . . . . . . . . . . . . . . . . . . . . . . . . . . . . . . . . . . . . . . . . . . . . . . . . . . . . . . . . . . . . . . . . . . . . 342,043 $ 7,518 $ 13,569PartnerRe Ltd. . . . . . . . . . . . . . . . . . . . . . . . . . . . . . . . . . . . . . . . . . . . . . . . . . . . . . . . . . . . . . . . . . . . . . . . . . . . . . . . . . . . . . . . . . . . . 112,374 8,825 13,088PepsiCo Inc. . . . . . . . . . . . . . . . . . . . . . . . . . . . . . . . . . . . . . . . . . . . . . . . . . . . . . . . . . . . . . . . . . . . . . . . . . . . . . . . . . . . . . . . . . . . . . . 139,841 13,023 13,324Philip Morris International Inc. . . . . . . . . . . . . . . . . . . . . . . . . . . . . . . . . . . . . . . . . . . . . . . . . . . . . . . . . . . . . . . . . . . . . . . . . . . . . . . . . . 78,730 3,507 7,079PNC Financial Services Group Inc. . . . . . . . . . . . . . . . . . . . . . . . . . . . . . . . . . . . . . . . . . . . . . . . . . . . . . . . . . . . . . . . . . . . . . . . . . . . . . . 143,660 7,845 13,643Stryker Corp. . . . . . . . . . . . . . . . . . . . . . . . . . . . . . . . . . . . . . . . . . . . . . . . . . . . . . . . . . . . . . . . . . . . . . . . . . . . . . . . . . . . . . . . . . . . . . 57,569 3,060 5,177SunTrust Banks Inc. . . . . . . . . . . . . . . . . . . . . . . . . . . . . . . . . . . . . . . . . . . . . . . . . . . . . . . . . . . . . . . . . . . . . . . . . . . . . . . . . . . . . . . . . 230,091 7,678 9,830Symantec Corp. . . . . . . . . . . . . . . . . . . . . . . . . . . . . . . . . . . . . . . . . . . . . . . . . . . . . . . . . . . . . . . . . . . . . . . . . . . . . . . . . . . . . . . . . . . . 658,236 12,194 16,075The Allstate Corp. . . . . . . . . . . . . . . . . . . . . . . . . . . . . . . . . . . . . . . . . . . . . . . . . . . . . . . . . . . . . . . . . . . . . . . . . . . . . . . . . . . . . . . . . . . 161,582 9,963 10,119The Bankshares Inc. . . . . . . . . . . . . . . . . . . . . . . . . . . . . . . . . . . . . . . . . . . . . . . . . . . . . . . . . . . . . . . . . . . . . . . . . . . . . . . . . . . . . . . . . 300,000 3,473 1,644Time Warner Cable Inc. . . . . . . . . . . . . . . . . . . . . . . . . . . . . . . . . . . . . . . . . . . . . . . . . . . . . . . . . . . . . . . . . . . . . . . . . . . . . . . . . . . . . . . 94,143 7,551 14,789Transocean Ltd. . . . . . . . . . . . . . . . . . . . . . . . . . . . . . . . . . . . . . . . . . . . . . . . . . . . . . . . . . . . . . . . . . . . . . . . . . . . . . . . . . . . . . . . . . . . 164,525 13,037 7,901Tribune Co., 1C . . . . . . . . . . . . . . . . . . . . . . . . . . . . . . . . . . . . . . . . . . . . . . . . . . . . . . . . . . . . . . . . . . . . . . . . . . . . . . . . . . . . . . . . . . . 72,670 — —Tribune Co., Warrants, 12/31/2032 . . . . . . . . . . . . . . . . . . . . . . . . . . . . . . . . . . . . . . . . . . . . . . . . . . . . . . . . . . . . . . . . . . . . . . . . . . . . . 48,934 2,076 4,404Tribune Co., A . . . . . . . . . . . . . . . . . . . . . . . . . . . . . . . . . . . . . . . . . . . . . . . . . . . . . . . . . . . . . . . . . . . . . . . . . . . . . . . . . . . . . . . . . . . . 25,644 1,088 2,326Tribune Co., B . . . . . . . . . . . . . . . . . . . . . . . . . . . . . . . . . . . . . . . . . . . . . . . . . . . . . . . . . . . . . . . . . . . . . . . . . . . . . . . . . . . . . . . . . . . . 15,723 667 1,426Twenty-First Century Fox Inc., B . . . . . . . . . . . . . . . . . . . . . . . . . . . . . . . . . . . . . . . . . . . . . . . . . . . . . . . . . . . . . . . . . . . . . . . . . . . . . . . 243,700 4,276 8,896Walgreen Co. . . . . . . . . . . . . . . . . . . . . . . . . . . . . . . . . . . . . . . . . . . . . . . . . . . . . . . . . . . . . . . . . . . . . . . . . . . . . . . . . . . . . . . . . . . . . . 156,100 4,910 12,341Wells Fargo & Co. . . . . . . . . . . . . . . . . . . . . . . . . . . . . . . . . . . . . . . . . . . . . . . . . . . . . . . . . . . . . . . . . . . . . . . . . . . . . . . . . . . . . . . . . . . 243,880 7,165 13,670White Mountains Insurance Group Ltd. . . . . . . . . . . . . . . . . . . . . . . . . . . . . . . . . . . . . . . . . . . . . . . . . . . . . . . . . . . . . . . . . . . . . . . . . . . . 9,280 5,344 6,022Xerox Corp. . . . . . . . . . . . . . . . . . . . . . . . . . . . . . . . . . . . . . . . . . . . . . . . . . . . . . . . . . . . . . . . . . . . . . . . . . . . . . . . . . . . . . . . . . . . . . . 901,197 8,519 11,956
416,188 603,040
United Kingdom: 15.53%Anglo American PLC . . . . . . . . . . . . . . . . . . . . . . . . . . . . . . . . . . . . . . . . . . . . . . . . . . . . . . . . . . . . . . . . . . . . . . . . . . . . . . . . . . . . . . . . 528,974 12,238 13,804AstraZeneca PLC . . . . . . . . . . . . . . . . . . . . . . . . . . . . . . . . . . . . . . . . . . . . . . . . . . . . . . . . . . . . . . . . . . . . . . . . . . . . . . . . . . . . . . . . . . 132,910 11,543 10,528AstraZeneca PLC, American Depositary Receipt . . . . . . . . . . . . . . . . . . . . . . . . . . . . . . . . . . . . . . . . . . . . . . . . . . . . . . . . . . . . . . . . . . . . 56,051 4,873 4,442Barclays PLC . . . . . . . . . . . . . . . . . . . . . . . . . . . . . . . . . . . . . . . . . . . . . . . . . . . . . . . . . . . . . . . . . . . . . . . . . . . . . . . . . . . . . . . . . . . . . 2,087,270 7,449 8,106BG Group PLC . . . . . . . . . . . . . . . . . . . . . . . . . . . . . . . . . . . . . . . . . . . . . . . . . . . . . . . . . . . . . . . . . . . . . . . . . . . . . . . . . . . . . . . . . . . . 520,691 9,066 11,735BP PLC . . . . . . . . . . . . . . . . . . . . . . . . . . . . . . . . . . . . . . . . . . . . . . . . . . . . . . . . . . . . . . . . . . . . . . . . . . . . . . . . . . . . . . . . . . . . . . . . . 1,408,724 10,700 13,237British American Tobacco PLC . . . . . . . . . . . . . . . . . . . . . . . . . . . . . . . . . . . . . . . . . . . . . . . . . . . . . . . . . . . . . . . . . . . . . . . . . . . . . . . . . 249,608 7,509 15,843Canary Wharf Group PLC . . . . . . . . . . . . . . . . . . . . . . . . . . . . . . . . . . . . . . . . . . . . . . . . . . . . . . . . . . . . . . . . . . . . . . . . . . . . . . . . . . . . . 391,460 1,967 3,174CNH Industrial NV . . . . . . . . . . . . . . . . . . . . . . . . . . . . . . . . . . . . . . . . . . . . . . . . . . . . . . . . . . . . . . . . . . . . . . . . . . . . . . . . . . . . . . . . . 656,082 7,832 7,186Direct Line Insurance Group PLC . . . . . . . . . . . . . . . . . . . . . . . . . . . . . . . . . . . . . . . . . . . . . . . . . . . . . . . . . . . . . . . . . . . . . . . . . . . . . . . 2,269,260 8,265 11,173HSBC Holdings PLC . . . . . . . . . . . . . . . . . . . . . . . . . . . . . . . . . . . . . . . . . . . . . . . . . . . . . . . . . . . . . . . . . . . . . . . . . . . . . . . . . . . . . . . . 1,263,455 11,109 13,670International Consolidated Airlines Group SA . . . . . . . . . . . . . . . . . . . . . . . . . . . . . . . . . . . . . . . . . . . . . . . . . . . . . . . . . . . . . . . . . . . . . . . 886,944 3,444 5,997Kingfisher PLC . . . . . . . . . . . . . . . . . . . . . . . . . . . . . . . . . . . . . . . . . . . . . . . . . . . . . . . . . . . . . . . . . . . . . . . . . . . . . . . . . . . . . . . . . . . . 1,592,742 7,282 10,435Reed Elsevier PLC . . . . . . . . . . . . . . . . . . . . . . . . . . . . . . . . . . . . . . . . . . . . . . . . . . . . . . . . . . . . . . . . . . . . . . . . . . . . . . . . . . . . . . . . . 736,677 6,131 12,637Royal Dutch Shell PLC, A . . . . . . . . . . . . . . . . . . . . . . . . . . . . . . . . . . . . . . . . . . . . . . . . . . . . . . . . . . . . . . . . . . . . . . . . . . . . . . . . . . . . 584,767 15,542 25,826RSA Insurance Group PLC . . . . . . . . . . . . . . . . . . . . . . . . . . . . . . . . . . . . . . . . . . . . . . . . . . . . . . . . . . . . . . . . . . . . . . . . . . . . . . . . . . . . 1,271,719 10,168 11,019Tesco PLC . . . . . . . . . . . . . . . . . . . . . . . . . . . . . . . . . . . . . . . . . . . . . . . . . . . . . . . . . . . . . . . . . . . . . . . . . . . . . . . . . . . . . . . . . . . . . . . 2,342,844 14,086 12,151Vodafone Group PLC . . . . . . . . . . . . . . . . . . . . . . . . . . . . . . . . . . . . . . . . . . . . . . . . . . . . . . . . . . . . . . . . . . . . . . . . . . . . . . . . . . . . . . . . 5,055,353 22,536 17,990
171,740 208,953
France: 3.61%Accor SA . . . . . . . . . . . . . . . . . . . . . . . . . . . . . . . . . . . . . . . . . . . . . . . . . . . . . . . . . . . . . . . . . . . . . . . . . . . . . . . . . . . . . . . . . . . . . . . . 300,816 15,543 16,690BNP Paribas SA . . . . . . . . . . . . . . . . . . . . . . . . . . . . . . . . . . . . . . . . . . . . . . . . . . . . . . . . . . . . . . . . . . . . . . . . . . . . . . . . . . . . . . . . . . . 142,734 8,803 10,328Cie Generale des Etablissements Michelin, B . . . . . . . . . . . . . . . . . . . . . . . . . . . . . . . . . . . . . . . . . . . . . . . . . . . . . . . . . . . . . . . . . . . . . . 64,900 8,427 8,271Safran SA . . . . . . . . . . . . . . . . . . . . . . . . . . . . . . . . . . . . . . . . . . . . . . . . . . . . . . . . . . . . . . . . . . . . . . . . . . . . . . . . . . . . . . . . . . . . . . . . 136,092 5,641 9,503Societe Generale SA . . . . . . . . . . . . . . . . . . . . . . . . . . . . . . . . . . . . . . . . . . . . . . . . . . . . . . . . . . . . . . . . . . . . . . . . . . . . . . . . . . . . . . . . 68,765 2,787 3,842
41,201 48,634
The accompanying notes are an integral part of these financial statements.
Franklin Templeton Investments Funds 301
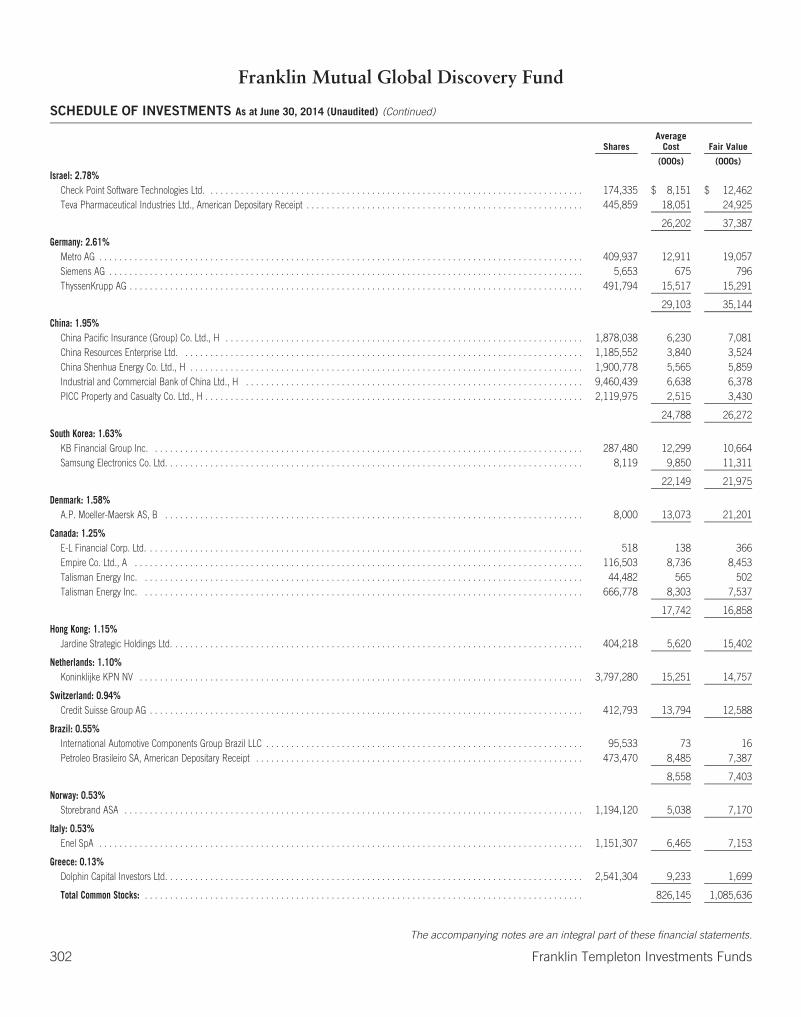
Franklin Mutual Global Discovery Fund
SCHEDULE OF INVESTMENTS As at June 30, 2014 (Unaudited) (Continued)
SharesAverage
Cost Fair Value
(000s) (000s)
Israel: 2.78%Check Point Software Technologies Ltd. . . . . . . . . . . . . . . . . . . . . . . . . . . . . . . . . . . . . . . . . . . . . . . . . . . . . . . . . . . . . . . . . . . . . . . . . . . 174,335 $ 8,151 $ 12,462Teva Pharmaceutical Industries Ltd., American Depositary Receipt . . . . . . . . . . . . . . . . . . . . . . . . . . . . . . . . . . . . . . . . . . . . . . . . . . . . . . . 445,859 18,051 24,925
26,202 37,387
Germany: 2.61%Metro AG . . . . . . . . . . . . . . . . . . . . . . . . . . . . . . . . . . . . . . . . . . . . . . . . . . . . . . . . . . . . . . . . . . . . . . . . . . . . . . . . . . . . . . . . . . . . . . . . 409,937 12,911 19,057Siemens AG . . . . . . . . . . . . . . . . . . . . . . . . . . . . . . . . . . . . . . . . . . . . . . . . . . . . . . . . . . . . . . . . . . . . . . . . . . . . . . . . . . . . . . . . . . . . . . 5,653 675 796ThyssenKrupp AG . . . . . . . . . . . . . . . . . . . . . . . . . . . . . . . . . . . . . . . . . . . . . . . . . . . . . . . . . . . . . . . . . . . . . . . . . . . . . . . . . . . . . . . . . . 491,794 15,517 15,291
29,103 35,144
China: 1.95%China Pacific Insurance (Group) Co. Ltd., H . . . . . . . . . . . . . . . . . . . . . . . . . . . . . . . . . . . . . . . . . . . . . . . . . . . . . . . . . . . . . . . . . . . . . . . 1,878,038 6,230 7,081China Resources Enterprise Ltd. . . . . . . . . . . . . . . . . . . . . . . . . . . . . . . . . . . . . . . . . . . . . . . . . . . . . . . . . . . . . . . . . . . . . . . . . . . . . . . . 1,185,552 3,840 3,524China Shenhua Energy Co. Ltd., H . . . . . . . . . . . . . . . . . . . . . . . . . . . . . . . . . . . . . . . . . . . . . . . . . . . . . . . . . . . . . . . . . . . . . . . . . . . . . . 1,900,778 5,565 5,859Industrial and Commercial Bank of China Ltd., H . . . . . . . . . . . . . . . . . . . . . . . . . . . . . . . . . . . . . . . . . . . . . . . . . . . . . . . . . . . . . . . . . . . 9,460,439 6,638 6,378PICC Property and Casualty Co. Ltd., H . . . . . . . . . . . . . . . . . . . . . . . . . . . . . . . . . . . . . . . . . . . . . . . . . . . . . . . . . . . . . . . . . . . . . . . . . . . 2,119,975 2,515 3,430
24,788 26,272
South Korea: 1.63%KB Financial Group Inc. . . . . . . . . . . . . . . . . . . . . . . . . . . . . . . . . . . . . . . . . . . . . . . . . . . . . . . . . . . . . . . . . . . . . . . . . . . . . . . . . . . . . . 287,480 12,299 10,664Samsung Electronics Co. Ltd. . . . . . . . . . . . . . . . . . . . . . . . . . . . . . . . . . . . . . . . . . . . . . . . . . . . . . . . . . . . . . . . . . . . . . . . . . . . . . . . . . . 8,119 9,850 11,311
22,149 21,975
Denmark: 1.58%A.P. Moeller-Maersk AS, B . . . . . . . . . . . . . . . . . . . . . . . . . . . . . . . . . . . . . . . . . . . . . . . . . . . . . . . . . . . . . . . . . . . . . . . . . . . . . . . . . . . 8,000 13,073 21,201
Canada: 1.25%E-L Financial Corp. Ltd. . . . . . . . . . . . . . . . . . . . . . . . . . . . . . . . . . . . . . . . . . . . . . . . . . . . . . . . . . . . . . . . . . . . . . . . . . . . . . . . . . . . . . . 518 138 366Empire Co. Ltd., A . . . . . . . . . . . . . . . . . . . . . . . . . . . . . . . . . . . . . . . . . . . . . . . . . . . . . . . . . . . . . . . . . . . . . . . . . . . . . . . . . . . . . . . . . 116,503 8,736 8,453Talisman Energy Inc. . . . . . . . . . . . . . . . . . . . . . . . . . . . . . . . . . . . . . . . . . . . . . . . . . . . . . . . . . . . . . . . . . . . . . . . . . . . . . . . . . . . . . . . 44,482 565 502Talisman Energy Inc. . . . . . . . . . . . . . . . . . . . . . . . . . . . . . . . . . . . . . . . . . . . . . . . . . . . . . . . . . . . . . . . . . . . . . . . . . . . . . . . . . . . . . . . 666,778 8,303 7,537
17,742 16,858
Hong Kong: 1.15%Jardine Strategic Holdings Ltd. . . . . . . . . . . . . . . . . . . . . . . . . . . . . . . . . . . . . . . . . . . . . . . . . . . . . . . . . . . . . . . . . . . . . . . . . . . . . . . . . . 404,218 5,620 15,402
Netherlands: 1.10%Koninklijke KPN NV . . . . . . . . . . . . . . . . . . . . . . . . . . . . . . . . . . . . . . . . . . . . . . . . . . . . . . . . . . . . . . . . . . . . . . . . . . . . . . . . . . . . . . . . 3,797,280 15,251 14,757
Switzerland: 0.94%Credit Suisse Group AG . . . . . . . . . . . . . . . . . . . . . . . . . . . . . . . . . . . . . . . . . . . . . . . . . . . . . . . . . . . . . . . . . . . . . . . . . . . . . . . . . . . . . . 412,793 13,794 12,588
Brazil: 0.55%International Automotive Components Group Brazil LLC . . . . . . . . . . . . . . . . . . . . . . . . . . . . . . . . . . . . . . . . . . . . . . . . . . . . . . . . . . . . . . . 95,533 73 16Petroleo Brasileiro SA, American Depositary Receipt . . . . . . . . . . . . . . . . . . . . . . . . . . . . . . . . . . . . . . . . . . . . . . . . . . . . . . . . . . . . . . . . . 473,470 8,485 7,387
8,558 7,403
Norway: 0.53%Storebrand ASA . . . . . . . . . . . . . . . . . . . . . . . . . . . . . . . . . . . . . . . . . . . . . . . . . . . . . . . . . . . . . . . . . . . . . . . . . . . . . . . . . . . . . . . . . . . 1,194,120 5,038 7,170
Italy: 0.53%Enel SpA . . . . . . . . . . . . . . . . . . . . . . . . . . . . . . . . . . . . . . . . . . . . . . . . . . . . . . . . . . . . . . . . . . . . . . . . . . . . . . . . . . . . . . . . . . . . . . . . 1,151,307 6,465 7,153
Greece: 0.13%Dolphin Capital Investors Ltd. . . . . . . . . . . . . . . . . . . . . . . . . . . . . . . . . . . . . . . . . . . . . . . . . . . . . . . . . . . . . . . . . . . . . . . . . . . . . . . . . . . 2,541,304 9,233 1,699
Total Common Stocks: . . . . . . . . . . . . . . . . . . . . . . . . . . . . . . . . . . . . . . . . . . . . . . . . . . . . . . . . . . . . . . . . . . . . . . . . . . . . . . . . . . . . . . . 826,145 1,085,636
The accompanying notes are an integral part of these financial statements.
302 Franklin Templeton Investments Funds
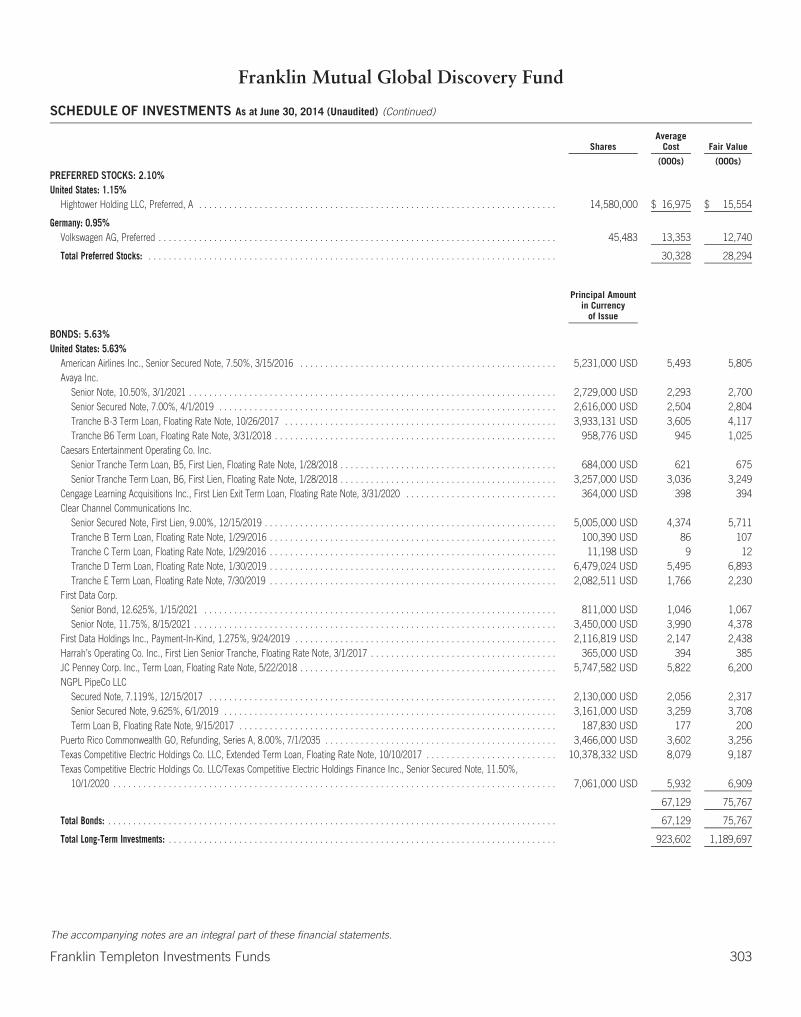
Franklin Mutual Global Discovery Fund
SCHEDULE OF INVESTMENTS As at June 30, 2014 (Unaudited) (Continued)
SharesAverage
Cost Fair Value
(000s) (000s)
PREFERRED STOCKS: 2.10%United States: 1.15%
Hightower Holding LLC, Preferred, A . . . . . . . . . . . . . . . . . . . . . . . . . . . . . . . . . . . . . . . . . . . . . . . . . . . . . . . . . . . . . . . . . . . . . . . 14,580,000 $ 16,975 $ 15,554
Germany: 0.95%Volkswagen AG, Preferred . . . . . . . . . . . . . . . . . . . . . . . . . . . . . . . . . . . . . . . . . . . . . . . . . . . . . . . . . . . . . . . . . . . . . . . . . . . . . . . 45,483 13,353 12,740
Total Preferred Stocks: . . . . . . . . . . . . . . . . . . . . . . . . . . . . . . . . . . . . . . . . . . . . . . . . . . . . . . . . . . . . . . . . . . . . . . . . . . . . . . . . . 30,328 28,294
Principal Amountin Currency
of Issue
BONDS: 5.63%United States: 5.63%
American Airlines Inc., Senior Secured Note, 7.50%, 3/15/2016 . . . . . . . . . . . . . . . . . . . . . . . . . . . . . . . . . . . . . . . . . . . . . . . . . . . 5,231,000 USD 5,493 5,805Avaya Inc.
Senior Note, 10.50%, 3/1/2021 . . . . . . . . . . . . . . . . . . . . . . . . . . . . . . . . . . . . . . . . . . . . . . . . . . . . . . . . . . . . . . . . . . . . . . . . . 2,729,000 USD 2,293 2,700Senior Secured Note, 7.00%, 4/1/2019 . . . . . . . . . . . . . . . . . . . . . . . . . . . . . . . . . . . . . . . . . . . . . . . . . . . . . . . . . . . . . . . . . . . 2,616,000 USD 2,504 2,804Tranche B-3 Term Loan, Floating Rate Note, 10/26/2017 . . . . . . . . . . . . . . . . . . . . . . . . . . . . . . . . . . . . . . . . . . . . . . . . . . . . . . 3,933,131 USD 3,605 4,117Tranche B6 Term Loan, Floating Rate Note, 3/31/2018 . . . . . . . . . . . . . . . . . . . . . . . . . . . . . . . . . . . . . . . . . . . . . . . . . . . . . . . . 958,776 USD 945 1,025
Caesars Entertainment Operating Co. Inc.Senior Tranche Term Loan, B5, First Lien, Floating Rate Note, 1/28/2018 . . . . . . . . . . . . . . . . . . . . . . . . . . . . . . . . . . . . . . . . . . . 684,000 USD 621 675Senior Tranche Term Loan, B6, First Lien, Floating Rate Note, 1/28/2018 . . . . . . . . . . . . . . . . . . . . . . . . . . . . . . . . . . . . . . . . . . . 3,257,000 USD 3,036 3,249
Cengage Learning Acquisitions Inc., First Lien Exit Term Loan, Floating Rate Note, 3/31/2020 . . . . . . . . . . . . . . . . . . . . . . . . . . . . . . 364,000 USD 398 394Clear Channel Communications Inc.
Senior Secured Note, First Lien, 9.00%, 12/15/2019 . . . . . . . . . . . . . . . . . . . . . . . . . . . . . . . . . . . . . . . . . . . . . . . . . . . . . . . . . . 5,005,000 USD 4,374 5,711Tranche B Term Loan, Floating Rate Note, 1/29/2016 . . . . . . . . . . . . . . . . . . . . . . . . . . . . . . . . . . . . . . . . . . . . . . . . . . . . . . . . . 100,390 USD 86 107Tranche C Term Loan, Floating Rate Note, 1/29/2016 . . . . . . . . . . . . . . . . . . . . . . . . . . . . . . . . . . . . . . . . . . . . . . . . . . . . . . . . . 11,198 USD 9 12Tranche D Term Loan, Floating Rate Note, 1/30/2019 . . . . . . . . . . . . . . . . . . . . . . . . . . . . . . . . . . . . . . . . . . . . . . . . . . . . . . . . . 6,479,024 USD 5,495 6,893Tranche E Term Loan, Floating Rate Note, 7/30/2019 . . . . . . . . . . . . . . . . . . . . . . . . . . . . . . . . . . . . . . . . . . . . . . . . . . . . . . . . . 2,082,511 USD 1,766 2,230
First Data Corp.Senior Bond, 12.625%, 1/15/2021 . . . . . . . . . . . . . . . . . . . . . . . . . . . . . . . . . . . . . . . . . . . . . . . . . . . . . . . . . . . . . . . . . . . . . . 811,000 USD 1,046 1,067Senior Note, 11.75%, 8/15/2021 . . . . . . . . . . . . . . . . . . . . . . . . . . . . . . . . . . . . . . . . . . . . . . . . . . . . . . . . . . . . . . . . . . . . . . . . 3,450,000 USD 3,990 4,378
First Data Holdings Inc., Payment-In-Kind, 1.275%, 9/24/2019 . . . . . . . . . . . . . . . . . . . . . . . . . . . . . . . . . . . . . . . . . . . . . . . . . . . . 2,116,819 USD 2,147 2,438Harrah’s Operating Co. Inc., First Lien Senior Tranche, Floating Rate Note, 3/1/2017 . . . . . . . . . . . . . . . . . . . . . . . . . . . . . . . . . . . . . 365,000 USD 394 385JC Penney Corp. Inc., Term Loan, Floating Rate Note, 5/22/2018 . . . . . . . . . . . . . . . . . . . . . . . . . . . . . . . . . . . . . . . . . . . . . . . . . . . 5,747,582 USD 5,822 6,200NGPL PipeCo LLC
Secured Note, 7.119%, 12/15/2017 . . . . . . . . . . . . . . . . . . . . . . . . . . . . . . . . . . . . . . . . . . . . . . . . . . . . . . . . . . . . . . . . . . . . . 2,130,000 USD 2,056 2,317Senior Secured Note, 9.625%, 6/1/2019 . . . . . . . . . . . . . . . . . . . . . . . . . . . . . . . . . . . . . . . . . . . . . . . . . . . . . . . . . . . . . . . . . . 3,161,000 USD 3,259 3,708Term Loan B, Floating Rate Note, 9/15/2017 . . . . . . . . . . . . . . . . . . . . . . . . . . . . . . . . . . . . . . . . . . . . . . . . . . . . . . . . . . . . . . . 187,830 USD 177 200
Puerto Rico Commonwealth GO, Refunding, Series A, 8.00%, 7/1/2035 . . . . . . . . . . . . . . . . . . . . . . . . . . . . . . . . . . . . . . . . . . . . . . 3,466,000 USD 3,602 3,256Texas Competitive Electric Holdings Co. LLC, Extended Term Loan, Floating Rate Note, 10/10/2017 . . . . . . . . . . . . . . . . . . . . . . . . . . 10,378,332 USD 8,079 9,187Texas Competitive Electric Holdings Co. LLC/Texas Competitive Electric Holdings Finance Inc., Senior Secured Note, 11.50%,
10/1/2020 . . . . . . . . . . . . . . . . . . . . . . . . . . . . . . . . . . . . . . . . . . . . . . . . . . . . . . . . . . . . . . . . . . . . . . . . . . . . . . . . . . . . . . . . 7,061,000 USD 5,932 6,909
67,129 75,767
Total Bonds: . . . . . . . . . . . . . . . . . . . . . . . . . . . . . . . . . . . . . . . . . . . . . . . . . . . . . . . . . . . . . . . . . . . . . . . . . . . . . . . . . . . . . . . . . 67,129 75,767
Total Long-Term Investments: . . . . . . . . . . . . . . . . . . . . . . . . . . . . . . . . . . . . . . . . . . . . . . . . . . . . . . . . . . . . . . . . . . . . . . . . . . . . . 923,602 1,189,697
The accompanying notes are an integral part of these financial statements.
Franklin Templeton Investments Funds 303
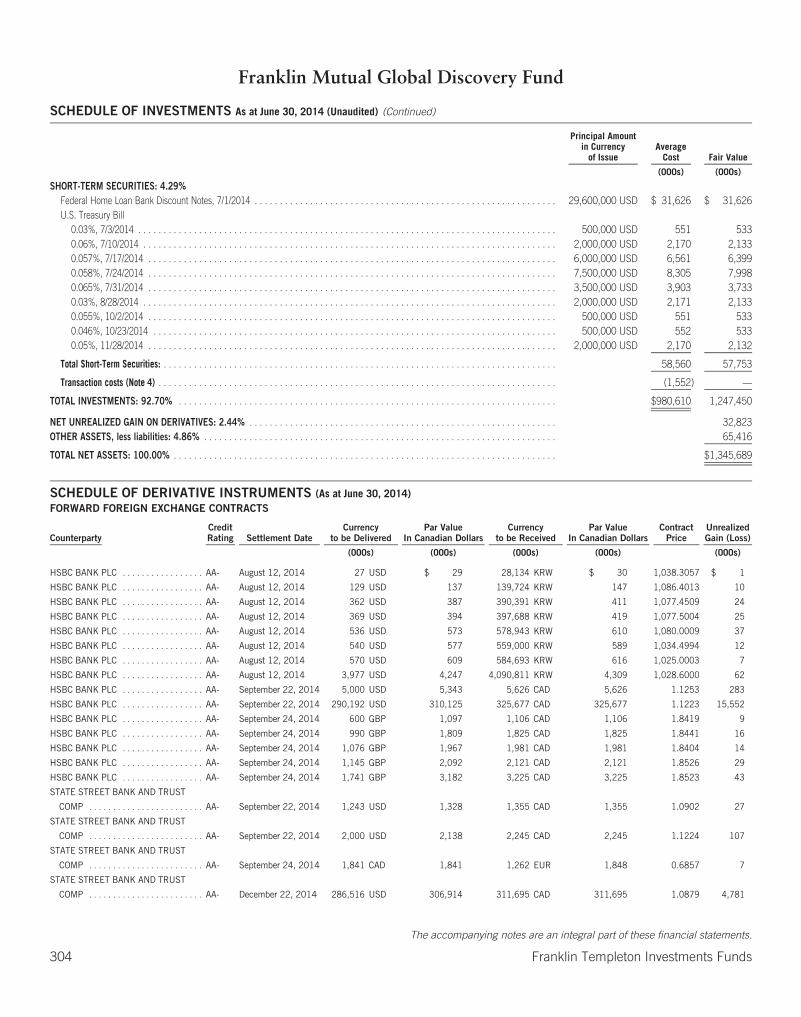
Franklin Mutual Global Discovery Fund
SCHEDULE OF INVESTMENTS As at June 30, 2014 (Unaudited) (Continued)
Principal Amountin Currency
of IssueAverage
Cost Fair Value
(000s) (000s)
SHORT-TERM SECURITIES: 4.29%Federal Home Loan Bank Discount Notes, 7/1/2014 . . . . . . . . . . . . . . . . . . . . . . . . . . . . . . . . . . . . . . . . . . . . . . . . . . . . . . . . . . . . 29,600,000 USD $ 31,626 $ 31,626U.S. Treasury Bill
0.03%, 7/3/2014 . . . . . . . . . . . . . . . . . . . . . . . . . . . . . . . . . . . . . . . . . . . . . . . . . . . . . . . . . . . . . . . . . . . . . . . . . . . . . . . . . . . 500,000 USD 551 5330.06%, 7/10/2014 . . . . . . . . . . . . . . . . . . . . . . . . . . . . . . . . . . . . . . . . . . . . . . . . . . . . . . . . . . . . . . . . . . . . . . . . . . . . . . . . . . 2,000,000 USD 2,170 2,1330.057%, 7/17/2014 . . . . . . . . . . . . . . . . . . . . . . . . . . . . . . . . . . . . . . . . . . . . . . . . . . . . . . . . . . . . . . . . . . . . . . . . . . . . . . . . . 6,000,000 USD 6,561 6,3990.058%, 7/24/2014 . . . . . . . . . . . . . . . . . . . . . . . . . . . . . . . . . . . . . . . . . . . . . . . . . . . . . . . . . . . . . . . . . . . . . . . . . . . . . . . . . 7,500,000 USD 8,305 7,9980.065%, 7/31/2014 . . . . . . . . . . . . . . . . . . . . . . . . . . . . . . . . . . . . . . . . . . . . . . . . . . . . . . . . . . . . . . . . . . . . . . . . . . . . . . . . . 3,500,000 USD 3,903 3,7330.03%, 8/28/2014 . . . . . . . . . . . . . . . . . . . . . . . . . . . . . . . . . . . . . . . . . . . . . . . . . . . . . . . . . . . . . . . . . . . . . . . . . . . . . . . . . . 2,000,000 USD 2,171 2,1330.055%, 10/2/2014 . . . . . . . . . . . . . . . . . . . . . . . . . . . . . . . . . . . . . . . . . . . . . . . . . . . . . . . . . . . . . . . . . . . . . . . . . . . . . . . . . 500,000 USD 551 5330.046%, 10/23/2014 . . . . . . . . . . . . . . . . . . . . . . . . . . . . . . . . . . . . . . . . . . . . . . . . . . . . . . . . . . . . . . . . . . . . . . . . . . . . . . . . 500,000 USD 552 5330.05%, 11/28/2014 . . . . . . . . . . . . . . . . . . . . . . . . . . . . . . . . . . . . . . . . . . . . . . . . . . . . . . . . . . . . . . . . . . . . . . . . . . . . . . . . . 2,000,000 USD 2,170 2,132
Total Short-Term Securities: . . . . . . . . . . . . . . . . . . . . . . . . . . . . . . . . . . . . . . . . . . . . . . . . . . . . . . . . . . . . . . . . . . . . . . . . . . . . . . 58,560 57,753
Transaction costs (Note 4) . . . . . . . . . . . . . . . . . . . . . . . . . . . . . . . . . . . . . . . . . . . . . . . . . . . . . . . . . . . . . . . . . . . . . . . . . . . . . . . (1,552) —
TOTAL INVESTMENTS: 92.70% . . . . . . . . . . . . . . . . . . . . . . . . . . . . . . . . . . . . . . . . . . . . . . . . . . . . . . . . . . . . . . . . . . . . . . . . . . . $980,610 1,247,450
NET UNREALIZED GAIN ON DERIVATIVES: 2.44% . . . . . . . . . . . . . . . . . . . . . . . . . . . . . . . . . . . . . . . . . . . . . . . . . . . . . . . . . . . . . 32,823OTHER ASSETS, less liabilities: 4.86% . . . . . . . . . . . . . . . . . . . . . . . . . . . . . . . . . . . . . . . . . . . . . . . . . . . . . . . . . . . . . . . . . . . . . . 65,416
TOTAL NET ASSETS: 100.00% . . . . . . . . . . . . . . . . . . . . . . . . . . . . . . . . . . . . . . . . . . . . . . . . . . . . . . . . . . . . . . . . . . . . . . . . . . . . $1,345,689
SCHEDULE OF DERIVATIVE INSTRUMENTS (As at June 30, 2014)FORWARD FOREIGN EXCHANGE CONTRACTS
CounterpartyCreditRating Settlement Date
Currencyto be Delivered
Par ValueIn Canadian Dollars
Currencyto be Received
Par ValueIn Canadian Dollars
ContractPrice
UnrealizedGain (Loss)
(000s) (000s) (000s) (000s) (000s)
HSBC BANK PLC . . . . . . . . . . . . . . . . . AA- August 12, 2014 27 USD $ 29 28,134 KRW $ 30 1,038.3057 $ 1
HSBC BANK PLC . . . . . . . . . . . . . . . . . AA- August 12, 2014 129 USD 137 139,724 KRW 147 1,086.4013 10
HSBC BANK PLC . . . . . . . . . . . . . . . . . AA- August 12, 2014 362 USD 387 390,391 KRW 411 1,077.4509 24
HSBC BANK PLC . . . . . . . . . . . . . . . . . AA- August 12, 2014 369 USD 394 397,688 KRW 419 1,077.5004 25
HSBC BANK PLC . . . . . . . . . . . . . . . . . AA- August 12, 2014 536 USD 573 578,943 KRW 610 1,080.0009 37
HSBC BANK PLC . . . . . . . . . . . . . . . . . AA- August 12, 2014 540 USD 577 559,000 KRW 589 1,034.4994 12
HSBC BANK PLC . . . . . . . . . . . . . . . . . AA- August 12, 2014 570 USD 609 584,693 KRW 616 1,025.0003 7
HSBC BANK PLC . . . . . . . . . . . . . . . . . AA- August 12, 2014 3,977 USD 4,247 4,090,811 KRW 4,309 1,028.6000 62
HSBC BANK PLC . . . . . . . . . . . . . . . . . AA- September 22, 2014 5,000 USD 5,343 5,626 CAD 5,626 1.1253 283
HSBC BANK PLC . . . . . . . . . . . . . . . . . AA- September 22, 2014 290,192 USD 310,125 325,677 CAD 325,677 1.1223 15,552
HSBC BANK PLC . . . . . . . . . . . . . . . . . AA- September 24, 2014 600 GBP 1,097 1,106 CAD 1,106 1.8419 9
HSBC BANK PLC . . . . . . . . . . . . . . . . . AA- September 24, 2014 990 GBP 1,809 1,825 CAD 1,825 1.8441 16
HSBC BANK PLC . . . . . . . . . . . . . . . . . AA- September 24, 2014 1,076 GBP 1,967 1,981 CAD 1,981 1.8404 14
HSBC BANK PLC . . . . . . . . . . . . . . . . . AA- September 24, 2014 1,145 GBP 2,092 2,121 CAD 2,121 1.8526 29
HSBC BANK PLC . . . . . . . . . . . . . . . . . AA- September 24, 2014 1,741 GBP 3,182 3,225 CAD 3,225 1.8523 43
STATE STREET BANK AND TRUST
COMP . . . . . . . . . . . . . . . . . . . . . . . . AA- September 22, 2014 1,243 USD 1,328 1,355 CAD 1,355 1.0902 27
STATE STREET BANK AND TRUST
COMP . . . . . . . . . . . . . . . . . . . . . . . . AA- September 22, 2014 2,000 USD 2,138 2,245 CAD 2,245 1.1224 107
STATE STREET BANK AND TRUST
COMP . . . . . . . . . . . . . . . . . . . . . . . . AA- September 24, 2014 1,841 CAD 1,841 1,262 EUR 1,848 0.6857 7
STATE STREET BANK AND TRUST
COMP . . . . . . . . . . . . . . . . . . . . . . . . AA- December 22, 2014 286,516 USD 306,914 311,695 CAD 311,695 1.0879 4,781
The accompanying notes are an integral part of these financial statements.
304 Franklin Templeton Investments Funds
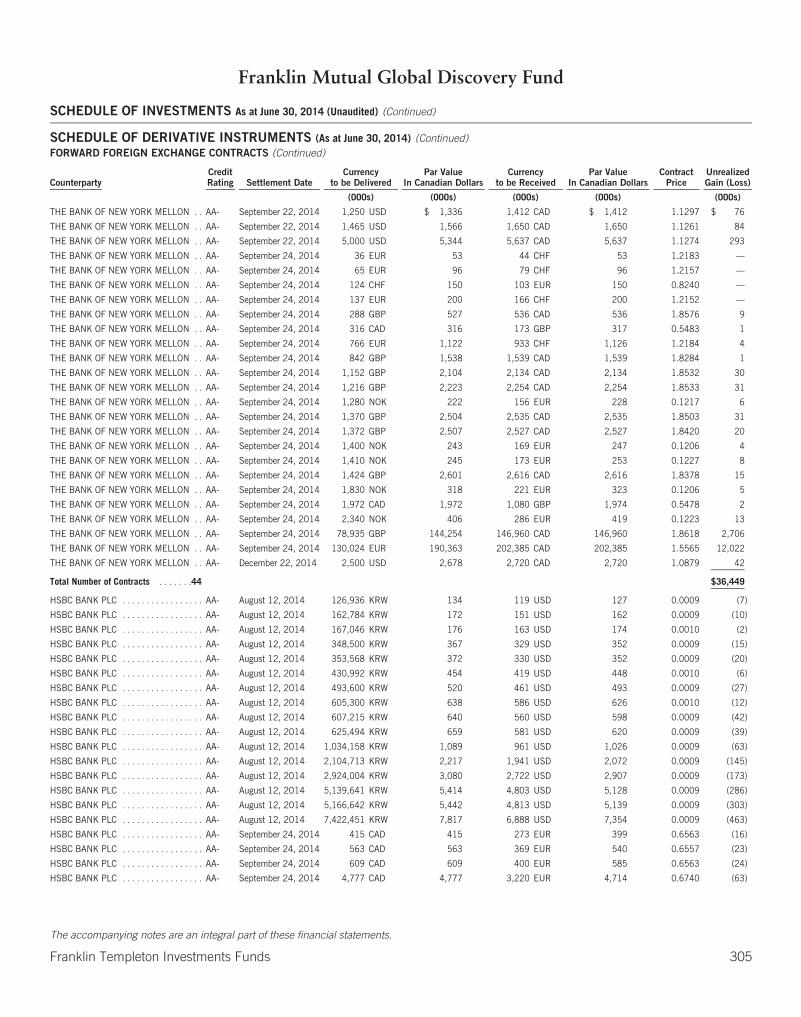
Franklin Mutual Global Discovery Fund
SCHEDULE OF INVESTMENTS As at June 30, 2014 (Unaudited) (Continued)
SCHEDULE OF DERIVATIVE INSTRUMENTS (As at June 30, 2014) (Continued)FORWARD FOREIGN EXCHANGE CONTRACTS (Continued)
CounterpartyCreditRating Settlement Date
Currencyto be Delivered
Par ValueIn Canadian Dollars
Currencyto be Received
Par ValueIn Canadian Dollars
ContractPrice
UnrealizedGain (Loss)
(000s) (000s) (000s) (000s) (000s)
THE BANK OF NEW YORK MELLON . . AA- September 22, 2014 1,250 USD $ 1,336 1,412 CAD $ 1,412 1.1297 $ 76
THE BANK OF NEW YORK MELLON . . AA- September 22, 2014 1,465 USD 1,566 1,650 CAD 1,650 1.1261 84
THE BANK OF NEW YORK MELLON . . AA- September 22, 2014 5,000 USD 5,344 5,637 CAD 5,637 1.1274 293
THE BANK OF NEW YORK MELLON . . AA- September 24, 2014 36 EUR 53 44 CHF 53 1.2183 —
THE BANK OF NEW YORK MELLON . . AA- September 24, 2014 65 EUR 96 79 CHF 96 1.2157 —
THE BANK OF NEW YORK MELLON . . AA- September 24, 2014 124 CHF 150 103 EUR 150 0.8240 —
THE BANK OF NEW YORK MELLON . . AA- September 24, 2014 137 EUR 200 166 CHF 200 1.2152 —
THE BANK OF NEW YORK MELLON . . AA- September 24, 2014 288 GBP 527 536 CAD 536 1.8576 9
THE BANK OF NEW YORK MELLON . . AA- September 24, 2014 316 CAD 316 173 GBP 317 0.5483 1
THE BANK OF NEW YORK MELLON . . AA- September 24, 2014 766 EUR 1,122 933 CHF 1,126 1.2184 4
THE BANK OF NEW YORK MELLON . . AA- September 24, 2014 842 GBP 1,538 1,539 CAD 1,539 1.8284 1
THE BANK OF NEW YORK MELLON . . AA- September 24, 2014 1,152 GBP 2,104 2,134 CAD 2,134 1.8532 30
THE BANK OF NEW YORK MELLON . . AA- September 24, 2014 1,216 GBP 2,223 2,254 CAD 2,254 1.8533 31
THE BANK OF NEW YORK MELLON . . AA- September 24, 2014 1,280 NOK 222 156 EUR 228 0.1217 6
THE BANK OF NEW YORK MELLON . . AA- September 24, 2014 1,370 GBP 2,504 2,535 CAD 2,535 1.8503 31
THE BANK OF NEW YORK MELLON . . AA- September 24, 2014 1,372 GBP 2,507 2,527 CAD 2,527 1.8420 20
THE BANK OF NEW YORK MELLON . . AA- September 24, 2014 1,400 NOK 243 169 EUR 247 0.1206 4
THE BANK OF NEW YORK MELLON . . AA- September 24, 2014 1,410 NOK 245 173 EUR 253 0.1227 8
THE BANK OF NEW YORK MELLON . . AA- September 24, 2014 1,424 GBP 2,601 2,616 CAD 2,616 1.8378 15
THE BANK OF NEW YORK MELLON . . AA- September 24, 2014 1,830 NOK 318 221 EUR 323 0.1206 5
THE BANK OF NEW YORK MELLON . . AA- September 24, 2014 1,972 CAD 1,972 1,080 GBP 1,974 0.5478 2
THE BANK OF NEW YORK MELLON . . AA- September 24, 2014 2,340 NOK 406 286 EUR 419 0.1223 13
THE BANK OF NEW YORK MELLON . . AA- September 24, 2014 78,935 GBP 144,254 146,960 CAD 146,960 1.8618 2,706
THE BANK OF NEW YORK MELLON . . AA- September 24, 2014 130,024 EUR 190,363 202,385 CAD 202,385 1.5565 12,022
THE BANK OF NEW YORK MELLON . . AA- December 22, 2014 2,500 USD 2,678 2,720 CAD 2,720 1.0879 42
Total Number of Contracts . . . . . . .44 $36,449
HSBC BANK PLC . . . . . . . . . . . . . . . . . AA- August 12, 2014 126,936 KRW 134 119 USD 127 0.0009 (7)
HSBC BANK PLC . . . . . . . . . . . . . . . . . AA- August 12, 2014 162,784 KRW 172 151 USD 162 0.0009 (10)
HSBC BANK PLC . . . . . . . . . . . . . . . . . AA- August 12, 2014 167,046 KRW 176 163 USD 174 0.0010 (2)
HSBC BANK PLC . . . . . . . . . . . . . . . . . AA- August 12, 2014 348,500 KRW 367 329 USD 352 0.0009 (15)
HSBC BANK PLC . . . . . . . . . . . . . . . . . AA- August 12, 2014 353,568 KRW 372 330 USD 352 0.0009 (20)
HSBC BANK PLC . . . . . . . . . . . . . . . . . AA- August 12, 2014 430,992 KRW 454 419 USD 448 0.0010 (6)
HSBC BANK PLC . . . . . . . . . . . . . . . . . AA- August 12, 2014 493,600 KRW 520 461 USD 493 0.0009 (27)
HSBC BANK PLC . . . . . . . . . . . . . . . . . AA- August 12, 2014 605,300 KRW 638 586 USD 626 0.0010 (12)
HSBC BANK PLC . . . . . . . . . . . . . . . . . AA- August 12, 2014 607,215 KRW 640 560 USD 598 0.0009 (42)
HSBC BANK PLC . . . . . . . . . . . . . . . . . AA- August 12, 2014 625,494 KRW 659 581 USD 620 0.0009 (39)
HSBC BANK PLC . . . . . . . . . . . . . . . . . AA- August 12, 2014 1,034,158 KRW 1,089 961 USD 1,026 0.0009 (63)
HSBC BANK PLC . . . . . . . . . . . . . . . . . AA- August 12, 2014 2,104,713 KRW 2,217 1,941 USD 2,072 0.0009 (145)
HSBC BANK PLC . . . . . . . . . . . . . . . . . AA- August 12, 2014 2,924,004 KRW 3,080 2,722 USD 2,907 0.0009 (173)
HSBC BANK PLC . . . . . . . . . . . . . . . . . AA- August 12, 2014 5,139,641 KRW 5,414 4,803 USD 5,128 0.0009 (286)
HSBC BANK PLC . . . . . . . . . . . . . . . . . AA- August 12, 2014 5,166,642 KRW 5,442 4,813 USD 5,139 0.0009 (303)
HSBC BANK PLC . . . . . . . . . . . . . . . . . AA- August 12, 2014 7,422,451 KRW 7,817 6,888 USD 7,354 0.0009 (463)
HSBC BANK PLC . . . . . . . . . . . . . . . . . AA- September 24, 2014 415 CAD 415 273 EUR 399 0.6563 (16)
HSBC BANK PLC . . . . . . . . . . . . . . . . . AA- September 24, 2014 563 CAD 563 369 EUR 540 0.6557 (23)
HSBC BANK PLC . . . . . . . . . . . . . . . . . AA- September 24, 2014 609 CAD 609 400 EUR 585 0.6563 (24)
HSBC BANK PLC . . . . . . . . . . . . . . . . . AA- September 24, 2014 4,777 CAD 4,777 3,220 EUR 4,714 0.6740 (63)
The accompanying notes are an integral part of these financial statements.
Franklin Templeton Investments Funds 305

Franklin Mutual Global Discovery Fund
SCHEDULE OF INVESTMENTS As at June 30, 2014 (Unaudited) (Continued)
SCHEDULE OF DERIVATIVE INSTRUMENTS (As at June 30, 2014) (Continued)FORWARD FOREIGN EXCHANGE CONTRACTS (Continued)
CounterpartyCreditRating Settlement Date
Currencyto be Delivered
Par ValueIn Canadian Dollars
Currencyto be Received
Par ValueIn Canadian Dollars
ContractPrice
UnrealizedGain (Loss)
(000s) (000s) (000s) (000s) (000s)
STATE STREET BANK AND TRUST
COMP . . . . . . . . . . . . . . . . . . . . . . . . AA- September 24, 2014 10 CHF $ 13 9 EUR $ 13 0.8217 $ —
STATE STREET BANK AND TRUST
COMP . . . . . . . . . . . . . . . . . . . . . . . . AA- September 24, 2014 90 EUR 132 750 NOK 130 8.3102 (2)
THE BANK OF NEW YORK MELLON . . AA- September 24, 2014 27 CHF 32 22 EUR 32 0.8225 —
THE BANK OF NEW YORK MELLON . . AA- September 24, 2014 41 EUR 59 337 NOK 58 8.2968 (1)
THE BANK OF NEW YORK MELLON . . AA- September 24, 2014 47 CHF 56 38 EUR 56 0.8203 —
THE BANK OF NEW YORK MELLON . . AA- September 24, 2014 48 CHF 58 39 EUR 58 0.8210 —
THE BANK OF NEW YORK MELLON . . AA- September 24, 2014 49 CHF 59 40 EUR 59 0.8219 —
THE BANK OF NEW YORK MELLON . . AA- September 24, 2014 63 EUR 93 525 NOK 91 8.2887 (2)
THE BANK OF NEW YORK MELLON . . AA- September 24, 2014 64 CHF 77 53 EUR 77 0.8207 —
THE BANK OF NEW YORK MELLON . . AA- September 24, 2014 66 CHF 80 54 EUR 80 0.8191 —
THE BANK OF NEW YORK MELLON . . AA- September 24, 2014 68 CHF 82 56 EUR 82 0.8198 —
THE BANK OF NEW YORK MELLON . . AA- September 24, 2014 69 CHF 83 56 EUR 83 0.8212 —
THE BANK OF NEW YORK MELLON . . AA- September 24, 2014 75 EUR 110 628 NOK 109 8.3860 (1)
THE BANK OF NEW YORK MELLON . . AA- September 24, 2014 81 CHF 97 66 EUR 97 0.8208 —
THE BANK OF NEW YORK MELLON . . AA- September 24, 2014 86 CHF 104 71 EUR 104 0.8224 —
THE BANK OF NEW YORK MELLON . . AA- September 24, 2014 95 EUR 140 779 NOK 136 8.1617 (4)
THE BANK OF NEW YORK MELLON . . AA- September 24, 2014 110 CHF 133 90 EUR 132 0.8187 (1)
THE BANK OF NEW YORK MELLON . . AA- September 24, 2014 119 CHF 144 98 EUR 143 0.8198 (1)
THE BANK OF NEW YORK MELLON . . AA- September 24, 2014 124 CHF 150 102 EUR 149 0.8206 (1)
THE BANK OF NEW YORK MELLON . . AA- September 24, 2014 127 CHF 153 104 EUR 152 0.8196 (1)
THE BANK OF NEW YORK MELLON . . AA- September 24, 2014 137 CAD 137 92 EUR 134 0.6686 (3)
THE BANK OF NEW YORK MELLON . . AA- September 24, 2014 144 CHF 174 118 EUR 173 0.8187 (1)
THE BANK OF NEW YORK MELLON . . AA- September 24, 2014 148 EUR 217 1,242 NOK 216 8.3869 (1)
THE BANK OF NEW YORK MELLON . . AA- September 24, 2014 149 CHF 180 123 EUR 180 0.8217 —
THE BANK OF NEW YORK MELLON . . AA- September 24, 2014 174 EUR 255 1,440 NOK 250 8.2652 (5)
THE BANK OF NEW YORK MELLON . . AA- September 24, 2014 193 CHF 233 158 EUR 232 0.8204 (1)
THE BANK OF NEW YORK MELLON . . AA- September 24, 2014 194 CAD 194 131 EUR 191 0.6729 (3)
THE BANK OF NEW YORK MELLON . . AA- September 24, 2014 218 EUR 320 1,782 NOK 310 8.1720 (10)
THE BANK OF NEW YORK MELLON . . AA- September 24, 2014 218 CAD 218 143 EUR 209 0.6546 (9)
THE BANK OF NEW YORK MELLON . . AA- September 24, 2014 226 EUR 330 1,871 NOK 325 8.2899 (5)
THE BANK OF NEW YORK MELLON . . AA- September 24, 2014 286 CHF 346 235 EUR 344 0.8196 (2)
THE BANK OF NEW YORK MELLON . . AA- September 24, 2014 344 CAD 344 225 EUR 330 0.6554 (14)
THE BANK OF NEW YORK MELLON . . AA- September 24, 2014 350 CHF 422 288 EUR 421 0.8219 (1)
THE BANK OF NEW YORK MELLON . . AA- September 24, 2014 379 CAD 379 259 EUR 379 0.6823 —
THE BANK OF NEW YORK MELLON . . AA- September 24, 2014 395 CAD 395 260 EUR 381 0.6587 (14)
THE BANK OF NEW YORK MELLON . . AA- September 24, 2014 396 CAD 396 265 EUR 388 0.6689 (8)
THE BANK OF NEW YORK MELLON . . AA- September 24, 2014 405 CAD 405 271 EUR 397 0.6689 (8)
THE BANK OF NEW YORK MELLON . . AA- September 24, 2014 409 CAD 409 279 EUR 409 0.6823 —
THE BANK OF NEW YORK MELLON . . AA- September 24, 2014 478 CAD 478 319 EUR 468 0.6687 (10)
THE BANK OF NEW YORK MELLON . . AA- September 24, 2014 597 CAD 597 399 EUR 584 0.6678 (13)
THE BANK OF NEW YORK MELLON . . AA- September 24, 2014 599 CAD 599 400 EUR 585 0.6675 (14)
THE BANK OF NEW YORK MELLON . . AA- September 24, 2014 605 CAD 605 405 EUR 593 0.6695 (12)
THE BANK OF NEW YORK MELLON . . AA- September 24, 2014 739 CAD 739 486 EUR 711 0.6572 (28)
THE BANK OF NEW YORK MELLON . . AA- September 24, 2014 762 CAD 762 509 EUR 745 0.6682 (17)
THE BANK OF NEW YORK MELLON . . AA- September 24, 2014 812 CAD 812 533 EUR 781 0.6572 (31)
THE BANK OF NEW YORK MELLON . . AA- September 24, 2014 890 CAD 890 600 EUR 878 0.6740 (12)
The accompanying notes are an integral part of these financial statements.
306 Franklin Templeton Investments Funds
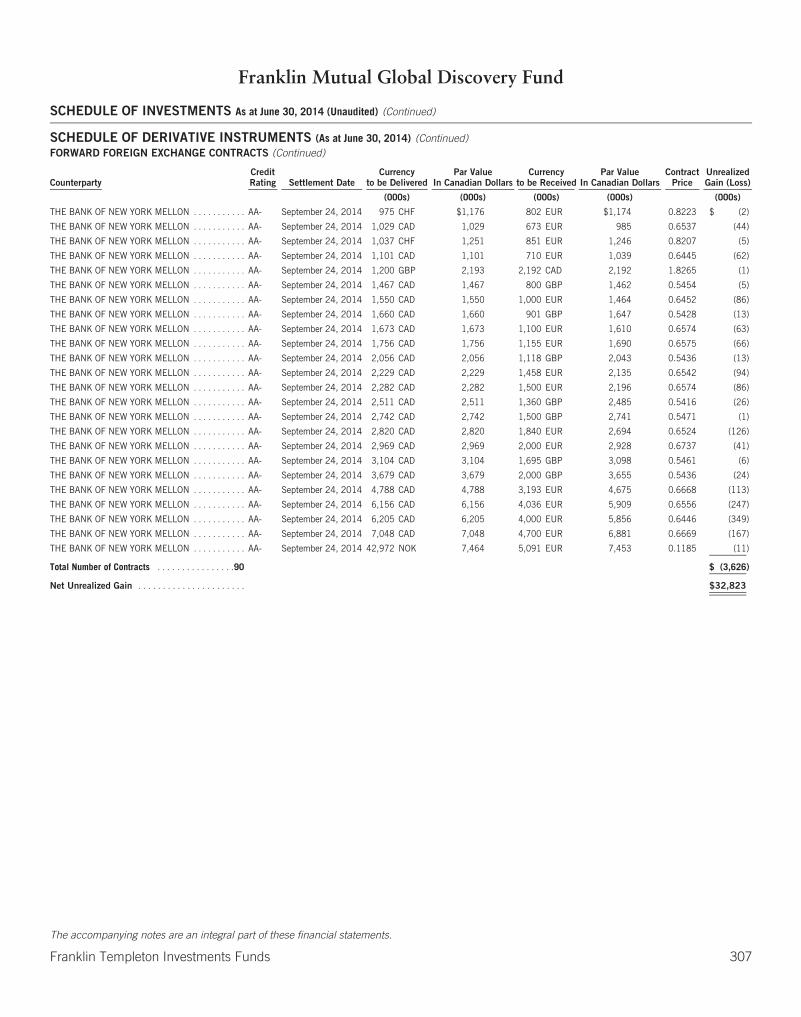
Franklin Mutual Global Discovery Fund
SCHEDULE OF INVESTMENTS As at June 30, 2014 (Unaudited) (Continued)
SCHEDULE OF DERIVATIVE INSTRUMENTS (As at June 30, 2014) (Continued)FORWARD FOREIGN EXCHANGE CONTRACTS (Continued)
CounterpartyCreditRating Settlement Date
Currencyto be Delivered
Par ValueIn Canadian Dollars
Currencyto be Received
Par ValueIn Canadian Dollars
ContractPrice
UnrealizedGain (Loss)
(000s) (000s) (000s) (000s) (000s)
THE BANK OF NEW YORK MELLON . . . . . . . . . . . AA- September 24, 2014 975 CHF $1,176 802 EUR $1,174 0.8223 $ (2)
THE BANK OF NEW YORK MELLON . . . . . . . . . . . AA- September 24, 2014 1,029 CAD 1,029 673 EUR 985 0.6537 (44)
THE BANK OF NEW YORK MELLON . . . . . . . . . . . AA- September 24, 2014 1,037 CHF 1,251 851 EUR 1,246 0.8207 (5)
THE BANK OF NEW YORK MELLON . . . . . . . . . . . AA- September 24, 2014 1,101 CAD 1,101 710 EUR 1,039 0.6445 (62)
THE BANK OF NEW YORK MELLON . . . . . . . . . . . AA- September 24, 2014 1,200 GBP 2,193 2,192 CAD 2,192 1.8265 (1)
THE BANK OF NEW YORK MELLON . . . . . . . . . . . AA- September 24, 2014 1,467 CAD 1,467 800 GBP 1,462 0.5454 (5)
THE BANK OF NEW YORK MELLON . . . . . . . . . . . AA- September 24, 2014 1,550 CAD 1,550 1,000 EUR 1,464 0.6452 (86)
THE BANK OF NEW YORK MELLON . . . . . . . . . . . AA- September 24, 2014 1,660 CAD 1,660 901 GBP 1,647 0.5428 (13)
THE BANK OF NEW YORK MELLON . . . . . . . . . . . AA- September 24, 2014 1,673 CAD 1,673 1,100 EUR 1,610 0.6574 (63)
THE BANK OF NEW YORK MELLON . . . . . . . . . . . AA- September 24, 2014 1,756 CAD 1,756 1,155 EUR 1,690 0.6575 (66)
THE BANK OF NEW YORK MELLON . . . . . . . . . . . AA- September 24, 2014 2,056 CAD 2,056 1,118 GBP 2,043 0.5436 (13)
THE BANK OF NEW YORK MELLON . . . . . . . . . . . AA- September 24, 2014 2,229 CAD 2,229 1,458 EUR 2,135 0.6542 (94)
THE BANK OF NEW YORK MELLON . . . . . . . . . . . AA- September 24, 2014 2,282 CAD 2,282 1,500 EUR 2,196 0.6574 (86)
THE BANK OF NEW YORK MELLON . . . . . . . . . . . AA- September 24, 2014 2,511 CAD 2,511 1,360 GBP 2,485 0.5416 (26)
THE BANK OF NEW YORK MELLON . . . . . . . . . . . AA- September 24, 2014 2,742 CAD 2,742 1,500 GBP 2,741 0.5471 (1)
THE BANK OF NEW YORK MELLON . . . . . . . . . . . AA- September 24, 2014 2,820 CAD 2,820 1,840 EUR 2,694 0.6524 (126)
THE BANK OF NEW YORK MELLON . . . . . . . . . . . AA- September 24, 2014 2,969 CAD 2,969 2,000 EUR 2,928 0.6737 (41)
THE BANK OF NEW YORK MELLON . . . . . . . . . . . AA- September 24, 2014 3,104 CAD 3,104 1,695 GBP 3,098 0.5461 (6)
THE BANK OF NEW YORK MELLON . . . . . . . . . . . AA- September 24, 2014 3,679 CAD 3,679 2,000 GBP 3,655 0.5436 (24)
THE BANK OF NEW YORK MELLON . . . . . . . . . . . AA- September 24, 2014 4,788 CAD 4,788 3,193 EUR 4,675 0.6668 (113)
THE BANK OF NEW YORK MELLON . . . . . . . . . . . AA- September 24, 2014 6,156 CAD 6,156 4,036 EUR 5,909 0.6556 (247)
THE BANK OF NEW YORK MELLON . . . . . . . . . . . AA- September 24, 2014 6,205 CAD 6,205 4,000 EUR 5,856 0.6446 (349)
THE BANK OF NEW YORK MELLON . . . . . . . . . . . AA- September 24, 2014 7,048 CAD 7,048 4,700 EUR 6,881 0.6669 (167)
THE BANK OF NEW YORK MELLON . . . . . . . . . . . AA- September 24, 2014 42,972 NOK 7,464 5,091 EUR 7,453 0.1185 (11)
Total Number of Contracts . . . . . . . . . . . . . . . .90 $ (3,626)
Net Unrealized Gain . . . . . . . . . . . . . . . . . . . . . . $32,823
The accompanying notes are an integral part of these financial statements.
Franklin Templeton Investments Funds 307

Franklin Mutual Global Discovery Fund
STATEMENTS OF FINANCIAL POSITION (Unaudited)
As atJune 30,
2014
As atDecember 31,
2013
As atJanuary 1,
2013
(000s) (000s) (000s)AssetsCurrent assetsInvestments at fair value through profit or loss $ 1,247,450 $ 1,249,748 $ 882,720Cash
Canadian 52,831 42,118 13,146Foreign 8,740 2,312 14,826
ReceivablesDue from brokers — 351 —Investment securities sold 1,106 5 604Subscription of redeemable units 756 438 325Dividends, interest and withholding tax 4,678 4,853 3,637
Unrealized gain on derivatives 36,449 1,426 1,731Other assets (Note 6(g)) 100 410 89
Total assets 1,352,110 1,301,661 917,078
LiabilitiesCurrent liabilitiesPayables
Investment securities purchased — 130 355Redemption of redeemable units 1,077 643 353Management fees 1,424 1,305 959Fixed administration fees 249 — —Accrued expenses — 665 487
Distributions to unitholders 45 — —Unrealized loss on derivatives 3,626 41,263 14,625
Total liabilities 6,421 44,006 16,779
Net assets attributable to holders of redeemable units $ 1,345,689 $ 1,257,655 $ 900,299
Represented by:Net assets as previously reported under Canadian GAAP — 1,256,384 899,787Revaluation of investments at fair value through profit or loss (Note 3(c)) — 1,271 512
Net assets attributable to holders of redeemable units $ 1,345,689 $ 1,257,655 $ 900,299
Net assets attributable to holders of redeemable units per series (000s)Series A $ 706,625 $ 672,876 $ 497,605Series F 80,217 64,847 40,448Series I 14,379 8,611 517Series O 537,659 505,053 357,928Series T 5,627 4,963 3,174Series T USD 1,182 1,305 627
Number of redeemable units outstanding (Note 5)Series A 39,340,881 39,395,460 36,959,200Series F 3,946,206 3,374,080 2,701,412Series I 1,069,645 676,428 51,921Series O 22,253,084 22,269,964 20,555,940Series T 615,122 548,405 414,271Series T USD 93,417 104,297 59,153
Net assets attributable to holders of redeemable units per unit — CADSeries A $ 17.96 $ 17.08 $ 13.46Series F 20.33 19.22 14.97Series I 13.44 12.73 9.95Series O 24.16 22.68 17.41Series T 9.15 9.05 7.66
Net assets attributable to holders of redeemable units per unit — USDSeries A $ 16.84 $ 16.08 $ 13.55Series F 19.06 18.10 15.07Series I 12.60 11.99 10.02Series O 22.65 21.35 17.53Series T USD (Note 11) 11.86 11.78 10.66
Cost of investments held (000s) $ 980,610 $ 956,254 $ 833,097
The accompanying notes are an integral part of these financial statements.
308 Franklin Templeton Investments Funds
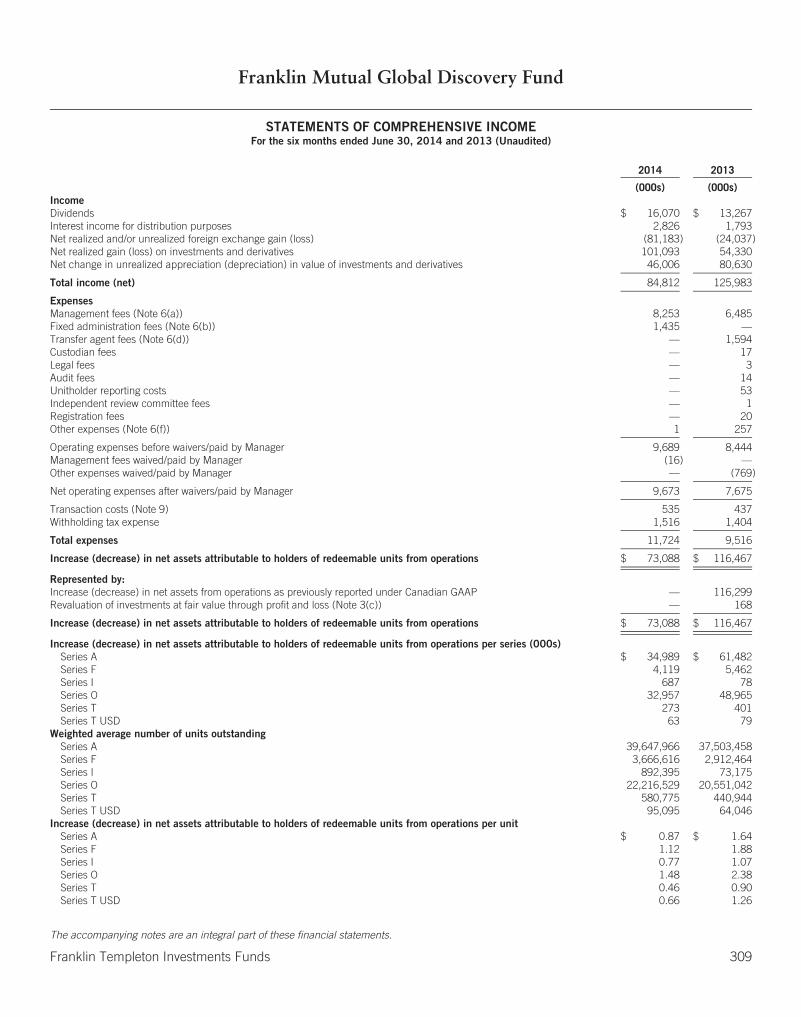
Franklin Mutual Global Discovery Fund
STATEMENTS OF COMPREHENSIVE INCOMEFor the six months ended June 30, 2014 and 2013 (Unaudited)
2014 2013
(000s) (000s)IncomeDividends $ 16,070 $ 13,267Interest income for distribution purposes 2,826 1,793Net realized and/or unrealized foreign exchange gain (loss) (81,183) (24,037)Net realized gain (loss) on investments and derivatives 101,093 54,330Net change in unrealized appreciation (depreciation) in value of investments and derivatives 46,006 80,630
Total income (net) 84,812 125,983
ExpensesManagement fees (Note 6(a)) 8,253 6,485Fixed administration fees (Note 6(b)) 1,435 —Transfer agent fees (Note 6(d)) — 1,594Custodian fees — 17Legal fees — 3Audit fees — 14Unitholder reporting costs — 53Independent review committee fees — 1Registration fees — 20Other expenses (Note 6(f)) 1 257
Operating expenses before waivers/paid by Manager 9,689 8,444Management fees waived/paid by Manager (16) —Other expenses waived/paid by Manager — (769)
Net operating expenses after waivers/paid by Manager 9,673 7,675
Transaction costs (Note 9) 535 437Withholding tax expense 1,516 1,404
Total expenses 11,724 9,516
Increase (decrease) in net assets attributable to holders of redeemable units from operations $ 73,088 $ 116,467
Represented by:Increase (decrease) in net assets from operations as previously reported under Canadian GAAP — 116,299Revaluation of investments at fair value through profit and loss (Note 3(c)) — 168
Increase (decrease) in net assets attributable to holders of redeemable units from operations $ 73,088 $ 116,467
Increase (decrease) in net assets attributable to holders of redeemable units from operations per series (000s)Series A $ 34,989 $ 61,482Series F 4,119 5,462Series I 687 78Series O 32,957 48,965Series T 273 401Series T USD 63 79
Weighted average number of units outstandingSeries A 39,647,966 37,503,458Series F 3,666,616 2,912,464Series I 892,395 73,175Series O 22,216,529 20,551,042Series T 580,775 440,944Series T USD 95,095 64,046
Increase (decrease) in net assets attributable to holders of redeemable units from operations per unitSeries A $ 0.87 $ 1.64Series F 1.12 1.88Series I 0.77 1.07Series O 1.48 2.38Series T 0.46 0.90Series T USD 0.66 1.26
The accompanying notes are an integral part of these financial statements.
Franklin Templeton Investments Funds 309
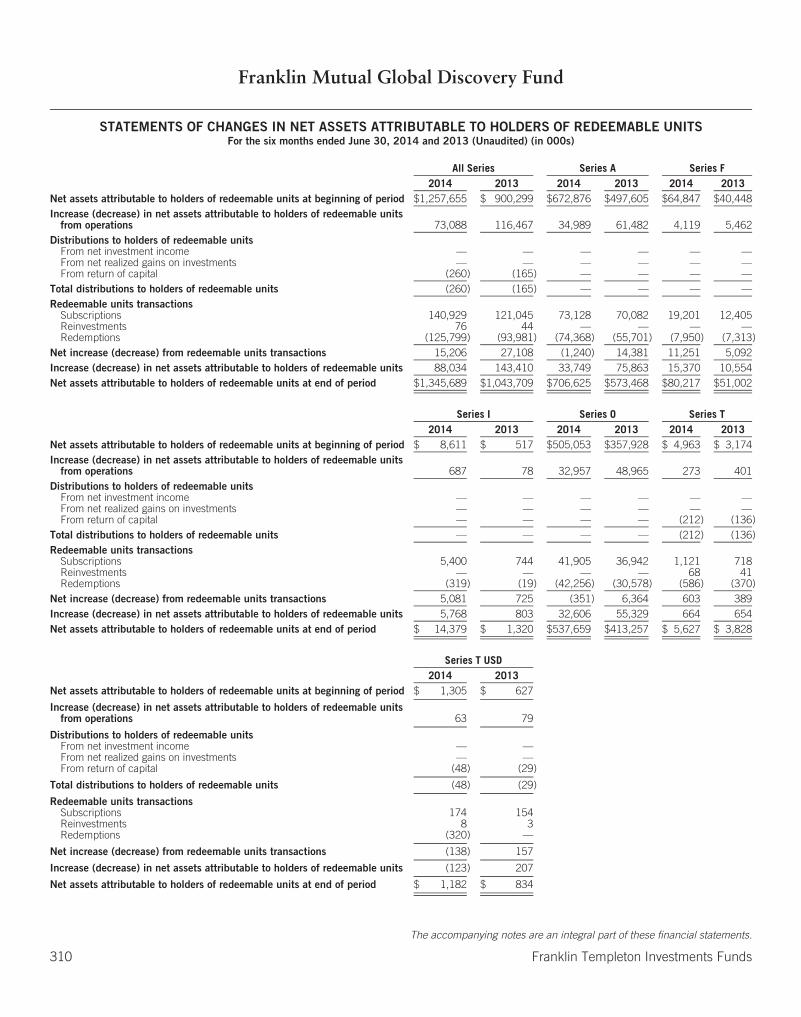
Franklin Mutual Global Discovery Fund
STATEMENTS OF CHANGES IN NET ASSETS ATTRIBUTABLE TO HOLDERS OF REDEEMABLE UNITSFor the six months ended June 30, 2014 and 2013 (Unaudited) (in 000s)
All Series Series A Series F2014 2013 2014 2013 2014 2013
Net assets attributable to holders of redeemable units at beginning of period $1,257,655 $ 900,299 $672,876 $497,605 $64,847 $40,448Increase (decrease) in net assets attributable to holders of redeemable units
from operations 73,088 116,467 34,989 61,482 4,119 5,462Distributions to holders of redeemable units
From net investment income — — — — — —From net realized gains on investments — — — — — —From return of capital (260) (165) — — — —
Total distributions to holders of redeemable units (260) (165) — — — —Redeemable units transactions
Subscriptions 140,929 121,045 73,128 70,082 19,201 12,405Reinvestments 76 44 — — — —Redemptions (125,799) (93,981) (74,368) (55,701) (7,950) (7,313)
Net increase (decrease) from redeemable units transactions 15,206 27,108 (1,240) 14,381 11,251 5,092Increase (decrease) in net assets attributable to holders of redeemable units 88,034 143,410 33,749 75,863 15,370 10,554Net assets attributable to holders of redeemable units at end of period $1,345,689 $1,043,709 $706,625 $573,468 $80,217 $51,002
Series I Series O Series T2014 2013 2014 2013 2014 2013
Net assets attributable to holders of redeemable units at beginning of period $ 8,611 $ 517 $505,053 $357,928 $ 4,963 $ 3,174Increase (decrease) in net assets attributable to holders of redeemable units
from operations 687 78 32,957 48,965 273 401Distributions to holders of redeemable units
From net investment income — — — — — —From net realized gains on investments — — — — — —From return of capital — — — — (212) (136)
Total distributions to holders of redeemable units — — — — (212) (136)Redeemable units transactions
Subscriptions 5,400 744 41,905 36,942 1,121 718Reinvestments — — — — 68 41Redemptions (319) (19) (42,256) (30,578) (586) (370)
Net increase (decrease) from redeemable units transactions 5,081 725 (351) 6,364 603 389Increase (decrease) in net assets attributable to holders of redeemable units 5,768 803 32,606 55,329 664 654Net assets attributable to holders of redeemable units at end of period $ 14,379 $ 1,320 $537,659 $413,257 $ 5,627 $ 3,828
Series T USD2014 2013
Net assets attributable to holders of redeemable units at beginning of period $ 1,305 $ 627
Increase (decrease) in net assets attributable to holders of redeemable unitsfrom operations 63 79
Distributions to holders of redeemable unitsFrom net investment income — —From net realized gains on investments — —From return of capital (48) (29)
Total distributions to holders of redeemable units (48) (29)
Redeemable units transactionsSubscriptions 174 154Reinvestments 8 3Redemptions (320) —
Net increase (decrease) from redeemable units transactions (138) 157
Increase (decrease) in net assets attributable to holders of redeemable units (123) 207
Net assets attributable to holders of redeemable units at end of period $ 1,182 $ 834
The accompanying notes are an integral part of these financial statements.
310 Franklin Templeton Investments Funds
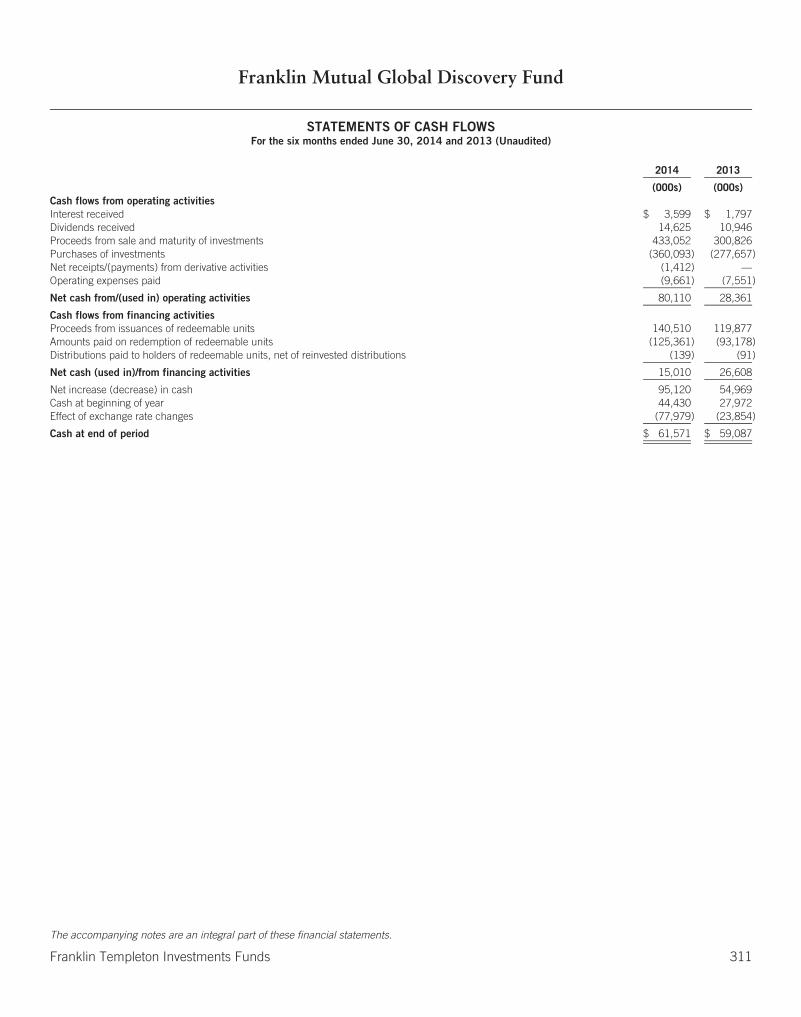
Franklin Mutual Global Discovery Fund
STATEMENTS OF CASH FLOWSFor the six months ended June 30, 2014 and 2013 (Unaudited)
2014 2013
(000s) (000s)Cash flows from operating activitiesInterest received $ 3,599 $ 1,797Dividends received 14,625 10,946Proceeds from sale and maturity of investments 433,052 300,826Purchases of investments (360,093) (277,657)Net receipts/(payments) from derivative activities (1,412) —Operating expenses paid (9,661) (7,551)
Net cash from/(used in) operating activities 80,110 28,361
Cash flows from financing activitiesProceeds from issuances of redeemable units 140,510 119,877Amounts paid on redemption of redeemable units (125,361) (93,178)Distributions paid to holders of redeemable units, net of reinvested distributions (139) (91)
Net cash (used in)/from financing activities 15,010 26,608
Net increase (decrease) in cash 95,120 54,969Cash at beginning of year 44,430 27,972Effect of exchange rate changes (77,979) (23,854)
Cash at end of period $ 61,571 $ 59,087
The accompanying notes are an integral part of these financial statements.
Franklin Templeton Investments Funds 311
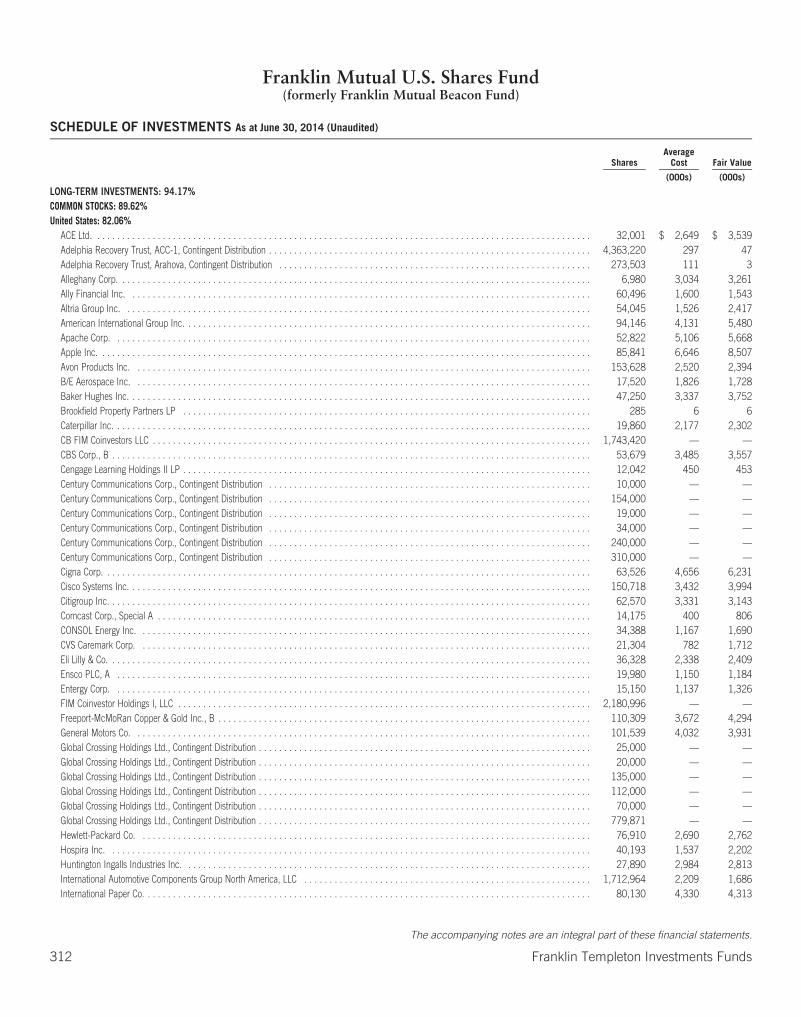
Franklin Mutual U.S. Shares Fund(formerly Franklin Mutual Beacon Fund)
SCHEDULE OF INVESTMENTS As at June 30, 2014 (Unaudited)
SharesAverage
Cost Fair Value
(000s) (000s)
LONG-TERM INVESTMENTS: 94.17%COMMON STOCKS: 89.62%United States: 82.06%
ACE Ltd. . . . . . . . . . . . . . . . . . . . . . . . . . . . . . . . . . . . . . . . . . . . . . . . . . . . . . . . . . . . . . . . . . . . . . . . . . . . . . . . . . . . . . . . . . . . . . . . . . . 32,001 $ 2,649 $ 3,539Adelphia Recovery Trust, ACC-1, Contingent Distribution . . . . . . . . . . . . . . . . . . . . . . . . . . . . . . . . . . . . . . . . . . . . . . . . . . . . . . . . . . . . . . . . 4,363,220 297 47Adelphia Recovery Trust, Arahova, Contingent Distribution . . . . . . . . . . . . . . . . . . . . . . . . . . . . . . . . . . . . . . . . . . . . . . . . . . . . . . . . . . . . . . 273,503 111 3Alleghany Corp. . . . . . . . . . . . . . . . . . . . . . . . . . . . . . . . . . . . . . . . . . . . . . . . . . . . . . . . . . . . . . . . . . . . . . . . . . . . . . . . . . . . . . . . . . . . . . 6,980 3,034 3,261Ally Financial Inc. . . . . . . . . . . . . . . . . . . . . . . . . . . . . . . . . . . . . . . . . . . . . . . . . . . . . . . . . . . . . . . . . . . . . . . . . . . . . . . . . . . . . . . . . . . . 60,496 1,600 1,543Altria Group Inc. . . . . . . . . . . . . . . . . . . . . . . . . . . . . . . . . . . . . . . . . . . . . . . . . . . . . . . . . . . . . . . . . . . . . . . . . . . . . . . . . . . . . . . . . . . . . 54,045 1,526 2,417American International Group Inc. . . . . . . . . . . . . . . . . . . . . . . . . . . . . . . . . . . . . . . . . . . . . . . . . . . . . . . . . . . . . . . . . . . . . . . . . . . . . . . . . 94,146 4,131 5,480Apache Corp. . . . . . . . . . . . . . . . . . . . . . . . . . . . . . . . . . . . . . . . . . . . . . . . . . . . . . . . . . . . . . . . . . . . . . . . . . . . . . . . . . . . . . . . . . . . . . . 52,822 5,106 5,668Apple Inc. . . . . . . . . . . . . . . . . . . . . . . . . . . . . . . . . . . . . . . . . . . . . . . . . . . . . . . . . . . . . . . . . . . . . . . . . . . . . . . . . . . . . . . . . . . . . . . . . . 85,841 6,646 8,507Avon Products Inc. . . . . . . . . . . . . . . . . . . . . . . . . . . . . . . . . . . . . . . . . . . . . . . . . . . . . . . . . . . . . . . . . . . . . . . . . . . . . . . . . . . . . . . . . . . 153,628 2,520 2,394B/E Aerospace Inc. . . . . . . . . . . . . . . . . . . . . . . . . . . . . . . . . . . . . . . . . . . . . . . . . . . . . . . . . . . . . . . . . . . . . . . . . . . . . . . . . . . . . . . . . . . 17,520 1,826 1,728Baker Hughes Inc. . . . . . . . . . . . . . . . . . . . . . . . . . . . . . . . . . . . . . . . . . . . . . . . . . . . . . . . . . . . . . . . . . . . . . . . . . . . . . . . . . . . . . . . . . . . 47,250 3,337 3,752Brookfield Property Partners LP . . . . . . . . . . . . . . . . . . . . . . . . . . . . . . . . . . . . . . . . . . . . . . . . . . . . . . . . . . . . . . . . . . . . . . . . . . . . . . . . . 285 6 6Caterpillar Inc. . . . . . . . . . . . . . . . . . . . . . . . . . . . . . . . . . . . . . . . . . . . . . . . . . . . . . . . . . . . . . . . . . . . . . . . . . . . . . . . . . . . . . . . . . . . . . . 19,860 2,177 2,302CB FIM Coinvestors LLC . . . . . . . . . . . . . . . . . . . . . . . . . . . . . . . . . . . . . . . . . . . . . . . . . . . . . . . . . . . . . . . . . . . . . . . . . . . . . . . . . . . . . . . 1,743,420 — —CBS Corp., B . . . . . . . . . . . . . . . . . . . . . . . . . . . . . . . . . . . . . . . . . . . . . . . . . . . . . . . . . . . . . . . . . . . . . . . . . . . . . . . . . . . . . . . . . . . . . . . 53,679 3,485 3,557Cengage Learning Holdings II LP . . . . . . . . . . . . . . . . . . . . . . . . . . . . . . . . . . . . . . . . . . . . . . . . . . . . . . . . . . . . . . . . . . . . . . . . . . . . . . . . . 12,042 450 453Century Communications Corp., Contingent Distribution . . . . . . . . . . . . . . . . . . . . . . . . . . . . . . . . . . . . . . . . . . . . . . . . . . . . . . . . . . . . . . . . 10,000 — —Century Communications Corp., Contingent Distribution . . . . . . . . . . . . . . . . . . . . . . . . . . . . . . . . . . . . . . . . . . . . . . . . . . . . . . . . . . . . . . . . 154,000 — —Century Communications Corp., Contingent Distribution . . . . . . . . . . . . . . . . . . . . . . . . . . . . . . . . . . . . . . . . . . . . . . . . . . . . . . . . . . . . . . . . 19,000 — —Century Communications Corp., Contingent Distribution . . . . . . . . . . . . . . . . . . . . . . . . . . . . . . . . . . . . . . . . . . . . . . . . . . . . . . . . . . . . . . . . 34,000 — —Century Communications Corp., Contingent Distribution . . . . . . . . . . . . . . . . . . . . . . . . . . . . . . . . . . . . . . . . . . . . . . . . . . . . . . . . . . . . . . . . 240,000 — —Century Communications Corp., Contingent Distribution . . . . . . . . . . . . . . . . . . . . . . . . . . . . . . . . . . . . . . . . . . . . . . . . . . . . . . . . . . . . . . . . 310,000 — —Cigna Corp. . . . . . . . . . . . . . . . . . . . . . . . . . . . . . . . . . . . . . . . . . . . . . . . . . . . . . . . . . . . . . . . . . . . . . . . . . . . . . . . . . . . . . . . . . . . . . . . . 63,526 4,656 6,231Cisco Systems Inc. . . . . . . . . . . . . . . . . . . . . . . . . . . . . . . . . . . . . . . . . . . . . . . . . . . . . . . . . . . . . . . . . . . . . . . . . . . . . . . . . . . . . . . . . . . . 150,718 3,432 3,994Citigroup Inc. . . . . . . . . . . . . . . . . . . . . . . . . . . . . . . . . . . . . . . . . . . . . . . . . . . . . . . . . . . . . . . . . . . . . . . . . . . . . . . . . . . . . . . . . . . . . . . . 62,570 3,331 3,143Comcast Corp., Special A . . . . . . . . . . . . . . . . . . . . . . . . . . . . . . . . . . . . . . . . . . . . . . . . . . . . . . . . . . . . . . . . . . . . . . . . . . . . . . . . . . . . . . 14,175 400 806CONSOL Energy Inc. . . . . . . . . . . . . . . . . . . . . . . . . . . . . . . . . . . . . . . . . . . . . . . . . . . . . . . . . . . . . . . . . . . . . . . . . . . . . . . . . . . . . . . . . . 34,388 1,167 1,690CVS Caremark Corp. . . . . . . . . . . . . . . . . . . . . . . . . . . . . . . . . . . . . . . . . . . . . . . . . . . . . . . . . . . . . . . . . . . . . . . . . . . . . . . . . . . . . . . . . . 21,304 782 1,712Eli Lilly & Co. . . . . . . . . . . . . . . . . . . . . . . . . . . . . . . . . . . . . . . . . . . . . . . . . . . . . . . . . . . . . . . . . . . . . . . . . . . . . . . . . . . . . . . . . . . . . . . . 36,328 2,338 2,409Ensco PLC, A . . . . . . . . . . . . . . . . . . . . . . . . . . . . . . . . . . . . . . . . . . . . . . . . . . . . . . . . . . . . . . . . . . . . . . . . . . . . . . . . . . . . . . . . . . . . . . 19,980 1,150 1,184Entergy Corp. . . . . . . . . . . . . . . . . . . . . . . . . . . . . . . . . . . . . . . . . . . . . . . . . . . . . . . . . . . . . . . . . . . . . . . . . . . . . . . . . . . . . . . . . . . . . . . 15,150 1,137 1,326FIM Coinvestor Holdings I, LLC . . . . . . . . . . . . . . . . . . . . . . . . . . . . . . . . . . . . . . . . . . . . . . . . . . . . . . . . . . . . . . . . . . . . . . . . . . . . . . . . . . 2,180,996 — —Freeport-McMoRan Copper & Gold Inc., B . . . . . . . . . . . . . . . . . . . . . . . . . . . . . . . . . . . . . . . . . . . . . . . . . . . . . . . . . . . . . . . . . . . . . . . . . . 110,309 3,672 4,294General Motors Co. . . . . . . . . . . . . . . . . . . . . . . . . . . . . . . . . . . . . . . . . . . . . . . . . . . . . . . . . . . . . . . . . . . . . . . . . . . . . . . . . . . . . . . . . . . 101,539 4,032 3,931Global Crossing Holdings Ltd., Contingent Distribution . . . . . . . . . . . . . . . . . . . . . . . . . . . . . . . . . . . . . . . . . . . . . . . . . . . . . . . . . . . . . . . . . . 25,000 — —Global Crossing Holdings Ltd., Contingent Distribution . . . . . . . . . . . . . . . . . . . . . . . . . . . . . . . . . . . . . . . . . . . . . . . . . . . . . . . . . . . . . . . . . . 20,000 — —Global Crossing Holdings Ltd., Contingent Distribution . . . . . . . . . . . . . . . . . . . . . . . . . . . . . . . . . . . . . . . . . . . . . . . . . . . . . . . . . . . . . . . . . . 135,000 — —Global Crossing Holdings Ltd., Contingent Distribution . . . . . . . . . . . . . . . . . . . . . . . . . . . . . . . . . . . . . . . . . . . . . . . . . . . . . . . . . . . . . . . . . . 112,000 — —Global Crossing Holdings Ltd., Contingent Distribution . . . . . . . . . . . . . . . . . . . . . . . . . . . . . . . . . . . . . . . . . . . . . . . . . . . . . . . . . . . . . . . . . . 70,000 — —Global Crossing Holdings Ltd., Contingent Distribution . . . . . . . . . . . . . . . . . . . . . . . . . . . . . . . . . . . . . . . . . . . . . . . . . . . . . . . . . . . . . . . . . . 779,871 — —Hewlett-Packard Co. . . . . . . . . . . . . . . . . . . . . . . . . . . . . . . . . . . . . . . . . . . . . . . . . . . . . . . . . . . . . . . . . . . . . . . . . . . . . . . . . . . . . . . . . . 76,910 2,690 2,762Hospira Inc. . . . . . . . . . . . . . . . . . . . . . . . . . . . . . . . . . . . . . . . . . . . . . . . . . . . . . . . . . . . . . . . . . . . . . . . . . . . . . . . . . . . . . . . . . . . . . . . 40,193 1,537 2,202Huntington Ingalls Industries Inc. . . . . . . . . . . . . . . . . . . . . . . . . . . . . . . . . . . . . . . . . . . . . . . . . . . . . . . . . . . . . . . . . . . . . . . . . . . . . . . . . 27,890 2,984 2,813International Automotive Components Group North America, LLC . . . . . . . . . . . . . . . . . . . . . . . . . . . . . . . . . . . . . . . . . . . . . . . . . . . . . . . . . 1,712,964 2,209 1,686International Paper Co. . . . . . . . . . . . . . . . . . . . . . . . . . . . . . . . . . . . . . . . . . . . . . . . . . . . . . . . . . . . . . . . . . . . . . . . . . . . . . . . . . . . . . . . . 80,130 4,330 4,313
The accompanying notes are an integral part of these financial statements.
312 Franklin Templeton Investments Funds
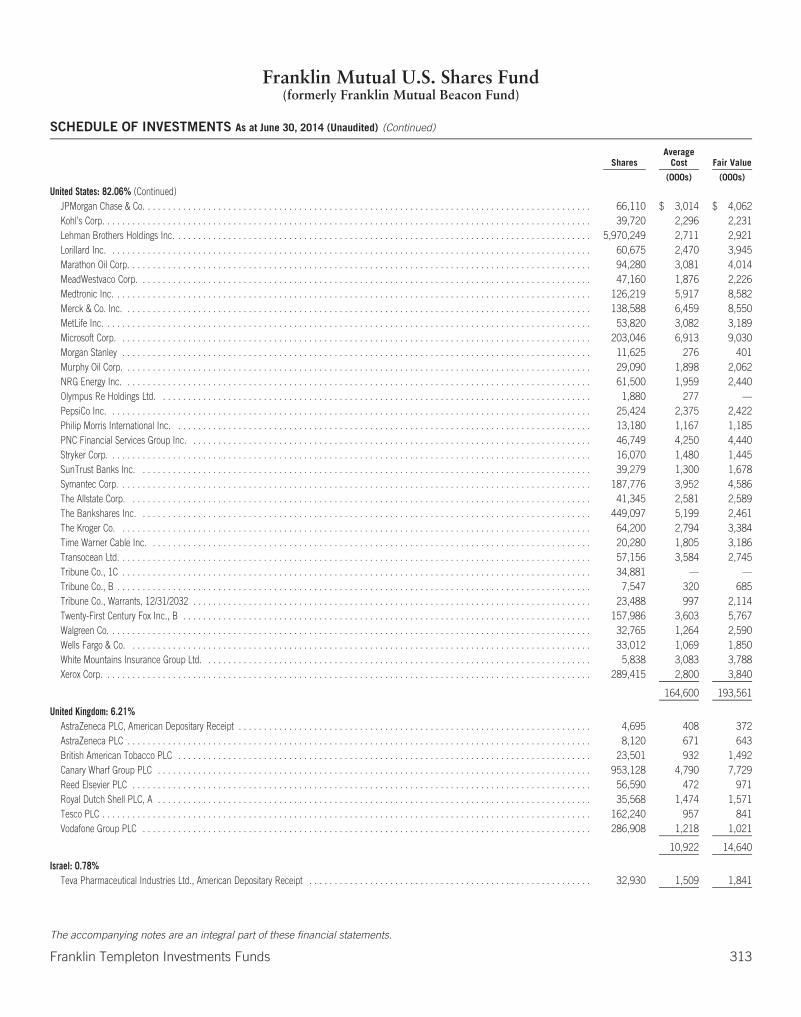
Franklin Mutual U.S. Shares Fund(formerly Franklin Mutual Beacon Fund)
SCHEDULE OF INVESTMENTS As at June 30, 2014 (Unaudited) (Continued)
SharesAverage
Cost Fair Value
(000s) (000s)
United States: 82.06% (Continued)JPMorgan Chase & Co. . . . . . . . . . . . . . . . . . . . . . . . . . . . . . . . . . . . . . . . . . . . . . . . . . . . . . . . . . . . . . . . . . . . . . . . . . . . . . . . . . . . . . . . . 66,110 $ 3,014 $ 4,062Kohl’s Corp. . . . . . . . . . . . . . . . . . . . . . . . . . . . . . . . . . . . . . . . . . . . . . . . . . . . . . . . . . . . . . . . . . . . . . . . . . . . . . . . . . . . . . . . . . . . . . . . . 39,720 2,296 2,231Lehman Brothers Holdings Inc. . . . . . . . . . . . . . . . . . . . . . . . . . . . . . . . . . . . . . . . . . . . . . . . . . . . . . . . . . . . . . . . . . . . . . . . . . . . . . . . . . . 5,970,249 2,711 2,921Lorillard Inc. . . . . . . . . . . . . . . . . . . . . . . . . . . . . . . . . . . . . . . . . . . . . . . . . . . . . . . . . . . . . . . . . . . . . . . . . . . . . . . . . . . . . . . . . . . . . . . . 60,675 2,470 3,945Marathon Oil Corp. . . . . . . . . . . . . . . . . . . . . . . . . . . . . . . . . . . . . . . . . . . . . . . . . . . . . . . . . . . . . . . . . . . . . . . . . . . . . . . . . . . . . . . . . . . . 94,280 3,081 4,014MeadWestvaco Corp. . . . . . . . . . . . . . . . . . . . . . . . . . . . . . . . . . . . . . . . . . . . . . . . . . . . . . . . . . . . . . . . . . . . . . . . . . . . . . . . . . . . . . . . . . 47,160 1,876 2,226Medtronic Inc. . . . . . . . . . . . . . . . . . . . . . . . . . . . . . . . . . . . . . . . . . . . . . . . . . . . . . . . . . . . . . . . . . . . . . . . . . . . . . . . . . . . . . . . . . . . . . . 126,219 5,917 8,582Merck & Co. Inc. . . . . . . . . . . . . . . . . . . . . . . . . . . . . . . . . . . . . . . . . . . . . . . . . . . . . . . . . . . . . . . . . . . . . . . . . . . . . . . . . . . . . . . . . . . . . 138,588 6,459 8,550MetLife Inc. . . . . . . . . . . . . . . . . . . . . . . . . . . . . . . . . . . . . . . . . . . . . . . . . . . . . . . . . . . . . . . . . . . . . . . . . . . . . . . . . . . . . . . . . . . . . . . . . 53,820 3,082 3,189Microsoft Corp. . . . . . . . . . . . . . . . . . . . . . . . . . . . . . . . . . . . . . . . . . . . . . . . . . . . . . . . . . . . . . . . . . . . . . . . . . . . . . . . . . . . . . . . . . . . . . 203,046 6,913 9,030Morgan Stanley . . . . . . . . . . . . . . . . . . . . . . . . . . . . . . . . . . . . . . . . . . . . . . . . . . . . . . . . . . . . . . . . . . . . . . . . . . . . . . . . . . . . . . . . . . . . . 11,625 276 401Murphy Oil Corp. . . . . . . . . . . . . . . . . . . . . . . . . . . . . . . . . . . . . . . . . . . . . . . . . . . . . . . . . . . . . . . . . . . . . . . . . . . . . . . . . . . . . . . . . . . . . 29,090 1,898 2,062NRG Energy Inc. . . . . . . . . . . . . . . . . . . . . . . . . . . . . . . . . . . . . . . . . . . . . . . . . . . . . . . . . . . . . . . . . . . . . . . . . . . . . . . . . . . . . . . . . . . . . 61,500 1,959 2,440Olympus Re Holdings Ltd. . . . . . . . . . . . . . . . . . . . . . . . . . . . . . . . . . . . . . . . . . . . . . . . . . . . . . . . . . . . . . . . . . . . . . . . . . . . . . . . . . . . . . 1,880 277 —PepsiCo Inc. . . . . . . . . . . . . . . . . . . . . . . . . . . . . . . . . . . . . . . . . . . . . . . . . . . . . . . . . . . . . . . . . . . . . . . . . . . . . . . . . . . . . . . . . . . . . . . . 25,424 2,375 2,422Philip Morris International Inc. . . . . . . . . . . . . . . . . . . . . . . . . . . . . . . . . . . . . . . . . . . . . . . . . . . . . . . . . . . . . . . . . . . . . . . . . . . . . . . . . . . 13,180 1,167 1,185PNC Financial Services Group Inc. . . . . . . . . . . . . . . . . . . . . . . . . . . . . . . . . . . . . . . . . . . . . . . . . . . . . . . . . . . . . . . . . . . . . . . . . . . . . . . . 46,749 4,250 4,440Stryker Corp. . . . . . . . . . . . . . . . . . . . . . . . . . . . . . . . . . . . . . . . . . . . . . . . . . . . . . . . . . . . . . . . . . . . . . . . . . . . . . . . . . . . . . . . . . . . . . . . 16,070 1,480 1,445SunTrust Banks Inc. . . . . . . . . . . . . . . . . . . . . . . . . . . . . . . . . . . . . . . . . . . . . . . . . . . . . . . . . . . . . . . . . . . . . . . . . . . . . . . . . . . . . . . . . . 39,279 1,300 1,678Symantec Corp. . . . . . . . . . . . . . . . . . . . . . . . . . . . . . . . . . . . . . . . . . . . . . . . . . . . . . . . . . . . . . . . . . . . . . . . . . . . . . . . . . . . . . . . . . . . . . 187,776 3,952 4,586The Allstate Corp. . . . . . . . . . . . . . . . . . . . . . . . . . . . . . . . . . . . . . . . . . . . . . . . . . . . . . . . . . . . . . . . . . . . . . . . . . . . . . . . . . . . . . . . . . . . 41,345 2,581 2,589The Bankshares Inc. . . . . . . . . . . . . . . . . . . . . . . . . . . . . . . . . . . . . . . . . . . . . . . . . . . . . . . . . . . . . . . . . . . . . . . . . . . . . . . . . . . . . . . . . . 449,097 5,199 2,461The Kroger Co. . . . . . . . . . . . . . . . . . . . . . . . . . . . . . . . . . . . . . . . . . . . . . . . . . . . . . . . . . . . . . . . . . . . . . . . . . . . . . . . . . . . . . . . . . . . . . 64,200 2,794 3,384Time Warner Cable Inc. . . . . . . . . . . . . . . . . . . . . . . . . . . . . . . . . . . . . . . . . . . . . . . . . . . . . . . . . . . . . . . . . . . . . . . . . . . . . . . . . . . . . . . . 20,280 1,805 3,186Transocean Ltd. . . . . . . . . . . . . . . . . . . . . . . . . . . . . . . . . . . . . . . . . . . . . . . . . . . . . . . . . . . . . . . . . . . . . . . . . . . . . . . . . . . . . . . . . . . . . . 57,156 3,584 2,745Tribune Co., 1C . . . . . . . . . . . . . . . . . . . . . . . . . . . . . . . . . . . . . . . . . . . . . . . . . . . . . . . . . . . . . . . . . . . . . . . . . . . . . . . . . . . . . . . . . . . . . 34,881 — —Tribune Co., B . . . . . . . . . . . . . . . . . . . . . . . . . . . . . . . . . . . . . . . . . . . . . . . . . . . . . . . . . . . . . . . . . . . . . . . . . . . . . . . . . . . . . . . . . . . . . . 7,547 320 685Tribune Co., Warrants, 12/31/2032 . . . . . . . . . . . . . . . . . . . . . . . . . . . . . . . . . . . . . . . . . . . . . . . . . . . . . . . . . . . . . . . . . . . . . . . . . . . . . . . 23,488 997 2,114Twenty-First Century Fox Inc., B . . . . . . . . . . . . . . . . . . . . . . . . . . . . . . . . . . . . . . . . . . . . . . . . . . . . . . . . . . . . . . . . . . . . . . . . . . . . . . . . . 157,986 3,603 5,767Walgreen Co. . . . . . . . . . . . . . . . . . . . . . . . . . . . . . . . . . . . . . . . . . . . . . . . . . . . . . . . . . . . . . . . . . . . . . . . . . . . . . . . . . . . . . . . . . . . . . . . 32,765 1,264 2,590Wells Fargo & Co. . . . . . . . . . . . . . . . . . . . . . . . . . . . . . . . . . . . . . . . . . . . . . . . . . . . . . . . . . . . . . . . . . . . . . . . . . . . . . . . . . . . . . . . . . . . 33,012 1,069 1,850White Mountains Insurance Group Ltd. . . . . . . . . . . . . . . . . . . . . . . . . . . . . . . . . . . . . . . . . . . . . . . . . . . . . . . . . . . . . . . . . . . . . . . . . . . . . 5,838 3,083 3,788Xerox Corp. . . . . . . . . . . . . . . . . . . . . . . . . . . . . . . . . . . . . . . . . . . . . . . . . . . . . . . . . . . . . . . . . . . . . . . . . . . . . . . . . . . . . . . . . . . . . . . . . 289,415 2,800 3,840
164,600 193,561
United Kingdom: 6.21%AstraZeneca PLC, American Depositary Receipt . . . . . . . . . . . . . . . . . . . . . . . . . . . . . . . . . . . . . . . . . . . . . . . . . . . . . . . . . . . . . . . . . . . . . . 4,695 408 372AstraZeneca PLC . . . . . . . . . . . . . . . . . . . . . . . . . . . . . . . . . . . . . . . . . . . . . . . . . . . . . . . . . . . . . . . . . . . . . . . . . . . . . . . . . . . . . . . . . . . . 8,120 671 643British American Tobacco PLC . . . . . . . . . . . . . . . . . . . . . . . . . . . . . . . . . . . . . . . . . . . . . . . . . . . . . . . . . . . . . . . . . . . . . . . . . . . . . . . . . . 23,501 932 1,492Canary Wharf Group PLC . . . . . . . . . . . . . . . . . . . . . . . . . . . . . . . . . . . . . . . . . . . . . . . . . . . . . . . . . . . . . . . . . . . . . . . . . . . . . . . . . . . . . . 953,128 4,790 7,729Reed Elsevier PLC . . . . . . . . . . . . . . . . . . . . . . . . . . . . . . . . . . . . . . . . . . . . . . . . . . . . . . . . . . . . . . . . . . . . . . . . . . . . . . . . . . . . . . . . . . . 56,590 472 971Royal Dutch Shell PLC, A . . . . . . . . . . . . . . . . . . . . . . . . . . . . . . . . . . . . . . . . . . . . . . . . . . . . . . . . . . . . . . . . . . . . . . . . . . . . . . . . . . . . . . 35,568 1,474 1,571Tesco PLC . . . . . . . . . . . . . . . . . . . . . . . . . . . . . . . . . . . . . . . . . . . . . . . . . . . . . . . . . . . . . . . . . . . . . . . . . . . . . . . . . . . . . . . . . . . . . . . . . 162,240 957 841Vodafone Group PLC . . . . . . . . . . . . . . . . . . . . . . . . . . . . . . . . . . . . . . . . . . . . . . . . . . . . . . . . . . . . . . . . . . . . . . . . . . . . . . . . . . . . . . . . . 286,908 1,218 1,021
10,922 14,640
Israel: 0.78%Teva Pharmaceutical Industries Ltd., American Depositary Receipt . . . . . . . . . . . . . . . . . . . . . . . . . . . . . . . . . . . . . . . . . . . . . . . . . . . . . . . . 32,930 1,509 1,841
The accompanying notes are an integral part of these financial statements.
Franklin Templeton Investments Funds 313
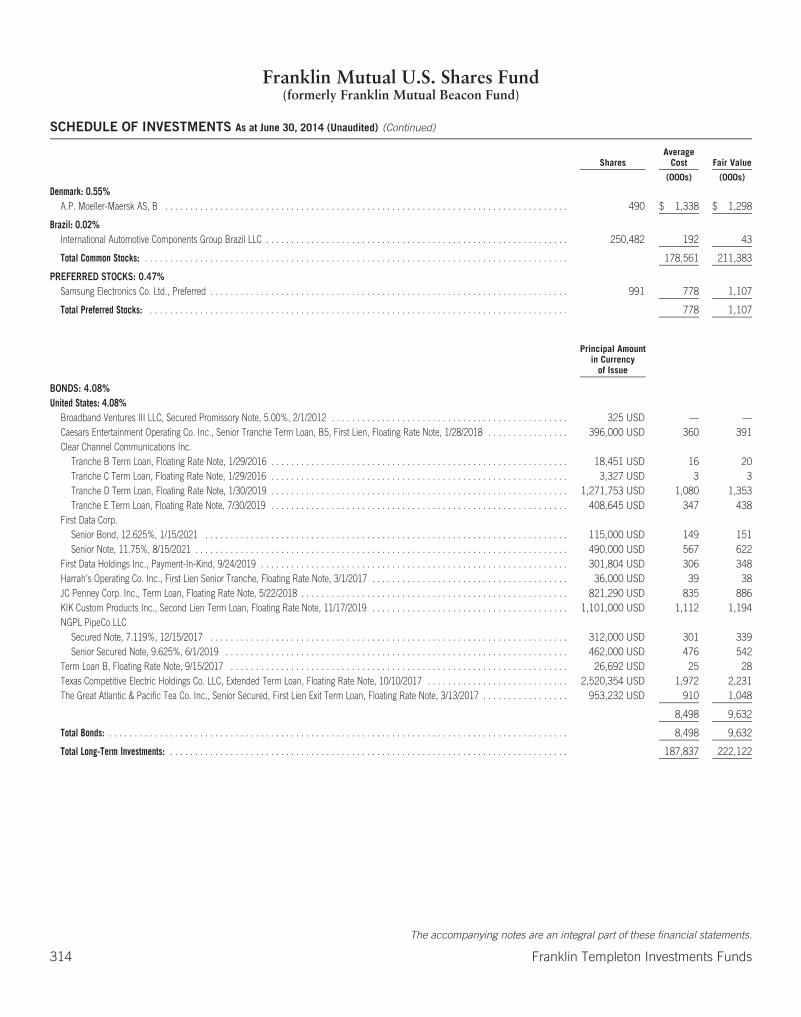
Franklin Mutual U.S. Shares Fund(formerly Franklin Mutual Beacon Fund)
SCHEDULE OF INVESTMENTS As at June 30, 2014 (Unaudited) (Continued)
SharesAverage
Cost Fair Value
(000s) (000s)
Denmark: 0.55%A.P. Moeller-Maersk AS, B . . . . . . . . . . . . . . . . . . . . . . . . . . . . . . . . . . . . . . . . . . . . . . . . . . . . . . . . . . . . . . . . . . . . . . . . . . . . . . . . 490 $ 1,338 $ 1,298
Brazil: 0.02%International Automotive Components Group Brazil LLC . . . . . . . . . . . . . . . . . . . . . . . . . . . . . . . . . . . . . . . . . . . . . . . . . . . . . . . . . . . . 250,482 192 43
Total Common Stocks: . . . . . . . . . . . . . . . . . . . . . . . . . . . . . . . . . . . . . . . . . . . . . . . . . . . . . . . . . . . . . . . . . . . . . . . . . . . . . . . . . . . . 178,561 211,383
PREFERRED STOCKS: 0.47%Samsung Electronics Co. Ltd., Preferred . . . . . . . . . . . . . . . . . . . . . . . . . . . . . . . . . . . . . . . . . . . . . . . . . . . . . . . . . . . . . . . . . . . . . . . 991 778 1,107
Total Preferred Stocks: . . . . . . . . . . . . . . . . . . . . . . . . . . . . . . . . . . . . . . . . . . . . . . . . . . . . . . . . . . . . . . . . . . . . . . . . . . . . . . . . . . . 778 1,107
Principal Amountin Currency
of Issue
BONDS: 4.08%United States: 4.08%
Broadband Ventures III LLC, Secured Promissory Note, 5.00%, 2/1/2012 . . . . . . . . . . . . . . . . . . . . . . . . . . . . . . . . . . . . . . . . . . . . . . . 325 USD — —Caesars Entertainment Operating Co. Inc., Senior Tranche Term Loan, B5, First Lien, Floating Rate Note, 1/28/2018 . . . . . . . . . . . . . . . . 396,000 USD 360 391Clear Channel Communications Inc.
Tranche B Term Loan, Floating Rate Note, 1/29/2016 . . . . . . . . . . . . . . . . . . . . . . . . . . . . . . . . . . . . . . . . . . . . . . . . . . . . . . . . . . . 18,451 USD 16 20Tranche C Term Loan, Floating Rate Note, 1/29/2016 . . . . . . . . . . . . . . . . . . . . . . . . . . . . . . . . . . . . . . . . . . . . . . . . . . . . . . . . . . . 3,327 USD 3 3Tranche D Term Loan, Floating Rate Note, 1/30/2019 . . . . . . . . . . . . . . . . . . . . . . . . . . . . . . . . . . . . . . . . . . . . . . . . . . . . . . . . . . . 1,271,753 USD 1,080 1,353Tranche E Term Loan, Floating Rate Note, 7/30/2019 . . . . . . . . . . . . . . . . . . . . . . . . . . . . . . . . . . . . . . . . . . . . . . . . . . . . . . . . . . . 408,645 USD 347 438
First Data Corp.Senior Bond, 12.625%, 1/15/2021 . . . . . . . . . . . . . . . . . . . . . . . . . . . . . . . . . . . . . . . . . . . . . . . . . . . . . . . . . . . . . . . . . . . . . . . . 115,000 USD 149 151Senior Note, 11.75%, 8/15/2021 . . . . . . . . . . . . . . . . . . . . . . . . . . . . . . . . . . . . . . . . . . . . . . . . . . . . . . . . . . . . . . . . . . . . . . . . . . 490,000 USD 567 622
First Data Holdings Inc., Payment-In-Kind, 9/24/2019 . . . . . . . . . . . . . . . . . . . . . . . . . . . . . . . . . . . . . . . . . . . . . . . . . . . . . . . . . . . . . 301,804 USD 306 348Harrah’s Operating Co. Inc., First Lien Senior Tranche, Floating Rate Note, 3/1/2017 . . . . . . . . . . . . . . . . . . . . . . . . . . . . . . . . . . . . . . . 36,000 USD 39 38JC Penney Corp. Inc., Term Loan, Floating Rate Note, 5/22/2018 . . . . . . . . . . . . . . . . . . . . . . . . . . . . . . . . . . . . . . . . . . . . . . . . . . . . . 821,290 USD 835 886KIK Custom Products Inc., Second Lien Term Loan, Floating Rate Note, 11/17/2019 . . . . . . . . . . . . . . . . . . . . . . . . . . . . . . . . . . . . . . . 1,101,000 USD 1,112 1,194NGPL PipeCo LLC
Secured Note, 7.119%, 12/15/2017 . . . . . . . . . . . . . . . . . . . . . . . . . . . . . . . . . . . . . . . . . . . . . . . . . . . . . . . . . . . . . . . . . . . . . . . 312,000 USD 301 339Senior Secured Note, 9.625%, 6/1/2019 . . . . . . . . . . . . . . . . . . . . . . . . . . . . . . . . . . . . . . . . . . . . . . . . . . . . . . . . . . . . . . . . . . . . 462,000 USD 476 542
Term Loan B, Floating Rate Note, 9/15/2017 . . . . . . . . . . . . . . . . . . . . . . . . . . . . . . . . . . . . . . . . . . . . . . . . . . . . . . . . . . . . . . . . . . . 26,692 USD 25 28Texas Competitive Electric Holdings Co. LLC, Extended Term Loan, Floating Rate Note, 10/10/2017 . . . . . . . . . . . . . . . . . . . . . . . . . . . . 2,520,354 USD 1,972 2,231The Great Atlantic & Pacific Tea Co. Inc., Senior Secured, First Lien Exit Term Loan, Floating Rate Note, 3/13/2017 . . . . . . . . . . . . . . . . . 953,232 USD 910 1,048
8,498 9,632
Total Bonds: . . . . . . . . . . . . . . . . . . . . . . . . . . . . . . . . . . . . . . . . . . . . . . . . . . . . . . . . . . . . . . . . . . . . . . . . . . . . . . . . . . . . . . . . . . . 8,498 9,632
Total Long-Term Investments: . . . . . . . . . . . . . . . . . . . . . . . . . . . . . . . . . . . . . . . . . . . . . . . . . . . . . . . . . . . . . . . . . . . . . . . . . . . . . . . 187,837 222,122
The accompanying notes are an integral part of these financial statements.
314 Franklin Templeton Investments Funds
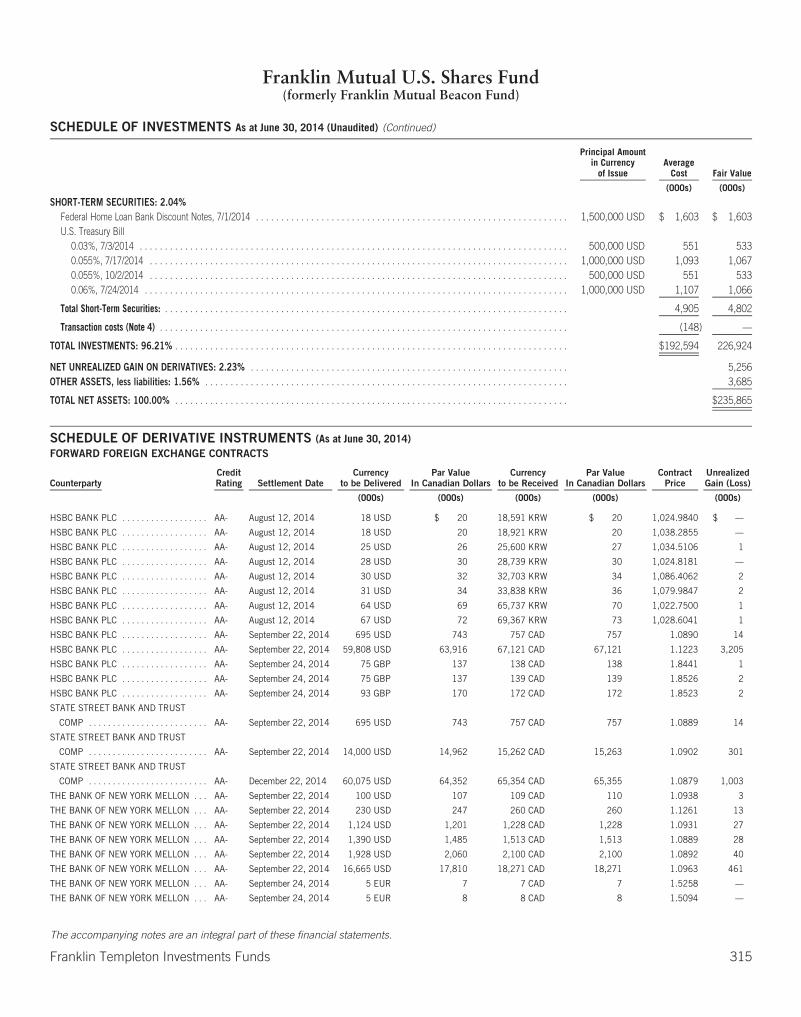
Franklin Mutual U.S. Shares Fund(formerly Franklin Mutual Beacon Fund)
SCHEDULE OF INVESTMENTS As at June 30, 2014 (Unaudited) (Continued)
Principal Amountin Currency
of IssueAverage
Cost Fair Value
(000s) (000s)
SHORT-TERM SECURITIES: 2.04%Federal Home Loan Bank Discount Notes, 7/1/2014 . . . . . . . . . . . . . . . . . . . . . . . . . . . . . . . . . . . . . . . . . . . . . . . . . . . . . . . . . . . . . . 1,500,000 USD $ 1,603 $ 1,603U.S. Treasury Bill
0.03%, 7/3/2014 . . . . . . . . . . . . . . . . . . . . . . . . . . . . . . . . . . . . . . . . . . . . . . . . . . . . . . . . . . . . . . . . . . . . . . . . . . . . . . . . . . . . . 500,000 USD 551 5330.055%, 7/17/2014 . . . . . . . . . . . . . . . . . . . . . . . . . . . . . . . . . . . . . . . . . . . . . . . . . . . . . . . . . . . . . . . . . . . . . . . . . . . . . . . . . . . 1,000,000 USD 1,093 1,0670.055%, 10/2/2014 . . . . . . . . . . . . . . . . . . . . . . . . . . . . . . . . . . . . . . . . . . . . . . . . . . . . . . . . . . . . . . . . . . . . . . . . . . . . . . . . . . . 500,000 USD 551 5330.06%, 7/24/2014 . . . . . . . . . . . . . . . . . . . . . . . . . . . . . . . . . . . . . . . . . . . . . . . . . . . . . . . . . . . . . . . . . . . . . . . . . . . . . . . . . . . . 1,000,000 USD 1,107 1,066
Total Short-Term Securities: . . . . . . . . . . . . . . . . . . . . . . . . . . . . . . . . . . . . . . . . . . . . . . . . . . . . . . . . . . . . . . . . . . . . . . . . . . . . . . . . 4,905 4,802
Transaction costs (Note 4) . . . . . . . . . . . . . . . . . . . . . . . . . . . . . . . . . . . . . . . . . . . . . . . . . . . . . . . . . . . . . . . . . . . . . . . . . . . . . . . . . (148) —
TOTAL INVESTMENTS: 96.21% . . . . . . . . . . . . . . . . . . . . . . . . . . . . . . . . . . . . . . . . . . . . . . . . . . . . . . . . . . . . . . . . . . . . . . . . . . . . . . $192,594 226,924
NET UNREALIZED GAIN ON DERIVATIVES: 2.23% . . . . . . . . . . . . . . . . . . . . . . . . . . . . . . . . . . . . . . . . . . . . . . . . . . . . . . . . . . . . . . . 5,256OTHER ASSETS, less liabilities: 1.56% . . . . . . . . . . . . . . . . . . . . . . . . . . . . . . . . . . . . . . . . . . . . . . . . . . . . . . . . . . . . . . . . . . . . . . . . 3,685
TOTAL NET ASSETS: 100.00% . . . . . . . . . . . . . . . . . . . . . . . . . . . . . . . . . . . . . . . . . . . . . . . . . . . . . . . . . . . . . . . . . . . . . . . . . . . . . . $235,865
SCHEDULE OF DERIVATIVE INSTRUMENTS (As at June 30, 2014)FORWARD FOREIGN EXCHANGE CONTRACTS
CounterpartyCreditRating Settlement Date
Currencyto be Delivered
Par ValueIn Canadian Dollars
Currencyto be Received
Par ValueIn Canadian Dollars
ContractPrice
UnrealizedGain (Loss)
(000s) (000s) (000s) (000s) (000s)
HSBC BANK PLC . . . . . . . . . . . . . . . . . . AA- August 12, 2014 18 USD $ 20 18,591 KRW $ 20 1,024.9840 $ —
HSBC BANK PLC . . . . . . . . . . . . . . . . . . AA- August 12, 2014 18 USD 20 18,921 KRW 20 1,038.2855 —
HSBC BANK PLC . . . . . . . . . . . . . . . . . . AA- August 12, 2014 25 USD 26 25,600 KRW 27 1,034.5106 1
HSBC BANK PLC . . . . . . . . . . . . . . . . . . AA- August 12, 2014 28 USD 30 28,739 KRW 30 1,024.8181 —
HSBC BANK PLC . . . . . . . . . . . . . . . . . . AA- August 12, 2014 30 USD 32 32,703 KRW 34 1,086.4062 2
HSBC BANK PLC . . . . . . . . . . . . . . . . . . AA- August 12, 2014 31 USD 34 33,838 KRW 36 1,079.9847 2
HSBC BANK PLC . . . . . . . . . . . . . . . . . . AA- August 12, 2014 64 USD 69 65,737 KRW 70 1,022.7500 1
HSBC BANK PLC . . . . . . . . . . . . . . . . . . AA- August 12, 2014 67 USD 72 69,367 KRW 73 1,028.6041 1
HSBC BANK PLC . . . . . . . . . . . . . . . . . . AA- September 22, 2014 695 USD 743 757 CAD 757 1.0890 14
HSBC BANK PLC . . . . . . . . . . . . . . . . . . AA- September 22, 2014 59,808 USD 63,916 67,121 CAD 67,121 1.1223 3,205
HSBC BANK PLC . . . . . . . . . . . . . . . . . . AA- September 24, 2014 75 GBP 137 138 CAD 138 1.8441 1
HSBC BANK PLC . . . . . . . . . . . . . . . . . . AA- September 24, 2014 75 GBP 137 139 CAD 139 1.8526 2
HSBC BANK PLC . . . . . . . . . . . . . . . . . . AA- September 24, 2014 93 GBP 170 172 CAD 172 1.8523 2
STATE STREET BANK AND TRUST
COMP . . . . . . . . . . . . . . . . . . . . . . . . . AA- September 22, 2014 695 USD 743 757 CAD 757 1.0889 14
STATE STREET BANK AND TRUST
COMP . . . . . . . . . . . . . . . . . . . . . . . . . AA- September 22, 2014 14,000 USD 14,962 15,262 CAD 15,263 1.0902 301
STATE STREET BANK AND TRUST
COMP . . . . . . . . . . . . . . . . . . . . . . . . . AA- December 22, 2014 60,075 USD 64,352 65,354 CAD 65,355 1.0879 1,003
THE BANK OF NEW YORK MELLON . . . AA- September 22, 2014 100 USD 107 109 CAD 110 1.0938 3
THE BANK OF NEW YORK MELLON . . . AA- September 22, 2014 230 USD 247 260 CAD 260 1.1261 13
THE BANK OF NEW YORK MELLON . . . AA- September 22, 2014 1,124 USD 1,201 1,228 CAD 1,228 1.0931 27
THE BANK OF NEW YORK MELLON . . . AA- September 22, 2014 1,390 USD 1,485 1,513 CAD 1,513 1.0889 28
THE BANK OF NEW YORK MELLON . . . AA- September 22, 2014 1,928 USD 2,060 2,100 CAD 2,100 1.0892 40
THE BANK OF NEW YORK MELLON . . . AA- September 22, 2014 16,665 USD 17,810 18,271 CAD 18,271 1.0963 461
THE BANK OF NEW YORK MELLON . . . AA- September 24, 2014 5 EUR 7 7 CAD 7 1.5258 —
THE BANK OF NEW YORK MELLON . . . AA- September 24, 2014 5 EUR 8 8 CAD 8 1.5094 —
The accompanying notes are an integral part of these financial statements.
Franklin Templeton Investments Funds 315

Franklin Mutual U.S. Shares Fund(formerly Franklin Mutual Beacon Fund)
SCHEDULE OF INVESTMENTS As at June 30, 2014 (Unaudited) (Continued)
SCHEDULE OF DERIVATIVE INSTRUMENTS (As at June 30, 2014) (Continued)FORWARD FOREIGN EXCHANGE CONTRACTS (Continued)
CounterpartyCreditRating Settlement Date
Currencyto be Delivered
Par ValueIn Canadian Dollars
Currencyto be Received
Par ValueIn Canadian Dollars
ContractPrice
UnrealizedGain (Loss)
(000s) (000s) (000s) (000s) (000s)
THE BANK OF NEW YORK MELLON . . . AA- September 24, 2014 20 EUR $ 29 30 CAD $ 30 1.5243 $ 1
THE BANK OF NEW YORK MELLON . . . AA- September 24, 2014 48 GBP 89 90 CAD 90 1.8532 1
THE BANK OF NEW YORK MELLON . . . AA- September 24, 2014 60 GBP 110 110 CAD 111 1.8368 1
THE BANK OF NEW YORK MELLON . . . AA- September 24, 2014 76 GBP 139 140 CAD 140 1.8378 1
THE BANK OF NEW YORK MELLON . . . AA- September 24, 2014 128 GBP 234 236 CAD 236 1.8421 2
THE BANK OF NEW YORK MELLON . . . AA- September 24, 2014 185 CAD 185 101 GBP 185 0.5478 —
THE BANK OF NEW YORK MELLON . . . AA- September 24, 2014 200 GBP 365 368 CAD 368 1.8399 3
THE BANK OF NEW YORK MELLON . . . AA- September 24, 2014 278 EUR 408 433 CAD 434 1.5565 26
THE BANK OF NEW YORK MELLON . . . AA- September 24, 2014 295 GBP 539 543 CAD 543 1.8405 4
THE BANK OF NEW YORK MELLON . . . AA- September 24, 2014 482 GBP 880 882 CAD 882 1.8306 2
THE BANK OF NEW YORK MELLON . . . AA- September 24, 2014 520 GBP 951 960 CAD 960 1.8455 9
THE BANK OF NEW YORK MELLON . . . AA- September 24, 2014 4,990 GBP 9,119 9,290 CAD 9,290 1.8618 171
Total Number of Contracts . . . . . . . . .36 $ 5,342
HSBC BANK PLC . . . . . . . . . . . . . . . . . . AA- August 12, 2014 4,370 KRW 5 4 USD 5 0.0010 —
HSBC BANK PLC . . . . . . . . . . . . . . . . . . AA- August 12, 2014 7,214 KRW 8 7 USD 8 0.0010 —
HSBC BANK PLC . . . . . . . . . . . . . . . . . . AA- August 12, 2014 11,698 KRW 13 11 USD 12 0.0009 (1)
HSBC BANK PLC . . . . . . . . . . . . . . . . . . AA- August 12, 2014 12,500 KRW 13 12 USD 13 0.0010 —
HSBC BANK PLC . . . . . . . . . . . . . . . . . . AA- August 12, 2014 14,843 KRW 16 14 USD 16 0.0010 —
HSBC BANK PLC . . . . . . . . . . . . . . . . . . AA- August 12, 2014 17,931 KRW 19 17 USD 19 0.0010 —
HSBC BANK PLC . . . . . . . . . . . . . . . . . . AA- August 12, 2014 20,955 KRW 22 20 USD 21 0.0009 (1)
HSBC BANK PLC . . . . . . . . . . . . . . . . . . AA- August 12, 2014 21,100 KRW 22 20 USD 22 0.0010 —
HSBC BANK PLC . . . . . . . . . . . . . . . . . . AA- August 12, 2014 24,800 KRW 26 23 USD 25 0.0009 (1)
HSBC BANK PLC . . . . . . . . . . . . . . . . . . AA- August 12, 2014 50,962 KRW 54 50 USD 53 0.0010 (1)
HSBC BANK PLC . . . . . . . . . . . . . . . . . . AA- August 12, 2014 54,600 KRW 58 51 USD 55 0.0009 (3)
HSBC BANK PLC . . . . . . . . . . . . . . . . . . AA- August 12, 2014 56,487 KRW 60 55 USD 59 0.0010 (1)
HSBC BANK PLC . . . . . . . . . . . . . . . . . . AA- August 12, 2014 81,790 KRW 87 75 USD 81 0.0009 (6)
HSBC BANK PLC . . . . . . . . . . . . . . . . . . AA- August 12, 2014 111,315 KRW 118 104 USD 111 0.0009 (7)
HSBC BANK PLC . . . . . . . . . . . . . . . . . . AA- August 12, 2014 138,269 KRW 146 128 USD 137 0.0009 (9)
HSBC BANK PLC . . . . . . . . . . . . . . . . . . AA- August 12, 2014 183,694 KRW 194 171 USD 183 0.0009 (11)
HSBC BANK PLC . . . . . . . . . . . . . . . . . . AA- August 12, 2014 198,444 KRW 209 184 USD 197 0.0009 (12)
HSBC BANK PLC . . . . . . . . . . . . . . . . . . AA- August 12, 2014 313,164 KRW 330 291 USD 310 0.0009 (20)
THE BANK OF NEW YORK MELLON . . . AA- September 24, 2014 130 GBP 238 237 CAD 238 1.8265 —
THE BANK OF NEW YORK MELLON . . . AA- September 24, 2014 285 CAD 285 155 GBP 283 0.5428 (2)
THE BANK OF NEW YORK MELLON . . . AA- September 24, 2014 462 CAD 462 308 EUR 451 0.6669 (11)
Total Number of Contracts . . . . . . .21 $ (86)
Net Unrealized Gain . . . . . . . . . . . . . . . $5,256
The accompanying notes are an integral part of these financial statements.
316 Franklin Templeton Investments Funds
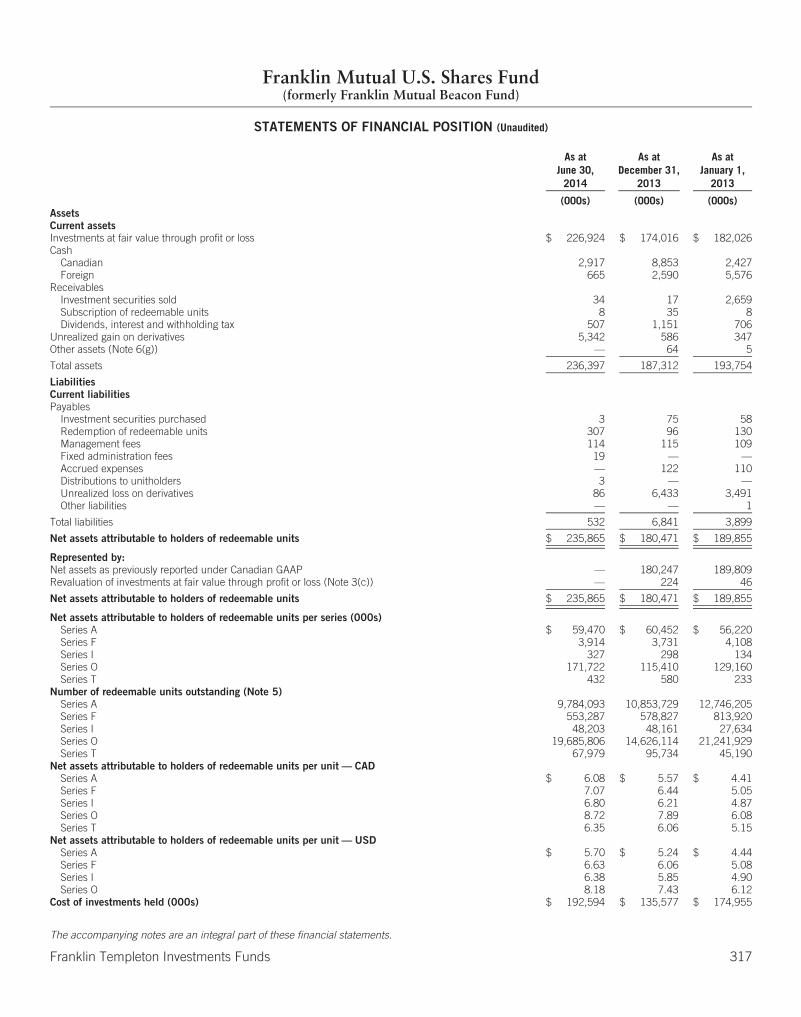
Franklin Mutual U.S. Shares Fund(formerly Franklin Mutual Beacon Fund)
STATEMENTS OF FINANCIAL POSITION (Unaudited)
As atJune 30,
2014
As atDecember 31,
2013
As atJanuary 1,
2013
(000s) (000s) (000s)AssetsCurrent assetsInvestments at fair value through profit or loss $ 226,924 $ 174,016 $ 182,026Cash
Canadian 2,917 8,853 2,427Foreign 665 2,590 5,576
ReceivablesInvestment securities sold 34 17 2,659Subscription of redeemable units 8 35 8Dividends, interest and withholding tax 507 1,151 706
Unrealized gain on derivatives 5,342 586 347Other assets (Note 6(g)) — 64 5
Total assets 236,397 187,312 193,754
LiabilitiesCurrent liabilitiesPayables
Investment securities purchased 3 75 58Redemption of redeemable units 307 96 130Management fees 114 115 109Fixed administration fees 19 — —Accrued expenses — 122 110Distributions to unitholders 3 — —Unrealized loss on derivatives 86 6,433 3,491Other liabilities — — 1
Total liabilities 532 6,841 3,899
Net assets attributable to holders of redeemable units $ 235,865 $ 180,471 $ 189,855
Represented by:Net assets as previously reported under Canadian GAAP — 180,247 189,809Revaluation of investments at fair value through profit or loss (Note 3(c)) — 224 46
Net assets attributable to holders of redeemable units $ 235,865 $ 180,471 $ 189,855
Net assets attributable to holders of redeemable units per series (000s)Series A $ 59,470 $ 60,452 $ 56,220Series F 3,914 3,731 4,108Series I 327 298 134Series O 171,722 115,410 129,160Series T 432 580 233
Number of redeemable units outstanding (Note 5)Series A 9,784,093 10,853,729 12,746,205Series F 553,287 578,827 813,920Series I 48,203 48,161 27,634Series O 19,685,806 14,626,114 21,241,929Series T 67,979 95,734 45,190
Net assets attributable to holders of redeemable units per unit — CADSeries A $ 6.08 $ 5.57 $ 4.41Series F 7.07 6.44 5.05Series I 6.80 6.21 4.87Series O 8.72 7.89 6.08Series T 6.35 6.06 5.15
Net assets attributable to holders of redeemable units per unit — USDSeries A $ 5.70 $ 5.24 $ 4.44Series F 6.63 6.06 5.08Series I 6.38 5.85 4.90Series O 8.18 7.43 6.12
Cost of investments held (000s) $ 192,594 $ 135,577 $ 174,955
The accompanying notes are an integral part of these financial statements.
Franklin Templeton Investments Funds 317

Franklin Mutual U.S. Shares Fund(formerly Franklin Mutual Beacon Fund)
STATEMENTS OF COMPREHENSIVE INCOMEFor the six months ended June 30, 2014 and 2013 (Unaudited)
2014 2013
(000s) (000s)IncomeDividends $ 1,558 $ 2,427Interest income for distribution purposes 543 486Net realized and/or unrealized foreign exchange gain (loss) (10,781) (5,408)Net realized gain (loss) on investments and derivatives 21,496 11,037Net change in unrealized appreciation (depreciation) in value of investments and derivatives 6,994 20,650
Total income (net) 19,810 29,192
ExpensesManagement fees (Note 6(a)) 676 679Fixed administration fees (Note 6(b)) 115 —Transfer agent fees (Note 6(d)) — 269Custodian fees — 1Legal fees — 2Audit fees — 12Unitholder reporting costs — 11Independent review committee fees — 1Registration fees — 12Other expenses (Note 6(f)) — 22
Operating expenses before waivers/paid by Manager 791 1,009Expenses waived/paid by Manager (Note 6(b)) — (168)
Net operating expenses after waivers/paid by Manager 791 841
Transaction costs (Note 9) 67 71Withholding tax expense 182 269
Total expenses 1,040 1,181
Increase (decrease) in net assets attributable to holders of redeemable units from operations $ 18,770 $ 28,011
Represented by:Increase (decrease) in net assets from operations as previously reported under Canadian GAAP — 27,913Revaluation of investments at fair value through profit and loss (Note 3(c)) — 98
Increase (decrease) in net assets attributable to holders of redeemable units from operations $ 18,770 $ 28,011
Increase (decrease) in net assets attributable to holders of redeemable units from operations per series (000s)Series A $ 5,081 $ 7,549Series F 354 561Series I 29 20Series O 13,272 19,849Series T 34 32
Weighted average number of units outstandingSeries A 10,261,900 12,171,658Series F 565,873 729,732Series I 49,084 29,956Series O 15,641,186 21,033,602Series T 72,787 44,196
Increase (decrease) in net assets attributable to holders of redeemable units from operations per unitSeries A $ 0.50 $ 0.62Series F 0.63 0.77Series I 0.58 0.68Series O 0.85 0.95Series T 0.46 0.72
The accompanying notes are an integral part of these financial statements.
318 Franklin Templeton Investments Funds
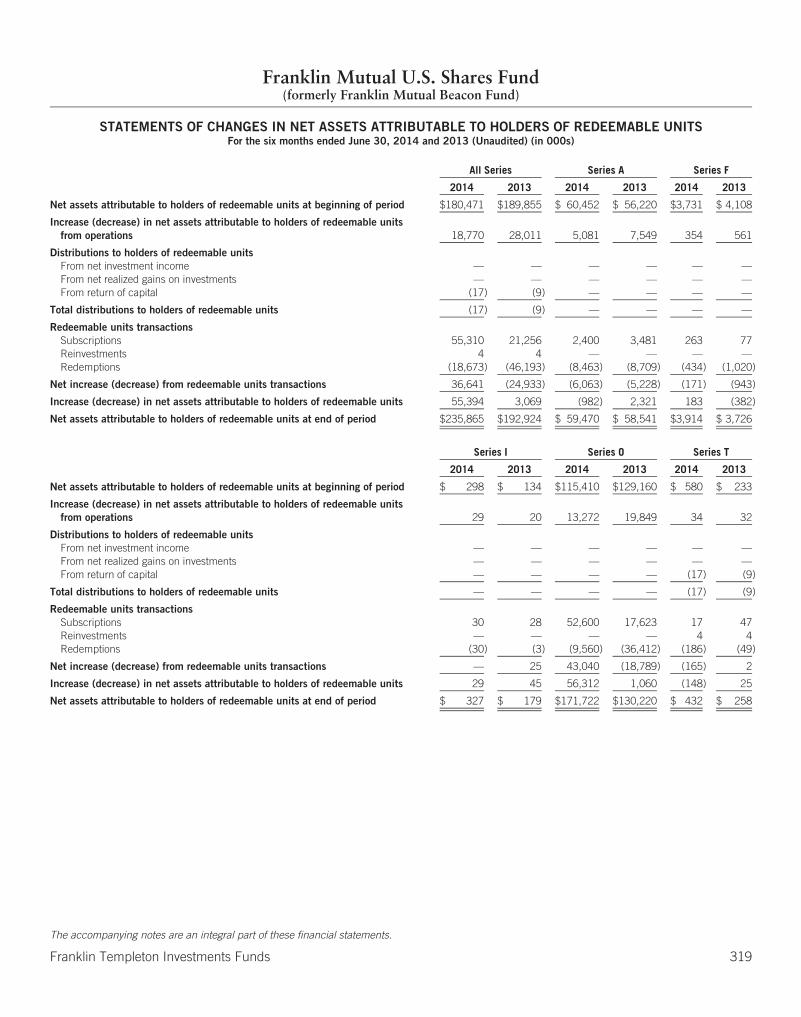
Franklin Mutual U.S. Shares Fund(formerly Franklin Mutual Beacon Fund)
STATEMENTS OF CHANGES IN NET ASSETS ATTRIBUTABLE TO HOLDERS OF REDEEMABLE UNITSFor the six months ended June 30, 2014 and 2013 (Unaudited) (in 000s)
All Series Series A Series F
2014 2013 2014 2013 2014 2013
Net assets attributable to holders of redeemable units at beginning of period $180,471 $189,855 $ 60,452 $ 56,220 $3,731 $ 4,108
Increase (decrease) in net assets attributable to holders of redeemable unitsfrom operations 18,770 28,011 5,081 7,549 354 561
Distributions to holders of redeemable unitsFrom net investment income — — — — — —From net realized gains on investments — — — — — —From return of capital (17) (9) — — — —
Total distributions to holders of redeemable units (17) (9) — — — —
Redeemable units transactionsSubscriptions 55,310 21,256 2,400 3,481 263 77Reinvestments 4 4 — — — —Redemptions (18,673) (46,193) (8,463) (8,709) (434) (1,020)
Net increase (decrease) from redeemable units transactions 36,641 (24,933) (6,063) (5,228) (171) (943)
Increase (decrease) in net assets attributable to holders of redeemable units 55,394 3,069 (982) 2,321 183 (382)
Net assets attributable to holders of redeemable units at end of period $235,865 $192,924 $ 59,470 $ 58,541 $3,914 $ 3,726
Series I Series O Series T
2014 2013 2014 2013 2014 2013
Net assets attributable to holders of redeemable units at beginning of period $ 298 $ 134 $115,410 $129,160 $ 580 $ 233
Increase (decrease) in net assets attributable to holders of redeemable unitsfrom operations 29 20 13,272 19,849 34 32
Distributions to holders of redeemable unitsFrom net investment income — — — — — —From net realized gains on investments — — — — — —From return of capital — — — — (17) (9)
Total distributions to holders of redeemable units — — — — (17) (9)
Redeemable units transactionsSubscriptions 30 28 52,600 17,623 17 47Reinvestments — — — — 4 4Redemptions (30) (3) (9,560) (36,412) (186) (49)
Net increase (decrease) from redeemable units transactions — 25 43,040 (18,789) (165) 2
Increase (decrease) in net assets attributable to holders of redeemable units 29 45 56,312 1,060 (148) 25
Net assets attributable to holders of redeemable units at end of period $ 327 $ 179 $171,722 $130,220 $ 432 $ 258
The accompanying notes are an integral part of these financial statements.
Franklin Templeton Investments Funds 319
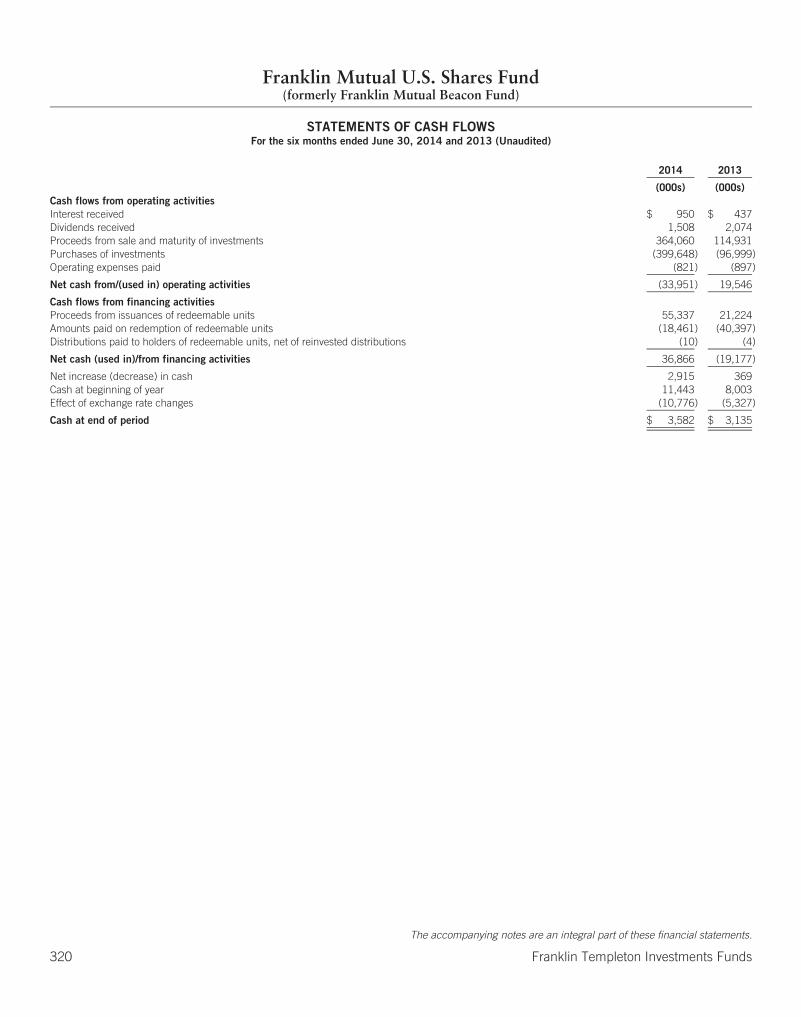
Franklin Mutual U.S. Shares Fund(formerly Franklin Mutual Beacon Fund)
STATEMENTS OF CASH FLOWSFor the six months ended June 30, 2014 and 2013 (Unaudited)
2014 2013
(000s) (000s)Cash flows from operating activitiesInterest received $ 950 $ 437Dividends received 1,508 2,074Proceeds from sale and maturity of investments 364,060 114,931Purchases of investments (399,648) (96,999)Operating expenses paid (821) (897)
Net cash from/(used in) operating activities (33,951) 19,546
Cash flows from financing activitiesProceeds from issuances of redeemable units 55,337 21,224Amounts paid on redemption of redeemable units (18,461) (40,397)Distributions paid to holders of redeemable units, net of reinvested distributions (10) (4)
Net cash (used in)/from financing activities 36,866 (19,177)
Net increase (decrease) in cash 2,915 369Cash at beginning of year 11,443 8,003Effect of exchange rate changes (10,776) (5,327)
Cash at end of period $ 3,582 $ 3,135
The accompanying notes are an integral part of these financial statements.
320 Franklin Templeton Investments Funds
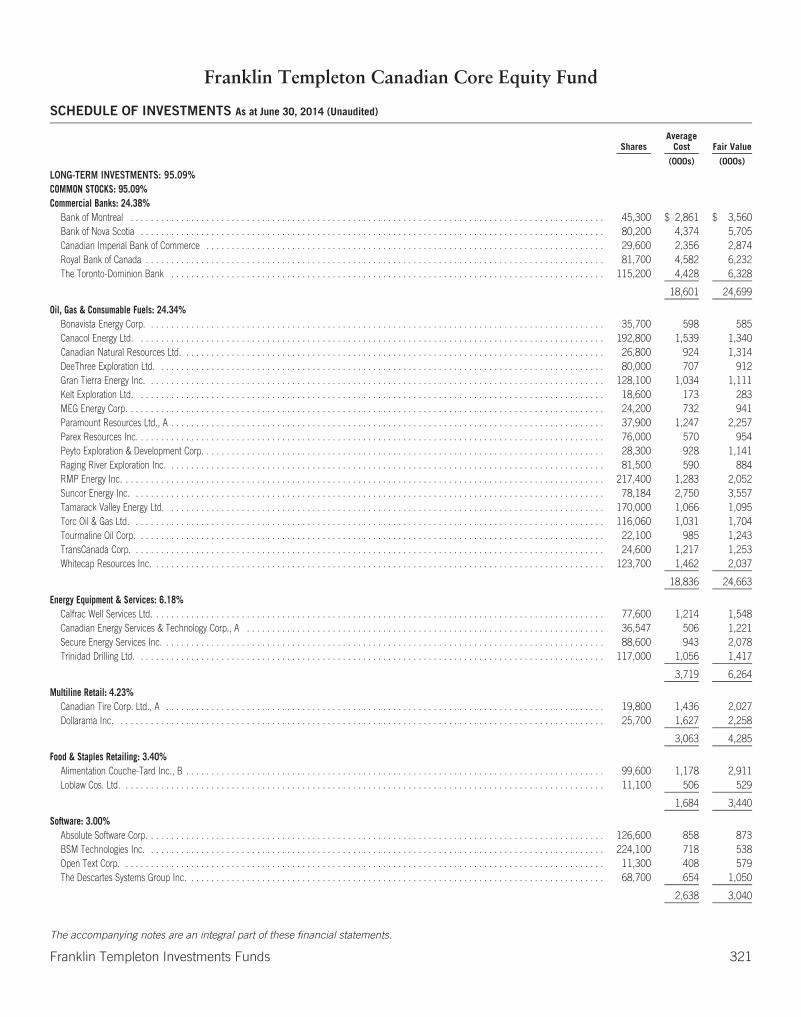
Franklin Templeton Canadian Core Equity Fund
SCHEDULE OF INVESTMENTS As at June 30, 2014 (Unaudited)
SharesAverage
Cost Fair Value
(000s) (000s)
LONG-TERM INVESTMENTS: 95.09%COMMON STOCKS: 95.09%Commercial Banks: 24.38%
Bank of Montreal . . . . . . . . . . . . . . . . . . . . . . . . . . . . . . . . . . . . . . . . . . . . . . . . . . . . . . . . . . . . . . . . . . . . . . . . . . . . . . . . . . . . . . . . . . . . . . 45,300 $ 2,861 $ 3,560Bank of Nova Scotia . . . . . . . . . . . . . . . . . . . . . . . . . . . . . . . . . . . . . . . . . . . . . . . . . . . . . . . . . . . . . . . . . . . . . . . . . . . . . . . . . . . . . . . . . . . . 80,200 4,374 5,705Canadian Imperial Bank of Commerce . . . . . . . . . . . . . . . . . . . . . . . . . . . . . . . . . . . . . . . . . . . . . . . . . . . . . . . . . . . . . . . . . . . . . . . . . . . . . . . 29,600 2,356 2,874Royal Bank of Canada . . . . . . . . . . . . . . . . . . . . . . . . . . . . . . . . . . . . . . . . . . . . . . . . . . . . . . . . . . . . . . . . . . . . . . . . . . . . . . . . . . . . . . . . . . . 81,700 4,582 6,232The Toronto-Dominion Bank . . . . . . . . . . . . . . . . . . . . . . . . . . . . . . . . . . . . . . . . . . . . . . . . . . . . . . . . . . . . . . . . . . . . . . . . . . . . . . . . . . . . . . 115,200 4,428 6,328
18,601 24,699
Oil, Gas & Consumable Fuels: 24.34%Bonavista Energy Corp. . . . . . . . . . . . . . . . . . . . . . . . . . . . . . . . . . . . . . . . . . . . . . . . . . . . . . . . . . . . . . . . . . . . . . . . . . . . . . . . . . . . . . . . . . . 35,700 598 585Canacol Energy Ltd. . . . . . . . . . . . . . . . . . . . . . . . . . . . . . . . . . . . . . . . . . . . . . . . . . . . . . . . . . . . . . . . . . . . . . . . . . . . . . . . . . . . . . . . . . . . . 192,800 1,539 1,340Canadian Natural Resources Ltd. . . . . . . . . . . . . . . . . . . . . . . . . . . . . . . . . . . . . . . . . . . . . . . . . . . . . . . . . . . . . . . . . . . . . . . . . . . . . . . . . . . . 26,800 924 1,314DeeThree Exploration Ltd. . . . . . . . . . . . . . . . . . . . . . . . . . . . . . . . . . . . . . . . . . . . . . . . . . . . . . . . . . . . . . . . . . . . . . . . . . . . . . . . . . . . . . . . . 80,000 707 912Gran Tierra Energy Inc. . . . . . . . . . . . . . . . . . . . . . . . . . . . . . . . . . . . . . . . . . . . . . . . . . . . . . . . . . . . . . . . . . . . . . . . . . . . . . . . . . . . . . . . . . . 128,100 1,034 1,111Kelt Exploration Ltd. . . . . . . . . . . . . . . . . . . . . . . . . . . . . . . . . . . . . . . . . . . . . . . . . . . . . . . . . . . . . . . . . . . . . . . . . . . . . . . . . . . . . . . . . . . . . 18,600 173 283MEG Energy Corp. . . . . . . . . . . . . . . . . . . . . . . . . . . . . . . . . . . . . . . . . . . . . . . . . . . . . . . . . . . . . . . . . . . . . . . . . . . . . . . . . . . . . . . . . . . . . . . 24,200 732 941Paramount Resources Ltd., A . . . . . . . . . . . . . . . . . . . . . . . . . . . . . . . . . . . . . . . . . . . . . . . . . . . . . . . . . . . . . . . . . . . . . . . . . . . . . . . . . . . . . . 37,900 1,247 2,257Parex Resources Inc. . . . . . . . . . . . . . . . . . . . . . . . . . . . . . . . . . . . . . . . . . . . . . . . . . . . . . . . . . . . . . . . . . . . . . . . . . . . . . . . . . . . . . . . . . . . . 76,000 570 954Peyto Exploration & Development Corp. . . . . . . . . . . . . . . . . . . . . . . . . . . . . . . . . . . . . . . . . . . . . . . . . . . . . . . . . . . . . . . . . . . . . . . . . . . . . . . . 28,300 928 1,141Raging River Exploration Inc. . . . . . . . . . . . . . . . . . . . . . . . . . . . . . . . . . . . . . . . . . . . . . . . . . . . . . . . . . . . . . . . . . . . . . . . . . . . . . . . . . . . . . . 81,500 590 884RMP Energy Inc. . . . . . . . . . . . . . . . . . . . . . . . . . . . . . . . . . . . . . . . . . . . . . . . . . . . . . . . . . . . . . . . . . . . . . . . . . . . . . . . . . . . . . . . . . . . . . . . 217,400 1,283 2,052Suncor Energy Inc. . . . . . . . . . . . . . . . . . . . . . . . . . . . . . . . . . . . . . . . . . . . . . . . . . . . . . . . . . . . . . . . . . . . . . . . . . . . . . . . . . . . . . . . . . . . . . 78,184 2,750 3,557Tamarack Valley Energy Ltd. . . . . . . . . . . . . . . . . . . . . . . . . . . . . . . . . . . . . . . . . . . . . . . . . . . . . . . . . . . . . . . . . . . . . . . . . . . . . . . . . . . . . . . 170,000 1,066 1,095Torc Oil & Gas Ltd. . . . . . . . . . . . . . . . . . . . . . . . . . . . . . . . . . . . . . . . . . . . . . . . . . . . . . . . . . . . . . . . . . . . . . . . . . . . . . . . . . . . . . . . . . . . . . 116,060 1,031 1,704Tourmaline Oil Corp. . . . . . . . . . . . . . . . . . . . . . . . . . . . . . . . . . . . . . . . . . . . . . . . . . . . . . . . . . . . . . . . . . . . . . . . . . . . . . . . . . . . . . . . . . . . . 22,100 985 1,243TransCanada Corp. . . . . . . . . . . . . . . . . . . . . . . . . . . . . . . . . . . . . . . . . . . . . . . . . . . . . . . . . . . . . . . . . . . . . . . . . . . . . . . . . . . . . . . . . . . . . . 24,600 1,217 1,253Whitecap Resources Inc. . . . . . . . . . . . . . . . . . . . . . . . . . . . . . . . . . . . . . . . . . . . . . . . . . . . . . . . . . . . . . . . . . . . . . . . . . . . . . . . . . . . . . . . . . 123,700 1,462 2,037
18,836 24,663
Energy Equipment & Services: 6.18%Calfrac Well Services Ltd. . . . . . . . . . . . . . . . . . . . . . . . . . . . . . . . . . . . . . . . . . . . . . . . . . . . . . . . . . . . . . . . . . . . . . . . . . . . . . . . . . . . . . . . . . 77,600 1,214 1,548Canadian Energy Services & Technology Corp., A . . . . . . . . . . . . . . . . . . . . . . . . . . . . . . . . . . . . . . . . . . . . . . . . . . . . . . . . . . . . . . . . . . . . . . . 36,547 506 1,221Secure Energy Services Inc. . . . . . . . . . . . . . . . . . . . . . . . . . . . . . . . . . . . . . . . . . . . . . . . . . . . . . . . . . . . . . . . . . . . . . . . . . . . . . . . . . . . . . . . 88,600 943 2,078Trinidad Drilling Ltd. . . . . . . . . . . . . . . . . . . . . . . . . . . . . . . . . . . . . . . . . . . . . . . . . . . . . . . . . . . . . . . . . . . . . . . . . . . . . . . . . . . . . . . . . . . . . 117,000 1,056 1,417
3,719 6,264
Multiline Retail: 4.23%Canadian Tire Corp. Ltd., A . . . . . . . . . . . . . . . . . . . . . . . . . . . . . . . . . . . . . . . . . . . . . . . . . . . . . . . . . . . . . . . . . . . . . . . . . . . . . . . . . . . . . . . 19,800 1,436 2,027Dollarama Inc. . . . . . . . . . . . . . . . . . . . . . . . . . . . . . . . . . . . . . . . . . . . . . . . . . . . . . . . . . . . . . . . . . . . . . . . . . . . . . . . . . . . . . . . . . . . . . . . . 25,700 1,627 2,258
3,063 4,285
Food & Staples Retailing: 3.40%Alimentation Couche-Tard Inc., B . . . . . . . . . . . . . . . . . . . . . . . . . . . . . . . . . . . . . . . . . . . . . . . . . . . . . . . . . . . . . . . . . . . . . . . . . . . . . . . . . . . 99,600 1,178 2,911Loblaw Cos. Ltd. . . . . . . . . . . . . . . . . . . . . . . . . . . . . . . . . . . . . . . . . . . . . . . . . . . . . . . . . . . . . . . . . . . . . . . . . . . . . . . . . . . . . . . . . . . . . . . . 11,100 506 529
1,684 3,440
Software: 3.00%Absolute Software Corp. . . . . . . . . . . . . . . . . . . . . . . . . . . . . . . . . . . . . . . . . . . . . . . . . . . . . . . . . . . . . . . . . . . . . . . . . . . . . . . . . . . . . . . . . . . 126,600 858 873BSM Technologies Inc. . . . . . . . . . . . . . . . . . . . . . . . . . . . . . . . . . . . . . . . . . . . . . . . . . . . . . . . . . . . . . . . . . . . . . . . . . . . . . . . . . . . . . . . . . . 224,100 718 538Open Text Corp. . . . . . . . . . . . . . . . . . . . . . . . . . . . . . . . . . . . . . . . . . . . . . . . . . . . . . . . . . . . . . . . . . . . . . . . . . . . . . . . . . . . . . . . . . . . . . . . 11,300 408 579The Descartes Systems Group Inc. . . . . . . . . . . . . . . . . . . . . . . . . . . . . . . . . . . . . . . . . . . . . . . . . . . . . . . . . . . . . . . . . . . . . . . . . . . . . . . . . . . 68,700 654 1,050
2,638 3,040
The accompanying notes are an integral part of these financial statements.
Franklin Templeton Investments Funds 321
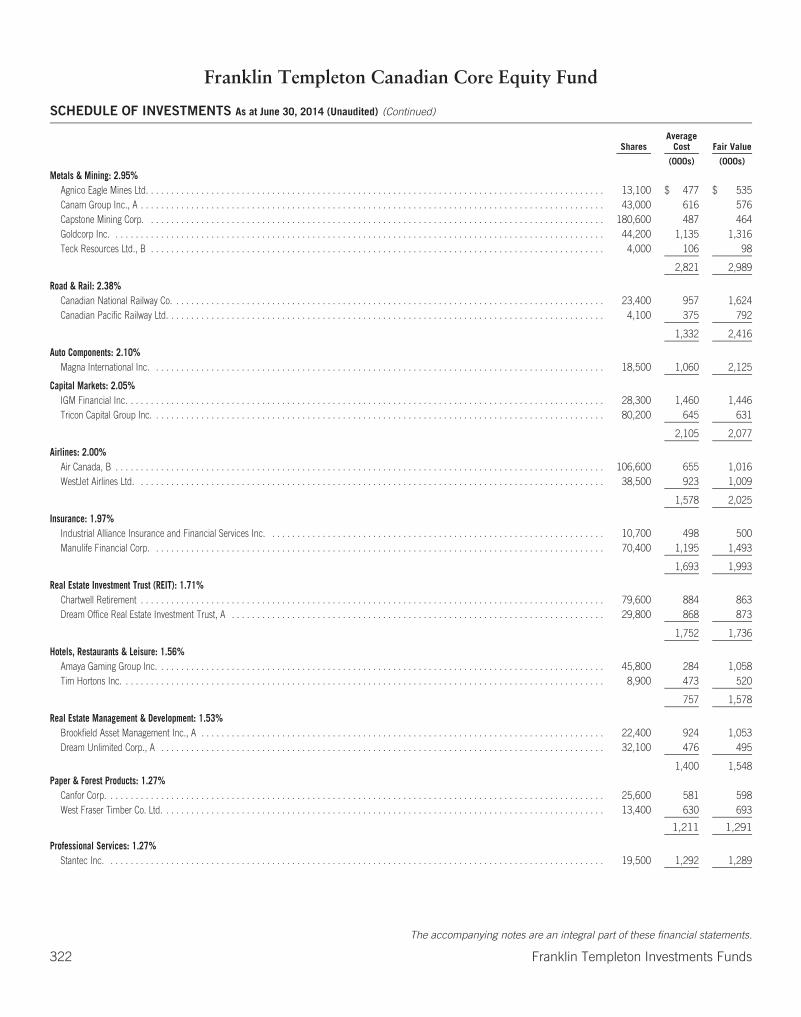
Franklin Templeton Canadian Core Equity Fund
SCHEDULE OF INVESTMENTS As at June 30, 2014 (Unaudited) (Continued)
SharesAverage
Cost Fair Value
(000s) (000s)
Metals & Mining: 2.95%Agnico Eagle Mines Ltd. . . . . . . . . . . . . . . . . . . . . . . . . . . . . . . . . . . . . . . . . . . . . . . . . . . . . . . . . . . . . . . . . . . . . . . . . . . . . . . . . . . . . . . . . . . 13,100 $ 477 $ 535Canam Group Inc., A . . . . . . . . . . . . . . . . . . . . . . . . . . . . . . . . . . . . . . . . . . . . . . . . . . . . . . . . . . . . . . . . . . . . . . . . . . . . . . . . . . . . . . . . . . . . 43,000 616 576Capstone Mining Corp. . . . . . . . . . . . . . . . . . . . . . . . . . . . . . . . . . . . . . . . . . . . . . . . . . . . . . . . . . . . . . . . . . . . . . . . . . . . . . . . . . . . . . . . . . . 180,600 487 464Goldcorp Inc. . . . . . . . . . . . . . . . . . . . . . . . . . . . . . . . . . . . . . . . . . . . . . . . . . . . . . . . . . . . . . . . . . . . . . . . . . . . . . . . . . . . . . . . . . . . . . . . . . 44,200 1,135 1,316Teck Resources Ltd., B . . . . . . . . . . . . . . . . . . . . . . . . . . . . . . . . . . . . . . . . . . . . . . . . . . . . . . . . . . . . . . . . . . . . . . . . . . . . . . . . . . . . . . . . . . 4,000 106 98
2,821 2,989
Road & Rail: 2.38%Canadian National Railway Co. . . . . . . . . . . . . . . . . . . . . . . . . . . . . . . . . . . . . . . . . . . . . . . . . . . . . . . . . . . . . . . . . . . . . . . . . . . . . . . . . . . . . . 23,400 957 1,624Canadian Pacific Railway Ltd. . . . . . . . . . . . . . . . . . . . . . . . . . . . . . . . . . . . . . . . . . . . . . . . . . . . . . . . . . . . . . . . . . . . . . . . . . . . . . . . . . . . . . . 4,100 375 792
1,332 2,416
Auto Components: 2.10%Magna International Inc. . . . . . . . . . . . . . . . . . . . . . . . . . . . . . . . . . . . . . . . . . . . . . . . . . . . . . . . . . . . . . . . . . . . . . . . . . . . . . . . . . . . . . . . . . 18,500 1,060 2,125
Capital Markets: 2.05%IGM Financial Inc. . . . . . . . . . . . . . . . . . . . . . . . . . . . . . . . . . . . . . . . . . . . . . . . . . . . . . . . . . . . . . . . . . . . . . . . . . . . . . . . . . . . . . . . . . . . . . . 28,300 1,460 1,446Tricon Capital Group Inc. . . . . . . . . . . . . . . . . . . . . . . . . . . . . . . . . . . . . . . . . . . . . . . . . . . . . . . . . . . . . . . . . . . . . . . . . . . . . . . . . . . . . . . . . . 80,200 645 631
2,105 2,077
Airlines: 2.00%Air Canada, B . . . . . . . . . . . . . . . . . . . . . . . . . . . . . . . . . . . . . . . . . . . . . . . . . . . . . . . . . . . . . . . . . . . . . . . . . . . . . . . . . . . . . . . . . . . . . . . . . 106,600 655 1,016WestJet Airlines Ltd. . . . . . . . . . . . . . . . . . . . . . . . . . . . . . . . . . . . . . . . . . . . . . . . . . . . . . . . . . . . . . . . . . . . . . . . . . . . . . . . . . . . . . . . . . . . . 38,500 923 1,009
1,578 2,025
Insurance: 1.97%Industrial Alliance Insurance and Financial Services Inc. . . . . . . . . . . . . . . . . . . . . . . . . . . . . . . . . . . . . . . . . . . . . . . . . . . . . . . . . . . . . . . . . . . 10,700 498 500Manulife Financial Corp. . . . . . . . . . . . . . . . . . . . . . . . . . . . . . . . . . . . . . . . . . . . . . . . . . . . . . . . . . . . . . . . . . . . . . . . . . . . . . . . . . . . . . . . . . 70,400 1,195 1,493
1,693 1,993
Real Estate Investment Trust (REIT): 1.71%Chartwell Retirement . . . . . . . . . . . . . . . . . . . . . . . . . . . . . . . . . . . . . . . . . . . . . . . . . . . . . . . . . . . . . . . . . . . . . . . . . . . . . . . . . . . . . . . . . . . . 79,600 884 863Dream Office Real Estate Investment Trust, A . . . . . . . . . . . . . . . . . . . . . . . . . . . . . . . . . . . . . . . . . . . . . . . . . . . . . . . . . . . . . . . . . . . . . . . . . . 29,800 868 873
1,752 1,736
Hotels, Restaurants & Leisure: 1.56%Amaya Gaming Group Inc. . . . . . . . . . . . . . . . . . . . . . . . . . . . . . . . . . . . . . . . . . . . . . . . . . . . . . . . . . . . . . . . . . . . . . . . . . . . . . . . . . . . . . . . . 45,800 284 1,058Tim Hortons Inc. . . . . . . . . . . . . . . . . . . . . . . . . . . . . . . . . . . . . . . . . . . . . . . . . . . . . . . . . . . . . . . . . . . . . . . . . . . . . . . . . . . . . . . . . . . . . . . . 8,900 473 520
757 1,578
Real Estate Management & Development: 1.53%Brookfield Asset Management Inc., A . . . . . . . . . . . . . . . . . . . . . . . . . . . . . . . . . . . . . . . . . . . . . . . . . . . . . . . . . . . . . . . . . . . . . . . . . . . . . . . . 22,400 924 1,053Dream Unlimited Corp., A . . . . . . . . . . . . . . . . . . . . . . . . . . . . . . . . . . . . . . . . . . . . . . . . . . . . . . . . . . . . . . . . . . . . . . . . . . . . . . . . . . . . . . . . 32,100 476 495
1,400 1,548Paper & Forest Products: 1.27%
Canfor Corp. . . . . . . . . . . . . . . . . . . . . . . . . . . . . . . . . . . . . . . . . . . . . . . . . . . . . . . . . . . . . . . . . . . . . . . . . . . . . . . . . . . . . . . . . . . . . . . . . . . 25,600 581 598West Fraser Timber Co. Ltd. . . . . . . . . . . . . . . . . . . . . . . . . . . . . . . . . . . . . . . . . . . . . . . . . . . . . . . . . . . . . . . . . . . . . . . . . . . . . . . . . . . . . . . . 13,400 630 693
1,211 1,291
Professional Services: 1.27%Stantec Inc. . . . . . . . . . . . . . . . . . . . . . . . . . . . . . . . . . . . . . . . . . . . . . . . . . . . . . . . . . . . . . . . . . . . . . . . . . . . . . . . . . . . . . . . . . . . . . . . . . . 19,500 1,292 1,289
The accompanying notes are an integral part of these financial statements.
322 Franklin Templeton Investments Funds
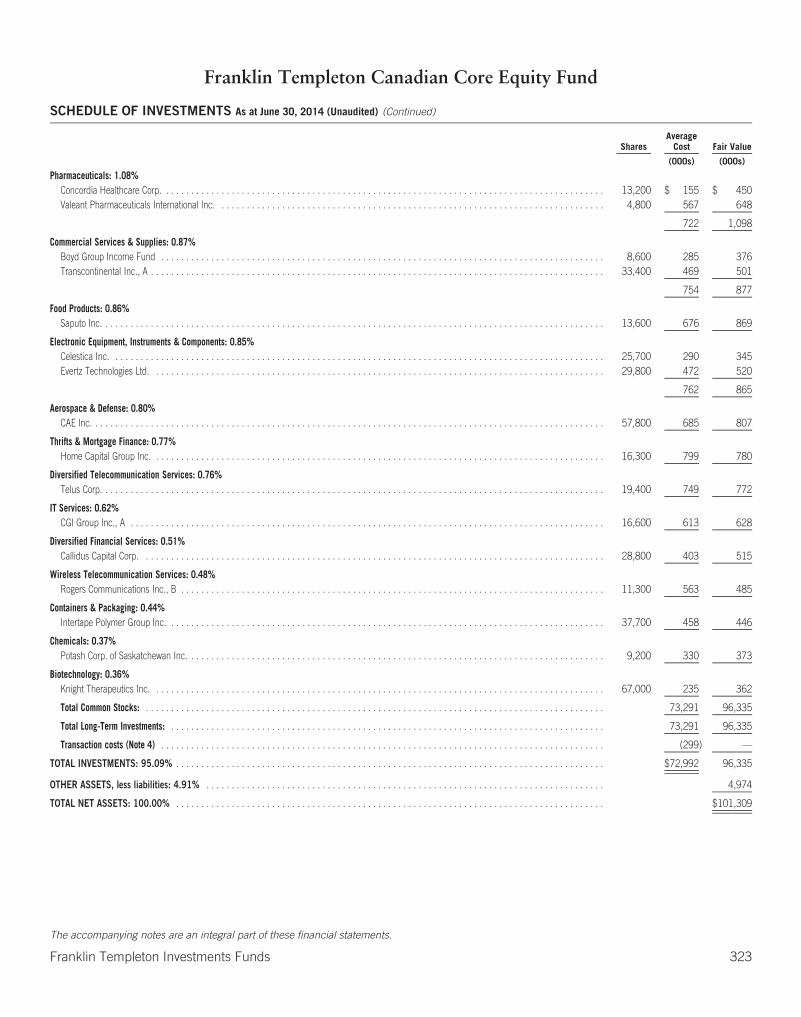
Franklin Templeton Canadian Core Equity Fund
SCHEDULE OF INVESTMENTS As at June 30, 2014 (Unaudited) (Continued)
SharesAverage
Cost Fair Value
(000s) (000s)
Pharmaceuticals: 1.08%Concordia Healthcare Corp. . . . . . . . . . . . . . . . . . . . . . . . . . . . . . . . . . . . . . . . . . . . . . . . . . . . . . . . . . . . . . . . . . . . . . . . . . . . . . . . . . . . . . . . 13,200 $ 155 $ 450Valeant Pharmaceuticals International Inc. . . . . . . . . . . . . . . . . . . . . . . . . . . . . . . . . . . . . . . . . . . . . . . . . . . . . . . . . . . . . . . . . . . . . . . . . . . . . 4,800 567 648
722 1,098
Commercial Services & Supplies: 0.87%Boyd Group Income Fund . . . . . . . . . . . . . . . . . . . . . . . . . . . . . . . . . . . . . . . . . . . . . . . . . . . . . . . . . . . . . . . . . . . . . . . . . . . . . . . . . . . . . . . . 8,600 285 376Transcontinental Inc., A . . . . . . . . . . . . . . . . . . . . . . . . . . . . . . . . . . . . . . . . . . . . . . . . . . . . . . . . . . . . . . . . . . . . . . . . . . . . . . . . . . . . . . . . . . 33,400 469 501
754 877
Food Products: 0.86%Saputo Inc. . . . . . . . . . . . . . . . . . . . . . . . . . . . . . . . . . . . . . . . . . . . . . . . . . . . . . . . . . . . . . . . . . . . . . . . . . . . . . . . . . . . . . . . . . . . . . . . . . . . 13,600 676 869
Electronic Equipment, Instruments & Components: 0.85%Celestica Inc. . . . . . . . . . . . . . . . . . . . . . . . . . . . . . . . . . . . . . . . . . . . . . . . . . . . . . . . . . . . . . . . . . . . . . . . . . . . . . . . . . . . . . . . . . . . . . . . . . 25,700 290 345Evertz Technologies Ltd. . . . . . . . . . . . . . . . . . . . . . . . . . . . . . . . . . . . . . . . . . . . . . . . . . . . . . . . . . . . . . . . . . . . . . . . . . . . . . . . . . . . . . . . . . 29,800 472 520
762 865
Aerospace & Defense: 0.80%CAE Inc. . . . . . . . . . . . . . . . . . . . . . . . . . . . . . . . . . . . . . . . . . . . . . . . . . . . . . . . . . . . . . . . . . . . . . . . . . . . . . . . . . . . . . . . . . . . . . . . . . . . . . 57,800 685 807
Thrifts & Mortgage Finance: 0.77%Home Capital Group Inc. . . . . . . . . . . . . . . . . . . . . . . . . . . . . . . . . . . . . . . . . . . . . . . . . . . . . . . . . . . . . . . . . . . . . . . . . . . . . . . . . . . . . . . . . . 16,300 799 780
Diversified Telecommunication Services: 0.76%Telus Corp. . . . . . . . . . . . . . . . . . . . . . . . . . . . . . . . . . . . . . . . . . . . . . . . . . . . . . . . . . . . . . . . . . . . . . . . . . . . . . . . . . . . . . . . . . . . . . . . . . . . 19,400 749 772
IT Services: 0.62%CGI Group Inc., A . . . . . . . . . . . . . . . . . . . . . . . . . . . . . . . . . . . . . . . . . . . . . . . . . . . . . . . . . . . . . . . . . . . . . . . . . . . . . . . . . . . . . . . . . . . . . . 16,600 613 628
Diversified Financial Services: 0.51%Callidus Capital Corp. . . . . . . . . . . . . . . . . . . . . . . . . . . . . . . . . . . . . . . . . . . . . . . . . . . . . . . . . . . . . . . . . . . . . . . . . . . . . . . . . . . . . . . . . . . . 28,800 403 515
Wireless Telecommunication Services: 0.48%Rogers Communications Inc., B . . . . . . . . . . . . . . . . . . . . . . . . . . . . . . . . . . . . . . . . . . . . . . . . . . . . . . . . . . . . . . . . . . . . . . . . . . . . . . . . . . . . 11,300 563 485
Containers & Packaging: 0.44%Intertape Polymer Group Inc. . . . . . . . . . . . . . . . . . . . . . . . . . . . . . . . . . . . . . . . . . . . . . . . . . . . . . . . . . . . . . . . . . . . . . . . . . . . . . . . . . . . . . . 37,700 458 446
Chemicals: 0.37%Potash Corp. of Saskatchewan Inc. . . . . . . . . . . . . . . . . . . . . . . . . . . . . . . . . . . . . . . . . . . . . . . . . . . . . . . . . . . . . . . . . . . . . . . . . . . . . . . . . . . 9,200 330 373
Biotechnology: 0.36%Knight Therapeutics Inc. . . . . . . . . . . . . . . . . . . . . . . . . . . . . . . . . . . . . . . . . . . . . . . . . . . . . . . . . . . . . . . . . . . . . . . . . . . . . . . . . . . . . . . . . . 67,000 235 362
Total Common Stocks: . . . . . . . . . . . . . . . . . . . . . . . . . . . . . . . . . . . . . . . . . . . . . . . . . . . . . . . . . . . . . . . . . . . . . . . . . . . . . . . . . . . . . . . . . . . 73,291 96,335
Total Long-Term Investments: . . . . . . . . . . . . . . . . . . . . . . . . . . . . . . . . . . . . . . . . . . . . . . . . . . . . . . . . . . . . . . . . . . . . . . . . . . . . . . . . . . . . . . 73,291 96,335
Transaction costs (Note 4) . . . . . . . . . . . . . . . . . . . . . . . . . . . . . . . . . . . . . . . . . . . . . . . . . . . . . . . . . . . . . . . . . . . . . . . . . . . . . . . . . . . . . . . . (299) —
TOTAL INVESTMENTS: 95.09% . . . . . . . . . . . . . . . . . . . . . . . . . . . . . . . . . . . . . . . . . . . . . . . . . . . . . . . . . . . . . . . . . . . . . . . . . . . . . . . . . . . . . $72,992 96,335
OTHER ASSETS, less liabilities: 4.91% . . . . . . . . . . . . . . . . . . . . . . . . . . . . . . . . . . . . . . . . . . . . . . . . . . . . . . . . . . . . . . . . . . . . . . . . . . . . . . . 4,974
TOTAL NET ASSETS: 100.00% . . . . . . . . . . . . . . . . . . . . . . . . . . . . . . . . . . . . . . . . . . . . . . . . . . . . . . . . . . . . . . . . . . . . . . . . . . . . . . . . . . . . . $101,309
The accompanying notes are an integral part of these financial statements.
Franklin Templeton Investments Funds 323
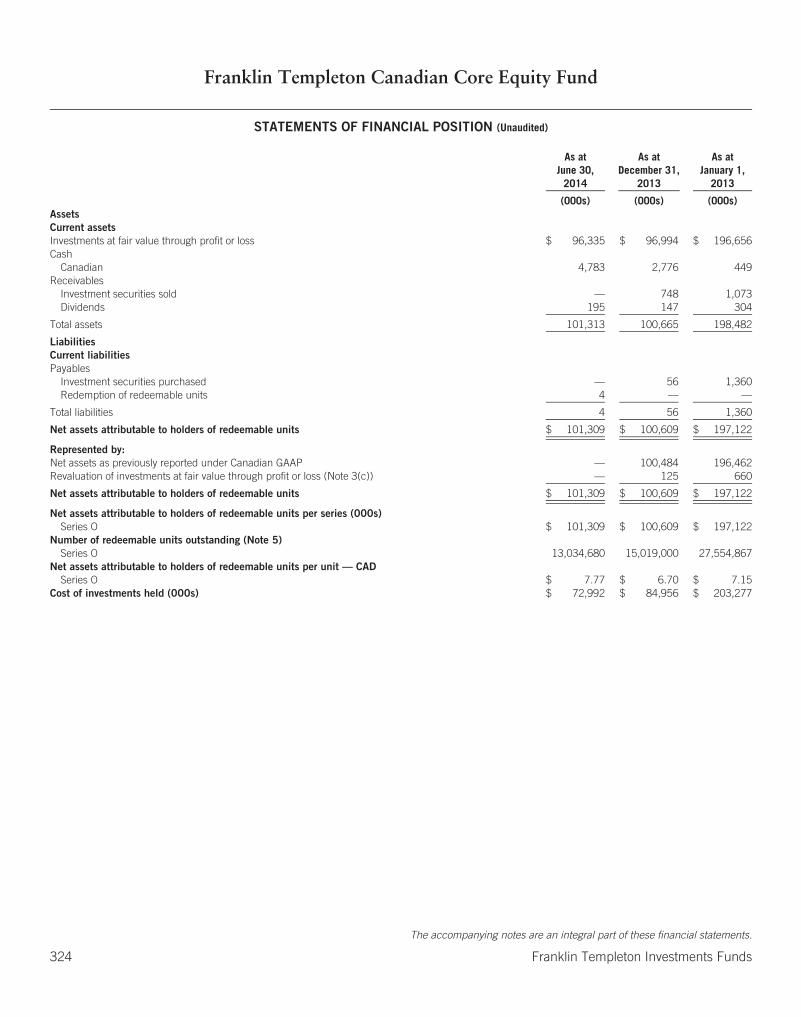
Franklin Templeton Canadian Core Equity Fund
STATEMENTS OF FINANCIAL POSITION (Unaudited)
As atJune 30,
2014
As atDecember 31,
2013
As atJanuary 1,
2013
(000s) (000s) (000s)AssetsCurrent assetsInvestments at fair value through profit or loss $ 96,335 $ 96,994 $ 196,656Cash
Canadian 4,783 2,776 449Receivables
Investment securities sold — 748 1,073Dividends 195 147 304
Total assets 101,313 100,665 198,482
LiabilitiesCurrent liabilitiesPayables
Investment securities purchased — 56 1,360Redemption of redeemable units 4 — —
Total liabilities 4 56 1,360
Net assets attributable to holders of redeemable units $ 101,309 $ 100,609 $ 197,122
Represented by:Net assets as previously reported under Canadian GAAP — 100,484 196,462Revaluation of investments at fair value through profit or loss (Note 3(c)) — 125 660
Net assets attributable to holders of redeemable units $ 101,309 $ 100,609 $ 197,122
Net assets attributable to holders of redeemable units per series (000s)Series O $ 101,309 $ 100,609 $ 197,122
Number of redeemable units outstanding (Note 5)Series O 13,034,680 15,019,000 27,554,867
Net assets attributable to holders of redeemable units per unit — CADSeries O $ 7.77 $ 6.70 $ 7.15
Cost of investments held (000s) $ 72,992 $ 84,956 $ 203,277
The accompanying notes are an integral part of these financial statements.
324 Franklin Templeton Investments Funds
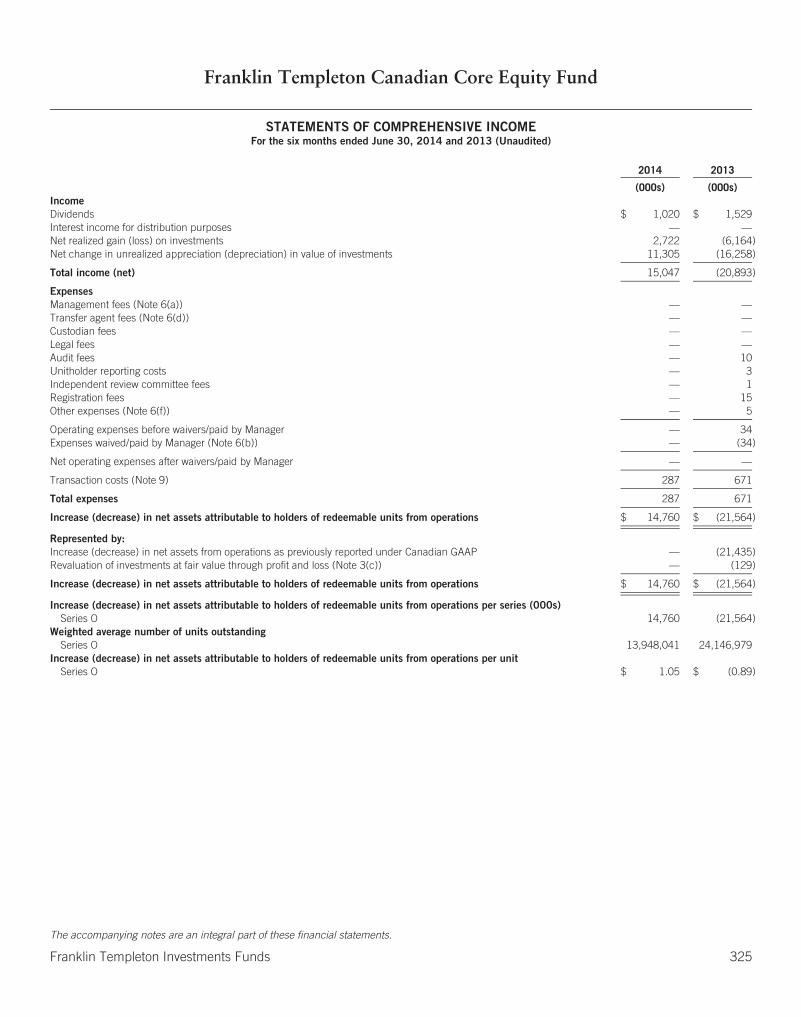
Franklin Templeton Canadian Core Equity Fund
STATEMENTS OF COMPREHENSIVE INCOMEFor the six months ended June 30, 2014 and 2013 (Unaudited)
2014 2013
(000s) (000s)IncomeDividends $ 1,020 $ 1,529Interest income for distribution purposes — —Net realized gain (loss) on investments 2,722 (6,164)Net change in unrealized appreciation (depreciation) in value of investments 11,305 (16,258)
Total income (net) 15,047 (20,893)
ExpensesManagement fees (Note 6(a)) — —Transfer agent fees (Note 6(d)) — —Custodian fees — —Legal fees — —Audit fees — 10Unitholder reporting costs — 3Independent review committee fees — 1Registration fees — 15Other expenses (Note 6(f)) — 5
Operating expenses before waivers/paid by Manager — 34Expenses waived/paid by Manager (Note 6(b)) — (34)
Net operating expenses after waivers/paid by Manager — —
Transaction costs (Note 9) 287 671
Total expenses 287 671
Increase (decrease) in net assets attributable to holders of redeemable units from operations $ 14,760 $ (21,564)
Represented by:Increase (decrease) in net assets from operations as previously reported under Canadian GAAP — (21,435)Revaluation of investments at fair value through profit and loss (Note 3(c)) — (129)
Increase (decrease) in net assets attributable to holders of redeemable units from operations $ 14,760 $ (21,564)
Increase (decrease) in net assets attributable to holders of redeemable units from operations per series (000s)Series O 14,760 (21,564)
Weighted average number of units outstandingSeries O 13,948,041 24,146,979
Increase (decrease) in net assets attributable to holders of redeemable units from operations per unitSeries O $ 1.05 $ (0.89)
The accompanying notes are an integral part of these financial statements.
Franklin Templeton Investments Funds 325

Franklin Templeton Canadian Core Equity Fund
STATEMENTS OF CHANGES IN NET ASSETS ATTRIBUTABLE TO HOLDERS OF REDEEMABLE UNITSFor the six months ended June 30, 2014 and 2013 (Unaudited) (in 000s)
Series O
2014 2013
Net assets attributable to holders of redeemable units at beginning of period $100,609 $197,122
Increase (decrease) in net assets attributable to holders of redeemable unitsfrom operations 14,760 (21,564)
Distributions to holders of redeemable unitsFrom net investment income — —From net realized gains on investments — —From return of capital — —
Total distributions to holders of redeemable units — —
Redeemable units transactionsSubscriptions 2,512 15,081Reinvestments — —Redemptions (16,572) (65,119)
Net increase (decrease) from redeemable units transactions (14,060) (50,038)
Increase (decrease) in net assets attributable to holders of redeemable units 700 (71,602)
Net assets attributable to holders of redeemable units at end of period $101,309 $125,520
The accompanying notes are an integral part of these financial statements.
326 Franklin Templeton Investments Funds
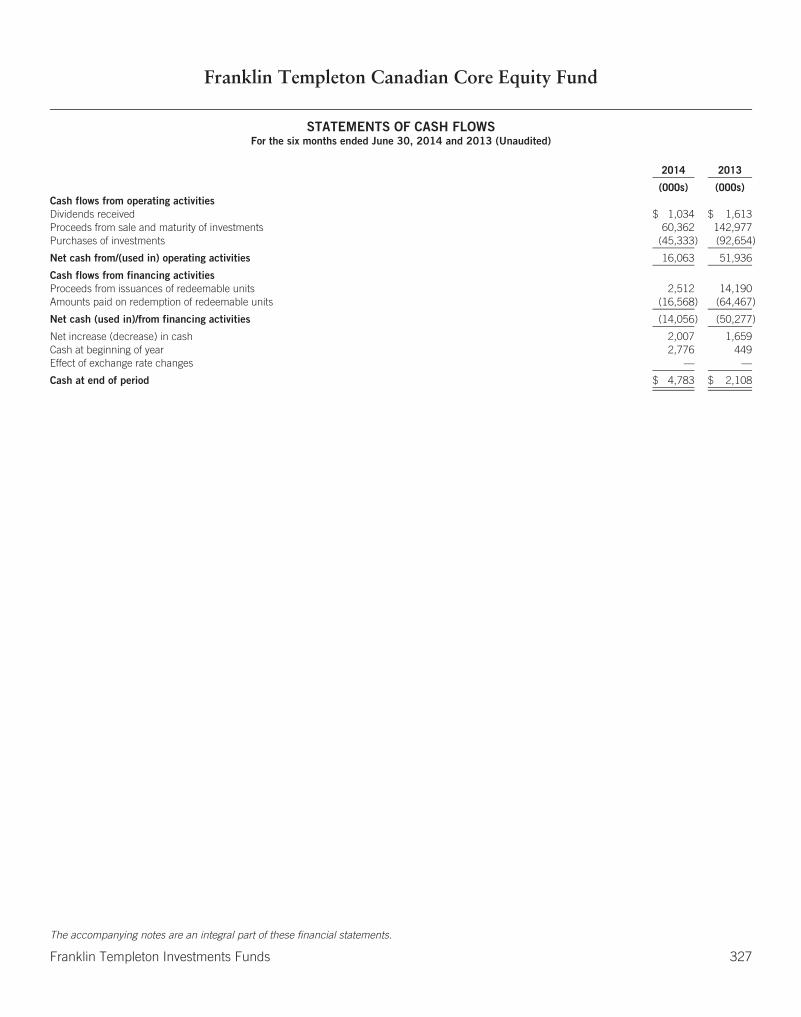
Franklin Templeton Canadian Core Equity Fund
STATEMENTS OF CASH FLOWSFor the six months ended June 30, 2014 and 2013 (Unaudited)
2014 2013
(000s) (000s)Cash flows from operating activitiesDividends received $ 1,034 $ 1,613Proceeds from sale and maturity of investments 60,362 142,977Purchases of investments (45,333) (92,654)
Net cash from/(used in) operating activities 16,063 51,936
Cash flows from financing activitiesProceeds from issuances of redeemable units 2,512 14,190Amounts paid on redemption of redeemable units (16,568) (64,467)
Net cash (used in)/from financing activities (14,056) (50,277)
Net increase (decrease) in cash 2,007 1,659Cash at beginning of year 2,776 449Effect of exchange rate changes — —
Cash at end of period $ 4,783 $ 2,108
The accompanying notes are an integral part of these financial statements.
Franklin Templeton Investments Funds 327
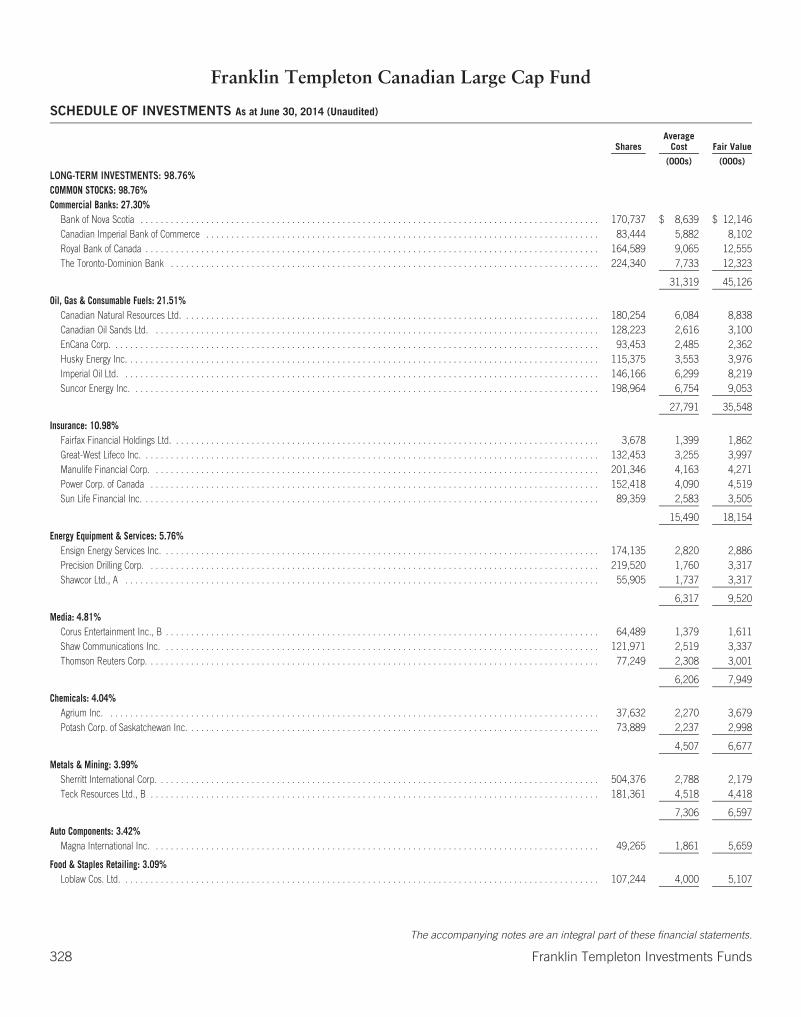
Franklin Templeton Canadian Large Cap Fund
SCHEDULE OF INVESTMENTS As at June 30, 2014 (Unaudited)
SharesAverage
Cost Fair Value
(000s) (000s)
LONG-TERM INVESTMENTS: 98.76%COMMON STOCKS: 98.76%Commercial Banks: 27.30%
Bank of Nova Scotia . . . . . . . . . . . . . . . . . . . . . . . . . . . . . . . . . . . . . . . . . . . . . . . . . . . . . . . . . . . . . . . . . . . . . . . . . . . . . . . . . . . . . . . . . . . 170,737 $ 8,639 $ 12,146Canadian Imperial Bank of Commerce . . . . . . . . . . . . . . . . . . . . . . . . . . . . . . . . . . . . . . . . . . . . . . . . . . . . . . . . . . . . . . . . . . . . . . . . . . . . . . 83,444 5,882 8,102Royal Bank of Canada . . . . . . . . . . . . . . . . . . . . . . . . . . . . . . . . . . . . . . . . . . . . . . . . . . . . . . . . . . . . . . . . . . . . . . . . . . . . . . . . . . . . . . . . . . 164,589 9,065 12,555The Toronto-Dominion Bank . . . . . . . . . . . . . . . . . . . . . . . . . . . . . . . . . . . . . . . . . . . . . . . . . . . . . . . . . . . . . . . . . . . . . . . . . . . . . . . . . . . . . 224,340 7,733 12,323
31,319 45,126
Oil, Gas & Consumable Fuels: 21.51%Canadian Natural Resources Ltd. . . . . . . . . . . . . . . . . . . . . . . . . . . . . . . . . . . . . . . . . . . . . . . . . . . . . . . . . . . . . . . . . . . . . . . . . . . . . . . . . . . 180,254 6,084 8,838Canadian Oil Sands Ltd. . . . . . . . . . . . . . . . . . . . . . . . . . . . . . . . . . . . . . . . . . . . . . . . . . . . . . . . . . . . . . . . . . . . . . . . . . . . . . . . . . . . . . . . . 128,223 2,616 3,100EnCana Corp. . . . . . . . . . . . . . . . . . . . . . . . . . . . . . . . . . . . . . . . . . . . . . . . . . . . . . . . . . . . . . . . . . . . . . . . . . . . . . . . . . . . . . . . . . . . . . . . . 93,453 2,485 2,362Husky Energy Inc. . . . . . . . . . . . . . . . . . . . . . . . . . . . . . . . . . . . . . . . . . . . . . . . . . . . . . . . . . . . . . . . . . . . . . . . . . . . . . . . . . . . . . . . . . . . . . 115,375 3,553 3,976Imperial Oil Ltd. . . . . . . . . . . . . . . . . . . . . . . . . . . . . . . . . . . . . . . . . . . . . . . . . . . . . . . . . . . . . . . . . . . . . . . . . . . . . . . . . . . . . . . . . . . . . . . 146,166 6,299 8,219Suncor Energy Inc. . . . . . . . . . . . . . . . . . . . . . . . . . . . . . . . . . . . . . . . . . . . . . . . . . . . . . . . . . . . . . . . . . . . . . . . . . . . . . . . . . . . . . . . . . . . . 198,964 6,754 9,053
27,791 35,548
Insurance: 10.98%Fairfax Financial Holdings Ltd. . . . . . . . . . . . . . . . . . . . . . . . . . . . . . . . . . . . . . . . . . . . . . . . . . . . . . . . . . . . . . . . . . . . . . . . . . . . . . . . . . . . . 3,678 1,399 1,862Great-West Lifeco Inc. . . . . . . . . . . . . . . . . . . . . . . . . . . . . . . . . . . . . . . . . . . . . . . . . . . . . . . . . . . . . . . . . . . . . . . . . . . . . . . . . . . . . . . . . . . 132,453 3,255 3,997Manulife Financial Corp. . . . . . . . . . . . . . . . . . . . . . . . . . . . . . . . . . . . . . . . . . . . . . . . . . . . . . . . . . . . . . . . . . . . . . . . . . . . . . . . . . . . . . . . . 201,346 4,163 4,271Power Corp. of Canada . . . . . . . . . . . . . . . . . . . . . . . . . . . . . . . . . . . . . . . . . . . . . . . . . . . . . . . . . . . . . . . . . . . . . . . . . . . . . . . . . . . . . . . . . 152,418 4,090 4,519Sun Life Financial Inc. . . . . . . . . . . . . . . . . . . . . . . . . . . . . . . . . . . . . . . . . . . . . . . . . . . . . . . . . . . . . . . . . . . . . . . . . . . . . . . . . . . . . . . . . . . 89,359 2,583 3,505
15,490 18,154
Energy Equipment & Services: 5.76%Ensign Energy Services Inc. . . . . . . . . . . . . . . . . . . . . . . . . . . . . . . . . . . . . . . . . . . . . . . . . . . . . . . . . . . . . . . . . . . . . . . . . . . . . . . . . . . . . . . 174,135 2,820 2,886Precision Drilling Corp. . . . . . . . . . . . . . . . . . . . . . . . . . . . . . . . . . . . . . . . . . . . . . . . . . . . . . . . . . . . . . . . . . . . . . . . . . . . . . . . . . . . . . . . . . 219,520 1,760 3,317Shawcor Ltd., A . . . . . . . . . . . . . . . . . . . . . . . . . . . . . . . . . . . . . . . . . . . . . . . . . . . . . . . . . . . . . . . . . . . . . . . . . . . . . . . . . . . . . . . . . . . . . . 55,905 1,737 3,317
6,317 9,520
Media: 4.81%Corus Entertainment Inc., B . . . . . . . . . . . . . . . . . . . . . . . . . . . . . . . . . . . . . . . . . . . . . . . . . . . . . . . . . . . . . . . . . . . . . . . . . . . . . . . . . . . . . . 64,489 1,379 1,611Shaw Communications Inc. . . . . . . . . . . . . . . . . . . . . . . . . . . . . . . . . . . . . . . . . . . . . . . . . . . . . . . . . . . . . . . . . . . . . . . . . . . . . . . . . . . . . . . 121,971 2,519 3,337Thomson Reuters Corp. . . . . . . . . . . . . . . . . . . . . . . . . . . . . . . . . . . . . . . . . . . . . . . . . . . . . . . . . . . . . . . . . . . . . . . . . . . . . . . . . . . . . . . . . . 77,249 2,308 3,001
6,206 7,949
Chemicals: 4.04%Agrium Inc. . . . . . . . . . . . . . . . . . . . . . . . . . . . . . . . . . . . . . . . . . . . . . . . . . . . . . . . . . . . . . . . . . . . . . . . . . . . . . . . . . . . . . . . . . . . . . . . . . 37,632 2,270 3,679Potash Corp. of Saskatchewan Inc. . . . . . . . . . . . . . . . . . . . . . . . . . . . . . . . . . . . . . . . . . . . . . . . . . . . . . . . . . . . . . . . . . . . . . . . . . . . . . . . . . 73,889 2,237 2,998
4,507 6,677
Metals & Mining: 3.99%Sherritt International Corp. . . . . . . . . . . . . . . . . . . . . . . . . . . . . . . . . . . . . . . . . . . . . . . . . . . . . . . . . . . . . . . . . . . . . . . . . . . . . . . . . . . . . . . . 504,376 2,788 2,179Teck Resources Ltd., B . . . . . . . . . . . . . . . . . . . . . . . . . . . . . . . . . . . . . . . . . . . . . . . . . . . . . . . . . . . . . . . . . . . . . . . . . . . . . . . . . . . . . . . . . 181,361 4,518 4,418
7,306 6,597
Auto Components: 3.42%Magna International Inc. . . . . . . . . . . . . . . . . . . . . . . . . . . . . . . . . . . . . . . . . . . . . . . . . . . . . . . . . . . . . . . . . . . . . . . . . . . . . . . . . . . . . . . . . 49,265 1,861 5,659
Food & Staples Retailing: 3.09%Loblaw Cos. Ltd. . . . . . . . . . . . . . . . . . . . . . . . . . . . . . . . . . . . . . . . . . . . . . . . . . . . . . . . . . . . . . . . . . . . . . . . . . . . . . . . . . . . . . . . . . . . . . . 107,244 4,000 5,107
The accompanying notes are an integral part of these financial statements.
328 Franklin Templeton Investments Funds
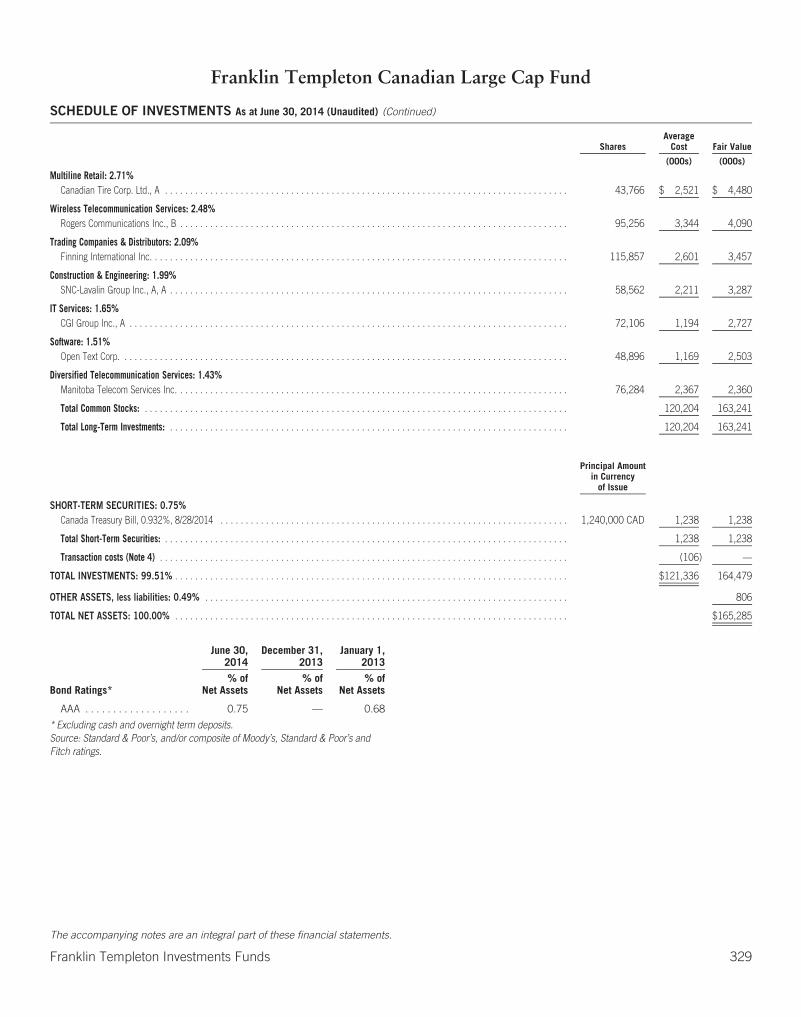
Franklin Templeton Canadian Large Cap Fund
SCHEDULE OF INVESTMENTS As at June 30, 2014 (Unaudited) (Continued)
SharesAverage
Cost Fair Value
(000s) (000s)
Multiline Retail: 2.71%Canadian Tire Corp. Ltd., A . . . . . . . . . . . . . . . . . . . . . . . . . . . . . . . . . . . . . . . . . . . . . . . . . . . . . . . . . . . . . . . . . . . . . . . . . . . . . . . . 43,766 $ 2,521 $ 4,480
Wireless Telecommunication Services: 2.48%Rogers Communications Inc., B . . . . . . . . . . . . . . . . . . . . . . . . . . . . . . . . . . . . . . . . . . . . . . . . . . . . . . . . . . . . . . . . . . . . . . . . . . . . . 95,256 3,344 4,090
Trading Companies & Distributors: 2.09%Finning International Inc. . . . . . . . . . . . . . . . . . . . . . . . . . . . . . . . . . . . . . . . . . . . . . . . . . . . . . . . . . . . . . . . . . . . . . . . . . . . . . . . . . . 115,857 2,601 3,457
Construction & Engineering: 1.99%SNC-Lavalin Group Inc., A, A . . . . . . . . . . . . . . . . . . . . . . . . . . . . . . . . . . . . . . . . . . . . . . . . . . . . . . . . . . . . . . . . . . . . . . . . . . . . . . . 58,562 2,211 3,287
IT Services: 1.65%CGI Group Inc., A . . . . . . . . . . . . . . . . . . . . . . . . . . . . . . . . . . . . . . . . . . . . . . . . . . . . . . . . . . . . . . . . . . . . . . . . . . . . . . . . . . . . . . . 72,106 1,194 2,727
Software: 1.51%Open Text Corp. . . . . . . . . . . . . . . . . . . . . . . . . . . . . . . . . . . . . . . . . . . . . . . . . . . . . . . . . . . . . . . . . . . . . . . . . . . . . . . . . . . . . . . . . 48,896 1,169 2,503
Diversified Telecommunication Services: 1.43%Manitoba Telecom Services Inc. . . . . . . . . . . . . . . . . . . . . . . . . . . . . . . . . . . . . . . . . . . . . . . . . . . . . . . . . . . . . . . . . . . . . . . . . . . . . . 76,284 2,367 2,360
Total Common Stocks: . . . . . . . . . . . . . . . . . . . . . . . . . . . . . . . . . . . . . . . . . . . . . . . . . . . . . . . . . . . . . . . . . . . . . . . . . . . . . . . . . . . . 120,204 163,241
Total Long-Term Investments: . . . . . . . . . . . . . . . . . . . . . . . . . . . . . . . . . . . . . . . . . . . . . . . . . . . . . . . . . . . . . . . . . . . . . . . . . . . . . . . 120,204 163,241
Principal Amountin Currency
of Issue
SHORT-TERM SECURITIES: 0.75%Canada Treasury Bill, 0.932%, 8/28/2014 . . . . . . . . . . . . . . . . . . . . . . . . . . . . . . . . . . . . . . . . . . . . . . . . . . . . . . . . . . . . . . . . . . . . . 1,240,000 CAD 1,238 1,238
Total Short-Term Securities: . . . . . . . . . . . . . . . . . . . . . . . . . . . . . . . . . . . . . . . . . . . . . . . . . . . . . . . . . . . . . . . . . . . . . . . . . . . . . . . . 1,238 1,238
Transaction costs (Note 4) . . . . . . . . . . . . . . . . . . . . . . . . . . . . . . . . . . . . . . . . . . . . . . . . . . . . . . . . . . . . . . . . . . . . . . . . . . . . . . . . . (106) —
TOTAL INVESTMENTS: 99.51% . . . . . . . . . . . . . . . . . . . . . . . . . . . . . . . . . . . . . . . . . . . . . . . . . . . . . . . . . . . . . . . . . . . . . . . . . . . . . . $121,336 164,479
OTHER ASSETS, less liabilities: 0.49% . . . . . . . . . . . . . . . . . . . . . . . . . . . . . . . . . . . . . . . . . . . . . . . . . . . . . . . . . . . . . . . . . . . . . . . . 806
TOTAL NET ASSETS: 100.00% . . . . . . . . . . . . . . . . . . . . . . . . . . . . . . . . . . . . . . . . . . . . . . . . . . . . . . . . . . . . . . . . . . . . . . . . . . . . . . $165,285
June 30,2014
December 31,2013
January 1,2013
Bond Ratings*% of
Net Assets% of
Net Assets% of
Net Assets
AAA . . . . . . . . . . . . . . . . . . . 0.75 — 0.68
* Excluding cash and overnight term deposits.Source: Standard & Poor’s, and/or composite of Moody’s, Standard & Poor’s andFitch ratings.
The accompanying notes are an integral part of these financial statements.
Franklin Templeton Investments Funds 329
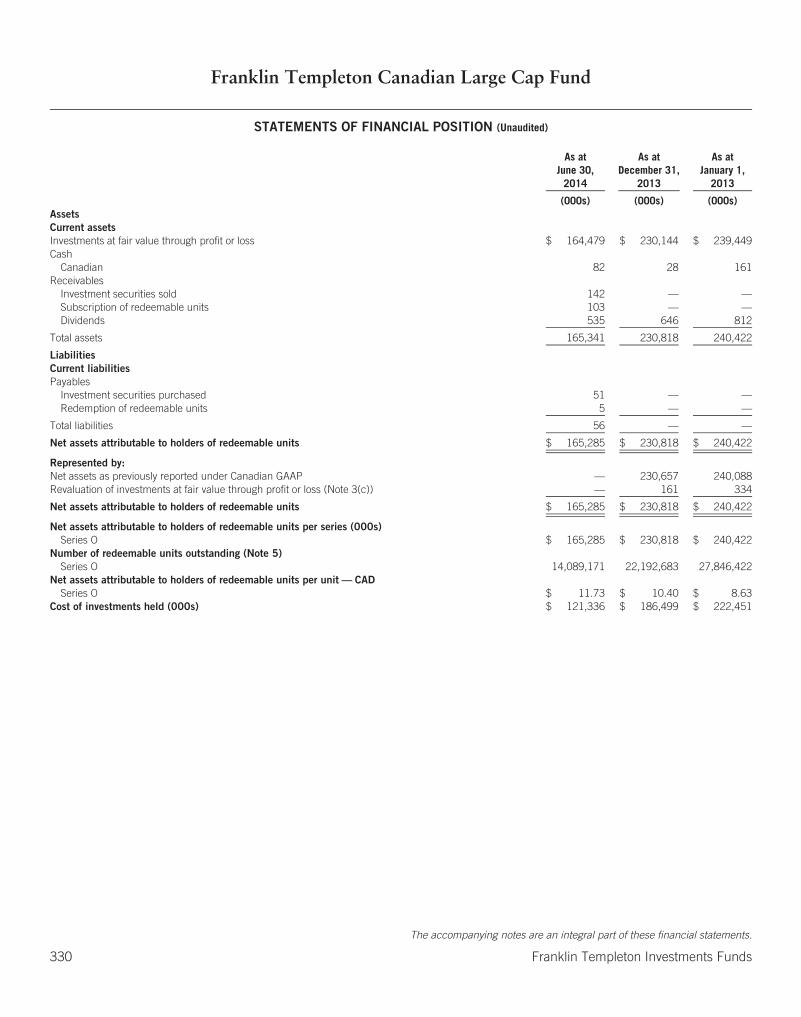
Franklin Templeton Canadian Large Cap Fund
STATEMENTS OF FINANCIAL POSITION (Unaudited)
As atJune 30,
2014
As atDecember 31,
2013
As atJanuary 1,
2013
(000s) (000s) (000s)AssetsCurrent assetsInvestments at fair value through profit or loss $ 164,479 $ 230,144 $ 239,449Cash
Canadian 82 28 161Receivables
Investment securities sold 142 — —Subscription of redeemable units 103 — —Dividends 535 646 812
Total assets 165,341 230,818 240,422
LiabilitiesCurrent liabilitiesPayables
Investment securities purchased 51 — —Redemption of redeemable units 5 — —
Total liabilities 56 — —
Net assets attributable to holders of redeemable units $ 165,285 $ 230,818 $ 240,422
Represented by:Net assets as previously reported under Canadian GAAP — 230,657 240,088Revaluation of investments at fair value through profit or loss (Note 3(c)) — 161 334
Net assets attributable to holders of redeemable units $ 165,285 $ 230,818 $ 240,422
Net assets attributable to holders of redeemable units per series (000s)Series O $ 165,285 $ 230,818 $ 240,422
Number of redeemable units outstanding (Note 5)Series O 14,089,171 22,192,683 27,846,422
Net assets attributable to holders of redeemable units per unit — CADSeries O $ 11.73 $ 10.40 $ 8.63
Cost of investments held (000s) $ 121,336 $ 186,499 $ 222,451
The accompanying notes are an integral part of these financial statements.
330 Franklin Templeton Investments Funds
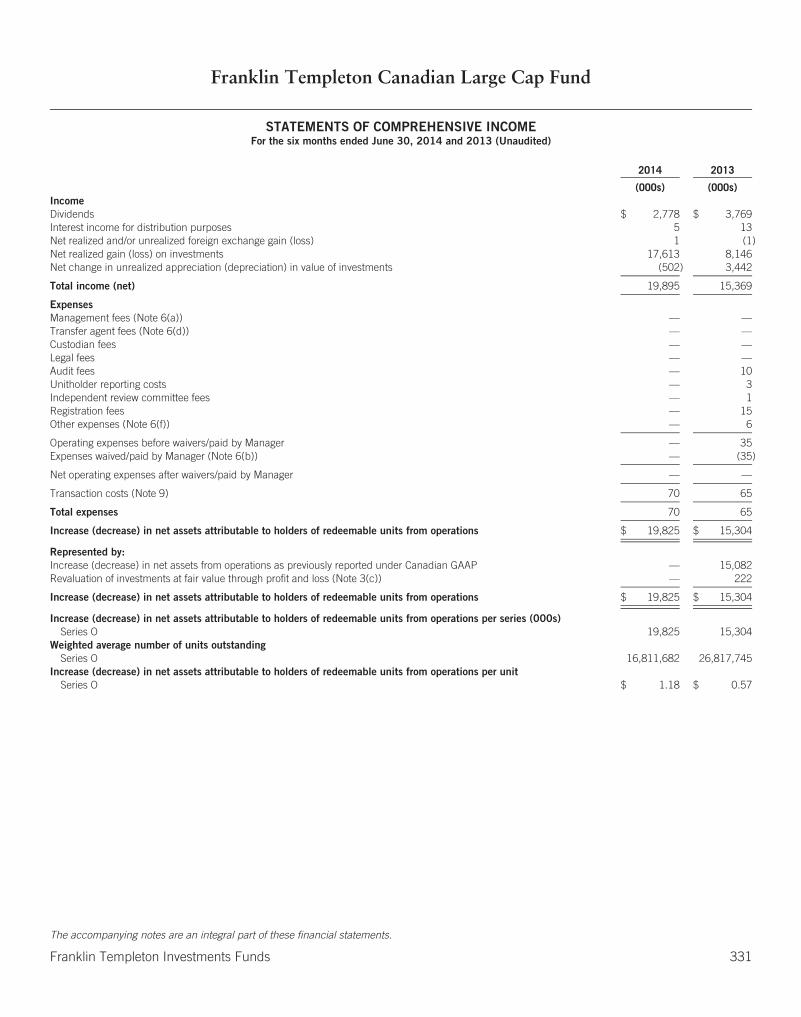
Franklin Templeton Canadian Large Cap Fund
STATEMENTS OF COMPREHENSIVE INCOMEFor the six months ended June 30, 2014 and 2013 (Unaudited)
2014 2013
(000s) (000s)IncomeDividends $ 2,778 $ 3,769Interest income for distribution purposes 5 13Net realized and/or unrealized foreign exchange gain (loss) 1 (1)Net realized gain (loss) on investments 17,613 8,146Net change in unrealized appreciation (depreciation) in value of investments (502) 3,442
Total income (net) 19,895 15,369
ExpensesManagement fees (Note 6(a)) — —Transfer agent fees (Note 6(d)) — —Custodian fees — —Legal fees — —Audit fees — 10Unitholder reporting costs — 3Independent review committee fees — 1Registration fees — 15Other expenses (Note 6(f)) — 6
Operating expenses before waivers/paid by Manager — 35Expenses waived/paid by Manager (Note 6(b)) — (35)
Net operating expenses after waivers/paid by Manager — —
Transaction costs (Note 9) 70 65
Total expenses 70 65
Increase (decrease) in net assets attributable to holders of redeemable units from operations $ 19,825 $ 15,304
Represented by:Increase (decrease) in net assets from operations as previously reported under Canadian GAAP — 15,082Revaluation of investments at fair value through profit and loss (Note 3(c)) — 222
Increase (decrease) in net assets attributable to holders of redeemable units from operations $ 19,825 $ 15,304
Increase (decrease) in net assets attributable to holders of redeemable units from operations per series (000s)Series O 19,825 15,304
Weighted average number of units outstandingSeries O 16,811,682 26,817,745
Increase (decrease) in net assets attributable to holders of redeemable units from operations per unitSeries O $ 1.18 $ 0.57
The accompanying notes are an integral part of these financial statements.
Franklin Templeton Investments Funds 331

Franklin Templeton Canadian Large Cap Fund
STATEMENTS OF CHANGES IN NET ASSETS ATTRIBUTABLE TO HOLDERS OF REDEEMABLE UNITSFor the six months ended June 30, 2014 and 2013 (Unaudited) (in 000s)
Series O
2014 2013
Net assets attributable to holders of redeemable units at beginning of period $230,818 $240,422
Increase (decrease) in net assets attributable to holders of redeemable unitsfrom operations 19,825 15,304
Distributions to holders of redeemable unitsFrom net investment income — —From net realized gains on investments — —From return of capital — —
Total distributions to holders of redeemable units — —
Redeemable units transactionsSubscriptions 2,487 31,305Reinvestments — —Redemptions (87,845) (47,731)
Net increase (decrease) from redeemable units transactions (85,358) (16,426)
Increase (decrease) in net assets attributable to holders of redeemable units (65,533) (1,122)
Net assets attributable to holders of redeemable units at end of period $165,285 $239,300
The accompanying notes are an integral part of these financial statements.
332 Franklin Templeton Investments Funds
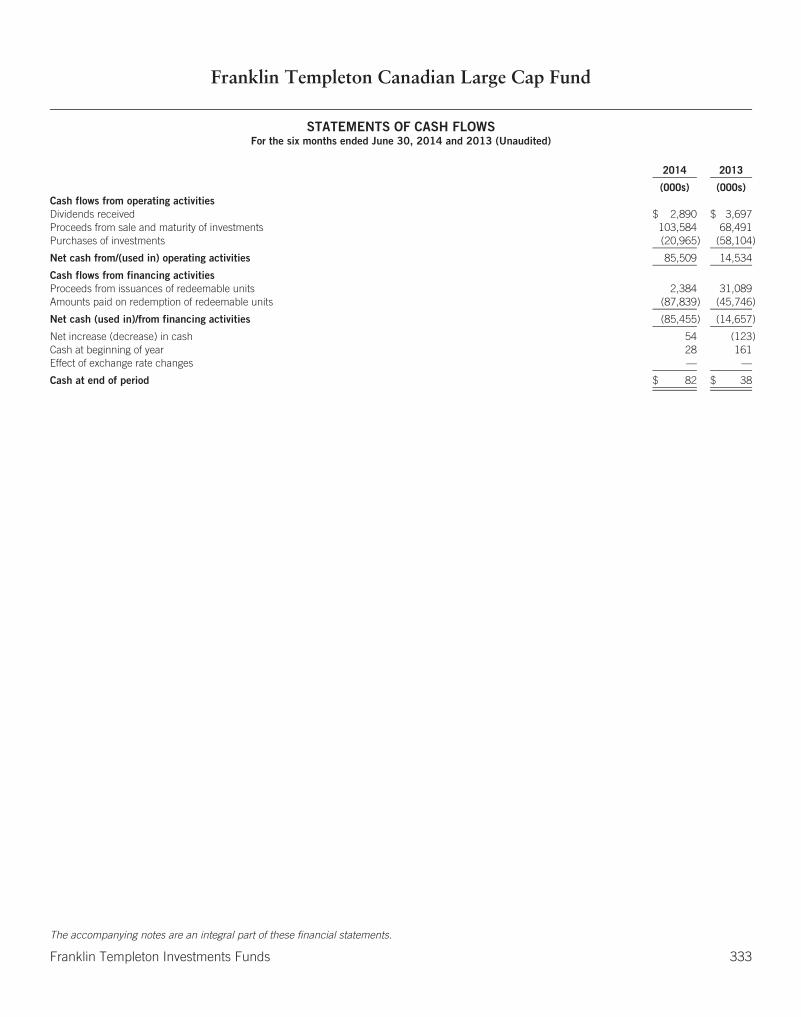
Franklin Templeton Canadian Large Cap Fund
STATEMENTS OF CASH FLOWSFor the six months ended June 30, 2014 and 2013 (Unaudited)
2014 2013
(000s) (000s)Cash flows from operating activitiesDividends received $ 2,890 $ 3,697Proceeds from sale and maturity of investments 103,584 68,491Purchases of investments (20,965) (58,104)
Net cash from/(used in) operating activities 85,509 14,534
Cash flows from financing activitiesProceeds from issuances of redeemable units 2,384 31,089Amounts paid on redemption of redeemable units (87,839) (45,746)
Net cash (used in)/from financing activities (85,455) (14,657)
Net increase (decrease) in cash 54 (123)Cash at beginning of year 28 161Effect of exchange rate changes — —
Cash at end of period $ 82 $ 38
The accompanying notes are an integral part of these financial statements.
Franklin Templeton Investments Funds 333
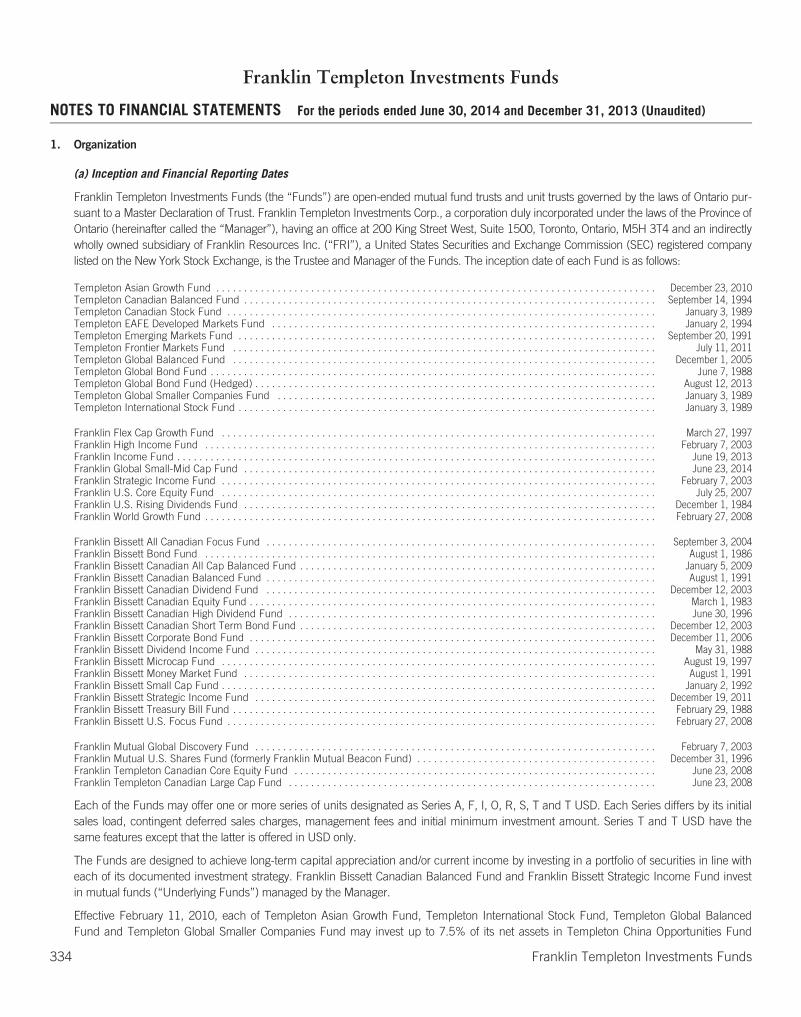
Franklin Templeton Investments Funds
NOTES TO FINANCIAL STATEMENTS For the periods ended June 30, 2014 and December 31, 2013 (Unaudited)
1. Organization
(a) Inception and Financial Reporting Dates
Franklin Templeton Investments Funds (the “Funds”) are open-ended mutual fund trusts and unit trusts governed by the laws of Ontario pur-suant to a Master Declaration of Trust. Franklin Templeton Investments Corp., a corporation duly incorporated under the laws of the Province ofOntario (hereinafter called the “Manager”), having an office at 200 King Street West, Suite 1500, Toronto, Ontario, M5H 3T4 and an indirectlywholly owned subsidiary of Franklin Resources Inc. (“FRI”), a United States Securities and Exchange Commission (SEC) registered companylisted on the New York Stock Exchange, is the Trustee and Manager of the Funds. The inception date of each Fund is as follows:
Templeton Asian Growth Fund . . . . . . . . . . . . . . . . . . . . . . . . . . . . . . . . . . . . . . . . . . . . . . . . . . . . . . . . . . . . . . . . . . . . . . . . . . . . . . . December 23, 2010Templeton Canadian Balanced Fund . . . . . . . . . . . . . . . . . . . . . . . . . . . . . . . . . . . . . . . . . . . . . . . . . . . . . . . . . . . . . . . . . . . . . . . . . . September 14, 1994Templeton Canadian Stock Fund . . . . . . . . . . . . . . . . . . . . . . . . . . . . . . . . . . . . . . . . . . . . . . . . . . . . . . . . . . . . . . . . . . . . . . . . . . . . . January 3, 1989Templeton EAFE Developed Markets Fund . . . . . . . . . . . . . . . . . . . . . . . . . . . . . . . . . . . . . . . . . . . . . . . . . . . . . . . . . . . . . . . . . . . . . January 2, 1994Templeton Emerging Markets Fund . . . . . . . . . . . . . . . . . . . . . . . . . . . . . . . . . . . . . . . . . . . . . . . . . . . . . . . . . . . . . . . . . . . . . . . . . . . September 20, 1991Templeton Frontier Markets Fund . . . . . . . . . . . . . . . . . . . . . . . . . . . . . . . . . . . . . . . . . . . . . . . . . . . . . . . . . . . . . . . . . . . . . . . . . . . . July 11, 2011Templeton Global Balanced Fund . . . . . . . . . . . . . . . . . . . . . . . . . . . . . . . . . . . . . . . . . . . . . . . . . . . . . . . . . . . . . . . . . . . . . . . . . . . . December 1, 2005Templeton Global Bond Fund . . . . . . . . . . . . . . . . . . . . . . . . . . . . . . . . . . . . . . . . . . . . . . . . . . . . . . . . . . . . . . . . . . . . . . . . . . . . . . . . June 7, 1988Templeton Global Bond Fund (Hedged) . . . . . . . . . . . . . . . . . . . . . . . . . . . . . . . . . . . . . . . . . . . . . . . . . . . . . . . . . . . . . . . . . . . . . . . . August 12, 2013Templeton Global Smaller Companies Fund . . . . . . . . . . . . . . . . . . . . . . . . . . . . . . . . . . . . . . . . . . . . . . . . . . . . . . . . . . . . . . . . . . . . January 3, 1989Templeton International Stock Fund . . . . . . . . . . . . . . . . . . . . . . . . . . . . . . . . . . . . . . . . . . . . . . . . . . . . . . . . . . . . . . . . . . . . . . . . . . . January 3, 1989
Franklin Flex Cap Growth Fund . . . . . . . . . . . . . . . . . . . . . . . . . . . . . . . . . . . . . . . . . . . . . . . . . . . . . . . . . . . . . . . . . . . . . . . . . . . . . . March 27, 1997Franklin High Income Fund . . . . . . . . . . . . . . . . . . . . . . . . . . . . . . . . . . . . . . . . . . . . . . . . . . . . . . . . . . . . . . . . . . . . . . . . . . . . . . . . . February 7, 2003Franklin Income Fund . . . . . . . . . . . . . . . . . . . . . . . . . . . . . . . . . . . . . . . . . . . . . . . . . . . . . . . . . . . . . . . . . . . . . . . . . . . . . . . . . . . . . . June 19, 2013Franklin Global Small-Mid Cap Fund . . . . . . . . . . . . . . . . . . . . . . . . . . . . . . . . . . . . . . . . . . . . . . . . . . . . . . . . . . . . . . . . . . . . . . . . . . June 23, 2014Franklin Strategic Income Fund . . . . . . . . . . . . . . . . . . . . . . . . . . . . . . . . . . . . . . . . . . . . . . . . . . . . . . . . . . . . . . . . . . . . . . . . . . . . . . February 7, 2003Franklin U.S. Core Equity Fund . . . . . . . . . . . . . . . . . . . . . . . . . . . . . . . . . . . . . . . . . . . . . . . . . . . . . . . . . . . . . . . . . . . . . . . . . . . . . . July 25, 2007Franklin U.S. Rising Dividends Fund . . . . . . . . . . . . . . . . . . . . . . . . . . . . . . . . . . . . . . . . . . . . . . . . . . . . . . . . . . . . . . . . . . . . . . . . . . December 1, 1984Franklin World Growth Fund . . . . . . . . . . . . . . . . . . . . . . . . . . . . . . . . . . . . . . . . . . . . . . . . . . . . . . . . . . . . . . . . . . . . . . . . . . . . . . . . . February 27, 2008
Franklin Bissett All Canadian Focus Fund . . . . . . . . . . . . . . . . . . . . . . . . . . . . . . . . . . . . . . . . . . . . . . . . . . . . . . . . . . . . . . . . . . . . . . September 3, 2004Franklin Bissett Bond Fund . . . . . . . . . . . . . . . . . . . . . . . . . . . . . . . . . . . . . . . . . . . . . . . . . . . . . . . . . . . . . . . . . . . . . . . . . . . . . . . . . August 1, 1986Franklin Bissett Canadian All Cap Balanced Fund . . . . . . . . . . . . . . . . . . . . . . . . . . . . . . . . . . . . . . . . . . . . . . . . . . . . . . . . . . . . . . . . January 5, 2009Franklin Bissett Canadian Balanced Fund . . . . . . . . . . . . . . . . . . . . . . . . . . . . . . . . . . . . . . . . . . . . . . . . . . . . . . . . . . . . . . . . . . . . . . August 1, 1991Franklin Bissett Canadian Dividend Fund . . . . . . . . . . . . . . . . . . . . . . . . . . . . . . . . . . . . . . . . . . . . . . . . . . . . . . . . . . . . . . . . . . . . . . December 12, 2003Franklin Bissett Canadian Equity Fund . . . . . . . . . . . . . . . . . . . . . . . . . . . . . . . . . . . . . . . . . . . . . . . . . . . . . . . . . . . . . . . . . . . . . . . . . March 1, 1983Franklin Bissett Canadian High Dividend Fund . . . . . . . . . . . . . . . . . . . . . . . . . . . . . . . . . . . . . . . . . . . . . . . . . . . . . . . . . . . . . . . . . . June 30, 1996Franklin Bissett Canadian Short Term Bond Fund . . . . . . . . . . . . . . . . . . . . . . . . . . . . . . . . . . . . . . . . . . . . . . . . . . . . . . . . . . . . . . . . December 12, 2003Franklin Bissett Corporate Bond Fund . . . . . . . . . . . . . . . . . . . . . . . . . . . . . . . . . . . . . . . . . . . . . . . . . . . . . . . . . . . . . . . . . . . . . . . . . December 11, 2006Franklin Bissett Dividend Income Fund . . . . . . . . . . . . . . . . . . . . . . . . . . . . . . . . . . . . . . . . . . . . . . . . . . . . . . . . . . . . . . . . . . . . . . . . May 31, 1988Franklin Bissett Microcap Fund . . . . . . . . . . . . . . . . . . . . . . . . . . . . . . . . . . . . . . . . . . . . . . . . . . . . . . . . . . . . . . . . . . . . . . . . . . . . . . August 19, 1997Franklin Bissett Money Market Fund . . . . . . . . . . . . . . . . . . . . . . . . . . . . . . . . . . . . . . . . . . . . . . . . . . . . . . . . . . . . . . . . . . . . . . . . . . August 1, 1991Franklin Bissett Small Cap Fund . . . . . . . . . . . . . . . . . . . . . . . . . . . . . . . . . . . . . . . . . . . . . . . . . . . . . . . . . . . . . . . . . . . . . . . . . . . . . . January 2, 1992Franklin Bissett Strategic Income Fund . . . . . . . . . . . . . . . . . . . . . . . . . . . . . . . . . . . . . . . . . . . . . . . . . . . . . . . . . . . . . . . . . . . . . . . . December 19, 2011Franklin Bissett Treasury Bill Fund . . . . . . . . . . . . . . . . . . . . . . . . . . . . . . . . . . . . . . . . . . . . . . . . . . . . . . . . . . . . . . . . . . . . . . . . . . . . February 29, 1988Franklin Bissett U.S. Focus Fund . . . . . . . . . . . . . . . . . . . . . . . . . . . . . . . . . . . . . . . . . . . . . . . . . . . . . . . . . . . . . . . . . . . . . . . . . . . . . February 27, 2008
Franklin Mutual Global Discovery Fund . . . . . . . . . . . . . . . . . . . . . . . . . . . . . . . . . . . . . . . . . . . . . . . . . . . . . . . . . . . . . . . . . . . . . . . . February 7, 2003Franklin Mutual U.S. Shares Fund (formerly Franklin Mutual Beacon Fund) . . . . . . . . . . . . . . . . . . . . . . . . . . . . . . . . . . . . . . . . . . . December 31, 1996Franklin Templeton Canadian Core Equity Fund . . . . . . . . . . . . . . . . . . . . . . . . . . . . . . . . . . . . . . . . . . . . . . . . . . . . . . . . . . . . . . . . . June 23, 2008Franklin Templeton Canadian Large Cap Fund . . . . . . . . . . . . . . . . . . . . . . . . . . . . . . . . . . . . . . . . . . . . . . . . . . . . . . . . . . . . . . . . . . June 23, 2008
Each of the Funds may offer one or more series of units designated as Series A, F, I, O, R, S, T and T USD. Each Series differs by its initialsales load, contingent deferred sales charges, management fees and initial minimum investment amount. Series T and T USD have thesame features except that the latter is offered in USD only.
The Funds are designed to achieve long-term capital appreciation and/or current income by investing in a portfolio of securities in line witheach of its documented investment strategy. Franklin Bissett Canadian Balanced Fund and Franklin Bissett Strategic Income Fund investin mutual funds (“Underlying Funds”) managed by the Manager.
Effective February 11, 2010, each of Templeton Asian Growth Fund, Templeton International Stock Fund, Templeton Global BalancedFund and Templeton Global Smaller Companies Fund may invest up to 7.5% of its net assets in Templeton China Opportunities Fund
334 Franklin Templeton Investments Funds
Franklin Templeton Investments Funds
NOTES TO FINANCIAL STATEMENTS For the periods ended June 30, 2014 and December 31, 2013 (Unaudited) (Continued)
1. Organization (Continued)
(“TCOF”), a sub-fund of Franklin Templeton Selected Markets Funds (“FTSMF”), an open-end investment company organized under thelaws of Luxembourg as a Société d’Investissement à Capital Variable. TCOF is managed by Templeton Investment Counsel, LLC, an affiliateof the Manager. TCOF’s portfolio will be managed in accordance with the investment restrictions applicable to a UCITS, an undertaking forcollective investment in transferable securities, which are substantially similar to those that govern each Fund in Canada. The principal dis-tributor and administrative agent of FTSMF is an affiliate of the Manager.
The financial statements of each Fund include the Schedule of Investments as at June 30, 2014, and the Statements of Financial Positionas at June 30, 2014, December 31, 2013 and January 1, 2013, if a Fund was in existence at that time. The Statements of ComprehensiveIncome, Changes in Net Assets Attributable to Holders of Redeemable Units and Cash Flows for each Fund are for the six months endedJune 30, 2014 and 2013, except for Funds established during either period, in which case the period is from commencement of operations(inception date) to June 30.
These financial statements have been authorized for issue by the Board of Directors of the Manager on August 13, 2014.
(b) Fund Events
Franklin Global Small-Mid Cap Fund was launched on June 23, 2014 and commenced offering units of Series A, F, I, M and O on July 7,2014. National Instrument 81-106, (the “Instrument”) Section 1.1 (a) defines an interim period as a period of at least three months thatends six months before the end of a financial year of an investment fund. Financial statements of the Franklin Global Small-Mid Cap Fundfor the interim period ending June 30, 2014, have not been included in these financial statements, as its interim period is less than threemonths since commencement of operations.
On December 9, 2013, unitholders approved a proposal to establish a fixed rate administration fee (“Administration Fee”) to replace certainoperating expenses attributable to a Fund. This was made effective on January 1, 2014. See Note 6(b) for further details.
Effective February 17, 2014 the following Fund was renamed as follows:
Former Name New Name
Franklin Mutual Beacon Fund . . . . . . . . . . . . . . . . . . . . . . . . . . . . . . . . . . . . Franklin Mutual U.S. Shares Fund
Effective July 29, 2013 the following Funds were renamed as follows:
Former Name New Name
Bissett All Canadian Focus Fund . . . . . . . . . . . . . . . . . . . . . . . . . . . . . . . . . . Franklin Bissett All Canadian Focus FundBissett Bond Fund . . . . . . . . . . . . . . . . . . . . . . . . . . . . . . . . . . . . . . . . . . . . . Franklin Bissett Bond FundBissett Canadian Balanced Fund . . . . . . . . . . . . . . . . . . . . . . . . . . . . . . . . . . Franklin Bissett Canadian Balanced FundBissett Canadian Dividend Fund . . . . . . . . . . . . . . . . . . . . . . . . . . . . . . . . . . Franklin Bissett Canadian Dividend FundBissett Canadian Equity Fund . . . . . . . . . . . . . . . . . . . . . . . . . . . . . . . . . . . . Franklin Bissett Canadian Equity FundBissett Canadian High Dividend Fund . . . . . . . . . . . . . . . . . . . . . . . . . . . . . . Franklin Bissett Canadian High Dividend FundBissett Canadian Short Term Bond Fund . . . . . . . . . . . . . . . . . . . . . . . . . . . . Franklin Bissett Canadian Short Term Bond FundBissett Corporate Bond Fund . . . . . . . . . . . . . . . . . . . . . . . . . . . . . . . . . . . . . Franklin Bissett Corporate Bond FundBissett Dividend Income Fund . . . . . . . . . . . . . . . . . . . . . . . . . . . . . . . . . . . . Franklin Bissett Dividend Income FundBissett Microcap Fund . . . . . . . . . . . . . . . . . . . . . . . . . . . . . . . . . . . . . . . . . . Franklin Bissett Microcap FundBissett Small Cap Fund . . . . . . . . . . . . . . . . . . . . . . . . . . . . . . . . . . . . . . . . . Franklin Bissett Small Cap FundBissett Strategic Income Fund . . . . . . . . . . . . . . . . . . . . . . . . . . . . . . . . . . . . Franklin Bissett Strategic Income FundBissett U.S. Focus Fund . . . . . . . . . . . . . . . . . . . . . . . . . . . . . . . . . . . . . . . . . Franklin Bissett U.S. Focus FundFranklin Templeton Money Market Fund . . . . . . . . . . . . . . . . . . . . . . . . . . . . Franklin Bissett Money Market FundFranklin Templeton Treasury Bill Fund . . . . . . . . . . . . . . . . . . . . . . . . . . . . . Franklin Bissett Treasury Bill FundMutual Beacon Fund . . . . . . . . . . . . . . . . . . . . . . . . . . . . . . . . . . . . . . . . . . . Franklin Mutual Beacon FundMutual Global Discovery Fund . . . . . . . . . . . . . . . . . . . . . . . . . . . . . . . . . . . . Franklin Mutual Global Discovery Fund
Effective October 25, 2013, Franklin Quotential Canadian Growth Portfolio (the “Terminated Fund”), a Fund managed by the Manager,merged with Franklin Bissett Canadian Equity Fund (the “Continuing Fund”). As a result $33,193,895 was transferred to the ContinuingFund in exchange for units in the same series of the Continuing Fund of equal value. For details of the merger refer to Note 12(c).
Templeton Global Bond Fund (Hedged) was launched on August 12, 2013 and commenced offering of Series A, F, I and O units onAugust 19, 2013. The Fund invests substantially all its assets in Series O units of Templeton Global Bond Fund. The Fund invests in for-ward contracts to reduce the potential effects of exchange rate fluctuations between the Canadian dollar and the US dollar.
Franklin Templeton Investments Funds 335
Franklin Templeton Investments Funds
NOTES TO FINANCIAL STATEMENTS For the periods ended June 30, 2014 and December 31, 2013 (Unaudited) (Continued)
1. Organization (Continued)
Franklin Income Fund was launched on June 19, 2013 and commenced offering of Series A, F, I, O, R, S, T and T-USD units on June 28,2013.
Effective May 13, 2013, Bissett Focus Balanced Fund was renamed Franklin Bissett Canadian All Cap Balanced Fund. The Fund wasrepositioned as a Canadian balanced fund focusing on capital appreciation through an allocation tilted toward equities.
2. Basis of Presentation and Adoption of IFRS.
These financial statements have been prepared in compliance with International Financial Reporting Standards (“IFRS”) applicable tothe preparation of interim financial statements, including IAS 34,“Interim Financial Reporting” and IFRS 1, “First-time Adoption ofInternational Financial Reporting Standards”. The Funds adopted this basis of accounting in 2014 as required by Canadian securitieslegislation and the Canadian Accounting Standards Board. Previously, the Funds prepared their financial statements in accordancewith Canadian generally accepted accounting principles as defined in the Part V of the CPA Handbook (“Canadian GAAP”). Thecomparative information has been restated from Canadian GAAP to comply with IFRS. The Funds have consistently applied theaccounting policies used in the preparation of their opening IFRS Statement of Financial Position at January 1, 2013, for those Fundsin existence at that date, and throughout all periods presented, as if these policies had always been in effect. Note 3 discloses theimpact of the transition to IFRS on the Funds’ reported financial position, financial performance and cash flows, including the natureand effect of significant changes in accounting policies from those used in the Funds’ financial statements for the year endedDecember 31, 2013 prepared under Canadian GAAP.
3. Transition to IFRS
The effect of the Funds’ transition to IFRS is summarized as follows:
(a) Upon transition to IFRS, the Funds adopted a voluntary exemption to designate a financial asset or financial liability at fair valuethrough profit or loss, as discussed in Note 4. Financial assets and liabilities were previously carried at fair value under Canadian GAAPas required by Accounting Guideline 18, Investment Companies.
(b) IAS 32, “Financial Instruments: Presentation”, requires that puttable instruments be classified as a liability when units of an entityinclude a contractual obligation for the issuer to repurchase or redeem them for cash or another financial asset. The Funds’redeemable units meets the definition of a puttable instrument. The Manager has assessed the Funds’ unitholder structure and hasdetermined the units of the Funds are liabilities. Under Canadian GAAP, the units of the Funds were classified as equity in accordancewith CPA Handbook 3863 and EIC -149 Accounting for Retractable or Mandatorily Redeemable Shares.
(c) Under IFRS, the Funds measure the fair value of their investments using the guidance in IFRS 13, “Fair Value Measurements”, whichrequires that if an asset or a liability has a bid price and an ask price, then its fair value is to be based on a price within the bid-askspread that is most representative of fair value, as discussed in Note 4(c). Under Canadian GAAP, the Funds measured the fair valueof their investments in accordance with Section 3855, “Financial Instruments – Recognition and Measurement”, which required theuse of bid prices for long positions and ask price for short positions. As a result, a difference in net assets arose upon conversion, forthe applicable Funds. The impact of the difference was an increase in the Funds’ net assets attributable to redeemable unitholdersand increase/decrease in net assets attributable to holders of redeemable units as shown on the Statements of Financial Position andComprehensive Income of the respective Fund and in Note 13.
(d) Under Canadian GAAP, the Funds were exempt from providing a Statement of Cash Flows. IAS 1 “Presentation of FinancialStatements” requires that a complete set of financial statements include a Statement of Cash Flows for the current and comparativeperiods, which is displayed for each Fund in these financial statements.
(e) The Funds reclassified certain amounts upon transition in order to conform with its financial statement presentation under IFRS.Under Canadian GAAP, withholding taxes which were previously netted against dividend income have been reclassified and presentedseparately as an expense under IFRS.
336 Franklin Templeton Investments Funds
Franklin Templeton Investments Funds
NOTES TO FINANCIAL STATEMENTS For the periods ended June 30, 2014 and December 31, 2013 (Unaudited) (Continued)
4. Summary of Significant Accounting Policies
The principal accounting policies applied in the preparation of these financial statements are set out below. These policies have been con-sistently applied to all the periods presented. The financial statements have been prepared under the historical cost convention as modifiedby the revaluation of financial assets and financial liabilities (including derivatives) at fair value through profit or loss. The preparation of thefinancial statements in conformity with IFRS requires the use of certain estimates and assumptions at the date of the financial statements.The areas involving a higher degree of judgment or complexity, or areas where assumptions and estimates are significant to the financialstatements are disclosed in Note 4(m).
The significant accounting policies are as follows:
(a) Classification of financial assets and liabilities — The Funds’ investments other than derivatives are classified as financial assets orliabilities at fair value through profit or loss. The Funds’ financial assets and financial liabilities, other than derivatives, are designated atfair value through profit or loss at inception, as those financial assets and liabilities are managed together and their performanceevaluated on a fair value basis in accordance with the Funds’ documented investment strategy. Derivatives are classified as held fortrading and measured at fair value through profit or loss. Unrealized gains(losses) arising on derivatives, are shown on the respectiveFund’s Statement of Financial Position and such amounts are included in the Statement of Comprehensive Income in net change inunrealized appreciation (depreciation) in value of investments and derivatives, where applicable. Realized gains arising on derivativesduring a period are included in the Statement of Comprehensive Income in net realized gain (loss) on investments and derivatives,where applicable.
The Funds’ obligation for net assets attributable to holders of redeemable units is measured at redemption amount. All other financialassets and liabilities are carried at amortized cost which approximates fair value due to their short-term nature.
The net asset value (NAV) is the value of the total assets of a fund less the value of its total liabilities determined, on each valuationday, in accordance with Part 14 of National Instrument (NI) 81-106 Investment Fund Continuous Disclosure for the purpose of proc-essing unitholder transactions. Net assets are determined in accordance with IFRS. As of June 30, 2014, each of the Fund’s NAV isequal to its net assets, determined in accordance with IFRS, except Franklin Bissett Microcap Fund. For details of the trading net assetvalues per unit, refer to Note 11(a).
(b) Classification of redeemable units — The Funds’ outstanding redeemable units’ entitlements include a contractual obligation todistribute any net income and net realized capital gains annually in cash (at the request of the unitholder) and therefore the ongoingredemption feature is not the units’ only contractual obligation. Consequently, the Fund’s outstanding redeemable units are classifiedas financial liabilities in accordance with the requirements of International Accounting Standard 32 “Financial Instruments:Presentation”.
(c) Valuation of investments — Fair value is the price that would be received to sell an asset or paid to transfer a liability in an orderlytransaction between market participants on the measurement date. The fair value of equity securities and derivative financialinstruments (derivatives) traded in active markets is measured at quoted market prices at the close of trading on the reporting date.The Funds use the last traded market price for both financial assets and financial liabilities where the last traded price falls within thebid-ask spread. In circumstances where the last traded price is not within the bid-ask spread, the Manager will review and apply aprice within the bid-ask spread that is most representative of fair value based on the specific facts and circumstances. Over thecounter (OTC) securities are valued within the range of the most recent quoted bid and ask prices. Securities that trade in multiplemarkets or on multiple exchanges are valued according to the broadest and most representative market. Certain equity securities arevalued based upon fundamental characteristics or relationships to similar securities.
Debt securities generally trade in the OTC market rather than on a securities exchange. The Funds use multiple valuation techniquesto determine fair value. In instances where sufficient market activity exists, a market-based approach utilizing quotes from marketmakers are used to determine fair value. In instances where sufficient market activity may not exist or is limited, proprietary valuationmodels are used, which may consider market characteristics such as benchmark yield curves, credit spreads, estimated default rates,anticipated market interest rate volatility, coupon rates, anticipated timing or principal repayments, underlying collaterals and otherunique security features in order to estimate the relevant cash flows, which are then discounted to calculate the fair value.
The Funds have procedures to determine the fair value of securities and other financial instruments for which market prices are notreadily available or which may not be reliably priced. Under these fair valuation procedures, the Funds primarily employ a
Franklin Templeton Investments Funds 337

Franklin Templeton Investments Funds
NOTES TO FINANCIAL STATEMENTS For the periods ended June 30, 2014 and December 31, 2013 (Unaudited) (Continued)
4. Summary of Significant Accounting Policies (Continued)
market-based approach, which may use related or comparable assets or liabilities, recent transactions, market multiples, book values,and other relevant information for the investment to determine its fair value. The Funds may also use an income-based valuationapproach in which the anticipated future cash flows of the investment are discounted to calculate fair value. Discounts may also beapplied due to the nature or duration of any restrictions on the disposition of the investments, but only if they arise as a feature of theinstrument itself. Due to the inherent uncertainty of valuations of such investments, the fair values may differ significantly from thevalues that would have been used had an active market existed.
Investments in Underlying Funds are made in Series O units of the Underlying Fund and valued at the respective closing net assetvalue.
Investments in TCOF are made in Series F1, denominated in USD, and valued at the CAD equivalent of the closing net asset value onvaluation day.
Warrants are valued using a recognized option pricing model, which includes factors such as the terms of the warrant, time value ofmoney and volatility inputs that are significant to such valuation.
All security valuation techniques are periodically reviewed by the Valuation and Liquidity Oversight Committee (“VLOC”) of theManager and are approved by the Manager. The VLOC provides administration and oversight of the Funds’ valuation policies andprocedures. These procedures allow the VLOC to utilize independent pricing services, quotations from securities and financial instru-ment dealers, and other market sources to determine fair value.
(d) Derivatives — Certain Funds may invest in derivatives in order to manage risk or gain exposure to various other investments ormarkets. Derivatives are financial contracts based on an underlying or notional amount, require no initial investment or an initialinvestment that is smaller than would normally be required to have similar response to changes in market factors, and require orpermit net settlement. Derivatives contain various risks including the potential inability of the counterparty to fulfill their obligationsunder the terms of the contract, the potential for an illiquid secondary market, and/or the potential for market movements whichexpose the applicable Funds to gains and losses in excess of the amounts shown on the Statement of Financial Position. Realized gainand loss and unrealized appreciation and depreciation on these contracts for the period are included in the Statement ofComprehensive Income.
The applicable Funds’ investments in over-the-counter (OTC) derivatives are subject to the terms of International Swaps andDerivatives Association Master Agreements (“ISDA”) and other related agreements between the Fund and certain derivative counter-parties. These agreements contain various provisions, including but not limited to collateral requirements, events of default, or earlytermination. In the event of default or early termination, the ISDA master agreement gives the non-defaulting party the right to net andclose-out all transactions traded to one net amount, payable by one counterparty to the other. However, absent an event of default orearly termination, OTC derivatives assets and liabilities are presented gross and not offset in the Statements of Financial Position.
Collateral requirements differ by type of derivative. Collateral or initial margin requirements are set by the broker or exchange clearinghouse for exchange traded and centrally cleared derivatives. For OTC derivatives traded under an ISDA master agreement, posting ofcollateral is required by either Fund or the applicable counterparty if the total net exposure of all OTC derivatives with the applicablecounterparty exceeds a certain minimum transfer amounts and can vary depending on the counterparty and the type of agreement.Generally, collateral is determined at the close of business each day and any additional collateral required due to changes in derivativevalues may be delivered by the Fund or the counterparty within a few business days. Collateral pledged may be in the form of cashand/or securities which is disclosed in Note 12(b). Should a Fund fail to meet any of these provisions, the derivative counterparty hasthe right to terminate the derivative contract and require immediate payment by the Fund for those OTC derivatives with that particularcounterparty that are in a net liability position.
(i) Foreign/Forward exchange contracts — When a Fund purchases or sells foreign securities, it may enter into foreign exchangecontracts to minimize foreign exchange risk from the trade date to the settlement date of the transactions. A foreign exchangecontract is an agreement between two parties to exchange different currencies at an agreed upon exchange rate at a future date.
A Fund may also enter into forward exchange contracts to hedge against fluctuations in foreign exchange rates. These contractsare valued as the difference between the contractual forward foreign exchange rates and the mid forward rate for currency held or
338 Franklin Templeton Investments Funds
Franklin Templeton Investments Funds
NOTES TO FINANCIAL STATEMENTS For the periods ended June 30, 2014 and December 31, 2013 (Unaudited) (Continued)
4. Summary of Significant Accounting Policies (Continued)
sold short at the reporting date. The unrealized gains or losses on the contracts are included in the Statement of Financial Posi-tion. Realized gains and losses and changes in unrealized gains and losses are included in the Statement of ComprehensiveIncome.
(ii) Options — Options are contracts entitling the holder to purchase or sell a specified item at a specified price, during a specifiedperiod or on a specified date. Options purchased are recorded as investments; options written (sold) are recorded as liabilities onthe Statement of Financial Position. Any gain or loss resulting from revaluation is included in unrealized appreciation(depreciation) in value of investments on the Statement of Comprehensive Income. Upon closing of an option other than byexercise, which results in the receipt of a cash settlement, the difference between the premium (original option value) and thesettlement proceeds is included in income (loss) from derivatives on the Statement of Comprehensive Income. When securitiesare acquired or delivered upon exercise, the acquisition cost or sale proceeds are adjusted by the amount of the premium. Whenan option is closed, the difference between the premium and the cost to close the position is included in income (loss) fromderivatives on the Statement of Comprehensive Income, as is the premium for options written or purchased when an optionexpires.
(iii) Equity-linked notes — Certain Funds may invest in equity-linked securities. Equity-linked notes are hybrid financial instrumentsthat generally combine both debt and equity characteristics into a single security. Equity-linked notes are valued based on thecorrelation with the related underlying security after the underlying security has been priced in accordance with the establishedpricing conventions. Income received from equity-linked notes is recorded in dividends received in the Statement ofComprehensive Income and may be based on the performance of an underlying security, an equity index, or an option position.
(iv) Credit default swaps — Certain Funds may enter into credit default swap contracts, primarily to manage and/or gain exposure tocredit risk. A credit default swap is an agreement between the Fund and a counterparty whereby the buyer of the contractreceives credit protection and the seller of the contract guarantees the credit worthiness of a referenced debt obligation. Theunderlying referenced debt obligation may be a single issuer of corporate or sovereign debt, a credit index, or a tranche of a creditindex. In the event of a default of the underlying referenced debt obligation, the buyer is entitled to receive the notional amount ofthe credit default swap contract from the seller in exchange for the referenced debt obligation, a net settlement amount equal tothe notional amount of the credit default swap less the recovery value of the referenced debt obligation, or other agreed uponamount.
Over the term of the contract, the buyer pays the seller a periodic stream of payments, provided that no event of default hasoccurred. Such periodic payments paid or received are accrued daily and are included in the Statement of ComprehensiveIncome in income (loss) from derivatives. The change in value of a credit default swap contract is included in the Statement ofFinancial Position as unrealized gain (loss) on derivatives. When the credit default swap contracts are closed out, gains or lossesare realized and included in the Statement of Comprehensive Income in net realized gain (loss) on investments and derivatives.Pursuant to the terms of the credit default swap contract, cash or securities may be required to be deposited as collateral.
(v) Interest rate swaps — Certain Funds may enter into interest rate swap contracts, primarily to manage and/or gain exposure tofluctuations in interest rates. An interest rate swap is an agreement between the fund and a counterparty whereby the partiesagree to exchange a fixed payment for a floating payment that is linked to an interest rate and an agreed upon notional amount.
Over the term of the contract, each party will pay to the other party a periodic stream of payments. Such periodic payments paidor received are accrued daily and are included in the Statement of Comprehensive Income in Income (loss) from derivatives. Thechange in value of an interest rate swap contract is included in the Statement of Financial Position as Unrealized gain (loss) onderivatives. When the interest rate swap contracts are closed out, gains or losses are realized and included in the Statements ofComprehensive Income in Net realized gain (loss) on investments and derivatives.
(e) Payment-in-kind bonds — Certain Funds may invest in Payment-in-kind (PIK) bonds. PIK securities are bonds or preferred shareswhere income may be received in the form of additional bonds or preferred shares. The coupon rate shown represents the rate atperiod end. These bonds typically have interest receivable included in the price quotation obtained each day. Accordingly, that portionof the quote representing interest income has been identified and reclassified as interest income for distribution purposes on theStatement of Comprehensive Income. In the event that interest income from the additional bonds is not expected to be realized, areserve against income is established.
Franklin Templeton Investments Funds 339
Franklin Templeton Investments Funds
NOTES TO FINANCIAL STATEMENTS For the periods ended June 30, 2014 and December 31, 2013 (Unaudited) (Continued)
4. Summary of Significant Accounting Policies (Continued)
(f) Participatory notes — Certain Funds may invest in Participatory Notes (P-Notes). P-Notes are promissory notes that are designed tooffer a return linked to the performance of a particular underlying equity security or index. P-Notes are issued by banks or broker-dealers and allow the fund to gain exposure to common stocks in markets where direct investment is not allowed. P-Notes are notlisted and are valued utilizing the price of the underlying equity security based upon the terms of the P-Notes. Income received fromP-Notes is recorded in dividend income in the Statement of Comprehensive Income.
(g) Valuation of series — A separate net assets per unit is calculated for each series of units in each Fund. The net assets of a series iscomputed by calculating the series’ proportionate share of the assets and liabilities of the Fund common to all series, adjusted for theassets and liabilities of the Fund attributable only to that series. Expenses directly attributable to a series are charged to that series.Other expenses, investment income, realized and unrealized capital and foreign exchange gains and losses are allocatedproportionately to each series based upon the relative net assets of each series, except for items that can be specifically attributed toone or more series.
(h) Transaction costs — Transaction costs, such as brokerage commissions, incurred on the purchase and sale of a security are chargedas an expense for the period and shown as transaction costs on the Statements of Comprehensive Income.
The Funds that invest in Underlying Funds do not incur transaction costs on those transactions.
(i) Security transactions, investment income, expenses and distributions — Security transactions are recorded on the trade date. Interestincome and estimated expenses are accrued daily. Dividend income, distributions received from Underlying Funds and distributions tounitholders are recorded on the ex-dividend date.
Interest for distribution purposes shown on the Statements of Comprehensive Income represents the coupon interest received by thefund accounted for on an accrual basis. The funds do not amortize premiums paid or discounts received on the purchase of fixedincome securities except for zero coupon bonds which are amortized on a straight line basis.
Realized and unrealized gains or losses on security transactions are determined on an average cost basis. Average cost does notinclude amortization of premiums or discounts on fixed income securities with the exception of zero coupon bonds.
(j) Taxes — Certain Funds qualify as mutual fund trusts within the meaning of the Income Tax Act (Canada) (the “Act”). Accordingly,these Funds are entitled to a capital gains refund and, as a result, income taxes payable on net realized capital gains are refundableon a formula basis when units of the Fund are redeemed. In addition, such Funds are not subject to alternative minimum tax or taxeson prescribed investments and certain designated income as defined under Part X.2 and Part XII.2, respectively of the Act.
Each year, each Fund distributes sufficient net taxable income and net capital gains for the tax calendar year so that the Fund does notpay tax under Part 1 of the Act. As a result, the Funds do not record income taxes. Since the Funds do not record income taxes, the taxbenefit of capital and non-capital losses has not been reflected in the Statements of Financial Position as a deferred income tax asset.
Templeton Asian Growth Fund, Templeton Frontier Markets Fund, Franklin Bissett U.S. Focus Fund and Franklin TempletonCanadian Core Equity Fund are not expected to qualify as mutual fund trusts at the time of filing the financial statements.
Certain Funds may be subject to foreign taxation related to income received, capital gains on the sale of securities and certain foreigncurrency transactions in the foreign jurisdictions in which they invest. Foreign taxes, if any, are recorded based on the tax regulationsand rates that exist in the foreign markets in which the Fund invests. When a capital gain tax is determined to apply, the Fund recordsan estimated deferred tax liability in an amount that would be payable if the securities were disposed of on the valuation date.
(k) Foreign currency translation — The financial statements are presented in CAD, the functional and presentation currency of the Funds.The Funds are distributed within Canada with the subscriptions and redemptions primarily denominated in CAD.
Portfolio securities and other assets and liabilities denominated in foreign currencies are translated into the functional currencybased on the mid exchange rate on the valuation date. Purchases and sales of securities and income items denominated in foreigncurrencies are translated into the functional currency at the exchange rate in effect on the transaction date. When an exchangerate is unavailable or unreliable, it will be determined using procedures established and accepted by the Board of Directors and theManager.
340 Franklin Templeton Investments Funds
Franklin Templeton Investments Funds
NOTES TO FINANCIAL STATEMENTS For the periods ended June 30, 2014 and December 31, 2013 (Unaudited) (Continued)
4. Summary of Significant Accounting Policies (Continued)
Realized foreign exchange gains or losses arise from sales of foreign currencies, changes between the trade date and settlement datevalues on security and capital transactions, and the difference between the recorded amounts of foreign currency denominated divi-dends, interest, withholding taxes, and U.S. short-term holdings, and the functional currency equivalent of the amounts actuallyreceived or paid. These gains or losses are reported on the Statements of Comprehensive Income as net realized and/or unrealizedforeign exchange gain (loss).
(l) Increase (decrease) in net assets from operations per unit — This calculation is based on the increase (decrease) in net assets fromoperations attributable to each series divided by the weighted average number of units of that series outstanding during the period.
(m) Accounting estimates — The preparation of financial statements in accordance with IFRS may require the Manager to make estimatesand assumptions that affect the reported amounts of assets and liabilities at the date of the financial statements and the amounts ofincome and expense reported during the periods. Actual results may differ from those estimates.
The key area where estimates, judgments and/or assumptions are applied is in the classification of financial instruments and in thedetermination of fair values of financial instruments not traded on an active market as discussed in Note 4(c). Critical judgment isapplied in the determination of the functional currency of the Funds as discussed in Note 4(k).
5. Capital Risk Management
The capital of each Fund is comprised of its net assets attributable to redeemable unitholders. Each Fund’s capital is managed in accord-ance with its respective investment objectives and policies, and there are no externally imposed restrictions in relation to each Fund’s units.Changes in capital during the period are reflected in the Statements of Changes in Net Assets Attributable to Holders of Redeemable Unitsfor each Fund. The Funds have no specific restrictions or capital requirements on the subscriptions and redemption of units, other thanminimum subscription requirements. The Funds endeavor to manage capital by maintaining a strong capital base to support the invest-ment activities of each of the Funds while maintaining sufficient liquidity to meet redemptions. Unitholders are entitled to distributions,which are then reinvested in additional units of the Fund or, at the option of the unitholder, paid in cash. Units of the Funds are redeemableat the option of the unitholders in accordance with the provisions in the Declarations of Trust.
Changes in issued capital stock are summarized as follows:
Templeton Asian Growth Fund
Series O
June 30, 2014 December 31, 2013
Outstanding units — beginning 24,481,692 33,003,719Subscriptions 8,269,792 5,891,336Reinvestments — 3,486,405Redemptions (1,647,684) (17,899,768)
Outstanding units — ending 31,103,800 24,481,692
Templeton Canadian Balanced Fund
Series A Series F Series O
June 30, 2014 December 31, 2013 June 30, 2014 December 31, 2013 June 30, 2014 December 31, 2013
Outstanding units — beginning 7,057,087 8,820,278 1,355,943 1,587,241 522,785 592,338Subscriptions 211,233 444,127 20,738 13,454 15,471 6,126Reinvestments — 54,599 — 10,866 — 4,206Redemptions (1,069,025) (2,261,917) (90,903) (255,618) (60,221) (79,885)
Outstanding units — ending 6,199,295 7,057,087 1,285,778 1,355,943 478,035 522,785
Franklin Templeton Investments Funds 341

Franklin Templeton Investments Funds
NOTES TO FINANCIAL STATEMENTS For the periods ended June 30, 2014 and December 31, 2013 (Unaudited) (Continued)
5. Capital Risk Management (Continued)
Templeton Canadian Balanced Fund (Continued)
Series T
June 30, 2014 December 31, 2013
Outstanding units — beginning 173,141 213,913Subscriptions 1,656 6,877Reinvestments 2,652 8,232Redemptions (16,443) (55,881)
Outstanding units — ending 161,006 173,141
Templeton Canadian Stock Fund
Series A Series F Series O
June 30, 2014 December 31, 2013 June 30, 2014 December 31, 2013 June 30, 2014 December 31, 2013
Outstanding units — beginning 5,528,217 6,618,217 64,815 85,483 392,080 451,887Subscriptions 66,277 140,787 8,108 6,268 62,321 43,818Reinvestments — 2,097 — 24 — 150Redemptions (549,019) (1,232,884) (3,635) (26,960) (89,697) (103,775)
Outstanding units — ending 5,045,475 5,528,217 69,288 64,815 364,704 392,080
Templeton EAFE Developed Markets Fund
Series A Series F Series O
June 30, 2014 December 31, 2013 June 30, 2014 December 31, 2013 June 30, 2014 December 31, 2013
Outstanding units — beginning 678,151 641,431 605,479 287,322 23,724,604 34,037,926Subscriptions 204,085 239,595 19,578 344,014 1,159,210 9,683,459Reinvestments — 16,285 — 6,947 — 598,417Redemptions (127,916) (219,160) (336,964) (32,804) (1,392,795) (20,595,198)
Outstanding units — ending 754,320 678,151 288,093 605,479 23,491,019 23,724,604
Templeton Emerging Markets Fund
Series A Series F Series I
June 30, 2014 December 31, 2013 June 30, 2014 December 31, 2013 June 30, 2014 December 31, 2013
Outstanding units — beginning 17,362,915 19,414,729 698,563 699,910 131,012 36,835Subscriptions 229,374 967,636 58,501 167,620 20,622 90,820Reinvestments (51) 687,410 — 26,990 — 4,079Redemptions (2,102,114) (3,706,860) (85,075) (195,957) (33,010) (722)
Outstanding units — ending 15,490,124 17,362,915 671,989 698,563 118,624 131,012
Series O
June 30, 2014 December 31, 2013
Outstanding units — beginning 11,391,885 12,011,332Subscriptions 2,039,400 3,427,776Reinvestments 7 466,040Redemptions (352,683) (4,513,263)
Outstanding units — ending 13,078,609 11,391,885
342 Franklin Templeton Investments Funds
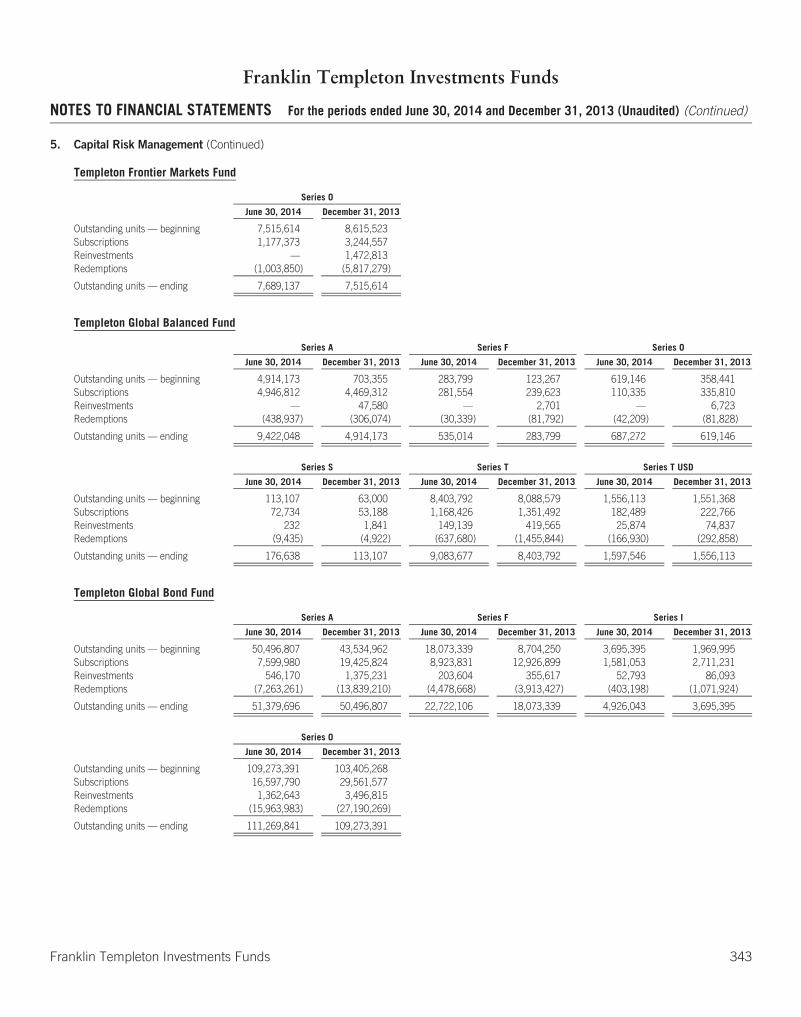
Franklin Templeton Investments Funds
NOTES TO FINANCIAL STATEMENTS For the periods ended June 30, 2014 and December 31, 2013 (Unaudited) (Continued)
5. Capital Risk Management (Continued)
Templeton Frontier Markets Fund
Series O
June 30, 2014 December 31, 2013
Outstanding units — beginning 7,515,614 8,615,523Subscriptions 1,177,373 3,244,557Reinvestments — 1,472,813Redemptions (1,003,850) (5,817,279)
Outstanding units — ending 7,689,137 7,515,614
Templeton Global Balanced Fund
Series A Series F Series O
June 30, 2014 December 31, 2013 June 30, 2014 December 31, 2013 June 30, 2014 December 31, 2013
Outstanding units — beginning 4,914,173 703,355 283,799 123,267 619,146 358,441Subscriptions 4,946,812 4,469,312 281,554 239,623 110,335 335,810Reinvestments — 47,580 — 2,701 — 6,723Redemptions (438,937) (306,074) (30,339) (81,792) (42,209) (81,828)
Outstanding units — ending 9,422,048 4,914,173 535,014 283,799 687,272 619,146
Series S Series T Series T USD
June 30, 2014 December 31, 2013 June 30, 2014 December 31, 2013 June 30, 2014 December 31, 2013
Outstanding units — beginning 113,107 63,000 8,403,792 8,088,579 1,556,113 1,551,368Subscriptions 72,734 53,188 1,168,426 1,351,492 182,489 222,766Reinvestments 232 1,841 149,139 419,565 25,874 74,837Redemptions (9,435) (4,922) (637,680) (1,455,844) (166,930) (292,858)
Outstanding units — ending 176,638 113,107 9,083,677 8,403,792 1,597,546 1,556,113
Templeton Global Bond Fund
Series A Series F Series I
June 30, 2014 December 31, 2013 June 30, 2014 December 31, 2013 June 30, 2014 December 31, 2013
Outstanding units — beginning 50,496,807 43,534,962 18,073,339 8,704,250 3,695,395 1,969,995Subscriptions 7,599,980 19,425,824 8,923,831 12,926,899 1,581,053 2,711,231Reinvestments 546,170 1,375,231 203,604 355,617 52,793 86,093Redemptions (7,263,261) (13,839,210) (4,478,668) (3,913,427) (403,198) (1,071,924)
Outstanding units — ending 51,379,696 50,496,807 22,722,106 18,073,339 4,926,043 3,695,395
Series O
June 30, 2014 December 31, 2013
Outstanding units — beginning 109,273,391 103,405,268Subscriptions 16,597,790 29,561,577Reinvestments 1,362,643 3,496,815Redemptions (15,963,983) (27,190,269)
Outstanding units — ending 111,269,841 109,273,391
Franklin Templeton Investments Funds 343
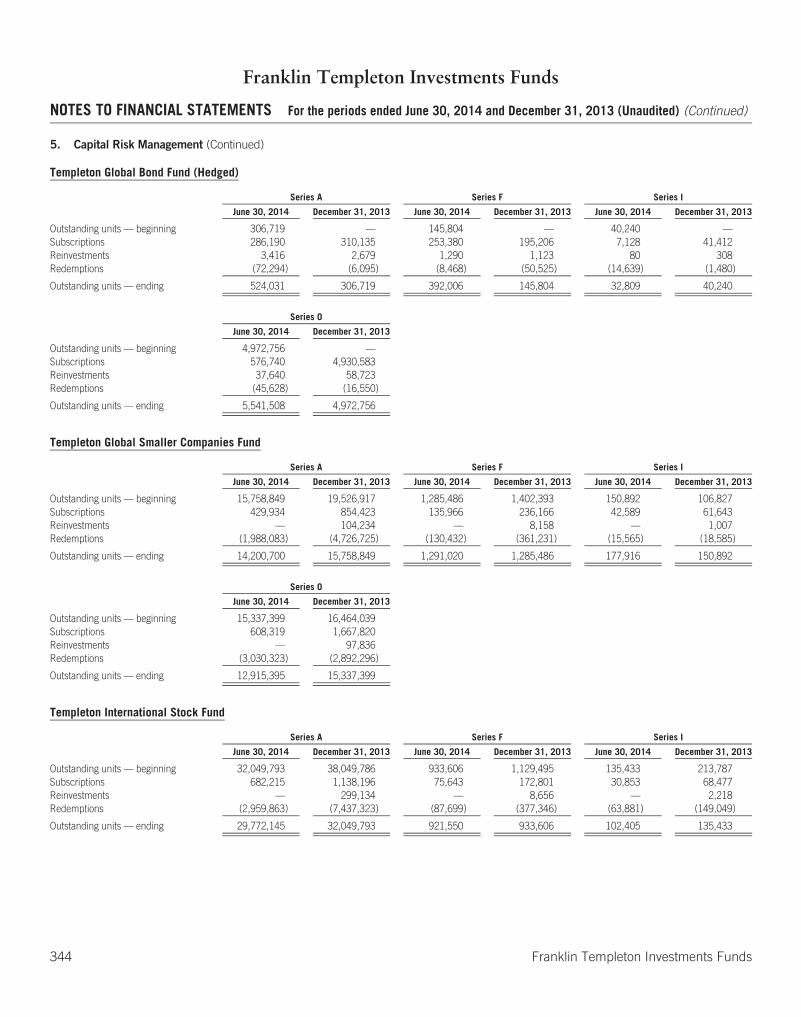
Franklin Templeton Investments Funds
NOTES TO FINANCIAL STATEMENTS For the periods ended June 30, 2014 and December 31, 2013 (Unaudited) (Continued)
5. Capital Risk Management (Continued)
Templeton Global Bond Fund (Hedged)
Series A Series F Series I
June 30, 2014 December 31, 2013 June 30, 2014 December 31, 2013 June 30, 2014 December 31, 2013
Outstanding units — beginning 306,719 — 145,804 — 40,240 —Subscriptions 286,190 310,135 253,380 195,206 7,128 41,412Reinvestments 3,416 2,679 1,290 1,123 80 308Redemptions (72,294) (6,095) (8,468) (50,525) (14,639) (1,480)
Outstanding units — ending 524,031 306,719 392,006 145,804 32,809 40,240
Series O
June 30, 2014 December 31, 2013
Outstanding units — beginning 4,972,756 —Subscriptions 576,740 4,930,583Reinvestments 37,640 58,723Redemptions (45,628) (16,550)
Outstanding units — ending 5,541,508 4,972,756
Templeton Global Smaller Companies Fund
Series A Series F Series I
June 30, 2014 December 31, 2013 June 30, 2014 December 31, 2013 June 30, 2014 December 31, 2013
Outstanding units — beginning 15,758,849 19,526,917 1,285,486 1,402,393 150,892 106,827Subscriptions 429,934 854,423 135,966 236,166 42,589 61,643Reinvestments — 104,234 — 8,158 — 1,007Redemptions (1,988,083) (4,726,725) (130,432) (361,231) (15,565) (18,585)
Outstanding units — ending 14,200,700 15,758,849 1,291,020 1,285,486 177,916 150,892
Series O
June 30, 2014 December 31, 2013
Outstanding units — beginning 15,337,399 16,464,039Subscriptions 608,319 1,667,820Reinvestments — 97,836Redemptions (3,030,323) (2,892,296)
Outstanding units — ending 12,915,395 15,337,399
Templeton International Stock Fund
Series A Series F Series I
June 30, 2014 December 31, 2013 June 30, 2014 December 31, 2013 June 30, 2014 December 31, 2013
Outstanding units — beginning 32,049,793 38,049,786 933,606 1,129,495 135,433 213,787Subscriptions 682,215 1,138,196 75,643 172,801 30,853 68,477Reinvestments — 299,134 — 8,656 — 2,218Redemptions (2,959,863) (7,437,323) (87,699) (377,346) (63,881) (149,049)
Outstanding units — ending 29,772,145 32,049,793 921,550 933,606 102,405 135,433
344 Franklin Templeton Investments Funds
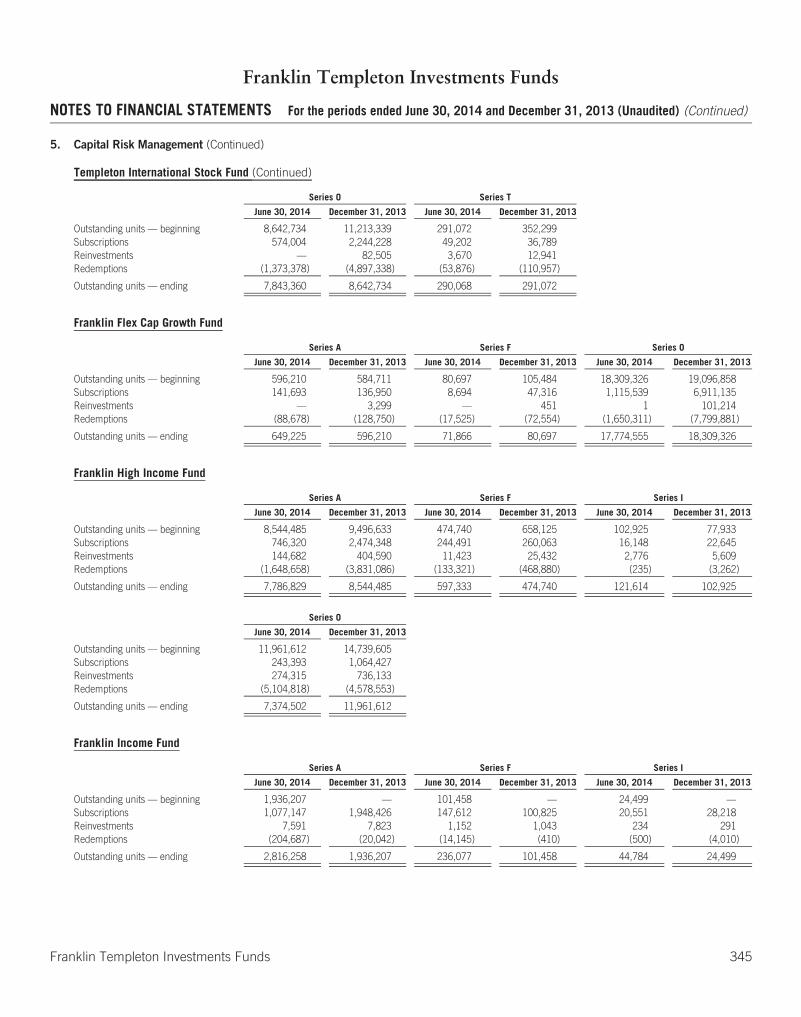
Franklin Templeton Investments Funds
NOTES TO FINANCIAL STATEMENTS For the periods ended June 30, 2014 and December 31, 2013 (Unaudited) (Continued)
5. Capital Risk Management (Continued)
Templeton International Stock Fund (Continued)
Series O Series T
June 30, 2014 December 31, 2013 June 30, 2014 December 31, 2013
Outstanding units — beginning 8,642,734 11,213,339 291,072 352,299Subscriptions 574,004 2,244,228 49,202 36,789Reinvestments — 82,505 3,670 12,941Redemptions (1,373,378) (4,897,338) (53,876) (110,957)
Outstanding units — ending 7,843,360 8,642,734 290,068 291,072
Franklin Flex Cap Growth Fund
Series A Series F Series O
June 30, 2014 December 31, 2013 June 30, 2014 December 31, 2013 June 30, 2014 December 31, 2013
Outstanding units — beginning 596,210 584,711 80,697 105,484 18,309,326 19,096,858Subscriptions 141,693 136,950 8,694 47,316 1,115,539 6,911,135Reinvestments — 3,299 — 451 1 101,214Redemptions (88,678) (128,750) (17,525) (72,554) (1,650,311) (7,799,881)
Outstanding units — ending 649,225 596,210 71,866 80,697 17,774,555 18,309,326
Franklin High Income Fund
Series A Series F Series I
June 30, 2014 December 31, 2013 June 30, 2014 December 31, 2013 June 30, 2014 December 31, 2013
Outstanding units — beginning 8,544,485 9,496,633 474,740 658,125 102,925 77,933Subscriptions 746,320 2,474,348 244,491 260,063 16,148 22,645Reinvestments 144,682 404,590 11,423 25,432 2,776 5,609Redemptions (1,648,658) (3,831,086) (133,321) (468,880) (235) (3,262)
Outstanding units — ending 7,786,829 8,544,485 597,333 474,740 121,614 102,925
Series O
June 30, 2014 December 31, 2013
Outstanding units — beginning 11,961,612 14,739,605Subscriptions 243,393 1,064,427Reinvestments 274,315 736,133Redemptions (5,104,818) (4,578,553)
Outstanding units — ending 7,374,502 11,961,612
Franklin Income Fund
Series A Series F Series I
June 30, 2014 December 31, 2013 June 30, 2014 December 31, 2013 June 30, 2014 December 31, 2013
Outstanding units — beginning 1,936,207 — 101,458 — 24,499 —Subscriptions 1,077,147 1,948,426 147,612 100,825 20,551 28,218Reinvestments 7,591 7,823 1,152 1,043 234 291Redemptions (204,687) (20,042) (14,145) (410) (500) (4,010)
Outstanding units — ending 2,816,258 1,936,207 236,077 101,458 44,784 24,499
Franklin Templeton Investments Funds 345

Franklin Templeton Investments Funds
NOTES TO FINANCIAL STATEMENTS For the periods ended June 30, 2014 and December 31, 2013 (Unaudited) (Continued)
5. Capital Risk Management (Continued)
Franklin Income Fund (Continued)
Series O Series R Series S
June 30, 2014 December 31, 2013 June 30, 2014 December 31, 2013 June 30, 2014 December 31, 2013
Outstanding units — beginning 1,816,722 — 337 — 337 —Subscriptions 1,658,128 1,829,745 — 334 — 334Reinvestments 16,305 20,647 — 3 — 3Redemptions (99,564) (33,670) — — — —
Outstanding units — ending 3,391,591 1,816,722 337 337 337 337
Series T Series T USD
June 30, 2014 December 31, 2013 June 30, 2014 December 31, 2013
Outstanding units — beginning 57,303 — 321 —Subscriptions 32,388 63,696 — 318Reinvestments 250 650 — 3Redemptions (12,224) (7,043) — —
Outstanding units — ending 77,717 57,303 321 321
Franklin Strategic Income FundSeries A Series F Series I
June 30, 2014 December 31, 2013 June 30, 2014 December 31, 2013 June 30, 2014 December 31, 2013
Outstanding units — beginning 7,212,261 6,397,540 1,269,582 683,748 139,596 93,549Subscriptions 870,709 2,804,348 496,350 1,082,739 37,512 112,782Reinvestments 105,902 262,598 23,451 47,230 2,961 5,869Redemptions (1,339,366) (2,252,225) (210,428) (544,135) (7,605) (72,604)
Outstanding units — ending 6,849,506 7,212,261 1,578,955 1,269,582 172,464 139,596
Series O
June 30, 2014 December 31, 2013
Outstanding units — beginning 53,689,112 57,311,747Subscriptions 1,628,254 9,078,676Reinvestments 1,040,742 2,603,819Redemptions (8,502,212) (15,305,130)
Outstanding units — ending 47,855,896 53,689,112
Franklin U.S. Core Equity Fund
Series A Series F Series O
June 30, 2014 December 31, 2013 June 30, 2014 December 31, 2013 June 30, 2014 December 31, 2013
Outstanding units — beginning 551,862 333,465 49,464 27,490 16,299,498 17,573,063Subscriptions 160,568 319,592 31,170 31,064 5,690,854 6,427,845Reinvestments — 6,162 — 563 — 179,541Redemptions (134,791) (107,357) (2,180) (9,653) (1,186,773) (7,880,951)
Outstanding units — ending 577,639 551,862 78,454 49,464 20,803,579 16,299,498
346 Franklin Templeton Investments Funds
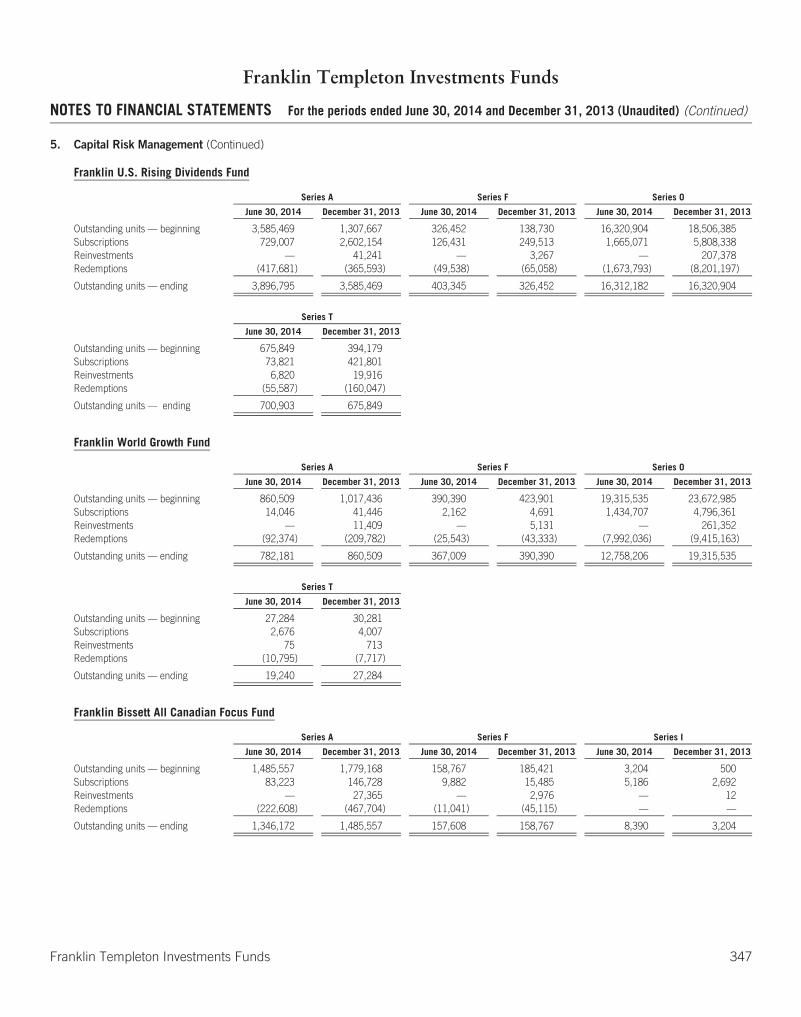
Franklin Templeton Investments Funds
NOTES TO FINANCIAL STATEMENTS For the periods ended June 30, 2014 and December 31, 2013 (Unaudited) (Continued)
5. Capital Risk Management (Continued)
Franklin U.S. Rising Dividends Fund
Series A Series F Series O
June 30, 2014 December 31, 2013 June 30, 2014 December 31, 2013 June 30, 2014 December 31, 2013
Outstanding units — beginning 3,585,469 1,307,667 326,452 138,730 16,320,904 18,506,385Subscriptions 729,007 2,602,154 126,431 249,513 1,665,071 5,808,338Reinvestments — 41,241 — 3,267 — 207,378Redemptions (417,681) (365,593) (49,538) (65,058) (1,673,793) (8,201,197)
Outstanding units — ending 3,896,795 3,585,469 403,345 326,452 16,312,182 16,320,904
Series T
June 30, 2014 December 31, 2013
Outstanding units — beginning 675,849 394,179Subscriptions 73,821 421,801Reinvestments 6,820 19,916Redemptions (55,587) (160,047)
Outstanding units — ending 700,903 675,849
Franklin World Growth Fund
Series A Series F Series O
June 30, 2014 December 31, 2013 June 30, 2014 December 31, 2013 June 30, 2014 December 31, 2013
Outstanding units — beginning 860,509 1,017,436 390,390 423,901 19,315,535 23,672,985Subscriptions 14,046 41,446 2,162 4,691 1,434,707 4,796,361Reinvestments — 11,409 — 5,131 — 261,352Redemptions (92,374) (209,782) (25,543) (43,333) (7,992,036) (9,415,163)
Outstanding units — ending 782,181 860,509 367,009 390,390 12,758,206 19,315,535
Series T
June 30, 2014 December 31, 2013
Outstanding units — beginning 27,284 30,281Subscriptions 2,676 4,007Reinvestments 75 713Redemptions (10,795) (7,717)
Outstanding units — ending 19,240 27,284
Franklin Bissett All Canadian Focus Fund
Series A Series F Series I
June 30, 2014 December 31, 2013 June 30, 2014 December 31, 2013 June 30, 2014 December 31, 2013
Outstanding units — beginning 1,485,557 1,779,168 158,767 185,421 3,204 500Subscriptions 83,223 146,728 9,882 15,485 5,186 2,692Reinvestments — 27,365 — 2,976 — 12Redemptions (222,608) (467,704) (11,041) (45,115) — —
Outstanding units — ending 1,346,172 1,485,557 157,608 158,767 8,390 3,204
Franklin Templeton Investments Funds 347
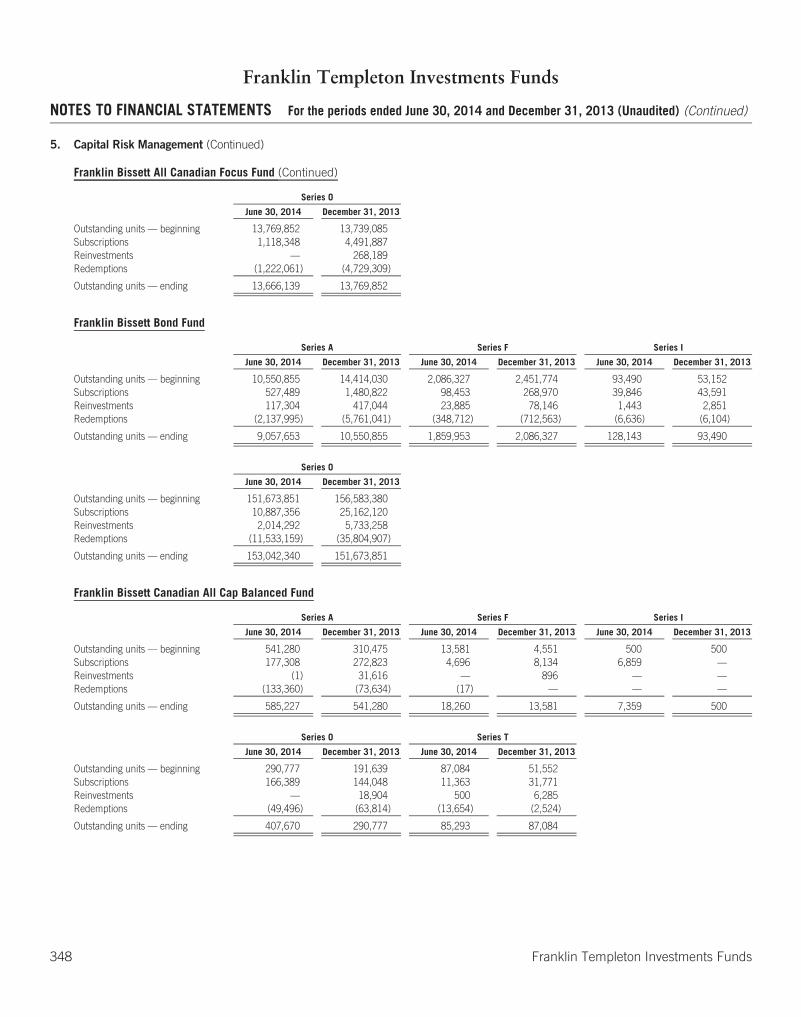
Franklin Templeton Investments Funds
NOTES TO FINANCIAL STATEMENTS For the periods ended June 30, 2014 and December 31, 2013 (Unaudited) (Continued)
5. Capital Risk Management (Continued)
Franklin Bissett All Canadian Focus Fund (Continued)
Series O
June 30, 2014 December 31, 2013
Outstanding units — beginning 13,769,852 13,739,085Subscriptions 1,118,348 4,491,887Reinvestments — 268,189Redemptions (1,222,061) (4,729,309)
Outstanding units — ending 13,666,139 13,769,852
Franklin Bissett Bond Fund
Series A Series F Series I
June 30, 2014 December 31, 2013 June 30, 2014 December 31, 2013 June 30, 2014 December 31, 2013
Outstanding units — beginning 10,550,855 14,414,030 2,086,327 2,451,774 93,490 53,152Subscriptions 527,489 1,480,822 98,453 268,970 39,846 43,591Reinvestments 117,304 417,044 23,885 78,146 1,443 2,851Redemptions (2,137,995) (5,761,041) (348,712) (712,563) (6,636) (6,104)
Outstanding units — ending 9,057,653 10,550,855 1,859,953 2,086,327 128,143 93,490
Series O
June 30, 2014 December 31, 2013
Outstanding units — beginning 151,673,851 156,583,380Subscriptions 10,887,356 25,162,120Reinvestments 2,014,292 5,733,258Redemptions (11,533,159) (35,804,907)
Outstanding units — ending 153,042,340 151,673,851
Franklin Bissett Canadian All Cap Balanced Fund
Series A Series F Series I
June 30, 2014 December 31, 2013 June 30, 2014 December 31, 2013 June 30, 2014 December 31, 2013
Outstanding units — beginning 541,280 310,475 13,581 4,551 500 500Subscriptions 177,308 272,823 4,696 8,134 6,859 —Reinvestments (1) 31,616 — 896 — —Redemptions (133,360) (73,634) (17) — — —
Outstanding units — ending 585,227 541,280 18,260 13,581 7,359 500
Series O Series T
June 30, 2014 December 31, 2013 June 30, 2014 December 31, 2013
Outstanding units — beginning 290,777 191,639 87,084 51,552Subscriptions 166,389 144,048 11,363 31,771Reinvestments — 18,904 500 6,285Redemptions (49,496) (63,814) (13,654) (2,524)
Outstanding units — ending 407,670 290,777 85,293 87,084
348 Franklin Templeton Investments Funds
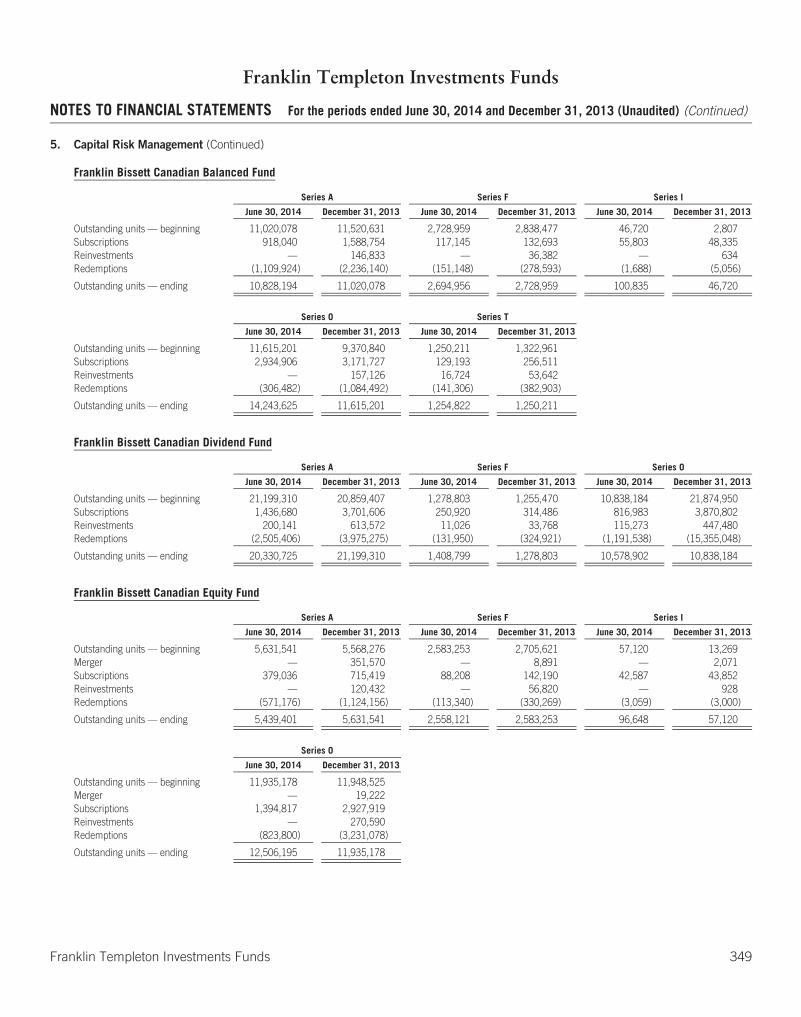
Franklin Templeton Investments Funds
NOTES TO FINANCIAL STATEMENTS For the periods ended June 30, 2014 and December 31, 2013 (Unaudited) (Continued)
5. Capital Risk Management (Continued)
Franklin Bissett Canadian Balanced Fund
Series A Series F Series I
June 30, 2014 December 31, 2013 June 30, 2014 December 31, 2013 June 30, 2014 December 31, 2013
Outstanding units — beginning 11,020,078 11,520,631 2,728,959 2,838,477 46,720 2,807Subscriptions 918,040 1,588,754 117,145 132,693 55,803 48,335Reinvestments — 146,833 — 36,382 — 634Redemptions (1,109,924) (2,236,140) (151,148) (278,593) (1,688) (5,056)
Outstanding units — ending 10,828,194 11,020,078 2,694,956 2,728,959 100,835 46,720
Series O Series T
June 30, 2014 December 31, 2013 June 30, 2014 December 31, 2013
Outstanding units — beginning 11,615,201 9,370,840 1,250,211 1,322,961Subscriptions 2,934,906 3,171,727 129,193 256,511Reinvestments — 157,126 16,724 53,642Redemptions (306,482) (1,084,492) (141,306) (382,903)
Outstanding units — ending 14,243,625 11,615,201 1,254,822 1,250,211
Franklin Bissett Canadian Dividend Fund
Series A Series F Series O
June 30, 2014 December 31, 2013 June 30, 2014 December 31, 2013 June 30, 2014 December 31, 2013
Outstanding units — beginning 21,199,310 20,859,407 1,278,803 1,255,470 10,838,184 21,874,950Subscriptions 1,436,680 3,701,606 250,920 314,486 816,983 3,870,802Reinvestments 200,141 613,572 11,026 33,768 115,273 447,480Redemptions (2,505,406) (3,975,275) (131,950) (324,921) (1,191,538) (15,355,048)
Outstanding units — ending 20,330,725 21,199,310 1,408,799 1,278,803 10,578,902 10,838,184
Franklin Bissett Canadian Equity Fund
Series A Series F Series I
June 30, 2014 December 31, 2013 June 30, 2014 December 31, 2013 June 30, 2014 December 31, 2013
Outstanding units — beginning 5,631,541 5,568,276 2,583,253 2,705,621 57,120 13,269Merger — 351,570 — 8,891 — 2,071Subscriptions 379,036 715,419 88,208 142,190 42,587 43,852Reinvestments — 120,432 — 56,820 — 928Redemptions (571,176) (1,124,156) (113,340) (330,269) (3,059) (3,000)
Outstanding units — ending 5,439,401 5,631,541 2,558,121 2,583,253 96,648 57,120
Series O
June 30, 2014 December 31, 2013
Outstanding units — beginning 11,935,178 11,948,525Merger — 19,222Subscriptions 1,394,817 2,927,919Reinvestments — 270,590Redemptions (823,800) (3,231,078)
Outstanding units — ending 12,506,195 11,935,178
Franklin Templeton Investments Funds 349
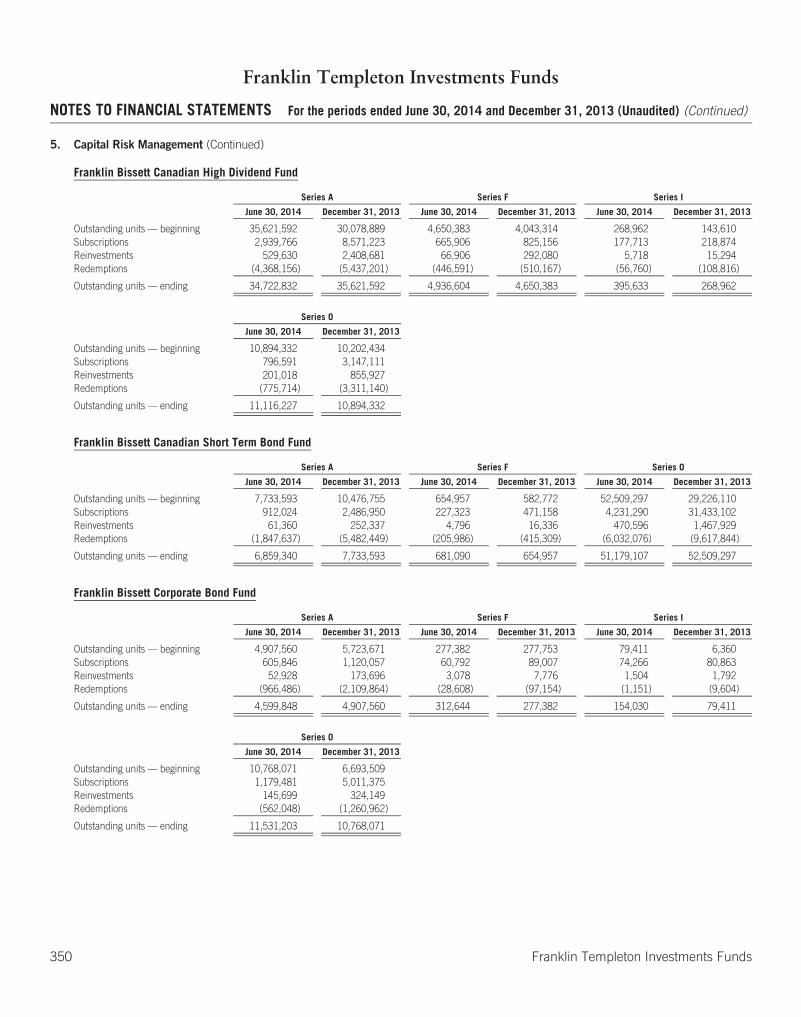
Franklin Templeton Investments Funds
NOTES TO FINANCIAL STATEMENTS For the periods ended June 30, 2014 and December 31, 2013 (Unaudited) (Continued)
5. Capital Risk Management (Continued)
Franklin Bissett Canadian High Dividend Fund
Series A Series F Series I
June 30, 2014 December 31, 2013 June 30, 2014 December 31, 2013 June 30, 2014 December 31, 2013
Outstanding units — beginning 35,621,592 30,078,889 4,650,383 4,043,314 268,962 143,610Subscriptions 2,939,766 8,571,223 665,906 825,156 177,713 218,874Reinvestments 529,630 2,408,681 66,906 292,080 5,718 15,294Redemptions (4,368,156) (5,437,201) (446,591) (510,167) (56,760) (108,816)
Outstanding units — ending 34,722,832 35,621,592 4,936,604 4,650,383 395,633 268,962
Series O
June 30, 2014 December 31, 2013
Outstanding units — beginning 10,894,332 10,202,434Subscriptions 796,591 3,147,111Reinvestments 201,018 855,927Redemptions (775,714) (3,311,140)
Outstanding units — ending 11,116,227 10,894,332
Franklin Bissett Canadian Short Term Bond Fund
Series A Series F Series O
June 30, 2014 December 31, 2013 June 30, 2014 December 31, 2013 June 30, 2014 December 31, 2013
Outstanding units — beginning 7,733,593 10,476,755 654,957 582,772 52,509,297 29,226,110Subscriptions 912,024 2,486,950 227,323 471,158 4,231,290 31,433,102Reinvestments 61,360 252,337 4,796 16,336 470,596 1,467,929Redemptions (1,847,637) (5,482,449) (205,986) (415,309) (6,032,076) (9,617,844)
Outstanding units — ending 6,859,340 7,733,593 681,090 654,957 51,179,107 52,509,297
Franklin Bissett Corporate Bond Fund
Series A Series F Series I
June 30, 2014 December 31, 2013 June 30, 2014 December 31, 2013 June 30, 2014 December 31, 2013
Outstanding units — beginning 4,907,560 5,723,671 277,382 277,753 79,411 6,360Subscriptions 605,846 1,120,057 60,792 89,007 74,266 80,863Reinvestments 52,928 173,696 3,078 7,776 1,504 1,792Redemptions (966,486) (2,109,864) (28,608) (97,154) (1,151) (9,604)
Outstanding units — ending 4,599,848 4,907,560 312,644 277,382 154,030 79,411
Series O
June 30, 2014 December 31, 2013
Outstanding units — beginning 10,768,071 6,693,509Subscriptions 1,179,481 5,011,375Reinvestments 145,699 324,149Redemptions (562,048) (1,260,962)
Outstanding units — ending 11,531,203 10,768,071
350 Franklin Templeton Investments Funds
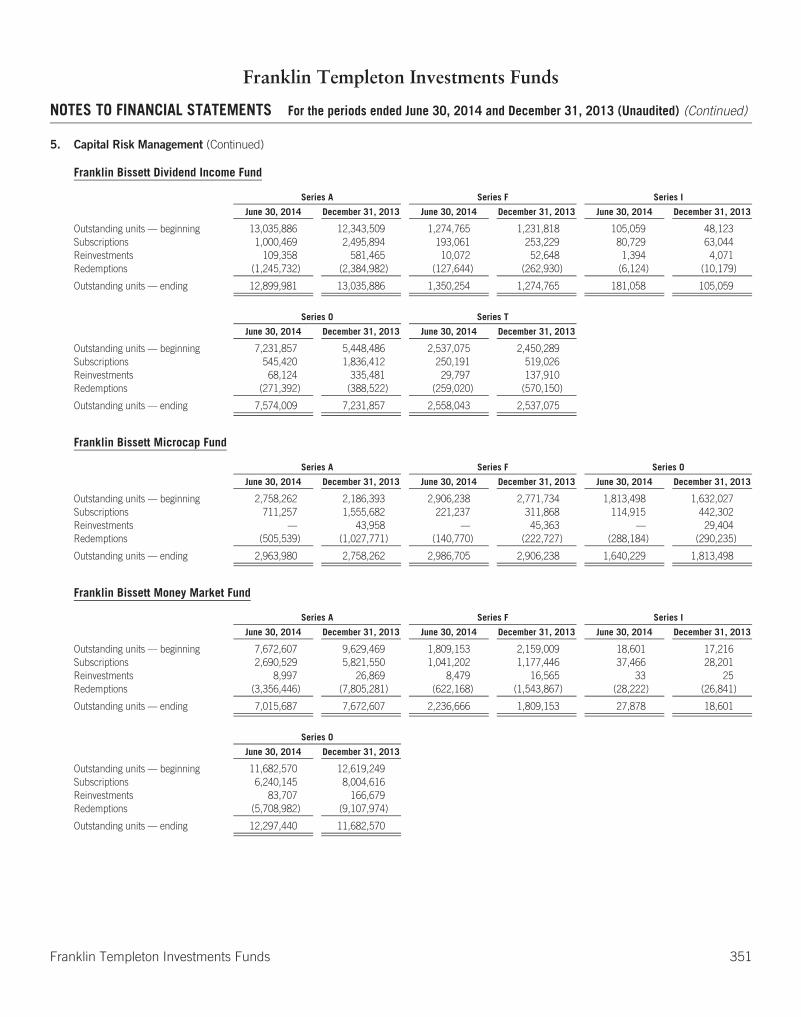
Franklin Templeton Investments Funds
NOTES TO FINANCIAL STATEMENTS For the periods ended June 30, 2014 and December 31, 2013 (Unaudited) (Continued)
5. Capital Risk Management (Continued)
Franklin Bissett Dividend Income Fund
Series A Series F Series I
June 30, 2014 December 31, 2013 June 30, 2014 December 31, 2013 June 30, 2014 December 31, 2013
Outstanding units — beginning 13,035,886 12,343,509 1,274,765 1,231,818 105,059 48,123Subscriptions 1,000,469 2,495,894 193,061 253,229 80,729 63,044Reinvestments 109,358 581,465 10,072 52,648 1,394 4,071Redemptions (1,245,732) (2,384,982) (127,644) (262,930) (6,124) (10,179)
Outstanding units — ending 12,899,981 13,035,886 1,350,254 1,274,765 181,058 105,059
Series O Series T
June 30, 2014 December 31, 2013 June 30, 2014 December 31, 2013
Outstanding units — beginning 7,231,857 5,448,486 2,537,075 2,450,289Subscriptions 545,420 1,836,412 250,191 519,026Reinvestments 68,124 335,481 29,797 137,910Redemptions (271,392) (388,522) (259,020) (570,150)
Outstanding units — ending 7,574,009 7,231,857 2,558,043 2,537,075
Franklin Bissett Microcap Fund
Series A Series F Series O
June 30, 2014 December 31, 2013 June 30, 2014 December 31, 2013 June 30, 2014 December 31, 2013
Outstanding units — beginning 2,758,262 2,186,393 2,906,238 2,771,734 1,813,498 1,632,027Subscriptions 711,257 1,555,682 221,237 311,868 114,915 442,302Reinvestments — 43,958 — 45,363 — 29,404Redemptions (505,539) (1,027,771) (140,770) (222,727) (288,184) (290,235)
Outstanding units — ending 2,963,980 2,758,262 2,986,705 2,906,238 1,640,229 1,813,498
Franklin Bissett Money Market Fund
Series A Series F Series I
June 30, 2014 December 31, 2013 June 30, 2014 December 31, 2013 June 30, 2014 December 31, 2013
Outstanding units — beginning 7,672,607 9,629,469 1,809,153 2,159,009 18,601 17,216Subscriptions 2,690,529 5,821,550 1,041,202 1,177,446 37,466 28,201Reinvestments 8,997 26,869 8,479 16,565 33 25Redemptions (3,356,446) (7,805,281) (622,168) (1,543,867) (28,222) (26,841)
Outstanding units — ending 7,015,687 7,672,607 2,236,666 1,809,153 27,878 18,601
Series O
June 30, 2014 December 31, 2013
Outstanding units — beginning 11,682,570 12,619,249Subscriptions 6,240,145 8,004,616Reinvestments 83,707 166,679Redemptions (5,708,982) (9,107,974)
Outstanding units — ending 12,297,440 11,682,570
Franklin Templeton Investments Funds 351
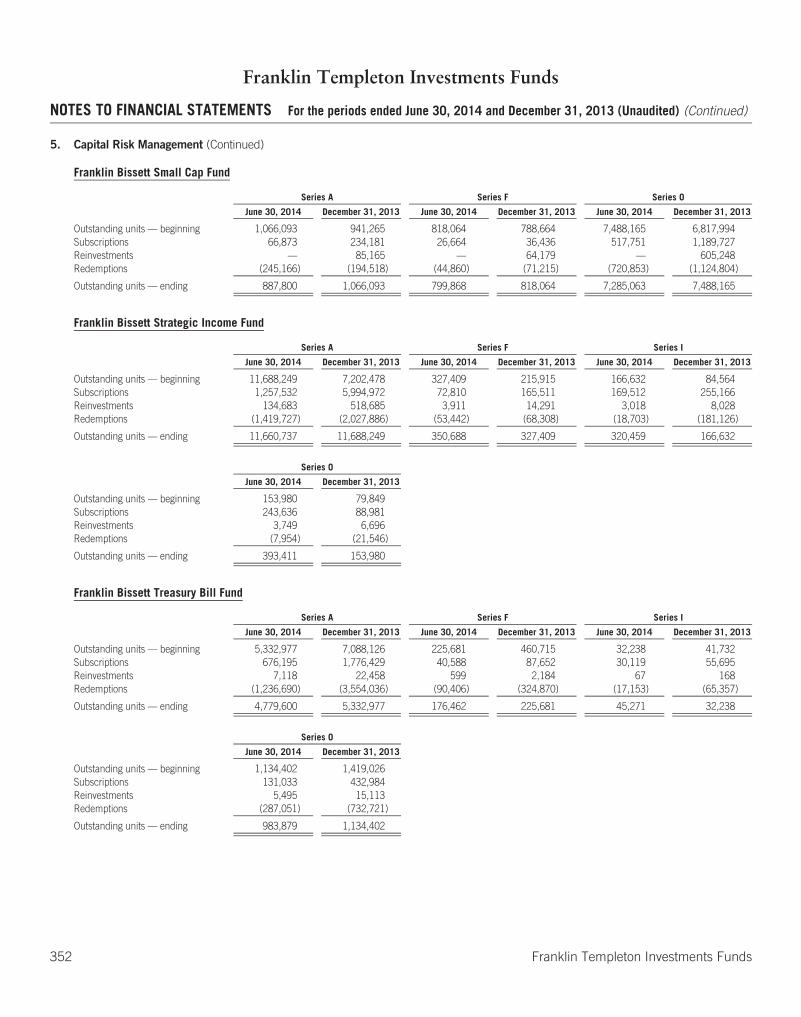
Franklin Templeton Investments Funds
NOTES TO FINANCIAL STATEMENTS For the periods ended June 30, 2014 and December 31, 2013 (Unaudited) (Continued)
5. Capital Risk Management (Continued)
Franklin Bissett Small Cap Fund
Series A Series F Series O
June 30, 2014 December 31, 2013 June 30, 2014 December 31, 2013 June 30, 2014 December 31, 2013
Outstanding units — beginning 1,066,093 941,265 818,064 788,664 7,488,165 6,817,994Subscriptions 66,873 234,181 26,664 36,436 517,751 1,189,727Reinvestments — 85,165 — 64,179 — 605,248Redemptions (245,166) (194,518) (44,860) (71,215) (720,853) (1,124,804)
Outstanding units — ending 887,800 1,066,093 799,868 818,064 7,285,063 7,488,165
Franklin Bissett Strategic Income Fund
Series A Series F Series I
June 30, 2014 December 31, 2013 June 30, 2014 December 31, 2013 June 30, 2014 December 31, 2013
Outstanding units — beginning 11,688,249 7,202,478 327,409 215,915 166,632 84,564Subscriptions 1,257,532 5,994,972 72,810 165,511 169,512 255,166Reinvestments 134,683 518,685 3,911 14,291 3,018 8,028Redemptions (1,419,727) (2,027,886) (53,442) (68,308) (18,703) (181,126)
Outstanding units — ending 11,660,737 11,688,249 350,688 327,409 320,459 166,632
Series O
June 30, 2014 December 31, 2013
Outstanding units — beginning 153,980 79,849Subscriptions 243,636 88,981Reinvestments 3,749 6,696Redemptions (7,954) (21,546)
Outstanding units — ending 393,411 153,980
Franklin Bissett Treasury Bill Fund
Series A Series F Series I
June 30, 2014 December 31, 2013 June 30, 2014 December 31, 2013 June 30, 2014 December 31, 2013
Outstanding units — beginning 5,332,977 7,088,126 225,681 460,715 32,238 41,732Subscriptions 676,195 1,776,429 40,588 87,652 30,119 55,695Reinvestments 7,118 22,458 599 2,184 67 168Redemptions (1,236,690) (3,554,036) (90,406) (324,870) (17,153) (65,357)
Outstanding units — ending 4,779,600 5,332,977 176,462 225,681 45,271 32,238
Series O
June 30, 2014 December 31, 2013
Outstanding units — beginning 1,134,402 1,419,026Subscriptions 131,033 432,984Reinvestments 5,495 15,113Redemptions (287,051) (732,721)
Outstanding units — ending 983,879 1,134,402
352 Franklin Templeton Investments Funds
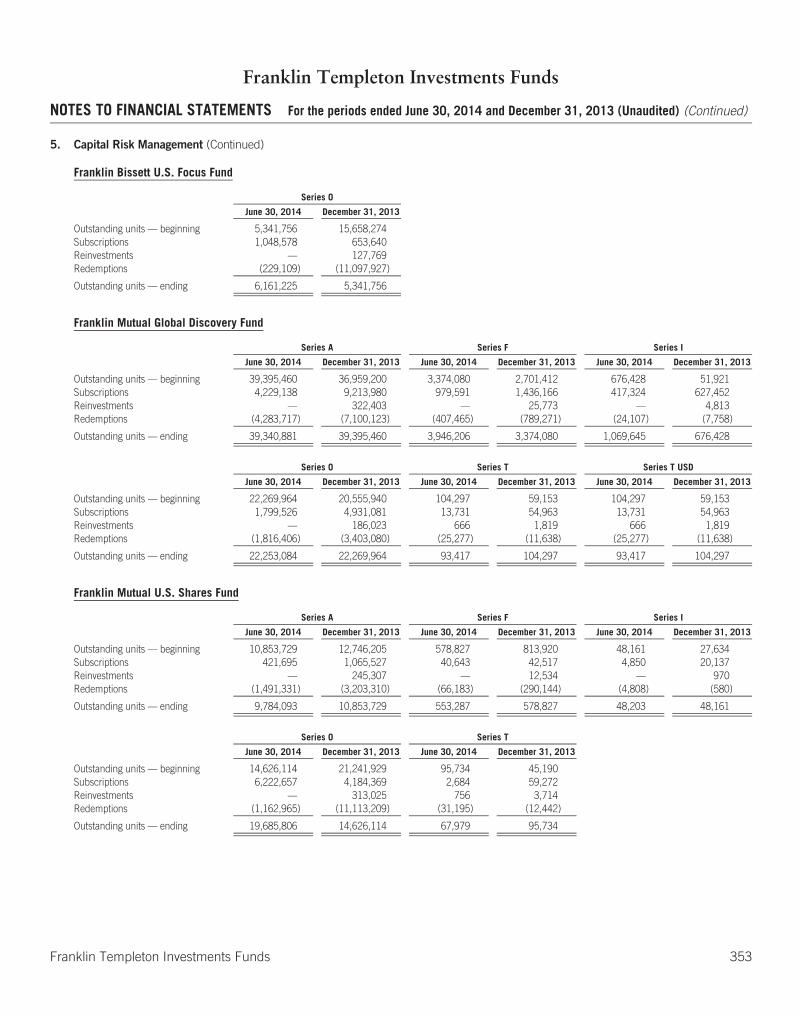
Franklin Templeton Investments Funds
NOTES TO FINANCIAL STATEMENTS For the periods ended June 30, 2014 and December 31, 2013 (Unaudited) (Continued)
5. Capital Risk Management (Continued)
Franklin Bissett U.S. Focus Fund
Series O
June 30, 2014 December 31, 2013
Outstanding units — beginning 5,341,756 15,658,274Subscriptions 1,048,578 653,640Reinvestments — 127,769Redemptions (229,109) (11,097,927)
Outstanding units — ending 6,161,225 5,341,756
Franklin Mutual Global Discovery Fund
Series A Series F Series I
June 30, 2014 December 31, 2013 June 30, 2014 December 31, 2013 June 30, 2014 December 31, 2013
Outstanding units — beginning 39,395,460 36,959,200 3,374,080 2,701,412 676,428 51,921Subscriptions 4,229,138 9,213,980 979,591 1,436,166 417,324 627,452Reinvestments — 322,403 — 25,773 — 4,813Redemptions (4,283,717) (7,100,123) (407,465) (789,271) (24,107) (7,758)
Outstanding units — ending 39,340,881 39,395,460 3,946,206 3,374,080 1,069,645 676,428
Series O Series T Series T USD
June 30, 2014 December 31, 2013 June 30, 2014 December 31, 2013 June 30, 2014 December 31, 2013
Outstanding units — beginning 22,269,964 20,555,940 104,297 59,153 104,297 59,153Subscriptions 1,799,526 4,931,081 13,731 54,963 13,731 54,963Reinvestments — 186,023 666 1,819 666 1,819Redemptions (1,816,406) (3,403,080) (25,277) (11,638) (25,277) (11,638)
Outstanding units — ending 22,253,084 22,269,964 93,417 104,297 93,417 104,297
Franklin Mutual U.S. Shares Fund
Series A Series F Series I
June 30, 2014 December 31, 2013 June 30, 2014 December 31, 2013 June 30, 2014 December 31, 2013
Outstanding units — beginning 10,853,729 12,746,205 578,827 813,920 48,161 27,634Subscriptions 421,695 1,065,527 40,643 42,517 4,850 20,137Reinvestments — 245,307 — 12,534 — 970Redemptions (1,491,331) (3,203,310) (66,183) (290,144) (4,808) (580)
Outstanding units — ending 9,784,093 10,853,729 553,287 578,827 48,203 48,161
Series O Series T
June 30, 2014 December 31, 2013 June 30, 2014 December 31, 2013
Outstanding units — beginning 14,626,114 21,241,929 95,734 45,190Subscriptions 6,222,657 4,184,369 2,684 59,272Reinvestments — 313,025 756 3,714Redemptions (1,162,965) (11,113,209) (31,195) (12,442)
Outstanding units — ending 19,685,806 14,626,114 67,979 95,734
Franklin Templeton Investments Funds 353

Franklin Templeton Investments Funds
NOTES TO FINANCIAL STATEMENTS For the periods ended June 30, 2014 and December 31, 2013 (Unaudited) (Continued)
5. Capital Risk Management (Continued)
Franklin Templeton Canadian Core Equity Fund
Series O
June 30, 2014 December 31, 2013
Outstanding units — beginning 15,019,000 27,554,867Subscriptions 343,932 2,664,457Reinvestments — 432,227Redemptions (2,328,252) (15,632,551)
Outstanding units — ending 13,034,680 15,019,000
Franklin Templeton Canadian Large Cap Fund
Series O
June 30, 2014 December 31, 2013
Outstanding units — beginning 22,192,683 27,846,422Subscriptions 230,286 4,956,647Reinvestments — 754,921Redemptions (8,333,798) (11,365,307)
Outstanding units — ending 14,089,171 22,192,683
6. Related Party Transactions
The Manager is the trustee, a principal distributor, registrar and transfer agent of the Funds. The Manager and or its affiliates provides orarranges for the provision of all management and administrative services for day-to-day Fund operations, including marketing, promotionand distribution of the Fund, portfolio advisory services and the provision of key management personnel to the Funds. The followingarrangements with the Manager and/or its affiliates are considered related party transactions.
(a) Investment advisory and management fees
Each Fund pays an aggregate monthly fee for management and investment advisory services to various wholly-owned subsidiaries of FRI.Management fees payable at the period ends are shown in the Statement of Financial Position of each Fund. The monthly fee is calculatedas 1/12 of the annual rate applied against the monthly average net assets of each series. The annual rates are set out below.
Series A Series F Series I Series S Series T†
Templeton Canadian Balanced Fund . . . . . . . . . . 2.00% 1.00% — — 2.00%Templeton Canadian Stock Fund . . . . . . . . . . . . . . 2.00% 1.00% — — —Templeton EAFE Developed Markets Fund . . . . . . 2.00% 1.00% — — —Templeton Emerging Markets Fund . . . . . . . . . . . . 2.25% 1.25% 1.75% — —Templeton Global Balanced Fund . . . . . . . . . . . . . 1.85% 0.85% — 0.85% 1.85%Templeton Global Bond Fund . . . . . . . . . . . . . . . . 1.75% 0.75% 1.15% — —Templeton Global Bond Fund (Hedged) . . . . . . . . 1.75% 0.75% 1.15% — —Templeton Global Smaller Companies Fund . . . . . 2.00% 1.00% 1.25% — —Templeton International Stock Fund . . . . . . . . . . . 2.00% 1.00% 1.30% — 2.00%Franklin Flex Cap Growth Fund . . . . . . . . . . . . . . . 2.00% 1.00% — — —Franklin High Income Fund . . . . . . . . . . . . . . . . . . 1.65% 0.75% 1.15% — —Franklin Income Fund . . . . . . . . . . . . . . . . . . . . . . 1.85% 0.85% 1.40% 0.85% 1.85%Franklin Strategic Income Fund . . . . . . . . . . . . . . . 1.65% 0.75% 1.15% — —Franklin U.S. Core Equity Fund . . . . . . . . . . . . . . . 2.00% 1.00% — — —Franklin U.S. Rising Dividends Fund . . . . . . . . . . . 2.00% 1.00% — — 2.00%Franklin World Growth Fund . . . . . . . . . . . . . . . . . 2.00% 1.00% — — 2.00%Franklin Bissett All Canadian Focus Fund . . . . . . . 2.00% 1.00% 1.40% — —Franklin Bissett Bond Fund . . . . . . . . . . . . . . . . . . 1.30% 0.70% 0.95% — —Franklin Bissett Canadian All Cap Balanced
Fund . . . . . . . . . . . . . . . . . . . . . . . . . . . . . . . . . . 1.90% 0.90% 1.35% — 1.90%Franklin Bissett Canadian Balanced Fund . . . . . . 1.85% 0.85% 1.35% — 1.85%Franklin Bissett Canadian Dividend Fund . . . . . . . 1.90% 0.90% — — —
354 Franklin Templeton Investments Funds
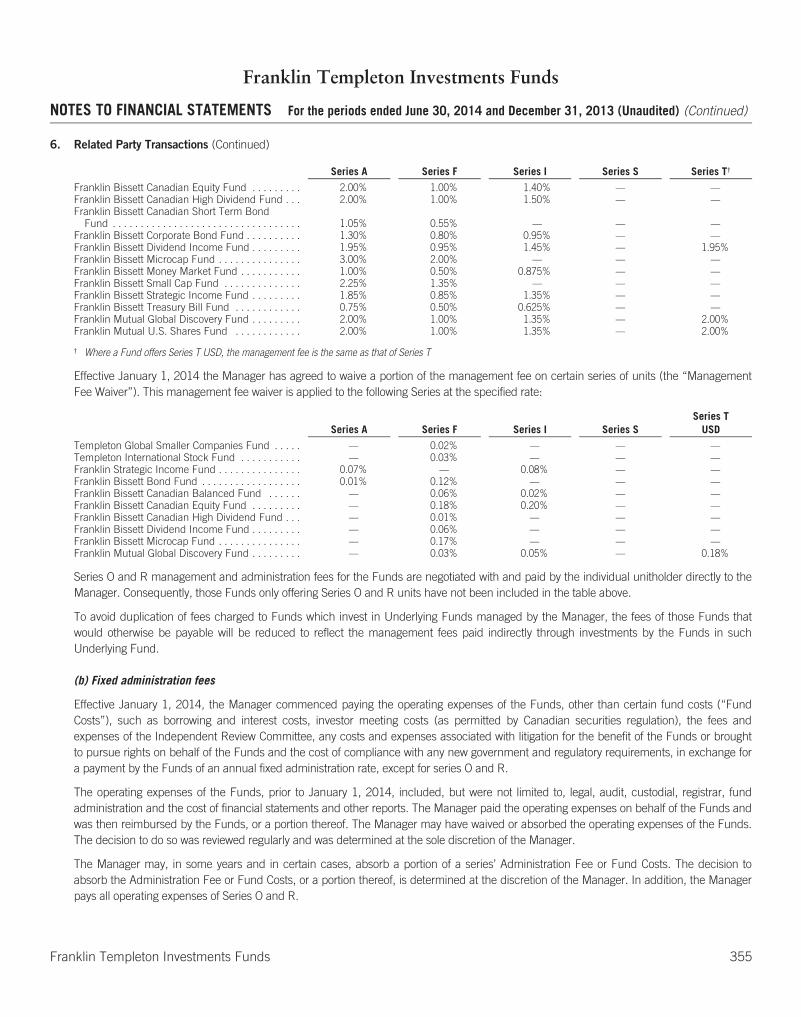
Franklin Templeton Investments Funds
NOTES TO FINANCIAL STATEMENTS For the periods ended June 30, 2014 and December 31, 2013 (Unaudited) (Continued)
6. Related Party Transactions (Continued)
Series A Series F Series I Series S Series T†
Franklin Bissett Canadian Equity Fund . . . . . . . . . 2.00% 1.00% 1.40% — —Franklin Bissett Canadian High Dividend Fund . . . 2.00% 1.00% 1.50% — —Franklin Bissett Canadian Short Term Bond
Fund . . . . . . . . . . . . . . . . . . . . . . . . . . . . . . . . . . 1.05% 0.55% — — —Franklin Bissett Corporate Bond Fund . . . . . . . . . . 1.30% 0.80% 0.95% — —Franklin Bissett Dividend Income Fund . . . . . . . . . 1.95% 0.95% 1.45% — 1.95%Franklin Bissett Microcap Fund . . . . . . . . . . . . . . . 3.00% 2.00% — — —Franklin Bissett Money Market Fund . . . . . . . . . . . 1.00% 0.50% 0.875% — —Franklin Bissett Small Cap Fund . . . . . . . . . . . . . . 2.25% 1.35% — — —Franklin Bissett Strategic Income Fund . . . . . . . . . 1.85% 0.85% 1.35% — —Franklin Bissett Treasury Bill Fund . . . . . . . . . . . . 0.75% 0.50% 0.625% — —Franklin Mutual Global Discovery Fund . . . . . . . . . 2.00% 1.00% 1.35% — 2.00%Franklin Mutual U.S. Shares Fund . . . . . . . . . . . . 2.00% 1.00% 1.35% — 2.00%
† Where a Fund offers Series T USD, the management fee is the same as that of Series T
Effective January 1, 2014 the Manager has agreed to waive a portion of the management fee on certain series of units (the “ManagementFee Waiver”). This management fee waiver is applied to the following Series at the specified rate:
Series A Series F Series I Series SSeries T
USD
Templeton Global Smaller Companies Fund . . . . . — 0.02% — — —Templeton International Stock Fund . . . . . . . . . . . — 0.03% — — —Franklin Strategic Income Fund . . . . . . . . . . . . . . . 0.07% — 0.08% — —Franklin Bissett Bond Fund . . . . . . . . . . . . . . . . . . 0.01% 0.12% — — —Franklin Bissett Canadian Balanced Fund . . . . . . — 0.06% 0.02% — —Franklin Bissett Canadian Equity Fund . . . . . . . . . — 0.18% 0.20% — —Franklin Bissett Canadian High Dividend Fund . . . — 0.01% — — —Franklin Bissett Dividend Income Fund . . . . . . . . . — 0.06% — — —Franklin Bissett Microcap Fund . . . . . . . . . . . . . . . — 0.17% — — —Franklin Mutual Global Discovery Fund . . . . . . . . . — 0.03% 0.05% — 0.18%
Series O and R management and administration fees for the Funds are negotiated with and paid by the individual unitholder directly to theManager. Consequently, those Funds only offering Series O and R units have not been included in the table above.
To avoid duplication of fees charged to Funds which invest in Underlying Funds managed by the Manager, the fees of those Funds thatwould otherwise be payable will be reduced to reflect the management fees paid indirectly through investments by the Funds in suchUnderlying Fund.
(b) Fixed administration fees
Effective January 1, 2014, the Manager commenced paying the operating expenses of the Funds, other than certain fund costs (“FundCosts”), such as borrowing and interest costs, investor meeting costs (as permitted by Canadian securities regulation), the fees andexpenses of the Independent Review Committee, any costs and expenses associated with litigation for the benefit of the Funds or broughtto pursue rights on behalf of the Funds and the cost of compliance with any new government and regulatory requirements, in exchange fora payment by the Funds of an annual fixed administration rate, except for series O and R.
The operating expenses of the Funds, prior to January 1, 2014, included, but were not limited to, legal, audit, custodial, registrar, fundadministration and the cost of financial statements and other reports. The Manager paid the operating expenses on behalf of the Funds andwas then reimbursed by the Funds, or a portion thereof. The Manager may have waived or absorbed the operating expenses of the Funds.The decision to do so was reviewed regularly and was determined at the sole discretion of the Manager.
The Manager may, in some years and in certain cases, absorb a portion of a series’ Administration Fee or Fund Costs. The decision toabsorb the Administration Fee or Fund Costs, or a portion thereof, is determined at the discretion of the Manager. In addition, the Managerpays all operating expenses of Series O and R.
Franklin Templeton Investments Funds 355
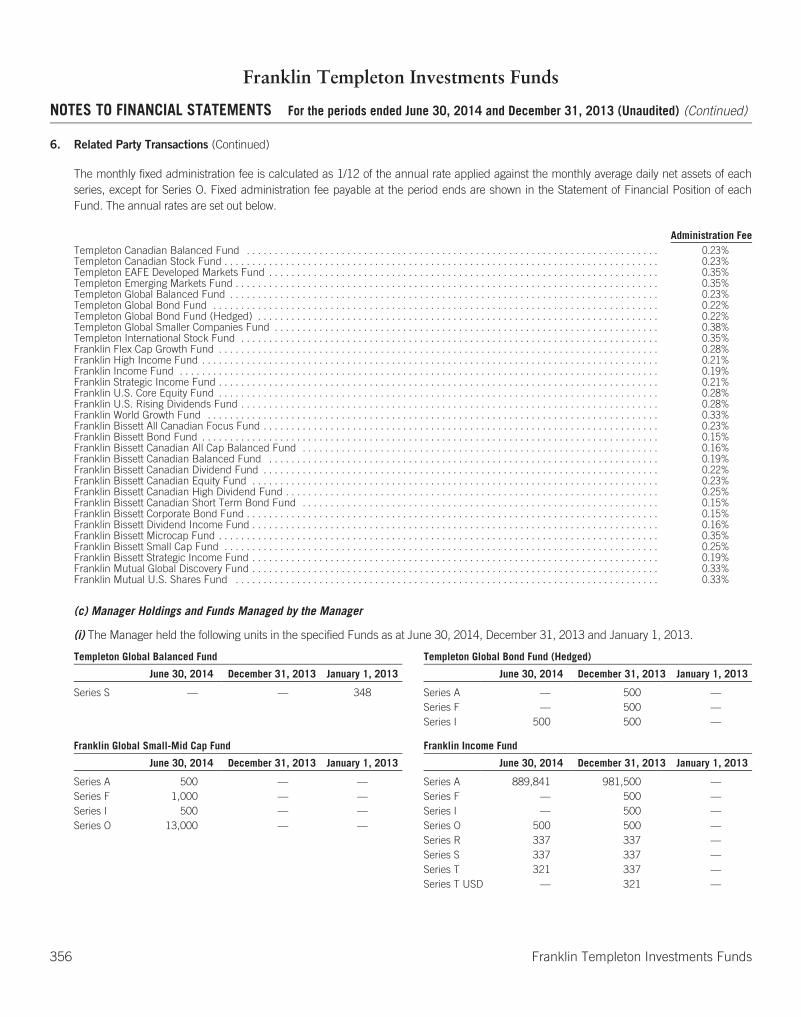
Franklin Templeton Investments Funds
NOTES TO FINANCIAL STATEMENTS For the periods ended June 30, 2014 and December 31, 2013 (Unaudited) (Continued)
6. Related Party Transactions (Continued)
The monthly fixed administration fee is calculated as 1/12 of the annual rate applied against the monthly average daily net assets of eachseries, except for Series O. Fixed administration fee payable at the period ends are shown in the Statement of Financial Position of eachFund. The annual rates are set out below.
Administration FeeTempleton Canadian Balanced Fund . . . . . . . . . . . . . . . . . . . . . . . . . . . . . . . . . . . . . . . . . . . . . . . . . . . . . . . . . . . . . . . . . . . . . . . . . . 0.23%Templeton Canadian Stock Fund . . . . . . . . . . . . . . . . . . . . . . . . . . . . . . . . . . . . . . . . . . . . . . . . . . . . . . . . . . . . . . . . . . . . . . . . . . . . . . 0.23%Templeton EAFE Developed Markets Fund . . . . . . . . . . . . . . . . . . . . . . . . . . . . . . . . . . . . . . . . . . . . . . . . . . . . . . . . . . . . . . . . . . . . . . 0.35%Templeton Emerging Markets Fund . . . . . . . . . . . . . . . . . . . . . . . . . . . . . . . . . . . . . . . . . . . . . . . . . . . . . . . . . . . . . . . . . . . . . . . . . . . . 0.35%Templeton Global Balanced Fund . . . . . . . . . . . . . . . . . . . . . . . . . . . . . . . . . . . . . . . . . . . . . . . . . . . . . . . . . . . . . . . . . . . . . . . . . . . . . 0.23%Templeton Global Bond Fund . . . . . . . . . . . . . . . . . . . . . . . . . . . . . . . . . . . . . . . . . . . . . . . . . . . . . . . . . . . . . . . . . . . . . . . . . . . . . . . . 0.22%Templeton Global Bond Fund (Hedged) . . . . . . . . . . . . . . . . . . . . . . . . . . . . . . . . . . . . . . . . . . . . . . . . . . . . . . . . . . . . . . . . . . . . . . . . 0.22%Templeton Global Smaller Companies Fund . . . . . . . . . . . . . . . . . . . . . . . . . . . . . . . . . . . . . . . . . . . . . . . . . . . . . . . . . . . . . . . . . . . . . 0.38%Templeton International Stock Fund . . . . . . . . . . . . . . . . . . . . . . . . . . . . . . . . . . . . . . . . . . . . . . . . . . . . . . . . . . . . . . . . . . . . . . . . . . . 0.35%Franklin Flex Cap Growth Fund . . . . . . . . . . . . . . . . . . . . . . . . . . . . . . . . . . . . . . . . . . . . . . . . . . . . . . . . . . . . . . . . . . . . . . . . . . . . . . . 0.28%Franklin High Income Fund . . . . . . . . . . . . . . . . . . . . . . . . . . . . . . . . . . . . . . . . . . . . . . . . . . . . . . . . . . . . . . . . . . . . . . . . . . . . . . . . . . 0.21%Franklin Income Fund . . . . . . . . . . . . . . . . . . . . . . . . . . . . . . . . . . . . . . . . . . . . . . . . . . . . . . . . . . . . . . . . . . . . . . . . . . . . . . . . . . . . . . 0.19%Franklin Strategic Income Fund . . . . . . . . . . . . . . . . . . . . . . . . . . . . . . . . . . . . . . . . . . . . . . . . . . . . . . . . . . . . . . . . . . . . . . . . . . . . . . . 0.21%Franklin U.S. Core Equity Fund . . . . . . . . . . . . . . . . . . . . . . . . . . . . . . . . . . . . . . . . . . . . . . . . . . . . . . . . . . . . . . . . . . . . . . . . . . . . . . . 0.28%Franklin U.S. Rising Dividends Fund . . . . . . . . . . . . . . . . . . . . . . . . . . . . . . . . . . . . . . . . . . . . . . . . . . . . . . . . . . . . . . . . . . . . . . . . . . . 0.28%Franklin World Growth Fund . . . . . . . . . . . . . . . . . . . . . . . . . . . . . . . . . . . . . . . . . . . . . . . . . . . . . . . . . . . . . . . . . . . . . . . . . . . . . . . . . 0.33%Franklin Bissett All Canadian Focus Fund . . . . . . . . . . . . . . . . . . . . . . . . . . . . . . . . . . . . . . . . . . . . . . . . . . . . . . . . . . . . . . . . . . . . . . . 0.23%Franklin Bissett Bond Fund . . . . . . . . . . . . . . . . . . . . . . . . . . . . . . . . . . . . . . . . . . . . . . . . . . . . . . . . . . . . . . . . . . . . . . . . . . . . . . . . . . 0.15%Franklin Bissett Canadian All Cap Balanced Fund . . . . . . . . . . . . . . . . . . . . . . . . . . . . . . . . . . . . . . . . . . . . . . . . . . . . . . . . . . . . . . . . 0.16%Franklin Bissett Canadian Balanced Fund . . . . . . . . . . . . . . . . . . . . . . . . . . . . . . . . . . . . . . . . . . . . . . . . . . . . . . . . . . . . . . . . . . . . . . 0.19%Franklin Bissett Canadian Dividend Fund . . . . . . . . . . . . . . . . . . . . . . . . . . . . . . . . . . . . . . . . . . . . . . . . . . . . . . . . . . . . . . . . . . . . . . . 0.22%Franklin Bissett Canadian Equity Fund . . . . . . . . . . . . . . . . . . . . . . . . . . . . . . . . . . . . . . . . . . . . . . . . . . . . . . . . . . . . . . . . . . . . . . . . . 0.23%Franklin Bissett Canadian High Dividend Fund . . . . . . . . . . . . . . . . . . . . . . . . . . . . . . . . . . . . . . . . . . . . . . . . . . . . . . . . . . . . . . . . . . . 0.25%Franklin Bissett Canadian Short Term Bond Fund . . . . . . . . . . . . . . . . . . . . . . . . . . . . . . . . . . . . . . . . . . . . . . . . . . . . . . . . . . . . . . . . 0.15%Franklin Bissett Corporate Bond Fund . . . . . . . . . . . . . . . . . . . . . . . . . . . . . . . . . . . . . . . . . . . . . . . . . . . . . . . . . . . . . . . . . . . . . . . . . . 0.15%Franklin Bissett Dividend Income Fund . . . . . . . . . . . . . . . . . . . . . . . . . . . . . . . . . . . . . . . . . . . . . . . . . . . . . . . . . . . . . . . . . . . . . . . . . 0.16%Franklin Bissett Microcap Fund . . . . . . . . . . . . . . . . . . . . . . . . . . . . . . . . . . . . . . . . . . . . . . . . . . . . . . . . . . . . . . . . . . . . . . . . . . . . . . . 0.35%Franklin Bissett Small Cap Fund . . . . . . . . . . . . . . . . . . . . . . . . . . . . . . . . . . . . . . . . . . . . . . . . . . . . . . . . . . . . . . . . . . . . . . . . . . . . . . 0.25%Franklin Bissett Strategic Income Fund . . . . . . . . . . . . . . . . . . . . . . . . . . . . . . . . . . . . . . . . . . . . . . . . . . . . . . . . . . . . . . . . . . . . . . . . . 0.19%Franklin Mutual Global Discovery Fund . . . . . . . . . . . . . . . . . . . . . . . . . . . . . . . . . . . . . . . . . . . . . . . . . . . . . . . . . . . . . . . . . . . . . . . . . 0.33%Franklin Mutual U.S. Shares Fund . . . . . . . . . . . . . . . . . . . . . . . . . . . . . . . . . . . . . . . . . . . . . . . . . . . . . . . . . . . . . . . . . . . . . . . . . . . . 0.33%
(c) Manager Holdings and Funds Managed by the Manager
(i) The Manager held the following units in the specified Funds as at June 30, 2014, December 31, 2013 and January 1, 2013.
Templeton Global Balanced Fund Templeton Global Bond Fund (Hedged)
June 30, 2014 December 31, 2013 January 1, 2013 June 30, 2014 December 31, 2013 January 1, 2013
Series S — — 348 Series A — 500 —Series F — 500 —Series I 500 500 —
Franklin Global Small-Mid Cap Fund Franklin Income Fund
June 30, 2014 December 31, 2013 January 1, 2013 June 30, 2014 December 31, 2013 January 1, 2013
Series A 500 — — Series A 889,841 981,500 —Series F 1,000 — — Series F — 500 —Series I 500 — — Series I — 500 —Series O 13,000 — — Series O 500 500 —
Series R 337 337 —Series S 337 337 —Series T 321 337 —Series T USD — 321 —
356 Franklin Templeton Investments Funds

Franklin Templeton Investments Funds
NOTES TO FINANCIAL STATEMENTS For the periods ended June 30, 2014 and December 31, 2013 (Unaudited) (Continued)
6. Related Party Transactions (Continued)
Franklin World Growth Fund Franklin Bissett All Canadian Focus Fund
June 30, 2014 December 31, 2013 January 1, 2013 June 30, 2014 December 31, 2013 January 1, 2013
Series A — — 500 Series I 500 500 500Series F — — 500Series T — — 345
Franklin Bissett Canadian All Cap Balanced Fund Franklin Bissett Canadian Balanced Fund
June 30, 2014 December 31, 2013 January 1, 2013 June 30, 2014 December 31, 2013 January 1, 2013
Series A — 58,715 58,715 Series I — — 184Series I 500 500 500
Franklin Bissett Strategic Income Fund
June 30, 2014 December 31, 2013 January 1, 2013
Series A — — 198,500Series F — — 500Series I — — 500Series O — — 500
The Manager’s holdings represent less than 1% of the net assets of each of the Funds, with the exception of the following Funds where itaccounts for the percentage indicated:
June 30, 2014 December 31, 2013 January 1, 2013
Franklin Income Fund 14% 25% —Franklin Bissett Canadian All Cap Balanced Fund — 6% 11%Franklin Bissett Strategic Income Fund — — 3%
(ii) The following Funds managed by the Manager or its affiliates owned units of the specified Underlying Fund as at June 30, 2014 andDecember 31, 2013.
% of Fund TotalOutstanding Units
% of Fund TotalOutstanding Units
June 30,2014
December 31,2013
June 30,2014
December 31,2013
Templeton Asian Growth Fund Templeton EAFE Developed Markets FundFranklin Quotential Balanced Growth Portfolio 45.3% 44.4% Franklin Templeton Institutional Balanced Trust 31.8% 29.2%Franklin Quotential Balanced Income Portfolio 15.5% 14.4% Franklin Bissett Canadian Balanced Fund 15.2% 13.6%Franklin Quotential Balanced Growth Corporate
Class Portfolio 9.9% 9.2%Franklin Quotential Growth Portfolio 9.8% 11.3%
Templeton Frontier Markets Fund Franklin Flex Cap Growth FundFranklin Quotential Balanced Growth Portfolio 36.9% 35.6% Franklin Quotential Balanced Growth Portfolio 38.6% 10.2%Templeton Frontier Markets Corporate Class 19.6% 21.2% Franklin Quotential Balanced Income Portfolio 13.1% 13.0%Franklin Quotential Balanced Income Portfolio 12.6% 11.5%
Franklin High Income Fund Franklin Income FundFranklin Quotential Diversified Income Portfolio 27.0% 33.9% Franklin Income Corporate Class 44.0% 36.8%Franklin Quotential Diversified Income Corporate
Class Portfolio 19.0% 22.5%
Franklin Strategic Income Fund Franklin U.S. Core Equity FundFranklin Quotential Balanced Growth Portfolio 16.3% 18.4% Franklin Quotential Balanced Growth Portfolio 36.7% 45.9%Franklin Quotential Diversified Income Portfolio 15.1% 15.7% Franklin Quotential Balanced Income Portfolio 12.5% 14.9%Franklin Quotential Balanced Income Portfolio 11.4% 13.6% Franklin Mutual U.S. Shares Corporate Class 10.0% —Franklin Quotential Diversified Income Corporate
Class Portfolio 10.6% 10.5%
Franklin Templeton Investments Funds 357
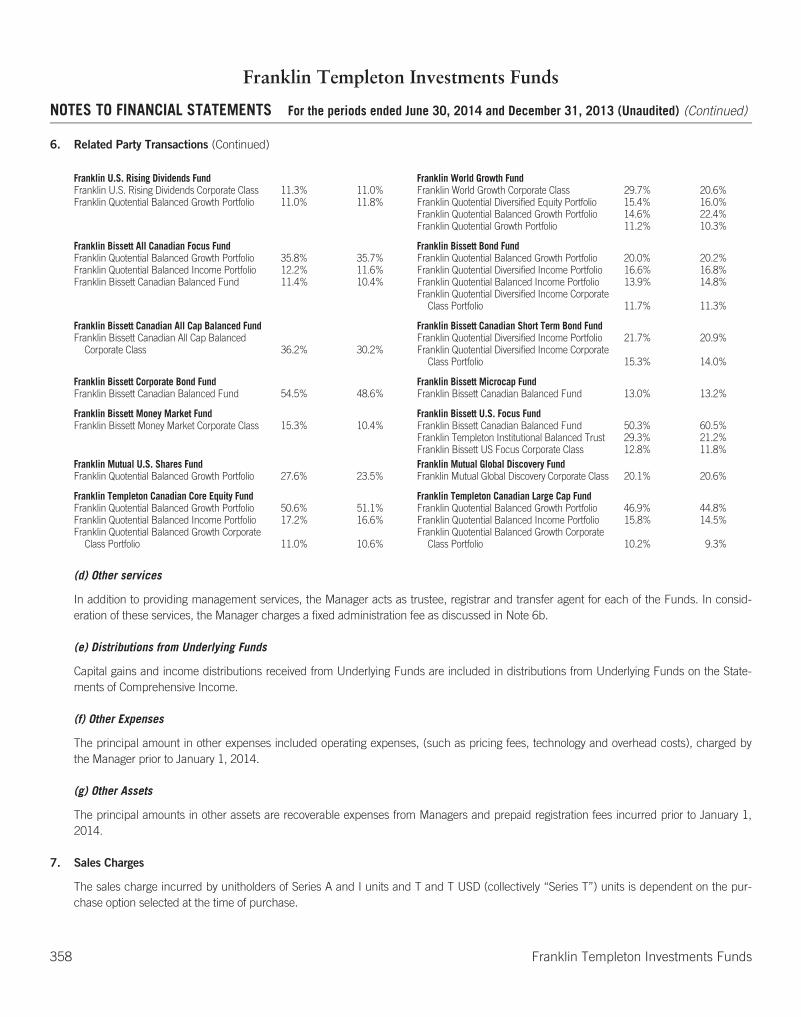
Franklin Templeton Investments Funds
NOTES TO FINANCIAL STATEMENTS For the periods ended June 30, 2014 and December 31, 2013 (Unaudited) (Continued)
6. Related Party Transactions (Continued)
Franklin U.S. Rising Dividends Fund Franklin World Growth FundFranklin U.S. Rising Dividends Corporate Class 11.3% 11.0% Franklin World Growth Corporate Class 29.7% 20.6%Franklin Quotential Balanced Growth Portfolio 11.0% 11.8% Franklin Quotential Diversified Equity Portfolio 15.4% 16.0%
Franklin Quotential Balanced Growth Portfolio 14.6% 22.4%Franklin Quotential Growth Portfolio 11.2% 10.3%
Franklin Bissett All Canadian Focus Fund Franklin Bissett Bond FundFranklin Quotential Balanced Growth Portfolio 35.8% 35.7% Franklin Quotential Balanced Growth Portfolio 20.0% 20.2%Franklin Quotential Balanced Income Portfolio 12.2% 11.6% Franklin Quotential Diversified Income Portfolio 16.6% 16.8%Franklin Bissett Canadian Balanced Fund 11.4% 10.4% Franklin Quotential Balanced Income Portfolio 13.9% 14.8%
Franklin Quotential Diversified Income CorporateClass Portfolio 11.7% 11.3%
Franklin Bissett Canadian All Cap Balanced Fund Franklin Bissett Canadian Short Term Bond FundFranklin Bissett Canadian All Cap Balanced
Corporate Class 36.2% 30.2%Franklin Quotential Diversified Income PortfolioFranklin Quotential Diversified Income Corporate
21.7% 20.9%
Class Portfolio 15.3% 14.0%
Franklin Bissett Corporate Bond Fund Franklin Bissett Microcap FundFranklin Bissett Canadian Balanced Fund 54.5% 48.6% Franklin Bissett Canadian Balanced Fund 13.0% 13.2%
Franklin Bissett Money Market Fund Franklin Bissett U.S. Focus FundFranklin Bissett Money Market Corporate Class 15.3% 10.4% Franklin Bissett Canadian Balanced Fund 50.3% 60.5%
Franklin Templeton Institutional Balanced Trust 29.3% 21.2%Franklin Bissett US Focus Corporate Class 12.8% 11.8%
Franklin Mutual U.S. Shares Fund Franklin Mutual Global Discovery FundFranklin Quotential Balanced Growth Portfolio 27.6% 23.5% Franklin Mutual Global Discovery Corporate Class 20.1% 20.6%
Franklin Templeton Canadian Core Equity Fund Franklin Templeton Canadian Large Cap FundFranklin Quotential Balanced Growth Portfolio 50.6% 51.1% Franklin Quotential Balanced Growth Portfolio 46.9% 44.8%Franklin Quotential Balanced Income Portfolio 17.2% 16.6% Franklin Quotential Balanced Income Portfolio 15.8% 14.5%Franklin Quotential Balanced Growth Corporate
Class Portfolio 11.0% 10.6%Franklin Quotential Balanced Growth Corporate
Class Portfolio 10.2% 9.3%
(d) Other services
In addition to providing management services, the Manager acts as trustee, registrar and transfer agent for each of the Funds. In consid-eration of these services, the Manager charges a fixed administration fee as discussed in Note 6b.
(e) Distributions from Underlying Funds
Capital gains and income distributions received from Underlying Funds are included in distributions from Underlying Funds on the State-ments of Comprehensive Income.
(f) Other Expenses
The principal amount in other expenses included operating expenses, (such as pricing fees, technology and overhead costs), charged bythe Manager prior to January 1, 2014.
(g) Other Assets
The principal amounts in other assets are recoverable expenses from Managers and prepaid registration fees incurred prior to January 1,2014.
7. Sales Charges
The sales charge incurred by unitholders of Series A and I units and T and T USD (collectively “Series T”) units is dependent on the pur-chase option selected at the time of purchase.
358 Franklin Templeton Investments Funds
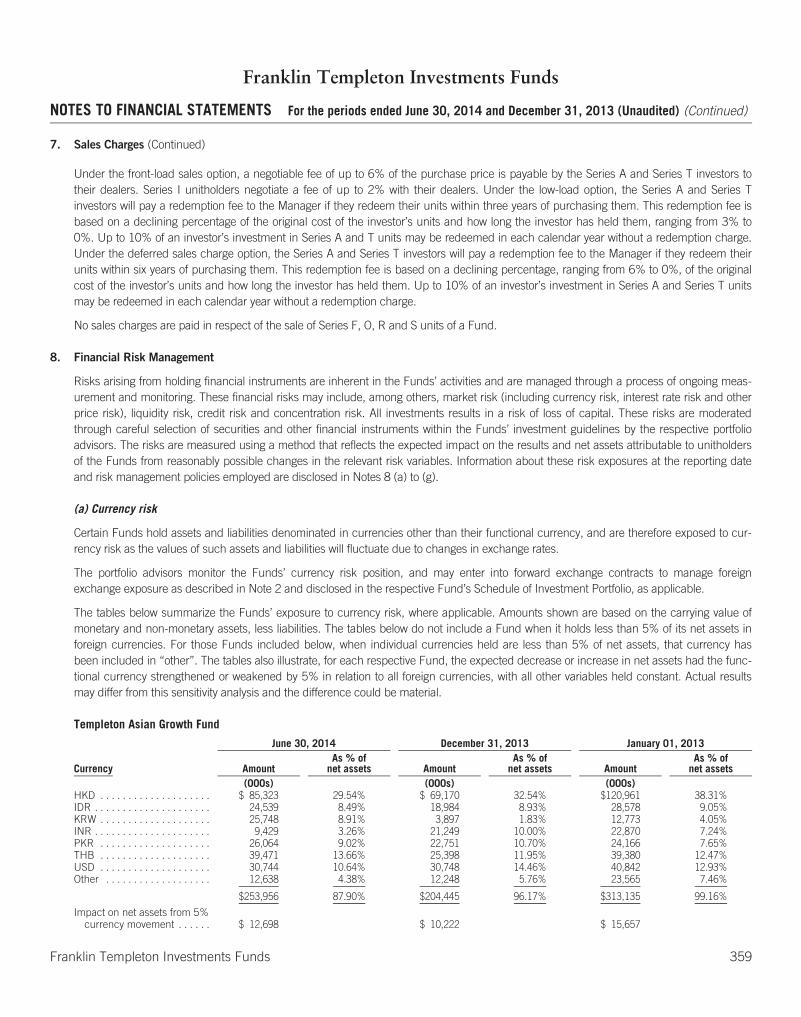
Franklin Templeton Investments Funds
NOTES TO FINANCIAL STATEMENTS For the periods ended June 30, 2014 and December 31, 2013 (Unaudited) (Continued)
7. Sales Charges (Continued)
Under the front-load sales option, a negotiable fee of up to 6% of the purchase price is payable by the Series A and Series T investors totheir dealers. Series I unitholders negotiate a fee of up to 2% with their dealers. Under the low-load option, the Series A and Series Tinvestors will pay a redemption fee to the Manager if they redeem their units within three years of purchasing them. This redemption fee isbased on a declining percentage of the original cost of the investor’s units and how long the investor has held them, ranging from 3% to0%. Up to 10% of an investor’s investment in Series A and T units may be redeemed in each calendar year without a redemption charge.Under the deferred sales charge option, the Series A and Series T investors will pay a redemption fee to the Manager if they redeem theirunits within six years of purchasing them. This redemption fee is based on a declining percentage, ranging from 6% to 0%, of the originalcost of the investor’s units and how long the investor has held them. Up to 10% of an investor’s investment in Series A and Series T unitsmay be redeemed in each calendar year without a redemption charge.
No sales charges are paid in respect of the sale of Series F, O, R and S units of a Fund.
8. Financial Risk Management
Risks arising from holding financial instruments are inherent in the Funds’ activities and are managed through a process of ongoing meas-urement and monitoring. These financial risks may include, among others, market risk (including currency risk, interest rate risk and otherprice risk), liquidity risk, credit risk and concentration risk. All investments results in a risk of loss of capital. These risks are moderatedthrough careful selection of securities and other financial instruments within the Funds’ investment guidelines by the respective portfolioadvisors. The risks are measured using a method that reflects the expected impact on the results and net assets attributable to unitholdersof the Funds from reasonably possible changes in the relevant risk variables. Information about these risk exposures at the reporting dateand risk management policies employed are disclosed in Notes 8 (a) to (g).
(a) Currency risk
Certain Funds hold assets and liabilities denominated in currencies other than their functional currency, and are therefore exposed to cur-rency risk as the values of such assets and liabilities will fluctuate due to changes in exchange rates.
The portfolio advisors monitor the Funds’ currency risk position, and may enter into forward exchange contracts to manage foreignexchange exposure as described in Note 2 and disclosed in the respective Fund’s Schedule of Investment Portfolio, as applicable.
The tables below summarize the Funds’ exposure to currency risk, where applicable. Amounts shown are based on the carrying value ofmonetary and non-monetary assets, less liabilities. The tables below do not include a Fund when it holds less than 5% of its net assets inforeign currencies. For those Funds included below, when individual currencies held are less than 5% of net assets, that currency hasbeen included in “other”. The tables also illustrate, for each respective Fund, the expected decrease or increase in net assets had the func-tional currency strengthened or weakened by 5% in relation to all foreign currencies, with all other variables held constant. Actual resultsmay differ from this sensitivity analysis and the difference could be material.
Templeton Asian Growth Fund
June 30, 2014 December 31, 2013 January 01, 2013
Currency AmountAs % of
net assets AmountAs % of
net assets AmountAs % of
net assets(000s) (000s) (000s)
HKD . . . . . . . . . . . . . . . . . . . . $ 85,323 29.54% $ 69,170 32.54% $120,961 38.31%IDR . . . . . . . . . . . . . . . . . . . . . 24,539 8.49% 18,984 8.93% 28,578 9.05%KRW . . . . . . . . . . . . . . . . . . . . 25,748 8.91% 3,897 1.83% 12,773 4.05%INR . . . . . . . . . . . . . . . . . . . . . 9,429 3.26% 21,249 10.00% 22,870 7.24%PKR . . . . . . . . . . . . . . . . . . . . 26,064 9.02% 22,751 10.70% 24,166 7.65%THB . . . . . . . . . . . . . . . . . . . . 39,471 13.66% 25,398 11.95% 39,380 12.47%USD . . . . . . . . . . . . . . . . . . . . 30,744 10.64% 30,748 14.46% 40,842 12.93%Other . . . . . . . . . . . . . . . . . . . 12,638 4.38% 12,248 5.76% 23,565 7.46%
$253,956 87.90% $204,445 96.17% $313,135 99.16%
Impact on net assets from 5%currency movement . . . . . . $ 12,698 $ 10,222 $ 15,657
Franklin Templeton Investments Funds 359
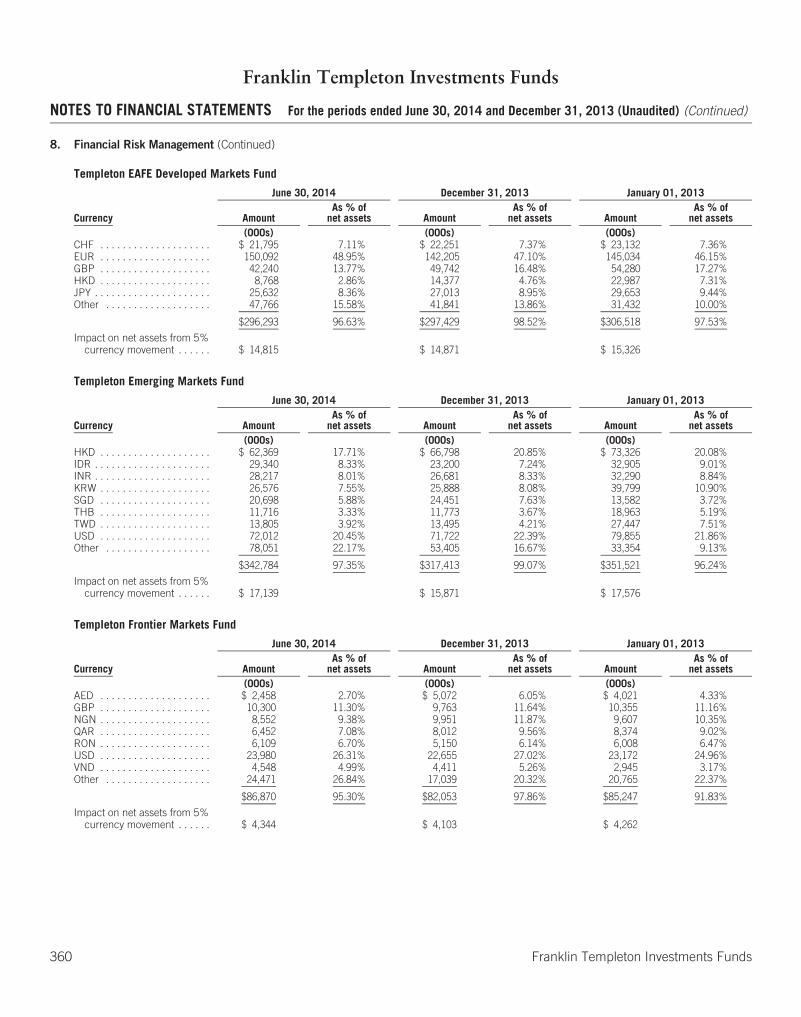
Franklin Templeton Investments Funds
NOTES TO FINANCIAL STATEMENTS For the periods ended June 30, 2014 and December 31, 2013 (Unaudited) (Continued)
8. Financial Risk Management (Continued)
Templeton EAFE Developed Markets Fund
June 30, 2014 December 31, 2013 January 01, 2013
Currency AmountAs % of
net assets AmountAs % of
net assets AmountAs % of
net assets(000s) (000s) (000s)
CHF . . . . . . . . . . . . . . . . . . . . $ 21,795 7.11% $ 22,251 7.37% $ 23,132 7.36%EUR . . . . . . . . . . . . . . . . . . . . 150,092 48.95% 142,205 47.10% 145,034 46.15%GBP . . . . . . . . . . . . . . . . . . . . 42,240 13.77% 49,742 16.48% 54,280 17.27%HKD . . . . . . . . . . . . . . . . . . . . 8,768 2.86% 14,377 4.76% 22,987 7.31%JPY . . . . . . . . . . . . . . . . . . . . . 25,632 8.36% 27,013 8.95% 29,653 9.44%Other . . . . . . . . . . . . . . . . . . . 47,766 15.58% 41,841 13.86% 31,432 10.00%
$296,293 96.63% $297,429 98.52% $306,518 97.53%
Impact on net assets from 5%currency movement . . . . . . $ 14,815 $ 14,871 $ 15,326
Templeton Emerging Markets Fund
June 30, 2014 December 31, 2013 January 01, 2013
Currency AmountAs % of
net assets AmountAs % of
net assets AmountAs % of
net assets(000s) (000s) (000s)
HKD . . . . . . . . . . . . . . . . . . . . $ 62,369 17.71% $ 66,798 20.85% $ 73,326 20.08%IDR . . . . . . . . . . . . . . . . . . . . . 29,340 8.33% 23,200 7.24% 32,905 9.01%INR . . . . . . . . . . . . . . . . . . . . . 28,217 8.01% 26,681 8.33% 32,290 8.84%KRW . . . . . . . . . . . . . . . . . . . . 26,576 7.55% 25,888 8.08% 39,799 10.90%SGD . . . . . . . . . . . . . . . . . . . . 20,698 5.88% 24,451 7.63% 13,582 3.72%THB . . . . . . . . . . . . . . . . . . . . 11,716 3.33% 11,773 3.67% 18,963 5.19%TWD . . . . . . . . . . . . . . . . . . . . 13,805 3.92% 13,495 4.21% 27,447 7.51%USD . . . . . . . . . . . . . . . . . . . . 72,012 20.45% 71,722 22.39% 79,855 21.86%Other . . . . . . . . . . . . . . . . . . . 78,051 22.17% 53,405 16.67% 33,354 9.13%
$342,784 97.35% $317,413 99.07% $351,521 96.24%
Impact on net assets from 5%currency movement . . . . . . $ 17,139 $ 15,871 $ 17,576
Templeton Frontier Markets Fund
June 30, 2014 December 31, 2013 January 01, 2013
Currency AmountAs % of
net assets AmountAs % of
net assets AmountAs % of
net assets(000s) (000s) (000s)
AED . . . . . . . . . . . . . . . . . . . . $ 2,458 2.70% $ 5,072 6.05% $ 4,021 4.33%GBP . . . . . . . . . . . . . . . . . . . . 10,300 11.30% 9,763 11.64% 10,355 11.16%NGN . . . . . . . . . . . . . . . . . . . . 8,552 9.38% 9,951 11.87% 9,607 10.35%QAR . . . . . . . . . . . . . . . . . . . . 6,452 7.08% 8,012 9.56% 8,374 9.02%RON . . . . . . . . . . . . . . . . . . . . 6,109 6.70% 5,150 6.14% 6,008 6.47%USD . . . . . . . . . . . . . . . . . . . . 23,980 26.31% 22,655 27.02% 23,172 24.96%VND . . . . . . . . . . . . . . . . . . . . 4,548 4.99% 4,411 5.26% 2,945 3.17%Other . . . . . . . . . . . . . . . . . . . 24,471 26.84% 17,039 20.32% 20,765 22.37%
$86,870 95.30% $82,053 97.86% $85,247 91.83%
Impact on net assets from 5%currency movement . . . . . . $ 4,344 $ 4,103 $ 4,262
360 Franklin Templeton Investments Funds
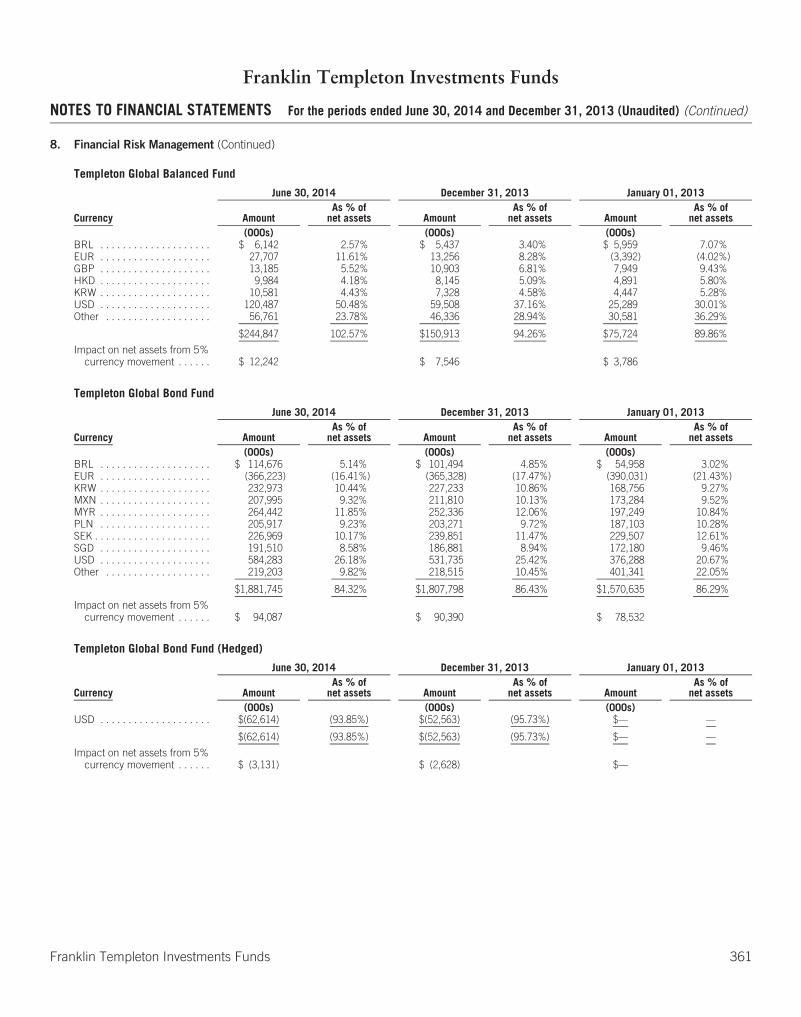
Franklin Templeton Investments Funds
NOTES TO FINANCIAL STATEMENTS For the periods ended June 30, 2014 and December 31, 2013 (Unaudited) (Continued)
8. Financial Risk Management (Continued)
Templeton Global Balanced Fund
June 30, 2014 December 31, 2013 January 01, 2013
Currency AmountAs % of
net assets AmountAs % of
net assets AmountAs % of
net assets(000s) (000s) (000s)
BRL . . . . . . . . . . . . . . . . . . . . $ 6,142 2.57% $ 5,437 3.40% $ 5,959 7.07%EUR . . . . . . . . . . . . . . . . . . . . 27,707 11.61% 13,256 8.28% (3,392) (4.02%)GBP . . . . . . . . . . . . . . . . . . . . 13,185 5.52% 10,903 6.81% 7,949 9.43%HKD . . . . . . . . . . . . . . . . . . . . 9,984 4.18% 8,145 5.09% 4,891 5.80%KRW . . . . . . . . . . . . . . . . . . . . 10,581 4.43% 7,328 4.58% 4,447 5.28%USD . . . . . . . . . . . . . . . . . . . . 120,487 50.48% 59,508 37.16% 25,289 30.01%Other . . . . . . . . . . . . . . . . . . . 56,761 23.78% 46,336 28.94% 30,581 36.29%
$244,847 102.57% $150,913 94.26% $75,724 89.86%
Impact on net assets from 5%currency movement . . . . . . $ 12,242 $ 7,546 $ 3,786
Templeton Global Bond Fund
June 30, 2014 December 31, 2013 January 01, 2013
Currency AmountAs % of
net assets AmountAs % of
net assets AmountAs % of
net assets(000s) (000s) (000s)
BRL . . . . . . . . . . . . . . . . . . . . $ 114,676 5.14% $ 101,494 4.85% $ 54,958 3.02%EUR . . . . . . . . . . . . . . . . . . . . (366,223) (16.41%) (365,328) (17.47%) (390,031) (21.43%)KRW . . . . . . . . . . . . . . . . . . . . 232,973 10.44% 227,233 10.86% 168,756 9.27%MXN . . . . . . . . . . . . . . . . . . . . 207,995 9.32% 211,810 10.13% 173,284 9.52%MYR . . . . . . . . . . . . . . . . . . . . 264,442 11.85% 252,336 12.06% 197,249 10.84%PLN . . . . . . . . . . . . . . . . . . . . 205,917 9.23% 203,271 9.72% 187,103 10.28%SEK . . . . . . . . . . . . . . . . . . . . . 226,969 10.17% 239,851 11.47% 229,507 12.61%SGD . . . . . . . . . . . . . . . . . . . . 191,510 8.58% 186,881 8.94% 172,180 9.46%USD . . . . . . . . . . . . . . . . . . . . 584,283 26.18% 531,735 25.42% 376,288 20.67%Other . . . . . . . . . . . . . . . . . . . 219,203 9.82% 218,515 10.45% 401,341 22.05%
$1,881,745 84.32% $1,807,798 86.43% $1,570,635 86.29%
Impact on net assets from 5%currency movement . . . . . . $ 94,087 $ 90,390 $ 78,532
Templeton Global Bond Fund (Hedged)
June 30, 2014 December 31, 2013 January 01, 2013
Currency AmountAs % of
net assets AmountAs % of
net assets AmountAs % of
net assets(000s) (000s) (000s)
USD . . . . . . . . . . . . . . . . . . . . $(62,614) (93.85%) $(52,563) (95.73%) $— —
$(62,614) (93.85%) $(52,563) (95.73%) $— —
Impact on net assets from 5%currency movement . . . . . . $ (3,131) $ (2,628) $—
Franklin Templeton Investments Funds 361
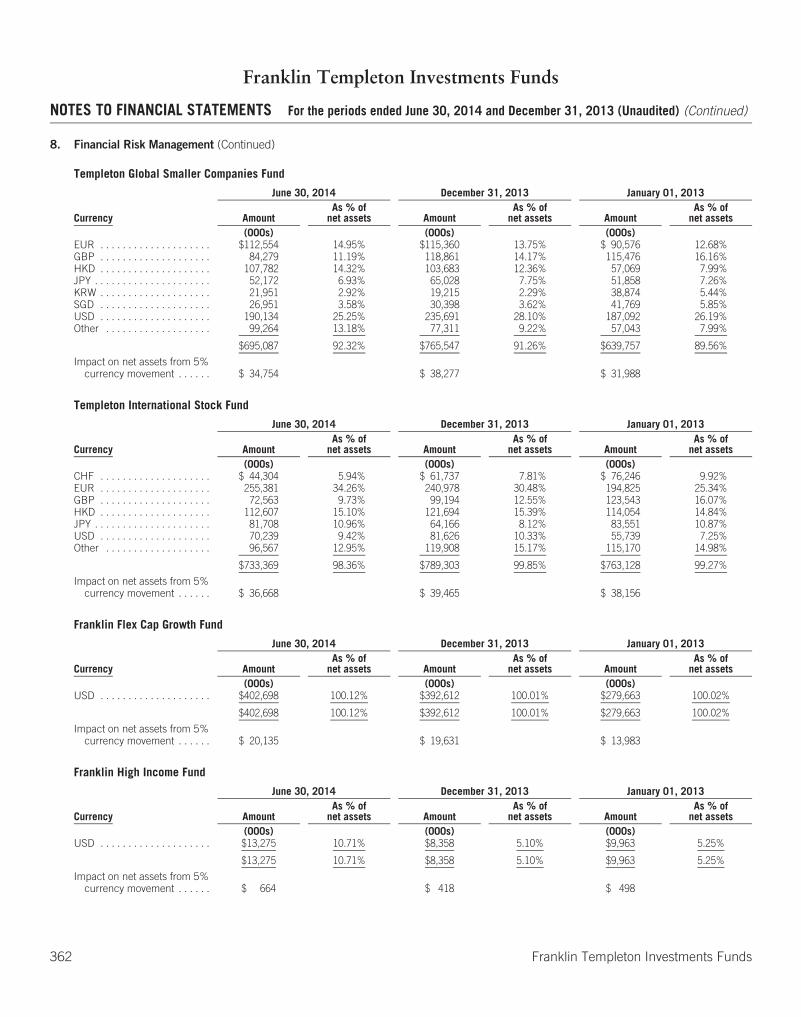
Franklin Templeton Investments Funds
NOTES TO FINANCIAL STATEMENTS For the periods ended June 30, 2014 and December 31, 2013 (Unaudited) (Continued)
8. Financial Risk Management (Continued)
Templeton Global Smaller Companies Fund
June 30, 2014 December 31, 2013 January 01, 2013
Currency AmountAs % of
net assets AmountAs % of
net assets AmountAs % of
net assets(000s) (000s) (000s)
EUR . . . . . . . . . . . . . . . . . . . . $112,554 14.95% $115,360 13.75% $ 90,576 12.68%GBP . . . . . . . . . . . . . . . . . . . . 84,279 11.19% 118,861 14.17% 115,476 16.16%HKD . . . . . . . . . . . . . . . . . . . . 107,782 14.32% 103,683 12.36% 57,069 7.99%JPY . . . . . . . . . . . . . . . . . . . . . 52,172 6.93% 65,028 7.75% 51,858 7.26%KRW . . . . . . . . . . . . . . . . . . . . 21,951 2.92% 19,215 2.29% 38,874 5.44%SGD . . . . . . . . . . . . . . . . . . . . 26,951 3.58% 30,398 3.62% 41,769 5.85%USD . . . . . . . . . . . . . . . . . . . . 190,134 25.25% 235,691 28.10% 187,092 26.19%Other . . . . . . . . . . . . . . . . . . . 99,264 13.18% 77,311 9.22% 57,043 7.99%
$695,087 92.32% $765,547 91.26% $639,757 89.56%
Impact on net assets from 5%currency movement . . . . . . $ 34,754 $ 38,277 $ 31,988
Templeton International Stock Fund
June 30, 2014 December 31, 2013 January 01, 2013
Currency AmountAs % of
net assets AmountAs % of
net assets AmountAs % of
net assets(000s) (000s) (000s)
CHF . . . . . . . . . . . . . . . . . . . . $ 44,304 5.94% $ 61,737 7.81% $ 76,246 9.92%EUR . . . . . . . . . . . . . . . . . . . . 255,381 34.26% 240,978 30.48% 194,825 25.34%GBP . . . . . . . . . . . . . . . . . . . . 72,563 9.73% 99,194 12.55% 123,543 16.07%HKD . . . . . . . . . . . . . . . . . . . . 112,607 15.10% 121,694 15.39% 114,054 14.84%JPY . . . . . . . . . . . . . . . . . . . . . 81,708 10.96% 64,166 8.12% 83,551 10.87%USD . . . . . . . . . . . . . . . . . . . . 70,239 9.42% 81,626 10.33% 55,739 7.25%Other . . . . . . . . . . . . . . . . . . . 96,567 12.95% 119,908 15.17% 115,170 14.98%
$733,369 98.36% $789,303 99.85% $763,128 99.27%
Impact on net assets from 5%currency movement . . . . . . $ 36,668 $ 39,465 $ 38,156
Franklin Flex Cap Growth Fund
June 30, 2014 December 31, 2013 January 01, 2013
Currency AmountAs % of
net assets AmountAs % of
net assets AmountAs % of
net assets(000s) (000s) (000s)
USD . . . . . . . . . . . . . . . . . . . . $402,698 100.12% $392,612 100.01% $279,663 100.02%
$402,698 100.12% $392,612 100.01% $279,663 100.02%
Impact on net assets from 5%currency movement . . . . . . $ 20,135 $ 19,631 $ 13,983
Franklin High Income Fund
June 30, 2014 December 31, 2013 January 01, 2013
Currency AmountAs % of
net assets AmountAs % of
net assets AmountAs % of
net assets(000s) (000s) (000s)
USD . . . . . . . . . . . . . . . . . . . . $13,275 10.71% $8,358 5.10% $9,963 5.25%
$13,275 10.71% $8,358 5.10% $9,963 5.25%
Impact on net assets from 5%currency movement . . . . . . $ 664 $ 418 $ 498
362 Franklin Templeton Investments Funds
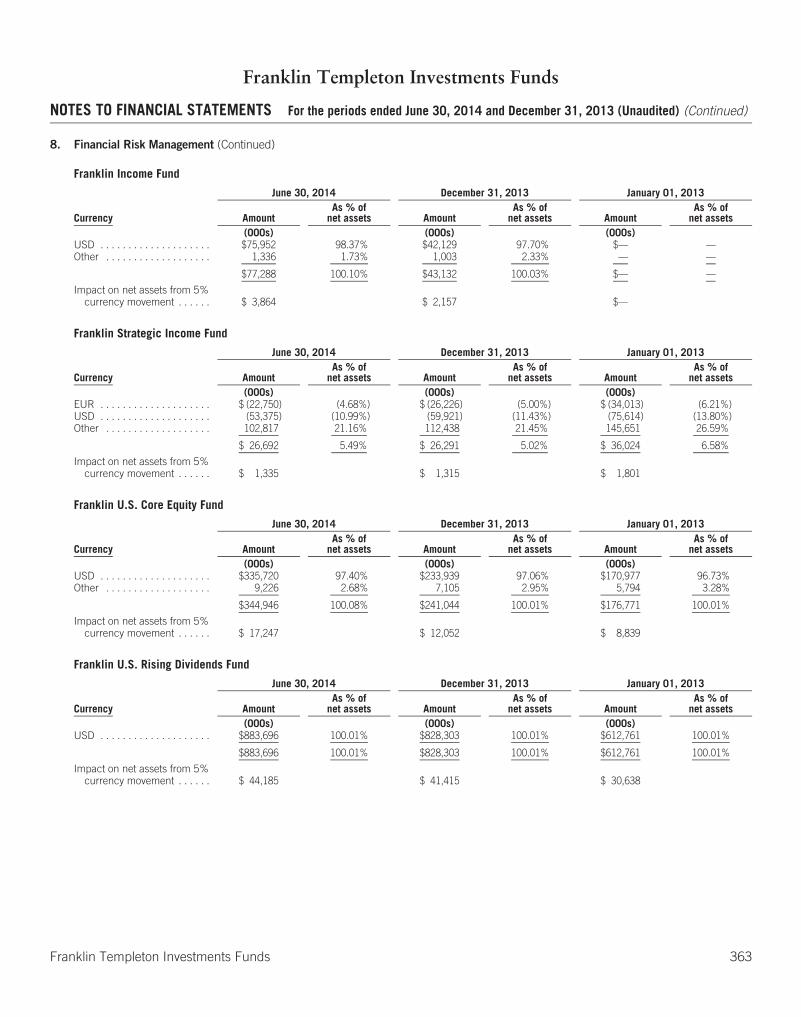
Franklin Templeton Investments Funds
NOTES TO FINANCIAL STATEMENTS For the periods ended June 30, 2014 and December 31, 2013 (Unaudited) (Continued)
8. Financial Risk Management (Continued)
Franklin Income Fund
June 30, 2014 December 31, 2013 January 01, 2013
Currency AmountAs % of
net assets AmountAs % of
net assets AmountAs % of
net assets(000s) (000s) (000s)
USD . . . . . . . . . . . . . . . . . . . . $75,952 98.37% $42,129 97.70% $— —Other . . . . . . . . . . . . . . . . . . . 1,336 1.73% 1,003 2.33% — —
$77,288 100.10% $43,132 100.03% $— —
Impact on net assets from 5%currency movement . . . . . . $ 3,864 $ 2,157 $—
Franklin Strategic Income Fund
June 30, 2014 December 31, 2013 January 01, 2013
Currency AmountAs % of
net assets AmountAs % of
net assets AmountAs % of
net assets(000s) (000s) (000s)
EUR . . . . . . . . . . . . . . . . . . . . $ (22,750) (4.68%) $ (26,226) (5.00%) $ (34,013) (6.21%)USD . . . . . . . . . . . . . . . . . . . . (53,375) (10.99%) (59,921) (11.43%) (75,614) (13.80%)Other . . . . . . . . . . . . . . . . . . . 102,817 21.16% 112,438 21.45% 145,651 26.59%
$ 26,692 5.49% $ 26,291 5.02% $ 36,024 6.58%
Impact on net assets from 5%currency movement . . . . . . $ 1,335 $ 1,315 $ 1,801
Franklin U.S. Core Equity Fund
June 30, 2014 December 31, 2013 January 01, 2013
Currency AmountAs % of
net assets AmountAs % of
net assets AmountAs % of
net assets(000s) (000s) (000s)
USD . . . . . . . . . . . . . . . . . . . . $335,720 97.40% $233,939 97.06% $170,977 96.73%Other . . . . . . . . . . . . . . . . . . . 9,226 2.68% 7,105 2.95% 5,794 3.28%
$344,946 100.08% $241,044 100.01% $176,771 100.01%
Impact on net assets from 5%currency movement . . . . . . $ 17,247 $ 12,052 $ 8,839
Franklin U.S. Rising Dividends Fund
June 30, 2014 December 31, 2013 January 01, 2013
Currency AmountAs % of
net assets AmountAs % of
net assets AmountAs % of
net assets(000s) (000s) (000s)
USD . . . . . . . . . . . . . . . . . . . . $883,696 100.01% $828,303 100.01% $612,761 100.01%
$883,696 100.01% $828,303 100.01% $612,761 100.01%
Impact on net assets from 5%currency movement . . . . . . $ 44,185 $ 41,415 $ 30,638
Franklin Templeton Investments Funds 363
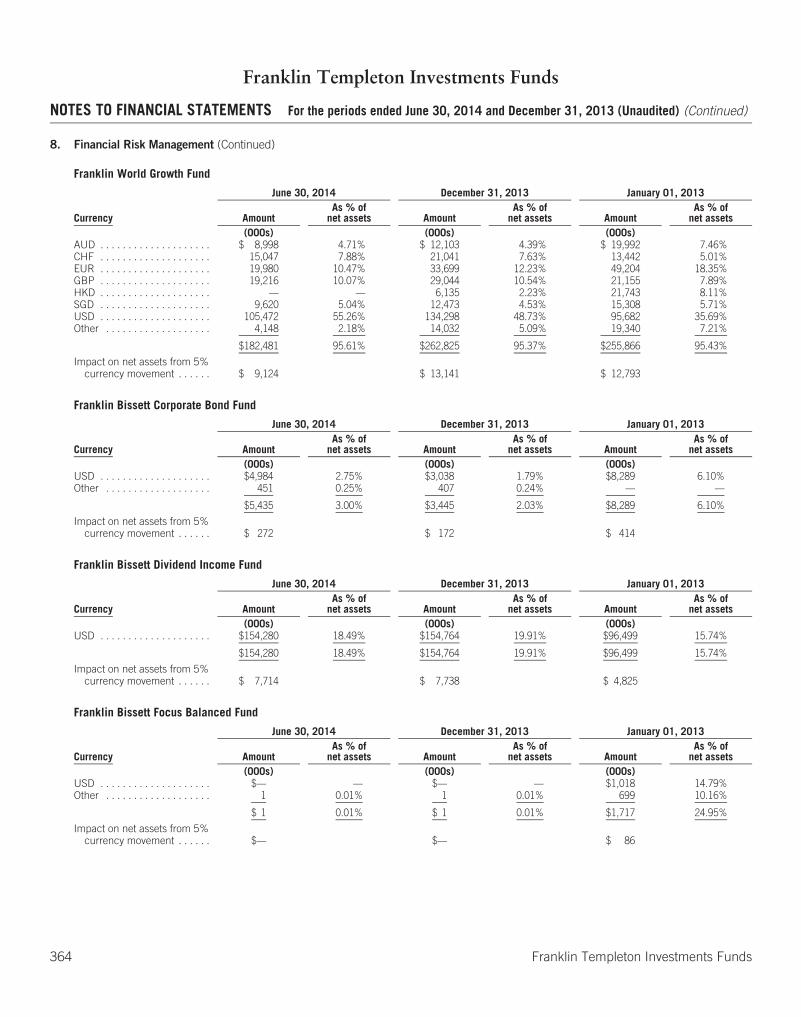
Franklin Templeton Investments Funds
NOTES TO FINANCIAL STATEMENTS For the periods ended June 30, 2014 and December 31, 2013 (Unaudited) (Continued)
8. Financial Risk Management (Continued)
Franklin World Growth Fund
June 30, 2014 December 31, 2013 January 01, 2013
Currency AmountAs % of
net assets AmountAs % of
net assets AmountAs % of
net assets(000s) (000s) (000s)
AUD . . . . . . . . . . . . . . . . . . . . $ 8,998 4.71% $ 12,103 4.39% $ 19,992 7.46%CHF . . . . . . . . . . . . . . . . . . . . 15,047 7.88% 21,041 7.63% 13,442 5.01%EUR . . . . . . . . . . . . . . . . . . . . 19,980 10.47% 33,699 12.23% 49,204 18.35%GBP . . . . . . . . . . . . . . . . . . . . 19,216 10.07% 29,044 10.54% 21,155 7.89%HKD . . . . . . . . . . . . . . . . . . . . — — 6,135 2.23% 21,743 8.11%SGD . . . . . . . . . . . . . . . . . . . . 9,620 5.04% 12,473 4.53% 15,308 5.71%USD . . . . . . . . . . . . . . . . . . . . 105,472 55.26% 134,298 48.73% 95,682 35.69%Other . . . . . . . . . . . . . . . . . . . 4,148 2.18% 14,032 5.09% 19,340 7.21%
$182,481 95.61% $262,825 95.37% $255,866 95.43%
Impact on net assets from 5%currency movement . . . . . . $ 9,124 $ 13,141 $ 12,793
Franklin Bissett Corporate Bond Fund
June 30, 2014 December 31, 2013 January 01, 2013
Currency AmountAs % of
net assets AmountAs % of
net assets AmountAs % of
net assets(000s) (000s) (000s)
USD . . . . . . . . . . . . . . . . . . . . $4,984 2.75% $3,038 1.79% $8,289 6.10%Other . . . . . . . . . . . . . . . . . . . 451 0.25% 407 0.24% — —
$5,435 3.00% $3,445 2.03% $8,289 6.10%
Impact on net assets from 5%currency movement . . . . . . $ 272 $ 172 $ 414
Franklin Bissett Dividend Income Fund
June 30, 2014 December 31, 2013 January 01, 2013
Currency AmountAs % of
net assets AmountAs % of
net assets AmountAs % of
net assets(000s) (000s) (000s)
USD . . . . . . . . . . . . . . . . . . . . $154,280 18.49% $154,764 19.91% $96,499 15.74%
$154,280 18.49% $154,764 19.91% $96,499 15.74%
Impact on net assets from 5%currency movement . . . . . . $ 7,714 $ 7,738 $ 4,825
Franklin Bissett Focus Balanced Fund
June 30, 2014 December 31, 2013 January 01, 2013
Currency AmountAs % of
net assets AmountAs % of
net assets AmountAs % of
net assets(000s) (000s) (000s)
USD . . . . . . . . . . . . . . . . . . . . $— — $— — $1,018 14.79%Other . . . . . . . . . . . . . . . . . . . 1 0.01% 1 0.01% 699 10.16%
$ 1 0.01% $ 1 0.01% $1,717 24.95%
Impact on net assets from 5%currency movement . . . . . . $— $— $ 86
364 Franklin Templeton Investments Funds

Franklin Templeton Investments Funds
NOTES TO FINANCIAL STATEMENTS For the periods ended June 30, 2014 and December 31, 2013 (Unaudited) (Continued)
8. Financial Risk Management (Continued)
Franklin Bissett U.S. Focus Fund
June 30, 2014 December 31, 2013 January 01, 2013
Currency AmountAs % of
net assets AmountAs % of
net assets AmountAs % of
net assets(000s) (000s) (000s)
USD . . . . . . . . . . . . . . . . . . . . $90,881 100.00% $71,086 100.00% $148,761 100.00%
$90,881 100.00% $71,086 100.00% $148,761 100.00%
Impact on net assets from 5%currency movement . . . . . . $ 4,544 $ 3,554 $ 7,438
Franklin Mutual U.S. Shares Fund
June 30, 2014 December 31, 2013 January 01, 2013
Currency AmountAs % of
net assets AmountAs % of
net assets AmountAs % of
net assets(000s) (000s) (000s)
USD . . . . . . . . . . . . . . . . . . . . $44,164 18.72% $31,429 17.42% $38,327 20.19%Other . . . . . . . . . . . . . . . . . . . 3,634 1.54% 3,842 2.13% 8,696 4.58%
$47,798 20.26% $35,271 19.55% $47,023 24.77%
Impact on net assets from 5%currency movement . . . . . . $ 2,390 $ 1,764 $ 2,351
Franklin Mutual Global Discovery Fund
June 30, 2014 December 31, 2013 January 01, 2013
Currency AmountAs % of
net assets AmountAs % of
net assets AmountAs % of
net assets(000s) (000s) (000s)
USD . . . . . . . . . . . . . . . . . . . . $215,953 16.05% $181,694 14.45% $121,981 13.55%Other . . . . . . . . . . . . . . . . . . . 115,236 8.56% 93,984 7.47% 79,069 8.78%
$331,189 24.61% $275,678 21.92% $201,050 22.33%
Impact on net assets from 5%currency movement . . . . . . $ 16,559 $ 13,784 $ 10,053
Franklin Templeton Investments Funds 365

Franklin Templeton Investments Funds
NOTES TO FINANCIAL STATEMENTS For the periods ended June 30, 2014 and December 31, 2013 (Unaudited) (Continued)
8. Financial Risk Management (Continued)
(b) Interest rate risk
Interest rate risk arises from the possibility that changes in interest rates will affect future cash flows or the fair values of interest bearingfinancial instruments. The portfolio advisors monitor overall interest rate sensitivity on a periodic basis.
The tables below summarize all interest bearing financial instruments (excluding overnight term deposits) held by the respective Fundwhich is subject to interest rate risk, categorized by the earlier of contractual re-pricing or maturity dates of the instrument. The tables illus-trate the increase or decrease expected in net assets for the Fund had the interest rates lowered or risen by 25 basis points, assuming allother variables remain constant. Actual results may differ from this sensitivity analysis and the difference could be material.
June 30, 2014LessThan
1 year1-3
years3-5
years>5
years Total
InterestRate
Sensitivity(000s) (000s) (000s) (000s) (000s) (000s)
Templeton Canadian Balanced Fund . . . . . . . . . . . . . . . . . . . . . . . . . . . . . . $ 34 $ 1,564 $ 3,543 $ 12,986 $ 18,127 $ 300Templeton Global Balanced Fund . . . . . . . . . . . . . . . . . . . . . . . . . . . . . . . . 9,251 17,317 5,320 25,756 57,644 460Templeton Global Bond Fund . . . . . . . . . . . . . . . . . . . . . . . . . . . . . . . . . . . . 665,084 489,806 140,561 448,438 1,743,889 5,879Franklin High Income Fund . . . . . . . . . . . . . . . . . . . . . . . . . . . . . . . . . . . . . 13 3,244 21,322 90,519 115,098 1,106Franklin Income Fund . . . . . . . . . . . . . . . . . . . . . . . . . . . . . . . . . . . . . . . . . . — — 1,064 18,874 19,938 280Franklin Strategic Income Fund . . . . . . . . . . . . . . . . . . . . . . . . . . . . . . . . . . 27,769 51,983 53,497 289,510 422,759 3,156Franklin Bissett All Cap Balanced Fund . . . . . . . . . . . . . . . . . . . . . . . . . . . . — 91 670 3,997 4,758 79Franklin Bissett Bond Fund . . . . . . . . . . . . . . . . . . . . . . . . . . . . . . . . . . . . . 23,922 181,549 464,930 1,805,247 2,475,648 38,855Franklin Bissett Canadian Short Term Bond Fund . . . . . . . . . . . . . . . . . . . . 29,769 147,746 223,667 225,635 626,817 4,147Franklin Bissett Corporate Bond Fund . . . . . . . . . . . . . . . . . . . . . . . . . . . . . 4,420 17,728 27,830 130,148 180,126 2,303Franklin Bissett Dividend Income Fund . . . . . . . . . . . . . . . . . . . . . . . . . . . . — 6,293 24,741 96,009 127,043 1,845Franklin Bissett Microcap Fund . . . . . . . . . . . . . . . . . . . . . . . . . . . . . . . . . . — 1,694 — — 1,694 —Franklin Bissett Money Market Fund . . . . . . . . . . . . . . . . . . . . . . . . . . . . . . 199,005 16,152 — — 215,157 108Franklin Bissett Strategic Income Fund . . . . . . . . . . . . . . . . . . . . . . . . . . . . 105 1,882 4,195 15,499 21,683 232Franklin Bissett Treasury Bill Fund . . . . . . . . . . . . . . . . . . . . . . . . . . . . . . . . 53,880 5,645 — — 59,525 39
December 31, 2013LessThan
1 year1-3
years3-5
years>5
years Total
InterestRate
Sensitivity(000s) (000s) (000s) (000s) (000s) (000s)
Templeton Canadian Balanced Fund . . . . . . . . . . . . . . . . . . . . . . . . . . . . . . $ 267 $ 2,271 $ 4,667 $ 12,053 $ 19,258 $ 304Templeton Global Balanced Fund . . . . . . . . . . . . . . . . . . . . . . . . . . . . . . . . 2,902 13,028 5,963 13,300 35,193 326Templeton Global Bond Fund . . . . . . . . . . . . . . . . . . . . . . . . . . . . . . . . . . . . 706,804 378,047 139,652 456,266 1,680,770 6,238Franklin High Income Fund . . . . . . . . . . . . . . . . . . . . . . . . . . . . . . . . . . . . . — 6,495 37,365 110,681 154,541 1,383Franklin Income Fund . . . . . . . . . . . . . . . . . . . . . . . . . . . . . . . . . . . . . . . . . . — 60 449 10,219 10,728 151Franklin Strategic Income Fund . . . . . . . . . . . . . . . . . . . . . . . . . . . . . . . . . . 56,255 44,193 74,466 293,698 468,612 3,778Franklin Bissett Canadian All Cap Balanced Fund . . . . . . . . . . . . . . . . . . . . — — 523 2,964 3,487 56Franklin Bissett Bond Fund . . . . . . . . . . . . . . . . . . . . . . . . . . . . . . . . . . . . . 36,379 193,254 513,586 1,627,317 2,370,536 36,468Franklin Bissett Canadian Short Term Bond Fund . . . . . . . . . . . . . . . . . . . . 78,131 150,935 207,859 197,043 633,968 3,864Franklin Bissett Corporate Bond Fund . . . . . . . . . . . . . . . . . . . . . . . . . . . . . 6,221 16,149 24,957 119,606 166,933 2,079Franklin Bissett Dividend Income Fund . . . . . . . . . . . . . . . . . . . . . . . . . . . . — 8,682 10,910 83,195 102,787 1,551Franklin Bissett Microcap Fund . . . . . . . . . . . . . . . . . . . . . . . . . . . . . . . . . . — 634 — — 634 —Franklin Bissett Money Market Fund . . . . . . . . . . . . . . . . . . . . . . . . . . . . . . 194,796 16,732 — — 211,528 106Franklin Bissett Strategic Income Fund . . . . . . . . . . . . . . . . . . . . . . . . . . . . 267 2,402 4,704 11,636 19,009 204Franklin Bissett Treasury Bill Fund . . . . . . . . . . . . . . . . . . . . . . . . . . . . . . . . 60,999 5,178 — — 66,177 48Franklin Templeton Canadian Large Cap Fund . . . . . . . . . . . . . . . . . . . . . . 1,833 — — — 1,833 2
366 Franklin Templeton Investments Funds
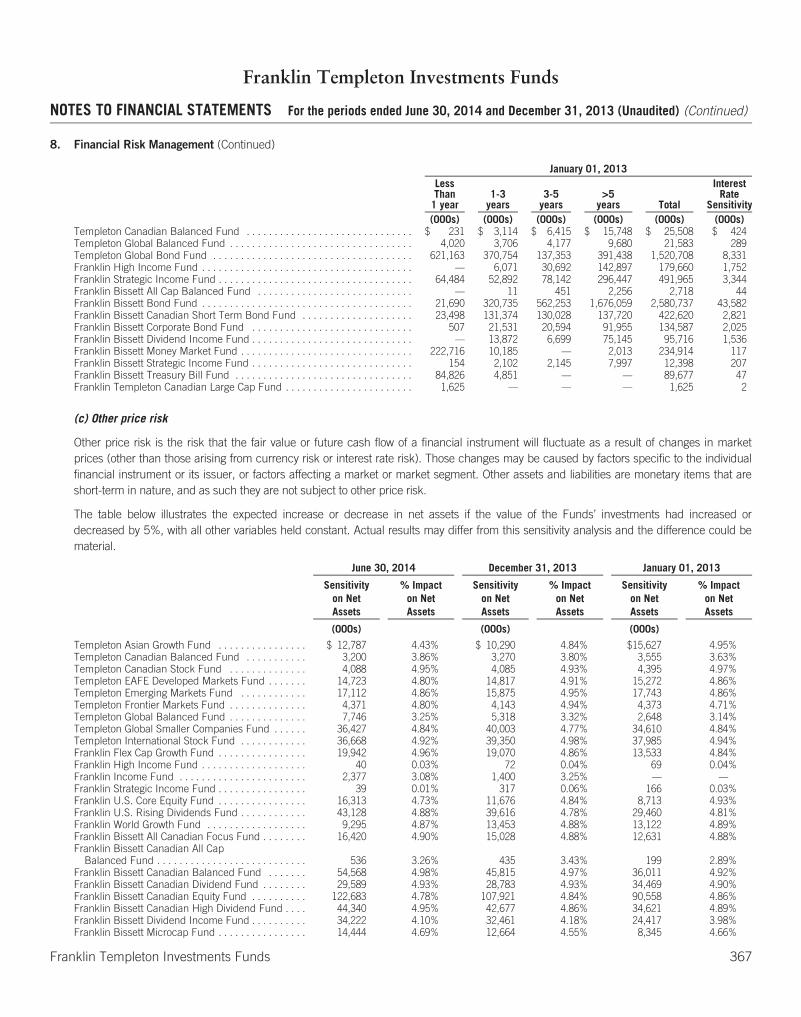
Franklin Templeton Investments Funds
NOTES TO FINANCIAL STATEMENTS For the periods ended June 30, 2014 and December 31, 2013 (Unaudited) (Continued)
8. Financial Risk Management (Continued)
January 01, 2013LessThan
1 year1-3
years3-5
years>5
years Total
InterestRate
Sensitivity(000s) (000s) (000s) (000s) (000s) (000s)
Templeton Canadian Balanced Fund . . . . . . . . . . . . . . . . . . . . . . . . . . . . . . $ 231 $ 3,114 $ 6,415 $ 15,748 $ 25,508 $ 424Templeton Global Balanced Fund . . . . . . . . . . . . . . . . . . . . . . . . . . . . . . . . . 4,020 3,706 4,177 9,680 21,583 289Templeton Global Bond Fund . . . . . . . . . . . . . . . . . . . . . . . . . . . . . . . . . . . . 621,163 370,754 137,353 391,438 1,520,708 8,331Franklin High Income Fund . . . . . . . . . . . . . . . . . . . . . . . . . . . . . . . . . . . . . . — 6,071 30,692 142,897 179,660 1,752Franklin Strategic Income Fund . . . . . . . . . . . . . . . . . . . . . . . . . . . . . . . . . . . 64,484 52,892 78,142 296,447 491,965 3,344Franklin Bissett All Cap Balanced Fund . . . . . . . . . . . . . . . . . . . . . . . . . . . . — 11 451 2,256 2,718 44Franklin Bissett Bond Fund . . . . . . . . . . . . . . . . . . . . . . . . . . . . . . . . . . . . . . 21,690 320,735 562,253 1,676,059 2,580,737 43,582Franklin Bissett Canadian Short Term Bond Fund . . . . . . . . . . . . . . . . . . . . 23,498 131,374 130,028 137,720 422,620 2,821Franklin Bissett Corporate Bond Fund . . . . . . . . . . . . . . . . . . . . . . . . . . . . . 507 21,531 20,594 91,955 134,587 2,025Franklin Bissett Dividend Income Fund . . . . . . . . . . . . . . . . . . . . . . . . . . . . . — 13,872 6,699 75,145 95,716 1,536Franklin Bissett Money Market Fund . . . . . . . . . . . . . . . . . . . . . . . . . . . . . . . 222,716 10,185 — 2,013 234,914 117Franklin Bissett Strategic Income Fund . . . . . . . . . . . . . . . . . . . . . . . . . . . . . 154 2,102 2,145 7,997 12,398 207Franklin Bissett Treasury Bill Fund . . . . . . . . . . . . . . . . . . . . . . . . . . . . . . . . 84,826 4,851 — — 89,677 47Franklin Templeton Canadian Large Cap Fund . . . . . . . . . . . . . . . . . . . . . . . 1,625 — — — 1,625 2
(c) Other price risk
Other price risk is the risk that the fair value or future cash flow of a financial instrument will fluctuate as a result of changes in marketprices (other than those arising from currency risk or interest rate risk). Those changes may be caused by factors specific to the individualfinancial instrument or its issuer, or factors affecting a market or market segment. Other assets and liabilities are monetary items that areshort-term in nature, and as such they are not subject to other price risk.
The table below illustrates the expected increase or decrease in net assets if the value of the Funds’ investments had increased ordecreased by 5%, with all other variables held constant. Actual results may differ from this sensitivity analysis and the difference could bematerial.
June 30, 2014 December 31, 2013 January 01, 2013
Sensitivityon NetAssets
% Impacton NetAssets
Sensitivityon NetAssets
% Impacton NetAssets
Sensitivityon NetAssets
% Impacton NetAssets
(000s) (000s) (000s)
Templeton Asian Growth Fund . . . . . . . . . . . . . . . . $ 12,787 4.43% $ 10,290 4.84% $15,627 4.95%Templeton Canadian Balanced Fund . . . . . . . . . . . 3,200 3.86% 3,270 3.80% 3,555 3.63%Templeton Canadian Stock Fund . . . . . . . . . . . . . . 4,088 4.95% 4,085 4.93% 4,395 4.97%Templeton EAFE Developed Markets Fund . . . . . . . 14,723 4.80% 14,817 4.91% 15,272 4.86%Templeton Emerging Markets Fund . . . . . . . . . . . . 17,112 4.86% 15,875 4.95% 17,743 4.86%Templeton Frontier Markets Fund . . . . . . . . . . . . . . 4,371 4.80% 4,143 4.94% 4,373 4.71%Templeton Global Balanced Fund . . . . . . . . . . . . . . 7,746 3.25% 5,318 3.32% 2,648 3.14%Templeton Global Smaller Companies Fund . . . . . . 36,427 4.84% 40,003 4.77% 34,610 4.84%Templeton International Stock Fund . . . . . . . . . . . . 36,668 4.92% 39,350 4.98% 37,985 4.94%Franklin Flex Cap Growth Fund . . . . . . . . . . . . . . . . 19,942 4.96% 19,070 4.86% 13,533 4.84%Franklin High Income Fund . . . . . . . . . . . . . . . . . . . 40 0.03% 72 0.04% 69 0.04%Franklin Income Fund . . . . . . . . . . . . . . . . . . . . . . . 2,377 3.08% 1,400 3.25% — —Franklin Strategic Income Fund . . . . . . . . . . . . . . . . 39 0.01% 317 0.06% 166 0.03%Franklin U.S. Core Equity Fund . . . . . . . . . . . . . . . . 16,313 4.73% 11,676 4.84% 8,713 4.93%Franklin U.S. Rising Dividends Fund . . . . . . . . . . . . 43,128 4.88% 39,616 4.78% 29,460 4.81%Franklin World Growth Fund . . . . . . . . . . . . . . . . . . 9,295 4.87% 13,453 4.88% 13,122 4.89%Franklin Bissett All Canadian Focus Fund . . . . . . . . 16,420 4.90% 15,028 4.88% 12,631 4.88%Franklin Bissett Canadian All Cap
Balanced Fund . . . . . . . . . . . . . . . . . . . . . . . . . . . 536 3.26% 435 3.43% 199 2.89%Franklin Bissett Canadian Balanced Fund . . . . . . . 54,568 4.98% 45,815 4.97% 36,011 4.92%Franklin Bissett Canadian Dividend Fund . . . . . . . . 29,589 4.93% 28,783 4.93% 34,469 4.90%Franklin Bissett Canadian Equity Fund . . . . . . . . . . 122,683 4.78% 107,921 4.84% 90,558 4.86%Franklin Bissett Canadian High Dividend Fund . . . . 44,340 4.95% 42,677 4.86% 34,621 4.89%Franklin Bissett Dividend Income Fund . . . . . . . . . . 34,222 4.10% 32,461 4.18% 24,417 3.98%Franklin Bissett Microcap Fund . . . . . . . . . . . . . . . . 14,444 4.69% 12,664 4.55% 8,345 4.66%
Franklin Templeton Investments Funds 367

Franklin Templeton Investments Funds
NOTES TO FINANCIAL STATEMENTS For the periods ended June 30, 2014 and December 31, 2013 (Unaudited) (Continued)
8. Financial Risk Management (Continued)
June 30, 2014 December 31, 2013 January 01, 2013
Sensitivityon NetAssets
% Impacton NetAssets
Sensitivityon NetAssets
% Impacton NetAssets
Sensitivityon NetAssets
% Impacton NetAssets
(000s) (000s) (000s)Franklin Bissett Small Cap Fund . . . . . . . . . . . . . . . $37,911 4.54% $36,382 4.57% $26,573 4.61%Franklin Bissett Strategic Income Fund . . . . . . . . . . 6,065 4.21% 5,761 4.23% 3,354 4.15%Franklin Bissett U.S. Focus Fund . . . . . . . . . . . . . . 4,293 4.72% 3,365 4.73% 7,302 4.91%Franklin Mutual Global Discovery Fund . . . . . . . . . . 55,697 4.14% 57,379 4.56% 41,413 4.60%Franklin Mutual U.S. Shares Fund . . . . . . . . . . . . . 10,625 4.50% 7,497 4.15% 8,101 4.27%Franklin Templeton Canadian Core Equity Fund . . . 4,817 4.75% 4,850 4.82% 9,833 4.99%Franklin Templeton Canadian Large Cap Fund . . . . 8,162 4.94% 11,416 4.95% 11,891 4.95%
(d) Liquidity risk
Liquidity risk is the risk that a Fund will not be able to meet its liabilities as they fall due. As the Funds are exposed to daily cash redemptionof units, the assets of the Funds are invested mainly in securities which are traded in active markets and can be readily disposed of. Inaddition, sufficient cash and cash equivalents are maintained to meet normal operating requirements. Each Fund has the ability to borrowup to 5% of its net assets for the purposes of funding redemptions. The Funds have a non-committed redemption line of credit agreementwith a Schedule 1 bank in Canada from which these amounts can be borrowed, if necessary. The loans are issued at prime rate and arepayable on demand. There were no loans issued or outstanding as at June 30, 2014, December 31, 2013 and January 1, 2013.
Certain Funds may invest in derivatives, debt securities and unlisted equity investments that are not traded in an active market. As a result,the Fund may not be able to quickly liquidate its investments in these instruments at amounts which approximate their fair values, or beable to respond to specific events such as deterioration in the creditworthiness of any particular issuer.
The Funds also have a policy that restricts them from holding illiquid assets that account for more than 10% of their respective net assets.Equity-linked notes, PIK bonds and P-Notes may be more volatile and less liquid than other investments held by the Funds. The Funds’holdings of equity-linked notes, PIK bonds and P-Notes represents less than 10% of their net asset value as at June 30, 2014,December 31, 2013 and January 1, 2013.
The Funds’ financial liabilities which include redemptions payable, distributions payable, accrued liabilities and derivative liabilities are duewithin 3 months. Redeemable units are redeemable on demand at the holder’s option. However, the Manager does not expect that thecontractual maturity disclosed above will be representative of the actual cash outflows, as holders of these instruments typically retain themfor a longer period.
In accordance with the Funds’ investment objective, the Manager monitors the Funds’ liquidity position on an ongoing basis.
(e) Credit risk
Credit risk is the risk that a counterparty to a financial instrument will fail to discharge an obligation or commitment that it has entered intowith a Fund. The fair value of a financial instrument takes into account the credit rating of its issuer, and accordingly, represents the max-imum credit a Fund is exposed to. Credit risk is generally lower if the issuer has a high credit rating from an independent credit ratingagency, while the risk is generally higher if the issuer has a low credit rating or no credit rating. Where applicable, credit ratings have beendisclosed at the end of each Fund’s Schedule of Investment Portfolio.
All transactions in listed securities are settled or paid for upon delivery using approved brokers. The credit risk related to the associatedreceivables is considered limited, as delivery of securities sold is only made once the broker has received payment. Payment is made on apurchase once the securities have been received by the broker. The trade will fail if either party fails to meet its obligation. However, thereare risks involved in dealing with custodians or prime brokers who settle trades and in rare circumstances, the securities and other assetsdeposited with the custodian or broker may be exposed to credit risk with regard to such parties. In addition, there may be practical prob-lems or time delays associated with enforcing the Fund’s rights to its assets in the case of an insolvency of any such party.
368 Franklin Templeton Investments Funds
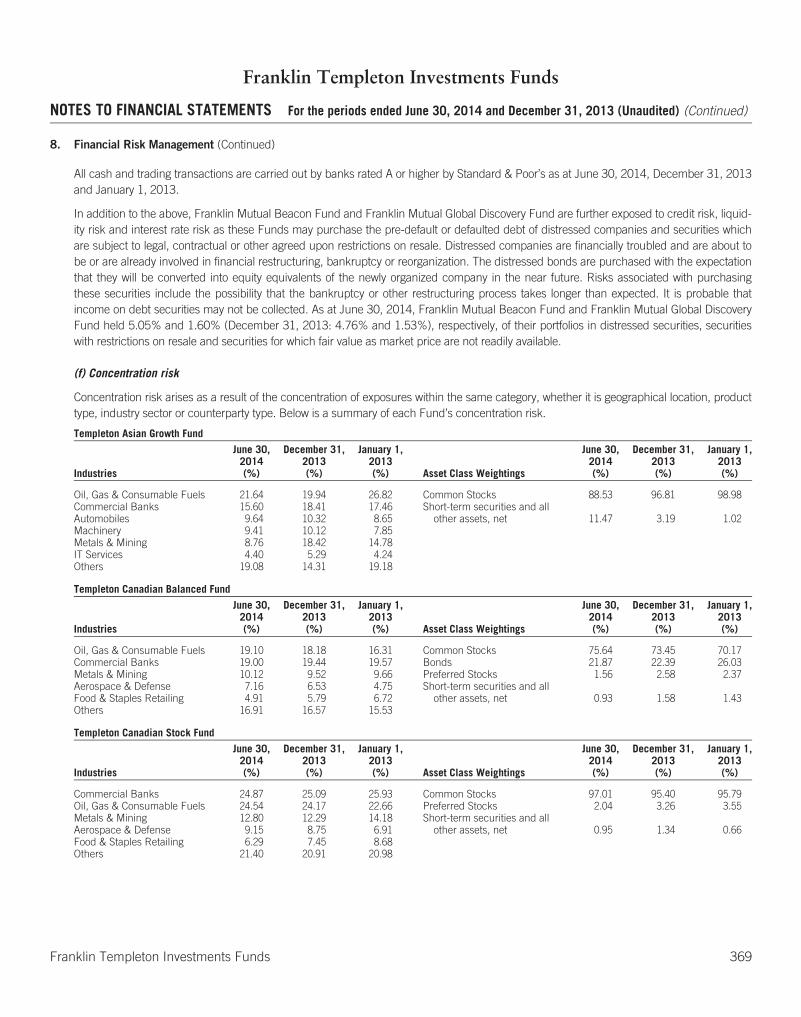
Franklin Templeton Investments Funds
NOTES TO FINANCIAL STATEMENTS For the periods ended June 30, 2014 and December 31, 2013 (Unaudited) (Continued)
8. Financial Risk Management (Continued)
All cash and trading transactions are carried out by banks rated A or higher by Standard & Poor’s as at June 30, 2014, December 31, 2013and January 1, 2013.
In addition to the above, Franklin Mutual Beacon Fund and Franklin Mutual Global Discovery Fund are further exposed to credit risk, liquid-ity risk and interest rate risk as these Funds may purchase the pre-default or defaulted debt of distressed companies and securities whichare subject to legal, contractual or other agreed upon restrictions on resale. Distressed companies are financially troubled and are about tobe or are already involved in financial restructuring, bankruptcy or reorganization. The distressed bonds are purchased with the expectationthat they will be converted into equity equivalents of the newly organized company in the near future. Risks associated with purchasingthese securities include the possibility that the bankruptcy or other restructuring process takes longer than expected. It is probable thatincome on debt securities may not be collected. As at June 30, 2014, Franklin Mutual Beacon Fund and Franklin Mutual Global DiscoveryFund held 5.05% and 1.60% (December 31, 2013: 4.76% and 1.53%), respectively, of their portfolios in distressed securities, securitieswith restrictions on resale and securities for which fair value as market price are not readily available.
(f) Concentration risk
Concentration risk arises as a result of the concentration of exposures within the same category, whether it is geographical location, producttype, industry sector or counterparty type. Below is a summary of each Fund’s concentration risk.
Templeton Asian Growth Fund
Industries
June 30,2014(%)
December 31,2013(%)
January 1,2013(%) Asset Class Weightings
June 30,2014(%)
December 31,2013(%)
January 1,2013(%)
Oil, Gas & Consumable Fuels 21.64 19.94 26.82 Common Stocks 88.53 96.81 98.98Commercial Banks 15.60 18.41 17.46 Short-term securities and all
other assets, net 11.47 3.19 1.02Automobiles 9.64 10.32 8.65Machinery 9.41 10.12 7.85Metals & Mining 8.76 18.42 14.78IT Services 4.40 5.29 4.24Others 19.08 14.31 19.18
Templeton Canadian Balanced Fund
Industries
June 30,2014(%)
December 31,2013(%)
January 1,2013(%) Asset Class Weightings
June 30,2014(%)
December 31,2013(%)
January 1,2013(%)
Oil, Gas & Consumable Fuels 19.10 18.18 16.31 Common Stocks 75.64 73.45 70.17Commercial Banks 19.00 19.44 19.57 Bonds 21.87 22.39 26.03Metals & Mining 10.12 9.52 9.66 Preferred Stocks 1.56 2.58 2.37Aerospace & Defense 7.16 6.53 4.75 Short-term securities and all
other assets, net 0.93 1.58 1.43Food & Staples Retailing 4.91 5.79 6.72Others 16.91 16.57 15.53
Templeton Canadian Stock Fund
Industries
June 30,2014(%)
December 31,2013(%)
January 1,2013(%) Asset Class Weightings
June 30,2014(%)
December 31,2013(%)
January 1,2013(%)
Commercial Banks 24.87 25.09 25.93 Common Stocks 97.01 95.40 95.79Oil, Gas & Consumable Fuels 24.54 24.17 22.66 Preferred Stocks 2.04 3.26 3.55Metals & Mining 12.80 12.29 14.18 Short-term securities and all
other assets, net 0.95 1.34 0.66Aerospace & Defense 9.15 8.75 6.91Food & Staples Retailing 6.29 7.45 8.68Others 21.40 20.91 20.98
Franklin Templeton Investments Funds 369

Franklin Templeton Investments Funds
NOTES TO FINANCIAL STATEMENTS For the periods ended June 30, 2014 and December 31, 2013 (Unaudited) (Continued)
8. Financial Risk Management (Continued)
Templeton EAFE Developed Markets Fund
Industries
June 30,2014(%)
December 31,2013(%)
January 1,2013(%) Asset Class Weightings
June 30,2014(%)
December 31,2013(%)
January 1,2013(%)
Pharmaceuticals 12.39 11.53 9.41 Common Stocks 96.03 98.16 97.20Commercial Banks 11.58 11.71 8.98 Short-term securities and all
other assets, net 3.97 1.84 2.80Diversified TelecommunicationServices 7.72 8.91 7.18
Oil, Gas & Consumable Fuels 7.20 7.23 9.50Insurance 6.84 7.77 7.69Others 50.30 51.01 54.44
Templeton Emerging Markets Fund
Region Mix
June 30,2014(%)
December 31,2013(%)
January 1,2013(%) Asset Class Weightings
June 30,2014(%)
December 31,2013(%)
January 1,2013(%)
Asia 57.96 61.87 70.80 Common Stocks 87.61 88.50 87.42Europe 18.67 18.84 9.06 Preferred Stocks 9.59 10.60 9.74Latin America & Caribbean 18.57 18.39 16.18 Short term securities and all
other assets, net 2.80 0.90 2.84Middle East & Africa 2.00 — 1.12
Templeton Frontier Markets Fund
Region Mix
June 30,2014(%)
December 31,2013(%)
January 1,2013(%) Asset Class Weightings
June 30,2014(%)
December 31,2013(%)
January 1,2013(%)
Middle East & Africa 55.70 54.66 53.43 Common Stocks 95.91 98.83 94.22Asia 17.99 19.45 18.16 Short term securities and all
other assets, net 4.09 1.17 5.78Latin America & Caribbean 11.18 12.47 12.43Europe 11.04 12.05 10.20North America — 0.20 —
Templeton Global Balanced Fund
Region Mix
June 30,2014(%)
December 31,2013(%)
January 1,2013(%) Asset Class Weightings
June 30,2014(%)
December 31,2013(%)
January 1,2013(%)
Europe 37.67 39.97 35.32 Common Stocks 63.30 63.76 59.51North America 23.51 21.58 26.99 Bonds 23.39 20.85 24.84Asia 16.16 13.95 11.71 Equity-Linked Notes 1.42 2.04 2.00Latin America & Caribbean 8.45 8.98 10.90 Preferred Stocks 0.22 0.62 1.32Middle East & Africa 2.05 2.19 1.02 Short term securities and all
other assets, net 11.67 12.73 12.33Supranational 0.44 0.60 1.14Australia & New Zealand 0.05 — 0.59
Templeton Global Bond Fund
Region Mix
June 30,2014(%)
December 31,2013(%)
January 1,2013(%) Asset Class Weightings
June 30,2014(%)
December 31,2013(%)
January 1,2013(%)
Europe 32.84 36.07 35.77 Bonds 62.43 68.06 74.10Asia 15.49 17.15 19.14 Short term securities and all
other assets, net 37.57 31.94 25.90Latin America & Caribbean 10.49 10.82 12.53North America 3.49 3.90 0.07Supranational 0.12 0.12 0.13Australia & New Zealand — — 4.39Middle East & Africa — — 2.07
370 Franklin Templeton Investments Funds

Franklin Templeton Investments Funds
NOTES TO FINANCIAL STATEMENTS For the periods ended June 30, 2014 and December 31, 2013 (Unaudited) (Continued)
8. Financial Risk Management (Continued)
Templeton Global Bond Fund (Hedged)
Region Mix
June 30,2014(%)
December 31,2013(%)
January 1,2013(%) Asset Class Weightings
June 30,2014(%)
December 31,2013(%)
January 1,2013(%)
Europe 32.84 36.07 35.77 Bonds 62.43 68.06 74.10Asia 15.49 17.15 19.14 Short term securities and all
other assets, net 37.57 31.94 25.90Latin America & Caribbean 10.49 10.82 12.53North America 3.49 3.90 0.07Supranational 0.12 0.12 0.13Australia & New Zealand — — 4.39Middle East & Africa — — 2.07
Templeton Global Smaller Companies Fund
Region Mix
June 30,2014(%)
December 31,2013(%)
January 1,2013(%) Asset Class Weightings
June 30,2014(%)
December 31,2013(%)
January 1,2013(%)
Asia 36.38 30.05 27.89 Common Stocks 96.24 94.72 96.90Europe 29.88 30.77 32.34 Preferred Stocks 0.53 0.66 —North America 27.32 30.54 31.80 Short term securities and all
other assets, net 3.23 4.62 3.10Latin America & Caribbean 2.29 4.02 3.44Middle East & Africa 0.90 —Australia & New Zealand — — 1.43
Templeton International Stock Fund
Region Mix
June 30,2014(%)
December 31,2013(%)
January 1,2013(%) Asset Class Weightings
June 30,2014(%)
December 31,2013(%)
January 1,2013(%)
Europe 64.32 67.34 61.67 Common Stocks 96.19 96.63 95.23Asia 29.79 28.03 30.56 Preferred Stocks 1.10 1.82 2.55Middle East & Africa 1.60 1.15 1.44 Underlying Funds 1.08 1.10 1.04Australia & New Zealand 1.56 1.21 2.61 Short term securities and all
other assets, net 1.63 0.45 1.18Latin America & Caribbean 1.10 1.82 2.54
Franklin Flex Cap Growth Fund
Industries
June 30,2014(%)
December 31,2013(%)
January 1,2013(%) Asset Class Weightings
June 30,2014(%)
December 31,2013(%)
January 1,2013(%)
Internet Software & Services 7.05 7.78 3.75 Common Stocks 99.16 97.16 96.80IT Services 5.16 5.82 6.74 Short term securities and all
other assets, net 0.84 2.84 3.20Biotechnology 5.09 6.37 2.76Media 4.79 5.67 5.15Software 4.34 5.24 6.99Pharmaceuticals 3.94 2.68 5.33Others 68.79 63.60 66.08
Franklin High Income Fund
Region Mix
June 30,2014(%)
December 31,2013(%)
January 1,2013(%) Asset Class Weightings
June 30,2014(%)
December 31,2013(%)
January 1,2013(%)
North America 75.25 77.65 80.02 Foreign Corporate Bonds 89.14 90.84 91.70Europe 14.47 13.28 12.01 Canadian Corporate Bonds 3.75 3.44 2.95Australia & New Zealand 1.96 1.66 1.09 Preferred Stocks 0.47 0.60 0.48Latin America & Caribbean 1.85 2.00 1.78 Common Stocks 0.17 0.28 0.24Asia — 0.57 0.47 Short-term securities and all
other assets, net 6.47 4.84 4.63
Franklin Templeton Investments Funds 371
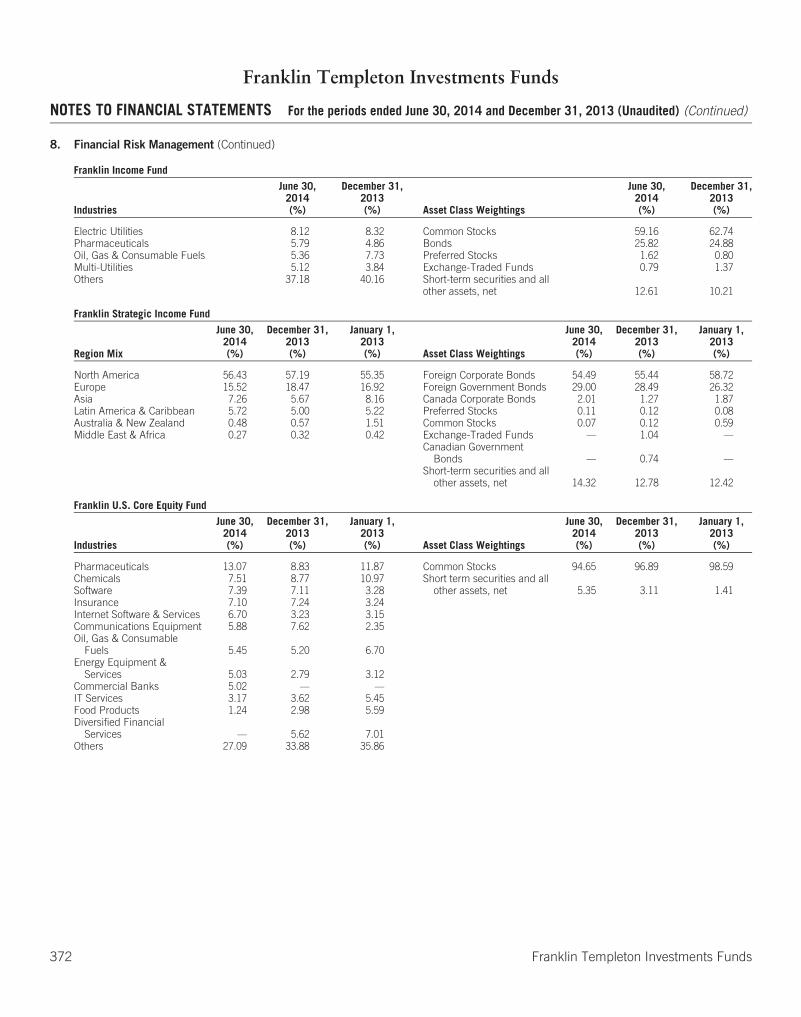
Franklin Templeton Investments Funds
NOTES TO FINANCIAL STATEMENTS For the periods ended June 30, 2014 and December 31, 2013 (Unaudited) (Continued)
8. Financial Risk Management (Continued)
Franklin Income Fund
Industries
June 30,2014(%)
December 31,2013(%) Asset Class Weightings
June 30,2014(%)
December 31,2013(%)
Electric Utilities 8.12 8.32 Common Stocks 59.16 62.74Pharmaceuticals 5.79 4.86 Bonds 25.82 24.88Oil, Gas & Consumable Fuels 5.36 7.73 Preferred Stocks 1.62 0.80Multi-Utilities 5.12 3.84 Exchange-Traded Funds 0.79 1.37Others 37.18 40.16 Short-term securities and all
other assets, net 12.61 10.21
Franklin Strategic Income Fund
Region Mix
June 30,2014(%)
December 31,2013(%)
January 1,2013(%) Asset Class Weightings
June 30,2014(%)
December 31,2013(%)
January 1,2013(%)
North America 56.43 57.19 55.35 Foreign Corporate Bonds 54.49 55.44 58.72Europe 15.52 18.47 16.92 Foreign Government Bonds 29.00 28.49 26.32Asia 7.26 5.67 8.16 Canada Corporate Bonds 2.01 1.27 1.87Latin America & Caribbean 5.72 5.00 5.22 Preferred Stocks 0.11 0.12 0.08Australia & New Zealand 0.48 0.57 1.51 Common Stocks 0.07 0.12 0.59Middle East & Africa 0.27 0.32 0.42 Exchange-Traded Funds — 1.04 —
Canadian GovernmentBonds — 0.74 —
Short-term securities and allother assets, net 14.32 12.78 12.42
Franklin U.S. Core Equity Fund
Industries
June 30,2014(%)
December 31,2013(%)
January 1,2013(%) Asset Class Weightings
June 30,2014(%)
December 31,2013(%)
January 1,2013(%)
Pharmaceuticals 13.07 8.83 11.87 Common Stocks 94.65 96.89 98.59Chemicals 7.51 8.77 10.97 Short term securities and all
other assets, net 5.35 3.11 1.41Software 7.39 7.11 3.28Insurance 7.10 7.24 3.24Internet Software & Services 6.70 3.23 3.15Communications Equipment 5.88 7.62 2.35Oil, Gas & Consumable
Fuels 5.45 5.20 6.70Energy Equipment &
Services 5.03 2.79 3.12Commercial Banks 5.02 — —IT Services 3.17 3.62 5.45Food Products 1.24 2.98 5.59Diversified Financial
Services — 5.62 7.01Others 27.09 33.88 35.86
372 Franklin Templeton Investments Funds
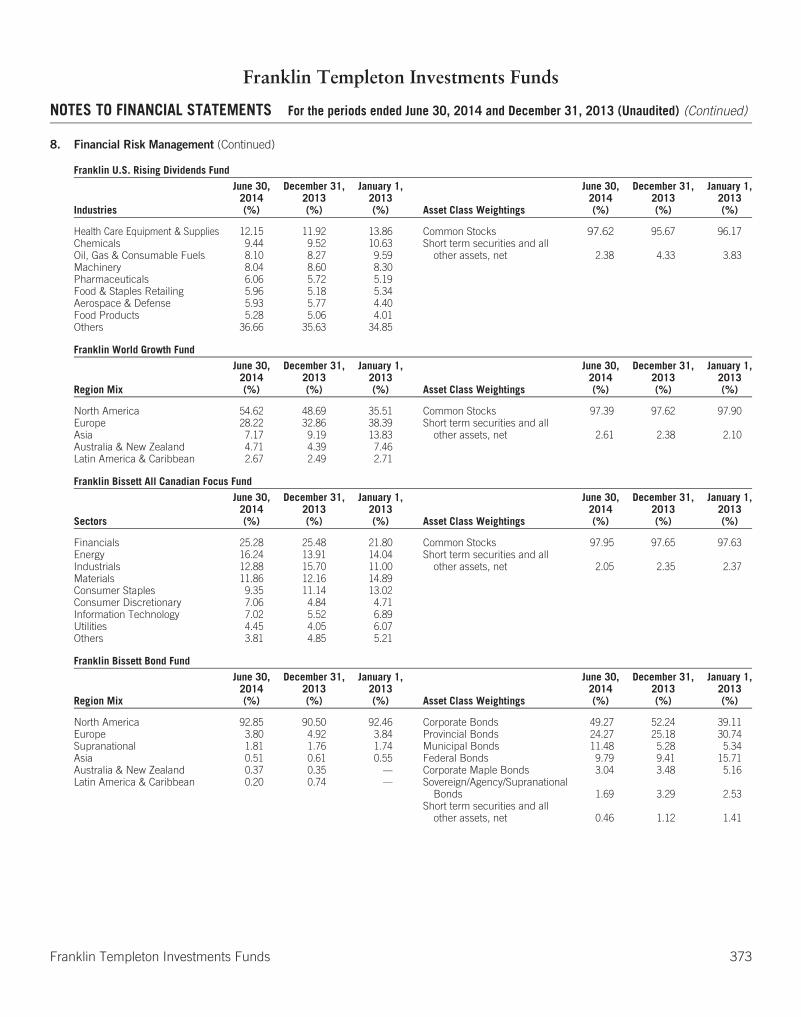
Franklin Templeton Investments Funds
NOTES TO FINANCIAL STATEMENTS For the periods ended June 30, 2014 and December 31, 2013 (Unaudited) (Continued)
8. Financial Risk Management (Continued)
Franklin U.S. Rising Dividends Fund
Industries
June 30,2014(%)
December 31,2013(%)
January 1,2013(%) Asset Class Weightings
June 30,2014(%)
December 31,2013(%)
January 1,2013(%)
Health Care Equipment & Supplies 12.15 11.92 13.86 Common Stocks 97.62 95.67 96.17Chemicals 9.44 9.52 10.63 Short term securities and all
other assets, net 2.38 4.33 3.83Oil, Gas & Consumable Fuels 8.10 8.27 9.59Machinery 8.04 8.60 8.30Pharmaceuticals 6.06 5.72 5.19Food & Staples Retailing 5.96 5.18 5.34Aerospace & Defense 5.93 5.77 4.40Food Products 5.28 5.06 4.01Others 36.66 35.63 34.85
Franklin World Growth Fund
Region Mix
June 30,2014(%)
December 31,2013(%)
January 1,2013(%) Asset Class Weightings
June 30,2014(%)
December 31,2013(%)
January 1,2013(%)
North America 54.62 48.69 35.51 Common Stocks 97.39 97.62 97.90Europe 28.22 32.86 38.39 Short term securities and all
other assets, net 2.61 2.38 2.10Asia 7.17 9.19 13.83Australia & New Zealand 4.71 4.39 7.46Latin America & Caribbean 2.67 2.49 2.71
Franklin Bissett All Canadian Focus Fund
Sectors
June 30,2014(%)
December 31,2013(%)
January 1,2013(%) Asset Class Weightings
June 30,2014(%)
December 31,2013(%)
January 1,2013(%)
Financials 25.28 25.48 21.80 Common Stocks 97.95 97.65 97.63Energy 16.24 13.91 14.04 Short term securities and all
other assets, net 2.05 2.35 2.37Industrials 12.88 15.70 11.00Materials 11.86 12.16 14.89Consumer Staples 9.35 11.14 13.02Consumer Discretionary 7.06 4.84 4.71Information Technology 7.02 5.52 6.89Utilities 4.45 4.05 6.07Others 3.81 4.85 5.21
Franklin Bissett Bond Fund
Region Mix
June 30,2014(%)
December 31,2013(%)
January 1,2013(%) Asset Class Weightings
June 30,2014(%)
December 31,2013(%)
January 1,2013(%)
North America 92.85 90.50 92.46 Corporate Bonds 49.27 52.24 39.11Europe 3.80 4.92 3.84 Provincial Bonds 24.27 25.18 30.74Supranational 1.81 1.76 1.74 Municipal Bonds 11.48 5.28 5.34Asia 0.51 0.61 0.55 Federal Bonds 9.79 9.41 15.71Australia & New Zealand 0.37 0.35 — Corporate Maple Bonds 3.04 3.48 5.16Latin America & Caribbean 0.20 0.74 — Sovereign/Agency/Supranational
Bonds 1.69 3.29 2.53Short term securities and all
other assets, net 0.46 1.12 1.41
Franklin Templeton Investments Funds 373

Franklin Templeton Investments Funds
NOTES TO FINANCIAL STATEMENTS For the periods ended June 30, 2014 and December 31, 2013 (Unaudited) (Continued)
8. Financial Risk Management (Continued)
Franklin Bissett Canadian All Cap Balanced Fund
Sectors
June 30,2014(%)
December 31,2013(%)
January 1,2013(%) Asset Class Weightings
June 30,2014(%)
December 31,2013(%)
January 1,2013(%)
Financials 17.11 17.38 12.44 Common Stocks 65.17 68.53 57.54Energy 16.66 15.43 6.92 Bonds 28.93 27.46 39.50Industrials 12.11 11.18 7.01 Preferred Stocks — — 0.35Consumer Discretionary 8.17 9.43 3.95 Short-term securities and all
other assets, net 5.90 4.01 2.61Materials 5.03 7.22 5.58Consumer Staples 3.03 3.93 7.47Others 3.06 3.96 14.52
Franklin Bissett Canadian Balanced Fund
Region Mix
June 30,2014(%)
December 31,2013(%)
January 1,2013(%) Asset Class Weightings
June 30,2014(%)
December 31,2013(%)
January 1,2013(%)
North America 79.99 79.58 80.22 Equity 57.68 60.05 62.81Europe 8.65 9.41 8.86 Income 37.78 35.73 32.81Asia 4.63 4.65 4.96 Other assets (of Underlying Funds) 4.06 3.62 2.88Latin America & Caribbean 1.30 1.43 0.93 Short term securities and all
other assets, net 0.48 0.60 1.50Supranational 0.32 0.29 0.34Middle East & Africa 0.30 0.18 0.16Australia & New Zealand 0.27 0.24 0.15
Franklin Bissett Canadian Dividend Fund
Sectors
June 30,2014(%)
December 31,2013(%)
January 1,2013(%) Asset Class Weightings
June 30,2014(%)
December 31,2013(%)
January 1,2013(%)
Financials 38.35 37.75 35.01 Common Stocks 98.68 98.54 97.91Energy 30.79 27.66 25.26 Short term securities and all
other assets, net 1.32 1.46 2.09Industrials 7.53 8.36 4.64Telecommunication Services 5.69 5.72 12.07Materials 5.23 6.50 2.95Consumer Discretionary 4.31 4.60 6.42Utilities 3.80 3.95 7.25Others 2.98 4.00 4.31
Franklin Bissett Canadian Equity Fund
Sectors
June 30,2014(%)
December 31,2013(%)
January 1,2013(%) Asset Class Weightings
June 30,2014(%)
December 31,2013(%)
January 1,2013(%)
Financials 35.99 34.98 33.62 Common Stocks 95.55 96.83 97.16Energy 24.51 23.34 24.01 Short term securities and all
other assets, net 4.45 3.17 2.84Industrials 14.22 13.15 10.21Materials 6.77 8.02 7.73Consumer Discretionary 5.58 6.38 7.35Consumer Staples 5.26 7.06 6.77Others 3.22 3.90 7.47
Franklin Bissett Canadian High Dividend Fund
Sectors
June 30,2014(%)
December 31,2013(%)
January 1,2013(%) Asset Class Weightings
June 30,2014(%)
December 31,2013(%)
January 1,2013(%)
Energy 33.83 34.71 33.82 Common Stocks 99.00 97.30 97.82Financials 31.46 28.74 27.65 Short term securities and all
other assets, net 1.00 2.70 2.18Industrials 15.04 16.14 18.16Materials 5.93 5.30 6.90Health Care 4.03 4.27 7.91Others 8.71 8.14 3.38
374 Franklin Templeton Investments Funds

Franklin Templeton Investments Funds
NOTES TO FINANCIAL STATEMENTS For the periods ended June 30, 2014 and December 31, 2013 (Unaudited) (Continued)
8. Financial Risk Management (Continued)
Franklin Bissett Canadian Short Term Bond Fund
Region Mix
June 30,2014(%)
December 31,2013(%)
January 1,2013(%) Asset Class Weightings
June 30,2014(%)
December 31,2013(%)
January 1,2013(%)
North America 94.32 91.93 96.59 Canadian Corporate Bonds 50.40 47.13 45.76Europe 3.63 4.81 3.02 Canadian Government Bonds 29.82 29.37 37.42Asia 1.29 0.92 0.19 Foreign Corporate Bonds 19.11 21.23 16.62Australia & New Zealand 0.40 0.36 — Foreign Government Bonds 0.31 0.29 —
Short term securities and allother assets, net 0.36 1.98 0.20
Franklin Bissett Corporate Bond Fund
Region Mix
June 30,2014(%)
December 31,2013(%)
January 1,2013(%) Asset Class Weightings
June 30,2014(%)
December 31,2013(%)
January 1,2013(%)
North America 95.02 93.07 95.84 Corporate Bonds 96.89 95.00 93.27Europe 2.03 2.69 2.35 Federal Bonds 1.24 2.45 —Asia 0.78 1.00 0.84 Municipal Bonds 0.83 0.44 1.45Australia & New Zealand 0.77 0.77 — Provincial Bonds — — 4.31Latin America & Caribbean 0.36 0.36 — Short term securities and all
other assets, net 1.04 2.11 0.97
Franklin Bissett Dividend Income Fund
Sectors
June 30,2014(%)
December 31,2013(%)
January 1,2013(%) Asset Class Weightings
June 30,2014(%)
December 31,2013(%)
January 1,2013(%)
Financials 27.06 24.55 19.17 Common Stocks 80.11 81.56 76.53Energy 21.96 21.10 19.38 Bonds 15.23 13.22 15.62Consumer Staples 7.34 9.53 8.03 Preferred Stocks 1.92 1.98 3.15Industrials 5.70 6.20 4.72 Short-term securities and all
other assets, net 2.74 3.24 4.70Telecommunication Services 3.99 4.03 8.51Consumer Discretionary 3.84 4.91 6.61Others 12.14 13.22 13.26
Franklin Bissett Microcap Fund
Sectors
June 30,2014(%)
December 31,2013(%)
January 1,2013(%) Asset Class Weightings
June 30,2014(%)
December 31,2013(%)
January 1,2013(%)
Energy 30.00 23.44 18.78 Common Stocks 93.79 91.08 93.20Consumer Discretionary 16.67 21.70 24.12 Bonds 0.55 0.23 —Financials 13.79 11.30 9.53 Short term securities and all
other assets, net 5.66 8.69 6.80Industrials 13.27 13.58 13.48Information Technology 9.83 9.54 13.00Materials 8.73 9.90 9.66Others 1.50 1.62 4.63
Franklin Bissett Money Market Fund
Region
June 30,2014(%)
December 31,2013(%)
January 1,2013(%) Asset Class Weightings
June 30,2014(%)
December 31,2013(%)
January 1,2013(%)
North America 99.71 99.86 99.71 Corporate Bonds 53.73 56.67 53.54Banker’s Acceptance 26.72 24.83 19.53Commercial Paper 10.34 5.24 1.95Treasury Bills 4.47 4.58 19.02Government Bonds 4.45 8.54 5.67Other Assets, less Liabilities 0.29 0.14 0.29
Franklin Templeton Investments Funds 375
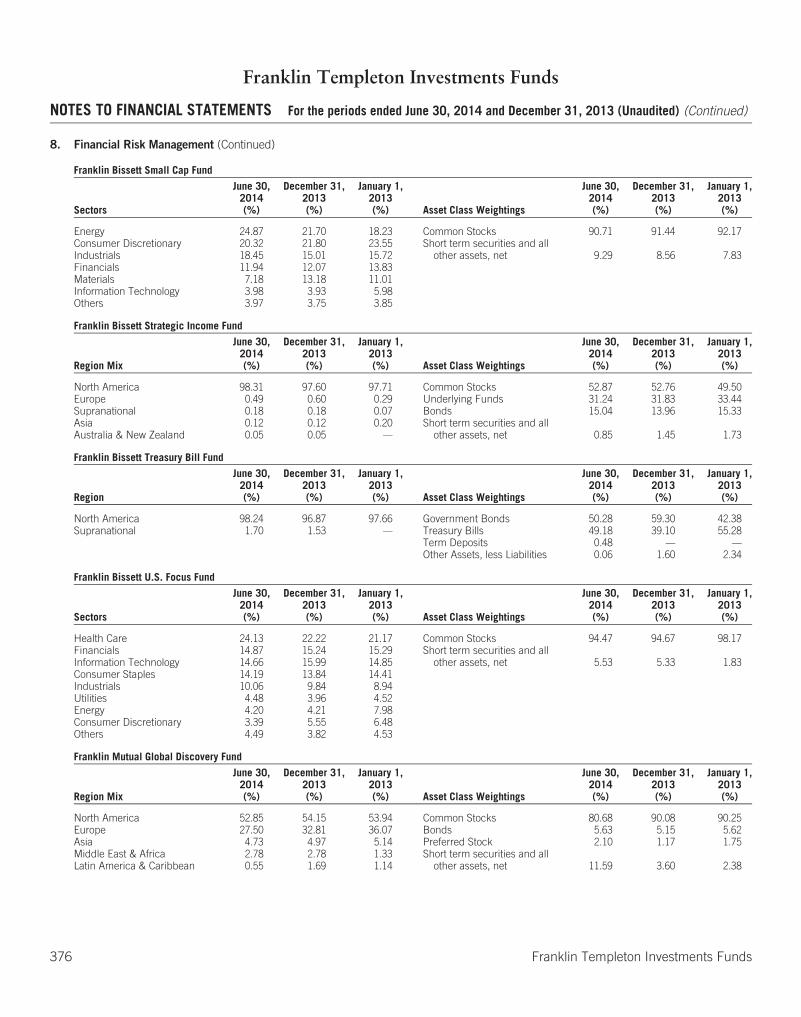
Franklin Templeton Investments Funds
NOTES TO FINANCIAL STATEMENTS For the periods ended June 30, 2014 and December 31, 2013 (Unaudited) (Continued)
8. Financial Risk Management (Continued)
Franklin Bissett Small Cap Fund
Sectors
June 30,2014(%)
December 31,2013(%)
January 1,2013(%) Asset Class Weightings
June 30,2014(%)
December 31,2013(%)
January 1,2013(%)
Energy 24.87 21.70 18.23 Common Stocks 90.71 91.44 92.17Consumer Discretionary 20.32 21.80 23.55 Short term securities and all
other assets, net 9.29 8.56 7.83Industrials 18.45 15.01 15.72Financials 11.94 12.07 13.83Materials 7.18 13.18 11.01Information Technology 3.98 3.93 5.98Others 3.97 3.75 3.85
Franklin Bissett Strategic Income Fund
Region Mix
June 30,2014(%)
December 31,2013(%)
January 1,2013(%) Asset Class Weightings
June 30,2014(%)
December 31,2013(%)
January 1,2013(%)
North America 98.31 97.60 97.71 Common Stocks 52.87 52.76 49.50Europe 0.49 0.60 0.29 Underlying Funds 31.24 31.83 33.44Supranational 0.18 0.18 0.07 Bonds 15.04 13.96 15.33Asia 0.12 0.12 0.20 Short term securities and all
other assets, net 0.85 1.45 1.73Australia & New Zealand 0.05 0.05 —
Franklin Bissett Treasury Bill Fund
Region
June 30,2014(%)
December 31,2013(%)
January 1,2013(%) Asset Class Weightings
June 30,2014(%)
December 31,2013(%)
January 1,2013(%)
North America 98.24 96.87 97.66 Government Bonds 50.28 59.30 42.38Supranational 1.70 1.53 — Treasury Bills 49.18 39.10 55.28
Term Deposits 0.48 — —Other Assets, less Liabilities 0.06 1.60 2.34
Franklin Bissett U.S. Focus Fund
Sectors
June 30,2014(%)
December 31,2013(%)
January 1,2013(%) Asset Class Weightings
June 30,2014(%)
December 31,2013(%)
January 1,2013(%)
Health Care 24.13 22.22 21.17 Common Stocks 94.47 94.67 98.17Financials 14.87 15.24 15.29 Short term securities and all
other assets, net 5.53 5.33 1.83Information Technology 14.66 15.99 14.85Consumer Staples 14.19 13.84 14.41Industrials 10.06 9.84 8.94Utilities 4.48 3.96 4.52Energy 4.20 4.21 7.98Consumer Discretionary 3.39 5.55 6.48Others 4.49 3.82 4.53
Franklin Mutual Global Discovery Fund
Region Mix
June 30,2014(%)
December 31,2013(%)
January 1,2013(%) Asset Class Weightings
June 30,2014(%)
December 31,2013(%)
January 1,2013(%)
North America 52.85 54.15 53.94 Common Stocks 80.68 90.08 90.25Europe 27.50 32.81 36.07 Bonds 5.63 5.15 5.62Asia 4.73 4.97 5.14 Preferred Stock 2.10 1.17 1.75Middle East & Africa 2.78 2.78 1.33 Short term securities and all
other assets, net 11.59 3.60 2.38Latin America & Caribbean 0.55 1.69 1.14
376 Franklin Templeton Investments Funds

Franklin Templeton Investments Funds
NOTES TO FINANCIAL STATEMENTS For the periods ended June 30, 2014 and December 31, 2013 (Unaudited) (Continued)
8. Financial Risk Management (Continued)
Franklin Mutual U.S. Shares Fund
Region Mix
June 30,2014(%)
December 31,2013(%)
January 1,2013(%) Asset Class Weightings
June 30,2014(%)
December 31,2013(%)
January 1,2013(%)
North America 86.14 67.36 67.11 Common Stocks 89.62 81.62 84.16Europe 6.76 20.62 22.71 Bonds 4.08 9.05 7.76Middle East & Africa 0.78 2.87 1.78 Preferred Stocks 0.47 1.46 1.18Asia 0.47 0.87 0.86 Short term securities and all
other assets, net 5.83 7.87 6.90Latin America & Caribbean 0.02 0.41 0.02Australia & New Zealand — — 0.62
Franklin Templeton Canadian Core Equity Fund
Industries
June 30,2014(%)
December 31,2013(%)
January 1,2013(%) Asset Class Weightings
June 30,2014(%)
December 31,2013(%)
January 1,2013(%)
Commercial Banks 24.38 26.16 21.98 Common Stocks 95.09 96.41 99.76Oil, Gas & Consumable Fuels 24.34 16.37 21.01 Short term securities and all
other assets, net 4.91 3.59 0.24Energy Equipment & Services 6.18 7.79 2.46Food & Staples Retailing 3.40 3.51 7.91Metals & Mining 2.95 6.82 26.44Biotechnology 0.36 0.97 5.07Others 33.48 34.79 14.89
Franklin Templeton Canadian Large Cap Fund
Industries
June 30,2014(%)
December 31,2013(%)
January 1,2013(%) Asset Class Weightings
June 30,2014(%)
December 31,2013(%)
January 1,2013(%)
Commercial Banks 27.30 26.60 25.37 Common Stocks 98.76 98.92 98.92Oil, Gas & Consumable Fuels 21.51 20.97 21.36 Short term securities and all
other assets, net 1.24 1.08 1.08Insurance 10.98 8.71 8.47Energy Equipment & Services 5.76 7.26 7.72Media 4.81 6.87 6.48Others 28.40 28.51 29.52
(g) Fair value estimation
The Funds classify fair value measurements of investments held using a fair value hierarchy that reflects the significance of the inputs usedin making the measurements. The fair value hierarchy has the following levels:
• Level 1 — quoted prices (unadjusted) in active markets for identical assets or liabilities
• Level 2 — inputs other than quoted prices included within Level 1 that are observable for the asset or liability, either directly (prices) orindirectly (derived from prices)
• Level 3 — inputs for the asset or liability that are not based on observable market data (unobservable inputs)
The determination of what constitutes “observable” requires significant judgment by the Manager. The Manager considers observable datato be market data that is readily available, regularly distributed or updated, reliable and verifiable, not proprietary, and provided byindependent sources that are actively involved in the relevant market. Financial instruments that trade in markets that are not considered tobe active but are valued based on quoted market prices, dealer quotations or alternative pricing sources supported by observable inputsare classified within Level 2. Investments classified within Level 3 have significant unobservable inputs, as they trade infrequently. Thesemay include private equity and corporate debt securities. As observable prices are not available for these securities, the Manager has usedvaluation techniques to derive the fair value.
Franklin Templeton Investments Funds 377

Franklin Templeton Investments Funds
NOTES TO FINANCIAL STATEMENTS For the periods ended June 30, 2014 and December 31, 2013 (Unaudited) (Continued)
8. Financial Risk Management (Continued)
The Funds’ investments are generally classified as follows:
• Equities — The Funds’ equity positions are classified as Level 1 when the security is actively traded and a reliable price is observable.Certain of the Funds’ equities may not trade frequently and therefore observable prices may not be available. In such cases, fair valueis determined using observable market data (e.g., transactions for similar securities of the same issuer) and the fair value is classifiedas Level 2, unless the determination of fair value requires significant unobservable data, in which case the measurement is classifiedas Level 3.
• Bonds and short-term investments — Debt securities generally trade in the OTC market rather than on a securities exchange. Theinputs that are significant to valuation are generally observable such as benchmark yield curves, credit spreads, estimated defaultrates, anticipated market interest rate volatility, coupon rates, anticipated timing of repayments, underlying collateral and other uniquesecurity features in order to estimate the relevant cash flows. Therefore the Fund’s bonds and short-term investments have beenclassified as Level 2, unless the determination of fair value requires significant unobservable data, in which case the measurement isclassified as Level 3.
• Investments in mutual funds / unit trusts and exchange traded funds — The Funds’ positions in the mutual funds / unit trusts andexchange traded funds are typically in positions that are actively traded and a reliable price is observable and as such is classified asLevel 1. Where the determination of fair value requires significant unobservable data the measurement is classified as Level 3.
• Derivative assets and liabilities — Derivative assets and liabilities consist of foreign currency forward contracts, interest rate swaps andcredit default swaps which are valued based primarily on the contract notional amount, the difference between the contract rate andthe forward market rate for the same currency, interest rates and credit spreads. Contracts for which counterparty credit spreads areobservable and reliable, or for which the credit-related inputs are determined not to be significant to fair value, are classified as Level 2.
The carrying values of cash, capital units sold receivable, interest receivable, payable for investments purchased, capital units redeemedpayable, distributions payable, accrued liabilities and the Fund’s obligation for net assets attributable to holders of redeemable unitsapproximate their fair values due to their short-term nature.
The following tables show the classification of the Funds’ financial assets and liabilities measured at fair value as at June 30, 2014,December 31, 2013 and January 1, 2013.
Templeton Asian Growth Fund
Equities —Long
ConvertibleEquities Bonds
Convertiblefixed
Mutual funds/Unit trusts/
ETFsShort-termsecurities
TotalInvestments
Derivativeassets
Derivativeliabilities
(000s) (000s) (000s) (000s) (000s) (000s) (000s) (000s) (000s)June 30, 2014Level 1 . . . . . . . . . . . . . . . $254,761 $978 $— $ — $ — $— $255,739 $ — $ —Level 2 . . . . . . . . . . . . . . . — — — — — — — — —Level 3 . . . . . . . . . . . . . . . — — — — — — — — —
Total . . . . . . . . . . . . . . . . $254,761 $978 $— $ — $ — $— $255,739 $ — $ —
December 31, 2013Level 1 . . . . . . . . . . . . . . . $205,797 $ — $— $ — $ — $— $205,797 $ — $ —Level 2 . . . . . . . . . . . . . . . — — — — — — — — —Level 3 . . . . . . . . . . . . . . . — — — — — — — — —
Total . . . . . . . . . . . . . . . . $205,797 $ — $— $ — $ — $— $205,797 $ — $ —
January 01, 2013Level 1 . . . . . . . . . . . . . . . $273,793 $ — $— $ — $ — $— $273,793 $ — $ —Level 2 . . . . . . . . . . . . . . . 38,756 — — — — — 38,756 — —Level 3 . . . . . . . . . . . . . . . — — — — — — — — —
Total . . . . . . . . . . . . . . . . $312,549 $ — $— $ — $ — $— $312,549 $ — $ —
378 Franklin Templeton Investments Funds
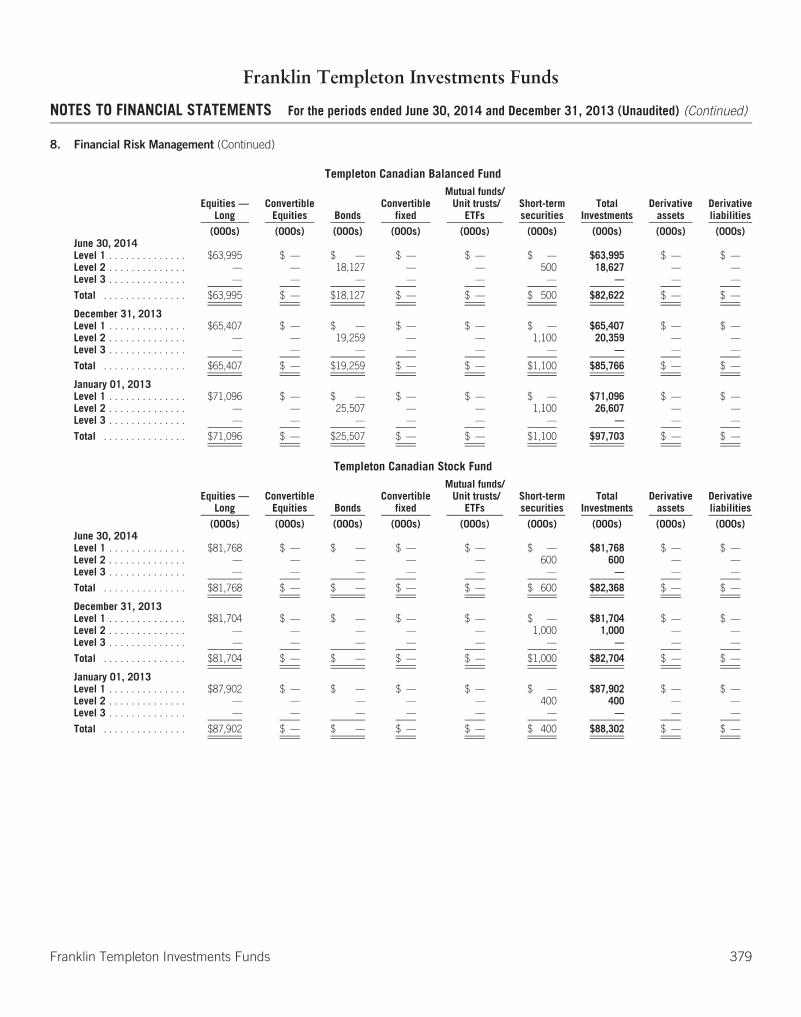
Franklin Templeton Investments Funds
NOTES TO FINANCIAL STATEMENTS For the periods ended June 30, 2014 and December 31, 2013 (Unaudited) (Continued)
8. Financial Risk Management (Continued)
Templeton Canadian Balanced Fund
Equities —Long
ConvertibleEquities Bonds
Convertiblefixed
Mutual funds/Unit trusts/
ETFsShort-termsecurities
TotalInvestments
Derivativeassets
Derivativeliabilities
(000s) (000s) (000s) (000s) (000s) (000s) (000s) (000s) (000s)June 30, 2014Level 1 . . . . . . . . . . . . . . $63,995 $ — $ — $ — $ — $ — $63,995 $ — $ —Level 2 . . . . . . . . . . . . . . — — 18,127 — — 500 18,627 — —Level 3 . . . . . . . . . . . . . . — — — — — — — — —
Total . . . . . . . . . . . . . . . $63,995 $ — $18,127 $ — $ — $ 500 $82,622 $ — $ —
December 31, 2013Level 1 . . . . . . . . . . . . . . $65,407 $ — $ — $ — $ — $ — $65,407 $ — $ —Level 2 . . . . . . . . . . . . . . — — 19,259 — — 1,100 20,359 — —Level 3 . . . . . . . . . . . . . . — — — — — — — — —
Total . . . . . . . . . . . . . . . $65,407 $ — $19,259 $ — $ — $1,100 $85,766 $ — $ —
January 01, 2013Level 1 . . . . . . . . . . . . . . $71,096 $ — $ — $ — $ — $ — $71,096 $ — $ —Level 2 . . . . . . . . . . . . . . — — 25,507 — — 1,100 26,607 — —Level 3 . . . . . . . . . . . . . . — — — — — — — — —
Total . . . . . . . . . . . . . . . $71,096 $ — $25,507 $ — $ — $1,100 $97,703 $ — $ —
Templeton Canadian Stock Fund
Equities —Long
ConvertibleEquities Bonds
Convertiblefixed
Mutual funds/Unit trusts/
ETFsShort-termsecurities
TotalInvestments
Derivativeassets
Derivativeliabilities
(000s) (000s) (000s) (000s) (000s) (000s) (000s) (000s) (000s)June 30, 2014Level 1 . . . . . . . . . . . . . . $81,768 $ — $ — $ — $ — $ — $81,768 $ — $ —Level 2 . . . . . . . . . . . . . . — — — — — 600 600 — —Level 3 . . . . . . . . . . . . . . — — — — — — — — —
Total . . . . . . . . . . . . . . . $81,768 $ — $ — $ — $ — $ 600 $82,368 $ — $ —
December 31, 2013Level 1 . . . . . . . . . . . . . . $81,704 $ — $ — $ — $ — $ — $81,704 $ — $ —Level 2 . . . . . . . . . . . . . . — — — — — 1,000 1,000 — —Level 3 . . . . . . . . . . . . . . — — — — — — — — —
Total . . . . . . . . . . . . . . . $81,704 $ — $ — $ — $ — $1,000 $82,704 $ — $ —
January 01, 2013Level 1 . . . . . . . . . . . . . . $87,902 $ — $ — $ — $ — $ — $87,902 $ — $ —Level 2 . . . . . . . . . . . . . . — — — — — 400 400 — —Level 3 . . . . . . . . . . . . . . — — — — — — — — —
Total . . . . . . . . . . . . . . . $87,902 $ — $ — $ — $ — $ 400 $88,302 $ — $ —
Franklin Templeton Investments Funds 379
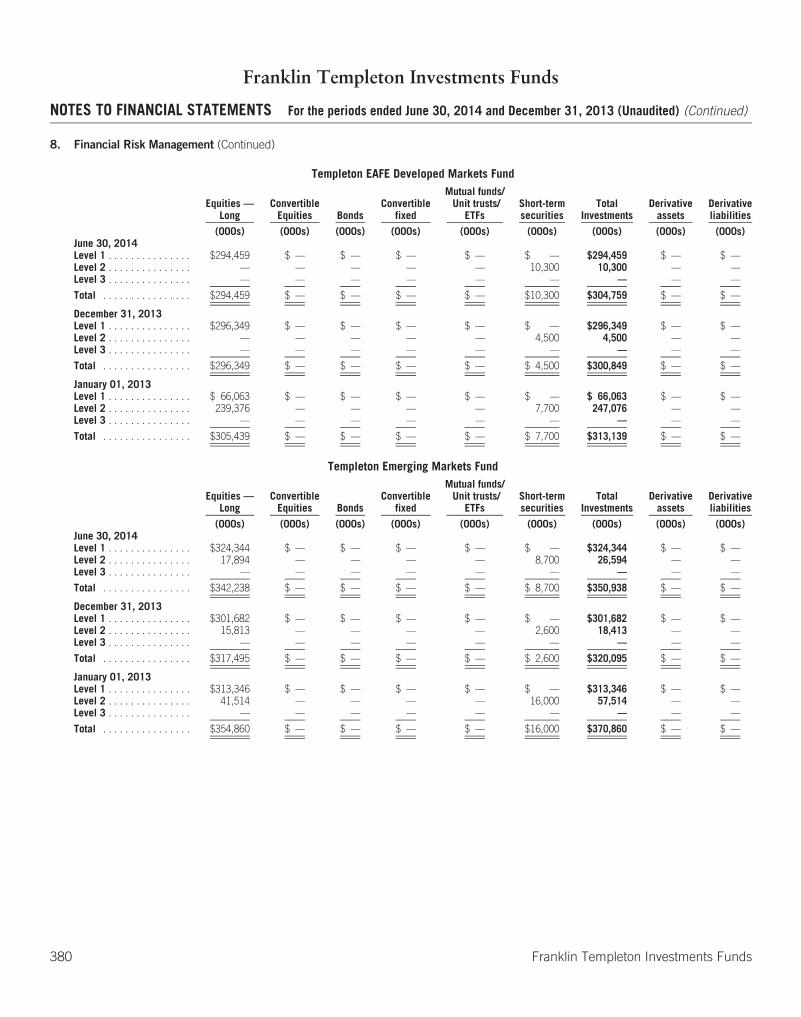
Franklin Templeton Investments Funds
NOTES TO FINANCIAL STATEMENTS For the periods ended June 30, 2014 and December 31, 2013 (Unaudited) (Continued)
8. Financial Risk Management (Continued)
Templeton EAFE Developed Markets Fund
Equities —Long
ConvertibleEquities Bonds
Convertiblefixed
Mutual funds/Unit trusts/
ETFsShort-termsecurities
TotalInvestments
Derivativeassets
Derivativeliabilities
(000s) (000s) (000s) (000s) (000s) (000s) (000s) (000s) (000s)June 30, 2014Level 1 . . . . . . . . . . . . . . . $294,459 $ — $ — $ — $ — $ — $294,459 $ — $ —Level 2 . . . . . . . . . . . . . . . — — — — — 10,300 10,300 — —Level 3 . . . . . . . . . . . . . . . — — — — — — — — —
Total . . . . . . . . . . . . . . . . $294,459 $ — $ — $ — $ — $10,300 $304,759 $ — $ —
December 31, 2013Level 1 . . . . . . . . . . . . . . . $296,349 $ — $ — $ — $ — $ — $296,349 $ — $ —Level 2 . . . . . . . . . . . . . . . — — — — — 4,500 4,500 — —Level 3 . . . . . . . . . . . . . . . — — — — — — — — —
Total . . . . . . . . . . . . . . . . $296,349 $ — $ — $ — $ — $ 4,500 $300,849 $ — $ —
January 01, 2013Level 1 . . . . . . . . . . . . . . . $ 66,063 $ — $ — $ — $ — $ — $ 66,063 $ — $ —Level 2 . . . . . . . . . . . . . . . 239,376 — — — — 7,700 247,076 — —Level 3 . . . . . . . . . . . . . . . — — — — — — — — —
Total . . . . . . . . . . . . . . . . $305,439 $ — $ — $ — $ — $ 7,700 $313,139 $ — $ —
Templeton Emerging Markets Fund
Equities —Long
ConvertibleEquities Bonds
Convertiblefixed
Mutual funds/Unit trusts/
ETFsShort-termsecurities
TotalInvestments
Derivativeassets
Derivativeliabilities
(000s) (000s) (000s) (000s) (000s) (000s) (000s) (000s) (000s)June 30, 2014Level 1 . . . . . . . . . . . . . . . $324,344 $ — $ — $ — $ — $ — $324,344 $ — $ —Level 2 . . . . . . . . . . . . . . . 17,894 — — — — 8,700 26,594 — —Level 3 . . . . . . . . . . . . . . . — — — — — — — — —
Total . . . . . . . . . . . . . . . . $342,238 $ — $ — $ — $ — $ 8,700 $350,938 $ — $ —
December 31, 2013Level 1 . . . . . . . . . . . . . . . $301,682 $ — $ — $ — $ — $ — $301,682 $ — $ —Level 2 . . . . . . . . . . . . . . . 15,813 — — — — 2,600 18,413 — —Level 3 . . . . . . . . . . . . . . . — — — — — — — — —
Total . . . . . . . . . . . . . . . . $317,495 $ — $ — $ — $ — $ 2,600 $320,095 $ — $ —
January 01, 2013Level 1 . . . . . . . . . . . . . . . $313,346 $ — $ — $ — $ — $ — $313,346 $ — $ —Level 2 . . . . . . . . . . . . . . . 41,514 — — — — 16,000 57,514 — —Level 3 . . . . . . . . . . . . . . . — — — — — — — — —
Total . . . . . . . . . . . . . . . . $354,860 $ — $ — $ — $ — $16,000 $370,860 $ — $ —
380 Franklin Templeton Investments Funds
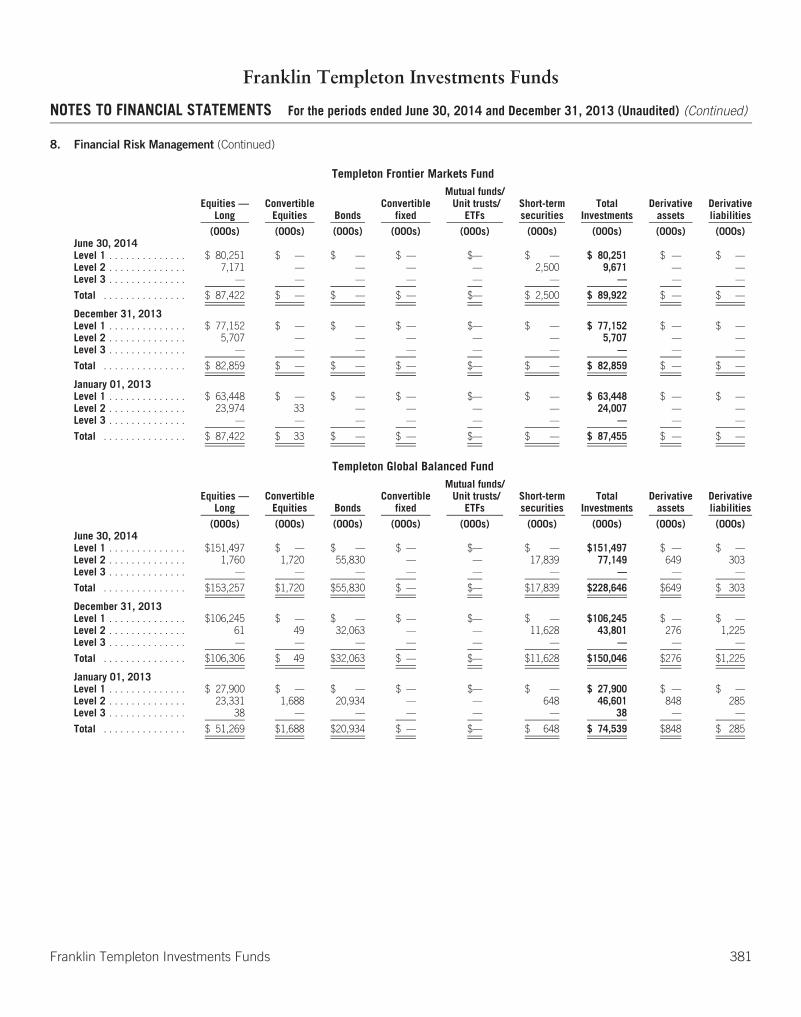
Franklin Templeton Investments Funds
NOTES TO FINANCIAL STATEMENTS For the periods ended June 30, 2014 and December 31, 2013 (Unaudited) (Continued)
8. Financial Risk Management (Continued)
Templeton Frontier Markets Fund
Equities —Long
ConvertibleEquities Bonds
Convertiblefixed
Mutual funds/Unit trusts/
ETFsShort-termsecurities
TotalInvestments
Derivativeassets
Derivativeliabilities
(000s) (000s) (000s) (000s) (000s) (000s) (000s) (000s) (000s)June 30, 2014Level 1 . . . . . . . . . . . . . . $ 80,251 $ — $ — $ — $— $ — $ 80,251 $ — $ —Level 2 . . . . . . . . . . . . . . 7,171 — — — — 2,500 9,671 — —Level 3 . . . . . . . . . . . . . . — — — — — — — — —
Total . . . . . . . . . . . . . . . $ 87,422 $ — $ — $ — $— $ 2,500 $ 89,922 $ — $ —
December 31, 2013Level 1 . . . . . . . . . . . . . . $ 77,152 $ — $ — $ — $— $ — $ 77,152 $ — $ —Level 2 . . . . . . . . . . . . . . 5,707 — — — — — 5,707 — —Level 3 . . . . . . . . . . . . . . — — — — — — — — —
Total . . . . . . . . . . . . . . . $ 82,859 $ — $ — $ — $— $ — $ 82,859 $ — $ —
January 01, 2013Level 1 . . . . . . . . . . . . . . $ 63,448 $ — $ — $ — $— $ — $ 63,448 $ — $ —Level 2 . . . . . . . . . . . . . . 23,974 33 — — — — 24,007 — —Level 3 . . . . . . . . . . . . . . — — — — — — — — —
Total . . . . . . . . . . . . . . . $ 87,422 $ 33 $ — $ — $— $ — $ 87,455 $ — $ —
Templeton Global Balanced Fund
Equities —Long
ConvertibleEquities Bonds
Convertiblefixed
Mutual funds/Unit trusts/
ETFsShort-termsecurities
TotalInvestments
Derivativeassets
Derivativeliabilities
(000s) (000s) (000s) (000s) (000s) (000s) (000s) (000s) (000s)June 30, 2014Level 1 . . . . . . . . . . . . . . $151,497 $ — $ — $ — $— $ — $151,497 $ — $ —Level 2 . . . . . . . . . . . . . . 1,760 1,720 55,830 — — 17,839 77,149 649 303Level 3 . . . . . . . . . . . . . . — — — — — — — — —
Total . . . . . . . . . . . . . . . $153,257 $1,720 $55,830 $ — $— $17,839 $228,646 $649 $ 303
December 31, 2013Level 1 . . . . . . . . . . . . . . $106,245 $ — $ — $ — $— $ — $106,245 $ — $ —Level 2 . . . . . . . . . . . . . . 61 49 32,063 — — 11,628 43,801 276 1,225Level 3 . . . . . . . . . . . . . . — — — — — — — — —
Total . . . . . . . . . . . . . . . $106,306 $ 49 $32,063 $ — $— $11,628 $150,046 $276 $1,225
January 01, 2013Level 1 . . . . . . . . . . . . . . $ 27,900 $ — $ — $ — $— $ — $ 27,900 $ — $ —Level 2 . . . . . . . . . . . . . . 23,331 1,688 20,934 — — 648 46,601 848 285Level 3 . . . . . . . . . . . . . . 38 — — — — — 38 — —
Total . . . . . . . . . . . . . . . $ 51,269 $1,688 $20,934 $ — $— $ 648 $ 74,539 $848 $ 285
Franklin Templeton Investments Funds 381

Franklin Templeton Investments Funds
NOTES TO FINANCIAL STATEMENTS For the periods ended June 30, 2014 and December 31, 2013 (Unaudited) (Continued)
8. Financial Risk Management (Continued)
Templeton Global Bond Fund
Equities —Long
ConvertibleEquities Bonds
Convertiblefixed
Mutual funds/Unit trusts/
ETFsShort-termsecurities
TotalInvestments
Derivativeassets
Derivativeliabilities
(000s) (000s) (000s) (000s) (000s) (000s) (000s) (000s) (000s)June 30, 2014Level 1 . . . . . . . . . . . $ — $ — $ — $ — $ — $ — $ — $ — $ —Level 2 . . . . . . . . . . . — — 1,393,445 — — 603,180 1,996,625 5,260 15,858Level 3 . . . . . . . . . . . — — — — — — — — —Total . . . . . . . . . . . . . $ — $ — $1,393,445 $ — $ — $603,180 $1,996,625 $ 5,260 $15,858
December 31, 2013Level 1 . . . . . . . . . . . $ — $ — $ — $ — $ — $ — $ — $ — $ —Level 2 . . . . . . . . . . . — — 1,423,585 — — 459,868 1,883,453 3,206 25,126Level 3 . . . . . . . . . . . — — — — — — — — —Total . . . . . . . . . . . . . $ — $ — $1,423,585 $ — $ — $459,868 $1,883,453 $ 3,206 $25,126
January 01, 2013Level 1 . . . . . . . . . . . $ — $ — $ — $ — $ — $ — $ — $ — $ —Level 2 . . . . . . . . . . . — — 1,348,833 — — 421,275 1,770,108 10,259 15,203Level 3 . . . . . . . . . . . — — — — — — — — —Total . . . . . . . . . . . . . $ — $ — $1,348,833 $ — $ — $421,275 $1,770,108 $10,259 $15,203
Templeton Global Bond Fund (Hedged)
Equities —Long
ConvertibleEquities Bonds
Convertiblefixed
Mutual funds/Unit trusts/
ETFsShort-termsecurities
TotalInvestments
Derivativeassets
Derivativeliabilities
(000s) (000s) (000s) (000s) (000s) (000s) (000s) (000s) (000s)June 30, 2014Level 1 . . . . . . . . . . . $ — $ — $ — $ — $65,533 $ — $ 65,533 $ — $ —Level 2 . . . . . . . . . . . — — — — — — — 1,401 —Level 3 . . . . . . . . . . . — — — — — — — — —Total . . . . . . . . . . . . . $ — $ — $ — $ — $65,533 $ — $ 65,533 $ 1,401 $ —
December 31, 2013Level 1 . . . . . . . . . . . $ — $ — $ — $ — $54,736 $ — $ 54,736 $ — $ —Level 2 . . . . . . . . . . . — — — — — — — 130 —Level 3 . . . . . . . . . . . — — — — — — — — —Total . . . . . . . . . . . . . $ — $ — $ — $ — $54,736 $ — $ 54,736 $ 130 $ —
Templeton Global Smaller Companies Fund
Equities —Long
ConvertibleEquities Bonds
Convertiblefixed
Mutual funds/Unit trusts/
ETFsShort-termsecurities
TotalInvestments
Derivativeassets
Derivativeliabilities
(000s) (000s) (000s) (000s) (000s) (000s) (000s) (000s) (000s)June 30, 2014Level 1 . . . . . . . . . . . $719,735 $240 $ — $ — $ — $ — $ 719,975 $ — $ —Level 2 . . . . . . . . . . . — — — — — 23,200 23,200 — —Level 3 . . . . . . . . . . . 8,558 — — — — — 8,558 — —Total . . . . . . . . . . . . . $728,293 $240 $ — $ — $ — $ 23,200 $ 751,733 $ — $ —
December 31, 2013Level 1 . . . . . . . . . . . $791,646 $ — $ — $ — $ — $ — $ 791,646 $ — $ —Level 2 . . . . . . . . . . . — — — — — 37,100 37,100 — —Level 3 . . . . . . . . . . . 8,421 — — — — — 8,421 — —Total . . . . . . . . . . . . . $800,067 $ — $ — $ — $ — $ 37,100 $ 837,167 $ — $ —
January 01, 2013Level 1 . . . . . . . . . . . $370,955 $ — $ — $ — $ — $ — $ 370,955 $ — $ —Level 2 . . . . . . . . . . . 313,227 — — — — 23,100 336,327 — —Level 3 . . . . . . . . . . . 8,026 — — — — — 8,026 — —Total . . . . . . . . . . . . . $692,208 $ — $ — $ — $ — $ 23,100 $ 715,308 $ — $ —
382 Franklin Templeton Investments Funds

Franklin Templeton Investments Funds
NOTES TO FINANCIAL STATEMENTS For the periods ended June 30, 2014 and December 31, 2013 (Unaudited) (Continued)
8. Financial Risk Management (Continued)
Templeton International Stock Fund
Equities —Long
ConvertibleEquities Bonds
Convertiblefixed
Mutual funds/Unit trusts/
ETFsShort-termsecurities
TotalInvestments
Derivativeassets
Derivativeliabilities
(000s) (000s) (000s) (000s) (000s) (000s) (000s) (000s) (000s)June 30, 2014Level 1 . . . . . . . . . . . . . . . $708,572 $226 $— $— $ — $ — $708,798 $— $—Level 2 . . . . . . . . . . . . . . . 16,547 — — — — 9,200 25,747 — —Level 3 . . . . . . . . . . . . . . . — — — — 8,024 — 8,024 — —
Total . . . . . . . . . . . . . . . . $725,119 $226 $— $— $8,024 $9,200 $742,569 $— $—
December 31, 2013Level 1 . . . . . . . . . . . . . . . $761,848 $273 $— $— $ — $ — $762,121 $— $—Level 2 . . . . . . . . . . . . . . . 16,164 — — — — 3,000 19,164 — —Level 3 . . . . . . . . . . . . . . . — — — — 8,720 — 8,720 — —
Total . . . . . . . . . . . . . . . . $778,012 $273 $— $— $8,720 $3,000 $790,005 $— $—
January 01, 2013Level 1 . . . . . . . . . . . . . . . $256,651 $228 $— $— $ — $ — $256,879 $— $—Level 2 . . . . . . . . . . . . . . . 494,742 — — — — 7,800 502,542 — —Level 3 . . . . . . . . . . . . . . . 112 — — — 7,968 — 8,080 — —
Total . . . . . . . . . . . . . . . . $751,505 $228 $— $— $7,968 $7,800 $767,501 $— $—
Franklin Flex Cap Growth Fund
Equities —Long
ConvertibleEquities Bonds
Convertiblefixed
Mutual funds/Unit trusts/
ETFsShort-termsecurities
TotalInvestments
Derivativeassets
Derivativeliabilities
(000s) (000s) (000s) (000s) (000s) (000s) (000s) (000s) (000s)June 30, 2014Level 1 . . . . . . . . . . . . . . . $398,842 $ — $— $— $ — $ — $398,842 $— $—Level 2 . . . . . . . . . . . . . . . — — — — — 3,781 3,781 — —Level 3 . . . . . . . . . . . . . . . — — — — — — — — —
Total . . . . . . . . . . . . . . . . $398,842 $ — $— $— $ — $3,781 $402,623 $— $—
December 31, 2013Level 1 . . . . . . . . . . . . . . . $381,402 $ — $— $— $ — $ — $381,402 $— $—Level 2 . . . . . . . . . . . . . . . — — — — — 5,313 5,313 — —Level 3 . . . . . . . . . . . . . . . — — — — — — — — —
Total . . . . . . . . . . . . . . . . $381,402 $ — $— $— $ — $5,313 $386,715 $— $—
January 01, 2013Level 1 . . . . . . . . . . . . . . . $270,656 $ — $— $— $ — $ — $270,656 $— $—Level 2 . . . . . . . . . . . . . . . — — — — — — — — —Level 3 . . . . . . . . . . . . . . . — — — — — — — — —
Total . . . . . . . . . . . . . . . . $270,656 $ — $— $— $ — $ — $270,656 $— $—
Franklin Templeton Investments Funds 383
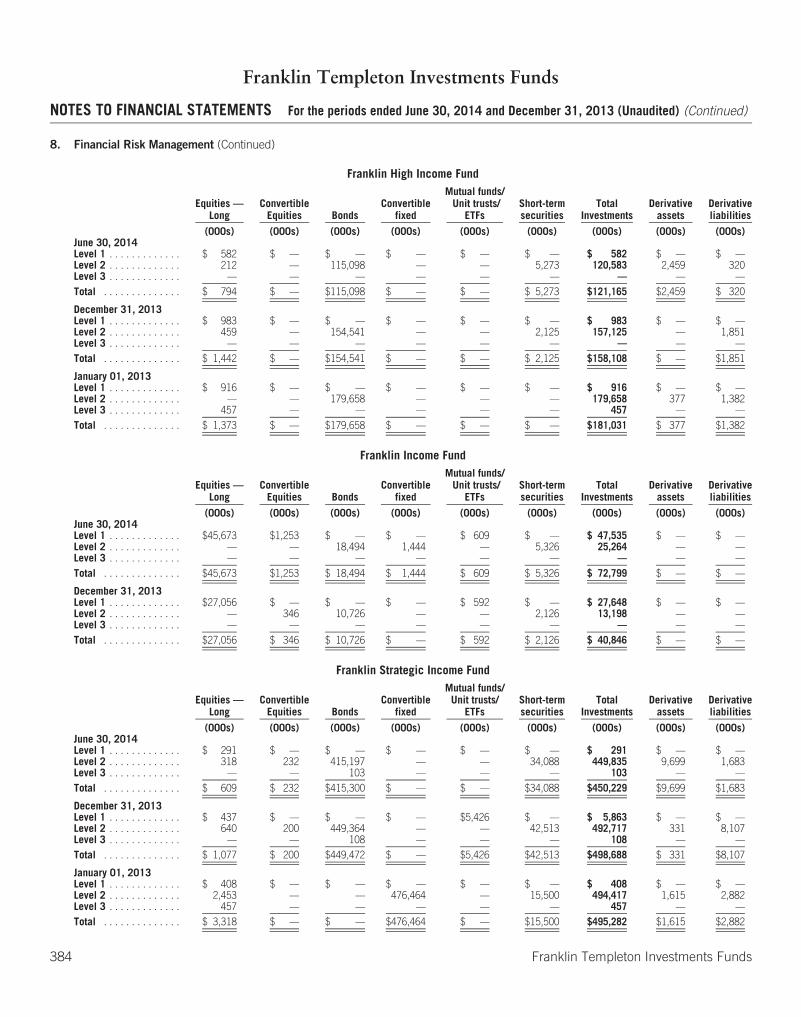
Franklin Templeton Investments Funds
NOTES TO FINANCIAL STATEMENTS For the periods ended June 30, 2014 and December 31, 2013 (Unaudited) (Continued)
8. Financial Risk Management (Continued)
Franklin High Income Fund
Equities —Long
ConvertibleEquities Bonds
Convertiblefixed
Mutual funds/Unit trusts/
ETFsShort-termsecurities
TotalInvestments
Derivativeassets
Derivativeliabilities
(000s) (000s) (000s) (000s) (000s) (000s) (000s) (000s) (000s)June 30, 2014Level 1 . . . . . . . . . . . . . $ 582 $ — $ — $ — $ — $ — $ 582 $ — $ —Level 2 . . . . . . . . . . . . . 212 — 115,098 — — 5,273 120,583 2,459 320Level 3 . . . . . . . . . . . . . — — — — — — — — —Total . . . . . . . . . . . . . . $ 794 $ — $115,098 $ — $ — $ 5,273 $121,165 $2,459 $ 320
December 31, 2013Level 1 . . . . . . . . . . . . . $ 983 $ — $ — $ — $ — $ — $ 983 $ — $ —Level 2 . . . . . . . . . . . . . 459 — 154,541 — — 2,125 157,125 — 1,851Level 3 . . . . . . . . . . . . . — — — — — — — — —Total . . . . . . . . . . . . . . $ 1,442 $ — $154,541 $ — $ — $ 2,125 $158,108 $ — $1,851
January 01, 2013Level 1 . . . . . . . . . . . . . $ 916 $ — $ — $ — $ — $ — $ 916 $ — $ —Level 2 . . . . . . . . . . . . . — — 179,658 — — — 179,658 377 1,382Level 3 . . . . . . . . . . . . . 457 — — — — — 457 — —Total . . . . . . . . . . . . . . $ 1,373 $ — $179,658 $ — $ — $ — $181,031 $ 377 $1,382
Franklin Income Fund
Equities —Long
ConvertibleEquities Bonds
Convertiblefixed
Mutual funds/Unit trusts/
ETFsShort-termsecurities
TotalInvestments
Derivativeassets
Derivativeliabilities
(000s) (000s) (000s) (000s) (000s) (000s) (000s) (000s) (000s)June 30, 2014Level 1 . . . . . . . . . . . . . $45,673 $1,253 $ — $ — $ 609 $ — $ 47,535 $ — $ —Level 2 . . . . . . . . . . . . . — — 18,494 1,444 — 5,326 25,264 — —Level 3 . . . . . . . . . . . . . — — — — — — — — —Total . . . . . . . . . . . . . . $45,673 $1,253 $ 18,494 $ 1,444 $ 609 $ 5,326 $ 72,799 $ — $ —
December 31, 2013Level 1 . . . . . . . . . . . . . $27,056 $ — $ — $ — $ 592 $ — $ 27,648 $ — $ —Level 2 . . . . . . . . . . . . . — 346 10,726 — — 2,126 13,198 — —Level 3 . . . . . . . . . . . . . — — — — — — — — —Total . . . . . . . . . . . . . . $27,056 $ 346 $ 10,726 $ — $ 592 $ 2,126 $ 40,846 $ — $ —
Franklin Strategic Income Fund
Equities —Long
ConvertibleEquities Bonds
Convertiblefixed
Mutual funds/Unit trusts/
ETFsShort-termsecurities
TotalInvestments
Derivativeassets
Derivativeliabilities
(000s) (000s) (000s) (000s) (000s) (000s) (000s) (000s) (000s)June 30, 2014Level 1 . . . . . . . . . . . . . $ 291 $ — $ — $ — $ — $ — $ 291 $ — $ —Level 2 . . . . . . . . . . . . . 318 232 415,197 — — 34,088 449,835 9,699 1,683Level 3 . . . . . . . . . . . . . — — 103 — — — 103 — —Total . . . . . . . . . . . . . . $ 609 $ 232 $415,300 $ — $ — $34,088 $450,229 $9,699 $1,683
December 31, 2013Level 1 . . . . . . . . . . . . . $ 437 $ — $ — $ — $5,426 $ — $ 5,863 $ — $ —Level 2 . . . . . . . . . . . . . 640 200 449,364 — — 42,513 492,717 331 8,107Level 3 . . . . . . . . . . . . . — — 108 — — — 108 — —Total . . . . . . . . . . . . . . $ 1,077 $ 200 $449,472 $ — $5,426 $42,513 $498,688 $ 331 $8,107
January 01, 2013Level 1 . . . . . . . . . . . . . $ 408 $ — $ — $ — $ — $ — $ 408 $ — $ —Level 2 . . . . . . . . . . . . . 2,453 — — 476,464 — 15,500 494,417 1,615 2,882Level 3 . . . . . . . . . . . . . 457 — — — — — 457 — —Total . . . . . . . . . . . . . . $ 3,318 $ — $ — $476,464 $ — $15,500 $495,282 $1,615 $2,882
384 Franklin Templeton Investments Funds

Franklin Templeton Investments Funds
NOTES TO FINANCIAL STATEMENTS For the periods ended June 30, 2014 and December 31, 2013 (Unaudited) (Continued)
8. Financial Risk Management (Continued)
Franklin U.S. Core Equity Fund
Equities —Long
ConvertibleEquities Bonds
Convertiblefixed
Mutual funds/Unit trusts/
ETFsShort-termsecurities
TotalInvestments
Derivativeassets
Derivativeliabilities
(000s) (000s) (000s) (000s) (000s) (000s) (000s) (000s) (000s)June 30, 2014Level 1 . . . . . . . . . . . . . . . $326,258 $ — $ — $ — $ — $ — $326,258 $ — $ —Level 2 . . . . . . . . . . . . . . . — — — — — 10,652 10,652 — —Level 3 . . . . . . . . . . . . . . . — — — — — — — — —
Total . . . . . . . . . . . . . . . . $326,258 $ — $ — $ — $ — $10,652 $336,910 $ — $ —
December 31, 2013Level 1 . . . . . . . . . . . . . . . $233,524 $ — $ — $ — $ — $ — $233,524 $ — $ —Level 2 . . . . . . . . . . . . . . . — — — — — 8,500 8,500 — —Level 3 . . . . . . . . . . . . . . . — — — — — — — — —
Total . . . . . . . . . . . . . . . . $233,524 $ — $ — $ — $ — $ 8,500 $242,024 $ — $ —
January 01, 2013Level 1 . . . . . . . . . . . . . . . $174,268 $ — $ — $ — $ — $ — $174,268 $ — $ —Level 2 . . . . . . . . . . . . . . . — — — — — — — — —Level 3 . . . . . . . . . . . . . . . — — — — — — — — —
Total . . . . . . . . . . . . . . . . $174,268 $ — $ — $ — $ — $ — $174,268 $ — $ —
Franklin U.S. Rising Dividends Fund
Equities —Long
ConvertibleEquities Bonds
Convertiblefixed
Mutual funds/Unit trusts/
ETFsShort-termsecurities
TotalInvestments
Derivativeassets
Derivativeliabilities
(000s) (000s) (000s) (000s) (000s) (000s) (000s) (000s) (000s)June 30, 2014Level 1 . . . . . . . . . . . . . . . $862,553 $ — $ — $ — $ — $ — $862,553 $ — $ —Level 2 . . . . . . . . . . . . . . . — — — — — 10,651 10,651 — —Level 3 . . . . . . . . . . . . . . . — — — — — — — — —
Total . . . . . . . . . . . . . . . . $862,553 $ — $ — $ — $ — $10,651 $873,204 $ — $ —
December 31, 2013Level 1 . . . . . . . . . . . . . . . $792,327 $ — $ — $ — $ — $ — $792,327 $ — $ —Level 2 . . . . . . . . . . . . . . . — — — — — 18,062 18,062 — —Level 3 . . . . . . . . . . . . . . . — — — — — — — — —
Total . . . . . . . . . . . . . . . . $792,327 $ — $ — $ — $ — $18,062 $810,389 $ — $ —
January 01, 2013Level 1 . . . . . . . . . . . . . . . $589,205 $ — $ — $ — $ — $ — $589,205 $ — $ —Level 2 . . . . . . . . . . . . . . . — — — — — — — — —Level 3 . . . . . . . . . . . . . . . — — — — — — — — —
Total . . . . . . . . . . . . . . . . $589,205 $ — $ — $ — $ — $ — $589,205 $ — $ —
Franklin Templeton Investments Funds 385
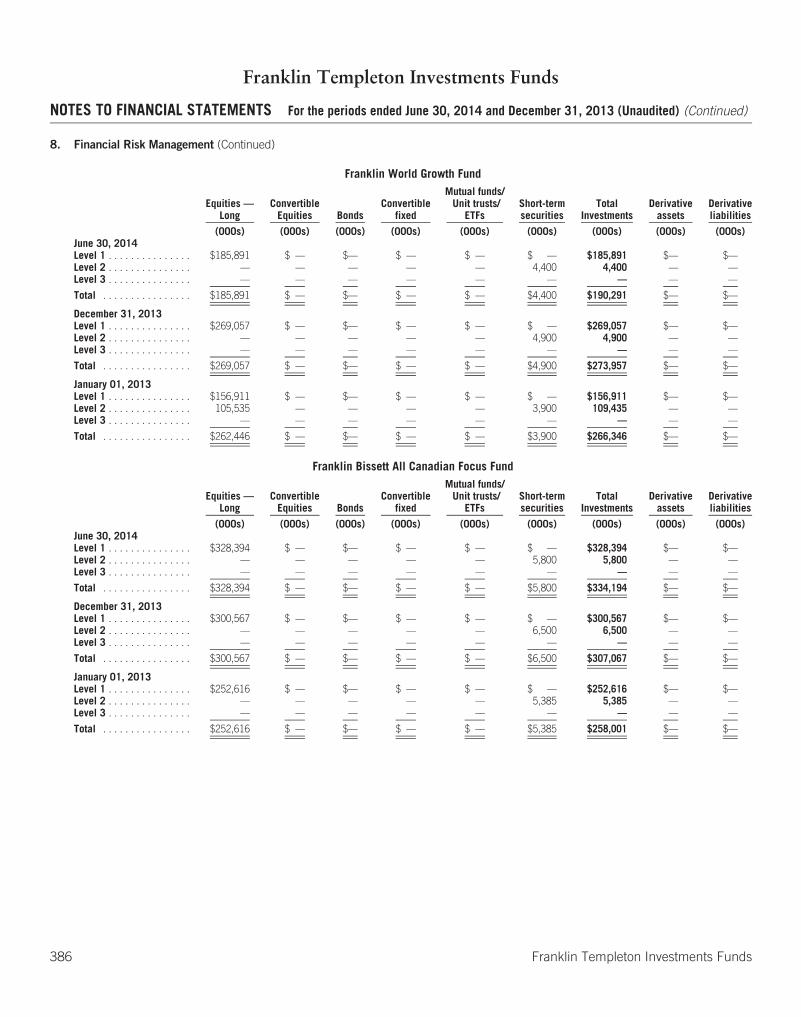
Franklin Templeton Investments Funds
NOTES TO FINANCIAL STATEMENTS For the periods ended June 30, 2014 and December 31, 2013 (Unaudited) (Continued)
8. Financial Risk Management (Continued)
Franklin World Growth Fund
Equities —Long
ConvertibleEquities Bonds
Convertiblefixed
Mutual funds/Unit trusts/
ETFsShort-termsecurities
TotalInvestments
Derivativeassets
Derivativeliabilities
(000s) (000s) (000s) (000s) (000s) (000s) (000s) (000s) (000s)June 30, 2014Level 1 . . . . . . . . . . . . . . . $185,891 $ — $— $ — $ — $ — $185,891 $— $—Level 2 . . . . . . . . . . . . . . . — — — — — 4,400 4,400 — —Level 3 . . . . . . . . . . . . . . . — — — — — — — — —
Total . . . . . . . . . . . . . . . . $185,891 $ — $— $ — $ — $4,400 $190,291 $— $—
December 31, 2013Level 1 . . . . . . . . . . . . . . . $269,057 $ — $— $ — $ — $ — $269,057 $— $—Level 2 . . . . . . . . . . . . . . . — — — — — 4,900 4,900 — —Level 3 . . . . . . . . . . . . . . . — — — — — — — — —
Total . . . . . . . . . . . . . . . . $269,057 $ — $— $ — $ — $4,900 $273,957 $— $—
January 01, 2013Level 1 . . . . . . . . . . . . . . . $156,911 $ — $— $ — $ — $ — $156,911 $— $—Level 2 . . . . . . . . . . . . . . . 105,535 — — — — 3,900 109,435 — —Level 3 . . . . . . . . . . . . . . . — — — — — — — — —
Total . . . . . . . . . . . . . . . . $262,446 $ — $— $ — $ — $3,900 $266,346 $— $—
Franklin Bissett All Canadian Focus Fund
Equities —Long
ConvertibleEquities Bonds
Convertiblefixed
Mutual funds/Unit trusts/
ETFsShort-termsecurities
TotalInvestments
Derivativeassets
Derivativeliabilities
(000s) (000s) (000s) (000s) (000s) (000s) (000s) (000s) (000s)June 30, 2014Level 1 . . . . . . . . . . . . . . . $328,394 $ — $— $ — $ — $ — $328,394 $— $—Level 2 . . . . . . . . . . . . . . . — — — — — 5,800 5,800 — —Level 3 . . . . . . . . . . . . . . . — — — — — — — — —
Total . . . . . . . . . . . . . . . . $328,394 $ — $— $ — $ — $5,800 $334,194 $— $—
December 31, 2013Level 1 . . . . . . . . . . . . . . . $300,567 $ — $— $ — $ — $ — $300,567 $— $—Level 2 . . . . . . . . . . . . . . . — — — — — 6,500 6,500 — —Level 3 . . . . . . . . . . . . . . . — — — — — — — — —
Total . . . . . . . . . . . . . . . . $300,567 $ — $— $ — $ — $6,500 $307,067 $— $—
January 01, 2013Level 1 . . . . . . . . . . . . . . . $252,616 $ — $— $ — $ — $ — $252,616 $— $—Level 2 . . . . . . . . . . . . . . . — — — — — 5,385 5,385 — —Level 3 . . . . . . . . . . . . . . . — — — — — — — — —
Total . . . . . . . . . . . . . . . . $252,616 $ — $— $ — $ — $5,385 $258,001 $— $—
386 Franklin Templeton Investments Funds

Franklin Templeton Investments Funds
NOTES TO FINANCIAL STATEMENTS For the periods ended June 30, 2014 and December 31, 2013 (Unaudited) (Continued)
8. Financial Risk Management (Continued)
Franklin Bissett Bond Fund
Equities —Long
ConvertibleEquities Bonds
Convertiblefixed
Mutual funds/Unit trusts/
ETFsShort-termsecurities
TotalInvestments
Derivativeassets
Derivativeliabilities
(000s) (000s) (000s) (000s) (000s) (000s) (000s) (000s) (000s)June 30, 2014Level 1 . . . . . . . . . . . $ — $ — $ — $ — $— $ — $ — $ — $ —Level 2 . . . . . . . . . . . — — 2,469,442 — — 7,106 2,476,548 3,174 139Level 3 . . . . . . . . . . . — — — — — — — — —
Total . . . . . . . . . . . . . $ — $ — $2,469,442 $ — $— $ 7,106 $2,476,548 $3,174 $139
December 31, 2013Level 1 . . . . . . . . . . . $ — $ — $ — $ — $— $ — $ — $ — $ —Level 2 . . . . . . . . . . . — — 2,357,711 — — 19,426 2,377,137 184 495Level 3 . . . . . . . . . . . — — — — — — — — —
Total . . . . . . . . . . . . . $ — $ — $2,357,711 $ — $— $19,426 $2,377,137 $ 184 $495
January 01, 2013Level 1 . . . . . . . . . . . $ — $ — $ — $ — $— $ — $ — $ — $ —Level 2 . . . . . . . . . . . — — 2,580,737 — — 16,000 2,596,737 46 23Level 3 . . . . . . . . . . . — — — — — — — — —
Total . . . . . . . . . . . . . $ — $ — $2,580,737 $ — $— $16,000 $2,596,737 $ 46 $ 23
Franklin Bissett Canadian All Cap Balanced Fund
Equities —Long
ConvertibleEquities Bonds
Convertiblefixed
Mutual funds/Unit trusts/
ETFsShort-termsecurities
TotalInvestments
Derivativeassets
Derivativeliabilities
(000s) (000s) (000s) (000s) (000s) (000s) (000s) (000s) (000s)June 30, 2014Level 1 . . . . . . . . . . . $10,691 $ — $ — $ — $— $ — $ 10,691 $ — $ —Level 2 . . . . . . . . . . . — — 4,758 — — 1,200 5,958 — —Level 3 . . . . . . . . . . . 26 — — — — — 26 — —
Total . . . . . . . . . . . . . $10,717 $ — $ 4,758 $ — $— $ 1,200 $ 16,675 $ — $ —
December 31, 2013Level 1 . . . . . . . . . . . $ 8,704 $ — $ — $ — $— $ — $ 8,704 $ — $ —Level 2 . . . . . . . . . . . — — 3,487 — — 400 3,887 — —Level 3 . . . . . . . . . . . — — — — — — — — —
Total . . . . . . . . . . . . . $ 8,704 $ — $ 3,487 $ — $— $ 400 $ 12,591 $ — $ —
January 01, 2013Level 1 . . . . . . . . . . . $ 3,428 $ — $ — $ — $— $ — $ 3,428 $ — $ —Level 2 . . . . . . . . . . . 556 — 2,718 — — 165 3,439 — —Level 3 . . . . . . . . . . . — — — — — — — — —
Total . . . . . . . . . . . . . $ 3,984 $ — $ 2,718 $ — $— $ 165 $ 6,867 $ — $ —
Franklin Templeton Investments Funds 387

Franklin Templeton Investments Funds
NOTES TO FINANCIAL STATEMENTS For the periods ended June 30, 2014 and December 31, 2013 (Unaudited) (Continued)
8. Financial Risk Management (Continued)
Franklin Bissett Canadian Balanced Fund
Equities —Long
ConvertibleEquities Bonds
Convertiblefixed
Mutual funds/Unit trusts/
ETFsShort-termsecurities
TotalInvestments
Derivativeassets
Derivativeliabilities
(000s) (000s) (000s) (000s) (000s) (000s) (000s) (000s) (000s)June 30, 2014Level 1 . . . . . . . . . . . . . . . $ — $ — $ — $ — $1,091,363 $ — $1,091,363 $ — $ —Level 2 . . . . . . . . . . . . . . . — — — — — 4,000 4,000 — —Level 3 . . . . . . . . . . . . . . . — — — — — — — — —
Total . . . . . . . . . . . . . . . . $ — $ — $ — $ — $1,091,363 $ 4,000 $1,095,363 $ — $ —
December 31, 2013Level 1 . . . . . . . . . . . . . . . $ — $ — $ — $ — $ 916,307 $ — $ 916,307 $ — $ —Level 2 . . . . . . . . . . . . . . . — — — — — 7,700 7,700 — —Level 3 . . . . . . . . . . . . . . . — — — — — — — — —
Total . . . . . . . . . . . . . . . . $ — $ — $ — $ — $ 916,307 $ 7,700 $ 924,007 $ — $ —
January 01, 2013Level 1 . . . . . . . . . . . . . . . $ — $ — $ — $ — $ 720,221 $ — $ 720,221 $ — $ —Level 2 . . . . . . . . . . . . . . . — — — — — 10,910 10,910 — —Level 3 . . . . . . . . . . . . . . . — — — — — — — — —
Total . . . . . . . . . . . . . . . . $ — $ — $ — $ — $ 720,221 $10,910 $ 731,131 $ — $ —
Franklin Bissett Canadian Dividend Fund
Equities —Long
ConvertibleEquities Bonds
Convertiblefixed
Mutual funds/Unit trusts/
ETFsShort-termsecurities
TotalInvestments
Derivativeassets
Derivativeliabilities
(000s) (000s) (000s) (000s) (000s) (000s) (000s) (000s) (000s)June 30, 2014Level 1 . . . . . . . . . . . . . . . $591,783 $ — $ — $ — $ — $ — $ 591,783 $ — $ —Level 2 . . . . . . . . . . . . . . . — — — — — 7,300 7,300 — —Level 3 . . . . . . . . . . . . . . . — — — — — — — — —
Total . . . . . . . . . . . . . . . . $591,783 $ — $ — $ — $ — $ 7,300 $ 599,083 $ — $ —
December 31, 2013Level 1 . . . . . . . . . . . . . . . $575,669 $ — $ — $ — $ — $ — $ 575,669 $ — $ —Level 2 . . . . . . . . . . . . . . . — — — — — 5,700 5,700 — —Level 3 . . . . . . . . . . . . . . . — — — — — — — — —
Total . . . . . . . . . . . . . . . . $575,669 $ — $ — $ — $ — $ 5,700 $ 581,369 $ — $ —
January 01, 2013Level 1 . . . . . . . . . . . . . . . $689,384 $ — $ — $ — $ — $ — $ 689,384 $ — $ —Level 2 . . . . . . . . . . . . . . . — — — — — 11,085 11,085 — —Level 3 . . . . . . . . . . . . . . . — — — — — — — — —
Total . . . . . . . . . . . . . . . . $689,384 $ — $ — $ — $ — $11,085 $ 700,469 $ — $ —
388 Franklin Templeton Investments Funds
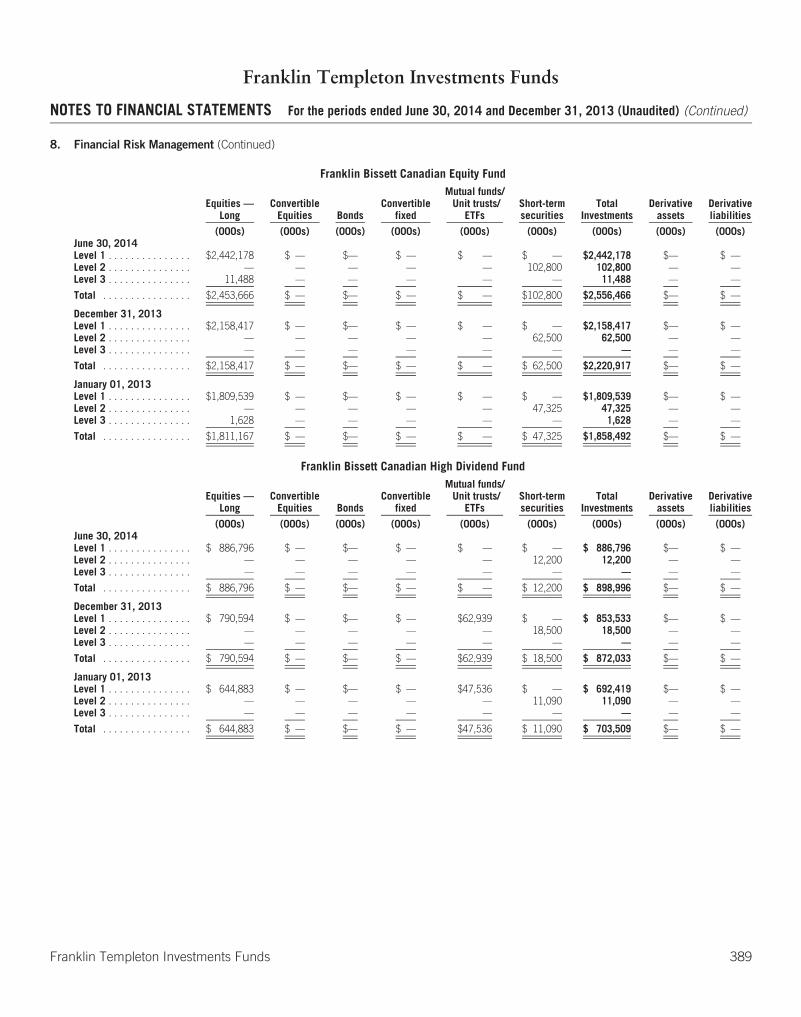
Franklin Templeton Investments Funds
NOTES TO FINANCIAL STATEMENTS For the periods ended June 30, 2014 and December 31, 2013 (Unaudited) (Continued)
8. Financial Risk Management (Continued)
Franklin Bissett Canadian Equity Fund
Equities —Long
ConvertibleEquities Bonds
Convertiblefixed
Mutual funds/Unit trusts/
ETFsShort-termsecurities
TotalInvestments
Derivativeassets
Derivativeliabilities
(000s) (000s) (000s) (000s) (000s) (000s) (000s) (000s) (000s)June 30, 2014Level 1 . . . . . . . . . . . . . . . $2,442,178 $ — $— $ — $ — $ — $2,442,178 $— $ —Level 2 . . . . . . . . . . . . . . . — — — — — 102,800 102,800 — —Level 3 . . . . . . . . . . . . . . . 11,488 — — — — — 11,488 — —
Total . . . . . . . . . . . . . . . . $2,453,666 $ — $— $ — $ — $102,800 $2,556,466 $— $ —
December 31, 2013Level 1 . . . . . . . . . . . . . . . $2,158,417 $ — $— $ — $ — $ — $2,158,417 $— $ —Level 2 . . . . . . . . . . . . . . . — — — — — 62,500 62,500 — —Level 3 . . . . . . . . . . . . . . . — — — — — — — — —
Total . . . . . . . . . . . . . . . . $2,158,417 $ — $— $ — $ — $ 62,500 $2,220,917 $— $ —
January 01, 2013Level 1 . . . . . . . . . . . . . . . $1,809,539 $ — $— $ — $ — $ — $1,809,539 $— $ —Level 2 . . . . . . . . . . . . . . . — — — — — 47,325 47,325 — —Level 3 . . . . . . . . . . . . . . . 1,628 — — — — — 1,628 — —
Total . . . . . . . . . . . . . . . . $1,811,167 $ — $— $ — $ — $ 47,325 $1,858,492 $— $ —
Franklin Bissett Canadian High Dividend Fund
Equities —Long
ConvertibleEquities Bonds
Convertiblefixed
Mutual funds/Unit trusts/
ETFsShort-termsecurities
TotalInvestments
Derivativeassets
Derivativeliabilities
(000s) (000s) (000s) (000s) (000s) (000s) (000s) (000s) (000s)June 30, 2014Level 1 . . . . . . . . . . . . . . . $ 886,796 $ — $— $ — $ — $ — $ 886,796 $— $ —Level 2 . . . . . . . . . . . . . . . — — — — — 12,200 12,200 — —Level 3 . . . . . . . . . . . . . . . — — — — — — — — —
Total . . . . . . . . . . . . . . . . $ 886,796 $ — $— $ — $ — $ 12,200 $ 898,996 $— $ —
December 31, 2013Level 1 . . . . . . . . . . . . . . . $ 790,594 $ — $— $ — $62,939 $ — $ 853,533 $— $ —Level 2 . . . . . . . . . . . . . . . — — — — — 18,500 18,500 — —Level 3 . . . . . . . . . . . . . . . — — — — — — — — —
Total . . . . . . . . . . . . . . . . $ 790,594 $ — $— $ — $62,939 $ 18,500 $ 872,033 $— $ —
January 01, 2013Level 1 . . . . . . . . . . . . . . . $ 644,883 $ — $— $ — $47,536 $ — $ 692,419 $— $ —Level 2 . . . . . . . . . . . . . . . — — — — — 11,090 11,090 — —Level 3 . . . . . . . . . . . . . . . — — — — — — — — —
Total . . . . . . . . . . . . . . . . $ 644,883 $ — $— $ — $47,536 $ 11,090 $ 703,509 $— $ —
Franklin Templeton Investments Funds 389
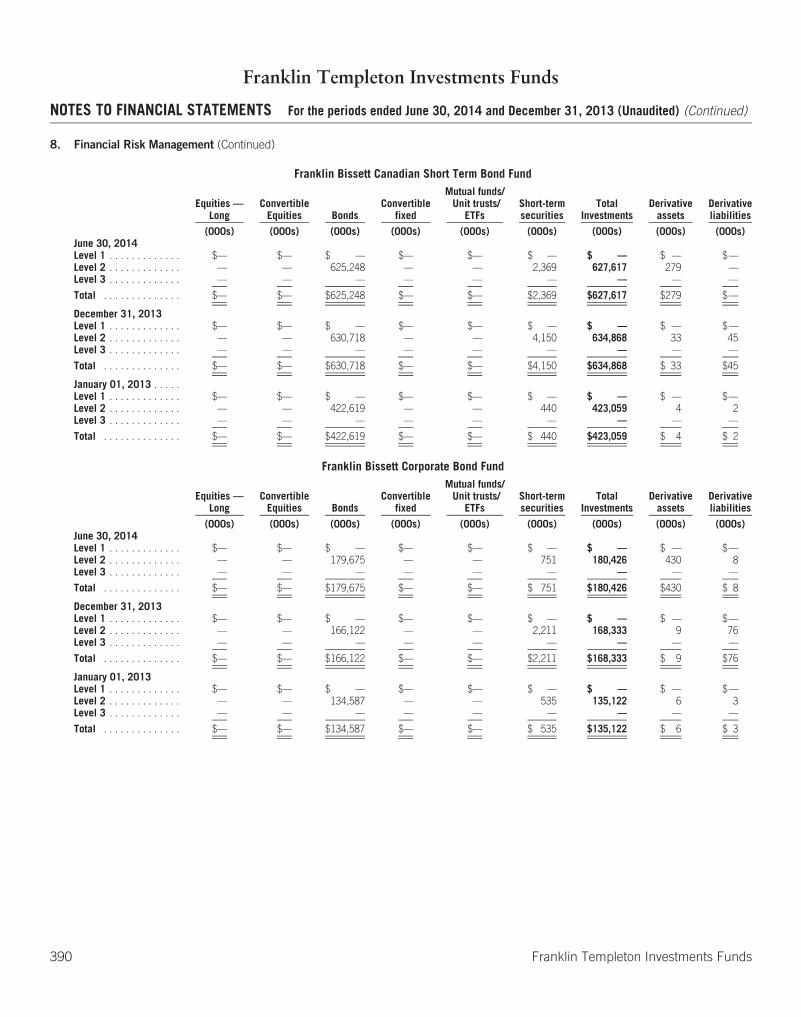
Franklin Templeton Investments Funds
NOTES TO FINANCIAL STATEMENTS For the periods ended June 30, 2014 and December 31, 2013 (Unaudited) (Continued)
8. Financial Risk Management (Continued)
Franklin Bissett Canadian Short Term Bond Fund
Equities —Long
ConvertibleEquities Bonds
Convertiblefixed
Mutual funds/Unit trusts/
ETFsShort-termsecurities
TotalInvestments
Derivativeassets
Derivativeliabilities
(000s) (000s) (000s) (000s) (000s) (000s) (000s) (000s) (000s)June 30, 2014Level 1 . . . . . . . . . . . . . $— $— $ — $— $— $ — $ — $ — $—Level 2 . . . . . . . . . . . . . — — 625,248 — — 2,369 627,617 279 —Level 3 . . . . . . . . . . . . . — — — — — — — — —
Total . . . . . . . . . . . . . . $— $— $625,248 $— $— $2,369 $627,617 $279 $—
December 31, 2013Level 1 . . . . . . . . . . . . . $— $— $ — $— $— $ — $ — $ — $—Level 2 . . . . . . . . . . . . . — — 630,718 — — 4,150 634,868 33 45Level 3 . . . . . . . . . . . . . — — — — — — — — —
Total . . . . . . . . . . . . . . $— $— $630,718 $— $— $4,150 $634,868 $ 33 $45
January 01, 2013 . . . . .Level 1 . . . . . . . . . . . . . $— $— $ — $— $— $ — $ — $ — $—Level 2 . . . . . . . . . . . . . — — 422,619 — — 440 423,059 4 2Level 3 . . . . . . . . . . . . . — — — — — — — — —
Total . . . . . . . . . . . . . . $— $— $422,619 $— $— $ 440 $423,059 $ 4 $ 2
Franklin Bissett Corporate Bond Fund
Equities —Long
ConvertibleEquities Bonds
Convertiblefixed
Mutual funds/Unit trusts/
ETFsShort-termsecurities
TotalInvestments
Derivativeassets
Derivativeliabilities
(000s) (000s) (000s) (000s) (000s) (000s) (000s) (000s) (000s)June 30, 2014Level 1 . . . . . . . . . . . . . $— $— $ — $— $— $ — $ — $ — $—Level 2 . . . . . . . . . . . . . — — 179,675 — — 751 180,426 430 8Level 3 . . . . . . . . . . . . . — — — — — — — — —
Total . . . . . . . . . . . . . . $— $— $179,675 $— $— $ 751 $180,426 $430 $ 8
December 31, 2013Level 1 . . . . . . . . . . . . . $— $— $ — $— $— $ — $ — $ — $—Level 2 . . . . . . . . . . . . . — — 166,122 — — 2,211 168,333 9 76Level 3 . . . . . . . . . . . . . — — — — — — — — —
Total . . . . . . . . . . . . . . $— $— $166,122 $— $— $2,211 $168,333 $ 9 $76
January 01, 2013Level 1 . . . . . . . . . . . . . $— $— $ — $— $— $ — $ — $ — $—Level 2 . . . . . . . . . . . . . — — 134,587 — — 535 135,122 6 3Level 3 . . . . . . . . . . . . . — — — — — — — — —
Total . . . . . . . . . . . . . . $— $— $134,587 $— $— $ 535 $135,122 $ 6 $ 3
390 Franklin Templeton Investments Funds
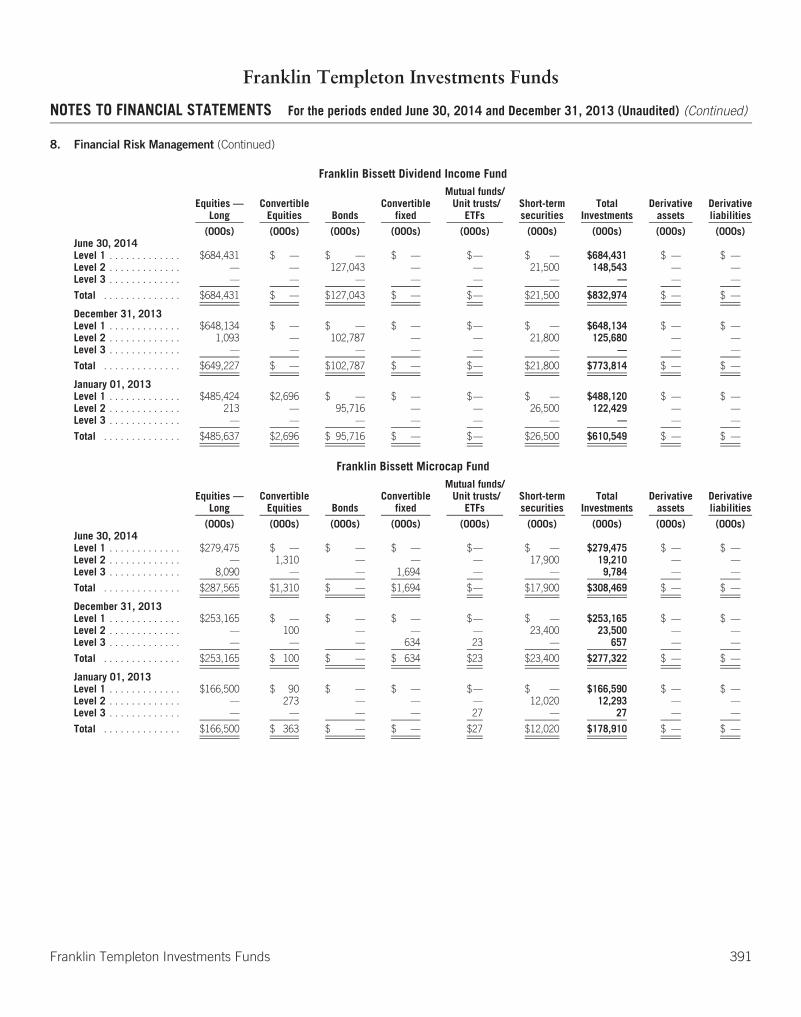
Franklin Templeton Investments Funds
NOTES TO FINANCIAL STATEMENTS For the periods ended June 30, 2014 and December 31, 2013 (Unaudited) (Continued)
8. Financial Risk Management (Continued)
Franklin Bissett Dividend Income Fund
Equities —Long
ConvertibleEquities Bonds
Convertiblefixed
Mutual funds/Unit trusts/
ETFsShort-termsecurities
TotalInvestments
Derivativeassets
Derivativeliabilities
(000s) (000s) (000s) (000s) (000s) (000s) (000s) (000s) (000s)June 30, 2014Level 1 . . . . . . . . . . . . . $684,431 $ — $ — $ — $— $ — $684,431 $ — $ —Level 2 . . . . . . . . . . . . . — — 127,043 — — 21,500 148,543 — —Level 3 . . . . . . . . . . . . . — — — — — — — — —
Total . . . . . . . . . . . . . . $684,431 $ — $127,043 $ — $— $21,500 $832,974 $ — $ —
December 31, 2013Level 1 . . . . . . . . . . . . . $648,134 $ — $ — $ — $— $ — $648,134 $ — $ —Level 2 . . . . . . . . . . . . . 1,093 — 102,787 — — 21,800 125,680 — —Level 3 . . . . . . . . . . . . . — — — — — — — — —
Total . . . . . . . . . . . . . . $649,227 $ — $102,787 $ — $— $21,800 $773,814 $ — $ —
January 01, 2013Level 1 . . . . . . . . . . . . . $485,424 $2,696 $ — $ — $— $ — $488,120 $ — $ —Level 2 . . . . . . . . . . . . . 213 — 95,716 — — 26,500 122,429 — —Level 3 . . . . . . . . . . . . . — — — — — — — — —
Total . . . . . . . . . . . . . . $485,637 $2,696 $ 95,716 $ — $— $26,500 $610,549 $ — $ —
Franklin Bissett Microcap Fund
Equities —Long
ConvertibleEquities Bonds
Convertiblefixed
Mutual funds/Unit trusts/
ETFsShort-termsecurities
TotalInvestments
Derivativeassets
Derivativeliabilities
(000s) (000s) (000s) (000s) (000s) (000s) (000s) (000s) (000s)June 30, 2014Level 1 . . . . . . . . . . . . . $279,475 $ — $ — $ — $— $ — $279,475 $ — $ —Level 2 . . . . . . . . . . . . . — 1,310 — — — 17,900 19,210 — —Level 3 . . . . . . . . . . . . . 8,090 — — 1,694 — — 9,784 — —
Total . . . . . . . . . . . . . . $287,565 $1,310 $ — $1,694 $— $17,900 $308,469 $ — $ —
December 31, 2013Level 1 . . . . . . . . . . . . . $253,165 $ — $ — $ — $— $ — $253,165 $ — $ —Level 2 . . . . . . . . . . . . . — 100 — — — 23,400 23,500 — —Level 3 . . . . . . . . . . . . . — — — 634 23 — 657 — —
Total . . . . . . . . . . . . . . $253,165 $ 100 $ — $ 634 $23 $23,400 $277,322 $ — $ —
January 01, 2013Level 1 . . . . . . . . . . . . . $166,500 $ 90 $ — $ — $— $ — $166,590 $ — $ —Level 2 . . . . . . . . . . . . . — 273 — — — 12,020 12,293 — —Level 3 . . . . . . . . . . . . . — — — — 27 — 27 — —
Total . . . . . . . . . . . . . . $166,500 $ 363 $ — $ — $27 $12,020 $178,910 $ — $ —
Franklin Templeton Investments Funds 391

Franklin Templeton Investments Funds
NOTES TO FINANCIAL STATEMENTS For the periods ended June 30, 2014 and December 31, 2013 (Unaudited) (Continued)
8. Financial Risk Management (Continued)
Franklin Bissett Money Market Fund
Equities —Long
ConvertibleEquities Bonds
Convertiblefixed
Mutual funds/Unit trusts/
ETFsShort-termsecurities
TotalInvestments
Derivativeassets
Derivativeliabilities
(000s) (000s) (000s) (000s) (000s) (000s) (000s) (000s) (000s)June 30, 2014Level 1 . . . . . . . . . . . . . $ — $ — $ — $ — $— $ — $ — $ — $ —Level 2 . . . . . . . . . . . . . — — 125,527 — — 90,165 215,692 — —Level 3 . . . . . . . . . . . . . — — — — — — — — —
Total . . . . . . . . . . . . . . $ — $ — $125,527 $ — $— $90,165 $215,692 $ — $ —
December 31, 2013Level 1 . . . . . . . . . . . . . $ — $ — $ — $ — $— $ — $ — $ — $ —Level 2 . . . . . . . . . . . . . — — 138,125 — — 73,403 211,528 — —Level 3 . . . . . . . . . . . . . — — — — — — — — —
Total . . . . . . . . . . . . . . $ — $ — $138,125 $ — $— $73,403 $211,528 $ — $ —
January 01, 2013Level 1 . . . . . . . . . . . . . $ — $ — $ — $ — $— $ — $ — $ — $ —Level 2 . . . . . . . . . . . . . — — 139,506 — — 95,408 234,914 — —Level 3 . . . . . . . . . . . . . — — — — — — — — —
Total . . . . . . . . . . . . . . $ — $ — $139,506 $ — $— $95,408 $234,914 $ — $ —
Franklin Bissett Small Cap Fund
Equities —Long
ConvertibleEquities Bonds
Convertiblefixed
Mutual funds/Unit trusts/
ETFsShort-termsecurities
TotalInvestments
Derivativeassets
Derivativeliabilities
(000s) (000s) (000s) (000s) (000s) (000s) (000s) (000s) (000s)June 30, 2014Level 1 . . . . . . . . . . . . . $758,219 $ — $ — $ — $— $ — $758,219 $ — $ —Level 2 . . . . . . . . . . . . . — — — — — 76,600 76,600 — —Level 3 . . . . . . . . . . . . . — — — — — — — — —
Total . . . . . . . . . . . . . . $758,219 $ — $ — $ — $— $76,600 $834,819 $ — $ —
December 31, 2013Level 1 . . . . . . . . . . . . . $727,640 $ — $ — $ — $— $ — $727,640 $ — $ —Level 2 . . . . . . . . . . . . . — — — — — 67,500 67,500 — —Level 3 . . . . . . . . . . . . . — — — — — — — — —
Total . . . . . . . . . . . . . . $727,640 $ — $ — $ — $— $67,500 $795,140 $ — $ —
January 01, 2013Level 1 . . . . . . . . . . . . . $531,457 $ — $ — $ — $— $ — $531,457 $ — $ —Level 2 . . . . . . . . . . . . . — — — — — 41,904 41,904 — —Level 3 . . . . . . . . . . . . . — — — — — — — — —
Total . . . . . . . . . . . . . . $531,457 $ — $ — $ — $— $41,904 $573,361 $ — $ —
392 Franklin Templeton Investments Funds

Franklin Templeton Investments Funds
NOTES TO FINANCIAL STATEMENTS For the periods ended June 30, 2014 and December 31, 2013 (Unaudited) (Continued)
8. Financial Risk Management (Continued)
Franklin Bissett Strategic Income Fund
Equities —Long
ConvertibleEquities Bonds
Convertiblefixed
Mutual funds/Unit trusts/
ETFsShort-termsecurities
TotalInvestments
Derivativeassets
Derivativeliabilities
(000s) (000s) (000s) (000s) (000s) (000s) (000s) (000s) (000s)June 30, 2014Level 1 . . . . . . . . . . . . . . $76,247 $ — $ — $ — $45,056 $ — $121,303 $ — $ —Level 2 . . . . . . . . . . . . . . — — 21,683 — — 1,300 22,983 — —Level 3 . . . . . . . . . . . . . . — — — — — — — — —
Total . . . . . . . . . . . . . . . $76,247 $ — $21,683 $ — $45,056 $ 1,300 $144,286 $ — $ —
December 31, 2013Level 1 . . . . . . . . . . . . . . $66,505 $ — $ — $ — $48,709 $ — $115,214 $ — $ —Level 2 . . . . . . . . . . . . . . — — 19,009 — — $ 1,800 20,809 — —Level 3 . . . . . . . . . . . . . . — — — — — — — — —
Total . . . . . . . . . . . . . . . $66,505 $ — $19,009 $ — $48,709 $ 1,800 $136,023 $ — $ —
January 01, 2013Level 1 . . . . . . . . . . . . . . $37,253 $ — $ — $ — $29,837 $ — $ 67,090 $ — $ —Level 2 . . . . . . . . . . . . . . — — 12,398 — — 1,035 13,433 — —Level 3 . . . . . . . . . . . . . . — — — — — — — — —
Total . . . . . . . . . . . . . . . $37,253 $ — $12,398 $ — $29,837 $ 1,035 $ 80,523 $ — $ —
Franklin Bissett Treasury Bill Fund
Equities —Long
ConvertibleEquities Bonds
Convertiblefixed
Mutual funds/Unit trusts/
ETFsShort-termsecurities
TotalInvestments
Derivativeassets
Derivativeliabilities
(000s) (000s) (000s) (000s) (000s) (000s) (000s) (000s) (000s)June 30, 2014Level 1 . . . . . . . . . . . . . . $ — $ — $ — $ — $ — $ — $ — $ — $ —Level 2 . . . . . . . . . . . . . . — — 30,093 — — 29,722 59,815 — —Level 3 . . . . . . . . . . . . . . — — — — — — — — —
Total . . . . . . . . . . . . . . . $ — $ — $30,093 $ — $ — $29,722 $ 59,815 $ — $ —
December 31, 2013Level 1 . . . . . . . . . . . . . . $ — $ — $ — $ — $ — $ — $ — $ — $ —Level 2 . . . . . . . . . . . . . . — — 39,878 — — 27,304 67,182 — —Level 3 . . . . . . . . . . . . . . — — — — — — — — —
Total . . . . . . . . . . . . . . . $ — $ — $39,878 $ — $ — $27,304 $ 67,182 $ — $ —
January 01, 2013Level 1 . . . . . . . . . . . . . . $ — $ — $ — $ — $ — $ — $ — $ — $ —Level 2 . . . . . . . . . . . . . . — — 38,135 — — 51,897 90,032 — —Level 3 . . . . . . . . . . . . . . — — — — — — — — —
Total . . . . . . . . . . . . . . . $ — $ — $38,135 $ — $ — $51,897 $ 90,032 $ — $ —
Franklin Templeton Investments Funds 393
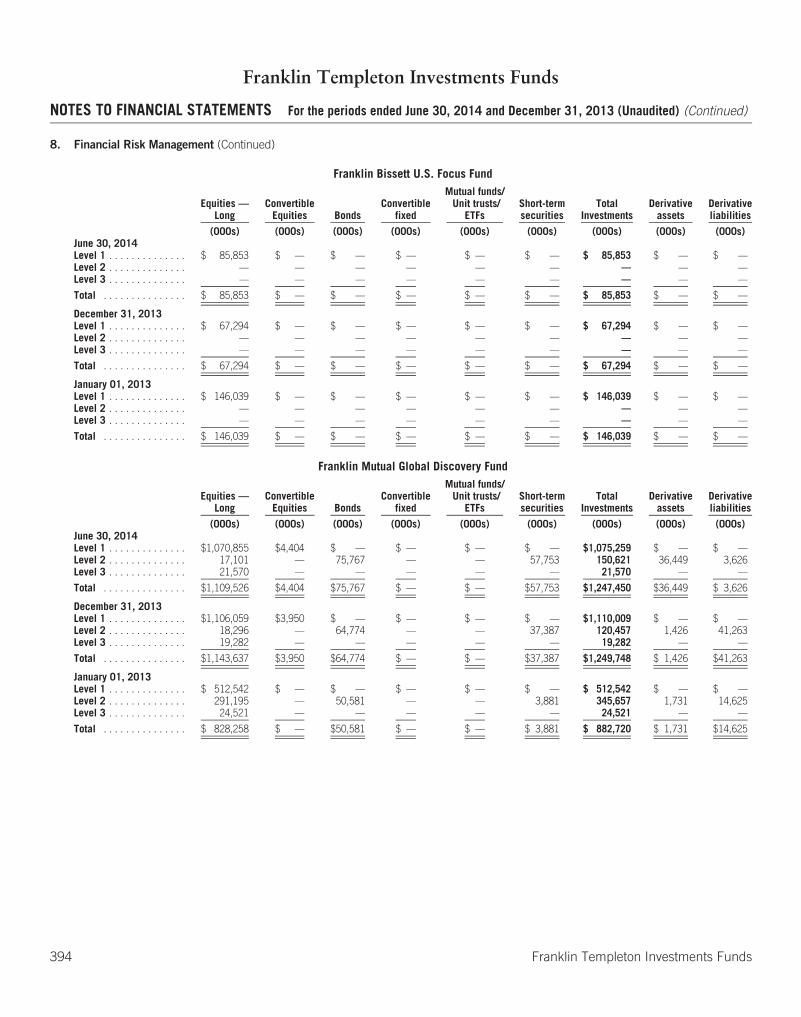
Franklin Templeton Investments Funds
NOTES TO FINANCIAL STATEMENTS For the periods ended June 30, 2014 and December 31, 2013 (Unaudited) (Continued)
8. Financial Risk Management (Continued)
Franklin Bissett U.S. Focus Fund
Equities —Long
ConvertibleEquities Bonds
Convertiblefixed
Mutual funds/Unit trusts/
ETFsShort-termsecurities
TotalInvestments
Derivativeassets
Derivativeliabilities
(000s) (000s) (000s) (000s) (000s) (000s) (000s) (000s) (000s)June 30, 2014Level 1 . . . . . . . . . . . . . . $ 85,853 $ — $ — $ — $ — $ — $ 85,853 $ — $ —Level 2 . . . . . . . . . . . . . . — — — — — — — — —Level 3 . . . . . . . . . . . . . . — — — — — — — — —
Total . . . . . . . . . . . . . . . $ 85,853 $ — $ — $ — $ — $ — $ 85,853 $ — $ —
December 31, 2013Level 1 . . . . . . . . . . . . . . $ 67,294 $ — $ — $ — $ — $ — $ 67,294 $ — $ —Level 2 . . . . . . . . . . . . . . — — — — — — — — —Level 3 . . . . . . . . . . . . . . — — — — — — — — —
Total . . . . . . . . . . . . . . . $ 67,294 $ — $ — $ — $ — $ — $ 67,294 $ — $ —
January 01, 2013Level 1 . . . . . . . . . . . . . . $ 146,039 $ — $ — $ — $ — $ — $ 146,039 $ — $ —Level 2 . . . . . . . . . . . . . . — — — — — — — — —Level 3 . . . . . . . . . . . . . . — — — — — — — — —
Total . . . . . . . . . . . . . . . $ 146,039 $ — $ — $ — $ — $ — $ 146,039 $ — $ —
Franklin Mutual Global Discovery Fund
Equities —Long
ConvertibleEquities Bonds
Convertiblefixed
Mutual funds/Unit trusts/
ETFsShort-termsecurities
TotalInvestments
Derivativeassets
Derivativeliabilities
(000s) (000s) (000s) (000s) (000s) (000s) (000s) (000s) (000s)June 30, 2014Level 1 . . . . . . . . . . . . . . $1,070,855 $4,404 $ — $ — $ — $ — $1,075,259 $ — $ —Level 2 . . . . . . . . . . . . . . 17,101 — 75,767 — — 57,753 150,621 36,449 3,626Level 3 . . . . . . . . . . . . . . 21,570 — — — — — 21,570 — —
Total . . . . . . . . . . . . . . . $1,109,526 $4,404 $75,767 $ — $ — $57,753 $1,247,450 $36,449 $ 3,626
December 31, 2013Level 1 . . . . . . . . . . . . . . $1,106,059 $3,950 $ — $ — $ — $ — $1,110,009 $ — $ —Level 2 . . . . . . . . . . . . . . 18,296 — 64,774 — — 37,387 120,457 1,426 41,263Level 3 . . . . . . . . . . . . . . 19,282 — — — — — 19,282 — —
Total . . . . . . . . . . . . . . . $1,143,637 $3,950 $64,774 $ — $ — $37,387 $1,249,748 $ 1,426 $41,263
January 01, 2013Level 1 . . . . . . . . . . . . . . $ 512,542 $ — $ — $ — $ — $ — $ 512,542 $ — $ —Level 2 . . . . . . . . . . . . . . 291,195 — 50,581 — — 3,881 345,657 1,731 14,625Level 3 . . . . . . . . . . . . . . 24,521 — — — — — 24,521 — —
Total . . . . . . . . . . . . . . . $ 828,258 $ — $50,581 $ — $ — $ 3,881 $ 882,720 $ 1,731 $14,625
394 Franklin Templeton Investments Funds
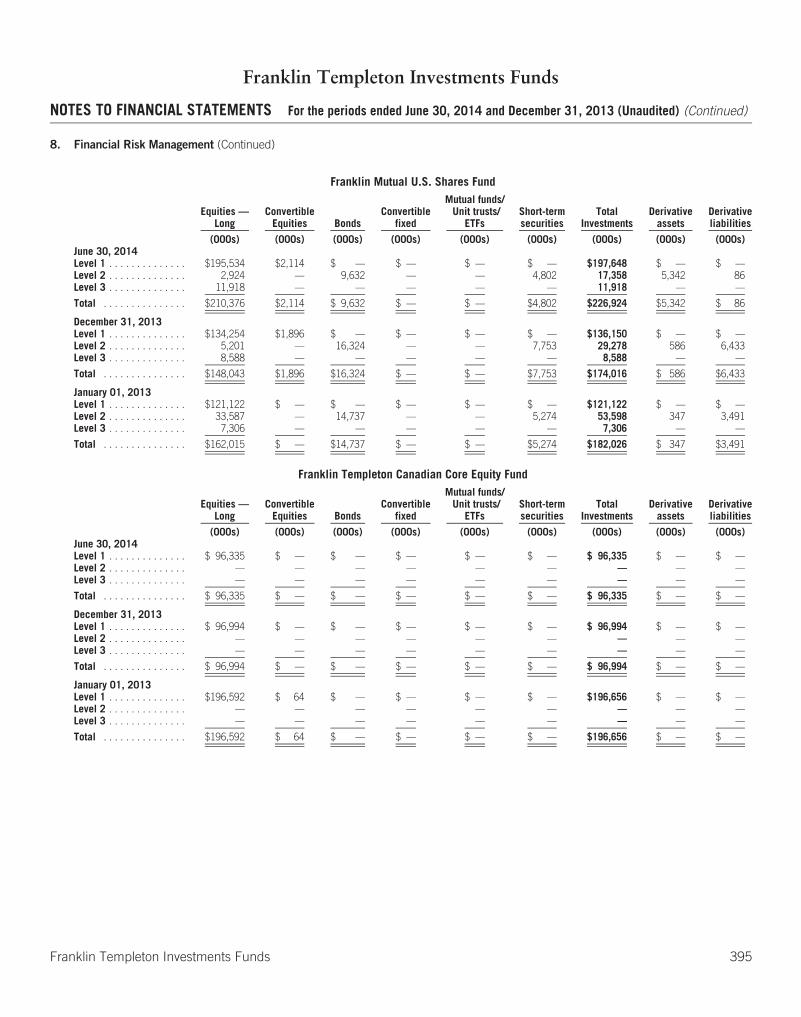
Franklin Templeton Investments Funds
NOTES TO FINANCIAL STATEMENTS For the periods ended June 30, 2014 and December 31, 2013 (Unaudited) (Continued)
8. Financial Risk Management (Continued)
Franklin Mutual U.S. Shares Fund
Equities —Long
ConvertibleEquities Bonds
Convertiblefixed
Mutual funds/Unit trusts/
ETFsShort-termsecurities
TotalInvestments
Derivativeassets
Derivativeliabilities
(000s) (000s) (000s) (000s) (000s) (000s) (000s) (000s) (000s)June 30, 2014Level 1 . . . . . . . . . . . . . . $195,534 $2,114 $ — $ — $ — $ — $197,648 $ — $ —Level 2 . . . . . . . . . . . . . . 2,924 — 9,632 — — 4,802 17,358 5,342 86Level 3 . . . . . . . . . . . . . . 11,918 — — — — — 11,918 — —
Total . . . . . . . . . . . . . . . $210,376 $2,114 $ 9,632 $ — $ — $4,802 $226,924 $5,342 $ 86
December 31, 2013Level 1 . . . . . . . . . . . . . . $134,254 $1,896 $ — $ — $ — $ — $136,150 $ — $ —Level 2 . . . . . . . . . . . . . . 5,201 — 16,324 — — 7,753 29,278 586 6,433Level 3 . . . . . . . . . . . . . . 8,588 — — — — — 8,588 — —
Total . . . . . . . . . . . . . . . $148,043 $1,896 $16,324 $ — $ — $7,753 $174,016 $ 586 $6,433
January 01, 2013Level 1 . . . . . . . . . . . . . . $121,122 $ — $ — $ — $ — $ — $121,122 $ — $ —Level 2 . . . . . . . . . . . . . . 33,587 — 14,737 — — 5,274 53,598 347 3,491Level 3 . . . . . . . . . . . . . . 7,306 — — — — — 7,306 — —
Total . . . . . . . . . . . . . . . $162,015 $ — $14,737 $ — $ — $5,274 $182,026 $ 347 $3,491
Franklin Templeton Canadian Core Equity Fund
Equities —Long
ConvertibleEquities Bonds
Convertiblefixed
Mutual funds/Unit trusts/
ETFsShort-termsecurities
TotalInvestments
Derivativeassets
Derivativeliabilities
(000s) (000s) (000s) (000s) (000s) (000s) (000s) (000s) (000s)June 30, 2014Level 1 . . . . . . . . . . . . . . $ 96,335 $ — $ — $ — $ — $ — $ 96,335 $ — $ —Level 2 . . . . . . . . . . . . . . — — — — — — — — —Level 3 . . . . . . . . . . . . . . — — — — — — — — —
Total . . . . . . . . . . . . . . . $ 96,335 $ — $ — $ — $ — $ — $ 96,335 $ — $ —
December 31, 2013Level 1 . . . . . . . . . . . . . . $ 96,994 $ — $ — $ — $ — $ — $ 96,994 $ — $ —Level 2 . . . . . . . . . . . . . . — — — — — — — — —Level 3 . . . . . . . . . . . . . . — — — — — — — — —
Total . . . . . . . . . . . . . . . $ 96,994 $ — $ — $ — $ — $ — $ 96,994 $ — $ —
January 01, 2013Level 1 . . . . . . . . . . . . . . $196,592 $ 64 $ — $ — $ — $ — $196,656 $ — $ —Level 2 . . . . . . . . . . . . . . — — — — — — — — —Level 3 . . . . . . . . . . . . . . — — — — — — — — —
Total . . . . . . . . . . . . . . . $196,592 $ 64 $ — $ — $ — $ — $196,656 $ — $ —
Franklin Templeton Investments Funds 395
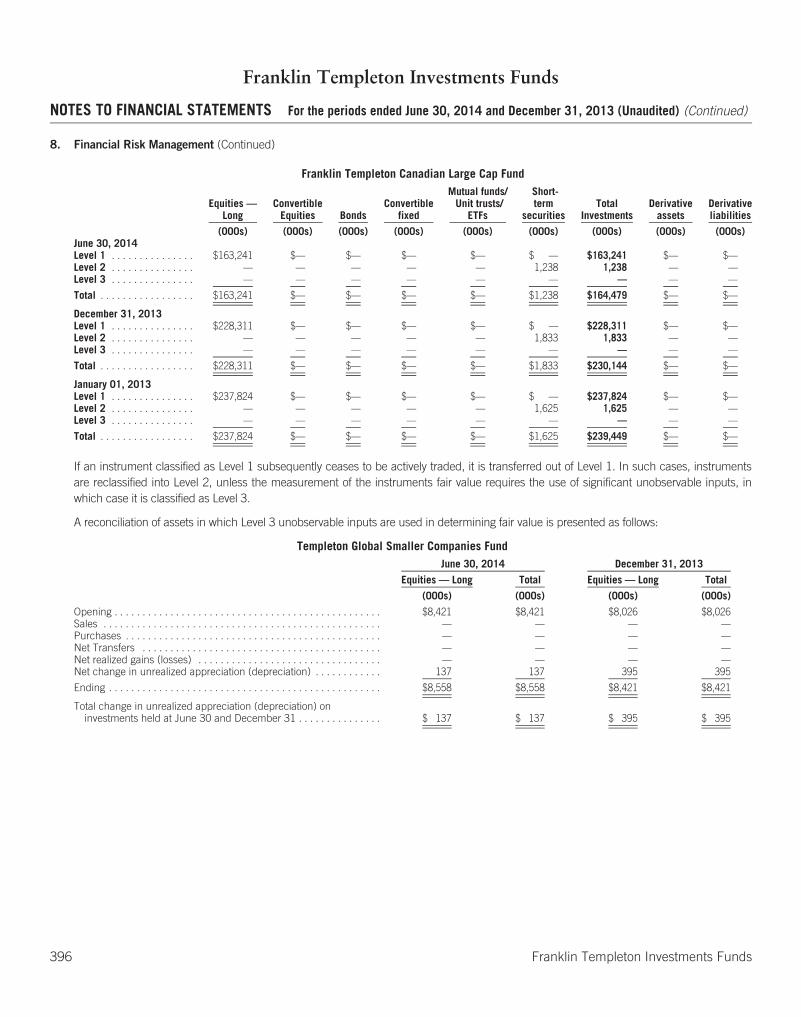
Franklin Templeton Investments Funds
NOTES TO FINANCIAL STATEMENTS For the periods ended June 30, 2014 and December 31, 2013 (Unaudited) (Continued)
8. Financial Risk Management (Continued)
Franklin Templeton Canadian Large Cap Fund
Equities —Long
ConvertibleEquities Bonds
Convertiblefixed
Mutual funds/Unit trusts/
ETFs
Short-term
securitiesTotal
InvestmentsDerivative
assetsDerivativeliabilities
(000s) (000s) (000s) (000s) (000s) (000s) (000s) (000s) (000s)June 30, 2014Level 1 . . . . . . . . . . . . . . . $163,241 $— $— $— $— $ — $163,241 $— $—Level 2 . . . . . . . . . . . . . . . — — — — — 1,238 1,238 — —Level 3 . . . . . . . . . . . . . . . — — — — — — — — —
Total . . . . . . . . . . . . . . . . . $163,241 $— $— $— $— $1,238 $164,479 $— $—
December 31, 2013Level 1 . . . . . . . . . . . . . . . $228,311 $— $— $— $— $ — $228,311 $— $—Level 2 . . . . . . . . . . . . . . . — — — — — 1,833 1,833 — —Level 3 . . . . . . . . . . . . . . . — — — — — — — — —
Total . . . . . . . . . . . . . . . . . $228,311 $— $— $— $— $1,833 $230,144 $— $—
January 01, 2013Level 1 . . . . . . . . . . . . . . . $237,824 $— $— $— $— $ — $237,824 $— $—Level 2 . . . . . . . . . . . . . . . — — — — — 1,625 1,625 — —Level 3 . . . . . . . . . . . . . . . — — — — — — — — —
Total . . . . . . . . . . . . . . . . . $237,824 $— $— $— $— $1,625 $239,449 $— $—
If an instrument classified as Level 1 subsequently ceases to be actively traded, it is transferred out of Level 1. In such cases, instrumentsare reclassified into Level 2, unless the measurement of the instruments fair value requires the use of significant unobservable inputs, inwhich case it is classified as Level 3.
A reconciliation of assets in which Level 3 unobservable inputs are used in determining fair value is presented as follows:
Templeton Global Smaller Companies FundJune 30, 2014 December 31, 2013
Equities — Long Total Equities — Long Total
(000s) (000s) (000s) (000s)
Opening . . . . . . . . . . . . . . . . . . . . . . . . . . . . . . . . . . . . . . . . . . . . . . . . $8,421 $8,421 $8,026 $8,026Sales . . . . . . . . . . . . . . . . . . . . . . . . . . . . . . . . . . . . . . . . . . . . . . . . . . — — — —Purchases . . . . . . . . . . . . . . . . . . . . . . . . . . . . . . . . . . . . . . . . . . . . . . — — — —Net Transfers . . . . . . . . . . . . . . . . . . . . . . . . . . . . . . . . . . . . . . . . . . . — — — —Net realized gains (losses) . . . . . . . . . . . . . . . . . . . . . . . . . . . . . . . . . — — — —Net change in unrealized appreciation (depreciation) . . . . . . . . . . . . 137 137 395 395
Ending . . . . . . . . . . . . . . . . . . . . . . . . . . . . . . . . . . . . . . . . . . . . . . . . . $8,558 $8,558 $8,421 $8,421
Total change in unrealized appreciation (depreciation) oninvestments held at June 30 and December 31 . . . . . . . . . . . . . . . $ 137 $ 137 $ 395 $ 395
396 Franklin Templeton Investments Funds

Franklin Templeton Investments Funds
NOTES TO FINANCIAL STATEMENTS For the periods ended June 30, 2014 and December 31, 2013 (Unaudited) (Continued)
8. Financial Risk Management (Continued)
Templeton International Stock FundJune 30, 2014 December 31, 2013
Mutual funds/Unit trusts/
ETFs Total
Mutual funds/Unit trusts/
ETFs Equities — Long Total
(000s) (000s) (000s) (000s) (000s)
Opening . . . . . . . . . . . . . . . . . . . . . . . . . . . . . . . . . . . . . $8,720 $8,720 $7,968 $ 112 $8,080Sales . . . . . . . . . . . . . . . . . . . . . . . . . . . . . . . . . . . . . . . . — — — (110) (110)Purchases . . . . . . . . . . . . . . . . . . . . . . . . . . . . . . . . . . . . 34 34 13 — 13Net Transfers . . . . . . . . . . . . . . . . . . . . . . . . . . . . . . . . . — — — — —Net realized gains (losses) . . . . . . . . . . . . . . . . . . . . . . . — — — (2) (2)Net change in unrealized appreciation (depreciation) . . (730) (730) 739 — 739
Ending . . . . . . . . . . . . . . . . . . . . . . . . . . . . . . . . . . . . . . $8,024 $8,024 $8,720 $ — $8,720
Total change in unrealized appreciation (depreciation)on investments held at June 30 and December 31 . . $ (730) $ (730) $ 739 $ — $ 739
Franklin Bissett Canadian All Cap Balanced FundJune 30, 2014
Equities — Long Total
(000s) (000s)
Opening . . . . . . . . . . . . . . . . . . . . . . . . . . . . . . . . . . . . . . . . . . . . . . . . $— $—Sales . . . . . . . . . . . . . . . . . . . . . . . . . . . . . . . . . . . . . . . . . . . . . . . . . . . — —Purchases . . . . . . . . . . . . . . . . . . . . . . . . . . . . . . . . . . . . . . . . . . . . . . 20 20Net Transfers . . . . . . . . . . . . . . . . . . . . . . . . . . . . . . . . . . . . . . . . . . . . — —Net realized gains (losses) . . . . . . . . . . . . . . . . . . . . . . . . . . . . . . . . . . — —Net change in unrealized appreciation (depreciation) . . . . . . . . . . . . 6 6
Ending . . . . . . . . . . . . . . . . . . . . . . . . . . . . . . . . . . . . . . . . . . . . . . . . . $26 $26
Total change in unrealized appreciation (depreciation) oninvestments held at June 30 . . . . . . . . . . . . . . . . . . . . . . . . . . . . . . $ 6 $ 6
Franklin Bissett Canadian Equity FundJune 30, 2014 December 31, 2013
Equities — Long Total Equities — Long Total
(000s) (000s) (000s) (000s)
Opening . . . . . . . . . . . . . . . . . . . . . . . . . . . . . . . . . . . . . . . . . . . . . . $ — $ — $ 1,628 $ 1,628Sales . . . . . . . . . . . . . . . . . . . . . . . . . . . . . . . . . . . . . . . . . . . . . . . . . — — — —Purchases . . . . . . . . . . . . . . . . . . . . . . . . . . . . . . . . . . . . . . . . . . . . 8,850 8,850 — —Net Transfers . . . . . . . . . . . . . . . . . . . . . . . . . . . . . . . . . . . . . . . . . . — — (1,969) (1,969)Net realized gains (losses) . . . . . . . . . . . . . . . . . . . . . . . . . . . . . . . . — — — —Net change in unrealized appreciation (depreciation) . . . . . . . . . . 2,638 2,638 341 341
Ending . . . . . . . . . . . . . . . . . . . . . . . . . . . . . . . . . . . . . . . . . . . . . . . $11,488 $11,488 $ — $ —
Total change in unrealized appreciation (depreciation) oninvestments held at June 30 and December 31 . . . . . . . . . . . . . $ 2,638 $ 2,638 $ — $ —
Franklin Templeton Investments Funds 397
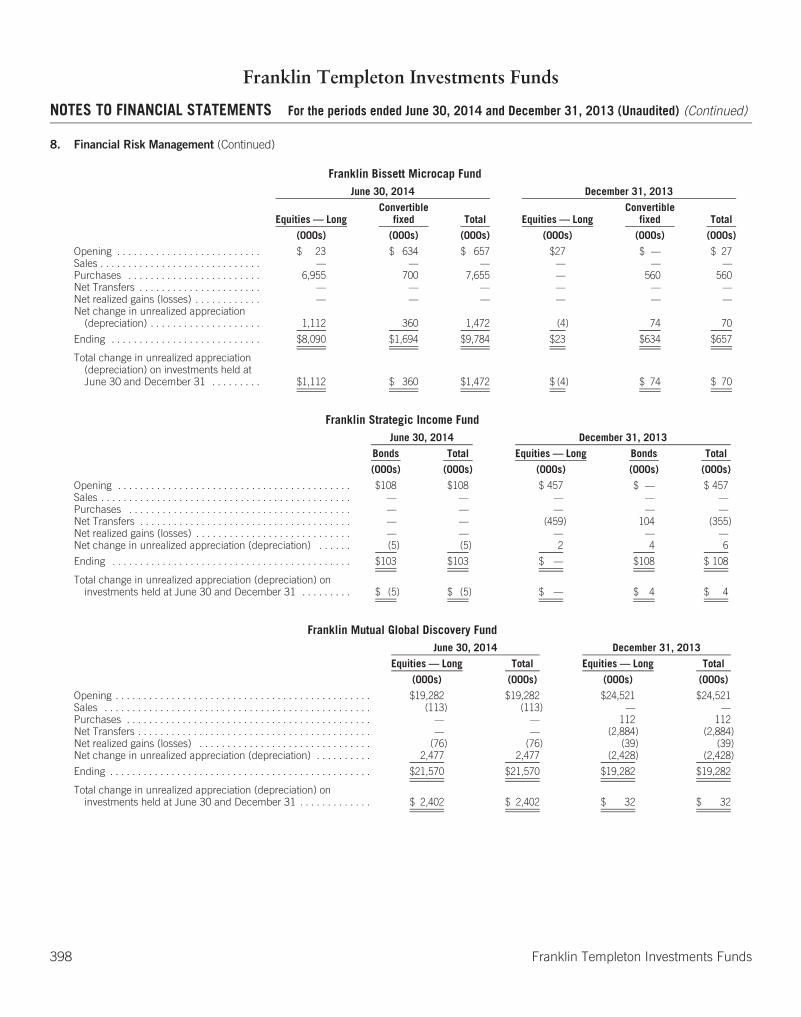
Franklin Templeton Investments Funds
NOTES TO FINANCIAL STATEMENTS For the periods ended June 30, 2014 and December 31, 2013 (Unaudited) (Continued)
8. Financial Risk Management (Continued)
Franklin Bissett Microcap FundJune 30, 2014 December 31, 2013
Equities — LongConvertible
fixed Total Equities — LongConvertible
fixed Total
(000s) (000s) (000s) (000s) (000s) (000s)
Opening . . . . . . . . . . . . . . . . . . . . . . . . . . $ 23 $ 634 $ 657 $27 $ — $ 27Sales . . . . . . . . . . . . . . . . . . . . . . . . . . . . . — — — — — —Purchases . . . . . . . . . . . . . . . . . . . . . . . . 6,955 700 7,655 — 560 560Net Transfers . . . . . . . . . . . . . . . . . . . . . . — — — — — —Net realized gains (losses) . . . . . . . . . . . . — — — — — —Net change in unrealized appreciation
(depreciation) . . . . . . . . . . . . . . . . . . . . 1,112 360 1,472 (4) 74 70
Ending . . . . . . . . . . . . . . . . . . . . . . . . . . . $8,090 $1,694 $9,784 $23 $634 $657
Total change in unrealized appreciation(depreciation) on investments held atJune 30 and December 31 . . . . . . . . . $1,112 $ 360 $1,472 $ (4) $ 74 $ 70
Franklin Strategic Income FundJune 30, 2014 December 31, 2013
Bonds Total Equities — Long Bonds Total
(000s) (000s) (000s) (000s) (000s)
Opening . . . . . . . . . . . . . . . . . . . . . . . . . . . . . . . . . . . . . . . . . . $108 $108 $ 457 $ — $ 457Sales . . . . . . . . . . . . . . . . . . . . . . . . . . . . . . . . . . . . . . . . . . . . . — — — — —Purchases . . . . . . . . . . . . . . . . . . . . . . . . . . . . . . . . . . . . . . . . — — — — —Net Transfers . . . . . . . . . . . . . . . . . . . . . . . . . . . . . . . . . . . . . . — — (459) 104 (355)Net realized gains (losses) . . . . . . . . . . . . . . . . . . . . . . . . . . . . — — — — —Net change in unrealized appreciation (depreciation) . . . . . . (5) (5) 2 4 6
Ending . . . . . . . . . . . . . . . . . . . . . . . . . . . . . . . . . . . . . . . . . . . $103 $103 $ — $108 $ 108
Total change in unrealized appreciation (depreciation) oninvestments held at June 30 and December 31 . . . . . . . . . $ (5) $ (5) $ — $ 4 $ 4
Franklin Mutual Global Discovery FundJune 30, 2014 December 31, 2013
Equities — Long Total Equities — Long Total
(000s) (000s) (000s) (000s)
Opening . . . . . . . . . . . . . . . . . . . . . . . . . . . . . . . . . . . . . . . . . . . . . . $19,282 $19,282 $24,521 $24,521Sales . . . . . . . . . . . . . . . . . . . . . . . . . . . . . . . . . . . . . . . . . . . . . . . . (113) (113) — —Purchases . . . . . . . . . . . . . . . . . . . . . . . . . . . . . . . . . . . . . . . . . . . . — — 112 112Net Transfers . . . . . . . . . . . . . . . . . . . . . . . . . . . . . . . . . . . . . . . . . . — — (2,884) (2,884)Net realized gains (losses) . . . . . . . . . . . . . . . . . . . . . . . . . . . . . . . (76) (76) (39) (39)Net change in unrealized appreciation (depreciation) . . . . . . . . . . 2,477 2,477 (2,428) (2,428)
Ending . . . . . . . . . . . . . . . . . . . . . . . . . . . . . . . . . . . . . . . . . . . . . . . $21,570 $21,570 $19,282 $19,282
Total change in unrealized appreciation (depreciation) oninvestments held at June 30 and December 31 . . . . . . . . . . . . . $ 2,402 $ 2,402 $ 32 $ 32
398 Franklin Templeton Investments Funds

Franklin Templeton Investments Funds
NOTES TO FINANCIAL STATEMENTS For the periods ended June 30, 2014 and December 31, 2013 (Unaudited) (Continued)
8. Financial Risk Management (Continued)
Franklin Mutual U.S. Shares FundJune 30, 2014 December 31, 2013
Equities — Long Total Equities — Long Total
(000s) (000s) (000s) (000s)
Opening . . . . . . . . . . . . . . . . . . . . . . . . . . . . . . . . . . . . . . . . . . . . . . . $ 8,588 $ 8,588 $7,306 $7,306Sales . . . . . . . . . . . . . . . . . . . . . . . . . . . . . . . . . . . . . . . . . . . . . . . . . — — (963) (963)Purchases . . . . . . . . . . . . . . . . . . . . . . . . . . . . . . . . . . . . . . . . . . . . . — — — —Net Transfers . . . . . . . . . . . . . . . . . . . . . . . . . . . . . . . . . . . . . . . . . . . — — — —Net realized gains (losses) . . . . . . . . . . . . . . . . . . . . . . . . . . . . . . . . — — 797 797Net change in unrealized appreciation (depreciation) . . . . . . . . . . . 3,330 3,330 1,448 1,448
Ending . . . . . . . . . . . . . . . . . . . . . . . . . . . . . . . . . . . . . . . . . . . . . . . . $11,918 $11,918 $8,588 $8,588
Total change in unrealized appreciation (depreciation) oninvestments held at June 30 and December 31 . . . . . . . . . . . . . . $ 3,330 $ 3,330 $2,245 $2,245
As discussed in Note 8(g), the fair value of securities classified as Level 3 is determined using inputs that are not based on observablemarket data. The tables below show the Funds with Level 3 securities exceeding 1.0% of the net assets of the respective Fund and thesignificant unobservable valuation inputs used to value those securities. The impact to fair value as a result of changes in the unobservableinputs is also disclosed below.
Franklin Mutual Global Discovery Fund
Description
Fair Value asat June 30,
2014 Valuation Technique Unobservable Inputs Amount/Rangea
(000s)
Assets:
Investments in Securities
Equity Investments:b
Commercial Banks . . . . . . . . . . . . . . . . . . . . . . . . . $ 1,644 Market comparable Discount for lack of marketability 5%
Diversified Financials . . . . . . . . . . . . . . . . . . . . . . . 15,553 Discounted cash flow model Cost of equityc 17%Long-term revenue growth rate 6.2%-26%Adjusted EBITDA marginc 11.19 - 21.60%
Real Estate Management & Development . . . . . . . 3,175 Market comparable Discount for lack of marketability 8%
All Other Investmentsd . . . . . . . . . . . . . . . . . . . . . . . . 1,198
Total . . . . . . . . . . . . . . . . . . . . . . . . . . . . . . . . . . . . . . $21,570
Description
Fair Valueas at
December 31,2013 Valuation Technique Unobservable Inputs Amount/Rangea
(000s)
Assets:
Investments in Securities
Equity Investments:b
Commercial Banks . . . . . . . . . . . . . . . . . . . . . . . . . $ 1,520 Market comparable Discount for lack of marketability 10%Price/tangible book multiple 1.37x
Diversified Financials . . . . . . . . . . . . . . . . . . . . . . . 14,758 Discounted cash flow model Cost of equity 17%Long-term revenue growth rate 6.2% - 34.9%Adjusted EBITDA margin 10.6% - 23.3%
Real Estate Management & Development . . . . . . . 2,149 Market comparable Discount for lack of marketability 8%
All Other Investmentsd . . . . . . . . . . . . . . . . . . . . . . . . 855
Total . . . . . . . . . . . . . . . . . . . . . . . . . . . . . . . . . . . . . . $19,282
Franklin Templeton Investments Funds 399
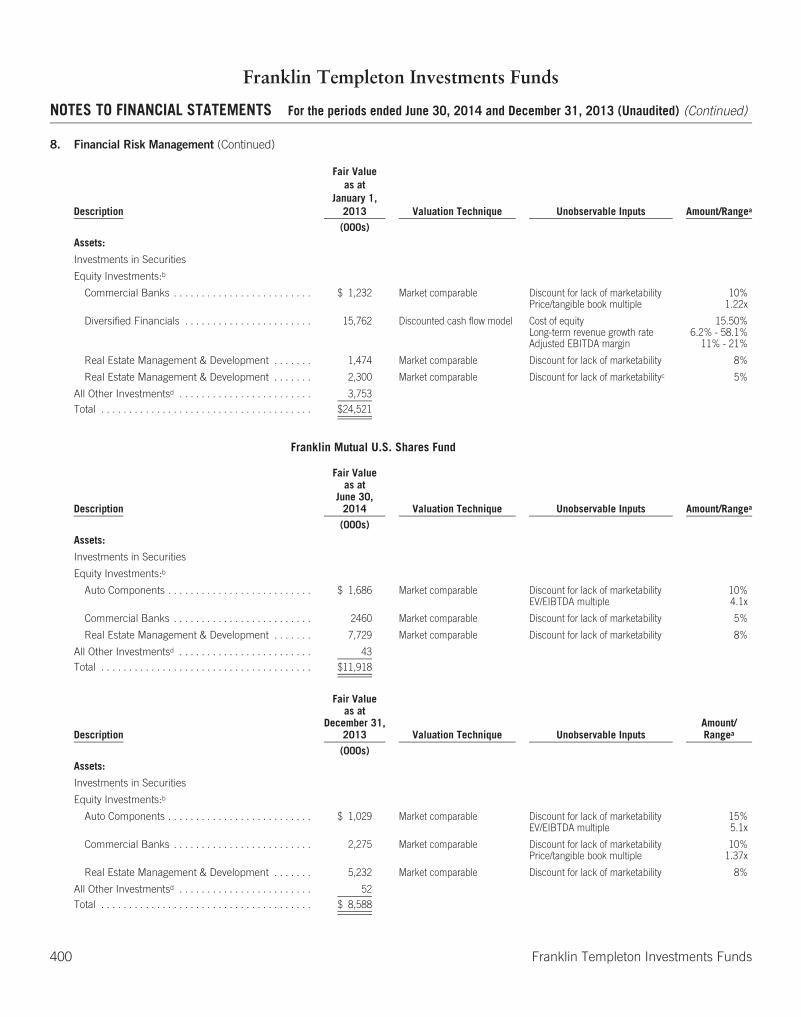
Franklin Templeton Investments Funds
NOTES TO FINANCIAL STATEMENTS For the periods ended June 30, 2014 and December 31, 2013 (Unaudited) (Continued)
8. Financial Risk Management (Continued)
Description
Fair Valueas at
January 1,2013 Valuation Technique Unobservable Inputs Amount/Rangea
(000s)Assets:
Investments in Securities
Equity Investments:b
Commercial Banks . . . . . . . . . . . . . . . . . . . . . . . . . $ 1,232 Market comparable Discount for lack of marketability 10%Price/tangible book multiple 1.22x
Diversified Financials . . . . . . . . . . . . . . . . . . . . . . . 15,762 Discounted cash flow model Cost of equity 15.50%Long-term revenue growth rate 6.2% - 58.1%Adjusted EBITDA margin 11% - 21%
Real Estate Management & Development . . . . . . . 1,474 Market comparable Discount for lack of marketability 8%
Real Estate Management & Development . . . . . . . 2,300 Market comparable Discount for lack of marketabilityc 5%
All Other Investmentsd . . . . . . . . . . . . . . . . . . . . . . . . 3,753Total . . . . . . . . . . . . . . . . . . . . . . . . . . . . . . . . . . . . . . $24,521
Franklin Mutual U.S. Shares Fund
Description
Fair Valueas at
June 30,2014 Valuation Technique Unobservable Inputs Amount/Rangea
(000s)Assets:
Investments in Securities
Equity Investments:b
Auto Components . . . . . . . . . . . . . . . . . . . . . . . . . . $ 1,686 Market comparable Discount for lack of marketability 10%EV/EIBTDA multiple 4.1x
Commercial Banks . . . . . . . . . . . . . . . . . . . . . . . . . 2460 Market comparable Discount for lack of marketability 5%
Real Estate Management & Development . . . . . . . 7,729 Market comparable Discount for lack of marketability 8%
All Other Investmentsd . . . . . . . . . . . . . . . . . . . . . . . . 43Total . . . . . . . . . . . . . . . . . . . . . . . . . . . . . . . . . . . . . . $11,918
Description
Fair Valueas at
December 31,2013 Valuation Technique Unobservable Inputs
Amount/Rangea
(000s)Assets:
Investments in Securities
Equity Investments:b
Auto Components . . . . . . . . . . . . . . . . . . . . . . . . . . $ 1,029 Market comparable Discount for lack of marketability 15%EV/EIBTDA multiple 5.1x
Commercial Banks . . . . . . . . . . . . . . . . . . . . . . . . . 2,275 Market comparable Discount for lack of marketability 10%Price/tangible book multiple 1.37x
Real Estate Management & Development . . . . . . . 5,232 Market comparable Discount for lack of marketability 8%
All Other Investmentsd . . . . . . . . . . . . . . . . . . . . . . . . 52Total . . . . . . . . . . . . . . . . . . . . . . . . . . . . . . . . . . . . . . $ 8,588
400 Franklin Templeton Investments Funds
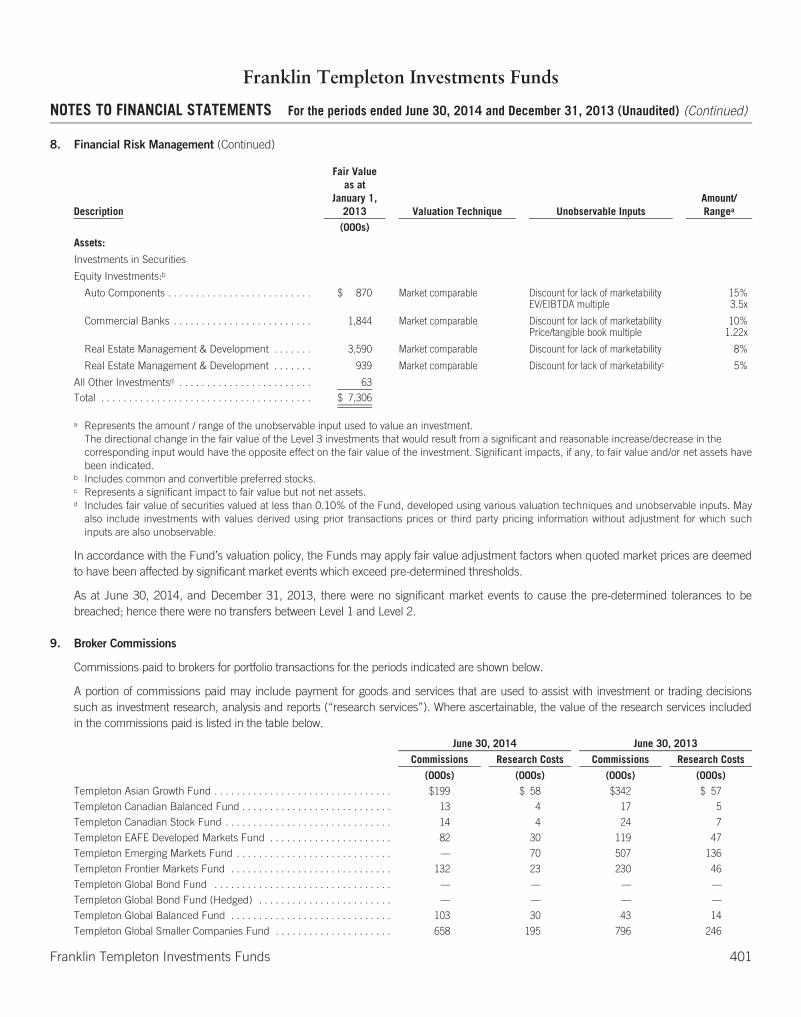
Franklin Templeton Investments Funds
NOTES TO FINANCIAL STATEMENTS For the periods ended June 30, 2014 and December 31, 2013 (Unaudited) (Continued)
8. Financial Risk Management (Continued)
Description
Fair Valueas at
January 1,2013 Valuation Technique Unobservable Inputs
Amount/Rangea
(000s)Assets:
Investments in Securities
Equity Investments:b
Auto Components . . . . . . . . . . . . . . . . . . . . . . . . . . $ 870 Market comparable Discount for lack of marketability 15%EV/EIBTDA multiple 3.5x
Commercial Banks . . . . . . . . . . . . . . . . . . . . . . . . . 1,844 Market comparable Discount for lack of marketability 10%Price/tangible book multiple 1.22x
Real Estate Management & Development . . . . . . . 3,590 Market comparable Discount for lack of marketability 8%
Real Estate Management & Development . . . . . . . 939 Market comparable Discount for lack of marketabilityc 5%
All Other Investmentsd . . . . . . . . . . . . . . . . . . . . . . . . 63Total . . . . . . . . . . . . . . . . . . . . . . . . . . . . . . . . . . . . . . $ 7,306
a Represents the amount / range of the unobservable input used to value an investment.The directional change in the fair value of the Level 3 investments that would result from a significant and reasonable increase/decrease in thecorresponding input would have the opposite effect on the fair value of the investment. Significant impacts, if any, to fair value and/or net assets havebeen indicated.
b Includes common and convertible preferred stocks.c Represents a significant impact to fair value but not net assets.d Includes fair value of securities valued at less than 0.10% of the Fund, developed using various valuation techniques and unobservable inputs. May
also include investments with values derived using prior transactions prices or third party pricing information without adjustment for which suchinputs are also unobservable.
In accordance with the Fund’s valuation policy, the Funds may apply fair value adjustment factors when quoted market prices are deemedto have been affected by significant market events which exceed pre-determined thresholds.
As at June 30, 2014, and December 31, 2013, there were no significant market events to cause the pre-determined tolerances to bebreached; hence there were no transfers between Level 1 and Level 2.
9. Broker Commissions
Commissions paid to brokers for portfolio transactions for the periods indicated are shown below.
A portion of commissions paid may include payment for goods and services that are used to assist with investment or trading decisionssuch as investment research, analysis and reports (“research services”). Where ascertainable, the value of the research services includedin the commissions paid is listed in the table below.
June 30, 2014 June 30, 2013
Commissions Research Costs Commissions Research Costs
(000s) (000s) (000s) (000s)Templeton Asian Growth Fund . . . . . . . . . . . . . . . . . . . . . . . . . . . . . . . . $199 $ 58 $342 $ 57
Templeton Canadian Balanced Fund . . . . . . . . . . . . . . . . . . . . . . . . . . . 13 4 17 5
Templeton Canadian Stock Fund . . . . . . . . . . . . . . . . . . . . . . . . . . . . . . 14 4 24 7
Templeton EAFE Developed Markets Fund . . . . . . . . . . . . . . . . . . . . . . 82 30 119 47
Templeton Emerging Markets Fund . . . . . . . . . . . . . . . . . . . . . . . . . . . . — 70 507 136
Templeton Frontier Markets Fund . . . . . . . . . . . . . . . . . . . . . . . . . . . . . 132 23 230 46
Templeton Global Bond Fund . . . . . . . . . . . . . . . . . . . . . . . . . . . . . . . . — — — —
Templeton Global Bond Fund (Hedged) . . . . . . . . . . . . . . . . . . . . . . . . — — — —
Templeton Global Balanced Fund . . . . . . . . . . . . . . . . . . . . . . . . . . . . . 103 30 43 14
Templeton Global Smaller Companies Fund . . . . . . . . . . . . . . . . . . . . . 658 195 796 246
Franklin Templeton Investments Funds 401
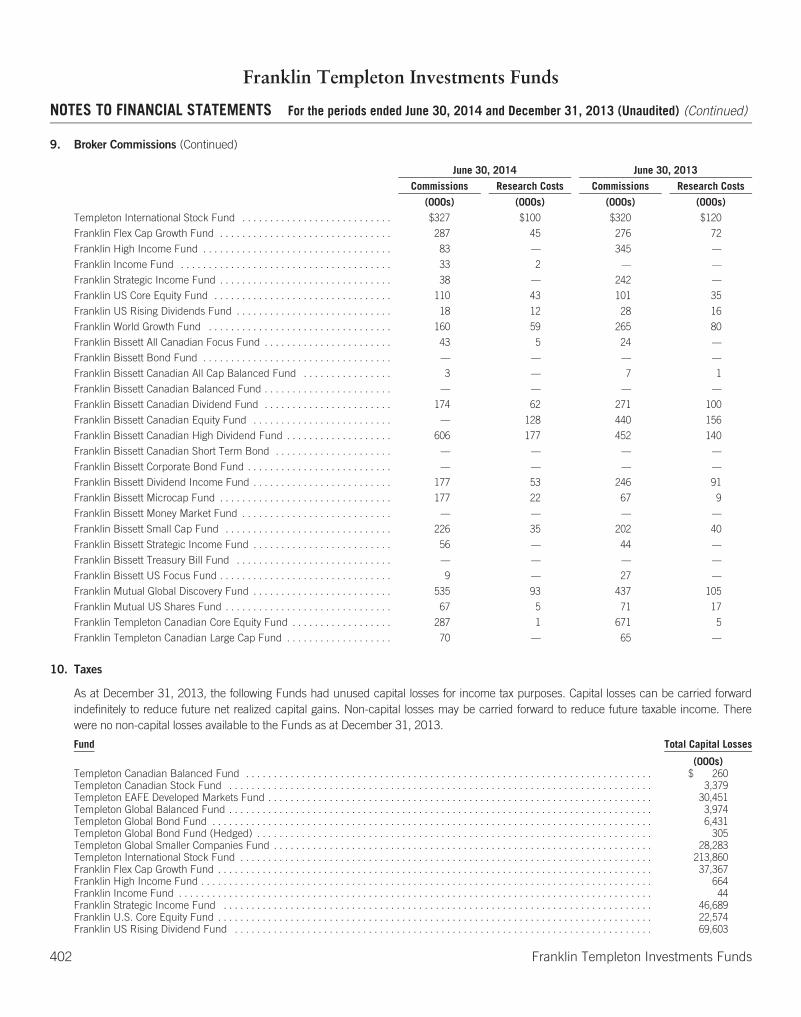
Franklin Templeton Investments Funds
NOTES TO FINANCIAL STATEMENTS For the periods ended June 30, 2014 and December 31, 2013 (Unaudited) (Continued)
9. Broker Commissions (Continued)
June 30, 2014 June 30, 2013
Commissions Research Costs Commissions Research Costs
(000s) (000s) (000s) (000s)Templeton International Stock Fund . . . . . . . . . . . . . . . . . . . . . . . . . . . $327 $100 $320 $120
Franklin Flex Cap Growth Fund . . . . . . . . . . . . . . . . . . . . . . . . . . . . . . . 287 45 276 72
Franklin High Income Fund . . . . . . . . . . . . . . . . . . . . . . . . . . . . . . . . . . 83 — 345 —
Franklin Income Fund . . . . . . . . . . . . . . . . . . . . . . . . . . . . . . . . . . . . . . 33 2 — —
Franklin Strategic Income Fund . . . . . . . . . . . . . . . . . . . . . . . . . . . . . . . 38 — 242 —
Franklin US Core Equity Fund . . . . . . . . . . . . . . . . . . . . . . . . . . . . . . . . 110 43 101 35
Franklin US Rising Dividends Fund . . . . . . . . . . . . . . . . . . . . . . . . . . . . 18 12 28 16
Franklin World Growth Fund . . . . . . . . . . . . . . . . . . . . . . . . . . . . . . . . . 160 59 265 80
Franklin Bissett All Canadian Focus Fund . . . . . . . . . . . . . . . . . . . . . . . 43 5 24 —
Franklin Bissett Bond Fund . . . . . . . . . . . . . . . . . . . . . . . . . . . . . . . . . . — — — —
Franklin Bissett Canadian All Cap Balanced Fund . . . . . . . . . . . . . . . . 3 — 7 1
Franklin Bissett Canadian Balanced Fund . . . . . . . . . . . . . . . . . . . . . . . — — — —
Franklin Bissett Canadian Dividend Fund . . . . . . . . . . . . . . . . . . . . . . . 174 62 271 100
Franklin Bissett Canadian Equity Fund . . . . . . . . . . . . . . . . . . . . . . . . . — 128 440 156
Franklin Bissett Canadian High Dividend Fund . . . . . . . . . . . . . . . . . . . 606 177 452 140
Franklin Bissett Canadian Short Term Bond . . . . . . . . . . . . . . . . . . . . . — — — —
Franklin Bissett Corporate Bond Fund . . . . . . . . . . . . . . . . . . . . . . . . . . — — — —
Franklin Bissett Dividend Income Fund . . . . . . . . . . . . . . . . . . . . . . . . . 177 53 246 91
Franklin Bissett Microcap Fund . . . . . . . . . . . . . . . . . . . . . . . . . . . . . . . 177 22 67 9
Franklin Bissett Money Market Fund . . . . . . . . . . . . . . . . . . . . . . . . . . . — — — —
Franklin Bissett Small Cap Fund . . . . . . . . . . . . . . . . . . . . . . . . . . . . . . 226 35 202 40
Franklin Bissett Strategic Income Fund . . . . . . . . . . . . . . . . . . . . . . . . . 56 — 44 —
Franklin Bissett Treasury Bill Fund . . . . . . . . . . . . . . . . . . . . . . . . . . . . — — — —
Franklin Bissett US Focus Fund . . . . . . . . . . . . . . . . . . . . . . . . . . . . . . . 9 — 27 —
Franklin Mutual Global Discovery Fund . . . . . . . . . . . . . . . . . . . . . . . . . 535 93 437 105
Franklin Mutual US Shares Fund . . . . . . . . . . . . . . . . . . . . . . . . . . . . . . 67 5 71 17
Franklin Templeton Canadian Core Equity Fund . . . . . . . . . . . . . . . . . . 287 1 671 5
Franklin Templeton Canadian Large Cap Fund . . . . . . . . . . . . . . . . . . . 70 — 65 —
10. Taxes
As at December 31, 2013, the following Funds had unused capital losses for income tax purposes. Capital losses can be carried forwardindefinitely to reduce future net realized capital gains. Non-capital losses may be carried forward to reduce future taxable income. Therewere no non-capital losses available to the Funds as at December 31, 2013.
Fund Total Capital Losses
(000s)Templeton Canadian Balanced Fund . . . . . . . . . . . . . . . . . . . . . . . . . . . . . . . . . . . . . . . . . . . . . . . . . . . . . . . . . . . . . . . . . . . . . . . . . $ 260Templeton Canadian Stock Fund . . . . . . . . . . . . . . . . . . . . . . . . . . . . . . . . . . . . . . . . . . . . . . . . . . . . . . . . . . . . . . . . . . . . . . . . . . . . 3,379Templeton EAFE Developed Markets Fund . . . . . . . . . . . . . . . . . . . . . . . . . . . . . . . . . . . . . . . . . . . . . . . . . . . . . . . . . . . . . . . . . . . . . 30,451Templeton Global Balanced Fund . . . . . . . . . . . . . . . . . . . . . . . . . . . . . . . . . . . . . . . . . . . . . . . . . . . . . . . . . . . . . . . . . . . . . . . . . . . . 3,974Templeton Global Bond Fund . . . . . . . . . . . . . . . . . . . . . . . . . . . . . . . . . . . . . . . . . . . . . . . . . . . . . . . . . . . . . . . . . . . . . . . . . . . . . . . 6,431Templeton Global Bond Fund (Hedged) . . . . . . . . . . . . . . . . . . . . . . . . . . . . . . . . . . . . . . . . . . . . . . . . . . . . . . . . . . . . . . . . . . . . . . . 305Templeton Global Smaller Companies Fund . . . . . . . . . . . . . . . . . . . . . . . . . . . . . . . . . . . . . . . . . . . . . . . . . . . . . . . . . . . . . . . . . . . . 28,283Templeton International Stock Fund . . . . . . . . . . . . . . . . . . . . . . . . . . . . . . . . . . . . . . . . . . . . . . . . . . . . . . . . . . . . . . . . . . . . . . . . . . 213,860Franklin Flex Cap Growth Fund . . . . . . . . . . . . . . . . . . . . . . . . . . . . . . . . . . . . . . . . . . . . . . . . . . . . . . . . . . . . . . . . . . . . . . . . . . . . . . 37,367Franklin High Income Fund . . . . . . . . . . . . . . . . . . . . . . . . . . . . . . . . . . . . . . . . . . . . . . . . . . . . . . . . . . . . . . . . . . . . . . . . . . . . . . . . . 664Franklin Income Fund . . . . . . . . . . . . . . . . . . . . . . . . . . . . . . . . . . . . . . . . . . . . . . . . . . . . . . . . . . . . . . . . . . . . . . . . . . . . . . . . . . . . . 44Franklin Strategic Income Fund . . . . . . . . . . . . . . . . . . . . . . . . . . . . . . . . . . . . . . . . . . . . . . . . . . . . . . . . . . . . . . . . . . . . . . . . . . . . . 46,689Franklin U.S. Core Equity Fund . . . . . . . . . . . . . . . . . . . . . . . . . . . . . . . . . . . . . . . . . . . . . . . . . . . . . . . . . . . . . . . . . . . . . . . . . . . . . . 22,574Franklin US Rising Dividend Fund . . . . . . . . . . . . . . . . . . . . . . . . . . . . . . . . . . . . . . . . . . . . . . . . . . . . . . . . . . . . . . . . . . . . . . . . . . . 69,603
402 Franklin Templeton Investments Funds
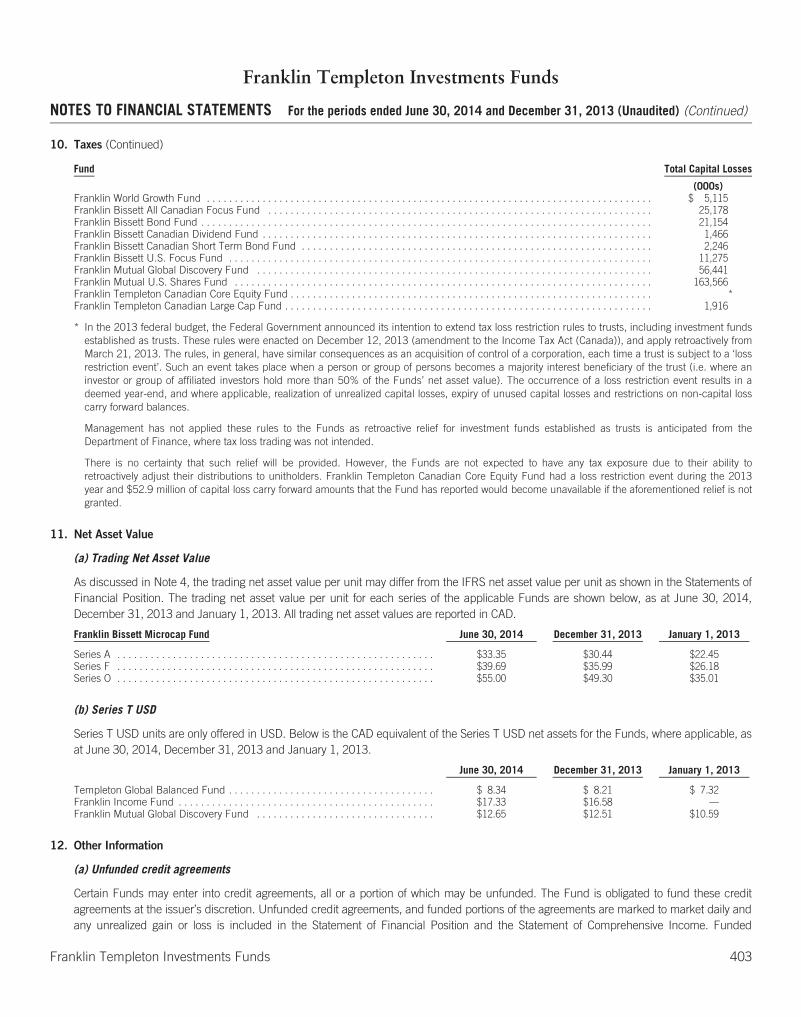
Franklin Templeton Investments Funds
NOTES TO FINANCIAL STATEMENTS For the periods ended June 30, 2014 and December 31, 2013 (Unaudited) (Continued)
10. Taxes (Continued)
Fund Total Capital Losses
(000s)Franklin World Growth Fund . . . . . . . . . . . . . . . . . . . . . . . . . . . . . . . . . . . . . . . . . . . . . . . . . . . . . . . . . . . . . . . . . . . . . . . . . . . . . . . . $ 5,115Franklin Bissett All Canadian Focus Fund . . . . . . . . . . . . . . . . . . . . . . . . . . . . . . . . . . . . . . . . . . . . . . . . . . . . . . . . . . . . . . . . . . . . . 25,178Franklin Bissett Bond Fund . . . . . . . . . . . . . . . . . . . . . . . . . . . . . . . . . . . . . . . . . . . . . . . . . . . . . . . . . . . . . . . . . . . . . . . . . . . . . . . . . 21,154Franklin Bissett Canadian Dividend Fund . . . . . . . . . . . . . . . . . . . . . . . . . . . . . . . . . . . . . . . . . . . . . . . . . . . . . . . . . . . . . . . . . . . . . . 1,466Franklin Bissett Canadian Short Term Bond Fund . . . . . . . . . . . . . . . . . . . . . . . . . . . . . . . . . . . . . . . . . . . . . . . . . . . . . . . . . . . . . . . 2,246Franklin Bissett U.S. Focus Fund . . . . . . . . . . . . . . . . . . . . . . . . . . . . . . . . . . . . . . . . . . . . . . . . . . . . . . . . . . . . . . . . . . . . . . . . . . . . 11,275Franklin Mutual Global Discovery Fund . . . . . . . . . . . . . . . . . . . . . . . . . . . . . . . . . . . . . . . . . . . . . . . . . . . . . . . . . . . . . . . . . . . . . . . 56,441Franklin Mutual U.S. Shares Fund . . . . . . . . . . . . . . . . . . . . . . . . . . . . . . . . . . . . . . . . . . . . . . . . . . . . . . . . . . . . . . . . . . . . . . . . . . . 163,566Franklin Templeton Canadian Core Equity Fund . . . . . . . . . . . . . . . . . . . . . . . . . . . . . . . . . . . . . . . . . . . . . . . . . . . . . . . . . . . . . . . . . *Franklin Templeton Canadian Large Cap Fund . . . . . . . . . . . . . . . . . . . . . . . . . . . . . . . . . . . . . . . . . . . . . . . . . . . . . . . . . . . . . . . . . . 1,916
* In the 2013 federal budget, the Federal Government announced its intention to extend tax loss restriction rules to trusts, including investment fundsestablished as trusts. These rules were enacted on December 12, 2013 (amendment to the Income Tax Act (Canada)), and apply retroactively fromMarch 21, 2013. The rules, in general, have similar consequences as an acquisition of control of a corporation, each time a trust is subject to a ‘lossrestriction event’. Such an event takes place when a person or group of persons becomes a majority interest beneficiary of the trust (i.e. where aninvestor or group of affiliated investors hold more than 50% of the Funds’ net asset value). The occurrence of a loss restriction event results in adeemed year-end, and where applicable, realization of unrealized capital losses, expiry of unused capital losses and restrictions on non-capital losscarry forward balances.
Management has not applied these rules to the Funds as retroactive relief for investment funds established as trusts is anticipated from theDepartment of Finance, where tax loss trading was not intended.
There is no certainty that such relief will be provided. However, the Funds are not expected to have any tax exposure due to their ability toretroactively adjust their distributions to unitholders. Franklin Templeton Canadian Core Equity Fund had a loss restriction event during the 2013year and $52.9 million of capital loss carry forward amounts that the Fund has reported would become unavailable if the aforementioned relief is notgranted.
11. Net Asset Value
(a) Trading Net Asset Value
As discussed in Note 4, the trading net asset value per unit may differ from the IFRS net asset value per unit as shown in the Statements ofFinancial Position. The trading net asset value per unit for each series of the applicable Funds are shown below, as at June 30, 2014,December 31, 2013 and January 1, 2013. All trading net asset values are reported in CAD.
Franklin Bissett Microcap Fund June 30, 2014 December 31, 2013 January 1, 2013
Series A . . . . . . . . . . . . . . . . . . . . . . . . . . . . . . . . . . . . . . . . . . . . . . . . . . . . . . . . . $33.35 $30.44 $22.45Series F . . . . . . . . . . . . . . . . . . . . . . . . . . . . . . . . . . . . . . . . . . . . . . . . . . . . . . . . . $39.69 $35.99 $26.18Series O . . . . . . . . . . . . . . . . . . . . . . . . . . . . . . . . . . . . . . . . . . . . . . . . . . . . . . . . . $55.00 $49.30 $35.01
(b) Series T USD
Series T USD units are only offered in USD. Below is the CAD equivalent of the Series T USD net assets for the Funds, where applicable, asat June 30, 2014, December 31, 2013 and January 1, 2013.
June 30, 2014 December 31, 2013 January 1, 2013
Templeton Global Balanced Fund . . . . . . . . . . . . . . . . . . . . . . . . . . . . . . . . . . . . . $ 8.34 $ 8.21 $ 7.32Franklin Income Fund . . . . . . . . . . . . . . . . . . . . . . . . . . . . . . . . . . . . . . . . . . . . . . $17.33 $16.58 —Franklin Mutual Global Discovery Fund . . . . . . . . . . . . . . . . . . . . . . . . . . . . . . . . $12.65 $12.51 $10.59
12. Other Information
(a) Unfunded credit agreements
Certain Funds may enter into credit agreements, all or a portion of which may be unfunded. The Fund is obligated to fund these creditagreements at the issuer’s discretion. Unfunded credit agreements, and funded portions of the agreements are marked to market daily andany unrealized gain or loss is included in the Statement of Financial Position and the Statement of Comprehensive Income. Funded
Franklin Templeton Investments Funds 403
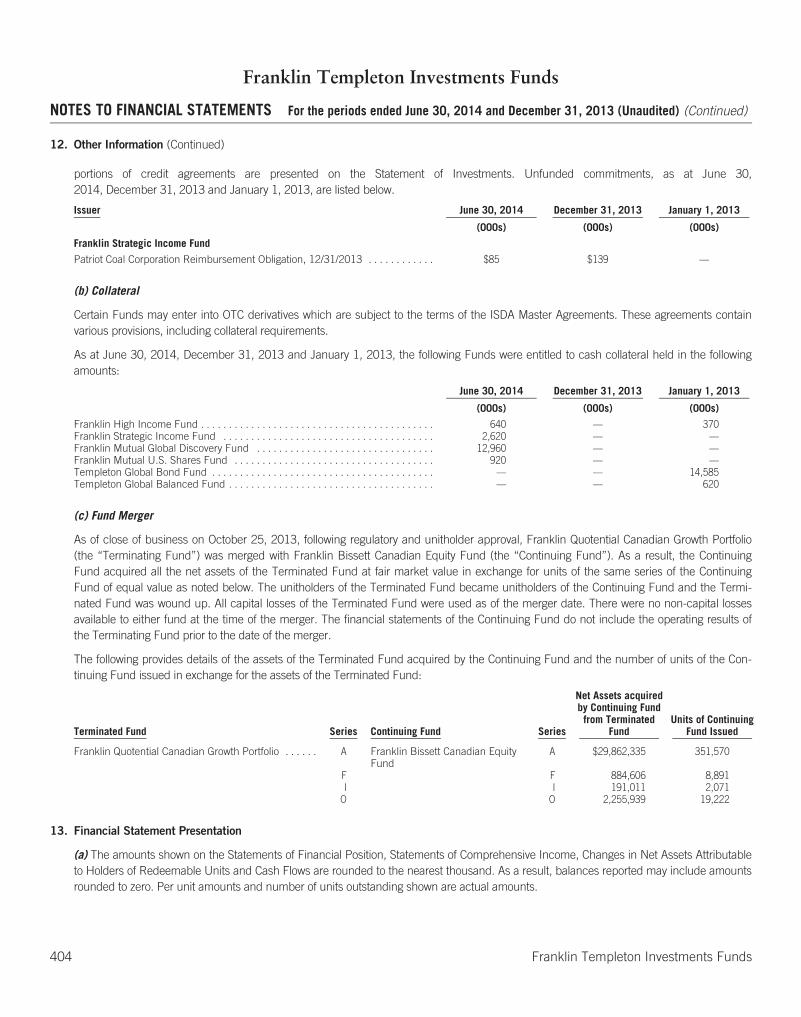
Franklin Templeton Investments Funds
NOTES TO FINANCIAL STATEMENTS For the periods ended June 30, 2014 and December 31, 2013 (Unaudited) (Continued)
12. Other Information (Continued)
portions of credit agreements are presented on the Statement of Investments. Unfunded commitments, as at June 30,2014, December 31, 2013 and January 1, 2013, are listed below.
Issuer June 30, 2014 December 31, 2013 January 1, 2013
(000s) (000s) (000s)
Franklin Strategic Income Fund
Patriot Coal Corporation Reimbursement Obligation, 12/31/2013 . . . . . . . . . . . . $85 $139 —
(b) Collateral
Certain Funds may enter into OTC derivatives which are subject to the terms of the ISDA Master Agreements. These agreements containvarious provisions, including collateral requirements.
As at June 30, 2014, December 31, 2013 and January 1, 2013, the following Funds were entitled to cash collateral held in the followingamounts:
June 30, 2014 December 31, 2013 January 1, 2013
(000s) (000s) (000s)
Franklin High Income Fund . . . . . . . . . . . . . . . . . . . . . . . . . . . . . . . . . . . . . . . . . . 640 — 370Franklin Strategic Income Fund . . . . . . . . . . . . . . . . . . . . . . . . . . . . . . . . . . . . . . 2,620 — —Franklin Mutual Global Discovery Fund . . . . . . . . . . . . . . . . . . . . . . . . . . . . . . . . 12,960 — —Franklin Mutual U.S. Shares Fund . . . . . . . . . . . . . . . . . . . . . . . . . . . . . . . . . . . . 920 — —Templeton Global Bond Fund . . . . . . . . . . . . . . . . . . . . . . . . . . . . . . . . . . . . . . . . — — 14,585Templeton Global Balanced Fund . . . . . . . . . . . . . . . . . . . . . . . . . . . . . . . . . . . . . — — 620
(c) Fund Merger
As of close of business on October 25, 2013, following regulatory and unitholder approval, Franklin Quotential Canadian Growth Portfolio(the “Terminating Fund”) was merged with Franklin Bissett Canadian Equity Fund (the “Continuing Fund”). As a result, the ContinuingFund acquired all the net assets of the Terminated Fund at fair market value in exchange for units of the same series of the ContinuingFund of equal value as noted below. The unitholders of the Terminated Fund became unitholders of the Continuing Fund and the Termi-nated Fund was wound up. All capital losses of the Terminated Fund were used as of the merger date. There were no non-capital lossesavailable to either fund at the time of the merger. The financial statements of the Continuing Fund do not include the operating results ofthe Terminating Fund prior to the date of the merger.
The following provides details of the assets of the Terminated Fund acquired by the Continuing Fund and the number of units of the Con-tinuing Fund issued in exchange for the assets of the Terminated Fund:
Terminated Fund Series Continuing Fund Series
Net Assets acquiredby Continuing Fundfrom Terminated
FundUnits of Continuing
Fund Issued
Franklin Quotential Canadian Growth Portfolio . . . . . . A Franklin Bissett Canadian EquityFund
A $29,862,335 351,570
F F 884,606 8,891I I 191,011 2,071
O O 2,255,939 19,222
13. Financial Statement Presentation
(a) The amounts shown on the Statements of Financial Position, Statements of Comprehensive Income, Changes in Net Assets Attributableto Holders of Redeemable Units and Cash Flows are rounded to the nearest thousand. As a result, balances reported may include amountsrounded to zero. Per unit amounts and number of units outstanding shown are actual amounts.
404 Franklin Templeton Investments Funds
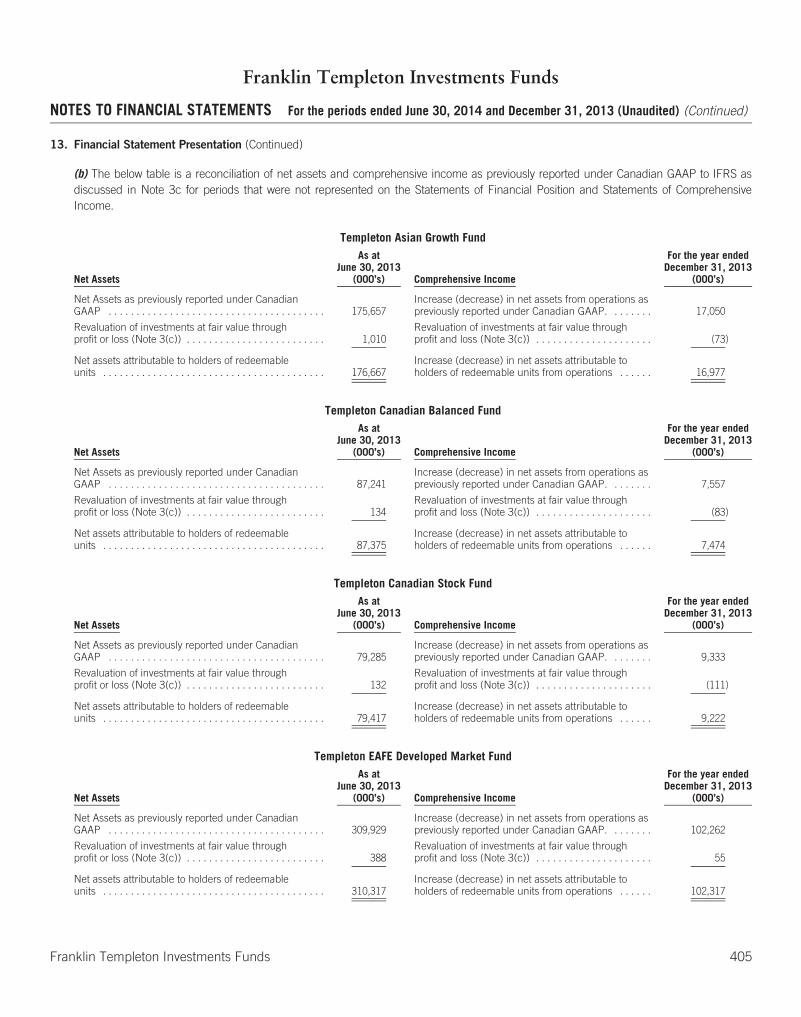
Franklin Templeton Investments Funds
NOTES TO FINANCIAL STATEMENTS For the periods ended June 30, 2014 and December 31, 2013 (Unaudited) (Continued)
13. Financial Statement Presentation (Continued)
(b) The below table is a reconciliation of net assets and comprehensive income as previously reported under Canadian GAAP to IFRS asdiscussed in Note 3c for periods that were not represented on the Statements of Financial Position and Statements of ComprehensiveIncome.
Templeton Asian Growth Fund
Net Assets
As atJune 30, 2013
(000’s) Comprehensive Income
For the year endedDecember 31, 2013
(000’s)
Net Assets as previously reported under CanadianGAAP . . . . . . . . . . . . . . . . . . . . . . . . . . . . . . . . . . . . . . . 175,657
Increase (decrease) in net assets from operations aspreviously reported under Canadian GAAP. . . . . . . . 17,050
Revaluation of investments at fair value throughprofit or loss (Note 3(c)) . . . . . . . . . . . . . . . . . . . . . . . . . 1,010
Revaluation of investments at fair value throughprofit and loss (Note 3(c)) . . . . . . . . . . . . . . . . . . . . . (73)
Net assets attributable to holders of redeemableunits . . . . . . . . . . . . . . . . . . . . . . . . . . . . . . . . . . . . . . . . 176,667
Increase (decrease) in net assets attributable toholders of redeemable units from operations . . . . . . 16,977
Templeton Canadian Balanced Fund
Net Assets
As atJune 30, 2013
(000’s) Comprehensive Income
For the year endedDecember 31, 2013
(000’s)
Net Assets as previously reported under CanadianGAAP . . . . . . . . . . . . . . . . . . . . . . . . . . . . . . . . . . . . . . . 87,241
Increase (decrease) in net assets from operations aspreviously reported under Canadian GAAP. . . . . . . . 7,557
Revaluation of investments at fair value throughprofit or loss (Note 3(c)) . . . . . . . . . . . . . . . . . . . . . . . . . 134
Revaluation of investments at fair value throughprofit and loss (Note 3(c)) . . . . . . . . . . . . . . . . . . . . . (83)
Net assets attributable to holders of redeemableunits . . . . . . . . . . . . . . . . . . . . . . . . . . . . . . . . . . . . . . . . 87,375
Increase (decrease) in net assets attributable toholders of redeemable units from operations . . . . . . 7,474
Templeton Canadian Stock Fund
Net Assets
As atJune 30, 2013
(000’s) Comprehensive Income
For the year endedDecember 31, 2013
(000’s)
Net Assets as previously reported under CanadianGAAP . . . . . . . . . . . . . . . . . . . . . . . . . . . . . . . . . . . . . . . 79,285
Increase (decrease) in net assets from operations aspreviously reported under Canadian GAAP. . . . . . . . 9,333
Revaluation of investments at fair value throughprofit or loss (Note 3(c)) . . . . . . . . . . . . . . . . . . . . . . . . . 132
Revaluation of investments at fair value throughprofit and loss (Note 3(c)) . . . . . . . . . . . . . . . . . . . . . (111)
Net assets attributable to holders of redeemableunits . . . . . . . . . . . . . . . . . . . . . . . . . . . . . . . . . . . . . . . . 79,417
Increase (decrease) in net assets attributable toholders of redeemable units from operations . . . . . . 9,222
Templeton EAFE Developed Market Fund
Net Assets
As atJune 30, 2013
(000’s) Comprehensive Income
For the year endedDecember 31, 2013
(000’s)
Net Assets as previously reported under CanadianGAAP . . . . . . . . . . . . . . . . . . . . . . . . . . . . . . . . . . . . . . . 309,929
Increase (decrease) in net assets from operations aspreviously reported under Canadian GAAP. . . . . . . . 102,262
Revaluation of investments at fair value throughprofit or loss (Note 3(c)) . . . . . . . . . . . . . . . . . . . . . . . . . 388
Revaluation of investments at fair value throughprofit and loss (Note 3(c)) . . . . . . . . . . . . . . . . . . . . . 55
Net assets attributable to holders of redeemableunits . . . . . . . . . . . . . . . . . . . . . . . . . . . . . . . . . . . . . . . . 310,317
Increase (decrease) in net assets attributable toholders of redeemable units from operations . . . . . . 102,317
Franklin Templeton Investments Funds 405
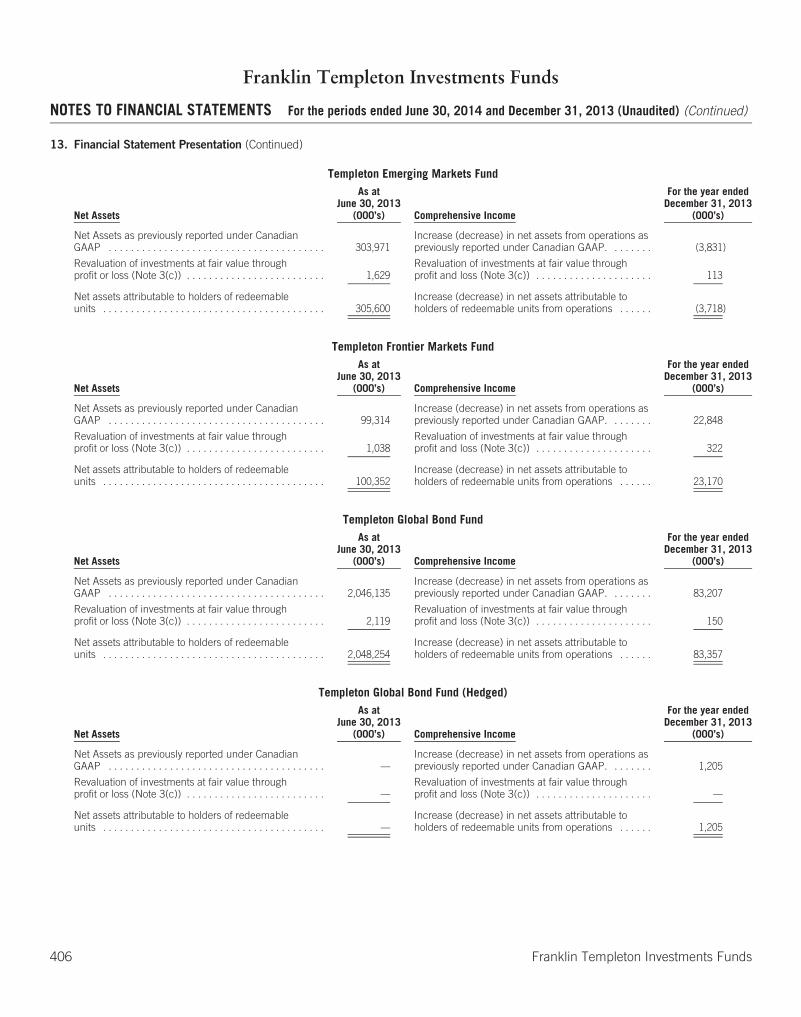
Franklin Templeton Investments Funds
NOTES TO FINANCIAL STATEMENTS For the periods ended June 30, 2014 and December 31, 2013 (Unaudited) (Continued)
13. Financial Statement Presentation (Continued)
Templeton Emerging Markets Fund
Net Assets
As atJune 30, 2013
(000’s) Comprehensive Income
For the year endedDecember 31, 2013
(000’s)
Net Assets as previously reported under CanadianGAAP . . . . . . . . . . . . . . . . . . . . . . . . . . . . . . . . . . . . . . . 303,971
Increase (decrease) in net assets from operations aspreviously reported under Canadian GAAP. . . . . . . . (3,831)
Revaluation of investments at fair value throughprofit or loss (Note 3(c)) . . . . . . . . . . . . . . . . . . . . . . . . . 1,629
Revaluation of investments at fair value throughprofit and loss (Note 3(c)) . . . . . . . . . . . . . . . . . . . . . 113
Net assets attributable to holders of redeemableunits . . . . . . . . . . . . . . . . . . . . . . . . . . . . . . . . . . . . . . . . 305,600
Increase (decrease) in net assets attributable toholders of redeemable units from operations . . . . . . (3,718)
Templeton Frontier Markets Fund
Net Assets
As atJune 30, 2013
(000’s) Comprehensive Income
For the year endedDecember 31, 2013
(000’s)
Net Assets as previously reported under CanadianGAAP . . . . . . . . . . . . . . . . . . . . . . . . . . . . . . . . . . . . . . . 99,314
Increase (decrease) in net assets from operations aspreviously reported under Canadian GAAP. . . . . . . . 22,848
Revaluation of investments at fair value throughprofit or loss (Note 3(c)) . . . . . . . . . . . . . . . . . . . . . . . . . 1,038
Revaluation of investments at fair value throughprofit and loss (Note 3(c)) . . . . . . . . . . . . . . . . . . . . . 322
Net assets attributable to holders of redeemableunits . . . . . . . . . . . . . . . . . . . . . . . . . . . . . . . . . . . . . . . . 100,352
Increase (decrease) in net assets attributable toholders of redeemable units from operations . . . . . . 23,170
Templeton Global Bond Fund
Net Assets
As atJune 30, 2013
(000’s) Comprehensive Income
For the year endedDecember 31, 2013
(000’s)
Net Assets as previously reported under CanadianGAAP . . . . . . . . . . . . . . . . . . . . . . . . . . . . . . . . . . . . . . . 2,046,135
Increase (decrease) in net assets from operations aspreviously reported under Canadian GAAP. . . . . . . . 83,207
Revaluation of investments at fair value throughprofit or loss (Note 3(c)) . . . . . . . . . . . . . . . . . . . . . . . . . 2,119
Revaluation of investments at fair value throughprofit and loss (Note 3(c)) . . . . . . . . . . . . . . . . . . . . . 150
Net assets attributable to holders of redeemableunits . . . . . . . . . . . . . . . . . . . . . . . . . . . . . . . . . . . . . . . . 2,048,254
Increase (decrease) in net assets attributable toholders of redeemable units from operations . . . . . . 83,357
Templeton Global Bond Fund (Hedged)
Net Assets
As atJune 30, 2013
(000’s) Comprehensive Income
For the year endedDecember 31, 2013
(000’s)
Net Assets as previously reported under CanadianGAAP . . . . . . . . . . . . . . . . . . . . . . . . . . . . . . . . . . . . . . . —
Increase (decrease) in net assets from operations aspreviously reported under Canadian GAAP. . . . . . . . 1,205
Revaluation of investments at fair value throughprofit or loss (Note 3(c)) . . . . . . . . . . . . . . . . . . . . . . . . . —
Revaluation of investments at fair value throughprofit and loss (Note 3(c)) . . . . . . . . . . . . . . . . . . . . . —
Net assets attributable to holders of redeemableunits . . . . . . . . . . . . . . . . . . . . . . . . . . . . . . . . . . . . . . . . —
Increase (decrease) in net assets attributable toholders of redeemable units from operations . . . . . . 1,205
406 Franklin Templeton Investments Funds

Franklin Templeton Investments Funds
NOTES TO FINANCIAL STATEMENTS For the periods ended June 30, 2014 and December 31, 2013 (Unaudited) (Continued)
13. Financial Statement Presentation (Continued)
Templeton Global Balanced Fund
Net Assets
As atJune 30, 2013
(000’s) Comprehensive Income
For the year endedDecember 31, 2013
(000’s)
Net Assets as previously reported under CanadianGAAP . . . . . . . . . . . . . . . . . . . . . . . . . . . . . . . . . . . . . . . 97,056
Increase (decrease) in net assets from operations aspreviously reported under Canadian GAAP. . . . . . . . 20,187
Revaluation of investments at fair value throughprofit or loss (Note 3(c)) . . . . . . . . . . . . . . . . . . . . . . . . . 491
Revaluation of investments at fair value throughprofit and loss (Note 3(c)) . . . . . . . . . . . . . . . . . . . . . 211
Net assets attributable to holders of redeemableunits . . . . . . . . . . . . . . . . . . . . . . . . . . . . . . . . . . . . . . . . 97,547
Increase (decrease) in net assets attributable toholders of redeemable units from operations . . . . . . 20,398
Templeton Global Smaller Companies Fund
Net Assets
As atJune 30, 2013
(000’s) Comprehensive Income
For the year endedDecember 31, 2013
(000’s)
Net Assets as previously reported under CanadianGAAP . . . . . . . . . . . . . . . . . . . . . . . . . . . . . . . . . . . . . . . 744,951
Increase (decrease) in net assets from operations aspreviously reported under Canadian GAAP. . . . . . . . 228,082
Revaluation of investments at fair value throughprofit or loss (Note 3(c)) . . . . . . . . . . . . . . . . . . . . . . . . . 2,619
Revaluation of investments at fair value throughprofit and loss (Note 3(c)) . . . . . . . . . . . . . . . . . . . . . 722
Net assets attributable to holders of redeemableunits . . . . . . . . . . . . . . . . . . . . . . . . . . . . . . . . . . . . . . . . 747,570
Increase (decrease) in net assets attributable toholders of redeemable units from operations . . . . . . 228,804
Templeton International Stock Fund
Net Assets
As atJune 30, 2013
(000’s) Comprehensive Income
For the year endedDecember 31, 2013
(000’s)
Net Assets as previously reported under CanadianGAAP . . . . . . . . . . . . . . . . . . . . . . . . . . . . . . . . . . . . . . . 733,694
Increase (decrease) in net assets from operations aspreviously reported under Canadian GAAP. . . . . . . . 179,968
Revaluation of investments at fair value throughprofit or loss (Note 3(c)) . . . . . . . . . . . . . . . . . . . . . . . . . 1,233
Revaluation of investments at fair value throughprofit and loss (Note 3(c)) . . . . . . . . . . . . . . . . . . . . . 76
Net assets attributable to holders of redeemableunits . . . . . . . . . . . . . . . . . . . . . . . . . . . . . . . . . . . . . . . . 734,927
Increase (decrease) in net assets attributable toholders of redeemable units from operations . . . . . . 180,044
Franklin Flex Cap Growth Fund
Net Assets
As atJune 30, 2013
(000’s) Comprehensive Income
For the year endedDecember 31, 2013
(000’s)
Net Assets as previously reported under CanadianGAAP . . . . . . . . . . . . . . . . . . . . . . . . . . . . . . . . . . . . . . . 390,047
Increase (decrease) in net assets from operations aspreviously reported under Canadian GAAP. . . . . . . . 137,010
Revaluation of investments at fair value throughprofit or loss (Note 3(c)) . . . . . . . . . . . . . . . . . . . . . . . . . 180
Revaluation of investments at fair value throughprofit and loss (Note 3(c)) . . . . . . . . . . . . . . . . . . . . . 82
Net assets attributable to holders of redeemableunits . . . . . . . . . . . . . . . . . . . . . . . . . . . . . . . . . . . . . . . . 390,227
Increase (decrease) in net assets attributable toholders of redeemable units from operations . . . . . . 137,092
Franklin Templeton Investments Funds 407
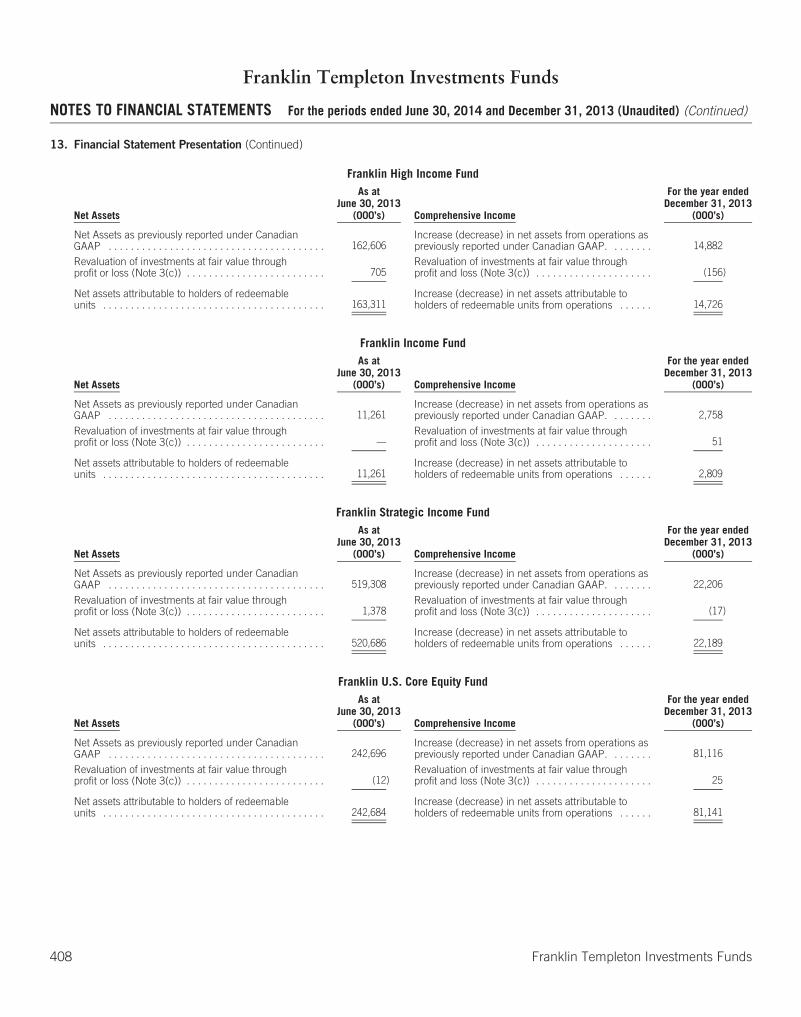
Franklin Templeton Investments Funds
NOTES TO FINANCIAL STATEMENTS For the periods ended June 30, 2014 and December 31, 2013 (Unaudited) (Continued)
13. Financial Statement Presentation (Continued)
Franklin High Income Fund
Net Assets
As atJune 30, 2013
(000’s) Comprehensive Income
For the year endedDecember 31, 2013
(000’s)
Net Assets as previously reported under CanadianGAAP . . . . . . . . . . . . . . . . . . . . . . . . . . . . . . . . . . . . . . . 162,606
Increase (decrease) in net assets from operations aspreviously reported under Canadian GAAP. . . . . . . . 14,882
Revaluation of investments at fair value throughprofit or loss (Note 3(c)) . . . . . . . . . . . . . . . . . . . . . . . . . 705
Revaluation of investments at fair value throughprofit and loss (Note 3(c)) . . . . . . . . . . . . . . . . . . . . . (156)
Net assets attributable to holders of redeemableunits . . . . . . . . . . . . . . . . . . . . . . . . . . . . . . . . . . . . . . . . 163,311
Increase (decrease) in net assets attributable toholders of redeemable units from operations . . . . . . 14,726
Franklin Income Fund
Net Assets
As atJune 30, 2013
(000’s) Comprehensive Income
For the year endedDecember 31, 2013
(000’s)
Net Assets as previously reported under CanadianGAAP . . . . . . . . . . . . . . . . . . . . . . . . . . . . . . . . . . . . . . . 11,261
Increase (decrease) in net assets from operations aspreviously reported under Canadian GAAP. . . . . . . . 2,758
Revaluation of investments at fair value throughprofit or loss (Note 3(c)) . . . . . . . . . . . . . . . . . . . . . . . . . —
Revaluation of investments at fair value throughprofit and loss (Note 3(c)) . . . . . . . . . . . . . . . . . . . . . 51
Net assets attributable to holders of redeemableunits . . . . . . . . . . . . . . . . . . . . . . . . . . . . . . . . . . . . . . . . 11,261
Increase (decrease) in net assets attributable toholders of redeemable units from operations . . . . . . 2,809
Franklin Strategic Income Fund
Net Assets
As atJune 30, 2013
(000’s) Comprehensive Income
For the year endedDecember 31, 2013
(000’s)
Net Assets as previously reported under CanadianGAAP . . . . . . . . . . . . . . . . . . . . . . . . . . . . . . . . . . . . . . . 519,308
Increase (decrease) in net assets from operations aspreviously reported under Canadian GAAP. . . . . . . . 22,206
Revaluation of investments at fair value throughprofit or loss (Note 3(c)) . . . . . . . . . . . . . . . . . . . . . . . . . 1,378
Revaluation of investments at fair value throughprofit and loss (Note 3(c)) . . . . . . . . . . . . . . . . . . . . . (17)
Net assets attributable to holders of redeemableunits . . . . . . . . . . . . . . . . . . . . . . . . . . . . . . . . . . . . . . . . 520,686
Increase (decrease) in net assets attributable toholders of redeemable units from operations . . . . . . 22,189
Franklin U.S. Core Equity Fund
Net Assets
As atJune 30, 2013
(000’s) Comprehensive Income
For the year endedDecember 31, 2013
(000’s)
Net Assets as previously reported under CanadianGAAP . . . . . . . . . . . . . . . . . . . . . . . . . . . . . . . . . . . . . . . 242,696
Increase (decrease) in net assets from operations aspreviously reported under Canadian GAAP. . . . . . . . 81,116
Revaluation of investments at fair value throughprofit or loss (Note 3(c)) . . . . . . . . . . . . . . . . . . . . . . . . . (12)
Revaluation of investments at fair value throughprofit and loss (Note 3(c)) . . . . . . . . . . . . . . . . . . . . . 25
Net assets attributable to holders of redeemableunits . . . . . . . . . . . . . . . . . . . . . . . . . . . . . . . . . . . . . . . . 242,684
Increase (decrease) in net assets attributable toholders of redeemable units from operations . . . . . . 81,141
408 Franklin Templeton Investments Funds
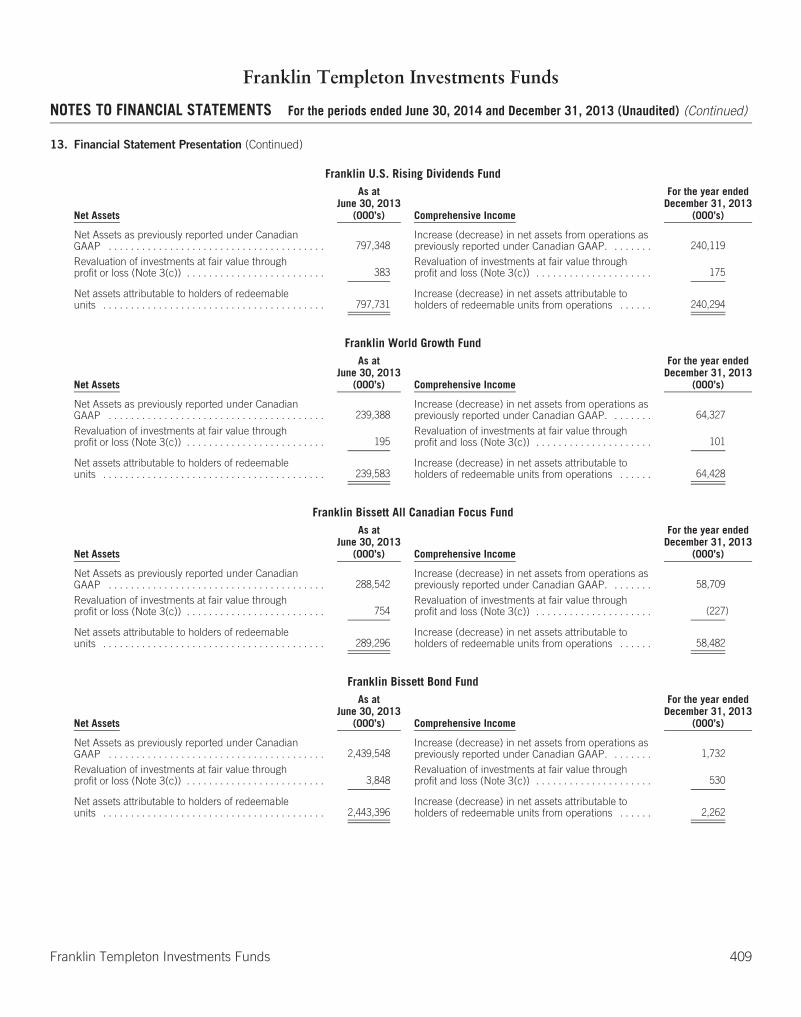
Franklin Templeton Investments Funds
NOTES TO FINANCIAL STATEMENTS For the periods ended June 30, 2014 and December 31, 2013 (Unaudited) (Continued)
13. Financial Statement Presentation (Continued)
Franklin U.S. Rising Dividends Fund
Net Assets
As atJune 30, 2013
(000’s) Comprehensive Income
For the year endedDecember 31, 2013
(000’s)
Net Assets as previously reported under CanadianGAAP . . . . . . . . . . . . . . . . . . . . . . . . . . . . . . . . . . . . . . . 797,348
Increase (decrease) in net assets from operations aspreviously reported under Canadian GAAP. . . . . . . . 240,119
Revaluation of investments at fair value throughprofit or loss (Note 3(c)) . . . . . . . . . . . . . . . . . . . . . . . . . 383
Revaluation of investments at fair value throughprofit and loss (Note 3(c)) . . . . . . . . . . . . . . . . . . . . . 175
Net assets attributable to holders of redeemableunits . . . . . . . . . . . . . . . . . . . . . . . . . . . . . . . . . . . . . . . . 797,731
Increase (decrease) in net assets attributable toholders of redeemable units from operations . . . . . . 240,294
Franklin World Growth Fund
Net Assets
As atJune 30, 2013
(000’s) Comprehensive Income
For the year endedDecember 31, 2013
(000’s)
Net Assets as previously reported under CanadianGAAP . . . . . . . . . . . . . . . . . . . . . . . . . . . . . . . . . . . . . . . 239,388
Increase (decrease) in net assets from operations aspreviously reported under Canadian GAAP. . . . . . . . 64,327
Revaluation of investments at fair value throughprofit or loss (Note 3(c)) . . . . . . . . . . . . . . . . . . . . . . . . . 195
Revaluation of investments at fair value throughprofit and loss (Note 3(c)) . . . . . . . . . . . . . . . . . . . . . 101
Net assets attributable to holders of redeemableunits . . . . . . . . . . . . . . . . . . . . . . . . . . . . . . . . . . . . . . . . 239,583
Increase (decrease) in net assets attributable toholders of redeemable units from operations . . . . . . 64,428
Franklin Bissett All Canadian Focus Fund
Net Assets
As atJune 30, 2013
(000’s) Comprehensive Income
For the year endedDecember 31, 2013
(000’s)
Net Assets as previously reported under CanadianGAAP . . . . . . . . . . . . . . . . . . . . . . . . . . . . . . . . . . . . . . . 288,542
Increase (decrease) in net assets from operations aspreviously reported under Canadian GAAP. . . . . . . . 58,709
Revaluation of investments at fair value throughprofit or loss (Note 3(c)) . . . . . . . . . . . . . . . . . . . . . . . . . 754
Revaluation of investments at fair value throughprofit and loss (Note 3(c)) . . . . . . . . . . . . . . . . . . . . . (227)
Net assets attributable to holders of redeemableunits . . . . . . . . . . . . . . . . . . . . . . . . . . . . . . . . . . . . . . . . 289,296
Increase (decrease) in net assets attributable toholders of redeemable units from operations . . . . . . 58,482
Franklin Bissett Bond Fund
Net Assets
As atJune 30, 2013
(000’s) Comprehensive Income
For the year endedDecember 31, 2013
(000’s)
Net Assets as previously reported under CanadianGAAP . . . . . . . . . . . . . . . . . . . . . . . . . . . . . . . . . . . . . . . 2,439,548
Increase (decrease) in net assets from operations aspreviously reported under Canadian GAAP. . . . . . . . 1,732
Revaluation of investments at fair value throughprofit or loss (Note 3(c)) . . . . . . . . . . . . . . . . . . . . . . . . . 3,848
Revaluation of investments at fair value throughprofit and loss (Note 3(c)) . . . . . . . . . . . . . . . . . . . . . 530
Net assets attributable to holders of redeemableunits . . . . . . . . . . . . . . . . . . . . . . . . . . . . . . . . . . . . . . . . 2,443,396
Increase (decrease) in net assets attributable toholders of redeemable units from operations . . . . . . 2,262
Franklin Templeton Investments Funds 409

Franklin Templeton Investments Funds
NOTES TO FINANCIAL STATEMENTS For the periods ended June 30, 2014 and December 31, 2013 (Unaudited) (Continued)
13. Financial Statement Presentation (Continued)
Franklin Bissett Canadian All Cap Balanced Fund
Net Assets
As atJune 30, 2013
(000’s) Comprehensive Income
For the year endedDecember 31, 2013
(000’s)
Net Assets as previously reported under CanadianGAAP . . . . . . . . . . . . . . . . . . . . . . . . . . . . . . . . . . . . . . . 8,585
Increase (decrease) in net assets from operations aspreviously reported under Canadian GAAP. . . . . . . . 1,587
Revaluation of investments at fair value throughprofit or loss (Note 3(c)) . . . . . . . . . . . . . . . . . . . . . . . . . 26
Revaluation of investments at fair value throughprofit and loss (Note 3(c)) . . . . . . . . . . . . . . . . . . . . . 22
Net assets attributable to holders of redeemableunits . . . . . . . . . . . . . . . . . . . . . . . . . . . . . . . . . . . . . . . . 8,611
Increase (decrease) in net assets attributable toholders of redeemable units from operations . . . . . . 1,609
Franklin Bissett Canadian Balanced Fund
Net Assets
As atJune 30, 2013
(000’s) Comprehensive Income
For the year endedDecember 31, 2013
(000’s)
Net Assets as previously reported under CanadianGAAP . . . . . . . . . . . . . . . . . . . . . . . . . . . . . . . . . . . . . . . 783,363
Increase (decrease) in net assets from operations aspreviously reported under Canadian GAAP. . . . . . . . 132,624
Revaluation of investments at fair value throughprofit or loss (Note 3(c)) . . . . . . . . . . . . . . . . . . . . . . . . . —
Revaluation of investments at fair value throughprofit and loss (Note 3(c)) . . . . . . . . . . . . . . . . . . . . . —
Net assets attributable to holders of redeemableunits . . . . . . . . . . . . . . . . . . . . . . . . . . . . . . . . . . . . . . . . 783,363
Increase (decrease) in net assets attributable toholders of redeemable units from operations . . . . . . 132,624
Franklin Bissett Canadian Dividend Fund
Net Assets
As atJune 30, 2013
(000’s) Comprehensive Income
For the year endedDecember 31, 2013
(000’s)
Net Assets as previously reported under CanadianGAAP . . . . . . . . . . . . . . . . . . . . . . . . . . . . . . . . . . . . . . . 696,149
Increase (decrease) in net assets from operations aspreviously reported under Canadian GAAP. . . . . . . . 100,947
Revaluation of investments at fair value throughprofit or loss (Note 3(c)) . . . . . . . . . . . . . . . . . . . . . . . . . 1,718
Revaluation of investments at fair value throughprofit and loss (Note 3(c)) . . . . . . . . . . . . . . . . . . . . . (664)
Net assets attributable to holders of redeemableunits . . . . . . . . . . . . . . . . . . . . . . . . . . . . . . . . . . . . . . . . 697,867
Increase (decrease) in net assets attributable toholders of redeemable units from operations . . . . . . 100,283
Franklin Bissett Canadian Equity Fund
Net Assets
As atJune 30, 2013
(000’s) Comprehensive Income
For the year endedDecember 31, 2013
(000’s)
Net Assets as previously reported under CanadianGAAP . . . . . . . . . . . . . . . . . . . . . . . . . . . . . . . . . . . . . . . 1,934,047
Increase (decrease) in net assets from operations aspreviously reported under Canadian GAAP. . . . . . . . 415,918
Revaluation of investments at fair value throughprofit or loss (Note 3(c)) . . . . . . . . . . . . . . . . . . . . . . . . . 4,083
Revaluation of investments at fair value throughprofit and loss (Note 3(c)) . . . . . . . . . . . . . . . . . . . . . (361)
Net assets attributable to holders of redeemableunits . . . . . . . . . . . . . . . . . . . . . . . . . . . . . . . . . . . . . . . . 1,938,130
Increase (decrease) in net assets attributable toholders of redeemable units from operations . . . . . . 415,557
410 Franklin Templeton Investments Funds

Franklin Templeton Investments Funds
NOTES TO FINANCIAL STATEMENTS For the periods ended June 30, 2014 and December 31, 2013 (Unaudited) (Continued)
13. Financial Statement Presentation (Continued)
Franklin Bissett Canadian High Dividend Fund
Net Assets
As atJune 30, 2013
(000’s) Comprehensive Income
For the year endedDecember 31, 2013
(000’s)
Net Assets as previously reported under CanadianGAAP . . . . . . . . . . . . . . . . . . . . . . . . . . . . . . . . . . . . . . . 771,946
Increase (decrease) in net assets from operations aspreviously reported under Canadian GAAP. . . . . . . . 132,230
Revaluation of investments at fair value throughprofit or loss (Note 3(c)) . . . . . . . . . . . . . . . . . . . . . . . . . 2,350
Revaluation of investments at fair value throughprofit and loss (Note 3(c)) . . . . . . . . . . . . . . . . . . . . . (262)
Net assets attributable to holders of redeemableunits . . . . . . . . . . . . . . . . . . . . . . . . . . . . . . . . . . . . . . . . 774,296
Increase (decrease) in net assets attributable toholders of redeemable units from operations . . . . . . 131,968
Franklin Bissett Canadian Short Term Bond Fund
Net Assets
As atJune 30, 2013
(000’s) Comprehensive Income
For the year endedDecember 31, 2013
(000’s)
Net Assets as previously reported under CanadianGAAP . . . . . . . . . . . . . . . . . . . . . . . . . . . . . . . . . . . . . . . 609,916
Increase (decrease) in net assets from operations aspreviously reported under Canadian GAAP. . . . . . . . 11,154
Revaluation of investments at fair value throughprofit or loss (Note 3(c)) . . . . . . . . . . . . . . . . . . . . . . . . . 574
Revaluation of investments at fair value throughprofit and loss (Note 3(c)) . . . . . . . . . . . . . . . . . . . . . 185
Net assets attributable to holders of redeemableunits . . . . . . . . . . . . . . . . . . . . . . . . . . . . . . . . . . . . . . . . 610,490
Increase (decrease) in net assets attributable toholders of redeemable units from operations . . . . . . 11,339
Franklin Bissett Corporate Bond Fund
Net Assets
As atJune 30, 2013
(000’s) Comprehensive Income
For the year endedDecember 31, 2013
(000’s)
Net Assets as previously reported under CanadianGAAP . . . . . . . . . . . . . . . . . . . . . . . . . . . . . . . . . . . . . . . 148,813
Increase (decrease) in net assets from operations aspreviously reported under Canadian GAAP. . . . . . . . 1,593
Revaluation of investments at fair value throughprofit or loss (Note 3(c)) . . . . . . . . . . . . . . . . . . . . . . . . . 292
Revaluation of investments at fair value throughprofit and loss (Note 3(c)) . . . . . . . . . . . . . . . . . . . . . 73
Net assets attributable to holders of redeemableunits . . . . . . . . . . . . . . . . . . . . . . . . . . . . . . . . . . . . . . . . 149,105
Increase (decrease) in net assets attributable toholders of redeemable units from operations . . . . . . 1,666
Franklin Bissett Dividend Income Fund
Net Assets
As atJune 30, 2013
(000’s) Comprehensive Income
For the year endedDecember 31, 2013
(000’s)
Net Assets as previously reported under CanadianGAAP . . . . . . . . . . . . . . . . . . . . . . . . . . . . . . . . . . . . . . . 671,449
Increase (decrease) in net assets from operations aspreviously reported under Canadian GAAP. . . . . . . . 106,137
Revaluation of investments at fair value throughprofit or loss (Note 3(c)) . . . . . . . . . . . . . . . . . . . . . . . . . 1,323
Revaluation of investments at fair value throughprofit and loss (Note 3(c)) . . . . . . . . . . . . . . . . . . . . . (395)
Net assets attributable to holders of redeemableunits . . . . . . . . . . . . . . . . . . . . . . . . . . . . . . . . . . . . . . . . 672,772
Increase (decrease) in net assets attributable toholders of redeemable units from operations . . . . . . 105,742
Franklin Templeton Investments Funds 411
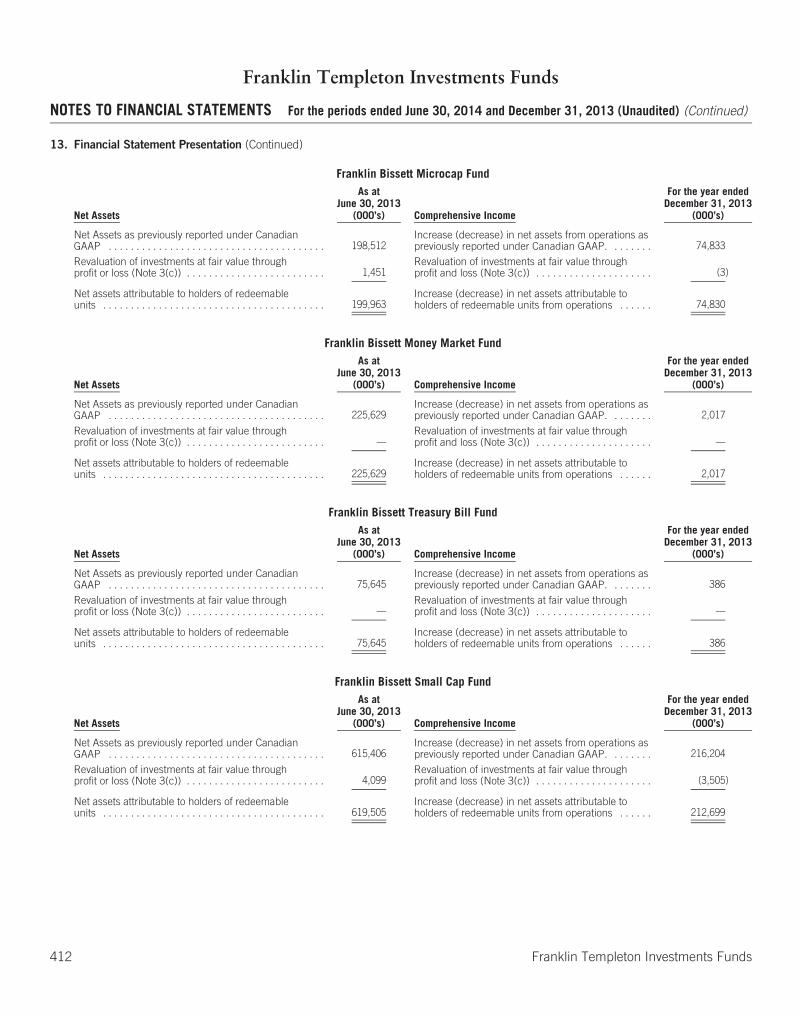
Franklin Templeton Investments Funds
NOTES TO FINANCIAL STATEMENTS For the periods ended June 30, 2014 and December 31, 2013 (Unaudited) (Continued)
13. Financial Statement Presentation (Continued)
Franklin Bissett Microcap Fund
Net Assets
As atJune 30, 2013
(000’s) Comprehensive Income
For the year endedDecember 31, 2013
(000’s)
Net Assets as previously reported under CanadianGAAP . . . . . . . . . . . . . . . . . . . . . . . . . . . . . . . . . . . . . . . 198,512
Increase (decrease) in net assets from operations aspreviously reported under Canadian GAAP. . . . . . . . 74,833
Revaluation of investments at fair value throughprofit or loss (Note 3(c)) . . . . . . . . . . . . . . . . . . . . . . . . . 1,451
Revaluation of investments at fair value throughprofit and loss (Note 3(c)) . . . . . . . . . . . . . . . . . . . . . (3)
Net assets attributable to holders of redeemableunits . . . . . . . . . . . . . . . . . . . . . . . . . . . . . . . . . . . . . . . . 199,963
Increase (decrease) in net assets attributable toholders of redeemable units from operations . . . . . . 74,830
Franklin Bissett Money Market Fund
Net Assets
As atJune 30, 2013
(000’s) Comprehensive Income
For the year endedDecember 31, 2013
(000’s)
Net Assets as previously reported under CanadianGAAP . . . . . . . . . . . . . . . . . . . . . . . . . . . . . . . . . . . . . . . 225,629
Increase (decrease) in net assets from operations aspreviously reported under Canadian GAAP. . . . . . . . 2,017
Revaluation of investments at fair value throughprofit or loss (Note 3(c)) . . . . . . . . . . . . . . . . . . . . . . . . . —
Revaluation of investments at fair value throughprofit and loss (Note 3(c)) . . . . . . . . . . . . . . . . . . . . . —
Net assets attributable to holders of redeemableunits . . . . . . . . . . . . . . . . . . . . . . . . . . . . . . . . . . . . . . . . 225,629
Increase (decrease) in net assets attributable toholders of redeemable units from operations . . . . . . 2,017
Franklin Bissett Treasury Bill Fund
Net Assets
As atJune 30, 2013
(000’s) Comprehensive Income
For the year endedDecember 31, 2013
(000’s)
Net Assets as previously reported under CanadianGAAP . . . . . . . . . . . . . . . . . . . . . . . . . . . . . . . . . . . . . . . 75,645
Increase (decrease) in net assets from operations aspreviously reported under Canadian GAAP. . . . . . . . 386
Revaluation of investments at fair value throughprofit or loss (Note 3(c)) . . . . . . . . . . . . . . . . . . . . . . . . . —
Revaluation of investments at fair value throughprofit and loss (Note 3(c)) . . . . . . . . . . . . . . . . . . . . . —
Net assets attributable to holders of redeemableunits . . . . . . . . . . . . . . . . . . . . . . . . . . . . . . . . . . . . . . . . 75,645
Increase (decrease) in net assets attributable toholders of redeemable units from operations . . . . . . 386
Franklin Bissett Small Cap Fund
Net Assets
As atJune 30, 2013
(000’s) Comprehensive Income
For the year endedDecember 31, 2013
(000’s)
Net Assets as previously reported under CanadianGAAP . . . . . . . . . . . . . . . . . . . . . . . . . . . . . . . . . . . . . . . 615,406
Increase (decrease) in net assets from operations aspreviously reported under Canadian GAAP. . . . . . . . 216,204
Revaluation of investments at fair value throughprofit or loss (Note 3(c)) . . . . . . . . . . . . . . . . . . . . . . . . . 4,099
Revaluation of investments at fair value throughprofit and loss (Note 3(c)) . . . . . . . . . . . . . . . . . . . . . (3,505)
Net assets attributable to holders of redeemableunits . . . . . . . . . . . . . . . . . . . . . . . . . . . . . . . . . . . . . . . . 619,505
Increase (decrease) in net assets attributable toholders of redeemable units from operations . . . . . . 212,699
412 Franklin Templeton Investments Funds

Franklin Templeton Investments Funds
NOTES TO FINANCIAL STATEMENTS For the periods ended June 30, 2014 and December 31, 2013 (Unaudited) (Continued)
13. Financial Statement Presentation (Continued)
Franklin Bissett Strategic Income Fund
Net Assets
As atJune 30, 2013
(000’s) Comprehensive Income
For the year endedDecember 31, 2013
(000’s)
Net Assets as previously reported under CanadianGAAP . . . . . . . . . . . . . . . . . . . . . . . . . . . . . . . . . . . . . . . 122,634
Increase (decrease) in net assets from operations aspreviously reported under Canadian GAAP. . . . . . . . 10,089
Revaluation of investments at fair value throughprofit or loss (Note 3(c)) . . . . . . . . . . . . . . . . . . . . . . . . . 224
Revaluation of investments at fair value throughprofit and loss (Note 3(c)) . . . . . . . . . . . . . . . . . . . . . 57
Net assets attributable to holders of redeemableunits . . . . . . . . . . . . . . . . . . . . . . . . . . . . . . . . . . . . . . . . 122,858
Increase (decrease) in net assets attributable toholders of redeemable units from operations . . . . . . 10,146
Franklin Bissett U.S. Focus Fund
Net Assets
As atJune 30, 2013
(000’s) Comprehensive Income
For the year endedDecember 31, 2013
(000’s)
Net Assets as previously reported under CanadianGAAP . . . . . . . . . . . . . . . . . . . . . . . . . . . . . . . . . . . . . . . 61,798
Increase (decrease) in net assets from operations aspreviously reported under Canadian GAAP. . . . . . . . 27,818
Revaluation of investments at fair value throughprofit or loss (Note 3(c)) . . . . . . . . . . . . . . . . . . . . . . . . . 22
Revaluation of investments at fair value throughprofit and loss (Note 3(c)) . . . . . . . . . . . . . . . . . . . . . 1
Net assets attributable to holders of redeemableunits . . . . . . . . . . . . . . . . . . . . . . . . . . . . . . . . . . . . . . . . 61,820
Increase (decrease) in net assets attributable toholders of redeemable units from operations . . . . . . 27,819
Franklin Mutual Global Discovery Fund
Net Assets
As atJune 30, 2013
(000’s) Comprehensive Income
For the year endedDecember 31, 2013
(000’s)
Net Assets as previously reported under CanadianGAAP . . . . . . . . . . . . . . . . . . . . . . . . . . . . . . . . . . . . . . . 1,043,029
Increase (decrease) in net assets from operations aspreviously reported under Canadian GAAP. . . . . . . . 272,098
Revaluation of investments at fair value throughprofit or loss (Note 3(c)) . . . . . . . . . . . . . . . . . . . . . . . . . 681
Revaluation of investments at fair value throughprofit and loss (Note 3(c)) . . . . . . . . . . . . . . . . . . . . . 759
Net assets attributable to holders of redeemableunits . . . . . . . . . . . . . . . . . . . . . . . . . . . . . . . . . . . . . . . . 1,043,710
Increase (decrease) in net assets attributable toholders of redeemable units from operations . . . . . . 272,857
Franklin Mutual U.S. Shares Fund
Net Assets
As atJune 30, 2013
(000’s) Comprehensive Income
For the year endedDecember 31, 2013
(000’s)
Net Assets as previously reported under CanadianGAAP . . . . . . . . . . . . . . . . . . . . . . . . . . . . . . . . . . . . . . . 192,780
Increase (decrease) in net assets from operations aspreviously reported under Canadian GAAP. . . . . . . . 52,344
Revaluation of investments at fair value throughprofit or loss (Note 3(c)) . . . . . . . . . . . . . . . . . . . . . . . . . 144
Revaluation of investments at fair value throughprofit and loss (Note 3(c)) . . . . . . . . . . . . . . . . . . . . . 177
Net assets attributable to holders of redeemableunits . . . . . . . . . . . . . . . . . . . . . . . . . . . . . . . . . . . . . . . . 194,924
Increase (decrease) in net assets attributable toholders of redeemable units from operations . . . . . . 52,521
Franklin Templeton Investments Funds 413
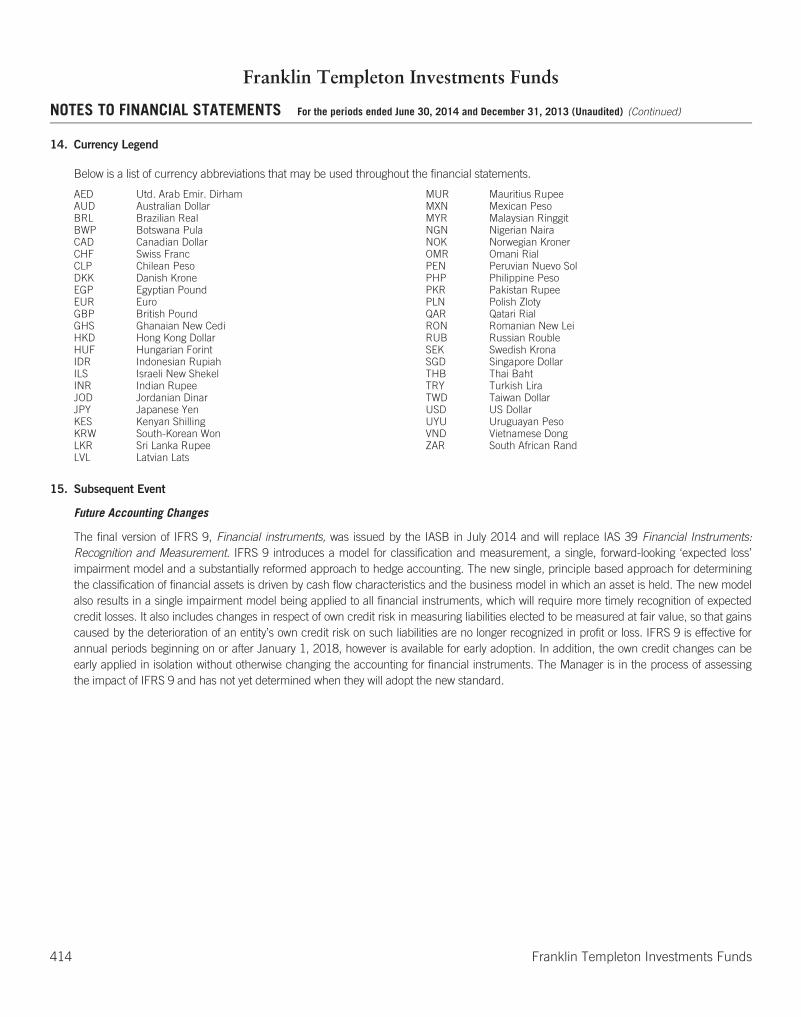
Franklin Templeton Investments Funds
NOTES TO FINANCIAL STATEMENTS For the periods ended June 30, 2014 and December 31, 2013 (Unaudited) (Continued)
14. Currency Legend
Below is a list of currency abbreviations that may be used throughout the financial statements.
AED Utd. Arab Emir. Dirham MUR Mauritius RupeeAUD Australian Dollar MXN Mexican PesoBRL Brazilian Real MYR Malaysian RinggitBWP Botswana Pula NGN Nigerian NairaCAD Canadian Dollar NOK Norwegian KronerCHF Swiss Franc OMR Omani RialCLP Chilean Peso PEN Peruvian Nuevo SolDKK Danish Krone PHP Philippine PesoEGP Egyptian Pound PKR Pakistan RupeeEUR Euro PLN Polish ZlotyGBP British Pound QAR Qatari RialGHS Ghanaian New Cedi RON Romanian New LeiHKD Hong Kong Dollar RUB Russian RoubleHUF Hungarian Forint SEK Swedish KronaIDR Indonesian Rupiah SGD Singapore DollarILS Israeli New Shekel THB Thai BahtINR Indian Rupee TRY Turkish LiraJOD Jordanian Dinar TWD Taiwan DollarJPY Japanese Yen USD US DollarKES Kenyan Shilling UYU Uruguayan PesoKRW South-Korean Won VND Vietnamese DongLKR Sri Lanka Rupee ZAR South African RandLVL Latvian Lats
15. Subsequent Event
Future Accounting Changes
The final version of IFRS 9, Financial instruments, was issued by the IASB in July 2014 and will replace IAS 39 Financial Instruments:Recognition and Measurement. IFRS 9 introduces a model for classification and measurement, a single, forward-looking ‘expected loss’impairment model and a substantially reformed approach to hedge accounting. The new single, principle based approach for determiningthe classification of financial assets is driven by cash flow characteristics and the business model in which an asset is held. The new modelalso results in a single impairment model being applied to all financial instruments, which will require more timely recognition of expectedcredit losses. It also includes changes in respect of own credit risk in measuring liabilities elected to be measured at fair value, so that gainscaused by the deterioration of an entity’s own credit risk on such liabilities are no longer recognized in profit or loss. IFRS 9 is effective forannual periods beginning on or after January 1, 2018, however is available for early adoption. In addition, the own credit changes can beearly applied in isolation without otherwise changing the accounting for financial instruments. The Manager is in the process of assessingthe impact of IFRS 9 and has not yet determined when they will adopt the new standard.
414 Franklin Templeton Investments Funds
20
14
06
10
09
32
Franklin Templeton Investments5000 Yonge Street, Suite 900 Toronto, ON, M2N 0A7 Client Services: (416) 364-4672 Fax: (416) 364-1163Client Services Toll-free: (800) 387-0830 Toll-free Fax: (866) 850-8241www.franklintempleton.ca
Commissions, trailing commissions, management fees and expenses all may be associated with mutual fund investments. Please read the Franklin Templeton Investments Funds’ prospectus before investing. Mutual fund securities are not covered by the Canada Deposit Insurance Corporation or by any other government deposit insurer. There can be no assurances that the money market funds will be able to maintain their net asset value per security at a constant amount or that the full amount of your investment in the fund(s) will be returned to you. Mutual funds are not guaranteed, unit/share values change frequently and past performance may not be repeated. Franklin Bissett Investment Management is part of Franklin Templeton Investments Corp. U
TF
SA
RE
06
/14
006027-UTF_SARE.CS6.indd 1 14-08-18 4:15 PM