for the quarter ended january 31, 2020 february 25, 2020 q1 20 - …€¦ · investor presentation...
TRANSCRIPT
Investor Presentation
Q1 20
For the Quarter Ended January 31, 2020
February 25, 2020
BMO Financial Group
February 25, 2020 2
Forward looking statements & non-GAAP measuresCaution Regarding Forward-Looking Statements
Bank of Montreal’s public communications often include written or oral forward-looking statements. Statements of this type are included in this document, and may be included in other filings with Canadian securities regulators or the U.S. Securities and Exchange Commission, or in other communications. All such statements are made pursuant to the “safe harbor” provisions of, and are intended to be forward-looking statements under, the United States Private Securities Litigation Reform Act of 1995 and any applicable Canadian securities legislation. Forward-looking statements in this document may include, but are not limited to, statements with respect to our objectives and priorities for fiscal 2020 and beyond, our strategies or future actions, our targets, expectations for our financial condition or share price, the regulatory environment in which we operate and the results of or outlook for our operations or for the Canadian, U.S. and international economies, and include statements of our management. Forward-looking statements are typically identified by words such as “will”, “would”, “should”, “believe”, “expect”, “anticipate”, “project”, “intend”, “estimate”, “plan”, “goal”, “target”, “may” and “could.”
By their nature, forward-looking statements require us to make assumptions and are subject to inherent risks and uncertainties, both general and specific in nature. There is significant risk that predictions, forecasts, conclusions or projections will not prove to be accurate, that our assumptions may not be correct, and that actual results may differ materially from such predictions, forecasts, conclusions or projections. We caution readers of this document not to place undue reliance on our forward-looking statements, as a number of factors – many of which are beyond our control and the effects of which can be difficult to predict – could cause actual future results, conditions, actions or events to differ materially from the targets, expectations, estimates or intentions expressed in the forward-looking statements.
The future outcomes that relate to forward-looking statements may be influenced by many factors, including but not limited to: general economic and market conditions in the countries in which we operate; the Canadian housing market and consumer leverage; weak, volatile or illiquid capital and/or credit markets; interest rate and currency value fluctuations; changes in monetary, fiscal, or economic policy and tax legislation and interpretation; the level of competition in the geographic and business areas in which we operate; changes in laws or in supervisory expectations or requirements, including capital, interest rate and liquidity requirements and guidance, and the effect of such changes on funding costs; judicial or regulatory proceedings; the accuracy and completeness of the information we obtain with respect to our customers and counterparties; failure of third parties to comply with their obligations to us; our ability to execute our strategic plans and to complete and integrate acquisitions, including obtaining regulatory approvals; critical accounting estimates and the effect of changes to accounting standards, rules and interpretations on these estimates; operational and infrastructure risks, including with respect to reliance on third parties; changes to our credit ratings; political conditions, including changes relating to or affecting economic or trade matters; global capital markets activities; the possible effects on our business of war or terrorist activities; outbreaks of disease or illness that affect local, national or international economies; natural disasters and disruptions to public infrastructure, such as transportation, communications, power or water supply; technological changes; information, privacy and cyber security, including the threat of data breaches, hacking, identity theft and corporate espionage, as well as the possibility of denial of service resulting from efforts targeted at causing system failure and service disruption; and our ability to anticipate and effectively manage risks arising from all of the foregoing factors.
We caution that the foregoing list is not exhaustive of all possible factors. Other factors and risks could adversely affect our results. For more information, please refer to the discussion in the Risks That May Affect Future Results section, and the sections related to credit and counterparty, market, insurance, liquidity and funding, operational, legal and regulatory, business, strategic, environmental and social, and reputation risk, in the Enterprise-Wide Risk Management section that begins on page 68 of BMO’s 2019 Annual Report, and the Risk Management section in BMO’s First Quarter 2020 Report to Shareholders, all of which outline certain key factors and risks that may affect our future results. Investors and others should carefully consider these factors and risks, as well as other uncertainties and potential events, and the inherent uncertainty of forward-looking statements. We do not undertake to update any forward-looking statements, whether written or oral, that may be made from time to time by the organization or on its behalf, except as required by law. The forward-looking information contained in this document is presented for the purpose of assisting our shareholders in understanding our financial position as at and for the periods ended on the dates presented, as well as our strategic priorities and objectives, and may not be appropriate for other purposes.
Material economic assumptions underlying the forward-looking statements contained in this document are set out in the Economic Developments and Outlook section on page 18 of BMO’s 2019 Annual Report and updated in the Economic Review and Outlook section set forth in BMO’s First Quarter 2020 Report to Shareholders. Assumptions about the performance of the Canadian and U.S. economies, as well as overall market conditions and their combined effect on our business, are material factors we consider when determining our strategic priorities, objectives and expectations for our business. In determining our expectations for economic growth, we primarily consider historical economic data, past relationships between economic and financial variables, changes in government policies, and the risks to the domestic and global economy. Please refer to the Economic Review and Outlook section of BMO’s First Quarter 2020 Report to Shareholders.
Non-GAAP Measures
Bank of Montreal uses both GAAP and non-GAAP measures to assess performance. Readers are cautioned that earnings and other measures adjusted to a basis other than GAAP do not have standardized meanings under GAAP and are unlikely to be comparable to similar measures used by other companies. Reconciliations of GAAP to non-GAAP measures, the rationale for their use, as well as the effects of changes in exchange rates on BMO’s U.S. segment reported and adjusted results can be found on pages 6 and 7 of BMO’s First Quarter 2020 Report to Shareholders and on pages 17 and 23 of BMO’s 2019 Annual Report, all of which are available on our website at www.bmo.com/investorrelations.Examples of non-GAAP amounts or measures include: efficiency and leverage ratios; revenue and other measures presented on a taxable equivalent basis (teb); amounts presented net of applicable taxes; results and measures that exclude the impact of Canadian/U.S. dollar exchange rate movements (i.e. constant currency basis or CCY), adjusted net income, revenues, non-interest expenses, earnings per share, effective tax rate, ROE, efficiency ratio, pre-provision pre-tax earnings, and other adjusted measures which exclude the impact of certain items such as, acquisition integration costs, amortization of acquisition-related intangible assets, reinsurance adjustment, restructuring costs, revaluation of U.S. net deferred tax asset as a result of U.S. tax reform and the remeasurement of an employee benefit liability as a result of an amendment to the benefits plan. Bank of Montreal provides supplemental information on combined business segments to facilitate comparisons to peers.

Darryl White
Q1 20
Chief Executive Officer

Strategic Highlights February 25, 2020 4
Financial Highlights
Q1’20• Adjusted1 net income growth of 5% Y/Y• All businesses contributed; good progress on
strategic and financial objectives
• Above 2% operating leverage in all operating Groups• Adjusted1,3 efficiency ratio 60.3%; Improvement of
270 bps Y/Y
1 See slide 25 for adjustments to reported results. Adjusted measures are non-GAAP measures, see slide 2 for more information On a reported basis: Q1’20 net income growth: 5%; Q1’20 expense growth 3%; Q1’20 efficiency ratio 60.8%, 280bps improvement Y/Y
2 Pre-Provision Pre-Tax earnings (PPPT) is the difference between net revenue and expenses3 Based on net revenue; net revenue is net of insurance claims, commissions and changes in policy benefit liabilities (CCPB). Operating leverage and efficiency ratio based on net revenue
$1,617MM
• Strength of overall performance earned through elevated provisions
Net Income1
EPS1
Operating Leverage1,3
Reported $1,592MM
Reported
Reported
• Strong capital position• Absorbed impact of accounting and regulatory
changesCapital
• Strong performance across all businesses• Revenue growth3 8%; expense growth1 3%
PPPT1,2 GrowthReported
$2.41
$2.37
16%
16%
4.6%
4.7%
CET1 11.4%

Strategic Highlights February 25, 2020 5
Strong and Consistent Delivery Across Businesses
Canadian Personal & Commercial U.S. Personal & Commercial
BMO Wealth Management BMO Capital Markets
• Strong quarter; net income up 8%• Robust loan and deposit growth; revenue up 7%• BMO Business Xpress on track to surpass $1B in
authorizations• Top overall score in JD Power’s 2020 Canadian
Retail Banking Advice Study
• Revenue up 3%, absorbing full impact of recent rate decreases
• New low efficiency ratio1 of 55.2%• Double-digit loan and deposit growth in
Commercial; opened office in L.A.• Continued personal deposit growth
momentum
• Strong quarter with net income1 of $362MM; good contributions across businesses and geographies
• Performing in-line with earnings potential; U.S. business net income above US$100MM
• Acquiring Clearpool, electronic trading platform with customizable algorithmic strategies
• Strong, balanced performance; net income1 up 21%, operating leverage1 of 5.9%
• Deposit growth of 12%; loan growth of 14%• Industry leading ETF net inflows; launched
suite of ESG ETFs• Opened new Private Wealth offices in Dallas
and Atlanta
1 On an adjusted basis. Adjusted measures are non-GAAP measures, see slide 2 for more information. See slide 25 for adjustments to reported results. On a reported basis: U.S. P&C efficiency ratio 56.1%; BMO Wealth Management net income growth 22%, operating leverage based on net revenue, reported operating leverage, net of CCPB 6.1%; BMO Capital Markets net income $356MM
Strategic Highlights February 25, 2020 6
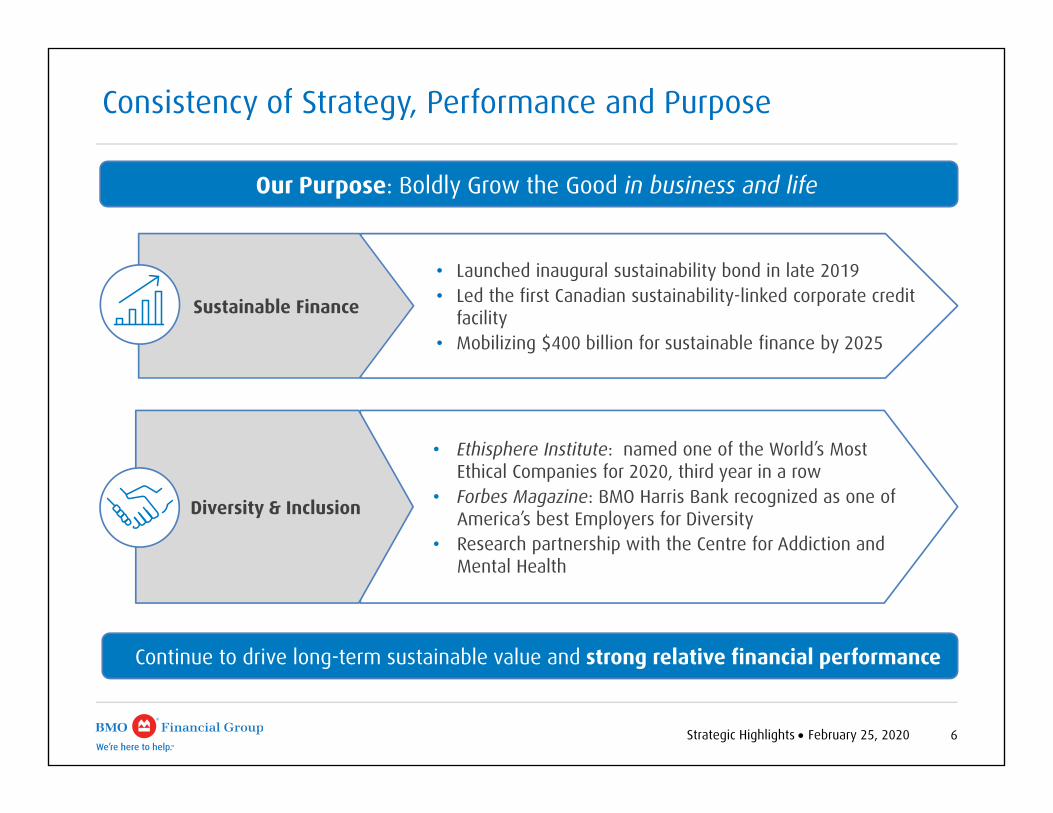
• Ethisphere Institute: named one of the World’s Most Ethical Companies for 2020, third year in a row
• Forbes Magazine: BMO Harris Bank recognized as one of America’s best Employers for Diversity
• Research partnership with the Centre for Addiction and Mental Health
• Launched inaugural sustainability bond in late 2019• Led the first Canadian sustainability-linked corporate credit
facility• Mobilizing $400 billion for sustainable finance by 2025
Sustainable Finance
Consistency of Strategy, Performance and Purpose
Diversity & Inclusion
Continue to drive long-term sustainable value and strong relative financial performance
Our Purpose: Boldly Grow the Good in business and life
Financial ResultsFor the Quarter Ended January 31, 2020
Tom FlynnChief Financial Officer
Q1 20

8Financial Results February 25, 2020
• Adjusted1 EPS $2.41, up 4% Y/Y, 5% CCY6 (reported $2.37, up 4%)
• Adjusted1 and reported net income up 5% Y/Y
• Adjusted1 and reported PPPT5 up 16% Y/Y
• Net revenue2 up 8% Y/Y
• Adjusted1 and reported expenses up 3% Y/Y
• Adjusted1 efficiency ratio2 60.3% (reported 60.8%)
• Adjusted1 operating leverage2 4.6% (reported 4.7%)
• Total PCL $349MM, up Y/Y from a low level (in part due to a recovery); up Q/Q– PCL on impaired loans $324MM; PCL on performing loans
$25MM– Total PCL to average net loans and acceptances 31 bps
• Adjusted1 ROE 13.5% (reported 13.3%)1,510 1,497 1,557
1,194 1,592
1,538 1,522 1,582 1,607 1,617
Q1'19 Q2'19 Q3'19 Q4'19 Q1'20
Net Income1 Trends
Reported Net Income ($MM) Adjusted Net Income ($MM)
1 See slide 25 for adjustments to reported results. Adjusted measures are non-GAAP measures, see slide 2 for more information2 Net revenue is net of insurance claims, commissions and changes in policy benefit liabilities (CCPB). Operating leverage and efficiency ratio based on net revenue. Reported gross revenue: Q1‘20 $6,747MM; Q4'19
$6,087MM; Q1'19 $6,517MM. Reported net revenue in Q4’19 includes $25MM reinsurance adjustment in CCPB for the net impact of major reinsurance claims from Japanese typhoons that were incurred after our announced decision to wind down our reinsurance business
3 Q4’19 reported expenses include $484MM restructuring charge4 Return on Tangible Common Equity (ROTCE)5 Pre-Provision Pre-Tax earnings (PPPT) is the difference between net revenue and expenses6 Constant currency (CCY) refers to the impact of CAD/US exchange rate movements on the U.S. segment only. Measures presented on a CCY basis are non-GAAP measures, see slide 2 for more information
Q1 F2020 - Financial HighlightsNet income up 5% Y/Y; PPPT5 up 16% Y/Y; adjusted1 operating leverage2 4.6% with all Groups above 2.0%
Reported Adjusted1
($MM) Q1 20 Q4 19 Q1 19 Q1 20 Q4 19 Q1 19
Net Revenue2 6,031 5,752 5,591 6,031 5,777 5,591
Expenses3 3,669 3,987 3,557 3,637 3,463 3,520
PPPT5 2,362 1,765 2,034 2,394 2,314 2,071
Total PCL 349 253 137 349 253 137
Net Income 1,592 1,194 1,510 1,617 1,607 1,538
Diluted EPS ($) 2.37 1.78 2.28 2.41 2.43 2.32
ROE (%) 13.3 9.9 13.6 13.5 13.5 13.9
ROTCE4 (%) 15.7 11.9 16.5 15.8 15.7 16.6
CET1 Ratio (%) 11.4 11.4 11.4
9Financial Results February 25, 2020
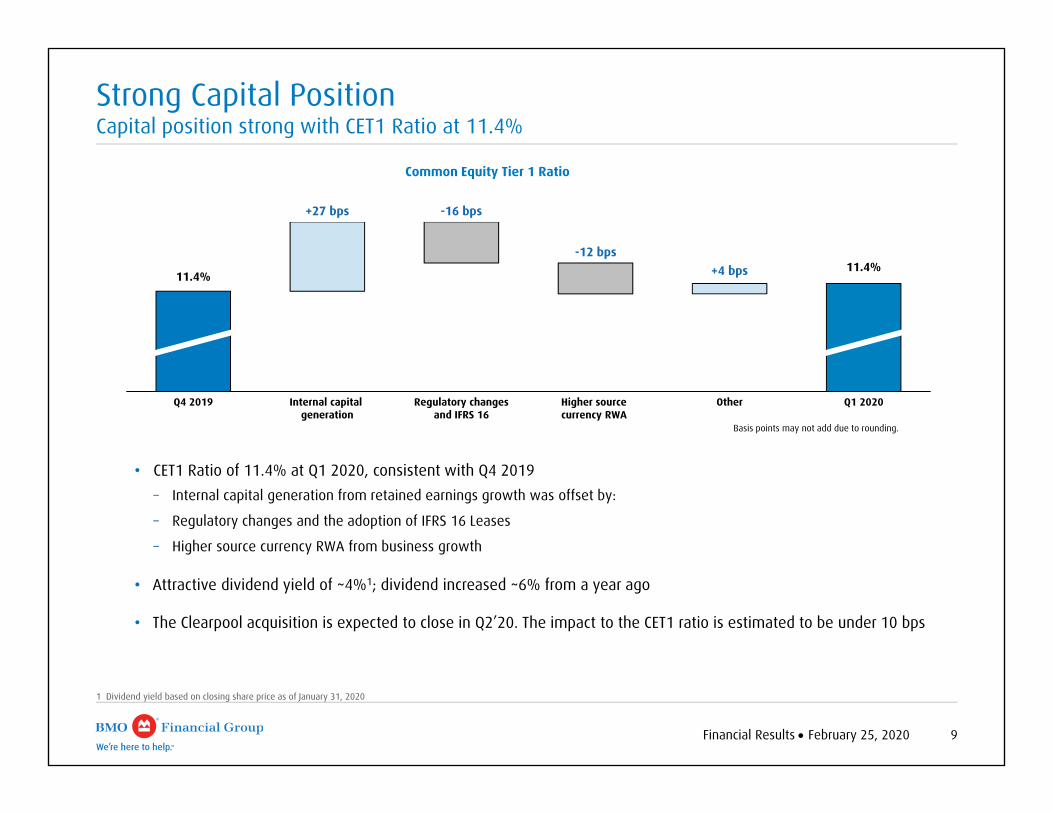
Strong Capital PositionCapital position strong with CET1 Ratio at 11.4%
1 Dividend yield based on closing share price as of January 31, 2020
Basis points may not add due to rounding.
• CET1 Ratio of 11.4% at Q1 2020, consistent with Q4 2019– Internal capital generation from retained earnings growth was offset by:
– Regulatory changes and the adoption of IFRS 16 Leases
– Higher source currency RWA from business growth
• Attractive dividend yield of ~4%1; dividend increased ~6% from a year ago
• The Clearpool acquisition is expected to close in Q2’20. The impact to the CET1 ratio is estimated to be under 10 bps
Common Equity Tier 1 Ratio
Internal capital generation
Q1 2020Regulatory changes and IFRS 16
OtherQ4 2019 Higher source currency RWA
11.4%11.4%
+27 bps -16 bps
+4 bps-12 bps

10Financial Results February 25, 2020
1 See slide 25 for adjustments to reported results. Adjusted measures are non-GAAP measures, see slide 2 for more information 2 Pre-Provision Pre-Tax earnings (PPPT) is the difference between revenue and expenses3 Commercial loan growth excludes corporate and small business credit cards4 Expense growth, efficiency ratio and operating leverage shown are on an adjusted and reported basis
Canadian Personal & Commercial BankingStrong performance and continued balance momentum
• Adjusted1 and reported net income up 8% Y/Y
• Adjusted1 and reported PPPT2 growth of 10% Y/Y
• Revenue up 7% Y/Y– Average loans up 7% Y/Y. Commercial3 up 15%;
proprietary mortgages (including amortizing HELOC) up 6%– Average deposits up 14% Y/Y. Personal up 14%;
Commercial up 14%– NIM down 1 bp Q/Q; up 7 bps Y/Y
• Expenses4 up 3% Y/Y
• Efficiency ratio4 47.3%
• Operating leverage4 3.6%
• Total PCL $152MM, up $32MM Y/Y; up $7MM Q/Q– PCL on impaired loans $138MM; PCL on performing loans
$14MM
Reported Adjusted1
($MM) Q1 20 Q4 19 Q1 19 Q1 20 Q4 19 Q1 19
Revenue (teb) 2,082 2,078 1,950 2,082 2,078 1,950
Expenses 986 976 956 986 976 955
PPPT2 1,096 1,102 994 1,096 1,102 995
Total PCL 152 145 120 152 145 120
Net Income 700 710 648 700 710 649
Net Income and NIM Trends
648 616 650 710 700
2.61 2.622.66 2.69 2.68
Q1'19 Q2'19 Q3'19 Q4'19 Q1'20
Reported Net Income ($MM) NIM (%)
11Financial Results February 25, 2020
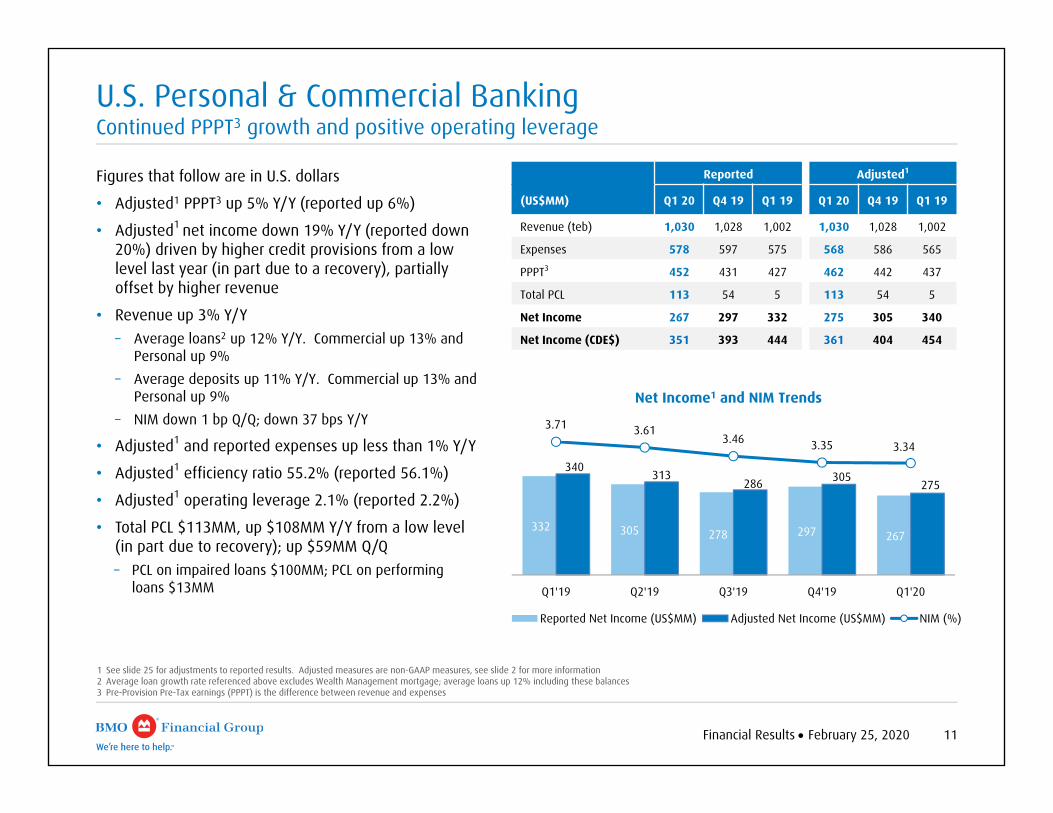
U.S. Personal & Commercial BankingContinued PPPT3 growth and positive operating leverage
Figures that follow are in U.S. dollars
• Adjusted1 PPPT3 up 5% Y/Y (reported up 6%)
• Adjusted1 net income down 19% Y/Y (reported down 20%) driven by higher credit provisions from a low level last year (in part due to a recovery), partially offset by higher revenue
• Revenue up 3% Y/Y– Average loans2 up 12% Y/Y. Commercial up 13% and
Personal up 9%– Average deposits up 11% Y/Y. Commercial up 13% and
Personal up 9%– NIM down 1 bp Q/Q; down 37 bps Y/Y
• Adjusted1 and reported expenses up less than 1% Y/Y
• Adjusted1 efficiency ratio 55.2% (reported 56.1%)
• Adjusted1 operating leverage 2.1% (reported 2.2%)
• Total PCL $113MM, up $108MM Y/Y from a low level (in part due to recovery); up $59MM Q/Q– PCL on impaired loans $100MM; PCL on performing
loans $13MM
Net Income1 and NIM Trends
1 See slide 25 for adjustments to reported results. Adjusted measures are non-GAAP measures, see slide 2 for more information2 Average loan growth rate referenced above excludes Wealth Management mortgage; average loans up 12% including these balances3 Pre-Provision Pre-Tax earnings (PPPT) is the difference between revenue and expenses
332 305 278 297 267
340 313
286 305 275
3.71 3.613.46 3.35 3.34
Q1'19 Q2'19 Q3'19 Q4'19 Q1'20
Reported Net Income (US$MM) Adjusted Net Income (US$MM) NIM (%)
Reported Adjusted1
(US$MM) Q1 20 Q4 19 Q1 19 Q1 20 Q4 19 Q1 19
Revenue (teb) 1,030 1,028 1,002 1,030 1,028 1,002
Expenses 578 597 575 568 586 565
PPPT3 452 431 427 462 442 437
Total PCL 113 54 5 113 54 5
Net Income 267 297 332 275 305 340
Net Income (CDE$) 351 393 444 361 404 454

12Financial Results February 25, 2020
1 See slide 25 for adjustments to reported results. Adjusted measures are non-GAAP measures, see slide 2 for more information2 Pre-Provision Pre-Tax earnings (PPPT) is the difference between revenue and expenses
BMO Capital MarketsStrong performance across all businesses; adjusted1 net income up 38% Y/Y
• Adjusted1 net income up 38% Y/Y (reported up 39%)
• Adjusted1 PPPT2 up 50% Y/Y (reported up 52%)
• Revenue up 20% Y/Y– Global Markets up 30% Y/Y– Investment and Corporate Banking up 8% Y/Y
• Adjusted1 and reported expenses up 7% Y/Y given strong revenue
• Adjusted1 operating leverage 13.1% (reported 13.4%)
• Total PCL $50MM, up $35MM Y/Y; up $10MM Q/Q– PCL on impaired loans $53MM; recovery on performing
loans $3MM
• Continued strong U.S. performance; adjusted1 net income of US$110MM up 53% Y/Y (reported US$106MM, up 60%)
• Entered into agreement to acquire Clearpool Group Inc.; provider of electronic trading solutions operating in the U.S. and Canada
Reported Adjusted1
($MM) Q1 20 Q4 19 Q1 19 Q1 20 Q4 19 Q1 19
Global Markets 823 686 631 823 686 631
I&CB 546 493 506 546 493 506
Revenue (teb) 1,369 1,179 1,137 1,369 1,179 1,137
Expenses 852 792 796 844 778 787
PPPT2 517 387 341 525 401 350
Total PCL 50 40 15 50 40 15
Net Income 356 271 256 362 282 263
Net Income1 Trends
256 250 314
271 356
263 254 319
282 362
Q1'19 Q2'19 Q3'19 Q4'19 Q1'20
Reported Net Income ($MM) Adjusted Net Income ($MM)

13Financial Results February 25, 2020
1 See slide 25 for adjustments to reported results. Adjusted measures are non-GAAP measures, see slide 2 for more information2 For purposes of this slide revenue is net of insurance claims, commissions and changes in policy benefit liabilities (CCPB). Reported gross revenue: Q1’20 $2,025MM, Q4’19 $1,567MM, Q1’19 $2,140MM3 Pre-Provision Pre-Tax earnings (PPPT) is the difference between net revenue and expenses4 Q4’19 reported Insurance results include $25MM (pre-tax and after-tax) reinsurance adjustment in CCPB for the net impact of major reinsurance claims from Japanese typhoons that were incurred after our announced decision
to wind down our reinsurance business
Net Income1 Trends
Reported Adjusted Reported Adjusted Reported Adjusted Reported Adjusted Reported AdjustedQ1’19 Q2’19 Q3’19 Q4’19 Q1’20
173 183 226 236 226 234 236 245 209 218
65 6579 79 55
82 8224 3024248238
305 315
250 258 266300 291 300
Insurance ($MM) Traditional Wealth ($MM)
• Adjusted1 net income up 21% Y/Y (reported up 22%)
• Adjusted1 Traditional Wealth net income up 19% Y/Y (reported up 21%)– Strong growth in client assets with good expense
discipline– Deposit growth of 12% and loan growth of 14%
• Insurance net income up 26% Y/Y primarily due to benefit from market movements
• Net revenue2 up 8% Y/Y; Traditional Wealth up 5%
• Adjusted1 and reported expenses up 2% Y/Y mainly due to revenue-based costs
• Adjusted1 operating leverage, net of CCPB 5.9% (reported 6.1%)
• Adjusted1 efficiency ratio, net of CCPB 68.8%, improved 4.0% Y/Y (reported 69.7%, improved 4.1%)
• Adjusted1 PPPT3 up 24% Y/Y (reported up 25%)
• AUM up 10% Y/Y; AUA up 9% Y/Y
BMO Wealth ManagementStrong Y/Y adjusted1 net income growth of 21%
Reported Adjusted1
($MM) Q1 20 Q4 19 Q1 19 Q1 20 Q4 19 Q1 19
Net Revenue2 1,309 1,232 1,214 1,309 1,257 1,214
Expenses 912 860 896 901 849 883
PPPT3 397 372 318 408 408 331
Total PCL (recovery) 3 (0) 2 3 (0) 2
Net Income 291 266 238 300 300 248
Traditional Wealth NI 209 236 173 218 245 183
Insurance NI4 82 30 65 82 55 65
AUM/AUA ($B) 893 865 816 893 865 816
14Financial Results February 25, 2020
1 See slide 25 for adjustments to reported results. Adjusted measures are non-GAAP measures, see slide 2 for more information2 Operating group revenue, income taxes and net interest margin are stated on a taxable equivalent basis (teb). This teb adjustment is offset in Corporate Services, and total BMO revenue, income taxes and net interest
margin are stated on a GAAP basis3 Q4’19 reported expenses include $484MM restructuring charge
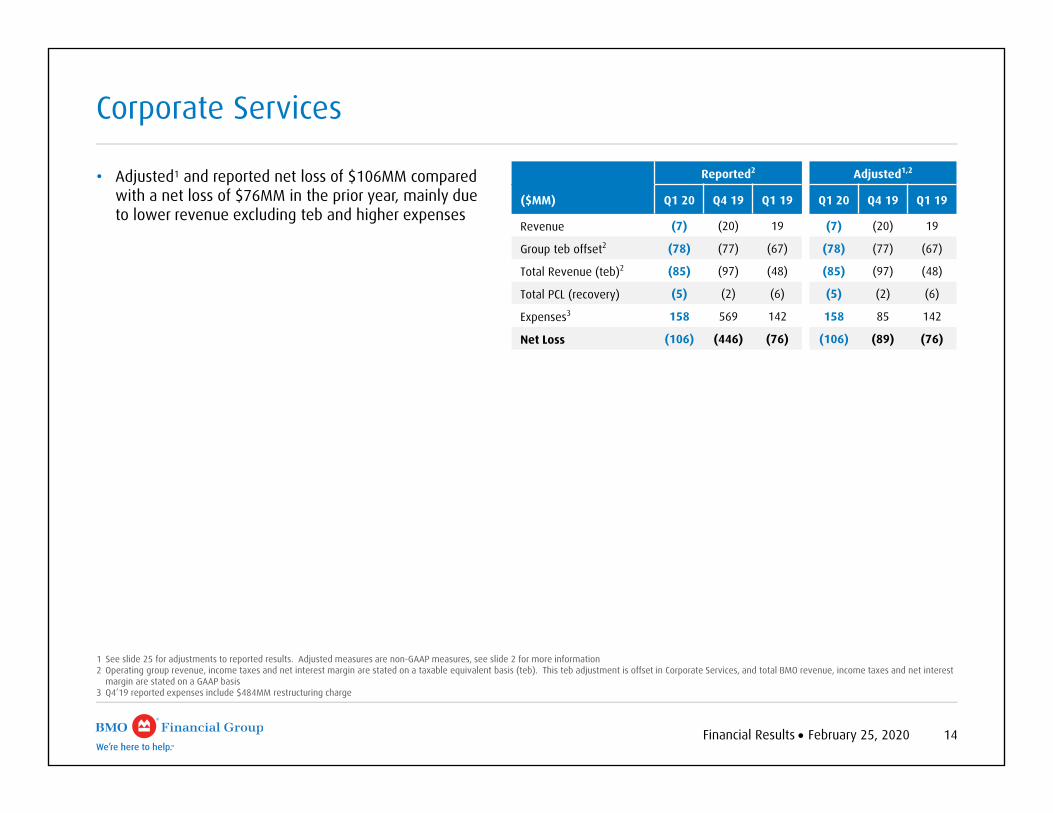
• Adjusted1 and reported net loss of $106MM compared with a net loss of $76MM in the prior year, mainly due to lower revenue excluding teb and higher expenses
Corporate Services
Reported2 Adjusted1,2
($MM) Q1 20 Q4 19 Q1 19 Q1 20 Q4 19 Q1 19
Revenue (7) (20) 19 (7) (20) 19
Group teb offset2 (78) (77) (67) (78) (77) (67)
Total Revenue (teb)2 (85) (97) (48) (85) (97) (48)
Total PCL (recovery) (5) (2) (6) (5) (2) (6)
Expenses3 158 569 142 158 85 142
Net Loss (106) (446) (76) (106) (89) (76)
Risk ReviewFor the Quarter Ended January 31, 2020
Patrick CroninChief Risk Officer
Q1 20
Risk Review February 25, 2020 16
127 150243 231
324
Q1'19 Q2'19 Q3'19 Q4'19 Q1'20
PCL on Impaired Loans1
($MM)
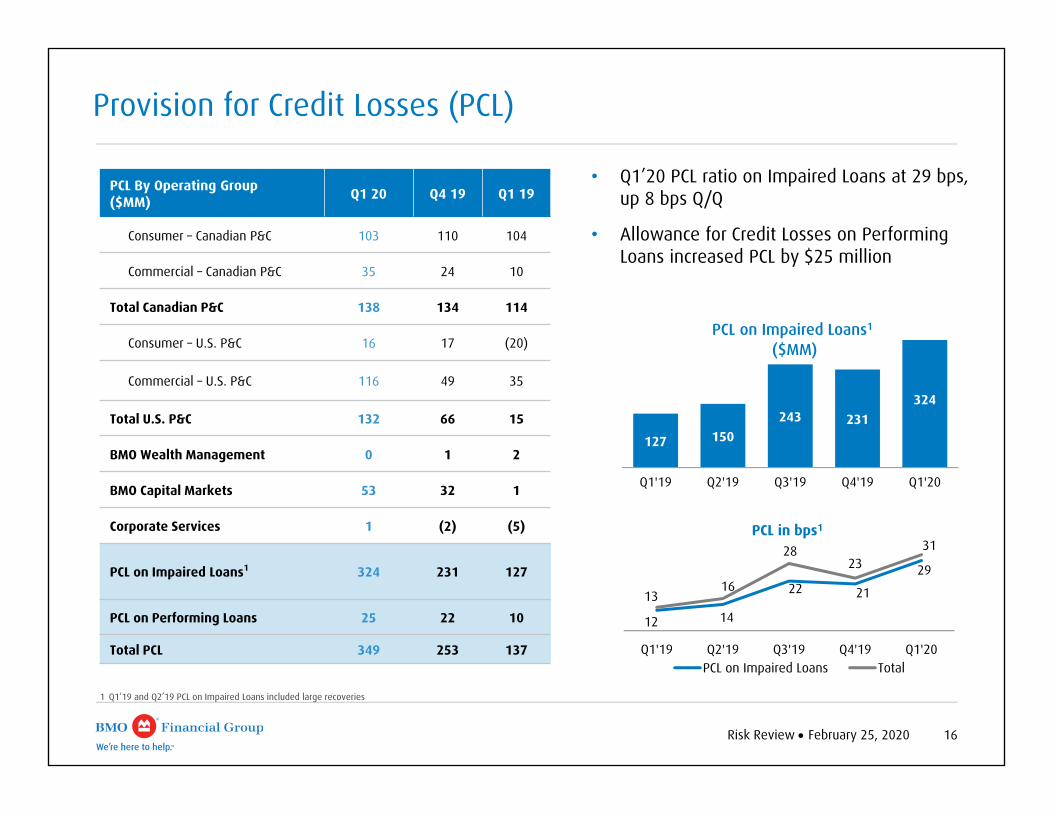
• Q1’20 PCL ratio on Impaired Loans at 29 bps, up 8 bps Q/Q
• Allowance for Credit Losses on Performing Loans increased PCL by $25 million
Provision for Credit Losses (PCL)
12 14
22 21
29
1316
2823
31
Q1'19 Q2'19 Q3'19 Q4'19 Q1'20
PCL in bps1
PCL on Impaired Loans Total
1 Q1’19 and Q2’19 PCL on Impaired Loans included large recoveries
PCL By Operating Group ($MM) Q1 20 Q4 19 Q1 19
Consumer – Canadian P&C 103 110 104
Commercial – Canadian P&C 35 24 10
Total Canadian P&C 138 134 114
Consumer – U.S. P&C 16 17 (20)
Commercial – U.S. P&C 116 49 35
Total U.S. P&C 132 66 15
BMO Wealth Management 0 1 2
BMO Capital Markets 53 32 1
Corporate Services 1 (2) (5)
PCL on Impaired Loans1 324 231 127
PCL on Performing Loans 25 22 10
Total PCL 349 253 137
Risk Review February 25, 2020 17
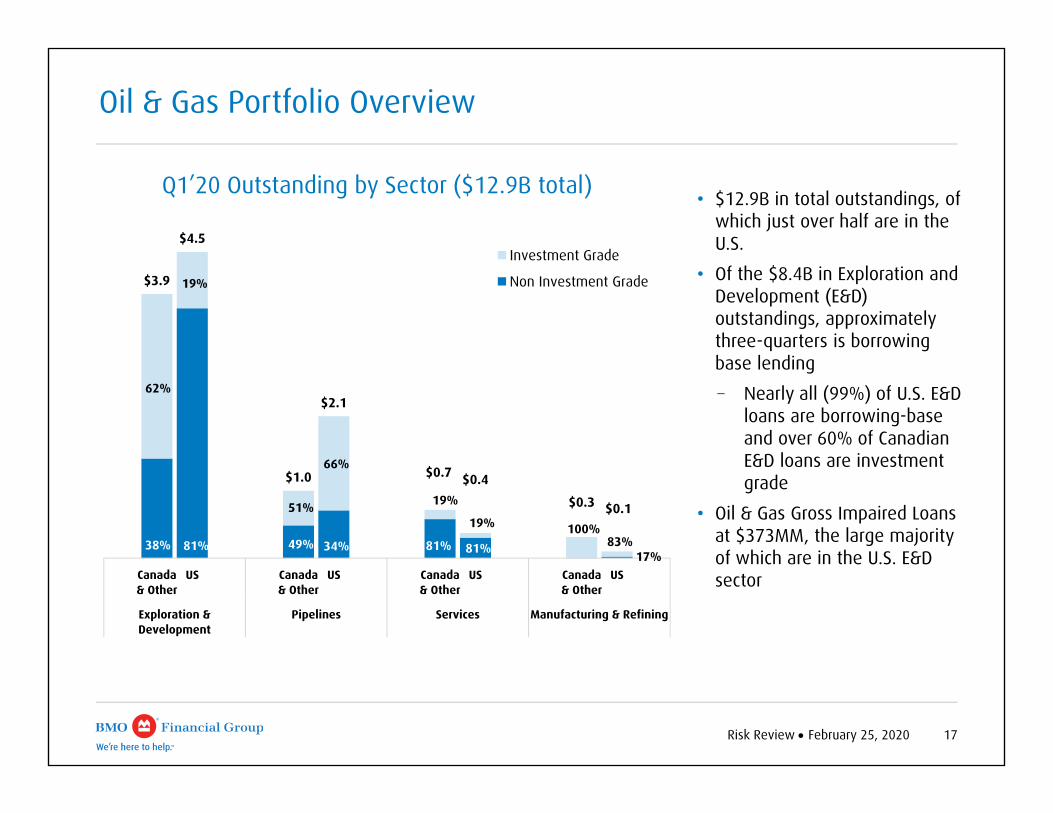
Oil & Gas Portfolio Overview
• $12.9B in total outstandings, of which just over half are in the U.S.
• Of the $8.4B in Exploration and Development (E&D) outstandings, approximately three-quarters is borrowing base lending
− Nearly all (99%) of U.S. E&D loans are borrowing-base and over 60% of Canadian E&D loans are investment grade
• Oil & Gas Gross Impaired Loans at $373MM, the large majority of which are in the U.S. E&D sector
$3.9
$4.5
$1.0
$2.1
$0.7 $0.4
$0.3 $0.1
38% 81% 49% 34% 81% 81%17%
62%
19%
51%
66%
19%
19% 100%83%
Canada& Other
US Canada& Other
US Canada& Other
US Canada& Other
US
Exploration &Development
Pipelines Services Manufacturing & Refining
Q1’20 Outstanding by Sector ($12.9B total)
Investment Grade
Non Investment Grade

Risk Review February 25, 2020 18
2,019 2,335 2,432 2,629 2,822
Q1'19 Q2'19 Q3'19 Q4'19 Q1'20
Gross Impaired Loans ($MM)
467741 679 799 831
Q1'19 Q2'19 Q3'19 Q4'19 Q1'20
Formations ($MM)
1 Total Business and Government includes $60MM GIL from Other Countries2 Other Business and Government includes industry segments that are each <1% of total GIL
• GIL ratio 62 bps, up 4 bps Q/Q
Gross Impaired Loans (GIL) and Formations
4853 55 58
62
Q1'19 Q2'19 Q3'19 Q4'19 Q1'20
GIL bps
By Industry($MM, as at Q1 20)
Formations Gross Impaired Loans
Canada & Other U.S. Total Canada &
Other1 U.S. Total
Consumer 205 54 259 479 383 862
Service Industries 10 77 87 113 264 377
Oil & Gas 49 93 142 59 314 373
Manufacturing 95 40 135 155 174 329
Agriculture 9 25 34 58 254 312
Transportation 3 49 52 8 156 164
Wholesale Trade 1 2 3 28 78 106
Retail Trade 29 3 32 46 41 87Construction (non-real estate) 1 52 53 9 71 80
Commercial Real Estate 9 2 11 48 12 60
Financial 13 0 13 19 20 39
Other Business and Government2 10 0 10 17 16 33
Total Business and Government 229 343 572 560 1,400 1,960
Total Bank 434 397 831 1,039 1,783 2,822
Risk Review February 25, 2020 19
1 Includes ~$11.2B from Other Countries2 Other Business and Government includes all industry segments that are each <2% of total loans
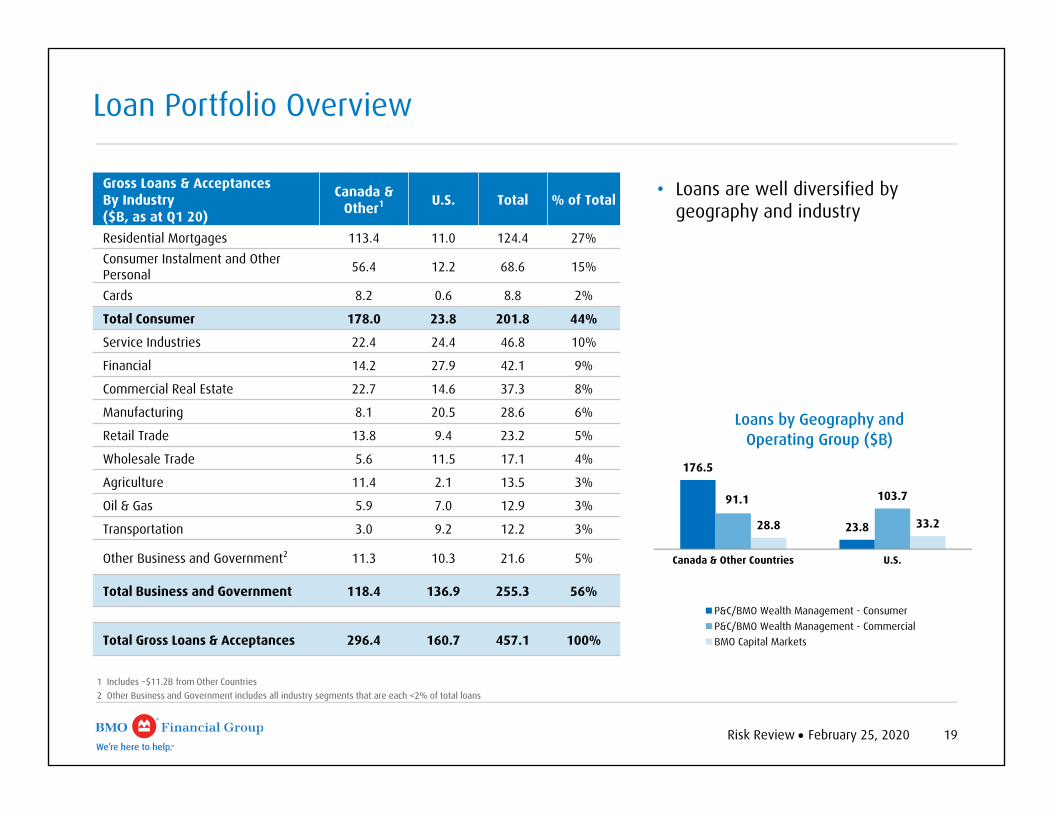
• Loans are well diversified by geography and industry
Loan Portfolio Overview
176.5
23.8
91.1 103.7
28.8 33.2
Canada & Other Countries U.S.
Loans by Geography and Operating Group ($B)
P&C/BMO Wealth Management - ConsumerP&C/BMO Wealth Management - CommercialBMO Capital Markets
Gross Loans & Acceptances By Industry($B, as at Q1 20)
Canada & Other1 U.S. Total % of Total
Residential Mortgages 113.4 11.0 124.4 27%Consumer Instalment and Other Personal 56.4 12.2 68.6 15%
Cards 8.2 0.6 8.8 2%
Total Consumer 178.0 23.8 201.8 44%
Service Industries 22.4 24.4 46.8 10%
Financial 14.2 27.9 42.1 9%
Commercial Real Estate 22.7 14.6 37.3 8%
Manufacturing 8.1 20.5 28.6 6%
Retail Trade 13.8 9.4 23.2 5%
Wholesale Trade 5.6 11.5 17.1 4%
Agriculture 11.4 2.1 13.5 3%
Oil & Gas 5.9 7.0 12.9 3%
Transportation 3.0 9.2 12.2 3%
Other Business and Government2 11.3 10.3 21.6 5%
Total Business and Government 118.4 136.9 255.3 56%
Total Gross Loans & Acceptances 296.4 160.7 457.1 100%

Appendix

21Financial Results February 25, 2020
75.5 84.6 86.7
8.8 9.2 9.4
46.0 47.6 48.2
100.1 102.0 103.1
Q1'19 Q4'19 Q1'20
Residential Mortgages Consumer LoansCredit Cards Commercial Loans & Acceptances
64.0 68.8 72.8
104.2 115.2 118.7
Q1'19 Q4'19 Q1'20Commercial Deposits Personal Deposits
Average Gross Loans & Acceptances ($B)
• Loans up 7% Y/Y – Proprietary channel residential mortgages and
amortizing HELOC loans up 6%– Commercial loans1 up 15%
• Deposits up 14% Y/Y – Personal deposits up 14%– Commercial deposits up 14%
168.2
184.0191.5
230.4243.4 247.4
1 Commercial lending excludes commercial and small business cards. Commercial and small business cards balances represented ~11% of total credit card portfolio in Q1’19 and Q4’19, ~12% in Q1’20
Average Deposits ($B)
Canadian Personal & Commercial Banking - Balances
22Financial Results February 25, 2020
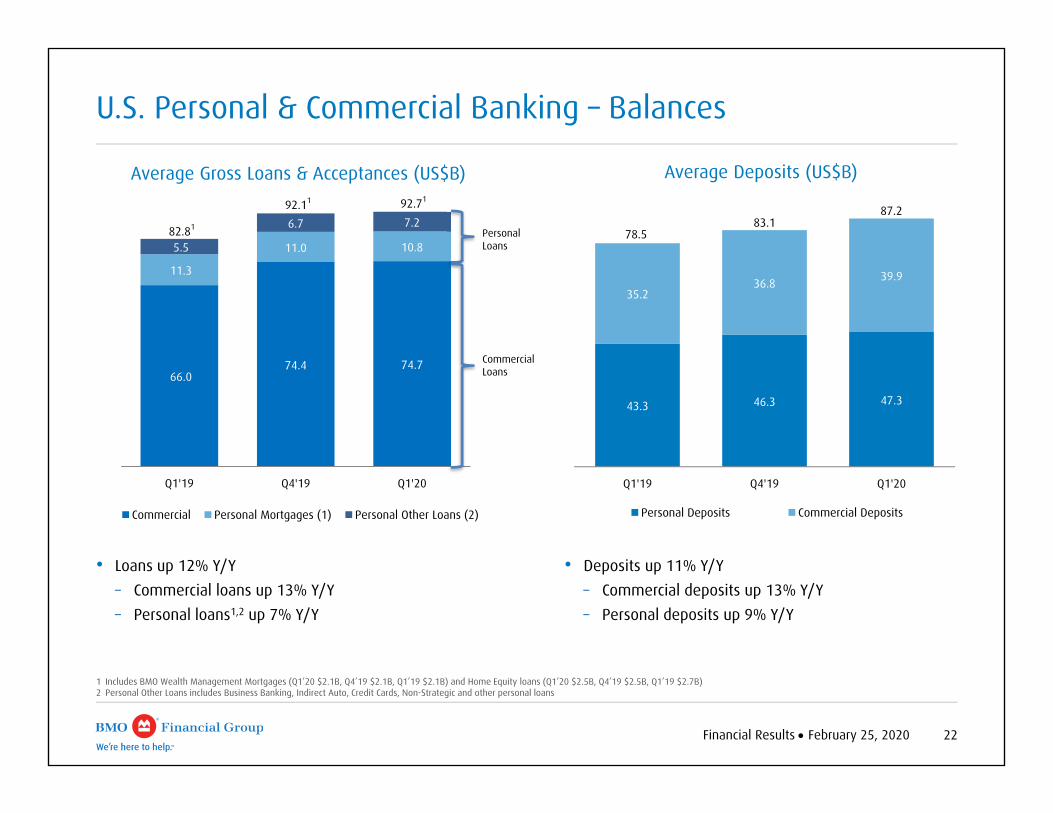
66.0 74.4 74.7
11.3
11.0 10.85.5
6.7 7.2
Q1'19 Q4'19 Q1'20
Commercial Personal Mortgages (1) Personal Other Loans (2)
92.71
82.81
92.11
43.3 46.3 47.3
35.236.8 39.9
Q1'19 Q4'19 Q1'20
Personal Deposits Commercial Deposits
78.583.1
87.2
Commercial Loans
Personal Loans
U.S. Personal & Commercial Banking – Balances
1 Includes BMO Wealth Management Mortgages (Q1’20 $2.1B, Q4’19 $2.1B, Q1’19 $2.1B) and Home Equity loans (Q1’20 $2.5B, Q4’19 $2.5B, Q1’19 $2.7B)2 Personal Other Loans includes Business Banking, Indirect Auto, Credit Cards, Non-Strategic and other personal loans
Average Gross Loans & Acceptances (US$B) Average Deposits (US$B)
• Deposits up 11% Y/Y – Commercial deposits up 13% Y/Y– Personal deposits up 9% Y/Y
• Loans up 12% Y/Y – Commercial loans up 13% Y/Y – Personal loans1,2 up 7% Y/Y
Risk Review February 25, 2020 23
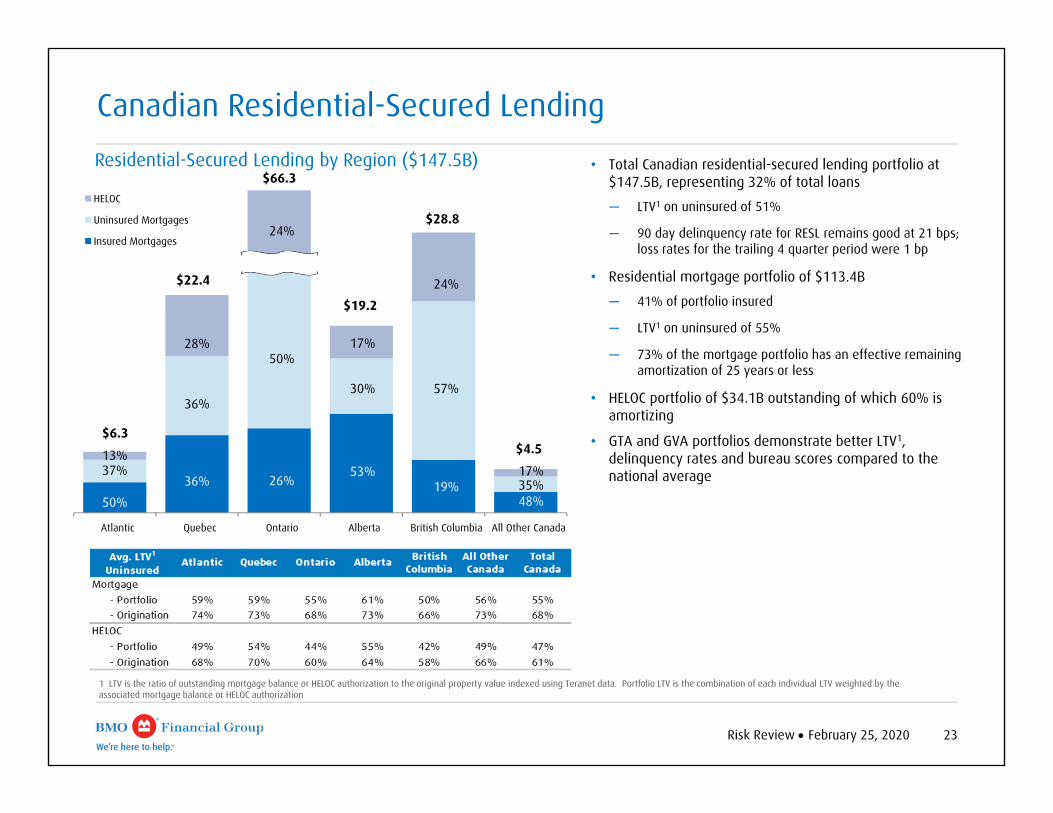
1 LTV is the ratio of outstanding mortgage balance or HELOC authorization to the original property value indexed using Teranet data. Portfolio LTV is the combination of each individual LTV weighted by the associated mortgage balance or HELOC authorization
$6.3
$22.4
$66.3
$19.2
$28.8
$4.5
50%36% 26%
53%19%
48%
37%
36%
50%
30% 57%
35%
13%
28%
24%
17%
24%
17%
Atlantic Quebec Ontario Alberta British Columbia All Other Canada
Residential-Secured Lending by Region ($147.5B)
HELOC
Uninsured Mortgages
Insured Mortgages
Canadian Residential-Secured Lending
• Total Canadian residential-secured lending portfolio at $147.5B, representing 32% of total loans
─ LTV1 on uninsured of 51%
─ 90 day delinquency rate for RESL remains good at 21 bps; loss rates for the trailing 4 quarter period were 1 bp
• Residential mortgage portfolio of $113.4B
─ 41% of portfolio insured
─ LTV1 on uninsured of 55%
─ 73% of the mortgage portfolio has an effective remaining amortization of 25 years or less
• HELOC portfolio of $34.1B outstanding of which 60% is amortizing
• GTA and GVA portfolios demonstrate better LTV1, delinquency rates and bureau scores compared to the national average
Risk Review February 25, 2020 24
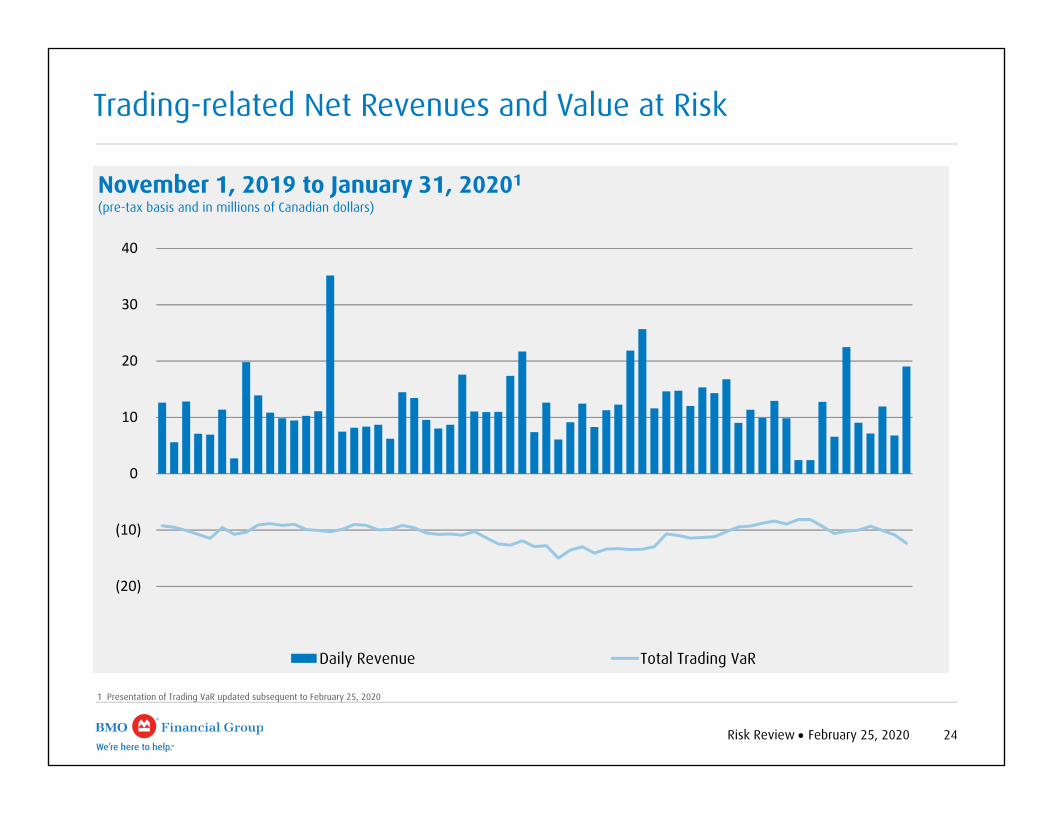
Trading-related Net Revenues and Value at Risk
(20)
(10)
0
10
20
30
40
November 1, 2019 to January 31, 20201
(pre-tax basis and in millions of Canadian dollars)
Daily Revenue Total Trading VaR
1 Presentation of Trading VaR updated subsequent to February 25, 2020

25Financial Results February 25, 2020
1 Adjusted measures are non-GAAP measures, see slide 2 for more information2 KGS–Alpha and Clearpool acquisition integration costs are reported in BMO Capital Markets. Acquisition integration costs are recorded in non-interest expense3 These amounts were charged to the non-interest expense of the operating groups4 Q4’19 reported net income included a restructuring charge of $357 million after-tax ($484 million pre-tax), related to severance and a small amount of real estate-related costs, to continue to improve efficiency,
including accelerating delivery against key bank-wide initiatives focused on digitization, organizational redesign and simplification of the way we do business. Restructuring costs are included in non-interest expense in Corporate Services
5 Q4’19 reported net income included a reinsurance adjustment of $25 million (pre-tax and after-tax) in commissions and changes in policy benefit liabilities for the net impact of major reinsurance claims from Japanese typhoons that were incurred after our announced decision to wind down our reinsurance business. This reinsurance adjustment is included in BMO Wealth Management
Adjusting items1 - Pre-tax ($MM) Q1 20 Q4 19 Q1 19
Acquisition integration costs2 (3) (2) (6)
Amortization of acquisition-related intangible assets3 (29) (38) (31)
Restructuring costs4 - (484) -
Reinsurance adjustment5 - (25) -
Adjusting items included in reported pre-tax income (32) (549) (37)
Adjusting items1 - After-tax ($MM) Q1 20 Q4 19 Q1 19
Acquisition integration costs2 (2) (2) (4)
Amortization of acquisition-related intangible assets3 (23) (29) (24)
Restructuring costs4 - (357) -
Reinsurance adjustment5 - (25) -
Adjusting items included in reported net income after tax (25) (413) (28)
Impact on diluted EPS ($) (0.04) (0.65) (0.04)
Adjusting Items

Investor RelationsContact Informationbmo.com/investorrelationsE-mail: [email protected]
JILL HOMENUKHead, Investor [email protected]
BMO Financial Group