for the year ended 31 august 2016 of queensland limited fy16 results presentation focus on niche...
TRANSCRIPT

Bank of Queensland Limited ABN 32 009 656 740. AFSL No 244616.
FOR THE YEAR ENDED 31 AUGUST 2016

Bank of Queensland Limited FY16 Results Presentation
JON SUTTON
Managing Director & CEO
ANTHONY ROSE
Chief Financial Officer
JON SUTTON
Managing Director & CEO

Bank of Queensland Limited FY16 Results Presentation
Focus on niche segments that value a more intimate customer relationship
Vision …
Strategy …
Strategic
pillars …
Customer in charge Grow the right wayThere’s always a
better wayLoved like no other
Target
segments …
Retail banking
Heartland
Business banking
SME
Mid-market
Property
Niche
Medical & Dental
Agribusiness
Retirement living
Hospitality &
Tourism
Asset-
Intensive
Franchising
Aussie Achievers
Today’s Families
Leading Lifestyles
Metro-techs
Making it easier for
our customers to deal
with us in the way
they prefer
Getting the right
balance between risk
and return
Having efficient
systems and
processes
Improving our talent,
capability and culture

Bank of Queensland Limited FY16 Results Presentation
Increased profit in a changing operating environment
Niche specialist businesses delivering strong results
Strong asset quality
Significant focus on productivity and deposits
Progressing well with execution of strategy
Bank of Queensland Limited FY16 Results Presentation
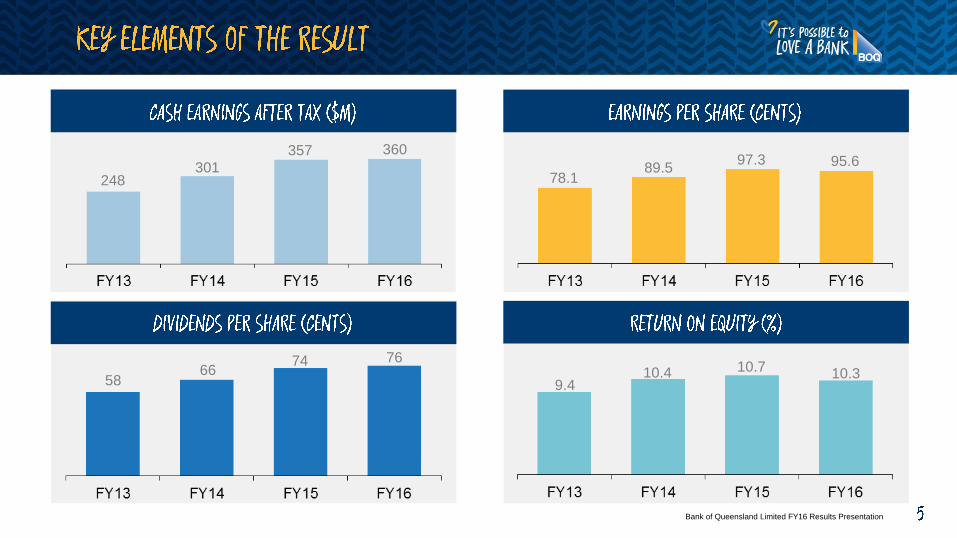
78.189.5
97.3 95.6
5866
74 76
248301
357 360
9.410.4 10.7 10.3

Bank of Queensland Limited FY16 Results Presentation(1) FY14 excludes the addition of the BOQ Specialist portfolio
115
86 74 67
44.3 43.946.0 46.8
1.691.82
1.97 1.94
742581
2,5492,177

Bank of Queensland Limited FY16 Results Presentation
• Mortgage product launched in May with ~800 brokers now accredited
• Next evolution to be deposit products
• Growth in credit card book & insurance products demonstrate power of the brand
• Commercial loan book growth 13%
• High margin business
• Benign loss experience continues
• Housing loan book growth of $1.5bn
• High quality residential loan portfolio
• Portfolio growth of 3% in a flat market
• Focus on higher margin business
• Impairment expense within expected range
• Bankers and credit teams aligned to target segments
• Growing above system – total niche business segment growth of $500m in FY16 or 16%

Bank of Queensland Limited FY16 Results Presentation
• The business is now much better placed to operate sustainably through the inevitable economic cycles
• 65% of housing loans written from FY13 onwards, under more conservative risk settings
• Limited exposure to apartment development hotspots
• Sound risk management has meant no significant impact to overall portfolio from mining and regional QLD downturn
(1) Excludes BOQ Specialist
(2) Includes BOQ Specialist from FY14
90DPD
30DPD
FY16FY13

Bank of Queensland Limited FY16 Results Presentation
• Revenue under pressure across the sector – lower credit growth and ‘lower for longer’ interest rate environment
• Net Interest Margin impacted by market dynamics post-May RBA cut: lower yield curve and higher TD spreads
• Prioritised margin over growth in 2H16
• Retail network increased emphasis on deposit growth in 2H16
(1) Excludes Consumer lending
69% 66% 68%
Retail
Commercial &
BOQ Finance
613
2,5672,197
Housing
settlements
Acquisition NIM
Bank of Queensland Limited FY16 Results Presentation
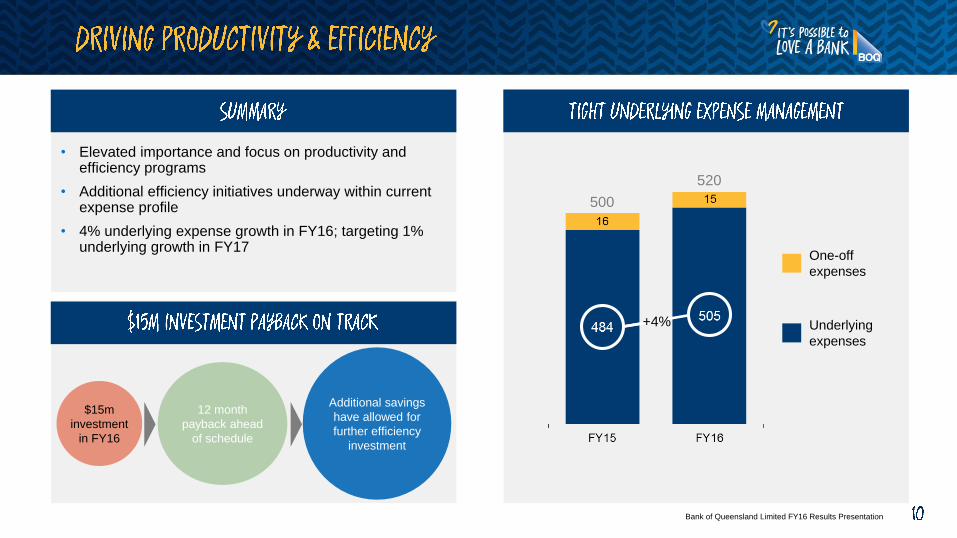
$15m
investment
in FY16
12 month
payback ahead
of schedule
Additional savings
have allowed for
further efficiency
investment
500
520
+4%
• Elevated importance and focus on productivity and efficiency programs
• Additional efficiency initiatives underway within current expense profile
• 4% underlying expense growth in FY16; targeting 1% underlying growth in FY17
Underlying
expenses
One-off
expenses

Bank of Queensland Limited FY16 Results Presentation
FY16 priorities
Customer in charge
1. Expand BOQ accredited brokers to 4,000
2. Roll out Virgin Money mortgage product
3. Digital enablement
4. Ongoing branch network optimisation
Grow the right way
1. Continue to increase customer deposits
2. Maintain discipline in pricing and credit quality
3. Grow specialist niches
There’s always a better way
1. Roll out new Lending origination system
2. Utilising data analytics
3. Continue to invest in risk foundations
Loved like no other
1. Instil sales and service culture
2. Invest in leadership and talent
3. Build diversity
Strategic pillar FY16 progress
Achieved Achieved & ongoing In progressLegend:

Bank of Queensland Limited ABN 32 009 656 740. AFSL No 244616.
ANTHONY ROSE
Chief Financial Officer
Bank of Queensland Limited FY16 Results Presentation
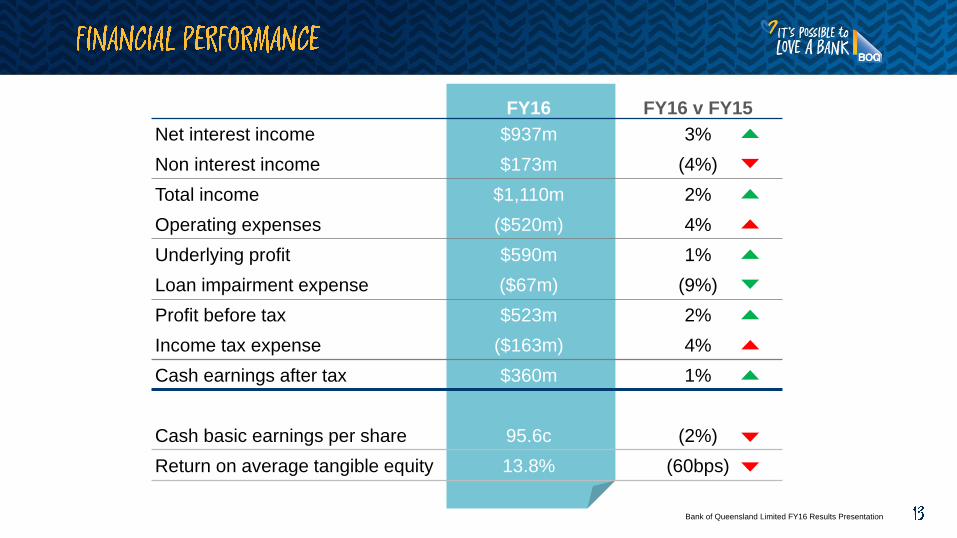
FY16 FY16 v FY15
Net interest income $937m 3%
Non interest income $173m (4%)
Total income $1,110m 2%
Operating expenses ($520m) 4%
Underlying profit $590m 1%
Loan impairment expense ($67m) (9%)
Profit before tax $523m 2%
Income tax expense ($163m) 4%
Cash earnings after tax $360m 1%
Cash basic earnings per share 95.6c (2%)
Return on average tangible equity 13.8% (60bps)
Bank of Queensland Limited FY16 Results Presentation
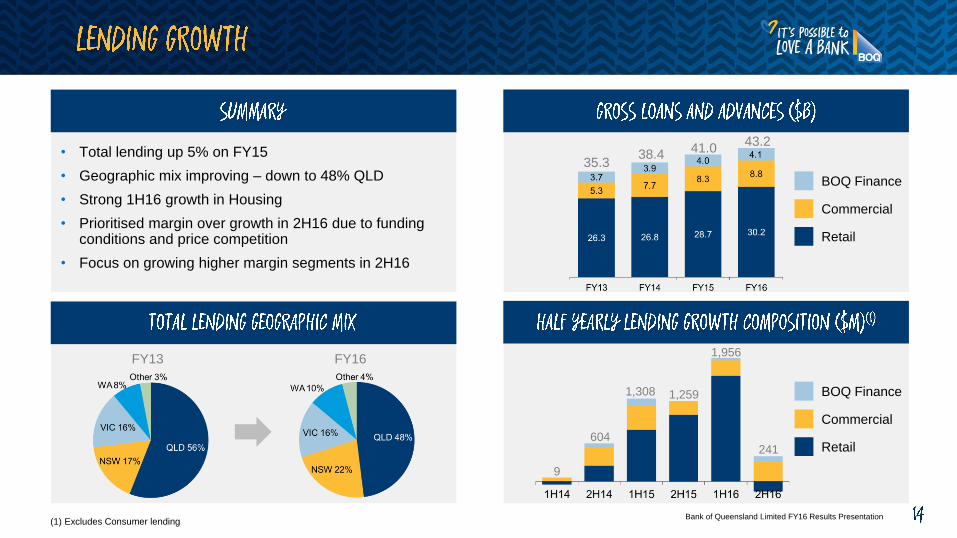
• Total lending up 5% on FY15
• Geographic mix improving – down to 48% QLD
• Strong 1H16 growth in Housing
• Prioritised margin over growth in 2H16 due to funding conditions and price competition
• Focus on growing higher margin segments in 2H16
35.338.4
41.043.2
9
604
1,308 1,259
1,956
241
(1) Excludes Consumer lending
Retail
Commercial
BOQ Finance
Retail
Commercial
BOQ Finance
FY16FY13

Bank of Queensland Limited FY16 Results Presentation
• BOQ Specialist delivered strong contribution
• Branch network remains consistent source of settlements
• Industry wide increase in refinancing activity
• Broker solid growth in 1H16 but slowed significantly in 2H16 with less competitive new business pricing
(49)248
8131,056
1,671
(160)
OMB
Corporate
BOQ
Specialist
Broker
BOQ
Housing
BOQ Specialist
Housing
FY16FY13
2H16

Bank of Queensland Limited FY16 Results Presentation
• Solid contribution from Business Banking niche segments
• BOQ Specialist & BOQ Finance performing well
• Lower quality business running off, being replaced by higher quality business
58
356
495
203
286
401
BOQ
Commercial
BOQ Specialist
Commercial
BOQ Finance
FY16FY13
Retirement
living growth
of 150% to
~$300m
Medical & Dental
growth of 13%
to $2.7bn

Bank of Queensland Limited FY16 Results Presentation
• $2.2bn in lending growth funded by deposits with transaction account growth of $320m
• Limited wholesale market issuance required to meet upcoming maturities
• Deposit to Loan ratio 68%
43.5 43.4 45.4 46.1
9.38.6
9.1 9.1
Customer
Deposits
Wholesale
Deposits
Long Term
Wholesale
BOQ Sub-
Debt/CPS
Securitisation
Senior
Unsecured
FY16FY15

Bank of Queensland Limited FY16 Results Presentation
Average reinvestment
differential (3.25%) in FY16
33bps average from Dec to Aug
20bps long term average
(1) Source: Bloomberg
(2) Spreads above 3-mth bank accepted bills, using average industry term deposit rates. Source: RBA
(3) Source: RBA
Rate differential
Reinvestment
rate
Run-off rate
Average
TD rate
spread
Average
TD special
spread
Bank of Queensland Limited FY16 Results Presentation
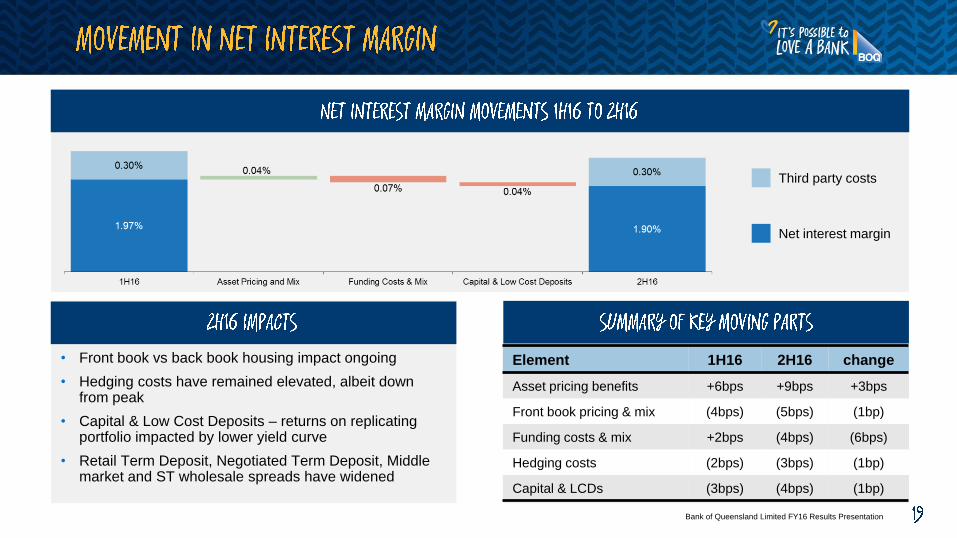
• Front book vs back book housing impact ongoing
• Hedging costs have remained elevated, albeit down from peak
• Capital & Low Cost Deposits – returns on replicating portfolio impacted by lower yield curve
• Retail Term Deposit, Negotiated Term Deposit, Middle market and ST wholesale spreads have widened
Element 1H16 2H16 change
Asset pricing benefits +6bps +9bps +3bps
Front book pricing & mix (4bps) (5bps) (1bp)
Funding costs & mix +2bps (4bps) (6bps)
Hedging costs (2bps) (3bps) (1bp)
Capital & LCDs (3bps) (4bps) (1bp)
Net interest margin
Third party costs

Bank of Queensland Limited FY16 Results Presentation
162 169 180 17384
9685 88
• Good performance in BOQ Finance equipment sales assisted ‘Other’ income
• Customer shift to lower fee products such as Clear Path mortgage product
• Change in interchange fee arrangements reduced result by $4m
• St Andrew’s Insurance transitioning to new agreement and product mix as expected; claims levels in line with expectations
Banking
Other
Insurance
Trading
Income
Banking
Other
Insurance
Trading
Income
Bank of Queensland Limited FY16 Results Presentation
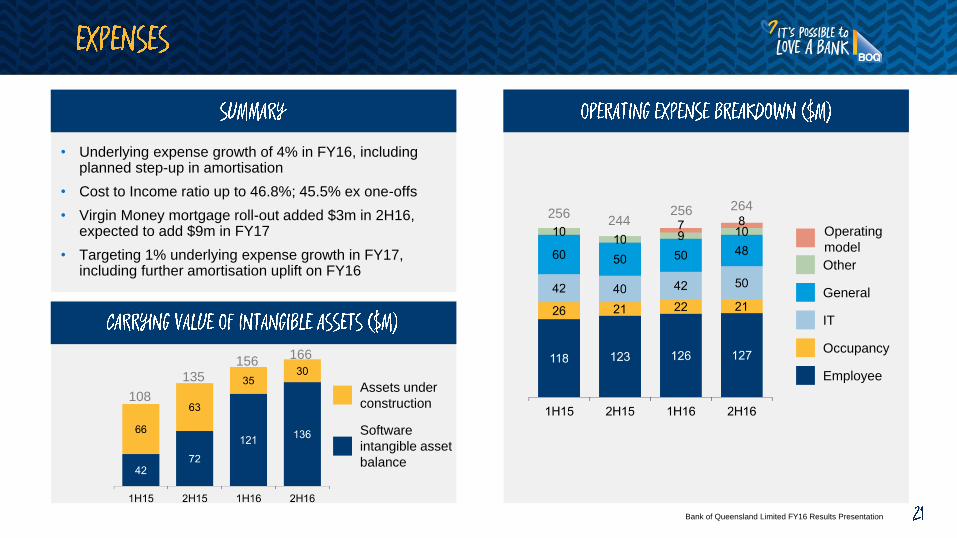
• Underlying expense growth of 4% in FY16, including planned step-up in amortisation
• Cost to Income ratio up to 46.8%; 45.5% ex one-offs
• Virgin Money mortgage roll-out added $3m in 2H16, expected to add $9m in FY17
• Targeting 1% underlying expense growth in FY17, including further amortisation uplift on FY16
256244
256 264
156166
135
108
Employee
Occupancy
IT
General
Other
Operating
model
Software
intangible asset
balance
Assets under
construction

Bank of Queensland Limited FY16 Results Presentation
• Continued improvement in asset quality
• Commercial portfolio performance in 2H16 particularly pleasing; no new impaired assets >$5m
• Retail portfolio benefiting from mix impact of new BOQ Specialist housing loans
8274
8680
259237 240 232
Commercial
Retail
BOQ Finance
Exposure > $10m
Exposure > $5m
to $10m
Exposure < $5m
Commercial
BOQ Finance
Group Total
Retail

Bank of Queensland Limited FY16 Results Presentation
• Improving trends across all portfolios
• BOQ Specialist growth contributing to improvement
• BOQ Finance impacted by QLD & WA downturn in particular
(1) Includes BOQ Specialist
(2) Housing excluding Lines of Credit

Bank of Queensland Limited FY16 Results Presentation
• Capital position compares well against peers, particularly given BOQ’s more conservative risk weightings
• Basel 4 should level the playing field further; Potential upside in SME risk weights
• Good progress made towards advanced accreditation if size of the prize warrants accelerating that step
(1) Based on most recent Pro-forma CET1 figures published by peers
Lower risk weights for
SME & Leasing books
Capital floor for
advanced banks
>70% capital floor
would help close the
gap between advanced
& standardised
Increases BOQ’s CET1
ratio and improves
returns on SME lending
Underlying capital
generation 22bps

Bank of Queensland Limited FY16 Results Presentation
Credit policy framework
Credit models
Collective Provision/GRCL
Lending origination systems
Operating model & framework
Governance framework implementation
Incident management system
Asset Liability Management (ALM) System
Policy review & governance framework
Integration of Funds Transfer Pricing (FTP) into ALM
Risk appetite statements
Compliance gateways & Risk KPIs
Credit risk
Operational
risk
Market risk
Enterprise
management
Initiatives in place
Applic
ation
for A
dva
nced

Bank of Queensland Limited ABN 32 009 656 740. AFSL No 244616.
JON SUTTON
Managing Director & CEO

Bank of Queensland Limited FY16 Results Presentation
Economic
Industry
• Low interest rates and low unemployment supporting
economic growth
• QLD benefiting from tourism
• Mining investment downturn impacting some regions
• Lower credit growth
• ROE impacted by lower for longer interest rates
• Conduct and culture focus
• Rapidly changing customer expectations
Regulatory
• Revised standardised approach
• Capital floor for advanced banks
• Staged approach to advanced accreditation
• Net Stable Funding Ratio
Bank of Queensland Limited FY16 Results Presentation
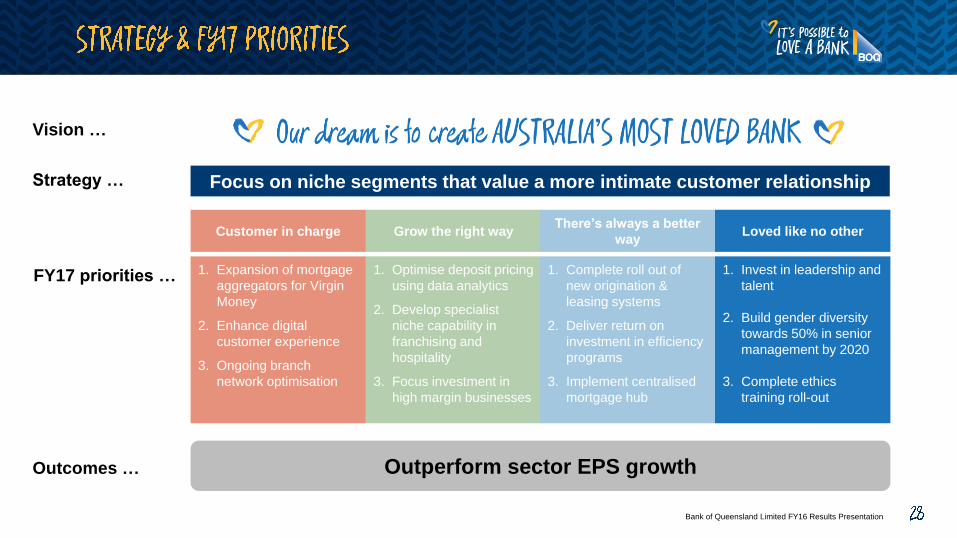
Focus on niche segments that value a more intimate customer relationship
Vision …
Strategy …
FY17 priorities …
Customer in charge
1. Expansion of mortgage
aggregators for Virgin
Money
2. Enhance digital
customer experience
3. Ongoing branch
network optimisation
Grow the right way
1. Optimise deposit pricing
using data analytics
2. Develop specialist
niche capability in
franchising and
hospitality
3. Focus investment in
high margin businesses
There’s always a better
way
1. Complete roll out of
new origination &
leasing systems
2. Deliver return on
investment in efficiency
programs
3. Implement centralised
mortgage hub
Loved like no other
1. Invest in leadership and
talent
2. Build gender diversity
towards 50% in senior
management by 2020
3. Complete ethics
training roll-out
Outperform sector EPS growthOutcomes …

Bank of Queensland Limited FY16 Results Presentation
Subdued revenue growth across the industry to persist
Focus on growing in high margin segments
Maintain risk discipline
Deliver additional efficiency program benefits
Continue with execution of strategy

Bank of Queensland Limited ABN 32 009 656 740. AFSL No 244616.
FOR THE YEAR ENDED 31 AUGUST 2016

Bank of Queensland Limited ABN 32 009 656 740. AFSL No 244616.

Bank of Queensland Limited FY16 Results Presentation
• Quality continues to improve under revised risk appetite
• Higher proportion of fixed rate lending in FY16
• Line of credit portfolio continues to reduce
Metrics (%) 2H15 1H16 2H16
Owner occupied 58 57 58
Investment 42 43 42
Broker originated 6 7 8
Weighted avg LVR 65 62 63
Line of Credit 11 10 9
Avg loan balance $258k $258k $262k
Variable rate 81 77 75
Fixed rate 19 23 25
Metrics (%) 2H15 1H16 2H16
Owner occupied 63 56 59
Investment 37 44 41
Broker originated 14 19 15
Weighted avg LVR 68 68 67
Line of Credit 4 3 3
Avg loan balance $354k $356k $376k
Variable rate 75 56 69
Fixed rate 25 41 31
90%+
80-90%
60-80%
40-60%
Less than 40%

Bank of Queensland Limited FY16 Results Presentation
QLD
VIC
TAS
NT
WA
587
446
Completion 2017
Completion 2016
Apartment construction exposures(1)
• $215m current exposure to residential
construction
• 30 developments across 3 states, majority
completing 2016 through 2017
• Highest concentration in VIC and NSW,
well diversified intra-state
Regional Housing exposures
• No material regional housing exposures
Regional Commercial & Leasing exposures
• No systemic issues emerging
• Direct mining industry exposure ~$110m
NSW
SA
Limit - $186m
Exposure -
$95m
# Apts - 639
Limit - $99m
Exposure -
$70m
# Apts - 296
Limit - $131m
Exposure -
$51m
# Apts - 433
65
68
313 252
107
24%
44%
32%
ConcentrationLending to residential apartment construction
# Apartments
228
261
335 Completion 2018
(1) Projects over $5m. Data as at 30 September 2016
74
Bank of Queensland Limited FY16 Results Presentation
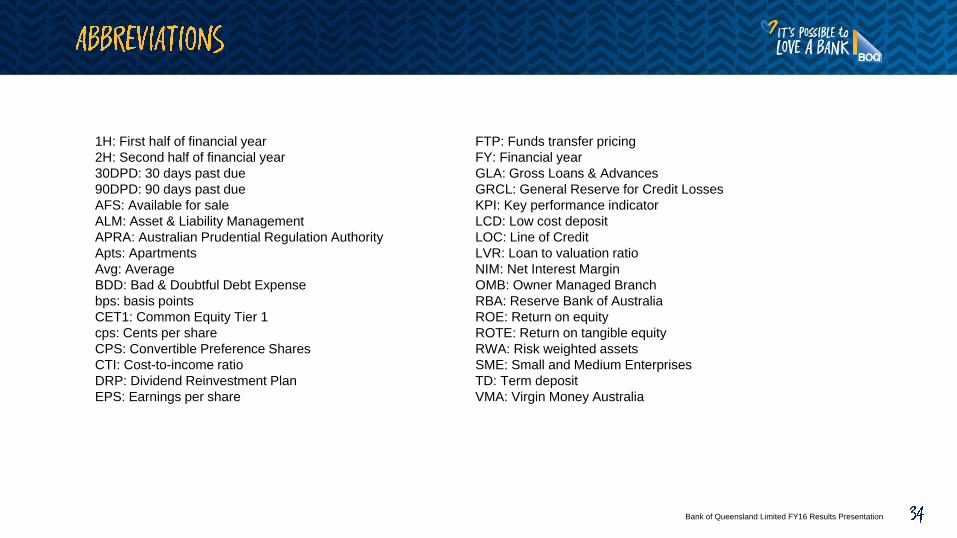
1H: First half of financial year
2H: Second half of financial year
30DPD: 30 days past due
90DPD: 90 days past due
AFS: Available for sale
ALM: Asset & Liability Management
APRA: Australian Prudential Regulation Authority
Apts: Apartments
Avg: Average
BDD: Bad & Doubtful Debt Expense
bps: basis points
CET1: Common Equity Tier 1
cps: Cents per share
CPS: Convertible Preference Shares
CTI: Cost-to-income ratio
DRP: Dividend Reinvestment Plan
EPS: Earnings per share
FTP: Funds transfer pricing
FY: Financial year
GLA: Gross Loans & Advances
GRCL: General Reserve for Credit Losses
KPI: Key performance indicator
LCD: Low cost deposit
LOC: Line of Credit
LVR: Loan to valuation ratio
NIM: Net Interest Margin
OMB: Owner Managed Branch
RBA: Reserve Bank of Australia
ROE: Return on equity
ROTE: Return on tangible equity
RWA: Risk weighted assets
SME: Small and Medium Enterprises
TD: Term deposit
VMA: Virgin Money Australia

Bank of Queensland Limited FY16 Results Presentation
This is a presentation of general background information about Bank of Queensland Limited’s (BOQ’s) activities at the
date of this document. It is in summary form and does not purport to be complete. It should be read in conjunction with
the BOQ’s other periodic and continuous disclosure announcements. All figures are presented on a cash earnings basis
unless otherwise stated.
The information contained in this presentation may include information derived from publicly available sources that has not
been independently verified. BOQ does not warrant the accuracy, completeness or reliability of the information contained
in this presentation or any assumptions on which it is based.
This presentation is not financial product advice and does not take into account the investment objectives, financial
situation or particular needs of any individual investors. These should be considered, with or without professional advice,
before deciding if an investment in BOQ is appropriate.
This presentation may contain forward-looking statements about BOQ’s business and operations, market conditions,
results of operations and financial condition, capital adequacy and risk management practices which reflect BOQ’s views
held as at the date of this document.
Forward-looking statements are not guarantees of future performance and involve known and unknown risks, uncertainties
and other factors, many of which are beyond the control of BOQ and which may cause actual results to differ materially
from those expressed or implied in such statements. Readers are cautioned not to place undue reliance on any forward-
looking statements. Actual results or performance may vary from those expressed in, or implied by, any forward-looking
statements. BOQ does not undertake to update any forward-looking statements contained in this document, subject to
disclosure requirements applicable to it.