ford motor credit company llccredit.ford.com/webcontent/investorcenter/q1_2011_10q.pdf · 2 part i....
TRANSCRIPT
1
UNITED STATES SECURITIES AND EXCHANGE COMMISSION
Washington, D.C. 20549
_______________
FORM 10-Q (Mark One) [X] QUARTERLY REPORT PURSUANT TO SECTION 13 OR 15(d)
OF THE SECURITIES EXCHANGE ACT OF 1934
For the quarterly period ended March 31, 2011 OR
[ ] TRANSITION REPORT PURSUANT TO SECTION 13 OR 15(d) OF THE SECURITIES EXCHANGE ACT OF 1934
For the transition period from ____________________ to ____________________
Commission file number 1-6368
Ford Motor Credit Company LLC (Exact name of registrant as specified in its charter)
Delaware 38-1612444 (State of organization) (I.R.S. employer identification no.)
One American Road, Dearborn, Michigan 48126 (Address of principal executive offices) (Zip code)
Registrant’s telephone number, including area code (313) 322-3000
Indicate by check mark whether the registrant (1) has filed all reports required to be filed by Section 13 or 15(d) of the Securities Exchange Act of 1934 during the preceding 12 months (or for such shorter period that the registrant was required to file such reports), and (2) has been subject to such filing requirements for the past 90 days. � Yes � No
Indicate by check mark whether the registrant has submitted electronically and posted on its Web site, if any, every Interactive Data File required to be submitted and posted pursuant to Rule 405 of Regulation S-T (§ 232.405 of this chapter) during the preceding 12 months (or for such shorter period that the registrant was required to submit and post such files). � Yes � No
Indicate by check mark whether the registrant is a large accelerated filer, an accelerated filer, a non-accelerated filer, or a smaller reporting company. See the definitions of “large accelerated filer,” “accelerated filer” and “smaller reporting company” in Rule 12b-2 of the Exchange Act. (Check one):
Large accelerated filer � Accelerated filer � Non-accelerated filer � Smaller reporting company � (Do not check if a smaller reporting company)
Indicate by check mark whether the registrant is a shell company (as defined in Rule 12b-2 of the Act). � Yes � No
All of the limited liability company interests in the registrant (“Shares”) are held by an affiliate of the registrant. None of the Shares are publicly traded.
REDUCED DISCLOSURE FORMAT
The registrant meets the conditions set forth in General Instruction H(1)(a) and (b) of Form 10-Q and is
therefore filing this Form with the reduced disclosure format.
EXHIBIT INDEX APPEARS AT PAGE 67
2
PART I. FINANCIAL INFORMATION
ITEM 1. FINANCIAL STATEMENTS
FORD MOTOR CREDIT COMPANY LLC AND SUBSIDIARIES
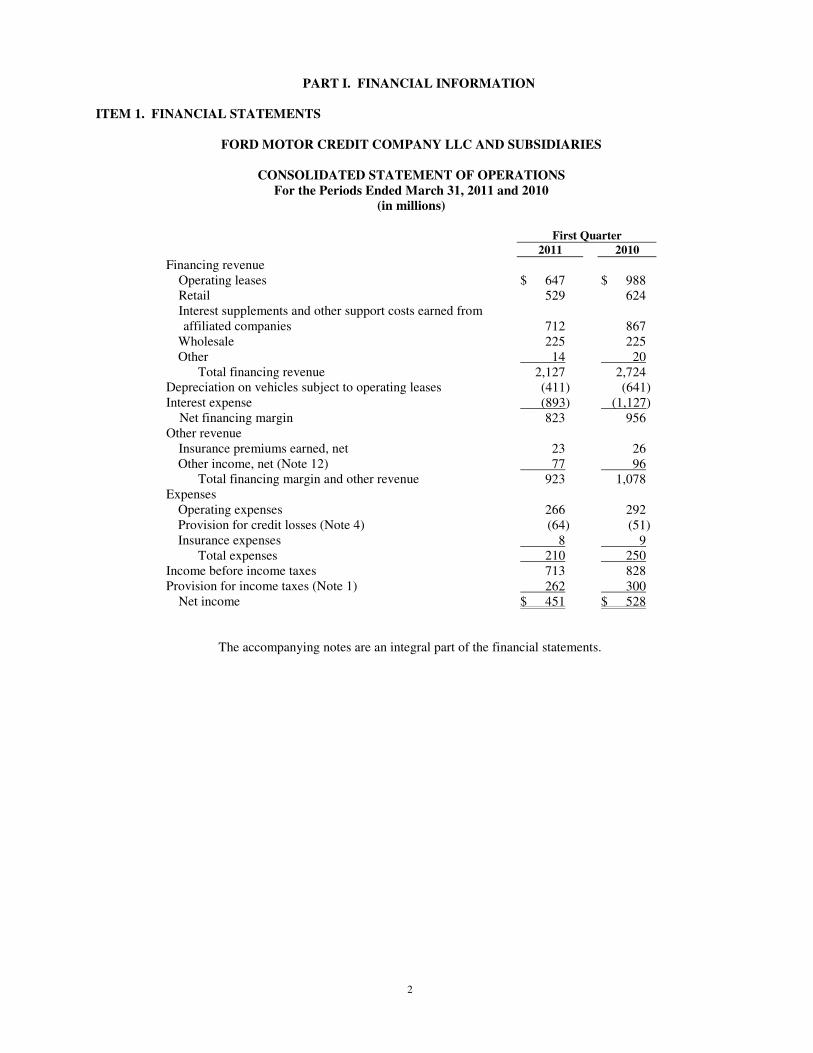
CONSOLIDATED STATEMENT OF OPERATIONS
For the Periods Ended March 31, 2011 and 2010
(in millions)
First Quarter 2011 2010
Financing revenue Operating leases $ 647 $ 988 Retail 529 624 Interest supplements and other support costs earned from affiliated companies 712
867
Wholesale 225 225 Other 14 20
Total financing revenue 2,127 2,724 Depreciation on vehicles subject to operating leases (411) (641) Interest expense (893) (1,127)
Net financing margin 823 956 Other revenue
Insurance premiums earned, net 23 26 Other income, net (Note 12) 77 96
Total financing margin and other revenue 923 1,078 Expenses
Operating expenses 266 292 Provision for credit losses (Note 4) (64) (51) Insurance expenses 8 9
Total expenses 210 250 Income before income taxes 713 828 Provision for income taxes (Note 1) 262 300
Net income $ 451 $ 528
The accompanying notes are an integral part of the financial statements.
3
Item 1. Financial Statements (Continued)
FORD MOTOR CREDIT COMPANY LLC AND SUBSIDIARIES
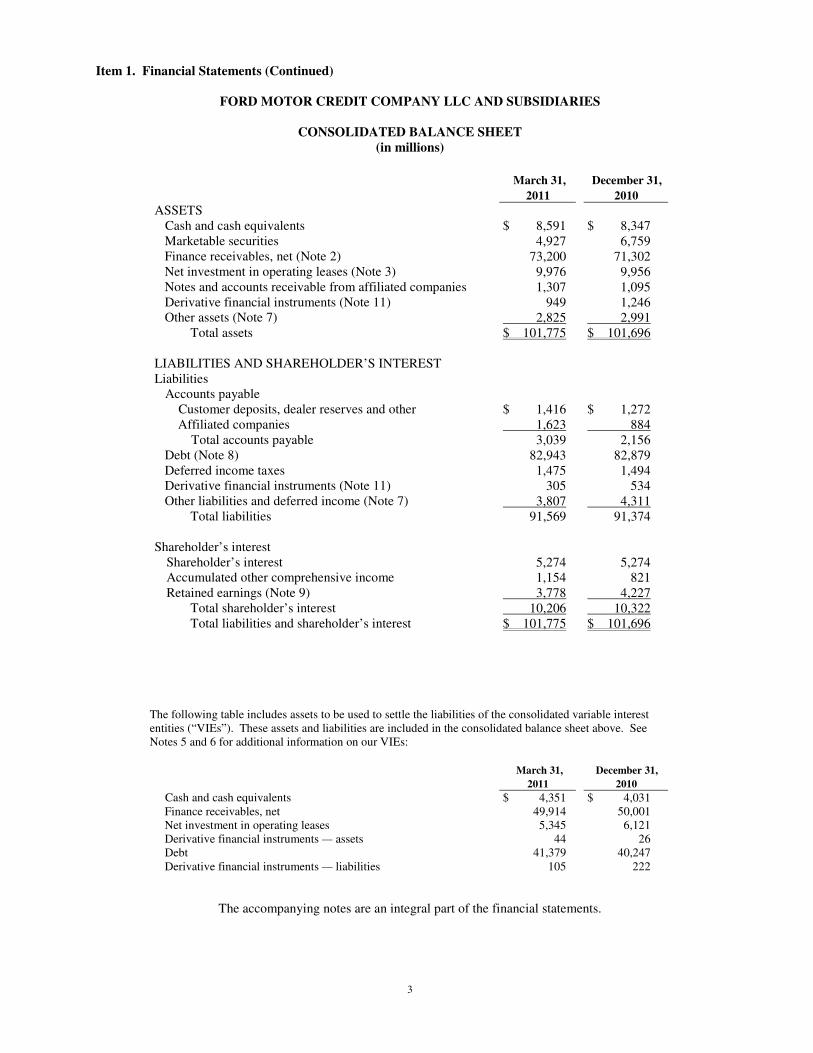
CONSOLIDATED BALANCE SHEET
(in millions)
March 31, December 31,
2011 2010
ASSETS Cash and cash equivalents $ 8,591 $ 8,347 Marketable securities 4,927 6,759 Finance receivables, net (Note 2) 73,200 71,302 Net investment in operating leases (Note 3) 9,976 9,956 Notes and accounts receivable from affiliated companies 1,307 1,095 Derivative financial instruments (Note 11) 949 1,246 Other assets (Note 7) 2,825 2,991
Total assets $ 101,775 $ 101,696
LIABILITIES AND SHAREHOLDER’S INTEREST Liabilities
Accounts payable Customer deposits, dealer reserves and other $ 1,416 $ 1,272 Affiliated companies 1,623 884
Total accounts payable 3,039 2,156 Debt (Note 8) 82,943 82,879 Deferred income taxes 1,475 1,494 Derivative financial instruments (Note 11) 305 534 Other liabilities and deferred income (Note 7) 3,807 4,311
Total liabilities 91,569 91,374
Shareholder’s interest Shareholder’s interest 5,274 5,274 Accumulated other comprehensive income 1,154 821 Retained earnings (Note 9) 3,778 4,227
Total shareholder’s interest 10,206 10,322 Total liabilities and shareholder’s interest $ 101,775 $ 101,696
The following table includes assets to be used to settle the liabilities of the consolidated variable interest entities (“VIEs”). These assets and liabilities are included in the consolidated balance sheet above. See Notes 5 and 6 for additional information on our VIEs: March 31, December 31,
2011 2010
Cash and cash equivalents $ 4,351 $ 4,031 Finance receivables, net 49,914 50,001 Net investment in operating leases 5,345 6,121 Derivative financial instruments — assets 44 26 Debt 41,379 40,247 Derivative financial instruments — liabilities 105 222
The accompanying notes are an integral part of the financial statements.
4
Item 1. Financial Statements (Continued)
FORD MOTOR CREDIT COMPANY LLC AND SUBSIDIARIES
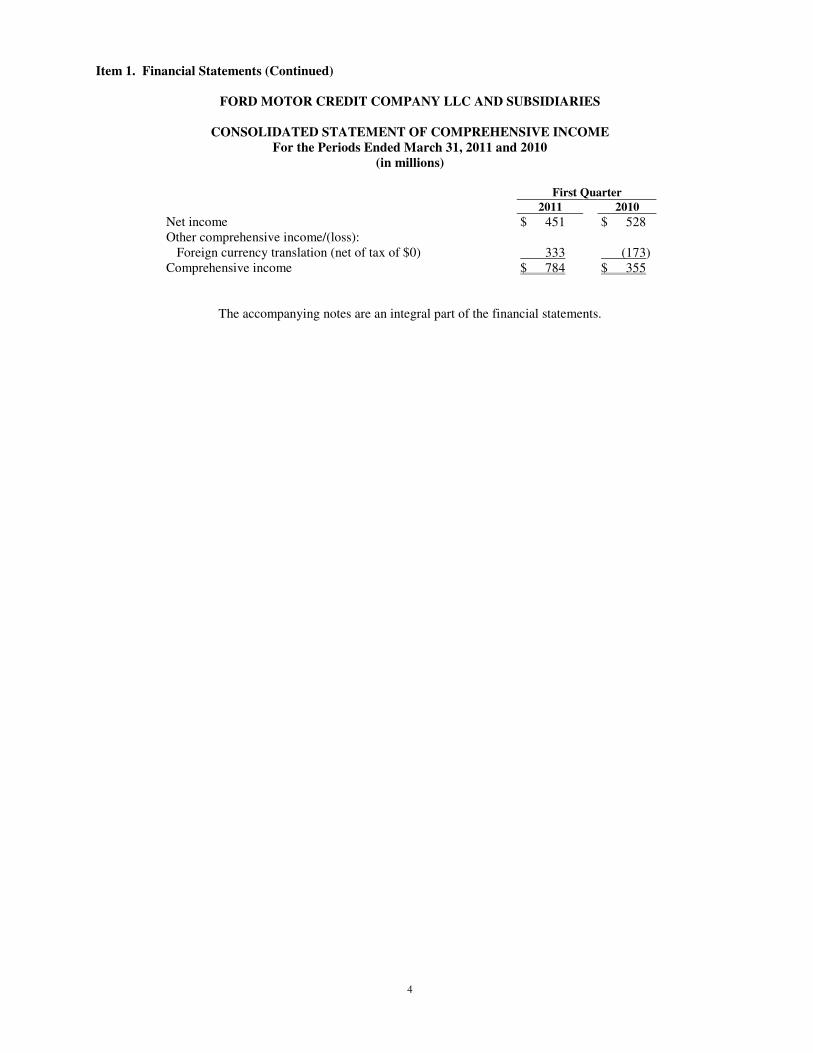
CONSOLIDATED STATEMENT OF COMPREHENSIVE INCOME
For the Periods Ended March 31, 2011 and 2010
(in millions)
First Quarter 2011 2010
Net income $ 451 $ 528 Other comprehensive income/(loss):
Foreign currency translation (net of tax of $0) 333 (173) Comprehensive income $ 784 $ 355
The accompanying notes are an integral part of the financial statements.
5
Item 1. Financial Statements (Continued)
FORD MOTOR CREDIT COMPANY LLC AND SUBSIDIARIES
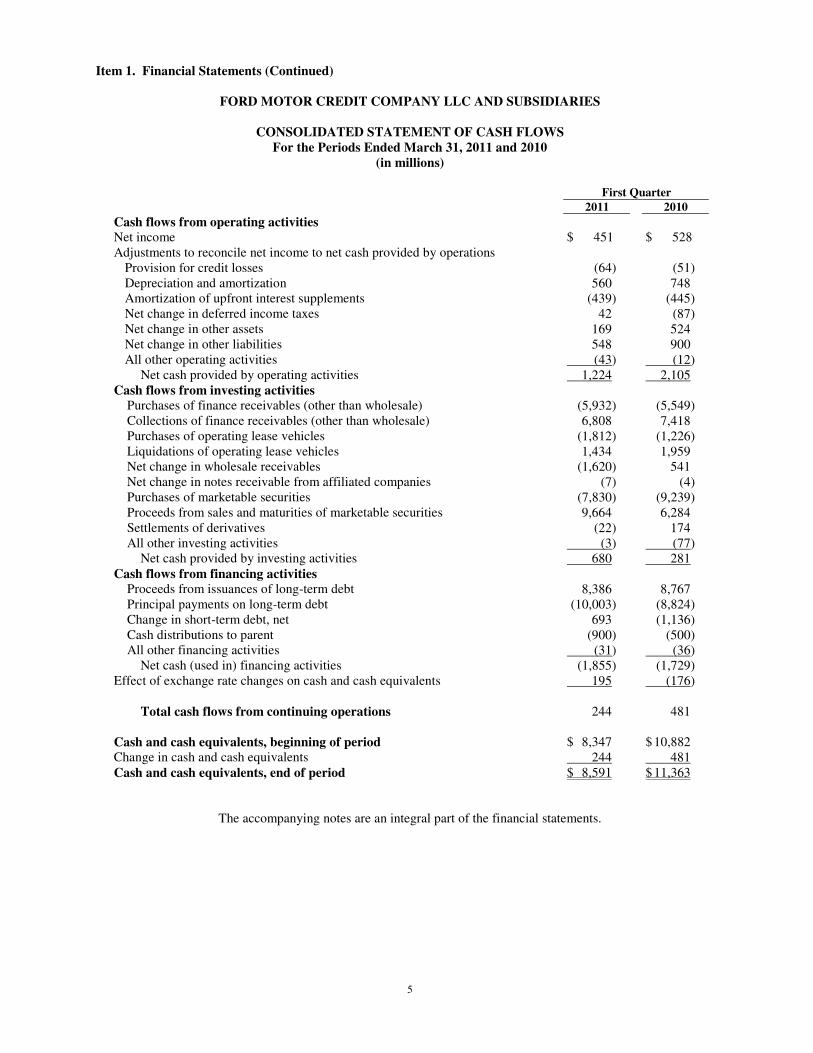
CONSOLIDATED STATEMENT OF CASH FLOWS
For the Periods Ended March 31, 2011 and 2010
(in millions)
First Quarter 2011 2010
Cash flows from operating activities Net income $ 451 $ 528 Adjustments to reconcile net income to net cash provided by operations
Provision for credit losses (64) (51) Depreciation and amortization 560 748 Amortization of upfront interest supplements (439) (445) Net change in deferred income taxes 42 (87) Net change in other assets 169 524 Net change in other liabilities 548 900 All other operating activities (43) (12)
Net cash provided by operating activities 1,224 2,105 Cash flows from investing activities
Purchases of finance receivables (other than wholesale) (5,932) (5,549) Collections of finance receivables (other than wholesale) 6,808 7,418 Purchases of operating lease vehicles (1,812) (1,226) Liquidations of operating lease vehicles 1,434 1,959 Net change in wholesale receivables (1,620) 541 Net change in notes receivable from affiliated companies (7) (4) Purchases of marketable securities (7,830) (9,239) Proceeds from sales and maturities of marketable securities 9,664 6,284 Settlements of derivatives (22) 174 All other investing activities (3) (77)
Net cash provided by investing activities 680 281 Cash flows from financing activities
Proceeds from issuances of long-term debt 8,386 8,767 Principal payments on long-term debt (10,003) (8,824) Change in short-term debt, net 693 (1,136) Cash distributions to parent (900) (500) All other financing activities (31) (36)
Net cash (used in) financing activities (1,855) (1,729) Effect of exchange rate changes on cash and cash equivalents 195 (176)
Total cash flows from continuing operations 244 481
Cash and cash equivalents, beginning of period $ 8,347 $ 10,882 Change in cash and cash equivalents 244 481 Cash and cash equivalents, end of period $ 8,591 $ 11,363
The accompanying notes are an integral part of the financial statements.
6
Item 1. Financial Statements (Continued)
FORD MOTOR CREDIT COMPANY LLC AND SUBSIDIARIES
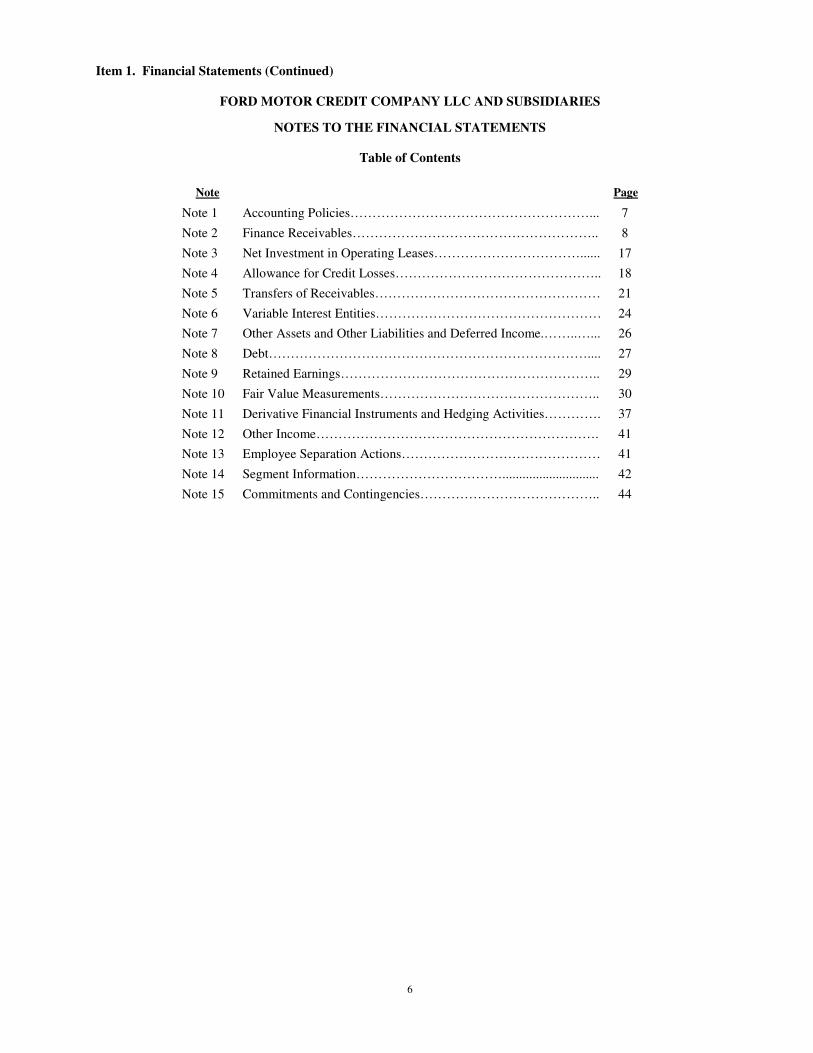
NOTES TO THE FINANCIAL STATEMENTS
Table of Contents
Note Page
Note 1 Accounting Policies………………………………………………... 7
Note 2 Finance Receivables……………………………………………….. 8
Note 3 Net Investment in Operating Leases……………………………...... 17
Note 4 Allowance for Credit Losses……………………………………….. 18
Note 5 Transfers of Receivables…………………………………………… 21
Note 6 Variable Interest Entities…………………………………………… 24
Note 7 Other Assets and Other Liabilities and Deferred Income.……..…... 26
Note 8 Debt……………………………………………………………….... 27
Note 9 Retained Earnings………………………………………………….. 29
Note 10 Fair Value Measurements………………………………………….. 30
Note 11 Derivative Financial Instruments and Hedging Activities…………. 37
Note 12 Other Income………………………………………………………. 41
Note 13 Employee Separation Actions……………………………………… 41
Note 14 Segment Information……………………………............................. 42
Note 15 Commitments and Contingencies………………………………….. 44
7
Item 1. Financial Statements (Continued)
FORD MOTOR CREDIT COMPANY LLC AND SUBSIDIARIES
NOTES TO THE FINANCIAL STATEMENTS
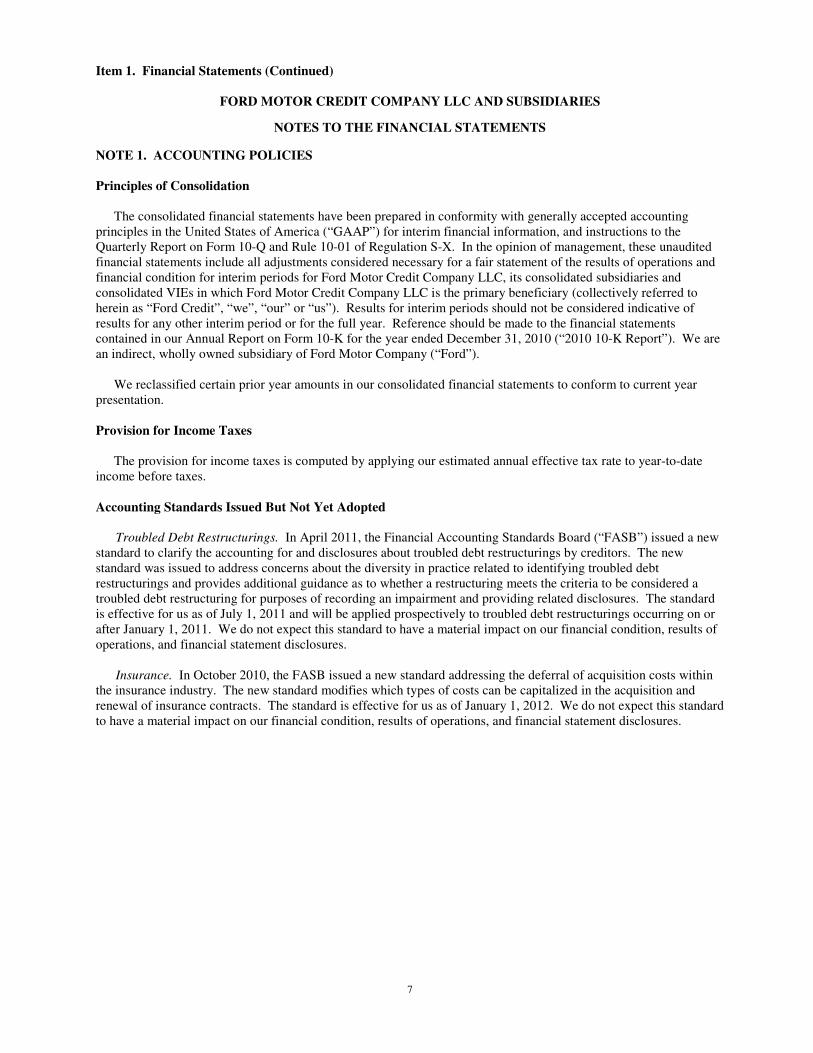
NOTE 1. ACCOUNTING POLICIES
Principles of Consolidation
The consolidated financial statements have been prepared in conformity with generally accepted accounting principles in the United States of America (“GAAP”) for interim financial information, and instructions to the Quarterly Report on Form 10-Q and Rule 10-01 of Regulation S-X. In the opinion of management, these unaudited financial statements include all adjustments considered necessary for a fair statement of the results of operations and financial condition for interim periods for Ford Motor Credit Company LLC, its consolidated subsidiaries and consolidated VIEs in which Ford Motor Credit Company LLC is the primary beneficiary (collectively referred to herein as “Ford Credit”, “we”, “our” or “us”). Results for interim periods should not be considered indicative of results for any other interim period or for the full year. Reference should be made to the financial statements contained in our Annual Report on Form 10-K for the year ended December 31, 2010 (“2010 10-K Report”). We are an indirect, wholly owned subsidiary of Ford Motor Company (“Ford”).
We reclassified certain prior year amounts in our consolidated financial statements to conform to current year
presentation.
Provision for Income Taxes
The provision for income taxes is computed by applying our estimated annual effective tax rate to year-to-date income before taxes.
Accounting Standards Issued But Not Yet Adopted
Troubled Debt Restructurings. In April 2011, the Financial Accounting Standards Board (“FASB”) issued a new
standard to clarify the accounting for and disclosures about troubled debt restructurings by creditors. The new standard was issued to address concerns about the diversity in practice related to identifying troubled debt restructurings and provides additional guidance as to whether a restructuring meets the criteria to be considered a troubled debt restructuring for purposes of recording an impairment and providing related disclosures. The standard is effective for us as of July 1, 2011 and will be applied prospectively to troubled debt restructurings occurring on or after January 1, 2011. We do not expect this standard to have a material impact on our financial condition, results of operations, and financial statement disclosures.
Insurance. In October 2010, the FASB issued a new standard addressing the deferral of acquisition costs within
the insurance industry. The new standard modifies which types of costs can be capitalized in the acquisition and renewal of insurance contracts. The standard is effective for us as of January 1, 2012. We do not expect this standard to have a material impact on our financial condition, results of operations, and financial statement disclosures.
8
Item 1. Financial Statements (Continued)
FORD MOTOR CREDIT COMPANY LLC AND SUBSIDIARIES
NOTES TO THE FINANCIAL STATEMENTS (Continued)
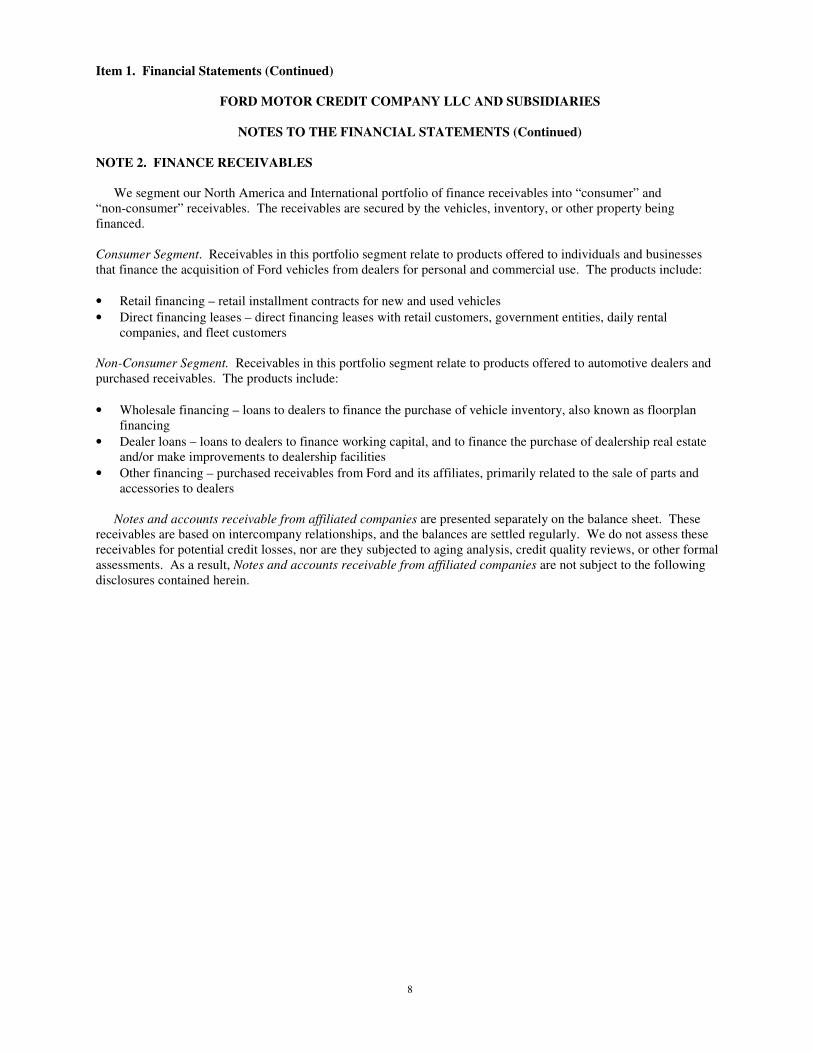
NOTE 2. FINANCE RECEIVABLES
We segment our North America and International portfolio of finance receivables into “consumer” and
“non-consumer” receivables. The receivables are secured by the vehicles, inventory, or other property being financed.
Consumer Segment. Receivables in this portfolio segment relate to products offered to individuals and businesses that finance the acquisition of Ford vehicles from dealers for personal and commercial use. The products include:
• Retail financing – retail installment contracts for new and used vehicles
• Direct financing leases – direct financing leases with retail customers, government entities, daily rental companies, and fleet customers
Non-Consumer Segment. Receivables in this portfolio segment relate to products offered to automotive dealers and purchased receivables. The products include:
• Wholesale financing – loans to dealers to finance the purchase of vehicle inventory, also known as floorplan financing
• Dealer loans – loans to dealers to finance working capital, and to finance the purchase of dealership real estate and/or make improvements to dealership facilities
• Other financing – purchased receivables from Ford and its affiliates, primarily related to the sale of parts and accessories to dealers
Notes and accounts receivable from affiliated companies are presented separately on the balance sheet. These
receivables are based on intercompany relationships, and the balances are settled regularly. We do not assess these receivables for potential credit losses, nor are they subjected to aging analysis, credit quality reviews, or other formal assessments. As a result, Notes and accounts receivable from affiliated companies are not subject to the following disclosures contained herein.
9
Item 1. Financial Statements (Continued)
FORD MOTOR CREDIT COMPANY LLC AND SUBSIDIARIES
NOTES TO THE FINANCIAL STATEMENTS (Continued)
NOTE 2. FINANCE RECEIVABLES (Continued)
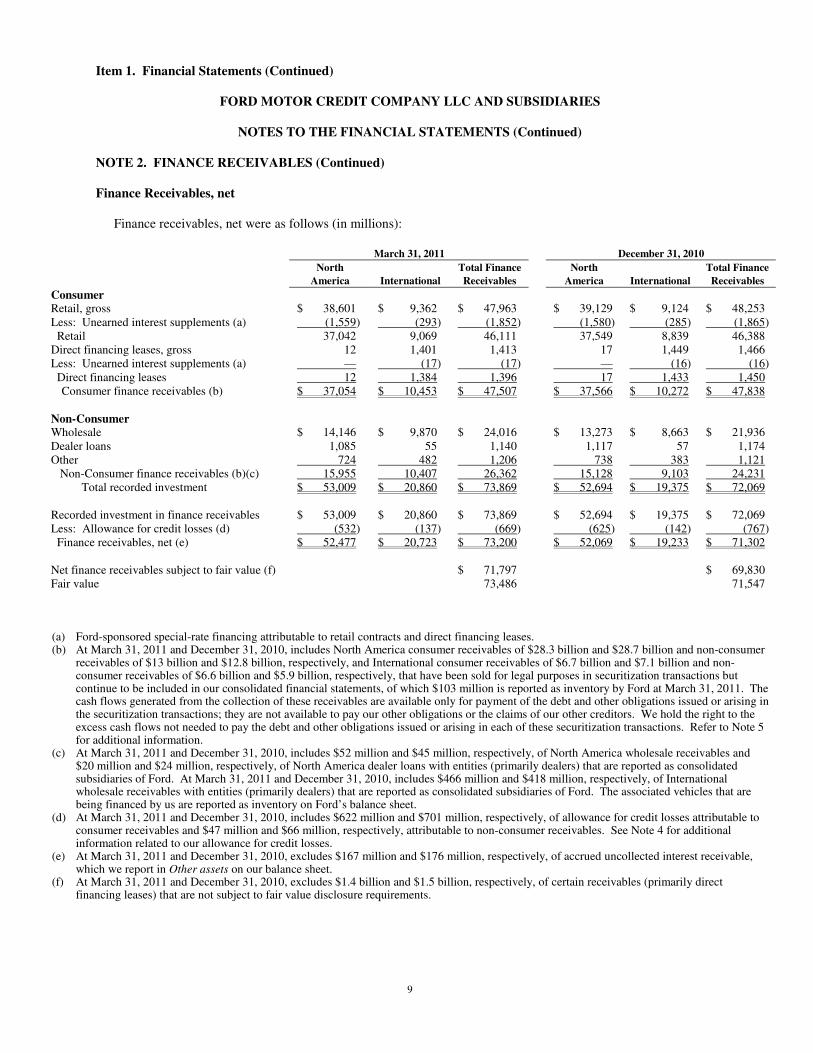
Finance Receivables, net
Finance receivables, net were as follows (in millions):
March 31, 2011 December 31, 2010
North
America
International
Total Finance
Receivables
North
America
International
Total Finance
Receivables
Consumer Retail, gross $ 38,601 $ 9,362 $ 47,963 $ 39,129 $ 9,124 $ 48,253 Less: Unearned interest supplements (a) (1,559) (293) (1,852) (1,580) (285) (1,865) Retail 37,042 9,069 46,111 37,549 8,839 46,388 Direct financing leases, gross 12 1,401 1,413 17 1,449 1,466 Less: Unearned interest supplements (a) — (17) (17) — (16) (16) Direct financing leases 12 1,384 1,396 17 1,433 1,450
Consumer finance receivables (b) $ 37,054 $ 10,453 $ 47,507 $ 37,566 $ 10,272 $ 47,838 Non-Consumer Wholesale $ 14,146 $ 9,870 $ 24,016 $ 13,273 $ 8,663 $ 21,936 Dealer loans 1,085 55 1,140 1,117 57 1,174 Other 724 482 1,206 738 383 1,121 Non-Consumer finance receivables (b)(c) 15,955 10,407 26,362 15,128 9,103 24,231
Total recorded investment $ 53,009 $ 20,860 $ 73,869 $ 52,694 $ 19,375 $ 72,069 Recorded investment in finance receivables $ 53,009 $ 20,860 $ 73,869 $ 52,694 $ 19,375 $ 72,069 Less: Allowance for credit losses (d) (532) (137) (669) (625) (142) (767) Finance receivables, net (e) $ 52,477 $ 20,723 $ 73,200 $ 52,069 $ 19,233 $ 71,302 Net finance receivables subject to fair value (f) $ 71,797 $ 69,830 Fair value 73,486 71,547
(a) Ford-sponsored special-rate financing attributable to retail contracts and direct financing leases. (b) At March 31, 2011 and December 31, 2010, includes North America consumer receivables of $28.3 billion and $28.7 billion and non-consumer
receivables of $13 billion and $12.8 billion, respectively, and International consumer receivables of $6.7 billion and $7.1 billion and non-consumer receivables of $6.6 billion and $5.9 billion, respectively, that have been sold for legal purposes in securitization transactions but continue to be included in our consolidated financial statements, of which $103 million is reported as inventory by Ford at March 31, 2011. The cash flows generated from the collection of these receivables are available only for payment of the debt and other obligations issued or arising in the securitization transactions; they are not available to pay our other obligations or the claims of our other creditors. We hold the right to the excess cash flows not needed to pay the debt and other obligations issued or arising in each of these securitization transactions. Refer to Note 5 for additional information.
(c) At March 31, 2011 and December 31, 2010, includes $52 million and $45 million, respectively, of North America wholesale receivables and $20 million and $24 million, respectively, of North America dealer loans with entities (primarily dealers) that are reported as consolidated subsidiaries of Ford. At March 31, 2011 and December 31, 2010, includes $466 million and $418 million, respectively, of International wholesale receivables with entities (primarily dealers) that are reported as consolidated subsidiaries of Ford. The associated vehicles that are being financed by us are reported as inventory on Ford’s balance sheet.
(d) At March 31, 2011 and December 31, 2010, includes $622 million and $701 million, respectively, of allowance for credit losses attributable to consumer receivables and $47 million and $66 million, respectively, attributable to non-consumer receivables. See Note 4 for additional information related to our allowance for credit losses.
(e) At March 31, 2011 and December 31, 2010, excludes $167 million and $176 million, respectively, of accrued uncollected interest receivable, which we report in Other assets on our balance sheet.
(f) At March 31, 2011 and December 31, 2010, excludes $1.4 billion and $1.5 billion, respectively, of certain receivables (primarily direct financing leases) that are not subject to fair value disclosure requirements.
10
Item 1. Financial Statements (Continued)
FORD MOTOR CREDIT COMPANY LLC AND SUBSIDIARIES
NOTES TO THE FINANCIAL STATEMENTS (Continued)
NOTE 2. FINANCE RECEIVABLES (Continued)
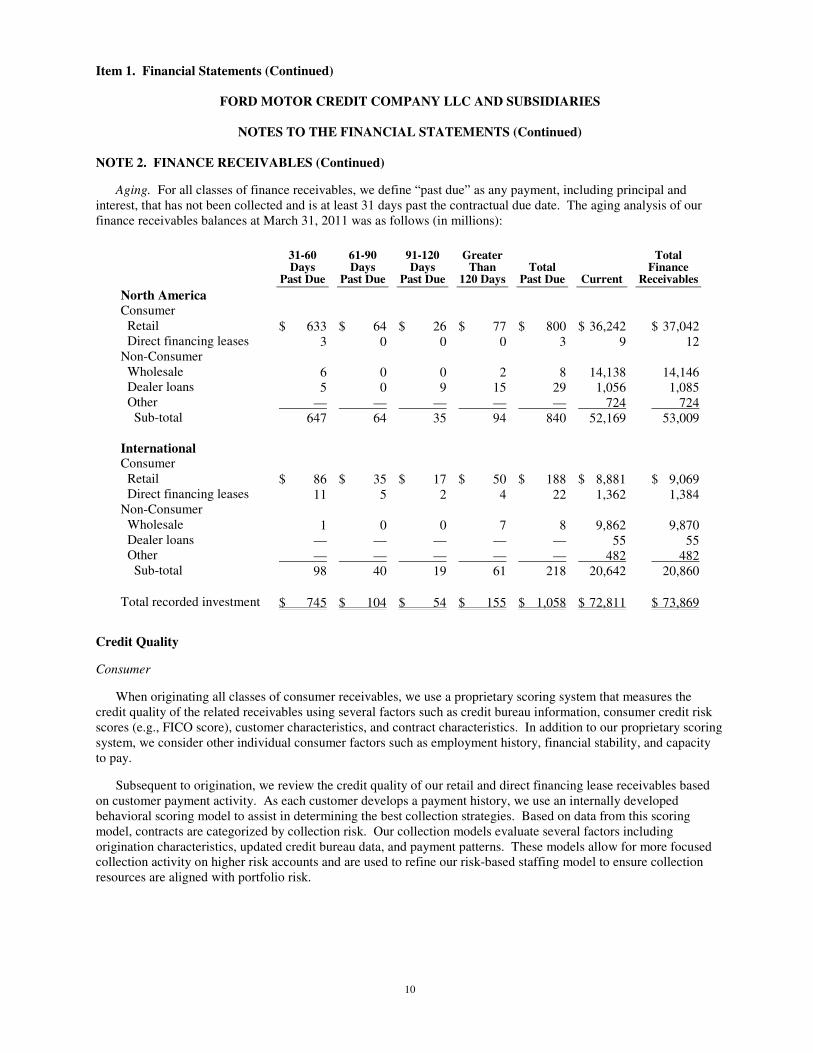
Aging. For all classes of finance receivables, we define “past due” as any payment, including principal and interest, that has not been collected and is at least 31 days past the contractual due date. The aging analysis of our finance receivables balances at March 31, 2011 was as follows (in millions):
Credit Quality
Consumer
When originating all classes of consumer receivables, we use a proprietary scoring system that measures the credit quality of the related receivables using several factors such as credit bureau information, consumer credit risk scores (e.g., FICO score), customer characteristics, and contract characteristics. In addition to our proprietary scoring system, we consider other individual consumer factors such as employment history, financial stability, and capacity to pay.
Subsequent to origination, we review the credit quality of our retail and direct financing lease receivables based on customer payment activity. As each customer develops a payment history, we use an internally developed behavioral scoring model to assist in determining the best collection strategies. Based on data from this scoring model, contracts are categorized by collection risk. Our collection models evaluate several factors including origination characteristics, updated credit bureau data, and payment patterns. These models allow for more focused collection activity on higher risk accounts and are used to refine our risk-based staffing model to ensure collection resources are aligned with portfolio risk.
31-60 Days
Past Due
61-90 Days
Past Due
91-120 Days
Past Due
Greater Than
120 Days Total
Past Due Current
Total Finance
Receivables
North America Consumer Retail $ 633 $ 64 $ 26 $ 77 $ 800 $ 36,242 $ 37,042 Direct financing leases 3 0 0 0 3 9 12 Non-Consumer Wholesale 6 0 0 2 8 14,138 14,146 Dealer loans 5 0 9 15 29 1,056 1,085 Other — — — — — 724 724 Sub-total 647 64 35 94 840 52,169 53,009 International Consumer Retail $ 86 $ 35 $ 17 $ 50 $ 188 $ 8,881 $ 9,069 Direct financing leases 11 5 2 4 22 1,362 1,384 Non-Consumer Wholesale 1 0 0 7 8 9,862 9,870 Dealer loans — — — — — 55 55 Other — — — — — 482 482 Sub-total 98 40 19 61 218 20,642 20,860 Total recorded investment $ 745 $ 104 $ 54 $ 155 $ 1,058 $ 72,811 $ 73,869
11
Item 1. Financial Statements (Continued)
FORD MOTOR CREDIT COMPANY LLC AND SUBSIDIARIES
NOTES TO THE FINANCIAL STATEMENTS (Continued)
NOTE 2. FINANCE RECEIVABLES (Continued)
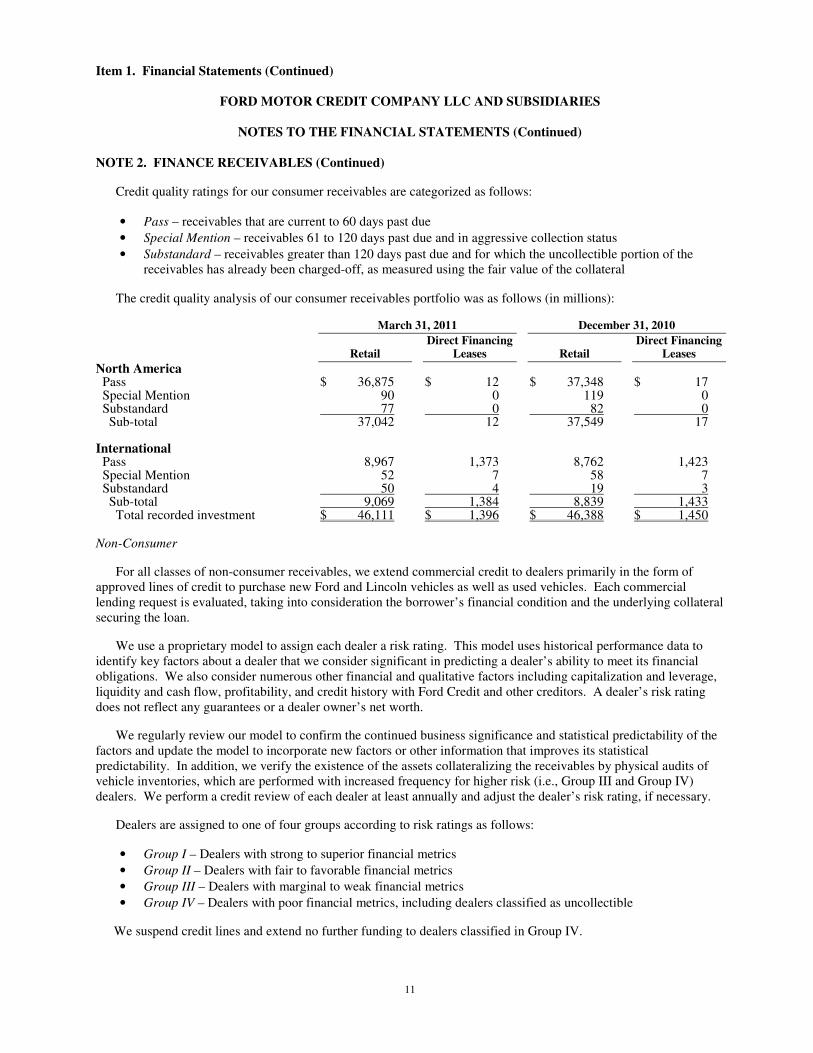
Credit quality ratings for our consumer receivables are categorized as follows:
• Pass – receivables that are current to 60 days past due
• Special Mention – receivables 61 to 120 days past due and in aggressive collection status
• Substandard – receivables greater than 120 days past due and for which the uncollectible portion of the receivables has already been charged-off, as measured using the fair value of the collateral
The credit quality analysis of our consumer receivables portfolio was as follows (in millions):
March 31, 2011 December 31, 2010
Retail Direct Financing
Leases Retail Direct Financing
Leases
North America Pass $ 36,875 $ 12 $ 37,348 $ 17 Special Mention 90 0 119 0 Substandard 77 0 82 0 Sub-total 37,042 12 37,549 17
International Pass 8,967 1,373 8,762 1,423
Special Mention 52 7 58 7 Substandard 50 4 19 3 Sub-total 9,069 1,384 8,839 1,433
Total recorded investment $ 46,111 $ 1,396 $ 46,388 $ 1,450
Non-Consumer
For all classes of non-consumer receivables, we extend commercial credit to dealers primarily in the form of approved lines of credit to purchase new Ford and Lincoln vehicles as well as used vehicles. Each commercial lending request is evaluated, taking into consideration the borrower’s financial condition and the underlying collateral securing the loan.
We use a proprietary model to assign each dealer a risk rating. This model uses historical performance data to identify key factors about a dealer that we consider significant in predicting a dealer’s ability to meet its financial obligations. We also consider numerous other financial and qualitative factors including capitalization and leverage, liquidity and cash flow, profitability, and credit history with Ford Credit and other creditors. A dealer’s risk rating does not reflect any guarantees or a dealer owner’s net worth.
We regularly review our model to confirm the continued business significance and statistical predictability of the factors and update the model to incorporate new factors or other information that improves its statistical predictability. In addition, we verify the existence of the assets collateralizing the receivables by physical audits of vehicle inventories, which are performed with increased frequency for higher risk (i.e., Group III and Group IV) dealers. We perform a credit review of each dealer at least annually and adjust the dealer’s risk rating, if necessary.
Dealers are assigned to one of four groups according to risk ratings as follows:
• Group I – Dealers with strong to superior financial metrics
• Group II – Dealers with fair to favorable financial metrics
• Group III – Dealers with marginal to weak financial metrics
• Group IV – Dealers with poor financial metrics, including dealers classified as uncollectible
We suspend credit lines and extend no further funding to dealers classified in Group IV.
12
Item 1. Financial Statements (Continued)
FORD MOTOR CREDIT COMPANY LLC AND SUBSIDIARIES
NOTES TO THE FINANCIAL STATEMENTS (Continued)
NOTE 2. FINANCE RECEIVABLES (Continued)
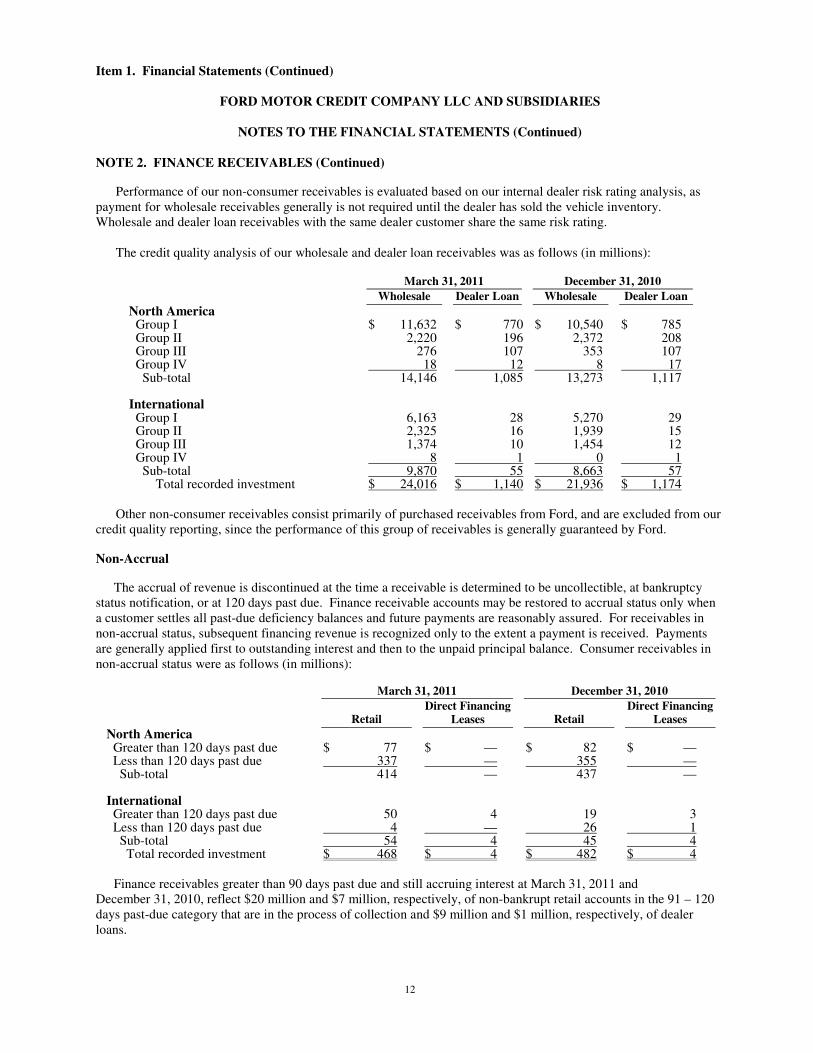
Performance of our non-consumer receivables is evaluated based on our internal dealer risk rating analysis, as payment for wholesale receivables generally is not required until the dealer has sold the vehicle inventory. Wholesale and dealer loan receivables with the same dealer customer share the same risk rating. The credit quality analysis of our wholesale and dealer loan receivables was as follows (in millions):
March 31, 2011 December 31, 2010
Wholesale Dealer Loan Wholesale Dealer Loan
North America Group I $ 11,632 $ 770 $ 10,540 $ 785 Group II 2,220 196 2,372 208 Group III 276 107 353 107 Group IV 18 12 8 17 Sub-total 14,146 1,085 13,273 1,117 International Group I 6,163 28 5,270 29 Group II 2,325 16 1,939 15 Group III 1,374 10 1,454 12 Group IV 8 1 0 1 Sub-total 9,870 55 8,663 57 Total recorded investment $ 24,016 $ 1,140 $ 21,936 $ 1,174
Other non-consumer receivables consist primarily of purchased receivables from Ford, and are excluded from our credit quality reporting, since the performance of this group of receivables is generally guaranteed by Ford.
Non-Accrual
The accrual of revenue is discontinued at the time a receivable is determined to be uncollectible, at bankruptcy status notification, or at 120 days past due. Finance receivable accounts may be restored to accrual status only when a customer settles all past-due deficiency balances and future payments are reasonably assured. For receivables in non-accrual status, subsequent financing revenue is recognized only to the extent a payment is received. Payments are generally applied first to outstanding interest and then to the unpaid principal balance. Consumer receivables in non-accrual status were as follows (in millions):
March 31, 2011 December 31, 2010
Retail Direct Financing
Leases Retail Direct Financing
Leases
North America Greater than 120 days past due $ 77 $ — $ 82 $ — Less than 120 days past due 337 — 355 — Sub-total 414 — 437 —
International Greater than 120 days past due 50 4 19 3
Less than 120 days past due 4 — 26 1 Sub-total 54 4 45 4
Total recorded investment $ 468 $ 4 $ 482 $ 4
Finance receivables greater than 90 days past due and still accruing interest at March 31, 2011 and December 31, 2010, reflect $20 million and $7 million, respectively, of non-bankrupt retail accounts in the 91 – 120 days past-due category that are in the process of collection and $9 million and $1 million, respectively, of dealer loans.
13
Item 1. Financial Statements (Continued)
FORD MOTOR CREDIT COMPANY LLC AND SUBSIDIARIES
NOTES TO THE FINANCIAL STATEMENTS (Continued)
NOTE 2. FINANCE RECEIVABLES (Continued)
Impaired Receivables
Our consumer receivables are collectively evaluated for impairment. Our non-consumer receivables are both collectively and specifically evaluated for impairment. Specifically impaired non-consumer receivables represent accounts with dealers that have weak or poor financial metrics or dealer loans that have been modified in troubled debt restructurings. We place impaired receivables in non-accrual status. The following factors (not necessarily in the order of importance or probability of occurrence) are considered in determining whether a receivable is impaired:
• Delinquency in contractual payments of principal or interest
• Deterioration of the borrower’s competitive position
• Cash flow difficulties experienced by the borrower
• Breach of loan covenants or conditions
• Initiation of dealer bankruptcy or other insolvency proceedings
• Fraud or criminal conviction
See Note 4 for additional information related to the development of our allowance for credit losses.
14
Item 1. Financial Statements (Continued)
FORD MOTOR CREDIT COMPANY LLC AND SUBSIDIARIES
NOTES TO THE FINANCIAL STATEMENTS (Continued)
NOTE 2. FINANCE RECEIVABLES (Continued)
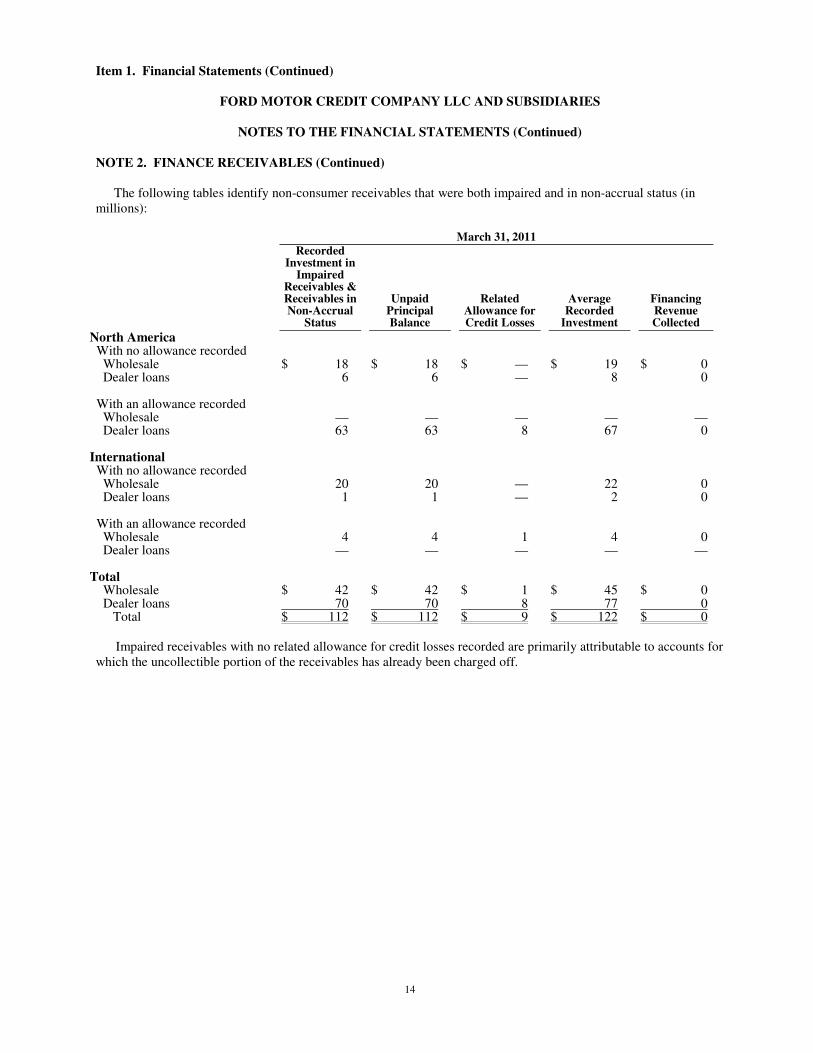
The following tables identify non-consumer receivables that were both impaired and in non-accrual status (in
millions):
March 31, 2011
Recorded Investment in
Impaired Receivables & Receivables in Non-Accrual
Status
Unpaid Principal Balance
Related Allowance for Credit Losses
Average Recorded
Investment
Financing Revenue Collected
North America With no allowance recorded Wholesale $ 18 $ 18 $ — $ 19 $ 0 Dealer loans 6 6 — 8 0 With an allowance recorded Wholesale — — — — — Dealer loans 63 63 8 67 0 International With no allowance recorded Wholesale 20 20 — 22 0 Dealer loans 1 1 — 2 0 With an allowance recorded Wholesale 4 4 1 4 0 Dealer loans — — — — — Total Wholesale $ 42 $ 42 $ 1 $ 45 $ 0 Dealer loans 70 70 8 77 0 Total $ 112 $ 112 $ 9 $ 122 $ 0
Impaired receivables with no related allowance for credit losses recorded are primarily attributable to accounts for
which the uncollectible portion of the receivables has already been charged off.
15
Item 1. Financial Statements (Continued)
FORD MOTOR CREDIT COMPANY LLC AND SUBSIDIARIES
NOTES TO THE FINANCIAL STATEMENTS (Continued)
NOTE 2. FINANCE RECEIVABLES (Continued)
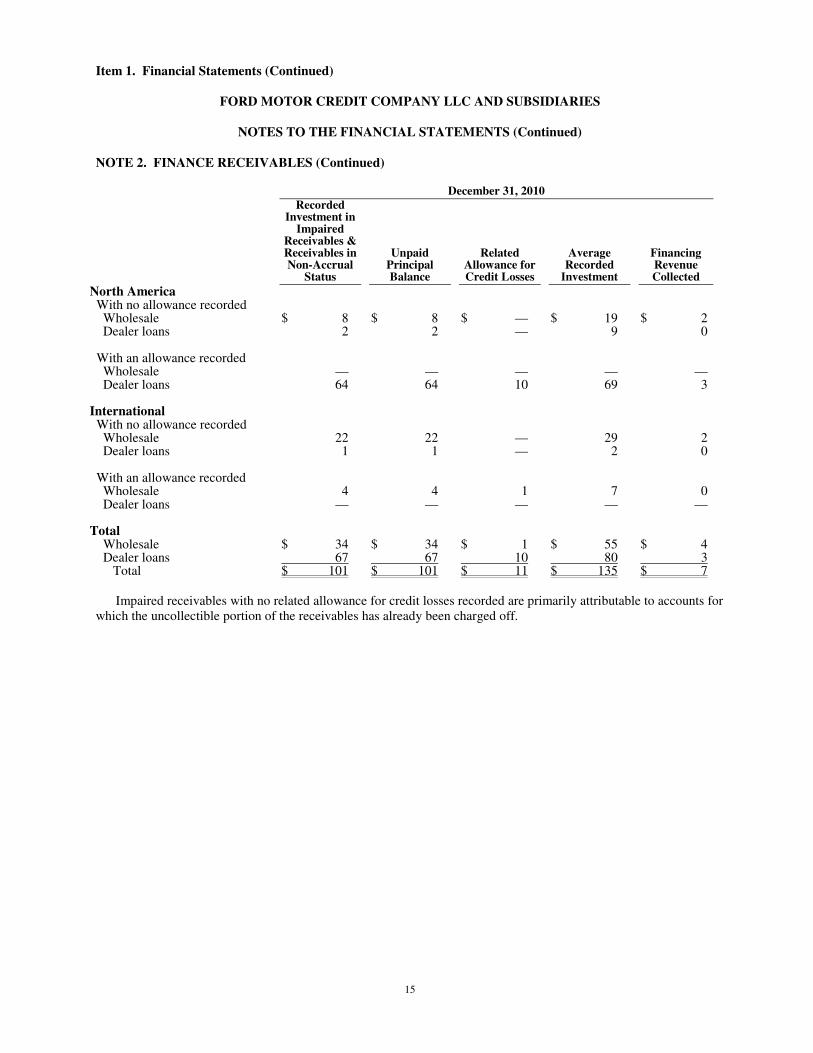
December 31, 2010
Recorded Investment in
Impaired Receivables & Receivables in Non-Accrual
Status
Unpaid Principal Balance
Related Allowance for Credit Losses
Average Recorded
Investment
Financing Revenue Collected
North America With no allowance recorded Wholesale $ 8 $ 8 $ — $ 19 $ 2 Dealer loans 2 2 — 9 0 With an allowance recorded Wholesale — — — — — Dealer loans 64 64 10 69 3 International With no allowance recorded Wholesale 22 22 — 29 2 Dealer loans 1 1 — 2 0 With an allowance recorded Wholesale 4 4 1 7 0 Dealer loans — — — — — Total Wholesale $ 34 $ 34 $ 1 $ 55 $ 4 Dealer loans 67 67 10 80 3 Total $ 101 $ 101 $ 11 $ 135 $ 7
Impaired receivables with no related allowance for credit losses recorded are primarily attributable to accounts for
which the uncollectible portion of the receivables has already been charged off.
16
Item 1. Financial Statements (Continued)
FORD MOTOR CREDIT COMPANY LLC AND SUBSIDIARIES
NOTES TO THE FINANCIAL STATEMENTS (Continued)
NOTE 2. FINANCE RECEIVABLES (Continued)
Troubled Debt Restructurings
A restructuring of debt constitutes a troubled debt restructuring if we grant a concession for economic or legal reasons related to the debtor’s financial difficulties that we otherwise would not consider in the normal course of our business.
Consumer. While payment extensions are granted on consumer receivables in the normal course of the collection
process, no concessions are made on the principal balance loaned or the interest rate charged. Payment extensions typically result in a one-month deferral of the consumer’s normal monthly payment and do not constitute a troubled debt restructuring.
Non-Consumer. Within our non-consumer receivables segment, only dealer loans subject to forbearance,
moratoriums, extension agreements, or other actions intended to minimize economic loss and to avoid foreclosure or repossession of collateral are classified as troubled debt restructurings.
Dealer loans involved in troubled debt restructurings are assessed for impairment and included in our allowance for credit losses based on either the present value of the expected future cash flows of the receivable discounted at the loan’s original effective interest rate, or the fair value of the collateral adjusted for estimated costs to sell.
For loans where foreclosure is probable, the fair value of the collateral is used to estimate the specific impairment.
An impairment charge is recorded as part of the provision to the allowance for credit losses for the amount by which the recorded investment of the receivable exceeds its estimated fair value. We do not grant concessions on the principal balance of dealer loan modifications but may make other concessions if the dealer is experiencing financial difficulties. The principal balance of dealer loans involved in troubled debt restructurings in the period ending March 31, 2011 was $12 million.
17
Item 1. Financial Statements (Continued)
FORD MOTOR CREDIT COMPANY LLC AND SUBSIDIARIES
NOTES TO THE FINANCIAL STATEMENTS (Continued)
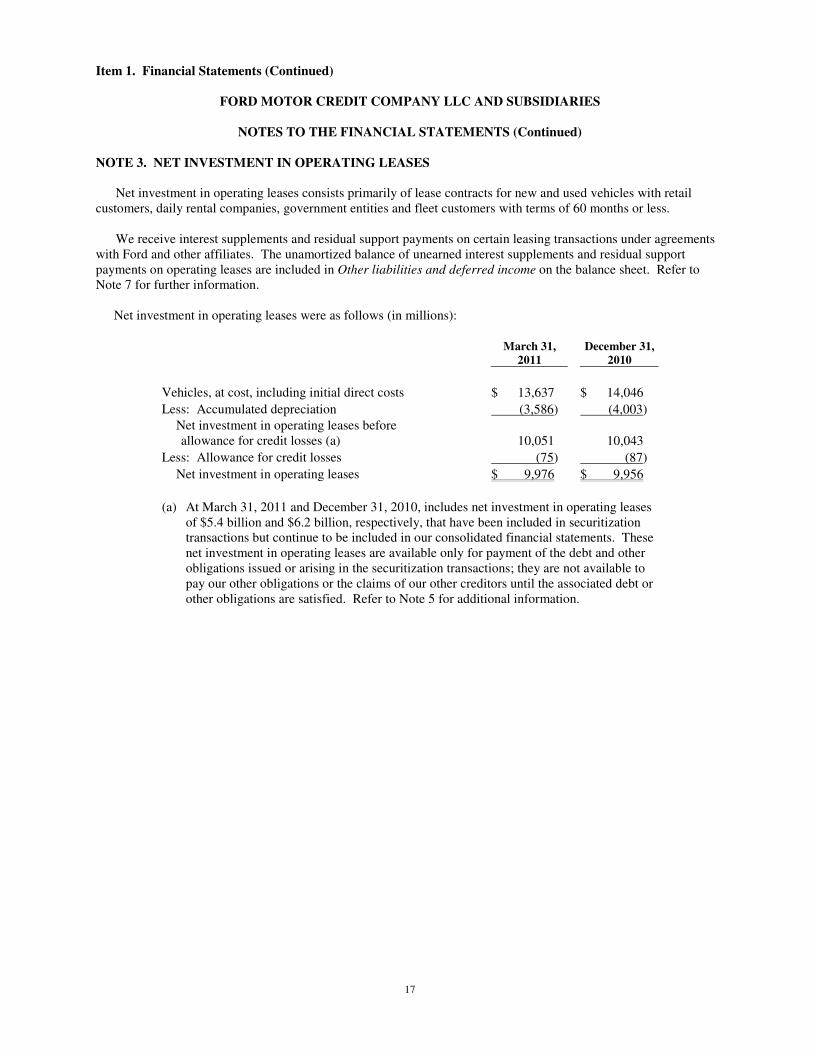
NOTE 3. NET INVESTMENT IN OPERATING LEASES
Net investment in operating leases consists primarily of lease contracts for new and used vehicles with retail
customers, daily rental companies, government entities and fleet customers with terms of 60 months or less. We receive interest supplements and residual support payments on certain leasing transactions under agreements
with Ford and other affiliates. The unamortized balance of unearned interest supplements and residual support payments on operating leases are included in Other liabilities and deferred income on the balance sheet. Refer to Note 7 for further information.
Net investment in operating leases were as follows (in millions):
March 31,
2011
December 31,
2010
Vehicles, at cost, including initial direct costs $ 13,637 $ 14,046
Less: Accumulated depreciation (3,586) (4,003)
Net investment in operating leases before allowance for credit losses (a) 10,051
10,043
Less: Allowance for credit losses (75) (87)
Net investment in operating leases $ 9,976 $ 9,956
(a) At March 31, 2011 and December 31, 2010, includes net investment in operating leases of $5.4 billion and $6.2 billion, respectively, that have been included in securitization transactions but continue to be included in our consolidated financial statements. These net investment in operating leases are available only for payment of the debt and other obligations issued or arising in the securitization transactions; they are not available to pay our other obligations or the claims of our other creditors until the associated debt or other obligations are satisfied. Refer to Note 5 for additional information.
18
Item 1. Financial Statements (Continued)
FORD MOTOR CREDIT COMPANY LLC AND SUBSIDIARIES
NOTES TO THE FINANCIAL STATEMENTS (Continued)
NOTE 4. ALLOWANCE FOR CREDIT LOSSES
The allowance for credit losses represents our estimate of the probable loss on the collection of finance receivables and operating leases as of the balance sheet date. The adequacy of the allowance for credit losses is assessed quarterly, and the assumptions and models used in establishing the allowance are regularly evaluated. Because credit losses can vary substantially over time, estimating credit losses requires a number of assumptions about matters that are uncertain.
Consumer
The majority of our credit losses are attributable to our consumer receivables segment. We estimate the allowance for credit losses on our consumer receivables segment and on our investments in operating leases using a combination of measurement models and management judgment. The models consider factors such as historical trends in credit losses and recoveries (including key metrics such as delinquencies, repossessions and bankruptcies), the composition of our present portfolio (including vehicle brand, term, risk evaluation and new/used vehicles), trends in historical and projected used vehicle values, and economic conditions. Estimates from these models rely on historical information and may not fully reflect losses inherent in the present portfolio. Therefore, we may adjust the estimate to reflect management’s judgment regarding justifiable changes in recent economic trends and conditions, portfolio composition and other relevant factors.
We make projections of two key assumptions to assist in estimating the consumer allowance for credit losses:
• Frequency – the number of finance receivables that are expected to default over the loss emergence period, measured as repossessions
• Loss severity – the expected difference between the amount a customer owes when the finance contract is charged-off and the amount received, net of expenses, from selling the repossessed vehicle, including any recoveries from the customer
The consumer receivables portfolio allowance is evaluated primarily using a collective loss-to-receivables
(“LTR”) model that based on historical experience indicates that credit losses have been incurred in the portfolio even though the particular receivables that are uncollectible cannot be specifically identified. The LTR model is based on the most recent years of history. Each LTR is calculated by dividing credit losses by average end-of-period receivables excluding unearned interest supplements and allowance for credit losses. A weighted-average LTR is calculated for each class of consumer receivables and multiplied by the end-of-period receivable balances for that given class.
19
Item 1. Financial Statements (Continued)
FORD MOTOR CREDIT COMPANY LLC AND SUBSIDIARIES
NOTES TO THE FINANCIAL STATEMENTS (Continued)
NOTE 4. ALLOWANCE FOR CREDIT LOSSES (Continued)
The loss emergence period (“LEP”) is a key assumption within our models and represents the average amount of
time between when a loss event first occurs to when it is charged-off. This time period starts when the borrower begins to experience financial difficulty. It is evidenced later, typically through delinquency, before eventually resulting in a charge-off. The LEP is a multiplier in the calculation of the collective consumer allowance for credit losses.
For consumer receivables greater than 120 days past due, the uncollectible portion of the receivable is charged-
off, such that the remaining recorded investment in the loan is equal to the estimated fair value of the collateral less costs to sell.
After establishing the collective allowance for credit losses, if management believes the allowance does not
reflect all losses inherent in the portfolio due to changes in recent economic trends and conditions, or other relevant factors, an adjustment is made based on management judgment.
Non-Consumer
We estimate the allowance for credit losses for non-consumer receivables based on historical LTR ratios, expected future cash flows, and the fair value of collateral.
Collective Allowance for Credit Losses. We estimate an allowance for non-consumer receivables that are not specifically identified as impaired using a LTR model for each financing product based on historical experience. This LTR is a weighted-average of the most recent historical experience and is calculated consistent with the consumer receivables LTR approach. All accounts that are specifically identified as impaired are excluded from the calculation of the non-specific or collective allowance.
Specific Allowance for Impaired Receivables. The wholesale and dealer loan portfolio is evaluated by grouping individual loans into risk pools determined by the risk characteristics of the loan (such as the amount of the loan, the nature of the collateral, and the financial status of the debtor). The risk pools are analyzed to determine if individual loans are impaired, and a specific allowance is estimated based on the present value of the expected future cash flows of the receivable discounted at the loan’s effective interest rate or the fair value of any collateral adjusted for estimated costs to sell.
After establishment of the collective and specific allowance for credit losses, if management believes the
allowance does not reflect all losses inherent in the portfolio due to changes in recent economic trends and conditions, or other relevant factors, an adjustment is made based on management judgment.
20
Item 1. Financial Statements (Continued)
FORD MOTOR CREDIT COMPANY LLC AND SUBSIDIARIES
NOTES TO THE FINANCIAL STATEMENTS (Continued)
NOTE 4. ALLOWANCE FOR CREDIT LOSSES (Continued)
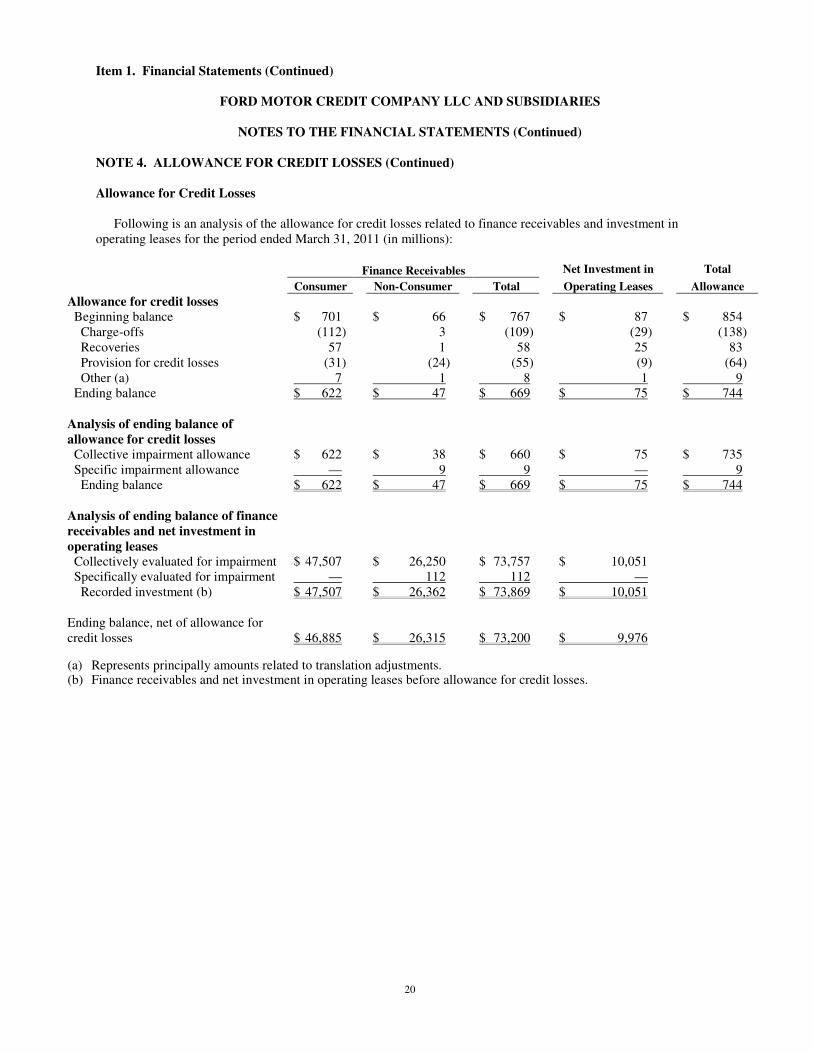
Allowance for Credit Losses
Following is an analysis of the allowance for credit losses related to finance receivables and investment in
operating leases for the period ended March 31, 2011 (in millions):
Finance Receivables Net Investment in Total
Consumer Non-Consumer Total Operating Leases Allowance
Allowance for credit losses Beginning balance $ 701 $ 66 $ 767 $ 87 $ 854 Charge-offs (112) 3 (109) (29) (138) Recoveries 57 1 58 25 83 Provision for credit losses (31) (24) (55) (9) (64) Other (a) 7 1 8 1 9 Ending balance $ 622 $ 47 $ 669 $ 75 $ 744 Analysis of ending balance of
allowance for credit losses Collective impairment allowance $ 622 $ 38 $ 660 $ 75 $ 735 Specific impairment allowance — 9 9 — 9 Ending balance $ 622 $ 47 $ 669 $ 75 $ 744 Analysis of ending balance of finance
receivables and net investment in
operating leases Collectively evaluated for impairment $ 47,507 $ 26,250 $ 73,757 $ 10,051 Specifically evaluated for impairment — 112 112 — Recorded investment (b) $ 47,507 $ 26,362 $ 73,869 $ 10,051 Ending balance, net of allowance for credit losses $ 46,885 $ 26,315 $ 73,200 $ 9,976
(a) Represents principally amounts related to translation adjustments. (b) Finance receivables and net investment in operating leases before allowance for credit losses.
21
Item 1. Financial Statements (Continued)
FORD MOTOR CREDIT COMPANY LLC AND SUBSIDIARIES
NOTES TO THE FINANCIAL STATEMENTS (Continued)
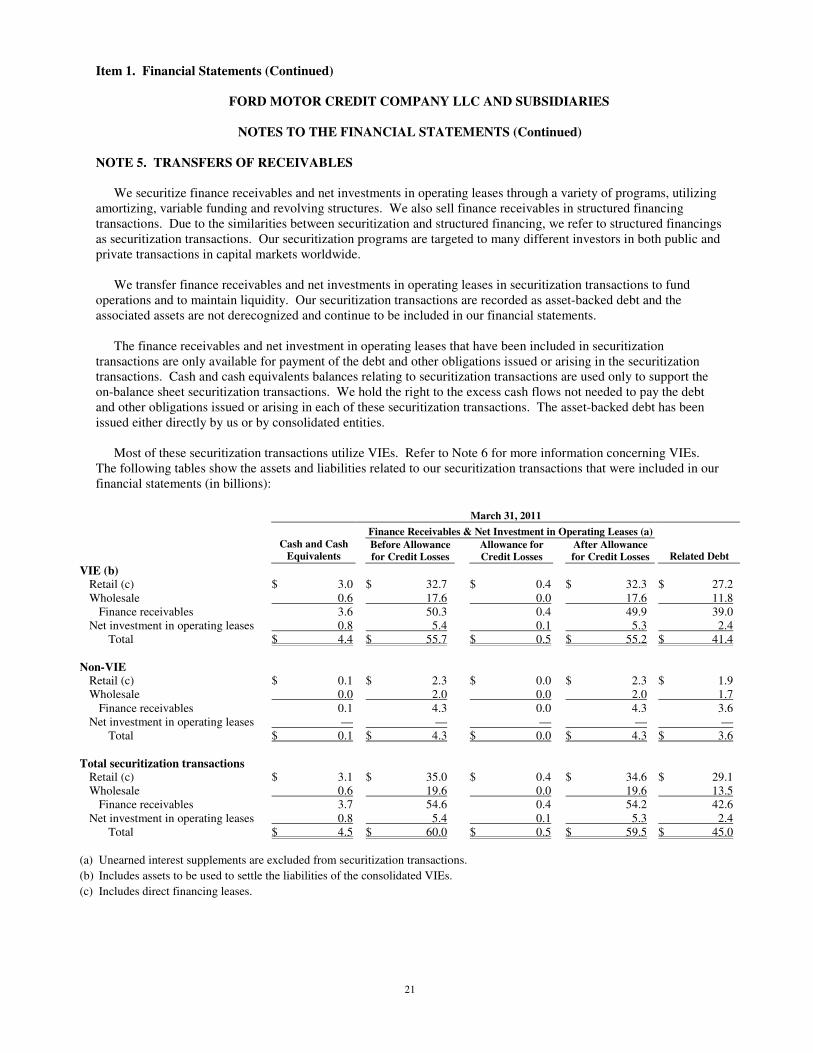
NOTE 5. TRANSFERS OF RECEIVABLES
We securitize finance receivables and net investments in operating leases through a variety of programs, utilizing
amortizing, variable funding and revolving structures. We also sell finance receivables in structured financing transactions. Due to the similarities between securitization and structured financing, we refer to structured financings as securitization transactions. Our securitization programs are targeted to many different investors in both public and private transactions in capital markets worldwide.
We transfer finance receivables and net investments in operating leases in securitization transactions to fund
operations and to maintain liquidity. Our securitization transactions are recorded as asset-backed debt and the associated assets are not derecognized and continue to be included in our financial statements.
The finance receivables and net investment in operating leases that have been included in securitization
transactions are only available for payment of the debt and other obligations issued or arising in the securitization transactions. Cash and cash equivalents balances relating to securitization transactions are used only to support the on-balance sheet securitization transactions. We hold the right to the excess cash flows not needed to pay the debt and other obligations issued or arising in each of these securitization transactions. The asset-backed debt has been issued either directly by us or by consolidated entities.
Most of these securitization transactions utilize VIEs. Refer to Note 6 for more information concerning VIEs. The following tables show the assets and liabilities related to our securitization transactions that were included in our financial statements (in billions):
March 31, 2011
Finance Receivables & Net Investment in Operating Leases (a)
Cash and Cash
Equivalents Before Allowance
for Credit Losses
Allowance for
Credit Losses
After Allowance
for Credit Losses Related Debt
VIE (b) Retail (c) $ 3.0 $ 32.7 $ 0.4 $ 32.3 $ 27.2 Wholesale 0.6 17.6 0.0 17.6 11.8
Finance receivables 3.6 50.3 0.4 49.9 39.0 Net investment in operating leases 0.8 5.4 0.1 5.3 2.4
Total $ 4.4 $ 55.7 $ 0.5 $ 55.2 $ 41.4 Non-VIE
Retail (c) $ 0.1 $ 2.3 $ 0.0 $ 2.3 $ 1.9 Wholesale 0.0 2.0 0.0 2.0 1.7
Finance receivables 0.1 4.3 0.0 4.3 3.6 Net investment in operating leases — — — — —
Total $ 0.1 $ 4.3 $ 0.0 $ 4.3 $ 3.6
Total securitization transactions Retail (c) $ 3.1 $ 35.0 $ 0.4 $ 34.6 $ 29.1 Wholesale 0.6 19.6 0.0 19.6 13.5
Finance receivables 3.7 54.6 0.4 54.2 42.6 Net investment in operating leases 0.8 5.4 0.1 5.3 2.4
Total $ 4.5 $ 60.0 $ 0.5 $ 59.5 $ 45.0
(a) Unearned interest supplements are excluded from securitization transactions.
(b) Includes assets to be used to settle the liabilities of the consolidated VIEs.
(c) Includes direct financing leases.
22
Item 1. Financial Statements (Continued)
FORD MOTOR CREDIT COMPANY LLC AND SUBSIDIARIES
NOTES TO THE FINANCIAL STATEMENTS (Continued)
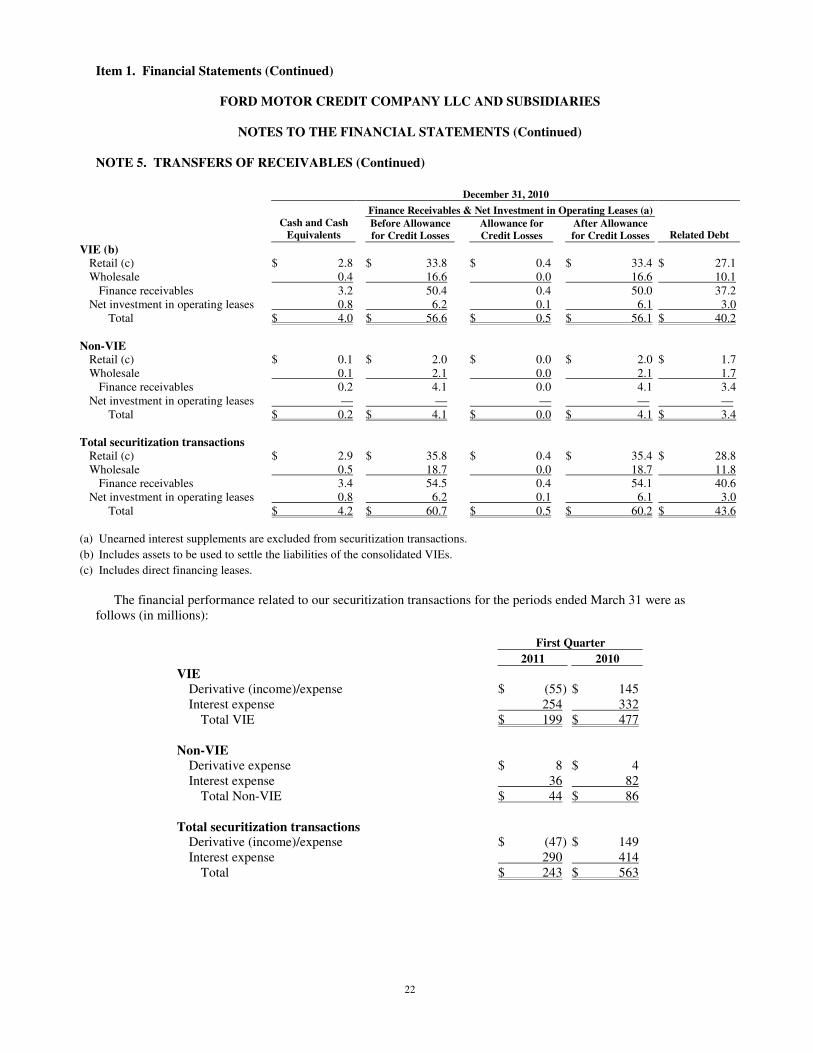
NOTE 5. TRANSFERS OF RECEIVABLES (Continued)
December 31, 2010
Finance Receivables & Net Investment in Operating Leases (a)
Cash and Cash
Equivalents Before Allowance
for Credit Losses
Allowance for
Credit Losses
After Allowance
for Credit Losses Related Debt
VIE (b) Retail (c) $ 2.8 $ 33.8 $ 0.4 $ 33.4 $ 27.1 Wholesale 0.4 16.6 0.0 16.6 10.1
Finance receivables 3.2 50.4 0.4 50.0 37.2 Net investment in operating leases 0.8 6.2 0.1 6.1 3.0
Total $ 4.0 $ 56.6 $ 0.5 $ 56.1 $ 40.2
Non-VIE Retail (c) $ 0.1 $ 2.0 $ 0.0 $ 2.0 $ 1.7 Wholesale 0.1 2.1 0.0 2.1 1.7
Finance receivables 0.2 4.1 0.0 4.1 3.4 Net investment in operating leases — — — — —
Total $ 0.2 $ 4.1 $ 0.0 $ 4.1 $ 3.4 Total securitization transactions
Retail (c) $ 2.9 $ 35.8 $ 0.4 $ 35.4 $ 28.8 Wholesale 0.5 18.7 0.0 18.7 11.8
Finance receivables 3.4 54.5 0.4 54.1 40.6 Net investment in operating leases 0.8 6.2 0.1 6.1 3.0
Total $ 4.2 $ 60.7 $ 0.5 $ 60.2 $ 43.6
(a) Unearned interest supplements are excluded from securitization transactions.
(b) Includes assets to be used to settle the liabilities of the consolidated VIEs.
(c) Includes direct financing leases.
The financial performance related to our securitization transactions for the periods ended March 31 were as
follows (in millions):
First Quarter
2011 2010
VIE Derivative (income)/expense $ (55) $ 145 Interest expense 254 332
Total VIE $ 199 $ 477
Non-VIE Derivative expense $ 8 $ 4 Interest expense 36 82
Total Non-VIE $ 44 $ 86
Total securitization transactions Derivative (income)/expense $ (47) $ 149 Interest expense 290 414
Total $ 243 $ 563
23
Item 1. Financial Statements (Continued)
FORD MOTOR CREDIT COMPANY LLC AND SUBSIDIARIES
NOTES TO THE FINANCIAL STATEMENTS (Continued)
NOTE 5. TRANSFERS OF RECEIVABLES (Continued)
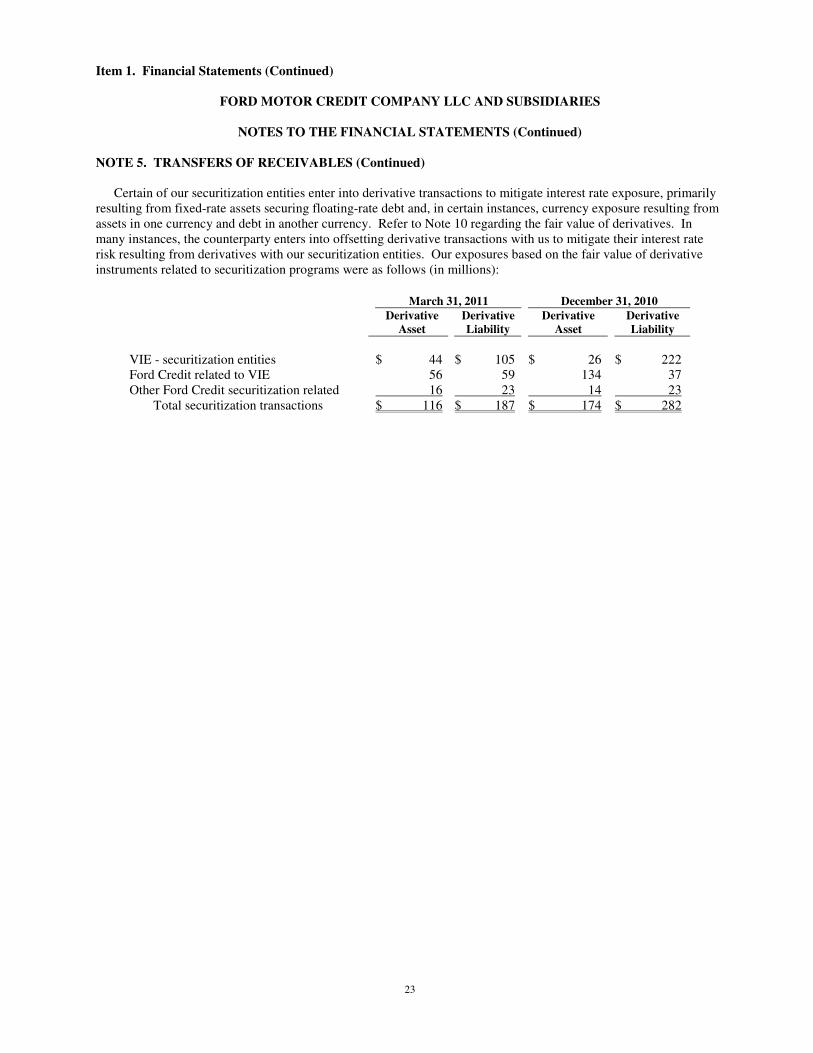
Certain of our securitization entities enter into derivative transactions to mitigate interest rate exposure, primarily
resulting from fixed-rate assets securing floating-rate debt and, in certain instances, currency exposure resulting from assets in one currency and debt in another currency. Refer to Note 10 regarding the fair value of derivatives. In many instances, the counterparty enters into offsetting derivative transactions with us to mitigate their interest rate risk resulting from derivatives with our securitization entities. Our exposures based on the fair value of derivative instruments related to securitization programs were as follows (in millions):
March 31, 2011 December 31, 2010
Derivative
Asset Derivative
Liability Derivative
Asset Derivative
Liability
VIE - securitization entities $ 44 $ 105 $ 26 $ 222 Ford Credit related to VIE 56 59 134 37 Other Ford Credit securitization related 16 23 14 23
Total securitization transactions $ 116 $ 187 $ 174 $ 282
24
Item 1. Financial Statements (Continued)
FORD MOTOR CREDIT COMPANY LLC AND SUBSIDIARIES
NOTES TO THE FINANCIAL STATEMENTS (Continued)
NOTE 6. VARIABLE INTEREST ENTITIES
A VIE is an entity that either (i) has insufficient equity to permit the entity to finance its activities without additional subordinated financial support, or (ii) has equity investors who lack the characteristics of a controlling financial interest. A VIE is consolidated by its primary beneficiary. The primary beneficiary has both the power to direct the activities that most significantly impact the entity’s economic performance and the obligation to absorb losses or the right to receive benefits from the entity that could potentially be significant to the VIE. Nearly all of our VIEs are special purpose entities used for our on-balance sheet securitizations.
If we determine that we have operating power and the obligation to absorb losses or receive benefits, we
consolidate the VIE as the primary beneficiary. We have operating power when we have the ability to exercise discretion in the servicing of financial assets, issue additional debt, exercise a unilateral call option, add assets to revolving structures, or control investment decisions.
Assets recognized as a result of consolidating these VIEs do not represent additional assets that could be used to satisfy claims against our general assets. Conversely, liabilities recognized as a result of consolidating these VIEs do not represent additional claims on our general assets; rather, they represent claims against the specific assets of the consolidated VIEs.
VIEs of which we are the primary beneficiary We use special purpose entities to issue asset-backed securities in transactions to public and private investors,
bank conduits and government-sponsored entities or others who obtain funding from government programs. We have deemed most of these special purpose entities to be VIEs. The asset-backed securities are secured by finance receivables and interests in net investments in operating leases. The assets continue to be consolidated by us. We retain interests in our securitization VIEs (including senior and subordinated securities issued by the VIEs), and rights to cash held for the benefit of the securitization investors (such as cash reserves), and residual interests.
The transactions create and pass along risks to the variable interest holders, depending on the assets securing the
debt and the specific terms of the transactions. We aggregate and analyze our transactions based on the risk profile of the product and the type of funding structure, including:
• Retail transactions — consumer credit risk and pre-payment risk, which are driven by the ability of the
customer to pay, as well as the timing of the customer payments; • Wholesale transactions — dealer credit risk and Ford risk, as the receivables owned by the VIEs primarily
arise from the financing provided by us to Ford-franchised dealers; therefore, the collections depend upon the sale of Ford vehicles; and
• Net investment in operating lease transactions — vehicle residual value risk, consumer credit risk and pre-payment risk.
25
Item 1. Financial Statements (Continued)
FORD MOTOR CREDIT COMPANY LLC AND SUBSIDIARIES
NOTES TO THE FINANCIAL STATEMENTS (Continued)
NOTE 6. VARIABLE INTEREST ENTITIES (Continued)
As residual interest holder, we are exposed to the underlying residual and credit risk of the collateral, and are
exposed to interest rate risk in some transactions. The amount of risk absorbed by our residual interests is generally represented by and limited to the amount of overcollateralization of our assets securing the debt and any cash reserves.
We have no obligation to repurchase or replace any securitized asset that subsequently becomes delinquent in payment or otherwise is in default, except under standard representations and warranties such as good and marketable title to the assets, or when certain changes are made to the underlying asset contracts. Securitization investors have no recourse to us or our other assets for credit losses on the securitized assets and have no right to require us to repurchase the investments. We do not guarantee any asset-backed securities and generally have no obligation to provide liquidity or contribute cash or additional assets to the VIEs. We may be required to support the performance of certain securitization transactions, however, by increasing cash reserves.
Although not contractually required, we regularly support our wholesale securitization programs by repurchasing
receivables of a dealer from the VIEs when the dealer’s performance is at risk, which transfers the corresponding risk of loss from the VIE to us. In order to continue to fund the wholesale receivables, we also may contribute additional cash or wholesale receivables if the collateral falls below the required levels. The balances of cash related to these contributions were $146 million and zero at March 31, 2011 and December 31, 2010, respectively, and ranged from zero to $146 million during the first quarter of 2011. In addition, while not contractually required, we may purchase the commercial paper issued by our FCAR Owner Trust asset-backed commercial paper program (“FCAR”).
VIEs that are exposed to interest rate or currency risk have reduced their risks by entering into derivatives. In
certain instances, we have entered into offsetting derivative transactions with the VIE to protect the VIE from the risks that are not mitigated through the derivative transactions between the VIE and its external counterparty. In other instances, we have entered into derivative transactions with the counterparty to protect the counterparty from risks absorbed through their derivative transactions with the VIEs. See Note 11 for additional information regarding our derivatives.
Refer to Note 5 for information on the financial position and financial performance of our VIEs.
VIEs of which we are not the primary beneficiary
We have an investment in Forso Nordic AB, a joint venture determined to be a VIE of which we are not the
primary beneficiary. The joint venture provides consumer and dealer financing in its local markets and is financed by external debt and additional subordinated interest provided by our joint venture partner. The operating agreement indicates that the power to direct economically significant activities is shared with our joint venture partner, and the obligation to absorb losses or right to receive benefits resides primarily with our joint venture partner. Our investment in the joint venture is accounted for as an equity method investment and is included in Other assets. Our maximum exposure to any potential losses associated with this VIE is limited to our equity investment, and amounted to $77 million and $71 million at March 31, 2011 and December 31, 2010, respectively.
26
Item 1. Financial Statements (Continued)
FORD MOTOR CREDIT COMPANY LLC AND SUBSIDIARIES
NOTES TO THE FINANCIAL STATEMENTS (Continued)
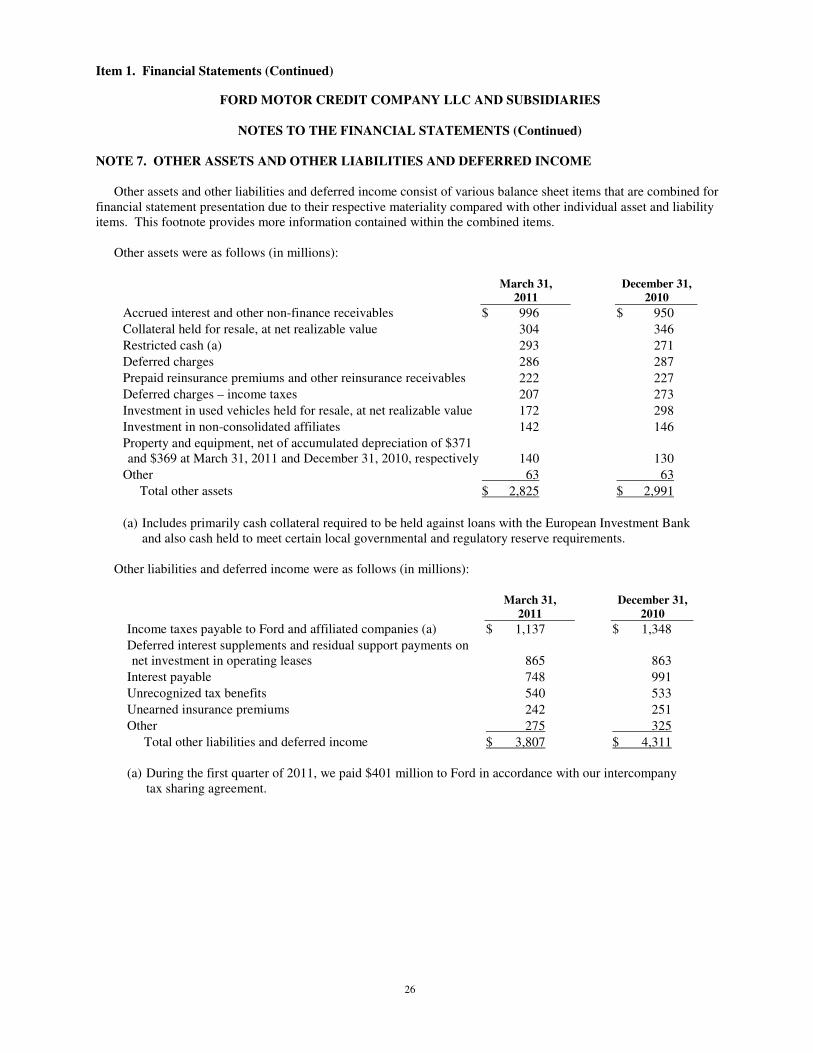
NOTE 7. OTHER ASSETS AND OTHER LIABILITIES AND DEFERRED INCOME
Other assets and other liabilities and deferred income consist of various balance sheet items that are combined for
financial statement presentation due to their respective materiality compared with other individual asset and liability items. This footnote provides more information contained within the combined items.
Other assets were as follows (in millions):
March 31,
2011
December 31,
2010
Accrued interest and other non-finance receivables $ 996 $ 950
Collateral held for resale, at net realizable value 304 346
Restricted cash (a) 293 271
Deferred charges 286 287
Prepaid reinsurance premiums and other reinsurance receivables 222 227
Deferred charges – income taxes 207 273
Investment in used vehicles held for resale, at net realizable value 172 298
Investment in non-consolidated affiliates 142 146
Property and equipment, net of accumulated depreciation of $371 and $369 at March 31, 2011 and December 31, 2010, respectively 140 130
Other 63 63
Total other assets $ 2,825 $ 2,991
(a) Includes primarily cash collateral required to be held against loans with the European Investment Bank and also cash held to meet certain local governmental and regulatory reserve requirements.
Other liabilities and deferred income were as follows (in millions):
March 31,
2011
December 31,
2010
Income taxes payable to Ford and affiliated companies (a) $ 1,137 $ 1,348
Deferred interest supplements and residual support payments on net investment in operating leases 865 863
Interest payable 748 991
Unrecognized tax benefits 540 533
Unearned insurance premiums 242 251
Other 275 325
Total other liabilities and deferred income $ 3,807 $ 4,311
(a) During the first quarter of 2011, we paid $401 million to Ford in accordance with our intercompany tax sharing agreement.
27
Item 1. Financial Statements (Continued)
FORD MOTOR CREDIT COMPANY LLC AND SUBSIDIARIES
NOTES TO THE FINANCIAL STATEMENTS (Continued)
NOTE 8. DEBT
We have an asset-backed commercial paper program in the United States with qualified institutional investors. We also obtain other short-term funding from the issuance of demand notes to retail investors through our floating rate demand notes program. We have certain asset-backed securitization programs that issue short-term debt securities that are sold to institutional investors. Bank borrowings by several of our international affiliates in the ordinary course of business are an additional source of short-term funding.
We obtain long-term debt funding through the issuance of a variety of unsecured and asset-backed debt securities in the United States and international capital markets. We also sponsor a number of asset-backed securitization programs that issue long-term debt securities that are sold to institutional investors in the United States and international capital markets.
28
Item 1. Financial Statements (Continued)
FORD MOTOR CREDIT COMPANY LLC AND SUBSIDIARIES
NOTES TO THE FINANCIAL STATEMENTS (Continued)
NOTE 8. DEBT (Continued)
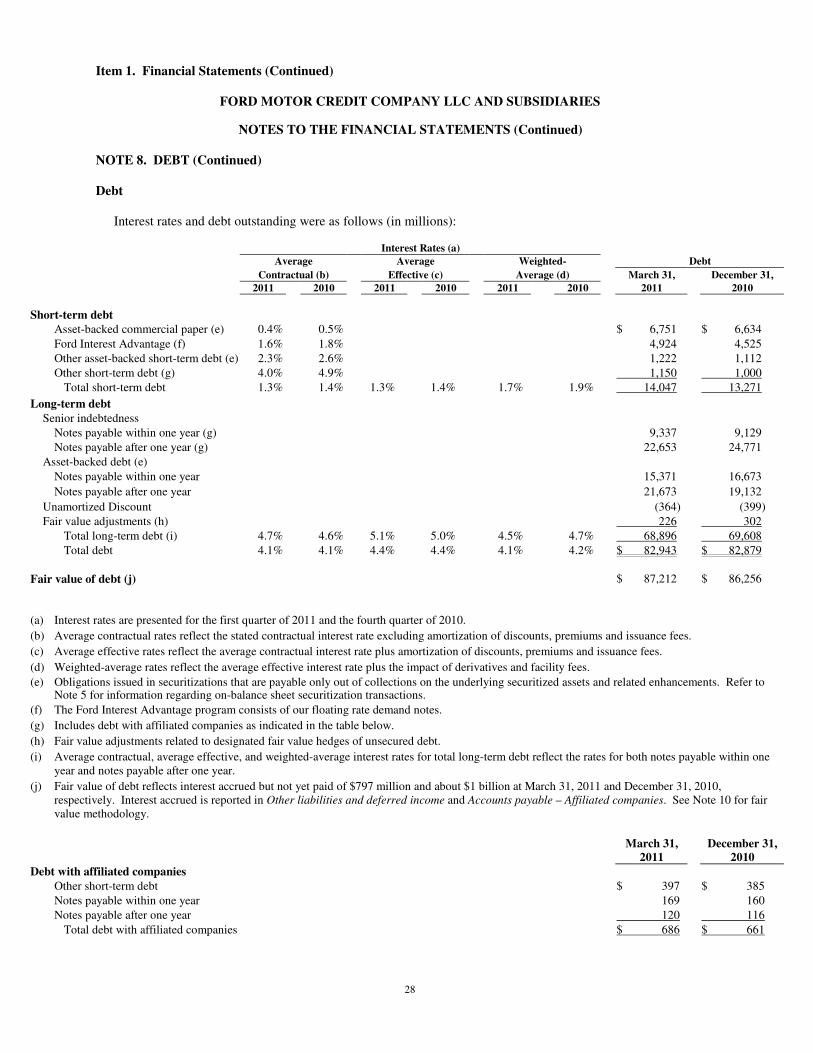
Debt
Interest rates and debt outstanding were as follows (in millions):
Interest Rates (a)
Average Average Weighted- Debt
Contractual (b) Effective (c) Average (d) March 31, December 31,
2011 2010 2011 2010 2011 2010 2011 2010
Short-term debt
Asset-backed commercial paper (e) 0.4% 0.5% $ 6,751 $ 6,634
Ford Interest Advantage (f) 1.6% 1.8% 4,924 4,525
Other asset-backed short-term debt (e) 2.3% 2.6% 1,222 1,112
Other short-term debt (g) 4.0% 4.9% 1,150 1,000
Total short-term debt 1.3% 1.4% 1.3% 1.4% 1.7% 1.9% 14,047 13,271
Long-term debt
Senior indebtedness
Notes payable within one year (g) 9,337 9,129
Notes payable after one year (g) 22,653 24,771
Asset-backed debt (e)
Notes payable within one year 15,371 16,673
Notes payable after one year 21,673 19,132
Unamortized Discount (364) (399)
Fair value adjustments (h) 226 302
Total long-term debt (i) 4.7% 4.6% 5.1% 5.0% 4.5% 4.7% 68,896 69,608
Total debt 4.1% 4.1% 4.4% 4.4% 4.1% 4.2% $ 82,943 $ 82,879
Fair value of debt (j) $ 87,212 $ 86,256
(a) Interest rates are presented for the first quarter of 2011 and the fourth quarter of 2010.
(b) Average contractual rates reflect the stated contractual interest rate excluding amortization of discounts, premiums and issuance fees.
(c) Average effective rates reflect the average contractual interest rate plus amortization of discounts, premiums and issuance fees.
(d) Weighted-average rates reflect the average effective interest rate plus the impact of derivatives and facility fees.
(e) Obligations issued in securitizations that are payable only out of collections on the underlying securitized assets and related enhancements. Refer to Note 5 for information regarding on-balance sheet securitization transactions.
(f) The Ford Interest Advantage program consists of our floating rate demand notes.
(g) Includes debt with affiliated companies as indicated in the table below.
(h) Fair value adjustments related to designated fair value hedges of unsecured debt.
(i) Average contractual, average effective, and weighted-average interest rates for total long-term debt reflect the rates for both notes payable within one year and notes payable after one year.
(j) Fair value of debt reflects interest accrued but not yet paid of $797 million and about $1 billion at March 31, 2011 and December 31, 2010, respectively. Interest accrued is reported in Other liabilities and deferred income and Accounts payable – Affiliated companies. See Note 10 for fair value methodology.
March 31, December 31, 2011 2010
Debt with affiliated companies
Other short-term debt $ 397 $ 385
Notes payable within one year 169 160
Notes payable after one year 120 116
Total debt with affiliated companies $ 686 $ 661
29
Item 1. Financial Statements (Continued)
FORD MOTOR CREDIT COMPANY LLC AND SUBSIDIARIES
NOTES TO THE FINANCIAL STATEMENTS (Continued)
NOTE 8. DEBT (Continued)
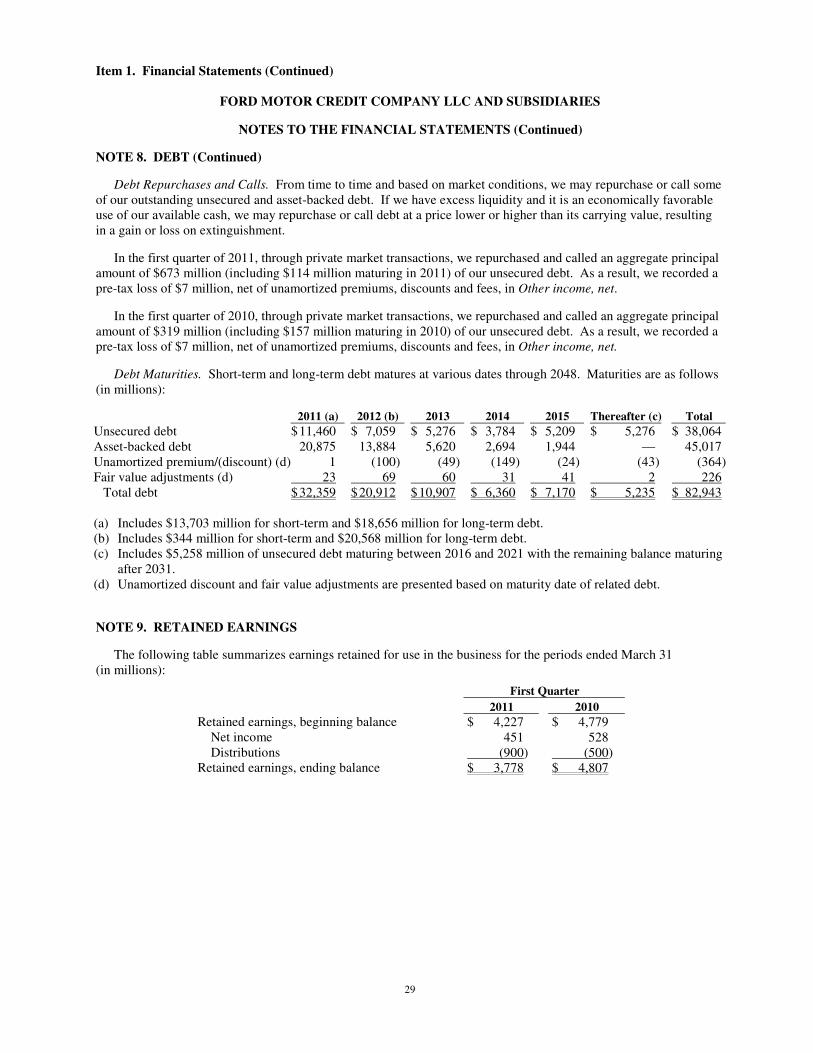
Debt Repurchases and Calls. From time to time and based on market conditions, we may repurchase or call some of our outstanding unsecured and asset-backed debt. If we have excess liquidity and it is an economically favorable use of our available cash, we may repurchase or call debt at a price lower or higher than its carrying value, resulting in a gain or loss on extinguishment.
In the first quarter of 2011, through private market transactions, we repurchased and called an aggregate principal amount of $673 million (including $114 million maturing in 2011) of our unsecured debt. As a result, we recorded a pre-tax loss of $7 million, net of unamortized premiums, discounts and fees, in Other income, net.
In the first quarter of 2010, through private market transactions, we repurchased and called an aggregate principal amount of $319 million (including $157 million maturing in 2010) of our unsecured debt. As a result, we recorded a pre-tax loss of $7 million, net of unamortized premiums, discounts and fees, in Other income, net.
Debt Maturities. Short-term and long-term debt matures at various dates through 2048. Maturities are as follows (in millions):
2011 (a) 2012 (b) 2013 2014 2015 Thereafter (c) Total
Unsecured debt $ 11,460 $ 7,059 $ 5,276 $ 3,784 $ 5,209 $ 5,276 $ 38,064 Asset-backed debt 20,875 13,884 5,620 2,694 1,944 — 45,017 Unamortized premium/(discount) (d) 1 (100) (49) (149) (24) (43) (364)Fair value adjustments (d) 23 69 60 31 41 2 226
Total debt $ 32,359 $ 20,912 $ 10,907 $ 6,360 $ 7,170 $ 5,235 $ 82,943 (a) Includes $13,703 million for short-term and $18,656 million for long-term debt. (b) Includes $344 million for short-term and $20,568 million for long-term debt. (c) Includes $5,258 million of unsecured debt maturing between 2016 and 2021 with the remaining balance maturing
after 2031. (d) Unamortized discount and fair value adjustments are presented based on maturity date of related debt.
NOTE 9. RETAINED EARNINGS
The following table summarizes earnings retained for use in the business for the periods ended March 31 (in millions):
First Quarter 2011 2010
Retained earnings, beginning balance $ 4,227 $ 4,779 Net income 451 528 Distributions (900) (500)
Retained earnings, ending balance $ 3,778 $ 4,807
30
Item 1. Financial Statements (Continued)
FORD MOTOR CREDIT COMPANY LLC AND SUBSIDIARIES
NOTES TO THE FINANCIAL STATEMENTS (Continued)
NOTE 10. FAIR VALUE MEASUREMENTS
Cash equivalents, marketable securities, derivative financial instruments and retained interests in securitized assets
are presented on our financial statements at fair value. The fair value of finance receivables and debt, together with the related carrying value, is disclosed in Notes 2 and 8, respectively. Certain other assets and liabilities are measured at fair value on a nonrecurring basis and vary based on specific circumstances such as impairments.
Fair Value Measurements
In determining fair value, we use various valuation methodologies and prioritize the use of observable inputs. We
assess the inputs used to measure fair value using a three-tier hierarchy based on the extent to which inputs used in measuring fair value are observable in the market:
• Level 1 — inputs include quoted prices for identical instruments and are the most observable. • Level 2 — inputs include quoted prices for similar assets and observable inputs such as interest rates, currency
exchange rates and yield curves. • Level 3 — inputs include data not observable in the market and reflect management’s judgments about the
assumptions market participants would use in pricing the asset or liability. The use of observable and unobservable inputs and their significance in measuring fair value are reflected in our
hierarchy assessment.
Valuation Methodologies
Cash and Cash Equivalents. Included in Cash and cash equivalents are highly liquid investments that are readily convertible to known amounts of cash, and which are subject to an insignificant risk of changes in value due to interest rate, market price, or penalty on withdraw. A debt security is classified as a cash equivalent if it meets these criteria and if it has a remaining time to maturity of 90 days or less from the date of acquisition. Amounts on deposit and available upon demand, or negotiated to provide for daily liquidity without penalty, are classified as Cash and
cash equivalents. Time deposits, certificates of deposit, and money market accounts meeting this criteria are classified as Cash and cash equivalents, reported at par value, and excluded from the tables below. Marketable Securities. Investments in securities with a maturity date greater than 90 days at the date of purchase and other securities for which there is a more than insignificant risk of changes in value because of interest rate, market price or penalty on withdraw are classified as Marketable securities. For marketable securities, we generally measure fair value based on a market approach using prices obtained from pricing services. We review all pricing data for reasonability and observability of inputs. Pricing methodologies and inputs to valuation models used by the pricing services depend on the security type (i.e., asset class). Where possible, fair values are generated using market inputs including quoted prices (the closing price in an exchange market), bid prices (the price at which a dealer stands ready to purchase) and other market information. For securities that are not actively traded, the pricing services obtain quotes for similar fixed-income securities or utilize matrix pricing, benchmark curves or other factors to determine fair value. In certain cases, when observable pricing data are not available, we estimate the fair value of investment securities based on an income approach using industry standard valuation models and estimates regarding non-performance risk.
31
Item 1. Financial Statements (Continued)
FORD MOTOR CREDIT COMPANY LLC AND SUBSIDIARIES
NOTES TO THE FINANCIAL STATEMENTS (Continued)
NOTE 10. FAIR VALUE MEASUREMENTS (Continued)
Derivative Financial Instruments. Our derivatives are over-the-counter customized derivative transactions and
are not exchange traded. We estimate the fair value of these instruments based on an income approach using industry standard valuation models. These models project future cash flows and discount the future amounts to a present value using market-based expectations for interest rates, foreign exchange rates and the contractual terms of the derivative instruments. The discount rate used is the relevant interbank deposit rate (e.g., LIBOR) plus an adjustment for non-performance risk. The adjustment reflects the full credit default swap (“CDS”) spread applied to a net exposure, by counterparty considering the master netting agreements. We use our counterparty’s CDS spread when we are in a net asset position and our own CDS spread when we are in a net liability position.
In certain cases, market data are not available and we develop assumptions or use models (e.g., Black Scholes)
which are used to determine fair value. This includes situations for longer-dated instruments where market data is less observable. Also, for interest rate swaps and cross-currency interest rate swaps used in securitization transactions, the notional amount of the swap is reset based on actual payments on the securitized contracts. We use management judgment to estimate the timing and amount of the remaining swap cash flows based on historical pre-payment speeds.
Retained Interests in Securitized Assets. We estimate the fair value of retained interests based on an income approach using internal valuation models. These models project future cash flows of the monthly collections on the sold finance receivables in excess of amounts needed for payment of the debt and other obligations issued or arising in the securitization transactions. The projected cash flows are discounted to a present value based on market inputs and our own assumptions regarding credit losses, pre-payment speed and the discount rate.
Finance Receivables. We generally estimate the fair value of finance receivables based on an income approach
using internal valuation models. These models project future cash flows of financing contracts based on scheduled contract payments (including principal and interest). The projected cash flows are discounted to a present value based on market inputs and our own assumptions regarding credit losses, pre-payment speed and the discount rate. Our assumptions regarding pre-payment speed and credit losses are based on historical performance.
Debt. We estimate the fair value of debt based on a market approach using quoted market prices or current market rates for similar debt with approximately the same remaining maturities, where possible. Where market prices or current market rates are not available, we estimate fair value based on an income approach using discounted cash flow models. These models project future cash flows and discount the future amounts to a present value using market-based expectations for interest rates, our own credit risk and the contractual terms of the debt instruments. For asset-backed debt issued in securitization transactions, the principal payments are based on projected payments for specific assets securing the underlying debt considering historical pre-payment speeds.
32
Item 1. Financial Statements (Continued)
FORD MOTOR CREDIT COMPANY LLC AND SUBSIDIARIES
NOTES TO THE FINANCIAL STATEMENTS (Continued)
NOTE 10. FAIR VALUE MEASUREMENTS (Continued)
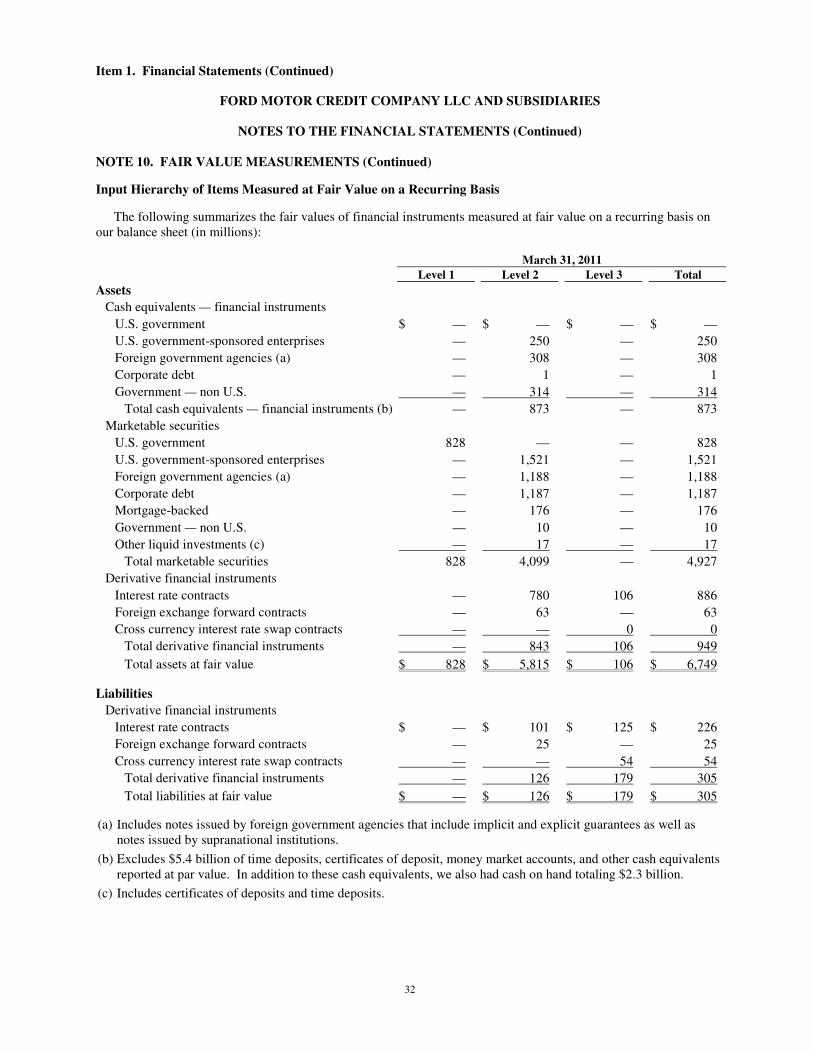
Input Hierarchy of Items Measured at Fair Value on a Recurring Basis
The following summarizes the fair values of financial instruments measured at fair value on a recurring basis on our balance sheet (in millions):
March 31, 2011
Level 1 Level 2 Level 3 Total
Assets
Cash equivalents — financial instruments
U.S. government $ — $ — $ — $ —
U.S. government-sponsored enterprises — 250 — 250
Foreign government agencies (a) — 308 — 308
Corporate debt — 1 — 1
Government — non U.S. — 314 — 314
Total cash equivalents — financial instruments (b) — 873 — 873
Marketable securities
U.S. government 828 — — 828
U.S. government-sponsored enterprises — 1,521 — 1,521
Foreign government agencies (a) — 1,188 — 1,188
Corporate debt — 1,187 — 1,187
Mortgage-backed — 176 — 176
Government — non U.S. — 10 — 10
Other liquid investments (c) — 17 — 17
Total marketable securities 828 4,099 — 4,927
Derivative financial instruments
Interest rate contracts — 780 106 886
Foreign exchange forward contracts — 63 — 63
Cross currency interest rate swap contracts — — 0 0
Total derivative financial instruments — 843 106 949
Total assets at fair value $ 828 $ 5,815 $ 106 $ 6,749
Liabilities
Derivative financial instruments
Interest rate contracts $ — $ 101 $ 125 $ 226
Foreign exchange forward contracts — 25 — 25
Cross currency interest rate swap contracts — — 54 54
Total derivative financial instruments — 126 179 305
Total liabilities at fair value $ — $ 126 $ 179 $ 305
(a) Includes notes issued by foreign government agencies that include implicit and explicit guarantees as well as notes issued by supranational institutions.
(b) Excludes $5.4 billion of time deposits, certificates of deposit, money market accounts, and other cash equivalents reported at par value. In addition to these cash equivalents, we also had cash on hand totaling $2.3 billion.
(c) Includes certificates of deposits and time deposits.
33
Item 1. Financial Statements (Continued)
FORD MOTOR CREDIT COMPANY LLC AND SUBSIDIARIES
NOTES TO THE FINANCIAL STATEMENTS (Continued)
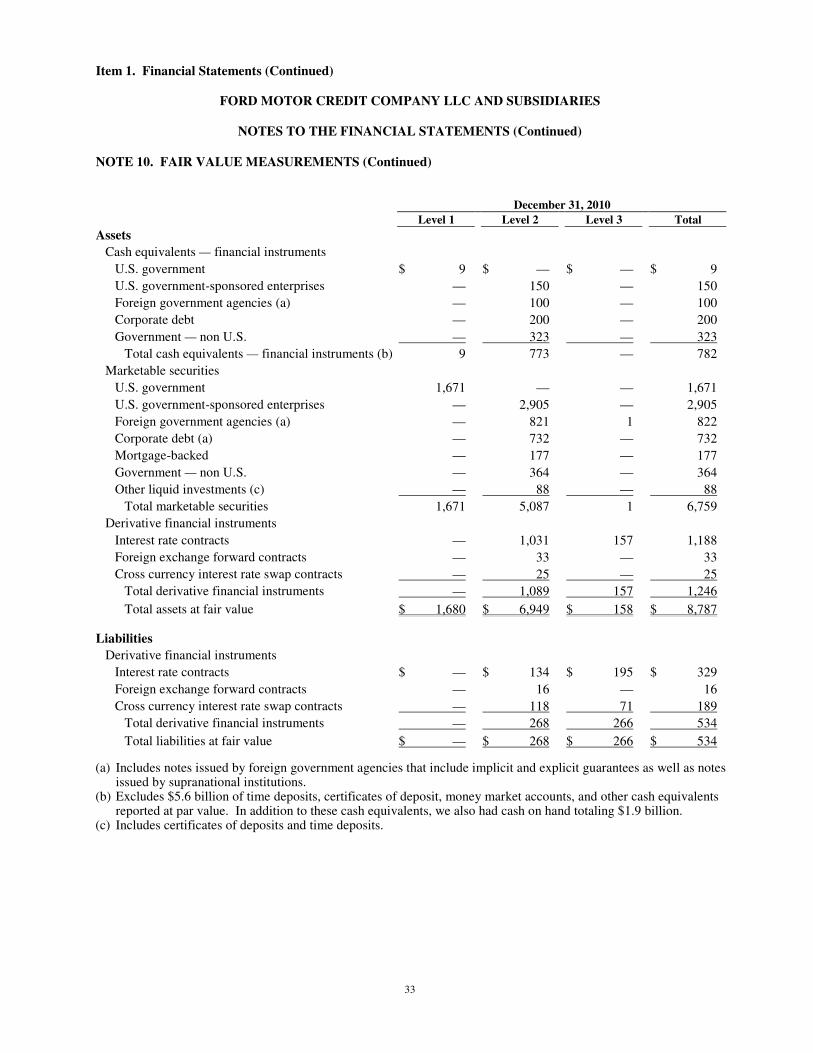
NOTE 10. FAIR VALUE MEASUREMENTS (Continued)
December 31, 2010
Level 1 Level 2 Level 3 Total
Assets
Cash equivalents — financial instruments
U.S. government $ 9 $ — $ — $ 9
U.S. government-sponsored enterprises — 150 — 150
Foreign government agencies (a) — 100 — 100
Corporate debt — 200 — 200
Government — non U.S. — 323 — 323
Total cash equivalents — financial instruments (b) 9 773 — 782
Marketable securities
U.S. government 1,671 — — 1,671
U.S. government-sponsored enterprises — 2,905 — 2,905
Foreign government agencies (a) — 821 1 822
Corporate debt (a) — 732 — 732
Mortgage-backed — 177 — 177
Government — non U.S. — 364 — 364
Other liquid investments (c) — 88 — 88
Total marketable securities 1,671 5,087 1 6,759
Derivative financial instruments
Interest rate contracts — 1,031 157 1,188
Foreign exchange forward contracts — 33 — 33
Cross currency interest rate swap contracts — 25 — 25
Total derivative financial instruments — 1,089 157 1,246
Total assets at fair value $ 1,680 $ 6,949 $ 158 $ 8,787
Liabilities
Derivative financial instruments
Interest rate contracts $ — $ 134 $ 195 $ 329
Foreign exchange forward contracts — 16 — 16
Cross currency interest rate swap contracts — 118 71 189
Total derivative financial instruments — 268 266 534
Total liabilities at fair value $ — $ 268 $ 266 $ 534
(a) Includes notes issued by foreign government agencies that include implicit and explicit guarantees as well as notes issued by supranational institutions.
(b) Excludes $5.6 billion of time deposits, certificates of deposit, money market accounts, and other cash equivalents reported at par value. In addition to these cash equivalents, we also had cash on hand totaling $1.9 billion.
(c) Includes certificates of deposits and time deposits.
34
Item 1. Financial Statements (Continued)
FORD MOTOR CREDIT COMPANY LLC AND SUBSIDIARIES
NOTES TO THE FINANCIAL STATEMENTS (Continued)
NOTE 10. FAIR VALUE MEASUREMENTS (Continued)
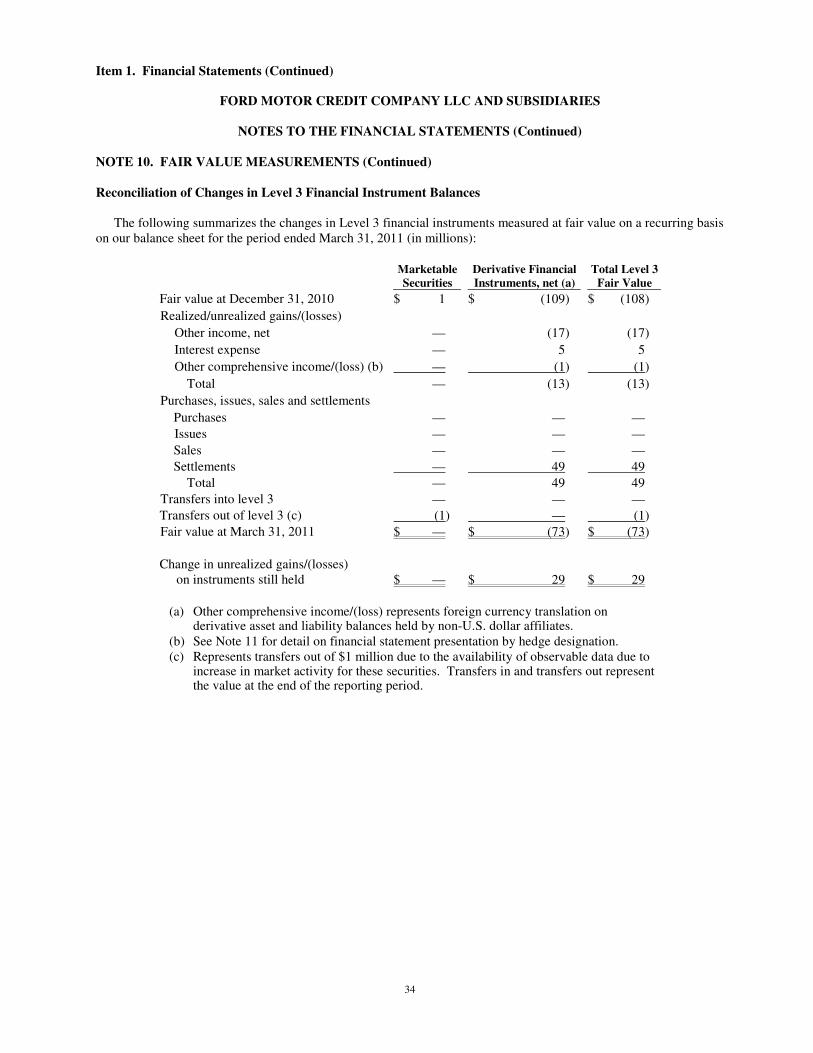
Reconciliation of Changes in Level 3 Financial Instrument Balances
The following summarizes the changes in Level 3 financial instruments measured at fair value on a recurring basis on our balance sheet for the period ended March 31, 2011 (in millions):
Marketable
Securities
Derivative Financial
Instruments, net (a)
Total Level 3
Fair Value
Fair value at December 31, 2010 $ 1 $ (109) $ (108)
Realized/unrealized gains/(losses)
Other income, net — (17) (17)
Interest expense — 5 5
Other comprehensive income/(loss) (b) — (1) (1)
Total — (13) (13)
Purchases, issues, sales and settlements
Purchases — — —
Issues — — —
Sales — — —
Settlements — 49 49
Total — 49 49
Transfers into level 3 — — —
Transfers out of level 3 (c) (1) — (1)
Fair value at March 31, 2011 $ — $ (73) $ (73)
Change in unrealized gains/(losses) on instruments still held $ — $ 29 $ 29
(a) Other comprehensive income/(loss) represents foreign currency translation on
derivative asset and liability balances held by non-U.S. dollar affiliates. (b) See Note 11 for detail on financial statement presentation by hedge designation. (c) Represents transfers out of $1 million due to the availability of observable data due to
increase in market activity for these securities. Transfers in and transfers out represent the value at the end of the reporting period.
35
Item 1. Financial Statements (Continued)
FORD MOTOR CREDIT COMPANY LLC AND SUBSIDIARIES
NOTES TO THE FINANCIAL STATEMENTS (Continued)
NOTE 10. FAIR VALUE MEASUREMENTS (Continued)
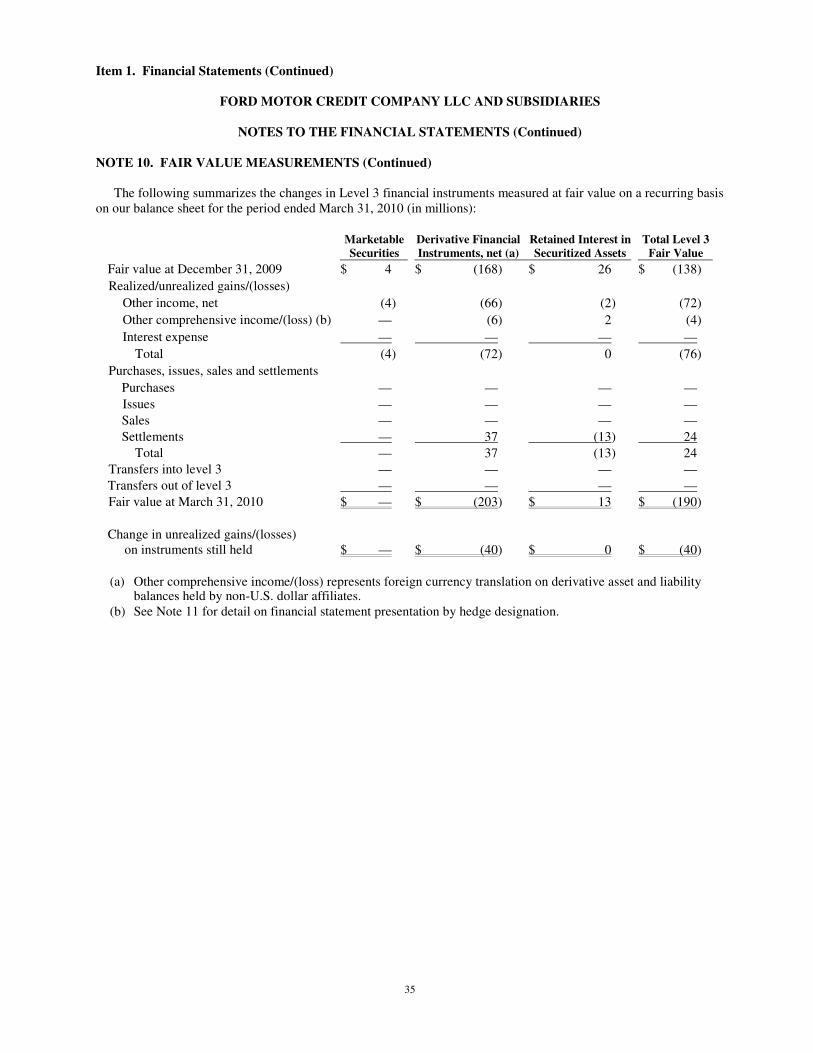
The following summarizes the changes in Level 3 financial instruments measured at fair value on a recurring basis
on our balance sheet for the period ended March 31, 2010 (in millions):
Marketable
Securities
Derivative Financial
Instruments, net (a)
Retained Interest in
Securitized Assets
Total Level 3
Fair Value
Fair value at December 31, 2009 $ 4 $ (168) $ 26 $ (138)
Realized/unrealized gains/(losses)
Other income, net (4) (66) (2) (72)
Other comprehensive income/(loss) (b) — (6) 2 (4)
Interest expense — — — —
Total (4) (72) 0 (76)
Purchases, issues, sales and settlements
Purchases — — — —
Issues — — — —
Sales — — — —
Settlements — 37 (13) 24
Total — 37 (13) 24
Transfers into level 3 — — — —
Transfers out of level 3 — — — —
Fair value at March 31, 2010 $ — $ (203) $ 13 $ (190)
Change in unrealized gains/(losses) on instruments still held $ — $ (40) $ 0 $ (40)
(a) Other comprehensive income/(loss) represents foreign currency translation on derivative asset and liability
balances held by non-U.S. dollar affiliates. (b) See Note 11 for detail on financial statement presentation by hedge designation.
36
Item 1. Financial Statements (Continued)
FORD MOTOR CREDIT COMPANY LLC AND SUBSIDIARIES
NOTES TO THE FINANCIAL STATEMENTS (Continued)
NOTE 10. FAIR VALUE MEASUREMENTS (Continued)
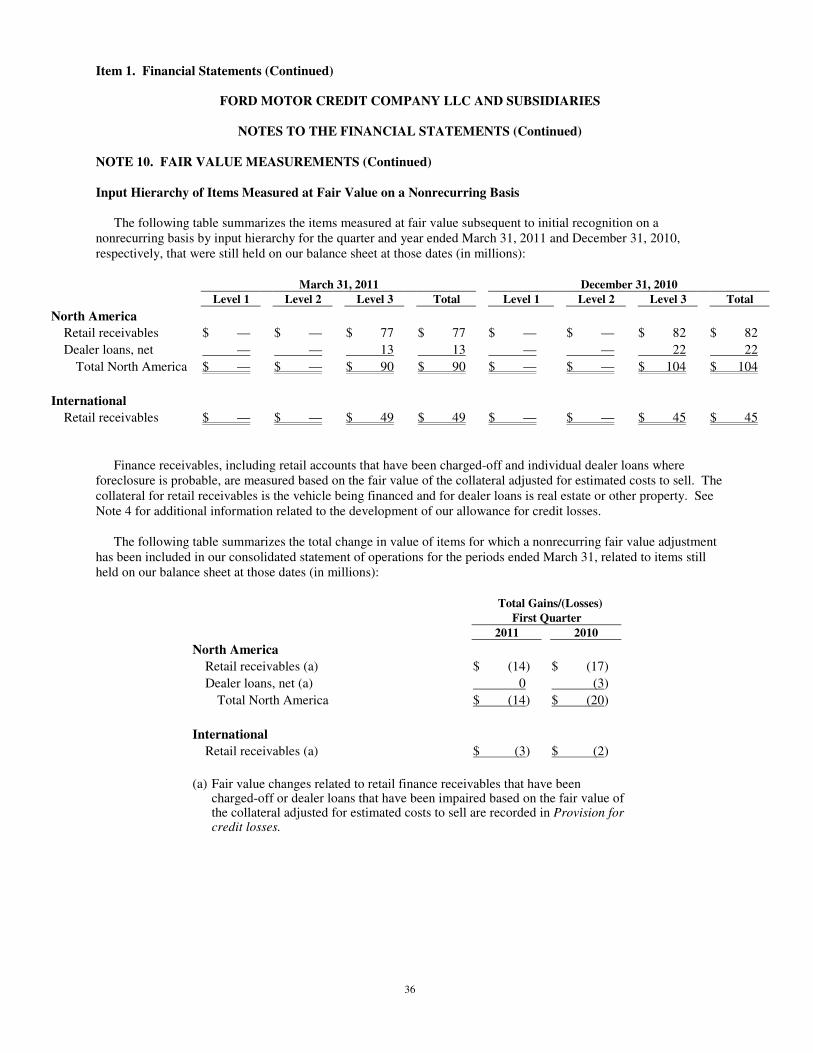
Input Hierarchy of Items Measured at Fair Value on a Nonrecurring Basis The following table summarizes the items measured at fair value subsequent to initial recognition on a
nonrecurring basis by input hierarchy for the quarter and year ended March 31, 2011 and December 31, 2010, respectively, that were still held on our balance sheet at those dates (in millions):
March 31, 2011 December 31, 2010
Level 1 Level 2 Level 3 Total Level 1 Level 2 Level 3 Total
North America
Retail receivables $ — $ — $ 77 $ 77 $ — $ — $ 82 $ 82
Dealer loans, net — — 13 13 — — 22 22
Total North America $ — $ — $ 90 $ 90 $ — $ — $ 104 $ 104
International
Retail receivables $ — $ — $ 49 $ 49 $ — $ — $ 45 $ 45
Finance receivables, including retail accounts that have been charged-off and individual dealer loans where
foreclosure is probable, are measured based on the fair value of the collateral adjusted for estimated costs to sell. The collateral for retail receivables is the vehicle being financed and for dealer loans is real estate or other property. See Note 4 for additional information related to the development of our allowance for credit losses.
The following table summarizes the total change in value of items for which a nonrecurring fair value adjustment
has been included in our consolidated statement of operations for the periods ended March 31, related to items still held on our balance sheet at those dates (in millions):
Total Gains/(Losses)
First Quarter
2011 2010
North America
Retail receivables (a) $ (14) $ (17)
Dealer loans, net (a) 0 (3)
Total North America $ (14) $ (20)
International
Retail receivables (a) $ (3) $ (2)
(a) Fair value changes related to retail finance receivables that have been charged-off or dealer loans that have been impaired based on the fair value of the collateral adjusted for estimated costs to sell are recorded in Provision for credit losses.
37
Item 1. Financial Statements (Continued)
FORD MOTOR CREDIT COMPANY LLC AND SUBSIDIARIES
NOTES TO THE FINANCIAL STATEMENTS (Continued)
NOTE 11. DERIVATIVE FINANCIAL INSTRUMENTS AND HEDGING ACTIVITIES
In the normal course of business, our operations are exposed to global market risks, including the effect of
changes in interest rates and foreign currency exchange rates. To manage these risks, we enter into various derivative contracts. Interest rate contracts including swaps, caps and floors are used to manage the effects of interest rate fluctuations. Cross-currency interest rate swap contracts are used to manage foreign currency and interest rate exposures on foreign denominated debt. Foreign exchange forward contracts are used to manage foreign exchange exposure. Our derivatives are over-the-counter customized derivative transactions and are not exchange traded. Management reviews our hedging program, derivative positions, and overall risk management on a regular basis.
We have elected to apply hedge accounting to certain derivatives. Derivatives that receive designated hedge
accounting treatment are documented and the relationships are evaluated for effectiveness using a regression method at the time they are designated, as well as throughout the hedge period. Cash flows and profit impact associated with designated hedges are reported in the same category as the underlying hedged item. Some derivatives do not qualify for hedge accounting; for others, we elect not to apply hedge accounting. Regardless of hedge accounting treatment, we only enter into transactions we believe will be highly effective at offsetting the underlying economic risk.
Fair Value Hedges. We use certain derivatives to reduce the risk of changes in the fair value of liabilities. We
have designated certain receive-fixed, pay-float interest rate swaps as fair value hedges of fixed-rate debt. The risk being hedged is the risk of changes in the fair value of the hedged debt attributable to changes in the benchmark interest rate. We use regression analysis to assess hedge effectiveness. If the hedge relationship is deemed to be highly effective, we record the changes in the fair value of the hedged debt related to the risk being hedged in Debt with the offset in Other income, net. The change in fair value of the related derivative (excluding accrued interest) also is recorded in Other income, net. Hedge ineffectiveness, recorded directly in earnings, is the difference between the change in fair value of the derivative and the change in the fair value of the hedged debt that is attributable to the changes in the benchmark interest rate. The exchange of cash associated with fair value hedges is reported in Cash
flows from operating activities in our consolidated statement of cash flows. When a derivative is de-designated from a fair value hedge relationship, or when the derivative in a fair value
hedge relationship is terminated before maturity, the fair value adjustment to the hedged debt continues to be reported as part of the basis of the item and is amortized over its remaining life.
Derivatives Not Designated as Hedging Instruments. We report changes in the fair value of derivatives not
designated as hedging instruments in Other income, net. The earnings impact primarily relates to changes in fair value of interest rate derivatives, which are included in evaluating our overall risk management objective, and foreign currency derivatives, which are substantially offset by the revaluation of foreign denominated debt. The exchange of cash associated with derivatives not designated as hedging instruments is reported in Cash flows from investing
activities in our consolidated statement of cash flows.
38
Item 1. Financial Statements (Continued)
FORD MOTOR CREDIT COMPANY LLC AND SUBSIDIARIES
NOTES TO THE FINANCIAL STATEMENTS (Continued)
NOTE 11. DERIVATIVE FINANCIAL INSTRUMENTS AND HEDGING ACTIVITIES (Continued)
Income Effect of Derivative Financial Instruments
The following table summarizes the pre-tax gain/(loss) for each type of hedge designation for the periods ended
March 31 (in millions):
First Quarter
2011 2010
Fair value hedges
Interest rate contracts
Net interest settlements and accruals excluded from the assessment of hedge effectiveness $ 66
$ 53
Ineffectiveness (a) (18) (2)
Total $ 48 $ 51
Derivatives not designated as hedging instruments
Interest rate contracts $ (2) $ 19
Foreign exchange forward contracts (b) (7) (60)
Cross currency interest rate swap contracts (b) (14) (8)
Total $ (23) $ (49)
(a) For the first quarter of 2011 and 2010, hedge ineffectiveness reflects change in fair value on derivatives of $88 million loss and $43 million gain, respectively, and change in fair value on hedged debt of $70 million gain and $45 million loss, respectively.
(b) Gains/(Losses) related to foreign currency derivatives were substantially offset by net revaluation impacts on foreign denominated debt, which were also recorded in Other income, net.
For our fair value hedges, net interest settlements and accruals are excluded from the assessment of hedge
effectiveness. We report net interest settlements and accruals in Interest expense. We report hedge ineffectiveness on fair value hedges and foreign currency revaluation on accrued interest in Other income, net. We report all income items on derivatives not designated as hedging instruments in Other income, net.
39
Item 1. Financial Statements (Continued)
FORD MOTOR CREDIT COMPANY LLC AND SUBSIDIARIES
NOTES TO THE FINANCIAL STATEMENTS (Continued)
NOTE 11. DERIVATIVE FINANCIAL INSTRUMENTS AND HEDGING ACTIVITIES (Continued)
Balance Sheet Effect of Derivative Financial Instruments
The following tables summarize the notional amounts and estimated fair value of our derivative financial
instruments (in millions):
March 31, 2011
Fair Fair
Value Value
Notional Assets Liabilities
Fair value hedges
Interest rate contracts $ 9,632 $ 444 $ 12
Derivatives not designated as hedging instruments
Interest rate contracts 52,240 442 214
Foreign exchange forward contracts (a) 4,810 63 25
Cross currency interest rate swap contracts 828 — 54
Total derivatives not designated as hedging instruments 57,878 505 293
Total derivative financial instruments $ 67,510 $ 949 $ 305
(a) Includes forward contracts between Ford Credit and an affiliated company.
December 31, 2010
Fair Fair
Value Value
Notional Assets Liabilities
Fair value hedges
Interest rate contracts $ 8,826 $ 503 $ 7
Derivatives not designated as hedging instruments
Interest rate contracts 52,698 685 322
Foreign exchange forward contracts (a) 3,309 33 16
Cross currency interest rate swap contracts 1,472 25 189
Total derivatives not designated as hedging instruments 57,479 743 527
Total derivative financial instruments $ 66,305 $ 1,246 $ 534
(a) Includes forward contracts between Ford Credit and an affiliated company. We report derivative assets and derivative liabilities in Derivative financial instruments in our consolidated
balance sheet. To ensure consistency in our treatment of derivative and non-derivative exposures with regard to our master agreements, we do not net our derivative position by counterparty for purposes of balance sheet presentation and disclosure.
The notional amounts of the derivative financial instruments do not represent amounts exchanged by the parties
and, therefore, are not a direct measure of our exposure to the financial risks described above. The amounts exchanged are calculated by reference to the notional amounts and by other terms of the derivatives, such as interest rates or foreign currency exchange rates.
40
Item 1. Financial Statements (Continued)
FORD MOTOR CREDIT COMPANY LLC AND SUBSIDIARIES
NOTES TO THE FINANCIAL STATEMENTS (Continued)
NOTE 11. DERIVATIVE FINANCIAL INSTRUMENTS AND HEDGING ACTIVITIES (Continued)
Counterparty Risk
Use of derivatives exposes us to the risk that a counterparty may default on a derivative contract. We establish
exposure limits for each counterparty to minimize this risk and provide counterparty diversification. Substantially all of our derivative exposures are with counterparties that have long-term credit ratings of single-A or better. The aggregate fair value of derivative instruments in asset positions at March 31, 2011 is $949 million, representing the maximum loss we would recognize at that date if all counterparties failed to perform as contracted. We enter into master agreements with counterparties that generally allow for netting of certain exposures; therefore, the actual loss we would recognize if all counterparties failed to perform as contracted would be significantly lower.
We include an adjustment for non-performance risk in the fair value of derivative instruments. Our adjustment for
non-performance risk relative to a measure based on an unadjusted inter-bank deposit rate (e.g., LIBOR) reduced our derivative assets by $4 million and $9 million and our derivative liabilities by $10 million and $4 million at March 31, 2011 and December 31, 2010, respectively. See Note 10 for additional information regarding fair value measurements.
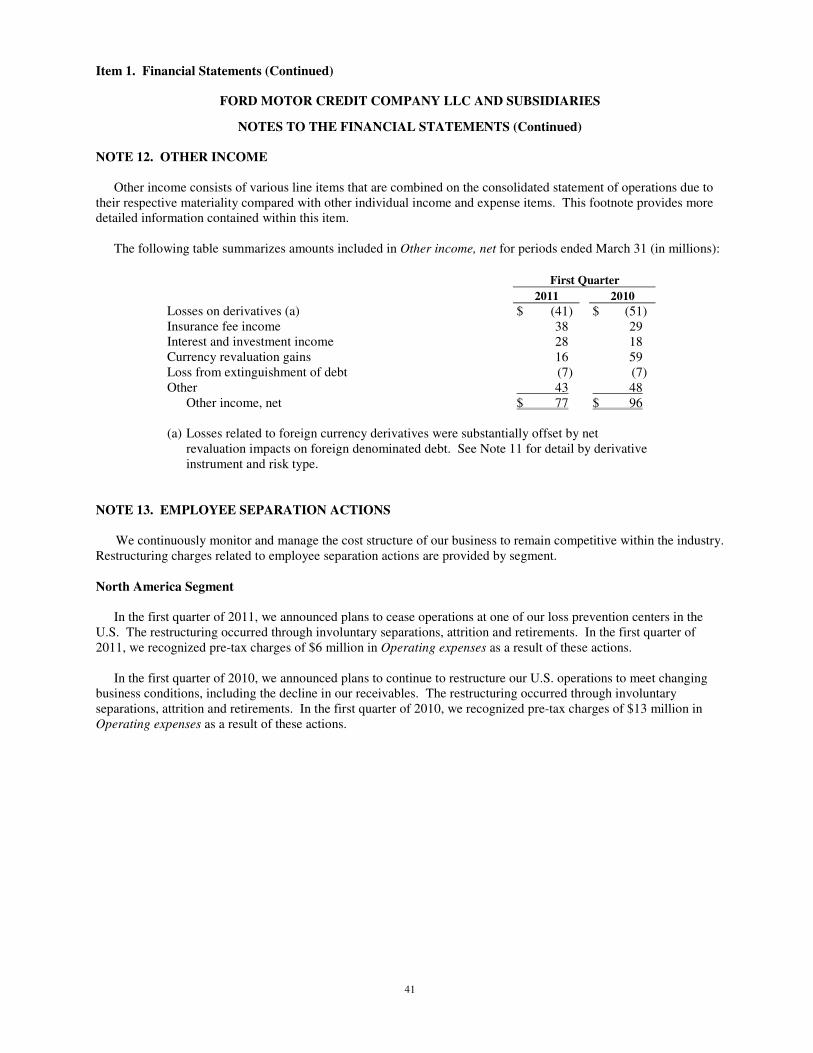
41
Item 1. Financial Statements (Continued)
FORD MOTOR CREDIT COMPANY LLC AND SUBSIDIARIES
NOTES TO THE FINANCIAL STATEMENTS (Continued)
NOTE 12. OTHER INCOME
Other income consists of various line items that are combined on the consolidated statement of operations due to
their respective materiality compared with other individual income and expense items. This footnote provides more detailed information contained within this item.
The following table summarizes amounts included in Other income, net for periods ended March 31 (in millions):
First Quarter 2011 2010
Losses on derivatives (a) $ (41) $ (51) Insurance fee income 38 29 Interest and investment income 28 18 Currency revaluation gains 16 59 Loss from extinguishment of debt (7) (7) Other 43 48
Other income, net $ 77 $ 96 (a) Losses related to foreign currency derivatives were substantially offset by net
revaluation impacts on foreign denominated debt. See Note 11 for detail by derivative instrument and risk type.
NOTE 13. EMPLOYEE SEPARATION ACTIONS
We continuously monitor and manage the cost structure of our business to remain competitive within the industry.
Restructuring charges related to employee separation actions are provided by segment.
North America Segment In the first quarter of 2011, we announced plans to cease operations at one of our loss prevention centers in the
U.S. The restructuring occurred through involuntary separations, attrition and retirements. In the first quarter of 2011, we recognized pre-tax charges of $6 million in Operating expenses as a result of these actions.
In the first quarter of 2010, we announced plans to continue to restructure our U.S. operations to meet changing
business conditions, including the decline in our receivables. The restructuring occurred through involuntary separations, attrition and retirements. In the first quarter of 2010, we recognized pre-tax charges of $13 million in Operating expenses as a result of these actions.
42
Item 1. Financial Statements (Continued)
FORD MOTOR CREDIT COMPANY LLC AND SUBSIDIARIES
NOTES TO THE FINANCIAL STATEMENTS (Continued)
NOTE 13. EMPLOYEE SEPARATION ACTIONS (Continued)
International Segment
In the first quarter of 2010, we recognized pre-tax charges of $2 million in Operating expenses for employee
separation actions primarily in European locations; related charges for the first quarter of 2011 were de minimis.
NOTE 14. SEGMENT INFORMATION
We conduct our financing operations directly and indirectly through our subsidiaries and affiliates. We offer
substantially similar products and services throughout many different regions, subject to local legal restrictions and market conditions. We divide our business segments based on geographic regions: the North America Segment (includes operations in the United States and Canada) and the International Segment (includes operations in all other countries).
We measure the performance of our segments primarily on an income before income taxes basis, after excluding the impact to earnings from gains and losses related to market valuation adjustments to derivatives primarily related to movements in interest rates. These adjustments are included in Unallocated Risk Management and are excluded in assessing our North America and International segment performance, because our risk management activities are carried out on a centralized basis at the corporate level, with only certain elements allocated to these segments. We also adjust segment performance to re-allocate interest expense between the North America and International segments reflecting debt and equity levels proportionate to their product risk. The North America and International segments are presented on a managed basis. Managed basis includes Finance receivables, net and Net investment in
operating leases included in our consolidated balance sheet, excluding unearned interest supplements related to finance receivables, and receivables we sold in off-balance sheet securitizations and continue to service.
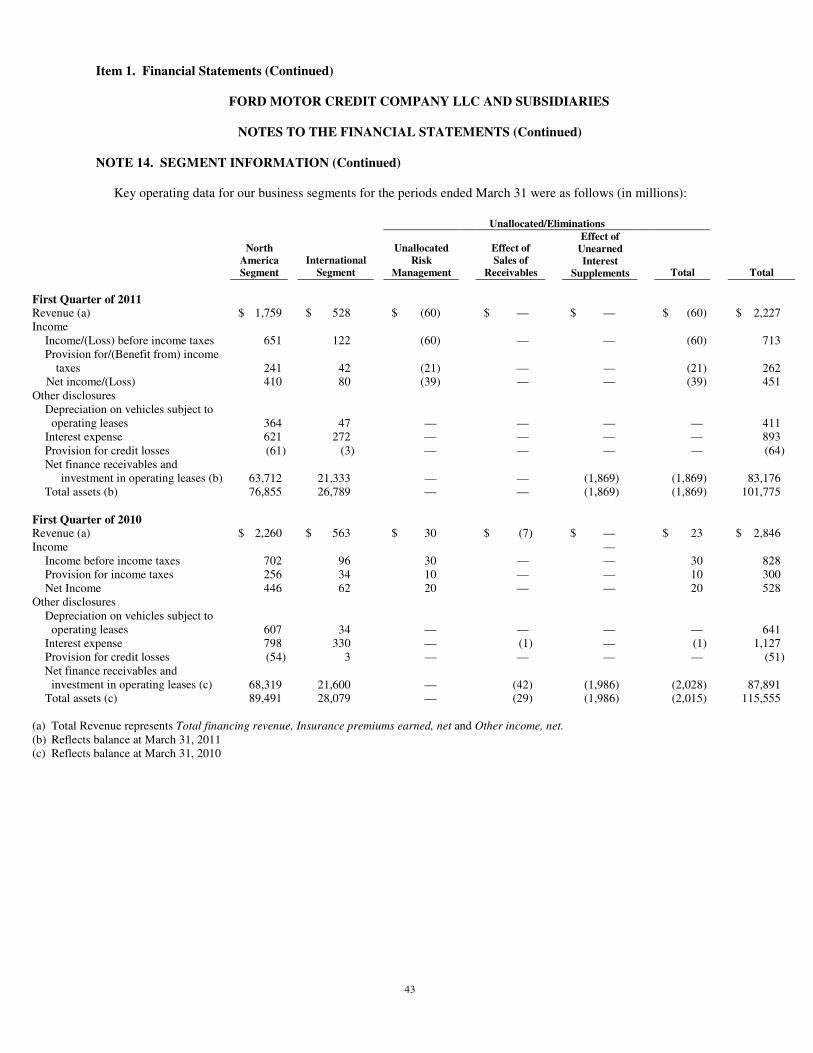
43
Item 1. Financial Statements (Continued)
FORD MOTOR CREDIT COMPANY LLC AND SUBSIDIARIES
NOTES TO THE FINANCIAL STATEMENTS (Continued)
NOTE 14. SEGMENT INFORMATION (Continued)
Key operating data for our business segments for the periods ended March 31 were as follows (in millions):
Unallocated/Eliminations
North
America
Segment International
Segment
Unallocated
Risk
Management
Effect of
Sales of
Receivables
Effect of
Unearned
Interest
Supplements Total Total
First Quarter of 2011 Revenue (a) $ 1,759 $ 528 $ (60) $ — $ — $ (60) $ 2,227 Income
Income/(Loss) before income taxes 651 122 (60) — — (60) 713 Provision for/(Benefit from) income
taxes 241
42
(21)
—
—
(21)
262 Net income/(Loss) 410 80 (39) — — (39) 451
Other disclosures Depreciation on vehicles subject to
operating leases 364
47
—
—
—
—
411 Interest expense 621 272 — — — — 893 Provision for credit losses (61) (3) — — — — (64) Net finance receivables and
investment in operating leases (b) 63,712
21,333
—
—
(1,869)
(1,869)
83,176 Total assets (b) 76,855 26,789 — — (1,869) (1,869) 101,775
First Quarter of 2010 Revenue (a) $ 2,260 $ 563 $ 30 $ (7) $ — $ 23 $ 2,846 Income —
Income before income taxes 702 96 30 — — 30 828 Provision for income taxes 256 34 10 — — 10 300 Net Income 446 62 20 — — 20 528
Other disclosures Depreciation on vehicles subject to
operating leases 607
34
—
—
—
—
641 Interest expense 798 330 — (1) — (1) 1,127 Provision for credit losses (54) 3 — — — — (51) Net finance receivables and
investment in operating leases (c) 68,319
21,600
—
(42)
(1,986)
(2,028)
87,891 Total assets (c) 89,491 28,079 — (29) (1,986) (2,015) 115,555
(a) Total Revenue represents Total financing revenue, Insurance premiums earned, net and Other income, net. (b) Reflects balance at March 31, 2011 (c) Reflects balance at March 31, 2010
44
Item 1. Financial Statements (Continued)
FORD MOTOR CREDIT COMPANY LLC AND SUBSIDIARIES
NOTES TO THE FINANCIAL STATEMENTS (Continued)
NOTE 15. COMMITMENTS AND CONTINGENCIES
Commitments and contingencies consist primarily of lease commitments, guarantees and indemnifications, and litigation and claims.
Guarantees and Indemnifications
The carrying value of recorded liabilities related to guarantees are not material. We have estimated the probability of payment for each guarantee to be remote and have not recorded any loss accruals. At March 31, 2011 and December 31, 2010, the following guarantees and indemnifications were issued and outstanding:
Guarantees of certain obligations of unconsolidated and other affiliates. In some cases, we have guaranteed debt and other financial obligations of unconsolidated affiliates, including Ford. Expiration dates vary, and guarantees will terminate on payment and/or cancellation of the obligation. A payment by us would be triggered by failure of the guaranteed party to fulfill its obligation covered by the guarantee. In some circumstances, we are entitled to recover from Ford or an affiliate of Ford amounts paid by us under the guarantee. However, our ability to enforce these rights is sometimes stayed until the guaranteed party is paid in full. The maximum potential payments under these guarantees totaled $131 million and $130 million at March 31, 2011 and December 31, 2010, respectively. Of these values, $80 million and $75 million at March 31, 2011 and December 31, 2010, respectively, were counter-guaranteed by Ford to us.
FCE Bank plc (“FCE”) has guaranteed obligations of Ford in Romania pursuant to four guarantees with maximum potential payments of $778 million. Two of the guarantees have been fully collateralized by $512 million of cash received from Blue Oval Holdings, a Ford U.K. subsidiary. This cash is available for use in FCE’s daily operations, and is recorded as Debt. The other guarantees of $266 million are not collateralized by Blue Oval Holdings, but are counter-guaranteed by Ford. These guarantees have expiration dates between August 2011 and August 2012, and they could terminate on payment and/or cancellation of the obligations by Ford. A payment to the guaranteed party would be triggered by failure of Ford to fulfill its obligation covered by the guarantee.
Indemnifications. In the ordinary course of business, we execute contracts involving indemnifications standard in the industry and indemnifications specific to a transaction. These indemnifications might include and are not limited to claims relating to any of the following: environmental, tax and shareholder matters; intellectual property rights; governmental regulations and employment-related matters; dealers; other commercial contractual relationships; and financial matters, such as securitizations. Performance under these indemnities generally would be triggered by a breach of terms of the contract or by a third-party claim. We are party to numerous indemnifications which do not limit potential payment; therefore, we are unable to estimate a maximum amount of potential future payments that could result from claims made under these indemnities.
Litigation and Claims
Various legal actions, governmental investigations and proceedings and claims are pending or may be instituted or asserted in the future against us including but not limited to those arising out of state and federal laws related to tax matters, financial services, employment-related matters, dealers, personal injury matters, investor matters, financial reporting matters and other contractual relationships. Certain of the pending legal actions are, or purport to be, class actions. Some of the foregoing matters involve or may involve compensatory, punitive, or treble damage claims in very large amounts, or other relief, which, if granted, would require very large expenditures.
Litigation is subject to many uncertainties, and the outcome of individual litigated matters is not predictable with assurance. We have established accruals for certain of the matters discussed in the foregoing paragraph where losses are deemed probable and reasonably estimable. It is reasonably possible, however, that some of the matters discussed in the foregoing paragraph for which accruals have not been established could be decided unfavorably to us and could require us to pay damages or make other expenditures in amounts or a range of amounts that cannot be estimated at March 31, 2011. We do not reasonably expect, based on our analysis, that such matters would have a material effect on future financial statements for a particular year, although such an outcome is possible.
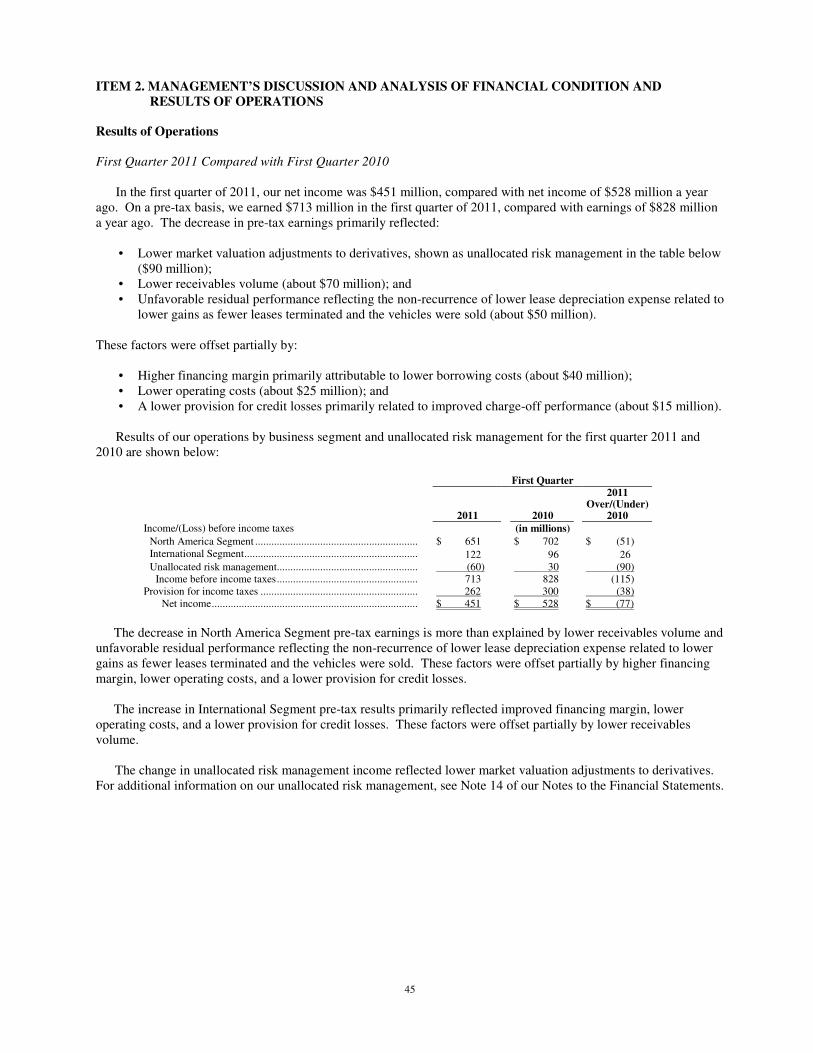
45
ITEM 2. MANAGEMENT’S DISCUSSION AND ANALYSIS OF FINANCIAL CONDITION AND
RESULTS OF OPERATIONS
Results of Operations
First Quarter 2011 Compared with First Quarter 2010
In the first quarter of 2011, our net income was $451 million, compared with net income of $528 million a year ago. On a pre-tax basis, we earned $713 million in the first quarter of 2011, compared with earnings of $828 million a year ago. The decrease in pre-tax earnings primarily reflected:
• Lower market valuation adjustments to derivatives, shown as unallocated risk management in the table below
($90 million); • Lower receivables volume (about $70 million); and • Unfavorable residual performance reflecting the non-recurrence of lower lease depreciation expense related to
lower gains as fewer leases terminated and the vehicles were sold (about $50 million).
These factors were offset partially by: • Higher financing margin primarily attributable to lower borrowing costs (about $40 million); • Lower operating costs (about $25 million); and • A lower provision for credit losses primarily related to improved charge-off performance (about $15 million). Results of our operations by business segment and unallocated risk management for the first quarter 2011 and
2010 are shown below:
First Quarter
2011
2010
2011 Over/(Under)
2010
Income/(Loss) before income taxes (in millions)
North America Segment ............................................................ $ 651 $ 702 $ (51) International Segment................................................................ 122 96 26 Unallocated risk management.................................................... (60) 30 (90)
Income before income taxes.................................................... 713 828 (115) Provision for income taxes .......................................................... 262 300 (38)
Net income............................................................................ $ 451 $ 528 $ (77)
The decrease in North America Segment pre-tax earnings is more than explained by lower receivables volume and unfavorable residual performance reflecting the non-recurrence of lower lease depreciation expense related to lower gains as fewer leases terminated and the vehicles were sold. These factors were offset partially by higher financing margin, lower operating costs, and a lower provision for credit losses.
The increase in International Segment pre-tax results primarily reflected improved financing margin, lower
operating costs, and a lower provision for credit losses. These factors were offset partially by lower receivables volume.
The change in unallocated risk management income reflected lower market valuation adjustments to derivatives.
For additional information on our unallocated risk management, see Note 14 of our Notes to the Financial Statements.
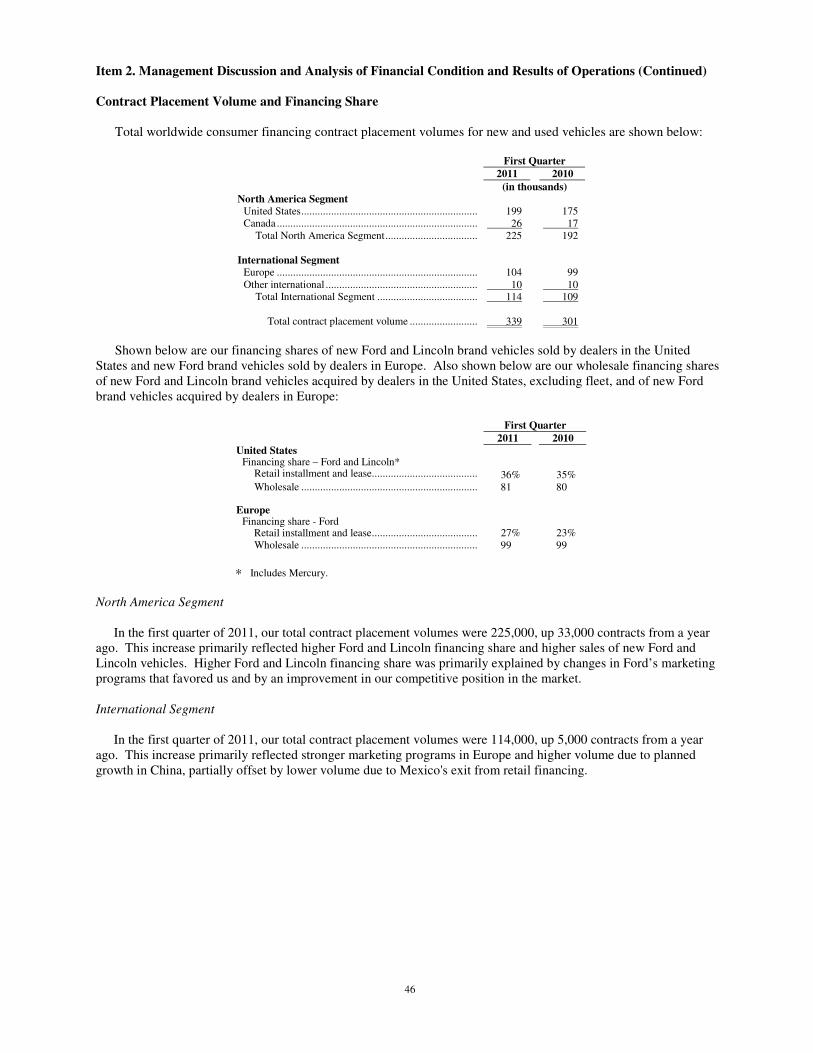
46
Item 2. Management Discussion and Analysis of Financial Condition and Results of Operations (Continued)
Contract Placement Volume and Financing Share
Total worldwide consumer financing contract placement volumes for new and used vehicles are shown below:
First Quarter
2011 2010
(in thousands)
North America Segment
United States................................................................. 199
175 Canada .......................................................................... 26 17
Total North America Segment.................................. 225 192
International Segment Europe .......................................................................... 104
99
Other international ........................................................ 10 10 Total International Segment ..................................... 114 109
Total contract placement volume ......................... 339 301
Shown below are our financing shares of new Ford and Lincoln brand vehicles sold by dealers in the United
States and new Ford brand vehicles sold by dealers in Europe. Also shown below are our wholesale financing shares of new Ford and Lincoln brand vehicles acquired by dealers in the United States, excluding fleet, and of new Ford brand vehicles acquired by dealers in Europe:
First Quarter
2011 2010
United States Financing share – Ford and Lincoln*
Retail installment and lease....................................... 36%
35% Wholesale ................................................................. 81 80
Europe
Financing share - Ford Retail installment and lease....................................... 27%
23% Wholesale ................................................................. 99 99
∗ Includes Mercury. North America Segment
In the first quarter of 2011, our total contract placement volumes were 225,000, up 33,000 contracts from a year
ago. This increase primarily reflected higher Ford and Lincoln financing share and higher sales of new Ford and Lincoln vehicles. Higher Ford and Lincoln financing share was primarily explained by changes in Ford’s marketing programs that favored us and by an improvement in our competitive position in the market. International Segment
In the first quarter of 2011, our total contract placement volumes were 114,000, up 5,000 contracts from a year
ago. This increase primarily reflected stronger marketing programs in Europe and higher volume due to planned growth in China, partially offset by lower volume due to Mexico's exit from retail financing.
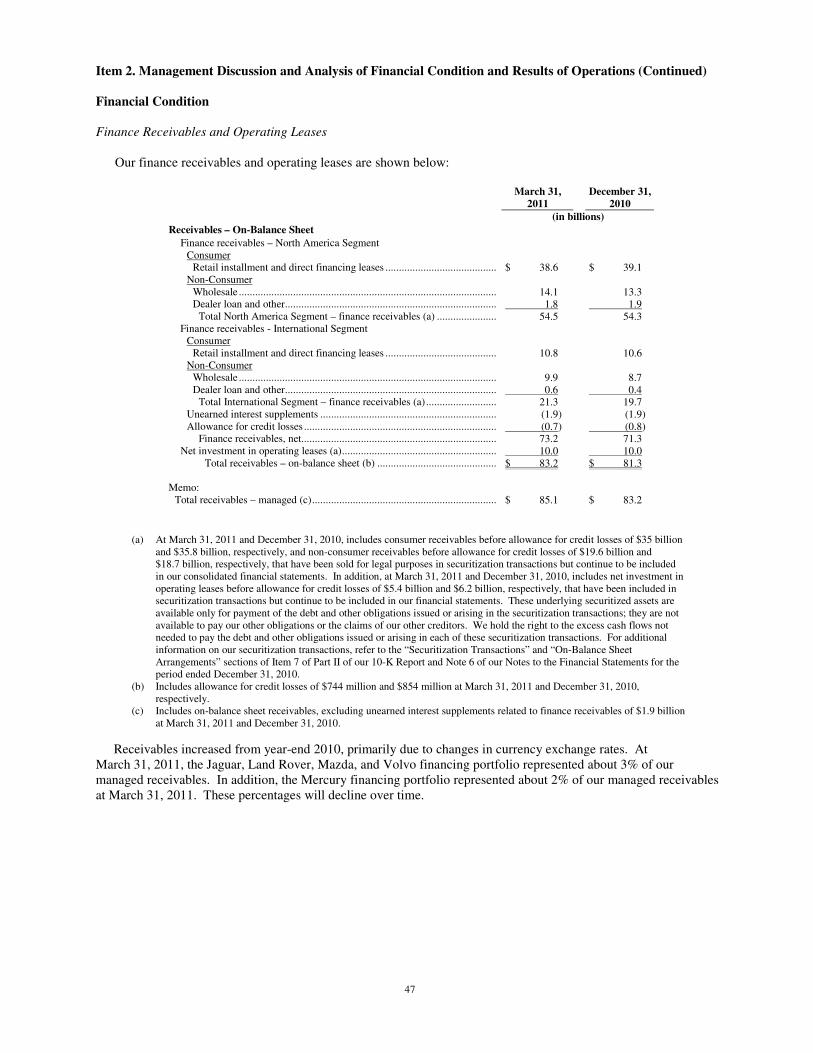
47
Item 2. Management Discussion and Analysis of Financial Condition and Results of Operations (Continued)
Financial Condition
Finance Receivables and Operating Leases
Our finance receivables and operating leases are shown below:
March 31, December 31,
2011 2010
(in billions)
Receivables – On-Balance Sheet
Finance receivables – North America Segment Consumer
Retail installment and direct financing leases ......................................... $ 38.6 $ 39.1 Non-Consumer
Wholesale ............................................................................................... 14.1 13.3 Dealer loan and other.............................................................................. 1.8 1.9
Total North America Segment – finance receivables (a) ...................... 54.5 54.3 Finance receivables - International Segment
Consumer Retail installment and direct financing leases ......................................... 10.8 10.6
Non-Consumer Wholesale ............................................................................................... 9.9 8.7 Dealer loan and other.............................................................................. 0.6 0.4
Total International Segment – finance receivables (a).......................... 21.3 19.7 Unearned interest supplements ................................................................. (1.9) (1.9) Allowance for credit losses ....................................................................... (0.7) (0.8)
Finance receivables, net........................................................................ 73.2 71.3 Net investment in operating leases (a)......................................................... 10.0 10.0
Total receivables – on-balance sheet (b) ............................................ $ 83.2 $ 81.3 Memo:
Total receivables – managed (c).................................................................... $ 85.1 $ 83.2
(a) At March 31, 2011 and December 31, 2010, includes consumer receivables before allowance for credit losses of $35 billion
and $35.8 billion, respectively, and non-consumer receivables before allowance for credit losses of $19.6 billion and $18.7 billion, respectively, that have been sold for legal purposes in securitization transactions but continue to be included in our consolidated financial statements. In addition, at March 31, 2011 and December 31, 2010, includes net investment in operating leases before allowance for credit losses of $5.4 billion and $6.2 billion, respectively, that have been included in securitization transactions but continue to be included in our financial statements. These underlying securitized assets are available only for payment of the debt and other obligations issued or arising in the securitization transactions; they are not available to pay our other obligations or the claims of our other creditors. We hold the right to the excess cash flows not needed to pay the debt and other obligations issued or arising in each of these securitization transactions. For additional information on our securitization transactions, refer to the “Securitization Transactions” and “On-Balance Sheet Arrangements” sections of Item 7 of Part II of our 10-K Report and Note 6 of our Notes to the Financial Statements for the period ended December 31, 2010.
(b) Includes allowance for credit losses of $744 million and $854 million at March 31, 2011 and December 31, 2010, respectively.
(c) Includes on-balance sheet receivables, excluding unearned interest supplements related to finance receivables of $1.9 billion at March 31, 2011 and December 31, 2010.
Receivables increased from year-end 2010, primarily due to changes in currency exchange rates. At March 31, 2011, the Jaguar, Land Rover, Mazda, and Volvo financing portfolio represented about 3% of our managed receivables. In addition, the Mercury financing portfolio represented about 2% of our managed receivables at March 31, 2011. These percentages will decline over time.
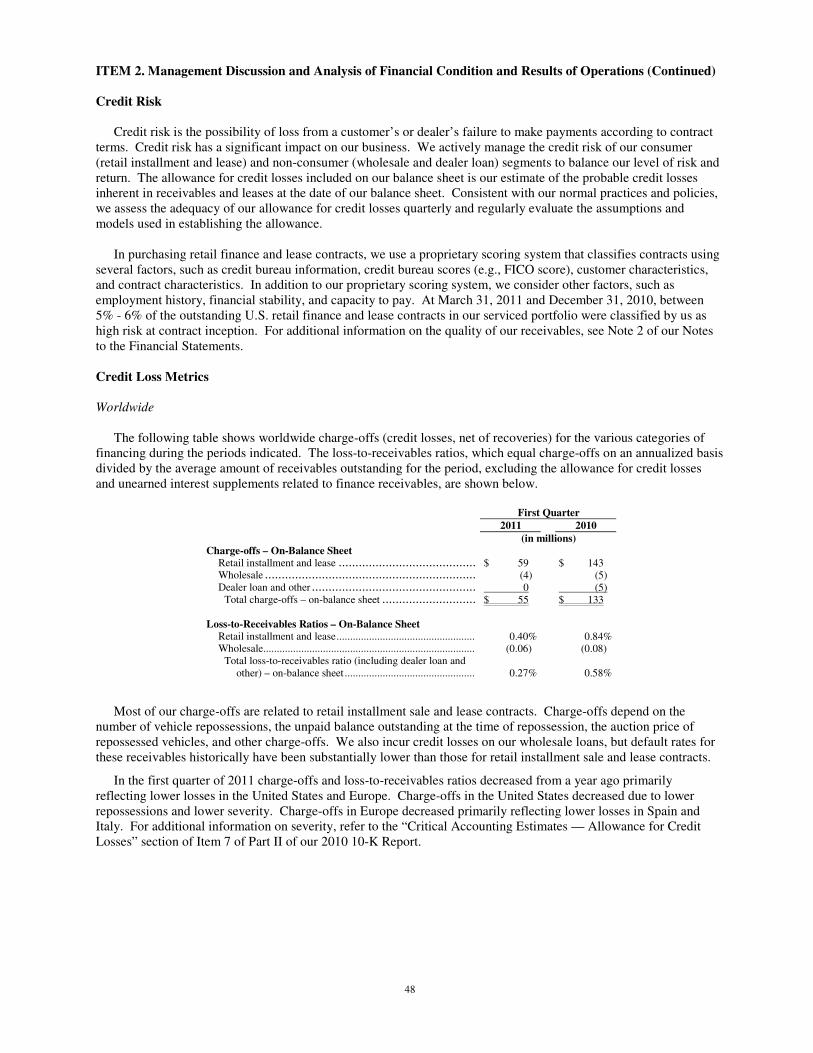
48
ITEM 2. Management Discussion and Analysis of Financial Condition and Results of Operations (Continued)
Credit Risk
Credit risk is the possibility of loss from a customer’s or dealer’s failure to make payments according to contract
terms. Credit risk has a significant impact on our business. We actively manage the credit risk of our consumer (retail installment and lease) and non-consumer (wholesale and dealer loan) segments to balance our level of risk and return. The allowance for credit losses included on our balance sheet is our estimate of the probable credit losses inherent in receivables and leases at the date of our balance sheet. Consistent with our normal practices and policies, we assess the adequacy of our allowance for credit losses quarterly and regularly evaluate the assumptions and models used in establishing the allowance.
In purchasing retail finance and lease contracts, we use a proprietary scoring system that classifies contracts using
several factors, such as credit bureau information, credit bureau scores (e.g., FICO score), customer characteristics, and contract characteristics. In addition to our proprietary scoring system, we consider other factors, such as employment history, financial stability, and capacity to pay. At March 31, 2011 and December 31, 2010, between 5% - 6% of the outstanding U.S. retail finance and lease contracts in our serviced portfolio were classified by us as high risk at contract inception. For additional information on the quality of our receivables, see Note 2 of our Notes to the Financial Statements.
Credit Loss Metrics
Worldwide
The following table shows worldwide charge-offs (credit losses, net of recoveries) for the various categories of
financing during the periods indicated. The loss-to-receivables ratios, which equal charge-offs on an annualized basis divided by the average amount of receivables outstanding for the period, excluding the allowance for credit losses and unearned interest supplements related to finance receivables, are shown below.
First Quarter
2011 2010
(in millions)
Charge-offs – On-Balance Sheet Retail installment and lease ......................................... $ 59 $ 143 Wholesale ............................................................... (4) (5) Dealer loan and other ................................................. 0 (5)
Total charge-offs – on-balance sheet ............................ $ 55 $ 133 Loss-to-Receivables Ratios – On-Balance Sheet
Retail installment and lease................................................... 0.40% 0.84% Wholesale.............................................................................. (0.06) (0.08)
Total loss-to-receivables ratio (including dealer loan and other) – on-balance sheet ................................................ 0.27%
0.58%
Most of our charge-offs are related to retail installment sale and lease contracts. Charge-offs depend on the
number of vehicle repossessions, the unpaid balance outstanding at the time of repossession, the auction price of repossessed vehicles, and other charge-offs. We also incur credit losses on our wholesale loans, but default rates for these receivables historically have been substantially lower than those for retail installment sale and lease contracts.
In the first quarter of 2011 charge-offs and loss-to-receivables ratios decreased from a year ago primarily reflecting lower losses in the United States and Europe. Charge-offs in the United States decreased due to lower repossessions and lower severity. Charge-offs in Europe decreased primarily reflecting lower losses in Spain and Italy. For additional information on severity, refer to the “Critical Accounting Estimates — Allowance for Credit Losses” section of Item 7 of Part II of our 2010 10-K Report.

49
ITEM 2. Management Discussion and Analysis of Financial Condition and Results of Operations (Continued)
U.S. Ford, Lincoln and Mercury Brand Retail Installment and Operating Lease
The following table shows the credit loss metrics for our Ford, Lincoln and Mercury brand U.S. retail installment
sale and operating lease portfolio. This portfolio was 69% of our worldwide on-balance sheet portfolio of retail installment receivables and net investment in operating leases at March 31, 2011. Trends and causal factors are consistent with the worldwide results, with repossessions down 7,000 units in the first quarter of 2011 from a year ago, reflecting improved portfolio performance, fewer accounts outstanding and the improved economic environment. Severity was lower by $800 per unit from a year ago, mainly due to improvements in auction values in the used vehicle market, offset partially by the impact of a higher mix of longer term contracts.
First Quarter
2011 2010
On-Balance Sheet
Charge-offs (in millions)...................................................... $ 44 $ 95 Loss-to-receivables ratio ...................................................... 0.45% 0.91%
Other Metrics
Repossessions (in thousands) ................................................ 12 19 Repossession ratio (a) ......................................................... 1.98% 2.77% Severity (b) ...................................................................... $ 6,500 $ 7,300 New bankruptcy filings (in thousands)..................................... 9 10 Over-60 day delinquency ratio (c) .......................................... 0.16% 0.17%
(a) Annualized repossessions as a percent of the average number of accounts outstanding during the periods.
(b) Average loss per disposed repossession. (c) Delinquencies are expressed as a percent of the accounts outstanding for non-bankrupt accounts.
Allowance for Credit Losses
Our allowance for credit losses and our allowance for credit losses as a percentage of end-of-period receivables (finance receivables, excluding unearned interest supplements, and net investment in operating leases, excluding the allowance for credit losses) for our on-balance sheet portfolio are shown below. A description of our allowance setting process is provided in the “Critical Accounting Estimates — Allowance for Credit Losses” section of Item 7 of Part II of our 2010 10-K Report.
March 31, December 31,
2011 2010
(in millions) Allowance for Credit Losses
Retail installment and lease ........................................................ $ 697 $ 788 Wholesale................................................................................... 33 48 Dealer loan and other ................................................................. 14 18
Total allowance for credit losses ............................................. $ 744 $ 854 As a Percentage of End-of-Period Receivables
Retail installment and lease ........................................................ 1.17% 1.32% Wholesale................................................................................... 0.14 0.22
Total including dealer loan and other ...................................... 0.87% 1.02%
The allowance for credit losses is estimated using a combination of models and management judgment, and is based on such factors as portfolio quality, historical loss performance, and receivable levels. Our allowance for credit losses has decreased from December 31, 2010, primarily reflecting the decrease in charge-offs.
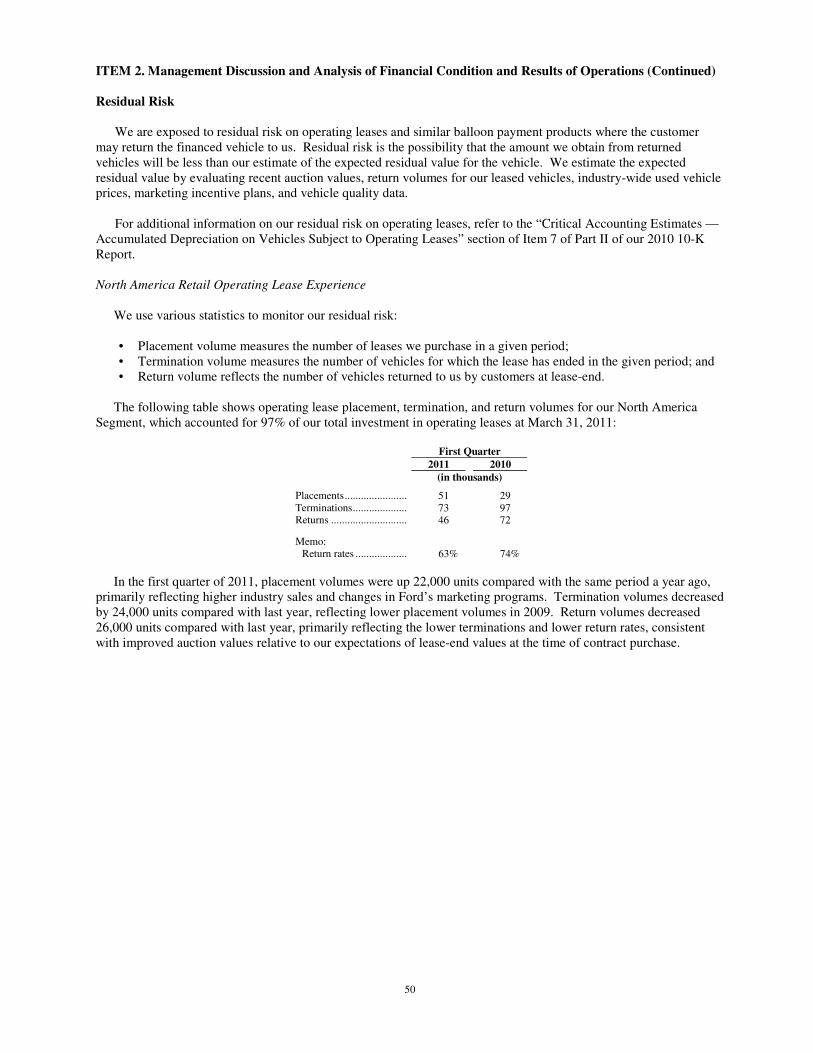
50
ITEM 2. Management Discussion and Analysis of Financial Condition and Results of Operations (Continued)
Residual Risk
We are exposed to residual risk on operating leases and similar balloon payment products where the customer may return the financed vehicle to us. Residual risk is the possibility that the amount we obtain from returned vehicles will be less than our estimate of the expected residual value for the vehicle. We estimate the expected residual value by evaluating recent auction values, return volumes for our leased vehicles, industry-wide used vehicle prices, marketing incentive plans, and vehicle quality data.
For additional information on our residual risk on operating leases, refer to the “Critical Accounting Estimates —
Accumulated Depreciation on Vehicles Subject to Operating Leases” section of Item 7 of Part II of our 2010 10-K Report. North America Retail Operating Lease Experience
We use various statistics to monitor our residual risk:
• Placement volume measures the number of leases we purchase in a given period; • Termination volume measures the number of vehicles for which the lease has ended in the given period; and • Return volume reflects the number of vehicles returned to us by customers at lease-end.
The following table shows operating lease placement, termination, and return volumes for our North America
Segment, which accounted for 97% of our total investment in operating leases at March 31, 2011:
First Quarter
2011 2010
(in thousands)
Placements....................... 51 29 Terminations.................... 73 97 Returns ............................ 46 72
Memo: Return rates ................... 63% 74%
In the first quarter of 2011, placement volumes were up 22,000 units compared with the same period a year ago, primarily reflecting higher industry sales and changes in Ford’s marketing programs. Termination volumes decreased by 24,000 units compared with last year, reflecting lower placement volumes in 2009. Return volumes decreased 26,000 units compared with last year, primarily reflecting the lower terminations and lower return rates, consistent with improved auction values relative to our expectations of lease-end values at the time of contract purchase.
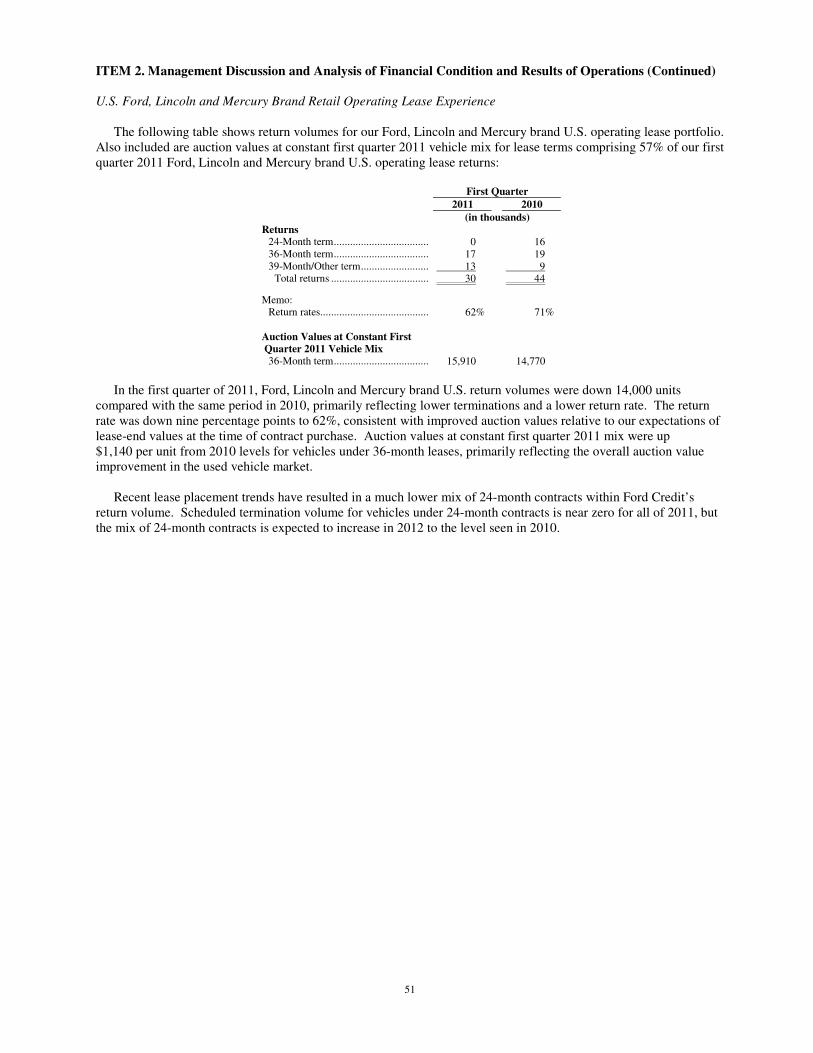
51
ITEM 2. Management Discussion and Analysis of Financial Condition and Results of Operations (Continued)
U.S. Ford, Lincoln and Mercury Brand Retail Operating Lease Experience
The following table shows return volumes for our Ford, Lincoln and Mercury brand U.S. operating lease portfolio. Also included are auction values at constant first quarter 2011 vehicle mix for lease terms comprising 57% of our first quarter 2011 Ford, Lincoln and Mercury brand U.S. operating lease returns:
First Quarter
2011 2010
(in thousands)
Returns 24-Month term................................... 0
16
36-Month term................................... 17 19 39-Month/Other term......................... 13 9
Total returns .................................... 30 44
Memo: Return rates........................................ 62% 71%
Auction Values at Constant First
Quarter 2011 Vehicle Mix
36-Month term................................... 15,910 14,770
In the first quarter of 2011, Ford, Lincoln and Mercury brand U.S. return volumes were down 14,000 units
compared with the same period in 2010, primarily reflecting lower terminations and a lower return rate. The return rate was down nine percentage points to 62%, consistent with improved auction values relative to our expectations of lease-end values at the time of contract purchase. Auction values at constant first quarter 2011 mix were up $1,140 per unit from 2010 levels for vehicles under 36-month leases, primarily reflecting the overall auction value improvement in the used vehicle market.
Recent lease placement trends have resulted in a much lower mix of 24-month contracts within Ford Credit’s return volume. Scheduled termination volume for vehicles under 24-month contracts is near zero for all of 2011, but the mix of 24-month contracts is expected to increase in 2012 to the level seen in 2010.
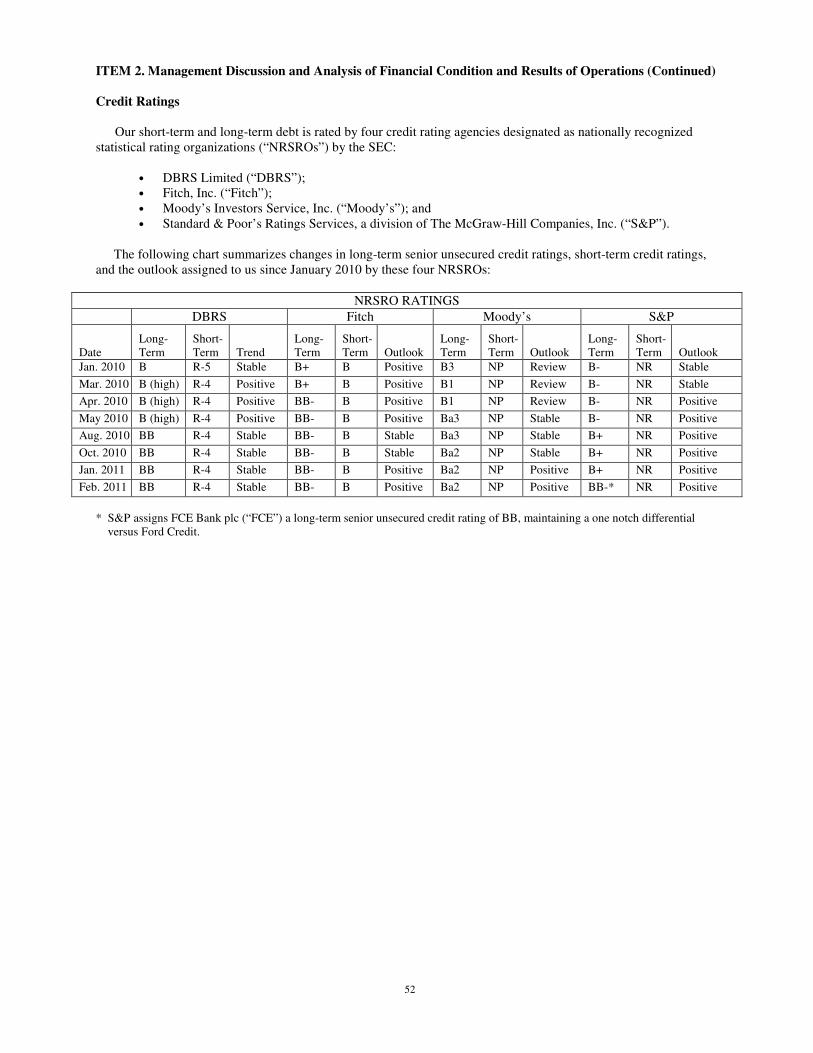
52
ITEM 2. Management Discussion and Analysis of Financial Condition and Results of Operations (Continued) Credit Ratings
Our short-term and long-term debt is rated by four credit rating agencies designated as nationally recognized statistical rating organizations (“NRSROs”) by the SEC:
• DBRS Limited (“DBRS”); • Fitch, Inc. (“Fitch”); • Moody’s Investors Service, Inc. (“Moody’s”); and • Standard & Poor’s Ratings Services, a division of The McGraw-Hill Companies, Inc. (“S&P”).
The following chart summarizes changes in long-term senior unsecured credit ratings, short-term credit ratings,
and the outlook assigned to us since January 2010 by these four NRSROs:
NRSRO RATINGS
DBRS Fitch Moody’s S&P
Date Long-Term
Short-Term Trend
Long-Term
Short-Term Outlook
Long-Term
Short-Term Outlook
Long-Term
Short-Term Outlook
Jan. 2010 B R-5 Stable B+ B Positive B3 NP Review B- NR Stable
Mar. 2010 B (high) R-4 Positive B+ B Positive B1 NP Review B- NR Stable
Apr. 2010 B (high) R-4 Positive BB- B Positive B1 NP Review B- NR Positive
May 2010 B (high) R-4 Positive BB- B Positive Ba3 NP Stable B- NR Positive
Aug. 2010 BB R-4 Stable BB- B Stable Ba3 NP Stable B+ NR Positive
Oct. 2010 BB R-4 Stable BB- B Stable Ba2 NP Stable B+ NR Positive
Jan. 2011 BB R-4 Stable BB- B Positive Ba2 NP Positive B+ NR Positive
Feb. 2011 BB R-4 Stable BB- B Positive Ba2 NP Positive BB-* NR Positive
* S&P assigns FCE Bank plc (“FCE”) a long-term senior unsecured credit rating of BB, maintaining a one notch differential
versus Ford Credit.
53
ITEM 2. Management Discussion and Analysis of Financial Condition and Results of Operations (Continued) Funding
Overview
Our funding strategy is to have sufficient liquidity to enable us to profitably support Ford, its dealers and customers in all economic environments. We maintain a substantial cash balance, committed funding capacity and access to diverse funding sources and we also manage interest rate and currency risks. Although our credit rating and rating outlook have been upgraded this year, we remain below investment grade levels. As a result, securitization continues to represent a substantial portion of our funding mix as this market remains more cost effective than unsecured funding and allows us access to a wider investor base. We expect our unsecured funding mix to increase as we are able to source term funding from the unsecured markets on increasingly favorable terms. We continued to diversify our funding sources with the successful launch of our new Ford Upgrade Exchange Linked (“FUEL”) notes program in April 2011. In addition, we have various alternative business arrangements for select products and markets that reduce our funding requirements while allowing us to support Ford (e.g., our partnering in Brazil for retail financing and FCE’s partnering with various institutions in Europe for full service leasing and retail and wholesale financing). We also have an application pending for Federal Deposit Insurance Corporation (“FDIC”) and State of Utah approval for an industrial loan corporation and have published notice of our intent to apply for a bank charter in Canada.
Through May 10, 2011, we completed about $9 billion of public and private securitization funding globally across
all asset classes. We also completed about $3 billion of unsecured funding in the United States and Canada. We extended the term of our funding by issuing unsecured debt at tenors up to 10 years and completing the FUEL transaction. Our credit spreads improved significantly compared to 2010 levels reflecting continuing improvements in the credit profiles of Ford and Ford Credit, strong investor demand for our transactions, and supportive capital markets.
At March 31, 2011, we had committed capacity totaling $33.6 billion, about equal to 2010 year-end levels. We
renewed about $1.3 billion of committed capacity in the first quarter of 2011. Our renewal strategy is to protect our global funding needs and optimize capacity. Most of our asset-backed committed facilities enable us to obtain term funding up to the time that the facilities mature. Any outstanding debt at the maturity of the facilities remains outstanding and is repaid as underlying assets liquidate. Our ability to obtain funding under our committed asset-backed liquidity programs is subject to having a sufficient amount of assets eligible for these programs, and for certain programs, having the ability to obtain derivatives to manage the interest rate risk. For additional information on our committed capacity programs, refer to the “Liquidity” section of Item 7 of Part II of our 2010 10-K Report.
Our funding plan is subject to risks and uncertainties, many of which are beyond our control, including disruption
in the capital markets for the types of asset-backed securities used in our asset-backed funding and the effects of regulatory reform efforts on the financial markets. Potential impacts of industry events and regulation on our ability to access debt and derivatives markets, or renew our committed liquidity programs in sufficient amounts and at competitive rates, represent another risk to our funding plan. As a result of such events or regulation, we may need to reduce new originations thereby reducing our ongoing profits and adversely affecting our ability to support the sale of Ford vehicles.
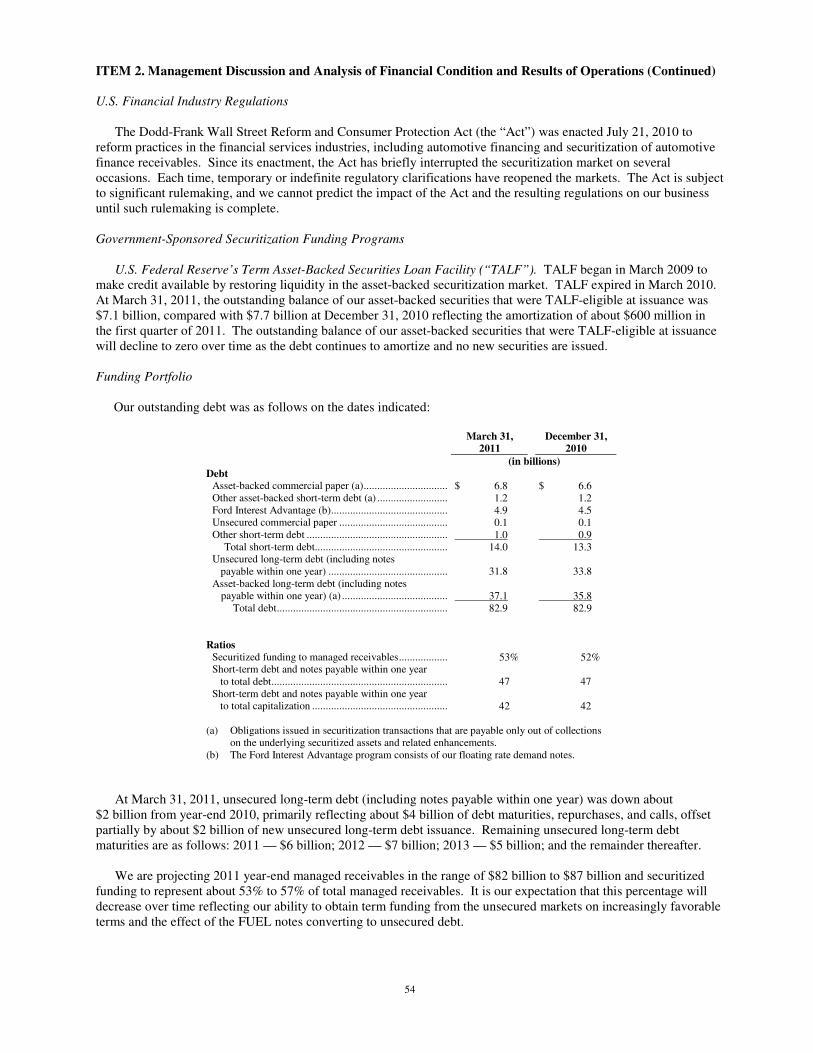
54
ITEM 2. Management Discussion and Analysis of Financial Condition and Results of Operations (Continued)
U.S. Financial Industry Regulations
The Dodd-Frank Wall Street Reform and Consumer Protection Act (the “Act”) was enacted July 21, 2010 to
reform practices in the financial services industries, including automotive financing and securitization of automotive finance receivables. Since its enactment, the Act has briefly interrupted the securitization market on several occasions. Each time, temporary or indefinite regulatory clarifications have reopened the markets. The Act is subject to significant rulemaking, and we cannot predict the impact of the Act and the resulting regulations on our business until such rulemaking is complete.
Government-Sponsored Securitization Funding Programs
U.S. Federal Reserve’s Term Asset-Backed Securities Loan Facility (“TALF”). TALF began in March 2009 to make credit available by restoring liquidity in the asset-backed securitization market. TALF expired in March 2010. At March 31, 2011, the outstanding balance of our asset-backed securities that were TALF-eligible at issuance was $7.1 billion, compared with $7.7 billion at December 31, 2010 reflecting the amortization of about $600 million in the first quarter of 2011. The outstanding balance of our asset-backed securities that were TALF-eligible at issuance will decline to zero over time as the debt continues to amortize and no new securities are issued.
Funding Portfolio
Our outstanding debt was as follows on the dates indicated:
March 31, December 31,
2011 2010
(in billions)
Debt Asset-backed commercial paper (a)............................... $ 6.8 $ 6.6 Other asset-backed short-term debt (a) .......................... 1.2 1.2 Ford Interest Advantage (b)........................................... 4.9 4.5 Unsecured commercial paper ........................................ 0.1 0.1 Other short-term debt .................................................... 1.0 0.9
Total short-term debt................................................. 14.0 13.3 Unsecured long-term debt (including notes
payable within one year) ............................................ 31.8
33.8 Asset-backed long-term debt (including notes
payable within one year) (a) ....................................... 37.1
35.8 Total debt............................................................... 82.9 82.9
Ratios
Securitized funding to managed receivables.................. 53% 52% Short-term debt and notes payable within one year
to total debt................................................................. 47
47 Short-term debt and notes payable within one year
to total capitalization .................................................. 42
42 (a) Obligations issued in securitization transactions that are payable only out of collections
on the underlying securitized assets and related enhancements. (b) The Ford Interest Advantage program consists of our floating rate demand notes.
At March 31, 2011, unsecured long-term debt (including notes payable within one year) was down about $2 billion from year-end 2010, primarily reflecting about $4 billion of debt maturities, repurchases, and calls, offset partially by about $2 billion of new unsecured long-term debt issuance. Remaining unsecured long-term debt maturities are as follows: 2011 — $6 billion; 2012 — $7 billion; 2013 — $5 billion; and the remainder thereafter.
We are projecting 2011 year-end managed receivables in the range of $82 billion to $87 billion and securitized
funding to represent about 53% to 57% of total managed receivables. It is our expectation that this percentage will decrease over time reflecting our ability to obtain term funding from the unsecured markets on increasingly favorable terms and the effect of the FUEL notes converting to unsecured debt.
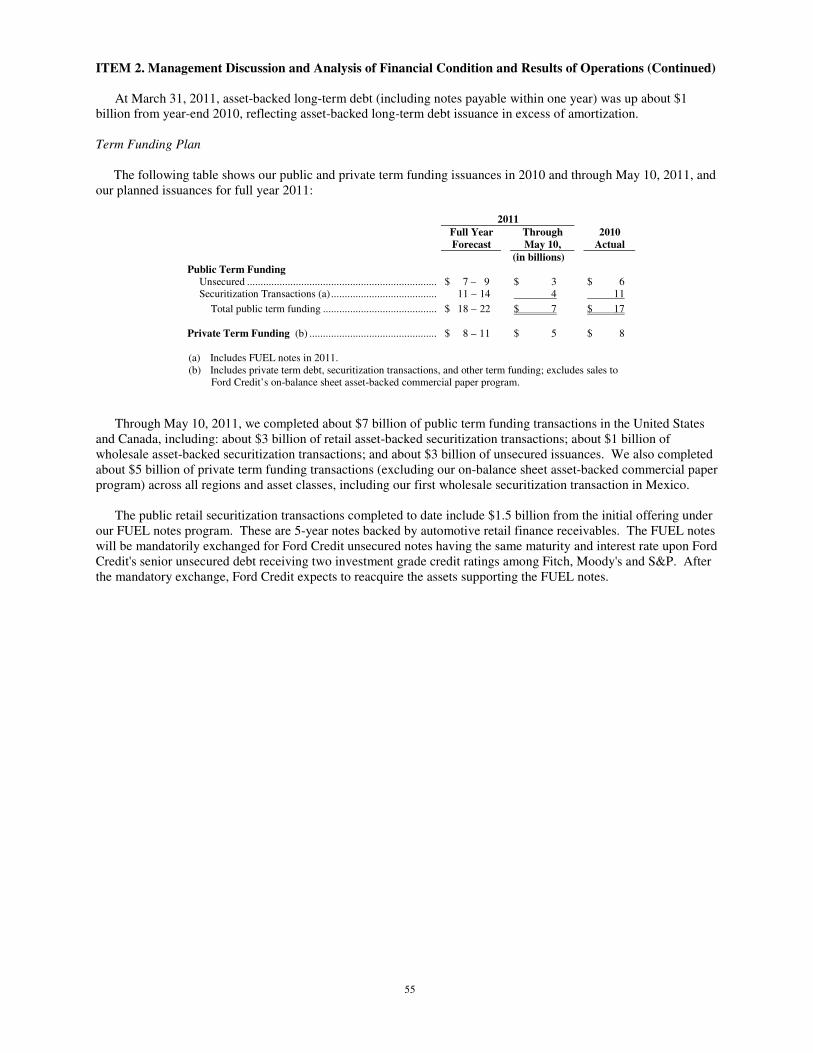
55
ITEM 2. Management Discussion and Analysis of Financial Condition and Results of Operations (Continued) At March 31, 2011, asset-backed long-term debt (including notes payable within one year) was up about $1
billion from year-end 2010, reflecting asset-backed long-term debt issuance in excess of amortization.
Term Funding Plan
The following table shows our public and private term funding issuances in 2010 and through May 10, 2011, and
our planned issuances for full year 2011:
2011
Full Year Through 2010
Forecast May 10, Actual
(in billions)
Public Term Funding Unsecured ...................................................................... $ 7 – 9 $ 3 $ 6 Securitization Transactions (a)....................................... 11 – 14 4 11
Total public term funding .......................................... $ 18 – 22 $ 7 $ 17 Private Term Funding (b) ............................................... $ 8 – 11 $ 5 $ 8 (a) Includes FUEL notes in 2011. (b) Includes private term debt, securitization transactions, and other term funding; excludes sales to
Ford Credit’s on-balance sheet asset-backed commercial paper program.
Through May 10, 2011, we completed about $7 billion of public term funding transactions in the United States
and Canada, including: about $3 billion of retail asset-backed securitization transactions; about $1 billion of wholesale asset-backed securitization transactions; and about $3 billion of unsecured issuances. We also completed about $5 billion of private term funding transactions (excluding our on-balance sheet asset-backed commercial paper program) across all regions and asset classes, including our first wholesale securitization transaction in Mexico.
The public retail securitization transactions completed to date include $1.5 billion from the initial offering under our FUEL notes program. These are 5-year notes backed by automotive retail finance receivables. The FUEL notes will be mandatorily exchanged for Ford Credit unsecured notes having the same maturity and interest rate upon Ford Credit's senior unsecured debt receiving two investment grade credit ratings among Fitch, Moody's and S&P. After the mandatory exchange, Ford Credit expects to reacquire the assets supporting the FUEL notes.
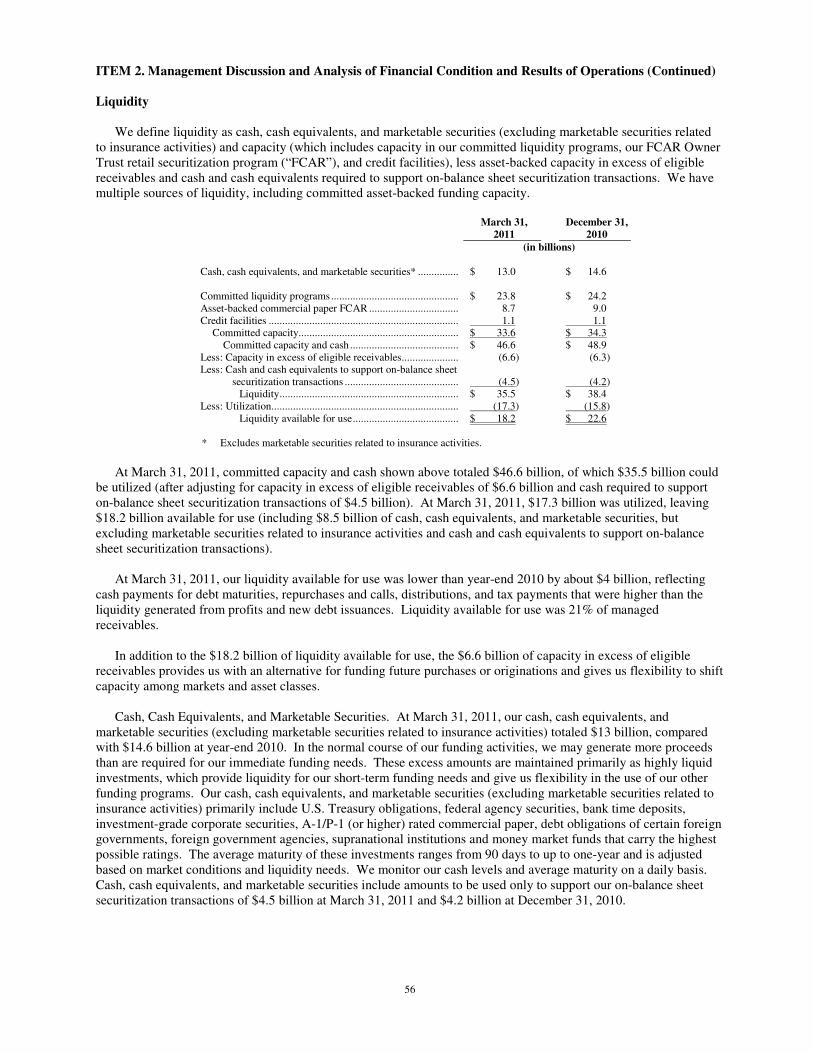
56
ITEM 2. Management Discussion and Analysis of Financial Condition and Results of Operations (Continued)
Liquidity
We define liquidity as cash, cash equivalents, and marketable securities (excluding marketable securities related to insurance activities) and capacity (which includes capacity in our committed liquidity programs, our FCAR Owner Trust retail securitization program (“FCAR”), and credit facilities), less asset-backed capacity in excess of eligible receivables and cash and cash equivalents required to support on-balance sheet securitization transactions. We have multiple sources of liquidity, including committed asset-backed funding capacity.
March 31, December 31,
2011 2010
(in billions)
Cash, cash equivalents, and marketable securities* ............... $ 13.0 $ 14.6 Committed liquidity programs............................................... $ 23.8 $ 24.2 Asset-backed commercial paper FCAR ................................. 8.7 9.0 Credit facilities ...................................................................... 1.1 1.1
Committed capacity........................................................... $ 33.6 $ 34.3 Committed capacity and cash ........................................ $ 46.6 $ 48.9
Less: Capacity in excess of eligible receivables..................... (6.6) (6.3) Less: Cash and cash equivalents to support on-balance sheet
securitization transactions .......................................... (4.5) (4.2) Liquidity.................................................................. $ 35.5 $ 38.4
Less: Utilization..................................................................... (17.3) (15.8) Liquidity available for use....................................... $ 18.2 $ 22.6
* Excludes marketable securities related to insurance activities.
At March 31, 2011, committed capacity and cash shown above totaled $46.6 billion, of which $35.5 billion could
be utilized (after adjusting for capacity in excess of eligible receivables of $6.6 billion and cash required to support on-balance sheet securitization transactions of $4.5 billion). At March 31, 2011, $17.3 billion was utilized, leaving $18.2 billion available for use (including $8.5 billion of cash, cash equivalents, and marketable securities, but excluding marketable securities related to insurance activities and cash and cash equivalents to support on-balance sheet securitization transactions).
At March 31, 2011, our liquidity available for use was lower than year-end 2010 by about $4 billion, reflecting
cash payments for debt maturities, repurchases and calls, distributions, and tax payments that were higher than the liquidity generated from profits and new debt issuances. Liquidity available for use was 21% of managed receivables.
In addition to the $18.2 billion of liquidity available for use, the $6.6 billion of capacity in excess of eligible
receivables provides us with an alternative for funding future purchases or originations and gives us flexibility to shift capacity among markets and asset classes.
Cash, Cash Equivalents, and Marketable Securities. At March 31, 2011, our cash, cash equivalents, and
marketable securities (excluding marketable securities related to insurance activities) totaled $13 billion, compared with $14.6 billion at year-end 2010. In the normal course of our funding activities, we may generate more proceeds than are required for our immediate funding needs. These excess amounts are maintained primarily as highly liquid investments, which provide liquidity for our short-term funding needs and give us flexibility in the use of our other funding programs. Our cash, cash equivalents, and marketable securities (excluding marketable securities related to insurance activities) primarily include U.S. Treasury obligations, federal agency securities, bank time deposits, investment-grade corporate securities, A-1/P-1 (or higher) rated commercial paper, debt obligations of certain foreign governments, foreign government agencies, supranational institutions and money market funds that carry the highest possible ratings. The average maturity of these investments ranges from 90 days to up to one-year and is adjusted based on market conditions and liquidity needs. We monitor our cash levels and average maturity on a daily basis. Cash, cash equivalents, and marketable securities include amounts to be used only to support our on-balance sheet securitization transactions of $4.5 billion at March 31, 2011 and $4.2 billion at December 31, 2010.
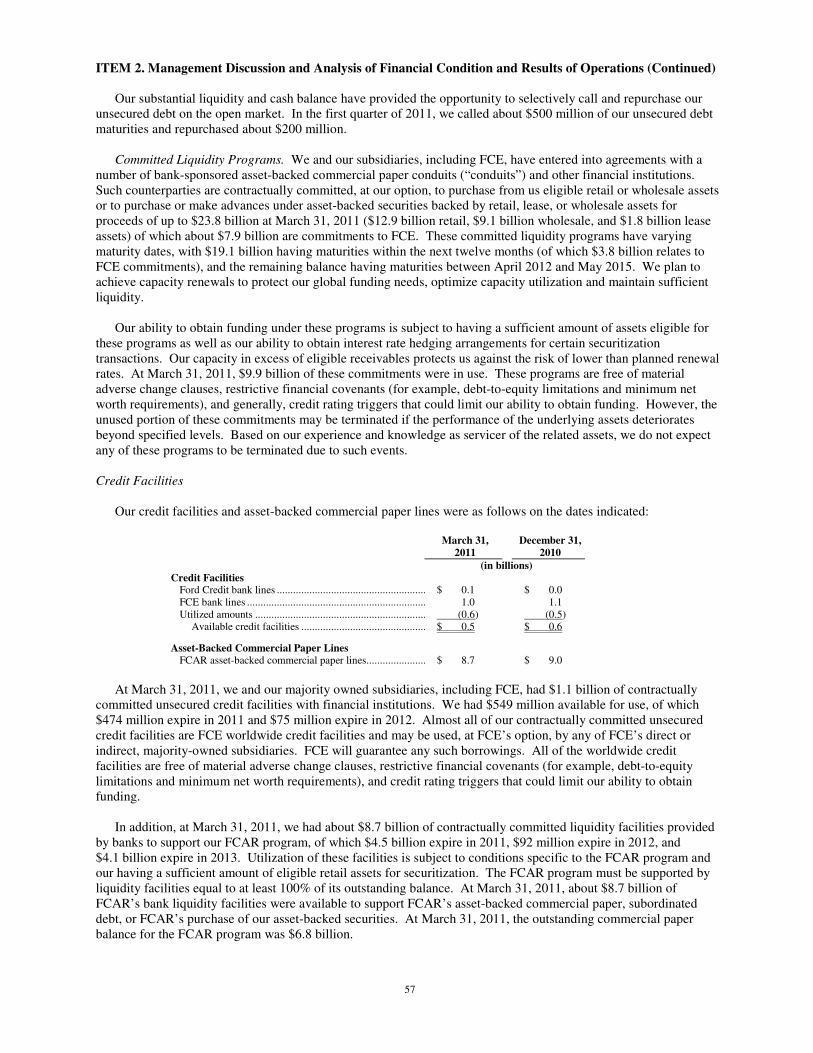
57
ITEM 2. Management Discussion and Analysis of Financial Condition and Results of Operations (Continued) Our substantial liquidity and cash balance have provided the opportunity to selectively call and repurchase our
unsecured debt on the open market. In the first quarter of 2011, we called about $500 million of our unsecured debt maturities and repurchased about $200 million.
Committed Liquidity Programs. We and our subsidiaries, including FCE, have entered into agreements with a
number of bank-sponsored asset-backed commercial paper conduits (“conduits”) and other financial institutions. Such counterparties are contractually committed, at our option, to purchase from us eligible retail or wholesale assets or to purchase or make advances under asset-backed securities backed by retail, lease, or wholesale assets for proceeds of up to $23.8 billion at March 31, 2011 ($12.9 billion retail, $9.1 billion wholesale, and $1.8 billion lease assets) of which about $7.9 billion are commitments to FCE. These committed liquidity programs have varying maturity dates, with $19.1 billion having maturities within the next twelve months (of which $3.8 billion relates to FCE commitments), and the remaining balance having maturities between April 2012 and May 2015. We plan to achieve capacity renewals to protect our global funding needs, optimize capacity utilization and maintain sufficient liquidity.
Our ability to obtain funding under these programs is subject to having a sufficient amount of assets eligible for
these programs as well as our ability to obtain interest rate hedging arrangements for certain securitization transactions. Our capacity in excess of eligible receivables protects us against the risk of lower than planned renewal rates. At March 31, 2011, $9.9 billion of these commitments were in use. These programs are free of material adverse change clauses, restrictive financial covenants (for example, debt-to-equity limitations and minimum net worth requirements), and generally, credit rating triggers that could limit our ability to obtain funding. However, the unused portion of these commitments may be terminated if the performance of the underlying assets deteriorates beyond specified levels. Based on our experience and knowledge as servicer of the related assets, we do not expect any of these programs to be terminated due to such events.
Credit Facilities
Our credit facilities and asset-backed commercial paper lines were as follows on the dates indicated:
March 31, December 31,
2011 2010
(in billions)
Credit Facilities Ford Credit bank lines ......................................................... $ 0.1 $ 0.0 FCE bank lines .................................................................... 1.0 1.1 Utilized amounts ................................................................ (0.6) (0.5)
Available credit facilities ................................................ $ 0.5 $ 0.6
Asset-Backed Commercial Paper Lines FCAR asset-backed commercial paper lines........................ $ 8.7 $ 9.0
At March 31, 2011, we and our majority owned subsidiaries, including FCE, had $1.1 billion of contractually
committed unsecured credit facilities with financial institutions. We had $549 million available for use, of which $474 million expire in 2011 and $75 million expire in 2012. Almost all of our contractually committed unsecured credit facilities are FCE worldwide credit facilities and may be used, at FCE’s option, by any of FCE’s direct or indirect, majority-owned subsidiaries. FCE will guarantee any such borrowings. All of the worldwide credit facilities are free of material adverse change clauses, restrictive financial covenants (for example, debt-to-equity limitations and minimum net worth requirements), and credit rating triggers that could limit our ability to obtain funding.
In addition, at March 31, 2011, we had about $8.7 billion of contractually committed liquidity facilities provided
by banks to support our FCAR program, of which $4.5 billion expire in 2011, $92 million expire in 2012, and $4.1 billion expire in 2013. Utilization of these facilities is subject to conditions specific to the FCAR program and our having a sufficient amount of eligible retail assets for securitization. The FCAR program must be supported by liquidity facilities equal to at least 100% of its outstanding balance. At March 31, 2011, about $8.7 billion of FCAR’s bank liquidity facilities were available to support FCAR’s asset-backed commercial paper, subordinated debt, or FCAR’s purchase of our asset-backed securities. At March 31, 2011, the outstanding commercial paper balance for the FCAR program was $6.8 billion.
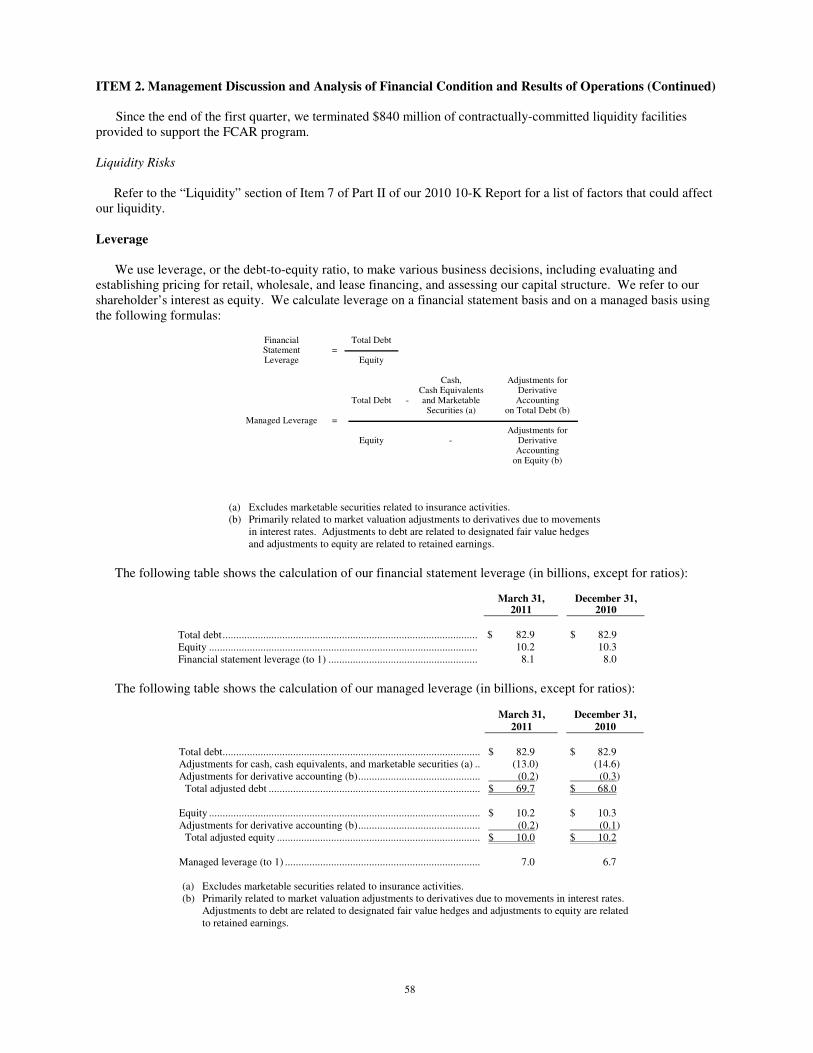
58
ITEM 2. Management Discussion and Analysis of Financial Condition and Results of Operations (Continued)
Since the end of the first quarter, we terminated $840 million of contractually-committed liquidity facilities provided to support the FCAR program.
Liquidity Risks
Refer to the “Liquidity” section of Item 7 of Part II of our 2010 10-K Report for a list of factors that could affect our liquidity.
Leverage
We use leverage, or the debt-to-equity ratio, to make various business decisions, including evaluating and establishing pricing for retail, wholesale, and lease financing, and assessing our capital structure. We refer to our shareholder’s interest as equity. We calculate leverage on a financial statement basis and on a managed basis using the following formulas:
Financial Total Debt Statement = Leverage Equity
Cash,
Cash Equivalents Adjustments for
Derivative
Total Debt - and Marketable Accounting Securities (a) on Total Debt (b)
Managed Leverage = Adjustments for
Equity - Derivative Accounting
on Equity (b)
(a) Excludes marketable securities related to insurance activities. (b) Primarily related to market valuation adjustments to derivatives due to movements in interest rates. Adjustments to debt are related to designated fair value hedges and adjustments to equity are related to retained earnings.
The following table shows the calculation of our financial statement leverage (in billions, except for ratios):
March 31, December 31, 2011 2010
Total debt.............................................................................................. $ 82.9 $ 82.9 Equity ................................................................................................... 10.2 10.3 Financial statement leverage (to 1) ....................................................... 8.1 8.0
The following table shows the calculation of our managed leverage (in billions, except for ratios):
March 31, December 31,
2011 2010
Total debt............................................................................................... $ 82.9 $ 82.9 Adjustments for cash, cash equivalents, and marketable securities (a) .. (13.0) (14.6) Adjustments for derivative accounting (b)............................................. (0.2) (0.3)
Total adjusted debt .............................................................................. $ 69.7 $ 68.0 Equity .................................................................................................... $ 10.2 $ 10.3 Adjustments for derivative accounting (b)............................................. (0.2) (0.1)
Total adjusted equity ........................................................................... $ 10.0 $ 10.2 Managed leverage (to 1) ........................................................................ 7.0 6.7 (a) Excludes marketable securities related to insurance activities. (b) Primarily related to market valuation adjustments to derivatives due to movements in interest rates.
Adjustments to debt are related to designated fair value hedges and adjustments to equity are related to retained earnings.
59
ITEM 2. Management Discussion and Analysis of Financial Condition and Results of Operations (Continued)
We plan our managed leverage by considering prevailing market conditions and the risk characteristics of our business. At March 31, 2011, our managed leverage was 7.0 to 1, compared with 6.7 to 1 at December 31, 2010. Based on our present analysis of the quality of our assets, we believe the appropriate leverage would be in the range of 10-11 to 1. Longer term, we expect to return our leverage to the appropriate level consistent with our analysis of the quality of the assets. Our managed leverage is significantly below the threshold of 11.5 to 1 set forth in the Amended and Restated Support Agreement with Ford. In the first quarter of 2011, we paid $900 million in distributions to our parent, Ford Holdings LLC. For additional information on our planned distributions, refer to the “Outlook” section.
Accounting Standards Issued But Not Yet Adopted
Troubled Debt Restructurings. In April 2011, the Financial Accounting Standards Board (“FASB”) issued a new standard to clarify the accounting for and disclosures about troubled debt restructurings by creditors. The new standard was issued to address concerns about the diversity in practice related to identifying troubled debt restructurings and provides additional guidance as to whether a restructuring meets the criteria to be considered a troubled debt restructuring for purposes of recording an impairment and providing related disclosures. The standard is effective for us as of July 1, 2011 and will be applied prospectively to troubled debt restructurings occurring on or after January 1, 2011. We do not expect it will have a material impact on our financial condition, results of operations, and financial statement disclosures.
Insurance. In October 2010, the FASB issued a new standard addressing the deferral of acquisition costs within
the insurance industry. The new standard modifies which types of costs can be capitalized in the acquisition and renewal of insurance contracts. The standard is effective for us as of January 1, 2012. We do not expect this standard to have a material impact on our financial condition, results of operations, and financial statement disclosures.
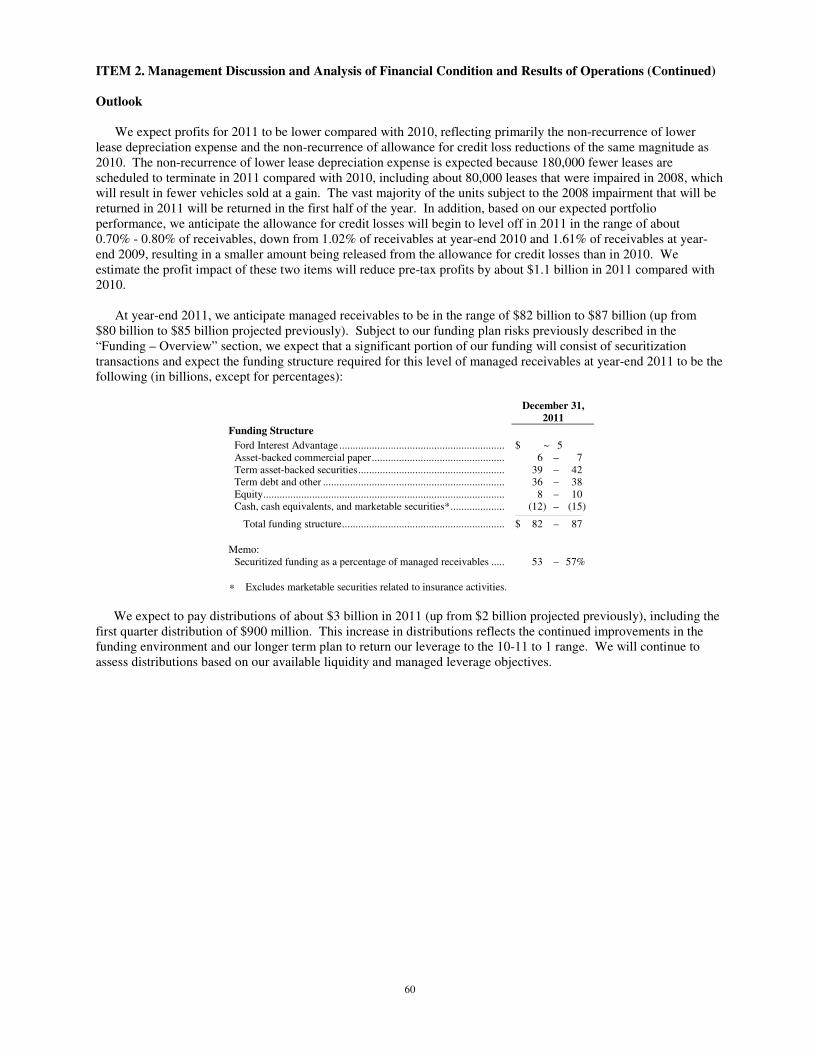
60
ITEM 2. Management Discussion and Analysis of Financial Condition and Results of Operations (Continued)
Outlook
We expect profits for 2011 to be lower compared with 2010, reflecting primarily the non-recurrence of lower
lease depreciation expense and the non-recurrence of allowance for credit loss reductions of the same magnitude as 2010. The non-recurrence of lower lease depreciation expense is expected because 180,000 fewer leases are scheduled to terminate in 2011 compared with 2010, including about 80,000 leases that were impaired in 2008, which will result in fewer vehicles sold at a gain. The vast majority of the units subject to the 2008 impairment that will be returned in 2011 will be returned in the first half of the year. In addition, based on our expected portfolio performance, we anticipate the allowance for credit losses will begin to level off in 2011 in the range of about 0.70% - 0.80% of receivables, down from 1.02% of receivables at year-end 2010 and 1.61% of receivables at year-end 2009, resulting in a smaller amount being released from the allowance for credit losses than in 2010. We estimate the profit impact of these two items will reduce pre-tax profits by about $1.1 billion in 2011 compared with 2010.
At year-end 2011, we anticipate managed receivables to be in the range of $82 billion to $87 billion (up from
$80 billion to $85 billion projected previously). Subject to our funding plan risks previously described in the “Funding – Overview” section, we expect that a significant portion of our funding will consist of securitization transactions and expect the funding structure required for this level of managed receivables at year-end 2011 to be the following (in billions, except for percentages):
December 31,
2011
Funding Structure
Ford Interest Advantage ............................................................. $ ~ 5 Asset-backed commercial paper................................................. 6 – 7 Term asset-backed securities...................................................... 39 – 42 Term debt and other ................................................................... 36 – 38 Equity......................................................................................... 8 – 10 Cash, cash equivalents, and marketable securities*.................... (12) – (15)
Total funding structure............................................................ $ 82 – 87
Memo:
Securitized funding as a percentage of managed receivables ..... 53 – 57%
∗ Excludes marketable securities related to insurance activities.
We expect to pay distributions of about $3 billion in 2011 (up from $2 billion projected previously), including the
first quarter distribution of $900 million. This increase in distributions reflects the continued improvements in the funding environment and our longer term plan to return our leverage to the 10-11 to 1 range. We will continue to assess distributions based on our available liquidity and managed leverage objectives.
61
ITEM 2. Management Discussion and Analysis of Financial Condition and Results of Operations (Continued) Cautionary Statement Regarding Forward Looking Statements
Statements included or incorporated by reference herein may constitute “forward-looking statements” within the meaning of the Private Securities Litigation Reform Act of 1995. Forward-looking statements are based on expectations, forecasts and assumptions by our management and involve a number of risks, uncertainties, and other factors that could cause actual results to differ materially from those stated, including, without limitation:
Automotive Related:
• Decline in industry sales volume, particularly in the United States or Europe, due to financial crisis, recession, geo-political events or other factors;
• Decline in Ford’s market share or failure to achieve growth; • Lower-than-anticipated market acceptance of new or existing Ford products; • An increase in or acceleration of market shift beyond Ford’s current planning assumptions from sales of trucks,
medium- and large-sized utilities, or other more profitable vehicles, particularly in the United States; • An increase in fuel prices, continued volatility of fuel prices, or reduced availability of fuel; • Continued or increased price competition resulting from industry overcapacity, currency fluctuations or other
factors; • Adverse effects from the bankruptcy, insolvency, or government-funded restructuring of, change in ownership or
control of, or alliances entered into by a major competitor; • Economic distress of suppliers may require Ford to provide substantial financial support or take other measures
to ensure supplies of components or materials and could increase Ford’s costs, affect Ford’s liquidity, or cause production constraints or disruptions;
• Work stoppages at Ford or supplier facilities or other interruptions of production; • Single-source supply of components or materials; • Restriction on use of tax attributes from tax law “ownership change”; • The discovery of defects in Ford vehicles resulting in delays in new model launches, recall campaigns,
reputational damage or increased warranty costs; • Increased safety, emissions, fuel economy or other regulation resulting in higher costs, cash expenditures and/or
sales restrictions; • Unusual or significant litigation, governmental investigations or adverse publicity arising out of alleged defects
in Ford products, perceived environmental impacts, or otherwise; • A change in Ford’s requirements for parts where it has entered into long-term supply arrangements that commit it
to purchase minimum or fixed quantities of certain parts, or to pay a minimum amount to the seller (“take-or-pay contracts”);
• Adverse effects on Ford’s results from a decrease in or cessation or clawback of government incentives related to capital investments;
• Adverse effects on Ford’s operations resulting from certain geo-political or other events; • Substantial levels of indebtedness adversely affecting Ford’s financial condition or preventing Ford from
fulfilling its debt obligations;
Ford Credit Related: • A prolonged disruption of the debt and securitization markets; • Inability to access debt, securitization or derivative markets around the world at competitive rates or in sufficient
amounts due to credit rating downgrades, market volatility, market disruption, regulatory requirements or other factors;
• Higher-than-expected credit losses; • Increased competition from banks or other financial institutions seeking to increase their share of financing Ford
vehicles; • Collection and servicing problems related to our finance receivables and net investment in operating leases; • Lower-than-anticipated residual values or higher-than-expected return volumes for leased vehicles; • New or increased credit, consumer or data protection or other laws and regulations resulting in higher costs
and/or additional financing restrictions; • Imposition of additional costs or restrictions due to the Dodd-Frank Wall Street Reform and Consumer Protection
Act and its implementing rules and regulations;
62
ITEM 2. Management Discussion and Analysis of Financial Condition and Results of Operations (Continued)
• Changes in Ford’s operations or changes in Ford’s marketing programs could result in a decline in our financing
volumes; • Inability to obtain competitive funding;
General: • Fluctuations in foreign currency exchange rates and interest rates; • Failure of financial institutions to fulfill commitments under committed credit and liquidity facilities; • Labor or other constraints on Ford’s or our ability to maintain competitive cost structure; • Substantial pension and postretirement healthcare and life insurance liabilities impairing Ford’s or our liquidity
or financial condition; and • Worse-than-assumed economic and demographic experience for postretirement benefit plans (e.g., discount rates
or investment returns); and • Inherent limitations of internal controls impacting financial statements and safeguarding of assets. We cannot be certain that any expectations, forecasts, or assumptions made by management in preparing these
forward-looking statements will prove accurate, or that any projections will be realized. It is to be expected that there may be differences between projected and actual results. Our forward-looking statements speak only as of the date of their initial issuance, and we do not undertake any obligation to update or revise publicly any forward-looking statements, whether as a result of new information, future events, or otherwise.
Other Financial Information
With respect to the unaudited financial information of Ford Motor Credit Company LLC as of March 31, 2011
and for the three-month periods ended March 31, 2011 and 2010 included in this Form 10-Q, PricewaterhouseCoopers LLP reported that they have applied limited procedures in accordance with professional standards for a review of such information. However, their separate report dated May 10, 2011 appearing herein states that they did not audit and they do not express an opinion on that unaudited financial information. Accordingly, the degree of reliance on their report on such information should be restricted in light of the limited nature of the review procedures applied. PricewaterhouseCoopers LLP is not subject to the liability provisions of Section 11 of the Securities Act of 1933 for their report on the unaudited financial information because that report is not a “report” or a “part” of the registration statement prepared or certified by PricewaterhouseCoopers LLP within the meaning of Sections 7 and 11 of the Act.
63
ITEM 3. QUANTITATIVE AND QUALITATIVE DISCLOSURES ABOUT MARKET RISK
In our 2010 10-K Report, we discuss in greater detail our market risk, counter-party risk, credit risk, residual
risk, liquidity risk, and operating risk. To provide a quantitative measure of the sensitivity of our pre-tax cash flow to changes in interest rates, we use
interest rate scenarios that assume a hypothetical, instantaneous change in interest rates of 100 basis points (or 1%) across all maturities, as well as a base case that assumes that interest rates remain constant at existing levels. These interest rate scenarios are purely hypothetical and do not represent our view of future interest rate movements. The differences in pre-tax cash flow between these scenarios and the base case over a twelve-month period represent an estimate of the sensitivity of our pre-tax cash flow. Under this model, we estimate that at March 31, 2011, all else constant, such an increase in interest rates would reduce our pre-tax cash flow by $3 million over the next twelve months, compared with $22 million at December 31, 2010. The sensitivity analysis presented above assumes a one-percentage point interest rate change to the yield curve that is both instantaneous and parallel. In reality, interest rate changes are rarely instantaneous or parallel and rates could move more or less than the one percentage point assumed in our analysis. As a result, the actual impact to pre-tax cash flow could be higher or lower than the results detailed above.
ITEM 4. CONTROLS AND PROCEDURES
Evaluation of Disclosure Controls and Procedures
Michael E. Bannister, our Chairman of the Board and Chief Executive Officer (“CEO”), and Michael L. Seneski, our Chief Financial Officer (“CFO”) and Treasurer, have performed an evaluation of the Company’s disclosure controls and procedures, as that term is defined in Rule 13a-15 (e) of the Securities Exchange Act of 1934, as amended (the “Exchange Act”), as of March 31, 2011 and each has concluded that such disclosure controls and procedures are effective to ensure that information required to be disclosed in our periodic reports filed under the Exchange Act is recorded, processed, summarized and reported within the time periods specified by the SEC’s rules and forms, and such information is accumulated and communicated to management as appropriate to allow timely decisions regarding required disclosures. Changes in Internal Control Over Financial Reporting
There were no changes in internal control over financial reporting during the quarter ended March 31, 2011 that have materially affected, or are reasonably likely to materially affect, our internal control over financial reporting.
64
PART II. OTHER INFORMATION
ITEM 5. OTHER INFORMATION
We have none to report.
ITEM 6. EXHIBITS
Exhibits: please refer to the Exhibit Index on page 67.
Instruments defining the rights of holders of certain issues of long-term debt of Ford Credit have not been filed as exhibits to this Report because the authorized principal amount of any one of such issues does not exceed 10% of the total assets of Ford Credit. Ford Credit will furnish a copy of each such instrument to the SEC upon request.
65
SIGNATURES
Pursuant to the requirements of Section 13 or 15(d) of the Securities Exchange Act of 1934, Ford Motor Credit Company LLC has duly caused this Report to be signed on its behalf by the undersigned, thereunto duly authorized. FORD MOTOR CREDIT COMPANY LLC By: /s/ Michael L. Seneski Michael L. Seneski Chief Financial Officer and Treasurer Date: May 10, 2011
66
REPORT OF INDEPENDENT REGISTERED PUBLIC ACCOUNTING FIRM
To the Board of Directors and Shareholder of Ford Motor Credit Company LLC: We have reviewed the accompanying consolidated balance sheet of Ford Motor Credit Company LLC and its subsidiaries (the “Company”) as of March 31, 2011 and 2010, and the related consolidated statement of operations and consolidated statement of comprehensive income for the three-month periods ended March 31, 2011 and 2010, and the consolidated statement of cash flows for the three-month periods ended March 31, 2011 and 2010. These interim financial statements are the responsibility of the Company’s management. We conducted our review in accordance with the standards of the Public Company Accounting Oversight Board (United States). A review of interim financial information consists principally of applying analytical procedures and making inquiries of persons responsible for financial and accounting matters. It is substantially less in scope than an audit conducted in accordance with the standards of the Public Company Accounting Oversight Board (United States), the objective of which is the expression of an opinion regarding the financial statements taken as a whole. Accordingly, we do not express such an opinion. Based on our review, we are not aware of any material modifications that should be made to the accompanying consolidated interim financial statements for them to be in conformity with accounting principles generally accepted in the United States of America. We previously audited, in accordance with the standards of the Public Company Accounting Oversight Board (United States), the consolidated balance sheet as of December 31, 2010, and the related consolidated statements of operations, of shareholder's interest, and of cash flows for the year then ended (not presented herein), and in our report dated February 28, 2011, we expressed an unqualified opinion on those consolidated financial statements. In our opinion, the information set forth in the accompanying consolidated balance sheet information as of December 31, 2010, is fairly stated in all material respects in relation to the consolidated balance sheet from which it has been derived. /s/ PricewaterhouseCoopers LLP Detroit, Michigan May 10, 2011
67
FORD MOTOR CREDIT COMPANY LLC
EXHIBIT INDEX
Designation
Description
Method of Filing
Exhibit 12 Ford Motor Credit Company LLC and Subsidiaries Calculation of Ratio of Earnings to Fixed Charges
Filed with this Report
Exhibit 15 Letter of PricewaterhouseCoopers LLP, dated May 10, 2011, relating to Unaudited Interim Financial Information
Filed with this Report
Exhibit 31.1 Rule 15d-14(a) Certification of CEO Filed with this Report
Exhibit 31.2 Rule 15d-14(a) Certification of CFO Filed with this Report
Exhibit 32.1 Section 1350 Certification of CEO Furnished with this Report
Exhibit 32.2 Section 1350 Certification of CFO Furnished with this Report
Exhibit 99 Items 2 - 4 of Part I and Items 1, 2, and 5 of Part II of Ford Motor Company’s Quarterly Report on Form 10-Q for the quarterly period ended March 31, 2011
Incorporated herein by reference to Ford Motor Company’s Quarterly Report on Form 10-Q for the quarter ended March 31, 2011. File No. 1-3950.
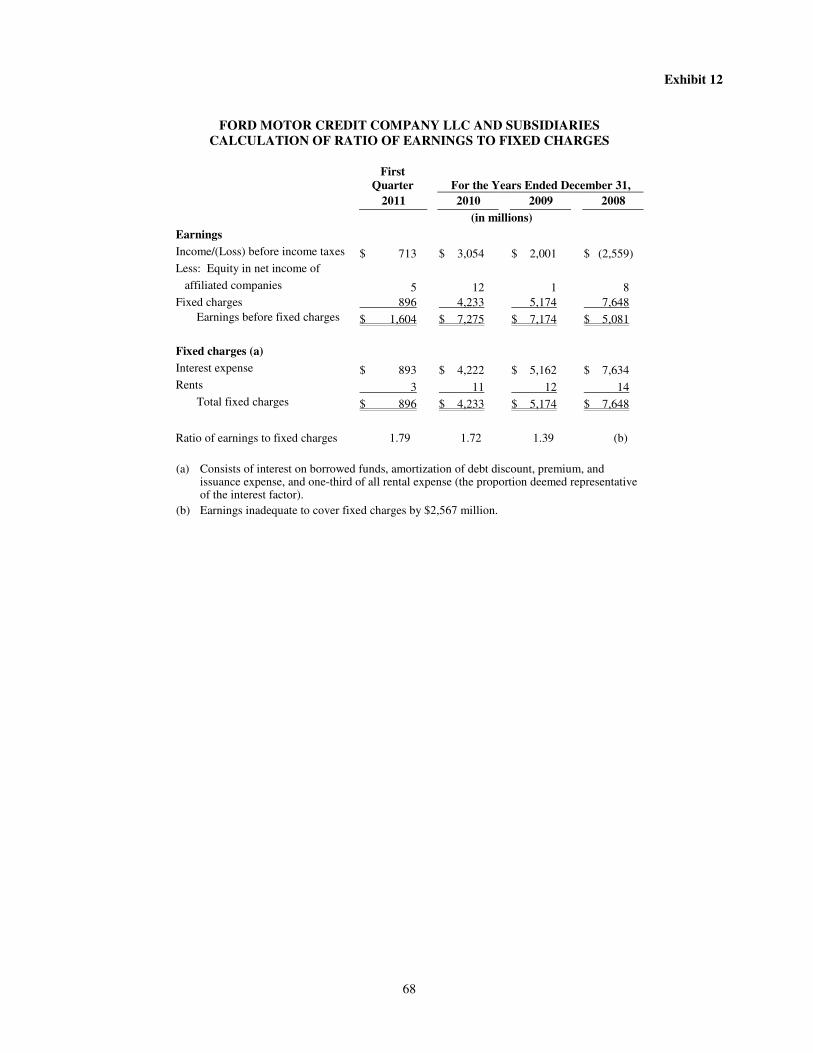
68
Exhibit 12
FORD MOTOR CREDIT COMPANY LLC AND SUBSIDIARIES
CALCULATION OF RATIO OF EARNINGS TO FIXED CHARGES
First
Quarter
For the Years Ended December 31,
2011 2010 2009 2008
(in millions)
Earnings
Income/(Loss) before income taxes $ 713 $ 3,054 $ 2,001 $ (2,559)
Less: Equity in net income of
affiliated companies 5 12 1 8
Fixed charges 896 4,233 5,174 7,648
Earnings before fixed charges $ 1,604 $ 7,275 $ 7,174 $ 5,081
Fixed charges (a)
Interest expense $ 893 $ 4,222 $ 5,162 $ 7,634
Rents 3 11 12 14
Total fixed charges $ 896 $ 4,233 $ 5,174 $ 7,648
Ratio of earnings to fixed charges 1.79 1.72 1.39 (b)
(a) Consists of interest on borrowed funds, amortization of debt discount, premium, and
issuance expense, and one-third of all rental expense (the proportion deemed representative of the interest factor).
(b) Earnings inadequate to cover fixed charges by $2,567 million.
Exhibit 15
CONSENT OF INDEPENDENT REGISTERED PUBLIC ACCOUNTING FIRM
May 10, 2011 Securities and Exchange Commission 100 F Street, N.E. Washington, DC 20549
Re: Ford Motor Credit Company LLC Registration Statement Nos. 333-168720 and 333-159107 on Form S-3 and
No. 333-137066 on Form S-4 Commissioners: We are aware that our report dated May 10, 2011 on our review of interim financial information of Ford Motor Credit Company LLC (the “Company”) for the three-month periods ended March 31, 2011 and 2010 and included in the Company's quarterly report on Form 10-Q for the quarter ended March 31, 2011 is incorporated by reference in the aforementioned Registration Statements. Very truly yours, /s/ PricewaterhouseCoopers LLP
Detroit, Michigan
Exhibit 31.1
CERTIFICATION I, Michael E. Bannister, certify that: 1. I have reviewed this Quarterly Report on Form 10-Q for the quarter ended March 31, 2011 of Ford Motor Credit
Company LLC; 2. Based on my knowledge, this report does not contain any untrue statement of a material fact or omit to state a
material fact necessary to make the statements made, in light of the circumstances under which such statements were made, not misleading with respect to the period covered by this report;
3. Based on my knowledge, the financial statements, and other financial information included in this report, fairly
present in all material respects the financial condition, results of operations and cash flows of the registrant as of, and for, the periods presented in this report;
4. The registrant’s other certifying officer(s) and I are responsible for establishing and maintaining disclosure
controls and procedures (as defined in Exchange Act Rules 13a-15(e) and 15d-15(e)) and internal control over financial reporting (as defined in Exchange Act Rules 13a-15(f) and 15d-15(f)) for the registrant and have:
(a) Designed such disclosure controls and procedures, or caused such disclosure controls and procedures to be designed under our supervision, to ensure that material information relating to the registrant, including its consolidated subsidiaries, is made known to us by others within those entities, particularly during the period in which this report is being prepared; (b) Designed such internal control over financial reporting, or caused such internal control over financial reporting to be designed under our supervision, to provide reasonable assurance regarding the reliability of financial reporting and the preparation of financial statements for external purposes in accordance with generally accepted accounting principles;
(c) Evaluated the effectiveness of the registrant’s disclosure controls and procedures and presented in this report our conclusions about the effectiveness of the disclosure controls and procedures, as of the end of the period covered by this report based on such evaluation; and
(d) Disclosed in this report any change in the registrant’s internal control over financial reporting that occurred during the registrant’s most recent fiscal quarter (the registrant’s fourth fiscal quarter in the case of an annual report) that has materially affected, or is reasonably likely to materially affect, the registrant’s internal control over financial reporting; and
5. The registrant’s other certifying officer(s) and I have disclosed, based on our most recent evaluation of internal
control over financial reporting, to the registrant’s auditors and the audit committee of the registrant’s board of directors (or persons performing the equivalent functions):
(a) All significant deficiencies and material weaknesses in the design or operation of internal control over financial reporting which are reasonably likely to adversely affect the registrant’s ability to record, process, summarize and report financial information; and (b) Any fraud, whether or not material, that involves management or other employees who have a significant role in the registrant’s internal control over financial reporting.
Date: May 10, 2011 /s/ Michael E. Bannister Michael E. Bannister Chairman of the Board and Chief Executive Officer
Exhibit 31.2
CERTIFICATION I, Michael L. Seneski, certify that: 1. I have reviewed this Quarterly Report on Form 10-Q for the quarter ended March 31, 2011 of Ford Motor Credit
Company LLC;
2. Based on my knowledge, this report does not contain any untrue statement of a material fact or omit to state a material fact necessary to make the statements made, in light of the circumstances under which such statements were made, not misleading with respect to the period covered by this report;
3. Based on my knowledge, the financial statements, and other financial information included in this report, fairly
present in all material respects the financial condition, results of operations and cash flows of the registrant as of, and for, the periods presented in this report;
4. The registrant’s other certifying officer(s) and I are responsible for establishing and maintaining disclosure
controls and procedures (as defined in Exchange Act Rules 13a-15(e) and 15d-15(e)) and internal control over financial reporting (as defined in Exchange Act Rules 13a-15(f) and 15d-15(f)) for the registrant and have:
(a) Designed such disclosure controls and procedures, or caused such disclosure controls and procedures to be designed under our supervision, to ensure that material information relating to the registrant, including its consolidated subsidiaries, is made known to us by others within those entities, particularly during the period in which this report is being prepared; (b) Designed such internal control over financial reporting, or caused such internal control over financial reporting to be designed under our supervision, to provide reasonable assurance regarding the reliability of financial reporting and the preparation of financial statements for external purposes in accordance with generally accepted accounting principles;
(c) Evaluated the effectiveness of the registrant’s disclosure controls and procedures and presented in this report our conclusions about the effectiveness of the disclosure controls and procedures, as of the end of the period covered by this report based on such evaluation; and (d) Disclosed in this report any change in the registrant’s internal control over financial reporting that occurred during the registrant’s most recent fiscal quarter (the registrant’s fourth fiscal quarter in the case of an annual report) that has materially affected, or is reasonably likely to materially affect, the registrant’s internal control over financial reporting; and
5. The registrant’s other certifying officer(s) and I have disclosed, based on our most recent evaluation of internal
control over financial reporting, to the registrant’s auditors and the audit committee of the registrant’s board of directors (or persons performing the equivalent functions):
(a) All significant deficiencies and material weaknesses in the design or operation of internal control over financial reporting which are reasonably likely to adversely affect the registrant’s ability to record, process, summarize and report financial information; and (b) Any fraud, whether or not material, that involves management or other employees who have a significant role in the registrant’s internal control over financial reporting.
Date: May 10, 2011 /s/ Michael L. Seneski Michael L. Seneski Chief Financial Officer and Treasurer
Exhibit 32.1
FORD MOTOR CREDIT COMPANY LLC
CERTIFICATION OF CHIEF EXECUTIVE OFFICER
I, Michael E. Bannister, Chairman of the Board and Chief Executive Officer of Ford Motor Credit Company LLC (the “Company”), hereby certify pursuant to Rule 15d-14(b) of the Securities Exchange Act of 1934, as amended, and Section 1350 of Chapter 63 of Title 18 of the United States Code, as adopted pursuant to § 906 of the Sarbanes-Oxley Act of 2002, that to my knowledge:
1. the Company’s Quarterly Report on Form 10-Q for the quarter ended March 31, 2011, to which this
statement is furnished as an exhibit (the “Report”), fully complies with the requirements of section 13(a) or 15(d) of the Securities Exchange Act of 1934, as amended; and
2. the information contained in the Report fairly presents, in all material respects, the financial condition
and results of operations of the Company. /s/ Michael E. Bannister Michael E. Bannister Chairman of the Board and Chief Executive Officer
Date: May 10, 2011
Exhibit 32.2
FORD MOTOR CREDIT COMPANY LLC
CERTIFICATION OF CHIEF FINANCIAL OFFICER
I, Michael L. Seneski, Chief Financial Officer and Treasurer of Ford Motor Credit Company LLC (the “Company”), hereby certify pursuant to Rule 15d-14(b) of the Securities Exchange Act of 1934, as amended, and Section 1350 of Chapter 63 of Title 18 of the United States Code, as adopted pursuant to § 906 of the Sarbanes-Oxley Act of 2002, that to my knowledge:
1. the Company’s Quarterly Report on Form 10-Q for the quarter ended March 31, 2011, to which this statement is furnished as an exhibit (the “Report”), fully complies with the requirements of section 13(a) or 15(d) of the Securities Exchange Act of 1934, as amended; and
2. the information contained in the Report fairly presents, in all material respects, the financial condition
and results of operations of the Company.
/s/ Michael L. Seneski Michael L. Seneski Chief Financial Officer and Treasurer
Date: May 10, 2011