forecasting labour supply and population: an integrated stochastic...
TRANSCRIPT

IAB Discussion PaperArticles on labour market issues
1/2017
Johann Fuchs (IAB)Doris Söhnlein (IAB)Brigitte Weber (IAB)Enzo Weber (IAB)
ISSN 2195-2663
Forecasting Labour Supply andPopulation: An Integrated Stochastic Model
Year
s
Aktualisierte Fassung vom 17. Mai 2017

IAB-Discussion Paper 1/2017 2
Forecasting Labour Supply and Population: An Integrated Stochastic Model
Johann Fuchs (IAB) Doris Söhnlein (IAB) Brigitte Weber (IAB) Enzo Weber (IAB)
Mit der Reihe „IAB-Discussion Paper“ will das Forschungsinstitut der Bundesagentur für Arbeit den Dialog mit der externen Wissenschaft intensivieren. Durch die rasche Verbrei-tung von Forschungsergebnissen über das Internet soll noch vor Drucklegung Kritik ange-regt und Qualität gesichert werden.
The “IAB-Discussion Paper” is published by the research institute of the German Federal Employment Agency in order to intensify the dialogue with the scientific community. The prompt publication of the latest research results via the internet intends to stimulate criti-cism and to ensure research quality at an early stage before printing.

IAB-Discussion Paper 1/2017 3
Erratum
Note that the originally uploaded version of this discussion paper contained wrong figures. This version is a corrected update of the previous version and the only differ-ence is that Table 6 was exchanged.

IAB-Discussion Paper 1/2017 4
Content
Abstract .................................................................................................................... 6
Zusammenfassung ................................................................................................... 6
1 Introduction ..................................................................................................... 7
2 Model structure ............................................................................................... 7
3 Data ................................................................................................................ 9 3.1 Fertility ............................................................................................................ 9 3.2 Mortality ........................................................................................................ 10 3.3 Naturalisations .............................................................................................. 10 3.4 Migration ....................................................................................................... 11 3.5 Labour force participation rates ..................................................................... 11
4 Estimates and projection ............................................................................... 11 4.1 Demography.................................................................................................. 11 4.2 Principal components .................................................................................... 12 4.3 Modelling principal components .................................................................... 14 4.4 Estimating labour force participation .............................................................. 16
5 Results .......................................................................................................... 19 5.1 Components of the population projection ...................................................... 19 5.2 Population ..................................................................................................... 22 5.3 Labour force participation .............................................................................. 25 5.4 Potential labour force .................................................................................... 28
6 Summary and outlook ................................................................................... 30
References ............................................................................................................. 32
Appendix ................................................................................................................ 34
Figures and Tables
Figure 1 Life expectancy for newborn boys in Germany, 1959 to 2060 ................. 20 Figure 2 Total fertility rate (TFR) for German women, 1970 to 2060 ..................... 21 Figure 3 Migration balance for foreign nationals, 1960 to 2060............................. 22 Figure 4 Population in Germany ........................................................................... 23 Figure 5 Total dependency ratio, old-age dependency ratio and youth
dependency ratio .................................................................................... 24 Figure 6 Working-age population (aged 15 to 66), Germany, 1991 to 2060 .......... 25 Figure 7 Age-specific labour force participation rates of German women ............. 26 Figure 8 Age-specific labour force participation rates of German men .................. 27 Figure 9 Labour force participation rate of female foreign nationals aged 30 to 34,
2000 to 2060 .......................................................................................... 28 Figure 10 Potential labour force, in Germany from 2000 to 2060 ............................ 29

IAB-Discussion Paper 1/2017 5
Table 1 Principal components analysis (excerpt) for the survival probability1) of women ................................................................................................... 13
Table 2 Overview of data and principal components ........................................... 14 Table 3 Equation for the first PC concerning the birth rates for female foreign
nationals ................................................................................................. 16 Table 4 Exogenous variables .............................................................................. 18 Table 5 Estimate result for German women aged 45 to 49 .................................. 19 Table 6 The German workforce in 2014, 2030 and 2060 ..................................... 30
IAB-Discussion Paper 1/2017 6
Abstract
This paper presents a stochastic integrated model to forecast the German population and labour supply until 2060. Within a cohort-component approach, the population forecast applies principal components to birth, mortality, emigration and immigration rates. The labour force participation rates are estimated by means of an econometric time series approach. All time series are forecast by bootstrapping. This allows fully integrated simulations and the possibility to illustrate the uncertainties in the form of confidence intervals. Our new forecast confirms the results from former studies. We conclude that even rising birth rates and high levels of immigration cannot break the basic demographic trend in the long run.
Zusammenfassung
In der vorliegenden Studie wird die Bevölkerung und das Arbeitskräfteangebot für Gesamtdeutschland bis zum Jahr 2060 in einem integrierten Modell projiziert. Dazu werden im Rahmen eines Kohorten-Komponenten-Ansatzes Geburten, Sterbefälle, Zu- und Fortzüge mittels einer Hauptkomponentenanalyse (Principal Component Analysis) geschätzt. Die Erwerbsquoten werden mit einem ökonometrischen Zeitrei-henmodell bestimmt. Mit einem stochastischen Ansatz (Bootstrapping) verwendet un-sere neue Vorausberechnung eine Alternative zu der deterministischen Schätzme-thode, die früheren IAB-Projektionen zugrunde lag. Das jetzige Modell ermöglicht voll-ständig integrierte Simulationen und erlaubt es, die existierenden Unsicherheiten in Form von Konfidenzbändern darzustellen. Die Ergebnisse bestätigen bekannte vor-liegende Projektionen. Wir schließen daraus, dass auch steigende Geburtenraten und hohe Zuwanderung den grundlegenden demografischen Trend langfristig nicht bre-chen können.
JEL classification: C38, J11, J20, J21, J22
Keywords: stochastic population forecast, principal components, demography, la-bour force participation, labour supply

IAB-Discussion Paper 1/2017 7
1 Introduction Unlike many other European countries, high unemployment is not the main problem with the German labour market. Rather, concerns have been voiced that there will not be sufficient well-trained workers for demographic reasons. A demographic decline is certainly not synonymous with a labour shortage, since economies adapt to such changes (Weber 2015). Nevertheless, the future demographic development in Ger-many is pivotal in the discussion surrounding the shortage of skilled workers and im-migration: How many people will be living here and how many will be available to the labour market? To answer these questions we need to analyse the components
▪ population of working age and
▪ labour force participationThe present paper delivers a projection of these two variables. In addition to the size of the population, its structure is also of interest, particularly with respect to different labour force participation rates in different demographic groups. The labour force par-ticipation rates among young people and older workers, women and particularly fe-male foreign nationals, are relatively low. The projection is disaggregated by gender, age, Germans and foreign nationals.
In order to estimate and project all the influential variables, we construct an integrated simulation model that endogenises all the components that are necessary for project-ing the labour force. Births, deaths, migration and naturalisations as well as participa-tion rates are analysed on the basis of time series and modelled stochastically. Unlike deterministic models, this makes it possible to specify the related confidence intervals in addition to the point estimates.
Our model has two special components with respect to labour force participation. Since the age-specific labour force participation rates of female foreign nationals are considerably lower than those of German women, the model distinguishes between Germans and non-Germans. It further estimates so-called potential labour force par-ticipation rates (LFPR), which include hidden unemployment. The multiplicative com-position of potential labour force participation rates and the related population yields the potential labour force.
The next section outlines the basic model structure (Section 2). Since there are some specific characteristics, the data material used is detailed in section 3. Section 4 ex-plains the methodology on which the estimates and projection are based. Section 5 outlines the results. Finally, there is a summary and our conclusion.
2 Model structure The method used by the Institute for Employment Research (IAB) to estimate the potential labour force for Germany as a whole involves breaking it down into its com-ponents of population and labour force participation rates.
IAB-Discussion Paper 1/2017 8
As far as the population components are concerned, birth and mortality rates, migra-tion and naturalisations are modelled by principal components (PC). These PCs are projected using time-series methods to yield the population forecast. The inputs for the model are the number and structure of the population in the above disaggregation in Germany for the base year of 2013. The intermediate result is the population for the subsequent year. This is multiplied by the respective LFPR to yield the potential labour force in the specified breakdown.
The probabilistic population forecast relies on the widely used cohort-component method (Rowland 2003), i.e. it starts out from an initial population, which is disaggre-gated by age, sex and German nationals/non-nationals. The number of persons aged 𝑖𝑖 in year 𝑡𝑡 is the survival probability (𝑠𝑠𝑠𝑠𝑠𝑠) for age group 𝑖𝑖 multiplied by the number of people (𝑝𝑝𝑝𝑝𝑝𝑝) in this age group, which are the 𝑖𝑖 − 1 𝑦𝑦𝑦𝑦𝑦𝑦𝑠𝑠 𝑝𝑝𝑜𝑜𝑜𝑜𝑠𝑠 from the previous year 𝑡𝑡 − 1. Then the number of immigrations (𝑖𝑖𝑖𝑖) is added and the number of emigrations (𝑦𝑦𝑖𝑖) is deducted. Finally, the number of naturalised citizens (𝑛𝑛𝑦𝑦𝑡𝑡) is added to the number of Germans (𝐺𝐺) and subtracted from the number of foreign nationals(𝐹𝐹).
�𝑝𝑝𝑝𝑝𝑝𝑝𝑡𝑡,𝑖𝑖� = 𝑠𝑠𝑠𝑠𝑠𝑠𝑡𝑡;𝑖𝑖𝐺𝐺/𝐹𝐹 ∗ �𝑝𝑝𝑝𝑝𝑝𝑝𝑡𝑡−1,𝑖𝑖−1
𝐺𝐺/𝐹𝐹 � + 𝑖𝑖𝑖𝑖𝑡𝑡,𝑖𝑖𝐺𝐺/𝐹𝐹 − 𝑦𝑦𝑖𝑖𝑡𝑡,𝑖𝑖
𝐺𝐺/𝐹𝐹 ± 𝑛𝑛𝑦𝑦𝑡𝑡𝑡𝑡,𝑖𝑖𝐹𝐹
The equation is simplified slightly, since the birth and mortality rates still need to be included in the migrations and naturalisations. Furthermore, the maximum age bracket is generated from two age groups, the group aged 89 and that aged 90 or older.
The youngest age group is determined by the number of births, so the total of age-specific birth rates (𝑏𝑏𝑖𝑖𝑠𝑠) is multiplied by the number of German (G) or foreign (F) women �𝑝𝑝𝑝𝑝𝑝𝑝𝑓𝑓� respectively. Emigration, immigration and the naturalisation of babies are included as described above.
�𝑝𝑝𝑝𝑝𝑝𝑝𝑡𝑡,0� = 𝑠𝑠𝑠𝑠𝑠𝑠𝑡𝑡;0𝐺𝐺/𝐹𝐹 ∗ �� 𝑝𝑝𝑝𝑝𝑝𝑝𝑤𝑤,𝑡𝑡,𝑖𝑖
𝐺𝐺/𝐹𝐹 ∗49
𝑖𝑖=15
𝑏𝑏𝑖𝑖𝑠𝑠𝑡𝑡,𝑖𝑖𝐺𝐺/𝐹𝐹� + 𝑖𝑖𝑖𝑖𝑡𝑡,0
𝐺𝐺/𝐹𝐹 − 𝑦𝑦𝑖𝑖𝑡𝑡,0𝐺𝐺/𝐹𝐹 ± 𝑛𝑛𝑦𝑦𝑡𝑡𝑡𝑡,0
𝐹𝐹
The model distinguishes between immigration and emigration. These are also mod-elled differently: the immigration rate is initially estimated as an aggregate, distinguish-ing between Germans and foreign nationals, and then arranged by gender and indi-vidual year of age using projected ratios (top-down). Previous projections proved that estimating emigration as an absolute, divided by gender, individual year of age as well as by Germans and foreign nationals based on the respective population is ad-vantageous. For this reason, emigration increases as the population grows. It also ensures that emigration does not exceed the population in any age group.
The labour force participation of the population is quantified by the potential LFPR. This rate is calculated in the same way as the usual LFPR, but also includes an esti-mate of hidden unemployed. This figure therefore corresponds to a LFPR assuming full employment in the labour market (Agbola 2005). As for the population, the rates

IAB-Discussion Paper 1/2017 9
are disaggregated by age, sex and nationality. To calculate the potential labour force, the participation rates are combined with the respective population. The summation across all groups yields the potential labour force.
With the estimates, probability distributions for fertility, mortality, migration and labour force participation rates are derived by bootstrapping, based on 5,000 random draws. This makes it possible to calculate confidence intervals.
3 Data The population data from the Federal Statistical Office (FSO) are available broken down into Germans and foreign nationals, with each group then differentiated further by gender and individual year of age (aged 90 or older combined to one group) up to and including 2013. The 2013 population structured according to these attributes is the initial population for this model.
There are two relevant changes in the time series, which have to be explained in detail.
In the year 2000: a change to the citizenship law According to the citizenship law effective since 2000, children of foreign parents born in Germany are granted German citizenship under certain circumstances. This means that official statistics count far less than half of the descendants of foreign parents as foreign nationals, the rest acquires German citizenship (BAMF 2016). However, the individuals have to decide whether they want to retain or forego German citizenship by the time they turn 21, as the law does not permit dual citizenship.
In the year 2011: the German census In May 2011, a register-based census was conducted in Germany (see FSO 2013). This “2011 census” resulted in a considerable cut in the official statistics. Among other things, the population in Germany was corrected downwards by approx. 1.5 million, or 1.8 percent, to 80.2 million – compared to the number of inhabitants from the cur-rent population estimate. The correction was particularly drastic with regard to foreign nationals: the new number of foreign nationals as of the census deadline was 1.1 million people (14.9%) lower than before, at 6.2 million .
Since the population figures are used in many other population statistics (e.g. mortal-ity rates, birth rates) these changes result in breaks in the respective time series.
3.1 Fertility The FSO provides birth rates of single-year age groups (15 to 49 years), broken down by German and foreign mothers, up to 2013 (starting with 1991). The 2011 census caused a significant jump in the age-specific birth rates of female foreign nationals. Since the number of births was not affected by the revision but the census yielded a smaller population to which the births are related, the age-specific birth rates changed

IAB-Discussion Paper 1/2017 10
(FSO 2015a). The increase in the total fertility rate (TFR)1 for female foreign nationals, from 1.6 (in 2010) to approx. 1.8 children per woman in 2011, is partly a result of the census population revision.
The statistic no longer includes all children of foreign mothers as non-Germans, this means that some of their children are included in the German population and some of them belong to the non-German population. Our population model, however, in-cludes all children of female foreign nationals in the foreign population, because the fertility rates of female foreign nationals were not split according to citizenship. Hence, the projection for babies born to foreign nationals is considerably higher than the fig-ure that would result based on the official statistic. The model takes this discrepancy into account in a larger number of naturalisations, at the same level as before the change to the citizenship law. Note that our model does not provide a projection of foreign nationals in Germany for this reason.
3.2 Mortality Mortality data are not available broken down by Germans and non-Germans. At the same time, there is some doubt whether the mortality rates of immigrants are valid at all.
First, it can be assumed that there are selectivity problems in the mortality of immi-grants which slant the “true” mortality rates (Kohls 2012). Second, the numbers of foreign nationals corrected downwards due to the 2011 census are inserted to com-pute the age-specific mortality rates, whereas the number of deaths remains valid. In this respect, the previous age-specific mortality rates were clearly too low. The ab-sence of specific mortality rates for Germans and foreign nationals, however, should not result in a noticeable distortion in the projected population of working age, as the mortality rates for the relevant age interval are very low.
The age-specific mortality rates are taken from the life tables from 1957/58 to 2010/2012 for Germany (territory of the former Federal Republic of Germany until 1990).2
3.3 Naturalisations As our model distinguishes between nationals and non-nationals it is necessary to take into account the number of naturalisations. Naturalisation figures were available for 1998 to 2013.
1 The total fertility rate (TFR) is the sum of age-specific birth rates. The TFR is used to meas-
ure the long-term reproduction level of a population. The German TFR is about 1.4 children per woman.
2 The mortality rate of those aged 90 or over was therefore estimated separately.
IAB-Discussion Paper 1/2017 11
In general, the naturalisation rate has been decreasing since the mid-1990s. The re-ductions due to the change in the citizenship law are extreme: for example, the num-ber of naturalisations of girls aged 0 fell from approx. 1400 in 1999 to 90 in 2000. More recently (2013), the figure was 25 naturalisations nationwide. The rise of the natural-isation rate between 2010 and 2011, jumping from 1.4 to almost 1.7, can primarily be attributed to the revision due to the 2011 census.
The naturalisation rate can be expected to decline in the long term as a result of the change in the citizenship law in 2000, as the children of immigrants who have been in the country for a long time are granted German citizenship at birth. However, this group is still small. Our model counts descendants of female foreign nationals as non-Germans. Some of them will acquire German citizenship by naturalisation.
3.4 Migration The migration data are taken from migration statistics. These are broken down by immigration and emigration of Germans and foreign nationals, by gender, and by in-dividual year of age from zero to 90 years, and cover the period from 1991 to 2014.
3.5 Labour force participation rates The potential LFPR incorporates hidden unemployed (the hidden labour force). The estimation of the potential LFPR is based on the group-specific LFPR from the labour force survey. The labour force survey is integrated into the German microcensus, a 1 percent household sample, conducted by the Federal Statistical Office; participation is mandatory. Labour force data are available up to 2013. Section 4.2 explains the estimation of the potential LFPR in more detail.
4 Estimates and projection
4.1 Demography The cohort-component method uses the components of population change, i.e. fertil-ity, mortality and migration, to project the population. In contrast to a deterministic forecast, where the mortality rates et cetera are point estimates, a probabilistic fore-cast estimates the distribution of the rates from historical data. These distributions form the basis for a probabilistic forecast of the rates.
The method described below is similar for the various elements, but a different ap-proach is used for immigration and emigration: immigration is initially estimated as an aggregate separately for Germans and foreign nationals, and then broken down by age and gender using the projected rates (top-down). Emigration, on the other hand, is determined using the age-specific shares of the respective population, which then yields the total emigration (bottom-up). A similar procedure is applied for naturalisa-tions. The respective life expectancy for men and women is calculated from the pro-jected mortality rates. The age-specific birth rates are calculated separately for Ger-mans and non-Germans and yield the total fertility rate (TFR).

IAB-Discussion Paper 1/2017 12
4.2 Principal components The PCs have proved appropriate for estimating demographic components, particu-larly mortality, at the latest since being published by Lee and Carter (1992). A singular-value decomposition generates 𝑗𝑗 different time-series random variables each orthog-onal (𝑤𝑤𝑖𝑖𝑡𝑡ℎ 𝑗𝑗 < 𝑘𝑘). The eigenvectors for the eigenvalues in the covariance matrix are the loadings in the time series, which are in turn used to generate the PCs. These PCs are projected to model and forecast the 𝑘𝑘 different time series.
In this model, the time series are always linear combinations of several PCs. For ex-ample, the age-specific birth rates for German women 𝑥𝑥𝑡𝑡,𝑖𝑖 for age groups 𝑖𝑖 = 15, … , 49 are modelled as
𝑜𝑜𝑛𝑛�𝑥𝑥𝑡𝑡,𝑖𝑖� = 𝑐𝑐1 + �𝑐𝑐𝑘𝑘+1𝑝𝑝𝑐𝑐𝑘𝑘,𝑡𝑡
𝑛𝑛
𝑘𝑘=1
+ 𝜀𝜀𝑡𝑡;
with 𝑝𝑝𝑐𝑐𝑘𝑘,𝑡𝑡 being the first n principal components for the group 𝑜𝑜𝑛𝑛�𝑥𝑥𝑡𝑡,𝑖𝑖� and 𝜀𝜀𝑡𝑡 the error term.
Various extensions and refinements of the Lee-Carter model can be found in the lit-erature3. Lundström/Qvist (2004) address breaks in the time series and O’Hare/Li (2014) attempt to reflect structural interruptions in the mortality data better in the model (for an overview see Booth/Tickle 2008): In addition to various parametric mod-els, they develop the Lee-Carter approach into more sophisticated principal compo-nents models, i.e. using more than one component. This method results in a better model fit (see also Renshaw/Haberman 2003). We therefore apply this extension to our model.
This in turn directly raises the question about the number of PCs. In the case of the age-specific mortality data, which are strongly correlated, it is plausible to limit the number to one PC, as the first component already explains most of the variance. Ta-ble 1 shows an example of the PCs of female mortality rates in Germany. The first component accounts for almost 98 percent of the variance:
All other age-specific time series (fertility, naturalisations, immigration and emigra-tion), however, are not so highly collinear, which raises the question of the appropriate number of PCs. Peres-Neto/Jackson/Somers (2004) suggest several more or less complex methods to determine a reasonable number. For practical purposes, we fa-vour the Kaiser-Guttmann criterion: only eigenvectors with an eigenvalue ≥ 1 are used. In most cases, this criterion yields a generally satisfactory explanation of the variance using an acceptable number of PCs (variance coverage).
3 See e.g. Hansen/Pflaumer 2011, Lee/Miller 2001 and Lee/Tuljapurkar 1994.

IAB-Discussion Paper 1/2017 13
Table 1 Principal components analysis (excerpt) for the survival probability1) of women Sample: 1959 - 2012 54 observations Eigenvalues
Value Cumulative Proportion Cum. proportion 1 88.1127 88.1127 0.9790 0.9790 2 0.5816 88.6943 0.0065 0.9855 3 0.4552 89.1494 0.0051 0.9905 4 0.1949 89.3443 0.0022 0.9927 5 0.1028 89.4472 0.0011 0.9939 6 0.0915 89.5386 0.0010 0.9949 7 0.0772 89.6159 0.0009 0.9957 8 0.0444 89.6603 0.0005 0.9962 9 0.0365 89.6967 0.0004 0.9966
10 0.0316 89.7283 0.0004 0.9970 11 0.0292 89.7576 0.0003 0.9973 12 0.0280 89.7855 0.0003 0.9976
1) Log (Survival probability) = log (1 – death rate) Note: The mortality data do not distinguish between German nationals and non-Germans. Source: Federal Statistical Office and own estimations
As is evident from Table 2, one or two PCs will suffice for the mortality series; for fertility and naturalisations there are a few more components, but projecting the mi-gration time series requires significantly more PCs to explain at least 90 percent of the variance.

IAB-Discussion Paper 1/2017 14
Table 2 Overview of data and principal components
Group Data points Age groups Components Variance explained
No. Mortality m 54 90 2 97% Mortality f 54 90 1 98% Fertility G 23 35 3 96% Fertility F 23 35 3 92% Naturalisations m 16 71 4 97% Naturalisations f 16 71 4 98% Immigration G, m 24 91 10 94% Immigration G, f 24 91 7 95% Immigration F, m 24 91 11 94% Immigration F, f 24 91 7 95% Emigration G, m 24 91 8 95% Emigration G, f 24 91 7 93% Emigration F, m 24 91 6 95% Emigration F, f 24 91 6 96%
Note: G=Germans, F=foreign nationals, m=male, f=female Source: Federal Statistical Office and own estimations
4.3 Modelling principal components Principal components are estimated and projected in a similar way to Lee-Carter (1992), using stochastic processes. There, the first principal component is modelled as a random walk with drift. Here, typically several (Table 2) principal components are represented and forecast using autoregressive (𝐴𝐴𝐴𝐴) or moving-average pro-cesses (𝑀𝑀𝐴𝐴). For example, a high autocorrelation in the first lags for the second prin-cipal component of the birth rates of German women 𝑝𝑝𝑐𝑐2(𝑐𝑐𝑐𝑐𝑠𝑠𝐺𝐺) indicates suitable modelling using 𝐴𝐴𝐴𝐴(𝑝𝑝) terms. So modelling using an 𝐴𝐴𝐴𝐴(2) process 𝑥𝑥𝑡𝑡, the error terms 𝜀𝜀𝑡𝑡 and 𝜀𝜀′𝑡𝑡 yields
≔ 𝑦𝑦
𝑝𝑝𝑐𝑐2(𝑐𝑐𝑐𝑐𝑠𝑠𝐺𝐺) = 𝑐𝑐1 + 𝑐𝑐2𝑥𝑥𝑡𝑡 + 𝜀𝜀𝑡𝑡 with 𝑥𝑥𝑡𝑡 = 𝑦𝑦1𝑥𝑥𝑡𝑡−1 + 𝑦𝑦2𝑥𝑥𝑡𝑡−2 + 𝜀𝜀′𝑡𝑡.
The models tested range from 𝐴𝐴𝐴𝐴(1) or 𝑀𝑀𝐴𝐴(1) to 𝐴𝐴𝐴𝐴𝑀𝑀𝐴𝐴(2,2). After the correlation diagram of residuals we selected an 𝐴𝐴𝐴𝐴(2) process, as both the Schwarz criterion (Schwarz 1978) and the Hannan-Quinn criterion (Hannan-Quinn 1979) were minimal.
The respective first PCs generally show a sharp downward or upward trend. This can yield impossible or absurd results. On the one hand, there are natural limits (e.g. a 100% mortality rate), on the other hand some results may be extremely implausible for theoretical considerations. For example, there is certainly an upper limit for a rise in births over a few years.
IAB-Discussion Paper 1/2017 15
Therefore, a logistic functional approach was applied for the respective principal com-ponents: for a given saturation level SN the expression 𝑝𝑝𝑐𝑐 = 𝑦𝑦 from above is re-placed by
𝑝𝑝𝑐𝑐 =𝑆𝑆𝑆𝑆
1 + 𝑦𝑦𝑥𝑥𝑝𝑝(𝑦𝑦)
So for 0 < 𝑝𝑝𝑐𝑐 < 𝑆𝑆𝑆𝑆 this will be:
𝑜𝑜𝑛𝑛 �𝑆𝑆𝑆𝑆𝑝𝑝𝑐𝑐
− 1� = 𝑦𝑦
The PCs can generally also be negative values. The logarithm would then not be defined for the term. A parallel translation of the principal components by 𝑘𝑘 will correct this. However, this will also translate the saturation level 𝑆𝑆𝑆𝑆 into 𝑆𝑆𝑆𝑆′
𝑜𝑜𝑛𝑛 �𝑆𝑆𝑆𝑆′
𝑝𝑝𝑐𝑐 + 𝑘𝑘− 1� = 𝑦𝑦
Like the other coefficients, 𝑆𝑆𝑆𝑆 or 𝑆𝑆𝑆𝑆′ and 𝑘𝑘 are estimated with maximum-likelihood.
For example, the first PC in the birth rates for female foreign nationals 𝑝𝑝𝑐𝑐1(𝑐𝑐𝑐𝑐𝑠𝑠𝐹𝐹), which is highly subject to a trend, is estimated using a logistic approach. The equation, however, has no autoregressive term, since it does not yield additional explanatory power in this case. The estimation for the equation
𝑜𝑜𝑛𝑛 �𝑆𝑆𝑆𝑆′
𝑝𝑝𝑐𝑐1(𝑐𝑐𝑐𝑐𝑠𝑠𝐹𝐹) + 𝑘𝑘− 1� = 𝑐𝑐1 + 𝑐𝑐2𝑡𝑡 + 𝜃𝜃𝑡𝑡
yields the parameters in Table 3, where 𝑆𝑆𝑆𝑆’ = 19. 51 and 𝑘𝑘 = 9. 25.4
4 All estimations and forecasts were conducted using EViews 8.

IAB-Discussion Paper 1/2017 16
Table 3 Equation for the first PC concerning the birth rates for female foreign nation-als
Dependent variable: PC1_CFR_F
Method: Least squares
Sample (adjusted): 1991 2013
PC1_CFR_F=SN'/(1+EXP(c1+c2*t))+k
Coefficient Std. error t-statistic Probability
SN' 19.50762 1.975521 9.87 0.000 c1 9.854861 1.399583 7.04 0.000 c2 -0.186835 0.026927 -6.94 0.000 k -9.2532 0.942678 -9.82 0.000
R-squared 0.994 Mean dependent var. -1.54E-16 Adjusted R-squared 0.993 SD dependent var. 5.122 SE of regression 0.432 Akaike info criterion 1.315 Sum squared resid. 3.542 Schwarz criterion 1.512 Log likelihood -11.12 Hannan-Quinn criterion 1.364 F-statistic 1.026 Durbin-Watson statistic 1.003 Prob(F-statistic) 0.000
Source: Federal Statistical Office and own estimations
4.4 Estimating labour force participation A well-known phenomenon is that labour force participation moves cyclically in re-spect to the development of the economy. Workers withdraw from a deteriorating la-bour market (e.g. Dernburg/Strand 1966; Holst/Schupp 2000). This is called discour-agement. On the other hand, additional labour force participants may enter the labour market in a recession, for example to ensure their family income (e.g. Prieto-Rodríguez and Rodríguez-Gutiérrez 2000). Obviously, unemployment plays a major role with regard to labour force participation.
For this reason, the estimating equations include an indicator specifying the labour market situation. Such an indicator can be the official unemployment rate, a group-specific unemployment rate, or the relation between vacancies and the labour force. Due to the high multicollinearity only one of these different unemployment rates (or the vacancy rate) was used per equation. The selection was based on the empirical literature and on statistical criteria.
IAB-Discussion Paper 1/2017 17
Due to the breakdown by gender, Germans and foreign nationals, as well as ten age groups covering the age ranges 15 to 64, equations were estimated for 40 groups.5 For each of the 40 population groups an equation of the following type was estimated:
𝑜𝑜𝑛𝑛 �𝑦𝑦�𝑗𝑗𝑡𝑡
�1 − 𝑦𝑦�𝑗𝑗𝑡𝑡�� = 𝑜𝑜𝑝𝑝𝑙𝑙𝑖𝑖𝑡𝑡 �𝑦𝑦�𝑗𝑗𝑡𝑡� = 𝑏𝑏0 + 𝑏𝑏𝑏𝑏𝑡𝑡 + 𝑐𝑐𝑐𝑐𝑡𝑡
where
▪ 𝑦𝑦�𝑗𝑗𝑡𝑡 is the estimated logit of the statistically measured LFPR 𝑦𝑦𝑗𝑗𝑡𝑡 5F
6
▪ 𝑏𝑏0, b and c are regression parameters
▪ 𝑐𝑐𝑡𝑡 represents a regressor serving as the indicator for the labour market situation, e.g. the unemployment rate.
▪ 𝑏𝑏𝑡𝑡 represents all other regressors, e.g. the part-time employment rate, a trend ele-ment or the lagged endogenous variable itself (therefore Z and b can be vectors).
▪ Both 𝑏𝑏𝑡𝑡 and 𝑐𝑐𝑡𝑡 were also used in lagged form. The index j represents the subpop-ulation and was omitted from the right in order to simplify matters.
A deterioration in the labour market situation on the one hand pushes the LFPR down and on the other hand involves lower values for the employment indicator K. The sign to be expected for parameter c of the employment indicator is therefore clearly de-fined. Which sign should be expected depends first on the indicator and second on whether the “discouragement” or the “added worker effect” prevails. Literature for Ger-many frequently assumes a larger “discouragement” effect, although both phenom-ena can certainly appear simultaneously (Fuchs/Weber 2013). In the case of discour-agement, the sign of the unemployment rate should be negative, whereas the added worker effect would imply a positive sign. For the vacancy rate, which seems to be important in empirical terms especially for men, the sign is reversed: discouragement involves a positive sign, the added worker effect a negative one.
The change from the estimated LFPR in equation (1) to the potential LFPR afterwards is based on the consideration of how a boom differs from a poor labour market situa-tion. In the case of a boom, the cyclical labour market indicator should be a value that could be considered the “full employment value” (Agbola 2005; Weber 2014). If an
5 The potential labour force covers the age interval from 15 to 74 years. For statistical rea-
sons it was assumed that the LFPR of the oldest group (65+) will remain largely unchanged in future. In addition, due to the retirement age, hidden unemployment should be important only up to the age of 64.
6 The LFPR ajt, is calculated from the employed and the unemployed figures in relation to the population. On the left-hand side of equation (1) the number of unemployed workers from the labour force survey is therefore shown. The unemployment rate on the right-hand side refers to the registered unemployment from the social security system. The two un-employment figures only overlap by 60%, as the definitions differ widely.

IAB-Discussion Paper 1/2017 18
equation contains the unemployment rate as the employment indicator, the full em-ployment value would be an extremely low unemployment rate.
Let 𝑐𝑐𝑣𝑣 be the “full employment value”. Replacing the actual value of 𝑐𝑐 with 𝑐𝑐𝑣𝑣, the equation will yield the logit of a potential LFPR 𝑦𝑦𝑗𝑗𝑡𝑡𝑣𝑣 ., i.e. a participation rate under full
employment conditions.
𝑜𝑜𝑝𝑝𝑙𝑙𝑖𝑖𝑡𝑡�𝑦𝑦�𝑗𝑗𝑡𝑡𝑣𝑣 � = 𝑏𝑏0 + 𝑏𝑏𝑏𝑏𝑡𝑡 + 𝑐𝑐𝑐𝑐𝑡𝑡𝑣𝑣
The full employment value 𝑐𝑐𝑣𝑣 may be variable, i.e. 𝑐𝑐𝑣𝑣 does not need to be constant throughout the period. The specification 𝑐𝑐𝑡𝑡𝑣𝑣 therefore includes the time index t.
The variables measured with vector Z represent the other determining factors for la-bour force participation, e.g. the part-time employment rate for women, the share of students in the population etc. Table 4 lists the regressors that were shown to be significant and were included in the equations estimated.
Table 4 Exogenous variables
Unemployment rates: • Unemployment rate related to dependent civilian labour force • Unemployment rate related to civilian labour force (for females, foreign nationals, young workers
under the age of 20, women working part-time)
Job vacancies: • Number of vacancies reported related to dependent civilian labour force • Number of vacancies subject to social security contributions reported related to dependent civil-
ian labour force
Wages: • Wage variable (average (median) daily pay of employees subject to social security contributions)
by gender for Germans and foreign nationals (significant variable: male foreign nationals aged 30-49)
Education: • Student ratio by gender and age (significant: men aged: 20-24, 25-29, women aged 20-24)
Household situation: • Rate of women working part-time • Relation between women age x and children age y (with different values for x and y) (significant:
women aged 35-39, children aged 5-9)
Retirement: • Average retirement age for those covered by old-age pension insurance by gender (significant:
men aged 60-64)
Source: Federal Statistical Office and own estimations
The estimate for German women aged 45 to 49 is shown as an example in Table 5. The dependent variable is the logit of the labour force participation rate. Like all others, this equation was estimated with weighted least squares, as the LFPR, just like the logits, are heteroscedastic. The time series of the LFPR cover the period from 1991 to 2013.

IAB-Discussion Paper 1/2017 19
Table 5 Estimate result for German women aged 45 to 49
Dependent variable: German women, aged 45-49 Coefficient Std. error Prob.
Unemployment rate related to civilian labour force for women -0.11380 0.003723 0.0065
Rate of women working part-time 0.065462 0.001308 0.0000
Dummy 2005 -0.718652 0.063438 0.0000
Constant -0.153828 0.016360 0.0000
Adjusted R-squared 0.989953
F-statistic 723,5820
Schwarz criterion -3,788348
Breusch-Godfrey Serial Correlation LM Test n.s.
Source: Federal Statistical Office and own estimations
Significant regressors were the unemployment rate for women, the ratio of women working part-time and a dummy variable for 2005. The dummy variable represents the labour market reform that became effective in 2005, also known as Hartz IV, as this was followed by a significant rise in open unemployment.
5 Results Below are the key results of the stochastic projections, each specifying the average and the confidence interval. The confidence intervals are based on up to 5,000 simu-lation runs (bootstrap generated) and not only show the variability of the residuals, but also include uncertainty in the coefficients. A 66 percent confidence level was selected for the following graphical representations of our results. The median is pre-ferred over the arithmetic mean as it is more stable with respect to outliers. Some more detailed results can be found in the appendix.
5.1 Components of the population projection Life expectancy rises from 77.8 years (current value from the 2010/2012 life table) to 85.5 years for newborn boys and from 82.8 years to 88.6 years for newborn girls; in other words, our model projects a reduction in the size of the mortality gap between the genders. This also corresponds to developments in the late 1970s (Eisen-menger/Emmerling 2011).
As an example of the estimated life expectancy, Figure 1 shows the result of the sto-chastic projection for newborn boys. According to our estimates, the 66% confidence interval for newborn boys is between 84.5 and 86.4 years in 2060 and therefore rela-tively small. The survival probabilities can therefore be projected quite well from the historical data. The confidence interval is similarly small for newborn girls.

IAB-Discussion Paper 1/2017 20
Figure 1 Life expectancy for newborn boys in Germany, 1959 to 2060
The TFR for female foreign nationals declines from the current level of 1.8 children per woman in 2013 to 1.77 in 2060. Among German women, on the other hand, the figure rises from 1.37 children in 2013 to 1.48 in 2060 (see Figure 2). This can be attributed to the age-specific birth rates for women aged 36 to 49, which on average rise by a third by 2060. Slightly declining birth rates for women under 30, in contrast, have less impact on the overall development.
The increase to almost 1.5 births per woman more or less corresponds to what de-mographers expect in the long term based on the “tempo effect”. This tempo effect results from the shifts in the age-specific birth rates towards older age groups (i.e. mothers are having children at an increasingly later age), provided that the delayed births do not ultimately become non-existent (Luy/Pötzsch 2010). Since - by virtue of nature – this process can ultimately be expected to end, one can all but automatically expect a rise in the TFR. Applying a stochastic approach with PCs as well, Vanella (2016) also reports an increasing TFR for Germany (without distinguishing between German nationals and non-Germans). In this respect, we assume that forecasting with PCs covers the tempo effect, simply as it incorporates the cross- and autocorre-lation relations between age-specific birth rates.

IAB-Discussion Paper 1/2017 21
Figure 2 Total fertility rate (TFR) for German women, 1970 to 2060
Unlike the natural population change (fertility and mortality), which has a rather long-term effect and remains relatively steady over time, the migration process can change the volume and structure of the population fairly directly. However, the variability of migration flows is disproportionately higher, and along with it the uncertainty of the projections.
Since the reunification in 1990, the average net immigration of non-Germans has been approx. 200,000 persons per year. In the last few years, however, Germany has experienced mass immigration of people from eastern and southern countries of the EU as well as from countries suffering from armed conflicts (Fuchs/Kubis/Schneider 2016).
To reflect these influences, an add-on as a markup on the estimated immigration with a regressive trend was incorporated into the model. Net immigration during the fore-cast period thus declines from the currently high starting level (over one million in 2015) to 120,000 foreign nationals per year in 2030. Although considerable immigra-tion is still forecast for 2060 (over 1.1 million), this is partly balanced out by high emi-gration figures. The latter will rise since emigration is linked to the population size, whereas the emigration rates that are projected by the PC are almost constant in the long term.

IAB-Discussion Paper 1/2017 22
Figure 3 Migration balance for foreign nationals, 1960 to 2060
The immigration and emigration of German nationals have not been significant in quantitative terms in the recent past. In the past 10 years, the average number of German emigrations exceeded the number of immigrations by 35,000 per year. Ac-cording to the latest available data, the net migration of German nationals stood at approx. -26,000 in 2014.
5.2 Population The current high immigration level will cause a slight increase in Germany’s popula-tion over the next few years. After that the overall demographic trend will continue. According to the forecast, Germany’s population is expected to decline from approx. 82 million persons to as low as about 75 million people in 2060 (Figure 4).
The 66% confidence interval of the forecast shows that the population will be between about 68 and 81 million in 2060. This covers the spectrum of the variants in the 13th population projection of the FSO (2015b), but our stochastic model includes the cur-rently very high immigration rate.

IAB-Discussion Paper 1/2017 23
Figure 4 Population in Germany
*Note: From 1957 to1989 territory of the former Federal Republic and former East Germany, from 1990 on-wards all of Germany
In addition to the decline in absolute numbers, the German population will also grow older. The median age of 44.5 for men and 46.8 for women in 2013 will continue to rise, peaking in 2050 at 47.2 and 50.1 for men and women respectively. When the baby boomer generation reaches old age, with high mortality, the median age will decline. In 2060, 50 percent of all women will be at least 49.4 years old and 50 percent of all men at least 47 years old.
In conjunction with the burden that demographic change places on the social system, the development of the dependency ratio is frequently contemplated. Here the de-pendency ratio is defined as the number of people under the age of 15 plus the num-ber over the age of 66 divided by the population aged between 15 and 66. It is made up of the old-age dependency ratio (the ratio between the older population and those of employable age) and the youth dependency ratio (the ratio between the young and the working age population). According to our forecast, there will be a significant in-crease in the dependency ratio, rising from 0.47 to almost 0.66, i.e. the relation be-tween those not of working age and the working age population will increase by 43 percent (Figure 5). The increase in the total ratio is solely due to the old-age depend-ency ratio. It will jump from 0.27 to over 0.45, a rise of almost 67 percent between 2014 and 2038. In contrast, the youth dependency ratio will remain relatively constant at approx. 0.2 for the forecast period.

IAB-Discussion Paper 1/2017 24
Figure 5 Total dependency ratio, old-age dependency ratio and youth dependency ratio
Note: Total dependency ratio = 𝑢𝑢𝑛𝑛𝑢𝑢𝑢𝑢𝑢𝑢 15 𝑦𝑦𝑢𝑢𝑦𝑦𝑢𝑢 𝑜𝑜𝑜𝑜𝑢𝑢𝑜𝑜+𝑜𝑜𝑣𝑣𝑢𝑢𝑢𝑢 66 𝑦𝑦𝑢𝑢𝑦𝑦𝑢𝑢 𝑜𝑜𝑜𝑜𝑢𝑢𝑜𝑜𝑏𝑏𝑢𝑢𝑡𝑡𝑤𝑤𝑢𝑢𝑢𝑢𝑛𝑛 15 𝑦𝑦𝑛𝑛𝑢𝑢 66 𝑦𝑦𝑢𝑢𝑦𝑦𝑢𝑢 𝑜𝑜𝑜𝑜𝑢𝑢𝑜𝑜
;
Old-age dependency ratio = 𝑜𝑜𝑣𝑣𝑢𝑢𝑢𝑢 66 𝑦𝑦𝑢𝑢𝑦𝑦𝑢𝑢 𝑜𝑜𝑜𝑜𝑢𝑢𝑜𝑜𝑏𝑏𝑢𝑢𝑡𝑡𝑤𝑤𝑢𝑢𝑢𝑢𝑛𝑛 15 𝑦𝑦𝑛𝑛𝑢𝑢 66 𝑦𝑦𝑢𝑢𝑦𝑦𝑢𝑢 𝑜𝑜𝑜𝑜𝑢𝑢𝑜𝑜
;
Youth dependency ratio = 𝑢𝑢𝑛𝑛𝑢𝑢𝑢𝑢𝑢𝑢 15 𝑦𝑦𝑢𝑢𝑦𝑦𝑢𝑢 𝑜𝑜𝑜𝑜𝑢𝑢𝑜𝑜𝑏𝑏𝑢𝑢𝑡𝑡𝑤𝑤𝑢𝑢𝑢𝑢𝑛𝑛 15 𝑦𝑦𝑛𝑛𝑢𝑢 66 𝑦𝑦𝑢𝑢𝑦𝑦𝑢𝑢 𝑜𝑜𝑜𝑜𝑢𝑢𝑜𝑜
;
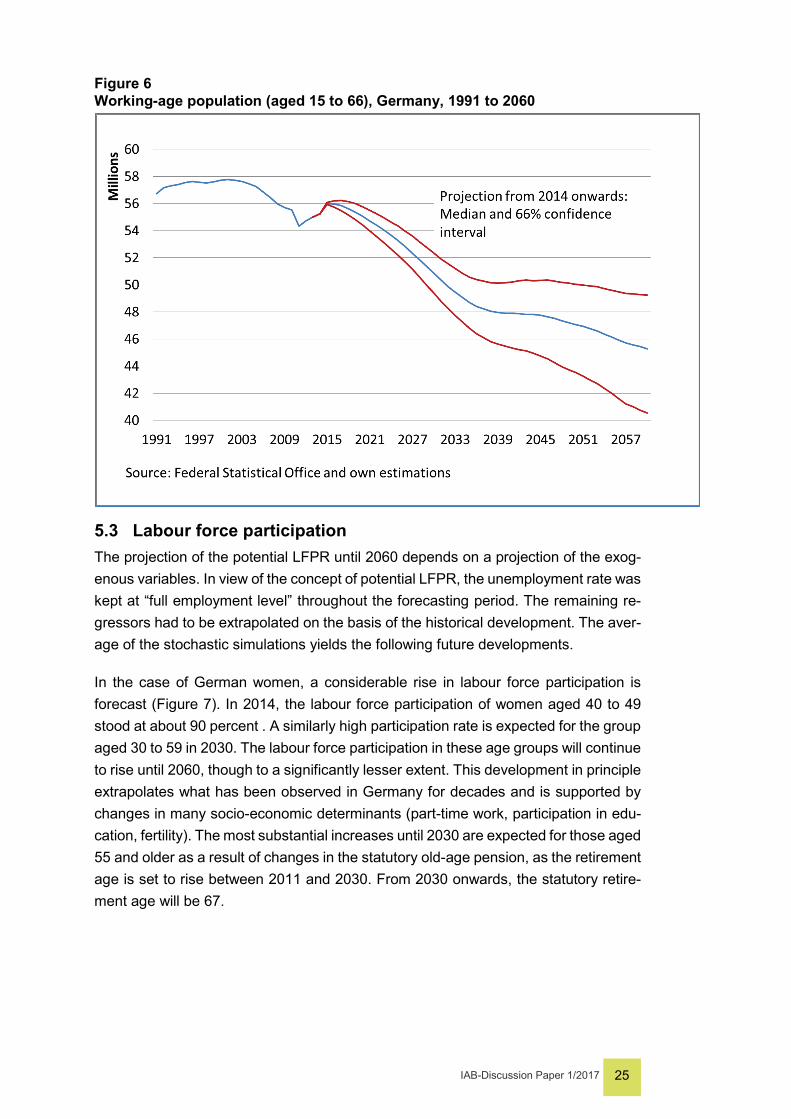
The working-age population, aged 15 to 66 years, will experience an above-average decrease. Figure 6 shows a decline from approx. 55 million to about 45 million. In 2060, it will be almost 18 percent smaller than in 2013. During the same period, the total population will decline by only 7 percent. Once the baby boomer generation has reached retirement age, around 2030, the downward trend will slow down noticeably. As long as the birth rate remains well below the level required to maintain the popu-lation in the long term, an end to this negative trend is not foreseeable.
IAB-Discussion Paper 1/2017 25
Figure 6 Working-age population (aged 15 to 66), Germany, 1991 to 2060
5.3 Labour force participation The projection of the potential LFPR until 2060 depends on a projection of the exog-enous variables. In view of the concept of potential LFPR, the unemployment rate was kept at “full employment level” throughout the forecasting period. The remaining re-gressors had to be extrapolated on the basis of the historical development. The aver-age of the stochastic simulations yields the following future developments.
In the case of German women, a considerable rise in labour force participation is forecast (Figure 7). In 2014, the labour force participation of women aged 40 to 49 stood at about 90 percent . A similarly high participation rate is expected for the group aged 30 to 59 in 2030. The labour force participation in these age groups will continue to rise until 2060, though to a significantly lesser extent. This development in principle extrapolates what has been observed in Germany for decades and is supported by changes in many socio-economic determinants (part-time work, participation in edu-cation, fertility). The most substantial increases until 2030 are expected for those aged 55 and older as a result of changes in the statutory old-age pension, as the retirement age is set to rise between 2011 and 2030. From 2030 onwards, the statutory retire-ment age will be 67.

IAB-Discussion Paper 1/2017 26
Figure 7 Age-specific labour force participation rates of German women
Among German men, in contrast, there is hardly any potential to increase employ-ment. The share of gainfully employed middle-aged men is very high at 98 percent, and is expected to remain this high in the future (Figure 8). As with women, higher labour force participation rates among older men can be attributed to the rise in the retirement age. Between 2014 and 2060, labour force participation of people aged 60 to 64 is expected to rise from 72 percent to 88 percent; among those aged 65 to 69 the labour force participation rate will increase by 12 percentage points to 38 percent.
The potential LFPR for middle-aged male foreign nationals in 2014 is about 90 per-cent. On average, the projections until 2060 yield an additional moderate increase of two to three percentage points. For 20-to-24-year-olds, who exhibited a labour force participation of about 80 percent in 2014, a growth of almost 8 percentage points is forecast by 2060. This might be due to their spending less time in the education sys-tem compared to the German population.

IAB-Discussion Paper 1/2017 27
Figure 8 Age-specific labour force participation rates of German men
Female foreign nationals participate in the labour market far less than German women. In 2014 only 70 percent of the female non-Germans aged 35 to 59 were part of the potential labour force, compared to about 85 percent of the German women of this age. Although the largest increases in all four demographic groups (men/women, Germans/non-Germans) by 2060 are forecasted for female foreign nationals, their labour market participation will remain comparatively low.
The example in Figure 9 shows an increase in the potential LFPR of about five per-centage points for female foreign nationals aged 30 to 34. The confidence interval is close to the average of the projection, so a stronger labour force participation among this group in the future can be assumed to be very likely.

IAB-Discussion Paper 1/2017 28
Figure 9 Labour force participation rate of female foreign nationals aged 30 to 34, 2000 to 2060
5.4 Potential labour force According to our forecast the potential labour force will decrease by about 6 million from 45.5 million (2014) to 39.5 million persons by 2060 (Fig. 10). In other words, labour supply will decline by 13 percent between 2014 and 2060 whilst the underlying population of 15-to-74-year-olds will fall by about 15 percent and the number of people aged 15 to 66 will decrease by as much as 18 percent. This indicates the demographic influence. The number of baby boomers retiring from working life will reach a level that will be difficult for immigration or higher LFPR to offset.
Once the baby boomer generation has retired around 2030, the demographic effect will weaken, as will the decline in the potential labour force. Yet it will continue to decline as a result of shrinking cohort sizes.
Whilst the confidence interval of the forecast shows considerable uncertainty with re-spect to the future development of the potential labour force, a constant trend would clearly fall outside the confidence interval.
By far the greatest potential for an increase in the labour force can be seen among women. Until 2030 the increased LFPR can still offset the negative demographic ef-fect. Therefore, a decrease of only 420,000 in the female labour force can be ex-pected. After 2030 a greater decline in the female potential labour force is inevitable, since the LFPR will increase only minimally between 2030 and 2060. This also applies

IAB-Discussion Paper 1/2017 29
in particular to older women, since the general retirement age will be 67 as of 2029. We do not assume a further increase in the LFPR for older workers. The female labour force in 2060 would then be 2.66 million women less than in 2014.
Figure 10 Potential labour force, in Germany from 2000 to 2060
Note: on the basis of the employment rates under full employment conditions, including the correction with regard to the employment figures of national accounts (from 2013)
For men we merely forecast an increase in the labour force participation among older workers due to the higher retirement age. The decline in the population will therefore initially have a greater effect for men than for women. The potential labour force will already decline by almost one million men between 2014 and 2030. This will be fol-lowed by a further decline of about 2.4 million between 2030 and 2060.
These different developments have a slight effect on the ratio of women participating in the labour market. At the end of the forecast period, the share of women in the potential labour force is about 47 percent (2000: 45.4%).
The age structure of the potential labour force is largely determined by demography. The share of 15-to-29-year-olds in the potential labour force is about 21 percent in 2014 and stabilizes at about 20 percent in the long term . The development of the share of people aged 30 to 49 primarily reflects the strong rise in the number of births until the mid-1960s (baby boomers) and the drastic drop in the birth rate in the 1970s. Their share has already been in decline since 2000 and will continue to fall from 53 percent to 44 percent by 2060.

IAB-Discussion Paper 1/2017 30
At the same time, the number of people aged 50 to 64 is growing. By 2020 their share of the potential labour force will have grown from 31 percent to 35 percent and will decline once the baby boomer cohorts start to retire. In the long term, it will plateau at about 31 percent. With baby boomers entering this age group (65-74 years) and the retirement age simultaneously increasing to 67 years, the share of this group of older workers will increase to six percent by 2030. By 2060 it will decline minimally and stabilise at five percent.
Table 6 The German workforce in 2014, 2030 and 2060
In 1000s 2014 2030 2060
Population, aged 15-66 55,232 50,854 45,279
Potential labour force 45,478 44,089 39,461
Of which
• Aged 15-29 9,521 8,460 7,901
• Aged 30-49 20,150 19,239 17,241
• Aged 50-64 14,454 13,817 12,325
• Aged 65-74 1,353 2,572 1,994
Source: Federal Statistical Office and own estimations
6 Summary and outlook A stochastic model was developed to forecast population and labour supply in Ger-many until 2060. Labour supply was quantified using the potential labour force, which in addition to the employed and the unemployed persons also includes the hidden labour force. Calculations were disaggregated in detail, namely by gender, age, and were separated into Germans and non-Germans.
The projections of birth rates, mortality rates, naturalisations as well as immigration and emigration are based on the principal component method. To forecast the esti-mated principal components we applied ARMA models. Similarly, the variability of the estimates of the potential LFPR was used for stochastic forecasts and simulations. The stochastic forecast relies on bootstrapping.
The stochastic model confirms the general demographic trends: the population and the labour force in Germany will decline in the long term. Even the currently extremely high immigration level will not be able to stop this development. The stochastic mod-elling makes it possible to define probabilities for the upper and lower limits – both for the individual components as well as for the total population or the potential labour force. The projected trends will be within the 66 percent confidence intervals.
According to the projections, the TFR for German women will rise to almost 1.5 chil-dren per woman by 2060, with a 66% confidence interval of 1.45 to 1.6. This growth corresponds with what many demographers are expecting based on methodical as-pects (tempo effect). We presume that applying principal components makes it pos-sible to uncover this underlying trend in the age-specific birth rates.

IAB-Discussion Paper 1/2017 31
Even though we project a rather high and rising level of immigration, net migration effects will be limited. The reason is that in our approach, emigration also grows, since it depends endogenously on the increasing population of non-Germans. Thus by 2030 the net immigration of foreign nationals will grow to 120,000 persons per year and then remain virtually constant. The confidence interval even includes a negative an-nual net immigration – which Germany last experienced in 1998.
Over the forecast period, the total population decreases in the average of all simula-tions (median -7%). The working-age population, aged 15 to 66, will decrease even further (median -18%). This is a result of the baby boomer generation retiring as well as the low numbers of subsequent cohorts. Even the high immigration level will have little effect on this, although the age structure of immigrants is beneficial for Germany, because migrants are younger than the local population.
The decline in the economically active population is therefore ultimately a result of the low birth rates and the ageing of the baby boomer generation. One consequence is an increasing dependency ratio, driven by a much higher old-age dependency ratio.
Although the group-specific potential LFPR, at least for the middle age groups and for the elderly, are the highest in an international comparison, in our model calculations they will increase even further and by 2060 will have reached values that are in some cases close to the upper limit of 100 percent. However, the population decline is stronger than this growth in labour force participation. The stochastic forecast for the potential labour force therefore yields on average a decline by six million workers, i.e. declining from about 46 million at present to under 40 million in 2060. Here the confi-dence interval grows to between just under 36 million and 43 million. This means that at best the potential labour force in 2060 will correspond to the number of people currently employed in Germany.
The result emphasises the need for both active labour market policies to promote domestic manpower reserves, which also includes a rise in working hours (Wanger/Weber 2016) as well as a labour market-oriented immigration policy, as un-necessary as this may seem in the current situation with net immigration amounting to over one million in 2015.
Further improvements of our model address the migration component in particular: for example, we plan to differentiate migration by country of origin.

IAB-Discussion Paper 1/2017 32
References Agbola, F.W. (2005): Integrating Hidden Unemployment in the Measurement of Un-employment in Selected OECD Countries. Applied Econometrics and International Development 5-2, 91-107.
Booth, Heather; Tickle, Leonie (2008): Mortality modelling and forecasting: A review of methods. Australian Demographic & Social Research Institute Working paper, No. 3.
Bundesamt für Migration und Flüchtlinge (BAMF) (2016): Migrationsbericht 2014 des Bundesamtes für Migration und Flüchtlinge im Auftrag der Bundesregierung. Hrsg. Bundesministerium des Inneren. http://www.bamf.de/SharedDocs/Anla-gen/EN/Publikationen/Migrationsberichte/migrationsbericht-2014.pdf?__blob=publicationFile (last access 10/27/2016)
Dernburg, T.; Strand K. (1966): Hidden Unemployment 1953-62: A Quantitative Analysis by Age and Sex. The American Economic Review 56(1/2): 71-95.
Eisenmenger, Matthias; Emmerling, Dieter (2011): Amtliche Sterbetafeln und Ent-wicklung der Sterblichkeit. Wirtschaft und Statistik, März: 219-238.
FSO >Federal Statistical Office< (2015a): Increase in 2014 fertility rate to 1.47 chil-dren per woman. Press release 468/2015-12-16. https://www.bamf.de/SharedDocs/Anla-gen/DE/Publikationen/Migrationsberichte/migrationsbericht-2011.pdf;jses-sionid=6954E0D4DB4897D155EA4AF4F8405D24.1_cid368?__blob=publicationFile
FSO >Federal Statistical Office< (2015b): Germany’s Population by 2060, Wiesba-den.
FSO <Federal Statistical Office> (2013): 2011 Census: 80.2 million inhabitants lived in Germany on 9 May 2011. About 1.5 million fewer inhabitants than assumed. Press release 188 / 2013-05-31. Wiesbaden. (https://www.destatis.de/EN/PressServices/Press/pr/2013/05/PE13_188_121.html , last access 10/19/2016)
Fuchs, Johann; Kubis, Alexander; Schneider, Lutz (2016): Replacement migration from a labour market perspective * Germany's long-term potential labour force and immigration from non-EU member countries. IAB-Discussion Paper, 04/2016, Nürn-berg.
Fuchs, Johann; Weber, Enzo (2013): A new look at the discouragement and the added worker hypotheses * applying a trend-cycle decomposition to unemployment. Applied Economics Letters, Vol. 20, No. 15, 1374-1378.
Hannan, Edward J.; Quinn, B. G. (1979): The determination of the order of an auto-regression. Journal of the Royal Statistical Society, Series B, 41, 190–195.
Hansen, Hendrik; Pflaumer, Peter (2011): Zur Prognose der Lebenserwartung in Deutschland: Ein Vergleich verschiedener Verfahren. AStA Wirtschafts- und Sozial-statistisches Archiv, Vol. 5 (3): 203-219.
Holst, Elke; Schupp, Jürgen (2000): Stille Reserve wichtig für die Arbeitsmarktflexi-bilität in Deutschland. In: DIW-Wochenbericht 29/2000, 457-465.
Kohls, Martin (2012): Demographie von Migranten in Deutschland. In: Challenges in Public Health, Band 63, Peter Lang, Frankfurt/Main.
Lee, Ronald D.; Carter, Lawrence R. (1992): Modelling and Forecasting U.S. Mortal-ity. Journal of the American Statistical Association, Vol. 87, No. 419, 659-671.

IAB-Discussion Paper 1/2017 33
Lee, Ronald; Miller, Timothy (2001): Evaluating the Performance of the Lee-Carter Method for Forecasting Mortality. Demography, Vol. 38, No. 4, 537–549.
Lee, Ronald D.; Tuljapurkar, Shripad (1994): Stochastic Population Forecasts for the United States: Beyond High, Medium, and Low. Journal of the American Statistical Association, Vol. 89, No. 428, 1175-1189.
Lundström, Hans; Qvist, Jan (2004): Mortality Forecasting and Trend Shifts: An Ap-plication of the Lee-Carter Model to Swedish Mortality Data. International Statistical Review, Vol. 72 (1): 37-50.
Luy, Marc; Pötzsch, Olga (2010): Estimates of the Tempo-adjusted Total Fertility Rate in Western and Eastern Germany, 1955-2008. Comparative Population Stud-ies, Vol. 35 (3): 605-636.
O’Hare, Colin; Li, Youwei (2014): Identifying structural breaks in stochastic mortality models. Journal of Risk and Uncertainty in Engineering Systems, Part B. Mechani-cal Engineering.
Peres-Neto, Pedro R.; Jackson Donald A.; Somers, Keith M. (2004): How many principal components? Stopping rules for determining the number of non-trivial axes revisited. Computational Statistics & Data Analysis, Vol. 49, 974-997.
Renshaw, Arthur E.; Haberman, Steven (2003): Lee-Carter mortality forecasting with age-specific enhancement. Insurance: Mathematics and Economics, Vol. 33, 255-272.
Prieto-Rodríguez, J.; Rodríguez-Gutiérrez, C. (2000): “The added worker effect in the Spanish case.” Applied Economics 32 (15): 1917-1925.
Rowland, Donald T. (2003): Demographic Methods and Concepts. Oxford.
Schwarz, Gideon E. (1978): Estimating the dimension of a model. Annals of Statis-tics Vol. 6 (2): 461–464.
Vanella, Patrizio (2016): The Total Fertility Rate in Germany until 2040 – A Stochas-tic Principal Component Projection based on Age-specific Fertility Rates. Diskussi-onspapiere - Hannover Economic Papers (HEP), Nr. 579, Aug 2016.
Wanger, Susanne; Weber, Enzo (2016): Erwerbspotenziale von Arbeitslosen und Erwerbstätigen: Das Stundenvolumen bringt zusätzliche Information. IAB-Kurzbericht, 08/2016, Nürnberg.
Weber, Enzo (2015): Demographie und Ökonomie: Was kommt auf uns zu? Zeit-schrift für Arbeitsrecht und Tarifpolitik in Kirche und Caritas, Jg. 3 (4): 134-135.
Weber, Enzo (2014): Das Ziel der Vollbeschäftigung in Deutschland: Fern, aber er-reichbar. IAB-Kurzbericht 15/2014, Nürnberg.

IAB-Discussion Paper 1/2017 34
Appendix
Table 1 Migration of Foreigners
Migration of Foreigners
- each median - in 1000 Imigration Emigration Balance
2015 1950 797 1153 2020 909 827 75 2030 920 798 111 2040 979 856 115 2050 1050 921 124 2060 1114 987 105
Source: Federal Statistical Office and own estimations
Table 2 Total Fertility Rate
Total Fertility Rate
- each median - German Foreign
2014 1,40 1,78 2015 1,43 1,78 2020 1,49 1,77 2030 1,52 1,77 2040 1,52 1,77 2050 1,52 1,77 2060 1,52 1,77
Source: Federal Statistical Office and own estimations

IAB-Discussion Paper 1/2017 35
Table 3 Life Expectancy at Birth
Life Expectancy at Birth
- each median - Women Men
2013 83,00 77,86 2015 83,40 78,31 2020 84,28 79,39 2030 85,83 81,33 2040 87,21 83,08 2050 88,48 84,67 2060 89,61 86,11
Source: Federal Statistical Office and own estimations
Table 4 Population
Population
- each median - in 1000 Population Working-age pop.* Potential labour force**
2013 80767 54997 45271 2015 81995 56007 45921 2020 82039 55077 46294 2030 80719 50854 44089 2040 79381 47918 41780 2050 77411 47069 40815 2060 75255 45279 39461
*aged 15 to 66 **on the basis of the employment rates under full employment conditions, including the correction with
regard to the employment figures of national accounts (from 2013) Source: Federal Statistical Office and own estimations

IAB-Discussion Paper 1/2017 36
Table 5 Exogenous variables to estimate the labour force participation Significant exogenous variables to esti-mate the labour force participation Period Mean Std
Dev. General unemployment rate Source: FEA7. 1991-2013 5.70 3.32
Youth unemployment rate Source: FEA. 1993-2013 3.95 1.81
Female unemployment rate Source: FEA. 1991-2013 6.11 3.21
Male unemployment rate Source: FEA. 1991-2013 5.99 3.06
Foreigners unemployment rate Source: FEA. 1992-2013 9.38 6.53
Females working part time unemployment rate Source: FEA, FSO8. 1991-2013 5.50 2.33
Job vacancies ratio Source: FEA. 1991-2013 1.67 0.49
Female students rate German females aged 20-24 to population aged 20-24. Source: FSO.
1992-2013 23.96 3.77
Male students rate German males aged 20-24 to population aged 20-24 Source: FSO.
1992-2013 23.05 3.21
Students rate German males aged 25-29 to population aged 20-24. Source: FSO.
1992-2013 15.38 0.98
Working part-time rate of women Source: FEA. 1991-2013 50.04 8.61
Wage for male foreigners aged 30-49 (average) daily pay of employee subject to so-cial insurance contribution Source: FEA.
1991-2013 87.36 4.32
Child care rate Relation women aged 35-39 to children aged 5-9. Source: FSO, own calculations.
1991-2013 0.76 0.076
Retirement age for men aged 60- 64 Source: German pension insurance Statistics Retirement.
1993-2013 64.75 1.38
7 FEA: Federal Employment Agency 8 FSO: Federal Statistical Office

IAB-Discussion Paper 1/2017 36
Recently published
No. Author(s) Title Date
29/2016 Bauer, A. Lochner, B.
History Dependence in Wages and Cyclical Se-lection: Evidence from Germany
10/16
30/2016 Anger, S. Schnitzlien, D.
Cognitive Skills, Non-Cognitive Skills, and Fam-ily Background: Evidence from Sibling Correla-tions
10/16
31/2016 Garloff, A. Side effects of the new German minimum wage on (un-)employment: First evidence from re-gional data
10/16
32/2016 Broszeit, S. Fritsch, U. Görg, H. Laible, M.
Management Practices and Productivity in Ger-many
10/16
33/2016 Uhl, M. Rebien, M. Abraham, M.
Welche Ein-Euro-Jobber werden qualifiziert? 10/16
34/2016 Capuano, S. Migali, S.
The migration of professionals within the EU: any barriers left?
10/16
35/2016 Boll, C. Leppin, J. Rossen, A. Wolf, A.
Overeducation - New Evidence for 25 European Countries
10/16
36/2016 Boll, C. Rossen, A. Wolf, A.
The EU Gender Earnings Gap: Job Segregation and Working Time as Driving Factors
10/16
37/2016 Roth, D. Moffat, J..
Cohort size and youth labour-market outcomes: the role of measurement error
11/16
38/2016 Dummert, S. Hohendanner, C.
Beschäftigungseffekte von Ein-Euro-Jobs in den Einsatzberieben
11/16
39/2016 Grass, K. Weber, E.
EU 4.0 – Die Debatte zu Digitalisierung und Ar-beitsmarkt in Europa
11/16
40/2016 Romiti, A. The Effects of Immigration on Household Ser-vices, Labour Supply and Fertility
12/16
41/2016 Dorner externe
Social Ties for Labor Market Access – Lessons from the Migration of East German Inventors
12/16
42/2016 Brixy, U. Murmann, M.
The Growth and Human Capital Structure of New Firms over the Business Cycle
12/16
43/2016 Dauth, W. Haller, P.
The valuation of changes in commuting dis-tances: An analysis using georeferenced data
12/16
As per: 2017-01-02
For a full list, consult the IAB website http://www.iab.de/de/publikationen/discussion-paper.aspx

ImprintIAB-Discussion Paper 1/2017
January 9, 2017
Editorial addressInstitute for Employment Research of the Federal Employment AgencyRegensburger Straße 104D-90478 Nuremberg
Editorial staffRicardo Martinez Moya, Jutta Palm-Nowak
Technical completionRenate Martin
All rights reservedReproduction and distribution in any form, also in parts, requires the permission of IAB Nuremberg
Websitehttp://www.iab.de
Download of this Discussion Paperhttp://doku.iab.de/discussionpapers/2017/dp0117.pdf
ISSN 2195-2663 For further inquiries contact the authors:
Doris SöhnleinPhone +49.911.179 5484E-mail [email protected]
Johann FuchsPhone +49.911.179 5216E-mail [email protected]