forest clearing in the pantropics: december 2005–august 2011
DESCRIPTION
This report summarizes recent trends in large-scale tropical forest clearing identified by FORMA (Forest Monitoring for Action).TRANSCRIPT

Working Paper 283December 2011
Forest Clearing in the Pantropics: December 2005–August 2011
Abstract
This report summarizes recent trends in large-scale tropical forest clearing identified by FORMA (Forest Monitoring for Action). Our analysis includes 27 countries that accounted for 94 percent of clearing during the period 2000–2005. We highlight countries with relatively large changes since 2005, both declines and increases. FORMA produces indicators that track monthly changes in the number of 1-sq.-km. tropical forest parcels that have experienced clearing with high probability. This report and the accompanying spreadsheet databases provide monthly estimates for 27 countries, 280 primary administrative units, and 2,907 secondary administrative units. Countries’ divergent experiences since 2005 have significantly altered their shares of global clearing in some cases. Brazil’s global share fell by 11.2 percentage points from December 2005 to August 2011, while the combined share of Malaysia, Indonesia, and Myanmar increased by 10.8. The diverse patterns revealed by FORMA’s first global survey caution against facile generalizations about forest clearing in the pantropics. During the past five years, the relative scale and pace of clearing have changed across regions, within regions, and within countries. Although the overall trend seems hopeful, it remains to be seen whether the decline in forest clearing will persist as the global economy recovers.
www.cgdev.org
David Wheeler, Robin Kraft, and Dan Hammer

Forest Clearing in the Pantropics: December 2005–August 2011
David WheelerRobin Kraft
Dan Hammer
FORMA would simply not have been possible without the advice, encouragement and support of many colleagues and friends. Our thanks to all who have helped, and particularly Manish Bapna, Nancy Birdsall, Brian Blankespoor, Jill Blockhus, Ken Chomitz, Susmita Dasgupta, Uwe Deichman, Michele de Nevers, Jeff Garland, Eva Granbye, Craig Hanson, Alex Lotsch, Lawrence MacDonald, Todd Moss, Darius Nassiry, Mead Over, Nigel Purvis, Sam Ritchie, Jacob Scherr, Jake Schmidt, Nigel Sizer, Fred Stolle, Tim Thomas and Dave Witzel.
CGD is grateful to its funders and board of directors for support of this work.
David Wheeler, Robin Kraft, and Dan Hammer. 2011. “Forest Clearing in the Pantropics: December 2005–August 2011.” CGD Working Paper 283. Washington, D.C.: Center for Global Development. http://www.cgdev.org/content/publications/detail/1425835
Center for Global Development1800 Massachusetts Ave., NW
Washington, DC 20036
202.416.4000(f ) 202.416.4050
www.cgdev.org
The Center for Global Development is an independent, nonprofit policy research organization dedicated to reducing global poverty and inequality and to making globalization work for the poor. Use and dissemination of this Working Paper is encouraged; however, reproduced copies may not be used for commercial purposes. Further usage is permitted under the terms of the Creative Commons License.
The views expressed in CGD Working Papers are those of the authors and should not be attributed to the board of directors or funders of the Center for Global Development.

1
Preface
This paper marks the first publication of global data from FORMA (Forest Monitoring for
Action). FORMA parses freely available satellite imagery to identify monthly clearing activity
in humid tropical forests. At the time of this writing, FORMA provides five years of
monthly data on large-scale clearing from December 2005 through August 2011, at 1 km
spatial resolution. Specifically, FORMA estimates the probability that each 1 km2 parcel of
previously-forested land has been cleared since January 2000. We provide a more detailed
explanation of the methodology in Appendix 2.
Designed to analyze data from NASA’s MODIS sensor, FORMA has three distinctive roles:
(1) Identification and mapping of new “hotspots” where clearing probabilities have exceeded
a significance threshold of 50%; (2) Consistent identification of large-scale clearing at local,
regional, national and international levels; (3) A steadily-growing record of large-scale forest
clearing that is updated each month.
The choice to use free MODIS data reflects our primary objectives: pantropical coverage,
rapid updates and low cost. The FORMA algorithms will be applied to imagery at higher
spatial (500 m2) and temporal (16-day) resolution as the algorithms are evaluated and refined
in the coming months. Other forest monitoring systems and methodologies offer data at
significantly higher spatial resolution, but at the cost of less frequent updates and more
expensive processing. FORMA provides users with a new set of capabilities that are
complementary to those offered by other systems.
The spatial resolution of the MODIS data limits FORMA’s ability to identify small-scale or
scattered clearing activities. But recent research indicates that large-scale clearing and
contiguous micro-clearing associated with logging or conversion to plantations, pastureland
and new settlements account for the majority of current tropical deforestation (Chomitz, et
al., 2007; Rudel, 2005). As we show in this paper and its predecessor (Hammer, Kraft and
Wheeler, 2008), FORMA’s accuracy and update frequency make it an effective early warning
system for such forest-clearing activity.
More effective monitoring, policy analysis and conservation management will be needed as
REDD+ and other programs begin spending billions of dollars to reduce tropical forest
clearing. We hope that FORMA will make a useful contribution to this effort.

2
Summary of Findings
This report summarizes recent trends in large-scale tropical forest clearing identified by
FORMA (Forest Monitoring for Action). Our analysis includes 27 countries that accounted
for 94% of clearing during the period 2000-2005 (Hansen et al., 2008 – see Table 1). We
highlight countries with relatively large changes since 2005, both declines (Brazil, Indonesia,
Paraguay, Bolivia) and increases (Myanmar, Peru, Malaysia, Venezuela). FORMA will soon
cover 25 additional countries that include other significant actors in recent clearing (e.g.,
Colombia, Guatemala, Nicaragua, Argentina, Ecuador) and important tropical forest sites
(e.g. the Democratic Republic of the Congo, Cameroon, Gabon).
FORMA produces indicators that track monthly changes in the number of 1 sq. km. tropical
forest parcels that have experienced clearing with high probability. This report and the
accompanying spreadsheet databases provide monthly estimates for 27 countries, 280
primary administrative units (e.g., provinces) and 2,907 secondary administrative units (e.g.,
subprovinces).
Figure 1 displays monthly changes in tropical forest parcels cleared with high probability
from December 2005 to August 2011, along with a 12-month moving average and regression
trend line. The moving average is clearly dominated by a drop from September 2008 to
September 2010, which coincides with the onset of the global economic crisis. Overall, the
results in Figure 1 and Table 1 suggest that tropical forest clearing has dropped by about
42% since 2005.
Figure 1: Tropical Forest Clearing, 2005–2011
While the total has dropped significantly during the global recession, widely-divergent
country patterns highlight the continued importance of local and regional factors in forest
clearing. Among the 27 countries in our assessment, clearing has declined in 12, increased in
14, and remained roughly constant in 1. Overall clearing has been mostly driven by large
10
00
20
00
30
00
40
00
50
00
60
00
Cle
ari
ng
In
dic
ato
r
Jan2006 Jan2008 Jan2010 Jan2012Month
Monthly Clearing Trend Line
Moving Average
3
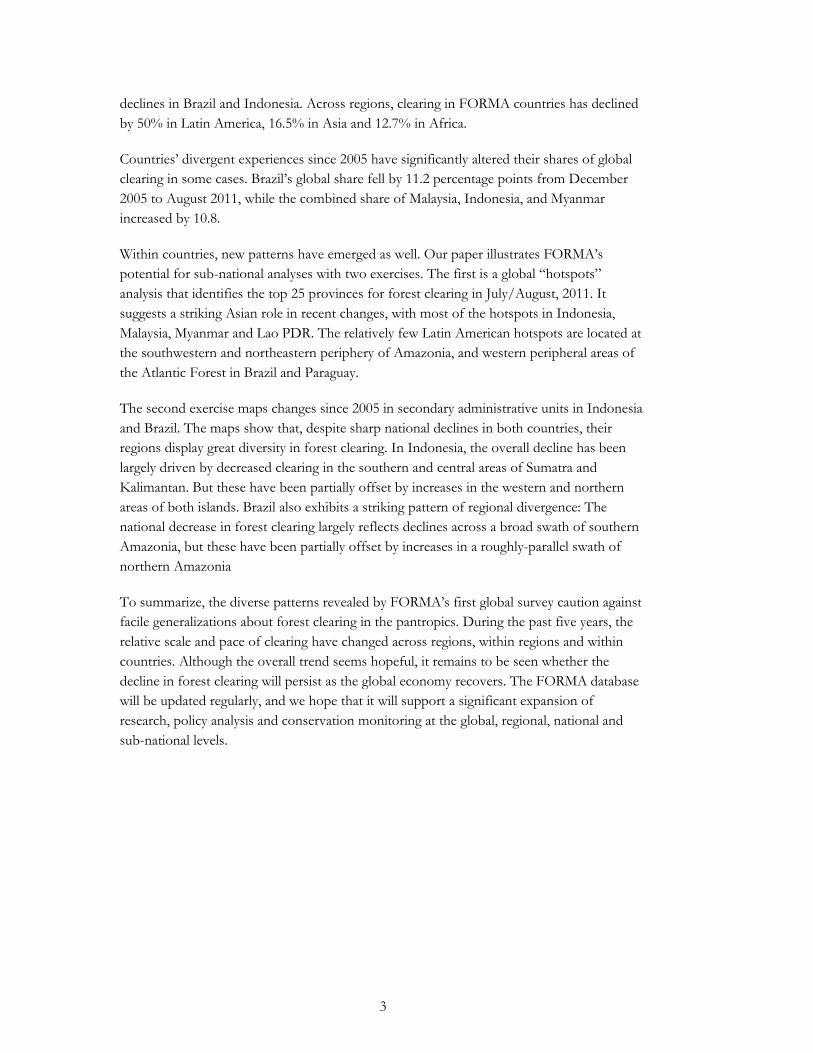
declines in Brazil and Indonesia. Across regions, clearing in FORMA countries has declined
by 50% in Latin America, 16.5% in Asia and 12.7% in Africa.
Countries’ divergent experiences since 2005 have significantly altered their shares of global
clearing in some cases. Brazil’s global share fell by 11.2 percentage points from December
2005 to August 2011, while the combined share of Malaysia, Indonesia, and Myanmar
increased by 10.8.
Within countries, new patterns have emerged as well. Our paper illustrates FORMA’s
potential for sub-national analyses with two exercises. The first is a global “hotspots”
analysis that identifies the top 25 provinces for forest clearing in July/August, 2011. It
suggests a striking Asian role in recent changes, with most of the hotspots in Indonesia,
Malaysia, Myanmar and Lao PDR. The relatively few Latin American hotspots are located at
the southwestern and northeastern periphery of Amazonia, and western peripheral areas of
the Atlantic Forest in Brazil and Paraguay.
The second exercise maps changes since 2005 in secondary administrative units in Indonesia
and Brazil. The maps show that, despite sharp national declines in both countries, their
regions display great diversity in forest clearing. In Indonesia, the overall decline has been
largely driven by decreased clearing in the southern and central areas of Sumatra and
Kalimantan. But these have been partially offset by increases in the western and northern
areas of both islands. Brazil also exhibits a striking pattern of regional divergence: The
national decrease in forest clearing largely reflects declines across a broad swath of southern
Amazonia, but these have been partially offset by increases in a roughly-parallel swath of
northern Amazonia
To summarize, the diverse patterns revealed by FORMA’s first global survey caution against
facile generalizations about forest clearing in the pantropics. During the past five years, the
relative scale and pace of clearing have changed across regions, within regions and within
countries. Although the overall trend seems hopeful, it remains to be seen whether the
decline in forest clearing will persist as the global economy recovers. The FORMA database
will be updated regularly, and we hope that it will support a significant expansion of
research, policy analysis and conservation monitoring at the global, regional, national and
sub-national levels.

4
1. Introduction
Leading climate scientists estimate that annual greenhouse gas (GHG) emissions will have to
decline by over 90% by 2050 to avert severe climate change. About 15% of GHG emissions
are generated by deforestation, mostly in tropical countries. It follows that any viable effort
to mitigate climate change will have to address forest clearing and its economic drivers.
Fortunately, international efforts to curb clearing through conservation payments are gaining
traction, as indicated by $3.5 billion pledged for projects within the REDD+ (Reducing
Emissions from Deforestation and Forest Degradation) framework. The payment stream for
REDD+ projects is potentially massive; early estimates suggest that total funding will
amount to $25-$30 billion annually. However, despite this surge in financial support, there is
still no timely and globally-consistent method for monitoring tropical forest clearing. Forest
Monitoring for Action (FORMA) has been designed to help fill this information gap.
FORMA uses free, constantly-updated satellite data to identify large-scale tropical forest
clearing. It builds on work by Hansen et al. (2008, 2010), Souza (2006, 2009), Hammer, et al.
(2009), Townshend, et al. (2008), Asner (2009), Jarvis (2009) and Hoekman, et al. (2009).
This work is creating new, high-resolution forest information systems based on NASA’s
MODIS (Moderate Resolution Imaging Spectrometer) and Landsat programs, as well as
airborne light detection and ranging (LiDAR). Drawing on advances for the MODIS system,
we initially published a FORMA database for forest clearing in Indonesia at 1 km resolution
by month, from 2006 to November 2009 (Hammer et al., 2009). Our Indonesia
implementation followed the development and testing of a FORMA prototype for Brazil,
where we could test FORMA’s accuracy using publicly-available data from Brazil’s PRODES
and DETER forest-monitoring programs. Publication of this paper marks the expansion of
FORMA to coverage of clearing in the humid tropical forests of Asia, Africa and Latin
America.
In developing FORMA, we have focused on building an automated and operationally useful
system with monthly update capability. We recognize that ex-post evaluations of
conservation projects will use higher-resolution imagery (≤ 30 m). Indeed, innovative high-
resolution work of this kind is being done by research teams around the world. But cloud
cover and large data volumes make comprehensive, consistent, high-resolution monitoring
of large areas difficult at sub-annual frequency. FORMA avoids this pitfall because MODIS
data are updated every 1-2 days and combined into 8-, 16- and 32-day composite datasets.
We currently use 32-day composites, but are moving FORMA to MODIS data at higher
spatial resolution and temporal frequency. Our methodology is consistent across space and
time, and does not depend heavily on any single, potentially cloudy image. Our work on
FORMA has been inspired by the pioneering development of near-real-time monitoring
capacity for Brazil by its national space agency (INPE), and Carlos Souza and his colleagues
at IMAZON. In effect, FORMA extends this approach to all humid tropical forests.
We have designed FORMA to provide immediately-usable information for policymakers,
researchers, conservation project staff, protected-area managers, research teams that study

5
deforestation, and other professionals who require rapidly-updated information on forest
clearing. FORMA’s outputs can also be aggregated to produce monthly reports on forest
clearing for local areas, sub-national political units, countries, and entire regions. Rapidly-
updated information from FORMA will promote more timely and comprehensive
evaluations of forest conservation programs, as well as enabling research on deforestation to
focus on the most recent trends.
In this paper and the accompanying databases, we combine FORMA’s estimates for 1 km2
parcels into comparable indices of large-scale forest clearing for countries, primary
administrative units (e.g. states, provinces) and secondary administrative units (e.g.,
subprovinces). Our methodology can also be applied to tertiary administrative units,
protected areas, commercial development zones, and other areas of interest. This paper is
accompanied by a spatially-formatted database of estimated forest-clearing status for each 1
km2 parcel in the humid tropical forest region covered by FORMA.
Our methodology combines parcel-level probabilities into area indices of large-scale forest
clearing in four steps: (1) Select 1 km2 parcels whose estimated probability of clearing since
2000 exceeds a significance threshold of 50%1; (2) Assign values of 1 to these parcels, and 0
to the others; (3) Sum the values within a given polygon (e.g. administrative unit, protected
area, etc.); (4) Calculate monthly changes in this summed total. These changes are FORMA’s
monthly indices of new clearing activity. They can be generated from December 2005 to
provide a running index of total large-scale forest clearing.
In this paper, we analyze monthly FORMA estimates from December 2005 to August 2011
for tropical forest areas in 27 countries: 12 in Asia (Bangladesh, Cambodia, China, India,
Indonesia, Lao PDR, Malaysia, Myanmar, Nepal, Papua New Guinea, Thailand and
Vietnam), 9 in Latin America (Bolivia, Brazil, French Guiana, Guyana, Mexico, Paraguay,
Peru, Suriname and Venezuela), and 6 in Sub-Saharan Africa (Burundi, Central African
Republic, Guinea, Kenya, Republic of Congo and Tanzania).
In the accompanying spreadsheet databases, we include forest clearing indices for the 27
countries, their 280 primary administrative units (henceforth primary units) and 2,907
secondary administrative units (henceforth secondary units). We hope that the database will
support new empirical studies of tropical forest clearing. In this paper, we limit ourselves to
reporting broad trends that are readily observable in the data. In a recently-published
econometric paper (Wheeler et al., 2011), we analyze the determinants of these trends in
Indonesia.
The remainder of the paper is organized as follows. Section 2 provides an overview of trends
at the global, regional and national levels. In Section 3, we use a “hotspots” methodology
1 A higher threshold will reduce the rate of false-positive identifications of cleared parcels, but increase the
rate of false negatives. We believe that the forthcoming re-specification of FORMA to 500 m resolution will
significantly reduce false-negative identifications.

6
and detailed mapping exercises to investigate sub-national patterns of change. We summarize
and conclude the paper in Section 4.
2. Global, Regional and National Forest Clearing, 2006–2011
2.1. Global Clearing
Figure 1 (page iii) displays monthly changes in tropical forest parcels cleared with high
probability from December 2005 to August 2011, along with a 12-month moving average
and a regression trend line.2 The series tracks total clearing for all 27 countries covered by
this paper. The 12-month moving average is dominated by a sharp drop from September
2008 to September 2010, which coincides with the onset of the global economic crisis. For
the entire period, the FORMA data suggest that tropical forest clearing has dropped by
42.3%. We are not convinced that this drop is primarily attributable to a fall in global
demand for forest products since, as we show below, increases and decreases in forest-
clearing are about evenly represented across FORMA countries. In any case, our global
result is certainly good news for carbon emissions reduction and biodiversity conservation.
2.2. Regional and National Clearing
While total clearing has dropped sharply since 2005, widely-divergent patterns at the regional
and country levels highlight the importance of local factors. Table 1 and Figure 2 display
results for the 27 countries and 3 regions in our assessment. Declines have occurred in 12
countries, led by Brazil, Indonesia, Paraguay, Bolivia and China. But forest clearing has
increased in 14 countries, led by Myanmar, Peru, Malaysia, and Venezuela.
Table 1 presents country information drawn from 12-month moving averages; the final 7
rows present summaries for country groups and regions. Several striking patterns are evident
in the table:
The skewed distribution of forest clearing across the 27 countries, which accounted
for 94% of pantropical clearing during 2000-2005 (Hansen, et al., 2008). In
December 2006 and August 2011, the shares of 27-country clearing accounted for
by the top 5 countries (summary row (3)) were 94.6% and 93.7%, respectively.3
2 The moving average is the mean of the current month and the previous 11 months. The regression trend
line is fitted to the moving average series. 3 In descending order, the top 5 countries in each period were: December, 2006 [Brazil (72.3%), Indonesia
(13.2%), Malaysia (6.4%), Paraguay (2.4%), Bolivia (1.3%)]; August, 2011 [Brazil (61.0%), Indonesia (16.5%,
Malaysia (12.2%), Myanmar (2.1%), Paraguay (1.9%)].
7
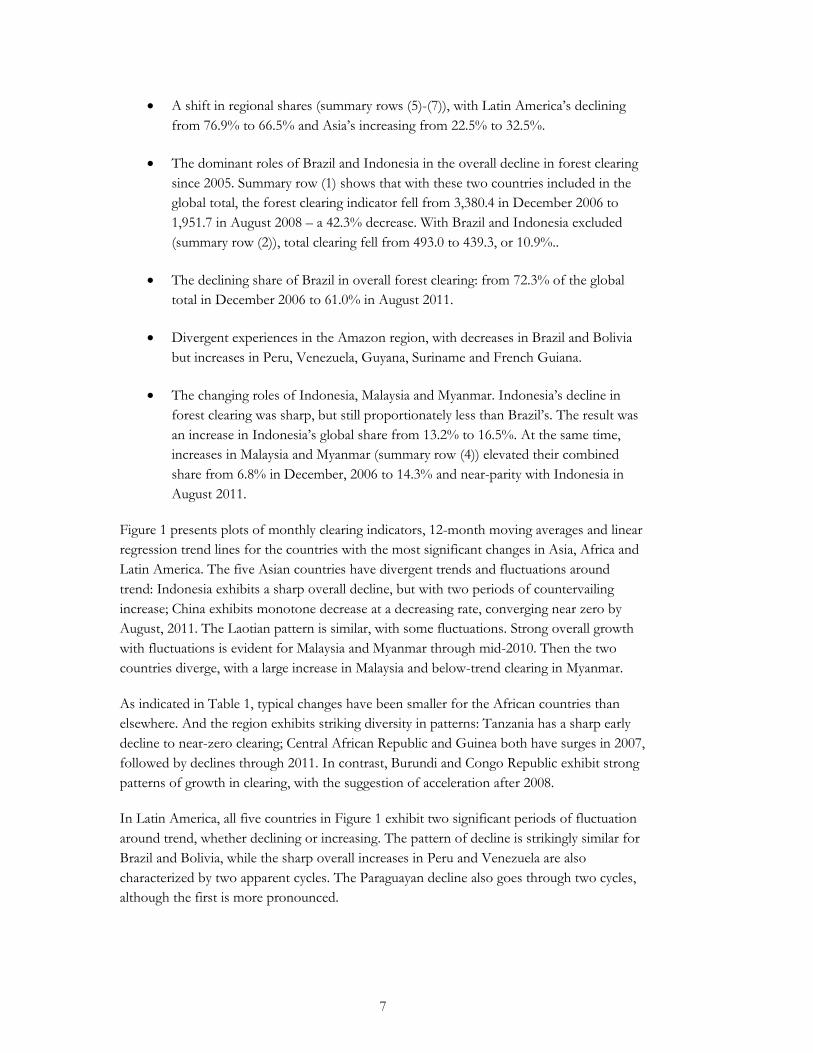
A shift in regional shares (summary rows (5)-(7)), with Latin America’s declining
from 76.9% to 66.5% and Asia’s increasing from 22.5% to 32.5%.
The dominant roles of Brazil and Indonesia in the overall decline in forest clearing
since 2005. Summary row (1) shows that with these two countries included in the
global total, the forest clearing indicator fell from 3,380.4 in December 2006 to
1,951.7 in August 2008 – a 42.3% decrease. With Brazil and Indonesia excluded
(summary row (2)), total clearing fell from 493.0 to 439.3, or 10.9%..
The declining share of Brazil in overall forest clearing: from 72.3% of the global
total in December 2006 to 61.0% in August 2011.
Divergent experiences in the Amazon region, with decreases in Brazil and Bolivia
but increases in Peru, Venezuela, Guyana, Suriname and French Guiana.
The changing roles of Indonesia, Malaysia and Myanmar. Indonesia’s decline in
forest clearing was sharp, but still proportionately less than Brazil’s. The result was
an increase in Indonesia’s global share from 13.2% to 16.5%. At the same time,
increases in Malaysia and Myanmar (summary row (4)) elevated their combined
share from 6.8% in December, 2006 to 14.3% and near-parity with Indonesia in
August 2011.
Figure 1 presents plots of monthly clearing indicators, 12-month moving averages and linear
regression trend lines for the countries with the most significant changes in Asia, Africa and
Latin America. The five Asian countries have divergent trends and fluctuations around
trend: Indonesia exhibits a sharp overall decline, but with two periods of countervailing
increase; China exhibits monotone decrease at a decreasing rate, converging near zero by
August, 2011. The Laotian pattern is similar, with some fluctuations. Strong overall growth
with fluctuations is evident for Malaysia and Myanmar through mid-2010. Then the two
countries diverge, with a large increase in Malaysia and below-trend clearing in Myanmar.
As indicated in Table 1, typical changes have been smaller for the African countries than
elsewhere. And the region exhibits striking diversity in patterns: Tanzania has a sharp early
decline to near-zero clearing; Central African Republic and Guinea both have surges in 2007,
followed by declines through 2011. In contrast, Burundi and Congo Republic exhibit strong
patterns of growth in clearing, with the suggestion of acceleration after 2008.
In Latin America, all five countries in Figure 1 exhibit two significant periods of fluctuation
around trend, whether declining or increasing. The pattern of decline is strikingly similar for
Brazil and Bolivia, while the sharp overall increases in Peru and Venezuela are also
characterized by two apparent cycles. The Paraguayan decline also goes through two cycles,
although the first is more pronounced.

Table 1: Comparative Trends in Forest Clearing, Dec. 2006 – Aug. 2011
Monthly Clearing (12-
Month Moving Average) Change in Monthly
Clearing Share of Total Forest
Clearing
Country Dec. 2006 Aug. 2011 Units % Dec. 2006 Aug. 2011 Change in Share
Brazil 2,442.25 1,191.33 -
1,250.92 -51.2
72.25 61.04
-11.21 Indonesia 445.08 321.08 -124.00 -27.9 13.17 16.45 3.28 Paraguay 81.33 37.08 -44.25 -54.4 2.41 1.90 -0.51 Bolivia 43.67 14.00 -29.67 -67.9 1.29 0.72 -0.57 China 30.67 1.17 -29.50 -96.2 0.91 0.06 -0.85 Mexico 20.58 0.58 -20.00 -97.2 0.61 0.03 -0.58 Tanzania 17.67 0.00 -17.67 -100.0 0.52 0.00 -0.52 Laos 23.25 9.33 -13.92 -59.9 0.69 0.48 -0.21 India 13.25 1.17 -12.08 -91.2 0.39 0.06 -0.33 Vietnam 4.50 2.50 -2.00 -44.4 0.13 0.13 -0.01 Thailand 2.50 0.92 -1.58 -63.3 0.07 0.05 -0.03 Bangladesh 0.17 0.00 -0.17 -100.0 0.00 0.00 0.00 Central African Republic 0.00 0.00 0.00
0.00 0.00 0.00
Nepal 0.00 0.08 0.08
0.00 0.00 0.00 Guinea 0.42 0.58 0.17 40.0 0.01 0.03 0.02 French Guiana 1.00 1.25 0.25 25.0 0.03 0.06 0.03 Suriname 0.25 0.83 0.58 233.3 0.01 0.04 0.04 Guyana 0.08 0.92 0.83 1,000.0 0.00 0.05 0.04 Kenya 2.25 4.67 2.42 107.4 0.07 0.24 0.17 Cambodia 8.50 12.42 3.92 46.1 0.25 0.64 0.38 Burundi 0.00 4.00 4.00
0.00 0.20 0.20
Papua New Guinea 3.83 8.00 4.17 108.7 0.11 0.41 0.30 Republic Of Congo 0.67 9.08 8.42 1,262.5 0.02 0.47 0.45 Venezuela 4.92 22.67 17.75 361.0 0.15 1.16 1.02 Malaysia 215.42 237.92 22.50 10.4 6.37 12.19 5.82 Peru 4.42 29.83 25.42 575.5 0.13 1.53 1.40 Myanmar 13.67 40.33 26.67 195.1 0.40 2.07 1.66 (1) Overall Totals 3,380.4 1,951.7 -1,428.6 -42.3 100.0 100.0 0.0 (2) Totals w/o Brazil and Indonesia 493.0 439.3
-53.7 -10.9
14.6 22.5
8.0
(3) Total, Top 5 Countries 3,227.8 1,827.7 -1,426.3 -44.2 94.6 93.7 -1.0 (4) Malaysia and Myanmar 229.1 278.3 49.2 21.5 6.8 14.3 7.5
(5) Latin America 2,598.50 1,298.49 -
1,300.01 -50.0
76.88 66.53
-10.34 (6) Asia 760.84 634.92 -125.91 -16.5 22.49 32.54 10.01 (7) Africa 21.01 18.33 -2.66 -12.7 0.62 0.94 0.32

9
Figure 2: Comparative Forest-Clearing Trends, 2005 – 2011
Indonesia
Malaysia
Myanmar
Lao PDR
China
20
04
00
60
08
00
Cle
ari
ng
In
dic
ato
r
Jul2005 Jan2007 Jul2008 Jan2010 Jul2011Month
Monthly Clearing Trend Line
Moving Average
01
02
03
04
0
Cle
ari
ng
In
dic
ato
r
Jul2005 Jan2007 Jul2008 Jan2010 Jul2011Month
Monthly Clearing Trend Line
Moving Average
02
04
06
0
Cle
ari
ng
In
dic
ato
r
Jul2005 Jan2007 Jul2008 Jan2010 Jul2011Month
Monthly Clearing Trend Line
Moving Average
10
02
00
30
04
00
50
06
00
Cle
ari
ng
In
dic
ato
r
Jul2005 Jan2007 Jul2008 Jan2010 Jul2011Month
Monthly Clearing Trend Line
Moving Average
05
01
00
15
02
00
Cle
ari
ng
In
dic
ato
r
Jul2005 Jan2007 Jul2008 Jan2010 Jul2011Month
Monthly Clearing Trend Line
Moving Average
Burundi
Congo Rep.
Tanzania
Guinea
Centr. Afr. Rep.
02
04
06
0
Cle
ari
ng
In
dic
ato
r
Jul2005 Jan2007 Jul2008 Jan2010 Jul2011Month
Monthly Clearing Trend Line
Moving Average
0.5
11
.52
Cle
ari
ng
In
dic
ato
r
Jul2005 Jan2007 Jul2008 Jan2010 Jul2011Month
Monthly Clearing Trend Line
Moving Average
02
46
8
Cle
ari
ng
In
dic
ato
r
Jul2005 Jan2007 Jul2008 Jan2010 Jul2011Month
Monthly Clearing Trend Line
Moving Average
02
46
8
Cle
ari
ng
In
dic
ato
r
Jul2005 Jan2007 Jul2008 Jan2010 Jul2011Month
Monthly Clearing Trend Line
Moving Average
05
10
15
20
25
Cle
ari
ng
In
dic
ato
r
Jul2005 Jan2007 Jul2008 Jan2010 Jul2011Month
Monthly Clearing Trend Line
Moving Average
Brazil
Paraguay
Peru
Bolivia
Venezuela
0
10
00
20
00
30
00
40
00
50
00
Cle
ari
ng
In
dic
ato
r
Jul2005 Jan2007 Jul2008 Jan2010 Jul2011Month
Monthly Clearing Trend Line
Moving Average
0
20
04
00
60
0
Cle
ari
ng
In
dic
ato
r
Jul2005 Jan2007 Jul2008 Jan2010 Jul2011Month
Monthly Clearing Trend Line
Moving Average
02
04
06
08
0
Cle
ari
ng
In
dic
ato
r
Jul2005 Jan2007 Jul2008 Jan2010 Jul2011Month
Monthly Clearing Trend Line
Moving Average
01
02
03
04
05
0
Cle
ari
ng
In
dic
ato
r
Jul2005 Jan2007 Jul2008 Jan2010 Jul2011Month
Monthly Clearing Trend Line
Moving Average
02
04
06
08
01
00
Cle
ari
ng
In
dic
ato
r
Jul2005 Jan2007 Jul2008 Jan2010 Jul2011Month
Monthly Clearing Trend Line
Moving Average
10
The contrasting patterns in Figure 1 strongly suggest the importance of country-specific
dynamics during the past five years. The factors driving short-run changes in forest clearing
remain largely unexplored, since the time series data needed for detailed econometric studies
were unavailable before the advent of FORMA. In a recently-published spatial econometric
paper on Indonesia (Wheeler, et al., 2011), we find significant roles for lagged changes in
several short-run economic variables – forest product prices, demands, exchange rates and
real interest rates – as well as fluctuations in rainfall (heavy rain impedes the burning that is
an important part of large-scale forest clearing). In addition, we find important roles for
topography, communications infrastructure and zoning for commercial development. It
seems likely that future research on other countries will reveal similar causal dynamics. For
the present, however, we are limited to speculation about the sharp cross-country differences
that FORMA has revealed.
3. Sub-National Trends
As the accompanying spreadsheet databases reveal, the national trends reported above mask
great diversity in local forest-clearing patterns. Many countries with overall decreases in
forest clearing contain areas with increased clearing, and countervailing patterns are also
common in countries with increases in total clearing. We cannot hope to explore all the
important and interesting patterns revealed by FORMA’s high-resolution temporal outputs,
and we hope that many colleagues will join the effort. In this paper, we illustrate two
potential uses of FORMA’s sub-national data. At the global level, we present a “hotspots”
analysis that highlights particularly significant outbreaks of local forest clearing across the
pantropics. At the national level, we use detailed mapping exercises to explore recent forest
clearing patterns in Indonesia and Brazil.
3.1. Global Hotspots
The hotspot concept has been used to identify areas with two salient features: an attribute
that commands policy priority, and a high level of threat to that attribute. Two attributes
have dominated hotspot analyses of tropical forests: local biodiversity value and sequestered
carbon. Myers, et al. (2000) identify biodiversity hotspots, where “exceptional concentrations
of endemic species are undergoing exceptional loss of habitat.”4 Treating biomes as
undifferentiated, Hansen et al. (2008) concentrate on forest clearing and identify tropical
forest hotspots as areas characterized by either large-scale forest clearing or high rates of
clearing relative to forest cover in 2000.
We follow Hansen in this paper, while recognizing the importance of differences in local
biodiversity value. Because we focus on short-period trends, we identify two geographic
hotspot components: exceptional base levels of forest clearing, and exceptional rates of
4 op cit, p. 853.

11
Table 2: FORMA Top 25 Hotspots: July/August, 2011
(1) (2) (3) (4) (5)
Region Country State/Province Ranka
Clearing (July, 2011)
Clearing (August, 2011)
% Change (2)→(3)
Geometric Mean (2)0.5(4)0.5
Latin America
Brazil Rondonia 7 28 38 35.7 31.6
Brazil Minas Gerais 8 5 14 180.0 30.0
Brazil Bahia 19 8 11 37.5 17.3
Brazil Acre 19 5 8 60.0 17.3
Brazil Amapa 25 1 3 200.0 14.1
Paraguay Canindeyu 11 7 13 85.7 24.5
Paraguay San Pedro 19 7 10 42.9 17.3
Paraguay Itapua 25 3 5 66.7 14.1
Africa Kenya Rift Valley 4 12 32 166.7 44.7
Asia Indonesia Kalimantan Timur 6 11 23 109.1 34.6
Indonesia Sumatera Barat 8 1 10 900.0 30.0
Indonesia Sumatera Utara 8 33 42 27.3 30.0
Indonesia Kalimantan Selatan 11 3 9 200.0 24.5
Indonesia Sumatera Selatan 11 10 16 60.0 24.5
Indonesia Jambi 11 3 9 200.0 24.5
Indonesia Aceh 16 8 12 50.0 20.0
Indonesia Bengkulu 16 5 9 80.0 20.0
Indonesia Kalimantan Tengah 19 20 23 15.0 17.3
Indonesia Sulawesi Tengah 19 1 4 300.0 17.3
Laos Bolikhamxai 15 1 6 500.0 22.4
Laos Savannakhet 19 2 5 150.0 17.3
Malaysia Sarawak 1 114 315 176.3 141.8
Malaysia Sabah 2 37 160 332.4 110.9
Malaysia Johor 16 2 6 200.0 20.0
Malaysia Kedah 25 2 4 100.0 14.1
Myanmar Chin 3 1 26 2500.0 50.0
Myanmar Rakhine 5 29 48 65.5 43.6
Myanmar Kachin 25 1 3 200.0 14.1 a Tied ranks for equal values, cutoff at rank 25
12
change in clearing. Our hotspot score for each administrative unit is the geometric mean of
the level and rate of change of forest clearing.5 For this exercise we focus on primary
administrative units (e.g. states, provinces). However, the same methodology could be
applied to nations, second- or third-level administrative units, or any other bounded
geographic areas.
Figure 3 displays the top 25 hotspots for July/August 2011 among the 280 primary
administrative units in FORMA’s 27 countries. Table 2 displays the associated states and
provinces, along with hotspot ranks, components, and numerical scores. More than 25 areas
are identified because some have identical scores. Four hotspot clusters are apparent in
Figure 3:
The periphery of Brazil’s Amazon region (Rondonia, Acre, Amapa);
The periphery of the Atlantic Forest region in Brazil (Bahia, Minas Gerais) and
Paraguay (Canindeyu, San Pedro, Itapua);
A northern arc in Southeast Asia through Myanmar (Chin, Rakhine, Kachin) and
Lao PDR (Bolikhamxai, Savannakhet);
A very large cluster in Southeast Asia that includes peninsular Malaysia (Johor,
Kedah), Malaysian Borneo (Sarawak, Sabah) and three Indonesian islands:
Kalimantan (Kalimantan Timur, Kalimantan Selatan, Kalimantan Tengah), Sumatra
(Sumatera Utara, Sumatera Barat, Jambi, Sumatera Selatan, Bengkulu, Aceh,) and
Sulawesi (Sulawesi Tengah).
With the exception of Kenya’s Rift Valley (rank #4), all of the hotspots with the highest
scores are in Malaysia (Sarawak (#1), Sabah (#2)) and Myanmar (Chin (#3), Rakhine (#5)).
These results highlight the recent dominance of the Southeast Asian countries in global
dynamics. In Table 2, 19 of the hotspots are in Southeast Asia, 8 are in Latin America and 1
is in Africa.
3.2. Changes within Countries: Illustrations for Indonesia and Brazil
The spatial resolution of the FORMA database is 1 km2, making it possible to assess patterns
of change across highly-disaggregated geographic units. For this illustration, we disaggregate
to second-level administrative units in Indonesia (kabupatens) and Brazil (municipios). The
same exercise (and even more spatially-disaggregated exercises) could be performed for any
5 The geometric mean of clearing (C) and its growth rate (G) is their exponentially-weighted product, ,
where ρ=0.5. We use the geometric mean because it is well-known; other values of ρ will yield nearly-identical
rankings. For ρ=1 and constant total clearing, each area’s score (CG) is identical to the change in its share of total
clearing. We also use this approach to scoring because it generates rankings that are relatively insensitive to outlier
values and independent of measurement units.

13
Figure 3: FORMA Top-25 Hotspots for July/August, 2011
other FORMA country. As Figure 2 shows, forest clearing has declined sharply in Indonesia
and Brazil since 2005. Both countries are large and diverse, however, and national declines
may mask divergent patterns of regional change. To investigate these patterns, we divide
FORMA’s 69 monthly observations into 34- and 35-month periods: December 2005 -
September 2008, and October 2008 – August 2011. Within each period, for each
administrative unit, we calculate the average monthly value (m) of the FORMA forest
clearing indicator. Then we calculate the ratio [r=m2/m1] and divide the units into those
characterized by reduced clearing (r < 0.9), little or no change (0.9 ≤ r ≤ 1.1), and increased
clearing (r > 1.1).
Figures 4 and 5 display the results, with kapupaten and municipio boundaries suppressed to
provide an uninterrupted view of spatial patterns. In both countries, our color-coded maps
reveal complex patterns of change that include large areas where forest clearing has declined,
increased, and remained roughly constant. In Indonesia, the regional balance has clearly
shifted in Sumatra and Kalimantan, the islands that have accounted for most of the country’s
forest clearing. Sumatra exhibits broad patterns of decline in the southern and east-central
areas, while clearing has increased in the northern and western areas. In Kalimantan, there
has been a clear shift away from the southern and central areas toward the west and north.
Similar geographic diversity characterizes the other island regions where significant forest
clearing has occurred: Sulawesi, Maluku and Irian Jaya.6
To summarize, Indonesia’s overall decline in forest clearing since 2005 largely reflects
declines in south/central Sumatra and Kalimantan, with partially-offsetting increases in the
northern and western areas of the two islands. We investigate the sources of these changes in
Wheeler, et al. (2011). Our econometric analysis of kabupaten-level FORMA data indicates
6 Java and Bali are almost entirely cleared, although changes still occur in small areas, as shown in Figure 4.
Nusa Tenggara has little moist tropical forest.

14
Figure 4: Indonesia: Regional Changes in Forest Clearing, [Dec. 2005 - Sept. 2008]
vs. [Oct. 2008 – Aug. 2011]
that changes in clearing reflect a complex interplay of numerous factors that affect the
economics of forest clearing for plantation agriculture. These factors include global market
prices and product demands, interest and exchange rates, communications infrastructure,
zoning for commercial production and physical factors (rainfall, topography).7
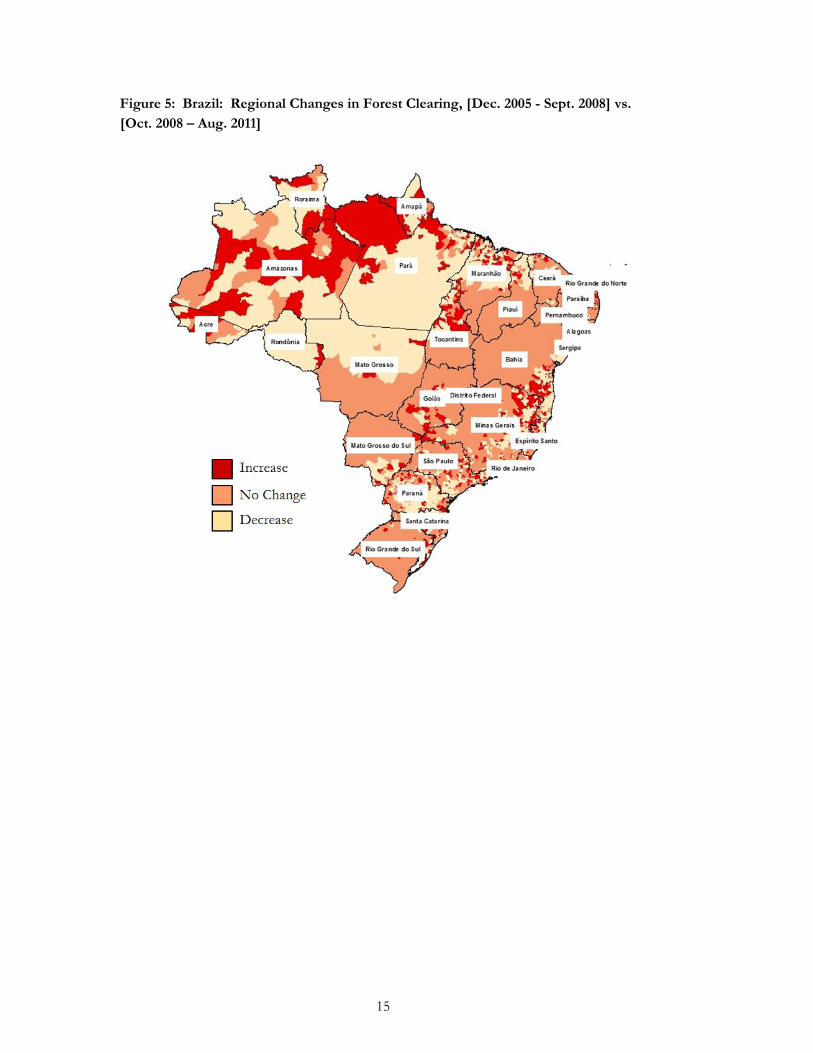
In Figure 5, Brazil exhibits similarly-striking patterns of change. In the Amazon region,
declines in forest clearing have occurred across a broad territorial band that runs from
Amazonas Rondonia and Mato Grosso in the south and west to Para and Maranhao in the
east. At the same time, forest clearing has increased in a broad parallel band from Acre and
Amazonas, through Roraima, to Amapa. Patterns of change are more complex and localized
in the Atlantic Forest region, with alternating patterns of increase, stability and decrease in a
coastal band extending southward from Bahia to Rio Grande do Sul.
Forest clearing in Brazil’s Amazon region has been extensively analyzed in studies that have
identified many determinants, including population scale and density, distance from markets,
the quality of transport infrastructure, agricultural input prices, physical factors such as
topography, precipitation and soil quality, and commercial zoning.8
The newly-available FORMA data, coupled with recent advances in spatial econometric
estimation, may permit a re-assessment of such results. Employment of these new resources
by Wheeler, et al. (2011) for Indonesia has yielded insignificant results for numerous factors
identified as important determinants of forest clearing by previous research. Our results may
or may not hold for Brazil and other countries. We hope that colleagues will use the new
FORMA data for spatial econometric panel estimation in forest-clearing studies for many
other countries.
7 For other empirical studies of Indonesian forest clearing, see San, et al. (2000) and Zikri (2009). 8 See particularly Pfaff (1997), Cattaneo (2001), Igliori (2006) and Ewers, et al. (2008).
Sumatra Kalimantan
Sulawesi
Maluku
Java
Nusa Tenggara Bali
Irian Jaya
15
Figure 5: Brazil: Regional Changes in Forest Clearing, [Dec. 2005 - Sept. 2008] vs.
[Oct. 2008 – Aug. 2011]

16
4. Summary and Conclusions
This report has summarized broad trends in recent tropical forest clearing identified by
FORMA (Forest Monitoring for Action). We focus on large-scale clearing since 2005 in 27
countries that Hansen, et al. (2008) identify as accounting for 94% of clearing during 2000-
2005. The current version of FORMA tracks monthly changes in the number of 1 sq. km.
tropical forest parcels that have experienced clearing with high probability. 9
For the pantropics as a whole, we find a sharp drop in forest clearing since 2005. Figure 1
shows that the drop is focused in the period from September 2008 to September 2010,
which coincides with the onset of the global economic crisis. For the entire period since
2005, the indicator suggests that tropical forest clearing has dropped by 42.3%.
While total clearing has dropped during the global recession, widely-divergent patterns at the
country level indicate the continued importance of local and regional factors in forest
clearing dynamics. Among the 27 countries in our assessment, reductions have occurred in
12 (led by Brazil, Indonesia, Paraguay, Bolivia and China), while increases have occurred in
14 (led by Myanmar, Peru, Malaysia and Venezuela). Across regions, clearing has declined
significantly in Asia, Latin America, and sub-Saharan Africa.
The individual roles of major forest-clearing countries have fluctuated markedly since 2005.
At the global level, Brazil’s share of global clearing fell by 11 percentage points from
December 2005 to August 2011, while three Southeast Asian countries exhibited notable
gains in share: Malaysia (+5.8), Indonesia (+3.3) and Myanmar (+1.7). Overall, Latin
America’s share of global clearing in our FORMA database fell from 76.9% to 66.5%, while
Asia’s share increased from 22.5% to 32.5% and Africa’s share increased from 0.6% to 0.9%.
We will revisit this assessment once FORMA coverage has been extended to several
countries with large tracts of uncleared tropical forest. These include the Democratic
Republic of the Congo (9.6% of uncleared forest in 2000), Colombia (4.8%), Cameroon
(1.8%), Gabon (1.4%) and Ecuador (1.0%).10
We illustrate FORMA’s potential to support sub-national analyses with two exercises. The
first is a global “hotspots” analysis that identifies the top 25 provinces for forest clearing in
July/August, 2011. The analysis reveals a striking Southeast Asian dominance, with most of
the hotspots in Indonesia, Malaysia, Myanmar and Lao PDR. The relatively few Latin
American hotspots are located at the southwestern and northeastern periphery of Amazonia
and western peripheral areas of the Atlantic Forest in Brazil and Paraguay.
9 A forthcoming version will increase spatial resolution to 500 m. 10 See Appendix 1 for information on past forest clearing and uncleared forest extent in the 27 FORMA
countries and 25 additional countries.
17
The second illustrative exercise maps changes since 2005 in secondary administrative units in
Indonesia and Brazil. The maps show that, despite sharp national declines in both countries,
their regions continue to display great diversity in forest clearing. In the case of Indonesia, an
overall decline, driven by decreased clearing in the southern and central areas of Sumatra and
Kalimantan, has been accompanied by partially-offsetting increases in the western and
northern areas of the two islands. Brazil also exhibits a striking pattern of regional change,
with the national decrease in forest clearing driven by declines across a broad swath of
southern Amazonia, but partially offset by increases in a roughly-parallel swath of northern
Amazonia
To summarize, the diverse patterns revealed by FORMA’s first global survey caution against
facile generalizations about forest clearing in the pantropics. During the past five years, the
relative scale and pace of clearing have changed across regions, within regions and within
countries. Although the overall trend seems extremely hopeful, it remains to be seen whether
the decline in forest clearing will persist as the global economy recovers. The database
generated by the FORMA project will now be updated regularly, and we hope that it will
support a significant expansion of research, policy analysis and conservation monitoring at
the global, regional, national and sub-national levels.

18
References
Asner, Gregory. 2009. Tropical forest carbon assessment: integrating satellite and airborne
mapping approaches. Environmental Research Letters, 4(3).
Cattaneo, Andrea. 2001. Deforestation in the Brazilian Amazon: Comparing the Impacts of
Macroeconomic Shocks, Land Tenure, and Technological Change. Land Economics
77(2): 219-240.
Chomitz, Ken, Piet Buys, Giacomo De Luca, Timothy S. Thomas, and Sheila Wertz-
Kanounnikoff. 2007. At Loggerheads? Agricultural Expansion, Poverty Reduction, and
Environment in the Tropical Forests. World Bank Policy Research Report. Washington,
DC: World Bank.
Ewers, Robert, William Laurance and Carlos Souza. 2008. Temporal fluctuations in
Amazonian deforestation rates. Environmental Conservation, 35:303-310.
Hammer, Daniel, Robin Kraft and David Wheeler. 2009. FORMA: Forest Monitoring for
Action—Rapid Identification of Pan-tropical Deforestation Using Moderate-Resolution
Remotely Sensed Data. Center for Global Development Working Paper No. 192,
November.
Hansen, M., R.S. DeFries, J.R.G. Townshend, M. Carroll, C. Dimiceli, and R.A. Sohlberg.
2003. "Global Percent Tree Cover at a Spatial Resolution of 500 Meters: First Results of
the MODIS Vegetation Continuous Fields Algorithm", Earth Interactions, Vol 7, No
10, pp 1-15.
Hansen, M., R. DeFries, J.R. Townshend, M. Carroll, C. Dimiceli, and R. Sohlberg. 2006.
Vegetation Continuous Fields MOD44B, 2001 Percent Tree Cover, Collection 4,
University of Maryland, College Park, Maryland, 2001.
Hansen, M.C., Stehman, S.V., Potapov, P.V., Loveland, T.R., Townshend, J.R.G., DeFries,
R.S., Pittman, .W., Stolle, F., Steininger, M.K., Carroll, M., Dimiceli, C. 2008. Humid
tropical forest-clearing from 2000 to 2005 quantified using multi-temporal and multi-
resolution remotely sensed data. PNAS, 105(27), 9439-9444.
Hansen, M., S. Stehman, and P. Potapov. 2010. Quantification of global gross forest cover
loss. PNAS. April 26.
Hoekman, Dirk, M. Quiñones, R. Verhoeven, M. Vissers, V. Schut, N. Wielaard. 2009.
PALSAR Tropical Forest Cover Mapping, Mosaicing and Validation, Case Study
Borneo. Proceedings of ‘4th Int. Workshop on Science and Applications of SAR
Polarimetry and Polarimetric Interferometry – PolInSAR 2009’, 26–30 January 2009,
Frascati, Italy (ESA SP-668, April 2009).
Igliori, Danilo Camargo. 2006. Deforestation, Growth and Agglomeration Effects: Evidence
from Agriculture in the Brazilian Amazon. Department of Land Economy, University of
Cambridge.
Jarvis, Andy. 2009. Parasid Near Real Time Monitoring Of Habitat Change Using A Neural
Network And Modis Data. CIAT (International Center for Tropical Agriculture).
September.
Myers, Norman, Russell Mittermeier, Cristina Mittermeier, Gustavo Fonseca and Jennifer
Kent. 2000. Biodiversity hotspots for conservation priorities. Nature 403(24): 853-858.

19
Pfaff, Alexander. 1997. What Drives Deforestation in the Brazilian Amazon? Evidence from
Satellite and Socioeconomic Data. Policy Research Working Paper No. 1772, World
Bank. May.
PRODES. 2009. Projeto PRODES: Monitoramento da Floresta Amazonica Brasileira por
Satelite. http://www.obt.inpe.br/prodes/.
Rudel, Thomas K. 2005. Tropical Forests: Regional Paths of Destruction and Regeneration
in the Late 20th Century. New York: Columbia University Press.
San, Nu Nu, Hans Löfgren and Sherman Robinson. 2000. Structural Adjustment,
Agriculture, and Deforestation in the Sumatera Regional Economy. TMD Discussion
Paper No. 52, International Food Policy Research Institute, March.
Souza, Carlos. 2006. Mapping land use of tropical regions from space. PNAS, 103(39):
14261-14262.
Souza, Carlos, Sanae Hayashi and Adalberto Veríssimo. 2009. Near real-time deforestation
detection for enforcement of forest reserves in Mato Grosso. Imazon, Brazil.
Townshend, J.R., Briggs. S., Gibson, R. Haruyama, Y., Hales, M., Ishida, Chu, Latham, J., Li
D., Li M., Liu L., Menzel, P., Smith, B. Sommeria, G. and Tschirley, J. 2008. Factors
affecting the Utilization of Remotely Sensed Data. In Liang, S. (ed.) Advances in Land
Remote Sensing: System, Modeling, Inversion and Applications, Springer-Verlag, pp.
465-483.
Wheeler, David, Dan Hammer, Robin Kraft, Susmita Dasgupta and Brian Blankespoor.
2011. Economic Dynamics and Forest Clearing: A Spatial Econometric Analysis for
Indonesia. Center for Global Development Working Paper (forthcoming).
Zikri, Muhammad. 2009. An Econometric Model for Deforestation in Indonesia. Working
Paper in Economics and Development Studies, No. 200903. Center for Economics and
Development Studies, Department of Economics, Padjadjaran University. July.

20
Appendix 1: FORMA’s Coverage of Humid Tropical Forests
FORMA will ultimately expand to countries that include over 99% of humid tropical forests.
At present, it covers 27 countries in Asia, Latin America, and Africa:
Asia/Pacific: Bangladesh, Cambodia, China, India, Indonesia, Lao PDR, Malaysia,
Myanmar, Nepal, Papua New Guinea, Thailand, Vietnam
Latin America/Caribbean: Bolivia, Brazil, French Guiana, Guyana, Mexico,
Paraguay, Peru, Suriname, Venezuela
Africa: Burundi, Central African Republic, Congo Republic, Guinea, Kenya,
Tanzania
Table A1 provides information for 52 countries that account for over 99% of the world’s
humid tropical forest, with current FORMA countries listed in the top half.11 FORMA and
non-FORMA countries are respectively ranked by their shares of humid tropical forest
clearing in 2000-2005, as estimated by Hansen, et al. (2008). The table also includes
countries’ estimated shares of uncleared tropical forest in 200012, as well as cumulative shares
According to these estimates, the FORMA countries accounted for 93.8% of clearing in
2000-2005, and 76.5% of uncleared tropical forest in 2000. The distribution of clearing is
highly skewed, with only 5 countries accounting for 82% of clearing (Brazil (61.9%),
Indonesia (10.1%), Malaysia (5.0%), Myanmar (2.6%) and Paraguay (2.3%). The distribution
of uncleared forest is also skewed, but less so, with the top 5 countries accounting for
60.4%.13 From 2000-2005, the countries with most notable disparities between clearing
activity and uncleared forest were Brazil (32.5% of uncleared forest but 61.9% of clearing),
Malaysia (1.9% uncleared vs. 5.0% of clearing) and Paraguay (.25% vs. 2.3%).
As FORMA expands, priority will be given to coverage of five countries that accounted for
at least 1% of uncleared tropical forest in 2000: Democratic Republic of the Congo (9.6%),
Colombia (4.8%), Cameroon (1.8%), Gabon (1.4%) and Ecuador (1.0%).
11 Table A1 does not incorporate humid tropical forest tracts in some island states in the Caribbean, Indian
and Pacific Oceans, as well as Australia, the US, and some territories administered by Australia, New Zealand, the
US, Japan, the UK and France. 12 This estimate is constructed from MODIS (Moderate Resolution Imaging Spectrometer) satellite data for
1 sq. km. parcels in the global humid tropical forest biome. We follow scientific convention by assigning
uncleared status to parcels with MODIS Vegetation Continuous Field (VCF) values greater than 25. For more
complete information, see Hansen, et al. (2003, 2006). 13 Please note that countries are ranked in descending order by forest clearing, not uncleared forest.

21
Table A1: Tropical Forest Country Shares: Clearing, 2000-05; Extent, 2000
Share of Humid Tropical Forest Clearing, 2000–2005
Cumulative Share
Share of Humid Tropical Forest, 2000
Cumulative Share
Co
un
trie
s C
over
ed b
y F
irst
FO
RM
A R
epo
rt
Brazil 61.937 61.9 32.509 32.5
Indonesia 10.122 72.1 8.334 40.8
Malaysia 5.040 77.1 1.899 42.7
Myanmar 2.598 79.7 3.130 45.9
Paraguay 2.307 82.0 0.251 46.1
China 1.771 83.8 4.432 50.6
Venezuela 1.461 85.2 3.505 54.1
Lao PDR 1.456 86.7 1.297 55.4
Thailand 1.253 87.9 0.893 56.3
Bolivia 1.142 89.1 2.739 59.0
Peru 0.886 90.0 5.143 64.1
Cambodia 0.863 90.8 0.235 64.4
Papua New Guinea
0.831 91.7 2.700 67.1
India 0.693 92.4 1.635 68.7
Mexico 0.576 92.9 1.122 69.8
Vietnam 0.356 93.3 0.647 70.5
Guyana 0.194 93.5 1.441 71.9
Tanzania 0.107 93.6 0.068 72.0
Bangladesh 0.061 93.7 0.081 72.1
Suriname 0.049 93.7 1.177 73.2
Congo, Rep. 0.033 93.7 1.763 75.0
Guinea 0.024 93.8 0.072 75.1
French Guiana
0.019 93.8 0.688 75.8
Kenya 0.015 93.8 0.067 75.8
Nepal 0.009 93.8 0.119 75.9
Burundi 0.006 93.8 0.008 76.0
Central African Republic
0.003 93.8 0.516 76.5
Oth
er T
rop
ical
Fo
rest
Co
un
trie
s
Colombia 2.224 96.0 4.826 81.3 Guatemala 0.915 96.9 0.333 81.6 Argentina 0.648 97.6 0.495 82.1 Nicaragua 0.477 98.1 0.213 82.3 Ecuador 0.397 98.5 0.965 83.3 Congo, Dem. Rep.
0.204 98.7 9.592 92.9
Philippines 0.154 98.8 0.529 93.4 Cameroon 0.142 99.0 1.835 95.3 Cote d'Ivoire 0.133 99.1 0.183 95.4 Sierra Leone 0.120 99.2 0.179 95.6 Honduras 0.119 99.3 0.226 95.8

22
Share of Humid Tropical Forest Clearing, 2000–2005
Cumulative Share
Share of Humid Tropical Forest, 2000
Cumulative Share
Oth
er T
rop
ical
Fo
rest
Co
untr
ies
(co
nti
nued
) Nigeria 0.107 99.4 0.211 96.1
Panama 0.093 99.5 0.191 96.3
Ghana 0.080 99.6 0.130 96.4
Madagascar 0.065 99.7 0.758 97.1
Costa Rica 0.064 99.8 0.172 97.3
Gabon 0.064 99.8 1.361 98.7
Liberia 0.051 99.9 0.671 99.3
Angola 0.029 99.9 0.018 99.4
Sri Lanka 0.012 99.9 0.086 99.4
Uganda 0.011 99.9 0.053 99.5
Brunei Darussalam
0.009 99.9 0.041 99.5
Haiti 0.005 99.9 0.012 99.6
Martinique 0.004 99.9 0.002 99.6
El Salvador 0.002 99.9 0.004 99.6
Appendix 2: FORMA Methodology
FORMA utilizes data recorded daily by the Moderate Resolution Imaging Spectrometer
(MODIS), which operates on NASA's Terra and Aqua (EOS PM) satellite platforms.
Although its signal-processing algorithms are relatively complex, FORMA is based on a
common-sense observation: Tropical forest-clearing involves the burning of biomass and a
pronounced temporary or long-term change in vegetation color, as the original forest is
cleared and replaced by pastures, croplands or plantations. Accordingly, FORMA constructs
forest-clearing indicators from MODIS-derived data on the incidence of fires and changes in
vegetation color as identified by the Normalized Difference Vegetation Index (NDVI). It
then calibrates to local forest-clearing by fitting a statistical model that relates the MODIS-
based indicator values to the best available information on actual forest-clearing in each area.
FORMA incorporates local diversity by dividing each country into WWF ecoregions and
separately fitting the model to data for each ecoregion. The dependent variable for each pixel
is coded 1 if it has experienced forest-clearing with high probability during the relevant time
period, and 0 otherwise. The MODIS-based indicator values are the independent variables.
For all tropical countries except Brazil, the best identification of recent forest clearing has
been published in the Proceedings of the National Academy of Sciences by Hansen, et al.14
14 Hansen, M.C., Stehman, S.V., Potapov, P.V., Loveland, T.R., Townshend, J.R.G., DeFries, R.S., Pittman,
K.W., Stolle, F., Steininger, M.K., Carroll, M., Dimiceli, C. 2008. Humid tropical forest clearing from 2000 to

23
(2008), who estimate the incidence of forest-clearing for 500m parcels in the humid tropics.
We calibrate FORMA using the map of forest cover loss hotspots (henceforth referred to as
the FCLH dataset) published by Hansen, et al. for the period 2000-2005.15
Using the FCLH pan-tropical dataset for 2000-2005, FORMA fits the calibration model to
observations on forest-clearing for 1 km2 cells in each country and ecoregion. As we
document in Hammer, et al. (2009), the model’s predicted probability distribution provides a
very close match to the spatial incidence of FCLH forest-clearing. FORMA then applies the
fitted model to monthly MODIS indicator data for the period after December 2005. The
output for each month is a predicted forest-clearing probability for each 1 km2 parcel outside
of previously-deforested areas, as identified in the FCLH map. FORMA selects parcels
whose probabilities exceed 50%.
Since FORMA identifies individual cells where forest-clearing has occurred with high
probability, it is straightforward to add across cells within a geographic area to produce an
index of forest-clearing activity in that area. Even small geographic areas can include
thousands of 1 km cells, so error-averaging ensures robust index values.16
2005 quantified using multi-temporal and multi-resolution remotely sensed data. PNAS, 105(27), 9439-9444.
www.pnas.org/cgi/doi/10.1073/pnas.0804042105 15 In Brazil, higher resolution estimates are also available annually from the INPE PRODES program. We
have used these estimates to test the accuracy of our FCLH-based calibration methodology. For more
information on PRODES, see Projeto PRODES: Monitoramento da Floresta Amazonica Brasileira por Satelite.
http://www.obt.inpe.br/prodes/ 16 For example, a square area 50 km on a side contains 2,500 1 km cells.