forest conversion and provision of ecosystem …lerf.eco.br/img/publicacoes/article ldd eduardo...
TRANSCRIPT
FOREST CONVERSION AND PROVISION OF ECOSYSTEM SERVICES IN THEBRAZILIAN ATLANTIC FOREST
E. H. DITT1*, S. MOURATO2, J. GHAZOUL3 AND J. KNIGHT4
1IPE - Instituto de Pesquisas Ecologicas, ESCAS - Escola Superior de Conservacao Ambiental e Sustentabilidade, Nazare Paulista, SP 12960-000 Brazil2Department of Geography and Environment, London School of Economics and Political Science, London, WC2A 2AE UK
3ETH Zurich, ETH, 8092 Zurich, Switzerland4Imperial College London, Centre for Environmental Policy, London, SL5 7PY UK
Received 8 November 2009; Revised 3 February 2010; Accepted 20 April 2010
ABSTRACT
The importance of quantifying existing ecosystem services, assessing the impacts of various land use decisions and ultimately evaluating theoverall costs and benefits of different land use patterns having internalized ecosystem services, is now widely recognized and such work is atthe forefront of current landscape management planning. We aim to quantify ecosystem services derived from different land uses within theAtibainha Reservoir catchment in Brazil, determine the spatial distribution of ecosystem services and quantify the impacts of land use changeson the provision of ecosystem services. Four ecosystem services were considered: carbon sequestration, mitigation of sediment delivery intothe reservoir, purification of water and maintenance of soil fertility. Results indicate strong increase in the provision of ecosystem servicesamong the main land uses in the following order: urban area/bare soil; pastures; plantation of eucalyptus and native forests. The mostimportant services provided by native forests, when compared with bare soil, were carbon sequestration and prevention of sedimentation, withan additional 864 569 tons of carbon stored in forest biomass in 30 years, and prevention of 244 511 tons of sediment delivery into the reservoirper year, respectively, from 7624 ha of lands around the reservoir. Spatial variation in the provision of ecosystem services were mapped todevelop a tool to support decision making at the landscape scale. Results and maps from the decision support tool can support policies thatensure effective land-use planning and can serve as the basis for the development of payment for ecosystem service schemes in the region.Copyright # 2010 John Wiley & Sons, Ltd.
key words: ecosystem services; Atlantic forest; land use changes; environmental services; Brazil
INTRODUCTION
There is increasing concern about losses of ecosystemservices due to conversion of native forests into urban areas,forestry plantations, agriculture and pastures in alreadydegraded biomes such as the Brazilian Atlantic Forest.However, there are few attempts to model variations in theprovision of ecosystem services (EPA, 2009). Forecastingthe impacts of landscape changes on these services isnecessary for the development of innovative mechanisms thatmay reverse the current levels of habitat loss and fragmenta-tion of ecosystems (Tabarelli et al., 2005). Preventing forestloss is particularly relevant to lands that provide ecosystemservices to major conurbations where half of the world’spopulation currently live and where more than 5 billionpeople will be living by 2030 (UNFPA, 2008). One suchconurbation is the city of Sao Paulo, home to 19 millioninhabitants, and located within the limits of the Atlantic Forest
biome in southeastern Brazil (Silvano et al., 2005). More than50% of Sao Paulo city relies on the water supply systemknown as Cantareira. This system is formed by six reservoirs,whose watersheds cover 228000 ha of land in 12 munici-palities. Currently, the Cantareira System is able to supply33000L of water per second (Whately and Cunha, 2007).
Inappropriate land uses in the Atlantic Forest regionthreatens the continued provision of clean water within theCantareira System (Braga, 2001), an issue of great concernconsidering rapidly growing demands on water resourcesfrom growing urban populations.
The Atibainha Reservoir, in the municipality of NazarePaulista, is one of six lakes within the Cantareira System.Since the 1970s, when the reservoir was built, thepicturesque landscape formed by the surrounding hillyland, remnants of Atlantic Forest and abundance of water,has been attracting people from neighbouring towns andcities, including Sao Paulo. The landscape has changed as aconsequence of the arrival of short-term visitors and newresidents in the region. New immigrants have placed furtherpressure on the land through expansion of pasture andeucalyptus plantations, as well as illegal clearing of native
land degradation & development
Land Degrad. Develop. 21: 591–603 (2010)
Published online 4 June 2010 in Wiley Online Library (wileyonlinelibrary.com) DOI: 10.1002/ldr.1010
*Correspondence to: E. H. Ditt, IPE - Instituto de Pesquisas Ecologicas,ESCAS - Escola Superior de Conservacao Ambiental e Sustentabilidade,Nazare Paulista, Brazil.E-mail: [email protected]
Copyright # 2010 John Wiley & Sons, Ltd.
forest for settlements (Fadini and Carvalho, 2004). Land-scape conversion is likely to impact the provision ofecosystem services derived from native forest remnants.Assessment and quantification of ecosystem services can beuseful for determining the extent to which these changes inland use affect human well being.Previous studies attempted to estimate values of
ecosystem services associated with the presence of nativeforests in Mexico (Adger et al., 2002), China (Guo et al.,2001; Li et al., 2006; Chen et al., in press), Costa Rica(Bernardt et al., 2009), in the Brazilian Amazonian Forest(Torras, 2000) and the entire planet (Costanza et al., 1997).Despite the fact that the Brazilian Atlantic Forest has beenhighly degraded due to unplanned land use, there are fewattempts to study losses of ecosystem services in this biome.In this study we consider four services derived from the
Atlantic Forest biome that are relevant to local farmers’ landproductivity, water security for regional downstream consum-ers and to the international community in terms of mitigationof climate change. Specifically, these services aremaintenanceof soil fertility, mitigation of sedimentation of the reservoir,purification of water and carbon sequestration. These servicesare called ‘ecosystem processes’ by some authors concernedwith the distinction between means and ends in the classi-fication and definition of concept of ecosystem services(Wallace, 2007; Fisher and Turner, 2008).Maintenance of soil fertility is a precondition for
biogeochemical processes and elemental cycles that occurin the soils of both cultivated lands and natural forests(CSIRO Sustainable Ecosystems, 2003). Preventing sedi-mentation is necessary to maintain the capacity of waterstorage in reservoirs in the long term. The role played byforests in purifying the water can be helpful in water supplysystems. Finally, the ability of plants to capture carbon fromatmosphere is crucial for climate regulation.Estimates of these services under different land use scen-
arios are necessary to underpin future land use decisionmaking to ensure optimal land use benefits and ecosystemservice provision.Thus the objectives of this study are to: (1) quantify the
value of ecosystem service provision under different landuses and land use scenarios; (2) determine the spatial distri-bution of ecosystem services in current land use scenarios;(3) quantify the impacts of land use changes on the avai-lability of ecosystem services and (4) determine the extent towhich human welfare can be affected by land use policiesdue to gains and losses of ecosystem services.
METHODOLOGY
Study Area
The study area includes 188 catchments that surround theAtibainha Reservoir (Figure 1). They occupy 25% of the
municipality of Nazare Paulista (at 23890S on 468200W) andless than 1% of the municipality of Piracaia. The total areaexcluding the reservoir is 7624 ha. There are approximately200 streams narrower than 2m in these catchments, flowinginto the reservoir. Steep slopes, with declivity higher than25 degrees, predominate in the region and altitudes varyfrom 785m above sea level, which is the height of thereservoir, to 1160m at the hilltops.The ‘argissolo vermelho-amarelo’ (Arenic Hapludult) is
the soil encountered in most of the study area. The ‘latossolovermelho-amarelo’ (Humic Hapludox) can also be found butover a smaller area (Oliveira et al., 1999). Fragments ofAtlantic Forest occupy 46% of the area, followed by pastures(27%), eucalyptus forests (10%) and other uses (17%). Mostof the native forests are secondary and older than 15 years,with canopies taller than 10m (Ditt et al., 2008).Cattle are grazed in the pastures mostly for the production
of milk by small farms with low productivity and low tech-nology. Eucalyptus plantation is one of the most profitableactivities in the region and has been expanded on smallproperties (Fadini and Carvalho, 2004).
Mapping Ecosystem Services and Scenario Analysis
An analysis of the different land use scenarios was usedto determine how the availability of ecosystem services isaffected by changes in land use. The ecosystem serviceswere quantified and mapped in the study area for the currentland use scenario (S1) and for four possible future land usescenarios (S2, S3, S4 and S5). The current land use scenario(S1) refers to heterogeneous landscape with 46% of nativeforest, 27% of pastures, 10% of eucalyptus and 9% of baresoil or urbanized areas. The four possible future land usescenarios refer to homogeneous landscape with 100% ofpastures (S2), 100% of eucalyptus (S3), 100% of nativeforests (S4) and 100% of bare soil or urban areas (S5).These future scenarios represent homogeneous land-
scapes that could occur 30 years into the future, that is in2039, resulting from the maximum expansion of each of thefour main land uses (native forest, eucalyptus, pasture andurban area/bare soil). While these may not be entirelyrealistic future outcomes, they are presented here by way ofcomparison.Each of the ecosystem services required a specific method
of assessment as described below. GIS layers in the formatof a shape file were constructed to express results of theassessments on a geo-referenced basis for further analysis ofscenarios of land use change. The analysis was applied toboth the entire study area composed of all the catchmentsand to each individual catchment.
Estimation of Carbon Stocks
Estimates of the capacity of forest ecosystems to sequesterand store carbon in biomass are helpful for quantifying their
Copyright # 2010 John Wiley & Sons, Ltd. LAND DEGRADATION & DEVELOPMENT, 21: 591–603 (2010)
592 E. H. DITT ET AL.

potential contribution for climate change mitigation becausethey indicate how much carbon dioxide, a greenhouse gas,would be released in the atmosphere if the forests were notpresent. Four main carbon pools may be considered: aboveground plant biomass, below ground biomass, soils andstanding litter. The first of these is the most easily mani-pulated carbon pool in carbon storage forest projects(MacDicken, 1997). In several studies the above groundplant biomass in native forests has been estimated from dataobtained in field surveys of vegetation, including: number oftrees per area, species, wood density, diameters of trees andheight of trees (Brown et al., 1989; Burger and Delitti, 1999;IPEF, 2006; Melo and Durigan, 2006).
In this research the benefits of climate mitigation derivedfrom the maintenance of carbon stocks in the trees above
ground were determined for the main land uses in the studyarea through estimates of biomass. Four categories of landuse were considered: eucalyptus; pastures/bare soil; youngernative forest (F1) and older native forest (F2). The twoclasses of native forests (F1 and F2) were previously definedby Ditt et al. (2008) and could be distinguished throughvisual classification of aerial photograph and stereoscopy.
Field sampling of native vegetation was developed in tenareas of forest F1 and in ten areas of forest F2. The quarterpoint method (Martins, 1993) was used to collect data for thefollowing variables: distance of the trees from the samplingpoints of the quadrants; and diameter of their trunks at1!30m above ground. Twenty sampling points were estab-lished in each area. Each sampling point was composed offour quadrants, giving 80 quadrants and 80 trees measured.
Figure 1. Study area, composed by catchments that surround the Atibainha Reservoir in eastern Sao Paulo State (source: Ditt et al., 2008).
Copyright # 2010 John Wiley & Sons, Ltd. LAND DEGRADATION & DEVELOPMENT, 21: 591–603 (2010)
FOREST CONVERSION AND ECOSYSTEM SERVICES 593
The most appropriate threshold value of trunks’ perimeterfor sampling trees that compose the canopy in the forests ofthe study area was considered to be 17 cm according toobservations during the fieldwork. Therefore, only trees withcircumference higher than this value were measured.The area occupied by each tree was determined through
calculation of the squared distance of the trees from eachsampling point, according to the quarter point method.The above ground biomass per tree was calculated using a
regression Equation suggested by Brown (1997) for tropicalforests in moist zones. The Equation is expressed by:
Y " expf#2 ! 134$ 2 ! 530% ln&D'g;
where: Y (kg)" biomass per tree and D (cm)" diameterof trunk at 1!3m above ground.The above ground forest biomass density in tons of biomass
per hectare was calculated from the sum of the estimated areaoccupied by the sampled trees and the sum of the aboveground biomass of the sampled trees.The below ground tree biomass was calculated using the
following regression model suggested by Pearson et al.(2005):
BBD " exp& # 1 ! 0587$ 0 ! 8836% ln ABD';
where: BBD" below ground biomass density and ABD"above ground biomass density.Finally, it was assumed that carbon corresponds to 50% of
forest biomass, as suggested by Brown and Lugo (1984).Therefore estimated values of biomass in forests F1 and F2were divided by 2 to determine their respective estimates ofabove ground carbon stocks per hectare.The capacity of eucalyptus plantations to accumulate
carbon in the above ground biomass in 6 years, estimated byPaixao et al. (2006), is 47!7 tons ha#1. This value was used inthe current study for determining the extent to which eucaly-ptus contribute to the mitigation of climate change. It wasassumed that the eucalyptus is regularly harvested every6 years (State Agency of Agriculture of Nazare Paulista/Camila Toledo, personal communication), and the accumu-lation of carbon in biomass is linear over the 6 years. Thus,the obtained average stock of carbon that is maintained ineucalyptus plantations during the cycle of 6 years is 41!66%of the estimated 47!7 tons ha#1, that is 19!87 tons ha#1.This study has focused only on the carbon stocks in the
biomass of trees, therefore in pastures and in areas with soilprepared for agriculture these stocks of carbon were consi-dered negligible.
Estimation of Sediment Delivery
Models that predict erosion and sediment yield can beused for assessing effects of land management on soil andwater. One of the most used models is the universal soil loss
equation—USLE (Wischmeier and Smith, 1978; Bacchiet al., 2003). An important limitation of USLE is that it doesnot predict deposition and sediment yields (Croke andNethery, 2006). This limitation is overcome by using themodified universal soil loss equation—MUSLE (Williams,1975), which was developed subsequently and has been usedfor estimating sediment deposition in catchments.The MUSLE was used in this study to quantify the cont-
ribution of each catchment for delivering sediments into thereservoir in the five land use scenarios considered. Themodel is expressed by the following Equation (Williams,1975):
Y " (89 ! 6% &Qq'0:56)KLSCP;where: Y"event sediment yield, Q" runoff amount, q"peak runoff rate, K" soil erodibility factor, L" slope lengthfactor, S" slope steepness factor, C" cover and manage-ment factor and P" support practice factor.The runoff amount (Q) was calculated for every day in a
period of 20 years—from 1984 to 2003—using the Equat-ion suggested by Chaves and Piau (2006), which is:
Q " pa# 0:2(&25 400=CN' # 254)2
pa$ 0:8(&25 400=CN' # 254) :
The curve number (CN) is a parameter determined byhydrological soil group, land use, treatment, hydrologicalcondition and antecedent runoff condition (USDA, 1986).The values of CN adopted for pasture, eucalyptus, nativeforest and urban areas were 69, 60, 43 and 82, respectively, assuggested by Bertoni and Lombardi-Neto (2005). The valuesof daily precipitation (pa) were obtained from the database ofthe state government, accessible through the Internet (www.sigrh.sp.gov.br, 11/08/2008).The peak runoff rate (q) was calculated through the
equation:
q " 0:0021QA
Tp&Chaves and Piau; 2006';
where: A" the area of the catchment and Tp" to the peakduration.The value of ‘Tp’ is calculated through the equation:
Tp "D
2$ L
3:28
0:8
f(&25 400=CN' # 254) $ 1g0:7
% f&1900(y&1=2')'g;where: D" the duration of the precipitation, expressed inhours, L" the length of the catchment and y" the averageslope, expressed as a percentage.Values of erodibility factor (K) suggested by Bertoni and
Lombardi-Neto (2005) for ‘Podzolizados Lins e Marılia,variacao Lins’ (K" 0!035) and ‘Solos de Campos do Jordao’(K" 0!015) were used for the catchments of the study area
Copyright # 2010 John Wiley & Sons, Ltd. LAND DEGRADATION & DEVELOPMENT, 21: 591–603 (2010)
594 E. H. DITT ET AL.

where ‘argissolo vermelho-amarelo’ (Arenic Hapludult) and‘latossolo vermelho-amarelo’ (Humic Hapludox) prevail,respectively.
Calculation of the slope length factor (L) was based onprocedures suggested by Silva (2003) as explained below:
i. Topographical maps of the study area at a scale 1:10!000,published by the Brazilian Institute of Geography andStatistics (IBGE, 1978), with altitude lines in intervalsof 10m were digitized using ArcMap.
ii. A raster digital elevation model (DEM) with cells of10m was produced from the digitized altitude lines.
iii. The DEM was used to produce a slope grid map withcells of 10m, expressing slope (s) in percentage.
iv. The grid cells were classified in four intervals of slopefor further attributing slope coefficient values (m),according to the following criteria: m" 0!5 (s* 5%);m" 0!4 (3% +s< 5%); m" 0!3 (1% +s< 3%);m" 0!2 (s< 1%).
v. The eight-direction pour point model (Maidment,2002) was applied using ArcHydro—an extension ofArcMap—to produce a flow direction grid (x), withcell values of 1, 2, 4, 8, 16, 32, 64 and 128, representingthe flow of water in one of the following directions,respectively: E, SE, S, SW, W, NW, N and NE.
vi. A flow accumulation grid was produced from the flowdirection grid. The number of flow accumulation assig-ned to each pixel refers to the number of contributingpixels.
vii. The values of flow accumulation were multiplied by thearea of each pixel (10% 10" 100m2) for producing amap of contribution area.
viii. The map of slope length factor (L) was created byapplying to each cell the Equation L " (&A$ D2'm$1#&A'm$1)=(Dm$2xm&22 ! 13'm), where, A" contributionarea, D" cell size" 10m, m" slope coefficient valueand x" flow direction value.
A grid map of slope steepness factor (S) was created usingthe following Equation of Wischmeier and Smith (1978):S" 0 ! 00654s2$0 ! 0456s$0 ! 065, where s"mean slope inthe catchment, expressed in percentage.
The cover management factor (C) and the support practicefactor (P) reflect effects of cropping and managementpractices on erosion rates and soil loss. The following valuesof ‘C’ and ‘P’ were found in literature (Wischmeier andSmith, 1978; Silva et al., 2003; Bertoni and Lombardi-Neto,2005) and applied in this study: 0!01 and 0!4 for pasture;0!001 and 0!01 for native forest; 0!003 and 0!04 for refor-estation; 1 and 1 for bare soil or urban area.
Among the land uses considered in the study, bare soil/urban area was supposed to be the least effective in pre-venting sediment delivery into the reservoir. Therefore, itbecame the reference land use scenario for determining the
additional benefits associated with native and eucalyptusforests in preventing sediment delivery. The followingEquations were defined to calculate these benefits:
PSDf " ESDu# ESDf;PSDe " ESDu# ESDe;PSDp " ESDu# ESDp;
## >
where: PSDf" additional prevention of sediment deliveryby native forest, ESDu" estimated sediment delivery incatchments occupied by urban area/bare soil, ESDp" esti-estimated sediment delivery in catchments occupied bypasture, ESDf" estimated sediment delivery in catchmentsoccupied by native forests, PSDe" additional prevention ofsediment delivery by eucalyptus and ESDe" estimatedsediment delivery in catchments occupied by eucalyptus.
Assessment of Water Quality
Several studies demonstrate effects of land use on the qualityof water (Johnson et al. 1997; Quinn and Stroud, 2002;Allan, 2004; Shineni, 2005). Nutrients such as nitrite, nitrateand orthophosphate are commonly measured as they aremore concentrated in predominantly agricultural and urbancatchments compared with forested catchments (Johnsonet al., 1997). Therefore, determining the relationship bet-ween land use and these chemical parameters is a way toquantify the services played by forests in water purification.
Thirty-seven streams around the Atibainha Reservoirwere randomly selected for assessment of water chemistry ineach of the four seasons of the year. Field kits were used tocollect samples of water for measurements of phosphate(PO4); nitrite (NO2-N); nitrate (NO3); alkalinity; Cl; Fe; pHand ammonium (N-NH3).
Regression analysis was used to determine the degree towhich the proportion of forests, eucalyptus and pastures inthe uplands influence water chemistry in streams. Con-sidering that the width of buffer areas of streams where landuse may influence water chemistry is unknown, the values ofland use proportion, that is the independent variable, werecalculated in three possible buffer zones: 30, 100 and 200maround the streams. ArcMap1 was used to delineate thesebuffers and to calculate the land use proportions.
Assessment of Variations in Soil Fertility
Soil fertility has received much attention due to its imp-ortance for agricultural productivity (Pulleman et al., 2000).However, fertility is not just important for agriculturepurposes. Humans obtainmany other benefits from themain-tenance of soil fertility. Biogeochemical processes andelemental cycles that occur in the soils of both cultivatedlands and natural forests depend on their fertility (CSIROSustainable Ecosystems, 2003).
Copyright # 2010 John Wiley & Sons, Ltd. LAND DEGRADATION & DEVELOPMENT, 21: 591–603 (2010)
FOREST CONVERSION AND ECOSYSTEM SERVICES 595

Land use change that causes soil fertility to decline willhave knock-on effects for other ecosystem services (Reidet al., 2005). The impacts on the life of plants are reflected inthe services associated with the forest such as carbon storage,watershed protection and ecotourism, among others.Procedures for the chemical analysis of soil were origi-
nally developed for the purpose of determining fertilizer andlime recommendations in agriculture but can equally well beused for evaluating the effects of land management. Toproduce these recommendations, agronomists often followthe guidelines of the ‘Technical Bulletin 100’ issued by theAgronomic Institute of Campinas (Van-Raij et al., 1997).The most common parameters considered are organic
matter, pH, CEC and levels of macro- and micronutrients(Van-Raij, 1991; Van-Raij et al., 1997). They have alreadybeen applied in studies for evaluating responses of soil qualityto land management (Garcia-Montiel et al., 2000; Schipperand Sparling, 2000; Krishnaswamy and Richter, 2002; Sauerand Meek, 2003). Therefore, these parameters can be usefulfor studies of ecosystem services that depend on soil fertility.Twenty areas of native forests, ten areas of pastures and
ten areas of eucalyptus within the boundaries of ‘argissolo
vermelho amarelo’ (Arenic Hapludult) were randomly sel-ected and sampled for assessing the effects of land use onsoil fertility. The lands occupied by ‘latossolo vermelho-amarelo’ (Humic Hapludox) were neglected in the assess-ment of soil fertility because of their relative small coverage.As previously, the native forests were divided in two groups(‘F1’ corresponding to younger forests and ‘F2’ correspond-ing to older forests). Twenty sub-samples of soil werecollected 20m from each other in each sampled area at twodepths: from 0 to 20 cm and from 40 to 60 cm. Every groupof 20 sub-samples was mixed for further extraction of aunique sample of each area. The samples of soil were sent tothe laboratory of the Agronomic Institute of Campinas foranalysis of pH, cation exchange capacity (CEC), content oforganic matter and contents of micro- and macronutrients.The methods and procedures of chemical analysis of soiladopted by the laboratory are detailed by Van-Raij (1991).Analysis of variance (ANOVA) was initially used to
compare means of the chemical parameters among the landuses. The Scheffe’s test was used for posthoc multiplecomparisons when significant differences were detected inANOVA.
Figure 2. Above ground stocks of carbon in trees per unit of area, estimated for each of the main land uses.
Copyright # 2010 John Wiley & Sons, Ltd. LAND DEGRADATION & DEVELOPMENT, 21: 591–603 (2010)
596 E. H. DITT ET AL.

A GIS layer was created to indicate areas that could bedistinguished by the effects of land use on soil fertility,according to the results of the multiple comparisons per-formed with the Scheffe’s test.
RESULTS
Land Use and Carbon Stocks
Results obtained from the calculation of forest biomass indi-cated that in older forest (F2) the average carbon storageis 113!4 tCha#1 and in younger forest (F1) it is 71!6 tCha#1.These values and the estimate of 19!8 tCha#1 found in lite-rature for eucalyptus are used to illustrate the carbon storageper unit of area in each land use in the map of Figure 2.
The total stock of carbon in trees biomass, estimated in thecurrent land use scenario of the study area, is 380 984 tons.Of these, 127 074 tons are stored in forests F1, 238 178 tons
Table I. Carbon stocks in the main land uses around the AtibainhaReservoir
Land use Area (ha) Above groundcarbon stockin trees per
hectare (t ha#1)
Total aboveground carbonstock in trees (t)
Younger nativeforest (F1)
1774!78 71!60 127 074
Older nativeforest (F2)
2099!78 113!43 238 178
Reforestation 794!55 19!8 15 732Pasture 2352!96 0 0Other uses(without forest)
602!00 0 0
Total 7624!07 — 380 984
Figure 3. Classification of the catchments according to the average prevention of sediment delivery in the reservoir per unit of area (t ha#1).
Copyright # 2010 John Wiley & Sons, Ltd. LAND DEGRADATION & DEVELOPMENT, 21: 591–603 (2010)
FOREST CONVERSION AND ECOSYSTEM SERVICES 597
are stored in forests F2, and 15 732 tons are stored ineucalyptus (Table I).The total value of carbon stock in trees biomass can
change to 864 596, 150 957 and 0 t in the next 30 years, if thelandscape is entirely converted to native forest (F2),eucalyptus or pasture, respectively.
Land Use and Sediment Delivery in the Reservoir
The annual estimates obtained through MUSLE of sedimentdelivered in the reservoir in homogeneous land use scenariosin the 188 catchments are 244 520 tons for urban area/bare
soil, 1483 tons for pastures, 67 tons for eucalyptus and 9 tonsfor native forests.These results indicate how the capacity of native forests,
pastures and eucalyptus to prevent sediment delivery variesamong catchments (see Table A1 in Appendix A for acomplete list of the catchments with their respectiveestimates of sedimentation under the various land uses).The last column of Table A1 (Appendix A) indicates thetotal prevention of sediment delivery that was obtainedthrough multiplication of the proportion of each land usewithin each catchment by the respective rate.
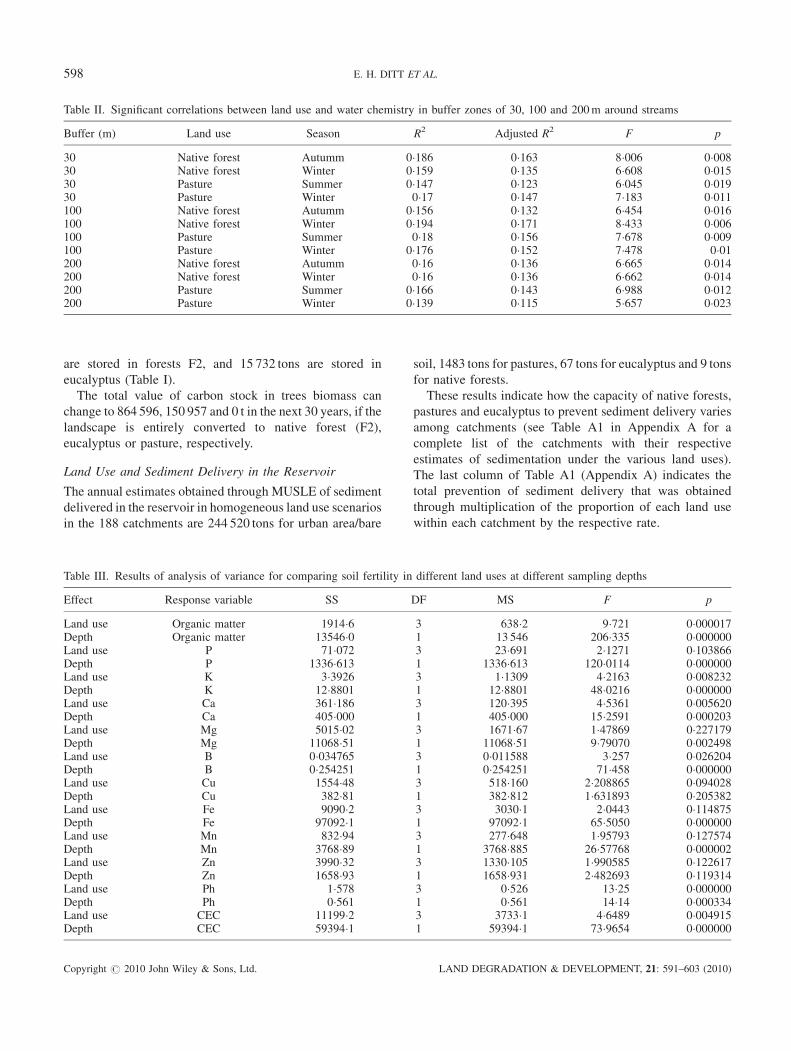
Table II. Significant correlations between land use and water chemistry in buffer zones of 30, 100 and 200m around streams
Buffer (m) Land use Season R2 Adjusted R2 F p
30 Native forest Autumm 0!186 0!163 8!006 0!00830 Native forest Winter 0!159 0!135 6!608 0!01530 Pasture Summer 0!147 0!123 6!045 0!01930 Pasture Winter 0!17 0!147 7!183 0!011100 Native forest Autumm 0!156 0!132 6!454 0!016100 Native forest Winter 0!194 0!171 8!433 0!006100 Pasture Summer 0!18 0!156 7!678 0!009100 Pasture Winter 0!176 0!152 7!478 0!01200 Native forest Autumm 0!16 0!136 6!665 0!014200 Native forest Winter 0!16 0!136 6!662 0!014200 Pasture Summer 0!166 0!143 6!988 0!012200 Pasture Winter 0!139 0!115 5!657 0!023
Table III. Results of analysis of variance for comparing soil fertility in different land uses at different sampling depths
Effect Response variable SS DF MS F p
Land use Organic matter 1914!6 3 638!2 9!721 0!000017Depth Organic matter 13546!0 1 13 546 206!335 0!000000Land use P 71!072 3 23!691 2!1271 0!103866Depth P 1336!613 1 1336!613 120!0114 0!000000Land use K 3!3926 3 1!1309 4!2163 0!008232Depth K 12!8801 1 12!8801 48!0216 0!000000Land use Ca 361!186 3 120!395 4!5361 0!005620Depth Ca 405!000 1 405!000 15!2591 0!000203Land use Mg 5015!02 3 1671!67 1!47869 0!227179Depth Mg 11068!51 1 11068!51 9!79070 0!002498Land use B 0!034765 3 0!011588 3!257 0!026204Depth B 0!254251 1 0!254251 71!458 0!000000Land use Cu 1554!48 3 518!160 2!208865 0!094028Depth Cu 382!81 1 382!812 1!631893 0!205382Land use Fe 9090!2 3 3030!1 2!0443 0!114875Depth Fe 97092!1 1 97092!1 65!5050 0!000000Land use Mn 832!94 3 277!648 1!95793 0!127574Depth Mn 3768!89 1 3768!885 26!57768 0!000002Land use Zn 3990!32 3 1330!105 1!990585 0!122617Depth Zn 1658!93 1 1658!931 2!482693 0!119314Land use Ph 1!578 3 0!526 13!25 0!000000Depth Ph 0!561 1 0!561 14!14 0!000334Land use CEC 11199!2 3 3733!1 4!6489 0!004915Depth CEC 59394!1 1 59394!1 73!9654 0!000000
Copyright # 2010 John Wiley & Sons, Ltd. LAND DEGRADATION & DEVELOPMENT, 21: 591–603 (2010)
598 E. H. DITT ET AL.

The catchments are classified into six levels according tothe capacity of native forests to prevent sediment deliveryper unit of area (Figure 3).
Land Use and Quality of Water
The significant correlations detected in the regressionanalysis between proportion of land use and chemicalparameters of water are presented in Table II. Thepercentage of pasture in any of the three buffer zonesconsidered, that is 30, 100 and 200m, had significantcorrelation (p< 0!05) with alkalinity in the summer and inthe winter. Percentage of native forest in the three buffer
zones had significant correlation (p< 0!05) with alkalinityin the autumn. In the winter, significant correlations(p< 0!05) were also found when buffer zones of 30 and200m were considered.
However, the low values of R2 obtained in all these casesindicate that the regressions explain a low proportion of thevariation in the alkalinity data. No significant correlationwas detected when considering percentage of eucalyptus asthe predictor variable, neither when considering any of theother chemical parameters as the response variable.
Soil Fertility
Results of ANOVA (Table III) indicate significant effect ofland use on pH, CEC, mean organic matter content, pota-ssium (K), calcium (Ca) and boron (B). The effect of depth issignificant for all the chemical parameters, except copper(Cu).
Posthoc analysis using the Scheffe’s test detected signi-ficant differences only in the contents of organic matterwhen native forests were compared with eucalyptus and withpastures (Table IV). No differences were found betweeneucalyptus and pastures, nor between the two types of nativeforest. Therefore, the land uses can be merged in two classes
Table IV. Results of posthoc analysis performed with Scheffe’stest for revealing influence of land use on the content of organicmatter
F2 F1 Eucalyptus Pasture
Forest F2 0!929965 0!004107 0!000411Forest F1 n.s. 0!039985 0!006511Eucalyptus s. s. 0!919953Pasture s. s. n.s.Mean contentof organic matter
41!500 39!778 32!000 30!200
Figure 4. Mean contents of organic matter in soils occupied by native forests or other uses.
Copyright # 2010 John Wiley & Sons, Ltd. LAND DEGRADATION & DEVELOPMENT, 21: 591–603 (2010)
FOREST CONVERSION AND ECOSYSTEM SERVICES 599

related to the content of organic matter: the lands with nativeforest and those without native forest. The mean contents oforganic matter at the depth interval of 0–20 cm, calculatedfor these classes are 55!7 and 42!15 g dm#3, respectively.Extrapolation of these classes of organic matter to the entirestudy area is illustrated in the map of Figure 4.The Scheffe’s test performed for all possible multiple
comparisons of land uses for the remaining nutrientsconsidered in this study revealed significant differences onlyin the content of Ca, when eucalyptus was compared withpasture (p" 0!006), and in the content of B, when foresttype F1 was compared with pasture (p" 0!0436).
DISCUSSION AND CONCLUSION
Ideally, a remnant of pristine forest should be assessed in thestudy area in order to determine the maximum capacity ofnatural forests to contribute to mitigation of climate change.However, the Atlantic Forest biome has been severelydisturbed by humans over the past 500 years (Dean, 1996)and no pristine forest is encountered in the region and it istherefore not possible to find a reference area to study carbonstorage.Both classes of native forest that have been studied, that is
F1 and F2, are secondary and their biomass is probably stillincreasing. If these forests remain untouched in the futuretheir average carbon stock above ground may be higher thanthe estimated 113!4 tons ha#1 for forests F2. In the west ofSao Paulo, for instance, the carbon stock estimated inanother study in the same type of forest, although it was inanother type of soil, was 149 tons ha#1 (Melo and Durigan,2006). Although the maximum capacity of carbon storage isunknown, results of the current study revealed that even theyounger native forests are more efficient than eucalyptus andpastures in their capacity to store carbon.If the eucalyptus plantations remain untouched for a long
time their stock of carbon will also probably increase andmay achieve a value beyond that estimated by Paixao et al.(2006). However, considering the practices of eucalyptusplantation currently adopted in Nazare Paulista, cycleslonger than 6 years are not likely to occur.The assessments of carbon in this study were focused on
above ground biomass of trees whose trunk circumference isgreater than 17 cm. Other carbon pools like soil, lianas andsmall trees have not been considered, thus the completestocks of carbon were not determined. Nevertheless, theresults obtained provide an initial understanding of thepotential magnitude of the contribution of each land use formitigation of climate change.The map of land uses and carbon stocks in Figure 2 can be
used as a tool to predict the consequences of interventions inthe landscape. The maps indicate that restoration of 1 ha ofnative forest may alleviate climate change through storing
more than 113 tons of carbon in forest biomass over theperiod of 30 years when the forest is expected to grow,whereas deforestation in 1 ha may intensify climate changeby releasing to the atmosphere this amount of carbon.The order in which the main types of land uses were
considered to contribute to the mitigation of climate change(native forests, eucalyptus, pastures and bare soil) is thesame as that for the services associated with the preventionof sediment delivery to the reservoir.If the entire study area were occupied by native forests a
total of 9 tons of sediment yield would be expected everyyear. However, occupation of the entire area by pasturewould be more detrimental to the storage of water in thereservoir as the estimated amount of sediment delivered peryear would be about 1500 tons. Effects of occupation of allthe area by eucalyptus are closer to native forests with36 tons of sediment yield per year. The estimated preventionof sediment yield in the current land use scenario is1037 tons y#1; therefore restoration of native forest in thestudy area has the potential to mitigate up to 500 tons ofsediment delivery per year. The achievement of this opti-mum level of ecosystem service probably is not feasiblebecause local forces such as the economic opportunity costof nonforest land uses would impede the establishment ofnative forests in the entire area.Forest recovery may be feasible in a certain proportion of
the deforested lands, thus the classification of the 188catchments of the study area according to the capacity offorests to prevent sedimentation is helpful for choosing themost appropriate areas to be restored. Despite most studiesthat have used the MUSLE approach for estimating theamount of sedimentation (Araujo-Junior, 1997; Chaves andPiau, 2006) being focused in single catchments the currentresearch has demonstrated how this approach can be appliedto analyze a portion of the landscape that is formed bynumerous catchments. The results obtained, such as the mapclassifying the watersheds according to the contribution ofland use in preventing sedimentation (Figure 3) can beapplied more broadly for the purposes of landscapemanagement through revealing priority areas for planninginterventions that can mitigate losses of soil and subsequentsedimentation.The map in Figure 3 can, in the samemanner, be helpful in
land use decisions because it shows catchments in thelandscape of the study area where forest conservation, forestrestoration and deforestation will most affect the waterstorage in the reservoir.The analysis of water chemistry indicated weak associ-
ation between land uses in the buffer zones of streams andthe quality of water with the exception of alkalinity.Therefore, the only consequence of changes in land use thatcould be perceived in water is a variation in the capacity ofneutralization of acids that originate from water pollution.
Copyright # 2010 John Wiley & Sons, Ltd. LAND DEGRADATION & DEVELOPMENT, 21: 591–603 (2010)
600 E. H. DITT ET AL.

The independence of levels of nutrients such as phosphates,nitrite and nitrate, from the influence of land use is probablydue to the current economic land use activities in the region:local farmers normally do not use mineral fertilizers; henceno meaningful leaching in water bodies can be expected.
Despite this lack of influence in the chemical quality ofwater, variations in land use were significantly related tosome of the chemical parameters of soil fertility. The map inFigure 4 indicates that the mean content of organic matter is55!7 g dm#3 in soils occupied by forests and 42!15 g dm#3 inother land uses. The difference, that is 13!55 g dm#3, can beinterpreted as the rate of organic matter losses that mayoccur through conversion of forests, or the gains that mayoccur through restoration.
The results discussed above are helpful in quantifying inphysical terms some of the negative impacts of land usechange on human welfare. The maps in Figures 2,3and 4 indicate, at the whole landscape, variations in: theamount of carbon potentially sequestered from the atmos-phere, the amount of sediment delivered to the reservoir, andthe amount of organic matter retained in the soils if nativeforests are replaced or if they replace other land uses.
Results of this study also reveal the maximum and theminimum achievable values of ecosystem services in thestudy area according to extreme expansion of the currentmain land uses (Table V).
Gains of ecosystem services due to expansion of nativeforests in the entire area would be equivalent to 483 612 tonsof carbon sequestered, 111 570 tons of organic mattermaintained in the soil and 227 tons of sedimentationprevented per year. Losses of these services due to expansionof bare soil or urban areas would be equivalent to 380 984,95 041 and 17 tons, respectively.
These results can support formulation of policies that aimto maximize benefits to humans from land use decisions.Among several potential strategies to be considered in suchpolicies is economic valuation of ecosystem services follo-wed by the development of mechanisms of payments for
such services. For instance, financial resources originatingfrom the marketing of carbon or from policies related tocharging for the use of water could be used to compensatefarmers that decide to conserve or to restore native forests inareas that are relevant for the provision of these ecosystemservices. Furthermore, the results can be used by local auth-orities and decision makers for assessing the effectiveness ofcurrent policies in ensuring the capacity of the AtibainhaReservoir for storing water for human consumption.
ACKNOWLEDGEMENTS
We are grateful to the following institutions that supported thisresearch: IEB—Instituto Internacional de Educacao do Brasil;IFS—International Foundation for Science; IPE—Institutode Pesquisas Ecologicas; ORSAS—Overseas Research Stu-dents Awards Scheme; Russell E. Train Education For NatureProgram—WWF; USAID—United States Agency for Inter-national Development and WFN—Whitley Fund for Nature.
REFERENCES
Adger WN, Brown K, Cevigni R, Moran, D. 2002. Tropical forest values inMexico. In Valuing the Environment in Developing Countries, DavidPearce, Corin Pearce, Charles Palmer (eds.) Case Studies. EdwardElgar: Cheltenham.
Allan JD. 2004. Landscapes and riverscapes: The influence of land use onstream ecosystems. Annual Review of Ecology Evolution and Systematics35: 257–284.
Araujo-Junior GJLD. 1997. Aplicacao dos modelos EUPS e MEUPS nabacia do Ribeirao Bonito (SP) atraves de tecnicas de sensoriamentoremoto e groprocessamento. INPE—Instituto Nacional de PesquisasEspaciais, Sao Jose dos Campos.
Bacchi OOS, Reichardt K, Sparovek G. 2003. Sediment spatial distributionevaluated by three methods and its relation to some soil properties. Soiland Tillage Research 69: 117–125.
Bernardt F, Groot RS, Campos JJ. 2009. Valuation of tropical forest servicesand mechanisms to finance their conservation and sustainable use: A casestudy of Tapantı National Park, Costa Rica. Forest Policy and Economics11: 174–183.
Bertoni J, Lombardi-Neto F. 2005. Conservacao do Solo. Icone Editora, SaoPaulo.
Table V. Estimates of ecosystem services in the entire study area in the current land use scenario (S1) and in scenarios of maximum expansionof pastures (S2), eucalyptus (S3), native forests (S4) and bare soil/urban areas (S5)
Ecosystem services Measurements Currentscenario (S1)
100%pastures (S2)
100%eucalyptus (S3)
100% nativeforests (S4)
100% baresoil/urbanareas (S5)
Maintenance of soilfertility
Tons of organicmatter in the soilat depth interval
of 0–20 cm
737 744t 642 703t 642 703 t 849 314 t 642 703 t
Mitigation of sedimentdelivery into reservoir
Kilogram of soildelivered in the
reservoir
227 076 kg 1483 kg 67 kg 9 kg 244 520 kg
Carbon sequestration Tons of C 380 984 0 150 957 864 596 0
Copyright # 2010 John Wiley & Sons, Ltd. LAND DEGRADATION & DEVELOPMENT, 21: 591–603 (2010)
FOREST CONVERSION AND ECOSYSTEM SERVICES 601

Braga BPF. 2001. Integrated urban water resources management: A chal-lenge into the 21st century. International Journal of Water ResourcesDevelopment 17: 581–599.
Brown S. 1997. Estimating Biomass and Biomass Change of TropicalForests: A Primer. FAO Forestry Paper 134, Rome.
Brown S, Lugo AE. 1984. Biomass of tropical forests—A new estimatebased on forest volumes. Science 223: 1290–1293.
Brown S, Gillespie AJR, Lugo AE. 1989. Biomass estimation methods fortropical forests with applications to forest inventory data. Forest Science35: 881–902.
Burger DM, Delitti WBC. 1999. Fitomassa epigea da mata ciliar do rioMogi-Guacu, Itapira—SP. Revista Brasileira de Botanica 22: 429–435.
Chaves HML, Piau L. 2006. Efeito da variabilidade climatica e do uso emanejo do solo sobre o escoamento superficial e o aporte de sedimentoem uma pequena bacia hidrografica do Distrito Federal. Annals of VIIEncontro Nacional de Engenharia de Sedimentos, Porto Alegre.
Chen N, Li H, Wang L. in press. A GIS-based approach for mapping directuse value of ecosystem services at a county scale: Management implica-tions.
Costanza R, d’Arge R, Groot R, Farber S, GrassoM, Hannon B, Limburg K,Naeem S, O’Neill RV, Paruelo J, Raskin RG, Sutton P, Belt M. 1997. Thevalue of the world’s ecosystem services and natural capital. Nature 387:253–260.
Croke J, Nethery M. 2006. Modelling runoff and soil erosion in loggedforests: Scope and application of some existing models.CATENA 67: 35–49.
CSIRO Sustainable Ecosystems. 2003. Natural Assets: An inventory ofecosystem goods and services in the Goulburn Broken Catchment.CSIRO, Canberra.
Dean W. 1996. A Ferro e Fogo: A historia e a devastacao da mata atlanticabrasileira. Companhia das Letras, Sao Paulo.
Ditt EH, Knight JD, Mourato S, Padua CV, Martins RR, Ghazoul J. 2008.Defying legal protection of Atlantic Forest in the transforming landscapearound the Atibainha Reservoir, south-eastern Brazil. Landscape andUrban Planning 86: 276–283.
EPA. 2009. Valuing the protection of ecological systems and services: Areporto f the EPA Science Advisory Committee. United States Environ-mental Protection Agency, Washington, DC.
Fadini AAB, Carvalho PF. 2004. Os Usos da Agua do Moinho: Um estudona Bacia Hidrografica do Ribeirao do Moinho. Annals of the II EncontroNacional da Associaco Nacional de Pos-Graduacao e Pesquisa emAmbiente e Sociedade. ANPPAS, Campinas.
Fisher B, Turner RK. 2008. Ecosystem services: Classification for valuation.Biological Conservation 141: 1167–1169.
Garcia-Montiel DC, Neill C, Melillo J, Thomas S, Steudler PA, Cerri CC.2000. Soil phosphorus transformations following forest clearing forpasture in the Brazilian Amazon. Soil Science Society American Journal64: 1792–1804.
Guo Z, Xiao X, Gan Y, Zheng Y. 2001. Ecosystem functions, services andtheir values—A case study in Xingshan County of China. EcologicalEconomics 38: 141–154.
IBGE. 1978. Cartas topograficas do Instituto Brasileiro de Geografia eEstatıstica. Instituto Brasileiro de Geografia e Estatıstica, Rio de Janeiro.
IPEF. 2006. Analise ecologica, dendrometrica e do uso potencial deespecies arboreas nativas em plantios consorciados visando o sequestrode carbono. Instituto de Pesquisas e Estudos Florestais, Piracicaba.
Johnson LB, Richards C, Host GE, Arthur JW. 1997. Landscape influenceson water chemistry in Midwestern stream ecosystems. FreshwaterBiology 37: 193–208.
Krishnaswamy J, Richter DD. 2002. Properties of advanced weathering-stage soils in tropical forests and pastures. Soil Science Society AmericanJournal 66: 244–253.
Li J, Ren ZY, Zhou ZX. 2006. Ecosystem services and their values: A casestudy in the Qinba mountains of China. Ecological Research 21: 597–604.
MacDicken KG. 1997. A Guide to Monitoring Carbon Storage in Forestryand Agroforestry Projects. Winrock International Institute for Agricul-tural Development, Arlington, VI.
Maidment DR. 2002. Arc-Hydro: GIS for water resources. ESRI, Austin.
Martins FR. 1993. Estrutura de Uma Floresta Mesofila. Ed. Unicamp,Campinas.
Melo ACG, Durigan G. 2006. Carbon sequestration by planted riparianforests in Paranapanema Valley, SP, Brazil. Scientia Forestalis 71: 149–154.
Oliveira JB, Camargo MN, Calderado-Filho B. 1999. Mapa pedologico doEstado de Sao Paulo: Escala 1:500.000. Embrapa-Solos, Rio de Janeiro.
Paixao F, Soares C, Jacovine L. 2006. Quantification of carbon stock andeconomic evaluation of management alternatives in a eucalypt plantation.Revista Arvore 30(3): 411–420.
Pearson T, Walker S, Brown S. 2005. Sourcebook for land use, land-usechange and forestry projects. BioCarbonFund, Washington, DC.
Pulleman MM, Bouma J, van-Essen EA, Meijles EW. 2000. Soil organicmatter content as a function of different land use history. Soil ScienceSociety American Journal 64: 689–693.
Quinn JM, Stroud MJ. 2002. Water quality and sediment and nutrientexport from New Zealand hill-land catchments of contrasting land use.New Zealand Journal of Marine and Freshwater Research 36: 409–429.
Reid WV, Mooney HA, Cropper A, Capistrano D, Carpenter SR, Chopra K,Dasgupta P, Dietz T, Duraiappah AK, Hassan R, Kasperson R, LeemansR, May RM, McMichael T, Pingali P, Samper C, Scholes R, Watson RT,Zakri AH, Shidong Z, Ash NJ, Bennett E, Kumar P, Lee MJ, Raudsepp-Hearne C, Simons H, Thonell J, Zurek MB. 2005.Millennium EcosystemAssessment. Island Press: Washington, DC.
Sauer TJ, Meek DW. 2003. Spatial variation of plant-available phosphorusin pastures with contrasting management. Soil Science Society AmericanJournal 67: 826–836.
Schipper LA, Sparling GP. 2000. Performance of soil condition indicatorsacross taxonomic groups and land uses. Soil Science Society AmericanJournal 64: 300–311.
Shineni R. 2005. The impact of land use on water chemistry and physicalparameters of tropical streams of the northeast shore of Lake Tanganyika.Nyanza Report 2005/University of Arizona, Tucson, AZ.
Silva VC. 2003. Calculo automatico do fator totpografico (LS) da EUPS,na bacia do Rio Paracatu. Pesquisa Agropecuaria Tropical 33:29–34.
Silva AM, Schulz HE, Camargo PB. 2003. Erosao e hidrosedimentologiaem bacias hidrograficas. Rima Editora, Sao Carlos.
Silvano RAM, Udvardy S, CeroniM, Farley J. 2005. An ecological integrityassessment of a Brazilian Atlantic Forest watershed based on surveys ofstream health and local farmers’ perceptions: Implications for manage-ment. Ecological Economics 53: 369–385.
Tabarelli M, Pinto LP, Silva JMC, Hirota M, Bede L. 2005. Challenges andopportunities for biodiversity conservation in the brazilian atlantic forest.Conservation Biology 19: 695–700.
Torras M. 2000. The total economic value of Amazonian deforestation1978–1993. Ecological Economics 33: 283–297.
UNFPA. 2008. State of the world population 2008: Reaching CommonGround: Culture, Gender and Human Rights. United Nations, New York,NY.
USDA 1986. Technical Release 55: Urban hydrology for small watersheds.United States Department of Agriculture, Washington, DC.
Van-Raij B. 1991. Fertilidade do solo e adubacao. Ed. Ceres, Piracicaba.Van-Raij B, Cantarella H, Quaggio JH, Furlani AMC. 1997. BoletimTecnico 100: Recomendacoes de adubacao e Calagem para o Estadode Sao Paulo. Instituto Agronomico—Fundag, Campinas.
Wallace KJ. 2007. Classification of ecosystem services: Problems andsolutions. Biological Conservation 139: 235–246.
Whately M, Cunha P. 2007. Cantareira 2006: um olhar sobre o maiormanancial de agua da Regiao Metropolitana de Sao Paulo. InstitutoSocioambiental, Sao Paulo.
Williams JR. 1975. Sediment yield prediction with universal equation usingrunoff energy factor. In: Present and prospective technology for predict-ing sediment yields and sources. United States Department of Agricul-ture, Washington, DC.
Wischmeier WH, Smith DD. 1978. USDA Agriculture Handbook, number537: Predicting rainfall erosion losses: A guide to conservation planning.United States Department of Agriculture, Washington, DC.
Copyright # 2010 John Wiley & Sons, Ltd. LAND DEGRADATION & DEVELOPMENT, 21: 591–603 (2010)
602 E. H. DITT ET AL.

APPENDIX
ASedim
entdeliveryrates(kghay#1)forthedifferentcatchments
withforests(PSDf),eucalyptys(PSDe),pastures(PSDp)andcurrentlanduses(CurS)
Catch
PSDf
(kgha#
1)
PSDe
(kgha#
1)
PSDp
(kgha#
1)
CurS
(kg)
Catch
PSDf
PSDe
PSDp
CurS
Catch
PSDf
PSDe
PSDp
CurS
Catch
PSDf
PSDe
PSDp
CurS
08767
8766
8726
208273
47
29305
29300
29167
559029
94
7748
7745
7678
303762
141
31904
31898
31753
916965
14179
4179
4160
66275
48
11713
11711
11657
440227
95
38446
38431
38102
343058
142
69100
69089
68773
1373191
28108
8106
8069
73149
49
80270
80256
79890
2291335
96
34181
34176
34036
1098947
143
48639
48631
48409
1460584
315408
15406
15335
566883
50
11709
11707
11654
428467
97
12449
12443
12325
327279
144
55247
55238
54985
621752
49288
9286
9244
130989
51
21582
21578
21480
1275486
98
57319
57297
56808
599255
145
112605
112587
112072
2394168
510136
10134
10088
906763
52
9534
9532
9489
350050
99
37068
37051
36700
193711
146
16634
16631
16555
1460263
611129
11128
11077
511937
53
10614
10613
10564
244935
100
12900
12895
12785
304055
147
20086
20082
19991
1232652
76539
6538
6508
174994
54
34689
34683
34525
959430
101
58955
58945
58676
3631641
148
42236
42229
42036
1085510
817724
17721
17640
1226452
55
21687
21684
21585
645688
102
22205
22195
21984
1386224
149
206896
206862
205916
8117177
916511
16508
16433
1250526
56
28175
28170
28042
2311306
103
12431
12429
12372
459994
150
21058
21055
20958
899029
10
30674
30669
30529
874372
57
33544
33539
33385
617680
104
23477
23473
23377
1135714
151
19196
19193
19105
235842
11
14591
14589
14522
1435228
58
24297
24293
24182
1071996
105
4494
4492
4454
163642
152
71941
71929
71600
3269256
12
26167
26162
26043
351151
59
30287
30282
30144
702854
106
15464
15462
15399
476532
153
25936
25931
25813
386235
13
7713
7712
7676
748838
60
17453
17450
17371
393851
107
32897
32884
32603
358231
154
19896
19887
19698
463017
14
25366
25362
25246
725841
61
42431
42424
42230
516396
108
27928
27924
27809
1664511
155
40977
40970
40783
2071359
15
2938
2937
2924
28867
62
13971
13968
13904
140445
109
22408
22398
22185
1039644
156
30137
30132
29994
1008275
16
12696
12693
12635
265716
63
6310
6309
6283
556565
110
26847
26835
26580
1859585
157
71449
71437
71111
1801008
17
5658
5657
5631
150488
64
24488
24484
24372
706568
111
30741
30736
30596
391961
158
35711
35705
35542
1898561
18
12523
12521
12464
126860
65
19059
19055
18968
437442
112
16409
16406
16339
245345
159
55571
55561
55307
2882588
19
7968
7967
7931
211468
66
7090
7087
7019
73617
113
42909
42890
42483
3254406
160
70262
70251
69930
3681968
20
13290
13288
13227
161221
67
3431
3430
3416
59282
114
46678
46671
46457
1914297
161
16578
16575
16500
409678
21
56276
56267
56009
2404464
68
31425
31420
31276
519240
115
13947
13945
13881
701557
162
5989
5988
5964
179416
22
13377
13374
13313
272507
69
19934
19931
19840
348993
116
10214
10212
10165
107928
163
44978
44970
44765
1630524
23
13702
13700
13638
358287
70
142267
142202
140854
5934699
117
26765
26761
26651
1187050
164
37155
37138
36785
829987
24
51029
51020
50787
529658
71
2817
2816
2792
34246
118
75301
75267
74553
2707464
165
72295
72283
71953
728042
25
82030
82016
81641
2763272
72
6176
6175
6147
74152
119
18564
18561
18476
656636
166
3266
3266
3252
19793
26
15474
15472
15401
453028
73
8101
8100
8067
371571
120
33568
33553
33235
336067
167
8806
8804
8768
251879
27
11973
11971
11916
106161
74
14321
14319
14253
443832
121
95109
95093
94659
1224448
168
79695
79658
78903
4501292
28
43556
43548
43349
856956
75
86198
86158
85341
720086
122
17210
17207
17136
878527
169
103755
103738
103263
5474280
29
34090
34084
33929
420942
76
3124
3124
3111
36209
123
10149
10147
10101
255456
170
88006
87966
87131
3639468
30
10210
10208
10162
289643
77
92964
92922
92040
2443153
124
5864
5863
5836
70461
171
45535
45527
45319
3339423
31
51959
51951
51713
1126040
78
6479
6478
6452
1206392
125
84128
84114
83730
1359012
172
47483
47476
47259
6035209
32
8641
8639
8600
236979
79
21652
21642
21436
992099
126
32624
32618
32469
611952
173
7775
7772
7705
450861
33
39695
39688
39507
1633637
80
40739
40732
40546
729801
127
16645
16642
16566
2778871
174
5800
5799
5775
320940
34
12913
12910
12851
288077
81
13385
13383
13322
216844
128
5359
5358
5334
125200
175
8693
8690
8616
88877
35
44621
44614
44410
2834828
82
28720
28706
28434
1210361
129
9670
9668
9624
118725
176
77774
77739
77002
10648759
36
12011
12009
11954
489100
83
6202
6201
6175
572231
130
10726
10725
10676
313453
177
48414
48406
48185
8623722
37
18009
18006
17924
567749
84
38773
38766
38589
2198742
131
17105
17102
17024
481798
178
8466
8465
8430
321482
38
35810
35804
35640
623122
85
40360
40344
39999
825071
132
71891
71879
71551
2965029
179
150110
150041
148618
4395161
39
180123
180094
179271
4882046
86
101382
101335
100374
3143296
133
15725
15723
15651
2171329
180
16656
16650
16507
395597
40
17015
17012
16934
731331
87
43889
43883
43703
1677835
134
21169
21165
21068
419725
181
8909
8908
8871
786555
41
61050
61040
60761
1889538
88
30165
30151
29866
316488
135
17238
17235
17156
1280388
182
76529
76516
76167
1419475
42
14737
14734
14667
414932
89
30132
30127
29989
156195
136
10326
10324
10277
314141
183
79180
79167
78805
941708
43
52419
52410
52170
1701623
90
8081
8080
8047
415613
137
55506
55497
55243
1008430
184
7375
7374
7343
235165
44
19740
19736
19646
465165
91
6787
6784
6726
344182
138
9713
9711
9667
173986
185
81675
81637
80863
2024527
45
61209
61199
60919
2220190
92
36789
36775
36460
1126450
139
33548
33542
33389
439095
186
60471
60461
60185
4112507
46
68228
68216
67905
1258485
93
7369
7368
7337
90237
140
59762
59752
59479
2314909
187
17727
17724
17643
913888
Copyright # 2010 John Wiley & Sons, Ltd. LAND DEGRADATION & DEVELOPMENT, 21: 591–603 (2010)
FOREST CONVERSION AND ECOSYSTEM SERVICES 603