forest products annual market review, 2011-2012 - unece
TRANSCRIPT
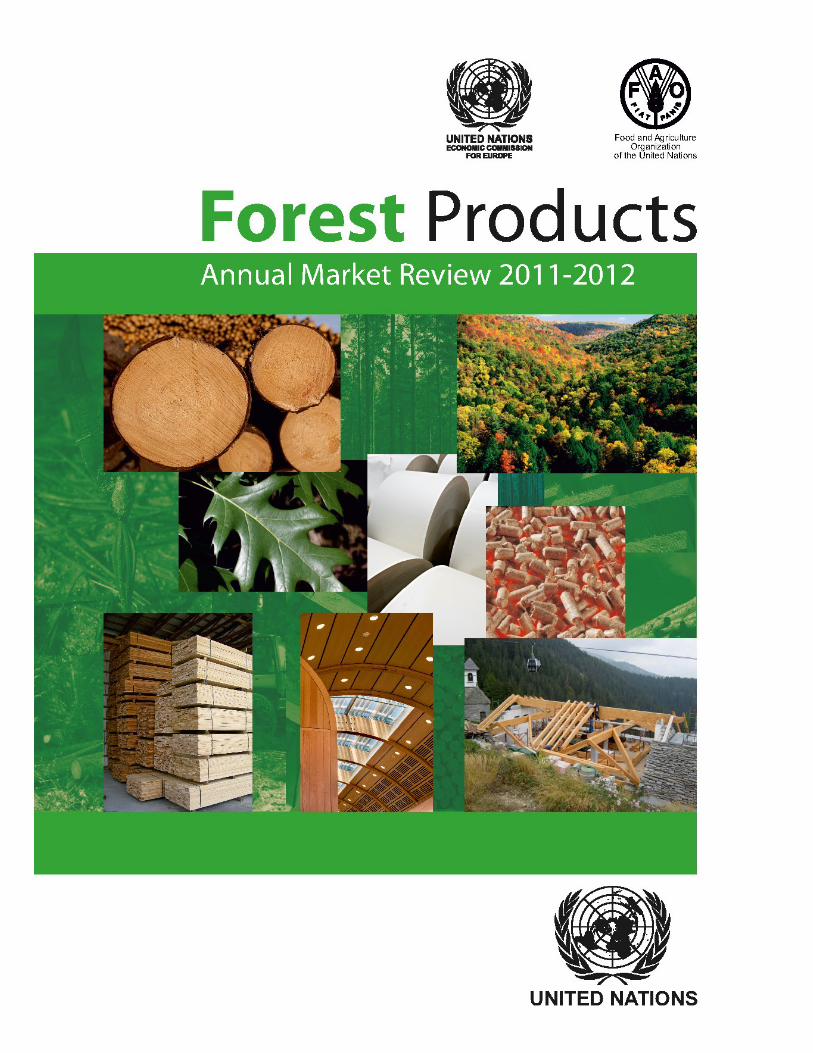

The photographs on the cover are courtesy of the following: American Hardwood Export Council, 2012
Ilaria Cerrutti, 2012
Metsä Group, 2012
Raunion Saha, 2012
Vapo, 2012
P. Wray, Iowa State University, 2012
ECE/TIM/SP/30
Geneva Timber and Forest Study Paper 30
FOREST PRODUCTS ANNUAL MARKET REVIEW
2011-2012
UNITED NATIONS New York and Geneva, 2012
United Nations Economic Commission for Europe/Food and Agriculture Organization of the United Nations
UNECE
NOTE The designations employed and the presentation of material in this publication do not imply the expression
of any opinion whatsoever on the part of the secretariat of the United Nations concerning the legal status of any country, territory, city or area, or of its authorities, or concerning the delimitation of its frontiers or boundaries. Data for the Commonwealth of Independent States (CIS) are for these 12 countries: Armenia, Azerbaijan, Belarus, Georgia, Kazakhstan, Kyrgyzstan, Republic of Moldova, Russian Federation, Tajikistan, Turkmenistan, Ukraine and Uzbekistan.
DISCLAIMER
The views expressed in this paper are those of the authors and do not necessarily reflect the views or carry the endorsement of the United Nations.
ABSTRACT The UNECE/FAO Forest Products Annual Market Review, 2011-2012 provides general and statistical
information on forest products markets and related policies in the UN Economic Commission for Europe region (Europe, North America and the Commonwealth of Independent States). The Review begins with an overview chapter, followed by a description of the macro-economic situation. Next it includes an analysis of government and industry policies affecting forest products markets. Five chapters are based on annual country-supplied statistics, describing: wood raw materials, sawn softwood, sawn hardwood, wood-based panels, and paper, paperboard and woodpulp. Additional chapters discuss markets for wood energy, certified forest products, value-added wood products, forest carbon and innovative wood products. In each chapter, production, trade and consumption are analysed and relevant material on specific markets is included. Tables and graphs provided throughout the text present summary information. Supplementary statistical tables may be found on the website of the UNECE Timber Committee and the FAO European Forestry Commission at www.unece.org/forests/fpamr2012.
KEYWORDS
Bioenergy, biomass, builders joinery, carbon, cardboard, carpentry, certification, certified forest products, climate change, China, construction, consumption, engineered wood products, EWP, exports, fiberboard, fibreboard, forest products markets, forestry industry, forestry statistics, fuelwood, furniture, housing market, imports, innovative wood products, lumber, market analysis, MDF, OSB, paperboard, particle board, particleboard, plywood, production, pulp and paper industry, pulplogs, pulpwood, REDD, roundwood, sawlogs, sawn hardwood, sawn softwood, sawnwood, sustainable forestry, timber, tropical timber, wood energy, wood fuels, wood industry, wood pellets, wood products, wood-based panels, woodpulp.
ECE/TIM/SP/30
UNITED NATIONS
PUBLICATIONS Sales No. 12.II.E.10
ISBN 978-92-1-117064-1
ISSN 1020-2269
U
tro
Ue
m
rem
caete
jose
UNECE/FAO F
Forest prodrends, the UN
opinion formeEvery year,
UNECE regioeconomic fact
2012 is themix of energy
In the UNeducing depe
more profitablThe recen
changes in theand FAO, byenvironmentaechnologies.
We take thoint publicatiecretariat.
A
Food and A
Forest Products A
ducts have coNECE/FAO Fers with the b, the Review oon. It focusestors that lie bee Internationasources. The
NECE region,endence on fle. It has beennt United Nae ways societiy promoting al challenges
his occasion tion—the exp
EduardoAssistant Dir
Forestry DAgriculture Or
Nat
Annual Market R
ontinued to eForest Productackground thoffers the first s on the varioehind the datal Year of Susworld’s forest
, wood is the fuel imports; n creating newations Confeies consume a
the use of into econom
to express ourperts, the man
o Rojas-Brialerector-GenerDepartment rganization otions
Review, 2011-20
FO
expand their ts Annual Ma
hey need for incomprehensi
ous sectors ofta, and analysstainable Enerts, as well as bprincipal souand it stimu
w investmenterence on Suand produce sustainably
mic opportuni
r great apprecny partner or
es ral
of the United
012 __________
OREWORD
share of the arket Review 2nformed decisive analysis off the industrysing the most rgy for All. A
being huge stource of renew
ulates social at and job oppoustainable Deare indispensproduced foties and boos
iation to all trganizations,
d
Unit
_____________
D
market this y2011-2012 aimsion-making.f the year’s foy, presenting recent marke
Any sustainablores of carbonwable energy. and economicortunities, espevelopment (sable for achieorest productssting the dem
those who havthe informat
Exted Nations Ec
______________
year. Presentims to provide
rest products market data
et changes. le energy futu
n, are also enoIt also contr
c developmenpecially in rur(Rio+20) higeving sustains, hope to c
mand for bett
ve played a pion suppliers
Sven Alkaxecutive Secreconomic Com
_____________
ing an analyse industry, pol
markets and a along with t
ure will have tormous stores ributes to enent through mral areas. ghlighted thaable developmcontribute toter products a
art in the proand, last but
alaj etary mmission for E
_____________
sis of the latelicymakers an
policies for ththe policy an
to depend onof energy.
ergy security bmaking forest
at fundamentment. UNECo transforminand productio
oduction of tht not least, th
Europe
_ iii
est nd
he nd
n a
by try
tal CE ng on
his he

UNECE/FAO Forest Products Annual Market Review, 2011-2012 ___________________________________________________________ v
C O N T E N T S Page
25T25T25T25T25T25T25T25T25T25T25T25T25T25T25T25T25T25T25T25T25T25T25T25T25T25T25T25T25T25T25T25T25T25T25T25T25T25T25T25T25T25T25T25T25T25T25T25T25T25T25T25T25T25T25T25T25T25T25T25T25T25T25T25T25T25T25T25T25T25T25T25T25T25T25T25T25T25T25T25T25T25T25T25T25T25T25T25T25T25T25T25T25T25T25T25T25T25T25T25T25T25T25T25T25T25T25T25T25T25T25T25T25T25T25T25T25T25T25T25T25T25T25T25T25T25T25T25T25T25T25T25T25T25T25T25T25T25T25T25T25T25T25T25T25T25T25T25T25T25T25T25T25T25T25T25T25T25T25T25T25T25T25T25T25T25T25T25T25T25T25T25T25T25T25T25T25T25T25T25T25T25T25T25T25T25T25T25T25T25T25T25T25T25T25T25T25T25T25T25T25T25T25T25T25T25T25T25T25T25T25T25T25T25T25T25T25T25T25T25T25T25T25T25T25T25T25T25T25T25T25T25T25T25T25T25T25T25T25T25T25T25T25T25T25T25T25T25T25T25T25T25T25T25T25T25T25T25T25T25T25T25T25T25T25T25T25T25T25T25T25T25T25T25T25T25T25T25T25T25T25T25T25T25T25T25T25T25T25T25T25T25T25T25T25T25T25T25T25T25T25T25T25T25T25T25T25T25T25T25T25T25T25T25T25T25T25T25T25T25T25T25T25T25T25T25T25T25T25T25T25T25T25T25T25T25T25T25T25T25T25T25T25T25T25T25T25T25T25T25T25T25T25T25T25T25T25T25T25T25T25T25T25T25T25T25T25T25T25T25T25T25T25T25T25T25T25T25T25T25T25T25T25T25T25T25T25T25T25T25T25T25T25T25T25T25T25T25T25T25T25T25T25T25T25T25T25T25T25T25T25T25T25T25T25T25T25T25T25T25T25T25T25T25T25T25T25T25T25T25T25T25T25T25T25T25T25T25T25T25T25T25T25T25T25T25T25T25T25T25T25T25T25T25T25T25T25T25T25T25T25T25T25T25T25T25T25T25T25T25T25T25T25T25T25T25T25T25T25T25T25T25T25T25T25T25T25T25T25T25T25T25T25T25T25T25T25T25T25T25T25T25T25T25T25T25T25T25T25T25T25T25T25T25T25T25T25T25T25T25T25T25T25T25T25T25T25T25T25T25T25T25T25T25T25T25T25T25T25T25T25T25T25T25T25T25T25T25T25T25T25T25T25T25T25T25T25T25T25T25T25T25T25T25T25T25T25T25T25T25T25T25T25T25T25T25T25T25T25T25T25T25T25T25T25T25T25T25T25T25T25T25T25T25T25T25T25T25T25T25T25T25T25T25T25T25T25T25T25T25T25T25T25T25T25T25T25T25T25T25T25T25T25T25T25T25T25T25T25T25T25T25T25T25T25T25T25T25T25T25T25T25T25T25T25T25T25T25T25T25T25T25T25T25T25T25T25T25T25T25T25T25T25T25T25T25T25T25T25T25T25T25T25T25T25T25T25T25T25T25T25T25T25T25T25T25T25T25T25T25T25T25T25T25T25T25T25T25T25T25T25T25T25T25T25T25T25T25T25T25T25T25T25T25T25T25T25T25T25T25T25T25T25T25T25T25T25T25T25T25T25T25T25T25T25T25T25T25T25T25T25T25T25T25T25T25T25T25T25T25T25T25T25T25T25T25T25T25T25T25T25T25T25T25T25T25T25T25T25T25T25T25T25T25T25T25T25T25T25T25T25T25T25T25T25T25T25T25T25T25T25T25T25T25T25T25T25T25T25T25T25T25T25T25T25T25T25T25T25T25T25T25T25T25T25T25T25T25T25T25T25T25T25T25T25T25T25T25T25T25T25T25T25T25T25T25T25T25T25T25T25T25T25T25T25T25T25T25T25T25T25T25T25T25T25T25T25T25T25T25T25T25T25T25T25T25T25T25T25T25T25T25T25T25T25T25T25T25T25T25T25T25T25T25T25T25T25T25T25T25T25T25T25T25T25T25T25T25T25T25T25T25T25T25T25T25T25T25T25T25T25T25T25T25T25T25T25T25T25T25T25T25T25T25T25T25T25T25T25T25T25T25T25T25T25T25T25T25T25T25T25T25T25T25T25T25T25T25T25T25T25T25T25T25T25T25T25T25T25T25T25T25T25T25T25T25T25T25T25T25T25T25T25T25T25T25T25T25T25T25T25T25T25T25T25T25T25T25T25T25T25T25T25T25T25T25T25T25T25T25T25T25T25T25T25T25T25T25T25T25T25T25T25T25T25T25T25T25T25T25T25T25T25T25T25T25T25T25T25T25T25T25T25T25T25T25T25T25T25T25T25T25T25T25T25T25T25T25T25T25T25T25T25T25T25T25T25T25T25T25T25T25T25T25T25T25T25T25T25T25T25T25T25T25T25T25T25T25T25T25T25T25T25T25T25T25T25T25T25T25T25T25T25T25T25T25T25T25T25T25T25T25T25T25T25T25T25T25T25T25T25T25T25T25T25T25T25T25T25T25T25T25T25T25T25T25T25T25T25T25T25T25T25T25T25T25T25T25T25T25T25T25T25T25T25T25T25T25T25T25T25T25T25T25T25T25T25T25T25T25T25T25T25T25T25T25T25T25T25T25T25T25T25T25T25T25T25T25T25T25T25T25T25T25T25T25T25T25T25T25T25T25T25T25T25T25T25T25T25T25T25T25T25T25T25T25T25T25T25T25T25T25T25T25T25T25T25T25T25T25T25T25T25T25T25T25T25T25T25T25T25T25T25T25T25T25T25T25T25T25T25T25T25T25T25T25T25T25T25T25T25T25T25T25T25T25T25T25T25T25T25T25T25T25T25T25T25T25T25T25T25T25T25T25T25T25T25T25T25T25T25T25T25T25T25T25T25T25T25T25T25T25T25T25T25T25T25T25T25T25T25T25T25T25T25T25T25T25T25T25T25T25T25T25T25T25T25T25T25T25T25T25T25T25T25T25T25T25T25T25T25T25T25T25T25T25T25T25T25T25T25T25T25T25T25T25T25T25T25T25T25T25T25T25T25T25T25T25T25T25T25T25T25T25T25T25T25T25T25T25T25T25T25T25T25T25T25T25T25T25T25T25T25T25T25T25T25T25T25T25T25T25T25T25T25T25T25T25T25T25T25T25T25T25T25T25T25T25T25T25T25T25T25T25T25T25T25T25T25T25T25T25T25T25T25T25T25T25T25T25T25T25T25T25T25T25T25T25T25T25T25T25T25T25T25T25T25T25T25T25T25T25T25T25T25T25T25T25T25T25T25T25T25T25T25T25T25T25T25T25T25T25T25T25T25T25T25T25T25T25T25T25T25T25T25T25T25T25T25T25T25T25T25T25T25T25T25T25T25T25T25T25T25T25T25T25T25T25T25T25T25T25T25T25T25T25T25T25T25T25T25T25T25T25T25T25T25T25T25T25T25T25T25T25T25T25T25T25T25T25T25T25T25T25T25T25T25T25T25T25T25T25T25T25T25T25T25T25T25T25T25T25T25T25T25T25T25T25T25T25T25T25T25T25T25T25T25T25T25T25T25T25T25T25T25T25T25T25T25T25T25T25T25T25T25T25T25T25T25T25T25T25T25T25T25T25T25T25T25T25T25T25T25T25T25T25T25T25T25T25T25T25T25T25T25T25T25T25T25T25T25T25T25T25T25T25T25T25T25T25T25T25T25T25T25T25T25T25T25T25T25T25T25T25T25T25T25T25T25T25T25T25T25T25T25T25T25T25T25T25T25T25T25T25T25T25T25T25T25T25T25T25T25T25T25T25T25T25T25T25T25T25T25T25T25T25T25T25T25T25T25T25T25T25T25T25T25T25T25T25T25T25T25T25T25T25T25T25T25T25T25T25T25T25T25T25T25T25T25T25T25T25T25T25T25T25T25T25T25T25T25T25T25T25T25T25T25T25T25T25T25T25T25T25T25T25T25T25T25T25T25T25T25T25T25T25T25T25T25T25T25T25T25T25T25T25T25T25T25T25T25T25T25T25T25T25T25T25T25T25T25T25T25T25T25T25T25T25T25T25T25T25T25T25T25T25T25T25T25T25T25T25T25T25T25T25T25T25T25T25T25T25T25T25T25T25T25T25T25T25T25T25T25T25T25T25T25T25T25T25T25T25T25T25T25T25T25T25T25T25T25T25T25T25T25T25T25T25T25T25T25T25T25T25T25T25T25T25T25T25T25T25T25T25T25T25T25T25T25T25T25T25T25T25T25T25T25T25T25T25T25T25T25T25T25T25T25T25T25T25T25T25T25T25T25T25T25T25T25T25T25T25T25T25T25T25T25T25T25T25T25T25T25T25T25T25T25T25T25T25T25T25T25T25T25T25T25T25T25T25T25T25T25T25T25T25T25T25T25T25T25T25T25T25T25T25T25T25T25T25T25T25T25T25T25T25T25T25T25T25T25T25T25T25T25T25T25T25T25T25T25T25T25T25T25T25T25T25T25T25T25T25T25T25T25T25T25T25T25T25T25T25T25T25T25T25T25T25T25T25T25T25T25T25T25T25T25T25T25T25T25T25T25T25T25T25T25T25T25T25T25T25T25T25T25T25T25T25T25T25T25T25T25T25T25T25T25T25T25T25T25T25T25T25T25T25T25T25T25T25T25T25T25T25T25T25T25T25T25T25T25T25T25T25T25T25T25T25T25T25T25T25T25T25T25T25T25T25T25T25T25T25T25T25T25T25T25T25T25T25T25T25T25T25T25T25T25T25T25T25T25T25T25T25T25T25T25T25T25T25T25T25T25T25T25T25T25T25T25T25T25T25T25T25T25T25T25T25T25T25T25T25T25T25T25T25T25T25T25T25T25T25T25T25T25T25T25T25T25T25T25T25T25T25T25T25T25T25T25T25T25T25T25T25T25T25T25T25T25T25T25T25T25T25T25T25T25T25T25T25T25T25T25T25T25T25T25T25T25T25T25T25T25T25T25T25T25T25T25T25T25T25T25T25T25T25T25T25T25T25T25T25T25T25T25T25T25T25T25T25T25T25T25T25T25T25T25T25T25T25T25T25T25T25T25T25T25T25T25T25T25T25T25T25T25T25T25T25T25T25T25T25T25T25T25T25T25T25T25T25T25T25T25T25T25T25T25T25T25T25T25T25T25T25T25T25T25T25T25T25T25T25T25T25T25T25T25T25T25T25T25T25T25T25T25T25T25T25T25T25T25T25T25T25T25T25T25T25T25T25T25T25T25T25T25T25T25T25T25T25T25T25T25T25T25T25T25T25T25T25T25T25T25T25T25T25T25T25T25T25T25T25T25T25T25T25T25T25T25T25T25T25T25T25T25T25T25T25T25T25T25T25T25T25T25T25T25T25T25T25T25T25T25T25T25T25T25T25T25T25T25T25T25T25T25T25T25T25T25T25T25T25T25T25T25T25T25T25T25T25T25T25T25T25T25T25T25T25T25T25T25T25T25T25T25T25T25T25T25T25T25T25T25T25T25T25T25T25T25T25T25T25T25T25T25T25T25T25T25T25T25T25T25T25T25T25T25T25T25T25T25T25T25T25T25T25T25T25T25T25T25T25T25T25T25T25T25T25T25T25T25T25T25T25T25T25T25T25T25T25T25T25T25T25T25T25T25T25T25T25T25T25T25T25T25T25T25T25T25T25T25T25T25T25T25T25T25T25T25T25T25T25T25T25T25T25T25T25T25T25T25T25T25T25T25T25T25T25T25T25T25T25T25T25T25T25T25T25T25T25T25T25T25T25T25T25T25T25T25T25T25T25T25T25T25T25T25T25T25T25T25T25T25T25T25T25T25T25T25T25T25T25T25T25T25T25T25T25T25T25T25T25T25T25T25T25T25T25T25T25T25T25T25T25T25T25T25T25T25T25T25T25T25T25T25T25T25T25T25T25T25T25T25T25T25T25T25T25T25T25T25T25T25T25T25T25T25T25T25T25T25T25T25T25T25T25T25T25T25T25T25T25T25T25T25T25T25T25T25T25T25T25T25T25T25T25T25T25T25T25T25T25T25T25T25T25T25T25T25T25T25T25T25T25T25T25T25T25T25T25T25T25T25T25T25T25T25T25T25T25T25T25T25T25T25T25T25T25T25T25T25T25T25T25T25T25T25T25T25T25T25T25T25T25T25T25T25T25T25T25T25T25T25T25T25T25T25T25T25T25T25T25T25T25T25T25T25T25T25T25T25T25T25T25T25T25T25T25T25T25T25T25T25T25T25T25T25T25T25T25T25T25T25T25T25T25T25T25T25T25T25T25T25T25T25T25T25T25T25T25T25T25T25T25T25T25T25T25T25T25T25T25T25T25T25T25T25T25T25T25T25T25T25T25T25T25T25T25T25T25T25T25T25T25T25T25T25T25T25T25T25T25T25T25T25T25T25T25T25T25T25T25T25T25T25T25T25T25T25T25T25T25T25T25T25T25T25T25T25T25T25T25T25T25T25T25T25T25T25T25T25T25T25T25T25T25T25T25T25T25T25T25T25T25T25T25T25T25T25T25T25T25T25T25T25T25T25T25T25T25T25T25T25T25T25T25T25T25T25T25T25T25T25T25T25T25T25T25T25T25T25T25T25T25T25T25T25T25T25T25T25T25T25T25T25T25T25T25T25T25T25T25T25T25T25T25T25T25T25T25T25T25T25T25T25T25T25T25T25T25T25T25T25T25T25T25T25T25T25T25T25T25T25T25T25T25T25T25T25T25T25T25T25T25T25T25T25T25T25T25T25T25T25T25T25T25T25T25T25T25T25T25T25T25T25T25T25T25T25T25T25T25T25T25T25T25T25T25T25T25T25T25T25T25T25T25T25T25T25T25T25T25T25T25T25T25T25T25T25T25T25T25T25T25T25T25T25T25T25T25T25T25T25T25T25T25T25T25T25T25T25T25T25T25T25T25T25T25T25T25T25T25T25T25T25T25T25T25T25T25T25T25T25T25T25T25T25T25T25T25T25T25T25T25T25T25T25T25T25T25T25T25T25T25T25T25T25T25T25T25T25T25T25T25T25T25T25T25T25T25T25T25T25T25T25T25T25T25T25T25T25T25T25T25T25T25T25T25T25T25T25T25T25T25T25T25T25T25T25T25T25T25T25T25T25T25T25T25T25T25T25T25T25T25T25T25T25T25T25T25T25T25T25T25T25T25T25T25T25T25T25T25T25T25T25T25T25T25T25T25T25T25T25T25T25T25T25T25T25T25T25T25T25T25T25T25T25T25T25T25T25T25T25T25T25T25T25T25T25T25T25T25T25T25T25T25T25T25T25T25T25T25T25T25T25T25T25T25T25T25T25T25T25T25T25T25T25T25T25T25T25T25T25T25T25T25T25T25T25T25T25T25T25T25T25T25T25T25T25T25T25T25T25T25T25T25T25T25T25T25T25T25T25T25T25T25T25T25T25T25T25T25T25T25T25T25T25T25T25T25T25T25T25T25T25T25T25T25T25T25T25T25T25T25T25T25T25T25T25T25T25T25T25T25T25T25T25T25T25T25T25T25T25T25T25T25T25T25T25T25T25T25T25T25T25T25T25T25T25T25T25T25T25T25T25T25T25T25T25T25T25T25T25T25T25T25T25T25T25T25T25T25T25T25T25T25T25T25T25T25T25T25T25T25T25T25T25T25T25T25T25T25T25T25T25T25T25T25T25T25T25T25T25T25T25T25T25T25T25T25T25T25T25T25T25T25T25T25T25T25T25T25T25T25T25T25T25T25T25T25T25T25T25T25T25T25T25T25T25T25T25T25T25T25T25T25T25T25T25T25T25T25T25T25T25T25T25T25T25T25T25T25T25T25T25T25T25T25T25T25T25T25T25T25T25T25T25T25T25T25T25T25T25T25T25T25T25T25T25T25T25T25T25T25T25T25T25T25T25T25T25T25T25T25T25T25T25T25T25T25T25T25T25T25T25T25T25T25T25T25T25T25T25T25T25T25T25T25T25T25T25T25T25T25T25T25T25T25T25T25T25T25T25T25T25T25T25T25T25T25T25T25T25T25T25T25T25T25T25T25T25T25T25T25T25T25T25T25T25T25T25T25T25T25T25T25T25T25T25T25T25T25T25T25T25T25T25T25T25T25T25T25T25T25T25T25T25T25T25T25T25T25T25T25T25T25T25T25T25T25T25T25T25T25T25T25T25T25T25T25T25T25T25T25T25T25T25T25T25T25T25T25T25T25T25T25T25T25T25T25T25T25T25T25T25T25T25T25T25T25T25T25T25T25T25T25T25T25T25T25T25T25T25T25T25T25T25T25T25T25T25T25T25T25T25T25T25T25T25T25T25T25T25T25T25T25T25T25T25T25T25T25T25T25T25T25T25T25T25T25T25T25T25T25T25T25T25T25T25T25T25T25T25T25T25T25T25T25T25T25T25T25T25T25T25T25T25T25T25T25T25T25T25T25T25T25T25T25T25T25T25T25T25T25T25T25T25T25T25T25T25T25T25T25T25T25T25T25T25T25T25T25T25T25T25T25T25T25T25T25T25T25T25T25T25T25T25T25T25T25T25T25T25T25T25T25T25T25T25T25T25T25T25T25T25T25T25T25T25T25T25T25T25T25T25T25T25T25T25T25T25T25T25T25T25T25T25T25T25T25T25T25T25T25T25T25T25T25T25T25T25T25T25T25T25T25T25T25T25T25T25T25T25T25T25T25T25T25T25T25T25T25T25T25T25T25T25T25T25T25T25T25T25T25T25T25T25T25T25T25T25T25T25T25T25T25T25T25T25T25T25T25T25T25T25T25T25T25T25T25T25T25T25T25T25T25T25T25T25T25T25T25T25T25T25T25T25T25T25T25T25T25T25T25T25T25T25T25T25T25T25T25T25T25T25T25T25T25T25T25T25T25T25T25T25T25T25T25T25T25T25T25T25T25T25T25T25T25T25T25T25T25T25T25T25T25T25T25T25T25T25T25T25T25T25T25T25T25T25T25T25T25T25T25T25T25T25T25T25T25T25T25T25T25T25T25T25T25T25T25T25T25T25T25T25T25T25T25T25T25T25T25T25T25T25T25T25T25T25T25T25T25T25T25T25T25T25T25T25T25T25T25T25T25T25T25T25T25T25T25T25T25T25T25T25T25T25T25T25T25T25T25T25T25T25T25T25T25T25T25T25T25T25T25T25T25T25T25T25T25T25T25T25T25T25T25T25T25T25T25T25T25T25T25T25T25T25T25T25T25T25T25T25T25T25T25T25T25T25T25T25T25T25T25T25T25T25T25T25T25T25T25T25T25T25T25T25T25T25T25T25T25T25T25T25T25T25T25T25T25T25T25T25T25T25T25T25T25T25T25T25T25T25T25T25T25T25T25T25T25T25T25T25T25T25T25T25T25T25T25T25T25T25T25T25T25T25T25T25T25T25T25T25T25T25T25T25T25T25T25T25T25T25T25T25T25T25T25T25T25T25T25T25T25T25T25T25T25T25T25T25T25T25T25T25T25T25T25T25T25T25T25T25T25T25T25T25T25T25T25T25T25T25T25T25T25T25T25T25T25T25T25T25T25T25T25T25T25T25T25T25T25T25T25T25T25T25T25T25T25T25T25T25T25T25T25T25T25T25T25T25T25T25T25T25T25T25T25T25T25T25T25T25T25T25T25T25T25T25T25T25T25T25T25T25T25T25T25T25T25T25T25T25T25T25T25T25T25T25T25T25T25T25T25T25T25T25T25T25T25T25T25T25T25T25T25T25T25T25T25T25T25T25T25T25T25T25T25T25T25T25T25T25T25T25T25T25T25T25T25T25T25T25T25T25T25T25T25T25T25T25T25T25T25T25T25T25T25T25T25T25T25T25T25T25T25T25T25T25T25T25T25T25T25T25T25T25T25T25T25T25T25T25T25T25T25T25T25T25T25T25T25T25T25T25T25T25T25T25T25T25T25T25T25T25T25T25T25T25T25T25T25T25T25T25T25T25T25T25T25T25T25T25T25T25T25T25T25T25T25T25T25T25T25T25T25T25T25T25T25T25T25T25T25T25T25T25T25T25T25T25T25T25T25T25T25T25T25T25T25T25T25T25T25T25T25T25T25T25T25T25T25T25T25T25T25T25T25T25T25T25T25T25T25T25T25T25T25T25T25T25T25T25T25T25T25T25T25T25T25T25T25T25T25T25T25T25T25T25T25T25T25T25T25T25T25T25T25T25T25T25T25T25T25T25T25T25T25T25T25T25T25T25T25T25T25T25T25T25T25T25T25T25T25T25T25T25T25T25T25T25T25T25T25T25T25T25T25T25T25T25T25T25T25T25T25T25T25T25T25T25T25T25T25T25T25T25T25T25T25T25T25T25T25T25T25T25T25T25T25T25T25T25T25T25T25T25T25T25T25T25T25T25T25T25T25T25T25T25T25T25T25T25T25T25T25T25T25T25T25T25T25T25T25T25T25T25T25T25T25T25T25T25T25T25T25T25T25T25T25T25T25T25T25T25T25T25T25T25T25T25T25T25T25T25T25T25T25T25T25T25T25T25T25T25T25T25T25T25T25T25T25T25T25T25T25T25T25T25T25T25T25T25T25T25T25T25T25T25T25T25T25T25T25T25T25T25T25T25T25T25T25T25T25T25T25T25T25T25T25T25T25T25T25T25T25T25T25T25T25T25T25T25T25T25T25T25T25T25T25T25T25T25T25T25T25T25T25T25T25T25T25T25T25T25T25T25T25T25T25T25T25T25T25T25T25T25T25T25T25T25T25T25T25T25T25T25T25T25T25T25T25T25T25T25T25T25T25T25T25T25T25T25T25T25T25T25T25T25T25T25T25T25T25T25T25T25T25T25T25T25T25T25T25T25T25T25T25T25T25T25T25T25T25T25T25T25T25T25T25T25T25T25T25T25T25T25T25T25T25T25T25T25T25T25T25T25T25T25T25T25T25T25T25T25T25T25T25T25T25T25T25T25T25T25T25T25T25T25T25T25T25T25T25T25T25T25T25T25T25T25T25T25T25T25T25T25T25T25T25T25T25T25T25T25T25T25T25T25T25T25T25T25T25T25T25T25T25T25T25T25T25T25T25T25T25T25T25T25T25T25T25T25T25T25T25T25T25T25T25T25T25T25T25T25T25T25T25T25T25T25T25T25T25T25T25T25T25T25T25T25T25T25T25T25T25T25T25T25T25T25T25T25T25T25T25T25T25T25T25T25T25T25T25T25T25T25T25T25T25T25T25T25T25T25T25T25T25T25T25T25T25T25T25T25T25T25T25T25T25T25T25T25T25T25T25T25T25T25T25T25T25T25T25T25T25T25T25T25T25T25T25T25T25T25T25T25T25T25T25T25T25T25T25T25T25T25T25T25T25T25T25T25T25T25T25T25T25T25T25T25T25T25T25T25T25T25T25T25T25T25T25T25T25T25T25T25T25T25T25T25T25T25T25T25T25T25T25T25T25T25T25T25T25T25T25T25T25T25T25T25T25T25T25T25T25T25T25T25T25T25T25T25T25T25T25T25T25T25T25T25T25T25T25T25T25T25T25T25T25T25T25T25T25T25T25T25T25T25T25T25T25T25T25T25T25T25T25T25T25T25T25T25T25T25T25T25T25T25T25T25T25T25T25T25T25T25T25T25T25T25T25T25T25T25T25T25T25T25T25T25T25T25T25T25T25T25T25T25T25T25T25T25T25T25T25T25T25T25T25T25T25T25T25T25T25T25T25T25T25T25T25T25T25T25T25T25T25T25T25T25T25T25T25T25T25T25T25T25T25T25T25T25T25T25T25T25T25T25T25T25T25T25T25T25T25T25T25T25T25T25T25T25T25T25T25T25T25T25T25T25T25T25T25T25T25T25T25T25T25T25T25T25T25T25T25T25T25T25T25T25T25T25T25T25T25T25T25T25T25T25T25T25T25T25T25T25T25T25T25T25T25T25T25T25T25T25T25T25T25T25T25T25T25T25T25T25T25T25T25T25T25T25T25T25T25T25T25T25T25T25T25T25T25T25T25T25T25T25T25T25T25T25T25T25T25T25T25T25T25T25T25T25T25T25T25T25T25T25T25T25T25T25T25T25T25T25T25T25T25T25T25T25T25T25T25T25T25T25T25T25T25T25T25T25T25T25T25T25T25T25T25T25T25T25T25T25T25T25T25T25T25T25T25T25T25T25T25T25T25T25T25T25T25T25T25T25T25T25T25T25T25T25T25T25T25T25T25T25T25T25T25T25T25T25T25T25T25T25T25T25T25T25T25T25T25T25T25T25T25T25T25T25T25T25T25T25T25T25T25T25T25T25T25T25T25T25T25T25T25T25T25T25T25T25T25T25T25T25T25T25T25T25T25T25T25T25T25T25T25T25T25T25T25T25T25T25T25T25T25T25T25T25T25T25T25T25T25T25T25T25T25T25T25T25T25T25T25T25T25T25T25T25T25T25T25T25T25T25T25T25T25T25T25T25T25T25T25T25T25T25T25T25T25T25T25T25T25T25T25T25T25T25T25T25T25T25T25T25T25T25T25T25T25T25T25T25T25T25T25T25T25T25T25T25T25T25T25T25T25T25T25T25T25T25T25T25T25T25T25T25T25T25T25T25T25T25T25T25T25T25T25T25T25T25T25T25T25T25T25T25T25T25T25T25T25T25T25T25T25T25T25T25T25T25T25T25T25T25T25T25T25T25T25T25T25T25T25T25T25T25T25T25T25T25T25T25T25T25T25T25T25T25T25T25T25T25T25T25T25T25T25T25T25T25T25T25T25T25T25T25T25T25T25T25T25T25T25T25T25T25T25T25T25T25T25T25T25T25T25T25T25T25T25T25T25T25T25T25T25T25T25T25T25T25T25T25T25T25T25T25T25T25T25T25T25T25T25T25T25T25T25T25T25T25T25T25T25T25T25T25T25T25T25T25T25T25T25T25T25T25T25T25T25T25T25T25T25T25T25T25T25T25T25T25T25T25T25T25T25T25T25T25T25T25T25T25T25T25T25T25T25T25T25T25T25T25T25T25T25T25T25T25T25T25T25T25T25T25T25T25T25T25T25T25T25T25T25T25T25T25T25T25T25T25T25T25T25T25T25T25T25T25T25T25T25T25T25T25T25T25T25T25T25T25T25T25T25T25T25T25T25T25T25T25T25T25T25T25T25T25T25T25T25T25T25T25T25T25T25T25T25T25T25T25T25T25T25T25T25T25T25T25T25T25T25T25T25T25T25T25T25T25T25T25T25T25T25T25T25T25T25T25T25T25T25T25T25T25T25T25T25T25T25T25T25T25T25T25T25T25T25T25T25T25T25T25T25T25T25T25T25T25T25T25T25T25T25T25T25T25T25T25T25T25T25T25T25T25T25T25T25T25T25T25T25T25T25T25T25T25T25T25T25T25T25T25T25T25T25T25T25T25T25T25T25T25T25T25T25T25T25T25T25T25T25T25T25T25T25T25T25T25T25T25T25T25T25T25T25T25T25T25T25T25T25T25T25T25T25T25T25T25T25T25T25T25T25T25T25T25T25T25T25T25T25T25T25T25T25T25T25T25T25T25T25T25T25T25T25T25T25T25T25T25T25T25T25T25T25T25T25T25T25T25T25T25T25T25T25T25T25T25T25T25T25T25T25T25T25T25T25T25T25T25T25T25T25T25T25T25T25T25T25T25T25T25T25T25T25T25T25T25T25T25T25T25T25T25T25T25T25T25T25T25T25T25T25T25T25T25T25T25T25T25T25T25T25T25T25T25T25T25T25T25T25T25T25T25T25T25T25T25T25T25T25T25T25T25T25T25T25T25T25T25T25T25T25T25T25T25T25T25T25T25T25T25T25T25T25T25T25T25T25T25T25T25T25T25T25T25T25T25T25T25T25T25T25T25T25T25T25T25T25T25T25T25T25T25T25T25T25T25T25T25T25T25T25T25T25T25T25T25T25T25T25T25T25T25T25T25T25T25T25T25T25T25T25T25T25T25T25T25T25T25T25T25T25T25T25T25T25T25T25T25T25T25T25T25T25T25T25T25T25T25T25T25T25T25T25T25T25T25T25T25T25T25T25T25T25T25T25T25T25T25T25T25T25T25T25T25T25T25T25T25T25T25T25T25T25T25T25T25T25T25T25T25T25T25T25T25T25T25T25T25T25T25T25T25T25T25T25T25T25T25T25T25T25T25T25T25T25T25T25T25T25T25T25T25T25T25T25T25T25T25T25T25T25T25T25T25T25T25T25T25T25T25T25T25T25T25T25T25T25T25T25T25T25T25T25T25T25T25T25T25T25T25T25T25T25T25T25T25T25T25T25T25T25T25T25T25T25T25T25T25T25T25T25T25T25T25T25T25T25T25T25T25T25T25T25T25T25T25T25T25T25T25T25T25T25T25T25T25T25T25T25T25T25T25T25T25T25T25T25T25T25T25T25T25T25T25T25T25T25T25T25T25T25T25T25T25T25T25T25T25T25T25T25T25T25T25T25T25T25T25T25T25T25T25T25T25T25T25T25T25T25T25T25T25T25T25T25T25T25T25T25T25T25T25T25T25T25T25T25T25T25T25T25T25T25T25T25T25T25T25T25T25T25T25T25T25T25T25T25T25T25T25T25T25T25T25T25T25T25T25T25T25T25T25T25T25T25T25T25T25T25T25T25T25T25T25T25T25T25T25T25T25T25T25T25T25T25T25T25T25T25T25T25T25T25T25T25T25T25T25T25T25T25T25T25T25T25T25T25T25T25T25T25T25T25T25T25T25T25T25T25T25T25T25T25T25T25T25T25T25T25T25T25T25T25T25T25T25T25T25T25T25T25T25T25T25T25T25T25T25T25T25T25T25T25T25T25T25T25T25T25T25T25T25T25T25T25T25T25T25T25T25T25T25T25T25T25T25T25T25T25T25T25T25T25T25T25T25T25T25T25T25T25T25T25T25T25T25T25T25T25T25T25T25T25T25T25T25T25T25T25T25T25T25T25T25T25T25T25T25T25T25T25T25T25T25T25T25T25T25T25T25T25T25T25T25T25T25T25T25T25T25T25T25T25T25T25T25T25T25T25T25T25T25T25T25T25T25T25T25T25T25T25T25T25T25T25T25T25T25T25T25T25T25T25T25T25T25T25T25T25T25T25T25T25T25T25T25T25T25T25T25T25T25T25T25T25T25T25T25T25T25T25T25T25T25T25T25T25T25T25T25T25T25T25T25T25T25T25T25T25T25T25T25T25T25T25T25T25T25T25T25T25T25T25T25T25T25T25T25T25T25T25T25T25T25T25T25T25T25T25T25T25T25T25T25T25T25T25T25T25T25T25T25T25T25T25T25T25T25T25T25T25T25T25T25T25T25T25T25T25T25T25T25T25T25T25T25T25T25T25T25T25T25T25T25T25T25T25T25T25T25T25T25T25T25T25T25T25T25T25T25T25T25T25T25T25T25T25T25T25T25T25T25T25T25T25T25T25T25T25T25T25T25T25T25T25T25T25T25T25T25T25T25T25T25T25T25T25T25T25T25T25T25T25T25T25T25T25T25T25T25T25T25T25T25T25T25T25T25T25T25T25T25T25T25T25T25T25T25T25T25T25T25T25T25T25T25T25T25T25T25T25T25T25T25T25T25T25T25T25T25T25T25T25T25T25T25T25T25T25T25T25T25T25T25T25T25T25T25T25T25T25T25T25T25T25T25T25T25T25T25T25T25T25T25T25T25T25T25T25T25T25T25T25T25T25T25T25T25T25T25T25T25T25T25T25T25T25T25T25T25T25T25T25T25T25T25T25T25T25T25T25T25T25T25T25T25T25T25T25T25T25T25T25T25T25T25T25T25T25T25T25T25T25T25T25T25T25T25T25T25T25T25T25T25T25T25T25T25T25T25T25T25T25T25T25T25T25T25T25T25T25T25T25T25T25T25T25T25T25T25T25T25T25T25T25T25T25T25T25T25T25T25T25T25T25T25T25T25T25T25T25T25T25T25T25T25T25T25T25T25T25T25T25T25T25T25T25T25T25T25T25T25T25T25T25T25T25T25T25T25T25T25T25T25T25T25T25T25T25T25T25T25T25T25T25T25T25T25T25T25T25T25T25T25T25T25T25T25T25T25T25T25T25T25T25T25T25T25T25T25T25T25T25T25T25T25T25T25T25T25T25T25T25T25T25T25T25T25T25T25T25T25T25T25T25T25T25T25T25T25T25T25T25T25T25T25T25T25T25T25T25T25T25T25T25T25T25T25T25T25T25T25T25T25T25T25T25T25T25T25T25T25T25T25T25T25T25T25T25T25T25T25T25T25T25T25T25T25T25T25T25T25T25T25T25T25T25T25T25T25T25T25T25T25T25T25T25T25T25T25T25T25T25T25T25T25T25T25T25T25T25T25T25T25T25T25T25T25T25T25T25T25T25T25T25T25T25T25T25T25T25T25T25T25T25T25T25T25T25T25T25T25T25T25T25T25T25T25T25T25T25T25T25T25T25T25T25T25T25T25T25T25T25T25T25T25T25T25T25T25T25T25T25T25T25T25T25T25T25T25T25T25T25T25T25T25T25T25T25T25T25T25T25T25T25T25T25T25T25T25T25T25T25T25T25T25T25T25T25T25T25T25T25T25T25T25T25T25T25T25T25T25T25T25T25T25T25T25T25T25T25T25T25T25T25T25T25T25T25T25T25T25T25T25T25T25T25T25T25T25T25T25T25T25T25T25T25T25T25T25T25T25T25T25T25T25T25T25T25T25T25T25T25T25T25T25T25T25T25T25T25T25T25T25T25T25T25T25T25T25T25T25T25T25T25T25T25T25T25T25T25T25T25T25T25T25T25T25T25T25T25T25T25T25T25T25T25T25T25T25T25T25T25T25T25T25T25T25T25T25T25T25T25T25T25T25T25T25T25T25T25T25T25T25T25T25T25T25T25T25T25T25T25T25T25T25T25T25T25T25T25T25T25T25T25T25T25T25T25T25T25T25T25T25T25T25T25T25T25T25T25T25T25T25T25T25T25T25T25T25T25T25T25T25T25T25T25T25T25T25T25T25T25T25T25T25T25T25T25T25T25T25T25T25T25T25T25T25T25T25T25T25T25T25T25T25T25T25T25T25T25T25T25T25T25T25T25T25T25T25T25T25T25T25T25T25T25T25T25T25T25T25T25T25T25T25T25T25T25T25T25T25T25T25T25T25T25T25T25T25T25T25T25T25T25T25T25T25T25T25T25T25T25T25T25T25T25T25T25T25T25T25T25T25T25T25T25T25T25T25T25T25T25T25T25T25T25T25T25T25T25T25T25T25T25T25T25T25T25T25T25T25T25T25T25T25T25T25T25T25T25T25T25T25T25T25T25T25T25T25T25T25T25T25T25T25T25T25T25T25T25T25T25T25T25T25T25T25T25T25T25T25T25T25T25T25T25T25T25T25T25T25T25T25T25T25T25T25T25T25T25T25T25T25T25T25T25T25T25T25T25T25T25T25T25T25T25T25T25T25T25T25T25T25T25T25T25T25T25T25T25T25T25T25T25T25T25T25T25T25T25T25T25T25T25T25T25T25T25T25T25T25T25T25T25T25T25T25T25T25T25T25T25T25T25T25T25T25T25T25T25T25T25T25T25T25T25T25T25T25T25T25T25T25T25T25T25T25T25T25T25T25T25T25T25T25T25T25T25T25T25T25T25T25T25T25T25T25T25T25T25T25T25T25T25T25T25T25T25T25T25T25T25T25T25T25T25T25T25T25T25T25T25T25T25T25T25T25T25T25T25T25T25T25T25T25T25T25T25T25T25T25T25T25T25T25T25T25T25T25T25T25T25T25T25T25T25T25T25T25T25T25T25T25T25T25T25T25T25T25T25T25T25T25T25T25T25T25T25T25T25T25T25T25T25T25T25T25T25T25T25T25T25T25T25T25T25T25T25T25T25T25T25T25T25T25T25T25T25T25T25T25T25T25T25T25T25T25T25T25T25T25T25T25T25T25T25T25T25T25T25T25T25T25T25T25T25T25T25T25T25T25T25T25T25T25T25T25T25T25T25T25T25T25T25T25T25T25T25T25T25T25T25T25T25T25T25T25T25T25T25T25T25T25T25T25T25T25T25T25T25T25T25T25T25T25T25T25T25T25T25T25T25T25T25T25T25T25T25T25T25T25T25T25T25T25T25T25T25T25T25T25T25T25T25T25T25T25T25T25T25T25T25T25T25T25T25T25T25T25T25T25T25T25T25T25T25T25T25T25T25T25T25T25T25T25T25T25T25T25T25T25T25T25T25T25T25T25T25T25T25T25T25T25T25T25T25T25T25T25T25T25T25T25T25T25T25T25T25T25T25T25T25T25T25T25T25T25T25T25T25T25T25T25T25T25T25T25T25T25T25T25T25T25T25T25T25T25T25T25T25T25T25T25T25T25T25T25T25T25T25T25T25T25T25T25T25T25T25T25T25T25T25T25T25T25T25T25T25T25T25T25T25T25T25T25T25T25T25T25T25T25T25T25T25T25T25T25T25T25T25T25T25T25T25T25T25T25T25T25T25T25T25T25T25T25T25T25T25T25T25T25T25T25T25T25T25T25T25T25T25T25T25T25T25T25T25T25T25T25T25T25T25T25T25T25T25T25T25T25T25T25T25T25T25T25T25T25T25T25T25T25T25T25T25T25T25T25T25T25T25T25T25T25T25T25T25T25T25T25T25T25T25T25T25T25T25T25T25T25T25T25T25T25T25T25T25T25T25T25T25T25T25T25T25T25T25T25T25T25T25T25T25T25T25T25T25T25T25T25T25T25T25T25T25T25T25T25T25T25T25T25T25T25T25T25T25T25T25T25T25T25T25T25T25T25T25T25T25T25T25T25T25T25T25T25T25T25T25T25T25T25T25T25T25T25T25T25T25T25T25T25T25T25T25T25T25T25T25T25T25T25T25T25T25T25T25T25T25T25T25T25T25T25T25T25T25T25T25T25T25T25T25T25T25T25T25T25T25T25T25T25T25T25T25T25T25T25T25T25T25T25T25T25T25T25T25T25T25T25T25T25T25T25T25T25T25T25T25T25T25T25T25T25T25T25T25T25T25T25T25T25T25T25T25T25T25T25T25T25T25T25T25T25T25T25T25T25T25T25T25T25T25T25T25T25T25T25T25T25T25T25T25T25T25T25T25T25T25T25T25T25T25T25T25T25T25T25T25T25T25T25T25T25T25T25T25T25T25T25T25T25T25T25T25T25T25T25T25T25T25T25T25T25T25T25T25T25T25T25T25T25T25T25T25T25T25T25T25T25T25T25T25T25T25T25T25T25T25T25T25T25T25T25T25T25T25T25T25T25T25T25T25T25T25T25T25T25T25T25T25T25T25T25T25T25T25T25T25T25T25T25T25T25T25T25T25T25T25T25T25T25T25T25T25T25T25T25T25T25T25T25T25T25T25T25T25T25T25T25T25T25T25T25T25T25T25T25T25T25T25T25T25T25T25T25T25T25T25T25T25T25T25T25T25T25T25T25T25T25T25T25T25T25T25T25T25T25T25T25T25T25T25T25T25T25T25T25T25T25T25T25T25T25T25T25T25T25T25T25T25T25T25T25T25T25T25T25T25T25T25T25T25T25T25T25T25T25T25T25T25T25T25T25T25T25T25T25T25T25T25T25T25T25T25T25T25T25T25T25T25T25T25T25T25T25T25T25T25T25T25T25T25T25T25T25T25T25T25T25T25T25T25T25T25T25T25T25T25T25T25T25T25T25T25T25T25T25T25T25T25T25T25T25T25T25T25T25T25T25T25T25T25T25T25T25T25T25T25T25T25T25T25T25T25T25T25T25T25T25T25T25T25T25T25T25T25T25T25T25T25T25T25T25T25T25T25T25T25T25T25T25T25T25T25T25T25T25T25T25T25T25T25T25T25T25T25T25T25T25T25T25T25T25T25T25T25T25T25T25T25T25T25T25T25T25T25T25T25T25T25T25T25T25T25T25T25T25T25T25T25T25T25T25T25T25T25T25T25T25T25T25T25T25T25T25T25T25T25T25T25T25T25T25T25T25T25T25T25T25T25T25T25T25T25T25T25T25T25T25T25T25T25T25T25T25T25T25T25T25T25T25T25T25T25T25T25T25T25T25T25T25T25T25T25T25T25T25T25T25T25T25T25T25T25T25T25T25T25T25T25T25T25T25T25T25T25T25T25T25T25T25T25T25T25T25T25T25T25T25T25T25T25T25T25T25T25T25T25T25T25T25T25T25T25T25T25T25T25T25T25T25T25T25T25T25T25T25T25T25T25T25T25T25T25T25T25T25T25T25T25T25T25T25T25T25T25T25T25T25T25T25T25T25T25T25T25T25T25T25T25T25T25T25T25T25T25T25T25T25T25T25T25T25T25T25T25T25T25T25T25T25T25T25T25T25T25T25T25T25T25T25T25T25T25T25T25T25T25T25T25T25T25T25T25T25T25T25T25T25T25T25T25T25T25T25T25T25T25T25T25T25T25T25T25T25T25T25T25T25T25T25T25T25T25T25T25T25T25T25T25T25T25T25T25T25T25T25T25T25T25T25T25T25T25T25T25T25T25T25T25T25T25T25T25T25T25T25T25T25T25T25T25T25T25T25T25T25T25T25T25T25T25T25T25T25T25T25T25T25T25T25T25T25T25T25T25T25T25T25T25T25T25T25T25T25T25T25T25T25T25T25T25T25T25T25T25T25T25T25T25T25T25T25T25T25T25T25T25T25T25T25T25T25T25T25T25T25T25T25T25T25T25T25T25T25T25T25T25T25T25T25T25T25T25T25T25T25T25T25T25T25T25T25T25T25T25T25T25T25T25T25T25T25T25T25T25T25T25T25T25T25T25T25T25T25T25T25T25T25T25T25T25T25T25T25T25T25T25T25T25T25T25T25T25T25T25T25T25T25T25T25T25T25T25T25T25T25T25T25T25T25T25T25T25T25T25T25T25T25T25T25T25T25T25T25T25T25T25T25T25T25T25T25T25T25T25T25T25T25T25T25T25T25T25T25T25T25T25T25T25T25T25T25T25T25T25T25T25T25T25T25T25T25T25T25T25T25T25T25T25T25T25T25T25T25T25T25T25T25T25T25T25T25T25T25T25T25T25T25T25T25T25T25T25T25T25T25T25T25T25T25T25T25T25T25T25T25T25T25T25T25T25T25T25T25T25T25T25T25T25T25T25T25T25T25T25T25T25T25T25T25T25T25T25T25T25T25T25T25T25T25T25T25T25T25T25T25T25T25T25T25T25T25T25T25T25T25T25T25T25T25T25T25T25T25T25T25T25T25T25T25T25T25T25T25T25T25T25T25T25T25T25T25T25T25T25T25T25T25T25T25T25T25T25T25T25T25T25T25T25T25T25T25T25T25T25T25T25T25T25T25T25T25T25T25T25T25T25T25T25T25T25T25T25T25T25T25T25T25T25T25T25T25T25T25T25T25T25T25T25T25T25T25T25T25T25T25T25T25T25T25T25T25T25T25T25T25T25T25T25T25T25T25T25T25T25T25T25T25T25T25T25T25T25T25T25T25T25T25T25T25T25T25T25T25T25T25T25T25T25T25T25T25T25T25T25T25T25T25T25T25T25T25T25T25T25T25T25T25T25T25T25T25T25T25T25T25T25T25T25T25T25T25T25T25T25T25T25T25T25T25T25T25T25T25T25T25T25T25T25T25T25T25T25T25T25T25T25T25T25T25T25T25T25T25T25T25T25T25T25T25T25T25T25T25T25T25T25T25T25T25T25T25T25T25T25T25T25T25T25T25T25T25T25T25T25T25T25T25T25T25T25T25T25T25T25T25T25T25T25T25T25T25T25T25T25T25T25T25T25T25T25T25T25T25T25T25T25T25T25T25T25T25T25T25T25T25T25T25T25T25T25T25T25T25T25T25T25T25T25T25T25T25T25T25T25T25T25T25T25T25T25T25T25T25T25T25T25T25T25T25T25T25T25T25T25T25T25T25T25T25T25T25T25T25T25T25T25T25T25T25T25T25T25T25T25T25T25T25T25T25T25T25T25T25T25T25T25T25T25T25T25T25T25T25T25T25T25T25T25T25T25T25T25T25T25T25T25T25T25T25T25T25T25T25T25T25T25T25T25T25T25T25T25T25T25T25T25T25T25T25T25T25T25T25T25T25T25T25T25T25T25T25T25T25T25T25T25T25T25T25T25T25T25T25T25T25T25T25T25T25T25T25T25T25T25T25T25T25T25T25T25T25T25T25T25T25T25T25T25T25T25T25T25T25T25T25T25T25T25T25T25T25T25T25T25T25T25T25T25T25T25T25T25T25T25T25T25T25T25T25T25T25T25T25T25T25T25T25T25T25T25T25T25T25T25T25T25T25T25T25T25T25T25T25T25T25T25T25T25T25T25T25T25T25T25T25T25T25T25T25T25T25T25T25T25T25T25T25T25T25T25T25T25T25T25T25T25T25T25T25T25T25T25T25T25T25T25T25T25T25T25T25T25T25T25T25T25T25T25T25T25T25T25T25T25T25T25T25T25T25T25T25T25T25T25T25T25T25T25T25T25T25T25T25T25T25T25T25T25T25T25T25T25T25T25T25T25T25T25T25T25T25T25T25T25T25T25T25T25T25T25T25T25T25T25T25T25T25T25T25T25T25T25T25T25T25T25T25T25T25T25T25T25T25T25T25T25T25T25T25T25T25T25T25T25T25T25T25T25T25T25T25T25T25T25T25T25T25T25T25T25T25T25T25T25T25T25T25T25T25T25T25T25T25T25T25T25T25T25T25T25T25T25T25T25T25T25T25T25T25T25T25T25T25T25T25T25T25T25T25T25T25T25T25T25T25T25T25T25T25T25T25T25T25T25T25T25T25T25T25T25T25T25T25T25T25T25T25T25T25T25T25T25T25T25T25T25T25T25T25T25T25T25T25T25T25T25T25T25T25T25T25T25T25T25T25T25T25T25T25T25T25T25T25T25T25T25T25T25T25T25T25T25T25T25T25T25T25T25T25T25T25T25T25T25T25T25T25T25T25T25T25T25T25T25T25T25T25T25T25T25T25T25T25T25T25T25T25T25T25T25T25T25T25T25T25T25T25T25T25T25T25T25T25T25T25T25T25T25T25T25T25T25T25T25T25T25T25T25T25T25T25T25T25T25T25T25T25T25T25T25T25T25T25T25T25T25T25T25T25T25T25T25T25T25T25T25T25T25T25T25T25T25T25T25T25T25T25T25T25T25T25T25T25T25T25T25T25T25T25T25T25T25T25T25T25T25T25T25T25T25T25T25T25T25T25T25T25T25T25T25T25T25T25T25T25T25T25T25T25T25T25T25T25T25T25T25T25T25T25T25T25T25T25T25T25T25T25T25T25T25T25T25T25T25T25T25T25T25T25T25T25T25T25T25T25T25T25T25T25T25T25T25T25T25T25T25T25T25T25T25T25T25T25T25T25T25T25T25T25T25T25T25T25T25T25T25T25T25T25T25T25T25T25T25T25T25T25T25T25T25T25T25T25T25T25T25T25T25T25T25T25T25T25T25T25T25T25T25T25T25T25T25T25T25T25T25T25T25T25T25T25T25T25T25T25T25T25T25T25T25T25T25T25T25T25T25T25T25T25T25T25T25T25T25T25T25T25T25T25T25T25T25T25T25T25T25T25T25T25T25T25T25T25T25T25T25T25T25T25T25T25T25T25T25T25T25T25T25T25T25T25T25T25T25T25T25T25T25T25T25T25T25T25T25T25T25T25T25T25T25T25T25T25T25T25T25T25T25T25T25T25T25T25T25T25T25T25T25T25T25T25T25T25T25T25T25T25T25T25T25T25T25T25T25T25T25T25T25T25T25T25T25T25T25T25T25T25T25T25T25T25T25T25T25T25T25T25T25T25T25T25T25T25T25T25T25T25T25T25T25T25T25T25T25T25T25T25T25T25T25T25T25T25T25T25T25T25T25T25T25T25T25T25T25T25T25T25T25T25T25T25T25T25T25T25T25T25T25T25T25T25T25T25T25T25T25T25T25T25T25T25T25T25T25T25T25T25T25T25T25T25T25T25T25T25T25T25T25T25T25T25T25T25T25T25T25T25T25T25T25T25T25T25T25T25T25T25T25T25T25T25T25T25T25T25T25T25T25T25T25T25T25T25T25T25T25T25T25T25T25T25T25T25T25T25T25T25T25T25T25T25T25T25T25T25T25T25T25T25T25T25T25T25T25T25T25T25T25T25T25T25T25T25T25T25T25T25T25T25T25T25T25T25T25T25T25T25T25T25T25T25T25T25T25T25T25T25T25T25T25T25T25T25T25T25T25T25T25T25T25T25T25T25T25T25T25T25T25T25T25T25T25T25T25T25T25T25T25T25T25T25T25T25T25T25T25T25T25T25T25T25T25T25T25T25T25T25T25T25T25T25T25T25T25T25T25T25T25T25T25T25T25T25T25T25T25T25T25T25T25T25T25T25T25T25T25T25T25T25T25T25T25T25T25T25T25T25T25T25T25T25T25T25T25T25T25T25T25T25T25T25T25T25T25T25T25T25T25T25T25T25T25T25T25T25T25T25T25T25T25T25T25T25T25T25T25T25T25T25T25T25T25T25T25T25T25T25T25T25T25T25T25T25T25T25T25T25T25T25T25T25T25T25T25T25T25T25T25T25T25T25T25T25T25T25T25T25T25T25T25T25T25T25T25T25T25T25T25T25T25T25T25T25T25T25T25T25T25T25T25T25T25T25T25T25T25T25T25T25T25T25T25T25T25T25T25T25T25T25T25T25T25T25T25T25T25T25T25T25T25T25T25T25T25T25T25T25T25T25T25T25T25T25T25T25T25T25T25T25T25T25T25T25T25T25T25T25T25T25T25T25T25T25T25T25T25T25T25T25T25T25T25T25T25T25T25T25T25T25T25T25T25T25T25T25T25T25T25T25T25T25T25T25T25T25T25T25T25T25T25T25T25T25T25T25T25T25T25T25T25T25T25T25T25T25T25T25T25T25T25T25T25T25T25T25T25T25T25T25T25T25T25T25T25T25T25T25T25T25T25T25T25T25T25T25T25T25T25T25T25T25T25T25T25T25T25T25T25T25T25T25T25T25T25T25T25T25T25T25T25T25T25T25T25T25T25T25T25T25T25T25T25T25T25T25T25T25T25T25T25T25T25T25T25T25T25T25T25T25T25T25T25T25T25T25T25T25T25T25T25T25T25T25T25T25T25T25T25T25T25T25T25T25T25T25T25T25T25T25T25T25T25T25T25T25T25T25T25T25T25T25T25T25T25T25T25T25T25T25T25T25T25T25T25T25T25T25T25T25T25T25T25T25T25T25T25T25T25T25T25T25T25T25T25T25T25T25T25T25T25T25T25T25T25T25T25T25T25T25T25T25T25T25T25T25T25T25T25T25T25T25T25T25T25T25T25T25T25T25T25T25T25T25T25T25T25T25T25T25T25T25T25T25T25T25T25T25T25T25T25T25T25T25T25T25T25T25T25T25T25T25T25T25T25T25T25T25T25T25T25T25T25T25T25T25T25T25T25T25T25T25T25T25T25T25T25T25T25T25T25T25T25T25T25T25T25T25T25T25T25T25T25T25T25T25T25T25T25T25T25T25T25T25T25T25T25T25T25T25T25T25T25T25T25T25T25T25T25T25T25T25T25T25T25T25T25T25T25T25T25T25T25T25T25T25T25T25T25T25T25T25T25T25T25T25T25T25T25T25T25T25T25T25T25T25T25T25T25T25T25T25T25T25T25T25T25T25T25T25T25T25T25T25T25T25T25T25T25T25T25T25T25T25T25T25T25T25T25T25T25T25T25T25T25T25T25T25T25T25T25T25T25T25T25T25T25T25T25T25T25T25T25T25T25T25T25T25T25T25T25T25T25T25T25T25T25T25T25T25T25T25T25T25T25T25T25T25T25T25T25T25T25T25T25T25T25T25T25T25T25T25T25T25T25T25T25T25T25T25T25T25T25T25T25T25T25T25T25T25T25T25T25T25T25T25T25T25T25T25T25T25T25T25T25T25T25T25T25T25T25T25T25T25T25T25T25T25T25T25T25T25T25T25T25T25T25T25T25T25T25T25T25T25T25T25T25T25T25T25T25T25T25T25T25T25T25T25T25T25T25T25T25T25T25T25T25T25T25T25T25T25T25T25T25T25T25T25T25T25T25T25T25T25T25T25T25T25T25T25T25T25T25T25T25T25T25T25T25T25T25T25T25T25T25T25T25T25T25T25T25T25T25T25T25T25T25T25T25T25T25T25T25T25T25T25T25T25T25T25T25T25T25T25T25T25T25T25T25T25T25T25T25T25T25T25T25T25T25T25T25T25T25T25T25T25T25T25T25T25T25T25T25T25T25T25T25T25T25T25T25T25T25T25T25T25T25T25T25T25T25T25T25T25T25T25T25T25T25T25T25T25T25T25T25T25T25T25T25T25T25T25T25T25T25T25T25T25T25T25T25T25T25T25T25T25T25T25T25T25T25T25T25T25T25T25T25T25T25T25T25T25T25T25T25T25T25T25T25T25T25T25T25T25T25T25T25T25T25T25T25T25T25T25T25T25T25T25T25T25T25T25T25T25T25T25T25T25T25T25T25T25T25T25T25T25T25T25T25T25T25T25T25T25T25T25T25T25T25T25T25T25T25T25T25T25T25T25T25T25T25T25T25T25T25T25T25T25T25T25T25T25T25T25T25T25T25T25T25T25T25T25T25T25T25T25T25T25T25T25T25T25T25T25T25T25T25T25T25T25T25T25T25T25T25T25T25T25T25T25T25T25T25T25T25T25T25T25T25T25T25T25T25T25T25T25T25T25T25T25T25T25T25T25T25T25T25T25T25T25T25T25T25T25T25T25T25T25T25T25T25T25T25T25T25T25T25T25T25T25T25T25T25T25T25T25T25T25T25T25T25T25T25T25T25T25T25T25T25T25T25T25T25T25T25T25T25T25T25T25T25T25T25T25T25T25T25T25T25T25T25T25T25T25T25T25T25T25T25T25T25T25T25T25T25T25T25T25T25T25T25T25T25T25T25T25T25T25T25T25T25T25T25T25T25T25T25T25T25T25T25T25T25T25T25T25T25T25T25T25T25T25T25T25T25T25T25T25T25T25T25T25T25T25T25T25T25T25T25T25T25T25T25T25T25T25T25T25T25T25T25T25T25T25T25T25T25T25T25T25T25T25T25T25T25T25T25T25T25T25T25T25T25T25T25T25T25T25T25T25T25T25T25T25T25T25T25T25T25T25T25T25T25T25T25T25T25T25T25T25T25T25T25T25T25T25T25T25T25T25T25T25T25T25T25T25T25T25T25T25T25T25T25T25T25T25T25T25T25T25T25T25T25T25T25T25T25T25T25T25T25T25T25T25T25T25T25T25T25T25T25T25T25T25T25T25T25T25T25T25T25T25T25T25T25T25T25T25T25T25T25T25T25T25T25T25T25T25T25T25T25T25T25T25T25T25T25T25T25T25T25T25T25T25T25T25T25T25T25T25T25T25T25T25T25T25T25T25T25T25T25T25T25T25T25T25T25T25T25T25T25T25T25T25T25T25T25T25T25T25T25T25T25T25T25T25T25T25T25T25T25T25T25T25T25T25T25T25T25T25T25T25T25T25T25T25T25T25T25T25T25T25T25T25T25T25T25T25T25T25T25T25T25T25T25T25T25T25T25T25T25T25T25T25T25T25T25T25T25T25T25T25T25T25T25T25T25T25T25T25T25T25T25T25T25T25T25T25T25T25T25T25T25T25T25T25T25T25T25T25T25T25T25T25T25T25T25T25T25T25T25T25T25T25T25T25T25T25T25T25T25T25T25T25T25T25T25T25T25T25T25T25T25T25T25T25T25T25T25T25T25T25T25T25T25T25T25T25T25T25T25T25T25T25T25T25T25T25T25T25T25T25T25T25T25T25T25T25T25T25T25T25T25T25T25T25T25T25T25T25T25T25T25T25T25T25T25T25T25T25T25T25T25T25T25T25T25T25T25T25T25T25T25T25T25T25T25T25T25T25T25T25T25T25T25T25T25T25T25T25T25T25T25T25T25T25T25T25T25T25T25T25T25T25T25T25T25T25T25T25T25T25T25T25T25T25T25T25T25T25T25T25T25T25T25T25T25T25T25T25T25T25T25T25T25T25T25T25T25T25T25T25T25T25T25T25T25T25T25T25T25T25T25T25T25T25T25T25T25T25T25T25T25T25T25T25T25T25T25T25T25T25T25T25T25T25T25T25T25T25T25T25T25T25T25T25T25T25T25T25T25T25T25T25T25T25T25T25T25T25T25T25T25T25T25T25T25T25T25T25T25T25T25T25T25T25T25T25T25T25T25T25T25T25T25T25T25T25T25T25T25T25T25T25T25T25T25T25T25T25T25T25T25T25T25T25T25T25T25T25T25T25T25T25T25T25T25T25T25T25T25T25T25T25T25T25T25T25T25T25T25T25T25T25T25T25T25T25T25T25T25T25T25T25T25T25T25T25T25T25T25T25T25T25T25T25T25T25T25T25T25T25T25T25T25T25T25T25T25T25T25T25T25T25T25T25T25T25T25T25T25T25T25T25T25T25T25T25T25T25T25T25T25T25T25T25T25T25T25T25T25T25T25T25T25T25T25T25T25T25T25T25T25T25T25T25T25T25T25T25T25T25T25T25T25T25T25T25T25T25T25T25T25T25T25T25T25T25T25T25T25T25T25T25T25T25T25T25T25T25T25T25T25T25T25T25T25T25T25T25T25T25T25T25T25T25T25T25T25T25T25T25T25T25T25T25T25T25T25T25T25T25T25T25T25T25T25T25T25T25T25T25T25T25T25T25T25T25T25T25T25T25T25T25T25T25T25T25T25T25T25T25T25T25T25T25T25T25T25T25T25T25T25T25T25T25T25T25T25T25T25T25T25T25T25T25T25T25T25T25T25T25T25T25T25T25T25T25T25T25T25T25T25T25T25T25T25T25T25T25T25T25T25T25T25T25T25T25T25T25T25T25T25T25T25T25T25T25T25T25T25T25T25T25T25T25T25T25T25T25T25T25T25T25T25T25T25T25T25T25T25T25T25T25T25T25T25T25T25T25T25T25T25T25T25T25T25T25T25T25T25T25T25T25T25T25T25T25T25T25T25T25T25T25T25T25T25T25T25T25T25T25T25T25T25T25T25T25T25T25T25T25T25T25T25T25T25T25T25T25T25T25T25T25T25T25T25T25T25T25T25T25T25T25T25T25T25T25T25T25T25T25T25T25T25T25T25T25T25T25T25T25T25T25T25T25T25T25T25T25T25T25T25T25T25T25T25T25T25T25T25T25T25T25T25T25T25T25T25T25T25T25T25T25T25T25T25T25T25T25T25T25T25T25T25T25T25T25T25T25T25T25T25T25T25T25T25T25T25T25T25T25T25T25T25T25T25T25T25T25T25T25T25T25T25T25T25T25T25T25T25T25T25T25T25T25T25T25T25T25T25T25T25T25T25T25T25T25T25T25T25T25T25T25T25T25T25T25T25T25T25T25T25T25T25T25T25T25T25T25T25T25T25T25T25T25T25T25T25T25T25T25T25T25T25T25T25T25T25T25T25T25T25T25T25T25T25T25T25T25T25T25T25T25T25T25T25T25T25T25T25T25T25T25T25T25T25T25T25T25T25T25T25T25T25T25T25T25T25T25T25T25T25T25T25T25T25T25T25T25T25T25T25T25T25T25T25T25T25T25T25T25T25T25T25T25T25T25T25T25T25T25T25T25T25T25T25T25T25T25T25T25T25T25T25T25T25T25T25T25T25T25T25T25T25T25T25T25T25T25T25T25T25T25T25T25T25T25T25T25T25T25T25T25T25T25T25T25T25T25T25T25T25T25T25T25T25T25T25T25T25T25T25T25T25T25T25T25T25T25T25T25T25T25T25T25T25T25T25T25T25T25T25T25T25T25T25T25T25T25T25T25T25T25T25T25T25T25T25T25T25T25T25T25T25T25T25T25T25T25T25T25T25T25T25T25T25T25T25T25T25T25T25T25T25T25T25T25T25T25T25T25T25T25T25T25T25T25T25T25T25T25T25T25T25T25T25T25T25T25T25T25T25T25T25T25T25T25T25T25T25T25T25T25T25T25T25T25T25T25T25T25T25T25T25T25T25T25T25T25T25T25T25T25T25T25T25T25T25T25T25T25T25T25T25T25T25T25T25T25T25T25T25T25T25T25T25T25T25T25T25T25T25T25T25T25T25T25T25T25T25T25T25T25T25T25T25T25T25T25T25T25T25T25T25T25T25T25T25T25T25T25T25T25T25T25T25T25T25T25T25T25T25T25T25T25T25T25T25T25T25T25T25T25T25T25T25T25T25T25T25T25T25T25T25T25T25T25T25T25T25T25T25T25T25T25T25T25T25T25T25T25T25T25T25T25T25T25T25T25T25T25T25T25T25T25T25T25T25T25T25T25T25T25T25T25T25T25T25T25T25T25T25T25T25T25T25T25T25T25T25T25T25T25T25T25T25T25T25T25T25T25T25T25T25T25T25T25T25T25T25T25T25T25T25T25T25T25T25T25T25T25T25T25T25T25T25T25T25T25T25T25T25T25T25T25T25T25T25T25T25T25T25T25T25T25T25T25T25T25T25T25T25T25T25T25T25T25T25T25T25T25T25T25T25T25T25T25T25T25T25T25T25T25T25T25T25T25T25T25T25T25T25T25T25T25T25T25T25T25T25T25T25T25T25T25T25T25T25T25T25T25T25T25T25T25T25T25T25T25T25T25T25T25T25T25T25T25T25T25T25T25T25T25T25T25T25T25T25T25T25T25T25T25T25T25T25T25T25T25T25T25T25T25T25T25T25T25T25T25T25T25T25T25T25T25T25T25T25T25T25T25T25T25T25T25T25T25T25T25T25T25T25T25T25T25T25T25T25T25T25T25T25T25T25T25T25T25T25T25T25T25T25T25T25T25T25T25T25T25T25T25T25T25T25T25T25T25T25T25T25T25T25T25T25T25T25T25T25T25T25T25T25T25T25T25T25T25T25T25T25T25T25T25T25T25T25T25T25T25T25T25T25T25T25T25T25T25T25T25T25T25T25T25T25T25T25T25T25T25T25T25T25T25T25T25T25T25T25T25T25T25T25T25T25T25T25T25T25T25T25T25T25T25T25T25T25T25T25T25T25T25T25T25T25T25T25T25T25T25T25T25T25T25T25T25T25T25T25T25T25T25T25T25T25T25T25T25T25T25T25T25T25T25T25T25T25T25T25T25T25T25T25T25T25T25T25T25T25T25T25T25T25T25T25T25T25T25T25T25T25T25T25T25T25T25T25T25T25T25T25T25T25T25T25T25T25T25T25T25T25T25T25T25T25T25T25T25T25T25T25T25T25T25T25T25T25T25T25T25T25T25T25T25T25T25T25T25T25T25T25T25T25T25T25T25T25T25T25T25T25T25T25T25T25T25T25T25T25T25T25T25T25T25T25T25T25T25T25T25T25T25T25T25T25T25T25T25T25T25T25T25T25T25T25T25T25T25T25T25T25T25T25T25T25T25T25T25T25T25T25T25T25T25T25T25T25T25T25T25T25T25T25T25T25T25T25T25T25T25T25T25T25T25T25T25T25T25T25T25T25T25T25T25T25T25T25T25T25T25T25T25T25T25T25T25T25T25T25T25T25T25T25T25T25T25T25T25T25T25T25T25T25T25T25T25T25T25T25T25T25T25T25T25T25T25T25T25T25T25T25T25T25T25T25T25T25T25T25T25T25T25T25T25T25T25T25T25T25T25T25T25T25T25T25T25T25T25T25T25T25T25T25T25T25T25T25T25T25T25T25T25T25T25T25T25T25T25T25T25T25T25T25T25T25T25T25T25T25T25T25T25T25T25T25T25T25T25T25T25T25T25T25T25T25T25T25T25T25T25T25T25T25T25T25T25T25T25T25T25T25T25T25T25T25T25T25T25T25T25T25T25T25T25T25T25T25T25T25T25T25T25T25T25T25T25T25T25T25T25T25T25T25T25T25T25T25T25T25T25T25T25T25T25T25T25T25T25T25T25T25T25T25T25T25T25T25T25T25T25T25T25T25T25T25T25T25T25T25T25T25T25T25T25T25T25T25T25T25T25T25T25T25T25T25T25T25T25T25T25T25T25T25T25T25T25T25T25T25T25T25T25T25T25T25T25T25T25T25T25T25T25T25T25T25T25T25T25T25T25T25T25T25T25T25T25T25T25T25T25T25T25T25T25T25T25T25T25T25T25T25T25T25T25T25T25T25T25T25T25T25T25T25T25T25T25T25T25T25T25T25T25T25T25T25T25T25T25T25T25T25T25T25T25T25T25T25T25T25T25T25T25T25T25T25T25T25T25T25T25T25T25T25T25T25T25T25T25T25T25T25T25T25T25T25T25T25T25T25T25T25T25T25T25T25T25T25T25T25T25T25T25T25T25T25T25T25T25T25T25T25T25T25T25T25T25T25T25T25T25T25T25T25T25T25T25T25T25T25T25T25T25T25T25T25T25T25T25T25T25T25T25T25T25T25T25T25T25T25T25T25T25T25T25T25T25T25T25T25T25T25T25T25T25T25T25T25T25T25T25T25T25T25T25T25T25T25T25T25T25T25T25T25T25T25T25T25T25T25T25T25T25T25T25T25T25T25T25T25T25T25T25T25T25T25T25T25T25T25T25T25T25T25T25T25T25T25T25T25T25T25T25T25T25T25T25T25T25T25T25T25T25T25T25T25T25T25T25T25T25T25T25T25T25T25T25T25T25T25T25T25T25T25T25T25T25T25T25T25T25T25T25T25T25T25T25T25T25T25T25T25T25T25T25T25T25T25T25T25T25T25T25T25T25T25T25T25T25T25T25T25T25T25T25T25T25T25T25T25T25T25T25T25T25T25T25T25T25T25T25T25T25T25T25T25T25T25T25T25T25T25T25T25T25T25T25T25T25T25T25T25T25T25T25T25T25T25T25T25T25T25T25T25T25T25T25T25T25T25T25T25T25T25T25T25T25T25T25T25T25T25T25T25T25T25T25T25T25T25T25T25T25T25T25T25T25T25T25T25T25T25T25T25T25T25T25T25T25T25T25T25T25T25T25T25T25T25T25T25T25T25T25T25T25T25T25T25T25T25T25T25T25T25T25T25T25T25T25T25T25T25T25T25T25T25T25T25T25T25T25T25T25T25T25T25T25T25T25T25T25T25T25T25T25T25T25T25T25T25T25T25T25T25T25T25T25T25T25T25T25T25T25T25T25T25T25T25T25T25T25T25T25T25T25T25T25T25T25T25T25T25T25T25T25T25T25T25T25T25T25T25T25T25T25T25T25T25T25T25T25T25T25T25T25T25T25T25T25T25T25T25T25T25T25T25T25T25T25T25T25T25T25T25T25T25T25T25T25T25T25T25T25T25T25T25T25T25T25T25T25T25T25T25T25T25T25T25T25T25T25T25T25T25T25T25T25T25T25T25T25T25T25T25T25T25T25T25T25T25T25T25T25T25T25T25T25T25T25T25T25T25T25T25T25T25T25T25T25T25T25T25T25T25T25T25T25T25T25T25T25T25T25T25T25T25T25T25T25T25T25T25T25T25T25T25T25T25T25T25T25T25T25T25T25T25T25T25T25T25T25T25T25T25T25T25T25T25T25T25T25T25T25T25T25T25T25T25T25T25T25T25T25T25T25T25T25T25T25T25T25T25T25T25T25T25T25T25T25T25T25T25T25T25T25T25T25T25T25T25T25T25T25T25T25T25T25T25T25T25T25T25T25T25T25T25T25T25T25T25T25T25T25T25T25T25T25T25T25T25T25T25T25T25T25T25T25T25T25T25T25T25T25T25T25T25T25T25T25T25T25T25T25T25T25T25T25T25T25T25T25T25T25T25T25T25T25T25T25T25T25T25T25T25T25T25T25T25T25T25T25T25T25T25T25T25T25T25T25T25T25T25T25T25T25T25T25T25T25T25T25T25T25T25T25T25T25T25T25T25T25T25T25T25T25T25T25T25T25T25T25T25T25T25T25T25T25T25T25T25T25T25T25T25T25T25T25T25T25T25T25T25T25T25T25T25T25T25T25T25T25T25T25T25T25T25T25T25T25T25T25T25T25T25T25T25T25T25T25T25T25T25T25T25T25T25T25T25T25T25T25T25T25T25T25T25T25T25T25T25T25T25T25T25T25T25T25T25T25T25T25T25T25T25T25T25T25T25T25T25T25T25T25T25T25T25T25T25T25T25T25T25T25T25T25T25T25T25T25T25T25T25T25T25T25T25T25T25T25T25T25T25T25T25T25T25T25T25T25T25T25T25T25T25T25T25T25T25T25T25T25T25T25T25T25T25T25T25T25T25T25T25T25T25T25T25T25T25T25T25T25T25T25T25T25T25T25T25T25T25T25T25T25T25T25T25T25T25T25T25T25T25T25T25T25T25T25T25T25T25T25T25T25T25T25T25T25T25T25T25T25T25T25T25T25T25T25T25T25T25T25T25T25T25T25T25T25T25T25T25T25T25T25T25T25T25T25T25T25T25T25T25T25T25T25T25T25T25T25T25T25T25T25T25T25T25T25T25T25T25T25T25T25T25T25T25T25T25T25T25T25T25T25T25T25T25T25T25T25T25T25T25T25T25T25T25T25T25T25T25T25T25T25T25T25T25T25T25T25T25T25T25T25T25T25T25T25T25T25T25T25T25T25T25T25T25T25T25T25T25T25T25T25T25T25T25T25T25T25T25T25T25T25T25T25T25T25T25T25T25T25T25T25T25T25T25T25T25T25T25T25T25T25T25T25T25T25T25T25T25T25T25T25T25T25T25T25T25T25T25T25T25T25T25T25T25T25T25T25T25T25T25T25T25T25T25T25T25T25T25T25T25T25T25T25T25T25T25T25T25T25T25T25T25T25T25T25T25T25T25T25T25T25T25T25T25T25T25T25T25T25T25T25T25T25T25T25T25T25T25T25T25T25T25T25T25T25T25T25T25T25T25T25T25T25T25T25T25T25T25T25T25T25T25T25T25T25T25T25T25T25T25T25T25T25T25T25T25T25T25T25T25T25T25T25T25T25T25T25T25T25T25T25T25T25T25T25T25T25T25T25T25T25T25T25T25T25T25T25T25T25T25T25T25T25T25T25T25T25T25T25T25T25T25T25T25T25T25T25T25T25T25T25T25T25T25T25T25T25T25T25T25T25T25T25T25T25T25T25T25T25T25T25T25T25T25T25T25T25T25TForeword ................................................................................................................................................... iii Acknowledgements ........................................................................................................................................ ix Contributors to the publication ........................................................................................................................... x Statistical correspondents ................................................................................................................................. xi
1 OVERVIEW OF FOREST PRODUCTS MARKETS AND POLICIES, 2011-2012 .................................................. 1
1.1 Introduction to the publication ............................................................................................................................... 2 1.2 Market developments ............................................................................................................................................... 2 1.3 Policy and regulatory framework development ...................................................................................................... 3 1.4 Sustainable forest products ....................................................................................................................................... 5 1.5 Regional and subregional markets ........................................................................................................................... 5
2 THE ECONOMIC SITUATION AND CONSTRUCTION-SECTOR DEVELOPMENTS IN THE UNECE REGION, 2011-2012 .............................................................................................................................................................. 11
2.1 Current economic developments ........................................................................................................................... 12 2.2 Construction-sector developments ........................................................................................................................ 18 2.3 References ................................................................................................................................................................ 23
3 POLICY AND REGULATORY FRAMEWORK DEVELOPMENTS, 2011-2012 .................................................. 25 3.1 Introduction ............................................................................................................................................................. 26 3.2 Trade-related policies ............................................................................................................................................. 26 3.3 Climate- and energy-related policies ..................................................................................................................... 30 3.4 Environment-related policies ................................................................................................................................. 33 3.5 Conclusions ............................................................................................................................................................. 35 3.6 References ................................................................................................................................................................ 35
4 WOOD RAW MATERIAL MARKETS, 2011-2012 ........................................................................................ 37 4.1 Introduction ............................................................................................................................................................. 38 4.2 Europe subregion ..................................................................................................................................................... 39 4.3 CIS subregion .......................................................................................................................................................... 40 4.4 North America subregion ....................................................................................................................................... 41 4.5 Wood raw material costs ........................................................................................................................................ 43 4.6 References ................................................................................................................................................................ 46
5 SAWN SOFTWOOD MARKETS, 2011-2012 ................................................................................................ 47 5.1 Introduction ............................................................................................................................................................. 48 5.2 Europe subregion ..................................................................................................................................................... 49 5.3 Commonwealth of Independent States, focusing on the Russian Federation ................................................... 52 5.4 North America subregion ....................................................................................................................................... 53 5.5 References ................................................................................................................................................................ 56
6 SAWN HARDWOOD MARKETS, 2011-2012 .............................................................................................. 57 6.1 Introduction ............................................................................................................................................................. 58 6.2 Europe subregion ..................................................................................................................................................... 59 6.3 CIS subregion .......................................................................................................................................................... 62 6.4 North America subregion ....................................................................................................................................... 63 6.5 Policy and other market issues ............................................................................................................................... 65 6.6 References ................................................................................................................................................................ 65
7 WOOD-BASED PANEL MARKETS, 2011-2012 .......................................................................................... 67 7.1 Introduction ............................................................................................................................................................. 68 7.2 Europe subregion ..................................................................................................................................................... 68 7.3 CIS subregion, with a focus on the Russian Federation ....................................................................................... 71 7.4 North America subregion ....................................................................................................................................... 74 7.5 Panel price trends .................................................................................................................................................... 76 7.6 References ................................................................................................................................................................ 77
8 PAPER, PAPERBOARD AND WOODPULP MARKETS, 2011-2012 ................................................................ 79 8.1 Introduction ............................................................................................................................................................. 80 8.2 Europe subregion ..................................................................................................................................................... 81 8.3 CIS subregion, focusing on the Russian Federation ............................................................................................. 86 8.4 North America subregion ....................................................................................................................................... 89 8.5 References ................................................................................................................................................................ 94
vi __________________________________________________________ UNECE/FAO Forest Products Annual Market Review, 2011-2012
9 WOOD ENERGY MARKETS, 2011-2012 .................................................................................................... 95 9.1 General energy market developments ................................................................................................................... 96 9.2 Economic considerations and sustainable wood energy ....................................................................................... 96 9.3 Environmental considerations of sustainable wood energy ............................................................................... 101 9.4 Social considerations of sustainable wood energy .............................................................................................. 103 9.5 Public policy and future developments ............................................................................................................... 104 9.6 References .............................................................................................................................................................. 105
10 CERTIFIED FOREST PRODUCTS MARKETS, 2011-2012 ........................................................................... 107 10.1 Introduction ........................................................................................................................................................... 108 10.2 Development of forest certification ..................................................................................................................... 108 10.3 Growth of chain-of-custody certification ............................................................................................................ 112 10.4 Key forest certification issues ............................................................................................................................... 113 10.5 References .............................................................................................................................................................. 116
11 CARBON MARKETS, 2011-2012 ............................................................................................................ 117 11.1 Introduction ........................................................................................................................................................... 118 11.2 Market outlook ...................................................................................................................................................... 118 11.3 Voluntary carbon markets .................................................................................................................................... 121 11.4 Carbon prices ......................................................................................................................................................... 123 11.5 Policy discussion .................................................................................................................................................... 123 11.6 National and regional carbon market developments ......................................................................................... 125 11.7 References .............................................................................................................................................................. 128
12 VALUE-ADDED WOOD PRODUCTS MARKETS, 2011-2012...................................................................... 129 12.1 Introduction ........................................................................................................................................................... 130 12.2 Markets for value-added wood products .............................................................................................................. 130 12.3 European market for engineered wood products ................................................................................................ 135 12.4 Engineered wood products market developments in North America............................................................... 137 12.5 References .............................................................................................................................................................. 140
13 INNOVATIVE WOOD-BASED PRODUCTS, 2011-2012 ............................................................................. 141 13.1 Introduction ........................................................................................................................................................... 142 13.2 Innovation in bioplastics ...................................................................................................................................... 143 13.3 Innovation in bio-based materials ....................................................................................................................... 145 13.4 Innovation in engineered wood products ........................................................................................................... 146 13.5 Innovation in biorefining ..................................................................................................................................... 149 13.6 Conclusion ............................................................................................................................................................. 149 13.7 References .............................................................................................................................................................. 150
ANNEXES .................................................................................................................................................. 151 Components of wood products groups .............................................................................................................................. 152 Countries in the UNECE region and its subregions ........................................................................................................ 155 List of Authors .................................................................................................................................................................... 156 Some facts about the Timber Committee ......................................................................................................................... 157 UNECE/FAO Publications ................................................................................................................................................ 158
UNECE/FAO Forest Products Annual Market Review, 2011-2012 __________________________________________________________ vii
LIST OF TABLES 1.5.1 Apparent consumption of sawnwood, wood-based panels, paper and paperboard in the UNECE region, 2007-2011… .. 7 2.1.1 UNECE region real GDP growth rates (%), 2011-2012 ............................................................................................................... 17 4.2.1 Roundwood balance in Europe, 2010-2011 ..................................................................................................................................... 39 4.3.1 Roundwood balance in the CIS, 2010-2011 .................................................................................................................................... 41 4.4.1 Roundwood balance in North America, 2010-2011 ...................................................................................................................... 41 5.2.1 Sawn softwood balance in Europe, 2010-2011 ................................................................................................................................ 49 5.2.3 EU-27 sawn softwood exports by principal importers, 2010-2011 .............................................................................................. 51 5.3.1 Sawn softwood balance in the CIS, 2010-2011 ............................................................................................................................... 52 5.3.2 Sawn softwood balance in the Russian Federation, 2010-2011 .................................................................................................... 52 5.4.1 Sawn softwood balance in North America, 2010-2011 ................................................................................................................. 54 6.2.1 Sawn hardwood balance in Europe, 2010-2011 .............................................................................................................................. 59 6.2.2 Production of sawn hardwood in Europe 2010-2011 ...................................................................................................................... 60 6.3.1 Sawn hardwood balance in the CIS, 2010-2011 ............................................................................................................................. 62 6.4.1 Sawn hardwood balance in North America, 2010-2011 ............................................................................................................... 63 7.2.1 Wood-based panel balance in Europe and EU 27, 2010-2011 ..................................................................................................... 70 7.3.1 Wood-based panel balance in the CIS subregion, 2010-2011 ...................................................................................................... 71 7.3.2 Wood-based panel production in the Russian Federation, 2007-2011 ....................................................................................... 71 7.3.3 Particle board balance in the Russian Federation, 2010-2011 ...................................................................................................... 71 7.3.4 Summary of wood-based panel projects completed and planned for 2011-2015....................................................................... 72 7.4.1 Wood-based panel balance in North America, 2010-2011 .......................................................................................................... 74 7.4.2 North American exports of wood-based panels 2007-2011. ......................................................................................................... 75 8.2.1 Paper and paperboard consumption in Europe, 2010-2011 ........................................................................................................... 82 8.2.2 Paper and paperboard in Europe ......................................................................................................................................................... 83 8.2.3 Woodpulp balance in Europe, 2010-2011 ........................................................................................................................................ 85 8.3.1 Output of chemical woodpulp, paper and paperboard in the Russian Federation, 2010-2011 ............................................... 86 8.3.2 Paper, paperboard and woodpulp balance in the CIS, 2010-2011 .............................................................................................. 87 8.4.1 Paper and paperboard balance in North America, 2010-2011 ..................................................................................................... 91 8.4.2 Paper and paperboard in North America ......................................................................................................................................... 92 10.2.1 Potential global and regional supply of roundwood from certified resources, 2010-2012 ..................................................... 109 11.2.1 Carbon markets 2010-2011 .............................................................................................................................................................. 119 11.2.2 CDM forestry projects registered since July 2011 ......................................................................................................................... 121 11.3.1 Voluntary carbon market forestry projects under the Verified Carbon Standard .................................................................. 122 11.6.1 REDD projects under BOCM .......................................................................................................................................................... 127 12.1.1 Furniture imports by origin (%) for the top five importing countries, and total value 2010-2011 ...................................... 131 12.2.2 Furniture balance in Italy 2008-2011 ............................................................................................................................................. 132 12.2.3 Builders’ joinery and carpentry imports by origin (%) for the top five importing countries, and total value 2010-2011 133 12.2.4 Profiled wood imports by origin (%) for the top five importing countries, and total value, 2010-2011 ............................. 134 12.4.1 Glulam consumption, production and trade in North America, 2010-2012 .......................................................................... 137 12.4.2 Wooden I-beam consumption and production in North America, 2010-2012 ..................................................................... 139 12.4.3 LVL consumption and production in North America, 2010-2012 .......................................................................................... 139
LIST OF GRAPHS
1.2.1 Housing starts in the UNECE region, 2006-2012 ............................................................................................................................. 3 1.2.2 US construction spending data, 2000-2012 ....................................................................................................................................... 3 1.2.3 Euroconstruct region housing starts, 2006-2014 ................................................................................................................................ 3 1.5.1 Consumption of forest products in the UNECE region, 2007-2011.............................................................................................. 6 2.1.1 Real exchange indices of selected currencies, 2007-2012 .............................................................................................................. 14 2.2.1 US construction spending data, 2006-2014 ..................................................................................................................................... 18 2.2.2 New and existing US housing sales, 2000-2012 .............................................................................................................................. 18 2.2.3 US sawnwood and panel prices versus US housing starts, 2004-2012 ........................................................................................ 19 2.2.4 Canadian housing starts, 2006-2013 .................................................................................................................................................. 20 2.2.5 Euroconstruct region housing starts, 2006-2014 .............................................................................................................................. 21 2.2.6 Euroconstruct region building permits, 2006-2014 ......................................................................................................................... 21 2.2.7 Euroconstruct region construction spending, 2006-2014 .............................................................................................................. 21 2.2.8 Euroconstruct region construction sector shares, 2011 ................................................................................................................... 22 3.2.1 Canada exports of softwood and hardwood logs, 1995-2011 ........................................................................................................ 28 3.2.2 British Columbia exports of softwood logs, 1995-2011 .................................................................................................................. 28 4.1.1 Consumption of softwood industrial roundwood in three UNECE subregions, 2007-2011 ................................................... 38 4.1.2 Consumption of hardwood industrial roundwood in three UNECE subregions 2007-2011 .................................................. 38 4.1.3 Top five global trade flows of softwood roundwood by volume, 2007-2011 ............................................................................... 39 4.5.1 Global softwood sawlog price index, 2002-2012 ............................................................................................................................. 43 4.5.2 Softwood sawlog price indices in North America, 2007-2012 ..................................................................................................... 44
viii _________________________________________________________ UNECE/FAO Forest Products Annual Market Review, 2011-2012
4.5.3 Softwood sawlog price indices in Europe and the Russian Federation, 2007-2012 ................................................................... 44 4.5.4 Global wood fibre price indices 1988-2012 ...................................................................................................................................... 45 4.5.5 Softwood pulplog price indices in Europe and North America, 2007-2012............................................................................... 45 4.5.6 Softwood wood chip price indices in Europe and North America, 2007-2012 ......................................................................... 46 5.1.1 Consumption of sawnwood in the UNECE region, 2007-2011 ................................................................................................... 48 5.1.2 Top five global trade flows of sawn softwood by value, 2006-2010 .............................................................................................. 48 5.2.1 Housing start index for Europe, 2001-2014 ...................................................................................................................................... 49 5.2.2 Swedish export price for sawn softwood and softwood sawlog cost per cubic metre of sawnwood, 2001-2012 ................... 50 5.2.3 EU-27 trade of sawn softwood with non-EU-27 partners, 2007-2011 ........................................................................................ 51 5.3.1 Housing construction in the Russian Federation, 2002-2011 ....................................................................................................... 53 5.3.2 Shares of individual houses for walling in the Russian Federation, 2011 .................................................................................... 53 5.4.1 Sawn softwood quarterly prices in Japan, Europe, US and China, 2003-2012 .......................................................................... 55 6.1.1 Consumption of sawn hardwood in the UNECE region, 2007-2011 ......................................................................................... 58 6.1.2 Chinese imports of temperate hardwood logs, 2006-2012 ............................................................................................................. 58 6.1.3 Chinese imports of sawn temperate hardwood, 2006-2012 ........................................................................................................... 59 6.2.1 European hardwood flooring species, 2009-2011 ............................................................................................................................ 61 6.4.1 United States sawn hardwood consumption by sector, 1972-2011 ............................................................................................. 64 6.4.2 Price development for selected hardwood species in the US, 2008-2012 ................................................................................... 64 7.1.1 Consumption of wood-based panels in three UNECE subregions, 2007-2012 ......................................................................... 68 7.1.2 Top five global trade flows of wood-based panels by value, 2006-2010 ....................................................................................... 68 7.2.1 Indices of primary input costs for wood-based panel production in Europe, 2007-2011 .......................................................... 70 7.3.1 Shares of countries in total exports of OSB to the Russian Federation in 2011 ........................................................................ 73 7.4.1 North American consumption of structural panels together with numbers of housing starts, 2008-2012 ........................... 74 7.4.2 North American structural panel capacity utilization, 2008-2012 ............................................................................................... 75 7.5.1 European panel prices, 2008-2012 ..................................................................................................................................................... 76 7.5.2 US panel prices (nominal), 2008-2012 ............................................................................................................................................. 77 8.1.1 Top five global trade flows of paper and paperboard by value, 2006-2010 ................................................................................. 80 8.1.2 Top five global trade flows of woodpulp by value, 2006-2010 ...................................................................................................... 80 8.1.3 Consumption of paper and paperboard in the UNECE region, 2007-2011 ............................................................................... 81 8.2.1 Production of paper and paperboard in Europe subregion, 2007-2011 ........................................................................................ 82 8.2.2 Average recycled paper prices, 2001-2012 ........................................................................................................................................ 86 8.3.1 Output of pulp, paper and paperboard in the Russian Federation, 1998-2011 .......................................................................... 86 8.3.2 Russian Federation exports and imports of pulp, paper and paperboard, 2007-2011 ................................................................ 87 8.3.3 Exports of market pulp, paper and paperboard from the Russian Federation, 1993-2011........................................................ 88 8.4.1 US pulp, paper and paperboard production indices, 2007-2012 .................................................................................................. 89 8.4.2 US paper industry capacity utilization ratio, 2008-2012 ................................................................................................................ 93 9.2.1 Annual average wood energy consumption per capita in the UNECE region, 2009 ............................................................... 96 9.2.2 UNECE regional wood energy uses per sector ................................................................................................................................. 97 9.2.3 Total production of wood co-products and wood pellets in the EU-27 ...................................................................................... 97 9.2.4 Austrian imports and exports of fuel wood, 2007-2010 .................................................................................................................. 98 9.2.5 Imports by EU-27 of fuel wood, pellets and woody residues, 2007-2010 ..................................................................................... 98 9.2.6 Capacity and production of wood pellets in Canada, 2002-2012 ............................................................................................. 100 9.2.7 Industrial wood pellet prices, 2008-2012 ........................................................................................................................................ 101 9.4.1 Average reported values of a survey of households in the US on the importance of selected sources in generating
renewable energy ................................................................................................................................................................................ 103 10.2.1 Forest area certified by major certification schemes, 2005-2012 ...............................................................................................108 10.2.2 Relative shares of total global certified forest area by world region, 2012 ................................................................................ 110 10.2.3 Five countries’ certified forest area, within the UNECE region, 2010-2012 ........................................................................... 110 10.2.4 Certified forest area in six countries outside the UNECE region, 2010-2012 ......................................................................... 112 10.3.1 Chain-of-custody certified trends worldwide, 2006-2012 ........................................................................................................... 112 10.3.2 Chain-of-custody certificates in five countries within the UNECE region, 2010-2012 ....................................................... 112 10.3.3 Chain-of-custody certificates in five countries outside the UNECE region, 2010-2012 ....................................................... 113 11.4.1 Carbon prices, 2011-2012 ................................................................................................................................................................. 123 12.2.1 Value of wooden furniture imported by the top five importing countries, 2007-2011 .......................................................... 130 12.2.2 Builders’ joinery and carpentry imports for the top five importing countries, 2007-2011 ..................................................... 133 12.2.3 Profiled wood imports for the top five importing countries, 2007-2011 ................................................................................... 134 12.3.1 Development of key sales markets (consumption) for glulam products in Europe, 2002-2010 ........................................... 135 12.3.2 Development of key-sales markets (consumption) for glulam products globally, 2002-2010 .............................................. 135 12.3.3 Nominal price and price difference between glulam and finger-jointed structural timber, 1999-2011 .............................. 136 12.3.4 Development of key-sales markets (consumption) for finger-jointed structural timber products globally, 2002-2010 ... 136 12.4.1 Glulam production in North America, 2008-2012 ..................................................................................................................... 138 12.4.2 I-beam market share of the raised floor area in the US, 2006-2012 .......................................................................................... 138 12.4.3 I-beam production in North America, 2008-2012 ...................................................................................................................... 139 12.4.4 LVL production in North America, 2008-2012 ........................................................................................................................... 140 13.4.1 Growth in numbers of new wooden residential buildings in Italy ............................................................................................. 14813.4.2 Growth in number of new wooden non residential buildings in Italy .......................................................................................148
UNECE/FAO Forest Products Annual Market Review, 2011-2012 ___________________________________________________________ ix
ACKNOWLEDGEMENTS
The UNECE/FAO Forest Products Annual Market Review is the result of a cooperative effort involving a network of official country correspondents, authors, reviewers, editors and a team of people working in the Forestry and Timber Section in Geneva, together with colleagues in FAO, Rome. In combination, they provide an unrivalled source of expertise and knowledge, which is the hallmark of the Review.
Many of these people give freely of their time and expertise; others are supported by companies, universities or industry
associations, institutions and a variety of organizations. Without their help, it would not have been possible to produce this valued annual publication. And this particular edition could not have been published without the financial support of the Swiss government.
The Review benefits from a longstanding partnership with the Department of Forest Sciences, University of Helsinki,
which provides two marketing assistants every year. This year, Juuso Pihamaa and Johannes Äärilä undertook market research, prepared price data, produced all the graphics, and revised our graphics production system, as well as updated the webpages associated with the Review. Their contribution has been critical to the quality and timelines of the publication. Anne Toppinen, Professor, and Lei Wang, Researcher, at the Department facilitated these annual internships: we thank them and look forward to continuing this mutually beneficial arrangement. We thank also Alexandra Niedzwiedz from Laboratoire d'Économie Forestière, Paris, and Igor Novoselov, LespromNetwork, Moscow, for providing market intelligence for the Wood Raw Materials chapter.
From the UNECE/FAO Forestry and Timber Section, Alex McCusker collected, validated and produced the statistics;
Arnaud Brizay and David Ellul contributed to the Policy chapter; and Karen Taylor dealt with administrative matters. Eve Charles translated the press release into French.
The project was managed by Matthew Fonseca and Jussi Posio. Douglas Clark reviewed the chapters, provided
guidance on content and also proofread the text. The chapters were reviewed by FAO in Rome by Arvydas Lebedys and Florian Steierer. Final review in Geneva was done by Paola Deda, Section Chief, Forestry and Timber Section and Virginia Cram-Martos, Director, Trade and Sustainable Land Management Division. The text was edited and proofread by Christina O'Shaughnessy.
This year’s Review is enhanced by a new cover design, produced by Yves Clopt, Graphic Designer, UNECE. In all, 48 people worked directly in preparing this publication, not including the additional contributors and statistical
correspondents listed separately on the next pages. This manuscript was completed on 3 August 2012.
x ___________________________________________________________ UNECE/FAO Forest Products Annual Market Review, 2011-2012
CONTRIBUTORS TO THE PUBLICATION
The secretariat would like to express our appreciation for the information and assistance received from the following people in preparation of the Forest Products Annual Market Review. The base data for the Review were supplied by country statistical correspondents, who are acknowledged in a separate listing. We regret any omissions.
Yngve Abrahamsen, Euroconstruct, Swiss Economic Institute, Switzerland
Craig Adair, APA – The Engineered Wood Association, United States
Ilaria Cerrutti, Cerutti Legnani s.n.c., Italy
Ash Charlton, ACE Training, London, United Kingdom
Jean-Christophe Claudon, International Tropical Timber Organization, Japan
Ariane Crèvecoeur, CEPI, Belgium
Alina Gilmanova, UNECE, Russian Federation
Ervedo Giordano, University of Tuscia, Italy
Filip de Jaeger, CEI-Bois, Belgium
Heikki Juslin, University of Helsinki, Finland
Eric Kilby, CEPI, Belgium
Antti Koskinen, Pöyry Management Consulting, Finland
Rajmund Laczkó, Eurostat, Luxembourg
Frederik Lauwaert, FEIC, Belgium
Arvydas Lebedys, FAO, Italy
Mathias Lundt, Pöyry Management Consulting, Germany
Marja Maaranto, Metsä Group, Finland
Marjo Maidell, FAO, Italy
Silvia Melegari, CEI-Bois, Belgium
Marcin Mionskowski, Poland
Csaba Mozes, Eurostat, Luxembourg
Ewald Rametsteiner, FAO, Italy
Olli Raunio, Raunion Saha, Finland
Jeff Readman, University of Sussex, United Kingdom
Mohini Sain, University of Toronto, Canada
Al Schuler, USDA Forest Service, United States
Richard Sikkema, Copernicus Institute, University of Utrecht, Netherlands
Ken Skog, USDA Forest Service, United States
Florian Steierer, FAO, Italy
Anne Toppinen, University of Helsinki, Finland
Petri Vasara, Pöyry Management Consulting, Finland
David Venables, American Hardwood Export Council, United Kingdom
Antje Wahl, FPInnovations – Forintek Division, Canada
Marilise Wolf-Crowther, Eurostat, Luxembourg

UNECE/FAO Forest Products Annual Market Review, 2011-2012 ___________________________________________________________ xi
STATISTICAL CORRESPONDENTS
The national statistical correspondents listed below are the key suppliers of data for this publication. We are grateful for their invaluable contributions and their significant efforts in collecting and preparing the data. Complete contact information for the correspondents is provided in the publication Forest Products Statistics.1 Mykola Afanasiev, International Cooperation Department, State Statistics Committee, Ukraine Gagik Ananyan, State Council on Statistics, National Statistical Service, Armenia Djanbulat Baijumanov, National Statistical Committee, Kyrgyzstan Ramazan Bali, Forest Product Market Research, General Directorate of Forestry, Turkey Aija Budreiko, Forest Resources Department, Ministry of Agriculture, Latvia Josefa Carvalho, National Forest Authority, Ministry of Agriculture, Rural Development and Fisheries, Portugal Matthias Dieter, Federal Research Institute for Rural Areas, Forestry, and Fisheries, Johann Heinrich von Thünen
Institut, Germany Guillermo Fernández Centeno, Forestry Statistical Unit, Biodiversity Databank, General Directorate of Biodiversity,
DG Rural Development and Forest Policy, Ministry of Agriculture, Food and Environment, Spain Branko Glavonjic, Faculty of Forestry, Belgrade State University, Serbia Hanne Haanaes, Division for Primary Industry Statistics, Statistics Norway - Statistisk sentralbyrå Johannes Hangler, Forest Policy and Forest Information, Federal Ministry of Agriculture, Forestry, Environment and
Water Management, Austria Eugene Hendrick, Department of Agriculture, Fisheries and Food, Ireland James L. Howard, Forest Products Laboratory, United States Department of Agriculture - Forest Service Aristides Ioannou, Department of Forests, Ministry of Agriculture, Natural Resources and Environment, Cyprus Surendra Joshi, Policy and Analysis Division, Swedish Forest Agency Nazira Kashkinbaeva, Office of the Agricultural Sector, Agency on Statistics of the Republic of Kazakhstan Bruno Kestemont, Statistique et information économique, Institut National des Statistiques, Belgium Peter Kottek, Statistical Department, State Forest Service, Hungary Boro Kovačević, Agency for Statistics of Bosnia and Herzegovina Linda Langner, United States Department of Agriculture - Forest Service Angela Larabie, Canadian Forest Service / Service canadien des forêts, Natural Resources Canada Jan-Olof Loman, Policy and Analysis Division, Swedish Forest Agency Elina Maki-Simola, Forest Statistics Information Service, Finnish Forest Research Institute Assem Manakova, International Communication Subdepartment, Agency of Statistics of the Republic of Kazakhstan Angelo Mariano, National Forest Service, Ministry of Agricultural, Food and Forest Policies, Italy Anthony Mifsud, Agricultural Services and Rural Development, Agricultural Research and Development Centre,
Malta Martin Moravčík, Department of Forest Policy and Economics, National Forest Centre, Slovakia Michel-Paul Morel, Service de la statistique et de la prospective, Ministère de l'agriculture, de l'alimentation, de la
pêche, de la ruralité et de l'aménagement du territoire, France Darko Motik, Faculty of Forestry, Department for Production Organization, University of Zagreb, Croatia Olivian Nutescu, National Institute of Statistics, Romania Eoin O'Driscoll, Forest Service, Department of Agriculture, Fisheries and Food, Ireland Knut Oistad, Department of Forest and Natural Resource Policy, Ministry of Agriculture and Food, Norway Jan Oldenburger, Probos Foundation, Netherlands Yuri M. Ostapchuk, Division of Statistics of Foreign Countries, State Committee on Statistics of Ukraine Tatiana Pasi, Forestry Division, Swiss Federal Office for the Environment, Federal Department of Environment,
Transportation, Energy and Communication Ewa Ratajczak, Wood Economics Department, Wood Technology Institute, Poland
1 Forest Products Statistics is available at: www.unece.org/forests/fpm/onlinedata.html
xii __________________________________________________________ UNECE/FAO Forest Products Annual Market Review, 2011-2012
Biljana Stefanova, Dissemination, State Statistical Office of the Republic of Macedonia, The former Yugoslav Republic of Macedonia
Václav Stránský, Conception and Economics of Forest Management Section, Forestry Department, Ministry of Agriculture, Czech Republic
Wladyslaw Strykowski, Wood Technology Institute, Poland Irena Tomšič, Statistical Office of the Republic of Slovenia María Torres-Quevedo García de Quesada, Directorate-General of Nature Conservation, Ministry of Environment, Spain Sabira Tulundieva, International Cooperation Department, National Statistical Committee, Kyrgyzstan Mati Valgepea, Department of Forestry Statistics, Estonian Environment Information Centre, Estonia Darius Vizlenskas, Forest management and forestry statistics department, State Forest Service (SFS), Lithuania Sheila Ward, Economics and Statistics, Forestry Commission, United Kingdom Frank Wolter, Administration de la nature et des forêts, Luxembourg Arthur Zesiger, Unternehmensstruktur, Office fédéral de la statistique suisse, Switzerland
DATA SOURCES The data on which the Forest Products Annual Market Review is based are collected from official national
correspondents through the FAO/UNECE/Eurostat/ITTO Joint Forest Sector Questionnaire, distributed in April 2012. Within the 56-country UNECE region, data for the 31 EU and EFTA countries are collected and validated by Eurostat, and for other UNECE countries by UNECE/FAO Geneva.
The statistics for this Review are from the TIMBER database system. As the database is continually being updated, any one publication’s analysis is only a snapshot of the database at that particular time. The database and questionnaires are in a state of permanent development. Data quality differs between countries, products and years. Improvement of the quality is a continuing task for the secretariat, paying special attention to the CIS and south-east European countries. With our partner organizations and national correspondents, we strongly believe that the quality of the international statistical base for analysis of the forest products sector is steadily improving. Our goal is to have a single, complete, current database, validated by national correspondents, with the same figures available from FAO in Rome, Eurostat in Luxembourg, ITTO in Yokohama and UNECE/FAO in Geneva. We are convinced that the data set used in the Review is the best available anywhere as of July 2012. The data appearing in this publication form only a small part of the total data available. Forest Products Statistics will include all of the data available for the years 2007-2011. The TIMBER database is available on the website of the joint Timber Committee and European Forestry Commission at www.unece.org/forests/fpm/onlinedata.html
The secretariat is grateful that correspondents provided actual statistics for 2011 and, in the absence of formal statistics, their best estimates. Therefore all statistics for 2011 are provisional and subject to confirmation next year. The responsibility for national data lies with the national correspondents. The official data supplied by the correspondents account for the great majority of records. In some cases, where no data were supplied, or when data were confidential, the secretariat estimated figures to keep region and product aggregations comparable and to maintain comparability over time. Estimations are flagged within this publication, but only for products at the lowest level of aggregation.
In spite of everyone’s best efforts, there are still some significant problems. Chief among these problems are differing definitions, especially when these are not mentioned, and unrecorded removals and production. In certain cases, for example woodfuel removals, the officially reported data may be as little as 20% of the actual figures. The Joint Wood Energy Enquiry has gone some way towards improving the quality and coverage of data for wood energy. Conversions into the standard units used here are also not necessarily done in a consistent manner. The Joint FAO/UNECE Working Party on Forest Statistics, Economics and Management is currently carrying out work to increase awareness of problems in measurement and how to deal with these. Intra-EU trade is less reliable than extra-EU trade.
In addition to the official statistics received by questionnaire, trade association and government statistics are used to complete the analysis for 2011 and early 2012. Supplementary information came from experts, including national statistical correspondents, trade journals, the United Nations trade database (COMTRADE) and Internet sites. These sources are cited where they occur in the text, and at the end of the chapters.
UNECE/FAO Forest Products Annual Market Review, 2011-2012 __________________________________________________________ xiii
EXPLANATORY NOTES “Apparent consumption” is calculated by adding imports to a country’s production and subtracting exports.
Apparent consumption volumes are not adjusted for levels of stocks. It is synonymous with “demand” and “use”. “Net trade” is the balance of exports and imports and is positive for net exports, i.e. when exports exceed imports, and
is negative for net imports, i.e. when imports exceed exports. Trade data for the 27 European Union countries include intra-EU trade, which is often estimated by the countries. Export data usually include re-exports. Subregional trade aggregates in tables include trade occurring between countries of the subregion.
For a breakdown of the regions, please see the map in the annex. References to EU refer to the 27 countries members of the EU in 2011. The term Commonwealth of Independent States (CIS) refers to 12 countries: Armenia, Azerbaijan, Belarus, Georgia, Kazakhstan, Kyrgyzstan, Republic of Moldova, Russian Federation, Tajikistan, Turkmenistan, Ukraine and Uzbekistan, and is used solely for the reader’s convenience.
The term “softwood” is used synonymously with “coniferous”. “Hardwood” is used synonymously with “non-coniferous” or “broadleaved”. More definitions appear in the electronic annex.
All references to “ton” or “tons” or "tonnes" in this text represent the metric unit of 1,000 kilograms (kg). A billion refers to a thousand million (109). Please note that all US and Canadian sawn softwood production and trade are in solid m3, converted from nominal
m3. An explanation of this is provided in the Forest Products Annual Market Review 2001-2002, page 84. Russian sawn softwood production data have been estimated to avoid negative apparent consumption. Please see
the Forest Products Annual Market Review 2009-2010 page 58 for an explanation of the procedure used. The use of the term “oven-dry” in this text is used in relation to the weight of a product in a completely dry state,
e.g. an oven-dry metric tonne of wood fibre means 1,000 kg of wood fibre, containing no moisture at all.
xiv _________________________________________________________ UNECE/FAO Forest Products Annual Market Review, 2011-2012
SYMBOLS AND ABBREVIATIONS USED
(Infrequently used abbreviations spelled out in the text may not appear in this list)
… not available € euro $ United States dollar, unless otherwise specified ATFS American Tree Farm System BC British Columbia, Canada BJC builders' joinery and carpentry CAN Canadian dollar CFP certified forest product CIS Commonwealth of Independent States CLT cross-laminated timber CO2 carbon dioxide CoC Chain-of-custody CSA Canadian Standards Association EFI European Forest Institute EFTA European Free Trade Association EQ equivalent of wood in the rough EU European Union EWPs engineered wood products FSC Forest Stewardship Council FOB Free on board GDP gross domestic product GHG greenhouse gas Gj gigajoule GWh gigawatt hour ha hectare IMF International Monetary Fund ITTO International Tropical Timber Organization kWh kilowatt hour LVL laminated veneer lumber m.t. metric ton or tonne m2 square metre m3 cubic metre MBF one thousand board feet MDF medium-density fibreboard MSF one thousand square feet MWe megawatt electrical MWth megawatt thermal NGO non-governmental organization OSB oriented-strand board PEFC Programme for the Endorsement of Forest Certification PJ petajoule PoC Province of China REDD Reducing Emissions from Deforestation and Forest Degradation SAR Special Administrative Region (of China) SFI Sustainable Forestry Initiative SFM sustainable forest management SWE the equivalent volume to what it was in the solid green roundwood VAWPs value-added wood products
UNECE/FAO Forest Products Annual Market Review, 2011-2012 ___________________________________________________________ 1
1 Overview of forest products markets and policies, 2011-2012
Highlights
Industrial roundwood production increased for the second year in a row, climbing by 2.4% over 2010, with harvests as much as 12% more than the lows of 2009, but still down 14% from 2007.
The economic recovery in the UNECE region has been sluggish; a deepening eurozone crisis has added to the uncertainty in markets – with new construction, still well below pre-crisis activity.
Exports of wood raw material and wood products to Asia continue to offset flat demand for forest products within the UNECE region.
The demand for wood energy continues apace, especially within the EU-27, but tightening public budgets may well result in reduced support payments.
The Russian Federation’s acceptance as a member by the World Trade Organization (WTO) in December 2011 is expected to lead to significant reductions in export and import duties.
The US Lacey Act Amendment and the EU Timber Regulation are placing new obligations on suppliers to demonstrate “low-risk” status with respect to illegal logging.
Life cycle assessments (LCA) measuring the environmental impact of products should favour forest products, but are not yet widely adopted in green-building guidelines.
After a promising start to 2011, sawn hardwood consumption across the UNECE region fell away in the second half of the year.
The Russian Federation’s wood-based panel sector continued to expand in 2011, with volumes of plywood and fibreboard production up by10% and particle board up by more than 20% over 2010.
Market conditions for pulp, paper and paperboard were mixed from 2011 to early 2012, as prices peaked and then subsequently fell for most pulp, paper and paperboard commodities.
The theme of sustainability continues to resonate among pulp and paper companies in the UNECE region, as firms develop pathways to help achieve product innovation and market growth, such as biorefining, biomass energy production, and development of nano-cellulosic fibres.
The global area of certified forest increased 4% last year: almost 92% of the world’s certified forests are in the northern hemisphere, contrasting with 2% of tropical forests that have been certified.
The volume of carbon traded in the global markets grew by 17% to 10.2 billion tonnes of CO2e in 2011, with its value increasing to $175.6 billion, a 10% increase from 2010.
Furniture markets have not yet seen a strong recovery, but the signs are positive. Global manufacturers are focusing on cost savings rather than capacity expansion.
The wood-based products sector has been highly effective in promoting new product innovation, but will need to be equally effective in developing market and organizational innovation.
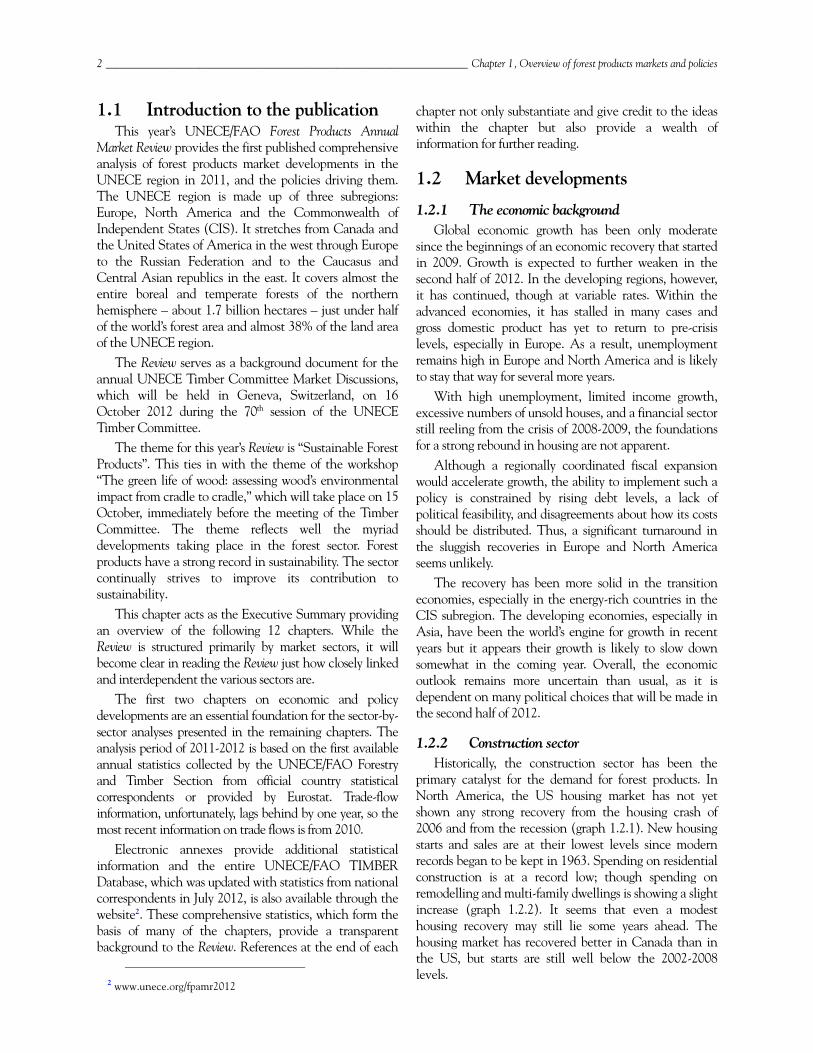
2 __________________________________________________________________ Chapter 1, Overview of forest products markets and policies
1.1 Introduction to the publication This year’s UNECE/FAO Forest Products Annual
Market Review provides the first published comprehensive analysis of forest products market developments in the UNECE region in 2011, and the policies driving them. The UNECE region is made up of three subregions: Europe, North America and the Commonwealth of Independent States (CIS). It stretches from Canada and the United States of America in the west through Europe to the Russian Federation and to the Caucasus and Central Asian republics in the east. It covers almost the entire boreal and temperate forests of the northern hemisphere – about 1.7 billion hectares – just under half of the world’s forest area and almost 38% of the land area of the UNECE region.
The Review serves as a background document for the annual UNECE Timber Committee Market Discussions, which will be held in Geneva, Switzerland, on 16 October 2012 during the 70th session of the UNECE Timber Committee.
The theme for this year’s Review is “Sustainable Forest Products”. This ties in with the theme of the workshop “The green life of wood: assessing wood’s environmental impact from cradle to cradle,” which will take place on 15 October, immediately before the meeting of the Timber Committee. The theme reflects well the myriad developments taking place in the forest sector. Forest products have a strong record in sustainability. The sector continually strives to improve its contribution to sustainability.
This chapter acts as the Executive Summary providing an overview of the following 12 chapters. While the Review is structured primarily by market sectors, it will become clear in reading the Review just how closely linked and interdependent the various sectors are.
The first two chapters on economic and policy developments are an essential foundation for the sector-by-sector analyses presented in the remaining chapters. The analysis period of 2011-2012 is based on the first available annual statistics collected by the UNECE/FAO Forestry and Timber Section from official country statistical correspondents or provided by Eurostat. Trade-flow information, unfortunately, lags behind by one year, so the most recent information on trade flows is from 2010.
Electronic annexes provide additional statistical information and the entire UNECE/FAO TIMBER Database, which was updated with statistics from national correspondents in July 2012, is also available through the website2. These comprehensive statistics, which form the basis of many of the chapters, provide a transparent background to the Review. References at the end of each
2 www.unece.org/fpamr2012
chapter not only substantiate and give credit to the ideas within the chapter but also provide a wealth of information for further reading.
1.2 Market developments
1.2.1 The economic background Global economic growth has been only moderate
since the beginnings of an economic recovery that started in 2009. Growth is expected to further weaken in the second half of 2012. In the developing regions, however, it has continued, though at variable rates. Within the advanced economies, it has stalled in many cases and gross domestic product has yet to return to pre-crisis levels, especially in Europe. As a result, unemployment remains high in Europe and North America and is likely to stay that way for several more years.
With high unemployment, limited income growth, excessive numbers of unsold houses, and a financial sector still reeling from the crisis of 2008-2009, the foundations for a strong rebound in housing are not apparent.
Although a regionally coordinated fiscal expansion would accelerate growth, the ability to implement such a policy is constrained by rising debt levels, a lack of political feasibility, and disagreements about how its costs should be distributed. Thus, a significant turnaround in the sluggish recoveries in Europe and North America seems unlikely.
The recovery has been more solid in the transition economies, especially in the energy-rich countries in the CIS subregion. The developing economies, especially in Asia, have been the world’s engine for growth in recent years but it appears their growth is likely to slow down somewhat in the coming year. Overall, the economic outlook remains more uncertain than usual, as it is dependent on many political choices that will be made in the second half of 2012.
1.2.2 Construction sector Historically, the construction sector has been the
primary catalyst for the demand for forest products. In North America, the US housing market has not yet shown any strong recovery from the housing crash of 2006 and from the recession (graph 1.2.1). New housing starts and sales are at their lowest levels since modern records began to be kept in 1963. Spending on residential construction is at a record low; though spending on remodelling and multi-family dwellings is showing a slight increase (graph 1.2.2). It seems that even a modest housing recovery may still lie some years ahead. The housing market has recovered better in Canada than in the US, but starts are still well below the 2002-2008 levels.
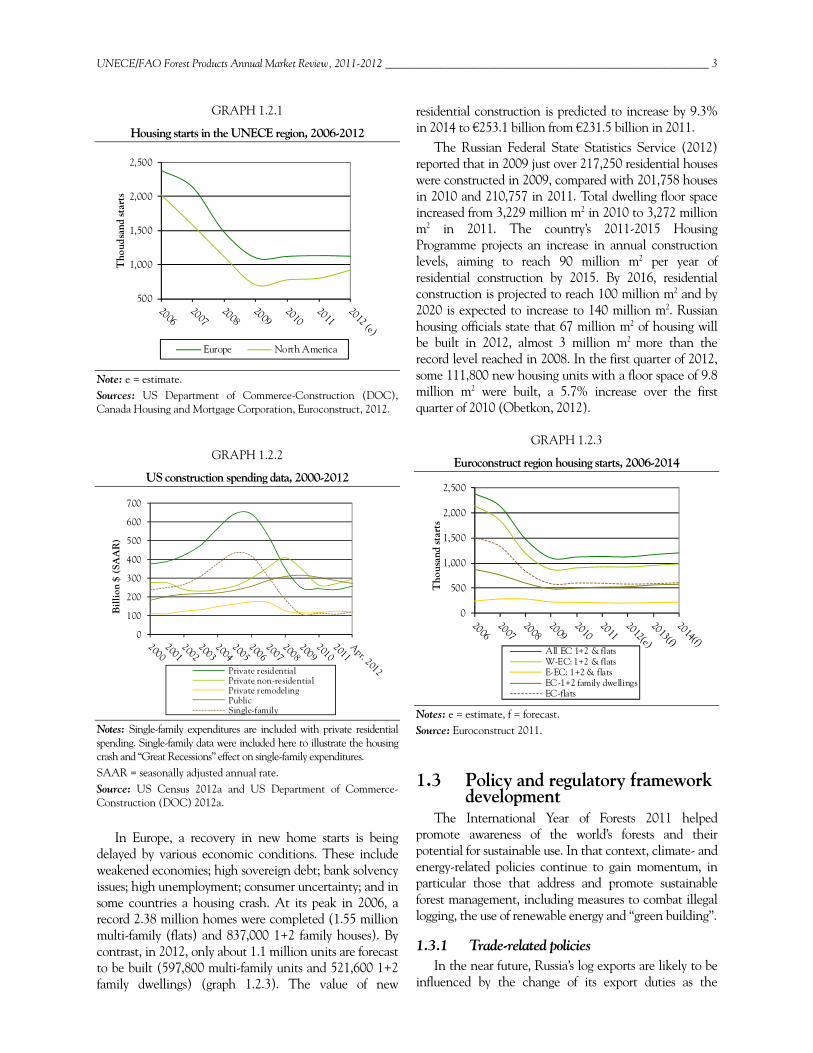
UNECE/FAO Forest Products Annual Market Review, 2011-2012 ___________________________________________________________ 3
GRAPH 1.2.1
Housing starts in the UNECE region, 2006-2012
Note: e = estimate. Sources: US Department of Commerce-Construction (DOC), Canada Housing and Mortgage Corporation, Euroconstruct, 2012.
GRAPH 1.2.2
US construction spending data, 2000-2012
Notes: Single-family expenditures are included with private residential spending. Single-family data were included here to illustrate the housing crash and “Great Recessions” effect on single-family expenditures. SAAR = seasonally adjusted annual rate. Source: US Census 2012a and US Department of Commerce-Construction (DOC) 2012a.
In Europe, a recovery in new home starts is being delayed by various economic conditions. These include weakened economies; high sovereign debt; bank solvency issues; high unemployment; consumer uncertainty; and in some countries a housing crash. At its peak in 2006, a record 2.38 million homes were completed (1.55 million multi-family (flats) and 837,000 1+2 family houses). By contrast, in 2012, only about 1.1 million units are forecast to be built (597,800 multi-family units and 521,600 1+2 family dwellings) (graph 1.2.3). The value of new
residential construction is predicted to increase by 9.3% in 2014 to €253.1 billion from €231.5 billion in 2011.
The Russian Federal State Statistics Service (2012) reported that in 2009 just over 217,250 residential houses were constructed in 2009, compared with 201,758 houses in 2010 and 210,757 in 2011. Total dwelling floor space increased from 3,229 million m2 in 2010 to 3,272 million m2 in 2011. The country’s 2011-2015 Housing Programme projects an increase in annual construction levels, aiming to reach 90 million m2 per year of residential construction by 2015. By 2016, residential construction is projected to reach 100 million m2 and by 2020 is expected to increase to 140 million m2. Russian housing officials state that 67 million m2 of housing will be built in 2012, almost 3 million m2 more than the record level reached in 2008. In the first quarter of 2012, some 111,800 new housing units with a floor space of 9.8 million m2 were built, a 5.7% increase over the first quarter of 2010 (Obetkon, 2012).
GRAPH 1.2.3
Euroconstruct region housing starts, 2006-2014
Notes: e = estimate, f = forecast. Source: Euroconstruct 2011.
1.3 Policy and regulatory framework development
The International Year of Forests 2011 helped promote awareness of the world’s forests and their potential for sustainable use. In that context, climate- and energy-related policies continue to gain momentum, in particular those that address and promote sustainable forest management, including measures to combat illegal logging, the use of renewable energy and “green building”.
1.3.1 Trade-related policies In the near future, Russia’s log exports are likely to be
influenced by the change of its export duties as the
500
1,000
1,500
2,000
2,500
Tho
udsa
nd st
arts
Europe North America
0
100
200
300
400
500
600
700
Bil
lion
$ (
SAA
R)
Private residentialPrivate non-residentialPrivate remodelingPublicSingle-family
0
500
1,000
1,500
2,000
2,500
Tho
usan
d st
arts
All EC 1+2 & flatsW-EC: 1+2 & flatsE-EC: 1+2 & flatsEC-1+2 family dwellingsEC-flats

4 __________________________________________________________________ Chapter 1, Overview of forest products markets and policies
country cleared the final hurdle to become a WTO member. Import duties to the Russian Federation are expected to fall, along with duties on most exported wood raw material.
The Softwood Lumber Agreement (SLA) between Canada and the US, which regulates lumber exports from Canada to the US, was renewed in January 2012, as both countries saw value in extending the agreement for an additional two years. It will expire in 2015. Related to this, the London Court of International Arbitrations considered the US claim that the province of British Columbia (BC) breached the Softwood Lumber Agreement by making changes to the system by which logs are graded. The changes led to a significant increase in the volume of logs from the BC interior being priced at the lowest permissible stumpage (Grade 4). Canada asserted that the rise in Grade 4 timber was the result of the mountain pine beetle infestation. In July 2012, the London Court ruled that there had been no contravention of the agreement.
The EU FLEGT (Forest Law Enforcement Governance and Trade) Action Plan has several measures for banning illegal timber from markets, to advance the supply of legally sourced wood products and to increase the demand for responsibly-sourced timber.
Voluntary Partnership Agreements (VPAs) are a vital part of the FLEGT Action Plan. These bilateral agreements between the EU and timber-exporting countries aim (a) to guarantee that the wood exported to the EU is from legal sources and (b) to support partner countries in improving their own regulation and governance of the sector. Six countries are currently developing VPAs, and a further six are in negotiation with the EU. The second key factor of the EU FLEGT Action Plan is the EU Timber Regulation 995/2010. The Regulation will take effect from 3 March 2013 with the aim of preventing illegally sourced wood products from entering the European market by requiring “due diligence” by operators and “traceability” through a “chain of custody”.
It covers a broad range of timber products, including solid wood products, flooring, plywood, pulp and paper. Not included are recycled products, as well as printed papers such as books, magazines and newspapers. The product scope can be amended if necessary.
The US Congress proposed amendments to the Lacey Act in 2011, called the “Retailers and Entertainers Lacey Implementation and Enforcement Fairness Act”. The amendments would provide limitations on applications, reduced penalties, changes to reviewing and reporting, and establish standard certification processes. In 2011, the Russian Federal Forestry Agency published the first version of the State "Forestry Development Programme 2012-2020" and
drafted a legal text, the “State regulation on the production of roundwood", aiming at improving sustainable forest management, taking measures against illegal logging, improving the transparency and legality of timber trade and reforestation. This is also seen as a necessary step in the development of forest law enforcement and to ensure compliance with the EU Timber Regulation and the US Lacey Act.
1.3.2 Climate and energy-related policies Phase 1 of the Kyoto Protocol expires at the end of
2012. Until a new agreement is reached, the Protocol is under “provisional application”. Fewer countries are expected to participate in the second commitment period than in the first (which were mainly European). Australia and New Zealand are yet to commit. One of the major outcomes of the climate conference COP-17 in Durban, South Africa, was that countries agreed to negotiate a legally binding agreement by 2015. A new set of forest carbon accounting rules for developed countries was decided on at the meeting, which will give full credit to the contribution of harvested wood products in mitigating climate change.
The general economic situation and vague results of climate change negotiations resulted in low activity on carbon markets. Within voluntary carbon markets, activity remained relatively sluggish. Efforts are nevertheless being made to revive and improve these markets. For example, the Reducing Emissions from Deforestation and Forest Degradation (REDD) programme issued credits to the voluntary carbon markets for the first time in 2011. REDD continue to be high on the international agenda. A number of key mechanisms for the implementation of REDD+ are still under discussion.
In 2010, the US Environmental Protection Agency issued new regulations under the Clean Air Act and the Resource Conservation and Recovery Act that cover emissions of hazardous air pollutants from incinerators and boilers. However, these policies have become highly controversial.
1.3.3 International and government policies support alternative wood-based energy and fuel sectors
In 2011, the International Energy Agency started developing a roadmap for some of the most important technologies to achieve a 2050 global energy-related CO2 target of 50% below current levels. It will provide additional focus and urgency to international discussions about the importance of biofuels to a low CO2 future.
In the United States, the Department of Agriculture has allocated $6.1 billion in renewable and clean energy and environmental improvements to spur the creation of high-value jobs, make the US more energy independent,
UNECE/FAO Forest Products Annual Market Review, 2011-2012 ___________________________________________________________ 5
and drive global competitiveness in the sector. In addition, the Department of Energy provided $27.2 billion in discretionary funds, a 3.2% increase above the 2012 enacted level.
1.3.4 Environment-related policies The International Green Construction Code (IgCC)
was issued in early 2012 following a period of public comment and feedback, and revision to the text. Most green building programmes increasingly focus on environmental aspects of construction materials. Life cycle assessment studies have consistently found that wood products require substantially less energy to manufacture, transport, construct and maintain than other materials. Although the use of wood and other agricultural fibres is favoured by the IgCC bio-based materials selection requirements, wood is the only material that is singled out as needing to be certified and third-party audited to obtain recognition.
This year’s update of the Leadership in Energy and Environmental Design (LEED) rating system, coined LEED 2012, is the next step in the continuous improvement process and ongoing development cycle of LEED. LEED projects are in progress in 120 countries.
The Energy Efficient Buildings Association partnered with the European Commission in the Energy-efficient Buildings research programme to develop a multi-annual roadmap with research priorities identified until 2013.
The European Commission sees climate change as a pressing challenge, with science and technology playing a central role in combating it. Research and development will benefit from €54 billion to €80 billion, mainly focusing on improving energy efficiency.
For the first time in modern Russian history, a draft “National Forest Policy” was formulated by the Federal Forest Agency. This policy would increase the emphasis on sustainable forest management, the strengthening of the wood-processing sector and the active participation of citizens in management of forest resources.
The North American timber supply will be affected by the reductions of the annual allowable cut foreseen in British Columbia (as a result of the mountain pine beetle epidemic) and in eastern Canada (to align harvest with improved sustainability). These effects will be more visible in the future, as demand increases and the salvaging of beetle-killed trees runs its course. Across the border in the US, where most of the North American demand for wood products occurs, the harvest on United States government forest lands (which has half of the country’s standing softwood timber inventory) has been reduced to less than 20% of what it was 25 years ago; further adding to the questions surrounding future timber supply.
1.4 Sustainable forest products Sustainable forest products is a wide concept. Not
only does it mean that forest products are durable and recyclable, but also that wood is a renewable material. Harvested wood products store carbon, and forests have a crucial role in carbon sequestration and in replacing products such as fossil fuels, concrete and steel, which have higher carbon emissions than wood. This stresses the role of forest products in fighting climate change.
Forest certification was originally introduced to prevent illegal logging, especially in tropical countries, and to develop forest management in those countries in a more sustainable direction. Most certified forests are in temperate and boreal forests. The failure of forest certification to address many of the problems in tropical forests has led the EU and the United States to introduce legislation to eliminate trade in illegally harvested wood.
Forest certification and legislation to combat the illegal timber trade are important steps towards improving the image of wood as sustainably produced material. Illegal logging and non-sustainable forest management has harmed wood’s image. The role of certified forest products has increased significantly during the past two decades, and this trend is continuing.
Nevertheless, public awareness of forest certification is limited, and many end-users do not understand the meaning of certified forest products. As end-users become more aware of certified forest products, the more they can be expected to demand certified or otherwise sustainably proven wood products.
1.5 Regional and subregional markets
Economic conditions remain difficult in the UNECE region and the associated uncertainty has affected markets for forest products. After promising signs of growth in demand in early 2011, the picture in the second half of 2011 became less clear.
In spite of the continuing uncertainty and the difficult economic conditions, the consumption of many forest products showed slight growth in 2011. Overall, consumption remained flat, except in the CIS, where the Russian Federation showed good growth (graph 1.5.1). Sawnwood and wood-based panel markets increased in 2011 over 2010 figures, but the paper and paperboard markets suffered from lower demand and overcapacity. In North America, forest products markets have been suffering as well, and the overall consumption of forest products decreased slightly in 2011 (table 1.5.1).
The Russian Federation’s accession to the World Trade Organization in late August 2012 should have a positive effect on global forest products trade.

6 __________________________________________________________________ Chapter 1, Overview of forest products markets and policies
Global trade continues to thrive. China continues to be an important forest products market for the UNECE region. Rising Chinese demand is partly responsible, as is further manufacture and export back to the UNECE region. In fact, many influences from outside the UNECE region affect its markets. There is strong demand for wood products in the Asian-Pacific rim, often remanufactured into value-added products and exported back to the UNECE region. North Africa continues to be an important importer of European wood products, despite the effects of the “Arab Spring”. North America has become an increasingly important supplier of wood pellets for Europe. In addition, South America is producing many products that directly or indirectly compete with products from the UNECE region.
GRAPH 1.5.1
Consumption of forest products in the UNECE region, 2007-2011
Note: Based on roundwood equivalent for sawnwood, panels and paper and paperboard. Source: UNECE/FAO TIMBER database, 2012.
1.5.1 Wood raw material markets Removals of industrial roundwood in the UNECE
region increased by 2.4% in 2011 reaching 970 million m3, with harvests of hardwood logs showing a slightly bigger increase than those of softwood logs, in percentage terms. Higher demand for logs by the sawmills within the region and a substantial increase in the export of logs to China from North America and the Russian Federation contributed to higher harvest levels in 2011. Since 2009, industrial roundwood harvests have risen by 12%, a significant recovery after the more than 30% plunge that occurred between 2007 and 2009.
Consumption of industrial roundwood in the UNECE region was up for the second year in a row in 2011, but was still 14% lower than before the global financial crisis. The biggest increase in log consumption in 2011 was in
the CIS region, where higher production at sawmills and plywood plants in the Russian Federation and Ukraine, resulted in an increase in demand for industrial roundwood of 14%.
Source: UNECE/FAO, 2011.
Trade of logs by the UNECE countries in 2011 continued the recovery that began in 2010, with Europe and North America expanding exports by 12% and 25 %, respectively: over the same period exports from the CIS declined by 2%.
Despite the recovery in demand, prices for softwood sawlogs fell in virtually all major markets worldwide in late 2011 and early 2012. The Global Sawlog Price Index (GSPI) fell 9% between the peak of the first quarter of 2011 and the first quarter of 2012. The weakening pulp markets and lower prices for market pulp resulted in lower wood chip and pulp log prices in early 2012 and, as a consequence, the global wood fibre price indices declined to their lowest levels in more than a year.
The prolonged crisis in Europe and the uncertainty about the US recovery, as well as the possible slowdown of the Chinese economy, are casting dark clouds over wood raw material markets in the region.
1.5.2 Sawn softwood markets Consumption of sawn softwood posted modest gains
(+2.3%) totalling almost 181million m3. Consumption in North America and Europe increased by 1.0% and 2.8%, respectively, but the largest increase was in the CIS (+5.8%). The positive development of demand for sawn softwood resulted in increases in terms of production and trade, Demand and prices continued to pick up slowly and steadily in the first half of 2012.
70
80
90
100
110
Inde
x (2
007=
100)
Europe CIS
North America Total
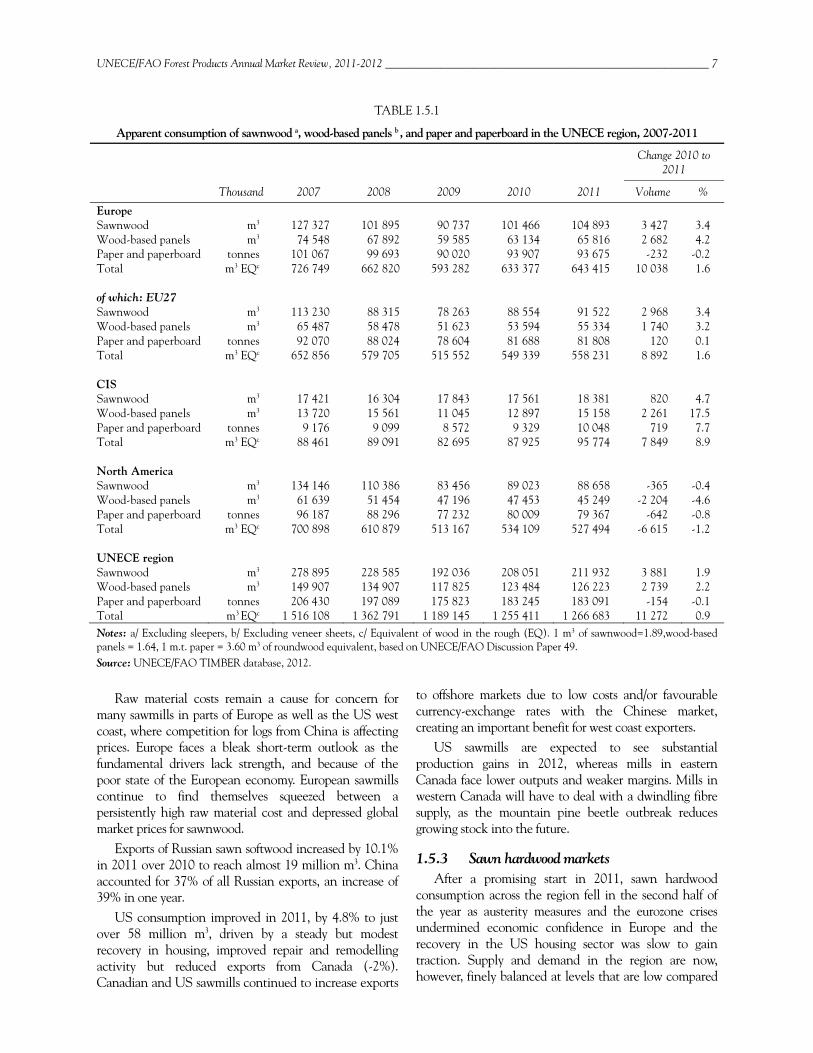
UNECE/FAO Forest Products Annual Market Review, 2011-2012 ___________________________________________________________ 7
TABLE 1.5.1
Apparent consumption of sawnwood a, wood-based panels b , and paper and paperboard in the UNECE region, 2007-2011
Change 2010 to
2011
Thousand 2007 2008 2009 2010 2011 Volume %
Europe Sawnwood m3 127 327 101 895 90 737 101 466 104 893 3 427 3.4 Wood-based panels m3 74 548 67 892 59 585 63 134 65 816 2 682 4.2 Paper and paperboard tonnes 101 067 99 693 90 020 93 907 93 675 -232 -0.2Total m3 EQc 726 749 662 820 593 282 633 377 643 415 10 038 1.6 of which: EU27 Sawnwood m3 113 230 88 315 78 263 88 554 91 522 2 968 3.4 Wood-based panels m3 65 487 58 478 51 623 53 594 55 334 1 740 3.2Paper and paperboard tonnes 92 070 88 024 78 604 81 688 81 808 120 0.1 Total m3 EQc 652 856 579 705 515 552 549 339 558 231 8 892 1.6 CIS Sawnwood m3 17 421 16 304 17 843 17 561 18 381 820 4.7Wood-based panels m3 13 720 15 561 11 045 12 897 15 158 2 261 17.5 Paper and paperboard tonnes 9 176 9 099 8 572 9 329 10 048 719 7.7Total m3 EQc 88 461 89 091 82 695 87 925 95 774 7 849 8.9 North America Sawnwood m3 134 146 110 386 83 456 89 023 88 658 -365 -0.4 Wood-based panels m3 61 639 51 454 47 196 47 453 45 249 -2 204 -4.6 Paper and paperboard tonnes 96 187 88 296 77 232 80 009 79 367 -642 -0.8 Total m3 EQc 700 898 610 879 513 167 534 109 527 494 -6 615 -1.2 UNECE region Sawnwood m3 278 895 228 585 192 036 208 051 211 932 3 881 1.9Wood-based panels m3 149 907 134 907 117 825 123 484 126 223 2 739 2.2 Paper and paperboard tonnes 206 430 197 089 175 823 183 245 183 091 -154 -0.1 Total m3 EQc 1 516 108 1 362 791 1 189 145 1 255 411 1 266 683 11 272 0.9 Notes: a/ Excluding sleepers, b/ Excluding veneer sheets, c/ Equivalent of wood in the rough (EQ). 1 m3 of sawnwood=1.89,wood-based panels = 1.64, 1 m.t. paper = 3.60 m3 of roundwood equivalent, based on UNECE/FAO Discussion Paper 49. Source: UNECE/FAO TIMBER database, 2012.
Raw material costs remain a cause for concern for
many sawmills in parts of Europe as well as the US west coast, where competition for logs from China is affecting prices. Europe faces a bleak short-term outlook as the fundamental drivers lack strength, and because of the poor state of the European economy. European sawmills continue to find themselves squeezed between a persistently high raw material cost and depressed global market prices for sawnwood.
Exports of Russian sawn softwood increased by 10.1% in 2011 over 2010 to reach almost 19 million m3. China accounted for 37% of all Russian exports, an increase of 39% in one year.
US consumption improved in 2011, by 4.8% to just over 58 million m3, driven by a steady but modest recovery in housing, improved repair and remodelling activity but reduced exports from Canada (-2%). Canadian and US sawmills continued to increase exports
to offshore markets due to low costs and/or favourable currency-exchange rates with the Chinese market, creating an important benefit for west coast exporters.
US sawmills are expected to see substantial production gains in 2012, whereas mills in eastern Canada face lower outputs and weaker margins. Mills in western Canada will have to deal with a dwindling fibre supply, as the mountain pine beetle outbreak reduces growing stock into the future.
1.5.3 Sawn hardwood markets After a promising start in 2011, sawn hardwood
consumption across the region fell in the second half of the year as austerity measures and the eurozone crises undermined economic confidence in Europe and the recovery in the US housing sector was slow to gain traction. Supply and demand in the region are now, however, finely balanced at levels that are low compared
8 __________________________________________________________________ Chapter 1, Overview of forest products markets and policies
with before the economic crisis; and prices are more stable. In 2011, consumption across the region was roughly 31 million m3, a 2% increase over 2010, and production was a little over 33 million m3, an increase of 2.4% over 2010. The increases in consumption and production were driven by growth in North America and the CIS. Stagnant Europe reported negative figures in both categories, with rising production in Croatia and Germany offset by declines in Romania and Slovakia.
Globalization in the furniture sector combined with weakness in the construction and housing sectors has led to a decline in demand for appearance-grade sawn hardwood and increasing exports of these grades to other markets, particularly to China. However, there are early signs of a trend towards “reshoring” of furniture and cabinet manufacturing within the UNECE region, which might revive demand for appearance-grade sawn hardwood. Oak continued to consolidate its dominant market position in the European flooring and joinery sectors.
The US Lacey Act Amendment and the EU Timber Regulation are placing new obligations on suppliers to demonstrate “low-risk” status with respect to illegal logging and should benefit hardwood supplies in regions where there is strong evidence of good forest governance.
1.5.4 Wood-based panel markets In 2011, the wood-based panel market in North
America was essentially flat. Despite a modest increase in housing starts in both the US (+3.5%) and Canada (+2.1%), demand for structural panels actually declined slightly, by 0.4% in the US and 0.2% in Canada. The continued weak demand for structural panels was especially difficult for the plywood industry, with six plywood mills closing in the US and one in Canada. Responding to the weak domestic markets, producers looked to offshore markets: exports of North American structural panels increased by 14%, with oriented strand board (OSB) recording the biggest increase at +16.5%, followed by plywood with +8.1%. A projected increase of 11.5% in the housing market in 2012 is expected to lead to increased demand for structural panels (+4.6%) in North America, with domestic production expected to increase by 7%. Demand for non-structural panels is expected to increase substantially in 2012, led by medium-density fibreboard (MDF).
The year 2011 was a challenging year for the European wood-based panel industry, with the decline in particle board production (-1.5%) and OSB (-5.2%). In contrast, MDF production rose by 3.7% and plywood production by more than 10%. The outlook for the European wood-based panel sector is gloomy, as the debt crisis continues to plague the entire region. With no long-
term solution in sight in mid-2012, consumption is projected to decline by a further 2.6%.
Stronger economic growth and continued infrastructure investment led to a rise of around 21% in wood-based panel consumption in the Russian Federation in 2011. All the major panel categories recorded increases in production, with particle board (+22.2%) recording the biggest rise. Investment in the wood-based panel sector also continued strongly that year. The outlook for 2012 is bullish, with overall consumption of wood-based panels expected to grow by a further 6.9%.
1.5.5 Paper, paperboard and woodpulp Generally, 2011 and the first half of 2012 proved
difficult for paper and paperboard producers in all markets, as the recovery from the 2008 financial crisis stalled. Pulp producers enjoyed stronger production and higher shipments, almost all of which was due to growing demand from China.
Paper and paperboard mill closures in 2011 and 2012 resulted in a loss of production capacity of over 7.4 million tonnes in North America and Europe. This was a consequence of the continuing decline in demand for paper as electronic media, including the Internet, continue their rise. Major investment in large paper machines in China is another factor, enabling China to become a world powerhouse in the paper industry.
Paper and paperboard production in 2011 decreased by 0.6% in Europe over 2010, while in North America the decline was 1.0%. Apparent consumption in Europe was lower by 1.2%, while in North America the decline was 2.9%. In the CIS, production was higher by 1.7%, and apparent consumption was up by 2.7%.
Pulp production in Europe in 2011 was almost unchanged from 2010 (+0.2%): apparent consumption fell by 3.2% but exports soared by 9.9%. In the United States, pulp production rose slightly, aided by strong Chinese demand. In the CIS, production fell by 0.2% and apparent consumption fell by 2.6%, but exports rose by 8.9%.
Capacity expansion in South American chemical market pulp continued to make headlines in 2011 and 2012, with an additional 30 million tonnes either now being built or planned over the next 10 years. If this expansion takes place, it would increase global chemical market pulp capacity by 50% probably causing higher-cost mills to close or to convert their production to innovative or value-added grades.
The pulp, paper and paperboard industry in 2011 and 2012 has faced the dual challenge of overcapacity, coupled with falling demand, with China being the principal exception to this. Adding to the financial difficulties faced by the sector is the need for capital
UNECE/FAO Forest Products Annual Market Review, 2011-2012 ___________________________________________________________ 9
investment for greener energy, environmentally friendly practices and innovative products such as nano-cellulose.
1.5.6 Wood energy markets In the UNECE region, wood energy is the principal
source of renewable energy and most of the demand is concentrated in the EU. Prices for wood energy feedstocks exhibit annual and seasonal fluctuations and these may increase as competition for raw material becomes more intense.
Greater price transparency in global markets is expected with the emergence and establishment of a global trading market in the APX-Endex and other regional initiatives. Discussions continue over the environmental credentials of using wood for energy, in particular the greenhouse gas neutrality of different types of woody feedstock.
Wood pellets dominate international wood energy trade, with Canada, the United States and the Russian Federation being the main exporters to the EU. Certification programmes for wood pellet quality and environmental stewardship have emerged and are expected to be widely adopted. Global forecasts for future wood energy use suggest that consumption will continue to rise, though any change to existing public support, such as the reduction of feed-in-tariffs or preferential taxation, could affect the situation significantly.
The low price of competing energy sources, especially natural gas, is likely to be a major barrier to greater investment in wood energy. Technological developments may make transport and storage of wood for energy easier and cheaper, as well as improve energy conversion and enhance cost efficiency. Whether wood energy consumption in the UNECE region increases or remains at current levels, it will continue to be an important component of a diverse portfolio of renewable energy sources.
1.5.7 Certified forest products markets By May 2012, the global area of certified forest was
394 million hectares, a 4% increase over May 2011. Globally, the certified area is not evenly distributed. More than half (51%) the certified forest area is in North America, one quarter (25%) in the EU/EFTA region and 12% in other Europe and the CIS. The remaining 13% is across the southern hemisphere. Chain-of-custody (CoC) certification has continued to grow but more slowly.
The continuing development of green building codes should help to reinforce wood’s position as the environmentally sound construction material of choice. In particular, the release of the International Green Construction Code (IgCC) in March 2012, with its emphasis on the use of materials that are recyclable or
reusable, and bio-based and certified wood products, may provide a further boost for wood in construction.
While certification programmes provide a detailed and comprehensive structure for evaluating the full spectrum of forest management, it is difficult for them to focus on few key indicators of sustainability.
Key indicators, including legality, responsible bioenergy and fuel efficiency are examples of areas where government standards may provide better tools for ensuring sustainability.
It seems likely that existing certification programmes will be challenged to define their niche in the light of the continued development of more targeted standards that address specific market issues, such as climate change policies, illegal-logging controls, and bio-based material assurances.
1.5.8 Carbon markets Carbon markets continued to grow in total volume
and value in 2010-2011. The amount of carbon traded in the global markets grew by 17% to more than 10 billion tonnes of CO2e in 2011. The value increased to $175.6 billion (a 10 % increase over 2010). Primary Clean Development Mechanism (CDM) markets (pre-2013) declined from 124 million tonnes of CO2e to 91 million tonnes of CO2e, while the post-2012 primary Certified Emission Reduction (CER) market grew to 173 million tonnes of CO2e in 2011 (worth $1,990 million). Only 11 new afforestation/reforestation projects were approved under CDM since the Review 2011-2012. The interest in secondary CER was maintained in the markets because the delivery risk is smaller and the credits are easy to obtain compared with the project-based primary CERs.
Despite its overall growth, thanks primarily to the EU Emissions Trading System (EU-ETS), which covers 78% of all trade, the carbon trade has suffered from the prolonged financial and economic crises in Europe, the political obstacles in the US, slow progress in the United Nations Framework Convention on Climate Change (UNFCCC) negotiation process, and the absence of full operation details for REDD+.
In the forest carbon segment of the voluntary carbon markets, eight new Verified Carbon Standard projects appeared, as well as 21 new Climate, Community and Biodiversity Alliance (CCBA) projects, since the second quarter of 2011. The first REDD credits entered voluntary carbon markets in February 2011, and these were followed by the first REDD credits issued in Brazil as temporary CERs, in April 2012. REDD projects accounted altogether for 7.3 million tonnes of CO2e in 2011.
Several countries, including Australia, China and the Republic of Korea, are preparing to launch national emission trading schemes with full market mechanisms
10 _________________________________________________________________ Chapter 1, Overview of forest products markets and policies
adopted by 2015. California's Air Resources Board formally adopted the State's greenhouse cap-and-trade programme, which started in January 2012.
The future of the climate change negotiations now hinges on the success of the Durban Platform for Enhanced Action, which pledged to create a legally binding climate treaty applicable for all countries. The second compliance period of the Kyoto Protocol starts as a voluntary agreement in 2013 and is characterized by falling interest in a binding treaty outside Europe. Currently, Canada, Japan, the Russian Federation and the US have no intention to commit.
1.5.9 Value-added wood products markets Global furniture production continued to recover and
was valued at $370 billion in 2011, a little lower than earlier expectations. The value of global furniture trade in 2011 at $109 billion is still below the pre-crisis peak level of $118 billion. The United States is the largest furniture-importing country, with imports valued at $12.4 billion in 2011.
Builders´ joinery and carpentry markets showed signs of recovery in 2011. The drop from pre-crisis levels was exceptionally hard, averaging 20% to 30%, though the US suffered a fall of roughly 60% between 2006 and 2011. German and French imports grew in 2011, while UK imports remained almost flat. Imports to the US decreased surprisingly.
Overall production of North American glulam timber declined steadily from 750, 000 m3 in 2006 to 285, 000 m3 in 2009. Modest growth was seen in 2011 to 312, 000 m3. Laminated veneer lumber production peaked along with the US housing market in 2005 at 2.6 million m3 but since then has declined, along with I-beam production. An estimated 1.2 million m3 is forecast to be produced in 2012. I-beam production has seen a modest increase in 2010 and 2011 and is forecast to rise to 155.2 million lineal metres in 2012.
Glulam is the largest segment of the engineered wood products in Europe and has shown significant growth from 2000. Germany and Austria are the biggest producing countries in Europe. In addition to glulam, finger-jointed structural sawnwood has a significant market share in central Europe. The growth of finger-jointed structural sawnwood production has averaged about 17% per year since the mid-1990s.
Cross-laminated timber is also a prominent value-added wood product. This structural panel consists of several layers of cross-glued sideboards. Static loads can be transferred to all directions and openings, e.g. windows can be cut at the plant or at the construction site. The production capacity has increased rapidly since 2006, in accordance with high market demand and now totals 200,000 m3 to 300,000 m3.
1.5.10 Innovative wood products The wood-based products industries continue to
perform well in terms of innovation: new materials and composites come on the market every year. Process innovation also continues to improve, with bio-refineries in particular, innovating cheaper, more streamlined production methods. Despite this, there is patchy take-up by different countries of these innovative, cheaper products.
In the bioplastics industry, new products are finding markets in the packaging and hygiene sectors, especially the latter with its emphasis on biodegradable, sustainably sourced materials. Innovative marketing strategies are also finding new niches in the electronics industry, with a range of paints, cover materials and even conducting materials being developed. There are also encouraging signs of an increased use of new bioplastics in the automotive industry.
For bio-based materials, the focus has principally been on market innovation. While new materials (such as foamed wood-plastic composites) have been successfully developed, the real achievement has been in getting market penetration for these products in Europe, with indicators that a similar success could also be achieved in Asia.
New engineered wood products, including lighter, stronger cross-laminated timbers and plies are finding innovative uses, notably in Europe where they adapt more easily to existing building methods than traditional wood-build houses. There are pilot multi-storey cross-laminated-timber buildings in several cities, and market and organizational innovation (notably government-backed projects) should see an increase in these in the near future due to advantages in carbon sequestration and low greenhouse emissions during the life of the building.
Finally, bio-refineries, themselves something of an innovation, are starting to move out of their niche markets as providers only of expensive chemicals and are likely to expand as other sources of chemicals (notably oil) become scarce.
In conclusion, the different wood-based products industries have shown a range of innovative strategies in promoting themselves, using all four methods of innovation. However, for success to continue, there will need to be a focus on marketing and organizational innovation, and not just on producing new products.
UNECE/FAO Forest Products Annual Market Review, 2011-2012 __________________________________________________________ 11
2 The economic situation and construction-sector developments in the UNECE region, 2011-2012
Authors, Delton Alderman (Construction), Robert Shelburne (Economics)
Highlights
The economic recovery in the UNECE region has been sluggish, national income in one half of the economies has yet to return to 2008 levels, and unemployment remains high.
There are numerous downside risks to even attaining moderate growth in 2013, a deepening eurozone crisis being the most likely.
If the eurozone crisis should further deteriorate, it will have significant implications not only for the EU but also for the global economy.
The modest recovery of the US economy is not strong enough to re-employ the people who lost their jobs during the crisis.
As a result, the US housing market is still weak, with new housing starts and sales at their lowest levels since modern records began to be kept in 1963.
The Canadian housing market is in a better state than that of the US, although housing starts are below 2008 levels; and some people are concerned about a housing bubble in Canada.
The European housing construction market is still sluggish, as the sovereign debt and lingering financial crisis continue to affect many countries. Norway and Switzerland are the notable exceptions to the ongoing housing malaise.
After four years, the correction in the housing market is far more advanced in the US than in Europe.
Economic conditions, such as unemployment, tightened loan requirements and consumer sentiment, are still hindering a robust recovery in new home starts in the UNECE region.
In the EU, there is no immediate sign of any housing recovery.
12 _________________________________________________________ Chapter 2, Economic situation and construction in the UNECE region
2.1 Current economic developments The global economy has entered its fourth year of
recovery since the Great Recession of 2008-2009, the largest peacetime economic downturn since the Great Depression of the 1930s. Although the national economic recoveries in the developing world have been reasonably strong, they have been weak in the UNECE region where one half of the economies have real gross domestic product (GDP) levels that are below those of 2008 (see table 2.1.1).
In the EU and south-east Europe, real GDP is still below the pre-crisis levels. In North America it is 3% higher, and in the CIS 6% higher; this lack of income growth has also translated into high rates of unemployment. Both in North America and in the CIS, unemployment remains high, although it is slowly falling. In Europe, it continues to rise, and in a few European countries has reached worrisome levels.
Throughout the region, youth unemployment is particularly high. The crisis and slow recovery created large budget deficits and rising debt levels. This has further resulted in several serious sovereign-debt crises in the eurozone.
During the past year, the eurozone has been moving from one crisis to another, and there are some who believe that its very existence is now threatened. Such a breakup would have serious ramifications for Europe and could well trigger another global financial crisis. Even in a reasonable best-case scenario, Europe is facing another one or two difficult years with very low growth, high unemployment and financial instability.
In the US, excessive housing stock remains a big drag on the economy and, until the housing market stabilizes, growth will remain sluggish.
Growth in the economies of the non-UNECE region, which account for about half of the world’s output, was only moderately affected by the crisis, and in recent years these economies have even seen relatively robust growth.
World growth in 2012 is forecast to be 3.5%, a slight decline from 2011, but a minor increase is expected in 2013. This subdued outlook for growth may, however, prove optimistic. Numerous downside risks could derail the global economy in 2012-2013 – including the further withdrawal of fiscal stimulus in the advanced economies, an unexpected slowdown in China, or a eurozone crisis. The global forecast is more uncertain than usual as critical policy choices that will be made in mid-2012, especially in the eurozone, will have significant implications for the global economy.
The Great Recession and sluggish recovery have had a greater impact on the UNECE region than on the other regions of the world. Quantifying the extent of this
difference is complicated because the crisis began in each region at different times and, already, regions had been growing at different rates. One possible approach is to ask how much lower current GDP is compared with what it might have been had the pre-crisis growth trends continued.
For the UNECE region as a whole, GDP is now about 14% lower than what might have been expected. This is more than double the figure of 6% for all the non-UNECE economies. Within the region, there is also considerable variation: North America is 11% below the longer-term trend, while the eurozone is 13% lower, south-east Europe 14%, the UK 17%, and the CIS 35% lower. A few economies such as in the Baltics, Armenia and Ukraine have GDP incomes that are only about one half of what would be expected had the pre-crisis trends continued.
Several western European economies that have seen a debt or banking crisis, such as Greece, Iceland and Ireland, have incomes about one third below trend expectations. Even Poland, which was the only EU economy that avoided recession in 2009, has a GDP of 10% below its trend rate. There is some uncertainty about how much of this decrease represents a permanent decline and how much of it could be made up once a strong recovery begins.
Any crisis and subsequent slow recovery affects the long-term potential of economies, as public and private investments are not made. Training, education and research are not undertaken, labour skills depreciate as people stay unemployed, workers retire early or take disability leave, population health deteriorates, and sectoral shifts (such as the decline of the financial sector) destroy human capital.
In some cases it may be possible to recover these losses, especially in countries where unemployment is high and there is a reasonable expectation that currently unused resources can be redeployed. How much of this lost growth might be recovered? The best estimates for the US suggest that about half of its GDP decline from trend or about 5% of GDP represents a permanent loss that will never be made up.
The slow recoveries in the advanced economies were generally expected. The Great Recession was not a typical recession, it was a financial crisis. Historically, economies recover more slowly from financial crises than from a recession. In this recovery, there has been sluggish growth in all the components of aggregate demand.3 Due to high unemployment and falling equity and house
3 Aggregate demand is the sum of consumption, investment, government spending and net exports, or more famously, Y=C+I+G+(X-M).
UNECE/FAO Forest Products Annual Market Review, 2011-2012 __________________________________________________________ 13
prices, households find themselves excessively in debt and needing to cut back on spending so as to restore their financial position4.
The financial system is not lending because it remains impaired by exposure to questionable loans (sovereign debt and mortgages) and also needs to pay off debt to meet recently proposed higher capital requirements. And although the monetary authorities have lowered interest rates to almost zero to encourage investment, with low inflation the real interest rate (nominal interest rate minus inflation) is not low enough to stimulate investment.
Housing has been a leading sector during earlier recoveries, a house purchase being a discretionary expenditure and sensitive to interest rates. Lower interest rates are usually effective in stimulating demand for new houses. When people buy new houses they also tend to buy new furniture and other objects for their house. In this instance, the financial crisis was preceded in the US and some European economies by a boom, with excessive housing construction, leaving large stocks of houses unsold, coupled with falling house prices. This has meant that the housing sector has been unable to play its traditional role during this particular recovery.
When consumers and businesses cannot maintain spending at the level necessary to maintain full employment, the government may step in, but to do so it must issue debt. If the recession and recovery is short, the additional debt may not be so significant or present a problem. However, if the recovery lasts longer, as it is currently doing, debt begins to mount up to such an extent that a government may find its ability to keep issuing debt heavily constrained.
This is what has happened in some UNECE economies, especially in those that were heavily indebted before the crisis. In these circumstances, several governments began cutting back expenditures and increasing taxes to try to contain their growing indebtedness – even when this may be the opposite of what is required to stimulate recovery.
Although expanding net trade (exports minus imports) could provide a source of stimulus, this can only happen if countries improve their competitiveness. In the short and medium term, the only way to achieve this is by depreciating the currency. However, the exchange rates of the major economies of the region are determined in foreign-exchange markets. If governments implemented policies such as exchange-market intervention to lower rates, this would risk setting off a series of competitive
4 For example, the median wealth of American families declined by 39% from 2007 to 2010 and is now back to the level in 1992.
devaluations, as happened during the Great Depression of the 1930s, and which proved destructive5.
In the final analysis, “net exports” is a zero-sum game: the gains for one come at a loss for others. Thus, governments are reluctant to attempt overtly to improve competitiveness through market intervention6. Also, a number of economies experiencing especially low demand form part of the eurozone and, consequently, do not have the option of changing their exchange rates.
As a result, aggregate demand is too low to fully employ the region’s labour supply. Unfortunately, there is no reason to think that there will be any great increase in the components of aggregate demand any time soon. If anything, there is a concern that the government spending component will decline further in 2012-2013.
In Europe, a number of legislated austerity programmes have yet to be fully implemented. In the US, several important temporary tax cuts and spending increases are due to expire at the end of 2012.
In its 2012 World Economic Situation and Prospects publication, using its Global Policy Model, the United Nations has modelled an ideal approach. This consists of a well-designed and regionally coordinated further fiscal expansion, combined with legislation that would ensure that budget deficits would be reduced significantly once robust growth was attained. In the Global Policy Model this policy package not only achieves higher growth and lower unemployment but also has better debt dynamics in the medium and longer term. However, the combination of a short-term policy with a long-term policy must be credible to assure financial markets that any increase in deficits would be temporary.
There has been much political opposition to such a programme by those who feel that the public sector is already too large. For them it makes little sense to increase government spending in the short term when it needs to be reduced in the long term, nor to cut taxes now when in the long term they will need to be raised.
As a result, a number of countries have put in place austerity programmes. Unfortunately, these programmes have yet to prove effective in improving the debt and economic dynamics of the affected countries. Under more normal conditions, reducing government borrowing results in lower interest rates that stimulate investment
5 Another non-cooperative option to increase net exports is trade protectionism, but just like a competitive depreciation, it is likely to result in a cycle of retaliations that ends poorly. 6 This has of course not stopped China and as a result there has been considerable criticism of their behaviour. The Swiss have also intervened but have largely avoided condemnation due to the feeling that they are not attempting to depreciate below the equilibrium rate but are simply trying to stop an appreciation that is significantly over the equilibrium rate.
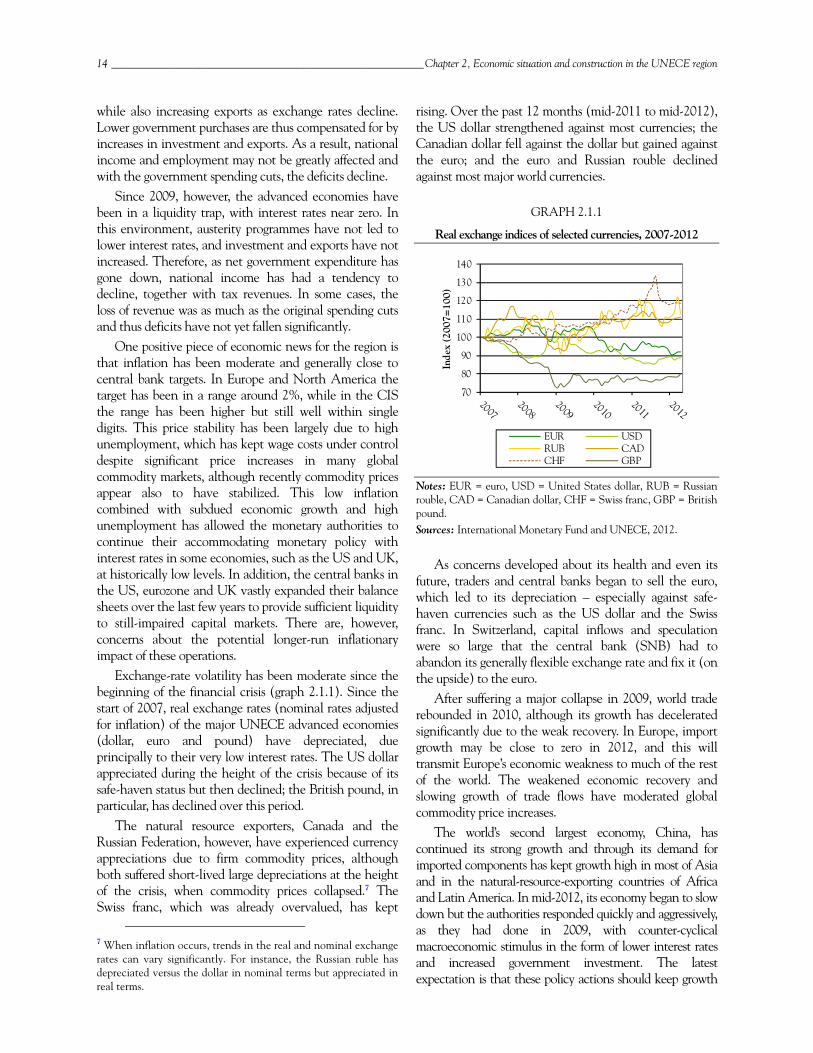
14 _________________________________________________________ Chapter 2, Economic situation and construction in the UNECE region
while also increasing exports as exchange rates decline. Lower government purchases are thus compensated for by increases in investment and exports. As a result, national income and employment may not be greatly affected and with the government spending cuts, the deficits decline.
Since 2009, however, the advanced economies have been in a liquidity trap, with interest rates near zero. In this environment, austerity programmes have not led to lower interest rates, and investment and exports have not increased. Therefore, as net government expenditure has gone down, national income has had a tendency to decline, together with tax revenues. In some cases, the loss of revenue was as much as the original spending cuts and thus deficits have not yet fallen significantly.
One positive piece of economic news for the region is that inflation has been moderate and generally close to central bank targets. In Europe and North America the target has been in a range around 2%, while in the CIS the range has been higher but still well within single digits. This price stability has been largely due to high unemployment, which has kept wage costs under control despite significant price increases in many global commodity markets, although recently commodity prices appear also to have stabilized. This low inflation combined with subdued economic growth and high unemployment has allowed the monetary authorities to continue their accommodating monetary policy with interest rates in some economies, such as the US and UK, at historically low levels. In addition, the central banks in the US, eurozone and UK vastly expanded their balance sheets over the last few years to provide sufficient liquidity to still-impaired capital markets. There are, however, concerns about the potential longer-run inflationary impact of these operations.
Exchange-rate volatility has been moderate since the beginning of the financial crisis (graph 2.1.1). Since the start of 2007, real exchange rates (nominal rates adjusted for inflation) of the major UNECE advanced economies (dollar, euro and pound) have depreciated, due principally to their very low interest rates. The US dollar appreciated during the height of the crisis because of its safe-haven status but then declined; the British pound, in particular, has declined over this period.
The natural resource exporters, Canada and the Russian Federation, however, have experienced currency appreciations due to firm commodity prices, although both suffered short-lived large depreciations at the height of the crisis, when commodity prices collapsed.7 The Swiss franc, which was already overvalued, has kept
7 When inflation occurs, trends in the real and nominal exchange rates can vary significantly. For instance, the Russian ruble has depreciated versus the dollar in nominal terms but appreciated in real terms.
rising. Over the past 12 months (mid-2011 to mid-2012), the US dollar strengthened against most currencies; the Canadian dollar fell against the dollar but gained against the euro; and the euro and Russian rouble declined against most major world currencies.
GRAPH 2.1.1
Real exchange indices of selected currencies, 2007-2012
Notes: EUR = euro, USD = United States dollar, RUB = Russian rouble, CAD = Canadian dollar, CHF = Swiss franc, GBP = British pound. Sources: International Monetary Fund and UNECE, 2012.
As concerns developed about its health and even its future, traders and central banks began to sell the euro, which led to its depreciation – especially against safe-haven currencies such as the US dollar and the Swiss franc. In Switzerland, capital inflows and speculation were so large that the central bank (SNB) had to abandon its generally flexible exchange rate and fix it (on the upside) to the euro.
After suffering a major collapse in 2009, world trade rebounded in 2010, although its growth has decelerated significantly due to the weak recovery. In Europe, import growth may be close to zero in 2012, and this will transmit Europe’s economic weakness to much of the rest of the world. The weakened economic recovery and slowing growth of trade flows have moderated global commodity price increases.
The world’s second largest economy, China, has continued its strong growth and through its demand for imported components has kept growth high in most of Asia and in the natural-resource-exporting countries of Africa and Latin America. In mid-2012, its economy began to slow down but the authorities responded quickly and aggressively, as they had done in 2009, with counter-cyclical macroeconomic stimulus in the form of lower interest rates and increased government investment. The latest expectation is that these policy actions should keep growth
70
80
90
100
110
120
130
140
Inde
x (2
007=
100)
EUR USDRUB CADCHF GBP
UNECE/FAO Forest Products Annual Market Review, 2011-2012 __________________________________________________________ 15
in China and much of the developing world on a reasonable growth trajectory in 2013, unless there is a serious decline in economic output in either the US or Europe.
2.1.1 Europe The eurozone is going through a severe economic and
political crisis. Real GDP is lower than five years ago and industrial production is 12% below its mid-2008 peak. Unemployment is at 11% and rising. By the end of 2012 in Greece and Spain unemployment could reach 25% and youth (i.e. under 25) unemployment is close to 50%. Five governments have already turned to the EU or IMF for financial assistance and one or two more may follow.
The financial system has been impaired by numerous bank bailouts, and more seem imminent. A double-dip recession seems to be under way and any recovery in 2013 and 2014 is likely to be weak. Long-term growth is also being jeopardized by falling investments in education and infrastructure.
A more coordinated European solution could help, especially if it were able to address a number of key issues in the eurozone that have contributed to this crisis. The three most important of these being: 1. No lender of last resort. This has made eurozone
members susceptible to currency/sovereign debt crises. 2. No adjustment mechanism for current-account
imbalances. Eurozone members have neither fiscal transfers nor significant labour mobility as in a typical monetary union such as the US or Canada and must rely on recession and wage deflation to restore competiveness. This was also the adjustment mechanism used under the gold standard and was ultimately the major cause of its collapse and it does not appear to be working today in the eurozone.
3. No central financial regulator or common system of deposit insurance. This would help avoid bank runs and support financial stability. For example, as the crisis has evolved, so too have concerns about the solvency of some countries’ banking systems; and as a result, customers have been transferring their money to other countries. Between the beginning of 2010 and mid-2012, Greek residents withdrew one third of their deposits from Greek banks and either moved those accounts to another country or “tucked the euros in their mattresses”.
The solution to the eurozone crisis will probably require finding solutions to these aspects of the eurozone: an enhanced lender of last resort, a more symmetric and growth-oriented adjustment mechanism, and a stronger regional banking authority.
Germany is one of the few advanced economies that has lower unemployment now than before the crisis; although unemployment was 6.8% in the first quarter of
2012, which is not so low. Germany also has been well positioned to take advantage of the more robust growth in the developing economies as it is a major exporter of capital equipment to these regions.
Outside the eurozone, the United Kingdom also introduced an austerity programme, and is, likewise, seeing an economic downturn and rising unemployment. Unlike the situation in the eurozone, where there were numerous institutional constraints and significant market pressure on a few economies, the motivation in the UK was to decrease the size of government more broadly as well as slow down the country’s increasing debt levels. However, as in the eurozone, austerity has proved to be only marginally successful in improving the country’s debt dynamics.
2.1.2 Transition economies In the transition economies, GDP fell during the
2008-2009 crisis. The CIS economies generally bounced back reasonably well so that, for most, GDP levels in 2012 are above pre-crisis levels. In southeast Europe, however, national recoveries have been slow and most of these countries still have not regained their pre-crisis GDP levels. Current incomes in the CIS are also much lower than might have been expected, based on earlier trends. This is due to their much higher trend growth rates before the crisis.
Foreign direct investment (FDI) throughout the transition economies fell significantly during the crisis and remains depressed today. This decline in investment is an important factor in explaining their current and expected lower future growth. A systemic problem for the region appears to be capital flight, especially when financial market conditions weaken as they might with a deeper eurozone crisis. In many countries, this is probably due to a history of hyperinflation and bank defaults, combined with weak rule of law.
Growth in Azerbaijan, the Russian Federation and Central Asia has been moderate since 2010 but remains much below the rates in the five years leading up to the crisis. The growth has been driven by continued high commodity prices, especially of oil and gas. Large crop harvests, following the drought in 2010, have also contributed to growth and have helped keep food prices and inflation under control.
Remittances from the Russian Federation to the Central Asian economies, which fell considerably in 2009 and 2010, rebounded in 2011 and 2012 but in many cases still constitute a smaller share of GDP than before the crisis. Post-crisis growth in the European CIS (Belarus, Republic of Moldova and Ukraine) has been weaker than elsewhere in the CIS.
Unemployment varies considerably throughout the CIS, with the officially reported statistics provided by
16 _________________________________________________________ Chapter 2, Economic situation and construction in the UNECE region
some countries generally underestimating unemployment, as defined by the International Labour Organization. It remains moderate (single figures), with a downward trend in the Russian Federation, Ukraine and much of Central Asia; but particularly high in Armenia and Georgia. Despite a currency crisis in Belarus in 2011, growth is expected to be about 3% in 2012 with low official unemployment. Inflation, however, has escalated due to its currency depreciation and is likely to continue at over 50% in 2012. The Ukrainian-EU free trade agreement and association agreement, which have largely been negotiated and agreed upon, have not yet been signed.
The economies in southeast Europe have performed poorly since the economic crisis and are forecast to have weak growth in 2012 as the eurozone crisis has had an impact on their economies due to the extensive trade and financial ties. Over 85% of southeast European exports (and over half of Turkey’s) go to some other European economy. Growth is likely to be near zero in 2012 and remain weak in 2013. In all of these countries, unemployment is above 10% and expected to stay high for several years. Unlike the high unemployment in much of the rest of the UNECE region, which is largely cyclical, the unemployment in this subregion is mostly structural. Reductions in unit labour costs, reforms in labour market policy, improved education and training facilities and more incentives for investment are needed to address this problem.
The transition economies were the worst affected region of the world during the 2008-2009 crisis, in large measure due to their over-reliance on commodity exports and on external capital to finance their development. If the eurozone crisis deteriorates into a full-blown financial crisis, where global credit markets seize up as they did in 2008-09, the region would once again be seriously exposed through trade and financial channels. Although the Central Asian economies have less intensive ties with Europe and would be less directly affected, they have strong ties with the Russian Federation, which would be significantly affected.
The transition economies have made progress in reducing their vulnerability to external events by reducing their reliance on capital inflows, but their policy space to address any downturn is less today than in 2008 because of already high unemployment rates, weakened financial systems, and rising sovereign debt levels (although not in the Russian Federation). A eurozone crisis would be expected to lead to a large fall in oil prices, a depreciation of the currencies of the region, and higher inflation and unemployment. Some countries, such as Ukraine, that remain severely depressed would be particularly hard hit.
2.1.3 North America The moderate economic recovery in North America
has not been strong enough to re-employ the many millions who lost their jobs early in the crisis and the approximately one million new entrants in the job market each year. As a result, while US unemployment has fallen from its peak of about 10% during the crisis to 9% in 2011 and 8% in 2012, it may still be three or four more years before it falls to its longer-term non-inflationary equilibrium rate of about 5.5%. Currently 40% of the unemployed, a large percentage by historical comparison, are long-term unemployed who have been without paid employment for at least six months.
Given the modest growth rate, the decline in unemployment over the last year has been much faster than what was expected due to the departure of an unusually large number of people from the labour force. Although the lower unemployment rate presents an optimistic picture, the lower labour force has negative long-term implications since there will be fewer people to pay off the debt and support the retiring baby-boomer generation.
The speed of the recovery in the US could be enhanced by any initiative that would stabilize the housing market. US policies to help distressed mortgage holders have, so far, had a limited impact on the overall market, although changes by the Federal Finance Housing Agency in its “Home Affordable Refinancing Programme” (HARP), raising the loan-to-value ratio, have resulted in a significant increase in refinancing by those with little equity in their houses. These borrowers have therefore been able to take advantage of the lower interest rates and lower their monthly payments. Overall, the enactment of any policies that could spur the economy has been made very difficult by the political gridlock that has developed, in part due to 2012 being an election year. The expectation is that the economy will continue to limp along with moderate growth and sustained high unemployment.
Since 2006, the Canadian economy has performed slightly better than that of the US but given the high level of trade and financial integration, these two economies tend not to diverge significantly over lengthy periods. In 2011, growth in Canada at 2.5% was much above the US’s 1.7% and it should at least match the US rate in 2012. Canada’s unemployment rate of 7.2% in the spring of 2012 was slightly below that of the US. Canada has enjoyed relatively good economic performance thanks to its housing market and financial sector having escaped much of the devastation in the US because of better regulation and corporate management. In addition, as a major exporter of natural resource products, Canada has benefited from firm global commodity prices due to robust growth in Asia. Growth has been stronger in the
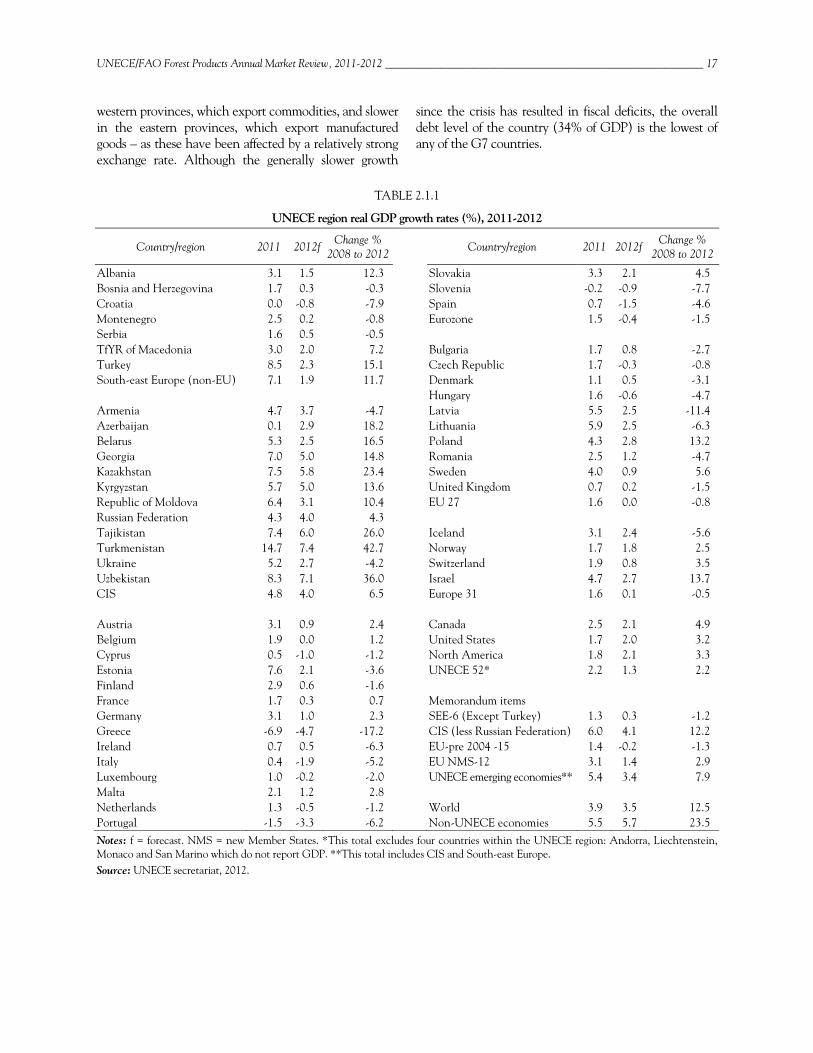
UNECE/FAO Forest Products Annual Market Review, 2011-2012 __________________________________________________________ 17
western provinces, which export commodities, and slower in the eastern provinces, which export manufactured goods – as these have been affected by a relatively strong exchange rate. Although the generally slower growth
since the crisis has resulted in fiscal deficits, the overall debt level of the country (34% of GDP) is the lowest of any of the G7 countries.
TABLE 2.1.1
UNECE region real GDP growth rates (%), 2011-2012
Country/region 2011 2012f Change % 2008 to 2012
Country/region 2011 2012f Change % 2008 to 2012
Albania 3.1 1.5 12.3 Slovakia 3.3 2.1 4.5 Bosnia and Herzegovina 1.7 0.3 -0.3 Slovenia -0.2 -0.9 -7.7 Croatia 0.0 -0.8 -7.9 Spain 0.7 -1.5 -4.6 Montenegro 2.5 0.2 -0.8 Eurozone 1.5 -0.4 -1.5 Serbia 1.6 0.5 -0.5 TfYR of Macedonia 3.0 2.0 7.2 Bulgaria 1.7 0.8 -2.7 Turkey 8.5 2.3 15.1 Czech Republic 1.7 -0.3 -0.8 South-east Europe (non-EU) 7.1 1.9 11.7 Denmark 1.1 0.5 -3.1 Hungary 1.6 -0.6 -4.7 Armenia 4.7 3.7 -4.7 Latvia 5.5 2.5 -11.4 Azerbaijan 0.1 2.9 18.2 Lithuania 5.9 2.5 -6.3 Belarus 5.3 2.5 16.5 Poland 4.3 2.8 13.2 Georgia 7.0 5.0 14.8 Romania 2.5 1.2 -4.7 Kazakhstan 7.5 5.8 23.4 Sweden 4.0 0.9 5.6 Kyrgyzstan 5.7 5.0 13.6 United Kingdom 0.7 0.2 -1.5 Republic of Moldova 6.4 3.1 10.4 EU 27 1.6 0.0 -0.8 Russian Federation 4.3 4.0 4.3 Tajikistan 7.4 6.0 26.0 Iceland 3.1 2.4 -5.6 Turkmenistan 14.7 7.4 42.7 Norway 1.7 1.8 2.5 Ukraine 5.2 2.7 -4.2 Switzerland 1.9 0.8 3.5 Uzbekistan 8.3 7.1 36.0 Israel 4.7 2.7 13.7 CIS 4.8 4.0 6.5 Europe 31 1.6 0.1 -0.5 Austria 3.1 0.9 2.4 Canada 2.5 2.1 4.9 Belgium 1.9 0.0 1.2 United States 1.7 2.0 3.2 Cyprus 0.5 -1.0 -1.2 North America 1.8 2.1 3.3 Estonia 7.6 2.1 -3.6 UNECE 52* 2.2 1.3 2.2 Finland 2.9 0.6 -1.6 France 1.7 0.3 0.7 Memorandum items Germany 3.1 1.0 2.3 SEE-6 (Except Turkey) 1.3 0.3 -1.2 Greece -6.9 -4.7 -17.2 CIS (less Russian Federation) 6.0 4.1 12.2 Ireland 0.7 0.5 -6.3 EU-pre 2004 -15 1.4 -0.2 -1.3 Italy 0.4 -1.9 -5.2 EU NMS-12 3.1 1.4 2.9 Luxembourg 1.0 -0.2 -2.0 UNECE emerging economies** 5.4 3.4 7.9 Malta 2.1 1.2 2.8 Netherlands 1.3 -0.5 -1.2 World 3.9 3.5 12.5 Portugal -1.5 -3.3 -6.2 Non-UNECE economies 5.5 5.7 23.5 Notes: f = forecast. NMS = new Member States. *This total excludes four countries within the UNECE region: Andorra, Liechtenstein, Monaco and San Marino which do not report GDP. **This total includes CIS and South-east Europe. Source: UNECE secretariat, 2012.
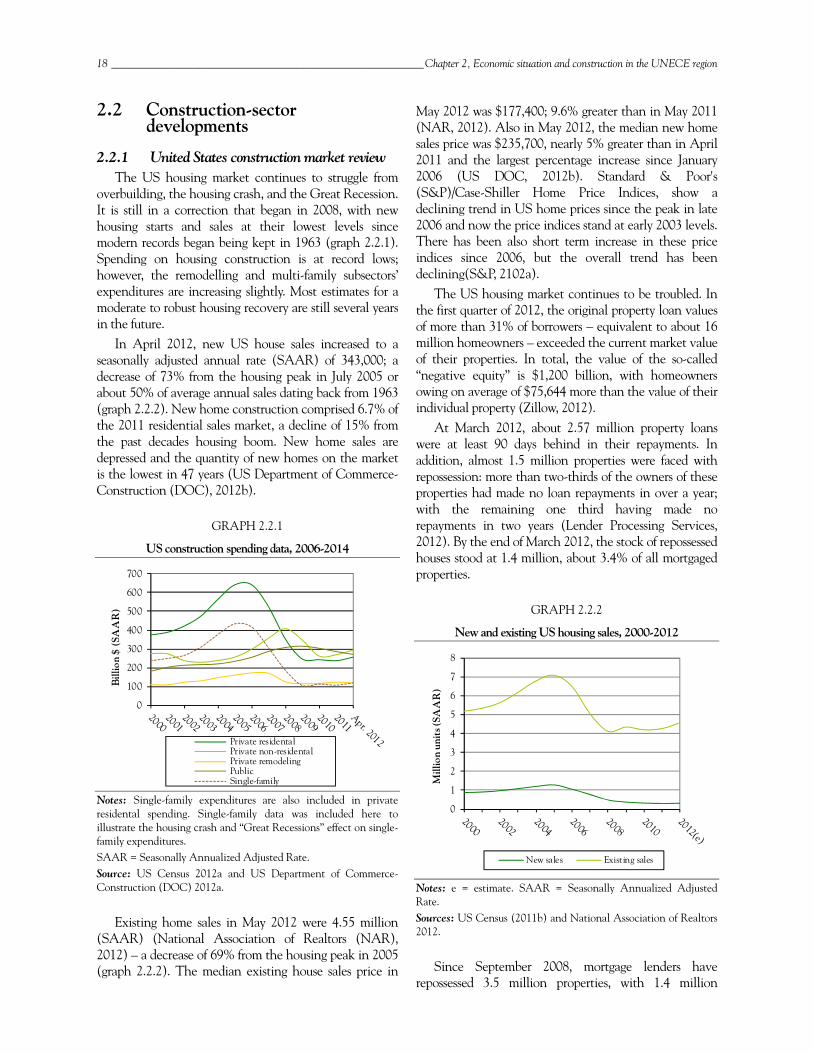
18 _________________________________________________________ Chapter 2, Economic situation and construction in the UNECE region
2.2 Construction-sector developments
2.2.1 United States construction market review The US housing market continues to struggle from
overbuilding, the housing crash, and the Great Recession. It is still in a correction that began in 2008, with new housing starts and sales at their lowest levels since modern records began being kept in 1963 (graph 2.2.1). Spending on housing construction is at record lows; however, the remodelling and multi-family subsectors’ expenditures are increasing slightly. Most estimates for a moderate to robust housing recovery are still several years in the future.
In April 2012, new US house sales increased to a seasonally adjusted annual rate (SAAR) of 343,000; a decrease of 73% from the housing peak in July 2005 or about 50% of average annual sales dating back from 1963 (graph 2.2.2). New home construction comprised 6.7% of the 2011 residential sales market, a decline of 15% from the past decades housing boom. New home sales are depressed and the quantity of new homes on the market is the lowest in 47 years (US Department of Commerce-Construction (DOC), 2012b).
GRAPH 2.2.1
US construction spending data, 2006-2014
Notes: Single-family expenditures are also included in private residental spending. Single-family data was included here to illustrate the housing crash and “Great Recessions” effect on single-family expenditures. SAAR = Seasonally Annualized Adjusted Rate. Source: US Census 2012a and US Department of Commerce-Construction (DOC) 2012a.
Existing home sales in May 2012 were 4.55 million (SAAR) (National Association of Realtors (NAR), 2012) – a decrease of 69% from the housing peak in 2005 (graph 2.2.2). The median existing house sales price in
May 2012 was $177,400; 9.6% greater than in May 2011 (NAR, 2012). Also in May 2012, the median new home sales price was $235,700, nearly 5% greater than in April 2011 and the largest percentage increase since January 2006 (US DOC, 2012b). Standard & Poor's (S&P)/Case-Shiller Home Price Indices, show a declining trend in US home prices since the peak in late 2006 and now the price indices stand at early 2003 levels. There has been also short term increase in these price indices since 2006, but the overall trend has been declining(S&P, 2102a).
The US housing market continues to be troubled. In the first quarter of 2012, the original property loan values of more than 31% of borrowers – equivalent to about 16 million homeowners – exceeded the current market value of their properties. In total, the value of the so-called “negative equity” is $1,200 billion, with homeowners owing on average of $75,644 more than the value of their individual property (Zillow, 2012).
At March 2012, about 2.57 million property loans were at least 90 days behind in their repayments. In addition, almost 1.5 million properties were faced with repossession: more than two-thirds of the owners of these properties had made no loan repayments in over a year; with the remaining one third having made no repayments in two years (Lender Processing Services, 2012). By the end of March 2012, the stock of repossessed houses stood at 1.4 million, about 3.4% of all mortgaged properties.
GRAPH 2.2.2
New and existing US housing sales, 2000-2012
Notes: e = estimate. SAAR = Seasonally Annualized Adjusted Rate. Sources: US Census (2011b) and National Association of Realtors 2012.
Since September 2008, mortgage lenders have repossessed 3.5 million properties, with 1.4 million
0
100
200
300
400
500
600
700
Bill
ion
$ (S
AA
R)
Private residentalPrivate non-residentalPrivate remodelingPublicSingle-family
0
1
2
3
4
5
6
7
8
Mill
ion
unit
s (SA
AR
)
New sales Existing sales
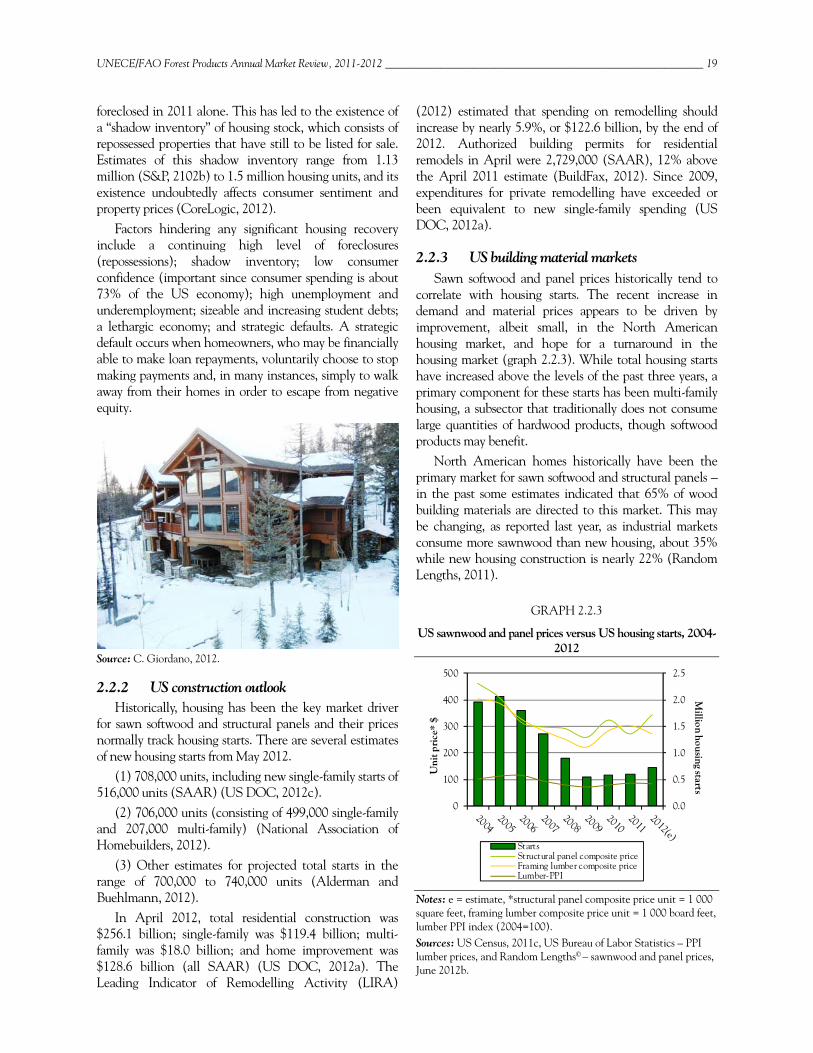
UNECE/FAO Forest Products Annual Market Review, 2011-2012 __________________________________________________________ 19
foreclosed in 2011 alone. This has led to the existence of a “shadow inventory” of housing stock, which consists of repossessed properties that have still to be listed for sale. Estimates of this shadow inventory range from 1.13 million (S&P, 2102b) to 1.5 million housing units, and its existence undoubtedly affects consumer sentiment and property prices (CoreLogic, 2012).
Factors hindering any significant housing recovery include a continuing high level of foreclosures (repossessions); shadow inventory; low consumer confidence (important since consumer spending is about 73% of the US economy); high unemployment and underemployment; sizeable and increasing student debts; a lethargic economy; and strategic defaults. A strategic default occurs when homeowners, who may be financially able to make loan repayments, voluntarily choose to stop making payments and, in many instances, simply to walk away from their homes in order to escape from negative equity.
Source: C. Giordano, 2012.
2.2.2 US construction outlook Historically, housing has been the key market driver
for sawn softwood and structural panels and their prices normally track housing starts. There are several estimates of new housing starts from May 2012.
(1) 708,000 units, including new single-family starts of 516,000 units (SAAR) (US DOC, 2012c).
(2) 706,000 units (consisting of 499,000 single-family and 207,000 multi-family) (National Association of Homebuilders, 2012).
(3) Other estimates for projected total starts in the range of 700,000 to 740,000 units (Alderman and Buehlmann, 2012).
In April 2012, total residential construction was $256.1 billion; single-family was $119.4 billion; multi-family was $18.0 billion; and home improvement was $128.6 billion (all SAAR) (US DOC, 2012a). The Leading Indicator of Remodelling Activity (LIRA)
(2012) estimated that spending on remodelling should increase by nearly 5.9%, or $122.6 billion, by the end of 2012. Authorized building permits for residential remodels in April were 2,729,000 (SAAR), 12% above the April 2011 estimate (BuildFax, 2012). Since 2009, expenditures for private remodelling have exceeded or been equivalent to new single-family spending (US DOC, 2012a).
2.2.3 US building material markets Sawn softwood and panel prices historically tend to
correlate with housing starts. The recent increase in demand and material prices appears to be driven by improvement, albeit small, in the North American housing market, and hope for a turnaround in the housing market (graph 2.2.3). While total housing starts have increased above the levels of the past three years, a primary component for these starts has been multi-family housing, a subsector that traditionally does not consume large quantities of hardwood products, though softwood products may benefit.
North American homes historically have been the primary market for sawn softwood and structural panels – in the past some estimates indicated that 65% of wood building materials are directed to this market. This may be changing, as reported last year, as industrial markets consume more sawnwood than new housing, about 35% while new housing construction is nearly 22% (Random Lengths, 2011).
GRAPH 2.2.3
US sawnwood and panel prices versus US housing starts, 2004-2012
Notes: e = estimate, *structural panel composite price unit = 1 000 square feet, framing lumber composite price unit = 1 000 board feet, lumber PPI index (2004=100). Sources: US Census, 2011c, US Bureau of Labor Statistics – PPI lumber prices, and Random Lengths© – sawnwood and panel prices, June 2012b.
0.0
0.5
1.0
1.5
2.0
2.5
0
100
200
300
400
500
Million housing starts
Uni
t pri
ce*
$
StartsStructural panel composite priceFraming lumber composite priceLumber-PPI
20 _________________________________________________________ Chapter 2, Economic situation and construction in the UNECE region
2.2.4 Canadian housing market The Canadian housing market has recovered better
that the US market from the effects of the economic crisis. Housing starts increased from 189,930 units in 2010 to 193,950 in 2011 but are still well below the 2002-2008 levels. Like in the US, multi-family housing is projected to be a primary component of housing in the future; generally multi-family housing consumes less sawnwood than single-family units. And sawn wood is vulnerable to substitute products such as steel, aluminium, and concrete. Single-family starts are estimated to be 86,800 and multi-family starts are 118,900, for an estimated 202,700 starts for 2012. Starts are projected to decrease to 196,750 in 2013 (graph 2.2.4). Mortgage rates are expected to range from 3.1% to 3.6% in 2012 and increasing to up to 5.0% - 5.4% in 5 years. Additionally, the unemployment rate is projected to decrease from 7.4% in 2011, to 7.3% in 2012, and to 7.1% by 2013 (Canada Housing and Mortgage Corporation, 2012). The Bank of Canada has reported that housing shows signs of being overvalued and is vulnerable to the European debt crisis. The report highlighted that the risk associated with high household debt levels and a possible correction in the housing market had not diminished (Palmer, 2012).
GRAPH 2.2.4
Canadian housing starts, 2006-2013
Note: e = estimate. Source: Canada Housing and Mortgage Corporation 2012.
2.2.5 European construction market
2.2.5.1 Review and outlook The global economy is teetering on the edge of a
double-dip recession and the eurozone has sovereign debt problems and banking woes. These problems are reflected in the overall volume and value of the Euroconstruct
region (ER)8 western European housing market. Residential construction is the largest single activity, accounting for 45% of total construction in 2011. Renovation and maintenance work comprises 60% of this subsector and typically is a source of stable activity – in contrast to new residential construction, which fluctuates due to economic conditions.
Throughout Europe, home construction is still sluggish with the exceptions of Finland, France, Norway and Switzerland. Conversely, Ireland and Spain’s housing prospects appear grim. From 2007 to 2010, there was a 22% decline in housing production in the Western European Euroconstruct region. Taking into account potential economic threats, a thin housing recovery is forecast for 2012 (1.4% gain); 2.4% for 2013; and 2.7% for 2014. The most promising construction areas, from an increasing percentage basis, are the eastern ER countries, which include the Czech Republic, Hungary, Poland and Slovakia. In absolute terms, 2012 new residential construction is estimated to be €235.64 billion in the ER region, nearly 25% less than in 2008 (Euroconstruct, 2011).
Reviewing housing valuations, the correction in the US is still far more advanced than in the United Kingdom and Spain. Spain will likely see further price adjustments as current valuations pose a threat to the banking sector and economic growth. However, for many ER countries, price changes were relatively modest. Several indices indicate that ER house prices are generally stable or declining (Ball, 2012).
2.2.5.2 European construction trends A recovery in new home starts is being delayed by
economic conditions that include a weak European economy, high sovereign debt; bank solvency issues; high unemployment; consumer uncertainty, and a housing crash in some countries. At its peak in 2006, a record 2.38 million homes were completed (1.55 million multi-family (flats) and 837,000 1+2 family houses). By contrast, in 2012, only about 1.1 million units are being forecast to be built (597,800 multi-family units and 521,600 1+2 family dwellings) (graph 2.2.5). In 2014, new residential construction values are predicted to increase by 9.3%
8 Euroconstruct is the main network providing forecasts about construction, finance and business. The Euroconstruct region comprises 19 countries. The western region includes EU-17 member States (Austria, Belgium, Czech Republic, Denmark, Finland, France, Germany, Hungary, Ireland, Italy, Netherlands, Poland, Portugal, Slovakia, Spain, Sweden, and United Kingdom), jointly with Norway and Switzerland. Euroconstruct’s western European countries are not the EU-27, but the first 17 countries listed above. Euroconstruct’s analysis of eastern European construction also is based on the Czech Republic, Hungary, Slovakia and Poland.
0
50
100
150
200
250
Tho
usan
d st
arts
Single-family Semi-detachedRow Multi-familyTotal
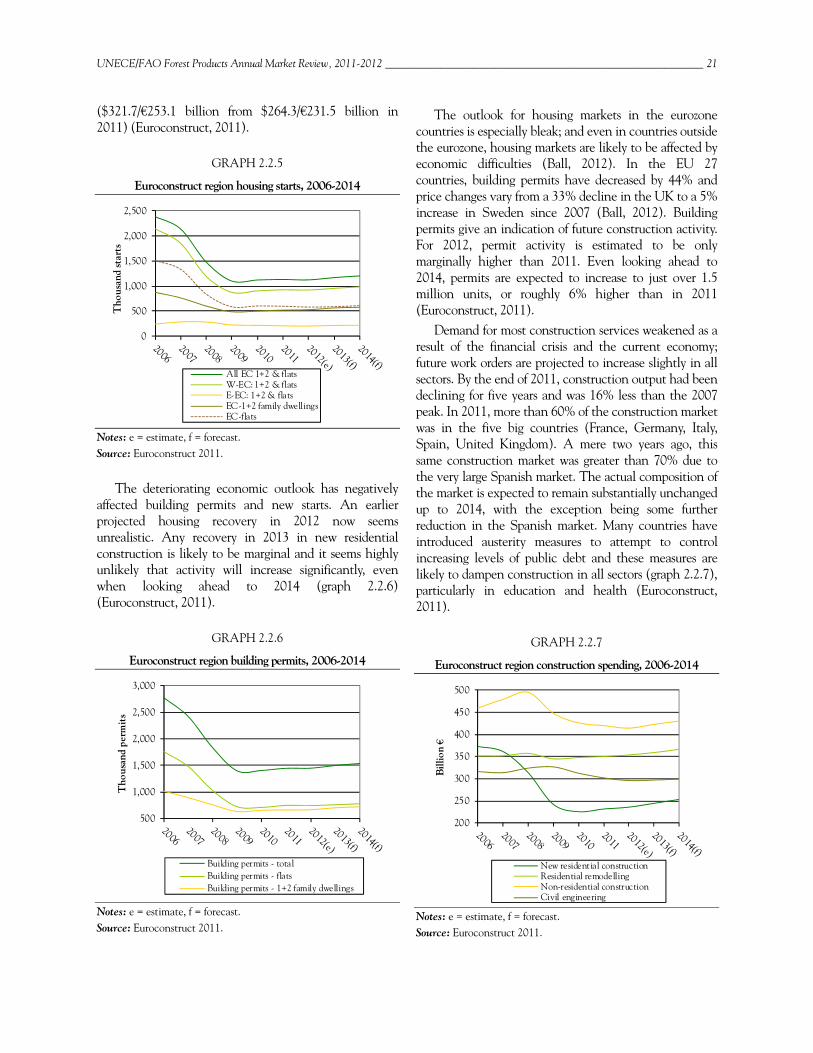
UNECE/FAO Forest Products Annual Market Review, 2011-2012 __________________________________________________________ 21
($321.7/€253.1 billion from $264.3/€231.5 billion in 2011) (Euroconstruct, 2011).
GRAPH 2.2.5
Euroconstruct region housing starts, 2006-2014
Notes: e = estimate, f = forecast. Source: Euroconstruct 2011.
The deteriorating economic outlook has negatively affected building permits and new starts. An earlier projected housing recovery in 2012 now seems unrealistic. Any recovery in 2013 in new residential construction is likely to be marginal and it seems highly unlikely that activity will increase significantly, even when looking ahead to 2014 (graph 2.2.6) (Euroconstruct, 2011).
GRAPH 2.2.6
Euroconstruct region building permits, 2006-2014
Notes: e = estimate, f = forecast. Source: Euroconstruct 2011.
The outlook for housing markets in the eurozone countries is especially bleak; and even in countries outside the eurozone, housing markets are likely to be affected by economic difficulties (Ball, 2012). In the EU 27 countries, building permits have decreased by 44% and price changes vary from a 33% decline in the UK to a 5% increase in Sweden since 2007 (Ball, 2012). Building permits give an indication of future construction activity. For 2012, permit activity is estimated to be only marginally higher than 2011. Even looking ahead to 2014, permits are expected to increase to just over 1.5 million units, or roughly 6% higher than in 2011 (Euroconstruct, 2011).
Demand for most construction services weakened as a result of the financial crisis and the current economy; future work orders are projected to increase slightly in all sectors. By the end of 2011, construction output had been declining for five years and was 16% less than the 2007 peak. In 2011, more than 60% of the construction market was in the five big countries (France, Germany, Italy, Spain, United Kingdom). A mere two years ago, this same construction market was greater than 70% due to the very large Spanish market. The actual composition of the market is expected to remain substantially unchanged up to 2014, with the exception being some further reduction in the Spanish market. Many countries have introduced austerity measures to attempt to control increasing levels of public debt and these measures are likely to dampen construction in all sectors (graph 2.2.7), particularly in education and health (Euroconstruct, 2011).
GRAPH 2.2.7
Euroconstruct region construction spending, 2006-2014
Notes: e = estimate, f = forecast. Source: Euroconstruct 2011.
0
500
1,000
1,500
2,000
2,500
Tho
usan
d st
arts
All EC 1+2 & flatsW-EC: 1+2 & flatsE-EC: 1+2 & flatsEC-1+2 family dwellingsEC-flats
500
1,000
1,500
2,000
2,500
3,000
Tho
usan
d pe
rmit
s
Building permits - totalBuilding permits - flatsBuilding permits - 1+2 family dwellings
200
250
300
350
400
450
500
Bill
ion
€
New residential constructionResidential remodellingNon-residential constructionCivil engineering
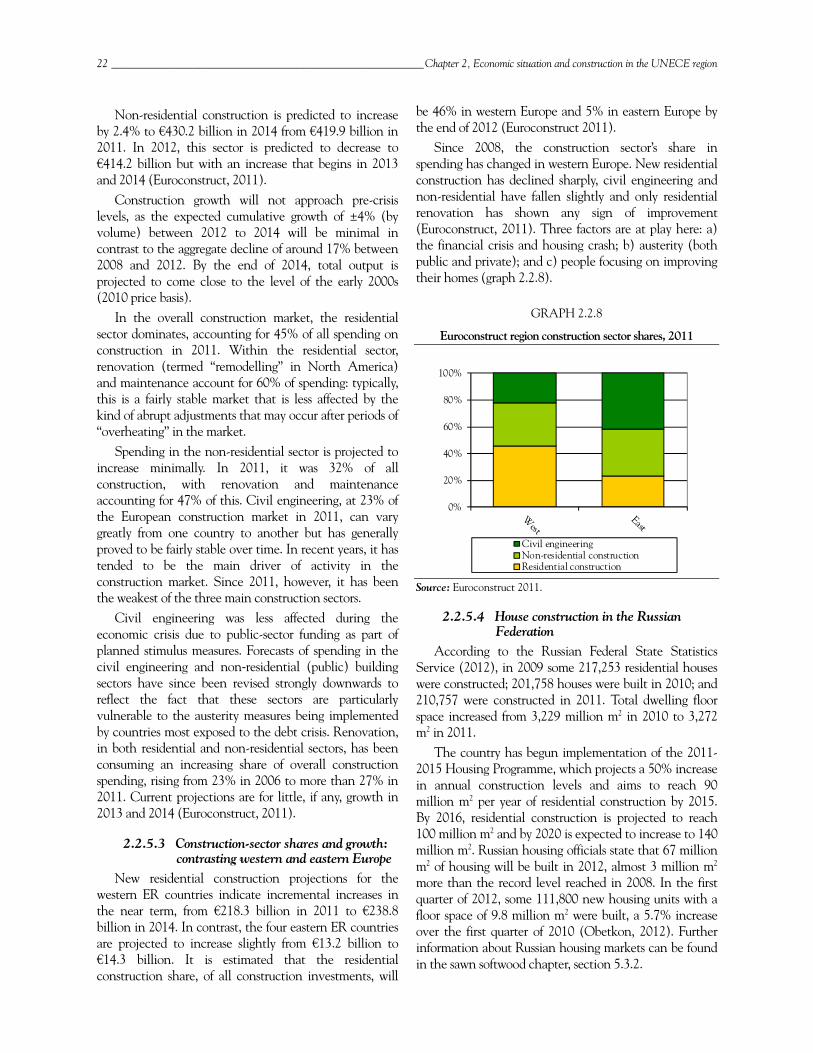
22 _________________________________________________________ Chapter 2, Economic situation and construction in the UNECE region
Non-residential construction is predicted to increase by 2.4% to €430.2 billion in 2014 from €419.9 billion in 2011. In 2012, this sector is predicted to decrease to €414.2 billion but with an increase that begins in 2013 and 2014 (Euroconstruct, 2011).
Construction growth will not approach pre-crisis levels, as the expected cumulative growth of ±4% (by volume) between 2012 to 2014 will be minimal in contrast to the aggregate decline of around 17% between 2008 and 2012. By the end of 2014, total output is projected to come close to the level of the early 2000s (2010 price basis).
In the overall construction market, the residential sector dominates, accounting for 45% of all spending on construction in 2011. Within the residential sector, renovation (termed “remodelling” in North America) and maintenance account for 60% of spending: typically, this is a fairly stable market that is less affected by the kind of abrupt adjustments that may occur after periods of “overheating” in the market.
Spending in the non-residential sector is projected to increase minimally. In 2011, it was 32% of all construction, with renovation and maintenance accounting for 47% of this. Civil engineering, at 23% of the European construction market in 2011, can vary greatly from one country to another but has generally proved to be fairly stable over time. In recent years, it has tended to be the main driver of activity in the construction market. Since 2011, however, it has been the weakest of the three main construction sectors.
Civil engineering was less affected during the economic crisis due to public-sector funding as part of planned stimulus measures. Forecasts of spending in the civil engineering and non‐residential (public) building sectors have since been revised strongly downwards to reflect the fact that these sectors are particularly vulnerable to the austerity measures being implemented by countries most exposed to the debt crisis. Renovation, in both residential and non-residential sectors, has been consuming an increasing share of overall construction spending, rising from 23% in 2006 to more than 27% in 2011. Current projections are for little, if any, growth in 2013 and 2014 (Euroconstruct, 2011).
2.2.5.3 Construction-sector shares and growth: contrasting western and eastern Europe
New residential construction projections for the western ER countries indicate incremental increases in the near term, from €218.3 billion in 2011 to €238.8 billion in 2014. In contrast, the four eastern ER countries are projected to increase slightly from €13.2 billion to €14.3 billion. It is estimated that the residential construction share, of all construction investments, will
be 46% in western Europe and 5% in eastern Europe by the end of 2012 (Euroconstruct 2011).
Since 2008, the construction sector’s share in spending has changed in western Europe. New residential construction has declined sharply, civil engineering and non-residential have fallen slightly and only residential renovation has shown any sign of improvement (Euroconstruct, 2011). Three factors are at play here: a) the financial crisis and housing crash; b) austerity (both public and private); and c) people focusing on improving their homes (graph 2.2.8).
GRAPH 2.2.8
Euroconstruct region construction sector shares, 2011
Source: Euroconstruct 2011.
2.2.5.4 House construction in the Russian Federation
According to the Russian Federal State Statistics Service (2012), in 2009 some 217,253 residential houses were constructed; 201,758 houses were built in 2010; and 210,757 were constructed in 2011. Total dwelling floor space increased from 3,229 million m2 in 2010 to 3,272 m2 in 2011.
The country has begun implementation of the 2011-2015 Housing Programme, which projects a 50% increase in annual construction levels and aims to reach 90 million m2 per year of residential construction by 2015. By 2016, residential construction is projected to reach 100 million m2 and by 2020 is expected to increase to 140 million m2. Russian housing officials state that 67 million m2 of housing will be built in 2012, almost 3 million m2 more than the record level reached in 2008. In the first quarter of 2012, some 111,800 new housing units with a floor space of 9.8 million m2 were built, a 5.7% increase over the first quarter of 2010 (Obetkon, 2012). Further information about Russian housing markets can be found in the sawn softwood chapter, section 5.3.2.
0%
20%
40%
60%
80%
100%
Civil engineeringNon-residential constructionResidential construction
UNECE/FAO Forest Products Annual Market Review, 2011-2012 __________________________________________________________ 23
2.3 References Alderman, D. and U. Buehlmann. 2012. March housing
commentary. USDA Forest Service. Princeton, West Virginia.
Ball, M. 2012. RICS European Housing Review 2012. Royal Institution of Chartered Surveyors. Brussels, Belgium. Available at: www.rics.org
BuildFax. 2012. March Residential Remodeling Permits. Available at: www.buildfax.com/public/remodeling/ index.html
Canada Housing and Mortgage Corporation. 2012. CMHC's Housing Market Outlook - Canada Highlights. Available at: www.cmhc-schl.gc.ca
CoreLogic. 2012. First-quarter 2012 shadow inventory update: national liquidation rates moderate, while regional differences widen. Available at: www.corelogic.com
Euroconstruct. 2011. 72nd Euroconstruct Summary Report, European Construction: market trends to 2014. The 72nd Euroconstruct Conference. Paris, France. November 8-9.
Kentikelenis, A., M. Karanikolos, I. Papanicolas, S. Basu, M. McKee, and D. Stuckler. 2011. Health Effects of Financial Crisis: Omens of a Greek Tragedy. The Lancet, 378 (9801), pp. 1,457 and 1,458.
Kindleberger, C. 1973. The World in Depression, 1929-1939.
Leading Indicator of Remodeling Activity. 2012. Remodeling recovery expected to strengthen by year’s end. Available at: www.jchs.harvard.edu
Lender Processing Services. 2012. April 2012 mortgage performance observations. Available at: www.lpsvcs.com
National Association of Homebuilders. 2012. National outlook. Available at: www.nahb.org
NAR. 2012. May existing home sales ease. Available at: www.realtor.org
Obetkon, R. 2012. Construction industry in Russia continues to grow. PMR Research. Kraków, Poland. 5 pp.
Palmer, R. 2012. Canadian housing market headed for a correction, BoC says. Available at: www.vancouversun.com
Random Lengths. 2011. OSB traders skeptical about repeat of 2010 spring spike. Random Lengths Publications, Inc. Eugene, Oregon. Vol. 67(10). 12 pp.
Random Lengths. 2012. Random lengths framing lumber and structural panel composite prices. Available at: www.randomlengths.com
Russian Federation Federal State Statistics Service. 2012. Russia' 2012 Statistical Pocketbook. Available at: www.gks.ru/free_doc/doc_2012/rus-eng12.pdf
Swetlishoff, D. and D. Quezada. 2012. Industry Comment – Changes. Available at: www.andrewjohns.ca
Standard & Poors. 2012a. Case-Shiller home price indices. Available at: www.housingviews.com
Standard & Poors. 2012b. First-quarter 2012 shadow inventory update: national liquidation rates moderate, while regional differences widen. Available: www.housingviews.com/page/3
U.S. Department of Commerce-NAICS 23, Construction. 2012b. New housing sales. Available at: www.census.gov/const/www/newresconstindex.html.
U.S. Department of Commerce-NAICS 23, Construction. 2012c. New housing starts. Available at: www.census.gov/const/www/newresconstindex.html.
Zillow Real Estate Research. 2012. Despite home value gains, underwater homeowners owe $1.2 trillion more than homes’ worth. Available at: www.zillow.com/blog/research

UNECE/FAO Forest Products Annual Market Review, 2011-2012 __________________________________________________________ 25
3 Policy and regulatory framework developments, 2011-2012
Lead author, Dominique Reeb Contributing authors, Christopher Gaston, Igor Novoselov, Helmuth Resch and Richard Vlosky
Highlights
A new set of forest carbon accounting rules for developed countries was agreed at the 2011 United Nations Climate Change Conference held in Durban. In this framework, the EC legislative proposal on accounting rules for harvested wood products clearly recognizes that forest harvesting is not a source of carbon emissions.
Russian export and import duties will be much influenced by that country’s accession to the WTO and are expected to decrease significantly.
The North American Free Trade Agreement, which aims to eliminate barriers to trade and investment between the US, Canada and Mexico, has been extended until 2015 and continues to influence Canada-US wood products trade.
Canadian Annual Allowable Cut (AAC) reductions in the provinces of British Columbia, Ontario and Quebec will affect the North American timber supply in the future.
Efforts to exclude illegal timber from markets are being strengthened in Europe with the EU Timber Regulation and Forest Law Enforcement, Governance and Trade (FLEGT) and, in the US, with the Lacey Act.
The EU’s targets for 2020 to reach 20% share of energy from renewable resources, 20% cut in greenhouse gas emissions and 20% improvement in energy efficiency are already putting wood energy at the centre of attention as it now provides 47% of renewable energy in Europe.
Increasing government support for alternative wood-based energy by governments is creating market opportunities for the forest sector but is not without controversy, given the potential implications on wood supply for other wood-using industry.
Green-building policies continue to affect markets, by highlighting the green credentials of building with sustainably produced wood.
Life cycle assessments (LCA) measuring the environmental impact of products should favour forest products, but are not yet widely adopted in green-building guidelines.
The Russian Federation has developed a programme for forestry development up to 2020 and a new forest policy to strengthen sustainable management, enhance yield and curb illegal logging.
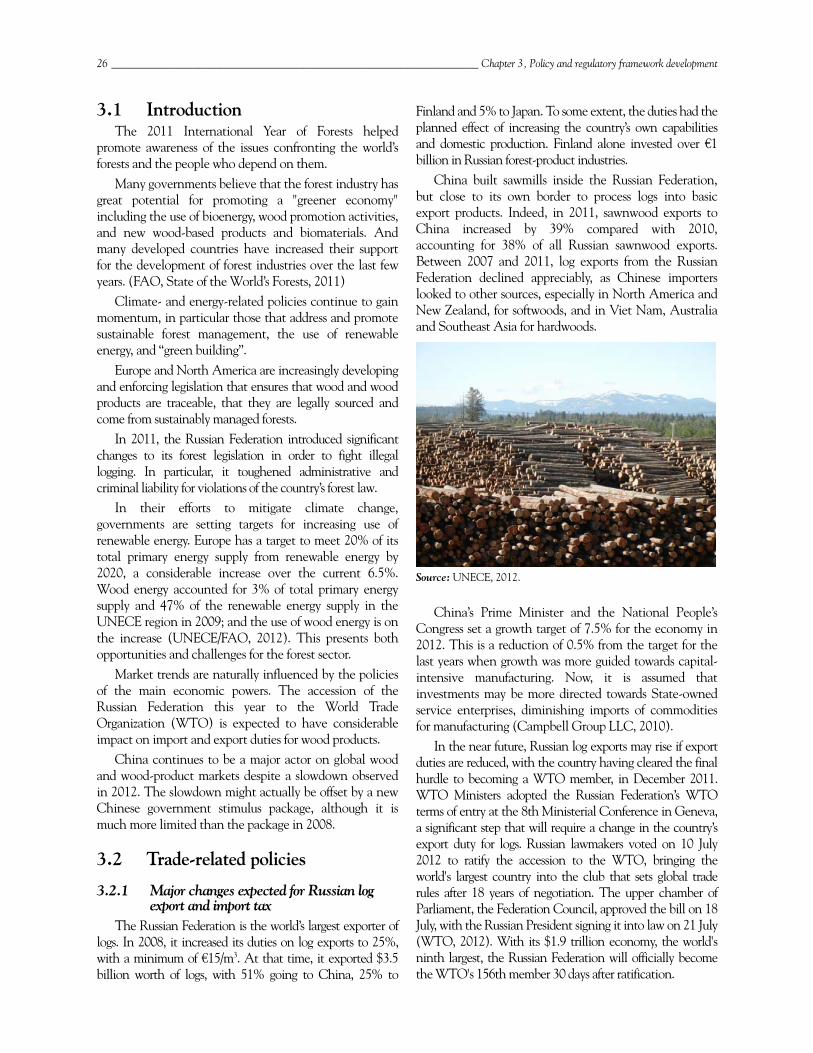
26 ___________________________________________________________________ Chapter 3, Policy and regulatory framework development
3.1 Introduction The 2011 International Year of Forests helped
promote awareness of the issues confronting the world’s forests and the people who depend on them.
Many governments believe that the forest industry has great potential for promoting a "greener economy" including the use of bioenergy, wood promotion activities, and new wood-based products and biomaterials. And many developed countries have increased their support for the development of forest industries over the last few years. (FAO, State of the World’s Forests, 2011)
Climate- and energy-related policies continue to gain momentum, in particular those that address and promote sustainable forest management, the use of renewable energy, and “green building”.
Europe and North America are increasingly developing and enforcing legislation that ensures that wood and wood products are traceable, that they are legally sourced and come from sustainably managed forests.
In 2011, the Russian Federation introduced significant changes to its forest legislation in order to fight illegal logging. In particular, it toughened administrative and criminal liability for violations of the country’s forest law.
In their efforts to mitigate climate change, governments are setting targets for increasing use of renewable energy. Europe has a target to meet 20% of its total primary energy supply from renewable energy by 2020, a considerable increase over the current 6.5%. Wood energy accounted for 3% of total primary energy supply and 47% of the renewable energy supply in the UNECE region in 2009; and the use of wood energy is on the increase (UNECE/FAO, 2012). This presents both opportunities and challenges for the forest sector.
Market trends are naturally influenced by the policies of the main economic powers. The accession of the Russian Federation this year to the World Trade Organization (WTO) is expected to have considerable impact on import and export duties for wood products.
China continues to be a major actor on global wood and wood-product markets despite a slowdown observed in 2012. The slowdown might actually be offset by a new Chinese government stimulus package, although it is much more limited than the package in 2008.
3.2 Trade-related policies
3.2.1 Major changes expected for Russian log export and import tax
The Russian Federation is the world’s largest exporter of logs. In 2008, it increased its duties on log exports to 25%, with a minimum of €15/m3. At that time, it exported $3.5 billion worth of logs, with 51% going to China, 25% to
Finland and 5% to Japan. To some extent, the duties had the planned effect of increasing the country’s own capabilities and domestic production. Finland alone invested over €1 billion in Russian forest-product industries.
China built sawmills inside the Russian Federation, but close to its own border to process logs into basic export products. Indeed, in 2011, sawnwood exports to China increased by 39% compared with 2010, accounting for 38% of all Russian sawnwood exports. Between 2007 and 2011, log exports from the Russian Federation declined appreciably, as Chinese importers looked to other sources, especially in North America and New Zealand, for softwoods, and in Viet Nam, Australia and Southeast Asia for hardwoods.
Source: UNECE, 2012.
China’s Prime Minister and the National People’s Congress set a growth target of 7.5% for the economy in 2012. This is a reduction of 0.5% from the target for the last years when growth was more guided towards capital-intensive manufacturing. Now, it is assumed that investments may be more directed towards State-owned service enterprises, diminishing imports of commodities for manufacturing (Campbell Group LLC, 2010).
In the near future, Russian log exports may rise if export duties are reduced, with the country having cleared the final hurdle to becoming a WTO member, in December 2011. WTO Ministers adopted the Russian Federation’s WTO terms of entry at the 8th Ministerial Conference in Geneva, a significant step that will require a change in the country’s export duty for logs. Russian lawmakers voted on 10 July 2012 to ratify the accession to the WTO, bringing the world's largest country into the club that sets global trade rules after 18 years of negotiation. The upper chamber of Parliament, the Federation Council, approved the bill on 18 July, with the Russian President signing it into law on 21 July (WTO, 2012). With its $1.9 trillion economy, the world's ninth largest, the Russian Federation will officially become the WTO's 156th member 30 days after ratification.
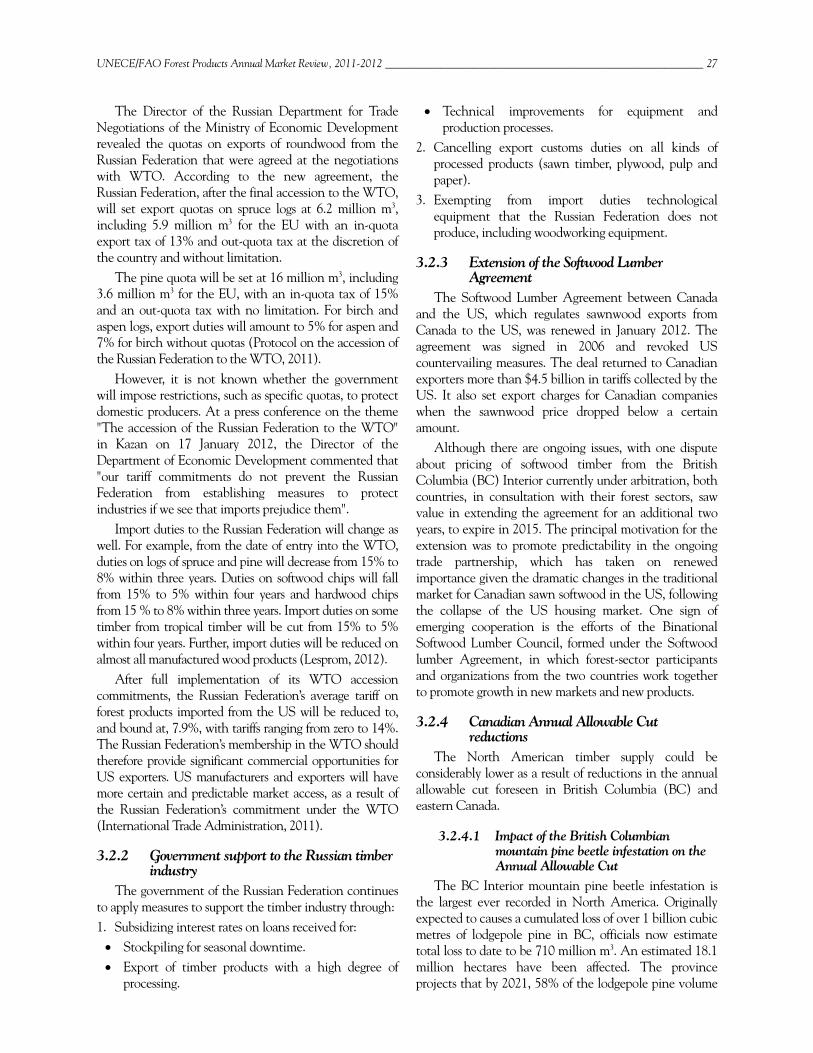
UNECE/FAO Forest Products Annual Market Review, 2011-2012 __________________________________________________________ 27
The Director of the Russian Department for Trade Negotiations of the Ministry of Economic Development revealed the quotas on exports of roundwood from the Russian Federation that were agreed at the negotiations with WTO. According to the new agreement, the Russian Federation, after the final accession to the WTO, will set export quotas on spruce logs at 6.2 million m3, including 5.9 million m3 for the EU with an in-quota export tax of 13% and out-quota tax at the discretion of the country and without limitation.
The pine quota will be set at 16 million m3, including 3.6 million m3 for the EU, with an in-quota tax of 15% and an out-quota tax with no limitation. For birch and aspen logs, export duties will amount to 5% for aspen and 7% for birch without quotas (Protocol on the accession of the Russian Federation to the WTO, 2011).
However, it is not known whether the government will impose restrictions, such as specific quotas, to protect domestic producers. At a press conference on the theme "The accession of the Russian Federation to the WTO" in Kazan on 17 January 2012, the Director of the Department of Economic Development commented that "our tariff commitments do not prevent the Russian Federation from establishing measures to protect industries if we see that imports prejudice them".
Import duties to the Russian Federation will change as well. For example, from the date of entry into the WTO, duties on logs of spruce and pine will decrease from 15% to 8% within three years. Duties on softwood chips will fall from 15% to 5% within four years and hardwood chips from 15 % to 8% within three years. Import duties on some timber from tropical timber will be cut from 15% to 5% within four years. Further, import duties will be reduced on almost all manufactured wood products (Lesprom, 2012).
After full implementation of its WTO accession commitments, the Russian Federation’s average tariff on forest products imported from the US will be reduced to, and bound at, 7.9%, with tariffs ranging from zero to 14%. The Russian Federation’s membership in the WTO should therefore provide significant commercial opportunities for US exporters. US manufacturers and exporters will have more certain and predictable market access, as a result of the Russian Federation’s commitment under the WTO (International Trade Administration, 2011).
3.2.2 Government support to the Russian timber industry
The government of the Russian Federation continues to apply measures to support the timber industry through: 1. Subsidizing interest rates on loans received for: Stockpiling for seasonal downtime. Export of timber products with a high degree of
processing.
Technical improvements for equipment and production processes.
2. Cancelling export customs duties on all kinds of processed products (sawn timber, plywood, pulp and paper).
3. Exempting from import duties technological equipment that the Russian Federation does not produce, including woodworking equipment.
3.2.3 Extension of the Softwood Lumber Agreement
The Softwood Lumber Agreement between Canada and the US, which regulates sawnwood exports from Canada to the US, was renewed in January 2012. The agreement was signed in 2006 and revoked US countervailing measures. The deal returned to Canadian exporters more than $4.5 billion in tariffs collected by the US. It also set export charges for Canadian companies when the sawnwood price dropped below a certain amount.
Although there are ongoing issues, with one dispute about pricing of softwood timber from the British Columbia (BC) Interior currently under arbitration, both countries, in consultation with their forest sectors, saw value in extending the agreement for an additional two years, to expire in 2015. The principal motivation for the extension was to promote predictability in the ongoing trade partnership, which has taken on renewed importance given the dramatic changes in the traditional market for Canadian sawn softwood in the US, following the collapse of the US housing market. One sign of emerging cooperation is the efforts of the Binational Softwood Lumber Council, formed under the Softwood lumber Agreement, in which forest-sector participants and organizations from the two countries work together to promote growth in new markets and new products.
3.2.4 Canadian Annual Allowable Cut reductions
The North American timber supply could be considerably lower as a result of reductions in the annual allowable cut foreseen in British Columbia (BC) and eastern Canada.
3.2.4.1 Impact of the British Columbian mountain pine beetle infestation on the Annual Allowable Cut
The BC Interior mountain pine beetle infestation is the largest ever recorded in North America. Originally expected to causes a cumulated loss of over 1 billion cubic metres of lodgepole pine in BC, officials now estimate total loss to date to be 710 million m3. An estimated 18.1 million hectares have been affected. The province projects that by 2021, 58% of the lodgepole pine volume
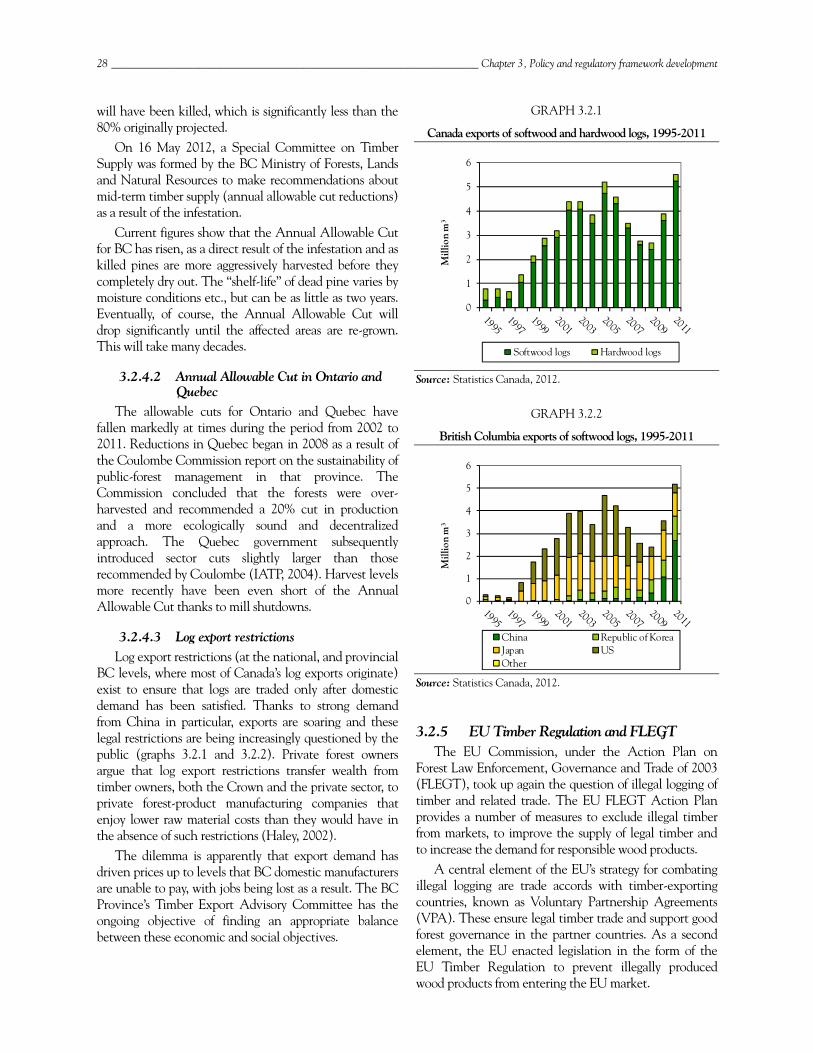
28 ___________________________________________________________________ Chapter 3, Policy and regulatory framework development
will have been killed, which is significantly less than the 80% originally projected.
On 16 May 2012, a Special Committee on Timber Supply was formed by the BC Ministry of Forests, Lands and Natural Resources to make recommendations about mid-term timber supply (annual allowable cut reductions) as a result of the infestation.
Current figures show that the Annual Allowable Cut for BC has risen, as a direct result of the infestation and as killed pines are more aggressively harvested before they completely dry out. The “shelf-life” of dead pine varies by moisture conditions etc., but can be as little as two years. Eventually, of course, the Annual Allowable Cut will drop significantly until the affected areas are re-grown. This will take many decades.
3.2.4.2 Annual Allowable Cut in Ontario and Quebec
The allowable cuts for Ontario and Quebec have fallen markedly at times during the period from 2002 to 2011. Reductions in Quebec began in 2008 as a result of the Coulombe Commission report on the sustainability of public-forest management in that province. The Commission concluded that the forests were over-harvested and recommended a 20% cut in production and a more ecologically sound and decentralized approach. The Quebec government subsequently introduced sector cuts slightly larger than those recommended by Coulombe (IATP, 2004). Harvest levels more recently have been even short of the Annual Allowable Cut thanks to mill shutdowns.
3.2.4.3 Log export restrictions Log export restrictions (at the national, and provincial
BC levels, where most of Canada’s log exports originate) exist to ensure that logs are traded only after domestic demand has been satisfied. Thanks to strong demand from China in particular, exports are soaring and these legal restrictions are being increasingly questioned by the public (graphs 3.2.1 and 3.2.2). Private forest owners argue that log export restrictions transfer wealth from timber owners, both the Crown and the private sector, to private forest-product manufacturing companies that enjoy lower raw material costs than they would have in the absence of such restrictions (Haley, 2002).
The dilemma is apparently that export demand has driven prices up to levels that BC domestic manufacturers are unable to pay, with jobs being lost as a result. The BC Province’s Timber Export Advisory Committee has the ongoing objective of finding an appropriate balance between these economic and social objectives.
GRAPH 3.2.1
Canada exports of softwood and hardwood logs, 1995-2011
Source: Statistics Canada, 2012.
GRAPH 3.2.2
British Columbia exports of softwood logs, 1995-2011
Source: Statistics Canada, 2012.
3.2.5 EU Timber Regulation and FLEGT The EU Commission, under the Action Plan on
Forest Law Enforcement, Governance and Trade of 2003 (FLEGT), took up again the question of illegal logging of timber and related trade. The EU FLEGT Action Plan provides a number of measures to exclude illegal timber from markets, to improve the supply of legal timber and to increase the demand for responsible wood products.
A central element of the EU’s strategy for combating illegal logging are trade accords with timber-exporting countries, known as Voluntary Partnership Agreements (VPA). These ensure legal timber trade and support good forest governance in the partner countries. As a second element, the EU enacted legislation in the form of the EU Timber Regulation to prevent illegally produced wood products from entering the EU market.
0
1
2
3
4
5
6
Mill
ion
m3
Softwood logs Hardwood logs
0
1
2
3
4
5
6
Mill
ion
m3
China Republic of KoreaJapan USOther
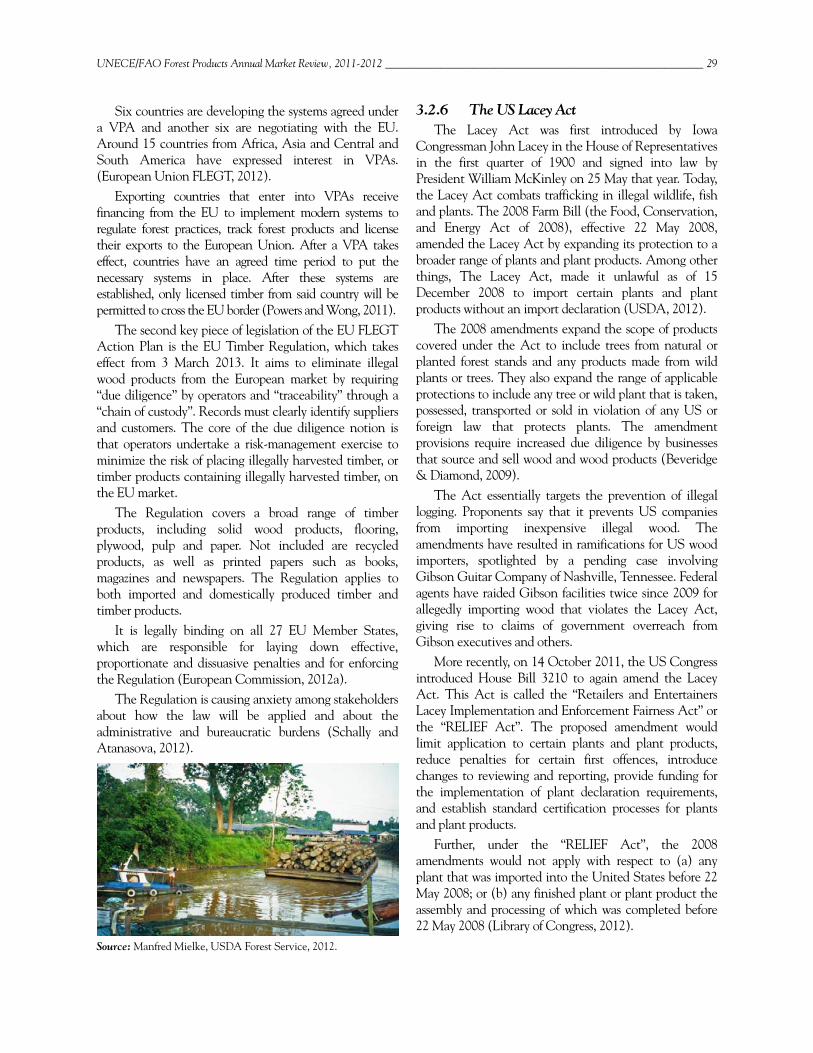
UNECE/FAO Forest Products Annual Market Review, 2011-2012 __________________________________________________________ 29
Six countries are developing the systems agreed under a VPA and another six are negotiating with the EU. Around 15 countries from Africa, Asia and Central and South America have expressed interest in VPAs. (European Union FLEGT, 2012).
Exporting countries that enter into VPAs receive financing from the EU to implement modern systems to regulate forest practices, track forest products and license their exports to the European Union. After a VPA takes effect, countries have an agreed time period to put the necessary systems in place. After these systems are established, only licensed timber from said country will be permitted to cross the EU border (Powers and Wong, 2011).
The second key piece of legislation of the EU FLEGT Action Plan is the EU Timber Regulation, which takes effect from 3 March 2013. It aims to eliminate illegal wood products from the European market by requiring “due diligence” by operators and “traceability” through a “chain of custody”. Records must clearly identify suppliers and customers. The core of the due diligence notion is that operators undertake a risk-management exercise to minimize the risk of placing illegally harvested timber, or timber products containing illegally harvested timber, on the EU market.
The Regulation covers a broad range of timber products, including solid wood products, flooring, plywood, pulp and paper. Not included are recycled products, as well as printed papers such as books, magazines and newspapers. The Regulation applies to both imported and domestically produced timber and timber products.
It is legally binding on all 27 EU Member States, which are responsible for laying down effective, proportionate and dissuasive penalties and for enforcing the Regulation (European Commission, 2012a).
The Regulation is causing anxiety among stakeholders about how the law will be applied and about the administrative and bureaucratic burdens (Schally and Atanasova, 2012).
Source: Manfred Mielke, USDA Forest Service, 2012.
3.2.6 The US Lacey Act The Lacey Act was first introduced by Iowa
Congressman John Lacey in the House of Representatives in the first quarter of 1900 and signed into law by President William McKinley on 25 May that year. Today, the Lacey Act combats trafficking in illegal wildlife, fish and plants. The 2008 Farm Bill (the Food, Conservation, and Energy Act of 2008), effective 22 May 2008, amended the Lacey Act by expanding its protection to a broader range of plants and plant products. Among other things, The Lacey Act, made it unlawful as of 15 December 2008 to import certain plants and plant products without an import declaration (USDA, 2012).
The 2008 amendments expand the scope of products covered under the Act to include trees from natural or planted forest stands and any products made from wild plants or trees. They also expand the range of applicable protections to include any tree or wild plant that is taken, possessed, transported or sold in violation of any US or foreign law that protects plants. The amendment provisions require increased due diligence by businesses that source and sell wood and wood products (Beveridge & Diamond, 2009).
The Act essentially targets the prevention of illegal logging. Proponents say that it prevents US companies from importing inexpensive illegal wood. The amendments have resulted in ramifications for US wood importers, spotlighted by a pending case involving Gibson Guitar Company of Nashville, Tennessee. Federal agents have raided Gibson facilities twice since 2009 for allegedly importing wood that violates the Lacey Act, giving rise to claims of government overreach from Gibson executives and others.
More recently, on 14 October 2011, the US Congress introduced House Bill 3210 to again amend the Lacey Act. This Act is called the “Retailers and Entertainers Lacey Implementation and Enforcement Fairness Act” or the “RELIEF Act”. The proposed amendment would limit application to certain plants and plant products, reduce penalties for certain first offences, introduce changes to reviewing and reporting, provide funding for the implementation of plant declaration requirements, and establish standard certification processes for plants and plant products.
Further, under the “RELIEF Act”, the 2008 amendments would not apply with respect to (a) any plant that was imported into the United States before 22 May 2008; or (b) any finished plant or plant product the assembly and processing of which was completed before 22 May 2008 (Library of Congress, 2012).
30 ___________________________________________________________________ Chapter 3, Policy and regulatory framework development
3.2.7 China continues to influence trade China’s growth has slowed down in 2012 to its lowest
rate – 7.6% in the second quarter – since the depths of the global financial crisis in 2009. The slowdown partly reflects the country’s shift to a more sustainable development pattern after years of double-digit growth (The Guardian, 2012).
Despite the slowdown, UN Comtrade statistics show that China is the third top importer, only 1.8% behind the top importer, the US. It is also the top exporter of wood and wood products. As such, China is one of the major drivers for overall growth in global timber consumption. Timber exports from China are estimated to be growing at an annual rate of 30%, and Global Witness (2012) reports that China accounts for about a quarter of the global trade in illegal timber.
While the Chinese government has made forestry protection one of its goals, there is still no evidence that it has made substantial progress in stemming the global trade of illegal timber. Domestically, there are no public procurement policies encouraging the use of legal timber. China’s effectiveness in controlling legal timber imports is equally weak (Powers and Wong, 2011).
3.3 Climate- and energy-related policies
3.3.1 Influences of climate change legislation on market dynamics
3.3.1.1 Reducing emissions from deforestation and forest degradation (REDD+)
Reducing Emissions from Deforestation and Forest Degradation (REDD) is an effort to assign a financial value to the carbon stored in forests, offering incentives for developing countries to reduce emissions from forested lands and invest in low-carbon paths to sustainable development. REDD+ goes beyond deforestation and forest degradation, and includes the role of conservation, sustainable management of forests and enhancement of forest carbon stocks.
To “seal the deal” on climate change, REDD+ activities in developing countries must complement, not be a substitute for, deep cuts in developed countries’ emissions. (UN-REDD Programme).
A number of key mechanisms, such as funding, reference levels and distribution of benefits, for the implementation of REDD+ are still under discussion. More about REDD+ can be read in chapter 11, Carbon markets.
3.3.1.2 Agreements at the Durban climate conference
A new set of forest carbon accounting rules for developed countries was proposed at the United Nations Climate Change Conference held in Durban (UNFCCC-COP17), 28 November-11 December 2011. If approved by EU Member States, these accounting rules will have to be applied for a time period from 2013 to the end of 2017 or even 2020. Afforestation, reforestation, and deforestation will be accounted for, as in the past, without caps on credit or debit. As far as the pool of harvested wood products is concerned, it is now to be accounted for when emissions occur, reflecting its contribution to climate change mitigation.
The Intergovernmental Panel on Climate Change (IPCC) had concluded that the mitigation benefits of the land use, land-use change and forestry (LULUCF) sector is a combination of sequestration, material substitution and fossil-fuel replacement. The policy provides an incentive to balance harvest and sequestration, as emissions from the harvested wood products pool need to be offset by new products entering the pool, otherwise debits would ensue.
The new rule provides a better balance between the use of wood for the generation of energy and solid wood products such as lumber and panels. However, wood products obtained from deforestation will still be considered as instant emissions. This consideration remained because of fears that delaying emissions from the harvest could provide an incentive for deforestation.
Related to these developments, the European Commission (EC) is beginning inter-service consultations on its proposed Communication on LULUCF and discussions with Member States. It presented its Communication and Proposal for a “Decision on accounting rules and action plans on greenhouse gas emissions and removals resulting from activities related to LULUCF” on 12 March 2012. The EC legislative proposal on accounting rules for harvested forest products clearly recognizes that forest harvesting is not a source of carbon emissions (United Nations, 2012).
The above agreements have been endorsed by the European wood industry association CEI-Bois, as follows:
“The European woodworking industries welcome the recent legislative proposal from the European Commission towards accounting rules and action plans on greenhouse gas emissions and removals resulting from activities related to LULUCF. The sector welcomes the move from the EC to start implementing the accounting system for harvested wood products on which a final agreement had been reached at the Durban climate conference. This will give full credit to the contribution of harvested wood products to climate change mitigation” (CEI-Bois, 2012).
UNECE/FAO Forest Products Annual Market Review, 2011-2012 __________________________________________________________ 31
3.3.1.3 Updating the EU Forestry Strategy and Forest Action Plan
In early 2011, the European Parliament, stressed that the EU Forestry Strategy and Forest Action Plan should be updated to include the climate change dimension. It issued a report on the EC’s Green Paper on forest protection and information in the EU: “Preparing forests for climate change”.
It pointed out that the Emissions Trading Scheme (ETS) in its current form was incompatible with LULUCF accounting. A difference existed between annual ETS-compliance requirements for industrial installations and the longer periods required for carbon stock changes in landholdings, and therefore no linkage should be made. Indeed, separate targets should be established for the LULUCF sector because of the differences in accounting precision and a large degree of natural variation.
Further concern was expressed with the short timeframes used in the current greenhouse gas (GHG) calculation methodology and the resulting carbon neutrality assumption for woody biomass. The EC should consult with the IPCC to establish a new GHG calculation methodology, accounting for the longer time horizons and for biomass emissions from land use, land-use change and forest management. Carbon flow should be assessed on a national level integrating the different phases in forestry.
The report also states that current biofuel criteria developed by the EC are not suitable for woody biomass. New legally binding sustainability criteria are to be developed for the use of biomass for energy considering indirect emissions and possible risks of distortion in the renewable energy market, i.e. one should not necessarily assume carbon neutrality. The detailed implementation of the criteria should be left to the local level accounting for specific site conditions (European Parliament, 2011).
3.3.1.4 New regulations under the Clean Air Act in the US
In the US, policies regarding the emissions from industrial boilers have become a major controversy. The proposed rules will also apply to the combustion of biomass and could discourage the development of renewable fuels that may have environmental benefits (Benway, 2011).
In 2010, the US Environmental Protection Agency (EPA) issued new regulations under the Clean Air Act and the Resource Conservation and Recovery Act, which cover emissions of hazardous air pollutants from incinerators and boilers. Boilers burn a variety of fuels to produce heat or steam for generating electricity and heating. The update to the Maximum Achievable Control Technology standards has been criticized for its latest restrictions on industrial companies (Benway,
2011). This is especially true for paper mills, which are very energy-intensive and utilize boilers for making pulp, producing power and for recovering inorganic chemicals from black liquor. But also biomass-based energy plants such as cogeneration units will be immediately affected.
The Maximum Achievable Control Technology standards were formulated based on the average emissions by the top-performing 12% of all existing sources and would apply to those sources that produce over 10 tons (9.1 tonnes) of emissions per year of any one hazardous air pollutant or over 25 tons (22.7 tonnes) per year of all hazardous air pollutants combined. Many in industry consider several features of the proposed legislation problematic, and questioned the EPA’s methodology and analysis.
The American Forest & Paper Association commissioned a study, which found that these new regulations would have severe consequences for the paper industry if enacted in their current form. The EPA issued an administrative stay on the regulation, which would allow more time for reconsideration. However, in January 2012, a US District Court vacated the EPA’s March 2011 stay, thus making the effective dates of the boiler Maximum Achievable Control Technology rules retroactive to May 2011, effectively putting many boilers out of compliance and adding a great deal of uncertainty to the pulp and paper industry.
3.3.2 International and government policies supporting alternative wood-based energy and fuel sectors
3.3.2.1 International perspective In 2011, the International Energy Agency (IEA)
started developing a roadmap for some of the most important technologies to achieve a global energy-related CO2 target in 2050 of 50% below current levels. Each participating country is to identify technology, financing, policy and public engagement milestones that need to be achieved to realize the technology’s full potential. This roadmap is to name technology goals and define key actions that stakeholders must undertake to expand biofuel production and sustainable use.
It will provide additional focus and urgency to international discussions about the importance of biofuels for a low CO2 future. The successful development of technologies will determine to what extent agricultural or forest feedstock is to be utilized. Thus, in the long run, it could strongly influence the availability and pricing of wood.
3.3.2.2 European perspective The Directive 2009/28/EC on renewable energy,
which had to be implemented by all Member States by December 2010, sets ambitious targets, such that the EU
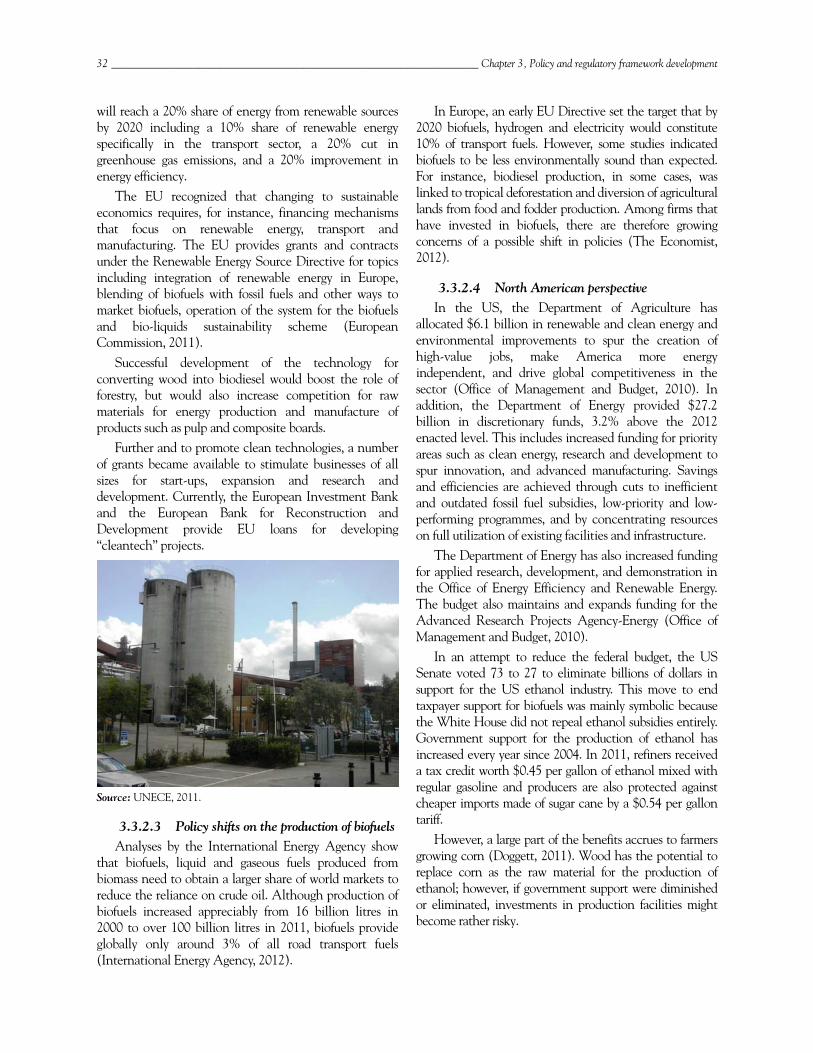
32 ___________________________________________________________________ Chapter 3, Policy and regulatory framework development
will reach a 20% share of energy from renewable sources by 2020 including a 10% share of renewable energy specifically in the transport sector, a 20% cut in greenhouse gas emissions, and a 20% improvement in energy efficiency.
The EU recognized that changing to sustainable economics requires, for instance, financing mechanisms that focus on renewable energy, transport and manufacturing. The EU provides grants and contracts under the Renewable Energy Source Directive for topics including integration of renewable energy in Europe, blending of biofuels with fossil fuels and other ways to market biofuels, operation of the system for the biofuels and bio-liquids sustainability scheme (European Commission, 2011).
Successful development of the technology for converting wood into biodiesel would boost the role of forestry, but would also increase competition for raw materials for energy production and manufacture of products such as pulp and composite boards.
Further and to promote clean technologies, a number of grants became available to stimulate businesses of all sizes for start-ups, expansion and research and development. Currently, the European Investment Bank and the European Bank for Reconstruction and Development provide EU loans for developing “cleantech” projects.
Source: UNECE, 2011.
3.3.2.3 Policy shifts on the production of biofuels Analyses by the International Energy Agency show
that biofuels, liquid and gaseous fuels produced from biomass need to obtain a larger share of world markets to reduce the reliance on crude oil. Although production of biofuels increased appreciably from 16 billion litres in 2000 to over 100 billion litres in 2011, biofuels provide globally only around 3% of all road transport fuels (International Energy Agency, 2012).
In Europe, an early EU Directive set the target that by 2020 biofuels, hydrogen and electricity would constitute 10% of transport fuels. However, some studies indicated biofuels to be less environmentally sound than expected. For instance, biodiesel production, in some cases, was linked to tropical deforestation and diversion of agricultural lands from food and fodder production. Among firms that have invested in biofuels, there are therefore growing concerns of a possible shift in policies (The Economist, 2012).
3.3.2.4 North American perspective In the US, the Department of Agriculture has
allocated $6.1 billion in renewable and clean energy and environmental improvements to spur the creation of high-value jobs, make America more energy independent, and drive global competitiveness in the sector (Office of Management and Budget, 2010). In addition, the Department of Energy provided $27.2 billion in discretionary funds, 3.2% above the 2012 enacted level. This includes increased funding for priority areas such as clean energy, research and development to spur innovation, and advanced manufacturing. Savings and efficiencies are achieved through cuts to inefficient and outdated fossil fuel subsidies, low-priority and low-performing programmes, and by concentrating resources on full utilization of existing facilities and infrastructure.
The Department of Energy has also increased funding for applied research, development, and demonstration in the Office of Energy Efficiency and Renewable Energy. The budget also maintains and expands funding for the Advanced Research Projects Agency-Energy (Office of Management and Budget, 2010).
In an attempt to reduce the federal budget, the US Senate voted 73 to 27 to eliminate billions of dollars in support for the US ethanol industry. This move to end taxpayer support for biofuels was mainly symbolic because the White House did not repeal ethanol subsidies entirely. Government support for the production of ethanol has increased every year since 2004. In 2011, refiners received a tax credit worth $0.45 per gallon of ethanol mixed with regular gasoline and producers are also protected against cheaper imports made of sugar cane by a $0.54 per gallon tariff.
However, a large part of the benefits accrues to farmers growing corn (Doggett, 2011). Wood has the potential to replace corn as the raw material for the production of ethanol; however, if government support were diminished or eliminated, investments in production facilities might become rather risky.
UNECE/FAO Forest Products Annual Market Review, 2011-2012 __________________________________________________________ 33
3.4 Environment-related policies
3.4.1 Green building and research and development
3.4.1.1 International Green Construction Code The International Green Construction Code (IgCC)
was issued in early 2012 following a period of public comment and feedback, and revision to the text. It addresses commercial construction and requirements for various building materials. However, it does not apply to residential structures of four storeys or less.
Its scope is “the design, construction, addition, alteration, change of occupancy, movement, enlargement, replacement, repair, equipment, location, maintenance, removal and demolition of every building or structure or any appurtenances connected or attached to such buildings or structures and to the site on which the building is located.”
Most green building programmes increasingly focus on environmental aspects of construction materials. Buildings with sufficient credits earn the desired “green” rating. The designation of environmentally better materials can be based on a systematic science-based environmental life cycle assessment (LCA), which compares different materials on the basis of consistent, measurable characteristics of their environmental impact. This favours forest products.
LCA studies have consistently found that wood products require substantially less energy to manufacture, transport, construct and maintain than other materials. Increasing the use of wood means less fossil fuel consumption and represents a simple way to meet national targets on reducing greenhouse gas emissions (Silvia Melegari, CEI-Bois, July 2012). Not all programmes have, as yet, incorporated LCA in their guidelines, however.
Although the use of wood and other agricultural fibres is favoured by the IgCC bio-based materials selection requirements, wood is the only material that is singled out as needing to be certified and third-party audited to obtain recognition. Requirements are more stringent for materials with recycled, recyclable, and bio-based content. Otherwise, the IgCC indigenous-materials specifications are similar to and possibly more flexible than those of the Leadership in Energy and Environmental Design (LEED) and other green building programmes.
While the IgCC does not apply to residential structures of four storeys or less, jurisdictions may adopt the code and decide whether the National Green Building Standard applies to various types of residential buildings and occupancies (International Code Council. 2012).
An alternative to the IgCC is the ANSI/ASHRAE/USGBC/IES 189.1 Standard for the
Design of High-Performance Green Buildings Except Low-Rise Residential Buildings. It has also been revised in 2011. Standard 189.1 serves as a compliance option in the 2012 IgCC (International Code Council, 2012).
LEED provides building owners and operators with a framework for identifying and implementing practical and measurable green building design, construction, operation and maintenance solutions. Developed by the US Green Building Council (USGBC) in 2000, the LEED rating systems are developed through an open, consensus-based process led by LEED committees. The next update of the rating system, coined LEED 2012, is the next step in the continuous improvement process and ongoing development cycle of LEED.
LEED certification provides independent, third-party verification that a building, home or community was designed and built using strategies aimed at achieving high performance in key areas of human and environmental health: sustainable site development, water savings, energy efficiency, materials selection and indoor environmental quality. LEED projects are in progress in 120 countries (US Green Building Council, 2012).
However, to attain “Responsible Extraction of Raw materials” credit towards LEED certification, forest products are facing obstacles in the US. In May 2012, eight Members of Congress sent a letter to the USGBC pressing for the immediate recognition and acceptance of all credible forest-management certification systems for qualification under the LEED rating system. The letter stated that “the only way for wood to earn this credit is to be “certified” to the Forest Stewardship Council (FSC) standard or an USBGC-approved equivalent. This is most unfortunate because 90% of FSCs land certifications are outside the United States, yet three quarters of the domestically certified forests are held to standards not recognized by LEED, including the Sustainable Forestry Initiative (FSI) and the American Tree Farm System (AFTS)”.
3.4.1.2 Strategic networking of R&D programmes in the construction of buildings
The European Commission set out to overcome the fragmentation in European Research Areas (ERA). Eracobuild was one of the first components of a European system for research and innovation in the construction and operation of buildings. In the past, a strong platform in ERA was established among the Member States for funding research, development, and implementation in the construction sector, with the Members successfully involved in planning and preparing a transnational R&D programme.
Representing the national governments’ funds for research, Eracobuild found a financial match for their research needs and built an efficient network of funding organizations and stakeholders (European Commission 2012b).
34 ___________________________________________________________________ Chapter 3, Policy and regulatory framework development
Also in this framework, the Energy Efficient Buildings Association (E2BA) collaborated with the European Commission in the Energy-efficient Buildings research program (E2B Association, 2012). They developed a multi-annual roadmap, with research priorities identified until 2013. In 2011, the Energy Efficient Buildings Association initiated the identification of RDI priorities for the period 2014-2020, taking into account advancements in the state of the art and the results emerging from past research (European Commission, 2010).
3.4.1.3 European Commissioner for Climate Action: develop a low-carbon economy
The European Commission sees climate change as a pressing challenge, with science and technology playing a central role in combatting it. The European Commissioner for Climate Action pointed to the EC Roadmap, which describes the cost-effective pathway to reaching the EU's objective of cutting greenhouse gas emissions by 80% – 95% of 1990 levels by 2050 – by stating that "while Europe is well on track to meet our 20% emissions targets (in 2020), and renewable goals, we are only on track for a 9% improvement in energy efficiency. Research and development is one of the few areas of the budget we have proposed to spend more money on. With a rise from €54bn to €80bn, it is a significant increase” (Public Service.Co.UK, 2011).
3.4.1.4 Legally Binding Agreement on Forests in Europe
The FOREST EUROPE Ministerial Conference on the Protection of Forests in Europe was held in Oslo from 14 to 16 June 2011. Ministers agreed on a common vision, strategic goals and measurable targets for European forests by 2020 and on negotiating a Legally Binding Agreement on Forests in Europe. The Agreement is to reinforce and strengthen the implementation of sustainable forest management with the objective of guaranteeing a balanced and stable continuity of all economic, environmental, cultural and social forest functions in Europe.9 Negotiations are continuing.
3.4.1.5 Action Plan for the Forest Sector in a Green Economy
This Action Plan describes how the forest sector in the UNECE region should lead the way towards the emerging green economy. It defines an overall vision and strategies and a number of areas of activity. For each area of activity, it proposes specific actions, and identifies potential actors who might contribute to achieving the objectives.
It is a work in progress and will be the outcome of a two-year inclusive process of consultation, under the leadership of the UNECE Timber Committee and the FAO European Forestry Commission. It will be presented
9 For more information: www.forestnegotiations.org/
for approval to the Committee and the Commission at their joint session in December 2013. It reflects the ideas of participants in the process but does not constitute a binding commitment by any participant.
3.4.1.6 Environmental Product Declaration In recent years, the International Organization for
Standardization (ISO) and a number of European countries have been focusing on environmental issues, specifically on the sustainability of construction works relating to the Construction Product Regulation (EN 15804), the Environmental Product Declaration (EPD) of building products (ISO 21930), environmental labels and declarations (ISO 14025) as well as on environmental management and life cycle assessment (LCA) (ISO 14040 and 14044).
The Environmental Product Declaration is a “standardized report of environmental impacts linked to a product or service” and is based on an LCA. It allows the comparison of environmental performance and substantiating marketing claims. Now ISO is developing a new standard ISO/Draft International Standards (DIS) 14067 on the “Carbon footprint of products: Requirements and guidelines for quantification and communication” (Know the Flow, 2011).
Considering this expansion of international standards, the possibility of trade barriers arising between conforming and nonconforming countries remains unclear.
3.4.2 Russian Federation
3.4.2.1 Draft State programme on forestry development, 2012-2020
In April 2011, the Russian Federal Forestry Agency published the first version of the State "Forestry Development Programme 2012-2020". This programme is in coherence with the “Concept of long-term socio-economic development of the Russian Federation until 2020” (approved in 2008) and with the "Strategy for the development of the Russian forest sector up to 2020" (approved in 2008 by order of the Ministry of Industry and Trade and the Ministry of Agriculture).
The programme is expected to have the following implications for forest products markets. It will: Implement sustainable forest management practices. Decrease the volume of illegal logging. Increase the density of forest roads and the
availability of forest resources. Enhance forest yield per unit of forest area, expand of
the volumes of various types of forest use, and create conditions for a comprehensive and rational processing of forest resources.
UNECE/FAO Forest Products Annual Market Review, 2011-2012 __________________________________________________________ 35
Introduce advanced domestic and foreign technologies of logging, providing the maximum conservation of the forest environment and biological diversity of forests.
Increasing work productivity in the forest sector and the competitiveness of Russian goods in world markets.
3.4.2.2 Draft Federal “State Regulation on the Production of Roundwood”
In 2011, the Russian Federal Forestry Agency drafted a legal text, the “State Regulation on the Production of Roundwood", aiming at taking measures against illegal logging, improving the transparency and legality of timber trade and at promoting reforestation. This is seen as a necessary step in developing forest-law enforcement and to ensure compliance with the EU Timber Regulation 995/2010 and the US Lacey Act.
The Regulation provides for the introduction of: A unified State information system on roundwood
production. A mandatory declaration of roundwood production
prior to processing. A liability for violation of legislation on roundwood
production and possible confiscation of timber in the event of such breach.
A mandatory labelling of valuable wood assortments. Accompanying documents for the transportation of
roundwood. A ban on the sale/transfer of roundwood harvested by
citizens for their own needs. In February 2012, at a meeting on the preparation of
this Federal law, the first deputy Prime Minister indicated that: "the enactment of the Regulation and its subsequent implementation will significantly reduce the amount of illegal logging and will increase budget revenues of all forestry activities. To support the implementation of the bill, the government plans to spend 500 million roubles in 2012-2014".
According to official government estimates, the annual volume of illegal logging in the Russian Federation in 2011 was about 1.3 million m3. Economic damage is estimated at 12-14 billion roubles a year.
3.4.2.3 Draft text of the “National Forest Policy”
For the first time in modern Russian history, a draft national forest policy was formulated this year. In March 2012, the Federal Forestry Agency presented the draft text. According to this text, the main objectives of forest policy are to: Achieve sustainable forest management,
conservation and enhancement of forest resources and of their ecological potential.
Increase the contribution of forests to socio-economic development and to environmental protection, while maintaining existing and creating new decent employment positions.
Meet the social needs of present and future generations of Russian citizens for forest resources and services.
Support Russian forest products to reach a leading position in world markets.
The National Forest Policy would enable a shift towards the up-scaling of sustainable forest management, the strengthening of the timber-processing sector and the active participation of citizens in managing forest resources. However, State ownership of forests should remain the main principle of the national forest policy (Maslyakov, 2012).
3.4.3 China The Chinese government is aiming at expanding its
total forest area by 40 million hectares, to reach a forest cover of 23% of its land area, and its total forest inventory by 1.3 billion m3 from 2005 to 2020.
To that end, the government will continue to subsidize tree planting to boost the development of the country’s forest industry.
3.5 Conclusions Overall, measures are being enacted to promote
certainty and predictability in timber markets in the UNECE region, although gaps exist as the full implications of the Russian Federation’s accession to the WTO are still unfolding. On the other hand, clarity has emerged on the treatment of LULUCF and harvested wood products within the climate change regime. International and national policies are increasingly supportive of wood-based energy and efforts to guarantee the sustainability of solid biofuels and measures against illegal logging and trade of timber are intensifying.
3.6 References American Forest & Paper Association. 2011. 13 June 2011.
Retrieved May 15, 2012. Available at: www.afandpa.org. Benway, S. 2011. Industry Surveys: Paper & Forest
Products. Standard and Poor’s. 10 February 2011. Beveridge & Diamond, P.C. 2009. Lacey Act
Amendments Impact Wood Products. Available at: www.bdlaw.com/news-511.html
Campbell Group LLC. 2010. Timberland Research and Education. March 2010. Available at: www.campbellgroup.com/_assets/downloads/public/understandingtimberland/WhatDoes_theEntryofRussia_totheWTO_ImplyforUSLogPrices.pdf
36 ___________________________________________________________________ Chapter 3, Policy and regulatory framework development
CEI-Bois. 2012. Green light to carbon accounting for harvested wood products. Available at: www.cei-bois.org/en/news/article/2012/green-light-to-carbon-accounting-for-harvested-wood-products
Doggett, T. 2011. Tight Senate vote seen on ethanol subsidy. Reuters. June 14, 2011. Available at: www.reuters.com/article/2011/06/14/us-usa-ethanol-senate-subsidies-idUSTRE75C5VV20110614?
The Economist. 2012. Biofuels. 7 January 2012. Available at: http://www.economist.com/node/21542431
European Commission. 2010. Energy-efficient buildings ppp: Multi-annual roadmap and longer term strategy. Available at: www.ectp.org/cws/params/ectp/ download_files/36D1191v1_EeB_Roadmap.pdf
European Commission. 2011. Energy: Grants and Contracts. Available at: http://ec.europa.eu/dgs/ energy/tenders/2011_en.htm
European Commission. 2012a. Timber Regulation. Available at: http://ec.europa.eu/environment/ forests/timber_regulation.htm
European Commission. 2012b. Reasearch Area. Available at: http://ec.europa.eu/research/era/index_en.html
European Parliament. 2011: Report on the Commission Green Paper on forest protection and information in the EU: preparing forests for climate change. Available at: www.europarl.europa.eu/sides/ getDoc.do?pubRef=-//EP//NONSGML+REPORT+ A7-2011-0113+0+DOC+PDF+V0//EN
European Union FLEGT. 2012. Partnership Agreements. Available at: www.euflegt.efi.int/portal/home/vpa_countries/
E2B Association. 2012. Available at: www.e2b-ei.eu/default.php
FAO. 2011. State of the World’s Forests, 2011. Available at: www.fao.org
Global Witness. 2012. Available at: www.globalwitness.org The Guardian. 2012. July 13th. Available at:
www.guardian.co.uk. Haley, D. 2002. Are Log Export Restrictions on Private
Forestland Good Public Policy? University of British Columbia.
IATP Institute for Agriculture and Trade Policies. 2004. Available at: www.iatp.org/news/quebec-forests-are-over-harvested-some-cutting-should-be-reduced-report
International Code Council. 2012. International Green Construction Code 2012. International Code Council. Washington D.C.
International Energy Agency. 2012. Biofuels. Available at: www.iea.org/topics/biofuels/
International Trade Administration. (2011, December). Publications. Retrieved May 15, 2012. Available at: www.trade.gov/mas/ian/build/groups/public/@tg_ian/documents/webcontent/tg_ian_003449.pdf
Know the Flow. 2011. What’s What: Understanding the ISO 14000 Family Of Standards. Available at: www.knowtheflow.com/2011/whats-what-understanding-the-iso-14000-family-of-standards/#
Lesprom. 2012. Available at: http://wood.lesprom.com/ research/710/
Library of Congress. 2012. Bill Text. 112th Congress (2011-2012) H.R.3210.IH. Available at: http://thomas.loc.gov/cgi-bin/query/z?c112:H.R.+3210:
Maslyakov. 2012. Russian workers forestry complex forum, March 29, 2012. 2012. Moscow. Available at: http://government.ru/
Office of Management and Budget. 2008. 2008 Report to Congress on the Benefits and Costs of Federal Regulations and Unfunded Mandates on State, Local, and Tribal Entities. Office of Information and Regulatory Affairs.
Office of Management and Budget. 2010. Budget. Retrieved 15 May 2012. Available at: www.whitehouse.gov/sites/default/files/omb/budget/fy2013/assets/budget.pdf
Powers, W. and Wong, A. 2011. Fairly Trading the World’s Timber: Lessons on Global Forest Governance and Trade from Europe and Liberia. Available at: www.worldpolicy.org
Protocol on the accession of the Russian Federation to the WTO. 2011. Available at: www.economy.gov.ru/
Public Service.Co.UK. 2011. European Commissioner for Climate Action Connie Hedegaard discusses with Public Service Review the direction that Europe must take to develop a low-carbon economy.15 November 2011. Available at: http://m.publicservice.co.uk/ feature_story.asp?id=17411
Report on the Activities Ministry of Industry and Trade of Russian Federation. 2011. (p.148) Available at: www.minpromtorg.gov.ru/reposit/minprom/ministry/plans/gov/6/MPT_ITOGOVAYa_VERSIYa.pdf
Schally, H. and Atanasova, S. 2012. Considerable preparatory work needed – View of the European Commission.
UNECE/FAO. 2012. UNECE/FAO Joint Wood Energy Enquiry (JWEE) 2009. Available at: www.unece.org.
United Nations FCCC. 2011. Report of the Conference of the Parties on its seventeenth session, held in Durban from 28 November to 11 December 2011. Available at: http://unfccc.int/resource/docs/2011/cop17/eng/09.pdf
US Green Building Council. 2012. LEED. Available at: http://www.usgbc.org/DisplayPage.aspx?CategoryID=19
USDA APHIS. 2012. Available at: www.aphis.usda.gov/ plant_health/lacey_act/
WTO. 2012. World Trade Organization. Available at: www.wto.org/
UNECE/FAO Forest Products Annual Market Review, 2011-2012 __________________________________________________________ 37
4 Wood raw material markets, 2011-2012
Lead author, Håkan Ekström
Highlights Consumption of industrial roundwood in the UNECE region was up for the second year in a
row in 2011 but was still 14% lower than before the global financial crisis of 2008.
The biggest increase in log consumption in 2011 was in the CIS subregion, where demand for both softwood and hardwood industrial roundwood was up by 14% because of higher production at sawmills and plywood plants in the Russian Federation and Ukraine.
Higher demand for logs by the sawmills within the UNECE region and a substantial increase in the importation of logs into China from North America and the Russian Federation contributed to higher harvests in the UNECE region in 2011.
Removals of industrial roundwood increased by 2.4%, reaching 970 million m3 in 2011 in the UNECE region, with harvests of hardwood logs going up slightly more than softwood logs. Since 2009, the total industrial roundwood harvests have gone up by 12%, a substantial recovery after the more than 30% plunge between 2007 and 2009.
The removal of fuelwood was estimated to be just over 200 million m3, constituting 18% of total roundwood removals in 2011.
The UNECE region’s trade of industrial roundwood in 2011 continued its upward trend from the previous year, with Europe and North America expanding exports by 12% and 25%, respectively, while CIS exports declined by 2%.
Prices for softwood sawlogs fell in virtually all major markets worldwide in late 2011 and early 2012. The Global Sawlog Price Index (GSPI) fell 9% between the first quarters of 2011 and 2012.
The weakening pulp markets and lower prices for market pulp resulted in lower wood chip and pulp log prices in early 2012. As a result, the global wood fibre price indices declined to their lowest levels in over 12 months.
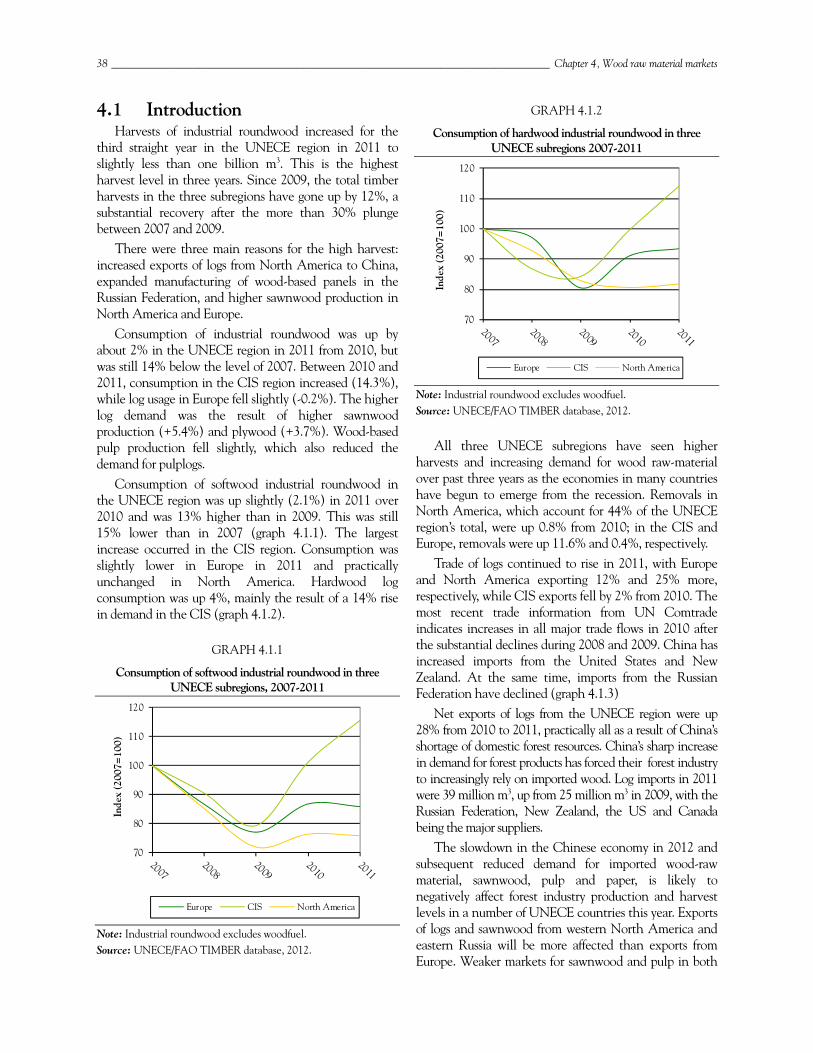
38 ________________________________________________________________________________ Chapter 4, Wood raw material markets
4.1 Introduction Harvests of industrial roundwood increased for the
third straight year in the UNECE region in 2011 to slightly less than one billion m3. This is the highest harvest level in three years. Since 2009, the total timber harvests in the three subregions have gone up by 12%, a substantial recovery after the more than 30% plunge between 2007 and 2009.
There were three main reasons for the high harvest: increased exports of logs from North America to China, expanded manufacturing of wood-based panels in the Russian Federation, and higher sawnwood production in North America and Europe.
Consumption of industrial roundwood was up by about 2% in the UNECE region in 2011 from 2010, but was still 14% below the level of 2007. Between 2010 and 2011, consumption in the CIS region increased (14.3%), while log usage in Europe fell slightly (-0.2%). The higher log demand was the result of higher sawnwood production (+5.4%) and plywood (+3.7%). Wood-based pulp production fell slightly, which also reduced the demand for pulplogs.
Consumption of softwood industrial roundwood in the UNECE region was up slightly (2.1%) in 2011 over 2010 and was 13% higher than in 2009. This was still 15% lower than in 2007 (graph 4.1.1). The largest increase occurred in the CIS region. Consumption was slightly lower in Europe in 2011 and practically unchanged in North America. Hardwood log consumption was up 4%, mainly the result of a 14% rise in demand in the CIS (graph 4.1.2).
GRAPH 4.1.1
Consumption of softwood industrial roundwood in three UNECE subregions, 2007-2011
Note: Industrial roundwood excludes woodfuel. Source: UNECE/FAO TIMBER database, 2012.
GRAPH 4.1.2
Consumption of hardwood industrial roundwood in three UNECE subregions 2007-2011
Note: Industrial roundwood excludes woodfuel. Source: UNECE/FAO TIMBER database, 2012.
All three UNECE subregions have seen higher harvests and increasing demand for wood raw-material over past three years as the economies in many countries have begun to emerge from the recession. Removals in North America, which account for 44% of the UNECE region’s total, were up 0.8% from 2010; in the CIS and Europe, removals were up 11.6% and 0.4%, respectively.
Trade of logs continued to rise in 2011, with Europe and North America exporting 12% and 25% more, respectively, while CIS exports fell by 2% from 2010. The most recent trade information from UN Comtrade indicates increases in all major trade flows in 2010 after the substantial declines during 2008 and 2009. China has increased imports from the United States and New Zealand. At the same time, imports from the Russian Federation have declined (graph 4.1.3)
Net exports of logs from the UNECE region were up 28% from 2010 to 2011, practically all as a result of China’s shortage of domestic forest resources. China’s sharp increase in demand for forest products has forced their forest industry to increasingly rely on imported wood. Log imports in 2011 were 39 million m3, up from 25 million m3 in 2009, with the Russian Federation, New Zealand, the US and Canada being the major suppliers.
The slowdown in the Chinese economy in 2012 and subsequent reduced demand for imported wood-raw material, sawnwood, pulp and paper, is likely to negatively affect forest industry production and harvest levels in a number of UNECE countries this year. Exports of logs and sawnwood from western North America and eastern Russia will be more affected than exports from Europe. Weaker markets for sawnwood and pulp in both
70
80
90
100
110
120
Inde
x (2
007=
100)
Europe CIS North America
70
80
90
100
110
120
Inde
x (2
007=
100)
Europe CIS North America
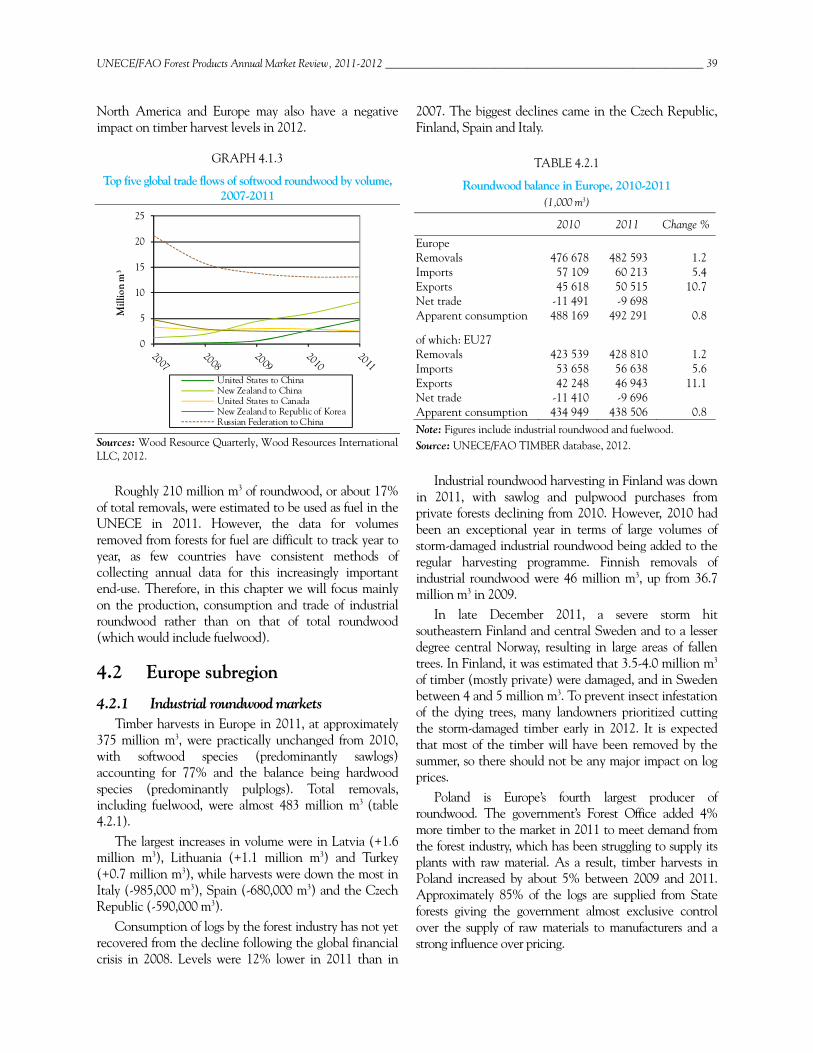
UNECE/FAO Forest Products Annual Market Review, 2011-2012 __________________________________________________________ 39
North America and Europe may also have a negative impact on timber harvest levels in 2012.
GRAPH 4.1.3
Top five global trade flows of softwood roundwood by volume, 2007-2011
Sources: Wood Resource Quarterly, Wood Resources International LLC, 2012.
Roughly 210 million m3 of roundwood, or about 17% of total removals, were estimated to be used as fuel in the UNECE in 2011. However, the data for volumes removed from forests for fuel are difficult to track year to year, as few countries have consistent methods of collecting annual data for this increasingly important end-use. Therefore, in this chapter we will focus mainly on the production, consumption and trade of industrial roundwood rather than on that of total roundwood (which would include fuelwood).
4.2 Europe subregion
4.2.1 Industrial roundwood markets Timber harvests in Europe in 2011, at approximately
375 million m3, were practically unchanged from 2010, with softwood species (predominantly sawlogs) accounting for 77% and the balance being hardwood species (predominantly pulplogs). Total removals, including fuelwood, were almost 483 million m3 (table 4.2.1).
The largest increases in volume were in Latvia (+1.6 million m3), Lithuania (+1.1 million m3) and Turkey (+0.7 million m3), while harvests were down the most in Italy (-985,000 m3), Spain (-680,000 m3) and the Czech Republic (-590,000 m3).
Consumption of logs by the forest industry has not yet recovered from the decline following the global financial crisis in 2008. Levels were 12% lower in 2011 than in
2007. The biggest declines came in the Czech Republic, Finland, Spain and Italy.
TABLE 4.2.1
Roundwood balance in Europe, 2010-2011 (1,000 m3)
2010 2011 Change %
Europe Removals 476 678 482 593 1.2 Imports 57 109 60 213 5.4 Exports 45 618 50 515 10.7 Net trade -11 491 -9 698 Apparent consumption 488 169 492 291 0.8
of which: EU27 Removals 423 539 428 810 1.2 Imports 53 658 56 638 5.6 Exports 42 248 46 943 11.1Net trade -11 410 -9 696 Apparent consumption 434 949 438 506 0.8 Note: Figures include industrial roundwood and fuelwood. Source: UNECE/FAO TIMBER database, 2012.
Industrial roundwood harvesting in Finland was down in 2011, with sawlog and pulpwood purchases from private forests declining from 2010. However, 2010 had been an exceptional year in terms of large volumes of storm-damaged industrial roundwood being added to the regular harvesting programme. Finnish removals of industrial roundwood were 46 million m3, up from 36.7 million m3 in 2009.
In late December 2011, a severe storm hit southeastern Finland and central Sweden and to a lesser degree central Norway, resulting in large areas of fallen trees. In Finland, it was estimated that 3.5-4.0 million m3 of timber (mostly private) were damaged, and in Sweden between 4 and 5 million m3. To prevent insect infestation of the dying trees, many landowners prioritized cutting the storm-damaged timber early in 2012. It is expected that most of the timber will have been removed by the summer, so there should not be any major impact on log prices.
Poland is Europe’s fourth largest producer of roundwood. The government’s Forest Office added 4% more timber to the market in 2011 to meet demand from the forest industry, which has been struggling to supply its plants with raw material. As a result, timber harvests in Poland increased by about 5% between 2009 and 2011. Approximately 85% of the logs are supplied from State forests giving the government almost exclusive control over the supply of raw materials to manufacturers and a strong influence over pricing.
0
5
10
15
20
25
Mill
ion
m3
United States to ChinaNew Zealand to ChinaUnited States to CanadaNew Zealand to Republic of KoreaRussian Federation to China
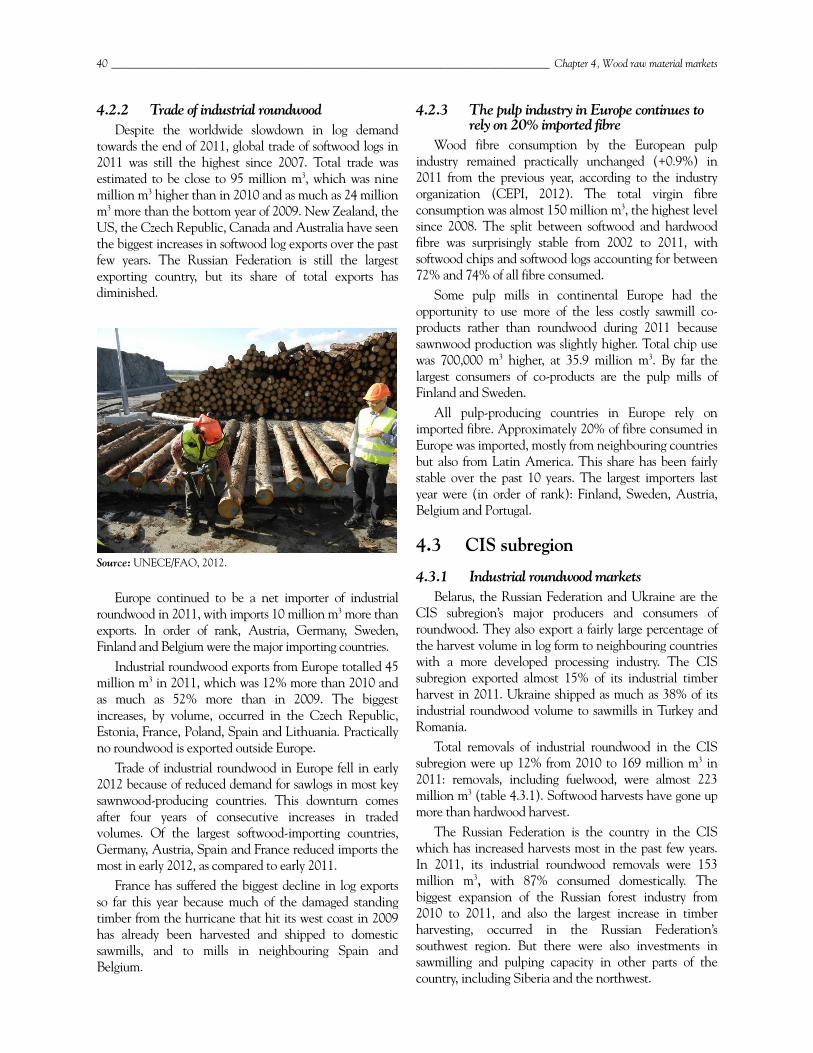
40 ________________________________________________________________________________ Chapter 4, Wood raw material markets
4.2.2 Trade of industrial roundwood Despite the worldwide slowdown in log demand
towards the end of 2011, global trade of softwood logs in 2011 was still the highest since 2007. Total trade was estimated to be close to 95 million m3, which was nine million m3 higher than in 2010 and as much as 24 million m3 more than the bottom year of 2009. New Zealand, the US, the Czech Republic, Canada and Australia have seen the biggest increases in softwood log exports over the past few years. The Russian Federation is still the largest exporting country, but its share of total exports has diminished.
Source: UNECE/FAO, 2012.
Europe continued to be a net importer of industrial roundwood in 2011, with imports 10 million m3 more than exports. In order of rank, Austria, Germany, Sweden, Finland and Belgium were the major importing countries.
Industrial roundwood exports from Europe totalled 45 million m3 in 2011, which was 12% more than 2010 and as much as 52% more than in 2009. The biggest increases, by volume, occurred in the Czech Republic, Estonia, France, Poland, Spain and Lithuania. Practically no roundwood is exported outside Europe.
Trade of industrial roundwood in Europe fell in early 2012 because of reduced demand for sawlogs in most key sawnwood-producing countries. This downturn comes after four years of consecutive increases in traded volumes. Of the largest softwood-importing countries, Germany, Austria, Spain and France reduced imports the most in early 2012, as compared to early 2011.
France has suffered the biggest decline in log exports so far this year because much of the damaged standing timber from the hurricane that hit its west coast in 2009 has already been harvested and shipped to domestic sawmills, and to mills in neighbouring Spain and Belgium.
4.2.3 The pulp industry in Europe continues to rely on 20% imported fibre
Wood fibre consumption by the European pulp industry remained practically unchanged (+0.9%) in 2011 from the previous year, according to the industry organization (CEPI, 2012). The total virgin fibre consumption was almost 150 million m3, the highest level since 2008. The split between softwood and hardwood fibre was surprisingly stable from 2002 to 2011, with softwood chips and softwood logs accounting for between 72% and 74% of all fibre consumed.
Some pulp mills in continental Europe had the opportunity to use more of the less costly sawmill co-products rather than roundwood during 2011 because sawnwood production was slightly higher. Total chip use was 700,000 m3 higher, at 35.9 million m3. By far the largest consumers of co-products are the pulp mills of Finland and Sweden.
All pulp-producing countries in Europe rely on imported fibre. Approximately 20% of fibre consumed in Europe was imported, mostly from neighbouring countries but also from Latin America. This share has been fairly stable over the past 10 years. The largest importers last year were (in order of rank): Finland, Sweden, Austria, Belgium and Portugal.
4.3 CIS subregion
4.3.1 Industrial roundwood markets Belarus, the Russian Federation and Ukraine are the
CIS subregion’s major producers and consumers of roundwood. They also export a fairly large percentage of the harvest volume in log form to neighbouring countries with a more developed processing industry. The CIS subregion exported almost 15% of its industrial timber harvest in 2011. Ukraine shipped as much as 38% of its industrial roundwood volume to sawmills in Turkey and Romania.
Total removals of industrial roundwood in the CIS subregion were up 12% from 2010 to 169 million m3 in 2011: removals, including fuelwood, were almost 223 million m3 (table 4.3.1). Softwood harvests have gone up more than hardwood harvest.
The Russian Federation is the country in the CIS which has increased harvests most in the past few years. In 2011, its industrial roundwood removals were 153 million m3, with 87% consumed domestically. The biggest expansion of the Russian forest industry from 2010 to 2011, and also the largest increase in timber harvesting, occurred in the Russian Federation’s southwest region. But there were also investments in sawmilling and pulping capacity in other parts of the country, including Siberia and the northwest.
UNECE/FAO Forest Products Annual Market Review, 2011-2012 __________________________________________________________ 41
The accuracy of Russian harvest data remains uncertain, as the Russian Government acknowledges “undocumented” timber harvest is occurring. In 2009, the Head of the Federal Forestry Agency reported that illegal logging may well lie in the range of 25-30 million m3 annually.
TABLE 4.3.1
Roundwood balance in the CIS, 2010-2011 (1,000 m3)
2010 2011 Change %
Removals 203 268 226 633 11.5 Imports 487 491 0.8 Exports 27 076 27 081 0.0 Net trade 26 589 26 591 Apparent consumption 176 679 200 042 13.2 Note: Figures include industrial roundwood and fuelwood. Source: UNECE/FAO TIMBER database, 2012.
4.3.2 Industrial roundwood exports Log exports have fallen sharply since 2008, when the
Russian Federation introduced a log export tariff of 25%. Despite having suffered a sharp decline in global market share, the Russian Federation is still the world’s largest exporter of softwood logs. In 2011, it exported 21 million m3 of industrial roundwood, down from 49 million m3 in 2006 – the bulk of the trade being in softwood sawlogs to China and hardwood pulplogs to Finland. During the first half of 2012, export volumes continued to decline and were 34% lower than in the same six-month period of 2011.
When the Russian Federation was accepted into the World Trade Organization (WTO) in December 2011, one of the requirements for entry into the organization was that the country had to reduce export and import tariffs on forest products. On 10 July 2012, the Russian State Duma ratified the agreement to join the WTO.
The amendment of the Russian log export tariff system will lower the tariffs on softwood logs from 25% to 15% for pine logs, and to 13% for spruce logs. The new proposed tariff for birch will actually be higher than the current tariffs for small diameter logs at 7%.
In addition to lowering the tariffs, the proposal also includes a volume quota for softwood logs. Below the quota limit, the new tariffs will apply, and for volumes above the quota, current tariffs will continue to be in effect.
The proposed quotas will almost certainly have no effect on trade with the EU, since they are set substantially higher than the volumes shipped in 2011, and are close to the record high levels of 2006. The quota level for countries outside the EU is proposed to be 13
million m3, of which pine species account for 95%. China is the major destination for Russian pine logs, and in 2011, shipments were well below the proposed quota volume. Since 2002, there have been only three occasions when the annual shipments of pine logs have been higher than the quota volume.
Even with the 12% reduction in export taxes, it remains to be seen whether foreign buyers will return to purchasing Russian logs. China, the largest importer of Russian softwood logs, is increasingly choosing to import sawnwood rather than logs from its northern neighbour. More about Russian Federation joining the WTO can be read from chapter 3, section 3.2.1.
4.4 North America subregion
4.4.1 Industrial roundwood markets Industrial roundwood removals were up less than 1%
in 2011 to 426 million m3, which was the highest level since 2008. However, the timber harvests last year were substantially lower in both Canada and the United States and compared with 2007 when they reached 540 million m3 in the two countries. The US suffered the biggest decline, with harvests falling from 379 million m3 in 2007 to 284 million m3 in 2011, a remarkable 25% reduction in available logs. Consumption of roundwood by the US domestic forest industry has fallen even further because the share of logs exported overseas has gone up steadily during the past five years. Total removals of roundwood, including fuelwood, were 469.5 million m3, which was little higher than in 2010. However, consumption in North America was almost the same as in 2011 (table 4.4.1).
TABLE 4.4.1
Roundwood balance in North America, 2010-2011 (1,000 m3)
2010 2011 Change %
Removals 465 999 469 499 0.8Imports 5 740 5 102 -11.1 Exports 13 967 17 727 27.9 Net trade 8 227 12 626 Apparent consumption 457 771 456 873 -0.2 Note: Figures include industrial roundwood and fuelwood. Source: UNECE/FAO TIMBER database, 2012.
In 2011, US domestic consumption of softwood logs fell 1.5% from 2010, and was 29% lower than in 2007. This downward trend was mainly the result of the sharp decline in US housing starts, as well as reduced demand for sawnwood by the construction sector. Log consumption by the pulp and wood panel sectors has fallen much less than that of the sawmilling sector.
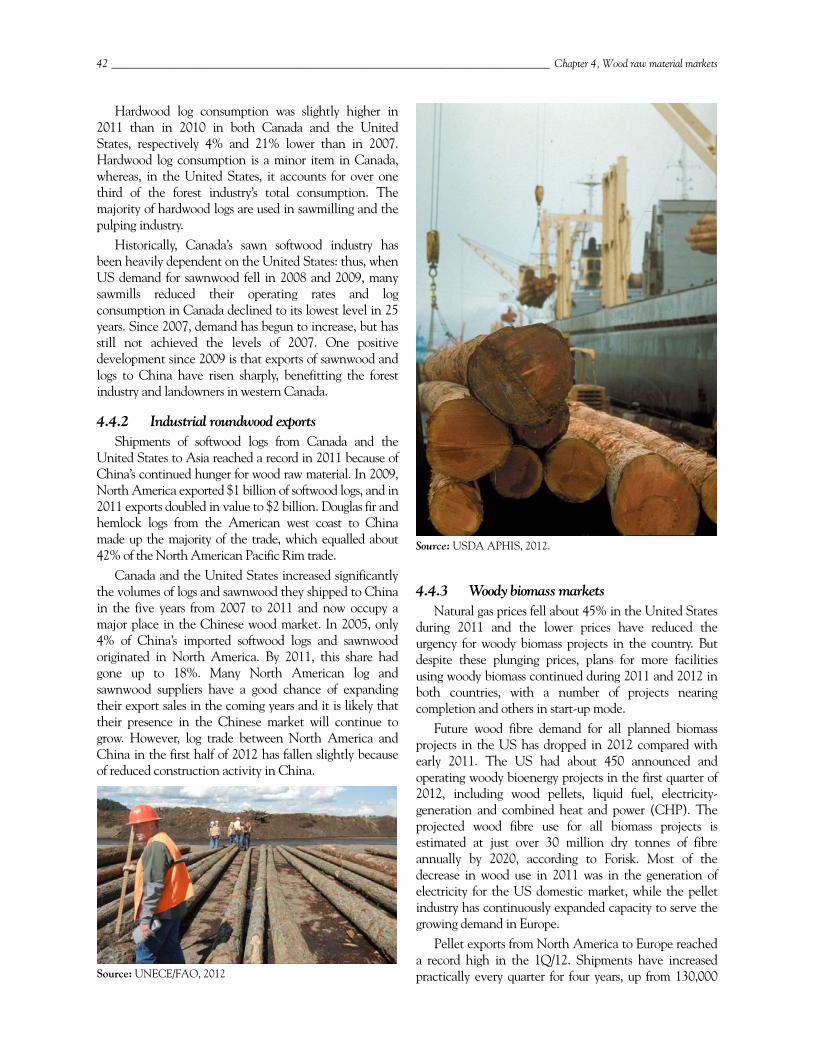
42 ________________________________________________________________________________ Chapter 4, Wood raw material markets
Hardwood log consumption was slightly higher in 2011 than in 2010 in both Canada and the United States, respectively 4% and 21% lower than in 2007. Hardwood log consumption is a minor item in Canada, whereas, in the United States, it accounts for over one third of the forest industry’s total consumption. The majority of hardwood logs are used in sawmilling and the pulping industry.
Historically, Canada’s sawn softwood industry has been heavily dependent on the United States: thus, when US demand for sawnwood fell in 2008 and 2009, many sawmills reduced their operating rates and log consumption in Canada declined to its lowest level in 25 years. Since 2007, demand has begun to increase, but has still not achieved the levels of 2007. One positive development since 2009 is that exports of sawnwood and logs to China have risen sharply, benefitting the forest industry and landowners in western Canada.
4.4.2 Industrial roundwood exports Shipments of softwood logs from Canada and the
United States to Asia reached a record in 2011 because of China’s continued hunger for wood raw material. In 2009, North America exported $1 billion of softwood logs, and in 2011 exports doubled in value to $2 billion. Douglas fir and hemlock logs from the American west coast to China made up the majority of the trade, which equalled about 42% of the North American Pacific Rim trade.
Canada and the United States increased significantly the volumes of logs and sawnwood they shipped to China in the five years from 2007 to 2011 and now occupy a major place in the Chinese wood market. In 2005, only 4% of China’s imported softwood logs and sawnwood originated in North America. By 2011, this share had gone up to 18%. Many North American log and sawnwood suppliers have a good chance of expanding their export sales in the coming years and it is likely that their presence in the Chinese market will continue to grow. However, log trade between North America and China in the first half of 2012 has fallen slightly because of reduced construction activity in China.
Source: UNECE/FAO, 2012
Source: USDA APHIS, 2012.
4.4.3 Woody biomass markets Natural gas prices fell about 45% in the United States
during 2011 and the lower prices have reduced the urgency for woody biomass projects in the country. But despite these plunging prices, plans for more facilities using woody biomass continued during 2011 and 2012 in both countries, with a number of projects nearing completion and others in start-up mode.
Future wood fibre demand for all planned biomass projects in the US has dropped in 2012 compared with early 2011. The US had about 450 announced and operating woody bioenergy projects in the first quarter of 2012, including wood pellets, liquid fuel, electricity-generation and combined heat and power (CHP). The projected wood fibre use for all biomass projects is estimated at just over 30 million dry tonnes of fibre annually by 2020, according to Forisk. Most of the decrease in wood use in 2011 was in the generation of electricity for the US domestic market, while the pellet industry has continuously expanded capacity to serve the growing demand in Europe.
Pellet exports from North America to Europe reached a record high in the 1Q/12. Shipments have increased practically every quarter for four years, up from 130,000
UNECE/FAO Forest Products Annual Market Review, 2011-2012 __________________________________________________________ 43
tons in the 1Q/08 to almost 670,000 tons in the 1Q/12, according to the North American Wood Fiber Review (Wood Resources International, LLC. 2012a).
In 2011, pellet shipments from North America reached almost two million tonnes, up almost 300% from 2008. The majority of North American pellets were shipped to the Netherlands, the United Kingdom and Belgium, with occasional shipments to Sweden, Denmark and Italy. In 2011, almost 35% of the Atlantic trade was destined for the United Kingdom, while 30% landed in the Netherlands.
Pellet producers in British Columbia had been the major exporters since the first shipments 14 years ago. This changed in early 2012, when investments in new capacity expanded in the US South and US overseas shipments were slightly higher than Canadian shipments.
Prices for woody biomass in the US, whether sawmill co-products, forest residues or urban wood waste, have been sliding for most of the past three years but were still higher in the 4Q/11 in most regions than they had been five years earlier, according to the North American Wood Fibre Review. The price drop in 2010 and 2011 was mainly the result of lower prices for fossil fuels, particularly natural gas, and reduced demand for energy. This declining price trend has reduced both commercial and residential energy consumers’ interest in switching to more expensive green energy (see the wood energy chapter, section 9.2.3.1).
4.5 Wood raw material costs Prices for softwood sawlogs fell in virtually all major
markets worldwide in late 2011 and early 2012, as reported in the Wood Resource Quarterly, both in local currencies as well as in US dollars. This resulted in the third consecutive quarterly decline of the Global Sawlog Price Index (GSPI) to $85.90/m3 in the 1Q/12. The Index was down 3.0% from late 2011, and almost 9% lower than the all-time high in the first quarter of 2011. Before the recent decline, the Index had gone up continuously since early 2009 (graph 4.5.1).
Lower demand for sawnwood in many markets in Europe and reduced log imports by China were two major factors that pushed softwood log prices down in early 2012. In US dollar terms, prices fell most in the Nordic countries, coastal British Columbia (BC), Poland, Germany and Austria.
GRAPH 4.5.1
Global softwood sawlog price index, 2002-2012
Note: Price index based on delivered sawlog prices in 19 key regions worldwide. Sources: Wood Resource Quarterly, Wood Resources International LLC, 2012.
Source: UNECE/FAO, 2012.
The slowdown in Chinese sawnwood and log demand affected sawlog prices for western hemlock (Tsuga heterophylla) sawlogs on the BC coast during the winter months, when they dropped 17% from the 3Q/11 to the 1Q/12. Prior to the recent slide, there was an almost 50% increase in log prices between 2009 and 2011. In the interior of the province, where most of the province‘s sawmills are located, log prices have been less affected by log exports but more by log supply and sawnwood sales to China (graph 4.5.2).
80
100
120
140
160
180
Inde
x (1
Q/2
002=
100)
44 ________________________________________________________________________________ Chapter 4, Wood raw material markets
GRAPH 4.5.2
Softwood sawlog price indices in North America, 2007-2012
Note: Indices are based on delivered log price per m3 in local currency. Sources: Wood Resource Quarterly, Wood Resources International LLC, 2012.
In many European countries, sawlog prices also fell during the winter months 2011/2012 (graph 4.5.3). This was predominantly the result of reduced domestic demand for sawnwood, slowing markets in the Middle East and North Africa, and uncertainty over the short-term financial health of the European Union.
Although sawlog prices fell in most of Europe’s large sawnwood-producing countries in late 2011, they were still higher in 2011 than in 2009 and 2010. Many of the continent’s sawmills were paying close to the highest sawlog prices seen in at least 17 years during 2011, and this at a time when sawnwood prices were far from any record highs, and in some markets were even declining. The high wood raw material costs and declining wood product prices forced many sawmills throughout Europe to reduce their operating rates during the second half of 2011 and into 2012.
In Northwest Russia, sawlog prices fell in the second and third quarter of 2011 because sawmills in the region had cut back production levels mainly as a result of reduced domestic demand for sawnwood. During the second half of 2011 and into 2012, sawnwood exports also started to decline and many export-oriented sawmills reduced production.
Increased harvesting activity over the summer months also contributed to lower log costs in late 2011. Despite the decline in prices in the second half of the year, sawlog costs in 2011 were still at the highest levels since the all-time highs in 2007-2008.
GRAPH 4.5.3
Softwood sawlog price indices in Europe and the Russian Federation, 2007-2012
Note: Indices are based on delivered log price per m3 in local currency. Sources: Wood Resource Quarterly, Wood Resources International LLC, 2012.
4.5.1 Pulpwood prices In 2012, the global pulp market has been mired in
uncertainty: uncertainty when China will move into buying mode, uncertainty about where the European economy is heading and uncertainty if low spot prices for softwood market pulp will push pulp mills in Europe and North America to take market-related downtime.
In this environment, mills have been trying to squeeze their costs to remain competitive and to be able to run at full capacity. Wood fibre costs account for 50% - 70 % of total production costs depending on the region of the world (Fisher International, 2012), leading mills to focus cost-cutting on reducing the price they pay for wood chip and pulpwood prices in 2012.
This has created a situation in which many wood fibre suppliers to the pulp industry have been forced to accept lower prices for their chips and logs. As a result, wood fibre prices were falling throughout the world in late 2011 and early 2012, according to the Wood Resource Quarterly (Wood Resources International, LCC, 2012b).
This caused the two global wood fibre price indices to decline to their lowest levels in over a year. The Hardwood Wood Fibre Price Index (HFPI) experienced the biggest decline, falling by 7% from its all-time high in the 3Q/11 to $109.67 per oven-dry metric tonne (odmt) in the first quarter of 2012. Wood costs were down most in Europe and Japan. Also in the first quarter of 2012, the price premium for hardwood fibre over softwood fibre was the lowest since early 2011.
60
70
80
90
100
110
120
Inde
x (1
Q/2
007=
100)
US south US west
Canada west Canada east
70
80
90
100
110
120
130
140
Inde
x (1
Q/2
007=
100)
Sweden GermanyRussian Federation PolandFrance
UNECE/FAO Forest Products Annual Market Review, 2011-2012 __________________________________________________________ 45
GRAPH 4.5.4
Global wood fibre price indices 1988-2012
Notes: SFPI = Softwood Wood Fibre Price Index, HFPI = Hardwood Wood Fibre Price Index. Prices are based on delivered log price per oven-dry metric tonne in US dollars. Sources: Wood Resource Quarterly, Wood Resources International LLC, 2012.
The Softwood Wood Fibre Price Index (SFPI) also declined in the second half of 2011 and into the first quarter of 2012, but by a more modest 4%, from $108.90/odmt in the 3Q/11 to $104.88/odmt in the 1Q/12. Softwood fibre price trends have been mixed, with price increases in Oceania, Chile and the US South, but decreases in Europe, western Canada and Japan (graph 4.5.4).
According to the North American Wood Fibre Review (Wood Resources International, LCC, 2012a), softwood chip prices in western Canada fell 25% from late 2011 to early 2012. In the 2Q/12, prices were 18% lower than in the latter part of 2011, when prices were at a 16-year high. This reduction was mainly the result of lower pulp prices, but also because of ample supply of co-product wood chips in the region.
In many European countries, pulplog and wood chip prices reached almost record heights in early 2011 when global pulp markets were buoyant (graphs 4.5.5 and 4.5.6). Market prices fell in late 2011, causing a fall in wood fibre prices in the spring of 2012 down to levels last seen in 2010.
Weaker pulp markets caused many pulp mills in France and Germany to reduce operating rates, resulting in lower demand for pulplogs in winter 2011/2012. This not only interrupted the almost two-year trend of price increases, but also actually contributed to a fall in prices, back to levels previously seen in summer 2011. With the euro weakening against the US dollar, wood prices in dollar terms have declined even more dramatically than in local currencies.
Source: UNECE/FAO, 2012.
In Northern Europe, pulplog prices in early 2012 were lower by 11%-15% from the first quarter of 2011, depending on country and species (graph 4.5.5). It has been difficult to be a forest owner in Sweden in 2011/2012, as prices have declined for both sawlogs and pulplogs. In parts of Sweden, it is not likely that pulplog prices will decline much further as they are now reaching the same levels as energy logs.
Eucalyptus log prices in Spain have been on a steady decline for almost a year now and in 2012 the major fibre consumers have lowered the price they pay to landowners practically every month. In US-dollar terms, the average cost for Eucalyptus log has fallen 21% since its all-time high in the second quarter of 2011.
Despite the recent decline in pulpwood and wood chip price, pulp mills in Europe still have higher wood costs than many of their competitors around the world.
GRAPH 4.5.5
Softwood pulplog price indices in Europe and North America, 2007-2012
Note: Indices are based on delivered log price per oven-dry metric tonne in local currency. Sources: Wood Resource Quarterly, Wood Resources International LLC, 2012.
60
70
80
90
100
110
120
$ pe
r ove
n-dr
y to
nne
SFPI HFPI
60
70
80
90
100
110
120
130
140
Inde
x (1
Q/2
007=
100)
Finland GermanyUS south Russian Federation
46 ________________________________________________________________________________ Chapter 4, Wood raw material markets
GRAPH 4.5.6
Softwood wood chip price indices in Europe and North America, 2007-2012
Note: Indices are based on delivered wood chip price per oven-dry metric tons in local currency. Sources: Wood Resource Quarterly, Wood Resources International LLC, 2012.
4.6 References Note: The Review has a statistical annex, which is available at: www.unece.org/fpamr2012
CEPI, 2012. Available at: www.cepi.org Fisher International, 2012. Available at: www.fisheri.com Forisk, 2012. Available at: www.forisk.com UNECE/FAO TIMBER Database. 2012. Available at:
www.unece.org/trade/timber Wood Resources International, LLC. 2012a. North
American Wood Fiber Review. Available at: www.woodprices.com
Wood Resources International, LLC . 2012b. Wood Resource Quarterly. Available at: www.woodprices.com
70
80
90
100
110
120
130
Inde
x (2
007=
100)
US south Canada west
Sweden Germany
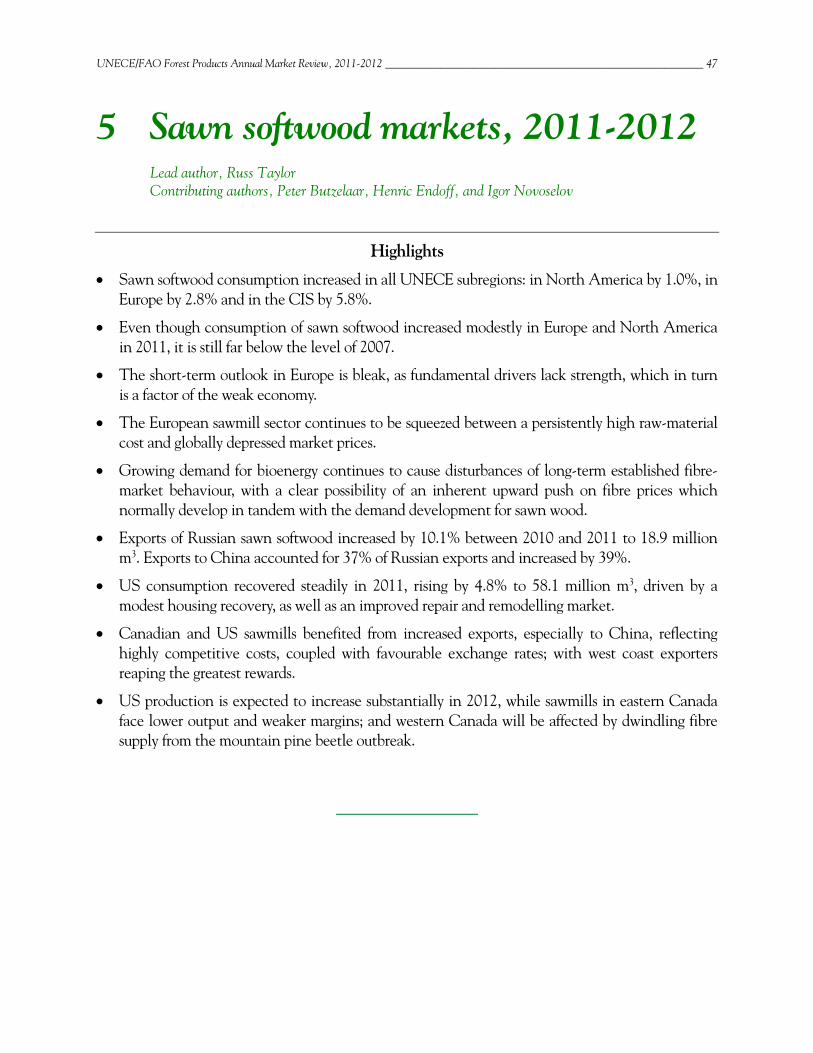
UNECE/FAO Forest Products Annual Market Review, 2011-2012 __________________________________________________________ 47
5 Sawn softwood markets, 2011-2012 Lead author, Russ Taylor Contributing authors, Peter Butzelaar, Henric Endoff, and Igor Novoselov
Highlights
Sawn softwood consumption increased in all UNECE subregions: in North America by 1.0%, in Europe by 2.8% and in the CIS by 5.8%.
Even though consumption of sawn softwood increased modestly in Europe and North America in 2011, it is still far below the level of 2007.
The short-term outlook in Europe is bleak, as fundamental drivers lack strength, which in turn is a factor of the weak economy.
The European sawmill sector continues to be squeezed between a persistently high raw-material cost and globally depressed market prices.
Growing demand for bioenergy continues to cause disturbances of long-term established fibre-market behaviour, with a clear possibility of an inherent upward push on fibre prices which normally develop in tandem with the demand development for sawn wood.
Exports of Russian sawn softwood increased by 10.1% between 2010 and 2011 to 18.9 million m3. Exports to China accounted for 37% of Russian exports and increased by 39%.
US consumption recovered steadily in 2011, rising by 4.8% to 58.1 million m3, driven by a modest housing recovery, as well as an improved repair and remodelling market.
Canadian and US sawmills benefited from increased exports, especially to China, reflecting highly competitive costs, coupled with favourable exchange rates; with west coast exporters reaping the greatest rewards.
US production is expected to increase substantially in 2012, while sawmills in eastern Canada face lower output and weaker margins; and western Canada will be affected by dwindling fibre supply from the mountain pine beetle outbreak.
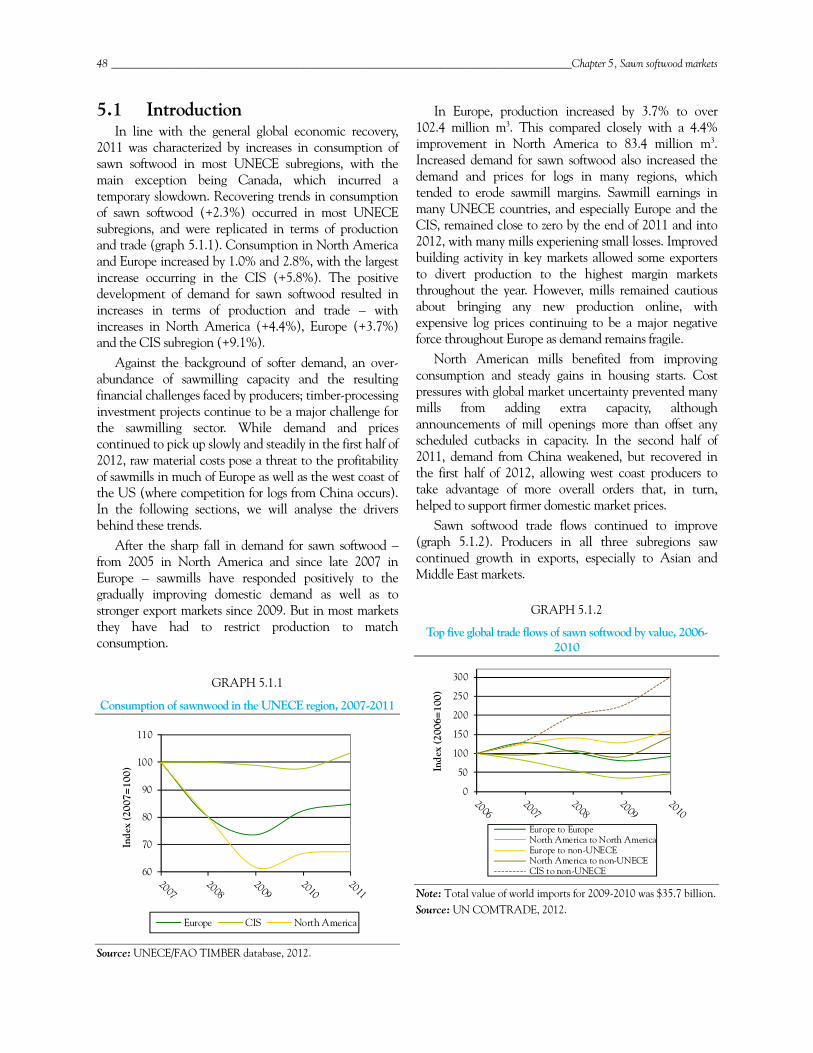
48 ____________________________________________________________________________________ Chapter 5, Sawn softwood markets
5.1 Introduction In line with the general global economic recovery,
2011 was characterized by increases in consumption of sawn softwood in most UNECE subregions, with the main exception being Canada, which incurred a temporary slowdown. Recovering trends in consumption of sawn softwood (+2.3%) occurred in most UNECE subregions, and were replicated in terms of production and trade (graph 5.1.1). Consumption in North America and Europe increased by 1.0% and 2.8%, with the largest increase occurring in the CIS (+5.8%). The positive development of demand for sawn softwood resulted in increases in terms of production and trade – with increases in North America (+4.4%), Europe (+3.7%) and the CIS subregion (+9.1%).
Against the background of softer demand, an over-abundance of sawmilling capacity and the resulting financial challenges faced by producers; timber-processing investment projects continue to be a major challenge for the sawmilling sector. While demand and prices continued to pick up slowly and steadily in the first half of 2012, raw material costs pose a threat to the profitability of sawmills in much of Europe as well as the west coast of the US (where competition for logs from China occurs). In the following sections, we will analyse the drivers behind these trends.
After the sharp fall in demand for sawn softwood – from 2005 in North America and since late 2007 in Europe – sawmills have responded positively to the gradually improving domestic demand as well as to stronger export markets since 2009. But in most markets they have had to restrict production to match consumption.
GRAPH 5.1.1
Consumption of sawnwood in the UNECE region, 2007-2011
Source: UNECE/FAO TIMBER database, 2012.
In Europe, production increased by 3.7% to over 102.4 million m3. This compared closely with a 4.4% improvement in North America to 83.4 million m3. Increased demand for sawn softwood also increased the demand and prices for logs in many regions, which tended to erode sawmill margins. Sawmill earnings in many UNECE countries, and especially Europe and the CIS, remained close to zero by the end of 2011 and into 2012, with many mills experiening small losses. Improved building activity in key markets allowed some exporters to divert production to the highest margin markets throughout the year. However, mills remained cautious about bringing any new production online, with expensive log prices continuing to be a major negative force throughout Europe as demand remains fragile.
North American mills benefited from improving consumption and steady gains in housing starts. Cost pressures with global market uncertainty prevented many mills from adding extra capacity, although announcements of mill openings more than offset any scheduled cutbacks in capacity. In the second half of 2011, demand from China weakened, but recovered in the first half of 2012, allowing west coast producers to take advantage of more overall orders that, in turn, helped to support firmer domestic market prices.
Sawn softwood trade flows continued to improve (graph 5.1.2). Producers in all three subregions saw continued growth in exports, especially to Asian and Middle East markets.
GRAPH 5.1.2
Top five global trade flows of sawn softwood by value, 2006-2010
Note: Total value of world imports for 2009-2010 was $35.7 billion. Source: UN COMTRADE, 2012.
60
70
80
90
100
110
Inde
x (2
007=
100)
Europe CIS North America
0
50
100
150
200
250
300
Inde
x (2
006=
100)
Europe to EuropeNorth America to North AmericaEurope to non-UNECENorth America to non-UNECECIS to non-UNECE
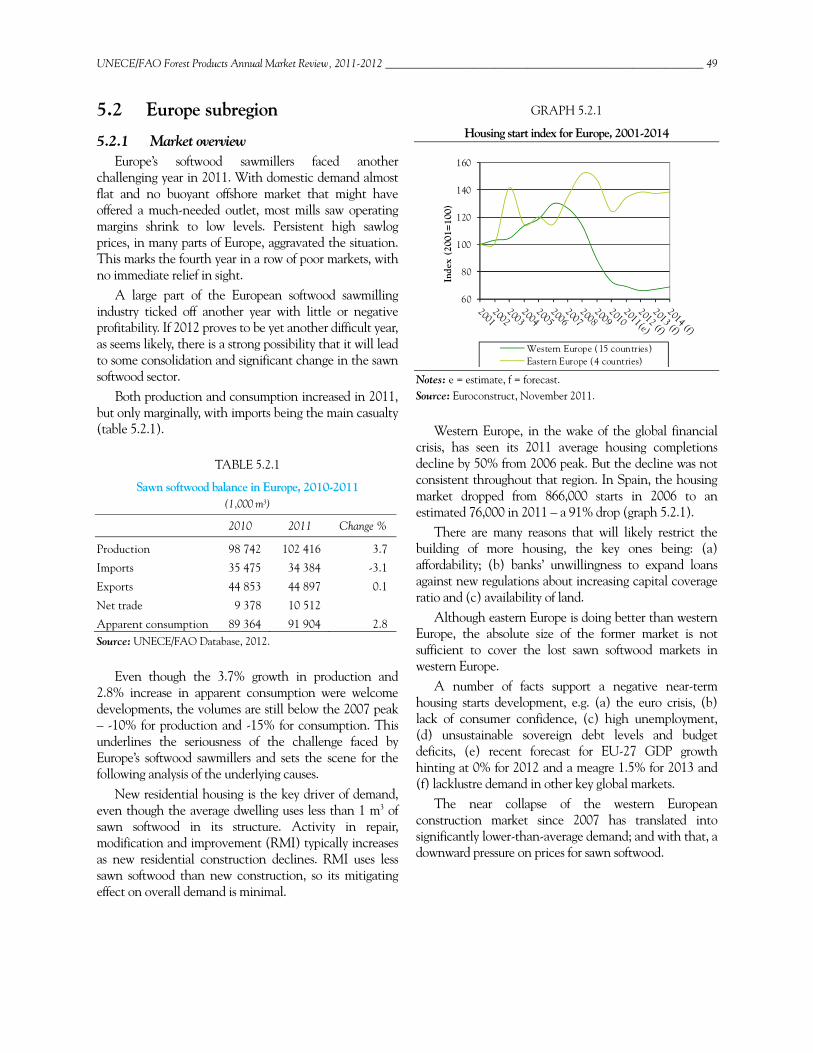
UNECE/FAO Forest Products Annual Market Review, 2011-2012 __________________________________________________________ 49
5.2 Europe subregion
5.2.1 Market overview Europe’s softwood sawmillers faced another
challenging year in 2011. With domestic demand almost flat and no buoyant offshore market that might have offered a much-needed outlet, most mills saw operating margins shrink to low levels. Persistent high sawlog prices, in many parts of Europe, aggravated the situation. This marks the fourth year in a row of poor markets, with no immediate relief in sight.
A large part of the European softwood sawmilling industry ticked off another year with little or negative profitability. If 2012 proves to be yet another difficult year, as seems likely, there is a strong possibility that it will lead to some consolidation and significant change in the sawn softwood sector.
Both production and consumption increased in 2011, but only marginally, with imports being the main casualty (table 5.2.1).
TABLE 5.2.1
Sawn softwood balance in Europe, 2010-2011 (1,000 m3)
2010 2011 Change %
Production 98 742 102 416 3.7
Imports 35 475 34 384 -3.1
Exports 44 853 44 897 0.1
Net trade 9 378 10 512
Apparent consumption 89 364 91 904 2.8 Source: UNECE/FAO Database, 2012.
Even though the 3.7% growth in production and 2.8% increase in apparent consumption were welcome developments, the volumes are still below the 2007 peak – -10% for production and -15% for consumption. This underlines the seriousness of the challenge faced by Europe’s softwood sawmillers and sets the scene for the following analysis of the underlying causes.
New residential housing is the key driver of demand, even though the average dwelling uses less than 1 m3 of sawn softwood in its structure. Activity in repair, modification and improvement (RMI) typically increases as new residential construction declines. RMI uses less sawn softwood than new construction, so its mitigating effect on overall demand is minimal.
GRAPH 5.2.1
Housing start index for Europe, 2001-2014
Notes: e = estimate, f = forecast. Source: Euroconstruct, November 2011.
Western Europe, in the wake of the global financial crisis, has seen its 2011 average housing completions decline by 50% from 2006 peak. But the decline was not consistent throughout that region. In Spain, the housing market dropped from 866,000 starts in 2006 to an estimated 76,000 in 2011 – a 91% drop (graph 5.2.1).
There are many reasons that will likely restrict the building of more housing, the key ones being: (a) affordability; (b) banks’ unwillingness to expand loans against new regulations about increasing capital coverage ratio and (c) availability of land.
Although eastern Europe is doing better than western Europe, the absolute size of the former market is not sufficient to cover the lost sawn softwood markets in western Europe.
A number of facts support a negative near-term housing starts development, e.g. (a) the euro crisis, (b) lack of consumer confidence, (c) high unemployment, (d) unsustainable sovereign debt levels and budget deficits, (e) recent forecast for EU-27 GDP growth hinting at 0% for 2012 and a meagre 1.5% for 2013 and (f) lacklustre demand in other key global markets.
The near collapse of the western European construction market since 2007 has translated into significantly lower-than-average demand; and with that, a downward pressure on prices for sawn softwood.
60
80
100
120
140
160
Inde
x (2
001=
100)
Western Europe (15 countries)Eastern Europe (4 countries)
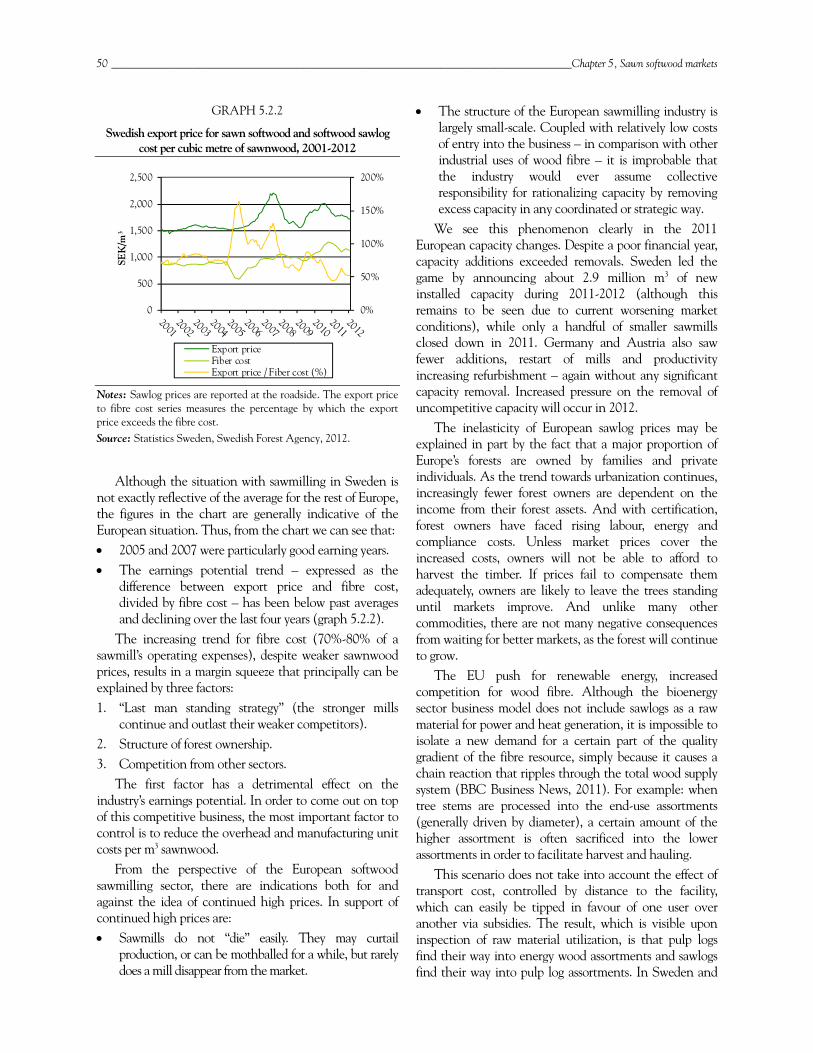
50 ____________________________________________________________________________________ Chapter 5, Sawn softwood markets
GRAPH 5.2.2
Swedish export price for sawn softwood and softwood sawlog cost per cubic metre of sawnwood, 2001-2012
Notes: Sawlog prices are reported at the roadside. The export price to fibre cost series measures the percentage by which the export price exceeds the fibre cost. Source: Statistics Sweden, Swedish Forest Agency, 2012.
Although the situation with sawmilling in Sweden is
not exactly reflective of the average for the rest of Europe, the figures in the chart are generally indicative of the European situation. Thus, from the chart we can see that: 2005 and 2007 were particularly good earning years. The earnings potential trend – expressed as the
difference between export price and fibre cost, divided by fibre cost – has been below past averages and declining over the last four years (graph 5.2.2).
The increasing trend for fibre cost (70%-80% of a sawmill’s operating expenses), despite weaker sawnwood prices, results in a margin squeeze that principally can be explained by three factors: 1. “Last man standing strategy” (the stronger mills
continue and outlast their weaker competitors). 2. Structure of forest ownership. 3. Competition from other sectors.
The first factor has a detrimental effect on the industry’s earnings potential. In order to come out on top of this competitive business, the most important factor to control is to reduce the overhead and manufacturing unit costs per m3 sawnwood.
From the perspective of the European softwood sawmilling sector, there are indications both for and against the idea of continued high prices. In support of continued high prices are: Sawmills do not “die” easily. They may curtail
production, or can be mothballed for a while, but rarely does a mill disappear from the market.
The structure of the European sawmilling industry is largely small-scale. Coupled with relatively low costs of entry into the business – in comparison with other industrial uses of wood fibre – it is improbable that the industry would ever assume collective responsibility for rationalizing capacity by removing excess capacity in any coordinated or strategic way.
We see this phenomenon clearly in the 2011 European capacity changes. Despite a poor financial year, capacity additions exceeded removals. Sweden led the game by announcing about 2.9 million m3 of new installed capacity during 2011-2012 (although this remains to be seen due to current worsening market conditions), while only a handful of smaller sawmills closed down in 2011. Germany and Austria also saw fewer additions, restart of mills and productivity increasing refurbishment – again without any significant capacity removal. Increased pressure on the removal of uncompetitive capacity will occur in 2012.
The inelasticity of European sawlog prices may be explained in part by the fact that a major proportion of Europe’s forests are owned by families and private individuals. As the trend towards urbanization continues, increasingly fewer forest owners are dependent on the income from their forest assets. And with certification, forest owners have faced rising labour, energy and compliance costs. Unless market prices cover the increased costs, owners will not be able to afford to harvest the timber. If prices fail to compensate them adequately, owners are likely to leave the trees standing until markets improve. And unlike many other commodities, there are not many negative consequences from waiting for better markets, as the forest will continue to grow.
The EU push for renewable energy, increased competition for wood fibre. Although the bioenergy sector business model does not include sawlogs as a raw material for power and heat generation, it is impossible to isolate a new demand for a certain part of the quality gradient of the fibre resource, simply because it causes a chain reaction that ripples through the total wood supply system (BBC Business News, 2011). For example: when tree stems are processed into the end-use assortments (generally driven by diameter), a certain amount of the higher assortment is often sacrificed into the lower assortments in order to facilitate harvest and hauling.
This scenario does not take into account the effect of transport cost, controlled by distance to the facility, which can easily be tipped in favour of one user over another via subsidies. The result, which is visible upon inspection of raw material utilization, is that pulp logs find their way into energy wood assortments and sawlogs find their way into pulp log assortments. In Sweden and
0%
50%
100%
150%
200%
0
500
1,000
1,500
2,000
2,500
SEK
/m3
Export priceFiber costExport price / Fiber cost (%)
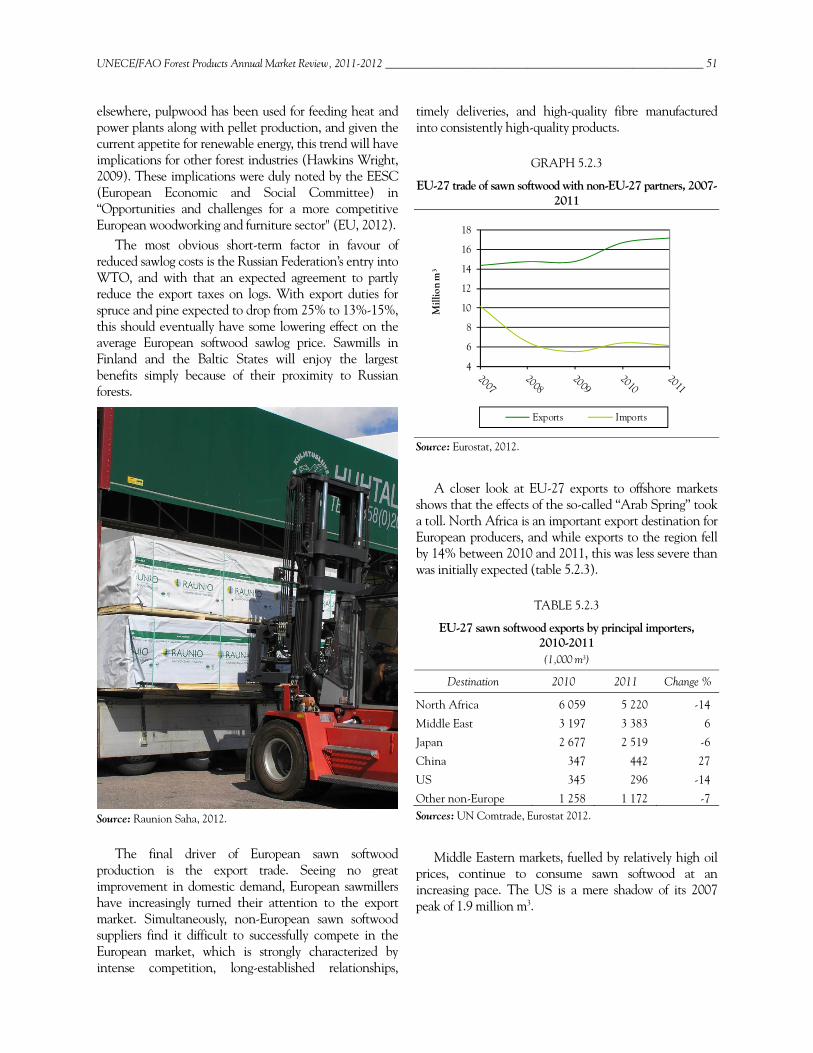
UNECE/FAO Forest Products Annual Market Review, 2011-2012 __________________________________________________________ 51
elsewhere, pulpwood has been used for feeding heat and power plants along with pellet production, and given the current appetite for renewable energy, this trend will have implications for other forest industries (Hawkins Wright, 2009). These implications were duly noted by the EESC (European Economic and Social Committee) in “Opportunities and challenges for a more competitive European woodworking and furniture sector" (EU, 2012).
The most obvious short-term factor in favour of reduced sawlog costs is the Russian Federation’s entry into WTO, and with that an expected agreement to partly reduce the export taxes on logs. With export duties for spruce and pine expected to drop from 25% to 13%-15%, this should eventually have some lowering effect on the average European softwood sawlog price. Sawmills in Finland and the Baltic States will enjoy the largest benefits simply because of their proximity to Russian forests.
Source: Raunion Saha, 2012.
The final driver of European sawn softwood production is the export trade. Seeing no great improvement in domestic demand, European sawmillers have increasingly turned their attention to the export market. Simultaneously, non-European sawn softwood suppliers find it difficult to successfully compete in the European market, which is strongly characterized by intense competition, long-established relationships,
timely deliveries, and high-quality fibre manufactured into consistently high-quality products.
GRAPH 5.2.3
EU-27 trade of sawn softwood with non-EU-27 partners, 2007-2011
Source: Eurostat, 2012.
A closer look at EU-27 exports to offshore markets shows that the effects of the so-called “Arab Spring” took a toll. North Africa is an important export destination for European producers, and while exports to the region fell by 14% between 2010 and 2011, this was less severe than was initially expected (table 5.2.3).
TABLE 5.2.3
EU-27 sawn softwood exports by principal importers, 2010-2011 (1,000 m3)
Destination 2010 2011 Change %
North Africa 6 059 5 220 -14
Middle East 3 197 3 383 6
Japan 2 677 2 519 -6
China 347 442 27
US 345 296 -14
Other non-Europe 1 258 1 172 -7 Sources: UN Comtrade, Eurostat 2012.
Middle Eastern markets, fuelled by relatively high oil prices, continue to consume sawn softwood at an increasing pace. The US is a mere shadow of its 2007 peak of 1.9 million m3.
4
6
8
10
12
14
16
18
Mill
ion
m3
Exports Imports
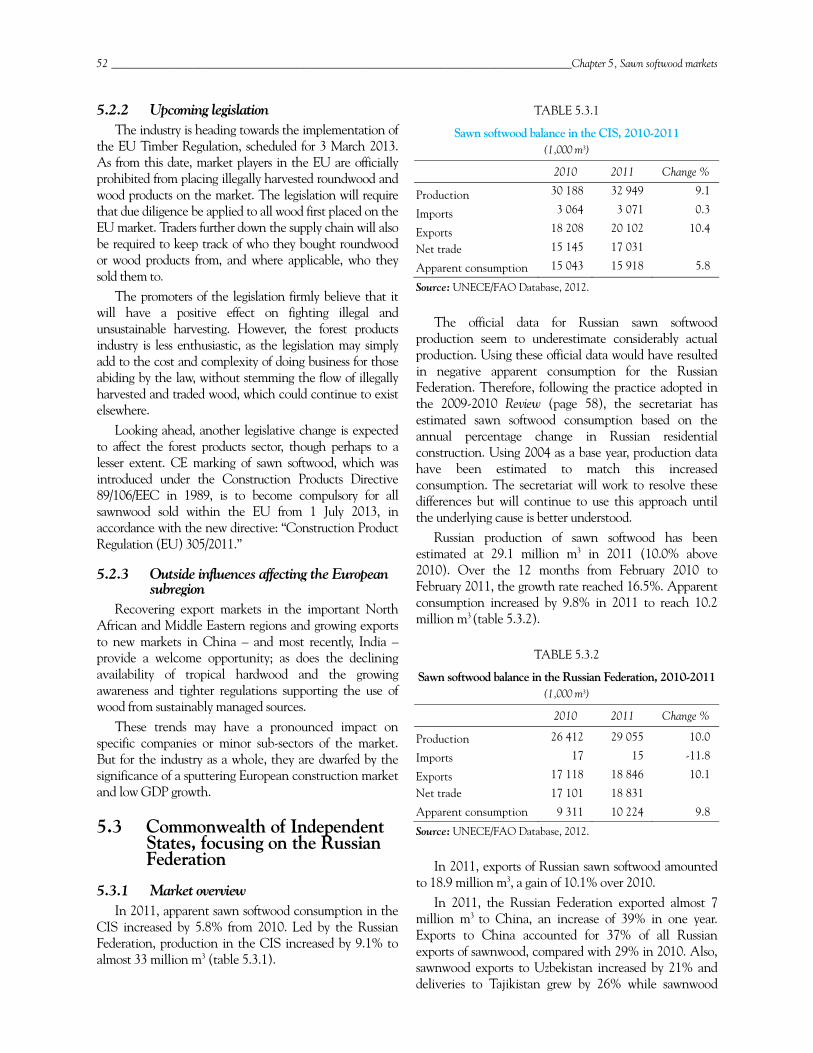
52 ____________________________________________________________________________________ Chapter 5, Sawn softwood markets
5.2.2 Upcoming legislation The industry is heading towards the implementation of
the EU Timber Regulation, scheduled for 3 March 2013. As from this date, market players in the EU are officially prohibited from placing illegally harvested roundwood and wood products on the market. The legislation will require that due diligence be applied to all wood first placed on the EU market. Traders further down the supply chain will also be required to keep track of who they bought roundwood or wood products from, and where applicable, who they sold them to.
The promoters of the legislation firmly believe that it will have a positive effect on fighting illegal and unsustainable harvesting. However, the forest products industry is less enthusiastic, as the legislation may simply add to the cost and complexity of doing business for those abiding by the law, without stemming the flow of illegally harvested and traded wood, which could continue to exist elsewhere.
Looking ahead, another legislative change is expected to affect the forest products sector, though perhaps to a lesser extent. CE marking of sawn softwood, which was introduced under the Construction Products Directive 89/106/EEC in 1989, is to become compulsory for all sawnwood sold within the EU from 1 July 2013, in accordance with the new directive: “Construction Product Regulation (EU) 305/2011.”
5.2.3 Outside influences affecting the European subregion
Recovering export markets in the important North African and Middle Eastern regions and growing exports to new markets in China – and most recently, India – provide a welcome opportunity; as does the declining availability of tropical hardwood and the growing awareness and tighter regulations supporting the use of wood from sustainably managed sources.
These trends may have a pronounced impact on specific companies or minor sub-sectors of the market. But for the industry as a whole, they are dwarfed by the significance of a sputtering European construction market and low GDP growth.
5.3 Commonwealth of Independent States, focusing on the Russian Federation
5.3.1 Market overview In 2011, apparent sawn softwood consumption in the
CIS increased by 5.8% from 2010. Led by the Russian Federation, production in the CIS increased by 9.1% to almost 33 million m3 (table 5.3.1).
TABLE 5.3.1
Sawn softwood balance in the CIS, 2010-2011 (1,000 m3)
2010 2011 Change %
Production 30 188 32 949 9.1
Imports 3 064 3 071 0.3
Exports 18 208 20 102 10.4
Net trade 15 145 17 031
Apparent consumption 15 043 15 918 5.8
Source: UNECE/FAO Database, 2012.
The official data for Russian sawn softwood production seem to underestimate considerably actual production. Using these official data would have resulted in negative apparent consumption for the Russian Federation. Therefore, following the practice adopted in the 2009-2010 Review (page 58), the secretariat has estimated sawn softwood consumption based on the annual percentage change in Russian residential construction. Using 2004 as a base year, production data have been estimated to match this increased consumption. The secretariat will work to resolve these differences but will continue to use this approach until the underlying cause is better understood.
Russian production of sawn softwood has been estimated at 29.1 million m3 in 2011 (10.0% above 2010). Over the 12 months from February 2010 to February 2011, the growth rate reached 16.5%. Apparent consumption increased by 9.8% in 2011 to reach 10.2 million m3 (table 5.3.2).
TABLE 5.3.2
Sawn softwood balance in the Russian Federation, 2010-2011 (1,000 m3)
2010 2011 Change %
Production 26 412 29 055 10.0
Imports 17 15 -11.8
Exports 17 118 18 846 10.1
Net trade 17 101 18 831
Apparent consumption 9 311 10 224 9.8
Source: UNECE/FAO Database, 2012.
In 2011, exports of Russian sawn softwood amounted to 18.9 million m3, a gain of 10.1% over 2010.
In 2011, the Russian Federation exported almost 7 million m3 to China, an increase of 39% in one year. Exports to China accounted for 37% of all Russian exports of sawnwood, compared with 29% in 2010. Also, sawnwood exports to Uzbekistan increased by 21% and deliveries to Tajikistan grew by 26% while sawnwood
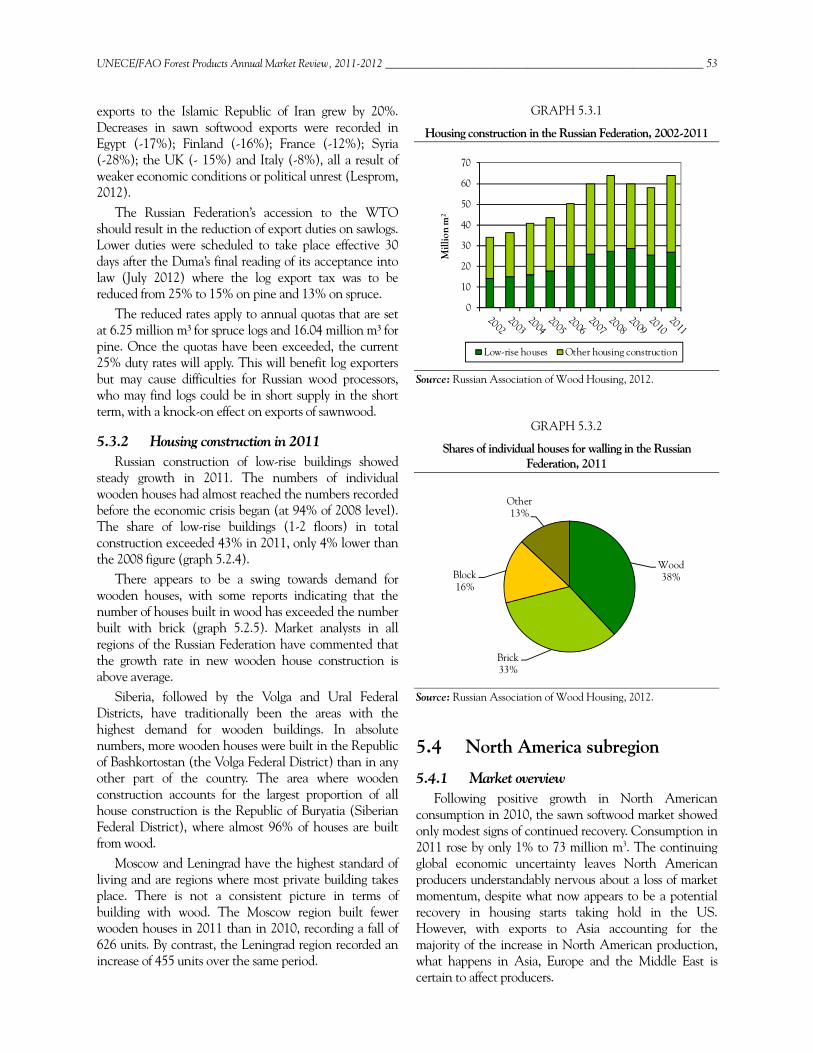
UNECE/FAO Forest Products Annual Market Review, 2011-2012 __________________________________________________________ 53
exports to the Islamic Republic of Iran grew by 20%. Decreases in sawn softwood exports were recorded in Egypt (-17%); Finland (-16%); France (-12%); Syria (-28%); the UK (- 15%) and Italy (-8%), all a result of weaker economic conditions or political unrest (Lesprom, 2012).
The Russian Federation’s accession to the WTO should result in the reduction of export duties on sawlogs. Lower duties were scheduled to take place effective 30 days after the Duma’s final reading of its acceptance into law (July 2012) where the log export tax was to be reduced from 25% to 15% on pine and 13% on spruce.
The reduced rates apply to annual quotas that are set at 6.25 million m3 for spruce logs and 16.04 million m3 for pine. Once the quotas have been exceeded, the current 25% duty rates will apply. This will benefit log exporters but may cause difficulties for Russian wood processors, who may find logs could be in short supply in the short term, with a knock-on effect on exports of sawnwood.
5.3.2 Housing construction in 2011 Russian construction of low-rise buildings showed
steady growth in 2011. The numbers of individual wooden houses had almost reached the numbers recorded before the economic crisis began (at 94% of 2008 level). The share of low-rise buildings (1-2 floors) in total construction exceeded 43% in 2011, only 4% lower than the 2008 figure (graph 5.2.4).
There appears to be a swing towards demand for wooden houses, with some reports indicating that the number of houses built in wood has exceeded the number built with brick (graph 5.2.5). Market analysts in all regions of the Russian Federation have commented that the growth rate in new wooden house construction is above average.
Siberia, followed by the Volga and Ural Federal Districts, have traditionally been the areas with the highest demand for wooden buildings. In absolute numbers, more wooden houses were built in the Republic of Bashkortostan (the Volga Federal District) than in any other part of the country. The area where wooden construction accounts for the largest proportion of all house construction is the Republic of Buryatia (Siberian Federal District), where almost 96% of houses are built from wood.
Moscow and Leningrad have the highest standard of living and are regions where most private building takes place. There is not a consistent picture in terms of building with wood. The Moscow region built fewer wooden houses in 2011 than in 2010, recording a fall of 626 units. By contrast, the Leningrad region recorded an increase of 455 units over the same period.
GRAPH 5.3.1
Housing construction in the Russian Federation, 2002-2011
Source: Russian Association of Wood Housing, 2012.
GRAPH 5.3.2
Shares of individual houses for walling in the Russian Federation, 2011
Source: Russian Association of Wood Housing, 2012.
5.4 North America subregion
5.4.1 Market overview Following positive growth in North American
consumption in 2010, the sawn softwood market showed only modest signs of continued recovery. Consumption in 2011 rose by only 1% to 73 million m3. The continuing global economic uncertainty leaves North American producers understandably nervous about a loss of market momentum, despite what now appears to be a potential recovery in housing starts taking hold in the US. However, with exports to Asia accounting for the majority of the increase in North American production, what happens in Asia, Europe and the Middle East is certain to affect producers.
0
10
20
30
40
50
60
70
Mill
ion
m2
Low-rise houses Other housing construction
Wood38%
Brick33%
Block16%
Other13%
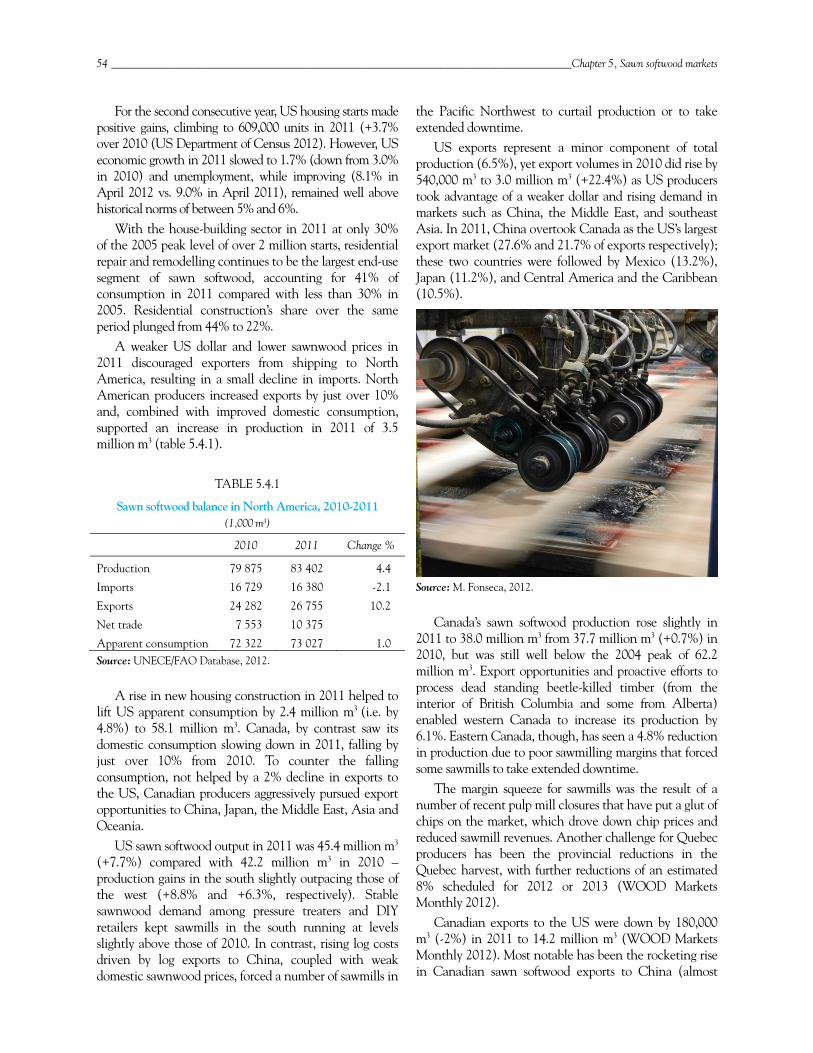
54 ____________________________________________________________________________________ Chapter 5, Sawn softwood markets
For the second consecutive year, US housing starts made positive gains, climbing to 609,000 units in 2011 (+3.7% over 2010 (US Department of Census 2012). However, US economic growth in 2011 slowed to 1.7% (down from 3.0% in 2010) and unemployment, while improving (8.1% in April 2012 vs. 9.0% in April 2011), remained well above historical norms of between 5% and 6%.
With the house-building sector in 2011 at only 30% of the 2005 peak level of over 2 million starts, residential repair and remodelling continues to be the largest end-use segment of sawn softwood, accounting for 41% of consumption in 2011 compared with less than 30% in 2005. Residential construction’s share over the same period plunged from 44% to 22%.
A weaker US dollar and lower sawnwood prices in 2011 discouraged exporters from shipping to North America, resulting in a small decline in imports. North American producers increased exports by just over 10% and, combined with improved domestic consumption, supported an increase in production in 2011 of 3.5 million m3 (table 5.4.1).
TABLE 5.4.1
Sawn softwood balance in North America, 2010-2011 (1,000 m3)
2010 2011 Change %
Production 79 875 83 402 4.4
Imports 16 729 16 380 -2.1
Exports 24 282 26 755 10.2
Net trade 7 553 10 375
Apparent consumption 72 322 73 027 1.0Source: UNECE/FAO Database, 2012.
A rise in new housing construction in 2011 helped to lift US apparent consumption by 2.4 million m3 (i.e. by 4.8%) to 58.1 million m3. Canada, by contrast saw its domestic consumption slowing down in 2011, falling by just over 10% from 2010. To counter the falling consumption, not helped by a 2% decline in exports to the US, Canadian producers aggressively pursued export opportunities to China, Japan, the Middle East, Asia and Oceania.
US sawn softwood output in 2011 was 45.4 million m3 (+7.7%) compared with 42.2 million m3 in 2010 – production gains in the south slightly outpacing those of the west (+8.8% and +6.3%, respectively). Stable sawnwood demand among pressure treaters and DIY retailers kept sawmills in the south running at levels slightly above those of 2010. In contrast, rising log costs driven by log exports to China, coupled with weak domestic sawnwood prices, forced a number of sawmills in
the Pacific Northwest to curtail production or to take extended downtime.
US exports represent a minor component of total production (6.5%), yet export volumes in 2010 did rise by 540,000 m3 to 3.0 million m3 (+22.4%) as US producers took advantage of a weaker dollar and rising demand in markets such as China, the Middle East, and southeast Asia. In 2011, China overtook Canada as the US’s largest export market (27.6% and 21.7% of exports respectively); these two countries were followed by Mexico (13.2%), Japan (11.2%), and Central America and the Caribbean (10.5%).
Source: M. Fonseca, 2012.
Canada’s sawn softwood production rose slightly in 2011 to 38.0 million m3 from 37.7 million m3 (+0.7%) in 2010, but was still well below the 2004 peak of 62.2 million m3. Export opportunities and proactive efforts to process dead standing beetle-killed timber (from the interior of British Columbia and some from Alberta) enabled western Canada to increase its production by 6.1%. Eastern Canada, though, has seen a 4.8% reduction in production due to poor sawmilling margins that forced some sawmills to take extended downtime.
The margin squeeze for sawmills was the result of a number of recent pulp mill closures that have put a glut of chips on the market, which drove down chip prices and reduced sawmill revenues. Another challenge for Quebec producers has been the provincial reductions in the Quebec harvest, with further reductions of an estimated 8% scheduled for 2012 or 2013 (WOOD Markets Monthly 2012).
Canadian exports to the US were down by 180,000 m3 (-2%) in 2011 to 14.2 million m3 (WOOD Markets Monthly 2012). Most notable has been the rocketing rise in Canadian sawn softwood exports to China (almost
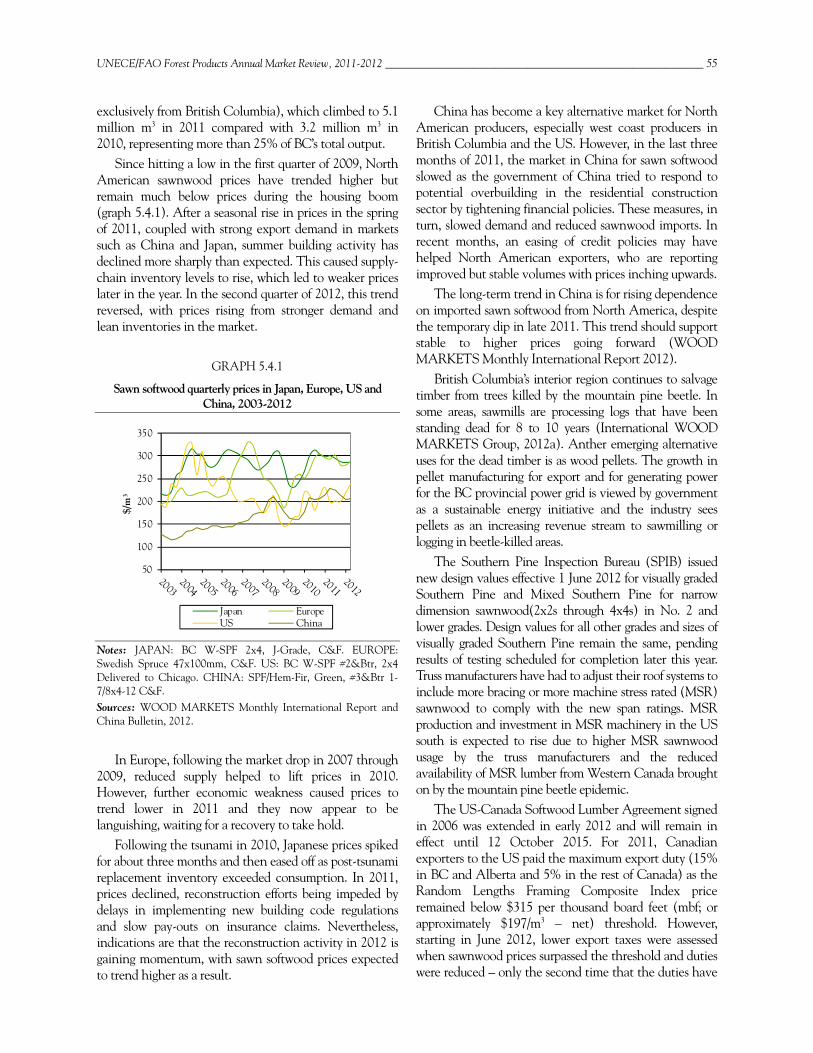
UNECE/FAO Forest Products Annual Market Review, 2011-2012 __________________________________________________________ 55
exclusively from British Columbia), which climbed to 5.1 million m3 in 2011 compared with 3.2 million m3 in 2010, representing more than 25% of BC’s total output.
Since hitting a low in the first quarter of 2009, North American sawnwood prices have trended higher but remain much below prices during the housing boom (graph 5.4.1). After a seasonal rise in prices in the spring of 2011, coupled with strong export demand in markets such as China and Japan, summer building activity has declined more sharply than expected. This caused supply-chain inventory levels to rise, which led to weaker prices later in the year. In the second quarter of 2012, this trend reversed, with prices rising from stronger demand and lean inventories in the market.
GRAPH 5.4.1
Sawn softwood quarterly prices in Japan, Europe, US and China, 2003-2012
Notes: JAPAN: BC W-SPF 2x4, J-Grade, C&F. EUROPE: Swedish Spruce 47x100mm, C&F. US: BC W-SPF #2&Btr, 2x4 Delivered to Chicago. CHINA: SPF/Hem-Fir, Green, #3&Btr 1-7/8x4-12 C&F. Sources: WOOD MARKETS Monthly International Report and China Bulletin, 2012.
In Europe, following the market drop in 2007 through
2009, reduced supply helped to lift prices in 2010. However, further economic weakness caused prices to trend lower in 2011 and they now appear to be languishing, waiting for a recovery to take hold.
Following the tsunami in 2010, Japanese prices spiked for about three months and then eased off as post-tsunami replacement inventory exceeded consumption. In 2011, prices declined, reconstruction efforts being impeded by delays in implementing new building code regulations and slow pay-outs on insurance claims. Nevertheless, indications are that the reconstruction activity in 2012 is gaining momentum, with sawn softwood prices expected to trend higher as a result.
China has become a key alternative market for North American producers, especially west coast producers in British Columbia and the US. However, in the last three months of 2011, the market in China for sawn softwood slowed as the government of China tried to respond to potential overbuilding in the residential construction sector by tightening financial policies. These measures, in turn, slowed demand and reduced sawnwood imports. In recent months, an easing of credit policies may have helped North American exporters, who are reporting improved but stable volumes with prices inching upwards.
The long-term trend in China is for rising dependence on imported sawn softwood from North America, despite the temporary dip in late 2011. This trend should support stable to higher prices going forward (WOOD MARKETS Monthly International Report 2012).
British Columbia’s interior region continues to salvage timber from trees killed by the mountain pine beetle. In some areas, sawmills are processing logs that have been standing dead for 8 to 10 years (International WOOD MARKETS Group, 2012a). Anther emerging alternative uses for the dead timber is as wood pellets. The growth in pellet manufacturing for export and for generating power for the BC provincial power grid is viewed by government as a sustainable energy initiative and the industry sees pellets as an increasing revenue stream to sawmilling or logging in beetle-killed areas.
The Southern Pine Inspection Bureau (SPIB) issued new design values effective 1 June 2012 for visually graded Southern Pine and Mixed Southern Pine for narrow dimension sawnwood(2x2s through 4x4s) in No. 2 and lower grades. Design values for all other grades and sizes of visually graded Southern Pine remain the same, pending results of testing scheduled for completion later this year. Truss manufacturers have had to adjust their roof systems to include more bracing or more machine stress rated (MSR) sawnwood to comply with the new span ratings. MSR production and investment in MSR machinery in the US south is expected to rise due to higher MSR sawnwood usage by the truss manufacturers and the reduced availability of MSR lumber from Western Canada brought on by the mountain pine beetle epidemic.
The US-Canada Softwood Lumber Agreement signed in 2006 was extended in early 2012 and will remain in effect until 12 October 2015. For 2011, Canadian exporters to the US paid the maximum export duty (15% in BC and Alberta and 5% in the rest of Canada) as the Random Lengths Framing Composite Index price remained below $315 per thousand board feet (mbf; or approximately $197/m3 – net) threshold. However, starting in June 2012, lower export taxes were assessed when sawnwood prices surpassed the threshold and duties were reduced – only the second time that the duties have
50
100
150
200
250
300
350
$/m
3
Japan EuropeUS China
56 ____________________________________________________________________________________ Chapter 5, Sawn softwood markets
not been at their maximum since the agreement was signed. If the index price rises above $355/mbf the duties fall to zero for all Canadian exporters to the US.
The London Court of International Arbitrations considered the US claim that the province of BC breached the Softwood Lumber Agreement through making changes to the system by which logs are graded. The changes led to a significant increase in the volume of logs from the BC interior being priced at the lowest permissible stumpage (Grade 4). Canada asserted that the rise in Grade 4 timber was the result of the mountain pine beetle infestation. In July 2012, the London Court of International Arbitration ruled there was no contravention of the Agreement.
Under the Softwood Lumber Agreement, the US and Canadian governments have agreed to establish a fund through the Bi-National Softwood Lumber Council (BSLC) to support the promotion of sawn softwood and defend and grow wood’s market share against steel, concrete, plastics and composites. In residential construction, the Council supports efforts to foster new product or building-system development such as cross-laminated timber technology and raised floor systems.
In non-residential light commercial construction, it sponsors programmes to provide technical support and continuing education for architects, engineers, building officials and others who make decisions about building materials. It also supports efforts to strengthen the acceptance of solid wood by green building certification bodies.
The outlook for 2012 appears to be for a gradual improvement in North American sawn softwood consumption, led by US residential new construction. Further growth may come from resurgence in demand from China and other Asian markets, as well as from the Middle East or North Africa.
Source: Metsägroup, 2012.
5.5 References Note: The Review has a statistical annex, which is available at: www.unece.org/fpamr2012
BBC Business News. 2011. Energy subsidies push the price of wood. Available at: www.bbc.co.uk/ news/business-15756074
China Bulletin. 2012. Various monthly issues. Available at: www.woodmarkets.com
EU. 2012. Official Journal of the European Union. Notice number 2012/C 24/04. Available at: http://eur-lex.europa.eu/LexUriServ/LexUriServ.do?uri=OJ:C:2012:024:0018:0023:EN:PDF
International WOOD MARKETS Group. 2012a. BC Mountain Pine Beetle: Evolving Impacts and Opportunities.
Hawkins Wright. 2009. Forest Energy Monitor. Volume 1, Issue 1, 8-May 2009. Available at: http://s288964693.websitehome.co.uk/hawkinswright/pdf/FEM_Issue_1_web.pdf
Lesprom. 2012. Softwood sawn timber export from Russia in 2011. Available at: http://wood.lesprom.com/ research/710/
Russian Association of Wood Housing. 2012: Housing Report. Available at: www.npadd.ru/
UNECE/FAO TIMBER database. 2011-12. Available at: www.unece.org/timber
US Department of Census. 2012. US Housing Starts. Available at: www.census.gov
WOOD MARKETS Monthly International Report. 2011 and 2012. Various issues: Available at: www.woodmarkets.com
WOOD MARKETS Monthly Newsletter. 2012. Available at: www.woodmarkets.com
U
6
10
UNECE/FAO F
6 SaLea
After a pthe secoconfiden
Sawn ha2% incre
After sevnow fine2009, an
Total Euwith risi
Overall compare
Oak conjoinery savailabil
Sawn harising lev
After diincreasea revival
Globalizsectors, hregion anare earlyUNECE
The USsuppliershardwoo
0 “Reshoring” is
Forest Products A
awn ad author, R
promising sond half ofnce in Euro
ardwood coease over 2
veral years ely balancend prices ar
uropean proing product
European ed with 201
ntinued tosectors durility and dev
ardwood prvels of expo
ipping to ed by 4.4% l in export
zation in thhas led to and increasiny signs of a E region, wh
S Lacey Acts to demonod supplies
s a technical te
Annual Market R
hardupert Oliver
start to 201f the year
ope and the
onsumption010. Produ
of turmoil,ed at levelse more stab
oduction otion in Croa
consumptio10 and well
o consolidaing 2011, wvelopment
roduction inorts of Russ
16.4 millioto 17.2 mildemand, pa
he furniturea decline inng exports otrend towa
hich might r
t Amendmenstrate “lowin regions w
erm defined as t
Review, 2011-20
dwoor
H11, sawn haas austerityrecovery in
n across theuction was 3
supply ands that are loble.
of sawn hardatia and Ge
on of sawndown on th
ate its domwhereas tropof innovati
n the CIS iian sawn oa
on m3 in 2llion m3 in articularly i
e sector, comn demand foof these gra
ards “reshorirevive dem
ent and thew-risk” statwhere there
the reversal of o
012 __________
od ma
Highlightsardwood coy measuresn the US ho
e UNECE 33.3 million
d demand foow compar
dwood decermany offs
n hardwoodhe level pre
minant markpical hardwive new pro
increased byak to China
2010, sawn2011 as do
in China an
mbined witor appearanades to otheing”10 of furand for app
e EU Timbtus with ree is strong e
outsourcing; the
_____________
arket
s onsumptions and the eousing sect
region wasn m3 in 201
for sawn hared with be
creased by 1set by declin
d in 2011 wevailing pri
rket positiowoods contoducts for e
y 6.8% to 3a.
n hardwoodomestic connd Viet Nam
th weaknessnce-grade saer markets, prniture and pearance-gra
er Regulatiespect to ilevidence of
e transfer of a b
______________
ts, 20
n across theeuro crisis or was slow
s 31.1 milli11, an incre
rdwood in efore the ec
1.4% to 12nes in Rom
was 13 milliior to the Eu
on in the Einued to loxternal app
3.5 million
d productionsumption sm.
s in the coawn hardwoparticularly cabinet ma
ade sawn ha
ion are placllegal loggif good fores
business operati
_____________
011-2
e UNECE rundermine
w to gain tra
ion m3 in 2ease of 2.4%
the UNECconomic cr
2.6 million mania and S
ion m3, a 0uropean rec
European fose share duplications.
m3 in 2011
on in Norstabilized an
onstruction ood within y China. Hoanufacturinardwood in
cing new obing and shot governan
on back to its c
____________ 5
2012
region fell ied economaction.
2011, only % over 2010
CE region arrisis of 2008
m3 in 201lovakia.
0.6% declincession.
flooring anue to limite
1, boosted b
rth Americnd there wa
and housinthe UNEC
owever, therng within th
the future.
bligations oould benef
nce.
country of origin
57
2
in ic
a 0.
re 8-
1,
ne
nd ed
by
ca as
ng CE
re he
on fit
n.

58 ___________________________________________________________________________________ Chapter 6, Sawn hardwood markets
6.1 Introduction The most valuable sawn hardwood demand stems from
appearance-grade sawnwood manufactured into furniture, cabinets, mouldings panels, and flooring. Low-grade hardwood is most often used for industrial applications including pallets, trailer floors, and railway ties (sleepers).
While preparing this chapter, I became aware of the generally poor quality of statistics on production and trade in sawn hardwoods. I have therefore heavily relied on anecdotal information from a wide range of contacts and market reports; which might account for discrepancies between trends in the text and those in the data tables and charts.
Although 2011 began with the promise of continuing improvements in the sawn hardwood industry after the severe downturn reported in the 2009 and 2010 Market Reviews, market activity during the year did not fully live up to expectations. Tightening austerity measures and the onset of the euro crisis severely dented market demand in the second half of 2011, particularly in southern Europe. The upturn in North American demand was also delayed by only very slow recovery in the US construction sector. As markets within the UNECE remained subdued, an increasing proportion of hardwood produced within the UNECE region was exported to other regions, notably China.
Total apparent consumption of sawn hardwood across the UNECE region was 31.1 million m3 in 2011, a mere 2% increase over 2010 (graph 6.1.1). This follows a 2% fall between 2009 and 2010. Overall production across the region was 33.3 million m3 in 2011, an increase of 2.4% over 2010. In 2010, the increase over 2009 had been 2.2%.
GRAPH 6.1.1
Consumption of sawn hardwood in the UNECE region, 2007-2011
Source: UNECE/FAO TIMBER database, 2012.
Although in this chapter we will be looking at events within the UNECE region, the long-term future of global sawn hardwood markets is becoming increasingly dependent on events outside the region. China’s role in the international hardwood trade is particularly critical. Its imports of temperate hardwood logs fell from a peak of 5.6 million m3 in 2007 to under 1.7 million m3 in 2009 (graph 6.1.2). This large downturn was largely due to a big fall in imports from the Russian Federation following the Russian government’s introduction of high log export taxes designed to boost the domestic processing industry. The decline affected China’s imports of birch logs for commodities other than sawnwood, notably plywood, and of oak logs for sawnwood and veneer. Russian exports of oak logs to China declined dramatically from 827,000 m3 in 2008 to 90,000 m3 in 2011.
Meanwhile, China’s imports of higher-value logs for manufacture of appearance-grade veneer and sawnwood from Europe and North America fell slightly in the 2008-2009 period during the economic downturn. However, these imports rebounded dramatically after 2009 to reach over 1.5 million m3 in 2011, thereby offsetting the decline in imports of Russian oak logs. Cooling economic conditions in China and in export markets for China’s finished products led to the build-up of excess stock of oak logs in China by the end of 2011. As a result, China’s imports of oak logs have declined slightly in 2012. This has been offset, however, by a rise in imports of beech logs, which are now more in demand in China due to stable and relatively competitive pricing (graph 6.1.3).
GRAPH 6.1.2
Chinese imports of temperate hardwood logs, 2006-2012
Source: Global Trade Atlas, 2012.
Despite importing large volumes of temperate hardwood saw and veneer logs, China has become more reliant on imported sawn timber. Its imports of sawn temperate hardwood had declined modestly between
50
60
70
80
90
100
110
Inde
x (2
007=
100)
Europe CIS North America
0
1
2
3
4
5
6
Mill
ion
m3
Russian Federation GermanyUnited States FranceOther
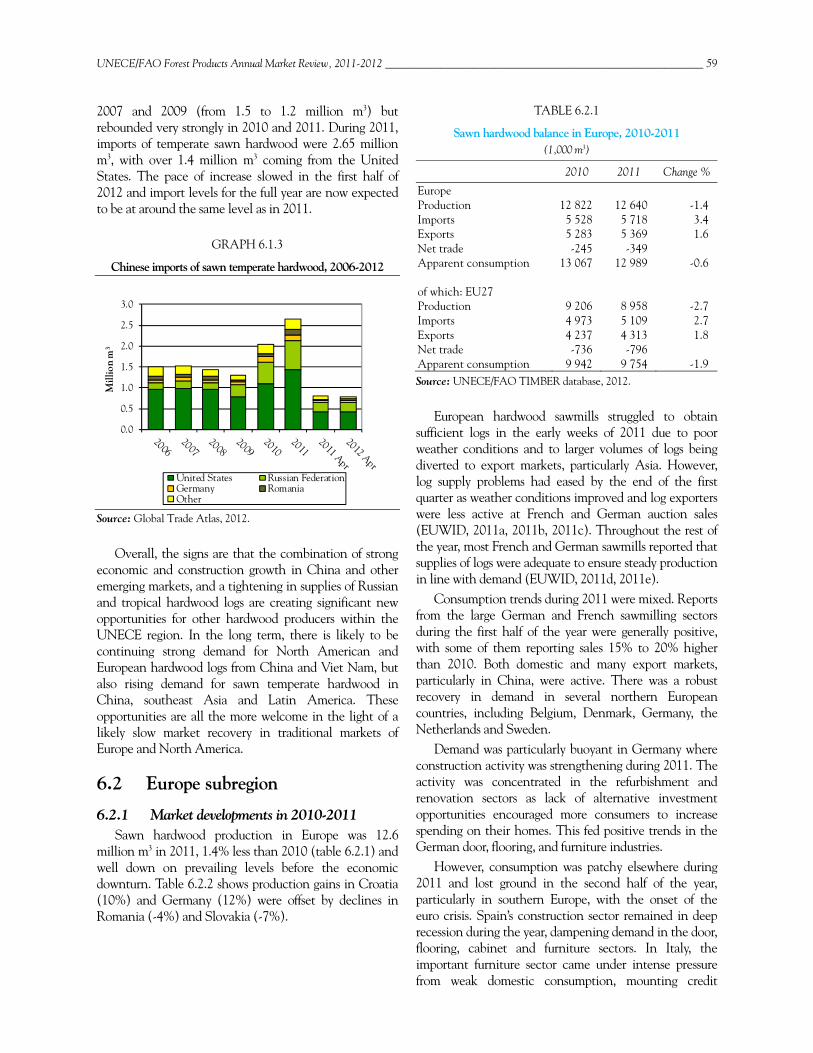
UNECE/FAO Forest Products Annual Market Review, 2011-2012 __________________________________________________________ 59
2007 and 2009 (from 1.5 to 1.2 million m3) but rebounded very strongly in 2010 and 2011. During 2011, imports of temperate sawn hardwood were 2.65 million m3, with over 1.4 million m3 coming from the United States. The pace of increase slowed in the first half of 2012 and import levels for the full year are now expected to be at around the same level as in 2011.
GRAPH 6.1.3
Chinese imports of sawn temperate hardwood, 2006-2012
Source: Global Trade Atlas, 2012.
Overall, the signs are that the combination of strong economic and construction growth in China and other emerging markets, and a tightening in supplies of Russian and tropical hardwood logs are creating significant new opportunities for other hardwood producers within the UNECE region. In the long term, there is likely to be continuing strong demand for North American and European hardwood logs from China and Viet Nam, but also rising demand for sawn temperate hardwood in China, southeast Asia and Latin America. These opportunities are all the more welcome in the light of a likely slow market recovery in traditional markets of Europe and North America.
6.2 Europe subregion
6.2.1 Market developments in 2010-2011 Sawn hardwood production in Europe was 12.6
million m3 in 2011, 1.4% less than 2010 (table 6.2.1) and well down on prevailing levels before the economic downturn. Table 6.2.2 shows production gains in Croatia (10%) and Germany (12%) were offset by declines in Romania (-4%) and Slovakia (-7%).
TABLE 6.2.1
Sawn hardwood balance in Europe, 2010-2011 (1,000 m3)
2010 2011 Change %
Europe Production 12 822 12 640 -1.4 Imports 5 528 5 718 3.4Exports 5 283 5 369 1.6 Net trade -245 -349 Apparent consumption 13 067 12 989 -0.6
of which: EU27 Production 9 206 8 958 -2.7Imports 4 973 5 109 2.7 Exports 4 237 4 313 1.8Net trade -736 -796 Apparent consumption 9 942 9 754 -1.9 Source: UNECE/FAO TIMBER database, 2012.
European hardwood sawmills struggled to obtain sufficient logs in the early weeks of 2011 due to poor weather conditions and to larger volumes of logs being diverted to export markets, particularly Asia. However, log supply problems had eased by the end of the first quarter as weather conditions improved and log exporters were less active at French and German auction sales (EUWID, 2011a, 2011b, 2011c). Throughout the rest of the year, most French and German sawmills reported that supplies of logs were adequate to ensure steady production in line with demand (EUWID, 2011d, 2011e).
Consumption trends during 2011 were mixed. Reports from the large German and French sawmilling sectors during the first half of the year were generally positive, with some of them reporting sales 15% to 20% higher than 2010. Both domestic and many export markets, particularly in China, were active. There was a robust recovery in demand in several northern European countries, including Belgium, Denmark, Germany, the Netherlands and Sweden.
Demand was particularly buoyant in Germany where construction activity was strengthening during 2011. The activity was concentrated in the refurbishment and renovation sectors as lack of alternative investment opportunities encouraged more consumers to increase spending on their homes. This fed positive trends in the German door, flooring, and furniture industries.
However, consumption was patchy elsewhere during 2011 and lost ground in the second half of the year, particularly in southern Europe, with the onset of the euro crisis. Spain’s construction sector remained in deep recession during the year, dampening demand in the door, flooring, cabinet and furniture sectors. In Italy, the important furniture sector came under intense pressure from weak domestic consumption, mounting credit
0.0
0.5
1.0
1.5
2.0
2.5
3.0
Mill
ion
m3
United States Russian FederationGermany RomaniaOther
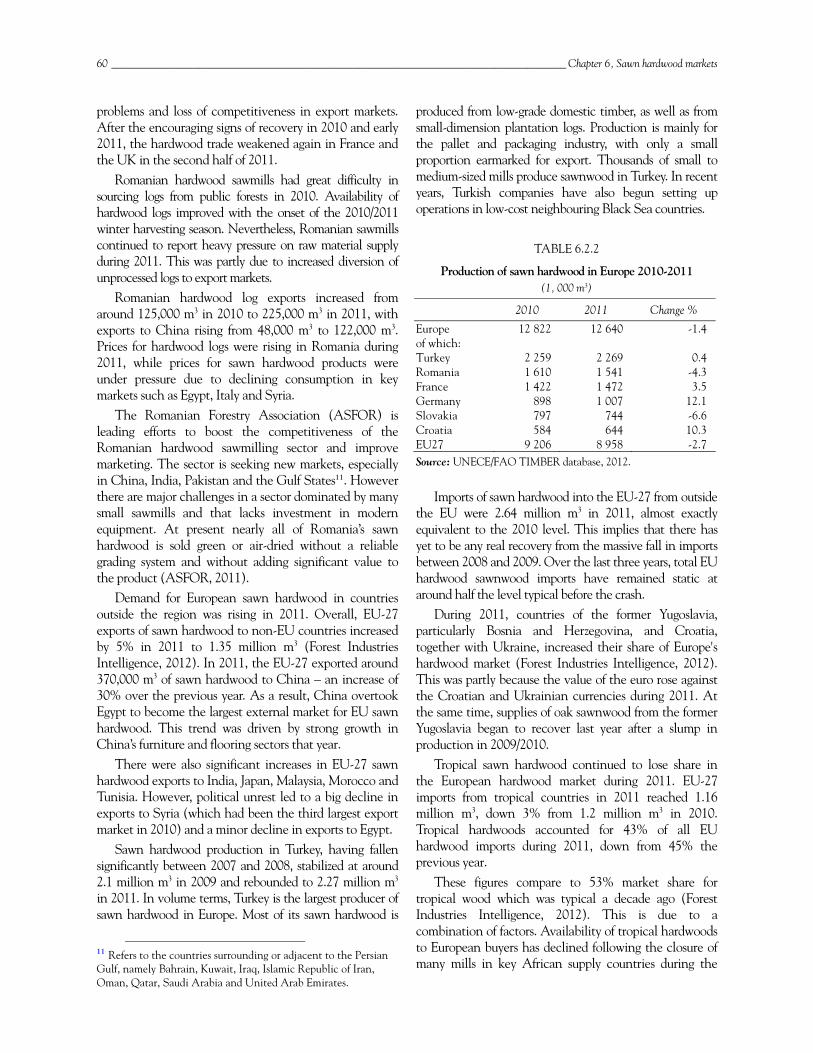
60 ___________________________________________________________________________________ Chapter 6, Sawn hardwood markets
problems and loss of competitiveness in export markets. After the encouraging signs of recovery in 2010 and early 2011, the hardwood trade weakened again in France and the UK in the second half of 2011.
Romanian hardwood sawmills had great difficulty in sourcing logs from public forests in 2010. Availability of hardwood logs improved with the onset of the 2010/2011 winter harvesting season. Nevertheless, Romanian sawmills continued to report heavy pressure on raw material supply during 2011. This was partly due to increased diversion of unprocessed logs to export markets.
Romanian hardwood log exports increased from around 125,000 m3 in 2010 to 225,000 m3 in 2011, with exports to China rising from 48,000 m3 to 122,000 m3. Prices for hardwood logs were rising in Romania during 2011, while prices for sawn hardwood products were under pressure due to declining consumption in key markets such as Egypt, Italy and Syria.
The Romanian Forestry Association (ASFOR) is leading efforts to boost the competitiveness of the Romanian hardwood sawmilling sector and improve marketing. The sector is seeking new markets, especially in China, India, Pakistan and the Gulf States11. However there are major challenges in a sector dominated by many small sawmills and that lacks investment in modern equipment. At present nearly all of Romania’s sawn hardwood is sold green or air-dried without a reliable grading system and without adding significant value to the product (ASFOR, 2011).
Demand for European sawn hardwood in countries outside the region was rising in 2011. Overall, EU-27 exports of sawn hardwood to non-EU countries increased by 5% in 2011 to 1.35 million m3 (Forest Industries Intelligence, 2012). In 2011, the EU-27 exported around 370,000 m3 of sawn hardwood to China – an increase of 30% over the previous year. As a result, China overtook Egypt to become the largest external market for EU sawn hardwood. This trend was driven by strong growth in China’s furniture and flooring sectors that year.
There were also significant increases in EU-27 sawn hardwood exports to India, Japan, Malaysia, Morocco and Tunisia. However, political unrest led to a big decline in exports to Syria (which had been the third largest export market in 2010) and a minor decline in exports to Egypt.
Sawn hardwood production in Turkey, having fallen significantly between 2007 and 2008, stabilized at around 2.1 million m3 in 2009 and rebounded to 2.27 million m3 in 2011. In volume terms, Turkey is the largest producer of sawn hardwood in Europe. Most of its sawn hardwood is
11 Refers to the countries surrounding or adjacent to the Persian Gulf, namely Bahrain, Kuwait, Iraq, Islamic Republic of Iran, Oman, Qatar, Saudi Arabia and United Arab Emirates.
produced from low-grade domestic timber, as well as from small-dimension plantation logs. Production is mainly for the pallet and packaging industry, with only a small proportion earmarked for export. Thousands of small to medium-sized mills produce sawnwood in Turkey. In recent years, Turkish companies have also begun setting up operations in low-cost neighbouring Black Sea countries.
TABLE 6.2.2
Production of sawn hardwood in Europe 2010-2011 (1, 000 m3)
2010 2011 Change %
Europe 12 822 12 640 -1.4 of which: Turkey 2 259 2 269 0.4 Romania 1 610 1 541 -4.3 France 1 422 1 472 3.5 Germany 898 1 007 12.1Slovakia 797 744 -6.6 Croatia 584 644 10.3 EU27 9 206 8 958 -2.7 Source: UNECE/FAO TIMBER database, 2012.
Imports of sawn hardwood into the EU-27 from outside the EU were 2.64 million m3 in 2011, almost exactly equivalent to the 2010 level. This implies that there has yet to be any real recovery from the massive fall in imports between 2008 and 2009. Over the last three years, total EU hardwood sawnwood imports have remained static at around half the level typical before the crash.
During 2011, countries of the former Yugoslavia, particularly Bosnia and Herzegovina, and Croatia, together with Ukraine, increased their share of Europe's hardwood market (Forest Industries Intelligence, 2012). This was partly because the value of the euro rose against the Croatian and Ukrainian currencies during 2011. At the same time, supplies of oak sawnwood from the former Yugoslavia began to recover last year after a slump in production in 2009/2010.
Tropical sawn hardwood continued to lose share in the European hardwood market during 2011. EU-27 imports from tropical countries in 2011 reached 1.16 million m3, down 3% from 1.2 million m3 in 2010. Tropical hardwoods accounted for 43% of all EU hardwood imports during 2011, down from 45% the previous year.
These figures compare to 53% market share for tropical wood which was typical a decade ago (Forest Industries Intelligence, 2012). This is due to a combination of factors. Availability of tropical hardwoods to European buyers has declined following the closure of many mills in key African supply countries during the
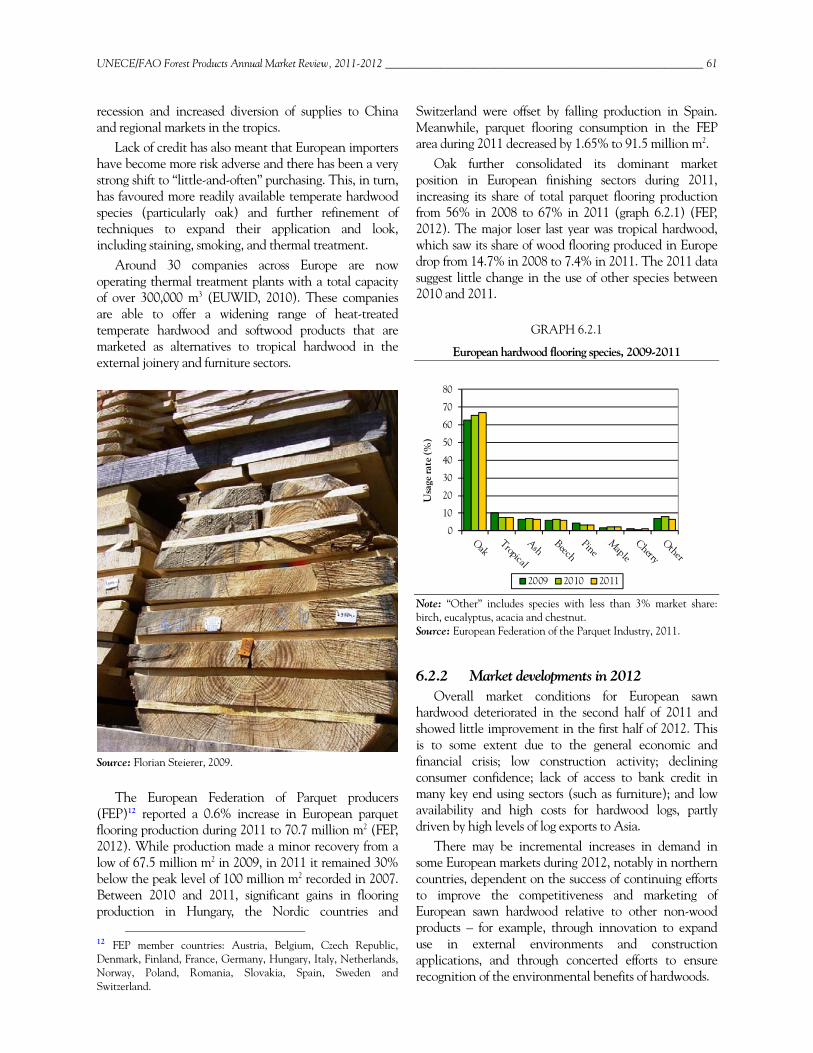
UNECE/FAO Forest Products Annual Market Review, 2011-2012 __________________________________________________________ 61
recession and increased diversion of supplies to China and regional markets in the tropics.
Lack of credit has also meant that European importers have become more risk adverse and there has been a very strong shift to “little-and-often” purchasing. This, in turn, has favoured more readily available temperate hardwood species (particularly oak) and further refinement of techniques to expand their application and look, including staining, smoking, and thermal treatment.
Around 30 companies across Europe are now operating thermal treatment plants with a total capacity of over 300,000 m3 (EUWID, 2010). These companies are able to offer a widening range of heat-treated temperate hardwood and softwood products that are marketed as alternatives to tropical hardwood in the external joinery and furniture sectors.
Source: Florian Steierer, 2009.
The European Federation of Parquet producers (FEP)12 reported a 0.6% increase in European parquet flooring production during 2011 to 70.7 million m2 (FEP, 2012). While production made a minor recovery from a low of 67.5 million m2 in 2009, in 2011 it remained 30% below the peak level of 100 million m2 recorded in 2007. Between 2010 and 2011, significant gains in flooring production in Hungary, the Nordic countries and
12 FEP member countries: Austria, Belgium, Czech Republic, Denmark, Finland, France, Germany, Hungary, Italy, Netherlands, Norway, Poland, Romania, Slovakia, Spain, Sweden and Switzerland.
Switzerland were offset by falling production in Spain. Meanwhile, parquet flooring consumption in the FEP area during 2011 decreased by 1.65% to 91.5 million m2.
Oak further consolidated its dominant market position in European finishing sectors during 2011, increasing its share of total parquet flooring production from 56% in 2008 to 67% in 2011 (graph 6.2.1) (FEP, 2012). The major loser last year was tropical hardwood, which saw its share of wood flooring produced in Europe drop from 14.7% in 2008 to 7.4% in 2011. The 2011 data suggest little change in the use of other species between 2010 and 2011.
GRAPH 6.2.1
European hardwood flooring species, 2009-2011
Note: “Other” includes species with less than 3% market share: birch, eucalyptus, acacia and chestnut. Source: European Federation of the Parquet Industry, 2011.
6.2.2 Market developments in 2012 Overall market conditions for European sawn
hardwood deteriorated in the second half of 2011 and showed little improvement in the first half of 2012. This is to some extent due to the general economic and financial crisis; low construction activity; declining consumer confidence; lack of access to bank credit in many key end using sectors (such as furniture); and low availability and high costs for hardwood logs, partly driven by high levels of log exports to Asia.
There may be incremental increases in demand in some European markets during 2012, notably in northern countries, dependent on the success of continuing efforts to improve the competitiveness and marketing of European sawn hardwood relative to other non-wood products – for example, through innovation to expand use in external environments and construction applications, and through concerted efforts to ensure recognition of the environmental benefits of hardwoods.
0
10
20
30
40
50
60
70
80
Usa
ge ra
te (%
)
2009 2010 2011
62 ___________________________________________________________________________________ Chapter 6, Sawn hardwood markets
However, the economic position of many hardwood sawmills in Europe remains precarious, limiting opportunities for new investment to increase processing efficiency, improve quality and create innovative products. The latest gross domestic product forecasts by the European Commission also suggest that short-term market prospects in southern Europe are extremely uncertain and may well further deteriorate.
The recession in the overall European economy is apparent in downgraded expectations for the construction sector. At its June 2012 conference, Euroconstruct revised downwards forecasts for construction-sector activity in 2012 and beyond, having in June 2011 forecast 1.3% growth for 2012. A decline of 2.1% is now expected.
However, the building renovation and maintenance market has remained robust, falling only 10% from the record levels of 2008-2009. The sector is expected to return to record levels by 2014 (Euroconstruct, 2012). This is particularly welcome for the hardwood sector, which, unlike softwood, tends to have a higher presence in renovation work than in new build.
A key feature of the market for European oak sawnwood in 2011 was the rise in exports to China, particularly to feed the furniture and flooring sector. However, in 2012, the market has cooled, partly due to a rise in the value of the yuan on international currency-exchange markets. This, combined with rising labour costs, has undermined the competitiveness of Chinese finished products. The pace of expansion in China’s domestic market for hardwood products has also slowed this year (EUWID, 2012a).
The lower demand from China’s wood-flooring and furniture sectors has coincided with relatively high stocks of European oak left over from 2011. As a result, there has been more European oak sawnwood available seeking-an outlet in the domestic market during 2012 than in the previous year.
European sawmillers’ plans to increase prices for sawn oak to absorb rising log and energy costs have been put on hold and, in some cases, prices have even declined. Nevertheless, some grades of European sawn oak have been performing reasonably well in certain areas during 2012. For example, there has been strong demand for “rustic grades” of sawn oak (which have a higher proportion of small knots) in central Europe this year. And in France this year, the use of oak in manufacture of garden furniture has been rising. In the UK, there continue to be reports of good demand for sawn oak for structural applications (EUWID, 2012b).
The market for European sawn beech has remained more stable than the oak market. Export demand for beech has been particularly active in Asia, North Africa
and the Gulf States during 2012, boosted by the weakening euro-dollar exchange rate which has increased price competitiveness compared with North American substitutes such as red oak, alder and maple. European domestic demand for beech has remained stable in 2012. Against this background, European sawmills have been able to push through small price increases for sawn beech. However, price rises combined with increases in freight rates, have prompted some Asian buyers to switch to lower quality grades of beech in an effort to reduce procurement costs (EUWID, 2012a, 2012b, 2012d).
6.3 CIS subregion Sawn hardwood production in the CIS increased by
6.8% between 2010 and 2011 to reach 3.52 million m3 (table 6.3.1).
TABLE 6.3.1
Sawn hardwood balance in the CIS, 2010-2011 (1,000 m3)
2010 2011 Change %
Production 3 293 3 518 6.8 Imports 72 71 -1.2Exports 983 1 126 14.6Net trade 911 1 055 Apparent consumption 2 383 2 463 3.4 Source: UNECE/FAO TIMBER database, 2012.
Sawn hardwood exports from the Russian Federation have increased in recent years from around 375,000 m3 in 2009 to 746,000 m3 in 2011. The gain was due to a large rise in exports to China and suggests that the Russian Federation’s introduction of log export taxes may have encouraged increased domestic conversion, at least in the eastern part of the country. Whether this will be a long-term trend is now in doubt following the government’s announcement that it intends to reduce log export taxes following its accession to the WTO (expected in August 2012 assuming the Duma votes to ratify the agreement).
Exports of sawn hardwood from Ukraine, which are dominated by oak, were around 336,000 m3 in 2011, a 12% gain on the 2010 figure of 301,000 m3. This continues the recovery since 2009 when exports were only 262,000 m3 at the height of the European recession. The dominant export markets for Ukrainian sawn hardwood are in the EU, notably (in order of significance) Poland, Lithuania, Italy and Germany. However, between 2008 and 2011 the share of Ukrainian sawn hardwood exports destined for EU countries fell from 88% to 78% as more volume is now being exported to China, India, the Russian Federation, Turkey and Viet Nam (Global Trade Atlas, 2012).
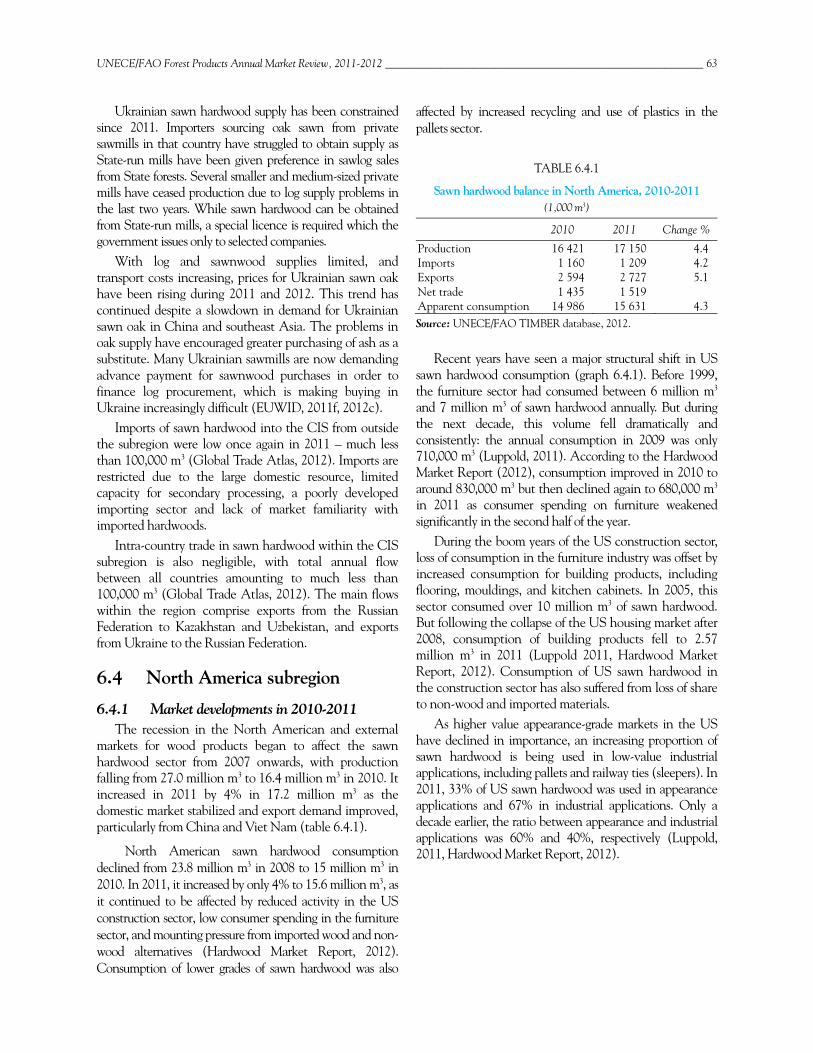
UNECE/FAO Forest Products Annual Market Review, 2011-2012 __________________________________________________________ 63
Ukrainian sawn hardwood supply has been constrained since 2011. Importers sourcing oak sawn from private sawmills in that country have struggled to obtain supply as State-run mills have been given preference in sawlog sales from State forests. Several smaller and medium-sized private mills have ceased production due to log supply problems in the last two years. While sawn hardwood can be obtained from State-run mills, a special licence is required which the government issues only to selected companies.
With log and sawnwood supplies limited, and transport costs increasing, prices for Ukrainian sawn oak have been rising during 2011 and 2012. This trend has continued despite a slowdown in demand for Ukrainian sawn oak in China and southeast Asia. The problems in oak supply have encouraged greater purchasing of ash as a substitute. Many Ukrainian sawmills are now demanding advance payment for sawnwood purchases in order to finance log procurement, which is making buying in Ukraine increasingly difficult (EUWID, 2011f, 2012c).
Imports of sawn hardwood into the CIS from outside the subregion were low once again in 2011 – much less than 100,000 m3 (Global Trade Atlas, 2012). Imports are restricted due to the large domestic resource, limited capacity for secondary processing, a poorly developed importing sector and lack of market familiarity with imported hardwoods.
Intra-country trade in sawn hardwood within the CIS subregion is also negligible, with total annual flow between all countries amounting to much less than 100,000 m3 (Global Trade Atlas, 2012). The main flows within the region comprise exports from the Russian Federation to Kazakhstan and Uzbekistan, and exports from Ukraine to the Russian Federation.
6.4 North America subregion
6.4.1 Market developments in 2010-2011 The recession in the North American and external
markets for wood products began to affect the sawn hardwood sector from 2007 onwards, with production falling from 27.0 million m3 to 16.4 million m3 in 2010. It increased in 2011 by 4% in 17.2 million m3 as the domestic market stabilized and export demand improved, particularly from China and Viet Nam (table 6.4.1).
North American sawn hardwood consumption declined from 23.8 million m3 in 2008 to 15 million m3 in 2010. In 2011, it increased by only 4% to 15.6 million m3, as it continued to be affected by reduced activity in the US construction sector, low consumer spending in the furniture sector, and mounting pressure from imported wood and non-wood alternatives (Hardwood Market Report, 2012). Consumption of lower grades of sawn hardwood was also
affected by increased recycling and use of plastics in the pallets sector.
TABLE 6.4.1
Sawn hardwood balance in North America, 2010-2011 (1,000 m3)
2010 2011 Change %
Production 16 421 17 150 4.4 Imports 1 160 1 209 4.2 Exports 2 594 2 727 5.1 Net trade 1 435 1 519 Apparent consumption 14 986 15 631 4.3 Source: UNECE/FAO TIMBER database, 2012.
Recent years have seen a major structural shift in US sawn hardwood consumption (graph 6.4.1). Before 1999, the furniture sector had consumed between 6 million m3
and 7 million m3 of sawn hardwood annually. But during the next decade, this volume fell dramatically and consistently: the annual consumption in 2009 was only 710,000 m3 (Luppold, 2011). According to the Hardwood Market Report (2012), consumption improved in 2010 to around 830,000 m3 but then declined again to 680,000 m3 in 2011 as consumer spending on furniture weakened significantly in the second half of the year.
During the boom years of the US construction sector, loss of consumption in the furniture industry was offset by increased consumption for building products, including flooring, mouldings, and kitchen cabinets. In 2005, this sector consumed over 10 million m3 of sawn hardwood. But following the collapse of the US housing market after 2008, consumption of building products fell to 2.57 million m3 in 2011 (Luppold 2011, Hardwood Market Report, 2012). Consumption of US sawn hardwood in the construction sector has also suffered from loss of share to non-wood and imported materials.
As higher value appearance-grade markets in the US have declined in importance, an increasing proportion of sawn hardwood is being used in low-value industrial applications, including pallets and railway ties (sleepers). In 2011, 33% of US sawn hardwood was used in appearance applications and 67% in industrial applications. Only a decade earlier, the ratio between appearance and industrial applications was 60% and 40%, respectively (Luppold, 2011, Hardwood Market Report, 2012).
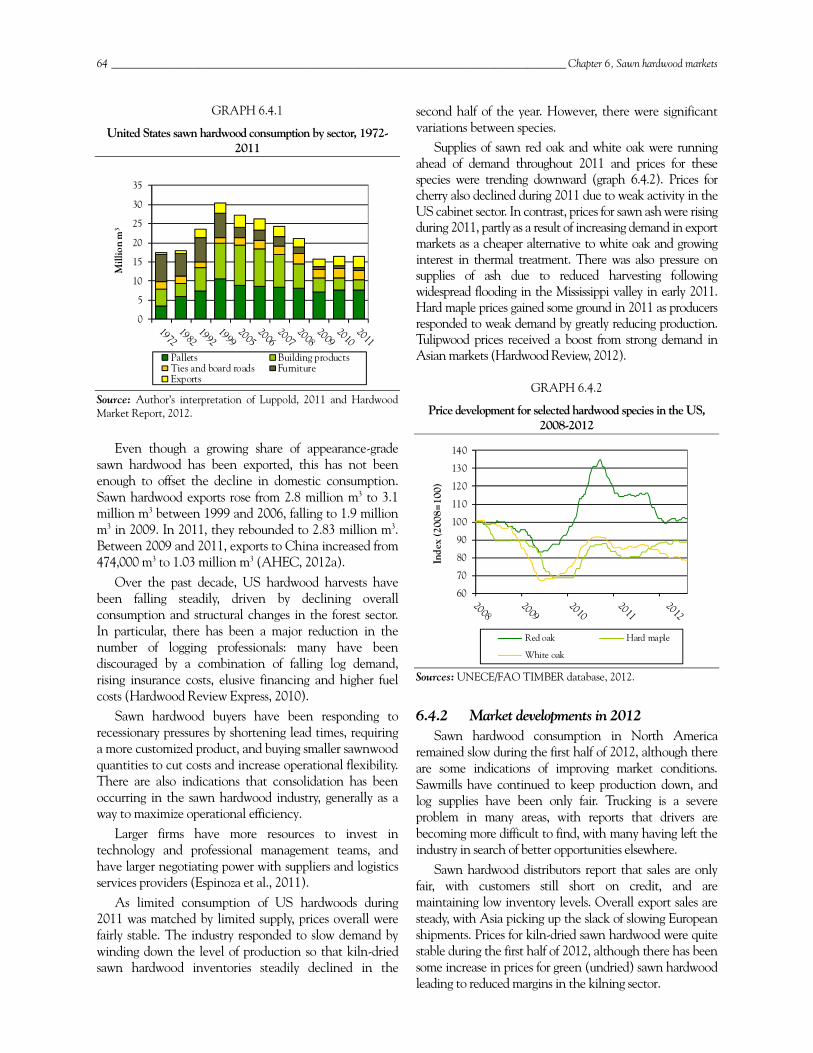
64 ___________________________________________________________________________________ Chapter 6, Sawn hardwood markets
GRAPH 6.4.1
United States sawn hardwood consumption by sector, 1972-2011
Source: Author’s interpretation of Luppold, 2011 and Hardwood Market Report, 2012.
Even though a growing share of appearance-grade sawn hardwood has been exported, this has not been enough to offset the decline in domestic consumption. Sawn hardwood exports rose from 2.8 million m3 to 3.1 million m3 between 1999 and 2006, falling to 1.9 million m3 in 2009. In 2011, they rebounded to 2.83 million m3. Between 2009 and 2011, exports to China increased from 474,000 m3 to 1.03 million m3 (AHEC, 2012a).
Over the past decade, US hardwood harvests have been falling steadily, driven by declining overall consumption and structural changes in the forest sector. In particular, there has been a major reduction in the number of logging professionals: many have been discouraged by a combination of falling log demand, rising insurance costs, elusive financing and higher fuel costs (Hardwood Review Express, 2010).
Sawn hardwood buyers have been responding to recessionary pressures by shortening lead times, requiring a more customized product, and buying smaller sawnwood quantities to cut costs and increase operational flexibility. There are also indications that consolidation has been occurring in the sawn hardwood industry, generally as a way to maximize operational efficiency.
Larger firms have more resources to invest in technology and professional management teams, and have larger negotiating power with suppliers and logistics services providers (Espinoza et al., 2011).
As limited consumption of US hardwoods during 2011 was matched by limited supply, prices overall were fairly stable. The industry responded to slow demand by winding down the level of production so that kiln-dried sawn hardwood inventories steadily declined in the
second half of the year. However, there were significant variations between species.
Supplies of sawn red oak and white oak were running ahead of demand throughout 2011 and prices for these species were trending downward (graph 6.4.2). Prices for cherry also declined during 2011 due to weak activity in the US cabinet sector. In contrast, prices for sawn ash were rising during 2011, partly as a result of increasing demand in export markets as a cheaper alternative to white oak and growing interest in thermal treatment. There was also pressure on supplies of ash due to reduced harvesting following widespread flooding in the Mississippi valley in early 2011. Hard maple prices gained some ground in 2011 as producers responded to weak demand by greatly reducing production. Tulipwood prices received a boost from strong demand in Asian markets (Hardwood Review, 2012).
GRAPH 6.4.2
Price development for selected hardwood species in the US, 2008-2012
Sources: UNECE/FAO TIMBER database, 2012.
6.4.2 Market developments in 2012 Sawn hardwood consumption in North America
remained slow during the first half of 2012, although there are some indications of improving market conditions. Sawmills have continued to keep production down, and log supplies have been only fair. Trucking is a severe problem in many areas, with reports that drivers are becoming more difficult to find, with many having left the industry in search of better opportunities elsewhere.
Sawn hardwood distributors report that sales are only fair, with customers still short on credit, and are maintaining low inventory levels. Overall export sales are steady, with Asia picking up the slack of slowing European shipments. Prices for kiln-dried sawn hardwood were quite stable during the first half of 2012, although there has been some increase in prices for green (undried) sawn hardwood leading to reduced margins in the kilning sector.
0
5
10
15
20
25
30
35
Mill
ion
m3
Pallets Building productsTies and board roads FurnitureExports
60
70
80
90
100
110
120
130
140In
dex
(200
8=10
0)
Red oak Hard maple
White oak
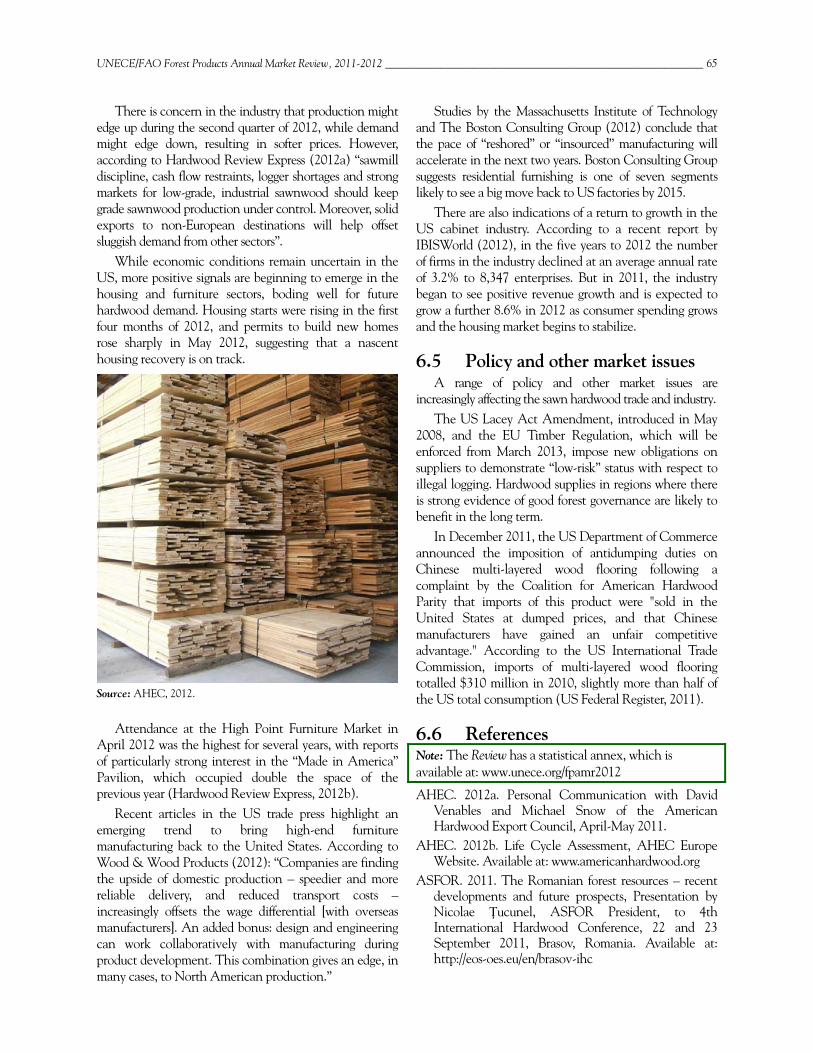
UNECE/FAO Forest Products Annual Market Review, 2011-2012 __________________________________________________________ 65
There is concern in the industry that production might edge up during the second quarter of 2012, while demand might edge down, resulting in softer prices. However, according to Hardwood Review Express (2012a) “sawmill discipline, cash flow restraints, logger shortages and strong markets for low-grade, industrial sawnwood should keep grade sawnwood production under control. Moreover, solid exports to non-European destinations will help offset sluggish demand from other sectors”.
While economic conditions remain uncertain in the US, more positive signals are beginning to emerge in the housing and furniture sectors, boding well for future hardwood demand. Housing starts were rising in the first four months of 2012, and permits to build new homes rose sharply in May 2012, suggesting that a nascent housing recovery is on track.
Source: AHEC, 2012.
Attendance at the High Point Furniture Market in April 2012 was the highest for several years, with reports of particularly strong interest in the “Made in America” Pavilion, which occupied double the space of the previous year (Hardwood Review Express, 2012b).
Recent articles in the US trade press highlight an emerging trend to bring high-end furniture manufacturing back to the United States. According to Wood & Wood Products (2012): “Companies are finding the upside of domestic production – speedier and more reliable delivery, and reduced transport costs – increasingly offsets the wage differential [with overseas manufacturers]. An added bonus: design and engineering can work collaboratively with manufacturing during product development. This combination gives an edge, in many cases, to North American production.”
Studies by the Massachusetts Institute of Technology and The Boston Consulting Group (2012) conclude that the pace of “reshored” or “insourced” manufacturing will accelerate in the next two years. Boston Consulting Group suggests residential furnishing is one of seven segments likely to see a big move back to US factories by 2015.
There are also indications of a return to growth in the US cabinet industry. According to a recent report by IBISWorld (2012), in the five years to 2012 the number of firms in the industry declined at an average annual rate of 3.2% to 8,347 enterprises. But in 2011, the industry began to see positive revenue growth and is expected to grow a further 8.6% in 2012 as consumer spending grows and the housing market begins to stabilize.
6.5 Policy and other market issues A range of policy and other market issues are
increasingly affecting the sawn hardwood trade and industry. The US Lacey Act Amendment, introduced in May
2008, and the EU Timber Regulation, which will be enforced from March 2013, impose new obligations on suppliers to demonstrate “low-risk” status with respect to illegal logging. Hardwood supplies in regions where there is strong evidence of good forest governance are likely to benefit in the long term.
In December 2011, the US Department of Commerce announced the imposition of antidumping duties on Chinese multi-layered wood flooring following a complaint by the Coalition for American Hardwood Parity that imports of this product were "sold in the United States at dumped prices, and that Chinese manufacturers have gained an unfair competitive advantage." According to the US International Trade Commission, imports of multi-layered wood flooring totalled $310 million in 2010, slightly more than half of the US total consumption (US Federal Register, 2011).
6.6 References Note: The Review has a statistical annex, which is available at: www.unece.org/fpamr2012
AHEC. 2012a. Personal Communication with David Venables and Michael Snow of the American Hardwood Export Council, April-May 2011.
AHEC. 2012b. Life Cycle Assessment, AHEC Europe Website. Available at: www.americanhardwood.org
ASFOR. 2011. The Romanian forest resources – recent developments and future prospects, Presentation by Nicolae Ţucunel, ASFOR President, to 4th International Hardwood Conference, 22 and 23 September 2011, Brasov, Romania. Available at: http://eos-oes.eu/en/brasov-ihc

66 ___________________________________________________________________________________ Chapter 6, Sawn hardwood markets
Boston Consulting Group. 2012. More Than a Third of Large Manufacturers Are Considering Reshoring from China to the U.S. Press release issued Chicago, April 20, 2012. Available at: www.bcg.com
Espinoza et al. 2011. US hardwood markets. BioResources 6(3), 2676-2689.
Euroconstruct. 2012. Press release issued on the occasion of the 73nd Euroconstruct Conference in Munich, June 2012. Available at: www.euroconstruct.org
EUWID. 2010. European thermally modified timber suppliers are still enlarging capacity. Vol. 84, No. 43, 27 October 2010, pp. 1-12. Available at: www.euwid-wood-products.com
EUWID. 2011a.Hardwood Industry found itself facing major bottlenecks in logs in January in some regions. Vol. 85, No. 7, 16 Feb 2011, p. 7. Available at: www.euwid-wood-products.com
EUWID. 2011b. Hardwood log marketing gradually coming to an end. Revenue for high-grade ash up 18% so far this year. Vol. 85, No. 14, 6 April 2011, p. 8. Available at: www.euwid-wood-products.com
EUWID. 2011c. Demand for French hardwood lumber remains brisk in the beginning of the second quarter. High supply of hardwood logs and softer prices in some case. Vol. 85, No. 8, 4 May 2011, p. 6. Available at: www.euwid-wood-products.com
EUWID. 2011d. Hardwood lumber producers registering perceptible slackening in demand lately. Vol. 85, No. 38, 21 September 2011, p. 9. Available at: www.euwid-wood-products.com
EUWID. 2011e. Another minor increase registered in Chinese demand for beech lumber made in France. Vol. 85, No. 49, 7 December 2011, p. 4. Available at: www.euwid-wood-products.com
EUWID. 2011f. Supply of Ukrainian oak lumber insufficient to satisfy demand since the start of 2011. Vol. 85, No. 21, 25 May 2011, p. 7. Available at: www.euwid-wood-products.com
EUWID. 2012a. Higher container costs not yet showing any negative effect on beech sawmills workloads. Vol. 86, No. 19, 9 May 2012, p. 8. EUWID. Available at: www.euwid-wood-products.com
EUWID. 2012b. Upswing in French hardwood sawmills business activity came to a halt in April. Vol. 86, No. 20, 16 May 2012, p. 8. Available at: www.euwid-wood-products.com
EUWID. 2012c. Several oak lumber grades short in supply in the Ukraine at the moment. Vol. 86, No. 15, 12 April 2012, p. 6. Available at: www.euwid-wood-products.com
EUWID. 2012d. Romanian hardwood sawmills are finding it difficult to push through higher prices. Vol. 86 No. 21, 23 May 2012, p.7. Available at: www.euwid-wood-products.com
FEP. 2012. Year 2011 Statistics. June 2012. European Federation of the Parquet Industry, Brussels. Available at: www.parquet.net
Forest Industries Intelligence. 2012. Statistical resource available at: www.sustainablewood.com
Global Trade Atlas. 2012. Available at: www.gtis.com/gta Goodland, 2010. Responding to climate change: wood’s
place in green building rating systems. On-line presentation for Forestry Innovation Investment, January 2010. Available at: www.naturallywood.com/ sites/default/files/Green-Rating-System.PDF
Hardwood Market Report. 2012. Wrapping Up the North American Hardwood Marketplace for 2011. Vol. 6, Issue 1, January 2012. Available at: www.hmr.com
Hardwood Review, 2012. Extracts from weekly Market Briefs. Available at: www.hardwoodreview.com
Hardwood Review Express. 2010. Hardwood Publishing Wins Federal Grant: Funded Forums Will Help Move Industry and Forests Forward. Vol. 9, Issue 34, May 7, 2010. Available at: www.hardwoodreview.com
Hardwood Review Express. 2012a. North American Hardwood Species Forecasts: Summer Won’t Be So Bad After All. Vol. 11, Issue 40, June 15, 2012. Available at: www.hardwoodreview.com
Hardwood Review Express. 2012b. Furniture Outlook Stronger After High Point Market: Manufacturers Report Increased Attendance, Orders and Optimism. Vol. 11, Issue 35, 11 May 2012. Available at: www.hardwoodreview.com
IBISWorld. 2012. Cabinet & Vanity Manufacturing in the US: Market Research Report. NAICS 33711. June 2012. Available at: www.ibisworld.com
Luppold, 2011. Personal communication with William Luppold, Project Leader at the US Forest Service Princeton West Virginia Forestry Sciences Laboratory, February/March 2011
US Federal Register. 2011. Multilayered Wood Flooring From the People's Republic of China: Amended Final Determination of Sales at Less Than Fair Value and Antidumping Duty Order, A Notice by the International Trade Administration on 12/08/2011. Available at: www.federalregister.gov
Wood & Wood Products. 2012. Wood Industry Sees Return of 'Made in America'. On-line article by Bill Esler. Published 7 June 2012. Available at: www.woodworkingnetwork.com
UNECE/FAO TIMBER database, 2012. Available at: www.unece.org/timber
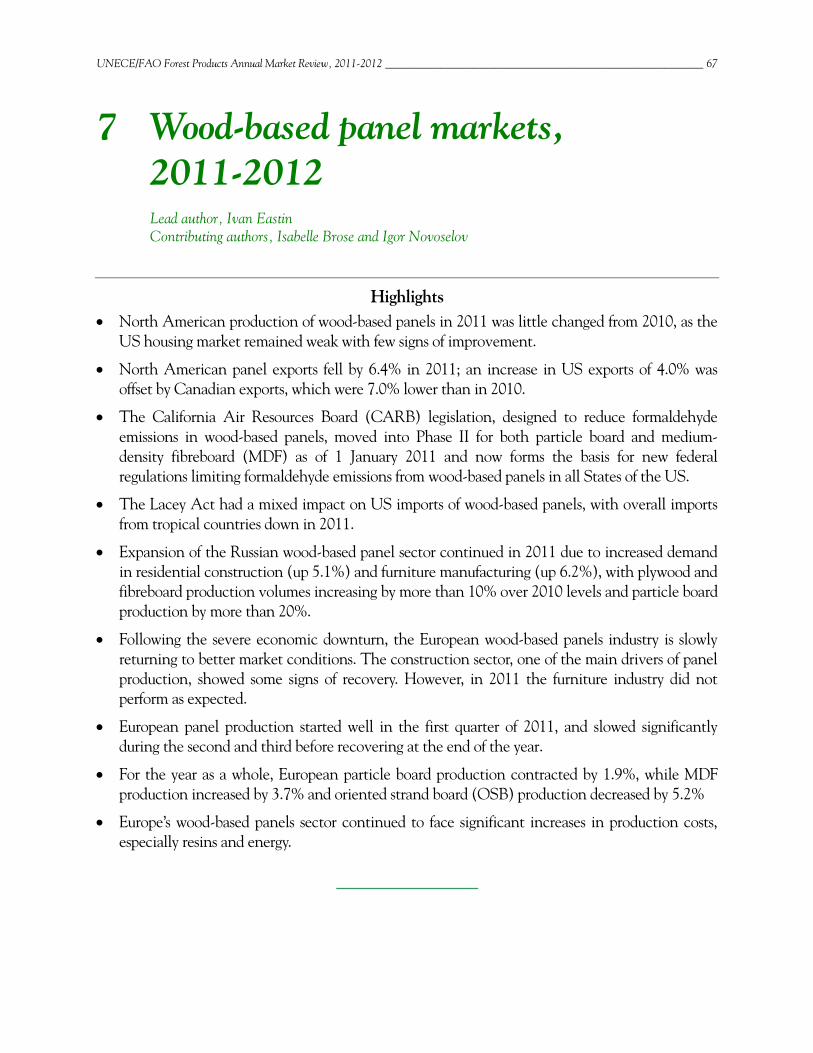
UNECE/FAO Forest Products Annual Market Review, 2011-2012 __________________________________________________________ 67
7 Wood-based panel markets, 2011-2012
Lead author, Ivan Eastin Contributing authors, Isabelle Brose and Igor Novoselov
Highlights North American production of wood-based panels in 2011 was little changed from 2010, as the
US housing market remained weak with few signs of improvement.
North American panel exports fell by 6.4% in 2011; an increase in US exports of 4.0% was offset by Canadian exports, which were 7.0% lower than in 2010.
The California Air Resources Board (CARB) legislation, designed to reduce formaldehyde emissions in wood-based panels, moved into Phase II for both particle board and medium-density fibreboard (MDF) as of 1 January 2011 and now forms the basis for new federal regulations limiting formaldehyde emissions from wood-based panels in all States of the US.
The Lacey Act had a mixed impact on US imports of wood-based panels, with overall imports from tropical countries down in 2011.
Expansion of the Russian wood-based panel sector continued in 2011 due to increased demand in residential construction (up 5.1%) and furniture manufacturing (up 6.2%), with plywood and fibreboard production volumes increasing by more than 10% over 2010 levels and particle board production by more than 20%.
Following the severe economic downturn, the European wood-based panels industry is slowly returning to better market conditions. The construction sector, one of the main drivers of panel production, showed some signs of recovery. However, in 2011 the furniture industry did not perform as expected.
European panel production started well in the first quarter of 2011, and slowed significantly during the second and third before recovering at the end of the year.
For the year as a whole, European particle board production contracted by 1.9%, while MDF production increased by 3.7% and oriented strand board (OSB) production decreased by 5.2%
Europe’s wood-based panels sector continued to face significant increases in production costs, especially resins and energy.
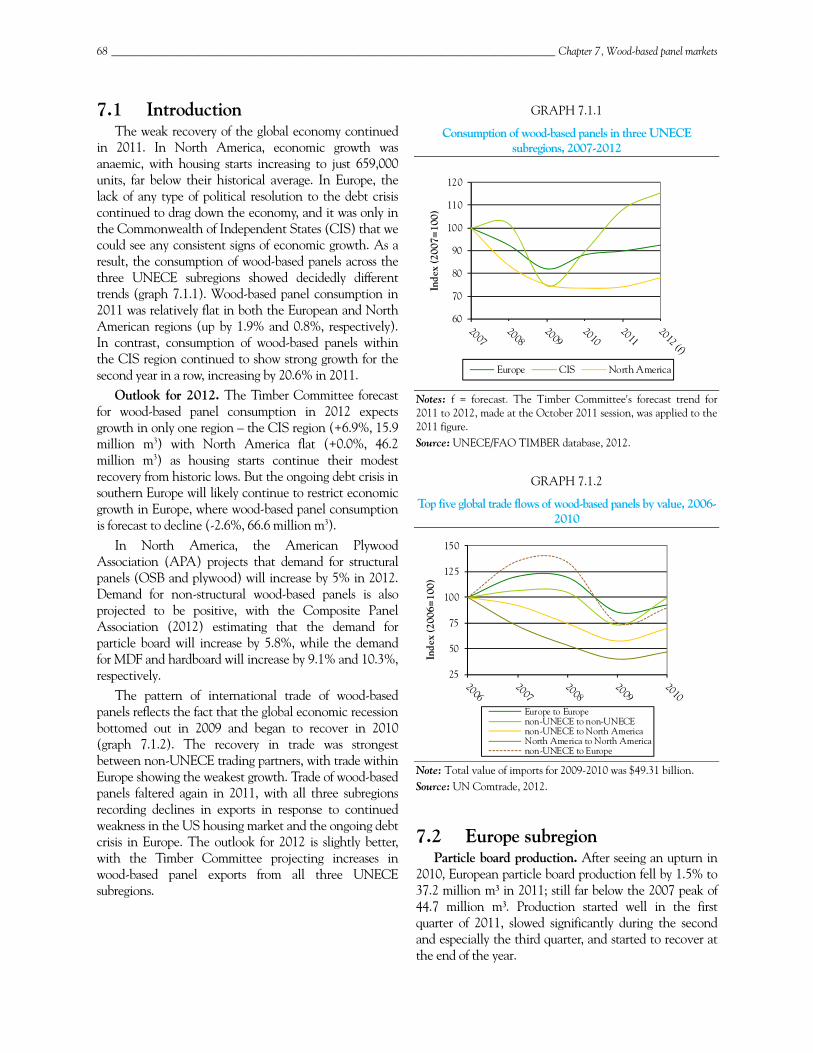
68 _________________________________________________________________________________ Chapter 7, Wood-based panel markets
7.1 Introduction The weak recovery of the global economy continued
in 2011. In North America, economic growth was anaemic, with housing starts increasing to just 659,000 units, far below their historical average. In Europe, the lack of any type of political resolution to the debt crisis continued to drag down the economy, and it was only in the Commonwealth of Independent States (CIS) that we could see any consistent signs of economic growth. As a result, the consumption of wood-based panels across the three UNECE subregions showed decidedly different trends (graph 7.1.1). Wood-based panel consumption in 2011 was relatively flat in both the European and North American regions (up by 1.9% and 0.8%, respectively). In contrast, consumption of wood-based panels within the CIS region continued to show strong growth for the second year in a row, increasing by 20.6% in 2011.
Outlook for 2012. The Timber Committee forecast for wood-based panel consumption in 2012 expects growth in only one region – the CIS region (+6.9%, 15.9 million m3) with North America flat (+0.0%, 46.2 million m3) as housing starts continue their modest recovery from historic lows. But the ongoing debt crisis in southern Europe will likely continue to restrict economic growth in Europe, where wood-based panel consumption is forecast to decline (-2.6%, 66.6 million m3).
In North America, the American Plywood Association (APA) projects that demand for structural panels (OSB and plywood) will increase by 5% in 2012. Demand for non-structural wood-based panels is also projected to be positive, with the Composite Panel Association (2012) estimating that the demand for particle board will increase by 5.8%, while the demand for MDF and hardboard will increase by 9.1% and 10.3%, respectively.
The pattern of international trade of wood-based panels reflects the fact that the global economic recession bottomed out in 2009 and began to recover in 2010 (graph 7.1.2). The recovery in trade was strongest between non-UNECE trading partners, with trade within Europe showing the weakest growth. Trade of wood-based panels faltered again in 2011, with all three subregions recording declines in exports in response to continued weakness in the US housing market and the ongoing debt crisis in Europe. The outlook for 2012 is slightly better, with the Timber Committee projecting increases in wood-based panel exports from all three UNECE subregions.
GRAPH 7.1.1
Consumption of wood-based panels in three UNECE subregions, 2007-2012
Notes: f = forecast. The Timber Committee's forecast trend for 2011 to 2012, made at the October 2011 session, was applied to the 2011 figure. Source: UNECE/FAO TIMBER database, 2012.
GRAPH 7.1.2
Top five global trade flows of wood-based panels by value, 2006-2010
Note: Total value of imports for 2009-2010 was $49.31 billion. Source: UN Comtrade, 2012.
7.2 Europe subregion Particle board production. After seeing an upturn in
2010, European particle board production fell by 1.5% to 37.2 million m3 in 2011; still far below the 2007 peak of 44.7 million m3. Production started well in the first quarter of 2011, slowed significantly during the second and especially the third quarter, and started to recover at the end of the year.
60
70
80
90
100
110
120
Inde
x (2
007=
100)
Europe CIS North America
25
50
75
100
125
150
Inde
x (2
006=
100)
Europe to Europenon-UNECE to non-UNECEnon-UNECE to North AmericaNorth America to North Americanon-UNECE to Europe
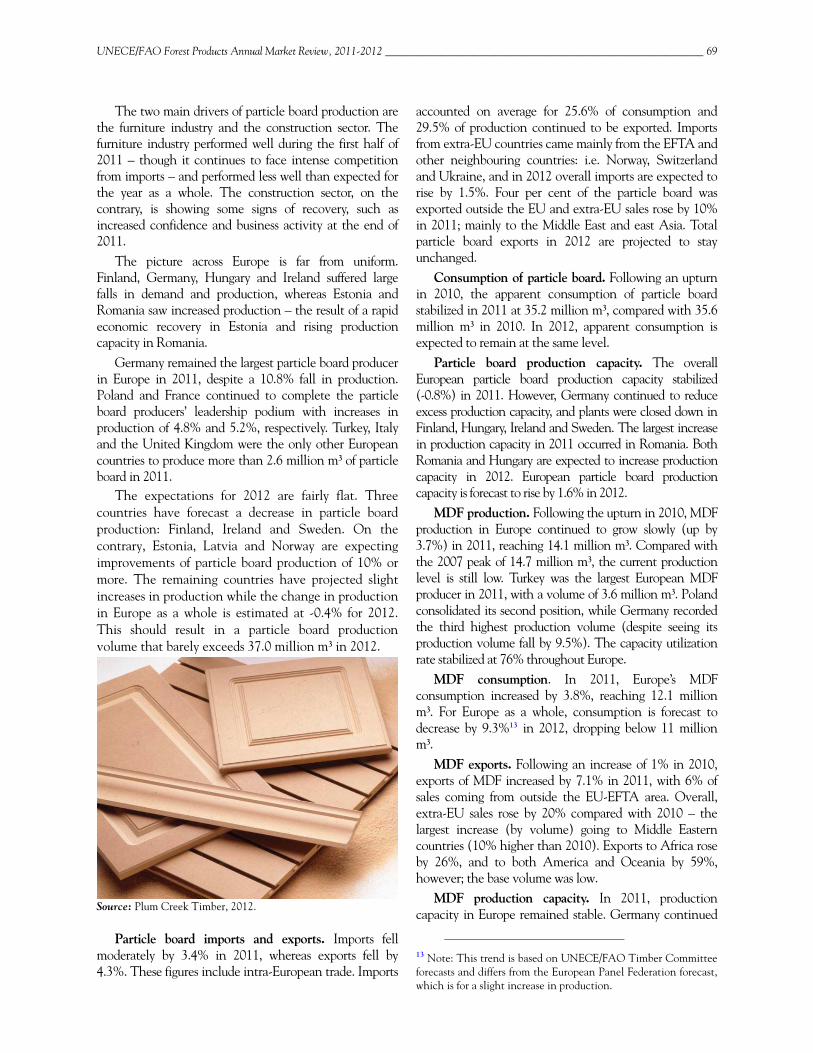
UNECE/FAO Forest Products Annual Market Review, 2011-2012 __________________________________________________________ 69
The two main drivers of particle board production are the furniture industry and the construction sector. The furniture industry performed well during the first half of 2011 – though it continues to face intense competition from imports – and performed less well than expected for the year as a whole. The construction sector, on the contrary, is showing some signs of recovery, such as increased confidence and business activity at the end of 2011.
The picture across Europe is far from uniform. Finland, Germany, Hungary and Ireland suffered large falls in demand and production, whereas Estonia and Romania saw increased production – the result of a rapid economic recovery in Estonia and rising production capacity in Romania.
Germany remained the largest particle board producer in Europe in 2011, despite a 10.8% fall in production. Poland and France continued to complete the particle board producers’ leadership podium with increases in production of 4.8% and 5.2%, respectively. Turkey, Italy and the United Kingdom were the only other European countries to produce more than 2.6 million m3 of particle board in 2011.
The expectations for 2012 are fairly flat. Three countries have forecast a decrease in particle board production: Finland, Ireland and Sweden. On the contrary, Estonia, Latvia and Norway are expecting improvements of particle board production of 10% or more. The remaining countries have projected slight increases in production while the change in production in Europe as a whole is estimated at -0.4% for 2012. This should result in a particle board production volume that barely exceeds 37.0 million m3 in 2012.
Source: Plum Creek Timber, 2012.
Particle board imports and exports. Imports fell moderately by 3.4% in 2011, whereas exports fell by 4.3%. These figures include intra-European trade. Imports
accounted on average for 25.6% of consumption and 29.5% of production continued to be exported. Imports from extra-EU countries came mainly from the EFTA and other neighbouring countries: i.e. Norway, Switzerland and Ukraine, and in 2012 overall imports are expected to rise by 1.5%. Four per cent of the particle board was exported outside the EU and extra-EU sales rose by 10% in 2011; mainly to the Middle East and east Asia. Total particle board exports in 2012 are projected to stay unchanged.
Consumption of particle board. Following an upturn in 2010, the apparent consumption of particle board stabilized in 2011 at 35.2 million m3, compared with 35.6 million m3 in 2010. In 2012, apparent consumption is expected to remain at the same level.
Particle board production capacity. The overall European particle board production capacity stabilized (-0.8%) in 2011. However, Germany continued to reduce excess production capacity, and plants were closed down in Finland, Hungary, Ireland and Sweden. The largest increase in production capacity in 2011 occurred in Romania. Both Romania and Hungary are expected to increase production capacity in 2012. European particle board production capacity is forecast to rise by 1.6% in 2012.
MDF production. Following the upturn in 2010, MDF production in Europe continued to grow slowly (up by 3.7%) in 2011, reaching 14.1 million m3. Compared with the 2007 peak of 14.7 million m3, the current production level is still low. Turkey was the largest European MDF producer in 2011, with a volume of 3.6 million m3. Poland consolidated its second position, while Germany recorded the third highest production volume (despite seeing its production volume fall by 9.5%). The capacity utilization rate stabilized at 76% throughout Europe.
MDF consumption. In 2011, Europe’s MDF consumption increased by 3.8%, reaching 12.1 million m3. For Europe as a whole, consumption is forecast to decrease by 9.3%13 in 2012, dropping below 11 million m3.
MDF exports. Following an increase of 1% in 2010, exports of MDF increased by 7.1% in 2011, with 6% of sales coming from outside the EU-EFTA area. Overall, extra-EU sales rose by 20% compared with 2010 – the largest increase (by volume) going to Middle Eastern countries (10% higher than 2010). Exports to Africa rose by 26%, and to both America and Oceania by 59%, however; the base volume was low.
MDF production capacity. In 2011, production capacity in Europe remained stable. Germany continued
13 Note: This trend is based on UNECE/FAO Timber Committee forecasts and differs from the European Panel Federation forecast, which is for a slight increase in production.
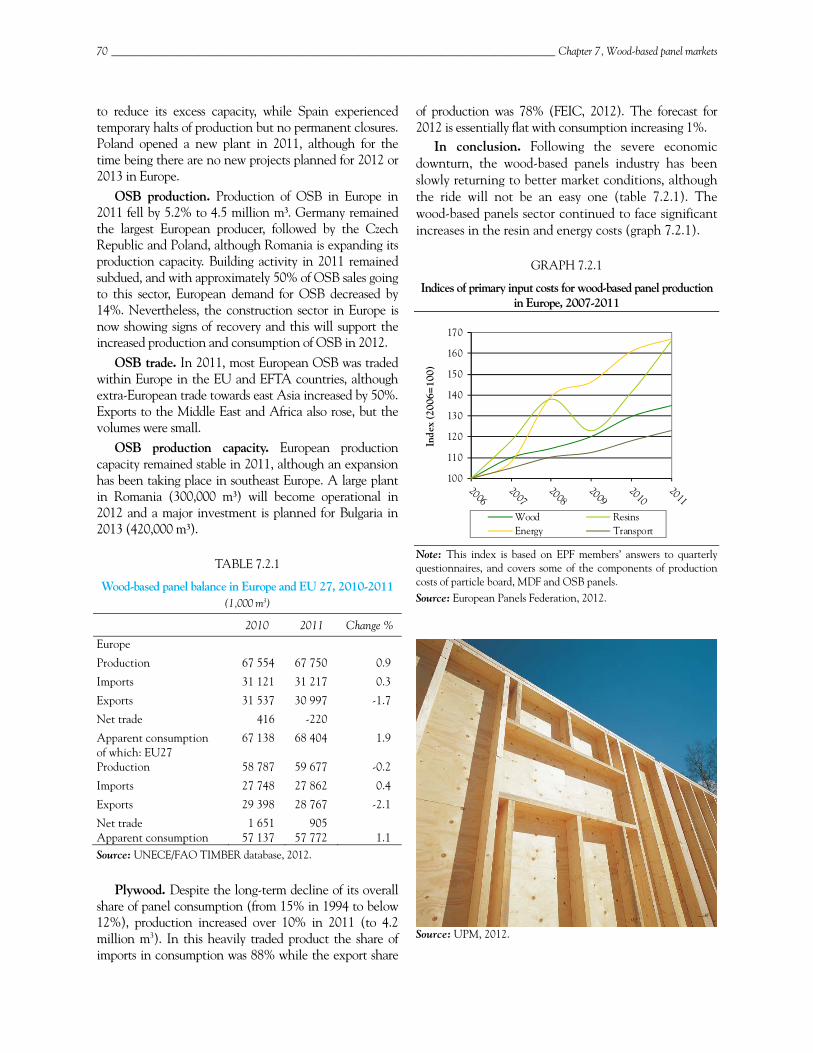
70 _________________________________________________________________________________ Chapter 7, Wood-based panel markets
to reduce its excess capacity, while Spain experienced temporary halts of production but no permanent closures. Poland opened a new plant in 2011, although for the time being there are no new projects planned for 2012 or 2013 in Europe.
OSB production. Production of OSB in Europe in 2011 fell by 5.2% to 4.5 million m3. Germany remained the largest European producer, followed by the Czech Republic and Poland, although Romania is expanding its production capacity. Building activity in 2011 remained subdued, and with approximately 50% of OSB sales going to this sector, European demand for OSB decreased by 14%. Nevertheless, the construction sector in Europe is now showing signs of recovery and this will support the increased production and consumption of OSB in 2012.
OSB trade. In 2011, most European OSB was traded within Europe in the EU and EFTA countries, although extra-European trade towards east Asia increased by 50%. Exports to the Middle East and Africa also rose, but the volumes were small.
OSB production capacity. European production capacity remained stable in 2011, although an expansion has been taking place in southeast Europe. A large plant in Romania (300,000 m3) will become operational in 2012 and a major investment is planned for Bulgaria in 2013 (420,000 m3).
TABLE 7.2.1
Wood-based panel balance in Europe and EU 27, 2010-2011 (1,000 m3)
2010 2011 Change %
Europe
Production 67 554 67 750 0.9
Imports 31 121 31 217 0.3
Exports 31 537 30 997 -1.7
Net trade 416 -220
Apparent consumption 67 138 68 404 1.9 of which: EU27 Production 58 787 59 677 -0.2
Imports 27 748 27 862 0.4
Exports 29 398 28 767 -2.1
Net trade 1 651 905 Apparent consumption 57 137 57 772 1.1 Source: UNECE/FAO TIMBER database, 2012.
Plywood. Despite the long-term decline of its overall share of panel consumption (from 15% in 1994 to below 12%), production increased over 10% in 2011 (to 4.2 million m3). In this heavily traded product the share of imports in consumption was 88% while the export share
of production was 78% (FEIC, 2012). The forecast for 2012 is essentially flat with consumption increasing 1%.
In conclusion. Following the severe economic downturn, the wood-based panels industry has been slowly returning to better market conditions, although the ride will not be an easy one (table 7.2.1). The wood-based panels sector continued to face significant increases in the resin and energy costs (graph 7.2.1).
GRAPH 7.2.1
Indices of primary input costs for wood-based panel production in Europe, 2007-2011
Note: This index is based on EPF members’ answers to quarterly questionnaires, and covers some of the components of production costs of particle board, MDF and OSB panels. Source: European Panels Federation, 2012.
Source: UPM, 2012.
100
110
120
130
140
150
160
170
Inde
x (2
006=
100)
Wood ResinsEnergy Transport
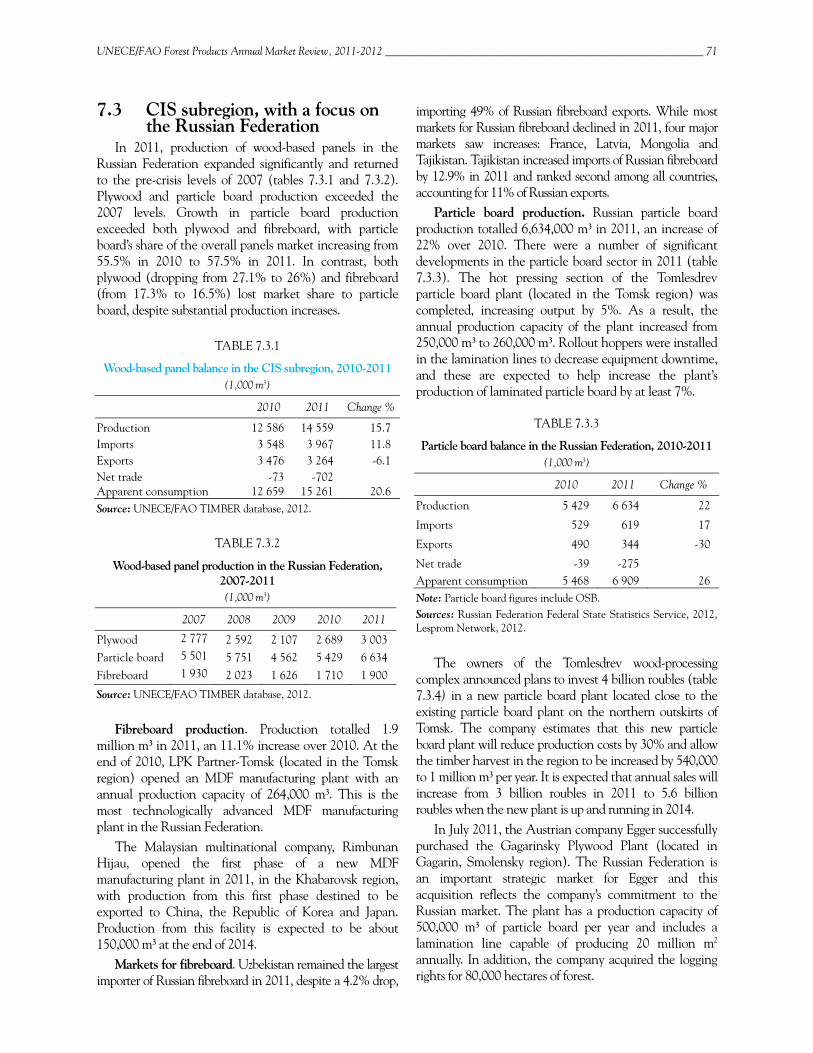
UNECE/FAO Forest Products Annual Market Review, 2011-2012 __________________________________________________________ 71
7.3 CIS subregion, with a focus on the Russian Federation
In 2011, production of wood-based panels in the Russian Federation expanded significantly and returned to the pre-crisis levels of 2007 (tables 7.3.1 and 7.3.2). Plywood and particle board production exceeded the 2007 levels. Growth in particle board production exceeded both plywood and fibreboard, with particle board’s share of the overall panels market increasing from 55.5% in 2010 to 57.5% in 2011. In contrast, both plywood (dropping from 27.1% to 26%) and fibreboard (from 17.3% to 16.5%) lost market share to particle board, despite substantial production increases.
TABLE 7.3.1
Wood-based panel balance in the CIS subregion, 2010-2011 (1,000 m3)
2010 2011 Change %
Production 12 586 14 559 15.7 Imports 3 548 3 967 11.8Exports 3 476 3 264 -6.1 Net trade -73 -702 Apparent consumption 12 659 15 261 20.6 Source: UNECE/FAO TIMBER database, 2012.
TABLE 7.3.2
Wood-based panel production in the Russian Federation, 2007-2011 (1,000 m3)
2007 2008 2009 2010 2011
Plywood 2 777 2 592 2 107 2 689 3 003 Particle board 5 501 5 751 4 562 5 429 6 634 Fibreboard 1 930 2 023 1 626 1 710 1 900
Source: UNECE/FAO TIMBER database, 2012.
Fibreboard production. Production totalled 1.9 million m3 in 2011, an 11.1% increase over 2010. At the end of 2010, LPK Partner-Tomsk (located in the Tomsk region) opened an MDF manufacturing plant with an annual production capacity of 264,000 m3. This is the most technologically advanced MDF manufacturing plant in the Russian Federation.
The Malaysian multinational company, Rimbunan Hijau, opened the first phase of a new MDF manufacturing plant in 2011, in the Khabarovsk region, with production from this first phase destined to be exported to China, the Republic of Korea and Japan. Production from this facility is expected to be about 150,000 m3 at the end of 2014.
Markets for fibreboard. Uzbekistan remained the largest importer of Russian fibreboard in 2011, despite a 4.2% drop,
importing 49% of Russian fibreboard exports. While most markets for Russian fibreboard declined in 2011, four major markets saw increases: France, Latvia, Mongolia and Tajikistan. Tajikistan increased imports of Russian fibreboard by 12.9% in 2011 and ranked second among all countries, accounting for 11% of Russian exports.
Particle board production. Russian particle board production totalled 6,634,000 m3 in 2011, an increase of 22% over 2010. There were a number of significant developments in the particle board sector in 2011 (table 7.3.3). The hot pressing section of the Tomlesdrev particle board plant (located in the Tomsk region) was completed, increasing output by 5%. As a result, the annual production capacity of the plant increased from 250,000 m3 to 260,000 m3. Rollout hoppers were installed in the lamination lines to decrease equipment downtime, and these are expected to help increase the plant’s production of laminated particle board by at least 7%.
TABLE 7.3.3
Particle board balance in the Russian Federation, 2010-2011 (1,000 m3)
2010 2011 Change %
Production 5 429 6 634 22
Imports 529 619 17
Exports 490 344 -30
Net trade -39 -275 Apparent consumption 5 468 6 909 26 Note: Particle board figures include OSB. Sources: Russian Federation Federal State Statistics Service, 2012, Lesprom Network, 2012.
The owners of the Tomlesdrev wood-processing complex announced plans to invest 4 billion roubles (table 7.3.4) in a new particle board plant located close to the existing particle board plant on the northern outskirts of Tomsk. The company estimates that this new particle board plant will reduce production costs by 30% and allow the timber harvest in the region to be increased by 540,000 to 1 million m3 per year. It is expected that annual sales will increase from 3 billion roubles in 2011 to 5.6 billion roubles when the new plant is up and running in 2014.
In July 2011, the Austrian company Egger successfully purchased the Gagarinsky Plywood Plant (located in Gagarin, Smolensky region). The Russian Federation is an important strategic market for Egger and this acquisition reflects the company’s commitment to the Russian market. The plant has a production capacity of 500,000 m3 of particle board per year and includes a lamination line capable of producing 20 million m2 annually. In addition, the company acquired the logging rights for 80,000 hectares of forest.
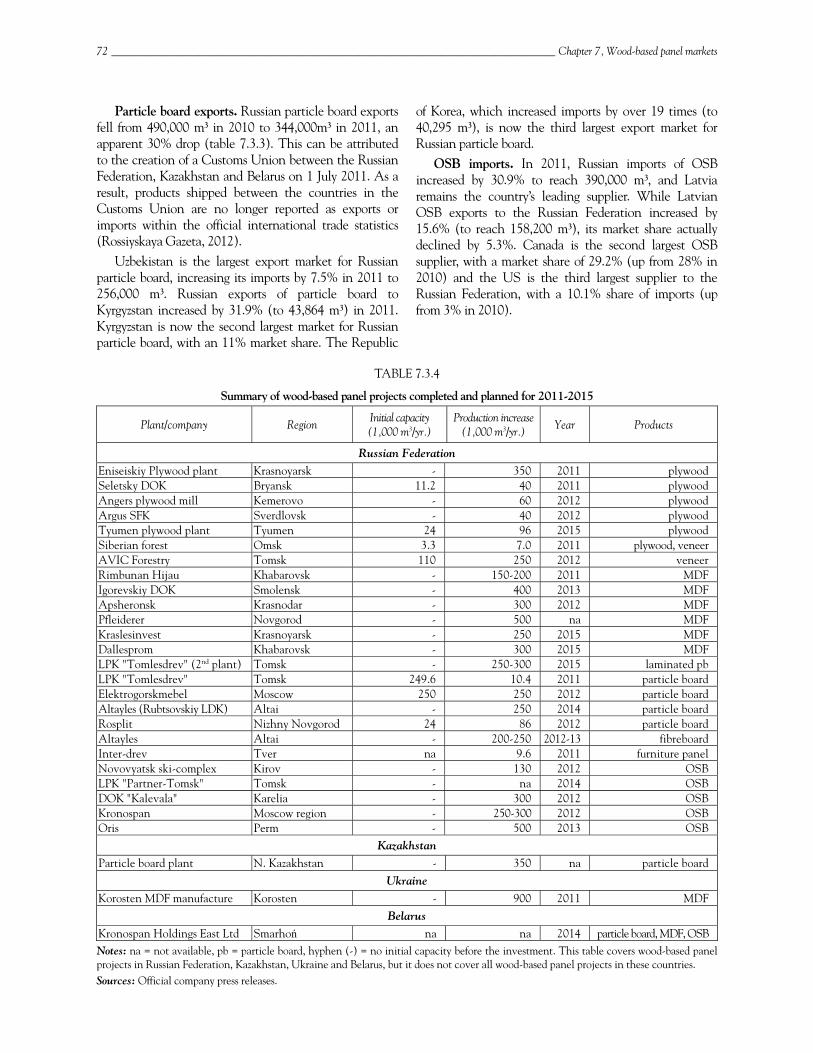
72 _________________________________________________________________________________ Chapter 7, Wood-based panel markets
Particle board exports. Russian particle board exports fell from 490,000 m3 in 2010 to 344,000m3 in 2011, an apparent 30% drop (table 7.3.3). This can be attributed to the creation of a Customs Union between the Russian Federation, Kazakhstan and Belarus on 1 July 2011. As a result, products shipped between the countries in the Customs Union are no longer reported as exports or imports within the official international trade statistics (Rossiyskaya Gazeta, 2012).
Uzbekistan is the largest export market for Russian particle board, increasing its imports by 7.5% in 2011 to 256,000 m3. Russian exports of particle board to Kyrgyzstan increased by 31.9% (to 43,864 m3) in 2011. Kyrgyzstan is now the second largest market for Russian particle board, with an 11% market share. The Republic
of Korea, which increased imports by over 19 times (to 40,295 m3), is now the third largest export market for Russian particle board.
OSB imports. In 2011, Russian imports of OSB increased by 30.9% to reach 390,000 m3, and Latvia remains the country’s leading supplier. While Latvian OSB exports to the Russian Federation increased by 15.6% (to reach 158,200 m3), its market share actually declined by 5.3%. Canada is the second largest OSB supplier, with a market share of 29.2% (up from 28% in 2010) and the US is the third largest supplier to the Russian Federation, with a 10.1% share of imports (up from 3% in 2010).
TABLE 7.3.4
Summary of wood-based panel projects completed and planned for 2011-2015
Plant/company Region Initial capacity (1,000 m3/yr.)
Production increase (1,000 m3/yr.) Year Products
Russian Federation
Eniseiskiy Plywood plant Krasnoyarsk - 350 2011 plywoodSeletsky DOK Bryansk 11.2 40 2011 plywoodAngers plywood mill Kemerovo - 60 2012 plywoodArgus SFK Sverdlovsk - 40 2012 plywoodTyumen plywood plant Tyumen 24 96 2015 plywoodSiberian forest Omsk 3.3 7.0 2011 plywood, veneerAVIC Forestry Tomsk 110 250 2012 veneerRimbunan Hijau Khabarovsk - 150-200 2011 MDFIgorevskiy DOK Smolensk - 400 2013 MDFApsheronsk Krasnodar - 300 2012 MDFPfleiderer Novgorod - 500 na MDFKraslesinvest Krasnoyarsk - 250 2015 MDFDallesprom Khabarovsk - 300 2015 MDFLPK "Tomlesdrev" (2nd plant) Tomsk - 250-300 2015 laminated pbLPK "Tomlesdrev" Tomsk 249.6 10.4 2011 particle boardElektrogorskmebel Moscow 250 250 2012 particle boardAltayles (Rubtsovskiy LDK) Altai - 250 2014 particle boardRosplit Nizhny Novgorod 24 86 2012 particle boardAltayles Altai - 200-250 2012-13 fibreboardInter-drev Tver na 9.6 2011 furniture panelNovovyatsk ski-complex Kirov - 130 2012 OSBLPK "Partner-Tomsk" Tomsk - na 2014 OSBDOK "Kalevala" Karelia - 300 2012 OSBKronospan Moscow region - 250-300 2012 OSBOris Perm - 500 2013 OSB
Kazakhstan Particle board plant N. Kazakhstan - 350 na particle board
Ukraine Korosten MDF manufacture Korosten - 900 2011 MDF
Belarus Kronospan Holdings East Ltd Smarhoń na na 2014 particle board, MDF, OSB Notes: na = not available, pb = particle board, hyphen (-) = no initial capacity before the investment. This table covers wood-based panel projects in Russian Federation, Kazakhstan, Ukraine and Belarus, but it does not cover all wood-based panel projects in these countries. Sources: Official company press releases.
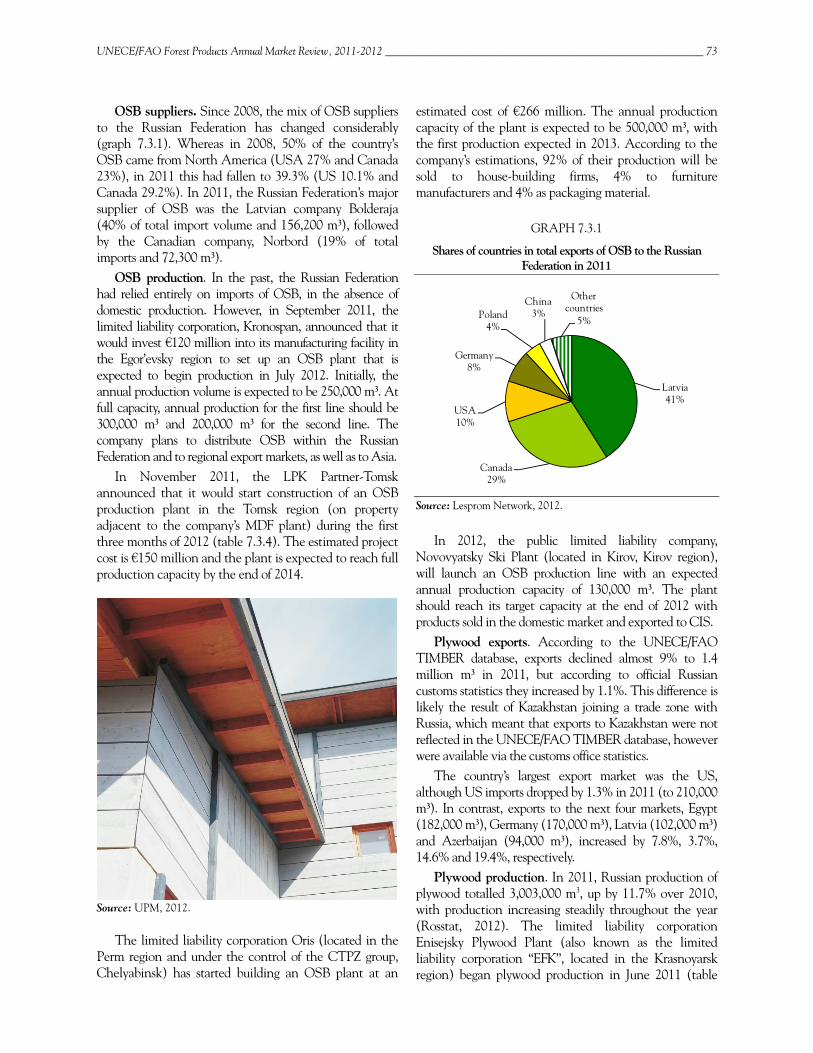
UNECE/FAO Forest Products Annual Market Review, 2011-2012 __________________________________________________________ 73
OSB suppliers. Since 2008, the mix of OSB suppliers to the Russian Federation has changed considerably (graph 7.3.1). Whereas in 2008, 50% of the country’s OSB came from North America (USA 27% and Canada 23%), in 2011 this had fallen to 39.3% (US 10.1% and Canada 29.2%). In 2011, the Russian Federation’s major supplier of OSB was the Latvian company Bolderaja (40% of total import volume and 156,200 m3), followed by the Canadian company, Norbord (19% of total imports and 72,300 m3).
OSB production. In the past, the Russian Federation had relied entirely on imports of OSB, in the absence of domestic production. However, in September 2011, the limited liability corporation, Kronospan, announced that it would invest €120 million into its manufacturing facility in the Egor’evsky region to set up an OSB plant that is expected to begin production in July 2012. Initially, the annual production volume is expected to be 250,000 m3. At full capacity, annual production for the first line should be 300,000 m3 and 200,000 m3 for the second line. The company plans to distribute OSB within the Russian Federation and to regional export markets, as well as to Asia.
In November 2011, the LPK Partner-Tomsk announced that it would start construction of an OSB production plant in the Tomsk region (on property adjacent to the company’s MDF plant) during the first three months of 2012 (table 7.3.4). The estimated project cost is €150 million and the plant is expected to reach full production capacity by the end of 2014.
Source: UPM, 2012.
The limited liability corporation Oris (located in the Perm region and under the control of the CTPZ group, Chelyabinsk) has started building an OSB plant at an
estimated cost of €266 million. The annual production capacity of the plant is expected to be 500,000 m3, with the first production expected in 2013. According to the company’s estimations, 92% of their production will be sold to house-building firms, 4% to furniture manufacturers and 4% as packaging material.
GRAPH 7.3.1
Shares of countries in total exports of OSB to the Russian Federation in 2011
Source: Lesprom Network, 2012.
In 2012, the public limited liability company, Novovyatsky Ski Plant (located in Kirov, Kirov region), will launch an OSB production line with an expected annual production capacity of 130,000 m3. The plant should reach its target capacity at the end of 2012 with products sold in the domestic market and exported to CIS.
Plywood exports. According to the UNECE/FAO TIMBER database, exports declined almost 9% to 1.4 million m3 in 2011, but according to official Russian customs statistics they increased by 1.1%. This difference is likely the result of Kazakhstan joining a trade zone with Russia, which meant that exports to Kazakhstan were not reflected in the UNECE/FAO TIMBER database, however were available via the customs office statistics.
The country’s largest export market was the US, although US imports dropped by 1.3% in 2011 (to 210,000 m3). In contrast, exports to the next four markets, Egypt (182,000 m3), Germany (170,000 m3), Latvia (102,000 m3) and Azerbaijan (94,000 m3), increased by 7.8%, 3.7%, 14.6% and 19.4%, respectively.
Plywood production. In 2011, Russian production of plywood totalled 3,003,000 m3, up by 11.7% over 2010, with production increasing steadily throughout the year (Rosstat, 2012). The limited liability corporation Enisejsky Plywood Plant (also known as the limited liability corporation “EFK”, located in the Krasnoyarsk region) began plywood production in June 2011 (table
Latvia41%
Canada29%
USA10%
Germany8%
Poland4%
China3%
Other countries
5%
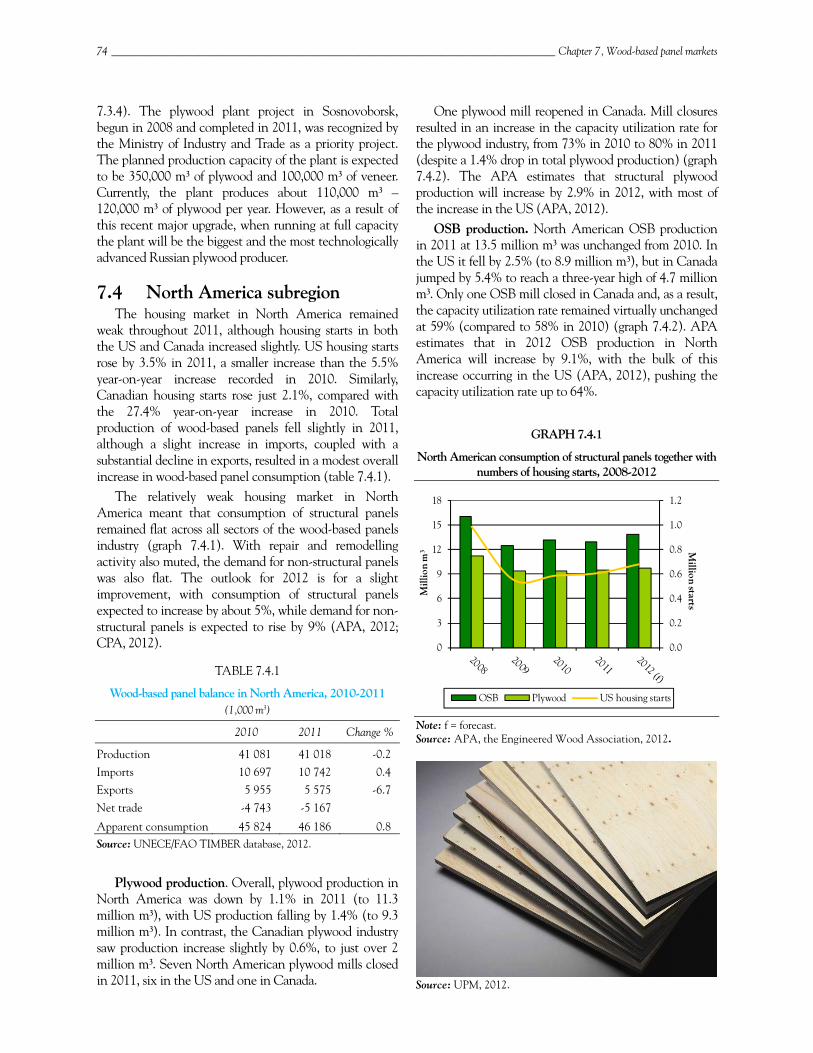
74 _________________________________________________________________________________ Chapter 7, Wood-based panel markets
7.3.4). The plywood plant project in Sosnovoborsk, begun in 2008 and completed in 2011, was recognized by the Ministry of Industry and Trade as a priority project. The planned production capacity of the plant is expected to be 350,000 m3 of plywood and 100,000 m3 of veneer. Currently, the plant produces about 110,000 m3 – 120,000 m3 of plywood per year. However, as a result of this recent major upgrade, when running at full capacity the plant will be the biggest and the most technologically advanced Russian plywood producer.
7.4 North America subregion The housing market in North America remained
weak throughout 2011, although housing starts in both the US and Canada increased slightly. US housing starts rose by 3.5% in 2011, a smaller increase than the 5.5% year-on-year increase recorded in 2010. Similarly, Canadian housing starts rose just 2.1%, compared with the 27.4% year-on-year increase in 2010. Total production of wood-based panels fell slightly in 2011, although a slight increase in imports, coupled with a substantial decline in exports, resulted in a modest overall increase in wood-based panel consumption (table 7.4.1).
The relatively weak housing market in North America meant that consumption of structural panels remained flat across all sectors of the wood-based panels industry (graph 7.4.1). With repair and remodelling activity also muted, the demand for non-structural panels was also flat. The outlook for 2012 is for a slight improvement, with consumption of structural panels expected to increase by about 5%, while demand for non-structural panels is expected to rise by 9% (APA, 2012; CPA, 2012).
TABLE 7.4.1
Wood-based panel balance in North America, 2010-2011 (1,000 m3)
2010 2011 Change %
Production 41 081 41 018 -0.2 Imports 10 697 10 742 0.4 Exports 5 955 5 575 -6.7 Net trade -4 743 -5 167
Apparent consumption 45 824 46 186 0.8 Source: UNECE/FAO TIMBER database, 2012.
Plywood production. Overall, plywood production in
North America was down by 1.1% in 2011 (to 11.3 million m3), with US production falling by 1.4% (to 9.3 million m3). In contrast, the Canadian plywood industry saw production increase slightly by 0.6%, to just over 2 million m3. Seven North American plywood mills closed in 2011, six in the US and one in Canada.
One plywood mill reopened in Canada. Mill closures resulted in an increase in the capacity utilization rate for the plywood industry, from 73% in 2010 to 80% in 2011 (despite a 1.4% drop in total plywood production) (graph 7.4.2). The APA estimates that structural plywood production will increase by 2.9% in 2012, with most of the increase in the US (APA, 2012).
OSB production. North American OSB production in 2011 at 13.5 million m3 was unchanged from 2010. In the US it fell by 2.5% (to 8.9 million m3), but in Canada jumped by 5.4% to reach a three-year high of 4.7 million m3. Only one OSB mill closed in Canada and, as a result, the capacity utilization rate remained virtually unchanged at 59% (compared to 58% in 2010) (graph 7.4.2). APA estimates that in 2012 OSB production in North America will increase by 9.1%, with the bulk of this increase occurring in the US (APA, 2012), pushing the capacity utilization rate up to 64%.
GRAPH 7.4.1
North American consumption of structural panels together with numbers of housing starts, 2008-2012
Note: f = forecast. Source: APA, the Engineered Wood Association, 2012.
Source: UPM, 2012.
0.0
0.2
0.4
0.6
0.8
1.0
1.2
0
3
6
9
12
15
18
Million starts
Mill
ion
m3
OSB Plywood US housing starts
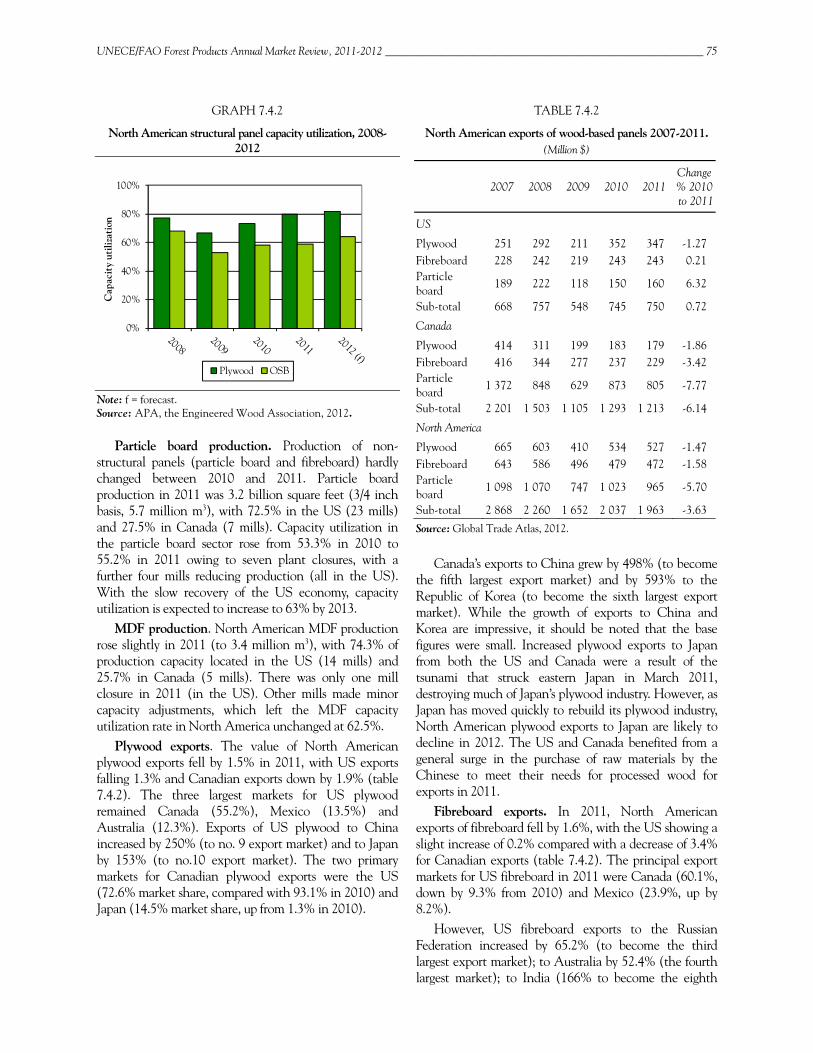
UNECE/FAO Forest Products Annual Market Review, 2011-2012 __________________________________________________________ 75
GRAPH 7.4.2
North American structural panel capacity utilization, 2008-2012
Note: f = forecast. Source: APA, the Engineered Wood Association, 2012.
Particle board production. Production of non-structural panels (particle board and fibreboard) hardly changed between 2010 and 2011. Particle board production in 2011 was 3.2 billion square feet (3/4 inch basis, 5.7 million m3), with 72.5% in the US (23 mills) and 27.5% in Canada (7 mills). Capacity utilization in the particle board sector rose from 53.3% in 2010 to 55.2% in 2011 owing to seven plant closures, with a further four mills reducing production (all in the US). With the slow recovery of the US economy, capacity utilization is expected to increase to 63% by 2013.
MDF production. North American MDF production rose slightly in 2011 (to 3.4 million m3), with 74.3% of production capacity located in the US (14 mills) and 25.7% in Canada (5 mills). There was only one mill closure in 2011 (in the US). Other mills made minor capacity adjustments, which left the MDF capacity utilization rate in North America unchanged at 62.5%.
Plywood exports. The value of North American plywood exports fell by 1.5% in 2011, with US exports falling 1.3% and Canadian exports down by 1.9% (table 7.4.2). The three largest markets for US plywood remained Canada (55.2%), Mexico (13.5%) and Australia (12.3%). Exports of US plywood to China increased by 250% (to no. 9 export market) and to Japan by 153% (to no.10 export market). The two primary markets for Canadian plywood exports were the US (72.6% market share, compared with 93.1% in 2010) and Japan (14.5% market share, up from 1.3% in 2010).
TABLE 7.4.2
North American exports of wood-based panels 2007-2011. (Million $)
2007 2008 2009 2010 2011 Change % 2010 to 2011
US
Plywood 251 292 211 352 347 -1.27 Fibreboard 228 242 219 243 243 0.21 Particle board
189 222 118 150 160 6.32
Sub-total 668 757 548 745 750 0.72
Canada
Plywood 414 311 199 183 179 -1.86 Fibreboard 416 344 277 237 229 -3.42 Particle board 1 372 848 629 873 805 -7.77
Sub-total 2 201 1 503 1 105 1 293 1 213 -6.14
North America
Plywood 665 603 410 534 527 -1.47 Fibreboard 643 586 496 479 472 -1.58 Particle board
1 098 1 070 747 1 023 965 -5.70
Sub-total 2 868 2 260 1 652 2 037 1 963 -3.63
Source: Global Trade Atlas, 2012.
Canada’s exports to China grew by 498% (to become the fifth largest export market) and by 593% to the Republic of Korea (to become the sixth largest export market). While the growth of exports to China and Korea are impressive, it should be noted that the base figures were small. Increased plywood exports to Japan from both the US and Canada were a result of the tsunami that struck eastern Japan in March 2011, destroying much of Japan’s plywood industry. However, as Japan has moved quickly to rebuild its plywood industry, North American plywood exports to Japan are likely to decline in 2012. The US and Canada benefited from a general surge in the purchase of raw materials by the Chinese to meet their needs for processed wood for exports in 2011.
Fibreboard exports. In 2011, North American exports of fibreboard fell by 1.6%, with the US showing a slight increase of 0.2% compared with a decrease of 3.4% for Canadian exports (table 7.4.2). The principal export markets for US fibreboard in 2011 were Canada (60.1%, down by 9.3% from 2010) and Mexico (23.9%, up by 8.2%).
However, US fibreboard exports to the Russian Federation increased by 65.2% (to become the third largest export market); to Australia by 52.4% (the fourth largest market); to India (166% to become the eighth
0%
20%
40%
60%
80%
100%
Cap
acit
y ut
iliza
tion
Plywood OSB
76 _________________________________________________________________________________ Chapter 7, Wood-based panel markets
largest market), and to the Republic of Korea by 299% (becoming the tenth largest export market). Canadian fibreboard exports went primarily to the US (90.7% market share; a fall of 3.4% from 2010).
Particle board exports. In 2011, North American particle board exports fell by 5.7%, mainly due to a 7.8% drop in Canadian exports; whereas US exports were up by 6.3% (table 7.4.2). The primary export markets for US particle board were Canada (49.7% market share; up by 1.6%) and Mexico (22.7% market share; down by 7%). The largest increases in US particle board exports in 2011 were to the Russian Federation (443% to become the third largest market) and to Ukraine (164% to become the sixth largest market). The US remained the primary market for Canadian particle board (88.5% market share; down by 11.3%).
US and Canadian trade in wood-based panels is largely confined to the North American region. While the recent trade data seem to suggest that US panel manufacturers are beginning to expand into new markets, Canadian panel manufacturers appear to remain focused on the US market.
Imports and the Lacey Act. In 2010, the US amended the Lacey Act to prevent imports of wood products manufactured from illegally harvested timber. At the time, many analysts suggested that this might cause a reduction in US imports of wood products from countries where illegal logging was thought to be a concern. However, the trade data are somewhat ambiguous on this point. While overall imports of wood-based panels from tropical countries into the US declined in 2011, imports from a few countries increased.
Formaldehyde emission levels: California. The California Air Resource Board (CARB) legislation, designed to reduce formaldehyde emissions in wood-based panels, moved into Phase II for both particle board and MDF as of 1 January 2011. Under CARB Phase II, formaldehyde emission levels for particle board cannot exceed 0.09 parts per million (down from 0.18 ppm under Phase I); while for MDF the allowable formaldehyde emission level cannot exceed 0.11 ppm (down from 0.21 ppm under Phase I).
Formaldehyde emission levels: new federal legislation. While the reduced formaldehyde emission levels have only been applicable in California to date, new federal legislation (signed into law on 7 July 2010) will become effective as of 1 June 2013. Entitled “Formaldehyde Standards for Composite Wood Products Act”, this legislation will expand the California law to the entire US. However, it applies only to hardwood plywood, particle board and MDF, not to OSB or softwood plywood. Demand for reduced formaldehyde panels is expected to increase with the increasing
adoption of green building programmes in the US. The cost of complying with the legislation could raise the price of wood-based panels by between 3% and 15%, although the price of finished furniture (where the majority of these panels are used) would increase only slightly since wood-based panels are a small component of the total cost of wooden furniture.
7.5 Panel price trends By early 2011, panel prices had largely recovered their
2008 levels (graph 7.5.1). Nevertheless, particle board prices started to decrease in June reflecting a cooling demand, especially for raw panels. Despite a continuous rise in production costs, notably for wood and resins, particle board producers were unable to fully implement planned mark-ups to Do-It-Yourself (DIY) chains. The drop in particle board prices also reflects the fact that manufacturers had to decrease their stocks.
GRAPH 7.5.1
European panel prices, 2008-2012
Source: EUWID, 2012. Note: Prices are not adjusted for inflation.
Despite the seasonal decrease in consumption, MDF producers partially managed to apply small mark-ups during the summer of 2011, reflecting reduced supply due to lower capacity utilization rate caused by production stoppages.
Finally, following two years of almost constant increase, OSB prices started to decrease during the summer of 2011, reflecting the cooling of demand. OSB manufacturers were unable to impose mark-ups to DYI chains.
In North America, low production volumes and low capacity utilization rates allowed manufacturers and wholesalers to reduce inventories (stocks) of structural panels, helping to set the stage for consistent price
50
100
150
200
250
300
€/m
3
Particle board OSB MDF
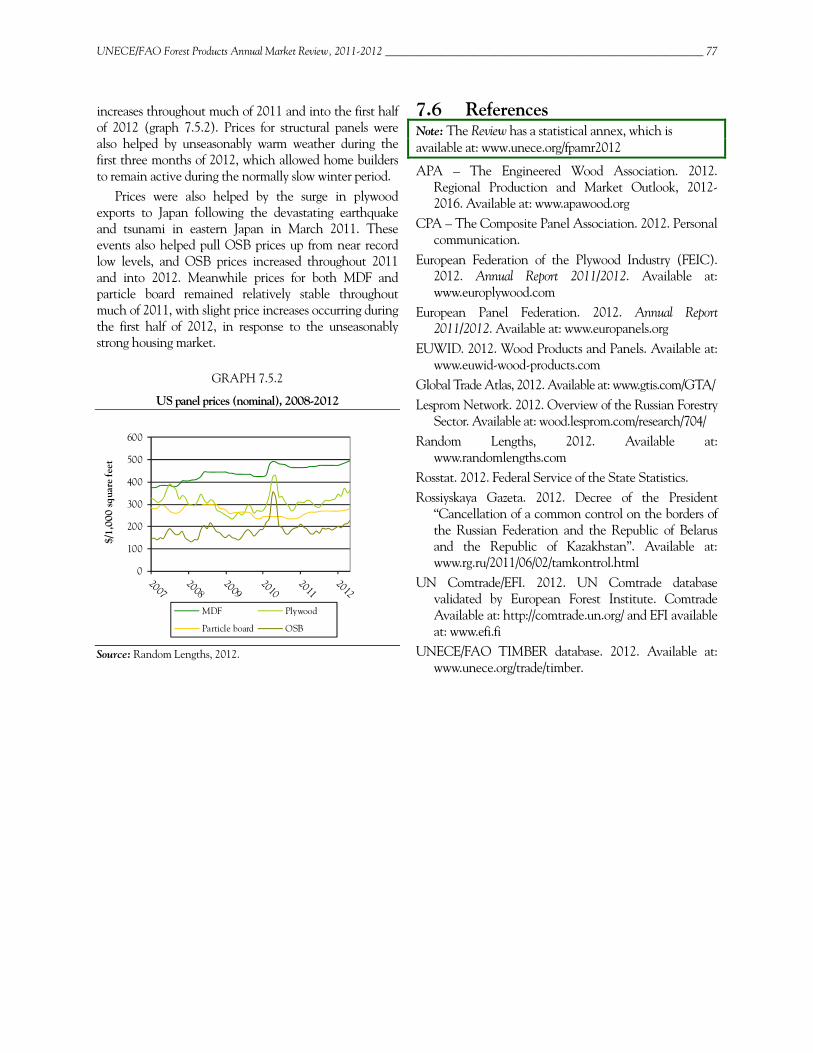
UNECE/FAO Forest Products Annual Market Review, 2011-2012 __________________________________________________________ 77
increases throughout much of 2011 and into the first half of 2012 (graph 7.5.2). Prices for structural panels were also helped by unseasonably warm weather during the first three months of 2012, which allowed home builders to remain active during the normally slow winter period.
Prices were also helped by the surge in plywood exports to Japan following the devastating earthquake and tsunami in eastern Japan in March 2011. These events also helped pull OSB prices up from near record low levels, and OSB prices increased throughout 2011 and into 2012. Meanwhile prices for both MDF and particle board remained relatively stable throughout much of 2011, with slight price increases occurring during the first half of 2012, in response to the unseasonably strong housing market.
GRAPH 7.5.2
US panel prices (nominal), 2008-2012
Source: Random Lengths, 2012.
7.6 References Note: The Review has a statistical annex, which is available at: www.unece.org/fpamr2012
APA – The Engineered Wood Association. 2012. Regional Production and Market Outlook, 2012-2016. Available at: www.apawood.org
CPA – The Composite Panel Association. 2012. Personal communication.
European Federation of the Plywood Industry (FEIC). 2012. Annual Report 2011/2012. Available at: www.europlywood.com
European Panel Federation. 2012. Annual Report 2011/2012. Available at: www.europanels.org
EUWID. 2012. Wood Products and Panels. Available at: www.euwid-wood-products.com
Global Trade Atlas, 2012. Available at: www.gtis.com/GTA/ Lesprom Network. 2012. Overview of the Russian Forestry
Sector. Available at: wood.lesprom.com/research/704/ Random Lengths, 2012. Available at:
www.randomlengths.com Rosstat. 2012. Federal Service of the State Statistics. Rossiyskaya Gazeta. 2012. Decree of the President
“Cancellation of a common control on the borders of the Russian Federation and the Republic of Belarus and the Republic of Kazakhstan”. Available at: www.rg.ru/2011/06/02/tamkontrol.html
UN Comtrade/EFI. 2012. UN Comtrade database validated by European Forest Institute. Comtrade Available at: http://comtrade.un.org/ and EFI available at: www.efi.fi
UNECE/FAO TIMBER database. 2012. Available at: www.unece.org/trade/timber.
0
100
200
300
400
500
600
$/1,
000
squa
re fe
et
MDF Plywood
Particle board OSB

UNECE/FAO Forest Products Annual Market Review, 2011-2012 __________________________________________________________ 79
8 Paper, paperboard and woodpulp markets, 2011-2012
Lead author, Michel Valois Contributing authors, Eduard Akim, Bernard Lombard and Tomas Parik
Highlights Paper and paperboard output fell along with overall industrial production in both Europe and the
US, as the recovery stalled with mill closures, mainly the result of poor financial performance.
A wave of consolidations and takeovers reduced demand for pulp commodities across Europe and North America; however, volumes to Asia, particularly China were stronger in 2011 and in early 2012.
Generally, market conditions were mixed from 2011 to early 2012, as prices peaked and then subsequently fell following overcapacity for most pulp, paper and paperboard commodities.
The Russian Federation is experiencing consolidation within the newsprint and magazine papers segments. Increased efficiency is needed as the forestry industry as a whole is noticing the effects of that country’s entry into the World Trade Organization.
European paper and paperboard output and consumption declined in 2011, following a recovery in 2010, with pulp production remaining essentially unchanged.
A wave of green transformation and biomass projects continued in 2011, with several North American pulp, paper and paperboard mills receiving subsidies.
The conclusion of stimulus spending by either European or North American governments left an economic void that the marketplace could not immediately replace.
Massive capital spending stemming from liberal credit markets in China allowed for European and North American pulp and recovered paper demand to soar in 2011, but tapering off in early 2012.
China has become the number one global market for chemical market pulp.
South American chemical market pulp expansions continue to make headlines. Incremental capacity announcements have exceeded forecast demand, leading to likely project delays and closures of higher-cost mills in the rest of the world.
Green and sustainable product features such as use of renewable resources and product recyclability help support sustainability initiatives and an evolving symbiotic relationship between pulp and paper market development and the green economy.
The theme of sustainability continues to resonate among pulp and paper companies throughout the UNECE region as firms develop pathways to help achieve product innovation and market growth, such as biorefining, biomass energy production, and development as well as commercialization of nano-cellulosic fibres.
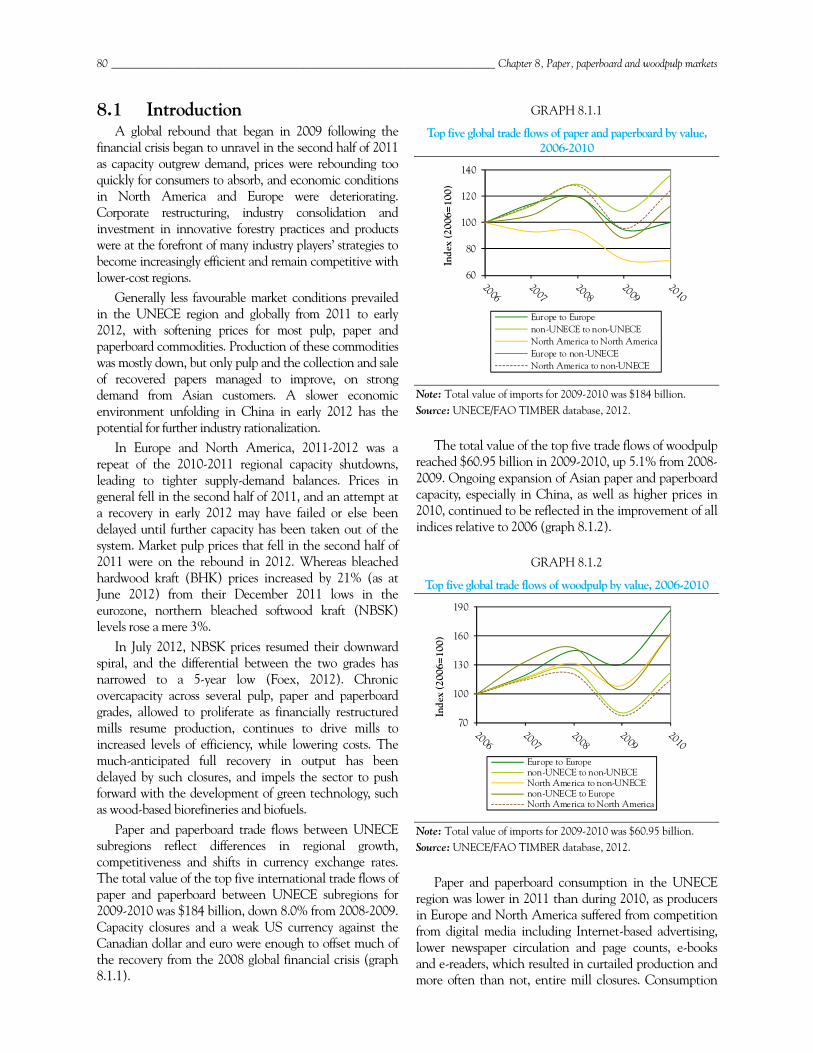
80 ______________________________________________________________________ Chapter 8, Paper, paperboard and woodpulp markets
8.1 Introduction A global rebound that began in 2009 following the
financial crisis began to unravel in the second half of 2011 as capacity outgrew demand, prices were rebounding too quickly for consumers to absorb, and economic conditions in North America and Europe were deteriorating. Corporate restructuring, industry consolidation and investment in innovative forestry practices and products were at the forefront of many industry players’ strategies to become increasingly efficient and remain competitive with lower-cost regions.
Generally less favourable market conditions prevailed in the UNECE region and globally from 2011 to early 2012, with softening prices for most pulp, paper and paperboard commodities. Production of these commodities was mostly down, but only pulp and the collection and sale of recovered papers managed to improve, on strong demand from Asian customers. A slower economic environment unfolding in China in early 2012 has the potential for further industry rationalization.
In Europe and North America, 2011-2012 was a repeat of the 2010-2011 regional capacity shutdowns, leading to tighter supply-demand balances. Prices in general fell in the second half of 2011, and an attempt at a recovery in early 2012 may have failed or else been delayed until further capacity has been taken out of the system. Market pulp prices that fell in the second half of 2011 were on the rebound in 2012. Whereas bleached hardwood kraft (BHK) prices increased by 21% (as at June 2012) from their December 2011 lows in the eurozone, northern bleached softwood kraft (NBSK) levels rose a mere 3%.
In July 2012, NBSK prices resumed their downward spiral, and the differential between the two grades has narrowed to a 5-year low (Foex, 2012). Chronic overcapacity across several pulp, paper and paperboard grades, allowed to proliferate as financially restructured mills resume production, continues to drive mills to increased levels of efficiency, while lowering costs. The much-anticipated full recovery in output has been delayed by such closures, and impels the sector to push forward with the development of green technology, such as wood-based biorefineries and biofuels.
Paper and paperboard trade flows between UNECE subregions reflect differences in regional growth, competitiveness and shifts in currency exchange rates. The total value of the top five international trade flows of paper and paperboard between UNECE subregions for 2009-2010 was $184 billion, down 8.0% from 2008-2009. Capacity closures and a weak US currency against the Canadian dollar and euro were enough to offset much of the recovery from the 2008 global financial crisis (graph 8.1.1).
GRAPH 8.1.1
Top five global trade flows of paper and paperboard by value, 2006-2010
Note: Total value of imports for 2009-2010 was $184 billion. Source: UNECE/FAO TIMBER database, 2012.
The total value of the top five trade flows of woodpulp reached $60.95 billion in 2009-2010, up 5.1% from 2008-2009. Ongoing expansion of Asian paper and paperboard capacity, especially in China, as well as higher prices in 2010, continued to be reflected in the improvement of all indices relative to 2006 (graph 8.1.2).
GRAPH 8.1.2
Top five global trade flows of woodpulp by value, 2006-2010
Note: Total value of imports for 2009-2010 was $60.95 billion. Source: UNECE/FAO TIMBER database, 2012.
Paper and paperboard consumption in the UNECE region was lower in 2011 than during 2010, as producers in Europe and North America suffered from competition from digital media including Internet-based advertising, lower newspaper circulation and page counts, e-books and e-readers, which resulted in curtailed production and more often than not, entire mill closures. Consumption
60
80
100
120
140
Inde
x (2
006=
100)
Europe to Europenon-UNECE to non-UNECENorth America to North AmericaEurope to non-UNECENorth America to non-UNECE
70
100
130
160
190
Inde
x (2
006=
100)
Europe to Europenon-UNECE to non-UNECENorth America to non-UNECEnon-UNECE to EuropeNorth America to North America
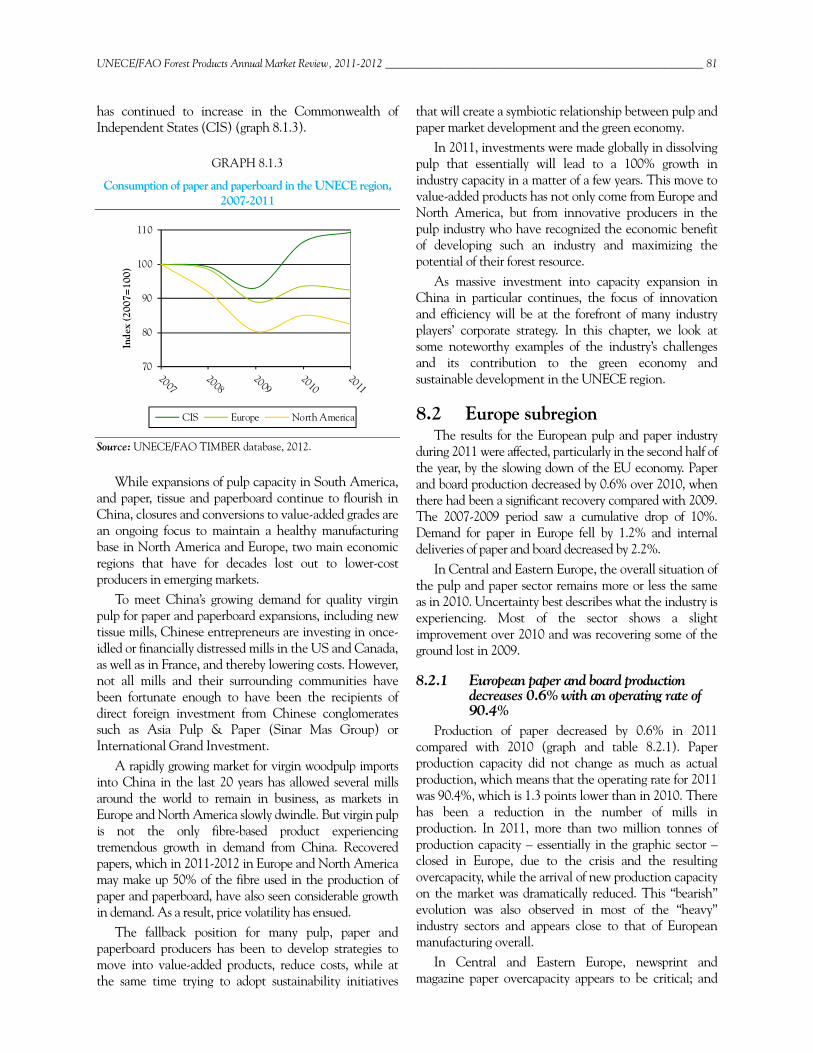
UNECE/FAO Forest Products Annual Market Review, 2011-2012 __________________________________________________________ 81
has continued to increase in the Commonwealth of Independent States (CIS) (graph 8.1.3).
GRAPH 8.1.3
Consumption of paper and paperboard in the UNECE region, 2007-2011
Source: UNECE/FAO TIMBER database, 2012.
While expansions of pulp capacity in South America, and paper, tissue and paperboard continue to flourish in China, closures and conversions to value-added grades are an ongoing focus to maintain a healthy manufacturing base in North America and Europe, two main economic regions that have for decades lost out to lower-cost producers in emerging markets.
To meet China’s growing demand for quality virgin pulp for paper and paperboard expansions, including new tissue mills, Chinese entrepreneurs are investing in once-idled or financially distressed mills in the US and Canada, as well as in France, and thereby lowering costs. However, not all mills and their surrounding communities have been fortunate enough to have been the recipients of direct foreign investment from Chinese conglomerates such as Asia Pulp & Paper (Sinar Mas Group) or International Grand Investment.
A rapidly growing market for virgin woodpulp imports into China in the last 20 years has allowed several mills around the world to remain in business, as markets in Europe and North America slowly dwindle. But virgin pulp is not the only fibre-based product experiencing tremendous growth in demand from China. Recovered papers, which in 2011-2012 in Europe and North America may make up 50% of the fibre used in the production of paper and paperboard, have also seen considerable growth in demand. As a result, price volatility has ensued.
The fallback position for many pulp, paper and paperboard producers has been to develop strategies to move into value-added products, reduce costs, while at the same time trying to adopt sustainability initiatives
that will create a symbiotic relationship between pulp and paper market development and the green economy.
In 2011, investments were made globally in dissolving pulp that essentially will lead to a 100% growth in industry capacity in a matter of a few years. This move to value-added products has not only come from Europe and North America, but from innovative producers in the pulp industry who have recognized the economic benefit of developing such an industry and maximizing the potential of their forest resource.
As massive investment into capacity expansion in China in particular continues, the focus of innovation and efficiency will be at the forefront of many industry players’ corporate strategy. In this chapter, we look at some noteworthy examples of the industry’s challenges and its contribution to the green economy and sustainable development in the UNECE region.
8.2 Europe subregion The results for the European pulp and paper industry
during 2011 were affected, particularly in the second half of the year, by the slowing down of the EU economy. Paper and board production decreased by 0.6% over 2010, when there had been a significant recovery compared with 2009. The 2007-2009 period saw a cumulative drop of 10%. Demand for paper in Europe fell by 1.2% and internal deliveries of paper and board decreased by 2.2%.
In Central and Eastern Europe, the overall situation of the pulp and paper sector remains more or less the same as in 2010. Uncertainty best describes what the industry is experiencing. Most of the sector shows a slight improvement over 2010 and was recovering some of the ground lost in 2009.
8.2.1 European paper and board production decreases 0.6% with an operating rate of 90.4%
Production of paper decreased by 0.6% in 2011 compared with 2010 (graph and table 8.2.1). Paper production capacity did not change as much as actual production, which means that the operating rate for 2011 was 90.4%, which is 1.3 points lower than in 2010. There has been a reduction in the number of mills in production. In 2011, more than two million tonnes of production capacity – essentially in the graphic sector – closed in Europe, due to the crisis and the resulting overcapacity, while the arrival of new production capacity on the market was dramatically reduced. This “bearish” evolution was also observed in most of the “heavy” industry sectors and appears close to that of European manufacturing overall.
In Central and Eastern Europe, newsprint and magazine paper overcapacity appears to be critical; and
70
80
90
100
110
Inde
x (2
007=
100)
CIS Europe North America
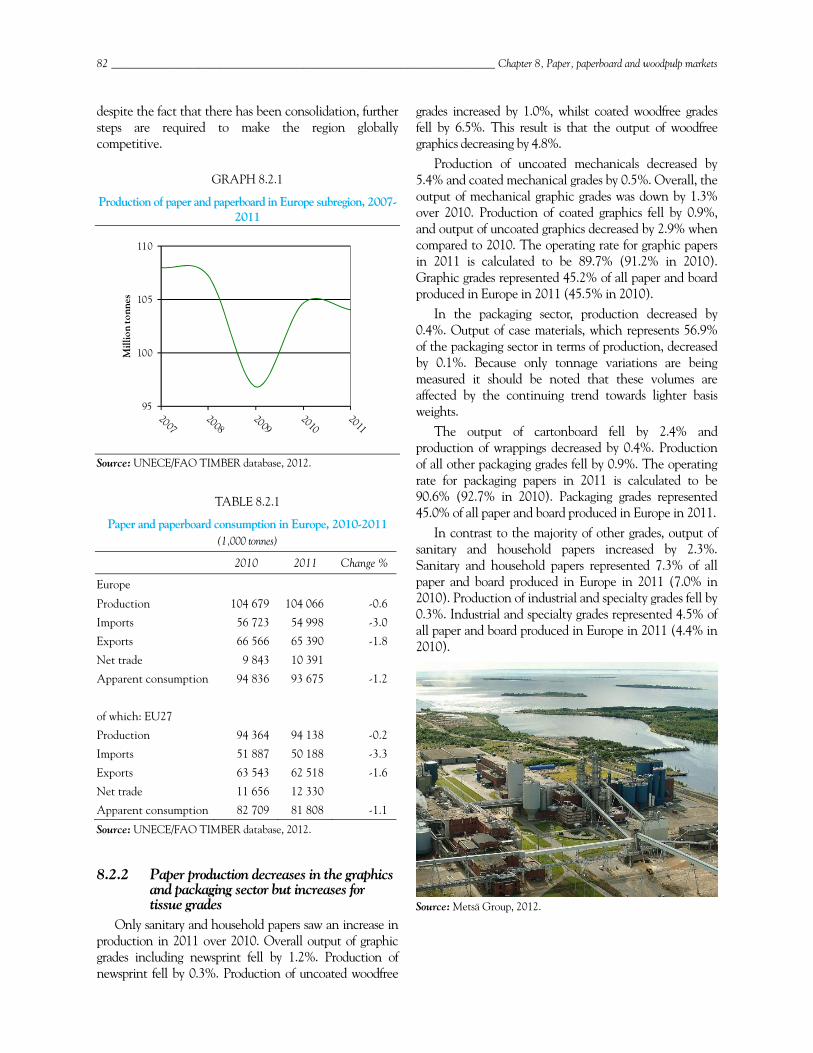
82 ______________________________________________________________________ Chapter 8, Paper, paperboard and woodpulp markets
despite the fact that there has been consolidation, further steps are required to make the region globally competitive.
GRAPH 8.2.1
Production of paper and paperboard in Europe subregion, 2007-2011
Source: UNECE/FAO TIMBER database, 2012.
TABLE 8.2.1
Paper and paperboard consumption in Europe, 2010-2011 (1,000 tonnes)
2010 2011 Change %
Europe
Production 104 679 104 066 -0.6
Imports 56 723 54 998 -3.0
Exports 66 566 65 390 -1.8
Net trade 9 843 10 391
Apparent consumption 94 836 93 675 -1.2
of which: EU27
Production 94 364 94 138 -0.2
Imports 51 887 50 188 -3.3
Exports 63 543 62 518 -1.6
Net trade 11 656 12 330
Apparent consumption 82 709 81 808 -1.1
Source: UNECE/FAO TIMBER database, 2012.
8.2.2 Paper production decreases in the graphics and packaging sector but increases for tissue grades
Only sanitary and household papers saw an increase in production in 2011 over 2010. Overall output of graphic grades including newsprint fell by 1.2%. Production of newsprint fell by 0.3%. Production of uncoated woodfree
grades increased by 1.0%, whilst coated woodfree grades fell by 6.5%. This result is that the output of woodfree graphics decreasing by 4.8%.
Production of uncoated mechanicals decreased by 5.4% and coated mechanical grades by 0.5%. Overall, the output of mechanical graphic grades was down by 1.3% over 2010. Production of coated graphics fell by 0.9%, and output of uncoated graphics decreased by 2.9% when compared to 2010. The operating rate for graphic papers in 2011 is calculated to be 89.7% (91.2% in 2010). Graphic grades represented 45.2% of all paper and board produced in Europe in 2011 (45.5% in 2010).
In the packaging sector, production decreased by 0.4%. Output of case materials, which represents 56.9% of the packaging sector in terms of production, decreased by 0.1%. Because only tonnage variations are being measured it should be noted that these volumes are affected by the continuing trend towards lighter basis weights.
The output of cartonboard fell by 2.4% and production of wrappings decreased by 0.4%. Production of all other packaging grades fell by 0.9%. The operating rate for packaging papers in 2011 is calculated to be 90.6% (92.7% in 2010). Packaging grades represented 45.0% of all paper and board produced in Europe in 2011.
In contrast to the majority of other grades, output of sanitary and household papers increased by 2.3%. Sanitary and household papers represented 7.3% of all paper and board produced in Europe in 2011 (7.0% in 2010). Production of industrial and specialty grades fell by 0.3%. Industrial and specialty grades represented 4.5% of all paper and board produced in Europe in 2011 (4.4% in 2010).
Source: Metsä Group, 2012.
95
100
105
110
Mill
ion
tonn
es
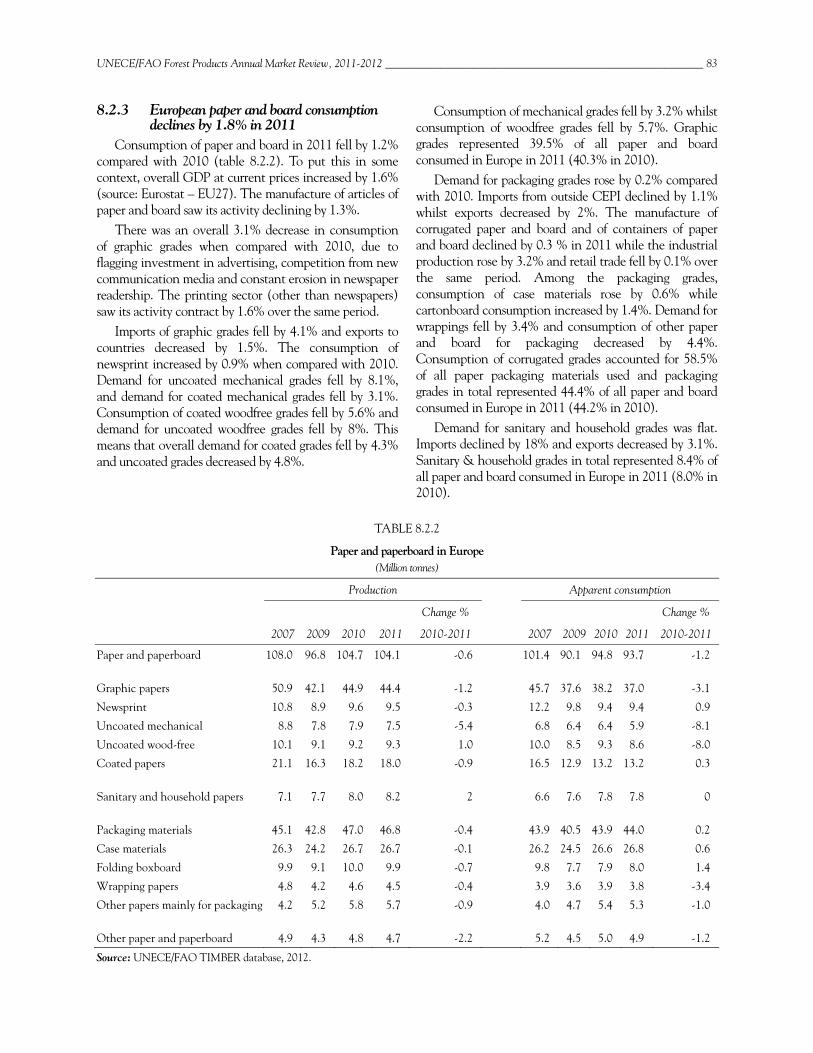
UNECE/FAO Forest Products Annual Market Review, 2011-2012 __________________________________________________________ 83
8.2.3 European paper and board consumption declines by 1.8% in 2011
Consumption of paper and board in 2011 fell by 1.2% compared with 2010 (table 8.2.2). To put this in some context, overall GDP at current prices increased by 1.6% (source: Eurostat – EU27). The manufacture of articles of paper and board saw its activity declining by 1.3%.
There was an overall 3.1% decrease in consumption of graphic grades when compared with 2010, due to flagging investment in advertising, competition from new communication media and constant erosion in newspaper readership. The printing sector (other than newspapers) saw its activity contract by 1.6% over the same period.
Imports of graphic grades fell by 4.1% and exports to countries decreased by 1.5%. The consumption of newsprint increased by 0.9% when compared with 2010. Demand for uncoated mechanical grades fell by 8.1%, and demand for coated mechanical grades fell by 3.1%. Consumption of coated woodfree grades fell by 5.6% and demand for uncoated woodfree grades fell by 8%. This means that overall demand for coated grades fell by 4.3% and uncoated grades decreased by 4.8%.
Consumption of mechanical grades fell by 3.2% whilst consumption of woodfree grades fell by 5.7%. Graphic grades represented 39.5% of all paper and board consumed in Europe in 2011 (40.3% in 2010).
Demand for packaging grades rose by 0.2% compared with 2010. Imports from outside CEPI declined by 1.1% whilst exports decreased by 2%. The manufacture of corrugated paper and board and of containers of paper and board declined by 0.3 % in 2011 while the industrial production rose by 3.2% and retail trade fell by 0.1% over the same period. Among the packaging grades, consumption of case materials rose by 0.6% while cartonboard consumption increased by 1.4%. Demand for wrappings fell by 3.4% and consumption of other paper and board for packaging decreased by 4.4%. Consumption of corrugated grades accounted for 58.5% of all paper packaging materials used and packaging grades in total represented 44.4% of all paper and board consumed in Europe in 2011 (44.2% in 2010).
Demand for sanitary and household grades was flat. Imports declined by 18% and exports decreased by 3.1%. Sanitary & household grades in total represented 8.4% of all paper and board consumed in Europe in 2011 (8.0% in 2010).
TABLE 8.2.2
Paper and paperboard in Europe (Million tonnes)
Production Apparent consumption
Change % Change %
2007 2009 2010 2011 2010-2011 2007 2009 2010 2011 2010-2011
Paper and paperboard 108.0 96.8 104.7 104.1 -0.6 101.4 90.1 94.8 93.7 -1.2
Graphic papers 50.9 42.1 44.9 44.4 -1.2 45.7 37.6 38.2 37.0 -3.1
Newsprint 10.8 8.9 9.6 9.5 -0.3 12.2 9.8 9.4 9.4 0.9
Uncoated mechanical 8.8 7.8 7.9 7.5 -5.4 6.8 6.4 6.4 5.9 -8.1
Uncoated wood-free 10.1 9.1 9.2 9.3 1.0 10.0 8.5 9.3 8.6 -8.0
Coated papers 21.1 16.3 18.2 18.0 -0.9 16.5 12.9 13.2 13.2 0.3 Sanitary and household papers 7.1 7.7 8.0 8.2 2 6.6 7.6 7.8 7.8 0 Packaging materials 45.1 42.8 47.0 46.8 -0.4 43.9 40.5 43.9 44.0 0.2
Case materials 26.3 24.2 26.7 26.7 -0.1 26.2 24.5 26.6 26.8 0.6
Folding boxboard 9.9 9.1 10.0 9.9 -0.7 9.8 7.7 7.9 8.0 1.4
Wrapping papers 4.8 4.2 4.6 4.5 -0.4 3.9 3.6 3.9 3.8 -3.4
Other papers mainly for packaging 4.2 5.2 5.8 5.7 -0.9 4.0 4.7 5.4 5.3 -1.0 Other paper and paperboard 4.9 4.3 4.8 4.7 -2.2 5.2 4.5 5.0 4.9 -1.2
Source: UNECE/FAO TIMBER database, 2012.

84 ______________________________________________________________________ Chapter 8, Paper, paperboard and woodpulp markets
8.2.4 Exports decline while imports increase, but trade balance remains overwhelmingly positive
Total paper deliveries fell by 0.6% in 2011 compared with 2010, with exports of paper outside Europe accounting for 18.4% (18.1% in 2010). Deliveries to Asian markets increased by 7.0% at 5.5 million tonnes, representing a further 30.4% of exports (28.3% in 2010). Deliveries to North America decreased by 5.3% and represented 10.8% of total exports, compared with 18.5% that region accounted for in 2004.
Imports of paper rose by 1.2% and contributed 5.6% of total European paper consumption in 2011 (5.4% in 2010). Imports from North America accounted for 38.8% of all imports (40.9% in 2010) and decreased by 4.0% in 2011. Imports from Asia fell by 16.7% and accounted for 11.5% of all imports (14.0% in 2010). Europe maintained an overall positive trade balance (exports exceeding imports) in paper in 2011.
It is also important to report on the EU’s adoption of anti-dumping measures in 2011, and a European first: anti-subsidy measures against China and its exports of coated wood-free paper. These measures, which will apply for a five-year period, combined with measures previously taken by the United States, have had a significant impact on Chinese exports.
8.2.5 Pulp production remains unchanged with an operating rate of 87.7%
Output of pulp remained virtually unchanged with a total output, of both integrated and market pulp (table 8.2.3). Exports of pulp to Asia increased by 40.2%, representing the main destination (74.2%).
Market pulp production rose by 1.8% compared with 2010 (33.0% of total pulp production, 32.7% in 2010). Chemical pulp for sale on the open market represents 94% of all market pulp. Output of this grade rose by 3.0% compared with 2010. These developments can be explained by the closure of integrated paper production units, mainly in the graphic sector, which requires virgin wood fibres. This made it possible to free up market pulp capacities, which grew sharply in Finland and to a lesser degree in Germany and Spain, to benefit from growing markets and lucrative prices.
Total production of chemical pulp rose by 1.2%. Total production of sulphite pulp decreased by 2.5% whereas total output of sulphate pulp rose by 1.5%. Production of both mechanical (-2.3%) and semi-chemical pulp (-5%) decreased.
Production in the first quarter of 2012 fell by 3.6% over the same quarter of the previous year. Total pulp production for that quarter was 2.8% below the level reached over the same period of 2011.
Source: UPM, 2012.
8.2.6 Trends in raw materials used for pulp production in Europe
Despite the specificities associated with each kind of wood and each country – these markets being rather regional – the price rise movement that has taken place in Europe since the end of 2009 for the majority of softwood and hardwood species for pulp manufacturing, went on through 2010 to reach a high-point mid-2011. The growing competition of “wood for energy” is also visible, which is widely encouraged and subsidized by public authorities within the context of their projects to promote bioenergy.
In central and eastern Europe, the wood supply situation parallels the trends found in the rest of Europe. There were no significant natural disasters in this part of Europe in 2011. While the lack of storm damage is good for forestry, the storm salvage from recent years helped with the availability of wood for the pulp and paper sector.
The European Union’s common policies in many areas also have an influence on wood availability. Continuous pressure on environmental issues reduces forest areas suitable for active sustainable forestry management. The administrative burden placed on forest owners reduces the willingness to harvest their forest resources, which is further magnified by the fact that many forest owners are not dependent on forestry activities for their income.
Policies related to “green energy” production are bringing positive effects for some forest owners by improving their total potential revenues. But this also leads to consumption of the wood directly as fuel. Instead of focusing on market-based added value and cascaded use of wood (energy at the end of the wood product lifecycle), wood energy production is subsidized, driving up the costs of wood fibre.
The wood-working manufacturers feel that they are put at a disadvantage, with arguments related to the need to provide incentives to build and feed a wood energy sector in order to meet EU renewable energy targets. This
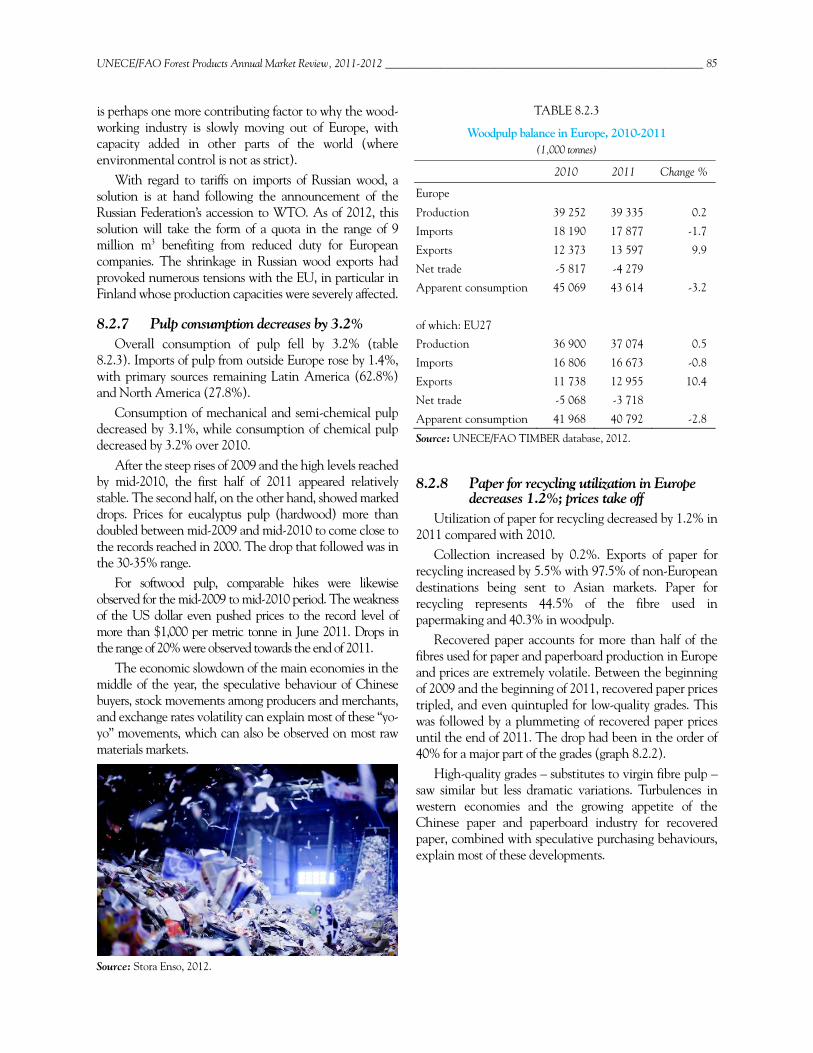
UNECE/FAO Forest Products Annual Market Review, 2011-2012 __________________________________________________________ 85
is perhaps one more contributing factor to why the wood-working industry is slowly moving out of Europe, with capacity added in other parts of the world (where environmental control is not as strict).
With regard to tariffs on imports of Russian wood, a solution is at hand following the announcement of the Russian Federation’s accession to WTO. As of 2012, this solution will take the form of a quota in the range of 9 million m3 benefiting from reduced duty for European companies. The shrinkage in Russian wood exports had provoked numerous tensions with the EU, in particular in Finland whose production capacities were severely affected.
8.2.7 Pulp consumption decreases by 3.2% Overall consumption of pulp fell by 3.2% (table
8.2.3). Imports of pulp from outside Europe rose by 1.4%, with primary sources remaining Latin America (62.8%) and North America (27.8%).
Consumption of mechanical and semi-chemical pulp decreased by 3.1%, while consumption of chemical pulp decreased by 3.2% over 2010.
After the steep rises of 2009 and the high levels reached by mid-2010, the first half of 2011 appeared relatively stable. The second half, on the other hand, showed marked drops. Prices for eucalyptus pulp (hardwood) more than doubled between mid-2009 and mid-2010 to come close to the records reached in 2000. The drop that followed was in the 30-35% range.
For softwood pulp, comparable hikes were likewise observed for the mid-2009 to mid-2010 period. The weakness of the US dollar even pushed prices to the record level of more than $1,000 per metric tonne in June 2011. Drops in the range of 20% were observed towards the end of 2011.
The economic slowdown of the main economies in the middle of the year, the speculative behaviour of Chinese buyers, stock movements among producers and merchants, and exchange rates volatility can explain most of these “yo-yo” movements, which can also be observed on most raw materials markets.
Source: Stora Enso, 2012.
TABLE 8.2.3
Woodpulp balance in Europe, 2010-2011 (1,000 tonnes)
2010 2011 Change %
Europe
Production 39 252 39 335 0.2
Imports 18 190 17 877 -1.7
Exports 12 373 13 597 9.9
Net trade -5 817 -4 279
Apparent consumption 45 069 43 614 -3.2
of which: EU27
Production 36 900 37 074 0.5
Imports 16 806 16 673 -0.8
Exports 11 738 12 955 10.4
Net trade -5 068 -3 718
Apparent consumption 41 968 40 792 -2.8
Source: UNECE/FAO TIMBER database, 2012.
8.2.8 Paper for recycling utilization in Europe decreases 1.2%; prices take off
Utilization of paper for recycling decreased by 1.2% in 2011 compared with 2010.
Collection increased by 0.2%. Exports of paper for recycling increased by 5.5% with 97.5% of non-European destinations being sent to Asian markets. Paper for recycling represents 44.5% of the fibre used in papermaking and 40.3% in woodpulp.
Recovered paper accounts for more than half of the fibres used for paper and paperboard production in Europe and prices are extremely volatile. Between the beginning of 2009 and the beginning of 2011, recovered paper prices tripled, and even quintupled for low-quality grades. This was followed by a plummeting of recovered paper prices until the end of 2011. The drop had been in the order of 40% for a major part of the grades (graph 8.2.2).
High-quality grades – substitutes to virgin fibre pulp – saw similar but less dramatic variations. Turbulences in western economies and the growing appetite of the Chinese paper and paperboard industry for recovered paper, combined with speculative purchasing behaviours, explain most of these developments.
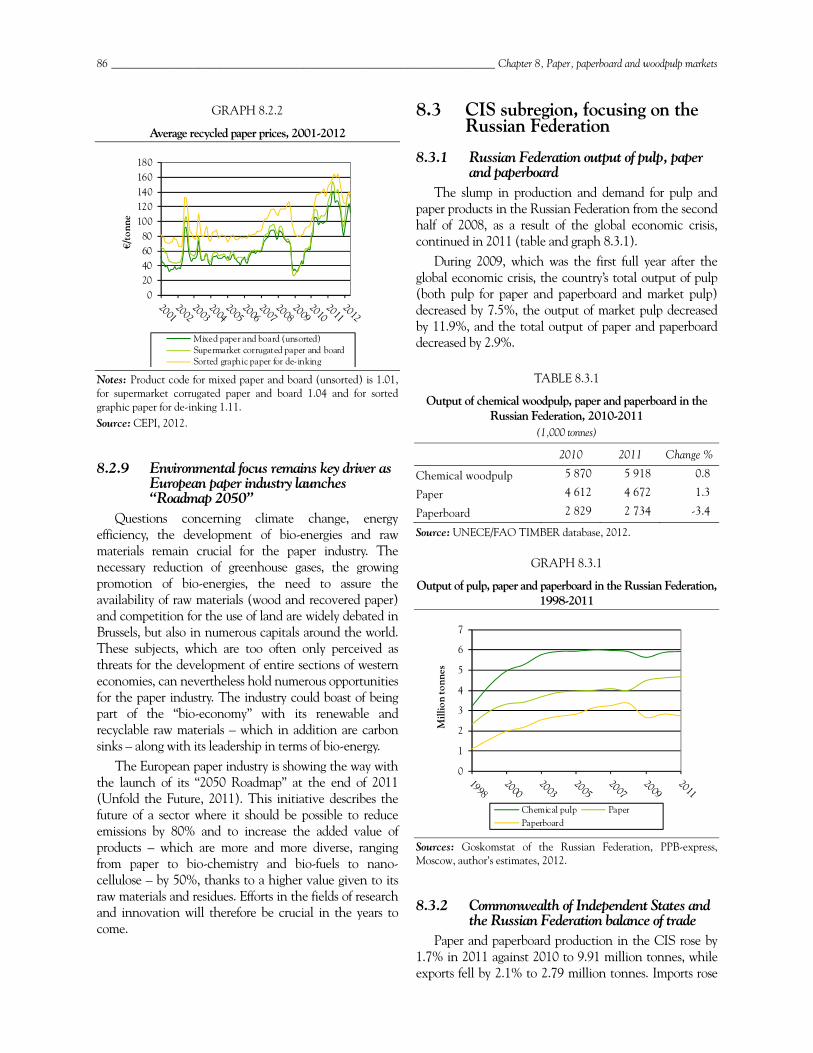
86 ______________________________________________________________________ Chapter 8, Paper, paperboard and woodpulp markets
GRAPH 8.2.2
Average recycled paper prices, 2001-2012
Notes: Product code for mixed paper and board (unsorted) is 1.01, for supermarket corrugated paper and board 1.04 and for sorted graphic paper for de-inking 1.11. Source: CEPI, 2012.
8.2.9 Environmental focus remains key driver as European paper industry launches “Roadmap 2050”
Questions concerning climate change, energy efficiency, the development of bio-energies and raw materials remain crucial for the paper industry. The necessary reduction of greenhouse gases, the growing promotion of bio-energies, the need to assure the availability of raw materials (wood and recovered paper) and competition for the use of land are widely debated in Brussels, but also in numerous capitals around the world. These subjects, which are too often only perceived as threats for the development of entire sections of western economies, can nevertheless hold numerous opportunities for the paper industry. The industry could boast of being part of the “bio-economy” with its renewable and recyclable raw materials – which in addition are carbon sinks – along with its leadership in terms of bio-energy.
The European paper industry is showing the way with the launch of its “2050 Roadmap” at the end of 2011 (Unfold the Future, 2011). This initiative describes the future of a sector where it should be possible to reduce emissions by 80% and to increase the added value of products – which are more and more diverse, ranging from paper to bio-chemistry and bio-fuels to nano-cellulose – by 50%, thanks to a higher value given to its raw materials and residues. Efforts in the fields of research and innovation will therefore be crucial in the years to come.
8.3 CIS subregion, focusing on the Russian Federation
8.3.1 Russian Federation output of pulp, paper and paperboard
The slump in production and demand for pulp and paper products in the Russian Federation from the second half of 2008, as a result of the global economic crisis, continued in 2011 (table and graph 8.3.1).
During 2009, which was the first full year after the global economic crisis, the country’s total output of pulp (both pulp for paper and paperboard and market pulp) decreased by 7.5%, the output of market pulp decreased by 11.9%, and the total output of paper and paperboard decreased by 2.9%.
TABLE 8.3.1
Output of chemical woodpulp, paper and paperboard in the Russian Federation, 2010-2011
(1,000 tonnes)
2010 2011 Change %
Chemical woodpulp 5 870 5 918 0.8
Paper 4 612 4 672 1.3
Paperboard 2 829 2 734 -3.4
Source: UNECE/FAO TIMBER database, 2012.
GRAPH 8.3.1
Output of pulp, paper and paperboard in the Russian Federation, 1998-2011
Sources: Goskomstat of the Russian Federation, PPB-express, Moscow, author’s estimates, 2012.
8.3.2 Commonwealth of Independent States and the Russian Federation balance of trade
Paper and paperboard production in the CIS rose by 1.7% in 2011 against 2010 to 9.91 million tonnes, while exports fell by 2.1% to 2.79 million tonnes. Imports rose
020406080
100120140160180
€/to
nne
Mixed paper and board (unsorted)Supermarket corrugated paper and boardSorted graphic paper for de-inking
0
1
2
3
4
5
6
7
Mill
ion
tonn
es
Chemical pulp PaperPaperboard
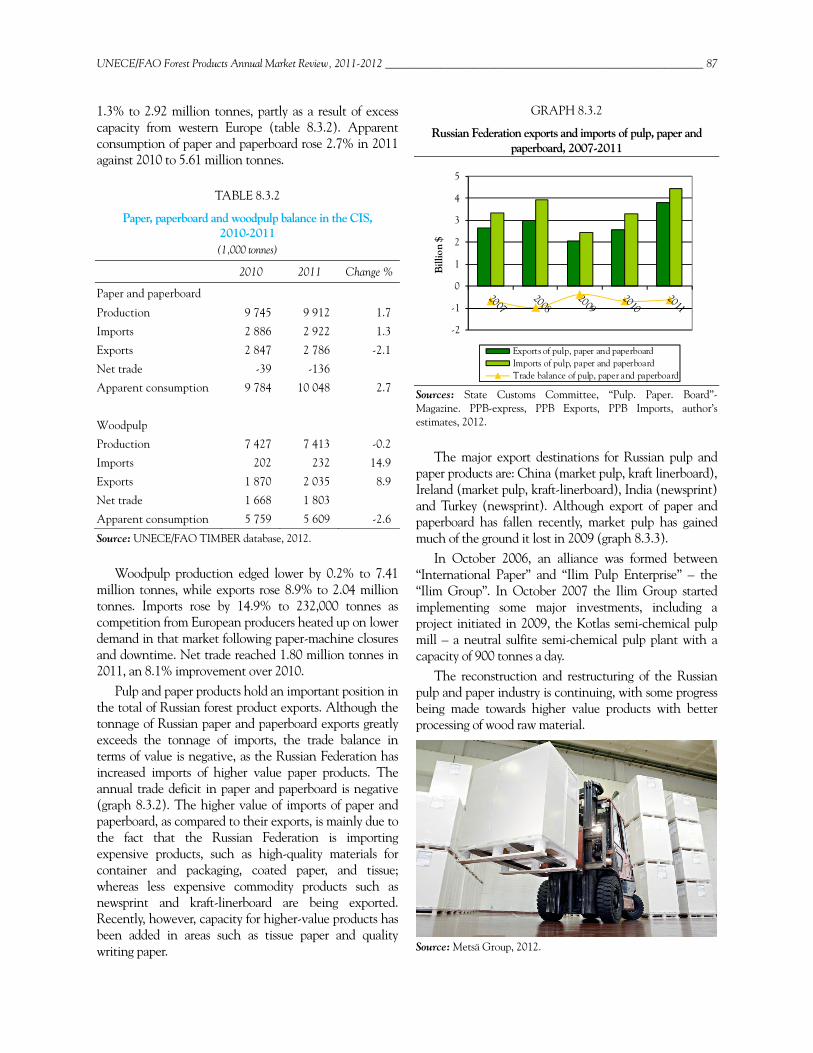
UNECE/FAO Forest Products Annual Market Review, 2011-2012 __________________________________________________________ 87
1.3% to 2.92 million tonnes, partly as a result of excess capacity from western Europe (table 8.3.2). Apparent consumption of paper and paperboard rose 2.7% in 2011 against 2010 to 5.61 million tonnes.
TABLE 8.3.2
Paper, paperboard and woodpulp balance in the CIS, 2010-2011 (1,000 tonnes)
2010 2011 Change %
Paper and paperboard
Production 9 745 9 912 1.7
Imports 2 886 2 922 1.3
Exports 2 847 2 786 -2.1
Net trade -39 -136
Apparent consumption 9 784 10 048 2.7
Woodpulp
Production 7 427 7 413 -0.2
Imports 202 232 14.9
Exports 1 870 2 035 8.9
Net trade 1 668 1 803
Apparent consumption 5 759 5 609 -2.6
Source: UNECE/FAO TIMBER database, 2012.
Woodpulp production edged lower by 0.2% to 7.41 million tonnes, while exports rose 8.9% to 2.04 million tonnes. Imports rose by 14.9% to 232,000 tonnes as competition from European producers heated up on lower demand in that market following paper-machine closures and downtime. Net trade reached 1.80 million tonnes in 2011, an 8.1% improvement over 2010.
Pulp and paper products hold an important position in the total of Russian forest product exports. Although the tonnage of Russian paper and paperboard exports greatly exceeds the tonnage of imports, the trade balance in terms of value is negative, as the Russian Federation has increased imports of higher value paper products. The annual trade deficit in paper and paperboard is negative (graph 8.3.2). The higher value of imports of paper and paperboard, as compared to their exports, is mainly due to the fact that the Russian Federation is importing expensive products, such as high-quality materials for container and packaging, coated paper, and tissue; whereas less expensive commodity products such as newsprint and kraft-linerboard are being exported. Recently, however, capacity for higher-value products has been added in areas such as tissue paper and quality writing paper.
GRAPH 8.3.2
Russian Federation exports and imports of pulp, paper and paperboard, 2007-2011
Sources: State Customs Committee, “Pulp. Paper. Board”-Magazine. PPB-express, PPB Exports, PPB Imports, author’s estimates, 2012.
The major export destinations for Russian pulp and paper products are: China (market pulp, kraft linerboard), Ireland (market pulp, kraft-linerboard), India (newsprint) and Turkey (newsprint). Although export of paper and paperboard has fallen recently, market pulp has gained much of the ground it lost in 2009 (graph 8.3.3).
In October 2006, an alliance was formed between “International Paper” and “Ilim Pulp Enterprise” – the “Ilim Group”. In October 2007 the Ilim Group started implementing some major investments, including a project initiated in 2009, the Kotlas semi-chemical pulp mill – a neutral sulfite semi-chemical pulp plant with a capacity of 900 tonnes a day.
The reconstruction and restructuring of the Russian pulp and paper industry is continuing, with some progress being made towards higher value products with better processing of wood raw material.
Source: Metsä Group, 2012.
-2
-1
0
1
2
3
4
5
Bill
ion
$
Exports of pulp, paper and paperboardImports of pulp, paper and paperboardTrade balance of pulp, paper and paperboard
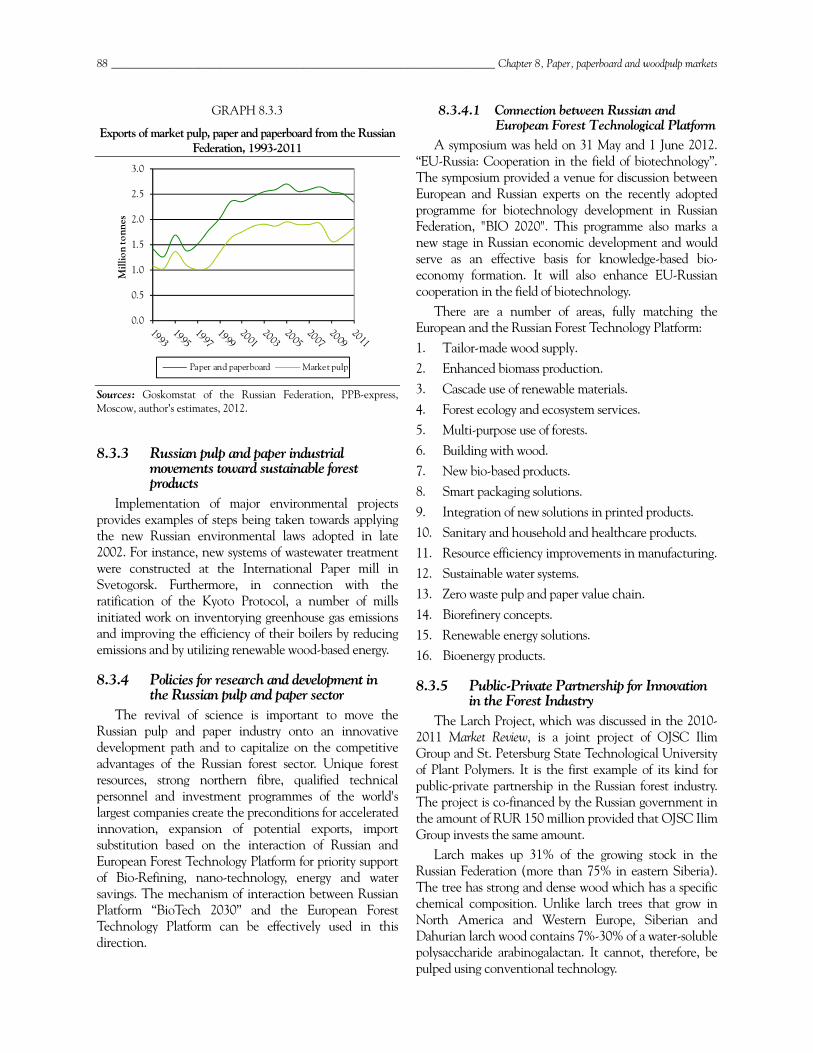
88 ______________________________________________________________________ Chapter 8, Paper, paperboard and woodpulp markets
GRAPH 8.3.3
Exports of market pulp, paper and paperboard from the Russian Federation, 1993-2011
Sources: Goskomstat of the Russian Federation, PPB-express, Moscow, author’s estimates, 2012.
8.3.3 Russian pulp and paper industrial movements toward sustainable forest products
Implementation of major environmental projects provides examples of steps being taken towards applying the new Russian environmental laws adopted in late 2002. For instance, new systems of wastewater treatment were constructed at the International Paper mill in Svetogorsk. Furthermore, in connection with the ratification of the Kyoto Protocol, a number of mills initiated work on inventorying greenhouse gas emissions and improving the efficiency of their boilers by reducing emissions and by utilizing renewable wood-based energy.
8.3.4 Policies for research and development in the Russian pulp and paper sector
The revival of science is important to move the Russian pulp and paper industry onto an innovative development path and to capitalize on the competitive advantages of the Russian forest sector. Unique forest resources, strong northern fibre, qualified technical personnel and investment programmes of the world's largest companies create the preconditions for accelerated innovation, expansion of potential exports, import substitution based on the interaction of Russian and European Forest Technology Platform for priority support of Bio-Refining, nano-technology, energy and water savings. The mechanism of interaction between Russian Platform “BioTech 2030” and the European Forest Technology Platform can be effectively used in this direction.
8.3.4.1 Connection between Russian and European Forest Technological Platform
A symposium was held on 31 May and 1 June 2012. “EU-Russia: Cooperation in the field of biotechnology”. The symposium provided a venue for discussion between European and Russian experts on the recently adopted programme for biotechnology development in Russian Federation, "BIO 2020". This programme also marks a new stage in Russian economic development and would serve as an effective basis for knowledge-based bio-economy formation. It will also enhance EU-Russian cooperation in the field of biotechnology.
There are a number of areas, fully matching the European and the Russian Forest Technology Platform: 1. Tailor-made wood supply. 2. Enhanced biomass production. 3. Cascade use of renewable materials. 4. Forest ecology and ecosystem services. 5. Multi-purpose use of forests. 6. Building with wood. 7. New bio-based products. 8. Smart packaging solutions. 9. Integration of new solutions in printed products. 10. Sanitary and household and healthcare products. 11. Resource efficiency improvements in manufacturing. 12. Sustainable water systems. 13. Zero waste pulp and paper value chain. 14. Biorefinery concepts. 15. Renewable energy solutions. 16. Bioenergy products.
8.3.5 Public-Private Partnership for Innovation in the Forest Industry
The Larch Project, which was discussed in the 2010-2011 Market Review, is a joint project of OJSC Ilim Group and St. Petersburg State Technological University of Plant Polymers. It is the first example of its kind for public-private partnership in the Russian forest industry. The project is co-financed by the Russian government in the amount of RUR 150 million provided that OJSC Ilim Group invests the same amount.
Larch makes up 31% of the growing stock in the Russian Federation (more than 75% in eastern Siberia). The tree has strong and dense wood which has a specific chemical composition. Unlike larch trees that grow in North America and Western Europe, Siberian and Dahurian larch wood contains 7%-30% of a water-soluble polysaccharide arabinogalactan. It cannot, therefore, be pulped using conventional technology.
0.0
0.5
1.0
1.5
2.0
2.5
3.0
Mill
ion
tonn
es
Paper and paperboard Market pulp
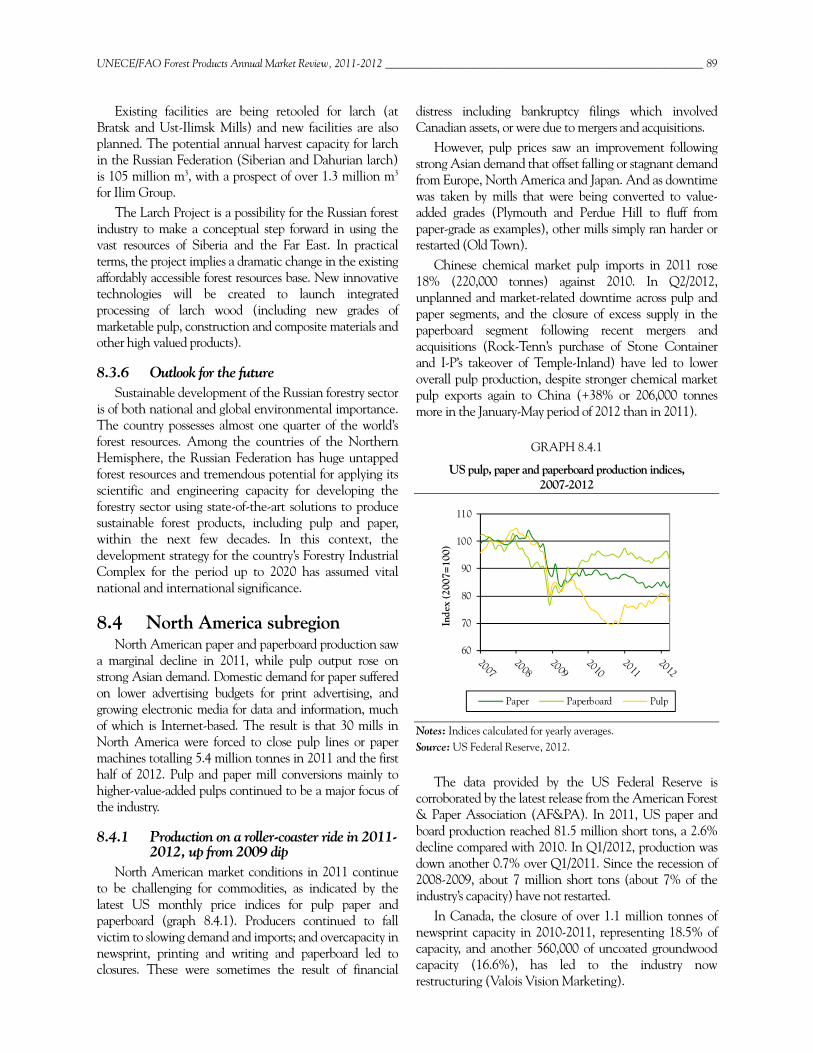
UNECE/FAO Forest Products Annual Market Review, 2011-2012 __________________________________________________________ 89
Existing facilities are being retooled for larch (at Bratsk and Ust-Ilimsk Mills) and new facilities are also planned. The potential annual harvest capacity for larch in the Russian Federation (Siberian and Dahurian larch) is 105 million m3, with a prospect of over 1.3 million m3 for Ilim Group.
The Larch Project is a possibility for the Russian forest industry to make a conceptual step forward in using the vast resources of Siberia and the Far East. In practical terms, the project implies a dramatic change in the existing affordably accessible forest resources base. New innovative technologies will be created to launch integrated processing of larch wood (including new grades of marketable pulp, construction and composite materials and other high valued products).
8.3.6 Outlook for the future Sustainable development of the Russian forestry sector
is of both national and global environmental importance. The country possesses almost one quarter of the world’s forest resources. Among the countries of the Northern Hemisphere, the Russian Federation has huge untapped forest resources and tremendous potential for applying its scientific and engineering capacity for developing the forestry sector using state-of-the-art solutions to produce sustainable forest products, including pulp and paper, within the next few decades. In this context, the development strategy for the country’s Forestry Industrial Complex for the period up to 2020 has assumed vital national and international significance.
8.4 North America subregion North American paper and paperboard production saw
a marginal decline in 2011, while pulp output rose on strong Asian demand. Domestic demand for paper suffered on lower advertising budgets for print advertising, and growing electronic media for data and information, much of which is Internet-based. The result is that 30 mills in North America were forced to close pulp lines or paper machines totalling 5.4 million tonnes in 2011 and the first half of 2012. Pulp and paper mill conversions mainly to higher-value-added pulps continued to be a major focus of the industry.
8.4.1 Production on a roller-coaster ride in 2011-2012, up from 2009 dip
North American market conditions in 2011 continue to be challenging for commodities, as indicated by the latest US monthly price indices for pulp paper and paperboard (graph 8.4.1). Producers continued to fall victim to slowing demand and imports; and overcapacity in newsprint, printing and writing and paperboard led to closures. These were sometimes the result of financial
distress including bankruptcy filings which involved Canadian assets, or were due to mergers and acquisitions.
However, pulp prices saw an improvement following strong Asian demand that offset falling or stagnant demand from Europe, North America and Japan. And as downtime was taken by mills that were being converted to value-added grades (Plymouth and Perdue Hill to fluff from paper-grade as examples), other mills simply ran harder or restarted (Old Town).
Chinese chemical market pulp imports in 2011 rose 18% (220,000 tonnes) against 2010. In Q2/2012, unplanned and market-related downtime across pulp and paper segments, and the closure of excess supply in the paperboard segment following recent mergers and acquisitions (Rock-Tenn’s purchase of Stone Container and I-P’s takeover of Temple-Inland) have led to lower overall pulp production, despite stronger chemical market pulp exports again to China (+38% or 206,000 tonnes more in the January-May period of 2012 than in 2011).
GRAPH 8.4.1
US pulp, paper and paperboard production indices, 2007-2012
Notes: Indices calculated for yearly averages. Source: US Federal Reserve, 2012.
The data provided by the US Federal Reserve is corroborated by the latest release from the American Forest & Paper Association (AF&PA). In 2011, US paper and board production reached 81.5 million short tons, a 2.6% decline compared with 2010. In Q1/2012, production was down another 0.7% over Q1/2011. Since the recession of 2008-2009, about 7 million short tons (about 7% of the industry’s capacity) have not restarted.
In Canada, the closure of over 1.1 million tonnes of newsprint capacity in 2010-2011, representing 18.5% of capacity, and another 560,000 of uncoated groundwood capacity (16.6%), has led to the industry now restructuring (Valois Vision Marketing).
60
70
80
90
100
110
Inde
x (2
007=
100)
Paper Paperboard Pulp
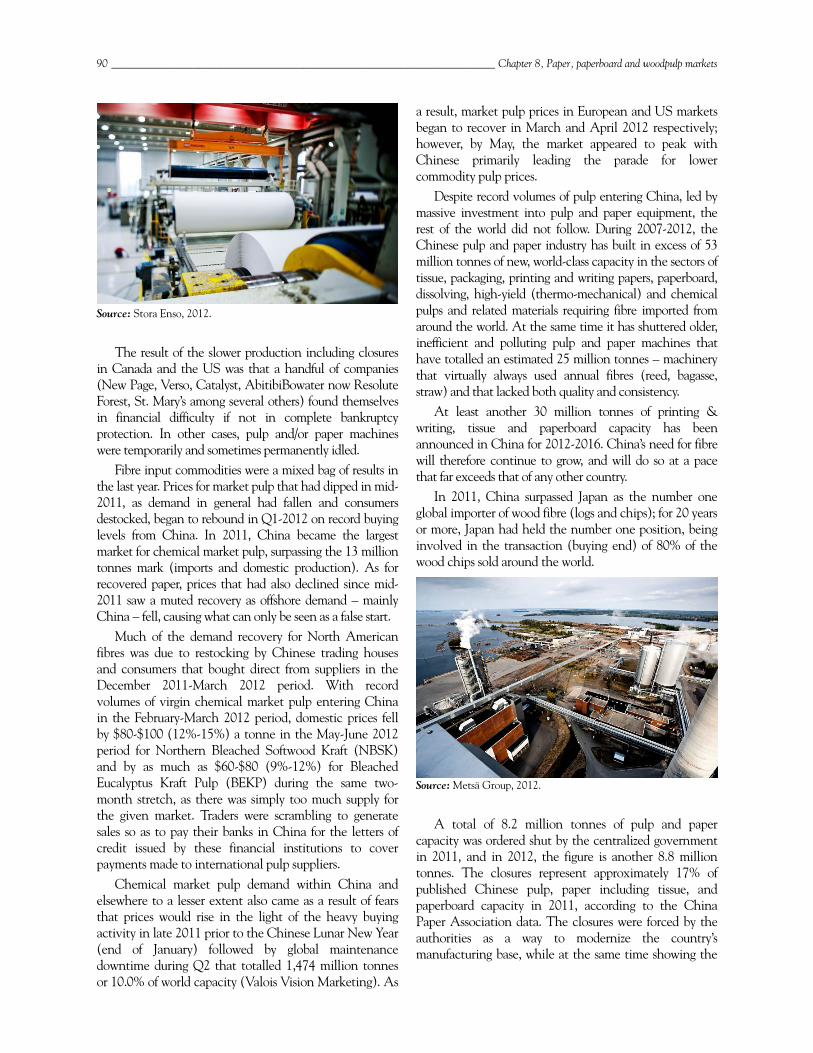
90 ______________________________________________________________________ Chapter 8, Paper, paperboard and woodpulp markets
Source: Stora Enso, 2012.
The result of the slower production including closures
in Canada and the US was that a handful of companies (New Page, Verso, Catalyst, AbitibiBowater now Resolute Forest, St. Mary’s among several others) found themselves in financial difficulty if not in complete bankruptcy protection. In other cases, pulp and/or paper machines were temporarily and sometimes permanently idled.
Fibre input commodities were a mixed bag of results in the last year. Prices for market pulp that had dipped in mid-2011, as demand in general had fallen and consumers destocked, began to rebound in Q1-2012 on record buying levels from China. In 2011, China became the largest market for chemical market pulp, surpassing the 13 million tonnes mark (imports and domestic production). As for recovered paper, prices that had also declined since mid-2011 saw a muted recovery as offshore demand – mainly China – fell, causing what can only be seen as a false start.
Much of the demand recovery for North American fibres was due to restocking by Chinese trading houses and consumers that bought direct from suppliers in the December 2011-March 2012 period. With record volumes of virgin chemical market pulp entering China in the February-March 2012 period, domestic prices fell by $80-$100 (12%-15%) a tonne in the May-June 2012 period for Northern Bleached Softwood Kraft (NBSK) and by as much as $60-$80 (9%-12%) for Bleached Eucalyptus Kraft Pulp (BEKP) during the same two-month stretch, as there was simply too much supply for the given market. Traders were scrambling to generate sales so as to pay their banks in China for the letters of credit issued by these financial institutions to cover payments made to international pulp suppliers.
Chemical market pulp demand within China and elsewhere to a lesser extent also came as a result of fears that prices would rise in the light of the heavy buying activity in late 2011 prior to the Chinese Lunar New Year (end of January) followed by global maintenance downtime during Q2 that totalled 1,474 million tonnes or 10.0% of world capacity (Valois Vision Marketing). As
a result, market pulp prices in European and US markets began to recover in March and April 2012 respectively; however, by May, the market appeared to peak with Chinese primarily leading the parade for lower commodity pulp prices.
Despite record volumes of pulp entering China, led by massive investment into pulp and paper equipment, the rest of the world did not follow. During 2007-2012, the Chinese pulp and paper industry has built in excess of 53 million tonnes of new, world-class capacity in the sectors of tissue, packaging, printing and writing papers, paperboard, dissolving, high-yield (thermo-mechanical) and chemical pulps and related materials requiring fibre imported from around the world. At the same time it has shuttered older, inefficient and polluting pulp and paper machines that have totalled an estimated 25 million tonnes – machinery that virtually always used annual fibres (reed, bagasse, straw) and that lacked both quality and consistency.
At least another 30 million tonnes of printing & writing, tissue and paperboard capacity has been announced in China for 2012-2016. China’s need for fibre will therefore continue to grow, and will do so at a pace that far exceeds that of any other country.
In 2011, China surpassed Japan as the number one global importer of wood fibre (logs and chips); for 20 years or more, Japan had held the number one position, being involved in the transaction (buying end) of 80% of the wood chips sold around the world.
Source: Metsä Group, 2012. A total of 8.2 million tonnes of pulp and paper
capacity was ordered shut by the centralized government in 2011, and in 2012, the figure is another 8.8 million tonnes. The closures represent approximately 17% of published Chinese pulp, paper including tissue, and paperboard capacity in 2011, according to the China Paper Association data. The closures were forced by the authorities as a way to modernize the country’s manufacturing base, while at the same time showing the
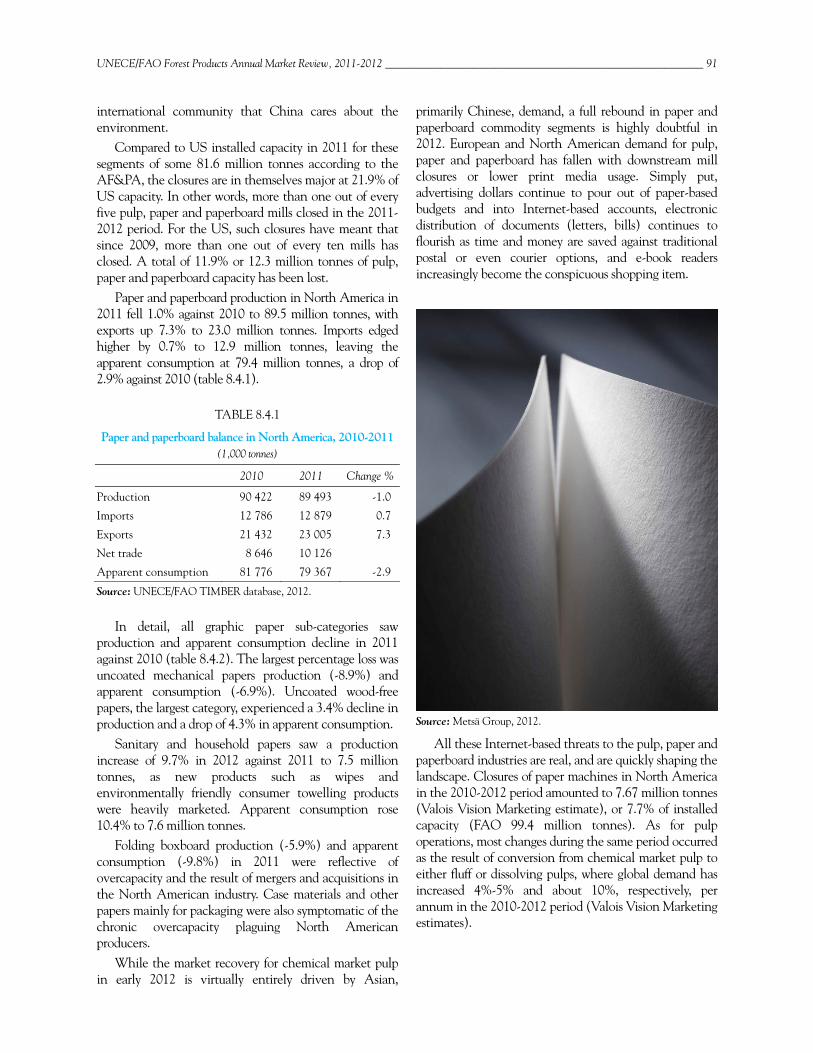
UNECE/FAO Forest Products Annual Market Review, 2011-2012 __________________________________________________________ 91
international community that China cares about the environment.
Compared to US installed capacity in 2011 for these segments of some 81.6 million tonnes according to the AF&PA, the closures are in themselves major at 21.9% of US capacity. In other words, more than one out of every five pulp, paper and paperboard mills closed in the 2011-2012 period. For the US, such closures have meant that since 2009, more than one out of every ten mills has closed. A total of 11.9% or 12.3 million tonnes of pulp, paper and paperboard capacity has been lost.
Paper and paperboard production in North America in 2011 fell 1.0% against 2010 to 89.5 million tonnes, with exports up 7.3% to 23.0 million tonnes. Imports edged higher by 0.7% to 12.9 million tonnes, leaving the apparent consumption at 79.4 million tonnes, a drop of 2.9% against 2010 (table 8.4.1).
TABLE 8.4.1
Paper and paperboard balance in North America, 2010-2011 (1,000 tonnes)
2010 2011 Change %
Production 90 422 89 493 -1.0
Imports 12 786 12 879 0.7
Exports 21 432 23 005 7.3
Net trade 8 646 10 126
Apparent consumption 81 776 79 367 -2.9
Source: UNECE/FAO TIMBER database, 2012.
In detail, all graphic paper sub-categories saw production and apparent consumption decline in 2011 against 2010 (table 8.4.2). The largest percentage loss was uncoated mechanical papers production (-8.9%) and apparent consumption (-6.9%). Uncoated wood-free papers, the largest category, experienced a 3.4% decline in production and a drop of 4.3% in apparent consumption.
Sanitary and household papers saw a production increase of 9.7% in 2012 against 2011 to 7.5 million tonnes, as new products such as wipes and environmentally friendly consumer towelling products were heavily marketed. Apparent consumption rose 10.4% to 7.6 million tonnes.
Folding boxboard production (-5.9%) and apparent consumption (-9.8%) in 2011 were reflective of overcapacity and the result of mergers and acquisitions in the North American industry. Case materials and other papers mainly for packaging were also symptomatic of the chronic overcapacity plaguing North American producers.
While the market recovery for chemical market pulp in early 2012 is virtually entirely driven by Asian,
primarily Chinese, demand, a full rebound in paper and paperboard commodity segments is highly doubtful in 2012. European and North American demand for pulp, paper and paperboard has fallen with downstream mill closures or lower print media usage. Simply put, advertising dollars continue to pour out of paper-based budgets and into Internet-based accounts, electronic distribution of documents (letters, bills) continues to flourish as time and money are saved against traditional postal or even courier options, and e-book readers increasingly become the conspicuous shopping item.
Source: Metsä Group, 2012.
All these Internet-based threats to the pulp, paper and paperboard industries are real, and are quickly shaping the landscape. Closures of paper machines in North America in the 2010-2012 period amounted to 7.67 million tonnes (Valois Vision Marketing estimate), or 7.7% of installed capacity (FAO 99.4 million tonnes). As for pulp operations, most changes during the same period occurred as the result of conversion from chemical market pulp to either fluff or dissolving pulps, where global demand has increased 4%-5% and about 10%, respectively, per annum in the 2010-2012 period (Valois Vision Marketing estimates).
92 ______________________________________________________________________ Chapter 8, Paper, paperboard and woodpulp markets
TABLE 8.4.2
Paper and paperboard in North America (Million tonnes)
Production Apparent consumption
Change % Change %
2007 2009 2010 2011 2010-2011 2007 2009 2010 2011 2010-2011
Paper and paperboard 101.3 84.2 90.4 89.5 -1.0 96.2 77.2 81.8 79.4 -2.9
Graphic papers 38.5 28.1 29.3 28.0 -4.6 38.6 26.7 27.4 26.0 -5.2
Newsprint 11.1 7.4 7.5 7.3 -1.6 8.6 5.4 4.9 4.7 -3.7
Uncoated mechanical 6.0 4.9 4.9 4.4 -8.9 6.3 4.8 4.8 4.5 -6.9
Uncoated wood-free 11.7 9.0 9.4 9.0 -3.4 11.8 9.0 9.4 9.0 -4.3
Coated papers 9.7 6.8 7.6 7.1 -6.2 11.9 7.6 8.3 7.8 -6.0
Sanitary and household papers 7.4 7.3 6.8 7.5 9.7 7.4 7.3 6.9 7.6 10.4
Packaging materials 50.9 44.6 49.9 50.0 0.2 45.6 38.9 43.0 40.8 -5.2
Case materials 33.5 30.7 32.7 32.7 0.1 30.5 27.4 28.9 28.1 -2.5
Folding boxboard 8.2 6.1 7.3 6.9 -5.9 7.3 5.1 5.9 5.3 -9.8
Wrapping papers 1.7 1.4 4.0 4.7 16.7 1.6 1.2 3.8 4.0 4.2
Other papers mainly for packaging 7.5 6.4 5.9 5.7 -2.9 6.2 5.2 4.4 3.4 -24.3
Other paper and paperboard 4.4 4.2 4.4 4.0 -8.2 4.6 4.3 4.5 5.0 11.4
Source: UNECE/FAO TIMBER database, 2012.
Converted capacity to fluff in North America amounted to 1.02 million tonnes or 6.7% of chemical market pulp capacity. Fluff pulp expansions during the 2010-2012 period would see North American capacity increase by 21.2% to 5.8 million tonnes. For specialty dissolving pulps, the incremental figure would add 443,000 tonnes, or 46.5% of the existing North American industry’s specialty dissolving pulp capacity (Valois Vision Marketing estimates).
During the same period, only 375,000 tonnes of chemical market pulp capacity was shuttered indefinitely. This followed a dark period in the industry when 2.78 million tonnes of chemical market pulp (18% of North American capacity) was shuttered during 2005-2009 (Valois Vision Marketing estimates).
Input costs in the 2011-2012 period have risen to the point where price increases for paper are cost-driven and not necessarily because of improved short-term demand. Paper merchants have yet to see a demand recovery, which has cast doubt on the success of price increase announcements for certain printing and writing paper grades in North America and Europe.
North American production of paper and board decreased by 1.0% in 2011 (table 8.4.2). Generally, while North American imports rose by 0.7% in 2011 to 12.9 million tonnes, aided by capacity closures, exports rose by 7.3% due to falling apparent consumption, and a weak US currency.
8.4.2 Output declines as industry rationalizes and consolidates – a sign of things to come
A rebound in market conditions in 2010 in the US paper industry, a major indicator of North American production trends, following the frail markets and weak pricing in 2008-2009 was reflected in the capacity utilization ratio that hovered just below 85%, up from lows of 72%-73% in late 2008 and early 2009. The rebound was short-lived with lower capacity utilization in much of the second half of 2011 compared with most of 2010. The early indication for 2012 is that the ratio will be consistently below 2011 levels.
US production indices show that output quantities of pulp, paper and paperboard all weakened in the second half of 2011 following a rebound in 2010 and during the first half of 2011 (graph 8.4.2).
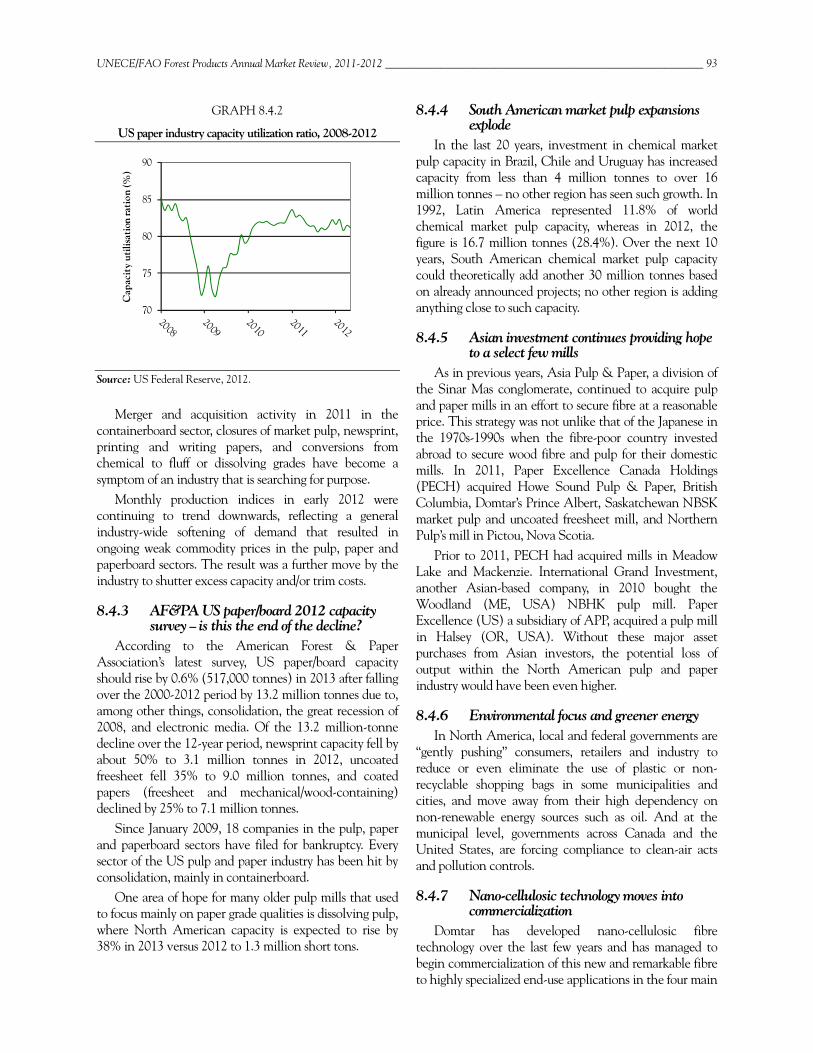
UNECE/FAO Forest Products Annual Market Review, 2011-2012 __________________________________________________________ 93
GRAPH 8.4.2
US paper industry capacity utilization ratio, 2008-2012
Source: US Federal Reserve, 2012.
Merger and acquisition activity in 2011 in the containerboard sector, closures of market pulp, newsprint, printing and writing papers, and conversions from chemical to fluff or dissolving grades have become a symptom of an industry that is searching for purpose.
Monthly production indices in early 2012 were continuing to trend downwards, reflecting a general industry-wide softening of demand that resulted in ongoing weak commodity prices in the pulp, paper and paperboard sectors. The result was a further move by the industry to shutter excess capacity and/or trim costs.
8.4.3 AF&PA US paper/board 2012 capacity survey – is this the end of the decline?
According to the American Forest & Paper Association’s latest survey, US paper/board capacity should rise by 0.6% (517,000 tonnes) in 2013 after falling over the 2000-2012 period by 13.2 million tonnes due to, among other things, consolidation, the great recession of 2008, and electronic media. Of the 13.2 million-tonne decline over the 12-year period, newsprint capacity fell by about 50% to 3.1 million tonnes in 2012, uncoated freesheet fell 35% to 9.0 million tonnes, and coated papers (freesheet and mechanical/wood-containing) declined by 25% to 7.1 million tonnes.
Since January 2009, 18 companies in the pulp, paper and paperboard sectors have filed for bankruptcy. Every sector of the US pulp and paper industry has been hit by consolidation, mainly in containerboard.
One area of hope for many older pulp mills that used to focus mainly on paper grade qualities is dissolving pulp, where North American capacity is expected to rise by 38% in 2013 versus 2012 to 1.3 million short tons.
8.4.4 South American market pulp expansions explode
In the last 20 years, investment in chemical market pulp capacity in Brazil, Chile and Uruguay has increased capacity from less than 4 million tonnes to over 16 million tonnes – no other region has seen such growth. In 1992, Latin America represented 11.8% of world chemical market pulp capacity, whereas in 2012, the figure is 16.7 million tonnes (28.4%). Over the next 10 years, South American chemical market pulp capacity could theoretically add another 30 million tonnes based on already announced projects; no other region is adding anything close to such capacity.
8.4.5 Asian investment continues providing hope to a select few mills
As in previous years, Asia Pulp & Paper, a division of the Sinar Mas conglomerate, continued to acquire pulp and paper mills in an effort to secure fibre at a reasonable price. This strategy was not unlike that of the Japanese in the 1970s-1990s when the fibre-poor country invested abroad to secure wood fibre and pulp for their domestic mills. In 2011, Paper Excellence Canada Holdings (PECH) acquired Howe Sound Pulp & Paper, British Columbia, Domtar’s Prince Albert, Saskatchewan NBSK market pulp and uncoated freesheet mill, and Northern Pulp’s mill in Pictou, Nova Scotia.
Prior to 2011, PECH had acquired mills in Meadow Lake and Mackenzie. International Grand Investment, another Asian-based company, in 2010 bought the Woodland (ME, USA) NBHK pulp mill. Paper Excellence (US) a subsidiary of APP, acquired a pulp mill in Halsey (OR, USA). Without these major asset purchases from Asian investors, the potential loss of output within the North American pulp and paper industry would have been even higher.
8.4.6 Environmental focus and greener energy In North America, local and federal governments are
“gently pushing” consumers, retailers and industry to reduce or even eliminate the use of plastic or non-recyclable shopping bags in some municipalities and cities, and move away from their high dependency on non-renewable energy sources such as oil. And at the municipal level, governments across Canada and the United States, are forcing compliance to clean-air acts and pollution controls.
8.4.7 Nano-cellulosic technology moves into commercialization
Domtar has developed nano-cellulosic fibre technology over the last few years and has managed to begin commercialization of this new and remarkable fibre to highly specialized end-use applications in the four main
70
75
80
85
90
Cap
acit
y ut
ilisa
tion
rati
on (%
)
94 ______________________________________________________________________ Chapter 8, Paper, paperboard and woodpulp markets
industrial sectors of paints and coatings, films and barriers, textiles and composites located across Canada, the United States, Europe and Asia.
8.4.8 Internet-based or digital advertising seen as an ongoing threat for newspapers’ print medium revenue streams (advertising and classifieds)
Since the mid-1990s, with the loss of advertising revenues to digital media across the wide range of Internet offerings – from magazines to newspapers, from radio to television – the Internet has transformed the advertising world in such a way that print media of all sorts are scrambling for a place in an ever-changing world. In 2011, according to the Pew Center’s Project for Excellence in Journalism, US newspapers lost $10 in print advertising revenue for every $1 they gained in online advertising revenue.
8.4.9 Chinese coated paper CVD and ADD – will they stay or will they go?
In September 2009, the US Department of Commerce began an investigation into imports of coated paper sheets from China. The largest impact was felt by China where countervailing duties and anti-dumping duties were imposed on major players after a six-month investigation. While these duties effectively shut out these Chinese coated paper exporters from the US market, other countries – namely Japan and regions including Europe – moved in and saw their market shares increase significantly. For Japan and the Republic of Korea, their share of the US coated paper sheet market rose from a combined 13% to 24% over the 2009 to 2010 period. European suppliers saw theirs grow from 8% to 15%, while US domestic suppliers saw their share rise by only 9% to 57% after the duties had been imposed. China’s market share fell from 22% to 2%.
8.5 References Note: The Review has a statistical annex, which is available at: www.unece.org/fpamr2012
American Forest & Paper Association. 2012. Press releases and industry statistics. Available at: www.afandpa.org/ and www.statmill.org/
Confederation of European Paper Industries (CEPI). 2012. CEPI Preliminary Statistics 2011. Available at: www.cepi.org/
Federal State Statistics Service. Goskomstat of the Russian Federation. 2011. Available in English at: www.gks.ru/wps/wcm/connect/rosstat/rosstatsite.eng/
Foex. 2012. Available at: www.foex.fi PPB-Express, PPB Exports, PPB Imports, Pulp Paper
Board (PPB) magazine (of Russia). 2011. Available at: www.cbk.ru/eng/cbk_mag.php
UN COMTRADE database. 2012. Available at: www.comtrade.un.org
Unfold the Future. 2011. Available at: http://www.unfoldthefuture.eu/
UNECE/FAO TIMBER database. 2012. Available at: www.unece.org/timber/
US Federal Reserve. 2012. Price indices and Utilization ratios. Available at: www.federalreserve.gov/ econresdata/statisticsdata.htm
Valois Vision Marketing. 2012. Pulp Mill Closures & Conversion Study 2012; China Study, 2012; Supply-Demand Analysis (2012-2022), June 2012. Available at: www.valoisvision.com/products/
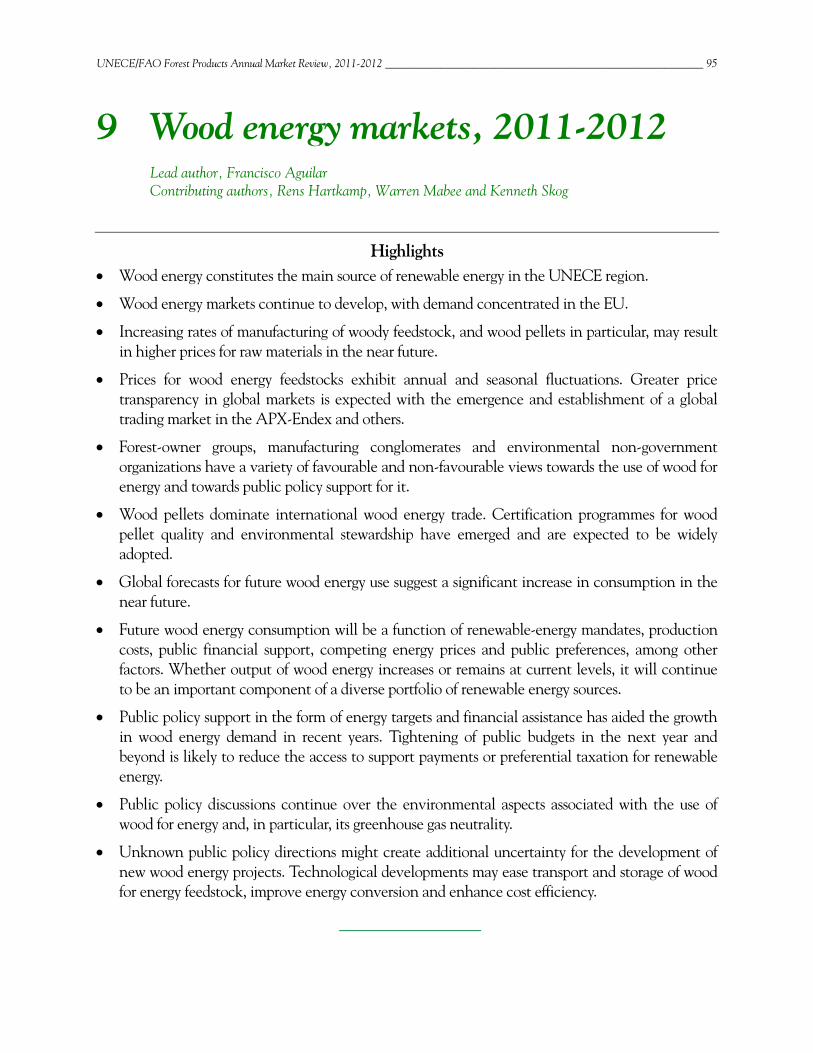
UNECE/FAO Forest Products Annual Market Review, 2011-2012 __________________________________________________________ 95
9 Wood energy markets, 2011-2012 Lead author, Francisco Aguilar Contributing authors, Rens Hartkamp, Warren Mabee and Kenneth Skog
Highlights Wood energy constitutes the main source of renewable energy in the UNECE region.
Wood energy markets continue to develop, with demand concentrated in the EU.
Increasing rates of manufacturing of woody feedstock, and wood pellets in particular, may result in higher prices for raw materials in the near future.
Prices for wood energy feedstocks exhibit annual and seasonal fluctuations. Greater price transparency in global markets is expected with the emergence and establishment of a global trading market in the APX-Endex and others.
Forest-owner groups, manufacturing conglomerates and environmental non-government organizations have a variety of favourable and non-favourable views towards the use of wood for energy and towards public policy support for it.
Wood pellets dominate international wood energy trade. Certification programmes for wood pellet quality and environmental stewardship have emerged and are expected to be widely adopted.
Global forecasts for future wood energy use suggest a significant increase in consumption in the near future.
Future wood energy consumption will be a function of renewable-energy mandates, production costs, public financial support, competing energy prices and public preferences, among other factors. Whether output of wood energy increases or remains at current levels, it will continue to be an important component of a diverse portfolio of renewable energy sources.
Public policy support in the form of energy targets and financial assistance has aided the growth in wood energy demand in recent years. Tightening of public budgets in the next year and beyond is likely to reduce the access to support payments or preferential taxation for renewable energy.
Public policy discussions continue over the environmental aspects associated with the use of wood for energy and, in particular, its greenhouse gas neutrality.
Unknown public policy directions might create additional uncertainty for the development of new wood energy projects. Technological developments may ease transport and storage of wood for energy feedstock, improve energy conversion and enhance cost efficiency.
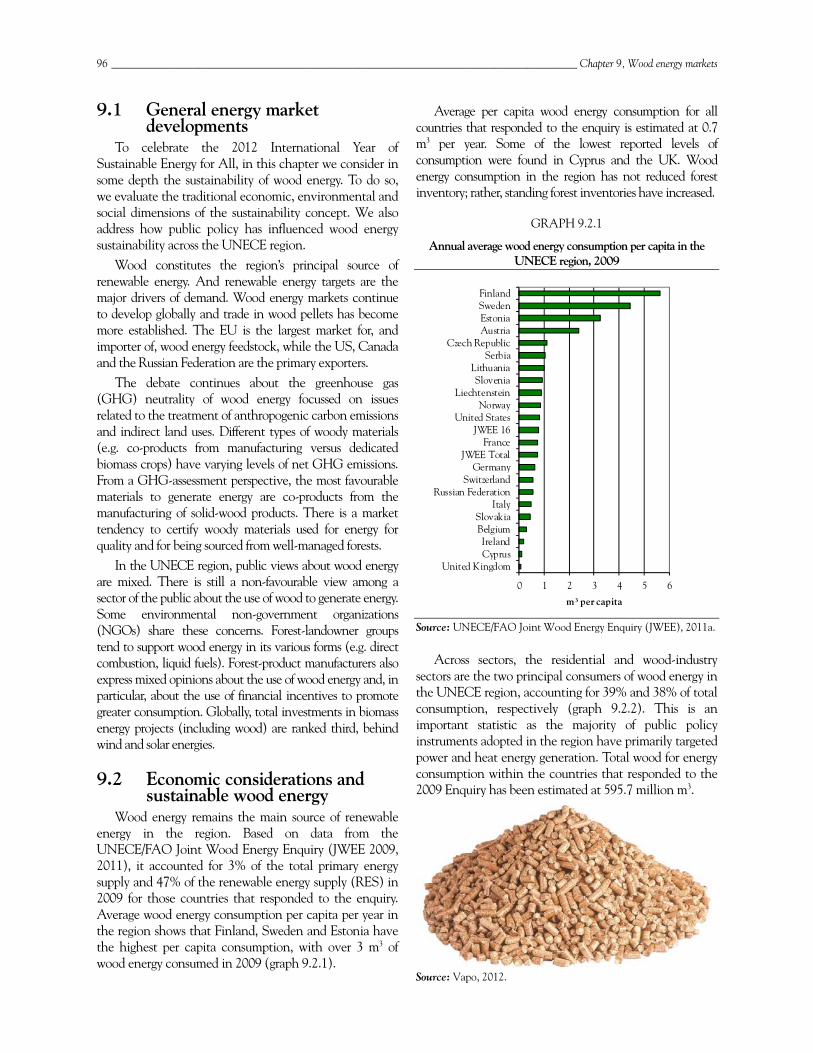
96 _____________________________________________________________________________________ Chapter 9, Wood energy markets
9.1 General energy market developments
To celebrate the 2012 International Year of Sustainable Energy for All, in this chapter we consider in some depth the sustainability of wood energy. To do so, we evaluate the traditional economic, environmental and social dimensions of the sustainability concept. We also address how public policy has influenced wood energy sustainability across the UNECE region.
Wood constitutes the region’s principal source of renewable energy. And renewable energy targets are the major drivers of demand. Wood energy markets continue to develop globally and trade in wood pellets has become more established. The EU is the largest market for, and importer of, wood energy feedstock, while the US, Canada and the Russian Federation are the primary exporters.
The debate continues about the greenhouse gas (GHG) neutrality of wood energy focussed on issues related to the treatment of anthropogenic carbon emissions and indirect land uses. Different types of woody materials (e.g. co-products from manufacturing versus dedicated biomass crops) have varying levels of net GHG emissions. From a GHG-assessment perspective, the most favourable materials to generate energy are co-products from the manufacturing of solid-wood products. There is a market tendency to certify woody materials used for energy for quality and for being sourced from well-managed forests.
In the UNECE region, public views about wood energy are mixed. There is still a non-favourable view among a sector of the public about the use of wood to generate energy. Some environmental non-government organizations (NGOs) share these concerns. Forest-landowner groups tend to support wood energy in its various forms (e.g. direct combustion, liquid fuels). Forest-product manufacturers also express mixed opinions about the use of wood energy and, in particular, about the use of financial incentives to promote greater consumption. Globally, total investments in biomass energy projects (including wood) are ranked third, behind wind and solar energies.
9.2 Economic considerations and sustainable wood energy
Wood energy remains the main source of renewable energy in the region. Based on data from the UNECE/FAO Joint Wood Energy Enquiry (JWEE 2009, 2011), it accounted for 3% of the total primary energy supply and 47% of the renewable energy supply (RES) in 2009 for those countries that responded to the enquiry. Average wood energy consumption per capita per year in the region shows that Finland, Sweden and Estonia have the highest per capita consumption, with over 3 m3 of wood energy consumed in 2009 (graph 9.2.1).
Average per capita wood energy consumption for all countries that responded to the enquiry is estimated at 0.7 m3 per year. Some of the lowest reported levels of consumption were found in Cyprus and the UK. Wood energy consumption in the region has not reduced forest inventory; rather, standing forest inventories have increased.
GRAPH 9.2.1
Annual average wood energy consumption per capita in the UNECE region, 2009
Source: UNECE/FAO Joint Wood Energy Enquiry (JWEE), 2011a.
Across sectors, the residential and wood-industry sectors are the two principal consumers of wood energy in the UNECE region, accounting for 39% and 38% of total consumption, respectively (graph 9.2.2). This is an important statistic as the majority of public policy instruments adopted in the region have primarily targeted power and heat energy generation. Total wood for energy consumption within the countries that responded to the 2009 Enquiry has been estimated at 595.7 million m3.
Source: Vapo, 2012.
0 1 2 3 4 5 6
United KingdomCyprusIreland
BelgiumSlovakia
ItalyRussian Federation
SwitzerlandGermany
JWEE TotalFrance
JWEE 16United States
NorwayLiechtenstein
SloveniaLithuania
SerbiaCzech Republic
AustriaEstoniaSwedenFinland
m3 per capita
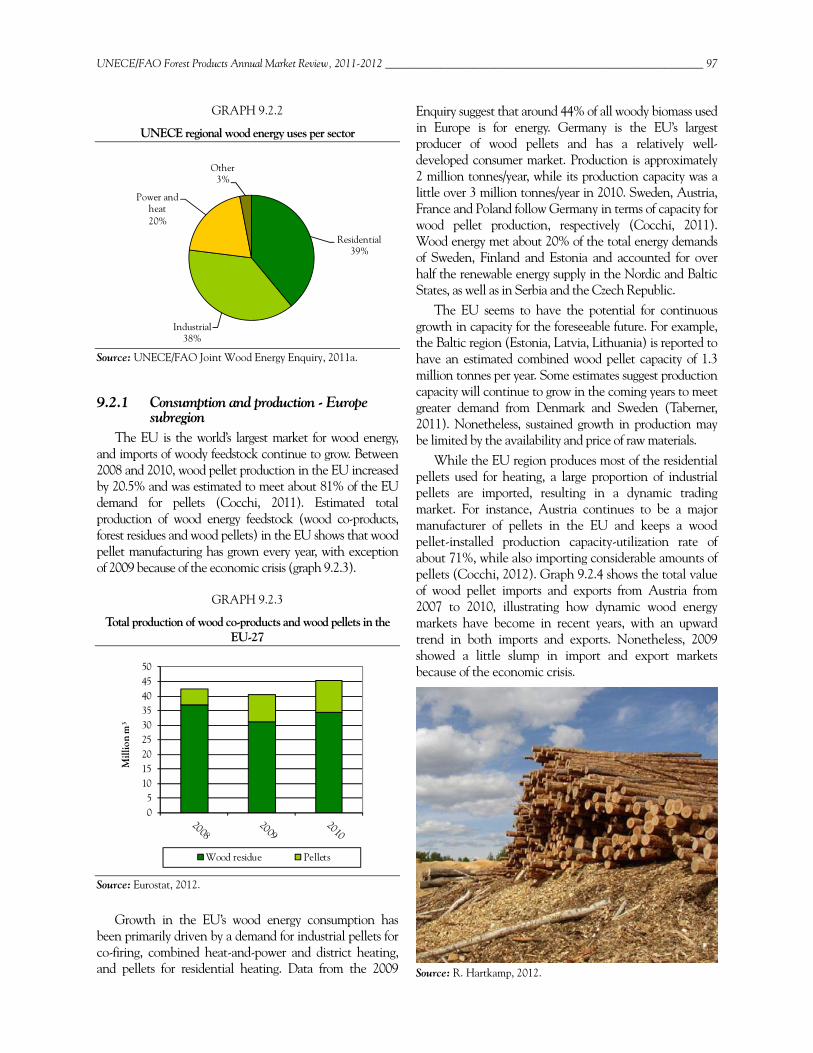
UNECE/FAO Forest Products Annual Market Review, 2011-2012 __________________________________________________________ 97
GRAPH 9.2.2
UNECE regional wood energy uses per sector
Source: UNECE/FAO Joint Wood Energy Enquiry, 2011a.
9.2.1 Consumption and production - Europe subregion
The EU is the world’s largest market for wood energy, and imports of woody feedstock continue to grow. Between 2008 and 2010, wood pellet production in the EU increased by 20.5% and was estimated to meet about 81% of the EU demand for pellets (Cocchi, 2011). Estimated total production of wood energy feedstock (wood co-products, forest residues and wood pellets) in the EU shows that wood pellet manufacturing has grown every year, with exception of 2009 because of the economic crisis (graph 9.2.3).
GRAPH 9.2.3
Total production of wood co-products and wood pellets in the EU-27
Source: Eurostat, 2012.
Growth in the EU’s wood energy consumption has been primarily driven by a demand for industrial pellets for co-firing, combined heat-and-power and district heating, and pellets for residential heating. Data from the 2009
Enquiry suggest that around 44% of all woody biomass used in Europe is for energy. Germany is the EU’s largest producer of wood pellets and has a relatively well-developed consumer market. Production is approximately 2 million tonnes/year, while its production capacity was a little over 3 million tonnes/year in 2010. Sweden, Austria, France and Poland follow Germany in terms of capacity for wood pellet production, respectively (Cocchi, 2011). Wood energy met about 20% of the total energy demands of Sweden, Finland and Estonia and accounted for over half the renewable energy supply in the Nordic and Baltic States, as well as in Serbia and the Czech Republic.
The EU seems to have the potential for continuous growth in capacity for the foreseeable future. For example, the Baltic region (Estonia, Latvia, Lithuania) is reported to have an estimated combined wood pellet capacity of 1.3 million tonnes per year. Some estimates suggest production capacity will continue to grow in the coming years to meet greater demand from Denmark and Sweden (Taberner, 2011). Nonetheless, sustained growth in production may be limited by the availability and price of raw materials.
While the EU region produces most of the residential pellets used for heating, a large proportion of industrial pellets are imported, resulting in a dynamic trading market. For instance, Austria continues to be a major manufacturer of pellets in the EU and keeps a wood pellet-installed production capacity-utilization rate of about 71%, while also importing considerable amounts of pellets (Cocchi, 2012). Graph 9.2.4 shows the total value of wood pellet imports and exports from Austria from 2007 to 2010, illustrating how dynamic wood energy markets have become in recent years, with an upward trend in both imports and exports. Nonetheless, 2009 showed a little slump in import and export markets because of the economic crisis.
Source: R. Hartkamp, 2012.
Residential39%
Industrial38%
Power and heat20%
Other3%
05
101520253035404550
Mill
ion
m3
Wood residue Pellets
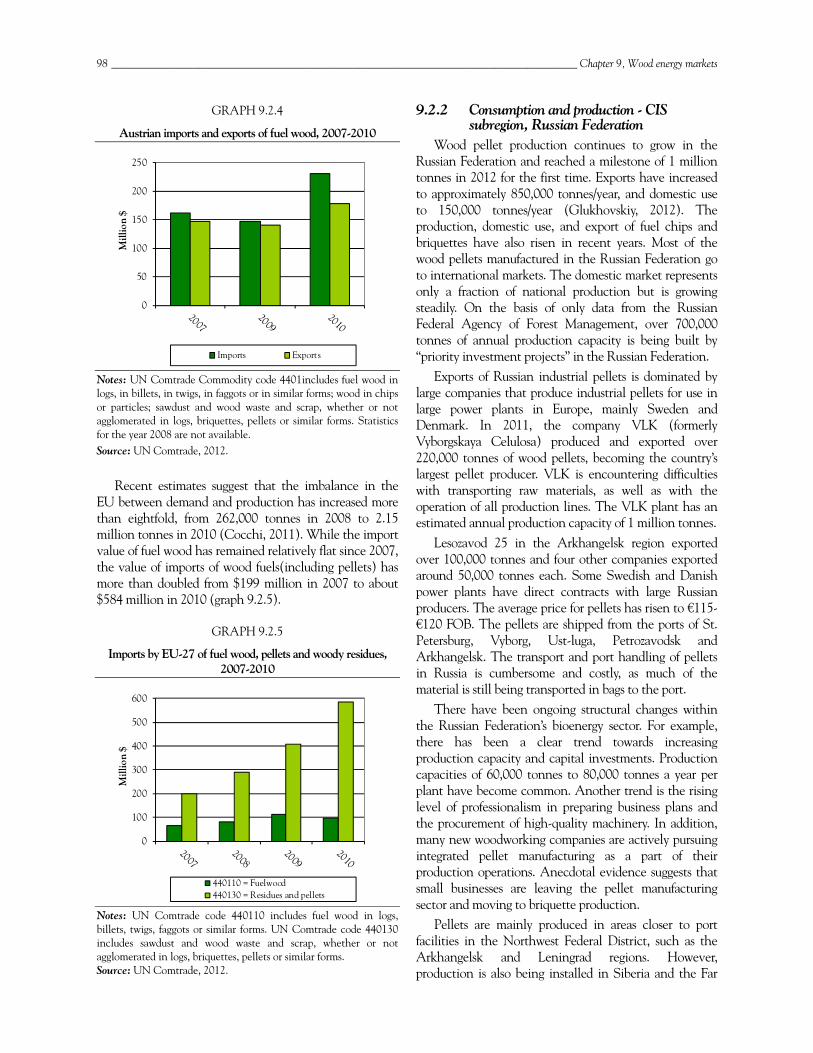
98 _____________________________________________________________________________________ Chapter 9, Wood energy markets
GRAPH 9.2.4
Austrian imports and exports of fuel wood, 2007-2010
Notes: UN Comtrade Commodity code 4401includes fuel wood in logs, in billets, in twigs, in faggots or in similar forms; wood in chips or particles; sawdust and wood waste and scrap, whether or not agglomerated in logs, briquettes, pellets or similar forms. Statistics for the year 2008 are not available. Source: UN Comtrade, 2012.
Recent estimates suggest that the imbalance in the EU between demand and production has increased more than eightfold, from 262,000 tonnes in 2008 to 2.15 million tonnes in 2010 (Cocchi, 2011). While the import value of fuel wood has remained relatively flat since 2007, the value of imports of wood fuels(including pellets) has more than doubled from $199 million in 2007 to about $584 million in 2010 (graph 9.2.5).
GRAPH 9.2.5
Imports by EU-27 of fuel wood, pellets and woody residues, 2007-2010
Notes: UN Comtrade code 440110 includes fuel wood in logs, billets, twigs, faggots or similar forms. UN Comtrade code 440130 includes sawdust and wood waste and scrap, whether or not agglomerated in logs, briquettes, pellets or similar forms. Source: UN Comtrade, 2012.
9.2.2 Consumption and production - CIS subregion, Russian Federation
Wood pellet production continues to grow in the Russian Federation and reached a milestone of 1 million tonnes in 2012 for the first time. Exports have increased to approximately 850,000 tonnes/year, and domestic use to 150,000 tonnes/year (Glukhovskiy, 2012). The production, domestic use, and export of fuel chips and briquettes have also risen in recent years. Most of the wood pellets manufactured in the Russian Federation go to international markets. The domestic market represents only a fraction of national production but is growing steadily. On the basis of only data from the Russian Federal Agency of Forest Management, over 700,000 tonnes of annual production capacity is being built by “priority investment projects” in the Russian Federation.
Exports of Russian industrial pellets is dominated by large companies that produce industrial pellets for use in large power plants in Europe, mainly Sweden and Denmark. In 2011, the company VLK (formerly Vyborgskaya Celulosa) produced and exported over 220,000 tonnes of wood pellets, becoming the country’s largest pellet producer. VLK is encountering difficulties with transporting raw materials, as well as with the operation of all production lines. The VLK plant has an estimated annual production capacity of 1 million tonnes.
Lesozavod 25 in the Arkhangelsk region exported over 100,000 tonnes and four other companies exported around 50,000 tonnes each. Some Swedish and Danish power plants have direct contracts with large Russian producers. The average price for pellets has risen to €115-€120 FOB. The pellets are shipped from the ports of St. Petersburg, Vyborg, Ust-luga, Petrozavodsk and Arkhangelsk. The transport and port handling of pellets in Russia is cumbersome and costly, as much of the material is still being transported in bags to the port.
There have been ongoing structural changes within the Russian Federation’s bioenergy sector. For example, there has been a clear trend towards increasing production capacity and capital investments. Production capacities of 60,000 tonnes to 80,000 tonnes a year per plant have become common. Another trend is the rising level of professionalism in preparing business plans and the procurement of high-quality machinery. In addition, many new woodworking companies are actively pursuing integrated pellet manufacturing as a part of their production operations. Anecdotal evidence suggests that small businesses are leaving the pellet manufacturing sector and moving to briquette production.
Pellets are mainly produced in areas closer to port facilities in the Northwest Federal District, such as the Arkhangelsk and Leningrad regions. However, production is also being installed in Siberia and the Far
0
50
100
150
200
250
Mill
ion
$
Imports Exports
0
100
200
300
400
500
600
Mill
ion
$
440110 = Fuelwood440130 = Residues and pellets
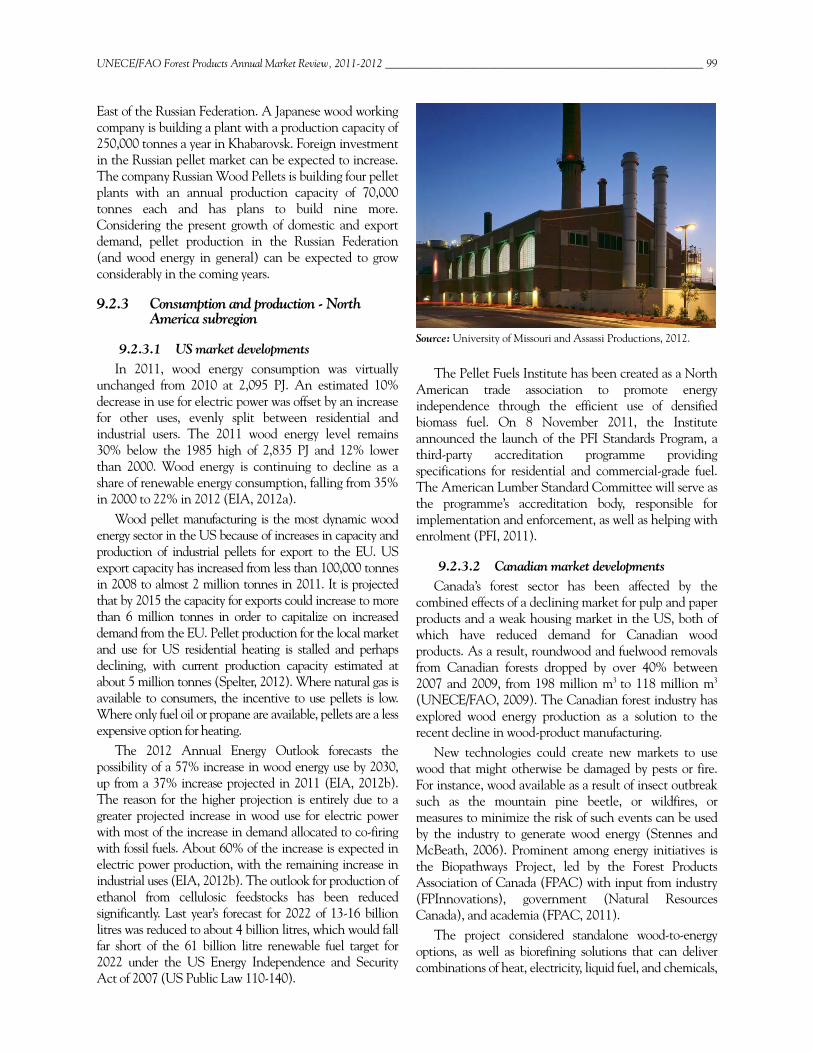
UNECE/FAO Forest Products Annual Market Review, 2011-2012 __________________________________________________________ 99
East of the Russian Federation. A Japanese wood working company is building a plant with a production capacity of 250,000 tonnes a year in Khabarovsk. Foreign investment in the Russian pellet market can be expected to increase. The company Russian Wood Pellets is building four pellet plants with an annual production capacity of 70,000 tonnes each and has plans to build nine more. Considering the present growth of domestic and export demand, pellet production in the Russian Federation (and wood energy in general) can be expected to grow considerably in the coming years.
9.2.3 Consumption and production - North America subregion
9.2.3.1 US market developments In 2011, wood energy consumption was virtually
unchanged from 2010 at 2,095 PJ. An estimated 10% decrease in use for electric power was offset by an increase for other uses, evenly split between residential and industrial users. The 2011 wood energy level remains 30% below the 1985 high of 2,835 PJ and 12% lower than 2000. Wood energy is continuing to decline as a share of renewable energy consumption, falling from 35% in 2000 to 22% in 2012 (EIA, 2012a).
Wood pellet manufacturing is the most dynamic wood energy sector in the US because of increases in capacity and production of industrial pellets for export to the EU. US export capacity has increased from less than 100,000 tonnes in 2008 to almost 2 million tonnes in 2011. It is projected that by 2015 the capacity for exports could increase to more than 6 million tonnes in order to capitalize on increased demand from the EU. Pellet production for the local market and use for US residential heating is stalled and perhaps declining, with current production capacity estimated at about 5 million tonnes (Spelter, 2012). Where natural gas is available to consumers, the incentive to use pellets is low. Where only fuel oil or propane are available, pellets are a less expensive option for heating.
The 2012 Annual Energy Outlook forecasts the possibility of a 57% increase in wood energy use by 2030, up from a 37% increase projected in 2011 (EIA, 2012b). The reason for the higher projection is entirely due to a greater projected increase in wood use for electric power with most of the increase in demand allocated to co-firing with fossil fuels. About 60% of the increase is expected in electric power production, with the remaining increase in industrial uses (EIA, 2012b). The outlook for production of ethanol from cellulosic feedstocks has been reduced significantly. Last year’s forecast for 2022 of 13-16 billion litres was reduced to about 4 billion litres, which would fall far short of the 61 billion litre renewable fuel target for 2022 under the US Energy Independence and Security Act of 2007 (US Public Law 110-140).
Source: University of Missouri and Assassi Productions, 2012.
The Pellet Fuels Institute has been created as a North American trade association to promote energy independence through the efficient use of densified biomass fuel. On 8 November 2011, the Institute announced the launch of the PFI Standards Program, a third-party accreditation programme providing specifications for residential and commercial-grade fuel. The American Lumber Standard Committee will serve as the programme’s accreditation body, responsible for implementation and enforcement, as well as helping with enrolment (PFI, 2011).
9.2.3.2 Canadian market developments Canada’s forest sector has been affected by the
combined effects of a declining market for pulp and paper products and a weak housing market in the US, both of which have reduced demand for Canadian wood products. As a result, roundwood and fuelwood removals from Canadian forests dropped by over 40% between 2007 and 2009, from 198 million m3 to 118 million m3 (UNECE/FAO, 2009). The Canadian forest industry has explored wood energy production as a solution to the recent decline in wood-product manufacturing.
New technologies could create new markets to use wood that might otherwise be damaged by pests or fire. For instance, wood available as a result of insect outbreak such as the mountain pine beetle, or wildfires, or measures to minimize the risk of such events can be used by the industry to generate wood energy (Stennes and McBeath, 2006). Prominent among energy initiatives is the Biopathways Project, led by the Forest Products Association of Canada (FPAC) with input from industry (FPInnovations), government (Natural Resources Canada), and academia (FPAC, 2011).
The project considered standalone wood-to-energy options, as well as biorefining solutions that can deliver combinations of heat, electricity, liquid fuel, and chemicals,
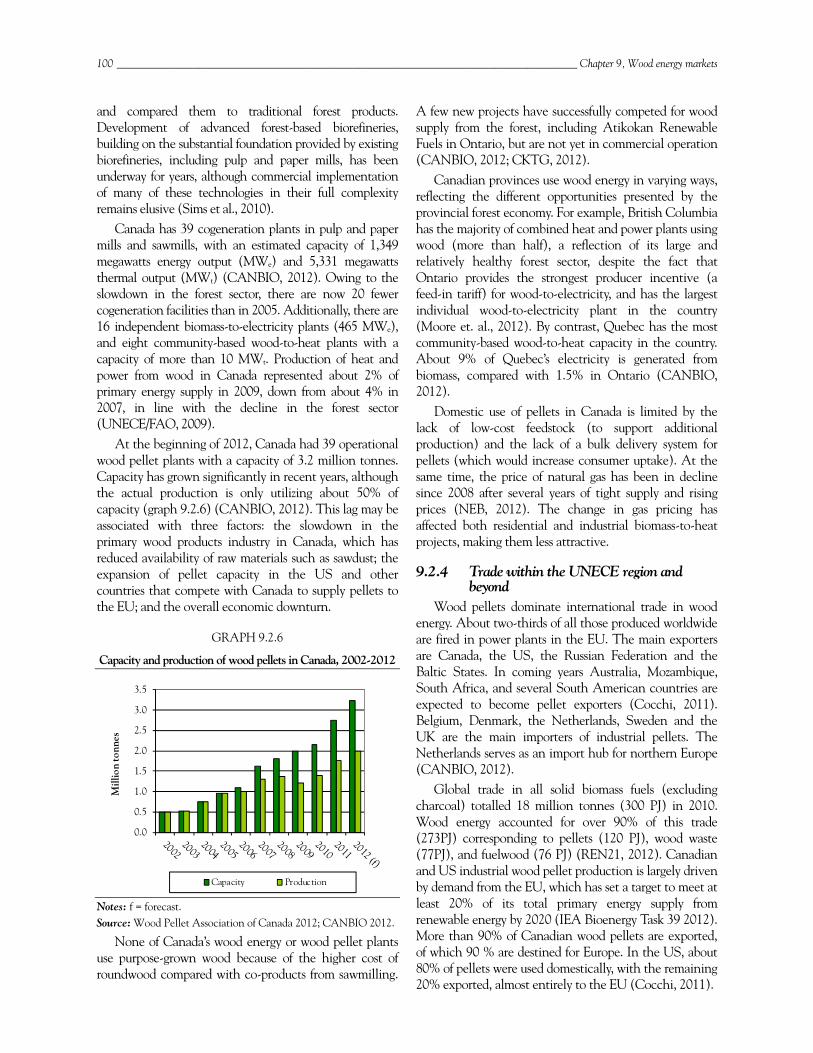
100 ____________________________________________________________________________________ Chapter 9, Wood energy markets
and compared them to traditional forest products. Development of advanced forest-based biorefineries, building on the substantial foundation provided by existing biorefineries, including pulp and paper mills, has been underway for years, although commercial implementation of many of these technologies in their full complexity remains elusive (Sims et al., 2010).
Canada has 39 cogeneration plants in pulp and paper mills and sawmills, with an estimated capacity of 1,349 megawatts energy output (MWe) and 5,331 megawatts thermal output (MWt) (CANBIO, 2012). Owing to the slowdown in the forest sector, there are now 20 fewer cogeneration facilities than in 2005. Additionally, there are 16 independent biomass-to-electricity plants (465 MWe), and eight community-based wood-to-heat plants with a capacity of more than 10 MWt. Production of heat and power from wood in Canada represented about 2% of primary energy supply in 2009, down from about 4% in 2007, in line with the decline in the forest sector (UNECE/FAO, 2009).
At the beginning of 2012, Canada had 39 operational wood pellet plants with a capacity of 3.2 million tonnes. Capacity has grown significantly in recent years, although the actual production is only utilizing about 50% of capacity (graph 9.2.6) (CANBIO, 2012). This lag may be associated with three factors: the slowdown in the primary wood products industry in Canada, which has reduced availability of raw materials such as sawdust; the expansion of pellet capacity in the US and other countries that compete with Canada to supply pellets to the EU; and the overall economic downturn.
GRAPH 9.2.6
Capacity and production of wood pellets in Canada, 2002-2012
Notes: f = forecast. Source: Wood Pellet Association of Canada 2012; CANBIO 2012.
None of Canada’s wood energy or wood pellet plants use purpose-grown wood because of the higher cost of roundwood compared with co-products from sawmilling.
A few new projects have successfully competed for wood supply from the forest, including Atikokan Renewable Fuels in Ontario, but are not yet in commercial operation (CANBIO, 2012; CKTG, 2012).
Canadian provinces use wood energy in varying ways, reflecting the different opportunities presented by the provincial forest economy. For example, British Columbia has the majority of combined heat and power plants using wood (more than half), a reflection of its large and relatively healthy forest sector, despite the fact that Ontario provides the strongest producer incentive (a feed-in tariff) for wood-to-electricity, and has the largest individual wood-to-electricity plant in the country (Moore et. al., 2012). By contrast, Quebec has the most community-based wood-to-heat capacity in the country. About 9% of Quebec’s electricity is generated from biomass, compared with 1.5% in Ontario (CANBIO, 2012).
Domestic use of pellets in Canada is limited by the lack of low-cost feedstock (to support additional production) and the lack of a bulk delivery system for pellets (which would increase consumer uptake). At the same time, the price of natural gas has been in decline since 2008 after several years of tight supply and rising prices (NEB, 2012). The change in gas pricing has affected both residential and industrial biomass-to-heat projects, making them less attractive.
9.2.4 Trade within the UNECE region and beyond
Wood pellets dominate international trade in wood energy. About two-thirds of all those produced worldwide are fired in power plants in the EU. The main exporters are Canada, the US, the Russian Federation and the Baltic States. In coming years Australia, Mozambique, South Africa, and several South American countries are expected to become pellet exporters (Cocchi, 2011). Belgium, Denmark, the Netherlands, Sweden and the UK are the main importers of industrial pellets. The Netherlands serves as an import hub for northern Europe (CANBIO, 2012).
Global trade in all solid biomass fuels (excluding charcoal) totalled 18 million tonnes (300 PJ) in 2010. Wood energy accounted for over 90% of this trade (273PJ) corresponding to pellets (120 PJ), wood waste (77PJ), and fuelwood (76 PJ) (REN21, 2012). Canadian and US industrial wood pellet production is largely driven by demand from the EU, which has set a target to meet at least 20% of its total primary energy supply from renewable energy by 2020 (IEA Bioenergy Task 39 2012). More than 90% of Canadian wood pellets are exported, of which 90 % are destined for Europe. In the US, about 80% of pellets were used domestically, with the remaining 20% exported, almost entirely to the EU (Cocchi, 2011).
0.0
0.5
1.0
1.5
2.0
2.5
3.0
3.5
Mill
ion
tonn
es
Capacity Production
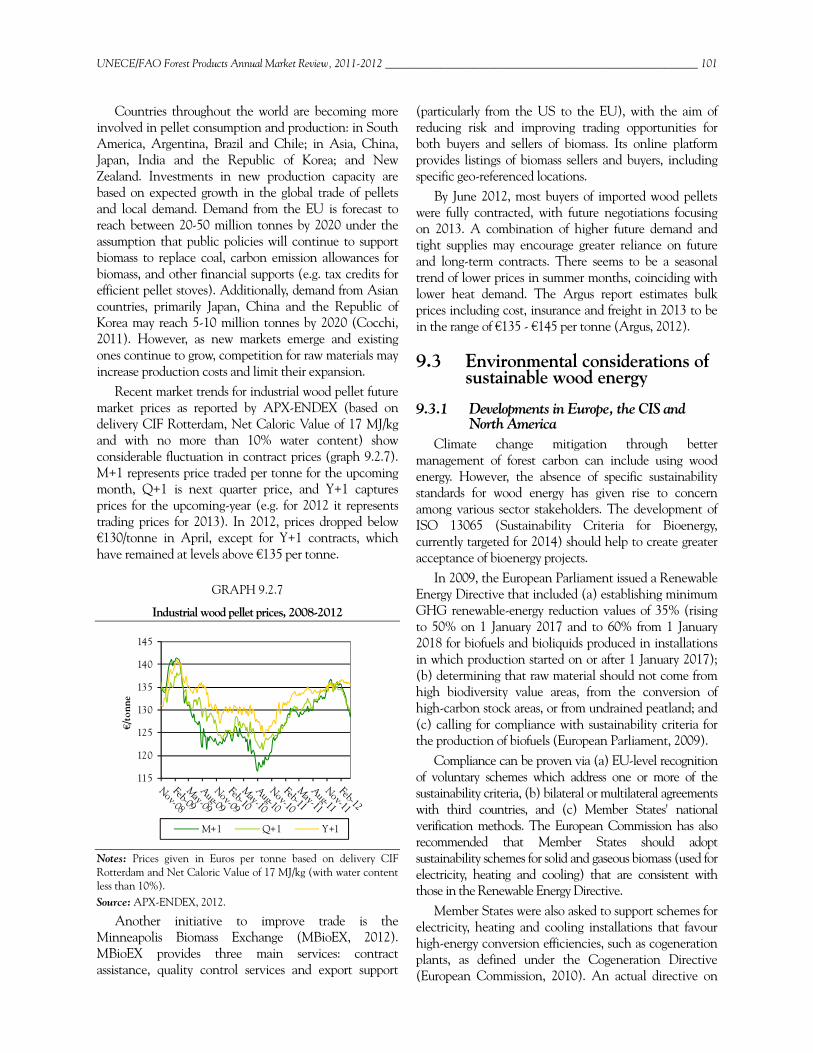
UNECE/FAO Forest Products Annual Market Review, 2011-2012 _________________________________________________________ 101
Countries throughout the world are becoming more involved in pellet consumption and production: in South America, Argentina, Brazil and Chile; in Asia, China, Japan, India and the Republic of Korea; and New Zealand. Investments in new production capacity are based on expected growth in the global trade of pellets and local demand. Demand from the EU is forecast to reach between 20-50 million tonnes by 2020 under the assumption that public policies will continue to support biomass to replace coal, carbon emission allowances for biomass, and other financial supports (e.g. tax credits for efficient pellet stoves). Additionally, demand from Asian countries, primarily Japan, China and the Republic of Korea may reach 5-10 million tonnes by 2020 (Cocchi, 2011). However, as new markets emerge and existing ones continue to grow, competition for raw materials may increase production costs and limit their expansion.
Recent market trends for industrial wood pellet future market prices as reported by APX-ENDEX (based on delivery CIF Rotterdam, Net Caloric Value of 17 MJ/kg and with no more than 10% water content) show considerable fluctuation in contract prices (graph 9.2.7). M+1 represents price traded per tonne for the upcoming month, Q+1 is next quarter price, and Y+1 captures prices for the upcoming-year (e.g. for 2012 it represents trading prices for 2013). In 2012, prices dropped below €130/tonne in April, except for Y+1 contracts, which have remained at levels above €135 per tonne.
GRAPH 9.2.7
Industrial wood pellet prices, 2008-2012
Notes: Prices given in Euros per tonne based on delivery CIF Rotterdam and Net Caloric Value of 17 MJ/kg (with water content less than 10%). Source: APX-ENDEX, 2012.
Another initiative to improve trade is the Minneapolis Biomass Exchange (MBioEX, 2012). MBioEX provides three main services: contract assistance, quality control services and export support
(particularly from the US to the EU), with the aim of reducing risk and improving trading opportunities for both buyers and sellers of biomass. Its online platform provides listings of biomass sellers and buyers, including specific geo-referenced locations.
By June 2012, most buyers of imported wood pellets were fully contracted, with future negotiations focusing on 2013. A combination of higher future demand and tight supplies may encourage greater reliance on future and long-term contracts. There seems to be a seasonal trend of lower prices in summer months, coinciding with lower heat demand. The Argus report estimates bulk prices including cost, insurance and freight in 2013 to be in the range of €135 - €145 per tonne (Argus, 2012).
9.3 Environmental considerations of sustainable wood energy
9.3.1 Developments in Europe, the CIS and North America
Climate change mitigation through better management of forest carbon can include using wood energy. However, the absence of specific sustainability standards for wood energy has given rise to concern among various sector stakeholders. The development of ISO 13065 (Sustainability Criteria for Bioenergy, currently targeted for 2014) should help to create greater acceptance of bioenergy projects.
In 2009, the European Parliament issued a Renewable Energy Directive that included (a) establishing minimum GHG renewable-energy reduction values of 35% (rising to 50% on 1 January 2017 and to 60% from 1 January 2018 for biofuels and bioliquids produced in installations in which production started on or after 1 January 2017); (b) determining that raw material should not come from high biodiversity value areas, from the conversion of high-carbon stock areas, or from undrained peatland; and (c) calling for compliance with sustainability criteria for the production of biofuels (European Parliament, 2009).
Compliance can be proven via (a) EU-level recognition of voluntary schemes which address one or more of the sustainability criteria, (b) bilateral or multilateral agreements with third countries, and (c) Member States' national verification methods. The European Commission has also recommended that Member States should adopt sustainability schemes for solid and gaseous biomass (used for electricity, heating and cooling) that are consistent with those in the Renewable Energy Directive.
Member States were also asked to support schemes for electricity, heating and cooling installations that favour high-energy conversion efficiencies, such as cogeneration plants, as defined under the Cogeneration Directive (European Commission, 2010). An actual directive on
115
120
125
130
135
140
145
€/to
nne
M+1 Q+1 Y+1
102 ____________________________________________________________________________________ Chapter 9, Wood energy markets
biomass sustainability criteria, replacing current recommendations, may be issued in the autumn of 2012.
In 2011, the US Environmental Protection Agency (USEPA) formed a Biogenic Carbon Emissions Panel to provide a review and recommendations to the accounting framework for biogenic CO2 emissions from stationary sources (USEPA, 2011a). The Panel’s main report suggested that to estimate the impact of biomass use, each case must be compared to an anticipated baseline scenario where biomass is not used for energy. The Panel acknowledges the difficulty and uncertainty in modelling anticipated baseline and biomass scenarios but sees this as the only way to estimate the additional emissions and sequestration changes in response to biomass feedstock use.
It pointed out that in evaluating wood energy it was important to capture market and landscape-level effects in evaluating scenarios including market-driven shifts in planting, management, harvest, displacement of existing users and land-use changes. Its main report recommends that USEPA should consider “…developing default BAFs (bioenergy accounting factors) by feedstock category and region. … facility-specific BAFs would be calculated to reflect the incremental carbon cycle and net emissions effects of a facility’s use of a biogenic feedstock. With default BAFs, biogenic emissions from a facility would be based on the weighted combination of default BAFs relevant to a facility’s feedstock consumption and location” (USEPA, 2011b).
In addition to the main draft report, there was one dissenting opinion included in the report to the full Panel. The argument went that should an Intergovernmental Panel on Climate Change (IPPC)-accounting approach be considered where determining carbon neutrality would depend on the qualification (for wood) that the forest stock be constant or expanding (USEPA, 2011b).
Also in the US, the Massachusetts Executive Office of Energy and Environmental Affairs (2012) has released draft Renewable Portfolio Standard regulations. These indicate how different types of wood feedstocks may be certified to have certain carbon-recovery performance that would offset their emissions over time after harvest and use in production of energy. The proposed final regulations identify three types of wood biomass feedstock – forest thinnings, forest residues (logging residues) and non-forest residue – and how their carbon recovery profile (in the case of thinnings) or avoided carbon decay profiles (in the case of residues) over time can be used to meet feedstock performance requirements. Restrictions on forest biomass supply include retention of logging residue on harvest sites, which differs by soil quality, and a limitation on overall removal of logging residue and thinnings for fuel as a fraction of conventional timber
harvest. For an energy plant to obtain 0.5 to 1.0 renewable energy credit per unit of energy, its mix of wood feedstocks each year must have a carbon recovery of at least 50% within 20 years. An energy plant must also meet energy efficiency requirements to receive renewable energy credits per unit of energy ranging from 0.5 to 1.0.
9.3.2 Private-sector certification for environmental stewardship
In the EU, several private-sector environmental standards have emerged in recent years. The APEX-ENDEX (2011) states that all wood pellet contracts traded on the exchange are certified for sustainability with either the Green Gold Label (GGL, 2012) certification scheme, the Laborelec (2012)-SGS Solid Biomass Sustainability Scheme, or the Drax Power Limited Biomass Sustainability Implementation Process (2011).
The GGL system, which is inspected by an independent third party, provides certification for sustainable biomass covering production, processing, transport and final energy transformation. GGL-inspected woody biomass is certified by either (a) recognized forest programmes (Forest Stewardship Council/FSC, Programme for the Endorsement of Forest Certification/PEFC, Canadian Standards Association’s Sustainable Forest Management, Sustainable Forest Initiative/SFI or Finnish Forest Certification System), (b) has approved pre-scope certificate of one of the endorsed forest management certification systems – with the intention of full certification, or (c) has been certified under GGL forest-management criteria.
The Laborelec-SGS verification procedure corroborates primary production to have PEFC, FSC or SFI certification, and allows for the traceability of biomass resources. It also estimates biomass accounting to meet a minimal 35% of threshold for GHG savings. Drax Power Limited has issued a set of sustainable biomass sourcing principles based on the developing regulatory and policy initiatives of the UK, EU and other markets (Drax Power Limited, 2011). The ENplus certificate combines quality and sustainability requirements.
By the end of 2011, ENplus-certified pellets were being produced in Austria, Belgium, Canada, Croatia, Czech Republic, France, Germany, Italy, Romania, Spain, and the United Kingdom (ENplus 2012). Over 90% of the pellet production of Germany and Austria is already ENplus certified. The ENplus certificate is given only to pellets that meet European Norm EN 14961-2 (quality standard). A certification system for wood briquettes for non-industrial use is currently being prepared based on European Norm EN 14961-3.
In the US, companies exporting woody biomass to the EU have sought certification from recognized standards. For example, Enviva 9T(9Ta company created in 2004 and
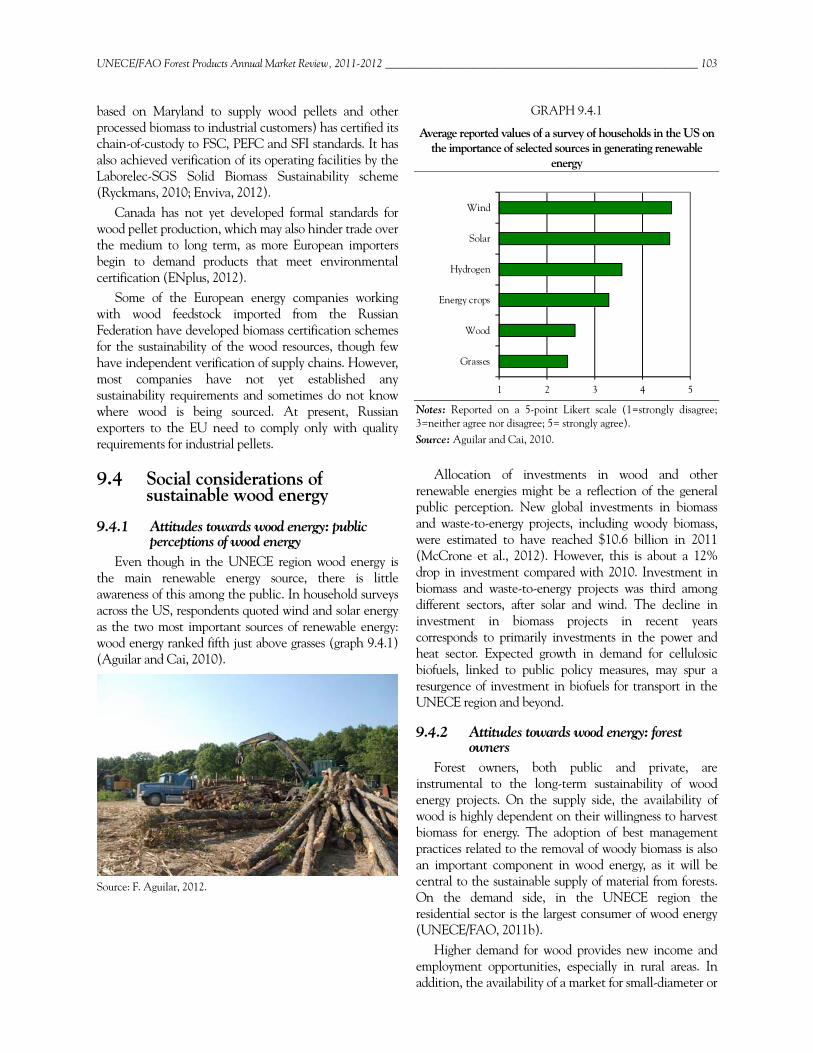
UNECE/FAO Forest Products Annual Market Review, 2011-2012 _________________________________________________________ 103
based on Maryland to supply wood pellets and other processed biomass to industrial customers) has certified its chain-of-custody to FSC, PEFC and SFI standards. It has also achieved verification of its operating facilities by the Laborelec-SGS Solid Biomass Sustainability scheme (Ryckmans, 2010; Enviva, 2012).
Canada has not yet developed formal standards for wood pellet production, which may also hinder trade over the medium to long term, as more European importers begin to demand products that meet environmental certification (ENplus, 2012).
Some of the European energy companies working with wood feedstock imported from the Russian Federation have developed biomass certification schemes for the sustainability of the wood resources, though few have independent verification of supply chains. However, most companies have not yet established any sustainability requirements and sometimes do not know where wood is being sourced. At present, Russian exporters to the EU need to comply only with quality requirements for industrial pellets.
9.4 Social considerations of sustainable wood energy
9.4.1 Attitudes towards wood energy: public perceptions of wood energy
Even though in the UNECE region wood energy is the main renewable energy source, there is little awareness of this among the public. In household surveys across the US, respondents quoted wind and solar energy as the two most important sources of renewable energy: wood energy ranked fifth just above grasses (graph 9.4.1) (Aguilar and Cai, 2010).
Source: F. Aguilar, 2012.
GRAPH 9.4.1
Average reported values of a survey of households in the US on the importance of selected sources in generating renewable
energy
Notes: Reported on a 5-point Likert scale (1=strongly disagree; 3=neither agree nor disagree; 5= strongly agree). Source: Aguilar and Cai, 2010.
Allocation of investments in wood and other renewable energies might be a reflection of the general public perception. New global investments in biomass and waste-to-energy projects, including woody biomass, were estimated to have reached $10.6 billion in 2011 (McCrone et al., 2012). However, this is about a 12% drop in investment compared with 2010. Investment in biomass and waste-to-energy projects was third among different sectors, after solar and wind. The decline in investment in biomass projects in recent years corresponds to primarily investments in the power and heat sector. Expected growth in demand for cellulosic biofuels, linked to public policy measures, may spur a resurgence of investment in biofuels for transport in the UNECE region and beyond.
9.4.2 Attitudes towards wood energy: forest owners
Forest owners, both public and private, are instrumental to the long-term sustainability of wood energy projects. On the supply side, the availability of wood is highly dependent on their willingness to harvest biomass for energy. The adoption of best management practices related to the removal of woody biomass is also an important component in wood energy, as it will be central to the sustainable supply of material from forests. On the demand side, in the UNECE region the residential sector is the largest consumer of wood energy (UNECE/FAO, 2011b).
Higher demand for wood provides new income and employment opportunities, especially in rural areas. In addition, the availability of a market for small-diameter or
1 2 3 4 5
Grasses
Wood
Energy crops
Hydrogen
Solar
Wind
104 ____________________________________________________________________________________ Chapter 9, Wood energy markets
lower-quality trees gives an incentive to manage forests sustainably, potentially resulting in their better resilience. Private European forest owners express overall support for wood energy projects (Lantiainen, 2012). Several studies in the US have explored how willing family forest owners might be to harvest wood for energy. Surveys in multiple States suggest that US forest owners are supportive of wood energy projects to enhance national energy independence, but also that they expect remuneration at competitive market prices (Gruchy et al., 2011; Joshi and Mehmood, 2011; Markowski-Lindsay et al., Forthcoming).
Based on responses from over 1,800 forest owners, Daniel and Aguilar (2011) report there are, nonetheless, some expressions of concern over potential harmful impacts to forest soils and wildlife habitat of wood removals for energy. In Canada, forest owners perceive that the price for wood for energy may not be sufficient to make it an economically feasible activity.
9.4.3 Attitudes towards wood energy: interest groups
Positions about the use of wood energy vary greatly among different interest groups. For instance, the Sierra Club in the US in a guidance statement indicates it believes that biomass projects can be sustainable, but that many are not. “We are not confident that massive new biomass energy resources are available without risking soil and forest health, given the lack of commitment by governments and industry to preservation, restoration, and conservation of natural resources” (Sierra Club, n.d.).
The wood-products industry also has mixed views about the type of energy projects and use of woody feedstocks. The European Panel Federation supports the use of wood for energy when it is generated from co-products from the solid-product manufacturing industry, or residues from forest harvests, and used in high-efficiency systems such as combined heat and power (Döry, 2012).
But the Federation has a strong position against large wood energy projects and recommends stopping public subventions to energy-inefficient installations, as they can distort competition for raw materials. On the other hand, the European Pellet Council (Rakos, 2012) advocates greater use of wood energy as an incentive to increase current depressed prices for wood fibre, promote better forest management and reduce energy costs for households.
There have also been several initiatives in Canada to promote the sustainable use of wood for energy. Prominent Canadian environmental NGOs have identified wood energy as a credible renewable energy alternative for Canada (e.g. David Suzuki Foundation, 2012). The World Wildlife Fund (WWF) has worked with the Forest Products Association of Canada to review
regulations and practices that could help better manage biomass harvesting for energy purposes (WWF Canada/FPAC, 2010). Greenpeace has asked, among other recommendations, that Canadian provincial governments focus wood energy on industrial co-products rather than relying directly on forests (Mainville, 2011).
9.5 Public policy and future developments
The public policy landscape affecting wood energy consumption is still dominated by regulatory policies, fiscal incentives and public financing. The UNECE region is leading the global trend in adopting policies to support renewable energy (REN21 2012). Nonetheless, an expected contraction in public spending for 2013 may potentially affect the current policy landscape, with less fiscal and financial support. In addition to public-spending considerations, the treatment of GHG emissions from different types of wood energy feedstocks (Section 9.3.1) may also influence new developments. As pointed out in the 2011 Forest Products Annual Market Report (UNECE/FAO, 2011) a lack of long-term policy certainty and stability may discourage current and future investments in wood energy.
If public support is to be restructured, some programmes may be phased out but general support for renewable energy is expected to continue. While recent years have seen a major focus on promoting greater wood energy production from the power and heat sector, policy support may shift to other sectors (Aguilar et al., 2011). The residential sector remains a potential target group given its large share of wood energy consumption and elasticity to respond to competing energy price changes, particularly in rural areas (UNECE/FAO 2011; Song et al., 2012).
Public policy will influence wood energy consumption in 2013 and beyond, as will the price of competing energies. Technological progress and public support have reduced extraction costs of other energy sources such as natural gas. In the US, in particular, prices for natural gas have consistently declined since 2008 when the annual average was at about $270 per thousand m3 to about $150 per thousand m3 in 2010 (U.S. Energy Information Administration 2012c). Low natural-gas prices may prove a major barrier to the greater use of wood energy.
The technology for harvesting, treating, storing and converting wood to energy will have to improve if wood energy is to remain price competitive. Improvements in cooking and heating stoves for use in the residential sector may motivate homeowners to adopt and use wood energy in larger quantities. This has already resulted in greater demand for residential quality wood pellets and firewood in the EU.
UNECE/FAO Forest Products Annual Market Review, 2011-2012 _________________________________________________________ 105
Torrefaction of woody biomass (a mild pyrolysis process that improves the fuel properties of wood) can also provide for more efficient gasification and energy conversion (Prins et al., 2006). Torrefaction permits higher co-firing percentages, and lowers handling, processing and transport costs thanks to higher energy density and lower degradation due to the hydrophobic nature of the processed material (Kleinschmidt 2011).
Torrefaction is being studied by several institutes and companies. Worldwide about 10 companies are making torrefied pellets. Arguably, the most productive and successful is “Topell” in the Netherlands (the company has won the first prize “WNF Cleantech Star” and is rated in the “Global CleanTech 100”). The plant was built as a test pilot for developing torrefaction technology. The result was a reactor with a capacity of 8-10 tonnes per hour. RWE (a strategic partner of the project) is building a production plant in the US. The price for torrefied pellets will likely be in line with its calorific value, at an estimated €170 per tonne FOB (Post van der Burg, 2012).
9.6 References Aguilar, F.X. and Cai, Z. 2010. Exploratory analysis of
prospects for renewable energy private investment in the U.S. Energy Economics. 32: pp.1245–1252.
Aguilar, F.X., Gaston, C., Hartkamp, R., Mabee, W. and Skog, K. 2011. Chapter 9: Wood energy markets. In: United Nations Forest Products Annual Market Review 2010-2011. pp.85-97. Available at: http://live.unece.org/fileadmin/DAM/publications/ timber/FPAMR_HQ_2010-2011.pdf.
APX-ENDEX. 2011. Endex Industrial Wood Pellets. www.apxendex.com/index.php?id=291
Argus. 2012. Argus Biomass Markets. Issue 12. (13 pp). CANBIO. 2012. Economic impact of bioenergy in
Canada - 2011. CKTG. 2012. Atikokan Renewable Fuels talks future9 May
2012. Available at http://thegiantnews.blogspot.ca Cocchi, M. 2011. Sustainable Bioenergy Trade. IEA
Bioenergy. (190 pp). Daniel, M. and Aguilar,F.X. Social Availability of Woody
Biomass from Missouri Family Forest Landowners. Society of American Foresters National Convention. Honolulu, Hawaii. Nov. 2-6, 2011.
David Suzuki Foundation. 2012. Energy overview. Available at: www.davidsuzuki.org
Döry, L. 2012. European Panel Federation and Wood Energy. UNECE/FAO Policy Debate on Wood Energy: Is it Good or Bad? 8 May 2012, Geneva, Switzerland. Available at: www.unece.org/energy-debate-2012.html
Drax Power Limited. 2011. Sustainability Policy for Biomass. Available at: www.draxpower.com
Enviva. Certification. Available at: www.envivabiomass.com ENplus. 2012. About EN Plus. Available at: www.enplus-
pellets.eu/ European Commission. 2010. Report from the
Commission to the Council and the European Parliament on sustainability requirements for the use of solid and gaseous biomass sources in electricity, heating and cooling SEC(2010) 65 final SEC(2010) 66 final. Available at: http://eur-lex.europa.eu
European Parliament. 2009. Directive 2009/28/EC of the European Parliament and of the Council. of 23 April 2009 on the promotion of the use of energy from renewable sources and amending and subsequently repealing Directives 2001/77/EC and 2003/30/EC. Available at: http://eur-lex.europa.eu
Eurostat, 2012. Available at: http://epp.eurostat.ec.europa.eu FPAC. 2011. Transforming Canada's forest products
industry: Summary of findings from the Future Bio-Pathways Project. Forest Products Association of Canada, Ottawa. Available at: www.fpac.ca
Glukhovskiy, V.M. 2011. Technical Director. LesInTech. (personal communication).
Green Gold Label. 2012. GGL-The Programme. Available at: www.greengoldcertified.org/site/pagina.php?id=9
Gruchy, S., Grebner, D., Munn, I.A., Joshi, O. and Hussain, A. 2012. An assessment of nonindustrial private forest landowner willingness to harvest woody biomass in support of bioenergy production in Mississippi: A contingent rating approach. Forest Policy and Economics 15: pp.140–145
IEA Bioenergy Task 39. 2012. Update on Implementation Agendas 2012. Mabee, W. and Saddler J.N. (editors). IEA Bioenergy Task 39, Vancouver, Canada. Available at: www.task39.org
IEA Statistics. 2012. 2009 Energy Balance for Canada. Available at: www.iea.org/stats/balancetable.asp ?COUNTRY_CODE=CA.
Joshi, O. and Mehmood, S. 2011. Factors affecting nonindustrial private forest landowners' willingness to supply woody biomass for bioenergy. Biomass and Bioenergy. 35(1): pp.186–192.
Kleinschmidt, C. 2011. Overview of international developments in torrefaction. IEA Bioenergy Task. Available at: www.ieabcc.nl
Lantiainen, S. 2012. Wood Energy and European Family Forest Owners. Confederation of European Forest Owners [personal communication].
Laborelec. 2012. Biomass. Available at: www.laborelec.be/ENG/about-us/about-us-3/
106 ____________________________________________________________________________________ Chapter 9, Wood energy markets
Mainville, N. 2011. Fuelling a BioMess: Why Burning Trees for Energy Will Harm People, the Climate and Forests. Greenpeace. (38 pp).
Markowski-Lindsay, M., Stevens, T., Kittredge, D. and Butler, B. Family forest owner preferences for biomass harvesting in Massachusetts. Forest Policy and Economics [forthcoming].
Massachusetts Executive Office of Energy and Environmental Affairs. 2012. Renewable Portfolio Standard – Biomass Policy Regulatory Process – Proposed final regulation, published 27 April, 2012. Available at: www.mass.gov
McCrone, A., Usher, E., Sonntag-O'Brien, V., Moslener, U. and Grüning, C (editors). 2012. Global Trends in Renewable Energy Investment 2012. UNEP Collaborating Center for Climate and Sustainable Energy Finance. (82 pp).
Minnesota Biomass Exchange. 2012. MBioEX News. Available at: www.mbioex.com/
Moore S., Durant V. and Mabee, W. 2012. Determining appropriate feed-in tariff rates to promote biomass-to-electricity generation in Eastern Ontario, Canada. Energy Policy (in review).
NEB. 2012. Natural gas - how Canadian markets work. National Energy Board, Ottawa, Canada. Available at: www.neb-one.gc.ca
Pellet Fuels Institute (PFI). 2012. PFI Standards Program. Available at: http://pelletheat.org
Post van der Burg, R. 2012. Business Development Director. Topell Energy (personal communication).
Prins, M.J., Ptasinski, K.J. and Janssen, F. 2006. More efficient biomass gasification via torrefaction. Energy. 31(15): 3458–3470.
Rakos, C. 2012. Wood use for energy – a benefit for the forest sector for society and the environment. European Pellet Council. UNECE/FAO Policy Debate on Wood Energy: Is it Good or Bad? 8 May 2012, Geneva, Switzerland. Available at: www.unece.org/energy-debate-2012.html
Renewable Energy Policy Network for the 21st century (REN21). 2012. Renewables 2012. Global Status Report. (171 pp).
Ryckmans, Y. 2010. Laborelec-SGS solid biomass sustainability scheme. Available at: www.laborelec.be/ENG
Sierra Club. N.d. Sierra Club Conservation Policies: Biomass Guidance. Available at: www.sierraclub.org
Sims, R.E.H., Mabee, W., Saddler J.N. and Taylor, M. 2010. An overview of second generation biofuel technologies. Bioresource Technology 101(6): pp.1570-1580.
Song, N., Aguilar, F. X., Shifley, S. R.; Goerndt, M. E. 2012. Factors affecting wood energy consumption by U.S. households. Energy Economics. 34: pp.389-397.
Spelter, H. 2012. Risks and opportunities: The new generation wood pellet industry is experiencing both. Timber Processing. April. pp.24-26.
Stennes, B.K. and McBeath, A. 2006. Bioenergy options for woody feedstock : are trees killed by mountain pine beetle in British Columbia a viable bioenergy resource? Canadian Forest Service, Pacific Forestry Centre, British Columbia. Report BC-X-405. (30 pp).
Taberner, P. 2011. Big in the Baltics. Biomass Magazine, 31.10.2011. Available at: http://biomassmagazine.com/
UN Comtrade. 2012. Available at: http://comtrade.un.org UNECE/FAO. 2009. Forest Products Annual Market
Review 2008-2009. Available at: http://www.unece.org/ forests/fpm/annualmarketreviews.html
UNECE/FAO. 2011a. Joint wood energy enquiry (JWEE) 2009. United Nations, Geneva. Available at www.unece.org/forests/jwee.html
UNECE/FAO. 2011b. Forest Products Annual Market Review 2010-2011. Available at: http://www.unece.org/ forests/fpm/annualmarketreviews.html
US Energy Information Administration (EIA). 2012a. Monthly energy review, April 2012. http://205.254.135.7/totalenergy/data/monthly/#summary
US Energy Information Administration (EIA). 2012b. Annual energy outlook. 2012. Report DOE/EIA-0383ER(2012).
US Energy Information Administration (EIA). 2012c. Natural Gas. Available at: http://205.254.135.7/naturalgas/annual/
US Environmental Protection Agency (USEPA). 2011a. Accounting framework for biogenic CO2 emissions from stationary sources. www.epa.gov
US Environmental Protection Agency (USEPA). 2011b.Biogenic Carbon Emissions Panel meeting. Available at: http://www.gpo.gov
US Public Law 110-140. Energy Independence and Security Act of 2007. Stat. 1492.
Wood Pellet Association of Canada. 2012. Available at: www.pellet.org
WWF Canada/FPAC. 2010. A National Scan of Regulations and Practices Relevant to Biomass Harvesting.

UNECE/FAO Forest Products Annual Market Review, 2011-2012 _________________________________________________________ 107
10 Certified forest products markets, 2011-2012
Lead author, Kathryn Fernholz Contributing author, Florian Kraxner
Highlights By May 2012, the global area of certified forest was 394 million hectares, a 4% increase since
May 2011. Almost all the recent growth in certified area is in the CIS subregion, primarily in the Russian Federation. There was also growth in North America.
Almost 92% of certified forests are in the northern hemisphere. Only 2% of tropical forests are certified.
The potential supply of industrial roundwood from certified forests was estimated at 469 million m3 in May 2012, about 27% of global roundwood production.
The development of green-building codes in Europe, the US and Asia-Pacific continues and will have a significant impact on wood products, certified wood products and the selection of building materials that meet criteria for recycled content, bio-based and indigenous (local) sources.
Forest-certification programmes continue to respond to and be reviewed within the context of the development of government programmes, including the due diligence systems of the Lacey Act in the United States and the EU Timber Regulation.
The benefits of certification and other market-based systems for supporting forest sustainability may be improved through more active involvement by the forest products sector, governments, and associated interest groups.
Certification programmes will face increasing competition and will need to define their niche in the light of the development of targeted standards that address specific market issues such as climate change policies, illegal logging controls and bio-based material assurances.

108 ___________________________________________________________________________ Chapter 10, Certified forest products markets
10.1 Introduction This chapter reviews the market and trade in certified
forest products (CFPs) and focuses on how market tools such as certification contribute to identifying and procuring sustainable wood products. It also examines policy-related aspects of certification.
CFPs carry labels demonstrating, in a manner verifiable by third-party independent bodies, that they come from forests that meet a standard of sustainable forest management (SFM). Consumers may find labels on products ranging from paper to furniture, while manufacturers can verify the source through the certification scheme’s chain-of-custody (CoC) procedures.
This chapter takes account of national and international, independent third-party certification of forest management by organizations such as the American Tree Farm System (ATFS), the Canadian Standards Association (CSA), the Sustainable Forestry Initiative (SFI) and the Malaysian Timber Certification Council (MTCC). However, the graphs present data primarily for the Forest Stewardship Council (FSC), and the Programme for the Endorsement of Forest Certification (PEFC). Data for national systems that have since been endorsed by PEFC (ATFS, CSA, MTCS, SFI) have been amalgamated into the PEFC data and do not appear separately after the date of endorsement.
The authors’ intent is to be impartial and objective. Certification and CFP markets are controversial within the forest sector. Their evaluation remains challenging because broadly organized data collection on CFP production and trade flows does not exist, so the overall picture has to be constructed from fragmented data. Section 4 of this chapter deals with topics such as the impact and awareness of certification, Green Building Initiatives (GBIs) and trade legislation related to certification and illegal logging. This chapter also examines one of the major objectives of certification: to provide a market-driven incentive for forest retention and responsible harvesting of forest resources.
10.2 Development of forest certification
10.2.1 Overview By at least one measure, third-party forest certification
will be 20 years old in 2013. The Forest Stewardship Council (FSC) was formed in Toronto, Canada, in 1993 and the first FSC certificates were issued that year. The Programme for the Endorsement of Forest Certification (PEFC) was established in 1999 by national organizations from 11 countries and recognized the first national system in 2000.
By May 2012, the global area of certified forest, endorsed by FSC and PEFC, amounted to 394 million hectares, up 4% (14.8 million hectares) since May 2011 (graph 10.2.1). There is an estimated overlap of roughly 6.5 million hectares (half of which is in Europe) due to double certification.
GRAPH 10.2.1
Forest area certified by major certification schemes, 2005-2012
Notes: Data cover all FSC- and PEFC-certified forest land together with land certified under the following large national certification systems: Malaysian Timber Certification System (MTCS), American Tree Farm System (ATFS), Sustainable Forest Initiative (SFI) and Canadian Standards Association (CSA). Data for national systems subsequently endorsed by PEFC (MTCS, ATFS, SFI, CSA) are amalgamated into the PEFC data and not shown separately after the date of endorsement. The shown statistics are not adjusted to reflect an estimated overlap of roughly 6.5 million hectares in FSC and PEFC certification. Sources: Individual certification systems, Certification Canada and authors’ compilation, 2012.
The world’s certified forest area is approaching 10%. At present rates of growth in certified forest area, it would take another 80 years before even half the world’s forests became certified (assuming no overall change in the global forest area).
The certified area already exceeds 50% of the regional forest area in some parts of the world, such as in western Europe (table 10.2.1). Canada has certified nearly three-quarters of its commercial forest land and some individual States in the United States have exceeded 50% certified managed forest lands. The greatest potential now for the expansion of forest certification lies in the tropical forests, where the certified area represents about 2% of total forest land. It is also the region where forest certification is needed the most.
The proportion of global industrial roundwood supply from certified forests was estimated at 26.5% (469 million
0
50
100
150
200
250
300
350
400
450
Mill
ion
hect
ares
FSC PEFC SFI ATFS
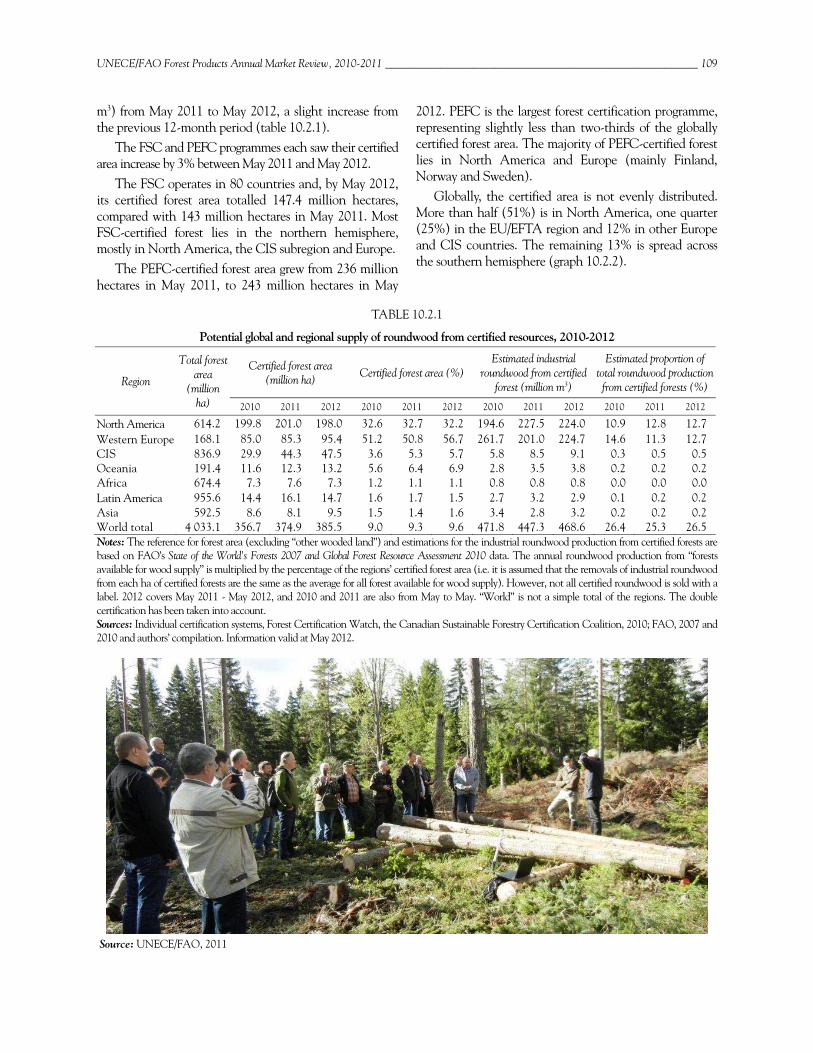
UNECE/FAO Forest Products Annual Market Review, 2010-2011 _________________________________________________________ 109
m3) from May 2011 to May 2012, a slight increase from the previous 12-month period (table 10.2.1).
The FSC and PEFC programmes each saw their certified area increase by 3% between May 2011 and May 2012.
The FSC operates in 80 countries and, by May 2012, its certified forest area totalled 147.4 million hectares, compared with 143 million hectares in May 2011. Most FSC-certified forest lies in the northern hemisphere, mostly in North America, the CIS subregion and Europe.
The PEFC-certified forest area grew from 236 million hectares in May 2011, to 243 million hectares in May
2012. PEFC is the largest forest certification programme, representing slightly less than two-thirds of the globally certified forest area. The majority of PEFC-certified forest lies in North America and Europe (mainly Finland, Norway and Sweden).
Globally, the certified area is not evenly distributed. More than half (51%) is in North America, one quarter (25%) in the EU/EFTA region and 12% in other Europe and CIS countries. The remaining 13% is spread across the southern hemisphere (graph 10.2.2).
TABLE 10.2.1
Potential global and regional supply of roundwood from certified resources, 2010-2012
Region
Total forest area
(million ha)
Certified forest area (million ha) Certified forest area (%)
Estimated industrial roundwood from certified
forest (million m3)
Estimated proportion of total roundwood production from certified forests (%)
2010 2011 2012 2010 2011 2012 2010 2011 2012 2010 2011 2012
North America 614.2 199.8 201.0 198.0 32.6 32.7 32.2 194.6 227.5 224.0 10.9 12.8 12.7 Western Europe 168.1 85.0 85.3 95.4 51.2 50.8 56.7 261.7 201.0 224.7 14.6 11.3 12.7 CIS 836.9 29.9 44.3 47.5 3.6 5.3 5.7 5.8 8.5 9.1 0.3 0.5 0.5 Oceania 191.4 11.6 12.3 13.2 5.6 6.4 6.9 2.8 3.5 3.8 0.2 0.2 0.2 Africa 674.4 7.3 7.6 7.3 1.2 1.1 1.1 0.8 0.8 0.8 0.0 0.0 0.0 Latin America 955.6 14.4 16.1 14.7 1.6 1.7 1.5 2.7 3.2 2.9 0.1 0.2 0.2 Asia 592.5 8.6 8.1 9.5 1.5 1.4 1.6 3.4 2.8 3.2 0.2 0.2 0.2 World total 4 033.1 356.7 374.9 385.5 9.0 9.3 9.6 471.8 447.3 468.6 26.4 25.3 26.5 Notes: The reference for forest area (excluding “other wooded land”) and estimations for the industrial roundwood production from certified forests are based on FAO’s State of the World’s Forests 2007 and Global Forest Resource Assessment 2010 data. The annual roundwood production from “forests available for wood supply” is multiplied by the percentage of the regions’ certified forest area (i.e. it is assumed that the removals of industrial roundwood from each ha of certified forests are the same as the average for all forest available for wood supply). However, not all certified roundwood is sold with a label. 2012 covers May 2011 - May 2012, and 2010 and 2011 are also from May to May. “World” is not a simple total of the regions. The double certification has been taken into account. Sources: Individual certification systems, Forest Certification Watch, the Canadian Sustainable Forestry Certification Coalition, 2010; FAO, 2007 and 2010 and authors’ compilation. Information valid at May 2012.
Source: UNECE/FAO, 2011
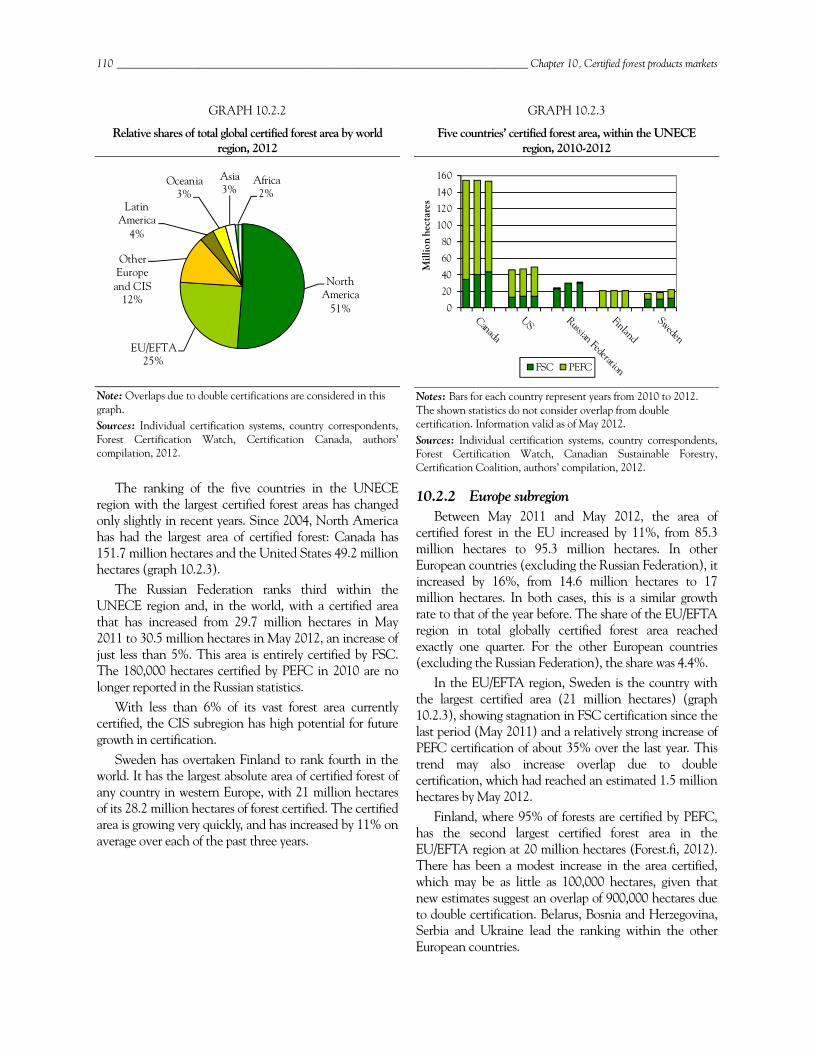
110 ___________________________________________________________________________ Chapter 10, Certified forest products markets
GRAPH 10.2.2
Relative shares of total global certified forest area by world region, 2012
Note: Overlaps due to double certifications are considered in this graph. Sources: Individual certification systems, country correspondents, Forest Certification Watch, Certification Canada, authors’ compilation, 2012.
The ranking of the five countries in the UNECE region with the largest certified forest areas has changed only slightly in recent years. Since 2004, North America has had the largest area of certified forest: Canada has 151.7 million hectares and the United States 49.2 million hectares (graph 10.2.3).
The Russian Federation ranks third within the UNECE region and, in the world, with a certified area that has increased from 29.7 million hectares in May 2011 to 30.5 million hectares in May 2012, an increase of just less than 5%. This area is entirely certified by FSC. The 180,000 hectares certified by PEFC in 2010 are no longer reported in the Russian statistics.
With less than 6% of its vast forest area currently certified, the CIS subregion has high potential for future growth in certification.
Sweden has overtaken Finland to rank fourth in the world. It has the largest absolute area of certified forest of any country in western Europe, with 21 million hectares of its 28.2 million hectares of forest certified. The certified area is growing very quickly, and has increased by 11% on average over each of the past three years.
GRAPH 10.2.3
Five countries’ certified forest area, within the UNECE region, 2010-2012
Notes: Bars for each country represent years from 2010 to 2012. The shown statistics do not consider overlap from double certification. Information valid as of May 2012. Sources: Individual certification systems, country correspondents, Forest Certification Watch, Canadian Sustainable Forestry, Certification Coalition, authors’ compilation, 2012.
10.2.2 Europe subregion Between May 2011 and May 2012, the area of
certified forest in the EU increased by 11%, from 85.3 million hectares to 95.3 million hectares. In other European countries (excluding the Russian Federation), it increased by 16%, from 14.6 million hectares to 17 million hectares. In both cases, this is a similar growth rate to that of the year before. The share of the EU/EFTA region in total globally certified forest area reached exactly one quarter. For the other European countries (excluding the Russian Federation), the share was 4.4%.
In the EU/EFTA region, Sweden is the country with the largest certified area (21 million hectares) (graph 10.2.3), showing stagnation in FSC certification since the last period (May 2011) and a relatively strong increase of PEFC certification of about 35% over the last year. This trend may also increase overlap due to double certification, which had reached an estimated 1.5 million hectares by May 2012.
Finland, where 95% of forests are certified by PEFC, has the second largest certified forest area in the EU/EFTA region at 20 million hectares (Forest.fi, 2012). There has been a modest increase in the area certified, which may be as little as 100,000 hectares, given that new estimates suggest an overlap of 900,000 hectares due to double certification. Belarus, Bosnia and Herzegovina, Serbia and Ukraine lead the ranking within the other European countries.
North America
51%
EU/EFTA25%
Other Europe and CIS
12%
Latin America
4%
Oceania3%
Asia3%
Africa2%
0
20
40
60
80
100
120
140
160
Mill
ion
hect
ares
FSC PEFC
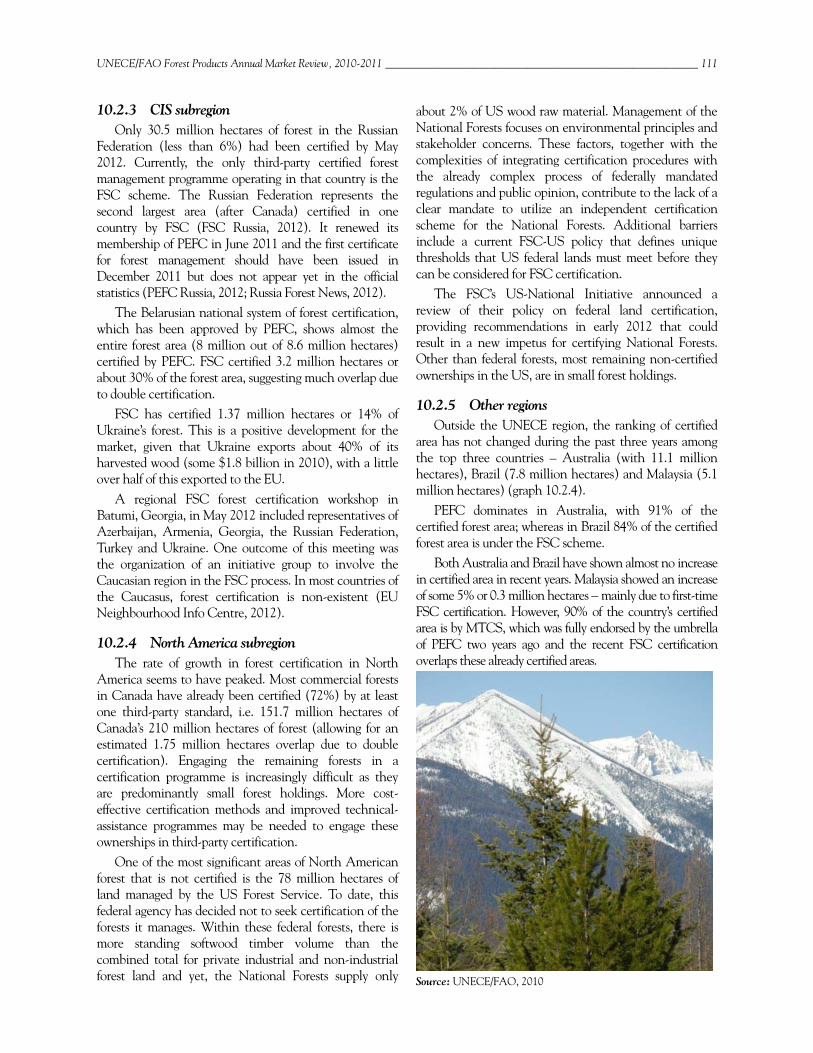
UNECE/FAO Forest Products Annual Market Review, 2010-2011 _________________________________________________________ 111
10.2.3 CIS subregion Only 30.5 million hectares of forest in the Russian
Federation (less than 6%) had been certified by May 2012. Currently, the only third-party certified forest management programme operating in that country is the FSC scheme. The Russian Federation represents the second largest area (after Canada) certified in one country by FSC (FSC Russia, 2012). It renewed its membership of PEFC in June 2011 and the first certificate for forest management should have been issued in December 2011 but does not appear yet in the official statistics (PEFC Russia, 2012; Russia Forest News, 2012).
The Belarusian national system of forest certification, which has been approved by PEFC, shows almost the entire forest area (8 million out of 8.6 million hectares) certified by PEFC. FSC certified 3.2 million hectares or about 30% of the forest area, suggesting much overlap due to double certification.
FSC has certified 1.37 million hectares or 14% of Ukraine’s forest. This is a positive development for the market, given that Ukraine exports about 40% of its harvested wood (some $1.8 billion in 2010), with a little over half of this exported to the EU.
A regional FSC forest certification workshop in Batumi, Georgia, in May 2012 included representatives of Azerbaijan, Armenia, Georgia, the Russian Federation, Turkey and Ukraine. One outcome of this meeting was the organization of an initiative group to involve the Caucasian region in the FSC process. In most countries of the Caucasus, forest certification is non-existent (EU Neighbourhood Info Centre, 2012).
10.2.4 North America subregion The rate of growth in forest certification in North
America seems to have peaked. Most commercial forests in Canada have already been certified (72%) by at least one third-party standard, i.e. 151.7 million hectares of Canada’s 210 million hectares of forest (allowing for an estimated 1.75 million hectares overlap due to double certification). Engaging the remaining forests in a certification programme is increasingly difficult as they are predominantly small forest holdings. More cost-effective certification methods and improved technical-assistance programmes may be needed to engage these ownerships in third-party certification.
One of the most significant areas of North American forest that is not certified is the 78 million hectares of land managed by the US Forest Service. To date, this federal agency has decided not to seek certification of the forests it manages. Within these federal forests, there is more standing softwood timber volume than the combined total for private industrial and non-industrial forest land and yet, the National Forests supply only
about 2% of US wood raw material. Management of the National Forests focuses on environmental principles and stakeholder concerns. These factors, together with the complexities of integrating certification procedures with the already complex process of federally mandated regulations and public opinion, contribute to the lack of a clear mandate to utilize an independent certification scheme for the National Forests. Additional barriers include a current FSC-US policy that defines unique thresholds that US federal lands must meet before they can be considered for FSC certification.
The FSC’s US-National Initiative announced a review of their policy on federal land certification, providing recommendations in early 2012 that could result in a new impetus for certifying National Forests. Other than federal forests, most remaining non-certified ownerships in the US, are in small forest holdings.
10.2.5 Other regions Outside the UNECE region, the ranking of certified
area has not changed during the past three years among the top three countries – Australia (with 11.1 million hectares), Brazil (7.8 million hectares) and Malaysia (5.1 million hectares) (graph 10.2.4).
PEFC dominates in Australia, with 91% of the certified forest area; whereas in Brazil 84% of the certified forest area is under the FSC scheme.
Both Australia and Brazil have shown almost no increase in certified area in recent years. Malaysia showed an increase of some 5% or 0.3 million hectares – mainly due to first-time FSC certification. However, 90% of the country’s certified area is by MTCS, which was fully endorsed by the umbrella of PEFC two years ago and the recent FSC certification overlaps these already certified areas.
Source: UNECE/FAO, 2010
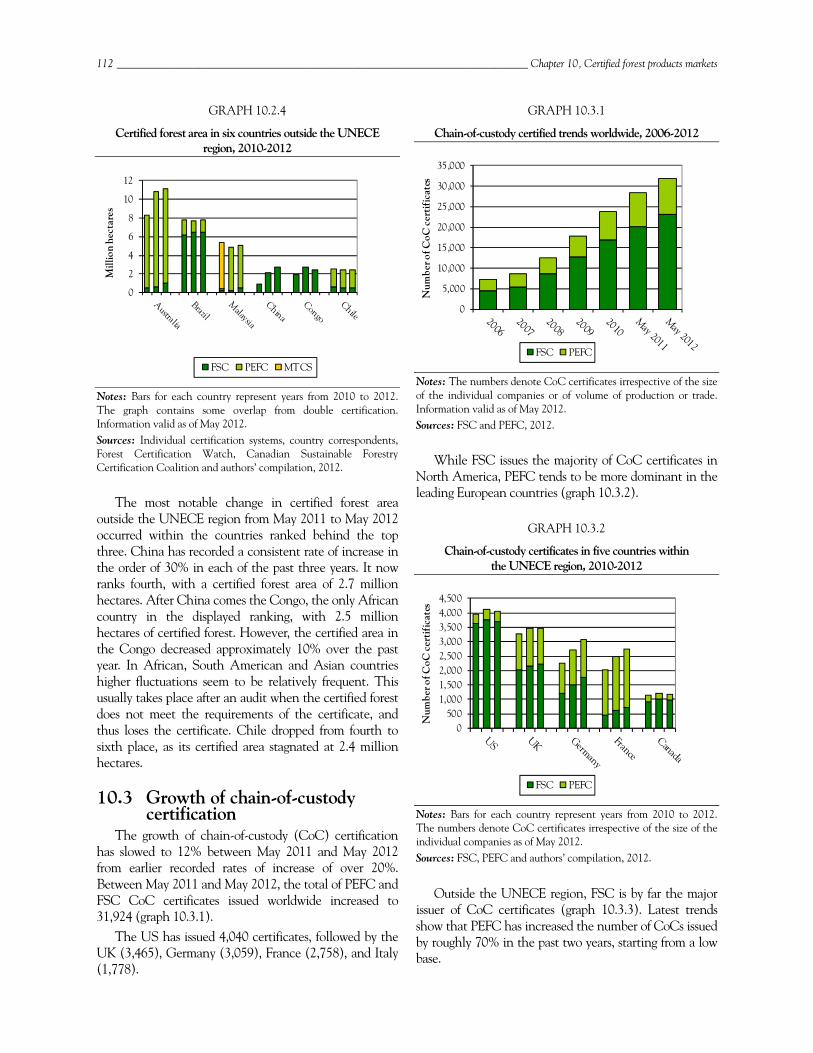
112 ___________________________________________________________________________ Chapter 10, Certified forest products markets
GRAPH 10.2.4
Certified forest area in six countries outside the UNECE region, 2010-2012
Notes: Bars for each country represent years from 2010 to 2012. The graph contains some overlap from double certification. Information valid as of May 2012. Sources: Individual certification systems, country correspondents, Forest Certification Watch, Canadian Sustainable Forestry Certification Coalition and authors’ compilation, 2012.
The most notable change in certified forest area outside the UNECE region from May 2011 to May 2012 occurred within the countries ranked behind the top three. China has recorded a consistent rate of increase in the order of 30% in each of the past three years. It now ranks fourth, with a certified forest area of 2.7 million hectares. After China comes the Congo, the only African country in the displayed ranking, with 2.5 million hectares of certified forest. However, the certified area in the Congo decreased approximately 10% over the past year. In African, South American and Asian countries higher fluctuations seem to be relatively frequent. This usually takes place after an audit when the certified forest does not meet the requirements of the certificate, and thus loses the certificate. Chile dropped from fourth to sixth place, as its certified area stagnated at 2.4 million hectares.
10.3 Growth of chain-of-custody certification
The growth of chain-of-custody (CoC) certification has slowed to 12% between May 2011 and May 2012 from earlier recorded rates of increase of over 20%. Between May 2011 and May 2012, the total of PEFC and FSC CoC certificates issued worldwide increased to 31,924 (graph 10.3.1).
The US has issued 4,040 certificates, followed by the UK (3,465), Germany (3,059), France (2,758), and Italy (1,778).
GRAPH 10.3.1
Chain-of-custody certified trends worldwide, 2006-2012
Notes: The numbers denote CoC certificates irrespective of the size of the individual companies or of volume of production or trade. Information valid as of May 2012. Sources: FSC and PEFC, 2012.
While FSC issues the majority of CoC certificates in North America, PEFC tends to be more dominant in the leading European countries (graph 10.3.2).
GRAPH 10.3.2
Chain-of-custody certificates in five countries within the UNECE region, 2010-2012
Notes: Bars for each country represent years from 2010 to 2012. The numbers denote CoC certificates irrespective of the size of the individual companies as of May 2012. Sources: FSC, PEFC and authors’ compilation, 2012.
Outside the UNECE region, FSC is by far the major issuer of CoC certificates (graph 10.3.3). Latest trends show that PEFC has increased the number of CoCs issued by roughly 70% in the past two years, starting from a low base.
0
2
4
6
8
10
12
Mill
ion
hect
ares
FSC PEFC MTCS
0
5,000
10,000
15,000
20,000
25,000
30,000
35,000
Num
ber o
f CoC
cer
tifi
cate
s
FSC PEFC
0500
1,0001,5002,0002,5003,0003,5004,0004,500
Num
ber o
f CoC
cer
tifi
cate
s
FSC PEFC

UNECE/FAO Forest Products Annual Market Review, 2010-2011 _________________________________________________________ 113
China is the leading country in terms of CoC certificates issued in 2012, with 2,160. Growth in the number of certificates in China has continued at a very fast pace from 2008 to 2010.
GRAPH 10.3.3
Chain-of-custody certificates in five countries outside the UNECE region, 2010-2012
Notes: Bars for each country represent years from 2010 to 2012. The numbers denote CoC certificates irrespective of the size of the individual companies as of May 2012. Sources: FSC, PEFC and authors’ compilation, 2012.
10.4 Key forest certification issues
10.4.1 Mutual recognition between certification schemes
For more than a decade, there has been discussion about possible mutual recognition as a method for reducing barriers and inefficiencies in forest certification. Even though competition between certification programmes has led to some innovations and improvements, it also creates additional costs for land managers and companies that find it necessary to be certified under multiple programmes to meet customers’ interests. The competing programmes and marketing campaigns can also create confusion in the marketplace.
It seems clear from the different structures and policies of the two principal programmes, FSC and PEFC, that mutual recognition is unlikely. In the light of the lack of readiness of the programmes themselves to explore harmonization as a method of reducing confusion and improving efficiencies, there is a real prospect of other organizations taking on the responsibility of clarifying the role of certified products in the marketplace. By recommending (or requiring) procurement policies that include certification, green-building advocates and regional and federal governments are playing the role of
evaluating standards and their equivalency or adequacy in meeting baseline expectations. The criteria for evaluation include legality ability and/or the suitability of certification schemes for meeting environmental purchasing goals or green-building codes. This involvement of government organizations and other stakeholders may lead to insights and innovations in approaches to accountability and traceability.
10.4.2 Costs of certification The costs of certification vary greatly, with research
suggesting that the direct costs of a certification assessment may vary from $2 to $60 per hectare (Hansen, 1998). A later study found the cost of assessment to range from $1.33 to $22.93 per hectare (Cubbage et al., 2003). Using the extreme estimates, it is likely that some amount between $499 million and $22.5 billion has been spent on the direct costs of certification assessments to achieve the currently certified forest area. Using the average of $21.56 provides an estimated cost of $8.5 billion. The true total costs are actually much higher because some certified lands have had multiple five-year re-assessments and these figures do not include either the costs of annual audits or any increase in operating expenses. To put this into perspective, in 2011, EU imports of roundwood and sawnwood had a total value of approximately $16 billion.
Annual audit costs are in addition to the direct cost of a full assessment and may vary between $0.10 per hectare for large parcels to $40 per hectare for smaller areas (Hansen, 1998). Based on these estimates, the direct cost of maintaining the certification of currently certified forest is between $37.5 million and $1.5 billion per year.
These wide-ranging estimates reflect the lack of available information about the actual costs associated with certification. The estimates also only address the direct costs of assessments and audits. They do not include the operating costs for the certification programmes or the indirect costs associated with management changes and actions required to comply with the certification standard. Neither do they include lost revenue due to changes in harvesting practices to address certification standards. One study estimates an average revenue loss of $3.05 per hectare due to these implementation costs (Brown and Zhang, 2005).
The chain-of-custody (CoC) system itself adds cost to the marketplace, with anecdotal evidence suggesting that CoC assessments appear to start at roughly $3,500 per certificate in North America, with annual audits costing around $1,800. Thus, the overall cost of chain-of-custody certification for a company would appear to be at least $10,700 per five-year period (one year of the assessment costs and four years of annual audit costs). Research in
0
500
1,000
1,500
2,000
2,500
Num
ber o
f CoC
cer
tifi
cate
s
FSC PEFC
114 ___________________________________________________________________________ Chapter 10, Certified forest products markets
North and South America found that forest management certification costs do not vary greatly between systems or countries (Moore, 2012). If the same cost relationships hold for CoC, the global five-year costs for the current number of certificates are approximately $300 million, equivalent to $60 million annually.
10.4.3 Green building and certification Green building continues to move from voluntary
programmes to integration into formal building codes. In March 2012, the International Green Construction Code (IgCC) was released. The code addresses all forms of commercial construction and also influences residential construction. It has already been adopted by several States and cities in the US and offers flexibility that should aid rapid uptake. The IgCC was developed by the International Code Council (ICC), along with many stakeholders. The ICC is a non-profit organization dedicated to developing uniform and comprehensive building codes for US territories. These building codes have been adopted by many government jurisdictions.
The materials and resource section of the code could potentially have a significant impact on wood and other building materials, with the emphasis on using materials that are recyclable or reusable and bio-based. The code encourages the use of certified wood products and recognizes all the major certification programmes. It also recognizes the desirability of using locally sourced materials, defining local as within 500 miles when road transport is used or up to 2,000 miles when rail or water is used. Its energy requirements could affect wood products, including incentives for on-site generation of renewable energy or purchasing agreements; and biomass energy could be utilized to meet these requirements.
The overall impact of the IgCC could include significant growth in green building, more consistency in green-building definitions and increased pressure for improved recycling and other changes in building material manufacturing.
Voluntary programmes are still the main driver behind green building. In 2005, the EU initiated the European Green Building Programme, which is strictly a voluntary programme designed to advance environment-friendly construction. When comparing new certified buildings in Europe from 2012 to 2011, the number of certified buildings has increased roughly by 20%. (RICS, 2012) Even though the figure for certified construction is promising, the share of certified buildings is small compared to total construction. There are no statistics measuring the share of certified buildings in total construction and research on green certified buildings has revealed that wood is often just a small component of the building materials used. This does not mean that
voluntary green building is not having an effect on the use of certified forest products. Two very recent high profile examples of green building are the new Olympic structures for the 2010 Vancouver winter games, which were built with Green building standards and extensive use of wood, and the London 2012 Olympic Games. The London games also used certified green buildings and have taken the additional step of using two different certificates (PEFC and FSC), and by this commitment the games are the first of their kind, showcasing wood that is 100% certified (Sustainable Timber Action, 2012).
While the direct contribution of voluntary green building certification towards consumption of certified forest products is small, the indirect contribution of displaying the use of certified wood in such high profile green building projects, such as those for the Vancouver and London games, helps to raise the profile of certified forest products.
10.4.4 Impact of trade legislation on certification Measures introduced to control illegal wood might be
expected to help boost interest in certification, since certification is generally regarded as a pathway for addressing legality requirements. The knowledge and experience gained by certification organizations over the past 20 years may also help in developing and implementing systems to ensure legality.
In May 2012, the Due Care Standard for the Lacey Act addressing illegally logged wood was approved in the United States. This standard provides pathways for meeting the mandate of the Lacey Act using FSC, PEFC or an alternative approach developed by the American Hardwood Export Council for their members. The EU Timber Regulation also has a due diligence system that recognizes the FSC and PEFC programmes.
10.4.5 Contribution of certification to the production of sustainable forest products
Certified wood has become synonymous with sustainable wood. However, to combat illegal logging, and despite the certification programmes, governments have had to draw up additional regulations, including tracking and enforcement measures. Prevention of deforestation in the tropics was among the main reasons for introducing forest certification but this is the area where the least progress has been made.
After 20 years, still only roughly 2% of tropical forest has been certified and, during that same period, more than 290 million hectares have been destroyed and converted to non-forest uses (FAO, 2010). The certification programmes have also not been able to provide standards that adequately address emerging issues such as climate change and biofuels. Additional

UNECE/FAO Forest Products Annual Market Review, 2010-2011 _________________________________________________________ 115
enforcement and standard-setting measures have been needed.
Certification cannot address all forestry concerns and it is likely that government regulations and other measures will continue to be necessary to address high-risk situations. While recognizing the limits of voluntary certification and the role of government policy, making progress on the production of sustainable forest products will require a better integration of these roles if tropical deforestation is to be prevented.
In terms of sustainable forest products, recent research has shown that there are areas of need and opportunity that may provide significant environmental benefits but that are neither well researched nor addressed in voluntary or regulatory programmes. Following a review of 208 published studies on forest operations efficiency and environmental improvements, researchers identified great potential for improved biomass harvesting and transport logistics (Lang and Mendell, 2012).
Improvements in biomass harvesting could bring about significant cost savings, which could reduce fuel costs and make wildfire prevention efforts more affordable. It could also provide environmental and wildlife habitat benefits, as well as social and economic services. Adopting different raw material hauling systems to reduce fuel consumption and the distances covered could reduce costs as well as carbon emissions.
While certification programmes provide a detailed and comprehensive structure for evaluating the full spectrum of forest management, it is difficult for them to focus on few key indicators of sustainability.
Key indicators, including legality, responsible bioenergy and fuel efficiency are examples of areas where government standards may provide better tools for ensuring sustainability. The benefits of certification and other market-based systems for supporting forest sustainability may be improved through more active involvement of the forest products sector, governments, and associated interest groups.
Forest certification and the production of sustainable forest products will continue to be influenced by the development of government programmes, including the Lacey Act in the United States and the EU Timber Regulation. Voluntary labelling programmes are also emerging, such as the United States Department of Agriculture (USDA) BioPreferred® Program for certified bio-based products. The auditing of the products for that programme began in March 2012, and wood-based products included in the BioPreferred® Catalog include thermally-modified wood building materials, composite panels with recycled and recovered wood fibres, and textiles made with a blend of fibres. We may expect significant impacts on the forest sector and the
production of sustainable forest products as such programmes continue to develop.
10.4.6 Impact of competition between certification schemes
The various certification schemes continue to compete. The situation in the United States between FSC and SFI is a good example of the pros and cons of such competition. On the one hand, this competition has been constructive in motivating each scheme to make strategic improvements in their structures. Over the years, SFI has established independent governance, a chain-of-custody standard and international recognition through PEFC. Recently, FSC in the US moved from nine regional standards to a single national standard.
On the other hand, this competition can have drawbacks. It could be perceived to have only diverted attention and resources to addressing programmatic and bureaucratic interests, with limited benefit to the overall programmes. The result has been missed opportunities to increase engagement in sustainable forestry. There is a clear cost to spending time and money on competitive activities.
An additional cost arises from confusion and frustration about forest certification in several segments of the marketplace. Certificate holders, including forest managers, as well as chain-of-custody firms, can be confused and frustrated by frequent changes in policies and standards. And consumers of wood products are also confused by unclear differentiation between varying systems and the lack of information to determine a responsible choice when it comes to buying wood products. It is possible that the forest certification programmes have paid too much attention to each other and too little to promoting sustainable forestry and sustainable forest products.
As forest certification enters the next 20 years of activity, it will face renewed pressure to meet the interests of the marketplace and clarify the benefits of its programmes and services. Certification programmes are likely to face increased competition from new approaches and will be challenged to define their niche as more targeted standards are developed that address specific market issues such as climate change policies, illegal logging controls, and bio-based material assurances.
116 ___________________________________________________________________________ Chapter 10, Certified forest products markets
10.5 References Brown, R., Zhang, D. 2005. The Sustainable Forestry
Initiative’s impact on stumpage markets in the US South. Canadian Journal of Forest Research. 35:2056-2064.
Cubbage, F., Moore, S., Cox, J., Jervis, L., Edeburn, J., Richter, D. Boyette, W., Thompson, M. and Chesnutt, M. 2003. Forest certification of state and university lands in North Carolina: A comparison. J. For. 101 (8): 26-31.
EU Neighbourhood Info Centre. 2012. Workshop held on voluntary forest certification in the Caucasus. Available at: www.enpi-info.eu
FAO. 2007 and 2010. Global Forest Resources Assessment 2007 and 2010. Available at: www.fao.org/forestry/fra/en/
Forest.fi. 2012. Area of FSC-certified forests multiplies in Finland. Available at: www.forest.fi
FSC - US Board of Directors. February 25, 2003. FSC Federal Lands Policy. Available at: www.fscus.org
FSC. 2012. Global FSC certificates: type and distribution. FSC Factsheet published May 2012.
FSC Russia. 2012. Available at: www.fsc.ru Hansen, E. 1998. Understanding Certification (Pacific
Northwest). Oregon State University Extension Service. Available at: http://sfp.cas.psu.edu/pdfs/certsht.pdf
Lang, A., Mendell, B. 2012. Sustainable Wood Procurement: What the Literature Tells Us. Journal of Forestry 110 (3): 157-163.
Malaysian Timber Certification Council. 2012. Available at: www.mtcc.com.my.
Moore, S., Cubbage, F., Eicheldinger, C. 2012. Impacts of Forest Stewardship Council (FSC) and Sustainable Forestry Initiative (SFI) Forest Certification in North America. J. For. 110 (2): 79-88.
PEFC. 2012. PEFC Council Information Register. Accessed 18 June 2011. Available at: http://register.pefc.cz/statistics.asp
PEFC Russia. 2012. Available at: www.pefc.ru/
RICS. 2012. Going for Green Sustainable Building Certification. Statistics Europe, May 2012. Available at: www.rics.org
Russia Forest News. 2012. Available at: www.lesvesti.ru/news/main/1834/
SFI, 2012. Sustainable Forestry Initiative (SFI) Program, Available at http://sfiprogram.org.
Sustainable Timber Action. 2012. Forest certification meets green building program, 2 July 2012. Available at: www.sustainable-timber-action.org
UNECE/FAO Forest Products Annual Market Review, 2011-2012 _________________________________________________________ 117
11 Carbon markets, 2011-2012 Lead author, Jukka Tissari Contributing author, Jaana Korhonen
Highlights
The volume of carbon traded in the global markets grew by 17% to 10.2 billion tonnes of CO2e
in 2011, with its value increasing to $175.6 billion – a 10% increase from 2010.
The first Reducing Emissions from Deforestation and Forest Degradation (REDD) credits entered voluntary carbon markets in February 2011.
Development of a market-based REDD mechanism continued in April 2012 when the first REDD credits were issued in Brazil as temporary Certified Emission Reductions (CERs).
Despite the overall growth, carbon trade has been slow to take off, having suffered from the prolonged financial and economic crises in Europe, political obstacles in the US, slow progress in the negotiation process of the United Nations Framework Convention on Climate Change (UNFCCC), and the absence of full operational details for REDD+.
The EU Emissions Trading System grew by 11% to $147.9 billion in 2011, and represents 78% of world trade.
Although the volume of the voluntary carbon market (VCM) dropped by 28% to 95 million tonnes of CO2e, the value increased by 33% to $576 million.
Since June 2011, 11 new afforestation/reforestation projects with a total area of 26,350 ha were approved under the Clean Development Mechanism (CDM) to offset 300,100 tonnes of CO2e.
REDD+ negotiations focused on: Safeguards; Measurement, Reporting and Verification (MRV); Reference Emission Levels (REL); and financing.
Several countries are preparing to launch their national emission trading schemes with full market mechanisms by 2015 (e.g. Australia, China, Republic of Korea).
California's Air Resources Board formally adopted the State's greenhouse cap-and-trade programme, which started in January 2012.
The future of the climate change negotiations hinges on the success of the Durban Platform for Enhanced Action (ADP), which pledged to create a legally binding climate treaty applicable for all countries.
The second compliance period of the Kyoto Protocol starts as a voluntary agreement in 2013, and is characterized by a lack of interest outside Europe for a binding treaty (Canada, Japan, the Russian Federation and the US do not intend to commit).
118 _______________________________________________________________________________________ Chapter 11, Carbon markets
11.1 Introduction This chapter builds on its counterparts in the three
previous Forest Products Annual Market Reviews14. It provides updates on the developments both in compliance and in voluntary carbon markets. It sets out the key market indicators and policy developments, and discusses the most important national start-ups.
For readers who may not be familiar with the different trading schemes and the main political and economic drivers of the carbon markets, it may be helpful to refer to those previous chapters.
Our aim is to concentrate on the forest-based carbon market segment; although the size of this segment has remained marginal in comparison with total greenhouse gas trade.
The general methodology for reporting on carbon trade is not completely standardized. We have tried our best to seek consistency in describing the market size. We would like to point out one methodological change from previous years. The much-increased secondary CDM market includes not only secondary Certified Emission Reductions (sCER) but also secondary Emission Reduction Units (sERU), and other spot and secondary offsets.
Phase 1 of the Kyoto Protocol15 expires at the end of 2012. Until a new agreement is reached, the Protocol is under “provisional application”. Fewer countries are expected to participate in the second commitment period16 than did in the first (which were mainly European). Australia and New Zealand are yet to commit. One of the major outcomes of the climate conference COP-17 in Durban, South Africa, was that countries agreed to negotiate a legally binding agreement17 by 2015.
The general economic situation and vague results of climate change negotiations resulted in low activity on carbon markets. Within voluntary carbon markets, activity remained relatively sluggish. Efforts are nevertheless being made to revive and improve these markets. For example, the REDD (Reducing Emissions from Deforestation and Forest Degradation) programme issued credits to the voluntary carbon markets for the first time in 2011.
14 These publications are available at: www.unece.org/forests 15 Kyoto Protocol Phase 1: 191 States have ratified (US not included).
16 Kyoto Protocol Phase 2, Canada, Japan, the Russian Federation and the US are not participating (UNFCCC, 2012a). 17 Durban platform: an agreement to formalize a legally binding commitment to reduce emissions by 2015. The agreement will be put in place in 2020.
11.2 Market outlook
11.2.1 Total carbon market size In 2010-2011, the global carbon market increased in
value from $159 billion to $175.6 billion (table 11.2.1). The volume grew from 8.7 billion tonnes CO2e to 10.2 billion tonnes CO2e. The growth originated from the EU-Emissions Trading System (EU-ETS), the Secondary Clean Development mechanism (sCDM) and Over-the-Counter (OTC) markets. All other market segments declined.
The 27 EU countries will participate in the second compliance period of the Kyoto Protocol, and prospects for the future of the EU-ETS are better than for many other markets. The EU-ETS continues to grow, with many new sectors joining it.
In this chapter, sCDM volumes and values include secondary Certified Emission Reductions (sCERs), secondary Emission Reduction Units (sERUs), as well as other spot and secondary offsets. This is a methodological change from previous reports, where only sCERs were reported. Here, 2010 and 2011 include both sCERs and sERUs. Interest in sCER has increased because the delivery risk is smaller and the credits are easier to obtain than with project-based primary CERs.
Uncertainty in the future of CDM and Joint Implementation (JI) and how these allowances transfer to the post-2012 period has contributed to the decline in their primary markets. Weak industrial activity has caused a drop in emissions, especially in Europe. The high volume of European Union Allowances (EUAs) available negatively affects the price and demand for CERs under EU-ETS (afforestation/reforestation CERs are not eligible for EU-ETS trade).
The first commitment period of the Kyoto Protocol closes at the end of 2012. The CDM has started to adapt to the new period by relabelling CERs into post-2012 CER and pre-2013 CER, on the basis of time when the CERs were issued. Pre-2013 CER refers to credits issued during the first commitment period of the Kyoto Protocol. Only post-2012 credits will be transferred to the second compliance period of the Kyoto Protocol.
Primary CDM markets (pre-2013) declined from 124 million tonnes of CO2e to 91 million tonnes CO2e, while the post-2012 primary CER market grew to 173 million tonnes of CO2e in 2011 (worth $1,990 million). Joint Implementation markets dropped from 41 million tonnes of CO2e to 28 million tonnes of CO2e.
OTC transactions helped the voluntary carbon markets grow in value only. OTC market includes voluntary market transactions that are not part of a regulatory cap-and-trade system. OTC grew $154 million in value to $576 million. Simultaneously, the volumes
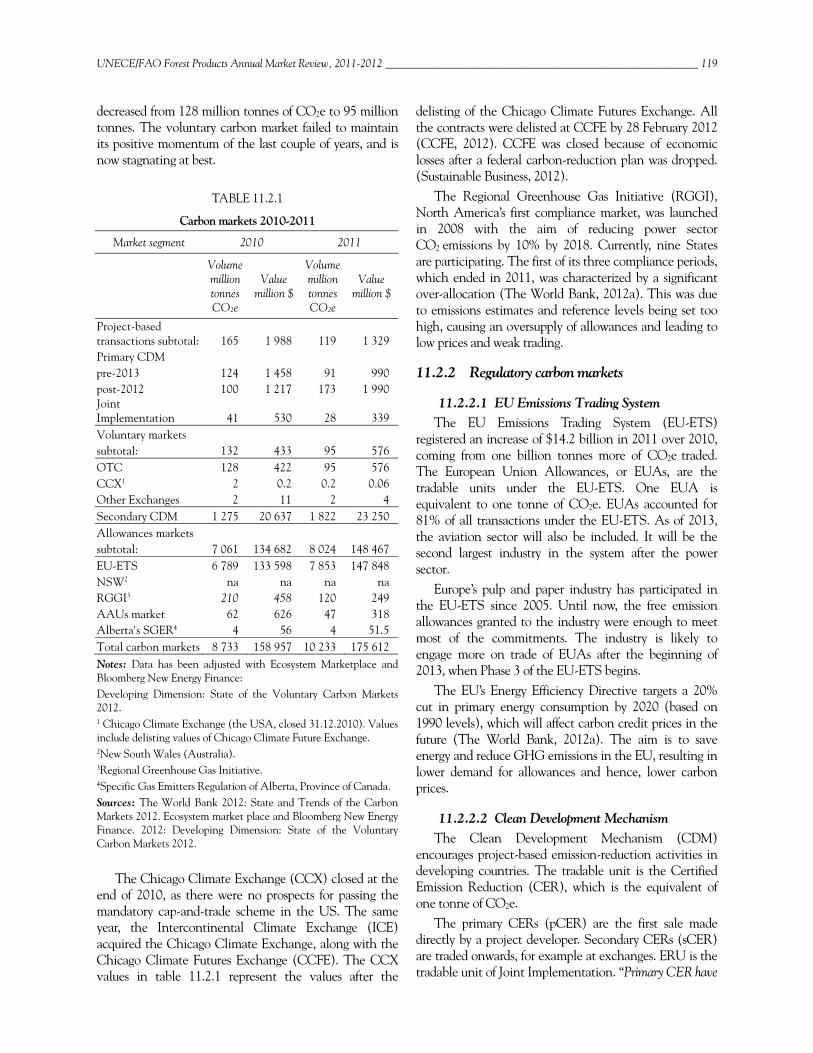
UNECE/FAO Forest Products Annual Market Review, 2011-2012 _________________________________________________________ 119
decreased from 128 million tonnes of CO2e to 95 million tonnes. The voluntary carbon market failed to maintain its positive momentum of the last couple of years, and is now stagnating at best.
TABLE 11.2.1
Carbon markets 2010-2011
Market segment 2010 2011
Volume million tonnes CO2e
Value million $
Volume million tonnes CO2e
Value million $
Project-based transactions subtotal: 165 1 988 119 1 329 Primary CDM pre-2013 124 1 458 91 990post-2012 100 1 217 173 1 990 Joint Implementation 41 530 28 339 Voluntary markets subtotal: 132 433 95 576 OTC 128 422 95 576 CCX1 2 0.2 0.2 0.06Other Exchanges 2 11 2 4 Secondary CDM 1 275 20 637 1 822 23 250 Allowances markets subtotal: 7 061 134 682 8 024 148 467 EU-ETS 6 789 133 598 7 853 147 848 NSW2 na na na na RGGI3 210 458 120 249 AAUs market 62 626 47 318 Alberta's SGER4 4 56 4 51.5 Total carbon markets 8 733 158 957 10 233 175 612 Notes: Data has been adjusted with Ecosystem Marketplace and Bloomberg New Energy Finance: Developing Dimension: State of the Voluntary Carbon Markets 2012. 1 Chicago Climate Exchange (the USA, closed 31.12.2010). Values include delisting values of Chicago Climate Future Exchange. 2New South Wales (Australia). 3Regional Greenhouse Gas Initiative. 4Specific Gas Emitters Regulation of Alberta, Province of Canada. Sources: The World Bank 2012: State and Trends of the Carbon Markets 2012. Ecosystem market place and Bloomberg New Energy Finance. 2012: Developing Dimension: State of the Voluntary Carbon Markets 2012.
The Chicago Climate Exchange (CCX) closed at the end of 2010, as there were no prospects for passing the mandatory cap-and-trade scheme in the US. The same year, the Intercontinental Climate Exchange (ICE) acquired the Chicago Climate Exchange, along with the Chicago Climate Futures Exchange (CCFE). The CCX values in table 11.2.1 represent the values after the
delisting of the Chicago Climate Futures Exchange. All the contracts were delisted at CCFE by 28 February 2012 (CCFE, 2012). CCFE was closed because of economic losses after a federal carbon-reduction plan was dropped. (Sustainable Business, 2012).
The Regional Greenhouse Gas Initiative (RGGI), North America’s first compliance market, was launched in 2008 with the aim of reducing power sector CO2 emissions by 10% by 2018. Currently, nine States are participating. The first of its three compliance periods, which ended in 2011, was characterized by a significant over-allocation (The World Bank, 2012a). This was due to emissions estimates and reference levels being set too high, causing an oversupply of allowances and leading to low prices and weak trading.
11.2.2 Regulatory carbon markets
11.2.2.1 EU Emissions Trading System The EU Emissions Trading System (EU-ETS)
registered an increase of $14.2 billion in 2011 over 2010, coming from one billion tonnes more of CO2e traded. The European Union Allowances, or EUAs, are the tradable units under the EU-ETS. One EUA is equivalent to one tonne of CO2e. EUAs accounted for 81% of all transactions under the EU-ETS. As of 2013, the aviation sector will also be included. It will be the second largest industry in the system after the power sector.
Europe’s pulp and paper industry has participated in the EU-ETS since 2005. Until now, the free emission allowances granted to the industry were enough to meet most of the commitments. The industry is likely to engage more on trade of EUAs after the beginning of 2013, when Phase 3 of the EU-ETS begins.
The EU’s Energy Efficiency Directive targets a 20% cut in primary energy consumption by 2020 (based on 1990 levels), which will affect carbon credit prices in the future (The World Bank, 2012a). The aim is to save energy and reduce GHG emissions in the EU, resulting in lower demand for allowances and hence, lower carbon prices.
11.2.2.2 Clean Development Mechanism The Clean Development Mechanism (CDM)
encourages project-based emission-reduction activities in developing countries. The tradable unit is the Certified Emission Reduction (CER), which is the equivalent of one tonne of CO2e.
The primary CERs (pCER) are the first sale made directly by a project developer. Secondary CERs (sCER) are traded onwards, for example at exchanges. ERU is the tradable unit of Joint Implementation. “Primary CER have
120 _______________________________________________________________________________________ Chapter 11, Carbon markets
a delivery risk while secondary CER are already generated and issued by the CDM Executive Board and are hence risk-free”(Point Carbon, 2008).
The value of primary (pre-2013) CDM trade declined 32% from $1,458 million to $990 million. The secondary CDM market value increased from $20.6 billion to $23.3 billion (table 11.2.1). The volume of secondary CDM increased by 43%, from 1,275 million tonnes of CO2e in 2010 to 1,822 million tonnes of CO2e in 2011.
About 8,500 CDM projects have been started since 2003 and there are currently about 3,500 CDM projects in the validation process. In 2011, 859 new projects entered the CDM pipeline (The World Bank, 2012a).
How the CDM market will develop is hard to predict. We see no consensus on types of project to be accepted under CDM after 2012. EU-ETS will accept new CERs only if they are produced in least-developed countries (LDC) in the post-2012 period. Only the last year’s contract volumes and values are transferred to the second period. The evolution of national trading schemes may also diminish the importance of the CDM. The Asia-Pacific region accounted for 51% of primary CDM projects (The World Bank, 2012a).
11.2.2.3 Joint Implementation Joint Implementation is a flexible mechanism under
the Kyoto Protocol designed to help developed countries meet their emission reduction targets. It allows generating emission reduction units (ERU) in a country that is classified as an Annex B country/economy. Annex B refers to the emission-capped industrialized countries and economies and countries in transition, as listed in the Kyoto Protocol (FPAMR, 2010-2011).
There was reduced activity in the Joint Implementation scheme in 2011, with volume falling by 32%, from 41 million tonnes of CO2e in 2010 to 28 million tonnes of CO2e and the value from $530 million to $339 million.
The second commitment period of the Kyoto Protocol will allow continuation of Joint Implementation. In an effort to improve transparency and credibility, the Joint Implementation Supervisory Committee took advice from several non-governmental organizations during the 14th United Nations Framework Convention on Climate Change (UNFCCC) on how the mechanism might be improved. The Committee aims to standardize the emission reduction unit (ERU) verification procedure, which has two tracks. Track 1 holds the host party responsible for verifying emission reductions, whereas in track 2 the responsibility rests with the Supervisory Committee. Responsibility for ERU issuance in future will be centralized with the Supervisory
Committee, accordingly track 2 will be the only procedure to verify ERUs (UNFCCC, 2012a).
As of May 2012, 570 joint implementation projects are at different stages of development (The World Bank, 2012a). The majority are in the Russian Federation and Ukraine, accounting for 76% (98 million) of the 131 million ERU issued to date.
During 2011, two new forestry-related projects were implemented or updated. Ukraine started a project using waste wood to substitute for natural gas and Bulgaria is initiating a new biomass project where wood is used together with straw for energy production (UNFCCC, 2012a).
11.2.2.4 Other compliance markets An assigned amount unit (AAU) is equivalent to one
tonne CO2. Annex B countries/economies have received an allocation of AAU for the total volume of greenhouse gases they are permitted to emit during the first Kyoto Protocol period. Countries that reduce their CO2
emissions below the targets set by the Protocol may sell those “spare” units to other countries that are unable to do so.
AAU markets declined in 2011, with the volume traded falling 24% from 62 million tonnes of CO2e to 47 million tonnes of CO2e, with the value dropping from $626 million to $318 million. The principal uncertainties concern “the adoption of quantified emission limitation or reduction objectives (QUELROs), the length of the second commitment period (2017 or 2020), and whether and how AAU from the first commitment period can be transferred to the second” (The World Bank, 2012a).
11.2.2.5 Forest carbon in the Clean Development Mechanism
Table 11.2.2 lists the afforestation/reforestation (A/R) projects developed or registered since the publication of the Forest Products Annual Market Review, 2010-2011. The Bagepalli CDM reforestation programme in India was registered in June 2011 and now has a total of 39 projects under way (UNFCCC, 2012b).
If its 11 new projects from 2011 are registered, verified and their credits issued, a total of 300,100 tonnes of CO2e
will be mitigated. The area covered by the new projects is 26,350 hectares, significantly lower than in earlier years. Forestry projects are long-term in nature and the uncertainty about the CDM continuing after 2012 has had a negative effect on interest in bringing new projects into the mechanism. The credits generated by another country (see other parties from table 11.2.2) could be excluded if the hosting country does not ratify the second compliance period of the Kyoto Protocol.

UNECE/FAO Forest Products Annual Market Review, 2011-2012 _________________________________________________________ 121
TABLE 11.2.2
CDM forestry projects registered since July 2011
Title and year registered Host parties Other parties Reduction in CO2e
Bagepalli CDM Reforestation Programme India 92 103
Commercial reforestation on lands dedicated to extensive cattle grazing activities in the region of Magdalena Bajo Seco (2011) Colombia 32 965
Aberdare Range/ Mt. Kenya Small Scale Reforestation Initiative Kamae-Kipipiri Small Scale A/R Project (2011) Kenya
Canada, Italy,
Luxembourg, France,
Japan, Spain 8 542
Uganda Nile Basin Reforestation Project No.5 (2011) Uganda
Italy, Luxembourg 5 925
Reforestation of degraded land by MTPL in India (2011) India 146 998
Uganda Nile Basin Reforestation Project No 2 (2011) Uganda
Italy, Luxembourg 4 861
Uganda Nile Basin Reforestation Project No 1 (2011) Uganda
Italy, Luxembourg 5 881
Uganda Nile Basin Reforestation Project No 4 Uganda
Italy, Luxembourg 3 969
Aberdare Range / Mt. Kenya Small Scale Reforestation Initiative Kirimara-Kithithina Small Scale A/R Project (2011) Kenya
Canada, Luxembourg 8 809
Securization and carbon sinks project (2012) Chile Spain 72 019
Aberdare Range/ Mt. Kenya Small Scale Reforestation Initiative Kibaranyeki Small Scale A/R Project * Kenya Canada 7 427
Oceanium mangrove restoration project * Senegal France 2 704 Notes: Estimated emission reductions in metric tonnes of CO2 equivalent per annum as stated by project participants. * Requesting Registration. Source: UNFCCC, CDM database, 2012b.
In Africa, many projects were registered in 2011-2012
in two key regions – the Nile Basin in Uganda and the Aberdare Range/Mt. Kenya region. In terms of CO2
reductions, India kept the lead with 239,000 tonnes
CO2e. In comparison South America reduced CO2 emissions by 105,000 tonnes. From 2009 to 2011, South America was the most attractive region for CDM projects. One of the main drivers attracting CDM projects in a country is its emission-reduction potential (UNIDO, 2003). Other factors include the institutional capacity of host projects (e.g. stable economy and advanced technology) and the general investment climate (Jung, 2005).
The most active countries participating in CDM projects registered since July 2011 were Canada, Italy and Luxembourg. Canada participates in three projects hosted by Kenya. Italy and Luxembourg have concentrated their participation on Uganda’s Nile Basin region, where they are involved in three projects. The industrialized countries participating in the projects buy the CERs generated by the projects to meet their emissions reduction requirements, while lending technical support to the host countries for developing the CDM project.
11.3 Voluntary carbon markets The total volume traded in the voluntary carbon market in 2011 fell by 28% from 2010 to 95 million tonnes of CO2e, although the value rose by 33% to $576 million. North America was the most attractive location for OTC transactions, trading 37% of total volume, with a value of $178 million. The trade also grew in Asia, Europe and Oceania, but in Latin American and non-EU European countries the market declined (Ecosystem Market Place, 2012).
Source: Metsä Group, 2012.
Voluntary markets that are not driven by emission caps are sometimes criticized for lack of clear rules and unequal regulation. We can nonetheless find a variety
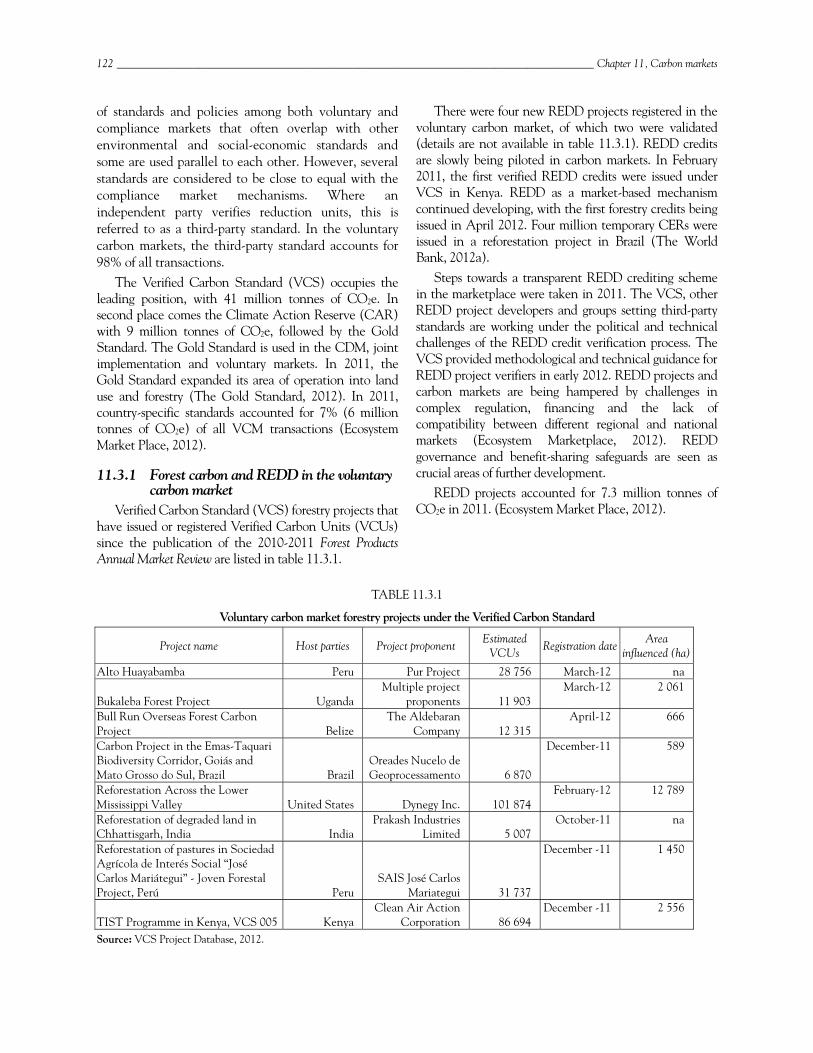
122 _______________________________________________________________________________________ Chapter 11, Carbon markets
of standards and policies among both voluntary and compliance markets that often overlap with other environmental and social-economic standards and some are used parallel to each other. However, several standards are considered to be close to equal with the compliance market mechanisms. Where an independent party verifies reduction units, this is referred to as a third-party standard. In the voluntary carbon markets, the third-party standard accounts for 98% of all transactions.
The Verified Carbon Standard (VCS) occupies the leading position, with 41 million tonnes of CO2e. In second place comes the Climate Action Reserve (CAR) with 9 million tonnes of CO2e, followed by the Gold Standard. The Gold Standard is used in the CDM, joint implementation and voluntary markets. In 2011, the Gold Standard expanded its area of operation into land use and forestry (The Gold Standard, 2012). In 2011, country-specific standards accounted for 7% (6 million tonnes of CO2e) of all VCM transactions (Ecosystem Market Place, 2012).
11.3.1 Forest carbon and REDD in the voluntary carbon market
Verified Carbon Standard (VCS) forestry projects that have issued or registered Verified Carbon Units (VCUs) since the publication of the 2010-2011 Forest Products Annual Market Review are listed in table 11.3.1.
There were four new REDD projects registered in the voluntary carbon market, of which two were validated (details are not available in table 11.3.1). REDD credits are slowly being piloted in carbon markets. In February 2011, the first verified REDD credits were issued under VCS in Kenya. REDD as a market-based mechanism continued developing, with the first forestry credits being issued in April 2012. Four million temporary CERs were issued in a reforestation project in Brazil (The World Bank, 2012a).
Steps towards a transparent REDD crediting scheme in the marketplace were taken in 2011. The VCS, other REDD project developers and groups setting third-party standards are working under the political and technical challenges of the REDD credit verification process. The VCS provided methodological and technical guidance for REDD project verifiers in early 2012. REDD projects and carbon markets are being hampered by challenges in complex regulation, financing and the lack of compatibility between different regional and national markets (Ecosystem Marketplace, 2012). REDD governance and benefit-sharing safeguards are seen as crucial areas of further development.
REDD projects accounted for 7.3 million tonnes of CO2e in 2011. (Ecosystem Market Place, 2012).
TABLE 11.3.1
Voluntary carbon market forestry projects under the Verified Carbon Standard
Project name Host parties Project proponent Estimated
VCUs Registration date Area
influenced (ha)
Alto Huayabamba Peru Pur Project 28 756 March-12 na
Bukaleba Forest Project Uganda Multiple project
proponents 11 903 March-12 2 061
Bull Run Overseas Forest Carbon Project Belize
The Aldebaran Company 12 315
April-12 666
Carbon Project in the Emas-Taquari Biodiversity Corridor, Goiás and Mato Grosso do Sul, Brazil Brazil
Oreades Nucelo de Geoprocessamento 6 870
December-11 589
Reforestation Across the Lower Mississippi Valley United States Dynegy Inc. 101 874
February-12 12 789
Reforestation of degraded land in Chhattisgarh, India India
Prakash Industries Limited 5 007
October-11 na
Reforestation of pastures in Sociedad Agrícola de Interés Social “José Carlos Mariátegui” - Joven Forestal Project, Perú Peru
SAIS José Carlos Mariategui 31 737
December -11 1 450
TIST Programme in Kenya, VCS 005 Kenya Clean Air Action
Corporation 86 694 December -11 2 556
Source: VCS Project Database, 2012.
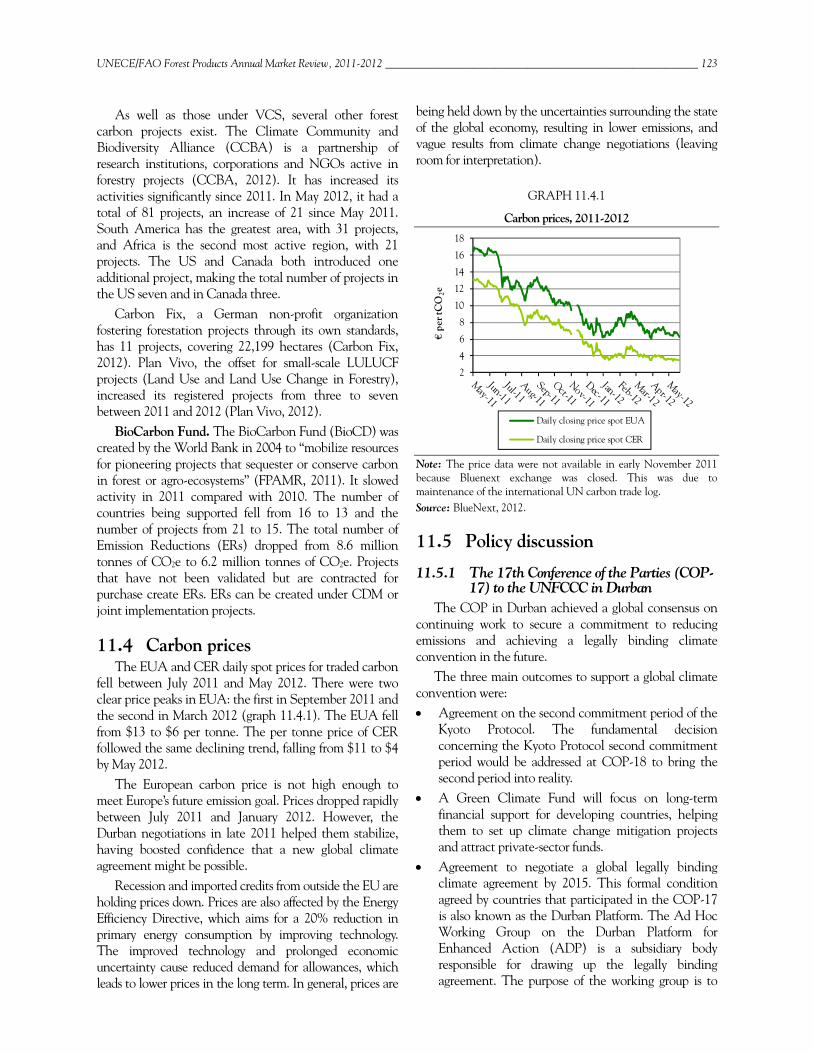
UNECE/FAO Forest Products Annual Market Review, 2011-2012 _________________________________________________________ 123
As well as those under VCS, several other forest carbon projects exist. The Climate Community and Biodiversity Alliance (CCBA) is a partnership of research institutions, corporations and NGOs active in forestry projects (CCBA, 2012). It has increased its activities significantly since 2011. In May 2012, it had a total of 81 projects, an increase of 21 since May 2011. South America has the greatest area, with 31 projects, and Africa is the second most active region, with 21 projects. The US and Canada both introduced one additional project, making the total number of projects in the US seven and in Canada three.
Carbon Fix, a German non-profit organization fostering forestation projects through its own standards, has 11 projects, covering 22,199 hectares (Carbon Fix, 2012). Plan Vivo, the offset for small-scale LULUCF projects (Land Use and Land Use Change in Forestry), increased its registered projects from three to seven between 2011 and 2012 (Plan Vivo, 2012).
BioCarbon Fund. The BioCarbon Fund (BioCD) was created by the World Bank in 2004 to “mobilize resources for pioneering projects that sequester or conserve carbon in forest or agro-ecosystems” (FPAMR, 2011). It slowed activity in 2011 compared with 2010. The number of countries being supported fell from 16 to 13 and the number of projects from 21 to 15. The total number of Emission Reductions (ERs) dropped from 8.6 million tonnes of CO2e to 6.2 million tonnes of CO2e. Projects that have not been validated but are contracted for purchase create ERs. ERs can be created under CDM or joint implementation projects.
11.4 Carbon prices The EUA and CER daily spot prices for traded carbon
fell between July 2011 and May 2012. There were two clear price peaks in EUA: the first in September 2011 and the second in March 2012 (graph 11.4.1). The EUA fell from $13 to $6 per tonne. The per tonne price of CER followed the same declining trend, falling from $11 to $4 by May 2012.
The European carbon price is not high enough to meet Europe’s future emission goal. Prices dropped rapidly between July 2011 and January 2012. However, the Durban negotiations in late 2011 helped them stabilize, having boosted confidence that a new global climate agreement might be possible.
Recession and imported credits from outside the EU are holding prices down. Prices are also affected by the Energy Efficiency Directive, which aims for a 20% reduction in primary energy consumption by improving technology. The improved technology and prolonged economic uncertainty cause reduced demand for allowances, which leads to lower prices in the long term. In general, prices are
being held down by the uncertainties surrounding the state of the global economy, resulting in lower emissions, and vague results from climate change negotiations (leaving room for interpretation).
GRAPH 11.4.1
Carbon prices, 2011-2012
Note: The price data were not available in early November 2011 because Bluenext exchange was closed. This was due to maintenance of the international UN carbon trade log. Source: BlueNext, 2012.
11.5 Policy discussion
11.5.1 The 17th Conference of the Parties (COP-17) to the UNFCCC in Durban
The COP in Durban achieved a global consensus on continuing work to secure a commitment to reducing emissions and achieving a legally binding climate convention in the future.
The three main outcomes to support a global climate convention were: Agreement on the second commitment period of the
Kyoto Protocol. The fundamental decision concerning the Kyoto Protocol second commitment period would be addressed at COP-18 to bring the second period into reality.
A Green Climate Fund will focus on long-term financial support for developing countries, helping them to set up climate change mitigation projects and attract private-sector funds.
Agreement to negotiate a global legally binding climate agreement by 2015. This formal condition agreed by countries that participated in the COP-17 is also known as the Durban Platform. The Ad Hoc Working Group on the Durban Platform for Enhanced Action (ADP) is a subsidiary body responsible for drawing up the legally binding agreement. The purpose of the working group is to
2
4
6
8
10
12
14
16
18
€pe
r tC
O2e
Daily closing price spot EUA
Daily closing price spot CER
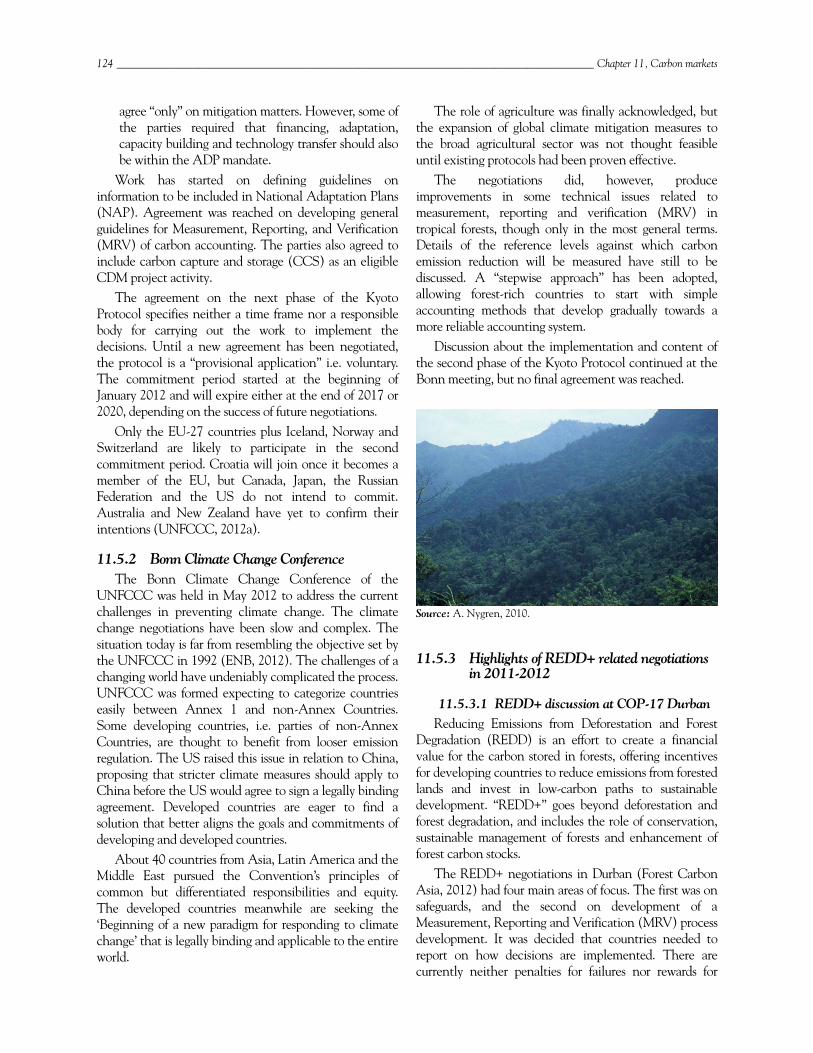
124 _______________________________________________________________________________________ Chapter 11, Carbon markets
agree “only” on mitigation matters. However, some of the parties required that financing, adaptation, capacity building and technology transfer should also be within the ADP mandate.
Work has started on defining guidelines on information to be included in National Adaptation Plans (NAP). Agreement was reached on developing general guidelines for Measurement, Reporting, and Verification (MRV) of carbon accounting. The parties also agreed to include carbon capture and storage (CCS) as an eligible CDM project activity.
The agreement on the next phase of the Kyoto Protocol specifies neither a time frame nor a responsible body for carrying out the work to implement the decisions. Until a new agreement has been negotiated, the protocol is a “provisional application” i.e. voluntary. The commitment period started at the beginning of January 2012 and will expire either at the end of 2017 or 2020, depending on the success of future negotiations.
Only the EU-27 countries plus Iceland, Norway and Switzerland are likely to participate in the second commitment period. Croatia will join once it becomes a member of the EU, but Canada, Japan, the Russian Federation and the US do not intend to commit. Australia and New Zealand have yet to confirm their intentions (UNFCCC, 2012a).
11.5.2 Bonn Climate Change Conference The Bonn Climate Change Conference of the
UNFCCC was held in May 2012 to address the current challenges in preventing climate change. The climate change negotiations have been slow and complex. The situation today is far from resembling the objective set by the UNFCCC in 1992 (ENB, 2012). The challenges of a changing world have undeniably complicated the process. UNFCCC was formed expecting to categorize countries easily between Annex 1 and non-Annex Countries. Some developing countries, i.e. parties of non-Annex Countries, are thought to benefit from looser emission regulation. The US raised this issue in relation to China, proposing that stricter climate measures should apply to China before the US would agree to sign a legally binding agreement. Developed countries are eager to find a solution that better aligns the goals and commitments of developing and developed countries.
About 40 countries from Asia, Latin America and the Middle East pursued the Convention’s principles of common but differentiated responsibilities and equity. The developed countries meanwhile are seeking the ‘Beginning of a new paradigm for responding to climate change’ that is legally binding and applicable to the entire world.
The role of agriculture was finally acknowledged, but the expansion of global climate mitigation measures to the broad agricultural sector was not thought feasible until existing protocols had been proven effective.
The negotiations did, however, produce improvements in some technical issues related to measurement, reporting and verification (MRV) in tropical forests, though only in the most general terms. Details of the reference levels against which carbon emission reduction will be measured have still to be discussed. A “stepwise approach” has been adopted, allowing forest-rich countries to start with simple accounting methods that develop gradually towards a more reliable accounting system.
Discussion about the implementation and content of the second phase of the Kyoto Protocol continued at the Bonn meeting, but no final agreement was reached.
Source: A. Nygren, 2010.
11.5.3 Highlights of REDD+ related negotiations in 2011-2012
11.5.3.1 REDD+ discussion at COP-17 Durban Reducing Emissions from Deforestation and Forest
Degradation (REDD) is an effort to create a financial value for the carbon stored in forests, offering incentives for developing countries to reduce emissions from forested lands and invest in low-carbon paths to sustainable development. “REDD+” goes beyond deforestation and forest degradation, and includes the role of conservation, sustainable management of forests and enhancement of forest carbon stocks.
The REDD+ negotiations in Durban (Forest Carbon Asia, 2012) had four main areas of focus. The first was on safeguards, and the second on development of a Measurement, Reporting and Verification (MRV) process development. It was decided that countries needed to report on how decisions are implemented. There are currently neither penalties for failures nor rewards for
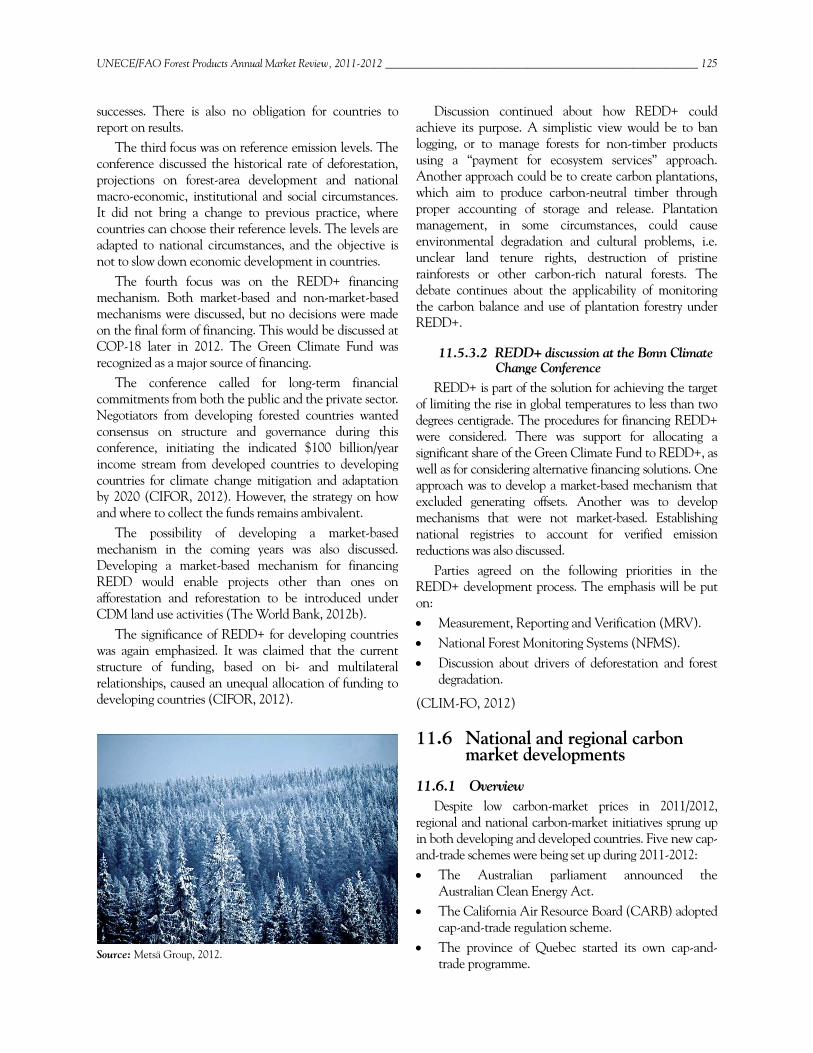
UNECE/FAO Forest Products Annual Market Review, 2011-2012 _________________________________________________________ 125
successes. There is also no obligation for countries to report on results.
The third focus was on reference emission levels. The conference discussed the historical rate of deforestation, projections on forest-area development and national macro-economic, institutional and social circumstances. It did not bring a change to previous practice, where countries can choose their reference levels. The levels are adapted to national circumstances, and the objective is not to slow down economic development in countries.
The fourth focus was on the REDD+ financing mechanism. Both market-based and non-market-based mechanisms were discussed, but no decisions were made on the final form of financing. This would be discussed at COP-18 later in 2012. The Green Climate Fund was recognized as a major source of financing.
The conference called for long-term financial commitments from both the public and the private sector. Negotiators from developing forested countries wanted consensus on structure and governance during this conference, initiating the indicated $100 billion/year income stream from developed countries to developing countries for climate change mitigation and adaptation by 2020 (CIFOR, 2012). However, the strategy on how and where to collect the funds remains ambivalent.
The possibility of developing a market-based mechanism in the coming years was also discussed. Developing a market-based mechanism for financing REDD would enable projects other than ones on afforestation and reforestation to be introduced under CDM land use activities (The World Bank, 2012b).
The significance of REDD+ for developing countries was again emphasized. It was claimed that the current structure of funding, based on bi- and multilateral relationships, caused an unequal allocation of funding to developing countries (CIFOR, 2012).
Source: Metsä Group, 2012.
Discussion continued about how REDD+ could achieve its purpose. A simplistic view would be to ban logging, or to manage forests for non-timber products using a “payment for ecosystem services” approach. Another approach could be to create carbon plantations, which aim to produce carbon-neutral timber through proper accounting of storage and release. Plantation management, in some circumstances, could cause environmental degradation and cultural problems, i.e. unclear land tenure rights, destruction of pristine rainforests or other carbon-rich natural forests. The debate continues about the applicability of monitoring the carbon balance and use of plantation forestry under REDD+.
11.5.3.2 REDD+ discussion at the Bonn Climate Change Conference
REDD+ is part of the solution for achieving the target of limiting the rise in global temperatures to less than two degrees centigrade. The procedures for financing REDD+ were considered. There was support for allocating a significant share of the Green Climate Fund to REDD+, as well as for considering alternative financing solutions. One approach was to develop a market-based mechanism that excluded generating offsets. Another was to develop mechanisms that were not market-based. Establishing national registries to account for verified emission reductions was also discussed.
Parties agreed on the following priorities in the REDD+ development process. The emphasis will be put on: Measurement, Reporting and Verification (MRV). National Forest Monitoring Systems (NFMS). Discussion about drivers of deforestation and forest
degradation.
(CLIM-FO, 2012)
11.6 National and regional carbon market developments
11.6.1 Overview Despite low carbon-market prices in 2011/2012,
regional and national carbon-market initiatives sprung up in both developing and developed countries. Five new cap-and-trade schemes were being set up during 2011-2012: The Australian parliament announced the
Australian Clean Energy Act. The California Air Resource Board (CARB) adopted
cap-and-trade regulation scheme. The province of Quebec started its own cap-and-
trade programme.
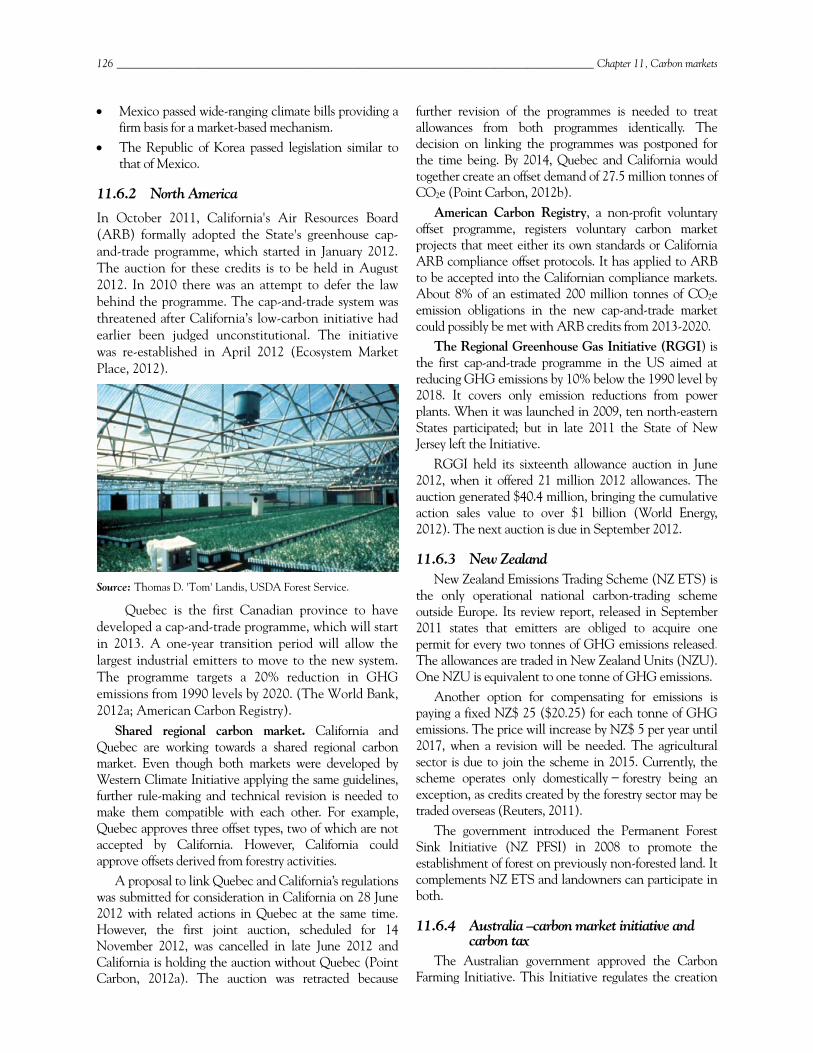
126 _______________________________________________________________________________________ Chapter 11, Carbon markets
Mexico passed wide-ranging climate bills providing a firm basis for a market-based mechanism.
The Republic of Korea passed legislation similar to that of Mexico.
11.6.2 North America
In October 2011, California's Air Resources Board (ARB) formally adopted the State's greenhouse cap-and-trade programme, which started in January 2012. The auction for these credits is to be held in August 2012. In 2010 there was an attempt to defer the law behind the programme. The cap-and-trade system was threatened after California’s low-carbon initiative had earlier been judged unconstitutional. The initiative was re-established in April 2012 (Ecosystem Market Place, 2012).
Source: Thomas D. 'Tom' Landis, USDA Forest Service.
Quebec is the first Canadian province to have developed a cap-and-trade programme, which will start in 2013. A one-year transition period will allow the largest industrial emitters to move to the new system. The programme targets a 20% reduction in GHG emissions from 1990 levels by 2020. (The World Bank, 2012a; American Carbon Registry).
Shared regional carbon market. California and Quebec are working towards a shared regional carbon market. Even though both markets were developed by Western Climate Initiative applying the same guidelines, further rule-making and technical revision is needed to make them compatible with each other. For example, Quebec approves three offset types, two of which are not accepted by California. However, California could approve offsets derived from forestry activities.
A proposal to link Quebec and California’s regulations was submitted for consideration in California on 28 June 2012 with related actions in Quebec at the same time. However, the first joint auction, scheduled for 14 November 2012, was cancelled in late June 2012 and California is holding the auction without Quebec (Point Carbon, 2012a). The auction was retracted because
further revision of the programmes is needed to treat allowances from both programmes identically. The decision on linking the programmes was postponed for the time being. By 2014, Quebec and California would together create an offset demand of 27.5 million tonnes of CO2e (Point Carbon, 2012b).
American Carbon Registry, a non-profit voluntary offset programme, registers voluntary carbon market projects that meet either its own standards or California ARB compliance offset protocols. It has applied to ARB to be accepted into the Californian compliance markets. About 8% of an estimated 200 million tonnes of CO2e emission obligations in the new cap-and-trade market could possibly be met with ARB credits from 2013-2020.
The Regional Greenhouse Gas Initiative (RGGI) is the first cap-and-trade programme in the US aimed at reducing GHG emissions by 10% below the 1990 level by 2018. It covers only emission reductions from power plants. When it was launched in 2009, ten north-eastern States participated; but in late 2011 the State of New Jersey left the Initiative.
RGGI held its sixteenth allowance auction in June 2012, when it offered 21 million 2012 allowances. The auction generated $40.4 million, bringing the cumulative action sales value to over $1 billion (World Energy, 2012). The next auction is due in September 2012.
11.6.3 New Zealand New Zealand Emissions Trading Scheme (NZ ETS) is
the only operational national carbon-trading scheme outside Europe. Its review report, released in September 2011 states that emitters are obliged to acquire one permit for every two tonnes of GHG emissions released. The allowances are traded in New Zealand Units (NZU). One NZU is equivalent to one tonne of GHG emissions.
Another option for compensating for emissions is paying a fixed NZ$ 25 ($20.25) for each tonne of GHG emissions. The price will increase by NZ$ 5 per year until 2017, when a revision will be needed. The agricultural sector is due to join the scheme in 2015. Currently, the scheme operates only domestically ̶ forestry being an exception, as credits created by the forestry sector may be traded overseas (Reuters, 2011).
The government introduced the Permanent Forest Sink Initiative (NZ PFSI) in 2008 to promote the establishment of forest on previously non-forested land. It complements NZ ETS and landowners can participate in both.
11.6.4 Australia –carbon market initiative and carbon tax
The Australian government approved the Carbon Farming Initiative. This Initiative regulates the creation
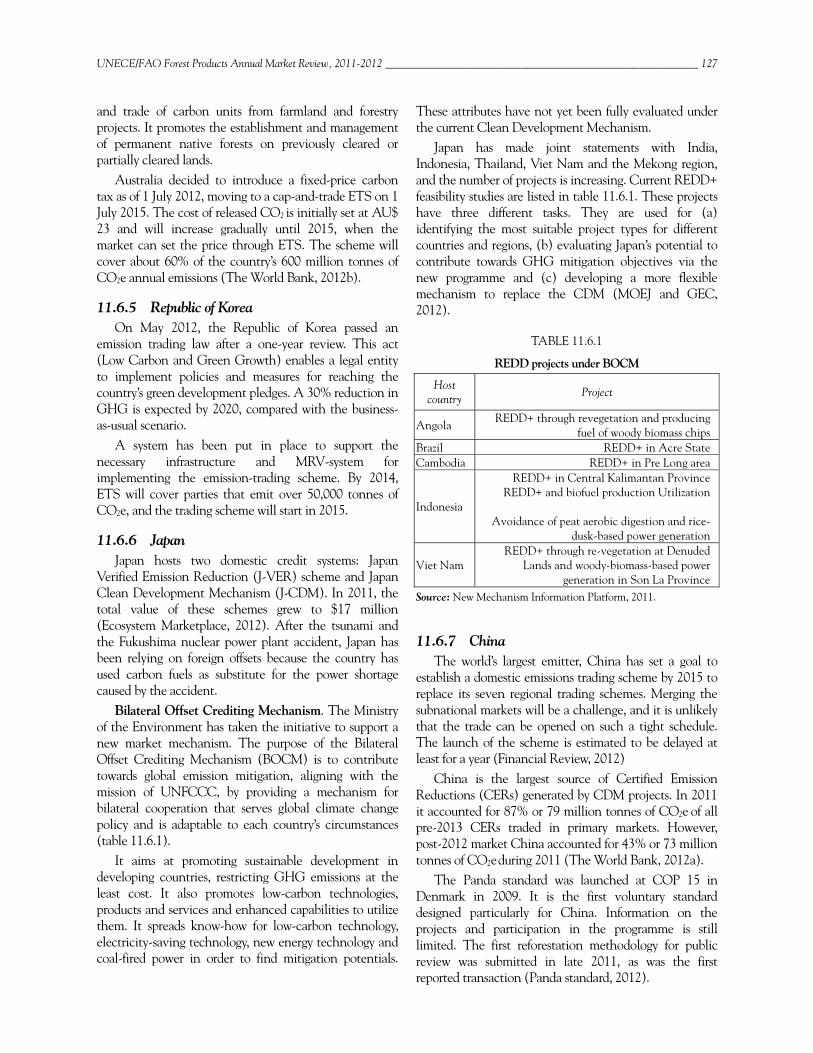
UNECE/FAO Forest Products Annual Market Review, 2011-2012 _________________________________________________________ 127
and trade of carbon units from farmland and forestry projects. It promotes the establishment and management of permanent native forests on previously cleared or partially cleared lands.
Australia decided to introduce a fixed-price carbon tax as of 1 July 2012, moving to a cap-and-trade ETS on 1 July 2015. The cost of released CO2 is initially set at AU$ 23 and will increase gradually until 2015, when the market can set the price through ETS. The scheme will cover about 60% of the country’s 600 million tonnes of CO2e annual emissions (The World Bank, 2012b).
11.6.5 Republic of Korea On May 2012, the Republic of Korea passed an
emission trading law after a one-year review. This act (Low Carbon and Green Growth) enables a legal entity to implement policies and measures for reaching the country’s green development pledges. A 30% reduction in GHG is expected by 2020, compared with the business-as-usual scenario.
A system has been put in place to support the necessary infrastructure and MRV-system for implementing the emission-trading scheme. By 2014, ETS will cover parties that emit over 50,000 tonnes of CO2e, and the trading scheme will start in 2015.
11.6.6 Japan Japan hosts two domestic credit systems: Japan
Verified Emission Reduction (J-VER) scheme and Japan Clean Development Mechanism (J-CDM). In 2011, the total value of these schemes grew to $17 million (Ecosystem Marketplace, 2012). After the tsunami and the Fukushima nuclear power plant accident, Japan has been relying on foreign offsets because the country has used carbon fuels as substitute for the power shortage caused by the accident.
Bilateral Offset Crediting Mechanism. The Ministry of the Environment has taken the initiative to support a new market mechanism. The purpose of the Bilateral Offset Crediting Mechanism (BOCM) is to contribute towards global emission mitigation, aligning with the mission of UNFCCC, by providing a mechanism for bilateral cooperation that serves global climate change policy and is adaptable to each country’s circumstances (table 11.6.1).
It aims at promoting sustainable development in developing countries, restricting GHG emissions at the least cost. It also promotes low-carbon technologies, products and services and enhanced capabilities to utilize them. It spreads know-how for low-carbon technology, electricity-saving technology, new energy technology and coal-fired power in order to find mitigation potentials.
These attributes have not yet been fully evaluated under the current Clean Development Mechanism.
Japan has made joint statements with India, Indonesia, Thailand, Viet Nam and the Mekong region, and the number of projects is increasing. Current REDD+ feasibility studies are listed in table 11.6.1. These projects have three different tasks. They are used for (a) identifying the most suitable project types for different countries and regions, (b) evaluating Japan’s potential to contribute towards GHG mitigation objectives via the new programme and (c) developing a more flexible mechanism to replace the CDM (MOEJ and GEC, 2012).
TABLE 11.6.1
REDD projects under BOCM
Host country Project
Angola REDD+ through revegetation and producing
fuel of woody biomass chipsBrazil REDD+ in Acre State Cambodia REDD+ in Pre Long area
Indonesia
REDD+ in Central Kalimantan Province REDD+ and biofuel production Utilization
Avoidance of peat aerobic digestion and rice-
dusk-based power generation
Viet Nam REDD+ through re-vegetation at Denuded
Lands and woody-biomass-based power generation in Son La Province
Source: New Mechanism Information Platform, 2011.
11.6.7 China The world’s largest emitter, China has set a goal to
establish a domestic emissions trading scheme by 2015 to replace its seven regional trading schemes. Merging the subnational markets will be a challenge, and it is unlikely that the trade can be opened on such a tight schedule. The launch of the scheme is estimated to be delayed at least for a year (Financial Review, 2012)
China is the largest source of Certified Emission Reductions (CERs) generated by CDM projects. In 2011 it accounted for 87% or 79 million tonnes of CO2e of all pre-2013 CERs traded in primary markets. However, post-2012 market China accounted for 43% or 73 million tonnes of CO2e during 2011 (The World Bank, 2012a).
The Panda standard was launched at COP 15 in Denmark in 2009. It is the first voluntary standard designed particularly for China. Information on the projects and participation in the programme is still limited. The first reforestation methodology for public review was submitted in late 2011, as was the first reported transaction (Panda standard, 2012).
128 _______________________________________________________________________________________ Chapter 11, Carbon markets
11.7 References American Carbon Registry. 2012. Available at:
http://americancarbonregistry.org/carbon-registry Bluenext Statistics database. 2012. Available at:
www.bluenext.eu/ CarbonFix project database. 2012. Available at:
www.carbonfix.info/ Center for International Forestry Research (CIFOR).
2012. Bonn climate talks: Forest-rich nations need progress on MRV and REDD+ financing, 16.5.2012. Available at: blog.cifor.org/
Chicago Climate Change Exchange (CCFE). 2012. CCFE Advisory 2012-04. Available at: www.ccfe.com/
Climate Change & Forestry (CLIM-FO). 2012. Electronic Journal and Newsletter June. FAO, Forestry Department, Forest and Climate Change Team.
The Climate, Community & Biodiversity Alliance (CCBA). 2012. Available at: www.climate-standards.org/
Earth Negotiation Bulletin (ENB). 2012. A Reporting Service for Environment and Development Negotiations. Vol 12. No. 546. Published by the International Institute for Sustainable Development (IISD), 28.5.2012.
Ecosystem market place and Bloomberg New Energy Finance. 2012. Developing Dimension: State of the Voluntary Carbon Markets 2012.
Financial Review. 2012. China goes softly on carbon price, 24.4.2012. Available at www.afr.com/
Forest Carbon Asia. 2012. Forest Carbon Asia Brief No. 4. Policy updates: Rise and spread of national and sub-national forest carbon schemes. Available at: www.forestcarbonasia.org/
The Gold Standard. 2012. The Gold Standard expands: announcements on forestry & land use and a new ‘Cities Programme’. Available at: www.cdmgoldstandard.org/
Jung., M. 2005. Host Country Attractiveness for CDM non-sink Projects. Discussion Paper. Hamburg Institute of International Economics. Available at: http://ageconsearch.umn.edu/bitstream/26328/1/dp050312.pdf
Ministry of the Environment Japan (MOIJ) and Global Environment Centre Foundation (GEC). Bilateral Offset Credit Mechanism Feasibility Study Program 2011. Poster. Available at: http://gec.jp/gec/jp/ Activities/unfcccconf/cop17/poster_bocm.pdf
New Mechanism Information Platform. 2012. Available at: www.mmechanisms.org/e/program/index.html
Panda standard. 2012. Available at: www.pandastandard.org/
Plan Vivo Project Database. 2012. Available at: http://www.planvivo.org/
Point Carbon. 2008. Press release, 20.11.2008. Available at: www.pointcarbon.com/aboutus/pressroom/pressreleases/ 1.1007881
Point Carbon. 2012a. California’s first CO2 allowance auction won’t include Quebec, 28.8.2012. Available at: www.pointcarbon.com/news/1.1932286
Point Carbon. 2012b. Quebec approves 3 types for CO2 markets, 11.6.2012. Available at: www.pointcarbon.com/news/1.1919352
Reuters. 2011. Factbox: Main recommendations of NZs CO2 scheme review. Available at www.reuters.com/
Sustainable business. 2012. Chicago Climate Futures Exchange closes in 2012, 8.8.2011. Available at www.sustainablebusiness.com/
UNECE/FAO Forest Products Annual Market Review (FPAMR), 2010-2011. 2011.
UNFCCC. 2012a. Report of the Conference of the Parties serving as the meeting of the Parties to the Kyoto Protocol on its seventh session, held in Durban from 28 November to 11 December 2011. Available at http://unfccc.int/resource/docs/2011/cmp7/eng/10a01.pdf
UNFCCC. 2012b. Clean Development Mechanism (CDM) Database. Available at http://cdm.unfccc.int/ Projects/projsearch.html
UNIDO United Nations Industrial Development Organization. 2003. Clean Development Mechanism (CDM) investor guide. South Africa. Available at: www.unido.org/
VCS Project Database. 2012. Available at www.vcsprojectdatabase.org/
The World Bank. 2012a. State and Trends of the Carbon Market 2012.
The World Bank. 2012b. Biocarbon Fund. Available at: www.worldbank.org/
World Energy. 2012. World energy solutions support sixteenth RGGI CO2 Allowances Auction, 20.6.2012. Available at: www.worldenergy.com
UNECE/FAO Forest Products Annual Market Review, 2011-2012 _________________________________________________________ 129
12 Value-added wood products markets, 2011-2012
Lead author, Tapani Pahkasalo Contributing authors, Peter Aurenhammer and Christopher Gaston
Highlights
Furniture markets have not seen a strong recovery, but the signs are positive; global manufacturers are focusing on cost savings rather than capacity expansion.
The different pace of economic recovery across the UNECE region is reflected in furniture imports, with imports growing in the stronger German economy while trade to the UK and US has been in decline.
The outlook for the mouldings markets is positive, with both new housing construction and remodelling on the rise; a smaller pool of producers will compete for these growing markets.
Remodelling is forecast to grow rapidly during 2012, but will not be enough to make up for the lower demand due to the low levels of new housing construction.
Profiled wood demand is increasingly concentrating on painted mouldings, meaning that some of the price advantage of clear knot-free pine is disappearing.
Glulam (glued laminated timber) is the largest segment of engineered wood products in Europe; it grew considerably between 2000 and 2010.
Many sawmills have invested in additional finger-joint capacity over the last few years due to the ease of integration, low market-entry barriers and the synergies with their traditional business. Consequently, over the past two decades it has taken some of the market share of traditional construction timber in Austria and Germany.
Until recently, the producers of wooden building systems could not compete with steel and concrete for the construction of high structural load bearing applications such as high-rise multi-family dwellings; cross laminated timber is changing this with low-energy solutions and the low carbon footprint of wood.
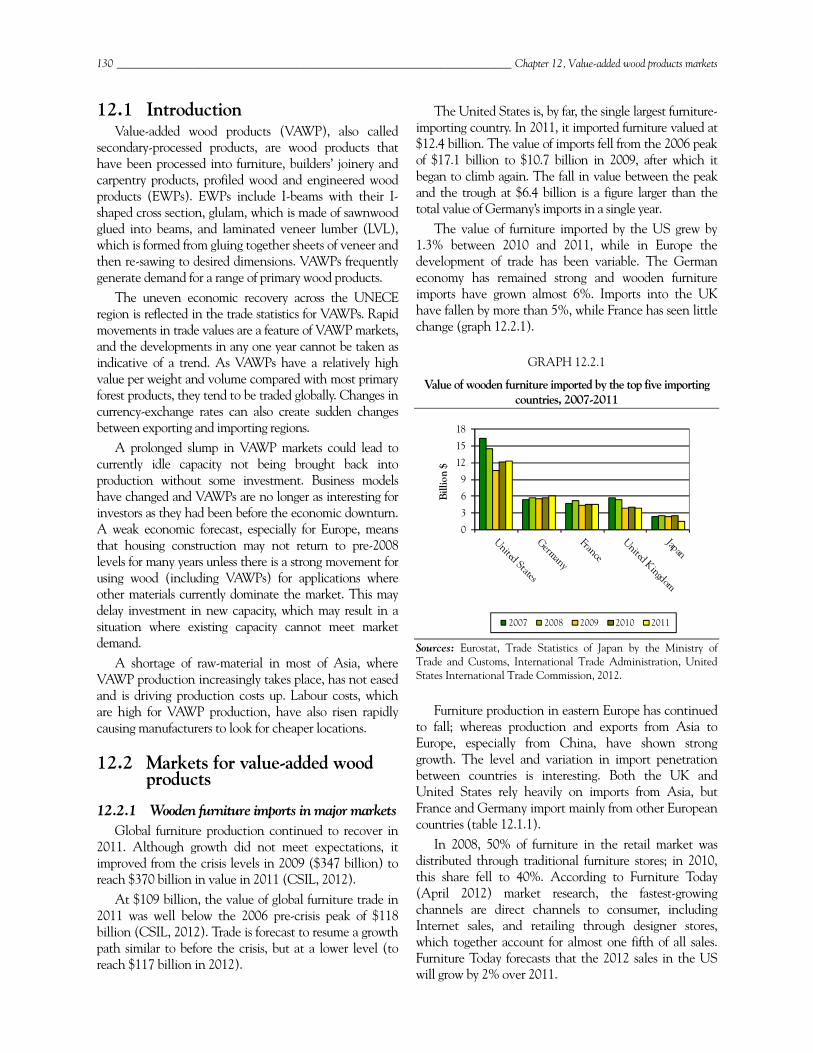
130 ________________________________________________________________________ Chapter 12, Value-added wood products markets
12.1 Introduction Value-added wood products (VAWP), also called
secondary-processed products, are wood products that have been processed into furniture, builders’ joinery and carpentry products, profiled wood and engineered wood products (EWPs). EWPs include I-beams with their I-shaped cross section, glulam, which is made of sawnwood glued into beams, and laminated veneer lumber (LVL), which is formed from gluing together sheets of veneer and then re-sawing to desired dimensions. VAWPs frequently generate demand for a range of primary wood products.
The uneven economic recovery across the UNECE region is reflected in the trade statistics for VAWPs. Rapid movements in trade values are a feature of VAWP markets, and the developments in any one year cannot be taken as indicative of a trend. As VAWPs have a relatively high value per weight and volume compared with most primary forest products, they tend to be traded globally. Changes in currency-exchange rates can also create sudden changes between exporting and importing regions.
A prolonged slump in VAWP markets could lead to currently idle capacity not being brought back into production without some investment. Business models have changed and VAWPs are no longer as interesting for investors as they had been before the economic downturn. A weak economic forecast, especially for Europe, means that housing construction may not return to pre-2008 levels for many years unless there is a strong movement for using wood (including VAWPs) for applications where other materials currently dominate the market. This may delay investment in new capacity, which may result in a situation where existing capacity cannot meet market demand.
A shortage of raw-material in most of Asia, where VAWP production increasingly takes place, has not eased and is driving production costs up. Labour costs, which are high for VAWP production, have also risen rapidly causing manufacturers to look for cheaper locations.
12.2 Markets for value-added wood products
12.2.1 Wooden furniture imports in major markets Global furniture production continued to recover in
2011. Although growth did not meet expectations, it improved from the crisis levels in 2009 ($347 billion) to reach $370 billion in value in 2011 (CSIL, 2012).
At $109 billion, the value of global furniture trade in 2011 was well below the 2006 pre-crisis peak of $118 billion (CSIL, 2012). Trade is forecast to resume a growth path similar to before the crisis, but at a lower level (to reach $117 billion in 2012).
The United States is, by far, the single largest furniture-importing country. In 2011, it imported furniture valued at $12.4 billion. The value of imports fell from the 2006 peak of $17.1 billion to $10.7 billion in 2009, after which it began to climb again. The fall in value between the peak and the trough at $6.4 billion is a figure larger than the total value of Germany’s imports in a single year.
The value of furniture imported by the US grew by 1.3% between 2010 and 2011, while in Europe the development of trade has been variable. The German economy has remained strong and wooden furniture imports have grown almost 6%. Imports into the UK have fallen by more than 5%, while France has seen little change (graph 12.2.1).
GRAPH 12.2.1
Value of wooden furniture imported by the top five importing countries, 2007-2011
Sources: Eurostat, Trade Statistics of Japan by the Ministry of Trade and Customs, International Trade Administration, United States International Trade Commission, 2012.
Furniture production in eastern Europe has continued to fall; whereas production and exports from Asia to Europe, especially from China, have shown strong growth. The level and variation in import penetration between countries is interesting. Both the UK and United States rely heavily on imports from Asia, but France and Germany import mainly from other European countries (table 12.1.1).
In 2008, 50% of furniture in the retail market was distributed through traditional furniture stores; in 2010, this share fell to 40%. According to Furniture Today (April 2012) market research, the fastest-growing channels are direct channels to consumer, including Internet sales, and retailing through designer stores, which together account for almost one fifth of all sales. Furniture Today forecasts that the 2012 sales in the US will grow by 2% over 2011.
0
3
6
9
12
15
18B
illio
n $
2007 2008 2009 2010 2011
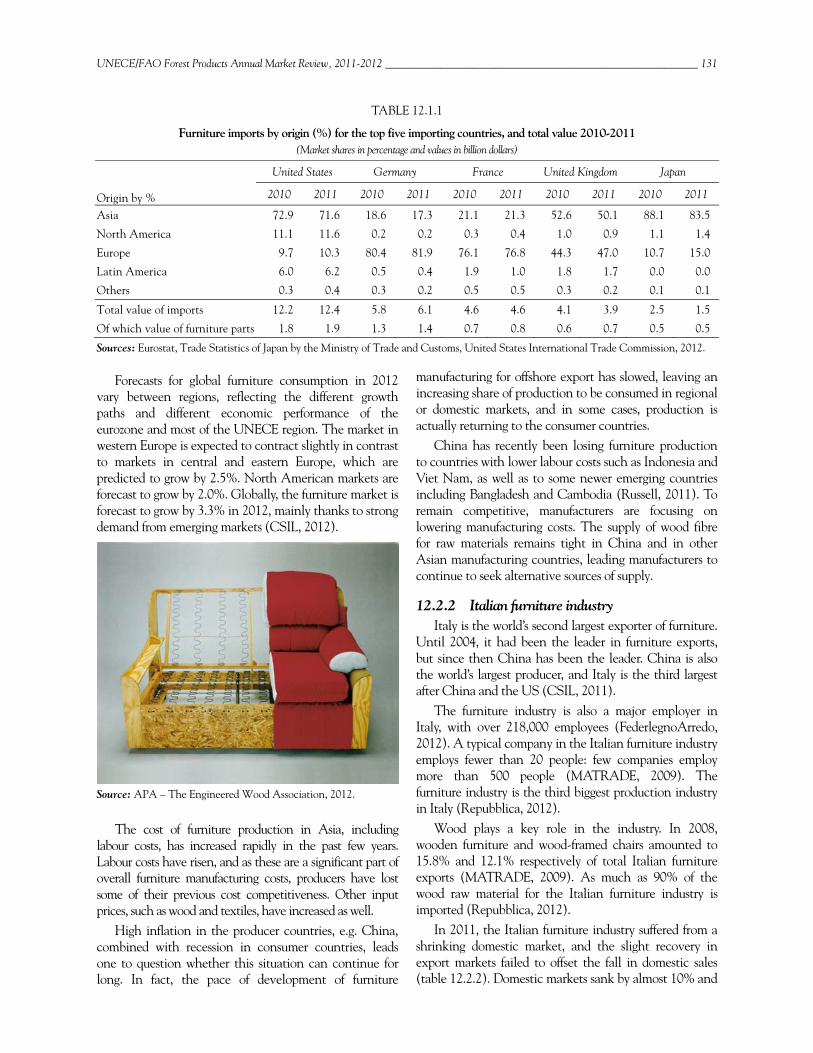
UNECE/FAO Forest Products Annual Market Review, 2011-2012 _________________________________________________________ 131
TABLE 12.1.1
Furniture imports by origin (%) for the top five importing countries, and total value 2010-2011 (Market shares in percentage and values in billion dollars)
United States Germany France United Kingdom Japan
Origin by % 2010 2011 2010 2011 2010 2011 2010 2011 2010 2011
Asia 72.9 71.6 18.6 17.3 21.1 21.3 52.6 50.1 88.1 83.5
North America 11.1 11.6 0.2 0.2 0.3 0.4 1.0 0.9 1.1 1.4
Europe 9.7 10.3 80.4 81.9 76.1 76.8 44.3 47.0 10.7 15.0
Latin America 6.0 6.2 0.5 0.4 1.9 1.0 1.8 1.7 0.0 0.0
Others 0.3 0.4 0.3 0.2 0.5 0.5 0.3 0.2 0.1 0.1
Total value of imports 12.2 12.4 5.8 6.1 4.6 4.6 4.1 3.9 2.5 1.5
Of which value of furniture parts 1.8 1.9 1.3 1.4 0.7 0.8 0.6 0.7 0.5 0.5
Sources: Eurostat, Trade Statistics of Japan by the Ministry of Trade and Customs, United States International Trade Commission, 2012. Forecasts for global furniture consumption in 2012
vary between regions, reflecting the different growth paths and different economic performance of the eurozone and most of the UNECE region. The market in western Europe is expected to contract slightly in contrast to markets in central and eastern Europe, which are predicted to grow by 2.5%. North American markets are forecast to grow by 2.0%. Globally, the furniture market is forecast to grow by 3.3% in 2012, mainly thanks to strong demand from emerging markets (CSIL, 2012).
Source: APA – The Engineered Wood Association, 2012.
The cost of furniture production in Asia, including labour costs, has increased rapidly in the past few years. Labour costs have risen, and as these are a significant part of overall furniture manufacturing costs, producers have lost some of their previous cost competitiveness. Other input prices, such as wood and textiles, have increased as well.
High inflation in the producer countries, e.g. China, combined with recession in consumer countries, leads one to question whether this situation can continue for long. In fact, the pace of development of furniture
manufacturing for offshore export has slowed, leaving an increasing share of production to be consumed in regional or domestic markets, and in some cases, production is actually returning to the consumer countries.
China has recently been losing furniture production to countries with lower labour costs such as Indonesia and Viet Nam, as well as to some newer emerging countries including Bangladesh and Cambodia (Russell, 2011). To remain competitive, manufacturers are focusing on lowering manufacturing costs. The supply of wood fibre for raw materials remains tight in China and in other Asian manufacturing countries, leading manufacturers to continue to seek alternative sources of supply.
12.2.2 Italian furniture industry Italy is the world’s second largest exporter of furniture.
Until 2004, it had been the leader in furniture exports, but since then China has been the leader. China is also the world’s largest producer, and Italy is the third largest after China and the US (CSIL, 2011).
The furniture industry is also a major employer in Italy, with over 218,000 employees (FederlegnoArredo, 2012). A typical company in the Italian furniture industry employs fewer than 20 people: few companies employ more than 500 people (MATRADE, 2009). The furniture industry is the third biggest production industry in Italy (Repubblica, 2012).
Wood plays a key role in the industry. In 2008, wooden furniture and wood-framed chairs amounted to 15.8% and 12.1% respectively of total Italian furniture exports (MATRADE, 2009). As much as 90% of the wood raw material for the Italian furniture industry is imported (Repubblica, 2012).
In 2011, the Italian furniture industry suffered from a shrinking domestic market, and the slight recovery in export markets failed to offset the fall in domestic sales (table 12.2.2). Domestic markets sank by almost 10% and
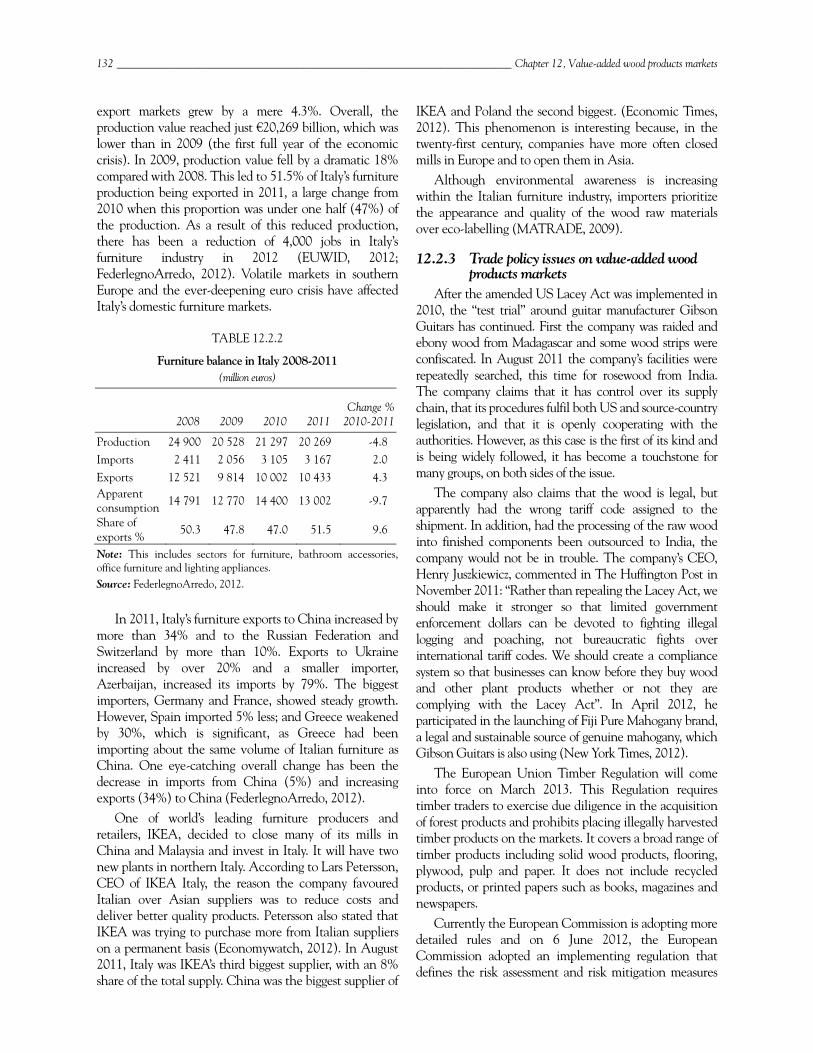
132 ________________________________________________________________________ Chapter 12, Value-added wood products markets
export markets grew by a mere 4.3%. Overall, the production value reached just €20,269 billion, which was lower than in 2009 (the first full year of the economic crisis). In 2009, production value fell by a dramatic 18% compared with 2008. This led to 51.5% of Italy’s furniture production being exported in 2011, a large change from 2010 when this proportion was under one half (47%) of the production. As a result of this reduced production, there has been a reduction of 4,000 jobs in Italy’s furniture industry in 2012 (EUWID, 2012; FederlegnoArredo, 2012). Volatile markets in southern Europe and the ever-deepening euro crisis have affected Italy’s domestic furniture markets.
TABLE 12.2.2
Furniture balance in Italy 2008-2011 (million euros)
Change %
2010-2011 2008 2009 2010 2011
Production 24 900 20 528 21 297 20 269 -4.8 Imports 2 411 2 056 3 105 3 167 2.0 Exports 12 521 9 814 10 002 10 433 4.3 Apparent consumption 14 791 12 770 14 400 13 002 -9.7
Share of exports %
50.3 47.8 47.0 51.5 9.6
Note: This includes sectors for furniture, bathroom accessories, office furniture and lighting appliances. Source: FederlegnoArredo, 2012.
In 2011, Italy’s furniture exports to China increased by more than 34% and to the Russian Federation and Switzerland by more than 10%. Exports to Ukraine increased by over 20% and a smaller importer, Azerbaijan, increased its imports by 79%. The biggest importers, Germany and France, showed steady growth. However, Spain imported 5% less; and Greece weakened by 30%, which is significant, as Greece had been importing about the same volume of Italian furniture as China. One eye-catching overall change has been the decrease in imports from China (5%) and increasing exports (34%) to China (FederlegnoArredo, 2012).
One of world’s leading furniture producers and retailers, IKEA, decided to close many of its mills in China and Malaysia and invest in Italy. It will have two new plants in northern Italy. According to Lars Petersson, CEO of IKEA Italy, the reason the company favoured Italian over Asian suppliers was to reduce costs and deliver better quality products. Petersson also stated that IKEA was trying to purchase more from Italian suppliers on a permanent basis (Economywatch, 2012). In August 2011, Italy was IKEA’s third biggest supplier, with an 8% share of the total supply. China was the biggest supplier of
IKEA and Poland the second biggest. (Economic Times, 2012). This phenomenon is interesting because, in the twenty-first century, companies have more often closed mills in Europe and to open them in Asia.
Although environmental awareness is increasing within the Italian furniture industry, importers prioritize the appearance and quality of the wood raw materials over eco-labelling (MATRADE, 2009).
12.2.3 Trade policy issues on value-added wood products markets
After the amended US Lacey Act was implemented in 2010, the “test trial” around guitar manufacturer Gibson Guitars has continued. First the company was raided and ebony wood from Madagascar and some wood strips were confiscated. In August 2011 the company’s facilities were repeatedly searched, this time for rosewood from India. The company claims that it has control over its supply chain, that its procedures fulfil both US and source-country legislation, and that it is openly cooperating with the authorities. However, as this case is the first of its kind and is being widely followed, it has become a touchstone for many groups, on both sides of the issue.
The company also claims that the wood is legal, but apparently had the wrong tariff code assigned to the shipment. In addition, had the processing of the raw wood into finished components been outsourced to India, the company would not be in trouble. The company’s CEO, Henry Juszkiewicz, commented in The Huffington Post in November 2011: “Rather than repealing the Lacey Act, we should make it stronger so that limited government enforcement dollars can be devoted to fighting illegal logging and poaching, not bureaucratic fights over international tariff codes. We should create a compliance system so that businesses can know before they buy wood and other plant products whether or not they are complying with the Lacey Act”. In April 2012, he participated in the launching of Fiji Pure Mahogany brand, a legal and sustainable source of genuine mahogany, which Gibson Guitars is also using (New York Times, 2012).
The European Union Timber Regulation will come into force on March 2013. This Regulation requires timber traders to exercise due diligence in the acquisition of forest products and prohibits placing illegally harvested timber products on the markets. It covers a broad range of timber products including solid wood products, flooring, plywood, pulp and paper. It does not include recycled products, or printed papers such as books, magazines and newspapers.
Currently the European Commission is adopting more detailed rules and on 6 June 2012, the European Commission adopted an implementing regulation that defines the risk assessment and risk mitigation measures
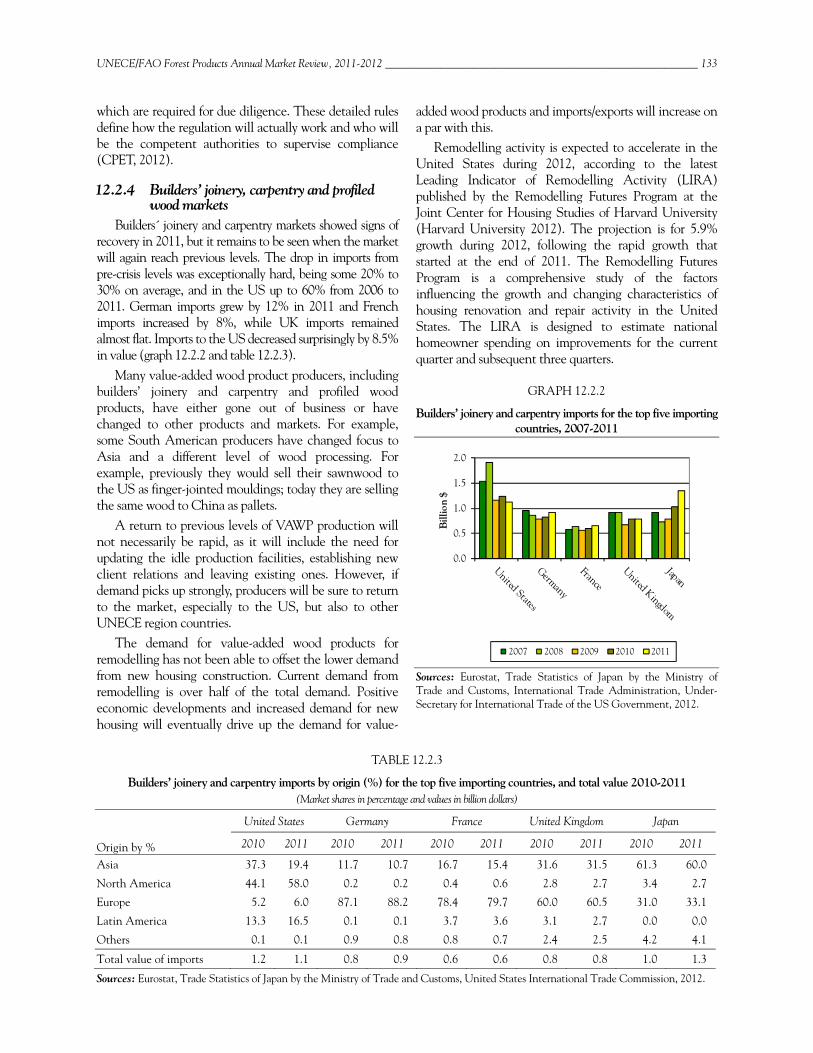
UNECE/FAO Forest Products Annual Market Review, 2011-2012 _________________________________________________________ 133
which are required for due diligence. These detailed rules define how the regulation will actually work and who will be the competent authorities to supervise compliance (CPET, 2012).
12.2.4 Builders’ joinery, carpentry and profiled wood markets
Builders ́joinery and carpentry markets showed signs of recovery in 2011, but it remains to be seen when the market will again reach previous levels. The drop in imports from pre-crisis levels was exceptionally hard, being some 20% to 30% on average, and in the US up to 60% from 2006 to 2011. German imports grew by 12% in 2011 and French imports increased by 8%, while UK imports remained almost flat. Imports to the US decreased surprisingly by 8.5% in value (graph 12.2.2 and table 12.2.3).
Many value-added wood product producers, including builders’ joinery and carpentry and profiled wood products, have either gone out of business or have changed to other products and markets. For example, some South American producers have changed focus to Asia and a different level of wood processing. For example, previously they would sell their sawnwood to the US as finger-jointed mouldings; today they are selling the same wood to China as pallets.
A return to previous levels of VAWP production will not necessarily be rapid, as it will include the need for updating the idle production facilities, establishing new client relations and leaving existing ones. However, if demand picks up strongly, producers will be sure to return to the market, especially to the US, but also to other UNECE region countries.
The demand for value-added wood products for remodelling has not been able to offset the lower demand from new housing construction. Current demand from remodelling is over half of the total demand. Positive economic developments and increased demand for new housing will eventually drive up the demand for value-
added wood products and imports/exports will increase on a par with this.
Remodelling activity is expected to accelerate in the United States during 2012, according to the latest Leading Indicator of Remodelling Activity (LIRA) published by the Remodelling Futures Program at the Joint Center for Housing Studies of Harvard University (Harvard University 2012). The projection is for 5.9% growth during 2012, following the rapid growth that started at the end of 2011. The Remodelling Futures Program is a comprehensive study of the factors influencing the growth and changing characteristics of housing renovation and repair activity in the United States. The LIRA is designed to estimate national homeowner spending on improvements for the current quarter and subsequent three quarters.
GRAPH 12.2.2
Builders’ joinery and carpentry imports for the top five importing countries, 2007-2011
Sources: Eurostat, Trade Statistics of Japan by the Ministry of Trade and Customs, International Trade Administration, Under-Secretary for International Trade of the US Government, 2012.
TABLE 12.2.3
Builders’ joinery and carpentry imports by origin (%) for the top five importing countries, and total value 2010-2011 (Market shares in percentage and values in billion dollars)
United States Germany France United Kingdom Japan
Origin by % 2010 2011 2010 2011 2010 2011 2010 2011 2010 2011
Asia 37.3 19.4 11.7 10.7 16.7 15.4 31.6 31.5 61.3 60.0
North America 44.1 58.0 0.2 0.2 0.4 0.6 2.8 2.7 3.4 2.7
Europe 5.2 6.0 87.1 88.2 78.4 79.7 60.0 60.5 31.0 33.1
Latin America 13.3 16.5 0.1 0.1 3.7 3.6 3.1 2.7 0.0 0.0
Others 0.1 0.1 0.9 0.8 0.8 0.7 2.4 2.5 4.2 4.1
Total value of imports 1.2 1.1 0.8 0.9 0.6 0.6 0.8 0.8 1.0 1.3
Sources: Eurostat, Trade Statistics of Japan by the Ministry of Trade and Customs, United States International Trade Commission, 2012.
0.0
0.5
1.0
1.5
2.0B
illio
n $
2007 2008 2009 2010 2011
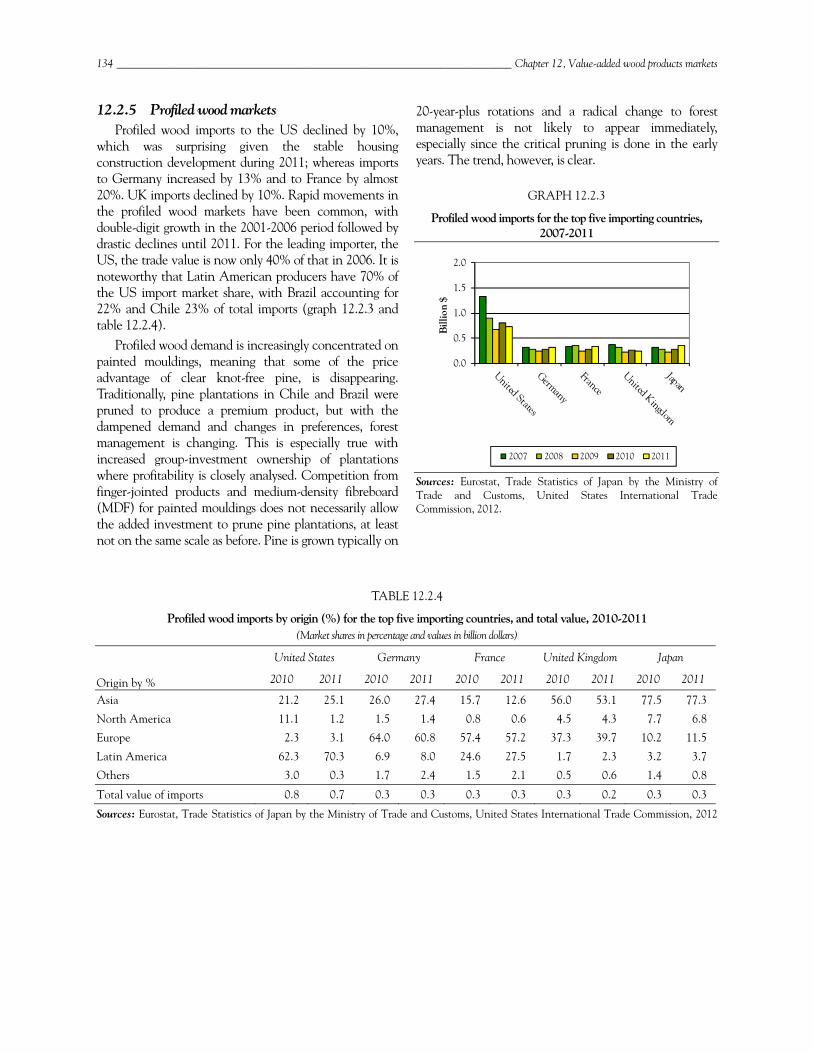
134 ________________________________________________________________________ Chapter 12, Value-added wood products markets
12.2.5 Profiled wood markets Profiled wood imports to the US declined by 10%,
which was surprising given the stable housing construction development during 2011; whereas imports to Germany increased by 13% and to France by almost 20%. UK imports declined by 10%. Rapid movements in the profiled wood markets have been common, with double-digit growth in the 2001-2006 period followed by drastic declines until 2011. For the leading importer, the US, the trade value is now only 40% of that in 2006. It is noteworthy that Latin American producers have 70% of the US import market share, with Brazil accounting for 22% and Chile 23% of total imports (graph 12.2.3 and table 12.2.4).
Profiled wood demand is increasingly concentrated on painted mouldings, meaning that some of the price advantage of clear knot-free pine, is disappearing. Traditionally, pine plantations in Chile and Brazil were pruned to produce a premium product, but with the dampened demand and changes in preferences, forest management is changing. This is especially true with increased group-investment ownership of plantations where profitability is closely analysed. Competition from finger-jointed products and medium-density fibreboard (MDF) for painted mouldings does not necessarily allow the added investment to prune pine plantations, at least not on the same scale as before. Pine is grown typically on
20-year-plus rotations and a radical change to forest management is not likely to appear immediately, especially since the critical pruning is done in the early years. The trend, however, is clear.
GRAPH 12.2.3
Profiled wood imports for the top five importing countries, 2007-2011
Sources: Eurostat, Trade Statistics of Japan by the Ministry of Trade and Customs, United States International Trade Commission, 2012.
TABLE 12.2.4
Profiled wood imports by origin (%) for the top five importing countries, and total value, 2010-2011 (Market shares in percentage and values in billion dollars)
United States Germany France United Kingdom Japan
Origin by % 2010 2011 2010 2011 2010 2011 2010 2011 2010 2011
Asia 21.2 25.1 26.0 27.4 15.7 12.6 56.0 53.1 77.5 77.3
North America 11.1 1.2 1.5 1.4 0.8 0.6 4.5 4.3 7.7 6.8
Europe 2.3 3.1 64.0 60.8 57.4 57.2 37.3 39.7 10.2 11.5
Latin America 62.3 70.3 6.9 8.0 24.6 27.5 1.7 2.3 3.2 3.7
Others 3.0 0.3 1.7 2.4 1.5 2.1 0.5 0.6 1.4 0.8
Total value of imports 0.8 0.7 0.3 0.3 0.3 0.3 0.3 0.2 0.3 0.3
Sources: Eurostat, Trade Statistics of Japan by the Ministry of Trade and Customs, United States International Trade Commission, 2012
0.0
0.5
1.0
1.5
2.0
Bill
ion
$2007 2008 2009 2010 2011
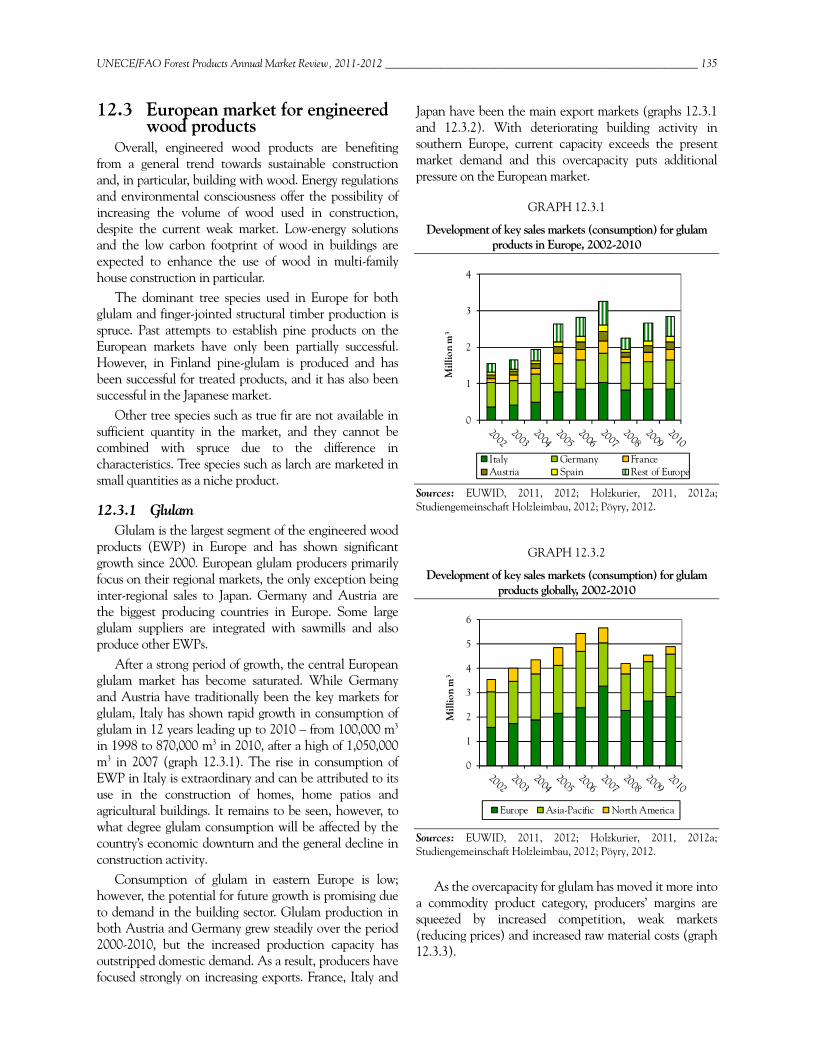
UNECE/FAO Forest Products Annual Market Review, 2011-2012 _________________________________________________________ 135
12.3 European market for engineered wood products
Overall, engineered wood products are benefiting from a general trend towards sustainable construction and, in particular, building with wood. Energy regulations and environmental consciousness offer the possibility of increasing the volume of wood used in construction, despite the current weak market. Low-energy solutions and the low carbon footprint of wood in buildings are expected to enhance the use of wood in multi-family house construction in particular.
The dominant tree species used in Europe for both glulam and finger-jointed structural timber production is spruce. Past attempts to establish pine products on the European markets have only been partially successful. However, in Finland pine-glulam is produced and has been successful for treated products, and it has also been successful in the Japanese market.
Other tree species such as true fir are not available in sufficient quantity in the market, and they cannot be combined with spruce due to the difference in characteristics. Tree species such as larch are marketed in small quantities as a niche product.
12.3.1 Glulam Glulam is the largest segment of the engineered wood
products (EWP) in Europe and has shown significant growth since 2000. European glulam producers primarily focus on their regional markets, the only exception being inter-regional sales to Japan. Germany and Austria are the biggest producing countries in Europe. Some large glulam suppliers are integrated with sawmills and also produce other EWPs.
After a strong period of growth, the central European glulam market has become saturated. While Germany and Austria have traditionally been the key markets for glulam, Italy has shown rapid growth in consumption of glulam in 12 years leading up to 2010 – from 100,000 m3 in 1998 to 870,000 m3 in 2010, after a high of 1,050,000 m3 in 2007 (graph 12.3.1). The rise in consumption of EWP in Italy is extraordinary and can be attributed to its use in the construction of homes, home patios and agricultural buildings. It remains to be seen, however, to what degree glulam consumption will be affected by the country’s economic downturn and the general decline in construction activity.
Consumption of glulam in eastern Europe is low; however, the potential for future growth is promising due to demand in the building sector. Glulam production in both Austria and Germany grew steadily over the period 2000-2010, but the increased production capacity has outstripped domestic demand. As a result, producers have focused strongly on increasing exports. France, Italy and
Japan have been the main export markets (graphs 12.3.1 and 12.3.2). With deteriorating building activity in southern Europe, current capacity exceeds the present market demand and this overcapacity puts additional pressure on the European market.
GRAPH 12.3.1
Development of key sales markets (consumption) for glulam products in Europe, 2002-2010
Sources: EUWID, 2011, 2012; Holzkurier, 2011, 2012a; Studiengemeinschaft Holzleimbau, 2012; Pöyry, 2012.
GRAPH 12.3.2
Development of key sales markets (consumption) for glulam products globally, 2002-2010
Sources: EUWID, 2011, 2012; Holzkurier, 2011, 2012a; Studiengemeinschaft Holzleimbau, 2012; Pöyry, 2012.
As the overcapacity for glulam has moved it more into a commodity product category, producers’ margins are squeezed by increased competition, weak markets (reducing prices) and increased raw material costs (graph 12.3.3).
0
1
2
3
4
Mill
ion
m3
Italy Germany FranceAustria Spain Rest of Europe
0
1
2
3
4
5
6
Mill
ion
m3
Europe Asia-Pacific North America
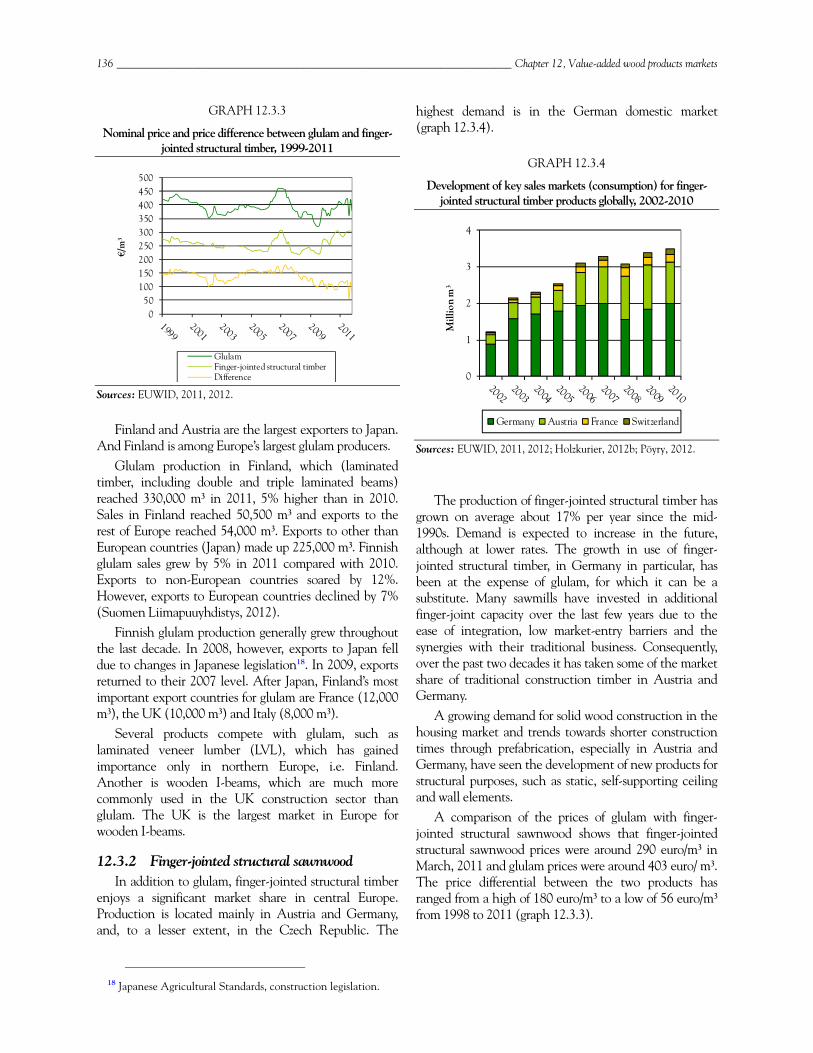
136 ________________________________________________________________________ Chapter 12, Value-added wood products markets
GRAPH 12.3.3
Nominal price and price difference between glulam and finger-jointed structural timber, 1999-2011
Sources: EUWID, 2011, 2012.
Finland and Austria are the largest exporters to Japan. And Finland is among Europe’s largest glulam producers.
Glulam production in Finland, which (laminated timber, including double and triple laminated beams) reached 330,000 m3 in 2011, 5% higher than in 2010. Sales in Finland reached 50,500 m3 and exports to the rest of Europe reached 54,000 m3. Exports to other than European countries (Japan) made up 225,000 m3. Finnish glulam sales grew by 5% in 2011 compared with 2010. Exports to non-European countries soared by 12%. However, exports to European countries declined by 7% (Suomen Liimapuuyhdistys, 2012).
Finnish glulam production generally grew throughout the last decade. In 2008, however, exports to Japan fell due to changes in Japanese legislation18. In 2009, exports returned to their 2007 level. After Japan, Finland’s most important export countries for glulam are France (12,000 m3), the UK (10,000 m3) and Italy (8,000 m3).
Several products compete with glulam, such as laminated veneer lumber (LVL), which has gained importance only in northern Europe, i.e. Finland. Another is wooden I-beams, which are much more commonly used in the UK construction sector than glulam. The UK is the largest market in Europe for wooden I-beams.
12.3.2 Finger-jointed structural sawnwood In addition to glulam, finger-jointed structural timber
enjoys a significant market share in central Europe. Production is located mainly in Austria and Germany, and, to a lesser extent, in the Czech Republic. The
18 Japanese Agricultural Standards, construction legislation.
highest demand is in the German domestic market (graph 12.3.4).
GRAPH 12.3.4
Development of key sales markets (consumption) for finger-jointed structural timber products globally, 2002-2010
Sources: EUWID, 2011, 2012; Holzkurier, 2012b; Pöyry, 2012.
The production of finger-jointed structural timber has grown on average about 17% per year since the mid-1990s. Demand is expected to increase in the future, although at lower rates. The growth in use of finger-jointed structural timber, in Germany in particular, has been at the expense of glulam, for which it can be a substitute. Many sawmills have invested in additional finger-joint capacity over the last few years due to the ease of integration, low market-entry barriers and the synergies with their traditional business. Consequently, over the past two decades it has taken some of the market share of traditional construction timber in Austria and Germany.
A growing demand for solid wood construction in the housing market and trends towards shorter construction times through prefabrication, especially in Austria and Germany, have seen the development of new products for structural purposes, such as static, self-supporting ceiling and wall elements.
A comparison of the prices of glulam with finger-jointed structural sawnwood shows that finger-jointed structural sawnwood prices were around 290 euro/m3 in March, 2011 and glulam prices were around 403 euro/ m3. The price differential between the two products has ranged from a high of 180 euro/m3 to a low of 56 euro/m3 from 1998 to 2011 (graph 12.3.3).
050
100150200250300350400450500
€/m
3
GlulamFinger-jointed structural timberDifference 0
1
2
3
4
Mill
ion
m3
Germany Austria France Switzerland
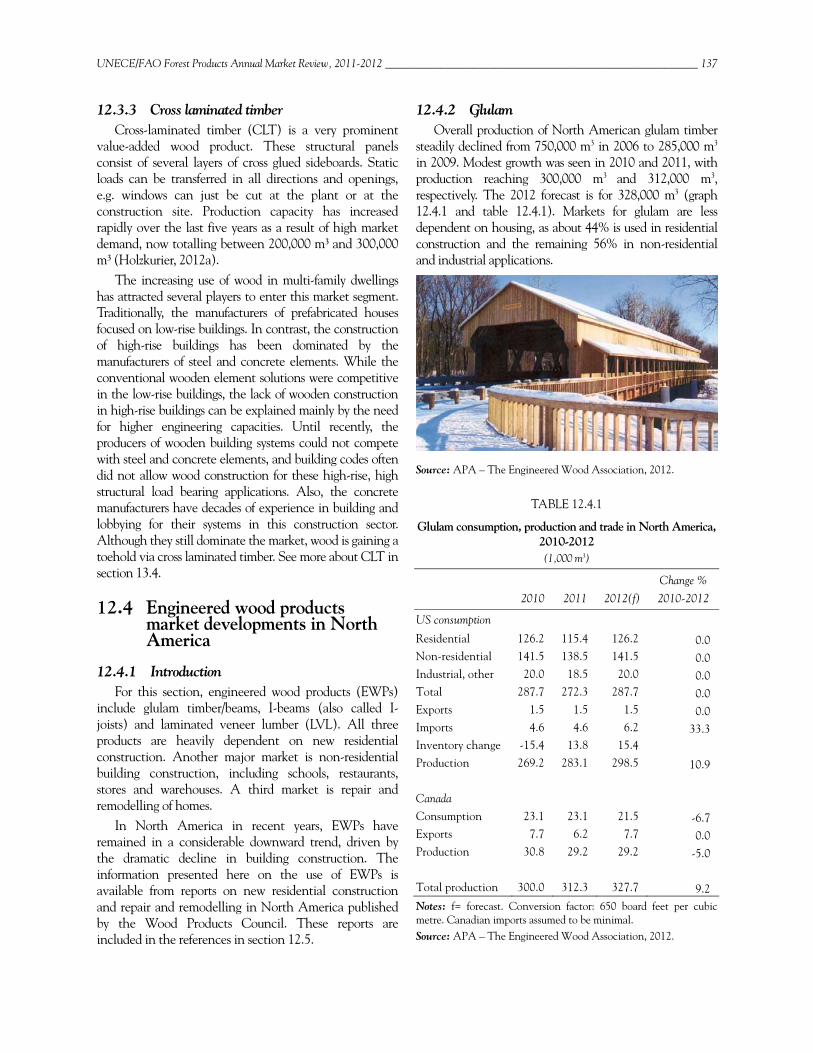
UNECE/FAO Forest Products Annual Market Review, 2011-2012 _________________________________________________________ 137
12.3.3 Cross laminated timber Cross-laminated timber (CLT) is a very prominent
value-added wood product. These structural panels consist of several layers of cross glued sideboards. Static loads can be transferred in all directions and openings, e.g. windows can just be cut at the plant or at the construction site. Production capacity has increased rapidly over the last five years as a result of high market demand, now totalling between 200,000 m3 and 300,000 m3 (Holzkurier, 2012a).
The increasing use of wood in multi-family dwellings has attracted several players to enter this market segment. Traditionally, the manufacturers of prefabricated houses focused on low-rise buildings. In contrast, the construction of high-rise buildings has been dominated by the manufacturers of steel and concrete elements. While the conventional wooden element solutions were competitive in the low-rise buildings, the lack of wooden construction in high-rise buildings can be explained mainly by the need for higher engineering capacities. Until recently, the producers of wooden building systems could not compete with steel and concrete elements, and building codes often did not allow wood construction for these high-rise, high structural load bearing applications. Also, the concrete manufacturers have decades of experience in building and lobbying for their systems in this construction sector. Although they still dominate the market, wood is gaining a toehold via cross laminated timber. See more about CLT in section 13.4.
12.4 Engineered wood products market developments in North America
12.4.1 Introduction For this section, engineered wood products (EWPs)
include glulam timber/beams, I-beams (also called I-joists) and laminated veneer lumber (LVL). All three products are heavily dependent on new residential construction. Another major market is non-residential building construction, including schools, restaurants, stores and warehouses. A third market is repair and remodelling of homes.
In North America in recent years, EWPs have remained in a considerable downward trend, driven by the dramatic decline in building construction. The information presented here on the use of EWPs is available from reports on new residential construction and repair and remodelling in North America published by the Wood Products Council. These reports are included in the references in section 12.5.
12.4.2 Glulam Overall production of North American glulam timber
steadily declined from 750,000 m3 in 2006 to 285,000 m3 in 2009. Modest growth was seen in 2010 and 2011, with production reaching 300,000 m3 and 312,000 m3, respectively. The 2012 forecast is for 328,000 m3 (graph 12.4.1 and table 12.4.1). Markets for glulam are less dependent on housing, as about 44% is used in residential construction and the remaining 56% in non-residential and industrial applications.
Source: APA – The Engineered Wood Association, 2012.
TABLE 12.4.1
Glulam consumption, production and trade in North America, 2010-2012 (1,000 m3)
2010 2011 2012(f)
Change %
2010-2012
US consumption Residential 126.2 115.4 126.2 0.0 Non-residential 141.5 138.5 141.5 0.0 Industrial, other 20.0 18.5 20.0 0.0 Total 287.7 272.3 287.7 0.0 Exports 1.5 1.5 1.5 0.0 Imports 4.6 4.6 6.2 33.3 Inventory change -15.4 13.8 15.4 Production 269.2 283.1 298.5 10.9 Canada Consumption 23.1 23.1 21.5 -6.7 Exports 7.7 6.2 7.7 0.0 Production 30.8 29.2 29.2 -5.0 Total production 300.0 312.3 327.7 9.2 Notes: f= forecast. Conversion factor: 650 board feet per cubic metre. Canadian imports assumed to be minimal. Source: APA – The Engineered Wood Association, 2012.
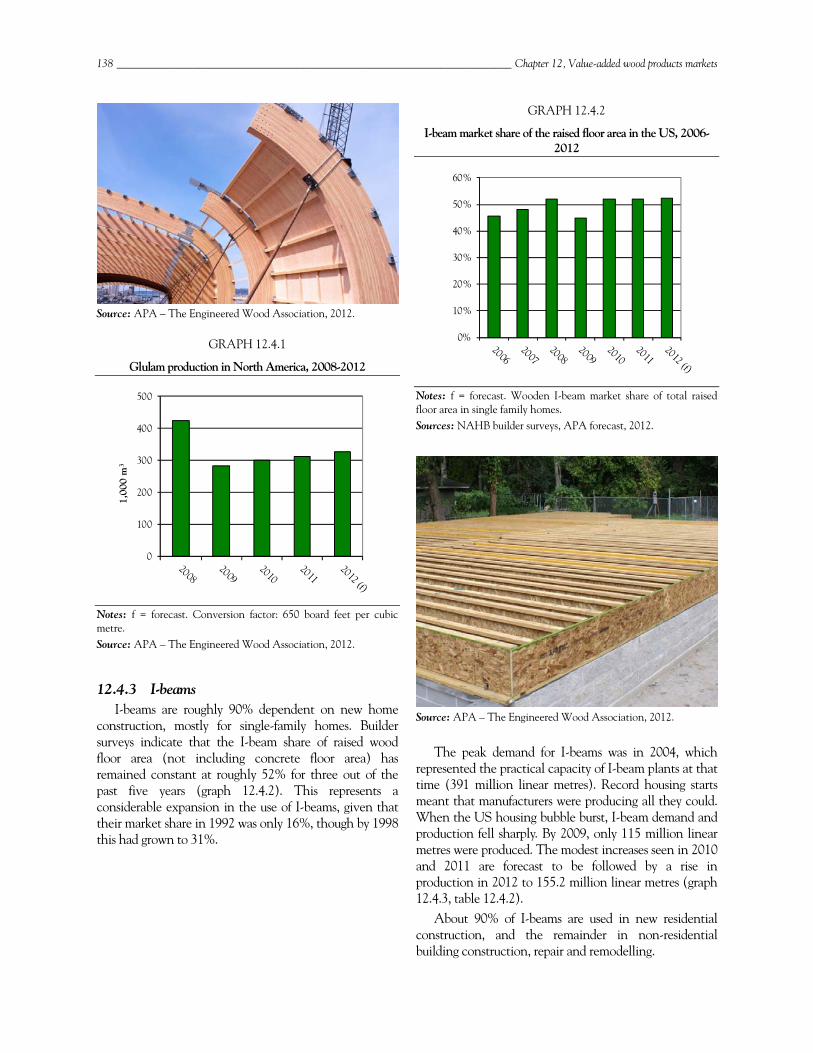
138 ________________________________________________________________________ Chapter 12, Value-added wood products markets
Source: APA – The Engineered Wood Association, 2012.
GRAPH 12.4.1
Glulam production in North America, 2008-2012
Notes: f = forecast. Conversion factor: 650 board feet per cubic metre. Source: APA – The Engineered Wood Association, 2012.
12.4.3 I-beams I-beams are roughly 90% dependent on new home
construction, mostly for single-family homes. Builder surveys indicate that the I-beam share of raised wood floor area (not including concrete floor area) has remained constant at roughly 52% for three out of the past five years (graph 12.4.2). This represents a considerable expansion in the use of I-beams, given that their market share in 1992 was only 16%, though by 1998 this had grown to 31%.
GRAPH 12.4.2
I-beam market share of the raised floor area in the US, 2006-2012
Notes: f = forecast. Wooden I-beam market share of total raised floor area in single family homes. Sources: NAHB builder surveys, APA forecast, 2012.
Source: APA – The Engineered Wood Association, 2012.
The peak demand for I-beams was in 2004, which represented the practical capacity of I-beam plants at that time (391 million linear metres). Record housing starts meant that manufacturers were producing all they could. When the US housing bubble burst, I-beam demand and production fell sharply. By 2009, only 115 million linear metres were produced. The modest increases seen in 2010 and 2011 are forecast to be followed by a rise in production in 2012 to 155.2 million linear metres (graph 12.4.3, table 12.4.2).
About 90% of I-beams are used in new residential construction, and the remainder in non-residential building construction, repair and remodelling.
0
100
200
300
400
500
1,00
0 m
3
0%
10%
20%
30%
40%
50%
60%

UNECE/FAO Forest Products Annual Market Review, 2011-2012 _________________________________________________________ 139
GRAPH 12.4.3
I-beam production in North America, 2008-2012
Notes: f = forecast. Conversion: 3.28 lineal feet per lineal metre. Source: APA – The Engineered Wood Association, 2012.
TABLE 12.4.2
Wooden I-beam consumption and production in North America, 2010-2012
(million linear metres)
2010 2011 2012(f)Change % 2010-2012
US consumption
New residential 79.3 74.1 84.1 6
Repair & remodelling 4 3.4 3.7 -8
Non-residential, other 6.1 5.5 5.8 -5
Total, domestic 89.3 82.9 93.6 5
Canada consumption 45.4 45.1 44.8 -1
All exports 129.9 122.9 133.5 3
Inventory change -6.4 -5.5 0
US production 91.2 89.3 99.4 9
Canada production 52.4 50 55.8 6
Total production in
North America 143.6 139.3 155.2 8
Notes: f = forecast. Conversion: 3.28 linear feet per metre. Source: APA – The Engineered Wood Association, 2012.
12.4.4 Laminated veneer lumber Most laminated veneer lumber (LVL) is eventually
used in new home construction. In 2011, 74% was used for beam and header applications, and 26% for I-beam flanges. A small amount is classified as industrial rim boards (included in the beam and header category). Rim
boards are used on the perimeter of an I-beam floor system to provide a fastening point for I-beams and to assist in distribution of loads from walls. Production peaked along with the US housing market in 2005 at 2.6 million m3. Since then, it has declined along with I-beam production and the housing market. An estimated 1.2 million m3 is forecast to be produced in 2012 (table 12.4.3 and graph 12.4.4).
LVL is well accepted for beams and headers, and with an improved housing market, growth should return. Like other engineered wood products, LVL allows the use of longer spans and fewer pieces to carry the same loads, compared to conventional wood products.
In addition to the engineered wood products we have looked at so far, North America also manufactures other structural composite lumber products, including parallel strand lumber (PSL), laminated strand lumber (LSL) and oriented strand lumber (OSL). Each is made from strands of wood of varying lengths and widths to achieve different strength and stiffness properties. PSL and LSL have been manufactured for several years, primarily by one company, and production volumes have been relatively low compared with other engineered wood products. There are cases where an OSB plant has been converted to manufacturing OSL. Uses for OSL are expected to be the same as solid sawnwood, timbers and glulam, including posts, beams, headers, rim boards and structural framing lumber.
TABLE 12.4.3
LVL consumption and production in North America, 2010-2012
(1,000 m3)
2010 2011 2012(f)
Change %
2010-2012
Demand
I-beam flanges 320 303 345.5 8 Beams, headers, others 843.9 876.7 886.3 5
Total demand (and production) 1 163.9 1 179.7 1 231.8 6
Production
United States 1 050.6 1 078.9 1 118.5 6
Canada 113.3 99.1 110.4 -2
Total production 1 163.9 1 178 1 229 6
Notes: f = forecast. Conversion: 35.3137 cubic feet per cubic metre. Source: APA – The Engineered Wood Association, 2012.
0
50
100
150
200
Mill
ion
linea
l met
res
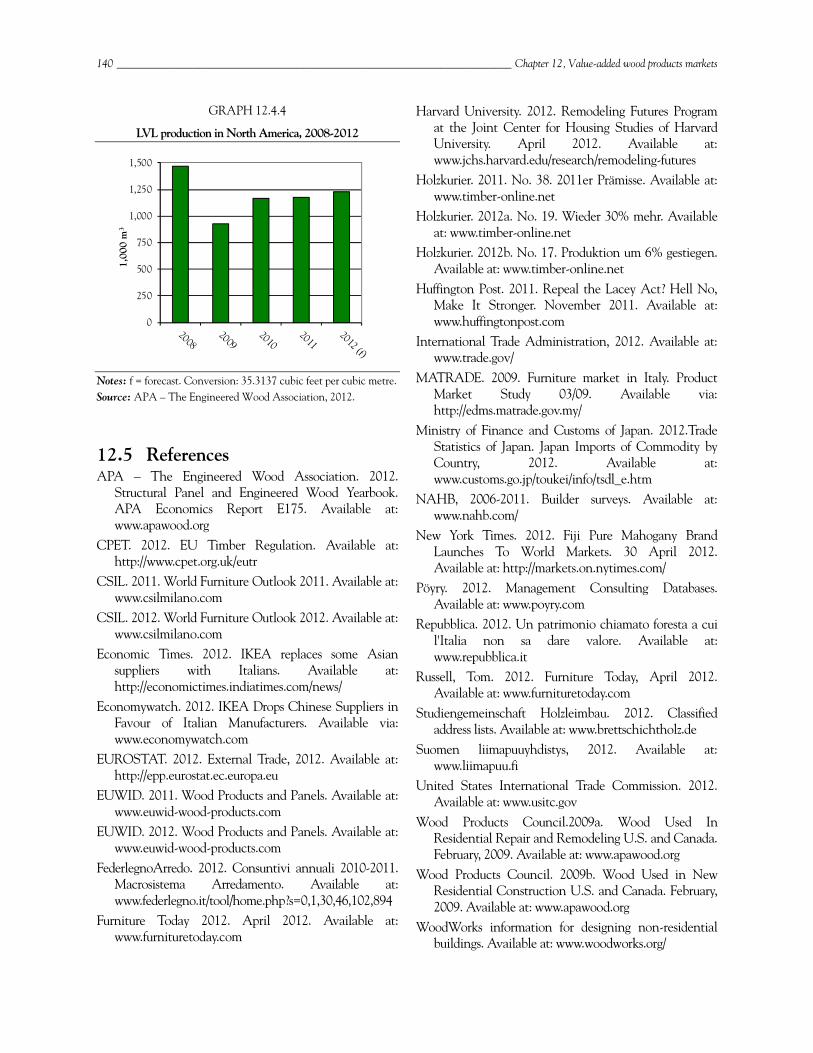
140 ________________________________________________________________________ Chapter 12, Value-added wood products markets
GRAPH 12.4.4
LVL production in North America, 2008-2012
Notes: f = forecast. Conversion: 35.3137 cubic feet per cubic metre. Source: APA – The Engineered Wood Association, 2012.
12.5 References APA – The Engineered Wood Association. 2012.
Structural Panel and Engineered Wood Yearbook. APA Economics Report E175. Available at: www.apawood.org
CPET. 2012. EU Timber Regulation. Available at: http://www.cpet.org.uk/eutr
CSIL. 2011. World Furniture Outlook 2011. Available at: www.csilmilano.com
CSIL. 2012. World Furniture Outlook 2012. Available at: www.csilmilano.com
Economic Times. 2012. IKEA replaces some Asian suppliers with Italians. Available at: http://economictimes.indiatimes.com/news/
Economywatch. 2012. IKEA Drops Chinese Suppliers in Favour of Italian Manufacturers. Available via: www.economywatch.com
EUROSTAT. 2012. External Trade, 2012. Available at: http://epp.eurostat.ec.europa.eu
EUWID. 2011. Wood Products and Panels. Available at: www.euwid-wood-products.com
EUWID. 2012. Wood Products and Panels. Available at: www.euwid-wood-products.com
FederlegnoArredo. 2012. Consuntivi annuali 2010-2011. Macrosistema Arredamento. Available at: www.federlegno.it/tool/home.php?s=0,1,30,46,102,894
Furniture Today 2012. April 2012. Available at: www.furnituretoday.com
Harvard University. 2012. Remodeling Futures Program at the Joint Center for Housing Studies of Harvard University. April 2012. Available at: www.jchs.harvard.edu/research/remodeling-futures
Holzkurier. 2011. No. 38. 2011er Prämisse. Available at: www.timber-online.net
Holzkurier. 2012a. No. 19. Wieder 30% mehr. Available at: www.timber-online.net
Holzkurier. 2012b. No. 17. Produktion um 6% gestiegen. Available at: www.timber-online.net
Huffington Post. 2011. Repeal the Lacey Act? Hell No, Make It Stronger. November 2011. Available at: www.huffingtonpost.com
International Trade Administration, 2012. Available at: www.trade.gov/
MATRADE. 2009. Furniture market in Italy. Product Market Study 03/09. Available via: http://edms.matrade.gov.my/
Ministry of Finance and Customs of Japan. 2012.Trade Statistics of Japan. Japan Imports of Commodity by Country, 2012. Available at: www.customs.go.jp/toukei/info/tsdl_e.htm
NAHB, 2006-2011. Builder surveys. Available at: www.nahb.com/
New York Times. 2012. Fiji Pure Mahogany Brand Launches To World Markets. 30 April 2012. Available at: http://markets.on.nytimes.com/
Pöyry. 2012. Management Consulting Databases. Available at: www.poyry.com
Repubblica. 2012. Un patrimonio chiamato foresta a cui l'Italia non sa dare valore. Available at: www.repubblica.it
Russell, Tom. 2012. Furniture Today, April 2012. Available at: www.furnituretoday.com
Studiengemeinschaft Holzleimbau. 2012. Classified address lists. Available at: www.brettschichtholz.de
Suomen liimapuuyhdistys, 2012. Available at: www.liimapuu.fi
United States International Trade Commission. 2012. Available at: www.usitc.gov
Wood Products Council.2009a. Wood Used In Residential Repair and Remodeling U.S. and Canada. February, 2009. Available at: www.apawood.org
Wood Products Council. 2009b. Wood Used in New Residential Construction U.S. and Canada. February, 2009. Available at: www.apawood.org
WoodWorks information for designing non-residential buildings. Available at: www.woodworks.org/
0
250
500
750
1,000
1,250
1,500
1,00
0 m
3
UNECE/FAO Forest Products Annual Market Review, 2011-2012 _________________________________________________________ 141
13 Innovative wood-based products, 2011-2012
Lead author, Douglas Clark Contributing authors, Peter Aurenhammer, Olin Bartlomé and Morwenna Spear
Highlights There are a number of different types of innovation: the wood-based products industry tends to
focus on only two of these, namely products and process innovation.
In the field of bioplastics, there have been a large number of effective innovations, specifically applied in the fields of hygiene and packaging.
Bioplastic innovations are finding new market niches in the automotive and electronics industries, with good implications for future development.
In the wood-based products industry, effective market innovations have been piloted to create new markets for innovative and existing products.
There have been considerable advances and improvement in engineered wood products, including many new types of cross-laminated timbers (CLT).
Many countries now have “showcase” CLT multi-storey buildings, demonstrating the effectiveness and carbon sequestration of this technique.
The new engineered wood products have been taken up to a greater or lesser extent in different regions due to local building styles and needs, the existing timber industry, and extent of government investment.
The new biorefineries are finding a niche market in the production of valuable chemicals. Demand is likely to expand in future as we reach or pass “peak oil”, and market and organizational innovation are likely to be needed to adapt to this.
In general, the wood-based product sector has been effective in new product innovation, but in future it will need increased use of market and organizational innovation.
142 ___________________________________________________________________________ Chapter 13, Innovative wood-based products
13.1 Introduction We are living in an era of innovation and in all fields
of industrial endeavour new products and new uses are being discovered. This is particularly so for wood-based products as the world wakes up to the reality of the need for sustainable materials to mitigate negative impacts on our environment. It seems that every week someone finds a new use of lignin, a new function for paper, composite material or product from wood-supplied bio-refineries.
Recent research into using paper or lignin for electrical storage is particularly encouraging, for example, in the light of the need for renewable energy sources and the problem many of these have in supplying power at times of greatest demand. There has never been a time when so many alternative and diverse uses have been found for wood-based products, and the industry has never been so attractive to potential investment.
On the other hand, however, many people within the industry feel that investment and consumption has failed to mirror this excitement. Throughout the world, and particularly in the UNECE region, wood-based products have not always penetrated markets to the extent they could. For example, the newer wood-plastic composites (WPC) have proven popular and useful in the US, but have not yet achieved the same market penetration in Europe. Despite the availability of innovative and superior wood-based products, consumers are continuing to use non-sustainable products. In this chapter, we will explain some of the possible reasons for this.
Innovation can take several forms; and impressive though it is, product innovation may not be the primary type required by the industry. There is a tendency to promote wood-based products as “getting better all the time” rather than as the already practical and sustainable products they actually are. As befits a market review, therefore, in this chapter we will focus on innovative market-ready products and processes: tried and tested innovations that are about to, or have already, found a place in the market. We will also examine which type of innovation is the current focus of the wood-based products industry, and discuss the type of innovation that might actually be needed.
After an introduction to innovation generally, we look at market-ready innovations in a four particular sectors of the industry: Bioplastics. Bio-based materials. Engineered wood products. Biorefining. We end with some general conclusions and recommendations on innovation policy and practice.
13.1.1 Types of innovation A number of publications, notably the European
Forest Sector Outlook Study II (UNECE/FAO, 2011), have pointed out that there are several different types of innovation. This bears repeating, as often only one of these types is treated as “real” innovation. In brief they are: a. Product innovation: New or improved goods or
services. This is only one type of innovation, but is generally what people think of when innovation is discussed: new products such as smart paper, or “solved problems” such as lighter, more competitive, wood-plastic composites.
b. Process innovation: A less exciting but equally valuable area of innovation. If a process can be made much cheaper, then a previously unprofitable product can become competitive. Today, this type of innovation is most important in the newer area of bio-refineries. At present, these are new and small in number, meaning that their products tend to be expensive and find niche markets (hard-to-produce chemicals for example). Innovations in process could lead to massive growth in the industry as it takes its place as a major supplier of products.
c. Organizational innovation: Linked to the above, but represents an innovation in a firm’s business practices, whether internally or externally. An example of this may be the “linking” of sawmills with emerging district heating plants (DHPs) or combined heat and power plants (CHPs) currently being considered in many transitional economies, leading to a “package” of cheap and sustainable wood energy. No new products or processes have been innovated in this process, but the organizational innovation leads to a great reduction in cost, making an existing technology highly competitive.
d. Marketing innovation: Changing the perception of how the product is seen in the marketplace, by design, packaging or promotion. This is the challenge currently facing the cross-laminated timber (CLT) industry for example, with an excellent product which has proven highly successful in one region but fails to find a marketplace in another. As a general rule, the focus within the wood-products
industry has often been on the first two: new products and new processes. In the following sections we will look at the limitations of this approach, and provide examples of the power of the other approaches in bringing innovation to market.
UNECE/FAO Forest Products Annual Market Review, 2011-2012 _________________________________________________________ 143
13.2 Innovation in bioplastics A good example of the general rule is bioplastics many
of which have wood as the whole or part of their raw materials. These include various types of packaging and hygiene materials, cellophane or other cellulose-based materials, and new textile materials such as Tencel™. Despite frequently being more expensive than similar petrochemical-derived materials such as polythene or nylon, these products have found a distinct and profitable niche in the food and hygiene industries (e.g. packaging for take-away food, disposable nappies/diapers), these are products that have come under scrutiny for being bad for the environment, so bioplastics increase their acceptability.
There is a certain irony that these industries have tended to respond to public criticism not by cutting down on packaging and waste but by using packaging from sustainable sources (i.e. bioplastics). They have thereby been able to win back a degree of public approval. For example, in the UK, food companies will proudly display that their extensive packaging is sustainably sourced. Whereas from an ecological standpoint it would be better if they used fewer resources in the first place, one must concede that their switching to bio-based sustainable materials is at least a step in the right direction.
Bioplastics, however, are not necessarily more biodegradable than regular plastic and the advantage to the environment may not be as great as sometimes imagined. Also, despite their high consumer acceptance, bioplastics tend to be more expensive than their petrochemically derived equivalents. Nonetheless, the biopolymer market has enjoyed almost continuous growth since the late 1990s, with double-digit growth since 2005 and growth continuing despite the recession.
Estimates of global consumption of 203,000 tonnes in 2006 were set to increase to just over 500,000 tonnes in 2015 (Helmut Kaiser Consultancy, 2008). The trend is being borne out by the increase in global production capacity, which has been estimated in 2011 as 296,000 tonnes for the non-degradable biopolymers alone. This figure reflects commercial scale-up and continued investment in production of many biopolymers, but also great advances in bio-sourced polyethylene, and bio-derived polyamides, as well as the emergence of commercially competitive bio-derived or partially bio-derived thermosetting polymers for durable applications (European Bioplastics, 2011).
In addition to the non-degradable biopolymers, a further 428,000 tonnes of degradable polymers includes both bio-derived (e.g. thermoplastic starch, polyhydroxyalkanoates and others) and degradable non-biosourced polymers (e.g. polycaprolactone). The total of 724,000 tonnes is a major increase since 2003 when the
pan-European consumption of biopolymers was a mere 40,000 tonnes (IBAW, 2005).
The network of biopolymer producers, users, and ancillary products such as bio-derived pigments, stabilisers, release agents, chain extenders and anti-static agents is increasingly well populated. This indicates the transition from an emerging to a growth market, and facilitates continued and rapidly expanding uptake of an available resource.
The three main areas of successful innovation in bioplastics are: Packaging Hygiene Consumer electronics
13.2.1 Packaging We have already outlined some issues relating to the
use of bioplastics for packaging. However, new products have increasingly replaced paper or board, especially as food-packaging material.
This, however, is often no more than a “visible” or “cosmetic” change; market penetration of bioplastics in the packaging that the consumer does not see has been much slower. Cheaper oil-based plastics still tend to be the industry standard. For example, food is delivered to supermarkets in crates, or shrink-wrapped on pallets, all made of standard, petrochemically-derived plastics. Whereas the packaging the consumer actually handles will proudly display a “sustainably sourced” logo.
The main growth area for bioplastics in packaging has been Asia, but these products are also well established throughout Europe and North America, and have generally increased in use with a market estimated at 200 million euro in 2010 and an expected growth rate of 18%-25% between 2010 and 2020. Advanced, biodegradable bioplastics have been particularly successful in Europe owing to supportive government policies on waste and recycling. Japan and North America appear to be following a similar pattern.
Examples of innovative products include Billerud’s Fibreform™, a stretchable paper that can replace much of the conventional plastic in packaging with little or no change in the production machinery. It is also a more stable material than many petroleum-based plastics (petroleum-derived) and is priced competitively. Similarly, a range of products have been developed based on wood-fibre cellulose, including clear films with good moisture-handling and heat-resistant properties, making them excellent competitors in the packaging of “ready” meals.
144 ___________________________________________________________________________ Chapter 13, Innovative wood-based products
13.2.2 Hygiene The ease with which innovative bioplastic fabrics and
absorbent materials can be produced makes them excellent entrants in the highly competitive hygiene market. And better product designs can give these biodegradable products a greater appeal.
Innovative product design (a combination of product innovation and organizational innovation) can be seen in the integration of numerous bioplastics into a single new product, e.g. sustainably-sourced, biodegradable disposable nappies. Again, there is a similar pattern to the food packaging sector, where existing petroleum-derived products are replaced with innovative, competitive. Likewise, new bio-sourced super-absorbent polymers are continually being developed for use in the hygiene industry. In many cases, the innovation is organizational rather than product-based.
13.2.3 Consumer electronics We already see a wide range of new bio-based
materials in this growing industry, including materials used for mobile-phone cases and structure; connectors; personal computer housings; battery packages and chargers; electronic equipment chassis; personal music systems; and keyboards. Many new computer screens are made from cellulose-derived bioplastics and new applications are constantly being developed. For example, the first commercial applications of mouse and SIM cards from bio-based plastic are being launched.
Given the increasing awareness of the sizeable carbon footprint of consumer electronics – alarming in view of the industry’s exponential expansion – there is much interest in the use of bio-based polymers to replace functional parts of these items, especially metals. Some companies have partnered to develop high-temperature bio-based polyamides whose properties would make them suitable for highly technical metal replacement applications in consumer electronics and automotive applications in cases where plastics could not be used before.
Examples of innovative products include Organic Light Emitting Diodes (OLED), a sustainably derived alterative to the now ubiquitous LED, potentially available to replace LEDS in computer and TV screens, as well as car headlights and numerous other uses.
The mobile-phone industry has been especially active in the application of bio-based plastics. Numerous manufacturers have presented their ecophones where the entire cover, the structure or parts are made of bio-based plastics. For example, a Nordic phone company has created a group of “environmental” devices that use bio-based materials. The company first introduced renewable raw materials in 2007 in its one phone model – with 50%
of the plastics in the phone cover being bio-based, including structural-device parts.
Recent product launches of this company include the first mobile-phone to use bio-based paints in top and base coats. The company has many recent phone models that all use bio-based plastics. It is focusing on the structural parts, as the trust in the uniform quality of bio-based plastics is still not sufficient for use in visible parts. In its products, the company is also using recycled metals that are free of toxic materials.
Despite the success of innovations in bioplastics in penetrating a number of lucrative markets, the following issues remain that should be of concern to manufacturers and policymakers.
13.2.4 Performance and cost In some cases, the bioplastic materials perform less
well than their petroleum-derived competitors and are still more expensive. That is the main reason market penetration is at the more “cosmetic” end of the spectrum – packaging, hygiene products and electronic items that consumers handle and buy, reassuring them that they are not damaging the environment. This, therefore, is a good example of where product innovation is not enough, and more market and organizational innovation may be needed to promote and sell the use of bioplastics in less obviously “cosmetic” areas of industry.
13.2.5 Public perception The danger in having a “green” reputation for
sustainable sourcing is that many consumers assume that this means the product is biodegradable when it might not be – in much the same way that many assume that margarine has fewer calories than butter. This mistaken belief, while it may currently benefit the bioplastics industry, leaves them vulnerable to exposés and loss of faith in a product that currently makes its sales primarily on the basis of consumer faith. If the industry is to tout its sustainably-sourced credentials as a marketing tool, it must use product innovation to ensure that the product is also green in its disposal method.
13.2.6 Political fallout Related to the above, many political commentators
promoting “green” have expressed alarm that increased land use for raw materials for bioplastics may encroach on land otherwise needed for food production, touching on sensitive issues of world hunger and first-world privilege. Some excellent market innovation in making non-conflict with food production part of the promotional and advertising strategy was made by a Nordic phone company.
UNECE/FAO Forest Products Annual Market Review, 2011-2012 _________________________________________________________ 145
13.3 Innovation in bio-based materials In this chapter, when we use the term "bio-based
materials" we are referring to composite materials, one component of which is wood (often in the form of fibre or flour) or plant fibre. These are distinct from the traditional wood composites such as MDF or particle board, as the matrix component in WPCs is a more continuous phase and thus a greater proportion of the product weight. These new products also tend to use finer wood particles or fibres, bonded with a variety of (usually) plastic based materials.
The most common examples are wood-plastic composites (WPC), well-established materials used in non-structural construction components, which continue to be innovated, developed and proliferated. At any exhibition of wood-based products, you are certain to be surprised by new composite materials that have been developed for use in maritime, automotive and even aerospace applications.
Apart from innovations that lead to new uses for these versatile materials, the number of products that use recycled or bio-based plastics has also grown, enhancing the products’ green credentials. A further welcome innovation is that of “foamed” WPCs, which are much lighter than their predecessors.
In 2009, global WPC demand was about 2.6 billion euro. By 2011, decking was projected to be the largest end use, accounting for 44% of demand. Despite the beauty and usefulness of these products, particularly in outdoor applications (e.g. decking, window frames) where despite strongly resembling natural wood they need no painting or weatherproofing, market penetration has been patchy. In a nutshell, WPCs are a well-established product in the US, with innovative variants taken up readily by various industries. In Europe, however, take-up has been slow (though improving) and is low in Asia, although production there is expanding rapidly. The European and Asian markets show a greater prevalence of natural fibre composites in the automotive sector – using long fibres such as flax, jute, hemp, kenaf and others.
The WPC market has grown steadily since its inception in the mid-1990s, with growth only faltering slightly in 2007, just before the financial crisis. At this point, global WPC production (including thermoplastics filled with other natural fibres) was estimated at 900,000 tonnes. Despite the downturn, growth continued, with European production reaching 193,000 tonnes in 2010.
Sustained production in South America and in east Asia for the automotive sector – and a sector-wide continued growth due to the increasing weight of secondary components per vehicle being moulded in natural fibre composite – will have dampened the effect of the financial downturn in the construction-dominated
North American WPC market. However, in many regions the repair, improvement and maintenance market remained steady through the recession period, as homeowners opted to improve their homes with simple upgrades while the market was weak, benefitting WPC decking and fencing producers.
Steady improvements in blending and moulding technology during the first decade of this century led to greater potential for injection moulding of complex forms, with high quality and low shrinkage on exiting the mould. Fibre reinforcement in moulded components has become more common, opening markets in furniture, household goods, stationery and electrical. There has also been a gradual exchange of the matrix polymer from polyolefins to biopolymers in items where the bio-content was important to the product’s green credentials, to its end-of-life considerations or to the consumer preference. Bio-degradable plant pots are one common example of combination of wood flour with biopolymer for short life-span products.
Excellent new products are being readily taken up in North America – products that have low or no sales elsewhere. It would, however, seem that there is a strong need for marketing innovation of some kind, as shown by, for example, the WRAP group consultancy, which published a market strategy for innovatively promoting WPCs in Europe (Optimat Ltd & Merl Ltd, 2003). This remains an excellent model of innovative marketing, examining the reasons the product and its innovations were not taken up by European markets and coming up with novel marketing approaches to overcome this. Innovative marketing strategies included targeted use of public-access trade fairs (such as the British Ideal Homes exhibition) to allow the consumer to handle and view the product directly, as Europeans often seem to have the attitude of “accepting no substitutes” when it comes to wood, and may be unaware of how wood-like WPC can be.
The industry went on to lobby the various large supply chains in the UK, for example, where a small number of national chain stores supply almost the entire country with products of this kind. As a result of this lobbying these chain stores began carrying WPC products as part of their range. Traditional avenues such as TV advertising were not adopted. The WRAP analysis showed that the primary resistance was concern about the look and feel of the product, and this cannot be determined from a television or magazine advertisement. All efforts were geared towards encouraging consumers to physically encounter the product. One key development for uptake of WPCs in DIY decking and similar products has been the development of foams to reduce product weight. Extruded foamed core sections, as well as textured surfaces, increase the "feels like wood" appeal of the product.
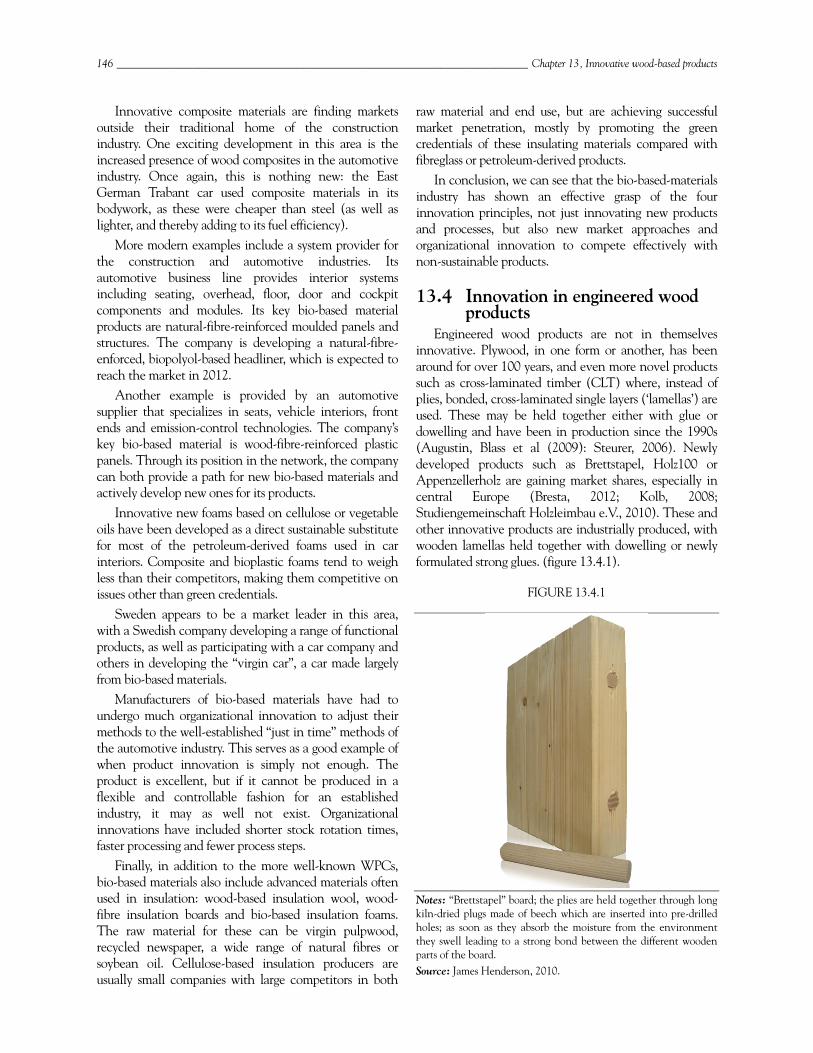
146 ___________________________________________________________________________ Chapter 13, Innovative wood-based products
Innovative composite materials are finding markets outside their traditional home of the construction industry. One exciting development in this area is the increased presence of wood composites in the automotive industry. Once again, this is nothing new: the East German Trabant car used composite materials in its bodywork, as these were cheaper than steel (as well as lighter, and thereby adding to its fuel efficiency).
More modern examples include a system provider for the construction and automotive industries. Its automotive business line provides interior systems including seating, overhead, floor, door and cockpit components and modules. Its key bio-based material products are natural-fibre-reinforced moulded panels and structures. The company is developing a natural-fibre-enforced, biopolyol-based headliner, which is expected to reach the market in 2012.
Another example is provided by an automotive supplier that specializes in seats, vehicle interiors, front ends and emission-control technologies. The company’s key bio-based material is wood-fibre-reinforced plastic panels. Through its position in the network, the company can both provide a path for new bio-based materials and actively develop new ones for its products.
Innovative new foams based on cellulose or vegetable oils have been developed as a direct sustainable substitute for most of the petroleum-derived foams used in car interiors. Composite and bioplastic foams tend to weigh less than their competitors, making them competitive on issues other than green credentials.
Sweden appears to be a market leader in this area, with a Swedish company developing a range of functional products, as well as participating with a car company and others in developing the “virgin car”, a car made largely from bio-based materials.
Manufacturers of bio-based materials have had to undergo much organizational innovation to adjust their methods to the well-established “just in time” methods of the automotive industry. This serves as a good example of when product innovation is simply not enough. The product is excellent, but if it cannot be produced in a flexible and controllable fashion for an established industry, it may as well not exist. Organizational innovations have included shorter stock rotation times, faster processing and fewer process steps.
Finally, in addition to the more well-known WPCs, bio-based materials also include advanced materials often used in insulation: wood-based insulation wool, wood-fibre insulation boards and bio-based insulation foams. The raw material for these can be virgin pulpwood, recycled newspaper, a wide range of natural fibres or soybean oil. Cellulose-based insulation producers are usually small companies with large competitors in both
raw material and end use, but are achieving successful market penetration, mostly by promoting the green credentials of these insulating materials compared with fibreglass or petroleum-derived products.
In conclusion, we can see that the bio-based-materials industry has shown an effective grasp of the four innovation principles, not just innovating new products and processes, but also new market approaches and organizational innovation to compete effectively with non-sustainable products.
13.4 Innovation in engineered wood products
Engineered wood products are not in themselves innovative. Plywood, in one form or another, has been around for over 100 years, and even more novel products such as cross-laminated timber (CLT) where, instead of plies, bonded, cross-laminated single layers (‘lamellas’) are used. These may be held together either with glue or dowelling and have been in production since the 1990s (Augustin, Blass et al (2009): Steurer, 2006). Newly developed products such as Brettstapel, Holz100 or Appenzellerholz are gaining market shares, especially in central Europe (Bresta, 2012; Kolb, 2008; Studiengemeinschaft Holzleimbau e.V., 2010). These and other innovative products are industrially produced, with wooden lamellas held together with dowelling or newly formulated strong glues. (figure 13.4.1).
FIGURE 13.4.1
Notes: “Brettstapel” board; the plies are held together through long kiln-dried plugs made of beech which are inserted into pre-drilled holes; as soon as they absorb the moisture from the environment they swell leading to a strong bond between the different wooden parts of the board. Source: James Henderson, 2010.
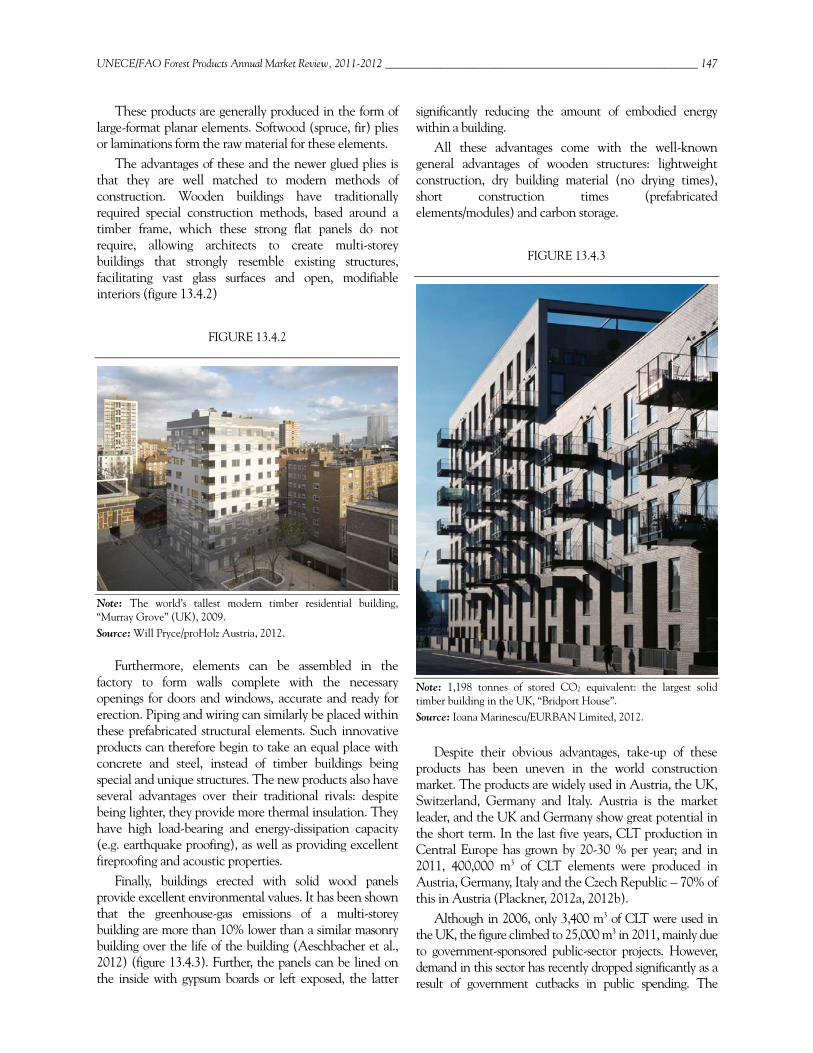
UNECE/FAO Forest Products Annual Market Review, 2011-2012 _________________________________________________________ 147
These products are generally produced in the form of large-format planar elements. Softwood (spruce, fir) plies or laminations form the raw material for these elements.
The advantages of these and the newer glued plies is that they are well matched to modern methods of construction. Wooden buildings have traditionally required special construction methods, based around a timber frame, which these strong flat panels do not require, allowing architects to create multi-storey buildings that strongly resemble existing structures, facilitating vast glass surfaces and open, modifiable interiors (figure 13.4.2)
FIGURE 13.4.2
Note: The world’s tallest modern timber residential building, “Murray Grove” (UK), 2009. Source: Will Pryce/proHolz Austria, 2012.
Furthermore, elements can be assembled in the factory to form walls complete with the necessary openings for doors and windows, accurate and ready for erection. Piping and wiring can similarly be placed within these prefabricated structural elements. Such innovative products can therefore begin to take an equal place with concrete and steel, instead of timber buildings being special and unique structures. The new products also have several advantages over their traditional rivals: despite being lighter, they provide more thermal insulation. They have high load-bearing and energy-dissipation capacity (e.g. earthquake proofing), as well as providing excellent fireproofing and acoustic properties.
Finally, buildings erected with solid wood panels provide excellent environmental values. It has been shown that the greenhouse-gas emissions of a multi-storey building are more than 10% lower than a similar masonry building over the life of the building (Aeschbacher et al., 2012) (figure 13.4.3). Further, the panels can be lined on the inside with gypsum boards or left exposed, the latter
significantly reducing the amount of embodied energy within a building.
All these advantages come with the well-known general advantages of wooden structures: lightweight construction, dry building material (no drying times), short construction times (prefabricated elements/modules) and carbon storage.
FIGURE 13.4.3
Note: 1,198 tonnes of stored CO2 equivalent: the largest solid timber building in the UK, “Bridport House”. Source: Ioana Marinescu/EURBAN Limited, 2012.
Despite their obvious advantages, take-up of these products has been uneven in the world construction market. The products are widely used in Austria, the UK, Switzerland, Germany and Italy. Austria is the market leader, and the UK and Germany show great potential in the short term. In the last five years, CLT production in Central Europe has grown by 20-30 % per year; and in 2011, 400,000 m3 of CLT elements were produced in Austria, Germany, Italy and the Czech Republic – 70% of this in Austria (Plackner, 2012a, 2012b).
Although in 2006, only 3,400 m3 of CLT were used in the UK, the figure climbed to 25,000 m3 in 2011, mainly due to government-sponsored public-sector projects. However, demand in this sector has recently dropped significantly as a result of government cutbacks in public spending. The
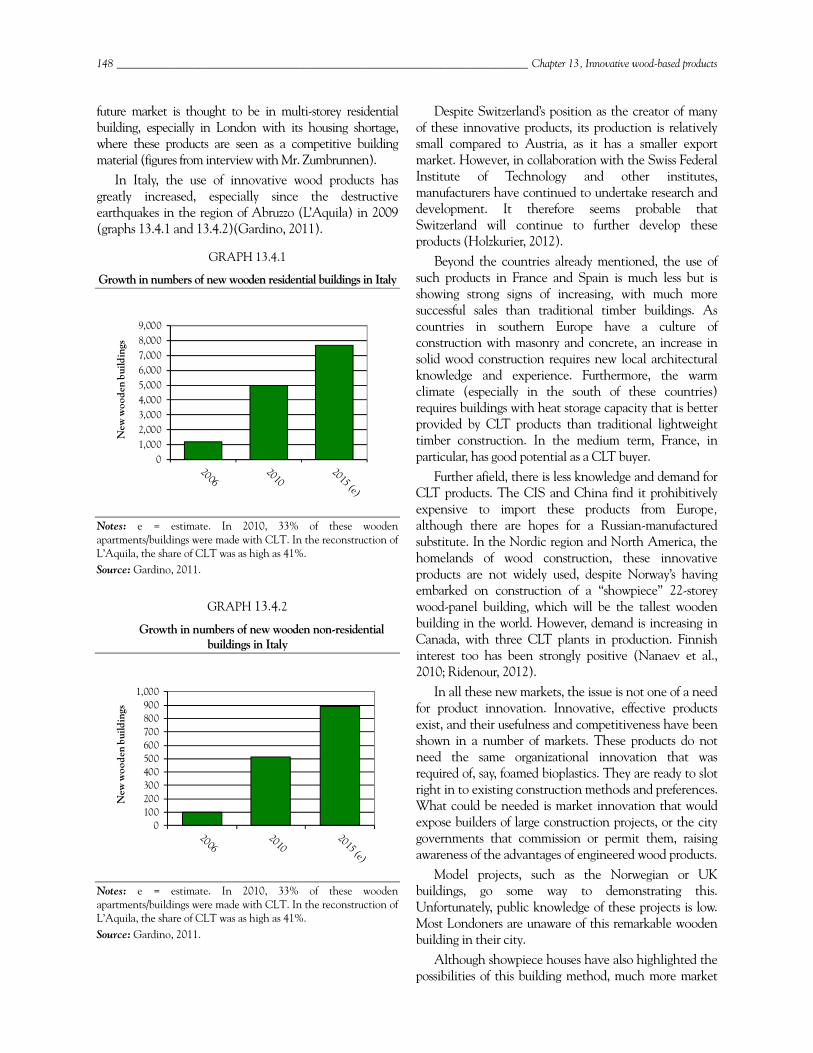
148 ___________________________________________________________________________ Chapter 13, Innovative wood-based products
future market is thought to be in multi-storey residential building, especially in London with its housing shortage, where these products are seen as a competitive building material (figures from interview with Mr. Zumbrunnen).
In Italy, the use of innovative wood products has greatly increased, especially since the destructive earthquakes in the region of Abruzzo (L’Aquila) in 2009 (graphs 13.4.1 and 13.4.2)(Gardino, 2011).
GRAPH 13.4.1
Growth in numbers of new wooden residential buildings in Italy
Notes: e = estimate. In 2010, 33% of these wooden apartments/buildings were made with CLT. In the reconstruction of L’Aquila, the share of CLT was as high as 41%. Source: Gardino, 2011.
GRAPH 13.4.2
Growth in numbers of new wooden non-residential buildings in Italy
Notes: e = estimate. In 2010, 33% of these wooden apartments/buildings were made with CLT. In the reconstruction of L’Aquila, the share of CLT was as high as 41%. Source: Gardino, 2011.
Despite Switzerland’s position as the creator of many of these innovative products, its production is relatively small compared to Austria, as it has a smaller export market. However, in collaboration with the Swiss Federal Institute of Technology and other institutes, manufacturers have continued to undertake research and development. It therefore seems probable that Switzerland will continue to further develop these products (Holzkurier, 2012).
Beyond the countries already mentioned, the use of such products in France and Spain is much less but is showing strong signs of increasing, with much more successful sales than traditional timber buildings. As countries in southern Europe have a culture of construction with masonry and concrete, an increase in solid wood construction requires new local architectural knowledge and experience. Furthermore, the warm climate (especially in the south of these countries) requires buildings with heat storage capacity that is better provided by CLT products than traditional lightweight timber construction. In the medium term, France, in particular, has good potential as a CLT buyer.
Further afield, there is less knowledge and demand for CLT products. The CIS and China find it prohibitively expensive to import these products from Europe, although there are hopes for a Russian-manufactured substitute. In the Nordic region and North America, the homelands of wood construction, these innovative products are not widely used, despite Norway’s having embarked on construction of a “showpiece” 22-storey wood-panel building, which will be the tallest wooden building in the world. However, demand is increasing in Canada, with three CLT plants in production. Finnish interest too has been strongly positive (Nanaev et al., 2010; Ridenour, 2012).
In all these new markets, the issue is not one of a need for product innovation. Innovative, effective products exist, and their usefulness and competitiveness have been shown in a number of markets. These products do not need the same organizational innovation that was required of, say, foamed bioplastics. They are ready to slot right in to existing construction methods and preferences. What could be needed is market innovation that would expose builders of large construction projects, or the city governments that commission or permit them, raising awareness of the advantages of engineered wood products.
Model projects, such as the Norwegian or UK buildings, go some way to demonstrating this. Unfortunately, public knowledge of these projects is low. Most Londoners are unaware of this remarkable wooden building in their city.
Although showpiece houses have also highlighted the possibilities of this building method, much more market
01,0002,0003,0004,0005,0006,0007,0008,0009,000
New
woo
den
build
ings
0100200300400500600700800900
1,000
New
woo
den
build
ings
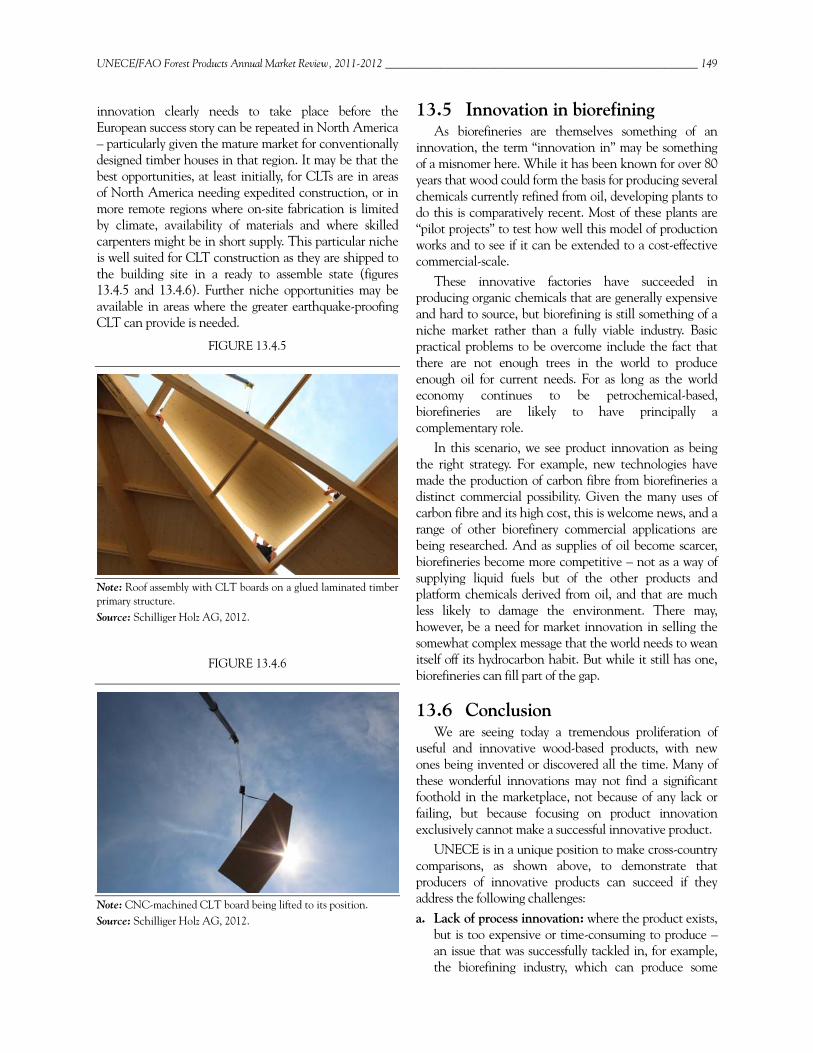
UNECE/FAO Forest Products Annual Market Review, 2011-2012 _________________________________________________________ 149
innovation clearly needs to take place before the European success story can be repeated in North America – particularly given the mature market for conventionally designed timber houses in that region. It may be that the best opportunities, at least initially, for CLTs are in areas of North America needing expedited construction, or in more remote regions where on-site fabrication is limited by climate, availability of materials and where skilled carpenters might be in short supply. This particular niche is well suited for CLT construction as they are shipped to the building site in a ready to assemble state (figures 13.4.5 and 13.4.6). Further niche opportunities may be available in areas where the greater earthquake-proofing CLT can provide is needed.
FIGURE 13.4.5
Note: Roof assembly with CLT boards on a glued laminated timber primary structure. Source: Schilliger Holz AG, 2012.
FIGURE 13.4.6
Note: CNC-machined CLT board being lifted to its position. Source: Schilliger Holz AG, 2012.
13.5 Innovation in biorefining As biorefineries are themselves something of an
innovation, the term “innovation in” may be something of a misnomer here. While it has been known for over 80 years that wood could form the basis for producing several chemicals currently refined from oil, developing plants to do this is comparatively recent. Most of these plants are “pilot projects” to test how well this model of production works and to see if it can be extended to a cost-effective commercial-scale.
These innovative factories have succeeded in producing organic chemicals that are generally expensive and hard to source, but biorefining is still something of a niche market rather than a fully viable industry. Basic practical problems to be overcome include the fact that there are not enough trees in the world to produce enough oil for current needs. For as long as the world economy continues to be petrochemical-based, biorefineries are likely to have principally a complementary role.
In this scenario, we see product innovation as being the right strategy. For example, new technologies have made the production of carbon fibre from biorefineries a distinct commercial possibility. Given the many uses of carbon fibre and its high cost, this is welcome news, and a range of other biorefinery commercial applications are being researched. And as supplies of oil become scarcer, biorefineries become more competitive – not as a way of supplying liquid fuels but of the other products and platform chemicals derived from oil, and that are much less likely to damage the environment. There may, however, be a need for market innovation in selling the somewhat complex message that the world needs to wean itself off its hydrocarbon habit. But while it still has one, biorefineries can fill part of the gap.
13.6 Conclusion We are seeing today a tremendous proliferation of
useful and innovative wood-based products, with new ones being invented or discovered all the time. Many of these wonderful innovations may not find a significant foothold in the marketplace, not because of any lack or failing, but because focusing on product innovation exclusively cannot make a successful innovative product.
UNECE is in a unique position to make cross-country comparisons, as shown above, to demonstrate that producers of innovative products can succeed if they address the following challenges: a. Lack of process innovation: where the product exists,
but is too expensive or time-consuming to produce – an issue that was successfully tackled in, for example, the biorefining industry, which can produce some
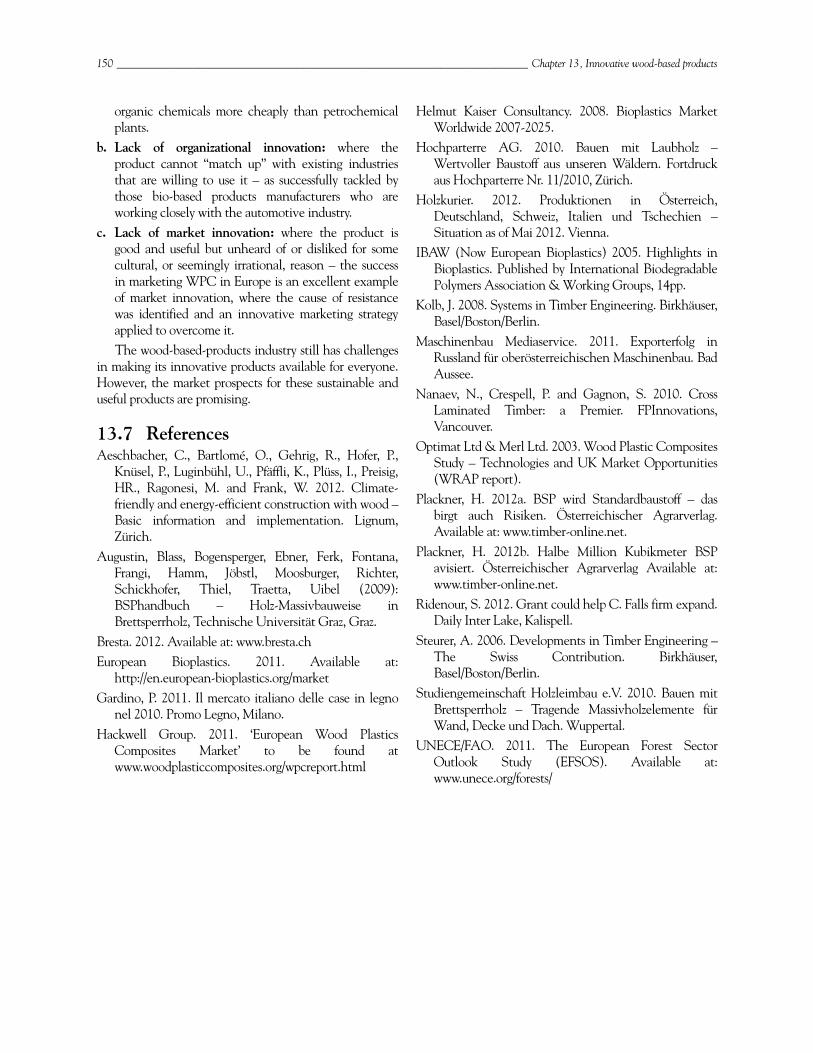
150 ___________________________________________________________________________ Chapter 13, Innovative wood-based products
organic chemicals more cheaply than petrochemical plants.
b. Lack of organizational innovation: where the product cannot “match up” with existing industries that are willing to use it – as successfully tackled by those bio-based products manufacturers who are working closely with the automotive industry.
c. Lack of market innovation: where the product is good and useful but unheard of or disliked for some cultural, or seemingly irrational, reason – the success in marketing WPC in Europe is an excellent example of market innovation, where the cause of resistance was identified and an innovative marketing strategy applied to overcome it. The wood-based-products industry still has challenges
in making its innovative products available for everyone. However, the market prospects for these sustainable and useful products are promising.
13.7 References Aeschbacher, C., Bartlomé, O., Gehrig, R., Hofer, P.,
Knüsel, P., Luginbühl, U., Pfäffli, K., Plüss, I., Preisig, HR., Ragonesi, M. and Frank, W. 2012. Climate-friendly and energy-efficient construction with wood – Basic information and implementation. Lignum, Zürich.
Augustin, Blass, Bogensperger, Ebner, Ferk, Fontana, Frangi, Hamm, Jöbstl, Moosburger, Richter, Schickhofer, Thiel, Traetta, Uibel (2009): BSPhandbuch – Holz-Massivbauweise in Brettsperrholz, Technische Universität Graz, Graz.
Bresta. 2012. Available at: www.bresta.ch European Bioplastics. 2011. Available at:
http://en.european-bioplastics.org/market Gardino, P. 2011. Il mercato italiano delle case in legno
nel 2010. Promo Legno, Milano. Hackwell Group. 2011. ‘European Wood Plastics
Composites Market’ to be found at www.woodplasticcomposites.org/wpcreport.html
Helmut Kaiser Consultancy. 2008. Bioplastics Market Worldwide 2007-2025.
Hochparterre AG. 2010. Bauen mit Laubholz – Wertvoller Baustoff aus unseren Wäldern. Fortdruck aus Hochparterre Nr. 11/2010, Zürich.
Holzkurier. 2012. Produktionen in Österreich, Deutschland, Schweiz, Italien und Tschechien – Situation as of Mai 2012. Vienna.
IBAW (Now European Bioplastics) 2005. Highlights in Bioplastics. Published by International Biodegradable Polymers Association & Working Groups, 14pp.
Kolb, J. 2008. Systems in Timber Engineering. Birkhäuser, Basel/Boston/Berlin.
Maschinenbau Mediaservice. 2011. Exporterfolg in Russland für oberösterreichischen Maschinenbau. Bad Aussee.
Nanaev, N., Crespell, P. and Gagnon, S. 2010. Cross Laminated Timber: a Premier. FPInnovations, Vancouver.
Optimat Ltd & Merl Ltd. 2003. Wood Plastic Composites Study – Technologies and UK Market Opportunities (WRAP report).
Plackner, H. 2012a. BSP wird Standardbaustoff – das birgt auch Risiken. Österreichischer Agrarverlag. Available at: www.timber-online.net.
Plackner, H. 2012b. Halbe Million Kubikmeter BSP avisiert. Österreichischer Agrarverlag Available at: www.timber-online.net.
Ridenour, S. 2012. Grant could help C. Falls firm expand. Daily Inter Lake, Kalispell.
Steurer, A. 2006. Developments in Timber Engineering – The Swiss Contribution. Birkhäuser, Basel/Boston/Berlin.
Studiengemeinschaft Holzleimbau e.V. 2010. Bauen mit Brettsperrholz – Tragende Massivholzelemente für Wand, Decke und Dach. Wuppertal.
UNECE/FAO. 2011. The European Forest Sector Outlook Study (EFSOS). Available at: www.unece.org/forests/
UNECE/FAO Forest Products Annual Market Review, 2011-2012 _________________________________________________________ 151
Annexes
Components of wood products groups ........................................................................................................ 152
Roundwood flowchart ........................................................................................................................................ 152
Wood-based panels flowchart ............................................................................................................................ 153
Wood pulp flowchart ......................................................................................................................................... 153
Paper and paperboard flowchart ........................................................................................................................ 154
Countries in the UNECE region and its subregions ................................................................................... 155
List of Authors .......................................................................................................................................... 156
Some facts about the Timber Committee ................................................................................................... 157
UNECE/FAO publications ........................................................................................................................ 158
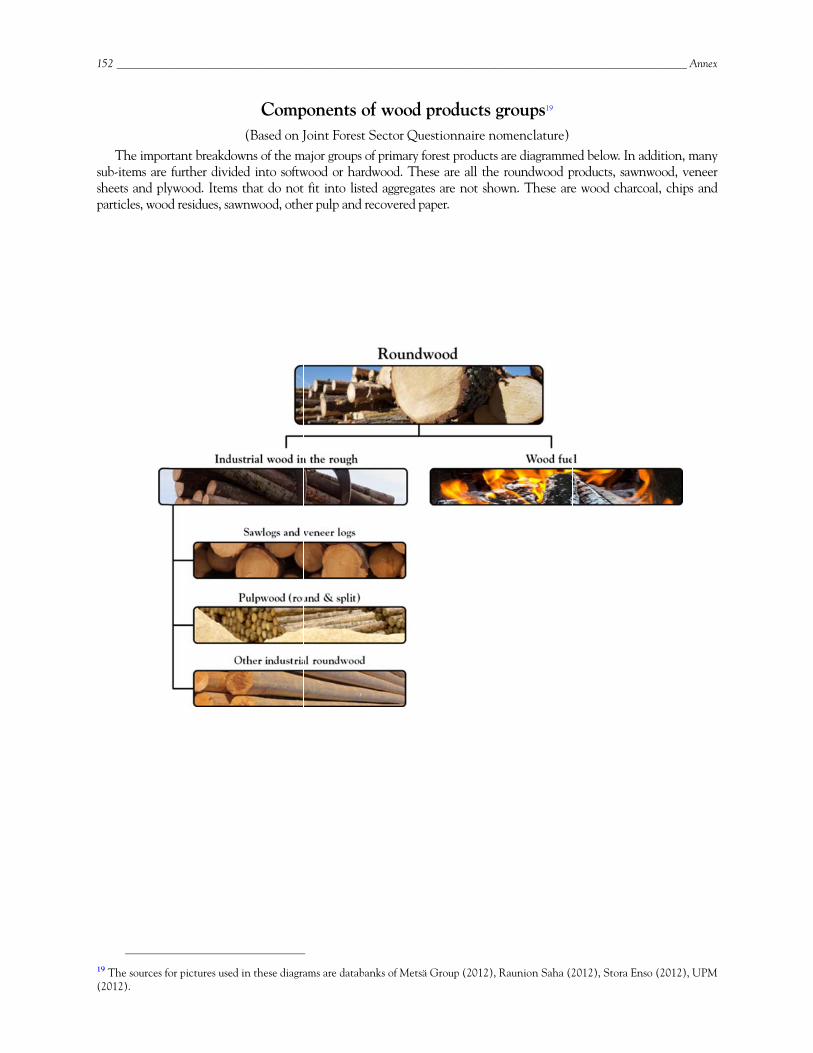
1
sushp
19
(2
52 __________
The imporub-items are heets and ply
particles, wood
9 The sources fo2012).
_____________
rtant breakdofurther divid
ywood. Itemsd residues, saw
or pictures used
______________
Comp(Based on J
owns of the mded into softws that do not wnwood, othe
d in these diagra
_____________
ponents ofJoint Forest S
major groups owood or hardt fit into listeer pulp and re
ams are databan
_____________
f wood prSector Quest
of primary foredwood. Theseed aggregates ecovered pape
nks of Metsä G
_____________
roducts grtionnaire nomest products ae are all the rare not shower.
Group (2012), R
______________
roups19 menclature)are diagrammeroundwood pwn. These are
Raunion Saha (2
_____________
ed below. In aproducts, sawne wood charc
2012), Stora En
_________ Ann
addition, mannwood, venecoal, chips an
nso (2012), UP
nex
ny eer nd
M
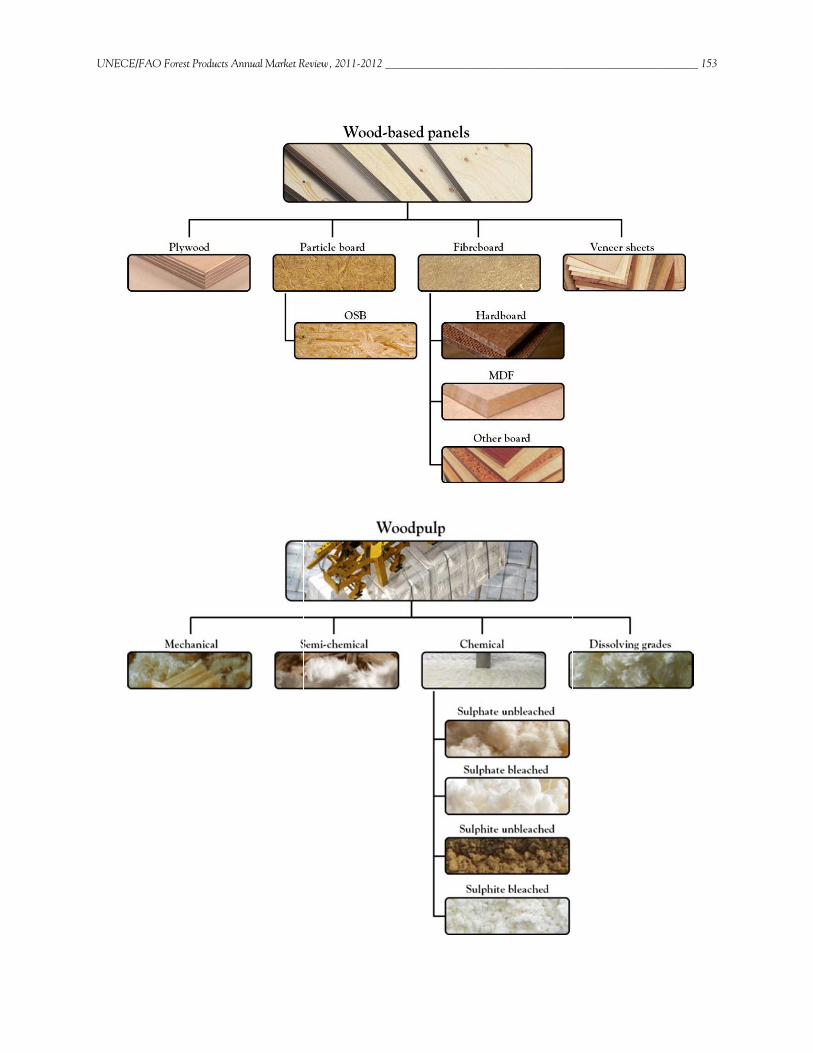
UUNECE/FAO F
Forest Products AAnnual Market RReview, 2011-20012 __________________________________________________
___________ 1553
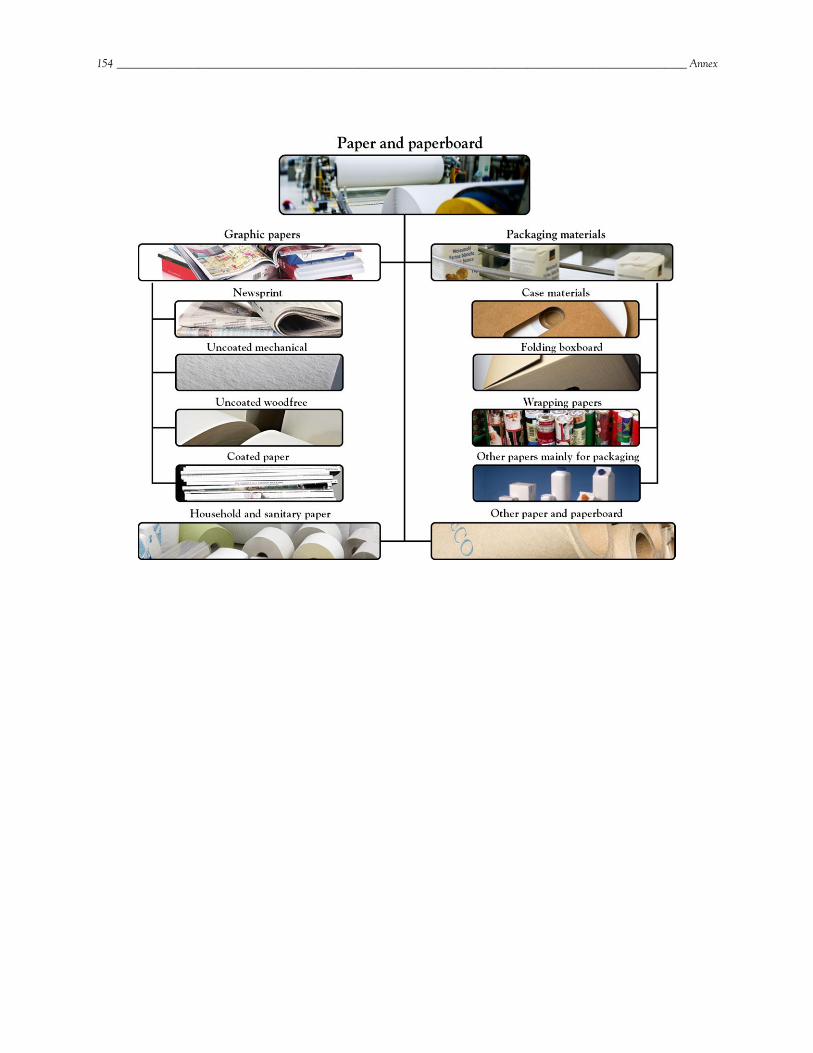
154 ________________________________________________________________________________________________________ Annex
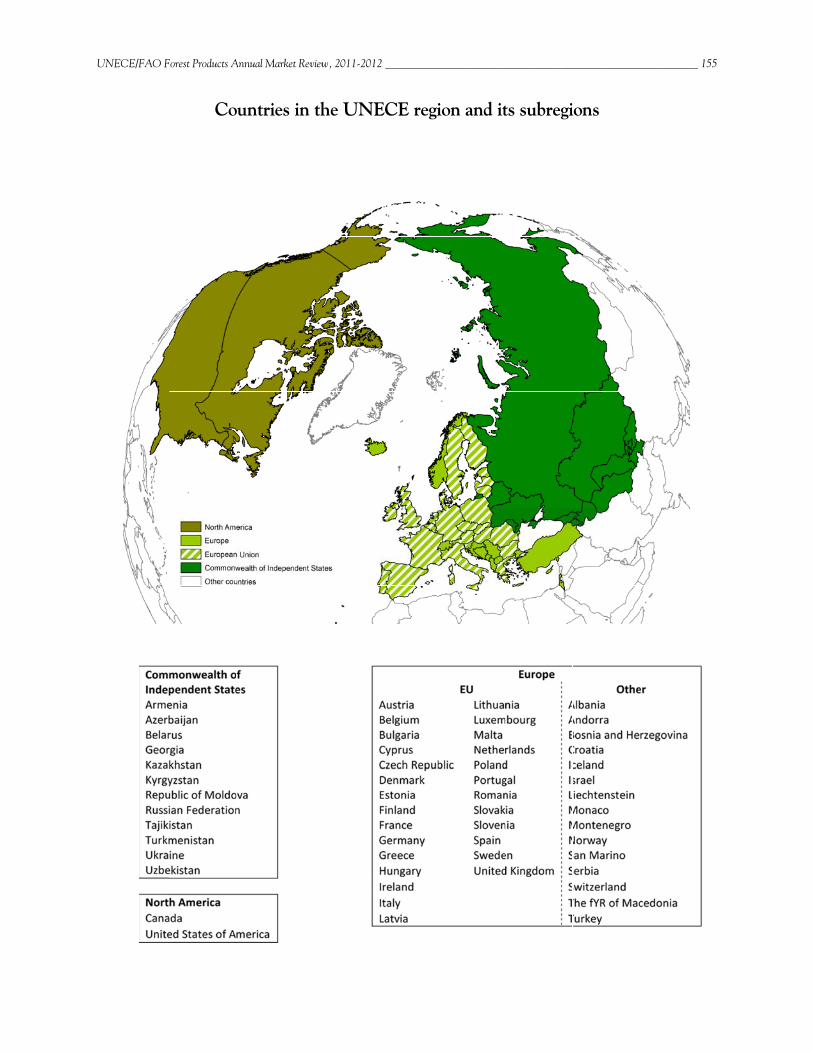
U
UNECE/FAO F
Forest Products A
Co
Annual Market R
ountries in
Review, 2011-20
n the UN
012 __________
NECE regi
_____________
ion and it
______________
ts subregi
_____________
ions
___________ 1555
156 ________________________________________________________________________________________________________ Annex
List of Authors
First Name Family Name Chapter Affiliation Email address
Francisco Aguilar 9 University of Missouri, Columbia, Missouri, US [email protected] Eduard Akim 8 State Technological University of Plant Polymers,
St. Petersburg, Russian Federation [email protected]
Delton Alderman 2 USDA Forest Service, Princeton, West Virginia, US [email protected] Peter Aurenhammer 12, 13 Pöyry Management Consulting Austria Gmbh [email protected] Olin Bartlomé 13 Lignum, Holzwirtschaft Schweiz, Zürich [email protected] Isabelle Brose 7 The European Confederation of Woodworking
Industries, Brussels, Belgium [email protected]
Peter Butzelaar 5 International Wood Markets Group Inc., Vancouver, BC, Canada
Douglas Clark 13 UNECE - United Nations Economic Commission for Europe, Geneva 10, Switzerland
Ivan Eastin 7 University of Washington, Seattle, Washington, US [email protected] Håkan Ekström 4 Wood Resources International LLC, Seattle,
Washington, US [email protected]
Henric Endoff 5 Agenda Business Development, Sweden [email protected] Kathryn Fernholz 10 Dovetail Partners, Minneapolis, Minnesota, US [email protected] Christopher Gaston 3, 12 FPInnovations, Vancouver, Canada [email protected] Rens Hartkamp 9 Free-lance consultant, Den Haag, Netherlands [email protected] Jaana Korhonen 11 Department of Forest Sciences, University of
Helsinki, Finland [email protected]
Florian Kraxner 10 International Institute for Applied Systems Analysis, Laxenburg, Austria
Bernard Lombard 8 Confederation of European Paper Industries (CEPI), Brussels, Belgium
Warren Mabee 9 Queens University, Kingston, Ontario, Canada [email protected] Igor Novoselov 3, 5, 7 LespromNetwork [email protected] Rupert Oliver 6 Forest Industries Intelligence Ltd, Settle, UK [email protected] Tapani Pahkasalo 12 INDUFOR, Helsinki, Finland [email protected] Tomas Parik 8 Confederation of European Paper Industries (CEPI),
Ivancice, Czech Republic [email protected]
Dominique Reeb 3 UNECE - United Nations Economic Commission for Europe, Geneva 10, Switzerland
Helmuth Resch 3 University of Natural Resources, Vienna, Austria [email protected] Robert Shelburne 2 UNECE - United Nations Economic Commission
for Europe, Geneva 10, Switzerland [email protected]
Kenneth E. Skog 9 USDA Forest Service, Forest Products Laboratory, Wisconsin, US
Morwenna Spear 13 The BioComposites Centre, University of Wales, Bangor [email protected]
Russ Taylor 5 International Wood Markets Group Inc., Vancouver, BC, Canada
Jukka Tissari 11 Food and Agriculture Organization of the United Nations (FAO), Rome, Italy
Michel Valois 8 Valois Vision Marketing, British Columbia Canada
Rich Vlosky 3 Louisiana State University, Baton Rouge, Louisiana, US

UNECE/FAO Forest Products Annual Market Review, 2011-2012 _________________________________________________________ 157
Some facts about the Timber Committee
The Timber Committee is a principal subsidiary body of the UNECE (United Nations Economic Commission for Europe) based in Geneva. It constitutes a forum for cooperation and consultation between member countries on forestry, the forest industry and forest product matters. All countries of Europe, the Commonwealth of Independent States, the United States, Canada and Israel are members of the UNECE and participate in its work.
The UNECE Timber Committee shall, within the context of sustainable development, provide member countries with the information and services needed for policy- and decision-making with regard to their forest and forest industry sectors (“the sector”), including the trade and use of forest products and, when appropriate, will formulate recommendations addressed to member governments and interested organizations. To this end, it shall:
1. With the active participation of member countries, undertake short-, medium- and long-term analyses of developments in, and having an impact on, the sector, including those offering possibilities for the facilitation of international trade and for enhancing the protection of the environment;
2. In support of these analyses, collect, store and disseminate statistics relating to the sector, and carry out activities to improve their quality and comparability;
3. Provide the framework for cooperation e.g. by organising seminars, workshops and ad hoc meetings and setting up time-limited ad hoc groups, for the exchange of economic, environmental and technical information between governments and other institutions of member countries required for the development and implementation of policies leading to the sustainable development of the sector and to the protection of the environment in their respective countries;
4. Carry out tasks identified by the UNECE or the Timber Committee as being of priority, including the facilitation of subregional cooperation and activities in support of the economies in transition of central and eastern Europe and of the countries of the region that are developing from an economic perspective;
5. It should also keep under review its structure and priorities and cooperate with other international and intergovernmental organizations active in the sector, and in particular with the FAO (Food and Agriculture Organization of the United Nations) and its European Forestry Commission, and with the ILO (International Labour Organisation), in order to ensure complementarity and to avoid duplication, thereby optimizing the use of resources.
More information about the Committee’s work may be obtained by writing to:
UNECE/FAO Forestry and Timber Section Trade and Sustainable Land Management Division United Nations Economic Commission for Europe Palais des Nations CH-1211 Geneva 10, Switzerland Fax: +41 22 917 0041 [email protected] www.unece.org/forests
158 ________________________________________________________________________________________________________ Annex
UNECE/FAO Publications
Forest Products Annual Market Review 2011-2012 ECE/TIM/SP/30
Note: other market related publications and information are available in electronic format from our website.
Geneva Timber and Forest Study Papers
The North American Forest Sector Outlook Study 2006-2030 ECE/TIM/SP/29 European Forest Sector Outlook Study 2010-2030 ECE/TIM/SP/28 Forest Products Annual Market Review 2010-2011 ECE/TIM/SP/27 Private Forest Ownership in Europe ECE/TIM/SP/26 Forest Products Annual Market Review 2009-2010 ECE/TIM/SP/25 Forest Products Annual Market Review 2008-2009 ECE/TIM/SP/24 Forest Products Annual Market Review 2007-2008 ECE/TIM/SP/23 Forest Products Annual Market Review 2006-2007 ECE/TIM/SP/22 Forest Products Annual Market Review, 2005-2006 ECE/TIM/SP/21 European Forest Sector Outlook Study: 1960 – 2000 – 2020, Main Report ECE/TIM/SP/20 Forest policies and institutions of Europe, 1998-2000 ECE/TIM/SP/19 Forest and Forest Products Country Profile: Russian Federation ECE/TIM/SP/18 (Country profiles also exist on Albania, Armenia, Belarus, Bulgaria, former Czech and Slovak Federal Republic, Estonia, Georgia, Hungary, Lithuania, Poland, Romania, Republic of Moldova, Slovenia and Ukraine) Forest resources of Europe, CIS, North America, Australia, Japan and New Zealand ECE/TIM/SP/17 The above series of sales publications and subscriptions are available through United Nations Publications Offices as follows:
Orders from Africa, Europe and the Middle East should be sent to: Sales and Marketing Section, Room C-113 United Nations Palais des Nations CH - 1211 Geneva 10, Switzerland
Fax: + 41 22 917 0027 E-mail: [email protected]
Orders from North America, Latin America and theCaribbean, Asia and the Pacific should be sent to:
Sales and Marketing Section, Room DC2-853 United Nations 2 United Nations Plaza New York, N.Y. 10017 United States, of America
Fax: + 1 212 963 3489 E-mail: [email protected]
Web site: http://www.un.org/Pubs/sales.htm
* * * * *
UNECE/FAO Forest Products Annual Market Review, 2011-2012 _________________________________________________________ 159
Geneva Timber and Forest Discussion Papers (original language only)
Swedish Forest Sector Outlook Study ECE/TIM/DP/58 The Importance of China’s Forest Products Markets to the UNECE Region ECE/TIM/DP/57 Good Practice Guidance on Sustainable Mobilisation of Wood: Proceedings from the Grenoble Workshop *ECE/TIM/DP/56 Harvested Wood Products in the Context of Climate Change Policies: Workshop Proceedings - 2008 *ECE/TIM/DP/55 The Forest Sector in the Green Economy ECE/TIM/DP/54 National Wood Resources Balances: Workshop Proceedings *ECE/TIM/DP/53 Potential Wood Supply in Europe *ECE/TIM/DP/52 Wood Availability and Demand in Europe *ECE/TIM/DP/51 Forest Products Conversion Factors for the UNECE Region ECE/TIM/DP/49 Mobilizing Wood Resources: Can Europe's Forests Satisfy the Increasing Demand for Raw Material and Energy Under Sustainable Forest Management? Workshop Proceedings - January 2007 *ECE/TIM/DP/48 European Forest Sector Outlook Study: Trends 2000-2005 Compared to the EFSOS Scenarios ECE/TIM/DP/47 Forest and Forest Products Country Profile; Tajikistan *ECE/TIM/DP/46 Forest and Forest Products Country Profile: Uzbekistan ECE/TIM/DP/45 Forest Certification – Do Governments Have a Role? ECE/TIM/DP/44 International Forest Sector Institutions and Policy Instruments for Europe: A Source Book ECE/TIM/DP/43 Forests, Wood and Energy: Policy Interactions ECE/TIM/DP/42 Outlook for the Development of European Forest Resources ECE/TIM/DP/41 Forest and Forest Products Country Profile: Serbia and Montenegro ECE/TIM/DP/40 Forest Certification Update for the UNECE Region, 2003 ECE/TIM/DP/39 Forest and Forest Products Country Profile: Republic of Bulgaria ECE/TIM/DP/38 Forest Legislation in Europe: How 23 Countries Approach the Obligation to Reforest, Public Access and Use of Non-Wood Forest Products ECE/TIM/DP/37 Value-Added Wood Products Markets, 2001-2003 ECE/TIM/DP/36 Trends in the Tropical Timber Trade, 2002-2003 ECE/TIM/DP/35 Biological Diversity, Tree Species Composition and Environmental Protection in the Regional FRA-2000 ECE/TIM/DP/33 Forestry and Forest Products Country Profile: Ukraine ECE/TIM/DP/32 The Development of European Forest Resources, 1950 To 2000: a Better Information Base ECE/TIM/DP/31 Modelling and Projections of Forest Products Demand, Supply and Trade in Europe ECE/TIM/DP/30 Employment Trends and Prospects in the European Forest Sector ECE/TIM/DP/29 Forestry Cooperation with Countries in Transition ECE/TIM/DP/28 Russian Federation Forest Sector Outlook Study ECE/TIM/DP/27 Forest and Forest Products Country Profile: Georgia ECE/TIM/DP/26 Forest certification update for the UNECE region, summer 2002 ECE/TIM/DP/25 Forecasts of economic growth in OECD and central and eastern European countries for the period 2000-2040 ECE/TIM/DP/24 Forest Certification update for the UNECE Region, summer 2001 ECE/TIM/DP/23 Structural, Compositional and Functional Aspects of Forest Biodiversity in Europe ECE/TIM/DP/22 Markets for secondary processed wood products, 1990-2000 ECE/TIM/DP/21 Forest certification update for the UNECE Region, summer 2000 ECE/TIM/DP/20 Trade and environment issues in the forest and forest products sector ECE/TIM/DP/19 Multiple use forestry ECE/TIM/DP/18 Forest certification update for the UNECE Region, summer 1999 ECE/TIM/DP/17 A summary of “The competitive climate for wood products and paper packaging: the factors causing substitution with emphasis on environmental promotions” ECE/TIM/DP/16 Recycling, energy and market interactions ECE/TIM/DP/15 The status of forest certification in the UNECE region ECE/TIM/DP/14 The role of women on forest properties in Haute-Savoie (France): Initial research ECE/TIM/DP/13 Interim report on the Implementation of Resolution H3 of the Helsinki Ministerial Conference on the protection of forests in Europe (Results of the second enquiry) ECE/TIM/DP/12 Manual on acute forest damage ECE/TIM/DP/7
* signifies web downloads only

160 ________________________________________________________________________________________________________ Annex
The above series of publications may be requested free of charge through:
UNECE/FAO Forestry and Timber Section Trade and Sustainable Land Management Division United Nations Economic Commission for Europe Palais des Nations CH-1211 Geneva 10, Switzerland Fax: +41 22 917 0041 E-mail: [email protected] Downloads are available at: www.unece.org/forests
UNECE/FAO GENEVA TIMBER AND FOREST STUDY PAPERS The UNECE/FAO Geneva Timber and Forest Study Paper series contains annual and periodic analyses of the
forest and forest industries sector. These studies are the official outputs of regular activities conducted within the Integrated Programme of Work of the UNECE Timber Committee and the FAO European Forestry Commission and as such should contribute to policy formation. Target audiences are governments, industry, research institutions, universities, international organizations, non-governmental organizations as well as experts from other sectors. These publications often form the basis for discussions of the Timber Committee and the European Forestry Commission and their subsidiary bodies.
Study Papers are usually based on statistics, forecasts and information submitted by country correspondents in the
UNECE region (Europe, North America and Commonwealth of Independent States). The basic information is often submitted via agreed questionnaires, and then complemented by expert analysis from outside and within the secretariat. Study papers are issued on the responsibility of the secretariat, although the studies most often are the work of many contributors outside the UNECE/FAO.
Study Papers are translated whenever possible into the three official languages of the UNECE: English, French and
Russian. They are UN sales documents and are distributed accordingly via UN bookstores and their affiliates. They are automatically distributed to heads of delegation of the Committee and the Commission, as well as nominated repository libraries, information centres and official distribution lists. They are also available via the Sales and Marketing Sections in Geneva and New York via [email protected] and [email protected] respectively. Study papers are also available on the Timber Committee and European Forestry Commission website at: www.unece.org/forests
UNECE/FAO Forestry and Timber Section Trade and Sustainable Land Management Division United Nations Economic Commission for Europe/ Food and Agriculture Organization of the United Nations Palais des Nations CH-1211 Geneva 10, Switzerland Fax +41 22 917 0041 www.unece.org/forests [email protected]
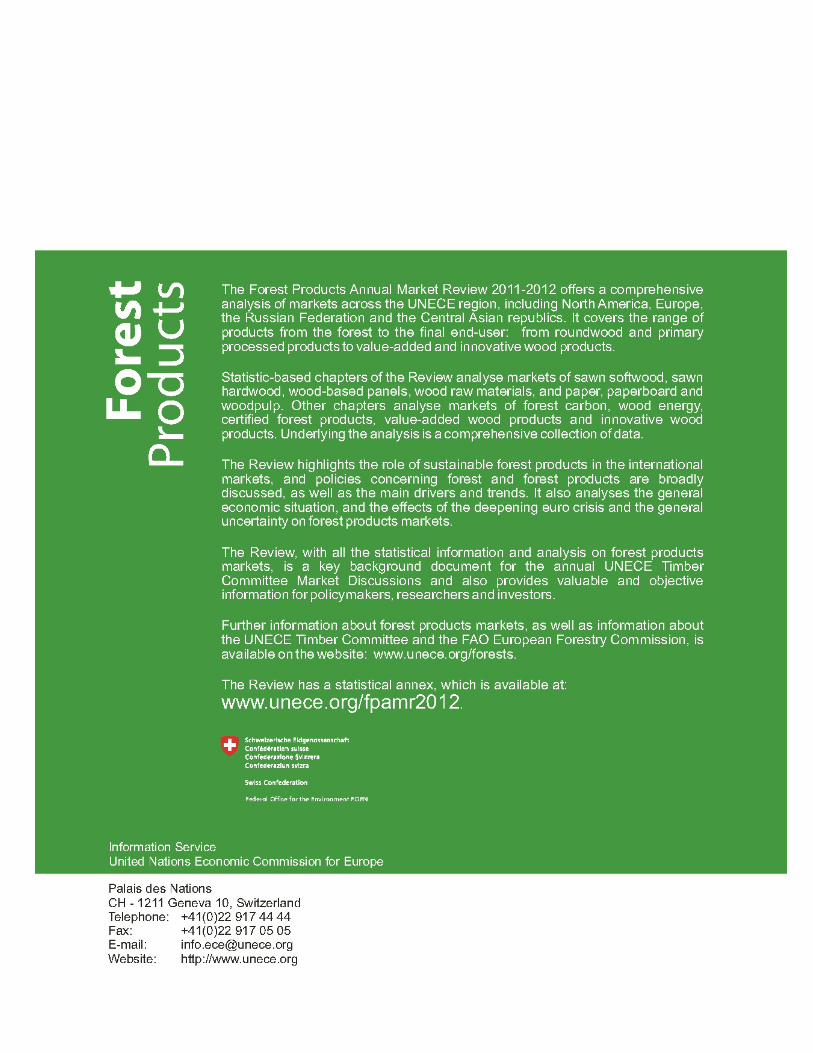
Back cover The Forest Products Annual Market Review 2011-2012 offers a comprehensive analysis of markets across the UNECE region, including North America, Europe, the Russian Federation and the Central Asian republics. It covers the range of products from the forest to the final end-user: from roundwood and primary processed products to value-added and innovative wood products. Statistic-based chapters of the Review analyse markets of sawn softwood, sawn hardwood, wood-based panels, wood raw materials, and paper, paperboard and woodpulp. Other chapters analyse markets of forest carbon, wood energy, certified forest products, value-added wood products and innovative wood products. Underlying the analysis is a comprehensive collection of data. The Review highlights the role of sustainable forest products in the international markets, and policies concerning forest and forest products are broadly discussed, as well as the main drivers and trends. It also analyses the general economic situation, and the effects of the deepening euro crisis and the general uncertainty on forest products markets. The Review, with all the statistical information and analysis on forest products markets, is a key background document for the annual UNECE Timber Committee Market Discussions and also provides valuable and objective information for policymakers, researchers and investors. Further information about forest products markets, as well as information about the UNECE Timber Committee and the FAO European Forestry Commission, is available on the website: www.unece.org/forests. The Review has a statistical annex, which is available at: www.unece.org/fpamr2012.