forest sector charter council b-bbee progress report to the portfolio committee of agriculture,...
TRANSCRIPT

FOREST SECTOR CHARTER COUNCIL
B-BBEE Progress Reportto the
Portfolio Committee of Agriculture, Forestry and Fisheries23 JUNE 2015
Mr Simangaliso Mkhwanazi(Executive Director)
1

PRESENTATION OUTLINE• Purpose
• Forest Sector Profile
• Forest Sector Charter
• Forest Sector Charter Council
• B-BBEE Transformation Status report
- Medium & Large Enterprises (MLE) analysis- Qualifying & Small Enterprises (QSE) analysis- Exempted Micro Enterprises (EME) analysis
• Challenges
• Conclusion
2

PURPOSE The presentation provides information on the progress and performance towards
the implementation of B-BBEE (Broad based Black Economic Empowerment) in
the Forestry sector and related industries.
The presentation also provides challenges in the implementation of B-BBEE in
the Forestry sector and related industries.
3

Forest Sector Profile• Uses 1% of total land (1 273 357ha)
• Employs about 146 000 in sawmilling, pulp & paper, timber boards, mining timber etc., (22.5% employment in Agriculture)
• Provides about 850 000 livelihood support
• Contributes 1% National GDP & 7.7% of manufacturing GDP
• Production mainly on pulp & paper and sawmilling products
• Derives 70%of revenue from exports
(Reference: FSA Facts 2011/12)
4

Forest Sector Charter•Originates from the B-BBEE Act, No 53 of 2003 (now Amendment Act)
•Launched in 2005, established a Steering Committee
•2005-2008 draft Charter developed by working groups & Steering Committee
•FB-BBEE draft Charter gazetted for public comments in May 2008
•Published as a Sector Code in June 2009
•Revised in 2014, still awaiting gazetting
5

Forest Sector Charter (Continuation)• Main objective:
“To extend the economic opportunities and benefits of the Forest Sector to the previously disadvantaged black groups”.
• Scope of application- Growers- Contracting- Fibre- Sawmilling- Pole &- Charcoal
6

• FSCC known as “Council”, launched in May 2008 & operating as a section 21 Company.
• Main responsibilities:
- To facilitate, oversee, encourage implementation of Charter
- To monitor & report on the Charter Undertakings
- To monitor & report on the Transformation Status
- To publicize the Charter &
• Participates in Government, Industry & Council forums & member of the Joint Technical Team (Dti initiative)
Forest Sector Charter Council (FSCC)
7

• 3 strategic sessions, highlighting strategic objectives
• Foresight exercise in 2011 to craft preferred future for the sector
• 4 Quarterly meetings on a annual basis.
• Reporting:
- The President’s B-BBEE Advisory Council,- Minister of Trade & Industry & - Minister of Agriculture, Forestry & Fisheries.
• Composition – 20 Board members & an Independent Chairperson
Forest Sector Charter Council (Continuation)
8
B-BBEE Status of Transformation• B-BBEE Status report: An annual report on scorecard
implementation & performance
• Objective: Assess the status of transformation in the Forest sector
• Scorecard seven (7) elements - Ownership (O)- Management Control (MC)- Employment Equity (EE)- Skills Development (SD)- Preferential procurement (PP)- Enterprise Development (ED)- Socio-economic Development (SED)
9

B-BBEE Status of Transformation• Measured entities are:
- Medium & Large Enterprises (MLE,˃ R35M turnover), - Qualifying Small Enterprises (QSE, R5M-R35M turnover), & - Exempted Micro Enterprises (EME˂ R5M)
• Medium and Large enterprises (MLE) scored on 7 elements
• Qualifying Small Enterprises (QSE) scored on any 4 element
• Exempted Micro Enterprises (EME) automatically level 4 status (level three if compliance with Codes of Good conduct)
• Fifth (5th) Transformation status report completed
10

B-BBEE Status of Transformation• Certificates with underlying information collected
• Information gathered analysed
• Analysis based on size of enterprise- Medium & Large Enterprises (MLE,˃ R35M turnover), - Qualifying Small Enterprises (QSE, R5M-R35M turnover), & - Exempted Micro Enterprises (EME˂ R5M)
• Further Sub-sector analysis:
• Results compared to KPMG report
(NB:KPMG report- an annual survey which aims to provide a tool to benchmark B-BBEE implementation progress)
11

B-BBEE Status of Transformation
• MLE analysis: Ownership
12
9.72
13.13 13.0410.54
12.2413.86
11.29 13.43 12.77
10.79
20.00
0
5
10
15
20
2010 2011 2012 2013 2014
Forestry KPMG Ownership Target
9.28
13.6712.33
14.76
12.24
0
2
4
6
8
10
12
14
16
Charcoal Contractors Fibre Growers Poles Sawmilling
Sub-Industries Average Forestry Average
No co
mpa
nies
repo
rted
Only
QSEs
and E
MEs
repo
rted

B-BBEE Status of Transformation
• MLE analysis: Management Control
13
4.015.19 5.46
4.33 4.295.51
4.16 5.57
4.87 4.28
10.00
0
2
4
6
8
10
2010 2011 2012 2013 2014
Forestry KPMG Management Control Target
5.00
4.153.82
4.83
4.29
0
1
2
3
4
5
6
Charcoal Contractors Fibre Growers Poles Sawmilling
Sub-Industries Average Forestry Average
Noco
mpa
nies
repo
rted
Only
QSEs
and E
MEs
repo
rted

B-BBEE Status of Transformation
• MLE analysis: Employment Equity
14
4.38 5.45 4.90 4.86 6.077.41 7.02 7.09 7.18
5.23
15.00
0
5
10
15
20
2010 2011 2012 2013 2014
Forestry KPMG Employment Equity Target
5.864.97
10.89
5.18 6.07
0
2
4
6
8
10
12
Charcoal Contractors Fibre Growers Poles Sawmilling
Sub-Industries Average Forestry Average
Noco
mpa
nies
repo
rted
Only
QSEs
and E
MEs
repo
rted

B-BBEE Status of Transformation
• MLE analysis: Skills Development
15
8.7710.03
8.35 7.17 7.6310.00
6.00 7.92 7.74 6.86
15.00
0
5
10
15
20
2010 2011 2012 2013 2014
Forestry KPMG Skills Development Target
8.08 7.61
12.49
8.34
7.63
0
2
4
6
8
10
12
14
Charcoal Contractors Fibre Growers Poles Sawmilling
Sub-Industries Average Forestry Average
No
com
pani
es re
port
ed
Onl
y Q
SEs a
nd E
MEs
repo
rted

B-BBEE Status of Transformation
• MLE analysis: Preferential Procurement
16
14.2416.34 16.46 15.84 15.31
10.2412.36
15.9914.79
12.03
20.00
0.00
5.00
10.00
15.00
20.00
2010 2011 2012 2013 2014
Forestry KPMG Preferential Procurement Target
17.82
15.17
16.50 16.27
15.31
13
14
15
16
17
18
19
Charcoal Contractors Fibre Growers Poles Sawmilling
Sub-Industries Average Forestry AverageNo
com
pani
es re
porte
d
Only
QSEs
and
EMEs
repo
rted
B-BBEE Status of Transformation
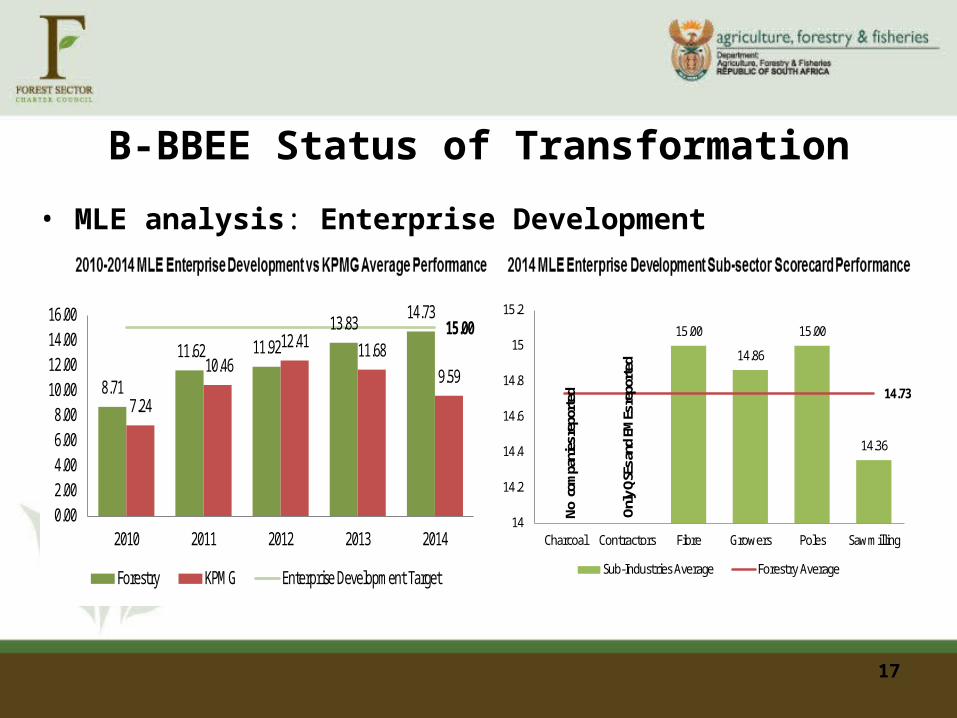
• MLE analysis: Enterprise Development
17
8.71
11.62 11.9213.83
14.73
7.24
10.46 12.41 11.68
9.59
15.00
0.002.004.006.008.00
10.0012.0014.0016.00
2010 2011 2012 2013 2014
Forestry KPMG Enterprise Development Target
15.00
14.86
15.00
14.36
14.73
14
14.2
14.4
14.6
14.8
15
15.2
Charcoal Contractors Fibre Growers Poles Sawmilling
Sub-Industries Average Forestry AverageNo
com
pani
es re
porte
d
Only
QSE
s and
EM
Es re
porte
d

B-BBEE Status of Transformation
• MLE analysis: Socio-Economic Development
18
6.92
8.22 8.89
8.02 7.81
5.00
3.74 4.51
4.92
3.755.00
0.00
1.00
2.00
3.00
4.00
5.00
6.00
7.00
8.00
9.00
10.00
2010 2011 2012 2013 2014
Forestry KPMG Socio-economic Development Target
6.73
8.05 8.008.93
7.81
0
1
2
3
4
5
6
7
8
9
10
Charcoal Contractors Fibre Growers Poles Sawmilling
Sub-Industries Average Forestry Average
Noco
mpa
nies
repo
rted
Only
QSE
s and
EM
Es re
port
ed

B-BBEE Status of Transformation
• QSE analysis: Ownership
19
36.8% 31.6%
100.0%
26.3%
73.7%
47.4%
79.0%
0.0%20.0%40.0%60.0%80.0%
100.0%120.0%
Selected Elements
19.82
25.0023.55
24.96 25.57
24.77
0.00
5.00
10.00
15.00
20.00
25.00
30.00
2010 2011 2012 2013 2014
Ownership Overall Mean

B-BBEE Status of Transformation
• QSE analysis: Management Control & Employment Equity
20
22.63 22.67 22.57
21.66
23.54
22.61
20.50
21.00
21.50
22.00
22.50
23.00
23.50
24.00
2010 2011 2012 2013 2014
Employment Equity Overall Mean

B-BBEE Status of Transformation
• QSE analysis: Skills Development & Preferential Procurement
21
9.20
3.12
7.81 7.93 8.02
6.72
0.00
1.00
2.00
3.00
4.00
5.00
6.00
7.00
8.00
9.00
10.00
2010 2011 2012 2013 2014
Skills Development Overall Mean
16.6918.97 18.44
20.27 20.44
19.53
0
5
10
15
20
25
2010 2011 2012 2013 2014
Preferential Procurement Overall Mean

B-BBEE Status of Transformation
• QSE analysis: Enterprise Development & Socio- economic Development
22
19.22
16.00
19.88
23.86
19.74
0
5
10
15
20
25
30
2010 2011 2012 2013 2014
Enterprise Development Overall Mean
Not s
elec
ted
for
verifi
catio
n
21.67
25.00
23.00
24.58 24.71
24.32
20.00
21.00
22.00
23.00
24.00
25.00
26.00
2010 2011 2012 2013 2014
Socio-Economic Development Overall Mean

B-BBEE Status of Transformation
23
OwnershipManagement
ControlEmployment
EquitySkills
DevelopmentPreferential
ProcurementEnterprise
Development
Socio-economic
Development
2010 49% 40% 29% 58% 71% 58% 138%
2011 66% 52% 36% 67% 82% 77% 164%
2012 65% 55% 33% 56% 82% 79% 178%
2013 53% 43% 32% 48% 79% 92% 160%
2014 61% 43% 40% 51% 77% 98% 156%
0%
20%
40%
60%
80%
100%
120%
140%
160%
180%
200%
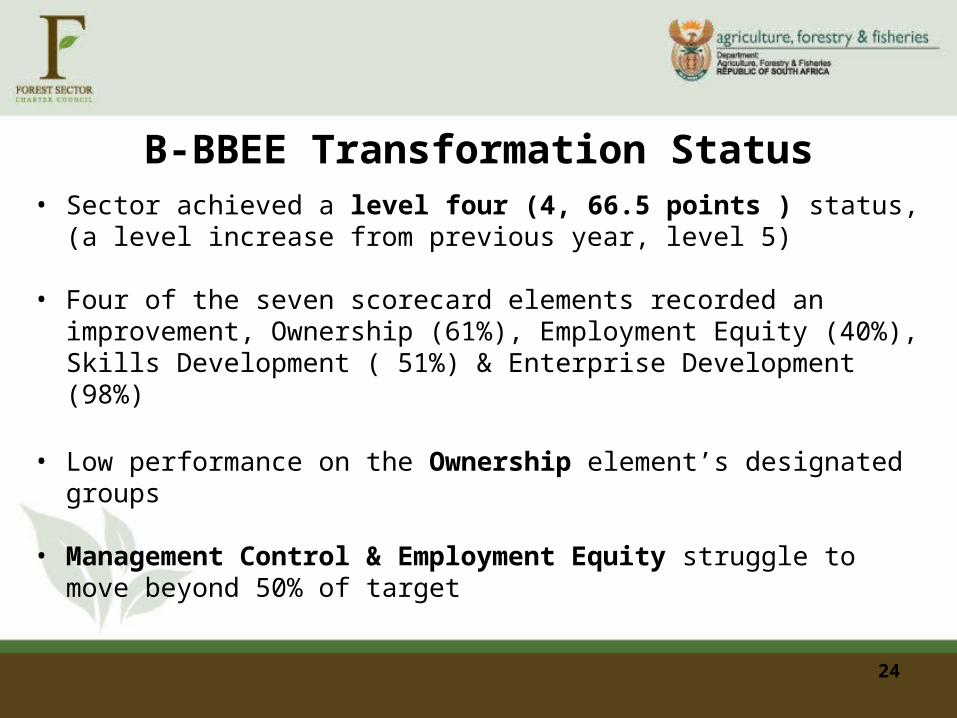
B-BBEE Transformation Status• Sector achieved a level four (4, 66.5 points ) status, (a level
increase from previous year, level 5)
• Four of the seven scorecard elements recorded an improvement, Ownership (61%), Employment Equity (40%), Skills Development ( 51%) & Enterprise Development (98%)
• Low performance on the Ownership element’s designated groups
• Management Control & Employment Equity struggle to move beyond 50% of target
24

B-BBEE Transformation Status• Black women representation as directors and executives limited
• Skills Development performance above KPMG target but still needs to improve
• Consistent & excellent performance in Enterprise development (98%), Preferential Procurement (77%) & Socio- Economic Development (156%)
• QSE’s achieved 80%+ of target, except in Skills Development
• QSE’s maintained level 3 status
• EME’s maintained level 4 status (65% of EME white managed)
25

B-BBEE Transformation Status
Challenges- Verification using generic scorecard - matter to be addressed
through Joint Technical Committee- Dti and New Codes, all enterprises falling within a sector that has sector code must be verified under Sector Code
- Inaccurate database - addressed through organised sub sector associations and updating database
- Level of awareness- an intensified awareness programme to be undertaken
- Some entities without B-BBEE certificates - addressed in the new Codes, all enterprises falling within a sector that has sector code must be verified under a Sector Code
26

Conclusion-Reporting entities numbers improved from 26 in 2010 to 77 in 2014
-Average performance in Ownership
-Sector performing well in Enterprise development, Socio-economic Development and Preferential Procurement (though sector specific guidelines need to be developed)
-More improvement required in Employment Equity & Management Control
27

Conclusion (Continuation)
- More efforts to be channelled on under represented sub sectors, Qualifying Small Enterprises & Exempted Micro Enterprises
(Better enforcement measures)
- Delivery on industry and government undertakings necessary to enhance transformation in Forest Sector
- Mandate of Council to be strengthen (such as actual visits to enterprises, monitoring and audits)
28

29
THANK YOU