foreword - megplanning.gov.in · foreword the current issue of the "statistical had book,...
TRANSCRIPT


FOREWORD
The current issue of the "Statistical H a d Book, heghalaya, 199?" is the eleventh in the series, It presents a concise factual account of the Socio-Economic Trend in the State based on .:urrently available data. An earnest attempt ha8 bcen made to quicken the proce:s of publi- shing the current issue ae compared to the r eleas c of past issues.
Data prese~lted in this publication have b e a coilected from various Government Departmenb, Public Bodies and also from Publfshed documents brought out by recognised Institutions.
Tr~e generous co-operation extended by vario-1s Government Departments, Public Bodies a0 wdl as Ken-Government Agencies in making available the required Statistical information for this publication is gratefully acknowledged.
Suggestions for the qualitative improvement of the future issues are most welcome.
Shillong, A. U. CHOUDHURY i he27th Jsn~~ary, 1993. Director of Economic
and Statistics, Govern- ment of Meghalaya,
Shillong. . ,

I 123AO DISTANCE IKms.)
shiilong to : Jowai ... ... ... -\ongstoin -
'1 ura ... ... WII. iamnagar
... Non:poh
aohra Che; rapun jce
Mairdng ... ... MA wkyrwat
... Brrghmara
Betasing ... ... Resubelpara
... Dadenggiri
Amjarem .. ... Kh iehriat
Mawsynram .. Mhwkynrew ..
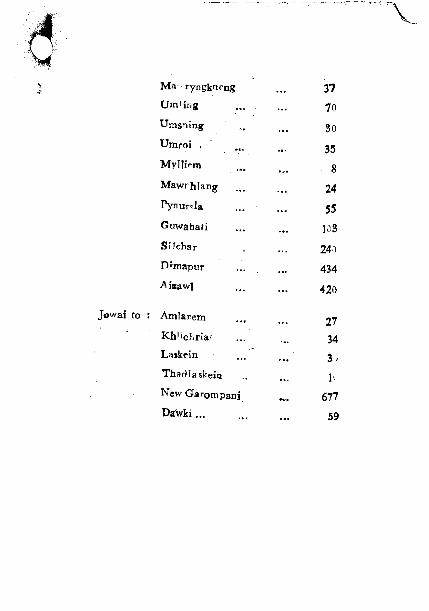

Sonapahar .*. ... Balat . Y . ... Ranikor (Via. Baiat) .-.
Tu*~ t o : Baghmara ~
Dadenggiri -. . * Betasing -
s.
Rowram ... ... Selsella - $ . ... Rongara .. se,
Rembelpara .. Zikzak -. . .. . Dalu
..a
Cbkpot ... . * Ampati * s
vlEamnag;ar Resubelpara , 60 :
rZ

? \
WEIGHTS
i Grain . . =0'065 pram
1 gram .. =0'035270 &me
=0.085735 Tola
I Ounce .. =28.350 grams
I Pound .. =0.4530 Kilcgmm
1 Kilogram -,- -~ '20462 Pounds
1 quintal -.. =!00 Kilograms
1 Tonne ... = 10 q~~intals =ou9a20 Tons
%
ITon ' -,- = !. 01 605 Tomes
1 Cwt -. . =0-508~24 quintals
-50'802 KiWgrama
1 Mauncl ... = 37'3242 Kilograms
1 Seer . a , =Cs933 10 Kilogrzms

1,ENGTH
1 Ccntimetre .., -0'393731 In&
1 Inch . . =25'4 Millimetrrs
=0'0254 Metres
1 Foot ... =Cm3u48 Meirs
=30'48 Centimeires
1 Metre ... =1.0Q361 Yards
1 Yard ... =0.9144 Metre
1 Mile .., =1-069344 Kilomctre~
1 Kilometre ... e0.62137 Miles
CAPACITY AVD VOLU 4E
1 Gallon (Imperi-I) 1 Gallon (U. S.)
1 Litre ... 1 Cubic Foot ... 1 Cubic M c t ~ e ... 1 Cubic Yard ...
-0.83266 Gall<,h;" (Imperial)
-0*219q67 Gallons (Tmpcrial)
~ 2 8 ' 3 1 6 8 Cubic Dcsi- metres
sJ .028 Cub c Metre 3 17'1.5 Cubic Ydrdg
~ 0 . 7 6 4 5 5 Cubic metre

AREA ,
1 Square Inch ... -6.45 16 Square Centimetres
1 Square foot . -0.r.92903 Jquarr Metres
1 Square Yard . ==0.8?613 1 Square Metres
1 Square Metre = 1.19593 Squzre Yada
1 Acre ... =Oa404686 Hectares 1 3 . 1 25 Bighas =4'84P -quare Yards
1 Square Mile ... =2'58999 Square Kilome tr er ~ 6 4 0 Acres
1 Fquare Kilometre K GO - Hectares
-247 ACFP -G-386101 Square Mile
I Hee'ares ... = 10000 Square Metres =746993 Bighas -2.47105 Acres
1 Bigha ,.. - ~ 1 3 3 8 7 Hec tam =0.33058 Acre

Co nveers:on R atioe Between Raw Material
I and Processed P~oduct
1 Rice (clean& =2/3 or Paddy produdion production)
2 Cotton
(a) Catton lint pro.-:lj3 of Icapas produetior? duction
(b) Cotton seed - 2 times cf cotton lint production production
3 Jute
(a) 100 yards of =54 1Ls of raw jute hersian
,b) 4148 yard.; of = I ton of raw jute hessian
4 Groundnut
(a1 Kernel to nuts in sheli=70 percent
(b) Oil to nuts in shell =28 perteni
[ c ; Oilro Kernel crushed =40 percent
(d) Cake to Kcrnei cruahtd=60 perccrit

, 5 Sesamum 1 (a) Oil to ~ ~ 4 s crushed =40 percent
(b) Cake to seeds crushed ==60 pepcent
6 Rape and MustardILinseed/Crnt4need
(a) Oil to seeds crushed -33 percenb
(b) Cakdto seeds crushed =67 percent
(a) Copra to nuts =One ton of copra =6,773 nuts
e (b) Oil to copra crushed =62 percent
1 (c) Cake to copra crushed=38 percent
1 - 8 $syaBean seed I
1 (a) Oil to soyabean seed = 18 pereent
I crushed
I I I
i b) Meal to wyabean seed=?3 percent crushed
f

(a) Gus hem enne trvohed- 1L' percent
(b) Crystal sugar from =62.4 perceat Gur Reti~td
(c) Khandaari Sugar f~om=37.5 percent Gur Refined
(d) Molasses from cane =3.5 percent crushed
f
(el Cane thrash from cane= 10.0 percent harvested
1 Q Butter and Ghee
(a) Butter from mixed milk=6.9 percent -
(b) Ghee from mixed milk ... 5.5 perseat
Source: Agriculture and Corporation, Ministry of Agricultare, Government of India.

Table No.
C O N T E N T S
Page No.
1. AREA AND POPULATION
1.0 1 District-wise Number of 1 Towns, Police Station, Outposts and Community Development BIock~, 1991.
1.02 District-wise Area, Popula- 2-3 tion, Density and Sex Ratio, 1991.
.1.03 Population Trend in Megha- 4 laya, 1901-1991 (P). .
1.04 Number of Villages and 5 Pooulation by Size of Villa- ges, 1981. .
1.B5 Popnlation of Towns, 1991 6 (Provisional).
1.0 6 Population of Scheduled 7 Castea/Tribes by District, 1981.
1.07 Workers and Non-workers by 8-- District, 1991 (Provisional).

Table No.
1.08 Workers Classified by Broad Industrial Cztegory, 1991 (Provisional).
Percentage of Workers and Non-Workers by District, - 1991 (Provisional). Estimated Mid-Year Popula-
tion of Meghalaya as on 1st October.
Birth and Death Rates in Meghalaya and All-lndia.
Sex-wise Break up of ,the Quinquinnial Proj-ron ( '00) of the Rural and Urban Population As on 1st March, 1981-2uLlP.
2. CLIMATE Maximum and Minimum
Temperature of Shiilong and Cherrapunjee, 1998.
Humidity in Shillong and Cherrapunjee, 1990.
Rainfall in SeIeeted Centres. Monthly Rainfall in Selected Centres, 1Y90.
Page Nos.

111
3. AGRICULTURE
Table Page Nos. No. 3.01 ~ s t i m a t e d Number and Area
of Operational Holdings by 2 1
Size Class in Meghalaya, 1985-86.
3.02 Estimated Number and Area 22-23 af Operational Holdisgs by Tenure and Tenancy jn BVIeghaleya, 1985-86.
3.03 Land Utilisation in Meghalaya 24-25 (Provisional).
3.04 District-wise Land Utiiisation 26 -27 in Meghaiaya, 1990-9: (Provisional).
3.05 Area under Principal Crops. 28-29 3.06 i?roduction of Principal Crops 50-32 3.07 Yield Rate of some importafit 3 3
% Crops m Sghalaya .
3.08 Area and Production of 34 Herticultural Crops in Meghalaya.
3.09 Area and Production ofcash 35-36 Crops. -
3.10 Consumption of Fertilizers 37 in Meghalaya.


Table No.
4.07 Production of Milk, Eggs and Meat in Meghalaya.
4.08 Average Daily Milk Yield per Animal in Milk in Meghalaya.
' 5. FOREST
5.0 1 Area under Forest ... .. - 5'02 Area under Piantation, Affores-
tation.
5-05 Progress oT orestry Se!!emes
5.04 Forest Produce ,, ... 5.05 Langth of Forest Roads by
Type in Megbalaya,
6 . FISHERIES .. 6161 Fish Seed Distributicn ... 6'02 Fish Seed Farms, Production
of Spawn and Fry and Finger- liage in Mcghalaya.
- 6'03 District-wise Number and Wa- ter Area of Fish Seed larms.
Page Nos.
54
55-5 6


vii .I
Table No.
9, INDUSTRY
Page Nos.
9.01 Number of Enterprises, 1990 74--75 and Person Usually Working (Provisional Results)
9-02 Number of Enterprises and 76 Number of Persons Usually Working (Provision Results)
9.83 Number of Registered Facto- ries in Meghalaya.
7 7
9.04 Number of small Scale Indu- 78 stries Registered with the Directorate of Industries.
9.05 Small Scale Industries by 79- 30 Type, 1991-92
.- 9.06 Annual Survey of Industries 81-82
(Summary Results) in Megha. laya.
9.07 Kumber of Industrial Estatks 83 A in Meghalaya. .
9.08 Production 0f Cement from 54 Mawluh Cherra Cement Lrd,


Table Page Nos. No.
12.U3 Statirtics Relating .to the Pri. 9.5 mary Agricultural Credits Socie- ties in Meghalaya.
12.04 Statistie Be!ating to Comumers 9 6 Go-operative in Meghalaya.
12.05 Statistics Relating to Meghalaya 9 7 Co-operative Apex Bank as on 30th Jane.
12-816 Number of Societies, Member- 98-39 ship and Capital Structure of the Meghalaya State Coopera- tive and Consumer Federation Ltd
1 3 . ROADS
13.61 Road Length Maintaned by 1 00-10 1 public Works Department in Mcghalaya.
13-02 Road Mileage by Class of Roads.


Page Nos.
!5. LABOUR AND EMPLOYMENT
15.01 Trend in Fublic ~ n d Private 115-116 Sector Employment.
i
15-02 Employme~lt by Industry Divi- 1 1 7-1 18 siora ='is on 31st December.
,
15.03 Employment Exchange Statistics 119 in Meghala~ a.
15.04 Distribution of Educated Appli- 120- 121 cants in the Live Register by Level of Education m Meghalaya.
15.05 Intake arid Outturn of Industrial 122 Training Institntes.
15.06 Occnpational Break-up of Job 123-!24 Seekers on the Live Register As on 31st December.


Table Page Nos. No.
17. EDUCATION STATISTICS
Percentage 0': Literacy, 1981 and 1991.
17.02 Proj-cted Population-Schoel 135 Going Age--Gr up As on ist March 1990.
17.03 Number of Educational In- 136-137 stitutions in Meghalaya 1989-90 and 1990-9 1 (Provisional).
17.04 Number of Educational Insti- 138-139 tutionr by Type of Manag* mefir 1989-96 and 1990-91 I*
Meghalaya (Provisionai).
17.05 hurnber of Teachers in the Edu- 140 cational Institrltioes of Megha- 1s y s (Provisional).
17.06 Number of Trained and Untl~liued ~ 4 1 Teachers in Educational Inetitu- tions in Meghalaya (Provisional).
7 Q7 Clars-wise Enrolment in Sehools 142-43 of Meghalaya iProvis'ona1).


1 able Page Nos. No.
12. SOCIAL WELFARE
15,01 Some Key Statisties on Social 154-55 Welfare.
18,02 Welfare of Physically Handi- 156 capped and Supply of bosthe- tic Aids.
18.03 Women welfare and Old Aged 157 Pension Scheme.
18.04. ?rogre:s of Integrated Child 15 8 Development Scheme.
. POLIqE AND CRIME STATISTIC%
19.01 Number o f Police Itatiom, Out- 159 posts etc.
19.02 Strength of Police Personnels 16'3-161
1 9.03 Incidence of Crimes by Major 162 Heads Under I. p. C.
3 .04 Offences under Local and Speci- 163 a1 Laws.
19.05 Juvcnilcs ~pprobended for Cam- 164 mitting Crimes Under I. P. C.


xvii
Table Page Nos. No.
21. ShALL SAVINGS
21.01 Statistics of Smalf Savings in Megh alaya (Provisional). 173
22. STATE FINANCE
22'01 Overall Budgetary Position of 1 74 the State of Meghalaya.
22'02 Revenue Receipts of the Go- 175 vernment ~f Meghalaya.
22'03 Revenue Expenditure of the State of Meghalaya. 176
22-04 Capital Receipts of the State 177-1 j g of Nleghalaya.
2205 Capital Expenditure of the 179-180 State of PYIe,ghalaya.
22-06 State Taxes by Types ... 181-182


xix
Table No.
Page Nos.
25, FIVE YEAR PLANS
25.01 Plan Outlay and Actual Expen- 19$ ditures of Meghalaya.
0 2 Minimum Needs Programme-- 195-196 Outlay and Expenditure.
25 .03 Outlay and Expenditure on Rural Development Program- mes (Mcghalaya,.
25.04 Achievements under Rural De- 198-199 velopment Programmes in Me- ghalaya,
25.05 E'hy~icd Achievements under 201) Jowabar Rozgar Yojana during
1990-91.
25.06 Physical Achievement Under 201 Jowahar Roz:ar Yojana during
1991-92.
26. ELECTION
2.6 .91 Meghalay~ Legislative Assem- 20 2 bly Election, 19813.


Table paeg No. Nos.
27. TOURISM ANL) RECREATION
27.01 Number of Tourist visit in^ 211 Meghalaya.
27.02 Number of Tourist Spots in 212 Meghalaya
27.03 ?umber of Cinema Houses 216 In Meghalaya for the year 1990 and 1991, District wise.
28. MISCELLANEOUS
28.01 Basic Scatistics of the Shillong 217-2'8 Municipal Board.
28,02 Statement Showing the Income 219 of the Shillong Municipal
Board. 28.03 Expenditure of the Shillong 220
hlunicipal Boar d.
28.04 Xumbers of Ware-Housing 221 Centre>, Capacity anL Occu- pancy in Meghalaya.
28.05 District-wi5e Number of Fair 222-223 Pricc Shops in Meghalaya.


- -
TA
BL
E .
1.0
1 D
istr
ict-
wT
se N
urnb
cr o
t ro
wns
, P
olic
e St
atio
ns,
Ou
tpos
ts
and
Com
mun
ity
Dev
elop
men
t Bla
cks,
199
1.
Di~
tric
t Su
b-D
ivis
ion
Tow
ns
Pol
ice
Pol
ice
.c $
. (e
xcIu
ding
S
tati
ons
Out
post
s I '
istr
ict
H. Q
.)
Jain
tia
Hil
ls
2 1
5 3
4 E
ast
Kha
si i
3ill
s 2
7 13
9
9 W
est
Kh
asi
Hil
ls
2
1 3
3 4
Bas
t G
aro
Hil
ls
1 1
5 3
4
Wes
t G
aru
Hill
s 3
2 8
6 9
Ueg
1la
la\a
10
12
34
24
30
V
Sour
ez:-
Dir
ecto
rate
of
Eos
nom
ies an
d St
atis
tics
, M
c,.b
alat
ya.


1.02 a d Scx .%tie, 1991. f gures) ation Density Sex Ratio. Popu- A ---- -- per Sq. (female8 lation Female Total Km. per 'A03' growth
males Qu& 1981-1991.
( 5 ) (61 (7) (8) (9 ) I 88257 219186 57 976 40' I 4
90002 198473 . . . 975 38'3 3 16255 20713 . -. 98 1 60'28 15944 457160 126 926 21.58
317002 427054 ... 94 1 291 7 208942 230106 ... 899 2737 106ali 217462 4.1 958 34-59 199447 203C84 ... 960 28-78
&4 14378 . . . 939 270.57 62604 189M3 7 3 960 38-44 87016 377058 ... 9 66 33'17
700056 1431547 - 957 30'88 + 156262 329079 ... 904 36,315
India, 1991 i


TA
BL
E : 1.06
Pop
tlla
tio~
l of
Sch
edul
ed
Car
ntes
lTri
bes
by D
istr
ict,
198
1
Dis
tri~
t Sc
h r
d~
lc~
l C
aste
s (1
) (2
) ja
inti
a H
ills
47
Eas
t K
hasi
Hill
s 'fi?
?
(0.2
91
. ,
Wes
t K
had
Hil
ls
...
Eas
t G
aro
Hill
s 11
4 (0
.08 l
W
est
Gar
o H
ills
' 38
5 1
(I .0
4)
Pde
ghal
aya
5492
(0
.41)
Sche
dule
d T
ribe
s (3
) 14
8710
(9
5.08
) 37
4081
(7
3.15
) 15
6995
(9
7.16
) 12
4462
i9
1.15
1
Oth
ers
'Tot
al
-
Fig
ures
in b
rack
ets
indi
cate
Per
cent
ages
. So
urce
:--C
ensu
s of
Ia
dia,
198
1.


TA
BL
E : 1
'i~'
l-cw
td.
< 1)
(2)
(31
(4)
(5)
(6)
(7)
Mar
gina
l W
arke
is
Rpv
al
5629
32
30
2569
70
89
1077
.1
3728
8 U
rb.:
n
1107
14
6 60
1
19
19
3 16
21
Tot
al
6786
33
76
2629
72
08
1838
4 38
913
Tot
al
Wor
kers
R
nr:
1 20
8137
66
590
7458
1 79
125
1944
11
6578
%
* U
baa
7007
5 45
95
71~2
2 36
17
1435
7 lo
r266
Urb
an
1594
3:
9783
13
691
868
3754
0 22
8813


E a r n - .* rO 0 z z : - m r - - w S "
t w c . I , . * - I C ) v ) -


TA
BL
E :
1.03
Per
cen
tlee
ol
Wor
kers
and
M
on-W
orke
rs b
y D
istr
ict,
1991
(P
rovi
sion
al)
Cat
rgo
rv
Eas
t W
est
Jein
tia
Eas
t W
est
&&
a-
Khn
si
Kha
ai
Hill
s G
aro
Gar
o la
ys
Hil
ls H~lls
Mills
Hills
11)
_(2)
(3)
(4)
(5)
(6)
(71
Wor
ker*
R
ura
l 47
-57
42.6
4 47
.65
44.6
9 45
.65
45-9
5 - C
hl
Urban
- 30
.71
31.96
33.9
0 30.18
27.66
30.47
Total
41.6
7 41
-94
46.5
5 43
.7'
45.7
0 43
.06
Nw
a-W
arkc
rs
ltu
ral
52.43
57.36
52.3
5 55.31
54.35
54.6
5
l Jrb
all
69.2
0 68
04
66.10
69.8
2 72
.34
69.5
8 'I
bta
l 58
.23
58.0
6 55
.65
56.2
1 56.33
56.8
6 &
Ssa
rce
:-C
GP
ISU
B BT
Indi
a, 1
5-9 1


TA
BL
E
2.01
M
axim
um a
nd
Min
imum
T
emp
erat
ure
of
Shi
llon
g an
d C
herr
apun
jee,
19
9c
(in
cera
tigr
ade)
S
hil
lmg
C
herr
apun
jce
?-- -- -
,L----y
r---.-
h----7
Mon
th
Max
imu
m
Min
im~
m
Max
imum
M
inim
um
( 1)
(2)
13)
(4)
(5)
Ja
~u
ary
15
.3
7.1
16.6
7.
6 F
ebru
ary
16.4
7.
7 17
.0
8.6
Mar
ch
18.2
9.
4 18
.1
10.6
A
pril
21
.8
12.2
20
.3
12.5
M
ay
22.8
15
.5
23.0
16
.1
June
24
.0
17.9
22
.8
17.5
Ju
ly
23.8
18
.0
21.5
17
.6
Aug
ust
24.2
17
.5
23.8
17
.7
Sep
tem
ber
23.3
17
.0
22.7
16
.9
Oct
ober
21
.1
13.8
22
4
14.6
N
ovem
ber
21.1
13
.6
; 2.4
11.4
D
ecem
ber
i6 3
7.
7 18
.5
6.! - -
Sour
ce : -1
ndia
n M
eteo
rolo
gica
l U
ep
art
m~
nt


TA
BL
E :
2.03
Rai
nfal
l in
Sel
ecte
d C
entr
es
(in
Mm
)
Cen
tre
1988
19
89
1990
East K
hasi
Hill
s (a) S
hillo
ng
3,76
2 2,
813
1,83
4 - 'a
(b)
Che
rrap
unje
e 17
,948
13
,432
11
,598
(c)
Maw
synr
am
16,7
50
8,82
8 12
,934
Wes
t K
hasi
Hill
s 5,
246
3,57
7 ...
Non
gsto
in.
Wes
t Gar
o H
ills
6,
525
5,11
0 4,
183
Tu
ra
-.. So
uroe
:-
Indi
an i
Met
eoro
logi
cal C
entr
e,
Guw
ahat
i A
irpo
rt.


Holdings by Tenure and Tenancy in Meghala ya, 1985-86 (Area in Hectares)
L otherwise Partly ownzrl Partly leased in Totai ted and otherwise Area
operated 4-. > r--* L---, F---A--
-? Area No . Area Leas-d 0th-rwise in Area operated
Officer, Meghalaya.


TABLE :
3.03
-con
ctd.
(1)
(2)
(3)
4. F
allo
w l
and
2400
35
2238
92
5. N
et a
rea
sow
n 19
4000
20
4335
6.
Are
a so
wn
mor
e th
an
3999
4 37
892
once
.
7. T
otal
cro
pped
are
a 23
3991
. 24
.228
7
111. 1
. N
et I
rrig
ated
are
a 49
203
4837
9
2. Gross I
r~ig
ated
area
49
752
4887
7
*Rep
ortin
g ar
ea e
xclu
des
the
area
und
er M
unic
ipal
ity
and
Tow
n
Com
miL
tee.
Sour
ce :-
Dir
ecto
rate
of
Eco
nom
ics a
nd
Sta
tist
ics,
Meg
hala
ya,


Meghalaya, 199081 (Provisional)
hectares)
J aintia & s t West Meqha- Hills &ro Garo laya
Hills Hills
Municipality and Town Committee,
and statistics, Megh alaya .


TA
B L
E :
3'0
5 (c
oncl
d)
(1)
(2)
(3)
(4)
To
tal F
ood
Gra
ins
1,3 8
,343
1,
33,8
00
6.
Ses
amum
1,
215
1,33
,290
1,
300
7. .
Cas
tor
1,32
0 4
1 29
3 3
8.
R
ape
& M
i~st
ard
6,
700
6,50
0 6,
64?
To
tal
oil
see
d 7,
956
9. J
ute
7,
829
(<,I
15
7,99
6
10.
Mes
ta
4,80
0 4.
356
5,07
5 4,
500
11.
Cot
ton
4,78
5 8,
044
7,30
0 12
. S
ug
ar c
are
7,3
64
166
84
I@
13.
Dry
C
hill8
es
1,77
2 1,
800
1,7f
7
14.
Tob
acco
73
9 70
0
15.
Tur
mer
ic
724
1,09
5 1,
300
1,33
5 16
. A
reca
nut
6,72
0 6,
100
17.
Pot
ato
6,12
0 17
,872
17
,500
17
,631
18
. S
wce
t po
tato
3,
824
5,20
0 5,
042
19.
Tap
ioca
4,
189'
4,
200
3,99
9 20
. S
oya
bean
88
1
900
21.
Pin
e ap
.,le
6,80
0 92
3 8,
252
8.3
00
22
, C
itru
s fr
uits
5,
990
6,78
9 6,
950
2 3.
Gin
ger
5,35
1
6,30
0 6,
500
Sour
ce
Eir
ecto
r ate
cC
Eco
nom
fcs &
Sta
tistic
s, h
leg
hal
aya


... 5.
'rot
a1 P
uls
es
2,23
4 2,4
00
2,
407
... T
otal
Foo
d G
rain
6 .
1,66
,b18
1,
51,0
00
1,53
,363
...
6. S
esam
um
604
700
679
... 7.
Cas
tor
... 8.
Rap
e an
d M
usta
rd
... 9.
Jut
e *
10.
Mes
ta *
... 11
. C
otto
n **
...
12.
Suga
r C
ane
... 13
. D
ry
Chi
lles ...
14.
Tob
acco
..-
15.
Tur
mer
ic
... 16
. A
reca
nlit
..


TA
BL
E : 3
.07
Yie
ld R
ate
of S
~m
e Im
por
tant
Cro
ps in
Meg
hala
ya
Nam
e of
Crops
Ave
rage
Yit
ld '
Kgs
/Hec
tare
) r---
---.A
--
----
-- -i
1985
-86
1989
-90
1990
- 1
1. R
ice
(1)
(a) A
utu
mn
(b)
Win
ter
(e)
Sp
rin
g
Total
Ric
e
2. M
aize
3.
Ju
te
4. P
C ta
t0
5. R
ape
Mus
tard
-
Sou
rce :-
Dir
ecto
rate
of
Eco
nom
ics and
Sta
tist
ics,
M
egha
laya


TA
BL
E :
1
-13
Con
sum
ptio
n o
f F
erti
lize
rs
in
Meg
hala
va
(in
m
etri
c t j
nnes
)
Yea
rs
Kha
rif
seas
on
Rab
i se
ason
---A
,,---
r---A
A--- -7
N
P K
N
P
I<
(1
) ' 2
) (3
) (4
) (5
) (6
) (7
)
-
N -N
itr o
qen
P
Pho
spha
te
K
Pot
akh
So
urce
:-D
irec
tora
te
of A
gric
ultu
re,
Meg
hala
ya.


Inrf
ex
Num
ber
and
B ie
l-l
Per
iod
Typ
e af
In
drx
(1)
(2)
1988
-14
Are
a P
rod
uct
ion
Y
leld
19
84-8
5 A
rts
Pro
duct
ion
Y,;
I~
1985
-86
Are
a P
r d
uct
ion
Y
ield
TA
BL
E:
3.13
of A
rea,
Pr
~d
~c
ti
~n
U
nder
C
rops
(Bas
e :-
Tri
enn
ium
~
nd
ing
,19
72
-73
~~
(~0
)
Non
-Foo
d-
grai
ns
(4'
112.
29
152-
59
125'
86
11 6
'32
166.
05
128.
99
11.5
'82
168.
18
133.
50
All
Com
rnod
i. ti
es (5)
118.
59,
140.
50
$
116.
11
120.
2'5
144.
89
115.
16
i 19-
03
149
85
120.
65
Sour
ce : D
irec
tora
t- o
f E
cono
mic
s an
d
Sta
~is
tics
, Meg
hal
aya.


T A
fiL
F, :
4.04
Ser
vice
Sta
tist
ics o
f V
eter
inar
y H
osp
ita
ls/~
~s~
e:~
sari
es
(in
'300
' N
os.)
Yea
r C
asns
: C
astr
atio
n A
rtif
icia
l In
nocu
lat,
oni
trea
ted
inse
min
a-
Vac
cina
tion
ti
on
(1)
(2)
(3)
(4)
(5)
1985
.86
306
2 5
21
27 1
19
6b-8
7 23
8 2 3
2
4
233
409
17
264
I+
1 987
-88
19
co
1 921
8 -8
9 42
5 16
13
28
3 19
89-9
0 52
9 17
L 3
33
1 19
90-9
1 39
4 10
13
35
9 19
9'9-
91 :-
Eas
t K
ha
si I
Till
s 16
5 4
11
86
Wes
t K
hasi
Hil
ls
8d
3 e-.
57
E
ast
Gar
o Il
iIls
69
1
... 57
W
est
Gar
o H
ills
35
1
2 11
0 Ja
intia
EIi
lls
45
1 . .
4 4
Sour
ce :
-Dir
ecto
rate
of
Ani
mal
H
usba
ndry
and
Vet
erin
ary,
M
egh
alay
a.


Population in Meghalaya,
farms Pig farms Sheep and Goat farm i -- r--.. 2 --.-_-.I C__- _-&.----- --I
Popula- Nos. Population Kos. Popuiation lion (Nos.) (Nos.) (Nos. )
(5) ( 6 ) ( 7: (8) (9!
- a n d Veterinary, Meghalaya.


TABLE: 4
.07
Pro
tluc
tion
of
Milk
, E
ggs
and
Mea
t in
Meg
hala
ya
I ter
ns
Pro
du
ctio
n
Un
it p
--- ------A
----,-
- 7
1985
-86
1988
-89
1989
-961
19
90-9
1
Mil
k:
'000
' T
onne
s N
on-D
escr
ipt
cow
s 23
G
ross
-bre
d co
ws
19
BuN
aloe
s 4
Tot
al
46
Egg
:
Lal
ch
Nos
. D
esi
537
Impr
oved
41
Tot
al
5 78


TA
BL
E : 5
.03.
Pro
grer
s of
For
estr
y S
chem
~s.
(He
cta
~e
s)
Yea
r P
~a
ilta
tio
n
Eco
nom
ic
Soc
ial
For
estr
Q
u~
cli
grow
- p
lan
tati
on
s in
g (s
peci
es)
(11
(2)
(3)
/4)
Pas
t I<
hasi
Hil
i 1
13
5 34
32
Wes
t I<
hdai
H
ills
J
1637
Ja
lnti
atia
H11
ls
100
It0
25
9:
Eaa
t Gar
o W
ills
1
I\ 5
11
25
Wcs
t G
aro
Hill
B J
'"
"
1382
Sou
rce :
Pri
ncip
al C
hitf
Con
serv
ator
of
For
est
Meg
hala
ya,
Shi
llon
g


Len
gih
of' F
ore:
t R
oads
by
Typ
e in
la
;rgh
al.r
ya
(In
kun
s.)
rota
1 R
oad
Len
gth
. . 53
3.62
8 58
1.6
q6
$. 6
10'1
76
hn'3
.255
A
. S
urfa
ced :
.. 1.
306
1.34
3 1.
749
2.02
5 Q
(i)
Bla
ck
Top
ped
.. 1'
306
1'94
9 1.
749
2.02
5 '
(ii)
C. 6
. Roa
d ...
...
.-,
. . . ...
B
. U
ilsu
r fac
ed :
... 53
2'32
2 58
0 33
7 60
8 42
7 68
1 23
0 (i
) M
ot-r
abJe
...
187
515
96.6
51
197.
741
9L.8
48
(ii)
Son
-Mot
>ra
bh
34
4.80
7 ,3
83.6
:6
410.
686
$81.
382
, -
Sour
ce :
--P
finc
i a1
Chi
ef C
onse
r vat
or o
f Fon s
t,
Meg
haE
aya,
\ Sh
illon
g.


TA
BL
E : 6'
02
Fis
h S
eed
Far
ms,
pr
odll
ctio
n o
f S
psw
n a
nd
Fry
an
d
Fin
gerl
ings
in
M
egha
laya
S1.
Par
ticu
lars
U
nit
19
85-8
6 19
8!-9
0 19
90-9
1 N
o.
(1)
(21
(3)
(4)
(5)
(6'
1.
Fish
-see
d F
arm
N
o8
9 12
14
2.
Nur
seri
e* A
rea
Hec
ts.
4.8
3.1
3.2
3. R
her
lan
d L
ake
Nec
ts
357.
4 35
7.4
375.
3 4:
To
thl
wat
er a
rea
for
Aec
ts.
22.3
14
.3
11.9
co
mpo
site
Fis
h fa
rmin
g.
5. S
paw
n pr
odll
ced
Mil
lion
s 1.
0 1.
6 1.
2 6,
F
rv a
nd
Fin
gerl
ings
M
illi
ons
0.4
0.4
0.4
prod
uced
. 7.
Inland
Fis
h pr
odu-
'0
00'
0.7
1 .0
1.3
ctio
n b
oth
cap
tu~
e T
on
nes
an
d c
ultu
re K
sher
ies
Sou
rce
:--D
irec
tora
te
of F
ishe
ries
M
egha
laya
.


11
f P
7. S
eric
ultu
re
TA
BL
E 7.01
Num
ber
of
Cer
icul
tura
l fa
rms,
F
ri-s
cad
Gra
inag
es a
nd S
ilk
Ree
lirig
un
its
in
Meg
hala
ya.
Par
ticu
lars
19
85-8
6 !9
07-8
8 19
88-0
9 19
89-9
0 19
CO
-91
1991
-92
Seri
cult
ural
farm
s (a)
Nos
8
8 9
6.(
6 6
r
(b) A
rea
(H~
ct
.) 37
m
41
71
77
N
.A.
N.A
. vl
sri-
seed
Gra
'nag
es
(a)
Nos
4
4 5
N.A
( h '
6 (b)
Are
a (I
-Iec
t.)
13
14
30
N.A
. N
.A.
N,A
. Silk R
eelin
g U
nits
(a
) N
os
7 6
6 N
.A.
N.A
. N
.A.'
(b)
Qua
ntit
y of
2
!I
550
727
N.A
. N
.A.
N.A
. ra
w
silk
pr
oduc
(k
g)
- N
. &=
No
t av
aila
ble.
Sour
ce :
-Dir
ecto
rate
of
Ser
icul
ture
and
Wen
vin
~, M
egha
laya
.


TA
BL
E
7.03
W
eavi
ng T
rain
ing
Cen
tres
and
T
rain
ers
in
Meg
hala
ya.
Yea
rslD
istr
ict
M'e
avin
g T
rain
ing
Wea
vers
Ext
ensi
on
Serv
ice
un t
s ,-.-
.--
A----7
'------A
- - -7
Cen
tres
T
rain
ees
Han
dloo
m
Han
dloo
m
Dem
onst
ra-
Pre
duct
ion
tlon
acu
m-
Cen
tres
. pr
oduc
tion
C
entr
es.
(1)
(2)
(3)
(4)
(5)
1987
-88
9 99
9
11
0
1988
-89
9 16
0 13
11
V
1989
-90
9 N
.A.
13 -
Y.A
. 19
90-9
1 9
N.A
. 24
10
19
91-9
2 f
N.A
. 24
1
0
Jain
tia
Hil
ls
N.A
. 1
1 E
ast
Kha
ai
EIi
lls
1 N
,A.
6 1
Wes
t K
hasi
HiU
s 2
N.A
. 2
... E
ast
Gar
o H
ills
2 N
.A.
3 3
Wes
t G
aro
Hil
ls
3 N .A
. 12
5
Sour
ce:-
Dir
ecto
rate
of
Se
ricu
ltur
e an
d W
eavi
ng,
Mtg
hal
aya,


TA
BL
E :
8,0
2
Gen
erat
ion
of
Ele
ctri
city
Yea
r G
enei
atio
n (M
KW
H)
Sour
ce : M
egha
!aya
Sta
te E
lect
rici
ty B
oard
.


I NUMBER OF
1 I VILLAGES ELECTRIFIED
IN '00 NUMBERS I 2 4


TA
BL
E:
9.01
-(C
ontd
.)
(1
(2)
13)
1x1,
Ow
n A
ccou
nt E
nter
pris
es ;
ii)
Tot
al
1502
5 79
48
11.
Est
abli
shm
ents
:
(a)
Tot
al
1723
0 97
70
(b)
Hir
ed w
orke
rs :
(i)
Tot
al
4923
2 65
413
(ii)
Mal
e 38
283
5166
3 (i
ii)
Fem
ale
1091
9 13
750
I v.
pr
inci
pal
Cha
ract
eris
tics
o
f al
l E
nter
pris
es :
(i)
Ope
rati
ng w
itho
ut
6102
25
99
prem
ises
, (i
i) p
eren
nia
l 30
623
1754
2 (i
ii)
Ow
ned
by P
riva
te
2595
2 16
180
(iv)
Wor
king
wit
hout
Pow
er
2598
9 14
330
-*'*
'goY
~;ce
:&
F~o
nor
nic
Cen
sus,
M
rgh
alay
a,
1990
.


TA
BL
E :
9.03
N
umbe
r of
Reg
iste
red
Fac
tori
es i
n M
:gha
laya
Yea
rlD
irtr
ict
(1)
1985
19
86
1987
19
08
1989
19
90
1991
19
91 :-
Jnin
tia
Hil
ls
E?s
t Kha
si I
Till
s W
est
Kha
si H
ills
East K
hasi
Hil
ls
Wes
t s-
iaro
Hill
s
Em
ploy
ees
(3)
3574
30
68
3068
S~
urc
e :- C
hief
Ins
pect
or o
f B
oil
~rs
and
F~ctrlit~ b , (
f; Ih
! a
.


TA
BL
E : 9
.05
Smal
l Sc
ale
Indu
stri
es b
y T
ype,
199
1-92
.
No.
of
Inve
stm
ent
No.
of
unit
s in
Pla
nt a
nd p
erso
na
Mac
hine
ry*
empl
o -
(Rs.
in
lakh
j)
yed
1. M
otor
Rep
airi
ng, S
ervi
cing
etc
. <
114
65.3
0 84
6 2.
Woo
deli
Furn
iture
4
...
179
28.9
1 93
2
3. L
eath
er b
ased
Ind
ustr
ies *
...
I8
1.66
90
4. B
aker
y-
... - .
... 16
6 59
.02
87 1
5. F
lour
and
Ric
e M
ills .<
...
164
92.8
3 77
4
6.
Tai
lori
ng ".
.. ...
.. 16
8 14
.19
85 7
7. P
rint
ing
Pres
s .. .
34
67
.94
317


TA
BL
E : 9.
05
Ann
ual S
urve
y - of I
ndus
trie
s (S
umm
ary
~es
ult
s) in M
egha
bya
S1.
Item
s un
it
1985
-86
1986
.87
1987
-85
:488
-89
d N
o.
(2)
(3)
(4)
(5)
(6)
(7)
1. R
epor
ting
F
acto
- Nos.
34
26
30
28
Co
rres
. -4
2. F
ired
Cap
ital
li
s. i
n la
khs
1309
15
2 12
24
239
3. W
orki
ng P
apit
a1
-do-
181
133
61
164
4. I
nves
ted
Cap
ital
-
do-
1815
28
3 17
94
388
5. O
lltst
andi
ng
--d
o--
111;
97
12
69
20
Loa
ns.
6. T
otal
War
kers
Nos
1498
75
6 14
+8
1355


Num
ber
of I
ndus
tria
l Esl
ates
in
3 M
egha
laya
I I
S1.
k'ar
tiaal
ars
bh
lllo
ng
Mcn
dipa
thar
T
ura
I N
o.
p --
.---
A
---
,-4
-L
-7
p-A--,
1989
-90
1990
-91 198%90
1990
- 19
89-
1@0c
- $1
SO
91
1 I I
(1)
(2)
13)
(41
(5)
(6)
(71
(8)
I
Co W
I
1 No.
of S
heds
b...
44
44
1i
1j
I
2 N
o. o
f Sh
eds
eccu
pie
d
4
4 3
3 ...
.- I
3 N
o. of F
actp
ry
Shed
s 4
4 3
3 ...
..!.y F
un
ctio
nin
g
-a,
, our
ce :- C
it e
ctcr
atc
of I
ndus
trie
s,
Meg
hal
aya.

TA
BL
E:
9.08
Prod
uctir
sn o
f C
emen
t fr
om
Maw
mlu
h C
hear
a C
emen
t,
Ltd
.
Yea
r P
rodu
ci io
n ('
000
M.
r.)
Em
pley
men
t (N
es.)
(31
696
766
1990
...
... ...
d28
64)
1991
...
...
... 12
4 637
Sour
ce :
-~a
wm
luh
C
herr
a C
emen
t &
td.
Meg
baIa
ya

TABLE :
9.09
Indu
stry
-w:s
e, K
hadi
an
d V
illag
e In
dust
rial
U
nits
In
Meg
hala
ya
Typ
e of
Ind
us-
. 1989-BO
1990-91
try
c A
m---+
, ,---.-A
--
----
N
o, o
f T
otal
V
alue
of
NO
. of
Tot
al
Value
Uni
ts
Em
ploy
- pr
oduc
. U
nits
E
mpl
oy-
ofp
ro-'
m
ent
tion
m
cnt
duct
ion
Rs.
in
Rs.
in
lakh
s la
khr
(1 1
(2)
(3)
4 (5
) (6)
(7)
03
Cn
I. G
anea
ndB
amq 386
447
18.00
446
518
75.9
4 bo
o
2. C
arpe
ntry
an
d 953
1394
125.08
1152
1566
177.05
Bla
cksm
ithy.
3.P
ott
cry
..
e5Q
1470
51
.53
269
1511
56
.56
4, P
roca
ring
of
64
0 13
25
107.37
741
14.87
117.4:
Lkr
eala
and
Pulse
a,

TA
BL
E: 9.09'
(Qon
td)
(1)
(2)
(3)
(4)
(5)
(6)
(7)
5.
Lim
e Industry
14.4
745
86.93
117
843
95.7
0
6. h
e Keeping
175
1843
22.09
185
2022
a5
.99
7. v
illa
ge O
il 44
13
0 4.
00
4 9
136
4.20
8. Fi
bre Industry 74
50
4.20
84
6@
5.64
9. L
ather
51
119
13.68
57
128
14.19
14.
Soa
p 3
.. ...
3
3 8.
36
a
12.
Tailoring
98
120
7.20
166
188
16.2
0
13.
Serv
ice
3
15
... 13
36
. . Total
2843
7688
440.80
3312
8522 341.84

lo.
JOIN
T
ST
OC
K C
0MP
.iN
IES
TABLE : 1
0.01
G
row
th o
f Joi
nt
Stoc
k C
ompa
nies
in
Meg
hela
ya
Com
pani
es a
t w
ork
as o
n 3
1st
Mar
ch
Yea
s/D
isf s
ict
--Jc-
- --
--
- -7
IS
Pub
lic
Pri
vate
ro
ta1
(11
(2)
(31
j4)
1988
30
90
12
0 19
89
30
102
132
1990
33
11
4 147
1991
34
12
0 8 5
4 19
92
34
124
158
1992
:-
Eas
t K
hasi
Hil
ls
31
119
15V
Wes
t K
has.i
Hill
s ...
1
1 Ja
itlt
ia H
llls
1
...
I E
ast
Gar
u H
iiL
...
3
3 W
est
Gar
o H
ills
, 2
1 3
- ..-
Sru
rce:
-Rgi
stra
r of
Com
pani
es,
Gov
r r,
mer
it of
Ind
ia.
Skill
ong

Rrg
istr
atio
n of
Joi
nt S
tock
Com
pani
es in
~
eg
ha
lay
a
No.
of'
Com
pani
es r
egis
tere
d A
utho
rise
d C
apit
al
duri
ng t
he y
ear
(3s.
in
lak
hs)
r-
.i ---.,-
r--.-
-A
- ---
-- - 7
Y
ear
Pub
lic
Pri
vate
T
otal
P
ubli
c T
riva
te
'P'.t
al
(1)
(21
(3)
(4)
(5)
(6)
(71
03
: 988
-89
aJ
1
14
15
100.
00
243.
00
342'
00
1989
-90
1 15
16
10
-CO
24
6.00
25
6.00
1990
-91
1 6
7 N
il
75'0
0 75
'00
1991
-92
Nil
4
4
Nil
14
0.00
14
3.00
-w
Sour
ce :-
Reg
istr
ar of o
f C
ompa
tlie
s, G
over
nmen
t of
In
dia
, Sh
illo
ng

Years
(,!I
1983
1984
1985
19
86
1987
1988
1989
19
90
I991
Tre
nd in
Min
eral
P
rodu
ctio
n
(In
'000
Ton
nes)
Coa
l L
in,r
ston
e Si
llirn
anit
e C
lay
(2)
(3)
(4.)
(5)
713
188
4-7
... 94
9 21
1 4.
0 ...
1265
23
6 4.
8 0
*2
1507
24
9 3.
5 0.
2 14
48
244
3.9
1.2
1807
23
7 3.
9 ...
2252
22
7 4.
2 ...
3747
27
3 3-
I . . .
3464
23
5 1.
6 ..
*
Sour
ce :-
Dir
ecto
rate
of
Min
eral
Res
ourc
es,
lLle
ghal
aya


12.
CO
-OP
ER
AT
ION
TA
BL
E : 1
2.81
G
row
th o
f C
o.op
crat
ive
Soci
etie
s
Yea
r So
ciet
ies
Mem
ber-
Sh
ara
Work
ing
(NO
S.)
sh
ip
Cap
ital
C
apit
al
(In
'000
l R
s. in
(R
r. in
N
os.)
la
khsi
la
khs)
(1
) (2
) (3
) (4
(5
) /
118-
81
688
78
366'
57
1701
1*89
19
94-8
5 . , •
620
95
419.
96
2451
.58
1985
.86
,.,a
646
111
512.
45
5183
'92
1986
-87
a -.
661
116
547.
14
44
93
~
1987
-81
a*.
678
117
4618
'50
4242
'69
1988
-&9
... 6%
111
714'
72
1541
.61
1999
-90
... 70
8 12
6 19
6&51
88
19'6
4 19
90-9
1 .a
a
723
140
1998'75
11653'70
___1__1
Sour
ce :-
Reg
istr
ar o
f C
o-op
erat
ive
So~
ieti
gs, M
egha
laya
, Sh
illon
g.

TA
BL
E :
12-0
2 N
umbe
r of
Co-
oper
ativ
e S
ocie
ties
by
Typ
e
1989-90
1998
-91
r---A
--$
S].
Nam
e ef
So
cica
ies
No.
of
M
em-
No.
of
Men
%-
NO
. 5o
eig.
ba
rshi
p S
ocie
- be
pshi
p tie
s tl
es
(11
(41
(3)
(4)
(8)
($1
1 T
he W
gh
alay
a C
o-op
erat
ive
1 46
9 1
475
Ape
x Bank
Ltd
. 2
Th
e M
egha
laya
S
tate
C
o-
1
178
'1
387
oper
atio
n M
arke
ting
an
d C
onsu
mer
's F
eder
atio
n.
3
Th
e M
egha
laya
S
tate
130
11-
1
3 1
1 3 1
si
ng F
inan
cing
Go-
oper
at~
ve
Sec
ieti
es.
4 P
rim
ary
Agr
icul
tura
l C
redi
t 18
0 7B
054
180
04
95
So
ciet
y.
5 ai
rnar
y M
arke
ting
(in
clud
ing
37
785
33
470
Sub-Areas
Mar
keti
ng
Co-
op
erat
ive
Soei
etie
s.)

TA
BL
E : 1
2'02
-(C
en
td.)
(1
(2)
(3)
(4)
6 (a
) W
hole
sale
~o
nsu
der
's Co-
1
168
oper
ativ
e B
tor e
. (b
) Pri
mar
y C
onsu
mer
s Co
rn
48
7553
op
erat
ive
Stor
e.
7 In
dust
rial
,
... 10
8 27
57
8 W
eave
rs G
o-op
erat
ive
.. 40
25
95
9 C
O-o
pera
tive
Urb
an Bank
...
3 54
46
16
Far
min
g C
o-op
erat
ive
Soci
etie
s 46
20
73
11
Milk
Pro
duce
rs C
o-op
erat
ive
47
3515
So
ciet
ies.
12
F
iahe
rits
Co-
oper
aliv
e qo
cie-
47
19
15
ties
. 13
Housing
GO
-ope
rati
ve S
ocie
- 36
27
08
tien.
14
T
hrifi
C
o-op
erat
ile
Soc
ieti
es
44
12938

TABLE, 12
-(32
-(C
ontd
.)
15
Pri
mar
y L
abou
r C
entr
act
Go-
oper
ativ
e So
ciet
ies.
16
Pi
pger
y an
d P
oult
ry
Co-
op
erat
ive
Soci
etie
s.
17
Gin
ning
and
Pro
cess
ing
Ca-
~
per
atix
e Sac
itti
es.
18
Pin
e A
pple
Co-
c pe
rati
ve S
o-
ciet
ies.
19
M
ulti
purp
ose
Co-
eper
ativ
a So
ciet
ies.
20
Co-
oper
ativ
e C
ante
ens
...
2 1
Oth
ers ...
... 22
C
o-op
erat
ive
Ban
ks
30Q
23
95
Nil
T
otal
..
708
1260
06
723
1401
36

TABLE : 12.04
'" %
St
atis
tics
rel
atin
g th
e P
rim
ary
Agr
icul
tura
l C
redi
t ~
~~
i~
ti
~~
in
M
egha
laya
,
Itcm
s U
nit
1989
-90
"
199a
gi
(1)
(2)
(3)
(4)
1. Se
ciet
ies
Nos
. 2.
T
otal
M
embe
rs
130
180
$3
79.8
54
3 P
aid
up
Sha
re e
apit
al
Rs, in
lak
hs
122.
77
88,4
95
l'35.
14
4.
Dep
osit
s YY
29
.09
61.8
3 co
5.
Wor
king
Cap
ital
,Y
2068
.79
1002
.88
CJI
6.
Lea
n is
sued
dur
ing
the
year
(a
) Sh
ort
Ter
m
9 s
298.
22
131.
74
(b)
Med
ium
Ter
m
SY
8
3.3
1
4.41
7.
L
oan
Out
stan
ding
99
5.00
66
4.46
8.
Sa
les
Tur
n O
ver
Du
rin
g th
e "
T&
dr.
(a)
Agr
ieu
l~u
ral P
rodu
ce
,, 4-
70
5.44
(b
) C
onsu
mer
s G
oods
3.
73.1
1 18
6.14
(e
) O
ther
s ,,
2.
61
3.35
Sour
ce : .-
Reg
istr
ar o
f C
O-o
pera
tive
Sat
ieti
es,
Meg
hala
ya.

TA
BL
E : 1
2,114
St
atis
rim
rel
atin
g to
Cot
lsum
er~
Co
-op
e~er
ti~
e in
Meg
hala
ya.
Item
s U
nit
Who
lcsa
lg S
tore
s P
rim
ary
~o
mu
me
ra
#----A
-7
,---
A.
-- 7
' 19
89-9
0 19
90-9
1 19
89-9
J 19
90-9
1
1 (1
) (2
) (3
) (4
1 (5
) (6
) 2-
Num
ber o
f S
t,.r
es
Nos
. 1
1
4.9
- 53
T
otal
Mcm
bers
s
p
168
- 168
95
53
7743
. P
aid
up
Sha
rrt
(aj
Tot
al
Rs.
in
18.5
1 18
.91
122.
11
132.
81
lakh
s (b
) O
f W
hich
,,
18.1
3 18
.53
'24.
14
26.7
4 G
ovt
4. W
orki
ng C
apit
al
, 27
.78
26.1
7 81
6.54
86
0.92
5.
Sa
les
(a)
'Tot
al S
ales
,,
28.8
5 30
.30
143,
57
136.
71
(b) S
ales
of
Con
- ,,
1.97
1.
79
73.9
9 '1
7.05
tr
olle
d C
om-
mod
itie
s.
6. P
rofi
t E
arne
u ,,
Nil
i\i. A
- 12
.48
17.3
8 '7.
L
oss
Susr
alne
d ,,
1.32
N. A
. V
61 '
7'16
:.L
UI(
L
:-
1.fg
lbtr
dl ~
f C
~r
ti
~~
~~
ti
~~
so
cltt
ies,
M
egL
alay
a.

I
TA
BL
E : 1
2.05
Stat
isti
cs r
elat
ing
to M
egha
laya
CO-o
pera
tive
Ap
ex B
ank
as o
n
30th
JJn
e.
Item
s U
nit
1989
19
90
1991
(11
(2)
(3)
(4)
(5)
1. N
umbe
r of
Ban
ks
No.
1
1 1
2.
Mem
bers
hip
470
470
470
3.
Paid
up
Shar
e R
s. &
lakh
s 14
4.09
16
1.17
17
1.77
C
apit
al.
4. W
orki
ng C
apit
al
J-
4454
.15
5518
.27
6528
.16
3
5. D
epos
its
9,
3096
.22
4803
.61
5834
.05
6.
Bor
row
ing
From
:-
(a)
Gov
ernm
ent
,, 63
.93
64.6
2 62
.85
(b)
NA
BA
RD
l .,
67.7
5 10
9.02
28
1.66
R
eser
ve B
ank.
7.
Loa
ns a
nd A
dvan
- J
J 14
72.6
9 17
61.2
0 20
12.4
7 ce
s.
8. I
nves
tmen
ts
7~
91
2.97
11
42.9
7 12
31.9
7 9.
N
et L
oss
y7
...
..* ...
10.
Net
Pro
fit
8. 7.
26
5.73
9.
52
-. S
Q~
~C
Q
:--M
egha
laya
C
boga
ativ
e A
pex Ba
nk Lt4.

98
TABLE : 12,06
Nun~ber Structure
of Sccieties, Membership and Capital of the Me&alaya State Cooperative and Consumers Federation LTD.
S1. Parti-- Unit 1985-86 1989-90 159R-91 1921-92 Nos. cuiars
1. Societies Nos. 1 1 1 1
2. Memhar- Nos. 187 172 177 !87 ship
3. Pzid up Rs. m ~ L C . ~ Q 251.97 534.60 547.16 Share capital lakhs
4, Other Borro- " 392.62 . . . . . . . ." wings

-2 99
TABLE: 12.06 (contd)
(a) Advanced ,, N. A. 548.53 315.51 358.23
(b) Outstan- ,, 4.45 71.84 73.60 38.27 ding
(c) Overdue ,, N. A. 99.72 146.95 173.46
6. Retail Out- Nos N.2. 17 17 17 lets I
7. Total values Rs. in N.A. 446.76 30S.56 470.33 of Sales lakhs
(a) Agriculture ,, 88.06 59.10 72.02 160.41 Produce
.. (b' Agriculture ,, 181.34 204.23 187.36 236.71 requisite
( c ) Consumer ,, 109.47 183.43 44.18 '73.21 goods.
Sourc e :- Maghalaya State C o o P ~ e v e Marketilbg, and Consumers de-
ration Ltd., Shillong -' +.=


TA
BL
E : 1
3.02
Roa
d M
ileag
e by
C
lass
of
Roads.
Yea
r M
atie
nal
Sta
te
Maj
or D
is-
Oth
er D
ib-
Tot
al
Hig
hway
H
ighw
ay
tric
t R
oads
tr
ict
Roa
ds
(1)
(2)
(3)
(4)
(5)
(6
364
N.A
. N
.A.
3460
36
4 N
.A.
N.A
. 35
11
364
N.A
. N
.A.
3651
36
4 N
.A.
N..4
. 37
49
N.A
. N
.A.
N.A;
N
.A.
461
917
1057
27
04
460
917
1072
27
70
460
917
1072
29
50
N.A
. N
.A.
N.A
. N
.A.
N.A
. N
.A.
N.A
. N
.A.
462
93
1
1058
32
33
A.
:-N
ot
Ava
ilabl
e.
Sour
ce:
P. W
. D, (R
and
.^), M
egha
l'aya
.
5399
M
.A.
N. A
. 56
87

14.
TR
AN
SPO
RT
AND C
OM
MU
NIC
AT
ION
TABLE : 14.01
Num
ber
of
Reg
iste
red
Veh
icle
s
/ T
ype
'of
Veh
icle
s 1987
-88
1988
-89
1989-90
Tru
cks
5751
6358
6913
B
uses
1246
1867
1443
T
hree
Whe
eler
s 6
14
18
Cars
3870
4325
4829
Jeep
s 4702
5213
'650
T
wo
Whe
eler
s 535
1 61
29
7126
T
ract
ors
313
336
3 59
Tra
ilers
151
6 1648
1750
Tax
ls
1266
1412
1556
O~h
ers
230
259
264
Tot
al
24251
27061
2395
8
Sour
ce :-
-Com
mis
sion
er o
f T
rans
port
, M
egha
l

Dis
tric
t-w
ise-
Num
ber of R
egis
tere
d V
ehic
lesa
s on
3 1
st M
arch
, 19
90.
Typ
e of
Veh
icle
s Ja
inti
a E
ast
Wes
t E
ast
Wes
t T
otal
H
ills
K
hasi
Kh
asi
Gar
o
Gar
o M
egha
- H
ills
E
Iillu
H
ills
H
ills
la
ya
Truck-
Gov
ernm
ent
16
247
1 3
68
358
Pri
vate
17
36
4101
16
7 18
8 '3
86
6578
c
Bus
es-
Gov
ernm
ent
1 59
...
2 5
67
;T.
Pri
vate
12
4 98
8 37
17
21
0 13
76
Thr
ee-
Gov
ernm
ent
.. .
. . . . .
...
... W
rhee
l~r
Pri
vah
18
- a 14
...
4 .
Car
- G
over
nmen
t 8
612
2 4
18
644
Pri
vate
24
3 36
55
22
71
194
f 41
85
Jeep
--
Gov
ernm
ent
55
1391
29
28
16
7 .
1671
P
riva
te
416
3005
63
10
6 38
4 39
79

(1)
(21
(3)
(41
(5)
(6)
(7)
Tw
o-
Gov
ernm
ent
9
186
2 7
204
Whe
eler
P
riva
te
143
5207
32
52
1 10
19
6922
'Tra
ctor
G
over
nmen
t 13
49
4
4 65
13
5 P
riva
te
17
175
14
3 15
22
4
Tra
iler
Gov
ernm
ent
21
196
8 8
63
296
Pri
vate
75
12
67
18
10
84
1454
i:
Tax
is
Gov
ernm
ent
... ,..
... P
riva
te
178
13di
. 18
3
49
1556
Oth
ers
Gov
ernm
ent
2 58
..,
3 39
10
2 P
riva
te
13
91
2 8
48
162
-
Gra
nd
Gov
ernm
ent
126
2798
46
5
2
432
3454
T
otal
P
riva
te
2945
19
811
378
931
2389
264
54
- ,. " a
Sour
ce :- C
omm
issi
oner
of
Tra
nspo
rt,
Meg
hala
ya.

TABLE: 1
4.03
Pro
gre:
~ of
M
egha
laya
Road
Tra
nspo
rt C
orpo
rati
on
Yea
r F
leet
Str
epgt
h R
oute
a C
ove~
~ed
Passengers
(Nos
.)
,-----A=---
(Ave
rag
e N
os.
Km
s.
dai
ly)
Sour
ce :-
Mqg
hala
ya
Tra
nspo
rt
Cor
pora
tion
.


TA
BL
E : 14.05
Roa
d A
ccid
ents
ar
d N
umbe
r of
P
erso
ns K
illed
and
In
jure
d in
Meg
hala
ya
Yea
r A
ccid
ents
P
erbo
ns K
ille
d Pe
rson
s In
jure
d
( 1)
(2)
(3)
(4)
1991
55
0 12
9 58
9
Saur
ce;-
Spec
ial
Supe
rint
ende
nt
of
Pol
ice,
C
rg.]D
. M
~gbs
rLya
~ SSki
lloag
.

FABE
E !
14.8
6 St
atis
tics
of
Poat
O
ffic
es
in
~eg
ha
la3
a
(In
Num
bers
) It
ems
1589
-90
1990
-91
19&
92
(1)
(2)
(3)
(4)
Gen
eral
Pos
t Office
1 1
1 H
ead
Post
Off
ice
1 1
1 Su
b-P
ost Office
60
60
60
- B
ranc
h Po
st
ffic
~
3 94
393
399
o
(O
Post
O
ffic
e w
ith
Savi
ng
456
455
461
Ban
k F
acili
ties
. Letter Boxes
1432
14
34
1439
T
eleg
raph
Cff
ice
44
43
N.A.
Tel
epho
ne F
xch
ange
5
5 N
. A.
Pub
lic C
all
Off
ice
75
75
74
N.A
.-Not
A
vaila
ble.
So
urce
:-Se
nior
Sup
erin
tend
ent
of
Post
Offi
ce,
Meg
hala
ya D
ivis
ion.

Dis
tric
t-w
ise
Stat
isti
cs o
f P
ost
Ofi
ces
1991
-9
Item
s E
ast
Wes
t Ja
inti
e E
ast
Wes
t K
hasi
~
ha
si
Kill
s G
aro
Gar
o H
ills
FIill
s H
ills
H
ills
w
1 -
- -
0
Gen
eral
Po
st, O
ffic
e H
ead
Pos
t €I
ffic
e -
-
-
1 S
ub-P
o st
Off
ice
9 7
3 \
4 7
9 B
ranc
h P
ost
Off
iee
126
77
69
63
70
Post
Ofl
ice
wit
h Sa
ving
15
8 80
73
70
80
R
ank
Fac
iliti
es
Pub
lic G
all Office
29
4 13
sora
rcc 8
Sa
rpes
i~te
adee
t sf P
~eb O
6coa
Meg
hkra
laya
Divi
eiee
ao

TABLE 14.08
Num
ber
of
Tel
epho
ne C
onne
ctio
ns
in
Meg
hala
ya
(In
N
umbe
rs)
Nam
e of
Cen
tres
19
85-8
6 19
89.9
3 1990-91
No.
(1
) (2
) (3
) (4)
(5)
1 A
mpa
ti
-
- 15
2
Bag
hmal
a 29
33
29
3
Brr
rapa
ni
57
73
4
Rar
enga
para
88
.2"7" 16
17
5
Byr
niti
at
3 1
43 '
6 G
herr
apun
jee
25
31
5 0
-
7 D
od
e~
!~~
iri
- 18
8 D
awhi
1G
10
10
9 G
arob
adha
14
13
15
10
Jow
ai
193
278
258
11
Ilh
lieh
riat
-
39
58
12
K
yrde
mku
lai
-
21
2 1
13
Mai
rang
1
8
2 1
2 1

TA
BL
E 1
4-08
(con
td.)
14 M
awky
iwat
13
16
16
15
Mah
endr
agan
j -
13
24
16 M
awng
ap
-
33
55
17
Men
dipa
thar
28
18
Nan
galb
ibra
25
25
18
19
18
19
Non
gpoh
2 1
20
Nor
~gst
ol~
25
27
X 87
10
7 21
Phu
lbar
i 25
34
22
Ron
g~en
g -
-
23 R
ongr
am
22
17
24 S
hillo
ng
16
18
5697
25
Tur
a 49
57
4953
37
5 26
um
snin
g 52
7 63
5 2J
27
Will
iam
naga
r 24
30
8
1 28
um
rang
ehu
47
12
4 13
6 5
1 -
Sour
ce :-
Tel
com
his
tric
t M
anag
er, M
egha
laya
Div
isio
n,
Shill
ong .

TA
BL
E 1
4.09
New
s Pa
pers
and
Per
iadi
cals
in M
egha
laya
.
(In
Num
bers
)
Dai
ly
1
1 1
Tri
-Wee
Lly
. . .
.,
. . .
Bi-
Wee
kly
3 8
8 W
eekl
y 34
3 1
$5
For
th-N
ight
ly
I 1
1 M
onth
ly
2)
t 6
Bi-
Mon
thly
...
. .
... .. .
Tot
al
60
44
46
Sour
ce -D
i:ect
orat
e of
Inf
orm
atio
n an
d P
ublic
R
elat
ions
M
egha
hyn.

TABLE : 14
.1 0
New
spap
ers
and
Per
iodi
oals
in M
egha
laya
, 19
811-
89.
Item
s E
nglis
h K
hasi
G
aro
All
Typ
es
Dai
ly
Tri
-Wee
kly
Bi-
Wee
kly
Wee
kly
Fort
h N
ight
ly
Mon
thly
B
i -Mon
thly
Tot
al
6 34
6
46
Sour
ce :-
Dir
ecto
rate
of
Info
rmat
ion
and
Publ
ic
Rel
atio
ns,
Meg
hala
ya.

15.
LA
BO
UR
A
ND
E
MP
LO
YM
EN
T
TABLE : 15.01
Tre
nd i
n Public and
Pri
vate
Sec
tor
Em
ploy
men
t
(In
Num
bers
)
Sect
ors
1985-86
1589-90
1950
-91
1991
-92
- (1)
(2
) (3
) (4
) (5)
01
H
PU
BL
IC S
EC
TO
R
Cen
tral
Gov
ernm
ent
11487
12504
12532
12714
Stat
e G
over
nmen
t 27699
32414
'33758
33417
Stat
e Quasi
Gov
ernm
ent
6755
7856
795
98074

TA
BL
E : 1
5.61
(c
o~
td.)
Tot
al
5304
0 62
089
6419
4 64
991
E
e,
PR
IVA
TE
SE
CT
OR
Lar
ger
Btr
bli8
hmen
t 35
46
3217
31
19
3417
Sm
alle
r E
stab
lishm
ent
1875
13
58
1408
14
18
Tot
al
4621
45
67
4527
48
35
Source :-
Dir
ecto
rate
of E
mpl
oym
ent a
nd C
raft
smen
t Tra
hin
g,
Meg
hala
ya.
fl,
I " .
i&

Tren
d in
P
UB
LIC
& P
RIV
ATE
SE
CTO
R E
MP
LOY
ME
NT
PU
BLI
C S
EC
TOR
PR
IVA
TE
SE
CTO
R
Cen
tral
Gov
ernm
ent
Lar
ger
E
stab
l~sh
men
t EB
Sta
te G
over
nmen
t 0 Sm
alle
r E
stab
l~sh
men
t S
tate
Qua
si-G
over
nmen
t UlD
Cen
tral
Qua
si-G
over
nmen
t a Lo
cal
Bod
ies

TA
BL
E : 1
5.02
mpl
oym
eet
by I
ndus
try
Div
isio
n as
on
31e
t Dec
embe
r.
1999
.̂. -IS
C_.-
1991
7 r--~
~-,
S1,
Ind
ust
ryD
ivi~
ion
P
ub-
hi-
T
ota
l Pu
b.
PPI.
TotZ]
No.
lic
vate
ll
c va
be
C1
pla
nt~
tion
and
Por
es-
2972
..
2972
3b
02 ...
30gg
$
try.
1,
Min
ing
and
Qua
rry-
2
)5
142
347
205
212
417
ing.
4 U
wic
itp
, G
al a
nd
7425
...
7425
77
99
. 7
7~
9
Wat
er,

TA
BL
E 15.02
(con
td.)
6 W
hole
sale
and R
etai
l 11
5 23
0 34
5 11
3 23
0 34
3 T
rade
, R
esta
uran
t a1
1d H
otel
s.
7 T
rans
port
, St
orag
e 28
30
23
2853
29
11
23
2934
G
omm
unic
atio
n.
4
8 F
inan
ce,
Insu
ranc
e 25
72
29
2501
26
19
22
2641
R
eal
Est
ate
and
Bus
ines
s.
9 C
omm
un
ity,
S
ocia
l 49
1163
34
63
4352
6 40
926
3813
447
39
and
H'e
rson
nel
Ser-
vi
ces.
10
G
rand
To
tal
... 63
731
4515
68
246
6502
5 49
33
6995
8 .
.
Source :
--D
irec
tora
te o
f .E
mpl
oym
ent
and
Cra
ftsm
en T
rain
iug,
M
egha
laya
.

TA
BL
E :
15 0
3 E
mpl
oym
ent
Pxc
hang
e St
a:i
tics
in
M
egha
laya
Num
ber
of
Reg
istr
a-
Vac
anci
es
Pla
cem
ents
N
umbe
r Y
ear
Em
ploy
men
t ti
on
Not
ifie
d on
the
Liv
e E
xcha
nge
A
* R
egis
ter
(1.;
(21
'3)
(4)
(5)
(6)
19B
(o
5 57
61
874
457
99
~3
19
81
5 62
44
1586
38
1 10
438
1982
5
6208
11
628
410
1010
1 19
83
5 5r 9
8 14
84
5c6
1088
1 19
84
5 54
37
1296
43
8 11
894
1985
5
5711
87
1 14
6 17
255
1986
7
5576
78
1
7 23
5 22
732
3 98
7 63
43
468
7 20
5 19
t~54
19
88
6131
69
3 31
1 2,
8597
19
89
7 81
81
1254
7
211
a344
1 19
93
7338
. 7
16
5'3
22
793
1991
7
8634
83
6 45
8 23
958
Sour
ce:-
Dir
ecto
rate
oi~
rnp
loy
mln
t and
Cla
ftsm
en T
rain
ing,
M
egha
la ya
.

3 -1% E m - 014 s Q I

TA
BL
E : 1
5'94
(ca
nt d
.)
(1 1
(2)
(3)
pass
ed O
ut
I.T
.I.
Tra
illee
s :
(a)
Eng
inee
ring
Tra
de
. . .
...
... (b
) N
on-E
ngin
eeri
ng T
rade
. .
... P
ost G
radu
ate
... ...
142
101
Gra
dual
e ...
...
1214
14
13
H.S
.S.C
.C./P
.U./I
nter
.
1841
22
03
Mat
ricu
late
s . . .
. 48
45
6830
Dip
lom
a H
olde
r E
ngin
eeri
ng
22
123
Tot
al ..
. ...
'778
2 10
750
Sour
ce :-
Dir
ecto
rate
of
Em
plo
~men
t and
Cra
ftsm
en T
rain
ing,
M
agha
laya
.

. . 0
..
c 9
~1
pu
t ~'$5)
ia
p~
a~
...
Y.:!.. 6..
...
.,,
~- -..
~
a-n
T.
alnl
rlsu
I ~u
;u!t
3.rg
, Ivrr
~snp
uI JO
uJ
nll
no
pua
aqe
luI
S9.S
: : il
18V
.L

TA
BL
E :
15'%
6
Occ
upat
iona
l B
reak
-up
of
.Job
See
kers
o
n t
he
Liv
e R
egis
ter
as o
n 3
1st D
ecem
ber
1)
(2)
(3)
(4)
(5)
- m
1. Professienal/Pechnical a
nd
253
445
402
398
rela
ted
wor
kers
.
2.
Adr
nini
strn
tive
, fi
xecu
tive
7
9 7
7 an
d M
anag
eria
l wor
kers
.
3. C
leri
cal
and
rel
a?ed
wor
kers
12
2 1
14
69
5
9
. Sal
es W
orke
rs . .
. .. ,..
2
a 14

TA
BL
E : 1
5.06
(eo
ntd.
)
5. S
ervi
ces
Wor
kers
...
515
421
6. F
arm
ers,
Fis
herm
en H
un-
54
ters
, Log
gars
and r
elat
ed
wor
kers
.
7. P
rodu
ctio
n and
rela
ted
64.2
76
8 w
orke
rs T
rans
port
equ
ip-
men
t op
erat
or
and
La-
bo
urer
.
8. W
erke
rs n
ot c
lass
ifie
d by
15
662
21 6
55
occu
pat
ion
.
Sour
ce :
--D
irec
tora
te o
f L
mpl
oym
cnt
and
Cra
ftsm
en T
rain
ing,
h.
legh
alzv
a.
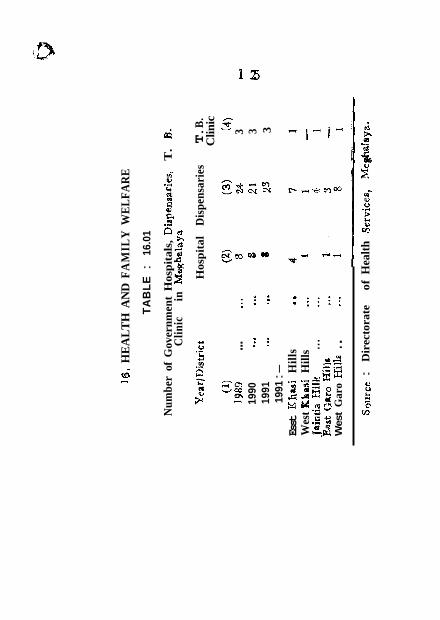
16.
HE
AL
TH
AN
D F
AM
ILY
WE
LFA
RE
TA
BL
E :
16
.01
Num
ber
of G
over
nmen
t H
osp
ital
s, D
iape
nrar
ies,
T
. B.
Clin
ic
in
Mug
hala
ya
(1)
I989
... 19
90
... 19
91
... 19
91 :-
Esst
Kha
si
Hil
ls
Wes
t K
hasi
Hill
s ...
Tai
ntia
Hilb
ka
st G
aro
Hill
e W
est
Gar
o H
illn
. .
Hos
pit
al
Dis
pens
arie
s T. B
. C
linic
(4)
3 C
o
3 w
tn
3
Sour
ce :
Dir
ecto
rate
of
Hea
lth
Ser
vice
s,
Me&
w!a
ya.

TA
BL
E :
16.0
2
Num
ber
of P
rirr
lary
Hea
lth
Cen
tres
, S
ub
.
MG
W C
entr
es e
rc.)
L
epro
cy C
olon
ies,
Lep
rosy
Con
trol
U
nkt
and
Su
rvey
and
Edu
cati
on T
ream
e
Yea
rj~i
rtri
ct P.
H.
C.
Sub-
Cen
- L
. C
. L
.0.U
. S
, E
. 'J?
trep
(h-
Cen
tres
el
ud
ing
M.C
.WJ.
(1)
(2)
(3)
(4)
t 5)
(61


TABLE :
16.0
3
Num
btr
of
Par
a M
edic
al S
taff
1991 :--
E
ast
Kba
si
Hill
a w
ear
Kha
si Hills
Jain
tia
H~
lls
Eas
t G
Rro
Hill
s W
est
Gar
o H
ills
Sour
ce :
Dir
ecto
rare
cf
Hea
lth
Serv
icca
. M
cgha
laya
.

Num
ber
and
Typ
es o
f B
eds
by D
istr
ict
1991
:-
East
Kha
si
I-lil
ls
Wes
t K
hari
Hil
ls
Jain
tia
Hil
ls
Eas
t G
aro
Hill
s W
est
Gar
0 M
ills
Gen
aral
B
cds
(2)
1117
11
17
1157
Mat
erni
- ty
bed
s
(3)
Pae
dia
tric
bed
&
(4)
T.B
. O
ther
be
ds be
ds
(5)
(6)
254
58
254
58
254
58
Tot
al
-
Sour
ce : -
Dir
ecto
rate
of
Hea
lth
Ser
vice
s, M
egh
alav
a.

TA
BL
E : 1
6.05
N
umbe
r of
P
atie
nts
Tre
ated
Yea
r/D
imtr
ict
Out
door
(1
) (2
) 19
87
1147
742
1988
12
2784
0 19
89
1443
700
1990
14
8021
2 19
91
1915
790
1991
:-
Eas
t K
hasi
H
ills
9128
65
Wes
t K
hasl
H
ills
1264
54
[ain
tia
Hill
a 16
4799
E
ast
Gar
o H
ills
30
3291
W
est
Gar
0 H
ills
39
6381
Indo
or
(3)
24.7
841
2465
94
2489
10
2485
51
3427
40
Sour
ce :-
Dir
ecto
rate
of
Hea
lth
Serv
ices
, M
exha
laya
.

TA
BL
E: 16.C6
Num
ber
Of
Fam
ily W
elfa
re O
linic
sjC
entr
es
Yea
r/ U
isir
ic t
Tot
al
Ku
rd
U~
ba
n
Oth
cc b
odie
d ,
(1 1
(2)
(3)
!a).
(5)
1989
-90
75
63
8 19
9u-9
1 75
63
8
1991
-92
7 5
63
8 1 9
9 1-9
2 :-
Eas
t K
hazl
H
~ll
s 23
19
2
Wes
t K
hasi
H
ills
8 7
1 Ja
inti
a H
ills
13
11
1
East
Gar
o H
ills
11
9 2
W
est
~aro H
ills
20
17
2
Sour
ce :-
Dir
ecto
rate
of
Hea
lth
Serv
ices
, (M
CH
and
F.W
. et
c) M
egna
laya
.

TABLE :
16.0
7 P
rogr
ess
Of
Fam
ily
WeI
rare
Se
rvic
es
Yea
r I.
U.D
, V
asec
tom
y T
ub
eeto
my
C.C
.Use
rs
Pil
ls
(i)
(2
) (3)
(4)
(51
( 6)
3980
-81
284
19
244
43 5
*
146
1981
-82
284
11
246
259
i 46
19
82-8
3 26
3 23
3 1
9 53
1 28
4 19
83-8
4 48
8 13
42
4 '15
80
367
1984
-85
532
14
4L7
31 1
4 5
33
19
65-8
6 12
60
32
51~2
3
29
.~
651
198G
-US
1487
2
455
2848
92
3
1987
-88
121'8
18
54
0 25
71
! 341
19
88-8
9 11
54
8 46
2 14
85
1282
19
89-9
0 -1
613
20
518
2343
12
03
199r
9-91
20
15
21
517
1732
11
00
1991
-92
1789
6
60 (!
1541
12
38
Sour
ce :-
Dir
ecto
rate
of
Hea
lth
Ser
vice
s,
(NC
H &
F.
W.
Etc
) M
egha
laya
.

TA
BL
E
: 16
.08
Mat
ern
al a
nd
C
hild
H
ealt
h W
dfa
re
part
icul
ars
1985
- 19
87-
1988
- 19
89-
1990
- 19
91-
86
88
89
90
91
92
1 (2
) (3
) ('4
.). (51
(6)
(7)
1. D
.P.T
. (P
re-S
choo
l 20
,325
25,
651
30,3
35 3
4,12
9 33
,894
26,
919
Chi
ldre
n)
2. D
.T.
Sch
ool G
hil-
23
,509
16;
476
24,6
26
23,9
:0
31,4
27 2
5,11
8 dr
en)
3, 'T.T. (Pre
gnan
t 17
,877
29,
919
38,7
39 3
?,07
4 39
,844
20
,518
M
othe
r)
w
4,
Iro
n a
nd
F
olic
Aci
d T
able
ts :-
(,) C
hild
ren
94,7
64
43,4
92 8
0,70
0 49
,664
55,
552
47,8
69
(b)
Mot
hers
86
,964
40,
184
47,4
62 4
7,32
9 34
,312
45,
258
5. s
up
ply
of
Vit
amin
"A
" S
olut
ion
(1-5
Yea
re)
47,2
77 5
8,73
0 68
,515
53,
494
54,1
60 5
3,00
7
Sour
ce:-
Dir
ecto
rate
of
H
ealt
h
Ser
vice
s,
(MC
H &
F.W.
etc,
) ~M
egha
laya
.

17,
EjI
UC
AT
ION
STATISTECS
TA
BL
E :
17.8
1
Per
cent
age
of L
iter
my:
19
81 ic
rrd
1991
d-
----
-A --- -, p
----A
-..--
-- D
istr
ict
Per
son
Mal
e F
emn'
e P
erso
n M
ale
Fem
ale
(1)
~2
)
(3)
(4)
(5)
(6)
(7)
Jain
tia
Hill
s ?4
'5i
24.6
3 :'4
'38
28-0
0 27
.33
28.6
8 E
ast
Kha
si H
ills
43.7
3 46
'96
40.3
0 48
'68
50.6
0 46
.60
Wes
t K
hadi
Hill
s 3
1 9
7 34
-08
29.7
5 39
.06
40.5
3 37
.52
Eas
t G
aro
Hill
s 33
'51
39-0
1 27
'66
37'0
4 42
'18
31'7
0 W
eat
Gar
o H
ills
25
'91
32.0
4 19
-55
52-0
7 36.22
27.7
1 M
eghr
laya
34
-08
37'8
9 30
.88
39.L
6 41
-72
36.4
5
Sour
ce :-
-Cen
sus
of I
ndia
, 19
81 a
nd 1
991,

I LI
TE
RA
CY
IN
ME
GH
ALA
YA
(C
ensu
s 19
91)
LII
ER
AT
E
ILL
ITE
RA
TE
-- -. H

,
TA
BL
E :
17'0
2
"roj
octe
d P
op~
alat
ien
-Sch
ool
gein
g ag
e-h
;roi
;p
as o
n 1
st
Mar
ch,
1990
(Fig
ures
in
'00
)
6- 1
1 Years
1 1 -
- 14
Yea
rs
y-r,,.-A
.----,
r-- .-
--h
------
Par
ticu
lars
P
erso
n M
alt
Fem
ale
Person
Mal
e F
emal
e +
(1)
(2)
(7)
(4)
(5)
(6)
(7)
g
Sche
dule
d C
-ate
s 8
4 4
4 -
2
2
Sche
d~ll
rd T
ribe
s 18
31
912
919
986
485
5C
l
Tot
al S
clro
ol
g, -
2272
11
32
1140
12
24
602
622
ing
Chi
ldre
n.
Seur
ee :-
S el e
cted
E
du
cati
on
al S
tati
stic
s, 1
989.
20
Min
iatr
y of
H
uman
Res
ourc
es D
evel
opm
ent,

TA
BL
E :
17.0
3
Num
ber
of E
duca
tion
al
Inst
itut
ions
in
Meg
hala
ya,
1989
-90
/
and
199
0-91
(P
rovi
sion
al)
I
Inst
itu
tim
s Y
ears
Ja
-iotia
E
asr
Wes
t E
ant
Wes
t M
egha
- )-
till
s K
hasi
Khn
si G
aro
Gar
o la
ya
Hil
ls
Hil
ls
H.11
8 H
ills
(1)
(1
(3
) (4
) (5
) (6
) (7
) i8
)
1. P
re-P
rim
ary/
19
89-9
0 91
44
5 44
1 83
18
2 12
42 ,
Pre
-Bas
ic
1990
-91
93
456
452
85
186
1272
w
a
2. P
rim
aryi
~
m1
-9u
424
10
73
919
55
; 11
64
4231
Ju
nior
Basic
1990
-91
425
1083
92
8 55
7 12
76
4273
3.
Mid
dle/
19
89-9
0 85
26
8 95
87
24
2 77
7 S
enio
r Bas
ic
1990
-91
89
278
98
YO
250
8u5
4. H
igh/
19
89-9
0 33
14
6 39
48
14
6 41
2
Hig
her
Seco
n-
1990
-91
16
159
42
52
158
4-/
9 da
ry.


TA
BL
E:
17.0
4 (e
ontd
; (1
) --
(2)
Hig
hjM
ighs
s Se
cocd
ary
Gov
ernm
ant
Prl
vate
Aid
ed a
nd
Una
ided
. L
ocal
Bod
iea
TO
TA
L
Bas
iclN
on-B
asic
Tra
i~t in
q G
ovcr
nrne
at
Scho
olr.
P
riva
te A
ided
an
d
3nai
dr-d
. B
.oca
l B
odie
s -
TO
TA
L
Tea
cher
's T
rain
ing C
olle
ge
~o
ves
nm
ent
Pri
vate
Aid
ed a
nd
Loc
al B
odie
s ...
... T
OT
AL
1
1 C
olIe
g-s
Gov
ernm
ent
3 3
Pri
rste
Aid
ed and
20
20
U
nai
ded
. ,G
I Bod
ies
- ...
- T
OT
AL
23
23
-
Sou
rce
:-D
irec
tora
te
of P
ubli
c In
stru
crio
n
Mcg
hala
y a,
Shill
ang.

TABLE : 1
1.05
N
umbe
r of
l'e
nche
rs
in
the
Ed
uca
f~an
al In
stit
utio
ns
of
Meg
hala
ya
(Pro
visi
onal
)
1969
-90
1990
-91
.----A
?--- --4-
--- -I
Inst
itut
ion
Mal
c F
erna
lr
Tot
al
Mal
e F
emal
e T
otal
(1
)
(2)
(3)
!4)
(5)
(6)
(7)
1. P
re-P
rim
aryl
Pse
- 34
8 91
2 37
4 3
1308
B
asic
2.
Pri
nlsr
y/T
unio
r 42
42
2455
67
27
4370
25
P6
(876
R
asic
3.
Mid
dleI
Sen
ior
1'14
.3 11
07
30.5
0 19
02
1149
31
31
Bas
ic
o
4.H
igh/
Wig
her
1741
14
37
3228
18
28
1513
33
41
Sec
o~ld
ary
5. R
asic
iNon
-Bas
ic
27
37
64
27
37
64
Training
Sch
ool
6, T
each
er's
T
rain
ing
8
11
10
8 11
;9
Col
lege
7.
C:o
llege
r 46
7 21
3 68
11
502
221
723
8.
Uni
vers
ity
178
26
70
4
20
3
32
235
All
Ins
titu
tion
s 09
51
6270
15
23!
9294
61
03
1569
7
------.-
-
--"_
_
_ _
- .
Sou
rce
:-D
irec
tora
te
of
Pub
lic
Inst
ruct
ions
, M
egha
laya

'TA
BLE
h :
17.0
6 N
umbe
r of
Tra
ined
an
d U
ntra
ined
'T
each
ers
in
~d
uca
tio
na
l In
stit
utio
ns
in
hle
ghal
qa
(Pro
visi
onal
)
1983
90
1990
.9 1
r----- h
,-- r-.
-A
w- --
-- - 7
rnst
itut
ions
~
~i.
ain
ed
U
ntra
ined
Tot
al T
rain
ed U
ntr
ain
ed T
otal
(1
) (2
) (3
) (4)
(5)
(6)
(7)
9 1
Pre
-Bas
ic/
90
1170
1?60
99
1209
13
08
Pre
-1)r
imar
y c-'
.p
2. P
rim
ary/
29
90
3737
67
27
3056
38
20
6876
-
Juni
or
Bas
ic
5. M
iddl
e E
nglis
h/
573
2477
90
5'1
590
2541
31
31
Seni
or B
asic
--
Sour
ce :-
Dir
ecto
rate
of
Pub
lic
Inst
ruct
ion,
M
egha
la y
n

TA
BL
E : 17
.07
Cla
ss-W
ise
Enr
olm
ent
in
Scho
ol o
f M
egha
laya
(~
rov
i~io
na
l)
Cla
ss
1989
-90
1990
-9 1
'9
r---A
---
7
Boys
Gir
ls
Tot
al
Boys
Gir
ls
Tot
al

TA
BL
E : 1
7 7
(con
td.1
('1
(2)
(3)
(4)
(5)
(6)
(7)
Sour
ce
:-D
irec
tora
te o
f P
ublic
In
stru
ctio
n,
Meg
hal
aya,

TA
BLE
: 1
7.08
(c
ontd
.)
(1)
(2)
(4)
(5)
(5)
(6)
(7)
Gra
duat
e :-
Art
s 23
01
2061
43
68
2363
21
1:
4474
I
Scie
nce
875
366
1241
88
8 37
2 12
60
I I
Com
mer
ce
461
86
547
490
92
582
Pos
t G
radu
ate :-
Art
s 41
5 28
2 69
7 46
7 31
7 78
4
Com
mer
ce
18
6 24
2
0
7
27
B.E
d.
i68
?5
6 32
4 N
.A.
N.A
. N
.A.
LL
.B.
335
122
457
N.A
. N
.A.
N.A
. J
1- --_
N.A
.-Not
A
vaila
ble.
Sour
ce :-
Dir
ecto
rate
of
Pub
lic
Inst
ruct
ion,
M
egha
laya
. ,

TA
BL
E :
17.10
"~
esu
lf of
~~*
~n
i~e
r~
ity
/~e
gr
ce
/~a
sto
r
Deg
ree
And
O
ther
E
xam
mat
ion
, 1 9
89 &
I 990.
Pre
-Uni
vprs
ity :
Art
s
.Gra
duat
e :
Art
s ,
Scie
nce '
Com
mar
ce
1989
Pgr
ccq.
1990
Per
eon-
r----A
--,
tag
8 o
f r-A
- ta
ge af
AP
P~
~-
P
asse
d Pa
ss
App
ea.
Par
sed
pass
re
d re
d

'? I
TA
BL
B :
17.1
1 6
D I
Num
ber of S
tuda
nts
in t
he
Sh
illo
ng
Fof
ytC
chic
D
urin
g -.
1989
-90
and
1990
-91
1 I P
arti
cula
rs
! 9&
9-90
19
96-9
1 ,-,
----,-
--A--
-A
"---- --
3 b
oys
Gir
ls
Tot
al
boys
G
irls
T
otal
(1)
(2)
(3)
i4)
(5)
(6)
(7)
Civ
il E
ngin
ee-
114
14
128
130
27
157
ring
.
E?i
;;ric
al
En-
6
5
7 72
83
. Y8
10
1 5
gmee
rmg.
<
~ec
ha
nic
al
69
6 75
85
3 88
Eng
inee
ring
. I
L

WA
BLb :
17.1
2 R
eaul
t~' o
f th
e ' Sh
ftlo
ng p
olyt
echn
ic
Yca
r P
arti
cala
rs
- A
ppea
red
Pas
sed
,---,A
---
Y-&
----
Boy
r G
irls
Tet
al Boys
Gir
ls T
otal
(11
(2)
(3)
(4, '
(5)
(6)
(7) '
(8)
Civ
il E
ngin
eeri
ng
98
21 : 1
1 9
40
6 46
1989
-96
Ele
ctri
crI
En
~in
ee
ri~
g
29
3
32
22
Nil
bC
r
U1
Mee
hanl
cal
En-
32
N
ilc
32
1
1
Nil
11
* gi
ncer
ing.
C
ivil
Em
gins
trin
g 11
8 20
138
38
7
45
19g0
.91
Elec
trica
l Eng
inee
ring
65
14
79
25
3 28
,
Mec
hani
cal
En-
55
N
il 55
1
0
Nil
10
gi
neor
ing.
Sour
ce :
-Pri
noip
d,
Shill
ong
Pol
ytec
hnic
! L
b
i

TA
BL
E :
17.1
3
Enr
olm
ent
and
Num
ber
of A
dult
E
duca
tion
Cen
treg
in
Meg
hala
ya
Yea
rlD
istr
icts
C
entr
es
Enr
olm
ent
----
- 4 - ,----
-- "7
MaI
e F
emal
e T
otal
(1
j (2
) (3
) (4
) (5
) 19
86-8
7 .
1300
21
069
1466
7 35
736
1987
-88
...
1400
20
463
1453
8 35
081
1988
-89
... 14
50
2013
5 14
331
3446
6 ,
1989
-90
... 15
00
2093
5 14
984
3591
9 19
96-9
1 ...
1500
16
765
1188
0 28
645
east
Kha
si H
ills
375
4314
30
09
7323
W
est
Kha
si H
ills
25
0 16
99
1379
30
78
Join
'ia H
ills
23
0 30
28
143 1
4
4K
9
Eas
t Gar
o H
ills
27
0 35
10
2502
60
12
Wes
t C
aro
Hil
ls
375
4214
35
59
7773
-
So u
rce:-
Dir
ecto
rate
of
Puh
lic
Inst
ruct
ion
Meg
hala
ya.
I

TA
EL
E:
17.1
4
Num
ber
of
Sche
dule
d T
ribe
sn
d S
ched
uled
ca
ste
Stud
ents
by
ty
pe
of
Inst
itut
ions
and
by
Sex
in
Meg
hala
ya
for
the
year
, 19
89-9
0 an
d 19
90-9
1
Sche
dule
d T
ribe
Sch
edul
ed C
g'st
e Ir
stit
utio
nr
Stud
ents
--,,----*-
-- -l
1989
-90
1390
-91
1989
-91,
199
0-91
(J
) (2
) (3
. (4
) (5
) (6
)
Pre
-Pri
mar
y an
d P
re-B
asic
B
o\ s
22
269
2285
9 G
irls
21
466
2239
5
Tot
al
4373
5 45
254
Prim
ary
and
Juni
or B
asic
B
oys
8927
4 91
644
Gir
ls
8270
5 86
297
Tot
al
1719
79
1779
41
Mid
dle
and
Sen
ior
Bas
ic
Boy
s 24
529
2517
5 G
irls
22
056
2302
0 T
otal
46
585
4519
5

TA
BL
E 1
7.14
(con
td.)
Hig
hlH
ighe
r Se
cond
ary
Boy
s 31
022
Scho
ol:
Gir
ls
2375
2 T
otal
54
774
P.U
./Int
erm
edia
te
Boy
s 41
68
Gir
ls
3160
T
otal
73
28
Gra
duat
e B
oys
2283
G
irls
16
58
Tot
al
3941
Po
st G
radu
ate
BO
YS
206
Gir
ls
185
Tot
al
391
Sour
ce:-
Dir
ecto
rate
of
Ins
truc
tion
, M
egha
aya.
/

18.
SOC
IAL
WELFARE
TA
BL
E 1
18
.01
Som
e Key
Stat
isti
cs o
n So
cial
Wel
fare
Par
ticu
lars
19
87-8
8 19
88-8
9
(1)
(21
(31
1.
Inte
grat
ed C
hi1 d
Dev
elop
men
t S
ervi
ce :-
(a) --N
o. of
P
roje
cts
16
20
c
(b)
No.
of
Ben
efic
iari
es
6134
2 61
382
cn
(i)
Mof
her
1299
3 13
043
+
(ii)
C
hild
ren
7593
0 77
203
2.
Scho
lars
hip
to p
hysi
cally
H
an-
dica
pped
Chi
ldre
n :-
(a)
No.
of
Ben
efic
ilrie
s (i
) B
oys
(ii)
G
irls
3.
G
rant
ii
l A
id t
o V
olui
ltary
Wel
- fa
re
Org
asis
atio
n :.-


TA
BL
EI
18-0
2 W
elfa
re o
f P
hy8i
oali
y H
andi
capp
ed a
nd
Sup
ply
of p
rost
heti
c A
ids
Par
ticu
lars
1987-88
1988
-89
-
(1)
(2)
(3)
1. F
rost
heti
c A
ids:-
(a)
No.
of
benc
fici
ai-i
es-
(i)M
ale
...
...
.m
n
.,.
1.5 28
(i
i) F
emal
e ...
,..
e..
. . .
5 to
2
voca
tion
al T
rain
ing
to P
hysi
call
y H
andi
capp
ed :
(a)
No.
of
bene
fici
arie
s ...
- 39
3.
Tok
en &
ids t
o P
hysi
call
y H
andi
capp
ed
815
2:: 4.
To
ken
Aid
s to
pa
saed
out
Phy
sica
lly
~a
nd
i'd
' N
.A.
128
a
capp
ed T
rain
ees.
fa.
Gra
nts
in a
id t
o V
oh
nta
ry O
rgan
isat
ion
for
the
Wel
fare
fr
andi
capp
ed :-
(a)
No.
of
O~
gap
iqat
ion
-.
...
N.A
. 2
(h)
Am
ount
gra
nted
(in
Rs.
) ...
.
N.A
. 46
bb0
N.A
,-
Not
Ava
ilab
le.
Sou
rce
:-D
irec
tora
te o
f S
ocia
l W
elfa
re,
Meg
hala
ya.

TABLE: 1
8'03
W
omen
Wel
fare
and
old
age
d P
ensi
on
S~
htm
e I
-:
I
,J
.
'
Bar
tieu
lars
19
87-
1988
-89
'-TlT
" -
1. Training
for
self
Em
ploy
men
t of
W
omen
in
' (2
) (31
,nee
d p
f~Q
are a
nd P
rote
ctio
n.-
s j
....
... I a
) N
o. o
f C
entr
es
,..
21 3
b) N
6. b
f T
rain
ees
.. ...
. .
63
67
2. T
rain
ing
for
Sel
f R
ehab
ilit
atio
n of
W
omen
in
D jsfrp8s :-
... (a)
No.
of,
Cen
tres
. ,
... 1
M.A
. +
...
(b)
No.
ef
Ben
chci
arie
s ...
. . , 70
N.A
, 3
3. H
qrte
ls fo
r no
rkin
g W
omen
ar-
d X
afirm
:-
(a3
No.
of
hoki
tels
...
...
... 2
a (b
) N
o.
of
bene
fici
arie
s ..,
me
111
111
4. M
ercy
Hom
e fo
r Old
&e&
- ...
No.
of
Mer
cy
Ho
he
...
1 1
... (b
) N
o.
of
Ben
efie
iari
es
... 52
52
5
. O
ld A
g~
d
Pea
sion
S&
enile
:-
... (a
) N
o. o
f B
enef
icia
ries
...
1120
15
00
r
N.A
.*N
O~
Ava
ilab
le
Sou
rce
;-D
irec
tora
te
of
Seci
ipl
Wel
fare
, iv
legh
alay
a.

TABLE : 18.04
Prog
ress
of
Inte
grat
ed
Chi
ld
Dev
elop
men
t Sc
hem
e
1985
-86
1987
-88
1988
-89
,--Ld7
CA
T C--&-- --
Dis
tric
t '
No.
of
No.
of
No.
of
No.
of
KO. o
f N
o.
of
Un
it
Byn
efi-
Uni
ts
Ben
efi-
U
nit
s B
cnef
i- cl
a~ie
r ci
arle
s cl
arie
s (1
) (2
) (3
) (4
) (5
) (6
) (7
) r_
Ja
inti
a Hills
... 2
10,359
2
10,2
60
3 10
,260
00
Ear
tKh
asiH
ills
3
9,149
5 20
,500
6
20,4
90
Wcs
t K
hasi
Hill
s 2
7,32
4 3
10,5
82
4
10,5
82
Eas
t G
aro
Yill
s 2
18,5
76
2 7,
680
2
7,73
6 W
cst G
aro
Hill
s 3
11,956
4
12,3
20
5 12,320
Mea
hala
ys ...
12
57,3
54
16
61,342
20
61,382
Sour
ce :-
-Dir
eeto
Pata
of
So
cial
Wel
fare
, Mag
hala
m.

19.
PO
LIC
E A
ND
CR
IME
ST
AT
IST
ICS
,
TA
BL
E : 1
9.01
N
umbe
r O
f Po
lice
Sta
tion
s,
Ou
t Po
sts,
E
tc.
S1.
Par
ticu
lars
19
88
1989
19
90
1991
N
o.
(1
(2)
(31
(4)
(5)
(6)
1.
Polic
e S
tati
on
2 1
23
34
34
2.
O
ut
Post
s 28
31
24
24
3.
P
atro
llin
g Po
sts
4 4
10
10
4.
Che
ck P
osts
incl
udin
g 14
14
22
18
&
Im
mig
rati
on C
heck
Pos
t CD
5.
W
atch
Po
sts
4 4
4 4
6.
Inve
stig
atio
n C
entr
es
3 3
-
-
7.
Bea
t H
ouse
s 17
17
11
11
8.
Wir
eles
s Sta
tion
s 92
11
6 12
8 N
.A.
9.
Fir
e S
tati
ons
- 2i
31
3 1
N
.A.
N.A
:-
Not
zva
ilab
le,
Sour
ce :-
Spec
ial
Sup
erin
tcvd
ent
of P
olic
e,
C.I.
D,
Meg
hala
ya.

TA
BL
E:
19.0
3 St
reng
th Of
Pol
ice
Per
s~u
nel
s
S1.
Par
ticu
lars
19
89
1990
No.
(1
) (2
) (3
) (4
) A
. G
zyet
tcd
Ran
la :
1. D.G.P.
1 1
R. I.G.P.
4
4
3,
W.1
.G.P
. 6
6
4.
A.1
.G.P
1
I
5.
Com
man
dant
/ S.
P.
12
13
6, 2n
d in
Com
man
d 9
8 A
ddit
iona
l S.P
. 7.
A
ssis
tant
Com
man
dant
/ 47
47
Dep
uty
S.
P.

TA
BL
E(
19.0
2 (C
cntd
.)
(1 1
(2)
(3 1
(4)
(5)
B.
Non
-Gaz
ette
d Rank:
8.
Inrp
eeto
r 12
1 12
4 12
9 9.
S
ub-I
nsp
ecto
r 41
8
441
421
10.
Ass
ista
nt Sub
-Inspec.
462
494
464
,- to
r z
11.
Hav
ild
arl~
ead
Con
. 65
3 665
6 54
stab
le
12.
N%
ik/L
. Nai
k 486
390
39Q
13.
Con
stab
le
5346
54
4 1
5369
'
Tot
al
746
6 76
35
7488
Sou
rce :-
Spe
cial
S
uper
inte
nden
t of
Pol
ice,
C
.I.D
., M
egha
laya
.

TABL
E : 19.03
Inci
denc
e of
Grim
-s b
y M
ajor
H
eads
und
er
1. P.
G.
Hea
d of
Cri
mes
(1)
1.
Mur
der
2:
Cul
pabl
e H
omes
ide
not
amou
ntit
lg t
o m
urde
r..
Rap
e K
idna
ppin
g an
d A
bduc
tioi
l D
acoi
ty
Rob
bery
B
urgl
ary
The
fts
Rio
ts
Cri
min
al
Bre
ach
of
Tru
st
Che
atin
g C
ount
erfe
itin
g M
isce
llane
ous
Sodr
ce
:-Sp
ecia
l Su
pwin
tend
ent
of P
olic
e,
C.
I. I>
., M e
ghal
aya.

TA
RL
B : 1
9.04
O
ffen
ces
Und
er
Loc
al a
rid
Spec
ial
Law
s
Hea
d o
f C
rim
es
1988
(1)
(2)
1.
Arm
s A
ct
32
2.
Opi
um A
ct
18
3.
Gam
blin
g A
ct
169
4,
Exc
ise
Act
8
5.
Cus
toin
Act
-
6.
Exp
losi
ve A
ct a
nd
Exp
losi
ve
3 Su
bsta
nce
Act
7.
P
rohi
biti
on A
ct
-
8.
S. 1.
T.
in
Wom
en a
nd G
irls
Act
1
9.
Mot
or V
ehic
les
Act
- -
10.
Oth
er O
ffen
ces
159
Sour
ce :-
Spec
ial
Su
per
inte
nd
ent of p
olic
e C
. I. D
., M
cgka
laya
.

TA
BL
E : 1
9.05
Jure
mlle
y A~
pre
hrn
ded
for
Com
mit
ting
C
rim
es
unde
r 1
.p.~
. 9..
> %
w
hm
- "
.
Tsa
d,sf
Criq
aea
1988
19
89
1990
$9
91
(1)
(2
(3)
(4)
1. M
urde
r (5
) 3
- (7
-
2.
Cul
pabl
e H
omic
ide
not -
- am
ount
ing
to M
urde
r -
3.
Rap
e, K
idna
ppin
g an
d -
- A
bduc
tion
-
1 '
4.
Dao
oity
-
- 5.
Rob
bery
-
- -
-
6.
Bur
glir
y 6
-3
-
7.
Thc
fts
15
18
22
35
7 8.
R
' lots
-
11
-
47
23
12 -
9* C
rim
inal
bre
ach
caf t
rust
, ,
- C
heat
ing
- -
16.
Kur
is,
Cc~
nte
rfci
tin
~ ,
--
h
1'.
Oth
er O
ffen
ces
4 -
- 5
- So
urce
'-S
Pw
ial
Sups
rint
ende
nt o
f P
olic
e,
C.I
.D, i
rkgh
alay
at

,..-,-
Can
es o
f Pr
oper
ty S
tole
n an
d R
ecov
ered
by
Cat
egor
y of
O
ffen
ces
duri
ng
the
Yea
r 1991
Prop
erty
P
rope
rty
perc
enta
ge
Stol
en
Rec
over
ed
of r
ecov
ery
--
h .-- 7
r-*--7
51.
Cat
egor
y of
Cri
mes
Nos
. V
alue
(in
N
os.
Value
(in
(In
term
s N
O.
'000
Rs.)
'000
R
s.)
of v
alue
)
Y
1,
Dac
oity
21
56
1 4
16
2.85
Q
, W
2.
R
obbe
ry
44
301
11
96
31.89
3.
Bur
glar
y 166
1059
74
252
23.8
0 4.
T
heft
s 52
0 32
12
209
832
25.6
6 5.
C
lrim
jahl
bre
ach 16
218
- -
-
of t
rust
+W
Total
767
5301
298
1196
22.2
3 *
Sour
ce:-
Spec
ial
Supz
rint
ends
nt o
f P
@!i
ec, C
.1.D
, M
egha
laya
. ,

20.
BA
NK
IN.6
T
AB
LE
: 20
.0 1
Num
ber o
f S&
edul
od C
omm
erci
al B
anks
as on December
Item
s 19
85
1990
19
91
1992
(M
arch
)
1. S
tate
Bank
of I
ndia
and
its
56
68
76
77
s A
moc
iate
s. m
2.
N
atio
nalis
ed B
anka
... ,
29
36
37
38
8. R
egio
nal
Rur
al Banks
39
50
50
51
4. o
ther
Sch
edul
ed
~o-e
rc:l'
n'l
3 1
1 1
Ban
ks. T
otal
.
127
155
154
167
.
Sour
ce :-
Ban
king
St
atis
tics
, R
esen
e B
ank
of Ip
dia.

TABLE ; ze
.02
Dep
osit
r an
d C
redi
t of
Sche
dule
d ~o
mm
erci
al Ba
nk
(Rs. in
lak
hs)
198.5
19
90
199 1
19
92 (
Mar
ch)
p-A
- ,--
A--9
p
- Lh- -7
-*--I
1. S
tate
~a
nk
ok 5488
1819
144
22
3192
170
28 1083
1873
0 11
44
bd
ia an
d it
s A
ssoc
iate
s. 2-
'Na~
jona
lise
d 64
69
1526
135
57
3181
E16
339
3491
169
31
8874
B
anks
. .

~.;
ke
~io
sd
Ru
- 21
2 91
11
38
521
1821
56
7 16
93
519
ral B
anb.
b,
. Oth
er
Schc
- 56
3 95
637
91
723
86
879
104
a
dule
d C
om-
I*cr
cial
Bar
b.
Sour
de.:-
Ba~
hing
Sw
tist
ics,
Res
crvc
Bark sf I
adia
.

TA
BL
E : 20.03
Dep
osit
s an
d C
redi
t ef
Sche
dule
d C
omm
erci
al B
aakn
by
Dis
tric
t as
on
Mar
ch,
1992
. (Rn. i
n lakhs)
Dia
tdct
O
ffic
es _
Dep
ositr
C
red
it C
redi
tlD
epes
it
Per
cent
age
(1)
(2)
(3)
(4)
IS)
I
' Ja
hti
a H
ills
21
2Z48
480
5-
2 1.4
4 E
ast K
hasi
Hill
s 81
31513
5687
18.8
5 8
Wea
t Kh
as~
Hill
s 20
82
1 13
4 4Q
.34
Eas
t G
aro Hills
15
744
416
54.45
wes
,t ($wo
Hill
a 30
28
86
792
27.8
9
P Meghalaya
167
38233
7711
20.1
7 ?'
7

. T
AB
LE
: 20
.04
~ ,
Bep
ubti
em
Per
Ban
k O
5c
e a
s on
D
ecem
ber
1990
, 19
91
and
Mar
ch
1992
.
No.
of Bank
Off
ices
P
opul
atio
n se
rved
per
D
bki.t
B
ank
Off
ice
('00
0)
----A---,
p----*
A- -
1990
19
91
1992
1
99
8*
19
91
1992
*
* Mar
ch**
(1)
(2)
(3)
(4)
6)
(6
) '(
7)
Jain
tia
Hil
k
2 1
21
21
7 10
10
o
5
Eas
t K
has
~ Hill
e 75
79
81
7
8 8
Wes
t Kha
si H
ills
19
19
20
9 11
1 I
E
ast
Gar
0 H
ills
12
15
15
11
13
13 ,
Wes
t Gar
o H
ills
23
30
30
13
16
16
Meg
hala
ya
155
164
167
9 E
ll
11
C
* =
Wcr
ked
out'
on 1
981
Cen
sus
Y~p
ulai
ion.
* *
=
Wor
ked
out
on 1
991
Cen
sus
Pro
visi
onal
Pop
ulat
ion.
So
ur(e
:--B
anki
ng S
hdst
ics,
Ree
erve
Ban
k of
Ind
ia.

Acc
ount
s an
d O
utst
andi
ng C
redi
t of
sc
hedu
led
Com
mer
cial
B
anks
by
Typ
e of
Occ
up
atio
n a
s on
Dec
embe
r, 1
985
i an
d M
arch
19
91
(In
Perc
enta
ge )
1 985
(D
ecem
ber)
19
91
[Mar
ch)
---.
-Au
--
.-, --
-A--
v--
Occ
upat
ion
M
El
U)
.?.
E
h;
&,
U 71
3
.rl
%,' v
.5
g; >
# ,
:a_ 62
;ij,
72
U
- 4
0
zb
8:
40
(1
) 3
(31
(41
is)
(61
(71
Ap
icu
ltu
n
44+5
11
.7
10,2
61
.6
23.4
24
.9
2. I
ndus
ry
3.4
16
.0
14.3
6.
4 29
.5
30.8

TABLE :
20'0
5 (C
oncl
d)
,
4. p
erso
nal
Loa
ns
12.6
14
.2
15
3
9.5
12.3
12
.9
and P
rofe
asie
nl
Serv
ices
5. T
rade
18.8
24.4
24
7
16.1
17
.2
17.3
w
.r
2
;
.N
"
6. F
inan
cial
-
-
-
-
0.9
0.7
Inst
itut
ions
7,
All
othe
rs
19.1
14
.5
17.7
4.
9 3.
1 3.
1
c-
~o;r
ce: -
Ean
klng
St
atis
tics
R
eser
ve B
ank
~f"
'1n
dia
. 4.‘

2!.
SMA
LL
SA
VIN
GS
T
AB
LE
:
2 1.0
1 S
tati
stic
s of
Sm
all
Sav
ings
in
M
elha
laya
(P
rovi
sio n
al)
(Rs. i
n O
Ob
) N
ame
of
Acc
ount
s/
1988
- 89
Sec
urit
ies
1989
. -90
7-
A- 7
p---h
J.----,
Dep
osit
w
ith
Dep
o.it
w
ith
draw
al
draw
al
(1)
(2)
(3)
(4)
1. Po
st O
ffic
e Sa
ving
45
184
4251
0 51
143
(5)
Aec
mnt
s 46
319
2, R
ecur
ring
Dep
osit
93
62
6422
12
376
9201
-
Aec
eunt
s v
3, T
ime
Dep
osit
5796
54
88
5519
W
.
Acc
ount
a 10
179
4. I
ndir
a V
ikas
Bat
ra
160 1
6 21
600
1 -
5.
Mon
thly
In
com
e 10
30
- 11
'973
-
Sehe
me
6. K
isan
Vik
as
Pat
ra
2469
6 -
2374
6 -
7. ~
ati
on
al'
Sav
ings
72
35
-
2463
0 -
Acc
ouni
s 8.
Pub
lic
Pro
vide
nt
5970
-
1465
-
Fund
Sch
eme
Sru
rcr :-
Reg
iona
l D
irec
tor
Nat
~o
nal
Sav
ings
(G
ove~
nmen
t of I
ndia
; M
eh ha
laya
S
hill
cng.

22.
STA
TE
FIN
AN
CE
TABLE :
22.d
1 O
vera
ll B
udge
tary
P
o3it
ion
of
the
Sta
te o
f M
-gha
laya
-
(Rs. in
lakh
s)
Part
icul
ars
1989
-93
1990
-91
1 991
-92
1992
-93
(Ks En)
(B.E
.)
1. O
peni
ng ~
ala
nce
(-)3
586,
37
(-12
797.
89
(-)4
326.
15
(-)2
466.
59
2.
Tot
al R
even
ue
(a)
Rec
eipt
...
3391
9-2
5 35
297.
42
421
72.1
4 43
075.
90
*
bb)
Exp
endi
ture
25
877.
49
31 0
77.4
1 39
195.
58
4361
7.8
1
(c)
Surp
lus O
r
(+)5
041-
76
(+)4
220.
01 (
+)2
976.
56
(-)5
41.9
1 D
efic
it on
Rev
enue
Acc
ount
3.
Tot
al C
apita
l

Rev
enue
L8
,OO
D
-
Rec
eip
ts a
nd
ME
GH
ALA
YA
19
9 1-
92 (R
.E
Rup
ees
In
Lakh
s
GR
AN
TS-
IN-
AID
FR
OM
TH
E C
EN
TRE
WA
RE
OF
CE
NTR
AL
TAX
ES
SU
RP
LUS
EC
ON
OM
IC
SE
RV
ICE
S
SO
CIA
L A
ND
C
OM
MU
NIT
Y
SE
RV
ICE
S
GE
NE
RA
L S
ER
VIC
ES
i R
ecei
pts
E
xpen
dit
ure
,I
KC
F.
, >"
4
G

TA
BL
E :
22.0
1
(con
td.)
I I I
('1
(2)
(3)
(4)
(5)
I (b
j E
xpen
ditu
re
9191
.98
9187
'47
1679
1'13
17
805.
10 '
I
(c)
Sur
plu'
~ (+)
(-)4
274.
10
(-)5
743'
27
(-1 1
70
(-
)546
8'19
D
eEci
t ( -)
I
4.
Ove
rall
ljrl
r,
(+)7
67.6
5 (-
)1j2
3'?6
(+
)185
7255
. (
-)60
10'1
0 p
lug (+
) kl
Def
icit
(--)
2
5. C
'oli
n?; B
al r
qcs
(-)?
319,
73
(-)4
3?6'
15
(-)2
165'
39
(-)9
i7
6.69
R. E
.-R
evis
ed E
stim
ates
B.
E.-B
udge
t E
stim
ates
Sollr
ce : -
Bud
get
at
a
glan
ce,
1992
-93.

TA
BL
E :
22.M
Rev
enue
Rec
eipt
s of
the
Gsv
ernm
rnt
of M
egba
laye
r
(Rs.
in
lakhs)
Hra
ds
1 989
-90
1 990
-91
1 991
-92
19
9m
(R
. 6
.)
(B.
E.1
(1
1
+.
1. Tax R
even
ue
(2)
(3)
(4)
(5)
(a)
Shar
e of
Cen
- 65
16.6
5 80
35.8
4 10
527.
W
1134
7.90
tr
al T
axes
, DU-
ties
, e
?c
. (h
) St
ate
Tax
es
3235
.59
36.1
1.44
36
69.3
0 39
90.5
0 2.
Won
-Tax
Ii e
venu
e :
(a)
Gra
nts
h-a
id 1
9282
.02
2178
8.89
26
079.
93
2598
0.94
fr
om th
e C
entr
al
(b)
Orh
rr
Non
- 18
85.0
1 18
71.2
5 18
95.9
1 17
57,4
6 T
ax R
even
ue
Tot
alR
even
uc
3~
9i9
.25
352
97.4
2 42
172.
14
4307
5.98
R
ecei
pts --
R.
E.-R
evis
ed
Est
imat
es
B.
E.-
Bud
get
Est
imat
es
Sour
ce :-
Bud
get
at a
gla
nce,
19
92-9
3

TA
BL
E :
22.0
3
R:v
ence
E
xpen
ditu
re of t
he
Sta
te of X
Iegl
ialy
a
(R..
in
lakh
s)
Hea
ds
1989
-911
19
90.9
1 19
91.9
2 19
92-9
3 (R.
E.)
B. E.)
(1)
(2)
(3)
(4)
(5)
1, G
ener
al
Serv
ices
78
44.7
2 87
10.0
3 10
78b.
61
1230
4.66
2. S
ocia
l an
d 96
13,3
2 11
427.
40
145'
18.3
4 16
117.
83
L
Com
mun
ity
Ser-
.
v
Ces
. V
3. E
cono
mic
Ser
vice
s 84
1 9.4
5 16
939.
98
1389
6.63
15
195.
32
Tot
al R
even
ue
2587
7.49
3
1077
.41
3919
5.58
43
61 7.
81
Exp
end
i~ ur
e
R.
E.-
Rev
ised
E
stin
bati
tes
B.
E.-B
udge
t E
stim
ates
Saur
cc :
-I3u
clgc
t a
t a g
lan
ce,
1992
-93.


TA
BL
22
.04
icon
td.
(1)
(2)
(3)
(4)
(5)
6. W
ays
and
Mea
m
. . .
. 20
'25.
00
2112
5 53
A
dv
an
crs
fro
m
the
Res
erve
ba
nk of
Ind
ia
7. L
oans
and
Adv
ance
s 35
! 1'
67
2786
'49
28 1
6.55
30
62.2
0 fr
om
the
Cen
rral
G
~v
crn
mt rr
r. 8.
R
rcov
erie
of
Loa
ns
338.
17
37,'
44
268'
63
289
21
and A
dvan
ces.
9.
In
~rr
-Sta
te S
ettl
e-
...
. . '..
...
mer
it.
111,
0 th
er L
oans
10
00'0
U
1 I.
C o
ntt
nge
r~cy
~uni'(+ 1
649.
75
(+)4
56.;
? (+
)861
4*i:
8 (+
)398
-710
a
nd
pu
bl~
c Acc
o-
unt
(ne
t).
Tot
al
... 49
17.8
8 37
39.2
0 15
6 '7
.43
1233
6 91
-
R.
E.-
Rev
ised
Est
imat
es.
B. E
.-B
udg
et
Eqr
imat
cs.
Sou
rce
:-B
udge
t a
t a G
lan
ce, 1
992-
93

TA
BL
E : 2
2.05
Cap
ital
Px~
cnd
itu
re of
the
Sta
te o
f M
egh
lla
ya
(Rs. in
lakh
r)
Par
ticu
lars
19
89-9
11
(1)
(21
(A)
Pub
lic
Deb
t :-
I. R
epay
men
t o
f M
ark
el
119.
87
Loa
ns.
2. h
rns fr
om
I ir
r In~u-
23-9
2 ra
nce
Cor
pora
tior
1 of
T
ndla
. 3.
L
eans
firm
th
e N
AB
AIZ
D
3.~
7
4. L
oans
fro
m t
hr h
rali
o~
la]
14.3
7 C
e-op
erat
ive
Dcv
clo
p-
men
t Cor
pn
rati
oq.
5. L
oans
fro
m G
ener
al
28.6
1 T
nstlx
ancc
Cor
por
at;o
n
of I
nd
ia.
199(
1-9 1
1,99
1 -9
2 v''
(R.E
.)
(3)
(4)


?A
BL
E : 2
2.06
(c
oned')
, u &.A
(1)
(2)
(?r
14)
15 t
5 Sa
le Tax
15
2.39
17
45'8
17
88 0
1)
1966
th1
16
1.2
2
11
13
17
7.00
18
586
I
6.
Tax
es om
V?h
i l
e~
,
7. T
axes
on
GO
)ds
and
84
'97
90 7
J 87
.85
92.2
1)
p ~
~~
ng
er
~.
8. T
a e
s and
Dut
ies
on
- '75
3.65
25
%0
26 2
0 E
lect
rici
ty
C
9
Ta
xes
on
Rnt
rrta
in-
5 8
rfi
59 1
0
63 0
7 70
.42
W
men
t in
clu
,lin
g ra
ves
on B
et i
ng
.
10.
Pur
chas
e T
ax
97
.40
. 12
5.22
13
7.88
14
0 h2
Gra
nd
ro
ta1
312
-59
360
43
3669
30
39 0
.50
, R
. E
. -li
ev~
sc r
E.~
tma
~c
~
B
E.-
Bud
ge
Est
i ll
dre
s
Sour
ce :-
Bud
get
at
a G
lanc
e, 1
992-
93.

23.
STA
TE
IN
CO
ME
Net
Sta
te D
omes
tic
Pro
duct
s by
In
dust
ry o
f O
rigi
n at
Cur
rent
Prices, Meghala~a (Ks. in
Lak
hs)
(1)
(2)
(3)
(4)
15)
(6)
- 12
106
w
1.
Agr
icul
ture
14
830
18856
2037
3 22
118
a
2.
For
estr
yan
d
431
108%
1180
J331
1507
Log
ging
.
3. Fishing
164
121
250
282
313
4.
Min
ing
and
12
04
1 ,2
7 2709
3u44
3
4~
Q
uarr
ying
Sub-
Icta
l 16629
14938
22995
25030
2738
2

TABLE : 23
-0 1
(c
ontt
i. \
(I i
i2)
(3)
(4
(5)
5.
Man
utac
turl
ng
1214
12
83
1605
17
36
5.1.
R~
g~
ster
ed
547
596
764
837
5 2.
Un-
regi
strr
rd
667
687
842
893
6.
Con
stru
ctio
n 67
90
6960
81
l07
8684
7.
Elrctriciry
and
487
773
654
78 1
M n
ter
Supp
ly.
Su b
--T
otal
84
91
9(11
6 1
~2
67
11
2111
8.
T
rans
port
34
50
3680
44
74
5~40
Sto
rag
e an
d C
omm
untc
atio
rr.
8.1.
Tra
nsp
ortb
y 38
30
3220
33
b2
4369
ot
her
rnea
nr.
\
8.2
. St
orag
e 4
7 5
5 8,
3. C
omm
unic
a-
416
453
587
666
tion
. 8.
T
rade
H
otel
s 36
71
5002
64
61
7121
and R
esta
uran
t.
1Q.B
a1ik
inl;
and
1125
14
44
1721
I S
99
Insu
ranc
e.
1 1.
R
eal
Est
ates
26
99
3566
37
63
4J91
O
wne
rshi
p of
Dw
~l-
li
ng and
Bug
in~s
s Services.

'TA
BL
1 : 2
1.0
1 (c
on
td,)
(1
) (2
) (6
) 12
. P
ublip
*,m
inis
- 7u
73
878:
) 96
8:)
1157
7 tr
atiq
n
13.
Oth
er S
ervi
ces
4 1
89
4901
70
8 1
7897
87
75
Net
Sta
te D
orne
a-
4722
7 5
1328
66
444
7290
1 79
756
t~
c
Pro
du
ct.
/ -
Pop
(la
tion
('00
0)
1598
16
46
1720
'
174
I 17
89
Q-
Qu
ick
Est
imat
es.
R-
Th
e fig
ures
of
1987
-88
are
repe
ated
.
Sour
ces : -
Dir
ecto
rate
of
Eno
norn
ics a
nd
Sta
tist
ics,
M
egh
ald
ya.

24.
PR
ICE
IN
DlC
ES
TA
BL
E:
24.0
:
Con
sum
er
Pri
ce
Inde
x N
1 m
ber
for
V r
ba
Non
-hfa
nu a
; E
mp
,oy
ees
.
Bas
e 11
960=
10
0
Now
R
evi
ed
to
19
34
-85
~
10d
Pe
l io
d
Shill
orlg
A
ll -I
ndia

( TA
BL
E:
24 .i) 1
(c
ontd
.)
(1)
199 1
(2
) 19
3 (3
1 1?
7
1932
Ja
nuar
y 20
7 19
0
Apr
il
212
193
May
21
3
195
L
June
2!
4
197
03
03
July
21
7 2b
2
Au
glis
t 21
7 20
3
-
Sept
embe
r 21
8 2 0
4 *-Mew
Bas
e so
urce
:-k
tra
l st
atis
tica
l O
.gm
iart
ion
, Q
,~
~~
~~
~~
~
of I
ndia
. N
ck-D
elhi
.

TA
BL
E:
24.0
2 C
osum
er
Pri
ce
Inci
ex
Num
bers
fo
r A
gric
ultu
ral
Lab
oure
rs
Bas
e J
u'v
, 19
60 -
June
, 19
61 =
100
Au
am
(I
ncl
ud
ing
All
-In
dia
Agr
icli
ltur
al
Me
gh
All
ay
a, M
ani-
Y
ear
pu
r and T
rip
ura
) (1
) (2
) (3
) 19
01)-8
1
40
1
409
1985
-86
564
55 5
1986
-8 7
60
6 57
8 l9
87
dB
66
4 ,
650
!988
-89
730
724
1989
:90
777
752
1930
-9 1
854
830
1991
-91
1014
10
07
1992
.93
July
lo
95
1098
A
ugus
t 11
07
1114
Se
ptun
bcr
1105
11
12
Oct
ober
! 11
5 10
99
Nov
embe
r 11
09
108 f
Sour
ce :-
Lmbo
ur
Bur
eau,
Gov
ernm
ent
bf
Indi
a.

TA
BL
E :
24.
03
Col
la~b
rner
Pri
ce I
ndex N
um
ber
s fo
r Working Class
Bas
e 19
49=
1C6
Now
Rrv
ised
To
1982
=lr
,0
'Per
iod
Guw
ahat
i S
ilch
ar
Tin
suk
la
Ass
am
1)
(2
(3)
(4)
15)
1950
45
0 49
1
528
494
1985
68 1
83 8
756
716
1986
7L
9 97
0 81
.5
782
1987
78
8 l(
r@
8911
85
1 19
88
839
1 b82
95
7 91
0 1.
89
943
1164
1(
,29
9 96
19
90'
191
170
174
...
1991
20
8 19
3 19
5 ...
IS
92 J
znua
ry
2'2.2
2 06
20
8 ...
k
ebru
ary
223
206
2 10
a
,
Mar
ch
229
210
2 15
...
Ap
ril
231
2 13
2
11
..,
Ma
y
234
2.9
21
4 ...
-
* =
K
ew B
~s
e
Sour
ce =
D
ircc
tora
tc o
f E
con
omic
s an
d
Sta
tist
ics
Asb
arn.


TA
BL
E :
24
.04
(con
td.)
(1
1 -
(2)
1792
Ja
riua
ry
Fctruary
Mar
ch
Apr
il
May
23
4 -
Juce
236
g
.-
Oct
obzr
24
4 *
= New B
ase
Sour
ce: =
Lab
our
Bur
eau,
Gov
ernm
ent
of
Ind
ia.


25.
FdV
E Y
EA
R P
LA
NS
TA
UL
B:
25.0
1 P
lan
Ou
tlay
an
d A
ctua
l E
xpef
idit
ure
of
Meg
hala
ya
IRs.
in
Cro
res'
l -.. -
e P
lan
Yea
r ~
~p
rov
e'd
~
ct;
al
Ou
tlay
E
xp
end
itu
re
( 1)
!:' F
ou
rth
P
lan
(2 1
(3)
1969
-74*
38
.00
(4)
34.1
3 :.
F~
fih
Pla
n
1471
-7 8
09.5
3 71
.81
'. A
~n
ua
l ) I
an
19-8
-79
29.1
1
27.7
4 4
, A
nnua
l P
ldn
1979
-80
33.3
0 30
.69
5.
Slx
~b
Pla
n
1980
-85
2 5.
00
259.
07
b.
Sev
enth
P
lan
19
85.0
0 55
6.00
54
fi.27
cn
7.
Anr
lual
P
lan
1390
.91
i 75.
00
(11.
0,)
166.
16
8.
Ann
ual
Pla
n
1991
-92
205.
1 0
(R.O
.)
... 9.
E~
gh
t Pla
n 19
92-9
7 11
29.0
0 (A
.O.)
...
10.
Arr
r~ua
l Pla
n 19
92 S
3
21 1
00
(A
.0 )
* =
Ih
r bt
ate
of
Mcg
hala
ya
c~
ule
lrlt
o be
ing
in
1970
-71 a
s an
A
uto
no
mo
us
Sta
te.
The
our
lay
for
4th
pla
n s
how
n he
se
repr
esen
ts
outl
ay t
or
the
peri
od 1
970-
74
revi
sed
ou
tlay
. R
.0.-
Rev
ised
O
utla
y A
.O
.=A
gree
d O
utl
ay
Sou
rce
:-Bud
get
at a
Gla
nce,
19
92-9
9.


TABLE :
25.0
3 O
utla
y A
nd E
xpen
ditu
re O
n K
ur i1
Dn
e!op
men
t P
rogr
amln
cs
in M
egha
laya
(Rs. in
lak
hs)
Pro
gram
lnes
O
utl
ay
' 1990-9i
1991
-92'
(1
) (2
) (3
) In
teg
rate
ti
Ru
ral
155.
10
179.
5 D
evel
opm
-n t
dev
elop
^^ ,
nt
of
Wom
en
8.03
1
! ,115
and
Chi
ldre
n in
Ru
ral
Are
as.
Jaw
ahnr
1:
ozqa
r Y
ojan
n 49
5.91
49
5.9:
T
rain
ing
of
Ru
ra
Yo
uth
-
6 2
0
for
Sel
f-E
mpl
oy n
lent
A
ssis
tanc
e to
S
mal
l &
75
.00
69.7
5 M
argi
nal
I'arr
ners
(SF
/lM
P)
Exp
endi
ture
F
-.--h
--- 7
1990
-'; 1
19
91-9
2 (4
) (5
) 19
2.93
17
5.23
.~ .
S
nu
rre:
-~i~
z~to
r of C
0m
mu
nit
jr a
nd R
l,ra
l D
evel
~p
mrn
t.
Meg
Lal
n ya
.

- d
E d l" 2 2 E - 23 - - y y
0
En
52 L. .- " A- + 2 s i 2 is.. - 6 s - 2 3 6 ~ 0
f53-22

TOTAL 2
5.04
(c.
ntd
).
A
(1)
(2)
(3\
(4)
(5)
(6)
(7)
(8)
Jaw
ahar
R
ozga
r L
akh
No.
8.
11*
12.0
2 O.C4 0
.07 8.11
11.9
5 Y
ojs
na
Man
days
Training
ofR
uta
l KO.
of
47
186
Nil
Nil
47
186
You
th f
or S
elf
Per
sons
E
nlpl
oym
cnt
Tra
ined
Ass
irta
nce
to
No,
o
f 41
81
5082
...
...
4181
50
82
Smal
l an
d
Mar
- I!
eeef
icia
- o
gi
mal
F
arm
ers
ries
IS
FIM
FI
---
Not
e *
=-
The
sho
rt f
all
of 0
.04
iakh
M
anda
yp a
re
thc
othe
r ca
tego
r: ;s
of
Man
d c y
3.
Sour
ce : .-
Dir
ecto
r of
(:
oqm
un
ity
L. d
Rur
al
Dev
eloi
ncn
t, .
cgh
al .
ya.

TA
BL
E :
25.
05
Phy
sica
l A
chie
vem
ent
Un
der
Jc
wah
ar
Roz
gar
Yoj
ana
Du
rin
g J9
90--
:; (L
akhs
) -
Ach
ic~
~~
men
t (M
an
3~
j'~
)
Ann
llal
+--
-- - -
---.--&
--- - -- --
-----
-- 9
D;s
tric
t T
arge
t Sc
hedu
led
Sche
dule
d O
ther
s T
otal
Lni
ld W
omen
C
aste
T
ribe
s le
ss
(1)
(21
(3)
(4)
(5)
(6r
(71
8)
1. E
ast
Kha
si.
6.18
...
3.
03
...
3.03
...
0.39
H
ills
i-3
2.
Wes
t K
haai
2.
66
.. 0.
5,
... 0.
55
...
0.11
3
Hill
3 3.
Jai
ntia
7
7 ..-
0.
e0
... 11
.80
...
0.17
H
ills
4. E
ast
Qa
~o
2.
21
0.0
; 0.
87
0.03
0.
92
0.92
0.
C4
Will
s 5.
Wes
t G
aro
5.26
0.
( 3
2.85
L.
GL
2.89
1.
45
0.50
@
i Is.
Meg
hala
ya
i 4.9
8 0.
05
8.10
0.
04
8.19
2.
17
1.21
/
Sour
ce :-
Dir
ecto
r G
oram
unit
y an
d R
ural
D
evcl
epm
ent,
M
egh
alay
a


TA
BL
E :
i6.
02
Num
ber
of
cand
idat
es
acl:
up
an
d se
ats
gain
ed b
y P
olit
ical
P
arti
es i
n t
he
1988
, M
egha
laya
L
egis
lati
ve
Asa
rmbl
y h
lcct
ior;
Par
ticu
lars
(1
)
Can
dida
tes
set
up
Se
ats '
gain
ed
(2)
(3)
Indi
an
Nat
ion
al
Con
gre~
s 60
C
omm
unis
t P
arti
of
Ind
ia
9
Hill
s pu
aple
U
nion
35
A
ll P
arty
Hill
s L
eade
rs c
on
fe~
ence
:A)
18
Ilill
q St
ate
Peo
ple
Dem
ocra
tic
Par
ty
31
Pub
lic
Dcr
nali
d Im
plem
enta
tion
C
onve
ntio
n In
depe
nden
tq
Tot
al
271
6 0
Sour
ce :-
Meg
hala
ya
Zle
ctio
n E
3and
book
, 198
8.

I
. 'TABL3 :
25.0
5 A
bstr
act
RI s
ults
of
the
1988
.fe
ghal
aya
Legi
slat
ive
Ars
emb?
y E
!ect
lon
Vot
es p
olle
d ni
stri
cts
Ele
ctor
ate
r----- .-
--A
----
7
To
t~l
\'slid
T
nval
id
(1)
(2)
(9)
(4)
(5)
Jain
tia
Hil
ls
...
1,00
:447
88
,844
87
,234
1,
619
(88'
45)
(98'
1 91
(1
.81)
E
ast
Kha
ni
Hil
ls
3 05
,351
2,
27,2
31
2,20
,482
6,
549
(74.
42)
(Q7.
12)
(2'8
8)
N
Wes
t Jc
hasi
Hill
s .
94.5
41
68,3
79
66,4
611
1,92
8 (7
2.33
)'-
(97.
20)
(2.8
0)
Eas
t G
aro
Hil
ls
...
68,1
89
65,6
20
62,6
80
2,91
0 (7
4.41
) (9
.5'5
2)
(4.4
8)
W!rt
Gar0 t:~lls
2,18
,213
1,
7~,2
54
l,b9
,476
5,
778
(80
91
) (9
6.70
: (3
.301
M
egha
laya
. .
8,07
,741
6,
25,3
28
6 06
,533
18
,795
---
- (7
7.51
) (96.99)
(3.0
1)
--. N
ote
:-F
igur
es in
bra
cket
s in
co
1.3
ar e
pe
rcen
tage
to
co1,
2 Fi
gure
s in
bra
cket
s in
co1
.4 a
nd c
o1.5
are
per
cent
age
to c
01.3
So
urce
:- -
Meg
hal
nya
Ele
ctio
n H
andb
ook,
b98d.


Dis
tric
t C
oull
c~l E
lect
ion
, 19
89
Par
ticu
lars
N
O. o
f E
lect
o-
Vot
es
cons
ti-
rate
C
---A
----
tu
enci
es
Val
id
Inva
lid
N
Jain
tia
Hill
s A
uton
omou
s 25
10
2115
90
812
1642
~
istr
ict C
ounc
il.
Kha
si
Hill
s A
~~
ton
omou
s 30
35
3593
23
54.3
5 49
59
Dis
tric
t ; 'o
unci
l.
Gar
o H
ills
A
uton
omou
s 30
30
1013
20
0553
48
14
Dht
rict
C
OU
SC
;~.
Sour
ce:-
E
lect
ion
Han
dboo
k. 1
989.

TA
BL
E :
26.0
6
Num
ber
of
Can
dida
tes
Set
up
and
Seat
G
aine
d by
Pol
itic
al P
arti
es ,i
n t
he
1989
D
iatr
icc
Cou
ncil
Ele
ctio
n
No.
of
Can
dida
tes
Seat
r gained
r- --A
- --
7
r-
--
U-
P
arti
cula
rs
Jain
tia
Kha
si
Car
o Ja
inti
a k
has
i G
aro
Hill
s H
ills
Hill
s H
ills
Hill
r H
ills
Indi
an N
atio
nal
@ng
rcrs
...
22 ,
25
27
6 8
18
I
Cou
~mun
ist P
arty
of
In
dia
... 2
2 3
... ...
.a.
A11
Par
ty H
ills
Lea
-'l
L de
rs C
anfc
renc
e (A
) -.
. . .
17
... .*
. 3

(1)
(?I
(3)
(4)
\
All
Par
ty €
3 11
Lea-
der
s on
fere
r~c-
...
... ...
Hill
Sta
te P
eop
le
Dem
ocrn
tic
Par
ty
16
21
.. P
ubli
c D
eman
d
Imp
lern
en ta
tion
Con
- V
-ntio
n . . .
.*.
4
...
Hil
l* P
eopl
e U
nio
n
19
26
26
Inde
pend
ents
35
49
. 4
3
To
tal
92
127
116
24
29
29
So
urc
e : -E
lect
ion
Han
dbno
k,
1989
.

TA
BL
E :
2.6.
07
~U
an
be
r an
d P
mcm
tage
of V o
tor
pojlc
d by
P
olit
ical
Psr
tie~
in
th
e I9
86
gzst
rict
Cou
ncil
Elc
ctjo
n 1
Par
ties
Jain
tia
Hil
ls
Khr
si
Hll
ls
Oar
6 N
iljls
Tota
l Val
id V
otes
pol
led
40
961
9974
5 89
110
Votes
secu
red
by : -
w
Ind
ian
Nat
ion
al C
angr
essl
107
69.
2519
1 66
019
r
(26.29)
(25.
45)
(67.
S5)
Com
mun
ist
Part
y of
In
dia
...
. .
... all
Par
ty H
ill
Lm
ders
C
onfe
renc
e (A
) ...

TA
BL
E :
26.0
7 (C
onlc
d)
Hill
t S
tate
Peo
ple
Dcmo-
crat
ic P
atty
1 68
83
2145
3 ...
Pub
lic
Dem
and
Imp
lc-
men
tati
on C
onve
nti
on
-.
780
1 . . .
!2 *P
(7
.02)
H
ills
Peo
ple
U
nio
n
17236
2980
1 10
254
(42.
08)
(23.
86)
(11.
51)
Oth
er
Pnr
tiat
and
6973
223
19
1225
9
Indr
pend
catr
(1
4.83
) (2
2.37
) ( 1
3-76
)
Fig
ur-s
in
brac
kets
are
percentages f
o to
tal
vsli
d I
~O
~C
~
p*j
ktj
Sour
ce :
-Ele
ctio
n H
andb
ook,
:9BS.

No.
of
Ele
ctor
ate
Vo
ter
Pol
led
Cen
siit
ucn
- co
uten
ting
c ----d
--.--~
r -6,-
7
tics
M
ale
Fem
ale
Tot
al
Val
id
Vot
es
Vo
tes
Rcj
ec-
tcd
1. S
hillo
ng
8 2,
97,1
10 2
,91,
783
5,88
,893
2,9
7,25
1 4,
729
Pirliancntary
2. T
ura
4 1,
77,8
36
1,74
,,83i
3,5
2,67
0 2,
00,0
59 3,306
Pad
inm
cnta
ry
Meg
hala
yr
12
4,74
,946
4,
66,6
17
9,41
,563
4,
97,3
1fl 8
,035
Sour
ce :
--C
hief
bl
cctu
ral
Off
icer
, M
eghr
laya
.

TA
BL
E :
26.
09
Num
ber and B
eren
tage
sf V
otes
pol
led
by ~
o~
itic
a'i
P
arti
es in
th
e L
ok S
abha
E
lecz
ion
, 19
91
Val
id V
otes
V
otr
s P
olle
.) by
Pol
itic
al
Par
ties
~
ns
titu
en
ci~
~
p0j
lcd
,-
- --
... -.h-----------
--l
1.N
.C.
C.P
.1,
B..J
.P
IsN
sD
(1)
(3 )
(4)
(5)
(61
1.
Sh
illo
ng
Par
lie-
2,
97,2
51
1,4(
,8g5
3,
524
15,8
35
1,3Q
97
- rn
enia
ry
(48.
74)
1 1.1
9)
(5.33)
(44.
74)
,Y
rP
2.
Tura ~
arl
iam
cn-
2,~
C,0
59 1
,36.
t 67
2,
672
18,4
40
42.,2
99
tary
(6
8.31
) (1
.34)
(9
.21)
(3
1.14
)
Mcg
hal a
ya
4,
97,3
10 2,P1,522
6,19
6 34
265
1,
75,2
87
r5c.
61)
1.25
) (6
.89)
(8
5 25
)
Not
e :- t
ilm
ra i
n
brac
kets
in
dica
te
per
crn
tage
s.
Seu
rce :-
Chid
Ele
ctor
al O
ice
r,
Meg
hala
ya.


TA
BL
E : 2P02
Num
ber
of T
ouri
st S
pots
in
Mcg
hala
ya
Dis
tric
ts
198j
1989
1990
1991
(1)
(2)
(3)
j.1)
(5)
Jain
tia I
Iiila
4
7 7
7
East
Kba
ri Hills
*17
26
28
2 0
Wep
t K
hasi
Hills
9 9
9
E5
... - O
I
Eas
t Garo H
ills
**5
4 4
4
Wes
t Gar
o H
ills
...
8 8
3
Mcg
hala
ya
26
5 5
~6
56
*--I
nclu
de f
igur
er of
&a
tt a
nd W
ert
Kha
si H
il&
**-
Incl
ude figures
of E
ast m
d W
est
Gsr
o H
illr
Sour
ce :
-Dir
ecto
rate
of
Tou
rirm
, ~eg
ha
lay
a, Shillong.

TA
BU
: 2
7.03
X
uinb
+r of C
!ina
ma
Nor
iaes
in
Meg
hd
ava
For
the
ycar
19
90 a
qd 1
991.
(D
ttxi
ct-)
Vue
)
a .
C in
ema
I$ou
s:?
S!!
ti?g
ca
!)at
ity
No
, D
isrr
icts
(N
os.)
(N
or.)
r--A
--\
?-.-A
----I
1990
19
91
1990
19
91
(1 1
(2)
(3)
4 (5)
(6)
1. E
ast
Kha
di H
ill8
_ 6
6 51
15
51.1
5 KI
2.
Wes
t K
had
Hill
a X
i1
Nil
Nil
N
il
3.
Jain
tia
Hill
s 2
2 14
92
1492
4.
E
ast Garo
Hil
ls
Nil
NI
~
Nil
Nil
5-
Wes
t G
aro
Hil
b 1
1 36
0 36
0 M
egha
!aya
9
9
7267
72
67
--- 1
Sour
ce :- G
ener
al
Adm
inis
trat
ion
(Ri
D p
arlm
cnt,
M
cgha
laya
, Sh
illon
g .


r@T ' 'w
220
TABLE : 28.02
In~orne of tlke Shill.)ng Municipal Board.
(Rs. in lakt~s)
1 . Tax Rtv@lue 28.68 02.56 90.1 1 510.73
2. Non-Tax Re- 14.78 16.02 5 . 1 rcnue
3,Grant and 57.19 86.06 18t.:O 202.96 Co;ltribution
4. E x t m O r d i ~ - .. 6.15 1745 24.15 ry Debt

.rA n
22 1
TABLE : 28.03
Expenditure of the Shillong Municipal Board
L . (as. in Lakhs)
Heads, 1986 I990 lggl
1. General Administra- 2 1.30 tion Collection Charges
2. Public Safety ... 0.73 3. Water Supply ... 23.23 4. Drainage ... 9.22 5. Consevailcy ... 29.00 6 . Hospital & Dispcn- 0.80
sary 7. Others ... 4.23 . 8. public Works ... 10.33 9. Miscelldneous ... 0.81 10. Repayment of .. . ...
Loans
Total- ... 93.73 187.88 233.011
Sourcc : - Shillo~lg Municipal Board.

TABLE : 28.0(+
Number. 05 Waie Housing Centres, Capacity ,
and Occupancy in M eghalay r .
Year No. 6E Average Average Ware- Capac~ ty Occupan-
Housing 6In A~.T.) cy (in Ccntrea MT.)
Source :--Meghalaya state Ware Housing Cplporat~on.

TA
BL
E : 2
8.05
D
istr
ict-
Wis
e N
umbe
r of
Pai
r P
rice
sh
pps in
Meg
hala
ya
Tot
al
799
842
1069
11
76
k?
W
Eas
t Ih
h.8i
H
ills
R,u
rsl
$32
331
42 1
431
Urb
an
466
511
648
695
Tot
al
503
54%
56
+ 58R
Ww
t K
hui
Hill
r R
ura
l 5
16
17
17
Urb
an
498
529
547
571

TA
BL
E:
&$'
US
(C
kn
d.)
Tot
al
219
239
250
266
Jain
tia
Hill
: R
ural
12
15
13
I7
U
rban
20
7 22
4 23
7 24
9
To181
255
296
Eas
t C
aro
Hil
ls
305
356
2
Rur
al
16
13
13
19
Urb
an
245
2e3
292
337
Tot
al
778
897
922
1021
W
est
Gar
u H
ills
Rur
al
67
80
93
113
Urb
an
711
817
829
908
Meg
hala
ya
Tot
al
2553
25
19
3110
33
57
Rur
al
426
455
597
ur
b~
~
2127
?361
2760
So
~rc8
:-D
irec
tora
te
ofS
up
ily , M
egL
al.r
ya.

TA
BL
E :
28'0
, R
dblr
ro of
Rim
, Whe
at a
nd S
ugar
;or
Publ
id D
istr
ibut
ion
Syst
om
in M
tgha
laya
by
F.C
.I.
(Met
ric
P0p
.m)
Yea
r R
ice
wh
eat
Oug
ar
Net
e :-
*With
ef
fect
from
Mar
sh,
1&85
to D
ecem
ber,
1RIC.
setr
J,..
(-B
ifaet
errk
bf
lup
ply,
Meg
hla
p.

226
TABLE: 28'87
Composite Xakis of c*change for Ascountat @f Tmsanctions . tqing Place in Foreign
Currencies for the Quarter ending De- cember, 1992.
Country Foreign Cur~ency
( 1 2 . (2)
I. Australia ... I As
2. Austria ... 1 AS Seh.
3. Belgium . . 1 B. Fr. 4. Canada ..- 1 C.H. 5. Denmark -.. 1 Doikroner
6. Federal Repu- 1 D. M. blic of Ger- many.
7. France - *. 1 Fr. Fr.
8. Italy . . . 1 Lira
9. Japan ... 1 Yen
0. Malaysia - - 1 Ringgit
Rupees
(31

22 7
TABLE : 28'07 (contd.)
11, Netherlands ... 1 D. G. 18'952&
12. Norway ... 1 N. Gonet 5.5975
13. Saudi Arabia.. 1 S. Riyal 8.0707
14. Singapore ... 1 S.S. 19.2961
15. Sweden ... 1 SW. Kroner 5.7821 S(
16, Switzerland ... I'SW. Fr. M.2284
17. United Kingdom ... 1 Pound (Stg.) 57'8518 b
1 8 . u . S . A . .- 1 US. 30.9491
w Source:-Government of India, &finisei~ of Fi- nance Department of h n o m i c Affairs (Sadget Division).

TABLE : 26.01
SOCIO ECONOMIC INDICATORS MEGHALAYA
1 Items Unit Reference Meg balaya I Period
Area ... 'BOO Sq. Kms.
Population L a b Np. Density of Nos. population Sex ratio Females
per tOOOs Males
Rural Popu- P.c. lation
Urban Popu- P.c. lation Scheduled Tri- P.c. bes Population Scheduled Cas- P.c. tes Population Literacy ... P.c. (a) Total ,,
f h) Rural ,, ( c ) Urban ,, (di Male ;, (e) Female ,,
1991 (P) 1991 (P)
1991 LP)
1991 (P)
1991 (P)
199 1
1991 (P) '<

4 229
* TABLE : 29.01 (Contd.)
(1) (2) (3) (4)
10. Main Workerr P.c. 199, (P) $0.85 '% as percentage
to total popula- tion
11. Percentage to P.c. 1991 (P) total main wor- kers
(a) Cultivators ,, I I 56.25 (b) Agricultural ,, ss 13.33
Labourers
(c) Workers en- ,, 3, 1 . 0 ~ gaged in House- hold Indus- / try, Manufac- turing, Preces- sing and repaim
-. (dl Other Wor- ,, I, 29.42
kers
12. Birth rate Per '000 !990 31.8 13. Death rate Per '000 1990 7.8
* L 14. Net area sown p.c, 1990-91 9.0 1
as percentage to total area

230
TABLE :' 29.01 (contd.7
15. Percentage of P.c. 1990-91 18.35 area sown more than once to net area sown
16. Per capital net Hec- 199C-91 oil1 area sown tars,
- 17. Averaee size of Hec. 1985-86 1.76
Operational tares Holdings
18. Average yield Kgs. 1990-91 per hectare
(a) Rice Y , 3 I 1,141 (b) Maize 3 9
) > 1,284 (c) Potato ,, 5) 6,350
(d) Rape and ,, , , 61 1 Mustard
19. Cansumption of Kgs. 1990-91 11.90 Fertilizers Per Hectare o f crop- ped area sown.

~""r 4 23 1 F TABLE : 29.01 (eontd .)
(11 (2) %31 ' t4)
2e. Go-operative Socie- Nos. 1990-91 41 . - tits per lakh ef ppopu- lation.
21. ? Q S ~ Officc~ per lakh Xes. 1991-92 26 of population.
22. Villages electrified P.c. 1990.91 46.3 as percentage to total villages.
28. Motor vehicles peg Ros. 1939-90 1,767 lakh of population.
24. Road length per 100 Kms. 16)90-91 25.4 Sq. Kms. of area.
\ 25. Surfaced Road per Kms. 1990-91 18.7 100 Sq. Kms. of area.
-. 26. percentage of surfa- P.c. 1990-91 42.3 ' ced road to total road length-
27. Primary Schools per Nos. 1990-91 (P) 2 thousand of popalatien
.. 2). I4iddla Schools par Nos, 199831 (P) 5 ten t hour and of popu- atio n. --

'%* TABLE : 29.01 (contd.)
(1) ;2) (3) (4.1
29. HiOh School3 per !akh Nos. 1990-91 (p) 25 ef Population.
Teadm-hpil ratio %s. 1990.91 (p) (a) Pzimary Stage r r @) Middle Stage 6. 99 35 (03 High/Higher &- 68 2 ) 24
mndary stage 9 ) 14
81, hverament Horpi tale Nea 1981 md Dipensarios par 2 lakh of population.
82. Primary Health Cen- Nos. 1990-91 4 trer pet lakh of popu- lation.
St. Hoapital Beds * per Nes. 1991 103 lakh of populat~an.
84. Bank Offices per lakh Nos. AAuch'92 9 ef population.
35. Per capita Income at RB. 1991-92 (Q) 4458 Curtent price.


TA
BL
E : 3
0.d1
(co
ntd.
) -
iGi
cs~
sus (P
RO
VIS
ION
AL
) el
'-- -------.--- ,-*h
,-.,,-.-
------
------
-,
Gro
wth
L
iter
acy
$ ,
3
Per
ccn-
%
z_ 1
Rat
e R
ate
g BQ E
; 'ag
e of
2 Q 4
(198
1-91
) P
erce
n-
rd
h~
2
a 0
Mab
Y
Z'
ZS
~~
0
~2
0
Per
cen
tage
ta
gc . a
, w
orke
rs
d +
1 1'3
o d
pl
to to
tal
2 .; .?
9 a
52.;
: 0
aDsp
l Pop
uia
&aq
jd
tion
N
0
(1)
(8)
(9)
And
hra
Pra
desh
23
.91
45.11
Aru
nach
al p
rnda
sh
35.8
6 41
-22
Ass
am
... 23
.58
53-4
2 B
fhar
...
23
49
38
'54
Goa
...
15
'96
76'9
6 G
ujar
at
... 20
'80
60.9
1 H
arya
na
...
26.2
7 55
.33
- H
irna
chal
Pra
desh
19
.59
63-5
4 .J
amm
u an
d K
ashm
ir 2
8'92
..


u on zz2 ~ 0 ' n . r ~ o O o c a q - ~ C C .a=, dA&w.&o. do* o=.l, 0 NV 0 * 4 ) \ 0 ~ 0 0 0 ~ 6 CI CI.r(-- %'s ti n.r( e'&%"rn P l o u
+ Q ) ~ P - ~ r n O ( 6 0 ~ 000'9) 06'E'IE 3 2 .&&sr;<&&& str pas!%raua N m : 3 gm" oc dun^ Uop - - m
-r %drI Jo JJQmnhi - 2 (SON 000~) Nh %g&g009:gzs
N ~ I n m - m 5 (6861 'innu'[ , o, - .g w Q o3dn) 68-8861 snwp! I 3n1.m~ par1QCuI a sernq~ pan*~dmI
0 - 0 b o o - 0 - n r 68-886T - N g : s z z s g g 2 (i 'dn ~ a s s ~ n e ~ d - . N co =- CQ
se%-018 JO JaqmnN A . . : : : : : : : ;I: . 0 . . . . . . .
F,
E, a 3 a$.:.. g a . . , . : = a 5 %
m -2 . . gsc * - t '='5 M fi-z
& % mzs r m ;i aE, s
s t
E: 2 - A o 32.3 a !i cc2ts"rrrcmx *

Sta
tes
Per
Cap
ita
Con
sum
ptio
n of
E
lect
rici
ty,
1989
-90
(KW
H)
(1)
(25)
(2
6)
(72)
(2
8)
(29)
A
ndhr
a P
rade
sh
..a
32.5
4 '7
.35
89.1
7 87
.42
227.
22
Aru
nach
al P
rade
rh ...
19.9
8 4.
74
8.39
2.
24
58.0
2 A
ssam
...
...
6.
60
4.54
34
.70
0.57
7'
1.93
ai
har
*..
..
5.00
2.
97
51.0
7 16
.60
102.
35
Coa
#..
.. 88
.36
27.6
0 21
1.02
9.
02
396.
25
Guj
arat
..
... 37
.36
14'8
2 19
9.52
99
.41
3: 8
.79
Har
yana
. .
. . 63
.20
10.0
5 91
99
158.
85
353.
37
Him
acha
l P
rade
sh ...
39.5
9 14
.75
88.8
9 5.
16
179.
78
.Jam
mu
and
Kas
hmir
44
.68
29.1
8 45
.23
18.2
6 17
8.02

sche
dule
d ~d
rnm
erci
al ba
nk a
s en
,3ls
t :
Mar
ch, 1
992
Sta
tes
(11
And
hra
Prad
esh
Aru
nrch
al P
rade
sh
Ass
am
. rn B
ihar
...
Co
a
.*.
Guj
arat
... ...
Ha~
yan
a H
imac
hal
Prad
esh
.Jam
mu &
Kas
hmir

Stat
es
TA
BL
E-
30.0
1 (
cont
d.)
0
Est
imat
ed A
nnua
l "I
0
Gnd
hra
Pra
desh
,..
1084
A
runa
chal
Pra
dash
..-
A
ssam
...
... 23
2 B
ihar
...
... 72
3 G
oa
... ...
72
3 G
uja
rat ...
... 16
04
Har
yana
... 41
0 H
imac
hal ~
rade
sl;"
59
Ja
mm
u &
K~
hm
ic
97

5 ! 3 ! 241 < -
TABLE 30.01 (Contd. )
Per Capita Income, 1989-90 (Q) r.̂ -__L---A-b--- 1
States At current At 1980.8 1 x prices Prices
1 (38) (39)
Andhra Pradesh ... ... .., Arunachal Pradcsh ... 4176 2199
Assaln . . ... 3173 1650
... Bihar ... 21 22 98 1
... ... C;oa ... 6939 3678
... Gujarat ... 5104 2629
Fiarysna - * . . 6265 3193
3 -
\


h CQ m N M I m - - " 2 " " g Z - NLm' ' . a * t.


TA
BL
E -
-31)
'3 1
-(co
ntd.
)
7 (I
S)
(19)
(2
0)
harn
atak
a .-
- ...
67
88
.85
2.01
I
9-92
Ker
ala
a-
...
10
74.6
9 2.
49
14.3
2
Mad
hya
Pra
desh
. .
:59
83.0
4 1.
85
18.9
9
Mah
aras
htra
...
.. !I
1 91
.84
2.11
h
.A. /
Man
ipur
...
... 3
73.6
8 3.
38
46.4
3
Meg
hala
ya
... a ,
1 82
.01
0.54
N
.A.
Mi z
oram
...
-. 1
95.5
9 0.
45
12.3
1


Ker
ala
.. M
adhy
a Pr
ades
h
Mah
aras
htra
Mag
ipur


I '
TA
BL
E-
30.0
1 (c
ontd
.)
Pun
jab
... 50
10
7 95
2u
2 40
1 88
8
Raj
asth
rn ...
34
2 22
29
210
439
128
913
Sikkim
...
7
2 2
4
57
878
Tam
il N
adu
13
0 48
2 27
4 55
6 42
1 9
72
'Eri
pura
...
19
14
18
27
262
946
Utt
ar Prademh
294
799
651
1398
47
2 88
1
Wes
t B
cnga
l 89
35
5 32
5 68
0 79
6 91
7
AL
L I
ND
IA
1287
43
78
4065
84
43
267
829 /

Orf
ssa
... 19
'50
48'5
5 13
-48
32-7
0 73
-06
Pun
jab
... 20
.26
57'1
4 29
'72
29.8
9 56
.14
Raj
asth
an
... 28
.07
38
.~1
22
'08
31'5
9 69
.31
g
Sikk
im
28'1
7 56
.53
9.1
2 40
'89
66'2
3 N
Tam
il N
auu
. .. 14
-94
63'7
2 34
.20
41-2
9 59
.18
Tri
pu
la
...
33.6
9 60
'39
15'2
6 28
'91
61.5
7 U
ttar
Pra
desh
25
.41
41'7
1 !$
'89
29'7
4 72
.07
Wes
t Bcn
girl
...
24-5
5 57
-72
27'3
9 50
'20
52'9
5 I
- --
--- -.-------I-
-.-
i A
LL
IN
DIA
23
.66
52.1
1 25
-72
34.1
2 64
.90
--

