form 10-q - transamerica insurance, investments & … · 2012-09-06 · form 10-q quarterly...
TRANSCRIPT

UNITED STATES SECURITIES AND EXCHANGE COMMISSION
Washington, D.C. 20549
FORM 10-Q
QUARTERLY REPORT PURSUANT TO SECTION 13 OR 15(d) OF THE SECURITIES EXCHANGE ACT OF 1934
FOR THE QUARTERLY PERIOD ENDED SEPTEMBER 30, 2010
COMMISSION FILE NUMBERS 33-34562; 33-60288; 333-48983; 333-133224
TRANSAMERICA ADVISORS LIFE INSURANCE COMPANY OF NEW YORK (Exact name of Registrant as specified in its charter)
440 Mamaroneck Avenue Harrison, NY 10528
(Address of Principal Executive Offices)
1-800-333-6524 (Registrant’s telephone number including area code)
Indicate by check mark whether the Registrant (1) has filed all reports required to be filed by Section 13 or 15(d) of the Securities Exchange Act of 1934 during the preceding 12 months (or for such shorter period that the Registrant was required to file such reports), and (2) has been subject to such filing requirements for the past 90 days.
Yes � No �
Indicate by check mark whether the registrant has submitted electronically and posted on its corporate Web site, if any, every Interactive Data File required to be submitted and posted pursuant to Rule 405 of Regulation S-T (§232.405 of this chapter) during the preceding 12 months (or for such shorter period that the registrant was required to submit and post such files).
Yes � No �
Indicate by check mark whether the registrant is a large accelerated filer, an accelerated filer, a non-accelerated filer, or a smaller reporting company. See the definitions of “large accelerated filer,” “accelerated filer” and “smaller reporting company” in Rule 12b-2 of the Exchange Act. (Check one):
Indicate by check mark whether the Registrant is a shell company (as defined in Rule 12b-2 of the Exchange Act).
Yes � No �
APPLICABLE ONLY TO ISSUERS INVOLVED IN BANKRUPTCY PROCEEDINGS DURING THE PRECEDING FIVE YEARS:
Indicate by check mark whether the Registrant has filed all documents and reports required to be filed by Sections 12, 13 or 15(d) of the Securities Exchange Act of 1934 subsequent to the distribution of securities under a plan confirmed by a court.
Yes � No �
APPLICABLE ONLY TO CORPORATE ISSUERS:
Indicate the number of shares outstanding of each of the issuer’s classes of common stock, as of the latest practicable date.
COMMON 220,000
NEW YORK
(State or other jurisdiction of incorporation or organization)
16-1020455 (IRS Employer
Identification No.)
Large accelerated filer �
Accelerated filer � Non-accelerated filer �
(Do not check if a smaller reporting company) Smaller reporting company �

REGISTRANT MEETS THE CONDITIONS SET FORTH IN GENERAL INSTRUCTION H(1)(a) AND (b) OF FORM 10-Q AND IS THEREFORE FILING THIS FORM WITH THE REDUCED DISCLOSURE FORMAT.

PART 1. Financial Information
Item 1. Financial Statements
TRANSAMERICA ADVISORS LIFE INSURANCE COMPANY OF NEW YORK (A WHOLLY OWNED SUBSIDIARY OF AEGON USA, LLC)
BALANCE SHEETS
See Notes to Financial Statements
1
September 30, December 31,(dollars in thousands, except share data) 2010 2009 (unaudited) (audited)ASSETS
Investments Fixed maturity available-for-sale securities, at estimated fair value (amortized cost: 2010 - $140,977;
2009 - $110,939) $ 153,918 $ 113,927Equity available-for-sale securities, at estimated fair value (cost: 2010 - $80; 2009 - $80) 69 57Policy loans 59,554 63,045
Total investments 213,541 177,029
Cash and cash equivalents 23,174 49,423Accrued investment income 3,276 2,706Deferred policy acquisition costs 379 360Deferred sales inducements 137 130Value of business acquired 30,314 30,982Goodwill 500 500Federal income taxes — current 372 —Reinsurance receivables 1,111 1,782Affiliated receivables — net 32 —Receivable for investments sold — net 22 65Other assets 3,488 2,624Separate Accounts assets 612,293 644,149
Total Assets $ 888,639 $ 909,750
LIABILITIES AND STOCKHOLDER’S EQUITY Liabilities
Policyholder liabilities and accruals Policyholder account balances $ 117,166 $ 125,329Future policy benefits 18,518 18,486Claims and claims settlement expenses 2,671 1,918
138,355 145,733
Other policyholder funds 82 157Federal income taxes — current — 368Federal income taxes — deferred 2,821 618Affiliated payables — net — 235Other liabilities 828 932Separate Accounts liabilities 612,293 644,149
Total Liabilities 754,379 792,192
Stockholder’s Equity Common stock ($10 par value; 220,000 shares authorized, issued and outstanding) 2,200 2,200Additional paid-in capital 128,638 128,638Accumulated other comprehensive income, net of taxes 8,324 2,050Retained deficit (4,902) (15,330)
Total Stockholder’s Equity 134,260 117,558
Total Liabilities and Stockholder’s Equity $ 888,639 $ 909,750
TRANSAMERICA ADVISORS LIFE INSURANCE COMPANY OF NEW YORK (A WHOLLY OWNED SUBSIDIARY OF AEGON USA, LLC)
STATEMENTS OF INCOME
See Notes to Financial Statements
2
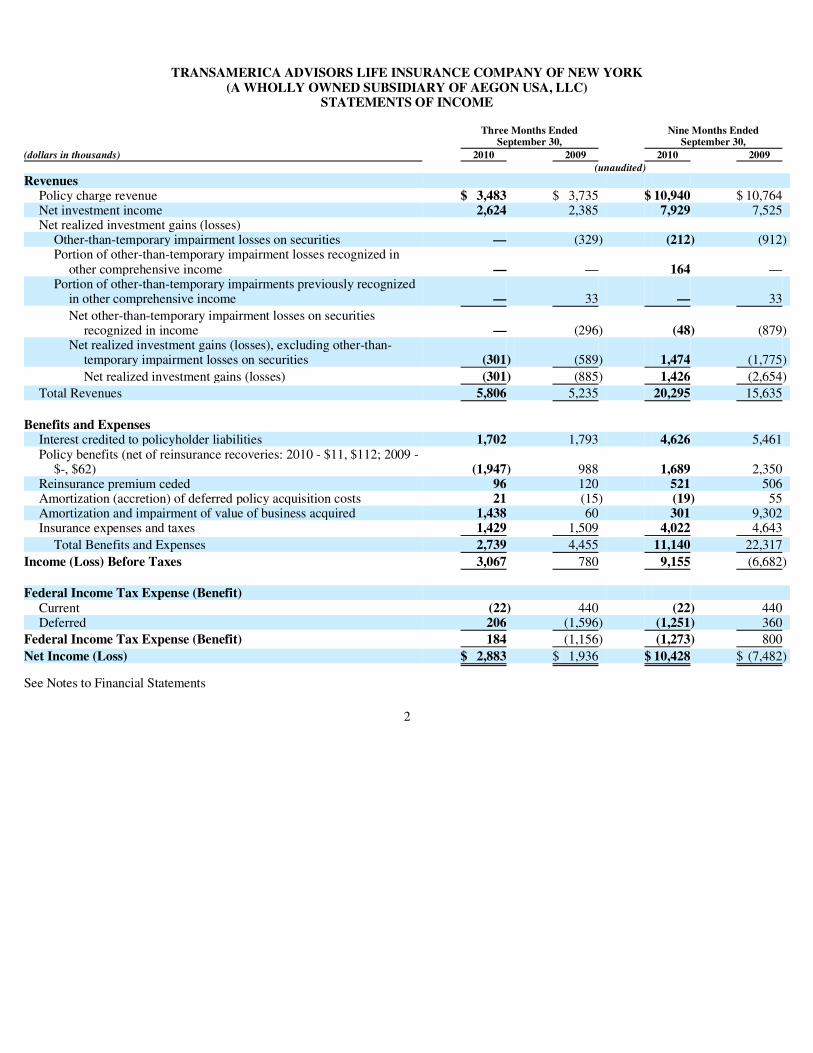
Three Months Ended Nine Months Ended September 30, September 30,(dollars in thousands) 2010 2009 2010 2009 (unaudited)Revenues
Policy charge revenue $ 3,483 $ 3,735 $ 10,940 $ 10,764Net investment income 2,624 2,385 7,929 7,525Net realized investment gains (losses)
Other-than-temporary impairment losses on securities — (329) (212) (912)Portion of other-than-temporary impairment losses recognized in
other comprehensive income — — 164 —Portion of other-than-temporary impairments previously recognized
in other comprehensive income — 33 — 33
Net other-than-temporary impairment losses on securities recognized in income — (296) (48) (879)
Net realized investment gains (losses), excluding other-than-temporary impairment losses on securities (301) (589) 1,474 (1,775)
Net realized investment gains (losses) (301) (885) 1,426 (2,654)
Total Revenues 5,806 5,235 20,295 15,635
Benefits and Expenses
Interest credited to policyholder liabilities 1,702 1,793 4,626 5,461Policy benefits (net of reinsurance recoveries: 2010 - $11, $112; 2009 -
$-, $62) (1,947) 988 1,689 2,350Reinsurance premium ceded 96 120 521 506Amortization (accretion) of deferred policy acquisition costs 21 (15) (19) 55Amortization and impairment of value of business acquired 1,438 60 301 9,302Insurance expenses and taxes 1,429 1,509 4,022 4,643
Total Benefits and Expenses 2,739 4,455 11,140 22,317
Income (Loss) Before Taxes 3,067 780 9,155 (6,682)
Federal Income Tax Expense (Benefit)
Current (22) 440 (22) 440Deferred 206 (1,596) (1,251) 360
Federal Income Tax Expense (Benefit) 184 (1,156) (1,273) 800
Net Income (Loss) $ 2,883 $ 1,936 $ 10,428 $ (7,482)

TRANSAMERICA ADVISORS LIFE INSURANCE COMPANY OF NEW YORK (A WHOLLY OWNED SUBSIDIARY OF AEGON USA, LLC)
STATEMENTS OF COMPREHENSIVE INCOME
See Notes to Financial Statements
3
Three Months Ended Nine Months Ended September 30, September 30,(dollars in thousands) 2010 2009 2010 2009 (unaudited) Net Income (Loss) $ 2,883 $ 1,936 $ 10,428 $ (7,482)
Other Comprehensive Income (Loss)
Net unrealized gains (losses) on available-for-sale securities Net unrealized holding gains arising during the period 5,752 7,103 10,558 13,028Reclassification adjustment for (gains) losses included in net income (20) 377 (456) 1,858
5,732 7,480 10,102 14,886
Net unrealized other-than-temporary impairments on securities
Net unrealized other-than-temporary impairment losses arising during the period — — (164) —
Change in previously recognized unrealized other-than-temporary impairments 27 — 27 79
Reclassification adjustment for other-than-temporary impairments included in net income — (33) — (33)
27 (33) (137) 46
Adjustments Policyholder liabilities 41 (22) 98 378Deferred policy acquisition costs — — — 38Value of business acquired (175) (183) (336) 275Deferred federal income taxes (1,997) (2,535) (3,453) (5,446)
(2,131) (2,740) (3,691) (4,755)
Total other comprehensive income, net of taxes 3,628 4,707 6,274 10,177
Comprehensive Income $ 6,511 $ 6,643 $ 16,702 $ 2,695
TRANSAMERICA ADVISORS LIFE INSURANCE COMPANY OF NEW YORK (A WHOLLY OWNED SUBSIDIARY OF AEGON USA, LLC)
STATEMENTS OF STOCKHOLDER’S EQUITY
See Notes to Financial Statements
4
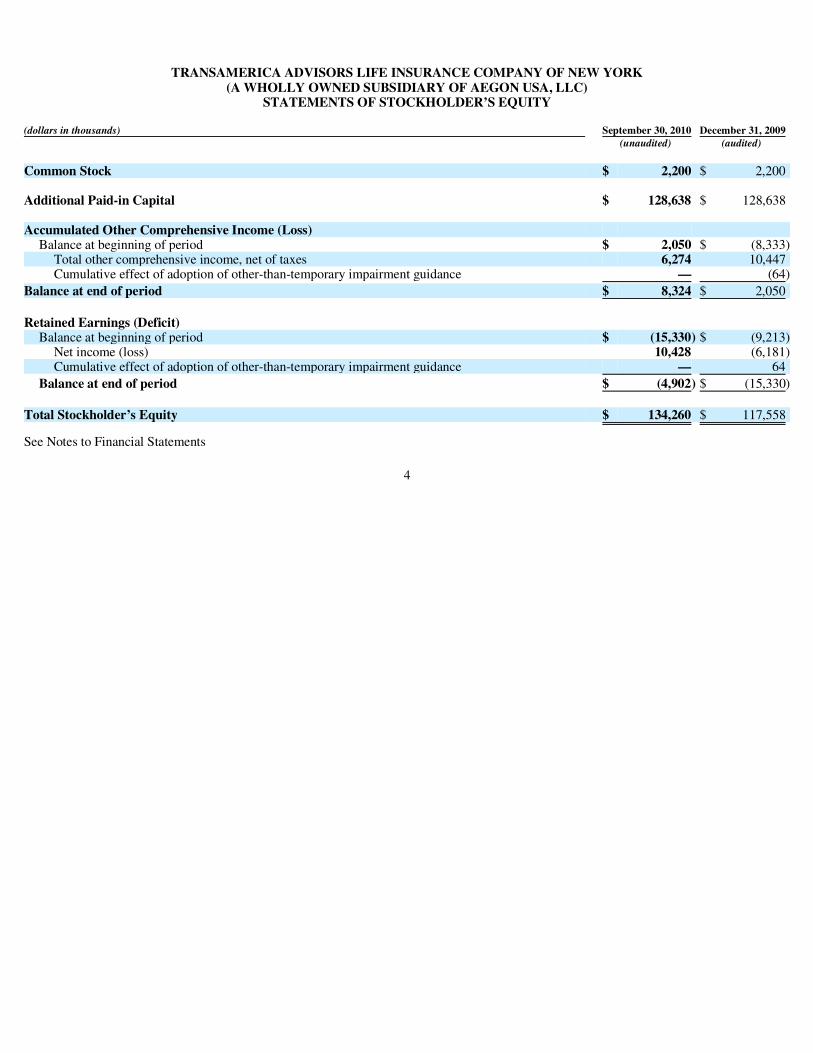
(dollars in thousands) September 30, 2010 December 31, 2009 (unaudited) (audited) Common Stock $ 2,200 $ 2,200 Additional Paid-in Capital $ 128,638 $ 128,638 Accumulated Other Comprehensive Income (Loss)
Balance at beginning of period $ 2,050 $ (8,333)Total other comprehensive income, net of taxes 6,274 10,447Cumulative effect of adoption of other-than-temporary impairment guidance — (64)
Balance at end of period $ 8,324 $ 2,050
Retained Earnings (Deficit)
Balance at beginning of period $ (15,330) $ (9,213)Net income (loss) 10,428 (6,181)Cumulative effect of adoption of other-than-temporary impairment guidance — 64
Balance at end of period $ (4,902) $ (15,330)
Total Stockholder’s Equity $ 134,260 $ 117,558

TRANSAMERICA ADVISORS LIFE INSURANCE COMPANY OF NEW YORK (A WHOLLY OWNED SUBSIDIARY OF AEGON USA, LLC)
STATEMENTS OF CASH FLOWS
See Notes to Financial Statements
5
Nine Months Ended September 30,(dollars in thousands) 2010 2009 (unaudited)CASH FLOWS FROM OPERATING ACTIVITIES
Net income (loss) $ 10,428 $ (7,482)Adjustment to reconcile net income (loss) to net cash and cash equivalents provided by operating
activities: Changes in:
Deferred policy acquisition costs (19) (10)Deferred sales inducements (7) 12Value of business acquired 301 9,302Benefit reserves (1,118) (926)Federal income tax accruals (1,990) 2,150Claims and claims settlement expenses 753 166Other policyholder funds (75) 311Other operating assets and liabilities, net (1,094) 4,400
Amortization (accretion) of investments 30 (143)Interest credited to policyholder liabilities 4,626 5,461Net realized investment (gains) losses (1,426) 2,654
Net cash and cash equivalents provided by operating activities 10,409 15,895
CASH FLOWS FROM INVESTING ACTIVITIES
Sales of available-for-sale securities 34,264 27,293Maturities of available-for-sale securities 5,568 9,483Purchases of available-for-sale securities (68,242) (24,370)Net settlements on futures contracts (200) (1,537)Policy loans on insurance contracts, net 3,491 2,985
Net cash and cash equivalents provided by (used in) investing activities (25,119) 13,854
CASH FLOWS FROM FINANCING ACTIVITIES
Policyholder deposits 415 2,745Policyholder withdrawals (11,954) (16,840)
Net cash and cash equivalents used in financing activities (11,539) (14,095)
Net increase (decrease) in cash and cash equivalents (1) (26,249) 15,654Cash and cash equivalents, beginning of year 49,423 29,973
Cash and cash equivalents, end of period $ 23,174 $ 45,627
(1) Included in net increase (decrease) in cash and cash equivalents is interest paid (2010 - $2; 2009 — $0); interest received (2010 — $2; 2009 — $0); Federal income taxes paid (2010 — $805; 2009 — $0); Federal income taxes received (2010 — $88; 2009 — $1,350)

TRANSAMERICA ADVISORS LIFE INSURANCE COMPANY OF NEW YORK (A WHOLLY OWNED SUBSIDIARY OF AEGON USA, LLC)
NOTES TO FINANCIAL STATEMENTS (unaudited) (Dollars in Thousands)
Note 1. Summary of Significant Accounting Policies
Basis of Presentation
Transamerica Advisors Life Insurance Company of New York (“TALNY” or the “Company”) is a wholly owned subsidiary of AEGON USA, LLC (“AUSA”). Prior to July 1, 2010, the Company was known as ML Life Insurance Company of New York (“MLLICNY”). AUSA is an indirect wholly owned subsidiary of AEGON N.V., a limited liability share company organized under Dutch law. During 2009, the Company, in addition to not issuing life insurance products, ceased issuing variable annuity and market value adjusted annuity products. The Company is licensed to sell insurance and annuities in nine states.
For a complete discussion of the Company’s 2009 Financial Statements and accounting policies, refer to the Company’s Annual Report on Form 10-K for the year ended December 31, 2009.
The interim Financial Statements for the three and nine month periods are unaudited; however in the opinion of management, all adjustments (consisting of normal recurring accruals) necessary for a fair statement of the Financial Statements have been included. These unaudited Financial Statements should be read in conjunction with the audited Financial Statements included in the 2009 Annual Report on Form 10-K. The nature of the Company’s business is such that results of any interim period are not necessarily indicative of results for a full year.
Basis of Reporting
The accompanying financial statements have been prepared in conformity with U.S. generally accepted accounting principles (“GAAP”). The Company also submits financial statements to insurance industry regulatory authorities, which are prepared on the basis of statutory accounting principles (“SAP”). The significant accounting policies and related judgments underlying the Company’s financial statements are summarized below.
Certain reclassifications and format changes have been made to prior period financial statements, where appropriate, to conform to the current period presentation. These reclassifications have no effect on net income or stockholder’s equity of the prior year.
Accounting Estimates and Assumptions
The preparation of financial statements requires management to make estimates and assumptions affecting the reported amounts of assets, liabilities, revenues and expenses and the disclosures of contingent assets and liabilities. Those estimates are inherently subject to change and actual results could differ from those estimates. Included among the material (or potentially material) reported amounts and disclosures that require extensive use of estimates are: fair value of certain invested assets, asset valuation allowances, deferred policy acquisition costs, deferred sales inducements, value of business acquired, goodwill, policyholder liabilities, income taxes, and potential effects of unresolved litigated matters.
Subsequent Events
The financial statements are adjusted to reflect events that occurred between the balance sheet date and the date when the financial statements are issued, provided they give evidence of conditions that existed at the balance sheet date.
Events that are indicative of conditions that arose after the balance sheet date are disclosed, but do not result in an adjustment of the financial statements themselves.
Recent Accounting Guidance
Current Adoption of Recent Accounting Guidance
Accounting Standards Codification (“ASC”) 820, Fair Value Measurements and Disclosures
The Company adopted guidance (Accounting Standards Update (“ASU”) 2010-06, Improving Disclosures about Fair Value Measurements) which includes new disclosures and clarifications of existing disclosures about fair value measurements as of the period ended March 31, 2010. The guidance requires disclosure of significant transfers in and out of Levels 1 and 2 of the fair value hierarchy and reasons for the transfers. Additionally, the ASU clarifies the level of disaggregation for fair value disclosures,
6
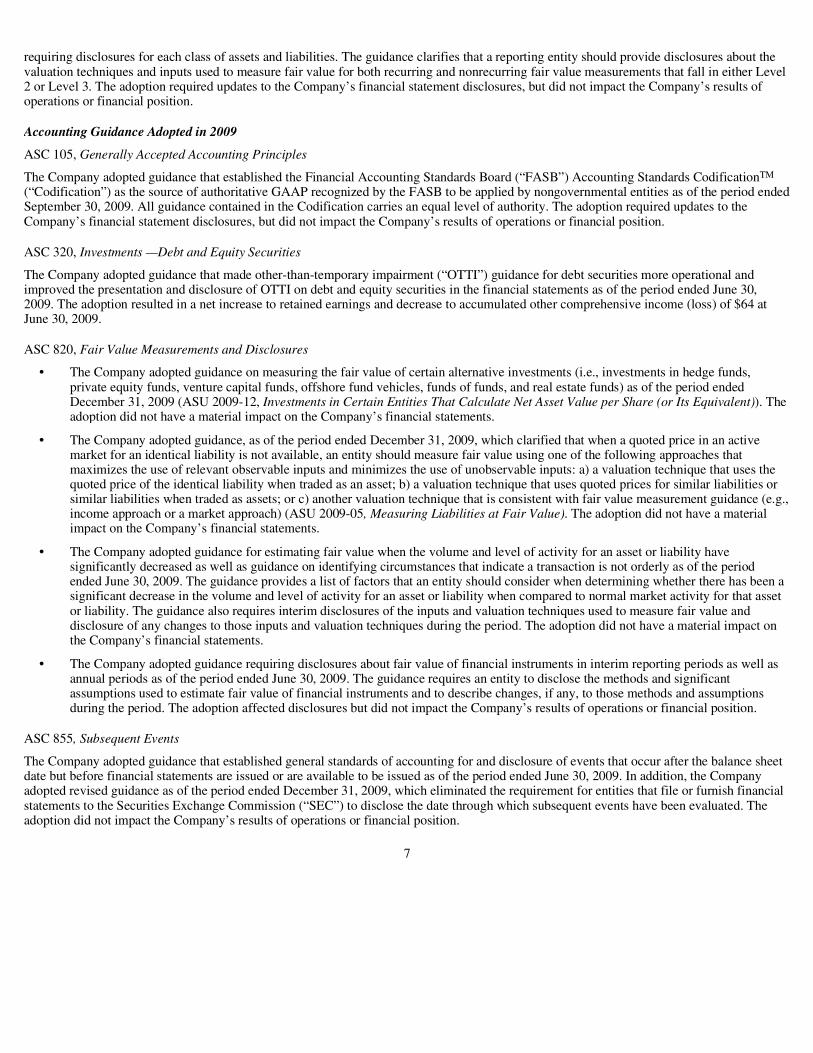
requiring disclosures for each class of assets and liabilities. The guidance clarifies that a reporting entity should provide disclosures about the valuation techniques and inputs used to measure fair value for both recurring and nonrecurring fair value measurements that fall in either Level 2 or Level 3. The adoption required updates to the Company’s financial statement disclosures, but did not impact the Company’s results of operations or financial position.
Accounting Guidance Adopted in 2009
ASC 105, Generally Accepted Accounting Principles
The Company adopted guidance that established the Financial Accounting Standards Board (“FASB”) Accounting Standards CodificationTM (“Codification”) as the source of authoritative GAAP recognized by the FASB to be applied by nongovernmental entities as of the period ended September 30, 2009. All guidance contained in the Codification carries an equal level of authority. The adoption required updates to the Company’s financial statement disclosures, but did not impact the Company’s results of operations or financial position.
ASC 320, Investments —Debt and Equity Securities
The Company adopted guidance that made other-than-temporary impairment (“OTTI”) guidance for debt securities more operational and improved the presentation and disclosure of OTTI on debt and equity securities in the financial statements as of the period ended June 30, 2009. The adoption resulted in a net increase to retained earnings and decrease to accumulated other comprehensive income (loss) of $64 at June 30, 2009.
ASC 820, Fair Value Measurements and Disclosures
ASC 855, Subsequent Events
The Company adopted guidance that established general standards of accounting for and disclosure of events that occur after the balance sheet date but before financial statements are issued or are available to be issued as of the period ended June 30, 2009. In addition, the Company adopted revised guidance as of the period ended December 31, 2009, which eliminated the requirement for entities that file or furnish financial statements to the Securities Exchange Commission (“SEC”) to disclose the date through which subsequent events have been evaluated. The adoption did not impact the Company’s results of operations or financial position.
7
• The Company adopted guidance on measuring the fair value of certain alternative investments (i.e., investments in hedge funds, private equity funds, venture capital funds, offshore fund vehicles, funds of funds, and real estate funds) as of the period ended December 31, 2009 (ASU 2009-12, Investments in Certain Entities That Calculate Net Asset Value per Share (or Its Equivalent)). The adoption did not have a material impact on the Company’s financial statements.
• The Company adopted guidance, as of the period ended December 31, 2009, which clarified that when a quoted price in an active market for an identical liability is not available, an entity should measure fair value using one of the following approaches that maximizes the use of relevant observable inputs and minimizes the use of unobservable inputs: a) a valuation technique that uses the quoted price of the identical liability when traded as an asset; b) a valuation technique that uses quoted prices for similar liabilities or similar liabilities when traded as assets; or c) another valuation technique that is consistent with fair value measurement guidance (e.g., income approach or a market approach) (ASU 2009-05, Measuring Liabilities at Fair Value). The adoption did not have a material impact on the Company’s financial statements.
• The Company adopted guidance for estimating fair value when the volume and level of activity for an asset or liability have significantly decreased as well as guidance on identifying circumstances that indicate a transaction is not orderly as of the period ended June 30, 2009. The guidance provides a list of factors that an entity should consider when determining whether there has been a significant decrease in the volume and level of activity for an asset or liability when compared to normal market activity for that asset or liability. The guidance also requires interim disclosures of the inputs and valuation techniques used to measure fair value and disclosure of any changes to those inputs and valuation techniques during the period. The adoption did not have a material impact on the Company’s financial statements.
• The Company adopted guidance requiring disclosures about fair value of financial instruments in interim reporting periods as well as annual periods as of the period ended June 30, 2009. The guidance requires an entity to disclose the methods and significant assumptions used to estimate fair value of financial instruments and to describe changes, if any, to those methods and assumptions during the period. The adoption affected disclosures but did not impact the Company’s results of operations or financial position.

ASC 815, Derivatives and Hedging
On January 1, 2009, the Company adopted guidance that amended and expanded the disclosure requirements related to derivative instruments and hedging activities to provide users of financial statements with an enhanced understanding of a) how and why an entity uses derivative instruments, b) how derivative instruments and related hedged items are accounted for, and c) how derivative instruments and related hedged items affect an entity’s financial position, financial performance, and cash flows. The adoption did not impact the Company’s results of operations or financial position.
ASC 805, Business Combinations
On January 1, 2009, the Company adopted guidance that established the principles and requirements for how the acquirer in a business combination: a) measures and recognizes the identifiable assets acquired, liabilities assumed, and any noncontrolling interests in the acquired entity, b) measures and recognizes positive goodwill acquired or a gain from bargain purchase (negative goodwill), and c) determines the disclosure information that is decision-useful to users of financial statements in evaluating the nature and financial effects of the business combination. The adoption did not have a material impact on the results of operation or financial position.
ASC 350, Intangibles—Goodwill and Other
On January 1, 2009, the Company adopted guidance that amended the factors that should be considered in developing renewal or extension assumptions used to determine the useful life of a recognized intangible asset. The adoption did not impact the Company’s results of operations or financial position.
Future Adoption of Accounting Guidance
ASC 820, Fair Value Measurements and Disclosures
In January 2010, the FASB issued ASU 2010-06, Improving Disclosures about Fair Value Measurements, which requires separate presentation of information about purchases, sales, issuances, and settlements in the Level 3 reconciliation for fair value measurements using significant unobservable inputs. This disclosure requirement is effective for fiscal years, and interim periods within those fiscal years, beginning after December 15, 2010. The Company will adopt the guidance on January 1, 2011, which affects disclosures and therefore will not impact the Company’s results of operations or financial position.
ASC 944, Financial Services — Insurance
In April 2010, the FASB issued ASU 2010-15, How Investments Held Through Separate Accounts Affect an Insurer’s Consolidation Analysis of Those Investments. This guidance clarifies that an insurance entity should not consider any separate account interest held for the benefit of policyholders in an investment to be the insurer’s interests and should not combine those interests with its general account interest in the same investment when assessing the investment for consolidation. The guidance is effective for fiscal years, and interim periods within those fiscal years, beginning January 1, 2011 with early adoption permitted with the guidance applied retrospectively to all prior periods upon the date of adoption. The Company will adopt the guidance on January 1, 2011 and does not expect this to have a material impact to the Company’s results of operations and financial position.
In October 2010, the FASB issued ASU 2010-26, Accounting for Costs Associated with Acquiring or Renewing Insurance Contracts. This guidance modifies the definition of the types of costs incurred by insurance entities that can be capitalized in the acquisition of new and renewal contracts. An insurance entity may only capitalize incremental direct costs of contract acquisition, the portion of employees’ compensation directly related to time spent performing specified acquisition activities for a contract that has actually been acquired, other costs related directly to specified activities that would not have been incurred had the acquisition contract transaction not occurred, and advertising costs that meet capitalization criteria in other GAAP guidance. The guidance is effective for fiscal years, and interim periods within those years, beginning after December 15, 2011. The Company will adopt the guidance on January 1, 2012 and is currently evaluating the impact to the Company’s results of operations and financial position.
8

Note 2. Fair Value of Financial Instruments
Fair Value Measurements
ASC 820 defines fair value, establishes a framework for measuring fair value, establishes a fair value hierarchy based on the quality of inputs used to measure fair value and enhances disclosure requirements for fair value measurements.
Fair Value Hierarchy
The Company has categorized its financial instruments into a three level hierarchy which is based on the priority of the inputs to the valuation technique. The fair value hierarchy gives the highest priority to quoted prices in active markets for identical assets or liabilities (Level 1) and the lowest priority to unobservable inputs (Level 3). If the inputs used to measure fair value fall within different levels of the hierarchy, the category level is based on the lowest priority level input that is significant to the fair value measurement of the instrument.
Assets and liabilities recorded at fair value on the Balance Sheets are categorized as follows:
Level 1. Unadjusted quoted prices for identical assets or liabilities in an active market.
Level 2. Quoted prices in markets that are not active or inputs that are observable either directly or indirectly for substantially the full term of the asset or liability. Level 2 inputs include the following:
Level 3. Prices or valuation techniques that require inputs that are both unobservable and significant to the overall fair value measurement. They reflect management’s own assumptions about the assumptions a market participant would use in pricing the asset or liability.
The Company recognizes transfers between levels as of the beginning of the period.
The following table presents the Company’s hierarchy for its assets and liabilities measured at fair value on a recurring basis:
9
a) Quoted prices for similar assets or liabilities in active markets
b) Quoted prices for identical or similar assets or liabilities in non-active markets
c) Inputs other than quoted market prices that are observable
d) Inputs that are derived principally from or corroborated by observable market data through correlation or other means
September 30, 2010 Level 1 Level 2 Level 3 TotalAssets
Fixed maturity securities Corporate securities $ — $110,862 $ — $110,862Asset-backed securities — 7,058 — 7,058Commercial mortgage-backed securities — 27,843 — 27,843Residential mortgage-backed securities — 1,265 — 1,265Government and government agencies
United States 3,145 — — 3,145Foreign 2,709 1,036 — 3,745
Total fixed maturity securities (a) 5,854 148,064 — 153,918Equity securities — banking securities (a) — 69 — 69Cash equivalents (b) — 23,644 — 23,644Separate Accounts assets (c) 612,293 — — 612,293
Total assets $618,147 $171,777 $ — $789,924
Liabilities Future policy benefits (embedded derivatives only) (d) $ — $ — $ (5,159) $ (5,159)
Total liabilities $ — $ — $ (5,159) $ (5,159)

At September 30, 2010, there were no transfers between Level 1 and 2, respectively.
10
December 31, 2009 Level 1 Level 2 Level 3 Total Assets
Fixed maturity securities Corporate securities $ — $ 65,484 $ — $ 65,484Asset-backed securities — 4,998 2,216 7,214Commercial mortgage-backed securities — 25,528 — 25,528Residential mortgage-backed securities — 9,115 — 9,115Government and government agencies
United States 3,134 — — 3,134Foreign 2,193 1,259 — 3,452
Total fixed maturity securities (a) 5,327 106,384 2,216 113,927Equity securities — banking securities (a) — 57 — 57Cash equivalents (b) — 47,114 — 47,114Separate Accounts assets (c) 644,149 — — 644,149
Total assets $649,476 $153,555 $ 2,216 $805,247
Liabilities Future policy benefits (embedded derivatives only) (d) $ — $ — $ (4,482) $ (4,482)
Total liabilities $ — $ — $ (4,482) $ (4,482)
(a) Securities are classified as Level 1 if the fair value is determined by observable inputs that reflect quoted prices for identical assets in active markets that the Company has the ability to access at the measurement date. Level 1 securities include highly liquid U.S. Treasury and U.S. Government Agency securities. Securities are classified as Level 2 if the fair value is determined by observable inputs, other than quoted prices included in Level 1, for the asset or prices for similar assets. Level 2 securities include fixed maturity securities and preferred stock for which the Company utilized pricing services and corroborated broker quotes. Securities are classified as Level 3 if the valuations are derived from techniques in which one or more of the significant inputs are unobservable. Level 3 consists principally of fixed maturity securities whose fair value is estimated based on non-binding broker quotes.
(b) Cash equivalents are primarily valued at amortized cost, which approximates fair value. Operating cash is not included in the abovementioned table.
(c) Separate Accounts assets are carried at the net asset value provided by the fund managers.
(d) The Company issued contracts containing guaranteed minimum withdrawal benefits riders (“GMWB”) and obtained reinsurance on guaranteed minimum income benefit riders (“GMIB reinsurance”). GMWB and GMIB reinsurance are treated as embedded derivatives and are required to be reported separately from the host variable annuity contract. The fair value of these guarantees are calculated as the present value of future expected payments to policyholders less the present value of assessed rider fees attributable to the guarantees. Given the complexity and long-term nature of these guarantees, their fair values are determined using stochastic techniques under a variety of market return, discount rates and actuarial assumptions. Since many of the assumptions are unobservable and are considered to be significant inputs to the liability valuation, the liability included in future policy benefits has been reflected within Level 3 of the fair value hierarchy.

The following table provides a summary of the change in fair value of the Company’s Level 3 assets at September 30, 2010 and December 31, 2009:
In certain circumstances, the Company will obtain non-binding broker quotes from brokers to assist in the determination of fair value. If those quotes can be corroborated by other market observable data, the investments will be classified as Level 2 investments. If not, the investments are classified as Level 3 due to the unobservable nature of the brokers’ valuation processes. The decrease in Level 3 securities at September 30, 2010 and December 31, 2009 is primarily due to an increase in market activity and availability of market observable data (Level 2).
The Company’s Level 3 liabilities (assets) consist of provisions for GMWB and GMIB reinsurance. The fair value of these guarantees are calculated as the present value of future expected payments to policyholders less the present value of assessed rider fees attributable to the guarantees. Given the complexity and long-term nature of these guarantees which are unlike instruments available in financial markets, their fair values are determined using stochastic techniques under a variety of market return scenarios. A variety of factors are considered, including expected market rates of return, equity and interest rate volatility, credit spread, correlations of market returns, discount rates and actuarial assumptions.
The expected returns are based on risk-free rates, such as the current London Inter-Bank Offered Rate (“LIBOR”) forward curve. The credit spread is set by using the credit default swap (“CDS”) spreads of a reference portfolio of life insurance companies, adjusted to reflect the subordination of senior debt holders at the holding company level to the position of policyholders at the operating company level (who have priority in payments to other creditors).
For equity volatility, the Company uses a term structure assumption with market-based implied volatility inputs for the first five years and a long-term forward rate assumption of 25% thereafter. The volume of observable option trading from which volatilities are derived generally declines as the contracts’ term increases, therefore, the volatility curve grades from implied volatilities for five years to the ultimate rate. The resulting volatility assumption in year 20 for the S&P 500 index (expressed as a spot rate) was 25.7% at September 30, 2010 and 25.3% at December 31, 2009. Correlations of market returns across underlying indices are based on historical market returns and their inter-relationships over a number of years preceding the valuation date. Assumptions regarding policyholder behavior, such as lapses, included in the models are derived in the same way as the assumptions used to measure insurance liabilities. These assumptions are reviewed at each valuation date and updated based on historical experience and observable market data as required.
11
Fixed maturity securities September 30, 2010 December 31, 2009
Balance at January 1 (a) $ 2,216 $ 5,108 Change in unrealized gains (losses) (b) 22 (125)Sales (29) (432)Transfers into Level 3 — 2,767Transfers out of Level 3 (2,213) (5,108)Changes in valuation (c) 4 5
Balance at end of period (a) $ — $ 2,216
(a) Recorded as a component of fixed maturity available-for-sale securities in the Balance Sheets.
(b) Recorded as a component of other comprehensive income (loss).
(c) Recorded as a component of net investment income in the Statements of Income.
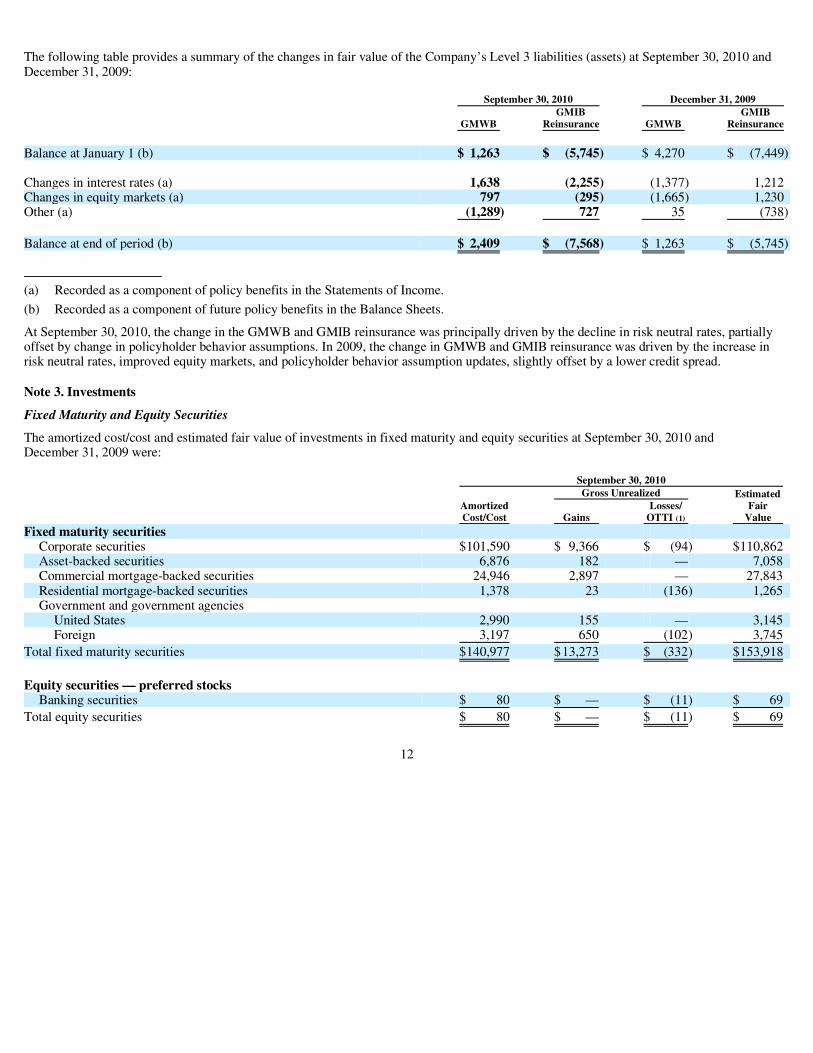
The following table provides a summary of the changes in fair value of the Company’s Level 3 liabilities (assets) at September 30, 2010 and December 31, 2009:
At September 30, 2010, the change in the GMWB and GMIB reinsurance was principally driven by the decline in risk neutral rates, partially offset by change in policyholder behavior assumptions. In 2009, the change in GMWB and GMIB reinsurance was driven by the increase in risk neutral rates, improved equity markets, and policyholder behavior assumption updates, slightly offset by a lower credit spread.
Note 3. Investments
Fixed Maturity and Equity Securities
The amortized cost/cost and estimated fair value of investments in fixed maturity and equity securities at September 30, 2010 and December 31, 2009 were:
12
September 30, 2010 December 31, 2009 GMIB GMIB GMWB Reinsurance GMWB Reinsurance Balance at January 1 (b) $ 1,263 $ (5,745) $ 4,270 $ (7,449) Changes in interest rates (a) 1,638 (2,255) (1,377) 1,212Changes in equity markets (a) 797 (295) (1,665) 1,230Other (a) (1,289) 727 35 (738)
Balance at end of period (b) $ 2,409 $ (7,568) $ 1,263 $ (5,745)
(a) Recorded as a component of policy benefits in the Statements of Income.
(b) Recorded as a component of future policy benefits in the Balance Sheets.
September 30, 2010 Gross Unrealized Estimated Amortized Losses/ Fair Cost/Cost Gains OTTI (1) ValueFixed maturity securities
Corporate securities $101,590 $ 9,366 $ (94) $110,862Asset-backed securities 6,876 182 — 7,058Commercial mortgage-backed securities 24,946 2,897 — 27,843Residential mortgage-backed securities 1,378 23 (136) 1,265Government and government agencies
United States 2,990 155 — 3,145Foreign 3,197 650 (102) 3,745
Total fixed maturity securities $140,977 $13,273 $ (332) $153,918
Equity securities — preferred stocks
Banking securities $ 80 $ — $ (11) $ 69
Total equity securities $ 80 $ — $ (11) $ 69

Excluding investments in United States government and government agencies, the Company is not exposed to any significant concentration of credit risk in its fixed maturity securities portfolio.
The amortized cost and estimated fair value of fixed maturity securities by investment grade at September 30, 2010 and December 31, 2009 were:
At September 30, 2010 and December 31, 2009, the estimated fair value of fixed maturity securities rated BBB- were $10,068 and $3,718, respectively, which is the lowest investment grade rating given by Standard & Poor’s (“S&P”).
The amortized cost and estimated fair value of fixed maturity securities at September 30, 2010 and December 31, 2009 by contractual maturities were:
13
December 31, 2009 Gross Unrealized Estimated Amortized Losses/ Fair Cost/Cost Gains OTTI (1) Value
Fixed maturity securities Corporate securities $ 62,214 $ 3,609 $ (339) $ 65,484Asset-backed securities 7,179 240 (205) 7,214Commercial mortgage-backed securities 25,788 363 (623) 25,528Residential mortgage-backed securities 9,024 331 (240) 9,115Government and government agencies
United States 3,194 1 (61) 3,134Foreign 3,540 92 (180) 3,452
Total fixed maturity securities $110,939 $ 4,636 $ (1,648) $113,927
Equity securities — preferred stocks
Banking securities $ 80 $ — $ (23) $ 57
Total equity securities $ 80 $ — $ (23) $ 57
(1) Subsequent unrealized gains (losses) on OTTI securities are included in Other comprehensive income (“OCI”)-OTTI.
September 30, 2010 December 31, 2009 Estimated Estimated Amortized Fair Amortized Fair Cost Value Cost ValueInvestment grade $136,243 $148,954 $105,980 $109,074Below investment grade 4,734 4,964 4,959 4,853
Total fixed maturity securities $140,977 $153,918 $110,939 $113,927
September 30, 2010 December 31, 2009 Estimated Estimated Amortized Fair Amortized Fair Cost Value Cost Value Fixed maturity securities
Due in one year or less $ 415 $ 420 $ 4,486 $ 4,511Due after one year through five years 28,978 30,621 18,774 19,517Due after five years through ten years 67,249 74,505 37,584 40,129Due after ten years 11,135 12,206 8,103 7,912
107,777 117,752 68,947 72,069Mortgage-backed securities and other asset-backed securities 33,200 36,166 41,992 41,858
Total fixed maturity securities $140,977 $153,918 $110,939 $113,927

In the preceding table fixed maturity securities not due at a single maturity date, have been included in the year of final maturity. Actual maturities may differ from contractual maturities because borrowers may have the right to call or prepay obligations with or without call or prepayment penalties.
Unrealized Gains (Losses) on Fixed Maturity and Equity Securities
The Company’s investments in fixed maturity and equity securities are classified as available-for-sale and are carried at estimated fair value. Unrealized gains and losses on available-for-sale securities are included in stockholder’s equity as a component of accumulated other comprehensive income (loss), net of taxes.
The estimated fair value and gross unrealized losses and OTTI of fixed maturity and equity securities aggregated by length of time that individual securities have been in a continuous unrealized loss position at September 30, 2010 and December 31, 2009 were as follows:
14
September 30, 2010 Gross Estimated Unrealized Fair Amortized Losses and Value Cost/Cost OTTI (1)
Less than or equal to six months Fixed maturity securities
Corporate securities $ 5,434 $ 5,456 $ (22)Residential mortgage-backed securities 3 3 —
Total fixed maturity and equity securities 5,437 5,459 (22)
Greater than one year
Fixed maturity securities Corporate securities 2,030 2,104 (72)Residential mortgage-backed securities 846 982 (136)Government and government agencies — foreign 359 459 (102)
Equity securities — banking securities 69 80 (11)
Total fixed maturity and equity securities 3,304 3,625 (321)
Total fixed maturity and equity securities $ 8,741 $ 9,084 $ (343)
December 31, 2009 Gross Estimated Unrealized Fair Amortized Losses and Value Cost/Cost OTTI (1)
Less than or equal to six months Fixed maturity securities
Corporate securities $ 998 $ 998 $ —Residential mortgage-backed securities 35 35 —Government and government agencies
United States 1,883 1,883 —Foreign 2,193 2,281 (88)
Total fixed maturity and equity securities 5,109 5,197 (88)
Greater than six months but less than or equal to one year
Fixed maturity securities Corporate securities 281 315 (34)Asset-backed securities 653 690 (37)Government and government agencies — United States 1,000 1,061 (61)
Total fixed maturity and equity securities $ 1,934 $ 2,066 $ (132)

The total number of securities in an unrealized loss position was 11 and 29 at September 30, 2010 and December 31, 2009, respectively.
At September 30, 2010 and December 31, 2009, the estimated fair value, gross unrealized losses, OTTI and number of securities where the fair value had declined below amortized cost by greater than 20% was as follows:
Unrealized gains (losses) incurred during the nine months ended September 30, 2010 and 2009 were primarily due to price fluctuations resulting from changes in interest rates and credit spreads. As the Company does not have the intent to sell and it is not more likely than not that the Company will be required to sell these securities prior to the anticipated recovery of the amortized cost, the Company did not consider these securities to be other-than-temporarily impaired.
15
December 31, 2009 Gross Estimated Unrealized Fair Amortized Losses and(continued) Value Cost OTTI (1)
Greater than one year Fixed maturity securities
Corporate securities $ 4,273 $ 4,578 $ (305)Asset-backed securities 1,563 1,731 (168)Commercial mortgage-backed securities 5,955 6,579 (624)Residential mortgage-backed securities 908 1,148 (240)Government and government agencies — foreign 368 459 (91)
Equity securities — banking securities 57 80 (23)
Total fixed maturity and equity securities 13,124 14,575 (1,451)
Total fixed maturity and equity securities $ 20,167 $ 21,838 $ (1,671)
(1) Subsequent unrealized gains (losses) on OTTI securities are included in OCI-OTTI.
September 30, 2010 Estimated Gross Fair Unrealized Number of Value Losses/OTTI (1) SecuritiesDecline > 20%
Greater than one year $ 359 $ (102) 1
Total $ 359 $ (102) 1
December 31, 2009 Estimated Gross Fair Unrealized Number of Value Losses/OTTI (1) Securities Decline > 20%
Greater than one year $ 2,407 $ (714) 4
Total $ 2,407 $ (714) 4
(1) Subsequent unrealized gains (losses) on OTTI securities are included in OCI-OTTI.

The components of net unrealized gain (loss) and OTTI included in accumulated other comprehensive income, net of taxes, at September 30, 2010 and December 31, 2009 was as follows:
The Company records certain adjustments to policyholder account balances in conjunction with the unrealized holding gains or losses on investments classified as available-for-sale. The Company adjusts a portion of these liabilities as if the unrealized holding gains or losses had actually been realized, with corresponding credits or charges reported in accumulated other comprehensive income (loss), net of taxes.
Policy Loans
Policy loans on insurance contracts are stated at unpaid principal balances. The Company estimates the fair value of policy loans as equal to the book value of the loans. The estimated fair value of the policy loans at September 30, 2010 and December 31, 2009 was $59,554 and $63,045, respectively. Policy loans are fully collateralized by the account value of the associated insurance contracts, and the spread between the policy loan interest rate and the interest rate credited to the account value held as collateral is fixed.
Derivatives
The Company uses derivatives to manage the capital market risk associated with the GMWB. The derivatives, which are S&P 500 Composite Stock Price Index futures contracts, are used to hedge the equity risk associated with these types of variable guaranteed products, in particular the claim and/or revenue risks of the liability portfolio. The Company will not seek hedge accounting on these hedges because, in most cases, the derivatives’ change in value will create a natural offset in the Statements of Income with the change in reserves. Net settlements on the futures occur daily. At September 30, 2010, the Company had 20 outstanding short futures contracts with a notional value of $5,684. At December 31, 2009, the Company had 20 outstanding short futures contracts with a notional value of $5,554.
Realized Investment Gains (Losses)
The Company considers fair value at the date of sale to be equal to proceeds received. Proceeds and gross realized investment gains (losses) from the sale of available-for-sale securities for the three and nine months ended September 30 were as follows:
16
September 30, December 31, 2010 2009 Assets
Fixed maturity securities $ 12,941 $ 2,987Equity securities (11) (23)Value of business acquired (398) (62)
12,532 2,902
Liabilities
Policyholder account balances 348 251Federal income taxes — deferred (4,556) (1,103)
(4,208) (852)
Stockholder’s equity
Accumulated other comprehensive income, net of taxes $ 8,324 $ 2,050
Three Months Ended Nine Months Ended September 30, September 30, 2010 2009 2010 2009Proceeds $3,364 $11,722 $34,264 $27,293Gross realized investment gains 274 130 1,794 526Gross realized investment losses — — (87) (731) Proceeds on available-for-sale securities sold at a realized loss — — 2,599 6,957

Net realized investment gains (losses) for the three and nine months ended September 30 were as follows:
OTTI
If management determines that a decline in the value of an available-for-sale equity security is other-than-temporary, the cost basis is adjusted to estimated fair value and the decline in value is recorded as a net realized investment loss. For debt securities, the manner in which an OTTI is recorded depends on whether management intends to sell a security or it is more likely than not that it will be required to sell a security in an unrealized loss position before its anticipated recovery. If management intends to sell or more likely than not will be required to sell the debt security before recovery, the OTTI is recognized in earnings for the difference between amortized cost and fair value. If these criteria are not met, the OTTI is bifurcated into two pieces: a credit loss is recognized in earnings at an amount equal to the difference between the amortized cost of the debt security and the present value of the security’s anticipated cash flows, and a non credit loss is recognized in OCI for any difference between the fair value and the net present value of the debt security at the impairment measurement date.
The following table sets forth the amount of credit loss impairments on fixed maturity securities held by the Company as of the dates indicated, for which a portion of the OTTI loss was recognized in OCI, and the corresponding changes in such amounts:
The components of OTTI reflected in the Statements of Income for the three and nine months ended September 30 was as follows:
For the three months ended September 30, 2010, the Company did not have any impairment losses. For the nine months ended September 30, 2010, the Company recorded impairment losses of $48 with no value of business acquired amortization. The impairment losses were principally the result of the Company impairing its holding of a 2005 vintage residential mortgage-backed security in the second quarter due to an adverse change in cash flows. For the three and nine months ended September 30, 2009, the Company recorded impairments of $296 and $879, respectively, with no value of business acquired amortization. For the three months ended September 30, 2009, impairments consisted principally of a holding of a preferred stock in CIT Group Inc. for $168. During the second quarter 2009, the Company adopted revised guidance for OTTI recognition, which resulted in a cumulative adjustment of $201 to retained earnings and amortized cost for fixed maturity securities and cost for equity securities for the non
17
Three Months Ended Nine Months Ended September 30, September 30, 2010 2009 2010 2009 Fixed maturity securities $ 274 $ 2 $ 1,658 $ (916)Equity securities — (168) — (168)Derivatives (575) (709) (200) (1,537)Adjustment related to value of business acquired — (10) (32) (33)
Net realized investment gains (losses) $ (301) $ (885) $ 1,426 $ (2,654)
Balance, December 31, 2009 $ —
Credit loss impairment recognized in the current period on securities not previously impaired 48Accretion of credit loss impairments previously recognized (11)
Balance, September 30, 2010 $ 37
Three Months Ended September 30, 2010 Nine Months Ended September 30, 2010 Net Net OTTI Net Net OTTI OTTI OTTI Loss Losses OTTI OTTI Loss Losses Losses on Recognized Recognized Losses on Recognized Recognized Securities in OCI in Income Securities in OCI in IncomeGross OTTI losses $ — $ — $ — $ 212 $ 164 $ 48Value of business acquired — — — — — —
Net OTTI Losses $ — $ — $ — $ 212 $ 164 $ 48
Three Months Ended September 30, 2009 Nine Months Ended September 30, 2009 Net Net OTTI Net Net OTTI OTTI OTTI Loss Losses OTTI OTTI Loss Losses Losses on Recognized Recognized Losses on Recognized Recognized Securities in OCI in Income Securities in OCI in Income
Gross OTTI losses $ 296 $ — $ 296 $ 879 $ — $ 879Value of business acquired — — — — — —
Net OTTI Losses $ 296 $ — $ 296 $ 879 $ — $ 879

credit portion of previously recorded impairments on securities still in inventory upon adoption. Of this, $70 related to non credit impairments previously recorded in income during the first quarter of 2009.
Note 4. Value of Business Acquired (“VOBA”), Deferred Acquisition Costs (“DAC”), and Deferred Sales Inducements (“DSI”)
VOBA reflects the estimated fair value of in force contracts acquired and represents the portion of the purchase price that is allocated to the value of the right to receive future cash flows from the life insurance and annuity contracts in force at the acquisition date. VOBA is based on actuarially determined projections, for each block of business, of future policy and contract charges, premiums, mortality, Separate Account performance, surrenders, operating expenses, investment returns and other factors. Actual experience on the purchased business may vary from these projections. If estimated gross profits or premiums differ from expectations, the amortization of VOBA is adjusted to reflect actual experience.
The short-term equity growth rate and the long-term growth rate for the amortization of VOBA, DAC and DSI were as follows:
The change in the carrying amount of VOBA for the three and nine months ended September 30 was as follows:
During the three months ended September 30, 2010, positive future gross profits, principally driven by favorable equity market movement resulted in increased amortization as compared to 2009. For the nine months ended September 30, 2010, mixed equity markets resulted in a small unfavorable unlocking and amortization expense. During the nine months ended September 30, 2009 the Company experienced unfavorable unlocking in the first quarter from the increased future benefit costs, which reduced the value of the future gross profits. In addition, an impairment charge was taken at March 31, 2009, as estimated future gross profits were less than the unamortized balance.
The change in the carrying amount of DAC and DSI for the three and nine months ended September 30 was as follows:
18
September 30, December 31, September 30, 2010 2009 2009
Gross short-term equity growth rate for five years 9.00% 7.25% 8.00% Gross long-term growth rate 9.00% 9.00% 9.00%
Three Months Ended Nine Months Ended September 30, September 30, 2010 2009 2010 2009Amortization expense $ (1,618) $ (508) $ (183) $ (1,271)Unlocking 180 448 (117) (866)Impairment charge — — — (7,165)Adjustment related to realized (gains) losses on investments — (10) (32) (33)Adjustment related to unrealized (gains) losses and OTTI on investments (175) (183) (336) 171
Change in VOBA carrying amount $ (1,613) $ (253) $ (668) $ (9,164)
Three Months Ended Nine Months Ended September 30, September 30, DAC 2010 2009 2010 2009 Capitalization $ — $ 47 $ — $ 65Accretion (amortization) expense (10) 6 47 (55)Unlocking (11) 9 (28) —Adjustment related to unrealized (gains) losses and OTTI on investments — — — 38
Change in DAC carrying amount $ (21) $ 62 $ 19 $ 48
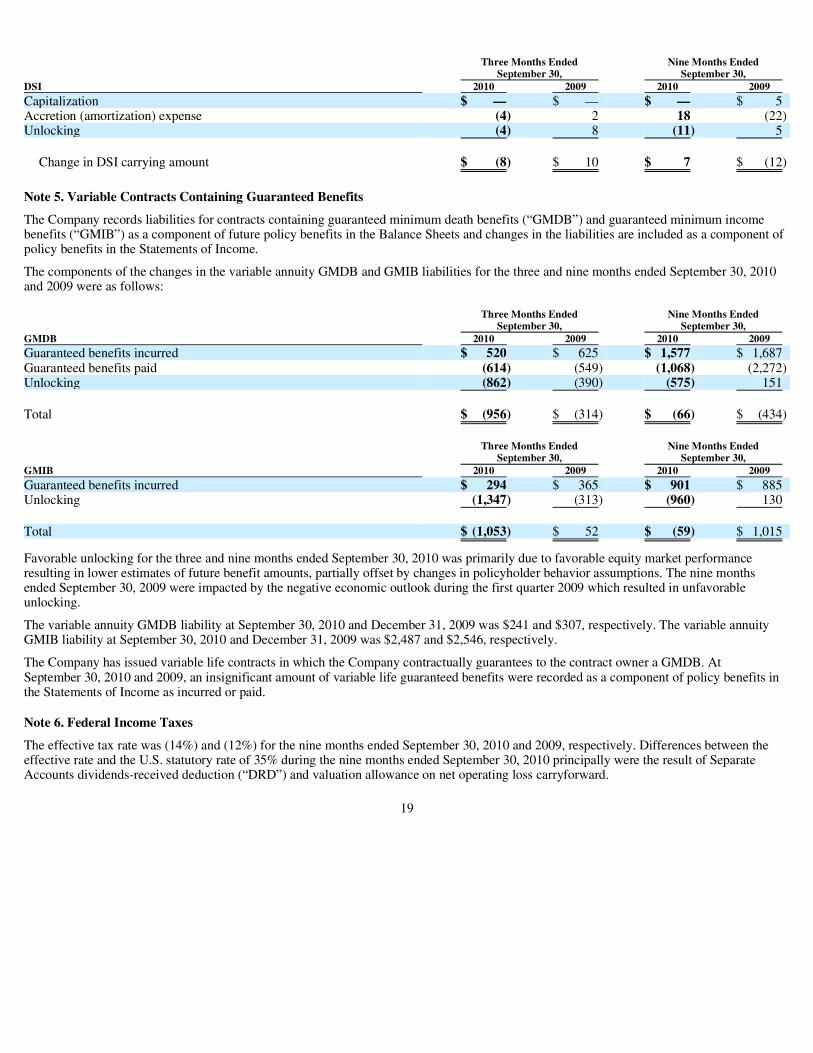
Note 5. Variable Contracts Containing Guaranteed Benefits
The Company records liabilities for contracts containing guaranteed minimum death benefits (“GMDB”) and guaranteed minimum income benefits (“GMIB”) as a component of future policy benefits in the Balance Sheets and changes in the liabilities are included as a component of policy benefits in the Statements of Income.
The components of the changes in the variable annuity GMDB and GMIB liabilities for the three and nine months ended September 30, 2010 and 2009 were as follows:
Favorable unlocking for the three and nine months ended September 30, 2010 was primarily due to favorable equity market performance resulting in lower estimates of future benefit amounts, partially offset by changes in policyholder behavior assumptions. The nine months ended September 30, 2009 were impacted by the negative economic outlook during the first quarter 2009 which resulted in unfavorable unlocking.
The variable annuity GMDB liability at September 30, 2010 and December 31, 2009 was $241 and $307, respectively. The variable annuity GMIB liability at September 30, 2010 and December 31, 2009 was $2,487 and $2,546, respectively.
The Company has issued variable life contracts in which the Company contractually guarantees to the contract owner a GMDB. At September 30, 2010 and 2009, an insignificant amount of variable life guaranteed benefits were recorded as a component of policy benefits in the Statements of Income as incurred or paid.
Note 6. Federal Income Taxes
The effective tax rate was (14%) and (12%) for the nine months ended September 30, 2010 and 2009, respectively. Differences between the effective rate and the U.S. statutory rate of 35% during the nine months ended September 30, 2010 principally were the result of Separate Accounts dividends-received deduction (“DRD”) and valuation allowance on net operating loss carryforward.
19
Three Months Ended Nine Months Ended September 30, September 30,DSI 2010 2009 2010 2009
Capitalization $ — $ — $ — $ 5Accretion (amortization) expense (4) 2 18 (22)Unlocking (4) 8 (11) 5
Change in DSI carrying amount $ (8) $ 10 $ 7 $ (12)
Three Months Ended Nine Months Ended September 30, September 30,GMDB 2010 2009 2010 2009Guaranteed benefits incurred $ 520 $ 625 $ 1,577 $ 1,687Guaranteed benefits paid (614) (549) (1,068) (2,272)Unlocking (862) (390) (575) 151
Total $ (956) $ (314) $ (66) $ (434)
Three Months Ended Nine Months Ended September 30, September 30, GMIB 2010 2009 2010 2009 Guaranteed benefits incurred $ 294 $ 365 $ 901 $ 885Unlocking (1,347) (313) (960) 130
Total $ (1,053) $ 52 $ (59) $ 1,015

The valuation allowance for deferred tax assets at September 30, 2010 and December 31, 2009 was $368 and $3,705, respectively. The valuation allowance is related to a net operating loss carryforward and other deferred tax assets that, in the judgment of management, is not more likely than not to be realized. In assessing the realizability of deferred tax assets, management considers whether it is more likely than not that all or some of the deferred tax assets will not be realized. The ultimate realization of deferred tax assets depends on generation of further taxable income during the periods in which those temporary differences are deductible. Management considers the scheduled reversal of deferred tax liabilities, projected taxable income, and tax-planning strategies in making the assessment.
The Company has analyzed all material tax positions under the guidance of ASC 740, Income Taxes, related to the accounting for uncertainty in income tax, and determined there were tax benefits of $403 (gross $1,152) and $343 (gross $981) that should not be recognized at September 30, 2010 and December 31, 2009, respectively, which primarily relates to uncertainty regarding the sustainability of certain deductions taken on the 2009 and 2008 U.S. Federal income tax return. To the extent these unrecognized tax benefits are ultimately recognized, they will not impact the effective tax rate in a future period. It is not anticipated that the total amounts of unrecognized tax benefits will significantly increase within twelve months of the reporting date.
The Components of the change in the unrecognized tax benefits were as follows:
At September 30, 2010 and December 31, 2009, the Company had an operating loss carryforward for federal income tax purposes of $10,103 (net of the ASC 740 reduction of $1,152) and $5,554 (net of the ASC 740 reduction of $981), respectively, with a carryforward period of fifteen years that expire at various dates up to 2023. At September 30, 2010, it is expected that the Company will utilize its December 31, 2009 capital loss carryforward of $570. The Company has a foreign tax credit carryforward at September 30, 2010 and December 31, 2009 of $420 and $412, respectively, with a carryforward period of ten years that will expire at various dates up to 2020. Also, the Company has an Alternative Minimum Tax tax credit carryforward for federal income tax purposes of $135 and $217 at September 30, 2010 and December 31, 2009, respectively, with an indefinite carryforward period.
The Company classifies interest and penalties related to income taxes as interest expense and penalty expense, respectively. The Company has recognized no material penalties in its financial statements at September 30, 2010 and December 31, 2009, respectively. The Company recognized interest expense of ($11) and $11 at September 30, 2010 and December 31, 2009, respectively. The accrued interest expense related to federal income tax was released during 2010 based on the expectation that the net operating loss will offset any taxable income generated by the uncertain tax position for the Company in future tax periods.
The Company files a separate federal income tax return for the years 2008 through 2012. Beginning in 2013 and assuming no changes in ownership, the Company will join the affiliated consolidated tax group. A tax return has been filed for 2008 and 2009, but no examination by the Internal Revenue Service has commenced.
Note 7. Stockholder’s Equity and Statutory Accounting Principles
The Company’s statutory financial statements are presented on the basis of accounting practices prescribed or permitted by the New York Insurance Department. The State of New York has adopted the National Association of Insurance Commissioners (“NAIC”) statutory accounting principles as a component of prescribed or permitted practices by the State of New York.
The Company’s statutory net income for the nine months ended September 30, 2010 and 2009 was $7,216 and $10,479, respectively. Statutory capital and surplus at September 30, 2010 and December 31, 2009 was $90,469 and $81,728, respectively.
During the first nine months of 2010 and 2009, the Company did not pay any dividends to AUSA or receive any capital contribution from AUSA.
20
September 30, December 31, 2010 2009Unrecognized tax benefits, beginning balance $ 981 $ —
Gross increases — tax positions in prior period 171 981
Unrecognized tax benefits, ending balance $ 1,152 $ 981

Note 8. Reinsurance
In the normal course of business, the Company seeks to limit its exposure to loss on any single insured life and to recover a portion of benefits paid by ceding mortality risk to other insurance enterprises or reinsurers under indemnity reinsurance agreements, primarily quota share coverage and coinsurance agreements. The maximum amount of mortality risk retained by the Company is approximately $1,000 on single and joint life policies. Effective second quarter of 2008, the Company began to recapture the majority of its life reinsurance, which is expected to befinalized in 2010.
Indemnity reinsurance agreements do not relieve the Company from its obligations to contract owners. Failure of reinsurers to honor their obligations could result in losses to the Company. The Company regularly evaluates the financial condition of its reinsurers so as to minimize its exposure to significant losses from reinsurer insolvencies. At September 30, 2010 and December 31, 2009, reinsurance receivables were $1,111 and $1,782, respectively, principally related to the recapture of life reinsurance and refined calculations in conjunction with system conversions. At September 30, 2010 and December 31, 2009, these reinsurance receivables were primarily from Swiss Re, Lincoln National Life Insurance Company, Reinsurance Group of America (“RGA”), Employers Reassurance Corporation (“ERAC”) and Munich American Reassurance Company.
The Company is party to an indemnity reinsurance agreement with an unaffiliated insurer whereby the Company coinsures, on a modified coinsurance basis, 50% of the unaffiliated insurer’s variable annuity contracts sold from January 1, 1997 to June 30, 2001.
In addition, the Company seeks to limit its exposure to guaranteed benefit features contained in certain variable annuity contracts. Specifically, the Company reinsures certain GMIB and GMDB provisions to the extent reinsurance capacity is available in the marketplace. At September 30, 2010 and December 31, 2009, 58% and 15% of the account value for variable annuity contracts containing GMIB and GMDB provisions, respectively, were reinsured.
Note 9. Related Party Transactions
At September 30, 2010, the Company had the following related party agreements in effect:
The Company is party to a common cost allocation service agreement between AUSA companies in which various affiliated companies may perform specified administrative functions in connection with the operation of the Company, in consideration of reimbursement of actual costs of services rendered. During the three and nine months ended September 30, 2010, the Company incurred $97 and $625, respectively, in expenses under this agreement. During the three and nine months ended September 30, 2009, the Company incurred $39 and $974, respectively, in expenses under this agreement. Charges attributable to this agreement are included in insurance expenses and taxes, net of amounts capitalized.
AEGON USA Investment Management, LLC acts as a discretionary investment manager under an investment management agreement with the Company. During the three and nine months ended September 30, 2010, the Company incurred $50 and $146, respectively, in expenses under this agreement. During the three and nine months ended September 30, 2009, the Company incurred $49 and $148, respectively, in expenses under this agreement. Charges attributable to this agreement are included in net investment income.
Transamerica Capital, Inc. provides underwriting services for the Company under an underwriting agreement. During the three and nine months ended September 30, 2010, the Company incurred $605 and $1,983, respectively, in expenses under this agreement. During the three and nine months ended September 30, 2009, the Company incurred $708 and $1,935 respectively, in expenses under this agreement. Charges attributable to this agreement are included in insurance expenses and taxes, net of amounts capitalized.
The Company has a participation agreement with Transamerica Series Trust to offer certain funds in the Company’s Separate Accounts. Transamerica Capital, Inc. acts as the distributor for said related party funds. The Company has entered into a distribution and shareholder services agreement for certain of the said funds. Revenue attributable to this agreement is included in policy charge revenue. During the three months ended September 30, 2010, the Company did not receive any revenue under this agreement. During the nine months ended September 30, 2010, the Company received $1 in revenue under this agreement. During the three and nine months ended September 30, 2009, the Company, did not receive any revenue under this agreement.
The Company has a reinsurance agreement with Transamerica Life Insurance Company. During the three and nine months ended September 30, 2010, the Company did not incur any reinsurance premium ceded expense under this agreement and there were no
21

reinsurance recoveries on death claims incurred. During the three and nine months ended September 30, 2009, the Company incurred $5 and $14, respectively, in reinsurance premium ceded expense under this agreement and there were no reinsurance recoveries on death claims incurred.
The Company has a service agreement with Western Reserve Life Assurance Co. of Ohio (“WRL”) whereby WRL will perform specified administrative functions in connection with the operation of the Company except to the extent that the services are performed for the Company by another party. During the three and nine months ended September 30, 2010, the Company incurred $413 and $502, respectively, in expenses under this agreement. During the three and nine months ended September 30, 2009, the Company incurred $103 and $103, respectively, in expenses under this agreement. Charges attributable to this agreement are included in insurance expenses and taxes, net of amounts capitalized.
While management believes that the service agreements referenced above are calculated on a reasonable basis, they may not necessarily be indicative of the costs that would have been incurred with an unrelated third party. Affiliated agreements generally contain reciprocal indemnity provisions pertaining to each party’s representations and contractual obligations thereunder.
Note 10. Segment Information
In reporting to management, the Company’s operating results are categorized into two business segments: Annuity and Life Insurance. The Company’s Annuity segment consists of variable annuities and interest-sensitive annuities. The Company’s Life Insurance segment consists of variable life insurance products and interest-sensitive life insurance products. The accounting policies of the business segments are the same as those for the Company’s financial statements included herein. All revenue and expense transactions are recorded at the product level and accumulated at the business segment level for review by management.
The following tables summarize each business segment’s contribution to net revenues and net income (loss):
22
Three Months Ended September 30, 2010 2009 Net revenues (a)
Annuity $ 2,874 $ 1,865Life Insurance 1,230 1,577
Net revenues (a) $ 4,104 $ 3,442
Net income
Annuity $ 2,475 $ 1,333Life Insurance 408 603
Net income $ 2,883 $ 1,936
Nine Months Ended September 30, 2010 2009Net revenues (a)
Annuity $ 11,359 $ 5,913Life Insurance 4,310 4,261
Net revenues (a) $ 15,669 $ 10,174
Net income (loss)
Annuity $ 9,368 $ (7,863)Life Insurance 1,060 381
Net income (loss) $ 10,428 $ (7,482)
(a) Net revenues include total net revenues net of interest credited to policyholder liabilities.

Item 2. Management’s Narrative Analysis of Results of Operations
This Management’s Narrative Analysis of Results of Operations should be read in conjunction with the Financial Statements and Notes to Financial Statements included herein.
Forward Looking Statements
Certain statements in this report may be considered forward-looking, including those about management expectations, strategic objectives, growth opportunities, business prospects, anticipated financial results and other similar matters. These forward-looking statements represent only management’s beliefs regarding future performance, which is inherently uncertain. There are a variety of factors, many of which are beyond the Company’s control, which affect its operations, performance, business strategy and results and could cause its actual results and experience to differ materially from the expectations and objectives expressed in any forward-looking statements. These factors include, but are not limited to, actions and initiatives taken by current and potential competitors, general economic conditions, the effects of current, pending and future legislation, regulation and regulatory actions, and the other risks and uncertainties detailed in this report. See Risk Factors in the 2009 Annual Report on Form 10-K. Accordingly, readers are cautioned not to place undue reliance on forward-looking statements, which speak only as of the dates on which they are made. The Company does not undertake to update forward-looking statements to reflect the impact of circumstances or events that arise after the dates they are made. The reader should, however, consult further disclosures the Company may make in future filings of its Annual Report on Form 10-K, Quarterly Reports on Form 10-Q and Current Reports on Form 8-K.
Business
Overview
Transamerica Advisors Life Insurance Company of New York (“TALNY”, “Registrant”, “Company”, “we”, “our”, or “us”) is a wholly owned subsidiary of AEGON USA, LLC (“AUSA”). Prior to July 1, 2010, the Company was known as ML Life Insurance Company of New York (“MLLICNY”). AUSA is an indirect wholly owned subsidiary of AEGON N.V., a limited liability share company organized under Dutch law. The Company was incorporated in 1973 under the laws of the State of New York.
TALNY conducts its business primarily in the annuity markets and to a lesser extent in the life insurance markets of the financial services industry. During 2009, the Company, in addition to not issuing life insurance products, ceased issuing variable annuity and market value adjusted annuity products. The Company offered the following guaranteed benefits within its variable annuity product suite: guaranteed minimum death benefits (“GMDB”), guaranteed minimum income benefits (“GMIB”) and guaranteed minimum withdrawal benefits (“GMWB”).
The Company’s gross earnings are principally derived from two sources:
The costs associated with acquiring contract owner deposits (deferred policy acquisition costs) are amortized over the period in which the Company anticipates holding those funds, as noted in the Critical Accounting Policies and Estimates section below. Insurance expenses and taxes reported in the Statements of Income are net of amounts deferred. In addition, the Company incurs expenses associated with the maintenance of in force contracts.
Deposits
Total direct deposits (including internal exchanges) were $0.2 million and $0.7 million, respectively, during the three and nine months ended September 30, 2010. Total direct deposits were $2.1 million and $2.8 million, respectively, during the three and nine months ended September 30, 2009. The decrease in deposits was due to the Company ceasing to issue new variable annuity and market value adjusted annuity products in 2009. There were $0.2 million and $0.3 million, respectively, of internal exchanges during the three and nine months ended September 30, 2010. There were no internal exchanges during the three and nine months ended September 30, 2009.
Financial Condition
At September 30, 2010, the Company’s assets were $888.6 million or $21.2 million lower than the $909.8 million in assets at December 31, 2009. Assets excluding Separate Accounts assets increased $10.7 million. Separate Accounts assets, which represent 69% of total assets, decreased $31.9 million to $612.3 million.
23
• the charges imposed on variable annuity and variable life insurance contracts, and
• the net earnings from investment of fixed rate life insurance and annuity contract owner deposits less interest credited to contract owners, commonly known as interest spread.

Changes in Separate Accounts assets were as follows:
During the nine months ended September 30, 2010 and 2009, the Company did not have any fixed contract owner deposits and fixed contract owner withdrawals were $5.9 million and $8.3 million, respectively.
Environment
The Company’s financial position and/or results of operations are primarily impacted by the following economic factors: equity market performance, fluctuations in medium term interest rates, and the corporate credit environment via credit quality and fluctuations in credit spreads.
Equity Market Performance
The investment performance of the underlying U.S. equity-based mutual funds supporting the Company’s variable products do not replicate the returns of any specific U.S. equity market index. However, investment performance will generally increase or decrease with corresponding increases or decreases of the overall U.S. equity market. There are several standard indices published on a daily basis that measure performance of selected components of the U.S. equity market. Examples include the Dow Jones Industrial Average (“Dow”), the NASDAQ Composite Index (“NASDAQ”) and the Standard & Poor’s 500 Composite Stock Price Index (“S&P”). The Dow, NASDAQ and S&P ended September 30, 2010 with increases of 10%, 12% and 11%, respectively, from June 30, 2010 and increases of 3%, 4% and 2%, respectively from December 31, 2009.
Changes in the U.S. equity market directly affect the values of the underlying U.S. equity-based mutual funds supporting Separate Accounts assets and, accordingly, the values of variable contract owner account balances. Approximately 74% of Separate Accounts assets were invested in equity-based mutual funds at September 30, 2010. Since asset-based fees collected on in force variable contracts represent a significant source of revenue, the Company’s financial condition will be impacted by fluctuations in investment performance of equity-based Separate Accounts assets.
During the nine months ended September 30, 2010, average variable account balances increased $33.7 million (or 6%) to $620.0 million as compared to the same period in 2009. The change in average variable account balances contributed $0.3 million to the increase in asset-based policy charge revenue during the nine months ended September 30, 2010 as compared to the same period in 2009.
Fluctuations in the U.S. equity market also directly impact the Company’s exposure to guaranteed benefit provisions contained in the variable contracts it manufactures. Minimal or negative investment performance generally results in greater exposure to guarantee provisions. Prolongedperiods of minimal or negative investment performance will result in greater guaranteed benefit costs as compared to assumptions. If the Company determines that it needs to increase its estimated long term cost of guaranteed benefits, it will result in establishing greater guaranteedbenefit liabilities as compared to current practice.
Medium Term Interest Rates, Corporate Credit and Credit Spreads
Changes in interest rates affect the value of investments, primarily fixed maturity securities and preferred equity securities, as well as interest-sensitive liabilities. Changes in interest rates have an inverse relationship to the value of investments and interest-sensitive liabilities. Also, since the Company has certain fixed products that contain guaranteed minimum crediting rates, decreases in interest rates can decrease the amount of interest spread earned.
Changes in the corporate credit environment directly impact the value of the Company’s investments, primarily fixed maturity securities. The Company primarily invests in investment-grade corporate debt to support its fixed rate product liabilities.
24
Nine Months Ended(dollars in millions) September 30, 2010
Investment performance $ 24.8Deposits 0.7Policy fees and charges (9.8)Surrenders, benefits and withdrawals (47.6)
Net change $ (31.9)
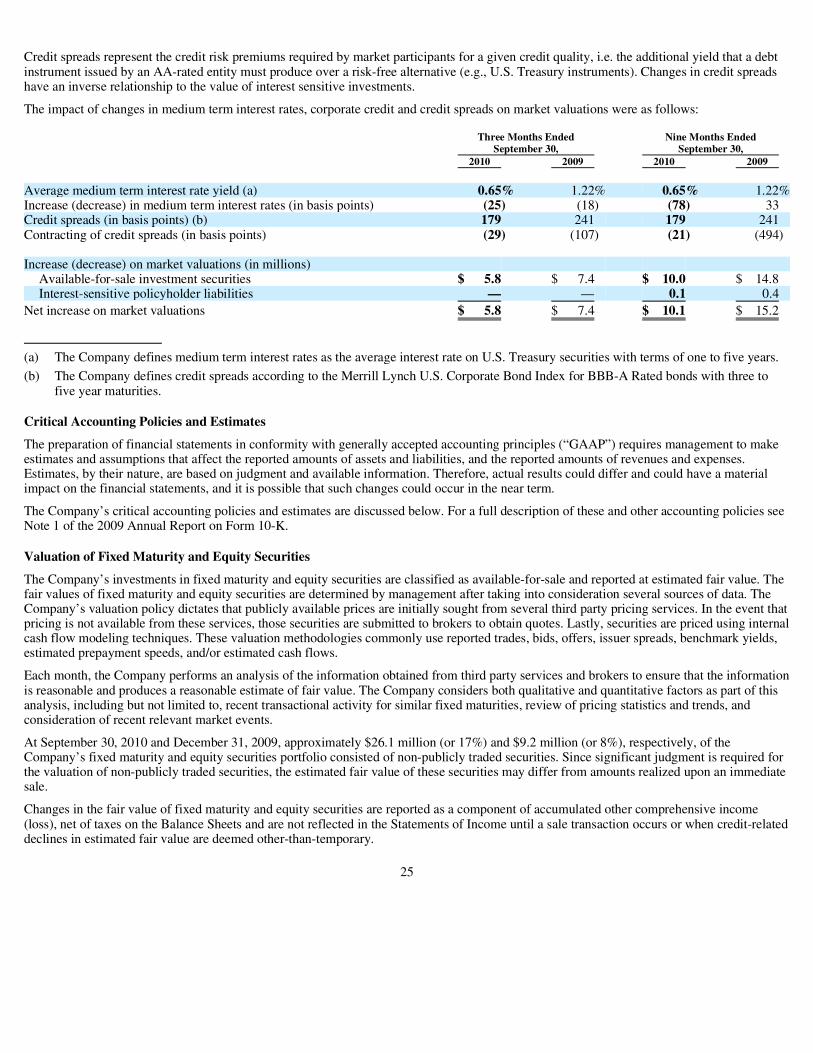
Credit spreads represent the credit risk premiums required by market participants for a given credit quality, i.e. the additional yield that a debt instrument issued by an AA-rated entity must produce over a risk-free alternative (e.g., U.S. Treasury instruments). Changes in credit spreads have an inverse relationship to the value of interest sensitive investments.
The impact of changes in medium term interest rates, corporate credit and credit spreads on market valuations were as follows:
Critical Accounting Policies and Estimates
The preparation of financial statements in conformity with generally accepted accounting principles (“GAAP”) requires management to make estimates and assumptions that affect the reported amounts of assets and liabilities, and the reported amounts of revenues and expenses. Estimates, by their nature, are based on judgment and available information. Therefore, actual results could differ and could have a material impact on the financial statements, and it is possible that such changes could occur in the near term.
The Company’s critical accounting policies and estimates are discussed below. For a full description of these and other accounting policies see Note 1 of the 2009 Annual Report on Form 10-K.
Valuation of Fixed Maturity and Equity Securities
The Company’s investments in fixed maturity and equity securities are classified as available-for-sale and reported at estimated fair value. The fair values of fixed maturity and equity securities are determined by management after taking into consideration several sources of data. The Company’s valuation policy dictates that publicly available prices are initially sought from several third party pricing services. In the event that pricing is not available from these services, those securities are submitted to brokers to obtain quotes. Lastly, securities are priced using internal cash flow modeling techniques. These valuation methodologies commonly use reported trades, bids, offers, issuer spreads, benchmark yields, estimated prepayment speeds, and/or estimated cash flows.
Each month, the Company performs an analysis of the information obtained from third party services and brokers to ensure that the information is reasonable and produces a reasonable estimate of fair value. The Company considers both qualitative and quantitative factors as part of this analysis, including but not limited to, recent transactional activity for similar fixed maturities, review of pricing statistics and trends, and consideration of recent relevant market events.
At September 30, 2010 and December 31, 2009, approximately $26.1 million (or 17%) and $9.2 million (or 8%), respectively, of the Company’s fixed maturity and equity securities portfolio consisted of non-publicly traded securities. Since significant judgment is required for the valuation of non-publicly traded securities, the estimated fair value of these securities may differ from amounts realized upon an immediate sale.
Changes in the fair value of fixed maturity and equity securities are reported as a component of accumulated other comprehensive income (loss), net of taxes on the Balance Sheets and are not reflected in the Statements of Income until a sale transaction occurs or when credit-related declines in estimated fair value are deemed other-than-temporary.
25
Three Months Ended Nine Months Ended September 30, September 30, 2010 2009 2010 2009 Average medium term interest rate yield (a) 0.65% 1.22% 0.65% 1.22%Increase (decrease) in medium term interest rates (in basis points) (25) (18) (78) 33Credit spreads (in basis points) (b) 179 241 179 241Contracting of credit spreads (in basis points) (29) (107) (21) (494) Increase (decrease) on market valuations (in millions)
Available-for-sale investment securities $ 5.8 $ 7.4 $ 10.0 $ 14.8Interest-sensitive policyholder liabilities — — 0.1 0.4
Net increase on market valuations $ 5.8 $ 7.4 $ 10.1 $ 15.2
(a) The Company defines medium term interest rates as the average interest rate on U.S. Treasury securities with terms of one to five years.
(b) The Company defines credit spreads according to the Merrill Lynch U.S. Corporate Bond Index for BBB-A Rated bonds with three to five year maturities.
Derivative Instruments
Derivatives are financial instruments in which the value changes in response to an underlying variable, that require little or no net initial investment and are settled at a future date. All derivatives recognized on the Balance Sheets are carried at fair value. All changes in fair value are recognized in the Statements of Income. The fair value for exchange traded derivatives, such as futures, are calculated net of the interest accrued to date and is based on quoted market prices. Net settlements on the futures occur daily. At September 30, 2010, the Company had 20 outstanding short futures contracts with a notional amount of $5.7 million. At December 31, 2009, the Company had 20 outstanding short futures contracts with a notional amount of $5.6 million.
Other-Than-Temporary Impairment (“OTTI”) Losses on Investments
The Company regularly reviews each investment in its fixed maturity and equity securities portfolio to evaluate the necessity of recording impairment losses for other-than-temporary declines in the fair value of investments. Management makes this determination through a series of discussions with the Company’s portfolio managers and credit analysts, and information obtained from external sources (i.e. company announcements, ratings agency announcements, or news wire services). For equity securities, the Company also considers the ability and intent to hold the investments for a period of time sufficient for a forecasted market price recovery up to or beyond the amortized cost of the investment. The factors that may give rise to a potential OTTI include, but are not limited to, i) certain credit-related events such as default of principal or interest payments by the issuer, ii) bankruptcy of issuer, iii) certain security restructurings, and iv) fair market value less than cost or amortized cost for an extended period of time. In the absence of a readily ascertainable market value, the estimated fair value on these securities represents management’s best estimate and is based on comparable securities and other assumptions as appropriate. Management bases this determination on the most recent information available.
For equity securities, once management determines a decline in the value of an available-for-sale security is other-than-temporary, the cost basis of the equity security is reduced to its fair value, with a corresponding charge to earnings.
For debt securities, an OTTI must be recognized in earnings when an entity either a) has the intent to sell the debt security or b) more likely than not will be required to sell the debt security before its anticipated recovery. If the Company meets either of these criteria, the OTTI is recognized in earnings in an amount equal to the entire difference between the security’s amortized cost basis and its fair value at the balance sheet date. For debt securities in unrealized loss positions that do not meet these criteria, the Company must analyze its ability to recover the amortized cost by comparing the net present value of projected future cash flows with the amortized cost of the security. The net present value is calculated by discounting the Company’s best estimate of projected future cash flows. If the net present value is less than the amortized cost of the investment, an OTTI is recorded. The OTTI is separated into two pieces: an amount representing the credit loss, where the present value of cash flows expected to be collected is less than the amortized cost basis of the security, and an amount related to all other factors (referred to as the non credit portion). The credit loss is recognized in earnings and the non credit loss is recognized in other comprehensive income (“OCI”), net of applicable taxes and value of business acquired. Management records subsequent changes in the estimated fair value (positive and negative) of available-for-sale debt securities for which non credit OTTI was previously recognized in OCI in OCI-OTTI.
For the three months ended September 30, 2010, the Company did not record an OTTI in income. For the nine months ended September 30, 2010, the Company recorded an OTTI in income of less than $0.1 million, with no associated value of business acquired amortization. For the three and nine months ended September 30, 2009, the Company recorded an OTTI in income of $0.3 million and $0.9 million, respectively, with no associated amortization of value of business acquired.
Value of Business Acquired (“VOBA”), Deferred Policy Acquisition Costs (“DAC”), and Deferred Sales Inducements (“DSI”)
The short-term equity growth rate and the long-term growth rate for the amortization of VOBA, DAC and DSI were as follows:
VOBA
VOBA represents the portion of the purchase price that is allocated to the value of the right to receive future cash flows from the insurance and annuity contracts in force at the acquisition date. VOBA is based on actuarially determined projections, for each block of business, of future policy and contract charges, premiums, mortality, policyholder behavior, Separate Account performance, operating expenses, investment returns, and other factors. Actual experience on the purchased business may vary
26
September 30, December 31, September 30, 2010 2009 2009 Gross short-term equity growth rate for five years 9.00% 7.25% 8.00% Gross long-term growth rate 9.00% 9.00% 9.00%

from these projections. Revisions in estimates result in changes to the amounts expensed in the reporting period in which the revisions are made and could result in the impairment of the asset and a charge to income if estimated future gross profits are less than the unamortized balance. At September 30, 2010 and December 31, 2009, the Company’s VOBA asset was $30.3 million and $31.0 million, respectively. For the three and nine months ended September 30, 2010, there was favorable (unfavorable) unlocking of $0.2 million and ($0.1) million, respectively. For the three and nine months ended September 30, 2009, the favorable (unfavorable) impact to pre-tax income related to VOBA unlocking was $0.5 million and ($0.9) million, respectively. In addition, during the first quarter 2009, there was an impairment charge of $7.2 million. See Note 4 to the Financial Statements for a further discussion.
DAC
The costs of acquiring business, principally commissions, certain expenses related to policy issuance, and certain variable sales expenses that relate to and vary with the production of new and renewal business are deferred and amortized based on the estimated future gross profits for a group of contracts. DAC are subject to recoverability testing at the time of policy issuance and loss recognition testing at the end of each reporting period. At September 30, 2010 and December 31, 2009, variable annuities accounted for the Company’s entire DAC asset of $0.4 million and $0.4 million, respectively.
DAC for variable annuities is amortized with interest over the anticipated lives of the insurance contracts in relation to the present values of estimated future gross profits from asset-based fees, guaranteed benefit rider fees, contract fees, and surrender charges, less a provision for guaranteed death and living benefit expenses, policy maintenance expenses, and non-capitalized commissions. Future gross profit estimates are subject to periodic evaluation with necessary revisions applied against amortization to date. The impact of revisions and assumptions to estimates on cumulative amortization is recorded as a charge or benefit to current operations, commonly referred to as “unlocking”. Changes in assumptions can have a significant impact on the amount of DAC reported and the related amortization patterns. In general, increases in the estimated Separate Accounts return and decreases in surrender or mortality assumptions increase the expected future profitability of the underlying business and may lower the rate of DAC amortization. Conversely, decreases in the estimated Separate Accounts returns and increases in surrender or mortality assumptions reduce the expected future profitability of the underlying business and may increase the rate of DAC amortization. For the three and nine month periods ended September 30, 2010 and 2009, there was relatively no impact to pre-tax income related to DAC unlocking. See Note 4 to the Financial Statements for a further discussion.
DSI
The Company offers a sales inducement whereby the contract owner receives a bonus which increases the initial account balance by an amount equal to a specified percentage of the contract owner’s deposit. This amount may be subject to recapture under certain circumstances. Consistent with DAC, sales inducements for variable annuity contracts are deferred and amortized based on the estimated future gross profits for each group of contracts. These future gross profit estimates are subject to periodic evaluation by the Company, with necessary revisions applied against amortization to date. The impact of these revisions on cumulative amortization is recorded as a charge or credit to current operations, commonly referred to as “unlocking”. It is reasonably possible that estimates of future gross profits could be reduced in the future, resulting in a material reduction in the carrying amount of the deferred sales inducement asset.
The expense and the subsequent capitalization and amortization are recorded as a component of policy benefits in the Statements of Income. At September 30, 2010 and December 31, 2009, variable annuities accounted for the Company’s entire DSI asset of $0.1 million and $0.1 million, respectively. See Note 4 to the Financial Statements for a further discussion.
Policyholder Account Balances
The Company’s liability for policyholder account balances represents the contract value that has accrued to the benefit of policyholders as of the Balance Sheet date. The liability is generally equal to the accumulated account deposits plus interest credited less policyholders’ withdrawals and other charges assessed against the account balance. Policyholder account balances at September 30, 2010 and December 31, 2009 were $117.2 million and $125.3 million, respectively.
Future Policy Benefits
Future policy benefits are actuarially determined liabilities, which are calculated to meet future obligations and are generally payable over an extended period of time. Principal assumptions used in the establishment of liabilities for future policy benefits are mortality, surrender rates, policy expenses, equity returns, interest rates, and inflation. These estimates and assumptions are influenced by historical experience, current developments and anticipated market trends. At September 30, 2010 and December 31, 2009, future policy benefits were $18.5 million and $18.5 million, respectively.
27

Included within future policy benefits are liabilities for GMDB and GMIB provisions contained in the variable products that the Company issues. At September 30, 2010 and December 31, 2009, GMDB and GMIB liabilities included within future policy benefits were as follows:
The Company regularly evaluates the assumptions used to establish these liabilities, as well as actual experience and adjusts GMDB and GMIB liabilities with a related charge or credit to earnings (“unlocking”), if actual experience or evidence suggests that the assumptions should be revised. For the three and nine months ended September 30, 2010, the favorable impact to pre-tax income related to GMDB and GMIB unlocking was $2.2 million and $1.5 million, respectively. For the three and nine months ended September 30, 2009, the favorable (unfavorable) impact to pre-tax income related to GMDB and GMIB unlocking was $0.7 million and ($0.3) million, respectively.
Future policy benefits also include liabilities, which can be either positive or negative, for contracts containing GMWB provisions and for the reinsurance of GMIB provisions (“GMIB reinsurance”) for variable annuities based on the fair value of the underlying benefit. GMWB and GMIB reinsurance are treated as embedded derivatives and are required to be reported separately from the host variable annuity contract. The fair value of these guarantees are calculated as the present value of future expected payments to policyholders less the present value of assessed rider fees attributable to the guarantees. Given the complexity and long-term nature of these guarantees which are unlike instruments available in financial markets, their fair values are determined using stochastic techniques under a variety of market return scenarios. A variety of factors are considered, including expected market rates of return, equity and interest rate volatility, credit spread, correlations of market returns, discount rates and actuarial assumptions.
At September 30, 2010 and December 31, 2009, GMWB liability and GMIB reinsurance asset included within future policy benefits were as follows:
Federal Income Taxes
The Company uses the asset and liability method in providing income taxes on all transactions that have been recognized in the financial statements. The asset and liability method requires that deferred taxes be adjusted to reflect the tax rates at which future taxable amounts will be settled or realized. The Company provides for federal income taxes based on amounts it believes it will ultimately owe. Inherent in the provision for federal income taxes are estimates regarding the realization of certain tax deductions and credits.
Specific estimates include the realization of dividend-received deductions (“DRD”) and foreign tax credits (“FTC”). A portion of the Company’s investment income related to Separate Accounts business qualifies for the DRD and FTC. Information necessary to calculate these tax adjustments is typically not available until the following year. However, within the current year’s provision, management makes estimates regarding the future tax deductibility of these items. These estimates are primarily based on recent historic experience. See Note 6 to the Financial Statements for a further discussion.
The valuation allowance for deferred tax assets at September 30, 2010 and December 31, 2009 was $0.4 million and $3.7 million, respectively. The valuation allowance is related to a net operating loss carryforward and other deferred tax assets that, in the judgment of management, is not more likely than not to be realized. In assessing the realizability of deferred tax assets, management considers whether it is more likely than not that all or some of the deferred tax assets will not be realized. The ultimate realization of deferred tax assets depends on generation of further taxable income during the periods in which those temporary differences are deductible. Management considers the scheduled reversal of deferred tax liabilities, projected taxable income, and tax-planning strategies in making the assessment.
The Company files a return in the U.S. federal tax jurisdiction and various state tax jurisdictions.
28
September 30, December 31,(dollars in millions) 2010 2009
GMDB liability $0.2 $0.3GMIB liability 2.5 2.5
September 30, December 31,(dollars in millions) 2010 2009GMWB liability $ 2.4 $ 1.3GMIB reinsurance asset (7.6) (5.7)

Recent Accounting Guidance
The following outlines the adoption of recent accounting guidance in 2010. See Note 1 to the Financial Statements for a further discussion.
The following outlines the adoption of accounting guidance in 2009. See Note 1 to the Financial Statements for a further discussion.
29
• Accounting Standards Codification (“ASC”) 820, Fair Value Measurements and Disclosure, ASU 2010-06, Improving Disclosures about Fair Value Measurements — guidance on new disclosures and clarifications of existing disclosures about fair value measurements — adopted January 1, 2010.
• ASC 105, Generally Accepted Accounting Principles — established the Financial Accounting Standards Board (“FASB”) Accounting Standards CodificationTM (“Codification”) as the source of authoritative GAAP recognized by the FASB to be applied by nongovernmental entities — adopted September 30, 2009.
• ASC 320, Investments—Debt and Equity Securities — guidance that makes OTTI guidance for debt securities more operational and improves the presentation and disclosure of OTTI on debt and equity securities in the financial statements. The revised guidance resulted in a net increase to retained earnings and decrease to accumulated other comprehensive income (loss) of $0.1 million at time of adoption — adopted June 30, 2009.
• ASC 820, Fair Value Measurements and Disclosures
• ASU 2009-12, Investments in Certain Entities That Calculate Net Asset Value per Share (or Its Equivalent) — guidance on measuring the fair value of certain alternative investments (i.e., investments in hedge funds, private equity funds, venture capital funds, offshore fund vehicles, funds of funds, and real estate funds) — adopted December 31, 2009.
• ASU 2009-05, Measuring Liabilities at Fair Value — guidance which clarified that when a quoted price in an active market for an identical liability is not available, an entity should measure fair value using one of the prescribed approaches that maximizes the use of relevant observable inputs and minimizes the use of unobservable inputs — adopted December 31, 2009.
• Guidance for estimating fair value when the volume and level of activity for an asset or liability have significantly decreased as well as guidance on identifying circumstances that indicate a transaction is not orderly — adopted June 30, 2009.
• Guidance required an entity to disclose the methods and significant assumptions used to estimate fair value of financial instruments and to describe changes, if any, to those methods and assumptions during the period — adopted June 30, 2009.
• ASC 855, Subsequent Events
• Guidance that establishes general standards of accounting for and disclosure of events that occur after the balance sheet date but before financial statements are issued or are available to be issued — adopted June 30, 2009.
• Revised guidance which eliminated the requirement for entities that file or furnish financial statements to the Securities Exchange Commission (“SEC”) to disclose the date through which subsequent events have been evaluated — adopted December 31, 2009.
• ASC 815, Derivatives and Hedging — guidance that amended and expanded the disclosure requirements related to derivative instruments and hedging activities to provide users of financial statements with an enhanced understanding of the instruments — adopted January 1, 2009.
• ASC 805, Business Combinations — guidance that established the principles and requirements for how the acquirer in a business combination: a) measures and recognizes the identifiable assets acquired, liabilities assumed, and any noncontrolling interests in the acquired entity, b) measures and recognizes positive goodwill acquired or a gain from bargain purchase (negative goodwill), and c) determines the disclosure information that is decision-useful to users of financial statements in evaluating the nature and financial effects of the business combination — adopted January 1, 2009.

In addition, the following is accounting guidance that will be adopted in the future. See Note 1 to the Financial Statements for a further discussion.
Investments
The Company maintains a conservative general account investment portfolio comprised primarily of investment grade fixed maturity securities, policy loans, and cash and cash equivalents.
30
• ASC 350, Intangibles—Goodwill and Other — guidance that amended the factors that should be considered in developing renewal or extension assumptions used to determine the useful life of a recognized intangible asset — adopted January 1, 2009.
• ASC 820, Fair Value Measurements and Disclosure, ASU 2010-06, Improving Disclosures about Fair Value Measurement —requires separate presentation of information about purchases, sales, issuances, and settlements in the Level 3 reconciliation for fair value measurements using significant unobservable inputs — will be adopted January 1, 2011.
• ASC 944, Financial Services — Insurance
• ASU 2010-15, How Investments Held Through Separate Accounts Affect an Insurer’s Consolidation Analysis of Those Investments — clarification that an insurance entity should not consider any separate account interest held for the benefit of policyholders in an investment to be the insurer’s interest and should not combine those interests with its general account interest in the same investment when assessing the investment for consolidation — will be adopted January 1, 2011.
• ASU 2010-26, Accounting for Costs Associated with Acquiring or Renewing Insurance Contracts — modifies the definition of the types of costs incurred by insurance entities that can be capitalized in the acquisition of new and renewal contracts — will be adopted January 1, 2012.

Fixed Maturities and Equity Securities
The amortized cost/cost and estimated fair value of investments in fixed maturity and equity securities at September 30, 2010 and December 31, 2009 were:
31
September 30, 2010 Gross Unrealized % of Amortized Losses/ Estimated Estimated(dollars in millions) Cost/Cost Gains OTTI (1) Fair Value Fair ValueFixed maturity securities
Corporate bonds Financial services $ 20.8 $ 1.6 $ (0.1) $ 22.3 14%Industrial 76.0 7.6 — 83.6 55Utility 4.8 0.4 — 5.2 3
Asset-backed securities Housing related 2.1 — — 2.1 1Credit cards 2.8 — — 2.8 2Autos 2.0 0.1 — 2.1 1
Commercial mortgage-backed securities — non agency backed 24.9 2.9 — 27.8 19
Residential mortgage-backed securities Agency backed 0.4 — — 0.4 —Non agency backed 1.0 — (0.1) 0.9 1
Government and government agencies United States 3.0 — — 3.0 2Foreign 3.2 0.6 (0.1) 3.7 2
Total fixed maturity securities 141.0 13.2 (0.3) 153.9 100
Equity securities — banking securities 0.1 — — 0.1 —
Total equity securities 0.1 — — 0.1 —
Total fixed maturity and equity securities $ 141.1 $ 13.2 $ (0.3) $ 154.0 100%

The Company regularly monitors industry sectors and individual debt securities for evidence of impairment. This evidence may include one or more of the following: 1) deteriorating market to book ratio, 2) increasing industry risk factors, 3) deteriorating financial condition of the issuer, 4) covenant violations, 5) high probability of bankruptcy of the issuer, 6) nationally recognized credit rating agency downgrades, and/or 7) intent and ability to hold to recovery. Additionally, for asset-backed securities (“ABS”), cash flow trends and underlying levels of collateral are monitored. A security is impaired if there is objective evidence that a loss event has occurred after the initial recognition of the asset that has a negative impact on the estimated future cash flows. A specific security is considered to be impaired when it is determined that it is probable that not all amounts due (both principal and interest) will be collected as scheduled. For debt securities, an OTTI must be recognized in earnings when an entity either a) has the intent to sell the debt security or b) more likely than not will be required to sell the debt security before its anticipated recovery. If the Company meets either of these criteria, the OTTI is recognized in earnings in an amount equal to the entire difference between the security’s amortized cost basis and its fair value at the balance sheet date. For debt securities in unrealized loss positions that do not meet these criteria, the Company must analyze its ability to recover the amortized cost by comparing the net present value of projected future cash flows with the amortized cost of the security. The Company has evaluated the near-term prospects of the issuers in relation to the severity and duration of the unrealized loss, and unless otherwise noted, does not consider these investments to be impaired as of September 30, 2010.
Three issuers represent more than 5% of the total unrealized loss position, comprised of one corporate non-convertible bond, one government security and one residential mortgage-backed security (“RMBS”) holding. The Company has an investment grade corporate non-convertible security issued by JP Morgan Chase with an unrealized loss totaling $0.1 million. The Company’s government security has an unrealized loss of $0.1 million, was issued in Venezuela and is rated below investment grade. The Company’s RMBS unrealized loss is $0.1 million and relates to a securitized portfolio of prime hybrid mortgages that contain fixed income positions where our holding is rated below investment grade and was previously impaired to discounted cash flows.
At September 30, 2010 and December 31, 2009, approximately $0.4 million (or 1%) and $8.2 million (or 24%), respectively, of RMBS and commercial mortgage-backed security (“CMBS”) holdings were fully collateralized by the Government National Mortgage Association, the Federal National Mortgage Association or the Federal Home Loan Mortgage Corporation. RMBS are securitizations of underlying pools of non-commercial mortgages on real estate. The underlying residential mortgages have varying credit ratings and are pooled together and sold in tranches. The Company’s RMBS includes collateralized mortgage obligations (“CMOs”), government sponsored enterprise (“GSE”) guaranteed passthroughs, whole loan passthroughs, and negative
32
December 31, 2009 Gross Unrealized % of Amortized Losses/ Estimated Estimated(dollars in millions) Cost/Cost Gains OTTI (1) Fair Value Fair Value
Fixed maturity securities Corporate bonds
Financial services $ 12.9 $ 0.5 $ (0.3) $ 13.1 11%Industrial 46.0 3.0 — 49.0 43Utility 3.3 0.2 — 3.5 3
Asset-backed securities Housing related 2.4 — (0.2) 2.2 2Credit cards 2.8 0.1 — 2.9 3Autos 2.0 0.1 — 2.1 2
Commercial mortgage-backed securities — non agency backed 25.8 0.3 (0.6) 25.5 22
Residential mortgage-backed securities Agency backed 7.9 0.3 — 8.2 7Non agency backed 1.1 — (0.2) 0.9 1
Government and government agencies United States 3.2 — (0.1) 3.1 3Foreign 3.5 0.1 (0.2) 3.4 3
Total fixed maturity securities 110.9 4.6 (1.6) 113.9 100
Equity securities — banking securities 0.1 — — 0.1 —
Total equity securities 0.1 — — 0.1 —
Total fixed maturity and equity securities $ 111.0 $ 4.6 $ (1.6) $ 114.0 100%
(1) Subsequent unrealized gains (losses) on OTTI securities are included in OCI-OTTI.

amortization mortgage-backed securities. RMBS and CMBS securities are structured to allow the investor to determine, within certain limits, the amount of interest rate risk, prepayment risk and default risk that the investor is willing to accept. It is this level of risk that determines the degree to which the yields on RMBS and CMBS will exceed the yields that can be obtained from corporate securities with similar credit ratings.
The following tables summarize the Company’s CMBS exposure by rating and vintage at September 30, 2010 and December 31, 2009:
33
September 30, 2010 Net Estimated Unrealized Amortized Fair Loss and(dollars in millions) Cost Value OTTIAAA $ 24.9 $ 27.8 $ 2.9
Total $ 24.9 $ 27.8 $ 2.9
December 31, 2009 Net Estimated Unrealized Amortized Fair Loss and (dollars in millions) Cost Value OTTI AAA $ 24.8 $ 24.8 $ —A 1.0 0.7 (0.3)
Total $ 25.8 $ 25.5 $ (0.2)
September 30, 2010 Estimated Fair Value by Vintage (dollars in millions) 2004 & Prior 2005 2006 2007 Total
AAA $ 0.2 $ 4.0 $ 21.5 $ 2.1 $ 27.8
Total $ 0.2 $ 4.0 $ 21.5 $ 2.1 $ 27.8
December 31, 2009 Estimated Fair Value by Vintage(dollars in millions) 2004 & Prior 2005 2006 2007 TotalAAA $ 0.2 $ 4.7 $ 19.9 $ — $ 24.8A — — 0.7 — 0.7
Total $ 0.2 $ 4.7 $ 20.6 $ — $ 25.5
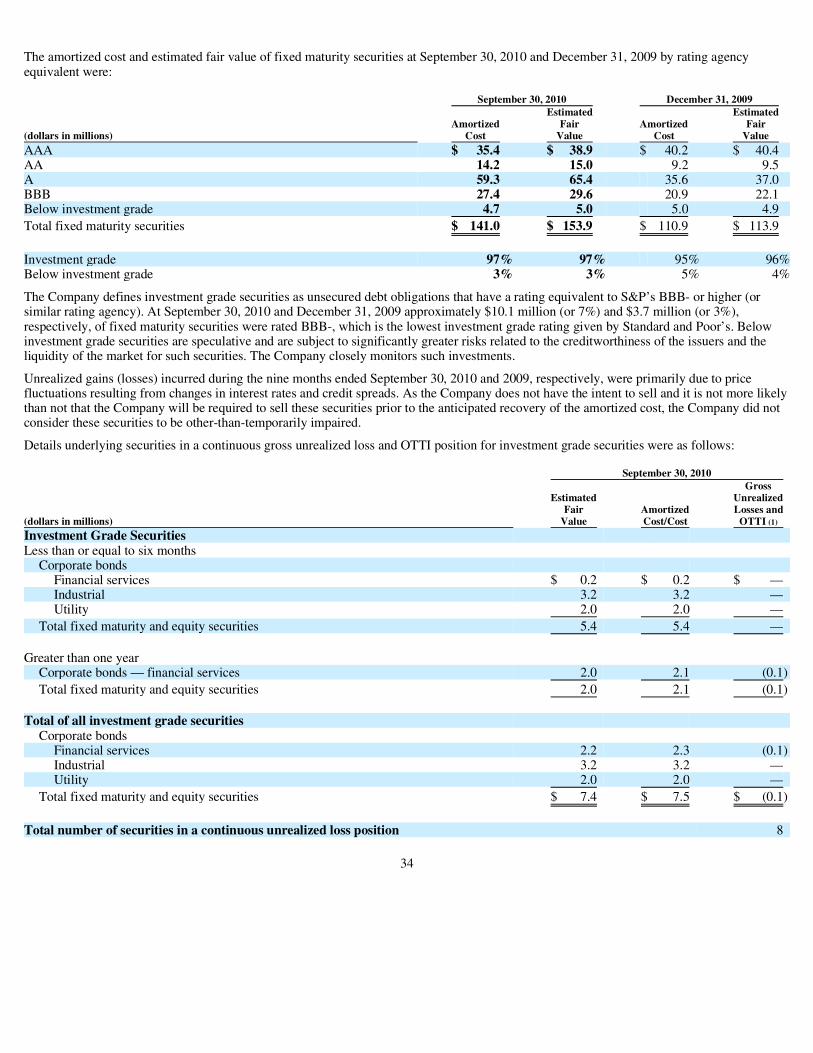
The amortized cost and estimated fair value of fixed maturity securities at September 30, 2010 and December 31, 2009 by rating agency equivalent were:
The Company defines investment grade securities as unsecured debt obligations that have a rating equivalent to S&P’s BBB- or higher (or similar rating agency). At September 30, 2010 and December 31, 2009 approximately $10.1 million (or 7%) and $3.7 million (or 3%), respectively, of fixed maturity securities were rated BBB-, which is the lowest investment grade rating given by Standard and Poor’s. Below investment grade securities are speculative and are subject to significantly greater risks related to the creditworthiness of the issuers and the liquidity of the market for such securities. The Company closely monitors such investments.
Unrealized gains (losses) incurred during the nine months ended September 30, 2010 and 2009, respectively, were primarily due to price fluctuations resulting from changes in interest rates and credit spreads. As the Company does not have the intent to sell and it is not more likely than not that the Company will be required to sell these securities prior to the anticipated recovery of the amortized cost, the Company did not consider these securities to be other-than-temporarily impaired.
Details underlying securities in a continuous gross unrealized loss and OTTI position for investment grade securities were as follows:
34
September 30, 2010 December 31, 2009 Estimated Estimated Amortized Fair Amortized Fair (dollars in millions) Cost Value Cost Value AAA $ 35.4 $ 38.9 $ 40.2 $ 40.4AA 14.2 15.0 9.2 9.5A 59.3 65.4 35.6 37.0BBB 27.4 29.6 20.9 22.1Below investment grade 4.7 5.0 5.0 4.9
Total fixed maturity securities $ 141.0 $ 153.9 $ 110.9 $ 113.9
Investment grade 97% 97% 95% 96%Below investment grade 3% 3% 5% 4%
September 30, 2010 Gross Estimated Unrealized Fair Amortized Losses and(dollars in millions) Value Cost/Cost OTTI (1)
Investment Grade Securities Less than or equal to six months
Corporate bonds Financial services $ 0.2 $ 0.2 $ —Industrial 3.2 3.2 —Utility 2.0 2.0 —
Total fixed maturity and equity securities 5.4 5.4 —
Greater than one year
Corporate bonds — financial services 2.0 2.1 (0.1)
Total fixed maturity and equity securities 2.0 2.1 (0.1)
Total of all investment grade securities
Corporate bonds Financial services 2.2 2.3 (0.1)Industrial 3.2 3.2 —Utility 2.0 2.0 —
Total fixed maturity and equity securities $ 7.4 $ 7.5 $ (0.1)
Total number of securities in a continuous unrealized loss position 8

35
December 31, 2009 Gross Estimated Unrealized Fair Amortized Losses and(dollars in millions) Value Cost/Cost OTTI (1)
Investment Grade Securities Less than or equal to six months
Corporate bonds — industrial $ 1.0 $ 1.0 $ —Government and government agencies
United States 1.9 1.9 —Foreign 2.2 2.3 (0.1)
Total fixed maturity and equity securities 5.1 5.2 (0.1)
Greater than six months but less than or equal to one year
Corporate bonds — industrial 0.3 0.3 —Asset-backed securities — housing related 0.7 0.7 —Government and government agencies — United States 1.0 1.1 (0.1)
Total fixed maturity and equity securities 2.0 2.1 (0.1)
Greater than one year Corporate bonds — financial services 3.8 4.1 (0.3)Asset-backed securities — housing related 1.5 1.7 (0.2)Commercial mortgage-backed securities — non agency backed 6.0 6.6 (0.6)
Total fixed maturity and equity securities 11.3 12.4 (1.1)
Total of all investment grade securities
Corporate bonds Financial services 3.8 4.1 (0.3)Industrial 1.3 1.3 —
Asset-backed securities — housing related 2.2 2.4 (0.2)Commercial mortgage-backed securities — non agency backed 6.0 6.6 (0.6)Government and government agencies
United States 2.9 3.0 (0.1)Foreign 2.2 2.3 (0.1)
Total fixed maturity and equity securities $ 18.4 $ 19.7 $ (1.3)
Total number of securities in a continuous unrealized loss position 25
(1) Subsequent unrealized gains (losses) on OTTI securities are included in OCI-OTTI.
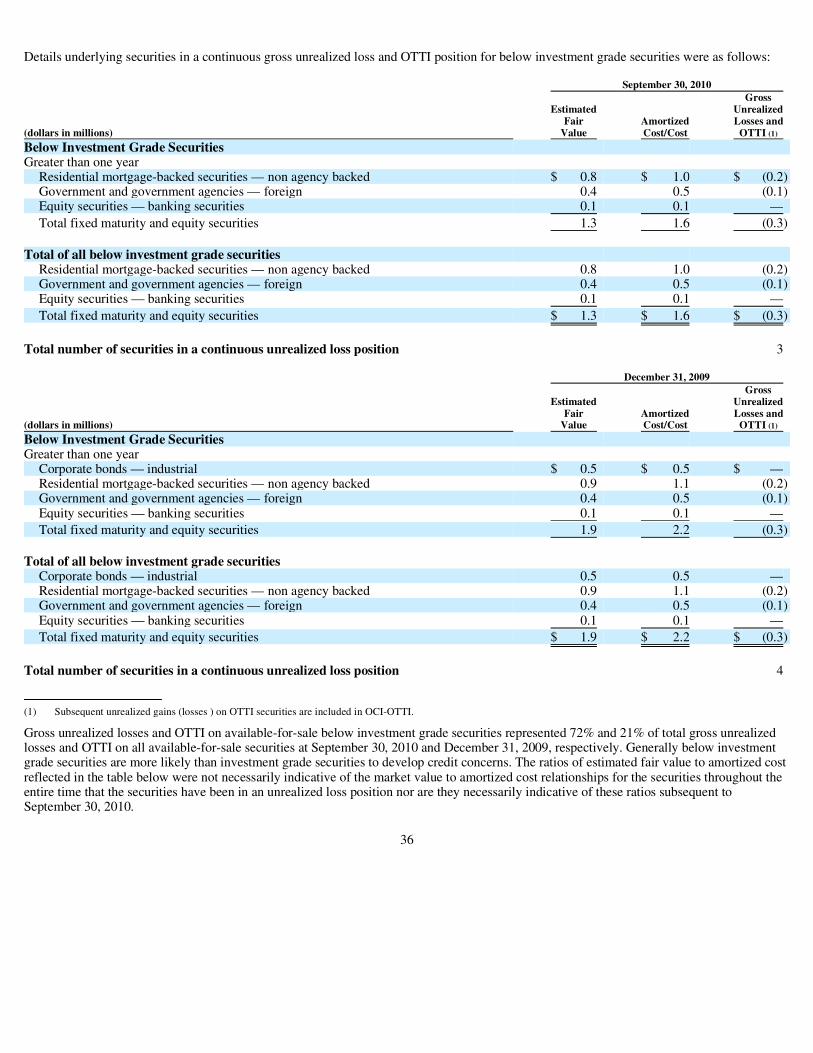
Details underlying securities in a continuous gross unrealized loss and OTTI position for below investment grade securities were as follows:
Gross unrealized losses and OTTI on available-for-sale below investment grade securities represented 72% and 21% of total gross unrealized losses and OTTI on all available-for-sale securities at September 30, 2010 and December 31, 2009, respectively. Generally below investment grade securities are more likely than investment grade securities to develop credit concerns. The ratios of estimated fair value to amortized cost reflected in the table below were not necessarily indicative of the market value to amortized cost relationships for the securities throughout the entire time that the securities have been in an unrealized loss position nor are they necessarily indicative of these ratios subsequent to September 30, 2010.
36
September 30, 2010 Gross Estimated Unrealized Fair Amortized Losses and(dollars in millions) Value Cost/Cost OTTI (1)
Below Investment Grade Securities Greater than one year
Residential mortgage-backed securities — non agency backed $ 0.8 $ 1.0 $ (0.2)Government and government agencies — foreign 0.4 0.5 (0.1)Equity securities — banking securities 0.1 0.1 —
Total fixed maturity and equity securities 1.3 1.6 (0.3)
Total of all below investment grade securities
Residential mortgage-backed securities — non agency backed 0.8 1.0 (0.2)Government and government agencies — foreign 0.4 0.5 (0.1)Equity securities — banking securities 0.1 0.1 —
Total fixed maturity and equity securities $ 1.3 $ 1.6 $ (0.3)
Total number of securities in a continuous unrealized loss position 3 December 31, 2009 Gross Estimated Unrealized Fair Amortized Losses and(dollars in millions) Value Cost/Cost OTTI (1)
Below Investment Grade Securities Greater than one year
Corporate bonds — industrial $ 0.5 $ 0.5 $ —Residential mortgage-backed securities — non agency backed 0.9 1.1 (0.2)Government and government agencies — foreign 0.4 0.5 (0.1)Equity securities — banking securities 0.1 0.1 —
Total fixed maturity and equity securities 1.9 2.2 (0.3)
Total of all below investment grade securities
Corporate bonds — industrial 0.5 0.5 —Residential mortgage-backed securities — non agency backed 0.9 1.1 (0.2)Government and government agencies — foreign 0.4 0.5 (0.1)Equity securities — banking securities 0.1 0.1 —
Total fixed maturity and equity securities $ 1.9 $ 2.2 $ (0.3)
Total number of securities in a continuous unrealized loss position 4
(1) Subsequent unrealized gains (losses ) on OTTI securities are included in OCI-OTTI.

Details underlying available-for-sale securities below investment grade and in an unrealized loss and OTTI position were as follows:
Subprime Mortgage Investments
Subprime mortgages are loans to homebuyers who have weak or impaired credit histories. Through 2008, the market for these loans had expanded rapidly. During that time, however, lending practices and credit assessment standards grew steadily weaker. As a result, the market is now experiencing a sharp increase in the number of loan defaults. Investors in subprime mortgage assets include not only mortgage lenders, but also brokers, hedge funds, and insurance companies. The Company does not currently invest in or originate whole loan residential mortgages. The Company categorizes ABS issued by a securitization trust as having subprime mortgage exposure when the average credit score of the underlying mortgage borrowers in a securitization trust is below 660 at issuance. The Company also categorizes ABS issued by a securitization trust with second lien mortgages as subprime mortgage exposure, even though a significant percentage of second lien mortgage borrowers may not necessarily have credit scores below 660 at issuance. The estimated fair value of the subprime mortgage investments at September 30, 2010 and December 31, 2009 was $2.1 million and $2.2 million, respectively, entirely in first lien — fixed rate, AAA quality and vintages prior to 2004.
OTTI
The Company did not incur any impairment losses during the three months ended September 30, 2010. The Company’s impairment losses were less than $0.1 million for the nine months ended September 30, 2010, with no associated VOBA amortization. The impairment losses were principally the result of the Company impairing its holding of a 2005 vintage RMBS in the second quarter due to an adverse change in cash flows. For the three and nine months ended September 30, 2009, the Company had impairment losses of $0.3 million and $0.9 million, with no associated VOBA amortization. The Company impaired its holding of a preferred stock in CIT Group, Inc. for $0.2 million during the third quarter 2009. In the first quarter 2009, the Company impaired its holdings in Harrah’s Entertainment Inc. to fair value for $0.3 million.
Liquidity and Capital Resources
Liquidity
The Company’s liquidity requirements include the payment of sales commissions and other underwriting expenses and the funding of its contractual obligations for the life insurance and annuity contracts it has in force. The Company has developed and utilizes a cash flow projection system and regularly performs asset/liability duration matching in the management of its asset and liability portfolios. The Company anticipates funding its cash requirements utilizing cash from operations, normal investment maturities and anticipated calls and repayments, consistent with prior years. At September 30, 2010 and December 31, 2009, the Company’s assets included $172.1 million and $158.5 million, respectively, of cash, short-term investments and investment grade publicly traded available-for-sale securities that could be liquidated if funds were required.
37
September 30, 2010 Ratio of Gross Amortized Cost Estimated Unrealized to Estimated Fair Amortized Losses and(dollars in millions) Fair Value Value Cost/Cost OTTI (1)
Greater than one year 70% to 100% $ 1.3 $ 1.6 $ (0.3)
Total $ 1.3 $ 1.6 $ (0.3)
December 31, 2009 Ratio of Gross Amortized Cost Estimated Unrealized to Estimated Fair Amortized Losses and(dollars in millions) Fair Value Value Cost/Cost OTTI (1)
Greater than one year 70% to 100% $ 1.9 $ 2.2 $ (0.3)
Total $ 1.9 $ 2.2 $ (0.3)
(1) Subsequent unrealized gains (losses) on OTTI securities are included in OCI-OTTI.

Capital Resources
During the first nine months of 2010 and 2009, the Company did not receive a capital contribution from AUSA nor did the Company pay a dividend to AUSA.
Ratings
Ratings are an important factor in establishing the competitive position in the insurance and financial services marketplace. Rating agencies rate insurance companies based on financial strength and the ability to pay claims, factors more relevant to contract holders than investors.
The insurer financial strength rating scales of S&P, A.M. Best, and Fitch Ratings (“Fitch”) are characterized as follows:
The following table summarizes the Company’s ratings at November 11, 2010:
A downgrade of our financial strength rating could affect our competitive position in the insurance industry and make it more difficult for us to market our products, as potential customers may select companies with higher financial strength ratings. These ratings are not a recommendation to buy or hold any of the Company’s securities and they may be revised or revoked at any time at the sole discretion of the rating organization.
Commitments and Contingencies
The following table summarizes the Company’s policyholders’ obligations at September 30, 2010:
In the normal course of business, the Company is subject to various claims and assessments. Management believes the settlement of these matters would not have a material effect on the financial position, results of operations or cash flows of the Company.
38
• S&P — AAA to R
• A.M. Best — A++ to S
• Fitch — AAA to C
S&P AA- (4th out of 21)A.M. Best A+ (2nd out of 16)Fitch AA- (4th out of 19)
Less One To Four To More Than One Three Five Than Five(dollars in millions) Year Years Years Years TotalGeneral accounts (a) $ 16.0 $ 25.9 $ 20.2 $ 74.2 $ 136.3Separate Accounts (a) 76.4 138.4 120.9 420.8 756.5
$ 92.4 $ 164.3 $ 141.1 $ 495.0 $ 892.8
(a) The policyholder liabilities include benefit and claim liabilities of which a significant portion represents policies and contracts that do not have a stated contractual maturity. The projected cash benefit payments in the table above are based on management’s best estimates of the expected gross benefits and expenses, partially offset by the expected gross premiums, fees and charges relating to the existing business in force. Estimated cash benefit payments are based on mortality and lapse assumptions comparable with the Company’s historical experience, modified for recently observed trends. Actual payment obligations may differ if experience varies from these assumptions. The cash benefit payments are presented on an undiscounted basis and are before deduction of tax and before reinsurance. The liability amounts in the Company’s Financial Statements reflect the discounting for interest as well as adjustments for the timing of other factors as described above. As a result, the sum of the cash benefit payments shown for all years in the table above exceeds the corresponding policyholder liability amounts.

Results of Operations
For the three months ended September 30, 2010 and 2009, the Company recorded net income of $2.9 million and $1.9 million, respectively. The increase in income was primarily due to a decrease in policy benefits, partially offset by an increase in VOBA amortization and the change in the tax valuation allowance.
For the nine months ended September 30, 2010 and 2009, the Company recorded net income (loss) of $10.4 million and ($7.5) million, respectively. The increase in income was primarily due to the 2009 impairment of VOBA, the change in the tax valuation allowance and net realized investment gains in 2010 as compared to losses in 2009.
Policy charge revenue decreased $0.3 million (or 7%) to $3.5 million during the three months ended September 30, 2010, as compared to the same period in 2009. Policy charge revenue increased $0.2 million (or 2%) to $10.9 million during the nine months ended September 30, 2010, as compared to the same period in 2009.
The following table provides the changes in policy charge revenue by type for each respective period:
Net realized investment gains (losses) increased $0.6 million to ($0.3) million during the three months ended September 30, 2010, as compared to the same period in 2009. Net realized investment gains (losses) increased $4.1 million to $1.4 million during the nine months ended September 30, 2010, as compared to the same period in 2009. The following table provides the changes in net realized investment gains (losses) by type:
39
Three Months Nine Months(dollars in millions) 2010 vs. 2009 2010 vs. 2009
Asset-based policy charge revenue $ (0.1) $ 0.3(a)Guaranteed benefit based policy charge revenue (0.1) (0.1)Non-asset based policy charge revenue (0.1) —
Total policy charge revenue $ (0.3) $ 0.2
(a) Asset-based policy charge revenue for the nine months ended September 30, 2010 was positively impacted by the increase in average variable account balances as compared to 2009.
Three Months Nine Months(dollars in millions) 2010 vs. 2009 2010 vs. 2009
Credit related gains (losses) $ — $ 0.6(a)Interest related gains (losses) 0.3 2.0(b)Equity related gains (losses) 0.3 1.5(c)
Total net realized investment gains (losses) $ 0.6 $ 4.1
Write-downs for OTTI included in net realized investment gains (losses) — 0.6(a)
(a) The change in credit related gains (losses) as compared to 2009 is primarily due to a decrease in OTTI impairments along with the change in accounting principle for OTTI impairments in 2009. See the Critical Accounting Policies and Estimates section above for further discussion on OTTI recognition.
(b) The increase in interest related gains was principally due to the credit spread movement tightening in 2010.
(c) The change in equity related gains (losses) principally relates to net gains on futures contracts during 2010 as compared to net losses on futures contracts in 2009.

Policy benefits decreased $2.9 million and $0.7 million, respectively, during the three and nine months ended September 30, 2010 as compared to the same period in 2009. The following table provides the changes in policy benefits by type:
Amortization of VOBA was $1.4 million and $0.3 million for the three and nine months ended September 30, 2010, respectively. Amortization and impairment of VOBA was $0.1 million and $9.3 million for the three and nine months ended September 30, 2009, respectively. For the three and nine months ended September 30, 2010, there was favorable (unfavorable) unlocking of $0.2 million and ($0.1) million, respectively. During the three months ended September 30, 2010, positive future gross profits, principally driven by favorable equity market movement resulted in increased amortization as compared to 2009. For the nine months ended September 30, 2010, mixed equity markets resulted in a small unfavorable unlocking and amortization expense. For the three and nine months ended September 30, 2009, there was favorable (unfavorable) unlocking of $0.4 million and ($0.9) million, respectively. The nine months ended September 30, 2009 were impacted by the negative economic outlook during the first quarter 2009 which resulted in unfavorable unlocking. In addition, an impairment charge of $7.2 million was taken at March 31, 2009, as estimated future gross profits were less than the unamortized balance.
Insurance expenses and taxes decreased $0.1 million and $0.6 million in the three and nine months ended September 30, 2010 as compared to the same period in 2009. The following table provides the changes in insurance expenses and taxes for each respective period:
Segment Information
The products that comprise the Annuity and Life Insurance segments generally possess similar economic characteristics. As such, the financial condition and results of operations of each business segment are generally consistent with the Company’s consolidated financial condition and results of operations presented herein.
ITEM 4. Controls and Procedures
The Company’s Disclosure Committee assists with the monitoring and evaluation of its disclosure controls and procedures. The Company’s President, Chief Financial Officer and Disclosure Committee have evaluated the effectiveness of the Company’s disclosure controls and procedures (as defined in Rule 15d-15(e) under the Securities Exchange Act of 1934) as of the end of the period covered by this Report. Based on that evaluation, the Company’s President and Chief Financial Officer have concluded that the Company’s disclosure controls and procedures are effective.
40
Three Months Nine Months (dollars in millions) 2010 vs. 2009 2010 vs. 2009 Annuity benefit unlocking $ (1.5) $ (1.8)(a)Annuity benefit expense (1.4) 0.2 (b)Life insurance mortality expense — 0.9 (c)
Total policy benefits $ (2.9) $ (0.7)
(a) See the Critical Accounting Policies and Estimates section above for further discussion of annuity benefit unlocking.
(b) The decrease in annuity benefit expense during the three months ended September 30, 2010 as compared to 2009, was primarily driven by favorable equity market movement and policyholder behavior assumption changes resulting in lower guaranteed benefits. For the nine months ended September 30, 2010 as compared to 2009, mixed equity markets resulted in slightly increased benefits.
(c) Life insurance mortality expenses increased in 2010 primarily due to an increase in claims with a high net amount at risk.
Three Months Nine Months(dollars in millions) 2010 vs. 2009 2010 vs. 2009 Commissions $ (0.1) $ 0.1General insurance expenses — (0.6)(a)Taxes, licenses, and fees — (0.1)
Total insurance expenses and taxes $ (0.1) $ (0.6)
(a) The decrease in general insurance expenses is primarily due to lower system and transition related expenses in 2010.

In addition, no change in the Company’s internal control over financial reporting (as defined in Rule 15d-15(f) under the Securities Exchange Act of 1934) occurred during the third fiscal quarter of 2010 that has materially affected, or is reasonably likely to materially affect, the Company’s internal control over financial reporting.
41

PART II Other Information
Item 1. Legal Proceedings.
Nothing to report.
Item 1A. Risk Factors.
In addition to the other information set forth in this report, you should carefully consider the factors discussed in Part 1.” Item 1A. Risk Factors” in the Annual Report on Form 10-K for the year ended December 31, 2009, which could materially affect the Company’s business, financial condition or future results. The risks described in the Company’s Annual Report on Form 10-K are not the only risks facing the Company. Additional risks and uncertainties not currently known to the Company or that the Company currently deems to be immaterial also may materially adversely affect the Company’s business, financial condition, and/or operating results.
Item 5. Other Information.
(a) Nothing to report.
(b) Nothing to report.
42

Item 6. Exhibits.
3.1
Certificate of Amendment of the Charter of ML Life Insurance Company of New York. (Incorporated by reference to Exhibit 6(a)(ii) to Post-Effective Amendment No. 10 to ML of New York Variable Annuity Account A’s registration statement on Form N-4, File No. 33-43654, filed December 9, 1996.)
3.2
Certificate of Amendment of the Charter of ML Life Insurance Company of New York. (Incorporated by reference to Exhibit 3.2 to the Quarterly Report on Form 10-Q of Transamerica Advisors Life Insurance Company of New York, File Nos. 33-34562, 33-60288, 333-48983, abd 333-133224, filed on August 12, 2010.)
3.3
By-Laws of Transamerica Advisors Life Insurance Company of New York. (Incorporated by reference to Exhibit 3.3 to the Quarterly Report on Form 10-Q of Transamerica Advisors Life Insurance Company of New York, File Nos. 33-34562, 33-60288, 333-48983, abd 333-133224, filed on August 12, 2010.)
4.1
Modified Guaranteed Annuity Contract. (Incorporated by reference to Exhibit 4(a) to Pre-Effective Amendment No. 1 to the Registrant’s registration statement on Form S-1, File No. 33-34562, filed October 16, 1990.)
4.2
Modified Guaranteed Annuity Contract Application. (Incorporated by reference to Exhibit 4(b) to Pre-Effective Amendment No. 1 to the Registrant’s registration statement on Form S-1, File No. 33-34562, filed October 16, 1990.)
4.3
Qualified Retirement Plan Endorsement. (Incorporated by reference to Exhibit 4(c) to Pre-Effective Amendment No. 1 to the Registrant’s registration statement on Form S-1, File No. 33-34562, filed October 16, 1990.)
4.4
IRA Endorsement. (Incorporated by reference to Exhibit 4(d) to Pre-Effective Amendment No. 1 to the Registrant’s registration statement on Form S-1, File No. 33-34562, filed October 16, 1990.)
4.5
Company Name Change Endorsement. (Incorporated by reference to Exhibit 4(e) to Post-Effective Amendment No. 3 to the Registrant’s registration statement on Form S-1, File No. 33-34562, filed March 30, 1992.)
4.6
IRA Endorsement, MLNY009 (Incorporated by reference to Exhibit 4(d)(2) to Post-Effective Amendment No. 1 to the Registrant’s registration statement on Form S-1, File No. 33-60288, filed March 31, 1994).
4.7
Modified Guaranteed Annuity Contract MLNY-AY-991/94. (Incorporated by reference to Exhibit 4(a)(2) to Post-Effective Amendment No. 3 to the Registrant’s registration statement on Form S-1, File No. 33-60288, filed December 7, 1994).
4.8
Qualified Retirement Plan Endorsement MLNY-AYQ-991/94. (Incorporation by reference to Exhibit 4(c)(2) to Post-Effective Amendment No. 3 to the Registrant’s registration statement on Form S-1, File No. 33-60288, filed December 7, 1994).
10.1
General Agency Agreement between Royal Tandem Life Insurance Company and Merrill Lynch Life Agency Inc. (Incorporated by reference to Exhibit 10(a) to Pre-Effective Amendment No. 1 to the Registrant’s registration statement on Form S-1, File No. 33-34562, filed October 16, 1990.)
10.2
Investment Management Agreement by and between Royal Tandem Life Insurance Company and Equitable Capital Management Corporation. (Incorporated by reference to Exhibit 10(b) to Pre-Effective Amendment No. 1 to the Registrant’s registration statement on Form S-1, File No. 33-34562, filed October 16, 1990.)
10.3
Shareholders’ Agreement by and among The Equitable Life Assurance Society of the United States and Merrill Lynch & Co., Inc. and Tandem Financial Group, Inc. (Incorporated by reference to Exhibit 10(c) to Pre-Effective Amendment No. 1 to the Registrant’s registration statement on Form S-1, File No. 33-34562, filed October 16, 1990.)
10.4
Service Agreement by and between Royal Tandem Life Insurance Company and Tandem Financial Group, Inc. (Incorporated by reference to Exhibit 10(d) to Pre-Effective Amendment No. 1 to the Registrant’s registration statement on Form S-1, File No. 33-34562, filed October 16, 1990.)
10.5
Service Agreement by and between Tandem Financial Group, Inc. and Merrill Lynch & Co., Inc. (Incorporated by reference to Exhibit 10(e) to Pre-Effective Amendment No. 1 to the Registrant’s registration statement on Form S-1, File No. 33-34562, filed October 16, 1990.)

10.6
Form of Investment Management Agreement by and between Royal Tandem Life Insurance Company and Merrill Lynch Asset Management, Inc. (Incorporated by reference to Exhibit 10(f) to Post-Effective Amendment No. 1 to the Registrant’s registration statement on Form S-1, File No. 33-34562, filed March 7, 1991.)
10.7
Assumption Reinsurance Agreement between Merrill Lynch Life Insurance Company, Tandem Insurance Group, Inc. and Royal Tandem Life Insurance Company and Family Life Insurance Company. (Incorporated by reference to Exhibit 10(g) to Post-Effective Amendment No. 3 to the Registrant’s registration statement on Form S-1, File No. 33-34562, filed March 30, 1992.)
10.8
Indemnity Agreement between ML Life Insurance Company of New York and Merrill Lynch Life Agency, Inc. (Incorporated by reference to Exhibit 10(h) to Post-Effective Amendment No. 3 to the Registrant’s registration statement on Form S-1, File No. 33-34562, filed March 30, 1992.)
10.9
Amended General Agency Agreement between ML Life Insurance Company of New York and Merrill Lynch Life Agency, Inc. (Incorporated by reference to Exhibit 10(i) to Post-Effective Amendment No. 3 to the Registrant’s registration statement on Form S-1, File No. 33-34562, filed March 30, 1992.)
10.10
Amended Management Agreement between ML Life Insurance Company of New York and Merrill Lynch Asset Management, Inc. (Incorporated by reference to Exhibit 10(j) to the Registrant’s registration statement on Form S-1, File No. 33-60288, filed March 30, 1993.)
10.11
Mortgage Loan Servicing Agreement between ML Life Insurance Company of New York and Merrill Lynch & Co., Inc. (Incorporated by reference to Exhibit 10(k) to Post-Effective Amendment No. 4 to the Registrant’s registration statement on Form S-1, File No. 33-60288, filed March 29, 1995.)
10.12
Non-Affiliated Broker-Dealer Wholesaling Agreement between ML Life Insurance Company of New York, Merrill Lynch, Pierce, Fenner & Smith Incorporated, and Transamerica Capital, Inc. (Incorporated by Reference to the Annual Report on Form 10-K of ML Life Insurance Company of New York, File Nos. 33-34562, 33-60288, 333-48983, and 333-133224, Filed March 27, 2008.)
10.13
Selling Agreement between ML Life Insurance Company of New York, Merrill Lynch, Pierce, Fenner & Smith Incorporated, and Merrill Lynch Life Agency, Inc. (Incorporated by Reference to the Annual Report on Form 10-K of ML Life Insurance Company of New York, File Nos. 33-34562, 33-60288, 333-48983, and 333-133224, Filed March 27, 2008.)
10.14
Keep Well Agreement between AEGON USA And ML Life Insurance Company of New York. (Incorporated by Reference to the Annual Report on Form 10-K of ML Life Insurance Company of New York, File Nos. 33-34562, 33-60288, 333-48983, and 333-133224, Filed March 27, 2008.)
10.15
Master Distribution Agreement between Merrill Lynch Insurance Group, Inc., Merrill Lynch & Co., Inc., and AEGON USA, Inc. (Incorporated by reference to Exhibit 10.2 to ML Life Insurance Company of New York’s Current Report on Form 8-K, File No. 33-34562, filed January 4, 2008.)
10.16
Purchase Agreement between Merrill Lynch Insurance Group, Inc., Merrill Lynch & Co., Inc., and AEGON USA, Inc. (Incorporated by reference to Exhibit 10.1 to ML Life Insurance Company of New York’s Current Report on Form 8-K, File No. 33-34562, filed August 17, 2007.)
10.17
First Amendment to Purchase Agreement between Merrill Lynch Insurance Group, Inc., Merrill Lynch & Co., Inc., and AEGON USA, Inc. (Incorporated by reference to Exhibit 10.1 to ML Life Insurance Company of New York’s Current Report on Form 8-K, File No. 33-34562, filed January 4, 2008.)
10.18
Principal Underwriting Agreement between Transamerica Capital, Inc. and ML Life Insurance Company of New York. (Incorporated by reference to the Annual Report on Form 10-K of ML Life Insurance Company of New York, File Nos. 33-34562, 33-60288, 333-48983, 333-133224, filed on March 26, 2009.)
31.1 Certification by the Chief Executive Officer pursuant to Rule 15d-14(a).
31.2 Certification by the Chief Financial Officer pursuant to Rule 15d-14(a).
32.1
Certification by the Chief Executive Officer pursuant to 18 U.S.C. Section 1350, as adopted pursuant to Section 906 of the Sarbanes-Oxley Act of 2002.
32.2
Certification by the Chief Financial Officer pursuant to 18 U.S.C. Section 1350, as adopted pursuant to Section 906 of the Sarbanes-Oxley Act of 2002.

SIGNATURES
Pursuant to the requirements of the Securities Exchange Act of 1934, the Registrant has duly caused this report to be signed on its behalf by the undersigned thereunto duly authorized.
Date: November 11, 2010
TRANSAMERICA ADVISORS LIFE INSURANCE COMPANY OF NEW YORK
/s/ Eric J. Martin Eric J. Martin
Vice President, Treasurer, Chief Financial Officer, and Controller

EXHIBIT INDEX
31.1 Certification by the Chief Executive Officer pursuant to Rule 15d-14(a).
31.2 Certification by the Chief Financial Officer pursuant to Rule 15d-14(a).
32.1
Certification by the Chief Executive Officer pursuant to 18 U.S.C. Section 1350, as adopted pursuant to Section 906 of the Sarbanes-Oxley Act of 2002.
32.2
Certification by the Chief Financial Officer pursuant to 18 U.S.C. Section 1350, as adopted pursuant to Section 906 of the Sarbanes-Oxley Act of 2002.

EXHIBIT 31.1
CERTIFICATION OF CHIEF EXECUTIVE OFFICER
I, Lon J. Olejniczak, certify that:
1. I have reviewed this quarterly report on Form 10-Q of Transamerica Advisors Life Insurance Company of New York;
2. Based on my knowledge, this report does not contain any untrue statement of a material fact or omit to state a material fact necessary to make the statements made, in light of the circumstances under which such statements were made, not misleading with respect to the period covered by this report;
3. Based on my knowledge, the financial statements, and other financial information included in this report, fairly present in all material respects the financial condition, results of operations and cash flows of the registrant as of, and for, the periods presented in this report;
4. The registrant’s other certifying officer(s) and I are responsible for establishing and maintaining disclosure controls and procedures (as defined in Exchange Act Rules 13a-15(e) and 15d-15(e)) and internal control over financial reporting (as defined in Exchange Act Rules 13a-15(f) and 15d-15(f)) for the registrant and have:
5. The registrant’s other certifying officer(s) and I have disclosed, based on our most recent evaluation of internal control over financial reporting, to the registrant’s auditors and the audit committee of the registrant’s board of directors (or persons performing the equivalent functions):
Dated: November 11, 2010
(a) Designed such disclosure controls and procedures, or caused such disclosure controls and procedures to be designed under our supervision, to ensure that material information relating to the registrant, including its consolidated subsidiaries, is made known to us by others within those entities, particularly during the period in which this report is being prepared;
(b) Designed such internal control over financial reporting, or caused such internal control over financial reporting to be designed under our supervision, to provide reasonable assurance regarding the reliability of financial reporting and the preparation of financial statements for external purposes in accordance with generally accepted accounting principles;
(c) Evaluated the effectiveness of the registrant’s disclosure controls and procedures and presented in this report our conclusions about the effectiveness of the disclosure controls and procedures, as of the end of the period covered by this report based on such evaluation; and
(d) Disclosed in this report any change in the registrant’s internal control over financial reporting that occurred during the registrant’s most recent fiscal quarter (the registrant’s fourth fiscal quarter in the case of an annual report) that has materially affected, or is reasonably likely to materially affect, the registrant’s internal control over financial reporting; and
(a) All significant deficiencies and material weaknesses in the design or operation of internal control over financial reporting which are reasonably likely to adversely affect the registrant’s ability to record, process, summarize and report financial information; and
(b) Any fraud, whether or not material, that involves management or other employees who have a significant role in the registrant’s internal control over financial reporting.
/s/ Lon J. Olejniczak Lon J. Olejniczak President

EXHIBIT 31.2
CERTIFICATION OF CHIEF FINANCIAL OFFICER
I, Eric J. Martin, certify that:
1. I have reviewed this quarterly report on Form 10-Q of Transamerica Advisors Life Insurance Company of New York;
2. Based on my knowledge, this report does not contain any untrue statement of a material fact or omit to state a material fact necessary to make the statements made, in light of the circumstances under which such statements were made, not misleading with respect to the period covered by this report;
3. Based on my knowledge, the financial statements, and other financial information included in this report, fairly present in all material respects the financial condition, results of operations and cash flows of the registrant as of, and for, the periods presented in this report;
4. The registrant’s other certifying officer(s) and I are responsible for establishing and maintaining disclosure controls and procedures (as defined in Exchange Act Rules 13a-15(e) and 15d-15(e)) and internal control over financial reporting (as defined in Exchange Act Rules 13a-15(f) and 15d-15(f)) for the registrant and have:
5. The registrant’s other certifying officer(s) and I have disclosed, based on our most recent evaluation of internal control over financial reporting, to the registrant’s auditors and the audit committee of the registrant’s board of directors (or persons performing the equivalent functions):
Dated: November 11, 2010
(a) Designed such disclosure controls and procedures, or caused such disclosure controls and procedures to be designed under our supervision, to ensure that material information relating to the registrant, including its consolidated subsidiaries, is made known to us by others within those entities, particularly during the period in which this report is being prepared;
(b) Designed such internal control over financial reporting, or caused such internal control over financial reporting to be designed under our supervision, to provide reasonable assurance regarding the reliability of financial reporting and the preparation of financial statements for external purposes in accordance with generally accepted accounting principles;
(c) Evaluated the effectiveness of the registrant’s disclosure controls and procedures and presented in this report our conclusions about the effectiveness of the disclosure controls and procedures, as of the end of the period covered by this report based on such evaluation; and
(d) Disclosed in this report any change in the registrant’s internal control over financial reporting that occurred during the registrant’s most recent fiscal quarter (the registrant’s fourth fiscal quarter in the case of an annual report) that has materially affected, or is reasonably likely to materially affect, the registrant’s internal control over financial reporting; and
(a) All significant deficiencies and material weaknesses in the design or operation of internal control over financial reporting which are reasonably likely to adversely affect the registrant’s ability to record, process, summarize and report financial information; and
(b) Any fraud, whether or not material, that involves management or other employees who have a significant role in the registrant’s internal control over financial reporting.
/s/ Eric J. Martin Eric J. Martin
Vice President, Treasurer, Chief Financial Officer, and Controller

EXHIBIT 32.1
CERTIFICATION PURSUANT TO 18 U.S.C. SECTION 1350,
AS ADOPTED PURSUANT TO SECTION 906 OF THE SARBANES-OXLEY ACT OF 2002
In connection with the Quarterly Report of Transamerica Advisors Life Insurance Company of New York (the “Company”) on Form 10-Q for the period ended September 30, 2010 as filed with the Securities and Exchange Commission on the date hereof (the “Report”), I, Lon J. Olejniczak, President of the Company, certify, pursuant to 18 U.S.C. section 1350, as adopted pursuant to Section 906 of the Sarbanes-Oxley Act of 2002, that:
Dated: November 11, 2010
A signed original of this written statement required by Section 906 has been provided to Transamerica Advisors Life Insurance Company of New York and will be retained by Transamerica Advisors Life Insurance Company of New York and furnished to the Securities and Exchange Commission or its staff upon request.
(1) The Report fully complies with the requirements of Section 13(a) or 15(d) of the Securities Exchange Act of 1934; and
(2) The information contained in the Report fairly presents, in all material respects, the financial condition and results of operations of the Company.
/s/ Lon J. Olejniczak Lon J. Olejniczak President

EXHIBIT 32.2
CERTIFICATION PURSUANT TO 18 U.S.C. SECTION 1350,
AS ADOPTED PURSUANT TO SECTION 906 OF THE SARBANES-OXLEY ACT OF 2002
In connection with the Quarterly Report of Transamerica Advisors Life Insurance Company of New York (the “Company”) on Form 10-Q for the period ended September 30, 2010 as filed with the Securities and Exchange Commission on the date hereof (the “Report”), I, Eric J. Martin, Vice President, Treasurer, Chief Financial Officer, and Controller of the Company, certify, pursuant to 18 U.S.C. section 1350, as adopted pursuant to Section 906 of the Sarbanes-Oxley Act of 2002, that:
Dated: November 11, 2010
A signed original of this written statement required by Section 906 has been provided to Transamerica Advisors Life Insurance Company of New York and will be retained by Transamerica Advisors Life Insurance Company of New York and furnished to the Securities and Exchange Commission or its staff upon request.
(1) The Report fully complies with the requirements of Section 13(a) or 15(d) of the Securities Exchange Act of 1934; and
(2) The information contained in the Report fairly presents, in all material respects, the financial condition and results of operations of the Company.
/s/ Eric J. Martin Eric J. Martin
Vice President, Treasurer, Chief Financial Officer, and Controller

[SUTHERLAND LETTERHEAD]
MARY THORNTON PAYNE DIRECT LINE: 202.383.0698 Internet: [email protected]
November 11, 2010
VIA EDGAR
Securities and Exchange Commission 100 F Street, N.E. Washington, DC 20549
Commissioners:
On behalf of Transamerica Advisors Life Insurance Company of New York (the “Registrant”), transmitted for filing under EDGAR is the Registrant’s Quarterly Report on Form 10-Q for the fiscal quarter ended September 30, 2010.
Should you have any questions about this filing, please contact the undersigned at (202)383-0698.
Sincerely,
/s/ Mary Thornton Payne
Mary Thornton Payne
Enclosures cc: Eric J. Martin
Re: Transamerica Advisors Life Insurance Company of New York Quarterly Report on Form 10-Q File Nos. 33-34562; 33-60288; 333-48983; 333-133224