form and function of the primate cervical vertebral column
TRANSCRIPT

Form and Function of the Primate Cervical Vertebral Column
by
Neysa Grider-Potter
A Dissertation Presented in Partial Fulfillment of the Requirements for the Degree
Doctor of Philosophy
Approved March 2019 by the Graduate Supervisory Committee:
William Kimbel, Chair
David Raichlen Gary Schwartz
Carol Ward
ARIZONA STATE UNIVERSITY
May 2019

i
ABSTRACT
As the junction between the head and the trunk, the neck functions in providing
head stability during behaviors like feeding to facilitating head mobility during behavior
like grooming and predator vigilance. Despite its importance to these vital behaviors, its
form and function remain poorly understood. Fossil hominin cervical vertebrae preserve
a striking diversity in form despite the commitment to orthograde bipedality. Do these
differences in cervical vertebral form correspond to functional variations among our
recent ancestors? This dissertation attempts to understand 1) how does the neck function
in head stability and mobility 2) how do these functions relate to cervical vertebral form.
Kinematic and passive range of motion studies were conducted in several species of
primate to obtain measures of function which were subsequently related to skeletal form.
Results show that cervical vertebral morphology does not significantly covary
with differences in joint mobility. Rather, they implicate the critical role of ligaments and
muscles in facilitating head mobility. Results of the kinematics study show that the neck
plays a role in maintaining head stability during locomotion. However, the kinematic
data do not significantly correlate with morphological variation among primate species.
Given the negative results of the extant morphological analyses, it is difficult to apply
them to the fossil record. As such, the functional significance of the disparate
morphologies found in the hominin fossil record remain ambiguous.

ii
ACKNOWLEDGMENTS
First, I would like to thank my committee Bill Kimbel, Dave Raichlen, Gary Schwartz,
and Carol Ward for their support throughout this process. I am grateful for their insight
into this research and the opportunity to learn from them. I’d like to thank the faculty
and staff of the School of Human Evolution and Social Change and Institute of Human
Origins for providing a collaborative environment in which to learn and grow.
I am eternally grateful to everyone at Duke University for making this project
happen. I would especially like to thank Dan Schmitt and Angel Zeininger for their
support, insightful discussions, use of their lab and equipment, and being a home away
from home. I would like to acknowledge Dave Brewer, Erin Ehmke, Bobby Schopler, Erin
Shaw, and many more at the Duke Lemur Center for all their hard work in facilitating
this research.
I am indebted to Matt O’Neill of Midwestern University, who spent many hours
teaching me the finer points of experimental work, kinematic analysis, and scientific
inquiry. I am also grateful to Ryosuke Goto and Yoshihiko Nakano of Osaka University
for welcoming me into their lab and introducing me to the complexities of experimental
kinematics. As well as Callum Ross for his helpful discussions. Thank you all for your
invaluable assistance.
I would also like to thank Jacques Cuisin at the Muséum of National de’Histoire
Naturelle, Gregg Gunnell at the Duke Lemur Center, Darrin Lunde at the National
Museum of Natural History, and Eileen Westwig at the American Museum of Natural
History for providing access to specimens. I would like to thank Arleyn Simon of Arizona
State University not only for providing access to specimens but for supporting me in the
early years of my graduate career.

iii
I’d also like to thank my peers, without whom this journey would not have been
possible: Susanne Daly, Halszka Glowacka, Addie Kemp, Ellis Locke, Amanda
McGrosky, Faye McGechie, Kathleen Paul, Terry Ritzman, John Rowan, Irene Smail,
Laura Stroik, and many others. I’d especially like to thank Thierra Nalley for her support,
encouragement, and collaboration.
I would also like to thank my family and friends for supporting me throughout
this process. To my mother, for always telling me I can do anything I put my mind to.
Finally, to my husband, Jon Paige, for his unfailing support, optimism, and partnership.

iv
TABLE OF CONTENTS
Page
LIST OF FIGURES………………………………………………………………………………………………..viii
LIST OF TABLES…………………………………………………………………………………………………....x
CHAPTER
CHAPTER 1 INTRODUCTION ............................................................................................. 1
1.1 BASICRANIAL FORM AND FUNCTION .................................................... 5
1.2 UPPER CERVICAL SPINE FORM AND FUNCTION ................................. 8
1.3 LOWER CERVICAL SPINE FORM AND FUNCTION ............................... 14
1.4 MAINTENANCE OF HEAD STABILITY DURING LOCOMOTION ......... 21
1.5 FOSSIL PRIMATE VERTEBRAL MORPHOLOGY ................................... 24
1.6 RESEARCH GOALS ................................................................................... 26
1.7 HYPOTHESIS AND PREDICTIONS ......................................................... 27
CHAPTER 2 MATERIALS AND METHODS ..................................................................... 34
2.1 MORPHOLOGICAL DATA ........................................................................ 34
2.2 MAXIMUM RANGE OF MOTION ............................................................ 39
2.3 KINEMATICS: LOCOMOTOR RANGE OF MOTION ............................... 45
2.4 STATISTICAL ANALYSES ......................................................................... 52
CHAPTER 3 INFLUENCES OF PASSIVE RANGE OF MOTION ON CERVICAL
VERTEBRAL FORM .......................................................................................................... 54

v
CHAPETER Page
3.1 RESULTS AND DISCUSSION ................................................................... 55
Spinous Process Length and Angle ............................................................ 55
Transverse Process Length and Angle ....................................................... 58
Uncinate Process Height ............................................................................. 61
Superior Articular Facet Height .................................................................. 61
Cervical Column Height ............................................................................. 63
Atlantooccipital Joint Curvature ................................................................ 65
3.2 DISCUSSION .............................................................................................. 66
Skeletal inhibition of motion ..................................................................... 66
CHAPTER 4 AXIAL KINEMATICS AND NECK FUNCTION DURING LOCOMOTION 69
4.1 RESULTS-KINEMATICS ........................................................................... 72
Trunk Kinematics vs. Species .................................................................... 72
Trunk vs. Neck Kinematics ........................................................................ 75
Segmental Stability ..................................................................................... 78
Species-specific kinematics ........................................................................ 82
4.2 RESULTS-MORPHOLOGY ........................................................................ 85
4.3 DISCUSSION .............................................................................................. 95
Speed .......................................................................................................... 95
Literature values and data accuracy ........................................................ 100
Further kinematic analyses ...................................................................... 103
Neck function ........................................................................................... 104
Morphological variation ........................................................................... 105

vi
CHAPTER Page
CHAPTER 5 DISCUSSION ............................................................................................... 107
5.1 SUMMARY OF RESULTS ......................................................................... 107
5.2 NECK FUNCTION .................................................................................... 108
5.3 FUNCTIONAL INFLUENCES ON VERTEBRAL MORPHOLOGY ......... 114
5.4 IMPLICATIONS FOR FOSSIL HOMININ SPECIES ............................... 118
Australopithecus afarensis ....................................................................... 119
Australopithecus sediba .......................................................................... 120
Homo erectus ............................................................................................ 121
Homo neanderthalensis ........................................................................... 122
5.5 FUTURE DIRECTIONS ............................................................................ 123
CHAPTER 6 BIBLIOGRAPHY .......................................................................................... 125
CHAPTER 7 APPENDIX .................................................................................................. 138
A. DATA TABLES………………………………………………………………………………139
B. IACUC APPROVAL…………..……………………………………...........................146

vii
LIST OF FIGURES
Figure Page
1.1. Strait and Ross’s (1999) measure of neck inclination ................................................ 4
1.2. Balance of the head ..................................................................................................... 7
1.3. Human cervical vertebrae .......................................................................................... 9
1.4. Ligaments of the cervical spine ................................................................................ 10
1.5. Predictions 1a and 1b ................................................................................................ 28
1.6. Prediction 1c ............................................................................................................. 29
1.7. Prediction 1d ............................................................................................................. 29
1.8. Prediction 1e ............................................................................................................. 30
1.9. Prediction 1f. .............................................................................................................. 31
2.1. Landmarks taken from vertebral specimens ........................................................... 37
2.2. Variables measured from skeletal material ............................................................. 38
2.3. Range of motion radiographs ................................................................................... 40
2.4. Cervical canal area and species means of body mass .............................................. 43
2.5. Axial landmarks used in the kinematics study ........................................................ 45
2.6. Terrestrial Quadrupedalism experimental setup ..................................................... 48
2.7. Arboreal locomotion setup. ...................................................................................... 49
2.8. Horizontal leaping setup. ......................................................................................... 50
2.9. Vertical clinging and leaping setup .......................................................................... 51
3.1. PGLS results of Spinous Process Length on flexion ............................................... 57
3.2 PGLS results of Transverse Process Length on lateral flexion ................................ 59
3.3 PGLS results of Transverse Process Angle on lateral flexion. ................................. 60
3.4 PGLS results of Superior Articular Facet Height on flexion .................................... 62
3.5 PGLS results of Vertebral Body Height on flexion-extension ................................. 64

viii
Figure Page
4.10 LMM results of Transverse Process Length ............................................................. 90
4.11 LMM results of Superior Articular Facet Height ...................................................... 91
4.12 LMM results of Uncinate Height .............................................................................. 92
4.13 LMM results of Vertebral Body Height .................................................................... 93
4.14 LMM results of Superior Articular Facet Angle ....................................................... 94
4.15 Speed effects on axial range of motion ..................................................................... 96

ix
LIST OF TABLES
Table Page
2.1. Species used in the morphological analyses and the number of individuals .......... 34
2.2. Description of skeletal landmarks digitized for morphological analyses. ............... 36
2.3. Morphological variables measured from the skeletal landmarks and their
abbreviations. ........................................................................................................... 38
2.4. Species used for range of motion analyses and their number of individuals ............ 41
2.5. Results of the PGLS regressions of species means of body mass on canal area for
each cervical level. .................................................................................................... 44
2.6. Species used in the kinematics study and their locomotion .................................... 47
3.1. Results of the PGLS analyses for range of motion and skeletal morphology .......... 56
4.1. Average ranges of segment motion across gait cycles for each species .................... 71
4.2. Results of the linear mixed models among both global segment angles and global
segment range of motion .......................................................................................... 72
4.3. Prediction 2b results of the linear mixed models .................................................... 73
4.4. Prediction 2c linear mixed model results for the vertebral segments (head, C3, C5,
C7, and T1) as well as the axial segments (head, neck, trunk). ................................ 80
4.5. Post-hoc results (Tukey HSD) for prediction 2c testing for differences among
levels, p-values corrected using Bonferroni’s method ............................................. 80
4.6. Prediction 2d results of the linear mixed models. ................................................... 82
4.7. Post-hoc test results (Tukey HSD) testing for significant differences between
species ....................................................................................................................... 83
4.8. Prediction 3 descriptions and results. ...................................................................... 87
4.9. Results of the linear mixed models testing for morphological variations among
species ....................................................................................................................... 87

x
Table Page
4.10. Post-hoc results (Tukey HSD) of the linear mixed models testing for morphological
differences between species ...................................................................................... 88
4.11. Effects of speed on locomotor segment range of motion ......................................... 95
4.12. Ranges of segment motion during one gait cycle. ................................................... 98
5.1. Head-neck kinematic values and semicircular canal morphology ......................... 113
7.1. Species averages of morphological measurements ................................................. 139
7.2. Ranges of intervertebral motion. ............................................................................ 143

1
Chapter 1 Introduction The neck is the junction between the head and trunk. As such, it transmits
mechanical loads from the head to the trunk, allows for a mobile visual field, and acts as
a conduit for vessels and nerves, as well as a home for digestive and respiratory organs.
One of the primary functions of the neck is to help maintain a stable head, which is
essential during locomotion because visual and vestibulocochlear inputs are required for
efficient navigation through complex environments (Dunbar et al., 2008). Despite its
manifest importance, the relationship between primate vertebral form and neck function
is understudied. The morphology of the cervical vertebrae should be adapted to their
function. The loads experienced are often higher in the postcrania during locomotion
than during other behaviors (Preuschoft, 2004). Therefore, variation primate cervical
vertebral form should theoretically reflect differences in locomotor and postural
behaviors. Primates, as a whole, practice a large range of locomotor modes and postural
repertoires. As such, exploring the diversity in their neck function can give insight into
how the spine may be adapted those functions. The aim of this research is to understand
how cervical vertebral form is adapted to providing head stability and facilitating
mobility during locomotion and its implications for locomotor evolution within
hominins.
The head and neck are traditionally modeled as a bow and string with the neck
muscles supporting vertebral position through tension (Slijper, 1946). Under this model,
species with more pronograde necks (those whose necks are habitually positioned more
perpendicular to the force of gravity) require greater support than those with more
orthograde necks (which are more aligned with the gravity vector). To maintain
pronograde postural function, either the muscular effort must be larger, or the muscle
force vectors must be oriented in a more mechanically advantageous direction. The shift

2
to orthograde bipedality affects the gravitational loading of the spine and, therefore, how
the neck maintains the position of the head. Therefore, differences in posture should
affect the form cervical vertebral column (Shapiro, 1991; Nalley and Grider-Potter, 2015).
While this bow-and-string model is informative it neglects the dynamic manner in which
head stability is maintained during habitual locomotion. The neck’s maintenance of head
stability should also influence vertebral morphology.
During locomotion, the neck controls head balance, which is vital for a stable field of
vision. Efficient locomotion requires visual stability in order to see and respond to
substrate variation (Assaiante and Amblard, 1993; Dunbar et al., 2008). Axial movement
during locomotion varies among species and among locomotor modes (Dunbar, 2004b;
Hirasaki and Kumakura, 2004; Dunbar et al., 2008; Xiang et al., 2008). Primates also
normally adjust their visual fields to reflect the orientation of the substrate, or
suprastrate (Strait and Ross, 1999; Hirasaki and Kumakura, 2004; Stevens and Heesy,
2013). Because the movement of the trunk differs between locomotor modes and the
position of the head varies with substrate position, how the neck maintains head stability
should also vary. In turn, the spine should be adapted to maintaining that stability
during locomotion.
Very few studies have attempted to relate primate cervical vertebral form to function
(Schultz, 1942, 1961; Toerien, 1961; Ankel, 1972; Gommery, 2000; Aiello and Dean,
2002; Manfreda et al., 2006; Parks, 2012; Gómez-Olivencia et al., 2013; Nalley, 2013;
Meyer et al., 2018). Several of these studies have proposed hypotheses about the effects
of cervical form in balance of the head or in locomotor function (Schultz, 1961; Toerien,
1961; Ankel, 1972; Aiello and Dean, 2002; Gommery, 2006). These have not been
empirically tested. Others have been hindered by their use of broad locomotor
categories, such as ‘quadruped’ (Manfreda et al., 2006; Parks, 2012; Nalley, 2013), to

3
classify cervical function rather. These broad locomotor categories are problematic in
that they do not reflect the nuances of actual locomotion. Overall, there are many gaps in
understanding the functional morphology of the cervical vertebrae that require further
investigation.
To establish form-function relationships, the many functions of the head-neck
complex must be explored. Neck postural data during locomotion have been collected
from a variety of primate species (Strait and Ross, 1999). Strait and Ross (1999)
measured the external inclination of the neck in the sagittal plane during mid-stance or
mid-swing (see Fig. 1.1). Though this study includes a diverse array of primate species,
the zoo animals used were unshaven. The presence of fur likely introduced a large
amount of error into their data. This measure also omits the variation in flexion-
extension across the gait cycle and excludes lateral flexion and rotation. The neck
functions in all three planes and in order to understand postural stability of the head,
neck motion needs to be understood in three dimensions. Despite these limitations,
these data have used to successfully establish form-function relationships in the cervical
spine (Nalley and Grider-Potter, 2015, 2017). Absolute head and neck range of motion
(ROM) has also been quantified in only four species of non-human primates (Graf et al.,
1995). These data are sparse in their quantity of subjects and in their number of primate
species. A greater breadth and depth of taxonomic sampling would allow functional
relationships to be elucidated.

4
Figure 1.1: Strait and Ross’s (1999) measure of neck inclination during mid-stance/mid-
swing is the angle (blue) between the neck (red) relative to the vertical line of gravity (yellow) in
Lemur catta (left) and Homo sapiens (right).
Previous research has linked cervical form to neck locomotor function (Nalley and
Grider-Potter, 2015, 2017). The primitive morphology found in early hominins likely
indicates functional differences among these species. In particular, Australopithecus
vertebral specimens show long spinous processes, small centra, and curved
atlantooccipital joint (Nalley, 2013). These morphologies are associated with more
pronograde neck postures in extant primates (Nalley and Grider-Potter, 2015, 2017).
Even later Homo does not possess the same pattern as modern Homo sapiens of large
centra, small, bifurcated spinous processes and flat atlantooccipital joints(Lordkipanidze
et al., 2007; Gómez-Olivencia et al., 2013). These variations likely demonstrate not only

5
differences in function, but also the piecemeal manner in which the hominin skeleton
adapted to bipedal locomotion.
The goal of this dissertation is to understand how craniocervical form is adapted to
maintaining head stability during locomotion. Once understood, these relationships will
be applied to fossil specimens in order to illuminate the evolution of the spine in
primates. Biomechanical principles will be used to create specific sets of predictions
relating form and function of the head and neck in a diverse group of primate taxa. Neck
function will be assessed through kinematic studies and radiographic imaging by
measuring both range of head and neck motion during frequent modes of locomotion
and maximum ROM respectively. Craniocervical form will be measured using 3D surface
scans. These data will be used to elucidate the relationships between form and function
in extant species. Results of such a study are applicable to the mammalian clade as a
whole as the cervical column is understudied in most taxa but will be immediately
applied to the problem of how the hominin neck evolved in response to the advent of
habitual bipedality.
1.1 Basicranial Form and Function
Numerous synapomorphies separate primates from other mammals, including larger
brains, decreased facial length, and convergent orbits (Preuschoft et al., 2002), all of
which should affect head stability and its maintenance. Unlike most other primates,
Homo sapiens possess an anteriorly positioned foramen magnum (see Russo and Kirk,
2013 for review). Historically, the anterior position and ventral orientation of the
foramen magnum is potentially related to orthograde posture and balancing the head on
an erect spinal column (Schultz, 1942); however, little empirical evidence demonstrates
the function of that relationship (Russo and Kirk, 2013, 2017). Recent research suggests

6
that both the advent of bipedal locomotion as well as increased brain size influence the
position and orientation of the foramen magnum (Spoor, 1997; Strait and Ross, 1999;
Lieberman et al., 2000; Bastir et al., 2010; Kimbel and Rak, 2010; Russo and Kirk,
2013). Both Spoor (1997) and Bastir (2010) showed that increased brain size is
correlated with stronger basicranial flexion (i.e. flexion between basion, sella, and the
foramen caecum) and a more inferiorly inclined foramen magnum. However, foramen
magnum angulation is thought to be a product of brain size rather than basicranial
flexion (Lieberman et al., 2000; Bastir et al., 2010). It is important to note that neck
posture, as measured by Strait and Ross (1999), is not related to foramen magnum
angulation (Strait, 1998). The exact relationship between the location and orientation of
the foramen magnum and inclination of the cervical spine is unknown.
Despite this gap in knowledge, we know that changes in hominin foramen magnum
position affects the mechanics of balancing the head on the neck and trunk (Demes,
1985). In combination with an enlarged braincase and retracted face, the alteration of the
craniocervical junction causes the cranium’s center of gravity to be shifted further
towards the middle of the head (Demes, 1985; Kapandji, 2008). The anterior location of
the foramen magnum requires nuchal musculature to pull the cranium ventrally and
caudally rather than dorsally and caudally in more posterior condition (Fig. 1.2; Demes,
1985). The head has been modeled as a first class lever, with the fulcrum at the occipital
condyles. The repositioning of the foramen magnum brings the head’s center of gravity
closer to the fulcrum, creating a mechanical environment where balancing the head
requires little muscular effort.

7
Figure 1.2 Differences in forces at the craniocervical junction in a human (left) and chimpanzee
(right). Balance of the head is dependent upon orientation of the center of gravity, position and
orientation of the foramen magnum, and neck posture. Taken from Lieberman (2011).
Angulation of the nuchal plane should also influence how the head is balance. Nuchal
muscles maintain equilibrium through balancing the pre-condylar weight of the skull.
The manner in which the head is balanced is affected by direction and magnitude of
nuchal forces (Demes, 1985). In Pan troglodytes, and presumably most mammalian
quadrupeds, the nuchal plane is inclined posteroinferiorly while it is directed inferiorly
in humans (Nevell and Wood, 2008). Increasing the distance between the
atlantooccipital joint (the fulcrum) and the site of muscular insertion lengthens the lever
arm thereby decreasing the required muscular effort (Strait and Ross, 1999; Preuschoft
and Witzel, 2002).
Muscles with greater cross-sectional area are capable of producing larger forces
(Brand et al., 1986) and muscles with greater cross-sectional area are correlated with
larger skeletal areas for attachment (Dean, 1985). Kunimatsu (1992) explored the size of

8
primate nuchal plane area, finding that all primates within his sample, with the
exemption of humans, had relatively similar nuchal plane areas. This exception is likely
because the human head has a center of gravity almost directly superior to its spinal
support, causing spinal compression rather than bending (Slijper, 1946; Aiello and Dean,
2002; Kapandji, 2008). Due to the more balanced relationship between the head and
spinal column, large neck muscles are superfluous in species with orthograde neck
postures. The reduction in nuchal musculature present in humans is also presumed in
fossil hominins (as measured by dimensions of the nuchal plane of the occipital bone, for
example) (Kunimatsu, 1992), possibly indicating the presence of neck orthogrady as
early as Australopithecus.
1.2 Upper Cervical Spine Form and Function
The goal of this section is to review what is known about mammalian cervical
vertebral form and how it is influenced by function. The eutherian cervical spine is
predominately composed of seven vertebrae. The overwhelming majority of
investigations into the biomechanics of the cervical spine pertain to the human neck,
though few non-human mammalian studies do exist within anthropological and
veterinary literature (Slijper, 1946; Fleagle, 1977; Penning and Badoux, 1987; Vidal et al.,
1988; Milne, 1991; Gál, 1993a; b; Graf et al., 1995; Keshner and Delp, 1997; Cullinane et
al., 1998; Strait and Ross, 1999; Choi et al., 2003b; a; Lu et al., 2005; Rhodin, 2008;
Sheng et al., 2010; Pierce et al., 2011; Farshadmanesh et al., 2013). The upper cervical
spine (C0-C2) is functionally and anatomically distinct from the lower cervical spine, Fig.
1.3 (White and Panjabi, 1990; Kapandji, 2008). The atlas is an unusual vertebra in that it
lacks a weight-bearing vertebral body, which has been incorporated into the axis as the
dens (Jenkins, 1969). Anterior and posterior arches connect the articular facets and
possess a circular odontoid facet anteriorly and a small spinous process posteriorly. The

9
occiput (C0), atlas (C1), and axis (C2) tend to couple, or move as a group, during lateral
bending and axial rotation (White and Panjabi, 1990). This pattern also occurs between
C2-C5, C5-T1, T1-T4, and T4-T8 (White and Panjabi, 1990), highlighting the importance
of considering these vertebrae as skeletal units, or parts of an integrated whole.
Figure 1.3 Human cervical vertebrae including A) the atlas or C1, B) the axis or C2, and C) a
typical lower cervical vertebra C3-C7. Adapted from Gray’s Anatomy (1918).
Recently, Villamil (2018) concluded a study of morphological integration in the
hominoid cervical column. Her results show several interesting patterns of integration
and evolvability in the cervical metrics of Homo, Pan, and Hylobates. C1 is both highly
integrated with other craniocervical elements and highly evolvable; this means its
morphology covaries with the morphology of the other cervical vertebrae but also
responds to natural selection most rapidly in comparison to other cervical levels
(Villamil, 2018). This result implicates C1 as the most valuable for functional analyses in
both extant and fossil species. Her results also demonstrate distinct units of integration
including C0-C1, C2, C3-C4-C5, and C6-C7. She also hypothesizes that the small degree
of integration found within C2 and C7 may be due to the transitional nature of these
vertebrae from upper to lower cervical column and from cervical to thoracic or perhaps
the differences in forces experienced at these levels. These patterns are similar to the
functional groups observed by (White and Panjabi, 1990).

10
In mammals, the occipital’s articulation with the cervical spine occurs between the
paired occipital condyles (C0) and the concave superior articular facets of the atlas (C1).
The paired articulations are more or less symmetrical and act together as a unit during
motion. In humans, this joint allows for 25-30o of flexion-extension and 3-4o of lateral
flexion (Bogduk and Mercer, 2000; Kapandji, 2008). Slight rotation at the
atlantooccipital joint is possible through ipsilateral translation and contralateral lateral
flexion, but only in conjunction with atlantoaxial rotation (White and Panjabi, 1990;
Mercer and Bogduk, 2001; Kapandji, 2008). Flexion of the atlantooccipital joint is
inhibited by contact between the anterior aspect of the foramen magnum and the dens of
the axis while the tectorial membranes and alar ligaments restrict extension and lateral
flexion, respectively (see Fig. 1.4). In addition, these joints are also stabilized by their
joint capsules (White and Panjabi, 1990).
Graf and colleagues (1995) conducted one of the few joint-motion studies that
included non-human mammals. Using radiographs and dissections, they determined
that non-primate quadrupeds (Lepus, Felis, and Cavia) have atlantooccipital joints with
Figure 1.4: Ligaments of the cervical spine, taken from (Crosby, 2006).

11
passive ranges of motion averaging between 92-106o of flexion-extension. The two
macaque species used in the study, M. fascicularis and M mulatta, have disparate
atlantooccipital flexion-extension ranges of only 1.5o and 32o, respectively, with Saimiri
falling in between them at 19o ±15o (Graf et al., 1995). Humans, in comparison, have ~25-
30o of flexion-extension at the atlantooccipital joint (White and Panjabi, 1990; Panjabi et
al., 1991). The human atlantoaxial joint has a range of flexion-extension of 20o and can
rotate 40o; its lateral flexion is negligible (White and Panjabi, 1990; Mercer and Bogduk,
2001; Kapandji, 2008). Graf and colleagues (Graf et al., 1995) showed that the flexion-
extensions range of motion of Macaca is between 1-3o while that of Saimiri is 16o. The
range of flexion-extension for cats and rabbits is roughly 20o and guinea pig is greatest at
39o (Graf et al., 1995). Domestic dogs range from 15-35o in flexion (Penning and Badoux,
1987).
Do these differences in range of motion relate to cervical vertebral form? It is difficult
to draw general conclusions about the relationship between mammalian cervical form
and cervical function from a study of very few individuals from a scatter of mammalian
species. Aiello and Dean (2002) suggested that the concavity of the atlantooccipital joint
reflects range of motion, but Manfreda and colleagues (2006) indicated that joint
curvature may correlate with locomotor mode. In a geometric morphometric study,
Manfreda et al. (2006) correlated atlas morphology to locomotor categories and body
size. Their analyses show some differences in overall atlas shape based on the type of
habitual locomotion. The articular facet angle in nine species of primate varies between
the curved facets (109o) in Papio and Ateles and the flatter facets (145o) of Homo
sapiens. However, this variation in curvature fails to correlate with locomotor mode
frequencies. Nalley and Grider-Potter (2017) have also investigated the function of
atlantooccipital joint curvature. They related the curvature to Strait and Ross’ (1999)

12
measure of neck posture during locomotion. Specifically, they found that the
atlantooccipital joint tends to be more curved in species with more pronograde neck
postures (Grider-Potter and Hallgren, 2013; Nalley and Grider-Potter, 2017).
Other aspects of atlas morphology are also functionally relevant. Within primates,
the posterior arch becomes more robust with increasing body size (Manfreda et al.,
2006). In addition, other dimensions of the anterior and posterior arches and transverse
process length have an isometric relationship with body and head size. This increase in
robusticity is likely related to the relative increase in size of nuchal muscles as well as the
increased forces associated with supporting a heavier head (Nalley and Grider-Potter,
2017). It is important to note, however, that body mass affects the locomotor repertoire
of an animal. For example, smaller-bodied primates tend to locomote above branch
while larger-bodied primates locomote below branch (Doran, 1993, 1997; McGraw,
1998). Therefore, these observed changes could relate to locomotor or postural
differences inherent in large or small-bodied primates. For example, The transverse
processes also become inclined more cranially with increasing body mass in primates
(Manfreda et al., 2006).
The vertebral arteries pass through the transverse processes via the transverse
foramina ubiquitously present in C1-C6 and thus, the morphology of these structures
likely influences arterial function. Though arteries are elastic, arterial blood flow between
the human atlas and axis significantly diminishes after 30o of rotation contralaterally and
45o ipsilaterally (White and Panjabi, 1990). Notably, Tarsius can rotate its head 180o on
its trunk. Ankel-Simons and Simons (2003) attribute this ability to the unusual coronal
orientation of its zygapophyseal joints. Looking outside Mammalia, owls also have
extreme degrees of axial rotation and they possess several anatomical adaptations to
accommodate this behavior (Kok-Mercado et al., 2013). Their transverse foramina, for

13
example, are roughly ten times larger than the vertebral artery passing through them.
Additionally, their carotid arteries anastomose in the hypophyseal fossa above the
sphenoid allowing significant collateral flow from the unobstructed vertebral artery,
preventing the cessation of blood flow during extreme rotation (Kok-Mercado et al.,
2013). Tarsiers show similar adaptations: their C1 foramen is relatively larger and their
vertebral arteries have much smaller cross-sectional areas throughout the cervical
column (Nalley and Grider-Potter, 2015; Nalley et al., 2019).
The atlantoaxial joint is composed of two paired zygapophyseal joints and the medial
dens facet. The zygapophyseal joints are slightly convex dorsoventrally, and are
stabilized by the articular capsules, which are elastic in order to facilitate ranges of
motion (White and Panjabi, 1990; Mercer and Bogduk, 2001; Kapandji, 2008). The dens
is anchored to the anterior arch by the transverse ligament of the atlas which runs
between its left and right tubercles. Superiorly, the apical ligament of the dens attaches
to the ventral aspect of the foramen magnum (Jenkins, 1969; White and Panjabi, 1990;
Mercer and Bogduk, 2001; Kapandji, 2008). Its elastic nature implies that it may not
significantly aid in stability (White and Panjabi, 1990). The alar ligaments run between
the dorsolateral surface of the dens and the medial portion of the occipital condyle.
These ligaments serve to limit rotation (Jenkins, 1969; White and Panjabi, 1990; Mercer
and Bogduk, 2001; Kapandji, 2008).
Many of the morphologies found in the axis correlate with both body size as well as
Strait and Ross’s (1999) measure of neck inclination. Dimensions of the C2’s pedicle and
lamina are strongly and isometrically correlated with skull geometric mean to the
exclusion of neck inclination. The C2 spinous process length also does not correlate with
neck inclination as it does in the lower cervical levels (Nalley and Grider-Potter, 2015,
2017). Perhaps this result is not surprising given that few nuchal muscles attach to the

14
spinous process or laminae of the axis. Axis spinous process length does, however, have a
positively allometric relationship with body mass. Both the angle of the dens and the
angle of the superior articular facets correlate with neck inclination. As the neck becomes
increasingly vertical, the dens becomes more dorsally inclined. This angle results in the
neutral orientation of the C0 and C1 to be more dorsally oriented, which better supports
the head by positioning it over the neck. As neck posture becomes more horizontal, the
articular facets become more caudally oriented. The flatter facet found in primates with
more orthograde necks may be an adaptation to withstanding the increased compressive
forces of gravity (Nalley and Grider-Potter, 2017).
1.3 Lower Cervical Spine Form and Function
Eutherian lower cervical vertebrae comprise two components: the centrum and
the neural arch (Fig. 1.3). This composition is highly conserved within the mammalian
clade, unlike other vertebrates. The exception to this conservation is the presence of
uncinate processes on the cranial aspect of the centrum, which are found in the
occasional marsupial, some rodents, and most primates (Hall, 1965). The raised sides of
the centrum form a saddle-shape joint unique to cervical vertebrae. In humans, uncinate
processes project most markedly in C3-C5 and sequentially decrease in height from C6-
T1 (Milne, 1991). These uncinate processes inhibit true lateral flexion, instead
necessitating rotation and extension at the joint to laterally flex the neck (Kapandji,
2008). Within primates, the great apes have the largest uncinate processes (Toerien,
1961; Hall, 1965). In humans, width of the vertebral body and laminae has been shown to
increase from C2 to C7 (Gaughran, 1954; Milne, 1991). Facet width and vertebral body
size are also thought to play a role in resistance to lateral flexion (Milne, 1991)or the
ability to bear greater load in more orthograde postures (Cartmill and Brown, 2014).
15
Between adjacent vertebral bodies are the intervertebral discs. These structures resist
compressive forces and permit movement. Bending forces that likely occur in the
pronograde are counteracted by the tension produced by the vertebral ligaments in order
to maintain posture (Slijper, 1946; Jenkins, 1969; Putz, 1992; Preuschoft and Gunther,
2012). Discs have three major components: the central nucleus pulposus, the
surrounding annulus fibrosis, and the cartilaginous end plates. The nucleus pulposus is
gelatinous and contains 70-90% water (White and Panjabi, 1990; Mercer and Bogduk,
2001; Kapandji, 2008). Between these structures and the vertebral body lies the
cartilaginous end plate adhering the layers to each other (White and Panjabi, 1990;
Mercer and Bogduk, 2001; Kapandji, 2008). Dissection of macaque spines revealed that
the craniocaudal height of the nucleus pulposus increases caudally (Longo et al., 2006).
However, in humans the nucleus pulposus is thickest in the lumbar region but thinnest
in the thoracic region (Cramer, 2013). This variation in thickness is unexpected. Axial
loading increases caudally in orthograde postures due to body mass (Boszczyk et al.,
2001; Cartmill and Brown, 2014). Thus, one would expect thickness to increase caudally
in order to combat increased axial loading. Further study is required to understand how
the thoracic region is compensating for relatively thin discs. Gál (1993a) found that the
nucleus pulposus varies in position within mammals and is typically located slightly
dorsal to the center of the vertebral body. In humans, the cervical nucleus pulposus is
located centrally while its more dorsal in the lumbar region. Peripherally, the concentric
layers of the annulus fibrosus are composed of obliquely alternating fibers. The annulus
fibrosis is thickened ventrally in terrestrial mammals, likely indicating a habitual loading
regime (Gál, 1993a).
The neural arches are predominately sites of muscular attachment and often act
as bony levers (White and Panjabi, 1990; Mercer and Bogduk, 2001; Kapandji, 2008).

16
Because of their function, the neural arch structures are of particular interest to
functional morphological studies. The pedicles are struts connecting the centrum to the
neural arch. As struts, they are thought to transmit compressive loads between the
neural arches and the vertebral bodies, especially when the pedicles are oriented parallel
to the line of gravity (Pal and Routal, 1986). Because of this, their cross-section areas
increase from the first thoracic vertebra to the last (Shapiro, 1993a) and cross-sectional
area positively scale with body mass (Shapiro, 1993a; Nalley, 2013).
The transverse processes are also largely sites of muscular attachment,
particularly for muscles that laterally flex the neck. In the mid-cervical column, the
transverse processes have an anterior root and a posterior root surrounding the
transverse foramina. The anterior root of the transverse process branches from the root
of the pedicle. The anterior root of the C3 transverse process is oriented at a 60o angle
from the sagittal plane and a 15o angle from a transverse plane in humans (Kapandji,
2008). Soricid, or shrew, transverse processes are more craniocaudally oriented in C3
and progressively become more ventrodosally inclined in C7 within the cervical column
(Gaughran, 1954). It is likely that this orientation is associated with the direction of the
force vectors of the muscles attached to it (Slijper, 1946; Shapiro, 1995; Pierce et al.,
2011), and thus, variation in orientation should reflect functional differences. The
posterior root of the transverse process originates from the pillar of the articular facets.
The two roots are bridged by superiorly concave groove on top of which lies the spinal
nerve. Both the posterior and anterior roots contain tubercles that serve as attachment
sites for the scalene muscles (Kapandji, 2008). In most primates, C2-C7 possess
transverse foramina through which the vertebral arteries pass. This foramen is
occasionally bipartite primates. In a small percentage of human C2 (3-5%), the
transverse foramen is incomplete, or open. This anomaly is not known to occur in other

17
primates. The lack of transverse foramen is much more common in C7, especially in
humans (Rios et al., 2014). The presence of the anterior root of the transverse process at
C7 seems to vary phylogenetically; it is absent in strepsirrhines, possessed by few
platyrrhines, and habitually present in catarrhines (Rios et al., 2014).
Immediately posterolateral to the pedicle is the pillar of the articular facets.
Human cranial and caudal articular (zygapophyseal) facets on the pillar are angled at
between 30°-50° relative to the ventral vertebral body margin. The facets become
increasingly more dorsal as they approach the cervicothoracic border (Harrison et al.,
2005). The orientation of these zygaphophyseal joints affects their ranges of motion
(Slijper, 1946; Milne, 1991; Russo, 2010; Pierce et al., 2011). It has been suggested that
the more cranial orientation of upper cervical articular facets is associated with larger
ranges of motion within the joints of C1 and C2 (Milne, 1991), but empirical studies do
not suggest a significant craniocaudal gradient in range of motion (White and Panjabi,
1990; Mercer and Bogduk, 2001; Kapandji, 2008). This pattern of increasingly dorsal
facets holds true for most, if not all, primates (Toerien, 1961).
Variations in articular facet orientation do not appear to affect the degree cervical
lordosis, at least in humans (Harrison et al., 2005). Gommery (2000) posits that the
orientation of the superior articular facets of the axis significantly contribute to a lordotic
cervical spine. This lordosis is thought to increase spinal flexibility and its capacity for
shock absorption (White and Panjabi, 1990; Mercer and Bogduk, 2001; Kapandji, 2008).
The caudal articular facet of a cranial vertebra abuts the cranial articular facet of the
caudally adjacent vertebra. A capsular ligament unites these articular facets to form a
zygophophyeal joint and is generally looser in the cervical region than the thoracolumbar
portion of the spine (White and Panjabi, 1990; Mercer and Bogduk, 2001; Kapandji,
2008). These joints also transmit loads through the vertebral column (Pal and Routal,

18
1986; White and Panjabi, 1990; Shapiro, 1993a). The orientation of these joints
throughout the spine reflects the types of motion that can be accommodated and how
much load they can dissipate (because the load must be normal to the joint surface). The
craniodorsal positioning of cervical articular facets facilitates flexion-extension, lateral
flexion, and axial rotation (Milne, 1991; Kapandji, 2008). Whereas the dorsoventral
orientation of the thoracic facets generally facilitates lateral flexion and rotation and the
mediolateral orientation lumbar facets restricts much of the motion to flexion-extension
(White and Panjabi, 1990; Kapandji, 2008).
Human C4-C5 and C5-C6 zygopophyseal joints generally have large ranges of
motion: 20° of flexion-extension, 10° of lateral flexion, and 7° of axial rotation (White
and Panjabi, 1990; Bogduk and Mercer, 2000; Mercer and Bogduk, 2001; Kapandji,
2008). Though each zygophphyseal joint has its own average range of motion, one joint
rarely, if ever, moves in isolation. As previously discussed, the spine can be functionally
subdivided into motion segments: C0-C2, C2-C5, C5-T1, and T1-T4. During human
lateral flexion and rotation, these segments tend to move as a unit (White and Panjabi,
1990; Mercer and Bogduk, 2001; Kapandji, 2008). These motion segments are
important because they indicate the that the greatest ranges of lateral flexion and
rotation should be found in the C2, C5, and T1 joints. During flexion the cranial vertebra
translates ventrally and angles cranially, leaving a gap on the dorsal side of the joint. The
posterior longitudinal ligament runs along the dorsal surface of the vertebral bodies,
within the vertebral canal. This position allows the ligament to impede cervical flexion.
Conversely, extension occurs predominately through caudal angular motion and slight
dorsal translation, creating a gap at the ventral portion of the joint surface. Extension is
inhibited by both the anterior longitudinal ligament. Collision of the spinous process of
the superiorly adjacent vertebra has also been shown to inhibit extension in the lower

19
cervical spine (Kapandji, 2008). Most agree that lateral flexion and axial rotation are
coupled (White and Panjabi, 1990; Mercer and Bogduk, 2001; Kapandji, 2008). There is
debate to whether the orientation of the articular facets (Milne, 1991; Kapandji, 2008) or
the uncinate processes (Mercer and Bogduk, 2001) restrict pure lateral flexion and
rotation.
Medial to the articular pillars, forming the dorsal margin of the bony vertebral canal,
are the laminae, to which many of the neck muscles attach. These plank-like structures
serve as attachment sites for the ligamenta flava, which occupy the area between
adjacent laminae. This ligament has a resting tension which slightly compresses the
intervertebral disc, potentially offering stability (White and Panjabi, 1990). It also
functions in resisting flexion and rotation (Putz, 1992; Kapandji, 2008). The laminae
meet medially where the spinous process originates. In humans, the spinous process is
bifurcated in C3-C6 with interspinous ligaments running between them, with which the
supraspinous ligament is continuous. The interspinous ligaments appear particularly
elastic in monkeys in comparison to humans (Slijper, 1946). This is of interest because
musculo-ligamentous variation among primate spines is relatively understudied. If little
significant differences are found between skeletal form and function, then soft tissues are
the next avenue to explore.
It is likely that the inclination and length of the spinous process is indicative of the
magnitude and direction of the forces produced by associated nuchal muscles. Most
primate spinous processes tend to lengthen from C3 to C7, within an individual. Apes
tend to have relatively longer spinous processes than other primates (Toerien, 1961;
Shapiro, 1993a). Additionally, the inclination of the spinous process relative to the
ventral surface of the vertebral body tends to about perpendicular. More cranial
inclinations are seen Gorilla, Macaca, and Papio. Notably, Homo and Alouatta exhibit
20
the most cranially inclined cervical spinous processes (Toerien, 1961). Toerien (1961) has
also observed a rough correlation between the changes in spinous processes inclination
and articular facet orientation within a vertebral column, but more recent, empirical
studies have yet to be conducted.
The nuchal ligament runs craniocaudally from the external occipital protuberance
and crest along the cervical spinous process and terminates at the seventh cervical
vertebra in humans−the first thoracic in ungulate and canids (White and Panjabi, 1990;
Mercer and Bogduk, 2003; Konig and Liebich, 2006; Lieberman, 2011). The nuchal
ligament does not appear to be present in non-human primates. Old World monkeys
have a midline raphe that seems to be less robust than the human ligament (Choi,
Keshner, and Peterson 2003a, unpublished dissections). Histologically, however, the
human nuchal ligament is much more raphe-like than the robust ligament found in
ungulates (Johnson et al., 2000; Mercer and Bogduk, 2003). In humans, the nuchal
ligament serves as an attachment site for cranial trapezius, rhomboid minor, splenius
capitis, and serratus posterior superior. This ligament is thick and elastic; it largely
functions in maintaining head stability and is likely important during rapid locomotion
(Rhodin, 2008; Lieberman, 2011). Takeshita and colleagues (2004) conducted an
empirical study using human cadaveric spines. By resecting the nuchal ligament, they
found that cervical spines exhibited larger ranges of flexion and decreased stiffness,
indicating that the ligament provides stability to the cervical spine during flexion
(Takeshita et al., 2004). The ligament’s evolution within the hominin lineage could be
related to maintaining head stability during running. If this is the case, reduced flexion
may simply be a by-product of selection for the nuchal ligament. To the exclusion of
humans, apes lack a well-developed nuchal ligament (Lieberman, 2011). Its absence in
most mammals suggests independent evolution within Homo, Ungulata, and Canidae
21
(Slijper, 1946) but whether it is an adaptation to reducing head movement during
locomotion in all these taxa is unclear.
1.4 Maintenance of Head Stability during Locomotion
Maintaining balanced, relatively immobile head (i.e. head stability) is a crucial
component of locomotion as the head houses the organs involved in spatial orientation,
navigation, and whole-body balance. Primates also normally adjust their visual fields to
reflect the orientation of the substrate, or suprastrate (Strait and Ross, 1999; Hirasaki
and Kumakura, 2004; Stevens and Heesy, 2013). The maintenance of head posture is
related to vertebral form (Nalley, 2013). Somewhat simplistically, the head has been
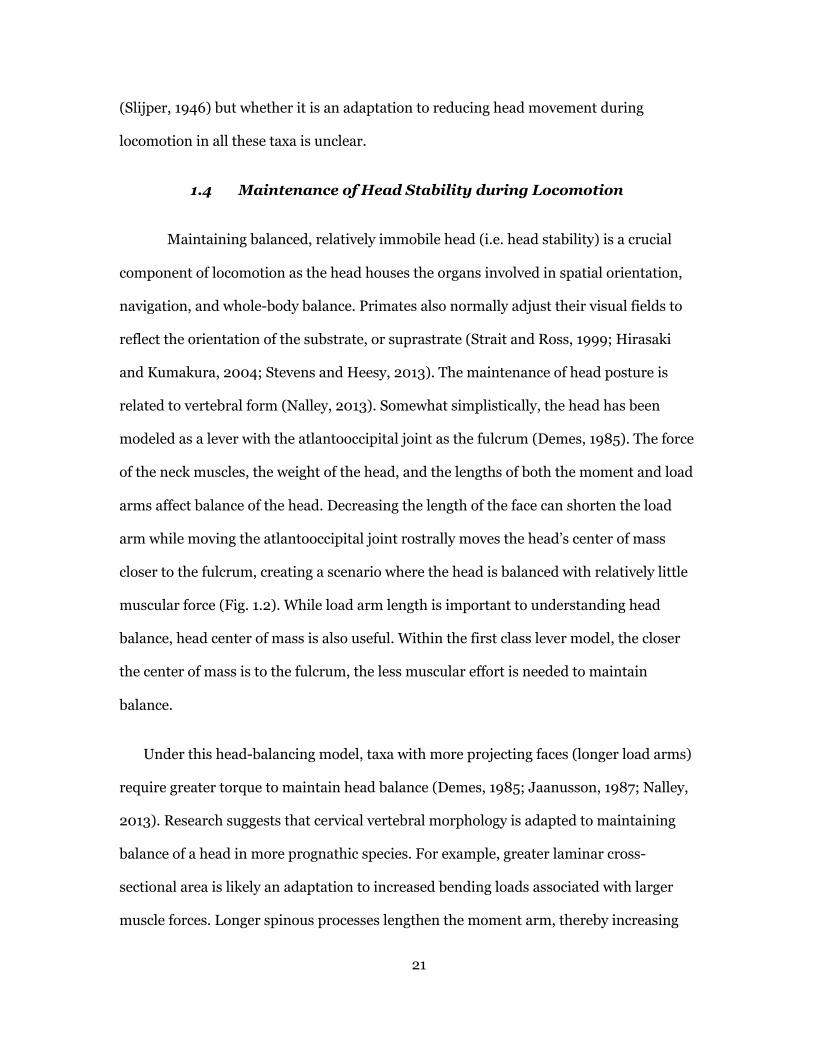
modeled as a lever with the atlantooccipital joint as the fulcrum (Demes, 1985). The force
of the neck muscles, the weight of the head, and the lengths of both the moment and load
arms affect balance of the head. Decreasing the length of the face can shorten the load
arm while moving the atlantooccipital joint rostrally moves the head’s center of mass
closer to the fulcrum, creating a scenario where the head is balanced with relatively little
muscular force (Fig. 1.2). While load arm length is important to understanding head
balance, head center of mass is also useful. Within the first class lever model, the closer
the center of mass is to the fulcrum, the less muscular effort is needed to maintain
balance.
Under this head-balancing model, taxa with more projecting faces (longer load arms)
require greater torque to maintain head balance (Demes, 1985; Jaanusson, 1987; Nalley,
2013). Research suggests that cervical vertebral morphology is adapted to maintaining
balance of a head in more prognathic species. For example, greater laminar cross-
sectional area is likely an adaptation to increased bending loads associated with larger
muscle forces. Longer spinous processes lengthen the moment arm, thereby increasing

22
the mechanical advantage. Longer spinous processes may also increase the area available
for muscular attachment, potentially increasing the muscular cross-sectional area
(Nalley, 2013; Nalley and Grider-Potter, 2015). Other adaptations to increased muscular
effort, such as a greater craniovertebral area for muscular attachment, should also be
found in more pronograde species but this hypothesis has yet to be tested.
This traditional head-balancing model fails to take into account the effects
differences in posture or locomotion may have on head balance. Slijper (1946) modeled
the cervical spine as a bow and string. The vertebral column acts as the bow, with
vertebral positions maintained through the tension of the string (the muscles and
ligaments). The amount of tension required differs between orthograde and pronograde
primates. Orthograde primates require less muscular effort to maintain head balance
than pronograde primates because neck muscles are advantageously oriented to
counteract the vertical force of gravity. Human heads are unique among primates in that
they are aided by the nuchal ligament, which helps maintain balance with little muscular
effort. In pronograde primates, the cervical spine is oriented perpendicular to the force
of gravity. This position is less mechanically advantageous than the orthograde
condition; it requires greater muscular force to maintain the appropriate orientation of
the head. Thus, both facial projection and posture should influence the muscular effort
needed to maintain head stability. This, in turn, will affect basicranial and cervical
vertebral morphology.
Using this biomechanical model, Nalley and Grider-Potter (2015, 2017) found
correlations between Strait and Ross’s (1999) measure of neck posture and cervical
vertebral morphology. As previously discussed, Strait and Ross (1999) measured the
dorsal inclination of the superficial neck during locomotion in several species of primate.
These data are valuable in that they provide a quantified measure of neck function

23
during locomotion. Nalley and Grider-Potter (2015, 2017) found that spinous process are
relatively longer in primate species with more pronograde neck postures. In addition,
more pronograde species tend to have laminae with greater cross-sectional areas. We
conclude that longer spinous processes offer greater mechanical advantage to the nuchal
muscles and more robust laminae better resist higher muscular loads. More pronograde
postures require greater muscular effort to maintain and, thus, the cervical spine shows
adaptations to mitigating those forces. In addition, the study found that articular facets
are more coronally oriented in species with more pronograde neck postures. It is possible
that this orientation functions in load transmission along the neural arch. This
relationship, however, was only significant in C4 and C7. There was also a significant
relationship between vertebral body height and posture. More pronograde species tend
to have taller vertebral bodies, which could aid in lordosis formation or
In addition to the morphology and orientation of the head and neck, the
thoracolumbar spine should also affect how head stability is maintained. Previous
research has variation among the movement of the head and trunk in primates (Dunbar,
2004a; Hirasaki and Kumakura, 2004; Dunbar et al., 2008; Xiang et al., 2008;
Thompson, 2016). Because the movement of the trunk differs between primates
(Dunbar, 2004a; Dunbar et al., 2008; Xiang et al., 2008) and the position of the head
varies with substrate position (Strait and Ross, 1999; Stevens and Heesy, 2007), how the
neck maintains head stability should covary. In turn, the cervical spine should be
adapted to maintaining a relatively immobile, balanced head during locomotion. As
primates are highly variable in the postural habits and locomotor modes, they are the
ideal subjects to test this hypothesis. The function of the neck during locomotion is
poorly understood. Elucidating its function in extant primates and relating that function

24
to the morphology of the cervical vertebrae will allow us to retrodict the neck function
and its evolution in fossil hominins.
1.5 Fossil Primate Vertebral Morphology
Most early hominin vertebrae are described as ape-like rather than Homo-like
(Coroner and Latimer, 1991; Gommery, 2000; Kikuchi et al., 2012). Many cervical
elements are rarely pictured or described in the literature making superficial evaluation
of morphology and preservation difficult. For example, ASI-VP-2 from Australopithecus
anamensis (White et al., 2006), DIK-1-1 Australopithecus afarensis (Alemseged et al.,
2006), SKW 3342 and KNM-ER 164c from Homo sp. (Day and Leakey, 1974; Susman et
al., 2001), and several specimens from Homo antecessor (Carretero et al., 1999) have
been reported in the literature have yet to be described or published with an informative
photograph.
Several Australopithecus cervical vertebrae are well known in the literature: A.L.
333-83, A.L. 333-101, A.L. 333-106, SK 4776 and SKW 854. The atlas belonging to
Australopithecus afarensis, A.L. 333-83, preserves the right articular facets, lateral
mass, and a fragment of the posterior arch and dates to ~3.2mya. Notably, the
atlantooccipital joint has a highly curved, apelike morphology (Coroner and Latimer,
1991; Gommery, 1996; Aiello and Dean, 2002) which could potentially indicate a more
pronograde neck posture (Nalley and Grider-Potter, 2017). A more pronograde neck
posture is unexpected in hominins because it is assumed that neck orthogrady likely co-
evolved with trunk orthogrady and bipedal locomotion. The implications of the curved
atlantooccipital joint present a puzzle. Axes A.L. 333-101 and SKW 854, A. afarensis
from Hadar and A. robustus from Swartkrans respectively, are somewhat damaged. The
fossil atlantooccipital joints are more curved than humans but are flatter than

25
chimpanzees, with that of A.L. 333-101 falling within the lower range of variation for
humans (Gommery, 2006). The 2mya SK 4776 from A. robustus is likely C3 or C4 and
seems to be most similar to Pan. A.L. 333-106 is most likely the sixth cervical vertebra
morphologically most similar to Pan with a long spinous process and large cross-
sectional area of the spinous process (Nalley, 2013).
Recently, field work at Woranso-Mille, Ethiopia recovered a nearly complete (C2-
C7) australopith cervical column (Meyer, 2016) dating to ~3.5mya (Haile-Selassie et al.,
2016). Overall, the KSD-VP-1/1 vertebrae show a mixture of human-like and ape-like
morphologies. In particular, the vertebral bodies of the lower levels are absolutely larger
than both the human and the slightly younger A.L. 333 material. Their whole-vertebra
geometric means are more similar to that of Gorilla (Meyer, 2016). This is unexpected
because as a weight-bearing structure vertebral body size correlates strongly with body
mass and Australopithecus was much smaller than extant Gorilla. However, vertebral
canal area, another variable strongly correlated with body mass (MacLarnon, 1995), is
more similar to humans than it is to gorillas and chimpanzees. Relative centrum height
of the australopith specimens is more similar to humans than to the great apes, unlike
the C6, A.L. 333-101. The vertebral bodies also possess wedging in similar degrees to that
found in other hominoids (Meyer, 2016) but intervertebral discs likely play a greater role
in creating cervical lordosis than bony morphology (Johnson and Shapiro, 1998) and
thus reconstructing cervical lordosis in fossil species is difficult. In addition, these
vertebrae preserve low, human-like uncinate processes. These low margins potentially
facilitated ranges of rotation and lateral flexion greater than that found in other great
apes (Meyer, 2016) but cervical ROM has not been measured in non-human apes.
Four cervical specimens of Australopithecus sediba dating to ~2mya have also
been recently described by Meyer and colleagues (Meyer et al., 2017). The overall size is

26
smaller than humans both absolutely and relative to the reconstructed body mass. It is
difficult to interpret the implications of such a result given the combination of the
subadult and adult specimen in both the vertebral analyses as well as the body size
reconstruction. The spinous processes appear shorter than chimpanzees, the facets are
angled acutely (relative to midline), and uncinate processes are tall and sharp, and the
anterior tubercle of the transverse process is robust (Meyer et al., 2017). Similar to other
hominin specimens, A. sediba preserves a mosaic morphology of ape-like and human-
like features, suggesting differences in cervical function. Following Nalley and Grider-
Potter (2015), one could interpret the short spinous processes and vertebral bodies as
evidence of orthograde posture. Incorporating these fossils into a broader data set could
further elucidate behaviors of extinct species.
1.6 Research Goals
This dissertation aims to build upon previous work to elucidate many of the
numerous functions of the neck, understand how these functions influence vertebral
morphology, and retrodict those functions within the hominin lineage. Specifically, it
explores 1) maximum ranges of motion of the primate head and neck and 2) locomotor
kinematics of the head, neck, and trunk and their influence on vertebral form. Why does
human cervical morphology diverge so significantly from that of other primates? If the
neck has a significant locomotor function, then can we attribute this divergence to the
advent orthograde posture necessitate by the reliance on habitual bipedality? If, on the
other hand, facilitating head mobility is a driving selective force on cervical form, then
can variation in cervical morphology be attributed to intervertebral ranges of motion.
The following chapters of this dissertation test the hypothesis that head stability and
head mobility both influence cervical form. This hypothesis is tested using two specific

27
aspects of neck function in primates: passive range of motion (i.e. facilitating head
mobility) and locomotor kinematics (i.e. maintaining head locomotor stability). The first
study investigates the relationship between maximum ranges of head and neck motion
and cervical morphology. After establishing these baseline maximum ranges of motion
(ROM), the second study will attempt to understand the influence of range of axial
motion during habitual locomotion on cervical morphology.
Vertebrae may be adapted to the most frequent modes of locomotion as they are the
most consistent loads the bones must withstand. It is also possible that the vertebrae are
adapted to rare but critical loading regimes associated with activities such as predator
vigilance that require full ranges of motion. Here, both the habitual ROMs associated
with locomotion as well as the behaviorally rarer maximum ROMs will be quantified. It
is expected that the species will not use its maximum ROM during locomotion but that
there will be greater absolute mobility in species that rely on that particular ROM during
locomotion (e.g., if a gibbon relies on significant degrees if rotation during locomotion
will also have a large range of maximum rotation) in order to prevent soft tissue damage
or joint dislocation. Vertebral morphology is likely a compromise between many
different functions. Balancing the head is likely just as important, if not more so, as
allowing head mobility. As such, morphologies affecting head balance will also be tested.
Overall, this dissertation attempts to understand the functional influences on vertebral
form in the hopes of shedding light on anomalous shape of human cervical vertebrae and
their evolution within the hominin fossil record.
1.7 Hypothesis and Predictions
This dissertation is divided into two distinct studies that test how the degree to which
the vertebral shape is influenced by facilitating head mobility and providing head

28
stability. The first study tests the degree to which cervical vertebrae are adapted to
facilitating or inhibiting maximum ranges of motion. For example, protruding bony
processes can offer greater mechanical advantage but could potentially collide in
maximal positions. From this hypothesis stem several predictions:
P1a: Spinous processes physically inhibit extension (Kapandji, 2008). Therefore, I
predict that spinous processes will be shorter in vertebral levels with greater maximum
ranges of extension (see Fig. 1.5).
Figure 1.5 Long vertebral processes (red, A) should collide at maximum ranges of motion,
inhibiting range of motion but short vertebral processes will not, Predictions 1a and 1b
P1b: Transverse processes will be both shorter and more cranially inclined in
vertebral levels with greater ranges of lateral flexion. Long transverse processes should
physically inhibit lateral movement, but more cranially oriented processes should
provide greater mechanical advantage for the lateral flexors of the neck (see Fig. 1.5).
P1c: Uncinate processes are known to physically inhibit lateral flexion (Kapandji,
2008). Thus, vertebrae with taller, more medially-oriented uncinate processes will have
smaller ranges of lateral flexion (see Fig. 1.6).

29
Figure 1.6 Tall uncinate processes (red, A) should inhibit large ranges of lateral flexion in
comparison to shorter processes, Prediction 1c.
P1d: Relatively larger joint surfaces should be associated with an increased the range
of motion at those joints. Thus, cranio-caudally taller articular facets should facilitate
greater ranges of flexion (see Fig. 1.7).
Figure 1.7 Craniocaudally shorter articular facets facilitate lesser ranges of flexion (red, A)
in comparison to taller facets, Prediction 1d.

30
P1e: Craniocaudally short vertebrae decrease the overall displacement of the
vertebral column (Ward, 1993; Breit and Künzel, 2004). Therefore, the range of whole-
neck flexion-extension will be greater in species with craniocaudally taller vertebral
bodies (see Fig. 1.8).
Figure 1.8 After Ward (1993), craniocaudally tall vertebral bodies (B), should facilitate
large ranges of flexion-extension in comparison to shorter vertebral bodies.
P1f: Greater curvature in ‘female’ joint surfaces (e.g., acetabulum and lunate bone)
should be associated with increased range of motion and multidirectional loading
(Hamrick, 1996; Aiello and Dean, 2002). Therefore, greater curvature in the caudal
portion of the atlantooccipital joint (i.e. smaller angular relationship between the ventral
and dorsal aspects of the facet) should correspond to larger ranges of flexion-extension
at that joint (see Fig. 1.9).
These predictions will be tested by comparing morphological measurements of
cervical vertebrae and to their joint ranges of motion.

31
Figure 1.9 Joint curvature should correlate with habitual, normal loading of the joint
surface, and therefore, the range of motion the joint can accommodate. Large curvature (B)
should be associated with large range of motion, Prediction 1f.
The goal of the second study is to understand the locomotor function of the neck
and how that function influences cervical vertebral morphology. Specifically, how does
the neck function in maintaining head balance.
P2a: Trunk kinematics vary among species during locomotion. In order to maintain
head stability, variation in trunk kinematics will, in turn, affect neck kinematics.
Therefore, trunk movement during a stride will correlate with neck movement, but not
head movement.
P2b: Trunk kinematics varies among species during locomotion. In order to
maintain head stability, this variation will, in turn, affect neck kinematics. Therefore,
trunk movement during a stride will correlate with neck movement, but not head
movement.
P2c: If head stability is the goal and the neck’s function is to counteract the
movements of the trunk in order to maintain that stability, then there should be a
proximodistal decrease in locomotor range of motion in each axial segment (i.e.,
head<C3<C5<C7<T1) in all species regardless of locomotor mode.

32
P2d: Trunk kinematics varies among species. Therefore, head-neck angular
kinematics should covary with trunk angular kinematics. As locomotor trunk range of
motion increases, so should neck range of motion in order to counteract the movement
of the trunk and maintain head stability.
These predictions will be assessed using axial kinematic data collected from four
species of lemur during their primary modes of locomotion (see Table 2.6).
The second set of predictions will also be tested using locomotor range of motion
in order to understand the degree to which cervical vertebral morphology is adapted to
facilitating ranges of motion during locomotion. By incorporating both maximum and
locomotor ranges of motion, I will compare how both rare (but potentially vital) and
frequent behaviors shape vertebral morphology. This hypothesis will be tested using the
same set of predictions as the passive ROM study (e.g. P1a=P3a) with the addition of
another:
P3g: Articular facets will be oriented more cranially (i.e. more parallel with the
cranial surface of the vertebral body) in species with larger ranges of rotation. The effects
of articular facet orientation on ROM are known within the human vertebral column
(White and Panjabi, 1990). A cranially oriented facet, like that found in the joint between
C1 and C2, facilitates larger rotational ROM while a facet that is oriented parallel with
the dorsal surface allow larger ranges of rotation. As it is difficult to measure rotation
using radiographs (Graf et al., 1995), this prediction cannot be tested with maximum
intervertebral rotation.
These predictions will be tested using the kinematic data of axial segments during
habitual locomotion from four species of lemur and comparing it to cervical morphology.
If both maximum and locomotor ROM are significantly correlated with the strength of

33
each influences will be compared using AIC values gather from the statistical models.
These hypotheses will be rejected if no significant correlations are found between
cervical form and neck function, at a significance level of p>0.05. Particular attention
will be paid to the pattern of significance. For example, if only one vertebral level
correlates with a specific functional measure, the results will be interpreted with greater
caution than a correlation that is found in all vertebral levels. If locomotor ROM
predictions are supported but ROM predictions are rejected (or vice versa) then the I
would conclude that habitual loading regimes more strongly influence vertebral form
than rarer behaviors. If both locomotor and maximum ROM predictions are rejected,
future investigations into muscle and ligament morphology and properties would likely
prove beneficial as it is possible that soft tissues more strongly influence vertebral ROM
than skeletal morphology. If both ROM and head balancing predictions are supported,
then corrected Akaike Information Criterion (AICc) values will be calculated for each
analysis and used to determine what function the morphology best predicts. AICc values
are commonly used to determine which model best fits the data. Significant results will
then be used to interpret the morphology found in fossil primate specimens.

34
Chapter 2 Materials and Methods
2.1 Morphological data
To test these hypotheses, both morphological and functional data were collected.
Morphological data were collected from 676 vertebral specimens (C1-T1) of 15 primate
species housed at the American Museum of Natural History (New York, New York),
National Museum of Natural History (Washington DC), Muséum national de’Histoire
naturelle (Paris, France), and Field Museum of Natural History (Chicago, IL) (see Table
2.1 for complete list). Taxa were chosen in order to complement the functional data
collected for this study as well as those available from the literature. Chosen species
encompass the diverse range locomotor repertoires, and postural habits found in extant
primates. Maturity of individuals was determined based on the fusion of annular rings;
only adult specimens were used in the analyses. Because all functional data came from
captive individuals, no attention was paid to the geographic origin of the specimens.
Table 2.1 Species used in the morphological analyses and the number of individuals
Species n Lemur catta 7 Eulemur mongoz 6 Varecia variegata 9 Propithecus verreauxi 9 Otolemur crassicaudatus 8 Macaca fascicularis 7 Macaca fuscata 2 Macaca mulatta 15 Sapajus apella 8 Saimiri sciureus 9 Hylobates lar 8 Pan troglodytes 13 Homo sapiens 6

35
Morphometric data were collected from surface scans of skeletal museum specimens
using an Einscan 3Ds (Shining 3D) white-light scanner. This scanner was chosen for
both its economy and accuracy (<0.05mm). Landmarks were taken from these three-
dimensional surface scans using the Rhinoceros (McNeel & Associates) CAD software.
Landmarks of interest were placed on scans and lengths measured between these
landmarks (see Fig. 2.1, Table 2.2). These data were complemented by digitized 3D
coordinate data collected from skeletal specimens using a Microscribe digitizer
(Immersion Corp.). The landmarks were then used to measure the morphologies of
interest (see Fig. 2.1, Table 2.3). In some cases, mostly C6, the vertebrae have both
posterior and anterior transverse processes. In this case, the anterior transverse process
was used for analysis because it is almost universally the longer and more robust of the
two. Measurements were taken from the left side unless absent or degraded; then, the
right side was used.

36
Table 2.2 Description of skeletal landmarks digitized for morphological analyses.
Landmark Level Description
1 C1-T1
Dorsal-most extent of the spinous process; In the case of bifurcated spinous processes, the point was taken on each bifurcation and the midpoint between the two used
2 C1-T1 Cranial-most aspect of the lamina, midway between the articular pillar and spinous process
3 C1-T1 Dorsal-most aspect of the lamina, midway between the articular pillar and spinous process
4 C1-T1 Caudal-most aspect of the lamina, midway between the articular pillar and spinous process
5 C1-T1 Ventral-most aspect of the lamina, midway between the articular pillar and spinous process
6 C1-T1 Cranial-most aspect of the transverse process 7 C1-T1 Lateral-most aspect of the transverse process 8 C1-T1 Dorsal-most extent of the vertebral canal 9 C1-T1 Ventral-most extent of the vertebral canal
10 C1-T1 Lateral-most extent of the vertebral canal, bilateral
11 C1-T1 Cranial-most extent of the joint surface of the superior articular facet
12 C1-T1 Caudal-most extent of the joint surface of the superior articular facet
13 C2-T1 Cranioventral-most extent of the vertebral body 14 C2-T1 Caudoventral-most extent of the vertebral body
15 C3-T1 Points along the margin of the cranial plateau of the vertebral body, excluding uncinate processes
16 C3-T1 Cranial-most extent of the uncinate process 17 C2 Cranial-most extent of the dens, or odontoid process
18 C1 Ventral-most extent of the joint surface of the superior articular facet
19 C1 Point of greatest curvature between the two aspect of the superior articular facet
20 C1 Dorsal-most extent of the joint surface of the superior articular facet

37
Figure 2.1 Landmarks taken from vertebral specimens. C1 (left), C2 (center), and lower
cervical (C4, right) of Lemur catta. See Table 2.2 for description. Colors correspond to linear
measurements taken (see Figure 2.2).
Angular measurements were taken relative to the plane created by 8-12 points
along the margins of the cranial surface of the vertebral body for C3-T1. Because C2 lacks
this cranial surface, its angular measurements were taken relative to a line between the
inferior-most and superior-most aspect of the vertebral body on the ventral surface at
midline. The atlas lacks a centrum entirely; thus, only the angular relationship between
the two aspects of the superior articular facet was measured (see Fig. 2.2, Table 2.3).

38
Figure 2.2 Variables measured from skeletal material. Linear measurements calculated
based on distances between landmarks. Angular measurements calculated between vertebral
body plane (C3-T1), VBH line (C2), and relative to itself (C1, superior articular facet).
Table 2.3 Morphological variables measured from the skeletal landmarks and their
abbreviations.
Measurement Abbreviation Description
Vertebral Body Plane VBP
Plane created from points (Point 15) along the margin of the cranial aspect of the vertebral body
Spinous Process Length SPL
Maximum length of the spinous process; distance between Point 1 and Point 8
Spinous Process Angle SPA
Craniocaudal orientation of the spinous process; angle between the SPL line and VBP (C3-T1) or VBH (C2)
Lamina Height LH Maximum height of the lamina; distance between Point 2 and Point 4
Lamina Width LW Maximum width of the lamina; distance between Point 3 and Point 5

39
Transverse Process Length TPL
Maximum length of the transverse process; distance between Point 6 and Point 7
Transverse Process Angle TPA
Craniocaudal orientation of the transverse process; angle between the TPL line and VBP (C3-T1) or VBH (C2)
Canal Length CL Maximum length of canal at midline; distance between Point 8 and Point 9
Canal Width CW Maximum width of vertebral canal; distance between Points 10 bilaterally
Superior Articular Facet Height SAFH
Maximum height of the superior articular facet; distance between Point 11 and Point 12
Superior Articular Facet Angle SAFA
Craniocaudal orientation of the transverse process; angle between the SAFH line and the VBP (C3-T1), VBH (C2), or itself (C1)
Vertebral Body Height VBH
Maximum height of the ventral aspect of the vertebral body; distance between Point 13 and Point 14
Uncinate Process Height UH
Maximum height of the uncinate process; distance beteen Point 16 and the nearest Point 15
Dens Height DH Maximum height of the dens; distance between Point 13 and Point 17
2.2 Maximum Range of Motion
Maximum intervertebral passive ranges of motion data were measured from
seven primate species (n=18) at three institutions. Following methods approved by
Institutional Animal Care and Use Committees (Protocol# A141-16-06), individuals were
anesthetized. They were gently, but firmly moved into their maximum ranges of flexion,
extension, and lateral flexion, held in place with sand bags, and radiographed. Because
the anesthesia mask often prohibited the chin from touching the chest, it was
momentarily removed for positioning and exposure during maximum flexion. To be able
to separate flexion and extension, a neutral posture was also radiographed. This neutral
posture was achieved by orienting the neck parallel to the trunk and allowing the head to
fall naturally. The Duke Lemur Center (DLC) possesses a digital x-ray machine and thus
the strepsirrhine images are higher quality than those of the gibbon (Osaka University)

40
or chimpanzees (Stony Brook University) were taken on traditional film and scanned. In
addition, the chimpanzee radiographs were taken by Dr. Nathan Thompson (Department
of Anatomy, New York Institute of Technology College of Osteopathic Medicine) and do
not include a neutral posture or lateral flexion.
Figure 2.3 Varecia variegata (Kizzy) radiographs of neutral posture (left) and extension
(right) overlain at T2. Images were imported into ImageJ to measure the angles between lines.
To measure range of motion in the sagittal plane, maximum flexion and
extension radiographs were overlain with the neutral posture at T2. Lines were drawn
along the articular pillars, which are quite dense and thus easily visible. Angles were
taken between the same vertebrae in these different positions using ImageJ (Wayne
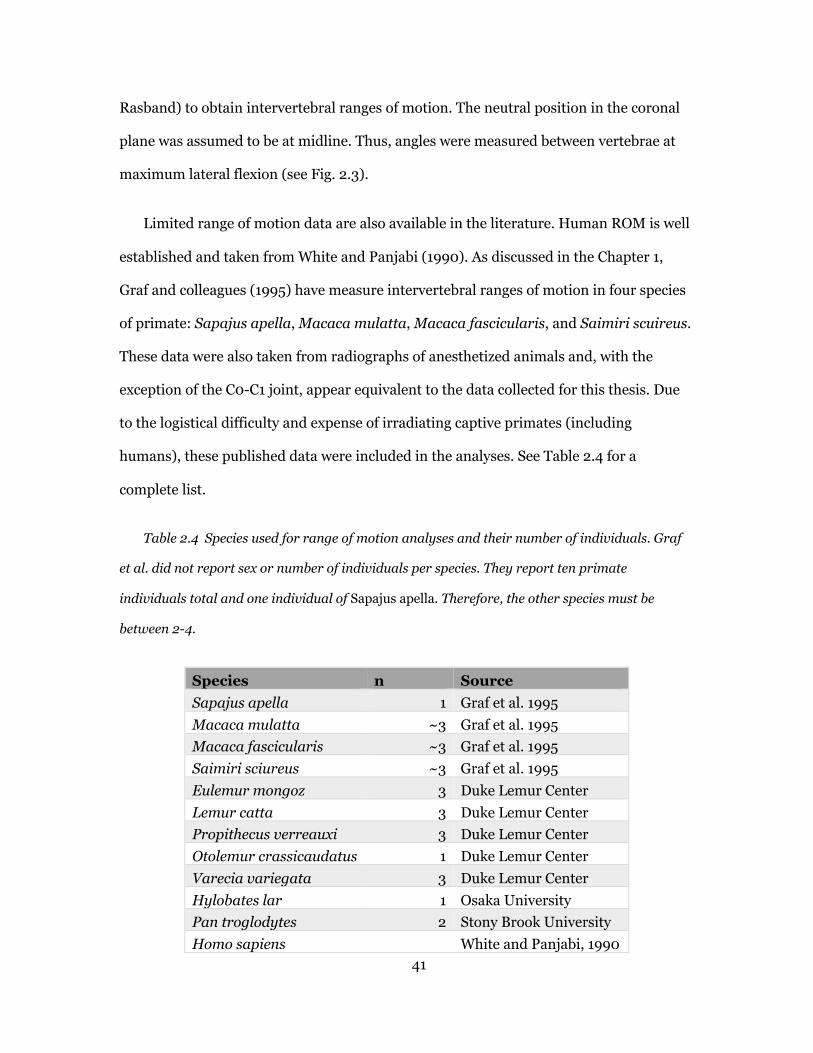
41
Rasband) to obtain intervertebral ranges of motion. The neutral position in the coronal
plane was assumed to be at midline. Thus, angles were measured between vertebrae at
maximum lateral flexion (see Fig. 2.3).
Limited range of motion data are also available in the literature. Human ROM is well
established and taken from White and Panjabi (1990). As discussed in the Chapter 1,
Graf and colleagues (1995) have measure intervertebral ranges of motion in four species
of primate: Sapajus apella, Macaca mulatta, Macaca fascicularis, and Saimiri scuireus.
These data were also taken from radiographs of anesthetized animals and, with the
exception of the C0-C1 joint, appear equivalent to the data collected for this thesis. Due
to the logistical difficulty and expense of irradiating captive primates (including
humans), these published data were included in the analyses. See Table 2.4 for a
complete list.
Table 2.4 Species used for range of motion analyses and their number of individuals. Graf
et al. did not report sex or number of individuals per species. They report ten primate
individuals total and one individual of Sapajus apella. Therefore, the other species must be
between 2-4.
Species n Source Sapajus apella 1 Graf et al. 1995 Macaca mulatta ~3 Graf et al. 1995 Macaca fascicularis ~3 Graf et al. 1995 Saimiri sciureus ~3 Graf et al. 1995 Eulemur mongoz 3 Duke Lemur Center Lemur catta 3 Duke Lemur Center Propithecus verreauxi 3 Duke Lemur Center Otolemur crassicaudatus 1 Duke Lemur Center Varecia variegata 3 Duke Lemur Center Hylobates lar 1 Osaka University Pan troglodytes 2 Stony Brook University Homo sapiens White and Panjabi, 1990

42
Phylogenetic generalized least squares (PGLS) regression was used to test for
correlations between vertebral morphology and intervertebral ROM. Most morphological
variables of interest should affect range of motion of the more cranial intervertebral
joint. For example, the uncinate processes of C3 should influence the range of lateral
flexion in the C2-C3 joint. Thus, all morphological variables were tested against their
cranial joint’s ROM with the exception of spinous process length and angle, which should
more strongly correlate with the inferior joint. Although some variables (e.g. vertebral
body height) have no reason to more strongly influence either superior or inferior joint,
they were regressed against the superior joint for consistency. Linear measurements
were size adjusted using the square root of vertebral canal area, which is known to
strongly correlate with body mass (MacLarnon, 1996). In addition, the relationship
between canal area and species mean body mass (Smith and Jungers, 1997) was
confirmed within the sample used for this dissertation. Phylogenetic generalized least
squares regressions demonstrate aa strongly significant relationship for all vertebral
level and both sexes (see Fig 2.4, Table 2.5). In addition, this has been used to scale
primate cervical vertebrae in other studies (Nalley, 2013). This allowed the dimensions
to be scaled per vertebral specimen rather than relying on species averages. In addition,
these values were logarithmically transformed prior to analysis in order to comply with
parametric assumptions. Consensus trees used in the analyses were downloaded from
10ktrees.nunn-lab.org (Arnold et al., 2010). Analyses were conducted in R using the
packages ape (Paradis et al., 2018), geiger (Harmon et al., 2015) and caper (Orme et al.,
2013).

43
Figure 2.4 Relationship between cervical canal area and species means of body mass within
this sample. PGLS analyses were conducted per level for each sex. Figure shows all levels and
both sexes.
8
32
1 2 4Body Mass^(1/3)
Can
al A
rea^
(1/2
)
FamilyCebidaeCercopithecidaeGalagidaeHominidaeHylobatidaeIndriidaeLemuridae
LevelC1C2C3C4C5C6C7
Canal Area v Body Mass

44
Table 2.5: Results of the PGLS regressions of species means of body mass on canal area for
each cervical level.
Y X Level Lambda Adj. r2 p Square Root Canal Area
Cube Root Body Mass C1 male 0 0.987 0.0004
Square Root Canal Area
Cube Root Body Mass C2 male 0 0.977 0.0001
Square Root Canal Area
Cube Root Body Mass C3 male 0 0.954 0.0000
Square Root Canal Area
Cube Root Body Mass C4 male 0 0.948 0.0000
Square Root Canal Area
Cube Root Body Mass C5 male 0 0.945 0.0000
Square Root Canal Area
Cube Root Body Mass C6 male 0 0.965 0.0000
Square Root Canal Area
Cube Root Body Mass C7 male 0 0.940 0.0000
Square Root Canal Area
Cube Root Body Mass C1 female 1 0.996 0.0013
Square Root Canal Area
Cube Root Body Mass C2 female 0 0.990 0.0000
Square Root Canal Area
Cube Root Body Mass C3 female 0.252 0.918 0.0000
Square Root Canal Area
Cube Root Body Mass C4 female 0.552 0.960 0.0000
Square Root Canal Area
Cube Root Body Mass C5 female 0.216 0.968 0.0000
Square Root Canal Area
Cube Root Body Mass C6 female 0.309 0.952 0.0000
Square Root Canal Area
Cube Root Body Mass C7 female 1 0.779 0.0023

45
2.3 Kinematics: Locomotor Range of Motion
Kinematic data focus on four species of lemur: Varecia variegata, Lemur catta,
Eulemur mongoz, and Propithecus verreauxi (n=12, see Table 2.4). Strepsirrhines are
well-suited to investigate the relationship between cervical form and function because
they practice a diversity of locomotor modes and postural repertoires. This diversity
offers a natural experiment on locomotor diversity within a single clade. By confining the
sample to lemurs, we are minimizing the potentially confounding effects of significant
differences in cranial morphology and phylogenetic distance. More importantly, these
species are readily available for kinematic research at the Duke Lemur Center. Ethics
committee approval was obtained prior to data collection.
While under anesthesia for radiographic data collection, individuals were shaved and
marked with permanent marker at palpable craniocervical landmarks (see Fig. 2.5).
Figure 2.5 Axial landmarks used in the kinematics study (Eulemur mongoz, Oscar).

46
Three-dimensional kinematics requires at least three landmarks to define xyz coordinate
systems. The head segment was defined by bilateral tragion and bilateral lateral canthus
landmarks. The cervical column was divided into three sections: upper (C1 spinous
process, C1 transverse process, C3 spinous process), middle (C3 spinous process, C5
transverse process, and C5 spinous process), and lower (C5 spinous process, C7 spinous
process, and C7 transverse process). The upper trunk segment was defined by: T1
spinous process, T5 spinous process, and the lateral-most aspect of rib 5 landmarks. The
left side of the body was arbitrarily chosen for transverse process and rib landmarks.
These sections correspond to functional division of the vertebral column found in the
human spine (White and Panjabi, 1990).
Kinematic data were collected in the experimental space at the Duke Lemur Center.
Individuals were brought from their enclosures and manually restrained while I re-
highlighted the landmarks using white, non-toxic paint pens because the permanent
marker, though visible, was often faded.
Substrates were constructed with the assistance of David Brewer, the research
technician at Duke Lemur Center. He and the lemur center staff are experienced
conducting locomotor experiments and are familiar with the habits and capabilities of
their animals. Thus, both their expertise as well as previously published naturalistic
studies were relied upon to construct locomotor substrates to achieve the desired mode
of locomotion. In addition, Drs. Angel Zeininger and Daniel Schmitt were immensely
helpful and advised in all aspects of the experiments.
At most, six cameras (GoPro Hero4, GoPro Inc., borrowed from the Animal
Locomotion Lab at Duke University) were used to capture locomotor bouts. Each was
modified with a BackBone Rib Cage (Ribcage, v1.0; Back-Bone, Ottawa, ON) in order to

47
eliminate the distortion inherent in the default fish-eye lens. These cameras were placed
at strategic locations in order to best capture landmarks from at least two angles. The
species’ most frequent mode of locomotion was used for the experiment (see Table 2.6).
If the neck is adapted to providing head stability during locomotion, then the most
frequent modes should give the strongest morphological signal.
Table 2.6 Species used in the kinematics study and their most frequent mode of locomotion.
Species n Primary mode of locomotion Frequency Source
Propithecus verreauxi 3
Vertical clinging and leaping (VCL) 68%
Gebo, 1987
Eulemur mongoz 3 Horizontal leaping 37%
Gebo, 1987
Varecia variegata 3 Arboreal Quadrupedalism 35%
Gebo, 1987
Lemur catta 3 Terrestrial Quadrupedalism 51% Gebo, 1987
Terrestrial quadrupedalism (Lemur catta): The experimental room is floored with
plastic tiles adhered to a wooden base. Although this substrate doesn’t occur naturally,
the plastic allows for easy cleaning and, therefore, prevention of disease transfer. In
addition, all individuals included in this study are accustomed to the room and its
flooring. To confine mediolateral movement, a wooden board adhered to cinderblocks
acted as the substrate. The measurement space was placed in the middle such that the
individual had at least one gait cycle prior to entering it. Five cameras were placed
anteriorly, laterally, and superiorly to best capture axial landmarks from multiple views
(see Fig. 2.6a). Video recordings were taken at 120f/s, 720p to best capture the speed of
locomotion at the highest possible quality.
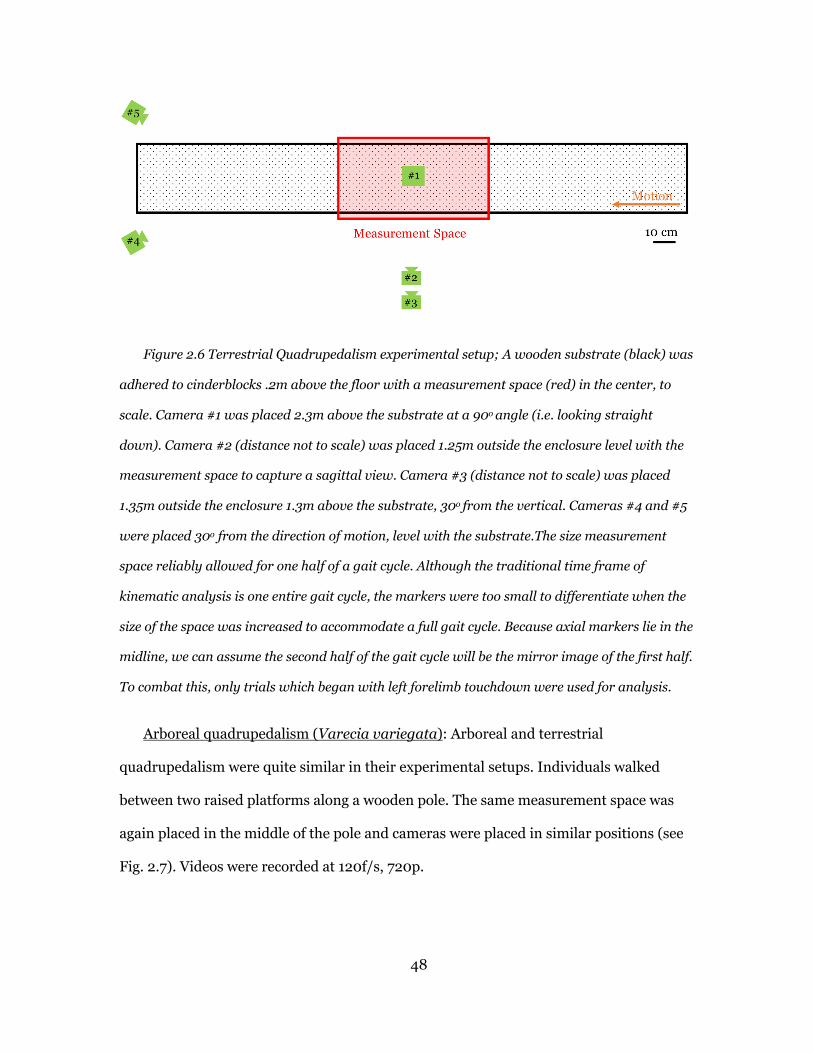
48
Figure 2.6 Terrestrial Quadrupedalism experimental setup; A wooden substrate (black) was
adhered to cinderblocks .2m above the floor with a measurement space (red) in the center, to
scale. Camera #1 was placed 2.3m above the substrate at a 90o angle (i.e. looking straight
down). Camera #2 (distance not to scale) was placed 1.25m outside the enclosure level with the
measurement space to capture a sagittal view. Camera #3 (distance not to scale) was placed
1.35m outside the enclosure 1.3m above the substrate, 30o from the vertical. Cameras #4 and #5
were placed 30o from the direction of motion, level with the substrate.The size measurement
space reliably allowed for one half of a gait cycle. Although the traditional time frame of
kinematic analysis is one entire gait cycle, the markers were too small to differentiate when the
size of the space was increased to accommodate a full gait cycle. Because axial markers lie in the
midline, we can assume the second half of the gait cycle will be the mirror image of the first half.
To combat this, only trials which began with left forelimb touchdown were used for analysis.
Arboreal quadrupedalism (Varecia variegata): Arboreal and terrestrial
quadrupedalism were quite similar in their experimental setups. Individuals walked
between two raised platforms along a wooden pole. The same measurement space was
again placed in the middle of the pole and cameras were placed in similar positions (see
Fig. 2.7). Videos were recorded at 120f/s, 720p.

49
Figure 2.7 Arboreal locomotion setup; a 3.2cm diameter wooden pole was placed between
two platforms 45cm above the floor. Platforms and pole were weighted with cinderblocks to
create a stable substrate. Camera #1 was placed 2.1m above the substrate at a 90o angle.
Camera #2 (distance not to scale) was placed 1.25 outside the enclosure level with the
measurement space. Camera #3 (distance not to scale) was placed 1.35m outside the enclosure
1m above the substrate, 30o from the vertical. Cameras #4 and #5 were placed 30o from the
direction of motion, level with the substrate.
Horizontal leaping (Eulemur mongoz): Two raised platforms were placed 0.75m
apart. This distance was chosen because it is easily accomplished by the individuals, so to
not tire them out or encourage them to jump down to the floor then up to the second
platform. It is also not close enough to where they can bridge the gap with forelimbs and
hindlimbs on either side. This distance has also been used in previous lemur kinematic
studies (Demes et al., 1995). The size of the measurement space was increased in order to
accommodate this distance (see Fig. 2.8). In addition, videos were recorded at a higher
frame rate (240f/s) and, thus, lower quality (WVGA). One complete gait cycle was
analyzed for this mode of locomotion beginning with right forelimb take-off and ending
with hindlimb touchdown.

50
Figure 2.8 Horizontal leaping setup; two 0.45m tall platforms were placed 0.75m apart and
weighted with cinderblocks. Camera #1 was placed 2.1m above the substrate at a 90o angle.
Camera #2 (distance not to scale) was placed 1.21m outside the enclosure level with the
measurement space. Camera #3 (distance not to scale) was placed 1.37m outside the enclosure
1m above the substrate, 10o from the vertical. Camera #4 was placed 30o from the direction of
motion, level with the substrate. Camera #5 (distance not to scale) was mounted 0.77m above
the platforms and angled inferiorly 20o.
Vertical clinging and leaping (Propithecus verreauxi): Two PVC poles were placed
1m apart. This distance was chosen because it was easily accomplished by subjects with
minimal reliance on the floor as an intermediate between the two (see Fig. 2.9). The gait
cycle was defined by right forelimb release to right forelimb touchdown. Videos were

51
recorded at 240f/s, WVGA.
Figure 2.9 Vertical clinging and leaping setup, camera distances not to scale; 1.65m tall,
6cm diameter PVC pipes were bolted to the 0.45m platforms and stabilized with cinderblocks.
Camera #1 was mounted 2.7m above the floor looking straight down. Camera #2 was placed in
lateral view 2m from the measurement space. Camera #3 was placed 2m from the measurement
space and oriented 10o inferiorly. Camera #4 was placed 1.35m from the floor, 1.5m from the
measurement space, and directed 30o from line of motion. Camera #5 was mounted 1.55m from
the floor, 1.5m from the measurement space, and oriented 10o inferiorly. Cameras #6 and #7
were mounted 2.1m from the floor, 1.65m from the measurement space, and oriented 20o
inferiorly.
In all modes of locomotion, substrates were weighted such that compliance was
minimal. All but one subject had previously been used for locomotor studies in the
research room and have been trained with whistles. They were enticed with food rewards
with the trainer holding the reward at the end of the substrate at roughly eye level if
reluctant. Otherwise, the treat was not shown until they completed the pass. With this
behavior, I hoped to minimize any artificial head postures resulting from the animal
focusing on the treat.

52
Landmark Processing and Analysis: The Matlab (The Mathworks, Inc.) package, DLT
data viewer (Hedrick, 2008), was used to obtain three-dimensional movement from the
two-dimensional videos. Objects of known dimensions (Zometool) were built and placed
in the experimental spaces before and after subjects’ trials and filmed with cameras in
position. These objects were used to calibrate the measurement space using the program.
After calibration, landmarks were hand digitized per gait cycle (or half gait cycle) per
frame for each camera and trial. At least five trials per individual, per mode of
locomotion were digitized. Three-dimensional motion of each landmark was then
exported.
With the assistance of Dr. Matt O’Neill (Department of Anatomy, Midwestern
University), the Matlab package Kinemat (Reinschmidt and van den Bogert, 1997) was
tailored to the data and used to create coordinate systems for each body segment. The
angular motion (i.e., cardan angles) of each axial coordinate system was calculated
relative to both the global coordinate system and the adjacent, proximal coordinate
system (e.g. motion of the head in space and relative to the C3 segment was calculated).
Both relative measures are important as the former allows us to understand the
locomotor movement of the axial skeleton and the latter how much of that motion is
dependent upon trunk movement. Data were then smoothed with a low-pass
Butterworth filter in accordance with suggested industry standards (Winter et al., 1974)
with a cutoff frequency of 6Hz depending upon which visually seemed to best suit the
data.
2.4 Statistical Analyses
These angular data (i.e., cardan angles) for head-neck-trunk segments for each frame
from each trial were used to test Prediction 2a and 2b. The angular data were then used

53
to calculate locomotor range of motion (maximum-minimum) for each segment (head,
C3, C5, C7, T1, neck, and trunk) for each trial. These trial ranges of motion were used to
test the Predictions 2c and 2d.
Kinematic and kinematic-morphology predictions were tested linear mixed-effect
models (LMM) in R. LMMs were used because it allowed me to control for 1) the
variation in speed between trials and locomotor modes, 2) variations in sex of the
individuals, as well as 3) repeatedly measuring the same individual. In addition, LMM
avoids issue with multiple testing (see Peres-Neto, 1999 and Lane, 2013 for review) and
issues with uneven sample sizes (a problem inherent in ANOVA). The motion of each
axial segment was analyzed with the morphology of the motion of the origin of its
coordinate system. For example, the neck segment is defined by C1 and C7 spinous
processes and C7 transverse process landmarks and, therefore, the neck was statistically
compared to C7 morphology. However, it is important to note that this type of analysis
does not allow for the control of non-independence among the data due to phylogenetic
relationships. Thus, the hope is that focusing on one clade (strepsirrhines) reduces any
confounding results phylogeny may have.

54
Chapter 3 Influences of passive range of motion on cervical vertebral form
The goal of this thesis is to understand the various functional influences on cervical
vertebral form. This chapter specifically investigates the effects of passive, intervertebral
range of motion (ROM) has on bony morphology. To test Predictions 1-5, passive,
intervertebral range of motion data were collected from radiographs of living primate
specimens and morphological measurements collected from skeletal specimens (see
Tables 3.1 and 3.2). In the cases of mixed sex samples (i.e. strepsirrhines), no significant
differences were found between male and female morphology (relative to vertebral canal
area) or intervertebral ranges of motion. In the case of range of motion data from the
literature, sex was not specified. In these instances, sexes were pooled for analysis. Range
of motion predictions were tested for each intervertebral joint using phylogenetic
generalized least squares (PGLS) regression (see Chapter 2 for details). Thus, the
strength of the support for the hypothesis will be analyzed not only through which test
are significant, but how many vertebral levels demonstrate significance. For example,
significant relationships between ROM and morphology in five out of seven cervical
levels demonstrates much greater support than significant relationships in only two
cervical levels. If there is a biological relationship between morphology and range of
motion, it should hold true for multiple vertebral levels. This method has been previously
used in vertebral functional morphological analyses (Nalley and Grider-Potter, 2015,
2017). In addition, the potential error (Type I) associated with multiple comparisons was
corrected for using false discovery rate (FDR). Because these types of analyses
(Bonferroni etc.) can increase Type II error, the tables report both the raw p-values as
well FDR-corrected p-values. The p-values were only adjusted within each prediction
(e.g. lateral flexion v. transverse process length) because each set of analyses is

55
independent. It would also create an unreasonably low p-value to correct for each
analysis separately, regardless of prediction or vertebral level.
3.1 Results and Discussion
Spinous Process Length and Angle
P1a: Spinous processes are known to physically inhibit extension (Kapandji, 2008). I
expect spinous processes to be shorter and more cranially oriented in vertebral levels
with greater maximum degrees of extension.
Results of the PGLS analyses comparing spinous process lengths (SPL) and
angles (SPA) are reported in Table 3.1. Significant, negative correlations between SPL
and intervertebral range of extension were found in the C5-6 and C7-T1 joints (Fig. 3.1).
In both these joints, range of extension decreases with increasing process length. These
results are only significant C7-T1, and approaches significance in C5-C6, which isn’t
terribly surprising. Spinous processes tend to become longer in more inferior cervical
levels and it is likely that there is a length threshold for inhibiting extension. Spinous
process angle does not significantly correlate with range of extension (Table 3.1).
Anecdotally, spinous processes only appear to collide during extension in the
chimpanzee. Given these mixed results, I conclude that, overall, this prediction is weakly
supported for spinous process length (but not angle), and only after a certain length
threshold is reached.

56
Table 3.1 Results of the PGLS analyses for range of motion and skeletal morphology.
Significant correlations in bold (p<0.05) and those approaching significance italicized
(0.1>p>0.05).
Joint Motion Morph λ Slope Adj. r2 p Adj. p C1-C2 Extension SPL 0 0.008 -0.136 0.838 0.838 C2-C3 Extension SPL 0 0.006 -0.111 0.667 0.838 C3-C4 Extension SPL 0 -0.008 -0.086 0.656 0.838 C4-C5 Extension SPL 0 0.010 -0.076 0.599 0.838 C5-C6 Extension SPL 0 -0.351 0.368 0.028 0.099 C6-C7 Extension SPL 0.122 0.012 -0.052 0.494 0.838 C7-T1 Extension SPL 0 -0.039 0.606 0.005 0.034 C2-C3 Extension SPA 0 2.694 -0.035 0.420 0.627 C3-C4 Extension SPA 0 -0.552 -0.090 0.627 0.627 C4-C5 Extension SPA 1 -0.968 0.031 0.289 0.627 C5-C6 Extension SPA 0 0.614 -0.068 0.533 0.627 C6-C7 Extension SPA 1 -1.304 0.241 0.085 0.324 C7-T1 Extension SPA 1 0.801 0.220 0.114 0.302 C0-C1 Lateral Flexion TPL 0.435 0.010 -0.200 0.970 0.970 C1-C2 Lateral Flexion TPL 0 0.078 0.213 0.166 0.221 C2-C3 Lateral Flexion TPL 0 -0.247 0.061 0.291 0.110 C3-C4 Lateral Flexion TPL 1 -0.303 0.606 0.024 0.064 C4-C5 Lateral Flexion TPL 0.974 -0.226 0.421 0.068 0.110 C5-C6 Lateral Flexion TPL 1 -0.460 0.682 0.014 0.055 C6-C7 Lateral Flexion TPL 1 -0.493 0.709 0.011 0.055 C7-T1 Lateral Flexion TPL 1 0.093 -0.236 0.843 0.844 C1-C2 Lateral Flexion TPA 0 0.093 -0.199 0.961 0.678 C2-C3 Lateral Flexion TPA 0 7.964 0.470 0.054 0.125 C3-C4 Lateral Flexion TPA 0 -2.813 0.050 0.303 0.425 C4-C5 Lateral Flexion TPA 0.932 -3.119 0.778 0.005 0.069 C5-C6 Lateral Flexion TPA 0 -6.273 0.521 0.041 0.125 C6-C7 Lateral Flexion TPA 1 -3.499 0.321 0.108 0.425 C7-T1 Lateral Flexion TPA 0 2.424 -0.186 0.666 0.678 C2-C3 Lateral Flexion UH 0 0.081 -0.128 0.595 0.821 C3-C4 Lateral Flexion UH 0 0.045 -0.167 0.722 0.821 C4-C5 Lateral Flexion UH 0 0.051 -0.158 0.688 0.821 C5-C6 Lateral Flexion UH 0 -0.039 -0.187 0.821 0.821 C6-C7 Lateral Flexion UH 0 -0.092 -0.159 0.691 0.821 C7-T1 Lateral Flexion UH 0 -0.057 -0.306 0.817 0.821 C0-C1 Flexion SAFH 0 0.027 0.786 0.920 0.920 C1-C2 Flexion SAFH 0 0.003 -0.151 0.783 0.895 C2-C3 Flexion SAFH 0 0.006 -0.034 0.004 0.030

57
C3-C4 Flexion SAFH 0.281 0.023 0.310 0.064 0.170 C4-C5 Flexion SAFH 0 0.014 0.599 0.010 0.038 C5-C6 Flexion SAFH 0.33 0.008 0.018 0.313 0.603 C6-C7 Flexion SAFH 0.487 0.006 -0.011 0.385 0.603 C7-T1 Flexion SAFH 0 -0.015 -0.060 0.453 0.603 C2-C3 Pitch VBH 0 0.028 -0.156 0.680 0.877 C3-C4 Pitch VBH 0 0.109 0.646 0.010 0.069 C4-C5 Pitch VBH 0 0.039 0.003 0.345 0.877 C5-C6 Pitch VBH 0 -0.022 -0.126 0.752 0.877 C6-C7 Pitch VBH 0 0.027 -0.015 0.379 0.877 C7-T1 Pitch VBH 0 -0.013 -0.169 0.730 0.877 C0-C7 Sum (Pitch) Sum (VBH) 0 -0.001 -0.198 0.938 0.920 C0-C1 Pitch SAFA 0 -0.222 -0.200 0.673 0.673
Figure 3.1 PGLS results of Spinous Process Length (SPL) on flexion per vertebral level.
Significant results (C7-T1) and those approaching significance (C5-C6) are colored and
insignificant results are shades of grey.
0.0
0.5
1.0
1.5
2.0
0 10 20Extension (degrees)
Log(
Spi
nous
Pro
cess
Len
gth/
Can
al A
rea)
JointC1-C2
C2-C3
C3-C4
C4-C5
C5-C6
C6-C7
C7-T1
Spinous Process Length v Extension

58
Nalley and Grider-Potter (2015) also found that neck inclination (as measured by
Strait and Ross (1999)) also strongly correlates with spinous process length in C3-C7
vertebrae. From these analyses, we concluded that longer spinous processes are found in
primates with more horizontal neck postures in order to increase the mechanical
advantage of the nuchal musculature. These correlations were significant (with high
correlation coefficients) across all levels. This indicates that neck posture may more
strongly influence cervical morphology than ROM, but additional analyses incorporating
both functional variables would be able to further elucidate the relative influence of each
function.
Transverse Process Length and Angle
P1b: Transverse processes will be shorter and more cranially oriented in vertebral
levels with greater ranges of lateral flexion. Long transverse processes should physically
inhibit lateral movement, but more cranially oriented processes should provide greater
mechanical advantage.
The C6 typically has anterior and posterior roots of the transverse processes.
Both processes are also occasionally present in C5 and C7 levels as well. In the case of C5
and C6, the anterior process was used for analysis because it is always longer and more
robust, whereas the reverse is true for C7. The longer process was used for analysis
because if one is going to more strongly inhibit or facilitate range of motion, it should be
the longer of the two. The longer one is more likely to collide with adjacent vertebrae
than the shorter one.

59
Figure 3.2 PGLS results of Transverse Process Length (TPL) on lateral flexion per vertebral
level. Results approaching significance (C3-C4, C5-C6, and C6-C7) are colored and insignificant
results are shades of grey.
Results demonstrate that, contrary to predictions, longer transverse processes
actually facilitate greater ranges of lateral flexion in three intervertebral joints (C3-C4,
C5-C6 and C6-C7, see Figure 3.2). Even though this result only approaches significance
at these levels, it potentially indicates that in the lower cervical vertebrae, longer
transverse processes offer greater mechanical advantage during ipsilateral lateral flexion.
This measure of motion is passive, meaning the muscles aren’t active. However, in order
to provide greater ranges of lateral flexion via muscle action, the joints need to be able to
accommodate that motion.
0.0
0.5
1.0
1.5
2.0
2.5
10 20Lateral Flexion (degrees)
Log
(Tra
nsve
rse
Pro
cess
Len
gth/
Can
al A
rea)
JointC0-C1
C1-C2
C2-C3
C3-C4
C4-C5
C5-C6
C6-C7
C7-T1
Transverse Process Length v Lateral Flexion

60
Transverse process angle is also weakly correlated with degree of lateral flexion
(Table 3.1, Figure 3.3). This relationship is significant for C4-C5 joint. The more caudal
joints seem to support the predictions: the transverse processes become more cranially
oriented with increasing ranges of lateral flexion. Overall the results do not strongly
support this prediction.
Figure 3.3 PGLS results of Transverse Process Angle (TPA) on lateral flexion per vertebral
level. Significant results (C4-C5 and C5-C6) and those approaching significance (C2-C3) are
colored and insignificant results are shades of grey.
40
80
120
10 20Lateral Flexion (degrees)
Tran
sver
se P
roce
ss A
ngle
(deg
rees
)
JointC1-C2
C2-C3
C3-C4
C4-C5
C5-C6
C6-C7
C7-T1
Transverse Process Angle v Lateral Flexion
61
Uncinate Process Height
P1c: Uncinate processes create a U-shape which is thought to stabilize the joint.
Therefore, craniocaudally taller uncinate processes should restrict the range of lateral
flexion.
Results of the PGLS regressions demonstrate no significant correlations between
lateral flexion and uncinate process height or angle (Table 3.1). Thus, this prediction is
not supported. It is likely that the intervertebral discs and associated ligaments restrict
motion to a greater degree than bony morphology.
Meyer and colleagues (2018) recently published an analysis of uncinate process
morphology in primates. The results indicate that uncinate process height is negatively
allometric, larger primates tending to have much less prominent processes than do
smaller-bodied species. Unsurprisingly, morphology does not correlate with locomotor
category. Further work using methods such as x-ray reconstruction of moving
morphology (XROMM) could further elucidate the role of the uncinate processes in a
comparative sample, because it would allow us to see the exact pattern of motion
between vertebrae during lateral flexion and rotation.
Superior Articular Facet Height
P1d: Relatively large joint surface areas should increase the range of motion.
Therefore, craniocaudally taller facets should correlate with increased ranges of flexion.
Results show that C2-C3 and C4-C5 joint ranges of motion are significantly
positively correlated with articular facet height. This indicates that increasing facet
height in these two joint increases range of flexion (see Table 3.1, Figure 3.4). Overall,
this prediction is weakly supported.

62
Nalley and Grider-Potter (2015, 2017) observed a significant influence of neck
posture on articular facet orientation but did not investigate its influence on height.
Specifically, they found that more coronal orientations were common in more
pronograde species, but only at the C4 and C7 vertebral levels. They concluded that these
orientations might offer greater resistance to displacement in these taxa. It is likely that
both these variables are important functional influences on vertebral form.
Figure 3.4 PGLS results of Superior Articular Facet Height (SAFH) on flexion per vertebral
level. The results approaching significance (C4-C5) are colored and insignificant results are
shades of grey.
0.5
0.6
0.7
0.8
0.9
0 10 20Flexion (degrees)
Log(
Sup
erio
r Arti
cula
r Fac
et H
eigh
t/Can
al A
rea)
JointC1-C2
C2-C3
C3-C4
C4-C5
C5-C6
C6-C7
C7-T1
Superior Articular Facet Height v Flexion

63
Cervical Column Height
P1e: A taller column should increase its overall angular displacement. Thus, range of
whole-neck flexion-extension will be greater in species with craniocaudally taller cervical
columns.
To test this prediction skeletal measures of vertebral body heights (C2-C7) were
summed and compared to the summed range of motion for total range of head and neck
motion in addition to the intervertebral correlations. Results demonstrate no significant
correlation between column height and range of flexion-extension, and only one
vertebral level, C3-C4, is approaching significance and positively correlated with range of
motion (Figure 3.5, Table 3.1). It may be that intervertebral discs and their associated
ligaments more strongly constrain vertebral motion.

64
Figure 3.5 PGLS results of Vertebral Body Height (VBH) on flexion-extension. Results
approaching significance (C3-C4) are colored and insignificant results are shades of grey.
Ward (1993) suggested that craniocaudally taller vertebral bodies should be
associated with larger degrees of angular excursion at the intervertebral joints. These
results suggest otherwise: total column length is not correlated with total of head-neck
motion and vertebral body height is only significantly correlated with flexion-extension
at one vertebral level. Nalley and Grider-Potter (2015) also found correlations between
vertebral body height and neck posture. They concluded that this might increase lordotic
curvature formation or maintenance because longer vertebrae would increase the total
amount of flexion at each joint in a resting posture. However, these results indicate that
might not be the case. Because vertebral body height is not strongly associated with
maximum range of flexion, it likely does not influence lordosis. It could be possible that
0.4
0.8
1.2
1.6
0 10 20 30 40Flexion and Extension (degrees)
Rel
ativ
e V
erte
bral
Bod
y H
eigh
t
JointC2-C3
C3-C4
C4-C5
C5-C6
C6-C7
C7-T1
Vertebral Body Height v Flexion and Extension
65
longer vertebral bodies offer greater area for force dissipation, thereby more efficiently
resisting the bending moments associated with more pronograde postures.
Atlantooccipital Joint Curvature
P1f: Larger curvature of the atlantooccipital joint facilitates greater range of flexion-
extension.
Regression results indicate that the curvature is not related to range of flexion-
extension in the atlantooccipital joint. This is contrary to the hypothesis put forth by
Aiello and Dean (2002) for the atlantooccipital joint .
Previous analyses conducted by Nalley and Grider-Potter (2017) have shown
significant correlations between atlantooccipital joint curvature and neck posture.
However, this relationship is largely driven by changes in the ventral aspect of the facet.
The ventral aspect becomes oriented more dorsally in more pronograde species (Grider-
Potter, 2013). It is possible that this orientation better protects the joint from
multidirectional forces and increasing curvature is not adapted to any particular increase
in ROM. The results of this study demonstrate that this variation does not affect joint
range of motion. Hamrick's (1996) study on primate carpals suggests that joint curvature
reflects habitual loading patterns. A relatively flat facet (e.g., the tibial plateau) is
adapted to dissipating unidirectional loads whereas a more curved joint (e.g., the
acetabulum) may habitually dissipate loads from many directions. Stability in multiple
directions may not be as important in more orthograde species whose atlantooccipital
joints largely combat unidirectional compression.

66
3.2 Discussion
Skeletal inhibition of motion
Overall, these results do not strongly support the hypothesis that vertebral
morphology is correlated with intervertebral range of motion. Some vertebral levels show
significant correlations between ROM and morphology; however, no correlation is
significant across all vertebral levels. Longer spinous processes appear to inhibit range of
extension in the lower vertebral levels. This isn’t surprising because spinous processes
tend to be longer in the lower levels, and thus, these lower levels pass the threshold
needed to inhibit motion. Anecdotally, the middle and lower spinous processes only
appear to touch bone-to-bone in the radiographs taken from P. troglodytes, which also
have relatively longer spinous processes. It is likely that spinous processes in the upper
cervical levels are too short in the species included here to inhibit range of extension.
It’s also important to note that these variables tested are isolated; meaning, they
don’t take into account how the morphologies might influence each other. For example,
both the length of the transverse process and angle of the transverse process influence
the range of motion in tandem (e.g. a more coronally oriented process may allow for a
longer process without inhibiting motion). In addition, the inhibition of motion is likely
influenced by the length of the transverse process and height of the vertebral body in
tandem; the transverse process can be longer when the vertebral body is craniocaudally
taller. Future work should investigate these variables in tandem in order to understand
their collective influences on range of motion.
Contrary to the prediction, longer transverse processes seem to facilitate greater
ranges of lateral flexion rather than inhibiting it. Longer processes move the muscular
action further from the joint center, thereby creating greater mechanical advantage: less
67
muscular force is required to laterally flex in species with longer transverse processes.
Although these ranges of motion are passive (i.e. muscles are inactive), the range of
motion should still be large, so that the muscles can facilitate the lateral neck flexors (e.g.
the scalenes, spinalis capitis, iliocostalis cervicis, and longissimus cervicis) originate on
these processes in humans, this result could be explained in terms of increasing
mechanical advantage of these muscles. These results further indicate that skeletal
morphology does not strongly correlate with motion motion.
Uncinate process height demonstrated no correlation with range of lateral
flexion. Spinal fusion is commonly practiced in the medical field to inhibit motion at
particular vertebral joints. Research has demonstrated that when a vertebral joint is
fused, the superior joint often exhibits an increased range of motion and concomitant
disc degeneration (Chow et al., 1996; Kumar et al., 2001; Eck et al., 2002; Hilibrand and
Robbins, 2004; Rohlmann et al., 2006). Cleary, the fibrocartilaginous annulus fibrosis
plays a critical role in providing joint stability. What, then, is the role of an uncinate
process? It is possible that it inhibits range of rotation, rather than lateral flexion. It is
commonly cited in the literature that the uncinate processes require humans to extend
and laterally flex their cervical vertebrae in order to accomplish neck rotation. It may
also be that hard tissues only inhibits motion if soft tissue degenerates or fails.
Recently, Manafzadeh and Padian (2018) conducted a study investigating the
degree to which ligaments restrain hip mobility in quail in an effort to retrodict hip
posture in fossil ornithodirans. They obtained an osteological measure of hip ROM by
overlaying 3D scans of the hip and femur and eliminating those overlays in which bones
touched or the joint was dislocated. Ligamentous ROM was measured through
manipulating dissected specimens and manipulating them in front of an x-ray
reconstruction of moving morphology (XROMM) system. They then mapped the

68
ligamentous point cloud of possible osteological and ligamentous positions and found
that ligaments restrict bony movement to 5.28% of the morphospace. This immense
reduction in ROM underscores the function of ligaments: to provide joint stability.
Coupled with the results of this study, it would appear that skeletal morphology rarely
provides a bony stop for range of motion and, therefore, should not be used to
reconstruct ROM in fossil taxa.

69
Chapter 4 Axial kinematics and neck function during locomotion
The overarching goal of this dissertation is to understand the functional relationships
of vertebral morphology. However, this chapter is dedicated to understanding how the
neck functions during locomotion. One must first recognize function before
understanding the relationship between form and function. This study tests the
hypothesis that the locomotor function of the neck is to maintain head stability. To test
this hypothesis, kinematic data were collected using videos taken from four species of
strepsirrhines (Eulemur mongoz, Lemur catta, Propithecus verreauxi, and Varecia
variegata) during their primary modes of locomotion: horizontal leaping, terrestrial
quadrupedalism, vertical clinging and leaping, and arboreal quadrupedalism respectively
(Gebo, 1987; Table 2.6; see Table 4.1 for average range of motion of each body segment
relative to the global coordinate system and Chapter 2 for description of methods).
These data were collected in order to test the hypothesis that the neck functions to
maintain head stability by counteracting the movements of the trunk during locomotion.
From this hypothesis stem several predictions: a) trunk kinematics varies due to
locomotor mode, b) trunk movement influences neck movement, but not head
movement, during locomotion , c) there is a proximodistal increase in locomotor range of
motion of each axial segment, and d) neck range of motion increases with increases
trunk range of motion during locomotion (see Chapter 2). These predictions were tested
using linear mixed models in order to incorporate differences in speed as a fixed effect as
well as repeatedly measuring the same individual and species. Depending on the
prediction, models used: 1) cardan angles for head-neck-trunk segments across trials
within the global coordinate system, 2) range of motion (max angle-min angle) of the
head-neck-trunk segment for each trial within the global coordinate system, or 3) range

70
of motion (max cardan angle-min cardan angle) of the head and vertebral segments (C3,
C5, C7, and T1) for each trial within the global coordinate system (see Chapter 2 for
details). Cardan angles are the angular motions of pitch (rotation in the sagittal plane),
roll (rotation in the quadruped transverse plane), and yaw (rotation in the quadruped
frontal plane). Speed was calculated using the distance traveled by the tragion landmark
and divided by the time of the gait cycle. Speed was included as a fixed effect in all
models. These kinematic data were then correlated with morphometric data using in
order to understand how locomotor range of motion influences cervical vertebral
morphology. In light of the results of these analyses, additional linear mixed models were
conducted in order to understand the variation in morphology across the sample.
Figure 4.1 Directions of angular motion in an orthograde sifaka and pronograde ring-tailed
lemur.

71
Spec
ies
Mod
e N
tria
l Sp
eed
(m
/s)
Lev
el
Pit
ch (
deg
) Y
aw (
deg
) R
oll (
deg
) E
. mon
goz
HL
11
8.
261
(+/-
) 1.
227
Hea
d 45
.3
(+/-
) 24
.0
53.3
(+
/-)
33.6
21
.5
(+/-
) 12
.9
C3
58.7
(+
/-)
39.1
53
.3
(+/-
) 45
.3
59.3
(+
/-)
32.6
C5
50.4
(+
/-)
32.0
38
.1
(+/-
) 28
.5
46.6
(+
/-)
43.7
C7
50.0
(+
/-)
36.0
56
.7
(+/-
) 52
.1
58.1
(+
/-)
36.9
Nec
k 19
.9
(+/-
) 8.
4 25
.9
(+/-
) 13
.4
25.6
(+
/-)
17.0
T1
40.7
(+
/-)
19.0
35
.8
(+/-
) 29
.2
40.3
(+
/-)
18.7
Trun
k 28
.7
(+/-
) 18
.8
39.0
(+
/-)
24.6
40
.3
(+/-
) 24
.6
L. c
atta
TQ
9
1.90
3 (+
/-)
0.44
6 H
ead
26.6
(+
/-)
12.7
59
.7
(+/-
) 29
.3
86.5
(+
/-)
54.7
C3
22.9
(+
/-)
16.0
12
.7
(+/-
) 9.
1 22
.0
(+/-
) 14
.2
C5
38.1
(+
/-)
24.4
11
.3
(+/-
) 6.
6 22
.2
(+/-
) 12
.4
C7
31.8
(+
/-)
17.8
24
.9
(+/-
) 32
.8
24.1
(+
/-)
15.6
Nec
k 13
.0
(+/-
) 5.
1 16
.1
(+/-
) 13
.1
12.3
(+
/-)
5.6
T1
24.3
(+
/-)
14.6
12
.0
(+/-
) 4.
9 25
.1
(+/-
) 10
.7
Trun
k 10
.5
(+/-
) 6.
9 22
.1
(+/-
) 20
.9
22.2
(+
/-)
17.0
P.
ver
reau
xi
VC
L 7
14.8
46
(+/-
) 1.
019
Hea
d 29
.4
(+/-
) 26
.3
63.0
(+
/-)
59.5
67
.2
(+/-
) 61
.0
C3
61.2
(+
/-)
22.6
78
.2
(+/-
) 61
.9
36.6
(+
/-)
21.7
C5
39.7
(+
/-)
33.9
31
.4
(+/-
) 33
.0
30.3
(+
/-)
26.0
C7
36.7
(+
/-)
18.7
31
.1
(+/-
) 28
.7
24.5
(+
/-)
19.9
Nec
k 54
.1
(+/-
) 17
.3
80.1
(+
/-)
44.3
34
.9
(+/-
) 20
.7
T1
39.3
(+
/-)
14.2
55
.0
(+/-
) 44
.6
40.9
(+
/-)
26.5
Trun
k 36
.4
(+/-
) 23
.4
28.5
(+
/-)
16.7
21
.3
(+/-
) 10
.7
V. v
arie
gata
A
Q
12
2.98
6 (+
/-)
0.68
1 H
ead
9.8
(+/-
) 5.
9 11
.0
(+/-
) 13
.7
12.4
(+
/-)
12.5
C3
43.8
(+
/-)
20.2
33
.7
(+/-
) 6.
4 18
.9
(+/-
) 16
.3
C5
32.9
(+
/-)
35.1
40
.7
(+/-
) 19
.8
15.0
(+
/-)
10.2
C7
21.1
(+
/-)
21.8
43
.1
(+/-
) 22
.4
11.0
(+
/-)
4.2
Nec
k 22
.5
(+/-
) 17
.1
26.2
(+
/-)
21.2
14
.6
(+/-
) 11
.5
T1
29.2
(+
/-)
23.6
49
.0
(+/-
) 16
.1
16.6
(+
/-)
23.4
Trun
k 12
.5
(+/-
) 11
.9
17.9
(+
/-)
6.7
19.5
(+
/-)
9.6
Ta
ble
4.1 A
vera
ge r
ange
s of s
egm
ent m
otio
n ac
ross
gai
t cyc
les f
or e
ach
spec
ies (
hori
zont
al le
apin
g =H
L, te
rres
tria
l
quad
rupe
dalis
m =
TQ, v
ertic
al cl
ingi
ng a
nd le
apin
g =
VCL,
arb
orea
l qua
drup
edal
ism
=AQ
).

72
4.1 Results-Kinematics
Trunk Kinematics vs. Species
P2a: Trunk kinematics varies among primate species during their primary mode of
locomotion.
Linear mixed models were conducted using both cardan angles of the trunk
during each frame of each trial as well as the resulting range of angular motion per trial.
Both sets of kinematic data demonstrate significant differences in trunk motion among
species. Both Eulemur and Propithecus experience larger ranges of pitch and yaw during
leaping than do Lemur and Varecia during quadrupedalism (see Table 4.2). Variation in
trunk yaw across the gait cycle does not seem to be vary due to species (p=0.135), but the
range of yaw does (p=0.011). Intuitively, this result makes sense: a sifakas’ trunk during
vertical clinging and leaping should move differently than a ring-tailed lemur’s during
terrestrial quadrupedalism. Given that it has been demonstrated that trunk motion
varies among species, I can now use it as the basis for subsequent predictions.
Table 4.2 Results of the linear mixed models among both global segment angles and global
segment range of motion. Significant correlations in bold (p<0.05).
Y: Segment Angle or ROM X X2 Random Effects r2 pX pX2
Trunk Yaw Species Speed Indv (Trial (Frame ) ) 0.104 0.135 0.563 Trunk Roll Species Speed Indv (Trial (Frame ) ) 0.601 0.000 0.313 Trunk Pitch Species Speed Indv (Trial (Frame ) ) 0.243 0.011 0.546 Trunk Yaw ROM Species Speed Indv (Trial (Frame ) ) 0.330 0.011 0.533 Trunk Roll ROM Species Speed Indv (Trial (Frame ) ) 0.334 0.011 0.544 Trunk Pitch ROM Species Speed Indv (Trial (Frame ) ) 0.510 0.014 0.558

73
Table 4.3 Prediction 2b results of the linear mixed models. Significant correlations in bold
(p<0.05).
Y X1 X2 Random Effects r2 pX PX2
Head Yaw Trunk Yaw Speed Species(Individual (Trial)) 0.099 0.000 0.317 Head Roll Trunk Roll Speed Species(Individual (Trial)) 0.008 0.000 0.022 Head Pitch Trunk Pitch Speed Species(Individual (Trial)) 0.054 0.276 0.338 Head Yaw Neck Yaw Speed Species(Individual (Trial)) 0.065 0.583 0.216 Head Roll Neck Roll Speed Species(Individual (Trial)) 0.002 0.388 0.845 Head Pitch Neck Pitch Speed Species(Individual (Trial)) 0.076 0.000 0.213 Neck Yaw Trunk Yaw Speed Species(Individual (Trial)) 0.260 0.000 0.006 Neck Roll Trunk Roll Speed Species(Individual (Trial)) 0.320 0.000 0.000 Neck Pitch Trunk Pitch Speed Species(Individual (Trial)) 0.424 0.000 0.023

74
Figure 4.2 Trunk range of pitch (a), roll
(b), and yaw (c) during primary mode of
locomotion in four species of lemur:
Eulemur mongoz, Lemur catta,
Propithecus verreauxi, and Varecia
variegata.

75
Trunk vs. Neck Kinematics
P2b: In order to maintain head stability, variation in trunk kinematics will, in turn,
affect neck kinematics. Therefore, trunk movement during a stride will predict neck
movement, but not head movement.
The data demonstrate variation in how the axial segments move with and
opposite each other during locomotion. These linear mixed models were conducted by
correlating cardan angles of the head, neck, and trunk in the global coordinate system
per frame of each trial (see Table 4.3 for model specifics). Trunk movement does predict
a significant, but minute amount of head yaw or roll during a gait cycle (r2yaw=0.099 and
r2roll=0.008, p<0.001, see Table 4.3). However, trunk pitch significantly predicts head
pitch, contrary to the predictions (ppitch=0.2761). Conversely, neck yaw and roll does not
predict head yaw or roll (pyaw=0.5825, proll=0.3877) but does weakly predict head pitch
(r2pitch=0.076, ppitch<0.001).
The neck and trunk are much more highly correlated with each other than the head
and trunk (r2yaw=0.260, r2roll=0.320, r2pitch=0.424, p<0.001). This implies that during
locomotion the head pitches with the neck but rolls and yaws with the trunk. As a whole,
these correlations indicate that trunk movement influences neck movement but also
weakly influences head movement.

76
Figure 4.3 Representative pitch of the head, neck, and trunk segments across the gait cycle.
Statistical analyses demonstrated variation in angular motion due to speed and thus,
representative trials are depicted rather than averages.

77
Figure 4.4 Representative roll of the head, neck, and trunk segments across the gait cycle.

78
Figure 4.5 Representative yaw of the head, neck, and trunk segments across the gait cycle.
Segmental Stability
P2c: If head stability is the goal and the neck’s function is to counteract the
movements of the trunk in order to maintain that stability, then there should be a
proximodistal decrease in locomotor range of motion in each axial segment (i.e.
Head<C3<C5<C7<T1).

79
To test this prediction, models incorporated the ranges of motion of each vertebral
segment across one trial. The vertebral segment data demonstrate unbelievably large
ranges of motion during locomotion (see Table 4.1). In many cases these locomotor
ranges of motion are larger than the passive range of motion found at those segments,
which leads be to believe that these data are not accurate. It is possible that
methodological error in the vertebral segment data are confounding the results.
Specifically, skin artifact likely plays a role in this error, see discussion below. Thus, the
analyses were also conducted using segment ranges of motion but found no difference in
significance. Results demonstrate very little support for this prediction: models for
movement in all planes are not significant (pyaw=0.094, proll=0.438, ppitch=0.493, see
Table 4.4). Post-hoc analyses show only one significant difference: C3-C7 yaw (see Table
4.5 and Figure 4.6). This result is surprising. If head stability is an important aspect of
locomotion, then the neck should act to minimize its motion.

80
Table 4.4 Prediction 2c linear mixed model results for the vertebral segments (head, C3, C5,
C7, and T1) as well as the axial segments (head, neck, trunk). Significant correlations in bold
(p<0.05) and those approaching significance italicized (0.1>p>0.05).
Y: ROM X X2 Random Effects r2 pX pX2 Yaw Vertebral Segment Speed Individual ( Trial ) 0.07 0.09 0.19 Roll Vertebral Segment Speed Individual ( Trial ) 0.04 0.44 0.27 Pitch Vertebral Segment Speed Individual ( Trial ) 0.03 0.49 0.42 Yaw Whole Segment Speed Individual ( Trial ) 0.14 0.41 0.00 Roll Whole Segment Speed Individual ( Trial ) 0.07 0.15 0.07 Pitch Whole Segment Speed Individual ( Trial ) 0.20 0.35 0.00
Table 4.5 Post-hoc results (Tukey HSD) for prediction 2c testing for differences among levels, p-
values corrected using Bonferroni’s method. Significant correlation in bold (p<0.05).
Head-C3 Head-C5 Head-C7 Head-T1 C3-C5 C3-C7 C3-T1 C5-C7 C5-T1 C7-T1 Yaw 0.42 1.00 0.80 1.00 0.27 0.04 0.31 0.95 1.00 0.88 Roll 0.94 1.00 0.84 0.94 0.95 1.00 0.56 0.85 0.95 0.37 Pitch 0.93 0.98 0.85 1.00 0.68 0.38 0.84 0.99 1.00 0.93

81
Figure 4.6 Species variation in
locomotor ranges of pitch (a),
roll (b), and yaw (c). No
significant differences were
found.

82
Species-specific kinematics
P2d: As locomotor trunk range of motion increases, so should neck range of motion
in order to counteract the movement of the trunk.
Models were conducted using head-neck-trunk segment ranges of motion per
trial to test this prediction. No significant results were found among species, but results
for roll and pitch approach significance (proll=0.051, ppitch=0.080, see Table 4.6). Post-
hoc analyses show an interesting pattern of significance differences: Eulemur has
significantly different pitch than Lemur (p=0.0195) or Varecia (p=0.0224), but not
Propithecus. While Varecia has significantly different ranges of roll than Lemur or and
Eulemur, see Table 4.7 and Figure 4.5a-c. This grouping is likely influenced by their
locomotor modes: Eulemur and Propithecus group together as leapers in their high
degrees of flexion-extension.
Table 4.6 Prediction 2d results of the linear mixed models. Significant correlations in bold
(p<0.05).
Y: ROM X X2 Random Effects r2 pX pX2
Yaw Species Speed Individual ( Trial ) 0.1490 0.4284 0.0004 Roll Species Speed Individual ( Trial ) 0.1155 0.0509 0.1177 Pitch Species Speed Individual ( Trial ) 0.2541 0.0802 0.0001

83
Table 4.7 Post-hoc test results (Tukey HSD) testing for significant differences between
species, p-values corrected using Bonferroni’s method. Significant correlations in bold (p<0.05)
and those approaching significance italicized (0.1>p>0.05).
Em-Lc Em-Pv Em-Vv Lc-Pv Lc-Vv Pv-Vv Yaw 0.6510 0.4220 0.3350 0.4690 0.4560 0.3220 Roll 0.3714 0.3004 0.0572 0.2734 0.0600 0.1061 Pitch 0.0195 0.6122 0.0224 0.1242 0.9979 0.1306

84
Figure 4.7 Species
differences in ranges of pitch
(a), roll (b), and yaw (c)
within one gait cycle.
Significant differences were
found between Eulemur and
Lemur as well as Eulemur and
Varecia.

85
4.2 Results-Morphology
The results of the kinematic analyses demonstrate that the intervertebral kinematics
had too much methodological error to be considered realistic (see Section 4.1). Thus, it is
difficult to apply locomotor ranges of motion to each vertebral level. Instead, head-neck-
trunk segment motion (yaw, pitch, and roll) was applied to C1, C7, and T5 morphology
respectively (see Table 4.8). In the case of sifakas, who are habitually orthograde, yaw
and roll were switched such that yaw corresponds to lateral flexion and roll corresponds
to axial rotation in all species (see Figure 4.8). Linear mixed models were used to
correlate average segment range of motion per species to vertebral morphology in order
to test the hypothesis that locomotor range of motion influences vertebral morphology,
see Chapter 2: P1a-g. Linear mixed models were chosen in order to avoid issues with
multiple comparison. However, these analyses ignore potential similarity within the data
due to close phylogenetic relationships.
Figure 4.8 Directions of anatomical motion in an orthograde sifakas (left) and pronograde
ring-tailed lemur (right).
86
As a whole, the results of the linear mixed models demonstrate very little support for
these predictions (see Table 4.8). The only significant result is that of transverse process
length and locomotor range of lateral flexion. Contrary to predictions, transverse process
length increases with decreasing range of lateral flexion. However, this contrary result
was also found for maximum range of motion (Table 3.1). Thus, it is unlikely that
transverse processes hinder movement during locomotor range of motion but not
maximum range of motion. The results of the kinematic analyses demonstrate no
significant differences in range of head and neck motion among species (see Table 4.4);
meaning, there is no difference in head and neck locomotor function within the sample.
Because there is no difference in function, it becomes difficult to relate any
morphological differences to that function. Therefore, both the results of the kinematics
analyses and the morphological analyses indicate that range of motion during the
primary mode of locomotion does not influence vertebral morphology. Given the
negative results of these analyses, what can we say about the influences on
morphological variation within these four species?
Additional analyses were subsequently conducted to understand how morphology
varies among species. To assess the morphological variation among species, linear mixed
models were conducted to understand differences in specific morphological variables at
each vertebral level among species (e.g. the differences among species’ spinous process
lengths per vertebral level). These analyses were chosen in order to account for any
potential variation due to sex as well as to avoid issues associated with uneven sample
sizes and multiple comparisons. Results of these analyses show some interesting
patterns of variation (see Table 4.9, 4.10 and Figure 4.9 and 4.10). Varecia has
significantly longer spinous processes than Lemur and Eulemur, but not Propithecus.
Varecia also has significantly longer transverse processes than all other species. Longer

87
processes are thought to offer greater mechanical advantage for the nuchal musculature
by increasing the distance from the joint center of rotation as well as offering greater
area for muscular attachment, potentially increasing the muscle PCSA.
Table 4.8 Prediction 3 descriptions and results.
Prediction Description Model Result
3a
Range of extension is smaller in species with relatively larger spinous processes
log(spl/sqrt(ca))~pitch + 1|level/species n.s.
3b
Range of lateral flexion is smaller in species with longer transverse processes
log(tpl/sqrt(ca))~roll + 1|level/species) p=0.02
3c
Range of lateral flexion will decrease with increasing uncinate process height
Unable to test in C1, C7, and T5 -
3d
Range of flexion should be larger in species with craniocaudally taller articular facets
log(safh/sqrt(ca)) ~ pitch + 1|level/Species n.s.
3e
Range of flexion-extension should be larger in species with taller vertebral bodies
log(sum(vbl/sqrt(ca))) ~ neck pitch + 1|level/Species n.s.
3f
Range of flexion-extension should be larger in species with more curved atlantooccipital joints
safa (c1) ~ head pitch + 1|level/Species n.s.
3g
Range of rotation should be larger in species with more cranially-oriented articular facets
safa (c7t5) ~ (neck, trunk) yaw + 1|level/Species n.s.
Table 4.9 Results of the linear mixed models testing for morphological variations among
species. Significant correlations in bold (p<0.05).
Morphology X Random r2 pX SPL Species Level (Species (ID)) 0.024 0.015 TPL Species Level (Species (ID)) 0.203 0.001 SAFH Species Level (Species (ID)) 0.238 0.001 UH Species Level (Species (ID)) 0.0936551 0.0335 VBH Species Level (Species (ID)) 0.213 0.001 SAFA Species Level (Species (ID)) 0.005 0.021

88
Table 4.10 Post-hoc results (Tukey HSD) of the linear mixed models testing for
morphological differences between species, p-values reflect Bonferroni corrections. Significant
correlations in bold (p<0.05).
Species Em-Lc Em-Pv Em-Vv Lc-Pv Lc-Vv Pv-Vv SPL 0.975 0.242 0.007 0.462 0.025 0.535 TPL 0.999 0.844 0.000 0.893 0.000 0.000 SAFH 0.996 0.001 0.001 0.001 0.001 0.326 UH 0.252 0.005 0.027 0.368 0.697 0.963 VBH 0.000 0.000 0.000 0.413 0.480 0.998 SAFA 0.758 0.370 0.439 0.910 0.047 0.007

89
Figure 4.9 Results of the linear mixed models demonstrate significant differences between
Varecia and Lemur and Varecia and Eulemur in relative spinous process length within each
vertebral level.

90
Figure 4.1 Results of the linear mixed models demonstrate significant differences between
Varecia and all other species in relative transverse process length at each vertebral level.
Eulemur and Lemur have significantly smaller articular facets than Propithecus and
Varecia. Larger articular facets are thought to transmit higher loads (Parr et al., 2011;
Yapuncich and Boyer, 2014). Eulemur also has significantly smaller uncinate processes
than both Varecia and Propithecus (see Figures 4.11 and 4.12). Taller uncinate processes
have been purported to offer greater neck stability (Kotani et al., 1998), however the
results of Chapter 3 do not lend support to this hypothesis.

91
Figure 4.2 Results of the linear mixed models demonstrate Eulemur and Lemur have
significantly shorter articular facets than do Propithecus and Varecia with vertebral levels.
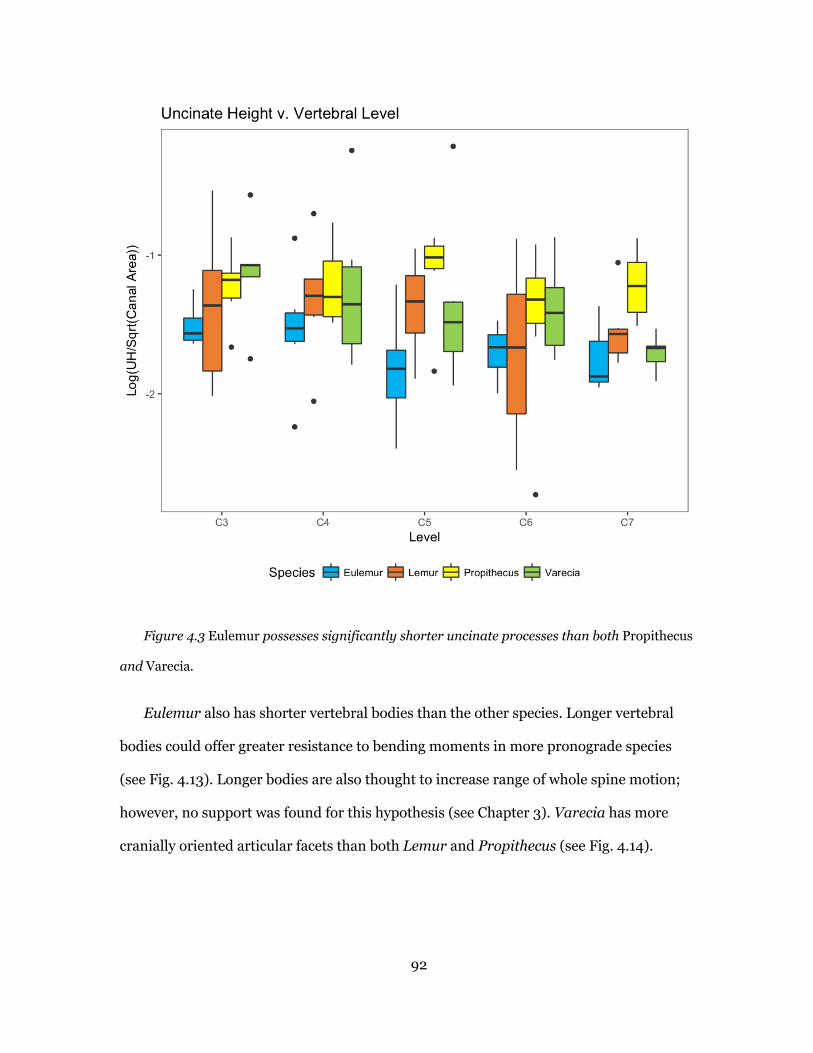
92
Figure 4.3 Eulemur possesses significantly shorter uncinate processes than both Propithecus
and Varecia.
Eulemur also has shorter vertebral bodies than the other species. Longer vertebral
bodies could offer greater resistance to bending moments in more pronograde species
(see Fig. 4.13). Longer bodies are also thought to increase range of whole spine motion;
however, no support was found for this hypothesis (see Chapter 3). Varecia has more
cranially oriented articular facets than both Lemur and Propithecus (see Fig. 4.14).

93
Figure 4.4 Eulemur has significantly shorter vertebral bodies than the other species.

94
Figure 4.5 Varecia has more coronally oriented facets per vertebral level than both Lemur
and Propithecus.

95
4.3 Discussion
Speed
Speed was a fixed effect in all of these analyses (see Tables 4.2-4.4 and 4.6). If the
purpose of head stability during locomotion is to navigate through a complex
environment, stability should increase with speed because the need to react to a more
quickly to changing substrate should also increase. However, speed did not demonstrate
a consistent pattern of significance within the models (see Tables 4.2-4.4 and 4.6). Thus,
post-hoc analyses were conducted specifically testing the effects of speed on segmental
motion across the gait cycles (see Table 4.11, Fig 4.8a-d). These results demonstrate that
speed predicts range of motion of the neck (in all planes) as well as trunk pitch. These
results are similar to that found in the literature: there is a significant increase in trunk
pitch with increasing speed, but head pitch is unaffected (see Table 4.12 and discussion
below).
Table 4.11 Effects of speed on locomotor segment range of motion. Significant correlations
in bold (p<0.05).
Y: ROM X Random Effects r2 pX Head Yaw Speed Species (Individual) 0.071281 0.1709 Head Roll Speed Species (Individual) 2.64E-05 0.9855 Head Pitch Speed Species (Individual) 0.01773 0.599 Neck Yaw Speed Species (Individual) 0.35734 9.00E-04 Neck Roll Speed Species (Individual) 0.222221 0.0073 Neck Pitch Speed Species (Individual) 0.27027 0.0231 Trunk Yaw Speed Species (Individual) 0.109576 0.1257 Trunk Roll Speed Species (Individual) 0.061382 0.2879 Trunk Pitch Speed Species (Individual) 0.481145 1.00E-04

96
Figure 4.6 Speed significantly predict neck range of pitch (a), roll (b), and yaw (c) as well as
trunk pitch (d), but species also (locomotor mode) demonstrate differences in speed.
Dunbar and colleagues (2008) conducted a kinematic study of sagittal-plane motion
of the horse head, neck, and trunk during walking, trotting, and cantering. Their data
demonstrate that the head during walking and cantering has a similar range of head
pitch (9o and 10o respectively) as well as trunk pitch (6o and 8o respectively), see Table
4.12. Vertical translation was also analyzed for these trials. Their analyses demonstrate

97
that there is an inverse relationship between vertical translation and head pitch: when
the head translates superiorly, it also angles inferiorly. The effect of this relationship is
likely to maintain a steady gaze. The similarity in head pitch between walking and
cantering would seem to indicate, at least in horses, that speed has little effect. However,
there is a large increase in vertical translation of the head between walking (12cm) and
cantering (23cm) (Dunbar et al., 2008). Given the relationship between translation and
angular movement, it would seem that there is a decrease angular movement relative to
head displacement. Because head displacement increases during cantering, this increase
in head angular stability could potentially decrease gaze stability, contrary to the
hypothesis tested in this chapter.
However, more recent research has suggested that ungulates possess different head-
neck kinematics than other mammals (Loscher et al., 2016). Loscher et al. (2016) have
shown that long-necked ungulates time their head movements in order to decrease
energy expenditure. Short-necked primates (cercopithecids) and felids moved their head
and trunk together during locomotion. However, the heads of long-neck ungulates are
out of phase with the trunk. They appear to time the oscillations of the head and neck
such that the greatest force is being transmitted during the single support phase. This
timing likely decreases the change in center of mass, thereby decreasing energy
expenditure (Loscher et al., 2016). These results imply that mechanisms of head stability
may be derived in ungulates, in comparison to primates, and that Dunbar et al.’s (2008)
results may not be directly applicable to primates.

98
Tabl
e 4.
12 R
ange
s of s
egm
ent m
otio
n du
ring
one
gai
t cyc
le, a
dapt
ed fr
om D
unba
r (20
08).
Dis
plac
emen
t Pi
tch
Angl
e
Vert
ical
Tr
ansla
tion
Spee
d Sl
ow
Fast
Sl
ow
Fa
st
Segm
ent
Hea
d N
eck
Trun
k H
ead
Nec
k Tr
unk
Hea
d Tr
unk
Hea
d
Hor
se1
9 (+
/-4)
10
(+/-
3)
6 (+
/-2)
10
(+/-
4)
8
(+/-
1)
12 (+
/-4)
10
(+/-
2)
23(+
/-5)
Gir
affe
2
4 (+
/-1)
Lang
ur1
17(+
/-5)
10 (+
/-3)
15
(+/-
2)
42
(+/-
4)
7 (+
/-2)
19 (+
/-4)
Ver
vet1
15(+
/-7)
6 (+
/2)
14 (+
/-7)
Mac
aque
1 13
(+/-
4)
13
(+/-
3)
13 (+
/-3)
30 (+
/-8)
7
(+/-
2)
11
(+/-
5)
Mac
aque
3 5
(+/-
2)
7
(+/-
2)
Gib
bon4
4(+/
-1)
2
(+/-
1)
Chim
panz
ee5
12 (+
/-5)
17
(+/-
7)
H
uman
6 12
(+/-
3)
18 (+
/-4)
7
(+/-
2)
Hum
an7
9 (+
/-3)
14
(+/-
4)
5-9
7-
16
Eule
mur
53(+
/-23
) 20
(+/-
8)
29(+
/-19
)
Lem
ur
21(+
/-13
) 13
(+/-
5)
11 (+
/-7)
Pr
opit
hecu
s
17 (+
/-9)
54
(+/-
17)
36(+
/-23
)
Var
ecia
10
(+/-
5)
23(+
/-17
) 13
(+/-
12)
1 Dun
bar 2
008,
2 Bas
u et
al.
2019
, 3 Xia
ng 2
008,
4 Hir
asak
i and
Kum
akur
a 20
04, 5 T
hom
son
2016
, 6 Cro
mw
ell 2
001,
7 Poz
zo 19
90

99
However, Dunbar conducted similar studies on several species of cercopithecids
(Dunbar, 2004a; b). The primate head and trunk kinematics show a pattern similar to
horses: there is little difference in range of pitch between speeds, but an increase in
vertical displacement. Unlike horses, non-human primates increase trunk pitch with
increasing speed (see Table 4.12). This increase in trunk pitch likely results in the
increased vertical displacement of the head. In their analysis of macaque
quadrupedalism, Xiang et al. (2008) found a slight decrease in head yaw with increasing
speed (0.4-1.0m/s) but not pitch or roll. The authors noted that trial-specific head yaw
tended to be larger trunk yaw and both head roll and pitch was smaller than that of the
trunk. These patterns were not subjected to statistical analyses, however.
Pozzo and colleagues (1990) also investigated head stabilization during locomotion
in humans both in lit and unlit conditions They found that both angular pitch and
vertical displacement of the head increases with locomotor speed. However, the effects of
speed were diminished in the darkness trials (Pozzo et al., 1990). This likely indicates
that maintaining gaze stability is an underlying influence on angular head movements
during locomotion.
Pozzo et al.’s (1990) human results, Dunbar’s (2004a; b) results, and Xiang et al.’s
(2008) results seem to contradict each other. Pozzo et al.’s (1990) humans increase head
pitch with faster speeds, Xiang and colleagues’ (2008) macaques decrease head yaw with
increasing speed, speed doesn’t seem to affect Dunbar’s (2004a; b) Old World monkey
head pitch. The results of this dissertation show that speed doesn’t predict head motion
in any plane (see Table 4.11). The lemur kinematic data, however, do show that neck
motion increases with speed as well as trunk pitch. Increases in trunk pitch were also
demonstrated in Dunbar’s data set, see Table 4.12. The data presented in this
dissertation, however, are not ideally suited to test the effects of speed because

100
locomotor mode seems to influence speed. For example, leaping (horizontal and vertical)
trials are much faster than the quadrupedal trials. Body size can also affect speed as well
as the kinematics used to attain faster locomotion (Gatesy and Biewener, 1991). Speed
was self-selected in all trials as well; therefore, differences between individuals is also
confounding. Additional, treadmill-based experiments within one mode of locomotion
would better facilitate our understanding the kinematic effects of speed.
Literature values and data accuracy
Very little has been published on the locomotor kinematics of the primate neck,
so it is difficult to ground the results of this dissertation in existing literature. However,
we can compare axial segment pitch for the few species that have been studied (see Table
4.12). Overall the head data seem comparable. The ranges of variation exhibited by
Lemur, Propithecus, and Varecia appear similar to that of other primate species: ~10-
20o of pitch. However, head pitch in Eulemur is higher than all other values (53o +/-
23o). Horizontal leaping involves a fair amount of whole-body flexion-extension, which
could explain these outlying results. Literature neck pitch values are only available for
human walking and so there is only one value to compare, rather than a pattern among
species. Ranges of pitch overlap for all species except Propithecus, which has a much
greater range of neck pitch than the other speices (54o +/- 17o). However, as a whole,
lemur trunk pitch appears to mirror data found in the literature: faster modes of
locomotion (e.g. leaping) have larger ranges of pitch than slower one (i.e. walking). The
trunk values for Eulemur and Propithecus (29o and 36o respectively), seem to match
those found in langurs and macaques locomoting at fast speeds while those of Lemur
and Varecia (11o and 13o, respectively) are similar to langurs and macaques walking at
slow speeds (see Table 4.12).

101
Leaping is a dynamic mode of locomotion and thus one would expect large ranges of
segment motion. Given the data, it appears that Eulemur has much greater pitch in its
head than its neck during locomotion, while Propithecus has a much greater range in its
neck than its head. This may indicate species- or locomotor-specific strategies in
mitigating trunk motion and maintaining gaze stability. Eulemur has a much greater
range of passive motion than Propithecus at the atlantooccipital joint (61o vs. 26o, see
Table 6.2). It is likely that this difference in range of passive motion influences the
locomotor kinematics. This difference in range of motion does not seem to be reflected in
skeletal morphology (see Fig. 4.14). Because Eulemur’s craniovertebral junction can
accommodate such a large range of pitch, the head moves much more than the neck
during leaping. It is possible that in order to maintain gaze and balance, other
anatomical variations compensate, such as increased eye range of motion or larger
semicircular canals.
In comparison with the literature values, however, the standard deviations for my
values tend to be much higher (100-30o) than previous studies (1o-10o), see Table 4.12.
This brings into question sources of variation in the data both inherent in the head-neck
complex as well as that due to methodological error. It is possible that movement of the
axial skeleton during locomotion is less stereotyped than the appendicular skeleton;
meaning, it is inherently variable.
It could also be that the variability is due to methodological error. The minimal data
available from the literature hint that the noise in this dataset is more likely due to error.
Specifically, it is possible that the error in the data come from skin-motion artifacts, or
the non-congruency of skin motion and skeletal motion. These artifacts are common
sources of error for any kinematic analysis that relies on superficial markers and has
been well-studied in human lower limbs (reviewed in Peters et al., 2010; Fukui et al.,

102
2016). These error tend to increase with increasing soft tissue coverage of the bone
(Taylor et al., 2005). Analysis comparing skeletal movement to that of dermal markers
has recently demonstrated that that the human lower cervical spine (C6) is more
vulnerable to error during flexion-extension while the upper cervical spine (C2) has
greater error in lateral flexion (Wang et al., 2016). These data suggest that soft tissue
artifact plays a role in the error found in these data. Future work should focus on
methods, such as XROMM (X-ray motion of moving morphology) in order to
satisfactorily understand intervertebral locomotor kinematics.
The kinematics of the vertebral segments seem much more prone to error than
that between head, neck, and trunk segments (see Table 4.1). They have much larger
ranges of motion and much larger standard deviations. These errors are so large that the
render the vertebral motion data suspect. For example, the pitch of the neck in Eulemur
averages 19.9o +/- 8.4o (see Table 4.1). This is a reasonable value, comparable to those of
other segments found in the literature. However, the average range of pitch for the C5
segment is 50.4o +/- 32o , far exceeding the both range of motion for the entire neck as
well as the passive range of motion for the C3-C4 and C4-C5 joints combined. The same
is true for the motion of many vertebral segments. This error could be due to several
factors, but soft tissue artifact likely plays a role.
For this study, gaze is a particular concern for head range of motion. Lemurs were
enticed with food rewards to walk through the measurement space. An effort was made
by the handlers to position the food at roughly eye level. However, this position may have
affected head range of motion. In particular, Lemur, head roll and yaw seem high (see
Figs. 4.4 and 4.5). This larger range of motion could be the result of looking at the food
or the handler.

103
It may also be error in digitizing. Markers were occasionally difficult to see and
sometimes obscured by fur; this is especially true of the C1 spinous process marker. In
addition, the DLTdv Matlab package that was used to digitize the videos creates
confidence intervals around the digitized point. These intervals often overlapped
between adjacent landmarks due to the low magnification of the image. Camera zoom
could have been increased for the experiments. However, increased zoom would have
sacrificed the percentage of stride available for digitization. Overall, these sources of
error lead me to believe that the kinematics of the vertebral segments do not reflect
reality and, therefore, cannot be used for subsequent analyses. It also calls into question
the results of the analyses used to test the predictions P2c and P2d that were obtained
using vertebral segment motion. Only the results using head, neck, and trunk segment
motion should be considered. Attention in future analyses will be focused on the
kinematics and range of motion of the head, neck, and trunk segments.
Further kinematic analyses
Axial translation is likely an important factor in rotation movement. Several
works have previously demonstrated the importance of including translation when
considering head rotational motion (Pozzo et al., 1990; Hirasaki and Kumakura, 2004;
Xiang et al., 2008; Thompson, 2016). This is especially true of leaping behaviors. In the
videos, it appears as the individual reaches the peak of its leap, the head and neck are
angled downward in order to maintain visual contact with their landing point (or the
food reward being held by the handler).
Future work should explore the influence of appendicular kinematics on axial
kinematics. Locomotor speed, for example, affects stride length and stride frequency.
Perhaps the effects of speed on neck and trunk movement (see Table 4.12) are

104
consequences of stride differences. It is also important to consider the timing of the limb
kinematics. Loscher and colleagues (2016) demonstrated in ungulates, timing of the
support can affect the energetics of axial kinematics. In addition, a diagonal sequence
gait was used in both arboreal and terrestrial quadrupedal trials (see Fig. 4.4). It would
be beneficial to compare the axial kinematics between diagonal and lateral sequence
gaits. It could be that gait sequence affects center of mass position, and therefore
influences head-neck-trunk ranges of motion during locomotion. Future work will
investigate these questions both within this dataset as well as through new experiments.
Neck function
Results for the vertebral segments exhibit far too much error to be confidently
used for analysis. Instead, I will focus on the results using the head-neck-trunk segment
data in order to understand how the neck’s locomotor function can be applied to
vertebral morphology. Overall, the data indicate minimal species-specific differences in
locomotor kinematics. However, it is difficult to discern the distinction between species
and locomotor mode because each species practices a different primary mode of
locomotion. This decision was by design because the ultimate goal of this dissertation is
to understand how different locomotor modes may affect vertebral morphology.
However, all these species practice more than one mode of locomotion. The experiments
conducted here relied on the assumption that habitual loading influences vertebral
morphology. However, behaviors which are rare but important (and produce much
higher loads) should also influence vertebral morphology. Future work will explore
intraspecific locomotor variation and the relative influences of species and locomotor
mode on axial kinematics.

105
Results indicate that trunk motion varies among species (Table 4.2) and that
trunk motion significantly predicts neck motion (Table 4.3). This implies that axial
segments may be under different biomechanical constraints during different modes of
locomotion and these constraints should influence vertebral form.
Morphological variation
The range of motion in the neck during locomotion does not vary significantly
within this sample. Thus, it is unlikely to correlate with any morphological variation
among these species. It is possible that function does not vary enough in the sample to
give a strong signal. Meaning, that the neck balances the head in similar ways regardless
of locomotor mode. Lemurs, in particular, are capable of locomoting a variety of different
ways. All species practice varying frequencies of leaping, climbing, and quadrupedalism
(Gebo, 1987). It may be that vertebral morphology is adapted to dissipating many
different kinds of forces from a variety of locomotor and postural modes. Large forces
occur during locomotion and should, therefore, most strongly influence skeletal
morphology (Preuschoft, 2004).
It may be that the locomotor signal is lost within the noise of other functional
influences on cervical vertebral morphology. The neck functions during many other
behaviors, such as feeding and foraging, grooming, predator vigilance, etc. All of these
behaviors are likely under selective pressures and, thus, so is the vertebral morphology
required to accomplish these behaviors. It is possible that vertebral morphology is
generalized in order to function many different ways.
Some of the morphological variables appear to separate out based on body size
despite the size-adjustment. Craniocaudal vertebral body height, for example, is
significantly smaller in Eulemur in comparison to the other species, which also has the

106
smallest body mass of the sample (Figure 4.13). In comparison to the larger Propithecus
and Varecia, the smaller Eulemur and Lemur have craniocaudally shorter articular
facets (see Figure 4.11). These indicate that these morphologies may not scale
isometrically with body mass. Perhaps, larger species require greater stability via
relatively larger joint surfaces or craniocaudally taller vertebral bodies.
The lack of correlation between locomotor range of motion and skeletal morphology
may indicate locomotor neck function more strongly influences soft tissue morphology
rather than bony vertebral shape. For example, spinous process length doesn’t correlate
with range of extension. Instead of increasing the mechanical advantage of the nuchal
musculature by increasing spinous process length, the cross-sectional area of the
muscles could increase.

107
Chapter 5 Discussion
5.1 Summary of Results
As the junction between the head and the trunk, the neck serves many different
functions. The primary functions investigated in this dissertation were head-neck
mobility and head-neck stability during locomotion. The hypothesis that vertebral
morphology influences head-neck mobility was tested using intervertebral joint ranges of
motion collected from radiographs. Regression results indicate little support for the
predictions, see Table 3.1. Therefore, I conclude that ligaments and muscle offer greater
stability to the joints than skeletal anatomy.
To understand how locomotion influences cervical vertebral morphology, I first
tested the hypothesis that the neck functions in providing head stability during
locomotion. This hypothesis was tested by collection axial kinematic data from four
species of lemur during the species’ primary mode of locomotion. The methods used
provided values too coarse to satisfactorily gauge intervertebral kinematics and ranges of
motion during locomotion. Analyses using axial segments (head, neck, and trunk)
demonstrated that the locomotor mode influence trunk movement and that the
movement of the trunk predicts neck movement in all planes as well as head roll and
yaw, but neck pitch predicts head pitch. These results imply that the neck has a
significant locomotor function. The last hypothesis attempted to understand the
influence of locomotor axial kinematics on vertebral morphology. Due to the coarseness
of the intervertebral results, however, axial segment ranges of motion could only be
applied to C1, C7, and T5. These analyses, unsurprisingly, did not produce significant
results. Thus, additional post-hoc analyses were conducted trying to understand how
vertebral morphology varied between species. Results showed significant variations
among species in all vertebral measurements. These significant differences appear to be

108
influenced by body size, despite the data being size adjusted. It is likely that these
morphological variables do not scale isometrically.
5.2 Neck Function
The neck originates with the advent of terrestrial tetrapods (see Ericsson et al., 2013
for review). A neck decouples the head from the trunk. This decoupling has led to a
variety of exaptations; although it may not have evolved for the express purpose of
grooming or feeding, the neck plays an important role in those behaviors. The neck’s
function in feeding has been well-documented in reptiles (Summers et al., 1998; Jones et
al., 2009; Taylor et al., 2011; Snively et al., 2014), but also of note in mammals (Dumont,
1999; Anton et al., 2003; Salesa et al., 2005; Van Valkenburgh, 2006; Simmons and
Altwegg, 2010). The neck’s function in feeding behaviors is understudied in primates,
but primates are known to manipulate objects with their head and neck (e.g. Torigoe,
1985) and anecdotally involve the neck in feeding behaviors (e.g. bark stripping or
fruit/nut peeling). The neck is also useful in other behaviors such as grooming
(Richmond et al., 1992) or predator vigilance. Behaviors like grooming and vigilance
should, theoretically, select for large ranges of motion, potentially facilitating head-neck
instability. Although the neck functions in these behaviors, I find it unlikely that they
strongly select for cervical vertebral morphology within the hominin lineage. Becoming
bipedal freed the hands from their locomotor function and, in turn, facilitated the
increased manual dexterity (Kivell, 2015) for functions like feeding and grooming. It is
more likely that the morphological differences found among fossil hominins (see Nalley,
2013 for review) stem from posture or locomotor selective pressures.
By decoupling the head from the trunk during locomotion the head is no longer
required to move strictly in concert with the trunk. Separating the head from the pectoral
109
girdle allowed for head stability during locomotor tasks and head mobility for behaviors
such as predation, feeding, and grooming. Work on salamanders has demonstrated that
the neck muscles are much more active during terrestrial locomotion than in aquatic
locomotion (Frölich and Biewener, 1992). These data lend support to the idea that the
neck originally evolved for balancing the head during locomotion. The link between
terrestrial locomotion and neck evolution is further supported by the presence of cervical
fusion (syncervical vertebrae) in cetaceans, especially those that swim in the open ocean
rather than shallow waters (e.g. river dolphins). It is likely that this fusion functions in
stabilizing the neck for hydrodynamic swimming (Vanburen and Evans, 2017).
Syncervical vertebrae found in ricochetal rodents (as well as shortened cervical
vertebrae) are also thought to limit head motion during locomotion but the functional
advantage of this has not been demonstrated (Vanburen and Evans, 2017). The presence
of syncervical vertebrae in ricochetal rodents is counterintuitive to the hypothesis that
neck mobility aids in head balance; this warrants further study.
Strait and Ross (1999) measured the average inclination of the neck during mid-
stance or mid-swing in a wide sample of primates. There is no correlation between this
measure of neck posture and the mode of locomotion in which it was collected. The
values during quadrupedal locomotion, for example, range from 48o to 108o from the
vertical line of gravity. However, species with locomotor modes requiring orthograde
trunk postures (brachiation, suspension, bipedalism) tend to have more orthograde
necks (18o -50o from vertical). This variation implies that neck function differs among
modes of locomotion, but further research is required to understand the correlation
between postural variation and locomotor function. Furthermore, locomotion places
much higher loads on the skeleton than other behaviors (Preuschoft, 2004), such as
grooming, and, therefore, should have greater influence on postcranial form.
110
If the neck functions to counteract movements of the trunk, then what variation is
present among trunk motion due to locomotor mode? According to the results of this
thesis research, range of whole-trunk pitch does not seem to exceed 20o normal walking
of large-bodied mammals (see Table 4.12). However, these ranges are much larger
during faster modes of locomotion both in the dataset collected for this dissertation as
well as those collected by Dunbar et al. (2008). The results of this dissertation
demonstrate cautious support for the hypothesis that speed influences axial kinematics.
Speed is a significant predictor of range of trunk pitch and all ranges of neck motion (see
Table 4.11). But because speed was self-selected by the animal locomoting, an
experiment controlling for both locomotor mode and speed would better be able to
understand the relationship between speed and axial kinematics.
Very few studies have investigated neck kinematics during locomotion. Data are
available for horses (Dunbar et al., 2008) and giraffes (Basu et al., 2019), but work by
Loscher and colleagues (2016) suggest that ungulates have derived locomotor head-neck
kinematics and, therefore, might not be useful for describing the general mammalian
condition. Cromwell et al. (2001) studied movement of the human head, neck, and trunk
in the sagittal plane during bipedal walking. The trunk, defined by landmarks at the
lumbosacral and cervicothoracic junctions, demonstrated the least angular motion and
the neck had the greatest range of motion, see Table 4.12 for (Cromwell et al., 2001)
Their results further reveal that the neck acts in opposition to the trunk. As the trunk
extends during double limb support, the head and neck flex. They conclude that this
oppositional movement allows for continued head balance and gaze stabilization.
Results of this thesis exhibit a similar pattern: the neck and the trunk move
opposite each other. Statistical analyses demonstrate that trunk motion predicts neck
motion in all planes of movement: yaw, pitch, and roll. Neck pitch also predicts head

111
pitch while trunk roll and yaw predict head roll and yaw, see Table 4.3. Visual inspection
of the data do not reveal as clear a pattern as Cromwell and colleagues’ (2001) study, see
Table 4.12. The neck and trunk appear to oppose each other in pitch, likely in order to
stabilize the head. In roll, the neck appears intermediate between the head and trunk; it
moves with neither. During quadrupedal trials, the neck and trunk move together in yaw.
The strepsirrhine ranges of motion also tell a complex story. The human neck ranges
of motion are almost three times greater than those of the trunk, see Table 4.12
(Cromwell et al., 2001). This pattern is seen in both Propithecus VCL and Varecia
arboreal quadrupedalism. For Lemur and Eulemur, however, the greatest range of
motion is in the head. This could indicate differences in mechanisms of head
stabilization. However, vertebral morphology does not statistically correlate with these
differences. Perhaps those species have different semicircular canal morphology or larger
eye range of motion or there are differences in muscular morphology.
The semicircular canals have historically been associated with locomotion because
they function in both the vestibulo-ocular reflex (VOR) and the vestibulo-collic reflex
(VCR), the reflexes stabilizing the eyes and head respectively. Both reflexes are
important aspects of head and gaze stabilization. The neural mechanisms of the VOR are
well understood: as fluid moves within the canal it activates the cranial nerves that
control ocular muscles, but the pathway for the VCR still remains nebulous but should
act to stabilize the head in space via neck musculature (Goldberg and Cullen, 2011).
Experimental work has demonstrated that these reflexes are vital in maintaining stability
during involuntary head movements, but usually don’t operate during voluntary head
and eye movements (Pozzo et al., 1989; Hirasaki et al., 1999; Goldberg and Cullen, 2011).
In comparison to birds, the mammalian VCR is relatively weak but the converse is true of
the VOR (Goldberg and Cullen, 2011). It seems that mammals stabilize gaze by

112
stabilizing the eyes and birds stabilize gaze by stabilizing the head (Goldberg and Cullen,
2011). Whether this difference is due to phylogenetic inertia or selection on whole-head
stability isn’t understood but the dichotomy exemplifies the importance of gaze stability
during involuntary movements.
Regardless of which reflex is employed, the semicircular canals clearly function in
locomotion in stabilizing the eyes and head. Research has linked larger canals to
increased locomotor agility (Spoor et al., 2007) and more recently canal orthogonality to
rotational head angular velocity during locomotion (Malinzak et al., 2012). Malinzak and
colleagues (2012) found a significant, inverse correlation between the angular
relationship between semicircular canals and the magnitude of the angular velocity of
the head during locomotion. When compared to head and neck pitch, semicircular canal
size and orientation does not seem to be correlated with axial movement during the
primary mode of locomotion within the sample, see Table 5.1. Lemur and Eulemur have
larger semicircular canals than Propithecus or Varecia. It is possible the larger canal size
allows for smaller neck movements (and, therefore, larger head movements) during
locomotion but further research on a greater number of taxa would be required to
satisfactorily answer this question. This thesis only included one mode of locomotion.
Malinzak suggests semicircular canals morphology could be adapted to high-risk
locomotor behaviors. It is very unlikely that the slow-paced quadrupedal locomotion of
Lemur and Varecia is the riskiest behavior in which they engage. Thus, it might also be
useful to study head-neck motion in a variety of locomotor modes both common and rare
(but risky).

113
Table 5.1 Head-neck kinematic values and semicircular canal morphology. Data taken from
1Spoor et al. (2007) and 2Malinzak et al. (2012).
Species Mode Head Pitch Neck Pitch Canal Radius1
Agility score1 90var2
Angular Velocity2
Eulemur HL 45 (+/-24) 20 (+/-8) 0.196 medium 77.9 78
Lemur TQ 26 (+/-12) 13 (+/-5) 0.161 medium 52.6 94
Propithecus VCL 29 (+/-26) 54 (+/-17) 0.149 fast 27.7 124
Varecia AQ 9 (+/-5) 23 (+/-17) 0.145 medium 55.6 56
Habitual posture during locomotion could be important for proper function of the
vestibulo-collic reflex. Differences in head, neck and trunk postures have been shown
affect the timing and activation of neck musculature (Thomson et al., 1996; McCluskey
and Cullen, 2007; Corneil et al., 2013). These differences in muscular activation, in turn,
affect the how the vestibulo-collic reflex operates. It is likely that these postures fall
within the ideal range for muscular activation. Strait and Ross’s (1999) dataset included
several platyrrhine species under different modes of locomotion. The intraspecific
difference between these modes is minimal (<20o). It could be that the VCR operates in
an ideal postural range and that range explains the variation in neck posture despite
similar modes of locomotion.
Differences in ocular mobility could also explain the smaller neck ROM, in
comparison to head ROM, found in Lemur and Eulemur. Larger ocular ranges of motion
could compensate for larger head movements. The human eye can move 89o in
adduction-abduction, elevate 28o, depress 47o, and 7o in both intorsion and extorsion
(Kushner and Kraft, 1983; Shin et al., 2016). Comparative data are not available for non-
human primates, but future work should investigate the differences in primate eye
function and anatomy and its bearing on the VOR and VCR.

114
Proprioception could also play a role in these large head movements. All individuals
were locomoting on stable, stiff substrates. They habituated to the space and substrates
prior to data collection. It is possible that substrate compliance affects head mechanics.
Compliant substrates have been shown to affect limb and trunk kinematics in primates.
As a whole, these studies demonstrate that primates tend to reduce whole-body center of
mass when locomoting on less stable substrates (Demes et al., 1995; Young, 2008;
Channon et al., 2011; Young et al., 2016). Kinematic differences due to substrate
compliance should also affect the head and neck. If the lemurs are on a stiff, familiar
substrate, head stability may be less important. They do not need to look where they are
going because they know where the substrate in relation to their bodies.
The results of this dissertation, coupled with previously conducted research,
demonstrate that the neck has an important locomotor function: to facilitate head
balance and gaze stability. The influence this function has on morphology, however, is
more ambiguous.
5.3 Functional Influences on Vertebral Morphology
This dissertation aimed to understand the relative influences of both passive and
locomotor range of motion on vertebral morphology. As a whole, the results demonstrate
little support for either hypothesis. It is more likely that ligamentous anatomy constrains
passive range of motion. The human spinal ligaments and their contributions to spinal
stability are well described in the medical literature (reviewed in White and Panjabi,
1990; Jaumard et al., 2011). For example, intraspecific analysis has indicated that
intervertebral discs with smaller areas offer greater mobility (Natarajan and Andersson,
1999). However, comparative data on morphological, histological and mechanical
differences in mammalian spinal ligaments are quite limited (Little et al., 1981), but see

115
Long et al.'s (1997) study in dolphins. Given the negative results of this dissertation
research, it is difficult to apply them to the fossil record, but we can attempt to apply
what is already known about functional morphology of the spine.
Other attempts have been made to reconstruct joint range of motion in fossil
specimens (Hutson and Hutson, 2012; Hammond, 2013; Kambic et al., 2017;
Manafzadeh and Padian, 2018) and they similarly conclude the important of soft tissue
in providing joint stability. Discussed previously, was the study conducted by
Manafzadeh and Padian (2018) which found incredible expansion in avian hip ROM
after ligamentous removal. They, and others, also highlight the necessity of studying
range of motion in three-dimensions (Kambic et al., 2017; Manafzadeh and Padian,
2018). A species rarely moves in one plane at a time. This is especially true of the neck:
the uncinate processes purportedly require lateral flexion and extension in order to
accomplish joint rotation (Kapandji, 2008). The 3D morphospace of possible
movements could inform the study of cervical vertebral morphology and its potential
effects on range of motion. The head and neck rarely move in one plane (e.g. flexion-
extension). Rather, movement is often three-dimensional. For example, the potential
range of rotation likely differs between maximum flexion and neutral postures. If both
passive and locomotor range of motion fail to impart a functional signal, then what can
we say about the vertebral morphology found within fossil hominoids?
The vertebral body is the primary weight-bearing vertebral structure. However,
in humans, it has been demonstrated that cervical neural arch bears as much as 36% of
the compressive loads applied to them (Pal and Sherk, 1988). It would be informative to
conduct similar experiment on a range of species and loading regimes, especially
applying tensile loads to primates with more pronograde neck postures. Because the
vertebral body functions significantly in weight-bearing, its dimensions are highly

116
correlated with body mass (Rose, 1975; Shapiro, 1993b; Shapiro and Simons, 2002;
Nakatsukasa and Hirose, 2003; Chen et al., 2005; Cotter, 2011; Nalley and Grider-
Potter, 2015). In the lower vertebral levels, expansion of vertebral body diameter has
been associated with increased compressive loading in orthograde trunk postures (Rose,
1975; Shapiro and Simons, 2002; Chen et al., 2005). The cervical vertebrae, however, do
not show a correlation between neck orthogrady and centrum surface expansion.
Instead, they demonstrate a significant link between pronograde posture and
craniocaudally longer vertebral bodies (Nalley and Grider-Potter, 2015). It is likely that
vertebral bodies experience greater bending moments in more pronograde postures and,
therefore, increasing length increases the area over which to distribute these loads. Work
across mammals by Arnold et al. (2017) has revealed that cervical body length has a
negatively allometric relationship with body mass and they reason that stouter vertebrae
can better accommodate the larger forces associated with increasing body mass. Similar
results have been demonstrated for primate lumbar vertebrae (Shapiro and Simons,
2002). Centrum length was also analyzed in this dissertation as a correlate of range of
flexion-extension with minimal success. It is likely that the relative size of the
intervertebral discs is also an important factor in flexion-extension movement (Breit and
Künzel, 2004).
Uncinate processes are also important as they are thought to offer joint stability. This
hypothesis is logical: a U-shaped joint and supported by human research (Kapandji,
2008), the analyses conducted as a part of this dissertation found no relationship
between relative uncinate height and passive range of lateral flexion. Uncinate height
and “roundness” has also been shown to be highly correlated with body size (Meyer et
al., 2018). Uncinate processes are relatively taller in smaller primates (Meyer et al.,
2018). The functional significance of this pattern is not clear.

117
The spinous process has received much attention in investigations of functional
morphology because it is the attachment site of the head-neck extensors. Longer, more
caudally oriented processes are thought to provide greater mechanical advantage to the
nuchal musculature because they extend the moment arm of the neck extensors further
from the joint’s center of rotation (Shapiro, 1993b; Nalley and Grider-Potter, 2015).
Spinous process length has been shown to scale with positive allometry, potentially
indicating the necessity for relatively greater muscular output to maintain stability in
larger animals (Shapiro and Simons, 2002; Arnold et al., 2016). In addition, Nalley and
Grider-Potter (2015) established a significant correlation between relative spinous
process length and neck posture. Species with have more pronograde neck postures
during locomotion have relatively longer spinous processes. This is likely due to the need
for greater force needed to balance the head in more pronograde neck postures (Nalley
and Grider-Potter, 2015). This dissertation provided little evidence longer spinous
processes result in either reduced ranges of extension through skeletal inhibition of
motion or increased ranges of flexion by lengthening the moment arm.
The cross-sectional area of the neural arch (i.e. pedicles, laminae, processes) is
also of interest. Relatively larger cross-section area should offer increased resistance to
deformation under loading (reviewed in Lieberman et al., 2004). Increased pedicle
dimensions are found in the lower lumbar vertebrae of more orthograde primate taxa
(Shapiro, 1993a), likely in response to greater compressive loading. The cross-sectional
area of cervical laminae was found to correlate with neck inclination in C4 and C5, as
well, but no other neural arch area correlations proved significant in the primate cervical
spine (Nalley and Grider-Potter, 2015).
Morphology of the articular facets should also affect the motion and loading
patterns that occurs between intervertebral joints. The angle of the facets within the
118
spinal column varies: lumbar facets are positioned medially to limit rotation, thoracic
facets are oriented ventro-dorsally to limit lateral flexion, and cervical facets are angled
cranially in order to facilitate greater freedom of motion (Kapandji, 2008). Despite these
known, gross differences in facet orientation and range of motion, no interspecific
correlation between the two was found in primate cervical vertebrae in this dissertation.
Neck posture, however, has been shown to correlate with facet orientation. More
orthograde primates possess more coronally oriented facets. This is likely an adaptation
to increasing compressive forces associated with neck orthogrady (Nalley and Grider-
Potter, 2015). In addition, pronograde primates tend to have much greater curvature of
the atlantooccipital joint, possibly to combat increased multidirectional loading
(Hamrick, 1996; Grider-Potter and Hallgren, 2013; Nalley and Grider-Potter, 2017).
Results of this dissertation also demonstrate little support for the prediction that
increased joint size equates to increased ranges of motion. This is likely due to stability
offered by the joint capsular ligaments. Articular facet size has been implicated in
habitual loading patterns (Breit and Kunzel, 2002; Meyer, 2016). Given that the articular
pillars can dissipate up to 1/3 of vertebral loading, it is possible that articular facet size
correlates with habitual posture. One would expect joint surface size to increase with the
large compressive loads associated with orthograde neck posture.
5.4 Implications for fossil hominin species
This research attempted understand the functional influences on cervical vertebral
form in order to retrodict the behaviors of extinct species. The vertebrae of fossil
hominins are particularly puzzling as they preserve human-like and ape-like
morphologies. If form follows function, this implies concomitant human-like and ape-

119
like functions. Specimens from several species of hominin have been described in the
literature.
Australopithecus afarensis
A C1, C2, and C6 from Hadar (Lovejoy et al., 1982), as well as the mostly complete
column (C2-C7) from Woranso-Mille (Meyer, 2016) have been unearthed. Relative
vertebral body height of the specimens is similar to that found in modern Homo sapiens
and shorter than that found in Pan, but not outside the values found in hylobatids
(Nalley, 2013; Meyer, 2016). The Hadar C6 (A.L. 333-106) possesses a long, robust
spinous process, similar to that found in Pan, more robust laminae than humans (but
not apes), and taller articular facets. No spinous processes are preserved from the KSD-
VP 1/1 series. However, the laminae are more robust than in modern humans. The lower
cervical articular facets of the KSD-VP 1/1 vertebrae are oriented more obliquely (relative
to midline) than in modern humans but the facets have similar relative heights.
A partial atlas of A. afarensis has been recovered, A.L. 333-83 (Lovejoy et al., 1982).
Similar to that found in more pronograde species, the atlantooccipital joint is highly
curved. Highly curved joints should offer greater stability under multidirectional loading
(Hamrick, 1996), e.g. different head-neck postures. The axes from Hadar and Woranso-
Mille also present disparate morphologies. The Hadar specimen, A.L. 333-101, preserves
articular facets that are flat (similar to humans) and a dens that lacks the dorsal
inclination found in some non-human primates. The articular facet orientation is
potentially a response to increased compressive loading associated with orthogrady
(Gommery, 2006). In contrast, the KSD-VP 1/1 C2 has highly angled superior articular
facets, similar to that found in New World monkeys, but lacks a dens (Meyer, 2016). This
variation is surprising. The Hadar specimen has significant taphonomic damage to the

120
articular facets, which could explain the variation in this specific variable. As a whole,
however, the apparently incongruent morphologies between the A.L. 333-101 and KSD-
VP 1/1 specimens are cause for concern. The linear measurements from KSD-VP 1/1 are
not scaled with a consistent measure of size, which could be obfuscating a pattern, but
this wouldn’t account for disparities in angular measurements. Future work should
investigate the intraspecific variation found in ape cervical morphology and if these
specimens fall outside the expected range of variation within one species.
The robusticity of the spinous process imply that like great apes, A. afarensis
benefitted from increased force output of the nuchal musculature. Similarly, the
morphologies indicate adaptations to habitually large, multidirectional loading of the
cervical spine (e.g. robust laminae and spinous processes, curved atlantooccipital joint).
Therefore, it is likely that A. afarensis’ neck posture was not as orthograde as that of
modern humans.
Australopithecus sediba
Several cervical vertebrae of A. sediba have been discovered: a C3 and C7 from a
subadult MH1 and a C3 and C6 from the adult MH2 (Berger et al., 2010). They have
subsequently been analyzed by (Meyer et al., 2017). Both individuals are absolutely
smaller than modern humans in vertebral body and canal dimensions. According to the
analyses conducted by Meyer et al. (2017), articular facet height does not fall outside the
range of human values but is angled much more acutely relative to midline. This
angulation is similar to that found in extant apes as well as A.L. 333-106 (but not KSD-
VP 1/1). The relative spinous process lengths of MH2 are not significantly different from
humans. All relative linear values are not significantly different in Meyer et al.'s (2017)
analyses, with the exception of uncinate ‘roundness’ and a ratio of centrum to neural

121
arch mass in C3, but not C6. In addition, the spinous processes of C6 are much more
inferiorly inclined than in anatomically modern humans, which could offer nuchal
musculature greater mechanical advantage during extension. The articular facets appear
more coronally oriented, in comparison to humans, which could indicate greater
compression in the articular pillars. Additionally, Meyer et al. (2017) show that in
comparison to humans, A. sediba has a more robust, inferiorly inclined transverse
process as well as more vertical uncinate processes. The transverse process robusticity
could, according to the results of this dissertation, relate to increased mechanical
advantage of the lateral neck flexors. Overall, these morphologies appear very similar to
that of H. sapiens, which may indicate similarities in head balance mechanisms and neck
posture. However, additional measurements (such as lamina cross-sectional area and
articular facet angle in the sagittal plane) would further elucidate the functional
implications of the preserved morphology.
Homo erectus
Two subadult cervical specimens from Dmanisi, C2 and C3, are described in the
literature (Meyer, 2005). Meyer (2005) reported absolute values. For purposes of
comparison, I scale his data to vertebral canal area and compared to species ranges from
Nalley (2013), which were previously scaled to vertebral canal area. The C2 preserves
laminae with relative thickness just outside the range of adult human variation. Its
spinous process is relatively long, similar to that found in Gorilla and Pongo. Given that
this specimen is immature, it is likely that these values would be on the lower end of the
species values. The articular facets are oriented 53o from the plane of the vertebral body.
Its uncinate processes are short and angled (unlike those found in the A. sediba
specimens). The relative thickness of the lamina is slightly thinner than the human and
chimpanzee values found for adult C3. The relative height of the vertebral body falls

122
within the range of the extant H. sapiens. Its pedicles are absolutely shorter than both
the adult and subadult specimens from Malapa (Meyer, 2005; Meyer et al., 2017). These
specimens, although immature, reveal an interesting pattern. Despite lacking annular
ring fusion, the C2 is more robust. However, the C3 appears more gracile. Cranial
vertebrae reach maturity earlier than more caudal vertebrae (Scheuer and Black, 2000;
Altan et al., 2012). Thus, these differences could be due to ontogeny: C2 is at a later stage
of maturation than C3. The robusticity found C2 would seem to indicate greater loading
associated with pronograde postures. However, it is difficult to partition functional
variation from ontogentic variation in these subadult specimens.
A subadult C7 attributed to Homo erectus, KNM-WT 15000r, has also been
described in the literature (Brown et al., 1985; Latimer and Ward, 1993). Its annular
rings are also unfused. The vertebral body of the specimen is craniocaudally shorter than
that of Homo sapiens but does not differ significantly in any other linear metric (Nalley,
2013; Meyer et al., 2018). However, this could also be attributed to its immaturity.
Homo neanderthalensis
Many more cervical vertebral specimens of Neanderthals have been found which
allows for both greater statistical power as well as an improved understanding of
variation within the extinct species. Neanderthal cervical vertebral morphology and its
implications was reviewed by (Gómez-Olivencia et al., 2013). They conducted their
analyses using raw measurements. At all levels, dorsoventral diameter of the vertebral
canal is not significantly different from that of humans, but the transverse diameter of
the canal is significantly larger. Correcting for body size would improve the comparisons
made here. Their analyses show that Neanderthals have significantly longer, and more
horizontally oriented spinous processes as well as thicker laminae, in comparison to

123
modern humans in the lower cervical vertebrae (C5-C7). The ventral aspect of the
vertebral body is significantly short in all levels. The uncinate processes do not differ in
height, nor do the pedicle dimensions. The robusticity of the vertebrae is expected in
Neanderthals, who are a robust species in many other aspects. The robusticity of the
neural arch is likely an adaptation to creating and transmitting high muscular loads. It
may be that the robust skull found in Neanderthals requires and equally robust neck to
balance it.
5.5 Future Directions
The results of this research show that both passive and locomotor range of
motion have little influence on cervical vertebral morphology. Very few functional
influences on cervical vertebral morphology have been identified. Analyses testing the
influences of locomotor mode on cervical morphology have had mixed success in
previous studies (Manfreda et al., 2006; Nalley, 2013; Arlegi et al., 2017; Meyer et al.,
2018; Villamil, 2018), but most are unsatisfactory in that they use of categorial variables.
These categories often ignore or reduces critical, explanatory variation. Quadrupedalism,
for example, encompasses a range of neck inclinations (Strait and Ross, 1999), positional
behaviors, and locomotor behaviors (Hunt et al., 1996). This category obscures
meaningful behavioral variation found within it. This dissertation attempted, in part, to
quantify locomotor variation in neck function via axial kinematics rather than relying on
broad, often meaningless, categories. Results demonstrate that the neck is an active
participant in locomotion. Locomotor behavior should, consequently, be reflected in
vertebral morphology. However, methodological issues prevented intervertebral
kinematics from being successfully applied to vertebral morphology. Future work would
benefit from more refined methods of skeletal kinematic data collection (i.e. XROMM).
It is also important to collect data from a variety of locomotor modes, especially those

124
that are rare but induce high loads or are potentially risky. This will facilitate
understanding species-specific vs. locomotion-specific behaviors of the axial skeleton.
Kinematic analyses would also benefit from a more controlled study of speed.
Understanding the influence of soft-tissue anatomy on cervical morphology is a large gap
in the literature. This gap is overly apparent in the discussion of passive range of motion
and its inhibitors. Detailed studies of muscular and ligamentous morphology and
histology would greatly benefit our understanding of neck form and function.
This dissertation quantified the locomotor function of the primate neck: to balance
the head and counteract the movements of the trunk. This is a critical step towards
understanding the neck’s myriad of functions and how they influence its form. Although
this measure of locomotor function did not correlate with skeletal morphology, habitual
neck posture during locomotion has previously been shown to influence it (Nalley and
Grider-Potter, 2015, 2017). Future work would benefit from furthering our
understanding of axial kinematics in a variety of species and their numerous modes of
locomotion and other behaviors (e.g. feeding). In understanding this, we may shed light
on the selective pressures that shape the disparate vertebral morphologies found in the
hominin fossil record.

125
Chapter 6 Bibliography Aiello LC, Dean MC. 2002. An Introduction to Human Evolutionary Anatomy. London:
Elsevier Academic Press.
Alemseged Z, Spoor F, Kimbel WH, Bobe R, Geraads D, Reed D, Wynn JG. 2006. A juvenile early hominin skeleton from Dikika, Ethiopia. Nature 443:296–301.
Altan M, Nebio Ö, İş H. 2012. Growth of the cervical vertebrae in girls from 8 to 17 years . A longitudinal study. Eur J Orthod 34:327–334.
Ankel-Simons F, Simons C. 2003. The axial skeleton of primates: how does the genus Tarsius fit? In: Tarsiers: Past, present, and future. . p 121–144.
Ankel F. 1972. Vertebral morphology of fossil and extant primates. In: The Functional and Evolution Biology of Primates. . p 233–240.
Anton M, Sanchez I, M. S, J. TA. 2003. The Muscle-Powered Bite of Allosaurus (Dinosauria; Theropoda): An Interpretation of Cranio-Dental Morphology. Estud Geol 323:313–323.
Arlegi M, Gomez-Olivencia A, Albessard L, Martínez I, Balzeau A, Arsuaga JL, Been E. 2017. The role of allometry and posture in the evolution of the hominin subaxial cervical spine. J Hum Evol 104:80–99.
Arnold C, Matthews LJ, Nunn CL. 2010. The 10kTrees website: A new online resource for primate phylogeny. Evol Anthropol 19:114–118.
Arnold P, Amson E, Fischer MS. 2017. Differential scaling patterns of vertebrae and the evolution of neck length in mammals. Evolution (N Y) 71:1–29.
Arnold P, Forterre F, Lang J, Fischer MS. 2016. Morphological disparity, conservatism, and integration in the canine lower cervical spine: Insights into mammalian neck function and regionalization. Mamm Biol 81:153–162.
Assaiante C, Amblard B. 1993. Ontogenesis of head stabilization in space during locomotion in children: influence of visual cues. Exp Brain Res 93:499–515.
Bastir M, Rosas A, Stringer C, Cuétara JM, Kruszynski R, Weber GW, Ross CF, Ravosa MJ. 2010. Effects of brain and facial size on basicranial form in human and primate evolution. J Hum Evol 58:424–31.
Basu C, Wilson AM, Hutchinson JR. 2019. The locomotor kinematics and ground reaction forces of walking giraffes. J Exp Biol 222:jeb159277.
Berger LR, de Ruiter DJ, Churchill SE, Schmid P, Carlson KJ, Dirks PHGM, Kibii JM. 2010. Australopithecus sediba: a new species of Homo-like australopith from South Africa. Science 328:195–204.
Bogduk N, Mercer S. 2000. Biomechanics of the cervical spine. I: Normal kinematics. Clin Biomech (Bristol, Avon) 15:633–48.

126
Boszczyk BM, Boszczyk a a, Putz R. 2001. Comparative and functional anatomy of the mammalian lumbar spine. Anat Rec 264:157–68.
Brand R a, Pedersen DR, Friederich J a. 1986. The sensitivity of muscle force predictions to changes in physiologic cross-sectional area. J Biomech 19:589–596.
Breit S, Kunzel W. 2002. Shape and Orientation of Articular Facets of Cervical Vertebrae (C3-C7) in Dogs Denoting Axial Rotational Ability: An Osteological Study. Eur J Morphol 40:43–51.
Breit S, Künzel W. 2004. A morphometric investigation on breed-specific features affecting sagittal rotational and lateral bending mobility in the canine cervical spine (C3-C7). J Vet Med Ser C Anat Histol Embryol 33:244–250.
Brown F, Harris JWK, Leakey RE, Walker A. 1985. Early Homo erectus skeleton from west Lake Turkana, Kenya. Nature 316:788–792.
Carretero JM, Lorenzo C, Arsuaga JL. 1999. Axial and appendicular skeleton of Homo antecessor. J Hum Evol:459–499.
Cartmill M, Brown K. 2014. Vertebral body area profiles in primates and other mammals. Am J Phys Anthropol S58:91.
Channon AJ, Günther MM, Crompton RH, Août KD, Preuschoft H, Vereecke EE. 2011. The effect of substrate compliance on the biomechanics of gibbon leaps. J Exp Biol 214:687–696.
Chen X, Milne N, O’Higgins P. 2005. Morphological variation of the thoracolumbar vertebrae in Macropodidae and its functional relevance. J Morphol 266:167–81.
Choi H, Keshner E, Peterson BW. 2003b. Comparison of Cervical Musculoskeletal Kinematics in Two Different Postures of Primate During Voluntary Head Tracking. KSME Int J 17:1140–1147.
Choi H, Keshner E, Peterson BW. 2003a. Musculoskeletal Kinematics During Voluntary Head Tracking Movements in Primate. KSME Int J 17:32–39.
Chow DHK, Luk KDK, Evans JH, Leong JCY. 1996. Effects of Short Anterior Lumbar Interbody Fusion on Biomechanics of Neighboring Segments. Spine (Phila Pa 1976) 21:549–555.
Corneil BD, Olivier E, Richmond FJR, Loeb GE, Munoz DP, Munoz P, Munoz DP, Munoz P, Munoz DP. 2013. Neck Muscles in the Rhesus Monkey . II . Electromyographic Patterns of Activation Underlying Postures and Movements. J Neurophysiol 86:1729–1749.
Coroner BD, Latimer B. 1991. Functional analysis of the atlanto-occipital joint in extant African hominoids and early hominids. Am J Phys Anthropol 12:61.
Cotter MM. 2011. Gross Morphology, Microarchitecture, Strength and Evolution of the Hominoid Vertebral Body.

127
Cramer GD. 2013. General Characteristics of the Spine. Third Edit. Elsevier Inc.
Cromwell R, Aadland-Monahan TK, Nelson AT, Stern-Sylvestre SM, Seder B, Cromwell R, Aadland-Monahan TK, Nelson AT, Stern-Sylvestre SM, Seder B. 2001. Sagittal Plane Analysis of Head, Neck, and Trunk Kinematics and Electromyographic Activity During Locomotion. J Orthop Sport Phys Ther 31:255–262.
Cullinane DM, Aleper D, Bertram JEA. 1998. The functional and biomechanical modifications of the spine of Scutisorex somereni, the hero shrew: skeletal scaling relationships. J Zool London 244:447–452.
Day MH, Leakey RE. 1974. New Evidence of the Genus Homo from East Rudolf, Kenya (III). Am J Phys Anthropol:367–380.
Dean MC. 1985. Comparative Myology of the Hominoid Cranial Base: The Muscles of the Prevertebral and Upper Pharyngeal Region. Folia Primatol 44:40–51.
Demes B. 1985. Biomechanic of the Primate Skull Base. Adv Anat Embryol Cell Biol 94:1–58.
Demes B, Jungers WL, Gross TS, Fleagle JG. 1995. Kinetics of leaping primates: Influence of substrate orientation and compliance. Am J Phys Anthropol 96:419–429.
Doran DM. 1993. Comparative locomotor behavior of chimpanzees and bonoboes: The influence of morphology on locomotion. Am J Phys Anthropol 91:83–98.
Doran DM. 1997. Ontogeny of locomotion in mountain gorillas and chimpanzees. J Hum Evol 1995:323–344.
Dumont ER. 1999. The effect of food hardness on feeding behaviour in frugivorous bats (Phyllostomidae): An experimental study. J Zool 248:219–229.
Dunbar DC. 2004a. Stabilization and mobility of the head and trunk in wild monkeys during terrestrial and flat-surface walks and gallops. J Exp Biol 207:1027–1042.
Dunbar DC, Macpherson JM, Simmons RW, Zarcades A. 2008. Stabilization and mobility of the head , neck and trunk in horses during overground locomotion : comparisons with humans and other primates. J Exp Biol 211:3889–3907.
Dunbar DCC. 2004b. Stabilization and mobility of the head and trunk in vervet monkeys (Cercopithecus aethiops) during treadmill walks and gallops. J Exp Biol 207:4427–38.
Eck JC, Humphreys SC, Lim TH, Jeong ST, Kim JG, Hodges SD, An HS. 2002. Biomechanical study on the effect of cervical spine fusion on adjacent-level intradiscal pressure and segmental motion. Spine (Phila Pa 1976) 27:2431–2434.
Ericsson R, Knight R, Johanson Z. 2013. Evolution and development of the vertebrate neck. J Anat 222:67–78.
Farshadmanesh F, Byrne P, Keith GP, Wang H, Brian D, Crawford JD, Corneil BD,

128
Crawford JD, Brian D. 2013. Cross-validated models of the relationships between neck muscle electromyography and three-dimensional head kinematics during gaze behavior. J Neurophysiol 107:573–590.
Fleagle JG. 1977. Locomotor Behavior and Muscular Anatomy of Sympatric Malaysian Leaf-Mon keys (Presbytis obscura and Presbytis melalophos). Am J Phys Anthropol 46:297–308.
Frölich LM, Biewener AA. 1992. Kinematic and Electromyographic Analysis of the Functional Role of the Body Axis During Terrestrial and Aquatic Locomotion in the. J Exp Biol 130:107–130.
Fukui T, Otake Y, Kondo T. 2016. In which direction does skin move during joint movement? Ski Res Technol 22:181–188.
Gál BYJM. 1993a. Mammalian Spinal Biomechanics I. J Exp Biol 174:247–280.
Gál BYJM. 1993b. Mammalian Spinal Biomechanics II. J Exp Biol 174:281–297.
Gatesy SM, Biewener AA. 1991. Bipedal locomotion : effects of speed , size and limb posture in birds and humans. J Zool London 224:127–147.
Gaughran GRLL. 1954. A Comparative Study of the Osteology and Myology of the Cranial and Cervical Regions of the Shrew, Blarina Brevicauda, and the Mole, Scalopus Aquaticus. Misc Publ Museum Zool Univ Michigan:1–136.
Gebo DL. 1987. Locomotor Diversity in Prosimian Primates. Am J Primatol 13:271–281.
Goldberg JL, Cullen KE. 2011. Vestibular control of the head: possible functions of the vestibulocollic reflex. Exp Brain Res 210:331–345.
Gómez-Olivencia A, Been E, Arsuaga JL, Stock JT, Luis J, Stock JT. 2013. The Neandertal vertebral column 1: the cervical spine. J Hum Evol 64:608–30.
Gommery D. 1996. Les cavites glenoides de l’atlas (fovea articulares superores atlantis) chez les primates actuales nouvelles donnees. Comptes rendus l’Academie des Sci 323:1067–1072.
Gommery D. 2000. Superior cervical vertebrae of a Miocene hominoid and a Plio-Pleistocene hominid from Southern Africa. Paleontol Africana 36:139–145.
Gommery D. 2006. Evolution of the Vertebral Column in Miocene Hominoids and Plio-Pleistocene Hominids. In: Human Origins and Environmental Backgrounds. . p 31–43.
Graf W, de Waele C, Vidal PP. 1995. Functional anatomy of the head-neck movement system of quadrupedal and bipedal mammals. J Anat 186:55–74.
Grider-Potter N, Hallgren RC. 2013. Atlantooccipital joint orientation and posture in catarrhines. Am J Phys Anthropol S56:137.
Haile-selassie Y, Su DF, Meyer MR, Haile-selassie Y, Su DF, Meyer MR, Haile-selassie Y,

129
Su DF. 2016. The Postcranial Anatomy of Australopithecus. :113–141. Available from: http://link.springer.com/10.1007/978-94-017-7429-1
Hall MC. 1965. Lushcka’s Joint. Springfield: C.C. Thomas.
Hammond AS. 2013. 3D ANALYSIS OF HIP JOINT MOBILITY AND THE EVOLUTION OF LOCOMOTOR ABILITIES IN MIOCENE HOMINOIDS.
Hamrick MW. 1996. Articular Size and Curvature as Determinants of Carpal Joint Mobility and Stability in Strepsirhine Primates. J Morphol 127:113–127.
Harmon L, Weir J, Brock C, Glor R, Challenger W, Hunt G, FitzJohn R, Pennell M, Slater G, Brown J, Uyeda J, Eastman J. 2015. Geiger.
Harrison DEDD, Harrison DEDD, Haas JW, Janik TJ. 2005. Do Sagittal Plane Anatomical Variations (Angulation) of the Cervical Facets and C2 Odontoid Affect the Geometrical Configuration of the Cervical Lordosis? Clin Anat 111:104–111.
Hedrick TL. 2008. Software techniques for two- and three-dimensional kinematic measurements of biological and biomimetic systems. Bioinspir Biomim 3:34001.
Hilibrand AS, Robbins M. 2004. Adjacent segment degeneration and adjacent segment disease: The consequences of spinal fusion? Spine J 4:190–194.
Hirasaki E, Kumakura H. 2004. Head movements during locomotion in a gibbon and Japanese macaques. Neuroreport 15:643–647.
Hirasaki E, Moore ST, Raphan T, Cohen B. 1999. Effects of walking velocity on vertical head and body movements during locomotion. Exp Brain Res 127:117–130.
Hunt KD, Cant JGH, Rico P. 1996. Standardized Descriptions of Primate Locomotor and Postural Modes. Primates 37:363–387.
Hutson JD, Hutson KN. 2012. Using the American alligator and a repeated-measures design to place constraints on in vivo shoulder joint range of motion in dinosaurs and other fossil archosaurs . J Exp Biol 216:275–284.
Jaanusson V. 1987. Balance of the head in hominid evolution. Lethaia 20:165–176.
Jaumard N V., Welch WC, Winkelstein BA. 2011. Spinal Facet Joint Biomechanics and Mechanotransduction in Normal, Injury and Degenerative Conditions. J Biomech Eng 133:071010.
Jenkins FA. 1969. The evolution and development of the dens of the mammalian axis. Anat Rec 164:173–84.
Johnson GM, Zhang M, Jones DG. 2000. The fine connective tissue architecture of the human ligamentum nuchae. Spine (Phila Pa 1976) 25:5–9.
Johnson SE, Shapiro LJ. 1998. Positional behavior and vertebral morphology in atelines and cebines. Am J Phys Anthropol 105:333–54.

130
Jones MEH, Curtis N, O’Higgins P, Fagan M, Evans SE. 2009. Head and neck muscles associated with feeding in Sphenodon (Reptilia: Lepidsauria: Rhynchocephalia). Palaeontol Electron 12:1–56.
Kambic RE, Roberts TJ, Gatesy SM. 2017. 3-D range of motion envelopes reveal interacting degrees of freedom in avian hind limb joints. J Anat 231:906–920.
Kapandji A. 2008. The Cervical Spine. In: The Physiology of Joints: The Vertebral Column, Pelvic Girdle, and Head. . p 186–274.
Keshner EA, Delp KDSSL. 1997. Kinematics of the freely moving head and neck in the alert cat. :257–266.
Kikuchi Y, Nakano Y, Nakatsukasa M, Kunimatsu Y, Shimizu D, Ogihara N, Tsujikawa H, Takano T, Ishida H. 2012. Functional morphology and anatomy of cervical vertebrae in Nacholapithecus kerioi, a middle Miocene hominoid from Kenya. J Hum Evol 62:677–695.
Kimbel WH, Rak Y. 2010. The cranial base of Australopithecus afarensis: new insights from the female skull. Philos Trans R Soc Lond B Biol Sci 365:3365–76.
Kivell TL. 2015. Evidence in hand: Recent discoveries and the early evolution of human manual manipulation. Philos Trans R Soc B Biol Sci 370.
Kok-Mercado F, Habib M, Phelps T, Gregg L, Gallioud P. 2013. Adaptations of the Owl’s Cervical & Cephalic Arteries in Relation to Extreme Neck Rotation. In: 2012 International Science & Engineering Visualization Challenge. . p 1.
Konig HE, Liebich HG. 2006. Veterinary Anatomy of Domestic Mammals. Stuttgart: Schattauer GmbH.
Kotani T, McHulty P, Abumi K, Cunningham B, Kaneda K, McAfee P. 1998. The Role of Anteromedial Foraminotomy and the Uncovertebral Joints in the Stability of the Cervical Spine : A Biomechanical Study. Spine (Phila Pa 1976) 23:1559–1565.
Kumar M, Baklanov A, Chopin D. 2001. Correlation between sagittal plane changes and adjacent segment degeneration following lumbar spine fusion. Eur Spine J 10:314–319.
Kunimatsu Y. 1992. Allometry of the nuchal plane in hominoids and its reduction in relation to bipedalism in hominids. In: Topics in primatology. . p 209–220.
Kushner B, Kraft S. 1983. Ocular torsion movement in normal humans. Am J Ophthalmol 95:752–762.
Lane DM. 2013. The Problem of Too Many Statistical Tests : Subgroup Analyses in a Study Comparing the Effectiveness of Online and Live Lectures The Problem of Too Many Statistical Tests : Subgroup Analyses in a Study. Numeracy 6:1–5.
Latimer B, Ward C. 1993. The thoracic and lumbar vertebrae. In: Walker A, Leakey R, editors. The Nariokotome Homo Erectus Skeleton. Harvard University Press Cambridge. p 226–293.

131
Lieberman DE. 2011. The Evolution of the Human Head. Cambridge: Harvard University Press.
Lieberman DE, Polk JD, Demes B. 2004. Predicting Long Bone Loading from Cross-Sectional Geometry. Am J Phys Anthropol 123:156–171.
Lieberman DE, Ross CF, Ravosa MJ. 2000. The primate cranial base: ontogeny, function, and integration. Am J Phys Anthropol Suppl 31:117–69.
Little RW, Hubbard RP, Hyler D, Slonim A. 1981. Mehcanical Properties of Spinal Ligaments for Rhesus Monkey, Baboon, and Chimpanzee.
Long JH, Pabst D a, Shepherd WR, McLellan W a. 1997. Locomotor design of dolphin vertebral columns: bending mechanics and morphology of Delphinus delphis. J Exp Biol 200:65–81.
Longo UG, Longo G, Ripalda P, Denaro VV, Denaro VV, Forriol F. 2006. Morphologic comparison of cervical, thoracic, lumbar intervertebral discs of cynomolgus monkey (Macaca fascicularis). Eur Spine J 15:1845–51.
Lordkipanidze D, Jashashvili T, Vekua A, Ponce de León MS, Zollikofer CPE, Rightmire GP, Pontzer H, Ferring R, Oms O, Tappen M, Bukhsianidze M, Agusti J, Kahlke R, Kiladze G, Martinez-Navarro B, Mouskhelishvili A, Nioradze M, Rook L. 2007. Postcranial evidence from early Homo from Dmanisi, Georgia. Nature 449:305–10.
Loscher DM, Meyer F, Kracht K, Nyakatura JA. 2016. Timing of head movements is consistent with energy minimization in walking ungulates. Proc R Soc B Biol Sci 283:20161908.
Lovejoy CO, Johanson DC, Coppens Y. 1982. Elements of the Axial Skeleton Recovered From the Hadar Formation: 1974-1977 Collections. Am J Phys Anthropol 57:631–635.
Lu Y, Chen C, Kallakuri S, Patwardhan A, Cavanaugh JM. 2005. Neurophysiological and biomechanical characterization of goat cervical facet joint capsules. J Orthop Res 23:779–87.
MacLarnon A. 1995. The distribution of spinal cord tissues and locomotor adaptation in primates. J Hum Evol 29:463–482.
MacLarnon A. 1996. The evolution of the spinal cord in primates: evidence from the foramen magnum and the vertebral canal. J Hum Evol 30:121–138.
Malinzak M, Kay RF, Hullar TE. 2012. Locomotor head movements and semicircular canal morphology in primates. Proc Natl Acad Sci 109:17914–17919.
Manafzadeh AR, Padian K. 2018. ROM mapping of ligamentous constraints on avian hip mobility: Implications for extinct ornithodirans. Proc R Soc B Biol Sci 285.
Manfreda E, Mitteroecker P, Bookstein FL, Schaefer K. 2006. Functional morphology of the first cervical vertebra in humans and nonhuman primates. Anat Rec B New Anat 289:184–194.

132
McCluskey MK, Cullen KE. 2007. Eye, Head, and Body Coordination During Large Gaze Shifts in Rhesus Monkeys: Movement Kinematics and the Influence of Posture. J Neurophysiol 97:2976–2991.
McGraw WS. 1998. Posture and support use of Old World monkeys (Cercopithecidae): the influence of foraging strategies, activity patterns, and the spatial distribution of preferred food items. Am J Primatol 46:229–50.
Mercer SR, Bogduk N. 2001. Joints of the cervical vertebral column. J Orthop Sports Phys Ther 31:174–82; discussion 183.
Mercer SR, Bogduk N. 2003. Clinical anatomy of ligamentum nuchae. Clin Anat 16:484–93.
Meyer MR. 2005. Functional biology of the Homo erectus axial skeleton from Dmanisi, Georgia. ProQuest Diss Theses: 567–567 p.
Meyer MR. 2016. The Cervical Vertebrae of KSD-VP-1/1. In: The Postcranial Anatomy of Australopithecus afarensis. . p 63–111.
Meyer MR, Williams SA, Schmid P, Churchill SE, Berger LR. 2017. The cervical spine of Australopithecus sediba. J Hum Evol 104:32–49.
Meyer MR, Woodward C, Tims A, Bastir M. 2018. Neck function in early hominins and suspensory primates: Insights from the uncinate process. Am J Phys Anthropol:1–25.
Milne N. 1991. The role of zygapophysial joint orientation and uncinate processes in controlling motion in the cervical spine. J Anat 178:189–201.
Nakatsukasa M, Hirose Y. 2003. Scaling of lumbar vertebrae in anthropoids and implications for evolution of the hominoid axial skeleton. Primates 44:127–135.
Nalley TK. 2013. Positional Behaviors and the Neck: A Comparative Analysis of the Cervical Vertebrae of Living Primates and Fossil Hominoids.
Nalley TK, Amin P, Grider-potter N, Mcgechie F, Organ JM. 2019. The Blood Must Flow: Vertebral-Artery Size Relative To Transverse-Foramen Size In The Tarsier Cervical Spine. Am J Phys Anthropol 165:173.
Nalley TK, Grider-Potter N. 2015. Functional Morphology of the Primate Head and Neck. Am J Phys Anthropol 156:531–542.
Nalley TK, Grider-Potter N. 2017. Functional analyses of the primate upper cervical vertebral column. J Hum Evol 107:19–35.
Natarajan RN, Andersson GBJ. 1999. The Influence of lumbar disc height and cross-sectional area on the mechanical response of the disc to physiologic loading. Spine (Phila Pa 1976) 24:1873–1881.
Nevell L, Wood B. 2008. Cranial base evolution within the hominin clade. J Anat 212:455–68.
133
Orme AD, Freckleton R, Thomas G, Petzoldt T, Isaac N, Pearse W, Orme MD. 2013. Package ‘ caper .’
Pal GP, Routal R V. 1986. A study of weight transmission through the cervical and upper thoracic regions of the vertebral column in man. J Anat 148:245–261.
Pal GP, Sherk HH. 1988. The vertical stability of the cervical spine. Spine (Phila Pa 1976) 13:447–449.
Panjabi M, Dvorak J, Iii JC. 1991. Flexion, extension, and lateral bending of the upper cervical spine in response to alar ligament transections. J Spinal Disord 4:157–167.
Paradis E, Blomberg S, Bolker B, Brown J, Claude J, Cuong HS, Desper R, Didier G, Durand B, Dutheil J, Ewing R, Gascuel, Guillerme, Heibl, Ives A, Jones B, Krah F, Lawson D, Lefort V, Legendre P, Lemon J, Marcon E, McCloskey R, Nylander J, Opgen-Rhein R, Popescu A-A, Royer-Carenzi M, Schleip K, Strimmer K, de Vinne D. 2018. Ape.
Parks H. 2012. Functional Morphology of the atlas in primates and its implications for reconstructing posture in fossil taxa.
Parr WCH, Chatterjee HJ, Soligo C. 2011. Inter- and intra-sepcific scaling of articular surface areas in the hominoid talus. J Anat 218:386–401.
Penning L, Badoux DM. 1987. Radiological study of the movements of the cervical spine in the dog compared with those in man. Anat Histol Embryol 16:1–20.
Peres-Neto PR. 1999. How many statsitical tests are too many? The problem of conducting multiple ecological inferences revisited. Mar Ecol Prog Ser 176:303–306.
Peters A, Galna B, Sangeux M, Morris M, Baker R. 2010. Quantification of soft tissue artifact in lower limb human motion analysis : A systematic review. Gait Posture 31:1–8.
Pierce SE, Clack J a, Hutchinson JR. 2011. Comparative axial morphology in pinnipeds and its correlation with aquatic locomotory behaviour. J Anat 219:502–14.
Pozzo T, Berthoz A, Lefort L. 1989. Head kinematic during various motor tasks in humans. Prog Brain Res 80:377–383.
Pozzo T, Berthoz A, Lefort L, Vitte E. 1990. Head stabilization during various locomotor tasks in humans - I. Normal Subjects. Exp Brain Res 82:97–106.
Preuschoft BH, Gunther MM. 2012. Biomechanics and body shape in primates compared with horses. Z Morphol Anthropol 80:149–165.
Preuschoft H. 2004. Mechanisms for the acquisition of habitual bipedality: are there biomechanical reasons for the acquisition of upright bipedal posture. J Anat 204:363–384.
Preuschoft H, Witte H, Witzel U. 2002. Pneumatized Spaces, Sinuses and Spongy Bones

134
in the Skulls of Primates. Anthropol Anzeiger 1:67–79.
Preuschoft H, Witzel U. 2002. Biomechanical investigations on the Skulls of Reptiles and Mammals. Senckenbergiana lethaea 82:207–222.
Putz R. 1992. The detailed functional anatomy of the ligaments of the vertebral column. Ann Anat 174:40–47.
Reinschmidt C, van den Bogert T. 1997. Kinemat.
Rhodin M. 2008. A Biomechanical Analysis of Relationship Between the Head and Neck Position , Vertebral Column and Limbs in the Horse at Walk and Trot.
Richmond FJR, Thomson DB, Loeb GE. 1992. Electromyographic studies of neck muscles in the inact cat. Exp Brain Res 88:41–58.
Rios L, Muñoz A, Cardoso H, Pastor F. 2014. Short communication: Traits unique to genus Homo within primates at the cervical spine (C2-C7). Ann Anat 196:167–173.
Rohlmann A, Zander T, Schmidt H, Wilke HJ, Bergmann G. 2006. Analysis of the influence of disc degeneration on the mechanical behaviour of a lumbar motion segment using the finite element method. J Biomech 39:2484–2490.
Rose MDD. 1975. Functional proportions of primate lumbar vertebral bodies. J Hum Evol 4:21–38.
Russo G a, Kirk EC. 2013. Foramen magnum position in bipedal mammals. J Hum Evol 65:656–70.
Russo GA. 2010. Prezygapophyseal Articular Facet Shape in the Catarrhine Thoracolumbar Vertebral Column. Am J Phys Anthropol 612:600–612.
Russo GA, Kirk EC. 2017. Another look at the foramen magnum in bipedal mammals. J Hum Evol 105:24–40.
Salesa MJ, Antón M, Turner A, Morales J. 2005. Aspects of the functional morphology in the cranial and cervical skeleton of the sabre-toothed cat Paramachairodus ogygi from the Late Miocene of Spain: implications for the origins of the machairodont kill. Zool J Linn Soc 144:363–377.
Scheuer L, Black S. 2000. Developmental Juvenile Osteology. San Diego: Academic Press.
Schultz AH. 1942. Conditions for Balancing the Head in Primates. Am J Phys Anthropol 29:483–497.
Schultz AH. 1961. Vertebral Column and Thorax. Primatologia 4:1–66.
Shapiro L. 1995. Functional morphology of indrid lumbar vertebrae. Am J Phys Anthropol 98:323–42.
Shapiro LJ. 1991. Functional morphology of the primate spine with special reference to

135
orthograde posture and bipedal locomotion.
Shapiro LJ. 1993a. Evaluation of “unique” aspects of human vertebral bodies and pedicles with a consideration of Australopithecus africanus. J Hum Evol 25:433–470.
Shapiro LJ. 1993b. Functional Morphology of the Vertebral Column in Primates. In: Gebo D, editor. Postcranial Adaptation in Nonhuman Primates. DeKalb: Northern Illinois University Press. p 121–149.
Shapiro LJ, Simons CVM. 2002. Functional aspects of strepsirrhine lumbar vertebral bodies and spinous processes. J Hum Evol 42:753–83.
Sheng S-R, Wang X-Y, Xu H-Z, Zhu G-Q, Zhou Y-F. 2010. Anatomy of large animal spines and its comparison to the human spine: a systematic review. Eur spine J 19:46–56.
Shin Y, Lim HW, Kang MH, Seong M, Cho H, Kim JH. 2016. Normal range of eye movement and its relationship to age. Acta Ophthalmol 94:S256.
Simmons RE, Altwegg R. 2010. Necks-for-sex or competing browsers? A critique of ideas on the evolution of giraffe. J Zool 282:6–12.
Slijper EJ. 1946. Comparative biologic-anatomical investigations on the vertebral column and spinal musculature of mammals. Verghandelingen der K Nedelandse Akad van Wet Afd Natuurkd 42:1–128.
Smith RJ, Jungers WL. 1997. Body mass in comparative primatology. J Hum Evol 32:523–59.
Snively E, Russell AP, Powell GL, Theodor JM, Ryan MJ. 2014. The role of the neck in the feeding behaviour of the Tyrannosauridae: Inference based on kinematics and muscle function of extant avians. J Zool 292:290–303.
Spoor F. 1997. Basicranial architecture and relative brain size of Sts 5 (Australopithecus africanus) and other Plio-Pleistocene hominids. S Afr J Sci 93:182–186.
Spoor F, Garland T, Krovitz G, Ryan TM, Silcox MT, Walker A. 2007. The primate semicircular canal system and locomotion. Proc Natl Acad Sci 104:10808–10812.
Stevens NJ, Heesy C. 2013. Head Posture and Visual Orientation in Loris tardigradus During Locomotion on Oblique Supports. In: Leaping Ahead: Advances in Prosimian Biology. p 97–104.
Stevens NJ, Heesy CP. 2007. Head Posture and Visual Orientation in Loris tardigradus durgin Locomotion on Oblique Supports. In: Leaping Ahead: Advances in Prosimian Biology. p 97–104.
Strait DS. 1998. Evolutionary Integration in the Hominid Cranial Base.
Strait DS, Ross CF. 1999. Kinematic data on primate head and neck posture: Implications for the evolution of basicranial flexion and an evaluation of

136
registration planes used in paleoanthropology. Am J Phys Anthropol 108:205–222.
Summers AP, Darouian KF, Richmond AM, Brainerd EL. 1998. Kinematics of Aquatic and Terrestrial Prey Capture in Terrapene carolina, with implications for the evolution of feeding in cryptodire turtles. J Exp Zool 281:280–287.
Susman RL, de Ruiter D, Brain CK. 2001. Recently identified postcranial remains of Paranthropus and early Homo from Swartkrans Cave, South Africa. J Hum Evol 41:607–29.
Takeshita K, Peterson ETK, Bylski-Austrow D, Crawford AH, Nakamura K. 2004. The nuchal ligament restrains cervical spine flexion. Spine (Phila Pa 1976) 29:388–93.
Taylor MP, Hone DWE, Wedel MJ, Naish D. 2011. The long necks of sauropods did not evolve primarily through sexual selection. J Zool 285:150–161.
Taylor WR, Ehrig RM, Duda GN, Seebeck P, Heller M, Schell H. 2005. On the influence of soft tissue coverage in the determination of bone kinematics using skin markers. J Orthop Res 23:726–734.
Thompson NE. 2016. The Evolution of Upper Body Stability in Hominins.
Thomson DB, Loeb GE, Richmond FJR. 1996. Effect of neck posture on patterns of activation of feline neck muscles during horizontal rotation. Exp Brain Res 110:392–400.
Toerien MJ. 1961. The Length and Inclinations of the Primate Cervical Spinous Process. Trans R Soc South Africa 36:95–105.
Torigoe T. 1985. Comparison of object manipulation among 74 species of non-human primates. Primates 26:182–194.
Van Valkenburgh B. 2006. Feeding Behavior in Free-Ranging, Large African Carnivores. J Mammal 77:240–254.
Vanburen CS, Evans DC. 2017. Evolution and function of anterior cervical vertebral fusion in tetrapods. Biol Rev 92:608–626.
Vidal PP, de Waele C, Graf W, Berthoz A. 1988. Skeletal Geometry Underlying Head Movements. Ann N Y Acad Sci 545:228–238.
Villamil CI. 2018. Phenotypic integration of the cervical vertebrae in the Hominoidea (Primates). Evolution (N Y) 72:490–517.
Wang J, Lui Z, Qian Z, Ren L. 2016. Soft tissue artifact evaluation of the cervical spine in motion patterns of flexion and lateral bending : a preliminary study. PeerJ 4e:1893.
Ward C V. 1993. Torso morphology and locomotion in Proconsul nyanzae. Am J Phys Anthropol 92:291–328.
Warltier, DC; Crosby E. 2006. Airway Management in Adults after Cervical Spine Trauma. Anesthesiology 104:1293–40.

137
White A, Panjabi MM. 1990. Clinical Biomechanics of the Spine. Philadelphia: J.B. Lippincott Company.
White TD, WoldeGabriel G, Asfaw B, Ambrose S, Beyene Y, Bernor RL, Boisserie J-R, Currie B, Gilbert H, Haile-Selassie Y, Hart WK, Hlusko LJ, Howell FC, Kono RT, Lehmann T, Louchart A, Lovejoy CO, Renne PR, Saegusa H, Vrba ES, Wesselman H, Suwa G. 2006. Asa Issie, Aramis and the origin of Australopithecus. Nature 440:883–9.
Winter DA, Sidwall HG, Hobso DA. 1974. Measurement and reduction of noise in kinematics of locomotion. J Biomech 7:157–159.
Xiang Y, Yakushin SB, Kunin M, Raphan T, Cohen B. 2008. Head stabilization by vestibulocollic reflexes during quadrupedal locomotion in monkey. J Neurophysiol 100:763–80.
Yapuncich GS, Boyer DM. 2014. Interspecific scaling patterns of talar articular surfaces within primates and their closest living relatives. J Anat 224:150–172.
Young JW. 2008. Substrate Determines Asymmetrical Gait Dynamics in Marmosets ( Callithrix jacchus ) and Squirrel Monkeys ( Saimiri boliviensis ). 000.
Young JW, Stricklen BM, Chadwell BA. 2016. Effects of support diameter and compliance on common marmoset ( Callithrix jacchus ) gait kinematics. J Exp Biol 219:2659–2672.

138
APPENDIX A
DATA TABLES

Table 0.1 Species averages of morphological measurements
Species Level CA SPL SAFH ATPL PTPL UH VBVH SPA SAFA ATPA PTPA S. apella C1 108.19 1.72 5.71 4.82
161.28
E. mongoz C1 81.52
4.29 7.00
153.93
H. sapiens C1 450.03 7.51 17.20 13.23
126.36
H. lar C1 136.37 2.85 6.36 6.19
139.89
L. catta C1 69.18
5.22 7.11
163.05
M. mulatta C1 175.54 2.85 5.19 5.62
143.78
O. crassicaudatus C1 28.78 1.78 4.57 4.48
149.37
P. verreauxi C1 86.52
5.24 9.13
153.82
S. sciureus C1 54.41
2.70 4.86
160.83
V. variegata C1 86.19 1.71 8.20 9.43
159.28
S. apella C2 55.01 6.55 5.61 5.58
5.29 7.85 88.24 59.02 66.96
E. mongoz C2 34.95 4.86 4.53 5.19
3.28
135.54 20.21 97.20 112.30 H. sapiens C2 445.23 15.78 16.27 9.57
15.55 17.18 117.16 53.82 131.42 113.00
H. lar C2 90.33 7.78 6.83 6.04
5.12 11.43 107.80 26.03 103.91 131.75 L. catta C2 39.83 6.11 4.62 5.10
4.39 6.68 111.61 32.09 86.40 120.78
M. mulatta C2 79.67 9.03 6.93 5.51
6.34 9.43 107.82 47.52 50.01 69.28 O. crassicaudatus C2 30.74 4.85 2.82 3.24
3.40 6.88 134.79 26.64 94.96 93.88
P. verreauxi C2 42.00 7.11 5.45 6.82
4.80 8.92 115.30 27.23 90.22
S. sciureus C2 30.69 3.64 4.15 4.15
2.78
175.69 27.11 54.43
V. variegata C2 52.37 6.49 5.50 7.74
5.79 6.56 101.21 25.10 128.39 96.04 S. apella C3 86.62 5.10 4.10 7.01
2.37 5.20 130.11 59.44 131.78 128.39
E. mongoz C3 36.72 3.57 3.67 5.96
1.10 7.62 140.15 31.80 135.06 112.45 H. sapiens C3 411.82 12.13 10.72 12.32 6.47 5.24 14.16 121.76 52.62 125.61 115.90 H. lar C3 82.66 6.01 5.45 6.45
3.41 8.94 111.17 33.95 118.68 103.77
L. catta C3 39.11 3.56 3.84 6.80
1.68 9.14 125.26 29.97 61.59 129.91
137
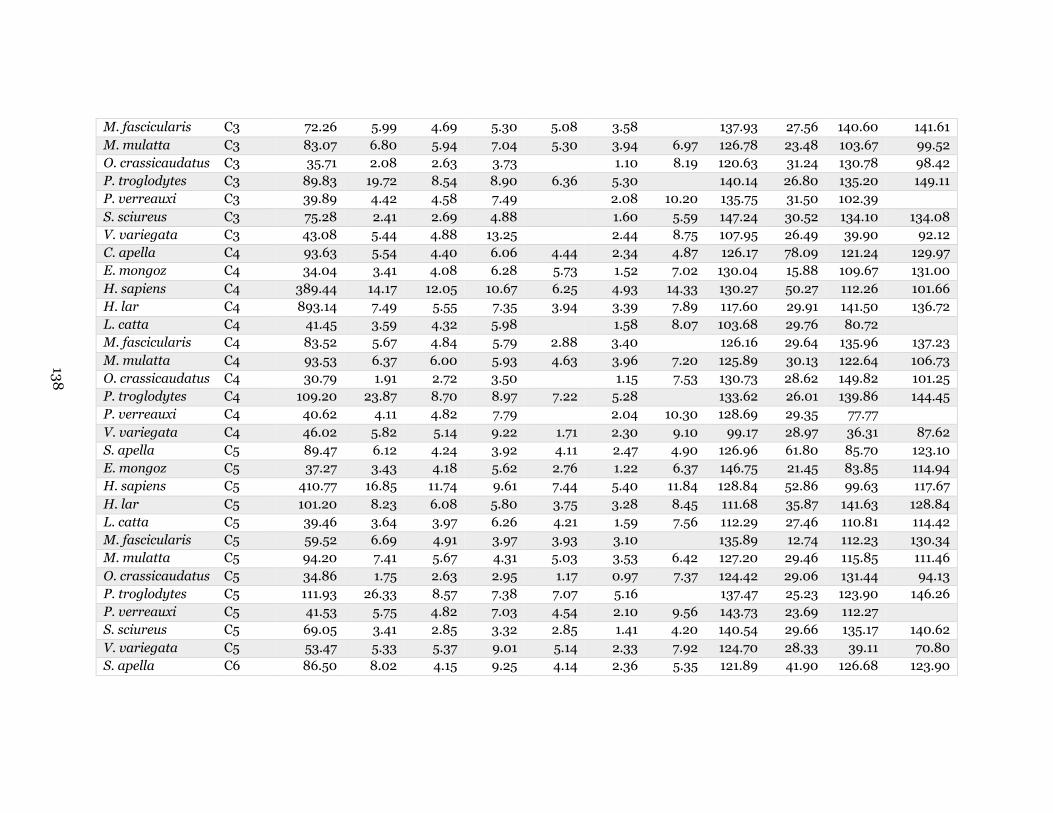
M. fascicularis C3 72.26 5.99 4.69 5.30 5.08 3.58
137.93 27.56 140.60 141.61 M. mulatta C3 83.07 6.80 5.94 7.04 5.30 3.94 6.97 126.78 23.48 103.67 99.52 O. crassicaudatus C3 35.71 2.08 2.63 3.73
1.10 8.19 120.63 31.24 130.78 98.42
P. troglodytes C3 89.83 19.72 8.54 8.90 6.36 5.30
140.14 26.80 135.20 149.11 P. verreauxi C3 39.89 4.42 4.58 7.49
2.08 10.20 135.75 31.50 102.39
S. sciureus C3 75.28 2.41 2.69 4.88
1.60 5.59 147.24 30.52 134.10 134.08 V. variegata C3 43.08 5.44 4.88 13.25
2.44 8.75 107.95 26.49 39.90 92.12
C. apella C4 93.63 5.54 4.40 6.06 4.44 2.34 4.87 126.17 78.09 121.24 129.97 E. mongoz C4 34.04 3.41 4.08 6.28 5.73 1.52 7.02 130.04 15.88 109.67 131.00 H. sapiens C4 389.44 14.17 12.05 10.67 6.25 4.93 14.33 130.27 50.27 112.26 101.66 H. lar C4 893.14 7.49 5.55 7.35 3.94 3.39 7.89 117.60 29.91 141.50 136.72 L. catta C4 41.45 3.59 4.32 5.98
1.58 8.07 103.68 29.76 80.72
M. fascicularis C4 83.52 5.67 4.84 5.79 2.88 3.40
126.16 29.64 135.96 137.23 M. mulatta C4 93.53 6.37 6.00 5.93 4.63 3.96 7.20 125.89 30.13 122.64 106.73 O. crassicaudatus C4 30.79 1.91 2.72 3.50
1.15 7.53 130.73 28.62 149.82 101.25
P. troglodytes C4 109.20 23.87 8.70 8.97 7.22 5.28
133.62 26.01 139.86 144.45 P. verreauxi C4 40.62 4.11 4.82 7.79
2.04 10.30 128.69 29.35 77.77
V. variegata C4 46.02 5.82 5.14 9.22 1.71 2.30 9.10 99.17 28.97 36.31 87.62 S. apella C5 89.47 6.12 4.24 3.92 4.11 2.47 4.90 126.96 61.80 85.70 123.10 E. mongoz C5 37.27 3.43 4.18 5.62 2.76 1.22 6.37 146.75 21.45 83.85 114.94 H. sapiens C5 410.77 16.85 11.74 9.61 7.44 5.40 11.84 128.84 52.86 99.63 117.67 H. lar C5 101.20 8.23 6.08 5.80 3.75 3.28 8.45 111.68 35.87 141.63 128.84 L. catta C5 39.46 3.64 3.97 6.26 4.21 1.59 7.56 112.29 27.46 110.81 114.42 M. fascicularis C5 59.52 6.69 4.91 3.97 3.93 3.10
135.89 12.74 112.23 130.34
M. mulatta C5 94.20 7.41 5.67 4.31 5.03 3.53 6.42 127.20 29.46 115.85 111.46 O. crassicaudatus C5 34.86 1.75 2.63 2.95 1.17 0.97 7.37 124.42 29.06 131.44 94.13 P. troglodytes C5 111.93 26.33 8.57 7.38 7.07 5.16
137.47 25.23 123.90 146.26
P. verreauxi C5 41.53 5.75 4.82 7.03 4.54 2.10 9.56 143.73 23.69 112.27
S. sciureus C5 69.05 3.41 2.85 3.32 2.85 1.41 4.20 140.54 29.66 135.17 140.62 V. variegata C5 53.47 5.33 5.37 9.01 5.14 2.33 7.92 124.70 28.33 39.11 70.80 S. apella C6 86.50 8.02 4.15 9.25 4.14 2.36 5.35 121.89 41.90 126.68 123.90
138

E. mongoz C6 37.59 4.06 4.25 8.39 2.29 1.22 6.27 132.52 29.44 126.16 113.82 H. sapiens C6 421.16 21.89 12.05 10.13 7.12 5.23 13.46 128.65 43.57 125.09 104.54 H. lar C6 93.16 9.66 5.77 6.79 3.19 3.16 7.38 114.66 25.96 147.55 129.71 L. catta C6 40.08 4.36 4.04 7.70 3.39 1.44 8.89 119.12 30.89 62.35 122.22 M. fascicularis C6 55.73 8.01 4.65 7.04 4.16 3.05
147.09 23.75 103.16 119.12
M. mulatta C6 96.41 8.60 5.63 8.66 5.18 3.82 7.34 126.18 28.91 118.59 113.25 O. crassicaudatus C6 31.45 2.08 3.06 4.84 1.56 0.93 7.02 128.23 30.86 128.23 91.14 P. troglodytes C6 123.70 28.13 9.02 8.79 6.45 5.50
128.79 26.79 129.43 136.59
P. verreauxi C6 41.82 9.58 5.11 10.45 3.49 1.75 8.77 145.57 24.83 115.90
S. sciureus C6 43.03 4.33 2.66 5.69 2.46 1.23 4.51 140.43 19.55 120.33
V. variegata C6 63.13 6.42 5.34 10.75 4.68 1.67 8.34 117.56 38.37 89.54 79.68 S. apella C7 93.09 11.51 4.15 4.80 5.07 1.96 5.38 116.72 66.52 147.14 118.15 E. mongoz C7 31.92 5.91 3.85
4.60 1.17 6.11 139.78 24.16 141.53 122.66
H. sapiens C7 320.93 29.82 11.41 10.62 11.90 5.79 11.23 128.96 55.32 121.35 111.78 H. lar C7 96.20 11.94 5.20 5.39 5.38 3.12 7.70 110.08 35.42 140.99 123.14 L. catta C7 37.26 7.03 3.83
5.74 1.25 7.89 133.52 28.08 82.35 100.82
M. fascicularis C7 54.29 9.04 4.27 4.34 6.16 3.33
141.14 29.50 120.18 128.71 M. mulatta C7 84.41 10.37 5.47
6.71 3.47 6.17 127.61 27.42 119.97 110.44
O. crassicaudatus C7 27.64 2.27 2.96
2.46 0.76 7.36 122.41 28.09 125.54 108.02 P. troglodytes C7 140.75 29.09 8.91
10.65 6.23
131.89 24.56 141.99 151.62
P. verreauxi C7 39.48 9.98 5.17 4.82 4.37 1.60 8.38 154.90 21.23 129.81 S. sciureus C7 4097.57 5.92 2.55
2.98 1.26 4.71 127.56 28.87 125.04 129.71
V. variegata C7 50.87 9.07 5.03
5.89 1.35 7.79 110.94 29.79 27.19 88.02 S. apella T1 35.34 12.99 3.77
4.94
6.25 117.66 80.04
94.36
E. mongoz T1 27.31 8.65 3.17
4.84
5.94 129.76 34.60 102.65 117.36 H. sapiens T1 384.88 32.03 12.50
19.71 5.02 16.31 128.19 52.14 109.05 107.04
H. lar T1 67.11 12.57 5.61
6.84 1.23 7.82 131.37 18.99
96.07 L. catta T1 36.23 9.56 3.06
5.16 1.14 8.63 128.98 29.02 61.95 115.09
M. mulatta T1 72.69 17.25 4.51
8.35 3.38 7.19 124.32 37.58 38.48 92.21 O. crassicaudatus T1 27.42 7.28 2.52
4.65 1.06 7.67 128.27 33.23 138.46 105.56
P. verreauxi T1 33.56 9.92 4.47
4.84 1.16 7.61 144.25 33.24 109.77
139

S. sciureus T1 23.76 7.57 2.26
3.37
4.79
V. variegata T1 44.08 11.41 4.36
6.79 0.71 7.86 120.93 34.83 31.35 98.65
140

Table 0.2 Ranges of intervertebral motion.
Species Joint Source Extension Flexion Flexion-Extension Lateral Flexion Sapajus apella C0-C1 Graf et al. 1995 107.50 Eulemur mongoz C0-C1 Duke Lemur Center 35.44 25.94 61.38 7.12 Homo sapiens C0-C1 White and Panjabi, 1990 12.40 14.40 26.80 5.00 Hylobates lar C0-C1 Osaka University 11.61 3.18 14.79 6.25 Lemur catta C0-C1 Duke Lemur Center 8.94 16.82 25.76 8.14 Macaca mulatta C0-C1 Graf et al. 1995 137.00 105.00 242.00 Macaca mulatta C0-C1 Graf et al. 1995 119.30 118.00 237.30 Otolemur crassicaudatus C0-C1 Duke Lemur Center 5.72 13.04 7.33 3.47 Propithecus verreauxi C0-C1 Duke Lemur Center 9.51 19.33 27.22 2.57 Pan troglodytes C0-C1 Stony Brook University 8.76 Saimiri sciureus C0-C1 Graf et al. 1995 116.40 106.70 223.10 Varecia variegata C0-C1 Duke Lemur Center 34.40 21.67 56.07 2.71 Sapajus apella C1-C2 Graf et al. 1995 0.00 Eulemur mongoz C1-C2 Duke Lemur Center 4.32 14.36 18.69 22.82 Homo sapiens C1-C2 White and Panjabi, 1990 10.50 12.70 23.20 5.00 Hylobates lar C1-C2 Osaka University 8.91 4.77 13.68 4.90 Lemur catta C1-C2 Duke Lemur Center 8.23 16.70 24.93 28.20 Macaca mulatta C1-C2 Graf et al. 1995 3.00 0.00 3.00 Macaca fascicularis C1-C2 Graf et al. 1995 7.00 5.30 12.30 Otolemur crassicaudatus C1-C2 Duke Lemur Center 7.08 8.79 1.71 16.26 Propithecus verreauxi C1-C2 Duke Lemur Center 8.50 11.03 18.35 11.51 Pan troglodytes C1-C2 Stony Brook University 16.07
141

Saimiri sciureus C1-C2 Graf et al. 1995 222.20 3.30 225.50 Varecia variegata C1-C2 Duke Lemur Center 4.76 2.77 7.52 28.44 Sapajus apella C2-C3 Graf et al. 1995 0.00 Eulemur mongoz C2-C3 Duke Lemur Center 8.50 5.13 13.63 7.33 Homo sapiens C2-C3 White and Panjabi, 1990 2.00 7.00 9.00 10.00 Hylobates lar C2-C3 Osaka University 11.91 7.02 18.93 11.72 Lemur catta C2-C3 Duke Lemur Center 8.58 5.47 14.05 6.71 Macaca mulatta C2-C3 Graf et al. 1995 4.00 20.00 24.00 Macaca fascicularis C2-C3 Graf et al. 1995 16.00 8.30 24.30 Otolemur crassicaudatus C2-C3 Duke Lemur Center 7.63 18.14 25.76 7.33 Propithecus verreauxi C2-C3 Duke Lemur Center 8.60 6.57 15.17 11.35 Pan troglodytes C2-C3 Stony Brook University 1.65 Saimiri sciureus C2-C3 Graf et al. 1995 3.60 0.70 4.30 Varecia variegata C2-C3 Duke Lemur Center 7.47 9.19 16.67 5.18 Sapajus apella C3-C4 Graf et al. 1995 1.50 Eulemur mongoz C3-C4 Duke Lemur Center 5.17 2.92 8.10 5.83 Homo sapiens C3-C4 White and Panjabi, 1990 4.00 10.00 14.00 11.00 Hylobates lar C3-C4 Osaka University 11.17 8.74 19.91 2.64 Lemur catta C3-C4 Duke Lemur Center 7.14 7.60 14.74 7.31 Macaca mulatta C3-C4 Graf et al. 1995 10.00 4.00 14.00 Macaca fascicularis C3-C4 Graf et al. 1995 8.00 5.00 13.00 Otolemur crassicaudatus C3-C4 Duke Lemur Center 13.38 3.74 17.12 Propithecus verreauxi C3-C4 Duke Lemur Center 19.57 6.83 26.39 10.15 Pan troglodytes C3-C4 Stony Brook University 10.81 Saimiri sciureus C3-C4 Graf et al. 1995 8.60 4.70 13.30
142

Varecia variegata C3-C4 Duke Lemur Center 8.17 13.27 21.44 7.09 Sapajus apella C4-C5 Graf et al. 1995 0.00 Eulemur mongoz C4-C5 Duke Lemur Center 9.20 7.83 17.02 5.11 Homo sapiens C4-C5 White and Panjabi, 1990 9.00 3.00 12.00 11.00 Hylobates lar C4-C5 Osaka University 17.50 0.07 17.57 1.66 Lemur catta C4-C5 Duke Lemur Center 10.85 10.17 21.01 5.48 Macaca mulatta C4-C5 Graf et al. 1995 13.00 5.00 18.00 Macaca fascicularis C4-C5 Graf et al. 1995 11.30 0.00 11.30 Otolemur crassicaudatus C4-C5 Duke Lemur Center 13.38 3.74 17.12 9.29 Propithecus verreauxi C4-C5 Duke Lemur Center 10.61 7.72 18.33 7.42 Pan troglodytes C4-C5 Stony Brook University 19.27 Saimiri sciureus C4-C5 Graf et al. 1995 11.20 3.70 14.90 Varecia variegata C4-C5 Duke Lemur Center 15.99 20.01 36.00 9.68 Sapajus apella C5-C6 Graf et al. 1995 2.50 Eulemur mongoz C5-C6 Duke Lemur Center 17.51 3.23 20.74 5.70 Homo sapiens C5-C6 White and Panjabi, 1990 3.00 15.00 18.00 8.00 Hylobates lar C5-C6 Osaka University 9.10 6.14 15.24 1.70 Lemur catta C5-C6 Duke Lemur Center 17.55 6.47 24.02 6.56 Macaca mulatta C5-C6 Graf et al. 1995 16.00 0.00 16.00 Macaca fascicularis C5-C6 Graf et al. 1995 8.60 0.00 8.60 Otolemur crassicaudatus C5-C6 Duke Lemur Center 15.46 -3.12 12.34 3.39 Propithecus verreauxi C5-C6 Duke Lemur Center 11.62 9.21 20.83 6.51 Pan troglodytes C5-C6 Stony Brook University 23.90 Saimiri sciureus C5-C6 Graf et al. 1995 12.00 3.70 15.70 Varecia variegata C5-C6 Duke Lemur Center 11.39 9.87 21.25 5.92
143

Sapajus apella C6-C7 Graf et al. 1995 20.50 Eulemur mongoz C6-C7 Duke Lemur Center 15.98 4.72 20.70 5.08 Homo sapiens C6-C7 White and Panjabi, 1990 10.00 9.00 19.00 7.00 Hylobates lar C6-C7 Osaka University 11.64 27.15 38.79 1.74 Lemur catta C6-C7 Duke Lemur Center 23.45 6.84 30.29 4.82 Macaca mulatta C6-C7 Graf et al. 1995 22.00 0.00 22.00 Macaca fascicularis C6-C7 Graf et al. 1995 16.70 0.00 16.70 Otolemur crassicaudatus C6-C7 Duke Lemur Center 1.26 10.65 9.39 5.26 Propithecus verreauxi C6-C7 Duke Lemur Center 15.62 6.65 22.27 4.34 Pan troglodytes C6-C7 Stony Brook University 14.06 Saimiri sciureus C6-C7 Graf et al. 1995 19.00 3.00 22.00 Varecia variegata C6-C7 Duke Lemur Center 17.95 13.57 31.53 5.88 Sapajus apella C7-T1 Graf et al. 1995 6.50 Eulemur mongoz C7-T1 Duke Lemur Center 19.33 6.64 25.96 4.14 Homo sapiens C7-T1 White and Panjabi, 1990 6.00 4.00 10.00 4.00 Hylobates lar C7-T1 Osaka University 2.25 Lemur catta C7-T1 Duke Lemur Center 14.15 9.17 23.33 3.84 Macaca mulatta C7-T1 Graf et al. 1995 10.00 0.00 10.00 Macaca fascicularis C7-T1 Graf et al. 1995 21.30 21.30 Otolemur crassicaudatus C7-T1 Duke Lemur Center 26.57 2.47 29.04 4.16 Propithecus verreauxi C7-T1 Duke Lemur Center 14.52 3.51 18.03 6.17 Saimiri sciureus C7-T1 Graf et al. 1995 22.60 3.00 25.60 Varecia variegata C7-T1 Duke Lemur Center 13.47 14.97 28.44 4.11 Eulemur mongoz C0-C7 Duke Lemur Center 115.45 70.76 186.21 63.12 Homo sapiens C0-C7 White and Panjabi, 1990 56.90 75.10 132.00 61.00
144

Hylobates lar C0-C7 Osaka University 81.84 57.07 138.91 32.86 Lemur catta C0-C7 Duke Lemur Center 98.88 79.25 178.13 71.06 Otolemur crassicaudatus C0-C7 Duke Lemur Center 90.47 57.45 119.81 58.44 Propithecus verreauxi C0-C7 Duke Lemur Center 98.54 70.85 166.58 60.00 Varecia variegata C0-C7 Duke Lemur Center 113.60 105.32 218.92 69.00
145

146
APPENDIX B
INSTITUTIONAL ANIMAL CARE AND USE COMMITTEE APPROVAL

147