form dot f 1700 - ctr library...of drilled shafts in sand. the study is based on the results of load...
TRANSCRIPT
.. . ..
TECHNICAL REPORT STANDARD TITLE PAGE
1. Report No. 2. Government Accession No. 3. Recipient· s Catalog No.
CFHR 3-5-72-176-1 ~~~ ____ ~~ ____________ L-_________________________ ~~~ __ ~ __________________ ~
4. Tdle and Subtitle 5. Report Dote
i "The Behavior of Axially Loaded Drilled Shafts in I
I I
December 1972 Sand"
7. Author's)
Fadlo T. Touma and Lymon C. Reese
9. Performing Orgoni zotion Nome and Address
Center for Highway Research The University of Texas at Austin Austin, Texas 78712
6. Performing Orgoni zotion Code
8. Performing Orgoni zotion Report No.
Research Report 176-1
10. Work Unit No .
1 J. Contract or Grant No.
Research Study 3-5-72-176 13. Type of Report and Period Covered
~~~~~~~------~~~--~~---~~~~--------------~ 12. Sponsoring Agency Nome and Address Interim Texas Highway Department Sept. 1971 - Oct. 1972 11th & Brazos Austin, Texas 78701
15. Supplementary Notes
14. Sponsoring Agency Code
Research performed in cooperation with Department of Transportation, Federal Highway Administration. Research Study Title: "The Behavior of Drilled Shafts"
16. Abstract
Study is mainly concerned with analysis of behavior of five full-scale instrumented drilled shafts cast in soil profiles containing sand and test loaded to
~ failure. Two shafts were cast by the dry method and three by the slurry displacement method.
From field observations and measurements taken during construction and load tests, important findings were made concerning the construction and the design of
~ drilled shafts. With respect to construction, the slurry displacement method was found to possess a great potential for future use, but this method must be used with care, to prevent the entrapment of mud and sediments at the tip and sides of the shaft and in the concrete.
With respect to design, the measured load transfer was correlated with the properties of the sand measured by dynamic penetrometers. Pressure-settlement curves were obtained for the tips of shafts in very dense sand and sand of medium denSity. The total side load transfer was correlated with the integral over the periphery of the shaft of the product p tan ~ ,where p = effective overburden pressure and ~ = effective friction angle •
The coefficient of correlation was found to be about 0.7 for shafts with penetrations in sand not exceeding 25 ft. There were indications that this coefficient decreases with depth and, therefore, care must be exercised when the results are extrapolated to deeper shafts.
17. Key Words 18. Distribution Statement
~ bored piles, design, drilled shafts, __ sand, slurry, standard penetration test
•
19. Security Classif. (of this report) 20. Security Classif. (of thi s page) 21. No. of Pages 22. Price
Unclassified Unclassified 275
Form DOT F 1700.7 (S·69)

'. .,.
11 ..
..
..
-•
THE BEHAVIOR OF AXIALLY LOADED DRILLED SHAFTS IN SAND
by
Fad10 T. Touma Lymon C. Reese
Research Report Number 176-1
The Behavior of Drilled Shafts
Research Project 3-5-72-176
conducted for
The Texas Highway Department
in cooperation with the U. S. Department of Transportation
Federal Highway Administration
by the
CENTER FOR HIGHWAY RESEARCH
THE UNIVERSITY OF TEXAS AT AUSTIN
December 1972

" .
•
PREFACE
This report is the first report on the findings of Research Project
3-5-72-176, "The Behavior of Drilled Shafts."
This report presents the results of an investigation of the behavior
of drilled shafts in sand. The study is based on the results of load tests
on five full-scale instrumented drilled shafts cast in soil profiles containing
sand. Two test shafts were constructed by the dry procedure and the other
three shafts were cast by slurry displacement. The report includes an
evaluation of these construction procedures.
The authors would like to acknowledge the work of a number of people
who contributed to this report. The field work was completed with the
technical assistance of Mr. Harold Dalrymple, Mr. James Anagnos, Mr. Fred
Koch, and Dr. Michael O'Neill. The planning and execution of the work were
done with the cooperation of Messrs. H. D. Butler, Horace Hoy, Tom Bell,
and Gaston Berthelot of the Texas Highway Department.
The authors would like also to gratefully acknowledge the support of
the Federal Highway Administration.
December 1972
iii
Fadlo Touma Lymon C. Reese

!!!!!!!!!!!!!!!!!!!"#$%!&'()!*)&+',)%!'-!$-.)-.$/-'++0!1+'-2!&'()!$-!.#)!/*$($-'+3!
44!5"6!7$1*'*0!8$($.$9'.$/-!")':!
. . ,
ABSTRACT
This study is mainly concerned with the analysis of the behavior of five
full-scale instrumented drilled shafts cast in soil profiles containing sand
and test loaded to failure. Two shafts were cast by the dry method and the
other three shafts were cast by the slurry displacement method.
From field observations and measurements taken during construction and
load tests, important findings were made concerning the construction and the
design of drilled shafts. With respect to the construction, the slurry dis
placement method was found to possess a great potential for future use.
This method, however, must be used with care, to prevent the entrapment of
mud and sediments at the tip and sides of the shaft and in the concrete.
With respect to the design, the measured load transfer was correlated
with the properties of the sand measured by dynamic penetrometers. Pressure
settlement curves were obtained for the tips of shafts in very dense sand
and sand of medium density. The total side load transfer was correlated with
the integral over the periphery of the shaft of the product p and ¢, where
p effective overburden pressure
o effective friction angle
The coefficient of correlation was found to be about 0.7 for shafts
with penetrations in sand not exceeding 25 ft. There were indications that
this coefficient decreases with depth and, therefore, care must be exercised
when the results are extrapolated to deeper shafts.
KEY WORDS: bored piles, design, drilled shafts, sand, slurry, SPT.
v

!!!!!!!!!!!!!!!!!!!"#$%!&'()!*)&+',)%!'-!$-.)-.$/-'++0!1+'-2!&'()!$-!.#)!/*$($-'+3!
44!5"6!7$1*'*0!8$($.$9'.$/-!")':!

..
• ..
"
SUMMARY
This study can be divided into three major sections:
1. An evaluation of the slurry displacement technique
2. An analysis of the factors controlling the behavior of drilled shafts
3. An analysis of the tests on five full scale instrumented drilled
shafts constructed in sand
The slurry displacement technique, was found to hold great potential for
the construction of drilled shafts. However, great care must be observed
in using this method to prevent the caving of holes in expansive clays and
to prevent the entrapment of mud and soft sediments at the tip and at the
sides of the shaft .
There are many factors that control the behavior of drilled shafts and
this study did not evaluate the influence of each of these variables. The
test results were used to obtain empirical evaluations of the tip and side
resistance of shafts in sand. Large displacements were found required to
mobilize significant tip resistance. An expression for evaluating an allowable
tip pressure was derived as a function of the tip diameter and the degree of
compactness of the sand. It was also found that the side resistance of
shafts penetrating less than 25 ft. in sand can be evaluated as 0.7 of
the integral over the periphery of the shaft of the product p tan ~.
There are indications that a smaller fraction of this integral could be
developed in shafts of greater penetration in sands.
Based on the findings of this study a design procedure was developed
for shafts penetrating in sand up to 25 ft.
vii

!!!!!!!!!!!!!!!!!!!"#$%!&'()!*)&+',)%!'-!$-.)-.$/-'++0!1+'-2!&'()!$-!.#)!/*$($-'+3!
44!5"6!7$1*'*0!8$($.$9'.$/-!")':!

•
IMPLEMENTATION STATE}ffiNT
This study presents a method for the design of drilled shafts in sand.
The method is based on full scale field tests and is recommended for
immediate implementation. This method is believed to be safer and more
economical than existing methods.
However, the proposed design procedure is limited to shafts penetrating
no more than 25 ft. into sand; therefore, it is recommended that further
field studies be carried out on the behavior of long drilled shafts in sand.
Further, additional load tests of short to moderate-length drilled shafts,
perhaps uninstrumented, should be carried out in order to refine and improve
the proposed design procedure.
The study also presents an evaluation of the slurry displacement
technique. It was found that this technique can be used successfully in
the construction of drilled shafts in caving soils .
ix

!!!!!!!!!!!!!!!!!!!"#$%!&'()!*)&+',)%!'-!$-.)-.$/-'++0!1+'-2!&'()!$-!.#)!/*$($-'+3!
44!5"6!7$1*'*0!8$($.$9'.$/-!")':!

.. .
..
TABLE OF CONTENTS
PREFACE
ABSTRACT
SUMMARY
IMPLEMENTATION STATEMENT
LIST OF TABLES • . . . . . LIST OF FIGURES
NOMENCIATURE • •
CHAPTER I. INTRODUCTION
General • • • • • • • • • • • • • • • 0 • • • • • •
Evolution of Drilled Shafts and Related Research Methods of Construction of Drilled Shafts Scope of this Study • • • • • • • • • • • • • • •
CHAPTER II. THE SLURRY DISPIACEMENT METHOD
Historical •••••• The Dri lUng Mud Stability of the Hole • • • • • . . . . . . .
. . iii
. . . . v
vii
ix
• xiii
. . . .
xv
xxi
1 2 6
15
Concreting ••• • • • • • • • Bearing Capacity Considerations Stresses in the Soil • • ••• . . . . . . . . .
19 20 26 29 39 46
CHAPTER III. THE ANALYSIS OF DRILlED SHAFTS
Bearing Capacity Theories • • • • • • • • • • • The Load-Settlement Curve ••••••• Analysis of the Stress Around a Drilled Shaft •
CHAPTER IV. INVESTIGATIONS OF TEST SITES
Locations of Test Sites •••••• Soil Investigation Program • • • • Correlations Between SPT and THDP •.
xi
. . ..
. . . . . . . . 51 65 70
87 91
109
xii
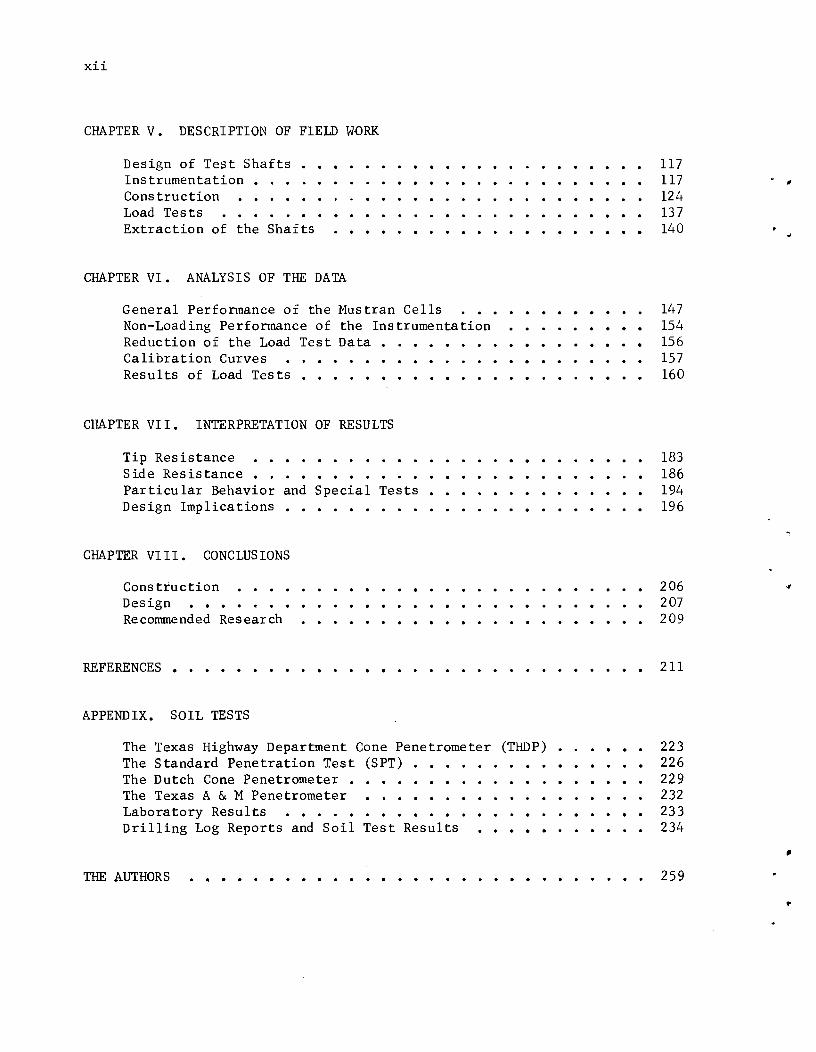
CHAPTER V. DESCRIPTION OF FIELD WDRK
Design of Test Shafts Instrumentation • Construction Load Tests Extraction of the Shafts
CHAPTER VI. ANALYSIS OF THE DATA
General Perfonnance of the Mustran Cells Non-Loading Performance of the Instrumentation Reduction of the Load Test Data . Calibration Curves Results of Load Tests
CHAPTER VII. INTERPRETATION OF RESULTS
Tip Resistance S ide Resistance Particular Behavior and Special Tests •• Design Implications
CHAPTER VIII. CONCLUSIONS
Construction • • • • Design • • • • • . Recommended Research
117 117 124 137 140
147 154 156 157 160
183 186 194 196
206 207 209
REFERENCES • • • • • • • • • • • • • • • • • • • • • . • • • • • • • • 2 11
APPENDIX. SOIL TESTS
The Texas Highway Department Cone Penetrometer (THDP) • The Standard Penetration Test (SPT) . • ••• The Dutch Cone Penetrometer • . The Texas A & M Penetrometer • . • • • • • • . Laboratory Results •••.••••••• ••• Drilling Log Reports and Soil Test Results ••••
THE AUTHORS . . . . . . . . . . . . . . . . . . . . . . . . . . . . .
223 226 229 232 233 234
259
. "
,
..
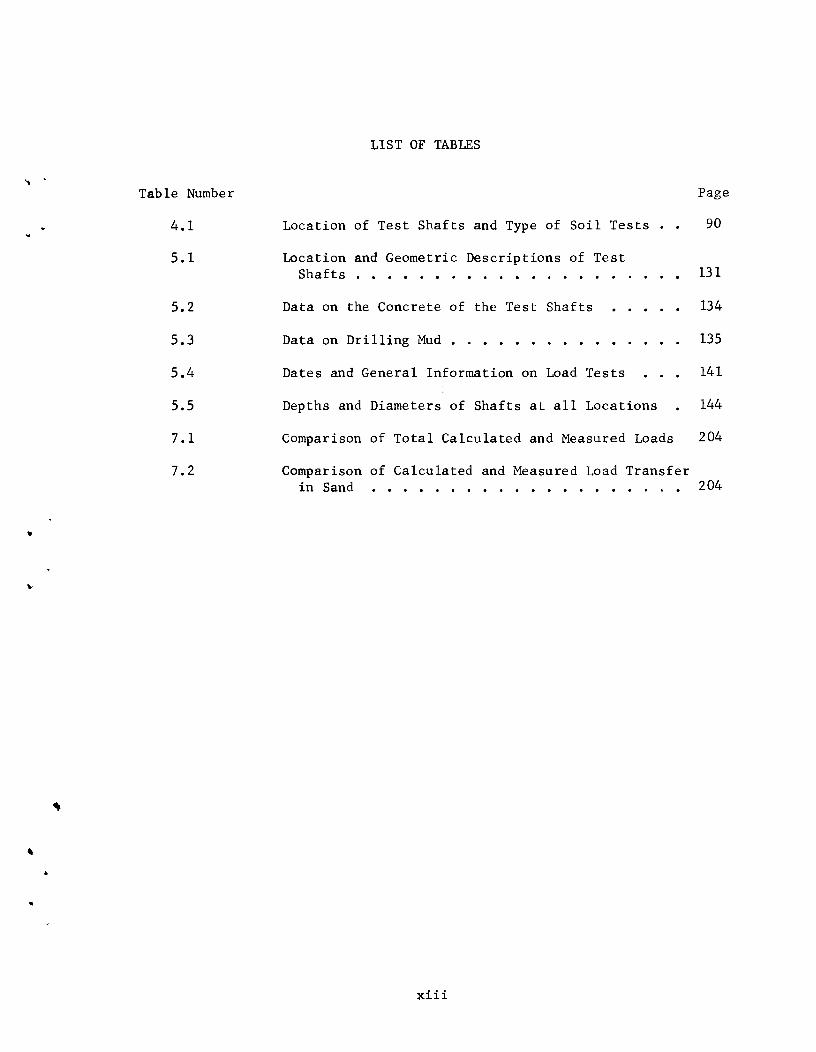
LIST OF TABLES
Table Number Page
4.1 Location of Test Shafts and Type of Soil Tests 90
5.1 Location and Geometric Descriptions of Test Shafts ••.• •..•. 131
5.2 Data on the Concrete of the Test Shafts 134
5.3 Data on Drilling Mud 135
5.4 Dates and General Information on Load Tests 141
5.5 Depths and Diameters of Shafts at all Locations 144
7.1 Comparison of Total Calculated and Measured Loads 204
7.2 Comparison of Calculated and Measured Load Transfer in Sand . . . . . .. ........... 204
•
..
xiii

!!!!!!!!!!!!!!!!!!!"#$%!&'()!*)&+',)%!'-!$-.)-.$/-'++0!1+'-2!&'()!$-!.#)!/*$($-'+3!
44!5"6!7$1*'*0!8$($.$9'.$/-!")':!

,
Figure Number
1.1
1.2
1.3
1.4
1.5
2.1
2.2
• 2.3
2.4
2.5
2.6
2.7
2.8
3.1
3.2
3.3
..
LIST OF FIGURES
Dry Drilling and Concreting, Without Casing .
Dry Drilling and Concreting with Preinstalled Casing . . • . . . . . . • • . . . . • .
Wet Drilling and Concreting, Without Casing (Slurry Displacement Method) •.••.•
Wet Drilling and Concreting, with Preinstalled Cas ing . . . . ... . . . . . • ....
Wet Drilling and Dry Concreting, with Casing (After O'Neill and Reese, 1970)
Dispersed and Flocculated Muds
Binghamian Behavior of Drilling Muds
Optimization of the Size of the Tremie
Schematical Description of the Flow of Concrete •
Effects of the Tremie Seal on the Conditions at the Tip of the Shaft
Concrete Soil Interface .•
Penetration of a 5% Bentonite Mud into Uniform Sand . • . . . . • • . • . • . . •
Effect of Concreting Procedure on the Pressure in the Concrete . . • . • • •
Diagrams of Failure Surfaces at the Tip
Point Resistance in Sand Vs. Depth (After Kerisel, 1961) •..•.••••
Load Settlement Curves for Friction and Point Bearing Bored Piles • • • . . • •
xv
Page
9
10
12
14
16
22
22
30
35
40
43
45
48
52
59
67

xvi
Figure Number
3.4
3.5
3.6
3.7
3.8
3.9
4.1
4.2
4.3
4.4
4.5
4.6
4.7
4.8
4.9
4.10
Mechanical Model of Axially Loaded Pile (After Reese, 1964) •.•.
Stresses Generated by Drilling
Stresses at the Periphery of the Shaft after Concreting
Stresses Due to Volumetric Strain •
Stresses from Axial Loading
Influence of the Tip on the Stresses Around t he Pi Ie • . .. • . . • • . . .
Location of the Different Test Sites (Adapted after Barker & Reese, 1970) •
Test Sites in Houston .
Attempted Correlations Between SPT and q u
for Clays (After DeMello) •.••.••
2 (kg/ cm )
Curves Showing the Relationship Between 0, Bearing Capacity Factors, and Values of N from the Standard Penetration Test
Relationship Between Penetration Resistance and Relative Density for Cohesionless Sand
Page
67
71
75
77
83
85
88
89
94
100
(Gibbs and Holtz, 1957) • . . • . . . . 101
Various Relationships Between Penetration Resistance and Relative Density for Cohesionless Sand (Adapted after Bazaraa, 1967) . . . • 102
Comparison of Triaxial 0 Values with 0 Estimated from Equatiowa~.2 (DeMello, 1971) 104
Dispersion Around Universal Relation 0 = f(Dr) (DeMello, 1971) • • • . . • • • • • . • • 106
Illustrations of Penetration Principles •
Correlation Between SPT and THD Cone Penetrometer in Clay
110
113
"
•
xvii
Figure Number Page
'. 4.11 Correlation Between SPT and THD Cone Penetrometer in Sand · · · · · 114
5.1 Soil Profiles and Sketches of Pile Instrumentation 119
5.2 Instrumentation . 123
5.3 Construction - Drilling and Cleaning 127
5.4 Load Testing . . . . 142
5.5 Extraction of the Shafts . · · . · 145
6.1 Non-Loading Output of Mustran Cells · 150
6.2 Raw Loading Output from Calibration Cells · 151
6.3 Output of Cells below the Ground Surface as a Function of Load on Shaft · · . · · · · 153
• 6.4 Calibration Curves for the Test Shafts 159
6.5 Load Distribution Curves - US59, Test 1 161
"-6.6 Load-Settlement Curves - US59 · 162
6.7 Load Transfer Curves - US59, Test 1 · 163
6.8 Load Transfer Vs. Depth - US59, Test 1 164
6.9 Load Distribution Curves - HH, Test 1 165
6.10 Load-Settlement Curves - HH · · 166
6.11 Load Transfer Curves - RH, Test 1 · · · · · . · 167
6.12 Load Transfer Vs. Depth - HH, Test 1 168
6.13 Load Distribution Curves - G1, Test 1 · 169
" 6.14 Lvad-Sett1ement Curves - G1 · 170
6.15 Load Transfer Curves - G1, Test 1 · · · · · 171
6.16 Load Transfer Vs. Depth - G1, Test 1 · · . · 172
xviii
Figure Number
6.17
6.18
6.19
6.20
6.21
6.22
6.23
6.24
7.1
7.2
7.3
7.4
7.5
7.6
Al
A2
A3
A4
A5
A6-AlO
Load Distribution Curves - G2, Test 1 •
Load-Settlement Curves - G2 .
Load Transfer Curves - G2, Test 1
Load. Transfer Vs. Depth - G2, Test 1
Load Distribution Curves - BB, Test 1
Load-Settlement Curves - BB
Load Transfer Curves - BB
Load Transfer Vs. Depth - BB, Test 1.
Pressure Vs. Relative Settlement for the Tip of the Test Shafts
Load Transfer in Clay
Typical Behavior of Load Transfer in Sand •
Average Load Transfer in Sand
Approximate Load Transfer and Load Settlement Curves for a 30- In. Dri lled Shaft. .•.
Relation Between THD Penetrometer Blm.;r Count and the Friction Angle
THD Cone Penetrometer Correlation to Shear Strength (THD Foundation Manual, 1964)
Allowable Point Bearing Load Vs. THDP Penetration (THD Foundation Manual, 1964)
Spoons for Standard Penetration Test
Static Penetrometers
Location of Test Shafts and Boreholes
Plots of Dynamic Penetration Tests at Test Sites
Page
173
174
175
176
177
178
179
180
184
188
190 ,
191 j
197
200
224
225
227
231
235 I
237
xix
Figure Number Page
.. All-A15 Shear Strength Profiles at Test Sites 242
A16-A20 Plots of Clays From Test Sites on the Plasticity Chart ••.••.•• 247
A2l-A25 Granulometry of Sands at Test Sites 252
A26 Moisture Content at US59 Site • 257
A27 ?lloisture Content at HH Si.te •• 258

!!!!!!!!!!!!!!!!!!!"#$%!&'()!*)&+',)%!'-!$-.)-.$/-'++0!1+'-2!&'()!$-!.#)!/*$($-'+3!
44!5"6!7$1*'*0!8$($.$9'.$/-!")':!

)0
Symbol
A
At
AI ,A2
B
C
C t
C w
c
D
D r '"
D number
d
d w
E
e
e
F cone' F •
F I ,F 2
Typical Units
sq ft
sq ft
sq ft
ft
ft
psi
ft
mm
ft
ft
lbs/sq ft
lbs spoon
psi
NOMENClATURE
Definition
Cross-sectional area of shaft
Cross-sectional area of tip of shaft
Constants used in solving differential equations
Diameter of shaft
Circumference of shaft
Function related to critical height of a column of concrete
Coefficient of settlement
Apparent cohesion of soil
Diameter of the borehole
Relative density of sand
Diameter such that the aggregate weight of all smaller grains is (number) per cent of the total weight of the sample
Diameter of the tremie
Height of the water table above the tip of the shaft
Young's modulus of elasticity (general)
Void ratio of soil
Base for Neperian logarithm
Force driving the cone or spoon penetrometers
Functions used in analyzing the flow of concrete
xxi

xxii
Symbol
f o
f r
H
H c
H m
h c
h m
I r
I w
i
K
K o
K s
k
Typical Units
psi
psi
ft
ft
ft
ft
ft
ft
ft
ft
sec
Definition
Average vertical shear stress at the outerface of the tremie
Average vertical shear stress at any distance r in the borehole
Height (general)
Height of concrete column above the tip of the tremie
Critical height b~yond which the concrete pressure does not increase
Height of column of concrete in a hole
Height of column of mud in a hole
Hydraulic head loss in the tremie and in the borehole respectively due to the flow of concrete in a section ~i of the hole
Total head loss due to concrete flow in a section ~£ of the hole
Stiffness index
Settlement index
Hydraulic gradient
Constant used in the analysis of the flow of the concrete in a borehole
Coefficient of earth pressure at rest
Coefficient of earth pressure (general)
Constant (general)
Constants function of the viscosity of concrete and roughness of the tremie and the borehole respectively

•
Symbol
L,.t
N
N Y
N c
N q
N' q
n
P v
p
Q
TyPical Units
ft
it
ft
psi
psi
psi
psi
psi
psi
psi
psi
lbs
lbs
Definition
Length (general)
Length of shaft where soil does not resist deformation
Length of a section
xxiii
Penetration test blow count (general)
Bearing capacity factor (friction)
Bearing capacity factor (cohesion)
Bearing capacity factor (overburden)
Bearing capacity factor (general for deep foundations)
Ratio of the diameter of the hole to the diameter of the tremie
Hydrostatic pressure at the bottom of the tremie
Hydrostatic pressure at the surface of the concrete column
Horizontal pressure
Peak stress in the penetrometer
Vertical pressure
Effective normal pressure on the failure plane
Effective horizontal pressure
Effective vertical pressure
Total load on top of shaft
Load carried by periphery of shaft

xxiv
Symbol Typical Units
Qt lbs
Qz lbs
q psi
3 qc ft /sec
qo psi
qs psi
qsz psi
qt psi
qu psi
R in
R c ft/hr
r in
r in 0
SPT
s psi
T of
T psi/in c
VI' V2 ft/sec
Vh ft/sec
v ft/sec
Definition
Load carried by tip of shaft
Total load in shaft at a point located a distance z from top of shaft
Confining pressure
Rate of flow of concrete in borehole
Effective pressure in the soil at the level of the tip of the shaft
Uni~ shear stress developed at the periphery of the shaft (general)
Unit shear stress developed at the periphery of the shaft and at a depth z
Ultimate tip resistance
Unconfined compressive strength
Radius of borehole
Rate of placement of concrete in borehole
Radius at any point in the borehole
External radius of tremie
Blow count of Standard Penetration Test
Shear strength of soil
Temperature of concrete
Stiffness of cushion
Average velocity of flow of concrete in the tremie and in the borehole
Velocity of hammer at impact
Velocity of sound in drilling rods

•
Symbol
W
w s
w z
z
Q'avg
B
y
y
Typical Units
psi
Ib
Ib
ft
ft
ft
ft
ft
Ib/ cu ft
Ib/cu ft
Ib/cu ft
Ib/ cu ft
Ib/cu ft
Ib/cu ft
degrees
degrees
degrees
xxv
Definitions
Pressure due to the weight of a concrete column
Weight of drilling rod
Weight of hammer
Compression in shaft due to load
Vertical movement of shaft at point z
Vertical movement at bottom of shaft
Total vertical movement of top of shaft
Vertical coordinate from top of shaft to a point in the shaft
Correlation factor between the shear strength of a stratum to the side shear resistance developed in the stratum
Shear modulus of soil
Unit weight of material (general)
Effective unit weight of soil
Unit weight of concrete
Unit weight of mud
Unit weight of water
Angle of shear resistance between the soil and the shaft
Apparent angle of internal friction of soil
Effective angle of internal friction of soil
Constant used in the relation between the friction angle and the void ratio of sand
xxvi
Symbol Typical Units Defini tions
.-Coefficient of volumetric strain of the concrete
ft/1b C EA
\) Poisson's ratio
0" psi Normal stress
0" psi Effec tive normal stress
O"r psi Radial stress
0"1,0"2 psi Major and minor principal stresses
T psi Shear stress
..

, .
'-
CHAPTER I. INTRODUCTION
GENERAL
Engineering is the "art and science by which the properties of matter
and the sources of power in nature are made useful to man in structures,
machines, and manufactured products" (Webster). While an "art" is a
skill acquired by observation and intuition, a "science" is a skill
acquired by a systemized knowledge, and a logical analysis of the cause
and the effect.
The application of engineering skills can only be perfected if these
skills are based on scientific foundations. In its development, engineering
has followed various courses. Many of the engineering techniques started
as a pure art and were later supported by a scientific analysis while
several others were developed from pure abstract logic. Engineering
cannot progress as an art, for if the scientific explanations of applied
skills are not exp~ored, those skills may result in the misuse of material
either by the production of an unsafe structure or by the waste of material
due to unnecessary conservatism.
The art and the practice of deep foundation engineering have constantly
progressed at large paces leaving the slow paced supporting scientific
theories a considerable distance behind. Old methods of construction are
continuously improved and new methods are continuously created while few
theories are being advanced on the behavior of deep foundations constructed
by the new methods.
I

2
Drilled shafts, interchangeably called "drilled piers," "drilled
caissons," or "bored piles," are only one manifestation of this phenomenon.
In this case, the application of modern drilling equipment to the construction
of drilled shafts has not only revolutionized the methods of construction of
these shafts but has also made them successfully competitive with other
types of foundations. Situations where drilled shafts are advantageously
replacing driven piles and shallow foundations are becoming more common.
The adaptation of drilled shafts to most types of soils will bring them into
more widespread use in the coming years because of their evident advantages.
However, as the new methods of construction are applied, a better under
standing of the behavior of drilled shafts constructed by these methods is
needed to make a better use of these shafts and bring more confidence in
their design.
EVOLUTION OF DRILLED SHAFTS AND RELATED RESEARCH
The multitude of the existing methods of construction of drilled
shafts is the product of a long process of evolution of construction
techniques. A detailed historical account of the development of drilled
shafts has been reported by various authors (Greer, D. M., 1969; O'Neill
and Reese, 1970). To include the work of these authors here seems
repetitious and unnecessary. However, an evaluation of the research
needed on drilled shafts at this stage requires a brief recapitulation
of the major steps in the evolution of modern drilled shafts.
. .
•

" . The first drilled deep foundations were hand drilled. The "Chicago
Caissons" or "Chicago Wells" used to found the first skyscrapers on the
"hardpan" layer of the city of Chicago are the best known examples of
hand-dug piers. These caissons used wood lagging to protect the walls of
the hole and the lagging was left in the hole after concreting. The "Cow
Caissons" that followed later in the first decades of this century were
also hand drilled but used steel casings of various diameters to form a
step tapered hole. The casings were extracted one section at a time
during the concreting process.
3
Mechanized drilling reported to be first initiated in Texas used a
horse driven helical auger to drill piers past the depth of soil affected
by seasonal variations. It was not until about the time of the second
World War that steam and fuel powered engines were used to drill large
diameter shafts for the foundations of buildings and power poles. The
effectiveness of mechanically drilled shafts resulted in their widespread
use in various parts of the world and particularly in areas where the soil
permitted the drilling of free-standing holes, such as in Texas, California,
Colorado, Illinois, and some parts of Canada and England, where stiff clays
prevail to a considerable depth below the surface. These same areas
contributed most of the research done to date on the behavior of drilled
shafts in clays (Meyerhof and Murdock, 1953; Dubose, 1955; Whitaker and
Cooke, 1966; O'Neill and Reese, 1970). A comprehensive survey of the
research done on drilled shafts in stiff clays is presented by O'Neill
and Reese, 1970.
4
Free-standing holes can be drilled in sandy soils above the water
table if the sand is cemented or is moist enough to develop shear strength
from capillary water pressures. However, few drilled shafts have been
built in such soils and there is little information available on the
behavior of drilled shafts cast in such soils.
The use of drilled shafts in free-standing soils offers evident
economical advantages over other types of foundations. However, the cost
of construction of drilled shafts can increase excessively when penetration
of water bearing sand and gravel layers is required. Until recently,
unstable layers were avoided and were only penetrated when bearing of the
shaft on an underlying competent layer was desired. The slurry displacement
method of construction has been employed recently in drilled shaft construction.
The layers of soil which formerly caved are maintained in place by the
slurry and these layers can be counted on for transfer of load by side
friction. This recent practice resulted primarily from individual efforts
of the drilling contractors who innovated several procedures to construct
drilled shafts in such soils. The drilling firms I.C.O.S. and Soletanche
developed and patented drilling equipment for the new procedures. Most of
the new methods of construction are still an art and considerable research
is needed to analyze and improve those methods. On the other hand, the
emergence of the new techniques brought forward new variables in the behavior
of drilled shafts and a comprehensive study is needed to assess the effects
of these variables.
. .

~ . Drilled shafts are also constructed in shales and weathered rock for
the purpose of developing a desired bearing capacity. The side friction
and tip resistance that can be developed in those soils has not yet been
evaluated.
Drilled shafts seat~d or anchored in rock penetrate very often layers
of expansive clays and there has not yet been proposed a comprehensive
analysis of shafts subjected to expansive pressures. Research on drilled
shafts is needed in the following areas:
1. The study of behavior of drilled shafts in granular soils,
2. The analysis and improvement of methods of construction,
3. The analysis of variables introduced by the different methods of
construction,
4. The study of behavior of drilled shafts iu expansive clay
layers, and
5. The study of load transfer in very stiff shales and soft or
weathered rock.
Research in the areas listed above is considered of immediate
importance. As the state of the art concerning drilled shafts advances,
new areas of research will be exposed in both the areas of construction
and analysis of behavior. Examples of such future possibilities are a
study of shafts belled at more than one level and the chemical interaction
of concrete with clays of various mineralogical composition.
5

6
In the following section, some of the procedures used to construct
drilled shafts are described with a particular emphasis on the procedures
used in caving soils. This description covers only the general principles
of construction, and many details are left out. There are as many minor
modifications to these procedures as the existing number of drilled shafts
contractors.
METHODS OF CONSTRUCTION OF DRILLED SHAFTS
Before any of the methods of construction is described, a clarification
of the definition of "drilled shafts" is needed. The terms "drilled shafts"
or "drilled caissons" are applied to the type of deep foundation formed by
casting concrete in a hole drilled in the ground. A "belled shaft" is a
drilled shaft that has an enlargement formed at its bottom. When steel
reinforcement is used in the concrete of the shaft it may consist of a
cage of steel bars, a rolled steel section, or an outer steel casing (shell).
The construction of drilled shafts, as known today, may be considered
to be the product of evolution of two types of deep foundations: caissons
and cast-in-situ piles. While the construction of drilled shafts has kept
some of the features of the construction of large caissons, several types
of cast-in-situ piles may be claimed to belong to the drilled shaft
category defined above. Nondisplacement, cast-in-situ piles constructed
by driving an open-end pipe pile, drilling the inner soil plug out, and
filling the hole with concrete deserve, in the opinion of the authors, the
. .

7
appelation of "drilled shafts" whether the steel casing is withdrawn from
the ground or not. The construction of certain types of cast-in-situ piles,
such as the Franki piles, requires the displacement of a volume of soil
equal to the volume of the pile. These piles, being basically displacement
piles, are eliminated from the drilled shaft designation. Some of the
literature classifies separately nondisplacement cast-in-situ piles and
drilled shafts. This separate classification is based on the idea that
more than one pile and a pile cap are employed to support one column load
while a drilled shaft is usually built coaxially with the loading column.
However, this difference in the terminology is not of any practical
engineering significance, and in this study no distinction shall be made
between the nondisplacement, cast-in-situ pile and the drilled shaft as
defined above.
Because the methods of construction have a primary influence on the
behavior of a drilled shaft, it seems appropriate to classify drilled
shafts by their various methods of construction. In this study, drilled
shafts shall be classified under two categories:
a. Shafts built by the dry process, where the drilling and the
concreting phases are executed in a dry hole,
b. Shafts built by the wet process, where either one or both of
the drilling or concreting phases are executed in a hole
containing a drilling fluid.

8
Different construction techniques are included in each of these
categories, and, therefore, a unique behavior of all the shafts under one
category cannot be expected.
Shafts Built by the Dry Process
Drilled shafts under this category are constructed without the use of
drilling fluid. The walls of the hole may be either free-standing or may
be supported by a steel casing.
1. Free standing holes: (Fig. 1.1). These holes may be drilled in
naturally stable soils such as stiff clays, cemented sands and silts, moist
sands above the water table, or in artificially stabilized soils. Stabili
zation of caving sands may be achieved by a lowering of the water table or
by grouting. Bentonite grouts and chemical grouts are reported to have
been used successfully in stabilizing large masses of sand before drilling
and belling was achieved (Glossop and Greeves, 1946; Polivka, et al., 1957).
Grouting usually reduces the permeability enough to allow a completely dry
operation.
In some particular situations, a technique similar to that used in
installing sand drains is used in drilled shaft installation. A hollow
stem, continuous flight auger is advanced in the ground to the full depth
of the drilled shaft and, as the auger is removed, cement grout is injected
through the stem to replace the removed soil.
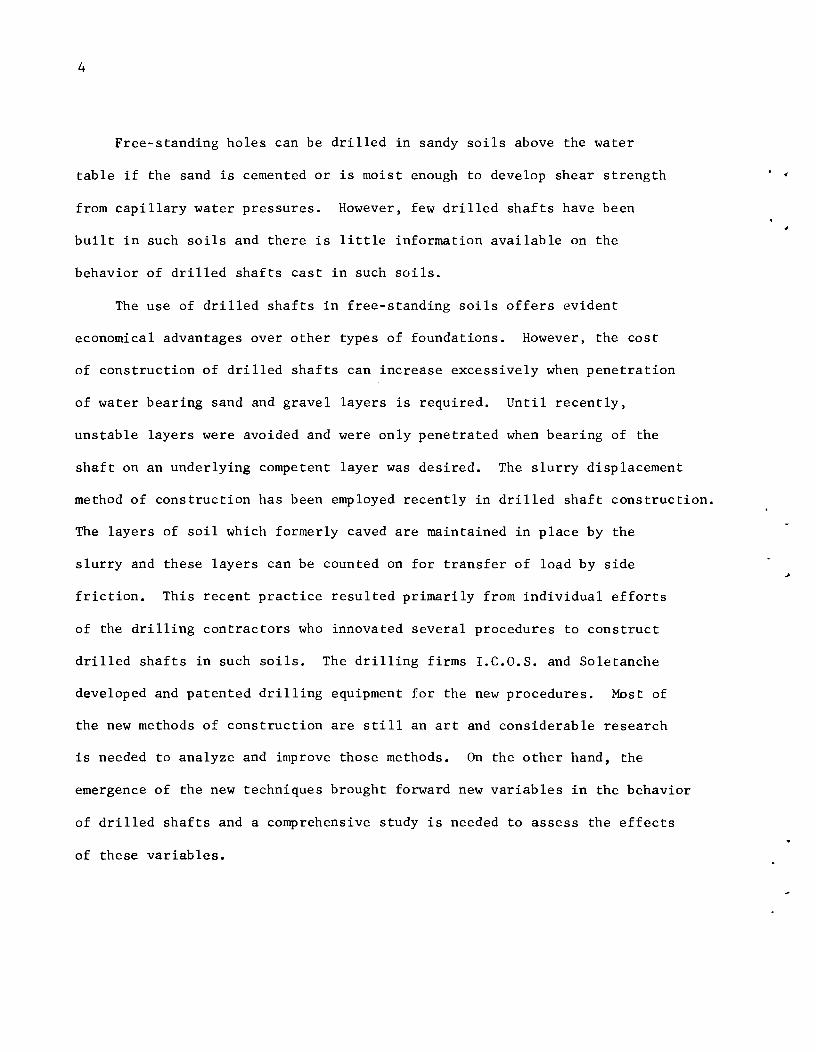
2. Cased holes: (Fig. 1.2). When an unstable sand layer is under
lain by a layer of clay, a casing may be driven by impact hammer or by a
vibrator through the sand layer and sealed in the impervious clay layer.

a. Naturally Stable Soils
b. Stabilization of Water-Bearing Caving Sand by Well Points
.. " ... ;:' o
.. C/).f ..
... .!!,. ~
" J:!" fC/)
" ".., .., ..... ..., ..,-
. . .. .. :- ..
:: I :. ',0" • . .. : C!J.~ • .. - ' . • CS ..
c. Stabilization of Caving Sand by Grouting
1 ... ?
t:a , 0" .. c;; ., ., ...... .. ... ., .....
d. Drilling in the Dry e. Concreting in the Dry
Fig. 1.1 Dry Drilling and Concreting, Without Casing
',' . .. " . • . .
'\ \
~
:,1
a. Driving of Casing and Sealing in the Clay
-!-0 0
- , . .. · , · " I . · . · , · · · .
b. Drilling and Cleaning of Casing
NOTES: 1. The extraction of the casing is optional
· I · ! · , . • ,.
go· · . ;. · . .'. .,.:~ . . , .
c. Concreting in the Dry
d. Extraction of Casing
2. Concreting in the dry may be possible without sealing of the casing in the clay whenever the water table is below the tip of the shaft
Fig. 1.2 Dry Drilling and Concreting with Preinsta11ed Casing
,,' . '. ' . . )'
" -'. t l
;::\ .~
...... o
The soil plug may then be drilled out by a drilling bucket, a helical
auger or a hammer grab. In certain situations the soil may be removed by
jetting and any accumulated water removed by a bailing bucket. Concrete
is then cast in the hole. The casing mayor may not be withdrawn.
Dry construction is preferable whenever possible to wet construction
because the bottom of the hole may be cleared and inspected, and because
the danger of soil or concrete contamination by the drilling fluid is
eliminated.
Shafts Built by the Wet Process
This procedure uses essentially water or a drilling mud (slurry) to
protect the walls of the drilled hole. In certain situations the slurry
may serve the purpose of carrying soil cuttings out when jetting, rotary,
or percussion drilling is used. In such instances, the mud is then
circulated through settling pits to free it from its suspended solids.
Steel casing may be used in conjunction with this process either to
overcome difficult drilling situations or to permit concreting in the dry.
1. Uncased holes: (Fig. 1.3). This method consists of drilling
the hole with the use of a drilling fluid, which is usually a bentonite
mud, and then casting tremie concrete to displace the mud. This method
shall be referred to in this study as the slurry displacement method and
shall receive a special treatment in the following chapter.
2. Cased holes: Situations where excessive groundwater pressure
exists which cannot be balanced by the mud pressure require the use of a
casing to protect the walls of the hole. The casing may then be driven,
11

Bentonite J6II" - ;
Slurry~~ -:
a. Drilling under Slurry
., ! 1---------t:II:I---t~ · \. · . · .. 'I" .. _
· ' . · .' · .
b. Setting Sealed
.. .' . , .
" I :
'. , '.'
Tremie after Cleaning of the Bottom of Hole
• f -
.. . •
Concrete Bucket
. ~. · . . . • 4 ~ · . · * •• ,
t " . , . . , • . . : . · : . .
· .. ,
c. Placing Concrete and Unplugging the Tremie
d. Finishing Concreting
Fig. 1.3 Wet Drilling and Concreting, Without Casing (Slurry Displacement Method)
vibrated, or sunk by jetting in the soil. If the casing cannot be sealed
in a watertight formation, drilling mud or soil-water slurry may be used
13
to prevent "blowing" of the bottom of the hole. Tremie concrete is then
cast to displace the mud, while the casing is being withdrawn (Fig. 1.4).
In certain exceptional cases of large underground water flows, the casing
may be left in the ground to prevent intrusion of ground water or soil into
the concrete. The penetration of layers of gravel and large boulders may
be very difficult. The "Benoto" drilling procedure, designed to penetrate
such layers, makes use of horizontal oscillations and vertical jacking to
drive a thick walled casing while a hammer grab excavates the soil. When
large boulders are encountered, chisels or chopping buckets may be used
to open a way for the casing. The casing used in this process is very
expensive, and in the case of excessive groundwater flow, a thin metallic
skirt is inserted inside the casing, which is pulled out during concreting.
In certain cases where waterbearing, loose sand is encountered,
bentonite mud can be worked with a helical auger in the sand to form a
column of mud and sand through which the casing is inserted and the soil
augered thereafter. This procedure is commonly called the "mudding-in"
procedure.
Casings are also used in combination with the wet process where a
concreting operation in the dry is desired. In this process, a steel
casing is inserted in a hole stabilized by a drilling fluid and sealed in
an impervious clay layer. The fluid is then bailed out and drilling
continued in the dry if desired. After inspection of the bottom of the

a.
~.: I , -=-
• t .
"
",
Impact or Vibratory b. Driving of Casing
Drilling under Water
. · · . • .. ' · "
c.
, , It '.~ •
Tremie Concreting
.....
Concrete Bucket
d. Extraction of the Casing
Fig. 1.4 Wet Drilling and Concreting, with Preinsta11ed Casing
"
. , . , }'
','. !,I .. \ !: , , It. 1 I • · : · . :i .. ·. · '

hole, concrete may be cast in the dry. The casing is removed (Fig. 1.5)
when the concrete has reached an appropriate level in the hole. This
method of construction is commonly used by drilling contractors in Texas.
A complete description of this method and a comprehensive analysis of the
behavior of shafts built by this method have been reported by O'Neill and
Reese, 1970; Barker and Reese, 1970; and Welch and Reese, 1972. In the
absence of an impervious layer, chemicals may be injected to stabilize the
bottom of the hole and allow the sealing of the casing.
SCOPE Of THIS STUDY
15
This study is primarily concerned with the analysis of the behavior of
drilled shafts cast in sandy soils by the wet and the dry procedures and
without the use of a casing. The study is based on the analysis of the
results of axial load tests on five drilled shafts constructed in soil
profiles containing sandy soils. All the test shafts were instrumented at
different levels with "Mustran" load cells developed at the Center for
Highway Research of The University of Texas at Austin (Barker and Reese,
1970).
In Live Oak County, Texas, two drilled shafts were cast using the dry
process in slightly cemented sands above the water table. In the Houston
area three other shafts were cast using the slurry displacement method in
sands below the water table. Several axial load tests to failure were
performed on each shaft. The instruments were read with a high speed

Benfonl1e . Soif-Cobesive Soil - -::. _ -.=---
"Slurry - - " - .- - -
"" .' .'~ '.".'.'.- .
....... ~ ;;,-;--"-:':'-" .,-,-~ .. "" __ A __ ... _
CoI'>isive Soil
a. Drilling under Mud Slurry
Cohesive Soil
- -.
-;: _ : ...... A • .. ~ .. ,. ~ ~ .~
:11 . -. :1 _
Cohe.ive Soil
Coh~siv,e Soil ",'.'
b. Sealing casing and Bailing Slurry Out
Cohesive Soll:- ."
","",,-:-:-~~;-:-;-'~;-..-.....,..,C"'il'" 'l~''=-~:'''''=;''~-:--····.··-~
i~'~i~~:~'~~i;\ ::. ...... </.:.~.:;:
d.
Cohesive Soil "
Placing Concrete
••• #. . ' ..
! IL":=-~':"'-:-'-'-'-'-'-
Cohnive Soil •• -
COhesive Soil
Level of Fluid Conerele
Drilling Fluid Forced from
( Spoce 8el" •• n Cosing and Soil
Fig. 1.5 Wet Drilling and Dry Concreting, with Casing (After O'Neill and Reese, 1970)
:it ...... : ,': '::. ~', .<-:. ," "Ii
. "
c. Drilling and Belling Below Casing
e. Extracting Casing
digital recording system at each increment of load. The data were then
analyzed and interpreted to determine design factors related to the
behavior of shafts built by these procedures.
The study based on these tests will cover the following:
1. A review and an analysis of the slurry displacement construction
method, based on available literature, field observations, and
laboratory tests.
2. An analysis of the behavior of drilled shafts constructed in
cohesion1ess soils.
3. A description of the soil investigations, including in situ soil
tests and laboratory tests.
4. A description of the instrumentation, installation and testing
of the drilled shafts.
5. A presentation of the results expressed in terms of load
settlement curves, load distribution curves, load transfer
curves, and correlations between the load transfer and the
measured properties of the soil.
6. Application of the results to future designs, and recommendations
for improvements in construction procedures.
17

!!!!!!!!!!!!!!!!!!!"#$%!&'()!*)&+',)%!'-!$-.)-.$/-'++0!1+'-2!&'()!$-!.#)!/*$($-'+3!
44!5"6!7$1*'*0!8$($.$9'.$/-!")':!

CHAPTER II. THE SLURRY DISPLACEMENT METHOD
HISTORICAL
The first use of water-based mud for drilling purposes is attributed
to the oil industry. Some of its first applications in civil engineering
were in the drilling of boreholes for soil exploration and as a lubricant
in the sinking of large caissons. The use of drilling muds in the con
struction of bored piles did not start until the second quarter of this
century, when the development of mechanized drilling necessitated the use
of a fluid to support the walls of the hole during drilling. Previously,
this support was provided by a casing or by strutting in hand-drilled holes.
The construction by the slurry displacement method of bored piles
was first reported by the Italians (Veder, 1953). Piles constructed by
this method were not considered to constitute good bearing elements. It
was believed that debris at the bottom of the hole eliminated the tip
resistance and that the bentonite mud acted as a lubricant between the
shaft and the soil and destroyed the side friction. Furthermore, the
quality of the tremie concrete and of the bond between the reinforcing
steel and the concrete were not considered structurally dependable.
However, this first application of the slurry displacement method was the
start of the rapid development of techniques for the construction of
concrete diaphragms for cut-off walls that took place in the 1950's.
During that period, several special drilling machines, used in the
drilling of continuous slurry trenches, were designed and patented and in
19

20
less than a decade a large number of concrete diaphragms were constructed
in Europe (Chadeisson, 1961a). Much of this work was reported in several
papers at the International Conference on Soil Mechanics and Foundation
Engineering in Paris (Chadeisson, 1961a; Barbedette and Beria, 1961; Edison
Group, et ~., 1961).
The slurry displacement method continued to be used in the construction
of drilled shafts, but engineers remained very skeptical as to the bearing
capacity of such shafts. During the last decade, a number of axial load
tests on drilled shafts constructed by slurry displacement have been reported
(Chadeisson, 1961b; Burland, 1963; Fernandez-Renau, 1965; Komornik and
Wiseman, 1967; Hager, 1970; Farmer, et al., 1970). The reported performance
of these shafts was comparable and sometimes considerably better than that
of shafts constructed by conventional procedures. However, the behavior of
shafts constructed by the slurry displacement technique has received up to
the present little systemized analysis. The lack of such an analysis and
the complex nature of these deep foundations left civil engineers puzzled
as to the degree of confidence to be allotted to shafts constructed by
slurry displacement. It is one of the aims of this research to analyze
various aspects of the slurry displacement method.
THE DRILLING MUD
In the oil industry, drilling mud is the subject of a very specialized
study, and the problems encountered in deep well drilling are intricate.
. .

Some of these problems deal with the effects of high pressure, high
temperature, and prolonged periods of drilling on drilling mud and hole
stability. Such problems are practically nonexistent in the "surface"
drilling required for slurry trenches and bored piles. This fact has led
engineers to believe that no special care should be taken with drilling
muds used for civil engineering purposes. Schneebe1i (1971) reports the
words of an Italian engineer talking about mud: "This is not a drilling
mud; this is dirty water." However, the collapse of boreholes and the
21
poor execution of drilled shafts remain common but unfortunate events on
drilling sites. Many such failures can be prevented by a minimal knowledge
of the basic principles of drilling muds. A brief and elementary report on
the behavior of drilling muds is, therefore, presented in the following
paragraphs.
The drilling mud used in the construction of bored piles is a water
base mud that consists of three phases:
1. The liquid phase or water,
2. The colloidal fraction which is the reactive portion, and
3. The inert fraction which consists of sands, weighting material,
and other inert solids (API, 1969).
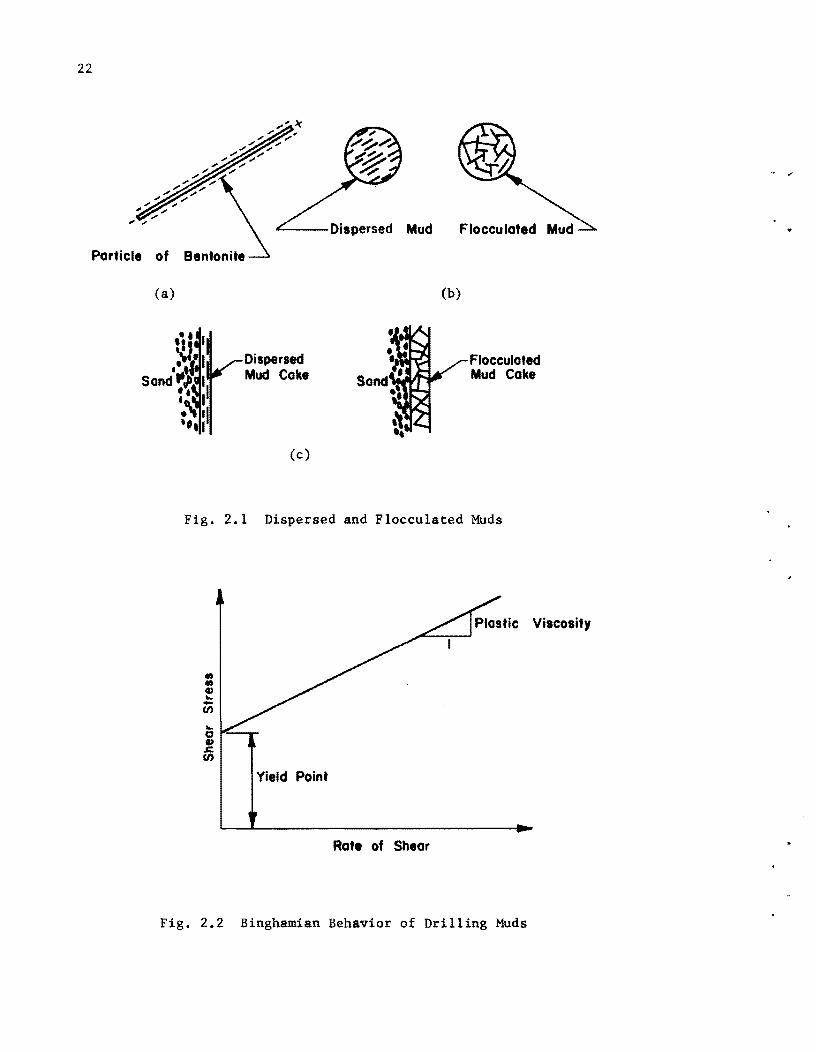
The colloidal fraction of clay consists of sub-microscopic particles that,
due to a charge deficiency in their molecular structure, generally carry
negative charges over most of their surface area (Fig. 2.1a). This
property of clays and their ability to hydrate allow them, when added to
22
Particle of
(a)
'---Dispersed Mud
Dispersed Mud Coke
(c)
(b)
Flocculated Mud Coke
Fig. 2.1 Dispersed and Flocculated Muds
... o ., s:. U)
Yield Point
Ratt of Shear
Fig. 2.2 Binghamian Behavior of Drilling Muds
. "
.. .
23
fresh water, to increase the viscosity of water and to suspend inert solids
such as sands and silts. Bentonite, which is mainly composed of sodium
montmorillonite, is the principal source of drilling clays. Clays and
clay shales, encountered during drilling, are also used when they can be
conveniently mixed and dispersed.
In the construction of drilled shafts, the drilling mud serves the
main function of supporting the walls of the hole. In connection with this
function, the following properties of the drilling mud are of interest.
Wall Building and Filtration Control
Where a pervious unstable soil layer is penetrated and the pressure of
the drilling mud is higher than the pore pressure of the soil formation,
water tends to flow into the formation. This flow filters the mud and
causes the formation of an impervious mud "cake" on the surface of the
hole. The cake prevents further flow of the mud and provides a sealing
membrane that allows the application of the mud pressure on the pervious
formation (Fig. 2.lc). A well dispersed clay allows the formation of a
thinner and a more impervious cake than that formed by a flocculated clay
(Fig. 2.lc). A cake does not usually form on clay layers because of their
low permeability and the small hydraulic gradient of the mud. This
hydraulic gradient may be greatly increased by an osmotic pressure created
when clay shales of a high salt concentration are penetrated. However, the
hydration of the shale causes its softening and sloughing before the mud
cake is formed.
24
Viscosity
Viscosity may be termed as the resistance of a fluid to flow. Water
base drilling muds usually exhibit the characteristics of a Binghamian
fluid (Fig. 2.2) having a threshold resistance (yield point) and a plastic
viscosity. The yield point is equivalent to the static shear strength of
the mud, a strength that develops from attractiona1 forces between the
clay particles. While these forces are partially destroyed by stirring, the
thixotropic properties of clays allow the forces to build up again when the
mud is given time to rest. The plastic viscosity depends mainly on the
viscosity of the water and on the friction between the solid particles in
suspension. The two components of viscosity are practically independent.
While the addition of water reduces the plastic viscosity by reducing the
concentration of the solids, a chemical dispersing agent is required to
reduce the yield point by reducing the attraction between particles. If
the drilling fluid has no viscosity, cuttings would not be lifted nor would
solids remain in suspension. Therefore, the viscosity is a very important
property of drilling fluids.
Density
A 5% bentonite mud has a specific gravity of about 1.04 which may be
too small to prevent the collapse of the hole. However, the density of mud
can be greatly increased if silt, sand, and weighting material (Barite)
are in suspension in the mud. In the construction of foundations the
weighting of the mud for stability purposes is an extreme measure taken
when unusual artesian pressures are encountered or when arching is not

. . effective such as in drilling large diameter holes. Such weighting
procedures (density> 1.4) have been reported by DuGuid, et al. (1971)
in connection with the construction of slurry trenches.
Of all the mud properties mentioned above, the wall-building capacity
is the most important. This property is controlled by the following
chemical characteristics of the mud.
~
A suspension of bentonite in fresh water produces a satisfactorily
dispersed alkaline solution having a pH of 8.0 or more. A lower pH
usually results in mud flocculation and the formation of a bulky, pervious
wall cake.
Hardness of Water
The presence of divalent magnesium and calcium ions in hard waters
reduces the dispersability of the mud. Excessive hardness is treated by
soda ash and, in the case where a calcium mud system is used, other
chemicals such as chrome lignosulfonate are added to disperse the mud.
Unlike other dispersive agents that disperse the mud by creating repulsive
charges, the chrome lignosulfonates improves the dispersion by physically
separating the clay particles (API, 1969).
Salt Concentration
Salt water is a very effective flocculent of bentonite muds.
Attapulgite clays are very successfully used in salt waters. However, in
certain cases, a bentonite mud premixed in fresh water may be used when
salt contamination is not excessive.
25

26
Contamination
Contamination and flocculation of the mud can result from the penetration
of formations containing gypsum or lime, the use of contaminated water, and
the reuse of cement-contaminated mud from a previous construction. Regen
eration of the mud or the use of a calcium mud system are two of the measures
to take when such contamination problems are encountered.
STABILITY OF THE HOLE
The sizes of drilled shafts range from a few inches to over ten feet in
diameter and from a few feet to over 100 feet in depth. The stability of
such holes depends greatly on the size of the hole, the formations
penetrated, the mud, and the drilling technique used.
Size of the Hole
The pressure required to keep a hole open is dependent on the diameter
of the shaft. In an infinitely large hole, the horizontal pressure required
to stabilize the walls of the hole is equal to the sum of the active earth
pressure and the hydrostatic pore pressure. As the diameter of the hole
decreases, this pressure is reduced by the ring-arching action. Approximate
solutions to this problem indicate that only a small fraction of the hydro
static water pressure is required to stabilize the hole (Terzaghi, 1943).
As an example, a ten-foot-diameter hole in dry sand exerts at a depth of
100 feet a pressure of about 345 psf on the protecting casing. The pressures
in an average size hole (two to five feet) are considerably smaller.
. .
27
Soil Formation
A hole in clay with a small diameter cannot fail if the clay has a
finite shear strength (Terzaghi, 1943) and if the clay does not have "quick"
properties. A hole in perfectly cohesionless sand cannot possibly stand
open because an element of sand at the surface of the hole does not possess
any shear strength. However, the presence even of weak, cementing calcareous
and siliceous bonds in natural sands and the existence of a thin mud cake
when drilling under mud reduce the earth pressure and make the stability
of the hole mainly dependent on the balancing of the hydrostatic pressure
of the ground water.
The collapse of holes in clay is usually due to a softening of the
clay by absorption of the water. In a dry hole, the water may be provided
by the ground water flowing into the hole, and in a wet hole, the water is
readily accessible from the mud. This softening process is greatly
accelerated in both cases by the existence of fissures.
Drilling Mud
The stabilizing effect of mud in the construction of slurry trenches
has been the subject of continuous, polemic debates since 1963 (Nash and
Jones, 1963; discussions by Veder, Jones, Morgenstern, 1963; Morgenstern
and Amir-Tahmasseb, 1965; Duguid, ~ al., 1971; Schneebeli, 1971). A
discussion of these debates is not relevant to the stability of drilled
holes where the stresses have been proved to be very small and can be
balanced by a slightly weighted mud. The stability of holes drilled under
mud in expansive clays deserves, however, special attention. The
28
softening of the clay by imbibition of water from the driling mud is known
to cause the collapse of a hole by a progressive action of softening and
sloughing that may be greatly accelerated by the existence of fissures.
This water imbibition is due to an osmotic pressure gradient resulting from
a different salt concentration between the mud and the pore fluid. On the
other hand the dispersibility and erodibility of a clay are a function Qf
the ratio of the exchangeable sodium ions to the total exchangeable ions in
the pore fluid (Sherard, 1972) and a function of the dispersive power and,
therefore, the alkalinity of the mud. When an erodible formation is
penetrated, a calcium mud is recommended. When a sodium mud is used, the
addition of lime and deflocculating agents is reported to result in a
successful performance (API, 1969). In certain situations a successful
operation may be achieved if the mud is kept at a minimum pH and the
drilling is done rapidly.
Drilling Techniques
The collapse of a hole may be triggered by poor drilling techniques.
Typical examples of this problem are:
a. The erosion of the soil in the hole at the level of the surface
of the mud due to the fluctuation of that surface. This problem
can be solved by use of a short, surface casing that contains the
fluctuating surface.
b. The suction of the hole resulting from a rapid extraction of the
drilling tool.
29
c. The mechanical erosion resulting from the wobbling of the drilling ..
tool in a non-plumb hole or from careless, erratic drilling.
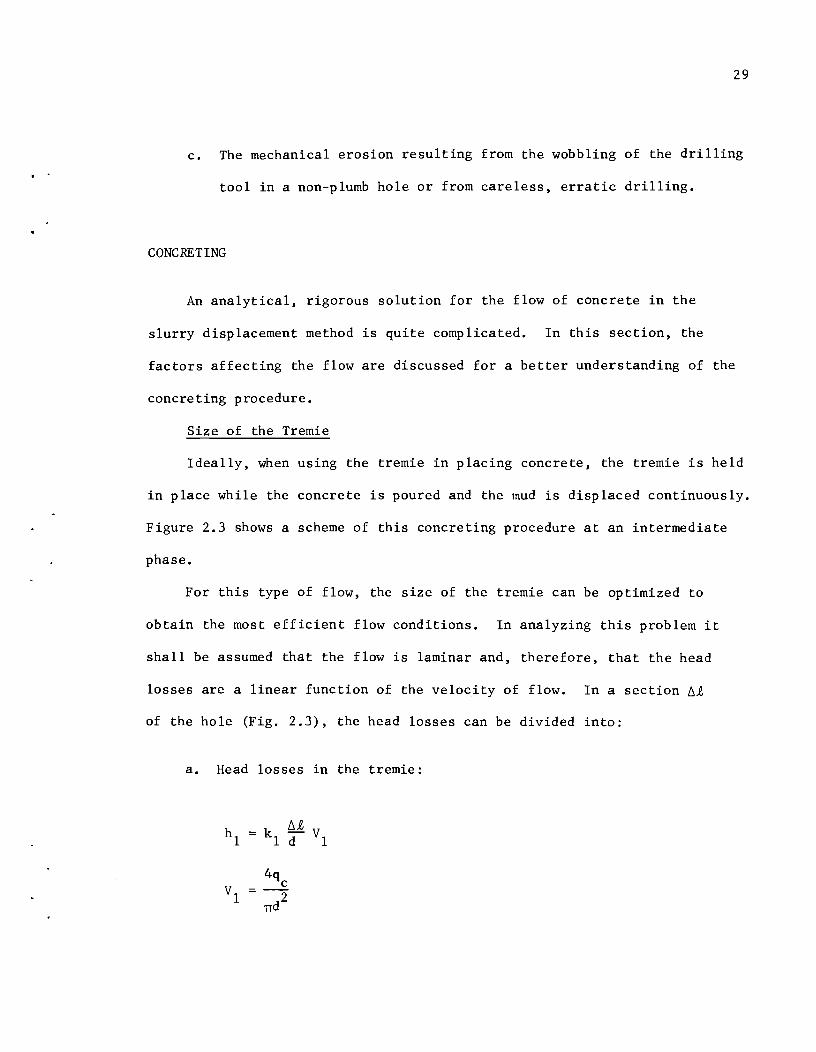
CONCRETING
An analytical, rigorous solution for the flow of concrete in the
slurry displacement method is quite complicated. In this section, the
factors affecting the flow are discussed for a better understanding of the
concreting procedure.
Size of the Tremie
Ideally, when using the tremie in placing concrete, the tremie is held
in place while the concrete is poured and the mud is displaced continuously.
Figure 2.3 shows a scheme of this concreting procedure at an intermediate
phase.
For this type of flow, the size of the tremie can be optimized to
obtain the most efficient flow conditions. In analyzing this problem it
shall be assumed that the flow is laminar and, therefore, that the head
losses are a linear function of the velocity of flow. In a section 6£
of the hole (Fig. 2.3), the head losses can be divided into:
a. Head losses in the tremie:
hI k 6£
I d VI
4q
VI c
--2 TId

30
a._ _ Section
Oh I 20K ,~
~ 16K II lL. ,I 0 12K I I >- I I 01
I I ~ Q)
8K L5 / I 4K
/ I / I
/ I /
0
~
I d
Tremie
Mud
Concrete
Through the Hole
1.6 2 3
Old
I ()(J~ : f1 O~l----r 0 0 (10 tu
• 0 , 0 0 :.°0 ..
h. Section of Thickness 61.
c. Energy of Flow Vs. Diameter Ratio
Fig. 2.3 Optimization of the Size of the Tremie

where
kl = a constant which is a function of the roughness of the
tremie and the viscosity of the concrete,
VI = average velocity of flow in the tremie,
qc = rate of flow of the concrete.
b. Head losses in the borehole:
h2 6£
k2 D-d V2
4q V
2 c
= n(D2_d2)
where
k2 = a constant which is a function of the roughness of the
tremie, the roughness of the walls of the borehole, and
the viscosity of the concrete,
V2 = average velocity of the flow in the borehole.
31
If the roughness of the walls of the borehole is considered equivalent
to that of the tremie, the total head loss can be expressed as
6h = 4qc k16£ r ( D ) 3 + --..::::.---l TT D3 d (D-d) (D+d)
32
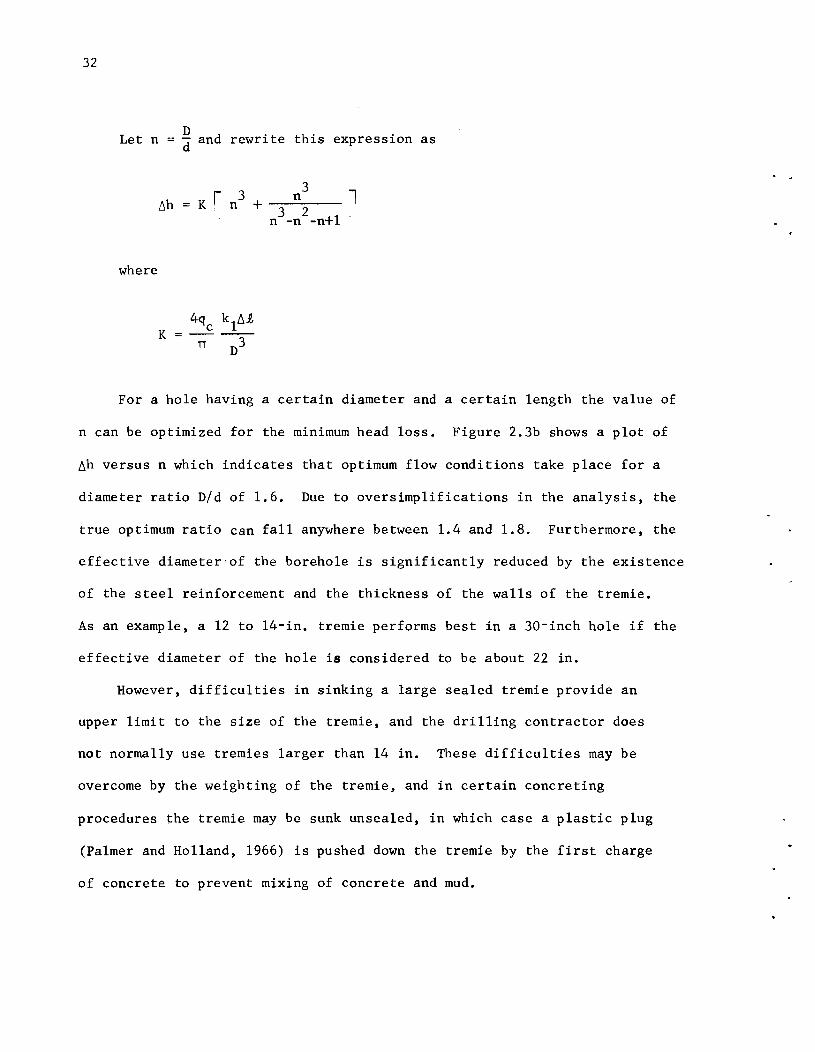
D Let n - d and rewrite this expression as
3 K r n 3 + __ n __ l
3 2 n -n -n+l
where
For a hole having a certain diameter and a certain length the value of
n can be optimized for the minimum head loss. Figure 2.3b shows a plot of
~h versus n which indicates that optimum flow conditions take place for a
diameter ratio Did of 1.6. Due to oversimplifications in the analysis, the
true optimum ratio can fall anywhere between 1.4 and 1.8. Furthermore, the
effective diameter'of the borehole is significantly reduced by the existence
of the steel reinforcement and the thickness of the walls of the tremie.
As an example, a 12 to l4-in. tremie performs best in a 30-inch hole if the
effective diameter of the hole is considered to be about 22 in.
However, difficulties in sinking a large sealed tremie provide an
upper limit to the size of the tremie, and the drilling contractor does
not normally use tremies larger than 14 in. These difficulties may be
overcome by the weighting of the tremie, and in certain concreting
procedures the tremie may be sunk unsealed, in which case a plastic plug
(Palmer and Holland, 1966) is pushed down the tremie by the first charge
of concrete to prevent mixing of concrete and mud.
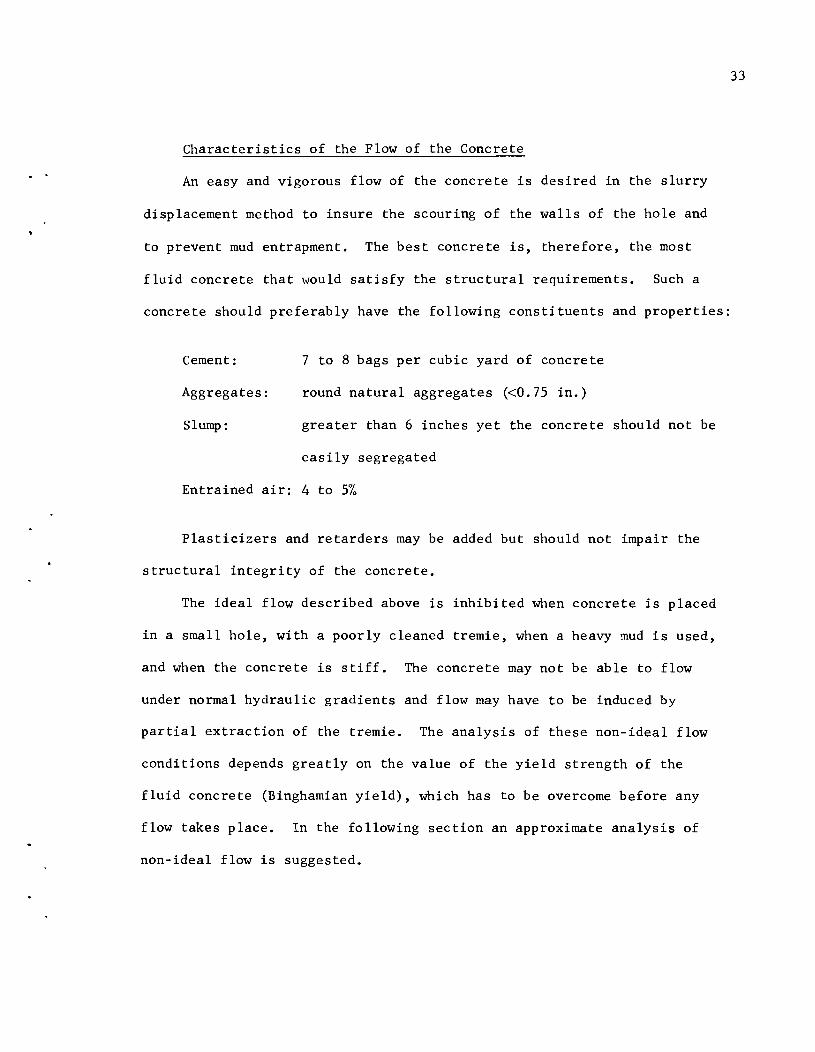
. . Characteristics of the Flow of the Concrete
An easy and vigorous flow of the concrete is desired in the slurry
displacement method to insure the scouring of the walls of the hole and
to prevent mud entrapment. The best concrete is, therefore, the most
fluid concrete that would satisfy the structural requirements. Such a
concrete should preferably have the following constituents and properties:
Cement:
Aggregates:
Slump:
7 to 8 bags per cubic yard of concrete
round natural aggregates «0.75 in.)
greater than 6 inches yet the concrete should not be
easily segregated
Entrained air: 4 to 5%
Plasticizers and retarders may be added but should not impair the
structural integrity of the concrete.
The ideal flow described above is inhibited when concrete is placed
in a small hole, with a poorly cleaned tremie, when a heavy mud is used,
and when the concrete is stiff. The concrete may not be able to flow
under normal hydraulic gradients and flow may have to be induced by
partial extraction of the tremie. The analysis of these non-ideal flow
conditions depends greatly on the value of the yield strength of the
fluid concrete (Binghamian yield), which has to be overcome before any
flow takes place. In the following section an approximate analysis of
non-ideal flow is suggested.
33

34
Figures 2.4a and 2.4b show schematically free body diagrams of a
column of concrete during concreting. In these diagrams the following
notation is employed.
r external radius of the tremie, in.; o
r radius to any point in the borehole, in.;
R radius of the borehole, in.;
H height of concrete column from the bottom of the tremie to c
the interface with the mud, in.;
PI hydrostatic pressure at the bottom of the tremie, psi;
P2
hydrostatic pressure at the surface of the concrete column, psi;
W pressure due to the weight of a concrete column, psi;
f average vertical shear stress at the outerface of the o
tremie, psi;
f average vertical shear stress at any distance r in the r
borehole, psi.
In this analysis it shall be assumed that the effects of arching in
the concrete are not significant and that, therefore, the hydraulic gradient
is constant throughout the concrete column. Figure 2.4c shows the free-
body diagram of a sectorial section of a unit height. The summation of
vertical forces on this section yields:
f r
"( 2 r 2) r 1 r -= f 0 + ________ ~o __ o r 2r Yc

. .
I
r
(b)
(a) i I
Hro
R ~ . t I i = 0 , t1;J~ PullinQ Tremie • () 0
i>o Frictionless Tremie
i>o PullinQ Tremie
i>o Stable Tremie
(d) (e)
Fig. 2.4 Schematical Description of the Flow of Concrete
35
(c)
FI

36
where
i
Let F 1
and F2 =
f
hydraulic gradient,
unit weight of concrete, lb/in3 .
r o
o r
'( 2 1 r -
2r
Figure 2.4e shows the independent plots of these functions. When the
shear stress f exceeds the yield strength of the fluid concrete, a flow of r
the concrete takes place. The plot of the function Fl shows that flow takes
place at the periphery of the tremie when the tremie is pulled upward.
Under these flow conditions, the concrete flows outward and away from the
tremie preventing any scour of the walls. In the case of an ideally
frictionless tremie, no force can develop at the walls of the tremie and
the shear stress in the concrete column is given only by the function F2
•
This case provides a better scour of the walls of the hole where the shear
stresses in the concrete are largest. When a significant hydraulic
gradient is used in conjunction with a rough surface tremie, the flow
tends to scour the walls of the tremie and of the borehole. However,
when "pumping" of the tremie is practiced the continuous motion of the
tremie reduces the thixotropic strength of the concrete around it and
forces the concrete to flow into paths in the immediate vicinity of the
tremie (Schneebeli, 1971), thus preventing the scour of the walls of the
hole.
. .
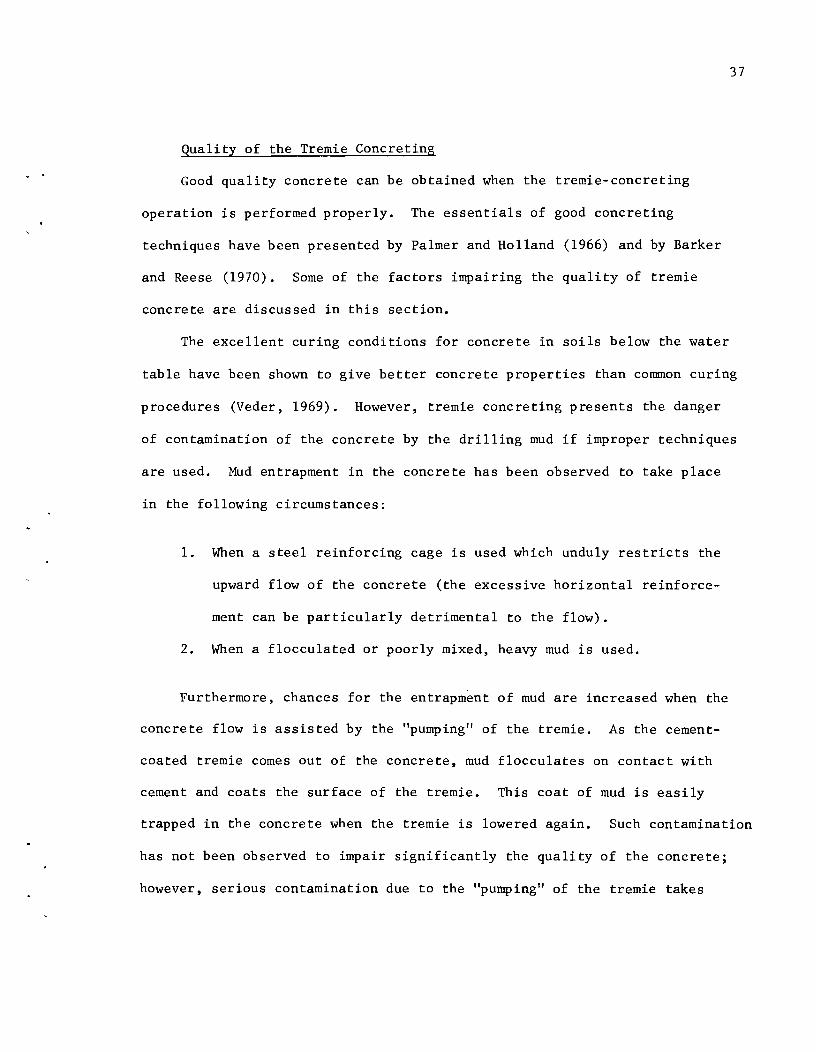
.. Quality of the Tremie Concreting
Good quality concrete can be obtained when the tremie-concreting
operation is performed properly. The essentials of good concreting
techniques have been presented by Palmer and Holland (1966) and by Barker
and Reese (1970). Some of the factors impairing the quality of tremie
concrete are discussed in this section.
37
The excellent curing conditions for concrete in soils below the water
table have been shown to give better concrete properties than common curing
procedures (Veder, 1969). However, tremie concreting presents the danger
of contamination of the concrete by the drilling mud if improper techniques
are used. Mud entrapment in the concrete has been observed to take place
in the following circumstances:
1. When a steel reinforcing cage is used which unduly restricts the
upward flow of the concrete (the excessive horizontal reinforce
ment can be particularly detrimental to the flow).
2. When a flocculated or poorly mixed, heavy mud is used.
Furthermore, chances for the entrapment of mud are increased when the
concrete flow is assisted by the "pumping" of the tremie. As the cement
coated tremie comes out of the concrete, mud flocculates on contact with
cement and coats the surface of the tremie. This coat of mud is easily
trapped in the concrete when the tremie is lowered again. Such contamination
has not been observed to impair significantly the quality of the concrete;
however, serious contamination due to the "pumping" of the tremie takes
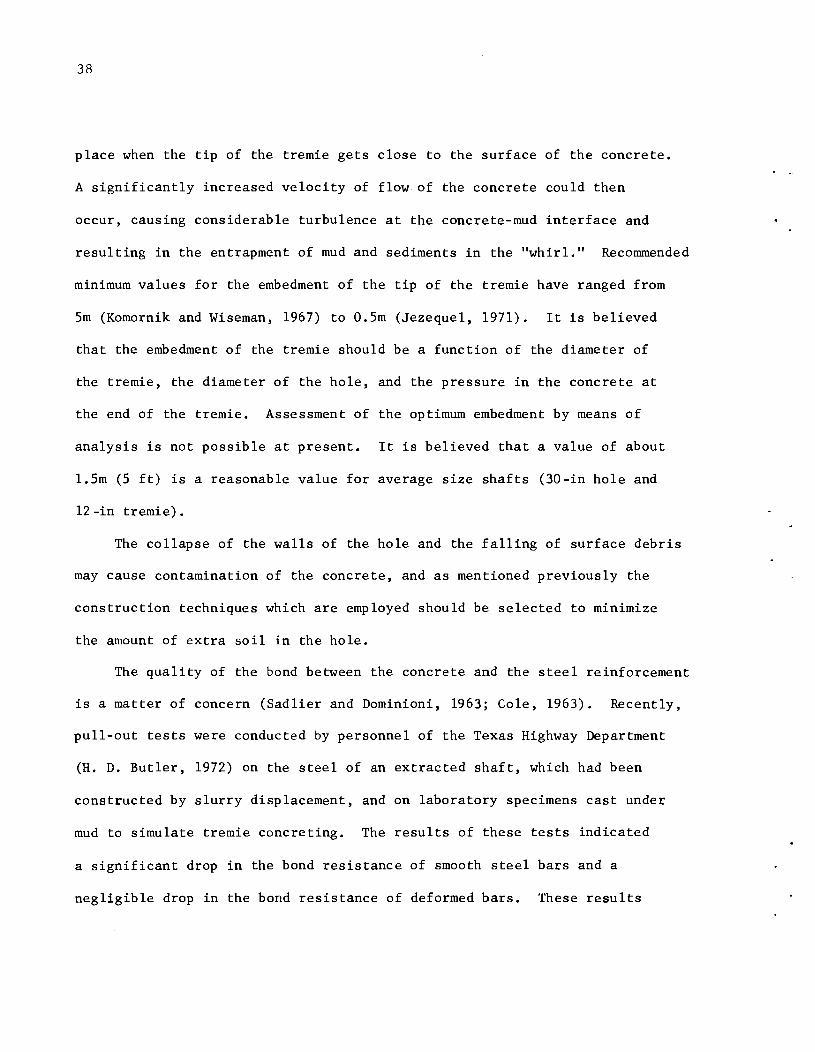
38
place when the tip of the tremie gets close to the surface of the concrete.
A significantly increased velocity of flow of the concrete could then
occur, causing considerable turbulence at the concrete-mud interface and
resul ting in the entrapment of mud and sediments in the "whirl." Recommended
minimum values for the embedment of the tip of the tremie have ranged from
5m (Komornik and Wiseman, 1967) to O.5m (Jezequel, 1971). It is believed
that the embedment of the tremie should be a function of the diameter of
the tremie, the diameter of the hole, and the pressure in the concrete at
the end of the tremie. Assessment of the optimum embedment by means of
analysis is not possible at present. It is believed that a value of about
1.5m (5 ft) is a reasonable value for average size shafts (30-in hole and
12 -in tremie).
The collapse of the walls of the hole and the falling of surface debris
may cause contamination of the concrete, and as mentioned previously the
construction techniques which are employed should be selected to minimize
the amount of extra soil in the hole.
The quality of the bond between the concrete and the steel reinforcement
is a matter of concern (Sadlier and Dominioni, 1963; Cole, 1963). Recently,
pull-out tests were conducted by personnel of the Texas Highway Department
(H. D. Butler, 1972) on the steel of an extracted shaft, which had been
constructed by slurry displacement, and on laboratory specimens cast under
mud to simulate tremie concreting. The results of these tests indicated
a significant drop in the bond resistance of smooth steel bars and a
negligible drop in the bond resistance of deformed bars. These results
. .
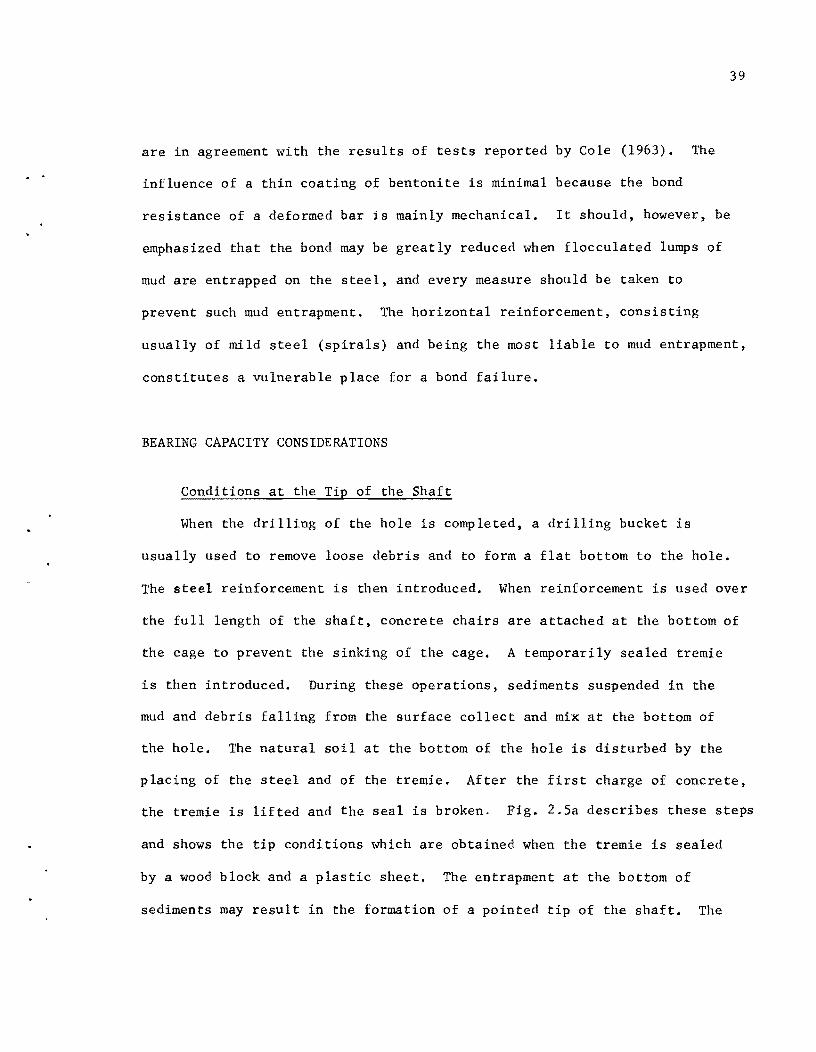
39
are in agreement with the results of tests reported by Cole (1963). The
influence of a thin coating of bentonite is minimal because the bond
resistance of a deformed bar is mainly mechanical. It should, however, be
emphasized that the bond may be greatly reduced when flocculated lumps of
mud are entrapped on the steel, and every measure should be taken to
prevent such mud entrapment. The horizontal reinforcement, consisting
usually of mild steel (spirals) and being the most liable to mud entrapment,
constitutes a vulnerable place for a bond failure.
BEARING CAPACITY CONSIDERATIONS
Conditions at the Tip of the Shaft
When the drilling of the hole is completed, a drilling bucket is
usually used to remove loose debris and to form a flat bottom to the hole.
The steel reinforcement is then introduced. When reinforcement is used over
the full length of the shaft, concrete chairs are attached at the bottom of
the cage to prevent the sinking of the cage. A temporarily sealed tremie
is then introduced. During these operations, sediments suspended in the
mud and debris falling from the surface collect and mix at the bottom of
the hole. The natural soil at the bottom of the hole is disturbed by the
placing of the steel and of the tremie. After the first charge of concrete,
the tremie is lifted and the seal is broken. Fig. 2.5a describes these steps
and shows the tip conditions which are obtained when the tremie is sealed
by a wood block and a plastic sheet. The entrapment at the bottom of
sediments may result in the formation of a pointed tip of the shaft. The

40
ood Bk)ck
a. Wood Block and Polyethylene Sheet
~ ~
I I
Trapped Flap Sediments
b. Proposed Alternatives for the Seal
Fig. 2.5 Effects of the Tremie Seal on the Conditions at the Tip of the Shaft
Trapped Sediments
. .

41
use of the type of seal shown in Fig. 2.Sa is not recommended in shafts
greatly depending for their bearing capacity on the tip resistance. For
such shafts a better seal should be devised. Possible improved seals are
a water tight flap gate hinged at two points or a tapered solid seal (Fig.
2.Sb). These two types of seals take advantage of the fact that the first
charge of concrete flows under the highest gradient and its initial surge
can be used advantageously to remove the bottom sediments (Jezequel, 1971).
Also, for better washing action the tremie size should be optimum as
suggested by the analysis in a previous section.
Soil-Concrete Interface
The nature and the characteristics of the interface between the concrete
and the soil have a decisive influence on the load transfer of drilled
shafts. In shafts constructed by slurry displacement the phenomena
described in the following paragraphs are postulated to take place during
the formation of the interface over the total depth of the shaft.
Figure 2.5 shows what are believed to be the conditions of the inter
face near the tip of the shaft. The heavy sediments at the bottom of the
shaft, if given the chance to be lifted by the first turbulent flow of the
concrete, may be trapped on the walls of the shaft, at a distance extending
probably to one diameter from the tip of the shaft.
The filtration of the mud into granular layers causes the formation
of a mud cake on the surface of those layers. The thickness of the cake
depends on the rate of loss of water, which in turn depends on the grain
size distribution of the soil, on the mud head applied, and on the
42
characteristics of the mud in use. When a well-dispersed mud is used in
drilling through fine sands, the thickness of the cake may be in the order
of 1/16 inch. When a flocculated mud loaded with sand is used in drilling
through a course granular formation, a cake in the order of 1 inch thick
or more may build up. Veder (1963) also showed that the thickness of the
cake is a function of an electrical current which occurs between the mud
and the native soil. The magnitude of this current and, therefore, the
thickness of the cake are dependent on the chemistry of both the mud and
the soil formation.
The vertical travel of the auger in the hole is coupled with a hori
zontal wobbling which has the effect of mechanically eroding the soil
formation at certain places, scraping the cake at others, and probably
depositing a coating of mud and soil at yet other places. Furthermore, if
the mud is heavily charged with sand, during the concreting process,
sediments from the mud collect on the surface of the concrete. When the
concrete is forced by the upward motion of the tremie to flow outward from
the tremie (Fig. 2.4d), the sediments are trapped between the concrete and
the walls of the hole (Fig. 2.6a). The sediments, usually consisting of
sand, squeeze into the mud-soil cake already existing on the walls of the
hole. This coating is usually softer than the cement paste and the concrete
aggregates in turn squeeze into the coating and may also engage the soil
formation, resulting in a rough concrete surface (Fig. 2.6b). When the
mud cake is absent, and the concrete is cast against a relatively stiff
soil formation, the surface of the concrete has been observed to be as
smooth as when cast against a rigid formwork (Fig. 2.6c).
..

. .
Reinforcement
Wall of Hole Coat of Mud Cake and Sediment.
a. Formation of Coating
Wall of Hole Wall of Hal.
-J I....-Coating
h. With Mud C~ke c. Without Mud Cake
Fig. 2.6 Concrete Soil Interface
43
44
Penetration of the Mud in the Soil
Various studies on the drilling of bored piles attribute the stability
of the hole to the penetration of the thixotropic mud into the granular
soil formation (Veder, 1953; McKinney and Gray, 1963; Elson, reported by
Florentin, 1969). While drilling muds may penetrate several feet into
layers of gravels and pebbles, their penetration into fine sand is insig-
nificant. Laboratory tests conducted by the author to study the penetration
of a 5% bentonite into Ottawa sands of different sizes and having uniformity
coefficients of one are reported in Fig. 2.7. Similar tests, conducted
on a fine sand having uniformity coefficients of 1.5 to 2.0, showed no
measurable penetration even at high pressures. Studies of the grouting
of granular materials (King and Bush, 1961) suggested, based on field
results, two criteria limiting the gradation of grouts with respect to that
of soils:
a.
b.
D15
of grouted soil
D85 of grout
DIO
of grouted soil
D90 of grout
> 15
> 8
Certain authors even recommend for the first criterion a ratio as high
as 20 to 30 to obtain a grout which will flow into the soil formation.
Considering the fine sand used in the laboratory penetration tests, which
had a D15
of 0.1 mm, the first criterion would require a D85 of the grout
smaller than about 5 microns. This criterion is not usually satisfied in

e .s
-
o
25
050 c .g -o .. -• c CD
a..
75
100
Sieve Opening (mm) .025 .050 .075 .100 .125 .150
· ...... . .. .. ... ., ." . ,-
t '. • ••
· .' I. •• ' <II' ., . . . .... . . · ,- ' .. I '-. ". .... .. . . . ..
, . ."
t Air Pressure
5 psi 10 psi
20 psi
30 psi
40 psi
Air Pressure
5% Bentonite Mud Colored With a Methylene Blue Solution
Saturated Sand
Permeameter Used in the Tests
.175
Fig. 2.7 Penetration of a 5% Bentonite Mud into Uniform Sand
.200 .225 .250 .275
46
commercial bentonite. In the drilling of a borehole, the mud is usually
charged with silts and sands and its penetration into layers finer than a
medium sand is almost impossible. The effects of mud penetration into
coarse grained soils are not yet well understood.
STRESSES IN THE SOIL
The opening of a hole in the ground results in a relief of horizontal
stresses near the hole. Overconso1idated soils have a coefficient of earth
pressure at rest that is significantly greater than 0.5 (Hendron, 1963).
To restore the original horizontal stresses in such soils by the imposition
of hydrostatic stresses from mud or concrete is impossible. This relief
of horizontal stress is usually coupled with a strain in the soil that may
result in the opening of fissures in clay and in the destruction of cementing
bonds in sand. Therefore, the magnitude of the stress relief can influence
significantly changes in the properties of the soil. The stress relief in
the slurry displacement method is considerably smaller than that which occurs
in most conventional drilling methods.
Lateral pressures between the concrete and the soil have a decisive
influence on the load transfer of the shaft. Studies on the pressure
developed on the formwork of a concrete column indicate that this pressure
reaches an ultimate value for heights of concrete greater than a certain
critical value (Peurifoy, 1965). The existence of an upper limit to this
pressure has been attributed to the setting and the arching of the concrete.
..

47
In concreting under mud, the pressures in the concrete are at least equal
to the pressure of the column of mud above it. Furthermore, when the
concrete is allowed to flow in large diameter holes without the "pumping"
of the tremie, and when the tip of the tremie is close to the bottom of the
shaft, the pressure in the concrete may be larger than the hydrostatic
pressure of a column of concrete. In Fig. 2.8 the pressure at a point A
at the bottom of the shaft is given by the following expressions:
a. Wet concreting:
Cq h P =h Y +h +--U.
v c c m Ym A
P - 2q v s
b. Dry concreting:
P v
where
h Y -c c
P - 2q v s
Cq h s c A
P = vertical pressure at point A, psi; v
Ph = horizontal pressure at point A, psi;
= unit weight of concrete, lb/in3 ;

48
Tremie
A A
Concrete
a. Concreting by Slurry Displacement b. Concreting in the Dry
Fig. 2.8 Effect of Concreting Procedure on the Pressure in the Concrete
h height of column of concrete, in; c
h m
height of column of mud, in;
unit weight of mud, lb/in3
;
C circumference of the shaft, in;
q shear stress developed on the periphery of the shaft; s
= shear strength of the plastic concrete, psi
A cross sectional area of the shaft, in2
The side shear forces developed on the periphery of the concrete
column may be locked in the concrete when concreting is completed due to
a combined action of setting and arching. These forces result in a
49
pressure in excess of the hydrostatic pressure when concreting is completed
under mud.

!!!!!!!!!!!!!!!!!!!"#$%!&'()!*)&+',)%!'-!$-.)-.$/-'++0!1+'-2!&'()!$-!.#)!/*$($-'+3!
44!5"6!7$1*'*0!8$($.$9'.$/-!")':!

CHAPTER III. THE ANALYSIS OF DRILLED SHAFTS
BEARING CAPACITY THEORIES
The ultimate bearing capacity Q of a deep foundation is conventionally
considered as the sum of the resistances to penetration Q and Q developed s t
respectively b~ the sides and the tip of the foundation element, Fig. 3.1.
The following sections offer a brief discussion of each one of these
components.
Tip Resistance
The theories proposed for the evaluation of the tip resistance of a
deep foundation are based on two main approaches. The first approach
considers the soil at the tip of the foundation as a rigid plastic
incompressible material and evaluates the force required to bring the soil
inside a logarithmic spiral failure surface into a plastic state, using
an extension of the solution originally derived for shallow footings
(Terzaghi, 1943; Meyerhof, 1951; Vesic, 1963), Fig. 3.la. The principal
difficulty encountered in the use of the logarithmic spiral to compute
bearing capacity is the selection of the shape and dimensions of the
failure surface. The computations of various investigators are based on
failure surfaces of different dimensions and, hence, the results obtained
have been greatly different (Vesic, 1965).
The second approach to the evaluation of the tip resistance of a deep
foundation equates the problem of the penetration of the tip of the founda-
tion to that of the expansion of a spherical cavity inside a semi-infinite,
elasto-plastic medium (Skempton, et al., 1953, after Vesic, 1965; Ladanyi,
51

d
Meyerhof
Q
B •
TerzoQhi
Q
1
Skempton. Yossin. a Gibson, 1953
(After Vesie', 1965)
Fig. 3.1 Diagrams of Failure Surfaces at the Tip
Ul N

S3
1961; Vesit, 1972). In this approach the elastic properties of the soil
(Young's modulus and Poisson's ratio) are introduced as variables in the
expression for the ultimate tip resistance.
The ultimate bearing capacity of a circular deep foundation on cohesion-
less soil is expressed by theories from the first approach as
. . . . . . . (3.1)
where
qt ; ultimate average tip pressure,
At cross-sectional area of the tip,
y = average effective unit weight of the soil around the tip,
B diameter of the tip,
qo effective pressure in the soil at the level of the tip,
Yw unit weight of ground water,
d height of the water level above the tip, w
N , N = bearing capacity coefficients related respectively to y q
the weight of the soil inside the failure zone and the
effective pressure q • o
It has been found convenient in the analysis of deep foundations to
express Equation 3.1 in the following form:
• • • • • • • • • • • • • • • • • • • (I • • (3.2)

54
where
N' = a factor combining the effects of Nand N q q Y
The values of N' given for deep foundations by the different theories q
differ extremely (Vesic, 1967). Experimental studies of bearing capacity
have met only with partial success mainly due to the scale effects in
laboratory model tests and due to the heterogeneity of natural deposits in
full-scale field tests. It is not the purpose of this study to discuss the
merits and the drawbacks of the different theories, yet in the following
sections the factors influencing the values of N' shall be discussed in q
the light of the findings of research conducted during the last decade.
Angle of Shearing Resistance. The extent of the failure surface and
therefore, the magnitude of N' depend on the friction angle ¢ of the sand. q
The Mohr envelope for a given sand is curved for low and moderately high
pressures « 50 kg/ cm2
) but at higher pressures tends to become a straight line
that is only a function of the composition of the sand. At stresses less
than those which cause crushing (about 10 kg/cm2) the value of 0 is a
function of the relative density of the sand and has been expressed by
various authors (Caquot and Kerisel, 1949; Vesic, 1963) as
-1 k ¢ ::: tan -........................... (3.3)
e
where

55
~ constant of the particular sand and includes the effects of
factors other than the density and the stress level,
e = initial void ratio of the sand.
Compressibility of the Sand. The influence of the compressibility of
sand on the ultimate bearing capacity of the tip of deep foundations may be
as important or more important than the friction angle of the soil. This
conclusion can be made from the analysis of the expansion of a sphere in a
semi-infinite medium. The analysis shows that the limit pressure that can
be applied to the sphere is a function of the modulus of elasticity of the
soil and of the Poisson's ratio (Kdrisel, 1964; Vesid, 1965, 1972). Vesi~
(1965) showed that the tip resistance depends strongly on the stiffness
index I which he defined as r
where
I r
E (l+v)(c+q tan m)
E the initial tangent modulus,
v Poisson's ratio,
c = cohesion of the soil,
q = confining pressure.
(3.4)
Recent studies on the compressibility of sand (Seed and Lee, 1967; Vesi~
and Clough, 1968) have shown that
56
1. Significant crushing of the sand grains and consequently significant
2 compression takes place at confining pressures larger than 10 kg/em.
The magnitude of the compression is a function of the original
density of the sand.
2. Dilation of sand takes place only when the sand is sheared at
pressures below a certain critical value which ranges between 10
2 and 100 kg/em.
3. The modulus of deformation E increases approximately as the 1/2
power of the mean normal stress in the low pressure range (0 - 10
2 kg/em) and approximately as the 1/3 power in the elevated pressure
2 range (10 - 100 kg/em). Finally, beyond a certain critical mean
pressure the sand behaves as a linearly deformable solid with the
modulus of deformation E being proportional to the mean normal
stress.
The influence of other factors on the compressibility of sand has not
yet received much attention. The mineralogical composition of the sand
exerts a considerable influence on its compressibility. The most common
minerals in sand deposits are quartz, feldspar, and hornblend. These
minerals have a hardness ranging between 5 and 7 on the Moh's scale.
However, the existence of large deposits of sands composed of carbonate
minerals is also common (Libyan sand, Lambe and Whitman, 1969). The
carbonate sands result commonly from the accumulation under water of
marine life shells or from the deposition of carbonates dissolved in

acidic rain water. The deposition of these carbonates in loose sediments
causes a cementation of the sand grains and may prevent further consolida
tion under later deposition of sediments.
The angularity, texture, and size of the individual grains also
influence the compressibility of sand. Sand grains that are large and
angular and with a rough surface tend to crush and, therefore, compress
more than grains that are small, round, and smooth.
Method of Installation of the Foundation. The method of installation
57
of the pile influences the ultimate tip resistance because the method of
installation affects the relative density of the sand and also affects the
stresses in the sand. In a driven pile a zone of highly densified sand is
formed in the immediate vicinity of the tip (Berezantzev, et al., 1957, 1961;
Robinsky and Morrison, 1964), while loosening of the sand at the bottom of
the hole may take place when installing a bored pile. The loosening of
the sand at the bottom of a drilled hole can result from the release of
stress and from possible seepage into the hole. Furtherlnore, when poor
construction techniques are used in drilling the hole for a drilled shaft,
loose soils may be left at the bottom of the hole as a result of the careless
cleaning of the hole, the sloughing of the walls of the hole, the deposition
of sediments suspended in the drilling mud, and the entrainment in the hole
of surface debris (Reese and Touma, 1972). The existence of very compressible
material at the bottom of a drilled hole usually results in a smaller tip
resistance for drilled shafts than for driven piles.
58
The Dimensions of the Foundation. The influence of the dimensions of
the pile on the ultimate tip resistance is a complex function of the two
factors emphasized above, namely, the friction angle and the compressibility
of the sand. At shallow depths, sand of medium to high density can be
treated as an incompressible material and the general shear failure theorized
by Terzaghi and Meyerhof can take place. For a general shear failure the
bearing capacity factor N' increases with the depth and with the diameter q
of the foundation. This increase is linear to a certain depth, beyond which
the effects of a reduced friction angle (due to a curved Mohr envelope) and
an increased compressibility (due to higher confining pressures) cause a
reduction in the rate of increase of N' with depth (Kerisel, 1961; De Beer, q
1963; Vesit, 1963). Furthermore, the contribution of the weight term N y
is relatively reduced with depth and consequently the influence of the
diameter on the ultimate unit tip bearing capacity becomes negligible.
De Beer (1963) used Meyerhof's theory to prove that for a dense sand the
value of N' decreases with depth beyond a critical depth of about twenty q
diameters.
Experimental data on model and full-scale piles (Kerisel, 1961; Vesit,
1963) indicate that the ultimate resistance of the tip increases with depth
and tends asymptotically to a limiting value at a critical depth varying
between ten diameters for loose sand and twenty diameters for dense sand.
Figure 3.2 presents measured values of the ultimate tip resistance of piles
jacked in sand as a function of the size and the depth of the piles, and
the density of the sand. The tendency of the bearing capacity to become
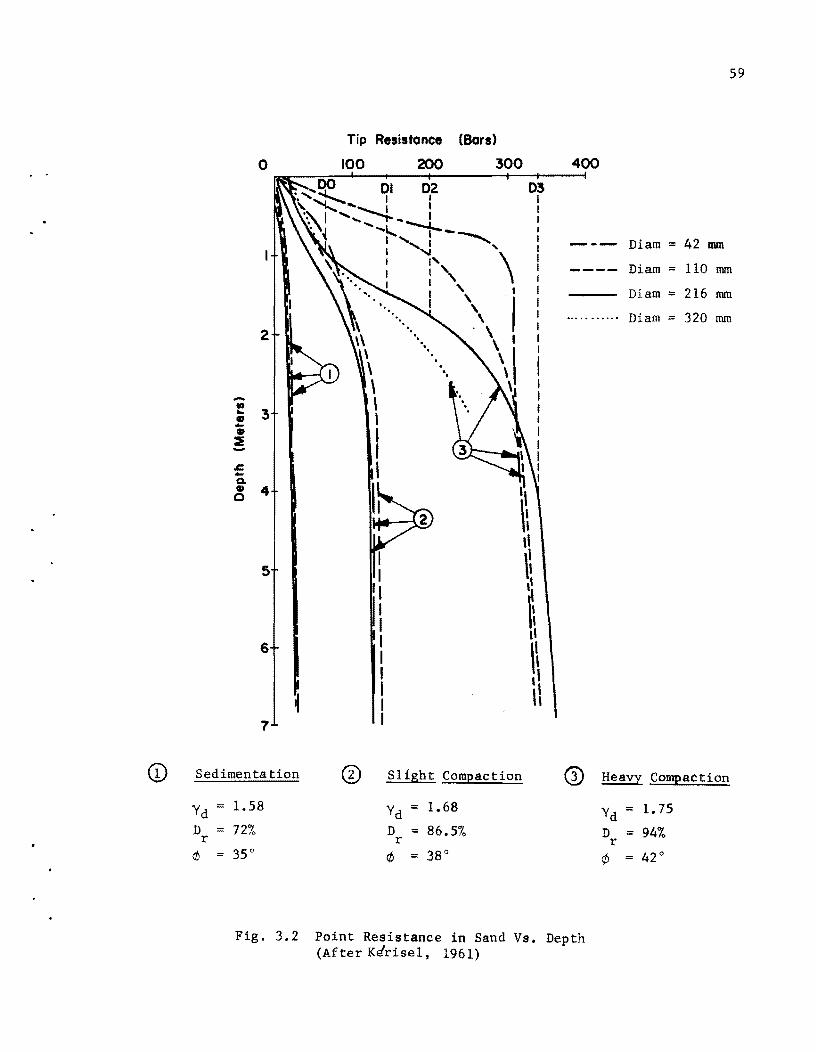
Tip Resistance (Bars)
O~ __ ~_IO+O ______ ~~ ______ 30rO~~~400 02 03
2
.... 10
= 3 -CD :IE -.t::. -a. 1&1 4 o
5
6
7
I I
'I I I I I I I I I
I I
---
----
.............
59
Diam = 42 nun
Diam = 110 mm
Diam = 216 mm
Diam = 320 mm
Sedimenta tion ® Sl1ght Compaction ([) Heavy Compaction
1.58
D = 72% r
riJ == 35°
Yd = 1.68
D = 86.5% r
(/J = 38°
Fig. 3.2 Point Resistance in Sand Vs. Depth (After Ke'rise1, 1961)
Yd = 1.75
D = 94% r
¢ = 42°

60
a constant has been explained (K~risel, 1961, 1964; Vesie, 1963) by the fact
that only "punching failure" can take place at great depths as a result of
the compressibility of the sand. The compression of the sand, followed by
an arching of the sand around the tip of the foundation, has the effect
of reducing the vertical pressure q at that level to a constant value which o
is independent of the depth of the foundation. The constant ultimate tip
resistance q was given by Vesie (1971), as a function of the relative t
density D , in the following equations: r
(Driven Piles)
(Drilled Shaf ts)
. . . . . . . . . . (3.5)
(3.6)
However, the practical application of these expressions, presented as an
exponential function of the relative density, is limited by the capability
to evaluate the relative density of natural sand deposits. A small change
in the relative density influences significantly, at high densities, the
values of the tip resistance evaluated from these expressions. It must
further be mentioned that since compressibility is the major property of the
soil controlling the tip resistance, qt cannot be expressed as a function
of the relative density only.
The Side Resistance
The side resistance of a pile in sand is conventionally expressed as
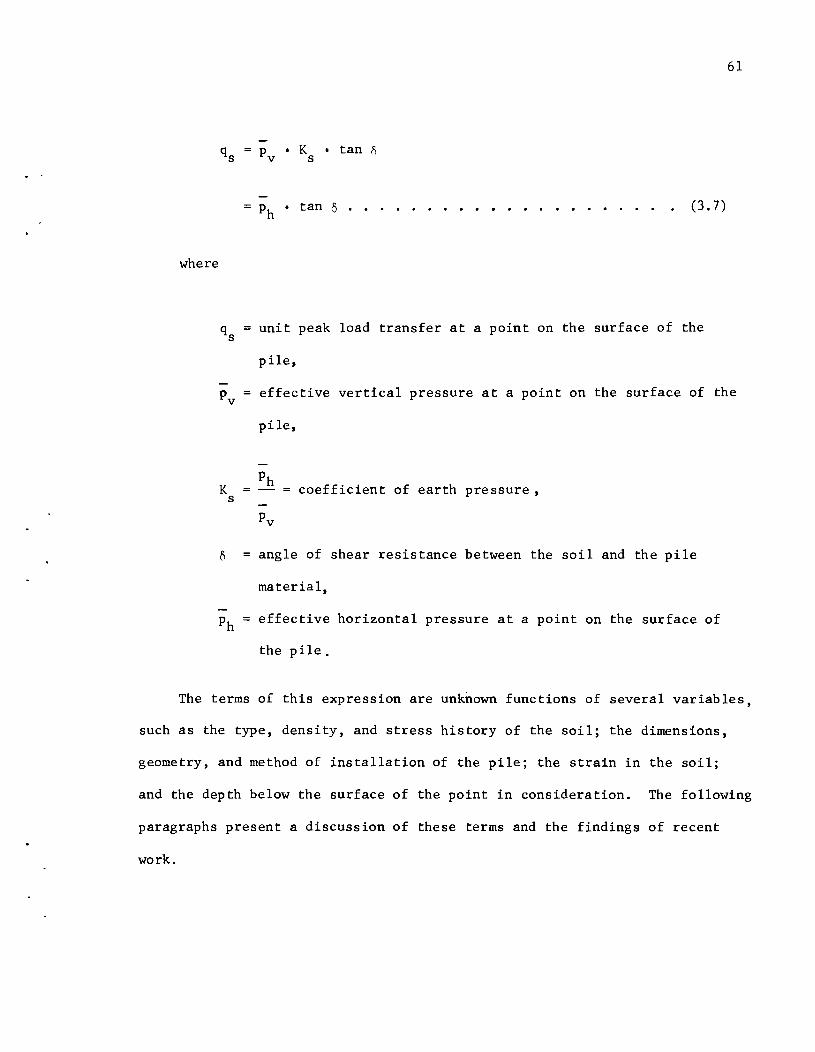
where
P • K • tan fi v s
Ph • tan 0 • • • • • • • • • • • • • • • • • • • • (3.7)
qs unit peak load transfer at a point on the surface of the
pile,
61
Pv effective vertical pressure at a point on the surface of the
pile,
K s
coefficient of earth pressure,
o angle of shear resistance between the soil and the pile
material,
Ph = effective horizontal pressure at a point on the surface of
the pile.
The terms of this expression are unknown functions of several variables,
such as the type, density, and stress history of the soil; the dimensions,
geometry, and method of installation of the pile; the strain in the soil;
and the depth below the surface of the point in consideration. The following
paragraphs present a discussion of these terms and the findings of recent
work.

62
The Earth Pressure. The average value of the effective vertical
pressure p at a point in a semi-infinite mass of soil is equal to the v
effective overburden pressure of the soil. The insertion of the pile
changes the value of p in the vicinity of the pile in an unknown manner. v
In regard to stress changes, the expansion of a cylindrical cavity at great
depth in an infinite medium (Ladanyi, 1963; Vesie, 1972) has been used to
simulate the driving of a pile. There are a number of obvious differences
between the process of driving a pile and that of expanding a cavity; how-
ever, the equations derived by Ladanyi and Vesie are useful in developing
additional understanding of the effects of pile driving.
The changes of stresses generated by the construction of a drilled
shaft are discussed in a subsequent section.
The Coefficient of Earth Pressure. In linearly elastic materials the
coefficient of earth pressure at rest K is given by o
K \I o = I-v ................... . . . . .
where
\I Poisson's ratio
(3.8)
In sands the value of K is dependent on the type of sand, its relative o
density, and the overconsolidation ratio. Experimental studies have shown
that for normally consolidated sands reasonable values of K are given by o
the following expression (Jaky, 1944, after Henkel, 1970):

K 1 - sin ¢ o
Jaky's expression yields values of K between 0.4 and 0.5. The expression o
does not apply to overconsolidated sand; Hendron (1963) has shown that K o
can be as high as 2.5 for high overconsolidation ratios.
While the earth pressure at rest is an important parameter related to
the earth pressure which will exist at the installed pile, the method of
installation is also of critical importance. The installation of the pile
causes highly complex strains and the coefficient of earth pressure K s
becomes an indeterminate function of the dimensions of the pile and the
63
depth below the ground surface. Attempts to measure the horizontal pressures
on bored piles (K~risel, 1957; Reese, ~ al., 1968) and on driven piles
(Reese and Seed, 1955; Koizumi, et al., 1971) have met with little success.
The failure to obtain reliable data on horizontal pressures is due
principally to the technical limitations of the pressure cells. Furthermore,
there is the physical problem of installing the large number of cells
required to reasonably portray an average pattern of stress distribution
that may be greatly affected by localized stresses. Indirect measurements
of K have been deduced from load tests on model and full-scale piles by s
measuring the side friction and by assuming a vertical pressure equal to
the overburden pressure. The values of K reported from such measurements s
vary between 0.2 and 3.0 for driven piles (Meyerhof, 1956; Ireland, 1957;
Mansur and Hunter, 1970) and between 0.3 and 0.5 for bored piles (Martins,
1963; De Beer, 1964). This large scatter in the results may be due to

64
errors in the theories of skin friction and in the experimental measurements,
and to the complex nature of K • s
Mazurkiewicz (1968) summarizes the values of K obtained from theoretical s
considerations. The scatter of the theoretical values is similar to that
observed in the experimental ones. However, for bored piles there seems to
be a general agreement that K will assume values limited between the s
coefficient of active earth pressure and the coefficient of earth pressure
at rest.
The Angle of Shear Resistance Q. The angle of shear resistance 0
between the concrete and the soil has been found to be, in the case of sand,
practically equal to the friction angle ¢ of the sand (Potyondy, 1961).
The value of the friction angle ¢ is, as discussed in previous paragraphs,
mainly dependent on the relative density of the sand. The changes in the
density of the sand surrounding the pile are a function of the method of
installation of the pile. Robinsky and Morrison (1964) have shown for a
driven pile that, although the displaced volume of sand increases the
density of the sand surrounding the pile, the vertical motion of the pile
forces the stretching and consequently the loosening of the sand at the
periphery of the pile. In bored piles the relief of stresses resulting
from the boring of the hole causes a loosening of the sand. The amount of
loosening is a function of the drilling and concreting procedures which
are used.
The difficulty of evaluating independently the terms of Eq. 3.9 led
some researchers to investigate only the average skin friction developed
65
at the periphery of the pile. The average skin friction was found to in-
crease almost linearly with depth and to tend beyond a certain critical depth
to a constant value, which is a function only of the original relative density
of the sand (Vesic, 1963, 1965, 1970; K~rise1, 1961, 1964). The critical
depth varies from ten diameters in loose sand to twenty diameters in dense
sand. The value of the constant average skin friction was found from
empirical measurements to be given by
(Driven Piles) • . • . . • • .• (3.9)
(Drilled Shafts) (Vesic, 1970) . (3.10)
The limitations to the practical application of these expressions are
the same as those discussed in a previous section for similar expressions
for the tip resistance of piles.
THE LOAD-SETTLEMENT CURVE
The bearing capacity of drilled shafts is usually determined from
either a static formula that relates the ultimate tip and side resistances
of the shaft to the shear strength of the soil or from an experimental
load-settlement curve, with the ultimate load being selected by one of a
number of empirical graphical procedures (Chellis, 1961). In friction
piles the ultimate load is attained at relatively small downward displace-
ments of the pile; therefore, the amount of settlement at the ultimate

66
load is a matter of little concern. Experience with load tests on drilled
shafts in sand that obtain their support principally in point bearing has
indicated that the load-settlement relationship follows a long sweeping
curve that tends asymptotically to an ultimate value at excessively large
settlements as shown in Fig. 3.3 (Brezantzev, 1961; Vesie, 1963; K~risel,
1964; Koizumi, et al., 1971). Some of the load-settlement curves reported
in this study are similar to the lower curve shown in Fig. 3.3. For such
piles the settlement can be a matter of great concern and the safe load
can only be determined by taking into account the tolerance of the supported
structure to total or differential settlement.
A pile normally constitutes an element in a complex two- or three
dimensional structure such as a bridge bent or a drilling platform. In
some such structures there is continuity between the piles and the super
structure and the analysis to determine reactions and moments at the top of
the piles requires the solution of simultaneous equations of compatibility
and equilibrium (Reese, et al., 1970; Awoshika and Reese, 1971). Load
settlement curves are essential to such analyses. The development of
load-settlement curves for bored piles is, therefore, very useful in the
design of a pile-structure system. The cost of field load tests suggests
the need for analytical procedures to allow the computation of load
settlement curves from a knowledge of the properties of the soil and of
the pile. One procedure suggested by Reese (1964) uses a model (Fig. 3.4)
in which the pile is divided into a number of deformable elements and the
soil is replaced by mechanisms. When the load-deformation properties of

· .
Q
-c CD E CD ;: -CD (/)
Point Piles
Load
Fig. 3.3 Load Settlement Curves for Friction and Point Bearing Bored Piles
Q
qS3 +qsl
QS4
qS2 + + QS2
Qt
+ +qS3
Displacement
Qt
Fig. 3.4 Mechanical Model of Axially Loaded Pile (After Reese, 1964)
67

68
the mechanisms are known, the analysis of the model can be easily computer-
ized to obtain the load-settlement curve (Coyle and Reese, 1968; Vijayvergiya
and Reese, 1969).
Procedures to obtain the load-deformation properties of the mechanisms
for piles in clay have been developed (Coyle and Reese, 1968; Barker and
Reese, 1970; O'Neill and Reese, 1971). Coyle and Sulaiman (1969) recommended
procedures, based on a field test and on laboratory model tests, for
developing load transfer versus pile settlement curves for sands. Parker
and Reese (1970) correlated the measured load transfer curves on buried
model piles in sands with stress-strain curves obtained from triaxial tests.
The data presented by the above mentioned authors and by Vesi~ (1963)
indicate that the values of displacement required to mobilize the side
friction in buried and driven piles in sand vary between 0.02 and 0.5 in.
The reasons for this wide scatter are not yet well known. It is believed
that the load-deformation properties of a point on the periphery of a pile
in sand are a complex function of the relative density of the sand, the
overburden pressure, the relative depth of the point, the diameter of the
pile, the arrangement of the soil layers, and the tip resistance.
The load-deformation curve for the mechanism at the tip of a pile is
conventionally given by an expression ~imilar to the one suggested by
Mindlin (1936) for the settlement under a force in a semi-infinite elastic
medium. This expression is typically written as
2 (I-v) I
qt E w B •••••••••••••••••• • (3.11)
. .
69
where
wt
settlement of the tip of the pile, ft;
I settlement factor; w
B diameter of the pile, ft;
qt tip pressure, tsf;
E modulus of elasticity of the sand, tsf;
v Poisson's ratio of the sand.
Vesic (1970) defined empirically a similar expression:
where
Qt load at the tip, tons;
B diameter of the pile, ft;
D = relative density of the sand; r
qt ultimate tip pressure, tsf;
C a coefficient of settlement that varies from 0.04 for w
driven piles to 0.18 for buried piles.
(3.12)
Expression 3.12 must be used in conjunction with the ultimate values of tip
resistance qt given by Vesit (1970). The coefficient of settlement C for w
70
buried piles was obtained by Vesi~ from tests on model footings and its
application to full sized bored piles is of questionable value.
ANALYSIS OF THE STRESS AROUND A DRILLED SHAFT
This section describes qualitatively the state of stress in the soil
surrounding the shaft as influenced by the drilling of the hole, the place-
ment and the curing of the concrete, and the loading of the shaft.
Drilling of the Hole
The analysis of the stresses generated in the vicinity of a hole drilled
in sand is complicated and depends greatly on the method of construction.
Approximate closed-form solutions of the problems of a lined hole in sand
have been suggested by Westergaard (1940) and Terzaghi (1943). A general
solution to take care of layered systems of variable densities and variable
coefficients of earth pressure has not yet been proposed. It is believed
that a solution by finite elements may offer some very useful insight into
this problem if the constitutive relationships of the natural sand can be
formulated properly.
A radial element of sand on the periphery of a hole is subjected to a
radial stress ar' a tangential stress a and a vertical stress a , as e' z
shown in Fig. 3.5a. The shear stress Trz is of significant value only in
large diameter holes (Westergaard, 1940), and if this stress is neglected
in small diameter drilled shafts the radial stress becomes a major principal
stress causing failure of the elements to take place along horizontal
planes instead of along vertical planes as is the case in large diameter

71
Radial Stresses
~ O"z I
I
I Mud
~ -Q. GJ
0"8 0
Z
a. Stresses on a Radial Element
Pressure Required To Stabilize the Hole (After TerloQhi, 1943)
b. Profile of Radial Stresses
\. of Shaft
I I
Wall of Shaft
O"z - _______ I~
-I-.i yZ
-~ 0",
c. Stresses A round the Role
Fig. 3.5 Stresses Generated by Drilling

72
holes. If the analysis is limited to small diameter holes, the radial and
tangential stresses can be considered as the minor and major stresses,
respectively. Figure 3.Sc represents what is believed to be the pattern of
variation of the principal stresses on the periphery of the shaft. When the
hole is drilled under mud, the value of the radial stress drops from the
horizontal pressure at rest (K cr) to the pressure provided by the drilling o z
fluid. When the hole is opened without the use of slurry, the radial stress
at the wall of the hole is reduced to zero, and the sand must possess an
apparent cohesion to keep the sand from sloughing. A zone of soil at the
plastic state develops on the periphery of the hole when drilling is done
without slurry. In wet drilling the plastification of the soil is a function
of the radial pressure of the mud and of the shear strength of the soil.
The extent of this zone and its effects on the properties of the soil are
not well understood. It is believed that the flow of the sand at the
periphery of the open hole loosens the sand and may partially destroy any
cementing bonds (carbonaceous or siliceous) between the grains. Figure 3.Sb
shows the effective radial pressure distribution required to stabilize the
hole and the effective hydrostatic pressure of the mud. Near the ground
surface the pressure of the mud may not be enough to prevent the sloughing
of the soil, and a short casing may be required. At greater depths, the
required stabilizing pressure becomes almost constant and the excess
hydrostatic pressure of the mud reduces the extent of the plastified zone.

Concreting
The vertical and radial pressures at a point in the freshly poured
concrete column depend on several factors. Some of these factors are the
rate of placement, the temperature, and the consistency of the concrete;
the size of the hole; the depth of the point under consideration; and the
method of construction. The full effects of these factors are not known.
The findings of Rodin in 1952 (After Courtois, 1966) and Peurifoy (1965)
and the recommendations given in the ACI code on the pressure of concrete
on formwork agree on the following points:
1. The maximum lateral pressure of the concrete on formwork may be
computed fairly closely by the following expression:
where
R 150 + 900 T c (ACI) •..•••.......• . (3.13)
Ph concrete pressure, psf;
R := rate of rise of concre te in the formwork, ft/hr; c
T temperature of the concrete, of.
The value of Ph is limited by the smaller value of 3000 psf or
150 times the maximum height of fresh concrete in the forms.
2. The concrete pressure at a point increases with the rise of the
column of concrete until a critical value H is reached and m
73

74
remains constant or possibly drops for greater heights. The
critical height H is given by Rodin as m
Hm = Ct Rcl/
3 .••.••••••.••....•.••• (3.14)
where
Ct = a function related to the temperature of the concrete.
The above mentioned research has been limited to rates of placement
smaller than 10 ft/hr. Such rates of placement are common in the construction
of concrete walls. Much higher rates may be experienced in the construction
of drilled shafts (30-40 ft/hr) and higher pressures than the upper limit
specified above may be exerted. Higher concrete pressures are also expected
to result from concreting under mud than from dry concreting as the pressure
in the former case is at any time at least equal to the pressure of a
column of mud. The size of the hole and the consistency of the fluid
concrete control the arching of the concrete and, therefore, the pressure
in the hole. Figures 3.6a and 3.6b show the probable stress profiles
immediately after concreting for both dry and wet concreting. Figure 3.6c
shows the forms of the patterns of stress distribution in the soil surrounding
the hole.
Volumetric Strains in the Concrete
After casting, the concrete incurs volumetric strains as a result of
curing and changes in its temperature. Concrete which is cured in a
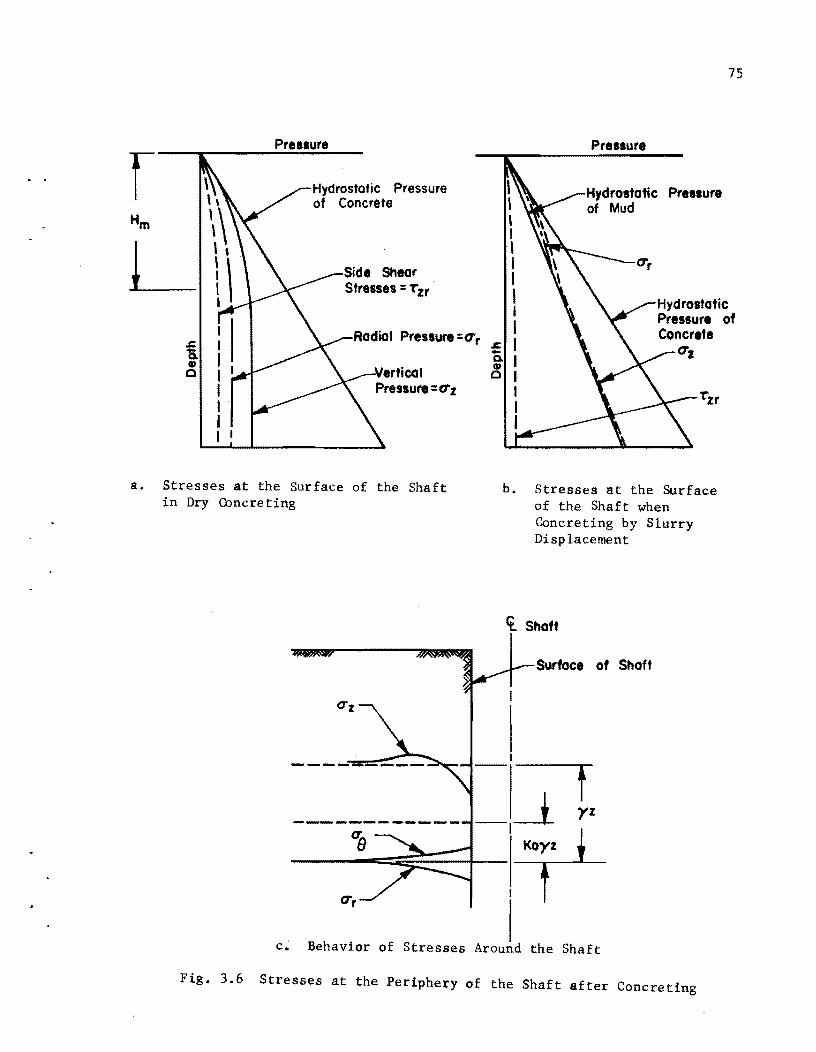
Pressure
f Hydrostatic Pressure of Concrete
Hm
L s; Radial Presture=CTr a ., 0
a. Stresses at the Surface of the Shaft in Dry Concreting
Pressure
, Prellure
I ~ , I , I I I I I
s; I -Q. I ., 0 I
I 'zr I I
b. Stresses at the Surface of the Shaft when Concreting by Slurry Displacement
ct. Shaft
Surface of Shaft
c. Behavior of Stresses Around the Shaft
Fig. 3.6 Stresses at the Periphery of the Shaft after Concreting
75

76
relatively dry medium has a tendency "to shrink as a result of a loss of the
water required to hydrate the cement grains. On the other hand, concrete
which is cured in a wet medium with free access to water has the tendency
to expand (Neville, 1963). However, due to the imperviousness of the con
crete and of some soils, a long period of time (as long as a year, Neville,
1963) may be required to cause this expansion.
The thermal strains of the concrete depend on its temperature during
casting. This temperature varies between 60°F and 90°F depending on the
air temperature, the admixtures used, and the duration of mixing. The
temperature during casting of plant-mixed cement in the summertime is
about 90°F. During setting, the temperature (as measured in shafts tested
in this study) rises to over 120°F and cools to about 75°F in a period of
two days. The resulting volumetric strain in this instance is a contraction
of about 100 ~ in/in. The net volumetric strain between the end of con
struction and time of loading of a drilled shaft may be a contraction or
an expansion. Contraction occurs in the general case and may reach values
as high as 200 ~ in/in, as discussed in later chapters. The effect of
these strains may be negligible an the radial stresses but could be significant
on the shear stresses on the surface of a long shaft. In the following
section, a simplified analysis based on the assumption of a homogeneous
linearly elastic soil is presented. Such an analysis can also be used
when volumetric strains occur in the soil such as in expansive clays.
Figure 3.7a represents the shear stresses developed on the periphery
of a pile incurring a uniform volumetric contraction. The tip resistance
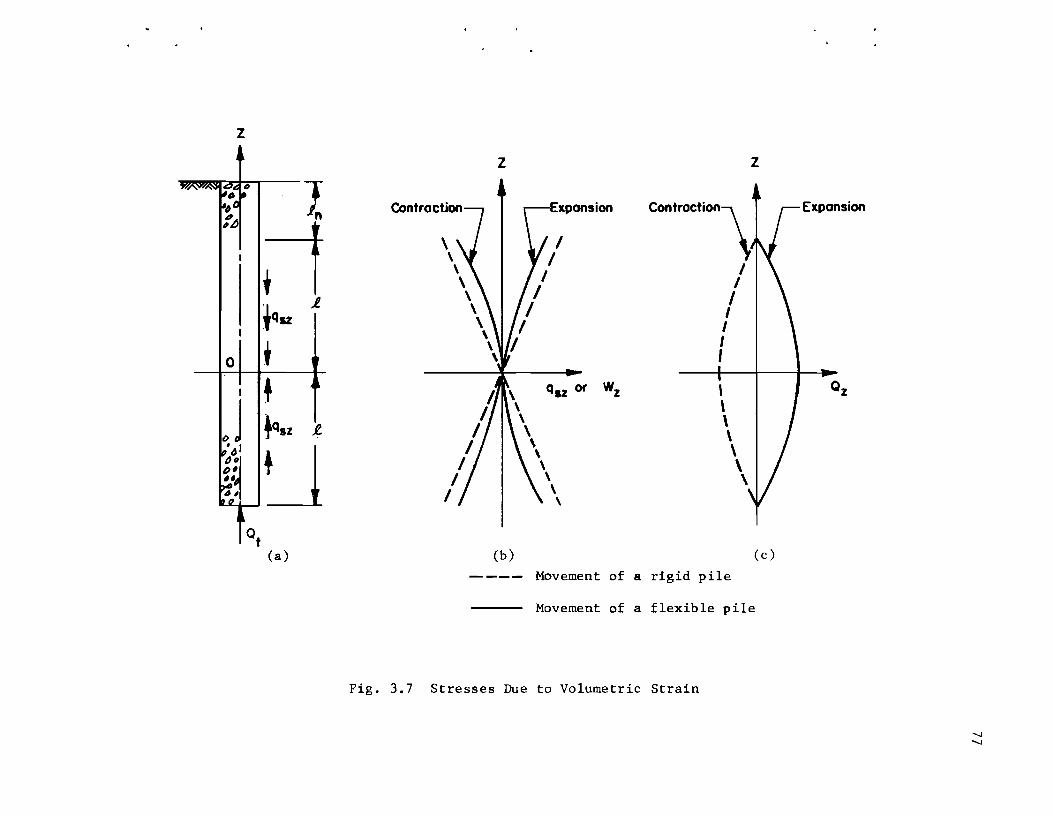
z
I t>
~
:~
;1 I
fqlZ
t (a)
\ \
z
\ \ \ \ \ \ \ \
\ \ \
Expansion
q.z or Wz
\
(b)
\ \ \ \ \ \
\ \ \ \ \ \ \
---- Movement of a rigid pile
z
(c)
Movement of a flexible pile
Fig. 3.7 Stresses Due to Volumetric Strain
Expansion
Qz
......
......

78
qt may be neglected for the envisaged displacements of the pile. If the
resistance of the soil is neglected for a distance t below the surface of n
the ground, and if the soil is assumed to have a uniform shear stiffness,
the point of zero movement divides equally the length of the shaft below
~. In developing an expression for the shear stresses on the wall of the n
shaft as a function of volumetric strains from curing or from temperature
variations, it is convenient to define the following terms.
w = displacement of a point on the pile, z
A coefficient of volumetric strain taken positive for an
expansion,
~ = half of the length the pile offering resistance to
c
A
E
deformation,
= circumference of the pile,
cross-sectional area of the pile,
modulus of elasticity of concrete,
qsz = shear modulus of the soil = w z
= unit shear stress developed at the periphery of the shaft
and at a depth z,
Q = load at any point in the pile, considered positive when it
is a compression.
The following relation can be written at any point in the pile:

79
ds Q z z
dz = ± A ± EA . (3.15)
Equation 3.15 becomes, for the case of an expansion of the shaft, the
following:
dz Qz
= A -EA . '" . oil. '" '" '" . '" . '" '" . '" . '" . '" '" . '" (3.16)
Differentiating Equation 3.16 with respect to z gives the following:
= -dQ
z EA dz '" '" '" ...... '" '" '" '" '" '" '" '" '" ... . (3.17)
where
dQ z = q • c sz dz
= f)w C • • • • • • . • • • • • • • • . . • . • • • • (3. 18) z
Therefore
2 d w I3w C z z dz2 = E:A ,. '" .. '" .. '" . '" '" . '" '" '" '" '" '" '" '" '" '" (3.19)
Equation 3.19 can be written as the following:
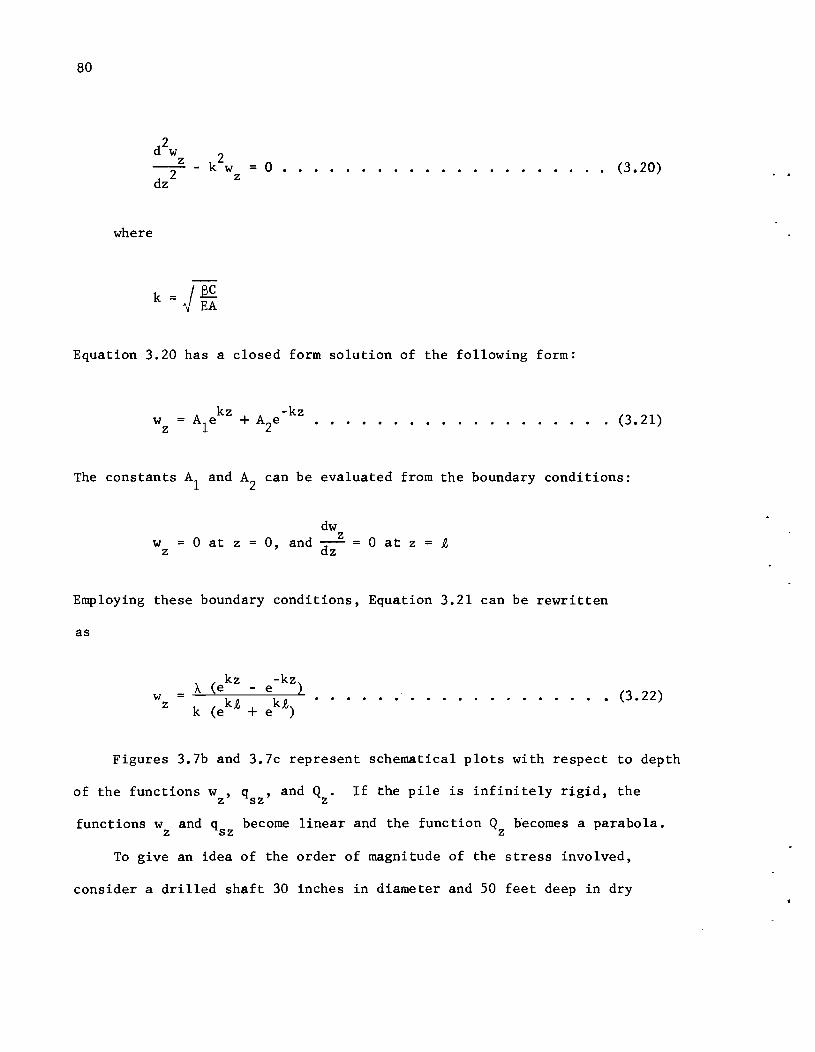
80
o ••••.....••••.•...... (3.20)
where
k =J~ EA
Equation 3.20 has a closed form solution of the following form:
w z
. . . . . . . . . . . . . . . . . . . (3.21)
The constants Al and A2 can be evaluated from the boundary conditions:
w = 0 at z z
dw 0, and dz
z = 0 at z = ~
Employing these boundary conditions, Equation 3.21 can be rewritten
as
w z
"- (ekz _ e-kz ) k (ek~ + ek~) ..•..•...•........• (3.22)
Figures 3.7b and 3.7c represent schematica1 plots with respect to depth
of the functions w ,q ,and Q. If the pile is infinitely rigid, the z sz z
functions wand q become linear and the function Q becomes a parabola. z sz z
To give an idea of the order of magnitude of the stress involved,
consider a drilled shaft 30 inches in diameter and 50 feet deep in dry

81
sand. The dimensions of such a shaft are consistent with shafts described
in this study. If the resistance of the upper ten feet of soil is neglected,
the displacement of the shaft at the bottom of the shaft and at ten feet
below the surface for a contraction strain of 200 microinches/inch is
about 0.05 in. As will be shown in subsequent chapters, a strain of this
magnitude may develop when shafts are constructed in dry soils. In most
soils the ultimate side shear is mobilized at a movement of the order of
0.1 to 0.2 inch and a movement of 0.05 inch may mobilize 25% to 50% of the
shear strength of the soil.
Furthermore, because the stiffness of sand increases with depth, the
point of zero movement is shifted to a lower position in the shaft than in
the example presented above, resulting in a larger displacement than the
value computed above, and resulting in the mobilization of a larger fraction
of the shear strength of the upper layers of sand. When the net strain in
the concrete is contraction, the shear stresses in the upper soil layers are
in the same direction as those mobilized during an axial compression loading
while the shear stresses in the lower layers are similar to those taking
place in an axial tension loading. When the shaft is later loaded in
compression, the upper layers of sand will offer a smaller resistance to
downward movement than the lower layers.
Axial Loading of the Shaft
The stresses generated in the soil by the axial loading of the shaft
are of a very complex nature. The loosening of the soil on the periphery
of the shaft and the nonhomogeneity of natural deposits result in an
indeterminate stress distribution. The computation of stresses in the
82
sand during axial loading of the pile is a very intricate and complex problem
and requires the analysis of the complete pile-soil system. The stress at
any point on the periphery of the pile is influenced by the load transfer
at all levels in the pile. Furthermore, the compression of the soil under
the high pressure at the tip is believed to cause arching of the sand around
the tip in a manner similar to that described by Terzaghi (1936) for the
yielding trap door and to influence the stresses in the sand to a considerable
distance above the tip. Figure 3.8a presents schematically the radial and
vertical shear stresses generated at level B as a result of the shear
transfer q developed at level A (Terzaghi, 1943). The figure also presa
sents the shear stresses at level B due to the shear transfer qsb. When
these stresses are added to the stresses existing before loading, the
stress distribution in the soil surrounding the shaft can assume the pattern
presented in Figure 3.8b. Failure can, therefore, take place at any point
around the shaft where the value of the shear T exceeds the value of the rz
product a tan ¢. The failure at a distance from the surface of the shaft, r
however, requires that the sand be compressible or have room to displace,
such as around the tip of the shaft.
The vertical force developed at the tip of the shaft compresses the
soil in the immediate vicinity of the tip. In drilled shafts, a plastic
zone develops at the tip at very large displacements (Vesic, 1963) and is
much smaller than that developed in driven piles. There is little infor-
mation, however, on the extent of this zone. The data reported by Koizumi,
et ale (1971) on a pile loaded in a cased open hole show a noticeable
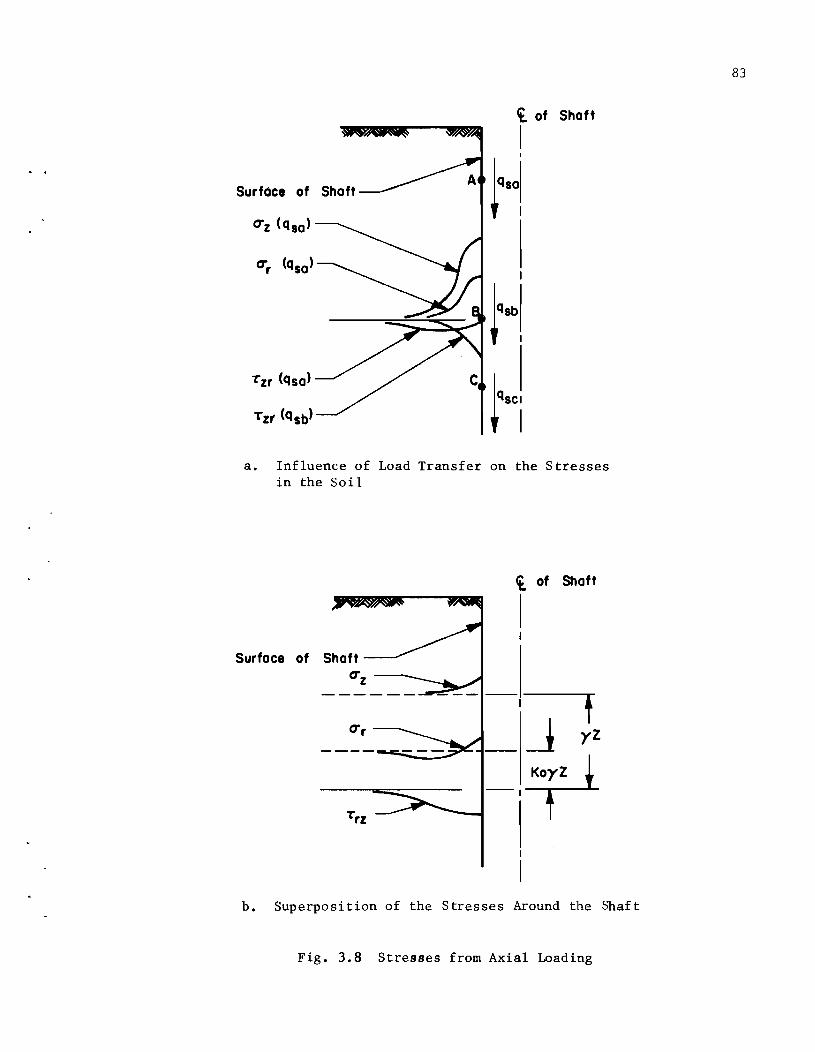
Surface of
Tzr (qsa)
a. Influence of Load Transfer on the Stresses in the Soil
Surface of Shaft --~ CTz --~
CTr ---~~
<t. of Shaft
I
t _~ yZ
-,? h. Superposition of the Stresses Around the Shaft
Fig. 3.8 Stresses from Axial Loading
83

84
densification of the sand at the tip of the pile to a distance of about
one and one-half radii from the surface of the pile. It is, therefore,
believed that the extent of the compacted zone is of the order of the size
of the pile.
Two distinct zones develop around the tip of the pile as a result of
the downward movement. These are the flow zone and the arching zone. The
deformation patterns, due to downward movement, of a horizontal plane through
the pile tip and at some distance above the tip, are shown in Fig. 3.9. For
the downward movement of the pile indicated there would be slippage between
the sides of the pile and the soil, as shown. The lack of compatibility
between the deformation patterns at the pile tip and above the tip leads to
arching. The arching phenomenon causes an increase in stresses in the non
yielding sand at some distance from the pile tip and a decrease in stresses
in the yielding soil near the tip. There can be a flow of soil toward the
pile near the tip to replace the subsiding soil in the region indicated in
Fig. 3.9. It can be postulated that above the zone of flow there will be,
also as a result of arching, an increase in the horizontal stresses at the
pile wall (See Fig. 3.9). Failure in the sand above the pile tip could in
these circumstances take place at a certain distance from the pile.
The dimensions of the two zones which are postulated are thought to be
mainly a function of the relative density of the sand and of the displace
ment of the tip. In a very compressible loose sand, the tip resistance is
small and the compression is limited to a small area under the tip, thus
causing a reduced influence on the sides. In a very dense sand, significant
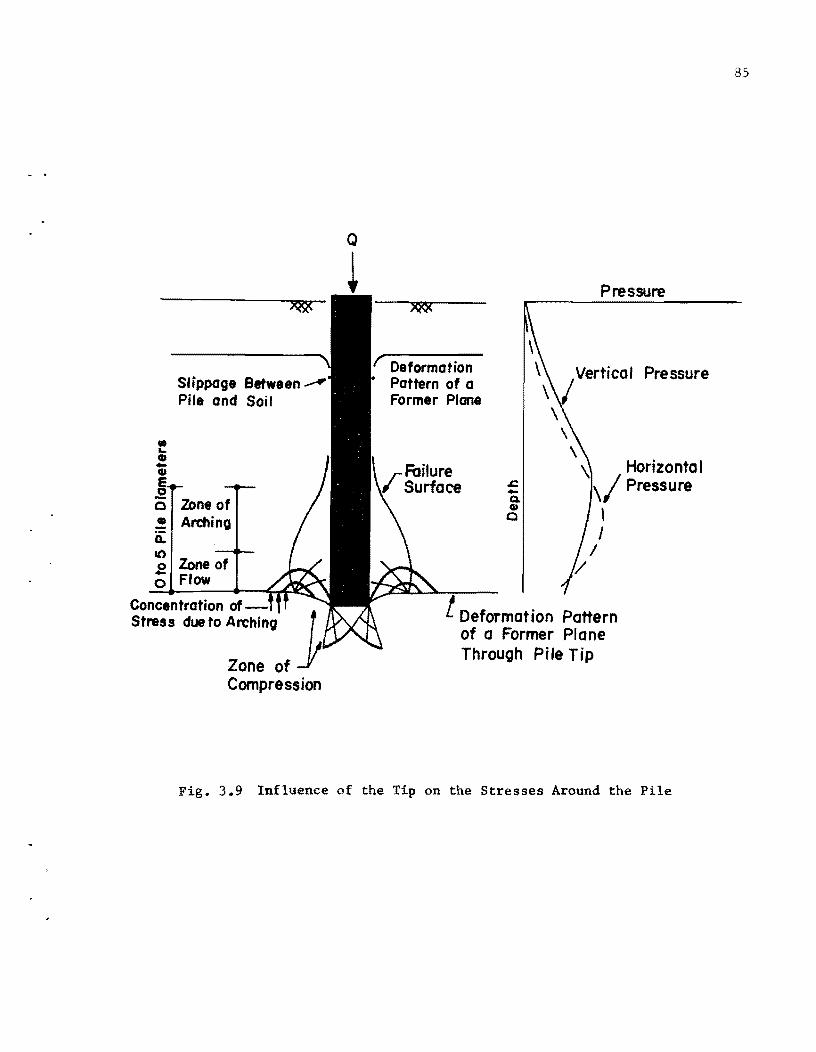
• "-CD -•
0 CD
a:: 10 0 -0
Slippage Between Pile and Soil
Zone of Arching
Zone of Flow
Concentration ofStress due to Arching
Zone of Compression
Q
~
r Deformation Pattern of a Former Plane
.t::. -Q, CD o
\
Pressure
\ Vertical Pressure \ \
\ \
'\ Horizonta I \/ Pressure
1 J
/ Y
Deformation Pattern of a Former Plane Through Pile Tip
Fig. 3.9 Influence of the Tip on the Stresses Around the Pile
8S

86
compression of the sand below the level of the tip takes place at high
pressures and the zones of flow and arching may extend to a distance of a
few pile diameters above the tip of the pile.

CHAPTER IV. INVESTIGATIONS OF TEST SITES
LOCATIONS OF TEST SITES
The Center for Highway Research (CFHR) at the University of Texas at
Austin since 1965 has conducted a research program to investigate the be
havior of drilled shafts installed in a variety of soils. To date, nine
instrumented drilled shafts have been installed and tested at various
locations in the state of Texas. Figures 4.1 and 4.2 indicate the location
of the nine test sites. A prospective test site (X) is now being studied.
Test sites I through IV have been the subject of previous research and have
been reported by Reese and Hudson (1968), Vijayvergiya and Reese (1969),
O'Neill and Reese (1970), Barker and Reese (1970), and Welch and Reese (1972).
Test sites V through IX constitute the subject of this current study.
In this research program undertaken jointly by the Center for Highway
Research and the Texas Highway Department, the test shafts are generally
located in future bridge bents to allow the use of permanent shafts of the
bents in providing the reaction for the test load and to allow a direct
implementation of the results of the load tests in the design of the other
shafts of the bridge.
Table 4.1 shows the location of the test shafts with respect to the
bridge bent in which each test shaft is located.
87

88
o
~-...-.-""" , , \ \ \ \ \ \ I I I I I ,
,. '" ,." /
, I
I I
/
.A ,. , ,. I
,/'/ I ,,/ I
/ I ,,/ I
/ I
/ ' / I / I
I '
PriMarJ fo,,"atiOftI
Beaumont. Lilt.
Willit. Gallad. &..qctrt.. Cabino. C.tohoukl
'100110. Crocko". Carrizo. Rockdoto. Setuin. Willi Point. Kincaid
To~. Auttin. Eagle fewd. NlWOrr.
G,orton. Det Rio. Edwordl • Walnut
Fig. 4.1 Location of the Different Test Sites (Adapted after Barker & Reese, 1970)

Fig. 4.2 Test Sites in Houston

Site Designation
v VS59
VI HH
VII Gl
VIII G2
IX BB
Table 4.1 Location of Test Shafts and Type of Soil Tests
Location
West bay of bent No. 3 of the left
roadway of IH-37 and OS59 structure
North bay of bent No. 2 of the left
main lane of IH-37 and Hailey Hollow
structure
South middle bay of bent No. 12 of
1610 (east bound) and 1-45 interchange
North bay of bent No. 27 of 1610
(east bound) and 1-45 interchange
West bay of bent No. 5 of left
frontage street of IH 288 and Brays
Bayou structure
Soil Tests
THDP, SPT, VT triaxial
tests, granulometric
analysis, Dutch cone,
and A & M penetrometer
THDP, SPT, OT triaxial
tests, granulometric
analysis
THDP, SPT, transmatic
triaxial tests, VT
triaxial tests, granu
lometric analysis
THDP, SPT, transmatic
triaxial tests, OT
triaxial tests, granu
lometric analysis
THDP, SPT, transmatic
triaxial tests, VT
triaxial tests, granu
lometric analysis

91
SOIL INVESTIGATION PROGRAM
The soil investigation program at the test sites had two main objectives:
1. To evaluate the shear strength of the soil as the principal
variable controlling the load transfer in a drilled shaft.
2. To evaluate properties of the soil, such as grain size distribution
and Atterberg limits, that may influence the load transfer through
a physical-chemical interaction with the drilling fluid or the
concrete of the shaft.
Table 4.1 lists the soil test conducted at each site. Appendix A
contains a brief description of the soil tests as well as the results of
those tests.
The soil profiles at the test sites consist in general of an upper
layer of overconsolidated clay overlaying a layer of sand. The evaluation
of the properties of these soil layers is discussed in the following
sections.
Clay
In this study, mainly concerned with the behavior of drilled shafts
in sand, the properties of the clay layers were investigated to allow a
comparison with the results of previous research and to evaluate the effect
of variations in the construction procedure on the load transfer.
The evaluation of the shear strength of soils is in general a major
problem. The sensitivity of soft clays and the fissured and heterogenous
structure of stiff clays constitute the major difficulties in evaluating
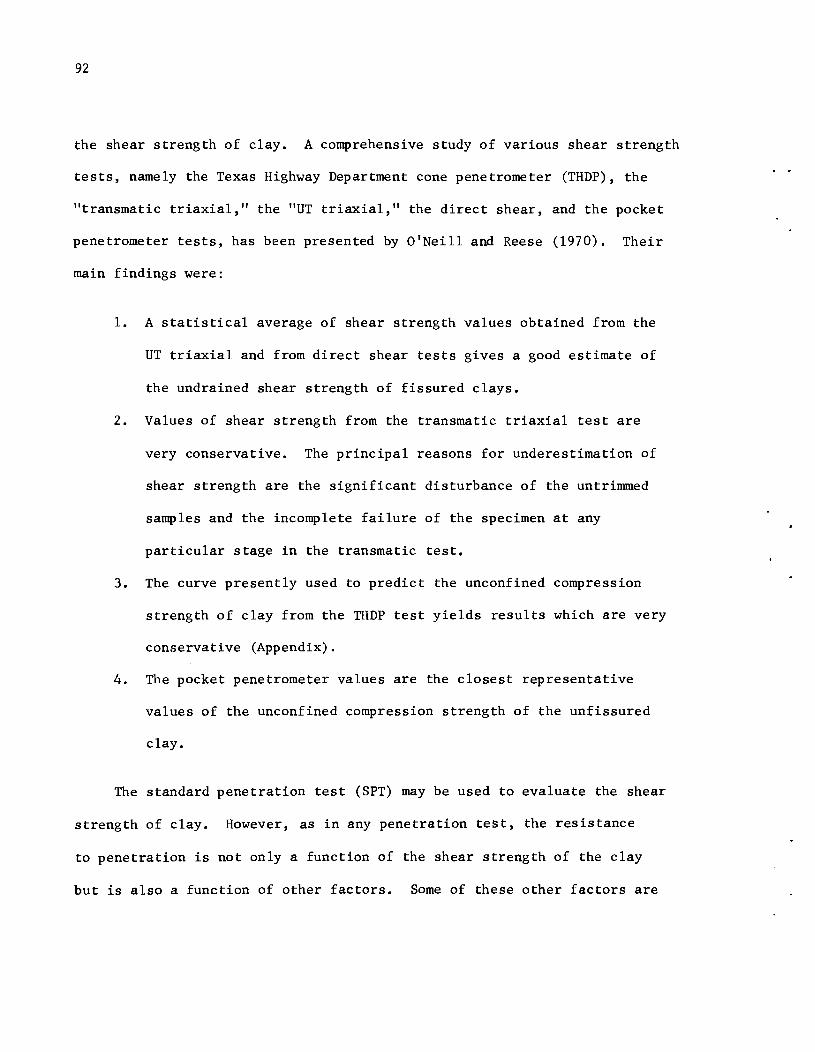
92
the shear strength of clay. A comprehensive study of various shear strength
tests, namely the Texas Highway Department cone penetrometer (THDP), the
"transmatic triaxial," the "UT triaxial," the direct shear, and the pocket
penetrometer tests, has been presented by O'Neill and Reese (1970). Their
main findings were:
1. A statistical average of shear strength values obtained from the
UT triaxial and from direct shear tests gives a good estimate of
the undrained shear strength of fissured clays.
2. Values of shear strength from the transmatic triaxial test are
very conservative. The principal reasons for underestimation of
shear strength are the significant disturbance of the untrimmed
samples and the incomplete failure of the specimen at any
particular stage in the transmatic test.
3. The curve presently used to predict the unconfined compression
strength of clay from the THDP test yields results which are very
conservative (Appendix).
4. The pocket penetrometer values are the closest representative
values of the unconfined compression strength of the unfissured
clay.
The standard penetration test (SPT) may be used to evaluate the shear
strength of clay. However, as in any penetration test, the resistance
to penetration is not only a function of the shear strength of the clay
but is also a function of other factors. Some of these other factors are

93
the sensitivity and the stress-strain properties of the clay and variables
related to the procedure used in conducting the test. The difficulty in
using SPT to obtain the unconfined compressive strength is illustrated in
Fig. 4.3, where different authorities obtained a multitude of widely
scattered curves. In the drilled shaft studies, correlations for local
clays do not exist and, therefore, an accurate evaluation of the shear
strength of clay from the SPT could not be made. It was, however, reasoned
that, since most of the clay deposits encountered at the test sites fell in
the range of medium to high plasticity and had a low sensitivity, the line
labeled (A) in Fig. 4.3 may give a reasonable representation of the shear
strength of clay. This line is very close to the line given by Terzaghi
and Peck (1948). The equation of this line is given by the following
expression.
N qu = 7. 5 . . • • . • • • • . . • • • • . • • • • • . • • (4. 1 )
where
qu unconfined compressive strength,
N SPT blow count.
Sand
The difficulties encountered in evaluating the shear strength of
sand are discussed in the following paragraphs.

94
..... 4.0 N E ~ 01 ~
:J 3.0 t7
0 10 20 30 40 50 60 SPT
CD Sowers - Very Plastic Clay CD Terzaghi - Peck
CD Peck - Reed (Most Data) CD Sowers - Clays, Very Low Plasticity
CD Ireland G) Trow
CD Sowers - Clays, Medium Plasticity~ DeMello
CD Fletcher @ DeMello - Santos Clays
0 Golder @ DeMello - S Paulo Clays
Fig. 4.3 2 Attempted Correlations Between SPT and q (kg/em) u
for Clays (After DeMello)
95
1. The shear strength of a granular material is usually defined with
respect to a failure criterion and a strength test. However, re
fined theories of failure of sand are only of academic interest
when a practical problem like the one under study is being dis
cussed. The influence of a multitude of variables and unknowns
such as the construction procedure and the initial state of stress
is more significant than a change of a few degrees in the friction
angle. It seems, therefore, that refinement beyond the simplest
strength tests and the Mohr-Coulomb theory of failure is not
justifiable.
2. In the Mohr-Coulomb theory of failure, the shear strength of soil
can be expressed by the following equation.
s = c + p tan ¢
where
s = shear strength of the soil,
c = cohesion,
p = effective normal pressure on the failure plane,
¢ = effective friction angle.
(4.2)
In a natural soil deposit, the variables on the right hand side
of Eq. 4.2 cannot now be measured. The cohesion is a function of
the stress level because the Mohr envelope is only a straight line
96
for certain ranges of stress (Vesic, 1968). Furthermore, cementation
of natural soil deposits by the deposition of calcium carbonates
or by the formation of silica cements may affect the cohesion
considerably (Denisov, et al., 1963). In sands above the water
table, moisture creates an unmeasurable apparent cohesion.
The effective stress p in a sand deposit is a major unknown,
mainly because the coefficient of earth pressure is unknown. This
coefficient has been proven to vary with the overconsolidation
ratio (Hendron, 1963). While the overconsolidation ratio can be
reasonably estimated in clays, there does not seem to be a
practical way of measuring this ratio in sand deposits. The angle
of shear resistance ¢ is mainly a function of the relative density
of the sand. However, other factors such as the gradation of the
sand, the mineralogy, the angularity, and the size of the grains
may significantly influence the shear strength of the sand. It
is, therefore, important when evaluating the friction angle by
any test to have the sample represent as nearly as possible the
field conditions of the sand in regard to density and to composition.
3. Sand deposits may be quite heterogeneous. The sand gradation may
vary significantly within one layer. Furthermore, sand deposits
may be interbedded with very thin layers of clay as a result of
seasonal variations in deposition or may contain clay lumps that
have been eroded and deposited before disintegrating.
97
In planning the soil investigation program employed in these studies,
several approaches were evaluated in light of the indicated difficulties
above. Vesit (1970) in his study of the Ogeechee River site mentions the
use of the standard penetration test, the static cone test, and the nuclear
probe for measurements of moisture contents and densities. He also used
laboratory triaxial testing. Various other investigators have reported
success in obtaining undisturbed samples of loose sand by special piston
samplers (Bishop, 1948; Sarota and Jennings, 1957) and of dense or cemented
sand by a double-core barrel (Denisson barrel, Taylor, 1948). In some
instances, undisturbed sampling of sand was made possible by freezing the
soil or by injection of chemicals. Other elaborate approaches consist of
digging pits (combined with dewatering when water is present) and hand
carving samples of sand (Wu, 1957).
After careful considerations, most of these approaches were rejected
as not being feasible or as being irrelevant to this study. Driving of
the tube of the nuclear probe (Vesic, 1970) was suspected to change the
density of the sand in the space around the probe, and the installation
of such a tube in a borehole was considered an impossible task. Further
more, according to literature on the nuclear probe, the accuracy to be
expected is ±2 pcf in density. Such errors would mean a considerable
variation in the relative density of the sand.
An attempt to use the Dutch cone was unsuccessful because of the un
availability of the standard driving equipments and because of the limita
tions of this test in very dense sands. Attempts to extract undisturbed
93
samples of the sand with a piston sampler and with the Texas Highway Depart
ment double core barrel were also unsuccessful. The disturbance of the
sample during sampling, transportation, and handling in the laboratory
eliminates the benefits of such an approach. It was felt that the evaluation
of the sand properties by the Dutch cone and by undisturbed sampling testing
was only necessary for academic interest since these methods are not common
on the American continent and attempts to use them were not pursued further.
The investigation of the sand layers of this study was then made using
two dynamic penetration tests: the Texas Highway Department cone penetrometer
and the standard penetration test. It was felt that the evaluation of the
in situ properties of sand with tools commonly used by the practicing
engineer will provide some valuable information to the profession.
The engineers of the Texas Highway Department use a single chart
(Appendix) to evaluate the shear strength of both sand and clay from re
sults of their penetrometer tests. One may question this approach if it
is admitted that the penetration phenomenon is basically related to a
bearing capacity failure and that the problem in sand is essentially a
partially drained problem whereas it is a quick problem in clay. In this
study results of the Texas Highway Department cone penetrometer were used
in the following manner: a statistical correlation was made between the
THDP and SPT by comparing blow counts in holes at the same site and using
the results of all test sites; the results of the THDP at one site were
then transformed to equivalent SPT blow count to verify the measured SPT
results. This verification was felt necessary since only one borehole
for SPT measurements was made at the Houston sites.
99
The standard penetration test has long been used to estimate the
. . relative density or the friction angle of the sand. The first correlations
between the SPT and the relative density were given by Terzaghi and Peck
(1967) and later by Peck, Hanson, and Thornburn (1953) (Fig. 4.4). Research
conducted at the US Bureau of Reclamation by Gibbs and Holtz (1957) led to
a more rational correlation between the relative density of sand and the
SPT by including the effect of the overburden pressure (Fig. 4.5). Results
of similar research conducted by Schultz, et al. (1965) are summarized in
Fig. 4.6. Bazaraa (1967) concluded from the analysis of 1300 penetration
tests that the USBR Charts overestimated the relative density and he
recommended the use of more conservative relationships (Fig. 4.6).
Recently, De Mello (1971) gave the standard penetration tests an
evaluation by presenting a rational analysis of the penetration phenomenon
and the results of a statistical analysis of a large volume of data. Using
expressions from the theory of bearing capacity, and a statistical regression
analysis of the USBR tests, De Mello derived the following relationship:
8PT 2 4 2 n ~ ntanm-l 4. 0 + O. 015 -'- tan (- + ) e tan¢ 4 2
(4.2)
where
. 2 cr = overburden pressure Tim .

100
.. .. ."
.§ .. c
e • • .2 .. 0
~~ .. 'C C ~
~j .. .. ~ :IE 0
14 0
c:r ""- I -z ~N I ..: , -120 ...... 'C ""- I 20 i c
" ,
0
" iii )... 100
.....
'" 40 z z
Ny --1 .- A -... en 0 80 60 {!!. - I u 0 I LL. c
I 0 ,.. I . .::;
:!:: 60 80 0 ... u I -0 I .. 0.. C 0 I. .. u 40 100
Q.
01 'E c 0 ';: 'C 0 20 120
c .. 0 m -(/)
0 140 28 32 36 40 44
Anole of Internal Friction, cpo
Fig. 4.4 Curves Showing the Relationship Between ¢, Bearing Capacity Factors, and Values of N from the Standard Penetration Test
. .
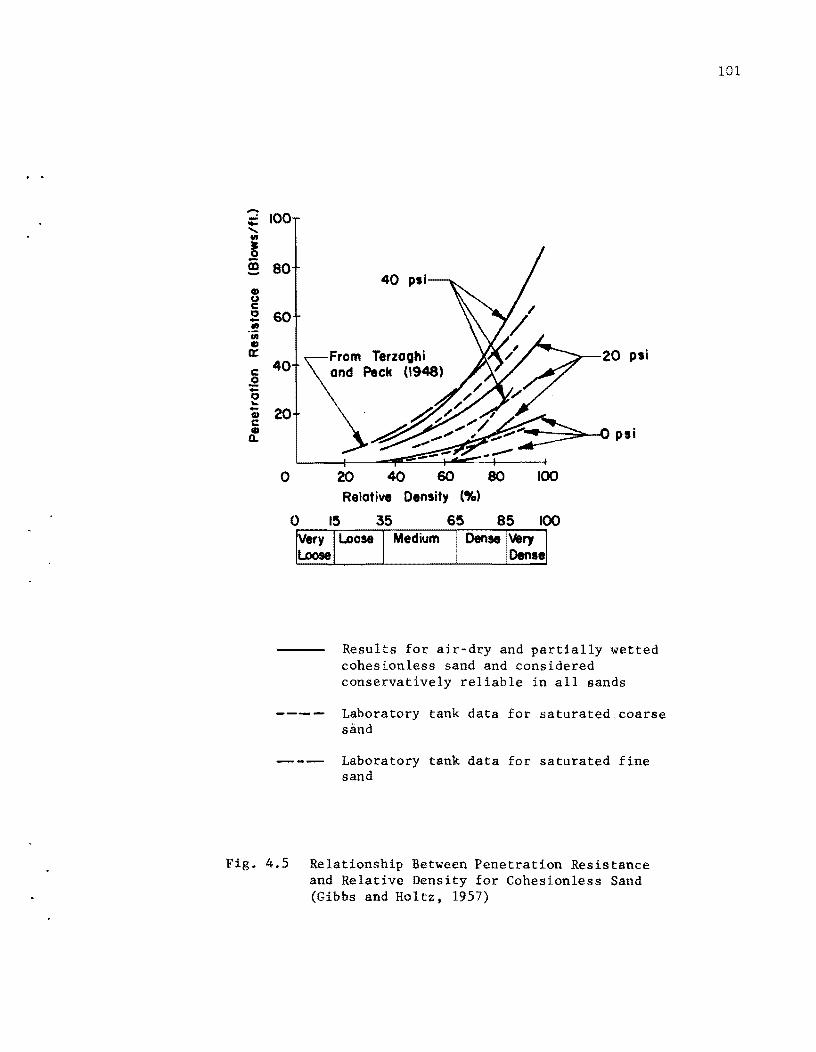
. . .... ..: .... ..... CII
1 m -II) u c: 0 -.!! CII II)
0::
c: .2 -0 ~ -IS) c: IS)
G-
100
80
60
40
20
O
40
From Terzaahi psi and Peck (1948)
psi
20 40 60 80 100 Relative Density (%)
65 85 100
Results for air-dry and partially wetted cohesionless sand and considered conservatively reliable in all sands
---- Laboratory tank data for saturated ,coarse sand
----- Laboratory tank data for saturated fine sand
Fig. 4.5 Relationship Between Penetration Resistance and Relative Density for Cohesionless Sand (Gibbs and Holtz, 1957)
101
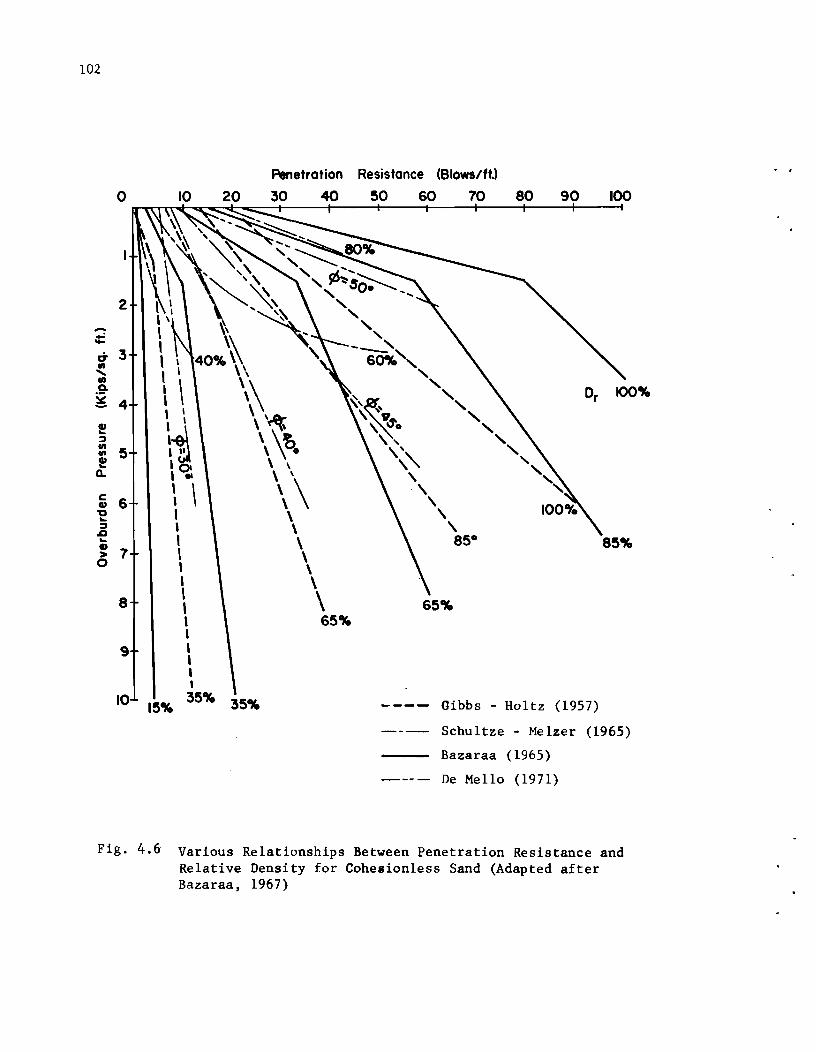
102
10
2
.... ..: -c7 3 , ., ..... , .,
\ .9-~ 4
CD ~
:J en
S '" e a..
c 6 CD "0 ~
:J .0 ~
CD 7 >
0
8
9
10 IS%
20
3S%
Penetration Resistance (Blows/ft.)
30 40 so
\: ~ .. ~'~~ \ ". \,
60 70
\' \'\. , '\
\ \
\ 8S·
6S%
80 90
---- Gibbs - Holtz (1957)
100
8S%
--- Schultze - Melzer (1965)
Bazaraa (1965)
--- - De Mello (1971)
Fig. 4.6 Various Relationships Between Penetration Resistance and Relative Density for Cohesionless Sand (Adapted after Bazaraa, 1967)

103
De Mello contends that the "shear resistance is the principal parameter
at play" in resisting penetration, and rejects the USBR approach of corre-
lating the standard penetration test with the relative density. Figure 4.7
shows a comparison between the triaxial ¢ values and the 0 values max
estimated from the above regression analysis.
For purposes of this study and with the views already explained in
mind, the SPT data were interpreted in the light of reasoning presented in
the following paragraphs.
The analysis of De Mello is, in the opinion of the authors, the best
analysis that has been made of the penetration test. However, this analysis
does not consider two aspects of the penetration resistance: the compressi-
bility of the sand and the friction on the sides of the penetrometer. One
can think of two sands having the same angle of shear resistance but having
two different compressibilities (due to differences in gradation, angularity
and mineralogy). The two sands would exhibit different penetration re-
sistances. On the other hand, sands of perfectly similar physical
characteristics may indicate different blow counts due to a difference in
the overconsolidation ratio and consequently a difference in the coefficient
of earth pressure and the side resistance.
Neglecting the effect of overconsolidation, cementation, and other
variables related to the SPT test procedure, it seems reasonable to assume
the penetration resistance to be a function both of the relative density
and of the angle of shear resistance of the soil. With two variables and
one output, the penetration test may not give accurate information on

104
JC CI e
"6-
50
45
40
_ 35 o ·s ~
30
25
~ Range of variation because of scatter of data
• Data from various references
• Vesic' values .... / ., / o S. Paulo subway (Promon's files) • / . , / • Own files (De Mello) .. . /
• •
25
•
•
• . / . / J/ // .
// o ,II 0
/0 /
/0 0 0
••
30 35 40 Estimated ~ From (SPT. u)
•
45
Fig. 4.7 Comparison of Triaxial ¢ Values with ¢ max Estimated from Equation 4.2 (De Mello, 1971)
105
either one of the variables. If the SPT is combined with another field or
laboratory test, it is possible that the influences of the variables can
be separated.
The next rational step, along this line of thinking, is to treat the
SPT blow count as an index property of the soil, directly related to the
behavior of foundations. However, a friction angle means more than a
number from a test that is not yet standardized (Ireland, ~ al., 1970).
Furthermore, certain aspects in the behavior of foundations, e.g., the side
shear on a pile, are mainly functions of the friction angle of the soil
and must, therefore, be expressed in terms of the friction angle.
De Mello, Fig. 4.8, presents a statistical regression analysis of
voluminous data in trying to relate the friction angle to the relative
density of the sand. As could be expected, such a universal relationship
does not seem to exist for all sands, but does seem to exist for "average"
sands. The term "average" is not explicitly defined by De Mello, but he
indicates that average sands are quartz sands of average uniformity of
gradation that occur most frequently and are similar to the sands used in
the USBR research.
If one accepts the existence of a relationship between the friction
angle and relative density for average sands, then the penetration re
sistance can be expressed as a function of either variable.
In looking for such an expression among the large number which have
been proposed, the relations given by the USBR are found to be most
reasonable. While Bazaraa (1965) indicates that the SPT overestimates

106
80
70
60
.... • 50 "9--~ 01
c'i c 40 o :;: u if
30
20 Peck, Hanson, and Thorn burn
95% Confidence for Average-__
95% Confidence for Individual Case
10~--------~----------+----------+----------~--------~ o 20 40 60 80 100 Relative Density (%)
Fig. 4.8 Dispersion Around Universal Relation 0 f(Dr) (De Mello, 1971)

107
the relative density of the sand, De Mello (1971) suggests that the SPT
underestimates it. The disagreement is apparently due to the several other
factors that neither one of the authors included in his analysis. The
criticism of Gibbs and Holtz for neglecting the effect of the weight of the
drive rods seems unjustified for depths between 15 and 80 feet below the
surface because the energy transmitted to the penetrometer in this range
of depths does not vary significantly.
It was, therefore, decided in this study to obtain the relative density
of the sand from the USBR charts. There does not seem, however, to be an
obvious choice of the relation to be used in correlating the relative
density to the friction angle of the sand. A relation proposed by Peck,
et al. (1953) seemed reasonable and was very close to the curve given by
De Mello for average sand, and was, therefore, adopted for this study.
With regard to possible errors in the friction angle from the use of
the procedures outlined above, it can be argued that an error of a few degrees
in estimating the friction angle cannot be very significant in the analysis
of drilled shafts when the side resistance of the shaft is considered.
Because the side resistance is a function of tan ¢, one can write the
following:
q tan ¢ s -
. . . . . . . . . . . . . . . . . . . . . . . (4.3)
where

108
and
dq s
unit shear stress
~~ . . . . . . . . . . . . . . . . . . . . . (4.4) cos ¢
The relative error in side friction can further be expressed as the
following:
1 (4.5) 2
cos ¢. tan ¢
The relative error in qs due to an error in ¢ of one degree varies
between 3.5% and 4% for a range of angles between 30 and 50 degrees.
An error of 20 percent in evaluating the side resistance of a drilled
shaft may not be very significant when the effects of other unknowns in
evaluating the properties of the sand or in the construction procedure
are considered.
On the other hand, many of the existing theories concerning the bearing
capacity of deep foundations show that a slight change in the friction angle,
particularly at higher densities, causes a significant change in the bearing
capacity of the tip of the foundation. It is, however, an accepted fact
that the bearing capacity failure of deep foundations is of the punching
failure type (Vesie, 1963). The large bearing capacity predicted for
large diameter deep foundations, by theories based on the plastic

109
equilibrium of the soil mass, is not realistic, because the stresses
generated by such bearing pressures lead to the crushing of the soil grains
(Vesic, 1968), and consequently to prohibitive settlements. It seems, then,
that for deep foundations, the bearing capacity of the tip of the foundation
is more sensitive to the compressibility of the soil than to the angle of
shearing resistance.
CORRELATIONS BETWEEN SPT AND THDP
A correlation between the standard penetration test (SPT) and the
Texas Highway Department cone penetrometer (THDP) is needed for the purposes
of this study and for the purpose of making the results of this study useful
to the users of the THDP. A correlation based strictly on analytical con
siderations is very complicated, and a statistical correlation is more
rational. However, a discussion of the basic principles and variables
involved in the penetration phenomenon is necessary before any correlation
is attempted.
The penetration phenomenon is similar to that of pile driving that has
been the subject of many investigations (Terzaghi, 1943). Figure 4.9 shows
schematically the free body diagrams of the penetrometers and the compression
wave generated in the drilling rod at the impact with the hammer. The
wave is simplified in a sharp triangular shape that characterizes the
steel to steel impact. When the wave reaches the soil, the shear strength
of the soil is partly or fully mobilized to resist the displacement of the
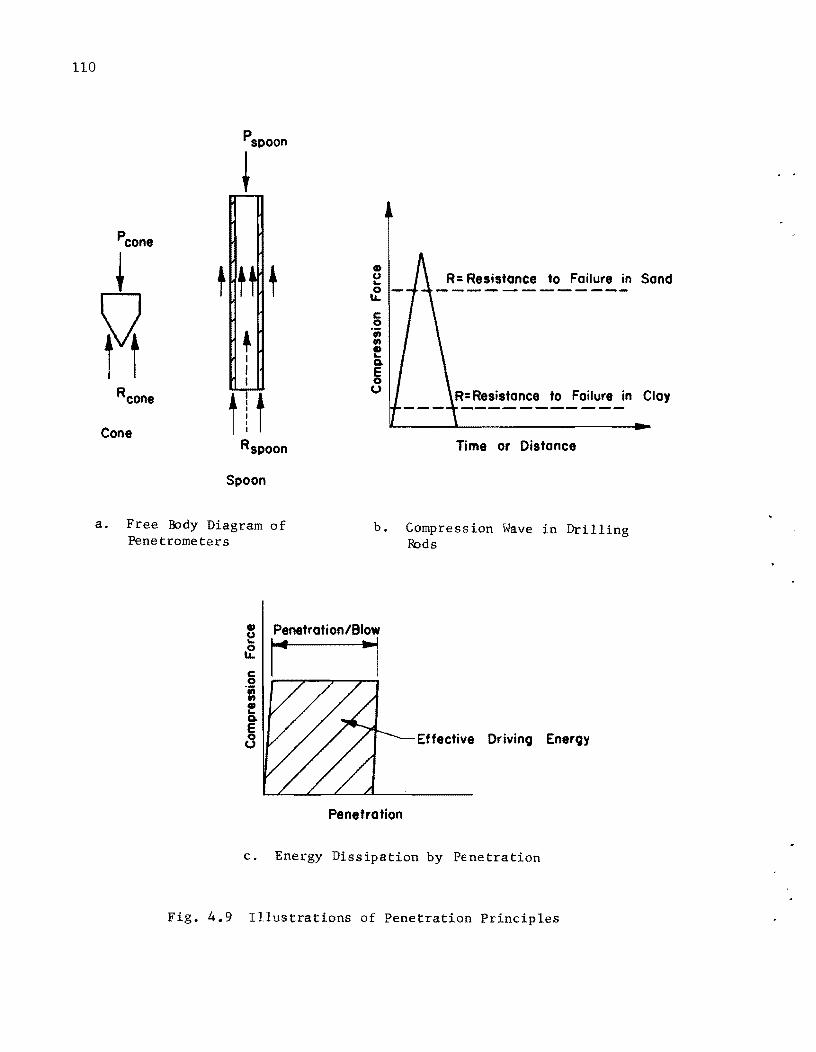
110
Cone t t Rspoon
Spoon
a. Free Body Diagram of Penetrometers
II) u "o u.. c o ';; In II) "-Q.
& o
R= Resistance to Failure in Sand
R=Resistance to Failure in Clay
Time or Distance
b. Compression Wave in Drilling fuds
Effective Drivino Eneroy
Penetration
c. Energy Dissipation by Penetration
Fig. 4.9 Illustrations of Penetration Principles
III
penetrometer. If the soil resistance is smaller than the peak force applied,
the soil fails and penetration takes place. The energy of the wave is then
dissipated in plastic deformation of the soil (See Fig. 4.9c). If the soil
resistance is larger than the peak force of the wave, the soil reflects the
wave and the energy is dissipated in heating the system.
Most clayey soils (such as the clay soil tested in this study) exert
a small resistance to both types of penetrometers, and the impact energy
is usually readily dissipated by penetration, with similar small amounts of
heat losses in both penetrometers. However, for the same penetrometers, the
bearing resistance is significantly larger in sands than in clays (particu-
larly sands of medium densities and above, as are the sands tested in this
study). This fact results in greater heat losses when sandy soils are
tested.
Furthermore, the peak stress of the compression wave can be roughly
estimated by
p max
where
E =
W p
Wh
L =
Vh
Wh
= E ~ W (l+E/T L) p c
(Terzaghi, 1943)
elastic modulus of drilling r.od,
weight of drilling rod,
weight of hammer,
length of rod,

112
T stiffness of cushion, c
Vh
velocity of hammer at impact,
v velocity of sound in drilling rods.
For two penetrometers using comparable driving mechanisms and driving rods
and differing only in the weights of the driving hammers, the ratio of the
peak stresses of the compression waves can be expressed as the following.
(Pma) cone
(Pma) spoon
=
v' (DRIVING ENERGY) cone (DRIVING ENERGY) spoon
v' 170 X 2.0 140 X 2.5
= 0.985
It can, therefore, be concluded that the peak stresses applied at
the penetrometer level are fairly comparable in both types of penetrometers.
Because the soil resistance is significantly larger for the larger cross-
sectional area of the cone than that of the spoon, while the peak driving
force is practically the same, it follows that the heat losses in the THDP
are larger than in the SPT.
Figures 4.10 and 4.11 show the plots for clay and for sand of the
penetration resistance of the two penetrometers. The comparisons were
only made for tests taken at about equal depths to eliminate the error
due to the weight of the rods (De Mello, 1971) and due to variations in
the type of soil.
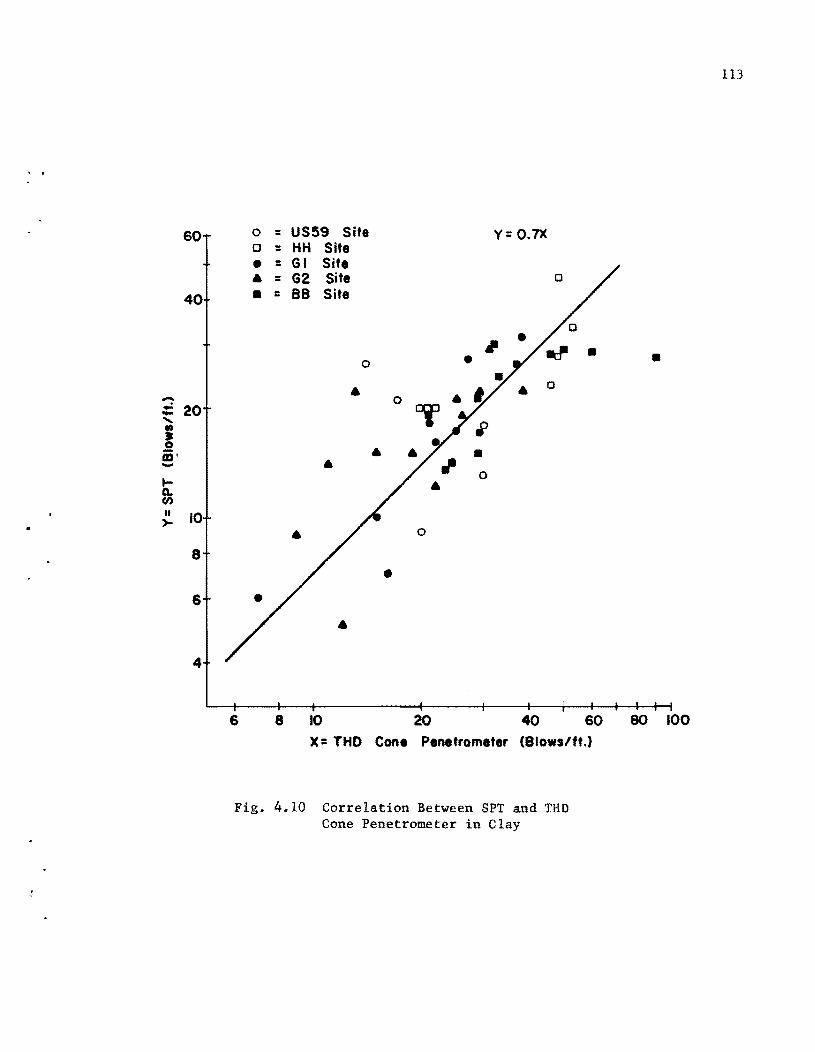
, .
60
40
-..: 20 -..... .. J 0
iii' .... t-Q. CI)
II 10 >-
8
6
4
0 = US59 Site y= 0.7)( 0 = HH Site
• = GI Site
• = G2 Site 0
• = BB Site
iJ • 0 • • 0
• • o •
• 0
• •
•
6 8 10 20 40 60 X= THO Cone Penetrometer (810wslft.)
Fig. 4.10 Correlation Between SPT and THD Cone Penetrometer in Clay
113
•
80 100

114
400
200
100
- 80 -..: -..... • 60 " • 0 CD 4O~ -I-eL (I)
II >-
20
10
8
6
20
0 = US59 Site Y=0.5X 0 = HH Site
• = GI Site
• = G2 Site
• = BB Site 0
• • • •• 0
~ 0 •
0 • • •• • • ••
0 •
•• • •
40 60 80 100 200 400 600 800 1000
X= THO Cone Penetrometer (BloWl/ft.)
Fig. 4.11 Correlation Between SPT and THD Cone Penetrometer in Sand
115
A rigorous statistical analysis was not attempted due to the limited
amount of data available. Furthermore, a linear correlation is proposed
for both soils. A straight line relationship is rational for clays and
soft driving soils because the heat losses are not enough to produce non
linear effects. There are larger heat losses in dense sand and in hard
driving soil and the losses are not comparable in both tests. As a result
a nonlinear correlation between the two tests may be anticipated. However,
the large scatter of the data in sands did not seem to warrant a nonlinear
correlation and a linear correlation as shown in Fig. 4.11 was adopted.

!!!!!!!!!!!!!!!!!!!"#$%!&'()!*)&+',)%!'-!$-.)-.$/-'++0!1+'-2!&'()!$-!.#)!/*$($-'+3!
44!5"6!7$1*'*0!8$($.$9'.$/-!")':!

CHAPTER V. DESCRIPTION OF FIELD WORK
This chapter describes the various phases of the field testing program
which were carried out. Personnel from the Texas Highway Department and
from the Center for Highway Research at The University of Texas at Austin
cooperated in performing the work.
DESIGN OF TEST SHAFTS
The test shafts located at the sites of future bridges were designed
to satisfy the following requirements:
1. To carry, with a reasonable factor of safety, a load equal to the
design load of the shaft.
2. To penetrate the maximum possible distance into the sand layers
and to give information on the load transfer in these layers.
3. To have a maximum capacity within the limits of the loading
system (1000 tons).
INSTRUMENTATION
The instrumentation of the test shafts consisted mainly of Mustran
cells for the purposes of measuring the load at various sections in the
shaft during the load test. Thermocouples were also installed in the
test shafts to measure the temperature of concrete during curing.
The thermocouples were "Quick tip" iron-constantan thermocouples
manufactured by the Leeds and Northrup Company and were installed at three
117

118
or four levels in each shaft, as shown in Fig. 5.1.
The MUstran cell is a strain-sensing cell developed at the Center for
Highway Research specifically to meet the needs of the research on the
behavior of drilled shafts. The construction and operation of the cell have
been described in detail by Barker and Reese (1969, 1970) and by O'Neill
and Reese (1970). In the following sections, a very brief description of
the cell and of the recent modifications in its usage are presented.
The Mustran cell consists of a one-half inch square steel bar in
strumented with two 90° foil strain gage rosettes to form a four-arm bridge
circuit. Two steel caps are fastened at the ends of the bar after enclosing
it in a 1-5/16 inch rubber hose to provide shock protection and water
proofing. Additional protection against the entry of water is provided
by partially filling the cavity around the bar with anhydrous calcium
chloride and by pressurizing the cell and lead wire with dry nitrogen.
Two types of Mustran cells are manufactured in the shops of The
University of Texas. Type-l cells are distinguished basically from type-2
cells by a reduction in the cross-sectional area of the bar at the location
of the strain gages to provide a higher multiplication of the concrete
strains. Also, the steel bar in type-l cell has a length of four inches
as compared to five and one-half inches in the type-2 cell. The sensi
tivity of the type-2 cells was estimated to be adequate for the test
shafts of this study and was, therefore, used exclusively in all of the
shafts described in this report. Various laboratory tests were conducted
on the cells, prior to their shipping for field use, to check their
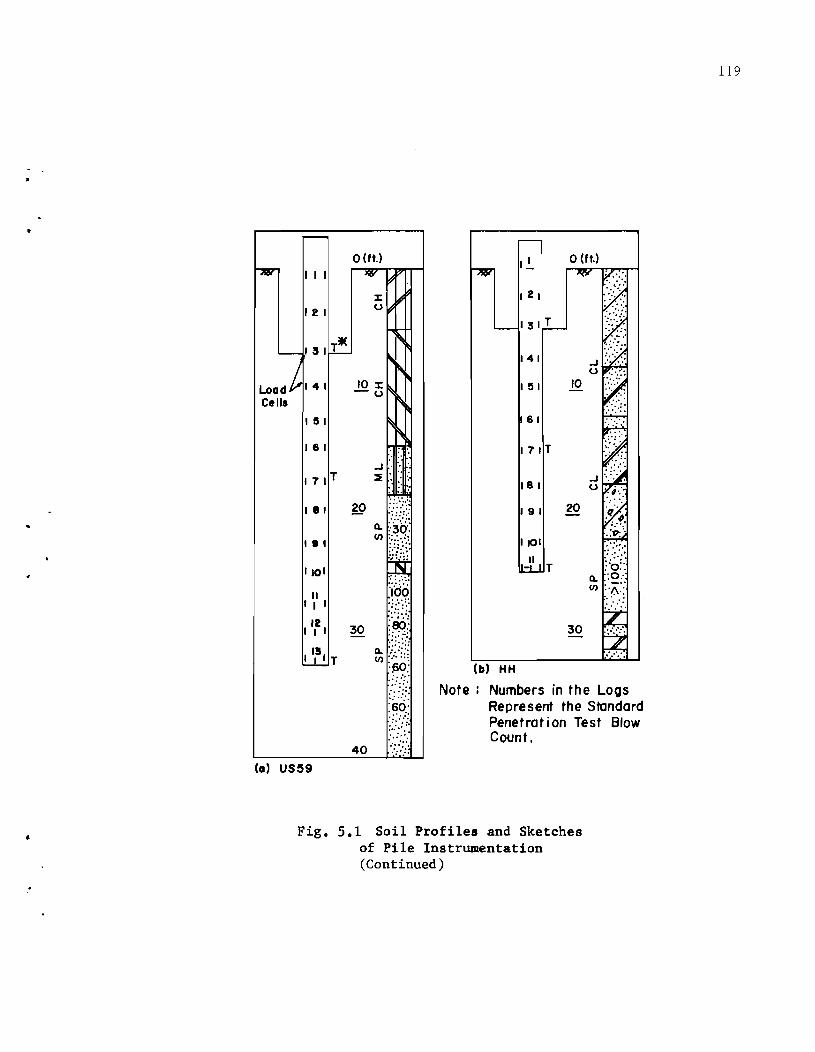
1 I 1
121
I !5 I
161
I II
181
1101
II 1 I 1
12 I I I
~T
(a) US~9
o (ft.) J\&' ~
~~~
roo,
~~ 10 J: ~ -u ~
30
~~
..J ': :: "
~', ':':
I~ o (ft,)
131 T
141
I !5 1
161
171T
18 I
191
I JOI
II T
(b) HH
Note: Numbers in the LOQs Represent the Standard Penetrat i on Test Blow Count.
Fig. 5.1 Soil Profiles and Sketches of Pile Instrumentation (Continued)
119

120
(c) G I Site
*T: Thermocouple
I"'""':"""" I \1 o (t"t)
\. flU ~ ~ 13 T ~
10
~ -I-
141 ~ %
20U
- t\ I IS IT
~ 30 ~ -
181 ~ ~
40% -u ~
171 T ~ ~O ~
181 % ~ U ~
60 ~~. -
19 1 ~ ~
101 70 :~.: ;40:
I II I Q. ,://:: 112 T
en ·70:· ~ .t-o;
BO ~ --~
141
151
181
I 9 I
1101
I II I
.!.J!.! T
-I 10 2 t" -j
u
...... ·60·
~ ~O ' ...
:.:.: :.:' • "0
,':-- :
(e) BB Site
(d) G2 Site
Fig. 5.1 (Continued)

electrical stability, their response to loading and their waterproofness.
The resistance-to-ground of the strain gages and their indicated strain,
121
as compared to a reference bridge of similar gages, were measured periodically
for a few weeks following the construction of the cells. Gages exhibiting
a resistance-to-ground smaller than 100 megohms or indicating a drift in
the strain reading were reopened and treated till a satisfactory performance
was obtained. The cells were exercised by subjecting them to a cyclic
loading of one ton at a constant rate of strain. The applied load, measured
by a calibrated load cell, and the response of the gages were plotted in
stantaneously by an x-y chart plotter. Cells exhibiting a nonlinear response
or an abnormally different output than the average output of the other gages
were opened and repaired. The output of most of the cells was, therefore,
practically the same except for some cells that exhibited slightly different
output (up to 10%). This difference was later accounted for in reducing
the data. The Mustran system of each shaft, consisting of the Mustran
cells, lead i'lires, and plugboard and the enclosing manifold, was pressurized
with dry nitrogen and submerged in water to detect possible leaks.
In the field, the Mustran cells were installed in pairs on two
diametrically opposite bars of the cage of reinforcing steel. Figure 5.1
shows the soil profile and sketches of the locations of the instruments in
the test shaft. The cells in the exposed part of the shaft serve to de
velop a calibration curve relating the known applied load on the top of
the shaft to the output of the cells. This calibration curve is later
adjusted as necessary to reflect variations in pile diameter and is used

122
to compute the load in the shaft at the other levels of cells. The photo
graphs in Fig. 5.2 show Mustran cells installed on the cage of reinforcing
steel. Figure 5.2a shows two cells at about mid-height of the cage on
diametrically opposite bars. Figure 5.2b is a view of the lower end of the
cage and shows four Mustran cells. The extra cells were placed at the
bottom of the shaft in order to measure more accurately the load in point
bearing. Figure 5.2c shows the construction of the shaft at the G2 site.
The lead wires from the instrumentation are collected in a manifold which
is pressurized with dry nitrogen as a further protection against migration
of moisture into the electrical system.
The distribution of the gages in the shafts was based on the following
considerations:
1. To insure a good calibration level at the top of the shaft.
2. To obtain more information from sand layers because clay was
the subject of previous research.
3. To obtain an accurate measurement of the tip resistance.
These considerations explain the higher intensity of gages at the top
and bottom levels of the shaft as shown in Fig. 5.1.
The non-loading performance of the Mustran cells was monitored with
a Budd strain indicator with the output of each cell being compared to
that of a reference bridge. During test loading, readings from the Mustran
cells were obtained with a digital data logging system (Honeywell, Model
620) and recorded on a paper tape at the approximate rate of one reading
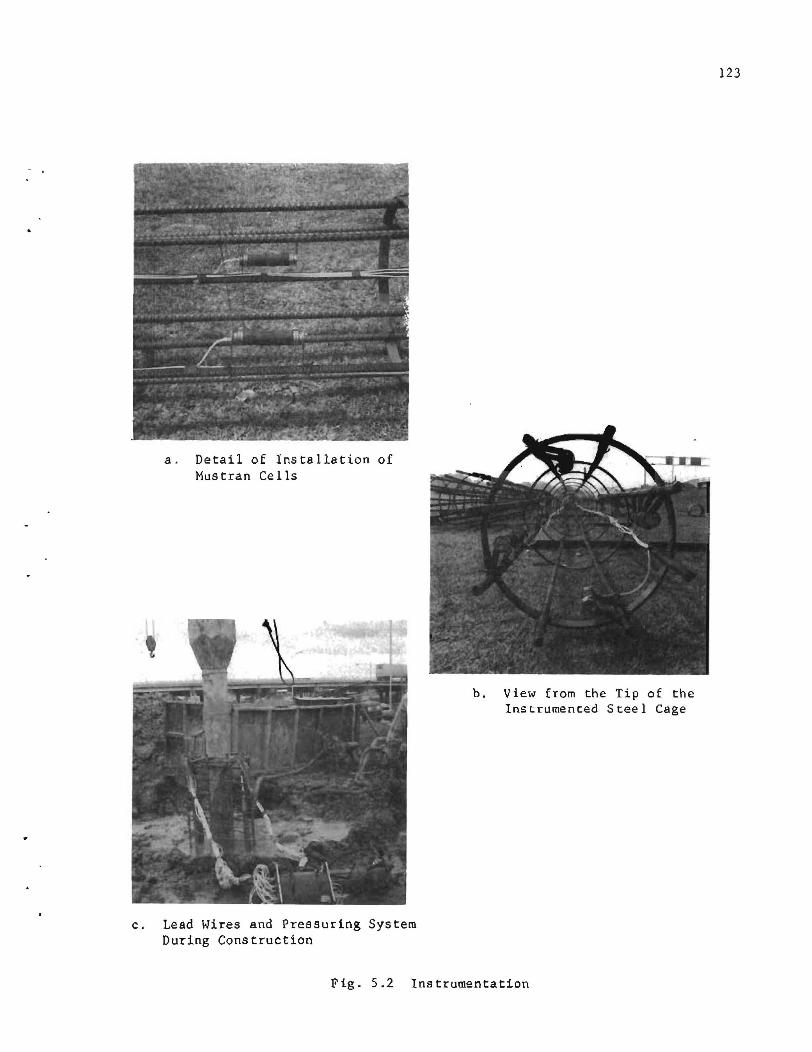
8. Detail oE Installation of Mustran Cells
c. Lead Wires and Pressuring System During Construction
b. View from the Tip of the Instrumented Steel Cage
Fig. 5.2 Instrumentation
123

124
per second. The cells were continuously powered and monitored for at least
one hour before the test to provide data on their possible electrical drift.
No significant drift in the cells or in the system was detected. Failures
in the cells which did occur were of a mechanical nature related mainly to
the construction techniques of the test shafts.
CONSTRUCTION
Two methods of construction were used to install the test shafts: the
dry method and the slurry displacement method. The dry method was used in
installing the test shafts in Live Oak County (shafts US59 and HH) and the
slurry displacement method was used in installing the test shafts in Harris
County (shafts Gl, G2, BB). The procedure which was followed in each
method of construction, except for minor variations, was as follows:
Dry Method
1. Open a hole until the plan elevation is reached.
2. Lower a workman who manually cleans the bottom of the hole.
3. Set the instrumented cage of reinforcing steel in the hole.
4. Insert a tremie in the hole and suspend it from one of the lines
of the crane. The tremie used was a la-inch pipe about 25 ft.
long and had staggered openings in the sides.
5. Apply a dry nitrogen pressure of· about 20 psi on the Mustran system
to prevent the migration of water from the concrete into the cells.

6. Pour the concrete in the hopper or into one of the side openings
of the tremie.
7. Fill the hole to about 7 ft. from the surface of the ground by a
continuous pouring of the concrete.
8. Retract carefully the tremie and continue filling the hole by
using the chute of the concrete truck.
9. Form the last 7 to 9 ft. of the shaft with a sonotube to prevent
the formation of a tapered shaft close to the surface of the
ground. (It has been previously reported that the drilling
process invariably results in a tapered hole due to the rapid
entry of the auger in the hole [Barker and Reese, 1970J.)
10. When the concrete is set, remove the soil from around the shaft
to a distance slightly below the calibration levels of the
Mustran cells.
Slurry Displacement Method
1. Open a hole without slurry until a water-bearing, caving layer
is encountered.
2. Immediately introduce the premixed mud slurry and keep its level
within three to five feet of the ground surface.
3. Continue drilling to plan elevation under slurry.
125
4. Clean the bottom of the hole with a bucket or an auger immediately
before the cage of reinforcing steel is set in place.
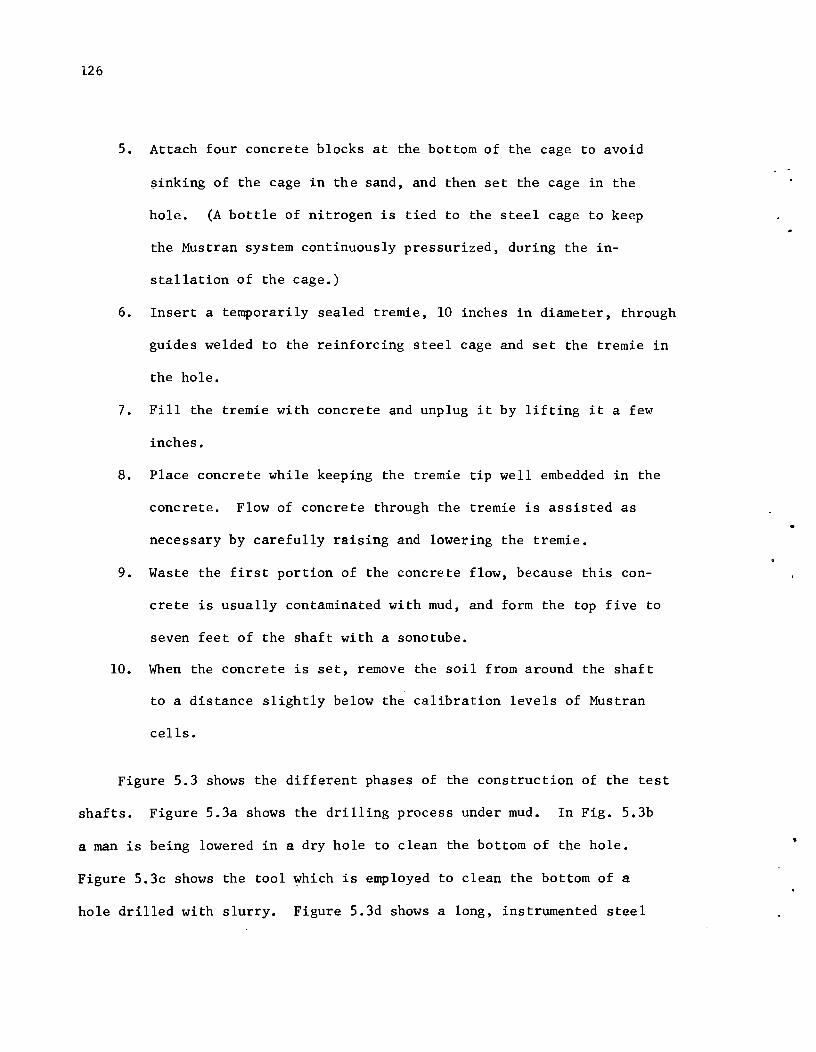
126
5. Attach four concrete blocks at the bottom of the cage to avoid
~inking of the cage in the sand, and then set the cage in the
hole. (A bottle of nitrogen is tied to the steel cage to keep
the Mustran system continuously pressurized, during the in
stallation of the cage.)
6. Insert a temporarily sealed tremie, 10 inches in diameter, through
guides welded to the reinforcing steel cage and set the tremie in
the hole.
7. Fill the tremie with concrete and unplug it by lifting it a few
inches.
8. Place concrete while keeping the tremie tip well embedded in the
concrete. Flow of concrete through the tremie is assisted as
necessary by carefully raising and lowering the tremie.
9. Waste the first portion of the concrete flow, because this con
crete is usually contaminated with mud, and form the top five to
seven feet of the shaft with a sonotube.
10. When the concrete is set, remove the soil from around the shaft
to a distance slightly below the calibration levels of Mustran
cells.
Figure 5.3 shows the different phases of the construction of the test
shafts. Figure s.3a shows the drilling process under mud. In Fig. s.3b
a man is being lowered in a dry hole to clean the bottom of the hole.
Figure 5.3c shows the tool ~hich is employed to clean the bottom of a
hole drilled with slurry. Figure s.3d shows a long, instrumented steel

•
a. Drilling Under Mud
c. Bucket Cleaning of the Bottom of a Hole Drilled Under Mud
b. Manual Cleaning of the Bottom of a Dry Hole
127
Fig. 5.3 Construction - Drilling and Cleaning (Continued)

'"
"_ If ''' ... of '." "'_"". st_, Co ••
•
o . , .... 11 .. ,_ 01 So_I "".0 I _ .... 1101.
•

g. Concreting of a Dry Hole
i. Fanning of the Top Section of a Test Shaft
129
h. Concreting by Slurry Dis~lacement
Fig. 5.3 (Continued)

130
cage, lifted with three points to avoid excessive bending of the cage;
while Fig. 5.3e shows the installation of the same cage in the hole.
Figure 5.3f shows the temporary seal of the tremie. Figures 5.3g and 5.3h
illustrate the concreting procedure followed in concreting dry holes and
in concreting by slurry displacement. Figure 5.3i shows the last phase of
the construction, consisting of forming the.top section of the shaft in a
sonotube.
Table 5.1 presents data on the dimensions of the shaft and some of the
field data related to the concreting phase of the construction. The time
required to concrete the hole and the temperature of the concrete have a
decisive influence on the lateral pressure developed by the concrete
against the walls of the hole.
Comments Concerning the Construction of Shaft US59
There was sloughing of the walls of the hole during drilling in the
sand at about 18 feet below the surface of the ground. The sloughing was
limited to an area of about two square feet and extended about two inches
into the walls of the hole. Difficult drilling was experienced in the
very dense dry sand below a depth of 25 ft. The wobbling of the kelly bar
beyond that depth created corrugations in the walls extending to the bottom
of the hole. The depth of the corrugations was estimated at about one inch.
Due to some technical difficulties, pressurizing of the Mustran system
was not possible till about two hours after concreting was completed. The
resistance-to-ground of the cells was still excellent after that time and
no moisture is believed to have reached the gages.

•
131
Table 5.1 Location and Geometric Descriptions of Test Shafts
Shaft dn, da, De, Db, As in. in. ft. ft.
U859 30 9.5 25.4 8it9 Cast 8-25-70
HH 24 7.2 19.8 8in .Cast 8-31-70
Gl 36 37.7 7.0 54.8 10ft8 Cast
G2 Cast
BB Cast
9-02-71
30 31.4 5.5 73.5 8-19-71
30 31.4 3.0 45.0 9-03-71
De = exposed height of shaft
Db = buried height of shaft
8/F8
8/F8
dn nominal diameter (or sonotube diameter)
As steel reinforcement
da = averaged measured diameter
Cone. No. of Slump, Cone.
in. Trucks
2.5-3.0 2
5.0-6.0 1
6.0-7.0 3
5.5-6.5 3
6 2
Db
Generalized Elevation of Test Shafts
Air Time Temp ., for
of Concreting
89 ~~ hr.
92 hr.
91 =-1 hr.
90 =--1.5-2 hr.
83 ~~ hr.
132
Comments Concerning the Construction of Shaft HH
The depth of the hole at this site was smaller than the length of the
tremie and, as a result, the concrete was poured through one of the side
openings of the tremie. This procedure forced the concrete into a sinuous
chute and is believed to have caused a segregation of the concrete at the
tip of the shaft.
Comments Concerning the Construction of Shaft GI
At this site, cleaning of the bottom of the hole with an auger was
unsuccessful. Cuttings and loose soil were believed to have fallen back
to the bottom. As the site was muddy and the top of the hole was not
protected, the workmen caused soft mud to fall into the hole while walking
around the shaft during and after the installation of the steel cage. The
belief that soft material existed at the bottom of the hole was later
sustained by the fact that the tremie sank about six inches when the first
bucket of concrete was poured into the tremie.
Comments Concerning the Construction of Shaft G2
A first attempt to install the shaft in the south bay of the bent
failed because the contractor did not keep the mud slurry at a high enough
level in the hole. Keeping the mud slurry near the level of the caving
soils accelerated the caving because of the scouring action caused by the
fluctuation of the mud surface. The first hole was filled with concrete
and abandoned.
The second attempt was successful because the mud slurry was kept near
the ground surface. Also, premixed mud slurry was used, a procedure

which was found advantageous. In-hole mixing as used during the first
attempt could have aided the scour and the caving which was observed.
133
The bottom of the hole was cleaned with a bucket just before the steel
cage was introduced. Unusually nonhomogeneous soil conditions existed at
the site and there was uncertainty about the character of the soil at the
tip of the shaft.
Comments Concerning the Construction of Shaft BB
Two observations were made concerning the mud at this site:
a. The mud slurry was too thick because some water drained out of the
hole leaving a thick bentonite gel.
b. Contaminated water from Brays Bayou was used in mixing the mud.
This contaminated water caused flocculation of the bentonite and
inhibited the formation of an impervious mud cake.
Soil borings at the site indicated that the sand formation contained
occasional sandstone lenses. At the shaft location these lenses were not
encountered; however, a lO-inch auger advanced in the sand below plan tip
elevation indicated hard layers interpreted as sandstone 2.5 feet below
the tip.
Data on the Concrete of the Test Shafts
Table 5.2 presents laboratory data on the compressive strength and the
modulus of elasticity measured on concrete cylinders. Cylinders recovered
from the construction of the shafts in Live Oak County were cured in a
100% moisture room and tested at the laboratories of The University of
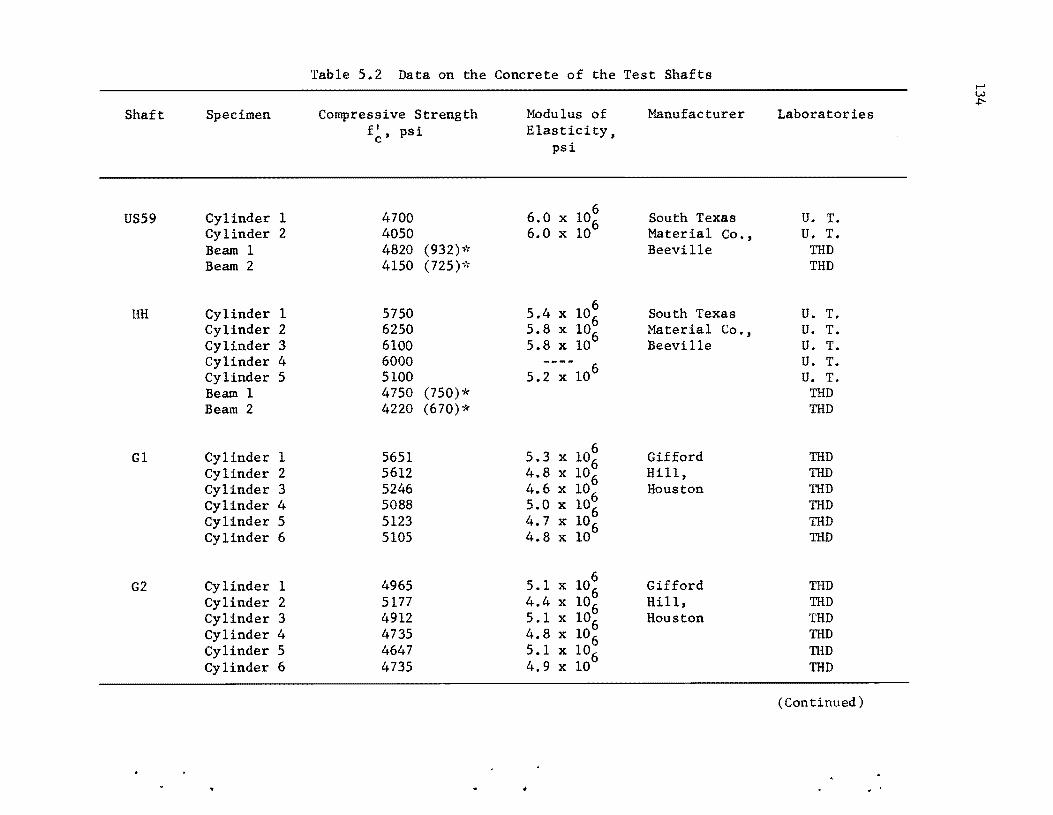
Shaft Specimen
US59 Cylinder 1 Cylinder 2 Beam 1 Beam 2
HH Cylinder 1 Cylinder 2 Cylinder 3 Cylinder 4 Cylinder 5 Beam 1 Beam 2
Gl Cylinder 1 Cylinder 2 Cylinder 3 Cylinder 4 Cylinder 5 Cylinder 6
G2 Cylinder 1 Cylinder 2 Cylinder 3 Cylinder 4 Cylinder 5 Cylinder 6
Table 5.2 Data on the Concrete of the Test Shafts
Compressive Strength f' , psi c
4700 4050 4820 (932)~'(
4150 (725)"'''
5750 6250 6100 6000 5100 4750 (750)* 4220 (670)*
5651 5612 5246 5088 5123 5105
4965 5177 4912 4735 4647 4735
Modulus of Elasticity,
psi
6.0 x 10⁶
6.0 x 10⁶
5.4 x 10⁶
5.8 x 10⁶
5.8 x 10⁶
---- 6 5.2 x 10
6 5.3 x 10⁶ 4.8 x 10⁶ 4.6 x 10⁶ 5.0 x 10⁶ 4.7 x 10⁶ 4.8 x 10
5.1 x 10⁶
4.4 x 10⁶
5.1 x 10⁶
4.8 x 10⁶
5.1 x 10⁶
4.9 x 10⁶
Manufacturer
South Texas Material Co. , Beeville
South Texas Material Co. , Beeville
Gifford Hill, Houston
Gifford Hill, Houston
Laboratories
U. T. U. T.
THD THD
U. T. U. T. U. T. U. T. U. T.
THD THD
THD THD THD THD THD THD
THD THD THD THD THD THD
(Continued)

.. . .
Table 5.2 (Continued)
Shaft Specimen Compressive Strength f' psi
Modulus of Elasticity,
psi
Manufacturer Laboratories
BB Cylinder 1 Cylinder 2 Cylinder 3 Cylinder 4
c'
4843 5035 4718 4701
5.2 x 1066 5 0 10 . x 6
4.3 x 10⁶ 4.2 x 10
Gifford Hill, Houston
THD THD THD THD
The tensile flexure strength Ft
measured from the center point loading is related to the
compressive strength f' by F = 1.22 x k x c t
where k = 0.14 for f' = 5000 psi c
= 0.13 for f' = 6000 psi (Neville, 1971) c
Shaft
Gl
G2
BB
Table 5.3 Data on Drilling Mud
Specific Gravity of Mud
1.30
1.05
1.40
pH of Mud
7.5-7.7
8.5-10.1
6.6-7.6
136
Texas. Concrete beams were also cast at these sites and were cured in
water and tested in flexure by the Texas Highway Department to obtain the
modulus of rupture. The concrete cylinders recovered from the construction
of the shafts in Harris County were tested by the Texas Highway Department.
The scatter of the results of compressive strength and modulus of elasticity
of the concrete is very remarkable. Some of the factors influencing this
scatter are
1. The difference in the mixture of each batch represented by a
concrete truck.
2. The different mixing time for each truck. The trucks are usually
dispatched at one time to the construction site but have to un
load at the rate imposed by the construction.
3. The problems inherent to sampling techniques. A large number of
samples is needed to allow a statistical consideration of the
quantities evaluated. This approach was not considered practical
and the cylinders recovered averaged about 1 cylinder per 3 cubic
yards of concrete.
4. Differences in the testing techniques. The concrete specimens
were tested in different laboratories and by different personnel,
a fact that results in inevitable differences in the results.
Of the above mentioned factors, only the first two affect the real
strength and stiffness of the concrete in the shaft. The variation in
the stiffness of concrete cast from different trucks results in an erratic
scatter of the data obtained from the Mustran cells.
,

137
Table 5.3 presents the values of the density and the pH of the mud used
in the construction of shafts in Harris County. It is believed that the low
pH at Gl and BB sites caused the mud to flocculate and, therefore, increase
in density by suspending solids.
LOAD TESTS
The test shafts were loaded to failure at periods of time varying, for
the different shafts, between 16 and 60 days after the end of construction.
The load tests at an early age were .intended to detect significant effects
of early loading on the capacity of drilled shafts.
Apparatus and Procedure
The loading system used in the tests is the same as that described by
Barker and Reese (1969, 1970), and O'Neill and Reese (1970). The main
features of this system are:
1. A reaction beam supported by two anchor shafts which are
permanent elements in the bridge.
2. Two calibrated hydraulic jacks.
3. An air operated oil pump provided with a bourdon gage and an
electrical pressure transducer to measure the pressure in the
hydraulic system.
The beam used in the tests at Live Oak County is the same as that
described by O'Neill and Reese (1970). A newly built reaction beam was

138
used in the tests at Harris County. Some of the features of the new beam
were improved connections between the anchor shafts and the beam for
easier erection of the reaction frame, and an improved design of the loading
box which provides the bearing area between the beam and the jack. Both
beams were designed to allow a load of 1000 tons to be applied to the test
shaft. The anchor shafts were, therefore, designed for a pullout force of
500 tons. The spacing of the anchor shafts was in all cases more than
seven times the diameter of the test shaft. The anchor shafts were
believed to have a minimal influence on the behavior of the test shaft.
The capacity of each jack was limited to 500 tons, a load which
corresponded to a pressure of 20000 psi in the hydraulic system. The
jacks were calibrated periodically to provide a fixed relation between the
hydraulic pressure and the applied load. Special provisions were taken
during the installation of the jacks to minimize the eccentricity of the
applied load. The top of the shaft was carefully leveled with a quick
setting capping compound before a one-inch-thick steel plate and the jacks
were placed. A one-inch-thick plywood board was inserted between the shaft
and the steel plate in the tests at Harris County and rotary swivel heads
were placed between the jacks and the beam in the tests at Live Oak
County in a further attempt to reduce the eccentricity of the load.
The settlement of the test shaft was measured with two dial indicators
mounted on diametrically opposite positions on the butt of the shaft.
The dial indicators had a two7inch travel and a resolution of .001 inch.
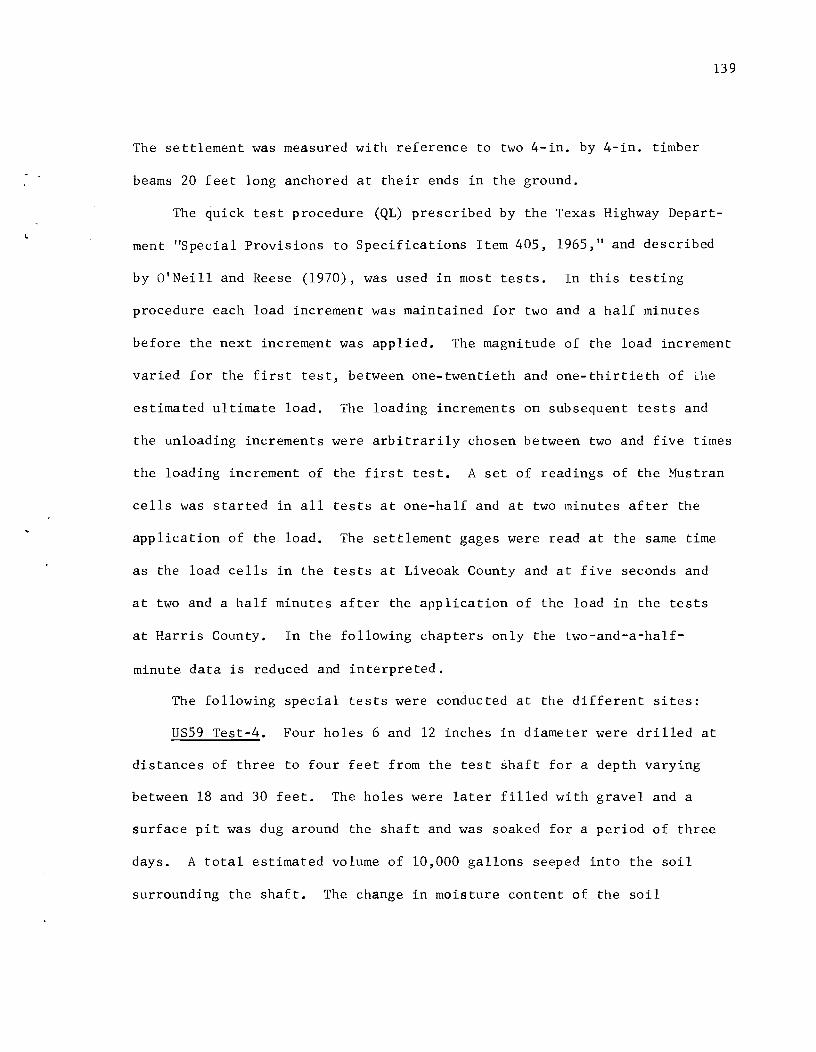
The settlement was measured with reference to two 4-in. by 4-in. timber
beams 20 feet long anchored at their ends in the ground.
139
The quick test procedure (QL) prescribed by the Texas Highway Depart
ment "Special Provisions to Specifications Item 405, 1965," and described
by O'Neill and Reese (1970), was used in most tests. In this testing
procedure each load increment was maintained for two and a half minutes
before the next increment was applied. The magnitude of the load increment
varied for the first test, between one-twentieth and one-thirtieth of the
estimated ultimate load. The loading increments on subsequent tests and
the unloading increments were arbitrarily chosen between two and five times
the loading increment of the first test. A set of readings of the Mustran
cells was started in all tests at one-half and at two minutes after the
application of the load. The settlement gages were read at the same time
as the load cells in the tests at Liveoak County and at five seconds and
at two and a half minutes after the application of the load in the tests
at Harris County. In the following chapters only the two-and-a-half
minute data is reduced and interpreted.
The following special tests were conducted at the different sites:
US59 Test-4. Four holes 6 and 12 inches in diameter were drilled at
distances of three to four feet from the test shaft for a depth varying
between 18 and 30 feet. The holes were later filled with gravel and a
surface pit was dug around the shaft and was soaked for a period of three
days. A total estimated volume of 10,000 gallons seeped into the soil
surrounding the shaft. The change in moisture content of the soil

140
surrounding the shaft is shown in Fig. A26. Test 4 was conducted to study
the effect of this change on the capacity of the shaft.
US59 Test-5 and HH Test-3. In these tests, the load increments were
maintained between 2~ and 30 minutes to observe the speed of penetration
of the shaft under constant loading.
Gl Test-3. This test was of the cyclic type described by Barker and
Reese (1970) and was conducted to study the effect of cyclic loading on
the behavior of drilled shafts in sand.
Table 5.4 summarizes the data from the load tests conducted at the
various sites and Fig. 5.4 shows some phases and details of the load
tests. Figure 5.4a shows the reaction system; Fig. 5.4b shows the jacks,
the swivel heads and the hydraulic equipment; and Fig. 5.4c shows the
read-out digital system.
EXTRACTION OF THE SHAFTS
The extraction of the shafts cast by slurry displacement was planned
to ascertain the effects of the construction technique on the integrity of
the concrete, the geometry of the shaft, and the concrete-soil interface.
The three shafts were extracted after load testing was finished. The
extraction was accomplished by drilling an annular opening around the
shaft to the depth of the test shaft. The shaft was loosened using a
large block-and-tackle frame and then extracted easily with the rig
cable. The operation encountered difficulties at the G2 site where the
annular opening kept sloughing and had to be protected by a large casing.
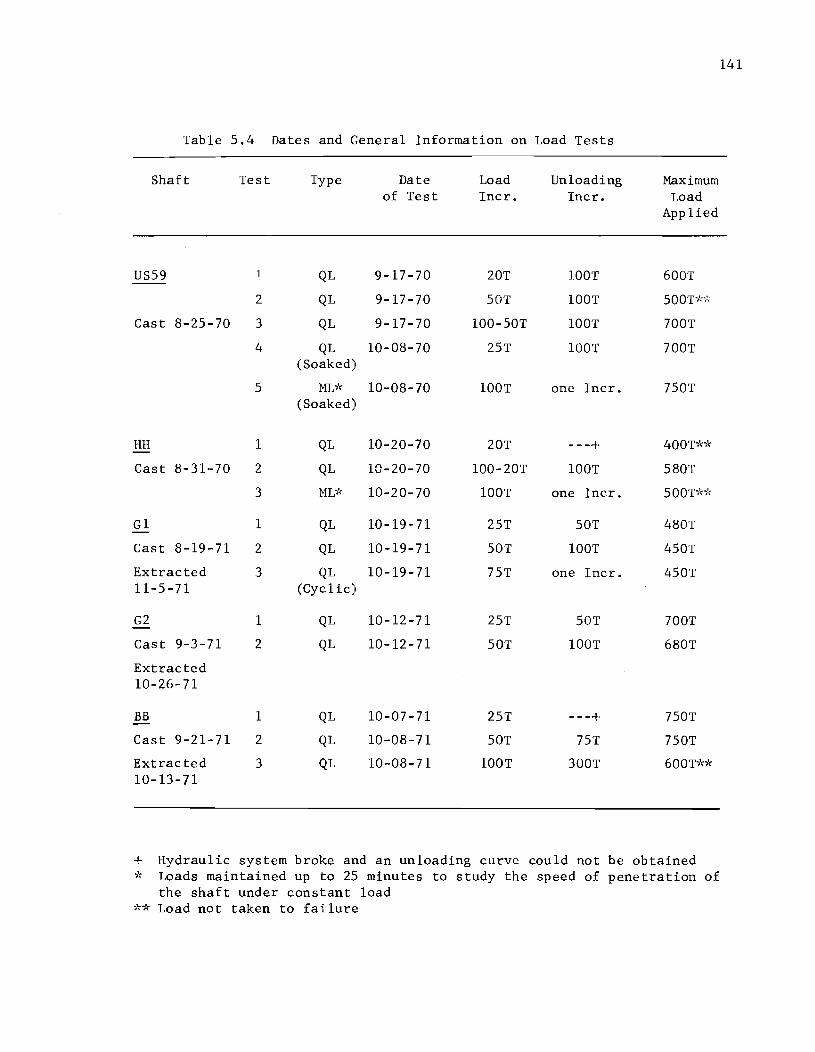
Table 5.4 Dates and General Information on Load Tests
Shaft Test Type
US59 QL
2 QL
Cast 8-25-70 3 QL
4 QL (Soaked)
5 ML~'<
(Soaked)
HH 1 QL
Cast 8-31-70 2 QL
3 MU<
G1 1 QL
Cast 8-19-71 2 QL
Extracted 3 QL 11-5-71 (Cyc1 ic)
G2 1 QL
Cast 9-3-71 2 QL
Extracted 10-26-71
BB 1 QL
Cast 9-21-71 2 QL
Extracted 3 QL 10-13-71
Date of Test
9-17-70
9-17-70
9-17-70
10-08-70
10-08-70
10-20-70
10-20-70
10-20-70
10-19-71
10-19-71
10-19-71
10-12-71
10-12-71
10-07-71
10-08-71
10-08-71
Load Incr.
20T
50T
100-50T
25T
lOOT
20T
100-20T
lOOT
25T
50T
75T
25T
50T
25T
50T
lOOT
Unloading Incr.
lOOT
lOOT
lOOT
lOOT
one Incr.
---+ lOOT
one Incr.
50T
lOOT
one Incr.
50T
lOOT
---+ 75T
300T
Maximum Load
Applied
600T
500T~b"
700T
700T
750T
400T~b'<
580T
500T~'d<
480T
450T
450T
700T
680T
750T
750T
600T*~'<
+ Hydraulic system broke and an unloading curve could not be obtained '1< Loads maintained up to 25 minutes to study the speed of penetration of
the shaft under constant load '1<* Load not taken to failure
141

142
a. Reaction System
b. Loading Jacks and Swivel Heads
c. Data Logging System
Fig. 5.4 Load Testing
•
143
When a shaft was removed from the soil, measurements were made of its
length and of the perimeter at the location of each of the Mustran cells.
The soil-concrete interface was carefully examined by studying original soil
still adhering to the shaft surface. Some Mustran cells were exposed by
use of a jack hammer to observe their seating conditions in the concrete.
In removing the cells, concrete was examined for possible contamination
from slurry. Table 5.5 presents the measured dimensions of the extracted
shafts. Figure 5.5 presents photographs taken during the extraction phase;
Figure 5.5a shows the extraction of the Gl shaft; Figure 5.5b shows the
measuring of the shaft diameter; Figure 5.5c shows an uncovered Mustran
cell; and Figs. 5.5d, 5.5e, and 5.5f show the tips of the extracted shafts •
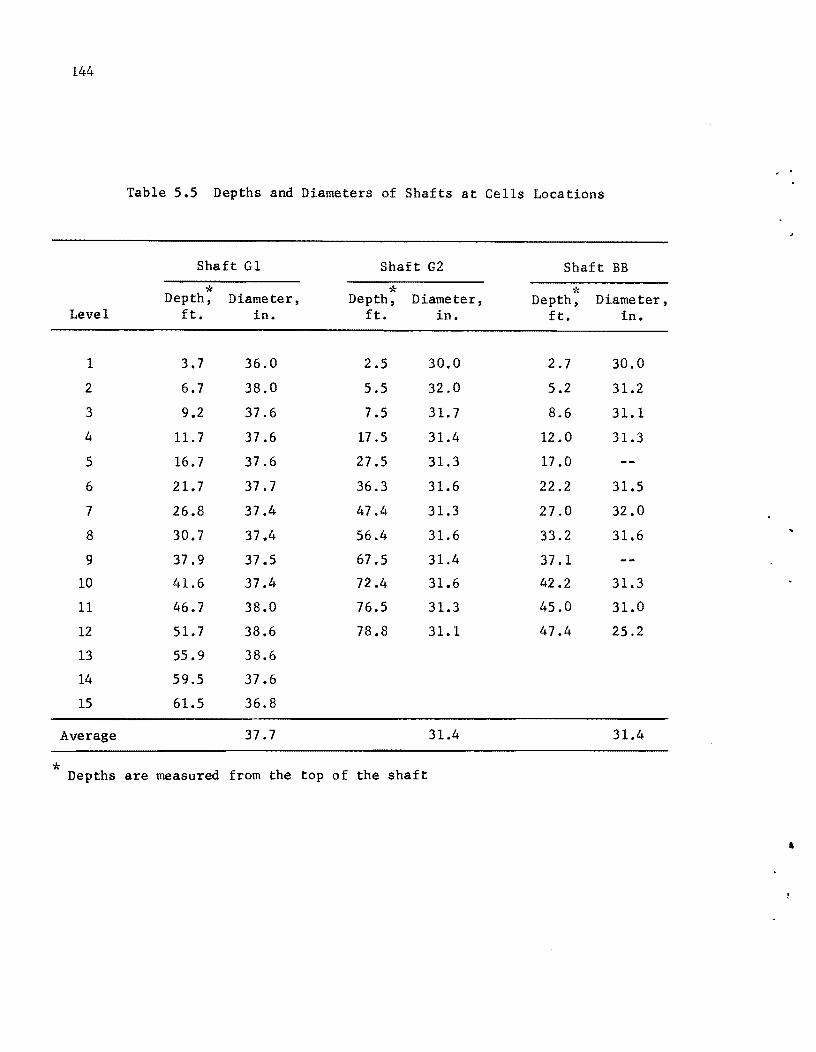
144
Table 5.5 Depths and Diameters of Shafts at Cells Locations
Shaft G 1 Shaft G2 Shaft BB
* ,1: * Depth, Diameter, Depth, Diameter, Depth, Diameter, Level ft. in. ft. in. ft. in.
1 3.7 36.0 2.5 30.0 2.7 30.0
2 6.7 38.0 5.5 32.0 5.2 31.2
3 9.2 37.6 7.5 31.7 8.6 31.1
4 11.7 37.6 17 .5 31.4 12.0 31.3
5 16.7 37.6 27.5 31.3 17 .0
6 21.7 37.7 36.3 31.6 22.2 31.5
7 26.8 37.4 47.4 31.3 27.0 32.0
8 30.7 37.4 56.4 31.6 33.2 31.6
9 37.9 37.5 67.5 31.4 37.1
10 41.6 37.4 72 .4 31.6 42.2 31.3
11 46.7 38.0 76.5 31.3 45.0 31.0
12 51.7 38.6 78.8 31.1 47.4 25.2
13 55.9 38.6
14 59.5 37.6
15 61.5 36.8
Average 37.7 31.4 31.4
* Depths are measured from the top of the shaft
,

,
c.
a. Extraction of the Shaft at GIS ite
Extraction of Mustran Cells
b. Measurement of the Diameter of the Shaft
145
Fig. 5.5 Extraction of the Shafts (Con tinued)
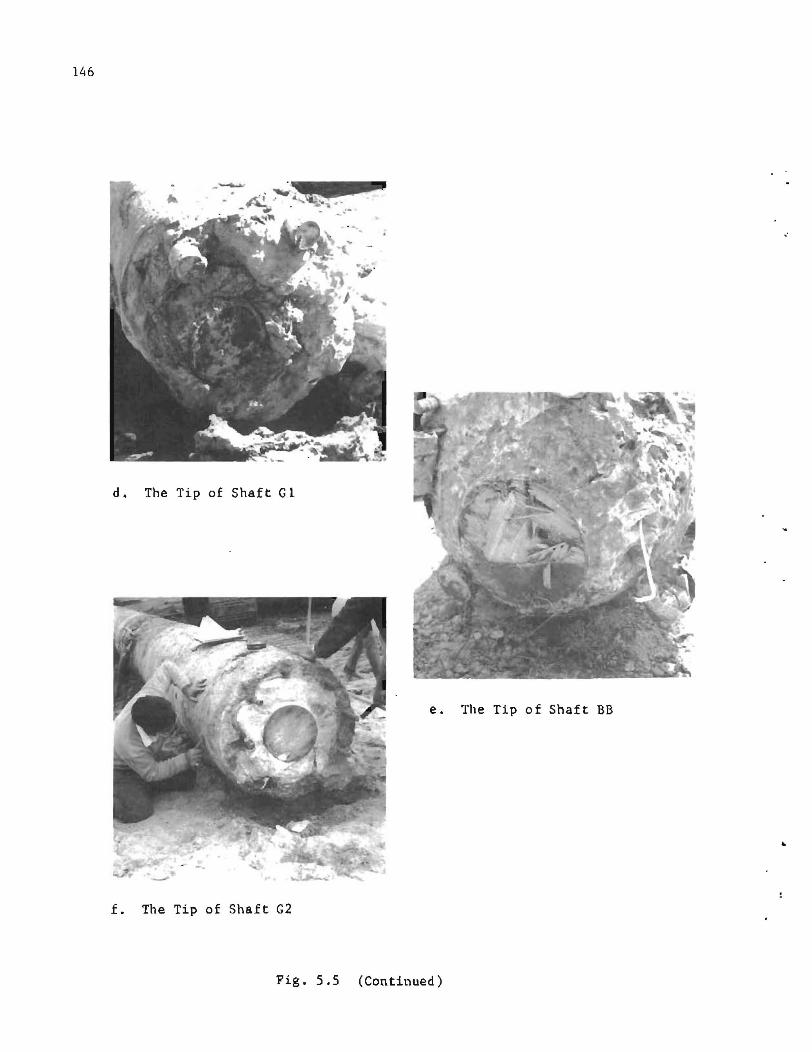
146
d. The Tip of Shaft Cl
e. The Tip of Shaft BB
f. The Tip of Shaft G2
Fig. 5.5 (Continued)

CHAPTER VI. ANALYSIS OF THE DATA
GENERAL PERFORMANCE OF THE MUSTRAN CELLS
To date, over 300 Mustran cells have been used in the testing of
drilled shafts and their general performance in short-term testing has
proven to be satisfactory. The Mustran cells are rugged and electrically
stable, and their resolution is competitive with if not superior to other
commercially available strain-measuring gages. Poor performance of some
Mustran cells has, however, been observed, and it is important to understand
the reasons for the failure of the cells and to recognize a faulty output
when it occurs.
Electrical Failures
Shorting to ground of the cells may be the result of defective con
struction such that one of the lead wires gets in direct contact with the
metal of the cell or with the unprotected ground line. Although great care
is observed in the laboratory to check the continuity of the cell circuit,
rough field handling may precipitate the shorting of a defective connection.
Moisture may also penetrate the cell through a defective fitting and
migrate through the waterproofing coat of the strain gages. Cells suffering
from the presence of moisture may exhibit an acceptable resistance to
ground but show a continuous drift in output with time.
Mechanical Failure
Mechanical failures of the Mustran cells result from accidental impact
of the cells during construction or from other phenomena related to the
147

M8
casting and the curing of the concrete. Mustran cells at lower levels of
the shaft incur a greater risk of being completely disconnected and destroyed
by the vertical traveling of the tremie in the case of shafts cast by
slurry displacement, and by the impact of the free falling concrete in the
case of shafts cast in the dry. Segregation and the existence of voids in
the concrete can result in a reduced section of the shaft or in a poor
embedment of the Mustran cells.
It has also been observed that the cells located in the top three feet
of the shaft exhibit a smaller response to load than the lower cells.
Freshly placed concrete tends to settle as a result of the plastic shrinkage
and the bleeding of the cement mortar (Neville, 1971). However, the rein
forcing steel tends to resist this settlement and, consequently, there may
be vertical cracking of the concrete at the top of the shaft. The settlement
of the concrete may also result in a gap below the bottom cap of the top
level of cells with bleeding water moving in and filling the gap. Later,
the water may be used for the hydration of the concrete leaving a permanent
void under the cell. This phenomenon is similar to that causing the lower
bond resistance of the upper layers of steel in a concrete beam (Neville,
1971). Furthermore, the severe curing conditions of the exposed part of
the shaft may result in the warping and the cracking of the concrete and,
consequently, in an erroneous output of the cells.
Special embedment problems with the cells were encountered in the
shafts cast by slurry displacement as a result of the entrapment of mud
at the end caps of the cells. This phenomenon was particularly evident

149
in the upper sections of the shaft where the energy of flow of the concrete
is greatly reduced and where the mud may have seveiely gelled due to its
continuous contact with the concrete. This fact was later sustained by
the inspection of the embedment of cells in extracted shafts.
It is generally possible to detect erroneous output of cells from p]0ts
of the non-loading output of the cells versus time and plots of the 10adlL~
output of the cells versus the applied load. The following observations
can be made concerning such plots:
1. A typical plot of the nonloading output of Mustran cells is pre
sented in Fig. 6.1. The sharp rise and drop of the curve immediately
after the casting of the concrete is associated with the rise in
temperature of the setting concrete. It has been a common obser
vation that for most well-behaved cells the curve levels off in a
few days after the end of construction. Unstable cells show a
continuous drift (Fig. 6.1) which may be caused by a moisture
migration into the gages.
2. A typical plot of the average output of good calibration cells
versus the pressure in the hydraulic system is shown in the solid
line of Fig. 6.2. The hysteresis of the plot is due to the
friction in the jacks, which reverses directions during loading
and unloading (Barker and Reese, 1970; O'Neill and Reese, 1970).
When the cells are well behaved and no permanent plastic strain
occurs in the concrete, the curve returns to the origin on un
loading. If, however, plastic strains are locked in the concrete,

150
.... c: ·s ... -(J)
., Gi o -o
-a -~ o
200
IS .!i 100 at ... Q. E o o
o~~~--~--------~-------+--------+-------~
c: o ·iii 100 c: ~
200
5 10 15 20 25
\ Day.
~-.... -----~ ...
--.............~ Shaft. Ca.t in Saturated Soil
--,-.-----Un.table ceuJ -- ~-----
Fig. 6.1 Non-Loading Output of Mustran Cells
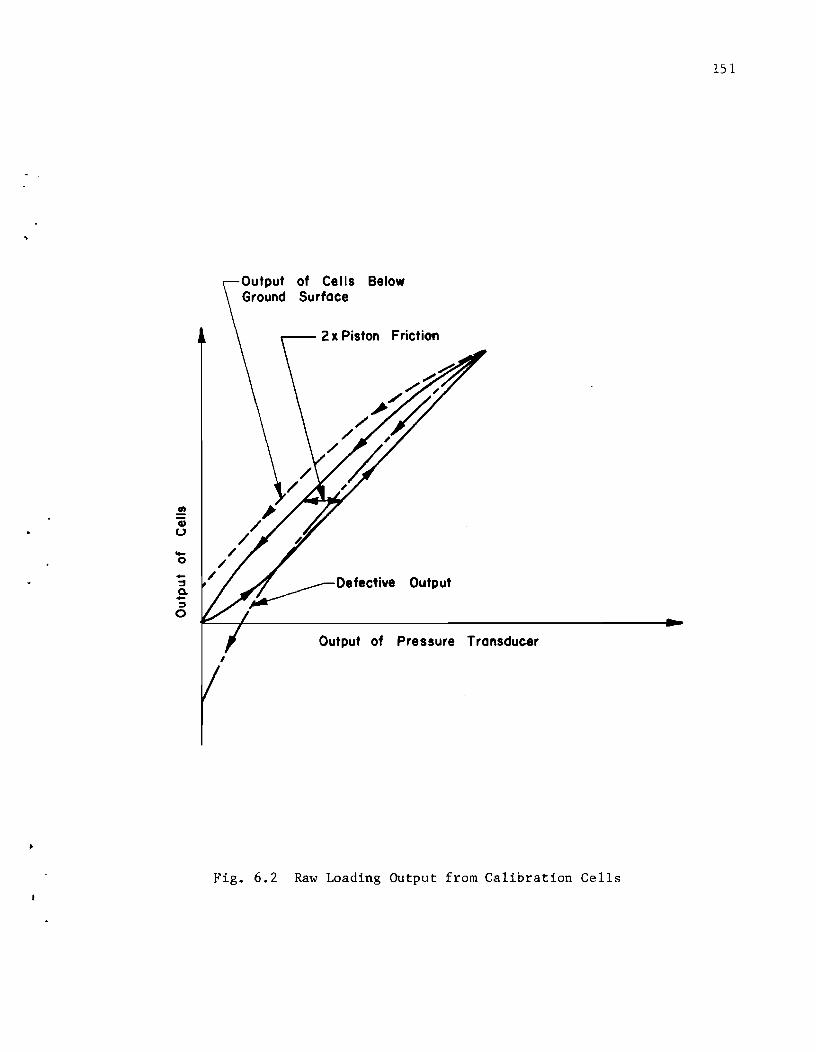
.!! Q; u -o
-:::3 Q. -:::J o
/ /
/
, /
/
of Cells Below Surface
Friction
Output
Output of Pressure Transducer
Fig. 6.2 Raw Loading Output from Calibration Cells
151
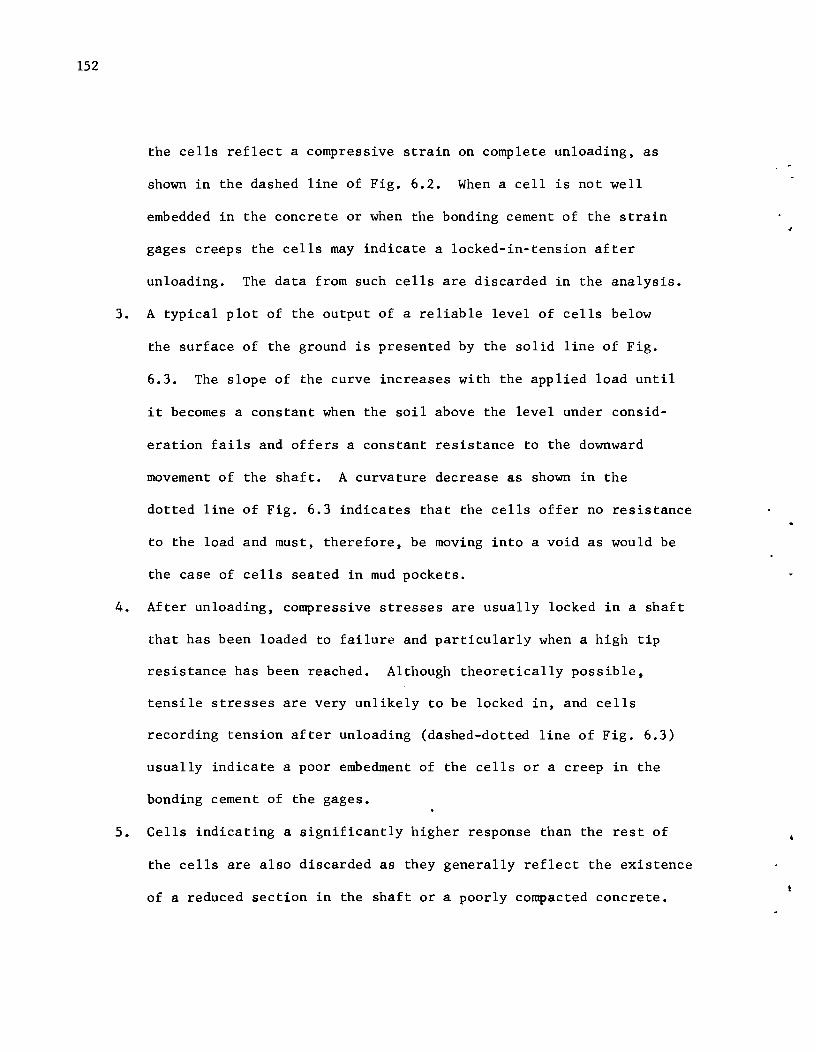
152
the cells reflect a compressive strain on complete unloading, as
shown in the dashed line of Fig. 6.2. When a cell is not well
embedded in the concrete or when the bonding cement of the strain
gages creeps the cells may indicate a locked-in-tension after
unloading. The data from such cells are discarded in the analysis.
3. A typical plot of the output of a reliable level of cells below
the surface of the ground is presented by the solid line of Fig.
6.3. The slope of the curve increases with the applied load until
it becomes a constant when the soil above the level under consid
eration fails and offers a constant resistance to the downward
movement of the shaft. A curvature decrease as shown in the
dotted line of Fig. 6.3 indicates that the cells offer no resistance
to the load and must, therefore, be moving into a void as would be
the case of cells seated in mud pockets.
4. After unloading, compressive stresses are usually locked in a shaft
that has been loaded to failure and particularly when a high tip
resistance has been reached. Although theoretically possible,
tensile stresses are very unlikely to be locked in, and cells
recording tension after unloading (dashed-dotted line of Fig. 6.3)
usually indicate a poor embedment of the cells or a creep in the
bonding cement of the gages.
5. Cells indicating a significantly higher response than the rest of
the cells are also discarded as they generally reflect the existence
of a reduced section in the shaft or a poorly compacted concrete.

CD o .... o -::J Q. -::J o
Defective Output
I
I Output of Pressure Transducer
I
Fig. 6.3 Output of Cells below the Ground Surface as a Function of Load on Shaft
153
154
In the analyses, the data were also corrected to take care of changes
in the cross section of the shaft wherever these changes were known. In
Harris County the exact diameter of the extracted shafts was measured at the
levels of the cells. In Live Oak County, the diameter of the shaft was
arbitrarily taken as one inch larger than the diameter of the sana tube and,
where the hole was observed to slough, the diameter of the shaft was estimated.
NON-LOADING PERFOR}~NCE OF THE INSTRUMENTATION
Monitoring of the instrumentation after the end of the construction re
vealed information on the temperature variation and the strains of the con
crete during its curing. Immediately after casting, the temperature of the
concrete rises due to the setting of the concrete. The temperature drops
normally to the temperature of the ambient medium in about two days after
the end of construction. The temperature of the concrete in the top ten
feet of the shaft oscillates with the normal cycles of the air temperature
while the temperature of the concrete at greater depths remains practically
constant. This temperature was found to be about 72°F in shafts cast in
saturated soil and about 80°F in shafts cast in dry soil.
Figure 6.1 shows a typical non-loading output of the Mustran cells.
The cells generally indicated a compression strain which tracked the rise
of the temperature of the concrete. The indicated strain of the cells after
the dissipation of the setting heat varied with the locations of the cells
and with the nature of the soil surrounding the shaft. In general, the cells
of the test shafts at Live Oak County indicated a compressive strain while
the cells of the test shafts at Harris County indicated a tensile strain.
,

155
The compression of the cells associated with the rise of temperature
is believed to be due to a thermal incompatibility between the concrete and
the cells. The observed behavior of the cells reflects a coefficient of
expansion of the concrete smaller than that of the steel. This agrees with
results reported by other investigators (York, ~ ~., 1970) when subjectiilg
concrete specimens instrumented with vibrating wire gages to a rise in
temperature. The same explanation is offered for the tension indicated by
the cells after the dissipation of the setting heat. The coefficient of
thermal expansion of the concrete varies with the degree of curing and
with the composition of the concrete, and, therefore, the real strains in
the concrete cannot be determined from the output of the Mustran cells. In
the following paragraphs an attempt is made to estimate the curing strains
of the concrete.
The autogenous curing of concrete normally results in a shrinkage be
tween 40 and 100 ~ in/in (Troxell and Davis, 1956). Curing in a dry medium
may further result in a shrinkage of the order of 1000 ~ in/in (Neville,
1963). However, the existence of the reinforcing steel prevents the de
velopment of excessive shrinkage strains which are relieved by the cracks
in the concrete. Concrete design codes require the design of structures to
withstand a concrete shrinkage of about 200 ~ in/in (AASHO, 1963). This
value is believed to be a maximum for drilled shafts and can only be
attained under very unfavorable conditions. On the other hand data re
ported by Neville (1971) indicate an expansion in concrete specimens
cured under water in the order of 100 to 160 ~ in/in. However, significant

156
expansion starts taking place only about three months after casting, and it
is believed that during the period of testing, which extended about two
months after the casting of the concrete, expansion could not have taken
place.
The thermal strain of the concrete starts affecting the stresses on the
sides of the shaft from the time the shear strength of the concrete exceeds
that of the surrounding soil. The temperature at which the concrete starts
shearing the soil is not known. This temperature is believed to be about
100°F for the shafts cast at 90°F. When the temperature finally stabilizes
at about 75°F the concrete will have incurred a net drop in temperature of
about 25°F. This variation in temperature is associated with strains of the
order of 100 to 150 ~ in/in.
In summary, it is believed that when the curing and temperature strains
are combined at the time of testing of the shafts, a contraction strain in
the order of 200 ~ in/in may have taken place.
REDUCTION OF THE LOAD TEST DATA
A computer program was written to plot the raw data from the Mustran
cells versus the hydraulic pressure in the loading system measured by the
pressure transducer. These plots served to eliminate defective cells as
discussed above. The data from reliable cells were then reduced using the
computer program DARES prepared by Barker and Reese (1970), specifically
for the purposes of reducing data from axial loads on instrumented drilled
shafts. The program DARES performs mainly the following functions:

157
1. Obtains for the calibration levels of cells a best fit polynomial
relating the load in the shaft to the average output of the cells.
2. Determines the load in the shaft at each level of cells from the
output of these cells and the relation obtained in the previous
step. A best fit polynomial is then obtained to describe the
load distribution along the length of the shaft.
3. Computes the downward movement of specified points along the length
of the shaft by subtracting the elastic compression of the shaft
from the measured settlement at the ground surface. The elastic
compression of the shaft is computed by integrating the load dis
tribution polynomial and using the elastic properties of the concrete.
4. Evaluates the load transfer from the derivative of the load dis
tribution polynomial at the same specified points.
The program has also the capacity of consider variations in the
cross section of the shaft and variations in the sensitivity of the cells.
The program was further supplemented with routines to plot the load-settle
ment, load distribution, and load transfer curves.
CALIBRATION CURVES
Each test shaft was equipped with more than one level of Mustran cells
above the ground surface to insure a reliable calibration curve for each
shaft. Invariably, and for reasons discussed before, many of the calibra
tion levels in each shaft did not function properly and considerable
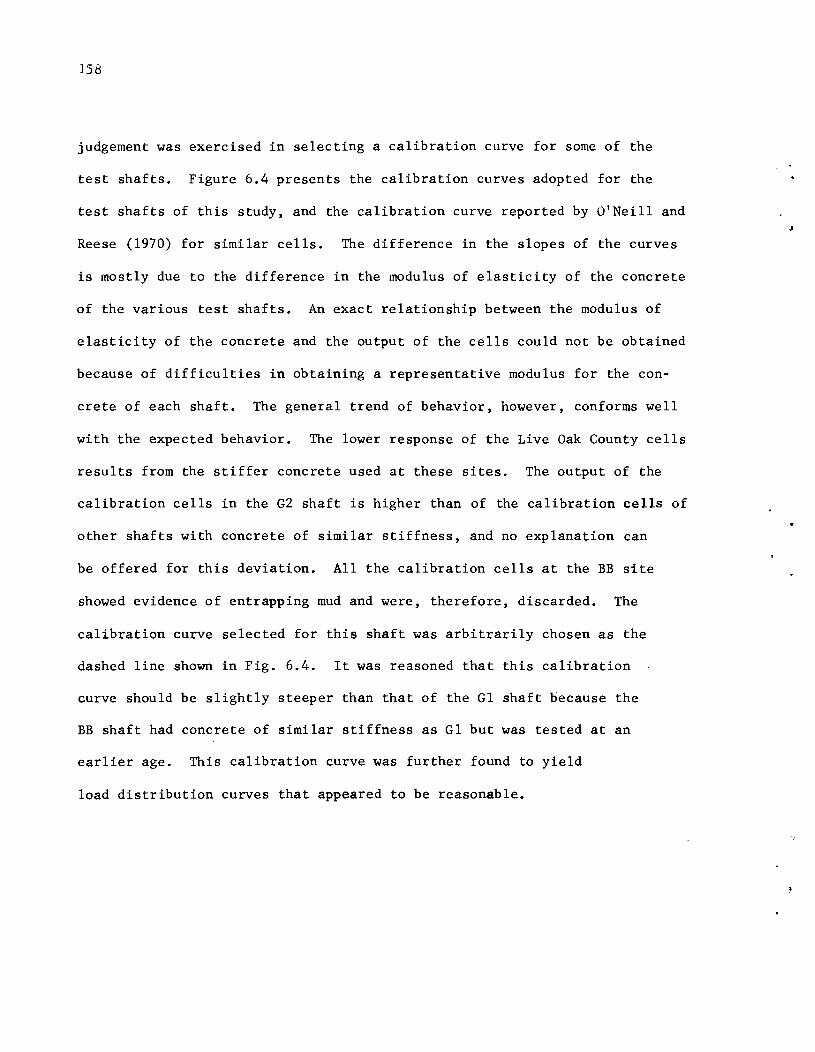
158
judgement was exercised in selecting a calibration curve for some of the
test shafts. Figure 6.4 presents the calibration curves adopted for the
test shafts of this study, and the calibration curve reported by O'Neill and
Reese (1970) for similar cells. The difference in the slopes of the curves
is mostly due to the difference in the modulus of elasticity of the concrete
of the various test shafts. An exact relationship between the modulus of
elasticity of the concrete and the output of the cells could not be obtained
because of difficulties in obtaining a representative modulus for the con
crete of each shaft. The general trend of behavior, however, conforms well
with the expected behavior. The lower response of the Live Oak County cells
results from the stiffer concrete used at these sites. The output of the
calibration cells in the G2 shaft is higher than of the calibration cells of
other shafts with concrete of similar stiffness, and no explanation can
be offered for this deviation. All the calibration cells at the BB site
showed evidence of entrapping mud and were, therefore, discarded. The
calibration curve selected for this shaft was arbitrarily chosen as the
dashed line shown in Fig. 6.4. It was reasoned that this calibration
curve should be slightly steeper than that of the GI shaft because the
BB shaft had concrete of similar stiffness as Gl but was tested at an
earlier age. This calibration curve was further found to yield
load distribution curves that appeared to be reasonable.
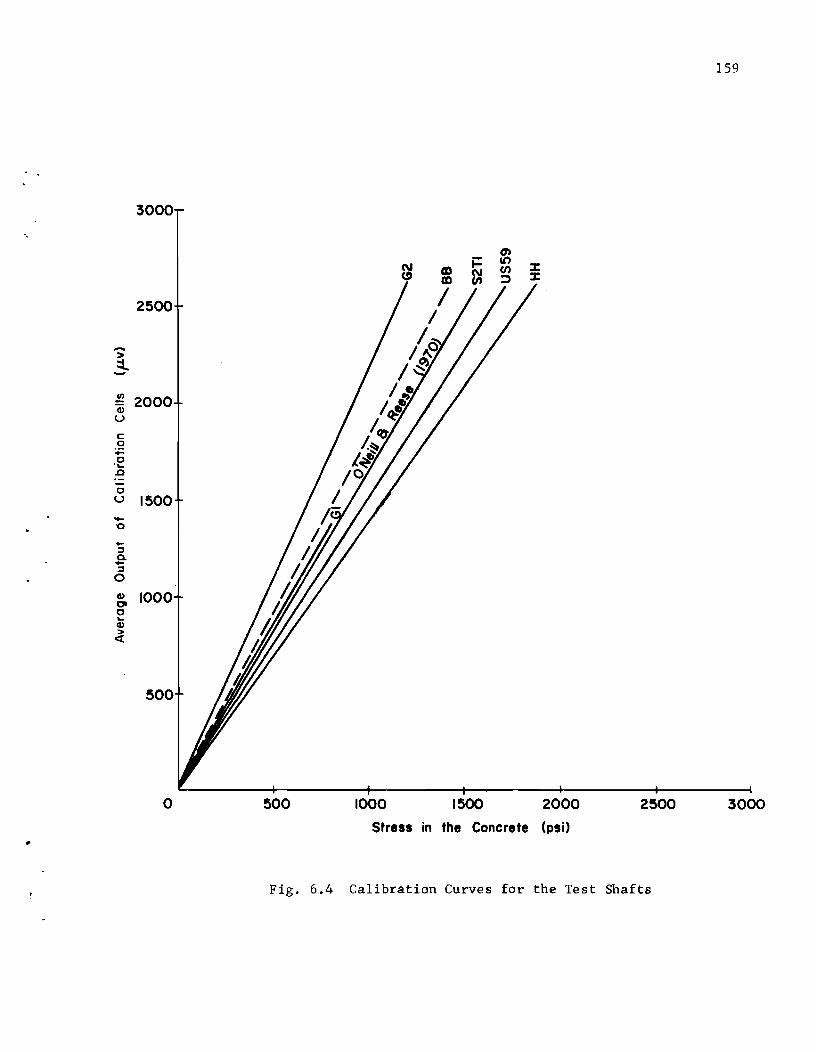
159
3000
~ J: J:
2500
.... > :::L .... ~ <lI
2000 U
C 0 -,e .0
0 u 1500 .... 0 -::J a. -::J 0
<lI 1000 0 0 ~
<lI :> «
o 500 1000 1500 2000 2500 3000
Stress in the Concrete (psi) •
Fig. 6.4 Calibration Curves for the Test Shafts
160
RESULTS OF LOAD TESTS
The results of the first load test on each shaft are presented in Fig.
6.5 through Fig. 6.24 in the following order:
1. Load distribution curves are shown in Figs. 6.5, 6.9, 6.13, 6.17,
and 6.21. The curves present, at selected butt loads, a plot of
the load measured by the load cells and the corresponding best
fit curves. It was found in all tests that a polynomial of the
fourth or fifth order provides a reasonable representation of the
distribution of the load in the shaft. However, anomalies in the
behavior of the curves at the top and the bottom of the shaft
were observed. In these regions the curves were visually adjusted
as shown by the dashed lines on the above mentioned figures. A
brief discussion of these anomalies is offered in the following
paragraphs.
The best fit curve represents a statistical average of the
load at various levels in the shaft, except at the ground surface,
where the curve is forced through a point of known applied load.
This imposed boundary condition results in an erroneous evaluation
of the load transferred in the top of the shaft between the ground
surface and the next level of cells.
The level of cells at the tips of shafts HH, Cl, and BB was
destroyed during construction. The analytical best-fit polynomial
was, therefore, extrapolated beyond the lowest reliable level of
(Text continued on page 181)
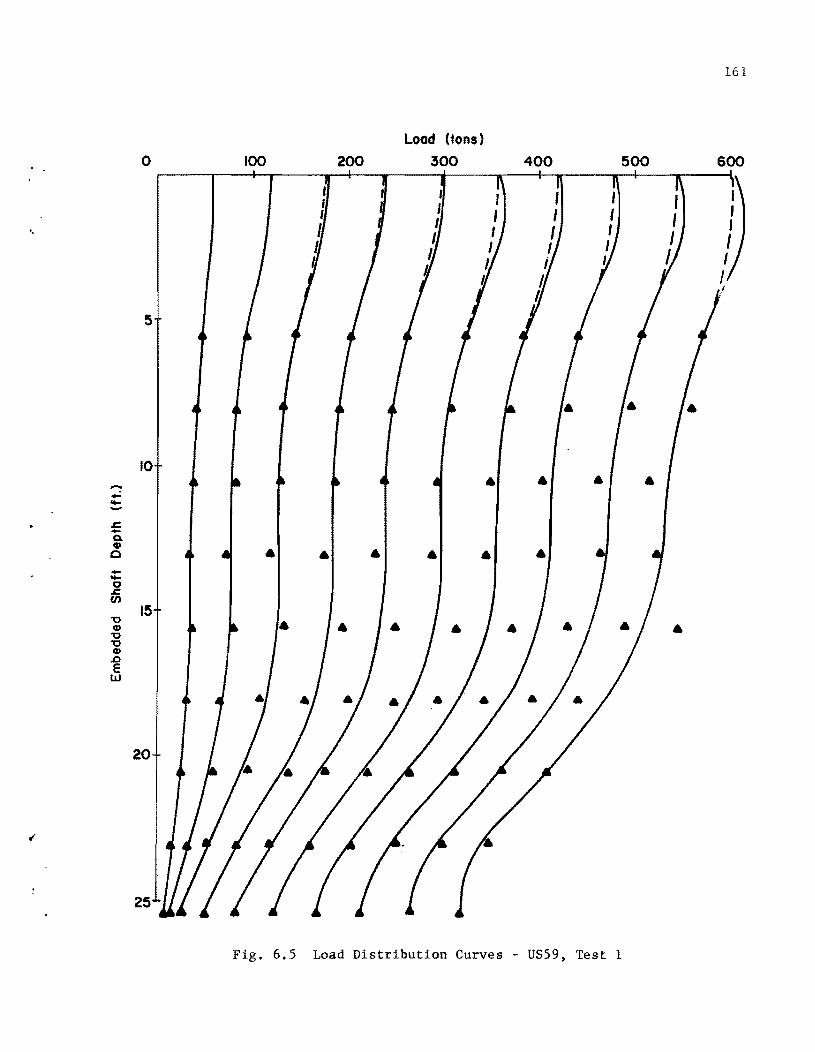
-.: -.c -0. IV o --o .c rn "0 IV "0 "0 IV .c E w
o 100 200
Load (tons)
300 400
Fig. 6.5 Load Distribution Curves - US59, Test 1
161
500 600

162
o
\.0
....... ..... ......
\00
..... .....
" "
200
"-" "-
Lood (tons)
300 400
" Te,t I "-"
500 600 100
Top of Shoft
"-2'0~~'~~ ..............
" , -. c: ::; -c: .., i --~
3.0
4.0
5.0
Tip of ShOft~
...,:--- .......... ........ ..... ..........
\
\
" , \
, '\
\
T8st 3
, \ \ \
Test 4
6.0 f ___ =_M!i'.!!!!!:::::=~t;::::;;;:::;~~-=-~} .--------........ ........ I
" " 7.0
8.0
" , , l , ..... ....
Tett 5
"
Fig. 6.6 Load_Settlement CUTVes
- US59
800
"
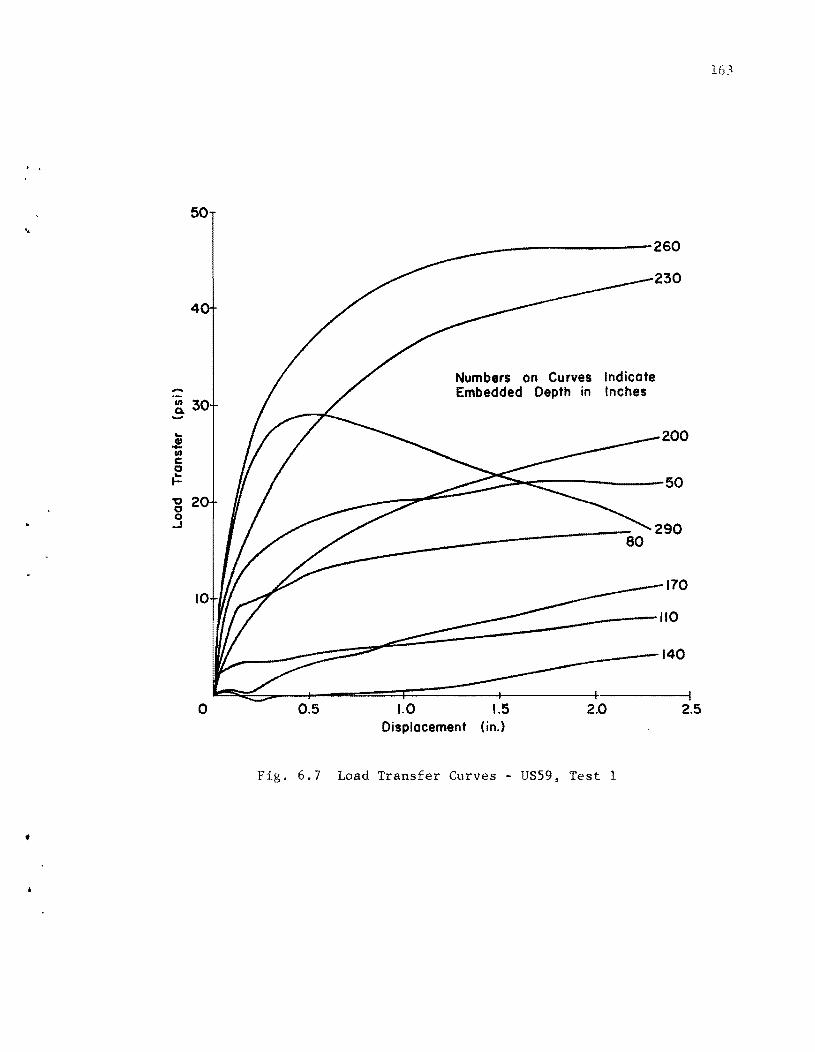
..
f
50
40
~ 30
... .! en c: o .= "0 20 o .3
10
o
__ --------------260
Numbers on Curves Indicate Embedded Depth in Inches
~~~----------50
170
_-__ ~.:::::::.::::::::::::::::::::=------__ IIO
_---140
0.5 1.0 1.5 2.0 Displacement (in.)
F . 6.7 Load Transfer Curves - US59, Test 1
I 2.5
163

164
.... ..: :t;
o
5
10
~ 15 o -... ::::I (J)
'a C ::::I e
(!)
~ o Q) m .c -0. Q)
o 25
30
35
Load Transfer (tst)
2 3 4 5
I Strenoth of Clay
"~' ,,~ " ...... ' ~~ ~~,~, \', ,,,~, I
Fig. 6.8
,~~" ___ Load Transfer in Test 4
ton 4>
, , ~ , ,
Conducted After Soaking
Numbers on Curves Indicate Nominal Applied Load in Tons
Load Transfer Vs. Depth - US59, Test 1 and Test 4
..

165
Load (tons) "
100 200 300 400 500
5
.... ..: ---~ -0- 10 CD 0
--c ~ (/)
"0 CD
"0 ." CD .0 E UJ
15
20
Fig. 6.9 Load Distribution Curves - RH, Test 1
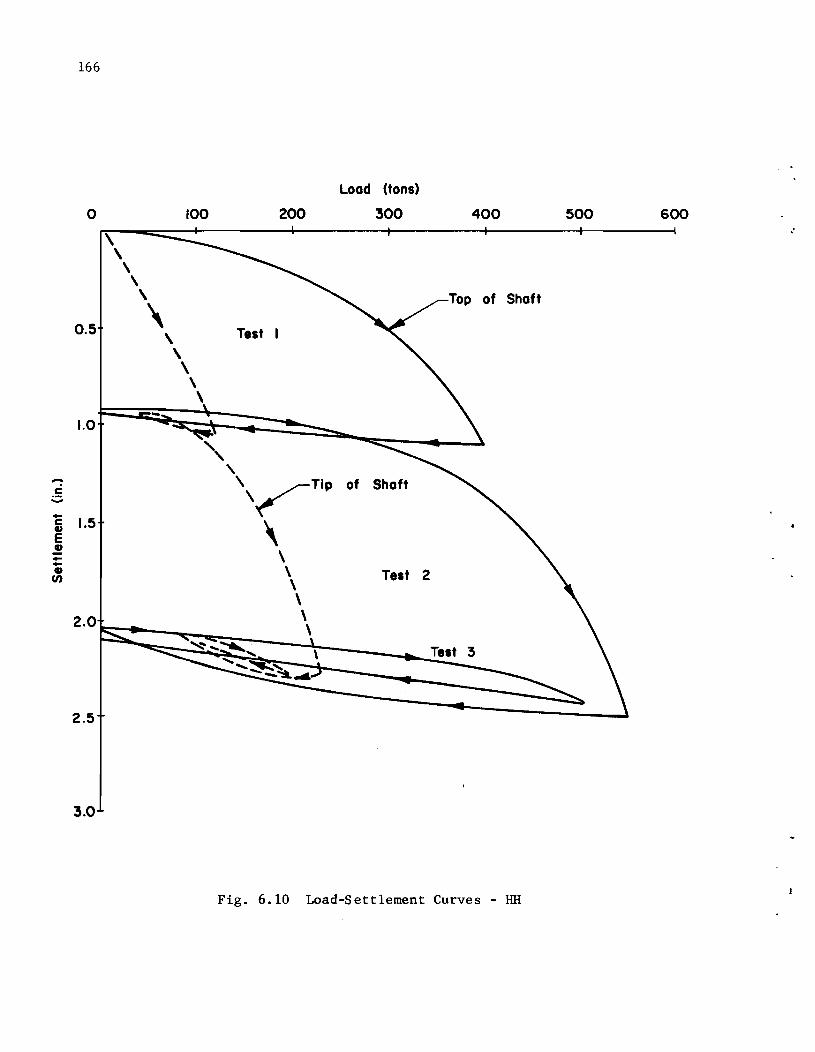
166
Load (tons)
0 100 200 300 400 500 600
\ .'
\ \ \ \
0.5 \ Test I \
\ \
\ \
1.0
" , .....
\~TlP of Shaft .!: --c 1.5 '\ CD E CD
\ --CD \ Test 2 C/) \ \
2.0 \ \
Telt 3
2,5
3.0
Fig. 6.10 Load-Settlement Curves - HH
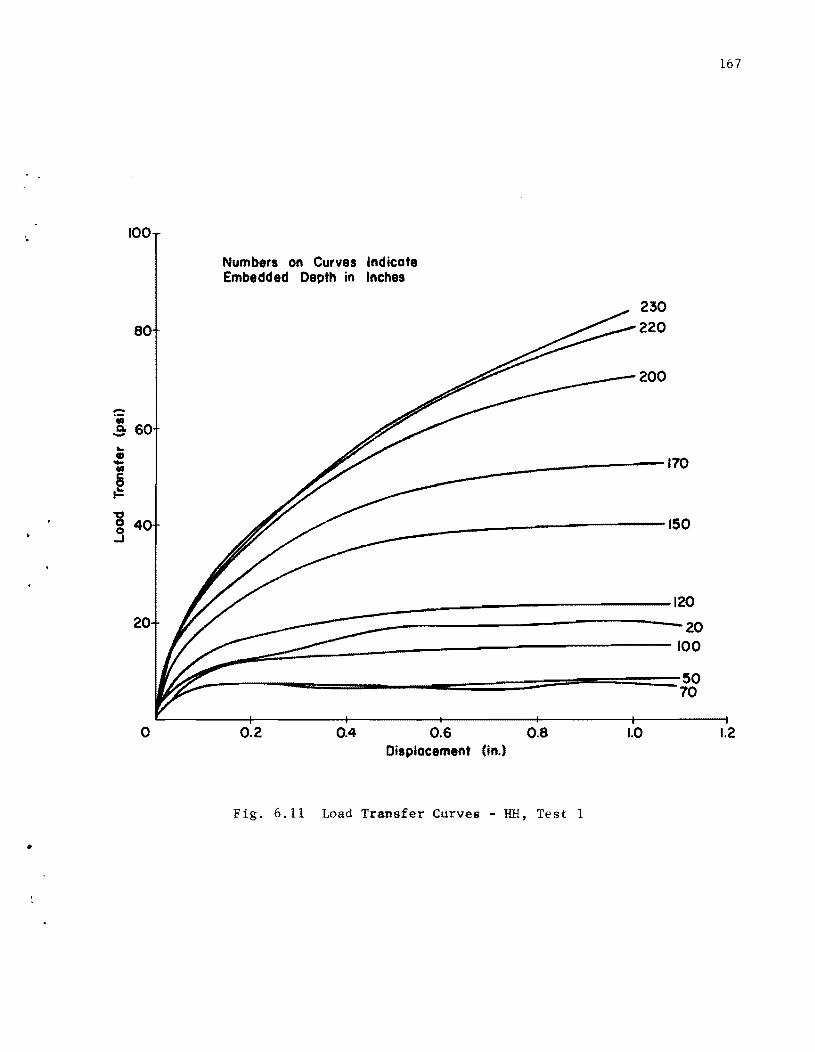
100
80
r.: • Q. 60 -... CD -• 6 .= 'a 0 40 .3
20
o
'.
Numbers on Curves Indicate Embedded Depth in Inches
230 220
200
110
150
_------------�2o ---------------------------20
~~~~~----------------------IOO
~_----__ ~~ ______ ~====:===-======50 .- 10
0.2 0.4 0.6 Displacement (in.)
0.8
Fig. 6.11 Load Transfer Curves - HH, Test 1
1.0
167
1.2

168
o
5
10
-.; --• u 0 15 -... :l en "0 c :l 0 ... C)
• 20 0 ..
CD
.c -Q. CD 0
25
30
35
1.0
\ \ \ \
2.0
Load Transfer (tsf)
3.0 4.0
Estimated Shear StrenQth of Clay
5.0
\/11 tan cp
\
Numbers on Curves Indicate Applied Load in Tons
Fig. b.12 Load Transfer Vs. Depth - HH, Test I
6.0 7.0

169
Lood (tons)
o 100 200 300 400 500
15
20
....
..: -- 25
.t:. -Q. ., 0 -- 30 0 .t:. (I)
-,::, C»
~ C» 35 .a e
IJJ
•
50
55
Fig. 6.13 Load Distribution Curves - GI, Test I

170
Load (ton.)
0 100 200 300 400 500
" , I.
\
\rTlP of Shaft
0.5 Test I
\
" 1.0 \ Test 2
~.:::: \
(Cyclic) -, , - 1.5 \ c
\ -.. Top of Shaft e: \ CD E \ ~ .. \ .. CD
2.0 \ VJ
\ \ \
Te.t 3 \ \
2.5 , 1 I I I
3.0 - __ ....... __ J
...
3.5
Fig. 6.14 Load-Settlement Curves - G1
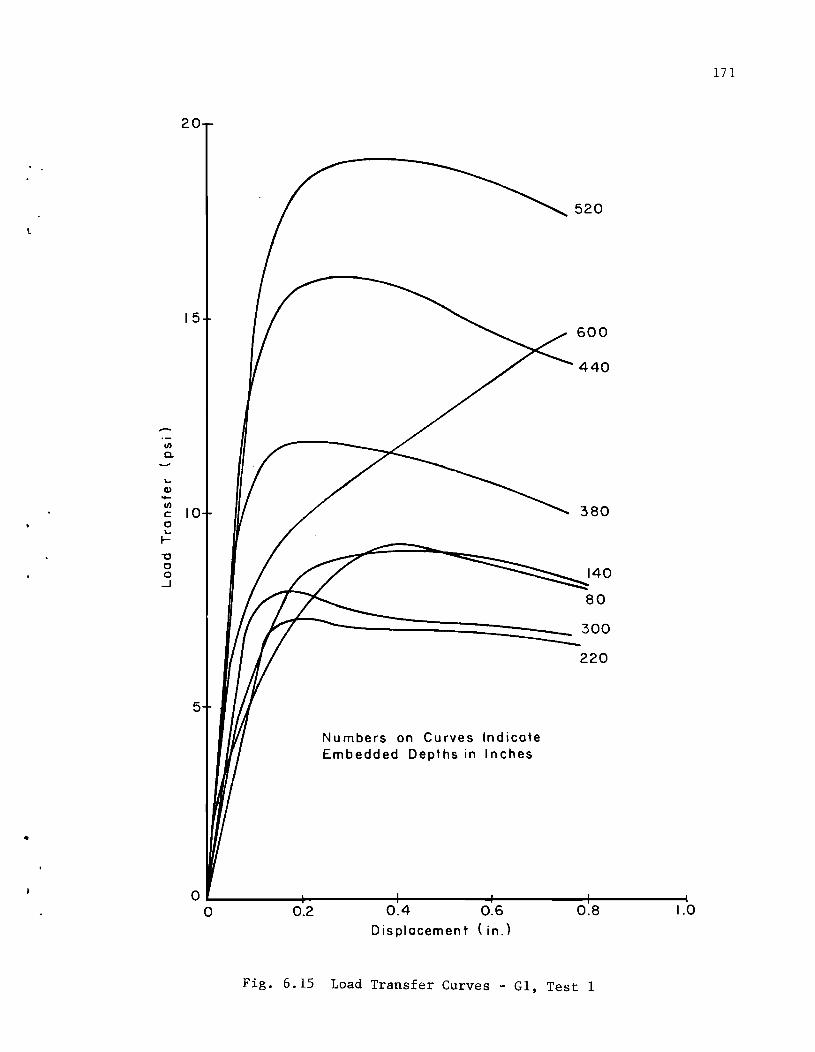
\.
II)
a.
.... Q,) -II) c 0 .... I-
"0 0 0 -.J
20
15
10
5
Numbers on Curves Indicate Embedded Depths in Inches
520
600
440
380
140
80
300
220
OL--------+--------4-------~~------_+--------~ o 0.2 0.4 0.6 0.8 1.0
Displacement (in.)
Fig. 6.15 Load Transfer Curves - Gl, Test 1
171

172
o
20 -£ • u .2 '-::lI
f/) 30 '0 c: ::lI
e C)
• 0 .. m 40
t • 0
60
70
0 Q
0.15 Load Transfer (tsn
1.0 1.15
Estimated Shear Strength of Clay
\ \
.~~ " \
\ \
\~~lS tan
\ \
\
~ \
\ 'It • \
• \
\ \ '\
\ '\ ,
2.0
~'
\ \
\ \ '\
Numbers on Curves Indicate' '\ ~
Applied Load in Tons \ \
Fig. 6.16 Load Transfer Vs. Depth - G1, Teat 1
2.15
'\
\

173
Load (tons)
o 100 200 300 400 500 600 700
20
30
..: :: s: -0.
40 CD 0 --0 s: en '0 CD '0
50 '0 CD
.Q
E IJJ
60
70
80
Fig. 6.17 Load Distribution Curves - G2, Test 1

174
0 lOO
\ \
0.5
,,(TiP c:::::-.t
\ \
- l.O \ c: 1 :.:::;
"E \ • \ E .!! , --• 1.5 , tJ) .\ ,
~I
2.0
2.5
Load (tans)
200 300 400 500 600
of Shaft Te,t ,
Top of Shott
Te,t 2
Fig. 6.18 Load-settlement Curves - G2
700
1
1
1
1
1
~ 1
1
1
1
1
1
1
1
1
1
1
1
1
1
1
1
1
1
1
1
I 1
1
1
1
1
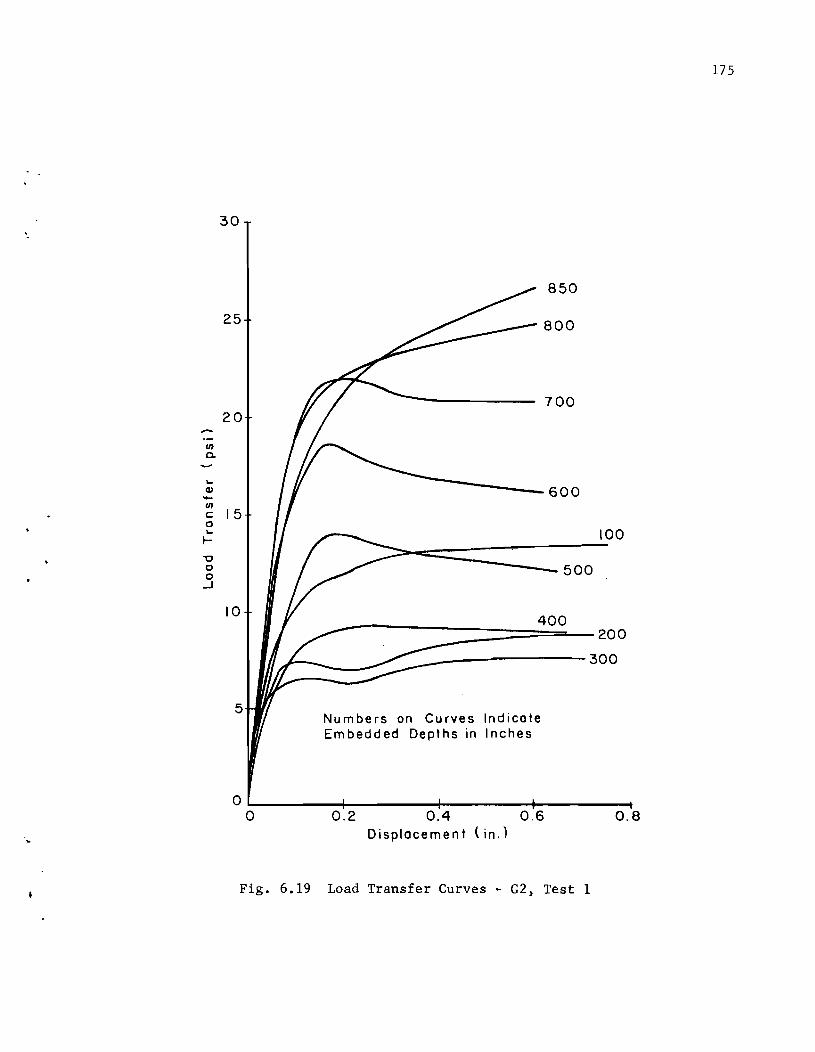
'.
II)
0.
.... Q) "-II)
c c .... ~
-0 C 0 -J
30
850
25 800
700 20
600
15 100
500
10 400
200
300
5 Nu m be rs on Curves Indicate Embedded Depths in Inches
o~ ________ ~ ________ -+ ________ ~~ ________ ~ o 0.2 0.4
Displacement (in.) 0.6
Fig. 6.19 Load Transfer Curves - G2, Test 1
0.8
175

176
o
10
20
..... ..: --.. 3 (,,)
0 -~ :J (I)
'0 c :J
e 40 C)
~ 0 'i CD
s:: -Go • 5 a
60
70
80
Load Tranlfer (tIt)
0.5 1.0 1.5 2.0 2.5 ~--------+---------~--~r---~---------+---------;
\
o ~
\ \
\ \
Estimated Shear Strength of Clay
\ \
,) ,/"'
Numbers on Curves Indicate Applied Load in Tons
Fig. 6.20 Load Transfer Va. Depth - G2, Test 1
!
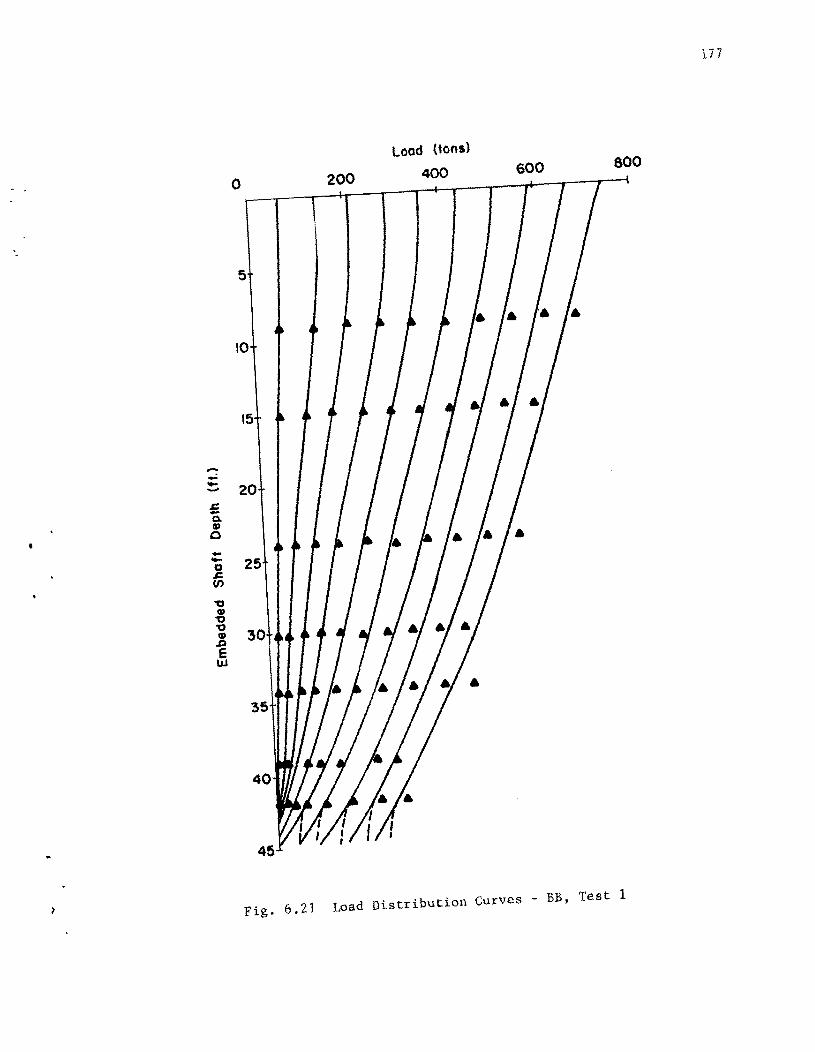
-..: --£ 0. Q)
0 --0 s:. fJ)
'0 Q) '0 '0 Q) .D e LLI
o
5
10
15
20
25
35
40
45
200
Load (tons)
400 600 800
Fig. 6.21 Load Distribution Curves - BB, Test 1
177
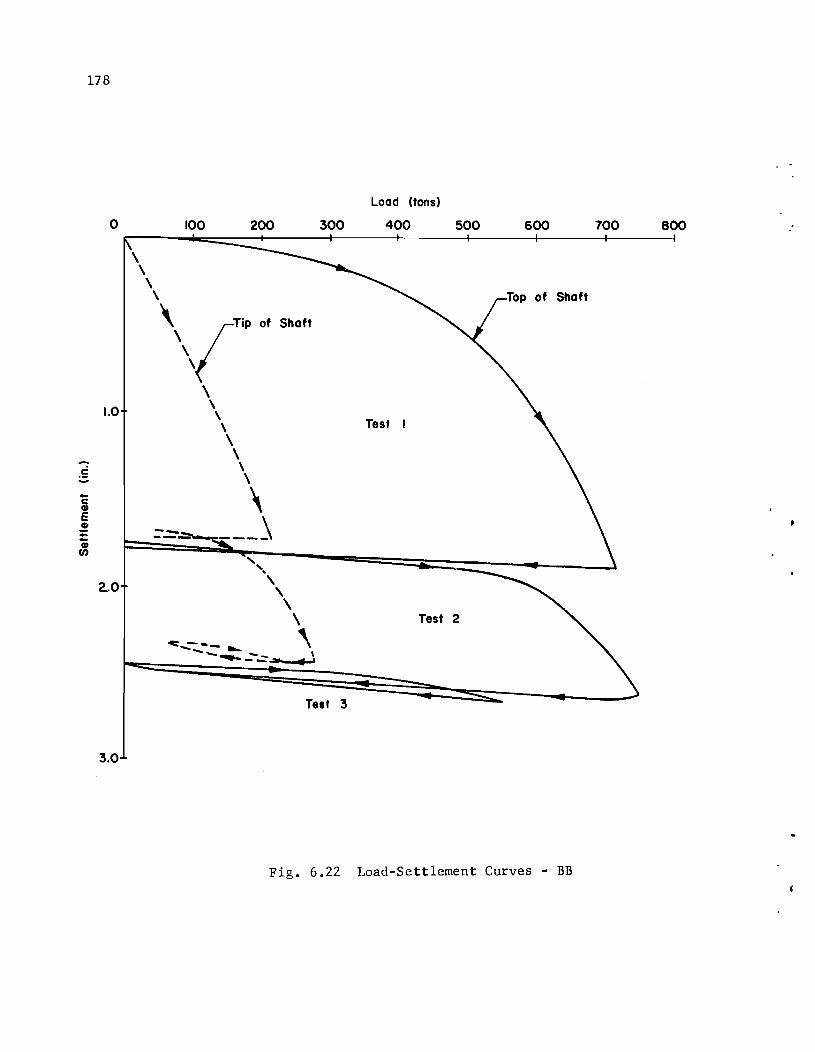
178
Load (tons)
0 100 200 300 400 500 600 700 800 :
\ \ \
\
\ ,\(TiP of Shaft
\ 1.0 \
\ \ Test I
\ \ -. \ .S \ - \ c
CD E ~ -- ~ - --~-----CD (f)
"-'. 2..0 \
\ \
\ Test 2
c:: ..... -:...,. __ ... \ ....... ~-... .:= ... \ .. -
Test 3
3.0
Fig. 6.22 Load-Settlement Curves - BB
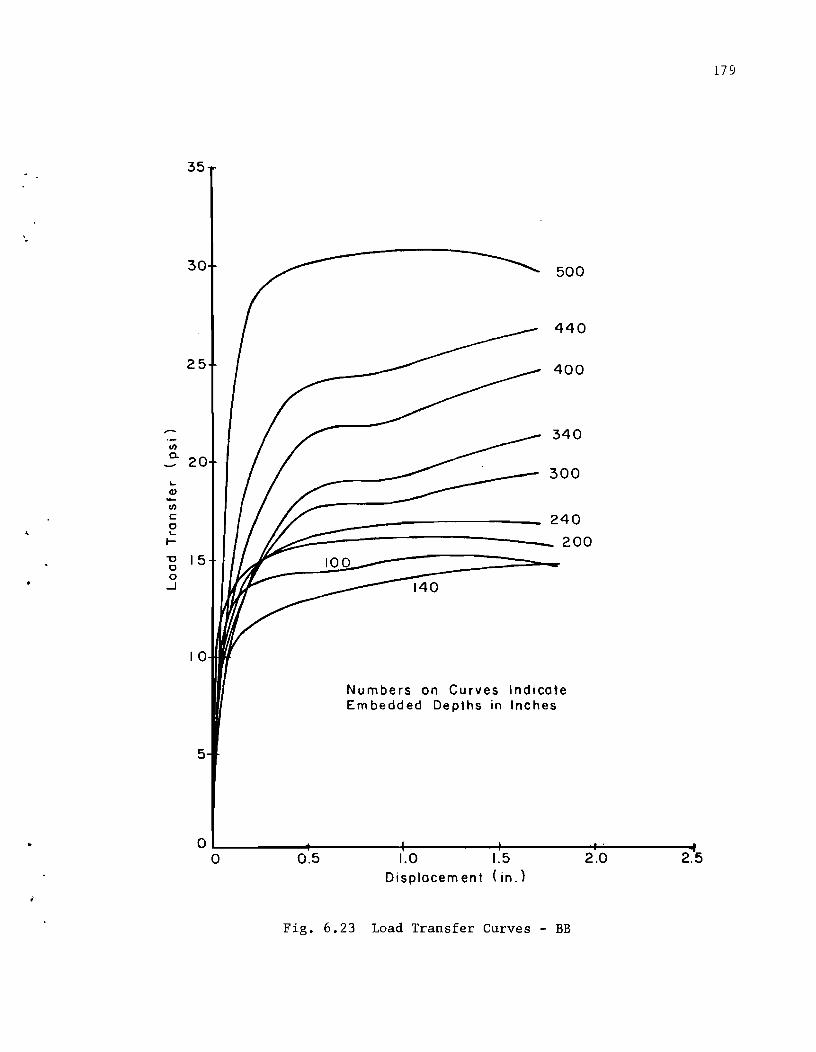
'.
U)
0.
.... cv U)
c 0 .... r "0 0 0
.....J
35
30
25
20
15
10
5
500
440
400
340
300
240
200
Numbers on Curves Indicate Em bedded Depths in Inches
o~ ______ ~~ ______ ~~ ______ ~~ ______ ~~ ______ ~ o 0,5 1.0 1.5 2,0 2,5
Displacem ent (in,)
Fig. 6.23 Load Transfer Curves - BB
l79
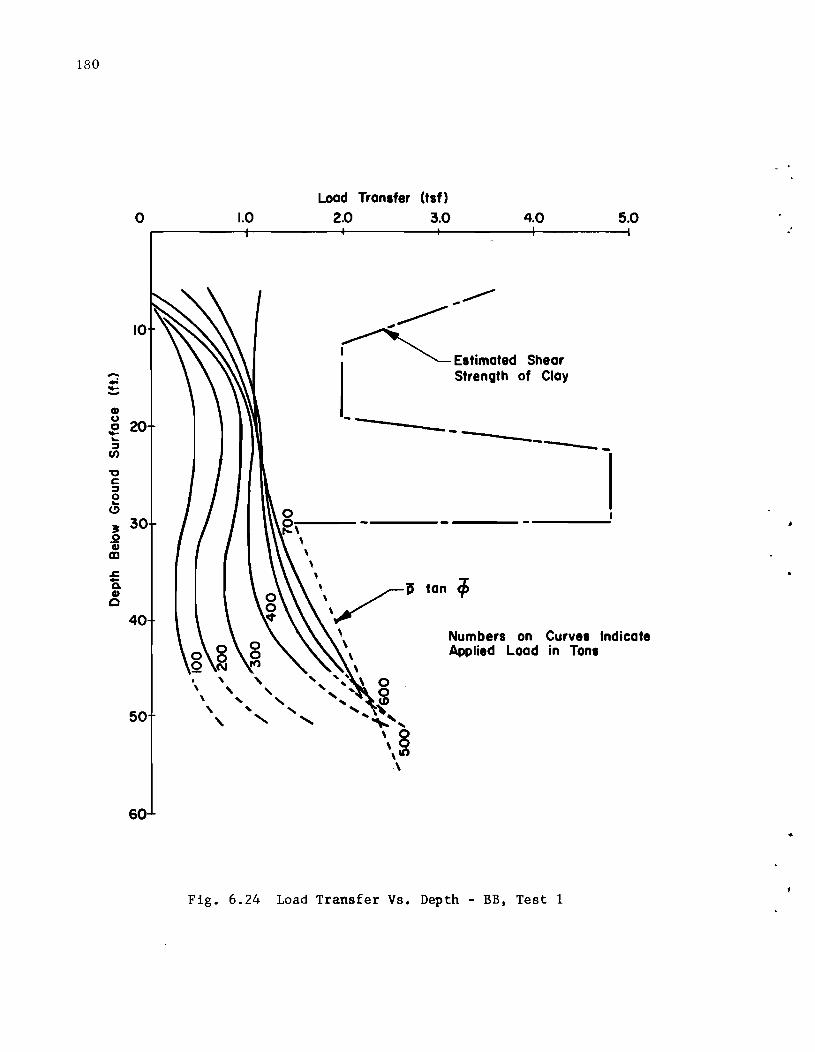
180
o
10
.... .,; -..... ell U
20 0 -... ~ f/)
'0 C ::::I 0 ... (!)
~ 0 Q) m .c -Q. ell 0
40
50
60
. , \ ,
1.0
\ , "-, " '-, " "
Load Transfer (tsf)
2.0 3.0 4.0
... ~ ~~
~ Estimated Shear StrenQth of Clay
-- -----------------
tan if>
5.0
Numbers on Curves Indicate Applied Load in Tons
Fig. 6.24 Load Transfer Vs. Depth - BB, Test 1
.'
181
cells to obtain the load at the tip of the shaft. However, this
extrapolation did not reflect in most cases the known interaction
between the tip and side resistances of the shaft that was
evidenced by the tests on shaft US59 and was reported by Vesit
(1970) and O'Neill and Reese (1970). The dashed line adjustments
are believed to represent a more probable behavior of the curves
near the tip.
2. Load settlement curves for the top and the tip of the shafts are
presented in Figs. 6.6, 6.10, 6.14, 6.18, and 6.22. The load
settlement curve of the top of the shaft was obtained by direct
measurement. For the tip of the shaft, the load was obtained
from the load distribution curves discussed above, and the settle
ment was computed by subtracting the computed elastic compression
from the observed settlement of the top of the shaft.
3. Load transfer curves, Figs. 6.7, 6.11, 6.15, 6.19, and 6.23, were
obtained at different depths in the shaft by plotting the shear
stress developed at a point, obtained by a differentiation of the
load distribution curves, versus the displacement of that particular
point with respect to its original position. The displacement of
a point is computed from knowledge of the butt settlement, the
load distribution curve, and the elastic properties of the shaft.
4. Curves plotting the load transfer versus depth at various butt
loads are presented in Figs. 6.8, 6.12, 6.16, 6.20, and 6.24. On
the same charts are plotted the shear strength profile of the
182
clay layers as estimated from the soil tests, and the line
representing the product p tan ¢, where p is the effective over
burden pressure.
CHAPTER VII. INTERPRETATION OF RESULTS
The problem of the bearing capacity of drilled shafts in sand depends
on a large number of variables which were not separately controlled in
this testing program. The results presented in the previous chapter
reflect the interference of these different variables in their random
occurrence. The approach followed in interpreting the data will consist
first of identifying the common findings of all the tests followed by an
explanation of the peculiar behavior of the different shafts.
TIP RESISTANCE
The instrumentation allowed a direct measurement of the tip resistance
of shafts US59 and G2. On the other shafts, only a reasonable estimate of
the tip resistance was possible. Figure 7.1 presents plots of the tip
pressure for all the shafts versus the relative settlement of the tip,
which is defined as the ratio of the settlement of the tip to the diameter
of the shaft. Also plotted on Fig. 7.1 are the results of tests conducted
on piles installed in cased boreholes and reported by Koizumi, et al. (1971).
As may be seen from the examination of Fig. 7.1, considerable
displacement is required to mobilize a significant tip resistance of
drilled shafts installed in sand.
On the average, the curves obtained for very dense sand tend to
behave fairly linearly to a pressure of about 40 tsf. Beyond that
pressure, the curves become nonlinear and diverge in an undefined manner.
183

184
o
0.05
-C IP E G) ;:: -G) (/)
• (;) N .!! .. -0
i m .. ~
0.10 (Jt
.... =-Z I .ll> 0
0.15
Fig. 7.1
20
,
, ,
\ I
\g (;) ~.
m .. I~-' UI
~ 0 • ....... ~ ;."": _ z I~ U
\~ ~ =- 0 .' m .. N 0 ()
:3 ... z II ~
Pressure Va.
Pressure (tst)
40 60 80
B= Pile Diameter
Average Curve for Very Dense Sand
<ft ~ CP
\\ - ~ ... '0 ~ . -\ 1"
~.
~ \ ~ 0
~ ~ . .,. ~
\ ~
Relative Settlement for the Tip of the Test Shafts
100
185
The nonlinearity of the curves is probably due to the excessive compression
and crushing of the sand grains at high stresses. The divergence of the
curves is believed to be due to the influence of the gradation of the sand
on the stress-strain properties of sand at very high stresses. The sands
tested in this study were of a relatively uniform gradation whereas the
sand tested by Koizumi was a well graded sand. Well graded sands compres.
less than sands of uniform gradation and, therefore, can resist higher
pressures.
The divergence may also have to do with the size of the shaft. There
are indications that arching effects are more significant in large diameter
drilled shafts.
Shaft Gl was presumably tipping in sand of medium density. Later,
observations made on the extracted shaft revealed the existence of lumps of
soft soil trapped at the tip of the shaft, which left doubts about the
measurements of the tip resistance of that shaft. However, measurements
made in medium dense sands by Koizumi, et ale (1971) indicate values in
the same order as those measured in shaft Gl. These curves are, therefore,
believed to be an indication of the behavior of the tip resistance of
drilled shafts in sand of medium density.
No measurements were made in loose sands. It is, however, believed
that loose sands can offer only a very small tip resistance.
The failure load is not easily defined on curves such as those
presented in Fig. 7.1. A rational approach consists of defining failure
at the maximum settlement tolerated by the structure. This settlement
depends on the nature and the stiffness of the structure envisaged. For

186
purposes of design, it is, therefore, desirable to define the load
settlement curve of the shaft for a wide range of settlement. The load
tests in this study were carried only to a settlement of about 10% of the
diameter of the shaft. The linear portion of tip pressure-settlement
curves ends at a relative settlement of about 0.05, which for drilled
shafts of a usual diameter of 30 in. corresponds to a settlement of 1.5
in. It is believed that this settlement is greater than most structures
can tolerate and, therefore, a study of the behavior of the curve beyond
this range is not of immediate importance.
There are very few field measurements reported in the literature on
the tip resistance of bored piles. Vesic (1970) summarized the results
of laboratory model tests on buried piles and the results of other tests
reported in the literature. His summary indicates that the ultimate tip
pressure of deep foundations may vary from over 100 tsf for very dense
sands to about 5 to 10 tsf for sands of medium density. Measurements
made in this study indicate smaller ultimate resistance for the very
dense sands. There are indications from the results of this study that
sands of medium density can resist slightly higher pressures than those
indicated by Vesit.
SInE RESISTANCE
The following sections discuss separately the side.resistance
developed in both the clay and the sand formations.
187
Side Resistance in Clay
The clay formations at the test sites were heterogeneous and were inter-
bedded with many layers of silt. An evaluation of the load transfer in
each independent layer was not possible. An average load transfer in the
total thickness of the clay layers could, however, be computed fairly
accurately.
The average load transfer in clay is conventionally expressed as a
fraction, a ,of the average shear strength of the clay formation. avg
Figure 7.2 presents plots of the values of aavg versus the average dis-
placement of the shaft. On these plots it is observed that the peak
load transfer in clay occurs at displacements of the order of 0.25 inch
and that for the stiff clays of sites US59, HH, and Gl, as well as the
stiff clay 1 of site G2, the peak a assumes values between 0.5 a~d 0.6. avg
These observations are in general agreement with the findings of previous
research (Whitaker and Cook, 1966; O'Neill and Reese, 1970). A higher
a value is exhibited, however, by the slightly overconsolidated clay 2 avg
layer at the G2 site which has an overconsolidation ratio of about two.
It is believed that the effects of remolding and softening during the
construction of drilled shafts are significantly reduced in slightly
overconsolidated clays.
The peak a value is much smaller for the hard clays of the BB avg
site where failure is believed to have taken place at the interface
between the concrete and the soil. It is thought that, when the slurry
displacement method is used, the shear transfer in hard clays is limited

188
... J:: CD -- 0' II) C C Q) 0 ... ... -.... (f)
'0 ... 0 0 0 CD
J:: -' (f)
CD .CD 0' 0' 0 0 ... ... CD CD
~ > <I
/I
0' > 0
ts
1.00
0.75
0.50
0.25
o
G2- Clay 2 (1.45 tsf)
GI (.54 tsf) US59 (1.96 tsf)
~:;""::::::="'---_...!.J.u.u.""""'....I.IiWo)G2_Clay 1 (.94 tsf)
~_------- BB (1.14 tsf)
0.5
Numbers on Curves Indicate Peak Unit Load Transfer
1.0 1.5 Displacement (in.)
Fig. 7.2 Load Transfer in Clay
2.0 2.5

189
to the shear strength of the coating separating the soil and the concrete.
In this case, the average shear transfer measured was about 1 tsf (Reese
and Touma, 1972).
Side Resistance in Sand
The inconsistency of the results from the different test shafts
reflects the influence of many variables on the measured load transfer in
sand. Some of these variables, discussed in previous chapters, are
related to the method of construction, the effect of load transfer, the
interference of layered soil systems, the interaction with the tip, and
the nature and relative density of the sand. A definite evaluation of the
influence of each variable is not possible from the obtained results. The
complexity of the problem challenges also the more sophisticated analytical
tools. While a finite element analysis may evaluate the influence of the
variables on the general behavior of the shaft, neither the constitutive
properties of the natural deposits nor the initial state of stress is
yet reasonably defined.
Figure 7.3 presents what is believed to be a typical behavior of the
side shear transfer in a homogeneous sand medium. The nonlinear increase
of the shear transfer with depth reflects the influence of the load
transfer in the upper layers of the soil and the arching of the sand near
the tip of the shaft. The significant reduction in shear transfer in
the lower depth of the pile is associated with the flow of the sand
near the tip as described previously. The extent of the zones of flow and
arching is dependent on the settlement of the tip and on the relative

190
.c -a-li)
o
Load Transfer
o ~ ~----------~I~------------------~
I p tan <p I
a r----\---~.-~
bl-----bl
I I I I I I
Transfer Due to
Hypothetical Load Transfer in Homogeneous Sand
+ o to 5 Shaft Diameters
•
Fig. 7.3 Typical Behavior of Load Transfer in Sand
:
•

191
density of the sand. This hypothetical curve is similar to curves from
experimental measurements on driven piles in sand deposits (Vesic, 1970)
and is in general agreement with load transfer curves measured in this
study.
At all test sites used in this study, the soil profile consisted of
an upper clay layer overlaying sand deposits. Thus, it was not possible
to study the shear transfer in sand at shallow depths. The influence of
the clay layer on the shear transfer in sand cannot be accurately measured.
The high load transfer in the top stiff clay increases the confinement of
the sand and should increase the shear transfer in the sand, as shown by
the dashed line in Fig. 7.3.
The total load transfer by side resistance is the product of the
circumference of the shaft and the integral vf the area under a load transfer
curve, such as the curve shown in Fig. 7.3. For the drilled shafts tested
in this study, correlations were obtained between the average load transfer
in the sand and the average value of the product p tan ¢. This is
equivalent to saying that the hatched area aalblb under the load transfer
curve of Fig. 7.3 is related to the area aa2
b2b under the line representing
the product p tan ¢.
It is convenient to define a factor a as the ratio of these areas. avg
Figure 7.4 presents plots of a versus the displacement of the shaft as avg
obtained from the various tests. That a for shaft HH is larger than for avg
the other shafts is due to the existence of thin layers of sandstone and
hard conglomerates in the sand formation and is not, therefore, representative

192
2.5
2.0
HH (2.83 tsf) ... CD -CIt c -e.. 0
J::. c 1.5 ..e "CI 0
.9 IQ.
• CD US 59 0.68 tsf) 01 01 0 0 ... ... ci
CD > 1.0 <[
" 01 > 0
BB 0.57 tst) tI GI (1.03 tsf)
0.5
Numbers on Curves Indicate Peak Unit Load Transfer
o 0.5 1.0 1.5 2.0 2.5 Displacement (in.)
Fig. 7.4 Average Load Transfer in Sand
•

193
of shafts in sand. The slight carbonaceous cementation of the sand at the
US59 test site partially explains the high load transfer measured at that
site. The differences between the a values of the Gl, G2, and BB sites avg
may be partially due to the varying influence of the load transfer in the
upper clay layers.
It is of interest to note that shafts US59 and G2, which penetrated
10-15 ft. in sand, exhibited larger a values than those of shafts Gl avg
and BB, which penetrated 20-25 ft. in sand. This difference could be
partially attributed to the varying influence of the interaction between
the sides and the tip. The arching stresses from this interaction have a
greater influence on shafts of smaller penetration in sand. This
phenomenon suggests that shafts having a penetration in sand greater than
25 ft. may indicate smaller a values than those measured in this study. avg
It is also observed from a study of Fig. 7.4 and the results presented
in the previous chapter that the movement required to mobilize the side
resistance of a sand element on the periphery of the shaft varies with
the density of the sand and the relative position of the sand element.
Outside the arching zone, shear failure takes place at a displacement of
about 0.25 in. On the other hand, the continuous expansion with settlement
of the arching zone results in larger displacements at failure of the
sand elements in that zone. Larger displacements are observed, as a
result, in the US59 and BB shafts where dense to very dense sands were
tested, and where the shear transfer in the arching zone accounted for a
large fraction of the total shear transfer.

194
PARTICULAR BEHAVIOR AND SPECIAL TESTS
The observations relative to the particular behavior of each of the
test shafts are discussed in the following paragraphs.
Shaft US59
This test shaft provides the best data on the behavior of the tip
resistance of drilled shafts installed in very dense sand because the shaft
was well seated in the sand and the tip level of Mustran cells functioned
properly. The results on load transfer indicated a behavior similar to
that described in Fig. 7.3. A very small side resistance was measured in
the medium dense sand layer, whereas a very large side resistance was
measured in the lower very dense and slightly cemented sand layer. The
cementation of the sand was evidenced by the fact that the construction
was made in a free-standing hole. Although the cohesive component of the
shear strength of the sand was not very significant, its presence may
have allowed a larger extension of the arching zone.
After soaking, the total bearing capacity of the shaft was not
changed although a redistribution of the load transfer was manifested
between the different layers. The load transfer in the top clay layer
was reduced as a result of an increase in the moisture content. On the
other hand, the repeated testing resulted in the compaction of the medium
dense sand layer and increased the load transferred in that layer. The
load transfer in the lower sand layers was reduced by the continuous
downward movement of the shaft while the tip resistance increased due to
the compaction of the sand at the tip.
,
195
The time required for the stabilization of the downward movement under
a constant load varied between 0 and 30 minutes depending on the load applied.
Studies by Vesit (1968) showed that the consolidation of sand takes place
in a comparable amount of time for stresses comparable to those applied at
the tip of the shaft.
Shaft HH
This test shaft yielded valuable information on the tip resistance of
drilled shafts in sand. However, the evaluation of the side resistance in
sand was not meaningful, because of the existence of very hard layers in the
sand deposits.
Shaft Gl
The first test on this shaft yielded very valuable information on the
side and tip resistance of shafts cast in sands of medium density. Results
from the second and the third tests indicated a significant influence of
repeated loading on the load transfer. Cyclic loading and large settlements
of the shaft reduce significantly the load transfer in the clay layer, as
was previously reported from research results (O'Neill and Reese, 1970).
The influence of cyclic loading on the load transfer in sand was not well
defined. While the average value of the side resistance in sand remained
essentially the same, its distribution with depth varied in the different
tests.
Shaft G2
The measured load distribution in the shaft during the first test
indicated a considerable scatter which was attributed to variations in the
196
modulus of elasticity of the concrete. However, the average measured load
transfer in the major soil layers is believed to be fairly representative.
Nonhomogeneous soil conditions existed below a depth of 55 feet, and
there was uncertainty about the character of the soil at the tip of the
shaft. Back calculations of the shear strength of the soil at the tip
from the measured tip resistance indicate that the shaft may be tipping in
a clay.
Shaft BB
The Mustran cells in the upper sections of the shaft were found to be
unreliable, and only an average value of load transfer could be obtained
in the upper clay formation. The destruction of the cells at the tip and
the scatter of the data allowed only the measurement of an average value
of the side shear transfer in the sand layer. The zones of flow and
interaction could not be identified in this shaft.
DESIGN IMPLICATIONS
Previous discussions emphasized the long sweeping character of the
load-settlement curve of drilled shafts in sand and the large settlements
required to mobilize the ultimate resistance of the shafts. Figure 7.5
presents straight line approximations of the side, tip, and total load
transfer in an average size shaft of 30 inches in diameter. It is
observed on this figure that the failure of the sides of the shaft takes
place at a downward movement of about 0.25 to 0.50 in. and that a large
fraction of the tip resistance is mobilized at a tip movement of 1.50 in.

'.
" o .3
..... -o -lit
o -... CD -en c o t!::
" o .3
A B d C - Fa'i re Loads at I" Settlement • • an - I U
A'. 8', and C' = Ultimate Failure Loads
A' Dense sand) (Very
e' (Medium Dense Sand)
C' (Loose Sand; Estimated) C ___ -------------.--.-. - -- .-..----,,--
/ /
0.5 1.0 1.5 2,0 2.5
Os (Very Dense Sand)
Os (Medium Dense Sand) -------
0.5 1.0 1.5 2.0 2.5 Shaft Movement (in.)
Fig. 7.5 Approximate Load Transfer and Load-Settlement Curves for a 30 in. Drilled Shaft
197

198
representing 5% of the tip diameter. Beyond this movement the tip resistance
flattens progressively and its magnitude becomes uncertain. The design of
drilled shafts, therefore, depends greatly on the settlement that can be
tolerated by the supported structure. In bridge design, the allowable
settlement depends on the stiffness of the bridge (continuous vs. simple
span, and reinforced vs. prestressed concrete), on the desired rideability
and on the cost of maintenance of the roa9.
The choice of design criteria from empirical results poses a
philosophical question: what factor of safety must be applied? The
factor of safety must reflect the confidence in the obtained results and
in their application to the design of similar shafts. It must also take
into consideration the existence of a multitude of variables in the
analysis, design and construction of drilled shafts, and must consider
the competence of the designing engineer.
For the purposes of design of bridge bents where the diameter of
drilled shafts varies commonly between two and four feet, the failure
load of a drilled shaft will be defined as the load corresponding to 0ne
inch of settlement of the shaft. The working design load is taken as one
half the failure load. It is believed that these criteria limit the
differential settlements to satisfactory values for most bridges (less
than 0.5 inch) and allow an economical design.
In the proposed criteria, the failure load includes the total side
resistance and a fraction of the ultimate tip resistance, varying between
40 and 100%. The larger fraction of the ultimate tip resistance is
199
developed in smaller diameter shafts and looser sands; however, in both of
these situations the tip resistance is only a small fraction of the total
shaft resistance. The uncertainties of the construction methods, the
variabilities of the measured results, and the large settlements associated
with the tip resistance make the tip resistance the more uncertain quantity
of the two components of the shaft resistance. A greater factor of safety
against ultimate failure is, therefore, required where the tip resistance
constitutes a larger fraction of the total shaft resistance. In the
proposed criteria, a factor of safety of two against the failure load
defined at one inch of settlement corresponds to a factor of safety of two
against the ultimate failure of small diameter shafts in loose sand and to
a larger factor of safety against ultimate failure of large diameter shafts
in very dense sand.
The following procedure for design is, therefore, suggested:
1. Obtain from the dynamic penetrometer blow count estimates of the
friction angle and the relative density of the sand. For the
standard penetration test, the USBR charts presented in Fig. 4.5
can be used in conjunction with the curve relating the friction
angle to the relative density of the sand given by Peck, Hanson,
and Thornburn in Fig. 4.8. For the THD cone penetrometer the
charts presented in Fig. 7.6 can be used. These charts were
obtained from the USBR charts based on previous correlations
that showed that the THD cone penetrometer blow count in sand is
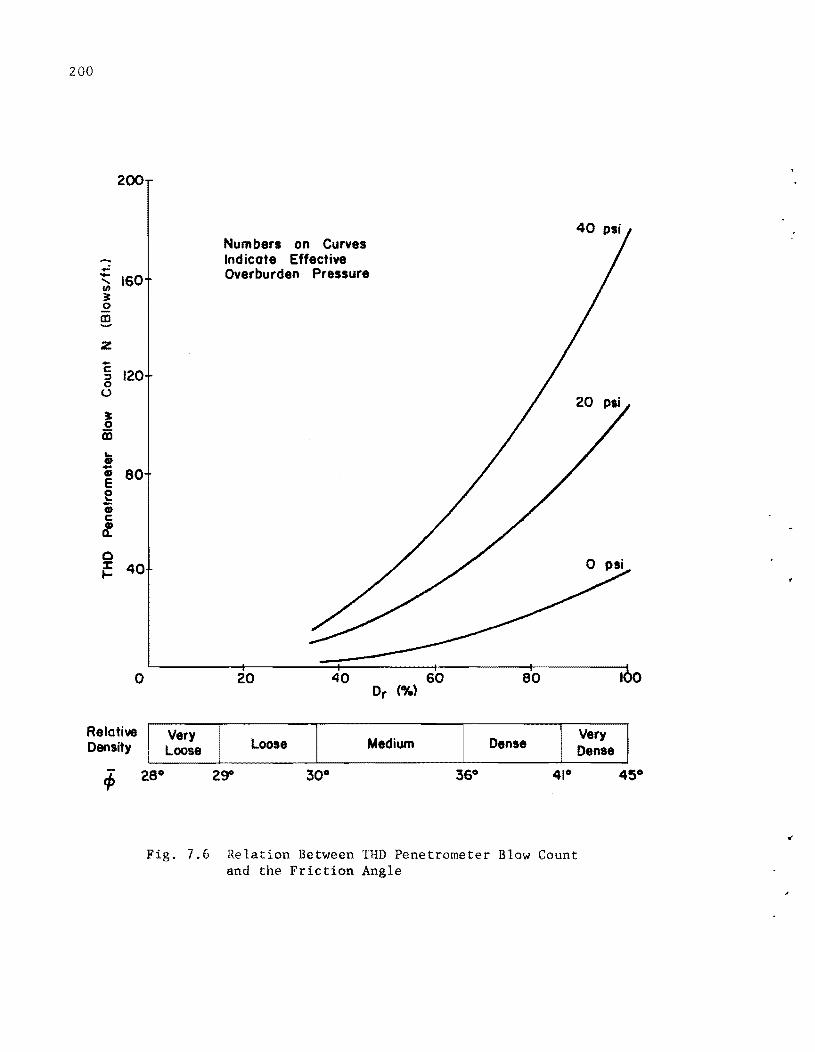
200
200
..: - 160 .... UI ~ ..2 III ...,
z
E 120 ::s 0
(.)
s 0 iii t.. 4D - 80 4D E e -4D c::
8? 0 ~ 40 ....
o
Relative Density
40 Numbers on Curves Indicate Effective Overburden Pressure
20 40 60 80 Dr C%)
Very Loose Medium Dense Loose
Fig. 7.6 Relation Between THD Penetrometer Blow Count and the Friction Angle
Very Dense
approximately equal to twice the SPT blow count. The relations
in Fig. 7.6 can be further approximately expressed as
_.--:8:..:N.:...:o<...:;T,:.:.H=..D )'--_ + 29 s: 45 0
20 + 0.01 P
where
~ effective friction angle, degrees,
N THD blow count,
p effective overburden pressure, psf.
2. Obtain the ultimate side resistance Q <lb) in sand as s
['H Q' C J 0 p tan ~ dz avg
where
C circumference of the shaft, ft,
H total depth of embedment of the shaft in sand, ft,
dz = differential element of length, ft.
The results of the load tests indicated a minimum Q' of about avg
0.7 which can safely be used for the design of shafts of a
penetration in sand not exceeding 25 ft. There are indications
that the value of Q' may decrease with greater penetration in avg
201

202
sand and, therefore, smaller values must be used in the design of
deeper shafts. Pending future research, it is suggested that for
shafts penetrating more than 25 but less than 40 ft. in sand an
a value of 0.6 shall be used and that an a value of 0.5 avg avg
shall be used for shafts of greater penetration.
3. Obtain the failure tip resistance Qt (lb) in sand at one inch
of downward movement of the shaft as
where
A
A 0.6 B
B ~ 2 ft.
2 cross-sectional area of the shaft, ft ,
B = diameter of the shaft, ft,
qt tip resistance at five percent movement. qt is taken
equal to 0, 32000 psf, and 80000 psf for loose, medium
dense, and very dense sand respectively. For sands of
intermediate densities linear interpolations can be used.
(These values of the tip resistance are limited to shafts
deeper than 10 shaft diameters).
4. Obtain the failure load Q (lb) at one inch downward movement of the
shaft as

5. Obtain the working resistance of the shaft by dividing the failure
load Q by two.
Based on these criteria, back calculations were made to evaluate the
failure load of the test shafts defined at one inch movement. The results
of these calculations are presented in Table 7.1 and are compared to the
measured values. In doing these calculations the measured load transfer
in clay was added to the computed load transfer in sand. Table 7.2 shows
similar calculations for the total measured and calculated load transfer
in sand at the various test sites.
In these tables it is observed that the error in estimating the failure
load is relatively small for all shafts except shaft HH. The existence
of sandstone and conglomerate layers at this site resulted in very high
load transfer that cannot be correlated to the load transfer in sand. Of
interest in Table 7.1 are also the small values of settlements measured at
the design loads and the factors of safety against the maximum loads
applied on the shaft. The factors of safety are close to two for shafts
depending greatly on the side resistance such as shaft Gl, and G2, that
were installed in medium dense sand and in clay. Larger factors of safety
are shown for shafts U859 and BB that were installed in very dense sand.
The factor of safety of shaft HH is not comparable to the others because
of reasons mentioned earlier. It is also important to note that the
larger factors of safety in shafts US59 and BB are associated with larger
settlements.

204
Table 7.1 Comparison of Total Calculated and Measured Loads
Shaft
US 59 HH Gl G2 BB
Calculated Load at One Inch Movement (T) 370 240 430 670 560
Measured Load at One Inch Movement (T) 410 430 450 670 590
Percent Difference* -9.7 -44.2 -4.4 0 -5.1
Maximum Load Applied (T) 700 540 480 690 750
Displacement at Design Load (In.) .36 .05 .07 .11 .10
Displacement at Max. Load (In.) 7.0 2.5 0.5 0.5 2.5
Factors of Safety w.r.t. Max. Load 3.78 4.50 2.14 2.00 2.68
1'S equal to ( Calculated load - Measured lOad) X 100 * Percent Difference Measured load
Table 7.2 Comparison of Calculated and Measured Load Transfer in Sand
Shaft
U859 HH Gl G2 BB
Calculated Load 250 145 305 200 340
Measured Load 300 300 350 220 365
Percent Difference -27.8 -51.2 -12.8 -9.1 -9.4
CHAPTER VIII. CONCLUSIONS
The solution of problems in soil mechanics and foundation engineering
is limited mostly by the following major factors: the indeterminate three
dimensional stress-strain behavior of an element of soil, the heterogeneity
of natural soil deposits, the complexity of the analysis of stresses in a
nonlinear material, and the unknown influences of the different methods of
construction. Practical, rigorous solutions to these problems cannot be
developed before tangible progress is realized in laboratory techniques,
field measurements, analytical procedures, and analysis of the methods of
construction.
This study has been concerned with the design and construction of
drilled shafts in sand. Five full-scale test shafts were constructed using
the dry method and the slurry displacement method. These two construction
methods were analyzed and evaluated in the light of field observations made
during the construction of test shafts and using published information on
similar construction techniques. With respect to the design, a rigorous
solution evaluating the influence of the many variables controlling the
behavior of drilled shafts in sand could not be obtained. However,
measurements taken from full-scale load tests on five drilled shafts, and
observations made during the construction and the extraction of the shafts,
allowed the development of approximate solutions to the problem. In the
following sections the main conclusions concerning the construction and
the design of drilled shafts will be summarized.
2M

206
CONSTRUCTION
The dry method and the slurry displacement method can both be success
fully used in the construction of drilled shafts. The dry construction is
preferable where feasible, and the rules for its good execution are well
known. Research made in this study on the more recent slurry displacement
technique resulted in the following findings:
1. The stability of a drilled hole is greatly influenced by the
quality of the drilling mud. While a high density mud may be
needed in holes with artesian pressures, a low density mud is more
desirable in general and can stabilize a hole when the mud is
maintained at a sufficient level above the ground water table.
The flocculation, and the weight of mud, can be reduced by using
fresh, soft, and uncontaminated water to mix the mud and by using
the proper mud constituents when penetrating contaminating formations.
Expansive clays are more troublesome than sands when exposed
to the drilling mud. In general, a calcium drilling mud prevents
the dispersion and erosion of the expansive clays.
2. The concreting must be executed with great care. Sediments
deposited at the bottom of the hole may be washed out by the first
charge of concrete if the proper seal of the tremie is used. It
was found that a seal made of a wood block and a polyethylene sheet
causes sediments to be trapped at the bottom of the hole. Possible
improvements of the seal are described in Chapter II. Care must

oosmN
207
be exercised to keep the tremie well embedded in concrete (about
5 ft.) during concreting to prevent the entrapment of mud in the
concrete.
The development of a thin mud cake on the side of the hole and
the existence of a thin coating of mud on deformed reinforcement
steel do not reduce the capacity of the shaft. However, a heavy
and flocculated mud may be entrapped in large lumps on the rein
forcing steel and on the sides of the shaft. A light, dispersed
mud and a high-slump concrete (6-7 in.) must be used to insure
good concreting.
The flow of the concrete is a function of the size of the hole
and the head of concrete applied. No criteria can be suggested at
this time for establishing the necessary flow of the concrete;
however, the construction by slurry displacement of shafts smaller
than 24 in. is not recommended.
The following paragraphs summarize findings concerning the design of
drilled shafts in sand.
1. With respect to the tip resistance, it was found that very large
displacements are required to mobilize a significant reaction at
the tip. In loose sand this resistance is a very small fraction
of the side resistance. In medium and in very dense sand, curves

208
relating the pressure at the tip to the settlement of the pile
have been recommended. In the general case, the designer's choice
of an allowable tip resistance is a function of the nature of the
proposed structure and the settlements it can tolerate. A method
has been recommended for the design of drilled shafts in bridge
bents. This method is based on defining the failure load at a
downward movement of the top of the shaft of one inch.
2. With respect to the side resistance, it was found that several
variables control the pattern of behavior of the shear resistance
at the periphery of the shaft. The influence of each of these
variables could not be evaluated separately. Instead, it was
found empirically that the average side resistance developed on
the periphery of the shaft is related to the overburden pressure
and the friction angle of the sand. This relationship can be
expressed as
a C JHO P tan ¢ avg
where
Q total side resistance of the depth of the shaft embedded s
in sand,
= factor that can be taken equal to 0.7 for penetrations in
sand not exceeding 25 ft. (Tentative values for greater •
depths are suggested as 0.6 for shafts penetrating sand
between 25 and 40 ft. and 0.5 for shafts of greater
penetration. ),
C circumference of the shaft,
p effective overburden pressure,
o effective friction angle of the sand,
H depth of embedment in sand.
These findings must be applied cautiously. The designer should keep
in mind that the construction of these test shafts was completed under
close supervision that may not be available on many construction sites.
Although results did not allow a significant distinction of the effects
209
of the dry and the slurry displacement methods of construction, the possible
adverse effects of excessive. entrapment of mud and sediments at the tip
and at the sides of shafts cast by slurry displacement cannot be over
emphasized, and every care must be exercised in using this technique.
RECOMMENDED RESEARCH
The large number of variables controlling the behavior of drilled shafts
in sand and the small number of controlled tests left many questions for
future investigations. Some of the recommended future research is dis
cussed in the following paragraphs.
1. The distribution of the effective concrete pressure on the walls
of the hole is a function of the size of the hole and the rate

210
of placement, the slump, the temperature, and the placing procedure
of the concrete. These variables deserve serious attention from
future investigators.
2. A finite element analysis, taking into consideration the proper
constitutive properties of the sand, may allow a better understanding
of the behavior of drilled shafts. Such a study could evaluate the
relative influences of the volumetric concrete strains and the
interaction of the stresses in the sand surrounding the shaft.
This analysis could also evaluate the influence of the interaction,
between the tip and the sides of the shaft, on the total load
transfer by side shear. It must be noted, however, that our
present knmv1edge of the constitutive properties of sand allows
the use of the finite element analysis to give only a better under
standing of the behavior of drilled shafts and of the influence
of the controlling variables. The limitations of our present soil
testing techniques in defining the in situ properties of sand
deposits and the behavior of sand under generalized stress
conditions prevent the use of the finite element analysis to
define practical design parameters.

REFERENCES
AASHO (1963), Standard Specifications for Highway Bridges, 1963.
API, Subcommittee API Southern District L9696), "Principals of Drilling Fluid Control," 12th Edition, 1969.
Awoshika, K. and Reese, L.C. (1971), Analysis of Foundation with Widely Spaced Batter Piles, Research report 117-3, Center for Highway Research, The University of Texas at Austin, Austin, 1971.
Barbedette, R. and Beria, E. (1961), "Proced~ d'execution de Tranchees et puits sans sout~nement," Proceedings of the Fifth International Conference on Soil Mechanics and Foundation Engineering, Vol. 2, Paris, 1961.
Barker, W.R. and Reese, L.C. (1969), Instrumentation for Measurement of Axial Load in Drilled Shafts, Research Report 89-6, Center for Highway Research, The University of Texas at Austin, Austin, November, 1969.
Barker, W.R. and Reese, L.C. (1970), Load-Carrying Characteristics of Drilled Shafts Constructed with the Aid of Drilling Fluids, Research Report 89-9, Center for Highway Research, The University of Texas at Austin, Austin, 1970.
Bazaraa, A.R.S.S. (1967), Use of the Standard Penetration Test for Estimating Settlements of Shallow Foundations on Sand, Thesis presented to the University of Illinois in partial fulfillment of the requirements for the degree of Doctor of Philosophy, Urbana, Illinois, 1967.
Berezantzev, V.G. and Yaroshenko, V.A. (1957), "The Bearing Capacity of Sands Under Deep Foundations," Proceedings of the Fourth International Conference on Soil Mechanics and Foundation Engineering, Vol. 1, London, 1957.
Berezantzev, V.G., Khristoforov, V.S., Go1ubkov, V.N. (1961), "Load Bearing Capacity and Deformation of Piles Foundations," Proceedings of the Fifth International Conference on Soil Mechanics and Foundation Engineering, Vol. 2, Paris, 1961.
Bishop, A.W. (1948), "A New Sampling Tool for Use in Cohesion1ess Sands Below Ground Water Level," Geotechnigue, Vol. I, No.2, London, 1948.
Burland, J.B. (1963), Discussion in Grouts and Drilling Muds in Engineering Practice, Butterworths, London, 1963, pp. 223-225.
211
212
Butler, H.D. (1972), Personal Communication, 1972.
Caquot, A. and Kerisel, J. (1949), Traite de Hecanique des sols, GauthierVillars, Paris, 1949.
Clladeisson, R. (1961), "Parois Continues Moul~es dans Ie sol," Proceedin~ of the Fifth International Conference on Soil Mechanics and Foundation Engineeri~, Vol. 2, Paris, 1961.
Chadeisson, R. (1961), "Influence Du Mode De Perforation Sur Le Comportement Des Pieux Fore's Et Moule's Dans Le Sol," Proceedings of the Fifth International Conference on Soil Mechanics and Foundation Engineering, Vol. 2, Paris, 1961.
Chuang, J.W. and Reese, L.C. (1969), Studies of Shearing Resistance Between Cement Hortar and Soil, Research Report 89-3, Center for Highway Research, The University of Texas at Austin, Austin, 1969.
Chellis, R.D. (1961), Pile Foundations, Second Edition, McGraw-Hill, New York, 1961.
Cole, R.W. (1963), Discussion in Grouts and Drilling Muds in Engineering ~ractice, Butterworths, London, 1963.
Coyle, H.H. and Reese, L.C. (1966), "Load Transfer for Axially Loaded Piles in Clay," Journal of the Soil Mechanics and Foundations Division, ASCE, Vol. 92, No. SM2, ~~rch, 1966.
Coyle, H.II. and Sulaiman, I.H. (1967), "Skin Friction for Steel Piles in Sand," Journal of the Soil Mechanics and Foundations Division, ASCE, Vol. 93, No. SN6, November, 1967.
DeBeer, E.E. (1963), "The Scale Effect in the Transportation of the Results of Deep-Sounding Tests on the Ultimate Bearing Capacity of Piles and Caisson Foundations," Geotechnique, Vol. 11, No.1, March, 1963.
DeBeer, E.E. (1964), "Some Considerations Concerning the Point of Bearing Capacity of Bored Piles," Proceedings, Symposium on Bearing Capacity of Piles, Central Buliding Research Institute, Vol. 1, Roorkee, India, February 1964.
DeMello, V.F.B. (1969), "Foundations of Buildings in Clay," Proceedings of the Seventh International Conference on Soil Mechanics and Foundation Engineering, State-of-the-Art Volume, Mexico City, 1969.
DeMello, V.F.B. (1971), liThe Standard Penetration Test," Fourth Panamerican Conference of Soil Mechanics and Foundation Engineering, Vol. 1, Puerto Rico, 1971.
213
Denisov, N. Y., Durante, V .A., and Kazanov, M.L (1963), "Studies of Changes of Strength and Compressibility of Hydraulically Filled Sands in Time," Proc~edi~s of the European Conference on Soil Mechanics and Foundation Engineering, Vol. 1, Weisbaden, 1963.
DuBose, L.A. (1955), "Small Scale Load Tests on Drilled and Cast-in-Place Concrete Piles," Proceedings, Highway Research Board, Vol. 34, Washington, D.C., 1955.
DuGuid, D. R., Forbes, D. J., Gordon, J. L., and Simmons, O. K. (1971), "The Slurry Trench Cut-Off for the Duncan Dam," Canadian GeotechnicaL Jou£nal, 8,94, 1971.
Edison Group, S.A.D.E. Group, S.LM.A. Company (1961), "Construction of Concrete Diaphragms (Cut-Off Walls) in Italy, PI Proceedings of the Fifth International Conference on Soil Mechanics and Foundation Engineering, Vol. 2, Paris, 1961.
Farmer, loW., Buckley, P.J.C., and Sliwinsky, z. (1970), "The Effect of Bentonite on the Skin Friction of Cast-in-Place Piles," Behavior of P_ile~Proceedings of the Conference Organized by the Institution of Civil Engineers in London, September, 1970.
Fernandez-Renau, L. (1965), Discussion in Proceedings of the Sixth International Conference on Soil Mechanics and Foundation Engineering, Vol. 3, Montreal, Canada, 1965.
F lorentin, J. (1969), "Cast-in- Situ Diaphragm Walls," Proceedings of the Seventh International Conference on Soil Hechanics and Foundation Engineering, Vol. 3, Mexico City, 1969.
Gibbs, H.J. and Holtz, W.C. (1957), "Research on Determining the Density of Sands by Spoon Penetration Testing," Proceedings of the Fourth International Conference on Soil Mechanics and Foundation Engin~ering, Vol. 1, London, 1957.
Glossop, R. and Greeves, loS. (1946), "A New Form of Bored Pile," Concrete and Construction Engineering, London, December, 1946.
Greer, D.M. (1969), "Drilled Piers State of the Art, 1969," W.C.A. Geotechnical Bulletin, Vol. 3, No.2, Woodward-Clyde & Associates, New York, September, 1969.
Hager, R.F. (1970), Cast-in-Drilled Hole-Piles in Adverse Soil Conditions Part I Wet Installations, Report Prepared in the Engineering Geology Section of the Bridge Department of the California Department of Public Works, July, 1970.
214
Hendron, A.J. (1963), The Behavior of Sand in One-Dimensional Compression, Thesis presented to the University of Illinois in partial fulfillment of the requirements for the degree of Doctor of Philosophy, Urbana, Illinois, 1963.
Henkel, D.J. (1970), Geotechnical Considerations of Lateral Stresses, ASCE 1970 Special Conference on Lateral Stresses in the Ground and Design of Earth-Retaining Structures, Cornell University, Ithaca, New York, June 1970.
Ireland, H.O. (1957), "Pulling Tests on Piles in Sand," Proceedings of the Fourth International Conference on Soil Mechanics and Foundation Engineering, Vol. 2, London, England, 1957.
Jones, G.K. (1963), Discussion in Grouts and Drilling Muds in Engineering Practice, Butterworths, London, 1963.
Jezequel, J. (1971), "Foundations Sur Pieux," Ecole National Des Ponts Et Chaussees, St. Quay-Portrieux, France 15-17, Juin, 1971.
Kefrisel, J.L. (1957), "Contributions a la Determination Experimentale des Refactions d'un Milieux Pulvdrulent sur une Foundation Profonde," Proceedings of the Fourth International Conference on Soil Mechanics and Foundation Engineering, Vol. 1, London, 1957.
Ke'risel, J.L. (1961), "Fondations Profondes enMilieuxSableux: Variation de la Force Portante Limite en Fonction de la Densite, de la Profondeur du diametre et de la Vitesse d'enforcement," Proceedings of the Fifth International Conference on Soil Mechanics and Foundation Engineering, Vol. 2, Paris, 1961.
Ke'risel, J.L. (1964), "Deep Foundations - Basic Experimental Facts," Proceedings, Conference on Deep Foundations, Mexican Society of Soil Mechanics, Vol. 1, Mexico City, 1964.
King, J.C. and Bush, E.G.W. (1961), "Grouting of Granular Materials," Symposium on Grouting, Journal of the Soil Mechanics and Foundations Division, ASCE, Vol. 87, No. SM2, April 1961.
Koizumi, Yasunori, et al., B.C.P. Corrunittee (1971), "Field Tests on Piles in Sand," Soils and Foundations, Vol. 11, No.2, Tokyo, June 1971.
Komornik, A., and Wiseman, G. (1967), "Experience with Large Diameter Castin-S i tu Pi ling," Proceedings 0 f the Third As ian Regional Conference on Soil Mechanics and Foundation Engineering, Jerusalem Academic Press, Jerusalem, 1967.
Ladanyi, B. (1961), Discussion in Proceedings of the Fifth International Conference on Soil Mechanics and Foundation Engineering, Paris, 1961.

Ladanyi, B. (1963), "Expansion of a Cavity in a Saturated Clay Medium," Journal of the Soil Mechanics and Foundation Division, ASCE, Vol. 89, No. SM4, July 1963.
215
Lambe, T.W. and Whitman, R.V. (1969), Soil Mechanics, Wiley, New York, 1969.
Mansur, C. 1. and Hunter, A.A. (1970), "Pile Tes ts-Arkansas River Project," Journal of Soil Mechanics and Foundation Division, ASCE, Vol. 96, SM5, September, 1970.
Martins, J.B. (1963), "Pile Load Tests on the Banks of the River Pungu~,' Proceedings of the Third Regional Conference for Africa on Soil Mechanics and Foundation Engineering, The Rhodesian Institution of Engineers, Salisbury, 1963.
Mazurkiewicz, B. K. (1968), "Skin Friction on Model Piles in Sand," Bulletin No. 25, Danish Geotechnical Institute, Copenhagen, 1968.
Meyerhof, G.G. (1951), "The Ultimate Bearing Capacity of Foundations," Geotechnigue, Vol. 2, No.4, London, December, 1951.
Meyerhof, G.G. (1956), "Penetration Tests and Bearing Capacity of Cohesionless Soils," Journal of the Soil Mechanics and Foundation Division, ASCE, Vol. 82, No. SM1, January, 1956.
Meyerhof, G.G. and Murdock, 1.J. (1953), "An Investigation of the Bearing Capacity of Some Bored and Driven Piles in London Clay," Geotechnique, Vol. 3, No.7, London, September, 1953.
Mindlin, R.D. (1936), "Force at a Point in the Interior of a Semi-Infinite Solid," Physics, Vol. 7, May, 1936.
Morgenstern, N.R. (1963), Discussion in Grouts and Drilling Muds in Engineering Practice, Butterworths, London, 1963.
Morgenstern, N.R. and Amir-Tahmassib, I. (1965), "The Stability of a Slurry Trench in Cohesionless Soils," Geotechnigue, Vol. 15, No.4, 1965.
Nash, J.K.T. and Jones, G.K. (1963), "The Support of Trenches Using Fluid Mud," Grouts and Drilling Muds, Butterworths, London, 1963.
Neville, A.M. (1963), Properties of Concrete, Wiley, New York, 1963.
Neville, A.M. (1971), Hardened Concrete: Physical and Mechanical Aspects, American Concrete Institue, 1971.
O'Neill, M.W. and Reese, L.C. (1970), Behavior of Axially Loaded Drilled Shafts in Beaumont Clay, Research Report 89-8, Center for Highway Research, The University of Texas at Austin, Austin, 1970.
216
Palmer, D.J. and Holland, G.R. (1966), "The Construction of Large Diameter Bored Piles with Particular Reference to London Clay," Proceedings of the Symposium on Large Bored Piles, Institution of Civil Engineers, London, February, 1966.
Parker, F., Jr. and Reese, L.C. (1970), Experimental and Analytical Studies of Behavior of Single Piles in Sand Under Lateral and Axial Loading, Research Report 117-2, Center for Highway Research, The University of Texas at Austin, Austin, 1970.
Peck, R.B., Hanson, W.E., and Thornburn, T.H. (1953), Foundation Engineering, Wiley, New York, 1953.
Perdue, G.W. and Coyle, H.M. (1970), In-Situ Measurements of Friction and Bearing Correlated with Instrumented Pile Tests, Report No. 125-4, Texas Transportation Institute, Texas A & M University, College Station, Texas, 1970.
Peurifoy, R.L. (1965), "Lateral Pressure of Concrete on Formwork," Civil Engineerin&, ASCE, December, 1965.
Polivka, M., White, L.P., and Cinaedingoer, J.P. (1957), "Field Experience with Chemical Grouting," Journal of the Soil Mechanics and Foundation Division, ASCE, Vol. 83, No. SM2, April, 1957.
Potyondy, J.G. (1961), "Skin Friction Between Various Soils and Construction Materials," Geotechnigue, Vol. 11, No.4, London, December, 1961.
Reese, L.C. (1964), "Load Vs. Settlement for an Axially Loaded Pile," Proceedings, Symposium on Central Building Research Institute, Vol. 2, 1964, Roorkee, India, 1964.
Reese, L.C., Brown, J.C., and Dalrymple, H.H. (1968), Instrumentation for Measurements of Lateral Earth Pressure in Drilled Shafts, Research Report 89-2, Center for Highway Research, The University of Texas at Austin, Austin, September, 1968.
Reese, L.C., O'Neill, M.W., and Smith, R.E. (1970), "Generalized Analysis of Pile Foundations," Journal of the Soil Mechanics and Foundations Division, ASCE, Vol. 96, No. SM1, January, 1970.
Reese, L.C. and Seed, H. R. (1955), "Pressure Distribution Along Friction Piles," Proceedings, American Society for Testing and Materials, Vol. 55, 1955, pp. 1156-1182.

Reese, L.C. and Touma, F.T. (1972), Load Test of Instrumented Drilled Shafts Constructed by the Slurry Displacement Method, Research Report Interagency Contract 108, Center for Highway Research, The University of Texas at Austin, Austin, 1972.
217
Robinsky, E.I. and Morrison, C.F. (1964), "Sand Displacement and Compaction Around Model Friction Piles," Canadian Geotechnical Journal, Vol. 1, No.2, March, 1964.
Sadlier, N.A. and Dominioni, G.C. (1963), "Underground Structured Concretc' Walls," Grouts and Drilling Muds in Engineering Practice, Butterworths, London, 1963.
Sarota, S. and Jennings, R.A. (1957), "Undis turbed Sampling Techniques for Sands and Very Soft Clays," Proceedings of the Fourth International Conference on Soil Mechanics and Foundation Engineering, Vol. 1, London, 1957.
Schneebeli, G. (1971), Les Parois Moul~es Dans Le Sol, Editions Eyrolles, Paris, 1971.
Schmertmann, J.H. (1967), "Static Cone Penetrometers for Soil Exploration," Civil Engineering, ASCE, 1967.
Schultze, E. and Meltzer, K.J. (1965), "The Determination of the Density and Modulus of Compressibility of Non-Cohesive Soils by Soundings," Proceedings of the Sixth International Conference on Soil Mechanics and Foundation Engineering, Vol. 1, Montreal, 1965.
Seed, H.B. and Lee, K.1. (1967), "Undrained Strength Characteristics of Cohesionless Soils," .Journal of the Soil Mechanics and Foundations Division, ASCE, SM6, November, 1967.
Sherard, J.1., Decker, R.S., and Ryker, N.1. (1972), "Piping in Earth Dams of Dispersive Clay," Proceedings of the Specialty Conference on Performance of Earth and Earth Suppo~ted Structures, Purdue University, 1972.
Taylor, D.W. (1948), Fundamentals of Soil Mechanics, Wiley, New York, 1948.
Terzaghi, K. V. (1936), "Stress Distribution in Dry and in Saturated Sand above a Yielding Trap-Door," Proceedings of the International Conference on Soil Mecbanics and Foundation Engineering, Vol. 1, No. 2-3, Harvard, 1936.
Terzaghi, K. (1943), Theoretical Soil Mechanics, Wiley, New York, 1943.
Terzaghi, K. and Peck, R.B. (1967), Soil Mechanics in Engineering Practice, Wiley, New York, 1967.

218
Troxell, G.E. and Davis, H. (1956), Composition and Properties of Concrete, McGraw-Hill, New York, 1956.
Veder, C. (1953), "Procede de Construction de Diaphragm Impermeables a Grande Profondeur au Moyen de Boues Thixotropiques," Proceedings of the Third International Conference on Soil Mechanics and Foundation Engineering, Vol. 3, Zurich, 1953.
Veder, C. (1963), Discussion in Grouts and Drilling Muds in Engineering P Butterworths, London, 1963.
Veder, C. and Kienberger, H. (1969), "Behavior of Concrete Poured Under Bentonite Suspensions," Proceedings of the Seventh International Conference on Soil Mechanics and Foundation Engineering, Mexico Ci ty, 1969.
Vesic, A. (1963), "Bearing Capacity of Deep Foundations in Sand," Highway Research Record No. 39, Highway Research Board, Washington, D.C., 1963.
VesiC, A. (1965), "Ultimate Loads and Settlements of Deep Foundations," Bearing Capacity and Settlement of Foundations, Proceedings of a Symposium held at Duke University, April 5-6, Durham, North Carolina, 1965.
VesiC, A. and Clough, W.G. (1968), "Behavior of Granular 11aterials Under High Stresses," Journal of Soil Mechanics and Foundation Engineering, ASCE, Vol. 94, No. SM3, May, 1968.
VesiC, A. (1970), "Tests on Instrumeted Piles, Ogeechee River Site, II Journal of the Soil Mechanics and Foundations Division, ASCE, Vol. 96, No. SM2, March, 1970.
VesiC, A. (1972), "Expansion of Cavities in Infinite Soil Mass," Journal of the Soil Mechanics and Foundations Division, ASCE, Vol. 98, No. SM3, March, 1972.
Vijayvergiya, V.N., Hudson, W.R., and Reese, L.C. (1969), Load Distribution for a Drilled Shaft in Clay Shale, Research Report 89-5, Center for Highway Research, The University of Texas at Austin, Austin, March, 1969.
Welch, R. and Reese, L.C. (1972), Lateral Load Behavior of Drilled Shafts, Research Report 89-10, Center for Highway Research, The University of Texas at Austin, Austin, 1972.
Westergaard, H.M. (1940), "Plastic State of Stress Around a Deep Well,1I Journal of the Boston Society of Civil Engineers, Vol. 27, No.1, Boston Society of Civil Engineers, Boston, 1940.

Whitaker, R. and Cooke, R.W. (1966), "An Investigation of the Shaft and Base Resistance of Large Bored Piles in London Clay," Proceedings of the Symposium on Large Bored Piles, Institution of Civil Engineers, London, February, 1966.
Wu, T.H. (1957), "Relative Density and Shear Strength of Sands," Journal of Soil Mechanics and Foundations Division, ASCE, Vol. 83, No. SM1, January, 1957.
219
York, Guy, P., Kennedy, Thomas, W., and Perry, Ervin, S. (1970), Experimental Investigation of Creep in Concrete Subjected to Mu1tiaxia1 Compressive Stresses and Elevated Temperatures, Research Report 2864-2 to Oak Ridge National Laboratories, Department of Civil Engineering, The University of Texas at Austin, Austin, June, 1970.

!!!!!!!!!!!!!!!!!!!"#$%!&'()!*)&+',)%!'-!$-.)-.$/-'++0!1+'-2!&'()!$-!.#)!/*$($-'+3!
44!5"6!7$1*'*0!8$($.$9'.$/-!")':!

APPENDIX

!!!!!!!!!!!!!!!!!!!"#$%!&'()!*)&+',)%!'-!$-.)-.$/-'++0!1+'-2!&'()!$-!.#)!/*$($-'+3!
44!5"6!7$1*'*0!8$($.$9'.$/-!")':!
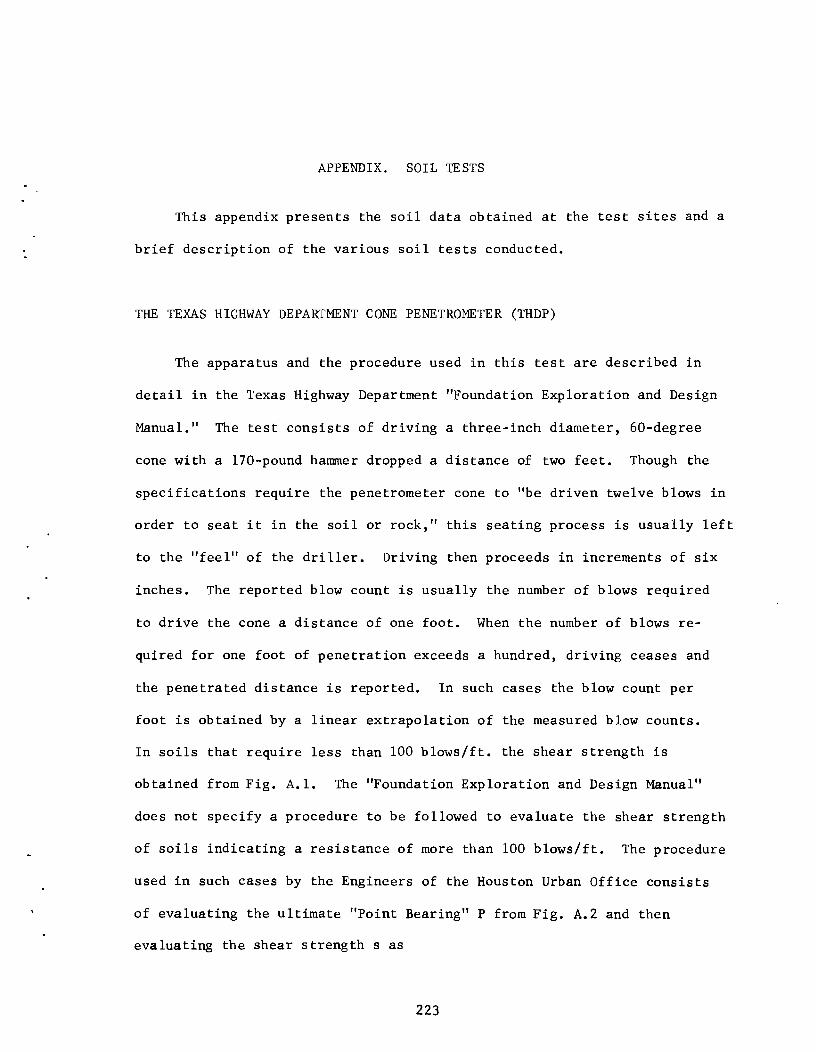
APPENDIX. SOIL TESTS
This appendix presents the soil data obtained at the test sites and a
brief description of the various soil tests conducted.
THE TEXAS HIGHWAY DEPARTMENT CONE PENETROMETER (THDP)
The apparatus and the procedure used in this test are described in
detail in the Texas Highway Department "Foundation Exploration and Design
Manual." The test consists of driving a three-inch diameter, 60-degree
cone with a l70-pound hammer dropped a distance of two feet. Though the
specifications require the penetrometer cone to "be driven twelve blows in
order to seat it in the soil or rock," this seating process is usually left
to the "feel" of the driller. Driving then proceeds in increments of six
inches. The reported blow count is usually the number of blows required
to drive the cone a distance of one foot. When the number of blows re
quired for one foot of penetration exceeds a hundred, driving ceases and
the penetrated distance is reported. In such cases the blow count per
foot is obtained by a linear extrapolation of the measured blow counts.
In soils that require less than 100 blows/ft. the shear strength is
obtained from Fig. A.I. The "Foundation Exploration and Design Manual"
does not specify a procedure to be followed to evaluate the shear strength
of soils indicating a resistance of more than 100 blows/ft. The procedure
used in such cases by the Engineers of the Houston Urban Office consists
of evaluating the ultimate "Point Bearing" P from Fig. A.2 and then
evaluating the shear strength s as
223

224
1.40
...... N 1.20 .: .... ..... ..
c {:. -i 1.00 -0
-= 01 C ~ ~
0.80 -(I) ... a ~ .s:.
(I)
N ::::: 0.60 .... 0 .. .. .., ... -(I) 0.40 c 01 .;; .., C
I (I)
0.20
o 20
/ Skin Friction~/
40 60 N - (Blows/ft.)
/ /
I
80
I /
/
I /
I
100
Fig. Al THD Cone Penetrometer Correlation to Shear Strength (THD Foundation Manual, 1964)
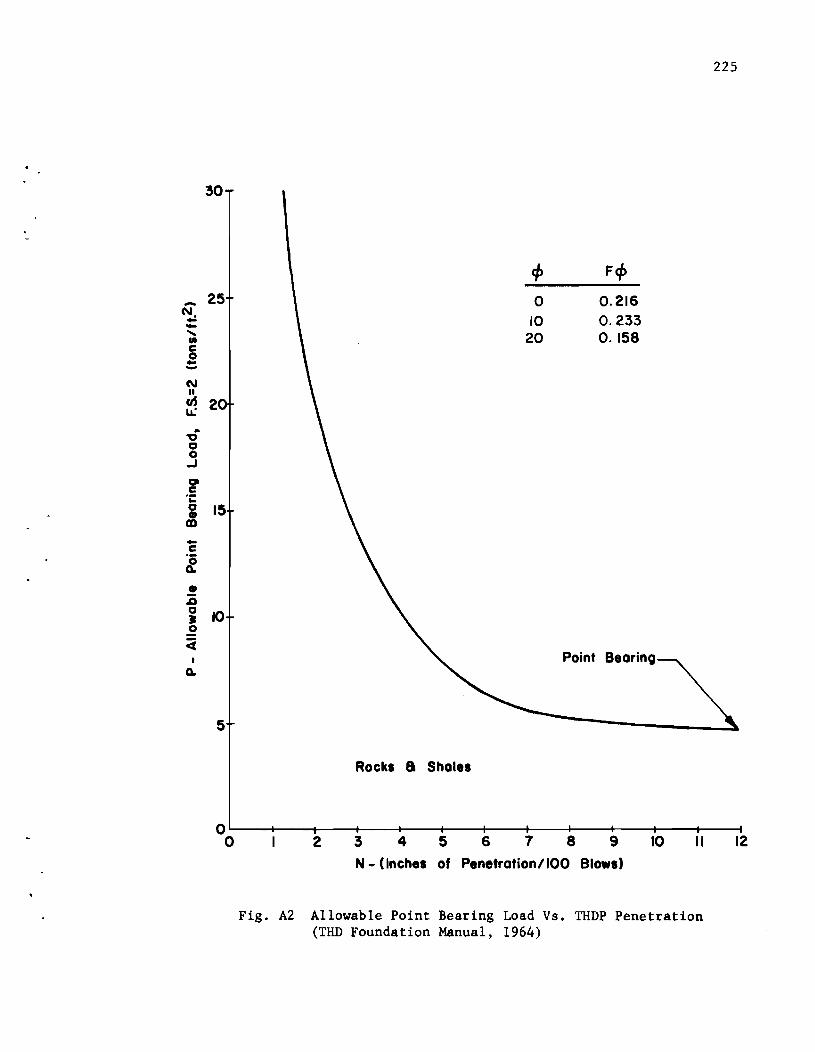
-N. --.... til c 0 -...... N II uS L!.: .. ~ 0 0
...J
01 C .;: 0 • CD -c ;f • ~ 0 • 0
<i I
Q.
225
30
e/> Fe/> 25 0 0.216
10 0.233 20 0.158
2
15
10
Point BeorinQ
5
Rocks 8 Sholes
OL---+---~--~--~---+--~--~~--~--+---~--~--~ o 2 3 4 5 6 7 8 9 10 II 12
N - (Inches of Penetration/IOO Blows)
Fig. A2 Allowable Point Bearing Load Vs. THDP Penetration (THD Foundation Manual, 1964)

226
s = p • F (¢)
where
F(¢) = a function of ¢ as given in Fig. A.2.
THE STANDARD PENETRATION TEST (SPT)
The apparatus and the procedure to be used in this test are specified
in ASTM Standards (D1586-67). In this study the Texas Highway Department
rotary drilling rigs, namely those of the Corpus Christi and Houston districts,
were used in conducting this test. The automatic tripping mechanism, the
driving rod, and the steel anvil used in the THDP test were used in running
the SPT. The drilling rod used is a three thread "N" rod (2 3/8" O.D.)
with a wall thickness of 0.281 inches. A l40-pound hammer was machined
from one of the l70-pound hammers used in the THDP. The split spoon was
provided by The University of Texas laboratories. The original spoon, shown
in Fig. A.3, had a standard cross section but had a length shorter than
the standard one. Tests at US59 and HH sites were run with that spoon.
For the tests on the Houston sites a ten-inch closed barrel section of the
same cross section as the spoon was added to bring the sampler to a
standard length.
The procedure used in running the test varied slightly between the
different sites depending on the penetrometer used and the soils encountered.
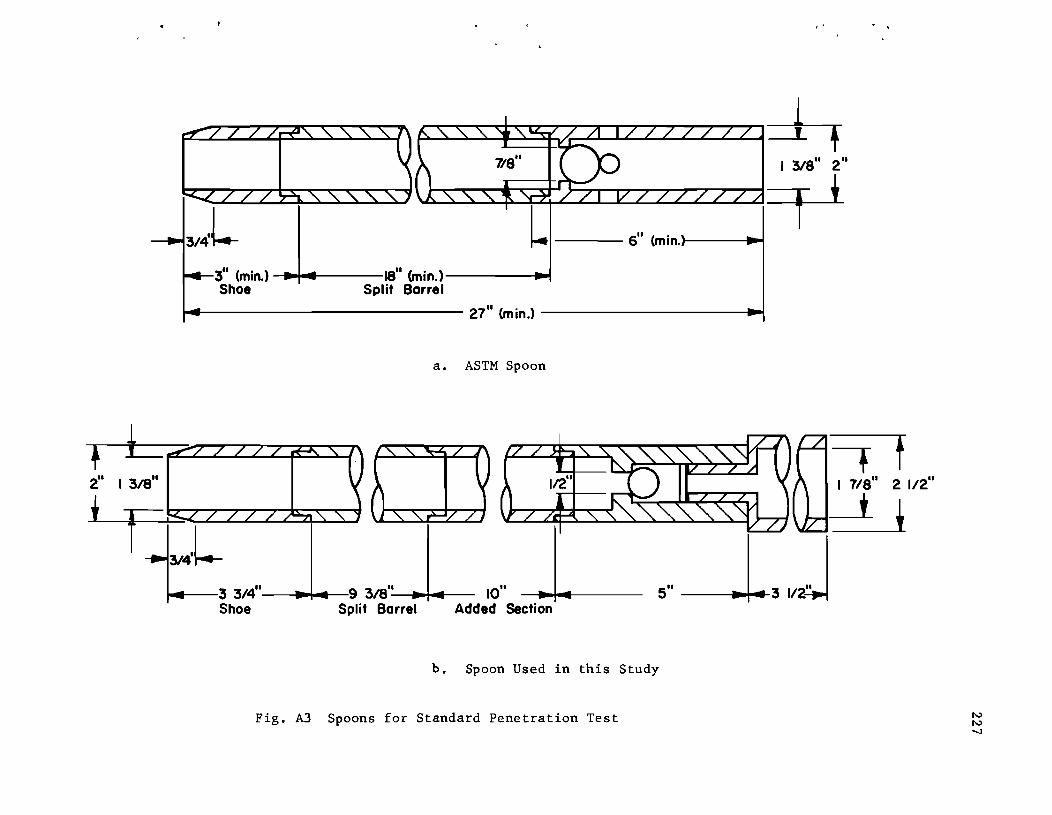
---- 6" (min.)----~
3" (min.) --... ...----18" (min.)------... Shoe Split Barrel
.... -------------- 27" (min.) -------------t~
a. ASTM Spoon
b. Spoon Used in this Study
Fig. A3 Spoons for Standard Penetration Test
, .
tt 2 1/2"
N N -...J

228
Live Oak County
The tested soils at these sites were above the water table. A four-inch
hole was first cored in the clay until the sand was encountered. Drilling
mud was then introduced and drilling was continued with a coring barrel by
a combined action of cutting and washing. It was in general possible to
core about six inches of soil at the test elevation to obtain a relatively
clean bottom.
The standard procedure requires that the spoon be driven in increments
of six inches a total distance of eighteen inches, and the number of blows
required for the last foot of penetration is reported as the penetration
resistance. The split spoon used at these sites had only a barrel length
of about fourteen inches and a total length of about eighteen inches. When
the eighteen-inch penetration was reached, the short length of the barrel
resulted in a driving of the "N" size drilling stem, and in a "jamming" of
the soil in the barrel. To eliminate the driving of the drilling stem, the
sampler was only seated four inches. However, jamming was still observed
on some of the tests. In certain cases, this problem is clearly indicated
by an excessive increase in the blow count needed for the last six inches
of penetration. However, this problem was not significantly experienced
in clay, and the blow count in sand was much larger than 50, so that the
increase in blow count due to jamming could not significantly influence
the interpretation of the data.
Harris County (Houston)
The depth of the water table in this area varied between fifteen and
thirty feet, and drilling mud was used from the beginning in drilling all
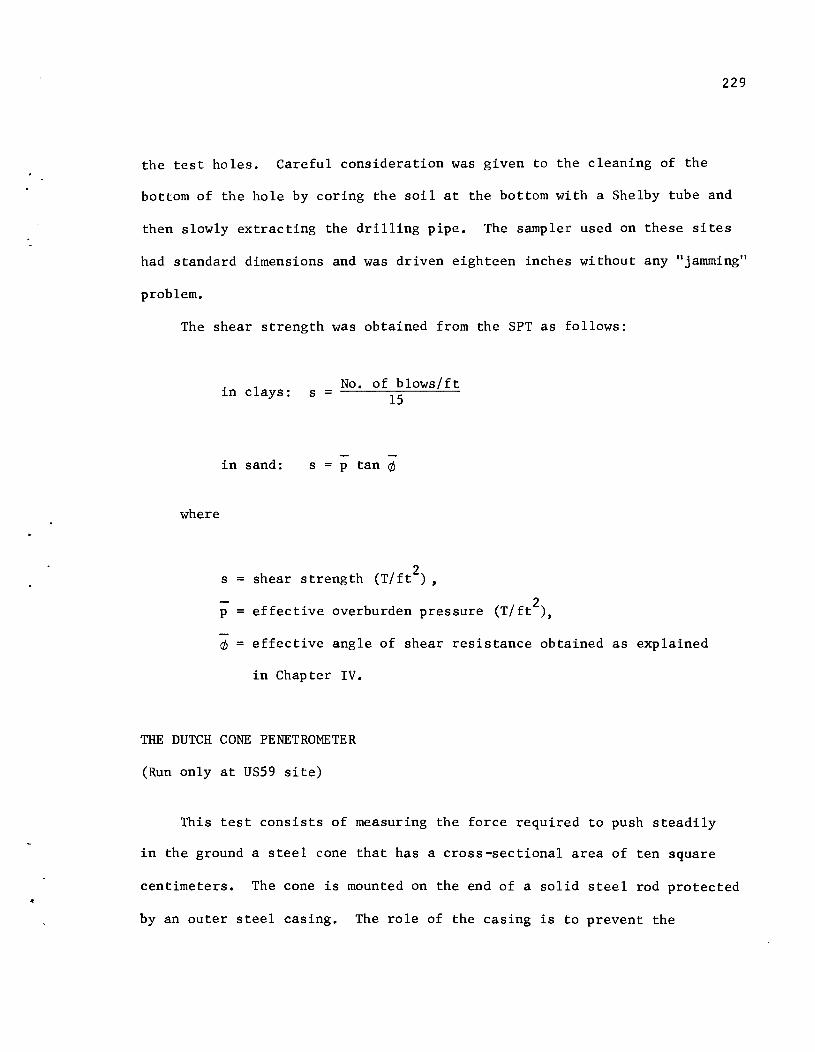
229
the test holes. Careful consideration was given to the cleaning of the
bottom of the hole by coring the soil at the bottom with a Shelby tube and
then slowly extracting the drilling pipe. The sampler used on these sites
had standard dimensions and was driven eighteen inches without any "jamming"
problem.
The shear strength was obtained from the SPT as follows:
where
in clays:
in sand:
s = No. of blows/ft 15
s = p tan ¢
2 s = shear strength (T/ ft ) ,
2 p = effective overburden pressure (T/ft ),
¢ = effective angle of shear resistance obtained as explained
in Chapter IV.
THE DUTCH CONE PENETROMETER
(Run only at US59 site)
This test consists of measuring the force required to push steadily
in the ground a steel cone that has a cross-sectional area of ten square
centimeters. The cone is mounted on the end of a solid steel rod protected
by an outer steel casing. The role of the casing is to prevent the

230
buckling of the inner rod and to allow it to displace with a minimum of friction.
The cone used in this investigation is equipped with a friction sleeve (Fig.
A.4) to allow the measurement of the skin friction. The ratio of the unit
sleeve friction to the unit point bearing is an indicator of the type of
soil penetrated (Schmertmann, 1967). The cone penetrometer and the rods
were provided by the laboratory of The University of Texas. The drilling
rig of the Texas Highway Department was used to run the test because the
standard equipment used to drive the cone was not available. The procedure
followed consisted of opening a four-inch hole in the ground to a desired
elevation, inserting the rods in the hole and using a ten-ton jack to
force the cone and the rods at least two feet below the bottom of the hole.
The reaction for jacking was provided by the drilling truck. The rods were
restrained horizontally near the surface by a wooden block inserted in the
collar of the mud reservoir, Fig. A.4. The force required to push the cone
at the test elevation was measured with a calibrated load cell, connected
to the jack. The displacement of the inner rod with respect to the outer
casing was measured with a Linear Variable Differential Transformer. Measure
ments of the load and the displacement were recorded on an x-y plotter.
When the truck reaction was insufficient, the hole was advanced further and
testing continued. Penetration became impossible in the sand at twenty
feet and the testing was discontinued. The measurements taken in the sand
were not very meaningful and are not presented here.

231
Kelly
Jack Wood Bloc
3.0"
6.0" Mud Reservoir
I 30" ~
Dutch Cone
a. Dutch Cone Penetrometer
Kelly
Bridge 2
Drilling Rod
Bridge I
2 Detail A
b. Texas A & M Penetrometer
Fig. A4 Static Penetrometers

232
THE TEXAS A & M PENETROMETER
(Run only at US59 site)
This test consists of steadily pushing in the ground an instrumented
steel cylinder (Perdue and Coyle, 1970) which measures separately the tip
and the side resistance. The penetrometer developed at Texas A & M Uni
versity was slightly modified for the purposes of this study. The penetrom
eter consists (Fig. A.4) of a closed section of a drilling "N" rod, equipped
with two full bridges of strain gages. One of the bridges was located near
the tip of the penetrometer to enable measurements of the tip reaction, while
the other bridge was located eleven inches above the first one and permitted
the measurement of the load transferred by side friction in the distance
between the gages. A third load cell, made also from a piece of drilling
pipe, was used at the ground surface to monitor the total load applied.
The test proceeded by drilling a four-inch hole to a certain desired depth.
The penetrometer was placed in the hole and pushed for a distance of one
foot below the bottom of the hole. The surface load cell, connected to an
x-y plotter, was then monitored as penetration was further continued.
When the applied load became relatively steady, the lower load cells were
read with a Budd strain indicator. The penetrometer could not be pushed
at all in the sand layers. The data obtained in the clay are not thought to
be reliable and are not reported here.
233
LABORATORY TESTS
Triaxial tests were run on clay samples recovered with a thin-wall
Shelby tube. The samples were extruded in the field, wrapped in aluminum
foil and sealed with wax. The samples from the Houston sites were further
preserved in cylindrical "ice cream" cans. All samples were stored in a
100 percent moisture room until they were tested. The triaxial test run at
the laboratories of The University of Texas is described by O'Neill and
Reese (1970). The test consisted of trimming the soil samples to a diameter
of 1.4 inches and to a height of about three inches. Then the specimens
were tested at a constant rate of strain in a triaxial testing machine.
The confining pressure used in the test is equal to the total overburden
pressure applied on the sample in the field. Samples from Live Oak County
sites were quite sandy, and could not be conveniently trimmed. All those
samples were, therefore, tested as extracted, with diameters of three or
four inches.
A transmatic triaxial test, used by the Houston Urban office, has been
conducted on the clay samples of the Houston sites. The test is described
by O'Neill and Reese (1970), and the evaluation of the shear strength
from this test is described by Reese and Touma (1972).
Routine laboratory tests, such as the measurements of moisture content,
total density, and Atterberg limits, were further conducted on the soil
samples. The moisture contents of the sandy soils of Live Oak County
were measured on samples taken from the auger during the drilling of the
test shafts. The samples preserved in moisture cans were weighed in the
field and were later oven dried in the University laboratories.

234
Mechanical sieve analysis was run on all the sand samples from
the split spoon barrel or from the drilling auger. The samples were carefully
washed on the sieves to measure accurately the content of fines. A hydrometer
analysis was run on the clayey silty sands of the Live Oak County sites to
determine the relative percentages of each grain size.
DRILLING LOG REPORTS AND SOIL TEST RESULTS
Figure A.S shows plans of the test sites and the locations of the test
boreholes. The drilling log reports are not presented here because it is
believed that the important information can be more explicitly presented
in diagrammatic charts. Figures A.6 to A.27 represent the pertinent soil
data.
(Last page of text)

II ~
• H-I 1/ ~"I
:-..Cli
L~ Left Lanes 1-37 t<'
WI
Sta. 892 + 00 / -~ - I
/ I
/
o • = Borehole
• Anchor Shaft
o = Test Shaft
bet. Left Main Lane 1-37
Sto. 775 + 00 ----
8. US59 Site
N b. HH Site
Fig. AS Location of Test Shafts and Boreholes
235
(Continued)
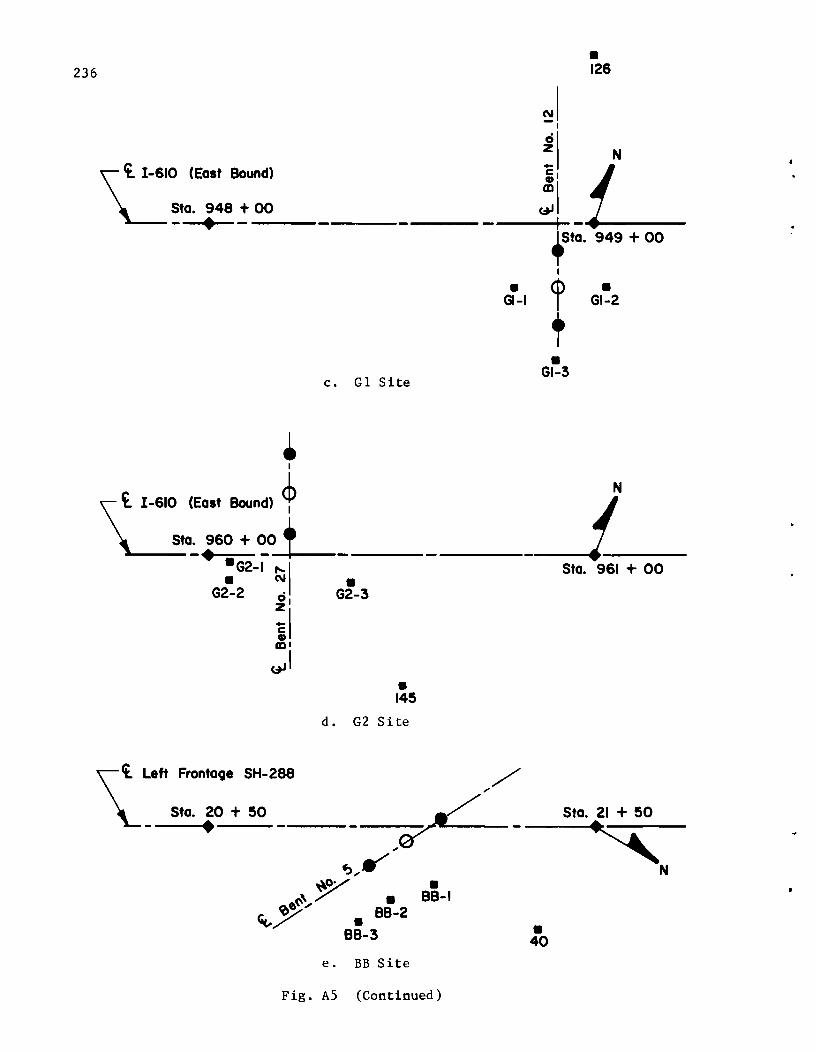
236
\:
1-610 (East Bound)
Sta. 948 + 00 -. ---
I
c. G 1 Site
• GI-I
• GI-3
• 126
N '\ ~ 1-610 (E.s' Bound) ~ ~:ro + ~~-----
·G2-1 ~I ------1-• C\I •
G2-2 0 G2-3 Zl
il rDl
~I • 145
d. G2 Site
/'
~Left Frontage SH-288
Sta. 20 + 50 - .--- -----~-
, f),....-~o:/ •
~ /' • BB-I e~;I' <ac..7 • BB-2 88-3
e. BB Site
Fig. AS (Continued)
• 40
Sta. 961 + 00
Sta. 21 + 50
~N
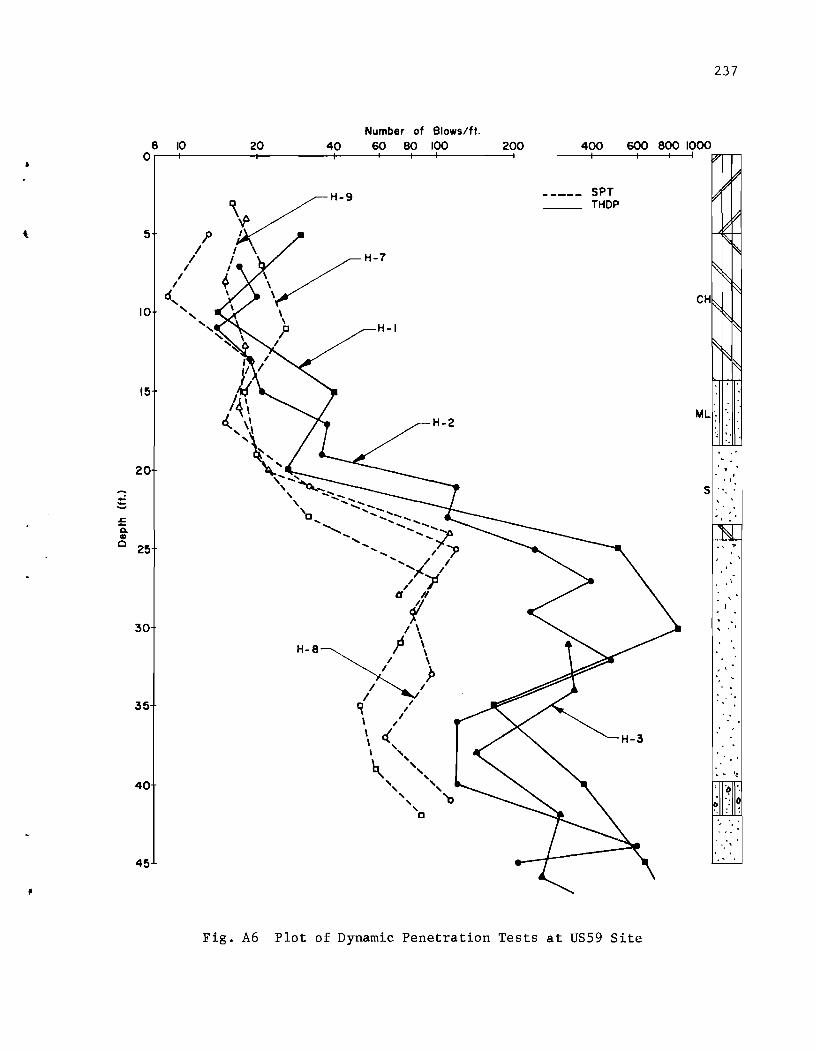
--:::; ~
ii III 0
,
237
20 40 Number of Blows/ft.
60 80 100 400 8 10 Or-~--------~--------~----~--~-+--------~--------~----~--~~
200 600 800 1000
5
10
15
20
25
30
35
40
45
I;. \ " \ &.. \'
H-I
"\, \.':. ,
" -"'0,..... , ............. ...... , .................. ...... , .................. ...... D ........... ...... ..... ...... ........... ......
........... ..... ... ...... 'P ...... , ............ ,,~
................. / "p ...... / / )t./ / )i
tJ /I
f I \
H-8~,P \ / \ / P
I / I , ~ ,
\ / \ r{ \ , \ , ~ "" , , , ,
" '0 , o
SPT THDP
Fig. A6 plot of Dynamic Penetration Tests at US59 Site
!.:, '.
, '\
5 ", : , . , ' ,
.. .,.
· . , "
, .
' ..
· " · .
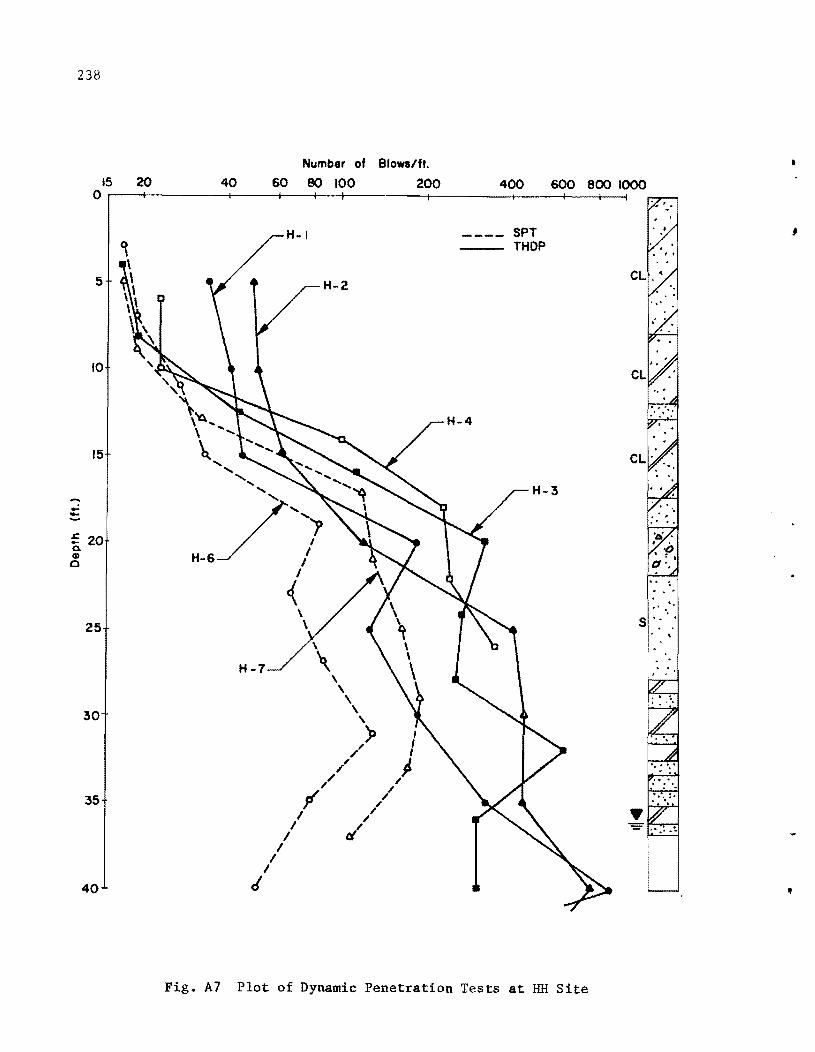
238
Number of Blows/ft.
15 20 40 60 eo 100 200 400 600 eoo 1000 o r---+---------+-----~--~_+---------_+--------~----~--~~
..: -~
5
10
15
= 20 a. CD o
25
30
35
40
Fig. A7
H-I
; ; ,
; ;
t/
, # I
~ ;
SPT THDP
Plot of Dynamic Penetration Tests at HH Site
... , ... '"
S ': .' . ,
•
J
•
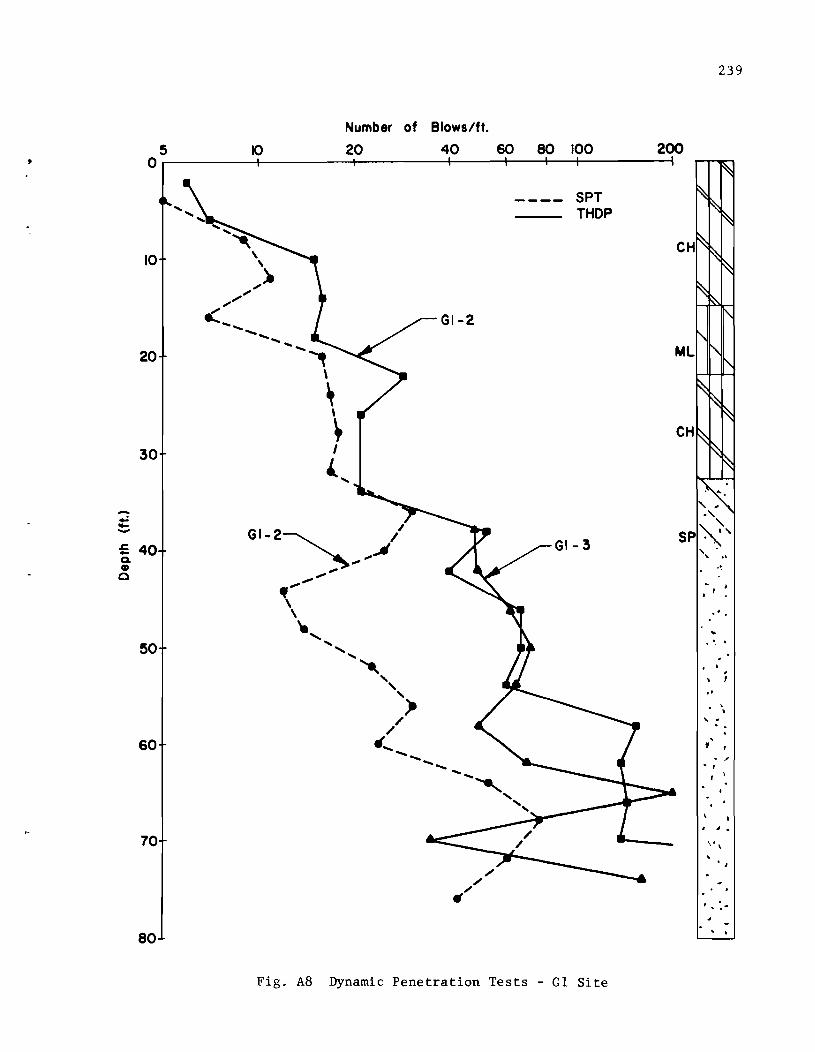
70
80
Fig, A8 Dynamic Penetration Tests - Gl Site
239
• J.
• I
~ .. , . , ,.
, .

240
Number of Blows/ft. 4 6 8 10 20 40 60 80 100 200 • 0 I I I
SPT THDP
10
\ \
20 )t ",,'"
'" ~
,. , , , ....
30 .... ... ...
'" J I
) " /
40 fI - \ ..:
G2_'/'\, ::;,
..e Q. II)
0
50 "" "" "" <. ... ........ ...
,. ",,'"
"')e
"" 60 < , ,
" \ \
70 ....... . .~ ...
.' , """'- .... ,
S.:. :. " -:::. -------80
90
Fig. A9 Dynamic Penetration Tests - G2 Site

.-...: ~
.s:: -0. CD 0
Number of Blows/ft. 10 20 40 60 80 100 200 400 600 800 O.-------~~------~~--~--~--~--------~--------~----~~
10
20
30
40
50
60
70
BB-3
BB-I~ ,/ -,./
,," ,." " , ......
..........
"" ",,""
",,'>
-=-----------.
SPT THDP
Fig. AlO Dynamic Penetration Tests - BE Site
B8-2
241
, . S . "
.. '
- .. '
. ;
.. .
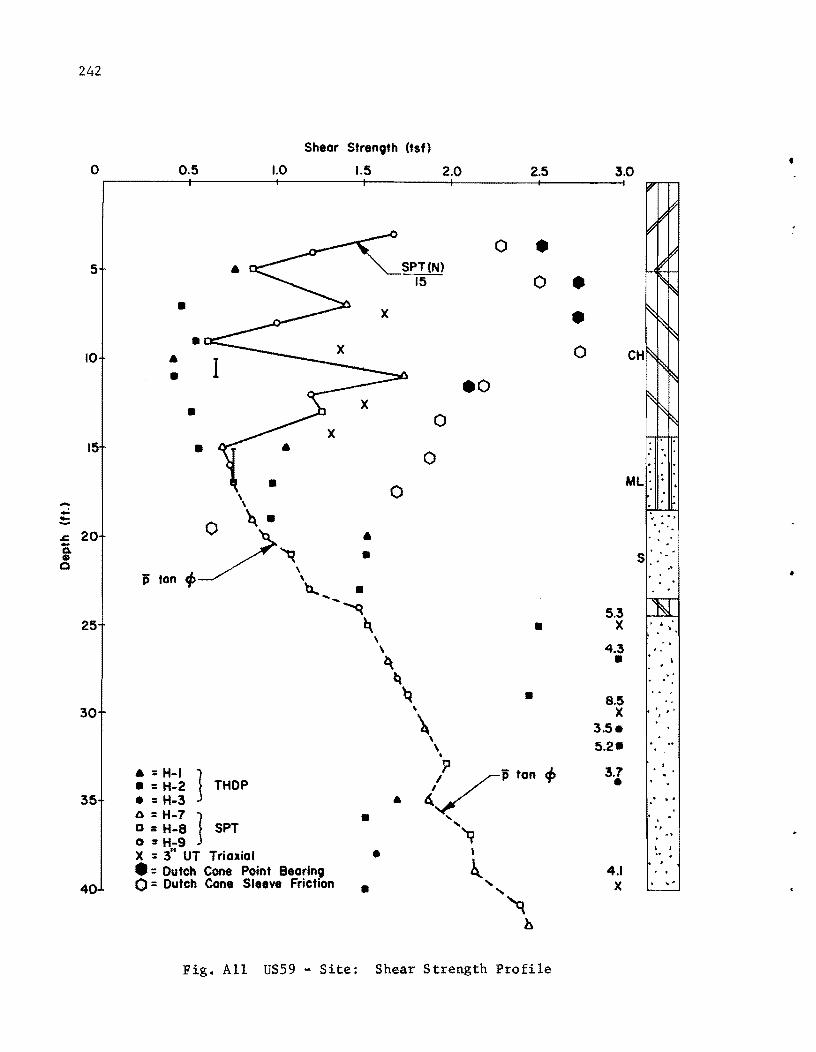
242
Shear Strength (tst) • o 0.5 1.0 1.5 2.0 2.5 3.0
0 • 5
0 • • • • 10 6 0
• .0
• 0
• 0 . ML· ~
\ .- \ ...: o ~. -.... .c 20
4>/~\ 6 -0. • • 0
p tan b... • .......
'q 25 h. •
· . . , · '. · ·
S · · · .> • · · . 5.3
X . . · \. \ \ 4.3 l\ • ~ q • 8.5
30 \
\ X · , . ,
3.5. \ \
. 5.2. ..
• 6 = H-I
1 ? - t 4>
• = H-2 THDP i/o•
n
35 • = H-3 • o = H-7 } • "-D :: H-8 SPT " o :: H-9 'q X = 3" UT Triaxial • , • = Dutch Cone Point Bearing ~
40 o = Dutch Cone Sleeve Friction • .... ....
3.7 J . •
, · · . · . "
I I
4.1 X · ~.
'q h
Fig. All US59 - Site: Shear Strength Profile
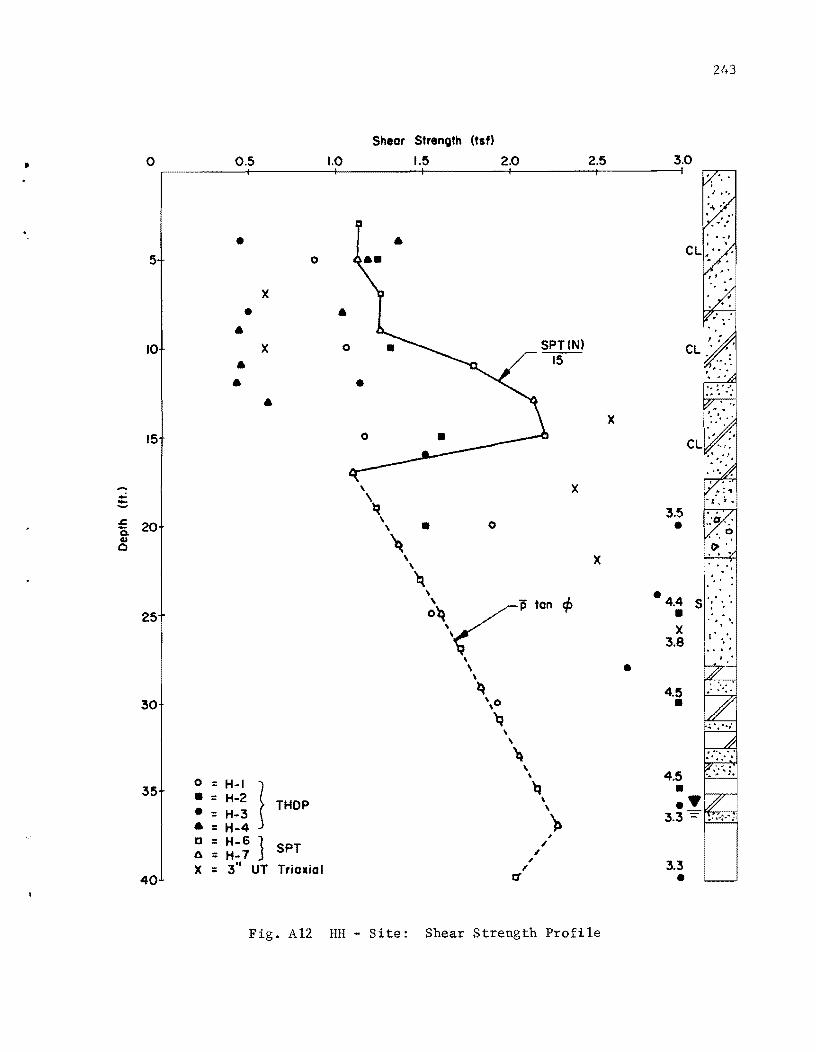
243
Shear Strenoth (tsf)
• o 1.5 2.0 2.5 .-------~--------_+--------~--------;_--------+_------_4
0.5 1.0 3.0
• 5 0
X
• &
&
10 X &
&
&
X
15
\ X ..: \ .:t; ~
.c \ 3.5 - 20 \ • 0 • 0-
G.I '&\ 0 \ X \ ... ~
, '. ~ ..
\
• 4.4 ~\~jjton ¢ S·,'· '. 25 • .. .. . .
X " .:. 3.8 ••• I
\ \ • \
~ 4.5 30 \0 •
'q \
\
\ \
0 H-I \
=
1 'q 35 • = H-2 THDP \
• H-3 \ = ~ & :: H-4
D :: H-6 J , SPT " ~ :: H-7 "
3" UT ~ 3.3 X :: Triaxial ,
40 r:I •
Fig. A12 HH - Site: Shear Strength Profile

244
-.s::. -a. Q)
Cl
o 0.5 1.0
s (TSF)
1.5 2.5 2.0 O~--~------------~--------~--------~---r--~
10
20
30
40
50
60
70
80
90
<> <>
0-- -0 Tronsmotic
• --. TH 0 Penetrometer
o 0 SPT
<>- --<> Pocket Penetrometer
A •• UT Triaxial
<> <>
<>
<> <> <> <>
<>
<> f
~ a:: ... Q) -Q)
E 0 ... -Q)
c Q)
a.
Q) .Jt;
u o a. -o
E
Fig. AI3 GI - Site: Shear Strength Profile
•• ', of,
" •• r
:." .. , • '0 • · ',' . · . '.' ,0'
.' ..... :. ' ..
• I ...
· . ", ". ," ", .. . ' .. I' ..•.• I' • ,-
0 ..... . ' .. " ," I •• . ' . .. '.
" . ••• I · , . ... '. '.
:" : .. .' • I"
.' -" . -I. : \
.: .. . · ... ~ " " '. " · " ~ -. .~ ... ,'
,
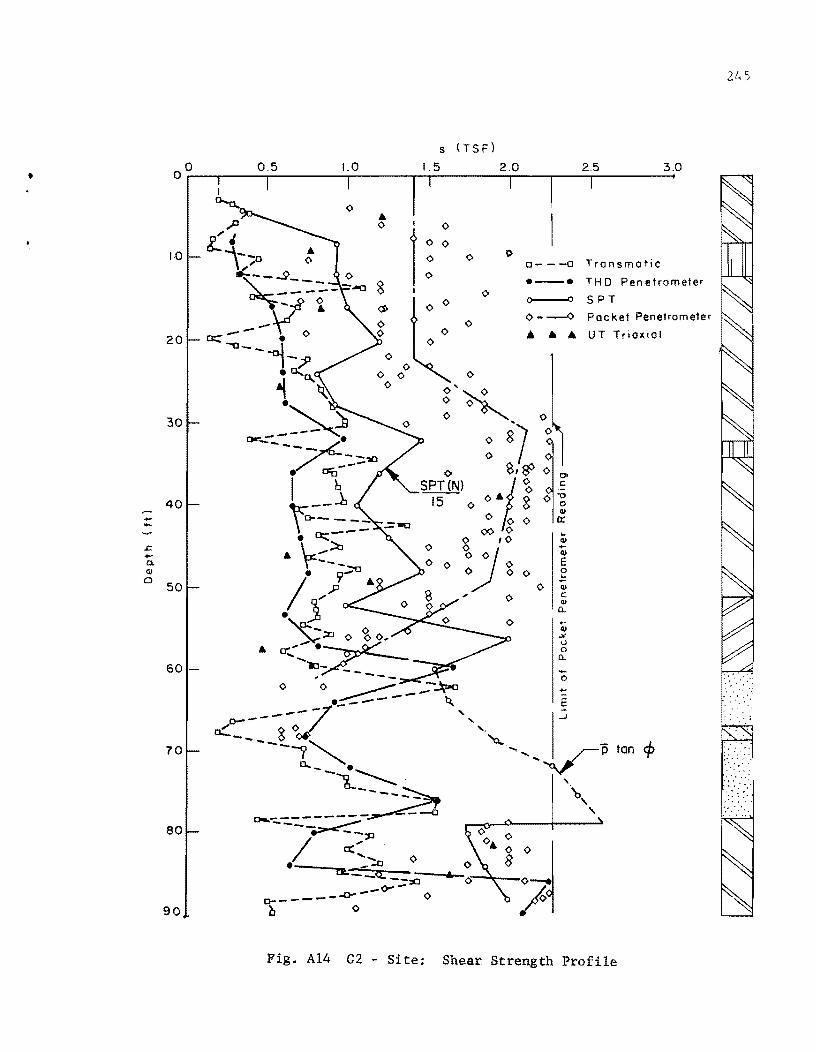
•
.---.t:: -a. <II
0
s (TSF)
00~~ ____ ~0~.5~ ______ ,1.~0 ______ ~lr·5~ ______ ~ __ -r ___ 2_·r5 ______ ~3.0
1.0
20
30
40
50
60
70
80
90
• o I 0
100
~ o 0
I)
0- --0 .--. Transmatic
TH 0 Pen etrometer
O_---<JO S P T
0--0 Pocket Penetrometer
... • • UT Triaxial
... Q.I .... Q.I
E 0 .::
0 (\/
c: <l)
0..
+-(\/ oX '-' 0
0..
-o .... E
tan ¢
Fig. A14 G2 - Site: Shear Strength Profile
245
:.: '.:'

246
--L:.
0. CI)
Q
s (TS F )
o 0.5 1.0 1.5 2.0 2.5 3.0 Or--------.--------.--------.--------~------~~----~~·
Q ~ 10
20
30
40
50
60
70
80
90
o
.,,0---- ---"¢.---0--1 'g ° °b
o
i • ct:'".:- - - \- --a
""'0-.-... ..... -11 .....
n/--r ......... """"o- __ : : I SPT(N)
15 .~ -0.. -':--'"'0 0
7 -:.: : =--=- 0 {o ':::"":10 _- 0 • 0::-..0-- 0
~----~ 1 0=-'::'-:'" _ _ <> ----.;: ...... -:..----- 7
~~. ..----.. ,
\ '1 "
\ .... , e___ ,,~ 7 ~~C7
... /\"i p ton ~J \~ e
. -------" .... ..""..--
V '\
~. '0 o CI)
0- - -0 Tronsmotic
e-e THO Penetrometer
;0:: .JIt: ... OCl) 0-0.11) o 0 SPT
0----<> Pocket Penetrometer
••• UT Triaxial
_E o~ :~; E c:
• _ CI)
.JQ.
Fig. Al5 BB - Site: Shear Strength Profile
.. 3.6 --too
.. 4.8 -+
.: .,' ", :.',: ::: :/:':: · •• ~ '0 ", : .' t • ~ • "
· f:' . ... '. · ; .... ,' · . .' .. • ',f. .. , ....
'.:',t.'
' ... :~ " . , # .:" .~'" · '. " ' ........ .
· . #:"~ ', .. '" .
.' • " * 0' • ,':-.", ':
<\'::: · ",." · ~ ~ ... . .' '" \ .
.. . .;~ ..~ ...
# : · .. . " ". .. ' .. ''\
:. \-. ; -.. · " · " .. -. ~
.... , ~ t t .. lo ..
· .. ;:~ .: ~." .'"
•
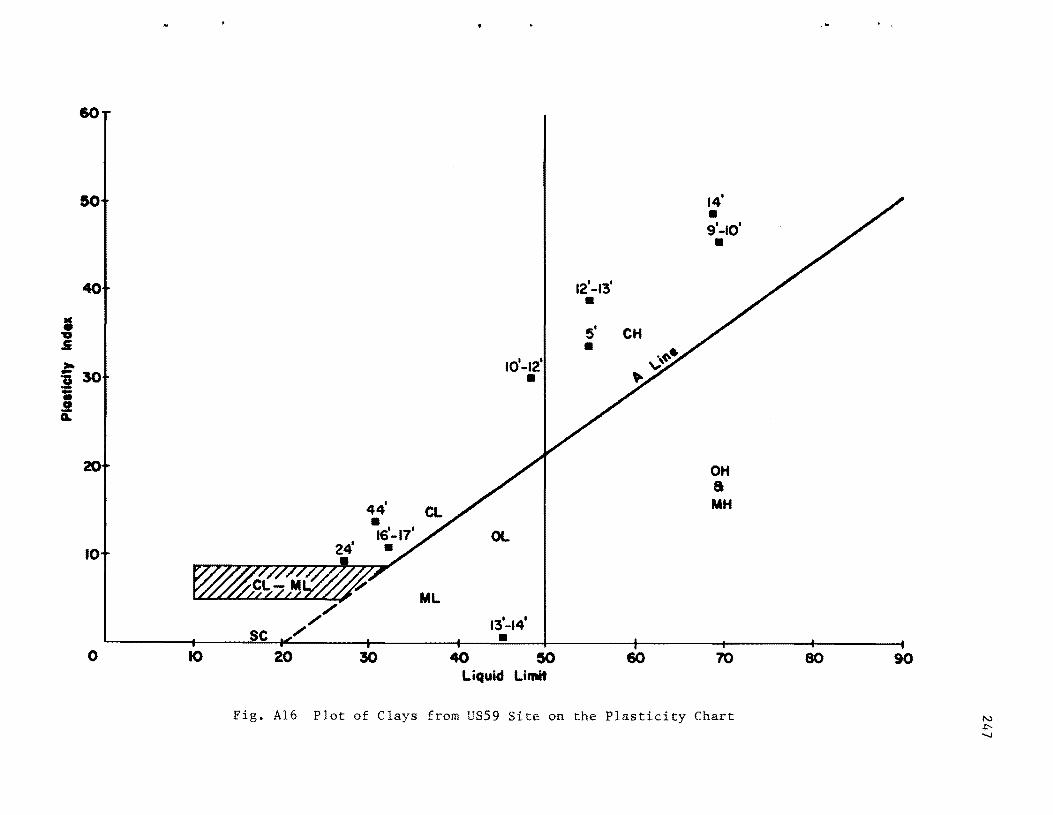
,- . \
60
14' • 9'-10' •
40 12'-13' •
I 5' CH " .s • :Il1o> 10'-12' -30 • :§ 1i E
20 OH a MH
OL 10
ML ./
"" 13'-14' SC "" •
0 10 20 30 40 50 60 70 80 90 Liquid Limit
Fig. A16 Plot of Clays from US59 Site on the Plasticity Chart IV .I:--...J

60
50
to
o 10
20' • OH 13'
II' • a 10' MH
6t:. ., 12' .4 OL
9'·
ML ,/
,/ ,/
20 30 40 50 60 70 Liquid Limit
Fig. Al7 plot of Plastic Soils from HH Site on the Plasticity Chart
80
'.
90
N ~ co

60
50
40
I "V .s Joo -30 U :;: • 0 i:
20
10
o 10
./ /
S / 20 30
at..
Liquid Limit
eH
60
Fig. AlB Plot of Clays from Gl Site on Plasticity Chart
28'-29-
24'-25' 11"-12" • • 6"-7' -
32'-33' •
OH a MH
70 80 90
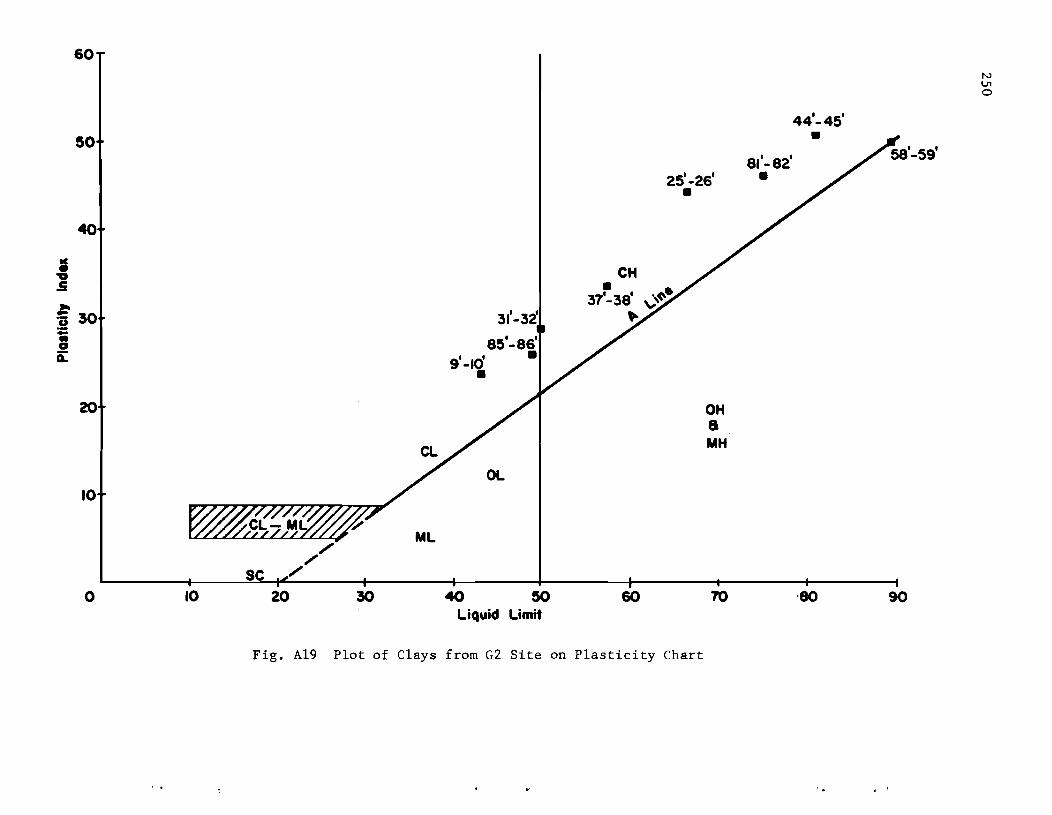
60
50
40
IC • 'V .s
€30 ;: • G iL
20
10
ML ./
,/
S ,/
0 10 20 30
Fig. A19 Plot of Clays
g'-IO' •
OL
40 &0 Liquid Limit
from G2 Site
CH
25'-26' •
• 37'-38' \,,~. ..
OH a MH
60 70
on Plasticity Chart
81'-82' •
44'-45'
•
,80 90
N VI o

60
10
o 10
y
5'-6' . , . 19'-20' .23-24 • CL
ilL
20 30 40
9'-10' •
OL
Liquid Limit
eH
60
Fig. A20 Plot of Clays from BB Site on Plasticity Chart
OH a IIH
70 80 90

SIEVE SllES - U.S. STAIDAID - IQUIP OPEII18S 01 t IICH , LAIeEI
% 10 Silt !
I-- L 80 I--- 5'-14' 50 20 30 i ~
% Clay Sand
1--14' -19' - Intermittent Layers of --t--+--t'"*~~"OF 70 r--- Silt, Sand, and Clay :~
! I fVI
~.~ - .... 0
~~=-3 ;---~~ _ _+~ __ -+--+--r-+-;20 .... ·':\1'-39'
_+;---t-r---+---;--t--r-r--+-+1--+-~~30: I -c
: IJO t; ~-r--+-~--~~----r~--t-+-~~~-r-+~ _
--:l1o-f'-"-- 2 5 I - 3 1 I ... • 50 ~
+;--------~-+-i-+~----~~~~~ E -~-~_+----+_----~-+--r-r-+_+_~~~~
! --r+--+-r---_+-------t-+-~~~-r_+--+__+_~70
!
20 I-----i~+__+++-+ 39' -44 ' :
g
CIa, Silt
Soli
PARTICLE SIZE - DIAMETER II MILLIMETERS
Fine Sand Coars.
Blnd.r Sand
Fig. A2l Granulometry of Soil at US59 Site
Coarse Aaareaate
N VI N
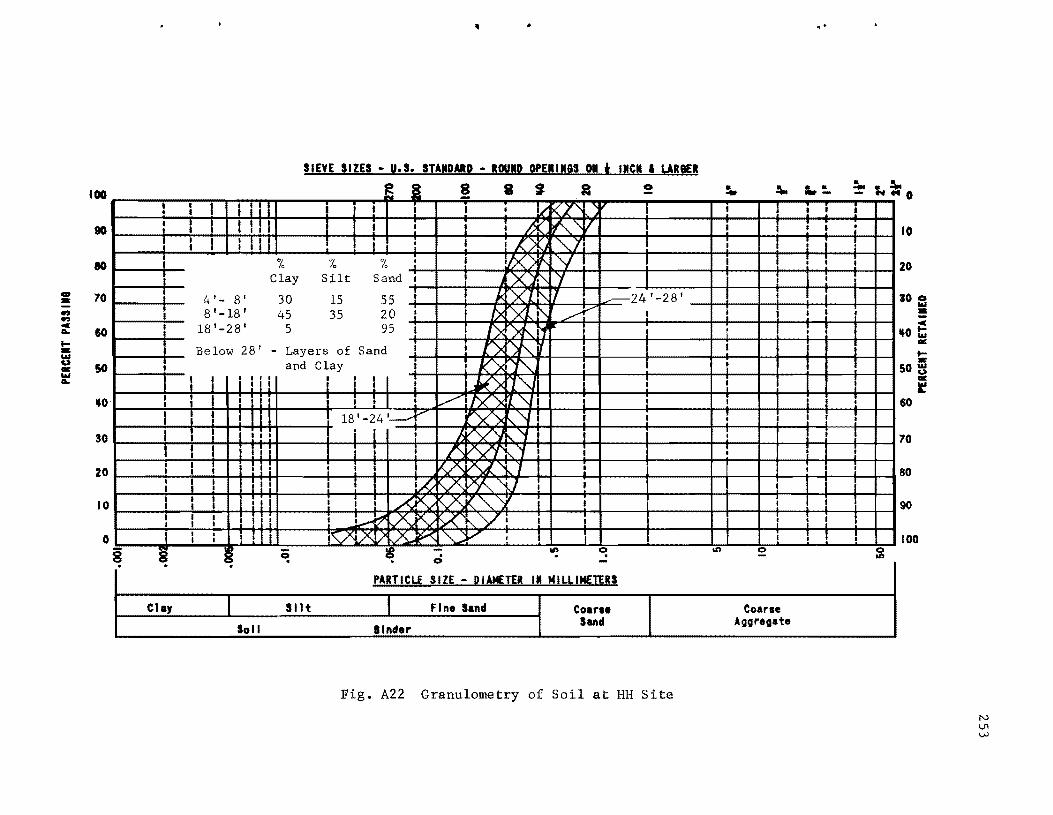
100 , t • I
80 • ; ;
80
CD 70 !! ., .., I c
10 A-I I
t--"" Co) 50 -"" A-
I I
I ... 0 I I
I I
I I 30 I !
I ! I
20 I I I
10 I I I I
0 I 8 8
CIa,
"
SIEYE SllES - U.S. STAIDAID - !OVIP QPEII18S 01 t IICH I LARQE!
~ I 8 a s iii 2 -I III I I t I I I 1./ K2'" I I III I I I I ~ Pf'....." / I I III • I I/:.. j "-..1
% % % • I If)('" '" Y Clay Silt Sand I X ~" Y
4'- 8' 30 15 55 I J< X If', II ~24'-28' 8'-18' 45 35 20 1 b< "Xl i\ /
;.---I
18'-28' 5 95 I I f>< ")f,J1 I I Below 28' - Layers of Sand I I ()< """ i
I i" • ! II I I ; I I
t I III I
I I I I
I I Iii I I t I :
I I I t I
I : I I I I i I I I .
I II i I
c~
Soli
and Clay I I K>.
""'" !
• I I I V>< 1"- ! ! I I
I I I ~ VI/)(')< 'L" I i 18'-24'-1 ~ '\ !
I I I I !J ~ "I I
I I f'; '()('f ,/1 I
f I I I 0 N" J I
I I 'h \)<\ ~ " J I I
! I I A ?\I ~ K"-..'\ I I
I 1-l' ~ Kt Y( ~yl I I
iYiLS V X ~ "- V , I i ~ g - 1ft ~ ,.; . . -
PUTICU SIZE - DIAMETER II MILLIMETERS
Sltt
Binder
Fin. Sand Coar •• Sand
T I
I
I
Fig. A22 Granulometry of Soil at HH Site
oil
• .. "" I
I
I
I
! : , I
I I
I I
• :
• I
I
I
I
I
I
I
I
• I
0 -
Coane Aggregate
..
• • --• I
i I
i : I
i I
I
I I
; i
I I I i
I
; I I
I
I I
I !
• -:!'! I
•
I
I
~ I
• ; I
I
I
; I t
• "" ... " o
0 oil
10
20
30 : -c ... 0 t;
GO:
t--50 ~ -r 60
70
80
90
100
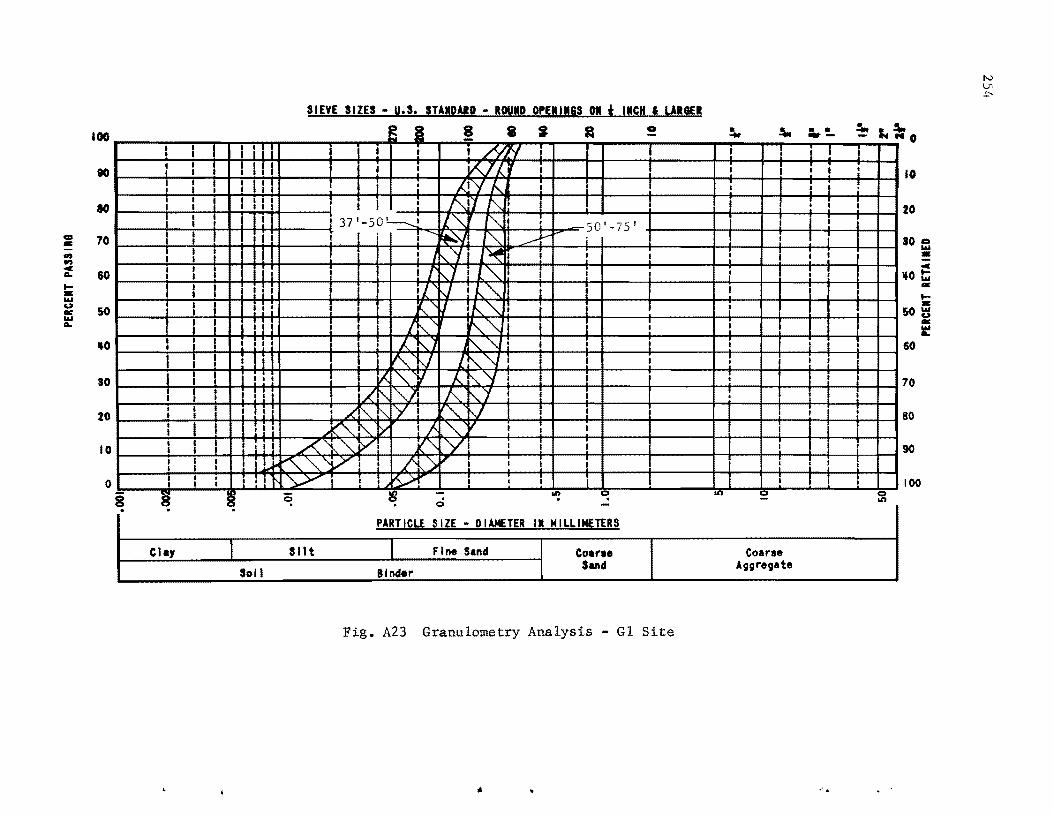
100 f I t I I •
90 : ! I I I I I I I I I
I i I I III I I
10 ~ I I I I I I I I I
I I I I CP 70 .: I I I
." .., l ! I c
60 a.. I I I, I ~ .: 1&.1 u
50 II: 1&.1 a..
I I I 1'1 ; I ! · 1 I I I ; I I
... 0 I I I II I I
I I I I i I I
30 I I I I: :
; I I 11 j I 20
I I I I I I 1 I I I
I I I • I I I I
10 I I I : I I I I I I I IJ.,. I I I
0 I I • I I I I I
8 § c~
Clay
Soil
SIEYE SIZES - U.S. STAID'" - ROUID OPEIlias 01 t IICH , LARGER ~ I 8 i S 2 -
• I , /Y) "('f ; I ! Wt.. 'I I
: I.fY"- i
I I I : Af1 "'-, I
I 37 '-50 '--......1 ! l ""- ~I : 50'-75' I I ; ......
~'" ""- /. i , , I ",,,{ ~I I : I If '" 1 I ""-, i i
I Ii V I ""-I I i I I I ~" 'I ."-. '" : ! I I r\.. "'-'" I I A r\..J "". • I
~ ~ [' "-."JI I i I f, ""-V "- , "/ I I
~ "- VI A. ,1 I ! I
• ~~"-. \. yl
"'" V I I
~ i'\.. >' If. ",,-I I l I
/" ""-V, V" yl I i I
~ '" "-VI I ./' )~ I I t I
~ I I r5..> I I I
g - ID ~ 0 0 . . -PARTICLE SIZE - DIAMETER II MILLIMETERS
Sl1t
Binder
Fine Sand Coa,.e Sand
0 -
I
I
I
I
I
1
Fig. A23 Granulometry Analysis - Gl Site
!tot ~
I • I i
E3 I I
• I
I I
I
I : :
It)
I
I
I i I
I
I
~
Coarse Aggregate
• • --I I
i I
J I • ;
I
! I I
: I I
I I
I I
I
J , I
I
• I
I
.' .
• ... :. ! : : I . I r I , ! I
I
: I
i i i I I ,
0 It)
~ "0
10
20
30 :2 -c _0 t:i
-= ~ .:
50~ -~ 60
70
80
90
100
N l.n .j>

SIEVE SIZES - U.S. STAMDAID - ROUMD OPEMIMas 01 t IMCH , LAReER
100 ~ Ii j o
I I III I I I I I /'./ I I I
• • --I I
\ ,
Ii ,I I III i I I I A I I !I I I • ~~------+-~~+-~I~I~I~I+-------~---+-~+-___ ~+----~f~'~----r~---~~------~--------~~---~~---~-r---~-+-i10 I I I III I I : II.. '"jl I' I Ii!
I il I III, I r-. 'J I I I i I ~~------~I---~~-+~I~I.I~I+-------~---+_~+-___ ~~~r'~'·~ ~~' ___ ~4----~~-----~--------~~---~~---~~--~-+~20
I I I I ! I I I [~ "'J I • I : ~
70 ~----+i'---~-+-!~~I+I+I+-------~I----r~'-+--~I---~~~r~~~~~----r'~---~l~L---~I--______ ~~---~--rl ___ ,I--~i~I---~30 ~ : I i III I : !A ~ "I I kr-58 '-77' I 'I I l i -----+----------+-+----+_;----+_;----+ ___ r-i c
SO I i I I I I J '" '0.. 7 Y iiI I ,I I ~o ~ ~------+!I---~-+-+'Ir+I+,+ :1+-----'I---rli~I-+--'I-j\~~~~r~~~r!I---~~I~--';~r---~------~-4I--~--~~I~r-~I--~ :
50; I" Ii! ,,~: I I: ! 509 ~------+!,---~-+-+~+,+,~,+-------'l~-r!,~l-+-~~~~~,,~)I~r,-----~,--~~--~~~~--~I---------~~I---~--I~~~~~I--~ ~
~o~----~l--~-+-+,'r+'+'+'+_----,'~_+'_;'~~~~~'~/---_r'------r'--_r'~---~'~~---~'--------~~'--~--r-___ I~r'--';~~60 I ! I I i I I I"<I~'/ I I ; I I : I I I !
30r-______ +_I~!---+-~I_+I+I+'+_----4:--_¥I~~~~~~/~_+--~'~---~i~ ___ I~---~I~----_4------_4~'--~ ___ ~_4--'~~1---~70 I I ", ! &. i',V I I I I I I I i , I ,I. : ~ 'I.. J" I I I I I I I I :
20 ~-----+I---~_+~~++++----~v~,~~:~~~r_~--+_--r_--~--~~---~~----~------~~--+_~--;_~--+_~~80 ; :1' AtY: I I I I I I
10~----+I---~~_+41~'+'+I+_---_4>1--~I_4I_+--,I--+_--rl ----rl ----'~---___ '_4------_4---------~~---~ ___ 'r_~--'~_4i--~~ l I I I I I I i I I I I I I 1 1 1 I
o~---~~'i---~~~~I~I.I~i~-----~i--~I~:~~~I--=_---~I------~1 __ ~I~--~i~~--~I-------~~---~~I~~---L'---~'---~ 100 8 8 l~ ~ ~ 0 II! ~ II> ~ g
Clay Slit
Soli
PARTICLE SIZE - DllMETER 1M MILLIMETERS
Fine Sand
Binder
Coaree Sand
Fig. A24 Granulometry Analysis - G2 Site
Coarse Aggregate
N VI VI
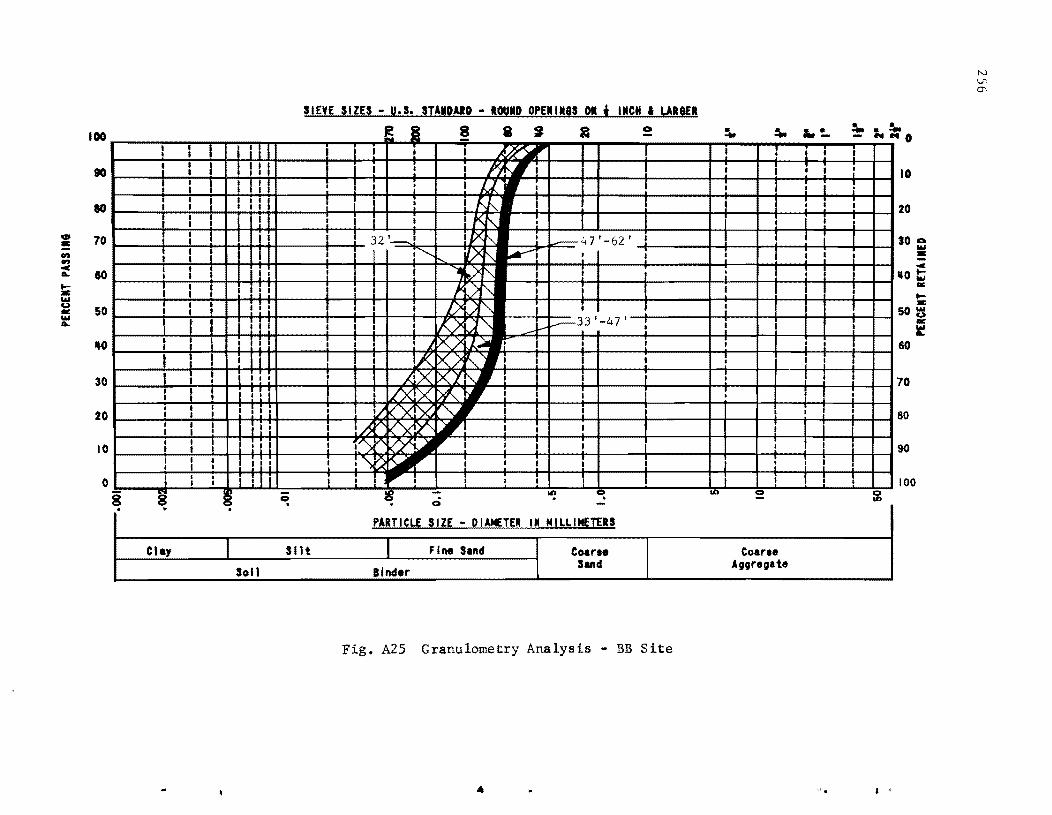
100
"1 I I I II • I
10 I I I . I III ; I II I
10 I I I I I I I I I I I I
I I I! I .. 70 - I II I ., .., I ! I I I c
10 A- I I I Ii I I I--w ~ 50 l1li: W A-
I I I I I;! I
I I I I I : I
r i I I !
" I I i I I I I I
I I I iI 30 I I I •
I I : I i I
20 • I I , I. I I I I . ': I I I
10 I I I " ! I f I
I I I I I II I I I
0 I I • I • I i I I
8 8 ~
Cia,
Soli
SIEYE SIZES - U.S. STAIDAID - RaulD OPEl lias 01 t IICN I LAReER
I
I I
I
I ! ! ;
i I
! : I I ! I
I
I
I
i ~
Silt
~ I 8 8 ~ 2 -I I I jrrL' I l I I'J f-.l1
: I UI I
: I 1,,, i I I t< " : 32 '--.,1 IJX "'- : _;"'7'-62 !
I : ............ V'< '\ ~, : I 'JIj V "'- i I
I I i I< ./ "- i ; I I I I.> "- ;
I I : IV" "- ~ ~33!-47' .
I I i 1. xy J,..':' • I i I !I<, XJ; ~ l i !
AX x:L I I
I LlXfX ~ : ! i I V /~ I I :A ~ I : I
I') I I i I
.'\, r:< I I I i , r I : I I
~ - IoCiI ~ ,; . -PARTICLE SIZE - DIAMETER I" MILLIMETERS
Fine Sand
Binder Coer"
Sand
!!
I
I
I
I I
, ! i
,
I
Fig. A25 Granulometry Analysis - BB Site
til
!.., ~
I
I
I
I
: l I
: ~ ; : : :
I
I
I
I
I
;
I
I
I
I
I
!!
Coarse Aggregate
... ~ 1 I
• I
i i : I
I
I
I I
: I
I
• I
I I
I
• I
I
I , I
• ... I
•
I
I
l I
! : ! I
• •
I
I
• ...
~
~ "0
10
20
30 ~ -c ~O ~
...: I-= 50 ~ l1li:
~ 60
70
80
90
100
, '
N \_;, 0'
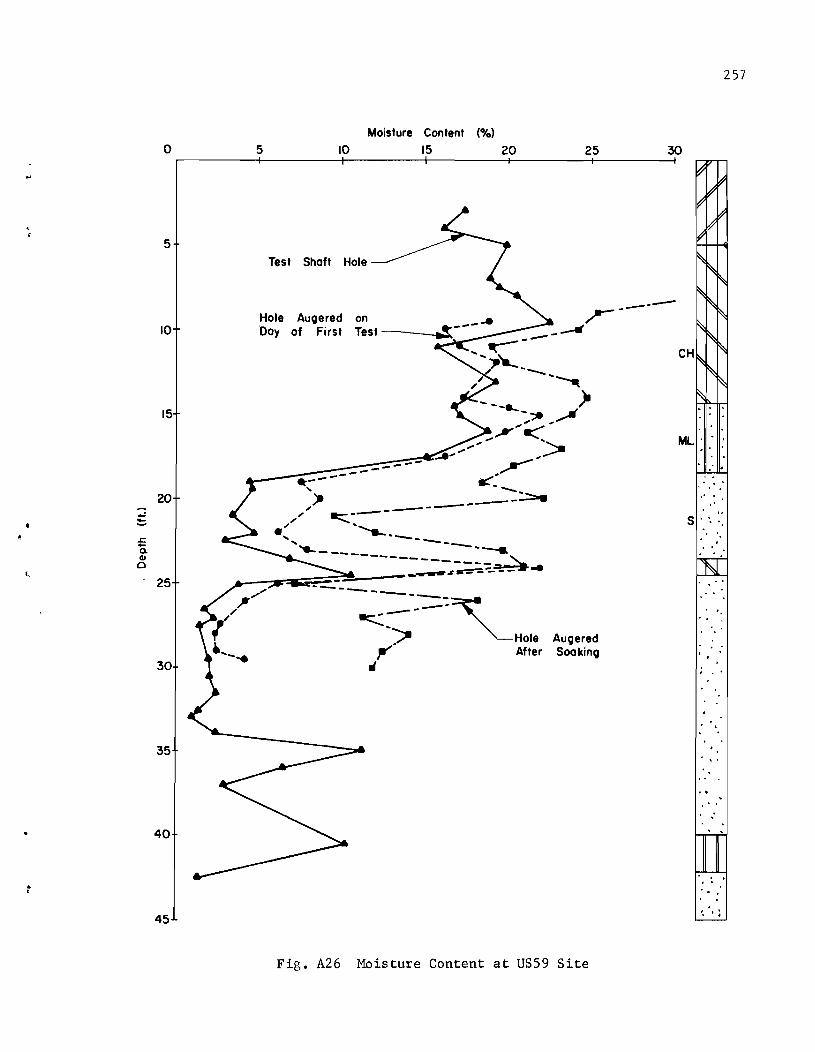
· (
· •
..: ~
.c Q. CII
0
o
5
10
15
20
25
35
40
45
Moisture Content (%)
5 10 15 20 25
Test Shaft Hole
Hole Auoered on Day of First Test --__ ~
Fig. A26 Moisture Content at US59 Site
257
30
ML' . . . · . o •
. . . • 0 0
o •
S' .
· ..
. .
.' . o ..
• 0 o·
• 0
o 0;

258
Moilture Content (%)
5 10 15 20 25 30 O~------~---------+---------r--------;---------;
5
15 -.,; -...-s:. -Q. 4U 0
20
25
30
35
Fig. A27 Moisture Content at HH Site
" l' :, .. ;. . , · . " . . " · , . •
S ' ." . , -, · . .
. . ,
•

, (
THE AUTHORS
Fadlo T. Touma is an instructor in civil engineering at
The University of Texas at Austin. His research interests
include work on foundation problems and in particular the
behavior of drilled shafts. He has worked for several years
on a variety of civil engineering problems, with special
emphasis on structural problems in building and bridge de
sign. He is the coauthor of several papers and reports on the behavior of
drilled shafts.
Lymon C. Reese is a Professor of Civil Engineering and
Associate Dean of Engineering at The University of Texas at
Austin. His specialization is in the area of soil mechanics
and foundation engineering. He was the recipient of the
Thomas A. Middlebrooks A\~ard of the American Society of
Civil Engineers in 1958. One of his primary interests has
been in the design of offshore structures and pile foundations. In recent
years, he has become well known for his research in the application of the
finite-element method of analysis to problems in soil and rock mechanics. He
holds memberships in numerous professional and learned societies and is a
Registered Professional Engineer in Texas.
259