form l-1-a-ra irda registration no: 138 date of
TRANSCRIPT

(Rs. '000)
Particulars Schedule Quarter ended March
2020
Year ended
March 2020
Quarter ended March
2019
Year ended
March 2019
Premiums earned – net
(a) Premium 20,41,966 57,57,367 22,42,553 56,88,819
(b) Reinsurance ceded (1,61,953) (6,16,014) (1,37,292) (5,08,193)
(c) Reinsurance accepted - - - -
Sub Total 18,80,013 51,41,353 21,05,261 51,80,626
Income From Investments
(a) Interest, Dividends and Rent – Gross 3,75,303 13,94,065 2,97,163 11,46,045
(b) Profit on sale/redemption of investments 1,73,922 8,61,844 1,81,913 9,37,169
(c) (Loss) on sale/ redemption of investments (4,20,902) (7,94,059) (63,208) (3,95,083)
(d) Transfer/Gain on revaluation/change in fair value* (13,18,740) (13,73,179) 2,65,722 2,35,157
(e) Amortisation of premium / discount on investments 33,556 1,36,534 37,608 1,36,196
Other Income
(a) Interest on Policy loans 486 1,256 173 624
(b) Miscellaneous Income 267 3,063 - -
(c) Contribution from Shareholders' Account - - 1,70,000 1,70,000
(d) Contribution from Shareholders' funds towards Excess EoM
(Refer Note 8 of Schedule A)
1,24,487 7,99,926 (1,54,579) 6,73,562
(e) Linked Income - - - -
TOTAL (A) 8,48,392 61,70,803 28,40,053 80,84,297
Commission L-5 17,355 46,219 17,395 41,420
Operating Expenses related to Insurance Business L-6 5,33,237 22,09,939 5,45,860 23,17,435
Goods and Service Tax on Unit Linked Charges 8,912 36,602 9,540 38,921
Provision for Doubtful debts 162 (4,947) 2,138 2,727
Bad debts written off - - - -
Provision for Tax
(a) Income Tax - - - -
Provisions (other than taxation)
(a) For diminution in the value of investments (Net) 12,500 12,500 (0) 30,000
(b) Others - - - -
TOTAL (B) 5,72,166 23,00,313 5,74,933 24,30,504
Benefits Paid (Net) L-7 8,75,771 28,02,800 9,97,586 29,69,473
Interim Bonuses Paid 288 1,087 668 1,970 Change in valuation of liability in respect of life policies
(a) Gross**
Non Linked 10,86,496 28,34,951 9,66,405 25,28,219
Linked ( Fund Reserve) (16,15,856) (15,42,501) 4,80,413 3,82,354
(b) Amount ceded in Reinsurance 61,857 (2,21,460) (1,340) (2,27,673)
(c) Amount accepted in Reinsurance - - - -
TOTAL (C) 4,08,556 38,74,877 24,43,733 56,54,343
SURPLUS/(DEFICIT) (D)=(A)-(B)-(C) (1,32,330) (4,387) (1,78,613) (550)
APPROPRIATIONS
Transfer to Shareholders’ Account 29,959 29,959 28,456 28,456
Transfer to Balance Sheet being "Deficit in Revenue Account (Policyholders' Account)" (1,73,924) (2,73,710) (5,55,829) (5,89,765)
Balance being Funds for Future Appropriations 11,635 2,39,364 3,48,760 5,60,759
TOTAL (E) (1,32,330) (4,387) (1,78,613) (550)
* Represents the deemed realised gain as per norms specified by the Authority
**Represents Mathematical Reserves after allocation of bonus
The breakup of total surplus is as under:
(a) Interim Bonus Paid 288 1,087 668 1,970
(b) Allocation of Bonus to policyholders 2,68,546 2,68,546 2,54,138 2,54,138
(c) Surplus / (Deficit) shown in the Revenue Account (1,32,330) (4,387) (1,78,613) (550)
(d) Total Surplus: [(a)+(b)+(c)] 1,36,504 2,65,246 76,193 2,55,558
Policyholders’ Account (Technical Account)
L-4
FORM L-1-A-RA
Aegon Life Insurance Company Limited
IRDA Registration No: 138
Date of Registration with IRDA: June 27, 2008
REVENUE ACCOUNT FOR THE YEAR ENDED MARCH 31, 2020

(Rs. '000)
Particulars Quarter ended March
2020
Year ended March
2020
Quarter ended March
2019
Year ended March
2019
Amount transferred from Policyholders Account (Technical Account) 29,959 29,959 28,456 28,456
Income From Investments
(a) Interest, Dividends and Rent – Gross 10,999 45,693 10,303 41,816
(b) Profit on sale/redemption of investments 389 389 292 9,661
(c) (Loss on sale/redemption of investments) 6 6 - -
(d) Transfer/Gain on revaluation/change in fair value - - - -
(e) Amortisation of premium/discount on investments 4,159 34,202 9,385 28,901
Other Income - - - -
TOTAL (A) 45,512 1,10,249 48,436 1,08,834
Expenses other than those directly related to the insurance business (17,860) 70,085 (54,505) 13,868
Bad debts written off - - - -
Provisions (Other than taxation)
(a) For diminution in the value of investments (net) - - - 20,000
(b) Provision for doubtful debts - (200) - 7
(c) Others - - - -
Contribution to the Policyholders Account (Technical Account) - - 1,70,000 1,70,000
Contribution towards the Remuneration of CEO 2,007 24,905 1,876 18,062
Contribution to the Policyholders funds towards Excess EoM 1,24,487 7,99,926 (1,54,579) 6,73,562
TOTAL (B) 1,08,634 8,94,716 (37,208) 8,95,500
Profit/(Loss) before tax (63,122) (7,84,467) 85,644 (7,86,665)
Provision for Tax
Current tax - - - -
Profit/(Loss) after tax (63,122) (7,84,467) 85,644 (7,86,665)
APPROPRIATIONS
(a) Balance at the beginning of the year/period (60,92,087) (53,70,742) (54,56,386) (45,84,077)
(b) Interim dividends paid during the year/period - - - -
(c) Proposed final dividend - - - -
(d) Dividend distribution on tax - - - -
(e) Transfer to reserves/ other accounts - - - -
Profit/ (Loss) carried forward to the Balance Sheet (61,55,209) (61,55,209) (53,70,742) (53,70,742)
PROFIT AND LOSS ACCOUNT FOR THE YEAR ENDED MARCH 31, 2020
Shareholders’ Account (Non-technical Account)
FORM L-2-A-PL
Aegon Life Insurance Company Limited
IRDA Registration No: 138
Date of Registration with IRDA: June 27, 2008

(Rs. '000)
Particulars Schedule As at
March 31, 2020
As at
March 31, 2019
SOURCES OF FUNDS
Shareholders’ Funds
Share Capital L-8, L-9 1,46,55,990 1,46,31,092
Share Application Money Pending Allotment - -
Reserves And Surplus L-10 76,74,705 64,66,905
Credit/(Debit) Fair Value Change Account (Net) - -
Sub-Total 2,23,30,695 2,10,97,997
Borrowings L-11 7,00,000 7,00,000
Policyholders’ Funds:
Credit/(Debit) Fair Value Change Account (Net) (89,425) 5,499
Policy Liabilities 1,52,26,081 1,26,09,002
Insurance Reserves - -
Linked Liabilities 82,51,230 82,65,288
Fair value change (13,73,179) 2,35,157
Provision For Linked Liabilities 68,78,051 85,00,445
2,27,14,707 2,18,14,946
Funds for Discontinued Policies
Discontinued on account of non-payment of premium 8,82,419 8,05,182
Others 12,081 13,014
Funds For Future Appropriations
Linked - -
Non Linked 14,86,035 12,46,671
TOTAL 4,74,25,937 4,49,77,810
Investments
Shareholders’ L-12 9,94,806 14,94,796
Policyholders’ L-13 1,67,84,170 1,40,85,907
Assets Held To Cover Linked Liabilities L-14 77,72,551 93,18,641
Loans L-15 6,83,493 6,57,564
Fixed Assets L-16 7,83,539 2,93,688
Current Assets
Cash and Bank Balances L-17 5,21,564 6,01,822
Advances And Other Assets L-18 13,62,420 15,28,503
Sub-Total (A) 18,83,984 21,30,325
Current Liabilities L-19 13,75,506 18,66,020
Provisions L-20 39,273 17,086
Sub-Total (B) 14,14,779 18,83,106
Net Current Assets (C) = (A – B) 4,69,205 2,47,219
Miscellaneous Expenditure L-21 - -
(To the extent not written off or adjusted)
Debit Balance of Profit and Loss Account 61,55,209 53,70,742
Deficit in the Revenue Account (Policyholders' Account) 1,37,82,964 1,35,09,253
TOTAL 4,74,25,937 4,49,77,810
CONTINGENT LIABILITIES
(Rs. '000)
Particulars As at
March 31, 2020
As at
March 31, 2019
Partly paid – up investments - -
Claims, other than against policies, not acknowledged as debts by the
Company
- -
Underwriting commitments outstanding - -
Guarantees given by or on behalf of the Company# 2,500 2,500
Statutory demands/ liabilities in dispute, not provided for * 82,052 82,052
Reinsurance obligations to the extent not provided for in accounts - -
Others
In relation to Claims against policies** 68,316 57,476
Others*** 1,928 1,928
Total 1,54,796 1,43,956
# Guarantee in favour of Unique Identification Authority of India
***Represents the amount towards the retrospective amendment of Payment of Bonus Act effective from April 1, 2014 for the
financial year 2014-15.
FORM L-3-A-BS
APPLICATION OF FUNDS
Sub-Total
BALANCE SHEET AS AT MARCH 31, 2020
IRDA Registration No: 138
Aegon Life Insurance Company Limited
Date of Registration with IRDA: June 27, 2008
*The Company’s pending litigations comprise of claims against the Company primarily from the proceedings on show cause cum
demand notices received from the respective Tax authorities.
The Company has reviewed all its pending litigations and proceedings and has adequately provided for where provisions are
required and disclosed the contingent liabilities where applicable, in its financial statements. The Company has been advised by
the experts that the grounds of appeal are well supported in law and therefore does not expect the outcome of these proceedings
to have a materially adverse effect on its financial results.
**In respect of litigations, where the management assessment of a financial outflow is probable, the Company has made a provision
of Rs 54,066 (‘000) as at March 31, 2020 (Previous year ended March 31, 2019 Rs. 61,422 (‘000)).

FORM L-4 PREMIUM SCHEDULE
PREMIUM
(Rs. '000)
Particulars Quarter ended March
2020
Year ended March
2020
Quarter ended March
2019
Year ended March
2019
First year premiums 2,48,237 8,82,318 3,94,708 11,21,884
Renewal premiums 17,91,640 48,40,044 18,36,718 45,12,483
Single premiums 2,089 35,005 11,127 54,452
TOTAL PREMIUM 20,41,966 57,57,367 22,42,553 56,88,819
FORM L-5 COMMISSION SCHEDULE
COMMISSION EXPENSES
(Rs. '000)
Particulars Quarter ended March
2020
Year ended March
2020
Quarter ended March
2019
Year ended March
2019
Commission paid
Direct - First year premiums 9,437 25,693 6,519 13,068
- Renewal premiums 7,913 20,519 10,868 28,344
- Single premiums 5 7 8 8
Total (A) 17,355 46,219 17,395 41,420
Add : Commission on Re-insurance Accepted - - - -
Less : Commission on Re-insurance Ceded - - - -
Net Commission 17,355 46,219 17,395 41,420
Break-up of Commission Expense (Gross) incurred to procure business
Agents 1,851 4,832 5,556 13,592
Brokers 7,974 19,822 3,170 8,447
Corporate Agencies 6,280 18,182 7,863 18,283
Web aggregators 1,249 3,383 806 1,098
Referrals - - - -
Total (B) 17,354 46,219 17,395 41,420
Aegon Life Insurance Company Limited
SCHEDULES FORMING PART OF THE REVENUE ACCOUNT FOR THE YEAR ENDED MARCH 31, 2020

(Rs. '000)
Particulars Quarter ended March
2020
Year ended March
2020
Quarter ended March
2019
Year ended March
2019
Employees’ remuneration and welfare benefits 1,77,099 8,34,315 1,78,406 8,84,606
Travel, conveyance & vehicle running expenses 10,589 51,650 12,031 46,779
Training expenses 512 3,423 392 986
Rents, rates and taxes 22,499 88,347 21,128 83,787
Repairs 1,381 5,767 1,336 5,238
Printing and stationery 1,081 7,243 2,514 8,506
Communication expenses 3,274 14,497 5,470 17,853
Legal and professional charges 20,404 54,142 6,999 46,003
Medical fees 5,171 38,535 14,646 75,901
Auditors' fees, expenses etc
a) (i) as auditor 1,225 3,850 1,225 3,850
(ii) Out of Pocket expenses 15 36 21 73
b) as adviser or in any other capacity, in respect of
(i) Taxation matters - - - -
(ii) Insurance matters - - - -
(iii) Management services - - - -
c) in any other capacity - 63 30 50
Advertisement, Marketing and publicity 56,909 3,58,542 96,962 4,44,558
Interest and bank charges 2,758 27,720 4,359 27,260
Depreciation/Amortisation 81,579 1,90,329 36,623 1,14,714
Others:
Information technology and related expenses 64,833 2,40,143 61,547 2,41,545
Business Processing Services 26,968 96,045 21,703 86,162
Office expenses 4,566 19,468 5,940 21,517
Recruitment 14,377 44,278 4,150 20,873
Other Miscellaneous expenses 3,441 8,764 10,754 17,097
Electricity 2,643 14,082 2,878 15,851
Sales and Business Promotion expenses 6,163 38,628 30,899 68,869
Goods and Services tax 214 1,170 1,457 1,896
Stamp Duty on Policies 25,536 68,902 24,390 83,460
TOTAL 5,33,237 22,09,939 5,45,860 23,17,434
Aegon Life Insurance Company Limited
SCHEDULE FORMING PART OF THE REVENUE ACCOUNT FOR THE YEAR ENDED MARCH 31, 2020
FORM L-6-OPERATING EXPENSES SCHEDULE
OPERATING EXPENSES RELATED TO INSURANCE BUSINESS

(Rs. '000)
Particulars Quarter ended March
2020
Year ended March
2020
Quarter ended March
2019
Year ended March
2019
Employees’ remuneration and welfare benefits 3,240 9,168 - -
Travel, conveyance & vehicle running expenses - - 29 93
Training expenses 105 105 - -
Rents, rates and taxes 616 1,233 1,042 1,835
Repairs - - - -
Printing and stationery - - - -
Communication expenses - - - -
Legal and professional charges 6,183 20,200 - 571
Director Sitting fees
(Refer Note 8 (iii) of Schedule 16)
800 1,850 600 2,050
Medical fees - - - -
Auditors' fees, expenses etc - -
a) (i) as auditor - - - -
(ii) Out of pocket expenses - - - -
b) as adviser or in any other capacity, in respect of - -
(i) Taxation matters - - - -
(ii) Insurance matters - - - -
(iii) Management services - - - -
c) in any other capacity - - - -
Advertisement, marketing and publicity - - - -
Interest and bank charges (43,719) 10,941 (49,124) 4,053
Custodian charges 650 2,083 353 1,690
Depreciation/Amortisation - - - -
Others: - -
Information technology and related expenses 3,153 5,632 (7,506) -
Policy related charges 84 4,771 101 (1,580)
Other miscellaneous expenses
(Refer Notes 2(m) and 22 of Schedule 16)
11,028 14,102 - 5,157
TOTAL (17,860) 70,085 (54,505) 13,868
Aegon Life Insurance Company Limited
SCHEDULE FORMING PART OF THE REVENUE ACCOUNT FOR THE YEAR ENDED MARCH 31, 2020
FORM L-6A-SHAREHOLDERS' EXPENSES SCHEDULE
EXPENSES OTHER THAN THOSE DIRECTLY RELATED TO THE INSURANCE BUSINESS

FORM L-7-BENEFITS PAID SCHEDULE
BENEFITS PAID [NET]
(Rs. '000)
Particulars Quarter ended March
2020
Year ended March
2020
Quarter ended March
2019
Year ended March
2019
Insurance Claims
(a) Claims by Death, 2,33,218 7,95,158 2,43,258 8,04,009
(b) Claims by Maturity, 80,183 2,76,087 60,399 95,368
(c) Annuities/Pensions payment, 32 151 32 151
(d) Other benefits
(i) Riders 2,966 43,749 (1,615) 35,607
(ii) Health 668 6,004 825 9,083
(iii) Surrenders 5,61,608 16,91,729 6,01,520 19,86,545
(iv) Partial Withdrawal 19,183 53,932 30,528 72,182
(v) Survival Benefits 1,07,765 4,24,552 1,83,849 4,26,297
(vi) Other Benefits - Investment income on unclaimed amount to
policyholders
2,592 16,966 6,883 28,095
(Amount ceded in reinsurance):
(a) Claims by Death, (1,23,065) (4,66,468) (1,26,715) (4,60,058)
(b) Claims by Maturity, - - - -
(c) Annuities/Pensions payment, - - - -
(d) Other benefits
(i) Riders (9,060) (36,195) (962) (23,314)
(ii) Health (319) (2,865) (416) (4,492)
Amount accepted in reinsurance :
(a) Claims by Death, - - - -
(b) Claims by Maturity, - - - -
(c) Annuities/Pensions payment, - - - -
(d) Other benefits
(i) Riders - - - -
(ii) Surrenders - - - -
TOTAL 8,75,771 28,02,800 9,97,586 29,69,473
Aegon Life Insurance Company Limited
SCHEDULE FORMING PART OF THE REVENUE ACCOUNT FOR THE YEAR ENDED MARCH 31, 2020

FORM L-8-SHARE CAPITAL SCHEDULE
SHARE CAPITAL
(Rs. '000)
Particulars As at
March 31, 2020
As at
March 31, 2019
Authorised Capital 2,00,00,000 2,00,00,000
2,000,000,000 Equity shares of Rs 10 each
Issued Capital 1,49,58,439 1,46,58,439
1,495,843,855 Equity shares (As at March 31, 2019 - 1,465,843,855) of Rs 10 each
Subscribed Capital 1,46,55,990 1,46,31,092
1,465,598,957 Equity shares (At March 31, 2019 - 1,463,109,161) of Rs 10 each
Called up Capital 1,46,55,990 1,46,31,092
1,465,598,957 Equity shares (At March 31, 2019 - 1,463,109,161) of Rs 10 each
Less: Calls unpaid - -
Add: Shares forfeited (Amount originally paid up) - -
Less: Par value of Equity Shares bought back - -
Less: Preliminary Expenses - -
TOTAL 1,46,55,990 1,46,31,092
SCHEDULE FORMING PART OF THE BALANCE SHEET AS AT MARCH 31, 2020
Aegon Life Insurance Company Limited

FORM L-9-PATTERN OF SHAREHOLDING SCHEDULE
PATTERN OF SHAREHOLDING
[As certified by the Management]
Number of shares %
of Holding
Number of shares %
of Holding
Promoters
- Indian
Bennett Coleman & Co. Limited 68,11,30,000 46.5% 68,11,30,000 46.6%
Aegon Life Insurance Employee Benefits Trust 6,63,25,470 4.5% 6,50,55,674 4.4%
- Foreign
Aegon India Holdings B.V. and its nominees 71,81,43,487 49.0% 71,69,23,487 49.0%
TOTAL 1,46,55,98,957 100% 1,46,31,09,161 100%
As at March 31, 2020 As at March 31, 2019
Aegon Life Insurance Company Limited
SCHEDULE FORMING PART OF THE BALANCE SHEET AS AT MARCH 31, 2020
Particulars

FORM L-10-RESERVES AND SURPLUS SCHEDULE
RESERVES AND SURPLUS
(Rs. '000)
Particulars As at
March 31, 2020
As at
March 31, 2020
As at
March 31, 2019
As at
March 31, 2019
Capital Reserve - -
Capital Redemption Reserve - -
Share Premium
Opening balance 64,66,905 - 48,37,305 -
Add: Additions during the year 12,07,800 - 16,29,600 -
Less: Utilized during the year - 76,74,705 - 64,66,905
Revaluation Reserve - -
General Reserves
Less: Debit balance in Profit and Loss Account - - - -
Less: Amount utilized for Buy-back - - - -
Catastrophe Reserve - -
Other Reserves - -
Balance of profit in Profit and Loss Account - -
TOTAL 76,74,705 64,66,905
FORM L-11-BORROWINGS SCHEDULE
BORROWINGS
(Rs. '000)
Particulars
Debentures/Bonds 7,00,000 7,00,000
Banks - -
Financial Institutions - -
Others - -
TOTAL 7,00,000 7,00,000
As at
March 31, 2020
As at
March 31, 2019
SCHEDULES FORMING PART OF THE BALANCE SHEET AS AT MARCH 31, 2020
Aegon Life Insurance Company Limited
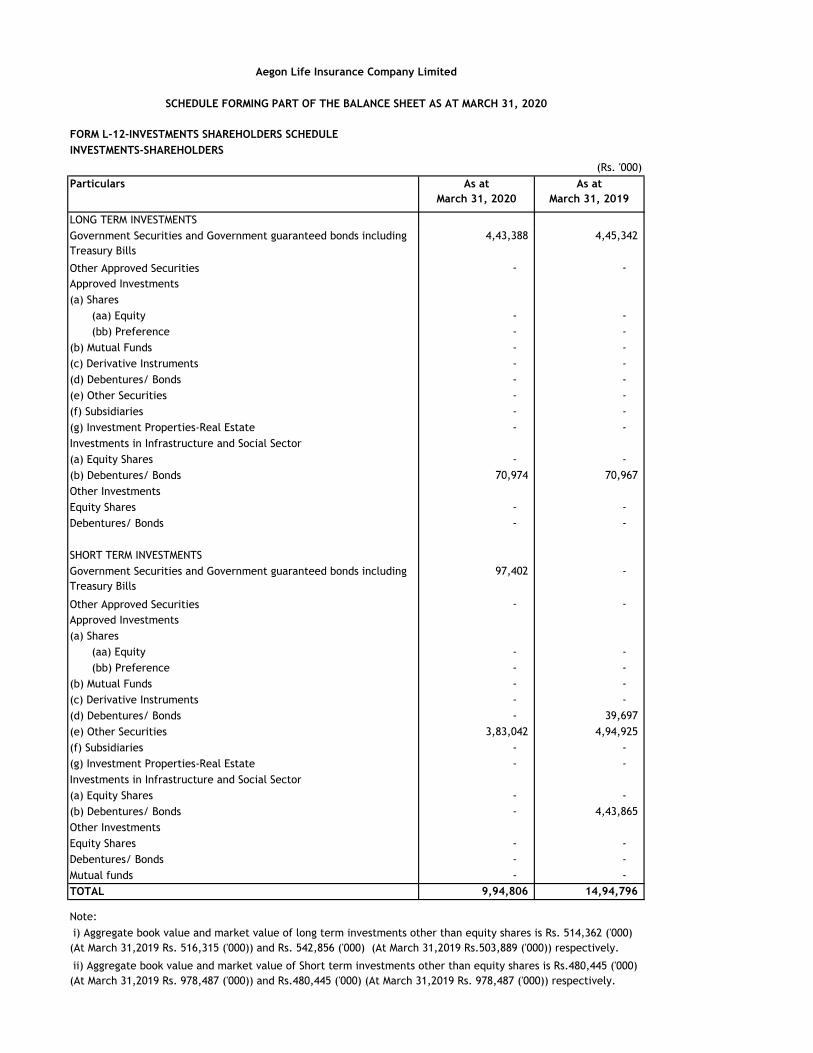
FORM L-12-INVESTMENTS SHAREHOLDERS SCHEDULE
INVESTMENTS-SHAREHOLDERS
(Rs. '000)
Particulars As at
March 31, 2020
As at
March 31, 2019
LONG TERM INVESTMENTS
Government Securities and Government guaranteed bonds including
Treasury Bills
4,43,388 4,45,342
Other Approved Securities - -
Approved Investments
(a) Shares
(aa) Equity - -
(bb) Preference - -
(b) Mutual Funds - -
(c) Derivative Instruments - -
(d) Debentures/ Bonds - -
(e) Other Securities - -
(f) Subsidiaries - -
(g) Investment Properties-Real Estate - -
Investments in Infrastructure and Social Sector
(a) Equity Shares - -
(b) Debentures/ Bonds 70,974 70,967
Other Investments
Equity Shares - -
Debentures/ Bonds - -
SHORT TERM INVESTMENTS
Government Securities and Government guaranteed bonds including
Treasury Bills
97,402 -
Other Approved Securities - -
Approved Investments
(a) Shares
(aa) Equity - -
(bb) Preference - -
(b) Mutual Funds - -
(c) Derivative Instruments - -
(d) Debentures/ Bonds - 39,697
(e) Other Securities 3,83,042 4,94,925
(f) Subsidiaries - -
(g) Investment Properties-Real Estate - -
Investments in Infrastructure and Social Sector
(a) Equity Shares - -
(b) Debentures/ Bonds - 4,43,865
Other Investments
Equity Shares - -
Debentures/ Bonds - -
Mutual funds - -
TOTAL 9,94,806 14,94,796
Note:
Aegon Life Insurance Company Limited
SCHEDULE FORMING PART OF THE BALANCE SHEET AS AT MARCH 31, 2020
i) Aggregate book value and market value of long term investments other than equity shares is Rs. 514,362 ('000)
(At March 31,2019 Rs. 516,315 ('000)) and Rs. 542,856 ('000) (At March 31,2019 Rs.503,889 ('000)) respectively.
ii) Aggregate book value and market value of Short term investments other than equity shares is Rs.480,445 ('000)
(At March 31,2019 Rs. 978,487 ('000)) and Rs.480,445 ('000) (At March 31,2019 Rs. 978,487 ('000)) respectively.

FORM L-13-INVESTMENTS POLICYHOLDERS SCHEDULE
INVESTMENTS-POLICYHOLDERS
(Rs. '000)
Particulars As at
March 31, 2020
As at
March 31, 2019
LONG TERM INVESTMENTS
Government Securities and Government guaranteed bonds including Treasury
Bills
79,08,395 74,81,460
Other Approved Securities 16,24,763 11,17,045
Approved Investments
(a) Shares
(aa) Equity - -
(bb) Preference - -
(b) Mutual Funds - -
(c) Derivative Instruments - -
(d) Debentures/ Bonds 15,14,436 8,99,094
(e) Other Securities - -
(f) Subsidiaries - -
(g) Investment Properties-Real Estate - -
Investments in Infrastructure and Social Sector
(a) Equity Shares - -
(b) Debentures/ Bonds 46,71,946 36,54,902
Other Investments
Equity Shares - -
Debentures/ Bonds - -
Investments in Infrastructure and Social Sector - Debentures/ Bonds 49,813 -
Less: Provision for diminution of investments (12,500) -
37,313 -
SHORT TERM INVESTMENTS
Government Securities and Government guaranteed bonds including Treasury
Bills
46,410 19,862
Other Approved Securities - -
Approved Investments
(a) Shares
(aa) Equity 2,25,166 2,55,825
(bb) Preference - -
(b) Mutual Funds - -
(c) Derivative Instruments - -
(d) Debentures/ Bonds - -
(e) Other Securities 7,05,943 5,79,241
(f) Subsidiaries - -
(g) Investment Properties-Real Estate - -
Investments in Infrastructure and Social Sector
(a) Equity Shares 41,425 24,954
(b) Debentures/ Bonds - -
Other Investments
Equity Shares 8,373 53,524
Debentures/ Bonds - -
Investments in Infrastructure Sector - -
Mutual funds - -
TOTAL 1,67,84,170 1,40,85,907
Note:
SCHEDULE FORMING PART OF THE BALANCE SHEET AS AT MARCH 31, 2020
Aegon Life Insurance Company Limited
i) Aggregate book value and market value of long term investments other than equity shares is Rs. 15,756,854 ('000)
(At March 31,2019 Rs. 13,152,507 ('000)) and Rs.17,156,823 ('000) (At March 31,2019 Rs. 13,375,923 ('000)) respectively.
ii) Aggregate book value and market value of Short term investments other than equity shares is Rs. 752,353 ('000)
(At March 31,2019 Rs. 599,102 ('000)) and Rs.752,353 ('000) (At March 31,2019 Rs.599,102 ('000)) respectively.

(Rs. '000)
Particulars As at
March 31, 2020
As at
March 31, 2019
LONG TERM INVESTMENTS
Government Securities and Government guaranteed bonds including
Treasury Bills
7,00,979 4,54,024
Other Approved Securities 2,06,220 1,02,885
Approved Investments
(a) Shares
(aa) Equity - -
(bb) Preference - -
(b) Mutual Funds - -
(c) Derivative Instruments - -
(d) Debentures/ Bonds 3,67,332 3,22,605
(e) Other Securities* - -
(f) Subsidiaries - -
(g) Investment Properties-Real Estate - -
Investments in Infrastructure and Social Sector
(a) Equity Shares - -
(b) Debentures/ Bonds 4,39,247 5,58,061
Other Investments - -
Equity Shares - -
Debentures/ Bonds - -
SHORT TERM INVESTMENTS
Government Securities and Government guaranteed bonds including
Treasury Bills
10,74,271 9,94,705
Other Approved Securities 51,191 1,50,880
Approved Investments
(a) Shares
(aa) Equity 29,34,911 45,54,495
(bb) Preference - -
(b) Mutual Funds - -
(c) Derivative Instruments - -
(d) Debentures/ Bonds - 59,562
(e) Other Securities* 7,40,916 4,30,192
(f) Subsidiaries - -
(g) Investment Properties-Real Estate - -
Investments in Infrastructure and Social Sector
(a) Equity Shares 7,85,249 8,75,372
(b) Debentures/ Bonds 86,372 10,061
Other Investments
Equity Shares 96,347 3,08,279
Debentures/ Bonds - -
Mutual Fund 2,53,602 3,39,318
Investments in Infrastructure Sector - -
Net Current assets 35,914 1,58,203
TOTAL 77,72,551 93,18,641
Note:
i) Aggregate book value and market value of long term investments other than equity shares is Rs.1,557,198 ('000)
(At March 31,2019 Rs. 1,411,521 ('000)) and Rs. 1,618,451 ('000) (At March 31,2019 Rs. 1,437,576 ('000)) respectively.
ii) Aggregate book value and market value of Short term investments other than equity shares is Rs. 2,420,839 ('000)
(At March 31,2019 Rs. 1,941,040 ('000)) and Rs. 2,301,680 ('000) (At March 31,2019 Rs. 1,984,718 ('000)) respectively.
* Other Securities include the Bank Fixed Deposits.
FORM L-14-ASSETS HELD TO COVER LINKED LIABILITIES SCHEDULE
ASSETS HELD TO COVER LINKED LIABILITIES
Aegon Life Insurance Company Limited
SCHEDULE FORMING PART OF THE BALANCE SHEET AS AT MARCH 31, 2020

FORM L-15-LOANS SCHEDULE
LOANS
(Rs. '000)
Particulars As at
March 31, 2020
As at
March 31, 2019
SECURITY-WISE CLASSIFICATION
Secured
(a) On mortgage of property
(aa) In India - -
(bb) Outside India - -
(b) On Shares, Bonds, Govt. Securities etc. - -
(c) Loans against policies 20,238 7,007
(d) Others - -
Unsecured-Trustees of Aegon Life Insurance Employee Benefits Trust 6,63,255 6,50,557
Total 6,83,493 6,57,564
BORROWER-WISE CLASSIFICATION
(a) Central and State Governments - -
(b) Banks and Financial Institutions - -
(c) Subsidiaries - -
(d) Companies - -
(e) Loans against policies 20,238 7,007
(f) Others - Trustees of Aegon Life Insurance Employee Benefits Trust 6,63,255 6,50,557
Total 6,83,493 6,57,564
PERFORMANCE-WISE CLASSIFICATION
(a) Loans classified as standard
(aa) In India 6,83,493 6,57,564
(bb) Outside India - -
(b) Non-standard loans less provisions
(aa) In India - -
(bb) Outside India - -
Total 6,83,493 6,57,564
MATURITY-WISE CLASSIFICATION
(a) Short Term - -
(b) Long Term 6,83,493 6,57,564
Total 6,83,493 6,57,564
Aegon Life Insurance Company Limited
SCHEDULE FORMING PART OF THE BALANCE SHEET AS AT MARCH 31, 2020
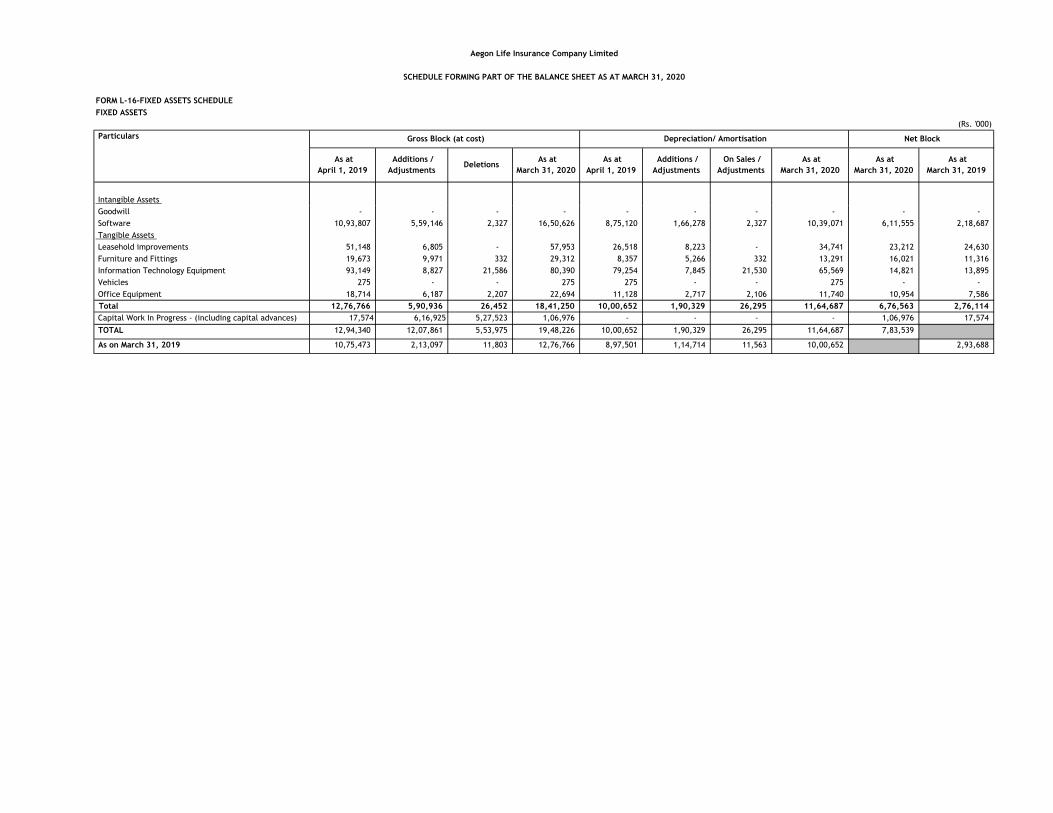
FORM L-16-FIXED ASSETS SCHEDULE
(Rs. '000)
Intangible Assets
Goodwill - - - - - - - - - -
Software 10,93,807 5,59,146 2,327 16,50,626 8,75,120 1,66,278 2,327 10,39,071 6,11,555 2,18,687
Tangible Assets
Leasehold improvements 51,148 6,805 - 57,953 26,518 8,223 - 34,741 23,212 24,630
Furniture and Fittings 19,673 9,971 332 29,312 8,357 5,266 332 13,291 16,021 11,316
Information Technology Equipment 93,149 8,827 21,586 80,390 79,254 7,845 21,530 65,569 14,821 13,895
Vehicles 275 - - 275 275 - - 275 - -
Office Equipment 18,714 6,187 2,207 22,694 11,128 2,717 2,106 11,740 10,954 7,586
Total 12,76,766 5,90,936 26,452 18,41,250 10,00,652 1,90,329 26,295 11,64,687 6,76,563 2,76,114
Capital Work In Progress - (including capital advances) 17,574 6,16,925 5,27,523 1,06,976 - - - - 1,06,976 17,574
TOTAL 12,94,340 12,07,861 5,53,975 19,48,226 10,00,652 1,90,329 26,295 11,64,687 7,83,539
As on March 31, 2019 10,75,473 2,13,097 11,803 12,76,766 8,97,501 1,14,714 11,563 10,00,652 2,93,688
SCHEDULE FORMING PART OF THE BALANCE SHEET AS AT MARCH 31, 2020
Aegon Life Insurance Company Limited
As at
March 31, 2019
Net Block
FIXED ASSETS
As at
March 31, 2020
Particulars Gross Block (at cost) Depreciation/ Amortisation
As at
April 1, 2019
Additions /
Adjustments Deletions
As at
March 31, 2020
As at
April 1, 2019
Additions /
Adjustments
On Sales /
Adjustments
As at
March 31, 2020

FORM L-17-CASH AND BANK BALANCE SCHEDULE
CASH AND BANK BALANCES
(Rs. '000)
Particulars As at
March 31, 2020
As at
March 31, 2019
Cash including cheques on hand, drafts and stamp in hand 54,510 1,13,783
Bank Balances
(a) Deposit Accounts
(aa) Short-term (due within 12 months of the date of balance sheet) - -
(bb) Others - -
(b) Current Accounts 4,67,054 4,88,039
(c) Others - -
Money at Call and Short Notice
(a) With Banks - -
(b) With other Institutions - -
Others - -
TOTAL 5,21,564 6,01,822
Balances with non-scheduled banks - -
CASH AND BANK BALANCES
In India 5,21,564 6,01,822
Outside India - -
TOTAL 5,21,564 6,01,822
SCHEDULE FORMING PART OF THE BALANCE SHEET AS AT MARCH 31, 2020
Aegon Life Insurance Company Limited

FORM L-18-ADVANCES AND OTHER ASSETS SCHEDULE
ADVANCES AND OTHER ASSETS
(Rs. '000)
Particulars As at
March 31, 2020
As at
March 31, 2019
ADVANCES
Reserve deposits with ceding companies - -
Application money for investments - -
Prepayments 46,762 49,245
Advances to Directors/Officers - -
Advance tax paid and taxes deducted at source
(Net of provision for taxation)
772 543
Others
Advances to Suppliers
Gross 1,69,785 1,71,791
Less: Provision for doubtful advances (1,65,117) (1,70,090)
Net 4,668 1,701
Advances to Employees 294 670
TOTAL (A) 52,496 52,159
OTHER ASSETS
Income accrued on investments 4,03,704 3,46,572
Income accrued on policy loans 1,718 802
Outstanding Premiums 2,35,724 2,08,161
Agents’ Balances
Gross 46,218 46,493
Less: Provision for doubtful agent's balances (46,218) (46,392)
Net - 101
Foreign Agencies Balances - -
Due from other entities carrying on insurance business (including reinsurers) 2,18,998 3,49,523
Due from subsidiaries/ holding company - -
Deposit with Reserve Bank of India
[Pursuant to section 7 of Insurance Act, 1938]
- -
Others
Refundable Security Deposits 98,550 91,691
Outstanding sale pending settlement 20,000 20,000
Less: Provision for diminution of investments (20,000) (20,000)
- -
Goods & Service Tax Unutilised Credit 1,04,711 77,781
Management fees receivable - -
Sundry Debtors
Gross 27,124 18,768
Less: Provision for Sundry debtors (65) (65)
Net 27,059 18,703
Gratuity - Plan Assets - 77
Assets towards Unclaimed amount of Policyholders-Principal 1,90,330 3,46,817
ADD: Accrued Interest on unclaimed amount of the policyholders 29,130 36,115
Total Unclaimed amount of the Policyholders 2,19,460 3,82,932
TOTAL (B) 13,09,924 14,76,343
TOTAL (A+B) 13,62,420 15,28,503
SCHEDULE FORMING PART OF THE BALANCE SHEET AS AT MARCH 31, 2020
Aegon Life Insurance Company Limited

FORM L-19-CURRENT LIABILITIES SCHEDULE
CURRENT LIABILITIES
(Rs. '000)
Particulars As at
March 31, 2020
As at
March 31, 2019
Agents’ Balances 50,427 44,074
Balances due to other insurance companies - -
Deposits held on re-insurance ceded - -
Premiums received in advance 14,146 13,113
Unallocated premium 74,251 49,199
Sundry creditors 4,04,379 5,65,552
Due to subsidiaries/ holding company - -
Claims Outstanding 1,18,847 1,06,747
Due to Directors/Officers - -
Others:
Premium / proposal deposits to be refunded 6,034 22,120
Outstanding purchase pending settlement - 2,15,353
Book Overdraft - -
Others (includes statutory dues payable and payables to employees) 37,197 24,868
Goods & Service Tax payable 1,09,135 59,689
Reinsurance Premium Payable 3,41,630 3,82,373
Unclaimed amount of the Policyholders-Principal 1,90,330 3,46,817
Add: Accrued Interest on unclaimed amount of the policyholders 29,130 36,115
Total Unclaimed amount of the Policyholders 2,19,460 3,82,932
TOTAL 13,75,506 18,66,020
FORM L-20-PROVISIONS SCHEDULE
PROVISIONS
(Rs. '000)
Particulars As at
March 31, 2020
As at
March 31, 2019
For taxation (less payments and taxes deducted at source) - -
For proposed dividends - -
For dividend distribution tax - -
Others:
Provision for Gratuity 21,339 -
Provision for Long Term Compensated Absence 17,934 17,086
TOTAL 39,273 17,086
SCHEDULES FORMING PART OF BALANCE SHEET AS AT MARCH 31, 2020
Aegon Life Insurance Company Limited

FORM L-21-MISCELLANEOUS EXPENDITURE SCHEDULE
MISCELLANEOUS EXPENDITURE
(To the extent not written off or adjusted )
(Rs. '000)
ParticularsAs at
March 31, 2020
As at
March 31, 2019
Discount Allowed in issue of shares/ debentures - -
Others - -
TOTAL - -
Aegon Life Insurance Company Limited
SCHEDULE FORMING PART OF THE BALANCE SHEET AS AT MARCH 31, 2020

FORM L-22: ANALYTICAL RATIOS
Insurer: Aegon Life Insurance Company Limited 31-Mar-20
Analytical Ratios for Life Companies
Sl.No. ParticularsQuarter ended March
2020
Year ended March
2020
Quarter ended
March 2019
Year ended March
2019
1 New business premium income growth rate - segment wise
Participating Individual -17% 3% -46% -47%
Participating Pension 0% 0% 0% 0%
Non - Participating Individual -29% -19% -15% 2%
Non - Participating Group 55% 51% 91% 181%
Non - Participating Annuity 0% 0% -100% -100%
Non - Participating Health 192% -3% -64% -64%
Linked Pension 0% -100% -100% -89%
Linked Life -71% -50% -39% -28%
Linked Group Gratuity -100% -69% 0% -61%
2 Net Retention Ratio 92% 89% 94% 91%
3 Expense of Management to Gross Direct Premium Ratio -12% 25% 62% 30%
4 Commission Ratio (Gross commission paid to Gross Premium) 1% 1% 1% 1%
5 Ratio of policy holder's liabilities to shareholder's funds 1020% 1020% 1045% 1045%
6 Growth rate of shareholders' fund * -4% 8% 35% 26%
7 Ratio of surplus to policyholders' liability -1% 0% -1% 0%
8 Change in net worth (Rs '000) 3,79,302 1,74,521 5,71,448 4,57,739
9 Profit after tax/Total Income -22% -13% -3% -10%
10 (Total real estate + loans)/(Cash & invested assets) 3% 3% 3% 3%
11 Total investments/(Capital + Surplus) -220% 1068% 334% 1123%
12 Total affiliated investments/(Capital+ Surplus) 0% 0% 0% 0%
13 Investment Yield (Gross and Net)
(i) With unrealized gains /losses
- Policyholders' Funds :
Participating 12% 13% 11% 9%
Non Participating 27% 18% 7% 10%
Pension Participating 11% 9% 7% 7%
Unit Linked -51% -13% 20% 10%
- Shareholders' Funds : 13% 10% 7% 6%
(ii) Without unrealized gains /losses
- Policyholders' Funds :
Participating 7% 8% 9% 9%
Non Participating 7% 8% 8% 8%
Pension Participating 6% 7% 7% 7%
Unit Linked -50% -12% 10% 12%
- Shareholders' Funds : 6% 7% 7% 5%
14 Conservation Ratio 80% 86% 87% 87%
15 Persistency Ratio ** ^ #
By annualized Premium
For 13th month 69% 76% 73% 77%
For 25th month 59% 65% 67% 66%
For 37th month 53% 56% 42% 40%
For 49th Month 36% 36% 24% 27%
for 61st month 20% 23% 25% 35%
By no.of policies
For 13th month 84% 84% 85% 83%
For 25th month 80% 76% 79% 74%
For 37th month 73% 68% 65% 55%
For 49th Month 62% 52% 51% 49%
for 61st month 30% 37% 40% 50%
16 NPA Ratio
Gross NPA Ratio NA NA NA NA
Net NPA Ratio NA NA NA NA
17 Solvency Ratio 2.36 2.36 2.59 2.59
Equity Holding Pattern for Life Insurers
1 (a) No. of shares 1,46,55,98,957 1,46,55,98,957 1,46,31,09,161 1,46,31,09,161
2
(b) Percentage of shareholding (Indian / Foreign)
- Indian
- Foreign
51%
49%
51%
49%
51%
49%
51%
49%
3 ( c) %of Government holding (in case of public sector insurance companies) NA NA NA NA
4(a) Basic and diluted EPS before extraordinary items (net of tax expense) for the period (not to be
annualized) (Rs.) (0.19) (0.78) (0.36) (1.01)
5(b) Basic and diluted EPS after extraordinary items (net of tax expense) for the period (not to be
annualized) (Rs.) (0.19) (0.78) (0.36) (1.01)
6 (iv) Book value per share (Rs.) 1.63 1.63 1.52 1.52
* The growth rate in share holders fund is the absolute incremental growth from March 31, 2019 (in case of year) and from December 31, 2019 (in case of quarter)
** Persistency ratio for the year ended March 31, 2020 has been calculated on April 30, 2020 and is the ratio of in-force policies at end of March 31, 2020 to the policies issued during April 01, 2018 to
March 31, 2019
# Persistency numbers have been calculated in accordance with the methodology in the circular on persistency (IRDA/ACT/CIR/MISC/035/01/2014) from the Insurance Regulatory and Development
Authority of India and hence are on non-reducing basis.
^ Persistency numbers are calculated for the Retail business only

FORM L-23-RECEIPTS AND PAYMENTS SCHEDULE
(Rs. '000)
Particulars Year ended March
2020
Year ended March
2019
CASH FLOWS FROM OPERATING ACTIVITIES
Premium collected from Policyholders, including advances receipts 57,39,804 56,58,364
Payments to reinsurers (net of claims) (20,703) (47,628)
Payment for operating expenses (22,77,242) (23,63,970)
Payments for Policyholders' Benefits (32,97,317) (34,24,677)
Payment of Commission (39,765) (32,954)
Deposits, Advances and Staff Loans refunded / (paid) (6,482) (481)
Taxes paid (229) (111)
Goods and Services tax collected (paid) (15,255) 33,331
Net cash used in operating activities 82,811 (1,78,126)
CASH FLOWS FROM INVESTING ACTIVITIES
Purchase of Fixed Assets (6,42,245) (2,12,660)
Proceeds from sale of Fixed Assets 655 450
Purchase of Investments (2,14,11,355) (1,88,02,532)
Proceeds from sale of Investments 1,92,78,188 1,67,87,380
Investments in money market instruments and in liquid mutual funds (Net) 10,391 (3,25,419)
Loans given to policyholders (13,231) (1,951)
Other loans (12,698) (1,04,498)
Interest, Rent and dividend received 13,94,820 11,38,074
Expenses related to Investments (5,052) (4,918)
Net cash used in investing activities (14,00,527) (15,26,074)
CASH FLOWS FROM FINANCING ACTIVITIES
Proceeds from issuance of share capital 24,898 2,04,898
Proceeds from issuance of Non convertible debenture - -
Proceeds from share premium 12,07,800 16,29,600
Net cash from financing activities 12,32,698 18,34,498
Net increase in cash and cash equivalent (85,019) 1,30,298
Cash and cash equivalent at the beginning of the year 6,26,184 4,95,886
Cash and cash equivalent at the end of the year 5,41,165 6,26,184
2. Cash and Cash equivalent at the end of year comprises of the following Balance sheet amounts :
(Rs. In '000)
Particulars
Cash (including cheques, drafts, stamps in hand)
Bank Balances (Other than unit linked funds)
Bank Balances in Unit Linked Funds
Total
As at
March 31, 2020
RECEIPTS AND PAYMENTS ACCOUNT FOR THE YEAR ENDED MARCH 31, 2020
Aegon Life Insurance Company Limited
IRDA Registration No: 138
Date of Registration with IRDA: June 27, 2008
1. The above Receipts and Payments Account has been prepared as prescribed by Insurance Regulatory and Development Authority
(Preparation of Financial Statements and Auditor's Report of Insurance Companies) Regulations, 2002 under the "Direct Method" laid out in
Accounting standard - 3 on Cash Flow Statements.
As at
March 31, 2019
6,26,184 5,41,165
1,13,782
4,88,039
24,363
54,510
4,67,054
19,601

FORM L-24: VALUATION OF NET LIABILITIES
Insurer: Aegon Life Insurance Company Limited
31-Mar-20
(Rs in Lakhs)
Sl.No. ParticularAs at
March 31, 2020
As at
March 31, 2019
1 Linked
a) Life 76,241 90,438
b) General Annuity - -
c) Pension 2,596 3,813
d) Health - -
2 Non-Linked
a) Life 1,50,600 1,24,518
b) General Annuity 30 30
c) Pension 313 267
d) Health 206 211
Valuation of net liabilities
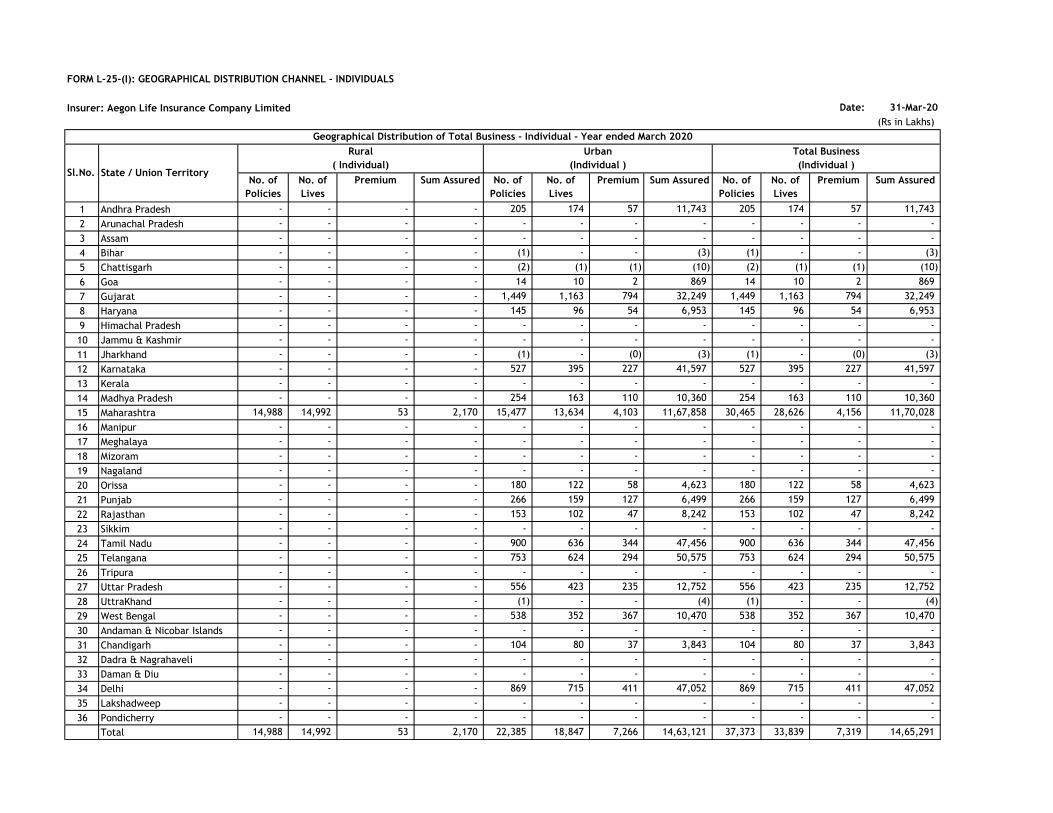
FORM L-25-(I): GEOGRAPHICAL DISTRIBUTION CHANNEL - INDIVIDUALS
Insurer: Aegon Life Insurance Company Limited Date: 31-Mar-20
(Rs in Lakhs)
No. of
Policies
No. of
Lives
Premium Sum Assured No. of
Policies
No. of
Lives
Premium Sum Assured No. of
Policies
No. of
Lives
Premium Sum Assured
1 Andhra Pradesh - - - - 205 174 57 11,743 205 174 57 11,743
2 Arunachal Pradesh - - - - - - - - - - - -
3 Assam - - - - - - - - - - - -
4 Bihar - - - - (1) - - (3) (1) - - (3)
5 Chattisgarh - - - - (2) (1) (1) (10) (2) (1) (1) (10)
6 Goa - - - - 14 10 2 869 14 10 2 869
7 Gujarat - - - - 1,449 1,163 794 32,249 1,449 1,163 794 32,249
8 Haryana - - - - 145 96 54 6,953 145 96 54 6,953
9 Himachal Pradesh - - - - - - - - - - - -
10 Jammu & Kashmir - - - - - - - - - - - -
11 Jharkhand - - - - (1) - (0) (3) (1) - (0) (3)
12 Karnataka - - - - 527 395 227 41,597 527 395 227 41,597
13 Kerala - - - - - - - - - - - -
14 Madhya Pradesh - - - - 254 163 110 10,360 254 163 110 10,360
15 Maharashtra 14,988 14,992 53 2,170 15,477 13,634 4,103 11,67,858 30,465 28,626 4,156 11,70,028
16 Manipur - - - - - - - - - - - -
17 Meghalaya - - - - - - - - - - - -
18 Mizoram - - - - - - - - - - - -
19 Nagaland - - - - - - - - - - - -
20 Orissa - - - - 180 122 58 4,623 180 122 58 4,623
21 Punjab - - - - 266 159 127 6,499 266 159 127 6,499
22 Rajasthan - - - - 153 102 47 8,242 153 102 47 8,242
23 Sikkim - - - - - - - - - - - -
24 Tamil Nadu - - - - 900 636 344 47,456 900 636 344 47,456
25 Telangana - - - - 753 624 294 50,575 753 624 294 50,575
26 Tripura - - - - - - - - - - - -
27 Uttar Pradesh - - - - 556 423 235 12,752 556 423 235 12,752
28 UttraKhand - - - - (1) - - (4) (1) - - (4)
29 West Bengal - - - - 538 352 367 10,470 538 352 367 10,470
30 Andaman & Nicobar Islands - - - - - - - - - - - -
31 Chandigarh - - - - 104 80 37 3,843 104 80 37 3,843
32 Dadra & Nagrahaveli - - - - - - - - - - - -
33 Daman & Diu - - - - - - - - - - - -
34 Delhi - - - - 869 715 411 47,052 869 715 411 47,052
35 Lakshadweep - - - - - - - - - - - -
36 Pondicherry - - - - - - - - - - - -
Total 14,988 14,992 53 2,170 22,385 18,847 7,266 14,63,121 37,373 33,839 7,319 14,65,291
Geographical Distribution of Total Business - Individual - Year ended March 2020
Sl.No. State / Union Territory
Rural
( Individual)
Urban
(Individual )
Total Business
(Individual )
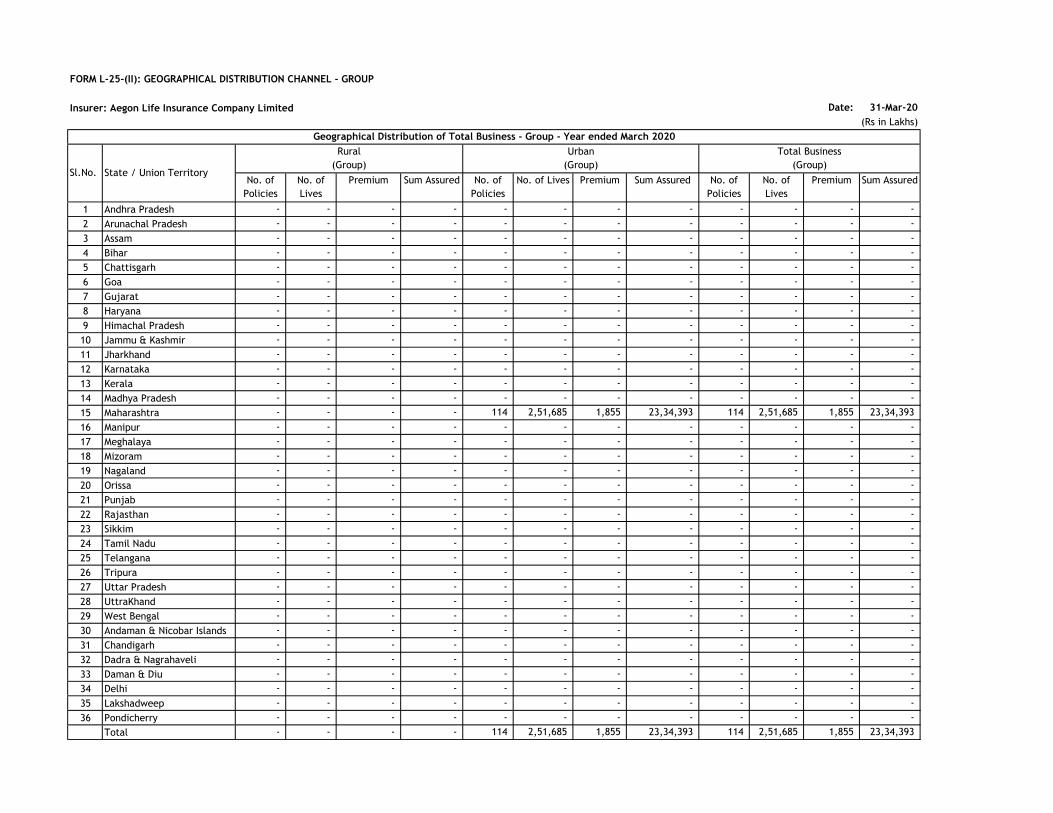
FORM L-25-(II): GEOGRAPHICAL DISTRIBUTION CHANNEL - GROUP
Insurer: Aegon Life Insurance Company Limited Date: 31-Mar-20
(Rs in Lakhs)
No. of
Policies
No. of
Lives
Premium Sum Assured No. of
Policies
No. of Lives Premium Sum Assured No. of
Policies
No. of
Lives
Premium Sum Assured
1 Andhra Pradesh - - - - - - - - - - - -
2 Arunachal Pradesh - - - - - - - - - - - -
3 Assam - - - - - - - - - - - -
4 Bihar - - - - - - - - - - - -
5 Chattisgarh - - - - - - - - - - - -
6 Goa - - - - - - - - - - - -
7 Gujarat - - - - - - - - - - - -
8 Haryana - - - - - - - - - - - -
9 Himachal Pradesh - - - - - - - - - - - -
10 Jammu & Kashmir - - - - - - - - - - - -
11 Jharkhand - - - - - - - - - - - -
12 Karnataka - - - - - - - - - - - -
13 Kerala - - - - - - - - - - - -
14 Madhya Pradesh - - - - - - - - - - - -
15 Maharashtra - - - - 114 2,51,685 1,855 23,34,393 114 2,51,685 1,855 23,34,393
16 Manipur - - - - - - - - - - - -
17 Meghalaya - - - - - - - - - - - -
18 Mizoram - - - - - - - - - - - -
19 Nagaland - - - - - - - - - - - -
20 Orissa - - - - - - - - - - - -
21 Punjab - - - - - - - - - - - -
22 Rajasthan - - - - - - - - - - - -
23 Sikkim - - - - - - - - - - - -
24 Tamil Nadu - - - - - - - - - - - -
25 Telangana - - - - - - - - - - - -
26 Tripura - - - - - - - - - - - -
27 Uttar Pradesh - - - - - - - - - - - -
28 UttraKhand - - - - - - - - - - - -
29 West Bengal - - - - - - - - - - - -
30 Andaman & Nicobar Islands - - - - - - - - - - - -
31 Chandigarh - - - - - - - - - - - -
32 Dadra & Nagrahaveli - - - - - - - - - - - -
33 Daman & Diu - - - - - - - - - - - -
34 Delhi - - - - - - - - - - - -
35 Lakshadweep - - - - - - - - - - - -
36 Pondicherry - - - - - - - - - - - -
Total - - - - 114 2,51,685 1,855 23,34,393 114 2,51,685 1,855 23,34,393
Geographical Distribution of Total Business - Group - Year ended March 2020
Sl.No. State / Union Territory
Rural
(Group)
Urban
(Group)
Total Business
(Group)
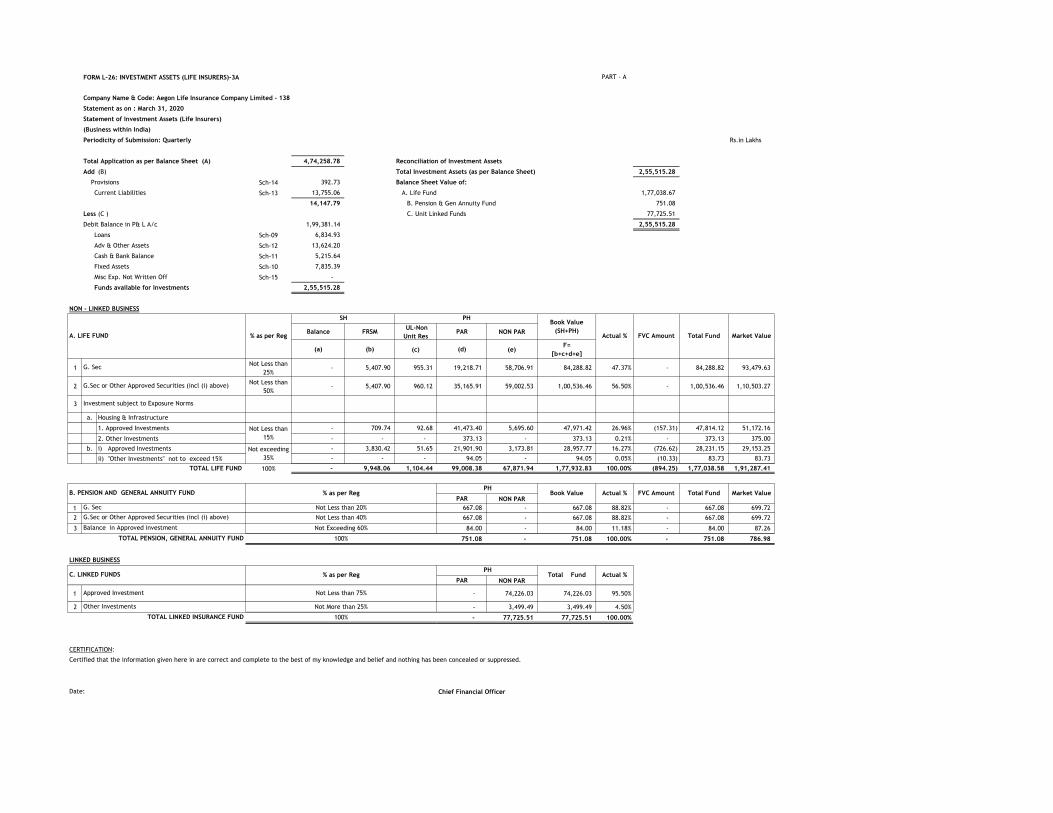
FORM L-26: INVESTMENT ASSETS (LIFE INSURERS)-3A PART - A
Company Name & Code: Aegon Life Insurance Company Limited - 138
Statement as on : March 31, 2020
Statement of Investment Assets (Life Insurers)
(Business within India)
Periodicity of Submission: Quarterly Rs.in Lakhs
Total Application as per Balance Sheet (A) 4,74,258.78 Reconciliation of Investment Assets
Add (B) Total Investment Assets (as per Balance Sheet) 2,55,515.28
Provisions Sch-14 392.73 Balance Sheet Value of:
Current Liabilities Sch-13 13,755.06 A. Life Fund 1,77,038.67
14,147.79 B. Pension & Gen Annuity Fund 751.08
Less (C ) C. Unit Linked Funds 77,725.51
Debit Balance in P& L A/c 1,99,381.14 2,55,515.28
Loans Sch-09 6,834.93
Adv & Other Assets Sch-12 13,624.20
Cash & Bank Balance Sch-11 5,215.64
Fixed Assets Sch-10 7,835.39
Misc Exp. Not Written Off Sch-15 -
Funds available for Investments 2,55,515.28
NON - LINKED BUSINESS
Balance FRSM UL-Non
Unit Res PAR NON PAR
(a) (b) (c) (d) (e)F=
[b+c+d+e]
1Not Less than
25%- 5,407.90 955.31 19,218.71 58,706.91 84,288.82 47.37% - 84,288.82 93,479.63
2Not Less than
50%- 5,407.90 960.12 35,165.91 59,002.53 1,00,536.46 56.50% - 1,00,536.46 1,10,503.27
3
a. Housing & Infrastructure
1. Approved Investments - 709.74 92.68 41,473.40 5,695.60 47,971.42 26.96% (157.31) 47,814.12 51,172.16
2. Other Investments - - - 373.13 - 373.13 0.21% - 373.13 375.00
b. i) Approved Investments - 3,830.42 51.65 21,901.90 3,173.81 28,957.77 16.27% (726.62) 28,231.15 29,153.25
ii) "Other Investments" not to exceed 15% - - - 94.05 - 94.05 0.05% (10.33) 83.73 83.73
TOTAL LIFE FUND 100% - 9,948.06 1,104.44 99,008.38 67,871.94 1,77,932.83 100.00% (894.25) 1,77,038.58 1,91,287.41
PAR NON PAR
1 667.08 - 667.08 88.82% - 667.08 699.72
2 667.08 - 667.08 88.82% - 667.08 699.72
3 84.00 - 84.00 11.18% - 84.00 87.26
751.08 - 751.08 100.00% - 751.08 786.98
LINKED BUSINESS
PAR NON PAR
1 - 74,226.03 74,226.03 95.50%
2 - 3,499.49 3,499.49 4.50%
- 77,725.51 77,725.51 100.00%
CERTIFICATION:
Certified that the information given here in are correct and complete to the best of my knowledge and belief and nothing has been concealed or suppressed.
Date: Chief Financial Officer
TOTAL LINKED INSURANCE FUND 100%
C. LINKED FUNDS % as per Reg Total Fund Actual %
Approved Investment Not Less than 75%
Other Investments Not More than 25%
Balance in Approved investment Not Exceeding 60%
TOTAL PENSION, GENERAL ANNUITY FUND 100%
PH
G.Sec or Other Approved Securities (incl (i) above) Not Less than 40%
% as per RegPH
Actual %
Not Less than
15%
Not exceeding
35%
B. PENSION AND GENERAL ANNUITY FUND Market Value
G. Sec Not Less than 20%
Book Value FVC Amount Total Fund
FVC Amount Total Fund Market Value
G. Sec
G.Sec or Other Approved Securities (incl (i) above)
Book Value
(SH+PH)Actual %
Investment subject to Exposure Norms
A. LIFE FUND % as per Reg
SH PH

FORM L-27: UNIT LINKED BUSINESS-3A
Unit Linked Insurance Business PART - B
Company Name & Code: Aegon Life Insurance Company Limited - 138
Periodicity of Submission : Quarterly Link to Item 'C' of FORM 3A (Part A)
Statement as on : March 31, 2020
Rs. Lakhs
PARTICULARS
Opening Balance (Market Value)
Add: Inflow during the Quarter
Increase / (Decrease) Value of Inv [Net]
Less: Outflow during the Quarter
TOTAL INVESTIBLE FUNDS (MKT VALUE)
Actual Inv. % Actual Actual Inv. % ActualActual
Inv.% Actual Actual Inv. % Actual Actual Inv. % Actual Actual Inv. % Actual Actual Inv. % Actual Actual Inv. % Actual Actual Inv. % Actual Actual Inv. % Actual Actual Inv. % Actual Actual Inv. % Actual Actual Inv. % Actual Actual Inv. % Actual Actual Inv. % Actual Actual Inv. % Actual Actual Inv. % Actual Actual Inv. % Actual
Approved Investments (>=75%)
Central Govt Securities - - 34.43 2.02 25.79 76.57 4,418.63 31.40 1,239.44 35.08 - - 46.15 19.48 210.85 32.40 60.90 43.55 - - - - - - 121.01 7.09 - - - - - - - - 6,157.20 7.92
State Governement Securities - - - - - - 1,013.84 7.20 932.52 26.40 - - - - 34.86 5.36 - - - - - - - - 52.58 3.08 - - - - - - - - 2,033.80 2.62
Other Approved Securities - - 324.32 19.05 - - - - - - - - 15.18 6.41 - - - - - - - - - - 200.82 11.77 - - - - - - - - 540.31 0.70
Corporate Bonds - - 34.23 2.01 - - 3,166.38 22.50 314.64 8.91 - - - - 146.66 22.54 - - - - - - - - 11.41 0.67 - - - - - - - - 3,673.32 4.73
Infrastructure Bonds* - - 200.21 11.76 - - 4,103.02 29.16 542.44 15.35 - - 21.05 8.88 198.59 30.52 - - - - - - - - 190.89 11.19 - - - - - - - - 5,256.20 6.76
Equity 5,692.00 82.70 971.08 57.05 4.89 14.52 - - - - 798.87 83.03 136.55 57.64 - - - - 546.51 93.65 754.05 15.87 12,231.36 83.73 1,018.98 59.74 7,855.19 80.15 6,314.38 78.35 - - 877.73 82.79 37,201.59 47.86
Money Market 495.37 7.20 78.18 4.59 2.32 6.89 777.17 5.52 414.90 11.74 64.99 6.75 9.77 4.12 37.68 5.79 77.81 55.64 6.53 1.12 3,948.69 83.13 1,264.82 8.66 107.83 6.32 806.94 8.23 1,031.12 12.79 9,801.51 109.58 78.85 7.44 19,004.46 24.45
Mutual funds - - - - - - - - - - - - - - - - - - - - - - - - - - - - - - - - - - - -
Deposit with Banks - - - - - - - - - - - - - - - - - - - - - - - - - - - - - - - - - - - -
Sub Total (A) 6,187.37 89.89 1,642.45 96.49 33.00 97.98 13,479.03 95.79 3,443.94 97.49 863.86 89.79 228.70 96.55 628.65 96.61 138.71 99.18 553.04 94.77 4,702.74 99.00 13,496.19 92.39 1,703.51 99.88 8,662.13 88.38 7,345.49 91.15 9,801.51 109.58 956.58 90.22 73,866.88 95.04
Current Assets:
Accrued Interest - - 14.07 0.83 0.41 1.22 369.14 2.62 72.12 2.04 - - 1.56 0.66 17.79 2.73 0.78 0.56 - - - - - - 15.45 0.91 - - - - - - - - 491.32 0.63
Dividend Recievable - - (0.00) (0.00) - - - - - - - - (0.00) (0.00) - - - - (0.00) (0.00) (0.00) (0.00) (0.00) (0.00) (0.00) (0.00) - - - - - - - - (0.00) (0.00)
Bank Balance 28.35 0.41 4.98 0.29 0.04 0.12 90.45 0.64 0.26 0.01 4.04 0.42 0.68 0.29 3.80 0.58 0.05 0.03 0.61 0.10 3.10 0.07 1.78 0.01 0.28 0.02 42.46 0.43 1.64 0.02 6.35 0.07 4.33 0.41 193.20 0.25
Receivable for Sale of Investments 97.87 1.42 - - - - - - - - 15.35 1.60 - - - - - - 1.68 0.29 (0.00) (0.00) - - - - 103.62 1.06 - - - - 15.18 1.43 233.69 0.30
Application Money-Debt Sec/Tax
deducted at source payable- - - - - - - - - - - - - - - - - - - - - - - - - - - - - - - - - - - -
Receivable for subscription - - - - - - - - - - - - - - - - - - - - - - - - - - - - - - - - - - - -
Receivable for Interest - - - - - - - - - - - - - - - - - - - - - - - - - - - - - - - - - - - -
Other Current Assets (for Investments) 6.97 0.10 4.77 0.28 - - 133.26 0.95 16.45 0.47 1.18 0.12 0.00 0.00 0.44 0.07 0.31 0.22 0.89 0.15 1.74 0.04 105.85 0.72 15.49 0.91 263.27 2.69 215.64 2.68 - - 0.01 0.00 766.30 0.99
Less: Current Liabilities
Payable for Investments 119.59 1.74 6.60 0.39 - - - - - - 15.78 1.64 0.85 0.36 - - - - 0.48 0.08 3.37 0.07 - - 80.06 4.69 216.45 2.21 - - - - 19.32 1.82 462.51 0.60
Payable for Redemption - - - - - - - - - - - - - - - - - - - - - - - - - - - - - - - - - - - -
Fund Mgmt Charges Payable - - - - - - - - - - - - - - - - - - - - - - - - - - - - - - - - - - - -
Other Current Liabilities (for Investments) - - - - 0.00 0.00 - - - - - - - - - - - - - - - - - - - - - - - - 862.86 9.65 - - 862.86 1.11
Sub Total (B) 13.60 0.20 17.22 1.01 0.45 1.34 592.85 4.21 88.83 2.51 4.79 0.50 1.40 0.59 22.04 3.39 1.14 0.82 2.69 0.46 1.47 0.03 107.63 0.74 (48.84) (2.86) 192.91 1.97 217.28 2.70 (856.51) (9.58) 0.19 0.02 359.14 0.46
Other Investments (<=25%)
Corporate Bonds - - - - - - - - - - - - - - - - - - - - - - - - - - - - - - - - - - - -
Infrastructure Bonds - - - - - - - - - - - - - - - - - - - - - - - - - - - - - - - - - - - -
Equity 82.54 1.20 42.60 2.50 0.23 0.69 - - - - 11.88 1.23 6.79 2.87 - - - - 27.83 4.77 46.03 0.97 71.10 0.49 50.97 2.99 114.41 1.17 496.07 6.16 - - 13.02 1.23 963.47 1.24
Money Market - - - - - - - - - - - - - - - - - - - - - - - - - - - - - - - - - - - -
Mutual funds 599.38 8.71 - - - - - - - - 81.60 8.48 - - - - - - - - - - 933.35 6.39 - - 831.23 8.48 - - - - 90.46 8.53 2,536.02 3.26
Sub Total (C) 681.92 9.91 42.60 2.50 0.23 0.69 - - - - 93.48 9.72 6.79 2.87 - - - - 27.83 4.77 46.03 0.97 1,004.45 6.88 50.97 2.99 945.64 9.65 496.07 6.16 - - 103.48 9.76 3,499.49 4.50
Total (A + B + C) 6,882.89 100.00 1,702.28 100.00 33.68 100.00 14,071.88 100.00 3,532.77 100.00 962.13 100.00 236.88 100.00 650.68 100.00 139.85 100.00 583.56 100.00 4,750.23 100.00 14,608.26 100.00 1,705.64 100.00 9,800.68 100.00 8,058.84 100.00 8,945.00 100.00 1,060.25 100.00 77,725.51 100.00
Fund Carried Forward (as per LB 2)
(0.00)
Date: Chief Financial Officer
* includes Housing Sector Investment
633.86
-936.93
138.88
59.72
864.72 6,431.84 10,542.78
969.2039.86
19,217.76
1,485.82
-4,152.50
1,992.23
-243.24
12,525.92
2,117.60
-3,793.49
2,133.87
55.15 1.19
10,168.87
PENSION BALANCED
FUND
CONSERVATIVE
FUND
34.33 13,016.45 3,336.32 1,425.64 298.73
1,820.53 633.39
TOTALPENSION SECURED
FUND
SECURED
FUND
PENSION ENHANCED
EQUITY FUND
PENSION BALANCED
FUND
PENSION DEBT
FUNDPENSION INDEX FUND NAV PROTECTOR FUND
283.92 9,796.48
10,681.06
-15,284.07479.69
1,244.79
75.79
512.73 2,689.83
-53.43
24.22
3.01
26.26
22.72
65.61
122.84
Par / Non-Par
ENHANCED EQUITY
FUND
BALANCED
FUND
DEBT
FUNDTOTAL
PENSION SECURED
FUND
SECURED
FUND
PENSION ENHANCED
EQUITY FUND
DISCONTINUED POLICY
FUND
PENSION DEBT
FUND
ACCELERATOR
FUND
STABLE
FUNDPENSION INDEX FUND NAV PROTECTOR FUND GROUP GRATUITY FUNDBLUE CHIP FUND OPPORTUNITY FUND
-2,842.18 -378.90
6,882.89
727.71 107.85
1,702.28 14,071.8833.68
INVESTMENT OF UNIT FUND
ENHANCED EQUITY
FUND
BALANCED
FUND
DEBT
FUND
CONSERVATIVE
FUND
-0.98
0.87
GROUP GRATUITY FUND
3,532.77 962.13 236.88 650.68 4,750.23
60.01
-395.69
127.82
17.96
26.38
DISCONTINUED POLICY
FUND
50.89 252.91
-367.53
171.98
STABLE
FUND
1,705.64
ACCELERATOR
FUNDBLUE CHIP FUND
1,049.35
9,800.68
OPPORTUNITY FUND
1,633.27
0.01
-429.98
143.04
1,060.258,945.00 77,725.51139.85 14,608.26583.56
77.77 1,942.81795.57
93,894.169,498.71
1,924.11
-2,393.28
970.70
8,058.84

FORM L-28: ULIP-NAV-3A
Company Name & Code: Aegon Life Insurance Company Limited - 138 PART - C
Statement as on : March 31, 2020 Link to FORM 3A (Part B)
Periodicity of Submission: Quarterly
No Name of the Scheme Assets Held on the
above date
NAV as on the
above date
NAV as per
LB 2 Previous Qtr NAV
2nd Previous Qtr
NAV
3rd Previous Qtr
NAV
4th Previous Qtr
NAV
Annualised
Return/Yield
3 Year Rolling
CAGR
1 Aegon Life Enhanced Equity Fund 6,882.89 20.9737 20.9737 29.5354 28.0645 29.3828 29.0547 -27.81% -2.93%
2 Aegon Life Balanced Fund 1,702.28 21.4766 21.4766 26.2225 25.2522 25.0595 24.5253 -12.43% 1.34%
3 Aegon Life Conservative Fund 33.68 23.1846 23.1846 23.8523 23.3797 23.2213 22.4331 3.35% 5.58%
4 Aegon Life Debt Fund 14,071.88 28.2522 28.2522 27.2603 26.7130 26.0936 25.1457 12.35% 7.55%
5 Aegon Life Secured Fund 3,532.77 20.9932 20.9932 20.5284 20.2889 19.9587 19.6732 6.71% 2.96%
6 Aegon Life Pension Enhanced Equity Fund 962.13 33.5552 33.5552 47.1207 44.7886 46.9071 46.4090 -27.70% -2.74%
7 Aegon Life Pension Balanced Fund 236.88 23.5916 23.5916 28.8462 27.7836 27.6636 27.0124 -12.66% 1.65%
8 Aegon Life Pension Debt Fund 650.68 22.6284 22.6284 21.8428 21.4160 20.9072 20.1654 12.21% 7.22%
9 Aegon Life Pension Secured Fund 139.85 21.5272 21.5272 21.0728 20.8849 20.6195 20.3522 5.77% 5.51%
10 Aegon Life Pension Index Fund 583.56 31.3722 31.3722 44.2697 41.8545 42.9176 42.3188 -25.87% -2.20%
11 Aegon Life NAV Protect Fund 4,750.23 17.0349 17.0349 20.1546 19.4553 19.8798 19.7212 -13.62% 1.26%
12 Aegon Life Accelerator Fund 14,608.26 15.4571 15.4571 19.8385 18.7604 19.0508 18.8707 -18.09% -0.24%
13 Aegon Life Stable Fund 1,705.64 15.9207 15.9207 19.5261 18.8012 18.7348 18.3319 -13.15% 1.21%
14 Aegon Life Discontinued Policy Fund 8,945.00 18.4607 18.4607 18.2410 18.0074 17.7624 17.5064 5.45% 5.69%
15 Aegon Life Group Gratuity Equity Fund 1,060.25 17.0848 17.0848 23.9588 22.9388 23.9979 23.6598 -27.79% -2.32%
16 Aegon Life Blue Chip Equity Fund 9,800.68 10.1493 10.1493 14.2963 13.5951 14.2369 14.0870 -27.95% -3.71%
17 Aegon Life Opportunity Fund 8,058.84 9.0743 9.0743 11.8759 11.2232 11.9536 12.0011 -24.39% -3.86%
Total 77,725.51
CERTIFICATION
Certified that the information given herein are correct and complete to the best of my knowledge and belief and nothing has been concealed or suppressed.
Date: Chief Financial Officer

FORM L-29: DETAIL REGARDING DEBT SECURITIES - LIFE FUND
Insurer: Aegon Life Insurance Company Limited Date: 31-Mar-20
(Rs in Lakhs)
Particulars As at
March 31, 2020
as % of total
for this class
As at
March 31, 2019
as % of total for
this class
As at
March 31, 2020
as % of total
for this class
As at
March 31, 2019
as % of total for
this class
Break down by credit rating
AAA rated 1,84,153.23 99.80 1,53,382.38 99.68 1,69,982.68 99.78 1,51,285.64 99.67
AA or better - - - - - - - -
Rated below AA but above A - - 494.90 0.32 - - 497.28 0.33
Rated below A but above B 375.00 0.20 - - 373.13 0.22 - -
Any other - - 0.00 - - - 0.00 -
Total 1,84,528.23 100.00 1,53,877.28 100.00 1,70,355.81 100.00 1,51,782.92 100.00
Break down by residual maturity
Up to 1 year 11,809.15 6.40 15,326.97 9.96 11,809.15 6.93 15,326.97 10.10
More than 1 year and upto 3 years 375.00 0.20 494.90 0.32 373.13 0.22 497.28 0.33
More than 3 years and up to 7 years 18,954.43 10.27 5,585.65 3.63 18,029.34 10.58 5,798.17 3.82
More than 7 years and up to 10 years 53,770.79 29.14 40,403.89 26.26 50,385.18 29.58 39,918.01 26.30
More than 10 years and up to 15 years 20,605.30 11.17 24,468.77 15.90 19,251.17 11.30 24,351.75 16.04
More than 15 years and up to 20 years 4,065.68 2.20 4,234.74 2.75 3,437.93 2.02 3,936.81 2.59
Above 20 years 74,947.88 40.62 63,362.35 41.18 67,069.91 39.37 61,953.92 40.82
Total 1,84,528.23 100.00 1,53,877.28 100.00 1,70,355.81 100.00 1,51,782.92 100.00
Breakdown by type of the issuer
Central Government 1,00,305.20 54.36 88,315.43 57.39 91,190.76 53.53 86,531.67 57.01
State Government 17,023.65 9.22 11,122.94 7.23 16,247.63 9.54 11,170.45 7.36
Corporate Securities 67,199.38 36.42 54,438.91 35.38 62,917.42 36.93 54,080.80 35.63
Total 1,84,528.23 100.00 1,53,877.28 100.00 1,70,355.81 100.00 1,51,782.92 100.00
Market Value Book Value
Detail regarding debt securities

FORM L-29: DETAIL REGARDING DEBT SECURITIES - PENSION, GENERAL ANNUITY FUND
Insurer: Aegon Life Insurance Company Limited Date: 31-Mar-20
(Rs in Lakhs)
Particulars As at
March 31, 2020
as % of total for
this class
As at
March 31, 2019
as % of total for
this class
As at
March 31, 2020
as % of total for
this class
As at
March 31, 2019
as % of total for
this class
Break down by credit rating
AAA rated 786.98 100.00 696.74 100.00 751.08 100.00 681.20 100.00
AA or better - - - - - - - -
Rated below AA but above A - - - - - - - -
Rated below A but above B* - - - - - - - -
Any other - - - - - - - -
Total 786.98 100.00 696.74 100.00 751.08 100.00 681.20 100.00
Break down by residual maturity
Up to 1 year 518.82 65.93 448.92 64.43 518.82 69.08 448.92 65.90
More than 1 year and upto 3 years - - - - - - - -
More than 3 years and up to 7 years 14.76 1.88 - - 13.53 1.80 - -
More than 7 years and up to 10 years 32.53 4.13 24.65 3.54 29.27 3.90 23.11 3.39
More than 10 years and up to 15 years 8.03 1.02 27.49 3.95 7.23 0.96 26.87 3.94
More than 15 years and up to 20 years 89.73 11.40 82.99 11.91 76.50 10.19 76.46 11.22
Above 20 years 123.11 15.64 112.69 16.17 105.73 14.08 105.83 15.54
Total 786.98 100.00 696.74 100.00 751.08 100.00 681.20 100.00
Breakdown by type of the issuer
Central Government 699.72 88.91 416.06 59.71 667.08 88.82 401.68 58.97
State Government - - - - - - - -
Corporate Securities 87.26 11.09 280.68 40.29 84.00 11.18 279.52 41.03
Total 786.98 100.00 696.74 100.00 751.08 100.00 681.20 100.00
Market Value Book Value
Detail regarding debt securities

FORM L-29: DETAIL REGARDING DEBT SECURITIES - LINKED FUND
Insurer: Aegon Life Insurance Company Limited Date: 31-Mar-20
(Rs in Lakhs)
Particulars As at
March 31, 2020
as % of total
for this class
As at
March 31, 2019
as % of total
for this class
As at
March 31, 2020
as % of total
for this class
As at
March 31, 2019
as % of total
for this class
Break down by credit rating
AAA rated 36,665.29 100.00 30,829.75 100.00 36,044.23 100.00 30,596.42 100.00
AA or better - - - - - - - -
Rated below AA but above A - - - - - - - -
Rated below A but above B - - - - - - - -
Any other - - 0.00 - - - - -
Total 36,665.29 100.00 30,829.75 100.00 36,044.23 100.00 30,596.42 100.00
Break down by residual maturity
Up to 1 year 20,480.78 55.86 16,453.99 53.37 20,472.26 56.80 16,481.21 53.87
More than 1 year and upto 3 years 2,925.74 7.98 2,526.17 8.19 2,888.89 8.01 2,495.28 8.16
More than 3 years and up to 7 years 5,398.79 14.72 5,268.76 17.09 5,040.10 13.98 5,090.93 16.64
More than 7 years and up to 10 years 2,131.04 5.81 4,032.25 13.08 2,046.47 5.68 4,010.73 13.11
More than 10 years and up to 15 years 4,451.69 12.14 338.36 1.10 4,373.31 12.13 328.05 1.07
More than 15 years and up to 20 years 284.75 0.78 517.14 1.68 279.95 0.78 515.63 1.69
Above 20 years 992.50 2.71 1,693.09 5.49 943.25 2.62 1,674.59 5.47
Total 36,665.29 100.00 30,829.75 100.00 36,044.23 100.00 30,596.42 100.00
Breakdown by type of the issuer
Central Government 25,701.97 70.10 19,309.52 62.63 25,570.97 70.94 19,265.49 62.97
State Government 2,033.80 5.55 2,017.34 6.54 2,037.06 5.65 2,036.92 6.66
Corporate Securities 8,929.52 24.35 9,502.89 30.82 8,436.20 23.41 9,294.01 30.38
Total 36,665.29 100.00 30,829.75 100.00 36,044.23 100.00 30,596.42 100.00
Market Value Book Value
Detail regarding debt securities

FORM L-30: RELATED PARTY TRANSACTIONS
Insurer: Aegon Life Insurance Company Limited Date: 31-Mar-20
(Rs in Lakhs)
Quarter ended
March 2020
Year ended March
2020
Quarter ended March
2019
Year ended March
2019
Subscription to Equity Shares (including securities premium) 6,100 12,200 10,000 17,300
Interest on Debentures accrued but not due (499) - (501) -
Insurance Premium received for Group Insurance Policies - - - 273
Group Refund Payment 5 5 - -
Advertisement, Marketing and Publicity 11 11 28 134
Reimbursement for Travel Related Expenses 199 199 - -
Reimbursement for Expenses 138 308 63 214
Insurance Premium received for Group Insurance Policies - - 50 50
Benefit Paid under Group Policy 14 127 37 88
4 AEGON N.V. Reimbursement for Expenses 17 61 16 77
5 Vineet Arora** 58 399 56 331
*Related Party relationships are identified by the Management
** Resigned as Managing Director and Chief Executive Officer; his last working day with the Company was February 24, 2020
Related Party Transactions*
Sl.No. Name of the Related Party
Nature of
Relationship with the
Company
Description of Transactions / Categories
Consideration paid / received
2
Managerial Remuneration
Joint Venture and
Entities where control
exists
Aegon India Holdings B.V.1
3 Aegon Life Insurance Employees Gratuity Trust
Bennett Coleman & Co. Limited
AEGON Asia Pacific B.V.2 Associate Companies
where transactions
have taken place
during the year

FORM L-31-LNL-6: BOARD OF DIRECTORS & KEY PERSON
Insurer: Aegon Life Insurance Company Limited
Date: 31-Mar-20
Sl. No. Name of person Role/designation Details of change in the period
1 Mr. S Sivakumar Non-executive Director
2 Mr. Srinivasan V Independent Director
3 Mr. G Ramaswamy Non-executive Director
4 Ms. Mitu Samar Non-executive Director
5 Mr. Ramaswamy P Subramaniam Non-executive Director
6 Mr. N Kumar Independent Director
7 Mr. Nani Javeri Independent Director
8 Mr. Marco Keim Non-executive Director
9 Mr. Patrick Curtin Non-executive Director
10 Mr. Vineet Arora Managing Director & Chief Executive Officer Resigned w.e.f. 24.02.2020
11 Mr. Satishwar Balakrishnan Interim In-charge & Principal Officer & Chief Financial Officer Appointed w.e.f. 25.02.2020
12 Mr. Saibal Ghosh Chief Investment Officer
13 Mr. Jitin Parekh Company Secretary
14 Mr. Lee Waddle Chief Risk Officer
15 Mr. Douglas Kennedy Chief Technology Officer
16 Mr. Ahmed Zackaria Chief Distribution Officer
17 Mr. Anil Agarwal Head - Compliance
18 Mr. Ketul Patel Head - Internal Audit Appointed w.e.f. 05.09.2019
19 Mr. Curtis Chen Non-executive Director Appointed w.e.f. 01.01.2020
20 Ms. Sunita Rath Chief People Officer Appointed w.e.f. 07.01.2020
21 Mr. Naveen Bachwani Chief Operating Officer Appointed w.e.f. 17.02.2020
22 Mr. Kamlesh Gupta Appointed Actuary Appointed w.e.f. 27.02.2020
Key Persons as defined in IRDAI Registration of Companies Regulations, 2000
BOD and Key Person information
No Change
No Change
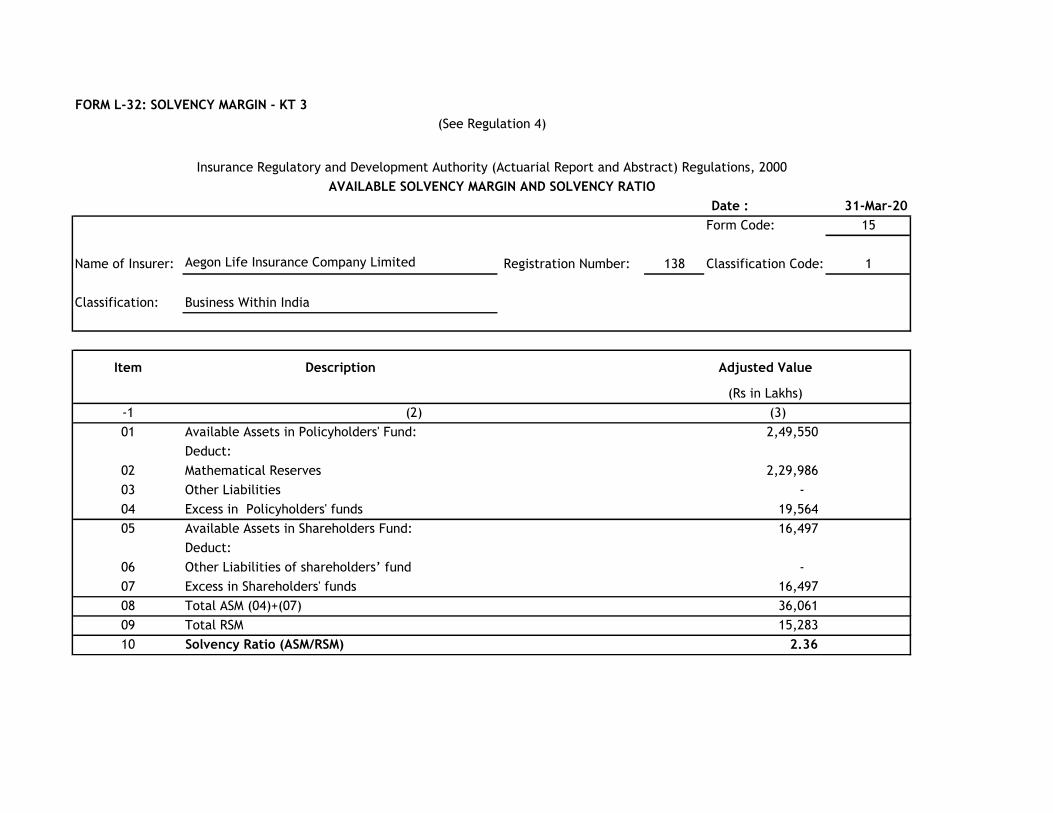
FORM L-32: SOLVENCY MARGIN - KT 3
Date : 31-Mar-20
Form Code: 15
Name of Insurer: Aegon Life Insurance Company Limited Registration Number: 138 Classification Code: 1
Classification: Business Within India
Item Description Adjusted Value
(Rs in Lakhs)
-1
01 Available Assets in Policyholders' Fund: 2,49,550
Deduct:
02 Mathematical Reserves 2,29,986
03 Other Liabilities -
04 Excess in Policyholders' funds 19,564
05 Available Assets in Shareholders Fund: 16,497
Deduct:
06 Other Liabilities of shareholders’ fund -
07 Excess in Shareholders' funds 16,497
08 Total ASM (04)+(07) 36,061
09 Total RSM 15,283
10 Solvency Ratio (ASM/RSM) 2.36
(See Regulation 4)
Insurance Regulatory and Development Authority (Actuarial Report and Abstract) Regulations, 2000
AVAILABLE SOLVENCY MARGIN AND SOLVENCY RATIO
(2) (3)

FORM L-33: NPAs-7A
Company Name & Code : Aegon Life Insurance Company Limited - 138
Statement as on : March 31, 2020 Name of the Fund: Life Fund
Details of Investment Portfolio
Periodicity of Submission : Quarterly
%
Has there
been
revision?
AmountBoard
Approval Ref
Nil
CERTIFICATION
Certified that the information given herein are correct and complete to the best of my knowledge and belief and nothing has been concealed or suppressed.
Date: Chief Financial Officer
Classificatio
n
Provision
(%)Provision (Rs)
Principal
Due from
Interest Due
from
Deferred
Principal
Deferred
Interest
Rolled
Over?
Has there been any
Principal Waiver?Default
Interest
(Book
Value)
COI Company NameInstrument
Type
Interest Rate
Total O/s
(Book Value)
Default
Principal
(Book Value)

FORM L-33: NPAs-7A
Company Name & Code : Aegon Life Insurance Company Limited - 138
Statement as on : March 31, 2020 Name of the Fund: Pension, General Annuity Fund
Details of Investment Portfolio
Periodicity of Submission : Quarterly
%
Has there
been
revision?
AmountBoard
Approval Ref
Nil
CERTIFICATION
Certified that the information given herein are correct and complete to the best of my knowledge and belief and nothing has been concealed or suppressed.
Date: Chief Financial Officer
Provision
(%)
Provision
(Rs)
Default
Interest
(Book
Value)
Principal
Due from
Interest
Due from
Deferred
Principal
Deferred
Interest
Rolled
Over?
Total O/s
(Book
Value)
Default
Principal
(Book Value)
Has there been any
Principal Waiver?Classificatio
nCOI Company Name
Instrument
Type
Interest Rate

FORM L-33: NPAs-7A
Company Name & Code : Aegon Life Insurance Company Limited - 138
Statement as on : March 31, 2020 Name of the Fund: Linked Fund
Details of Investment Portfolio
Periodicity of Submission : Quarterly
%
Has there
been
revision?
Amount
Board
Approval
Ref
Nil
CERTIFICATION
Certified that the information given herein are correct and complete to the best of my knowledge and belief and nothing has been concealed or suppressed.
Date: Chief Financial Officer
Default
Interest
(Book
Value)
Classificatio
n
Provision
(%)Provision (Rs)
Principal
Due from
Interest Due
from
Deferred
Principal
Deferred
Interest
Rolled
Over?
Has there been any
Principal Waiver?Total O/s
(Book Value)
Default
Principal (Book
Value)
COI Company NameInstrument
Type
Interest Rate

FORM L-34-YIELD ON INVESTMENTS-1
Company Name & Code : Aegon Life Insurance Company Limited- 138
Statement as on : March 31, 2020 Name of the Fund: Life Fund
Statement of Investment and Income on Investment
Periodicity of Submission: Quarterly (Rs.in Lakhs)
Book Value Market Value Book Value Market Value Book Value Market Value
A GOVERNMENT SECURITIES
A01 Central Government Bonds CGSB 83,315 92,506 1,590 1.92% 1.92% 83,315 92,506 6,663 8.31% 8.31% 76,040 77,824 5,457 7.84% 7.84%
A02 Special Deposits CSPD - - - - - - - - - - - - - - -
A03 Deposit Under Section 7 of Insurance Act, 1938 CDSS - - - - - - - - - - - - - - -
A04 Treasury Bills CTRB 10 974 13 1.36% 1.36% 9.74 974 27 2.80% 2.80% - - - - -
B GOVERNMENT SECURITIES / OTHER APPROVED SECURITIES
B01 Central Government Guaranteed Loans / Bonds CGSL - - - - - - - 39 1.29% 1.29% 3,025 2,936 229 7.56% 7.56%
B02 State Government Bonds SGGB 16,248 17,024 305 1.92% 1.92% 16,248 17,024 1,104 7.80% 7.80% 11,170 11,123 590 7.65% 7.65%
B03 State Government Guaranteed Bonds SGGL - - - - - - - - - - - - - - -
B04 Other Approved Securities (excluding infrastructure Investments) SGOA - - - - - - - - - - - - - - -
B05 Guaranteed Equity SGGE - - - - - - - - - - - - - - -
CHOUSING AND LOANS TO STATE GOVT. FOR HOUSING AND FIRE FIGHTING
EQUIPMENT
C01 Loans to State Government for Housing HLSH - - - - - - - - - - - - - - -
C02 Loans to State Government for Fire Fighting Equipment HLSF - - - - - - - - - - - - - - -
C03 Term Loan - HUDCO / NHB / Institution accredited by NHB HTLH - - - - - - - - - - - - - - -
C04 Commercial Papers - NHB / Institution accredited by NHB HTLN - - - - - - - 50 1.83% 1.83% 2,950 2,950 3 0.12% 0.12%
C05 Housing - Securitised Assets HMBS - - - - - - - - - - - - - - -
C06 Debentures / Bonds / CPs / Loans - (Promoter Group) HDPG - - - - - - - - - - - - - - -
TAXABLE BONDS
C07 Bonds / Debentures issued by HUDCO HTHD - - - - - - - - - - - - - - -
C08 Bonds / Debentures issued by NHB / Institutions accredited by NHB HTDN 7,764 8,307 154 2.08% 2.08% 7,764 8,307 580 8.27% 8.27% 6,769 6,754 498 8.13% 8.13%
C09
Bonds / Debentures issued by Authority Constituted under any Housing /
Building Scheme Approved By Central / State / any authority or Body
Constituted by Central / State Act
HTDA - - - - - - - - - - - - - - -
TAX FREE BONDS
C10 Bonds / Debentures issued by HUDCO HFHD - - - - - - - - - - - - - - -
C11 Bonds / Debentures issued by NHB / Institutions accredited by NHB HFDN - - - - - - - - - - - - - - -
C12
Bonds / Debentures issued by Authority Constituted under any Housing /
Building Scheme Approved By Central / State / any authority or Body
Constituted by Central / State Act
HFDA - - - - - - - - - - - - - - -
OTHER INVESTMENTS
C13 Debentures / Bonds / CPs / Loans HODS - - - - - - - - - - - - - - -
C14 Housing - Securitised Assets HOMB - - - - - - - - - - - - - - -
C15 Debentures / Bonds / CPs / Loans - (Promoter Group) HOPG - - - - - - - - - - - - - - -
D INFRASTRUCTURE INVESTMENTS
D01 Infrastructure - Other Approved Securities ISAS - - - - - - - - - - - - - - -
D02 Infrastructure - PSU - Equity Shares - Quoted ITPE 224 143 7 3.85% 3.85% 224 143 19 9.42% 9.42% 244 250 5 1.58% 1.58%
D03 Infrastructure - Corporate Securities - Equity Shares - Quoted ITCE 348 271 49 17.66% 17.66% 348 271 52 19.61% 19.61% - - 66 14.63% 14.63%
D04Infrastructure - Equity and Equity related Instruments (Promoter Group)
IEPG - - - - - - - - - - - - - - -
D05 Infrastructure - Securitised Assets IESA - - - - - - - - - - - - - - -
D06 Infrastructure - Debentures / Bonds / CPs / loans - (Promoter Group) IDPG - - - - - - - - - - - - - - -
D07 Infrastructure - Infrastructure Development Fund (IDF) IDDF 1,000 1,132 42 3.18% 3.18% 1,000 1,132 213 8.68% 8.68% 3,000 3,103 259 8.64% 8.64%
TAXABLE BONDS
D08 Infrastructure - PSU - Debentures / Bonds IPTD 36,110 38,628 699 2.04% 2.04% 36,110 38,628 2,657 8.14% 8.14% 25,964 26,332 1,844 8.41% 8.41%
D09 Infrastructure - PSU - CPs IPCP - - - - - - - 12 0.79% 0.79% 1,488 1,488 2 0.13% 0.13%
D10 Infrastructure - Other Corporate Securities - Debentures / Bonds ICTD 2,526 2,691 50 2.07% 2.07% 2,526 2,691 120 8.51% 8.51% 1,000 1,001 116 9.37% 9.37%
D11 Infrastructure - Other Corporate Securities - CPs ICCP - - - - - - - - - - - - - - -
D12 Infrastructure - Term Loans (with Charge) ILWC - - - - - - - - - - - - - - -
TAX FREE BONDS
D13 Infrastructure - PSU - Debentures / Bonds IPFD - - - - - - - - - - - - - - -
D14 Infrastructure - Other Corporate Securities - Debentures / Bonds ICFD - - - - - - - - - - - - - - -
Investment (Rs.)Net Yield
(%)
No.Investment (Rs.) Income on
Investment
(Rs.)
Category of Investment
Previous Year
Gross Yield
(%)
Category
CodeGross Yield
(%)
Net Yield
(%)
Current Quarter Year to Date
Income on
Investment
(Rs.)
Investment (Rs.) Income on
Investment
(Rs.)
Gross Yield
(%)
Net Yield
(%)
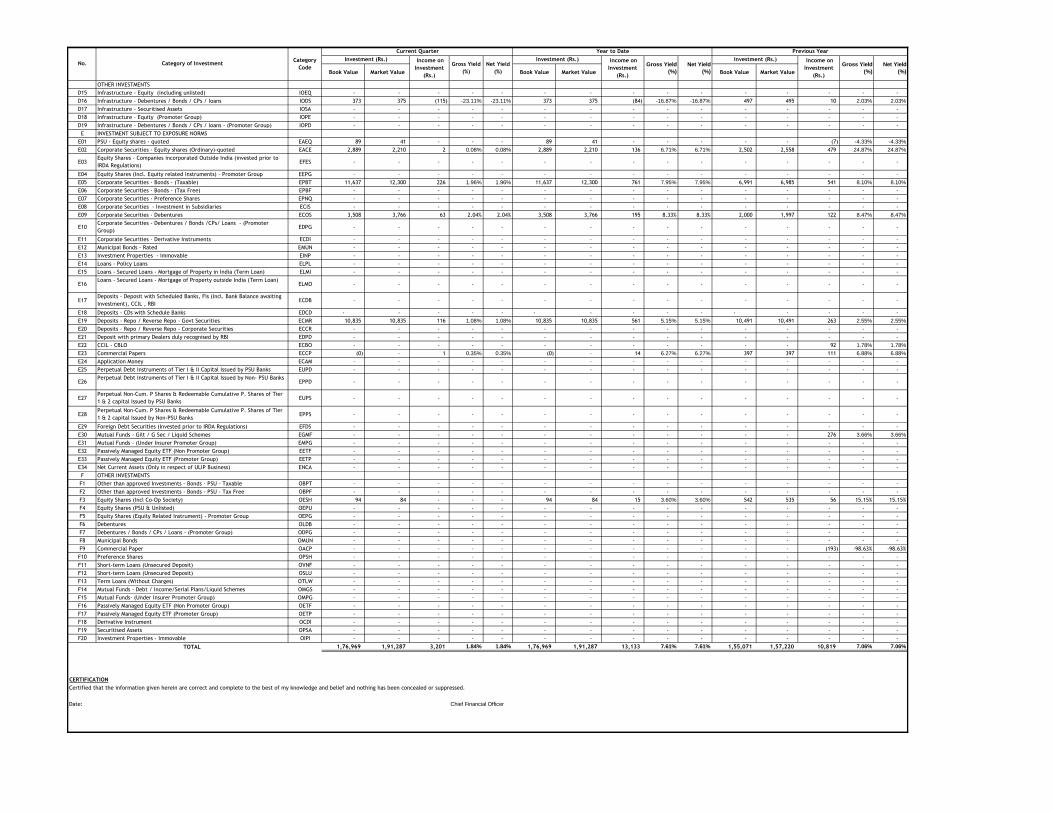
Book Value Market Value Book Value Market Value Book Value Market Value
Investment (Rs.)Net Yield
(%)
No.Investment (Rs.) Income on
Investment
(Rs.)
Category of Investment
Previous Year
Gross Yield
(%)
Category
CodeGross Yield
(%)
Net Yield
(%)
Current Quarter Year to Date
Income on
Investment
(Rs.)
Investment (Rs.) Income on
Investment
(Rs.)
Gross Yield
(%)
Net Yield
(%)
OTHER INVESTMENTS
D15 Infrastructure - Equity (including unlisted) IOEQ - - - - - - - - - - - - - - -
D16 Infrastructure - Debentures / Bonds / CPs / loans IODS 373 375 (115) -23.11% -23.11% 373 375 (84) -16.87% -16.87% 497 495 10 2.03% 2.03%
D17 Infrastructure - Securitised Assets IOSA - - - - - - - - - - - - - - -
D18 Infrastructure - Equity (Promoter Group) IOPE - - - - - - - - - - - - - - -
D19 Infrastructure - Debentures / Bonds / CPs / loans - (Promoter Group) IOPD - - - - - - - - - - - - - - -
E INVESTMENT SUBJECT TO EXPOSURE NORMS
E01 PSU - Equity shares - quoted EAEQ 89 41 - - - 89 41 - - - - - (7) -4.33% -4.33%
E02 Corporate Securities - Equity shares (Ordinary)-quoted EACE 2,889 2,210 2 0.08% 0.08% 2,889 2,210 136 6.71% 6.71% 2,502 2,558 479 24.87% 24.87%
E03Equity Shares - Companies incorporated Outside India (invested prior to
IRDA Regulations)EFES - - - - - - - - - - - - - - -
E04 Equity Shares (Incl. Equity related Instruments) - Promoter Group EEPG - - - - - - - - - - - - - - -
E05 Corporate Securities - Bonds - (Taxable) EPBT 11,637 12,300 226 1.96% 1.96% 11,637 12,300 761 7.95% 7.95% 6,991 6,985 541 8.10% 8.10%
E06 Corporate Securities - Bonds - (Tax Free) EPBF - - - - - - - - - - - - - - -
E07 Corporate Securities - Preference Shares EPNQ - - - - - - - - - - - - - - -
E08 Corporate Securities - Investment in Subsidiaries ECIS - - - - - - - - - - - - - - -
E09 Corporate Securities - Debentures ECOS 3,508 3,766 63 2.04% 2.04% 3,508 3,766 195 8.33% 8.33% 2,000 1,997 122 8.47% 8.47%
E10Corporate Securities - Debentures / Bonds /CPs/ Loans - (Promoter
Group)EDPG - - - - - - - - - - - - - - -
E11 Corporate Securities - Derivative Instruments ECDI - - - - - - - - - - - - - - -
E12 Municipal Bonds - Rated EMUN - - - - - - - - - - - - - - -
E13 Investment Properties - Immovable EINP - - - - - - - - - - - - - - -
E14 Loans - Policy Loans ELPL - - - - - - - - - - - - - - -
E15 Loans - Secured Loans - Mortgage of Property in India (Term Loan) ELMI - - - - - - - - - - - - - - -
E16Loans - Secured Loans - Mortgage of Property outside India (Term Loan)
ELMO - - - - - - - - - - - - - - -
E17Deposits - Deposit with Scheduled Banks, Fis (Incl. Bank Balance awaiting
Investment), CCIL , RBIECDB - - - - - - - - - - - - - - -
E18 Deposits - CDs with Schedule Banks EDCD - - - - - - - - - - - - - - -
E19 Deposits - Repo / Reverse Repo - Govt Securities ECMR 10,835 10,835 116 1.08% 1.08% 10,835 10,835 561 5.15% 5.15% 10,491 10,491 263 2.55% 2.55%
E20 Deposits - Repo / Reverse Repo - Corporate Securities ECCR - - - - - - - - - - - - - - -
E21 Deposit with primary Dealers duly recognised by RBI EDPD - - - - - - - - - - - - - - -
E22 CCIL - CBLO ECBO - - - - - - - - - - - - 92 1.78% 1.78%
E23 Commercial Papers ECCP (0) - 1 0.35% 0.35% (0) - 14 6.27% 6.27% 397 397 111 6.88% 6.88%
E24 Application Money ECAM - - - - - - - - - - - - - - -
E25 Perpetual Debt Instruments of Tier I & II Capital Issued by PSU Banks EUPD - - - - - - - - - - - - - - -
E26Perpetual Debt Instruments of Tier I & II Capital Issued by Non- PSU Banks
EPPD - - - - - - - - - - - - - - -
E27Perpetual Non-Cum. P Shares & Redeemable Cumulative P. Shares of Tier
1 & 2 capital Issued by PSU BanksEUPS - - - - - - - - - - - - - - -
E28Perpetual Non-Cum. P Shares & Redeemable Cumulative P. Shares of Tier
1 & 2 capital Issued by Non-PSU BanksEPPS - - - - - - - - - - - - - - -
E29 Foreign Debt Securities (Invested prior to IRDA Regulations) EFDS - - - - - - - - - - - - - - -
E30 Mutual Funds - Gilt / G Sec / Liquid Schemes EGMF - - - - - - - - - - - - 276 3.66% 3.66%
E31 Mutual Funds - (Under Insurer Promoter Group) EMPG - - - - - - - - - - - - - - -
E32 Passively Managed Equity ETF (Non Promoter Group) EETF - - - - - - - - - - - - - - -
E33 Passively Managed Equity ETF (Promoter Group) EETP - - - - - - - - - - - - - - -
E34 Net Current Assets (Only in respect of ULIP Business) ENCA - - - - - - - - - - - - - - -
F OTHER INVESTMENTS
F1 Other than approved Investments - Bonds - PSU - Taxable OBPT - - - - - - - - - - - - - - -
F2 Other than approved Investments - Bonds - PSU - Tax Free OBPF - - - - - - - - - - - - - - -
F3 Equity Shares (Incl Co-Op Society) OESH 94 84 - - - 94 84 15 3.60% 3.60% 542 535 56 15.15% 15.15%
F4 Equity Shares (PSU & Unlisted) OEPU - - - - - - - - - - - - - - -
F5 Equity Shares (Equity Related Instrument) - Promoter Group OEPG - - - - - - - - - - - - - - -
F6 Debentures OLDB - - - - - - - - - - - - - - -
F7 Debentures / Bonds / CPs / Loans - (Promoter Group) ODPG - - - - - - - - - - - - - - -
F8 Municipal Bonds OMUN - - - - - - - - - - - - - - -
F9 Commercial Paper OACP - - - - - - - - - - - - (193) -98.63% -98.63%
F10 Preference Shares OPSH - - - - - - - - - - - - - - -
F11 Short-term Loans (Unsecured Deposit) OVNF - - - - - - - - - - - - - - -
F12 Short-term Loans (Unsecured Deposit) OSLU - - - - - - - - - - - - - - -
F13 Term Loans (Without Charges) OTLW - - - - - - - - - - - - - - -
F14 Mutual Funds - Debt / Income/Serial Plans/Liquid Schemes OMGS - - - - - - - - - - - - - - -
F15 Mutual Funds- (Under Insurer Promoter Group) OMPG - - - - - - - - - - - - - - -
F16 Passively Managed Equity ETF (Non Promoter Group) OETF - - - - - - - - - - - - - - -
F17 Passively Managed Equity ETF (Promoter Group) OETP - - - - - - - - - - - - - - -
F18 Derivative Instrument OCDI - - - - - - - - - - - - - - -
F19 Securitised Assets OPSA - - - - - - - - - - - - - - -
F20 Investment Properties - Immovable OIPI - - - - - - - - - - - - - - -
TOTAL 1,76,969 1,91,287 3,201 1.84% 1.84% 1,76,969 1,91,287 13,133 7.61% 7.61% 1,55,071 1,57,220 10,819 7.06% 7.06%
CERTIFICATION
Certified that the information given herein are correct and complete to the best of my knowledge and belief and nothing has been concealed or suppressed.
Date: Chief Financial Officer

FORM L-34-YIELD ON INVESTMENTS-1
Company Name & Code : Aegon Life Insurance Company Limited - 138
Statement as on : March 31, 2020 Name of the Fund: Pension, General Annuity Fund
Statement of Investment and Income on Investment
Periodicity of Submission: Quarterly (Rs.in Lakhs)
Book Value Market Value Book Value Market Value Book Value Market Value
A GOVERNMENT SECURITIES
A01 Central Government Bonds CGSB 203 236 4 2.07% 2.07% 203 236 17 8.37% 8.37% 203 217 22 7.92% 7.92%
A02 Special Deposits CSPD - - - - - - - - - - - - - - -
A03 Deposit Under Section 7 of Insurance Act, 1938 CDSS - - - - - - - - - - - - - - -
A04 Treasury Bills CTRB 464 464 5 1.39% 1.39% 464 464 18 5.81% 5.81% 199 199 2 0.96% 0.96%
B GOVERNMENT SECURITIES / OTHER APPROVED SECURITIES
B01 Central Government Guaranteed Loans / Bonds CGSL - - - - - - - - - - - - - - -
B02 State Government Bonds SGGB - - - - - - - - - - - - - - -
B03 State Government Guaranteed Bonds SGGL - - - - - - - - - - - - - - -
B04 Other Approved Securities (excluding infrastructure Investments) SGOA - - - - - - - - - - - - - - -
B05 Guaranteed Equity SGGE - - - - - - - - - - - - - - -
CHOUSING AND LOANS TO STATE GOVT. FOR HOUSING AND FIRE FIGHTING
EQUIPMENT
C01 Loans to State Government for Housing HLSH - - - - - - - - - - - - - - -
C02 Loans to State Government for Fire Fighting Equipment HLSF - - - - - - - - - - - - - - -
C03 Term Loan - HUDCO / NHB / Institution accredited by NHB HTLH - - - - - - - - - - - - - - -
C04 Commercial Papers - NHB / Institution accredited by NHB HTLN - - - - - - - - - - - - - - -
C05 Housing - Securitised Assets HMBS - - - - - - - - - - - - - - -
C06 Debentures / Bonds / CPs / Loans - (Promoter Group) HDPG - - - - - - - - - - - - - - -
TAXABLE BONDS
C07 Bonds / Debentures issued by HUDCO HTHD - - - - - - - - - - - - - - -
C08 Bonds / Debentures issued by NHB / Institutions accredited by NHB HTDN - - - - - - - - - - - - - - -
C09
Bonds / Debentures issued by Authority Constituted under any Housing /
Building Scheme Approved By Central / State / any authority or Body
Constituted by Central / State Act
HTDA - - - - - - - - - - - - - - -
TAX FREE BONDS
C10 Bonds / Debentures issued by HUDCO HFHD - - - - - - - - - - - - - - -
C11 Bonds / Debentures issued by NHB / Institutions accredited by NHB HFDN - - - - - - - - - - - - - - -
C12
Bonds / Debentures issued by Authority Constituted under any Housing /
Building Scheme Approved By Central / State / any authority or Body
Constituted by Central / State Act
HFDA - - - - - - - - - - - - - - -
OTHER INVESTMENTS
C13 Debentures / Bonds / CPs / Loans HODS - - - - - - - - - - - - - - -
C14 Housing - Securitised Assets HOMB - - - - - - - - - - - - - - -
C15 Debentures / Bonds / CPs / Loans - (Promoter Group) HOPG - - - - - - - - - - - - - - -
D INFRASTRUCTURE INVESTMENTS
D01 Infrastructure - Other Approved Securities ISAS - - - - - - - - - - - - - - -
D02 Infrastructure - PSU - Equity Shares - Quoted ITPE - - - - - - - - - - - - - - -
D03 Infrastructure - Corporate Securities - Equity Shares - Quoted ITCE - - - - - - - - - - - - - - -
D04Infrastructure - Equity and Equity related Instruments (Promoter Group)
IEPG - - - - - - - - - - - - - - -
D05 Infrastructure - Securitised Assets IESA - - - - - - - - - - - - - - -
D06 Infrastructure - Debentures / Bonds / CPs / loans - (Promoter Group) IDPG - - - - - - - - - - - - - - -
D07 Infrastructure - Infrastructure Development Fund (IDF) IDDF - - - - - - - - - - - - - - -
TAXABLE BONDS
D08 Infrastructure - PSU - Debentures / Bonds IPTD 29 33 1 2.19% 2.19% 29 33 2.6 8.85% 8.85% 29 30 3 8.83% 8.83%
D09 Infrastructure - PSU - CPs IPCP - - - - - - - - - - - - - - -
D10 Infrastructure - Other Corporate Securities - Debentures / Bonds ICTD - - - - - - - - - - - - - - -
D11 Infrastructure - Other Corporate Securities - CPs ICCP - - - - - - - - - - - - - - -
D12 Infrastructure - Term Loans (with Charge) ILWC - - - - - - - - - - - - - - -
TAX FREE BONDS
D13 Infrastructure - PSU - Debentures / Bonds IPFD - - - - - - - - - - - - - - -
D14 Infrastructure - Other Corporate Securities - Debentures / Bonds ICFD - - - - - - - - - - - - - - -
Net Yield
(%)
Year to Date Previous Year
Gross Yield
(%)
Net Yield
(%)
Income on
Investment
(Rs.)
Investment (Rs.) Income on
Investment
(Rs.)
Investment (Rs.)Gross Yield
(%)
No. Category of InvestmentCategory
Code
Current Quarter
Investment (Rs.) Income on
Investment
(Rs.)
Gross Yield
(%)
Net Yield
(%)

Book Value Market Value Book Value Market Value Book Value Market Value
Net Yield
(%)
Year to Date Previous Year
Gross Yield
(%)
Net Yield
(%)
Income on
Investment
(Rs.)
Investment (Rs.) Income on
Investment
(Rs.)
Investment (Rs.)Gross Yield
(%)
No. Category of InvestmentCategory
Code
Current Quarter
Investment (Rs.) Income on
Investment
(Rs.)
Gross Yield
(%)
Net Yield
(%)
OTHER INVESTMENTS
D15 Infrastructure - Equity (including unlisted) IOEQ - - - - - - - - - - - - - - -
D16 Infrastructure - Debentures / Bonds / CPs / loans IODS - - - - - - - - - - - - - - -
D17 Infrastructure - Securitised Assets IOSA - - - - - - - - - - - - - - -
D18 Infrastructure - Equity (Promoter Group) IOPE - - - - - - - - - - - - - - -
D19 Infrastructure - Debentures / Bonds / CPs / loans - (Promoter Group) IOPD - - - - - - - - - - - - - - -
E INVESTMENT SUBJECT TO EXPOSURE NORMS
E01 PSU - Equity shares - quoted EAEQ - - - - - - - - - - - - - - -
E02 Corporate Securities - Equity shares (Ordinary)-quoted EACE - - - - - - - - - - - - - - -
E03Equity Shares - Companies incorporated Outside India (invested prior to
IRDA Regulations)EFES - - - - - - - - - - - - - - -
E04 Equity Shares (Incl. Equity related Instruments) - Promoter Group EEPG - - - - - - - - - - - - - - -
E05 Corporate Securities - Bonds - (Taxable) EPBT - - - - - - - - - - - - - - -
E06 Corporate Securities - Bonds - (Tax Free) EPBF - - - - - - - - - - - - - - -
E07 Corporate Securities - Preference Shares EPNQ - - - - - - - - - - - - - - -
E08 Corporate Securities - Investment in Subsidiaries ECIS - - - - - - - - - - - - - - -
E09 Corporate Securities - Debentures ECOS - - - - - - - - - - - - - - -
E10Corporate Securities - Debentures / Bonds /CPs/ Loans - (Promoter
Group)EDPG - - - - - - - - - - - - - - -
E11 Corporate Securities - Derivative Instruments ECDI - - - - - - - - - - - - - - -
E12 Municipal Bonds - Rated EMUN - - - - - - - - - - - - - - -
E13 Investment Properties - Immovable EINP - - - - - - - - - - - - - - -
E14 Loans - Policy Loans ELPL - - - - - - - - - - - - - - -
E15 Loans - Secured Loans - Mortgage of Property in India (Term Loan) ELMI - - - - - - - - - - - - - - -
E16Loans - Secured Loans - Mortgage of Property outside India (Term Loan)
ELMO - - - - - - - - - - - - - - -
E17Deposits - Deposit with Scheduled Banks, Fis (Incl. Bank Balance awaiting
Investment), CCIL , RBIECDB - - - - - - - - - - - - - - -
E18 Deposits - CDs with Schedule Banks EDCD - - - - - - - - - - - - - - -
E19 Deposits - Repo / Reverse Repo - Govt Securities ECMR 55 55 1 1.10% 1.10% 55 55 9 5.23% 5.23% 250 250 8 2.55% 2.55%
E20 Deposits - Repo / Reverse Repo - Corporate Securities ECCR - - - - - - - - - - - - - - -
E21 Deposit with primary Dealers duly recognised by RBI EDPD - - - - - - - - - - - - - - -
E22 CCIL - CBLO ECBO - - - - - - - - - - - - 10 3.57% 3.57%
E23 Commercial Papers ECCP - - - - - - - - - - - - - - -
E24 Application Money ECAM - - - - - - - - - - - - - - -
E25 Perpetual Debt Instruments of Tier I & II Capital Issued by PSU Banks EUPD - - - - - - - - - - - - - - -
E26Perpetual Debt Instruments of Tier I & II Capital Issued by Non- PSU Banks
EPPD - - - - - - - - - - - - - - -
E27Perpetual Non-Cum. P Shares & Redeemable Cumulative P. Shares of Tier
1 & 2 capital Issued by PSU BanksEUPS - - - - - - - - - - - - - - -
E28Perpetual Non-Cum. P Shares & Redeemable Cumulative P. Shares of Tier
1 & 2 capital Issued by Non-PSU BanksEPPS - - - - - - - - - - - - - - -
E29 Foreign Debt Securities (Invested prior to IRDA Regulations) EFDS - - - - - - - - - - - - - - -
E30 Mutual Funds - Gilt / G Sec / Liquid Schemes EGMF - - - - - - - - - - - - 2 3.63% 3.63%
E31 Mutual Funds - (Under Insurer Promoter Group) EMPG - - - - - - - - - - - - - - -
E32 Passively Managed Equity ETF (Non Promoter Group) EETF - - - - - - - - - - - - - - -
E33 Passively Managed Equity ETF (Promoter Group) EETP - - - - - - - - - - - - - - -
E34 Net Current Assets (Only in respect of ULIP Business) ENCA - - - - - - - - - - - - - - -
F OTHER INVESTMENTS
F1 Other than approved Investments - Bonds - PSU - Taxable OBPT - - - - - - - - - - - - - - -
F2 Other than approved Investments - Bonds - PSU - Tax Free OBPF - - - - - - - - - - - - - - -
F3 Equity Shares (Incl Co-Op Society) OESH - - - - - - - - - - - - - - -
F4 Equity Shares (PSU & Unlisted) OEPU - - - - - - - - - - - - - - -
F5 Equity Shares (Equity Related Instrument) - Promoter Group OEPG - - - - - - - - - - - - - - -
F6 Debentures OLDB - - - - - - - - - - - - - - -
F7 Debentures / Bonds / CPs / Loans - (Promoter Group) ODPG - - - - - - - - - - - - - - -
F8 Municipal Bonds OMUN - - - - - - - - - - - - - - -
F9 Commercial Paper OACP - - - - - - - - - - - - - - -
F10 Preference Shares OPSH - - - - - - - - - - - - - - -
F11 Short-term Loans (Unsecured Deposit) OVNF - - - - - - - - - - - - - - -
F12 Short-term Loans (Unsecured Deposit) OSLU - - - - - - - - - - - - - - -
F13 Term Loans (Without Charges) OTLW - - - - - - - - - - - - - - -
F14 Mutual Funds - Debt / Income/Serial Plans/Liquid Schemes OMGS - - - - - - - - - - - - - - -
F15 Mutual Funds- (Under Insurer Promoter Group) OMPG - - - - - - - - - - - - - - -
F16 Passively Managed Equity ETF (Non Promoter Group) OETF - - - - - - - - - - - - - - -
F17 Passively Managed Equity ETF (Promoter Group) OETP - - - - - - - - - - - - - - -
F18 Derivative Instrument OCDI - - - - - - - - - - - - - - -
F19 Securitised Assets OPSA - - - - - - - - - - - - - - -
F20 Investment Properties - Immovable OIPI - - - - - - - - - - - - - - -
TOTAL 751 787 12 1.56% 1.56% 751 787 47 6.52% 6.52% 681 697 47 4.03% 4.03%
CERTIFICATION
Certified that the information given herein are correct and complete to the best of my knowledge and belief and nothing has been concealed or suppressed.
Date: Chief Financial Officer

FORM L-34-YIELD ON INVESTMENTS-1
Company Name & Code : Aegon Life Insurance Company Limited - 138
Statement as on : March 31, 2020 Name of the Fund: Linked Fund
Statement of Investment and Income on Investment
Periodicity of Submission: Quarterly (Rs.in Lakhs)
Book Value Market Value Book Value Market Value Book Value Market Value
A GOVERNMENT SECURITIES
A01 Central Government Bonds CGSB 6,060 6,157 300 4.36% 4.36% 6,060 6,157 929 14.81% 14.81% 4,527 4,555 420 7.78% 7.78%
A02 Special Deposits CSPD - - - - - - - - - - - - - - -
A03 Deposit Under Section 7 of Insurance Act, 1938 CDSS - - - - - - - - - - - - - - -
A04 Treasury Bills CTRB 11,595 11,595 137 1.37% 1.37% 11,595 11,595 597 6.01% 6.01% 9,932 9,932 672 6.49% 6.49%
B GOVERNMENT SECURITIES / OTHER APPROVED SECURITIES
B01 Central Government Guaranteed Loans / Bonds CGSL - - - - - - - - - - - - - - -
B02 State Government Bonds SGGB 2,037 2,034 26 1.86% 1.86% 2,037 2,034 100 7.04% 7.04% 2,037 2,017 144 8.18% 8.18%
B03 State Government Guaranteed Bonds SGGL - - - - - - - - - - - - - - -
B04 Other Approved Securities (excluding infrastructure Investments) SGOA 506 540 18 3.34% 3.34% 506 540 61 11.40% 11.40% 505 520 50 9.81% 9.81%
B05 Guaranteed Equity SGGE - - - - - - - - - - - - - - -
C HOUSING AND LOANS TO STATE GOVT. FOR HOUSING AND FIRE FIGHTING EQUIPMENT
C01 Loans to State Government for Housing HLSH - - - - - - - - - - - - - - -
C02 Loans to State Government for Fire Fighting Equipment HLSF - - - - - - - - - - - - - - -
C03 Term Loan - HUDCO / NHB / Institution accredited by NHB HTLH - - - - - - - - - - - - - - -
C04 Commercial Papers - NHB / Institution accredited by NHB HTLN - - - - - - - - - - - - - - -
C05 Housing - Securitised Assets HMBS - - - - - - - - - - - - - - -
C06 Debentures / Bonds / CPs / Loans - (Promoter Group) HDPG - - - - - - - - - - - - - - -
TAXABLE BONDS
C07 Bonds / Debentures issued by HUDCO HTHD - - - - - - - - - - - - - - -
C08 Bonds / Debentures issued by NHB / Institutions accredited by NHB HTDN 890 931 33 3.63% 3.63% 890 931 112 11.00% 11.00% 1,389 1,400 113 7.06% 7.06%
C09
Bonds / Debentures issued by Authority Constituted under any Housing / Building Scheme
Approved By Central / State / any authority or Body Constituted by Central / State Act HTDA - - - - - - - - - - - - - - -
TAX FREE BONDS
C10 Bonds / Debentures issued by HUDCO HFHD - - - - - - - - - - - - - - -
C11 Bonds / Debentures issued by NHB / Institutions accredited by NHB HFDN - - - - - - - - - - - - - - -
C12Bonds / Debentures issued by Authority Constituted under any Housing / Building Scheme
Approved By Central / State / any authority or Body Constituted by Central / State ActHFDA - - - - - - - - - - - - - - -
OTHER INVESTMENTS
C13 Debentures / Bonds / CPs / Loans HODS - - - - - - - - - - - - - - -
C14 Housing - Securitised Assets HOMB - - - - - - - - - - - - - - -
C15 Debentures / Bonds / CPs / Loans - (Promoter Group) HOPG - - - - - - - - - - - - - - -
D INFRASTRUCTURE INVESTMENTS
D01 Infrastructure - Other Approved Securities ISAS - - - - - - - - - - - - - - -
D02 Infrastructure - PSU - Equity Shares - Quoted ITPE 3,622 2,656 (1,368) -35.83% -35.83% 3,622 2,656 (1,950) -48.95% -48.95% 3,509 3,633 162 4.49% 4.49%
D03 Infrastructure - Corporate Securities - Equity Shares - Quoted ITCE 5,309 5,197 (1,532) -22.52% -22.52% 5,309 5,197 (666) -10.29% -10.29% 3,748 5,121 1,592 33.53% 33.53%
D04 Infrastructure - Equity and Equity related Instruments (Promoter Group) IEPG - - - - - - - - - - - - - - -
D05 Infrastructure - Securitised Assets IESA - - - - - - - - - - - - - - -
D06 Infrastructure - Debentures / Bonds / CPs / loans - (Promoter Group) IDPG - - - - - - - - - - - - - - -
D07 Infrastructure - Infrastructure Development Fund (IDF) IDDF 514 542 23 4.30% 4.30% 514 542 79 15.12% 15.12% 497 506 24 4.31% 4.31%
TAXABLE BONDS
D08 Infrastructure - PSU - Debentures / Bonds IPTD 2,600 2,731 112 4.16% 4.16% 2,600 2,731 299 12.63% 12.63% 2,696 2,720 121 8.27% 8.27%
D09 Infrastructure - PSU - CPs IPCP - - - - - - - - - - - - - - -
D10 Infrastructure - Other Corporate Securities - Debentures / Bonds ICTD 1,042 1,052 23 2.17% 2.17% 1,042 1,052 100 9.47% 9.47% 1,042 1,056 79 5.26% 5.26%
D11 Infrastructure - Other Corporate Securities - CPs ICCP - - - - - - - - - - - - - - -
D12 Infrastructure - Term Loans (with Charge) ILWC - - - - - - - - - - - - - - -
TAX FREE BONDS
D13 Infrastructure - PSU - Debentures / Bonds IPFD - - - - - - - - - - - - - - -
D14 Infrastructure - Other Corporate Securities - Debentures / Bonds ICFD - - - - - - - - - - - - - - -
OTHER INVESTMENTS
D15 Infrastructure - Equity (including unlisted) IOEQ - - (26) -44.83% -44.83% - - (26) -44.83% -44.83% - - - - -
D16 Infrastructure - Debentures / Bonds / CPs / loans IODS - - - - - - - - - - - - - - -
D17 Infrastructure - Securitised Assets IOSA - - - - - - - - - - - - - - -
D18 Infrastructure - Equity (Promoter Group) IOPE - - - - - - - - - - - - - - -
D19 Infrastructure - Debentures / Bonds / CPs / loans - (Promoter Group) IOPD - - - - - - - - - - - - - - -
Investment (Rs.) Income on
Investment
Previous Year
Net Yield
(%)
Gross Yield
(%)
Net Yield
(%)
No. Category of InvestmentCategory
Code
Current Quarter
Gross Yield
(%)
Year to Date
Investment (Rs.) Income on
Investment
Gross Yield
(%)
Net Yield
(%)
Investment (Rs.) Income on
Investment

Book Value Market Value Book Value Market Value Book Value Market Value
Investment (Rs.) Income on
Investment
Previous Year
Net Yield
(%)
Gross Yield
(%)
Net Yield
(%)
No. Category of InvestmentCategory
Code
Current Quarter
Gross Yield
(%)
Year to Date
Investment (Rs.) Income on
Investment
Gross Yield
(%)
Net Yield
(%)
Investment (Rs.) Income on
Investment
E INVESTMENT SUBJECT TO EXPOSURE NORMS
E01 PSU - Equity shares - quoted EAEQ 235 179 (76) -27.26% -27.26% 235 179 (84) -27.13% -27.13% 358 315 (77) -5.98% -5.98%
E02 Corporate Securities - Equity shares (Ordinary)-quoted EACE 33,577 29,170 (10,024) -25.56% -25.56% 33,577 29,170 (8,095) -19.65% -19.65% 40,550 45,230 5,527 12.98% 12.98%
E03 Equity Shares - Companies incorporated Outside India (invested prior to IRDA Regulations) EFES - - - - - - - - - - - - - - -
E04 Equity Shares (Incl. Equity related Instruments) - Promoter Group EEPG - - - - - - - - - - - - - - -
E05 Corporate Securities - Bonds - (Taxable) EPBT - - 2 0.77% 0.77% - - 17 5.73% 5.73% - - - - -
E06 Corporate Securities - Bonds - (Tax Free) EPBF - - - - - - - - - - - - - - -
E07 Corporate Securities - Preference Shares EPNQ - - - - - - - - - - - - - - -
E08 Corporate Securities - Investment in Subsidiaries ECIS - - - - - - - - - - - - - - -
E09 Corporate Securities - Debentures ECOS 3,391 3,673 140 4.07% 4.07% 3,391 3,673 444 13.41% 13.41% 3,075 3,226 272 8.41% 8.41%
E10 Corporate Securities - Debentures / Bonds /CPs/ Loans - (Promoter Group) EDPG - - - - - - - - - - - - - - -
E11 Corporate Securities - Derivative Instruments ECDI - - - - - - - - - - - - - - -
E12 Municipal Bonds - Rated EMUN - - - - - - - - - - - - - - -
E13 Investment Properties - Immovable EINP - - - - - - - - - - - - - - -
E14 Loans - Policy Loans ELPL - - - - - - - - - - - - - - -
E15 Loans - Secured Loans - Mortgage of Property in India (Term Loan) ELMI - - - - - - - - - - - - - - -
E16 Loans - Secured Loans - Mortgage of Property outside India (Term Loan) ELMO - - - - - - - - - - - - - - -
E17Deposits - Deposit with Scheduled Banks, Fish (Incl. Bank Balance awaiting Investment), CCIL ,
RBIECDB - - - - - - - - - - - - - - -
E18 Deposits - CDs with Schedule Banks EDCD - - - - - - - - - - - - - - -
E19 Deposits - Repo / Reverse Repo - Govt Securities ECMR 7,409 7,409 55 1.07% 1.07% 7,409 7,409 274 5.12% 5.12% 4,302 4,302 126 2.56% 2.56%
E20 Deposits - Repo / Reverse Repo - Corporate Securities ECCR - - - - - - - - - - - - - - -
E21 Deposit with primary Dealers duly recognised by RBI EDPD - - - - - - - - - - - - - - -
E22 CCIL - CBLO ECBO - - - - - - - - - - - - 101 3.56% 3.56%
E23 Commercial Papers ECCP - - 1 0.34% 0.34% - - 20 6.22% 6.22% 596 596 43 7.19% 7.19%
E24 Application Money ECAM - - - - - - - - - - - - - - -
E25 Perpetual Debt Instruments of Tier I & II Capital Issued by PSU Banks EUPD - - - - - - - - - - - - - - -
E26 Perpetual Debt Instruments of Tier I & II Capital Issued by Non- PSU Banks EPPD - - - - - - - - - - - - - - -
E27Perpetual Non-Cum. P Shares & Redeemable Cumulative P. Shares of Tier 1 & 2 capital Issued by
PSU BanksEUPS - - - - - - - - - - - - - - -
E28Perpetual Non-Cum. P Shares & Redeemable Cumulative P. Shares of Tier 1 & 2 capital Issued by
Non-PSU BanksEPPS - - - - - - - - - - - - - - -
E29 Foreign Debt Securities (Invested prior to IRDA Regulations) EFDS - - - - - - - - - - - - - - -
E30 Mutual Funds - Gilt / G Sec / Liquid Schemes EGMF - - - - - - - - - - - - 63 3.47% 3.47%
E31 Mutual Funds - (Under Insurer Promoter Group) EMPG - - - - - - - - - - - - - - -
E32 Passively Managed Equity ETF (Non Promoter Group) EETF - - - - - - - - - - - - - - -
E33 Passively Managed Equity ETF (Promoter Group) EETP - - - - - - - - - - - - - - -
E34 Net Current Assets (Only in respect of ULIP Business) ENCA 359 359 - - - 359 359 - - - 1,582 1,582 - - -
F OTHER INVESTMENTS
F1 Other than approved Investments - Bonds - PSU - Taxable OBPT - - - - - - - - - - - - - - -
F2 Other than approved Investments - Bonds - PSU - Tax Free OBPF - - - - - - - - - - - - - - -
F3 Equity Shares (Incl Co-Op Society) OESH 1,585 963 (1,248) -41.87% -41.87% 1,585 963 (1,462) -38.99% -38.99% 2,924 3,083 42 2.21% 2.21%
F4 Equity Shares (PSU & Unlisted) OEPU - - - - - - - - - - - - - - -
F5 Equity Shares (Equity Related Instrument) - Promoter Group OEPG - - - - - - - - - - - - - - -
F6 Debentures OLDB - - - - - - - - - - - - - - -
F7 Debentures / Bonds / CPs / Loans - (Promoter Group) ODPG - - - - - - - - - - - - - - -
F8 Municipal Bonds OMUN - - - - - - - - - - - - - - -
F9 Commercial Papers OACP - - - - - - - - - - - - (290) -110.51% -110.51%
F10 Preference Shares OPSH - - - - - - - - - - - - - - -
F11 Venture Fund OVNF - - - - - - - - - - - - - - -
F12 Short-term Loans (Unsecured Deposit) OSLU - - - - - - - - - - - - - - -
F13 Term Loans (Without Charges) OTLW - - - - - - - - - - - - - - -
F14 Mutual Funds - Debt / Income/Serial Plans/Liquid Schemes OMGS - - - - - - - - - - - - - - -
F15 Mutual Funds- (Under Insurer Promoter Group) OMPG - - - - - - - - - - - - - - -
F16 Passively Managed Equity ETF (Non Promoter Group) OETF 3,736 2,536 (1,571) -47.73% -47.73% 3,736 2,536 (1,383) -41.10% -41.10% 2,929 3,393 547 19.12% 19.12%
F17 Passively Managed Equity ETF (Promoter Group) OETP - - - - - - - - - - - - - - -
F18 Derivative Instrument OCDI - - - - - - - - - - - - - - -
F19 Securitised Assets OPSA - - - - - - - - - - - - - - -
F20 Investment Properties - Immovable OIPI - - - - - - - - - - - - - - -
TOTAL 84,468 77,726 (14,975) -16.63% -16.63% 84,468 77,726 (10,634) -11.57% -11.57% 86,197 93,186 9,732 10.20% 10.20%
CERTIFICATION
Certified that the information given herein are correct and complete to the best of my knowledge and belief and nothing has been concealed or suppressed.
Date: Chief Financial Officer

FORM L-35: DOWNGRADING OF INVESTMENTS - 2
Company Name & Code : Aegon Life Insurance Company Limited - 138
Statement as on : March 31, 2020
Statement of Down Graded Investments Name of Fund: Life Fund
Periodicity of Submission: Quarterly
(Rs in Lakhs)
No Name of the Security COI AmountDate of
Purchase
Rating
Agency
Original
Grade
Current
Grade
Date of
DowngradeRemarks
A. During the Quarter
8.03% NCD VODAFONE IDEA LTD MD 14/02/2022 IODS 373.1267777 25th May' 2017 CRISIL AA+ BB- 18th Feb' 2020
B. As on Date
8.03% NCD VODAFONE IDEA LTD MD 14/02/2022 IODS 373.1267777 25th May' 2017 CRISIL AA+ BB- 18th Feb' 2020
CERTIFICATION
Certified that the information given herein are correct and complete to the best of my
knowledge and belief and nothing has been concealed or suppressed.
Date: Chief Financial Officer

FORM L-35: DOWNGRADING OF INVESTMENTS - 2
Company Name & Code : Aegon Life Insurance Company Limited - 138
Statement as on : March 31, 2020
Statement of Down Graded Investments Name of Fund: Pension, General Annuity Fund
Periodicity of Submission: Quarterly
(Rs in Lakhs)
No Name of the Security COI AmountDate of
Purchase
Rating
Agency
Original
Grade
Current
Grade
Date of
DowngradeRemarks
A. During the Quarter
NIL
B. As on Date
NIL
CERTIFICATION
Certified that the information given herein are correct and complete to the best of my
knowledge and belief and nothing has been concealed or suppressed.
Date: Chief Financial Officer

FORM L-35: DOWNGRADING OF INVESTMENTS - 2
Company Name & Code : Aegon Life Insurance Company Limited - 138
Statement as on : March 31, 2020 Name of Fund: Linked Fund
Statement of Down Graded Investments
Periodicity of Submission: Quarterly
(Rs in Lakhs)
No Name of the Security COI AmountDate of
PurchaseRating Agency
Original
Grade
Current
Grade
Date of
DowngradeRemarks
A. During the Quarter
NIL
B. As on Date
NIL
CERTIFICATION
Certified that the information given herein are correct and complete to the best of my
knowledge and belief and nothing has been concealed or suppressed.
Date: Chief Financial Officer

FORM L-36: PREMIUM AND NUMBER OF LIVES COVERED BY POLICY TYPE
Insurer: Aegon Life Insurance Company Limited Date: 31-Mar-20
(Rs in Lakhs)
PremiumNo. of
Policies *
No. of
LivesSum Insured Premium
No. of
Policies *No. of Lives Sum Insured Premium
No. of
Policies *
No. of
LivesSum Insured Premium
No. of
Policies *No. of Lives Sum Insured
1
i Individual Single Premium- (ISP)
From 0 - 10000 3 2 2 90 52 15,001 14,999 2,463 27 5,584 5,585 917 48 11,316 11,302 2,114
From 10,001 - 25,000 5 2 1 80 37 21 14 184 12 7 1 101 37 20 11 360
From 25,001 - 50,000 11 2 1 43 43 10 6 447 10 4 3 157 44 13 10 513
From 50,001 - 75,000 2 - - - 10 1 1 7 - - - - 7 1 1 100
From 75,001 - 100,000 - - - - 18 2 2 208 12 1 - 100 13 1 - 100
From 100,001 - 125,000 - - - - - - - - - - - - - - - -
Above 125,000 - - - - 83 3 3 1,150 - - - - 42 1 1 44
ii Individual Single Premium (ISPA)- Annuity
From 0 - 50,000 - - - - - - - - - - - - - - - -
From 50,001 - 100,000 - - - - - - - - - - - - - - - -
From 100,001 - 150,000 - - - - - - - - - - - - - - - -
From 150,001 - 200,000 - - - - - - - - - - - - - - - -
From 200,001 - 250,000 - - - - - - - - - - - - - - - -
From 250,001 - 300,000 - - - - - - - - - - - - - - - -
Above 300,000 - - - - - - - - - - - - - - - -
iii Group Single Premium (GSP)
From 0 - 10000 - - - - - - - - - - - - - - - -
From 10,000 - 25,000 - - - - - - - - - - - - - - - -
From 25,001 - 50,000 - - - - - - - - - - - - - - - -
From 50,001 - 75,000 - - - - - - - - - - - - - - - -
From 75,000 - 100,000 - - - - - - - - - - - - - - - -
From 100,001 - 125,000 - - - - - - - - - - - - - - - -
Above 125,000 - - - - 108 - - - 50 - - - 354 - - -
iv Group Single Premium- Annuity- GSPA
From 0 - 50000 - - - - - - - - - - - - - - - -
From 50,001 - 100,000 - - - - - - - - - - - - - - - -
From 100,001 - 150,000 - - - - - - - - - - - - - - - -
From 150,001 - 200,000 - - - - - - - - - - - - - - - -
From 200,001 - 250,000 - - - - - - - - - - - - - - - -
From 250,001 - 300,000 - - - - - - - - - - - - - - - -
Above 300,000 - - - - - - - - - - - - - - - -
v Individual non Single Premium- INSP
From 0 - 10000 122 1,435 1,234 89,533 596 7,207 6,579 4,56,547 422 3,527 3,292 2,24,624 1,116 16,555 15,601 10,51,348
From 10,001 - 25,000 322 1,874 1,494 1,55,290 1,538 8,709 7,355 7,09,643 668 4,160 3,608 3,25,823 2,447 16,387 14,296 13,84,099
From 25,001 - 50,000 331 941 672 51,440 1,383 3,707 2,801 1,71,853 706 1,901 1,461 69,898 1,885 5,037 3,787 2,70,433
From 50,001 - 75,000 143 253 167 13,005 501 826 610 41,592 249 422 314 12,463 691 1,117 803 48,908
From 75,001 - 100,000 254 272 199 7,796 880 928 722 21,320 514 548 434 8,171 1,238 1,270 923 27,302
From 100,001 - 125,000 71 67 50 3,030 252 225 175 14,190 92 89 62 3,472 289 248 174 11,200
Above 125,000 636 251 185 21,650 1,927 733 573 45,686 907 386 323 17,582 2,397 903 716 53,600
vi Individual non Single Premium- Annuity- INSPA
From 0 - 50,000 - - - - - - - - - - - - - - - -
From 50,001 - 100,000 - - - - - - - - - - - - - - - -
From 100,001 - 150,000 - - - - - - - - - - - - - - - -
From 150,001 - 2,00,000 - - - - - - - - - - - - - - - -
From 200,001 - 250,000 - - - - - - - - - - - - - - - -
From 250,001 - 300,000 - - - - - - - - - - - - - - - -
Above 300,000 - - - - - - - - - - - - - - - -
vii Group Non Single Premium (GNSP)
From 0 - 10000 - - - - - - - - - - - - - - - -
From 10,001 - 25,000 - - - - - - - - - - - - - - - -
From 25,001 - 50,000 - - - - - - - - - - - - - - - -
From 50,001 - 75,000 - - - - - - - - - - - - - - - -
From 75,001 - 100,000 - - - - - - - - - - - - - - - -
From 100,001 - 125,000 - - - - - - - - - - - - - - - -
Above 125,000 604 33 65,966 6,62,869 1,746 114 2,51,685 23,34,393 390 54 54,720 6,08,485 1,157 94 1,42,855 12,98,765
viii Group Non Single Premium- Annuity- GNSPA
From 0 - 10000 - - - - - - - - - - - - - - - -
From 10,001 - 25,000 - - - - - - - - - - - - - - - -
From 25,001 - 50,000 - - - - - - - - - - - - - - - -
From 50,001 - 75,000 - - - - - - - - - - - - - - - -
From 75,001 - 100,000 - - - - - - - - - - - - - - - -
From 100,001 - 125,000 - - - - - - - - - - - - - - - -
Above 125,000 - - - - - - - - - - - - - - - -
2
i Individual
From 0 - 10000 1,743 24,025 22,983 15,57,179 5,649 89,818 87,234 58,03,195 1,694 25,256 24,228 15,77,172 4,962 80,633 78,190 51,33,162
From 10,001 - 25,000 4,481 24,805 22,739 16,33,117 13,233 86,089 81,297 58,97,263 4,462 25,541 23,337 15,31,829 12,373 79,173 74,441 48,72,363
From 25,001 - 50,000 4,049 9,548 8,022 3,30,119 10,793 29,489 26,147 11,50,692 4,835 11,201 9,443 3,16,496 10,744 29,210 25,750 9,66,005
From 50,001 - 75,000 1,294 1,758 1,418 67,216 3,430 5,918 5,127 2,32,077 869 1,138 849 63,096 3,366 5,869 5,063 2,02,279
From 75,001 - 100,000 2,049 1,959 1,618 44,036 4,867 5,092 4,382 1,30,247 2,196 2,152 1,727 43,313 4,640 4,871 4,114 1,19,360
From 100,001 - 125,000 503 359 284 16,322 1,458 1,346 1,169 60,653 590 452 351 14,964 1,457 1,364 1,173 54,093
Above 125,000 3,344 1,243 1,037 60,983 7,809 3,201 2,780 1,78,166 3,551 1,348 1,102 57,788 7,266 2,997 2,550 1,53,214
Sl. No Particulars
Year ended March 2020 Year ended March 2019Quarter ended March 2020 Quarter ended March 2019
Renewal Premium
First year Premium

PremiumNo. of
Policies *
No. of
LivesSum Insured Premium
No. of
Policies *No. of Lives Sum Insured Premium
No. of
Policies *
No. of
LivesSum Insured Premium
No. of
Policies *No. of Lives Sum Insured
Sl. No Particulars
Year ended March 2020 Year ended March 2019Quarter ended March 2020 Quarter ended March 2019
ii Individual- Annuity
From 0 - 10000 - - - - - - - - - - - - - - - -
From 10,001 - 25,000 - - - - - - - - - - - - - - - -
From 25,001 - 50,000 - - - - - - - - - - - - - - - -
From 50,001 - 75,000 - - - - - - - - - - - - - - - -
From 75,001 - 100,000 - - - - - - - - - - - - - - - -
From 100,001 - 125,000 - - - - - - - - - - - - - - - -
Above 125,000 - - - - - - - - - - - - - - - -
iii Group
From 0 - 10000 - - - - - - - - - - - - - - - -
From 10,001 - 25,000 - - - - - - - - - - - - - - - -
From 25,001 - 50,000 - - - - - - - - - - - - - - - -
From 50,001 - 75,000 - - - - - - - - - - - - - - - -
From 75,001 - 100,000 - - - - - - - - - - - - - - - -
From 100,001 - 125,000 - - - - - - - - - - - - - - - -
Above 125,000 454 49 38,048 6,29,230 1,161 97 97,180 11,47,089 170 14 16,850 1,97,283 316 36 30,312 4,71,366
iv Group- Annuity
From 0 - 10000 - - - - - - - - - - - - - - - -
From 10,001 - 25,000 - - - - - - - - - - - - - - - -
From 25,001 - 50,000 - - - - - - - - - - - - - - - -
From 50,001 - 75,000 - - - - - - - - - - - - - - - -
From 75,001 - 100,000 - - - - - - - - - - - - - - - -
From 100,001 - 125,000 - - - - - - - - - - - - - - - -
Above 125,000 - - - - - - - - - - - - - - - -
* No of policies in case of First year premium for ISP and INSP refers to no of new policies issued.
* No of policies in case of Renewal premium refers to those policies on which renewal premium is received.

FORM L-37: BUSINESS ACQUISITION THROUGH DIFFERENT CHANNELS (GROUP)
Insurer: Aegon Life Insurance Company Limited
Date: 31-Mar-20
(Rs in Lakhs)
1 Individual Agents - - - - - - - - - - - -
2 Corporate Agents - Banks - - - - - - - - - - - -
3 Corporate Agents - Others 1 10,281 28 - - - 2 37,324 144 - - -
4 Brokers 23 37,150 470 48 49,423 340 78 91,290 1,140 70 78,224 651
5 Micro Agents - - - - - - - - - - - -
6 Direct Business 9 18,535 107 6 5,297 100 34 1,23,071 570 24 64,631 860
Total(A) 33 65,966 604 54 54,720 440 114 2,51,685 1,855 94 1,42,855 1,511
1 Referral (B) - - - - - - - - - - - -
Grand Total (A+B) 33 65,966 604 54 54,720 440 114 2,51,685 1,855 94 1,42,855 1,511
Year ended March 2019
No. of Policies/
No. of Schemes
No. of Lives
Covered
Business Acquisition through different channels (Group)
Premium
Year ended March 2020
No. of Policies/
No. of Schemes
No. of Lives
CoveredPremium
Sl.No.Quarter ended March 2020 Quarter ended March 2019
ChannelsNo. of Policies/
No. of Schemes
No. of Lives
CoveredPremium
No. of Policies/
No. of Schemes
No. of Lives
CoveredPremium

FORM L-38: BUSINESS ACQUISITION THROUGH DIFFERENT CHANNELS (INDIVIDUAL)
Insurer: Aegon Life Insurance Company Limited
Date: 31-Mar-20
(Rs in Lakhs)
No. of Policies Premium No. of Policies Premium No. of Policies Premium No. of Policies Premium
1 Individual agents 19 (1) (6) (5) 5 3 (15) (9)
2 Corporate Agents-Banks 6 2 2,808 6 61 15 3,285 69
3 Corporate Agents -Others 103 234 213 196 427 631 438 333
4 Brokers 446 193 207 (9) 971 363 744 1
5 Micro Agents - - - - - - - -
6 Direct Business 4,523 1,470 13,407 3,431 35,903 6,306 48,419 9,861
7 IMF 2 1 - - 6 2 - -
Total (A) 5,099 1,899 16,629 3,618 37,373 7,319 52,871 10,255
1 Referral (B) - - - - - - (2) (2)
Grand Total (A+B) 5,099 1,899 16,629 3,618 37,373 7,319 52,869 10,252
Year ended March 2019Sl.No.Channels
Quarter ended March 2020 Quarter ended March 2019 Year ended March 2020
Business Acquisition through different channels (Individuals)

FORM L-39: DATA ON SETTLEMENT OF CLAIMS (INDIVIDUAL)
Insurer: Aegon Life Insurance Company Limited Date: 31-Mar-20
(Rs in Lakhs)
On or before
maturity1 month
1 - 3
months
3 - 6
months
6 months -
1 year> 1 year
1 Maturity Claims - 253 3 1 1 - 258 770
2 Survival Benefit # - 2,257 61 9 (1) 1 2,327 957
3 For Annuities / Pension - - - - - - - -
4 For Surrender - 2,319 130 7 5 (9) 2,452
5 Other benefits ## - 259 1 4 - - 264 239
1 Death Claims - 91 - - - - 91 1,649
This data is for year ended March 31, 2020
*Ageing is computed from the date of completion of all necessary documentation in case of death claims and date of accounting
in case of Survival / Surrender/Maturity/Annuity/Other benefits
# Rider Claims (Critical Illness) and money backs are reported in Survival Benefit
## Rider Claims (Accident, income Benefit & Waiver Premium), Partial withdrawals and Health Claims are reported in Other Benefits
FORM L-39: DATA ON SETTLEMENT OF CLAIMS (GROUP)
Insurer: Aegon Life Insurance Company Limited Date: 31-Mar-20
(Rs in Lakhs)
On or before
maturity1 month
1 - 3
months
3 - 6
months
6 months -
1 year> 1 year
1 Maturity Claims - - - - - - - -
2 Survival Benefit - - - - - - - -
3 for Annuities / Pension - - - - - - - -
4 For Surrender - - - - - - - -
5 Other benefits - - - - - - - -
1 Death Claims - 50 - - - - 50 667
This data is for year ended March 31, 2020
*Ageing is computed from the date of completion of all necessary documentation.
Ageing of Claims *
Sl.No. Types of Claims
No. of claims paidTotal No. of
claims paid
Total amount of
claims paid
Ageing of Claims *
Sl.No. Types of Claims
No. of claims paidTotal No. of
claims paid
Total amount of
claims paid

FORM L-40: QUARTERLY CLAIMS DATA FOR LIFE (INDIVIDUAL)
Insurer: Aegon Life Insurance Company Limited Date: 31-Mar-20
No. of claims only
Sl. No. Claims Experience For DeathFor
Maturity
Survival
Benefit #
For
Annuities
/ Pension
For
Surrender
Other
Benefits ##
1 Claims o/s at the beginning of the period * 1 8 87 - 192 17
2 Claims reported during the period ** 90 259 2,531 - 2,792 266
3 Claims settled during the period 91 258 2,327 - 2,452 264
4 Claims repudiated during the period - - 2 - - 3
a Less than 2 years from the date of acceptance of risk - - - - - 1
b Greater than 2 year from the date of acceptance of risk - - - - - 2
5 Claims written back - - - - - -
6 Claims o/s at end of the period - 9 289 - 532 16
a Less than 3 months - 6 269 - 471 10
b 3 months to 6 months - 1 3 - 6 -
c 6 months to 1 year - 1 7 - 18 -
d 1 year and above - 1 10 - 37 6
* Opening balance is the closing balance as on 31/12/2019
** In case of Health claims reported under Other Benefits, Claims reported includes net of claims reopened and claims closed due to other reason
# Rider Claims (Critical Illness) and money backs are reported in Survival Benefit
## Rider Claims (Accident, income Benefit & Waiver Premium), Partial withdrawals and Health Claims are reported in Other Benefits
FORM L-40: QUARTERLY CLAIMS DATA FOR LIFE (GROUP)
Insurer: Aegon Life Insurance Company Limited Date: 31-Mar-20
No. of claims only
Sl. No. Claims Experience For DeathFor
Maturity
Survival
Benefit
For
Annuities
/ Pension
For
Surrender
Other
Benefits
1 Claims o/s at the beginning of the period * - - - - - -
2 Claims reported during the period 50 - - - - -
3 Claims settled during the period 50 - - - - -
4 Claims repudiated during the period - - - - - -
a Less than 2 years from the date of acceptance of risk - - - - - -
b Greater than 2 year from the date of acceptance of risk - - - - - -
5 Claims written back - - - - - -
6 Claims o/s at end of the period - - - - - -
Less than 3 months - - - - - -
3 months to 6 months - - - - - -
6 months to 1 year - - - - - -
1 year and above - - - - - -
* Opening balance is the closing balance as on 31/12/2019
In line with the IRDAI Master circular on 'Unclaimed Amounts of Policyholders', policies ageing more than six months in the above table have been
transferred to a separate seggregated fund 'Unclaimed Amounts to Policyholders'

FORM L-41: GRIEVANCE DISPOSAL
Insurer: Aegon Life Insurance Company Limited Date: 31-Mar-20
Fully
Accepted
Partial
Accepted
Rejected
1 Complaints made by customers
a) Death Claims 1 3 - - 4 - 8
b) Policy Servicing 1 6 4 - 3 - 50
c) Proposal Processing - 3 1 - 2 - 16
d) Survival Claims - 1 - - 1 - 12
e) ULIP Related - - - - - - 1
f) Unfair Business Practices 15 132 14 1 132 - 681
g) Others 1 9 1 - 9 - 22
Total Number of complaints: 18 154 20 1 151 - 790
2 Total No . of policies during previous year 52,963
3 Total No. of claims during previous year ** 20,715
4 Total No. of policies during current year 37,487
5 Total No. of claims during current year ** 18,504
6 Total No. of Policy Complaints ( current year)
per 10, 000 policies ( current year)
211
7 Total No. of Claim Complaints (current year)
per 10,000 claims registered ( current year)
11
8 Duration wise Pending Status Complaints made by
customers
Complaints
made by
intermediaries
Total
a) Upto 7 days - - -
b) 7 - 15 days - - -
c) 15-30 days - - -
d) 30-90 days - - -
e) 90 days & Beyond - - -
Total No. of complaints - - -
* Opening balance is the closing balance as on 31/12/2019
** Claims refer to Death Claims and Survival Claims (Classification as per IRDA IGMS Master). Partial withdrawals are not considered here.
Total complaints
registered upto the
quarter during the
financial year
GRIEVANCE DISPOSAL
Sl No. Particulars Opening Balance *
as at the beginning
of the quarter
Additions Complaints Resolved/ settled during
the quarter
Complaints
Pending at the
end of the
quarter

FORM L-42: VALUATION BASIS (Life Insurance)
Insurer: Aegon Life Insurance Company Limited
a. How the policy data needed for valuation is accessed.
b. How the valuation bases are supplied to the system
1) Interest : Maximum and minimum interest rate taken for each segment
i. Individuals Business
1. Participating policies Max: 6.70% and Min: 5.50%
2. Life - Non-participating Policies Max: 6.85% and Min: 5.50%
3. Annuities - Participating policies Not Applicable
4. Annuities - Non-participating policies Max: 5.25% and Min: 1.99%
5. Annuities - Individual Pension Plan Not Applicable
6. Unit Linked Max: 6.15% and Min: 5.50%
7. Health Insurance Max: 6.15% and Min: 5.50%
ii. Group Business Max: 6.15% and Min: 5.50%
2) Mortality Rates : the mortality rates used for each segment
i. Individuals Business
1. Participating policies Max: 118.25% and Min: 79.75% of IALM 12-14
2. Life - Non-participating Policies Max: 178.75% and Min: 24.75% of IALM 12-14
3. Annuities - Participating policies Not Applicable
4. Annuities - Non-participating policies 100% of Mortality for annuitants - LIC (a) (1996-98) Ultimate Rates
5. Annuities - Individual Pension Plan Not Applicable
6. Unit Linked Max: 118.25% and Min: 79.75% of IALM 12-14
7. Health Insurance 60.75% of IALM 12-14
ii. Group Business 86.90% of IALM 12-14
3) Expense : (per policy & premium related maintenance expense)
i. Individuals Business
1. Participating policies Rs.308 to Rs.798 p.a. & 1.38% of renewal premium
2. Life - Non-participating Policies Rs.163* to Rs.798 p.a. & 1.38% of renewal premium
3. Annuities - Participating policies Not Applicable
4. Annuities - Non-participating policies Rs.308 p.a.
5. Annuities - Individual Pension Plan Not Applicable
6. Unit Linked Rs.308 to Rs.798 p.a. & 1.38% of renewal premium
7. Health Insurance Rs.308 to Rs.798 p.a. & 1.38% of renewal premium
ii. Group Business
1. Non Linked Regular Premium : Rs.308 & 1.38% of Renewal Premium
2. Unit Linked Not Applicable
* The expense for Rural Term Plan is Rs.35 per policy
4) Bonus Rates (Declared on 31st March 2020) :
i. Individuals Business
1. Life - Participating policies Min: 0.72% to Max: 7.5% (simple reversionary bonus)
2. (i) Pension - Participating policies Min: 1.6% to Max: 2.4% (simple reversionary bonus)
(ii) Pension - Participating policies 5% (terminal bonus) for policies maturing in FY 20-21.
ii. Group Business Not Applicable
5) Policyholders Reasonable Expectations:
6) Taxation and Shareholder Transfers:
The data used for valuation is obtained from the policy administration systems 'FFA' (Future First Asia), 'eBao Tech' & 'HPMS' (Health Portfolio Management System)
for base, fund and rider coverage.
For group policies, member-wise data is maintained and provided in an MS Excel based system
Majority of the policy liability under Individual Par and Individual Non Par business (excluding unit liabilities) have been valued using actuarial software called
'Prophet'. The assumptions for each plan are fed in the software. Monthly cash flows are then projected by the software to determine the reserves using the specific
characteristics of each policy such as age at entry, sum assured, term, etc. A small proportion of the policy liabilities are valued using the excel spreadsheets. The
valuation basis is supplied in the excel template.
Policyholders' reasonable expectations (PRE) are formed on the basis of the sales Illustrations and other policy communication provided by the company to its
participating policyholders. The company provides bonus rates under 6% and 10% interest rate scenarios for products launched uptil 2013 and provides bonus rates under
4% and 8% interest rate scenarios for products launched post 2014. The company considers this PRE while declaring bonus rates to its participating policyholders.
Mathematical reserves include allowance for shareholder share and taxes as applicable during the period of projection. The tax rate is as per prevailing laws. Currently
we have used a policyholder tax rate of 12.50% base plus applicable surcharge and cess. For shareholders’ share, we have considered 1/9th of the value of bonus
distributable to the policyholder

7) Basis of provisions for Incurred But Not Reported (IBNR):
1. InterestInterest assumption has been revised taking into account the observed movement of G-Sec yield in the
market.
2. Expenses Renewal expenses are revised to reflect the average inflation in FY 19-20.
3. Inflation No Change
4. MortalityMortality table has been updated from IALM 06-08 to IALM 12-14 and mortality assumptions have been
revised accordingly in line with emerging experience.
1. Interest No Change
a. Annuity in payment No Change
b. Annuity during deferred period Not Applicable
c. Pension : All Plans Not Applicable
2. Expenses Renewal expenses are revised to reflect the average inflation in FY 19-20.
3. Inflation No Change
4. Mortality No Change
1. InterestInterest assumption has been revised taking into account the observed movement of G-Sec yield in the
market.
2. Expenses Renewal expenses are revised to reflect the average inflation in FY 19-20.
3. Inflation No Change
4. MortalityMortality table has been updated from IALM 06-08 to IALM 12-14 and mortality assumptions have been
revised in line with emerging experience.
* All assumptions described above include margins for adverse deviations (MADs)
8) Change in Valuation Methods or Bases
IBNR reflects the total amount owed by the company to all valid claimants where the contingent event covered under the policy has occurred but has not been reported.
An explicit provision for IBNR was made based on the "Average Delay method" for Individual business and Group Linked business and total of last two months mortality
charges collected for Group Non Linked business.
i. Individuals Assurances
ii. Annuities
iii. Unit Linked
iv. Health
v. Group