formation and evolution of al–ti oxide inclusions during
TRANSCRIPT

ISIJ International, Vol. 49 (2009), No. 8, pp. 1133–1140
1. Introduction
Ti stabilized IF (interstitial free) steel is commonly pro-duced by the combination of primary (BOF) and secondarysteelmaking (RH degassing treatment), during which Ti isadded as an alloying element. Since Ti is substantially moreexpensive than Al, it is added after Al deoxidation in orderto minimize losses through reaction with oxygen. However,if thermodynamic and kinetic conditions allow, Ti will reactwith oxygen in the molten steel and/or with Al2O3 duringthe Ti alloying process. These reactions lead to the forma-tion of Ti containing inclusions, which influence Ti yieldduring alloying and also steel cleanliness. The formation ofnon-metallic inclusions such as Al2O3, TiOx, and Al–Ti–Ooxides might cause both nozzle clogging during continuouscasting and loss of final product quality.1) From the view-point of “oxide metallurgy”, Ti containing complex oxidescan be utilized as nuclei for MnS precipitation,2) which canserve again as nucleation site for acicular ferrite after weld-ing or heat treatment, hence improving steel toughness andstrength.3,4) It is, therefore, of great concern to study thecombined oxidation of [Al] and [Ti] in order to try to un-derstand the formation mechanisms of Ti containing ox-ides. The symbol [ ] refers to concentration in liquid steel.
Several authors5–8) have investigated Al/Ti and Ti/Al de-oxidation using sampling techniques. Kunisada et al.5,6) re-ported that in the case of Ti/Al deoxidation, the oxygencontent in the liquid steel is lower than in the case of singleTi deoxidation but higher than in case of single Al deoxida-tion. Hence, there is no advantage of Ti/Al deoxidation forreducing the oxygen content compared with single Al deox-
idation. They observed that angular Al2O3 inclusions thathad been formed during Al deoxidation, changed after Tiaddition to spherical inclusions containing a small amountof Ti, while, in the case of Ti/Al deoxidation, TiOx resultingfrom Ti deoxidation was reduced by the second Al addition.Ruby-Meyer et al.7) performed inclusion analyses in Ti-deoxidized steel and multiphase equilibrium calculationsbased on the IRSID slag model (code CEQCSI). They ob-served that Al2O3 inclusions were formed at high [Al] con-tent, whereas inclusions containing both Ti oxides andAl2O3 were formed at low Al contents. There was a goodcorrelation between the analyzed oxide composition andthat predicted by the calculated Fe–Al–Ti–O inclusion dia-gram. More recently, Matsuura et al.8) investigated the in-clusion evolution at 1 600°C during Al and/or Ti additionsto molten Fe with constant total oxygen concentration.They reported that Al2O3 inclusions were formed at firstafter Al and Ti additions, followed by Ti oxide formationon the existing particles. The latter were then reduced by[Al], resulting in a change of particle morphology fromspherical inclusions formed immediately after Al deoxida-tion to polygonal inclusions.
Park et al.1) studied the reoxidation of Al–Ti containingsteel in the tundish by CaO–Al2O3–MgO–SiO2 slag at1 550°C with an initial [Al] of 820 ppm and [Ti] varyingfrom 100 to 500 ppm. They observed that [Al] and [Ti]were simultaneously oxidized by SiO2 from the slag, andthat dissolved oxygen was supersaturated with respect tothe Al–O–Al2O3 equilibrium. The oxygen supersaturationcaused the formation of inclusions with a two-layer com-plex structure, consisting of an Al2O3 core surrounded by
Formation and Evolution of Al–Ti Oxide Inclusions duringSecondary Steel Refining
Marie-Aline VAN ENDE,1) Muxing GUO,1) Rob DEKKERS,1) Marc BURTY,2) Joris VAN DYCK,1)
Peter Tom JONES,1) Bart BLANPAIN1) and Patrick WOLLANTS1)
1) Department of Metallurgy and Materials Engineering, Katholieke Universiteit Leuven, Kasteelpark Arenberg 44 box 2450,BE-3001 Heverlee, Belgium. E-mail: [email protected] 2) ArcelorMittal Burns Harbor, 250 W.U.S. Highway 12, Burns Harbor, IN 46304-9745, USA.
(Received on January 14, 2009; accepted on March 31, 2009)
The process of Al deoxidation and Ti alloying during RH degassing treatment was studied under an Ar at-mosphere at secondary steelmaking temperature (1 600—1 650°C) in an induction furnace equipped with anoxygen probe and a steel sampler. The formation of inclusions during partial Al deoxidation and Ti addition,and the reduction of Ti–Al–O inclusions by second Al addition are discussed using thermodynamic calcula-tions. Specific attention is given to inclusion size and the compositional relation between the inclusions andthe steel. The combination of experimental and calculated results shows that, in order to prevent Ti oxida-tion in liquid steel, it is essential to control [Al] in liquid steel to a level of approximately 200 ppm prior to Tiaddition to achieve around 500 ppm [Ti] with minimal Ti loss during the alloying process.
KEY WORDS: IF steel; Al–Ti deoxidation; Ti alloying; Al–Ti–O inclusions; Fe–Al–Ti–O equilibrium diagram.
1133 © 2009 ISIJ
Al–Ti–O oxides.In the present study, Al/Ti and Al/Ti/Al deoxidation ex-
periments are carried out under Ar atmosphere at secondarysteelmaking temperatures (1 600–1 650°C) in an inductionfurnace equipped with an oxygen probe and a steel sampler.The influences of the amount of Ti addition and the oxygenlevel in liquid steel prior to Ti alloying on the formationmechanism of complex Al–Ti–O inclusions are highlightedin association with inclusion composition and comparedwith thermodynamic calculations. The purpose is to simu-late the influence of locally high [O] and high [Ti] in theladle on the type and chemistry of inclusions. The subse-quent reduction of Ti-containing inclusions through a sec-ond Al addition was evaluated in order to investigate howthe Ti recovery can be maximized. Special attention isgiven to inclusion size, and the compositional correlationbetween inclusion and steel.
2. Experimental
2.1. Experimental Set-up and Procedures
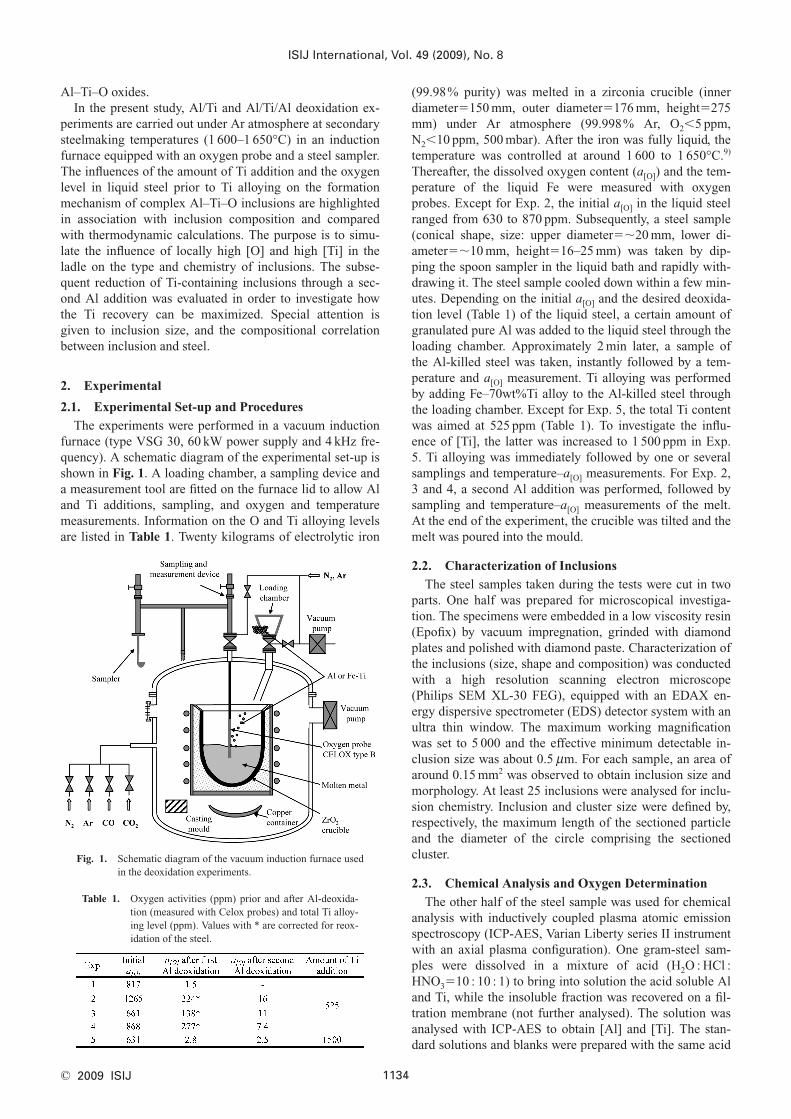
The experiments were performed in a vacuum inductionfurnace (type VSG 30, 60 kW power supply and 4 kHz fre-quency). A schematic diagram of the experimental set-up isshown in Fig. 1. A loading chamber, a sampling device anda measurement tool are fitted on the furnace lid to allow Aland Ti additions, sampling, and oxygen and temperaturemeasurements. Information on the O and Ti alloying levelsare listed in Table 1. Twenty kilograms of electrolytic iron
(99.98% purity) was melted in a zirconia crucible (inner diameter�150 mm, outer diameter�176 mm, height�275mm) under Ar atmosphere (99.998% Ar, O2�5 ppm,N2�10 ppm, 500 mbar). After the iron was fully liquid, thetemperature was controlled at around 1 600 to 1 650°C.9)
Thereafter, the dissolved oxygen content (a[O]) and the tem-perature of the liquid Fe were measured with oxygenprobes. Except for Exp. 2, the initial a[O] in the liquid steelranged from 630 to 870 ppm. Subsequently, a steel sample(conical shape, size: upper diameter��20 mm, lower di-ameter��10 mm, height�16–25 mm) was taken by dip-ping the spoon sampler in the liquid bath and rapidly with-drawing it. The steel sample cooled down within a few min-utes. Depending on the initial a[O] and the desired deoxida-tion level (Table 1) of the liquid steel, a certain amount ofgranulated pure Al was added to the liquid steel through theloading chamber. Approximately 2 min later, a sample ofthe Al-killed steel was taken, instantly followed by a tem-perature and a[O] measurement. Ti alloying was performedby adding Fe–70wt%Ti alloy to the Al-killed steel throughthe loading chamber. Except for Exp. 5, the total Ti contentwas aimed at 525 ppm (Table 1). To investigate the influ-ence of [Ti], the latter was increased to 1 500 ppm in Exp.5. Ti alloying was immediately followed by one or severalsamplings and temperature–a[O] measurements. For Exp. 2,3 and 4, a second Al addition was performed, followed bysampling and temperature–a[O] measurements of the melt.At the end of the experiment, the crucible was tilted and themelt was poured into the mould.
2.2. Characterization of Inclusions
The steel samples taken during the tests were cut in twoparts. One half was prepared for microscopical investiga-tion. The specimens were embedded in a low viscosity resin(Epofix) by vacuum impregnation, grinded with diamondplates and polished with diamond paste. Characterization ofthe inclusions (size, shape and composition) was conductedwith a high resolution scanning electron microscope(Philips SEM XL-30 FEG), equipped with an EDAX en-ergy dispersive spectrometer (EDS) detector system with anultra thin window. The maximum working magnificationwas set to 5 000 and the effective minimum detectable in-clusion size was about 0.5 mm. For each sample, an area ofaround 0.15 mm2 was observed to obtain inclusion size andmorphology. At least 25 inclusions were analysed for inclu-sion chemistry. Inclusion and cluster size were defined by,respectively, the maximum length of the sectioned particleand the diameter of the circle comprising the sectionedcluster.
2.3. Chemical Analysis and Oxygen Determination
The other half of the steel sample was used for chemicalanalysis with inductively coupled plasma atomic emissionspectroscopy (ICP-AES, Varian Liberty series II instrumentwith an axial plasma configuration). One gram-steel sam-ples were dissolved in a mixture of acid (H2O : HCl :HNO3�10 : 10 : 1) to bring into solution the acid soluble Aland Ti, while the insoluble fraction was recovered on a fil-tration membrane (not further analysed). The solution wasanalysed with ICP-AES to obtain [Al] and [Ti]. The stan-dard solutions and blanks were prepared with the same acid
ISIJ International, Vol. 49 (2009), No. 8
1134© 2009 ISIJ
Fig. 1. Schematic diagram of the vacuum induction furnace usedin the deoxidation experiments.
Table 1. Oxygen activities (ppm) prior and after Al-deoxida-tion (measured with Celox probes) and total Ti alloy-ing level (ppm). Values with * are corrected for reox-idation of the steel.

concentrations as those of the sample solutions. a[O] andtemperature of the liquid steel were on-line measured bythe intermittent immersion of single-use oxygen probes(Celox type B, provided by Heraeus Electro-Nite). The datawere collected by a Multi-Lab III Celox instrument (v3.01).At 1 600°C, the lowest analytical limit and the accuracy ofO probe measurements are, respectively, about 10�5 ppmand 0.04 ppm.
3. Results and Discussion
The sampling moment, [Al], [Ti], a[O] and the correspond-ing Al and Ti contents of the Ti–Al–O inclusions in thesamples are summarized in Table 2. The symbols ( )c and ( )s refer to, respectively, the concentrations in clusters andin single particles.
3.1. Compositional Evolution of Metal and Inclusionsduring Al/Ti and Al/Ti/Al Deoxidation
3.1.1. Al/Ti Deoxidation
Changes in [Al], [Ti] and a[O] during Al–Ti deoxidationas a function of time after Al deoxidation for Exp. 1 areshown in Fig. 2. With Al addition, the liquid steel was rap-idly deoxidized from an initial a[O] level of 817 to 1.5 ppm.Thereafter, a[O] remained constant at this low level until thecompletion of the experiment. There was no decrease ina[O] after Ti addition. With Ti alloying (aimed at 525 ppm),the [Ti] reached a level of approximately 505 ppm. There-after, it remained almost constant (see Table 2). Only45 ppm [Ti] was lost after holding the melt for 60 min in thecrucible without top slag coverage. This confirms that Tican be efficiently alloyed into the liquid steel after a strongAl deoxidation. On the other hand, the [Al] gradually de-creased with time, as a result of [Al] oxidation through re-action with the residual oxygen in the Ar gas flow. Consid-ering the metal composition changes with time for everytest, the reoxidation rate of the melt is evaluated at approxi-mately 20 ppm/min. Only pure Al2O3 inclusions were ob-served in the metal samples taken after Ti alloying (Table3).
3.1.2. Al/Ti/Al Deoxidation
Figure 3 shows the evolutions of [Al], [Ti], a[O] and the(Ti)s/(Al)s ratio in the Ti–Al–O inclusions as a function oftime after the first Al addition for Exp. 2. The purpose ofthis test was to perform a partial deoxidation of the steelwith the first Al addition, followed by Ti alloying and a sec-ond Al addition. As seen in the upper diagram of Fig. 3,a[O] was controlled at 64 ppm by the first Al addition. a[O] atthe moment of the Ti addition was corrected to 224 ppm totake into account steel reoxidation during the 8 min be-tween the oxygen measurement and the Ti addition. It wasfurther reduced to 22 and 16 ppm with, respectively, Ti al-loying (aimed at 525 ppm) and a second Al addition. Theformer suggests that part of the added Ti was consumedthrough Ti deoxidation. This is confirmed by analyses ofthe inclusion composition. The ratio (Ti)s/(Al)s in the smallrandomly dispersed inclusions drastically increased after Tiaddition (lower diagram of Fig. 3), while only 78 ppm [Ti]was obtained in the bulk metal immediately after Ti addi-tion, indicating the occurrence of Ti deoxidation. After the
second Al addition, a[O] is still relatively high (upper dia-gram of Fig. 3, a[O]�16 ppm), substantiating the findings byKunisada et al.5) that Ti/Al deoxidation was less efficientthan single Al deoxidation. With the second Al addition,[Ti] rose abruptly. Afterwards, it increased moderately withtime. Meanwhile [Al] decreases. Apparently, Ti containingoxides formed during Ti alloying were reduced after thesecond Al addition, the reduction proceeding fast at the be-
ISIJ International, Vol. 49 (2009), No. 8
1135 © 2009 ISIJ
Table 2. Chemical composition of liquid steel and that of in-clusions. tAl1, tTi and tAl2 represent, respectively, thetime after first Al addition, Ti addition and second Aladdition. a[O] was measured with Celox probes. * in-dicates modified a[O] values considering the reoxida-tion rate of the steel. [Al] and [Ti] were obtainedwith ICP-AES. The inclusion composition was deter-mined by EDS analysis. ( )c and ( )s refer to the con-tent in clusters and in single particles.
Fig. 2. Evolution of [Al], [Ti] and a[O] in liquid steel after Al–Tideoxidation (Exp. 1).

ginning. The (Ti)s/(Al)s ratio in the Ti–Al–O inclusionsdropped rapidly from around 8 to 1 within 1 min after thesecond Al addition, and remained constant at (Ti)s/(Al)s�1(lower diagram of Fig. 3). A fraction of Ti was inevitablylost during the alloying process since Ti containing oxidescould not be completely reduced with the second Al addi-tion under the present test conditions.
3.2. Characteristics of Al/Ti and Al/Ti/Al DeoxidationProducts
3.2.1. Overview of Inclusions Formed during Deoxidation
Per sample the following information is provided inTable 3: (1) sampling moment (tAl1, tTi and tAl2 are respec-tively the holding times after first Al addition, Ti additionand second Al addition), (2) inclusion size (dmean, dmax anddmin are respectively the mean, maximum and minimum di-ameters for complete cluster, single particle within a clus-ter, and single particles randomly distributed in the steelmatrix) and (3) type of inclusions. Prior to Ti alloying, onlyAl2O3 inclusions, mainly present as clusters, were found.
After the Ti addition, the inclusions can be roughly catego-rized into two types: large Al2O3 clusters (Fig. 4(a)) andsmall Ti–Al oxide particles (Fig. 4(b)). The latter are ran-domly distributed in the steel matrix. These small particlesconsist of a Ti–Al–O core with Al2O3 overgrowth (Fig.4(b)). In some samples taken immediately after Ti alloying(2B, 3B and 4B), several Ti oxide particles were detected inthe Al2O3 clusters (Fig. 4(c)). After the second Al addition,only Al2O3 clusters and a limited amount of small Al–Ti–Oinclusions were found in the samples, owing to the reduc-tion of Al–Ti–O inclusions by Al addition. Few cubic TiNparticles with Al–Ti oxide core, formed through reactionwith residual N2 in the Ar gas flow, were observed belowthe sample surface in Exp. 5 in which Ti alloying level wasraised to 1 500 ppm (Fig. 4(d)). Based on Thermo-Calc pre-dictions, Van der Eijk et al.10) pointed out that the TiN for-mation probably occurs through an exchange reaction withTi2O3 (or Ti3O5) in the solid state. No evidence indicatingthe existence of a liquid Al–Ti–O phase was found duringthe SEM observations. An extremely fast quenching of the
ISIJ International, Vol. 49 (2009), No. 8
1136© 2009 ISIJ
Table 3. Inclusion type and dimensions (in mm) in the samples. tAl1, tTi and tAl2 represent, respectively, the time after first Al addition,Ti addition and second Al addition. dmean, dmax and dmin are respectively the mean, maximum and minimum diameters of theinclusions.

sample may be required to be assured about the liquid orsolid state of the Al–Ti–O inclusions at steelmaking tem-perature.
3.2.2. Inclusion Size
The average size of single Ti–Al–O inclusions variesfrom 0.75 to 2.5 mm, while single Al2O3 particles within theclusters ranged from 2.2 to 4.4 mm (Table 3). No correlationwas found between particle size and time after first Al de-oxidation and/or Ti alloying. Nevertheless, Table 3 showsthat the average size of the single Ti–Al–O inclusions isabout 2 mm smaller than that of the single Al2O3 particleswithin clusters. This might be explained by the differentlevels of supersaturation with respect to the [Al]–[O]–
Al2O3 (s) and [Ti]–[O]–TiOx (s) equilibria. For a given [O],[Al] has a much higher supersaturation level with respect to[Ti],1) resulting in a larger driving force for precipitationand growth of Al2O3 inclusions compared with TiOx inclu-sions. The size of the Al2O3 clusters ranged from 50 mm to1.5 mm. As shown in Fig. 5, the diameter of the cluster in-creased with time between the first and second Al addition,due to coalescence of Al2O3 particles. Collision-coagula-tion mechanisms, and especially turbulent and Stokes colli-sions, seem to be the major contributor to inclusion growthunder the present conditions.
3.2.3. Inclusion Composition
Figure 6 shows the influence of [Al] on the (Ti)s/(Al)s
ratio of the inclusions. The Ti content in the Ti–Al–O in-clusions rapidly decreases with increasing [Al]. It can beconcluded from these experimental data that more than300 ppm [Al] is required to prevent the formation of Ti-ox-ides during Ti alloying, as a result of low a[O] in the liquidsteel. It is therefore essential to ensure a sufficiently high[Al] value and homogeneity throughout the ladle prior to Tiaddition, to avoid locally low [Al], high a[O] and high [Ti],
ISIJ International, Vol. 49 (2009), No. 8
1137 © 2009 ISIJ
Fig. 4. Types of inclusions observed after Ti alloying: (a) Al2O3 cluster (3B, 3 min after Ti addition); (b) small Ti–Al–Oparticles with Al2O3 overgrowth (3B, 3 min after Ti addition); (c) Al–Ti–O cluster (2C, 12 min after Ti addition);and (d) cubic TiN (5D, 3 min after second Al addition).
Fig. 3. Changes in [Al], [Ti] and a[O] in liquid steel, and changesin (Ti)s/(Al)s ratio in inclusions with time duringAl–Ti–Al deoxidation (Exp. 2).
Fig. 5. Evolution of the average cluster size with time after firstAl addition.

causing the formation of Al–Ti–O inclusions.
3.3. Ti Deoxidation during Ti Alloying and Reductionof Ti Containing Inclusions by a Strong Second AlDeoxidation
3.3.1. Oxidation of Ti during Ti Alloying
The influence of a[O] prior to Ti addition on the oxidationof Ti was investigated by varying a[O] before Ti alloying.Figure 7 depicts the evolution of [Ti] and [O] in the steelbefore and after Ti addition for Exp. 1 to 4. [O] prior to Tiaddition were adjusted to take into account the reoxidationof the melt occurring between the oxygen measurement andthe Ti addition. In the ideal case, when Ti3O5–[Ti]–[O]equilibrium would be reached without reoxidation of themelt, the melt composition after Ti addition would corre-spond to the open markers in Fig. 7. The observed steelcomposition evolutions during Ti addition for Exp. 1 to 4are indicated by the arrows and grey markers. The steelcomposition after Ti addition tends to the correspondingequilibrium value. However, higher [O] and lower [Ti] areattained compared to the equilibrium composition, suggest-ing that equilibrium is not reached and/or reoxidation of themelt occurs (1 to 2 min elapsed between Ti addition and thenext sampling and oxygen measurement). As seen in Fig. 7,the extent of Ti oxidation strongly depends on a[O] prior toTi addition. Low a[O] prior to Ti alloying prevents Ti oxida-tion during Ti alloying to 525 ppm (Exp. 1), while Ti lossby oxidation increases significantly with a[O] prior to Ti al-loying (Exp. 2, 3 and 4).
With Exp. 5, the Ti alloying level was raised to1 500 ppm after that low a[O] was achieved through Al deox-idation, in order to assess whether [Ti] oxidation may beachieved by combining high [Ti] and low a[O]. Although Ti-containing inclusions were found near the sample surface(samples 5B, C and D in Table 3), they have a low Ti con-tent. The Ti to Al ratio of the inclusions ranged between 0.1and 0.5 (Table 2). Raising the Ti alloying level to 1 500 ppmhad no significant effect on [Ti] oxidation when low a[O]
was maintained.
3.3.2. Reduction of Ti Containing Inclusions by a StrongSecond Al Deoxidation
Figure 8 shows the changes in [Al] and [Ti] as a functionof time after the second Al addition. The reduction of Tioxides took place efficiently in the beginning of the second
Al addition, but the complete recovery of Ti from Ti–Al–Oinclusions took time. The combination of higher Ti addition(1 500 ppm) and higher [Al] (Exp. 5) results in a higher[Ti].
The comparison of the results in Fig. 8 with respect to Exp. 2, 3 and 4 indicates that, with identical Ti alloyinglevels (525 ppm Ti) and similar [Al], distinct [Ti] wereachieved after similar second Al additions. The time be-tween Ti addition and second Al addition influences Ti re-covery. As shown in Fig. 9, with longer time between Ti ad-dition and second Al addition, lower [Ti] were achievedafter the second Al deoxidation. The rise and removal ofTi–Al–O inclusions to the liquid steel surface hinder Ti re-covery at longer times. Less Ti–Al–O inclusions were avail-able in the bulk steel to react with [Al] when late second Aladdition was performed. Hence, to improve Ti recovery, Aladdition should be made shortly after Ti alloying.
ISIJ International, Vol. 49 (2009), No. 8
1138© 2009 ISIJ
Fig. 6. Correlation between [Al] and the (Ti)s/(Al)s ratio in theTi–Al–O inclusions. Fig. 7. Relation between [Ti] and a[O] before and after Ti addi-
tion for Exp. 1 to 4. Solid black and solid grey markerscorrespond to, respectively, the observed melt composi-tion before and after Ti addition. The solid line shows theTi3O5(s)–[Ti]–[O] equilibrium relation at 1 620°C. Openmarkers indicate the calculated melt compositions afterTi addition, considering the stoichiometry of the Ti oxi-dation reaction and assuming that equilibrium is reached.
Fig. 8. Changes in [Al] and [Ti] with time after second Al deoxi-dation.

3.4. Thermodynamic Considerations3.4.1. Inclusion Phase Stability
Ti forms many types of oxide and some of them havelarge solid solubility.11) When [Ti] and [Al] simultaneouslyexist in the liquid steel at a given a[O], equilibrium in theFe (l)–Al2O3–TiOx–AlTiOx system can be expressed by thereactions,
2[Ti]�3[O]�Ti2O3 (s) , DG1°��263 000�85.25T 12,13)
...........................................(1)
3[Ti]�5[O]�Ti3O5 (s) , DG2°��424 000�136.2T 12,13)
...........................................(2)
2[Al]�3[O]�Al2O3 (s) , DG3°��289 060�93.52T 13,14)
...........................................(3)
Al2O3 (s)�[Ti]�2[O]�Al2O3·TiO2 (s) ,
DG4°��168 940�55.51T 12,13,15) .....(4)
Ti2O3 (s)�2[Al]�Al2O3 (s)�2[Ti] ,
DG5°��26 060�8.27T 12–14) ............(5)
Ti3O5 (s)�10/3 [Al]�5/3 Al2O3 (s)�3[Ti] ,
DG6°��57 767�19.67T 12–14) ..........(6)
Al2O3·TiO2 (s)�4/3 [Al]�5/3 Al2O3 (s)�[Ti] ,
DG7°��23 767�6.84T 12–15) ............(7)
selecting Ti2O3 and Ti3O5 as stable Ti oxides in the investi-gated range of [Ti], [Al] and a[O]. The standard reactionGibbs free energy changes DG° are expressed in cal · mol�1.
Using the interaction coefficients of Table 4 and the stan-dard reaction Gibbs free energy changes of reactions (1) to(7), the equilibrium diagram of the Fe–Al–Ti–O system canbe drawn at 1 620°C (Fig. 10). It gives the type of oxidesformed at equilibrium as a function of [Al], [Ti] and [O].Thick lines mark the phase boundaries of the deoxidationproducts, whereas thin lines delimit the liquid Fe stable re-gion at a given a[O]. The compositions of the steel samplestaken after Ti addition are superimposed on the diagram.The samples containing predominantly Al2O3 inclusions(solid square markers) are located in the Al2O3 stable re-gion, while those containing Ti–Al–O complex inclusions(solid dot markers) are close to the calculated line or withinthe Ti oxide stable region. To prevent [Ti] oxidation during
alloying, it is essential to control [Al] to a sufficiently highvalue. This required [Al] is determined by the line delimit-ing the Al2O3 stable region. According to the calculationsand considering that [Ti] is aimed at 525 ppm, approxi-mately 200 ppm [Al] is required prior to Ti addition to pre-vent [Ti] oxidation. This calculated value is consistent withthe experimental results depicted in Fig. 10. This is also ina good agreement with the compositional analyses of theinclusions shown in Fig. 6.
3.4.2. Reaction Mechanism during Al/Ti/Al Deoxidation
Figure 11 shows, for Exp. 3, the evolution of the liquidsteel composition superimposed on the inclusion phase dia-gram. As indicated by the open circle (point A), the [Ti]and [Al] at the moment of Ti addition fell within the Ti3O5
stable region. This was intentionally controlled by partialAl deoxidation and Ti addition. Just after the addition, [Ti]reacted with oxygen in steel to form Ti oxides, resulting ina decrease of a[O] and [Ti] (from point A to point B). Thesteel was gradually reoxidized by the residual oxygen in theAr flow, causing an increase in a[O] and a decrease of [Ti],while [Al] remained constant (from point B to point C).This is consistent with the fact that the steel compositionevolved in the Ti3O5 stable region, where only Ti oxidationis predicted. The steel composition reached the Ti3O5/Al2O3·TiO2 phase boundary at point C. By steel reoxida-tion, both [Ti] and [Al] decrease through reaction with oxy-gen, as entering the Al2O3·TiO2 stable region where bothAl and Ti oxidation is possible (from point C to point D).
ISIJ International, Vol. 49 (2009), No. 8
1139 © 2009 ISIJ
Table 4. Interaction coefficients used in the present work.
Fig. 9. Relation between the amount of Ti recovered after thesecond Al addition and the time between Ti alloying andthe second Al addition.
Fig. 10. Equilibrium diagram for the system Fe–Al–Ti–O at1 620°C and various a[O] (10 to 200 ppm). Square mark-ers indicate the metal composition of the samples inwhich Al2O3 inclusions were found, while round mark-ers correspond to the metal composition of the samplescontaining Al–Ti–O inclusions.

Meanwhile, a[O] increased. [Ti] and [Al] proceeded throughthe Al2TiO5 stable region and approached the Al2O3·TiO2/Al2O3 phase boundary (point D), where Fe (l)–Al2O3·TiO2 (s)–Al2O3 (s) equilibrium is established. Twenty min-utes elapsed between Ti addition (point A) and point D. Thesecond Al addition was then performed. Steel deoxidationand Ti recovery from Ti–Al–O inclusions simultaneouslytook place, resulting in a decrease of a[O] and a considerableincrease of [Ti]. Hence, the steel composition moved to thepoint E, where Al2O3 is stable. The reduction reaction pro-ceeded with time by consuming [Al] and increasing [Ti] upto point F. This reduction process was also observed duringExp. 2 and 4 (Fig. 8). In the case of strong second Al deoxi-dation (implying high [Al]), [Ti] and [Al] changed withtime, attempting to maximize Ti recovery by consuming[Al] until the Ti3O5/Al2O3 phase boundary is reached.
4. Conclusions
(1) Only Al2O3 inclusions were observed when strongAl deoxidation prior to Ti alloying was performed. On theother hand, with partially deoxidized steel prior to Ti addi-tion (a[O]�140–280 ppm), Ti deoxidation took place. In thatcase, large Al2O3 clusters and small Ti–Al oxide particlesrandomly distributed in the steel were found. After the second Al addition, only Al2O3 clusters and few smallTi–Al–O inclusions remained due to the reduction of Ti ox-ides by [Al].
(2) The extent of [Ti] oxidation increased with a[O]
prior to Ti alloying. No Ti deoxidation occurred with low
a[O] prior to Ti alloying. On the other hand, increasing theTi addition to 1 500 ppm had no significant effect on Ti de-oxidation.
(3) The reduction of Ti oxides through the second Aladdition was confirmed by inclusion observations and compositional analysis of the samples. Ti recovery fromTi–Al–O inclusions occurred rapidly after the second Aladdition and was enhanced by performing the latter shortlyafter Ti alloying.
(4) The combination of experimental and calculated re-sults shows that, in order to prevent Ti oxidation, it is essen-tial to maintain [Al] to a sufficiently high value. Approxi-mately 200 ppm [Al] is necessary prior to Ti addition tominimize Ti loss during the alloying process.
(5) The mechanisms of Ti–Al deoxidation reactions in-volving inclusion formation at various stages of the experi-ments were elucidated based on the calculated Fe–Al–Ti–Ophase diagram.
REFERENCES
1) D. C. Park, I. H. Jung, P. C. H. Rhee and H. G. Lee: ISIJ Int., 44(2004), 1669.
2) M. Ito, K. Morita and N. Sano: ISIJ Int., 37 (1997), 839.3) K. Yamamoto, S. Matsuda, T. Haze, R. Chijiiwa and H. Mimura:
Proc. Int. Symp. Residual and Unspecified Elements in Steel, ASTMInternational, Philadelphia, PA, (1989), 266.
4) C. Van der Eijk, Ø. Grong, S. S. Babu and S. A. David: Proc. 5th Int.Conf. on Trends in Welding Research, ASM International, MaterialsPark, OH, (1999), 729.
5) K. Kunisada and K. Iwai: CAMP-ISIJ, 7 (1994), 1130.6) K. Kunisada and K. Iwai: CAMP-ISIJ, 6 (1993), 1173.7) F. Ruby-Meyer, J. Lehmann and H. Gaye: Scand. J. Metall., 29
(2000), 206.8) H. Matsuura, C. Wang, G. H. Wen and S. Sridhar: ISIJ Int., 47
(2007), 1265.9) M. Guo, P. T. Jones, S. Parada, E. Boydens, J. V. Dyck, B. Blanpain
and P. Wollants: J. Eur. Ceram. Soc., 26 (2006), 3831.10) C. Van der Eijk, Ø. Grong and J. Walmsley: Proc. 6th Int. Conf. on
Molten Slags, Fluxes and Salts, KTH, Stockholm, (2000).11) M. Pajunen and J. Kivilahti: Z. Metallkd., 83 (1992), 17.12) O. Kubaschewski and W. A. Dench: J. Inst. Met., 82 (1953), 87.13) J. F. Elliott: Proc. Electric Furnace Conf., The Iron and Steel Soc.
AIME, Warrendale, PA, (1974), 293.14) M. W. Chase, J. L. Curnutt, R. A. McDonald and A. N. Syverud: J.
Phys. Chem. Ref. Data, 7 (1978), 793.15) I. Barin, O. Knacke and O. Kubaschewski: Thermochemical Proper-
ties of Inorganic Substances (supplement), Springer-Verlag, Berlin,(1977), 1546, 1548.
16) H. Ohta and H. Suito: The Final Report of Ultra Clean Steel Re-search Group, Thermodynamics of Production of Ultra Clean Steel,ISIJ, Tokyo, (1999), 66.
17) G. K. Sigworth and J. F. Elliott: Met. Sci., 8 (1974), 298.18) G. Yuanchang and W. Changzhen: Metall. Trans. B, 21B (1990),
543.
ISIJ International, Vol. 49 (2009), No. 8
1140© 2009 ISIJ
Fig. 11. Evolution of [Ti] and [Al] during Exp. 3, plotted on thecomputed equilibrium diagram of the Fe–Al–Ti–O sys-tem at 1 620°C. a[O] is given next to each point.