formation of tungsten/ammonium perchlorate composites and
TRANSCRIPT
703Formation of Tungsten/Ammonium Perchlorate Composites...
Central European Journal of Energetic Materials, 2015, 12(4), 703-722
Formation of Tungsten/Ammonium Perchlorate Composites and Their Reaction Kinetics
Hong-Min SHIM 1, Eun-Ae LEE 1, Jae-Kyeong KIM 1, Hyoun-Soo KIM 2, Kee-Kahb KOO 1,*
1 Department of Chemical and Biomolecular Engineering, Sogang University, Seoul, 121-742, Korea2 Agency for Defense Development, Daejeon, 305-600, Korea*E-mail: [email protected]
Abstract: The reaction kinetics of tungsten nanoparticles/ammonium perchlorate (W/AP) composites, produced by a spray drying technique, were analyzed and compared with those of neat AP particles and aluminum nanoparticles/AP (Al/AP) composites. The W was found to raise the onset temperature of the thermal decomposition of AP by increasing the activation energy, whereas Al conversely lowered the onset temperature of AP due to the decreased activation energy. From the master plots of kinetic models with the experimental data, the Prout-Tompkins model and the 1-D diffusion controlled model were found to describe the low-temperature decomposition (LTD) and high-temperature decomposition (HTD), respectively, giving remarkable agreement with experimental curves for all heating rates. The presence of W was found to increase the HTD zone width compared with that of neat AP particles and Al/AP composites. Analysis of the average activation energy and pre-exponential factor showed that W increases the energy barrier and the frequency of occurrence of the reaction compared with that of neat AP particles at the LTD state, whereas W decreases both of them at the HTD state. The effect of Al was also shown to be similar to that of W, but the magnitudes of the variation in activation energy and the pre-exponential factor were relatively small.
Keywords: ammonium perchlorate, composite, thermal decomposition
1 Introduction
A great deal of attention has been paid to the compositions of ammonium perchlorate (AP) with metal nanoparticles (NPs) and metal oxide NPs being
ISSN 1733-7178e-ISSN 2353-1843

704 H.-M. Shim, E.-A. Lee, J.-K. Kim, H.-S. Kim , K.-K. Koo
used to improve the performance of AP. CuCo2O4 NPs were found to decrease the thermal decomposition temperature of AP, and the Fe2O3 NPs/AP composite showed a faster decomposition rate than that of neat AP [1, 2]. When employing Cu NPs, a decrease in activation energy of AP was observed [3]. These observations are closely related to the gas production of propellants and the thermal stability of the solid materials. For this reason, metal NPs or metal oxide NPs are mixed with AP particles as composite solid propellants [4].
To understand the effects of metal NPs or metal oxide NPs on the thermal decomposition of AP, the decomposition mechanism of AP needs to be clarified. The two different types of thermal decompositions of AP, low- and high-temperature decomposition, make identification of the reaction kinetics complicated [5]. Manelis et al. tried to investigate the thermal decomposition reaction of AP using a multistep kinetic model for the low-temperature decomposition [6]. Vyazovkin and Wight attempted to study the kinetics of thermal decomposition of AP by using the model-free isoconversional method, in which dependence of the effective activation energy on the extent of conversion was proposed [7]. On the other hand, Zhu et al. [8] tried to analyze the kinetics of thermal decomposition of AP with Al nanoparticles by employing various decomposition models.
In the 20th century, the catalytic effects of W on the oxidation of ammonia were specifically treated by Il’chenko et al. [9, 10]. Recently, the presence of W was found to increase the conversion of NH3 to NOx or N2 [11]. This raises the potential of W/AP composites for enhancing gas emission. In the present article, we aim to find the reaction models that are suitable for describing the thermal decomposition of W/AP composites, including neat AP particles and Al/AP composites. Initially, the W/AP composites were produced by a spray drying system and their morphologies were identified by scanning electron microscopy (SEM) and transmission electron microscopy (TEM). Then, the effective activation energy was calculated by the model-free isoconversional method. Subsequently, based on the average activation energy, the mechanism of thermal decomposition of the W/AP composites was revealed by the model-fitting method, and then the pre-exponential factor of the kinetic parameters was determined, where the effect of W NPs on the thermal decomposition of AP was tackled in detail. Finally, we demonstrate the correctness of the selected kinetic models through comparison with the experimental curves for neat AP particles, W/AP and Al/AP composites.

705Formation of Tungsten/Ammonium Perchlorate Composites...
2 Materials and Methods
2.1 Preparation In the present work, AP (98.0%, Sigma Aldrich), 100 nm Al NPs (99.9%, Nano technology) and 100 nm W NPs (99.9%, Nano technology) were used. The surface of the Al and W NPs were fully protected by their oxide layers. Therefore, these NPs were not explosive. A schematic diagram of a spray drying system for the formation of the composites is illustrated in Figure 1. The AP (0.06 wt.%)/methanol solution was prepared in a solution tank (Figure 1a). 1 wt.% of W or Al NPs, based on the AP, was mixed with the AP/methanol solution by mechanical stirring at 200 rpm. Fine droplets of the solution were produced by a two-fluid nozzle with N2 gas. The N2 gas pressure was fixed with 2 MPa. The atomized particles were rapidly dried in a reactor (Figure 1c) at 140 °C by a heat gun. The dried metal NPs/AP composites were filtered using a cyclone with a vacuum pump (ULVAC GCD-051X). To prevent explosion which may be caused by static electricity, the inner surface of the reactor was coated with polytetrafluoroethylene (PTFE), and the exposed metal parts were grounded.
Figure 1. A schematic diagram of the spray drying system: a – solution tank, b – spray nozzle with two-fluids, c – reactor, d – cyclone, e – vacuum pump, and f – dust box.

706 H.-M. Shim, E.-A. Lee, J.-K. Kim, H.-S. Kim , K.-K. Koo
2.2 InstrumentationThe size and morphology of the metal NPs/AP composites, after gold coating, were observed by SEM (JEOL JSM-7500F) with an accelerating voltage of 15 kV. The inner structure of the metal NPs/AP composites was investigated by high-resolution TEM (FEI Tecnai F20) operated at 200 kV. Analysis of the non-isothermal decomposition of the composites was performed with a thermogravimetric analyzer, TGA (Q600, TA Instrument), with heating rates of 5, 10, 20 and 30 °C/min in a nitrogen atmosphere at a flow rate of 100 mL/min. The samples, 5-16 mg, were accurately weighted into aluminum pans without seals.
2.3 Kinetic analysisFor non-isothermal kinetics, the rate of a solid-state reaction is written as [12]:
( ) ( )/d
d
aE RTA e fTα α
β−= (1)
where A is the pre-exponential factor, Ea is the activation energy, T is the absolute temperature, R is the ideal gas constant, f(α) is the differential reaction model (see Table 1), β is the heating rate, and α is the conversional fraction defined by:
0
0
tm mm m
α∞
−=− (2)
where: m0 is the initial weight of the sample, mt is the weight at time t, and m∞ is the final weight.
Table 1. Differential and integral forms of the solid-state reaction models [12]
Model Differential formf(α) = 1/k dα/dt
Integral formg(α) = kt
Nucleation modelspower law (P2) 2α1/2 α1/2
power law (P3) 3α2/3 α1/3
Avrami-Erofeyev (A2) 2(1 – α)[ –ln(1 – α)]1/2 [–ln(1 – α)]1/2
Avrami-Erofeyev (A3) 3(1 – α)[ –ln(1 – α)]2/3 [–ln(1 – α)]1/3
Prout-Tompkins (B1) α(1 – α) ln[α/(1 – α)]+c

707Formation of Tungsten/Ammonium Perchlorate Composites...
Model Differential formf(α) = 1/k dα/dt
Integral formg(α) = kt
Geometrical contraction modelscontracting area (R2) 2(1 – α)1/2 1 – (1 – α)1/2
contracting volume (R3) 3(1 – α)2/3 1 – (1 – α)1/3
Diffusion models1-D diffusion (D1) 1/(2α) α2
2-D diffusion (D2) –[1/ln(1 – α)] ((1 – α)ln(1 – α)) + α
The differential form of Equation (1) was transformed by integration to:
( ) ( )( ) ( )/
0 0
da
T E RTa
d A Ag e T I E , Tf
α ααα β β
−= = =∫ ∫ (3)
where g(α) is an integral reaction model (Table 1). In the present work, the activation energy was calculated by the Vyazovkin method, and results in an effective activation energy [13].
( )( )
, ,
1 , ,
,
,
n na i j
i j i a j i
I E TI E T
α α
α α
ββ= ≠
Φ = ∑∑ (4)
( ) ( ),/
,, d
aT E RT
a TI E T e Tα α
α αα α
−∆
−= ∫ (5)
where I(Ea,α, Tα,i) and I(Ea,α, Tα,j) are the exponential integrals at heating rates βi and βj, respectively. At a given α, the Ea is the value that minimizes Φ.
3 Results and Discussion
3.1 Morphologies of W/AP and Al/AP compositesThe neat AP particles, W/AP and Al/AP composites prepared in the present work are shown in Figure 2. For the neat AP, the one micrometer-sized AP particles were found to aggregate as spherical shapes, which may be caused by rapid evaporation of the droplets. On the other hand, the particle sizes of W/AP or Al/AP were found to be larger than that of the neat AP particles due to heterogeneous nucleation by metal NPs. Figure 3 shows the particle size

708 H.-M. Shim, E.-A. Lee, J.-K. Kim, H.-S. Kim , K.-K. Koo
distribution for the neat AP particles, and the W/AP and Al/AP composites, where their average sizes were estimated to be 0.8, 1.4, and 4.0 μm, respectively. The dispersion of the metal NPs in the AP crystals was confirmed by the TEM images (Figures 2d and 2e), where the metal NPs were not uniformly dispersed in the AP crystals, some of them being located on the crystal surfaces. Figure 4 shows the EDX spectrum of the W/AP and Al/AP composites. The presence of elements such as W, Al, O, and Cl is observed in the spectra.
Figure 2. SEM images of (a) neat AP particles, (b) W/AP composite, and (c) Al/AP composite. TEM images of (d) W/AP composite, and (e) Al/AP composite. (The white arrows indicate the metal NPs).

709Formation of Tungsten/Ammonium Perchlorate Composites...
Figure 3. Cumulative particle size distribution of neat AP particles, and W/AP and Al/AP composites.
Figure 4. EDX data for (a) W/AP composite, and (b) Al/AP composite.

710 H.-M. Shim, E.-A. Lee, J.-K. Kim, H.-S. Kim , K.-K. Koo
3.2 Analysis of TGA data In general, the decomposition of AP was analyzed as a two step reaction: low-temperature decomposition (LTD, < 350 °C) and high-temperature decomposition (HTD, > 350 °C). In the present work, the inflection points were found to be close to 80, 92, and 76 wt.% for AP, W/AP, and Al/AP, respectively (Figure 5a-c). According to the mechanism of thermal decomposition of AP, the LTD state starts with proton transfer from NH4
+ to ClO4− [14, 15]. From the crystal defects, such
as dislocations, the gaseous products begin to form numerous nuclei and fill the cavities. However, as the nuclei reach a critical size, they stop growing when the pressure inside the cavity reaches 20 atm [16]. The main gaseous products of the LTD state are NH3, H2O, N2O, and O2 [17]. In that case, it is known that about 30% of AP has decomposed and then the reaction ceases. On the other hand, at the HTD state, the chemical reaction takes place on the crystal surface, where the layer of gas phase is increased by the movement of NH3(g) and HClO4(g). In that case, decomposition and sublimation processes competitively interact, where energy is required to sublime the solid AP. The decomposition products include mainly HCl, H2O, N2O, NH3, Cl2, NO, O2, NO2, and ClO2 [17].
Figure 5. TG curves of (a) neat AP particles, (b) W/AP composite, and (c) Al/AP composite, for all heating rates. DTG curves of (d) neat AP particles, (e) W/AP composite, and (f) Al/AP composite for all heating rates; (solid line: 5 °C/min, dashed line: 10 °C/min, short dashed line: 20 °C/min, dotted line: 30 °C/min).
In this present work, the onset temperature is defined as the point where the weight of material begins to be decomposed, α = 0.02. From Table 2, the onset

711Formation of Tungsten/Ammonium Perchlorate Composites...
temperature was found to be shifted by the presence of metal NPs. Al NPs are shown to decrease the onset temperature of the LTD reaction, whereas W NPs increases the onset temperature of the LTD reaction. The reason behind the difference in onset temperatures is the relative magnitude of the activation energies. Figure 6 represents the variation of Ea as a function of degree of conversion, α, determined by the isoconversional method for non-isothermal TG data. The presence of metal NPs was found to change the distribution of the activation energies. Theoretically, the Ea(α) implies the energy barrier required for reaction from the previous point α − Δα, to the present point α. At α = 0.02, the Ea of the W/AP composite, 144.0 kJ/mol, is larger than the Ea of neat AP particles, 120.6 kJ/mol, whereas the Ea of the Al/AP composite, 89.5 kJ/mol, is smaller than that of neat AP particles. Therefore, it can be understood that the decreased Ea of Al/AP composites promotes the LTD state, whereas the increased Ea of W/AP composites retards the LTD state. Interestingly, the points of the LTD termination correspond approximately to the points, α = 0.22 (neat AP), 0.10 (W/AP), and 0.26 (Al/AP), respectively, where the Ea starts to increase dramatically.
Table 2. Onset temperature of the thermal decomposition of neat AP particles, W/AP composite, and Al/AP compositeHeating rate, β,
[°C/min]Onset temperature, [°C]
neat AP W/AP Al/AP5 240.1 252.3 232.210 246.7 256.8 238.320 263.5 266.0 256.330 268.4 280.2 264.6
Figure 6. Variation of the effective activation energy determined by the isoconversional method.

712 H.-M. Shim, E.-A. Lee, J.-K. Kim, H.-S. Kim , K.-K. Koo
Furthermore, the existence of metal NPs was found to affect considerably the LTD zone width. For the neat AP particles, 20 wt.% of AP was decomposed in the LTD state, whereas in the presence of W only 8 wt.% of AP was decomposed in the LTD state. However, in the case of the Al/AP composite, the LTD state was expanded to 24 wt.%. From the fact that the LTD reaction is hindered by the adsorption of NH3 gas on the AP crystal surfaces, the different effects of the metal NPs on AP may be surmised as follows. Metal NPs containing many defects have the potential to capture the gaseous products from AP [18]. Therefore, the concentration of NH3 on the metal NPs/AP interfaces increases and accordingly the LTD reaction tends to be terminated. Furthermore, the metal NPs existing within the AP could increase the dislocation density. The creation of dislocations and their movement can promote the accumulation of products in the nucleus and slowing of the LTD reaction ensues [19]. On the other hand, metal NPs could stimulate the thermal decomposition of AP because the surface-located electrons of molecules are attracted by the metal and consequently chemical bonds are broken [20]. The former would decelerate the thermal decomposition, whereas the latter would accelerate it. From this point of view, the difference in the LTD zone width for the W/AP and Al/AP composites may be derived from the different mechanisms that occur competitively.
3.3 Solid-state kinetic analysis3.3.1 Neat APBased on the effective activation energy, model-fitting was performed to find the reaction model for thermal decomposition of neat AP particles, and W/AP and Al/AP composites. At the LTD state, nucleation models such as P2, P3, A2, A3 and B1 were employed because the nucleation of gaseous products occurs inside the AP crystals [21]. On the other hand, at the HTD state, the nucleation occurs markedly on the surface [5], which leads to a reaction controlled by crystal shape and mobility of the gas phase. For this reason, the geometrical contraction models (R2 and R3) and the diffusion models (D1 and D2) were employed. In this work, the Ea values were shown to not be significantly changed with respect to α for each of the LTD and HTD states, where the Ea was roughly constant over each range and the difference between the maximum and minimum values of Ea were smaller than 20 - 30% of the average Ea. Therefore, it is reasonable to employ two single reaction models for each state [22].
To explore the reaction model which was most suitable for describing the thermal decomposition processes, the master plot of g(α)/g(0.5) against α was evaluated from the experimental data and different heating rates for each reaction model. Based on the average Ea of the LTD state and of the HTD state,
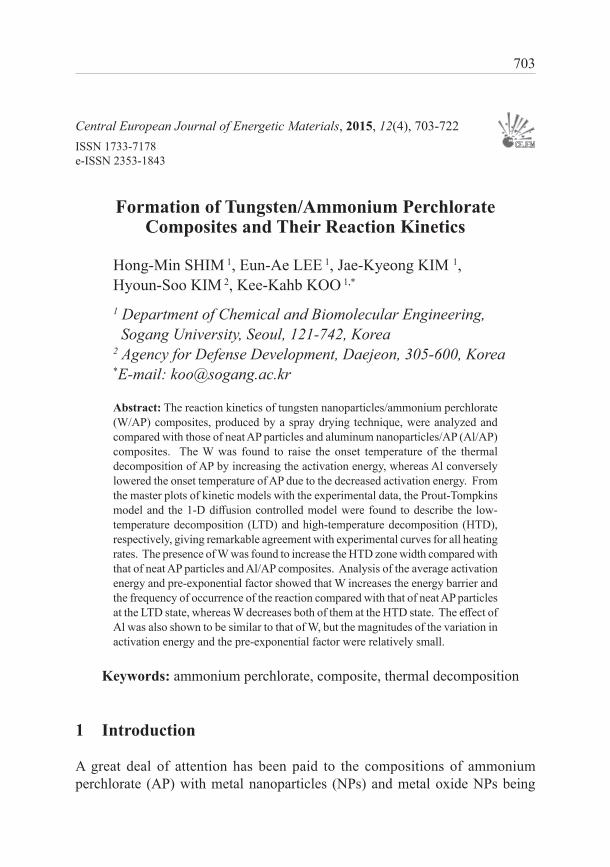
713Formation of Tungsten/Ammonium Perchlorate Composites...
121.49 kJ/mol (0.00 < α < 0.20) and 157.45 kJ/mol (0.20 < α < 1.00), respectively, the experimental master plots were obtained as shown in Figure 7. In this figure, all values were separately normalized for each state. To check the correctness of the selected models, the deviation, σ, of the master plots between a selected model and the experimental curves was introduced as follows:
( ) ( ) ( ) ( )( )2
, , , , , ,
1
0.5 0.5
n
N exp i N exp i N mod N modi
E g g g g nσ α α=
= − ∑ (6)
where the subscripts N, exp and mod, denote the normalized, experimental, and reaction model, respectively, E and n represent the mean and the number of experiments, respectively.
Figure 7. Master plots of the experimental data and the reaction models for neat AP particles: (a) P2, P3, A2, A3, and B1 at 0.00 < α < 0.20; (b) R2, R3, D1, and D2 at 0.20 < α < 1.00.
In Table 3, the A2 and B1 models are shown to exhibit small deviations in the LTD state, and accordingly they seem to follow exactly the trends of the LTD state as shown in Figure 7a. However, the ambiguity of a selected reaction model still remains when performing the model-fitting method without experimental observation. In practice, it is difficult to discriminate between the Avrami-Erofeyev (A2, A3) and Prout-Tompkins (B1) models due to their similar sigmoidal trend of the solid state reaction and the narrow domain of the LTD state. This exacerbates identification of the process for thermal decomposition of AP.
Nuclei formation processes have been reported to be localized in the screw and edge dislocations inside crystals in an experimental study on the nucleation of AP [23, 24]. Nucleation does not occur randomly over the whole crystal volume but originates from dislocations. Once nucleation occurs near existing

714 H.-M. Shim, E.-A. Lee, J.-K. Kim, H.-S. Kim , K.-K. Koo
dislocations, the AP crystal is deformed by increased pressure and leads to the formation of new dislocations [25, 26]. The density of newly generated dislocations was found to be larger near the nucleus rather than near unreacted AP [27]. In this way, the kinetics of thermal decomposition of AP in the LTD state is similar to the autocatalysis of the B1 model proposed by Prout and Tompkins. Consequently, the Avrami-Erofeyev model developed for describing random nucleation processes appears to be insufficient for describing the LTD state of AP. For this reason, the B1 model was selected as the reaction model in the LTD state. On the other hand, the D1 model was selected as the reaction model in the HTD state, providing the best fit for the experimental master plots of AP, with the lowest deviations, as given in Table 3 and Figure 7b.
Table 3. Deviation (σ) of the master plots for neat AP particlesLTD (0.00 < α < 0.20) HTD (0.20 < α < 1.00)Model σ Model σ
P2 0.2824 R2 0.4244P3 0.3403 R3 0.3099A2 0.0621 D1 0.1983A3 0.3400 D2 0.7186B1 0.1191
The pre-exponential factors were obtained from Equation (3), where A was determined from the slope of the g(α) vs. I(Ea,T)/β plot at various heating rates by the method of linear least square fitting. The values of A for the LTD and HTD states were 5.13 × 10¹¹/min and 4.07 × 10¹¹/min, respectively. Figure 8 shows the reconstructed curves for all heating rates based on the average Ea and A. The predicted plots for AP were shown to give good agreement with the experimental data. It seems that the combination of two single reaction models, B1 and D1, are suitable for describing the thermal decomposition of AP. Experimentally, the LTD reaction ceases due to accumulation of the gaseous products which are mainly generated near the dislocations of AP. Hence, it markedly follows the B1 model. On the other hand, the HTD state is governed by mass transfer that competes with sublimation [7]. The adsorption of gaseous products on the AP crystal surfaces is a reaction-limiting factor of AP that hinders diffusion of the gaseous products from the reaction sites. Furthermore, the diffusion is also hampered by the crystal lattice of AP, through which gaseous products should permeate. Therefore, the thermal decomposition of AP at the HTD state seems to follow the D1 model due to restriction of the motion of gaseous products.

715Formation of Tungsten/Ammonium Perchlorate Composites...
Figure 8. The experimental and reconstructed curves for neat AP particles.
3.3.2 W/APAs with the analysis of neat AP particles, the average Ea values of the W/AP composite for the LTD and HTD states were obtained as 132.78 kJ/mol (0.00 < α < 0.08) and 124.04 kJ/mol (0.08 < α < 1.00), respectively. Compared with the Ea values for neat AP particles, the presence of W was shown to increase the average Ea in the LTD state. The elevated activation energy in the LTD state implies that a relatively high potential barrier is imposed on the nucleation process for AP particles and therefore nucleation near the W NPs could be hindered. Moreover, the presence of W NPs enables the Ea of AP particles to decrease continuously to α = 0.08, whereas the Ea of neat AP particles increases continuously to α = 0.12, and then drastically decreases to α = 0.16. The declining tendency of the activation energy is one of the distinctive characteristics of the W/AP composite. This seems to be significantly associated with the LTD zone width, which is narrower compared to neat AP particles.
In Figure 9, the A3 and B1 models are shown to provide a good fit to experimental data in the LTD state, whereas only the D1 model exclusively follows the experimental data in the HTD state. The deviations of the master plots helped us to determine the reaction model. In the present work, the A3, B1 and D1 models were found to have smaller deviations in the experimental master plots, as can be seen from Table 4.
Employing the B1 and D1 models in the LTD and HTD states, respectively, the pre-exponential factors were obtained as 1.05 × 10¹³/min and 1.09 × 10⁹/min.

716 H.-M. Shim, E.-A. Lee, J.-K. Kim, H.-S. Kim , K.-K. Koo
Figure 10 shows that the reaction model accurately predicts the experimental curves of the W/AP composite at all heating rates, where a mechanism change in the thermal decomposition of AP is well developed. Fundamentally, exp(−Ea/RT) is the fraction of the bond redistribution step that has occurred to convert reactants into products, and A is the frequency of occurrence of the reaction [28]. Hence, the product of A and exp(−Ea/RT) becomes a rate constant for determining the total reaction rate. In this work, the frequency of occurrence A of the W/AP composite was found to be larger than that of neat AP particles. However, as shown in Figure 5, the magnitude of dα/dT of the W/AP composite is generally smaller than that of neat AP particles in the LTD state (250-290 °C). This implies that decomposition of the W/AP composite is slower than that of neat AP particles at a given heating rate. In that case, the reason is mainly due to a very high activation energy of the W/AP composite, which drastically decreases the fraction of occurrence of the bond redistribution step and cancels out to a large extent the effect of A on the reaction. On the other hand, the W/AP composite decomposes more rapidly than neat AP particles in the HTD state (320-420 °C), even though the frequency of occurrence A of the W/AP composite is much lower than that of neat AP particles. In that case, a very large fraction of the bond redistribution step originating from a considerably decreased activation energy Ea offsets a low frequency of occurrence A.
Figure 9. Master plots of experimental data and reaction models for the W/AP composite: (a) P2, P3, A2, A3, and B1 at 0.00 < α < 0.08; (b) R2, R3, D1, and D2 at 0.08 < α < 1.00.

717Formation of Tungsten/Ammonium Perchlorate Composites...
Table 4. Deviation (σ) of the master plots for the W/AP compositeLTD (0.00 < α < 0.08) HTD (0.08 < α < 1.00)Model σ Model σ
P2 0.0473 R2 0.3977P3 0.0986 R3 0.2749A2 0.1901 D1 0.0534A3 0.0254 D2 0.5436B1 0.0220
Figure 10. The experimental and reconstructed curves for the W/AP composite.
3.3.3 Al/APFrom the variation of Ea in Figure 6, the average values of Ea for the LTD and HTD states were 127.98 kJ/mol (0.00 < α < 0.24) and 108.83 kJ/mol (0.24 < α < 1.00), respectively. Compared with neat AP particles, the presence of Al NPs was found not only to increase the average Ea in the LTD state, but also to decrease the average Ea in the HTD state. These results are similar to the case of the W/AP composite, in which a relatively high potential barrier is imposed on the process of nucleation. From Figure 11, the A3 and B1 models were found to accurately mirror the experimental curves in the LTD state, whereas there is ambiguity between R3 and D1 in the HTD state. In this work, the B1 model was selected as the reaction model of the LTD state and D1, with the lowest deviation (Table 5), was selected in the HTD state. Based on these reaction models, B1 and D1, and the average Ea, the pre-exponential factors A for the LTD and HTD states were estimated as 5.03 × 10¹²/min and 5.21 × 10⁷/min, respectively.

718 H.-M. Shim, E.-A. Lee, J.-K. Kim, H.-S. Kim , K.-K. Koo
Figure 11. Master plots of experimental data and reaction models for the Al/AP composite: (a) P2, P3, A2, A3, and B1 at 0.00 < α < 0.24; (b) R2, R3, D1, and D2 at 0.24 < α < 1.00.
Table 5. Deviation (σ) of the master plots for the Al/AP compositeLTD (0.00 < α < 0.24) HTD (0.24 < α < 1.00)Model σ Model σ
P2 0.0791 R2 0.4306P3 0.1441 R3 0.3265A2 0.1833 D1 0.2018A3 0.0523 D2 0.7501B1 0.0501
Figure 12. The experimental and reconstructed curves for the Al/AP composite.

719Formation of Tungsten/Ammonium Perchlorate Composites...
Figure 12 shows the reconstructed curves of the B1 and D1 models for each state that accurately follow the experimental curves. Consequently, the calculated kinetics parameters, such as Ea and A, were found to be suitable for describing the thermal decomposition of the Al/AP composite. The presence of metal NPs yields a large value of A in the LTD state, whereas it provides a smaller value of A in the HTD state. However, the Al NPs have a diametrically opposite effect on the reaction rate compared to the W NPs. In Figure 5, the magnitude of dα/dT of the Al/AP composite was found to be larger than that of neat AP particles in the LTD state (250-290 °C). In that case, a high frequency of occurrence A in the Al/AP composite exceeds a low fraction originating from a high activation energy, so that the Al/AP composite decomposes more rapidly than neat AP particles. On the other hand, the Al/AP composite decomposes more slowly compared to neat AP particles in the HTD state (320-420 °C), where the fraction of occurrence of the bond redistribution step originating from the lower Ea cannot offset a very low frequency of occurrence A.
4 Conclusions
In the present work, the effect of tungsten nanoparticles on the thermal decomposition of AP was quantitatively identified by using the isoconversional method and reaction models suitable for describing the thermal kinetics. At the degree of conversion, α = 0.02, the activation energy of the W/AP composite was found to be larger than that of neat AP particles, and led to the delay of the LTD state. On the other hand, the Al/AP composite exhibits advanced decomposition due to the low activation energy compared with neat AP particles. The W NPs were found to expand the HTD zone width compared to neat AP particles, whereas the Al NPs conversely affect the LTD zone width. In practical terms, the HTD of AP is important because its temperature range is in the combustion zone of composite propellants [29], and a larger amount of gaseous products is produced from one mole of AP than at the LTD zone [30]. In this respect, the W NPs/AP composite may improve the performance of AP-based composite solid propellants by increasing the HTD zone width.
Using the model-fitting method combined with the master plot, it was found that the Prout-Tompkins model and 1-D diffusion controlled model could reproduce the experimental curves with high accuracy. These give a good explanation for autocatalytic nucleation in the LTD zone and diffusion controlled reaction in the HTD zone, respectively. In this work, the W NPs and Al NPs increase the activation energy, Ea, and the pre-exponential factor, A, in the LTD
720 H.-M. Shim, E.-A. Lee, J.-K. Kim, H.-S. Kim , K.-K. Koo
state, whereas they decrease both parameters in the HTD state. However, the W/AP and Al/AP composites were found to exhibit different behaviour. The W/AP composite showed a tendency for the decomposition rate to be dominated by the fraction of occurrence of the bond redistribution step originating from the activation energy Ea rather than the frequency of occurrence A. On the other hand, a decomposition rate of the Al/AP composite appeared to be affected by the frequency of occurrence A to a larger extent, and the effect of Ea became relatively smaller.
The model-fitting method combined with an isoconversional method was shown to give a good explanation for the effect of W NPs on the thermal decomposition of AP. However, it should be kept in mind that, although the LTD and HTD states were found to be described by the Prout-Tompkins model and the 1-D diffusion model with high accuracy, this does not mean that the thermal decomposition of AP must take place only by these two consecutive reactions, which are essential in these reaction models. Nevertheless, they offer a key clue to the reaction model that significantly dominates the thermal decomposition of AP, and that the kinetic analysis is sufficiently adequate to accomplish support for the experimental observations. Consequently, the kinetic parameters that are obtained here allow an understanding of the decomposition behaviour of the W/AP composite compared with that of neat AP particles and Al/AP composites.
AcknowledgementsThis work was supported by Next-Generation Converged Energy Materials Research Center and by the Human Resources Development Program (No. 20114010203090) of the Korea Institute of Energy Technology Evaluation and Planning (KETEP) grant funded by the Korea Government Ministry of Trade, Industry and Energy.
5 References
[1] Alizadeh-Gheshlaghi E., Shaabani B., Khodayari A., Azizian-Kalandaragh Y., Rahimi R., Investigation of the Catalytic Activity of Nano-sized CuO, Co3O4 and CuCo2O4 Powders on Thermal Decomposition of Ammonium Perchlorate, Powder Technol., 2012, 217, 330-339.
[2] Xu H., Wang X., Zhang L., Selective Preparation of Nanorods and Micro-octahedrons of Fe2O3 and Their Catalytic Performances for Thermal Decomposition of Ammonium Perchlorate, Powder Technol., 2008, 185, 176-180.
[3] Dubey R., Srivastava P., Kapoor I.P.S., Singh G., Synthesis, Characterization and Catalytic Behavior of Cu Nanoparticles on the Thermal Decomposition of AP,

721Formation of Tungsten/Ammonium Perchlorate Composites...
HMX, NTO and Composite Solid Propellants, Part 83, Thermochim. Acta, 2012, 549, 102-109.
[4] Singh G., Kappor I.P.S., Dubey S., Bimetallic Nanoalloys: Preparation, Characterization and Their Catalytic Activity, J. Alloys Compd., 2009, 480, 270-274.
[5] Boldyrev V.V., Thermal Decomposition of Ammonium Perchlorate, Thermochim. Acta, 2006, 443, 1-36.
[6] Manelis G.B., Rubtsov Yu.I., Kinetics of the Thermal Decomposition of Ammonium Perchlorate (in Russian), Russ. J. Phys. Chem., 1966, 40, 770-774.
[7] Vyazovkin S., Wight C.A., Kinetics of Thermal Decomposition of Cubic Ammonium Perchlorate, Chem. Mater., 1999, 11, 3386-3393.
[8] Zhu Y.-L., Huang H., Ren H., Jiao Q.-J., Effects of Aluminum Nanoparticles on Thermal Decomposition of Ammonium Perchlorate, J. Korean Chem. Soc., 2013, 57, 109-114.
[9] Il’chenko N.I., Golovatyi V.G., Mischanchuk B.G., Golodets G.I., Catalytic Oxidation of Ammonia on Platinum and Tungsten Emitters in a Strong Electric Field, Theor. Exp. Chem., 1975, 11, 99-100.
[10] Il’chenko N.I., Catalytic Oxidation of Ammonia (in Russian), Russ. Chem. Rev., 1976, 45, 1119-1134.
[11] Kim G.J., Lee S.M., Hong S.C., A Study on the Reaction Characteristics of the NH3 Oxidation over W/TiO2, Appl. Chem. Eng., 2013, 24, 645-649.
[12] Khawam A., Flanagan D.R., Solid-state Kinetic Models: Basics and Mathematical Fundamentals, J. Phys. Chem. B, 2006, 110, 17315-17328.
[13] Vyazovkin S., Dollimore D., Linear and Nonlinear Procedures in Isoconversional Computations of the Activation Energy of Nonisothermal Reactions in Solids, J. Chem. Inf. Model., 1996, 36, 42-45.
[14] Jacobs P.W.M., Ng W.L., Thermal Decomposition of Ammonium Perchlorate Single Crystals, J. Solid State Chem., 1974, 9, 315-322.
[15] Jacobs P.W.M., Ng W.L., Proton Transfer Conduction in Ammonium Perchlorate, J. Phys. Chem. Solids, 1972, 33, 2031-2039.
[16] Raevsky A.V., Manelis G.B., On the Mechanism of Decomposition of Ammonium Perchlorate (in Russian), Dokl. Akad. Nauk SSSR, 1963, 151, 886-889.
[17] Yu Z., Chen L., Lu L., Yang X., Wang X., DSC/TG-MS Study on in situ Catalytic Thermal Decomposition of Ammonium Perchlorate over CoC2O4 (in Chinese), Chin. J. Catal., 2009, 30, 19-23.
[18] Chaturvedi S., Dave P.N., A Review on the Use of Nanometals as Catalysts for the Thermal Decomposition of Ammonium Perchlorate, J. Saudi Chem. Soc., 2013, 17, 135-149.
[19] Raevsky A.V., Manelis G.B., Development of Reaction Centers with Thermal Decomposition of Orthorhombic Ammonium Perchlorate and the Role of Dislocations in this Process, Foreign Technology Div., Wright-Patterson AFB, Ohio, No. FTD-MT-24-2024-74, 1974.
[20] Zhi J., Feng-Qi Z., Study on Effects of Nanometer Metal Powder on Thermal Decomposition of HMX, J. Propul. Technol., 2002, 23, 258-261.

722 H.-M. Shim, E.-A. Lee, J.-K. Kim, H.-S. Kim , K.-K. Koo
[21] Boldyrev V.V., Savintzev Y.P., Mulina T.V., On the Mechanism of Formation and Growth of the Nuclei in Thermal Decomposition of Ammonium Salts, Proc. 7th International Symposium on the Reactivity of Solids, 17-21 July 1972, Bristol, England, 1972, 421-430.
[22] Vyazovkin S., Burnham A.K., Criado J.M., Pérez-Maqueda L.A., Popescu C., Sbirrazzuoli N., ICTAC Kinetics Committee Recommendations for Performing Kinetic Computations on Thermal Analysis Data, Thermochim. Acta, 2011, 520, 1-19.
[23] Herley P.J., Jacobs P.W.M., Levy P.W., A Photomicrographic and Electron Microscopy Study of Nucleation in Ammonium Perchlorate, Proc. Roy. Soc. Lond. A, 1970, 318, 197-211.
[24] Raevsky A.V., Manelis G.B., Boldyrev V.V., Votinova L.A., On the Role of Dislocations in Thermal Decomposition of Ammonium Perchlorate Crystals (in Russian), Dokl. Akad. Nauk SSSR, 1965, 160, 1136-1137.
[25] Boldyreva E.V., Feed-back in Solid State Reactions, React. Solids, 1990, 8, 269-282. [26] Boldyreva E.V., Feed-back in Chemical Solid State Reactions (in Russian), Sib.
J. Chem., 1991, 1, 41-50. [27] Raevsky A.V., Topographic Features of Thermal Decomposition of Ammonium
Perchlorate, Mechanism of Thermal Decomposition of Ammonium Perchlorate (in Russian), A collection of papers (Manelis G.B., Ed.), Chernogolovka: Institute of Chemical Physics AS USSR, 1981, 30-67.
[28] Galwey A.K., Brown M.E., Application of the Arrhenius Equation to Solid State Kinetics: Can This Be Justified?, Thermochim. Acta, 2002, 386, 91-98.
[29] Bircumshaw L.L., Newman B.H., The Thermal Decomposition of Ammonium Perchlorate. II. The Kinetics of the Decomposition, the Effect of Particle Size, and Discussion of Results, Proc. Roy. Soc. Lond. A, 1955, 227, 228-237.
[30] Keenan A.G., Siegmund R.F., The Thermal Decomposition of Ammonium Perchlorate – a Literature Review, Office of Naval Research, Power Program, Special Report No. 6, 1968.