perchlorate occurrence mapping - american water works ...€¦ · perchlorate occurrence was found...
TRANSCRIPT
Government Affairs Office 1401 New York AVE, NW, Suite 640 Washington, DC 20005 (202) 628-8303 Fax: (202) 628-2846
The Authoritative Resource on Safe Water SM
PERCHLORATE OCCURRENCE MAPPING
Submitted by:
Philip Brandhuber Ph.D Sarah Clark PE
HDR Denver, Colorado
Submitted to:
American Water Works Association Washington, DC
January, 2005
Table of Contents
ABSTRACT........................................................................................................................ 1 1.0 INTRODUCTION ........................................................................................................ 1 2.0 RESULTS OF THIS STUDY....................................................................................... 2
2.1 National Map of Perchlorate Detections in Drinking Water .................................... 2 2.2 Impact of Perchlorate Occurrence on Drinking Water Systems............................... 2
3.0 STUDY GROUND RULES AND ASSUMPTIONS................................................... 4 4.0 PREVIOUS STUDIES OF PERCHLORATE OCCURRENCE.................................. 5
4.1 American Water Works Service Company Survey .................................................. 5 4.2 National Assessment of Perchlorate Contamination Occurrence ............................. 6 4.3 EPA Tracking of Perchlorate Manufacturing and Release ...................................... 6
5.0 PERCHLORATE OCCURRENCE INFORMATION INCLUDED IN THIS STUDY............................................................................................................................................. 6 6.0 ANALYSIS OF INDIVIDUAL DATA SOURCES..................................................... 7
6.1 Unregulated Contaminants Monitoring Rule (UCMR) ............................................ 7 6.1.1 Background........................................................................................................ 7 6.1.2 Completeness of Data Set .................................................................................. 8 6.1.3 Analysis of Data Set........................................................................................... 8 6.1.4 Comparison of UCMR Occurrence to Known Perchlorate Releases .............. 11
6.2 California Department of Health Serviced Drinking Water Database.................... 11 6.2.1 Background...................................................................................................... 12 6.2.2 Completeness of Data Set ................................................................................ 12 6.2.3 Analysis of Data Set......................................................................................... 12
6.3 Massachusetts Department of Environmental Protection Study............................. 14 6.3.1 Background...................................................................................................... 14 6.3.2 Completeness of Data Set ................................................................................ 14 6.3.3 Analysis of Data Set......................................................................................... 14
6.4 Arizona Department of Environmental Quality 2004 Study .................................. 15 6.4.1 Background...................................................................................................... 15 6.4.2 Completeness of Data Set ................................................................................ 16 6.4.3 Analysis of Data Set......................................................................................... 16
6.5 Texas Commission on Environmental Quality Study (Texas Tech Study) ............ 17 6.5.1 Background...................................................................................................... 17 6.5.2 Completeness of Data Set ................................................................................ 18 6.5.3 Analysis of Data Set......................................................................................... 18
7.0 CONCLUSIONS......................................................................................................... 19 REFERENCES ................................................................................................................. 21
ii
APPENDIX - PERCHLORATE OCCURRENCE MAPS............................................... 22
Map 1. National Occurrence of Perchlorate in Drinking Water. ................................. 23 Map 2. National Occurrence of Perchlorate in UCMR Systems by Congressional District........................................................................................................................... 24 Map 3. UCMR Systems Measuring for Perchlorate. ................................................... 25 Map 4. UCMR Systems (CWS and NTNCWS) with Perchlorate Detections ≥ 4 ug/L – August, 2004 Data. .................................................................................................... 26 Map 5. Comparison of Known Perchlorate Releases and UCMR perchlorate Detections by System.................................................................................................... 27 Map 6. California Public Water Systems with Perchlorate Detections. ...................... 28 Map 7. Massachusetts Systems Measuring for Perchlorate......................................... 29 Map 8. Massachusetts Systems Detecting Perchlorate in Finished Water. ................. 29 Map 9. Arizona 2004 Study Perchlorate Sample Sites. ............................................... 30 Map 10. Arizona 2004 Study Perchlorate Detections.................................................. 30 Map 11. Arizona Pre-2004 Perchlorate Sample Sites.................................................. 31 Map 12. Arizona Pre-2004 Perchlorate Detections. .................................................... 31 Map 13. Texas 2004 Study Perchlorate Sample Sites and Detections. ....................... 32
iii
List of Figures
Figure 6.1. Distribution of UCMR Detections................................................................... 8 Figure 6.2. Number of EPTDS and Large CWS Impacted by Potential Perchlorate MCLs – August, 2004 UCMR Data............................................................................................. 10 Figure 6.3. Percentage of System Entry Points Containing Perchlorate for Systems Which Have Detected Perchlorate– August, 2004 UCMR Data. ..................................... 11 Figure 6.4. Distribution of CalDHS Perchlorate Detections............................................ 12 Figure 6.5. Number of Sources and Systems Impacted by Potential Perchlorate MCLs – July 2004 CalDHS Data.................................................................................................... 14 Figure 6.6. Number of Treated Waters and CWS’s in Massachusetts Impacted by Potential Perchlorate MCLs – September, 2004 MDEP Data. ......................................... 15 Figure 6.7. Distribution of Perchlorate Detections in Arizona Study.............................. 17
iv

List of Tables
Table 2.1. Impact of Alternative MCL – Includes All System Sizes. ............................... 3 Table 2.2. Impact of Alternative MCL – by EPTDS/Source............................................. 4 Table 5.1. Summary of Data Sources. ............................................................................... 7 Table 6.1. Completeness of August 2004 UCMR Perchlorate Data Set ........................... 8 Table 6.2. Perchlorate Detection by EPTDS. .................................................................... 9 Table 6.3. UCMR Results as of August, 2004................................................................... 9 Table 6.4. California Perchlorate Detection by Source. .................................................. 13 Table 6.5. Perchlorate Detections by System Size and Source Water............................. 13 Table 6.6. Massachusetts Results as of September, 2004................................................ 15 Table 6.7. Arizona Perchlorate Sampling Results. .......................................................... 17 Table 6.8. Texas Perchlorate Sampling Results............................................................... 18
v

Acknowledgements Funding for this project was provided by the Water Industry Technical Action Fund (WITAF). WITAF is administered by AWWA and is funded through member dues. WITAF funds information collection and analysis and other activities in support of sound and effective legislation, regulation, and drinking water policies and programs. The authors of this report wish to thank all of those who supported its preparation. Particular thanks are given to the AWWA project manager, Kevin Morley. The contributions of the Project Advisory Committee (PAC) were also invaluable in completing this report. The members of the PAC included, Ms. Traci Case of the AWWA Research Foundation, Dr. Michelle Frey, PureSense Environmental Inc., Mr. Kevin Mayer, USEPA Region 9, and Dr. Shane Snyder, Southern Nevada Water Authority.
vi
ABSTRACT The national occurrence of perchlorate in drinking water was analyzed and geographically mapped by compiling data from existing perchlorate occurrence surveys. The existing surveys included studies by USEPA and by the States of Arizona, California, Massachusetts, and Texas. Perchlorate occurrence was found to be national in scope, with detections in 26 states and Puerto Rico. Perchlorate was detected in at least one entry point to the distribution system of approximately 5% of the nation’s large (>10,000 population) Community Water Systems. Geographically, the highest density of perchlorate detection was found to be in Southern California, west central Texas, along the east coast between New Jersey and Long Island and in Massachusetts. At the present time no perchlorate has been detected in drinking water in the northern Great Plains, the central and northern Rocky Mountains, Alaska or Hawaii. If detected, perchlorate was typically present at concentrations of less than 12 ug/L. The frequency of perchlorate detection increased with lower detection limits, indicating that perchlorate will be more frequently detected if analytical methods of greater sensitivity are used. Perchlorate was often detected in drinking water in areas for which there was no documented environmental release of perchlorate. This implies that the environmental release of perchlorate is more wide spread than anticipated or that undocumented mechanisms of perchlorate formation exist. Since two of the occurrence surveys summarized by this study are still in progress, it is likely that the estimates of perchlorate occurrence made by this report represent a lower bound of the actual number of drinking water systems impacted by perchlorate contamination. 1.0 INTRODUCTION In 1998 perchlorate was added to the USEPA contaminant candidate list (CCL), indicating the agency’s potential interest in regulating this contaminant in drinking water.1 Inclusion of perchlorate on the CCL was primarily based upon the discovery of perchlorate in California drinking water supplies. Of key concern was the environmental release of ammonium perchlorate by two manufacturers located in Nevada. These releases were associated with low levels of perchlorate contamination in found in Lake Mead and the Colorado River. This water is used for drinking water, irrigation and recreation by millions of people in Nevada, California, and Arizona.2 Subsequent investigations have identified perchlorate releases to the environment in as many as 26 states.3 Salts of perchlorate (ClO4
-) are used in a number of applications including as an oxidizer in solid rocket fuel, and as a component of fireworks, pyrotechnics, flares and explosives. It has also been used medicinally as a treatment for hyperthyroidism as well as a analytical chemical reagent. Perchlorate has also been identified in fertilizers.4 On a volume basis, more perchlorate is used in the production of solid rocket fuel than for all other uses combined.5 While the vast majority of perchlorate occurrence in the environment is anthropogenic in nature, there may be instances of natural perchlorate occurrence.6
1
In preparation for the potential regulation of perchlorate, the American Water Works Association (AWWA) has developed an Action Plan to address issues related to perchlorate which may impact the drinking water industry. Part of this Action Plan is to consolidate and map the national occurrence of perchlorate using information from existing occurrence surveys. The existing surveys included results from the Unregulated Contaminants Monitoring Rule (UCMR) and surveys by the states of Arizona, California, Massachusetts and Texas. This report presents consolidated perchlorate occurrence information from these surveys and maps the known location of perchlorate occurrence as of the fall of 2004. 2.0 RESULTS OF THIS STUDY 2.1 National Map of Perchlorate Detections in Drinking Water Map 1 (See appendix) presents the national map of perchlorate detections in drinking water. This map is a compilation of all perchlorate detections in drinking water extracted from the August, 2004 UCMR data and from studies performed by the states of California, Massachusetts and Texas. Data from the Arizona study did not distinguish between potable and non-potable sources. For this reason it is not included on the map, but will be analyzed in detail later. As can be seen in reviewing Map 1, perchlorate occurrence in drinking water is national in scope. Perchlorate has been detected in drinking water in 26 states and Puerto Rico. Geographically, the highest density of perchlorate detection is in Southern California, west central Texas, along the east coast between New Jersey and Long Island and in Massachusetts. At present, no perchlorate has been detected in drinking water in the northern Great Plains, the central and northern Rocky Mountains, Alaska or Hawaii. However, the apparent absence of perchlorate occurrence in these regions may merely be because relatively few sources have been sampled. More intensive sampling, particularly of small systems, may detect perchlorate contaminated drinking water sources in these regions. While completely mapping the perchlorate detections of the databases which were analyzed, this map is likely to under represent the occurrence of perchlorate in drinking water. This is because small systems are under represented in the UCMR data and the UCMR study is incomplete. In particular, relatively sparse sampling data exists for the northern Great Plains and the central and northern Rocky Mountains. Map 2 (Appendix) present perchlorate detections by Congressional District. This map is limited to detections in UCMR systems only. It does not include perchlorate detections recorded by state agencies in California, Massachusetts and Texas. 2.2 Impact of Perchlorate Occurrence on Drinking Water Systems The USEPA has not proposed a MCL for perchlorate. However eight states have established guidance levels or goals for perchlorate in drinking water. Depending upon
2

the state, the guidance levels range from 1 ug/L to 18 ug/L. Hence it appears that a MCL in the range of 1 ug/L to 20 ug/L1 is plausible. Using information from this study a preliminary estimate of the percentage of systems which could be impacted by a range of potential MCL’s was made. Table 2.1 compares the percentage of systems impacted by alternative MCL’s for the UCMR, California and Massachusetts data. The Arizona study again is not included in this comparison since it did not distinguish between potable and non-potable sources. The Texas data is also not included in Table 2.1 since it only identified potable sources and not systems.
Table 2.1. Impact of Alternative MCL – Includes All System Sizes.
Number and Percent Systems Exceeding Study Detection
Limit ug/L
# Systems Sampled 2 ug/L 4 ug/L 6 ug/L 10 ug/L 20 ug/L
136 88 55 29 7 UCMR 4 3356
4.1% 2.6% 1.6% 0.9% 0.2% 123 68 37 18 4
CalDHS 4 1168 10.5% 5.8% 3.2% 1.5% 0.3%
7 5 4 2 0 MDEP 1 617
1.1% 0.8% 0.6% 0.3% 0.0%
At a hypothetical perchlorate MCL of 20 ug/L less than one half percent of all drinking water systems will be impacted by the presence of perchlorate nationally. At this MCL there appears to be little regional impact and the handful of impacted systems would be scattered throughout the nation. The percentage of systems impacted increases with decreasing hypothetical MCL’s. If the hypothetical MCL is an order of magnitude lower, 2 ug/L, approximately 4% of all systems will be impacted. At a 2 ug/L MCL clear regional impacts of perchlorate occurrence will be present. For example, at 2 ug/L up to 10% of all systems impacted in California would be impacted. It should be noted that these estimates are based upon direct extrapolation of the raw occurrence data. As will be discussed later in this report (section 6.1.3), due to the design of the UCMR small system sampling program, adjustments must made to the data to create a statistically rigorous occurrence estimate.7 Insufficient data is available at the present time to perform these adjustments. At present it appears that the impact to small systems is underestimated in the unadjusted data, so the overall impact of perchlorate on all systems sizes is likely to be higher than indicated in Table 2.1. None the less, even after adjustment, it is not expected that the percentage of systems impacted will be substantially greater than indicated in Table 2.1. 1 In 2002 USEPA completed a Toxicological Review and Risk Characterization8 for perchlorate which proposed an oral reference dose (RfD) of 0.00003 mg/kg per day. This corresponds to a drinking water MCL of 1 ug/L using the standard assumption of 2 L/day consumption for a 70 kg individual. In January, 2005 the National Research Council9 (NRC) recommended a perchlorate RfD of 0.0007 mg/kg per day as protective of human health. Using similar assumptions, this corresponds to a MCL of 24 ug/L. However the NRC only recommended a RfD, not a MCL. The determination of a MCL will be made by USEPA.
3
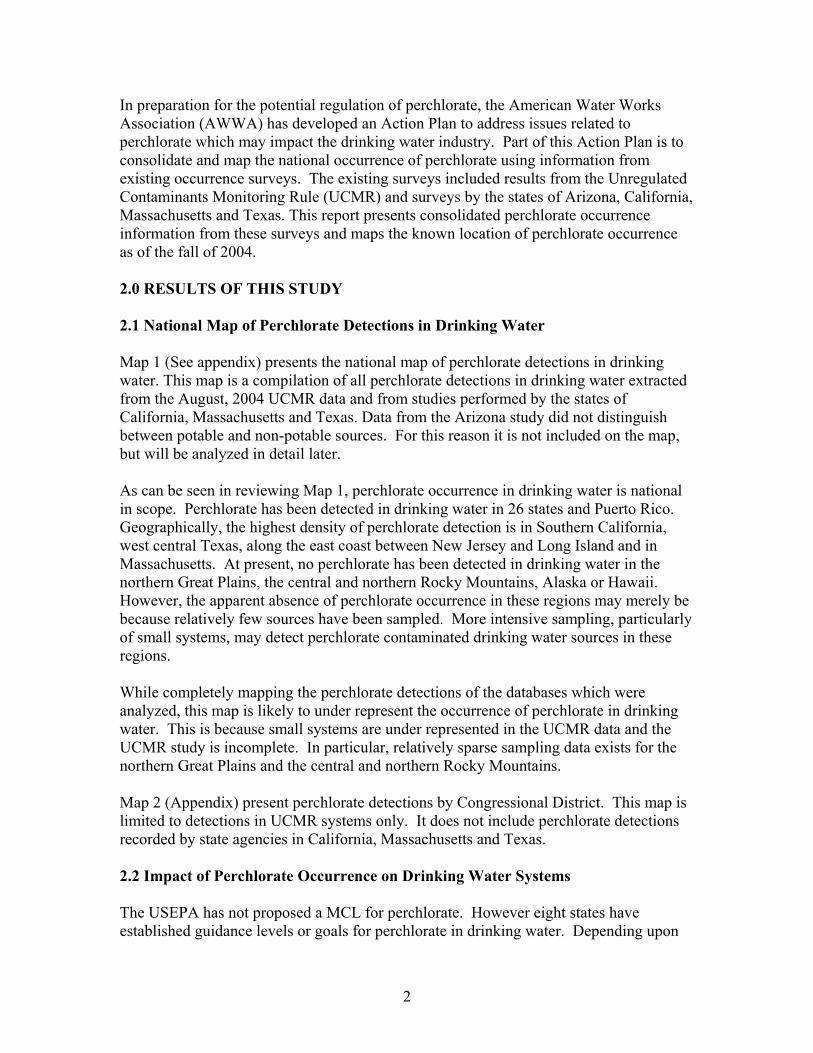
The percentage of sources or entry points to the distribution system (EPTDS) impacted by alternative MCL’s is presented in Table 2.2. At a theoretical perchlorate MCL of 20 ug/L, only a fraction of a percent of sources/EPTDS are impacted either nationally (UCMR data) or in California. No EPTDS are impacted in Massachusetts. In the Texas panhandle area slightly more than 1% of the sources are impacted at hypothetical MCL of 20 ug/L. Using this information as a rough guideline, it appears that one percent or less of sources/ EPTDS would be impacted nationally by a perchlorate MCL of 20 ug/L. Excluding the Texas study, if a MCL of 2 ug/L were promulgated by USEPA, between one and seven percent of the sources/EPTDS would be impacted. Source waters in Texas appear to be a unique case compared to waters in other locations in the country. A potential MCL of 2 ug/L would impact approximately 36% of the sources in the panhandle area. More information regarding regional perchlorate occurrence in Texas will be presented in section 6.5.
Table 2.2. Impact of Alternative MCL – by EPTDS/Source.
Number and Percent EPTDS Exceeding Study
Detection Limit ug/L
# EPTDS/ Sources Sampled
2 ug/L 4 ug/L 6 ug/L 10 ug/L 20 ug/L
348 227 141 55 9 UCMR 4 13,357
2.6% 1.7% 1.1% 0.4% 0.1% 398 175 98 40 6
CalDHS 4 5512 7.2% 3.2% 1.8% 0.7% 0.1%
15 6 5 3 0 MDEP 1 1140
1.3% 0.5% 0.4% 0.3% 0.0% 201 102 64 27 7
TCEQ 1 559 36.0% 18.2% 11.4% 4.8% 1.3%
In the following sections background information regarding this study will be presented and the individual data sources will be analyzed in greater detail. 3.0 STUDY GROUND RULES AND ASSUMPTIONS No sampling of perchlorate was performed by this study. Several national and state databases monitoring perchlorate occurrence were used to develop the information presented in this report. Two of the perchlorate monitoring programs were in progress at the time the analysis was performed. For this reason the occurrence information contained in this report represents a “snap shot” of the perchlorate occurrence information available in the second half of 2004. Several ground rules were established regarding the scope of the mapping effort and the procedures for the analysis of data. These are summarized as follows:
4

• Scope: The scope of this analysis was limited to perchlorate occurrence in drinking water sources or in treated drinking water. This report does not attempt to quantify or map general levels of perchlorate occurrence in all surface or groundwaters.
• Data sources: The data sources for this project were limited to surveys of perchlorate performed by or under the direction of the USEPA or State agencies. Department of Defense, local government or private surveys of perchlorate occurrence were not included in this analysis.
• Acceptable analytical methods: Only perchlorate concentration data obtained per USEPA method 314.0 or subsequent revisions was used.
• Determination of detection in a source: A detection of perchlorate was defined as one or more measurements of perchlorate at or above the detection limit.
• Averaging of perchlorate values: Multiple perchlorate measurements at a single source were averaged to provide an estimate of the source’s concentration. Non-detects were assigned a value of one half of the detection limit for the sample and included in the average for the source.
• Data quality: The information contained in the databases which were evaluated by this study was assumed to be correct. Data was used “as is.” If possible, clearly erroneous information was corrected, otherwise it was excluded from the analysis.
• Mapping: Occurrence information was mapped to the greatest level of geographic accuracy possible with the available data. The precedence used for mapping the location of perchlorate occurrence was in this order
o Latitude/longitude of the source o Centroid of zip code of the source o Centroid of zip code of administrative unit responsible for source o Centroid of nearest city
4.0 PREVIOUS STUDIES OF PERCHLORATE OCCURRENCE Two published studies have been completed which evaluated perchlorate occurrence in surface and groundwater. These were performed by the American Water Works Service Company and AwwaRF. In addition, USEPA has been tracking the manufacturing, use and release of perchlorate to the environment since the late 1990’s. 4.1 American Water Works Service Company Survey This survey was sponsored and performed by the American Water Works Service Company during 1997 and 1998.10 The survey included both surface and groundwaters. In total, 522 groundwater samples from 367 wells in 17 states were analyzed. These included 329 untreated sources and 38 treated sources. Of the 367 wells tested, 18 wells tested positive (ClO4
- ≥ 4 ug/L) at least once. The presence of perchlorate was confirmed by a second detection in 9 of the 18 wells. Of the remaining 9 wells with perchlorate detects, the study concluded that 5 wells were false positives caused by analytical abnormalities. Wells with confirmed perchlorate detections were located in California and New Mexico.
5

4.2 National Assessment of Perchlorate Contamination Occurrence The objective of this AwwaRF sponsored study11 was to “assess perchlorate occurrence in US drinking water supplies.” The conclusions of the study were as follows:
• A total of 196 sites in 39 states were identified to have used, manufactured or received shipment of perchlorate compounds.
• Of 160 drinking water samples collected in a targeted sampling, 4 groundwaters and 2 surface waters tested positive for perchlorate. One additional unidentified source tested positive for perchlorate.
• A total of 138 samples were collected from large utilities (> 100,000 population served). No perchlorate was found in any sample.
• Targeted sampling did not detect perchlorate in groundwater sources supplying drinking water utilities located within a 4 mile radius of 12 different fertilizer manufacturing plants.
It should be noted that both studies were performed prior to the approval of EPA method 314.0 for perchlorate detection in water. Consistent with the ground rules of this study, data from the American Water Works Service Company and AwwaRF study have not been included in the occurrence maps presented in this report. 4.3 EPA Tracking of Perchlorate Manufacturing and Release In a series of updates to the public, USEPA has been tracking known and potential sources of perchlorate releases to the environment. Perchlorate occurrence information collected by Region 9 of the USEPA through April, 2003 is posted on the USEPA Hazardous Waste Cleanup website. According USEPA, in 2003 there were approximately 230 locations in 40 states where perchlorate was manufactured or used. As of April 2004 USEPA estimated there were 98 perchlorate releases from governmental and non governmental sites in 26 states.3 5.0 PERCHLORATE OCCURRENCE INFORMATION INCLUDED IN THIS STUDY The results presented in this study are a compilation of occurrence surveys performed or sponsored by various governmental agencies. Six sets of data were analyzed. Two sets of data were obtained from USEPA. These included the Unregulated Contaminants Monitoring Rule (UCMR) database, obtained from the Office of Ground Water Drinking Water, and the list of Known Perchlorate Releases was obtained from Office of Solid Waste and Emergency Response. Four data sets were obtained from state agencies. These included perchlorate occurrence surveys performed by the State of Arizona, obtained from the Department of Environmental Quality; California, obtained from the Department of Health Services; Massachusetts, obtained from the Department of Environmental Protection; and Texas, obtained from the Commission on Environmental Quality through Texas Tech University.
6

Table 5.1 summarizes the data sources used for this study.
Table 5.1. Summary of Data Sources. Data Set
Sponsoring Agency
Date Type of Water Tested
Available Locational
Information
Reported Detection
Limit UCMR USEPA
OGWDW Aug 04 Potable City, Zip,
County 4 ug/L
California CalDHS Jul 04 Potable Non
potable
City, Zip, County
4 ug/L
Massachusetts MDEP Sept 04 Potable Lat/long, County, Zip
1 ug/L
Texas TCEQ Sept 04 Potable Non
potable
Lat/long, County
1 ug/L
Arizona ADEQ Dec 04 Potable Non
potable
Lat/long, County
4 ug/l 2 ug/L
Known Perchlorate
Releases
USEPA OSWER
Aug 04 -- Facility/site name, Zip
Unknown
6.0 ANALYSIS OF INDIVIDUAL DATA SOURCES 6.1 Unregulated Contaminants Monitoring Rule (UCMR) 6.1.1 Background Perchlorate was included by USEPA on List 1 of contaminants to be monitored under the UCMR in September 1999.12 Sampling began in 2001 and was scheduled to be completed by the end of 2003. Approximately 2800 large systems (>10,000 served) and 800 small systems were required to perform perchlorate sampling. The sampling strategy for the UCMR is to perform a census of large systems, and perform a stratified sampling of small systems. Samples were taken at entry points to the distribution system (EPTDS) and analyzed by EPA Method 314.0. The detection level for UCMR reported perchlorate data is 4 ug/L. Sampling frequency depended on source water type. Surface water sources were to be sampled quarterly over a one year period and groundwater sources twice in a one year period. The UCMR sampling has been completed and data analysis is in progress. Data input by USEPA is expected to be completed in mid 2005 at which time the UCMR database should be fully populated. USEPA periodically posts the most recent update of the UCMR data set on the UCMR website. The results presented in this report are based on the August, 2004 UCMR database release.
7

6.1.2 Completeness of Data Set Since the UCMR database is not fully populated, an analysis of the August 2004 release was performed to assess the “completeness” of the data set. Table 6.1 summarizes the completeness of the August 2004 release. The perchlorate data set was complete for approximately 80% of the groundwater entry points and 44% of the surface water entry points. Hence while the August 2004 release provides a fairly complete picture of groundwater perchlorate occurrence, the surface water occurrence information is largely incomplete. Given the inherent variability of water quality in surface waters, it is likely that perchlorate will be detected at least once in some of the remaining samples from surface waters which have yet to detect perchlorate.
Table 6.1. Completeness of August 2004 UCMR Perchlorate Data Set Water Type EPTDS
Sampled EPTDS with
complete data set Percentage
GW 8479 6813 80% SW 4622 2034 44%
Not Defined 256 - - GW => Complete is 2 or more measurements SW => Complete is 4 or more measurements Does not include EPTDS for which no measurements have been recorded 6.1.3 Analysis of Data Set Overall, out of 29,870 results recorded in the database, perchlorate was detected 583 times or in 1.9% of the samples. The range of detected values extends from 4 ug/L (the minimum detection limit) to a maximum value of 420 ug/L. The distribution of detections is presented in Figure 6.1.
394
108
33 19 7 3 4 3 1 40
50100150200250300350400450
4-8 8-12 12-16 16-20 20-24 24-28 28-32 32-36 36-40 40-44
Perchlorate Concentration (ug/L)
Num
ber o
f Det
ectio
ns
7 Detections exceeded 44 ug/L
Figure 6.1. Distribution of UCMR Detections.
8

Table 6.2 consolidates the occurrence information by EPTDS. Perchlorate was detected in 363 of the 13,357 EPTDS or at a rate of 2.7%. Of the 363 perchlorate detections, about half of the detections were unconfirmed (perchlorate only detected once in the EPTDS when there was more than one sampling of the EPTDS). Conversely, approximately about 27% of the EPTDS detected perchlorate in all samples.
Table 6.2. Perchlorate Detection by EPTDS. Category Number % of all
EPTDS % of EPTDS
with detections Total EPTDS 13,357 - - EPTDS with detects 363 2.7 - EPTDS with unconfirmed detection
173 1.3 48
EPTDS with single measurement and detection
56 0.4 15
EPTDS with 2 or more detections 134 1.0 37 EPTDS with all detections 98 0.7 27
Additional analysis of the data set was performed to determine the occurrence of perchlorate by source water type and system size. As presented in Table 6.3, perchlorate was detected at approximately equal rates for surface and groundwater sources. There appears to be a difference in the rate of occurrence between large and small systems, with perchlorate being found more frequently in large systems. However, caution must be applied in interpreting this data. Since small systems were sampled through a stratified sampling strategy,7 an unbiased estimate of occurrence for the entire small system population can only be made by an estimator which is weighted by the sampling probability of each sample within the strata. Because the weighting factors use by USEPA were not available and not all small system data has been compiled, the calculation of an occurrence estimate for small systems could not be completed. Hence the information presented in Table 6.3 for small systems (≤ 10,000 population) represents the rate of perchlorate occurrence within the subset of small systems sampled, not a projection of perchlorate occurrence in the total population of small systems. Occurrence information for large systems is valid without any adjustment since, as previously mentioned, a census of large systems was performed and the sampled population and total population are one and the same.
Table 6.3. UCMR Results as of August, 2004. Systems with Population
≤ 10,000 Systems with Population
> 10,000 Water Sampled Detected Percentage Sampled Detected Percentage
GW 526 4 0.8% 1140 69 6.1% SW 245 1 0.4% 1359 67 4.9% Total 771 5 0.6% 2499 136 5.4% Totals do not include 86 UCMR systems for which population or water type data was unavailable. No perchlorate was detected in these systems.
9

Limiting the analysis to Community Water Systems (CWS) with populations greater than 10,000, an initial estimate can be made of the number of large systems impacted by alternative perchlorate MCLs. Figure 6.2 illustrates the numbers of EPTDS and the corresponding number of large systems impacted by potential MCLs ranging from 2 ug/L to 20 ug/L.
348
227
136
0
50
100
150
200
250
300
350
400
2 4
Perchlo
Num
ber
Exc
eedi
ng
Figure 6.2. Number of EPTDMCLs – August, 2004 UCMR Most systems have multiple ennot be present in all the entry p
Note: Based on mean value measured at EPTDS with non-detects calculated at 0.5x detection level. Systems with multiple EPTDS impacted byperchlorate are classified by the EPTDS with the highest concentration
141
559
8855
297
6 10 20
rate Concentration (ug/L)
EPTDSSystem
S and Large CWS Impacted by Potential Perchlorate Data.
try points to the distribution system and perchlorate may oints. A system which has detected perchlorate in only a
10

portion of its entry points may have the option of eliminating the perchlorate contaminated source. Alternatively, a system detecting perchlorate in most or all of its entry points will probably be forced to treat perchlorate. As illustrated in Figure 6.3, approximately 89% of the systems detecting perchlorate detected it in 50% or less of their entry points. Only 3% of the systems detected perchlorate in more than 75% of their entry points.
25% to 50% 63%
75% to 100%
3%
50% to 75% 8%
25% or less 26%
Key % of EPTDS
% of Systems
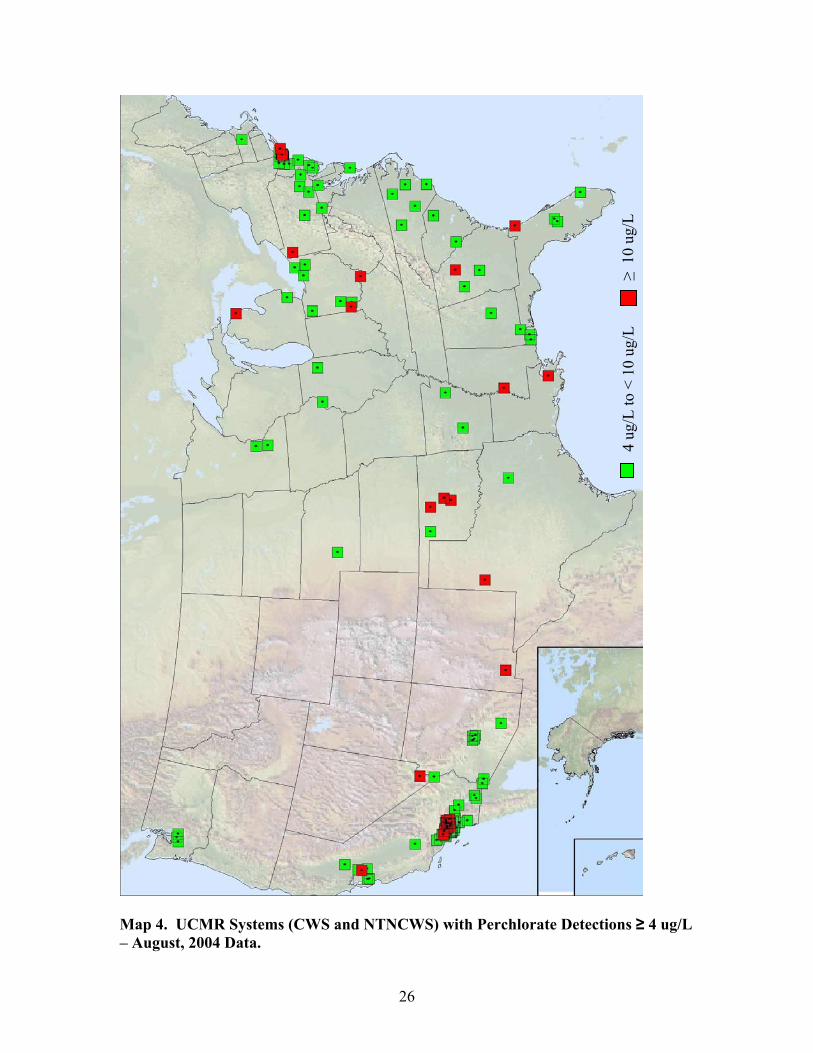
Figure 6.3. Percentage of System Entry Points Containing Perchlorate for Systems Which Have Detected Perchlorate– August, 2004 UCMR Data. Maps 3 and 4 (Appendix) present the location of UCMR systems measuring for perchlorate and the occurrence of perchlorate respectively. 6.1.4 Comparison of UCMR Occurrence to Known Perchlorate Releases An attempt was made to determine if there was a correspondence between the locations of perchlorate occurrence in drinking water as determined by UCMR and the locations of known releases of perchlorate into the environment as tracked by USEPA. Little correspondence was found. As can be seen in Map 5, perchlorate is frequently found in areas in for which there is no known source of environmental release. For example perchlorate has been detected by UCMR sampling in the States of North Carolina and Minnesota, yet there is no known release of perchlorate in any of these States. The implication is that sources of perchlorate release to the environment are more widespread and numerous than indicated by the USEPA OSWER list. Other possible sources of perchlorate release could potentially include localized activities, such as blasting or other uses of explosives, residual contamination from firework displays, releases from manufacturing processes or laboratories or the use of perchlorate containing fertilizers. The formation of perchlorate in undocumented natural processes is also possible. 6.2 California Department of Health Serviced Drinking Water Database
11

6.2.1 Background In the late 1990’s perchlorate was found in California waters. A preliminary sampling of several hundred wells was initiated in 1997 by the California Department of Health Services (CalDHS). The study found perchlorate in both northern and southern California groundwaters. In 1999, CalDHS added perchlorate to the list of unregulated contaminants for which monitoring is required. At the present time CalDHS is collecting perchlorate samples from drinking water sources and analyzing per EPA 314.0 or 314.1. The “official” reporting limit for perchlorate in the database 4.0 ug/L, but lower values are included in the database. 6.2.2 Completeness of Data Set The dataset used for this analysis was extracted from the California Department of Health Services Drinking Water Database. Perchlorate data from 1999 through July 2004 was analyzed. The database is continuously being updated by the State. 6.2.3 Analysis of Data Set Out of 36,217 measurements in the data set, perchlorate was detected 7256 times or in approximately 20% of the samples. The highest detection was 820 ug/L. (This well has been abandoned.) The distribution of detections is presented in Figure 6.4.
3732
1443
756313 1
0500
10001500200025003000350040004500
4-8 8-12 12-16 16-20 20
Perchlorate C
Num
ber
of D
etec
tions
L
Figure 6.4. Distribution of CalDHS Per The CalDHS database tracks a number of wells, inactive wells and monitoring wellssupplies. The results for all wells sampled in Figure 6.4. To provide a more accuratesources, subsequent analysis has been limi
171 Detections less than 4 ug/L 427 Detections greater than 44 ug/
60 74 48 33 27 72
-24 24-28 28-32 32-36 36-40 40-44
oncentration (ug/L)
chlorate Detections.
different types of sources, including standby which are not regularly used as drinking water for perchlorate are included in data presented assessment of the impact to potable water ted to active drinking water sources (sources
12

with an AR or AU status in the CalDHS database). Table 6.4 compares the detection of perchlorate, by source, for all sources in the database and those sources identified as active drinking water sources. If all sources are considered, approximately 9% have detected perchlorate in at least one sample. Of active drinking water sources, approximately 7% have detected perchlorate in at least one sample. Approximately 1% of active drinking water sources have detected perchlorate in all samples.
Table 6.4. California Perchlorate Detection by Source. All Sources Active Drinking Water
Sources Category Number % of Sources Number % of Sources
Total Sources 6726 - 5512 - Sources with detects 613 9.1 398 7.2 Sources with unconfirmed detection
153 2.3 124 2.2
Sources with single measurement and detection
35 0.5 10 0.2
Sources with 2 or more detections
425 6.3 264 4.8
Sources with all detections
152 2.3 59 1.1
The information can be further aggregated to the system level Table 6.5 summarizes perchlorate occurrence by system size and water type. In California, perchlorate is overwhelmingly found in groundwater. Numerically, it is also found in more large systems than small systems.
Table 6.5. Perchlorate Detections by System Size and Source Water. System Size (Population) Water Type
≤ 10,000 > 10,000* Surface Water 3 6† Groundwater 47 70
* Includes 3 systems with both surface and groundwater perchlorate detections. † Includes Metropolitan Water District of Southern California which has no population estimate in the database.
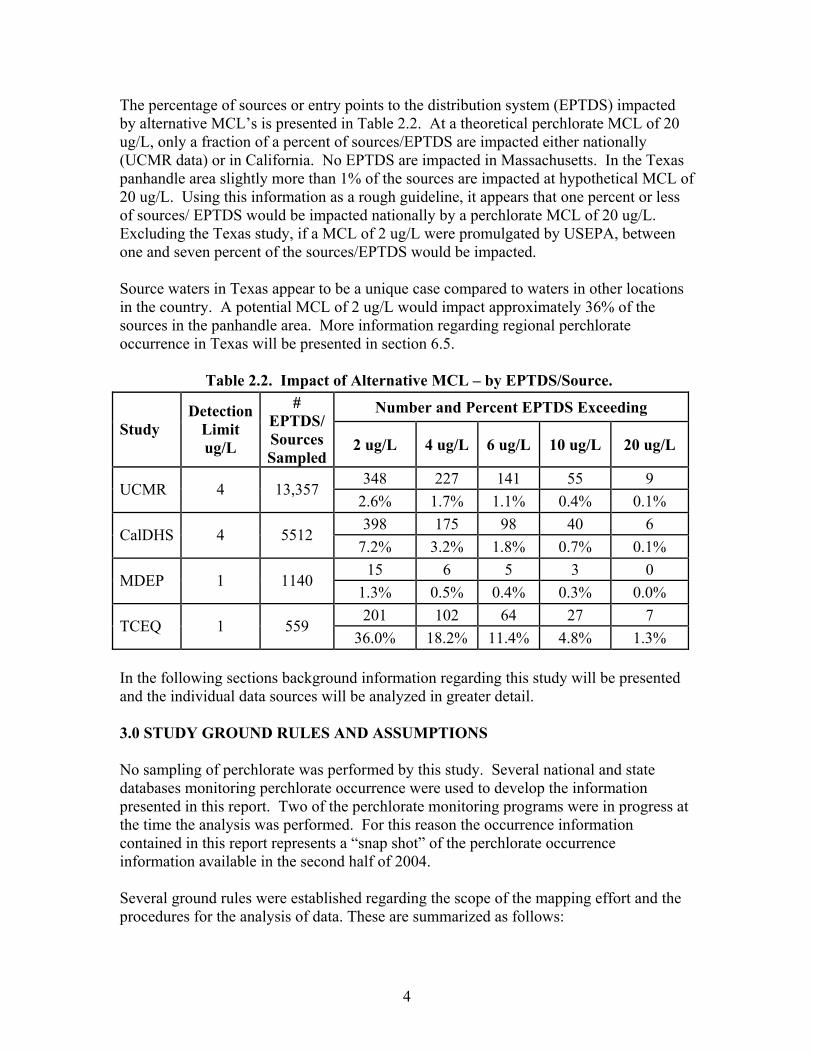
Figure 6.5 plots the numbers of sources and the corresponding number of systems impacted by potential MCLs ranging from 2 ug/L to 20 ug/L.
13
398
175123
050
100150200250300350400450
2 4
Perchlo
Num
ber E
xcee
ding
Figure 6.5. Number of SourceMCLs – July 2004 CalDHS Da Map 6 (Appendix) presents the detections for the 1999 to July, 2 6.3 Massachusetts Departmen 6.3.1 Background The Massachusetts Department perchlorate monitoring programcommunity and non-transient noto collect samples in April and Squarterly samples, beginning in Samples were taken after treatmPerchlorate samples were analyzof 1 ug/L. Detections of less thanot quantified. 6.3.2 Completeness of Data Set The analyzed data set was obtaifirst round of groundwater sampsurface water sampling results. complete as of September, 2004 6.3.3 Analysis of Data Set
Note: Based on mean value of all samples taken at a source with non-detects calculated at 0.5x detection level. Systems with multiple sources impacted by perchlorate are classified by the source withthe highest concentration
98
406
6837 18 4
6 10 20
rate Concentration (ug/L)
SourcesSystems
s and Systems Impacted by Potential Perchlorate ta.
location of perchlorate sampling sites and perchlorate 004 CalDHS perchlorate data.
t of Environmental Protection Study
of Environmental Protection (MDEP) initiated a in the spring of 2004. The program applies to all n-community water systems. Groundwater systems were eptember, 2004. Surface water systems were to collect March, 2004 and completing by December, 2004. ent and prior to the entry to the distribution system. ed per EPA Method 314.1, with a method detection level n 1 ug/L were recorded as “trace” detections and were
ned from MDEP on September 30, 2004. It contained the ling results and the first and some of the second round of Overall the data set was approximately 40% to 50% .
14

As of September, 2004, a total of 1354 measurements were recorded for 1140 treated waters in 617 systems. Of these measurements, 126 (9.3%) detected perchlorate. Of the 1140 treated waters, 35 (2.4%) contained detectable levels of perchlorate. Table 6.6 presents the rate of occurrence for small and large systems. Figure 6.6 illustrates the numbers of EPTDS and the corresponding number of systems impacted by potential perchlorate MCLs.
Table 6.6. Massachusetts Results as of September, 2004. Systems with Population
≤ 10,000 Systems with Population
> 10,000 Sampled Detected Percentage Sampled Detected Percentage
504 20* 7**
4.0%* 1.4%** 113 9*
3** 8.0%* 2.7%**
* At trace level or greater ** At quantifiable level or greater (≥1 ug/L)
35
22
15
6 53
1
29
107
5 42 1
0
5
10
15
20
25
30
35
40
Trace 1 2 4 6 10 20
Perchlorate Concentration (ug/L)
Num
ber E
xcee
ding
TreatedSystems
Total population: 1140 treated waters in 617 systems
Figure 6.6. Number of Treated Waters and CWS’s in Massachusetts Impacted by Potential Perchlorate MCLs – September, 2004 MDEP Data. Maps 7 and 8 (Appendix) present the location of Massachusetts systems measuring for perchlorate and the occurrence of perchlorate respectively. 6.4 Arizona Department of Environmental Quality 2004 Study 6.4.1 Background
15

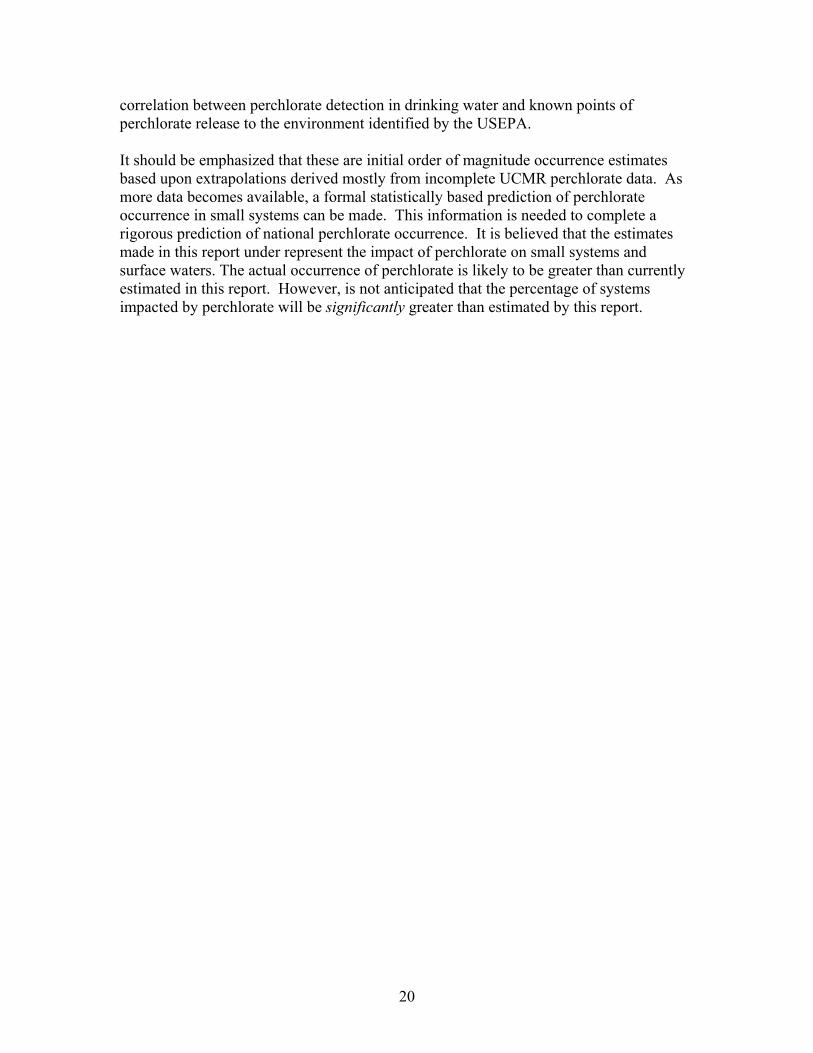
In the spring of 2004 the State of Arizona initiated a statewide perchlorate sampling program. The objective of the program was to conduct a comprehensive assessment of perchlorate concentration in Arizona waters. The program was a collaborative effort between the Arizona Departments of Environmental Quality and Water Resources. Raw water samples were collected between May and July 2004. Sampling focused on three types of sources: surface water, groundwaters and groundwater in aquifers used for storage by recharge. Since the study was a general assessment of perchlorate occurrence, both potable and non-potable sources were sampled. Unfortunately the study did not distinguish potable from non-potable sources. For this reason the Arizona occurrence data was not included in the national perchlorate map (Map 1). Nevertheless, given the limited water resources available in Arizona it is likely most samples, particularly of surface water and recharge water, are of sources used for potable supply. Samples were analyzed per EPA 314.1 with a MDL of 2 ug/L. In addition to the 2004 sampling program, the State has also assembled an ad hoc database of perchlorate occurrence from samples taken prior to 2004. These samples were analyzed by several analytical methods with detection levels of 2 or 4 ug/L. 6.4.2 Completeness of Data Set Sampling is for the 2004 survey is finished and the data set is complete. The final report was released by the State of Arizona in December, 2004. 6.4.3 Analysis of Data Set The 2004 survey took 88 perchlorate measurements at 85 sites. Perchlorate was detected in 34 measurements and at 33 of the sites. Most sites detecting perchlorate were surface waters on or supplied by the Colorado River at locations downstream of the Kerr-McGee facility near Henderson, NV. Twelve of 17 samples taken from the Colorado River and 10 of 11 samples taken from the Central Arizona Project detected perchlorate. In general, perchlorate concentrations in the 2004 sampling were lower than in samples taken at similar locations prior to 2004. The State attributes the decrease in perchlorate concentrations in Colorado River water and Central Arizona Project water to the initiation of perchlorate treatment at the Kerr-McGee facility. Groundwater sampling focused on wells potently impacted by irrigation with Colorado River water or Central Arizona Project water. Of 35 wells tested, 4 detected perchlorate. Twelve perchlorate samples were taken at groundwater recharge facilities. Perchlorate was detected in water supplying the facilities, but no perchlorate was found in any treated recharge facility effluent. Table 6.7 summarizes perchlorate sampling results for the 2004 survey and for the ad hoc samples taken prior to 2004. Figure 6.7 presents the distribution of perchlorate concentrations derived from the Arizona data.
16
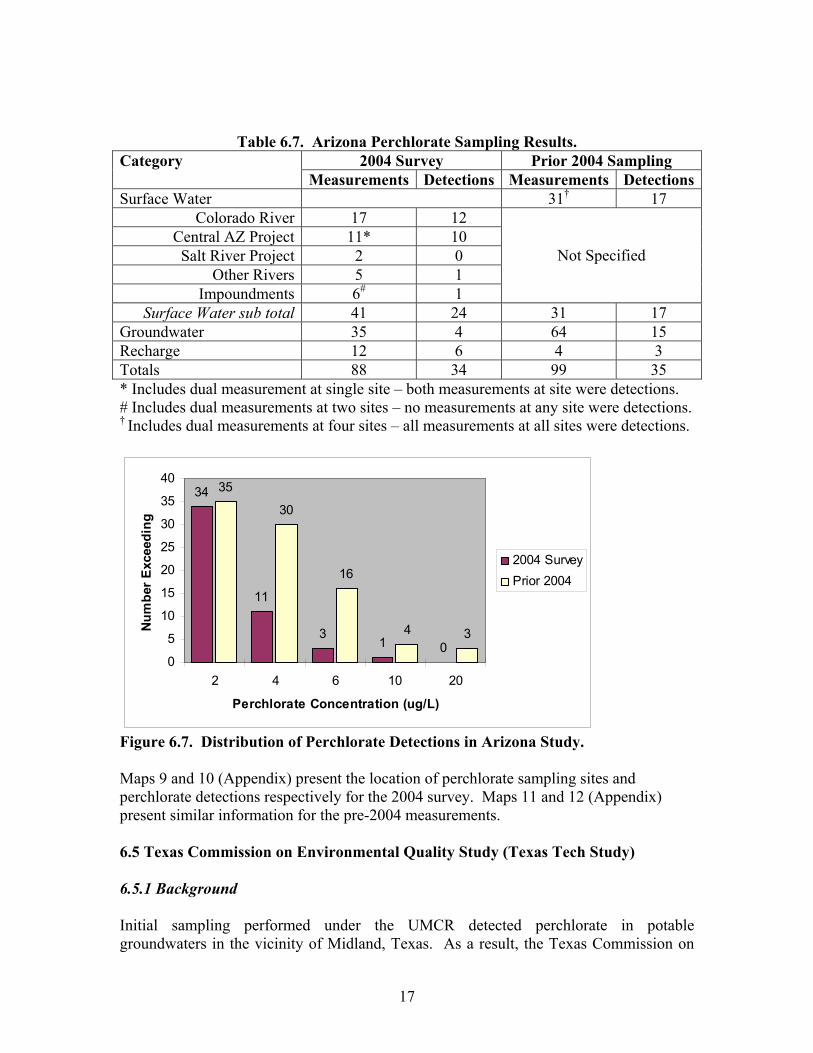
Table 6.7. Arizona Perchlorate Sampling Results. 2004 Survey Prior 2004 Sampling Category
Measurements Detections Measurements DetectionsSurface Water 31† 17
Colorado River 17 12 Central AZ Project 11* 10 Salt River Project 2 0
Other Rivers 5 1 Impoundments 6# 1
Not Specified
Surface Water sub total 41 24 31 17 Groundwater 35 4 64 15 Recharge 12 6 4 3 Totals 88 34 99 35 * Includes dual measurement at single site – both measurements at site were detections. # Includes dual measurements at two sites – no measurements at any site were detections. † Includes dual measurements at four sites – all measurements at all sites were detections.
34
11
31 0
35
30
16
4 3
0
5
10
15
20
25
30
35
40
2 4 6 10 20
Perchlorate Concentration (ug/L)
Num
ber
Exce
edin
g
2004 SurveyPrior 2004
Figure 6.7. Distribution of Perchlorate Detections in Arizona Study. Maps 9 and 10 (Appendix) present the location of perchlorate sampling sites and perchlorate detections respectively for the 2004 survey. Maps 11 and 12 (Appendix) present similar information for the pre-2004 measurements. 6.5 Texas Commission on Environmental Quality Study (Texas Tech Study) 6.5.1 Background Initial sampling performed under the UMCR detected perchlorate in potable groundwaters in the vicinity of Midland, Texas. As a result, the Texas Commission on
17

Environmental Quality (TCEQ) contracted the Texas Tech University Water Resources Center to perform an initial evaluation of the extent of perchlorate contamination in a nine county region near Midland. Samples were collected between July and December, 2002. A total of 254 public and private wells were sampled. Perchlorate was detected in 88 wells (35%) at a detection level of 4 ug/L. The initial nine county study was expanded to 54 counties in Texas and 3 counties in eastern New Mexico. The expanded study included sampling of irrigation wells, private wells and wells used by public water systems (PWS). Sampling for the expanded study was completed in the summer of 2004. Single samples were taken of each well. Samples were analyzed by Texas Tech using EPA method 314.0 with a detection limit of 1 ug/L. This study is of particular interest since no credible anthropogenic source of perchlorate has been identified which could be responsible for the consistent detection of perchlorate over such a large geographic area. Researchers at Texas Tech University are investigating the possibility of perchlorate contamination of groundwater by natural sources.6 If true, this would be the first detection of natural perchlorate in the United States. Conceivably other locations in the United States with similar meteorological and geological conditions could also have natural sources of perchlorate. However at the present time no evidence exists to indicate that the presence of perchlorate in drinking water in other regions of the United States is due to natural sources. 6.5.2 Completeness of Data Set The study is complete. 6.5.3 Analysis of Data Set Overall a total of 734 irrigation, private and PWS wells were sampled. Perchlorate was detected in 325 (44%) of the wells. Of the 734 wells sampled 559 were used by PWS. Two hundred forty seven of the PWS wells contained detectable levels of perchlorate. A summary of sampling results is contained in Table 6.8. The distribution of perchlorate detections for the PWS wells is presented in Figure 6.8.
Table 6.8. Texas Perchlorate Sampling Results.
Description Irrigation wells
Private wells
PWS Wells
Total sources 99 76 559 Sources with detects 42 36 247 Percentage 42% 47% 44%
18

Figure 6.8. Distribution of Perchlorate Detections for PWS Wells in 54 County Texas Study.
247
201
102
64
277
0
50
100
150
200
250
300
1 2 4 6 10 20
Perchlorate Concentration (ug/L)
Num
ber E
xcee
ding
Map 13 (Appendix) presents the location of perchlorate sampling sites and perchlorate detections for the 54 county Texas survey. 7.0 CONCLUSIONS This study consolidated existing potable water perchlorate occurrence information taken from recently completed and ongoing occurrence studies. It mapped the location of known detections of perchlorate in public drinking water systems and provided insights into the level at which perchlorate has been detected in these systems. It also compared the location of detections of perchlorate in drinking water systems to known environmental releases of perchlorate. The detection of perchlorate in drinking water was determined to be national in scope but at very low concentrations. Perchlorate has been detected in drinking water in at least 26 States and Puerto Rico and in approximately 5% of the nation’s large CWS’s. Yet when detected, perchlorate was typically present at concentrations of less than 12 ug/L and was generally found in less than one half of the sources for systems which sampled multiple sources. No difference in the rate of perchlorate occurrence between surface and groundwaters was found. However, the available data regarding surface water occurrence in the UCMR was largely incomplete. Extrapolating the results of the occurrence studies reviewed by this report, it appears that nationally less than 1% of all drinking water systems would be impacted if a MCL of 20 ug/L were established. A MCL of 2 ug/L could impact on the order of 4% of public water systems nationally. Regional impacts in California and Texas would be greater. Significantly, there was little
19
correlation between perchlorate detection in drinking water and known points of perchlorate release to the environment identified by the USEPA. It should be emphasized that these are initial order of magnitude occurrence estimates based upon extrapolations derived mostly from incomplete UCMR perchlorate data. As more data becomes available, a formal statistically based prediction of perchlorate occurrence in small systems can be made. This information is needed to complete a rigorous prediction of national perchlorate occurrence. It is believed that the estimates made in this report under represent the impact of perchlorate on small systems and surface waters. The actual occurrence of perchlorate is likely to be greater than currently estimated in this report. However, is not anticipated that the percentage of systems impacted by perchlorate will be significantly greater than estimated by this report.
20
REFERENCES 1. Federal Register, 1998, 63 (40) 10273-10287. 2. Potius, F.W., Damian, P., and A. Eaton. 2000. Regulation of Perchlorate in
Drinking Water, in Perchlorate in the Environment. E.T. Urbansky editor. Kluwer Academic/Plenum Publishers. New York. pp31-37.
3. USEPA Federal Facilities Restoration and Reuse website
http://www.epa.gov/swerffrr/. 4. Urban Water Research Center, University of California, Irvine. 2004. Perchlorate
in Drinking Water: A Science and Policy Review. 5. Susarlam S., Collette, T. W., Garrison, A. W., Wolfe, N. L., and S.C.
McCutcheon. 1999. Perchlorate Identification in Fertilizers. Environ. Sci. Technol. 33( 19) 3469.
6. Jackson, A., Rainwater, K., Anderson, T., Lehman, T., Ridley, M., Waldon, S.
and R. Tock R. 2004. Perchlorate in Groundwaters in the Southern High Plains of Texas. Presented at the 2004 AWWA Annual Conference and Exposition. Orlando, FL.
7. USEPA 1999. Statistical Design and Sample Selection for the Unregulated
Contaminants Monitoring Regulation. Office of Water. EPA 815-R-01-004. 8. USEPA 2002 External Review Draft. Perchlorate Environmental Contamination:
Toxicological Review and Risk Characterization. Office of Research and Development, National Center for Environmental Assessment. NCEA-1-0503, 2002.
9. National Research Council. 2005. Health Implications of Perchlorate Ingestion.
National Academy Press, Washington, DC. 10. Gullick, R. W., LeChevallier, M. and T. Barhorst. 2001. Occurrence of
Perchlorate in Drinking Water Sources. JAWWA. 93, 1, 66-77. 11. Wang, H., Eaton, A., and B. Narloch. 2002. National Assessment of Perchlorate
Contamination Occurrence. Awwa Research Foundation, Denver, CO. 12. USEPA. 2001. Unregulated Contaminant Monitoring Regulation: Monitoring for
List 1 Contaminants by Large Public Water Systems, EPA 815-F-01-003.
21

APPENDIX - PERCHLORATE OCCURRENCE MAPS
22

Fall
2004
D
etec
tion
Leve
l: 1
ug/L
to 4
ug/
L O
ne d
etec
tion
in P
uerto
Ric
o no
t
Map 1. National Occurrence of Perchlorate in Drinking Water.
23

Aug
ust,
2004
UC
MR
Dat
a
Map 2. National Occurrence of Perchlorate in UCMR Systems by Congressional District
24
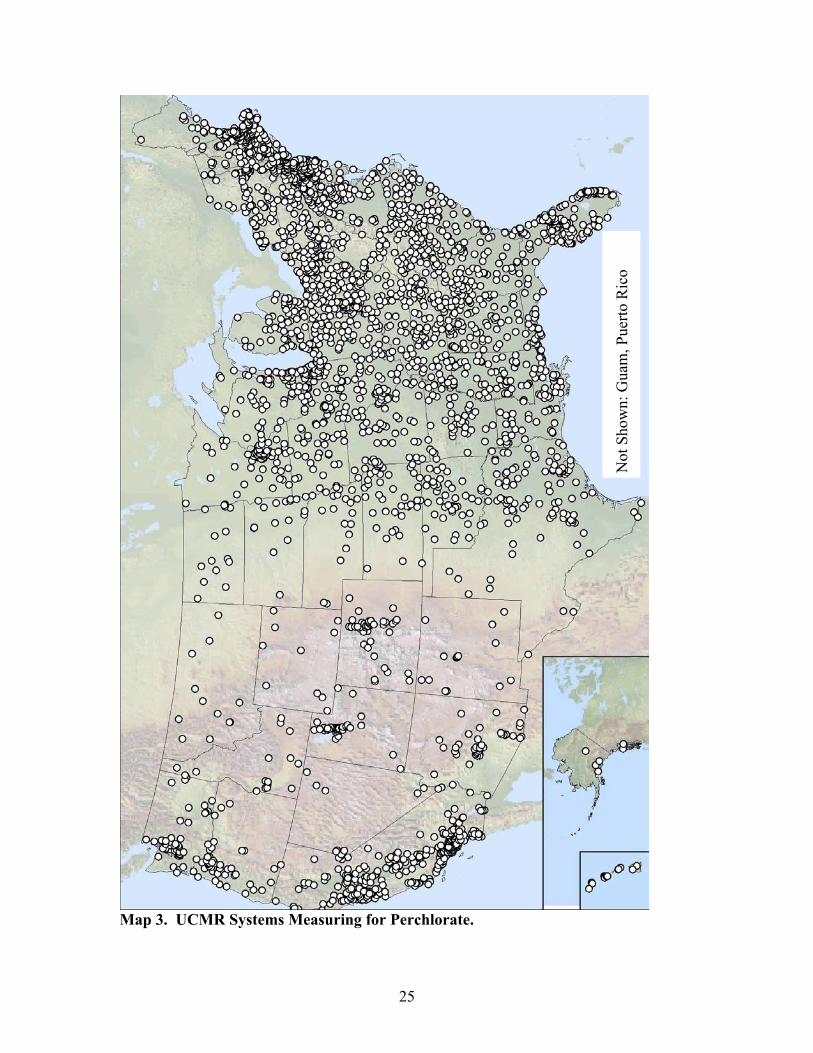
Not
Sho
wn:
Gua
m, P
uerto
Ric
o
Map 3. UCMR Systems Measuring for Perchlorate.
25
≥ 1
0 ug
/L
4 ug
/L to
< 1
0 ug
/L
Map 4. UCMR Systems (CWS and NTNCWS) with Perchlorate Detections ≥ 4 ug/L – August, 2004 Data.
26

≥ 1
0 ug
/L
4 ug
/L to
< 1
0 ug
/L
Drin
king
Wat
er D
etec
tions
: K
now
n Pe
rchl
orat
e R
elea
se
Map 5. Comparison of Known Perchlorate Releases and UCMR perchlorate Detections by System
27

3 to ≤ 4 ug/L
4 to ≤ 10ug/L
> 10ug/L Map 6. California Public Water Systems with Perchlorate Detections.
28

Map 7. Massachusetts Systems Measuring for Perchlorate.
1 ug/L to < 4 ug/L
≥ 4 ug/L Map 8. Massachusetts Systems Detecting Perchlorate in Finished Water.
29

Map 9. Arizona 2004 Study Perchlorate Sample Sites.
2 ug/L to < 4 ug/L
≥ 4 ug/L
Map 10. Arizona 2004 Study Perchlorate Detections.
30
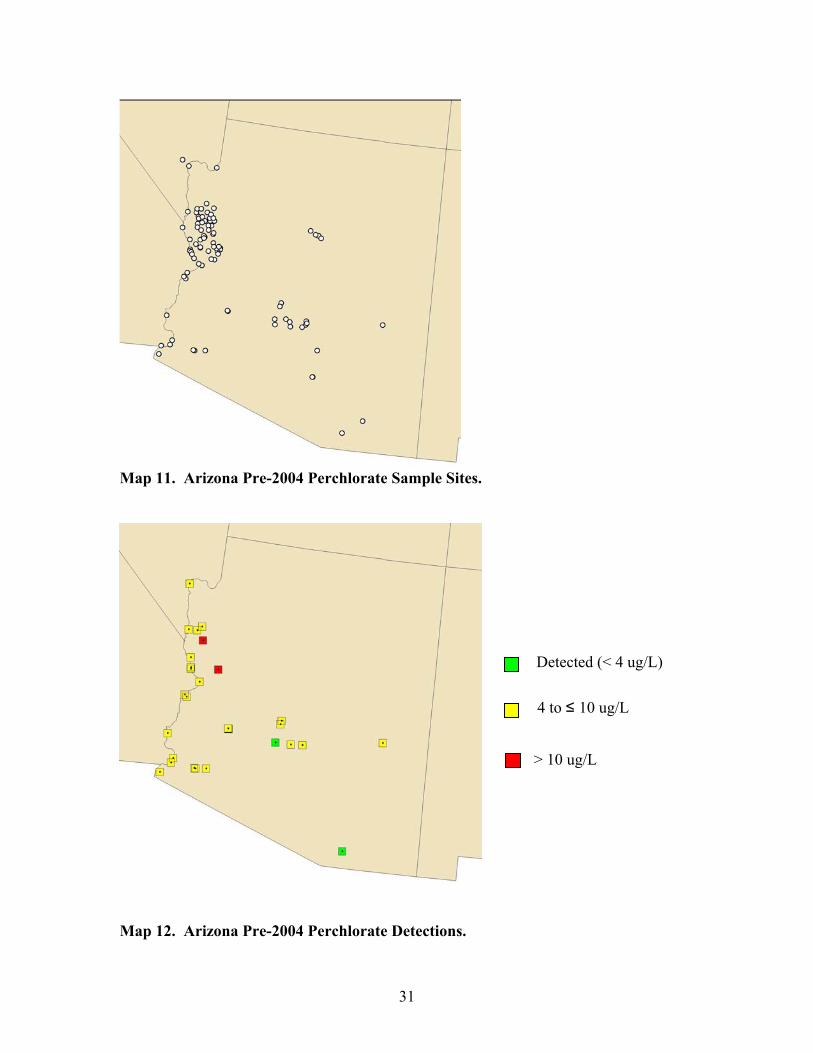
Map 11. Arizona Pre-2004 Perchlorate Sample Sites.
Detected (< 4 ug/L)
4 to ≤ 10 ug/L
> 10 ug/L
Map 12. Arizona Pre-2004 Perchlorate Detections.
31
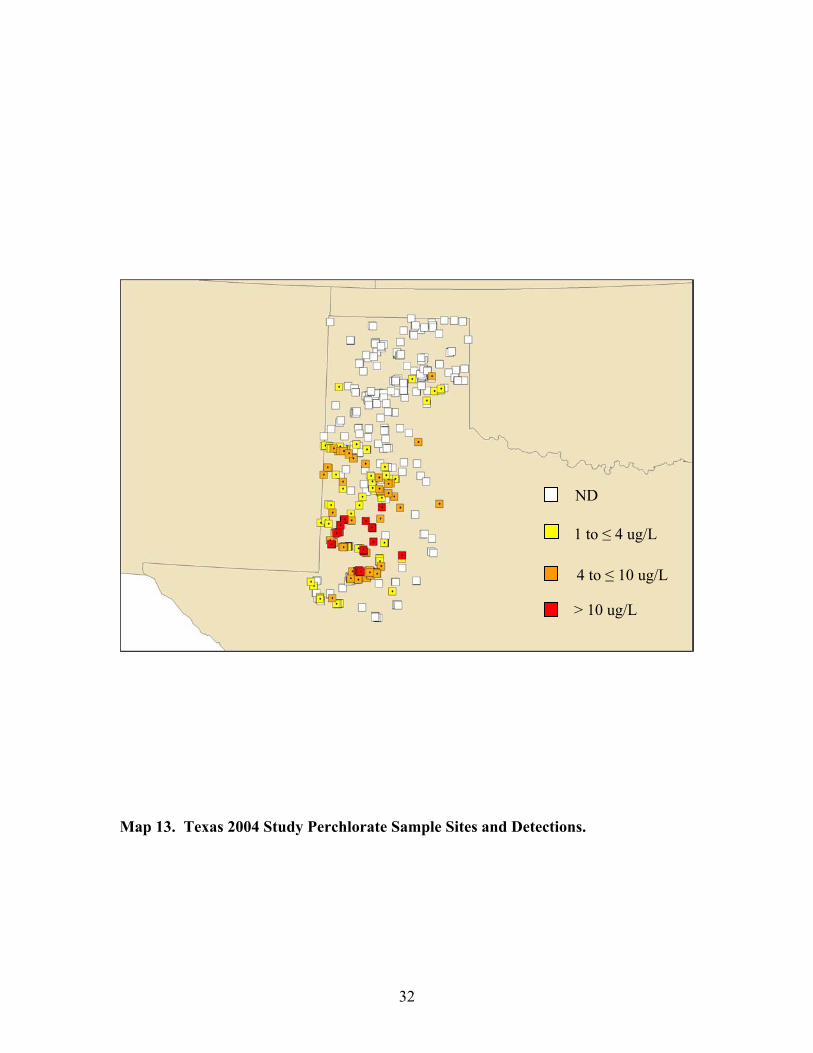
ND
1 to ≤ 4 ug/L
4 to ≤ 10 ug/L
> 10 ug/L
Map 13. Texas 2004 Study Perchlorate Sample Sites and Detections.
32