forsmark site investigation sampling and analyses of
TRANSCRIPT

P-03-49
Svensk Kärnbränslehantering ABSwedish Nuclear Fueland Waste Management CoBox 5864SE-102 40 Stockholm SwedenTel 08-459 84 00
+46 8 459 84 00Fax 08-661 57 19
+46 8 661 57 19
Forsmark site investigation
Sampling and analyses ofgroundwater in percussion drilledboreholes at drillsite DS3
Results from the percussion boreholesHFM06 and HFM08
Ann-Chatrin Nilsson
Geosigma AB
April 2003

ISSN 1651-4416
SKB P-03-49
Forsmark site investigation
Sampling and analyses ofgroundwater in percussion drilledboreholes at drillsite DS3
Results from the percussion boreholesHFM06 and HFM08
Ann-Chatrin Nilsson
Geosigma AB
April 2003
Keywords: Groundwater, early water sampling after drilling, chemical analyses,isotope determinations, AP PF 400-02-39, Field notes No 73 and 95
This report concerns a study which was conducted in part for SKB. Theconclusions and viewpoints presented in the report are those of the authorsand do not necessarily coincide with those of the client.
A pdf version of this document can be downloaded from www.skb.se

3
Contents
1 Introduction 5
2 Objective and scope 9
3 Equipment 113.1 Sampling equipment used in percussion boreholes 11
4 Performance 134.1 Sampling 134.2 Sample treatment and chemical analyses 134.3 Data handling 14
5 Results 175.1 Analysis results from HFM06 and HFM08 175.2 Quality of the analyses 17
6 Future work 196.1 Percussion boreholes 196.2 Monitoring wells 19
7 References 21
Appendix 1 – Designs of boreholes 23
Appendix 2 – Overview of sample treatment and analysis routines 27
Appendix 3 – Water composition, compilation of basic wateranalysis data 33
Appendix 4 – Isotopes I, compilation of H-, O-, B-, S-, Cl- andC-isotopes and isotope ratios. 35
Appendix 5 – Drinking water parameters 37

5
1 Introduction
This document reports the performance of and results from sampling of percussionboreholes after drilling. The work was conducted according to activity plan AP PF400-02-39 (SKB internal controlling document) within the site investigation at Forsmark/1/. The document presents groundwater-chemical data from the percussion boreholesHFM06 and HFM08 drilled in hard rock at drillsite DS3 /2/. Data were obtainedduring the period January 2003–March 2003.
Borehole KFM03A is the third telescopic borehole drilled at the site investigations inthe Forsmark area. The location of the borehole, which is currently being drilled, isshown in Figure 1-1. The borehole is planned to be c. 1000 m deep, and the boreholesection 0–100 m is percussion drilled. During drilling, the groundwater yield from thispart of the borehole was too low to allow sampling. Section 100–1000 m will be coredrilled with a diameter of c. 77 mm. Drilling is supposed to be completed in June 2003.
Figure 1-1. The investigation area at Forsmark (approximately the area inside the black square)including the candidate area selected for more detailed investigations. Drillsites DS1-3 are markedwith blue circles.

6
The locations of all boreholes at drillsite DS3 are illustrated in Figure 1-2. A thirdpercussion drilled borehole at this site, HFM07, was, like section 0–100 m in boreholeKFM03A, characterized by a low groundwater-yield, and was excluded from sampling.
So far, groundwater sampling has not been conducted in the monitoring wells SFM0006,SFM0007 and SFM0008 (see Figure 1-2), drilled in the unconsolidated overburden atdrillsite DS3 /3/. The first sampling is planned to occur in May 2003.
The percussion boreholes HFM06 and HFM08 were drilled at relatively short distancesfrom the telescopic borehole KFM03A, see Figure 1-2. Borehole HFM06 was drilledwith the primary purpose to serve as a supply well for the flushing water needed fordrilling the core drilled part of borehole KFM03A. The borehole HFM06 is likethe telescopic borehole KFM03A of the so called SKB chemical type, see methoddescriptions MD 620.003 (Method description for drilling cored boreholes) and 610.003(Method description for percussion drilling). A borehole being of SKB chemical typeentails cleaning procedures of all in-hole equipment to be used in the borehole duringand after drilling according to level 2 in the cleaning instructions in MD 600.004(Instruktion för rengöring av borrhålsutrustning och viss markbaserad utrustning).
Boreholes HFM08, as well as HFM07, were drilled primarily as monitoring wellsfor groundwater levelling in the shallow part of the bedrock. However, also for theseboreholes, cleaning according to level 2 in MD 600.004 was applied in order to letthese boreholes serve as reserve flushing water wells.
Basic borehole information is given in Table 1-1 below. The designs of the boreholesare presented in Appendix 1. A map showing the locations of the boreholes at drillsiteDS3, depth of dominating water bearing fracture zones and chloride concentrations ispresented in Figure 1-2.
Figure 1-2. Locations of boreholes and monitoring wells at drillsite DS3, water bearing zones andtypical chloride concentrations.

7
Table 1-1. Borehole information, percussion boreholes at drillsite DS3.
Borehole Date of Length (m) Water bearing zones Commentcompletion (length along borehole, m)
HFM06 2003-01-14 110.7 69–71 Source of flushing water fordrilling the cored part ofKFM03A
HFM07 2003-0128 122.5 Low groundwater-yield
HFM08 2003-02-12 143.5 90
KFM03A 2003-03-28 Borehole section Low groundwater-yield Casing only 12 m into the0–100 m bedrock. Section 12–100 m
is stable and low-fracturedand does not need a casing.
Sampling of HFM06 and HFM08, which both have a diameter of 140 mm or afew millimetres less, was accomplished a short time after drilling, in connection withpumping tests and flow logging carried out within the programme for hydrogeologicalinvestigations /4/. The time separation for pumping/logging/sampling between the twoboreholes was a few weeks, see Table 4-1. No other borehole tests were carried out inthe boreholes in question prior to the hydrotest/water sampling campaign.

9
2 Objective and scope
Sampling and analysis of groundwater from boreholes HFM06 and HFM08 wasperformed in order to:
• Check the suitability of HFM06 to serve as a supply well for the flushing waterneeded for drilling the cored part of the telescopic borehole KFM03A. Pumpingcapacity and water quality are critical parameters when assessing the suitability ofa potential flushing water well.
• Gain data on the groundwater composition of so called “first strike” groundwater,i.e. groundwater sampled before the impact of short circuiting between fractures ofdifferent hydrogeochemical character has become significant.
• Obtain groundwater-chemical data from the shallow part of the bedrock (toapproximately 200 m depth) at drillsite DS3.
Of primary interest in this activity was to investigate if the groundwater in boreholeHFM06 was of sufficient quality to be used as flushing water for drilling the cored partof telescopic borehole KFM03A. Core drilling of a 1000 m long borehole will consume1000 m3 or more flushing water. As borehole KFM03A is of SKB chemistry type, thecontent of organic components in the flushing water should be low, preferably below5 mg/L. The reason for this is that introduction of hydrocarbons may affect themicrobiological flora in the borehole, which, consequently, would obstruct a reliablecharacterization of the in situ microbiological conditions.
Sampling and analysis was performed according to the SKB class 3 procedure /1/.

11
3 Equipment
3.1 Sampling equipment used in percussion boreholes
The sampling in boreholes HFM06 and HFM08 was performed in connection withhydraulic tests with the HTHB (HydroTester för HammarBorrhål) pump & packerequipment described in SKB MD 326.001 (Mätsystembeskrivning för hydrotest-utrustning för hammarborrhål – HTHB). The equipment allows pumping from packedoff sections in boreholes of diameter 165 mm and 140 mm (± a few millimetres) usinga single- or double packer system. The in-hole equipment includes a packer system, ameasurement tube, an enclosed pump, and a combined pressure sensor and data logger.An overview of the HTHB equipment is given in Figure 3-1 below.
~ 230V
Figure 3-1. The HTHB (HydroTester för HammarBorrhål) equipment, configured for pumping at“open hole” conditions in combination with flow logging.

13
4 Performance
4.1 Sampling
Sampling of the percussion boreholes at drillsite DS3 was performed according toactivity plan AP PF 400-02-39 (SKB internal controlling document) following themethod described in SKB MD 423.002 (Metodbeskrivning för vattenprovtagning ihammarborrhål efter borrning).
The sampling started in borehole HFM06, and HFM08 was sampled a few weeks later.An extra sampling was then conducted in HFM06 in March 2003 in order to check thedrinking water quality. Generally, pumping was performed during 10 hours, and sampleswere collected twice or three times during the pumping period. Table 4-1 displays thepumping times and sampling occasions during the pumping tests.
Sampling and analyses was performed according to SKB class 3, and isotopedeterminations were performed in the last sample collected for each borehole andsampling occasion. Total organic carbon (TOC) was determined in samples fromHFM06 to investigate its suitability as a source for flushing water. The parametersiron, manganese, hydrogen-sulphide and iodide are not included in class 3 andtherefore not determined.
Table 4-1. Pumping times and sampling occasions in percussion boreholes atdrillsite DS3.
Borehole Section m Pump start Pump stop Sampl. Time Comments
HFM06 0–110.7 030121 10:04 030121 12:50 030121 11:55 Pump stop due to el. powerfailure
HFM06 0–110.7 030121 14:17 030121 21:02 030121 16:52030121 21:50
HFM06 0–110.7 – – 2003-03-06 Check of drinking waterquality (not in connectionwith pump test)
HFM08 0–143.5 030218 09:30 030218 18:28 030218 09:30030218 18:05
HFM08 0–93 030220 09:02 030220 13:53 030220 13:40 Sample collected abovepacker

14
4.2 Sample treatment and chemical analyses
An general overview of sample treatment and analysis methods is given in Appendix 2.The routines are applicable independent of sampling method or sampling object.
4.3 Data handling
The field measurement data were manually registered directly in the SICADA table“hydrogeol_field_measurement” as soon as possible after performance of the field work.
The following routines for quality control and data management are generally appliedfor hydrogeochemical analysis data, independent of sampling method or sampling object.
Several components are determined by more than one method and/or laboratory.Moreover, control analyses by an independent laboratory are performed routinelyon each fifth or tenth collected sample.
All analytical results are stored in the SICADA database. The applicable hierarchy path“Hydrochemistry/Hydrochemical investigation/Analyses/Water” in the database containstwo types of tables, raw data tables and primary data tables (final data tables).
Data on basic water analyses are inserted into raw data tables for further evaluation.The evaluation results in a final reduced data set for each sample. These data setsare compiled in a primary data table named “water_composition”. The evaluation isbased on:
• Comparison of the results from different laboratories and/or methods. The analysesare repeated if a large disparity is noted (generally more than 10%).
• Calculation of charge balance errors. Relative errors within ± 5% are consideredacceptable (in surface waters ± 10%).
(∑ cations(equivalents) – ∑ anions(equivalents)Rel. Error (%) = 100 ×
(∑ cations(equivalents) + ∑ anions(equivalents)
• General expert judgement of plausibility based on earlier results and experiences.
All results from “biochemical” components and special analyses of trace metals and isotopes areinserted directly into primary data tables. In those cases where the analyses are repeatedor performed by more than one laboratory, a “best choice” notation will indicate thoseresults which are considered most reliable.
An overview of the data management is given in Figure 4-1.

15
Figure 4-1. Overview of data management for hydrogeochemical data.
Water sampleComments on sampling
Insertion of sampling activity & sample no. SICADA
Basic water analysis by SKB
Mobile field laboratory orÄspö chemical laboratory
Basic water analysis by external laboratory
Special analysis by external laboratory
SICADA- insertion of raw data(- calculation of result, SKB analysis)(- selection of best determ. or aver. calc. SKB analyses)- storage in raw data tables
SICADA- charge balance calculation - quality control- selection of dataset for sample- insertion of comments on controland evaluation- transfer of data to primary data table
SICADA - Storage in primary data table- QC
Storage of raw data- File system- Binders

17
5 Results
5.1 Analysis results from HFM06 and HFM08
The analytical data from percussion boreholes HFM06 and HFM08 reported from theconsulted laboratories and inserted into the database SICADA before 2003-04-01 arepresented in Appendix 3 and 4. Isotopes and isotope ratios (except for 10B/11B) have notbeen reported within that time limit and are not included.
Samples were collected two or three times during the pumping test. The watercompositions of the samples differ considerably due to pumping time in HFM06,but not at all in HFM08. Generally, the last sample in each sampling series shouldbe regarded as the one most representative.
The concentration of Total Organic Carbon (TOC) in the samples collected in HFM06was found to be between 5.1 and 5.8 mg/L which is exactly on the limit to be acceptablein a flushing water. Although with some hesitation, it was decided that the water couldbe used as flushing water for the core drilling of KFM03A without further measures.
5.2 Quality of the analyses
Comparison between results from different laboratories and methods indicates that theagreement is acceptable in most cases. Generally, the difference in concentrationsbetween each controlled component is less than 10%.
The charge balance errors give an indication of the quality and uncertainty of theanalyses of the major components. The relative charge balance errors are calculatedfor the selected sets of data, see Appendix 3. The error is close to +6% in one casebut below ± 3% in the remaining six cases, which is regarded as quite satisfactory.
19
6 Future work
6.1 Percussion boreholes
The initial sampling of percussion boreholes at drillsite DS3 (reported here), performedaccording to the SKB class 3 procedure, will in the future be repeated on a regular basisin a long-term monitoring programme. This will include a selection of boreholes, andsamples will be collected regularly with a frequency of twice a year from one or twopacked off sections in each borehole. Sampling and analysis within the frame of themonitoring programme will be performed according to the SKB class 5 procedure /1/.
6.2 Monitoring wells
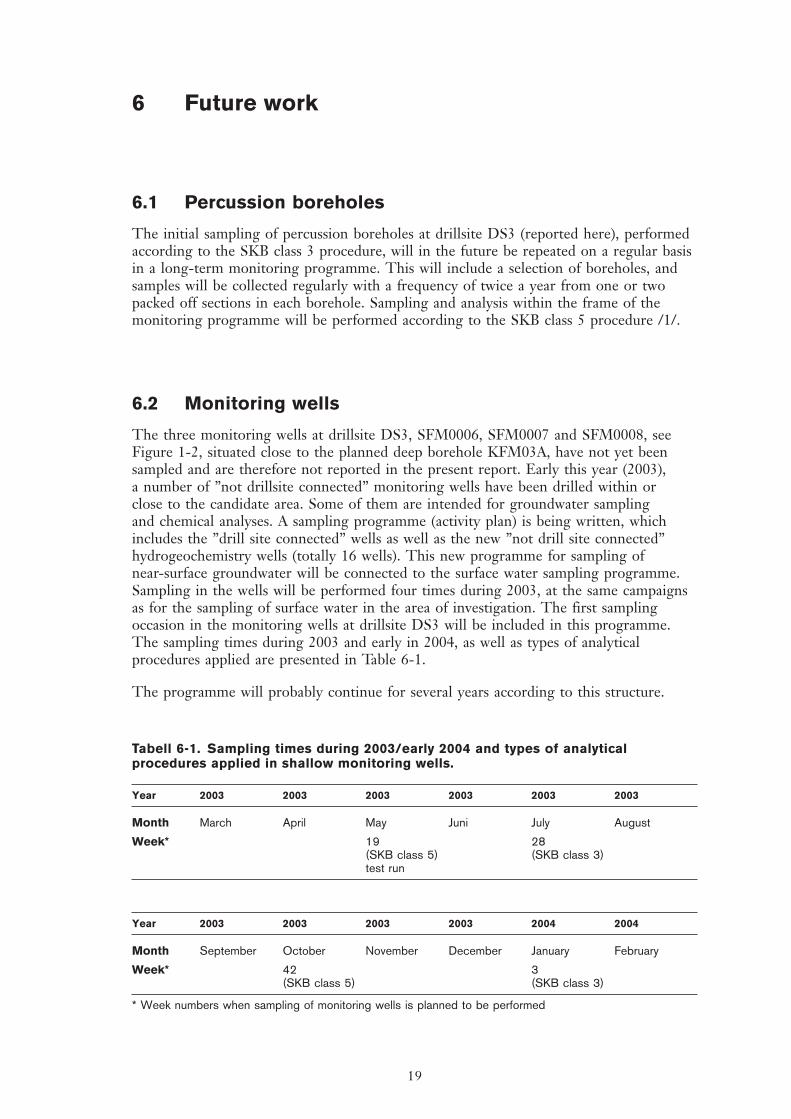
The three monitoring wells at drillsite DS3, SFM0006, SFM0007 and SFM0008, seeFigure 1-2, situated close to the planned deep borehole KFM03A, have not yet beensampled and are therefore not reported in the present report. Early this year (2003),a number of ”not drillsite connected” monitoring wells have been drilled within orclose to the candidate area. Some of them are intended for groundwater samplingand chemical analyses. A sampling programme (activity plan) is being written, whichincludes the ”drill site connected” wells as well as the new ”not drill site connected”hydrogeochemistry wells (totally 16 wells). This new programme for sampling ofnear-surface groundwater will be connected to the surface water sampling programme.Sampling in the wells will be performed four times during 2003, at the same campaignsas for the sampling of surface water in the area of investigation. The first samplingoccasion in the monitoring wells at drillsite DS3 will be included in this programme.The sampling times during 2003 and early in 2004, as well as types of analyticalprocedures applied are presented in Table 6-1.
The programme will probably continue for several years according to this structure.
Tabell 6-1. Sampling times during 2003/early 2004 and types of analyticalprocedures applied in shallow monitoring wells.
Year 2003 2003 2003 2003 2003 2003
Month March April May Juni July August
Week* 19 28(SKB class 5) (SKB class 3)test run
Year 2003 2003 2003 2003 2004 2004
Month September October November December January February
Week* 42 3(SKB class 5) (SKB class 3)
* Week numbers when sampling of monitoring wells is planned to be performed

21
7 References
/1/ SKB, 2001. Platsundersökningar – undersökningsmetoder och generelltgenomförandeprogram. SKB R-01-10, Svensk Kärnbränslehantering AB.
/2/ Claesson L-Å, Nilsson G, 2003. Forsmark site investigation. Drilling of aflushing water well, HFM06, and two groundwater monitoring wells, HFM07and HFM08, at drillsite DS3.SKB P-03-58, Svensk Kärnbränslehantering AB.
/3/ Claesson L-Å, Nilsson G, 2003. Forsmark site investigation. Drilling ofgroundwater monitoring wells SFM0006, SFM0007 and SFM0008 in soil atdrillsite DS3. SKB P-03-57, Svensk Kärnbränslehantering AB.
/4/ Ludvigsson J-E, Källgården J, 2003. Forsmark site investigation. Pumping testsand flow logging. Boreholes KFM03A (0–100 m), HFM06, HFM07 and HFM08.SKB P-03-36, Svensk Kärnbränslehantering AB.

23
Appendix 1
Designs of boreholes
HFM06
HFM07
HFM08

24
2.2.437o
-84.598598o
11
0.7
0 m
12
.00
m
98
.8
.70
m
0.168 8 m
0.21515 m
0.135 5 m
0.160 m
Technihnical dcal datataBoBoreholhole He HFM 0606
NoNortrthihing:EasEasting:Elevation:on:
DrDrilling st start art dadate:Drilling sling stop daop date:
Drilling rling referencence point
Drilling peling periodod
(m), R, RT90 2 2,5 5 gon Von V 0 0:-1-1516316345224522.188 (m),6 (m), RHB 70 RHB 70
2002002-2-1212-1-182002003-3-0101-1-14
66966977527752.012 R RT90 2,90 2,5 g5 gon V 0: V 0:-15
.637637
NoNorth
0.13434 m

25
NoNorth
342342.324324o
-84.517517o
12
2.5
0 m
18
.00
m
10
10
4.5
0 m
0.168 8 m
0.21414 m
0.140 0 m
0.160 m
Technihnical dcal datataBoBoreholhole He HFM 0707
NoNortrthihing:EasEasting:Elevation:on:
DrDrilling st start art dadate:Drilling sling stop daop date:
Drilling rling referencence point
Drilling peling periodod
(m),(m),
5 (m),
2002003-03-01-162002003-03-01-28
66966974167416.248 248 RT9090 2,2,5 gon Von V 0 0:-1516316347154715.687 687 RT9090 2,2,5 gon Von V 0 0:-15
.781781 RHB B 70
0.13939 m

26
NoNorth
348348.690690o
-84.444444o
14
3.5
0 m
18
.00
m
12
12
5.5
0 m
0.168 8 m
0.21313 m
0.139 9 m
0.160 m
Technihnical dcal datataBoBoreholhole He HFM 0808
NoNortrthihing:EasEasting:Elevation:on:
DrDrilling st start art dadate:Drilling sling stop daop date:
Drilling rling referencence point
Drilling peling periodod
(m),(m),
7 (m),
2002003-03-01-292002003-03-02-12
66966977037703.205 205 RT9090 2,2,5 gon Von V 0 0:-1516316347774777.502 502 RT9090 2,2,5 gon Von V 0 0:-15
.132132 RHB B 70
0.13737 m

27
Appendix 2
Overview of sample treatment and analysis routines

28
Table A2-1. Overview of general sample handling routines and analysis methods.
Component group Component/ Sample Volume Filtering Preparation/ Analysis method Laboratory**** Analysis within –element container (mL) Conservation* or delivery time
(material) to lab
Anions 1. HCO3p Plastic 250 Yes (not in No Titration Mobile field lab. The same day –H(lab) the field) Pot. meas, Alcontrol maximum 24 hourscond (lab) Cond. meas
Anions 2 Cl, SO4, Br–, F–, I– Plastic 100 Yes (not in No Titration (Cl–) Äspö:s chemistry Not critical (month)the field) IC (Cl–, SO4, Br–, F–) lab.
ISE (F–) Alcontrol
Br, I Plastic 100 Yes (not in No ICP MS Paavo Ristola OY Not critical (month)the field) SGAB Analytica
Cations, Si and S Na, K, Ca, Mg, Plastic (at low 100 Yes (not in Yes (not in the ICP-AESICP-MS SGAB Analytica, Not critical (month)according to SKB S(tot), Si(tot), Li, Sr conc. acid the field) field, 1 mL HNO3) SLU, Umeåclass 3 washed bottles)
Cations, Si and S Na, K, Ca, Mg, Plastic 100 Yes Yes (1mL HNO3) ICP-AESICP-MS SGAB Analytica, Not critical (month)according to SKB S(tot), Si(tot), Fe, (Acid washed) (immediately SLU, Umeåclass 4 and 5 Mn, Li, Sr in the field)
Fe(II), Fe(tot) Fe(II), Fe(tot) Plastic 500 Yes Yes (5 mL HCl)) Spectrophotometry Mobile field lab. As soon as possible(Acid washed) Ferrozine method the same day
Hydrogen sulphide HS– Glass (Winkler) About No Ev 1 mL 1 M Spectrophotometry Alcontrol Immediately or if120×2 NaOH+ 1 mL Äspö’s chemistry conserved, a few days
1M ZnAc lab.
Nutrient salts NO2, NO3+NO2, Plastic 250 No No Spectrophotometry Äspö:s chemistry Maximum 24 hoursNH4, PO4 lab. Alcontrol
Environmental Al, As, Ba, B, Cd, Plastic 100 Yes Yes (1 mL HNO3) ICP-AESICP-MS SGAB Analytica, Not critical (month)metals Co, Cr, Cu, Hg, Mo, Alcontrol
Ni, P, Pb, V, Zn
Lantanoids, U, Th Sc, Rb, Y, Zr, I, Sb, Plastic 100 Yes Yes (1 mL HNO3) ICP-AESICP-MS SGAB Analytica, Not critical (month)and so on. Cs, La, Hf, Tl, Ce, Alcontrol
Pr, Nd, Sm, Eu, Gd,Tb, Dy, Ho, Er, Tm,Yb, Lu, U, Th
Dissolved organic DOC, DIC Plastic 250 Yes Frozen, UV oxidation, IR Paavo Ristola OY Short transportationCarbon, dissolved 25 transported in Carbon analysator Dept. of System timeinorganic Carbon isolated bag Shimadzu TOC5000 ecology, SU
Total organic TOC Plastic 250 No Frozen, UV oxidation, IR Paavo Ristola OY Short transportationCarbon 25 transported in Carbon analysator Dept. of System times
isolated bag Shimadzu TOC5000 ecology, SU

29
Component group Component/ Sample Volume Filtering Preparation/ Analysis method Laboratory**** Analysis within –element container (mL) Conservation* or delivery time
(material) to lab
Environmental 2H, 18O Plastic 100 No — MS IFE Not critical (month)isotopes
Tritium, 3H (enhanced.) Plastic 500 No – LSC Univ. Of Waterloo Not critical (month)(dry bottle)
Chlorine-37 Chlorine-37 Plastic 100 No – ICP MS
Carbon isotopes 13C, 14C Glass (brown) 100´2 No – (A)MS Univ. Of Waterloo A few days
Sulphur isotopes 34S Plastic 500–1000 Yes – Combustion, ICP MS IFE No limit
Strontium-isotopes 87Sr/86Sr Plastic 100 Yes – TIMS IFE Days or Week
Uranium and 234U, 235U, 238U, Plastic 50 Nej – Chemical separat. IFE No limitThorium isotopes 232Th, 230Th Alfa/gamma
spectrometry
Boron isotopes 10B Plastic 100 Yes Yes (1 mL HNO3) ICP – MS SGAB Analytica No limit
Radon and Radium 222Rn, 226Ra Plastic 500 No No EDA, RD-200 IFE Immediate transportisotopes
Dissolved gas Ar, N2, CO2, O2, Cylinder of 200 No No GC Paavo Ristola OY Immediate transport(content and CH4, H2, CO, C2H2, stainless steelcomposition) C2H4, C2H6, C3H8
Colloids Filter series and Polycarbonate 0.45, 0.2 – N2 atmosphere ICP-AESICP-MS SGAB Analytica Immediate transportfractionation filter and 0.05 µm(see below)
Humic and fulvic Fractionation Fractions are 250 – N2 atmosphere UV oxidation, IR Paavo Ristola OY Immediate transportacids collected in (DOC)
plastic bottles
Archive samples – Plast (washed 100×2** Yes Yes (1 mL HNO3) – – Storage in freezewith acid in acid) container
Archive samples – Plastic 250×2** Yes No – – Storage in freezewithout acid container
Carbon isotopes 13C, 14C DEAE cellulose – – – (A)MS The Ångström A few daysin humic and fulvic (anion exchanger) laboratory, Uppsalaacids
* Suprapur acid is used for conservation of samples.
** Minimum number, the number of archive samples can vary depending on how many similar samples that are collected at the same occasion.
**** Full name and address is given in Table A2-3.

30
Abbreviations and definitions:
IC Ion chromatograph
ISE Ion selective electrode
ICP-AES Inductively Coupled Plasma Atomic Emission Spectrometry
ICP-MS Inductively Coupled Plasma Mass Spectrometry
INAA Instrumental Neutron Activation Analysis
MS Mass Spectrometry
LSC Liquid Scintillation Counting
(A)MS (Accelerator) Mass Spectrometry
GC Gas Chromatography
Table A2-2. Reporting limits and measurement uncertainties.
Component Method Reporting limits Unit Measurement ”Total”or range uncertainties 3 uncertainties 4
HCO3 Alkalinity titration 1 mg/L 4% Time delay affectsthe results
Cl– Mohr- titration >70 mg/L 5% <10%Cl– IC 1–100 6% 20%
SO4 IC 1 mg/L 10% 20%
Br– IC 0.2 mg/L 9% 30%Br– ICP 0.001 15%
F–F– ICPotentiometric 0.1 mg/L 10% 20%– –
I– ICP 0.001 mg/L 15% 20%
Na ICP 0.1 mg/L 4% 10%
K ICP 0.4 mg/L 6% 20%
Ca ICP 0.1 mg/L 4% 10%
Mg ICP 0.09 mg/L 4% 10%
S(tot) ICP 0.160 mg/L 21% 20%
Si(tot) ICP 0.03 mg/L 4% 15%
Sr ICP 0.002 mg/L 4% 10%
Li ICP 0.21 22 mg/L 10% 20%
Fe ICP 0.41 42 mg/L 6% 10%
Mn ICP 0.031 0.12 µg/L 8% 10%
Fe(II), Fe(tot) Spectrophotometry 0.02 mg/L 22% 30%(DL=0.005 mg/L)
HS– Spectrophotometry SKB 0.03 (DL=0.002) mg/L 20% 30%Alcontrol (DL= 0.003)
NO2 as N Spectrophotometry 0.1 µg/L 2% 20%
NO3 as N Spectrophotometry 0.2 µg/L 5% 20%
NO2+NO3 Spectrophotometry 0.2 µg/L 0.2 (0.2–20 mg/L) 20%as N 2% (> 20 mg/L)
NH4 as N Spectrophotometry 0.8 µg/L 0.8 (0.8–20 mg/L) 20%5% (> 20 mg/L)
50 (SKB) 20%
PO4 as P Spectrophotometry 0.7 µg/L 0.7 (0.7–20 mg/L) 20%3% (>20 mg/L)
SiO2 Spectrophotometry 1 µg/L 3% (>200 mg/L)
O2 Jodometrisc titration µg/L
Chlorophyll a, c See table A1-2 0.5 µg/L 5%pheopigment6

31
Component Method Reporting limits Unit Measurement ”Total”or range uncertainties 3 uncertainties 4
PON6 See table A1-2 0.5 µg/L 5%
POP6 See table A1-2 0.1 µg/L 5%
POC6 See table A1-2 1 µg/L 4%
Tot-N6 See table A1-2 10 µg/L 4%
Tot-P6 See table A1-2 0.5 µg/L 6%
Al, Zn ICP 0.2 µg/L 12% 20%5
Ba, Cr, Mo, Pb ICP 0.01 µg/L 7–10% 20%5
Cd, Hg ICP 0.002 µg/L 9 resp 5% 20%5
Co, V ICP 0.005 µg/L 8 resp 5% 20%5
Cu ICP 0.1 µg/L 8% 20%5
Ni ICP 0.05 µg/L 8% 20%5
P ICP 1 µg/L 6% 10%
As 1CP 0.01 µg/L 20% Correct order ofsize
La, Ce, Pr, Nd, ICP 0.0051 0.052 µg/L 10% Correct order ofSm, Eu, Gd, sizeTb, Dy, Ho, Er,Tm, Yb
Sc, In, Th ICP 0.051 0.52 µg/L 10% Correct order ofsize
Rb, Zr, Sb, ICP 0.0251 0.252 µg/L 10% Correct order ofCs, Tl size
Y, Hf ICP 0.0051 0.052 µg/L 10% Correct order ofsize
U ICP 0.0011 – µg/L 12% Correct order ofsize
DOC, DIC See table A1-1 0.1 Mg/L 20% 50%
TOC See table A1-1 0.1 Mg/L 20% 50%2H MS 2 %° dev 1.0%°
SMOW18O MS 0.1 %° dev 0.2%°
SMOW3H LSC 0.8 or 0.1 TU 0.8 Correct order of
size37Cl ICP MS 0.2%° (20 mg/L) SMOC –13C A (MS) – PDB –14C pmc A (MS) – PMC – Correct order of
size34 S ICP MS 0.2%° 0.3%°
87Sr/86Sr TIMS – No unit <±0.00002010B/11B ICP MS – No unit –234U, 235U, 238U, Alfa spectr. LSC 0.1 (234U, 238U, 226Ra) Bq/L 0.05 Bq/L Correct order of232Th, 230Th, 0.3 (235U) size222Rn, 226Ra 0.05 (232Th, 230Th)
1 Salt ≤0.4% (520 mS/m)2 Salt ≤3.5% (3810 mS/m)3 Measurement uncertainty reported by consulted laboratory4 “Total” uncertainty estimated by experience (includes sampling and sample handling)5 Valid for surface water samples collected by metal free “Ruttner sampler”, filtered and acidified in the field.The risk of contamination varies depending on sampling method.6 Determined only in surface waters and near surface groundwater

32
Table A2-3. Consulted laboratories, full name and address.
Äspö waterchemical laboratory (SKB)
Mobile field laboratory, Forsmark (SKB)
Inainööritoimisto
Paavo Ristola Oy
Teollisuus-ja
Voimalaitoskemia
Rajantorpantie 8, C-talo
01600 Vantaa
FINLAND
Dept. of System ecology
Stockholm University
10691 Stockholm
Analytica AB
Aurorum 10
977 75 Luleå
(Nytorpsvägen 16
Box 511
183 25 Täby)
Environmental Isotope Laboratory
Dep. Of earth sciences
University of Waterloo
Waterloo, Ontario
N2L 3G1 CANADA
Institutt for energiteknik (IFE)
Insituttveien 18
P.O Box 40
2027 Kjeller
NORGE
Alcontrol Nordic AB
Box 905
531 19 Lidköping
The Ångström laboratory
Box 534
SE-751 21 Uppsala
Environmental research laboratory (SLU), Luleå
Alcontrol
Box 1083
581 10 Linköping

33
Appendix 3
Water composition, compilation of basic water analysis data
Idcode Secup Seclow Sample Date Time Charge Na K Ca Mg HCO3 Cl SO4 SO4-S Br F– Si Fe Mn Li Sr pH TOCm m no. Bal % mg/L mg/L mg/L mg/L mg/L mg/L mg/L mg/L mg/l mg/L mg/L mg/L mg/L mg/L mg/L mg/L
HFM06 0,0 110,7 4463 2003-01-21 11:55 5,68 384 17,6 73,3 20,4 231 476 135 44,1 1,87 1,70 5,0 _ _ 0,01 0,43 7,7 5,7
HFM06 0,0 110,7 4464 2003-01-21 16:52 0,36 447 19,1 92,9 27,0 418 586 156 50,0 2,25 1,60 5,1 _ _ 0,01 0,60 7,6 5,8
HFM06 0,0 110,7 4465 2003-01-21 21:50 –0,40 519 21,4 125 37,2 404 797 173 55,5 3,02 1,48 5,2 _ _ 0,02 0,85 7,6 5,1
HFM06 0,0 110,7 4618 2003-03-06 08:55 –0,78 629 28,2 175 54,5 372 1110 208 71,6 3,71 1,80 4,7 _ _ 0,02 1,25 7,6 _
HFM08 0,0 143,5 4521 2003-02-18 09:30 0,83 2240 68,0 760 289 113 5160 512 169 20,2 1,33 4,6 _ _ 0,05 6,48 7,3 _
HFM08 0,0 143,5 4522 2003-02-18 18:05 –1,98 2210 67,8 754 287 115 5420 534 168 24,1 1,43 4,8 _ _ 0,05 6,36 7,3 _
HFM08 0,0 93,0 4535 2003-02-20 13:40 2,68 1150 32,6 572 139 173 2690 319 115 11,0 0,78 6,6 _ _ 0,03 4,16 7,3 _
– = Not analysed
x = No result due to sampling problems
xx = No result due to analytical problems
– “value” = result less than detection limit
ChargeBal % = Relative charge balance error %
SICADA: water_composition, 030101–030301

35
Appendix 4
Isotopes I, compilation of H-, O-, B-, S-, Cl- and C-isotopes and isotope ratios.
Idcode Secup Seclow Sample Date Time D Tr O-18 10B/11B S-34 Cl-37 C-13 87Sr/86Sr C-14 AGE_BPm m no dev TU dev no unit dev CDT dev dev PDB no unit pmc years
SMOW SMOW SMOC
HFM06 0,0 110,7 4463 2003-01-21 11:55 _ _ _ 0,24 _ _ _ _ _ _
HFM06 0,0 110,7 4464 2003-01-21 16:52 _ _ _ 0,24 _ _ _ _ _ _
HFM06 0,0 110,7 4465 2003-01-21 21:50 A A A 0,24 A A A A A A
HFM06 0,0 110,7 4618 2003-03-06 08:55 _ _ _ 0,24 _ _ _ _ _ _
HFM08 0,0 143,5 4521 2003-02-18 09:30 _ _ _ 0,24 _ _ _ _ _ _
HFM08 0,0 143,5 4522 2003-02-18 18:05 A A A 0,24 A A A A A A
HFM08 0,0 93,0 4535 2003-02-20 13:40 A A A 0,24 A A A A A A
– = Not analysed
A = Results will be reported later
x = No result due to sampling problems
xx = No result due to analytical problems
SICADA: h_o_isotopes, b_s_cl_sr_isotopes 030101–030301

37
Appendix 5
Drinking water parameters
Idcode Secup Seclow Sample Date Time Hardness NH4_N NO2_N PO4_P COD-Mn Rnm m no Germ. dH mg/L mg/L mg/L mg/L Bq/L
HFM06 0,0 110,7 4618 2003-03-06 08:55 35,3 0,69 0,002 0,016 6,2 286
Microbiological judgement:
suitable
Chemical judgement:
suitable with remarcs due to radon, fluoride, sulphate, chloride, hardness and ammonium
– = Not analysed
x = No result due to sampling problems
xx = No result due to analytical problems
– “value” = result less than detection limit
SICADA: WellChemistry 1 T, 030101–030301, 1 av 1
Idcode Secup Seclow Sample Date Time Hbakt Kbakt Ecoli Smell_Lab Muddy Colourm m no no/100 mL no/100 mL no/100 mL no.
HFM06 0,0 110,7 4618 2003-03-06 08:55 –100 –1 –1 No No 15