fortis hybrid financing - cmvmweb3.cmvm.pt/sdi2004/emitentes/docs/fsd12549.pdf · fortis hybrid...
TRANSCRIPT

Fortis Hybrid FinancingEuro Denominated Perpetual Securities
having the benefit of a support agreement and subordinated guarantee of.
Fortis N.V. and Fortis SA/NV
(co-guarantors)
The Euro Denominated Perpetual Securities (the “Securities”) will be issued on or about May 30, 2008 (the “Issue Date”) under anindenture by Fortis Hybrid Financing, a special purpose financing vehicle incorporated in Luxembourg in the form of a limited liability company(société anonyme) and registered with the Luxembourg Register of Commerce and Companies with registration number B-116671. The Securitieswill constitute direct, subordinated obligations of Fortis Hybrid Financing. The Securities will bear interest at a fixed rate to be determined on thebasis of a bookbuilding procedure (the “Coupon”) from and including the Issue Date, payable annually in arrears on or about May 30 of each year,beginning on or about May 30, 2009.
The Coupon and the total principal amount of the Securities to be issued shall be determined on or about May 23, 2008 (the “PricingDate”) following the end of the public offer period as described below and notified to the Commission de Surveillance du Secteur Financier (the“CSSF”) and published on the website of the Luxembourg Stock Exchange and in the Euronext Daily Official List (“Officiële Prijscourant”) ofEuronext Amsterdam N.V. (“Euronext”).
The Securities will have the benefit of a support agreement and subordinated guarantee entered into by Fortis Hybrid Financing’s ultimateparent companies, Fortis SA/NV and Fortis N.V. The guarantee agreement will constitute direct, unsecured and subordinated obligations of eachparent company.
For a more detailed description of the Securities and the support and guarantee arrangements, see “Description of the Securities”.
The CSSF is the competent authority in Luxembourg for the purpose of Directive 2003/71/EC (the “Prospectus Directive”) and theLuxembourg law on prospectuses dated 10 July 2005, for the purpose of approving this Prospectus. In addition, Fortis Hybrid Financing hasrequested that the CSSF provides a copy of the certificate of approval to the competent authority in the Netherlands, the Netherlands Authority forthe Financial Markets (“Stichting Autoriteit Financiële Markten”). Application has been made to the (i) Luxembourg Stock Exchange for theSecurities to be listed on the official list of the Luxembourg Stock Exchange and to be admitted to trading on the Regulated Market of theLuxembourg Stock Exchange and (ii) Euronext Amsterdam by NYSE Euronext (“Euronext Amsterdam”), the regulated market of Euronext, whichare each regulated markets within the meaning of Directive 2004/39/EC.
Investing in the Securities involves risks. See “Risk Factors”.
PRICE 100% AND ACCRUED INTEREST, IF ANY
THE COUPON RATE IS EXPECTED TO BE BETWEEN 8.00% AND 8.25% PER ANNUM.
THE SECURITIES HAVE NOT BEEN AND WILL NOT BE REGISTERED UNDER THE UNITED STATES SECURITIES ACTOF 1933, AS AMENDED (THE “SECURITIES ACT”), OR UNDER ANY STATE SECURITIES LAWS AND MAY NOT BE OFFERED,SOLD OR DELIVERED WITHIN THE UNITED STATES OR TO, OR FOR THE BENEFIT OF, ANY US PERSON (AS DEFINED INREGULATION S UNDER THE SECURITIES ACT) UNLESS REGISTERED UNDER THE SECURITIES ACT OR AN EXEMPTIONFROM THE REGISTRATION REQUIREMENTS OF THE SECURITIES ACT IS AVAILABLE. THE SECURITIES ARE BEINGOFFERED AND SOLD IN OFFSHORE TRANSACTIONS OUTSIDE THE UNITED STATES IN RELIANCE ON REGULATION SUNDER THE SECURITIES ACT.
The Securities will be evidenced by a global certificate in registered form, deposited on or about May 30, 2008, registered in the name ofthe nominee of the common depositary for Euroclear Bank SA/NV and Clearstream société anonyme, Luxembourg. The Securities traded onEuronext Amsterdam are eligible for settlement in the systems of Euroclear Nederlands Interprofessioneel Effectencentrum NIEC B.V. (“EuroclearNIEC”).
Joint Lead Managers and Joint BookrunnersMerrill Lynch International Fortis Bank
Joint Lead ManagerMorgan Stanley
Co-ManagersABN Amro ING Rabobank
The date of this Prospectus is May 14, 2008.
Level: 6 – From: 6 – Wednesday, May 14, 2008 – 1:34 pm – g5mac4 – 3960 Intro : 3960 Intro

If Fortis Hybrid Financing gives a notice stating that it will satisfy any coupon in accordance withthe Alternative Coupon Payment Method described in this Prospectus (an “Alternative Coupon Notice”),then the Alternative Coupon shall be payable, subject to a Postponement Event, on the Alternative CouponSatisfaction Date. Fortis Hybrid Financing may give an Alternative Coupon Notice in its sole discretion(except in the case of a Mandated Election in which case Fortis Hybrid Financing is required to give anAlternative Coupon Notice), but if a Trigger Event has occurred and is continuing or would occur on aRegular Coupon Date, Fortis Hybrid Financing is required to give an Alternative Coupon Notice.
Subject to certain exceptions, coupons payable following any payment of dividends or otherdistributions on Ordinary Shares or Parity Securities of Fortis Hybrid Financing or either Parent Companyor any redemption, repurchase or other acquisition by Fortis Hybrid Financing or either Parent Companyof its Ordinary Shares or Parity Securities will have the benefit of the Support Agreement from the ParentCompanies.
The Securities have no stated maturity. The Securities are not redeemable at the option of theholders at any time and are not redeemable at the option of Fortis Hybrid Financing prior to May 30, 2013or such other date that will be the fifth anniversary of the Issue Date, (the “First Call Date”), except incertain circumstances described herein. Subject to compliance with applicable regulatory requirements, theSecurities may be redeemed at the option of Fortis Hybrid Financing, in whole or in part, on the First CallDate or on any subsequent Regular Coupon Date. Upon the occurrence of a Tax Event or a Tier 1Disqualification Event, Fortis Hybrid Financing will have the right at any time to redeem the Securities inwhole (and not in part). The redemption price for such redemptions will be the Base Redemption Price.
In the event of the occurrence of a Capital Deficiency Event, under certain circumstances, theprincipal amount of the Securities will be reduced in an amount necessary to remedy the CapitalDeficiency Event to the fullest extent possible (“Loss Absorption”). In the event of Loss Absorption,coupons will continue to be paid at the then applicable rate but on the reduced principal amount and mayonly be paid using the Alternative Coupon Payment Method. Under certain circumstances relating to theprofitability of the Parent Companies, the principal amount of the Securities will be reinstated to the extentdescribed herein. In the event of a bankruptcy or liquidation of the Parent Companies or Fortis HybridFinancing, the Original Principal Amount of the Securities shall be reinstated.
All payment obligations of Fortis Hybrid Financing under the Securities will be unsecuredsubordinated obligations ranking behind the claims of holders of Senior and Subordinated Indebtedness,before the claims of holders of Fortis Hybrid Financing Ordinary Shares and claims for payment of anyindebtedness or obligation that, expressly or by applicable law, is subordinated to the Securities, andequally with the claims of creditors that, expressly or by applicable law, are pari passu with the Securities.
The Parent Companies will give an unconditional and irrevocable Subordinated Guarantee for thedue payment of the Base Redemption Price payable when the Securities become payable in accordancewith their terms in the event of a judicial or voluntary liquidation or bankruptcy of Fortis HybridFinancing. Holders of Securities will have certain third-party beneficiary rights to pursue remedies againstthe Parent Companies.
The Securities will form part of the solvency capital of the Fortis Group and, as such, it is theintention of Fortis Hybrid Financing to redeem the Securities only to the extent that it (or the ParentCompanies), in the period of six months prior to such redemption, raise funds (in an amount at least equalto the aggregate principal amount of the Securities to be redeemed) by the issuance and sale of anysecurities that have equal or greater equity characteristics than the Securities.
The Securities will be issued in registered form in denominations of EUR 1,000 principal amountand will be evidenced by a global certificate in registered form, which will be deposited with a commondepositary for Euroclear SA/NV and Clearstream, société anonyme, Luxembourg, as described in thisProspectus. Ownership of beneficial interests in the Securities will be shown on, and transfers thereof willbe effected only through, records maintained in book-entry form by Euroclear Bank SA/NV, ClearstreamBanking, société anonyme, Luxembourg, and their respective participants. The Securities traded onEuronext Amsterdam are eligible for settlement in the systems of Euroclear NIEC.
ii
Level: 6 – From: 6 – Wednesday, May 14, 2008 – 1:34 pm – g5mac4 – 3960 Intro : 3960 Intro

TABLE OF CONTENTS
Page11
Forward-Looking Information . . . . . . . . . . . . . . . . . . . . . . . . . . . . . . . . . . . . . . . . . . . . . . . . . . . viiIncorporation of Certain Documents by Reference . . . . . . . . . . . . . . . . . . . . . . . . . . . . . . . . . . . ixSummary . . . . . . . . . . . . . . . . . . . . . . . . . . . . . . . . . . . . . . . . . . . . . . . . . . . . . . . . . . . . . . . . . . . 1Risk Factors . . . . . . . . . . . . . . . . . . . . . . . . . . . . . . . . . . . . . . . . . . . . . . . . . . . . . . . . . . . . . . . . . 22Terms and Conditions of the Public Offer . . . . . . . . . . . . . . . . . . . . . . . . . . . . . . . . . . . . . . . . . . 36Description of the Securities . . . . . . . . . . . . . . . . . . . . . . . . . . . . . . . . . . . . . . . . . . . . . . . . . . . . 39Description of the Support Agreement . . . . . . . . . . . . . . . . . . . . . . . . . . . . . . . . . . . . . . . . . . . . 56Description of the Subordinated Guarantee Agreement . . . . . . . . . . . . . . . . . . . . . . . . . . . . . . . 59Description of Fortis Capital Stock . . . . . . . . . . . . . . . . . . . . . . . . . . . . . . . . . . . . . . . . . . . . . . . 61Use of Proceeds . . . . . . . . . . . . . . . . . . . . . . . . . . . . . . . . . . . . . . . . . . . . . . . . . . . . . . . . . . . . . . 72Information About the Acquisition of ABN AMRO . . . . . . . . . . . . . . . . . . . . . . . . . . . . . . . . . . 73Fortis Hybrid Financing . . . . . . . . . . . . . . . . . . . . . . . . . . . . . . . . . . . . . . . . . . . . . . . . . . . . . . . . 91Capitalization of Fortis Group . . . . . . . . . . . . . . . . . . . . . . . . . . . . . . . . . . . . . . . . . . . . . . . . . . . 94Selected Financial and Statistical Data of Fortis Group . . . . . . . . . . . . . . . . . . . . . . . . . . . . . . . 95Operating and Financial Review and Prospects . . . . . . . . . . . . . . . . . . . . . . . . . . . . . . . . . . . . . 99Selected Statistical Information . . . . . . . . . . . . . . . . . . . . . . . . . . . . . . . . . . . . . . . . . . . . . . . . . . 228Risk Management . . . . . . . . . . . . . . . . . . . . . . . . . . . . . . . . . . . . . . . . . . . . . . . . . . . . . . . . . . . . 247Business . . . . . . . . . . . . . . . . . . . . . . . . . . . . . . . . . . . . . . . . . . . . . . . . . . . . . . . . . . . . . . . . . . . . 266Supervision and Regulation . . . . . . . . . . . . . . . . . . . . . . . . . . . . . . . . . . . . . . . . . . . . . . . . . . . . . 309Management . . . . . . . . . . . . . . . . . . . . . . . . . . . . . . . . . . . . . . . . . . . . . . . . . . . . . . . . . . . . . . . . . 321Employee Stock and Option Plans . . . . . . . . . . . . . . . . . . . . . . . . . . . . . . . . . . . . . . . . . . . . . . . 336Shareholding . . . . . . . . . . . . . . . . . . . . . . . . . . . . . . . . . . . . . . . . . . . . . . . . . . . . . . . . . . . . . . . . 341Certain Tax Considerations . . . . . . . . . . . . . . . . . . . . . . . . . . . . . . . . . . . . . . . . . . . . . . . . . . . . . 342Subscription and Sale . . . . . . . . . . . . . . . . . . . . . . . . . . . . . . . . . . . . . . . . . . . . . . . . . . . . . . . . . . 374Legal Matters . . . . . . . . . . . . . . . . . . . . . . . . . . . . . . . . . . . . . . . . . . . . . . . . . . . . . . . . . . . . . . . . 377Independent Auditors . . . . . . . . . . . . . . . . . . . . . . . . . . . . . . . . . . . . . . . . . . . . . . . . . . . . . . . . . . 377General Information . . . . . . . . . . . . . . . . . . . . . . . . . . . . . . . . . . . . . . . . . . . . . . . . . . . . . . . . . . . 378General Listing Information . . . . . . . . . . . . . . . . . . . . . . . . . . . . . . . . . . . . . . . . . . . . . . . . . . . . 379Glossary . . . . . . . . . . . . . . . . . . . . . . . . . . . . . . . . . . . . . . . . . . . . . . . . . . . . . . . . . . . . . . . . . . . . 382Index to Fortis Hybrid Financing Unaudited Financial Information . . . . . . . . . . . . . . . . . . . . . . F-1
iii
Level: 6 – From: 6 – Wednesday, May 14, 2008 – 1:34 pm – g5mac4 – 3960 Intro : 3960 Intro

Each of Fortis Hybrid Financing, Fortis N.V. and Fortis SA/NV, having taken all reasonable care toensure that such is the case, confirms that the information contained in the prospectus is, to the best of itsknowledge, in accordance with the facts and contains no omission likely to affect its import. Each of FortisHybrid Financing, Fortis N.V. and Fortis SA/NV accepts responsibility for the information contained inthis document.
We are offering to sell, and are seeking offers to buy, the Securities only in jurisdictions whereoffers and sales are permitted. This Prospectus does not constitute an offer to sell, or a solicitation ofan offer to buy, the Securities offered by this Prospectus by any person in any jurisdiction in whichit is unlawful for such person to make such an offer or solicitation. Neither the delivery of thisProspectus nor any sale made under it implies that there has been no change in our affairs or thatthe information in this Prospectus is correct as of any date after the date of this Prospectus.
We and Merrill Lynch International (“Merrill Lynch”), Morgan Stanley & Co. International plc(“Morgan Stanley”) and Fortis Bank (the “Managers”) reserve the right to reject any offer to purchasefor any reason, or to sell less than all of the Securities offered by this Prospectus.
The Securities described herein have not been and will not be registered under the SecuritiesAct or under any State securities laws and may not be offered or sold in the United States or to, orfor the account or benefit of US Persons, unless registered under the Securities Act or an exemptionfrom the registration requirements is available. This Prospectus has not been recommended orapproved by the United States Securities and Exchange Commission (the “SEC”) or any otherregulatory authority and neither the SEC nor any other regulatory authority has passed upon theaccuracy or adequacy of this Prospectus. Any representation to the contrary is a criminal offense.
In connection with the issue of the Securities, Merrill Lynch (the “Stabilizing Manager”) (orpersons acting on behalf of the Stabilizing Manager) may over-allot or effect transactions with a view tosupporting the market price of the Securities at a level higher than that which might otherwise prevail.However, there is no assurance that the Stabilizing Manager (or persons acting on behalf of the StabilizingManager) will undertake stabilization action. Any stabilization action may begin on or after the date onwhich adequate public disclosure of the final terms of the offer of the Securities is made and, if begun,may be ended at any time, but it must end no later than the earlier of 30 days after the Issue Date and 60days after the date of the allotment of the Securities. Any stabilization action or over-allotment must beconducted by the Stabilizing Manager (or persons acting on behalf of any Stabilizing Manager) inaccordance with all applicable laws and rules.
This Prospectus has been prepared on the basis that any offer of the Securities in any Member Stateof the European Economic Area which has implemented the Prospectus Directive (each, a “RelevantMember State”) other than offers (the “Permitted Public Offers”) which are made prior to the IssueDate (or such later date as Fortis Hybrid Financing may permit), and which are contemplated in thisProspectus in Austria, Belgium, France, Germany, Ireland, Italy, Luxembourg, Portugal, Spain, TheNetherlands, the United Kingdom and the Principality of Liechtenstein once this Prospectus has beenapproved by the CSSF and published and notified to the relevant competent authorities in accordance withthe Prospectus Directive as implemented in Austria, Belgium, France, Germany, Ireland, Italy, Portugal,Spain, The Netherlands, the United Kingdom and the Principality of Liechtenstein, will be made pursuantto an exemption under the Prospectus Directive, as implemented in that Relevant Member State, from therequirement to publish a prospectus for offers of the Securities. Accordingly, any person making orintending to make an offer in that Relevant Member State of the Securities which are the subject of theoffering contemplated in this Prospectus, other than the Permitted Public Offers, may only do so incircumstances in which no obligation arises for Fortis Hybrid Financing or any of the Managers to publisha prospectus pursuant to Article 3 of the Prospectus Directive or supplement a prospectus pursuant toArticle 16 of the Prospectus Directive, in each case, in relation to such offer. Neither Fortis HybridFinancing nor the Managers have authorized, nor do they authorize, the making of any offer (other thanPermitted Public Offers) of the Securities in circumstances in which an obligation arises for Fortis HybridFinancing or the Managers to publish or supplement a prospectus for such offer.
iv
Level: 6 – From: 6 – Wednesday, May 14, 2008 – 1:34 pm – g5mac4 – 3960 Intro : 3960 Intro

You must (1) comply with all applicable laws and regulations in force in any jurisdiction inconnection with the possession or distribution of this Prospectus and the purchase, offer or sale of theSecurities and (2) obtain any consent, approval or permission required to be obtained by you for thepurchase, offer or sale by you of the Securities under the laws and regulations applicable to you in force inany jurisdiction to which you are subject or in which you make such purchases, offers or sales, and neitherwe nor the Managers shall have any responsibility therefor.
We have prepared this Prospectus and we are solely responsible for its contents. You may contact usat any time if you need additional information. By purchasing Securities, you acknowledge that:
• you have not relied on the Managers or any person affiliated with the Managers in connectionwith your investigation of the accuracy of the information set forth in this Prospectus or yourinvestment decision; and
• no person has been authorized to give any information or to make any representationconcerning us or the Securities, other than as contained in this Prospectus and, if given ormade, any such other information or representation should not be relied upon as having beenauthorized by us or the Managers.
Neither the Managers nor the Indenture Trustee and its agents are making any representation orwarranty, express or implied, as to the accuracy or completeness of the information contained in thisProspectus. You should not rely upon the information set forth in this Prospectus, as a promise orrepresentation, whether as to the past or the future.
See “Risk Factors” for a description of some important factors relating to an investment in theSecurities offered by this Prospectus. None of us, the Managers or any of our respective representatives ismaking any representation to you regarding the legality of an investment by you under appropriateinvestment or similar laws. You should consult with your own advisers as to legal, tax, business, financialand related aspects of a purchase of the Securities.
Presentation of Financial Information
Fortis is not a legal entity but collectively refers to Fortis SA/NV and Fortis N.V. and the group ofcompanies owned and/or controlled by Fortis SA/NV and Fortis N.V. In this Prospectus, “Fortis Group”,“Group” and “Fortis” refer to Fortis SA/NV, Fortis N.V. and the group of companies owned and/orcontrolled by Fortis SA/NV and Fortis N.V., including Fortis Hybrid Financing.
In this Prospectus, references to “we”, “us” or “our” refer to the Fortis Group and references to the“Parent Companies” mean Fortis SA/NV and Fortis N.V. and their respective successors and not any oftheir respective subsidiaries.
Consolidated Financial Statements
Fortis published its full-year 2007, 2006 and 2005 results (the “Consolidated FinancialStatements”), in accordance with International Financial Reporting Standards including InternationalAccounting Standards and Interpretations and as adopted by the European Union (“IFRS”). For IAS 39,Financial Instruments: Recognition and Measurement this takes into account the amendments regardingthe fair value option as published on June 16, 2005 by the International Accounting Standards Board(“IASB”) and as adopted by the European Union on November 15, 2005, as well as the exclusionregarding hedge accounting (the so-called ‘carve-out’) decided by the European Union on November 19,2004.
Fortis publishes its financial statements in euros. References to “€”, “euro”, “EUR” and “Euro” areto the euro, the single unified currency that was introduced in Belgium and The Netherlands and nine othermember states of the European Union on January 1, 1999.
v
Level: 6 – From: 6 – Wednesday, May 14, 2008 – 1:34 pm – g5mac4 – 3960 Intro : 3960 Intro

Fortis SA/NV Financial Statements
Fortis SA/NV prepares financial statements that reflect its share in Fortis. In these financialstatements, Fortis SA/NV accounts for its share in Fortis on a cost basis. Fortis SA/NV’s financialstatements are prepared in accordance with generally accepted accounting principles in Belgium (“BelgianGAAP”).
Fortis N.V. Financial Statements
Fortis N.V. prepares financial statements that reflect its share in Fortis. In these financial statements,Fortis N.V. accounts for its share in Fortis on a net equity basis. Fortis N.V.’s financial statements for 2005,2006 and 2007 were prepared in accordance with generally accepted accounting principles in TheNetherlands (“Dutch GAAP”).
vi
Level: 6 – From: 6 – Wednesday, May 14, 2008 – 1:34 pm – g5mac4 – 3960 Intro : 3960 Intro

FORWARD-LOOKING INFORMATION
There are statements in this Prospectus, such as statements that include the words or phrases “willlikely result”, “are expected to”, “will continue”, “is anticipated”, “estimate”, “project”, or similarexpressions, that are “forward-looking statements”. These statements are subject to certain risks anduncertainties. Actual results may differ materially from those suggested by these statements due to risks oruncertainties associated with Fortis’s expectations with respect to, among others, its market riskevaluations or potential acquisitions, potential cost and revenue synergies associated with acquisitions, orwith respect to expansion and premium growth and investment income or cash flow projections and, moregenerally, to general economic conditions, including changes in interest rates and the performance of thefinancial markets, changes in domestic and foreign laws, regulations and taxes, changes in competition andpricing environments, regional or general changes in asset valuations, the occurrence of significant naturaldisasters, the inability to reinsure certain risks economically, the adequacy of technical provisions, as wellas general market conditions, competition, pricing and restructurings, continuing uncertainties over theacquisition of the ABN AMRO Businesses (as defined below) (the “ABN AMRO Acquisition”) and theintegration of those ABN AMRO Businesses into Fortis and the costs and liabilities related to such anacquisition. See “Risk Factors” for further discussion of risks and uncertainties that could impact the FortisGroup’s business.
These forward-looking statements are not guarantees of future performance. Rather, they are basedon current views and assumptions and involve known and unknown risks, uncertainties and other factors,many of which are outside the control of Fortis and are difficult to predict, that may cause actual results ordevelopments to differ materially from any future results or developments expressed or implied from theforward-looking statements. Factors that could cause actual results to differ materially from thosecontemplated by the forward-looking statements include, among other factors:
• costs (including taxes) or difficulties related to the integration of acquisitions, including theacquisition of ABN AMRO and the ABN AMRO Businesses, may be greater than expected;
• the risk of unexpected consequences resulting from acquisitions, including the acquisition ofABN AMRO and the ABN AMRO Businesses;
• our ability to achieve revenue synergies and cost savings from the integration of the ABNAMRO Businesses and related assets;
• the potential exposure of Fortis and ABN AMRO to various types of market risks, such asinterest rate risk, foreign exchange rate risk and commodity and equity price risk. Suchstatements are subject to risks and uncertainties. For example, certain of the market riskdisclosures are dependent on choices about key model characteristics and assumptions andare subject to various limitations. By their nature, certain of the market risk disclosures areonly estimates and, as a result, actual future gains and losses could differ materially fromthose that have been estimated;
• the continuing impact of the credit crisis relating to structured credit instruments, includingsubprime mortgages, and the related valuation issues associated with such instruments, whichcould result in additional impairments, and the concurrent liquidity problems which havearisen associated with these credit issues;
• general economic conditions in the European Union, in particular in Belgium and TheNetherlands, and in other countries in which we or ABN AMRO have significant businessactivities or investments, including the United States;
• the monetary and interest rate policies of central banks, in particular the Dutch Central Bank,the European Central Bank, the Board of Governors of the U.S. Federal Reserve System, theBank of England, and other G-7 central banks;
vii
Level: 6 – From: 6 – Wednesday, May 14, 2008 – 1:34 pm – g5mac4 – 3960 Intro : 3960 Intro

• changes or volatility in interest rates, foreign exchange rates (including the sterling/U.S.dollar and Euro/U.S. dollar rates), asset prices, equity markets, commodity prices, inflation ordeflation;
• the effects of competition and consolidation in the markets in which we or ABN AMROoperate, which may be influenced by regulation, deregulation or enforcement policies;
• tax consequences of restructuring;
• changes in consumer spending and savings habits, including changes in government policieswhich may influence investment decisions;
• changes in applicable laws, regulations and taxes in jurisdictions in which we and ABNAMRO operate, including the laws and regulations governing the structure of the transactionsdescribed in this Prospectus, as well as actions or decisions by courts and regulators;
• natural and other disasters;
• the inability of Fortis or ABN AMRO to hedge certain risks economically;
• the adequacy of our or ABN AMRO’s impairment provisions and loss reserves;
• technological changes; and
• the success of Fortis and/or ABN AMRO in managing the risks involved in the foregoing.
We caution that these statements are further qualified by the risk factors disclosed in this Prospectusthat could cause actual results to differ materially from those in the forward-looking statements. See “RiskFactors”. Without prejudice to our obligations under Luxembourg law in relation to disclosure and ongoinginformation, we undertake no obligation to update publicly or revise any forward-looking statements,whether as a result of new information, future events or otherwise.
The statements relating to the revenue synergies, costs savings and business growth opportunitiesFortis expects to achieve following the transactions are based on assumptions. However, these expectedrevenue synergies, cost savings and business growth opportunities may not be achieved. There can be noassurance that we will be able to implement successfully the strategic and operational initiatives that areintended.
The prospective financial information included in this Prospectus in the “Information About theAcquisition of ABN AMRO “— Business rationale of the ABN AMRO Acquisition” section below hasbeen prepared by, and is the responsibility of, Fortis’s management. PricewaterhouseCoopers Reviseursd’Entreprises SCCRL and KPMG Accountants N.V. have neither examined nor compiled the prospectivefinancial information and, accordingly, PricewaterhouseCoopers Reviseurs d’Entreprises SCCRL andKPMG Accountants N.V. do not express an opinion or any other form of assurance with respect thereto.The auditors’ reports incorporated by reference in this Prospectus relate to Fortis’s historical consolidatedfinancial information and the separate stand alone financial statements of the Parent Companies. They donot extend to the prospective financial information and should not be read to do so.
This prospective financial information was not prepared with a view to complying with publishedguidelines of the SEC or the guidelines established by the American Institute of Certified PublicAccountants for preparation and presentation of prospective financial information.
Some figures in this Prospectus may not sum due to rounding. Some percentages in this Prospectushave been calculated using unrounded figures.
Parts of this Prospectus contain information regarding European Embedded Value (“EEV”), AnnualPremium Equivalent (“APE”), Value Added by New Business (“VANB”), Present Value of NewBusinesses Premiums (“PVNBP”) and other banking- and insurance- specific measures and other financialinformation that are sometimes used by investors to evaluate the performance of companies in the bankingand insurance sectors. The financial information included in this Prospectus is not intended to comply with
viii
Level: 6 – From: 6 – Wednesday, May 14, 2008 – 1:34 pm – g5mac4 – 3960 Intro : 3960 Intro

SEC or other specific reporting requirements. Compliance with such requirements would require themodification or exclusion of some of these financial measures. EEV, APE, VANB, PVNBP and such otherfinancial information included herein are industry measures and investors should not consider such itemsas alternatives to the applicable GAAP measures.
These alternative financial measures are explained in detail in this Prospectus and investors shouldreview such explanations to understand fully how they have been prepared. In particular, an investorshould not consider EEV, APE, VANB, PVNBP or such other financial information as measures of theFortis Group’s financial performance or liquidity under IFRS or U.S. GAAP or as an alternative to profitfor the period, operating profit or any other performance measures derived in accordance with IFRS orU.S. GAAP.
INCORPORATION OF CERTAIN DOCUMENTS BY REFERENCE
The following documents which have previously been published and have been filed with the CSSFshall be incorporated in, and form part of, this Prospectus:
Consolidated Audited Financial Statements of Fortis for the Financial Years ended December31, 2007, 2006 and 2005
(a) the audited Consolidated Financial Statements of Fortis prepared in accordance with IFRS forthe financial years ended December 31, 2007 and 2006 (the “2007 Consolidated Financial Statements”)including, in particular, the following information set out on the following pages:
Consolidated Balance Sheet . . . . . . . . . . . . . . . . . . . . . . . . . . . . . . . . . . . . . . . . . . . . . . . 10Consolidated Income Statement . . . . . . . . . . . . . . . . . . . . . . . . . . . . . . . . . . . . . . . . . . . . 11Consolidated Statement of Changes in Equity . . . . . . . . . . . . . . . . . . . . . . . . . . . . . . . . . 12Consolidated Cash Flow Statement . . . . . . . . . . . . . . . . . . . . . . . . . . . . . . . . . . . . . . . . . 13General Notes . . . . . . . . . . . . . . . . . . . . . . . . . . . . . . . . . . . . . . . . . . . . . . . . . . . . . . . . . . 15Auditors’ Report . . . . . . . . . . . . . . . . . . . . . . . . . . . . . . . . . . . . . . . . . . . . . . . . . . . . . . . . 270
(b) the audited Consolidated Financial Statements of Fortis prepared in accordance with IFRS forthe financial years ended December 31, 2006 and 2005 including, in particular, the following informationset out on the following pages:
Consolidated Balance Sheet . . . . . . . . . . . . . . . . . . . . . . . . . . . . . . . . . . . . . . . . . . . . . . . 8Consolidated Income Statement . . . . . . . . . . . . . . . . . . . . . . . . . . . . . . . . . . . . . . . . . . . . 9Consolidated Statement of Changes in Equity . . . . . . . . . . . . . . . . . . . . . . . . . . . . . . . . . 10Consolidated Cash Flow Statement . . . . . . . . . . . . . . . . . . . . . . . . . . . . . . . . . . . . . . . . . 11General Notes . . . . . . . . . . . . . . . . . . . . . . . . . . . . . . . . . . . . . . . . . . . . . . . . . . . . . . . . . . 13Auditors’ Report . . . . . . . . . . . . . . . . . . . . . . . . . . . . . . . . . . . . . . . . . . . . . . . . . . . . . . . . 242
(c) the audited Consolidated Financial Statements of Fortis prepared in accordance with IFRS forthe financial year ended December 31, 2005 including, in particular, the following information set out onthe following pages:
Auditors’ Report . . . . . . . . . . . . . . . . . . . . . . . . . . . . . . . . . . . . . . . . . . . . . . . . . . . . . . . . 7Consolidated Balance Sheet . . . . . . . . . . . . . . . . . . . . . . . . . . . . . . . . . . . . . . . . . . . . . . . 8Consolidated Income Statement . . . . . . . . . . . . . . . . . . . . . . . . . . . . . . . . . . . . . . . . . . . . 9Consolidated Statement of Changes in Equity . . . . . . . . . . . . . . . . . . . . . . . . . . . . . . . . . 10Consolidated Cash Flow Statement . . . . . . . . . . . . . . . . . . . . . . . . . . . . . . . . . . . . . . . . . 11Notes . . . . . . . . . . . . . . . . . . . . . . . . . . . . . . . . . . . . . . . . . . . . . . . . . . . . . . . . . . . . . . . . . 12
ix
Level: 6 – From: 6 – Wednesday, May 14, 2008 – 1:34 pm – g5mac4 – 3960 Intro : 3960 Intro

Consolidated Interim Financial Statements of Fortis for the Three Months ended March 31,2008 and 2007
(a) the unaudited Consolidated Interim Financial Statements of Fortis prepared in accordance withIFRS for the three months ended March 31, 2008 and 2007 including, in particular, the followinginformation set out on the following pages:
Consolidated Balance Sheet . . . . . . . . . . . . . . . . . . . . . . . . . . . . . . . . . . . . . . . . . . . . . . . 4Consolidated Income Statement . . . . . . . . . . . . . . . . . . . . . . . . . . . . . . . . . . . . . . . . . . . . 5Consolidated Statement of Changes in Equity . . . . . . . . . . . . . . . . . . . . . . . . . . . . . . . . . 6Consolidated Cash Flow Statement . . . . . . . . . . . . . . . . . . . . . . . . . . . . . . . . . . . . . . . . . 7General Notes . . . . . . . . . . . . . . . . . . . . . . . . . . . . . . . . . . . . . . . . . . . . . . . . . . . . . . . . . . 9Review Report . . . . . . . . . . . . . . . . . . . . . . . . . . . . . . . . . . . . . . . . . . . . . . . . . . . . . . . . . . 78
Financial Statements of Fortis SA/NV for the Financial Years ended December 31, 2007, 2006and 2005
(b) the audited Financial Statements of Fortis SA/NV prepared in accordance with Belgium GAAPfor the financial years ended December 31, 2007 and 2006, which appear in the 2007 Fortis ConsolidatedFinancial Statements, including, in particular, the following information set out on the following pages:
Balance Sheet Before Profit Appropriation . . . . . . . . . . . . . . . . . . . . . . . . . . . . . . . . . . . 281Income Statement . . . . . . . . . . . . . . . . . . . . . . . . . . . . . . . . . . . . . . . . . . . . . . . . . . . . . . . 283Notes . . . . . . . . . . . . . . . . . . . . . . . . . . . . . . . . . . . . . . . . . . . . . . . . . . . . . . . . . . . . . . . . 285Auditor’s Report . . . . . . . . . . . . . . . . . . . . . . . . . . . . . . . . . . . . . . . . . . . . . . . . . . . . . . . . 295
(c) the audited Financial Statements of Fortis SA/NV prepared in accordance with Belgian GAAPfor the financial years ended December 31, 2006 and 2005, which appear in the 2006 ConsolidatedFinancial Statements, including, in particular, the following information set out on the following pages:
Balance Sheet Before Profit Appropriation . . . . . . . . . . . . . . . . . . . . . . . . . . . . . . . . . . . 253Income Statement . . . . . . . . . . . . . . . . . . . . . . . . . . . . . . . . . . . . . . . . . . . . . . . . . . . . . . . 255Notes . . . . . . . . . . . . . . . . . . . . . . . . . . . . . . . . . . . . . . . . . . . . . . . . . . . . . . . . . . . . . . . . 257Auditor’s Report . . . . . . . . . . . . . . . . . . . . . . . . . . . . . . . . . . . . . . . . . . . . . . . . . . . . . . . . 267
(d) the audited Financial Statements of Fortis SA/NV prepared in accordance with Belgian GAAPfor the financial year ended December 31, 2005, which appear in the 2005 Fortis Consolidated FinancialStatements, including, in particular, the following information set out on the following pages:
Balance Sheet Before Profit Appropriation . . . . . . . . . . . . . . . . . . . . . . . . . . . . . . . . . . . 225Income Statement . . . . . . . . . . . . . . . . . . . . . . . . . . . . . . . . . . . . . . . . . . . . . . . . . . . . . . . 227Notes . . . . . . . . . . . . . . . . . . . . . . . . . . . . . . . . . . . . . . . . . . . . . . . . . . . . . . . . . . . . . . . . 229Auditor’s Report . . . . . . . . . . . . . . . . . . . . . . . . . . . . . . . . . . . . . . . . . . . . . . . . . . . . . . . . 239
Financial Statements of Fortis N.V. for the Financial Years ended December 31, 2007, 2006and 2005
(a) the audited Financial Statements of Fortis N.V. prepared in accordance with Dutch GAAP forthe financial years ended December 31, 2007 and 2006, which appear in the 2007 Fortis ConsolidatedFinancial Statements, including, in particular, the following information set out on the following pages:
Balance Sheet Before Profit Appropriation . . . . . . . . . . . . . . . . . . . . . . . . . . . . . . . . . . . 300Income Statement . . . . . . . . . . . . . . . . . . . . . . . . . . . . . . . . . . . . . . . . . . . . . . . . . . . . . . . 301Notes . . . . . . . . . . . . . . . . . . . . . . . . . . . . . . . . . . . . . . . . . . . . . . . . . . . . . . . . . . . . . . . . 302Auditor’s Report . . . . . . . . . . . . . . . . . . . . . . . . . . . . . . . . . . . . . . . . . . . . . . . . . . . . . . . . 308
x
Level: 6 – From: 6 – Wednesday, May 14, 2008 – 1:34 pm – g5mac4 – 3960 Intro : 3960 Intro

(b) the audited Financial Statements of Fortis N.V. prepared in accordance with Dutch GAAP forthe financial years ended December 31, 2006 and 2005, which appear in the 2006 Consolidated FinancialStatements, including, in particular, the following information set out on the following pages:
Balance Sheet Before Profit Appropriation . . . . . . . . . . . . . . . . . . . . . . . . . . . . . . . . . . . 272Income Statement . . . . . . . . . . . . . . . . . . . . . . . . . . . . . . . . . . . . . . . . . . . . . . . . . . . . . . . 273Notes . . . . . . . . . . . . . . . . . . . . . . . . . . . . . . . . . . . . . . . . . . . . . . . . . . . . . . . . . . . . . . . . 274Auditor’s Report . . . . . . . . . . . . . . . . . . . . . . . . . . . . . . . . . . . . . . . . . . . . . . . . . . . . . . . . 279
(c) the audited Financial Statements of Fortis N.V. prepared in accordance with Dutch GAAP forthe financial year ended December 31, 2005, which appear in the 2005 Fortis Consolidated FinancialStatements, including, in particular, the following information set out on the following pages:
Balance Sheet Before Profit Appropriation . . . . . . . . . . . . . . . . . . . . . . . . . . . . . . . . . . . 244Income Statement . . . . . . . . . . . . . . . . . . . . . . . . . . . . . . . . . . . . . . . . . . . . . . . . . . . . . . . 245Notes . . . . . . . . . . . . . . . . . . . . . . . . . . . . . . . . . . . . . . . . . . . . . . . . . . . . . . . . . . . . . . . . 246Auditor’s Report . . . . . . . . . . . . . . . . . . . . . . . . . . . . . . . . . . . . . . . . . . . . . . . . . . . . . . . . 252
Financial Statements of Fortis Hybrid Financing for the Financial Years ended December 31,2007 and 2006
(a) the audited Financial Statements of Fortis Hybrid Financing prepared in accordance withLuxembourg legal and regulatory requirements for the financial year ended December 31, 2007 including,in particular, the following information set out on the following pages:
Auditor’s Report . . . . . . . . . . . . . . . . . . . . . . . . . . . . . . . . . . . . . . . . . . . . . . . . . . . . . . . . 1Balance Sheet . . . . . . . . . . . . . . . . . . . . . . . . . . . . . . . . . . . . . . . . . . . . . . . . . . . . . . . . . . 3Profit and Loss Account . . . . . . . . . . . . . . . . . . . . . . . . . . . . . . . . . . . . . . . . . . . . . . . . . . 4Notes . . . . . . . . . . . . . . . . . . . . . . . . . . . . . . . . . . . . . . . . . . . . . . . . . . . . . . . . . . . . . . . . . 5
(b) the audited Financial Statements of Fortis Hybrid Financing prepared in accordance withLuxembourg legal and regulatory requirements for the financial year ended December 31, 2006 including,in particular, the following information set out on the following pages:
Auditor’s Report . . . . . . . . . . . . . . . . . . . . . . . . . . . . . . . . . . . . . . . . . . . . . . . . . . . . . . . . 1Balance Sheet . . . . . . . . . . . . . . . . . . . . . . . . . . . . . . . . . . . . . . . . . . . . . . . . . . . . . . . . . . 3Profit and Loss Account . . . . . . . . . . . . . . . . . . . . . . . . . . . . . . . . . . . . . . . . . . . . . . . . . . 4Notes . . . . . . . . . . . . . . . . . . . . . . . . . . . . . . . . . . . . . . . . . . . . . . . . . . . . . . . . . . . . . . . . . 5
Any other information not listed above but contained in such documents is incorporated byreference for information purposes only.
Copies of the documents incorporated by reference in this Prospectus can be obtained from theprincipal executive offices of each Parent Company (Fortis SA/NV, Rue Royale 20, 1000 Brussels,Belgium; Fortis N.V., Archimedeslaan 6, 3584 BA Utrecht, The Netherlands) and from the offices of FortisHybrid Financing at 65, boulevard Grande Duchesse Charlotte, L-1331 Luxembourg. Copies of thefinancial statements for Fortis and for each of the Parent Companies are also available from Fortis’swebsite at www.fortis.com/Shareholders/annualreports.asp and from the specified office of the payingagents in Luxembourg and in The Netherlands.
Except as provided above, no other information or documents included on Fortis’s website are orshall be incorporated by reference in this Prospectus.
This Prospectus and the documents incorporated by reference will be available for viewing atwww.bourse.lu upon approval of this Prospectus by the Luxembourg Stock Exchange. Fortis can becontacted by telephone on +31(0) 30 226 6222.
xi
Level: 6 – From: 6 – Wednesday, May 14, 2008 – 1:34 pm – g5mac4 – 3960 Intro : 3960 Intro

SUMMARY
This summary must be read as an introduction to this Prospectus. Any decision, by any investor,to invest in any Securities should be based on a consideration of this Prospectus as a whole, includingthe documents incorporated by reference. Following the implementation of the relevant provisions of theProspectus Directive in each EEA Member State, no civil liability will attach to the Issuer or the ParentCompanies as guarantors in any such Member State solely on the basis of this summary, including anytranslation thereof, unless it is misleading, inaccurate or inconsistent when read together with the otherparts of this Prospectus. Where a claim relating to information contained in this Prospectus is broughtbefore a court in an EEA Member State, the plaintiff may, under the national legislation of the EEAMember State where the claim is brought, be required to bear the costs of translating this Prospectusbefore the legal proceedings are initiated.
Fortis Hybrid Financing
Fortis Hybrid Financing is a special purpose financing vehicle incorporated under the laws ofLuxembourg in the form of a limited liability company (société anonyme) and registered with theLuxembourg Register of Commerce and Companies with registration number B-116671. The registeredoffice of Fortis Hybrid Financing is located at 65, boulevard Grande Duchesse Charlotte, L-1331Luxembourg, Luxembourg.
Fortis Hybrid Financing is part of the Fortis Group. Its articles of incorporation restrict itsactivities to issuing securities ranking pari passu among themselves, qualifying as solvency capital forFortis SA/NV, Fortis N.V. and the other companies in the Fortis Group, and to investing the proceedsthereof in instruments (other than ordinary share capital) issued by any of the Fortis operating companiesthat qualify as solvency capital for such Group entity.
Fortis Group
Fortis Group was created in 1990 when the activities of AG Group (the predecessor of FortisSA/NV), a large Belgian insurer, and AMEV/VSB (the predecessor of Fortis N.V.) combined theirrespective operations. AMEV, a large Dutch insurer, and VSB, a medium-sized Dutch savings bank,merged earlier that year. The Parent Companies have remained separate legal entities. Since the merger,the operating businesses of Fortis have been managed together.
Overview
Fortis is an international provider of financial services to personal, business and institutionalcustomers through its own distribution channels and via intermediaries and other partners.
In its home market, the Benelux countries, Fortis occupies a leading position in each of itsprincipal business segments, banking and insurance. Fortis’s retail banking operations are a marketleader in the Benelux region — one of Europe’s wealthiest regions. Building on that leadership, Fortishas developed an integrated, European-wide network to serve its international client base. The sameexpertise it has developed in its home market is used to provide high net worth individuals, enterprisesand entrepreneurs with advanced financial services tailored to their specific needs. Fortis also operatesworldwide in selected activities, such as fund administration, trade finance, shipping finance, export andproject finance and global markets.
With total assets of EUR 871 billion and total equity of EUR 34 billion at December 31, 2007,Fortis ranks among the 20 largest financial institutions in Europe based on market capitalization.1 Withits sound solvency position, broad risk spread and the extensive expertise of its approximately 62,000employees (full time equivalents) as of December 31, 2007 (approximately 62,500 at March 31, 2008),Fortis combines an international presence with local flexibility to provide strong support to its customers.
1
Level: 6 – From: 6 – Wednesday, May 14, 2008 – 1:34 pm – g5mac4 – 3960 Section 01 : 3960 Section 01
1 Source: Bloomberg December 31, 2007.

As at December 31, 2007, Fortis core equity2 was EUR 26,063 million and total capital3 was EUR 27,999million (at March 31, 2008, respectively EUR 25,984 million and EUR 27,751 million)1, which exceededthe minimum regulatory total capital solvency requirements of Fortis (EUR 25,725 million at December31, 2007 and EUR 26,782 million at March 31, 2008).3
Recent Developments
Relationship with Ping An Insurance (Group) Company of China
On November 28, 2007, Fortis entered into a Memorandum of Understanding (the “MoU”) withPing An Insurance (Group) Company of China Ltd., which had, through a subsidiary, taken a stake ofapproximately 4.18% in Fortis. As a result, Ping An is now the single largest shareholder of Fortis andadheres to the Fortis Governance Statement.
Ping An Asset Management Agreement
On April 2, 2008, Ping An and Fortis signed an agreement that formalized the establishment of aglobal asset management partnership between the two companies. Under the agreement, Ping An agreed toacquire a 50% equity stake in Fortis Investments for EUR 2.15 billion. The partnership is expected toallow Ping An to advance its strategy to establish a global asset management business and a QualifiedDomestic Institutional Investor platform, while Fortis is expected to benefit from enhanced access to thegrowing economies of China and Asia, which would allow Fortis to accelerate the development of itsbusiness in the region.
ABN AMRO Acquisition
On October 17, 2007, Fortis, RBS and Santander (collectively, the “Consortium Banks”)completed, through RFS Holdings B.V. (“RFS” or “RFS Holdings”), a company jointly owned by theConsortium Banks, the acquisition of ABN AMRO (the “ABN AMRO Acquisition”). The considerationpaid by RFS Holdings in the aggregate amounted to approximately EUR 71.1 billion (EUR 73 billion on afully diluted basis). For each ABN AMRO ordinary share tendered, RFS Holdings paid:
• EUR 35.60 in cash, without interest; and
• 0.296 newly issued RBS ordinary shares, nominal value £0.25 per share.
RFS is controlled by RBS. RFS is currently in the process of implementing an orderly separation ofthe business units of ABN AMRO through a Consortium and Shareholders’ Agreement which governs therelationship among the Consortium Banks and RFS with respect to the ABN AMRO Acquisition and thetransfer of the ABN AMRO Businesses (as defined below). As a result of the ABN AMRO Acquisition,Fortis acquired the ABN AMRO Businesses for a consideration of EUR 24.0 billion, representing 33.8%of the total consideration payable in the ABN AMRO Acquisition.
To finance its acquisition of the ABN AMRO Businesses, Fortis raised EUR 13 billion of newequity financing via a rights issue (the “Rights Offer”). Fortis financed and intends to finance itsremaining portion of the ABN AMRO Acquisition consideration as follows:
• EUR 2 billion from the issue on July 11, 2007 of Conditional Capital Exchangeable Notesexchanged into Mandatory Convertible Securities on December 7, 2007;
• EUR 3 billion from the issuance of Tier 1 capital instruments consisting of EUR 3 billionprincipal amount of Convertible and Subordinated Hybrid Equity-linked Securities(CASHES); and
2
Level: 6 – From: 6 – Wednesday, May 14, 2008 – 1:34 pm – g5mac4 – 3960 Section 01 : 3960 Section 01
2 Fortis core equity includes equity capital and reserves and required deductions from core equity. See also “Operating and FinancialReview and Prospects — Liquidity and Capital Resources — Group Solvency” regarding solvency.
3 Total capital includes, in accordance with Basel I, equity capital, reserves and supplementary capital elements and required deductionsfrom total capital. See also “Operating and Financial Review and Prospects — Liquidity and Capital Resources — Group Solvency”regarding solvency.

• EUR 6.5 to 8.0 billion from the proceeds of a combination of (i) the sale of specific non-coreassets (approximately EUR 2.5 billion); (ii) sale of shared assets of the Consortium(approximately EUR 2.0 billion); and (iii) securitization and other similar transactions(approximately EUR 2.0 billion).
In this respect, Fortis announced on July 12, 2007 that EUR 1.6 billion (sale price) of such anamount had been raised, representing a capital relief of EUR 1.2 billion due to the decrease in the riskweighted assets, by divesting various assets and shareholdings in European financial institutions. Thisamount included the proceeds (EUR 980 million) from the sale by Fortis, announced on July 11, 2007, ofits share in the joint venture CaiFor to its Spanish partner “la Caixa”. This transaction closed on November13, 2007. In addition, Fortis raised additional amounts when it sold its stakes in Banco ComercialPortuguês and ICBC in September and December 2007.
As a result of the completion of the ABN AMRO Acquisition, Fortis holds shares in RFS Holdingsthat equal its proportionate funding commitment (33.8%) for the ABN AMRO Acquisition considerationand the capital and income rights of shares issued to each of the Consortium Banks are linked to the netassets and income of the respective ABN AMRO businesses that each of them will acquire following thereorganization of ABN AMRO. Following the reorganization, Fortis will acquire:
• the ABN AMRO Business Unit Netherlands (excluding the former Dutch wholesale clients,Interbank, DMC Consumer Finance, as well as certain assets including Hollandsche BankUnie N.V. proposed to be divested by Fortis following the acquisition of the ABN AMROBusinesses as described further in this summary and in the cautionary statement at thebeginning of the “Information About the Acquisition of ABN AMRO” section of theProspectus),
• the ABN AMRO Business Unit Private Clients globally,
• the ABN AMRO Business Unit Asset Management globally, and
• the ABN AMRO brand name (collectively, the “ABN AMRO Businesses”).
3
Level: 6 – From: 6 – Wednesday, May 14, 2008 – 1:34 pm – g5mac4 – 3960 Section 01 : 3960 Section 01

Summary Selected Financial Data
The following summary selected consolidated income statement and balance sheet data of Fortis,prepared in accordance with International Financial Reporting Standards (IFRS), is extracted from the2007 Consolidated Financial Statements and the Fortis Consolidated Interim Financial Statements for thethree months ended March 31, 2008, incorporated by reference in this Prospectus.
Summary Consolidated income statement
Three Months EndedMarch 31, Year Ended December 31,
11112123441112 23332111121111211112
2008 2007 2007 2006 200511112 11112 11112 11112 11112
(unaudited)(EUR million)
IncomeInterest income . . . . . . . . . . . . . . . . . 25,517 20,852 94,869 72,583 66,845Insurance premiums . . . . . . . . . . . . . . 4,499 4,258 14,934 13,984 12,919Realized capital gains (losses) on
investments . . . . . . . . . . . . . . . . . . 421 399 2,133 1,137 1,642Other realized and unrealized gains
and losses . . . . . . . . . . . . . . . . . . . . 508 391 1,176 1,362 878Fee and commission income . . . . . . . 1,076 1,024 4,400 3,734 3,124
Total income . . . . . . . . . . . . . . . . . 30,698 27,813 120,457 96,541 90,419Expenses
Interest expense . . . . . . . . . . . . . . . . . (23,607) (19,042) (87,354) (65,121) (60,227)Insurance claims and benefits . . . . . . (4,119) (3,849) (14,075) (13,151) (11,788)Changes in impairments . . . . . . . . . . (524) (32) (3,042) (194) (235)Fee and commission expense . . . . . . (653) (564) (2,344) (1,922) (1,615)Staff expenses . . . . . . . . . . . . . . . . . . (1,267) (1,165) (4,980) (4,485) (4,291)Other expenses . . . . . . . . . . . . . . . . . . (811) (832) (3,798) (3,336) (2,856)
Total expenses . . . . . . . . . . . . . . . . (29,541) (26,487) (117,631) (91,159) (85,269)Profit before taxation . . . . . . . . . . . 1,157 1,326 (2,826) 5,382 5,150
Income tax expense . . . . . . . . . . . . . . (324) (149) 235 (1,030) (1,164)Net profit for the period . . . . . . . . . 833 1,177 3,061 4,352 3,986
4
Level: 6 – From: 6 – Wednesday, May 14, 2008 – 1:34 pm – g5mac4 – 3960 Section 01 : 3960 Section 01

Summary Consolidated balance sheet (before appropriation of profit)
At March 31, At December 31,11112123441112 23332111121111211112
2008 2007 2007 2006 200511112 11112 11112 11112 11112
(unaudited)(EUR million)
AssetCash and cash equivalents . . . . . . . . . 21,946 26,371 26,360 20,413 21,822Assets held for trading . . . . . . . . . . . . 96,234 88,426 74,800 70,215 62,705Due from banks . . . . . . . . . . . . . . . . . 143,876 118,982 119,036 90,131 81,002Due from customers . . . . . . . . . . . . . 333,621 312,644 316,308 286,459 280,759Total investments . . . . . . . . . . . . . . . . 192,939 196,505 206,280 202,434 193,069
Total assets . . . . . . . . . . . . . . . . . . . 927,771 862,141 871,179 775,229 728,994Liabilities
Liabilities held for trading . . . . . . . . . 112,202 87,606 89,589 64,308 50,562Due to banks . . . . . . . . . . . . . . . . . . . 209,840 208,675 192,431 177,481 175,183Due to customers . . . . . . . . . . . . . . . . 274,253 266,298 262,298 254,225 252,603Liabilities arising from insurance and
investment contracts . . . . . . . . . . . 66,635 61,881 64,732 59,764 56,109Debt certificates . . . . . . . . . . . . . . . . . 101,852 102,155 102,073 95,719 83,727Subordinated liabilities . . . . . . . . . . . 22,539 15,821 21,925 15,375 13,757Other borrowings . . . . . . . . . . . . . . . . 1,737 2,149 3,018 2,149 1,699
Total liabilities . . . . . . . . . . . . . . . . 895,798 839,671 836,985 753,678 709,338Shareholders’ equity . . . . . . . . . . . . . 30,833 21,563 33,047 20,644 18,929Minority interests . . . . . . . . . . . . . . . . 1,140 907 1,147 907 727
11112 11112 11112 11112 11112
Total equity . . . . . . . . . . . . . . . . . . . . . . 31,973 22,470 34,194 21,551 19,65611112 11112 11112 11112 11112
Total liabilities and equity . . . . . . . 927,771 862,141 871,179 775,229 728,99411112 11112 11112 11112 1111211112 11112 11112 11112 11112
5
Level: 6 – From: 6 – Wednesday, May 14, 2008 – 1:34 pm – g5mac4 – 3960 Section 01 : 3960 Section 01

Other Financial Data
At March 31, At December 31,11112123441112 23332111121111211112
2008 2007 2007 2006 200511112 11112 11112 11112 11112
(unaudited)
Statistical dataGroup ratios
Return on total equity(1) . . . . . . . . . . . 13.9% 20.3% 14.9% 22.0% 20.4%Return on assets(2) . . . . . . . . . . . . . . . . 0.4% 0.5% 0.5% 0.6% 0.5%Average equity to average assets(3) . . . 3.0% 2.5% 3.3% 2.6% 2.6%
Banking dataTier 1 ratio(4) . . . . . . . . . . . . . . . . . . . . 10.5% 6.5% 9.5% 7.1% 7.4%Total capital ratio(4) . . . . . . . . . . . . . . . 11.0% 10.5% 10.1% 11.1% 10.5%Cost income ratio(5) . . . . . . . . . . . . . . 53.7% 61.1% 62.4% 61.2% 62.3%
Insurance dataEmbedded Value (EUR million)(6) . . . N.A. N.A. 12,411 12,307 10,623Claims ratio(7) . . . . . . . . . . . . . . . . . . . 65.4% 69.2% 67.4% 61.2% 61.3%Combined ratio(8) . . . . . . . . . . . . . . . . 96.7% 101.1% 100.1% 96.1% 96.0%
(1) The net profit for the financial year as a percentage of the average total equity during that period.
(2) The net profit for the financial year as a percentage of the average assets during that period.
(3) Average equity as a percentage of average assets.
(4) Ratio of March 31, 2008 is in accordance with Basel II.
(5) Only used for banks. The ratio of Total expenses to Total income where the “Interest expense” and the “Fee and commission expense”are netted in calculating Total income for this ratio.
(6) Embedded Value is an estimate of the economic value of a life company, excluding any value attributed to future new business. See“Glossary” and “Operating and Financial Review and Prospects — Insurance — European Embedded Value”.
(7) The claims ratio is the cost of claims, net of reinsurance, as a percentage of the net earned premiums, excluding the internal costs ofhandling non-life claims.
(8) Combined ratio: The sum of the claims ratio and the expense ratio for the non-life insurance business. Expense ratio: Only used fornon-life insurance business. Expenses as a percentage of the earned premiums, net of reinsurance. Expenses are the costs plus netcommissions charged to the financial year, less internal investment costs.
For a discussion of the important trends affecting Fortis’s results of operations, see “Operating andFinancial Review and Prospects — Overview”.
6
Level: 6 – From: 6 – Wednesday, May 14, 2008 – 1:34 pm – g5mac4 – 3960 Section 01 : 3960 Section 01

Terms of the Securities
Issuer: Fortis Hybrid Financing
Guarantors: The Securities will have the benefit of a support agreement andsubordinated guarantee entered into by Fortis Hybrid Financing’sultimate parent companies, Fortis SA/NV and Fortis N.V. (the“Parent Companies”). The guarantee agreement will constitutedirect, unsecured and subordinated obligations of each ParentCompany.
“Fortis Group” refers to Fortis SA/NV, Fortis N.V. and the groupof companies controlled or owned by them, including FortisHybrid Financing.
Issue: Euro Denominated Perpetual Securities (“Securities”)
Issue Date: On or about May 30, 2008. The Issue Date will be notified to theCSSF and published on or about the Pricing Date on the websiteof the Luxembourg Stock Exchange (www.bourse.lu) and in theEuronext Daily Official List (“Officiële Prijscourant”) ofEuronext.
Issue Price: 100%
Coupon: The Coupon rate is expected to be between 8.00% and 8.25% perannum. The Coupon shall be determined on the Pricing Datefollowing the end of the public offer period as described herein.The Coupon will be notified to the CSSF and published on orabout the Pricing Date on the website of the Luxembourg StockExchange (www.bourse.lu) and in the Euronext Daily Official List(“Officiële Prijscourant”) of Euronext.
Coupon Payment: Coupons on the Securities will be payable annually in arrear on orabout May 30 of each year (a “Regular Coupon Date”)beginning on or about May 30, 2009.
If and to the extent that a Trigger Event has occurred and iscontinuing or would occur on a Regular Coupon Date, includingafter giving effect to any coupon on the Securities otherwisepayable on such Regular Coupon Date or otherwise, the couponson the Securities will be payable on the Alternative CouponSatisfaction Date and Fortis Hybrid Financing will give anAlternative Coupon Notice. If Fortis Hybrid Financing has givenan Alternative Coupon Notice with respect to an ElectiveAlternative Coupon and subsequent to delivery of such notice andprior to the Regular Coupon Date, a Trigger Event has occurredand is continuing or would occur on such Regular Coupon Date,such coupon shall be deemed an Exceptional Alternative Coupon.
If no Trigger Event has occurred or is continuing, Fortis HybridFinancing may give an Alternative Coupon Notice with respect tothe next succeeding Regular Coupon Date, in which case a fullcoupon will be payable on such Regular Coupon Date using theAlternative Coupon Payment Method, subject to a PostponementEvent; provided that (x) if such Regular Coupon Date is not aSupported Coupon Date and (y) no Trigger Event has occurred oris continuing on such date, Fortis Hybrid Financing shall be
7
Level: 6 – From: 6 – Wednesday, May 14, 2008 – 1:34 pm – g5mac4 – 3960 Section 01 : 3960 Section 01

obligated to use the Alternative Coupon Payment Method to paythe coupon due on such Regular Coupon Date (the “MandatedElection”).
Coupons that are paid using the Alternative Coupon PaymentMethod due to the occurrence of a Trigger Event are referred toherein as “Exceptional Alternative Coupons”. Coupons that arepaid using the Alternative Coupon Payment Method in thecircumstances described in the immediately preceding paragraphare referred to herein as “Elective Alternative Coupons”.
“Trigger Event” means (i) the sum of Fortis Group assets are lessthan the sum of its liabilities on a consolidated basis, excludingliabilities not considered Senior Debt; (ii) there has occurred abreach of the solvency requirements set forth in the Belgian RoyalDecree dated November 21, 2005 relating to the consolidatedsupervision of financial conglomerates, as determined inaccordance with a calculation method approved by the BFIC, tothe extent such breach is caused by a consolidated loss of theParent Companies as reflected in their last quarterly financialstatements, unless the BFIC exempts Fortis Group from treatingsuch breach as a Trigger Event (each of (i) and (ii), a “CapitalDeficiency Event”); or (iii) there has occurred a breach of thesolvency requirements set forth in the Belgian Royal Decree datedNovember 21, 2005 relating to the consolidated supervision offinancial conglomerates, as determined in accordance with acalculation method approved by the BFIC, unless the BFICexempts Fortis Group from treating such breach as a TriggerEvent.
“Senior Debt” means all liabilities of the Parent Companies(including those in respect of bonds, notes and debentures),whether senior or subordinated, other than liabilities of the ParentCompanies which rank pari passu with or junior to theSubordinated Guarantee or the Securities.
Loss Absorption: In the event of the occurrence of a Capital Deficiency Event, theboards of directors of the Parent Companies will convene anextraordinary shareholders’ meeting to be held during the threemonths following the occurrence of such Capital Deficiency Eventin order to propose a share capital increase or any other measureregarded as necessary or useful to remedy such event. If a sharecapital increase or any such other proposed measure is not adoptedby the extraordinary shareholders’ meetings of the ParentCompanies or if the share capital increase is not sufficientlysubscribed to remedy such Capital Deficiency Event in full, or ifsuch Capital Deficiency Event remains in effect for six monthsfollowing the occurrence of such event, the boards of directors ofthe Parent Companies will implement and cause Fortis HybridFinancing to implement, within ten days following the date that issix months following the occurrence of such event, a proportionatereduction of the amount of the Current Principal Amount of eachSecurity (a “Loss Absorption”) necessary in order to remedy theCapital Deficiency Event to the fullest extent possible.Notwithstanding anything to the contrary, the nominal value of
8
Level: 6 – From: 6 – Wednesday, May 14, 2008 – 1:34 pm – g5mac4 – 3960 Section 01 : 3960 Section 01

any Security shall never be reduced to an amount lower than oneEuro cent (€0.01).
The amount by which the aggregate Current Principal Amount ofthe Securities is reduced to enable the Parent Companies to absorblosses in order to ensure the continuity of their activities, will bethe lower of (i) the amount by which the applicable regulatorysolvency requirements exceed the solvency capital of the ParentCompanies at the time of the Capital Deficiency Event and (ii) theaggregate amount of the Current Principal Amount of theSecurities before such reduction.
Outstanding Alternative Coupons will not be written down butmay only be paid using the Alternative Coupon Payment Method.In the event of Loss Absorption, coupons will continue to accrueon the Current Principal Amount of the Securities but may only bepaid using the Alternative Coupon Payment Method for as long asa Trigger Event exists.
For the avoidance of doubt, the first remedy to the CapitalDeficiency Event will be the share capital increase or theimplementation of any other measures adopted by theextraordinary shareholders’ meetings of the Parent Companies toremedy such Capital Deficiency Event. To the extent such increaseof share capital or other measures are not sufficient, the LossAbsorption will be applied against the Current Principal Amountof the Securities as herein described.
In the event that other Parity Securities (as defined below) whichwould be subject to such principal reductions are outstanding,such reduction will be applied on a pro-rata basis among theSecurities and such other Parity Securities.
“Current Principal Amount” of any Security means the principalamount of each Security outstanding at any time calculated on thebasis of the Original Principal Amount of each Security as suchamount may be proportionately reduced pursuant to theapplication of the Loss Absorption mechanism and/or reinstatedon one or more occasions.
“Original Principal Amount” of any Security means the initialdenomination of €1,000 principal amount per Security.
Reinstatement: If, following a Loss Absorption, the Parent Companies haverecorded positive Consolidated Profit for at least two consecutivefiscal years (a “Return to Profitability”) following the end of themost recent fiscal year in which there was a Loss Absorption, theParent Companies may cause Fortis Hybrid Financing to increase,and in such case Fortis Hybrid Financing shall increase, theCurrent Principal Amount of each Security (a “Reinstatement”)on any date and in an amount that they determine (either up to theOriginal Principal Amount or up to any other amount lower thanthe Original Principal Amount, but in each case proportionate tothe denomination held by each holder), subject to any necessaryregulatory approval. Irrespective of whether a Return toProfitability has occurred, the Parent Companies shall cause FortisHybrid Financing to increase, and Fortis Hybrid Financing shall
9
Level: 6 – From: 6 – Wednesday, May 14, 2008 – 1:34 pm – g5mac4 – 3960 Section 01 : 3960 Section 01

increase, the aggregate Current Principal Amount of the Securitiesin an amount equal to the Mandatory Reinstatement Amount onthe date of a Mandatory Reinstatement Event.
For the avoidance of doubt, following a Reinstatement theaggregate Current Principal Amount of the Securities may neverbe greater than the aggregate Original Principal Amount of theSecurities.
In the event that other Parity Securities are outstanding and mayalso benefit from a reinstatement or an increase of their currentprincipal amount in accordance with their terms, anyReinstatement will be applied on a pro rata basis with otherreinstatements or increases of the principal amount made in suchother Parity Securities.
“Consolidated Profit” means the consolidated profit (excludingdistributions to minority interests) of Fortis Group, as calculatedand set out in the audited annual consolidated financial statementsof Fortis Group.
“Mandatory Reinstatement Amount” means the lesser of (i) thedifference between the aggregate Original Principal Amount of theSecurities and the aggregate Current Principal Amount of theSecurities, and (ii) the positive Consolidated Profit of Fortis Groupas set out in its latest audited annual Consolidated FinancialStatements. Additionally, for the purpose of a Reinstatementpursuant to clause (ii) of the definition of “MandatoryReinstatement Event”, the Mandatory Reinstatement Amountwill be computed so that the Securities will be reinstated by anincrease in aggregate principal amount which is proportionate tothe largest increase in principal amount of such Parity Securities.
“Mandatory Reinstatement Event” means (i) a RestrictedPayment or (ii) the increase by the Parent Companies or FortisHybrid Financing of the principal amount of any Parity Securitiesother than the Securities, the terms of which contain a provisionfor the reinstatement of their principal amount similar to that ofthe Securities.
In the event of a judicial or voluntary liquidation (liquidationjudiciaire ou volontaire/gerechtelijke of vrijwillige vereffening) orbankruptcy (faillite/faillissement) of a Parent Company or FortisHybrid Financing, the Parent Companies or Fortis HybridFinancing shall cause a Reinstatement, as necessary, in an amountup to the Original Principal Amount of the Securities, subject toany necessary regulatory approval.
The rights of holders of Securities in the event of such liquidationor bankruptcy will be calculated on the basis of (i) the OriginalPrincipal Amount of the Securities they hold, plus (ii) an amountequal to unpaid coupons, if any, thereon with respect to the currentCoupon Period accrued on a daily basis through the date of thedecision of the court or the shareholders’ meeting relating to theliquidation or of the decision of the court relating to thebankruptcy, as the case may be, plus (iii) an amount equal tounpaid Alternative Coupons, if any; provided that the amount of
Reinstatement upon Liquidation or Bankruptcy:
10
Level: 6 – From: 6 – Wednesday, May 14, 2008 – 1:34 pm – g5mac4 – 3960 Section 01 : 3960 Section 01

any claim related to such Alternative Coupons (whether againstFortis Hybrid Financing or the Parent Companies) may not exceedan amount equal to 25% of the Original Principal Amount of theSecurities. No payments will be made to the holders of Securitiesbefore all amounts due, but unpaid, to all other senior andsubordinated creditors of the liquidated or bankrupt entity havebeen paid by the Parent Companies or Fortis Hybrid Financing.
Dividend Stopper: Fortis Hybrid Financing will agree, and the Parent Companies willagree in the Support Agreement, that, in the case of anyExceptional Alternative Coupon, beginning on the day FortisHybrid Financing gives an Alternative Coupon Notice, and in thecase of any Elective Alternative Coupon, beginning on the relevantRegular Coupon Date relating to such coupon if the ElectiveAlternative Coupon is not paid on such Regular Coupon Date, andin each case continuing until all Alternative Coupons are paid infull, (A) each of Fortis Hybrid Financing and the ParentCompanies (i) will not propose to its shareholders and, to thefullest extent permitted by applicable law, will otherwise act toprevent the declaration or payment of any dividend, distribution orother payment on its Ordinary Shares or Parity Securities and (ii)will not redeem, repurchase or otherwise acquire any of itsOrdinary Shares or Parity Securities (other than pursuant to aPermitted Share Acquisition) and (B) each of the ParentCompanies (i) will not declare or pay, and to the fullest extentpermitted by applicable law, will otherwise act to prevent thedeclaration or payment of, any dividend, distribution or otherpayment on its Ordinary Shares or Parity Securities and (ii) agreesthat it will not vote, or will cause that no vote is made by any ofits subsidiaries, in favor of any of the actions of Fortis HybridFinancing described in clauses (A) (i) and (ii) above; provided thatthe foregoing restriction shall not apply (i) to a dividend,distribution, payment or redemption in respect of any ExemptShare Class (as defined below) and (ii) to a dividend, distributionor other payment on any Parity Securities that is required to bepaid, pursuant to the terms of such Parity Securities, solely as aresult of a dividend, distribution, payment or redemption in respectof any Exempt Share Class.
Supported Coupons: If during the Relevant Period Fortis Hybrid Financing or eitherParent Company (A) declares any dividend or makes anydistribution or other payment on any Ordinary Shares or ParitySecurities or (B) redeems, repurchases or otherwise acquires anyOrdinary Shares or Parity Securities (other than pursuant to aPermitted Share Acquisition) (the foregoing events (A) and (B)each referred to as a “Restricted Payment”) the ParentCompanies will, subject to the terms of the Support Agreement,jointly and severally contribute or cause to be contributed to thecapital of Fortis Hybrid Financing or otherwise make availablesuch funds as may be necessary to permit Fortis Hybrid Financingto pay in full the coupon payable on each Regular Coupon Dateoccurring during the Relevant Period (a “Supported Coupon”),each such date a “Supported Coupon Date”; provided that if aTrigger Event shall have occurred prior to such Regular CouponDate and is continuing on such Regular Coupon Date, the
11
Level: 6 – From: 6 – Wednesday, May 14, 2008 – 1:34 pm – g5mac4 – 3960 Section 01 : 3960 Section 01

Supported Coupon Date shall be such date as provided for inclause (i) of the definition of Alternative Coupon SatisfactionDate. Fortis Hybrid Financing will be permitted, but shall not berequired, to satisfy its obligation to pay the coupon payable on aSupported Coupon Date in accordance with the AlternativeCoupon Payment Method; provided, however, that if a TriggerEvent has occurred and is continuing on such Supported CouponDate, Fortis Hybrid Financing will be required to satisfy itsobligation to pay such coupon payable on a Supported CouponDate in accordance with the Alternative Coupon Payment Method.
“Relevant Period” means one year.
Exempt Share Class: The currently authorized number of 1,820 million cumulativepreference shares in the capital of Fortis N.V. or any successorthereto of €0.42 each (an “Exempt Share Class”) shall be exemptfrom the dividend stopper and Supported Coupon provisions to theextent described above.
The Parent Companies will agree not to authorize unilaterally orto propose to their shareholders that they authorize any additionalpreference shares, other than Replacement Preference Shares,unless such additional preference shares are subject to thedividend stopper and Supported Coupon provisions describedabove. “Replacement Preference Shares” means any preferenceshares to be created or issued by either Parent Company inconnection with the merger, consolidation, amalgamation or othercombination of an entity with and into such Parent Company inwhich such Parent Company is the surviving entity, for thepurpose of replacing preference shares issued or authorized bysuch other entity at the time of the transaction.
SPV Parity Securities: “SPV Parity Securities” means any preferred or preference sharesor profit-sharing certificates (parts bénéficiaires) of Fortis HybridFinancing and any securities which rank or are expressly stated torank pari passu with the Securities (collectively, “SPV ParityShares”) or any securities which are expressly stated to rankjunior to the Securities (“SPV Junior Securities”). For theavoidance of doubt, the Perpetual Securities issued by FortisHybrid Financing on February 27, 2008 and June 20, 2006 areSPV Parity Shares. Fortis Hybrid Financing will covenant in theIndenture not to issue any guarantees of any debt securities of anyPerson.
Parent Company Parity Securities: “Parent Company Parity Securities” means (i) any preferred orpreference shares and any securities of either Parent Companywhich rank or are expressly stated to rank pari passu with theSecurities, SPV Parity Shares or the Subordinated Guarantee(“Parent Company Parity Shares”) or any securities of eitherParent Company which rank or are expressly stated to rank juniorto the Securities, SPV Parity Shares or the SubordinatedGuarantee (“Parent Company Junior Securities”), (ii)guarantees by either or both Parent Companies (whether throughan agreement or instrument labeled as a guarantee, as a supportagreement, or with some other name but with an effect similar to aguarantee or support agreement) of any preferred securities or
12
Level: 6 – From: 6 – Wednesday, May 14, 2008 – 1:35 pm – g5mac4 – 3960 Section 01 : 3960 Section 01

preferred or preference shares issued by any of either ParentCompany’s subsidiaries (including Fortis Hybrid Financing),which guarantees rank or are expressly stated to rank pari passuwith the Securities or SPV Parity Shares or rank pari passu withParent Company Parity Shares (“Parent Company ParityGuarantees”) or which guarantees rank or are expressly stated torank junior to the Securities or SPV Parity Shares or rank junior toParent Company Parity Shares (“Parent Company JuniorGuarantees”) and (iii) securities issued by any subsidiary ofeither Parent Company (including Fortis Hybrid Financing) thatare guaranteed under any Parent Company Parity Guarantee orParent Company Junior Guarantee. For the avoidance of doubt, the(i) undated Floating Rate Equity-linked Subordinated Hybrid(FRESH) Capital Securities issued by Fortfinlux S.A. on May 7,2002, (ii) Mandatory Convertible Securities (MCS) issued byFortis Bank Nederland (Holding) N.V. , Fortis Bank nv-sa, FortisSA/NV and Fortis N.V. on December 7, 2007 and (iii) ConvertibleAnd Subordinated Hybrid Equity-linked Securities (CASHES)issued by Fortis Bank nv-sa on December 19, 2007 are ParentCompany Parity Securities.
Parent Company Parity Securities and SPV Parity Securities arecollectively referred to as “Parity Securities”, Parent CompanyParity Shares and SPV Parity Shares are collectively referred to as“Parity Shares” and Parent Company Junior Securities and SPVJunior Securities are collectively referred to as “JuniorSecurities”.
SPV Ordinary Shares: SPV Ordinary Shares means ordinary shares of Fortis HybridFinancing. “Parent Company Ordinary Shares” means ordinaryshares of either of the Parent Companies or any ordinary shareequivalent that may replace or be substituted for the ordinaryshares of either or both Parent Companies. SPV Ordinary Sharesand Parent Company Ordinary Shares are referred to collectivelyas “Ordinary Shares”.
Alternative Coupon Payment Method: Fortis Hybrid Financing will be required to satisfy its obligation topay any Alternative Coupon on the Alternative CouponSatisfaction Date relating to such coupon (the “AlternativeCoupon Payment Method”).
In respect of any coupon which Fortis Hybrid Financing will payusing the Alternative Coupon Payment Method, Fortis HybridFinancing shall give notice (an “Alternative Coupon Notice”) tothe Trustee, any paying agent, any Calculation Agent and theholders that Fortis Hybrid Financing will satisfy the ElectiveAlternative Coupon or Exceptional Alternative Coupon(collectively, an “Alternative Coupon”) payable on the applicableRegular Coupon Date using the Alternative Coupon PaymentMethod.
In respect of an Elective Alternative Coupon, except in the case ofa Mandated Election, Fortis Hybrid Financing may give anAlternative Coupon Notice in its sole discretion and for anyreason. Alternative Coupons are mandatorily payable with the
13
Level: 6 – From: 6 – Wednesday, May 14, 2008 – 1:35 pm – g5mac4 – 3960 Section 01 : 3960 Section 01

Alternative Coupon Payment Method and shall be payable on theAlternative Coupon Satisfaction Date.
The Trustee will contribute the Alternative Coupons to the capitalof the Parent Companies in exchange for issue by the ParentCompanies of Fortis Shares having an aggregate fair market valueequal to the aggregate amount of Alternative Coupons that will bepayable on such Alternative Coupon Satisfaction Date. TheTrustee will collect any sales proceeds and use them towards thepayment of Alternative Coupons.
The payment of Exceptional Alternative Coupons on anAlternative Coupon Satisfaction Date will be in full satisfaction ofFortis Hybrid Financing’s obligation to pay such ExceptionalAlternative Coupons, without regard to whether the net salesproceeds ultimately delivered to the holders of the Securities areequal to the amount of the Exceptional Alternative Couponspayable on such Alternative Coupon Satisfaction Date. For theavoidance of doubt, Exceptional Alternative Coupons includecoupons for which an Alternative Coupon Notice has beendelivered regarding an Elective Alternative Coupon but wheresubsequent to the delivery of such notice and prior to the RegularCoupon Date a Trigger Event shall occur and be continuing.
If the net sales proceeds from the sale of Fortis Shares availablefor distribution to holders of the Securities are less than the fullamount of the Alternative Coupon, holders of Securities will bepaid ratably in any distribution of such proceeds, in proportion tothe full amount of the Alternative Coupon on such holder’sSecurities.
In connection with the payment of Elective Alternative Couponson an Alternative Coupon Satisfaction Date, if the net salesproceeds from the sale of Fortis Shares are insufficient to pay thefull amount of the coupon, then Fortis Hybrid Financing shallmake such additional payments as shall be necessary to ensure thecoupon is paid in full and, in the case of any coupon payable on aSupported Coupon Date, if Fortis Hybrid Financing is unable tomake such payments the Parent Companies shall make suchadditional payments in accordance with the support agreement.
“Fortis Share” means a unit comprising one ordinary share in thecapital of Fortis N.V. twinned with one ordinary share in thecapital of Fortis SA/NV, or any successor ordinary share issued byeither Parent Company.
“Alternative Coupon Satisfaction Date” shall be a date, subjectto a Postponement Event, which is (i) in the case of anExceptional Alternative Coupon or a Supported Coupon where aTrigger Event occurs, or has occurred and is continuing, on theapplicable Regular Coupon Date, the later of 90 business daysfollowing the date on which such Trigger Event first occurred orthe next Regular Coupon Date following the date on which suchTrigger Event first occurred; provided that Fortis HybridFinancing shall use its best efforts to satisfy an ExceptionalAlternative Coupon within 30 calendar days following the firstRegular Coupon Date after such Trigger Event first occurred, or
14
Level: 6 – From: 6 – Wednesday, May 14, 2008 – 1:35 pm – g5mac4 – 3960 Section 01 : 3960 Section 01

(ii) in the case of an Elective Alternative Coupon or a SupportedCoupon with respect to which Fortis Hybrid Financing elects touse the Alternative Coupon Payment Method, the relevant RegularCoupon Date.
Postponement Event: Any Alternative Coupon shall be payable on an AlternativeCoupon Satisfaction Date. However, if any Postponement Eventshall occur, Fortis Hybrid Financing’s obligation to make paymentusing the Alternative Coupon Payment Method shall be deferreduntil a Postponement Event is no longer continuing.
“Postponement Event” shall mean:
• a Market Disruption Event exists on or after the 15thbusiness day preceding any Alternative Coupon SatisfactionDate,
• if, notwithstanding the actions by the Parent Companies, theavailable Ordinary Shares of either Parent Company are notsufficient to raise any amount of the Alternative Couponsthat would otherwise be payable on an Alternative CouponSatisfaction Date, a Postponement Event will occur withrespect to the Alternative Coupon Satisfaction Date withrespect to any such unpaid amount until such time as theshareholders of the Parent Companies approve resolutionsauthorizing the issuance of sufficient ordinary shares,
• the Parent Companies are subject to a “blackout” periodwhich, under applicable securities laws or Parent Companypolicies then in place, would not permit the ParentCompanies to issue Fortis Shares until the release ofinformation which has resulted in the commencement ofsuch blackout period or such blackout period has otherwiseterminated, or
• as a result of any covenant, undertaking, guarantee or othersimilar provision in any Senior and SubordinatedIndebtedness and/or Parity Securities (other than JuniorSecurities and Junior Guarantees), either Fortis HybridFinancing or the Parent Companies would not be permittedto pay any Alternative Coupon because Fortis HybridFinancing or the Parent Companies has not satisfied itsobligations under such Senior and SubordinatedIndebtedness and/or Parity Securities (other than JuniorSecurities and Junior Guarantees), as the case may be.
General concursus creditorum: General concursus creditorum means with respect to (i) FortisHybrid Financing, any concursus creditorum (concours decréanciers) on the entire assets of Fortis Hybrid Financing,including bankruptcy (faillite), moratorium (concordat judiciaire),suspension of payment (sursis de paiement), controlledmanagement (gestion contrôlée) and judicial or voluntaryliquidation (liquidation judiciaire ou volontaire), (ii) FortisSA/NV, any concursus creditorum (concours decréanciers/samenloop van schuldeisers) on the entire assets ofFortis SA/NV, including bankruptcy (faillite/faillissement),moratorium (concordat judiciaire/gerechtelijk akkoord) and
15
Level: 6 – From: 6 – Wednesday, May 14, 2008 – 1:35 pm – g5mac4 – 3960 Section 01 : 3960 Section 01

judicial or voluntary dissolution and liquidation (dissolution etliquidation judiciaire ou volontaire/gerechtelijke of vrijwilligeontbinding en vereffening), except in the latter case for corporatereorganizations involving a voluntary dissolution withoutliquidation (dissolution volontaire sans liquidation/vrijwilligeontbinding zonder vereffening) as referred to in Articles 671-676of the Belgian Code of Companies and (iii) Fortis N.V.,bankruptcy (faillissement), moratorium of payments (surséancevan betaling) or dissolution (ontbinding).
Optional Redemption: The Securities are not redeemable at the option of the holdersthereof at any time and are not redeemable at the option of FortisHybrid Financing prior to the First Call Date, except in certaincircumstances upon the occurrence of a Tax Event or a Tier 1Disqualification Event. Following the First Call Date, FortisHybrid Financing may redeem the Securities, in whole or in part,on any Regular Coupon Date at the Base Redemption Price.
The redemption price for such redemptions will be (i) 100% of theOriginal Principal Amount of the Securities, plus (ii) an amountequal to unpaid coupons, if any, thereon with respect to the then-current Coupon Period accrued on a daily basis through the datefixed for redemption, plus (iii) an amount equal to unpaidAlternative Coupons, if any (the “Base Redemption Price”).
Any optional redemption of Securities is subject to compliancewith applicable regulatory requirements, including the priorapproval of the BFIC. In any event, no redemption of Securitieswill be permitted if, (i) before or after giving effect to suchredemption a Trigger Event has occurred and is continuing orwould occur, or (ii) a Loss Absorption has occurred and theSecurities have not yet been reinstated in full, unless the BFICapproves a redemption in such circumstances at 100% of theOriginal Principal Amount of the Securities.
“First Call Date” means May 30, 2013 or such other date thatwill be the fifth anniversary of the Issue Date.
Tax Event: Upon the occurrence of a Tax Event, Fortis Hybrid Financing willhave the right at any time to redeem the Securities in whole (andnot in part) at the Base Redemption Price.
“Tax Event” means the receipt by Fortis Hybrid Financing of anopinion of a nationally recognized law firm or other tax adviser(which may be an accounting firm) in Luxembourg experienced insuch matters to the effect that, as a result of (i) any amendment to,clarification of, or change (including any announced prospectivechange) in, the laws or treaties (or any regulations thereunder) ofLuxembourg or any political subdivision or taxing authoritythereof or therein affecting taxation, (ii) any Administrative Actionor (iii) any amendment to, clarification of, or change in the officialposition on the interpretation of any Administrative Action or anyinterpretation or pronouncement that provides for a position withrespect to any Administrative Action that differs from thetheretofore generally accepted position, in each case, by anylegislative body, court, governmental authority or regulatory body,irrespective of the manner in which such amendment, clarification,
16
Level: 6 – From: 6 – Wednesday, May 14, 2008 – 1:35 pm – g5mac4 – 3960 Section 01 : 3960 Section 01

change, interpretation or pronouncement is made known, whichamendment, clarification or change is effective or whichinterpretation or pronouncement is announced on or after the IssueDate of the Securities there is more than an insubstantial risk that(A) Fortis Hybrid Financing is or will be required to pay anyAdditional Amounts or (B) any interest deduction or other similardirect or indirect tax benefit available to Fortis Hybrid Financingunder Luxembourg law in respect of the Current Principal Amountof the Securities is eliminated, reduced or otherwise adverselyaffected in any material respect.
Tier 1 Disqualification Event: Upon the occurrence of a Tier 1 Disqualification Event, FortisHybrid Financing will have the right at any time to redeem theSecurities in whole (and not in part) at the Base Redemption Price.
“Tier 1 Disqualification Event” means the receipt by either ofthe Parent Companies of an opinion, declaration, rule or decree ofthe BFIC to the effect that there has been a change in (i) the lawor regulation or (ii) the interpretation thereof, resulting in morethan an insubstantial risk that the Securities (or any portionthereof) will not be eligible to be included in calculating the Tier 1capital of Fortis Group.
Any redemption of Securities upon the occurrence of a Tax Eventor a Tier 1 Disqualification Event is subject to compliance withapplicable regulatory requirements, including the prior approval ofthe BFIC. In any event, no redemption of Securities will bepermitted if and to the extent that, (i) before or after giving effectto such redemption a Trigger Event has occurred and is continuingor would occur, or (ii) a Loss Absorption has occurred and theSecurities have not yet been reinstated in full, unless the BFICapproves a redemption in such circumstances at 100% of theOriginal Principal Amount of the Securities.
Additional Amounts: All payments in respect of the Securities will be made free andclear of and without withholding or deduction for or on account ofany present or future taxes, duties, or other governmental chargesof whatever nature imposed or levied by or on behalf ofLuxembourg or any political subdivision thereof or any authorityor agency therein or thereof having the power to tax (“RelevantTax”), unless the withholding or deduction is required by law. If atany time Fortis Hybrid Financing is required to withhold or deductany Relevant Tax with respect to any payments on the Securities,Fortis Hybrid Financing will be required to pay such additionalamounts (“Additional Amounts”) as shall be required so that thenet amount received by each holder of Securities after thewithholding or deduction of any such Relevant Tax will not be lessthan the amount then due and payable to each holder of Securitiesin the absence of such withholding or deduction.
Subordination of the Securities: The Securities, as obligations of Fortis Hybrid Financing, arecontractually subordinated to Senior and SubordinatedIndebtedness of Fortis Hybrid Financing. The payment obligationsof Fortis Hybrid Financing under the Securities constituteunsecured subordinated obligations of Fortis Hybrid Financing.
17
Level: 6 – From: 6 – Wednesday, May 14, 2008 – 1:35 pm – g5mac4 – 3960 Section 01 : 3960 Section 01

The claims of the holders of the Securities for payment by FortisHybrid Financing under the Securities will rank:
(i) behind (junior to) the claims of holders of Senior andSubordinated Indebtedness;
(ii) pari passu with claims of holders of Other Pari passuClaims; and
(iii) before (senior to) (x) the claims for payment of anyobligation that, expressly or by applicable law, issubordinated to the Securities and (y) the claims of holdersof SPV Ordinary Shares.
The debt evidenced by the Securities is subordinated in right ofpayment, to the extent and in the manner provided in theIndenture, to the prior payment of all existing and future Seniorand Subordinated Indebtedness. The subordination provisions arefor the benefit of and enforceable by the holders of Senior andSubordinated Indebtedness of Fortis Hybrid Financing.
The Parent Companies will give an unconditional and irrevocableSubordinated Guarantee for the due payment of the BaseRedemption Price payable when the Securities become payable inaccordance with their terms in the event of a judicial or voluntaryliquidation or bankruptcy of Fortis Hybrid Financing.
“Senior and Subordinated Indebtedness” means all liabilities ofFortis Hybrid Financing (including those in respect of bonds,notes and debentures (whether senior or subordinated)), other thanliabilities of Fortis Hybrid Financing under the Securities or SPVParity Securities.
“Other Pari passu Claims” means claims of creditors of FortisHybrid Financing which are subordinated so as to rank pari passuwith claims in respect of the Securities.
Limitation on Remedies: A “Remedies Event” occurs if (1) Fortis Hybrid Financing fails topay any Alternative Coupons due and payable on the AlternativeCoupon Satisfaction Date with respect thereto and such failurecontinues for a period of 30 days; or (2) Fortis Hybrid Financingfails to pay any Supported Coupons due and payable on theSupported Coupon Date with respect thereto and such failurecontinues for a period of 30 days.
Consequences of a Remedies Event
If a Remedies Event occurs and is continuing under the Indenture,the Trustee or the holders of at least 25% in aggregate CurrentPrincipal Amount then outstanding, by written notice to FortisHybrid Financing (and to the Trustee if the notice is given by theholders), may, and the Trustee at the request of such holders shall(provided that the Trustee is secured and/or indemnified to itssatisfaction), institute proceedings to obtain the payment of theamounts due or compliance with the defaulted covenant oragreement or to obtain the bankruptcy of Fortis Hybrid Financing(or any analogous proceeding which may be available from timeto time under the laws of Luxembourg). Neither the Trustee nor
18
Level: 6 – From: 6 – Wednesday, May 14, 2008 – 1:35 pm – g5mac4 – 3960 Section 01 : 3960 Section 01

the holders may declare the principal amount of the Securities dueand payable. No remedy against Fortis Hybrid Financing, otherthan the institution of the proceedings referred to above orresulting in the liquidation of Fortis Hybrid Financing, shall beavailable to the holders of the Securities in respect of anyRemedies Event except as otherwise provided in the SubordinatedGuarantee.
Further Issues: Additional securities may from time to time, without the consentof the holders of the Securities, be created and issued with thesame terms and conditions as the Securities in all respects (or inall respects save for the first payment of interest thereon) so thatsuch further issue shall be consolidated and form a single serieswith the respective Securities.
Support Agreement: The Parent Companies will, in accordance with the terms of theSupport Agreement, agree to make certain capital contributions inconnection with Supported Coupons and payment of AdditionalAmounts. In addition, each Parent Company will make certainundertakings regarding dividend payments and Loss Absorption.
Subordinated Guarantee: The Parent Companies will jointly and severally guarantee certainobligations of Fortis Hybrid Financing, including payment of theBase Redemption Price if such payment is due and Fortis HybridFinancing is in bankruptcy or liquidation.
Governing Law of the Securities: State of New York, except the subordination and meetings ofshareholders provisions, which will be governed by the laws ofLuxembourg.
Public Offer
The Securities will be offered by certain banks, financial intermediaries and other authorizedentities to the public in certain jurisdictions in Switzerland and in the European Economic Area, includingAustria, Belgium, France, Germany, Ireland, Italy, Luxembourg, Portugal, Spain, The Netherlands, theUnited Kingdom and the Principality of Liechtenstein during a period ending no later than 5:00 p.m. CETon or about May 23, 2008. Such offers shall not commence until all requirements necessary to any suchoffer to be made in accordance with all applicable laws, rules and regulations in such jurisdiction. (See“Terms and Conditions of the Public Offer”).
Risk Factors
Prior to making an investment decision, prospective investors should read carefully the mattersdiscussed under “Risk Factors”. Such risk factors include:
Risks relating to Our Business
• As part of the financial services industry, we face substantial competitive pressures whichcould adversely affect our results of operations.
• Market conditions and volatility can adversely affect our results, including losses resultingfrom continuing impairments on structured credit instruments.
• Securities market volatility or downturns can adversely affect our banking, asset managementand insurance activities.
• Volatility in interest rates may adversely affect our insurance, banking and asset managementbusinesses.
19
Level: 6 – From: 6 – Wednesday, May 14, 2008 – 1:35 pm – g5mac4 – 3960 Section 01 : 3960 Section 01

• Asset illiquidity can adversely affect our business.
• Our risk management methods may leave us exposed to unidentified, unanticipated orincorrectly quantified risks, which could lead to material losses or material increases inliabilities.
• While we manage our operational risks, these risks remain an inherent part of all of ourbusinesses.
• Our insurance business is subject to risks concerning the adequacy of our technicalprovisions to cover future losses and benefits.
• We have significant counterparty risk exposure.
• Catastrophic events, terrorist attacks and other acts of war could have a negative impact onour business and results.
• Our results of operations can be adversely affected by significant adverse regulatorydevelopments, including changes in tax laws.
• Our business is sensitive to changes in governmental policies and international economicconditions that could limit our operating flexibility and reduce our profitability.
• Litigation or other proceedings or actions may adversely affect our business, financialcondition and results of operations.
Risks relating to our Acquisition of the ABN AMRO Businesses
• The uncertainties about the effects of the ABN AMRO Acquisition could materially andadversely affect the businesses and operations of ABN AMRO to be acquired by Fortis.
• We may fail to realize the anticipated business growth opportunities, synergies and otherbenefits anticipated from the ABN AMRO Acquisition and our results of operations, financialcondition and the price of our ordinary shares may suffer.
• The complex nature of the reorganization plan and the level of cooperation required amongthe Consortium Banks could have adverse consequences on the transaction and our ability torealize benefits therefrom.
• Compliance with conditions and obligations imposed in connection with regulatory approvalsin connection with the ABN AMRO Acquisition could adversely affect Fortis businesses andthe ABN AMRO Businesses.
• We conducted only a limited due diligence review of ABN AMRO in making the ABNAMRO Acquisition and, only since December 2007 have we obtained access to additionalinformation, and therefore Fortis may become subject to unknown liabilities of ABN AMRO,in particular, with respect to the ABN AMRO Businesses, which may have an adverse effecton Fortis’s financial condition and results of operations.
• Consummation of the ABN AMRO Acquisition may result in adverse tax consequencesresulting from a change of ownership of ABN AMRO.
• Change of control provisions in ABN AMRO’s agreements may be triggered upon thecompletion of the ABN AMRO Acquisition, upon RFS Holdings’ acquisition of 100% ofABN AMRO or upon the completion of the reorganization, and may lead to adverseconsequences for Fortis, including the loss of significant contractual rights and benefits, thetermination of joint venture and/or licensing agreements or the requirement to repayoutstanding indebtedness.
20
Level: 6 – From: 6 – Wednesday, May 14, 2008 – 1:35 pm – g5mac4 – 3960 Section 01 : 3960 Section 01

• Fortis will incur substantial transaction and offer-related costs in connection with the ABNAMRO Acquisition.
• You may not be able to effectively compare our future financial statements to our, or ABNAMRO’s, historical financial statements or those of ABN AMRO.
Risks relating to the Securities
• Holders of Securities may not receive full payment of coupons.
• In the event of Loss Absorption the principal amount of the Securities will be written downand coupons will be reduced or, if the principal amount is fully written down, coupons couldstop. If Loss Absorption should occur there is no assurance that the principal amount of theSecurities will be written back up although the principal amount will be reinstated in theevent of a judicial or voluntary liquidation or bankruptcy of a Parent Company or FortisHybrid Financing.
• Fortis Hybrid Financing may redeem the Securities (i) at any time upon the occurrence of aTax Event or a Tier 1 Disqualification Event or (ii) on the First Call Date or on any RegularCoupon Date thereafter.
• Holders of Securities have no voting rights.
• As Securities will be issued in global form, holders of Securities have no direct relationshipwith Fortis Hybrid Financing or with the Parent Companies.
• There has been no prior public market for the Securities.
• The Securities are undated securities.
• Holders of Securities are exposed to risks associated with fixed rate securities. Movements ofthe market interest rate can adversely affect the price of the Securities and lead to losses upona sale.
Risks related to Fortis Hybrid Financing
• Fortis Hybrid Financing is a special purpose vehicle with no operations of its own. Theprimary credit protection for investors derives from the Support Agreement and SubordinatedGuarantee from the Parent Companies, it being understood that all obligations of the ParentCompanies under the Subordinated Guarantee are deeply subordinated. In addition, FortisHybrid Financing may onlend the proceeds of the offering of Securities to any of Fortis’soperating companies as solvency capital. As a result, Fortis Hybrid Financing’s ability tomeet its obligations will be largely dependent on the financial condition of the operatingcompanies who receive the proceeds of the offering.
Risks relating to the Parent Companies
• Security holders’ rights under the Support Agreement and Subordinated Guarantee arelimited.
• The ability of the Parent Companies to make payments under the Support Agreement and theSubordinated Guarantee depends primarily on the earnings of their subsidiaries and theirability to distribute such earnings to the Parent Companies; these subsidiaries are highlyregulated and such regulations could impose restrictions on such distributions.
Risks relating to Fortis Hybrid Financing and the Parent Companies
• Fortis Hybrid Financing and the Parent Companies may issue additional debt.
• Regulatory authorities have oversight powers over the Fortis Group.
21
Level: 6 – From: 6 – Wednesday, May 14, 2008 – 1:35 pm – g5mac4 – 3960 Section 01 : 3960 Section 01

RISK FACTORS
Any investment in the Securities involves risks, including those described in this section. You shouldcarefully consider the following risks and the other information in this Prospectus before deciding whetheran investment in the Securities is suitable for you. If any of the following risks actually occur, the tradingprice of the Securities could decline and you could lose all or part of your investment. Additional risks notcurrently known to Fortis or Fortis Hybrid Financing or that Fortis or Fortis Hybrid Financing now deemsimmaterial may also harm Fortis or Fortis Hybrid Financing and affect your investment.
Risk Factors Relating to our Business
As part of the financial services industry, we face substantial competitive pressures which could
adversely affect our results of operations.
There is substantial competition in the Benelux and the other regions in which we do business forthe types of insurance, banking and asset management, and other products and services we provide(including the ABN AMRO Businesses we acquired). Such competition is most pronounced in our coreBenelux markets where we face competition from companies such as ING Group, Aegon N.V., Rabobank,KBC Bank N.V. and Dexia. As a result, our strategy is to maintain customer loyalty and retention, whichcan be influenced by a number of factors, including service levels, the prices and attributes of products andservices, financial strength and claims-paying ratings and actions taken by competitors. If we are unable tocompete with attractive product and service offerings that are profitable, we may lose market share orincur losses on some or all of our activities and/or those of the ABN AMRO Businesses.
Competition in the financial services industry is affected by a high level of consolidation, both at anational and an international level, in the markets in which we operate, as well as by the emergence ofalternative distribution channels for many of the products we offer. Consumer demand, technologicalchanges, regulatory actions and other factors also affect competition in our industry. In other internationalmarkets, we face competition from the leading domestic and international institutions active in the relevantnational and international markets. Competitive pressures could result in increased pricing pressures on anumber of our products and services, particularly as competitors seek to win market share, and may harmour ability (including with respect to the ABN AMRO Businesses we acquired) to maintain or increaseprofitability.
Market conditions and volatility can adversely affect our results, including losses resulting from
continuing impairments on structured credit instruments.
Each of our business segments (including the ABN AMRO Businesses we acquired) is affected bychanging general market conditions, which can cause our results to fluctuate from year to year, as well ason a long-term basis. The financial performance of the ABN AMRO Businesses that we have acquired canalso be affected by changes in general economic conditions and other business conditions. Theseconditions include economic cycles such as insurance industry cycles, particularly with respect to non-lifeinsurance, financial market cycles, including volatile movements in market prices for securities, andbanking industry cycles. The non-life insurance industry cycles are characterized by periods of pricecompetition, fluctuations in underwriting results and the occurrence of unpredictable weather-related andother losses. Fluctuations in interest rates and exchange rates, monetary policy, consumer and businessspending, demographics and changes with respect to mortality, particularly with respect to life insurance,and competitive and other factors also influence our performance. As a result of changing marketconditions, and the influence of financial and industry cycles, our results of operations are subject tovolatility that may be outside our control. In particular, the profits of most of our merchant banking,securities trading and brokerage activities before taxation may vary significantly from year to yeardepending on market conditions. Since July 2007, market conditions have been significantly more volatilethan in previous periods and there can be no assurance as to the effect of this volatility, particularly if it isprolonged, on the profits of most of our merchant banking, securities trading and brokerage activitiesbefore taxation.
22
Level: 6 – From: 6 – Wednesday, May 14, 2008 – 1:35 pm – g5mac4 – 3960 Section 02 : 3960 Section 02Level: 6 – From: 6 – Wednesday, May 14, 2008 – 1:35 pm – g5mac4 – 3960 Section 02 : 3960 Section 02

As has been well publicized recently, credit markets and subprime residential mortgage markets,particularly in the U.S. but also worldwide, have experienced severe dislocations and liquidity disruptions.Subprime mortgage loans have experienced increased rates of delinquency, foreclosure and impairmentssince 2007. These and other related events have had a significant impact on the capital markets associatednot only with subprime mortgage backed securities, asset backed securities and collateralized debtobligations, but also with credit and financial markets as a whole. These events have also adverselyaffected monoline insurers and other market participants, resulting in a risk for the monoline insurers ofratings downgrades. If the monoline insurers’ and other market participants’ credit ratings weaken, theweaker credit of such entities may affect the values of hedges and other transactions with them ascounterparties and result in write downs of the values of the assets represented by such instruments. As aresult, financial institutions world-wide have been operating, and continue to operate, in a difficultenvironment characterized by liquidity constraints and increased short-term funding costs. If suchcircumstances were further to deteriorate or continue for protracted periods of time, this could have anegative impact on the results of our banking business and our profitability as a whole.
Although we do not have any direct mortgage financing activities in the U.S., we are exposed to theU.S. subprime mortgage market through our ownership of mortgage backed securities, asset backedsecurities and collateralized debt obligations. As these securities and obligations are accounted for on a fairvalue basis, it is necessary to mark-to-market such securities and obligations. The valuation of suchsecurities and obligations has, particularly in recent months, become increasingly complex and subject tosignificant uncertainty in light of the illiquidity of certain of the underlying obligations, with financialinstitutions applying different valuation models to reflect both actual and perceived underlying risk profilesof such securities or obligations when market prices are not available. Valuations may vary significantlyaccording to the particular valuation models and assumptions applied to holdings of such securities andobligations. Such valuation models and assumptions may need to be changed to reflect more currentinformation relating to the underlying risk profiles of those holdings, possibly resulting in significant writedowns in the value attributed to those holdings with a consequent impact on the balance sheet and incomestatements of such institutions. Since Fortis holds portfolios of mortgage backed securities, asset backedsecurities and collateralized debt obligations, it is accordingly subject to these uncertainties in relation tothe value attributable to those holdings and it is possible that significant write downs in the values(resulting in unrealized losses) attributed to those holdings may be necessary from time to time to reflectany adverse developments in the risk profile of those assets. In addition, the values of many of the otherinstruments we hold and invest in are sensitive to dislocations and disruptions in the credit markets (suchas leveraged loans) and the valuing of certain of those instruments has become both more uncertain andmore difficult due to volatility and lack of liquidity. In addition, as more hedge funds, monoline insurers,banks and other institutions are negatively affected by these market disruptions, our merchant banking,securities trading and brokerage activities may be further affected.
Securities market volatility or downturns can adversely affect our banking, asset management and
insurance activities.
Market volatility and overall declines in market indices can negatively affect our merchant banking,securities trading, brokerage, asset management and insurance activities. Volatility and declines in marketindices can reduce unrealized gains in our various portfolios, the excess solvency margin of our insurancesubsidiaries or the demand for some of our banking, asset management or insurance products. We wereaffected by such declines during the stock market declines in 2000-2002, which adversely impactedinvestments in, and sales of products linked to, financial assets, particularly equity securities during thisperiod. During this period net operating profit and solvency levels were materially adversely impacted bydeclines in equity values which affected our operating profit and group equity. Since 2003, financialmarkets, and equity markets in particular, have recovered and improved significantly, particularly in 2005,which improvement had a material positive effect on various of our businesses. Since July of 2007,however, both the credit and the equity markets have been very volatile. There is no assurance that suchvolatility will not result in a prolonged market decline, or such market declines for other reasons will notoccur in the future. Such market declines, if they did occur, could have a material adverse effect on ourfinancial condition and results of operations. Market downturns and high volatility can occur not only as a
23
Level: 6 – From: 6 – Wednesday, May 14, 2008 – 1:35 pm – g5mac4 – 3960 Section 02 : 3960 Section 02

result of purely economic factors, but also as a result of war, acts of terrorism, natural disasters or othersimilar events outside our control.
Volatility in interest rates may adversely affect our insurance, banking and asset management
businesses.
Fluctuations in interest rates affect the returns we earn on fixed interest investments. Interest ratechanges also affect the market values of, and the amounts of capital gains or losses we take on, the fixedinterest securities we hold. These fluctuations and changes affect our net interest income and recognizedgains and losses on securities held in our investment portfolios.
While we reduce the impact of interest rate fluctuations on our life insurance business bytransferring interest rate exposure to some policyholders through product design, our insurance businesscan be adversely affected by sustained low interest rates as well as certain interest rate movements. Inparticular, the profitability of spread-based insurance products depends in large part upon the ability tomanage interest rate spreads and the credit and other risks inherent in the investment portfolio. In addition,certain of our traditional life insurance products provide for guaranteed returns. Although the impact ofsuch guarantees on results of operations will be spread out over a period of years in a sustained lowinterest rate environment, such guarantees may also affect profitability. There can be no assurance that wewill be able to successfully manage interest rate spreads or the potential negative impact of risksassociated with sustained low rates or interest rate changes.
The results of our banking operations (including the banking operations we acquired as part of theABN AMRO Businesses) are affected by our management of interest rate sensitivity. Interest ratesensitivity refers to the relationship between changes in market interest rates and changes in net interestincome. The composition of our banking assets and liabilities, and any gap position resulting from thecomposition, causes our banking operations’ net interest income to vary with changes in interest rates. Inaddition, variations in interest rate sensitivity may exist within the repricing periods or between thedifferent currencies in which we hold interest rate positions. A mismatch of interest-earning assets andinterest-bearing liabilities in any given period may, in the event of changes in interest rates, have a materialeffect on the financial condition or results of operations of our banking businesses (including the bankingoperations we acquired as part of the ABN AMRO Businesses).
Asset illiquidity can adversely affect our business.
Liquidity risk is inherent in much of our business, including the ABN AMRO Businesses. Eachasset purchased and liability sold has liquidity characteristics that are unique. Some liabilities aresurrenderable while some assets, such as privately placed loans, mortgage loans, real estate and limitedpartnership interests, have low liquidity. Additionally, protracted market declines can reduce the liquidityof markets that are typically liquid. If, in the course of our banking, insurance or other activities, werequire significant amounts of cash on short notice in excess of anticipated cash requirements, we mayhave difficulty selling these investments at attractive prices, in a timely manner, or both.
Any downgrade in our ratings may increase our borrowing costs, limit our access to capital marketsand adversely affect our ability to sell or market our products, engage in business transactions –particularly longer term and derivatives transactions – and retain our current customers. This, in turn, couldreduce our liquidity and have an adverse effect on our operating results and financial condition.
Our risk management methods may leave us exposed to unidentified, unanticipated or incorrectly
quantified risks, which could lead to material losses or material increases in liabilities.
We devote significant resources to developing risk management policies, procedures and assessmentmethods for our banking, insurance and asset management businesses. We use a sophisticated value-at-risk(VaR) model, duration analysis and sensitivity analysis as well as other risk assessment methods.Nonetheless, our risk management techniques and strategies, including those of the ABN AMRObusinesses, may not be fully effective in mitigating our risk exposure in all economic market environmentsor against all types of risk, including risks that we fail to identify or anticipate. Some of our qualitative
24
Level: 6 – From: 6 – Wednesday, May 14, 2008 – 1:35 pm – g5mac4 – 3960 Section 02 : 3960 Section 02

tools and metrics for managing risk are based upon use of observed historical market behavior. We applystatistical and other tools to these observations to arrive at quantifications of risk exposures. These toolsand metrics may fail to predict future risk exposures. Our losses thus could be significantly greater thanour measures would indicate. In addition, our quantified modeling does not take all risks into account. Ourmore qualitative approach to managing risks takes into account a broader set of risks, but is less precisethan quantified modeling and could prove insufficient. Unanticipated or incorrectly quantified riskexposures could result in material losses in our insurance, banking and asset management businesses.
While we manage our operational risks, these risks remain an inherent part of all of our businesses.
The operational risks that our business, including the ABN AMRO Businesses, face include thepossibility of inadequate or failed internal or external processes or systems, human error, regulatorybreaches, employee misconduct or external events such as fraud. These events can potentially result infinancial loss as well as harm to our reputation. Additionally, the loss of key personnel could adverselyaffect our operations and results.
Our business, including the ABN AMRO Businesses, inherently generates operational risks. Thesebusinesses are dependent on processing a large number of complex transactions across numerous anddiverse products, and is subject to a number of different legal and regulatory regimes. Additionally,because of the long-term nature of much of these businesses, accurate records have to be maintained forsignificant periods.
We attempt to keep operational risks at appropriate levels by maintaining a sound and wellcontrolled environment in light of the characteristics of our business, the markets and the regulatoryenvironments in which we operate. While these control measures mitigate operational risks they do noteliminate them.
Our insurance business is subject to risks concerning the adequacy of our technical provisions to cover
future losses and benefits.
Our technical provisions may prove to be inadequate to cover our actual losses and benefitsexperience. For example, we derive our life and health insurance reserves from actuarial practices andassumptions, including an assessment of mortality and morbidity rates. If the actual future mortality andmorbidity rates deviate from those we have projected, our insurance reserves could be inadequate. Otherassumptions that influence insurance reserves relate to long-term development of interest rates, guaranteedreturn levels, investment returns, policyholder bonus rates, policyholder lapses and future expense levels.Additionally, some of our insurance products are affected by certain unpredictable events, includingcatastrophic events. For example, some weather-related events could result in substantial costs to us.
To the extent that technical provisions are insufficient to cover our actual insurance losses, lossadjustment expenses or future policy benefits, we would have to add to these technical provisions andincur a charge to our earnings. Additional losses, including losses arising from changes in the legalenvironment, the type or magnitude of which we cannot foresee, may emerge in the future. Anyinsufficiencies in technical provisions for future claims could have a material adverse effect on ourconsolidated financial condition, results of operations and cash flows.
We have significant counterparty risk exposure and exposure to systemic risks.
Our business, including the ABN AMRO Businesses, are subject to general credit risks, includingcredit risks of borrowers and other counter parties, as well as credit risks of our reinsurers. Third partiesthat owe us money, securities or other assets may not pay or perform under their obligations. These partiesinclude borrowers under loans made, the issuers whose securities we hold, customers, tradingcounterparties, counterparties under swaps and credit and other derivative contracts, clearing agents,exchanges, clearing houses and other financial intermediaries. These parties may default on theirobligations to us due to bankruptcy, lack of liquidity, downturns in the economy or real estate values,operational failure or other reasons.
25
Level: 6 – From: 6 – Wednesday, May 14, 2008 – 1:35 pm – g5mac4 – 3960 Section 02 : 3960 Section 02

In addition, in the past, the general credit environment has been adversely affected by significantinstances of fraud. Concerns about, or a default by, one institution could lead to significant liquidityproblems, losses or defaults by other institutions because the commercial soundness of many financialinstitutions may be closely related as a result of their credit, trading, clearing or other relationships. Thisrisk is sometimes referred to as “systemic risk” and may adversely affect financial intermediaries, such asclearing agencies, clearing houses, banks, securities firms and exchanges with whom we interact on a dailybasis, and could have an adverse effect on our business.
We transfer our exposure to certain risks in our non-life and life insurance businesses to othersthrough reinsurance arrangements. Under these arrangements, other insurers assume a portion of our lossesand expenses associated with reported and unreported losses in exchange for a portion of policy premiums.The availability, amount and cost of reinsurance depend on general market conditions and may varysignificantly. Any decrease in the amount of our reinsurance relative to our own primary insurance liabilitywill increase our risk of loss. When we obtain reinsurance, we are still liable for those transferred risks ifthe reinsurer cannot meet its obligations. Therefore, the inability of our reinsurers to meet their financialobligations could materially affect our results of operations. Although we conduct periodic reviews of thefinancial statements and reputations of our reinsurers, the reinsurers may become financially unsound bythe time they are called upon to pay amounts due, which may not occur for many years.
Catastrophic events, terrorist attacks and other acts of war could have a negative impact on our
business and results.
Catastrophic events, terrorist attacks, other acts of war or hostility, and responses to those acts maycreate economic and political uncertainties, which could have a negative impact on economic conditions inthe regions in which we operate and, more specifically, on our business and results in ways that cannot bepredicted.
Our results of operations can be adversely affected by significant adverse regulatory developments,
including changes in tax laws.
We conduct our businesses subject to ongoing regulation and associated regulatory risks, includingthe effects of changes in the laws, regulations, policies and interpretations in the European Union, theBenelux and the other regions in which we do business. The timing and form of future changes inregulation are unpredictable and beyond our control, and changes made could materially adversely affectour business, the products and services we offer or the value of our assets or extent of our liabilities.
Insurance products enjoy certain tax advantages, particularly in The Netherlands, which permit thetax-deferred accumulation of earnings on the premiums paid by the holders of annuities and life insuranceproducts under certain conditions and within limits. Taxes, if any, are payable on accumulated tax-deferredearnings when earnings are actually paid. Recent tax changes have included the abolition of a standardamount of tax-deductible life insurance premium. This has reduced the attractiveness of life insuranceproducts in The Netherlands. The current administration in The Netherlands has indicated that it iscontemplating further changes in tax law. These changes could affect the tax advantages of certain of ourproducts, including group savings products. Any changes in Dutch tax law, or the tax laws of otherjurisdictions in which we operate which affect our products, could have a material adverse effect on ourinsurance or other businesses and results of operations and financial condition.
Our business is sensitive to changes in governmental policies and international economic conditions
that could limit our operating flexibility and reduce our profitability.
Our business and results of operations, including those of the ABN AMRO Businesses, may bematerially affected by market fluctuations and by economic factors, including governmental, political andeconomic developments relating to inflation, interest rates, taxation, currency fluctuations, traderegulations, social or political instability, diplomatic relations, international conflicts and other factors thatcould limit its operating flexibility and reduce our profitability. In addition, results of operations in the pasthave been, and in the future may continue to be, materially affected by many factors of a global nature,
26
Level: 6 – From: 6 – Wednesday, May 14, 2008 – 1:35 pm – g5mac4 – 3960 Section 02 : 3960 Section 02
including: political, economic and market conditions; the availability and cost of capital; the level andvolatility of equity prices, commodity prices and interest rates; currency values and other market indices;technological changes and events; the availability and cost of credit; inflation; and investor sentiment andconfidence in the financial markets. In addition, there has been a heightened level of legislative, legal andregulatory developments related to the financial services industry in the European Union, the United Statesand elsewhere that potentially could increase costs, thereby affecting our future results of operations. Suchfactors may also have an impact on our ability to achieve our strategic objectives on a global basis.
In addition, there is continuing political and regulatory scrutiny of the operation of the retailbanking and consumer credit industries in Belgium, The Netherlands and elsewhere. The nature andimpact of future changes in policies and regulatory action are not predictable and are beyond our controlbut could have an adverse impact on our businesses and earnings.
In the European Union, these regulatory actions included an inquiry into retail banking in all of theMember States by the European Commission’s Directorate General for Competition. The inquiryexamined retail banking in Europe generally. On January 31, 2007, the European Commission announcedthat barriers to competition in certain areas of retail banking, payment cards and payment systems in theEuropean Union had been identified. The European Commission indicated that it will use its powers toaddress these barriers and will encourage national competition authorities to enforce European andnational competition laws where appropriate. Any action taken by the European Commission and nationalcompetition authorities could have an adverse impact on our payment cards and payment systemsbusinesses and on our retail banking activities in the European Union countries in which we operate.
Litigation or other proceedings or actions may adversely affect our business, financial condition and
results of operations.
Our business is subject to the risk of litigation by customers, employees, shareholders or othersthrough private actions, class actions, administrative proceedings, regulatory actions or other litigation.The outcome of litigation or similar proceedings or actions is difficult to assess or quantify. Plaintiffs inthese types of actions may seek recovery of large or indeterminate amounts or other remedies that mayaffect our ability to conduct business, and the magnitude of the potential loss relating to such actions mayremain unknown for substantial periods of time. The cost to defend future actions may be significant.There may also be adverse publicity associated with litigation that could decrease customer acceptance ofour services, regardless of whether the allegations are valid or whether we are ultimately found liable. As aresult, litigation may adversely affect our business, financial condition and results of operations.
Risks relating to the ABN AMRO Acquisition
The uncertainties about the effects of the ABN AMRO Acquisition could materially and adversely affect
the businesses and operations of ABN AMRO to be acquired by Fortis.
Uncertainty about the effects of the ABN AMRO Acquisition on employees, partners, regulators andcustomers may materially and adversely affect the ABN AMRO Businesses acquired by Fortis and theiroperations. These uncertainties could cause customers, business partners and other parties that havebusiness relationships with ABN AMRO to defer the consummation of other transactions or otherdecisions concerning ABN AMRO Businesses, or to seek to change existing business relationships withABN AMRO. In addition, employee retention may be challenging until the ABN AMRO Acquisition iscompleted.
We may fail to realize the anticipated business growth opportunities, synergies and other benefits
anticipated from the transaction and our results of operations, financial condition and the price of our
ordinary shares may suffer.
There is no assurance that our acquisition of the ABN AMRO Businesses will achieve theanticipated business growth opportunities, synergies and other benefits Fortis anticipates. Fortis believesthe offer consideration is justified, in part, by the business growth opportunities, synergies, revenuebenefits, cost savings and other benefits it expects to achieve by combining its operations with the ABN
27
Level: 6 – From: 6 – Wednesday, May 14, 2008 – 1:35 pm – g5mac4 – 3960 Section 02 : 3960 Section 02

AMRO Businesses. However, these expected business growth opportunities, synergies and other benefitsmay not develop and other assumptions upon which Fortis determined the offer consideration may proveto be incorrect, as, among other things, such assumptions were based on publicly available information.
The reorganization plan is complex and involves a restructuring of, and the implementation ofsubstantial changes to, a significant portion of ABN AMRO’s operations. In addition, the reorganizationcontemplates actions being taken in a number of businesses and jurisdictions simultaneously.Implementation of the planned reorganization and realization of the forecast benefits will be challengingwithin the timeframe contemplated. Successful implementation of this plan will require a significantamount of management time and, thus, may affect or impair management’s ability to run the businesseffectively during the period of implementation. In addition, we may not have, or be able to retain,personnel with the appropriate skill sets for the tasks associated with Fortis’s reorganization plan, whichcould adversely affect the implementation of the plan.
The estimated expense savings and revenue synergies contemplated by the reorganization plan aresignificant. There can be no assurance that Fortis will realize these benefits in the time expected or at all.In addition, Fortis currently anticipates that the total costs associated with the implementation of thereorganization will amount to approximately EUR 1.54 billion and there can be no assurance that the costswill not exceed this amount.
In particular, the reorganization plan currently contemplated may have to be modified as a result ofemployee consultations and approvals, which may delay its implementation. Fortis may also facechallenges in obtaining the required approvals of various regulatory agencies, any of which could refuse orimpose conditions or restrictions on its approval, retaining key employees, redeploying resources indifferent areas of operations to improve efficiency, minimizing the diversion of management attention fromongoing business concerns, and addressing possible differences between our business culture, processes,controls, procedures and systems and those of the ABN AMRO Businesses. In addition, because Fortis hasonly recently gained access to information regarding ABN AMRO’s tax situation and structure,unanticipated substantial tax costs may be incurred in the implementation of the reorganization plan.
The complex nature of the reorganization plan and the level of cooperation required among the
Consortium Banks could have adverse consequences on the transaction and our ability to realize
benefits therefrom.
Although the Consortium and Shareholders’ Agreement (as defined in “Information About theAcquisition of ABN AMRO” below) provides a mechanism for assets to be re-allocated or transferredamong the Consortium Banks where it is established that any asset is held by or will be held by the wrongConsortium Bank, disputes may otherwise arise in implementing the Consortium and Shareholders’Agreement. Such disputes would be resolved in accordance with the dispute resolution processes set out inthe Consortium and Shareholders’ Agreement. While these processes have been designed to resolve anydisagreements swiftly, such disputes could result in delay to implementation of the reorganization.
Under any of these circumstances, the business growth opportunities, synergies, revenue benefits,cost savings and other benefits anticipated by Fortis to result from the reorganization may not be achievedas expected, or at all, or may be delayed. To the extent that Fortis incurs higher integration costs orachieves lower revenue benefits or fewer cost synergies than expected, its results of operations, financialcondition and the price of our ordinary shares may suffer.
Compliance with conditions and obligations imposed in connection with regulatory approvals in
connection with the ABN AMRO Acquisition could adversely affect Fortis businesses and the ABN
AMRO Businesses.
The acquisition and subsequent proposed restructuring of ABN AMRO has required variousapprovals or consents from, among others, the Dutch Central Bank, the Board of Governors of the U.S.Federal Reserve System, the UK Financial Services Authority (the “FSA”), the Bank of Spain, theEuropean Commission and various other bank regulatory, antitrust, securities, insurance and otherauthorities in The Netherlands, the United States, the UK, Spain, Belgium, other countries of the European
28
Level: 6 – From: 6 – Wednesday, May 14, 2008 – 1:35 pm – g5mac4 – 3960 Section 02 : 3960 Section 02

Union and any other member state of the European Union that has successfully sought jurisdiction toreview the ABN AMRO Acquisition under its national competition law and certain other jurisdictions. Thesubsequent proposed restructuring of the ABN AMRO group may also require further antitrust clearancein, among other jurisdictions, the United States, Russia and Argentina. The governmental entities fromwhich these approvals are required, including the Dutch Central Bank, the U.S. Federal Reserve Board, theFSA and the European Commission and others, may refuse to grant such approval, or may imposeconditions on, or require divestitures or other changes in connection with, the completion of thetransaction. In this regard, in order to solve competition concerns of the Commission in the commercialbanking segment in The Netherlands, on October 3, 2007, the European Commission granted Fortispermission to acquire the ABN AMRO Businesses subject to the business dispositions described in theCautionary Statement in the “Information about the Acquisition of ABN AMRO” section below. These orany conditions, remedies or changes could have the effect of delaying completion of the acquisition andreorganization of ABN AMRO, reducing the anticipated benefits of the transaction or imposing additionalcosts on or limiting our revenues following the transaction, any of which might have a material adverseeffect on Fortis following the transaction. In order to obtain these regulatory approvals, Fortis may have todivest, or commit to divesting, certain additional businesses or assets to third parties. In addition, Fortismay be required to make other commitments to regulatory authorities.
These divestitures and other commitments, if any, may have an adverse effect on Fortis’s business,results of operations, financial condition or prospects after the transaction.
In addition, the DNB has imposed and made public certain specific restrictions and conditions onthe reorganization process (as more fully described in “Information About the Acquisition of ABN AMRO— Details of the ABN AMRO Acquisition — Regulatory Matters” below) and it may impose furtherrestrictions and conditions, some of which may adversely affect Fortis’s business, results of operations,financial condition or prospects after the transaction.
Certain jurisdictions claim jurisdiction under their competition or antitrust laws in respect ofacquisitions or mergers that have the potential to affect their domestic marketplace. A number of thesejurisdictions may claim to have jurisdiction to review the acquisition and reorganization of ABN AMRO.Such investigations or proceedings may be initiated and, if initiated, may have an adverse effect on Fortis’sbusiness, results of operations, financial condition or prospects after the transaction. For further details onthe status of the approval process, please see “Information About the Acquisition of ABN AMRO —Details of the ABN AMRO Acquisition — Regulatory Matters” below.
We conducted only a limited due diligence review of ABN AMRO in making the ABN AMRO
Acquisition and, only since December 2007 did we obtain access to additional information, and
therefore Fortis may become subject to unknown liabilities of ABN AMRO, in particular, with respect to
the ABN AMRO Businesses, which may have an adverse effect on Fortis’s financial condition and
results of operations.
In making the ABN AMRO Acquisition and determining its terms and conditions, we reliedprincipally on publicly available information relating to ABN AMRO and the ABN AMRO Businesses,including the ABN AMRO Form 20-F for 2006, as filed with the SEC on April 2, 2007 and CurrentReports on Form 6-K submitted by ABN AMRO to the SEC prior to the date of the ABN AMROAcquisition. We also conducted a limited, high-level due diligence review of additional information aboutABN AMRO and the ABN AMRO Businesses that was provided to us by ABN AMRO in connection withour making the ABN AMRO Acquisition. Although we have had access to additional ABN AMROinformation since December 2007, we continue to be in the process of integration of the ABN AMROBusinesses and there can be no assurance that we will not be subject to unknown liabilities of ABNAMRO, which may have an adverse effect on Fortis’s financial condition and results of operations.
29
Level: 6 – From: 6 – Wednesday, May 14, 2008 – 1:35 pm – g5mac4 – 3960 Section 02 : 3960 Section 02

Consummation of the ABN AMRO Acquisition may result in adverse tax consequences resulting from a
change of ownership of ABN AMRO.
We only gained access to information (other than publicly available information) concerning ABNAMRO’s tax situation in December 2007. It is possible that the consummation of the ABN AMROAcquisition may result in adverse tax consequences arising from a change of ownership of ABN AMROand the ABN AMRO Businesses. The tax consequences of a change of ownership of a corporation canlead to an inability to carry-over certain tax attributes, including, but not limited to, tax losses, the taxcredits and/or tax basis of assets. Moreover, a change of ownership may result in other tax costs notnormally associated with the ordinary course of business. Such other tax costs include, but are not limitedto, stamp duties, land transfer taxes, franchise taxes and other levies.
Change of control provisions in ABN AMRO’s agreements may be triggered upon the completion of the
ABN AMRO Acquisition, upon RFS Holdings’ acquisition of 100% of ABN AMRO or upon the
completion of the reorganization, and may lead to adverse consequences for Fortis, including the loss of
significant contractual rights and benefits, the termination of joint venture and/or licensing agreements
or the requirement to repay outstanding indebtedness.
ABN AMRO may be a party to joint ventures, licenses and other agreements and instruments thatcontain change of control provisions that will be triggered upon the completion of the ABN AMROAcquisition, upon RFS Holdings’ acquisition of 100% of ABN AMRO or upon completion of thereorganization.
Agreements with change of control provisions typically provide for or permit the termination of theagreement upon the occurrence of a change of control of one of the parties or, in the case of debtinstruments, require repayment of all outstanding indebtedness. If, upon review of these agreements aftercompletion of the ABN AMRO Acquisition, RFS Holdings determines that such provisions can be waivedby the relevant counterparties, it will consider whether it will seek these waivers. In the absence of thesewaivers, the operation of the change of control provisions, if any, could result in the loss of materialcontractual rights and benefits, the termination of joint venture agreements and licensing agreements or therequirement to repay outstanding indebtedness.
In addition, employment agreements with members of the ABN AMRO senior management andother ABN AMRO employees may contain change of control provisions providing for compensation to bepaid in the event the employment of these employees is terminated, either by ABN AMRO or by thoseemployees, following completion of the ABN AMRO Acquisition, RFS Holdings’ acquisition of 100% ofABN AMRO or completion of the post-closing reorganization. Such employment agreements may alsocontain change of control provisions providing for compensation to be paid following the occurrence ofsuch events even if the employee is not terminated. We have established a reserve in respect of lossesarising on the operation of change of control provisions, including compensation arising on change ofcontrol clauses in employment agreements. If payments made under these provisions were substantially inexcess of the reserve, our results of operations in the period they become payable could be adverselyaffected.
Fortis will incur substantial transaction and offer-related costs in connection with the ABN AMRO
Acquisition.
Fortis expects to incur a number of non-recurring transaction fees and other costs associated withcompleting the ABN AMRO Acquisition, combining its operations with the ABN AMRO Businesses andachieving desired synergies. These fees and costs will be substantial and include financing, financialadvisory, legal and accounting fees and expenses. Additional unanticipated costs may be incurred in theintegration of Fortis and the ABN AMRO Businesses. Although Fortis expects that the realization of otherefficiencies related to the transaction will offset the incremental and transaction costs over time, this netbenefit may not be achieved in the near term, or at all.
30
Level: 6 – From: 6 – Wednesday, May 14, 2008 – 1:35 pm – g5mac4 – 3960 Section 02 : 3960 Section 02

You may not be able to effectively compare our future financial statements to our, or ABN AMRO’s,
historical financial statements or those of ABN AMRO.
Fortis is not acquiring all of ABN AMRO, and the businesses which Fortis is acquiring are notcurrently segregated by segment or business line in ABN AMRO’s financial statements. In addition, priorto the acquisition, the ABN AMRO Businesses did not operate as a stand-alone company and relied upontheir parent entities for administrative, treasury, management and other services. As a result, theconsolidated financial statements of ABN AMRO and the financial information regarding the ABN AMROBusinesses included in this Prospectus do not necessarily reflect what the ABN AMRO Businesses’ resultsof operations, financial position or cash flows will be in the future or what its results of operations,financial position or cash flow would have been in the past had the ABN AMRO Businesses been a stand-alone company during the periods presented. In addition, the proposed acquisition will be a fundamentalchange to the organization, business segments and reporting of Fortis as compared with periods prior tothe transaction. Accordingly, you may not be able to effectively compare Fortis 2006, 2007 and futureconsolidated financial statements to the historical financial statements of ABN AMRO or the ABN AMROBusinesses.
Risk Factors Relating to a Purchase of the Securities
Holders of Securities may not receive full payment of coupons.
Fortis Hybrid Financing will be permitted to satisfy its obligations on an Alternative CouponSatisfaction Date only by means of the Alternative Coupon Payment Method. The Alternative CouponPayment Method involves the sale of Fortis Shares in the market. In connection with any ExceptionalAlternative Coupon, to the extent the proceeds from such sale are not adequate to pay the full amount ofthe coupons then due, Fortis Hybrid Financing is nonetheless deemed to have satisfied its obligation in fulland holders of the Securities will have no claim for any amounts not paid. In addition, the occurrence of aPostponement Event could result in the use of the Alternative Coupon Payment Method and the paymentof coupons being deferred indefinitely. See “Description of the Securities — Alternative Coupon PaymentMethod”.
In the event of Loss Absorption the principal amount of the Securities will be written down and coupons
will be reduced or, if the principal amount is fully written down, coupons could stop. If Loss Absorption
should occur there is no assurance that the principal amount of the Securities will be written back up
although the principal amount will be reinstated in the event of a judicial or voluntary liquidation or
bankruptcy of a Parent Company or Fortis Hybrid Financing.
If a Capital Deficiency Event should occur, and such Capital Deficiency Event cannot be cured bymeans of a capital increase, the principal amount of the Securities will be reduced (a “Loss Absorption”)by an amount sufficient to remedy the Capital Deficiency Event to the extent possible. Under certaincircumstances this means the principal amount of the Securities could be fully reduced (although no lowerthan EUR 0.01). Although coupons will continue to be paid following a Loss Absorption, the amount ofsuch coupons will be calculated on the basis of the then reduced principal amount. As a result, unless theprincipal amount of the Securities is reinstated (which could occur if the Parent Companies record positiveconsolidated profit for two years), coupons will be reduced or could be stopped. As a result, depending onthe application of the Loss Absorption mechanism, coupons may fluctuate and such fluctuations could bematerial. In addition, for so long as a Trigger Event exists, coupons may only be paid using the AlternativeCoupon Payment Method.
In addition, although under certain circumstances the principal amount of the Securities may bereinstated and under certain circumstances it will be mandatory, there can be no assurance thatReinstatement will occur. As a result, coupon payments may be reduced or stopped as noted above.Notwithstanding the foregoing, in the event of a judicial or voluntary liquidation or bankruptcy of a ParentCompany or Fortis Hybrid Financing, there shall be a full Reinstatement of the principal amount of theSecurities.
31
Level: 6 – From: 6 – Wednesday, May 14, 2008 – 1:35 pm – g5mac4 – 3960 Section 02 : 3960 Section 02

Fortis Hybrid Financing may redeem the Securities (i) at any time upon the occurrence of a Tax Event
or a Tier 1 Disqualification Event or (ii) on the First Call Date or on any Regular Coupon Date
thereafter.
The Securities are perpetual and have no final maturity date and holders of Securities have no rightto call for the redemption of the Securities. However, Fortis Hybrid Financing may elect to redeem theSecurities (in whole not in part) upon the occurrence of a Tax Event or a Tier 1 Disqualification Event,whether before or after the First Call Date, or for any reason (in whole or in part), on the First Call Date oron any subsequent Regular Coupon Date, in each case subject to the prior approval of the BFIC, if thenrequired.
Holders of Securities have no voting rights.
Holders of the Securities will not have any voting rights, except as described under “Description ofthe Securities — Meetings of Shareholders and Right to Information”.
As Securities will be issued in global form, holders of Securities have no direct relationship with Fortis
Hybrid Financing or with the Parent Companies.
All notices and payments to be delivered to holders of Securities will be distributed by FortisHybrid Financing through the relevant clearing agencies. In the event that a beneficial owner does notreceive such notices or payments, its rights may be prejudiced but it will not have a direct claim againstFortis Hybrid Financing or Fortis therefor.
There has been no prior public market for the Securities.
The Securities constitute a new issue of securities and have no established trading market. Prior tothis offering, there has been no public market for the Securities. Although application has been made to listthe Securities on the official list of the Luxembourg Stock Exchange and Euronext Amsterdam, there canbe no assurance that an active public market for the Securities will develop, and if such a market were todevelop, there is no obligation to maintain such a market. The liquidity and the market prices for theSecurities can be expected to vary with changes in market and economic conditions, the financialcondition and prospects of Fortis Hybrid Financing and the Fortis Group and other factors that generallyinfluence the market prices of securities. Such fluctuations may significantly affect the liquidity and themarket prices of the Securities, which may trade at a discount to the price at which you purchase theSecurities. In addition, there is no assurance that a trading market for the Securities will exist and noassurance as to the liquidity of any trading market.
The Securities are undated securities.
The Securities are undated securities, with no specific maturity date. The Issuer is under noobligation to redeem the Securities at any time. The holders of the Securities have no right to requireredemption of the Securities.
Holders of the Securities are exposed to risks associated with fixed rate securities. Movements of the
market interest rate can adversely affect the price of the Securities and lead to losses upon a sale.
A holder of securities with a fixed compensation rate is exposed to the risk that the price of suchsecurities falls as a result of changes in the market interest rate. While the nominal Coupon of theSecurities is fixed until redemption, if any, of the Securities, the current interest rate on the capital market(market interest rate) typically changes on a daily basis. As the market interest rate changes, the price ofthe Securities changes in the opposite direction. If the market interest rate increases, the price of theSecurities would typically fall and if the market interest rate falls, the price of the Securities wouldtypically increase. Hence, holders of the Securities should be aware that movements of the market interestrate can adversely affect the price of the Securities and can lead to losses if holders sell their Securitiesduring the period in which the market interest rate is higher than the compensation.
32
Level: 6 – From: 6 – Wednesday, May 14, 2008 – 1:35 pm – g5mac4 – 3960 Section 02 : 3960 Section 02

Risks Related to Fortis Hybrid Financing
Fortis Hybrid Financing is a special purpose vehicle with no operations of its own. The primary credit
protection for investors derives from the Support Agreement and Subordinated Guarantee from the
Parent Companies, it being understood that all obligations of the Parent Companies under the
Subordinated Guarantee are deeply subordinated. In addition, Fortis Hybrid Financing may onlend the
proceeds of the offering of Securities to any of Fortis’s operating companies as solvency capital. As a
result, Fortis Hybrid Financing’s ability to meet its obligations will be largely dependent on the
financial condition of the operating companies who receive the proceeds of the offering.
Fortis Hybrid Financing is a special purpose vehicle with no operations of its own. As a result, theprimary credit protection for investors derives from the Support Agreement and Subordinated Guaranteefrom the Parent Companies, it being understood that all obligations of the Parent Companies under theSubordinated Guarantee are deeply subordinated. As a result, the rights of holders under the Securities toparticipate in the distribution of assets of Fortis Hybrid Financing upon Fortis Hybrid Financing’sliquidation will be effectively subordinated to substantially all existing and future liabilities of theoperating companies to which the proceeds are lent and of the Parent Companies.
Fortis Hybrid Financing will loan the proceeds from this offering to certain of the Group’s operatingcompanies in a form which will permit the operating company to treat such loan as solvency capital.Under certain circumstances, such operating companies may under the terms of the internal loan be unableto make payment. Fortis Hybrid Financing will only be able to make coupon payments on the Securities,subject to support arrangements, if it receives payments from the operating companies which have beenthe recipients of the loans. Investors are, therefore, also exposed to the operating performance of theoperating companies to which Fortis Hybrid Financing may lend proceeds, which performance couldchange over time.
As Fortis Hybrid Financing’s ability to meet its obligations will be reliant on the financial conditionof the operating companies, if such operating companies’ financial condition were to deteriorate and to theextent that funds are not available through the Support Agreement or the Subordinated Guarantee, FortisHybrid Financing and holders of Securities could suffer direct and materially adverse consequences,including insufficient coupon payments on the Securities through the Alternative Coupon Payment Methodand, if a liquidation or bankruptcy of Fortis Hybrid Financing were to occur, loss by holders of all or partof their investment.
Risk Related to the Parent Companies
Security holders’ rights under the Support Agreement and Subordinated Guarantee are limited.
Each Parent Company’s obligations under the Support Agreement constitute unsecured andunsubordinated obligations of such Parent Company and will rank pari passu effectively, from a financialpoint of view, with all other unsecured and unsubordinated obligations of the Parent Companies, except tothe extent that such other obligations are preferred by applicable law. The Parent Companies’ obligationsunder the Support Agreement with respect to coupons payable on a Supported Coupon Date will besatisfied by making capital contributions to Fortis Hybrid Financing or otherwise making funds availableto Fortis Hybrid Financing and, as a result, any claims of holders of Securities will be subordinated toclaims of creditors of Fortis Hybrid Financing. The Support Agreement does not limit the ability of theParent Companies to incur indebtedness. See “Description of the Support Agreement — General”.
The Parent Companies will not be obligated to make any contribution or payment in respect ofSupported Coupons under the Support Agreement (i) if the coupon is payable due to the occurrence of aTrigger Event to be satisfied using the Alternative Coupon Payment Method or (ii) if and to the extent thatfollowing such contribution or payment, the assets of a Parent Company would be less than the sum of itsliabilities on a consolidated basis, excluding liabilities not considered Senior Debt. See “Description of theSupport Agreement”.
33
Level: 6 – From: 6 – Wednesday, May 14, 2008 – 1:35 pm – g5mac4 – 3960 Section 02 : 3960 Section 02

In the event that the Parent Companies are in the situation mentioned in (ii) above, the ParentCompanies will not be able to contribute or otherwise make available to Fortis Hybrid Financing suchadditional funds as may be necessary to ensure that Fortis Hybrid Financing will be able to pay allcoupons due on a Supported Coupon Date. The Support Agreement requires that any claim or proceedingbrought by a holder of Securities to enforce the obligations of the Parent Companies to Fortis HybridFinancing thereunder be brought exclusively in a court of competent jurisdiction in Belgium. See“Description of the Support Agreement”.
The Parent Companies will also give an unconditional and irrevocable Subordinated Guarantee forthe due payment of the Base Redemption Price when the Securities become payable in the event ofliquidation or bankruptcy of Fortis Hybrid Financing. The holders’ claims are subordinated, however, andin the event of a general concursus creditorum affecting either Parent Company, the claims of holders ofthe Securities under the Subordinated Guarantee will be satisfied only after the claims of all creditors ofthe Parent Companies, whether senior or subordinated, other than those which rank pari passu with orjunior to the Subordinated Guarantee, have first been paid in full. Holders of Securities may not set off anyclaims arising under the Subordinated Guarantee against claims the Parent Companies may have againstthem. In the case of a liquidation or bankruptcy of Fortis Hybrid Financing and the concurrent existence ofa Trigger Event, the Trustee may institute bankruptcy proceedings against the Parent Companies only inBelgium or The Netherlands, and no other legal remedy may be pursued, including a judicial proceedingfor the collection of the sums due and unpaid.
The ability of the Parent Companies to make payments under the Support Agreement and the
Subordinated Guarantee depends primarily on the earnings of their subsidiaries and their ability to
distribute such earnings to the Parent Companies; these subsidiaries are highly regulated and such
regulations could impose restrictions on such distributions.
The Parent Companies’ assets consist solely of their investments in the operating subsidiaries of theFortis Group. Accordingly, the cash flow and the consequent ability to service obligations of the ParentCompanies, including those obligations that may arise under the Support Agreement and the SubordinatedGuarantee, are primarily dependent upon the earnings of Fortis subsidiaries, and the distribution of thoseearnings to the Parent Companies.
In addition, the payment of distributions and the making of loans and other advances to the ParentCompanies by Fortis subsidiaries are and may continue to be subject to certain statutory and regulatoryrestrictions. The Dutch and Belgian banking and insurance regulators, as well as European Unionregulatory authorities, the BFIC in Belgium and regulatory authorities in other countries have regulatoryauthority over each Parent Company and its subsidiaries. Under certain circumstances, any of suchregulatory authorities could make determinations or take decisions in the future with respect to the ParentCompanies and/or any of the Parent Companies’ subsidiaries or a portion of their respective operations orassets that could adversely affect the ability of Fortis Hybrid Financing or the Parent Companies to, amongother things, make distributions to their respective security holders, to engage in transactions withaffiliates, to purchase or transfer assets, to pay their respective obligations or to make any redemption orliquidation payments to their security holders. See “Supervision and Regulation”.
Furthermore, the Parent Companies’ rights and the rights of their creditors to participate in thedistribution of assets of any subsidiary upon such subsidiary’s liquidation or reorganization will beeffectively subordinated to all existing and future liabilities, including trade payables, of such subsidiary,except to the extent that the Parent Companies are themselves recognized as creditors of such subsidiary,in which case the claims of the Parent Companies would still be subordinated to any security interests inthe assets of such subsidiary and any indebtedness of such subsidiary senior to that held by the ParentCompanies.
34
Level: 6 – From: 6 – Wednesday, May 14, 2008 – 1:35 pm – g5mac4 – 3960 Section 02 : 3960 Section 02

Risks Relating to Fortis Hybrid Financing and the Parent Companies
Fortis Hybrid Financing and the Parent Companies may issue additional debt.
Neither the Parent Companies nor Fortis Hybrid Financing is prohibited or restricted from issuingadditional debt ranking pari passu with the Securities in the case of Fortis Hybrid Financing, or senior tothe Securities and the Subordinated Guarantee in the case of the Parent Companies. None of the Securities,the Indenture, the Support Agreement or the Subordinated Guarantee Agreement limits the ability of FortisHybrid Financing or the Parent Companies or any other members of the Fortis Group to incurindebtedness, including indebtedness that ranks pari passu with the obligations of the Parent Companiesunder the Support Agreement or senior to the obligations of the Parent Companies under the SubordinatedGuarantee. The issuance of any such further debt may dilute the claim of holders of Securities and ofFortis Hybrid Financing under the Support Agreement and the Subordinated Guarantee, and under certaincircumstances holders of Securities may be unable to recover any amounts under the Support Agreementor the Subordinated Guarantee.
Regulatory authorities have oversight powers over the Fortis Group.
The BFIC or its successors, regulatory authorities in the European Union and regulatory authoritiesin other countries have oversight powers over Fortis and in varying degrees over the operating entities ofFortis to which the proceeds of the Securities will be lent. Under certain circumstances, any of suchregulatory authorities could make determinations or take decisions in the future with respect to any of suchentities or a portion of their respective operations or assets that could adversely affect the ability of FortisHybrid Financing or the Parent Companies to, among other things, make distributions to their respectivesecurity holders, to engage in transactions with affiliates, to purchase or transfer assets, to pay theirrespective obligations and to make any redemption or liquidation payments to their security holders.
35
Level: 6 – From: 6 – Wednesday, May 14, 2008 – 1:35 pm – g5mac4 – 3960 Section 02 : 3960 Section 02

TERMS AND CONDITIONS OF THE PUBLIC OFFER
The Securities may be offered by certain banks, financial intermediaries and other authorizedentities to the public in Austria, Belgium, France, Germany, Ireland, Italy, Luxembourg, Portugal, Spain,The Netherlands, Switzerland, the United Kingdom and the Principality of Liechtenstein in accordancewith the following terms and conditions:
The total principal amount of the Securities to be issued shall bedetermined on or about May 23, 2008 (the “Pricing Date”)following the end of the public offer period as described belowand notified to the CSSF and published on the website of theLuxembourg Stock Exchange and in the Euronext Daily OfficialList (“Officiële Prijscourant”) of Euronext.
Start of the offer period:
In respect of the above mentioned jurisdictions, not earlier thanthe date on which all requirements necessary to enable any suchoffer in any such jurisdiction to be made in accordance with allapplicable laws, rules and regulations in such jurisdiction which,at the date hereof, is expected to be on or about May 15, 2008, at9:00 a.m. (CET).
End of the offer period:
No later than 5.00 p.m. CET on or about May 23, 2008.
The timetable for the offering may be accelerated or extended.Any such acceleration or extension of the timetable for theoffering will be announced as soon as practicable before theproposed expiration of the accelerated offer period, or, in the eventof an extended timetable for the offering, as soon as practicablebefore the expiration of the original offer period (i) on the websiteof the Luxembourg Stock Exchange (www.bourse.lu), and (ii) in apress release and an advertisement in the Euronext Daily OfficialList (Officiële Prijscourant) and in at least one daily newspaperwith nationwide distribution in the Netherlands. Any extension ofthe timetable for the offering will be for a minimum of one fullbusiness day.
Investors will be notified by the relevant Manager or any placersof their allocations of Securities and the settlement arrangementsin respect thereof as soon as practicable after the end of the offerperiod.
The issue of the Securities is subject to certain conditionsprecedent customary for transactions of this type (including issueof the Securities, delivery of legal opinions and comfort letters) asset out in the Underwriting Agreement. Both Fortis HybridFinancing and the Managers are entitled in certain circumstancesto be released and discharged from their obligations under theUnderwriting Agreement prior to the issue of the Securities.
Conditions to which the offer issubject:
The time period, including anypossible amendments, duringwhich the offer will be open anddescription of the applicationprocess:
Total amount of the issue/offer; ifthe amount is not fixed,description of the arrangementsand time for announcing to thepublic the definitive amount ofthe offer:
36
Level: 6 – From: 6 – Wednesday, May 14, 2008 – 1:35 pm – g5mac4 – 3960 Section 03 : 3960 Section 03Level: 6 – From: 6 – Wednesday, May 14, 2008 – 1:35 pm – g5mac4 – 3960 Section 03 : 3960 Section 03

Not applicable.
Not applicable.
The Securities will be issued on the Issue Date against payment toFortis Hybrid Financing of the net subscription moneys. FortisHybrid Financing, in consultation with the Managers, retains fulldiscretion as to the total amount of the issue and how to allocatethe Securities applied for. Investors will be notified by the relevantManager or any placers of their allocations of Securities and thesettlement arrangements in respect thereof.
Not applicable.
Not applicable.
Upon approval of this Prospectus for use in connection with publicoffers, such offers may be made in Austria, Belgium, France,Germany, Ireland, Italy, Luxembourg, Portugal, Spain, TheNetherlands, Switzerland, the United Kingdom and thePrincipality of Liechtenstein to any person. Until such time insuch countries, and at all times in other EEA countries, offers willonly be made by the Managers pursuant to an exemption under theProspectus Directive as implemented in the relevant countries.
Investors will be notified by the relevant Manager or placer oftheir allocations of Securities.
The Securities will be issued at an issue price of 100 percent oftheir nominal amount. Any investor intending to acquire anySecurities from a bank, financial intermediary or other entity(other than a Manager in its capacity as such) will do so inaccordance with any terms and other arrangements in placebetween the seller or placer and such investor, including as toprice, allocations and settlement arrangements. Fortis HybridFinancing will not be a party to such arrangements with investors,and accordingly investors must obtain such information from therelevant seller or placer.
An indication of the expectedprice at which the Securities willbe offered or the method ofdetermining the price and theprocess for its disclosure. Indicatethe amount of any expenses andtaxes specifically charged to thesubscriber or purchaser:
Process for notification toapplicants of the amount allottedand indication whether dealingmay begin before notification ismade:
The various categories ofpotential investors to which theSecurities are offered:
The procedure for the exercise ofany right of pre-emption, thenegotiability of subscriptionrights and the treatment ofsubscription rights not exercised:
A full description of the mannerand date in which results of theoffer are to be made public:
Method and time limits forpaying up the Securities and fordelivery of the Securities:
Details of the minimum and/ormaximum amount of application,(whether in number of Securitiesor aggregate amount to invest):
A description of the possibility toreduce subscriptions and themanner for refunding excessamount paid by applicants:
37
Level: 6 – From: 6 – Wednesday, May 14, 2008 – 1:35 pm – g5mac4 – 3960 Section 03 : 3960 Section 03

The offer will be made by licensed banks, financial intermediariesand other entities duly authorized in the relevant jurisdictions.
The name and address of the paying agents with respect to theSecurities are set out at the end of this Prospectus and the namesand addresses of the depositary agents are set out elsewhere in thisProspectus.
The Managers, pursuant to an Underwriting Agreement, agreed toprocure subscribers, failing which, to subscribe and pay for theSecurities at a price equal to 100 percent of their nominal amount.The Underwriting Agreement provides that Fortis HybridFinancing will pay the Managers a combined management, sellingand underwriting commission of 1.70 percent of the nominalamount of the Securities. See “Subscription and Sale” below.
The addresses of the Managers are set out at the end of thisProspectus.
The Underwriting Agreement, as supplemental by a PricingAgreement, will be dated on or about May 23, 2008. See“Subscription and Sale”.
For the avoidance of doubt, this Prospectus may not be used in any country for the purposes of anypublic offer of the Securities other than as described above and, in such cases, only until the end of theoffer period as described above, unless otherwise authorised by Fortis Hybrid Financing.
When the underwritingagreement has been or will bereached:
Indication of the materialfeatures of the agreements,including the quotas. Where notall of the issue is underwritten, astatement of the portion notcovered. Indication of the overallamount of the underwritingcommission and of the placingcommission:
Name and address of the entitiesagreeing to underwrite the issueon a firm commitment basis, andname and address of the entitiesagreeing to place the issuewithout a firm commitment orunder “best efforts”arrangements
Name and address of any payingagents and depository agents ineach country:
Name and address of the co-ordinator(s) of the global offerand of single parts of the offerand, to the extent known to FortisHybrid Financing or to theofferor, of the placers in thevarious countries where the offertakes place:
38
Level: 6 – From: 6 – Wednesday, May 14, 2008 – 1:35 pm – g5mac4 – 3960 Section 03 : 3960 Section 03

DESCRIPTION OF THE SECURITIES
General
Fortis Hybrid Financing will issue the Euro Denominated Perpetual Securities (the “Securities”)under an Indenture to be dated on or about May 30, 2008 between Fortis Hybrid Financing and The Bankof New York, as Trustee. The Issue Date will be notified to the CSSF and published on the website of theLuxembourg Stock Exchange and in the Euronext Daily Official List (“Officiële Prijscourant”) ofEuronext. The terms of the Securities include those stated in the Indenture. In accordance with the terms ofthe Indenture, Fortis Hybrid Financing may from time to time, without the consent of the holders of theSecurities, create and issue additional securities with the same terms and conditions as the Securities in allrespects (or in all respects save for the first payment of interest thereon) so that such further issue shall beconsolidated and form a single series with the Securities offered pursuant to this Prospectus. Theobligations of Fortis Hybrid Financing pursuant to the Securities will benefit from a Support Agreemententered into by the Parent Companies and a Subordinated Guarantee Agreement. See “Description of theSupport Agreement” and “Description of the Subordinated Guarantee Agreement”.
The following is a summary of the material provisions of the Indenture. Because this is a summary,it may not contain all the information that is important to you. You should read each of the Indenture, theSupport Agreement and the Subordinated Guarantee Agreement in its entirety. Copies of these documentsare available as described under “General Listing Information — Availability of Documents andIncorporation by Reference”. Defined terms not otherwise defined in this description have the meaninggiven to those terms in the Indenture.
The Securities
• are unsecured subordinated obligations of Fortis Hybrid Financing, subordinated in right ofpayment to all existing and future Senior and Subordinated Indebtedness of Fortis HybridFinancing in accordance with the subordination provisions of the Indenture;
• are issued in an aggregate principal amount of Euro; and
• have no fixed maturity date.
In accordance with its articles of incorporation, Fortis Hybrid Financing may only issue securitieswhich are pari passu with each other.
Coupons
Coupons on the Securities will be payable annually in arrear on or about May 30 of each year,beginning on or about May 30, 2009 at a fixed rate per annum on their Current Principal Amount (which,solely for the purpose of calculating coupons, will be deemed to include the aggregate amount of anyunpaid Elective Alternative Coupons), which coupon shall be determined on the Pricing Date following theend of the public offer period as described herein and notified to the CSSF and published on the website ofthe Luxembourg Stock Exchange and in the Euronext Daily Official List (“Officiële Prijscourant”) ofEuronext. The Coupon rate is expected to be between 8.00% and 8.25% per annum. Such date is a“Regular Coupon Date”. If any Regular Coupon Date is not a business day, coupons will be payable on,and accrue to, the next business day unless such business day would fall in the next calendar month, inwhich case coupons will be payable on, and accrue to, the preceding business day.
Each period from and including a Regular Coupon Date or the Issue Date, as applicable, to but notincluding the next Regular Coupon Date is a “Coupon Period”.
If and to the extent that a Trigger Event has occurred and is continuing or would occur, includingafter giving effect to any coupon on the Securities otherwise payable on such Regular Coupon Date orotherwise, the coupons on the Securities will be payable on the Alternative Coupon Satisfaction Date andFortis Hybrid Financing will give an Alternative Coupon Notice. If Fortis Hybrid Financing has given anAlternative Coupon Notice with respect to an Elective Alternative Coupon and subsequent to delivery of
39
Level: 6 – From: 6 – Wednesday, May 14, 2008 – 1:35 pm – g5mac4 – 3960 Section 03 : 3960 Section 03

such notice and prior to the Regular Coupon Date, a Trigger Event has occurred and is continuing orwould occur on such Regular Coupon Date, such coupon shall be deemed an Exceptional AlternativeCoupon.
If no Trigger Event has occurred or is continuing, Fortis Hybrid Financing may give an AlternativeCoupon Notice with respect to the next succeeding Regular Coupon Date, in which case a full coupon willbe payable on such Regular Coupon Date using the Alternative Coupon Payment Method, subject to aPostponement Event; provided that (x) if such Regular Coupon Date is not a Supported Coupon Date and(y) no Trigger Event has occurred or is continuing on such date, Fortis Hybrid Financing shall be obligatedto use the Alternative Coupon Payment Method to pay the coupon due on such Regular Coupon Date (the“Mandated Election”). See “— Alternative Coupon Payment Method — Notice”.
Coupons that are paid using the Alternative Coupon Payment Method due to the occurrence of aTrigger Event are referred to herein as “Exceptional Alternative Coupons”. Coupons that are paid usingthe Alternative Coupon Payment Method in the circumstances described in the immediately precedingparagraph are referred to herein as “Elective Alternative Coupons”.
For purposes of the foregoing, “Trigger Event” means (i) the sum of Fortis Group assets are lessthan the sum of its liabilities on a consolidated basis, excluding liabilities not considered Senior Debt; (ii)there has occurred a breach of the solvency requirements set forth in the Belgian Royal Decree datedNovember 21, 2005 relating to the consolidated supervision of financial conglomerates, as determined inaccordance with a calculation method approved by the BFIC, to the extent such breach is caused by aconsolidated loss of the Parent Companies as reflected in their last quarterly financial statements, unlessthe BFIC exempts Fortis Group from treating such breach as a Trigger Event (each of (i) and (ii), a“Capital Deficiency Event”); or (iii) there has occurred a breach of the solvency requirements set forth inthe Belgian Royal Decree dated November 21, 2005 relating to the consolidated supervision of financialconglomerates, as determined in accordance with a calculation method approved by the BFIC, unless theBFIC exempts Fortis Group from treating such breach as a Trigger Event.
For purposes of the definition of “Trigger Event”, “Senior Debt” means all liabilities of the ParentCompanies (including those in respect of bonds, notes and debentures), whether senior or subordinated,other than liabilities of the Parent Companies which rank pari passu with or junior to the SubordinatedGuarantee or the Securities.
Loss Absorption
In the event of the occurrence of a Capital Deficiency Event, the boards of directors of the ParentCompanies will convene an extraordinary shareholders’ meeting to be held during the three monthsfollowing the occurrence of such Capital Deficiency Event in order to propose a share capital increase orany other measure regarded as necessary or useful to remedy such event. If a share capital increase or anysuch other proposed measure is not adopted by the extraordinary shareholders’ meetings of the ParentCompanies or if the share capital increase is not sufficiently subscribed to remedy such Capital DeficiencyEvent in full, or if such Capital Deficiency Event remains in effect for six months following the occurrenceof such event, the boards of directors of the Parent Companies will implement and cause Fortis HybridFinancing to implement, within ten days following the date that is six months following the occurrence ofsuch event, a proportionate reduction of the amount of the Current Principal Amount of each Security (a“Loss Absorption”) necessary in order to remedy the Capital Deficiency Event to the fullest extentpossible. Notwithstanding anything to the contrary, the nominal value of any Security shall never bereduced to an amount lower than one Euro cent (€0.01).
The amount by which the aggregate Current Principal Amount of the Securities is reduced to enablethe Parent Companies to absorb losses in order to ensure the continuity of their activities, will be the lowerof (i) the amount by which the applicable regulatory solvency requirements exceed the solvency capital ofthe Parent Companies at the time of the Capital Deficiency Event and (ii) the aggregate amount of theCurrent Principal Amount of the Securities before such reduction.
40
Level: 6 – From: 6 – Wednesday, May 14, 2008 – 1:35 pm – g5mac4 – 3960 Section 03 : 3960 Section 03

Outstanding Alternative Coupons will not be written down but may only be paid using theAlternative Coupon Payment Method. In the event of Loss Absorption, coupons will continue to accrue onthe Current Principal Amount of the Securities but may only be paid using the Alternative CouponPayment Method for as long as a Trigger Event exists.
For the avoidance of doubt, the first remedy to the Capital Deficiency Event will be the sharecapital increase or the implementation of any other measures adopted by the extraordinary shareholders’meetings of the Parent Companies to remedy such Capital Deficiency Event. To the extent such increase ofshare capital or other measures are not sufficient, the Loss Absorption will be applied against the CurrentPrincipal Amount of the Securities as herein described.
In the event that other Parity Securities, which would be subject to such principal reductions, areoutstanding, such reduction will be applied on a pro-rata basis among the Securities and such other ParitySecurities.
“Current Principal Amount” of any Security means the principal amount of each Securityoutstanding at any time calculated on the basis of the Original Principal Amount of each Security as suchamount may be proportionately reduced pursuant to the application of the Loss Absorption mechanismand/or reinstated on one or more occasions.
“Original Principal Amount” of any Security means the initial denomination of €1,000 principalamount per Security.
Reinstatement
If, following a Loss Absorption, the Parent Companies have recorded positive Consolidated Profitfor at least two consecutive fiscal years (a “Return to Profitability”) following the end of the most recentfiscal year in which there was a Loss Absorption, the Parent Companies may cause Fortis HybridFinancing to increase, and in such case Fortis Hybrid Financing shall increase, the Current PrincipalAmount of each Security (a “Reinstatement”) on any date and in an amount that they determine (either upto the Original Principal Amount or up to any other amount lower than the Original Principal Amount, butin each case proportionate to the denomination held by each holder), subject to any necessary regulatoryapproval.
Irrespective of whether a Return to Profitability has occurred, the Parent Companies shall causeFortis Hybrid Financing to increase, and Fortis Hybrid Financing shall increase, the aggregate CurrentPrincipal Amount of the Securities in an amount equal to the Mandatory Reinstatement Amount on thedate of a Mandatory Reinstatement Event.
For the avoidance of doubt, following a Reinstatement, the aggregate Current Principal Amount ofthe Securities may never be greater than the aggregate Original Principal Amount of the Securities.
In the event that other Parity Securities are outstanding and may also benefit from a reinstatement oran increase of their current principal amount in accordance with their terms, any Reinstatement will beapplied on a pro-rata basis with other reinstatements or increases of the principal amount made in suchother Parity Securities.
“Consolidated Profit” means the consolidated profit (excluding distributions to minority interests)of Fortis Group, as calculated and set out in the audited annual Consolidated Financial Statements ofFortis Group.
“Mandatory Reinstatement Amount” means the lesser of (i) the difference between the aggregateOriginal Principal Amount of the Securities and the aggregate Current Principal Amount of the Securities,and (ii) the positive Consolidated Profit of Fortis Group as set out in its latest audited annual ConsolidatedFinancial Statements. Additionally, for the purpose of a Reinstatement pursuant to clause (ii) of thedefinition of “Mandatory Reinstatement Event”, the Mandatory Reinstatement Amount will becomputed so that the Securities will be reinstated by an increase in aggregate principal amount which isproportionate to the largest increase in principal amount of such Parity Securities.
41
Level: 6 – From: 6 – Wednesday, May 14, 2008 – 1:35 pm – g5mac4 – 3960 Section 03 : 3960 Section 03

“Mandatory Reinstatement Event” means (i) a Restricted Payment or (ii) the increase by theParent Companies or Fortis Hybrid Financing of the principal amount of any Parity Securities other thanthe Securities, the terms of which contain a provision for the reinstatement of their principal amountsimilar to that of the Securities.
Dividend Stopper and Supported Coupons
Dividend Stopper
Fortis Hybrid Financing will agree in the Indenture, and the Parent Companies will each agree inthe Support Agreement, that, in the case of any Exceptional Alternative Coupon, beginning on the dayFortis Hybrid Financing gives an Alternative Coupon Notice, and in the case of any Elective AlternativeCoupon, beginning on the relevant Regular Coupon Date relating to such coupon if the ElectiveAlternative Coupon is not paid on such Regular Coupon Date, and in each case continuing until allAlternative Coupons are paid in full, (A) each of Fortis Hybrid Financing and the Parent Companies (i)will not propose to its shareholders and, to the fullest extent permitted by applicable law, will otherwiseact to prevent the declaration or payment of any dividend, distribution or other payment on its OrdinaryShares or Parity Securities and (ii) will not redeem, repurchase or otherwise acquire any of its OrdinaryShares or Parity Securities (other than pursuant to a Permitted Share Acquisition) and (B) each of theParent Companies (i) will not declare or pay, and to the fullest extent permitted by applicable law, willotherwise act to prevent the declaration or payment of, any dividend, distribution or other payment on itsOrdinary Shares or Parity Securities and (ii) agrees that it will not vote, or will cause that no vote is madeby any of its subsidiaries, in favor of any of the actions of Fortis Hybrid Financing described in clauses(A)(i) and (ii) above; provided that the foregoing restriction shall not apply (i) to a dividend, distribution,payment or redemption in respect of any Exempt Share Class and (ii) to a dividend, distribution or otherpayment on any Parity Securities that is required to be paid, pursuant to the terms of such ParitySecurities, solely as a result of a dividend, distribution, payment or redemption in respect of any ExemptShare Class.
“SPV Parity Securities” means any preferred or preference shares or profit-sharing certificates(parts bénéficiaires) of Fortis Hybrid Financing and any securities which rank or are expressly stated torank pari passu with the Securities (collectively, “SPV Parity Shares”) or any securities which areexpressly stated to rank junior to the Securities (“SPV Junior Securities”). For the avoidance of doubt,the Perpetual Securities issued by Fortis Hybrid Financing on February 27, 2008 and June 20, 2006 areSPV Parity Shares. Fortis Hybrid Financing will covenant in the Indenture not to issue any guarantees ofany debt securities of any Person.
“Parent Company Parity Securities” means (i) any preferred or preference shares and anysecurities of either Parent Company which rank or are expressly stated to rank pari passu with theSecurities, SPV Parity Shares or the Subordinated Guarantee (“Parent Company Parity Shares”) or anysecurities of either Parent Company which rank or are expressly stated to rank junior to the Securities,SPV Parity Shares or the Subordinated Guarantee (“Parent Company Junior Securities”), (ii) guaranteesby either or both Parent Companies (whether through an agreement or instrument labeled as a guarantee,as a support agreement, or with some other name but with an effect similar to a guarantee or supportagreement) of any preferred securities or preferred or preference shares issued by any of either ParentCompany’s subsidiaries (including Fortis Hybrid Financing), which guarantees rank or are expressly statedto rank pari passu with the Securities or SPV Parity Shares or rank pari passu with Parent CompanyParity Shares (“Parent Company Parity Guarantees”) or which guarantees rank or are expressly statedto rank junior to the Securities or SPV Parity Shares or rank junior to Parent Company Parity Shares(“Parent Company Junior Guarantees”) and (iii) securities issued by any subsidiary of either ParentCompany (including Fortis Hybrid Financing) that are guaranteed under any Parent Company ParityGuarantee or Parent Company Junior Guarantee. For the avoidance of doubt, the (i) undated Floating RateEquity-linked Subordinated Hybrid (FRESH) Capital Securities issued by Fortfinlux S.A. on May 7, 2002,(ii) Mandatory Convertible Securities (MCS) issued by Fortis Bank Nederland (Holding) N.V. , FortisBank nv-sa, Fortis SA/NV and Fortis N.V. on December 7, 2007 and (iii) Convertible And Subordinated
42
Level: 6 – From: 6 – Wednesday, May 14, 2008 – 1:35 pm – g5mac4 – 3960 Section 03 : 3960 Section 03

Hybrid Equity-linked Securities (CASHES) issued by Fortis Bank nv-sa on December 19, 2007 are ParentCompany Parity Securities.
SPV Parity Securities and Parent Company Parity Securities are collectively referred to as “ParitySecurities”, Parent Company Parity Shares and SPV Parity Shares are collectively referred to as “ParityShares” and Parent Company Junior Securities and SPV Junior Securities are collectively referred to as“Junior Securities”.
“SPV Ordinary Shares” means ordinary shares of Fortis Hybrid Financing. “Parent CompanyOrdinary Shares” means ordinary shares of either of the Parent Companies or any ordinary shareequivalent that may replace or be substituted for the ordinary shares of either or both Parent Companies.Parent Company Ordinary Shares and SPV Ordinary Shares are referred to collectively as “OrdinaryShares”.
Supported Coupons
If during the Relevant Period, Fortis Hybrid Financing or either Parent Company (A) declares anydividend or makes any distribution or other payment on any Ordinary Shares or Parity Securities or (B)redeems, repurchases or otherwise acquires any Ordinary Shares or Parity Securities (other than pursuantto a Permitted Share Acquisition) (the foregoing events (A) and (B) each referred to as a “RestrictedPayment”), then, as necessary, the Parent Companies will, subject to the terms of the Support Agreement,jointly and severally contribute or cause to be contributed to the capital of Fortis Hybrid Financing orotherwise make available such funds as may be necessary to permit Fortis Hybrid Financing to pay in fullthe coupon payable on each Regular Coupon Date occurring during the Relevant Period (a “SupportedCoupon”), each such date a “Supported Coupon Date”; provided that if a Trigger Event shall haveoccurred prior to such Regular Coupon Date and is continuing on such Regular Coupon Date, theSupported Coupon Date shall be such date as provided for in clause (i) of the definition of AlternativeCoupon Satisfaction Date. Fortis Hybrid Financing will be permitted, but shall not be required, to satisfyits obligation to pay the coupon payable on a Supported Coupon Date in accordance with the AlternativeCoupon Payment Method; provided, however, that if a Trigger Event has occurred and is continuing onsuch Supported Coupon Date, Fortis Hybrid Financing will be required to satisfy its obligation to pay suchcoupon payable on a Supported Coupon Date in accordance with the Alternative Coupon PaymentMethod.
For purposes of the foregoing, “Relevant Period” means one year provided that such RelevantPeriod shall commence on and include the day of the relevant dividend, distribution, payment orredemption, repurchase or other acquisition but shall not include the corresponding day of the twelfthmonth thereafter.
Exempt Share Classes
The currently authorized number of 1,820 million cumulative preference shares in the capital ofFortis N.V. or any successor thereto of €0.42 each (an “Exempt Share Class”) shall be exempt from thedividend stopper and Supported Coupon provisions to the extent described above.
The Parent Companies will agree not to authorize unilaterally or to propose to their shareholdersthat they authorize any additional preference shares (other than Replacement Preference Shares) unlesssuch additional preference shares are subject to the dividend stopper and Supported Coupon provisionsdescribed above. “Replacement Preference Shares” means any preference shares to be created or issuedby either Parent Company in connection with the merger, consolidation, amalgamation or othercombination of an entity with and into such Parent Company in which such Parent Company is thesurviving entity, for the purpose of replacing preference shares issued or authorized by such other entity atthe time of the transaction.
43
Level: 6 – From: 6 – Wednesday, May 14, 2008 – 1:35 pm – g5mac4 – 3960 Section 03 : 3960 Section 03

Alternative Coupon Payment Method
General
Fortis Hybrid Financing will be required to satisfy its obligation to pay any Alternative Coupon onthe Alternative Coupon Satisfaction Date relating to such coupon in accordance with the proceduredescribed below (the “Alternative Coupon Payment Method”).
Notice
In respect of any coupon which Fortis Hybrid Financing will pay using the Alternative CouponPayment Method, Fortis Hybrid Financing shall give notice (an “Alternative Coupon Notice”) to theTrustee, any paying agent, any Calculation Agent and the holders that Fortis Hybrid Financing will satisfythe Elective Alternative Coupon or Exceptional Alternative Coupon (collectively, an “AlternativeCoupon”) payable on the applicable Regular Coupon Date using the Alternative Coupon Payment Method.Alternative Coupon Notices shall be given at least 16 business days prior to the applicable RegularCoupon Date or, if a Trigger Event should occur at any time prior to a Regular Coupon Date, as soon aspracticable following the occurrence of such Trigger Event and, in the case of an Exceptional AlternativeCoupon, any such notice shall also set forth, subject to a Postponement Event, the Alternative CouponSatisfaction Date. In respect of an Elective Alternative Coupon, except in the case of a Mandated Election,Fortis Hybrid Financing may give an Alternative Coupon Notice in its sole discretion and for any reason.Each Alternative Coupon Notice shall be given by mail and facsimile to the Trustee and any CalculationAgent and, if required, shall be published in an Authorized Newspaper.
Alternative Coupons are mandatorily payable with the Alternative Coupon Payment Method andshall be payable on the Alternative Coupon Satisfaction Date.
“Alternative Coupon Satisfaction Date” shall be a date, subject to a Postponement Event, whichis (i) in the case of an Exceptional Alternative Coupon or a Supported Coupon where a Trigger Eventoccurs, or has occurred and is continuing, on the applicable Regular Coupon Date, the later of 90 businessdays following the date on which such Trigger Event first occurred or the next Regular Coupon Datefollowing the date on which such Trigger Event first occurred; provided that Fortis Hybrid Financing shalluse its best efforts to satisfy an Exceptional Alternative Coupon within 30 calendar days following the firstRegular Coupon Date after such Trigger Event first occurred, or (ii) in the case of an Elective AlternativeCoupon or a Supported Coupon with respect to which Fortis Hybrid Financing elects to use the AlternativeCoupon Payment Method, the relevant Regular Coupon Date.
Notwithstanding the provision (i) above, if any Postponement Event has occurred, the AlternativeCoupon Satisfaction Date shall be the date notified to the Trustee, the paying agents, the Calculation Agentand the holders of the Securities, which shall be a date no later than 20 business days following the date onwhich, in the opinion of Fortis Hybrid Financing and the Parent Companies, a Postponement Event is nolonger continuing.
Issuance, Exchange and Sale Procedure
Fortis Hybrid Financing’s obligation to pay Alternative Coupons on the Alternative CouponSatisfaction Date relating to such coupon, in accordance with the Alternative Coupon Payment Method,will be satisfied as follows:
(i) Fortis Hybrid Financing will give an Alternative Coupon Notice to the Trustee, any payingagent, the Calculation Agent and holders of the Securities of the forthcoming AlternativeCoupon Satisfaction Date, including if the Alternative Coupon Payment Method will be usedto satisfy a coupon payable on a Regular Coupon Date or Supported Coupon Date, as thecase may be;
(ii) on or before the 7th business day preceding such Alternative Coupon Satisfaction Date, theTrustee (or its custodian), acting on behalf of the holders of the Securities, will contribute theAlternative Coupons to the capital of Fortis SA/NV and/or Fortis N.V. (as instructed by the
44
Level: 6 – From: 6 – Wednesday, May 14, 2008 – 1:35 pm – g5mac4 – 3960 Section 03 : 3960 Section 03

Parent Companies and, in each case, subject to compliance with applicable Belgian andDutch law), against which the Parent Companies will issue Fortis Shares having, in thejudgment of the Calculation Agent, an aggregate fair market value equal to the aggregateamount of Alternative Coupons that will be payable on such Alternative Coupon SatisfactionDate, plus, subject to the proviso below, any expenses to be borne by Fortis Hybrid Financingor the Parent Companies in connection with using the Alternative Coupon Payment Method(including, without limitation, claims for the costs, fees and expenses of the CalculationAgent and the Trustee and their agents); provided that, for purposes of the foregoingcalculation, such expenses shall not be included in such calculation or contributed as a claimfor reimbursement against Fortis Hybrid Financing or either Parent Company, to the extentthat such expenses are otherwise paid or provided for by Fortis Hybrid Financing or eitherParent Company, as the case may be, on or before the 8th business day preceding suchAlternative Coupon Satisfaction Date;
(iii) as soon as reasonably practicable after receipt by Fortis SA/NV and/or Fortis N.V. of theapplicable Alternative Coupons in exchange for the Fortis Shares referenced in clause (ii)above, the Calculation Agent will use reasonable endeavors on normal market terms toprocure purchasers for such Fortis Shares which, when sold, are intended to provide enoughcash to enable the Trustee to make full payment of the Alternative Coupons then payable.The Trustee (or its custodian) will then transfer such Fortis Shares as instructed by theCalculation Agent, and the Trustee (or any paying agent) will collect any sales proceeds; and
(iv) on such Alternative Coupon Satisfaction Date, the Trustee (or any paying agent) will applysuch sales proceeds first, towards the payment of any expenses to be borne by Fortis HybridFinancing or the Parent Companies in connection with the use of the Alternative CouponPayment Method (including without limitation, claims for the costs, fees and expenses of theCalculation Agent and the Trustee) and then, towards the payment of the Alternative Couponsthen payable.
In connection with the payment of Exceptional Alternative Coupons on an Alternative CouponSatisfaction Date, the completion of the foregoing steps (i) through (iv) will be in full satisfaction of FortisHybrid Financing’s obligation to pay such Exceptional Alternative Coupons, without regard to whether thenet sales proceeds ultimately delivered to the holders of the Securities are equal to the amount of theExceptional Alternative Coupons payable on such Alternative Coupon Satisfaction Date. For the avoidanceof doubt, Exceptional Alternative Coupons include coupons for which an Alternative Coupon Notice hasbeen delivered regarding an Elective Alternative Coupon but where subsequent to the delivery of suchnotice and prior to the Regular Coupon Date a Trigger Event shall occur and be continuing.
If the net sales proceeds from the sale of Fortis Shares available for distribution to holders of theSecurities are less than the full amount of the Alternative Coupon, holders of Securities will be paidratably in any distribution of such proceeds, in proportion to the full amount of the Alternative Coupon onsuch holder’s Securities.
In connection with the payment of Elective Alternative Coupons on an Alternative CouponSatisfaction Date, if the net sales proceeds from the sale of Fortis Shares are insufficient to pay the fullamount of the coupon, then Fortis Hybrid Financing shall make such additional payments as shall benecessary to ensure the coupon is paid in full and, in the case of any coupon payable on a SupportedCoupon Date, if Fortis Hybrid Financing is unable to make such payments the Parent Companies shallmake such additional payments in accordance with the Support Agreement described below.
As used herein, the “fair market value” of one Fortis Share shall be calculated by the CalculationAgent and notified to the Trustee and the Parent Companies and shall be equal to the Volume WeightedAverage Price on the first Stock Exchange Business Day preceding the eighth business day preceding theapplicable Alternative Coupon Satisfaction Date. In the event that the Volume Weighted Average Price isnot available on such date, “fair market value” shall be the first available Volume Weighted Average Pricein the seven Stock Exchange Business Days immediately preceding such eighth business day precedingsuch Alternative Coupon Satisfaction Date. In the event that the Volume Weighted Average Price is not
45
Level: 6 – From: 6 – Wednesday, May 14, 2008 – 1:35 pm – g5mac4 – 3960 Section 03 : 3960 Section 03

available during such period, then the fair market value shall be determined by the Parent Companies inconjunction with two investment banks (unaffiliated with the Parent Companies) of international reputeselected by the Parent Companies.
“Fortis Share” means a unit comprising one ordinary share in the capital of Fortis N.V. twinnedwith one ordinary share in the capital of Fortis SA/NV, or any successor ordinary share issued by eitherParent Company.
“Stock Exchange Business Day” means any day (other than a Saturday or Sunday) on which theRelevant Exchange is open for business.
“Relevant Exchange” means Euronext Brussels SA/NV (“Euronext Brussels”) and EuronextAmsterdam N.V. (Euronext Amsterdam) or the principal stock exchange or securities market on which theFortis Shares are traded.
“Volume Weighted Average Price” means the average of the volume weighted average price of aFortis Share as traded on the Relevant Exchange for each of the five preceding Stock Exchange BusinessDays to and including the date of calculation. For so long as the Fortis Share is traded on both EuronextBrussels and Euronext Amsterdam, the volume weighted average price shall be the arithmetic average ofsuch volume weighted average prices.
Sufficiency of Ordinary Shares
Fortis Hybrid Financing will be able to pay Alternative Coupons in accordance with the AlternativeCoupon Payment Method only to the extent that the Parent Companies have enough authorized andunissued Parent Company Ordinary Shares to permit the issuance of Fortis Shares to enable Fortis HybridFinancing to pay Alternative Coupons on any Alternative Coupon Satisfaction Date in accordance with theAlternative Coupon Payment Method. The Parent Companies will jointly and severally undertake in theSupport Agreement to use all reasonable efforts to ensure that each of the Parent Companies has sufficientauthorized and unissued Parent Company Ordinary Shares for this purpose; provided that the ParentCompanies shall not be required to acquire any issued and outstanding Fortis Shares. See “Description ofthe Support Agreement — Alternative Coupon Payment Method”.
The Trustee and the holders of the Securities will agree that Fortis Hybrid Financing will be entitledto pay coupons on any Regular Coupon Date, whether or not such Regular Coupon Date is an AlternativeCoupon Satisfaction Date or a Supported Coupon Date, in accordance with the Alternative CouponPayment Method.
Postponement Event
Any Alternative Coupon shall be payable on an Alternative Coupon Satisfaction Date. However, ifany Postponement Event shall occur, Fortis Hybrid Financing’s obligation to make payment using theAlternative Coupon Payment Method shall be deferred until a Postponement Event is no longercontinuing.
For these purposes, “Postponement Event” shall mean:
• a Market Disruption Event exists on or after the 15th business day preceding any AlternativeCoupon Satisfaction Date,
• if, notwithstanding the actions taken by the Parent Companies as described under “—Alternative Coupon Payment Method — Sufficiency of Ordinary Shares”, the availableOrdinary Shares of either Parent Company are not sufficient to raise any amount of theAlternative Coupons that would otherwise be payable on an Alternative Coupon SatisfactionDate, a Postponement Event will occur with respect to the Alternative Coupon SatisfactionDate with respect to any such unpaid amount until such time as the shareholders of the ParentCompanies approve resolutions authorizing the issuance of sufficient Ordinary Shares,
46
Level: 6 – From: 6 – Wednesday, May 14, 2008 – 1:35 pm – g5mac4 – 3960 Section 03 : 3960 Section 03
• the Parent Companies are subject to a “blackout” period which, under applicable securitieslaws or Parent Company policies then in place, would not permit the Parent Companies toissue Fortis Shares until the release of information which has resulted in the commencementof such blackout period or such blackout period has otherwise terminated, or
• as a result of any covenant, undertaking, guarantee or other similar provision in any Seniorand Subordinated Indebtedness and/or Parity Securities (other than Junior Securities andJunior Guarantees), either Fortis Hybrid Financing or the Parent Companies would not bepermitted to pay any Alternative Coupon because Fortis Hybrid Financing or the ParentCompanies has not satisfied its obligations under such Senior and Subordinated Indebtednessand/or Parity Securities (other than Junior Securities and Junior Guarantees), as the case maybe.
For all purposes of these terms and conditions, if any Postponement Event has occurred, theAlternative Coupon Satisfaction Date shall be the date notified by Fortis Hybrid Financing or the ParentCompanies to the Trustee, any paying agent, the Calculation Agent and the holders of the Securities, whichshall be a date no later than 20 business days following the date on which, in the opinion of Fortis HybridFinancing and the Parent Companies, a Postponement Event is no longer continuing.
“Market Disruption Event” means (i) the occurrence or existence of any material suspension of orlimitation on trading or on settlement procedures for transactions in Fortis Shares through the primarystock exchange or exchanges on which Fortis Shares are then traded or the principal central securitiesdepositary through which Fortis Shares are then cleared which are material in the context of the FortisShares or (ii) the existence of any prohibition or material restriction imposed by applicable law (or byorder, decree or regulation of any governmental entity, stock exchange or self-regulating body havingjurisdiction) on the ability of either Parent Company to issue and/or transfer Fortis Shares.
Fortis Hybrid Financing shall agree to use its reasonable best efforts to complete the steps describedin clause (i) under “— Alternative Coupon Payment Method — Issuance, Exchange and Sale Procedure”,notwithstanding the occurrence of a Postponement Event, to the extent it can do so without violation ofany applicable law and in compliance with any covenant, undertaking, guarantee or other similar provisionin any Senior and Subordinated Indebtedness and/or Parity Securities (other than Junior Securities andJunior Guarantees).
Additional Amounts
All payments in respect of the Securities will be made free and clear of and without withholding ordeduction for or on account of any present or future taxes, duties, or other governmental charges ofwhatever nature imposed or levied by or on behalf of Luxembourg or any political subdivision thereof orany authority or agency therein or thereof having the power to tax (“Relevant Tax”), unless thewithholding or deduction is required by law. If at any time Fortis Hybrid Financing is required to withholdor deduct any Relevant Tax with respect to any payments on the Securities, Fortis Hybrid Financing willbe required to pay such additional amounts (“Additional Amounts”) as shall be required so that the netamount received by each holder of Securities after the withholding or deduction of any such Relevant Taxwill not be less than the amount then due and payable to each holder of Securities in the absence of suchwithholding or deduction. However, Fortis Hybrid Financing will not be required to pay AdditionalAmounts:
(i) to the extent that the Relevant Tax is imposed or levied because the holder of Securities (orthe beneficial owner of such Securities) has some connection with Luxembourg, other thanbeing a holder (or beneficial owner) of Securities;
(ii) to the extent that the Relevant Tax is imposed or levied because that holder (or beneficialowner) has not made a declaration of non-residence in, or other lack of connection with,Luxembourg or any similar claim for exemption, to the relevant tax authority; provided thatsuch declaration or claim is required by law, regulations or the relevant tax treaty and Fortis
47
Level: 6 – From: 6 – Wednesday, May 14, 2008 – 1:35 pm – g5mac4 – 3960 Section 03 : 3960 Section 03

Hybrid Financing or its agent has given the holder or beneficial owner at least 60 days’ priorwritten notice of and opportunity to make the declaration or claim;
(iii) where such Relevant Tax is imposed on a payment to an individual and is required to bemade pursuant to the European Council Directive 2003/48/EC or any other directive on thetaxation of savings income or any law or treaty implementing or complying with, orintroduced in order to conform to, such Directives;
(iv) where such Relevant Tax is imposed on a payment to a Luxembourg resident individual andis required to be made pursuant to the Luxembourg law of December 23, 2005; or
(v) in respect of any coupon or Security presented for payment by or on behalf of a holder whowould have been able to avoid such Relevant Tax by having such coupon or Security paid byanother paying agent in a member state of the European Union other than Luxembourg.
If Fortis Hybrid Financing is unable to make payments of such Additional Amounts, the ParentCompanies shall make such payments of Additional Amounts available to Fortis Hybrid Financing inaccordance with the Support Agreement described below.
Each reference herein to payments in respect of the Securities (including, without limitation,Alternative Coupons and Supported Coupons, if any) shall be deemed to include Additional Amounts, ifany.
Optional Redemption
The Securities are not redeemable at the option of the holders thereof at any time and are notredeemable at the option of Fortis Hybrid Financing prior to May 30, 2013 or such other date that will bethe fifth anniversary of the Issue Date (the “First Call Date”), except in certain circumstances upon theoccurrence of a Tax Event or a Tier 1 Disqualification Event. See “ — Redemption upon Certain Events”.
The Securities may be redeemed at the option of Fortis Hybrid Financing, in whole or in part, onthe First Call Date or on any subsequent Regular Coupon Date; provided that Fortis Hybrid Financing willgive notice to holders of Securities and the Trustee not less than 30 business days but not more than 60business days prior to any such redemption. This notice shall be given in accordance with the noticeprovisions described under “General Listing Information — Notices to Holders”.
The redemption price for such redemptions will be (i) 100% of the Original Principal Amount ofthe Securities, plus (ii) an amount equal to unpaid coupons, if any, thereon with respect to the then-currentCoupon Period accrued on a daily basis through the date fixed for redemption, plus (iii) an amount equalto unpaid Alternative Coupons, if any (the “Base Redemption Price”).
Partial redemptions shall be performed by drawing for redemption in a manner approved by theTrustee or, for so long as the Securities are held in a clearing system, in accordance with the operatingprocedures of such clearing system. For the avoidance of doubt, such redemption of Current PrincipalAmount is distinct from a Loss Absorption.
Any optional redemption of Securities is subject to compliance with applicable regulatoryrequirements, including the prior approval of the BFIC. In any event, no redemption of Securities will bepermitted if and to the extent that, (i) before or after giving effect to such redemption, a Trigger Event hasoccurred and is continuing or would occur, or (ii) a Loss Absorption has occurred and the Securities havenot yet been reinstated in full, unless the BFIC approves a redemption in such circumstances at 100% ofthe Original Principal Amount of the Securities.
The Base Redemption Price shall be paid to the person(s) who are the registered holders of theSecurities as evidenced by the register for the Securities on the date which is 15 calendar days precedingthe date fixed for redemption.
48
Level: 6 – From: 6 – Wednesday, May 14, 2008 – 1:35 pm – g5mac4 – 3960 Section 03 : 3960 Section 03

Redemption upon Certain Events
Tax Event
Upon the occurrence of a Tax Event, subject to the conditions set forth below, Fortis HybridFinancing will have the right at any time to redeem the Securities in whole (and not in part) at the BaseRedemption Price.
For purposes of the foregoing, “Tax Event” means the receipt by Fortis Hybrid Financing of anopinion of a nationally recognized law firm or other tax adviser (which may be an accounting firm) inLuxembourg experienced in such matters to the effect that, as a result of (i) any amendment to,clarification of, or change (including any announced prospective change) in, the laws or treaties (or anyregulations thereunder) of Luxembourg or any political subdivision or taxing authority thereof or thereinaffecting taxation, (ii) any Administrative Action or (iii) any amendment to, clarification of, or change inthe official position on the interpretation of any Administrative Action or any interpretation orpronouncement that provides for a position with respect to any Administrative Action that differs from thetheretofore generally accepted position, in each case, by any legislative body, court, governmentalauthority or regulatory body, irrespective of the manner in which such amendment, clarification, change,interpretation or pronouncement is made known, which amendment, clarification or change is effective orwhich interpretation or pronouncement is announced on or after the Issue Date of the Securities, there ismore than an insubstantial risk that (A) Fortis Hybrid Financing is or will be required to pay anyAdditional Amounts or (B) any interest deduction or other similar direct or indirect tax benefit available toFortis Hybrid Financing under Luxembourg law in respect of the Current Principal Amount of theSecurities is eliminated, reduced or otherwise adversely affected in any material respect.
The Base Redemption Price shall be paid to the person(s) who are the registered holders of theSecurities as evidenced by the register for the Securities on the date which is 15 calendar days precedingthe date fixed for redemption.
Tier 1 Disqualification Event
Upon the occurrence of a Tier 1 Disqualification Event, and subject to the conditions set forthbelow, Fortis Hybrid Financing will have the right at any time to redeem the Securities in whole (and notin part) at the Base Redemption Price.
For purposes of the foregoing, “Tier 1 Disqualification Event” means the receipt by either of theParent Companies of an opinion, declaration, rule or decree of the BFIC to the effect that there has been achange in (i) the law or regulation or (ii) the interpretation thereof, resulting in more than an insubstantialrisk that the Securities (or any portion thereof) will not be eligible to be included in calculating the Tier 1capital of Fortis Group.
Any redemption of Securities upon the occurrence of a Tax Event or a Tier 1 Disqualification Eventis subject to compliance with applicable regulatory requirements, including the prior approval of the BFIC.In any event, no redemption of Securities will be permitted if and to the extent that, (i) before or aftergiving effect to such redemption, a Trigger Event has occurred and is continuing or would occur, or (ii) aLoss Absorption has occurred and the Securities have not yet been reinstated in full, unless the BFICapproves a redemption in such circumstances at 100% of the Original Principal Amount of the Securities.
The Base Redemption Price shall be paid to the person(s) who are the registered holders of theSecurities as evidenced by the register for the Securities on the date which is 15 calendar days precedingthe date fixed for redemption.
Subordination
Subordination of the Securities
The Securities, as obligations of Fortis Hybrid Financing, are contractually subordinated to Seniorand Subordinated Indebtedness of Fortis Hybrid Financing. The payment obligations of Fortis Hybrid
49
Level: 6 – From: 6 – Wednesday, May 14, 2008 – 1:35 pm – g5mac4 – 3960 Section 03 : 3960 Section 03

Financing under the Securities constitute unsecured subordinated obligations of Fortis Hybrid Financing.The claims of the holders of the Securities for payment by Fortis Hybrid Financing under the Securitieswill rank:
(vi) behind (junior to) the claims of holders of Senior and Subordinated Indebtedness;
(vii) pari passu with claims of holders of Other Pari passu Claims; and
(viii) before (senior to) (x) the claims for payment of any obligation that, expressly or byapplicable law, is subordinated to the Securities and (y) the claims of holders of SPVOrdinary Shares.
“Senior and Subordinated Indebtedness” means all liabilities of Fortis Hybrid Financing(including those in respect of bonds, notes and debentures (whether senior or subordinated)), other thanliabilities of Fortis Hybrid Financing under the Securities or SPV Parity Securities.
“Other Pari passu Claims” means claims of creditors of Fortis Hybrid Financing which aresubordinated so as to rank pari passu with claims in respect of the Securities.
The debt evidenced by the Securities is subordinated in right of payment, to the extent and in themanner provided in the Indenture, to the prior payment of all existing and future Senior and SubordinatedIndebtedness. The subordination provisions are for the benefit of and enforceable by the holders of Seniorand Subordinated Indebtedness of Fortis Hybrid Financing.
In accordance with Fortis Hybrid Financing’s articles of incorporation it may only issue securitieswhich are pari passu with each other.
General Effect of Contractual Subordination
By reason of the subordination provisions contained in the Indenture, in an event creating a generalconcursus creditorum on the entire assets of Fortis Hybrid Financing, creditors of Fortis Hybrid Financingthat are holders of Senior and Subordinated Indebtedness of Fortis Hybrid Financing may recover more,ratably, than the holders in respect of the Securities.
“general concursus creditorum” means with respect to (i) Fortis Hybrid Financing, any concursuscreditorum (concours de créanciers) on the entire assets of Fortis Hybrid Financing, including bankruptcy(faillite), moratorium (concordat judiciaire), suspension of payment (sursis de paiement), controlledmanagement (gestion contrôlée) and judicial or voluntary liquidation (liquidation judiciaire ou volontaire),(ii) Fortis SA/NV, any concursus creditorum (concours de créanciers/samenloop van schuldeisers) on theentire assets of Fortis SA/NV, including bankruptcy (faillite/faillissement), moratorium (concordatjudiciaire/gerechtelijk akkoord) and judicial or voluntary dissolution and liquidation (dissolution etliquidation judiciaire ou volontaire/gerechtelijke of vrijwillige ontbinding en vereffening), except in thelatter case for corporate reorganizations involving a voluntary dissolution without liquidation (dissolutionvolontaire sans liquidation/vrijwillige ontbinding zonder vereffening) as referred to in Articles 671-676 ofthe Belgian Code of Companies and (iii) Fortis N.V., bankruptcy (faillissement), moratorium of payments(surséance van betaling) or dissolution (ontbinding).
Consolidation, Merger or Sale of Assets
The Indenture provides as follows regarding consolidation, merger or sale of all or substantially allof the assets of Fortis Hybrid Financing:
Consolidation, Merger or Sale of Assets by Fortis Hybrid Financing; No Lease of All orSubstantially All Assets
Fortis Hybrid Financing will not
• consolidate with or merge with or into any Person, or
50
Level: 6 – From: 6 – Wednesday, May 14, 2008 – 1:35 pm – g5mac4 – 3960 Section 03 : 3960 Section 03
• sell, convey, transfer, or otherwise dispose of all or substantially all of its assets as an entiretyor substantially an entirety, in one transaction or a series of related transactions, to anyPerson or
• permit any Person to merge with or into Fortis Hybrid Financing unless:
(1) either (x) Fortis Hybrid Financing is the continuing Person or (y) the resulting, surviving ortransferee Person expressly assumes by supplemental indenture all of the obligations of FortisHybrid Financing under the Indenture and the Securities;
(2) immediately after giving effect to the transaction, no Remedies Event has occurred and iscontinuing; and
(3) Fortis Hybrid Financing delivers to the Trustee an Officer’s Certificate and an opinion ofcounsel, in form and substance satisfactory to the Trustee, each stating that the consolidation,merger or transfer and the supplemental indenture (if any) comply with the Indenture;
provided that clauses (2) and (3) do not apply (i) to the consolidation or merger of Fortis HybridFinancing with or into a wholly-owned subsidiary or the consolidation or merger of a wholly-ownedsubsidiary with or into Fortis Hybrid Financing or (ii) if, in the good faith determination of the board ofdirectors of Fortis Hybrid Financing, whose determination is evidenced by a board resolution, the solepurpose of the transaction is to change the jurisdiction of incorporation of Fortis Hybrid Financing.
Upon the consummation of any transaction effected in accordance with these provisions, if FortisHybrid Financing is not the continuing Person, the resulting, surviving or transferee Person will succeedto, and be substituted for, and may exercise every right and power of, Fortis Hybrid Financing under theIndenture with the same effect as if such successor Person had been named as Fortis Hybrid Financing inthe Indenture. Upon such substitution, Fortis Hybrid Financing will be released from its obligations underthe Indenture and the Securities.
Limitation on Remedies
A “Remedies Event” occurs if
(1) Fortis Hybrid Financing fails to pay any Alternative Coupons due and payable on theAlternative Coupon Satisfaction Date with respect thereto and such failure continues for aperiod of 30 days; or
(2) Fortis Hybrid Financing fails to pay any Supported Coupons due and payable on theSupported Coupon Date with respect thereto and such failure continues for a period of 30days.
Consequences of a Remedies Event
If a Remedies Event occurs and is continuing under the Indenture, the Trustee or the holders of atleast 25% in aggregate Current Principal Amount then outstanding, by written notice to Fortis HybridFinancing (and to the Trustee if the notice is given by the holders), may, and the Trustee at the request ofsuch holders shall (provided it is indemnified and/or secured to its satisfaction), institute proceedings toobtain the payment of the amounts due or compliance with the defaulted covenant or agreement or toobtain the bankruptcy of Fortis Hybrid Financing (or any analogous proceeding which may be availablefrom time to time under the laws of Luxembourg). Neither the Trustee nor the holders may declare theprincipal amount of the Securities due and payable. No remedy against Fortis Hybrid Financing, other thanthe institution of the proceedings referred to above or resulting in the liquidation of Fortis HybridFinancing, shall be available to the holders of the Securities in respect of any Remedies Event except asotherwise provided in the Subordinated Guarantee.
In connection with the institution of proceedings by such holders, or the Trustee at the request ofsuch holders, against Fortis Hybrid Financing, to obtain payments of any amounts due under the
51
Level: 6 – From: 6 – Wednesday, May 14, 2008 – 1:35 pm – g5mac4 – 3960 Section 03 : 3960 Section 03

Securities, such holders or the Trustee may require Fortis Hybrid Financing, and Fortis Hybrid Financingshall agree, to enforce any rights it may have under the intercompany loans it makes to any of the FortisGroup operating companies. See “Use of Proceeds”.
The holders of a majority in aggregate Current Principal Amount may direct the time, method andplace of conducting any proceeding for any remedy available to the Trustee or exercising any trust orpower conferred on the Trustee. However, the Trustee may refuse to follow any direction that conflictswith law or the Indenture, that may involve the Trustee in personal liability, or that the Trustee determinesin good faith may be unduly prejudicial to the rights of holders of Securities not joining in the giving ofsuch direction, and may take any other action it deems proper that is not inconsistent with any suchdirection received from holders of Securities.
A holder may not institute any proceeding, judicial or otherwise, with respect to the Indenture or theSecurities, or for the appointment of a receiver or trustee, or for any other remedy under the Indenture orthe Securities, unless:
(1) the holder has previously given to the Trustee written notice of a continuing Remedies Event;
(2) holders of at least 25% in aggregate Current Principal Amount have made a written request tothe Trustee to institute proceedings in respect of the Remedies Event in its own name asTrustee under the Indenture;
(3) holders have offered to the Trustee indemnity and/or security reasonably satisfactory to theTrustee against any costs, liabilities or expenses to be incurred in compliance with suchrequest;
(4) the Trustee for 60 days after its receipt of such notice, request and offer of indemnity hasfailed to institute any such proceeding; and
(5) during such 60-day period, the holders of a majority in aggregate Current Principal Amountof the outstanding Securities have not given the Trustee a direction that is inconsistent withsuch written request;
it being understood and intended that no one or more holders shall have any right in any manner whateverby virtue of, or by availing of, any provision of the Indenture to affect, disturb or prejudice the rights ofany other holders, or to obtain or to seek to obtain priority or preference over any other holders or toenforce any right under the Indenture, except in the manner herein provided and for the equal and ratablebenefit of all the holders.
If any Remedies Event occurs and is continuing and is known to the Trustee, the Trustee will sendnotice of the Remedies Event to each holder within 90 days after it occurs, unless the Remedies Event hasbeen cured.
Reinstatement upon Liquidation or Bankruptcy
In the event of a judicial or voluntary liquidation (liquidation judiciaire ou volontaire/gerechtelijkeof vrijwillige vereffening) or bankruptcy (faillite/faillissement) of a Parent Company or Fortis HybridFinancing, the Parent Companies or Fortis Hybrid Financing shall cause a Reinstatement, as necessary, inan amount up to the Original Principal Amount of the Securities, subject to any necessary regulatoryapproval.
The rights of holders of Securities in the event of such liquidation or bankruptcy will be calculatedon the basis of (i) the Original Principal Amount of the Securities they hold, plus (ii) an amount equal tounpaid coupons, if any, thereon with respect to the current Coupon Period accrued on a daily basis throughthe date of the decision of the court or the shareholders’ meeting relating to the liquidation or of thedecision of the court relating to the bankruptcy, as the case may be, plus (iii) an amount equal to unpaidAlternative Coupons, if any; provided that the amount of any claim related to such Alternative Coupons(whether against Fortis Hybrid Financing or the Parent Companies) may not exceed an amount equal to
52
Level: 6 – From: 6 – Wednesday, May 14, 2008 – 1:35 pm – g5mac4 – 3960 Section 03 : 3960 Section 03

25% of the Original Principal Amount of the Securities. No payments will be made to the holders ofSecurities before all amounts due, but unpaid, to all other senior and subordinated creditors of theliquidated or bankrupt entity have been paid by the Parent Companies or Fortis Hybrid Financing, as thecase may be, as ascertained by the liquidator or the trustee in bankruptcy.
No Liability of Directors, Officers, Employees, Incorporators and Shareholders
Subject to mandatory provisions of applicable law, no director, officer, employee, incorporator,member or shareholder of Fortis Hybrid Financing or either Parent Company, as such, will have anyliability for any obligations of Fortis Hybrid Financing or such Parent Company under the Securities, theSupport Agreement, the Subordinated Guarantee Agreement or the Indenture or for any claim based on, inrespect of, or by reason of, such obligations. Each holder of Securities by accepting a Security waives andreleases all such liability. The waiver and release are part of the consideration for issuance of theSecurities.
Amendments and Waivers
Amendments without Consent of Holders
Fortis Hybrid Financing and the Trustee may amend or supplement the Indenture or the Securitieswithout notice to or the consent of any holder of Securities:
(1) to cure any ambiguity, to correct or supplement any provision of the Indenture which may beinconsistent with any other provision therein, or to make any other provisions with respect tomatters or questions arising under the Indenture which shall not be inconsistent with theprovisions of the Indenture;
(2) to comply with the provisions relating to consolidation, merger and sale of assets in theIndenture;
(3) to evidence and provide for the acceptance of appointment by a successor trustee; or
(4) to make any other change that shall not adversely affect the interests of the holders in anymaterial respect.
Amendments with Consent of Holders
Except as otherwise provided in “— Amendments without Consent of Holders” or the followingparagraph, Fortis Hybrid Financing and the Trustee may amend or supplement the Indenture and theSecurities with the written consent of the holders of a majority of 75% in aggregate Current PrincipalAmount and the holders of a majority of 75% in aggregate Current Principal Amount may waive futurecompliance by Fortis Hybrid Financing with any provision of the Indenture or the Securities.
Notwithstanding the provisions of the preceding paragraph, without the consent of each holder ofSecurities affected, an amendment, supplement or waiver may not
(1) reduce the principal amount of any Security,
(2) change the time of payment of any coupon or reduce the rate of any coupon payment on anySecurity,
(3) reduce the amount payable upon the redemption of any Security or change the times at whichany Security may be redeemed or, once notice of redemption has been given, the time atwhich it must thereupon be redeemed,
(4) change the obligation of Fortis Hybrid Financing (or its successor) to pay AdditionalAmounts and coupons (including Supported Coupons and Alternative Coupons), if any,
(5) make any Security payable in money other than that stated in the Security,
53
Level: 6 – From: 6 – Wednesday, May 14, 2008 – 1:35 pm – g5mac4 – 3960 Section 03 : 3960 Section 03

(6) impair the right of any holder of Securities to receive any principal payment or couponpayment (including Supported Coupons) on such holder’s Securities, on or after theapplicable Coupon Date thereof, or to institute suit for the enforcement of any such payment,
(7) make any change in the percentage of the aggregate principal amount of the Securitiesrequired for amendments or waivers, or
(8) modify or change any provision of the Indenture affecting the ranking of the Securities in amanner adverse to the holders of the Securities.
Neither Fortis Hybrid Financing nor any of its subsidiaries or affiliates may, directly or indirectly,pay or cause to be paid any consideration, whether by way of interest, fee or otherwise, to any holder ofSecurities for or as an inducement to any consent, waiver or amendment of any of the terms or provisionsof the Indenture or the Securities unless such consideration is offered to be paid or agreed to be paid to allholders of the Securities that consent, waive or agree to amend such term or provision within the timeperiod set forth in the solicitation documents relating to the consent, waiver or amendment.
Meetings of Shareholders and Right to Information
The holders of the Securities shall be entitled to attend all general meetings of shareholders ofFortis Hybrid Financing, in accordance with Luxembourg law, and they shall be entitled to receive anydocuments that are to be remitted to them in accordance with applicable Luxembourg law. The holders ofthe Securities who attend any general meeting of shareholders shall be entitled only to a consultative vote.
Concerning the Trustee
The Bank of New York is the Trustee under the Indenture.
Except during the continuance of a Remedies Event, the Trustee need perform only those duties thatare specifically set forth in the Indenture and no others, and no implied covenants or obligations will beread into the Indenture against the Trustee. In case a Remedies Event has occurred and is continuing, theTrustee shall exercise those rights and powers vested in it by the Indenture and use the same degree of careand skill in their exercise, as a prudent person would exercise or use under the circumstances in theconduct of his or her own affairs. No provision of the Indenture, the Support Agreement or theSubordinated Guarantee Agreement will require the Trustee to expend or risk its own funds or otherwiseincur any financial liability in the performance of its duties thereunder, or in the exercise of its rights orpowers, unless it receives indemnity and/or security satisfactory to it against any loss, liability or expense.
Reports to Trustee
Fortis Hybrid Financing will deliver to the Trustee as soon as possible and in any event within 30days after Fortis Hybrid Financing becomes aware or should reasonably become aware of the occurrenceof a Remedies Event or an event which, with notice or the lapse of time or both, would constitute aRemedies Event, an Officer’s Certificate setting forth the details of such Remedies Event, and the actionwhich Fortis Hybrid Financing proposes to take with respect thereto.
Form and Denomination
The Securities will be issued in registered form in denominations of €1,000 principal amount.
The Securities will be evidenced by a global certificate, in registered form, deposited on the ClosingDate with, and registered in the name of, a common depositary for Euroclear Bank SA/NV (“Euroclear”)and Clearstream Banking, société anonyme, Luxembourg (“Clearstream”). The address of Euroclear is 1Boulevard de Roi Albert II, 1210 Brussels, Belgium. The address of Clearstream is 42 Avenue JF Kennedy,L-1835 Luxembourg.
The Securities traded on Euronext Amsterdam are eligible for settlement in the systems of EuroclearNIEC.
54
Level: 6 – From: 6 – Wednesday, May 14, 2008 – 1:35 pm – g5mac4 – 3960 Section 03 : 3960 Section 03

Interests in the global certificate will be exchangeable in whole but not in part for definitiveSecurities in registered form with no coupons attached only if (A) (i) the Securities become ineligible forclearance and settlement through Euroclear and Clearstream and (ii) Fortis Hybrid Financing is not able,after using reasonable efforts, to arrange for clearance and settlement of the Securities through a successorclearing system within 120 days of receiving notice of such event or (B) if as a result of any amendmentto, or change in, the laws or regulations of Luxembourg (or any political sub-division thereof) or of anyauthority therein or thereof having power to tax or in the interpretation, by a revenue authority or a courtor administration, of such laws or regulations which become effective on or after the Closing Date, FortisHybrid Financing or any paying agent is or will be required to make any deduction or withholding fromany payment in respect of the Securities which would not be required were the Securities in definitiveregistered form.
Listing and Trading
Application has been made to list the Securities on the official list of the Luxembourg StockExchange and Euronext Amsterdam and to admit them to trading on the Regulated Market of theLuxembourg Stock Exchange on the regulated market of Euronext Amsterdam.
Coupon and Principal Payments
The Indenture will require that payments of coupons and principal in respect of the Securitiesevidenced by the global certificate shall be made by Fortis Hybrid Financing directly or through anypaying agent by wire transfer of immediately available funds to the account specified by the holder of theglobal certificate. Payments shall be made by Fortis Hybrid Financing directly or through any paying agentto the person in whose name the Security is registered at the close of business on the Record Date, and, inrespect of definitive Securities, shall be paid by check payable in Euros mailed to the address of the personas it appears on the Security register, or, at the option of such holder, by transfer to an accountdenominated in Euros.
Governing Law
The Indenture and the Securities will be governed by the laws of the State of New York, except thatthe subordination and meetings of Shareholders provisions of the Indenture and the Securities will begoverned by the laws of Luxembourg; the provisions of articles 86 to 94-8 of the Luxembourg law ofAugust 10, 1915 concerning commercial companies, as amended, are excluded. The Support Agreementwill be governed by the laws of Belgium. The Subordinated Guarantee Agreement will be governed by thelaws of the State of New York except that the subordination provisions of the Subordinated GuaranteeAgreement will be governed by the laws of Belgium in the case of Fortis SA/NV and the laws of TheNetherlands in the case of Fortis N.V.
Prescription
Under New York law, claims relating to payment of principal and interest on the Securities will beprescribed according to the later of the applicable statute of limitations or not less than five years.
55
Level: 6 – From: 6 – Wednesday, May 14, 2008 – 1:35 pm – g5mac4 – 3960 Section 03 : 3960 Section 03

DESCRIPTION OF THE SUPPORT AGREEMENT
General
The Parent Companies will jointly and severally agree to perform the obligations described belowunder a Support Agreement to be dated on or about May 30, 2008 among Fortis Hybrid Financing, theParent Companies and the Trustee.
By virtue of their subscription to or acquisition of the Securities, holders of the Securities will betreated, in accordance with Article 1121 of the Belgian Civil Code, as third-party beneficiaries, entitled tothe rights conferred upon them by the Support Agreement. Holders of the Securities will be able toexercise enforcement rights either directly or through the Trustee.
The obligations of each of the Parent Companies under the Support Agreement constitute unsecuredand unsubordinated obligations of such Parent Company and the corresponding rights shall in the event ofa general concursus creditorum affecting such Parent Company rank pari passu with all other unsecuredand unsubordinated obligations of such Parent Company, except to the extent that such other obligationsare preferred by applicable law.
Supported Coupons; Dividend Stopper
Supported Coupons
The Parent Companies will jointly and severally contribute or cause to be contributed to the capitalof Fortis Hybrid Financing or otherwise make available such funds as may be necessary to permit FortisHybrid Financing to pay any coupon on the Securities that is payable on a Supported Coupon Date. Nosuch contribution to the capital of Fortis Hybrid Financing or other payment will be payable (i) if thecoupon payable on the Supported Coupon Date shall have become an Exceptional Alternative Coupon dueto the occurrence of a Trigger Event to be satisfied using the Alternative Coupon Payment Method or (ii) ifand to the extent that following the contribution or payment, the assets of a Parent Company would be lessthan the sum of its liabilities on a consolidated basis, excluding liabilities not considered Senior Debt;provided that, notwithstanding the occurrence of any Trigger Event with respect to both Parent Companies,such contributions to the capital of Fortis Hybrid Financing or other payments will be mandatorily payableon or before any Supported Coupon Date or any Alternative Coupon Satisfaction Date that is triggered bydividends, distributions, payments or redemptions, repurchases or other acquisitions in respect of FortisShares or Parent Company Parity Securities (in the circumstances described under “Description of theSecurities — Dividend Stopper and Supported Coupons”).
Dividend Stopper
Each Parent Company agrees that, in the case of any Exceptional Alternative Coupon, beginning onthe day Fortis Hybrid Financing gives an Alternative Coupon Notice, and in the case of any ElectiveAlternative Coupon, beginning on the relevant Regular Coupon Date relating to such coupon if theElective Alternative Coupon is not paid on such Regular Coupon Date, and in each case continuing untilall Alternative Coupons which are payable are paid in full, such Parent Company (A) (i) will not declare orpay, and will not propose to its shareholders and, to the fullest extent permitted by applicable law, willotherwise act to prevent the declaration or payment of, any dividend on its Ordinary Shares or ParitySecurities and (ii) will not redeem, repurchase or otherwise acquire any of its Ordinary Shares or ParitySecurities (other than pursuant to a Permitted Share Acquisition) and (B) it will not vote, or will cause thatno vote is made by any of its subsidiaries, in favor of any of the actions of Fortis Hybrid Financingotherwise prohibited under the Indenture. No such restrictions shall apply (i) to a dividend or redemptionin respect of any Exempt Share Class or (ii) to a dividend on any Parity Securities that is required to bepaid, pursuant to the terms of such Parity Securities, solely as a result of a dividend or redemption inrespect of any Exempt Share Class.
56
Level: 6 – From: 6 – Wednesday, May 14, 2008 – 1:36 pm – g5mac4 – 3960 Section 04 : 3960 Section 04Level: 6 – From: 6 – Wednesday, May 14, 2008 – 1:36 pm – g5mac4 – 3960 Section 04 : 3960 Section 04

Alternative Coupon Payment Method
In order that Fortis Hybrid Financing is able to pay Alternative Coupons on any Alternative CouponSatisfaction Date in accordance with the Alternative Coupon Payment Method, the Parent Companies willjointly and severally undertake to use all reasonable efforts to ensure that the Parent Companies havesufficient authorized and unissued Parent Company Ordinary Shares to permit the issuance of FortisShares for this purpose; provided that this undertaking shall not be construed to require the ParentCompanies to acquire any issued and outstanding Fortis Shares. Without limiting the generality of theforegoing, at each annual shareholders’ meeting the Parent Companies will propose that their respectiveshareholders approve resolutions authorizing the issuance of such number of Parent Company OrdinaryShares as the Parent Companies reasonably determine are sufficient to permit the issuance of Fortis Sharesto pay the next two scheduled coupons on the Securities in accordance with the Alternative CouponPayment Method, except to the extent that the Parent Companies reasonably determine that there aresufficient authorized and unissued Parent Company Ordinary Shares for such purpose already in existence.
Loss Absorption, Reinstatement
In the event of the occurrence of a Capital Deficiency Event, the Parent Companies will, jointly andseverally, use all reasonable efforts to ensure that all the necessary actions described under “Description ofthe Securities — Loss Absorption” and “Description of the Securities — Reinstatement” will occur.
Additional Amounts
The Parent Companies will jointly and severally contribute or cause to be contributed to the capitalof Fortis Hybrid Financing or otherwise make available such funds as may be necessary to permit FortisHybrid Financing to pay any Additional Amounts payable in the circumstances described under“Description of the Securities — Additional Amounts”; provided that this obligation shall not change itsobligations with respect to Supported Coupons. No such contribution to the capital of Fortis HybridFinancing or other payment will be payable (i) if and to the extent that, before or after giving effect tosuch contribution or payment, a Trigger Event has occurred and is continuing with respect to both ParentCompanies and such Additional Amounts shall be paid on the applicable Alternative Coupon SatisfactionDate using the Alternative Coupon Payment Method or (ii) if and to the extent that following thecontribution or payment, the assets of a Parent Company would be less than the sum of its liabilities on aconsolidated basis, excluding liabilities not considered Senior Debt.
Amendments to the Support Agreement
Except as provided in the following paragraphs, the Support Agreement may be modified by theparties thereto only with the prior approval of holders of not less than 75% of the aggregate CurrentPrincipal Amount of Securities (excluding any Securities held by Fortis Hybrid Financing or any of itsaffiliates, other than Securities purchased or acquired by Fortis Hybrid Financing or its affiliates inconnection with transactions effected by or for the account of customers of the Fortis Group or any of itsaffiliates in connection with the distribution or trading of, or market-making in connection with, theSecurities).
The Support Agreement may be amended without the consent of the holders of the Securities to:
• amend, waive or otherwise modify any provision incorporated by reference from or definedwith reference to the Indenture for purposes of the Support Agreement, provided suchamendment, waiver or other modification is implemented in accordance with the provisionsof the Indenture;
• cure any ambiguity;
• correct or supplement any provision in the Support Agreement that may be defective orinconsistent with any other provision of the Support Agreement;
57
Level: 6 – From: 6 – Wednesday, May 14, 2008 – 1:36 pm – g5mac4 – 3960 Section 04 : 3960 Section 04

• add to the covenants, restrictions or obligations of the Parent Companies; or
• subject to applicable Belgian law, modify, eliminate and add to any provision of the SupportAgreement;
provided, in each case, that no such amendment shall have a material adverse effect on the rights,preferences or privileges of holders of the Securities or affect the ranking of the Support Agreement, asdetermined by Fortis Hybrid Financing and the Parent Companies.
Notwithstanding the foregoing, neither the provisions relating to Supported Coupons nor thepercentage of the aggregate amount of outstanding Securities which shall be required for the holders toapprove any modification to the Support Agreement may be amended without the prior approval of holdersof 100% of the aggregate Current Principal Amount of Securities.
Governing Law
The Support Agreement will be governed by the laws of Belgium.
58
Level: 6 – From: 6 – Wednesday, May 14, 2008 – 1:36 pm – g5mac4 – 3960 Section 04 : 3960 Section 04

DESCRIPTION OF THE SUBORDINATED GUARANTEE AGREEMENT
General
The Parent Companies (the “Guarantors”) will jointly and severally agree to perform theobligations described below under a Subordinated Guarantee Agreement to be dated on or about May 30,2008 among Fortis Hybrid Financing, the Parent Companies and the Trustee.
General. The Parent Companies will give an unconditional and irrevocable Subordinated Guaranteefor the due payment of the Base Redemption Price payable when the Securities become payable inaccordance with their terms in the event of a judicial or voluntary liquidation (liquidation judiciaire ouvolontaire) or bankruptcy (faillite) of Fortis Hybrid Financing. Holders of the Securities are intended to bethird-party beneficiaries of the Subordinated Guarantee Agreement and will be able to exerciseenforcement rights either directly or through the Trustee.
Subordination. In the event of a general concursus creditorum affecting either Parent Company, theclaims of holders of the Securities under the Subordinated Guarantee will be satisfied after (but only after)the claims of all creditors of the Guarantors (including claims in respect of bonds, notes and debentures)whether senior or subordinated have first been paid in full, other than liabilities of the Parent Companieswhich rank pari passu with or junior to the Securities or the Subordinated Guarantee, including, for theavoidance of doubt, the guarantees with respect to the Perpetual Securities issued by Fortis HybridFinancing on February 27, 2008 and June 20, 2006.
The holders of the Securities explicitly accept that, in the circumstances described above, paymentsin respect of the Securities will be made by the Parent Companies pursuant to the Subordinated Guaranteeonly in accordance with the subordination provisions described above.
No Right to Set-Off. No holder of Securities may set off any claims arising under the SubordinatedGuarantee against claims that the Parent Companies may have against it. The Parent Companies may setoff against any claims of any holder of Securities under the Subordinated Guarantee only if such amountshave been replaced by other at least equivalent capital of at least equivalent status or if the appropriateregulatory authority has given its consent to the set-off, and subject to there existing no Trigger Event.
Remedy for Non-payment. In any event resulting in a judicial or voluntary liquidation (liquidationjudiciaire ou volontaire) or bankruptcy (faillite) of Fortis Hybrid Financing, whether due to a RemediesEvent or otherwise, the Trustee or the holders of at least 25% in aggregate Current Principal Amount, bywritten notice to either or both of the Parent Companies (and to the Trustee if the notice is given by theholders), may, and the Trustee at the request of such holders (provided that the Trustee is indemnifiedand/or secured to its satisfaction) shall, institute proceedings to obtain the payment of the amounts due orcompliance with the defaulted covenant or agreement or to obtain the bankruptcy of either or both of theParent Companies (or any analogous proceeding which may be available from time to time under the lawsof Belgium or The Netherlands). Neither the Trustee nor the holders may declare the principal amount ofthe Securities due and payable.
If a judicial or voluntary liquidation (liquidation judiciaire ou volontaire) or bankruptcy (faillite) ofFortis Hybrid Financing has occurred and there exists a Trigger Event, the Trustee may institutebankruptcy proceedings against the Parent Companies exclusively in Belgium or The Netherlands but maynot pursue any other legal remedy, including a judicial proceeding for the collection of the sums due andunpaid. The amount of any claim which may be sought in any such proceeding shall be determined as setforth above under “— General”.
Amendments to the Subordinated Guarantee Agreement
Except as provided in the following paragraphs, the Subordinated Guarantee Agreement may bemodified by the parties thereto only with the prior approval of holders of not less than 75% of theaggregate Current Principal Amount of Securities (excluding any Securities held by Fortis HybridFinancing or any of its affiliates, other than Securities purchased or acquired by Fortis Hybrid Financing or
59
Level: 6 – From: 6 – Wednesday, May 14, 2008 – 1:36 pm – g5mac4 – 3960 Section 04 : 3960 Section 04

its affiliates in connection with transactions effected by or for the account of customers of Fortis Group orany of its affiliates in connection with the distribution or trading of, or market-making in connection with,the Securities).
The Subordinated Guarantee Agreement may be amended without the consent of the holders of theSecurities to:
• amend, waive or otherwise modify any provision incorporated by reference from or definedwith reference to the Indenture for purposes of the Subordinated Guarantee Agreement,provided such amendment, waiver or other modification is implemented in accordance withthe provisions of the Indenture;
• cure any ambiguity;
• correct or supplement any provision in the Subordinated Guarantee Agreement that may bedefective or inconsistent with any other provision of the Subordinated Guarantee Agreement;
• add to the covenants, restrictions or obligations of the Parent Companies; or
• subject to applicable New York law, modify, eliminate and add to any provision of theSubordinated Guarantee Agreement;
provided, in each case, that no such amendment shall have a material adverse effect on the rights,preferences or privileges of holders of the Securities or affect the ranking of the Subordinated GuaranteeAgreement, as determined by Fortis Hybrid Financing and the Parent Companies.
In certain circumstances, the consent of holders of 100% of the aggregate Current Principal Amountof the outstanding Securities is required to amend the Subordinated Guarantee Agreement.
Governing Law
The Subordinated Guarantee Agreement will be governed by the laws of the State of New York,except that the subordination provisions therein shall be governed by the laws of Belgium in the case ofFortis SA/NV and the laws of The Netherlands in the case of Fortis N.V.
60
Level: 6 – From: 6 – Wednesday, May 14, 2008 – 1:36 pm – g5mac4 – 3960 Section 04 : 3960 Section 04

DESCRIPTION OF FORTIS CAPITAL STOCK
The description set forth below is a summary of the material information relating to Fortis N.V.’sand Fortis SA/NV’s share capital, including summaries of certain provisions of the articles of associationand applicable Dutch and Belgian law in effect at the date hereof. This summary does not purport to becomplete and is qualified in its entirety by reference to the full articles of association.
Fortis Shares
On December 14, 2001 Fortis unified the separately listed securities of the two Parent Companiesthrough the creation of a new single listed security, the Fortis Share, comprising one ordinary share inFortis SA/NV twinned with one ordinary share in Fortis N.V.
According to the articles of association of each of Fortis SA/NV and Fortis N.V., the number ofordinary shares in Fortis SA/NV and Fortis N.V. shall remain identical at all times. Any issue of a FortisShare will require the issue of one ordinary share in each of the Parent Companies. The ordinary shares inFortis SA/NV and Fortis N.V. cannot be transferred separately, and any holder of a Fortis Share holds aninterest in each of the Parent Companies and will be treated as a shareholder for voting and other purposesof each Parent Company. All holders of a Fortis Share will have the right to choose whether they receive aFortis SA/NV dividend or a Fortis N.V. dividend.
The table below sets out the dividends Fortis has paid over recent years:
Coupon No. Gross amount Payment date Type11111111 11111111 1111111111111 1111111111
40 0.59 May 27, 2008 Final dividend 200739 0.70 September 6, 2007 Interim dividend 200738 0.82 June 14, 2007 Final dividend 200637 0.58 September 7, 2006 Interim dividend 200636 0.64 June 22, 2006 Final dividend 200535 0.52 September 15, 2005 Interim dividend 200534 1.04 June 16, 2005 Dividend 200433 0.92 June 17, 2004 Dividend 200332 0.88 June 18, 2003 Dividend 200231 0.88 June 20, 2002 Dividend 2001
Fortis N.V.
General
Fortis N.V. is a public limited liability company in the form of a naamloze vennootschap underDutch law. Fortis N.V. was incorporated on April 19, 1984 as a private company with limited liability andconverted into a limited liability company on December 6, 1990. Fortis N.V. has its corporate seat inUtrecht, The Netherlands, with its head office at Archimedeslaan 6, 3584 BA Utrecht, The Netherlands,and is registered with the Trade Register at the Chamber of Commerce of Utrecht under number30072145. Its telephone number is +31 (0)30 226 6222.
Share Capital
Authorized Capital
The authorized share capital of Fortis N.V. amounts to EUR 1,948,800,000 and is currently dividedinto (i) 2,820 million Fortis N.V. Shares, each with a nominal value of EUR 0.42; and (ii) 1,820 million(cumulative) preference shares, each with a nominal value of EUR 0.42. The General Meeting ofShareholders of Fortis N.V. approved on April 29, 2008 an amendment to the articles of association ofFortis N.V. As a consequence of this amendment, the corporate seat of Fortis N.V. will be moved toAmsterdam and the authorized share capital of Fortis N.V. will be increased to EUR 2,007,600,000. Thecumulative preference shares will only be in registered form. As of January 1, 2008, Fortis N.V. Shares are
61
Level: 6 – From: 6 – Wednesday, May 14, 2008 – 1:36 pm – g5mac4 – 3960 Section 04 : 3960 Section 04

issued in bearer form for inclusion in the giro system under the Dutch Securities Giro Transfer Act (Wetgiraal effectenverkeer), the giro system under the Belgian Royal Decree No. 62 of November 10, 1967 oranother giro system designated by the Board of Directors. Holders of bearer Fortis N.V. Shares which arenot included in such a giro system must either register their shareholding or include it in such a girosystem no later than on December 31, 2013.
In accordance with Dutch law, transfer of a registered share in Fortis N.V. requires, among otherthings, a deed of transfer and, if Fortis N.V. is not a party to the transfer, a written acknowledgment byFortis N.V. or service of the deed of transfer on Fortis N.V. The acknowledgment must be made in thedeed of transfer, or by a dated statement on the deed of transfer or on a copy or extract thereof certified bya civil law notary or the transferor to be a true copy or extract of the deed of transfer. Official service by apublic bailiff of the deed of transfer or of such copy or extract on Fortis N.V. has the same effect as anacknowledgment by Fortis N.V. of the transfer.
Holders of registered shares are entered in a shareholder register, which is maintained by Fortis N.V.for each class of shares. On request of the holder of registered shares, Fortis N.V. is required to provide anextract from the register of shareholders in the name of the holder.
The Fortis N.V. Shares will be issued in the form of unit certificates which bear a dividend couponsheet consisting of separate dividend coupons and talons. These unit certificates indicate that the holder ofa bearer Fortis N.V. Share is also holder of a Fortis SA/NV Share.
Ordinary Twinned Shares
On March 31, 2008, 2,366,595,497 ordinary twinned shares were issued and outstanding. All issuedand outstanding ordinary twinned shares are fully paid.
Preference Shares
None of Fortis N.V.’s 1,820 million, EUR 0.42 par value, authorized cumulative preference shares(as provided for in Fortis N.V.’s articles of association as part of its authorized share capital) are issued oroutstanding. However, Fortis N.V. has granted an option to the Stichting Continuïteit Fortis (the“Foundation”) to acquire a maximum number of cumulative preference shares of Fortis N.V. (which havethe same voting rights as the Fortis N.V. Shares). Once the option has been exercised, the number ofcumulative preference shares issued shall not exceed the number of ordinary shares issued.
Under Dutch law, the Foundation is an independent legal entity and is not owned or controlled byany person or entity. Its purpose is ensure continuity, so that the interests of Fortis N.V. and itsstakeholders are safeguarded as fully as possible. The Foundation will only exercise its option rights inaccordance with this purpose. The exercise price of each of the options is EUR 0.42 per cumulativepreference share, although upon exercise of the option only 25% of the nominal value is required to bepaid. The additional 75% of the nominal value per cumulative preference share will not be required to bepaid by the Foundation until a call for payment is made by Fortis N.V. by resolution of the Fortis N.V.Board of Directors.
The Board of the Foundation consists of six members: four members are independent with respectto Fortis while two members may be related to Fortis. Additionally, the four independent members havetwo votes per member while the other two related members have one vote per member. This compositionof the Board has been approved by Euronext Amsterdam.
Each transfer of cumulative preference shares requires the approval of the Fortis N.V. Board ofDirectors. If any cumulative preference shares are issued, a General Meeting of shareholders shall beconvened which shall be held no later than two years after the date on which cumulative preference shareswere first issued. A resolution concerning repurchase/acquisition by Fortis N.V. or cancellation, as the casemay be, of the cumulative preference shares shall be put on the agenda of such a meeting.
If the resolution to be taken on this agenda item is not a resolution for the repurchase/acquisition byFortis N.V. or cancellation, as the case may be, of the cumulative preference shares, a General Meeting of
62
Level: 6 – From: 6 – Wednesday, May 14, 2008 – 1:36 pm – g5mac4 – 3960 Section 04 : 3960 Section 04

Shareholders will be convened and held, in each case within two years of the previous Meeting, for whichMeeting a resolution concerning the repurchase/acquisition by Fortis N.V. or cancellation, as the case maybe, of the cumulative preference shares will be put on the agenda, until there are no cumulative preferenceshares outstanding.
Issuance of Fortis N.V. Shares
The Board of Directors may be authorized by resolution of the General Meeting of Shareholders toissue from time to time Fortis N.V. Shares and cumulative preference shares. If the Board of Directors hasbeen so authorized, the General Meeting of Shareholders may not resolve to issue new shares for theduration of the authorization. The Board of Directors of Fortis N.V. was authorized to this effect on May31, 2006.
The authority of the Board of Directors to issue shares of capital stock will terminate on May 31,2009 unless renewed by the General Meeting of Shareholders of Fortis N.V. in accordance with Dutch lawand the articles of association, in each instance for a period not exceeding five years. In the event that theauthority of the Board of Directors to issue shares of capital stock terminates, the issuance of capital stockwould require a resolution of the General Meeting of Shareholders. For purposes of the foregoing grantedauthority, issuance of shares of capital stock includes the granting of rights to subscribe to shares of capitalstock, such as options and subscription rights, but does not apply to the issue of shares to a personexercising prior rights to take shares. Ordinary shares shall only be issued against payment of at least thenominal value. Cumulative preference shares may be issued against partial payment; provided that uponthe taking of such shares at least one-quarter of the nominal value is paid.
With the exception of shares issued for the purpose of distributing a stock dividend (provided, insuch case, that they are only issued to Fortis SA/NV against contribution in cash by the latter), Fortis N.V.Shares can only be issued, subscribed, cancelled, transferred by persons/companies others than Fortis N.V.and encumbered with a right of pledge or usufruct or any other limited right in rem (beperkt zakelijkrecht), together with a Fortis SA/NV Share in the form of a Fortis Share, so that shareholders are in thesame position as if they held shares in a single company.
Dividends
Subject to certain exceptions, dividends may only be paid out of annual profits as shown in theannual accounts of Fortis N.V. Distributions may not be made if the distribution would reduceshareholders’ equity below the sum of the paid-up capital and any reserves required by Dutch law or thearticles of association. Prior to paying dividends on ordinary shares, Fortis N.V. has an obligation to paydividends on outstanding cumulative preference shares, if any. Subject to the foregoing, the GeneralMeeting of Shareholders shall decide on the appropriation of the profits upon proposal of the Board ofDirectors.
The Board of Directors may pay interim dividends on one or more classes of shares, subject to thecondition that the distribution of interim dividends shall only be possible if an interim statement of capital,drawn up in accordance with the statutory requirements, shows that the shareholders’ equity exceeds thesum of the issued and paid-up share capital plus the reserves to be maintained pursuant to the law andFortis N.V. articles of association.
Fortis N.V. will follow the same dividend policy as Fortis SA/NV. The gross amount of dividendspaid out of Fortis N.V. depends on the outcome of the dividend election procedure. In this procedure, theshareholders may elect to receive dividends from either Fortis SA/NV or Fortis N.V., but not from both, insuch a way that the source of the dividends distributed on the Fortis Shares will be either Belgium or TheNetherlands.
Distributions shall be due and payable with effect from a day to be determined by the Board ofDirectors. The days for distributions on ordinary shares and on cumulative preference shares may differ. Ashareholder’s claim to a particular dividend shall lapse five years after commencement of the dayfollowing the day on which the claim became payable.
63
Level: 6 – From: 6 – Wednesday, May 14, 2008 – 1:36 pm – g5mac4 – 3960 Section 04 : 3960 Section 04

Voting Rights
The Annual General Meeting of Shareholders shall be held on the last Wednesday of April of eachyear in Utrecht or Amsterdam, at 2:30 p.m., or at any other time, date or place in The Netherlandsmentioned in the convocation. Extraordinary General Meetings of Shareholders shall be held as often asthe Board of Directors convenes the same and must be held if one or more shareholders representing atleast one-tenth of the issued share capital make a written request to that effect to the Board of Directorsspecifying in detail the exact items to be discussed. All notices of those meetings shall be given by meansof an advertisement in (a) a nationally distributed newspaper in The Netherlands, (b) the Official Price listof Euronext Amsterdam N.V. in Amsterdam, (c) a nationally distributed newspaper in the French languagedistributed in Belgium, (d) a nationally distributed newspaper in the Dutch language distributed inBelgium, and (e) nationally distributed newspapers in every country where the Fortis Share is admitted tothe official listing of a stock exchange. The Board of Directors may determine that 00.00 hrs on theseventh business day preceding the date of any General Meeting shall be the registration date for thatmeeting, which will be included in the convocation for the relevant General Meeting. In that case, onlypersons who, on the registration date, are registered in the register designated for the purpose by the Boardof Directors as a person holding Fortis N.V. Shares, may participate in the General Meeting as ashareholder and vote for the number of Fortis N.V. Shares registered in their name on the registration date(irrespective of whether they continue to be the holder of the relevant Fortis Shares on the date of theGeneral Meeting). If the Board of Directors does not determine a registration date, a shareholder is entitledto attend the General Meetings of Fortis N.V. and to vote there; provided that, at least at the datementioned in the convocation, which date may not be before the seventh day before the meeting, (a) theowner of registered twinned shares has informed Fortis N.V. of his intention to take part in the meeting,(b) the owner of physical bearer Fortis N.V. Shares has lodged his securities at the registered office or anyother place indicated in the convocation and (c) the owner of bearer Fortis N.V. Shares through the book-entry system has lodged at the registered office or any other place indicated in the convocation, a notice ofa banking institution stating the non-transferability of the securities until the date of the meeting.
Resolutions are adopted at General Meetings of Shareholders by a majority of the votes cast (exceptwhere a different proportion of votes is required by the articles of association or Dutch law), and there aregenerally no quorum requirements applicable to such meetings, except as set forth in the followingparagraphs. Each share in the capital of Fortis N.V. is entitled to one vote except for shares owned byFortis N.V., Fortis SA/NV, or any of their subsidiaries, which do not have voting rights.
Amendment of articles of association and dissolution of Fortis N.V.
A resolution to amend the articles of association of Fortis N.V. or to dissolve Fortis N.V. may onlybe passed upon proposal of the Board of Directors. The resolution to amend the articles of association orto dissolve Fortis N.V. may only be passed at a General Meeting of Shareholders at which more than halfof the issued capital is represented and by at least three-quarters of the votes cast; if the required capital isnot represented at a meeting convened for this purpose, then a new meeting shall be convened and heldwithin four weeks, which meeting may pass the resolution to amend the articles of association or todissolve Fortis N.V. regardless of the represented capital, but by at least three-quarters of the votes cast.
Appointment of the Board of Directors
The Board of Directors of Fortis N.V. is composed of a maximum of 17 members. Board memberswithout management functions within Fortis N.V., or in general within the Fortis Group, are considered asnon-executive Board members. Board members with management functions within Fortis N.V., or ingeneral within the Fortis Group, are considered as executive Board members. The members of the Boardof Directors are appointed by the General Meeting of Shareholders upon proposal of the Board ofDirectors for a maximum period of four years, subject to renewal for maximum periods of four years each.The Board of Directors appoints from amongst its members a Chairman and a Vice Chairman.
64
Level: 6 – From: 6 – Wednesday, May 14, 2008 – 1:36 pm – g5mac4 – 3960 Section 04 : 3960 Section 04

Approval of financial statements
The financial year of Fortis N.V. coincides with the calendar year. Within five months after the endof the financial year, the Board of Directors submits Fortis N.V.’s financial statements (jaarrekening),together with an opinion of the statutory auditor in respect thereof, to the General Meeting of Shareholdersfor adoption. Following adoption of Fortis N.V.’s financial statements by the General Meeting ofShareholders, the shareholders will be requested to discharge the members of the Board of Directors fromliability for the performance of their respective duties for the past financial year. Under Dutch law thisdischarge is not absolute and is not effective as to matters not disclosed to the shareholders.
Liquidation rights
In the event of the dissolution and liquidation of Fortis N.V., the assets remaining after payment ofall debts and liquidation expenses shall be distributed to the holders of Fortis N.V. Shares, each receiving asum proportional to the number of Fortis N.V. Shares held by them, after payment of any sums due to theholders of the then outstanding cumulative preference shares, if any.
Shareholders’ pre-emptive rights
Each holder of Fortis Shares and cumulative preference shares has upon issue of their respectiveclass of shares a pre-emptive right to take new Fortis N.V. Shares or cumulative preference shares, as thecase may be, proportional to the amount of existing shares held. Notwithstanding the foregoing, holders ofshares will not have pre-emptive rights in respect of (i) issuances of shares to employees of Fortis N.V. orgroup companies and (ii) issuances of shares for non-cash consideration.
Holders of shares also do not have pre-emptive rights in connection with the issuance of shares thatare issued pursuant to the exercise of a right to subscribe to such shares, such as options and subscriptionrights, although the holders of shares have pre-emptive rights in respect of the issuance of such optionsand subscription rights.
The Board of Directors may be authorized by resolution of the General Meeting of Shareholders torestrict or exclude pre-emptive rights with respect to the shares if the shareholders have delegated theauthority to issue these shares to the Board of Directors, subject to a similar decision to be made by theappropriate corporate body of Fortis SA/NV. The shareholders delegated that authority by resolution datedMay 31, 2006. The authority of the Board of Directors to restrict or exclude pre-emption rights isunlimited and will terminate on May 31, 2009 unless renewed by the General Meeting of Shareholders ofFortis N.V. in accordance with Dutch law and the articles of association, in each instance for a period notexceeding five years. In the absence of such authorization or extension of such authorization the GeneralMeeting of Shareholders has the power to limit or eliminate such rights, subject to a similar decision to bemade by the appropriate corporate body of Fortis SA/NV. Such a resolution requires a two-thirds majorityof the votes cast, if less than half of the issued share capital is represented at the Meeting.
Acquisition by Fortis N.V. of its own Fortis Shares
Fortis N.V. or any subsidiary of Fortis N.V. may acquire shares of any class of its capital, subject tocertain provisions of Dutch law and the articles of association, if (i) shareholders’ equity less the paymentrequired to make the acquisition does not fall below the sum of paid-up capital and any reserves requiredby Dutch law or the articles of association and (ii) Fortis N.V. and its subsidiaries would thereafter nothold or retain by way of pledge shares with an aggregate nominal value exceeding one-tenth of FortisN.V.’s issued share capital. No right to any distributions shall accrue to Fortis N.V. in respect of shares inits own capital. At a General Meeting of Shareholders, no votes may be cast in respect of a share held byFortis N.V. or a subsidiary. An acquisition by Fortis N.V. of shares of any class of its capital may beeffected by the Board of Directors; provided that the General Meeting of Shareholders of Fortis N.V. hasgranted to the Board of Directors the authority to do so. Such grant of authority may apply for a maximumperiod of 18 months and must specify the number of shares that may be acquired, the manner in which theshares may be acquired and the price limits within which shares may be acquired.
65
Level: 6 – From: 6 – Wednesday, May 14, 2008 – 1:36 pm – g5mac4 – 3960 Section 04 : 3960 Section 04

On April 29, 2008, the Annual General Meeting of Shareholders of Fortis N.V. authorized the Boardof Directors to repurchase paid-up shares in its own capital up to the maximum number of sharespermitted by law. Such a repurchase may be carried out privately or on a stock exchange, for aconsideration equal to the average of the closing prices of the Fortis Share on Euronext Brussels andEuronext Amsterdam on the day immediately preceding the repurchase, increased or decreased by amaximum of 15%, or through stock-lending transactions on market-conforming terms. This authorizationshall expire on October 29, 2009. No such authority is required for the acquisition by Fortis N.V. of sharesin its own capital for the purpose of transferring such shares to employees of Fortis N.V. or any subsidiarythereof pursuant to any arrangements applicable to such employees; provided that such shares are includedin the price list of a stock exchange.
Limitation on right to hold or vote shares
There are no limitations imposed by Dutch law or the articles of association on the right of non-resident owners to hold or vote the shares solely by reason of such non-residence.
Obligation of shareholders to disclose major holdings
Under the Dutch Financial Supervision Act (Wet op het financieel toezicht), any person whosecapital interest or voting rights in Fortis N.V. (whether direct or indirect) reaches, exceeds or falls belowany of the following thresholds: 5%, 10%, 15%, 20%, 25%, 30%, 40%, 50%, 60%, 75% and 95%, mustpromptly notify the AFM by means of a standard form. In addition, any person holding (whether directlyor indirectly) a capital interest or voting right in Fortis N.V. of 5% or more, must notify the AFM bymeans of a standard form within four weeks after December 31 of each year, if on December 31 thecomposition of that holding differs from the composition of the holding most recently notified to the AFMas a result of certain acts including (without limitation) the exchange of shares for depositary receipts orvice versa and the exercise of a right to acquire shares. The AFM will include all notifications in a publicregister.
For the purpose of calculating a person’s capital interest or voting rights in Fortis N.V., amongothers the following interests must be taken into account: (i) shares and voting rights held by that person,(ii) shares and voting rights held by a subsidiary of that person or by a third party for that person’s accountor by a third party with whom that person has concluded an oral or written voting agreement (including adiscretionary power of attorney), and (iii) shares and voting rights which that person, or any subsidiary ofthat person or third party referred to above, may acquire pursuant to any option or other right held by thatperson. Specific rules apply to the attribution of shares and voting rights which are part of the property ofa partnership or other community of property. If shares are pledged or subject to a right of usufruct, theholder of the pledge or right of usufruct may be subject to the notification requirements set out above ifthat holder has or may acquire the voting rights attaching to the shares. If a pledgee or usufructuaryacquires voting rights on shares which have been pledged or are subject to a right of usufruct, theshareholder may be required to notify the reduction in his voting rights. For the purpose of the disclosurerequirement, shares include depositary receipts for shares.
Non-compliance with the obligations of the Financial Supervision Act constitutes a criminaloffence. In addition, the AFM may impose administrative fines. Furthermore, the District Court(Arrondissementsrechtbank) competent for the jurisdiction within which Fortis N.V. has its corporate seatcan impose measures at the request of one or more holders of shares who alone or together with othersrepresent at least one-twentieth of the issued share capital of Fortis SA/NV, and by Fortis N.V.
The measures which the District Court may impose include (i) condemnation of the person who isobliged to notify to do so in accordance with the Financial Supervision Act; (ii) suspension of votingrights in respect of such person’s shares for a period to be determined by the court with a maximum ofthree years; (iii) suspension of a resolution of Fortis N.V.’s General Meeting of Shareholders until anirrevocable decision has been taken on an order as referred to in subsection (iv); (iv) nullification of aresolution by Fortis N.V.’s General Meeting of Shareholders, insofar as it is reasonable to assume that suchresolution would not have been adopted if the voting rights on the shares in Fortis N.V.’s capital held by
66
Level: 6 – From: 6 – Wednesday, May 14, 2008 – 1:36 pm – g5mac4 – 3960 Section 04 : 3960 Section 04

the person who is obliged to notify had not been exercised; and (v) an order to the person who is obligedto notify to refrain, during a period to be determined by the court with a maximum of five years, fromacquiring shares in the capital of Fortis N.V. and/or voting rights.
Fortis SA/NV
General
Fortis SA/NV is a public limited liability company incorporated in the form of a sociétéanonyme/naamloze vennootschap under Belgian law. Fortis SA/NV was incorporated on November 16,1993 and has its registered office at Rue Royale/Koningsstraat 20, 1000 Brussels, Belgium. Fortis SA/NVis registered in the register of legal entities (registre des personnes morales/rechtspersonenregister) underenterprise number 0451.406.524. Its telephone number is +32(0)2 565 11 11.
Share capital
Issued share capital
On March 31, 2008, the issued share capital of Fortis SA/NV amounted to EUR 10,138,296,713.74and was represented by 2,366,595,497 shares, without indication of nominal value.
Authorized capital
The Extraordinary General Meeting held on April 29, 2008 renewed the authorization to the Boardof Directors to increase the share capital of Fortis SA/NV, in one or more transactions, with a maximumamount of EUR 2,022,048,000. This authorization is granted for three years, with effect as from the dateof publication in the Belgian State Gazette of the resolutions of the Extraordinary General Meeting.
Issuance of Fortis SA/NV Shares
Fortis SA/NV Shares are issued by way of resolution of either the General Meeting of Shareholdersor the Board of Directors in the case of capital increase through authorized capital. Any resolution to issueFortis SA/NV Shares or to grant any right to subscribe or acquire Fortis SA/NV Shares (including, but notlimited to, subscription rights and convertible bonds) is only effective once and to the extent that there is acorresponding resolution of the appropriate corporate body of Fortis N.V., both resolutions taking effect atthe same time, to issue the same number of Fortis N.V. Shares or, as the case may be, the same number ofrights to subscribe or acquire Fortis N.V. Shares.
Dividends
The Belgian Companies Code provides that dividends can only be paid up to an amount equal to theexcess of a company’s shareholders’ equity over the sum of (i) paid up or called up capital and (ii) reservesnot available for distribution pursuant to law or the articles of association. Fortis SA/NV will follow thesame dividend policy as Fortis N.V. The gross amount of dividends paid out of Fortis SA/NV depends onthe outcome of the dividend election procedure. In this procedure, the shareholders may elect to receivedividends from either Fortis SA/NV or Fortis N.V., but not from both, in such a way that the source of thedividends distributed on the Fortis Shares will be either Belgium or The Netherlands.
According to the law, the right to receive dividends on registered shares lapses five years after thepayment date of these dividends. The right to claim dividends on bearer shares does not lapse except if thecompany lodges the dividends with the Bank for Official Deposits (Caisse des Dépôts etConsignations/Deposito- en Consignatiekas), in which case the right to claim dividends lapses 30 yearsafter the date on which these dividends were lodged. The Belgian State then becomes the beneficiary of allunclaimed dividends on bearer shares.
67
Level: 6 – From: 6 – Wednesday, May 14, 2008 – 1:36 pm – g5mac4 – 3960 Section 04 : 3960 Section 04

Voting rights
The Ordinary General Meeting of Shareholders shall be held on the last Wednesday of April of eachyear at the registered office, at 9:30 a.m., or at any other time, date or place in Belgium mentioned in theconvocation. Extraordinary General Meetings of Shareholders are held as often as decided by the Board ofDirectors or at the written request of shareholders representing at least one-tenth of the capital, whichrequest shall include the exact items to be discussed.
Notice for the General Meeting of Shareholders shall be given in the form of announcements placedin (a) a nationally distributed newspaper in the French language in Belgium, (b) a nationally distributednewspaper in the Dutch language in Belgium, (c) a regional newspaper in the region where the registeredoffice is located, (d) the Belgian State Gazette (Moniteur belge/Belgisch Staatsblad), (e) a nationallydistributed newspaper in The Netherlands, and (f) nationally distributed newspapers in every countrywhere the Fortis Share is admitted to the official listing of a stock exchange.
All holders of Fortis SA/NV Shares are entitled to attend the General Meetings of Shareholders,take part in the deliberations and, within the limits prescribed by the Belgian Companies Code, to vote.The Board of Directors may determine that 00.00 hrs on the seventh business day preceding the date ofany General Meeting shall be the registration date for that meeting, which will be included in theconvocation for the relevant General Meeting. In that case, only persons who, on the registration date, areregistered in the register designated for the purpose by the Board of Directors as a person holding FortisSA/NV Shares may participate in the General Meeting as a shareholder and vote for the number of FortisSA/NV Shares registered in their name on the registration date (irrespective of whether they continue to bethe holder of the relevant Fortis Shares on the date of the General Meeting). If the Board of Directors doesnot determine a registration date, a shareholder must (i) have lodged his or her Fortis SA/NV Shares at theregistered office or any other place indicated in the convocation at least five working days before the dateset for the meeting and within the same period have informed Fortis SA/NV of his/her/its intention to takepart in the meeting or (ii) lodge, at the registered office or any other place indicated in the convocation andat least five working days before the date set for the meeting, a notice of a banking institution stating thenon-transferability of the securities until the date of the meeting.
Resolutions are adopted at General Meetings of Shareholders by a majority of the votes cast (exceptwhere a different proportion of votes is required by Fortis SA/NV’s articles of association or by Belgianlaw), and there are generally no quorum requirements applicable to such meetings, except as set forth inthe following paragraphs.
Each share in the capital of Fortis SA/NV is entitled to one vote except for shares owned by FortisSA/NV, or by any of its direct subsidiaries, the voting rights of which are suspended.
Right to share in the result
The shareholders have the right to share in the result of Fortis under the conditions laid down by theBelgian Companies Code and by the articles of association.
Amendment of articles of association and dissolution of Fortis SA/NV
A resolution to amend the provisions of the articles of association or to dissolve Fortis SA/NV mustbe passed in a General Meeting of Shareholders in which at least half of the issued share capital isrepresented and by at least three-quarters of the votes cast (or four-fifths of the votes cast in the event of anamendment to the provisions of the articles of association dealing with the corporate purpose). Should therequired proportion of the capital not be represented in a meeting called for this purpose, a new meetingshall be convened, which meeting may pass the resolution to amend the provisions of the articles ofassociation or dissolve Fortis SA/NV irrespective of the proportion of the issued share capital represented,but with at least three-quarters of the votes cast (or four-fifths for amendments to the provisions of thearticles of association dealing with the corporate purpose).
68
Level: 6 – From: 6 – Wednesday, May 14, 2008 – 1:36 pm – g5mac4 – 3960 Section 04 : 3960 Section 04

Appointment of the Board of Directors
The Board of Directors is composed of a maximum of 17 members. Board members withoutmanagement functions within Fortis SA/NV, or in general within the Fortis Group, are considered as non-executive Board members. Board members with management functions within Fortis SA/NV, or in generalwithin the Fortis Group, are considered as executive Board members. The members of the Board ofDirectors are appointed by the General Meeting of Shareholders upon proposal of the Board of Directors,for a maximum period of four years, subject to renewal for maximum periods of four years each. TheBoard of Directors appoints from amongst its members a Chairman and a Vice Chairman.
Approval of financial statements
The financial year of Fortis SA/NV coincides with the calendar year. Within six months after theend of the financial year, the Board of Directors submits Fortis SA/NV’s financial statements, togetherwith an opinion of the statutory auditor in respect thereof, to the General Meeting of Shareholders foradoption. Following adoption of Fortis SA/NV’s financial statements by the General Meeting ofShareholders, the shareholders will be requested to discharge the members of the Board of Directors fromliability for the performance of their respective duties for the past financial year. Under Belgian law thisdischarge is not absolute and is not effective as to matters not disclosed to the shareholders.
Liquidation rights
In the event of the dissolution and liquidation of Fortis SA/NV, the assets remaining after paymentof all debts and liquidation expenses shall be distributed to the holders of the Fortis SA/NV Shares, eachreceiving a sum proportional to the number of Fortis SA/NV Shares held by them.
Shareholders’ preference rights
Pursuant to Belgian law, existing shareholders must be offered a preference right in the event of acapital increase to be subscribed in cash. However, the General Meeting of Shareholders may decide, inthe interest of the company and in accordance with the conditions required for amending the articles ofassociation, that all or part of the new Fortis SA/NV Shares to be subscribed will not be offered to existingshareholders on a preferential basis, subject to a similar decision to be made by the appropriate corporatebody of Fortis N.V. The Board of Directors may equally, in connection with a capital increase by way ofauthorized capital, in the interest of the company, decide that the preference rights of existing shareholdersare to be limited or cancelled, even if this limitation or cancellation is undertaken in favor of one or morespecific persons other than employees of Fortis SA/NV or one or more of its subsidiaries. The decision ofthe Board of Directors is subject to a similar decision to be made by the appropriate corporate body ofFortis N.V.
Acquisition by Fortis SA/NV of its own Fortis Shares
Fortis SA/NV may only acquire its own shares pursuant to a decision by the General Meeting ofShareholders taken under the conditions of quorum and majority provided for in the Belgian CompaniesCode. The General Meeting of Shareholders of April 29, 2008 delegated authority to the Board ofDirectors, for a period of 18 months from such a date, to acquire Fortis Shares up to the maximum numberallowed under Article 620, §1, 2° of the Belgian Companies Code and for a consideration equal to theaverage of the closing prices of the Fortis Share on Euronext Brussels and Euronext Amsterdam on the dayimmediately preceding such a repurchase, increased or decreased by a maximum of 15%.
Limitation on right to hold or vote shares
There are no limitations imposed by Belgian law or the articles of association on the right of non-resident owners to hold or vote the shares solely by reason of such non-residence.
69
Level: 6 – From: 6 – Wednesday, May 14, 2008 – 1:36 pm – g5mac4 – 3960 Section 04 : 3960 Section 04

Option Rights
See “Employee Stock and Option Plans” above.
Obligation of shareholders to disclose major holdings
All natural or legal persons who possess or acquire rights or other securities in the meaning of theBelgian Law of March 2, 1989 concerning the notification of major shareholdings in companies listed onthe stock market and regulating public take-over bids, must declare to the Board of Directors and theCBFA the number of rights or securities directly or indirectly owned or owned in concert with one or moreother persons, when these rights or securities confer voting rights amounting to 3% or more of the totalvoting rights in the company at the time when the situation giving rise to the declaration occurs.
All additional rights or securities acquired or transferred under the same conditions as thosedescribed above must also be declared to the Board of Directors and to the CBFA if, as a result of thisoperation, the voting rights in the company attached to the rights or securities attain 6%, 9%, 12% etc., ineach case per bracket of 3%, of the aggregate voting rights at the time when the operation giving rise tothe declaration is implemented. This declaration is also required in the case of transferring rights orsecurities if, as a result thereof, the voting rights drop below one of the thresholds mentioned in this andthe previous paragraph.
The above mentioned thresholds of 3%, 6%, 9%, 12% and so on are set out in the articles ofassociation of Fortis SA/NV and are without prejudice to the thresholds of 5%, 10%, 15%, 20% and so onset out in the Belgian Law of March 2, 1989.
The declarations relating to the acquisition or transfer of rights or securities must be sent to theCBFA and, by registered letter, to the Board of Directors no later than the second working day followingthe day on which the acquisition or transfer took place. Rights or securities acquired by means of aninheritance do not have to be declared until 30 days following the acceptance of the inheritance, subject tothe benefit of an estate inventory, as the case may be.
Fortis SA/NV shall take the necessary steps to publish any declarations it has received by postingthese on public notice boards and including them in the official listings of all stock exchanges on whichFortis Shares are officially listed no later than the working day following the receipt of the declaration.
No one may cast a greater number of votes at the General Meeting than those attached to the rightsor securities it has declared to be in its possession according to the provisions described above at least 20days before the date of the General Meeting of Shareholders, subject to certain exceptions.
The Belgian Law of May 2, 2007 on the disclosure of significant shareholdings in issuers whosesecurities are admitted to trading on a regulated market and containing various provisions (the “NewTransparency Law”), implementing the European Directive 2004/109/EC of December 15, 2004 on theharmonization of transparency requirements in relation to information about issuers whose securities areadmitted to trading on a regulated market and amending Directive 2001/34/EC, will modify the regime onthe notification of significant shareholdings as of September 1, 2008. The provisions of the Belgian Law ofMarch 2, 1989 described above will be abrogated as of September 1, 2008. The New Transparency Lawwas implemented by the Belgian Royal Decree of February 14, 2008 on the disclosure of significantholdings, which also enters into force on September 1, 2008.
The main changes contained in this legislation are the following:
• According to Article 18 of the New Transparency Law, thresholds of 1%, 2%, 3%, 4% and7.5% may be introduced in the articles of association. An issuer may choose to apply any orall of these lower and intermediary thresholds. Since the introduction of these thresholds maynot impair mandatory compliance with the legal thresholds (5% and multiples of 5%), anotification will be required when either of the legal thresholds or the thresholds laid downby the articles of association are reached.
70
Level: 6 – From: 6 – Wednesday, May 14, 2008 – 1:36 pm – g5mac4 – 3960 Section 04 : 3960 Section 04

• The events triggering a mandatory notification are extended. While the principle under theLaw of March 2, 1989 is that the possession, acquisition and transfer of securities areessentially the only events that trigger the obligation to notify, the New Transparency Lawextends the notification obligation to events where there is no acquisition or transfer ofsecurities.
• Under the New Transparency Law, a notification is required where, as a result ofevents changing the breakdown of voting rights, the percentage of voting rightsattached to securities with voting rights reaches, exceeds or falls below the thresholdsprovided for above, even where no acquisition or disposal of securities has occurred(e.g., share capital increase or cancellation of treasury shares).
• A notification is also required when natural persons or legal entities enter into anagreement of action in concert, where as a result of such event, the percentage ofvoting rights subject to the action in concert or the percentage of voting rights of oneof the parties acting in concert, reaches, exceeds or falls below the thresholdsmentioned above.
• The disclosure obligations of the New Transparency Law apply not only to securities withvoting rights but also to certain assimilated financial instruments which entitle the holderthereof to acquire securities with voting rights that have already been issued (e.g. options,futures). Contrary to the Law of March 2, 1989, the disclosure obligations do not apply tofinancial instruments which entitle the holder thereof to acquire securities with voting rightsthat have not yet been issued (e.g. convertible bonds, subscription rights).
• The disclosure obligation must be complied with within four trading days (rather than twoworking days). The issuer, in turn, must disclose the declaration to the public no later thanthree trading days following receipt thereof (it being understood that applicable rules on thedisclosure of inside information also apply and may require an immediate disclosure). Inaccordance with the Belgian Royal Decree of November 14, 2007 on the obligations ofissuers of financial instruments that are admitted to trading on a regulated market, the issuermust disseminate the declarations received through the media in the European EconomicArea and must put them on its website.
71
Level: 6 – From: 6 – Wednesday, May 14, 2008 – 1:36 pm – g5mac4 – 3960 Section 04 : 3960 Section 04

USE OF PROCEEDS
Fortis Hybrid Financing will use the net proceeds of the issue and sale of the Securities to onlend tocertain of the operating companies within the Fortis Group in a form approved by the applicable regulatorof such operating company such that any on loan will be treated as solvency capital for the applicableoperating company.
72
Level: 6 – From: 6 – Wednesday, May 14, 2008 – 1:36 pm – g5mac4 – 3960 Section 04 : 3960 Section 04

INFORMATION ABOUT THE ACQUISITION OF ABN AMRO
Cautionary statement
There can be no assurance that Fortis will be able to successfully implement the strategic oroperational initiatives that are intended or that the combined information presented is an indication offuture results. See also “Risk Factors” and “Forward-Looking Statements”.
In order to secure the approval of the European competition authorities in respect of the ABNAMRO transaction, Fortis and the European Commission have discussed alternative remedies to solvecompetition concerns identified by the European Commission in the commercial banking segment in TheNetherlands following the acquisition of the ABN AMRO Businesses. In this context, Fortis proposed and,on October 3, 2007 the European Commission accepted, a post-acquisition divestment package relating tospecified parts of the Business Unit Netherlands of ABN AMRO (the “Divestment”).
Central to the Divestment is the proposed sale of certain parts of the ABN AMRO Businesses in thecommercial banking segment in The Netherlands, including Hollandsche Bank Unie N.V., an independent,separately licensed commercial bank, 13 advisory branches and 2 Corporate Client Units (excludingcustomers with a turnover above EUR 250 million), as well as of the assets of IFN Finance BV, the Dutchfactoring subsidiary of ABN AMRO.
The scope of the Divestment represents approximately 10% of the scope of the part of Business UnitNetherlands to be acquired by Fortis in terms of assets, income and projected revenue and cost synergies.
The ultimate financial impact of the Divestment on the contemplated business combination willdepend on the net sale proceeds that Fortis will be able to realize from this divestment.
ABN AMRO Acquisition
On October 17, 2007, RFS Holdings, a company formed by the Consortium Banks for the purposeof acquiring ABN AMRO, completed the acquisition of ABN AMRO. The ABN AMRO Acquisitionconsideration payable by the Consortium Banks in the aggregate amounted to approximately EUR 71.1billion (EUR 73 billion on a fully diluted basis). For each ABN AMRO ordinary share tendered, RFSHoldings paid EUR 35.60 in cash plus 0.296 new RBS shares. Under the terms of the Consortium andShareholders’ Agreement described below under “— Summary of Consortium and Shareholders’Agreement”, Fortis has funded EUR 24 billion (EUR 24.7 billion on a fully diluted basis), 33.8% of thetotal consideration payable in the ABN AMRO Acquisition.
To finance its acquisition of the ABN AMRO Businesses, Fortis raised EUR 13 billion of newequity financing via a rights issue (the “Rights Offer”). Fortis financed and intends to finance itsremaining portion of the ABN AMRO Acquisition consideration as follows:
• EUR 2 billion from the issue on July 11, 2007 of Conditional Capital Exchangeable Notesexchanged into Mandatory Convertible Securities on December 7, 2007;
• EUR 3 billion from the issuance of Tier 1 capital instruments consisting of EUR 3 billionprincipal amount of Convertible and Subordinated Hybrid Equity-linked Securities(“CASHES”); and
• EUR 6.5 to 8.0 billion from the proceeds of a combination of (i) the sale of specific non-coreassets (approximately EUR 2.5 billion); (ii) sale of shared assets of the Consortium(approximately EUR 2.0 billion); and (iii) securitization and other similar transactions(approximately EUR 2.0 billion).
In this respect, Fortis announced on July 12, 2007 that EUR 1.6 billion (sale price) of such anamount had been raised, representing a capital relief of EUR 1.2 billion due to the decrease in the riskweighted assets, by divesting various assets and shareholdings in European financial institutions. Thisamount included the proceeds (EUR 980 million) from the sale by Fortis, announced on July 11, 2007, of
73
Level: 6 – From: 6 – Wednesday, May 14, 2008 – 1:36 pm – g5mac4 – 3960 Section 05 : 3960 Section 05Level: 6 – From: 6 – Wednesday, May 14, 2008 – 1:36 pm – g5mac4 – 3960 Section 05 : 3960 Section 05

its share in the joint venture CaiFor to its Spanish partner “la Caixa”; this transaction was closed onNovember 13, 2007. In addition, Fortis raised additional amounts when it sold its stakes in BancoComercial Português and ICBC in September and December 2007.
Plans for the ABN AMRO Businesses
With the successful completion of the ABN AMRO Acquisition, RFS Holdings has acquired ABNAMRO. The ABN AMRO Businesses will be governed and reorganized as contemplated by theConsortium and Shareholders’ Agreement among the Consortium Banks. Fortis now holds shares in RFSHoldings that equal its proportionate funding commitment (33.8%) for the ABN AMRO Acquisitionconsideration and the capital and income rights of shares issued to each of the Consortium Banks will belinked to the net assets and income of the respective ABN AMRO Businesses that they will acquirefollowing the reorganization of ABN AMRO.
Following the reorganization, Fortis will acquire:
• Business Unit Netherlands (excluding the former Dutch wholesale clients, Interbank, DMCConsumer Finance as well as certain commercial banking activities to be divested by Fortisafter the completion of the acquisition as part of the Divestment),
• Business Unit Private Clients globally,
• Business Unit Asset Management globally, and
• the ABN AMRO brand name (collectively, the “ABN AMRO Businesses”).
During the reorganization period, the Consortium Banks will retain a shared economic interest in allcentral functions (including Head Office functions) that provide support to ABN AMRO’s businesses. TheConsortium Banks will also retain shared economic interests in certain assets and liabilities of ABNAMRO which the Banks regard as non-strategic. These include ABN AMRO’s private equity portfolio, itsstakes in Capitalia and Saudi Hollandi, and Prime Bank. These are expected to be disposed of over aperiod of time with a view to maximizing value.
The ABN AMRO Businesses
Business Unit Netherlands (excluding the former Dutch wholesale clients, Interbank and DMC
Consumer Finance)
The ABN AMRO Business Unit Netherlands acquired by Fortis serves consumer and commercialbanking clients in The Netherlands. After implementation of the Divestment, this Business Unit will have,with approximately 21,000 staff operating through a network of 561 bankshops, 65 advisory branches,three dedicated mid-market corporate client units, two large corporate client wholesale centers and fourintegrated call centers. Business Unit Netherlands also operates approximately 1,600 ATMs and internetand mobile channels and is active in the intermediary market with amongst others mortgages.
For the year ended December 31, 2007, excluding discontinued businesses, the Business UnitNetherlands generated total operating income of EUR 4,094 million and reported a net operating profitafter tax from continuing operations of EUR 854 million.
74
Level: 6 – From: 6 – Wednesday, May 14, 2008 – 1:36 pm – g5mac4 – 3960 Section 05 : 3960 Section 05

The following table shows for the year ended December 31, 2007 certain financial informationrelating to the activities of ABN AMRO’s Business Unit Netherlands acquired by Fortis (Retail andCommercial/Corporate activities in The Netherlands:
BU Netherlands11112111
(EUR Million)
Total income . . . . . . . . . . . . . . . . . . . . . . . . . . . . . . . . . . . . . . . . . . . . . . . . . . . . . . . . . . . . . . . . . 4,094Total expenses . . . . . . . . . . . . . . . . . . . . . . . . . . . . . . . . . . . . . . . . . . . . . . . . . . . . . . . . . . . . . . . (2,069)Change in impairments . . . . . . . . . . . . . . . . . . . . . . . . . . . . . . . . . . . . . . . . . . . . . . . . . . . . . . . . (375)Profit before taxes . . . . . . . . . . . . . . . . . . . . . . . . . . . . . . . . . . . . . . . . . . . . . . . . . . . . . . . . . . . . 1,111Income tax expenses . . . . . . . . . . . . . . . . . . . . . . . . . . . . . . . . . . . . . . . . . . . . . . . . . . . . . . . . . . (257)Profit from continuing operations . . . . . . . . . . . . . . . . . . . . . . . . . . . . . . . . . . . . . . . . . . . . . . . . 854Discontinued operations (net) . . . . . . . . . . . . . . . . . . . . . . . . . . . . . . . . . . . . . . . . . . . . . . . . . . . 52Net profit . . . . . . . . . . . . . . . . . . . . . . . . . . . . . . . . . . . . . . . . . . . . . . . . . . . . . . . . . . . . . . . . . . . 906
Business Unit Private Clients
The Business Unit Private Clients provides private banking services to wealthy individuals andinstitutions with EUR 1 million or more in net assets to invest. In 2007, ABN AMRO was one of the topfive private banks in Europe measured by assets under administration. It employed approximately 3,000staff, operating through 103 offices in 16 countries and had EUR 138 billion of assets underadministration.4
For the year ended December 31, 2007, the ABN AMRO Business Unit Private Clients acquired byFortis generated total income of EUR 1,366 million and reported net operating profit after tax of EUR 310million.
The following table shows certain financial information relating to ABN AMRO’s Business UnitPrivate Clients for the year ended December 31, 2007:
BU Private Clients11112111
(EUR Million)
Total income . . . . . . . . . . . . . . . . . . . . . . . . . . . . . . . . . . . . . . . . . . . . . . . . . . . . . . . . . . . . . . . . . 1,366Total expenses . . . . . . . . . . . . . . . . . . . . . . . . . . . . . . . . . . . . . . . . . . . . . . . . . . . . . . . . . . . . . . . (927)Change in impairments . . . . . . . . . . . . . . . . . . . . . . . . . . . . . . . . . . . . . . . . . . . . . . . . . . . . . . . . (4)Profit before taxes . . . . . . . . . . . . . . . . . . . . . . . . . . . . . . . . . . . . . . . . . . . . . . . . . . . . . . . . . . . . 434Income tax expenses . . . . . . . . . . . . . . . . . . . . . . . . . . . . . . . . . . . . . . . . . . . . . . . . . . . . . . . . . . (124)Profit from continuing operations . . . . . . . . . . . . . . . . . . . . . . . . . . . . . . . . . . . . . . . . . . . . . . . . 310Discontinued operations (net) . . . . . . . . . . . . . . . . . . . . . . . . . . . . . . . . . . . . . . . . . . . . . . . . . . . –Net profit . . . . . . . . . . . . . . . . . . . . . . . . . . . . . . . . . . . . . . . . . . . . . . . . . . . . . . . . . . . . . . . . . . . 310
Business Unit Asset Management
The Business Unit Asset Management provides asset management services directly to institutionalclients (such as central banks, pension funds, insurance companies and leading charities) and to privateinvestors through ABN AMRO’s consumer and private banking arms and through third-party distributorssuch as insurance companies and other banks. It employs approximately 1,800 staff and operates in 26countries worldwide. At the end of 2007, the Business Unit Asset Management managed EUR 199 billionof assets under management; just over half of the assets managed were for institutional clients, around30% for consumer and third-party clients and the remainder in discretionary portfolios for Business UnitPrivate Clients.
For the year ended December 31, 2007, the ABN AMRO Business Unit Asset Managementgenerated total income of EUR 935 million and reported net profit after tax of EUR 182 million.
75
Level: 6 – From: 6 – Wednesday, May 14, 2008 – 1:36 pm – g5mac4 – 3960 Section 05 : 3960 Section 05
4. Source: Annual report 2007.

The following table shows certain financial information relating to ABN AMRO’s AssetManagement business for the year ended December 31, 2007:
BU AssetManagement
11112111
(EUR Million)
Total income . . . . . . . . . . . . . . . . . . . . . . . . . . . . . . . . . . . . . . . . . . . . . . . . . . . . . . . . . . . . . . . . . 935Total expenses . . . . . . . . . . . . . . . . . . . . . . . . . . . . . . . . . . . . . . . . . . . . . . . . . . . . . . . . . . . . . . . (652)Change in impairments . . . . . . . . . . . . . . . . . . . . . . . . . . . . . . . . . . . . . . . . . . . . . . . . . . . . . . . . (1)Profit before taxes . . . . . . . . . . . . . . . . . . . . . . . . . . . . . . . . . . . . . . . . . . . . . . . . . . . . . . . . . . . . 283Income tax expenses . . . . . . . . . . . . . . . . . . . . . . . . . . . . . . . . . . . . . . . . . . . . . . . . . . . . . . . . . . (101)Profit from continuing operations . . . . . . . . . . . . . . . . . . . . . . . . . . . . . . . . . . . . . . . . . . . . . . . . 182Discontinued operations (net) . . . . . . . . . . . . . . . . . . . . . . . . . . . . . . . . . . . . . . . . . . . . . . . . . . . –Net profit . . . . . . . . . . . . . . . . . . . . . . . . . . . . . . . . . . . . . . . . . . . . . . . . . . . . . . . . . . . . . . . . . . . 182
Combination with the ABN AMRO Businesses
The successful combination of Fortis and the ABN AMRO Businesses is expected to create a topEuropean financial institution. Based on 2007 published data and after implementation of the Divestment,the combined businesses would have more than 80,000 employees worldwide, more than 10 millioncustomers in the Benelux alone, projected revenues of EUR 16.4 billion, total Banking and Insurance netprofit of more than EUR 5.5 billion (which is among the top five in countries that use the Euro), 2,500retail branches and 145 business centers across Europe.
The combination resulting from Fortis and the ABN AMRO Businesses will enjoy pre-eminentpositions in all major market segments in the Benelux.
• Leading positions in The Netherlands.5 This transaction is truly transformational and a uniqueopportunity for Fortis to cement its position as a leading financial institution in TheNetherlands. The new combined group is expected to occupy a leading position in RetailBanking (No. 3 based on retail banking assets and main bank relationships), CommercialBanking (No. 1 based on number of main bank relationships) and Private Banking (No. 1based on assets under management).
• A Leading European Private Bank.6 Fortis and ABN AMRO’s combined private bank wouldbe the third largest European private bank based on assets under management. With oneintegrated network and a large European and Asian footprint, the combined private bank willbe positioned to be the service provider of choice for high net worth clients and ultra high networth clients,
• Top-tier Asset Management.7 The combined businesses would also be a top-tier Europeanasset manager based on assets under management. The combined asset management businessis expected to benefit from a larger geographic footprint and enhanced offering to third-partydistributors, leveraging on a wide, innovative and well-performing product range. Thecombined product range is anticipated to reach top quartile position across many asset classesand achieve scale in core growth products.
Fortis believes that its combination with ABN AMRO will benefit all stakeholders. Clients willbenefit from an enhanced product offering and distribution network; employees will benefit from increased
76
Level: 6 – From: 6 – Wednesday, May 14, 2008 – 1:36 pm – g5mac4 – 3960 Section 05 : 3960 Section 05
5. Source: Greenwich Associate 2007 based on, amongst others, Credit impact on Domestic and Overall International Cash ManagementRelationships (2006) and Overall Relationship Performance (2006) (Greenwich Quality Index Score), TOF (Totaal OnderzoekFinanciële Diensten) Particulier 2006 (2-yearly survey on the retail banking sector in The Netherlands) based on consumer credits,customer cards, investment funds, mortgages, etc., all cross-checked against the overall market data available in reports by the DNBon the Dutch market and in annual accounts.
6. Source: Annual report 2007.
7. Source: Global Investor Magazine based on total third party assets under management 2007.

career opportunities; and both companies have a strong reputation for contributing to the localcommunities in which they operate.
Fortis values the strong brand of ABN AMRO in The Netherlands, and, as its owner, intends tocapitalize on it, as well as on the Fortis brand. Both companies have best-in-class servicing models: whileABN AMRO has been named “Best Bank” on several occasions, including by Global Finance, and has anextremely well equipped retail branch network, Fortis has twice been awarded the title of Dutch“Commercial Bank of the Year” in the last three years and has a distinctive European network to serviceinternationally active medium-sized enterprises.
Fortis believes that through combining their significant expertise in service quality, productdevelopment and distribution channels, the combined Fortis and the ABN AMRO Businesses will provideenormous opportunities to innovate, to invest in the best talents in the market, and to take the lead inproduct and technological development.
The combined business intends to pursue a socially responsible approach to business, in activedialogue with all stakeholders, in all the countries where it is present, leveraging on both companies’experience in investing in the community (through sponsorship, funding and employee volunteering).
Business rationale of the ABN AMRO Acquisition
Anticipated cost synergies and revenue benefits
Fortis believes that the combined activities will allow it to accelerate its strategy to become one ofEurope’s most dynamic and sustainable financial services providers, helping it to grow its businesses in“Enlarged Europe”, and selectively in Asia and North America.
In addition, Fortis believes that its acquisition of the ABN AMRO Businesses will create substantialsynergies. The expected pre-tax synergies are estimated at approximately EUR 1.3 billion, 87% on the costsavings side and 13% on the revenue benefit side.
Fortis estimates that the Business Unit Netherlands will account for EUR 437 million of these pre-tax synergies. Of that EUR 437 million, EUR 381 million is expected to be achieved on the cost sidethrough network rationalization through branch mergers and the combinations of Direktbank andFlorius/ABN AMRO hypotheekbedrijf and ABN AMRO credit cards into International Card Services onthe retail bank side and a focused business centers approach and corporate and investment bankingpresence combined with efficient management structuring the commercial banking. Additional BusinessUnit Netherlands cost synergies are expected to be obtained through the combination and integration ofoverlapping support functions. Fortis also estimates that the combination with Business Unit Netherlandswill result in EUR 56 million of pre-tax revenue synergies, attributable to higher sales volumes on mutualfunds, increased bancassurance penetration and a higher activation of ABN AMRO credit on the retailbanking side as well as an increased ability to exploit value-added skills, such as leasing and factoring, onan enlarged customer portfolio along with benefits from the pan-European “network effect” in thecommercial banking business. Additionally, risk enhancement is expected to lead to lower credit losses.
Fortis estimates that the Business Unit Private Clients will account for EUR 203 million of pre-taxsynergies, of which EUR 160 million is expected to be achieved through a combination of overlappingsupport functions and EUR 43 million is expected to be achieved through leveraging credit and investmentservices and the cross-selling of products.
Fortis estimates that the Business Unit Asset Management will account for EUR 160 million ofthese pre-tax synergies. Of that EUR 160 million, Fortis expects that EUR 145 million in cost synergieswill be realized through the alignment of the investment process and the combination and integration ofoverlapping support functions and IT infrastructure. Fortis expects the remaining EUR 15 million ofrevenue synergies to result from the cross-selling of products to Fortis’s and ABN AMRO’s respectiveclient bases and leveraging growth in Asia.
77
Level: 6 – From: 6 – Wednesday, May 14, 2008 – 1:36 pm – g5mac4 – 3960 Section 05 : 3960 Section 05

The remaining EUR 468 million of these EUR 1.3 billion in synergies is expected to be achievedthrough the integration of the major business systems (34%), shared operations (24%) and ITinfrastructure (42%).
Fortis intends to integrate the ABN AMRO Businesses over a 36-month period, focusing on, amongothers, the identification and mitigation of all relevant integration risks. During the integration process,Fortis is focusing on ensuring minimal disruption for clients. Fortis expects the total integration costs to beEUR 1.54 billion, of which 30% will be attributable to Retail Banking, 17% to IT and Operations, 16% toPrivate Banking, 14% to Asset Management, 12% to Commercial Banking and the remaining 11% togeneral overhead.
The following table sets out the benefits that Fortis expects to gain within three years of completionof the transaction as a result of the integration of the ABN AMRO Businesses. For further informationabout the plans, proposals, estimates and assumptions of Fortis for achieving these benefits, see “— Plansfor the ABN AMRO Businesses” and “— Combination with the ABN AMRO Businesses” above. Thefollowing table sets out the pre-tax benefits that Fortis expects to gain within three years of completion ofthe ABN AMRO Acquisition as a result of the integration of the ABN AMRO Businesses (after givingeffect to the impact of the Divestment). While Fortis believes these figures provide a reasonable estimationof such benefits, these estimates are based on historical information and assumptions and there can be noassurance that such synergies or savings will be attained.
Estimated EstimatedCost Revenue
Savings per Synergies perAnnum by Annum by
Figures Before Tax End of 2010 End of 201011111111 111111 111111
(EUR million)
Dutch Retail Business(1) . . . . . . . . . . . . . . . . . . . . . . . . . . . . . . . . . . . . . . . . . . . . . 297 46Dutch Commercial Business(1) . . . . . . . . . . . . . . . . . . . . . . . . . . . . . . . . . . . . . . . . 84 10Private Banking . . . . . . . . . . . . . . . . . . . . . . . . . . . . . . . . . . . . . . . . . . . . . . . . . . . 160 43Asset Management . . . . . . . . . . . . . . . . . . . . . . . . . . . . . . . . . . . . . . . . . . . . . . . . . 145 15Central Functions . . . . . . . . . . . . . . . . . . . . . . . . . . . . . . . . . . . . . . . . . . . . . . . . . . 414 54
111111 111111
Total . . . . . . . . . . . . . . . . . . . . . . . . . . . . . . . . . . . . . . . . . . . . . . . . . . . . . . . . . . . . 1,100 168111111 111111111111 111111
(1) Taking into account the impact of the Divestment.
Most of the estimated transaction benefits are expected to result from cost savings which Fortisbelieves are based on reasonable estimates, in line with past achievements. Fortis expects that a substantialproportion of the estimated cost savings will result from de-duplication of overlapping activities and arenot dependent on a substantial off-shoring of functions.
While the clear cost-saving opportunities underpin the potential value creation, Fortis also believesthat there are considerable opportunities to create sustainable increases in profitable revenue growth. Thecombination of complementary businesses and capabilities will create additional opportunities for growthwhich are not available to ABN AMRO alone. Fortis has the resources to capitalize on these opportunitiesfor growth. Fortis estimates that identified revenue benefits, net of associated costs and bad debts, beforetax, will be approximately EUR 168 million by the end of 2010.
Due to the comprehensive strategic fit of its current businesses with the ABN AMRO Businesses,Fortis expects that, following its acquisition of the ABN AMRO Businesses, it will be able to createstronger businesses with enhanced market presence and growth prospects, leading to substantial valuecreation and benefits for shareholders, customers and employees. Fortis has the financial and managerialresources to invest in and grow the ABN AMRO Businesses and has proven records of growing its ownbusinesses.
78
Level: 6 – From: 6 – Wednesday, May 14, 2008 – 1:36 pm – g5mac4 – 3960 Section 05 : 3960 Section 05

Expected Financial Impact
The Securities are expected to strengthen Fortis’s core Tier 1 capital.
Fortis Bank’s end of year 2007 solvency surpassed regulatory requirements and Fortis Bank’s coreTier 1 ratio was 9.5%. See “Operating and Financial Review — Liquidity and Capital Resources —Supervision and Solvency.” The year-end 2007 Fortis Bank Tier 1 capital ratio is before all other actions tobe taken to finalize the reorganization of ABN AMRO and with the investment in RFS Holdings accountedfor by Fortis using the equity method, resulting in a deduction of 50% of the participation from Tier 1capital and 50% from Tier 2 capital.
After the successful completion of the consolidation of ABN AMRO activities, Fortis Bank’s Tier 1ratio is expected to be close to its target of 7%. Each time an activity is integrated, the related goodwilland intangibles will be deducted from Tier 1 capital. See “Operating and Financial Review and Prospects— Liquidity and Capital Resources”. This projection considers that the acquisition, the financing, thereorganization and the separation of the ABN AMRO Businesses, the sale of non-core assets and othercapital relief transactions are fully executed.
Based on Fortis’s forecasts for business growth and transaction benefits, the acquisition is expectedto lead to a 2.7% accretion in cash earnings per share in 2010 and to produce a return on investment on acash basis of 11.1% in 2010. The foregoing is based on the assumption that the proceeds from theDivestment will be used to reduce the core capital as appropriate. There can be no assurance that suchgrowth or benefits will be attained.
Overview of the integration process
Following the completion of the ABN AMRO Acquisition, ABN AMRO is now owned by theConsortium Banks through RFS Holdings.
On November 1, 2007, the ABN AMRO extraordinary general meeting of shareholders confirmedthe appointment to the Supervisory Board of ABN AMRO of Jean-Paul Votron, Chief Executive Officer ofFortis; Sir Fred Goodwin, Chief Executive Officer of RBS; and Juan Inciarte, General Manager ofSantander. As of November 1, 2007 ABN AMRO’s Managing Board is chaired by Mark Fisher of RBS;Karel De Boeck of Fortis is Deputy Chairman of ABN AMRO’s Managing Board and John Hourican, ofRBS, is Chief Financial Officer of ABN AMRO.
Together with ABN AMRO, the Consortium Banks have prepared a base-lined plan for theseparation and transfer of, among other things, the ABN AMRO Businesses. This plan was submitted tothe DNB on December 11, 2007. Separately with representatives of the businesses it is acquiring, Fortis isdrawing up plans that will allow it to achieve synergies in the months following the transfer of the ABNAMRO Businesses to the Consortium Banks.
This plan has been further developed with detailed plans for the separation of businesses in order tominimize the uncertainty for staff and other stakeholders. In each function and Business Unit, theManaging Board has created a Transition Steering Group (“TSG”). Each TSG comprises the relevantfunctional experts/managers seconded to ABN AMRO Group from the appropriate Consortium membersfor the period of the transition and the relevant ABN AMRO Group functional executive/business manager.
Each TSG is responsible for planning the orderly separation of businesses in line with the guidingprinciples agreed to by the Banks as set out in the Consortium and Shareholders’ Agreement.
Each TSG reports to the Transition Management Committee, which is a sub-committee of theManaging Board. The Transition Management Committee is responsible for reviewing and coordinatingthe individual plans in order to create an integrated plan for the entire transition, including appropriate riskmanagement and control mechanisms.
The Consortium intends to continue the close and continuous dialogue with the Dutch Central Bank(DNB). In particular, relevant approvals will be obtained from the DNB for each separation before
79
Level: 6 – From: 6 – Wednesday, May 14, 2008 – 1:36 pm – g5mac4 – 3960 Section 05 : 3960 Section 05

implementation. Fortis has already received the permission from the DNB concerning the proposeddemerger of ABN AMRO Asset Management. This demerger was completed on April 1, 2008.
Business Unit Netherlands
(i) Retail Banking
Subsequent to completion of the reorganization, Fortis retail activities in The Netherlands willmerge with ABN AMRO’s existing operations, while aiming to ensure a smooth transition andundisrupted service to all customers. In the future, Fortis expects that its customers will benefitfrom an even stronger product portfolio, full-service SME banking and a combinedpersonal/preferred banking proposition. Individual customers will have access to this enlargedproduct offering through a wider branch network with nationwide coverage, intermediary channelsand an advanced online banking platform. In addition, professionals and small businesses will haveaccess the overall branch network, completed with dedicated advisory branches. To strengthen itscompetitive positioning and stimulate entrepreneurship, Fortis intends to rollout a performance-driven reward system.
(ii) Commercial Banking
Fortis expects that internationally active medium-sized enterprises will be able to take advantage ofa distinctive network of business centers in 19 countries across Europe. One global accountmanager with access to the combined Fortis and the ABN AMRO Businesses using an integratedplatform, will serve these clients’ interests in the different countries where they are active.
Fortis believes the combined networks will provide a wider-reaching geographical footprint ofaround 35 to 40 dedicated business centers in The Netherlands. These centers will be fullyintegrated into Fortis international business center network and will benefit from the continuousupgrade of staff quality, coming from both of Fortis and ABN AMRO.
Fortis will endeavor to share best practices and intends to implement new added-value solutions forrisk management, liquidity and asset-based finance with short time to market, drawing on thecapabilities of Fortis and ABN AMRO locally, as well as Fortis on a global basis. For example,Fortis Enterprise & Entrepreneur solutions, by which owners and managers of companies servicedby Commercial Banking are offered wealth management solutions, will be transposed onto theenlarged customer base in the business community and private Dutch market in order to foster thegrowth of the combined businesses’ Private Banking operations.
Private Clients
Fortis expects that the addition of ABN AMRO Private Banking (excluding the private bankingbusiness in Latin America which will be acquired by Santander in the reorganization) will strengthenFortis Private Banking franchise in Europe and establish a solid growth platform in Asia. Based on assetsunder management data, the combination is expected to create the third largest European private bank. Thecombined Private Banking operations are expected by Fortis to be well positioned to reap the benefits ofenlarged scale and a broader skill set.
Fortis anticipates that its enlarged geographic footprint will allow for an accelerated rollout of a fullservice offering in growth locations, such as UAE, India, Hong Kong and Singapore, and will strengthenits position in relation to other providers. As a result of the acquisition, Fortis expects to build a solidplatform in Asia for capturing future growth. The combined organization is expect to be well diversifiedgeographically, with around 50% of its business (in terms of AuM) coming from non-Benelux based on2007 data.
Fortis believes that a close match in service philosophy and similar client focus will allow the newcombined businesses to leverage best practices and local market strengths across the international network.
80
Level: 6 – From: 6 – Wednesday, May 14, 2008 – 1:36 pm – g5mac4 – 3960 Section 05 : 3960 Section 05

The enhanced operating scale and heightened private bank identity is expected by Fortis to facilitate therecruitment, development and retention of international talent.
Asset Management
Fortis believes that its and ABN AMRO’s fund managers share a common management philosophyand comparable strategy. Fortis expects that since the products are highly complementary, the combinedbusinesses will enjoy an established European franchise along with global reach and scale.
The combined business will be based on individual investment centers, each offering a broad rangeof asset classes. Fortis expects that each investment center will have access to core proprietary research inorder to be able to offer true multi-product investment and structuring solutions. Based on year end 2006figures, the new team will comprise some 570 investment professionals, supported by more than 500specialist sales and marketing executives. The offering will include the whole range of investment stylesfrom traditional long only products to long/short products focused on absolute return strategies.
The complementary nature of the two product ranges is expected to allow the combined businessesto reach top quartile position across many asset classes and achieve scale in core growth products (such asequity and structured products, Socially Responsible Investors, global property, asset and liabilitymanagement (“ALM”) capability and alternatives).
On January 31, 2008, Fortis received permission from the DNB concerning the proposed demergerof ABN AMRO Asset Management from ABN AMRO Bank. This Business Unit merged with FortisInvestments, the asset management company of Fortis, on April 1, 2008.
Details of the ABN AMRO Acquisition
Overview of the ABN AMRO Acquisition
On May 28, 2007, Fortis and the other Consortium Banks entered into a Consortium andShareholders’ Agreement described in the “— Summary of Consortium and Shareholders’ Agreement”section below in order to govern the terms of their joint investment in RFS Holdings, a company formedspecifically for the purpose of acquiring ABN AMRO. On completion of this offer the Banks had acquired98.8% of the ABN AMRO share capital.
Regulatory matters
RFS Holdings and the Consortium Banks have obtained all necessary approvals for the acquisitionof ABN AMRO with their home regulators and have made substantially all other applications forregulatory change of control approval. Approval was obtained from, amongst others, the UK FinancialServices Authority, De Nederlandse Bank (“DNB”) in The Netherlands, the Spanish Securities MarketCommission (Comisión Nacional del Mercado de Valores, or “CNMV”), and the CBFA in Belgium. Theconsents obtained were in respect of the acquisition of the ABN AMRO group as a whole.
In addition, in order for the conditions to the ABN AMRO Acquisition to have been satisfied, RFSHoldings and/or the Consortium Banks made certain competition and antitrust filings with, and obtainedapprovals from, certain regulatory authorities with respect to the acquisition of ABN AMRO as well as insome cases the reorganization of ABN AMRO following completion of the ABN AMRO Acquisition. Inparticular, competition consents or confirmations were obtained from, among others, the U.S. FederalTrade Commission and the antitrust division of the U.S. Department of Justice.
Although the Consortium Banks sought certain regulatory approvals for the reorganization of ABNAMRO after the acquisition, other than as contemplated in the Antitrust Condition, obtaining regulatoryapprovals for the reorganization (as opposed to the acquisition) of ABN AMRO was not a condition to theABN AMRO Acquisition. Since the ABN AMRO Acquisition was declared wholly unconditional, RFSHoldings and the Consortium Banks have approached banking regulators in each jurisdiction where ABNAMRO entities are located and, where relevant, requested consent to the proposed restructuring of theABN AMRO group.
81
Level: 6 – From: 6 – Wednesday, May 14, 2008 – 1:36 pm – g5mac4 – 3960 Section 05 : 3960 Section 05

The subsequent restructuring of the ABN AMRO group may also require further antitrust clearancein certain jurisdictions, which processes are being progressed.
On September 17, 2007, the Dutch Minister of Finance, on the advice of DNB, granted theConsortium Banks the Declarations of No Objection they required in respect of the ABN AMROAcquisition. The Declarations of No Objection contained specific conditions and requirements, including(i) that the Consortium Banks ensure sufficient continuity within the Management Board and theSupervisory Board of ABN AMRO Holding N.V. and ABN AMRO Bank N.V., (ii) that RBS be primarilyresponsible for the governance of ABN AMRO during the transition phase of the reorganization, (iii) thatwithin two months of the entry into force of the Declarations of No Objection, the Consortium Banks shallensure that ABN AMRO draws up a robust and detailed Transitional Plan, which was submitted to theDNB in the first quarter of 2008 (iv) that the Consortium Banks shall not make any fundamental changesto the current setup of ABN AMRO before (a) the Consortium Banks have obtained sufficient control overABN AMRO in order to effect an orderly execution of the proposed reorganization and (b) the transitionalplan is approved by the DNB and (v) the Consortium Banks commit to maintain target levels of capitaland liquidity determined between DNB and ABN AMRO. The Declarations of No Objection entered intoforce when ABN AMRO Acquisition was declared unconditional by the Consortium Banks.
In order to secure the approval of the European competition authorities in respect of the ABNAMRO transaction, Fortis and the European Commission have discussed alternative remedies to solve thecompetition concerns identified by the European Commission in the commercial banking segment in TheNetherlands following the acquisition of the ABN AMRO Businesses. In this context, Fortis proposed and,on October 3, 2007 the European Commission accepted, Fortis to implement the Divestment as discussedin the Cautionary Statement to Section 3 above, and granted Fortis the necessary approval for theacquisition of the ABN AMRO Businesses.
In certain jurisdictions where ABN AMRO has operations, the local regulatory regime imposes astatutory timeframe within which the relevant regulator must communicate its decision on the applicationfor regulatory change of control consent. In others, there is no such timeframe and RFS Holdings cannot,therefore, be certain as to when consent might be granted (if at all).
Summary of Consortium and Shareholders’ Agreement
The Consortium and Shareholders’ Agreement (the “Consortium and Shareholder’ Agreement”)was executed by and among Fortis, RBS, Santander and RFS Holdings on May 28, 2007, supplemented onSeptember 17, 2007 and may be further amended or supplemented from time to time.
The Consortium and Shareholders’ Agreement governs the relationships among Fortis, RBS,Santander and RFS Holdings in relation to the ABN AMRO Acquisition. It also details the approach theConsortium Banks have adopted for the governance and management of ABN AMRO following theacquisition. The provisions of the Consortium and Shareholders’ Agreement relating to the restructuringand management of ABN AMRO set out certain goals to be achieved by ABN AMRO’s Managing Board;such goals will also require resolutions to be passed by the board of certain ABN AMRO groupcompanies.
The arrangements contemplated by the Consortium and Shareholders’ Agreement include, amongothers:
• the funding of RFS Holdings in connection with the ABN AMRO Acquisition;
• the governance of RFS Holdings before and after the ABN AMRO Acquisition;
• Fortis, RBS and Santander’s equity interests in RFS Holdings;
• the transfer of certain ABN AMRO businesses, assets and liabilities to Fortis, RBS andSantander (or their group members) after the acquisition of ABN AMRO by RFS Holdings;
82
Level: 6 – From: 6 – Wednesday, May 14, 2008 – 1:36 pm – g5mac4 – 3960 Section 05 : 3960 Section 05

• the management and disposal of any businesses, assets and liabilities of ABN AMRO notintended to be transferred to Fortis, RBS or Santander;
• allocation of core tier 1 capital;
• further funding obligations after the acquisition of ABN AMRO where funding is required byregulatory authorities in connection with the businesses of ABN AMRO; and
• allocation of taxes and conduct of tax affairs.
Funding of RFS Holdings
Fortis, RBS and Santander agreed to subscribe to shares in RFS Holdings of a sufficient amount tofund the consideration due under the ABN AMRO Acquisition. This funding commitment was split amongFortis, RBS and Santander as follows:
• Fortis: 33.8%;
• RBS: 38.3%; and
• Santander: 27.9%.
Ownership of RFS Holdings
Upon funding for the settlement of the ABN AMRO Acquisition, Fortis, RBS and Santanderacquired shareholdings in RFS Holdings equal to their proportionate funding commitments. Four classesof shares were issued by RFS Holdings, with one class for each of Fortis, RBS and Santander and afurther class issued to all three.
The application to RFS Holdings of the economic/accounting mechanism agreed in the Consortiumand Shareholders’ Agreement results in the capital and income rights of the three classes of shares thathave been issued to Fortis, RBS and Santander, respectively, to be linked effectively to the net assets andincome of the business units which the relevant shareholder will acquire following implementation of therestructuring of ABN AMRO contemplated by the Consortium and Shareholders’ Agreement. The fourthclass, which will be issued to Fortis, RBS and Santander in proportion to their funding commitments, willreflect their ultimate pro rata interests in the businesses, assets and liabilities that are not being acquired byany of them individually.
Governance (post-completion)
ABN AMRO
It has been agreed that the roles of the Supervisory Board and the Managing Board of ABN AMROremain unchanged while the reorganization process is taking place; the Supervisory Board and theManaging Board remain responsible for the management of the ABN AMRO group and each Boardmember has a duty to the ABN AMRO group in its entirety. Each member of the Managing Board reportsto the Chairman of the Managing Board and is accountable for a defined set of responsibilities aimed atachieving efficient management of the ABN AMRO group. The Chairman of the Managing Board isexpected to ensure that each members of the Managing Board has the necessary skills and experience inthe relevant markets and is able to carry out its duties in relation to the business for which each suchManaging Board member has the lead responsibility.
A number of additional matters have been agreed to be referred to the Supervisory Board forapproval by a simple majority, in addition to those matters already reserved for reference to theSupervisory Board according to ABN AMRO’s practice. The most significant of such additional matters isthe approval of the Transitional Plan (as defined below) and any subsequent material amendment to it.Such additional matters are: (i) proposals for capital expenditure in excess of EUR 150 million; (ii)
83
Level: 6 – From: 6 – Wednesday, May 14, 2008 – 1:36 pm – g5mac4 – 3960 Section 05 : 3960 Section 05

material changes in the nature of businesses; (iii) material acquisitions and disposals; (iv) materiallitigation; and (v) material contracts not in the ordinary course of business.
RFS Holdings
Since the completion of the ABN AMRO Acquisition, the Board of RFS Holdings consists of fourdirectors, two nominated by RBS and one nominated by each of Fortis and Santander. Sir Fred Goodwinof RBS is one of the RBS nominees and is the Chairman of the Board, with a casting vote to decidematters on which the Board cannot otherwise agree.
Board decisions will generally be taken by a simple majority vote subject to minority protections inthe form of reserved matters set out in the Consortium and Shareholders’ Agreement that will require theapproval of at least one director nominated by each of Fortis, RBS and Santander.
The Consortium Banks have agreed for RBS to take lead responsibility for running the whole ofABN AMRO throughout the transition period until the individual ABN AMRO businesses are legallytransferred to the individual Consortium Banks. Until that time, the ABN AMRO group will continue toact as a single coordinated institution in respect of all liabilities, requirements and regulatory interfaces.
Reorganization
ABN AMRO
Pursuant to the Consortium and Shareholders’ Agreement, a transition plan (the “Transition Plan”)was agreed in the first 45 days following completion of the ABN AMRO Acquisition. The Transition Plancovers the orderly reorganization of the ABN AMRO group to achieve the separation and allocation of thebusinesses in line with the Consortium and Shareholders’ Agreement. The Transition Plan was submittedto DNB in the first quarter of 2008.
For the development of the Transition Plan, including the information gathering and verificationexercise required for that purpose, a project structure has been implemented within ABN AMRO,operating under the authority of the ABN AMRO Managing Board, and remaining distinct from managingday to day service to customers and control. The workstreams comprise relevant functionalexperts/managers seconded to ABN AMRO group from the Consortium Banks and the relevant ABNAMRO group functional executive/business manager(s). This plan was submitted for approval to the DNBon December 11, 2007.
The ABN AMRO Managing and Supervisory Boards have to adopt the Transition Plan and, subjectto their satisfaction, will use it as the basis of formal consultation with relevant stakeholders includingregulators, works councils and unions. In particular, relevant approvals will have to be obtained from theDNB for each separation before implementation. Fortis received on January 31, 2008 permission from theDNB for the demerger of ABN AMRO Asset Management, which was completed on April 1, 2008.
The Consortium Banks have agreed that the shareholders of ABN AMRO should also approve theTransition Plan.
The Consortium and Shareholders’ Agreement recognizes that the actual implementation of theTransition Plan will be dependent, among other things, on the elimination of minority shareholders inABN AMRO. At year-end of 2007, the Consortium Banks owned 99.04% of all ordinary shares, or99.34% of total share capital, issued by ABN AMRO.
RFS Holdings
Under the terms of the Consortium and Shareholders’ Agreement, each of Fortis, RBS andSantander, as shareholder in RFS Holdings, will effectively bear the costs and liabilities (historic andfuture) relating to the ABN AMRO assets it will ultimately acquire and indemnities among Fortis, RBSand Santander reflect this position.
84
Level: 6 – From: 6 – Wednesday, May 14, 2008 – 1:36 pm – g5mac4 – 3960 Section 05 : 3960 Section 05
Businesses, assets and liabilities that are not to be acquired by any of Fortis, RBS or Santanderindividually will be disposed of over a period of time. The terms of the Consortium and Shareholders’Agreement aim for disposal of such assets as soon as possible.
The Agreement contains provisions for determination of issues between Fortis, RBS and Santanderon which they cannot agree on in the context of the restructuring. Disputes are first escalated to groupchief executive level at each of Fortis, RBS and Santander and, in the absence of agreement, a jointly-appointed independent accountant will determine the issues in dispute. Such dispute-resolution mechanismwill apply at RFS Holdings level and will not have any direct effect on the management of the ABNAMRO group.
If, prior to the implementation of the restructuring, it becomes clear that the necessary approvals forthe transfer of assets to Fortis, RBS or Santander, as applicable, will not be obtained (such as due torejection by a financial regulatory authority), the shareholder of RFS Holdings that was the intendedacquirer of such assets will be entitled to the distribution of the proceeds of such sale at the level of RFSHoldings.
Allocation of capital on restructuring
In the Consortium and Shareholders’ Agreement, the partners guaranteed each other a minimumcore equity to risk-weighted assets of at least 4.95% for the businesses acquired by the individual partnersas of December 31, 2006.
Based on the provisional figures as per year-end 2007 and according to the Consortium andShareholders Agreement, Fortis is entitled to capital support of the Consortium partners. The capitalsupport can be structured in the form of an exchange of capital relief transactions or a subscription to coreequity instruments. A condition related to the capital support is the acceptance of these transactions orinstruments as core equity by the home regulators.
The capital support to Fortis, together with the anticipated impact of the EU Remedies, will lead toa transfer of capital of around EUR 3 billion.
Intra-group arrangements
All shared services have been agreed to continue upon the acquisition of ABN AMRO on the sameterms as applied by ABN AMRO as at December 31, 2006. The same principles applies as of separationand allocation of the respective businesses, unless Fortis, RBS and Santander agree otherwise.
Provision of further capital
If a regulator requires contribution of capital or liquidity in a particular ABN AMRO entity, suchrequest shall be addressed in the first instance by ABN AMRO, contributing the required capital orliquidity from within its own resources. In the event that the ABN AMRO contribution is not sufficient tomeet the regulator’s demands, additional capital or liquidity shall be provided by RBS.
Contributions of capital or liquidity are shared among the Consortium Banks as follows:
• the intended owner of the relevant business giving rise to the capital call will be liable to theother shareholders in RFS Holdings for meeting such a call (by providing further funding orotherwise).
• if a capital requirement is imposed in relation to assets that are not to be acquired by anyshareholder of RFS Holdings, the Consortium Banks will be liable to each other inproportion to their shareholdings.
• in the event that the FSA increases the capital requirements of RBS and that obligation arisesin relation to one of the ABN AMRO businesses to be acquired by Fortis or Santander, the
85
Level: 6 – From: 6 – Wednesday, May 14, 2008 – 1:36 pm – g5mac4 – 3960 Section 05 : 3960 Section 05

Consortium Banks will agree in good faith and acting reasonably how to satisfy the imposedrequirements or otherwise alleviate the issue.
Information technology and operations
There will be a specially constituted Transition Steering Committee (established by the ABNAMRO Managing Board) tasked with overseeing and making proposals on information technology andoperational matters, including the separation of all information technology and operations assets used byor relating to businesses owned by more than one of Fortis, RBS and Santander.
Intra-group debt
The Consortium and Shareholders’ Agreement provides that the Consortium Banks will seek toavoid a repayment of intra-group debt when assets are transferred to Fortis, RBS and Santander.Accordingly, unless otherwise agreed, such debt is intended to continue to maturity according to its terms.
Regulatory compliance
Fortis, RBS and Santander have each undertaken to co-operate fully to ensure that ABN AMROcontinues to meet its regulatory obligations following completion of the ABN AMRO Acquisition.However, the Consortium and Shareholders’ Agreement provides that RBS will take the lead in ensuringsuch compliance.
Provision of information
RFS Holdings is required to provide appropriate information to its shareholders, subject to bothcompetition law and regulatory requirements and the duties of the Managing Board of ABN AMRO andunless this would cause any interruption in the business of the ABN AMRO group.
Termination and conditionality
The Consortium and Shareholders’ Agreement terminates if Fortis, RBS and Santander unanimouslyagree such a termination.
Transfer of shares
Transfers of shareholdings in RFS Holdings to third parties are restricted although intra-grouptransfers are permitted subject to Fortis, RBS and Santander retaining full responsibility for theircontractual obligations.
Governing law/arbitration
The Consortium and Shareholders’ Agreement is governed by English law. Subject to the expertdetermination provisions referred to above, disputes will be resolved by arbitration in Paris under the rulesof the International Chamber of Commerce.
Implementation
The Consortium Banks and RFS Holdings have agreed to act in a manner consistent with theConsortium and Shareholders’ Agreement, as amended from time to time, and to take all such action,exercising all legally available rights and powers (as shareholders in RFS Holdings or, in the case of RFSHoldings, as a shareholder in ABN AMRO), as is reasonable in order to implement the terms of theConsortium and Shareholders’ Agreement and/or any transaction, matter or thing contemplated by it.
The approach as adopted by the Consortium Banks to the governance and management of the ABNAMRO group as set out in the Consortium and Shareholders’ Agreement has been discussed with DNB.
86
Level: 6 – From: 6 – Wednesday, May 14, 2008 – 1:36 pm – g5mac4 – 3960 Section 05 : 3960 Section 05

The Consortium Banks have undertaken to discuss and agree any potential change to such approach withDNB before implementing it.
Financial information and accounting aspects relating to the acquisition of the ABN AMROBusinesses
In accordance with IAS 28 Investments in Associates, the shareholding of Fortis in RFS Holdings isconsidered an investment in an associate, representing an entity over which Fortis has significantinfluence. RFS Holdings is consolidated as a subsidiary by RBS because of its control over RFS holdings.The minority interest owned by Fortis in RFS Holdings is accounted for using the equity method. Underthe equity method, the investment in RFS Holdings is initially recognized at cost and the carrying amountis increased or decreased to recognize Fortis’s share in the profit or loss and net assets of RFS Holdingsafter the date of acquisition.
On October 10, 2007, the Banks declared the Offer unconditional and effective settlement of theOffer took place on October 17, 2007. This date is identified, pursuant to IFRS 3 Business combinations,as the date of acquisition of control by RFS Holdings on ABN AMRO (with legal, accounting and taxeffects) and thus as the date on which the balance sheet figures of ABN AMRO are recognized in theaccounts of RFS Holdings.
According to IFRS 3, the acquired ABN AMRO businesses are accounted for using the purchaseaccounting method.
This process includes the identification and the fair value calculation of the assets and liabilitiesacquired by Fortis and the recognition and valuation of intangible assets. This process is executed indifferent stages, which include:
• review of the accounting policies as applied by ABN AMRO and recognition of differenceswith the accounting policies of Fortis,
• preparation of the fair value accounting of the on-balance and off-balance sheet items ofABN AMRO at the date of acquisition,
• recognition of intangible assets and their value and consequently the calculation of thegoodwill paid, and
• accounting for the result of the business units of ABN AMRO acquired by Fortis for theperiod October 17 - December 31, 2007.
The review of the accounting policies, the preparation of the fair value of the balance sheet items,the recognition and measurement of the intangible assets and the calculation of the goodwill, as describedbelow, are currently taking place and are planned to be finalized by the end of June 2008. Figuresdisclosed in relation to the recognition and valuation of ABN AMRO related assets and liabilities aretherefore provisional.
87
Level: 6 – From: 6 – Wednesday, May 14, 2008 – 1:36 pm – g5mac4 – 3960 Section 05 : 3960 Section 05

The provisional identifiable assets and liabilities of the acquired ABN AMRO Businesses and thepart of Fortis in the shared assets, as well as the goodwill related to the acquisition, can be presented asfollows:
At October 17,2007
11111
Due from customers . . . . . . . . . . . . . . . . . . . . . . . . . . . . . . . . . . . . . . . . . . . . . . . . . . . . . . . . . . . 139,202Investments . . . . . . . . . . . . . . . . . . . . . . . . . . . . . . . . . . . . . . . . . . . . . . . . . . . . . . . . . . . . . . . . . . 3,856Property, plant and equipment . . . . . . . . . . . . . . . . . . . . . . . . . . . . . . . . . . . . . . . . . . . . . . . . . . . 1,721Intangible assets . . . . . . . . . . . . . . . . . . . . . . . . . . . . . . . . . . . . . . . . . . . . . . . . . . . . . . . . . . . . . . 3,075Deferred tax assets . . . . . . . . . . . . . . . . . . . . . . . . . . . . . . . . . . . . . . . . . . . . . . . . . . . . . . . . . . . . 652Other assets . . . . . . . . . . . . . . . . . . . . . . . . . . . . . . . . . . . . . . . . . . . . . . . . . . . . . . . . . . . . . . . . . 14,440
11111
Total identifiable assets . . . . . . . . . . . . . . . . . . . . . . . . . . . . . . . . . . . . . . . . . . . . . . . . . . . . . . . 162,94611111
Due to customers . . . . . . . . . . . . . . . . . . . . . . . . . . . . . . . . . . . . . . . . . . . . . . . . . . . . . . . . . . . . . 125,187Deferred tax liabilities . . . . . . . . . . . . . . . . . . . . . . . . . . . . . . . . . . . . . . . . . . . . . . . . . . . . . . . . . 138Other liabilities . . . . . . . . . . . . . . . . . . . . . . . . . . . . . . . . . . . . . . . . . . . . . . . . . . . . . . . . . . . . . . . 32,923
11111
Total identifiable liabilities . . . . . . . . . . . . . . . . . . . . . . . . . . . . . . . . . . . . . . . . . . . . . . . . . . . . 158,24811111
Total net assets . . . . . . . . . . . . . . . . . . . . . . . . . . . . . . . . . . . . . . . . . . . . . . . . . . . . . . . . . . . . . . 4,698Minority interests . . . . . . . . . . . . . . . . . . . . . . . . . . . . . . . . . . . . . . . . . . . . . . . . . . . . . . . . . . . . . 99
11111
Total net assets attributable to shareholders . . . . . . . . . . . . . . . . . . . . . . . . . . . . . . . . . . . . . . 4,5991111111111
Purchase price . . . . . . . . . . . . . . . . . . . . . . . . . . . . . . . . . . . . . . . . . . . . . . . . . . . . . . . . . . . . . . . 24,046Net assets . . . . . . . . . . . . . . . . . . . . . . . . . . . . . . . . . . . . . . . . . . . . . . . . . . . . . . . . . . . . . . . . . . . (4,599)
11111
Goodwill . . . . . . . . . . . . . . . . . . . . . . . . . . . . . . . . . . . . . . . . . . . . . . . . . . . . . . . . . . . . . . . . . . . 19,4471111111111
At Fortis level, the acquisition cost and the goodwill amount are reduced by EUR 92 million due tothe elimination (33.81%) of the gains realized on the exchange of the ABN AMRO shares previously heldby Fortis entities.
There were no major measurement differences between the accounting principles applied by ABNAMRO and the accounting principles applied by Fortis and as such, there were no resulting significantadjustments of the carrying value of assets and liabilities.
Adjustments following from the application of fair value accounting on the on-balance and off-balance items of the acquired ABN AMRO Businesses mainly related to the mortgage portfolio, fundingpositions related to the asset and liability management, the property portfolio and the investments inassociates.
Intangible assets include an amount of EUR 195 million relating to intangible assets previouslyaccounted for by ABN AMRO. Additionally, an amount of EUR 2,880 million has been recognized inrelation to the application of IFRS 3 Business combinations. Presently, Fortis has initially recognized thefollowing intangible assets according to IFRS 3: core deposits, core overdrafts, client relations and thebrand name.
• The value of a core deposit intangible asset arises from the deposit base of the acquiredbusiness being a source of funding at lower cost than wholesale or money market funding.The spread between the cost of deposit funding – i.e., the interest paid to customers – and thecost of wholesale funding represents the most significant component of value of the coredeposit intangible.
• The value of a core overdraft intangible asset arises primarily from future interest incomethat will be received on revolving loans throughout the length of a relationship with currentaccount customers.
88
Level: 6 – From: 6 – Wednesday, May 14, 2008 – 1:36 pm – g5mac4 – 3960 Section 05 : 3960 Section 05

• The value of the customer relationship intangible asset arises from future non-interest (i.e.,fee & commission) income. These future benefits are not encompassed in the fair value ofloans and receivable balances and are therefore recognized as a separate intangible asset.
As part of the transaction, Fortis also took ownership of the ABN AMRO brand and has valued it asan intangible asset.
The provisional purchase accounting applied on the assets and liabilities of the acquired ABNAMRO businesses and the part of Fortis in the shared assets currently results in goodwill of EUR 19.4billion (EUR 24 billion acquisition price and EUR 4.6 billion net assets).
The net intangible assets to be deducted in the local regulatory solvency calculation, assuming fullconsolidation of the acquired ABN AMRO businesses, are currently valued at EUR 2.9 billion, subject tofinal determination.
The acquired ABN AMRO businesses contributed EUR 179 million to the net profit attributable toshareholders of Fortis in 2007. The share of Fortis in the net assets of acquired ABN AMRO businesses asat December 31, 2007 was EUR 4,755 million. The income statement for the period October 17 toDecember 31, 2007 (76 days) for the acquired ABN AMRO businesses and the shared assets part of Fortisis as follows:
October 17, toDecember 31,
200711111
Net interest income . . . . . . . . . . . . . . . . . . . . . . . . . . . . . . . . . . . . . . . . . . . . . . . . . . . . . . . . . . . 727Net commissions and fees . . . . . . . . . . . . . . . . . . . . . . . . . . . . . . . . . . . . . . . . . . . . . . . . . . . . . . 472Realized and unrealized gains and losses . . . . . . . . . . . . . . . . . . . . . . . . . . . . . . . . . . . . . . . . . . 37Other income . . . . . . . . . . . . . . . . . . . . . . . . . . . . . . . . . . . . . . . . . . . . . . . . . . . . . . . . . . . . . . . . 159
11111
Total income . . . . . . . . . . . . . . . . . . . . . . . . . . . . . . . . . . . . . . . . . . . . . . . . . . . . . . . . . . . . . . . . 1,3951111111111
Change in impairments . . . . . . . . . . . . . . . . . . . . . . . . . . . . . . . . . . . . . . . . . . . . . . . . . . . . . . . . (61)11111
Net revenues . . . . . . . . . . . . . . . . . . . . . . . . . . . . . . . . . . . . . . . . . . . . . . . . . . . . . . . . . . . . . . . . 1,33411111
Staff expenses . . . . . . . . . . . . . . . . . . . . . . . . . . . . . . . . . . . . . . . . . . . . . . . . . . . . . . . . . . . . . . . . (410)Depreciation and amortization . . . . . . . . . . . . . . . . . . . . . . . . . . . . . . . . . . . . . . . . . . . . . . . . . . . (184)Other expenses . . . . . . . . . . . . . . . . . . . . . . . . . . . . . . . . . . . . . . . . . . . . . . . . . . . . . . . . . . . . . . . (496)
11111
Total expenses . . . . . . . . . . . . . . . . . . . . . . . . . . . . . . . . . . . . . . . . . . . . . . . . . . . . . . . . . . . . . . . (1,090)1111111111
Profit before taxation . . . . . . . . . . . . . . . . . . . . . . . . . . . . . . . . . . . . . . . . . . . . . . . . . . . . . . . . . 24411111
Income tax expenses . . . . . . . . . . . . . . . . . . . . . . . . . . . . . . . . . . . . . . . . . . . . . . . . . . . . . . . . . . (56)Net profit for the period . . . . . . . . . . . . . . . . . . . . . . . . . . . . . . . . . . . . . . . . . . . . . . . . . . . . . . 188
11111
Net profit attributable to minority interests . . . . . . . . . . . . . . . . . . . . . . . . . . . . . . . . . . . . . . . . . 911111
Net profit attributable to shareholders . . . . . . . . . . . . . . . . . . . . . . . . . . . . . . . . . . . . . . . . . . 1791111111111
89
Level: 6 – From: 6 – Wednesday, May 14, 2008 – 1:36 pm – g5mac4 – 3960 Section 05 : 3960 Section 05

The following table provides further information on the total assets and liabilities of the acquiredABN AMRO businesses and the shared assets part of Fortis at year-end 2007:
At December 31,2007
11111
Total assets . . . . . . . . . . . . . . . . . . . . . . . . . . . . . . . . . . . . . . . . . . . . . . . . . . . . . . . . . . . . . . . . . . 164,118Total liabilities . . . . . . . . . . . . . . . . . . . . . . . . . . . . . . . . . . . . . . . . . . . . . . . . . . . . . . . . . . . . . . . 159,263
11111
Total net assets . . . . . . . . . . . . . . . . . . . . . . . . . . . . . . . . . . . . . . . . . . . . . . . . . . . . . . . . . . . . . . 4,855Minority interests . . . . . . . . . . . . . . . . . . . . . . . . . . . . . . . . . . . . . . . . . . . . . . . . . . . . . . . . . . . . . 100
11111
Total net assets attributable to shareholders . . . . . . . . . . . . . . . . . . . . . . . . . . . . . . . . . . . . . . 4,7551111111111
The net assets evolution between the opening balance (October 17, 2007) and as at December 31,2007 is explained by the following elements:
Net assets arising on the opening balance . . . . . . . . . . . . . . . . . . . . . . . . . . . . . . . . . . . . . . . . 4,599Result of the year (76 days period) . . . . . . . . . . . . . . . . . . . . . . . . . . . . . . . . . . . . . . . . . . . . . . . 179Unrealized gains and losses (net) . . . . . . . . . . . . . . . . . . . . . . . . . . . . . . . . . . . . . . . . . . . . . . . . (23)Currency translation differences . . . . . . . . . . . . . . . . . . . . . . . . . . . . . . . . . . . . . . . . . . . . . . . . . (11)Other changes in equity . . . . . . . . . . . . . . . . . . . . . . . . . . . . . . . . . . . . . . . . . . . . . . . . . . . . . . . . 11
11111
Net assets at December 31, 2007 . . . . . . . . . . . . . . . . . . . . . . . . . . . . . . . . . . . . . . . . . . . . . . . . 4,7551111111111
90
Level: 6 – From: 6 – Wednesday, May 14, 2008 – 1:36 pm – g5mac4 – 3960 Section 05 : 3960 Section 05

FORTIS HYBRID FINANCING
General
Fortis Hybrid Financing is a special purpose financing vehicle formed by Fortis and incorporated onMay 24, 2006 in Luxembourg in the form of a limited liability company (société anonyme) and registeredwith the Luxembourg Register of Commerce and Companies with registration number B-116671. Thearticles of incorporation of Fortis Hybrid Financing have not been amended since incorporation. Theregistered office (siège social) of Fortis Hybrid Financing is located at 65, boulevard Grande DuchesseCharlotte, L-1331 Luxembourg, Luxembourg, and the telephone number of its registered office is +352 5644 95 04. Fortis Hybrid Financing’s independent auditors are PricewaterhouseCoopers S.à. r.l.,Luxembourg, located at 400 route d’Esch, L-1014 Luxembourg. PricewaterhouseCoopers S.à. r.l.,Luxembourg is a member of the Institut des Réviseurs d’Entreprises.
Business
Article 3 of its articles of incorporation provides that the sole purpose of Fortis Hybrid Financing isto provide a vehicle for raising solvency capital for the Parent Companies and the operating companies ofthe Fortis Group by issuance of securities which shall rank pari passu among themselves, and investingthe proceeds thereof in instruments (other than ordinary share capital) issued by any of the Fortis operatingcompanies that qualify as solvency for such Group entity. Fortis Hybrid Financing will not carry out anyactivities falling within the scope of the Luxembourg law of April 5, 1993 on the financial sector, asamended.
Fortis Hybrid Financing is not subject to the Luxembourg law of April 5, 1993 on the financialsector, as amended, and is not subject to the ordinary supervision of the Luxembourg CSSF.
Fortis Hybrid Financing is currently not subject to any specific corporate governance rules, otherthan the general rules deriving from Luxembourg law on commercial companies, with which it complies.
The following selected financial information shows the balance sheet at March 31, 2008, December31, 2007 and December 31, 2006 and the income statement for the three month period ended March 31,2008, the year ended December 31, 2007 and the period since the date of its incorporation throughDecember 31, 2006. This selected financial information is derived from Fortis Hybrid Financing’s auditedfinancial statements for the period ended December 31, 2007 and 2006, prepared in accordance withLuxembourg legal and regulatory requirements and its unaudited financial information as of and for thethree month period ended March 31, 2008.
At At AtMarch 31, December 31, December 31,
Balance Sheet 2008 2007 200612111 12111 12111 12111
(EUR millions)(unaudited)
AssetsFinancial assets . . . . . . . . . . . . . . . . . . . . . . . . . . . . . . . . . . . . . . . . . 997.3 500.00 500.0Debtors . . . . . . . . . . . . . . . . . . . . . . . . . . . . . . . . . . . . . . . . . . . . . . . 25.1 13.8 13.7Prepayments . . . . . . . . . . . . . . . . . . . . . . . . . . . . . . . . . . . . . . . . . . . 16.2 6.4 7.2
12111 12111 12111
Total assets . . . . . . . . . . . . . . . . . . . . . . . . . . . . . . . . . . . . . . . . . . . . 1,038.6 520.2 520.912111 12111 1211112111 12111 12111
LiabilitiesDebenture & other loans . . . . . . . . . . . . . . . . . . . . . . . . . . . . . . . . . . 997.3 500.0 500.0Other creditors . . . . . . . . . . . . . . . . . . . . . . . . . . . . . . . . . . . . . . . . . 23.9 13.8 13.7Deferred income . . . . . . . . . . . . . . . . . . . . . . . . . . . . . . . . . . . . . . . . 17.4 6.4 7.1
12111 12111 12111
Total liabilities . . . . . . . . . . . . . . . . . . . . . . . . . . . . . . . . . . . . . . . . . 1,038.6 520.2 520.912111 12111 1211112111 12111 12111
Share capital (320 shares nominal value EUR 100; fully paid up) . 0.0 0.0 0.012111 12111 12111
Total share capital and liabilities . . . . . . . . . . . . . . . . . . . . . . . . . . 1,038.6 520.2 520.912111 12111 1211112111 12111 12111
91
Level: 6 – From: 6 – Wednesday, May 14, 2008 – 1:36 pm – g5mac4 – 3960 Section 05 : 3960 Section 05

May 24Three Month Year Ended through
Period Ended March 31, December 31, December 31,11111112311 11112 11112
Income Statement 2008 2007 2007 20061121211 11211 11211 11211 11211
(unaudited)
Interest receivable and similar income 0.4 0.1 0.7 0.4
Interest income from fixed assets . . . . . . . . . . . . . . . . 10.0 6.4 25.8 13.7Other operating income . . . . . . . . . . . . . . . . . . . . . . . . 0.2 0.0 0.0 0.4
11211 11211 11211 11211
10.6 6.5 26.5 14.5Interest payable and similar charges . . . . . . . . . . . . . . (9.9) (6.3) (25.6) (13.6)Other operating charges . . . . . . . . . . . . . . . . . . . . . . . (0.3) 0.0 (0.1) (0.5)
11211 11211 11211 11211
Amortization issuing premium . . . . . . . . . . . . . . . . . . (0.4) (0.2) (0.8) 0.411211 11211 11211 11211
(10.6) (6.5) (26.5) (14.5)11211 11211 11211 11211
Net result . . . . . . . . . . . . . . . . . . . . . . . . . . . . . . . . . . . 0.0 0.0 0.0 0.011211 11211 11211 1121111211 11211 11211 11211
Fortis Hybrid Financing is a special purpose vehicle, which intends to issue Tier 1 Securities,qualifying as solvency capital for Fortis SA/NV, Fortis N.V. and other companies in the Fortis group, andto invest the proceeds thereof in instruments (other than ordinary share capital) issued by any of the Fortisoperating companies that qualify as solvency capital for such Fortis group entity. The Fortis groupprovides consolidated financial statements and a cash flow statement. Fortis Hybrid Financing has alreadyissued securities in 2006 and 2008 on a stand-alone basis to qualified investors and has had no otheractivities than these two issues of securities. Therefore, pursuant to article 23.4 of the EC Regulation No809/2004, as a cash flow statement is not pertinent to Fortis Hybrid Financing, to the offer or to theSecurities and is unlikely to influence an informed assessment of the Securities by investors, Fortis HybridFinancing has not prepared cash flow statements.
There has been no significant change in the financial or trading position of Fortis Hybrid Financingsince March 31, 2008 and there has been no material adverse change in the prospects of Fortis HybridFinancing since December 31, 2007.
Fortis Hybrid Financing is not currently involved, nor has it been involved during the twelve monthperiod immediately prior to the date of this Prospectus, in any governmental, legal or arbitrationproceedings which may have or have had a material effect on its business, financial position orprofitability.
Share Capital
Fortis Hybrid Financing is a special purpose vehicle whose subscribed share capital amounts toEUR 32,000 (thirty-two thousand Euro) divided into 320 (three hundred and twenty) ordinary shares. Eachissued ordinary share has a nominal value of EUR 100 (one hundred Euro). All of the issued shares arefully paid-up.
Management of Fortis Hybrid Financing
The members of the board of directors of Fortis Hybrid Financing are:
• Patrick Depovere. Director of Fortis Hybrid Financing. Professional address at Rue Royale20, 1000 Brussels;
• Jean Dessain. General Manager of Capital and Funding of Fortis Group. Professional addressat Rue Royale 20, 1000 Brussels;
• Pierre-Henri Bagon. Director of Capital Raising of Fortis Group. Professional address at RueRoyale 20, 1000 Brussels;
92
Level: 6 – From: 6 – Wednesday, May 14, 2008 – 1:36 pm – g5mac4 – 3960 Section 05 : 3960 Section 05

• Carl Speecke. Team Leader. Region 3. Fortis Intertrust. Professional address at 65, boulevardGrande Duchesse Charlotte. L-1331 Luxembourg; and
• Edward Bruin. Director Fiscal Affairs. Fortis Intertrust. Professional address at 65, boulevardGrande Duchesse Charlotte. L-1331 Luxembourg.
Patrick Depovere has taken up a new position within ABN AMRO and therefore will resign fromhis mandate as director and chairman of the Board of Directors as of the next Annual General Meeting ofShareholders.
Edward Bruin has also taken up a new position within Fortis Banque Luxembourg and willconsequently also resign from his mandate as director as of the next Annual General Meeting ofShareholders.
The Board, upon discussion during its Board of Directors meeting held on April 25, 2008 resolvedto propose to the next Annual General Meeting of Shareholders the appointment of Mr. Jean Fell asdirector of Fortis Hybrid Financing as replacement of Mr. Edward Bruin for a period of four years.Therefore, his mandate will come to term at the same time as the mandates of the present members of theBoard. Mr. Jean Fell is a member of Fortis Intertrust Luxembourg Management. He was born on April 9,1956 in Echternach and is professionally residing at 65, Bd. Grande-Duchesse Charlotte, L-1331Luxembourg.
In his capacity as Team Leader at Fortis Intertrust, the purpose of which is to provide dailymanagement of companies, including provision of directors, Mr. Speecke is a director of numerouscompanies. No other member of Fortis Hybrid Financing’s board of directors holds positions outside ofFortis.
No potential conflicts of interest exist between any duties to Fortis Hybrid Financing of the personsreferred to above and their private interests and/or other duties.
Major Shareholders
The indirect shareholders of Fortis Hybrid Financing are:
Fortis N.V., a public company with limited liability incorporated under the laws of The Netherlands,with its registered office at Archimedeslaan 6, 3584 BA Utrecht, The Netherlands, and registered with theTrade Register at the Chamber of Commerce of Utrecht under number 30072145.
Fortis SA/NV, a public company with limited liability incorporated under the laws of Belgium, withits registered office at Rue Royale 20, 1000 Brussels, Belgium and registered with the register of legalentities under enterprise number 0451.406.524.
Each of Fortis N.V. and Fortis SA/NV hold, indirectly, 50% of the voting securities in Fortis HybridFinancing.
93
Level: 6 – From: 6 – Wednesday, May 14, 2008 – 1:36 pm – g5mac4 – 3960 Section 05 : 3960 Section 05

CAPITALIZATION OF FORTIS GROUP
The following table sets forth as of March 31, 2008 the actual capitalization of Fortis Group. Thistable should be read in conjunction with the unaudited consolidated financial statements of Fortis at March31, 2008 prepared in accordance with IFRS.
At March 31,2008
11111
Actual11111
(EUR million)(unaudited)
Debt Certificates(1)(2) . . . . . . . . . . . . . . . . . . . . . . . . . . . . . . . . . . . . . . . . . . . . . . . . . . . . . . . . . . . 101,852Subordinated liabilities(3)(4) . . . . . . . . . . . . . . . . . . . . . . . . . . . . . . . . . . . . . . . . . . . . . . . . . . . . . . 22,539Total Debt Issues . . . . . . . . . . . . . . . . . . . . . . . . . . . . . . . . . . . . . . . . . . . . . . . . . . . . . . . . . . . . . 124,391Share Capital . . . . . . . . . . . . . . . . . . . . . . . . . . . . . . . . . . . . . . . . . . . . . . . . . . . . . . . . . . . . . . . . 11,132Share Premium Reserve . . . . . . . . . . . . . . . . . . . . . . . . . . . . . . . . . . . . . . . . . . . . . . . . . . . . . . . . 22,723Other reserves and components of shareholder’s equity . . . . . . . . . . . . . . . . . . . . . . . . . . . . . . . (3,022)Total shareholder’s equity . . . . . . . . . . . . . . . . . . . . . . . . . . . . . . . . . . . . . . . . . . . . . . . . . . . . . . 30,833Minority interest . . . . . . . . . . . . . . . . . . . . . . . . . . . . . . . . . . . . . . . . . . . . . . . . . . . . . . . . . . . . . . 1,140
11111
Total Capitalization . . . . . . . . . . . . . . . . . . . . . . . . . . . . . . . . . . . . . . . . . . . . . . . . . . . . . . . . . . . 156,364
(1) Also includes amounts which will mature within 12 months.
(2) All of the debt certificates are unsecured. None of the debt certificates are guaranteed by third parties.
(3) Total debt issues do not include indirect and contingent liabilities.
(4) All subordinated liabilities are unsecured, except for the FRESH capital securities, with a nominal amount of EUR 1,250 millionissued in May 2002, and the CASHES with a nominal value of EUR 3,000 million. None of the liabilities certificates are guaranteedby third parties.
The following table shows the components of the outstanding debt certificates at March 31, 2008:
As atMarch 31,
Current Debt Certificates (including Current Position of Long-Term Debt) 20081111111111111111111111211 11111
(EUR million)(unaudited)
Short-term debt certificates (commercial paper) . . . . . . . . . . . . . . . . . . . . . . . . . . . . . . . . . . . . . 51,312Bons de caisse/Kasbons (short-term) . . . . . . . . . . . . . . . . . . . . . . . . . . . . . . . . . . . . . . . . . . . . . . 9Debt certificates held at fair value through net income . . . . . . . . . . . . . . . . . . . . . . . . . . . . . . . . 1,986
11111
Total current debt certificates . . . . . . . . . . . . . . . . . . . . . . . . . . . . . . . . . . . . . . . . . . . . . . . . . . . . 53,307
As atMarch 31,
Non-Current Debt Certificates (Excluding Current Position of Long-Term Debt) 2008111111111111111112111111211 11111
(EUR million)(unaudited)
Long-term debt certificates . . . . . . . . . . . . . . . . . . . . . . . . . . . . . . . . . . . . . . . . . . . . . . . . . . . . . 14,595Medium-term debt certificates . . . . . . . . . . . . . . . . . . . . . . . . . . . . . . . . . . . . . . . . . . . . . . . . . . . 19,659Bons de caisse/Kasbons (long-term) . . . . . . . . . . . . . . . . . . . . . . . . . . . . . . . . . . . . . . . . . . . . . . 4,818Bons de caisse/Kasbons (medium-term) . . . . . . . . . . . . . . . . . . . . . . . . . . . . . . . . . . . . . . . . . . . 369Other (medium term) . . . . . . . . . . . . . . . . . . . . . . . . . . . . . . . . . . . . . . . . . . . . . . . . . . . . . . . . . . 335Debt certificates held at fair value through net income . . . . . . . . . . . . . . . . . . . . . . . . . . . . . . . . 8,769Total non-current debt certificates . . . . . . . . . . . . . . . . . . . . . . . . . . . . . . . . . . . . . . . . . . . . . . . . 48,545
11111
Total debt certificates . . . . . . . . . . . . . . . . . . . . . . . . . . . . . . . . . . . . . . . . . . . . . . . . . . . . . . . . . . 101,852
There has been no material change in the capitalization of Fortis since March 31, 2008.
For additional information regarding the financing transactions relating to the ABN AMROAcquisition see “Summary — Recent Developments — ABN AMRO Acquisition” and “InformationAbout the Acquisition of ABN AMRO — ABN AMRO Acquisition”.
94
Level: 6 – From: 6 – Wednesday, May 14, 2008 – 1:36 pm – g5mac4 – 3960 Section 05 : 3960 Section 05
SELECTED FINANCIAL AND STATISTICAL DATA OF FORTIS GROUP
The financial information for the years ended and as of December 31, 2007, 2006 and 2005 setforth below is derived from Fortis’s Consolidated Financial Statements for the years then ended which areincorporated by reference herein. These Consolidated Financial Statements have been jointly audited byPricewaterhouseCoopers Reviseurs d’Entreprises SCCRL and KPMG Accountants N.V., independentpublic accountants for Fortis SA/NV and Fortis N.V., respectively and jointly for Fortis.
The historical data set out below are only a summary. You should read it in conjunction with theConsolidated Financial Statements for the years ended December 31, 2007, 2006 and 2005 incorporatedby reference herein and “Operating and Financial Review and Prospects” included elsewhere in thisProspectus.
The summary consolidated financial data for the three month period ended March 31, 2008 and2007 and as at March 31, 2008 have been derived from the unaudited interim consolidated financialstatements for the three months ended March 31, 2008, and have been reviewed byPricewaterhouseCoopers Reviseurs d’Entreprises SCCRL and KPMG Accountants N.V., joint independentpublic accountants for Fortis. In the opinion of management, the unaudited interim consolidated financialstatements include all adjustments consisting of all normal recurring adjustments necessary for a fairstatement of results for the unaudited interim periods. The interim financial results are not necessarilyindicative of results for the full year 2008.
IFRS differ in certain significant respects from accounting principles generally accepted in the U.S.(“U.S. GAAP”) Fortis has made no attempt to quantify the impact of those differences. In making aninvestment decision, investors must rely upon their own examination of Fortis, the terms of the Offeringand the financial information presented and incorporated herein by reference. Potential investors shouldconsult their own professional advisors for an understanding of the differences between IFRS and U.S.GAAP and how those differences might affect the information herein.
95
Level: 6 – From: 6 – Wednesday, May 14, 2008 – 1:36 pm – g5mac4 – 3960 Section 05 : 3960 Section 05

Consolidated Income Statement
Three MonthPeriod Ended March 31, Year Ended December 31,11111112311 11111111111212311
2008 2007 2007 2006 200511211 11211 11211 11211 11211
(unaudited)(EUR million)
IncomeInterest income . . . . . . . . . . . . . . . . . . . 25,517 20,852 94,869 72,583 66,845Insurance premiums . . . . . . . . . . . . . . . . 4,499 4,258 14,934 13,984 12,919Dividend and other investment income . 213 196 1,086 996 918Share in result of associates and jointventures . . . . . . . . . . . . . . . . . . . . . . . . 120 45 359 198 157
Realized capital gains (losses) oninvestments . . . . . . . . . . . . . . . . . . . . . 421 399 2,133 1,137 1,642
Other realized and unrealized gains andlosses . . . . . . . . . . . . . . . . . . . . . . . . . . 508 391 1,176 1,362 878
Fee and commission income . . . . . . . . . 1,076 1,024 4,400 3,734 3,124Income related to investments for unit-linked contracts . . . . . . . . . . . . . . . . . . (1,828) 452 648 1,929 3,224
Other income . . . . . . . . . . . . . . . . . . . . . 172 196 852 679 71211211 11211 11211 11211 11211
Total income . . . . . . . . . . . . . . . . . . . . . 30,698 27,813 120,457 96,541 90,41911211 11211 11211 11211 1121111211 11211 11211 11211 11211
ExpensesInterest expense . . . . . . . . . . . . . . . . . . . 23,607 (19,042) (87,354) (65,121) (60,227)Insurance claims and benefits . . . . . . . . (4,119) (3,849) (14,075) (13,151) (11,788)Charges related to unit-linked contracts 1,608 (860) (1,426) (2,374) (3,709)Changes in impairments . . . . . . . . . . . . (524) (32) (3,042) (194) (235)Fee and commission expense . . . . . . . . (653) (564) (2,344) (1,922) (1,615)Depreciation and amortization oftangible and intangible assets . . . . . . . (168) (143) (612) (576) (548)
Staff expenses . . . . . . . . . . . . . . . . . . . . (1,267) (1,165) (4,980) (4,485) (4,291)Other expenses . . . . . . . . . . . . . . . . . . . . (811) (832) (3,798) (3,336) (2,856)
11211 11211 11211 11211 11211
Total expenses . . . . . . . . . . . . . . . . . . . . (29,541) (26,487) (117,631) (91,159) (85,269)11211 11211 11211 11211 1121111211 11211 11211 11211 11211
Profit before taxation . . . . . . . . . . . . . . 1,157 1,326 (2,826) 5,382 5,150Income tax expense . . . . . . . . . . . . . . . . (324) (149) 235 (1,030) (1,164)
11211 11211 11211 11211 11211
Net profit for the period . . . . . . . . . . . 833 1,177 3,061 4,352 3,986Net gain (loss) on discontinuedoperations . . . . . . . . . . . . . . . . . . . . . . . – 13 1,013 – –
11211 11211 11211 11211 11211
Net profit attributable to minority interests 25 23 80 62 4511211 11211 11211 11211 11211
Net profit attributable to shareholders 808 1,167 3,994 4,351 3,94111211 11211 11211 11211 1121111211 11211 11211 11211 11211
96
Level: 6 – From: 6 – Wednesday, May 14, 2008 – 1:36 pm – g5mac4 – 3960 Section 05 : 3960 Section 05

Consolidated balance sheet (before appropriation of profit)
At March 31, At December 31,11111112311 11111111111212311
2008 2007 2007 2006 200511211 11211 11211 11211 11211
(unaudited)(EUR million)
AssetsCash and cash equivalents . . . . . . . . . . . 21,946 26,371 26,360 20,413 21,822Assets held for trading . . . . . . . . . . . . . . 96,234 88,426 74,800 70,215 62,705Due from banks . . . . . . . . . . . . . . . . . . . 143,876 118,982 119,036 90,131 81,002Due from customers . . . . . . . . . . . . . . . 333,621 312,644 316,308 286,459 280,759InvestmentsHeld to maturity . . . . . . . . . . . . . . . . . . . 4,072 4,478 4,234 4,505 4,670Available for sale . . . . . . . . . . . . . . . . . . 152,441 180,448 164,089 186,428 179,020Held at fair value through profit or loss 4,927 6,344 6,193 6,600 5,127Investment property . . . . . . . . . . . . . . . . 3,703 3,205 3,656 3,047 2,546Associates and joint ventures . . . . . . . . 27,796 2,030 28,108 1,854 1,706
11211 11211 11211 11211 11211
Total Investments . . . . . . . . . . . . . . . . . 192,939 196,505 206,280 202,434 193,06911211 11211 11211 11211 1121111211 11211 11211 11211 11211
Investments related to unit-linked contracts 30,420 29,795 31,120 28,749 25,667Reinsurance and other receivables . . . . 11,704 9,218 9,718 9,187 9,557Property, plant and equipment . . . . . . . . 3,955 3,485 4,004 3,522 3,197Goodwill and other intangible assets . . 3,275 2,523 3,339 2,261 1,922Accrued interest and other assets . . . . . 89,801 74,192 80,214 61,858 49,294
11211 11211 11211 11211 11211
Total assets . . . . . . . . . . . . . . . . . . . . . . 927,771 862,141 871,179 775,229 728,99411211 11211 11211 11211 1121111211 11211 11211 11211 11211
LiabilitiesLiabilities held for trading . . . . . . . . . . . 112,202 87,606 89,589 64,308 50,562Due to banks . . . . . . . . . . . . . . . . . . . . . 209,840 208,675 192,431 177,481 175,183Due to customers . . . . . . . . . . . . . . . . . . 274,253 266,298 262,298 259,258 252,603Liabilities arising from insurance andinvestment contracts . . . . . . . . . . . . . . 66,635 61,881 64,732 59,764 56,109
Liabilities related to unit-linkedcontracts . . . . . . . . . . . . . . . . . . . . . . . . 30,938 30,273 31,788 29,156 26,151
Debt certificates . . . . . . . . . . . . . . . . . . . 101,852 102,155 102,073 90,686 77,266Subordinated liabilities . . . . . . . . . . . . . 22,539 15,821 21,925 15,375 13,757Other borrowings . . . . . . . . . . . . . . . . . . 1,737 2,149 3,018 2,149 1,699Provisions . . . . . . . . . . . . . . . . . . . . . . . 909 838 899 817 907Current and deferred tax liabilities . . . . 2,452 2,726 2,490 2,733 3,629Accrued interest and other liabilities . . . 72,441 61,249 65,742 51,951 45,011
11211 11211 11211 11211 11211
Total liabilities . . . . . . . . . . . . . . . . . . . 895,798 839,671 836,985 753,678 709,33811211 11211 11211 11211 1121111211 11211 11211 11211 11211
Shareholders’ equity . . . . . . . . . . . . . . 30,833 21,563 33,047 20,644 18,929Minority interests . . . . . . . . . . . . . . . . . . 1,140 907 1,147 907 727
11211 11211 11211 11211 11211
Total equity . . . . . . . . . . . . . . . . . . . . . . 31,973 22,470 34,194 21,551 19,65611211 11211 11211 11211 1121111211 11211 11211 11211 11211
Total liabilities and equity . . . . . . . . . . 927,771 862,141 871,179 775,229 728,99411211 11211 11211 11211 1121111211 11211 11211 11211 11211
97
Level: 6 – From: 6 – Wednesday, May 14, 2008 – 1:36 pm – g5mac4 – 3960 Section 05 : 3960 Section 05

At March 31, At December 31,11111112311 11111111111212311
2008 2007 2007 2006 200511211 11211 11211 11211 11211
(unaudited)
Statistical dataGroup ratiosReturn on total equity(1) . . . . . . . . . . . . 13.9% 20.3% 14.9% 22.0% 20.4%Return on assets(2) . . . . . . . . . . . . . . . . . 0.4% 0.5% 0.5% 0.6% 0.5%Average equity to average assets(3) . . . . 3.0% 2.5% 3.3% 2.6% 2.6%Banking dataTier 1 ratio(4) . . . . . . . . . . . . . . . . . . . . . 10.5% 6.5% 9.5% 7.1% 7.4%Total capital ratio(4) . . . . . . . . . . . . . . . . 11.0% 10.5% 10.1% 11.1% 10.5%Cost income ratio(5) . . . . . . . . . . . . . . . 53.7% 61.1% 62.4% 61.2% 62.3%Insurance dataEmbedded Value(6) (EUR million) . . . . N.A. N.A. 12,411 12,307 10,623Claims ratio(7) . . . . . . . . . . . . . . . . . . . . 65.4% 69.2% 67.4% 61.2% 61.3%Combined ratio(8) . . . . . . . . . . . . . . . . . 96.7% 101.1% 100.1% 96.1% 96.0%
(1) The net profit for the financial year as a percentage of the average total equity during that period.
(2) The net profit for the financial year as a percentage of the average assets during that period.
(3) Average equity as a percentage of average assets.
(4) Ratio of March 31, 2008 is in accordance with Basel II.
(5) Only used for banks. The ratio of Total expenses to Total income where the “Interest expense” and the “Fee and commission expense”are netted in calculating Total income for this ratio.
(6) Embedded Value is an estimate of the economic value of a life company, excluding any value attributed to future new business. See“Glossary” and “Operating and Financial Review and Prospects — Insurance — European Embedded Value”.
(7) The claims ratio is the cost of claims, net of reinsurance, as a percentage of the net earned premiums, excluding the internal costs ofhandling non-life claims.
(8) Combined ratio: The sum of the claims ratio and the expense ratio for the non-life insurance business. Expense ratio: Only used fornon-life insurance business. Expenses as a percentage of the earned premiums, net of reinsurance. Expenses are the costs plus netcommissions charged to the financial year, less internal investment costs.
For a discussion of the important trends affecting Fortis’s results of operations, see “Operating andFinancial Review and Prospects — Overview”.
98
Level: 6 – From: 6 – Wednesday, May 14, 2008 – 1:36 pm – g5mac4 – 3960 Section 05 : 3960 Section 05

OPERATING AND FINANCIAL REVIEW AND PROSPECTS
The following review and analysis should be read together with Fortis’s Consolidated FinancialStatements and the related notes incorporated by reference herein. The Consolidated Financial Statementshave been prepared in accordance with IFRS, including International Accounting Standards andInterpretations as adopted by the European Union.
Overview
General Market Conditions
Fortis’s results of operations are affected by general economic conditions, including economiccycles, insurance industry cycles particularly with respect to non-life insurance, the financial markets,banking industry cycles and fluctuations in interest rates and exchange rates, monetary policy,demographics, particularly with respect to life insurance, and competitive factors.
Demographic studies suggest that over the next decade there will be continued growth in thenumber of individuals who enter the age group which management believes is most likely to purchaseretirement oriented life insurance products in Fortis’s principal life insurance markets of the Benelux. Inaddition, in a number of European markets, including Belgium and The Netherlands, retirement, medicaland other social benefits previously provided by governments have been, or are expected in the comingyears to be, further curtailed, which management believes will increase opportunities for private sectorproviders of life insurance, health, pension and other social benefits-related insurance products.Management believes that Fortis’s insurance distribution networks, the quality and diversity of its productsand its asset management expertise in many of these markets, particularly in the Benelux, position Fortisto benefit from these demographic developments. Conditions in the non-life insurance markets in whichFortis operates are cyclical, and characterized by periods of price competition, fluctuations in underwritingresults and the occurrence of unpredictable weather-related and other losses.
Revenues and net profit from Fortis’s banking and insurance operations may vary from year to yeardepending on fluctuations in interest rates, changes in market conditions and business cycles. Operatingresults and income from Fortis’s investment banking, securities trading and brokerage activities may varysignificantly from year to year depending on market conditions. Until the second half of 2007 financialmarkets had recovered significantly and, in particular, equity markets had recovered from their low levelsof 2002 and 2003. Also, interest rates began rising at the start of 2005, both in the US and the UK as wellas in the Eurozone modestly reducing some of the rate pressure associated with guaranteed and interestspread products. Due to the disruption and severe dislocation in the credit markets which began in theSummer 2007, however, the US Federal reserve has reduced interest rates by 250 basis points to a federalfunds rate of 2.25%, with the most recent reductions made in January and March 2008. Further interestrate increases in the Eurozone appear to be on hold and interest rates in the UK have fallen 75 basis points.However, in the more favorable market conditions which continued into the Summer 2007, the increasedvalue of the Group’s free assets significantly improved solvency and realized and unrealized capital gainscontributed to the high level of profitability of the Fortis Group in 2005 and 2006. As a result of increasingmarket volatility and more general concerns about economic strength, particularly in the US, following thecredit and liquidity problems which arose during the Summer 2007, equity markets declined, with manyreturning to levels which reduced or eliminated gains that had been made through the first half of 2007.Equity markets have continued to be volatile through the first quarter of 2008 as the markets have reactedto economic weakness in the U.S., high commodity prices and continuing liquidity problems.
Fortis’s asset management performance as well as its merchant banking, securities trading andbrokerage activities were positively impacted by the favorable market trends of 2005 and 2006 andthrough the first half of 2007. As the fees earned in these businesses are often based on the value of assetsmanaged, the significant improvement in financial markets contributed to the high level of fees earnedduring these periods (2007: EUR 1,482 million; 2006: EUR 1,265 million; 2005: EUR 998 million). Alsothe favorable market conditions contributed to high levels of revenues earned from securities trading andbrokerage activities of EUR 1,181 million, EUR 925 million and EUR 705 million in 2007, 2006 and
99
Level: 6 – From: 6 – Wednesday, May 14, 2008 – 1:37 pm – g5mac4 – 3960 Section 06 : 3960 Section 06Level: 6 – From: 6 – Wednesday, May 14, 2008 – 1:37 pm – g5mac4 – 3960 Section 06 : 3960 Section 06

2005, respectively. These trends continued through the first half of 2007 but due to market declines in thesecond half of 2007 conditions were less favorable and adversely impacted the net inflows in our assetmanagement business.
Since the end of the third quarter of 2007, credit markets and subprime residential mortgagemarkets, particularly in the U.S. but also worldwide, have experienced severe dislocations and liquiditydisruptions. Sub-prime mortgage loans have experienced increased rates of delinquency, foreclosure andloss since 2007. These and other related events have had a significant impact on the capital marketsassociated not only with subprime mortgage backed securities, asset backed securities and collateralizeddebt obligations, but also with credit and financial markets as a whole. These events have also adverselyaffected monoline insurers and other market participants, resulting in a risk for the monoline insurers ofratings downgrades. If the monoline insurers’ and other market participants’ credit ratings weaken, theweaker credit of such entities may affect the values of hedges and other transactions with them ascounterparties and result in write downs of the values of the assets represented by such instruments,including some instruments which we hold. As a result, banks world-wide have been operating andcontinue to operate in a difficult environment characterized by liquidity constraints and increased short-term funding costs. Although we do not have any direct mortgage financing activities in the U.S., we areexposed to the U.S. subprime mortgage market though our ownership of mortgage backed securities, assetbacked securities and collateralized debt obligations. As these securities and obligations are accounted foron a fair value basis, it is necessary to mark-to-market such securities and obligations. The valuation ofsuch securities and obligations has, particularly in recent months, become increasingly complex andsubject to significant uncertainty in light of the illiquidity of certain of the underlying obligations, withfinancial institutions applying different valuation models to reflect both actual and perceived underlyingrisk profiles of such securities or obligations when market prices are not available. Valuations may varysignificantly according to the particular valuation models and assumptions applied to holdings of suchsecurities and obligations. Such valuation models and assumptions may need to be changed to reflect morecurrent information relating to the underlying risk profiles of those holdings, possibly resulting insignificant write downs in the value attributed to those holdings with a consequent impact on the balancesheet and income statements of such institutions. Since Fortis holds portfolios of mortgage backedsecurities, asset backed securities and collateralized debt obligations, it is accordingly subject to theseuncertainties in relation to the value attributable to those holdings and it is possible that significantimpairments (resulting in unrealized losses) attributed to those holdings may be necessary from time totime to reflect any adverse developments in the risk profile of those assets and/or the application of adifferent valuation model or assumptions to such holdings. In the fourth quarter of 2007 Fortis tookimpairments on these portfolios of € 2.5 billion. See “— Structured Credit Exposure”. In addition, thevalues of many of the other instruments we hold and invest in are sensitive to dislocations and disruptionsin those markets and the valuing of certain of those instruments has become both more uncertain and moredifficult due to volatility and lack of liquidity. In addition, as more hedge funds, monoline insurers, banksand other institutions are negatively affected by these market disruptions, our merchant banking, securitiestrading and brokerage activities may be further affected.
Interest Rate Fluctuations
Changes in interest rates, including changes in the yield curve, can affect Fortis’s banking andinsurance results of operations. Over the past several years, movements in both short and long-terminterest rates have affected the level and timing of recognition of gains and losses on securities held inFortis’s investment portfolios. Generally, a sustained period of lower interest rates will reduce theinvestment yield of the interest-earning assets in the investment portfolios of Fortis’s insurance andbanking companies over time as higher yielding investments are called or mature and the proceeds of theseinvestments are reinvested at lower rates. However, declining interest rates can lead to higher returns fromFortis’s banking operations if interest-earning assets reprice more slowly than interest-bearing liabilities orthe volume of average interest-earning assets grows as a result of higher amounts of credit demand.Declining interest rates also typically increase demand for mutual funds and investment-linked insuranceproducts. Conversely, rising interest rates should over time increase investment income but may reduce themarket value of existing investments in Fortis’s portfolios. This can also lead to higher returns from
100
Level: 6 – From: 6 – Wednesday, May 14, 2008 – 1:37 pm – g5mac4 – 3960 Section 06 : 3960 Section 06

Fortis’s banking operations if the interest rate spread widens, assuming this effect is not offset by lowervolumes of average interest-earning assets as a result of lower levels of credit demand or a deterioration inthe quality of Fortis’s loan portfolio or an increase in provisions for possible credit risk or lower interestincome due to slower repricing of interest-earning assets compared to the repricing of interest-earningliabilities. Besides absolute levels of interest rates, income in the banking activities can be influenced bythe steepness of the yield curve. In the case that the duration of interest earning assets is longer than theduration of interest-earning liabilities, a steeper yield curve would normally generate higher income in thebanking operations. During periods of rapidly increasing interest rates, policy loans, surrenders andwithdrawals may increase and usually do increase. Premiums in flexible premium policies may decrease aspolicyholders seek investments with higher perceived returns. This activity may result in cash payments byFortis requiring that it sell invested assets at a time when the prices of those assets are adversely affectedby the increase in market interest rates, which may result in realized investment losses. These cashpayments to policyholders result in a decrease in total invested assets and a decrease in net income.Among other things, early withdrawals may also cause Fortis to accelerate amortization of policyacquisition costs, reducing net income.
In the United States interest rates began to rise during the course of 2004 and, through March 31,2007, the Federal Reserve had increased the Federal Funds rate from 1% to 5.25% in 17 separate 25 basispoint increases. As a result of the dislocations in the credit market and severe liquidity issues which arosein August 2007 and which have continued into 2008, the Federal Reserve reduced interest rates six times,initially by 50 basis points on September 18, 2007 and by an additional 25 basis points on October 31,2007 and December 11, 2007, reducing the Federal Funds rate to 4.25% followed by an additional 125basis point decrease, implemented in two steps in January 2008 to 3.00%. On March 18, 2008, the FederalReserve reduced interest rates by a further 75 basis point to 2.25%. In Europe, the ECB has raised interestrates since December 2005 from 2% to 3.75% in 7 separate 25 basis points increases. Further rate changesby the ECB remain on hold. Interest rates in the United Kingdom which had reached 5.50% during 2007,have been reduced to 5.0% with two 25 basis point reductions on February 7, 2008 and April 10, 2008 inresponse to the credit market dislocations.
The impact of interest rate fluctuations on Fortis’s life insurance business is reduced in part byproduct design which operates to transfer partly or entirely from Fortis to the policyholder the exposure tointerest rate movements. Examples of such products include investment-linked individual policies, andsegregated fund pension plans in group business. At December 31, 2007, (2006: 35%) of Fortis’s liabilitiesto policyholders for life products related to insurance policies where gains or losses arising from interestrate fluctuations are entirely for the risk of policyholders. In addition, in many markets Fortis sells profitsharing life insurance policies, where profit sharing may be based either on total profits or excess interestmargins to policyholders. In most cases the profit sharing is at the discretion of Fortis. However, due to theuncertainties in the capital markets of the last few years, these products with discretionary participationfeatures have become more popular.
In Europe, Fortis has a substantial historic portfolio of contracts with guaranteed and/or profitsharing investment returns, including returns of 4.75% in Belgium on policies. Although Fortis haslowered its guaranteed rate of return on certain contracts written after December 31, 1998, to 3.25% inBelgium, if interest rates are below 4% for any sustained period, it could cause Fortis to increase the levelof reserves required on such guaranteed products. At times these technical rates tend to be matched byassets of similar yield, but often significant asset liability duration mismatch exists and this creates theexposure to low interest rate environments and a need to test the adequacy of provisions under currentyield curve assumptions.
The key means of determining adequacy with respect to interest rate risk are:
• IFRS liability adequacy tests (“LAT”) including loss recognition and shadow adjustments.
• Additional risk reporting to assess economic adequacy in line with market consistentembedded value (“MCEV”) or Fortis Fair Value Economic model (ForCap).
• Local regulatory tests.
101
Level: 6 – From: 6 – Wednesday, May 14, 2008 – 1:37 pm – g5mac4 – 3960 Section 06 : 3960 Section 06

In Insurance Belgium, interest rate adequacy is supported by a low interest rate reserve (“LIRR”).The LIRR itself will decrease over time, in line with a decrease in the portfolio and is still considered tobe a significant buffer against low interest rates. A comparison of local provisions and the fair value ofliabilities at year end 2006 showed the provisions to be adequate, largely as a result of the interest ratereserve.
In Insurance Netherlands the regulatory test applied locally measures the impact of reinvestmentrates below 4%. This test shows the provisions to be adequate on 3% reinvestment (4% for pre-1999business). In addition, an internal test on the same basis as the regulatory test was performed, but assuming3.5% reinvestment for the pre-1999 business. In addition, an internal test on the same basis as theregulatory test was performed, but assuming 3.0% reinvestment for the total portfolio including the pre-1999 business. Results based on year-end 2006 data still show positive margins compared to the prescribedregulatory test.
However, the same test also shows that the business is very sensitive to interest rates. Thissensitivity is a result of a significant duration mismatch and the business needs to be monitored closely interms of the potential impact of a continued low interest environment. To this end, information is reportedto senior management on a monthly basis to flag any potential issues.
In Insurance International, IFRS liability adequacy tests and low interest rate provisions alsoevidence that reserves are sufficient in respect of interest rate risk coverage.
Fortis’s investment banking, securities trading and brokerage activities are significantly affected bythe levels of activity in the securities markets, which in turn may be affected by, among other factors, thelevel and trend of interest rates. Results of asset management activities may also be affected by interestrates, since management fees are generally based on the value of assets under management, whichfluctuates with changes in the level of interest rates. The improved financial markets in 2005 and 2006 andthrough the first half of 2007 favorably impacted fees earned in our asset management operations with lessfavorable and more volatile markets since July 2007 adversely impacting net inflows with the concurrentimpact on fees.
Exchange Rate Fluctuations
Fortis is an international financial institution doing business in almost all currencies. However, theopen positions per currency are strictly monitored and managed through on and off balance sheettransactions and are kept within well-defined limits.
Structured Credit Exposure
Structured credit portfolio
The net exposure of Fortis’s total structured credit portfolio after impairments amounted to EUR 48billion at the end of 2007. The portfolio can be divided into three major segments:
• US subprime CDO portfolio: EUR 2.9 billion
• Credit spread portfolio: EUR 42.2 billion
• Insurance ABS portfolio: EUR 3.1 billion
At the Bank, an impairment of EUR 2.4 billion (after tax EUR 1.5 billion) was taken on the supersenior CDO portfolio with subprime exposure in the fourth quarter of 2007. Additionally, an impairmentof EUR 0.2 billion was recorded in 2007 on the below super senior tranches and some warehousepositions related to origination activity. Finally, an impairment of EUR 0.1 billion was booked in the creditspread portfolio, bringing total subprime impairments taken at the Bank to EUR 2.7 billion in 2007 (aftertax EUR 1.7 billion).
102
Level: 6 – From: 6 – Wednesday, May 14, 2008 – 1:37 pm – g5mac4 – 3960 Section 06 : 3960 Section 06

The total impact of the credit market turmoil on insurance amounted to EUR 0.3 billion (after taxEUR 0.2 billion), approximately half of which was due to impairments and half to changes in fair valuethrough the income statement.
US subprime CDO portfolio
Fortis has reviewed the value of its US subprime super senior CDO portfolio with a gross exposureof EUR 5.3 billion. Fortis applied a prudent approach to impairments, using stringent assumptions on thesuper senior CDO subprime exposure. This resulted in impairments of 43% for the High Grade supersenior CDO tranches and 57% for Mezzanine super senior CDO tranches. The impact on net profit ofthese impairments amounted to EUR 1.5 billion (EUR 2.4 billion pre-tax).
In addition, an impairment of EUR 0.2 billion was taken in the fourth quarter on below super seniortranches and some warehouse positions related to the origination activity. The only net exposure left (afterimpairments) related to subprime CDO’s are the AAA High Grade and Mezzanine super senior tranches.
Credit spread portfolio
Fortis Bank manages a portfolio of structured credits aimed at generating long-term stable spreadincome. The conservative portfolio focuses on the highest quality of assets and is well diversified over alarge number of securities with an average size of EUR 20 – 25 million.
Over 93% of the portfolio is AA or better, 84% of which is AAA. The vast majority of securities inthe portfolio are first-order securitizations such as RMBS, ABS and CLOs. Less than 6% of the portfolioconsists of CDOs.
Besides its exposure to subprime CDO tranches, Fortis has a limited exposure to subprime RMBS.At the end of 2007 gross exposure amounted to EUR 0.6 billion. The portfolio consists predominantly ofAAA super senior tranches (76%), and the remainder are AA. Given current credit enhancements, evenwith cumulative losses of 30%, no impairments on these tranches are expected to be necessary.
Total impairments on the credit spread portfolio amounted to EUR 0.1 billion in 2007. Due tofurther widening of credit spreads, the negative revaluation of the structured credit portfolio recordedunder ‘available for sale’ increased from EUR 0.7 billion at the end of the third quarter to EUR 0.9 billionat year-end 2007. These negative revaluations did not have an impact on the income statement or on coreequity.
Insurance portfolio
Fortis Insurance’s total net exposure to structured credits amounts to EUR 3.1 billion. The portfolioprovides Insurance with fixed and relatively high financial income while contributing to the diversificationof Insurance’s investment book. A large majority of the portfolio is composed of high quality and welldiversified securities, in terms of collateral type and geography. US subprime exposure is limited to EUR0.2 billion, mostly high quality and older vintages, as the exposure to 2006 and 2007 vintages is less thanEUR 10 million.
Impairments of EUR 147 million were taken on various debt instruments at Insurance in 2007.Taking into account changes in fair value through the income statement, the total impact of credit marketturmoil on Insurance for the full year amounted to EUR 336 million before tax.
Scaldis
Fortis manages one conduit, Scaldis, which was established in 1999 and has current outstandings ofaround EUR 18 billion. Scaldis is part of the credit spread portfolio described above. Scaldis is a hybridABCP programme with 70% AAA securities and 30% multi-seller receivables, and it enjoys the highestpossible ST ratings (P1/F1+/A1+). Despite the developments in the global commercial paper market, the
103
Level: 6 – From: 6 – Wednesday, May 14, 2008 – 1:37 pm – g5mac4 – 3960 Section 06 : 3960 Section 06

program has been able to finance itself externally for the majority of the portfolio. As at December 31,2007 100% of funding comes from third party commercial paper investors.
Leveraged finance
Fortis has limited exposure to the leveraged finance market, representing EUR 4.3 billion or around1.5% of total loans to customers. This is a highly diversified portfolio in terms of geography and sectorwhich focuses on the mid-cap segment. This portfolio was created as a result of over 200 deals, aroundhalf of which date back to before 2007, with an average ticket size of around EUR 25 million.
Hedge funds financing
As part of its Merchant Banking activities, Fortis engages in the financing of hedge funds. Theoutstandings to hedge funds is limited as it represents less than 1% of total loans to customers. Around90% of this exposure relates to funds of hedge funds, making this a highly diversified portfolio with a highcollateral ratio of 6:1. Only one-third of the total amount outstanding is taken up for leverage, and the restis for bridge financing.
Real estate financing
Asset-based real estate financing commitments with Merchant Banking amount to EUR 6.2 billion(2% of total loans to customers). The average loan to value of this diversified and entirely Europeanportfolio is in the 60-70% range. The portfolio does not contain speculative financing.
US corporate lending
US corporate outstandings amounted to EUR 10 billion at the end of 2007, around 60% of whichare included in the Energy, Commodities & Transportation (“ECT”) portfolio. Risk mitigating factors arethe high level of collateral, long-standing relations with these clients and relatively short-term and self-liquidating nature of commodities financing at ECT.
Monoline insurers
Fortis has a EUR 0.5 billion direct exposure to a number of monoline insurers. Fortis also has aEUR 4.7 billion indirect exposure to monoline insurers, EUR 3.5 billion of which in the structured creditportfolio and EUR 1.2 billion in other financings. Fortis has not taken any impairment related to theseexposures.
Liquidity
Since the global liquidity crisis of 2007, Fortis has been strictly managing its strong liquidityposition and taken appropriate measures to maintain it. Fortis benefits from a diversified funding base withmore than half of funding coming from customer deposits. As a bancassurer, Fortis is able to utilise itslarge liquid asset base to attract collateralized funding at attractive rates.
Equity markets
Fortis’s total equity portfolio amounted to EUR 13.8 billion in 2007, broken down into EUR 9.4billion at Insurance and EUR 4.4 billion at Banking at year-end, with total unrealized gains after tax ofEUR 1.8 billion. A substantial part of the Insurance portfolio is hedged dynamically via ConstantProportion Portfolio Insurance (“CPPI”) techniques. For a discussion of the CPPI techniques, see “RiskManagement — Market Risk in Insurance — ALM risk: Currency risk”. 90% of changes in net unrealizedcapital gains in the Insurance portfolio are included in core capital. Based on the size of the portfolio at theend of 2007, the impact of segregated accounts and the hedges in place, the sensitivity of Fortis’s corecapital to 10% changes in the equity market is estimated at EUR 600 to 700 million.
104
Level: 6 – From: 6 – Wednesday, May 14, 2008 – 1:37 pm – g5mac4 – 3960 Section 06 : 3960 Section 06

Real estate
Fortis’s real estate portfolio is valued at amortized cost in its balance sheet at 6.2 billion. The fairvalue of this portfolio amounts to EUR 9.0 billion implying an unrealized gain net of tax of EUR 2.0billion. This high quality portfolio is well balanced over offices, retail, residential, parking facilities andland, with a strong foothold in Belgium and The Netherlands.
Solvency
Fortis has presented its solvency using the core capital cap/floor model since 1998. Although thismodel has served its purpose well, it had some limitations that have prompted the introduction of a newmodel based on “target capital”.
The new model (i) provides greater detail and insight into the capitalization at both the Banking andInsurance level, (ii) gives better guidance for future capital management actions, (iii) is in line with marketpractice, and (iv) is consistent with the regulators’ guidelines on capitalization. For additional informationon the new “target capital” model see “— Liquidity and Capital Resources — Group Solvency”.
Critical Accounting Policies
Fortis’s Consolidated Financial Statements for the financial year ended December 31, 2007(including the 2006 and 2005 comparative figures), are prepared in accordance with IFRS, including theInternational Accounting Standards and Interpretations at December 31, 2007 and as adopted by theEuropean Union. For IAS 39, Financial Instruments: Recognition and Measurement, this takes intoaccount the exclusion regarding hedge accounting (the so-called “carve-out”) decreed by the EuropeanUnion on November 19, 2004.
Fortis has identified below the accounting policies that are most critical to its business operationsand the understanding of its results. In each case, the application of these policies requires management tomake complex or subjective decisions or assessments based on information and financial data that maychange in future periods, the results of which can have a significant effect on our results of operations. Asa result, determinations regarding these items necessarily involve the use of assumptions and judgments asto future events and are subject to change. Different assumptions or judgments could lead to materiallydifferent results. See the Notes to the 2007 Consolidated Financial Statements incorporated by referenceherein for additional discussion of the application of our accounting policies.
The preparation of financial statements in conformity with IFRS requires the use of certainaccounting estimates. It also requires management to exercise its judgment in the process of applying theseaccounting policies. Actual results may differ from these estimates and judgmental decisions.
Judgments and estimates are principally made in the following areas:
• Estimation of the recoverable amount of impaired assets;
• Determination of fair values of non-quoted financial instruments;
• Determination of the useful life and the residual value of property, plant and equipment,investment property and intangible assets;
• Measurement of liabilities for insurance contracts;
• Actuarial assumptions related to the measurement of pension obligations and assets;
• Estimation of present obligations resulting from past events in the recognition of provisions.
The accounting policies of each area are treated in more detail in the next section.
105
Level: 6 – From: 6 – Wednesday, May 14, 2008 – 1:37 pm – g5mac4 – 3960 Section 06 : 3960 Section 06

Estimation of the recoverable amount of impaired assets
An asset is impaired when its carrying amount exceeds its recoverable amount. Fortis reviews all ofits assets at each reporting date for indicators of impairment.
A financial asset (or group of financial assets) is impaired if there is objective evidence ofimpairment as a result of one or more events that occurred after the initial recognition of the asset and thatloss event (or events) has an impact on the estimated future cash flows of the financial asset (or group offinancial assets) that can be reliably estimated.
Depending on the type of financial asset, the recoverable amount can be estimated as follows:
• The fair value using an observable market price;
• Present value of expected future cash flows discounted at the instrument’s original effectiveinterest rate (for financial assets carried at amortized cost); or
• Based on the fair value of the collateral.
A credit risk for specific loan impairment is established if there is objective evidence that Fortis willnot be able to collect all amounts due in accordance with contractual terms. The amount of the provision isthe difference between the carrying amount and the recoverable amount, being the present value ofexpected cash flows or, alternatively, the collateral value less costs to sell if the loan is secured.
An “incurred but not reported” (“IBNR”) impairment on loans is recorded when there is objectiveevidence that incurred losses are present in components of the loan portfolio, without having specificallyidentified impaired loans. This impairment is estimated based upon historical patterns of losses in eachcomponent, reflecting the current economic climate in which the borrowers operate and taking intoaccount the risk of difficulties in servicing external debt in some foreign countries based on an assessmentof the political and economic situation.
Fortis assesses the carrying value of goodwill annually or more frequently, if events or changes incircumstances indicate that such carrying value may not be recoverable. If such indication exists, therecoverable amount is determined for the cash-generating unit to which goodwill belongs. This amount isthen compared to the carrying amount of the cash-generating unit and an impairment loss is recognized ifthe recoverable amount is less than the carrying amount. Impairment losses are recognized immediately inthe income statement.
For non-financial assets, the recoverable amount is measured as the higher of the fair value less costto sell and the value in use. Fair value less cost to sell is the amount obtainable from the sale of an asset inan arm’s length transaction between knowledgeable, willing parties, after deducting any direct incrementaldisposal costs. Value in use is the present value of estimated future cash flows expected to arise fromcontinuing use of an asset and from its disposal at the end of its useful life.
The identification of impaired assets and the assumptions to be used in calculating the recoverableamounts of such assets involves management judgment. Changes in the assumptions concerning amountsand timing of cash flows and concerning the value of the collateral underlying the calculation of therecoverable amounts can have a positive or negative impact on the carrying value of the assets and theamount of change in impairments in the income statement.
Determination of fair values of unquoted financial instruments
The principal methods and assumptions used by Fortis in determining the fair value of unquotedfinancial instruments are:
• If for securities no quoted prices are available from an active market, the fair value isdetermined using discounted cash flow models. Discount factors are based on the swap curveplus a spread reflecting the risk characteristics of the instrument.
106
Level: 6 – From: 6 – Wednesday, May 14, 2008 – 1:37 pm – g5mac4 – 3960 Section 06 : 3960 Section 06

• Fair values for unquoted derivative financial instruments are obtained from discounted cashflow models and option pricing models.
• Fair values for unquoted private equity investments are estimated using applicable marketmultiples (e.g., price/earnings or price/cash flow ratios) refined to reflect the specificcircumstances of the issuer.
• Fair values for loans are determined using discounted cash flow models based upon Fortis’scurrent incremental lending rates for similar type loans. For variable-rate loans that re-pricefrequently and have no significant change in credit risk, fair values are approximated by thecarrying amount. Option pricing models are used for valuing caps and prepayment optionsembedded in loans that have been separated according to IFRS.
• Off-balance sheet commitments or guarantees are fair valued based on fees currently chargedto enter into similar agreements, taking into account the remaining terms of the agreementsand the counterparties’ credit standings.
• For short-term payables and receivables, the carrying amounts are considered to approximatefair values.
The fair values of unquoted financial instruments are used for measurement in the balance sheet ofsuch instruments or for additional disclosure purposes. The valuation involves management judgment.Changes in the models or parameters used to determine the fair value of unquoted financial instrumentscan lead to changes in the fair value of these instruments. The changes in the fair value can impact:
• The income statement if these financial instruments are accounted for at fair value throughprofit or loss.
• Equity, if these instruments are accounted for as available for sale.
• The fair value disclosure as in Note 36 of the Notes to the 2007 Consolidated FinancialStatements.
Determination of the useful life and the residual value of property, plant and equipment, investmentproperty and intangible assets
All real estate (investment property and held for own use) and fixed assets are stated at cost lessaccumulated depreciation (except for land that is not depreciated) and any accumulated impairment losses.Cost is the amount of cash or cash equivalents paid or the fair value of the other consideration given toacquire an asset at the time of its acquisition or construction. Generally, depreciation is calculated on thestraight-line method to write down the cost of such assets to their residual values over their estimateduseful lives. The residual value and the useful life of real estate and fixed assets are reviewed at each year-end.
The costs of new and renewed insurance business, principally commissions, underwriting, agencyand policy issue expenses, all of which vary with and primarily are related to the production of newbusiness, are deferred and amortized.
Deferred acquisition costs (“DAC”) are periodically reviewed to ensure they are recoverable basedon estimates of future profits of the underlying contracts.
Value of business acquired (“VOBA”) represents the difference between the fair value at acquisitiondate and the subsequent carrying value of a portfolio of contracts acquired in a business or portfolioacquisition. VOBA is recognized as an intangible asset and amortized over the income recognition periodof the portfolio of contracts acquired.
Acquisitions of companies are accounted for using the purchase method of accounting. Goodwillrepresents the excess of the fair value of the assets given, liabilities incurred or assumed, and equityinstruments issued, plus any costs directly attributable to the business combination, over the Fortis’s
107
Level: 6 – From: 6 – Wednesday, May 14, 2008 – 1:37 pm – g5mac4 – 3960 Section 06 : 3960 Section 06

interest in the fair value of assets acquired and liabilities and contingent liabilities assumed. Goodwill isnot amortized, but instead is tested for impairment.
Intangible assets with finite lives, such as trademarks and licenses, are generally amortized overtheir useful lives using the straight-line method. Intangible assets with finite lives are reviewed at eachreporting date for indicators of impairment.
Indefinite-lived intangibles, which are not amortized, are instead tested for impairment at leastannually. Any impairment loss identified is recognized in the income statement.
Intangible assets are recorded on the balance sheet at cost less any accumulated amortization andany accumulated impairment losses. The residual value and the useful life of intangible assets are reviewedat each year-end.
The determination of the useful life and residual value of assets are best estimates involvingjudgment on future economic or technological developments. Changes in the estimated useful life orresidual values will result in changes in the future amortization/depreciation amounts in the incomestatement.
Measurement of liabilities for insurance contracts
For life insurance contracts, future policy benefit liabilities are calculated using a net level premiummethod (present value of future net cash flows) on the basis of actuarial assumptions as determined byhistorical experience and industry standards. Participating policies include any additional liabilities relatingto any contractual dividends or participations. For some designated contracts, the future policy benefitliabilities have been remeasured to reflect current market interest rates.
For life insurance contracts with minimum guaranteed returns, additional liabilities have been set upto reflect expected long-term interest rates. The liabilities relating to annuity policies during theaccumulation period are equal to accumulated policyholder balances. After the accumulation period, theliabilities are equal to the present value of expected future payments. Changes in mortality tables thatoccurred in previous years are fully reflected in these liabilities. Actuarial assumptions are revised at eachreporting date with the resulting impact recognized in the income statement.
The adequacy of the liability is tested at each reporting date on the level of homogeneous productgroups. If the liabilities are not adequate to provide for future cash flows, including cash flows such asmaintenance costs, as well as cash flows resulting from embedded options and guarantees andamortization of the DAC, the DAC is written off and/or additional liabilities are established based on bestestimate assumptions. Any recognized deficiency is immediately recorded in the income statement.
Claims and claim adjustment expenses are charged to the income statement as incurred. Unpaidclaims and claim adjustment expenses include estimates for reported claims and provisions for claimsincurred but not reported. Estimates of claims incurred but not reported are developed using pastexperience, current claim trends and the prevailing social, economic and legal environments. The liabilityfor non-life insurance claims and claim adjustment expenses is based on estimates of expected losses andtakes into consideration management’s judgment on anticipated levels of inflation, claim handling costs,legal risks and the trends in claims. Non-life liabilities for workers’ compensation business are presented attheir net present value. The liabilities established are adequate to cover the ultimate costs of claims andclaim adjustment expenses. Resulting adjustments are recorded in the income statement. Fortis does notdiscount its liabilities for claims other than for claims with determinable and fixed payment terms.
The establishment of liabilities for insurance contracts involves assumptions about regulatory,economic and demographic trends, investment returns and potential future events and actuarialassumptions, which may lead to different liabilities and different insurance claims and benefit expenses ifdiffering assumptions are made.
108
Level: 6 – From: 6 – Wednesday, May 14, 2008 – 1:37 pm – g5mac4 – 3960 Section 06 : 3960 Section 06

Actuarial assumptions related to the measurement of pension obligations and assets
At least annually qualified internal actuaries calculate the pension assets and liabilities.
For defined benefit plans, the pension costs and related pension asset or liability are estimated usingthe projected unit credit method. This method sees each period of service as giving rise to an additionalunit of benefit entitlement and measures each unit separately to build up the final liability. Under thismethod, the cost of providing these benefits is charged to the income statement to spread the pension costover the service lives of employees. The pension liability is measured at the present value of the estimatedfuture cash outflows using interest rates determined by reference to market yields on high qualitycorporate bonds that have terms to maturity approximating the terms of the related liability. Netcumulative unrecognized actuarial gains and losses for defined benefit plans exceeding the corridor(greater of 10% of the present value of the defined benefit obligation or 10% of the fair value of any planassets) are recognized in the income statement over the average remaining service lives of the employees.
The establishment of liabilities for pension obligations involves assumptions about changes in sociallaw, economic and demographic trends, investment returns and potential future events and actuarialassumptions, which may lead to different liabilities and different pension costs if differing assumptions aremade.
Estimation of present obligations resulting from past events in the recognition of provisions
Provisions are liabilities with uncertainties in the amount or timing of payments. Provisions arerecognized if there is a present obligation to transfer economic benefits, such as cash flows, as a result ofpast events and a reliable estimate can be made at the balance sheet date. Provisions are established forcertain guarantee contracts for which Fortis is responsible to pay upon default of payment. Provisions areestimated based on all relevant factors and information existing at the balance sheet date, and typically arediscounted at the risk free rate.
The establishment of provisions involves uncertainties in the amount or the timing of payments.Changes in the timing, the discount rate or the expected amount can lead to different provisions andrelated income statement amounts.
Consolidated Financial Statements
Preparation of Consolidated Financial Statements
Fortis has opted for consortium accounting through which the financial statements of Fortis SA/NVand Fortis N.V. are consolidated. The Consolidated Financial Statements are prepared in accordance withIFRS.
Determination of Accounting Policies
The IFRS standards allow in certain cases the application of different options. The followingoptions were chosen by Fortis:
Trade date accounting: all purchases and sales of financial assets requiring delivery within the timeframe established by regulation or market convention are recognized on the trade date, which is the datewhen Fortis becomes a party to the contractual provisions of the financial assets.
Investment property, real estate held for own use, fixed assets and intangible fixed assets aremeasured at cost less accumulated depreciation and any accumulated impairment losses.
Investments in joint ventures are accounted for using the equity method.
Fortis uses three types of hedges: fair value hedges, cash flow hedges and net investment hedges.Fair value hedge accounting is applied as from January 1, 2005 for portfolio hedges of interest rate risk(“macro hedging”). In this context, the difference between the fair value and the carrying value of thehedged item at designation of the hedging relationship is amortized over the remaining life of the hedged
109
Level: 6 – From: 6 – Wednesday, May 14, 2008 – 1:37 pm – g5mac4 – 3960 Section 06 : 3960 Section 06

item. For macro hedges, Fortis uses the “carved out” version of IAS 39 adopted by the European Unionwhich removes some of the limitations on fair value hedges and the strict requirements on theeffectiveness of those hedges. Under this version, the impact of the changes in the estimates of therepricing dates is only considered ineffective if it leads to underhedging.
At initial recognition or first-time adoption of IFRS, Fortis has irrevocably designated somefinancial assets and liabilities as held at fair value through profit or loss, because:
• the host contract includes an embedded derivative that would otherwise require separation, or
• it eliminates or significantly reduces a measurement or recognition inconsistency(“accounting mismatch”), or
• it relates to a portfolio of financial assets and/or liabilities that are managed and evaluated ona fair value basis.
Fortis applies “shadow accounting” to the unrealized changes in fair value of the investments andassets and liabilities held for trading that are linked to and therefore affect the measurement of theinsurance liabilities. These changes in fair value will therefore not be part of net equity.
The whole of the remaining unrealized changes in fair value of the available-for-sale portfolio —after application of “shadow accounting” — that are subject to discretionary participation features areclassified as a separate component of equity.
The adequacy of insurance liabilities (“liability adequacy test”) is tested at each reporting date withrespect to homogeneous product groups.
Borrowing costs are generally expensed as incurred. Borrowing costs that are directly attributable tothe acquisition or construction of an asset are capitalized while the asset is being constructed as part of thecost of that asset.
Pensions: under IFRS, Fortis uses the corridor approach, i.e., not recording actuarial differenceswithin defined limits.
Changes in Accounting Policies
The accounting policies used to prepare the 2007 consolidated annual financial statements areconsistent with those applied for the years ended December 31, 2006 and December 31, 2005.
On June 1, 2007 the European Union endorsed the two following International Financial ReportingInterpretations Committee (“IFRIC”) reports:
• IFRIC 10, Interim Financial Reporting and Impairment. This interpretation prohibits theimpairment losses recognized in an interim period on goodwill, investments in equityinstruments and investments in financial assets carried at cost to be reversed at a subsequentbalance sheet date. The accounting policies of Fortis were already in line with thisinterpretation.
• IFRIC 11, IFRS 2: Group and Treasury Share Transaction, applicable as from the financialyear 2008. This interpretation provides further guidance on the implementation of IFRS 2,Share-based Payment. Fortis is evaluating the effect of this interpretation for implementationin 2008.
On September 6, 2007, the IASB issued a revised version of IAS 1, Presentation of FinancialStatements applicable as from the financial year 2009. The changes will only have an impact on thepresentation, not on recognition or measurement.
On November 21, 2007, the European Union endorsed IFRS 8, Operating Segments. Fortis isevaluating the effect of this Standard for implementation in 2009.
110
Level: 6 – From: 6 – Wednesday, May 14, 2008 – 1:37 pm – g5mac4 – 3960 Section 06 : 3960 Section 06

Scope of Consolidation
The Consolidated Financial Statements include Fortis SA/NV and Fortis N.V. and their subsidiaries.In combining the financial statements of Fortis SA/NV and Fortis N.V., Fortis has opted for consortiumaccounting in order to reflect in the most reliable manner its banking and insurance activities inaccordance with the seventh Directive dated June 3, 1983 (83/349/EEC).
Fortis sponsors the formation of Special Purpose Entities (“SPEs”) primarily for the purpose ofasset securitization transactions, structured debt issuance, or to accomplish another narrow well-definedobjective. Some of the SPEs are bankruptcy-remote companies whose assets are not available to settle theclaims of Fortis. SPEs are consolidated if in substance they are controlled by Fortis.
Investments in joint ventures — contractual agreements whereby Fortis and other parties undertakean economic activity that is subject to joint control — are accounted for using the equity method.
Investments in associates — investments where Fortis has significant influence, but which it doesnot control — are accounted for using the equity method.
First-Time Adoption of IFRS
IFRS 1, First-time Adoption of International Financial Reporting Standards, required theretrospective application of IFRS when an entity is first adopting IFRS. However, to facilitate theimplementation of IFRS, the standard provides entities with twelve optional exemptions. On first-timeadoption, Fortis elected to use the following exemptions:
Business Combinations that occurred prior to January 1, 2004 are not restated under IFRS. As aconsequence previously paid goodwill that was included in equity is not restated.
Employee Benefits: IFRS allows entities when preparing the IFRS opening balance sheet torecognize in net equity all cumulative actuarial gains and losses that were not yet recognized previously inthe income statement. Fortis makes use of this option. As stated above, Fortis continues to use the corridorapproach (not recording actuarial differences within defined limits) from January 1, 2004.
Cumulative Translation Differences: the cumulative translation differences for all foreign operationsare deemed to be zero at the date of transition to IFRS, and the gain or loss on a subsequent disposal ofany foreign operation shall exclude translation differences that arose before the date of transition to IFRS.
Designation of Previously Recognized Financial Instruments: Fortis designated previouslyrecognized financial assets as held at fair value through profit or loss or available for sale, and previouslyrecognized financial liabilities as held at fair value through profit or loss at the date of transition.
Share-Based Payments: Fortis elected to apply IFRS 2 to all options and restricted shares granted toemployees and outstanding as of November 30, 2003 and all options and restricted shares issuedsubsequent to January 1, 2004.
To emphasize that Fortis is an integrated financial services provider, Fortis chose an integratedpresentation of its consolidated balance sheet and income statement. Separate schedules included in theConsolidated Financial Statements give a split of the balance sheet and income statement by segment(insurance and banking). The notes to the balance sheet and the income statement are also given bysegment. Fortis prepares its balance sheet prior to appropriation of profit. The appropriation of profit isrecorded at the time of the General Meeting of Shareholders and the adoption of the proposedappropriation of profit occurs once the shareholders have elected their source of dividend.
Change in the Composition of Fortis and Comparability of Results
2007 Compared to 2006
Results for 2007 compared to 2006 are not directly comparable as Fortis made a number ofacquisitions and dispositions during 2007, the most significant of which are:
111
Level: 6 – From: 6 – Wednesday, May 14, 2008 – 1:37 pm – g5mac4 – 3960 Section 06 : 3960 Section 06

• The acquisition of the ABN AMRO Businesses, consolidated based on the equity method asof October 17, 2007.
• The disposition of its stake in CaiFor (its Spanish joint venture insurance operations),deconsolidated as of November 13, 2007.
• the acquisition of Pacific Century Insurance (a Hong Kong based insurance company nowrenamed Fortis Insurance Company Asia), consolidated as of May, 25 2007.
• the acquisition of Dominet SA (a full-service retail bank in Poland) for EUR 240 million,consolidated as of March 22, 2007.
2006 Compared to 2005
Results for 2006 compared to 2005 are not directly comparable as Fortis made a number ofacquisitions during 2006 and certain 2005 acquisitions were consolidated for the full year 2006 comparedto only part of 2005. The most significant acquisitions in 2006 and 2005 were:
• The acquisition of O’Connor & Co (a Chicago based leading supplier of clearing services inthe United States), consolidated as of the first quarter of 2006.
• The acquisition of Dreieck Industrie Leasing AG (a Swiss based leasing company),consolidated as of the first quarter of 2006.
• The acquisition of Von Essen KG Bankgesellschaft (a German consumer finance bank),consolidated as of the first quarter of 2006.
• The acquisition of William Properties (a leading Dutch real estate developer), consolidated asof the third quarter of 2006.
• The acquisition of Cinergy Marketing & Trading (a marketing and trading platform withoperations in all key North America power and gas markets), consolidated as of the fourthquarter of 2006.
• The acquisition of Cadogan (a fund of hedge fund asset manager), consolidated as ofDecember 31, 2006.
• The acquisition of Disbank, the seventh largest bank in Turkey, consolidated as of the thirdquarter of 2005.
• The acquisition of Dryen (an international asset manager), consolidated as of the fourthquarter of 2005.
• The acquisition of Atradius (a European factoring company), consolidated as of the fourthquarter of 2005.
Segment Reporting
Fortis is an international financial services provider active in the fields of banking and insurance.The primary format for reporting segment information is based on business segments. It has two primarybusiness segments – banking and insurance. Over the past several years it has made a number oforganizational and management changes, primarily with respect to banking, so its reporting segments havechanged over the past several years, with the most recent changes effective January 1, 2008.
New Management and Organizational Structure as of January 1, 2008
As of January 1, 2008 Fortis has reorganized its management and organizational structure into fourcore businesses (the figures as reported for the first quarter of 2007 have been restated for comparisonpurposes and will be restated for the full year 2007):
112
Level: 6 – From: 6 – Wednesday, May 14, 2008 – 1:37 pm – g5mac4 – 3960 Section 06 : 3960 Section 06

• Retail Banking;
• Asset Management & Private Banking;
• Merchant Banking; and
• Insurance.
Activities not related to banking and insurance and elimination differences are reported separatelyfrom the banking and insurance activities.
Fortis will begin reporting its financial results on this basis beginning with the first quarter of 2008and will restate financial results for 2007 on a comparable basis. See “—Results for the Three MonthPeriod Ended March 31, 2008 and 2007.” As this new management and organizational structure was onlyeffective as of January 1, 2008 the following discussion of the years 2007, 2006 and 2005 is based on thesegments as the Group was organized, during these periods and as described below.
The reorganization on January 1, 2008 was driven in part by the acquisition of the ABN AMROBusinesses. This reorganization only affected the presentation of financial information of the Bankingbusiness segments and not the presentation of financial information for the Insurance business segments.Therefore, the discussion of the results of operations of the Banking business segments for the threemonths ended March 31, 2008 and 2007 will not be comparable to the discussion for the full years 2007,2006 and 2005.
The differences in the presentation of financial information between the Banking business segmentsin 2007 compared to as reorganized in 2008 are:
• The financial information for the three month period ended March 31, 2007 for RetailBanking is the same as the financial information for the same period for the old RetailBanking Network.
• The financial information for the three month period ended March 31, 2007 for AssetManagement & Private Banking is the same as the addition of financial information for thesame period for the old business segments Retail Banking Asset Management and PrivateBanking because the eliminations made for the Merchant & Private Banking split were nil.
The restated financial information for the three month period ended March 31, 2007 for MerchantBanking is only slightly different from Merchant Banking as separated from the old Merchant & PrivateBanking segment because the eliminations made for the Merchant & Private Banking split were nil.
Management and Organizational Structure as of January 1, 2007
As of January 1, 2007 Fortis reorganized its organizational and management structure into threecore businesses (the figures as reported for 2006 were restated for comparison purposes):
• Retail Banking;
• Merchant & Private Banking; and
• Insurance.
As such, Fortis was organized on a worldwide basis into three businesses, further subdivided intobusiness segments as described below:
Retail Banking
• Retail Banking Network; and
• Retail Banking Asset Management.
113
Level: 6 – From: 6 – Wednesday, May 14, 2008 – 1:37 pm – g5mac4 – 3960 Section 06 : 3960 Section 06

Merchant & Private Banking
• Merchant & Private Banking Clients; and
• Merchant & Private Banking Skills.
Insurance
• Insurance Belgium — Life;
• Insurance Belgium — Non-Life;
• Insurance Netherlands — Life;
• Insurance Netherlands — Non-Life;
• Insurance International — Life; and
• Insurance International — Non-Life.
Activities not related to banking and insurance and elimination differences are reported separatelyfrom the banking and insurance activities.
Transactions between the different segments are executed under standard commercial terms andconditions (“at arm’s length”).
Retail Banking
Retail Banking consisted of the segments Retail Banking Network and Retail Banking AssetManagement.
Retail Banking Network
Retail Banking Network provides financial services to retail customers, independent professionalsand small-sized enterprises. In the Benelux, Fortis offers advice on all forms of daily banking, saving,investment, credit and insurance through a variety of distribution channels. Fortis also provides retailbanking services in Germany, Ireland, Poland and Turkey.
Retail Banking Asset Management
Fortis Investments carries out asset management activities, acting as a multi-center, multi-productasset management company. Based in Europe, the company has a global presence with both sales officesand some key investment centers in Europe, the United States and Asia. Activities range from institutionalportfolio management to the development and management of mutual funds.
Merchant & Private Banking
Merchant & Private Banking consisted of the segments Merchant & Private Banking Clients andMerchant & Private Banking Skills.
Merchant & Private Banking Clients
Merchant & Private Banking Clients encompasses a wide range of banking products and skill-oriented financial services for large international companies and institutional clients, medium-sizedenterprises and entrepreneurs, and private banking clients. The Merchant & Private Banking Clientscoverage model includes Corporate, Institutional & Public Banking, Commercial Banking, ECT (Energy,Commodities and Transportation) and Private Banking.
Corporate, Institutional & Public Banking is responsible for the global relationship management ofcorporate, institutional and public-sector clients. Commercial Banking aims to be the partner of choice for
114
Level: 6 – From: 6 – Wednesday, May 14, 2008 – 1:37 pm – g5mac4 – 3960 Section 06 : 3960 Section 06

Europe-oriented medium-sized enterprises by offering value-added solutions through a cohesive networkof Business Centers. Within ECT, Fortis offers financial solutions to these industry sectors. PrivateBanking offers integrated, worldwide asset and liability management solutions to high net worthindividuals, their businesses and their advisors.
Merchant & Private Banking Skills
Merchant & Private Banking Skills provides high added value products and services potentially toall Clients segments. Skills include Global Markets, Clearing, Funds and Custody, Investment Banking andSpecialized Financial Services. Specialized Financial Services include leasing, commercial finance, globaltrade services, cash management, trust and corporate services. Global Markets performs all trading, salesand research activities. Clearing, Funds and Custody offers financial services in custody, clearing and fundadministration that support the trading and investment activities of financial professionals.
Investment Banking offers a wide variety of financial services, including corporate finance,structural finance and private equity. Specialized Financial Services consists of leasing, commercialfinance, global trade services, cash management, trust and corporate services.
Other Banking
Balance sheet items, revenues and costs for support functions, operations and ALM are reported inthis section. The figures reported are those after allocation to the business segments.
Fortis Hypotheek Bank, Belgolaise (the African banking operations) and some other Fortiscompanies are also reported in Other Banking.
Allocation rules
Segment reporting within the banking segments makes use of balance sheet allocation rules, a fundtransfer pricing system including balance sheet squaring mechanisms (through which all transactions withclients are matched with equal transactions with the central bankers for the Group), rebilling of supportand operations expenses and overhead allocation. The balance sheet allocation and squaring methodologyaim at reporting information to reflect Fortis’s business model in a consistent way across the varioussegments of Fortis’s banking operations.
Under Fortis’s business model, segments do not act as their own treasurer in bearing the interest raterisk and the foreign exchange risk by funding their own assets with their own liabilities, or by havingdirect access to the financial markets. This is reflected in the fund transfer pricing system, which removesthe interest and currency risks by transferring them from the segments to the central bankers. A key role inthis system is attributed to Asset and Liability Management (“ALM”). The results of ALM are allocated tothe segments based on the economic capital used and the interest margin generated within the segment.
Support and operations departments provide services to the segments. These services include humanresources, information technology, payment services, settlement of security transactions, and ALM. Thecosts and revenues of these departments are charged to the segments via a rebilling system on the basis ofservice level agreements (“SLAs”) reflecting the economic consumption of the products and servicesprovided. The SLAs ensures that the costs and revenues are charged based on actual use and at a fixedrate. Differences between the actual costs and the rebilled costs based on standard tariffs are passedthrough to the three segments in a final allocation.
Insurance
Insurance leverages its existing skills in distribution, operations and products from its home marketsin the Benelux region and has established leading positions in selected European and Asian markets. Lifeincludes insurance contracts with coverage related to the risks of the life and death of individuals. Life alsoincludes investment contracts. Non-Life includes accident, health and motor, fire and other insurancecovering the risk of property losses or claim liabilities.
115
Level: 6 – From: 6 – Wednesday, May 14, 2008 – 1:37 pm – g5mac4 – 3960 Section 06 : 3960 Section 06
Insurance Belgium
Insurance Belgium works through intermediaries to offer a comprehensive range of life and non-lifeinsurance products to private individuals and small and medium sized enterprises (“SMEs”). InsuranceBelgium also offers group policies to large enterprises through Fortis Employee Benefits and sells acomprehensive range of life and non-life insurance products through bank branches.
Insurance Belgium — Life
Life insurance includes both Savings, with investment-focused Unit-linked contracts, and traditionalproducts with a guaranteed interest rate.
Insurance Belgium — Non-Life
Non-Life insurance includes, in addition to the retail and business targeted Property & Casualtyproduct range (motor, fire, liability), workmens’ compensation, and accident and health products.
Insurance Netherlands
Insurance Netherlands serves the market via independent insurance brokers, bancassurance and tiedagents using the internet and offers businesses and individuals a wide range of life, non-life, healthcareand disability insurance products, and mortgage and savings products.
Insurance Netherlands — Life
Life includes insurance contracts with coverage to the risks of the life and death of individuals. Lifealso includes investment contracts.
Insurance Netherlands — Non-Life
Non-Life includes accident and health, motor, fire and other insurance covering the risk of propertylosses or claim liabilities.
Insurance International
Insurance International comprises Fortis’s insurance activities outside Belgium and TheNetherlands. Insurance activities are carried out in Luxembourg, France, the United Kingdom, Germany,Russia, Ukraine and Turkey via Fortis Insurance International and its subsidiaries. Fortis also hasinsurance operations in Portugal, China, Malaysia and Thailand in cooperation with local partners.
Insurance International — Life
In Life insurance, Insurance International is active through wholly-owned subsidiaries in France,Luxembourg, Germany and Russia, Ukraine and Turkey. In Portugal, Insurance International holds a 51%shareholding in Millenniumbcp. In Asia, Insurance International also operates through minorityshareholdings in Thailand, Malaysia and China.
Insurance International — Non-Life
In Non-Life, Insurance International is active through wholly-owned subsidiaries in Luxembourgand the UK. In Portugal Insurance International holds a 51% shareholding in Millennium bcp.
In Asia Insurance International also operates through minority shareholdings in Thailand andMalaysia. Fortis Corporate Insurance is a Non-Life insurer for large and medium-sized national andinternational companies in the Benelux.
116
Level: 6 – From: 6 – Wednesday, May 14, 2008 – 1:37 pm – g5mac4 – 3960 Section 06 : 3960 Section 06

Eliminations
The eliminations of transactions between insurance segments is reported in “— Eliminations”.
Allocation rules
Unlike banking, support functions are provided by each of the insurance segments and, as a result,insurance companies do not report support activities separately. When allocating balance sheet items to thelife and non-life activities, a bottom-up approach is used based on the products sold to external customers.For the balance sheet items not related to products sold to customers, a tailor-made methodology is appliedby each reportable insurance segment.
General
This section comprises activities not related to the core banking and insurance business, such astreasury and finance and other holding activities.
Management and Organizational Structure Prior to January 1, 2007
Prior to January 1, 2007, Fortis was organized and managed world-wide on the basis of six businesssegments:
• Retail Banking
• Merchant Banking
• Commercial & Private Banking
• Insurance Belgium
• Insurance Netherlands
• Insurance International
Activities of these business segments were substantially the same as described for the organizationalstructure in 2007 and 2008.
Recent developments
On May 13, 2008 Fortis announced its results for the three month period ended March 31, 2008.Despite challenging markets, continued growth in income supported by strict cost management allowedFortis to report net profit of EUR 808 million for the first quarter of 2008 compared with net profit ofEUR 1,167 million in the first quarter of 2007. The first quarter of 2008 was adversely impacted by EUR380 million net of tax impact attributable to the credit market turmoil.
117
Level: 6 – From: 6 – Wednesday, May 14, 2008 – 1:37 pm – g5mac4 – 3960 Section 06 : 3960 Section 06

Key figures FortisThree Month
Period Ended March 311111211111344 11112
2008 2007 Change11112 11112 11112
(unaudited)(EUR million)
Net profit before results on divestments . . . . . . . . . . . . . . . . . . . . . . 808 1,167 (31)%Banking . . . . . . . . . . . . . . . . . . . . . . . . . . . . . . . . . . . . . . . . . . . . . 721 903 (20)%Insurance . . . . . . . . . . . . . . . . . . . . . . . . . . . . . . . . . . . . . . . . . . . . 219 352 (38)%General (including eliminations) . . . . . . . . . . . . . . . . . . . . . . . . . (132) (88) 50%
Results on divestments . . . . . . . . . . . . . . . . . . . . . . . . . . . . . . . . . . . 0 0 –11112 11112
Net profit Fortis . . . . . . . . . . . . . . . . . . . . . . . . . . . . . . . . . . . . . . . . 808 1,167 (31)%11112 11112
Weighted average number of ordinary shares (in million) . . . . . . . . 2,191 1,544 42%EPS (in EUR) . . . . . . . . . . . . . . . . . . . . . . . . . . . . . . . . . . . . . . . . . . 0.37 0.76 (51)%
Before results on divestments . . . . . . . . . . . . . . . . . . . . . . . . . . . . 0.37 0.75 (51)%Net equity per share (in EUR) . . . . . . . . . . . . . . . . . . . . . . . . . . . . . 14.08 16.68 (16)%Return on equity . . . . . . . . . . . . . . . . . . . . . . . . . . . . . . . . . . . . . . . . 14%(1) 17%(2) –
(1) Rolling average, based on last four quarters.
(2) Refers to full year.
Consolidated results for the three month period ended March 31, 2008 and 2007
Net profit Fortis
Net profit before divestments in the first quarter of 2008 reached EUR 808 million, compared withEUR 1,167 million in the first quarter of 2007. Both Banking and Insurance came in lower year-on-year,due to additional impairments on the structured credit portfolio totalling EUR 380 million net of tax.Underlying commercial performance showed resilience despite difficult market conditions. Cost measureskept expenses well under control.
Net profit Banking
First quarter 2008 net profit amounted to EUR 721 million, 20% lower than the same quarter lastyear, a resilient performance given the challenging market conditions. The main impact came from anadditional impairment on structured credit products of EUR 231 million after tax.
Compared with the first quarter of 2007, income grew by 17% mainly on the back of strongtreasury and financial market results, which more than compensated for slightly higher expenses. However,the positive impact of higher income was partly offset by significantly higher effective taxes (EUR 183million), driven mainly by taxable capital gains on government bonds and the specific tax treatment oftrading results.
Net profit Insurance
Fortis Insurance posted a net profit of EUR 219 million in the first quarter 2008, 38% down on thefirst quarter last year, while the negative effect from the credit market turmoil in the first quarter 2008 onnet profit was EUR 149 million (pre-tax impact of EUR 209 million). This effect offset the positive impactof sound commercial growth and strict cost control.
Gross premiums both at Life and Non-Life increased in the first quarter by respectively 5% and 3%year on year driven by strong commercial performance in all Benelux countries. The implementation ofthe Fortify strategy is continuing in both Europe and Asia. Life insurance operations were recently startedup in India.
118
Level: 6 – From: 6 – Wednesday, May 14, 2008 – 1:37 pm – g5mac4 – 3960 Section 06 : 3960 Section 06

Net profit General
The net negative result for the first quarter of 2008 was EUR 132 million, EUR 44 million down onthe first quarter of last year.
This result was driven by higher financing charges related to the ABN AMRO transaction and thenegative effect of fair-value changes on investments.
Structured credit portfolio
Fortis’s total structured credit portfolio net of write-downs amounted to EUR 41.6 billion at the endof the first quarter of 2008. The EUR 5.7 billion decline compared to the end of 2007 can be fullyexplained by repayments, changes in exchange rates, some selective sales and additional write downs:
– US subprime CDO portfolio EUR 2.3 billion– Credit spread portfolio EUR 36.9 billion– Insurance ABS portfolio EUR 2.4 billion
A further deterioration in credit market conditions in March 2008 led to various downgrades ofinvestment securities within the structured credit portfolio. This led to additional impairments on theinvestment portfolios of both Banking and Insurance.
Banking incurred impairments totalling EUR 366 million (after tax EUR 231 million). Two thirds ofthese impairments were taken on the super senior CDO portfolio with subprime exposure. Deterioration inthe quality of the vintages before 2006 was the primary reason for the additional impairments.
An additional impairment of EUR 32 million was taken on super senior mezzanine CDOs withsubprime exposure, increasing coverage as a percentage of the notional amount from 57% to 63%. Anadditional impairment of EUR 212 million was booked with respect to super senior high grade CDOs withsubprime exposure, leading to a coverage ratio of 48% compared to 43% at the end of 2007. In addition,EUR 79 million of impairments were taken on warehouse positions related to the CDO originationactivity.
The remaining EUR 43 million impairments were booked primarily on HELOCs wrapped bydowngraded monolines and to a lesser extent on subprime and Alt-A securities.
The total impact of the credit market turmoil on Insurance amounted to EUR 209 million (after taxEUR 149 million), of which the vast majority was due to changes in fair value through the P&L with theremainder due to impairments.
The strong deterioration in credit markets pushed down the valuation of instruments that werefundamentally sound from a credit point of view. During the first quarter of 2008 the unrealized loss of thestructured credit portfolio recorded under ‘available for sale’ (AFS) increased by EUR 1.6 billion to EUR2.5 billion. This unrealized loss does not have an impact on our P&L and core equity.
Loans to customers
Credit quality of various types of loans remained very strong during the first quarter of 2008, asevidenced by the low credit loss ratio of 12 basis points as a percentage of credit risk-weightedcommitments excluding impairments on the structured credit portfolio.
Monoline insurers
Fortis’s direct exposure to monoline insurers has been reduced from EUR 0.5 billion to EUR 0.3billion as a result of repayments. The remaining direct monoline exposure is to FSA.
119
Level: 6 – From: 6 – Wednesday, May 14, 2008 – 1:37 pm – g5mac4 – 3960 Section 06 : 3960 Section 06

Equity markets
Fortis’s total equity portfolio recorded in AFS amounted to EUR 10.8 billion at the end of the firstquarter of 2008, down EUR 3.0 billion from year-end 2007. The decrease is the result of a decision tolower our equity exposure, the negative evolution of equity markets and the realisation of capital gains.
Sharply lower equity markets in the first quarter had a negative impact on Fortis core equity of EUR1.2 billion, EUR 0.2 billion of which was related to the realisation of capital gains on equities. Theremaining negative impact of EUR 1.0 billion is the result of on average around 14% lower equity marketsin the first quarter of 2008. This is fully in line with earlier guidance on the sensitivity of Fortis’s coreequity to a 10% change in equity markets, amounting to EUR 600 to 700 million.
Solvency
Introduction
For a discussion of Fortis’ core equity targets, see “—Liquidity and Capital Resources—Supervisionand Solvency.”
Given the moderate risk profile of the ABN AMRO Acquired Businesses, Fortis will maintain thecurrent capital targets after the acquisition (expressed under Basel I framework for the Bank) in line withrating expectations.
Solvency under Basel II regime
Moving from Basel I to Basel II is a gradual process during which both banks and regulators needto gain confidence in the way capital requirements are calculated. This is certainly the case for bankswhich, like Fortis Bank, apply the most sophisticated approaches (Advanced Internal Ratings BasedApproach for credit risk and Advanced Measurement Approach for operational risk). The CBFA, Fortis’ssupervisor on a consolidated basis, has granted its approval for using the most advanced approaches forcalculating the own funds requirements under Basel II. Furthermore, the terms and conditions set by theregulator include a high degree of conservatism, which is applied to the calculations published today. Atthe same time, one must take into account that there are differences between Basel I and Basel II in thetreatment of certain exposures. See “—Bank Cash Flows—Capital Adequacy—Basel II.”
The calculation of risk-weighted commitments under Basel II at the end of the first quarter of 2008resulted in a decrease to EUR 253.1 billion or 89% of risk-weighted commitments of EUR 284.0 billionunder Basel I. Fortis benefits from the implementation of the most sophisticated capital requirementcalculation approaches, leading to a much more granular risk weighting than under Basel I. This waspartially offset by an increase of Basel II risk-weighted commitments due to the downgrade in the firstquarter of 2008 of part of the ABS portfolio.
Moreover, the computation of available capital has been adjusted for Basel II, although mostchanges were already applied by Fortis in 2007. Since January 1, 2007, Fortis has deducted 50% ofspecific participations from Tier 1 capital and the remaining 50% from total capital, in line with the rulesof the Belgian regulator. The main change in our available capital base under the Basel II regime is thatthe IRB (Internal Rating Based) provision excess (i.e. the difference between the loan loss provisions andthe expected loss) is added to Tier 2 capital. If the difference is negative, 50% is subtracted from Tier 1capital and the remaining 50% from Tier 2 capital.
120
Level: 6 – From: 6 – Wednesday, May 14, 2008 – 1:37 pm – g5mac4 – 3960 Section 06 : 3960 Section 06

The table below presents the solvency of Fortis Bank and Fortis Group calculated under Basel IIand Basel I at the end of the first quarter of 2008 as well as Basel I figures at 2007 year-end.
Key Capital IndicatorsAt
At March 31, December 31,1111211111344 11112
2008(1) 2007(2) 2007(2)
11112 11112 11112
(unaudited)(EUR million, except ratios)
FortisCore equity . . . . . . . . . . . . . . . . . . . . . . . . . . . . . . . . . . . . . . . . . . . . 26,002 25,984 26,063Core equity target . . . . . . . . . . . . . . . . . . . . . . . . . . . . . . . . . . . . . . . – 20,525 19,892Amount of core equity above target . . . . . . . . . . . . . . . . . . . . . . . . . – 5,459 6,171Group leverage on core equity . . . . . . . . . . . . . . . . . . . . . . . . . . . . . 18.5% 18.6% 18.2%
Total available capital . . . . . . . . . . . . . . . . . . . . . . . . . . . . . . . . . . . . 27,883 27,751 27,999Minimum solvency requirements . . . . . . . . . . . . . . . . . . . . . . . . . . . 24,313 26,782 25,725Amount of total capital above minimum solvency requirements . . . 3,570 969 2,274
BankRisk-bearing capital . . . . . . . . . . . . . . . . . . . . . . . . . . . . . . . . . . . . . 27,968 27,837 27,231Risk-weighted commitments . . . . . . . . . . . . . . . . . . . . . . . . . . . . . . 253,145 284,010 270,207
Credit risk . . . . . . . . . . . . . . . . . . . . . . . . . . . . . . . . . . . . . . . . . . . 225,860 257,489 249,280Market risk . . . . . . . . . . . . . . . . . . . . . . . . . . . . . . . . . . . . . . . . . . 13,270 26,521 20,927Operational risk . . . . . . . . . . . . . . . . . . . . . . . . . . . . . . . . . . . . . . . 14,015 – –
Core Tier 1 ratio . . . . . . . . . . . . . . . . . . . . . . . . . . . . . . . . . . . . . . . . 9.5% 8.5% 8.6%Tier 1 ratio . . . . . . . . . . . . . . . . . . . . . . . . . . . . . . . . . . . . . . . . . . . . 10.5% 9.3% 9.5%Total capital ratio . . . . . . . . . . . . . . . . . . . . . . . . . . . . . . . . . . . . . . . 11.0% 9.8% 10.1%
InsuranceRisk-bearing capital . . . . . . . . . . . . . . . . . . . . . . . . . . . . . . . . . . . . . 8,876 8,876 9,656Regulatory Minimum Margin . . . . . . . . . . . . . . . . . . . . . . . . . . . . . . 4,061 4,061 4,108
Core solvency ratio . . . . . . . . . . . . . . . . . . . . . . . . . . . . . . . . . . . . . . 192.0% 192.0% 209.2%Total solvency ratio . . . . . . . . . . . . . . . . . . . . . . . . . . . . . . . . . . . . . . 218.6% 218.6% 235.1%
(1) Based on RWCs and capital under Basel II for Bank and Group.
(2) Based on RWCs and capital under Basel I for Bank and Group.
Methodology used to consolidate ABN AMRO activities for key capital calculations
The amounts presented are based on the consolidation of the businesses acquired from ABN AMROunder the equity method, whereby 50% of Fortis’s EUR 24 billion stake in RFS Holdings is deducted fromcore equity. The remaining 50% is deducted from total capital, which does not affect the measurement ofcore equity.
Every time an ABN AMRO activity is transferred to Fortis, the goodwill and intangibles related tothat activity will be deducted from core equity and the related risk-weighted commitments will beconsolidated. On the other hand, the amount of the participating interest previously deducted will bereduced accordingly. The asset management activities were transferred at the beginning of the secondquarter of 2008. The remaining activities will be transferred between the fourth quarter of 2008 and thelast quarter of 2009. In the course of this period, the surplus of core equity will decrease, but Fortis willmanage its capital in such a way that core equity ratio and leverage are close to target once the ABNAMRO activities have been fully consolidated.
121
Level: 6 – From: 6 – Wednesday, May 14, 2008 – 1:37 pm – g5mac4 – 3960 Section 06 : 3960 Section 06

Group solvency
The group core equity was EUR 5.5 billion above target at the end of the first quarter of 2008,compared with EUR 6.2 billion at the end 2007, whereby the target is computed on the basis of Basel Irisk-weighted commitments.
During the first quarter of 2008, Fortis’s core equity was unchanged at EUR 26 billion compared toyear and 2007. Retained net profit of EUR 0.8 billion and the issue of EUR 0.5 billion of non-innovativetier 1 hybrid securities (NITSH) were offset by the EUR 1.2 billion negative impact of the equity marketon Fortis’s available for sale equity portfolio and EUR 0.1 billion due to other elements predominantlyrelated to translation differences deducted from core equity. Of the EUR 1.2 billion impact of equitymarkets on core equity, EUR 0.2 billion was related to the realization of capital gains on equity.
Rising bank risk-weighted commitments (predominantly related to market risks), computed underBasel I, drove up group core equity target to EUR 20.5 billion at the end of the first quarter of 2008, 3%above the EUR 19.9 billion target core equity at the end of 2007.
Group leverage stood at 18.6% at the end of the first quarter of 2008, but is expected to be back ontarget by the end of the year.
Bank solvency
Fortis Bank remained well capitalised at the end of the first quarter of 2008. Under Basel I, the coretier 1 ratio decreased slightly compared with the end of the year, from 8.6% to 8.5%, whereas the totalcapital ratio went down from 10.1% to 9.8%.
Under the Basel II regime, Fortis Bank’s tier 1 ratio was 10.5% and the total capital ratio stood at11.0%. These ratios reflect a relief resulting from the application of an advanced approach in thecalculation of capital requirements.
In the course of the first quarter of 2008, bank core equity rose from EUR 23.3 billion to EUR 24.1billion both under Basel I and Basel II. The increase was driven by retained net profit of EUR 0.8 billionin the first quarter and the issue of EUR 0.5 billion non-innovative tier 1 hybrid instruments (NITSH).Both elements more than compensated for the EUR 0.2 billion negative impact from unrealized losses onthe available for sale equity portfolio and other elements, predominantly related to translation differencesdeducted from core equity.
Total capital climbed from EUR 27.2 billion to EUR 28.0 billion under Basel II (EUR 27.8 billionunder Basel I). This increase was fuelled chiefly by the change in core equity described above and theimpact of the equity market on Fortis Bank’s unrealized capital gains, which reduced Fortis’s capital byEUR 0.3 billion.
The volume of Basel I risk-weighted commitments increased by 5% to EUR 284.0 billion. Creditrisks grew by 3%, slightly more than underlying loan growth, while market risks rose by 27%. Theincrease in market risks of EUR 5.6 billion was due primarily to EUR 3.1 billion in repurchase agreementswith Fortis Insurance, while the remaining part resulted from increased market volatility. Yearly growth oftotal risk-weighted commitments is expected to remain limited to a maximum of 10%. Basel II risk-weighted commitments stood at EUR 253.1 billion at the end of the first quarter of 2008, EUR 14.0 billionof which was related to operational risk.
Insurance solvency
At the end of the first quarter of 2008, the insurance core solvency ratio and the total solvency ratiostood at 192% and 219% respectively.
During the first quarter of 2008, the core equity of the insurance sector decreased from EUR 8.6billion to EUR 7.8 billion. The EUR 0.2 billion of net retained profit of the quarter could not compensatefor the negative EUR 1.0 billion impact of the equity market on unrealized capital gains in AFS equities.
122
Level: 6 – From: 6 – Wednesday, May 14, 2008 – 1:37 pm – g5mac4 – 3960 Section 06 : 3960 Section 06
Of the EUR 1.0 billion impact of equity markets on core equity, EUR 0.2 billion is related to therealization of capital gains on equity.
The required minimum margin remained flat, at EUR 4.1 billion. Business growth was offset bytechnical adjustments.
Fortis Capital Composition
Fortis Bank Insurance General11111121 11111121 11111121 11111121
At At At At At At At AtMarch December March December March December March December
31, 31, 31, 31, 31, 31, 31, 31,1112 1112 1112 1112 1112 1112 1112 1112
2008(1) 2007(2) 2008(1) 2007(2) 2008 2007 2008 20071112 1112 1112 1112 1112 1112 1112 1112
(unaudited)(EUR million)
Share Capital & Reserves . . . . 28,073 28,451 31,911 32,235 3,343 3,399 (7,181) (7,183)Net profit attributable toshareholders . . . . . . . . . . . . . . 4,802 3,994 2,490 1,768 2,752 2,534 (440) (308)
Unrealized gains and losses . . (2,042) 602 (2,348) (699) 268 1,225 38 76Shareholders’ equity . . . . . . . 30,833 33,047 32,053 33,304 6,363 7,158 (7,583) (7,415)Non-innovative capitalinstruments . . . . . . . . . . . . . . 6,181 5,683 3,219 2,756 – – 2,962 2,927
Minority interests . . . . . . . . . . 1,140 1,147 420 429 680 676 40 42Revaluation of real estate tofair value . . . . . . . . . . . . . . . . 1,591 1,556 – – 1,591 1,556 – –Revaluation of debtsecurities, net of tax andshadow accounting . . . . . . . . 2,148 1,288 2,038 1,070 133 235 (23) (17)Revaluation of equity securities, net of tax andshadow accounting . . . . . . . . (30) (528) – (385) (29) (137) (1) (6)Goodwill . . . . . . . . . . . . . . . . (1,489) (1,515) (970) (1,025) (519) (490) – –Expected dividend . . . . . . . . . (1,313) (1,313) – – – – (1,313) (1,313)
Subordinated loans . . . . . . . . . 12,693 12,739 15,474 15,582 756 757 (3,537) (3,600)Other prudential filters anddeductions on total capital . . (14,346) (14,336) (14,071) (14,043) (275) (293) – –
Total Capital . . . . . . . . . . . . . 27,883 27,999 27,968 27,231 8,876 9,656 (8,961) (8,888)
(1) Capital is computed under Basel II.
(2) Capital is computed under Basel I.
Fortis’s solvency after full consolidation of ABN AMRO activities
When assessing Fortis’s pro forma solvency position with full consolidation of the acquired ABNAMRO activities, the following core equity movements need to be taken into account:
• Reversal of the 50% acquisition price deduction of EUR 12.1 billion
• Deduction of goodwill and intangible assets, inclusion of the capital support as stipulated inthe Consortium Shareholders Agreement and the anticipated impact of the EU remedies,leading to a total reduction of around EUR 19 billion.
Furthermore, a fully consolidated Fortis core equity target includes the capital requirements for therisk-weighted commitments of the acquired ABN AMRO activities. The risk-weighted commitments wereslightly up to around EUR 79 billion at the end of the first quarter of 2008.
The majority of events influencing the reported solvency will take place between the end of 2008and the end of 2009. During this period, the following four factors will ensure continued compliance withour capital targets:
• Retained earnings
123
Level: 6 – From: 6 – Wednesday, May 14, 2008 – 1:37 pm – g5mac4 – 3960 Section 06 : 3960 Section 06

• Controlled growth of capital requirements
• Disposal of non-strategic assets and creation of joint ventures
• Non-dilutive capital raisings and capital relief transactions
With regard to disposals and joint ventures, Fortis has already announced several transactions thatwill have a positive impact on its core equity in the next quarters :
• Fortis and VINCI have signed a memorandum of understanding with a view to combiningtheir respective activities in the public car park industry. This transaction would involvecombining VINCI Park, a subsidiary of VINCI Concessions, and Interparking, a subsidiary ofFortis Real Estate. Both groups would share the equity of the new entity, which would bemajority owned by VINCI, with Fortis retaining a significant holding. This transaction isestimated to benefit the core equity of both Fortis Insurance and Fortis Group by aroundEUR 0.5 billion in the second half of 2008.
• In the process of integrating the acquired ABN AMRO businesses, Fortis Investments tookover the asset management activities of ABN AMRO on April 1, 2008. A 50% stake in themerged company will subsequently be sold to Ping An for EUR 2.15 billion, which equalsthe solvency impact. This transaction is expected to take place in the second or third quarterof 2008.
After full consolidation of all activities acquired from ABN AMRO in 2009, the group core equityis expected to be in line with Fortis’s target.
FTE developments
Key figuresMarch 31, December 31,11112 11112 11112
2008 2007 Change11112 11112 11112
(unaudited)
Banking . . . . . . . . . . . . . . . . . . . . . . . . . . . . . . . . . . . . . . . . . . . . . . . 47,219 46,861 1%Insurance . . . . . . . . . . . . . . . . . . . . . . . . . . . . . . . . . . . . . . . . . . . . . . 15,131 14,967 1%General . . . . . . . . . . . . . . . . . . . . . . . . . . . . . . . . . . . . . . . . . . . . . . . 174 181 (4)%Fortis Total . . . . . . . . . . . . . . . . . . . . . . . . . . . . . . . . . . . . . . . . . . . . 65,524 62,010 1%
11112 11112
Benelux . . . . . . . . . . . . . . . . . . . . . . . . . . . . . . . . . . . . . . . . . . . . . 63% 63% –Outside Benelux . . . . . . . . . . . . . . . . . . . . . . . . . . . . . . . . . . . . . . 37% 37% –
Fortis workforce continued to grow in the first quarter of 2008, increasing by 514 FTEs (from62,010 to 62,524). More then 2,000 FTEs were hired, while about 1,800 left the company. The rest of thegrowth came from minor acquisitions made at the end of 2007, for which the FTE figures were included asfrom 2008.
At the end of the first quarter of 2008, 37 % of the workforce was based outside the Beneluxcountries.
124
Level: 6 – From: 6 – Wednesday, May 14, 2008 – 1:37 pm – g5mac4 – 3960 Section 06 : 3960 Section 06

Banking
Key figuresThree Month
Period Ended March 31,1111211111344 11112
2008 2007 Change11112 11112 11112
(unaudited)
(EUR million, except ratiosand employees)
Total income . . . . . . . . . . . . . . . . . . . . . . . . . . . . . . . . . . . . . . . . . . . 3,215 2,743 17%Total expenses . . . . . . . . . . . . . . . . . . . . . . . . . . . . . . . . . . . . . . . . . . 1,727 (1,677) 2%Change in impairments . . . . . . . . . . . . . . . . . . . . . . . . . . . . . . . . . . . (448) (26) –Profit before taxation . . . . . . . . . . . . . . . . . . . . . . . . . . . . . . . . . . . . 1,040 1,040 0%Net profit for the period . . . . . . . . . . . . . . . . . . . . . . . . . . . . . . . . . . 725 908 (20)%Net profit attributable to minority interest . . . . . . . . . . . . . . . . . . . . 4 5 (20)%Net profit attributable to shareholders . . . . . . . . . . . . . . . . . . . . . 721 903 (20)%Cost/income ratio . . . . . . . . . . . . . . . . . . . . . . . . . . . . . . . . . . . . . . . 53.7% 61.1% –Operating leverage . . . . . . . . . . . . . . . . . . . . . . . . . . . . . . . . . . . . . . 14.2% (2.1)% –No. of FTEs . . . . . . . . . . . . . . . . . . . . . . . . . . . . . . . . . . . . . . . . . . . 47,219 46,861(2) 1%Credit loss ratio (basis points)(1) . . . . . . . . . . . . . . . . . . . . . . . . . . . . 68 5 –Basel IRWCs – End of period (in EUR million) . . . . . . . . . . . . . . . . . . . 284,010 270,207(2) 5%
Credit RWCs . . . . . . . . . . . . . . . . . . . . . . . . . . . . . . . . . . . . . . . . . 257,489 249,280(2) 3%Market RWCs . . . . . . . . . . . . . . . . . . . . . . . . . . . . . . . . . . . . . . . . 26,521 20,927 27%
Basel IIRWCs – End of period (in EUR million) . . . . . . . . . . . . . . . . . . . 253,145 – –
Credit RWCs . . . . . . . . . . . . . . . . . . . . . . . . . . . . . . . . . . . . . . . . . 225,860 – –Market RWCs . . . . . . . . . . . . . . . . . . . . . . . . . . . . . . . . . . . . . . . . 13,270 – –Operational risk . . . . . . . . . . . . . . . . . . . . . . . . . . . . . . . . . . . . . . . 14,015 0 –
Tier 1 ratio . . . . . . . . . . . . . . . . . . . . . . . . . . . . . . . . . . . . . . . . . . . . 9.3% 9.5%(2) –Funds under management (in EUR million) . . . . . . . . . . . . . . . . 198.8 207.8(2) (4)%Inflow/Outflow . . . . . . . . . . . . . . . . . . . . . . . . . . . . . . . . . . . . . . . . . 1.8 13.9(2) (87)%
(1) As a % of average Credit Risk-Weighted Commitments.
(2) Refers to full year.
Banking net profit for the first quarter 2008 was EUR 721 million, down 20% on the same periodlast year. Higher income was more than offset by additional impairments and higher tax charges.
First quarter 2008 total income amounted to EUR 3,215 million, up 17% on the first quarter 2007.This sharp rise was essentially driven by high treasury and financial markets results and a resilientcommercial performance despite challenging financial market conditions. Excluding ABN AMRO-relatedfinancing costs, net interest income grew 6% while commissions and fees remained flat, due to thenegative impact of the equity markets downturn on assets under management.
Commercial activity remained solid in the first quarter of 2008, resulting in 2% underlying growthin loans. Total deposits were up 5%. The first quarter 2008 also saw continued intake at Private Bankingand Asset Management.
The cost containment measures announced earlier this year started to deliver results. In the firstquarter 2008 excluding ABN AMRO-related integration costs (EUR 45 million) and some one-offs,expense growth remained limited to 3% year-on-year. The cost/income ratio of 53.7% for the first quarter2008 was 7.4 percentage points lower than the first quarter of 2007.
The acquired activities of ABN AMRO contributed EUR 84 million to net profit in the first quarterof 2008, after purchase accounting. The net impact for Fortis Bank, including financing (EUR 108 millionpost-tax) and integration costs (EUR 33 million post- tax), came to EUR 57 million negative. In addition,
125
Level: 6 – From: 6 – Wednesday, May 14, 2008 – 1:37 pm – g5mac4 – 3960 Section 06 : 3960 Section 06

EUR 28 million post-tax of financing costs were recorded in General. The total impact of ABN AMROtherefore, including financing and integration costs, and after purchase accounting, on the net profit ofFortis was EUR 85 million negative.
Net interest income on interest-margin products amounted to EUR 1,250 million, a 5% decrease onthe same quarter last year. This decline reflects the impact of the ABN AMRO financing costs in theamount of EUR 138 million pre-tax. Excluding this factor, underlying growth was 6%. Solid customer-related volume growth in loans and deposits contributed positively, and margins improved in some areas ofRetail & Merchant Banking.
The increase at Retail Banking was driven by strong volume growth. Net interest income rose 5%for the first quarter of 2008 compared to the same quarter of 2007 due to improving margins in theBenelux home markets and growing volumes at high margins in growth engines, such as Turkey. AtMerchant Banking, stronger volumes and higher interest rates in specific business lines, such as CorporateBanking, were partially offset by increased funding costs.
Excluding the impact of ABN AMRO financing the duration remained at 5.3 years. This isunchanged compared to the end of 2007 as mismatch opportunities remain limited due to the flat yieldcurve. Including ABN AMRO financing, the average duration in the first quarter of 2008 came in at 4years.
Credit risk-weighted commitments calculated according to Basel I amounted to EUR 257 billion, up3% on the year-end 2007 level. This increase was mainly fuelled by underlying loan volume growth atMerchant Banking. At EUR 27 billion, market risk-weighted commitments increased 27% due primarily toEUR 3.1 billion repurchase agreements with Fortis Insurance and higher market volatility. Total risk-weighted commitments amounted to EUR 284 billion, 5% above the previous quarter’s level. Yearlygrowth of risk-weighted commitments is expected to remain limited to a maximum of 10%.
Funds under management decreased from EUR 208 billion to EUR 199 billion, down 4% on year-end 2007. Net inflow of EUR 1.8 billion in the first quarter failed to compensate for the negative impact ofequity markets.
At EUR 723 million, net commissions and fees remained virtually flat in the first quarter 2008compared with the same quarter of last year, despite difficult financial market conditions. Higher netcommissions and fees earned on securities brokerage, on custody and on insurance products compensatedfor lower fee income on assets under management, on corporate finance and other banking services.
Capital gains on the investment portfolio amounted to EUR 181 million in the first quarter of 2008,5% lower compared with the same period in 2007. The equity exposure was reduced in the first quarter of2008, causing realized losses, though these were offset by capital gains on bonds.
At EUR 826 million, treasury and financial markets results more than doubled in first quarter 2008from their level in the first quarter of 2007. Adjusted for grossing up, which was a negative EUR 116million due to non-deductible losses on equities, income from treasury and financial markets activitiesamounted to EUR 709 million for first quarter 2008. This was a sharp increase (65%) on the grossed-upEUR 430 million recorded in the first quarter of 2007. These results can be broken down into trading andnon-trading activities.
Non-trading revenues (mainly Private Equity, Global Securities & Financing Group and CreditHedging) ended the first quarter at EUR 411 million, up EUR 252 million over the first quarter 2007,mainly driven by a EUR 210 million positive contribution of the credit portfolio hedge.
- Private Equity contribution was nil compared with EUR 49 million in the first quarter of 2007,which benefited from exits and revaluations. Valuation remained flat over the first quarter despite thechallenging market environment.
- GSFG (Global Securities & Financing Group) recorded EUR 54 million in revenues in the firstquarter 2008, up 16% over first quarter 2007 despite less favorable market conditions. This highly seasonalclient-driven business entails very limited credit and market risks.
126
Level: 6 – From: 6 – Wednesday, May 14, 2008 – 1:37 pm – g5mac4 – 3960 Section 06 : 3960 Section 06

- The Credit Portfolio Management unit recorded a positive revaluation of EUR 210 million in thefirst quarter 2008, benefiting from widening credit spreads. A EUR 24 million negative revaluation wasrecorded in the first quarter of 2007. The Credit Portfolio Management team converted the entire hedgingportfolio into single-name credit default swaps in the last quarter of 2007. They now cover a EUR 13billion total notional amount, distributed between counterparties that are all highly rated European and USinvestment banks. This portfolio is managed actively with the aim of reducing volatility in net revenues.
- An increase of EUR 35 million in income at Other Banking reflects strong ALM results, whichbenefited from movements in the yield curve and interest rate volatility on derivatives.
Trading revenues (adjusted for grossing up) amounted to EUR 298 million, up 10% due to theexcellent performance of equities, money markets and fixed income activities in the first quarter of 2008.This performance was well above the average quarterly floor. Although Global Markets had to bear higherfunding costs, it benefited from highly volatile money markets and sharply lower equity markets. TheGlobal Forex and Rates Group also benefited from spread adjustments and a flight into quality in creditsand fixed income markets, combined with large customer flows on interest rate derivatives. Thisperformance was brought down somewhat by the negative contribution of the Capital Markets and EnergyTrading Groups, which remained weak due to difficult market conditions and sluggish commercial activity.
The global trading performance should be seen in the light of an average daily Value at Risk (VAR)which remained moderate throughout the first quarter 2008. It stood at EUR 38 million on average, upslightly on the EUR 30 million average for full year 2007, due mainly to the increased market volatility.
The change in provisions for impairments increased to EUR 448 million in the first quarter 2008from EUR 26 million in the first quarter of 2007. In the first quarter 2008, an additional impairment ofEUR 366 million was taken on the structured credit portfolio. Two-thirds was related to additionalimpairments on the Super Senior CDO portfolio with subprime exposure. The remainder was primarilyrelated to impairments on warehouse positions and to a lesser extent on HELOC’s wrapped bydowngraded monoline insurers and RMBS. Total coverage ratio currently stands at 3% of the subprimeRMBS portfolio, 48% of the High Grade super senior CDO tranches and 63% of the Mezzanine supersenior CDO tranches. All tranches ranked lower than super senior were fully impaired last year. Withrespect to the loan book, specific provisions remained very limited.
The credit loss ratio (calculated as a percentage of average credit risk-weighted commitments) camein at 68 basis points. Excluding the impairments on the structured credit portfolio, the overall credit lossratio stood at 12 basis points reflecting strong overall credit quality. This is well below the cross-cyclecredit loss ratio of around 25 basis points.
Total expenses increased 3% to EUR 1,727 million in the first quarter of 2008 compared with thesame quarter of 2007. ABN AMRO integration costs (EUR 45 million) were offset by one-off positiveelements in the first quarter of 2008. In addition, the first quarter of 2007 suffered from an exceptionalprovision at Fortis Hypotheek Bank. As a result, underlying expenses grew by 3%. Strong costcontainment limited organic expense growth to 2%, while continued investments in growth engines droveup costs by 1%.
Staff expenses amounted to EUR 1,027 million in the first quarter 2008, rising by EUR 85 millionor 9% compared to the same quarter last year. Excluding costs related to the ABN AMRO integration(EUR 33 million), underlying staff expenses increased by 6% or EUR 52 million. 2% of the rise in staffexpenses was due to a rise in the number of FTEs in support of growth investments, while wage driftaccounted for 4%. The positive impact of some one-offs helped to reduce staff expenses.
The total number of Banking FTEs was 47,219 at the end of first quarter 2008, up 4% (or 1,860FTEs) on the same period last year. Hiring continued within the businesses and countries defined asgrowth engines, specifically to support the expansion of Consumer Finance, Turkey, Global Markets andSpecialised Financial Services.
Other operating and administrative expenses decreased 5% to EUR 700 million in the first quarterof 2008 compared with the same quarter last year. Excluding EUR 12 million in costs related to the ABN
127
Level: 6 – From: 6 – Wednesday, May 14, 2008 – 1:37 pm – g5mac4 – 3960 Section 06 : 3960 Section 06

AMRO integration, underlying other expenses were 8% lower than in the same period in 2007 due to tightcost control. Scope changes and one-offs such as an exceptional provision at Fortis Hypotheek Bank in2007 accounted for 6% of the reduction, while more selective expenditure on strategic investmentsrepresented another 1%. Underlying growth was almost flat, aided by lower communication and brandingcosts in the first quarter of the year.
The effective tax rate was higher in the first quarter of 2008 than it was in the comparable periodlast year. The specific tax treatment of trading results led to higher pre-tax results and higher taxes in thefirst quarter of 2008. At the same time, tax-exempt capital gains on equities helped to lower the tax rate in2007, whereas in 2008 capital gains were realized on government bonds subject to taxation.
Retail banking
Key figuresThree Month
Period Ended March 31,1111211111344 11112
2008 2007 Change11112 11112 11112
(unaudited)
(EUR million, exceptpercentages and employees)
Total income . . . . . . . . . . . . . . . . . . . . . . . . . . . . . . . . . . . . . . . . . . 1,133 1,093 4%Total expenses . . . . . . . . . . . . . . . . . . . . . . . . . . . . . . . . . . . . . . . . . . (718) (755) (5)%Net profit attributable to shareholders . . . . . . . . . . . . . . . . . . . . . 270 259 4%
Cost/income ratio . . . . . . . . . . . . . . . . . . . . . . . . . . . . . . . . . . . . . . . 63.4% 69.0% –Operating leverage . . . . . . . . . . . . . . . . . . . . . . . . . . . . . . . . . . . . . . 8.5% (1.6)% –No. of FTEs . . . . . . . . . . . . . . . . . . . . . . . . . . . . . . . . . . . . . . . . . . . 18,725 18,255(1) 3%
(1) Refers to full year.
Net profit at Retail Banking was EUR 270 million in first quarter 2008. Total income reached EUR1,133 million in the first quarter 2008, up 4%, while total expenses were down 5% on the same quarter lastyear, primarily due to tight cost control measures.
Retail Banking net profit for the first quarter of 2008 increased by 4% to EUR 270 millioncompared with EUR 259 million for the same period last year. Total income increased 4% to EUR 1,133million, driven by higher net interest income and higher allocated ALM results. Total expenses were 5%lower at EUR 718 million in first quarter 2008 compared to EUR 755 million in first quarter 2007, ashigher costs for investments were more than offset by cost reductions in Belgium and The Netherlands inmarketing, consultancy and IT. The effective tax rate was 30% in the first quarter of 2008, up from 15% inthe first quarter of 2007, as the ALM results in 2007 were attributable chiefly to tax-exempt realizedcapital gains.
The decision to move the retail activities of Fortis Banque France to Merchant Banking led to achange in reporting as of the second quarter of 2007. All figures below were adjusted for this change forreasons of comparability.
Total income increased by 7% year-on-year to EUR 1,133 million, mainly on an increase of 8% innet interest income and 19% in allocated ALM results. Net interest income rose to EUR 696 million infirst quarter 2008, up EUR 51 million year-on-year or 8%, supported by positive developments in differentgeographies. Net commissions and fees remained stable at EUR 267 million in the first quarter 2008compared with the same period last year.
Customer deposits rose by 2% year-on-year to EUR 92 billion. High short-term interest rates in2007 drove customers’ appetite for time deposits, resulting in an increase of EUR 3.8 billion year-on-year,part of which came from a shift of savings. Loans to customers rose to EUR 86 billion, up 10% year-on-year, driven mainly by a EUR 5 billion increase in residential mortgages, EUR 1.9 billion of which inBelgium and EUR 2.6 billion in The Netherlands.
128
Level: 6 – From: 6 – Wednesday, May 14, 2008 – 1:37 pm – g5mac4 – 3960 Section 06 : 3960 Section 06

Total expenses amounted to EUR 718 million in the first quarter 2008, down 1% on the previousyear, as a steep drop in costs in Belgium and The Netherlands more than compensated for the cost growthrelated to continued investments in Turkey and Poland, and on the inclusion of Dominet.
Merchant banking
Key figuresThree Month
Period Ended March 31,1111211111344 11112
2008 2007 Change11112 11112 11112
(unaudited)
(EUR million, exceptpercentages and employees)
Total income . . . . . . . . . . . . . . . . . . . . . . . . . . . . . . . . . . . . . . . . . . 1,828 1,305 40%Change in impairments . . . . . . . . . . . . . . . . . . . . . . . . . . . . . . . . . . . (404) 7 –Total expenses . . . . . . . . . . . . . . . . . . . . . . . . . . . . . . . . . . . . . . . . . . (738) (698) 6%Net profit attributable to shareholders . . . . . . . . . . . . . . . . . . . . . 453 548 (17)%
Cost/income ratio . . . . . . . . . . . . . . . . . . . . . . . . . . . . . . . . . . . . . . . 40.1% 52.4% –Operating leverage . . . . . . . . . . . . . . . . . . . . . . . . . . . . . . . . . . . . . . 33.5% (9.9)% –No. of FTEs . . . . . . . . . . . . . . . . . . . . . . . . . . . . . . . . . . . . . . . . . . . 14,295 14,393(1) (1)%
(1) Refers to full year.
The decision to transfer the retail activities of Fortis Banque France to Merchant Banking in thesecond quarter 2007 led to a scope change that has impacted the year-on-year comparison. These activitiescontributed EUR 31 million to income and EUR 28 million to total expenses in the first quarter of 2008.
Net profit declined by 17% to EUR 453 million in the first quarter of 2008 compared to EUR 548million in the first quarter of 2007, as impairments on the structured credit portfolio offset the strongperformance underlying all Merchant Banking activities. Excluding these impairments, net profit was up25% to EUR 682 million: the sharp increase in total income (43%) and controlled growth of total expenses(9%) were partly offset by a higher effective tax rate as the result of higher non-deductible losses onequities.
Total income was up 40% to EUR 1,828 million in the first quarter of 2008, buoyed by the strongperformance of treasury and financial markets as well as higher net interest income and net commissionsand fees. Net interest income increased 12% (or 9% excluding Retail Bank France) despite theappreciation of the euro and some exceptional items recorded in the first quarter of 2007. Net commissionsand fees improved 7% on a comparable basis with particularly strong commissions and fees at Clearing,Funds and Custody on high volumes and at Global Trade Services.
Total expenses increased by 9% to EUR 738 million in the first quarter of 2008 compared to EUR698 million (excluding Fortis Bank France) in the first quarter 2007. Adjusted for Retail Bank France, totalexpenses grew by a moderate 5% compared with the first quarter of 2007, of which 1% was linked to theintegration of ABN AMRO. Staff expenses were up 12% (9% on the same basis) due to the strong FTEincrease recorded mainly in the first half of 2007. Other direct expenses in the first quarter 2008 increasedonly by 6% due primarily to tight cost control and monitoring.
The effective tax rate at Merchant Banking was 34% in the first quarter of 2008, up from a low 11%in the first quarter of 2007. This was mainly the result of higher non-deductible losses on equities.
129
Level: 6 – From: 6 – Wednesday, May 14, 2008 – 1:37 pm – g5mac4 – 3960 Section 06 : 3960 Section 06

Private Banking & Asset Management
Key figuresThree Month
Period Ended March 31,1111211111344 11112
2008 2007 Change11112 11112 11112
(unaudited)
(EUR million, exceptpercentages and employees)
Total income . . . . . . . . . . . . . . . . . . . . . . . . . . . . . . . . . . . . . . . . . . 283 302 (6)%Change in impairments . . . . . . . . . . . . . . . . . . . . . . . . . . . . . . . . . . . (4) 4 –Total expenses . . . . . . . . . . . . . . . . . . . . . . . . . . . . . . . . . . . . . . . . . . (220) (186) 18%Net profit attributable to shareholders . . . . . . . . . . . . . . . . . . . . . 48 102 (54)%
Cost/income ratio . . . . . . . . . . . . . . . . . . . . . . . . . . . . . . . . . . . . . . . 77.8% 61.1% –Operating leverage . . . . . . . . . . . . . . . . . . . . . . . . . . . . . . . . . . . . . . (25.8)% 0.1% –No. of FTEs . . . . . . . . . . . . . . . . . . . . . . . . . . . . . . . . . . . . . . . . . . . 2,834 2,900(1) (2)%Funds under management (in EUR billion) . . . . . . . . . . . . . . . . . 205.6 215.2(1) (4)%
Inflow/Outflow . . . . . . . . . . . . . . . . . . . . . . . . . . . . . . . . . . . . . . . 2.6 12.4(1) (79)%
(1) Refers to full year.
Net profit at Private Banking & Asset Management was EUR 48 million in the first quarter of 2008compared to EUR 102 million in the first quarter of 2007. The net profit was impacted by EUR 19 millionof restructuring costs taken at Fortis Investments, related to the integration process with ABN AMROAsset Management, and several one-offs at Private Banking. Despite challenging market conditions, totalnet inflow in the first quarter 2008 amounted to EUR 2.6 billion.
Private Banking’s first-quarter net profit was EUR 40 million, 48% lower year-on-year. The firstquarter of 2007 was impacted by a capital gain, a new methodology for allocating indirect expenses and arelease of impairments. Excluding these factors, net profit remained stable compared with the first quarterof 2007, reconfirming the strong business fundamentals. Strict cost control measures and new productlaunches helped compensate for the impact of the challenging market conditions. Funds undermanagement declined from EUR 82.3 billion at year-end 2007 to EUR 78.7 billion at the end of the firstquarter 2008, due to lower equity markets. Net inflow of EUR 1.1 billion in the first quarter of 2008reconfirms the strong commercial momentum achieved in 2007.
Fortis Investments recorded net profit of EUR 12 million for the first quarter of 2008. This figurewas impacted by the EUR 19 million (EUR 12 million after tax) restructuring provision related to theintegration of ABN AMRO activities acquired in 2008. Excluding this factor, net profit was down 6% onthe first quarter of 2007. The financial results were also negatively affected by difficult market conditions.Assets under management were EUR 126.9 billion at the end of March 2008, down 5% from EUR 132.9billion at the end of December 2007, but 2% higher than at the end of March 2007 (EUR 124.7 billion).The decline in 2008 has been due to poor market conditions (down EUR 7.6 billion), which were partiallyoffset by EUR 1.5 billion of net inflow into money market products.
130
Level: 6 – From: 6 – Wednesday, May 14, 2008 – 1:37 pm – g5mac4 – 3960 Section 06 : 3960 Section 06

Acquired ABN AMRO businesses
The acquired ABN AMRO businesses contributed EUR 84 million to the net profit attributable tothe shareholders of Fortis as of March 31, 2008. The share of Fortis in the net assets of acquired ABNAMRO businesses as at March 31, 2008 was EUR 4,723 million (December 31, 2007: EUR 4,755million). The income statement for the period January 1 to March 31, 2008 for the acquired ABN AMRObusinesses and the shared assets part of Fortis is as follows:
Three MonthPeriod Ended
March 31,11112
200811112
(unaudited)(EUR million)
Net interest income . . . . . . . . . . . . . . . . . . . . . . . . . . . . . . . . . . . . . . . . . . . . . . . . . . . . . . . . . . . 861Net commissions and fees . . . . . . . . . . . . . . . . . . . . . . . . . . . . . . . . . . . . . . . . . . . . . . . . . . . . . 496Realized and unrealized gains and losses . . . . . . . . . . . . . . . . . . . . . . . . . . . . . . . . . . . . . . . . . . 143Other income . . . . . . . . . . . . . . . . . . . . . . . . . . . . . . . . . . . . . . . . . . . . . . . . . . . . . . . . . . . . . . . . (50)
11112
Total income . . . . . . . . . . . . . . . . . . . . . . . . . . . . . . . . . . . . . . . . . . . . . . . . . . . . . . . . . . . . . . . . 1,450Change in impairments . . . . . . . . . . . . . . . . . . . . . . . . . . . . . . . . . . . . . . . . . . . . . . . . . . . . . . . . (88)
11112
Net revenues . . . . . . . . . . . . . . . . . . . . . . . . . . . . . . . . . . . . . . . . . . . . . . . . . . . . . . . . . . . . . . . . 1,362Staff expenses . . . . . . . . . . . . . . . . . . . . . . . . . . . . . . . . . . . . . . . . . . . . . . . . . . . . . . . . . . . . . . . (478)Depreciation and amortisation . . . . . . . . . . . . . . . . . . . . . . . . . . . . . . . . . . . . . . . . . . . . . . . . . . (215)Other expenses . . . . . . . . . . . . . . . . . . . . . . . . . . . . . . . . . . . . . . . . . . . . . . . . . . . . . . . . . . . . . . (509)
11112
Total expenses . . . . . . . . . . . . . . . . . . . . . . . . . . . . . . . . . . . . . . . . . . . . . . . . . . . . . . . . . . . . . . . (1,202)11112
Profit before taxation . . . . . . . . . . . . . . . . . . . . . . . . . . . . . . . . . . . . . . . . . . . . . . . . . . . . . . . . . . 160Income tax expenses . . . . . . . . . . . . . . . . . . . . . . . . . . . . . . . . . . . . . . . . . . . . . . . . . . . . . . . . . . (68)
11112
Net profit for the period . . . . . . . . . . . . . . . . . . . . . . . . . . . . . . . . . . . . . . . . . . . . . . . . . . . . . . . 92Net profit attributable to minority interests . . . . . . . . . . . . . . . . . . . . . . . . . . . . . . . . . . . . . . . . 8
11112
Net profit attributable to shareholders . . . . . . . . . . . . . . . . . . . . . . . . . . . . . . . . . . . . . . . . . . . . . 8411112
The following table provides further information on the total assets and liabilities of the acquiredABN AMRO businesses and the shared assets part of Fortis at March 31, 2008:
At AtMarch 31, December 31,111111111344
2008 20071111 1111
(unaudited)(EUR million)
Total assets . . . . . . . . . . . . . . . . . . . . . . . . . . . . . . . . . . . . . . . . . . . . . . . . . . . . . . 165,056 164,118Total liabilities . . . . . . . . . . . . . . . . . . . . . . . . . . . . . . . . . . . . . . . . . . . . . . . . . . . . 160,219 159,263
1111 1111
Total net assets . . . . . . . . . . . . . . . . . . . . . . . . . . . . . . . . . . . . . . . . . . . . . . . . . . . 4,837 4,855Minority interests . . . . . . . . . . . . . . . . . . . . . . . . . . . . . . . . . . . . . . . . . . . . . . . . . 114 100
1111 1111
Total net assets attributable to shareholders . . . . . . . . . . . . . . . . . . . . . . . . . . . . . 4,723 4,7551111 11111111 1111
131
Level: 6 – From: 6 – Wednesday, May 14, 2008 – 1:37 pm – g5mac4 – 3960 Section 06 : 3960 Section 06

The net assets evolution between October 17, 2007 and March 31, 2008 is explained by thefollowing elements:
Net assets arising on the opening balance (October 17, 2007) . . . . . . . . . . . . . . . . . . . . . . . . . 4,599Result of the year (76 day period) . . . . . . . . . . . . . . . . . . . . . . . . . . . . . . . . . . . . . . . . . . . . . . . 179Unrealized gains and losses (net) . . . . . . . . . . . . . . . . . . . . . . . . . . . . . . . . . . . . . . . . . . . . . . . . (23)Currency translation differences . . . . . . . . . . . . . . . . . . . . . . . . . . . . . . . . . . . . . . . . . . . . . . . . . (11)Other changes in equity . . . . . . . . . . . . . . . . . . . . . . . . . . . . . . . . . . . . . . . . . . . . . . . . . . . . . . . 11
11112
Net assets at December 31, 2007 . . . . . . . . . . . . . . . . . . . . . . . . . . . . . . . . . . . . . . . . . . . . . . . . 4,7551111211112
Result of the period . . . . . . . . . . . . . . . . . . . . . . . . . . . . . . . . . . . . . . . . . . . . . . . . . . . . . . . . . . . 84Unrealized gains and losses (net) . . . . . . . . . . . . . . . . . . . . . . . . . . . . . . . . . . . . . . . . . . . . . . . . (116)Currency translation differences . . . . . . . . . . . . . . . . . . . . . . . . . . . . . . . . . . . . . . . . . . . . . . . . . (10)Other changes in equity . . . . . . . . . . . . . . . . . . . . . . . . . . . . . . . . . . . . . . . . . . . . . . . . . . . . . . . 10
11112
Net assets at March 31, 2008 . . . . . . . . . . . . . . . . . . . . . . . . . . . . . . . . . . . . . . . . . . . . . . . . . . . 4,7231111211112
Insurance
Key figuresThree Month
Period Ended March 31,1111211111344 11112
2008 2007 Change11112 11112 11112
(unaudited)
(EUR million, exceptpercentages and employees)
Net profit attributable to shareholders . . . . . . . . . . . . . . . . . . . . . 219 352 (38)%Life . . . . . . . . . . . . . . . . . . . . . . . . . . . . . . . . . . . . . . . . . . . . . . . . 161 271 (40)%Non-Life . . . . . . . . . . . . . . . . . . . . . . . . . . . . . . . . . . . . . . . . . . . . 58 81 (28)%Other . . . . . . . . . . . . . . . . . . . . . . . . . . . . . . . . . . . . . . . . . . . . . . . 0 0 (57)%
Operating leverage(1) . . . . . . . . . . . . . . . . . . . . . . . . . . . . . . . . . . . . . (16.1)% (3.8)% –No. of FTEs . . . . . . . . . . . . . . . . . . . . . . . . . . . . . . . . . . . . . . . . . . . 15,131 14,967(2) 1%
LifeGross written premiums . . . . . . . . . . . . . . . . . . . . . . . . . . . . . . . . . . 3,157 3,003 5%Investment contracts without dpf . . . . . . . . . . . . . . . . . . . . . . . . . . . 884 851 4%Gross inflow Life . . . . . . . . . . . . . . . . . . . . . . . . . . . . . . . . . . . . . . . 4,041 3,853 5%Technical result . . . . . . . . . . . . . . . . . . . . . . . . . . . . . . . . . . . . . . . . . (12) 159 –Operating margin . . . . . . . . . . . . . . . . . . . . . . . . . . . . . . . . . . . . . . . 88 206 (57)%
Non-LifeGross written premiums Non-Life . . . . . . . . . . . . . . . . . . . . . . . . . . 1,856 1,799 3%Technical result . . . . . . . . . . . . . . . . . . . . . . . . . . . . . . . . . . . . . . . . . 107 71 51%Operating margin . . . . . . . . . . . . . . . . . . . . . . . . . . . . . . . . . . . . . . . 103 79 29%Combined ratio . . . . . . . . . . . . . . . . . . . . . . . . . . . . . . . . . . . . . . . . . 96.7% 101.1% –
(1) Excluding CaiFor.
(2) Refers to full year.
Fortis Insurance continued to build on strong commercial momentum in the first three months of2008, driven by the further implementation of the Fortify strategy and focus on cost control.
The impact of the turmoil in global capital markets more than offset the good results produced bythe solid business performance at both Life and Non-Life and the higher capital gains triggered byportfolio protection techniques (CPPI) that led to lower exposure to equities. Net profit decreased in thefirst quarter 2008 compared to the first quarter 2007 to EUR 219 million from EUR 352 million, while thenegative effect from the credit market in the first quarter 2008 on net profit was EUR 149 million (pre-taximpact of EUR 209 million).
132
Level: 6 – From: 6 – Wednesday, May 14, 2008 – 1:37 pm – g5mac4 – 3960 Section 06 : 3960 Section 06

Net profit at Life fell by 40% to EUR 161 million, despite higher volumes. The Non-Life result wasdown by 28% to EUR 58 million, while underlying profitability remained strong, with a combined ratio of96.7%.
Fortis Insurance’s marketing efforts continued to drive total gross inflow, which reached EUR 5.9billion in the first three months of 2008, up 4% on the first quarter 2007, despite challenging marketcircumstances in 2008 and strong growth in the first quarter 2007. Life grew by 5% to EUR 4.0 billion,due to robust growth at the International Division (34%) and in The Netherlands (19%), which more thanoffset the differences in the timing of marketing bancassurance campaigns in Belgium. Annualisedpremium equivalent (APE) advanced 18% to EUR 403 million in the first quarter 2008, proving the strongbusiness momentum. Non-Life gross written premiums, driven by product innovation across all countries,increased by 3% to EUR 1.9 billion, while maintaining healthy margins.
The focus on tight cost control in all countries, supported by various efficiency programmes, isdemonstrated by the low year-on-year cost growth of 2%. This relates mostly to the inclusion of FICA, theHong Kong based insurance activity, which was consolidated as from the second quarter 2007.
Fortify strategy
Fortis Insurance’s Fortify strategy aims to create revenue synergies by applying the principle‘optimise locally by sharing globally’, i.e., share proven skills across borders and across businesses. Thegoal is to continuously focus attention on the client by adapting the product portfolio and aligning themulti-distribution strategy to changing customer needs. Other goals are to improve operational excellencein all countries and to expand internationally. Implementation of the Fortify strategy is well on track.
Examples of extended multi-channel distribution are the VIP concept in Belgium that aims toexploit the cross-sell opportunities between the bank and the broker channel, the start-up of ‘Ditzo’, theDutch direct distribution channel, which increased its product portfolio in the first quarter 2008, and thenew P&C broker channel targeting the SME market, launched by Millenniumbcp in Portugal. FortisTurkey has started to diversify its distribution by entering the agency channel.
Fortis Insurance Belgium continues to create new packaged products. These successful product-market innovations have contributed to further gains in market share. Other European initiatives have beentaken by Fortis Luxembourg, which has started selling insurance under the ‘freedom of services’ principlein Germany, Spain and Switzerland, and by Fortis UK, which has launched an aggregator (insurancecomparison website) with an affinity approach to its customers.
The focus on operational excellence (lean program) is ongoing. This program aims to improveinternal processes in order to service customers better and at lower cost. Several programs have beenstarted and/or implemented at Fortis Insurance, thus improving cost efficiency.
International expansion has continued. In India, IDBI Fortis, the Life insurance joint venture withIndustrial and Development Bank of India (IDBI) and Federal Bank, commenced operations in March2008. In Malaysia, Mayban Fortis announced that it would pursue the proposed acquisition of a 60% stakein PT Anugrah Life Insurance of Indonesia in order to be able to tap the Indonesian bancassurance market.
Dutch funeral insurer Ardanta has started selling policies in Belgium via direct mail and the websiteof Fortis Bank Belgium, bringing its specific expertise to the Belgium market.
Life
The first quarter 2008 was affected by developments in global capital markets, which put pressureon the sales of unit-linked and other products. Fortis Insurance, due to its diverse product portfolio, wasable to grow gross inflow to EUR 4,041 million, up 5% on the strong first quarter 2007. Life gross inflowin Belgium lagged with inflow 17% below the strong performance of the first quarter last year. Inflow inThe Netherlands increased by 19% compared with 2007, driven by pension-related activities. Growth of34% at International was mainly attributable to Portugal, which benefited from the upgraded productoffering.
133
Level: 6 – From: 6 – Wednesday, May 14, 2008 – 1:37 pm – g5mac4 – 3960 Section 06 : 3960 Section 06

Life technical result was a negative EUR 12 million, largely due to the turmoil in global creditmarkets, which depressed technical result by EUR 155 million, while also negatively impacted by equitymarkets.
For the same reason, net profit decreased to EUR 161 million in the first quarter 2008 from EUR271 million in the first quarter of 2007. The pre-tax technical and non-technical impact of the global creditmarkets totalled a negative EUR 191 million.
Non-Life
Gross written premiums advanced 3% to EUR 1.9 billion in the first quarter 2008, while the focuson profitability was maintained in all countries. Belgium posted a very sound 7% increase, mainly in theSME market, supported by a comprehensive basic product offering combined with continuous productinnovation. In The Netherlands, primarily Accident & Health contributed to the 9% growth and furtherstrengthened its leading market position by entering the newly privatised long-term disability market.International decreased 7%, mainly due to the focus on profitable growth in the UK, but was also affectedby the depreciation of the pound sterling against the euro.
Technical result improved substantially, rising by 50% to EUR 107 million in the first quarter 2008,sustained by an excellent combined ratio of 96.7%. It was up from EUR 71 million in the first quarter2007, which was impacted by Windstorm Kyrill (depressing the technical result in 2007 by EUR 86million). Without Windstorm Kyrill, the first quarter of 2007 showed a strong performance with acombined ratio at 95.7%. The negative impact of the global credit markets was EUR 5 million in the firstquarter of 2008.
Net profit, depressed by lower capital gains and higher taxes, was EUR 58 million, down by 28%on a year-on-year basis. On a pre-tax basis, the technical and non-technical impact of global credit marketswas a negative EUR 18 million.
Insurance Belgium
Key figuresThree Month
Period Ended March 31,1111211111344 11112
2008 2007 Change11112 11112 11112
(unaudited)
(EUR million, exceptratios and employees)
Net profit attributable to shareholders . . . . . . . . . . . . . . . . . . . . . 119 137 (13)%Gross inflow Life . . . . . . . . . . . . . . . . . . . . . . . . . . . . . . . . . . . . . . . 1,531 1,851 (17)%Gross written premiums Non-Life . . . . . . . . . . . . . . . . . . . . . . . . . . 430 402 7%
Combined ratio . . . . . . . . . . . . . . . . . . . . . . . . . . . . . . . . . . . . . . . . . 102.4% 111.6% –Operating leverage . . . . . . . . . . . . . . . . . . . . . . . . . . . . . . . . . . . . . . 1.1% (14.4)% –No. of FTEs . . . . . . . . . . . . . . . . . . . . . . . . . . . . . . . . . . . . . . . . . . . 5,359 5,298(1) 1%
(1) Refers to full year.
First quarter 2008 net profit at Fortis Insurance Belgium reached EUR 119 million, compared withEUR 137 million last year. It suffered as a result of the ongoing turmoil in the global credit and capitalmarkets, while 2007 was depressed by Windstorm Kyrill (EUR 30 million post-tax). The post-tax creditmarket effect on net profit was EUR 51 million (pre-tax effect of EUR 77 million) and experienced in Lifeonly. Positive factors were high tax-exempt capital gains triggered by portfolio protection techniques,volume effects at Life insurance, and continued sound underwriting margins. These positive factors wereunable to fully compensate for the impact of the turbulence in the financial markets.
Total gross inflow was EUR 1,961 million in the first three months of 2008, 13% lower than lastyear. Life inflow decreased by 17%. In 2007, unlike in 2008, marketing campaigns were concentrated in
134
Level: 6 – From: 6 – Wednesday, May 14, 2008 – 1:37 pm – g5mac4 – 3960 Section 06 : 3960 Section 06

the first half of the year, generating record inflow at the start of the year. Furthermore, first quarter 2008inflow was negatively impacted by the ongoing turbulence in the stock markets, which reduced theappetite for unit-linked products. Gross written premiums at Non-Life increased by 7%, due mainly to theproven business model, i.e. a strong basic product offering, combined with excellent service and effectivebroker incentives.
Tight cost control and the ongoing quest for efficiency gains kept operating costs flat, only 1%higher in the first quarter 2008 than last year. As part of the Fortify ‘Operational Excellence’ lever, FortisInsurance Belgium will implement lean management in all its back-offices by 2011.
Insurance Netherlands
Key figuresThree Month
Period Ended March 31,1111211111344 11112
2008 2007 Change11112 11112 11112
(unaudited)
(EUR million, except ratiosand employees)
Net profit attributable to shareholders . . . . . . . . . . . . . . . . . . . . . 68 166 (59)%Gross inflow Life . . . . . . . . . . . . . . . . . . . . . . . . . . . . . . . . . . . . . . . 1,408 1,181 19%Gross written premiums Non-Life . . . . . . . . . . . . . . . . . . . . . . . . . . 864 791 9%
Combined ratio . . . . . . . . . . . . . . . . . . . . . . . . . . . . . . . . . . . . . . . . . 89.5% 93.1% –Operating leverage . . . . . . . . . . . . . . . . . . . . . . . . . . . . . . . . . . . . . . (30.9)% 14.4% –No. of FTEs . . . . . . . . . . . . . . . . . . . . . . . . . . . . . . . . . . . . . . . . . . . 4,651 4,626(1) 1%
(1) Refers to full year.
Net profit at Fortis Insurance Netherlands dropped from EUR 166 million in 2007 to EUR 68million in 2008. The dip at both Life and Non-Life was caused mainly by the turmoil in global capitalmarkets, of which the credit markets influenced net profit by a negative EUR 94 million (pre-tax EUR 126million). Excluding these impacts, the Life technical result was stable and net profit was up due to highercapital gains. Non-Life delivered a stable performance, illustrated by improvements in the cost and claimsratios, while market conditions remained challenging. Non-Life net profit decreased due to lower capitalgains.
Gross inflow increased by 15% to EUR 2,272 million in the first quarter 2008 based on strongcommercial activities and supported by high service levels that were acknowledged by several independentmarket surveys last year. Individual and Group Life grew in total by 19% to EUR 1,408 million in the firstquarter 2008. Gross written premiums were up by 9% to EUR 864 million in the first quarter 2008 at Non-Life, growth at Accident & Health being the main contributor.
Operating costs remained flat at EUR 135 million in the first quarter 2008 (up 1%) as a result ofcost savings, while investment was made in processes, IT infrastructure and multi-channel distribution. Afurther rollout of the operational excellence programme (lean programme) also contributed to cost control.Selective hiring as part of tight cost management resulted in a marginal increase in the number of FTEscompared with the end of 2007.
135
Level: 6 – From: 6 – Wednesday, May 14, 2008 – 1:37 pm – g5mac4 – 3960 Section 06 : 3960 Section 06

Insurance International
Key figuresThree Month
Period Ended March 31,1111211111344 11112
2008 2007 Change11112 11112 11112
(unaudited)
(EUR million, exceptpercentages and employees)
Net profit attributable to shareholders . . . . . . . . . . . . . . . . . . . . . 32 49 (34)%Gross inflow Life . . . . . . . . . . . . . . . . . . . . . . . . . . . . . . . . . . . . . . . 1,101 821 34%Gross written premiums Non-Life . . . . . . . . . . . . . . . . . . . . . . . . . . 562 606 (7)%
Combined ratio . . . . . . . . . . . . . . . . . . . . . . . . . . . . . . . . . . . . . . . . . 100.8% 102.2% –Operating leverage(1) . . . . . . . . . . . . . . . . . . . . . . . . . . . . . . . . . . . . . (5.7)% (18.3)% –No. of FTEs . . . . . . . . . . . . . . . . . . . . . . . . . . . . . . . . . . . . . . . . . . . 5,121 5,043(2) 2%
(1) Excluding CaiFor.
(2) Refers to full year.
The net profit of Fortis Insurance International for the first quarter 2008 at EUR 32 million waslower than for the first quarter 2007. This was mainly due to the loss of profits related to the Spanishactivities (CaiFor joint venture) that were sold at the end of 2007, which affected both Life and Non-Liferesults. The impact of the credit market turmoil on net profit was a negative EUR 4 million (EUR 6million on a pre-tax basis).
Gross inflow at consolidated companies increased 17% to EUR 1,663 million in the first quarter2008 from EUR 1,427 million for the first quarter 2007, driven by new product developments, especiallyin Portugal, and the rollout of multi-channel distribution in several countries in Europe and Asia. Theinclusion of FICA (consolidated as from the second quarter of 2007) supported the growth. Gross inflowat non-consolidated joint ventures (on a 100% basis) increased by 30% to EUR 887 million for the firstquarter 2008, driven by growth in China and Thailand.
Operating costs increased by 4% to EUR 104 million in the first quarter 2008. On a comparablebasis (excluding FICA in the first quarter 2008) operating costs decreased by 3% owing to tight costmanagement.
Comparison of financial information of 2007 versus 2006 and 2006 versus 2005
In connection with the reorganization in 2007, Fortis restated its financial information for the yearended December 31, 2006 but not for the year ended December 31, 2005. The reorganization only affectedthe presentation of financial information of the Banking business sub-segments and not the presentation offinancial information for the Insurance business segments.
Therefore, the discussion of the results of operations of the Banking business segments for the yearsended December 31, 2007 and 2006 are presented on the basis of the organizational structure at January 1,2007. This discussion is followed by the discussion of the results of operations for the years endedDecember 31, 2006 and 2005, which are presented on the basis of the organizational structure prior toJanuary 1, 2007. Fortis has not prepared any financial data that quantifies the changes between the bankingsegments following the 2007 reorganization. However, while the segments have been restructured formanagement purposes, the reorganization does not impact the discussion of trends and developments in thebusiness segments.
The main difference between the 2007/2006 presentation and the 2006/2005 presentation are asfollows:
• Retail Banking was from January 1, 2007 split into Retail Banking Network and RetailBanking Asset Management.
136
Level: 6 – From: 6 – Wednesday, May 14, 2008 – 1:37 pm – g5mac4 – 3960 Section 06 : 3960 Section 06

• Merchant and Private Banking as reorganized in 2007 combined the activities of MerchantBanking and Commercial Banking into one business unit, although the respective activitieswere split between Merchant and Private Banking Clients and Merchant & Private BankingSkills.
The discussion of the results of operation of the Insurance business segments for the years endedDecember 31, 2007, 2006 and 2005 are presented on the basis of the same organizational structure and arecomparable except for changes as described under “—Change in the Composition of Fortis andComparability of Results.”
Consolidated Results of Operations for Years Ended December 31, 2007, 2006 and 2005
Certain summary consolidated income statement information for the years ended December 31,2007, 2006 and 2005 is set forth below.
Year Ended December 31,1111111111111123
2007 2006 20051111 1111 1111
(EUR million, except % and per share data)
Net profit before results on divestments— Banking . . . . . . . . . . . . . . . . . . . . . . . . . . . . . . . . . . . . . . . . . . . . 1,768 3,149 2,434— Insurance . . . . . . . . . . . . . . . . . . . . . . . . . . . . . . . . . . . . . . . . . . . 1,587 1,420 1,225— General (including eliminations) . . . . . . . . . . . . . . . . . . . . . . . . . (308) (218) (161)
1111 1111 1111
Total . . . . . . . . . . . . . . . . . . . . . . . . . . . . . . . . . . . . . . . . . . . . . . . . . 3,047 4,351 3,4981111 1111 1111
Results on divestments— Assurant (General) . . . . . . . . . . . . . . . . . . . . . . . . . . . . . . . . . . . . — — 443— CaiFor (Insurance) . . . . . . . . . . . . . . . . . . . . . . . . . . . . . . . . . . . . 947 — —Total . . . . . . . . . . . . . . . . . . . . . . . . . . . . . . . . . . . . . . . . . . . . . . . . . 947 — 443
1111 1111 1111
Net profit . . . . . . . . . . . . . . . . . . . . . . . . . . . . . . . . . . . . . . . . . . . . . 3,994 4,351 3,9411111 1111 1111
Basic EPS (in EUR) . . . . . . . . . . . . . . . . . . . . . . . . . . . . . . . . . . . . . 2.30 2.83 2.57— Before net gain on discontinued operations . . . . . . . . . . . . . . . . 1.72 2.79 2.33Net equity per share . . . . . . . . . . . . . . . . . . . . . . . . . . . . . . . . . . . . . 15.08 15.98 14.75Return on equity (in %)(1) . . . . . . . . . . . . . . . . . . . . . . . . . . . . . . . . . 17.1% 21.7% 23.0%
(1) Based on the average capital (five last quarters) and results of the last four quarters.
Consolidated Results of Operations — 2007 Compared to 2006
Total net profit before results on divestments decreased by 30% to EUR 3,047 million in 2007 fromEUR 4,351 million in 2006. The decrease was due to the decline in Banking, principally attributable toimpairments taken on our super senior CDO subprime portfolio, offset in part by improved results inInsurance, while General reported increased losses. Total net profit for 2007 declined 8% compared to2006, with 2007 benefiting from the divestment of CaiFor resulting in a gain of EUR 947 million,reducing further the impact of the impairments.
Banking net profit before results on divestment was EUR 1,768 million in 2007, a substantialdecline of 44% or EUR 1,382 million compared with EUR 3,149 million in 2006. The level ofimpairments was due, in part, to Fortis applying a prudent approach to impairments, using stringentassumptions on the super senior CDO exposure. The impact on net profit of these impairments amountedto EUR 1,500 million (EUR 2,400 million pre-tax). Total banking revenues rose by 10% to EUR 11,311million in 2007 compared to EUR 10,324 million in 2006 due to the rise in net interest income and netcommissions and fees, as well as other capital gains and the contributions of the acquired ABN AMROBusinesses for 76 days, which was accounted for on an equity basis. Expenses increased by 12% to EUR7,053 million in 2007 compared to EUR 6,315 million in 2006 due to business developments at Merchant& Private Banking, Retail Banking and Asset Management, underlying expense growth and costs relatingto the integration of the ABN AMRO Businesses. In addition to the significant impairment charges,Banking net profit before results on divestments was also impacted by higher income tax expense (EUR359 million in 2007) compared to a tax benefit in 2006 (EUR 692 million).
137
Level: 6 – From: 6 – Wednesday, May 14, 2008 – 1:37 pm – g5mac4 – 3960 Section 06 : 3960 Section 06

Insurance net profit before results on divestment for 2007 increased by 13% to EUR 1,587 million,with Life advancing 36% to EUR 1,223 million (EUR 909 million in 2006) , Non-Life decreasing 25% toEUR 368 million in 2007 (EUR 491 million in 2006) and Other insurance to EUR 6 million negative. Theincrease in Life was due to strong commercial growth, capital gains and a lower effective tax rate. Theeffects of Windstorm Kyrill and floods in the United Kingdom (EUR 213 million pre-tax) and, to a lesserextent, of global capital markets (EUR 36 million) decreased the technical results in Non-Life by 44% toEUR 319 million in 2007 from EUR 573 million in 2006.
The General segment registered a negative contribution to net profit attributable to shareholders in2007 of EUR 308 million in 2007 compared to a negative contribution of EUR 218 million in 2006, a 41%increase. The increased losses in 2007 were attributable to the EUR 89 million elimination of part of therealized capital gains on ABN AMRO shares, lower favorable fair-value changes of the mandatoryexchangeable bond (“MEB”) convertible into Assurant shares, the absence of the EUR 83 millionsurrender penalties that contributed positively to the 2006 results, and increased financing charges. Thelosses in 2006 were attributable to higher financing charges paid by the general segment due to theacquisition of FB Insurance from Fortis Bank Belgium financed by a loan obtained from external sourcesby the General segment in anticipation of the merger of Fortis AG and FB Insurance into Fortis InsuranceBelgium, a lower positive change in the fair value of the MEB convertible into Assurant shares (EUR 52million in 2006), and higher costs related to the promotion of the Fortis brand.
In 2007, the net underlying profit of the acquired ABN AMRO Businesses, excluding certain one-off charges and integration costs, increased 17% to EUR 1, 355 million in 2007 from EUR 1,158 millionin 2006. The increase was attributable to the strong commercial performance of the ABN AMROBusinesses despite volatile market conditions at the end of 2007 and uncertainty during the acquisitionprocess. The ABN AMRO Businesses, Retail and Commercial/Corporate Netherlands, Private Clients andAsset Management, had net profit of EUR 854 million, EUR 307 million and EUR 194 millionrespectively. Fortis’s share of the net profit of the acquired ABN AMRO Businesses was EUR 179 million.Total announced synergies of EUR 1,300 million are still expected as previously announced, with a fullimpact as from 2010. Total estimated integration costs are in line with the original calculation ofapproximately 1,500 million.
Consolidated Results of Operations — 2006 Compared to 2005
Total net profit before results on divestments increased by 24% to EUR 4,351 million in 2006 fromEUR 3,498 million in 2005. The increase was attributable to strong results in Banking and improvedresults in Insurance, while General reported increased losses. Total net profit for 2006 increased 10%compared to 2005, with 2005 benefiting from the divestment of Assurant (EUR 443 million).
Banking net profit before results on divestment was EUR 3,149 million in 2006, a substantialincrease of 29% or EUR 715 million compared with EUR 2,434 million in 2005. Total banking revenuesrose by 15% to EUR 10,324 million in 2006 compared to EUR 8,991 million in 2005 due to buoyantcommercial activity and higher treasury and financial markets results. Expenses increased by 13% to EUR6,315 million in 2006 compared to EUR 5,603 million in 2005 mainly due to accelerated investments inthe latter part of 2006 for growth initiatives, new hiring and the consolidation of acquisitions. Banking netprofit before results on divestments also benefited from lower changes in impairments and a lowereffective tax rate.
Insurance net profit before results on divestment for 2006 increased 16% to EUR 1,420 million,with Life advancing 24% to EUR 924 million (EUR 748 million in 2005) and Non-Life rising 4% to EUR496 million in 2006 (EUR 477 million in 2005). The increase in Life was due to higher investment incomeand higher capital gains, partly offset by the result-related commission (EUR 49 million) paid to RetailBanking in Belgium. As part of the sale of FB Insurance to Fortis Insurance it was agreed that FBInsurance would pay a result related commission to Fortis Bank as of January 1, 2006. A lower effectivetax rate owing to a more favorable capital gains mix also contributed to the rise in Life net profit. Theimprovement in Non-Life results was in line with Non-Life technical results which increased 7%, mainlyowing to volume growth and a stable combined ratio. Higher technical results in the Dutch Accident &Health market and better results at Motor compensated for lower results at Fire.
138
Level: 6 – From: 6 – Wednesday, May 14, 2008 – 1:37 pm – g5mac4 – 3960 Section 06 : 3960 Section 06

The General segment registered a negative contribution to net profit before divestments of EUR 218million in 2006 compared with a loss of EUR 161 million in 2005, a 35% increase. The increased losses in2006 were attributable to higher financing charges paid by the general segment due to the acquisition ofFB Insurance from Fortis Bank Belgium financed by a loan obtained from external sources by the Generalsegment in anticipation of the merger of Fortis AG and FB Insurance into Fortis Insurance Belgium, alower positive change in the fair value of the mandatory exchangeable bond (“MEB”) convertible intoAssurant shares (EUR 52 million in 2006 compared with EUR 76 million in 2005), and higher costsrelated to the promotion of the Fortis brand.
In 2006, Fortis restyled its brand and accompanied it with a worldwide promotion campaign. Thesehigher costs were offset in part by the receipt of EUR 91 million in surrender penalties received fromgroup entities owing to early loan repayments and lower eliminations of treasury share revenues. Net lossfor the General segment in 2006 (EUR 218 million in 2006) was not impacted by dispositions compared to2005 which was favorably impacted by the follow on offering of Assurant shares resulting in a gain ofEUR 443 million which resulted in a positive contribution after results on divestments of EUR 282 millionin 2005.
Banking
The following table sets forth selected financial information for Fortis’s consolidated bankingoperations for the periods indicated. For purposes of this presentation, in showing revenues and expenses,Fortis has netted certain expenses (interest expense, fee and commission income and certain otherexpenses) against its revenues, so the presentation below does not follow the segment presentation in theConsolidated Financial Statements. These are only presentation changes and have no impact on net profit.
Year Ended December 31, 2007 vs. 2006 2006 vs. 200511111111111111234 1111 1111
2007 2006 2005 Change Change1111 1111 1111 1111 1111
(EUR million)
Income statementNet interest income . . . . . . . . . . . . . . . . 5,267 5,086 4,653 4% 9%Net commissions and fees . . . . . . . . . . . 3,065 2,764 2,290 11% 21%Realized capital gains (losses) . . . . . . . . 881 576 712 53% (19)%(Un)realized gains (losses) . . . . . . . . . . 1,278 1,339 805 (5) 66%Dividend and other investment income . 508 287 259 77% 11%Other income . . . . . . . . . . . . . . . . . . . . . 312 272 272 15% 0%
1111 1111 1111
Total revenues . . . . . . . . . . . . . . . . . . . . 11,311 10,324 8,991 10% 15%1111 1111 1111
Change in provisions for impairment . . (2,835) (158) (209) — (24)%Net revenues . . . . . . . . . . . . . . . . . . . . . 8,476 10,166 8,782 (17)% 16%
1111 1111 1111
Staff expenses . . . . . . . . . . . . . . . . . . . . (4,026) (3,625) (3,370) 11% 8%Other operating and administrative
expenses . . . . . . . . . . . . . . . . . . . . . . . (3,027) (2,690) (2,233) 13% 20%1111 1111 1111
Total expenses . . . . . . . . . . . . . . . . . . . . (7,053) (6,315) (5,603) 12% 13%1111 1111 1111
Profit before income tax . . . . . . . . . . . 1,423 3,851 3,179 (63)% 21%Income tax . . . . . . . . . . . . . . . . . . . . . . . 359 (692) (734) — (6)%
1111 1111 1111
Net profit before minority interests . . 1,782 3,159 2,245 (44)% 29%1111 1111 1111
Minority interests . . . . . . . . . . . . . . . . . . 14 10 11 (41)% (9)%1111 1111 1111
Net profit . . . . . . . . . . . . . . . . . . . . . . . . 1,768 3,149 2,434 (44)% 29%1111 1111 1111
Results on divestments . . . . . . . . . . . . . — — — — —1111 1111 1111
Net profit before results on divestments . . . . . . . . . . . . . . . . . . . . 1,768 3,149 2,434 (44)% 29%
1111 1111 1111
139
Level: 6 – From: 6 – Wednesday, May 14, 2008 – 1:37 pm – g5mac4 – 3960 Section 06 : 3960 Section 06

Banking Key Performance Indicators
Year Ended December 31,11111111111111234 2007 vs. 2006 2006 vs. 2005
2007 2006 2005 Change Change1111 1111 1111 1111 1111
(EUR million)
Cost/Income ratio (%) . . . . . . . . . . . . . . 62.4% 61.2% 62.3% — —Operating leverage(1) . . . . . . . . . . . . . . . (2.1)% 2.1% 28.7% — —Credit Risk Weighted Commitments
(“RWCs”)(EUR million) . . . . . . . . . . . . . . . . . . . . 249,280 221,633 198,241 12% 12%— Credit loss ratio (basis points)(2) . . . . 116 7 10 — —Credit Quality (EUR million)— Total loans to customers . . . . . . . . . . 317,303 288,078 280,233 10% 3%— Impaired outstandings . . . . . . . . . . . 5,476 5,937 – (8)% –As a % of total loans to customers . . . . 1.7% 2.0% – – –
(1) Operating leverage is defined as the difference between the percentage growth in total revenues, prior to changes in provisions, andin total expenses.
(2) As a % of average Credit RWCs.
Under IFRS (accounting based) all interest income and expenses, including interest income andexpenses relating to trading positions, are reported in net interest income. Since the net interest income ontrading positions is dependent on the structure of the trading positions (long/short) the corresponding netinterest income can become very volatile.
Fortis believes that the activity-based presentation of net interest income and related Realizedcapital gains/losses and Other (un)realized gains and losses set out below provides a more accuratedescription of its net interest income. This alternative presentation has no impact on the total net result.
Year Ended December 31,1111111111111123
2007 2006 20051111 1111 1111
(unaudited)(EUR million)
Accounting basedNet interest income . . . . . . . . . . . . . . . . . . . . . . . . . . . . . . . . . . . . . . 5,267 5,086 4,653Realized capital gains (losses) on investments . . . . . . . . . . . . . . . . . 881 576 712Other (un)realized gains/losses . . . . . . . . . . . . . . . . . . . . . . . . . . . . . 1,278 1,339 805
1111 1111 1111
Total . . . . . . . . . . . . . . . . . . . . . . . . . . . . . . . . . . . . . . . . . . . . . . . . . 7,426 7,001 6,1701111 1111 11111111 1111 1111
Activity based(1)
Net interest income on interest margin products(2) . . . . . . . . . . . . . . 5,241 5,087 4,574Capital gains not linked to financial markets activity . . . . . . . . . . . 806 530 496Treasury and financial markets . . . . . . . . . . . . . . . . . . . . . . . . . . . . . 1,379 1,384 1,100
1111 1111 1111
Total . . . . . . . . . . . . . . . . . . . . . . . . . . . . . . . . . . . . . . . . . . . . . . . . . 7,426 7,001 6,1701111 1111 11111111 1111 1111
(1) Data reclassified according to certain criteria, which, in the view of Fortis, provide a more accurate presentation of Fortis’s bankingactivities.
(2) Interest products are, among others, loans, saving accounts, deposits and bonds (but not part of the trading portfolio).
2007 Compared to 2006
Total revenues. Total revenues for 2007 increased 10% to EUR 11,311 million from EUR 10,324million in 2006, with more than half the increase due to the rise in net interest income and netcommissions and fees with the remainder due to capital gains and the contribution of the ABN AMROBusinesses. Treasury and financial markets results were only slightly lower than last year despite theturmoil on the global capital markets, demonstrating the resilience of these activities due to their
140
Level: 6 – From: 6 – Wednesday, May 14, 2008 – 1:37 pm – g5mac4 – 3960 Section 06 : 3960 Section 06

diversified nature. This income remained above its cycle-neutral run-rate. Higher capital gains relatedprimarily to the financing of the ABN AMRO acquisition.
The increase in total revenues in 2007 was impacted by certain one-time events and scope changesin 2006 and 2007. Underlying growth stood at 10%. This reflects a strong performance in what was adifficult financial market environment.
Commercial activity remained strong throughout 2007, resulting in 16% underlying growth inlending, a 5% increase in deposits and a 9% rise in funds under management. Credit risk-weightedcommitments amounted to EUR 249,280 million in 2007, a 12% increase from EUR 221,633 million in2006, due to sharp growth at Merchant & Private Banking.
Underlying total revenue growth was well balanced across all major revenue lines, with almost halfof the increase coming from higher net interest income and net commissions and fees, providing a stableand recurring revenue base. In addition, approximately 75% of the underlying growth in net interestincome and net commissions and fees was generated by activities earmarked as growth engines.
Net interest income on interest-margin products (activity based) amounted to EUR 5,241 million in2007, a 3% increase from EUR 5,086 million in 2006. Underlying growth would have been 7% whenexcluding ABN AMRO financing costs (EUR 92 million), lower prepayment fees on mortgages (EUR 75million) as refinancings declined and the one-off correction at Fortis Hypotheek Bank (EUR 38 million).This rise was due to volume growth in loans and deposits and the release of provisions for interestreserves, which offset margin pressure resulting from competition and the impact of a flatter yield curve.
Double-digit growth rates in net interest income were recorded at Commercial Banking, Corporate,Institutional & Public Banking, Energy, Commodities & Transportation. This partly offset the slightdecrease at deposit-taking businesses like Retail Banking Belgium. Growth of 22% at Merchant & PrivateBanking and a 3% rise at Retail Banking (both adjusted for the transfer of the retail activities of FortisBanque France), offset the decline in ALM results at Other Banking.
Funds under management increased from EUR 191 billion in 2006 to EUR 208 billion in 2007, a9% increase. Net inflow continued to grow sharply despite adverse market conditions in the third andfourth quarters of 2007, reaching EUR 13.9 billion, with Asset Management contributing about 69% tothis growth.
Net commissions and fees rose significantly in 2007, increasing 11% to EUR 3,065 million in 2007from EUR 2,764 million in 2006. The increase was mainly attributable to higher funds under management,as well as to commissions and fees (EUR 46 million) relating to the acquisition and financing of ABNAMRO activities (partly offset by group companies for EUR 19 million). The increase in net commissionsand fees from the growth in funds under management was driven by a substantially higher fee base andstrong net inflow at Asset Management and Private Banking. Cross-selling across Banking and Insuranceaccounted for 16% of the total rise in net commissions and fees, mainly on the distribution of insuranceproducts through the banking network. The remainder of the increase (about one-third) came primarilyfrom higher fees earned on securities brokerage, credit card commissions and payment transactions.
Capital gains on the investment portfolio (activity based) amounted to EUR 806 million in 2007, a52% increase from EUR 530 million in 2006. Growth was achieved on the sale of a number of non-strategic equity holdings (including Banco Comercial Português, Kasbank and ICBC Asia) during thesecond, third and fourth quarters of 2007, in connection with the financing of the acquisition of ABNAMRO activities.
Treasury and financial markets remained stable in 2007, at EUR 1,379 million in 2007 comparedwith EUR 1,373 million in 2006, despite the global capital markets turmoil. Excluding one-offs such asthe non-qualifying hedge and the penalty on an internal financing repayment, treasury and financialmarkets results improved 6% in 2007. Treasury and financial markets results consist of trading and non-trading income. Non-trading income was the primary factor in the treasury and financial market results,offsetting weaker trading results in a very difficult market environment.
141
Level: 6 – From: 6 – Wednesday, May 14, 2008 – 1:37 pm – g5mac4 – 3960 Section 06 : 3960 Section 06

Non-trading revenues (mainly at Private Equity, Global Securities & Financing Group, CreditHedging and Other Banking) ended the year 38% higher at EUR 956 million compared to 2006, mainlydue to the positive contribution of the credit portfolio hedge and the strong result at Other Banking.
• Private Equity recorded EUR 219 million in revenues in 2007, a 4% increase compared to2006, benefiting from exits and revaluations in funds of funds.
• GSFG (Global Securities & Financing Group) contributed EUR 334 million, a 6% increasecompared to 2006, despite higher commissions paid on new exclusivity rights contracts.
• The Credit Portfolio Management unit recorded a total positive revaluation of EUR 40million in 2007. During the final quarter of 2007, the Credit Portfolio Management teamconverted the entire hedging portfolio into single-name credit default swap protections. Theynow cover a EUR 14 billion total notional amount, distributed over 136 referencecounterparties that are exclusively highly rated European and American investment banks.This resulted in a EUR 6 billion relief in credit risk weighted commitments because of theconversion into single name credit default swaps.
• Treasury and financial markets income reported under Other Banking reflected strong resultsfrom non-linear derivative positions and prepayment fees on long-term deposits.
Trading revenues (adjusted for grossing-up) amounted to EUR 546 million in 2007, a decrease of36% compared to 2006, mainly due to the impact of the US subprime market turmoil and resultingliquidity crisis. The revenue stream nonetheless benefited from diversification. This decline should be seenin the light of an average daily Value at Risk that remained moderate throughout 2007 ending at EUR 30million. The weak performance of the Capital Markets Group, which suffered from negative revaluationsin the structured credit business, was offset by good results at the Forex and Rates Group and GlobalEquities Group.
Profit before income tax. The 2007 credit loss ratio (expressed as a percentage of average creditrisk-weighted commitments) was 116 basis points. Excluding the subprime super senior CDO-relatedimpairments, the overall credit loss ratio was 5 basis points, reflecting strong overall credit quality.Adjusting for the change in IBNR methodology, the credit loss ratio was at 13 basis points, in line withearlier guidance and still well below the cross-cycle credit loss ratio of approximately 25 basis points.
Change in provisions for impairments reached EUR 2.8 billion in 2007 mainly due to theimpairments on the US subprime related investments (EUR 2.7 billion). Fortis applied a prudent approachto impairments, using stringent assumptions on the super senior CDO portfolio with subprime exposure.An impairment of EUR 2.4 billion (after tax EUR 1.5 billion) was taken on this exposure in the fourthquarter of 2007. Additionally, an impairment of EUR 0.2 billion was recorded in 2007 on the below supersenior tranches and some warehouse positions related to the origination activity. Finally, an impairment ofEUR 0.1 billion was booked in the credit spread portfolio, bringing total subprime impairments taken toEUR 2.7 billion in 2007 (after tax EUR 1.7 billion). For a complete discussion, see “— Overview —Structural Credit Exposure.”
Total expenses increased 12% to EUR 7,053 million in 2007 compared with EUR 6,315 million in2006. Two-thirds of this growth was due to business developments at Merchant & Private Banking whilethe remainder was attributable to Retail Banking and Asset Management. Underlying expense growth was10%, excluding costs relating to the ABN AMRO integration incurred in the fourth quarter, scope changesand one-offs. Various investments in growth accounted for 6%, while underlying cost growth was 4%. Thecost/income ratio for 2007 was 62.4% compared to 61.2% in 2006.
Staff expenses amounted to EUR 4,026 million, an increase of EUR 401 million or 11% in 2007compared with EUR 3,625 million in 2006. More than half of the increase was due to the rise in thenumber of FTEs in support of growth investments, while wage drift accounted for 3%. The consolidationof acquisitions, the integration of ABN AMRO (EUR 17 million) and some one-offs were responsible forthe balance of the increase.
142
Level: 6 – From: 6 – Wednesday, May 14, 2008 – 1:37 pm – g5mac4 – 3960 Section 06 : 3960 Section 06

The total number of Banking FTEs reached 46,861 at the end of 2007, an increase of 8% or 3,286FTEs compared with 43,575 FTEs in 2006. Almost one-third of the increase related to recent acquisitions,including Dominet and Cinergy. Excluding scope changes, the balance of hiring took place at thebusinesses and countries defined as growth engines, ultimately divided equally between Merchant &Private Banking and Retail Banking. More specifically, recruitments were made to support the expansionof Consumer Finance, Turkey, Global Markets, Specialised Financial Services, Clearing Funds & Custodyand Services to Hedge Funds. Retail Banking in the Benelux countries enhanced efficiency, mainly in thesupport functions, resulting in a 2% decrease in the number of FTEs.
Other expenses increased 13% to EUR 3,027 million in 2007 compared to EUR 2,690 million in2006. Strategic investments represent 7% of the increase and related mainly to upgrading of thetechnology infrastructure, expansion of the distribution networks in Germany, Turkey and Poland, and theexpansion of Merchant & Private Banking in the US, UK and Asia. The remainder was due to underlyinggrowth (3%) and to acquisitions, the ABN AMRO integration and one-time events (2%).
Taxation. Total Banking recognised a tax credit for 2007, as tax deductible losses in the US relatingto Merchant & Private Banking’s subprime exposure outweighed the tax expenses on Banking profitrealised elsewhere. Excluding the subprime related tax credit in the US, the effective tax rate was at a low16% in 2007 compared with 18% in 2006. The lower tax rate was due mainly to the mix of capital gains(largely tax exempt equity transactions), the reduced corporate tax rate in The Netherlands and theestablishment of the Belgian treasury centre, whereas the structure of the treasury and financial marketsresults was less favourable in 2007.
Net profit before results on divestments. Full-year net profit was EUR 1,768 million, a 44% decreasefrom EUR 3,149 million in 2006. Fortis applied a prudent approach to impairments, using stringentassumptions on the super senior subprime CDO exposure. An impairment of EUR 2.4 billion (after taxEUR 1.5 billion) was taken on this exposure in the fourth quarter of 2007. Additionally, an impairment ofEUR 0.2 billion was recorded in 2007 on the below super senior tranches and some warehouse positionsrelated to the origination activity. Finally, an impairment of EUR 0.1 billion was booked in the creditspread portfolio, bringing total subprime impairments taken at the Bank to EUR 2.7 billion in 2007 (aftertax EUR 1.7 billion).
The net contribution of the acquired activities of ABN AMRO after purchase accounting and theimpact of the broken quarter amounted to EUR 179 million. Taking into account the negative impact ontotal income of EUR 100 million and integration costs of EUR 35 million, the net impact of theconsolidation of acquired activities on the net profit of Fortis Bank was EUR 86 million.
2006 Compared to 2005
Total revenues. Total revenues for 2006 increased to EUR 10,324 million, up 15% from EUR 8,991million in 2005. The increase reflected ongoing robust customer activity, a substantially highercontribution from treasury and financial markets and the inclusion of acquisitions. Excluding the impact ofacquisitions, organic year-on-year growth was 12%. Net interest income rose by 9% in 2006 compared to2005. Net interest income from interest-margin products reached EUR 5,087 million for 2006, up 11% on2005 (EUR 4,574 million), or 7% adjusting for the impact of acquisitions. All three banking businesseshad increased net interest income with increases of 16% in Merchant Banking, 15% in Commercial &Private Banking and 7% in Retail Banking. The growth in net interest income at Merchant Banking andCommercial & Private Banking was due to high levels of commercial activity. The increase at RetailBanking was principally due to the positive impact of acquisitions. All three businesses experiencedvolume growth, partly offset by contracting margins. Underlying loan volume (excluding reverserepurchase agreements) rose 14% compared with year-end 2005. Net interest income from ALM benefitedfrom higher short-term interest rates, higher retained earnings and a slightly higher duration of equity.
Net inflow of Private Banking (EUR 6.9 billion) and Fortis Investments (EUR 9.9 billion),combined with favorable market movements resulted in an increase in assets under management of 16% toEUR 181.6 billion.
143
Level: 6 – From: 6 – Wednesday, May 14, 2008 – 1:37 pm – g5mac4 – 3960 Section 06 : 3960 Section 06

Capital gains that were not linked to financial markets were EUR 530 million in 2006, rising EUR34 million or 7% from the level achieved in 2005. Realized capital gains in 2006 were primarily equity-based and event-driven, bringing down the overall effective tax rate, while the 2005 gains were essentiallybond-driven.
Treasury and financial markets revenues rose by 26% to EUR 1,384 million for 2006 compared toEUR 1,100 million in 2005. This activity benefited from robust trading results, higher market values offinancial market instruments and private equity shareholdings, and seasonally strong global securities-financing activities in the second quarter. A EUR 180 million gain, posted as a result of a non-qualifyinghedge on the part of the mortgage portfolio, was offset in part by one-off surrender penalty charges ofEUR 91 million on early repayment of intercompany loans and negative revaluation of derivativepositions. These penalty charges were recorded as benefits in the General segment as discussed above.
Net commissions and fees amounted to EUR 2,764 million in 2006, up 21% on EUR 2,290 millionin 2005. Acquisitions accounted for 4% of the increase. Banking benefited from a new EUR 83 millionresult-related commission from FB Insurance on sales of insurance products through the bank channelfollowing the transfer of FB Insurance to the Insurance segment. Excluding this factor, net commissionsand fees increased organically by 13%. This healthy growth was achieved due to fees related to assetsunder management (up 18%) and security transactions (up 24%). Fees for assets under managementbenefited from high net inflows and higher asset values, resulting in a substantially higher fee base.Growth of securities-related fees related to the high levels of such activity on stock exchanges.
Other income for 2006 was EUR 272 million, unchanged from 2005. While 2005 benefited from anexceptional reimbursement from the Belgian Deposit Protection Fund of EUR 48 million, 2006 wasimpacted favorably by the merger of the facility operations of Banking and Insurance in the Bank during2006, which led to increased costs for the Bank which were then recharged to Insurance. This recharge isincluded in Other income for 2006.
Profit before income tax. The benign credit environment resulted in very low changes in provisionsfor impairments in 2005 and 2006, mainly due to net releases posted by Merchant Banking in both years.Impairment levels at Commercial Banking in 2006 improved due to the strong underlying credit qualitywhile Other Banking benefited from provision releases for Belgolaise, Fortis’s banking operations inAfrica. The change in impairments for Retail Banking increased year-on-year (EUR 150 million in 2006and EUR 130 million in 2005), reflecting higher credit provisions related to the integration of theacquisitions in Germany and Turkey, although underlying credit quality at Retail Banking remained sound.The annualized credit loss ratio for the year was 7 basis points, in line with expectations and below the 10basis points posted for full-year 2005. The 2006 credit loss ratio is considerably lower than the expectedaverage cross-cycle credit loss ratio of around 25 to 30 basis points.
Total expenses were EUR 6,315 million in 2006, up EUR 712 million or 13% on 2005. Organicyear-on-year growth amounted to 8%, resulting in an organic operating leverage of 370 basis points.Operating leverage on a fully consolidated basis was 210 basis points. The full year cost/income ratioimproved by 1.1 percentage point to 61.2%. Excluding acquisitions, the cost/income ratio would have been59.8% in 2006, a 2 percentage point improvement on 2005.
Staff expenses rose 8% to EUR 3,625 million in 2006 compared with EUR 3,370 million in 2005. AEUR 135 million restructuring charge related to the upgrade of the quality of management was taken in2005, while EUR 40 million in early departure costs was posted in the fourth quarter of 2006. Adjustingboth years for these one-off provisions, staff expenses rose by 11% year-on-year partly due to acquisitions.The organic increase was 6% due mainly to the impact of hiring and wage drift, which were partly offsetby exceptional releases in health insurance and pension provisions.
Total Banking FTEs stood at 43,575 at the end of 2006, an increase of 6% compared with year-end2005. Organic hiring, representing about half of year-on-year growth, was made to support more robustcommercial activity at Commercial & Private Banking and Merchant Banking.
144
Level: 6 – From: 6 – Wednesday, May 14, 2008 – 1:37 pm – g5mac4 – 3960 Section 06 : 3960 Section 06

Other operating and administrative expenses were EUR 2,690 million in 2006, 20% higher than in2005. Five percent of this increase is attributable to the integration of acquisitions, putting organic growthat 15%, in line with revenue growth. Other expenses rose chiefly due to investments in technologyinfrastructure, consultancy, growth engines and branding in support of our long-term growth plans.
Taxation. Income tax decreased from EUR 734 million in 2005 to EUR 692 million in 2006, despitethe higher levels of profit, resulting in an effective tax rate of 18% in 2006, 5 percentage points lower thanin 2005. The decrease can be attributed to the structure of the trading results, higher tax exempt gains onshares and tax deductible losses on derivatives, and the establishment of a Treasury center in Belgium. Theequity investment of the Treasury center allowed Fortis to benefit from an interest reduction on Belgiumtaxes payable and resulted in considerable tax savings.
Net profit before results on divestments. Net profit before results on divestments was EUR 3,149million, an increase of 29% or EUR 715 million compared with 2005. This strong performance wasachieved due to the reasons described above with the buoyant commercial activity, higher treasury andfinancial markets results, lower changes in impairments and a lower effective tax rate offset only in part byhigher expenses which rose mainly due to accelerated investments in growth, new hires and theconsolidation of acquisitions.
Banking Balance Sheet
The table below shows information regarding Fortis’s banking balance sheet at the dates indicated.
Year Ended December 31,1111111111111123
2007 2006 20051111 1111 1111
(EUR million, except %)
Due from banks . . . . . . . . . . . . . . . . . . . . . . . . . . . . . . . . . . . . . . . . 118,346 89,413 80,0541111 1111 1111
Due from customersGovernment and official institutions . . . . . . . . . . . . . . . . . . . . . . . . 5,343 5,313 7,781Residential mortgage . . . . . . . . . . . . . . . . . . . . . . . . . . . . . . . . . . . . 95,445 89,322 80,098Consumer loans . . . . . . . . . . . . . . . . . . . . . . . . . . . . . . . . . . . . . . . . . 9,774 10,226 9,431Commercial loans . . . . . . . . . . . . . . . . . . . . . . . . . . . . . . . . . . . . . . . 138,696 110,650 93,646Reverse repurchase agreements . . . . . . . . . . . . . . . . . . . . . . . . . . . . 28,186 37,649 61,074Securities borrowing transactions . . . . . . . . . . . . . . . . . . . . . . . . . . . 24,279 22,091 17,307Other loans and impairments . . . . . . . . . . . . . . . . . . . . . . . . . . . . . . 13,578 10,626 8,525
1111 1111 1111
Total due from customers . . . . . . . . . . . . . . . . . . . . . . . . . . . . . . . . 315,301 285,877 277,8621111 1111 1111
Investments . . . . . . . . . . . . . . . . . . . . . . . . . . . . . . . . . . . . . . . . . . . . 141,392 137,777 135,314Other assets(1) . . . . . . . . . . . . . . . . . . . . . . . . . . . . . . . . . . . . . . . . . . . 192,041 161,591 145,966
1111 1111 1111
Total assets . . . . . . . . . . . . . . . . . . . . . . . . . . . . . . . . . . . . . . . . . . . . 767,080 674,658 639,196Due to banks . . . . . . . . . . . . . . . . . . . . . . . . . . . . . . . . . . . . . . . . . . 192,141 177,161 174,780Due to customersDemand deposits . . . . . . . . . . . . . . . . . . . . . . . . . . . . . . . . . . . . . . . . 87,191 76,127 73,477Saving deposits . . . . . . . . . . . . . . . . . . . . . . . . . . . . . . . . . . . . . . . . . 50,795 55,720 58,051Time deposits . . . . . . . . . . . . . . . . . . . . . . . . . . . . . . . . . . . . . . . . . . 79,245 74,770 60,209Other deposits . . . . . . . . . . . . . . . . . . . . . . . . . . . . . . . . . . . . . . . . . . 301 229 649
1111 1111 1111
Total Deposits . . . . . . . . . . . . . . . . . . . . . . . . . . . . . . . . . . . . . . . . . 217,532 206,846 192,3861111 1111 1111
145
Level: 6 – From: 6 – Wednesday, May 14, 2008 – 1:37 pm – g5mac4 – 3960 Section 06 : 3960 Section 06

Year Ended December 31,1111111111111123
2007 2006 20051111 1111 1111
(EUR million, except %)
Repurchase agreements . . . . . . . . . . . . . . . . . . . . . . . . . . . . . . . . . . . 41,857 48,391 67,364Securities lending . . . . . . . . . . . . . . . . . . . . . . . . . . . . . . . . . . . . . . . 5,425 4,271 2,271Other . . . . . . . . . . . . . . . . . . . . . . . . . . . . . . . . . . . . . . . . . . . . . . . . . 2,350 548 1,264
1111 1111 1111
Total due to customers . . . . . . . . . . . . . . . . . . . . . . . . . . . . . . . . . . 267,164 260,056 263,285Other liabilities(2) . . . . . . . . . . . . . . . . . . . . . . . . . . . . . . . . . . . . . . . . 274,042 220,577 187,948
1111 1111 1111
Total Liabilities . . . . . . . . . . . . . . . . . . . . . . . . . . . . . . . . . . . . . . . . . 733,347 657,794 626,0131111 1111 1111
Shareholders’ equity . . . . . . . . . . . . . . . . . . . . . . . . . . . . . . . . . . . . 33,304 16,666 12,975Minority interests . . . . . . . . . . . . . . . . . . . . . . . . . . . . . . . . . . . . . . . 429 198 208Total equity . . . . . . . . . . . . . . . . . . . . . . . . . . . . . . . . . . . . . . . . . . . . 33,733 16,864 13,183Total liabilities and equity . . . . . . . . . . . . . . . . . . . . . . . . . . . . . . . 767,080 674,658 639,196
1111 1111 1111
Risk-bearing capital(3) . . . . . . . . . . . . . . . . . . . . . . . . . . . . . . . . . . . . 27,231 26,664 22,2101111 1111 1111
Risk-weighted commitments(4) . . . . . . . . . . . . . . . . . . . . . . . . . . . . . 270,207 240,105 212,0951111 1111 1111
Tier 1 ratio(5) . . . . . . . . . . . . . . . . . . . . . . . . . . . . . . . . . . . . . . . . . . . 9.5% 7.1% 7.4%Total capital ratio(5) . . . . . . . . . . . . . . . . . . . . . . . . . . . . . . . . . . . . . . 10.1% 11.1% 10.5%
1111 1111 11111111 1111 1111
(1) Other assets includes Cash and cash equivalents, Assets held for trading, Reinsurance, trade and other receivables, property, plant andequipment, Goodwill and other intangible assets, and accrued interest and other assets.
(2) Other liabilities includes Liabilities held for trading, Debt certificates, Liabilities arising from insurance and investment contracts,Subordinated liabilities, Other borrowings, Provisions, Current and deferred tax liabilities, and Accrued interest and other liabilities.
(3) Calculated in accordance with Belgian GAAP at December 31, 2005 and calculated in accordance with IFRS at December 31, 2007and 2006.
(4) Risk-weighted commitments consist of both off-balance sheet and on-balance sheet credit risk plus market risk associated withtrading activity.
(5) As of January 1, 2006, the basis for calculating the components of capital adequacy ratios is IFRS, whereas prior to this time, thebasis was Belgian GAAP. See “— Liquidity and Capital Resources — Bank Cash Flows — Capital Adequacy” for a discussion ofthe impact on equity as a result of the transition to IFRS.
2007 Compared to 2006
Robust business growth was evidenced by a steady increase in both underlying loan volumes anddeposits. Underlying loan volumes (excluding securities lending and reverse repurchase agreements) roseby 16% in 2007, with commercial loans advancing 25% and residential mortgages 7%. Total customerdeposits were up 5% on the 2006 year-end level. Retail customers continued to shift funds away fromsaving deposits to time deposits, affecting the net margin.
Total assets. Total assets increased by 14% to EUR 767,080 million compared to year-end 2006 dueto an increase in due from banks, due from customers and other assets.
Due from banks. Due from banks increased by 32% or EUR 29 billion in 2007 to EU 118 billion,primarily as a result of higher repurchase agreements (EUR 16 billion), higher securities borrowingtransactions (EUR 3 billion), higher mandatory reserve deposits with central banks (EUR 4 billion) andhigher interest-bearing deposits (EUR 3 billion).
Due from customers. Due to customers increased by 10% or EUR 29 billion to EUR 315 billion in2007 (2006: EUR 286 billion) due to an increase in commercial loans of EUR 27 billion, residentialmortgages of EUR 6 billion and other loans and impairments of EUR 3 billion, offset by a decrease inrepurchase agreements of EUR 9 billion.
Due to banks. Due to banks increased by EUR 15 billion in 2007 to EUR 192 billion. This increasewas due to an increase in deposits of EUR 5 billion, and increases of EUR 8 billion in repurchaseagreements and EUR 8 billion in advances against collateral, offset by lower securities lendingtransactions of EUR 7 billion.
146
Level: 6 – From: 6 – Wednesday, May 14, 2008 – 1:37 pm – g5mac4 – 3960 Section 06 : 3960 Section 06

Due to customers. Due to customers increased by EUR 7 billion to EUR 267 billion in 2007 (2006:EUR 260 billion). The decrease in repurchase agreements of EUR 7 billion was fully offset by increases indeposits of EUR 11 billion. The increase was principally in demand deposits (EUR 87.2 billion in 2007compared to EUR 76.1 billion in 2006) reflecting the shift away from savings deposits.
Risk weighted commitments. Credit risk-weighted commitments amounted to EUR 249 billion in2007, a 12% increase from EUR 222 billion in 2006. This increase was driven by strong volume growth,particularly at Merchant & Private Banking. At EUR 21 billion in 2007, market risk-weightedcommitments increased 13% from EUR 18 billion in 2006. Total risk-weighted commitments were EUR270 billion in 2007, a 13% increase from EUR 240 billion in 2006. Credit risk-weighted commitmentswere strictly controlled during the second half of 2007 which resulted in a 3% decrease compared to theirlevel at the end of the first half, notwithstanding the strong growth in commercial activity. Proactivemeasures were undertaken: undrawn credit commitments were reduced. In addition Merchant & PrivateBanking benefited from EUR 7 billion in relief provided by the conversion of its credit hedge portfoliointo single-name credit default swap protections. Moreover, further impairments on CDO’s also accountedfor the reduction of credit risk-weighted commitments in the fourth quarter.
2006 Compared to 2005
Total assets. Total assets increased by 6% compared to year-end 2006 due to growth in commercialactivities resulting in an increase in loans to customers and amounts due from banks.
Due from banks. Due from banks increased by EUR 9 billion in 2006, primarily as a result ofhigher securities lending transactions (EUR 11 billion), higher mandatory reserve deposits with centralbanks (EUR 2.4 billion) and higher loans and advances (EUR 3.3 billion), partly offset by lower reverserepurchase agreements.
Due from customers. Due from customers increased by 3% to EUR 286 billion in 2006 (2005: EUR278 billion) as a result of an increase in mortgages of 11% to EUR 89 billion and an 18% increase incommercial loans up to EUR 111 billion due to increased commercial activities offset in part by a decreasein reverse repurchase agreements of EUR 23 billion in 2005.
Due to banks. Due to banks increased by only EUR 2.4 billion in 2006 to EUR 177.1 billion. Thissmall increase was due to an increase in deposits from banks (EUR 6.8 billion) and securities borrowing(EUR 7.5 billion), offset by lower repurchase agreements (EUR 11.8 billion).
Due to customers. Due to customers decreased by EUR 3.2 billion to EUR 260 billion in 2006(2005: EUR 263 billion). The decrease in repurchase agreements of EUR 19 billion was not fully offset byincreases in deposits of EUR 14 billion and security lending of EUR 2 billion.
Time deposits increased by EUR 14 billion in 2006. The increase in time deposits was due to marketconditions making time deposits more attractive than saving deposits. Interest rates on short term depositswere higher than the rates on saving accounts due to the flat increase in the interest curve.
Risk weighted commitments. In line with the strong underlying loan volume growth, credit risk-weighted commitments (“CRWCs”) rose to EUR 222 billion at the end of 2006, up 12% on year-end2005. This increase was principally due to an increase in, and composition of, the loan book. Lowweighting repo agreements were replaced by straight loans. Total risk-weighted commitments, includingmarket risk-weighted commitments of EUR 18 billion, were up 13% on 2005, reaching EUR 240 billion atthe end of 2006.
147
Level: 6 – From: 6 – Wednesday, May 14, 2008 – 1:37 pm – g5mac4 – 3960 Section 06 : 3960 Section 06

Assets Under Management
The following table shows assets under management of Fortis at December 31, 2007, 2006 and2005 by segment.
General (Incl. Banking Insurance Eliminations)(1) Total11112 11112 11112 11112
(EUR million)
December 31, 2007Investments for own account:Debt securities . . . . . . . . . . . . . . . . . . . . . . . . . . . . . . . 104,991 53,661 (330) 158,322Equity securities . . . . . . . . . . . . . . . . . . . . . . . . . . . . . 7,822 8,942 (1,259) 15,505Real estate . . . . . . . . . . . . . . . . . . . . . . . . . . . . . . . . . . 688 2,984 (16) 3,656Other . . . . . . . . . . . . . . . . . . . . . . . . . . . . . . . . . . . . . . 27,891 1,143 (237) 28,797
11112 11112 11112 11112
141,392 66,730 (1,842) 206,280Investments related to unit-linked contracts . . . . . . . . – 31,395 (275) 31,120Funds under Management:Debt securities . . . . . . . . . . . . . . . . . . . . . . . . . . . . . . . 119,721 3,061 — 122,782Equity securities . . . . . . . . . . . . . . . . . . . . . . . . . . . . . 102,989 3,767 — 106,756Real estate . . . . . . . . . . . . . . . . . . . . . . . . . . . . . . . . . . 587 2,989 — 3,576Eliminations . . . . . . . . . . . . . . . . . . . . . . . . . . . . . . . . (25,283) — — (25,283)
198,014 9,817 — 207,83111112 11112 11112 11112
Total assets under management . . . . . . . . . . . . . . . . 339,406 107,942 (2,117) 445,23111112 11112 11112 1111211112 11112 11112 11112
December 31, 2006Investments for own account:Debt securities . . . . . . . . . . . . . . . . . . . . . . . . . . . . . . . 131,427 50,554 (669) 181,312Equity securities . . . . . . . . . . . . . . . . . . . . . . . . . . . . . 4,150 10,239 996 15,385Real estate . . . . . . . . . . . . . . . . . . . . . . . . . . . . . . . . . . 600 2,447 — 3,047Other . . . . . . . . . . . . . . . . . . . . . . . . . . . . . . . . . . . . . . 1,600 1,109 19 2,690
11112 11112 11112 11112
137,777 64,349 308 202,434Investments related to unit-linked contracts . . . . . . . . – 28,865 (116) 28,749Funds under Management:Debt securities . . . . . . . . . . . . . . . . . . . . . . . . . . . . . . . 114,386 2,147 — 116,533Equity securities . . . . . . . . . . . . . . . . . . . . . . . . . . . . . 92,705 4,064 — 96,769Real estate . . . . . . . . . . . . . . . . . . . . . . . . . . . . . . . . . . 773 2,801 — 3,574Eliminations . . . . . . . . . . . . . . . . . . . . . . . . . . . . . . . . (26,242) — — (26,242)
181,622 9,012 — 190,63411112 11112 11112 11112
Total assets under management . . . . . . . . . . . . . . . . 319,399 102,226 192 421,81711112 11112 11112 1111211112 11112 11112 11112
148
Level: 6 – From: 6 – Wednesday, May 14, 2008 – 1:37 pm – g5mac4 – 3960 Section 06 : 3960 Section 06

General (Incl. Banking Insurance Eliminations)(1) Total11112 11112 11112 11112
(EUR million)
December 31, 2005Investments for own account:Debt securities . . . . . . . . . . . . . . . . . . . . . . . . . . . . . . . 129,718 46,089 (829) 174,978Equity securities . . . . . . . . . . . . . . . . . . . . . . . . . . . . . 3,393 8,448 817 12,658Real estate . . . . . . . . . . . . . . . . . . . . . . . . . . . . . . . . . . 402 2,144 — 2,546Other . . . . . . . . . . . . . . . . . . . . . . . . . . . . . . . . . . . . . . 1,801 1,110 (24) 2,887
11112 11112 11112 11112
135,314 57,791 (36) 193,069Investments related to unit-linked contracts . . . . . . . . — 25,907 (240) 25,667Funds under Management:Debt securities . . . . . . . . . . . . . . . . . . . . . . . . . . . . . . . 101,727 2,970 — 104,697Equity securities . . . . . . . . . . . . . . . . . . . . . . . . . . . . . 79,812 2,603 — 82,415Real estate . . . . . . . . . . . . . . . . . . . . . . . . . . . . . . . . . . 1,045 1,998 — 3,043Eliminations . . . . . . . . . . . . . . . . . . . . . . . . . . . . . . . . (25,661) — — (25,661)
11112 11112 11112 11112
156,923 7,571 — 164,49411112 11112 11112 11112
Total assets under management . . . . . . . . . . . . . . . . 292,237 91,269 (276) 383,23011112 11112 11112 1111211112 11112 11112 11112
(1) General consists of investments of the General sector (mainly Assurant shares) and eliminations of crossholdings of, among others,insurance companies’ investments in Fortis Bank notes and Fortis shares.
2007 Compared to 2006
Funds under management increased from EUR 191 billion to EUR 208 billion, up 9% comparedwith year-end 2006. Net inflow continued to grow sharply despite adverse market conditions in the thirdand fourth quarters of 2007, reaching EUR 13.9 billion, with Asset Management contributing about 75%to this growth. For the year market gains contributed EUR 5.4 billion to finds under management despitethe negative market impact of the last quarter of 2007. Net inflow also benefited from acquisitions in Asiain Asset Management.
2006 Compared to 2005
Assets under management increased by 10% from EUR 383 billion at December 31, 2005 to EUR422 billion at December 31, 2006. Investments for own account (up EUR 9 billion), investments related tounit-linked contracts (up EUR 3 billion) and funds under management (up EUR 26 billion) contributed tothe increase. Funds under management ended the year at EUR 191 billion, 16% higher compared withyear-end 2005. Net inflow hit a record EUR 18 billion for the year, EUR 7 billion of which wasattributable to Private Banking and EUR 11 billion at Fortis Investments. Growth at Private Banking wasdue chiefly to network expansion and effective cross-selling to Commercial Banking and Trust customers.Fortis Investments’ substantial net inflows were the result of its strong focus on the diversification ofdistribution channels, with major successes among external institutional customers in countries like Italy,Spain, France and Germany.
149
Level: 6 – From: 6 – Wednesday, May 14, 2008 – 1:37 pm – g5mac4 – 3960 Section 06 : 3960 Section 06

Funds Under Management by Roll Forward
The table below gives the roll forward of the Funds Under Management per segment fromDecember 31, 2006 to December 31, 2007.
Merchant & Retail Private
Banking Banking Other(1) Intercompany Total1111 1111 1111 1111 1111
(EUR million)
Balance at December 31, 2006 . . . . . . . 128,106 79,246 9,524 (26,242) 190,6341111 1111 1111 1111 1111
In/out flow . . . . . . . . . . . . . . . . . . . . . . . 9,564 2,740 434 1,178 13,916Market gains / losses . . . . . . . . . . . . . . . 2,649 2,687 240 (237) 5,339Other(2) . . . . . . . . . . . . . . . . . . . . . . . . . . – (2,076) – 18 (2,058)
1111 1111 1111 1111 1111
Balance at December 31, 2007 . . . . . . . 140,319 82,597- 10,198 (25,283) 207,8311111 1111 1111 1111 1111
(1) Other includes funds under management within the insurance segments as well as funds managed by operating companies reportedin the “Other Banking” segment.
(2) Other includes the transfers between segments, the impact of acquisitions and divestments and the currency translation differences.
Net Interest Income
The change in total net interest income in 2007 and 2006 can be allocated as follows by the averagerate and volume effects:
Year Ended December 31,111111111344
2007 20061111 1111
(EUR million)
Change due to changes in average rates . . . . . . . . . . . . . . . . . . . . . . . . . . . . . . . . . (1,828) (2,038)Change due to changes in average balances . . . . . . . . . . . . . . . . . . . . . . . . . . . . . 2,105 2,274Change due to other interest on balance . . . . . . . . . . . . . . . . . . . . . . . . . . . . . . . . (96) 198
1111 1111
Change in total net interest income . . . . . . . . . . . . . . . . . . . . . . . . . . . . . . . . . . . . 181 4341111 1111
The following table sets forth certain information concerning the gross yield and the interest spreadfor Fortis’s banking operations for the years indicated, including other interest on balance (mainly fromhedging transactions via derivatives). Interest margin is presented for the bank as a whole due to certainintra-bank loans being funded by Merchant Banking with funds borrowed from external sources wherebythe liabilities for Merchant Banking are not offset by interest income which is eliminated on such intra-company loans. The interest figures in the following table do not include interest related to non-accrualloans, the portion of interest that is not recognized on partially non-accruing loans or lending commissionsincome. Net interest income is not calculated on a tax-equivalent basis.
150
Level: 6 – From: 6 – Wednesday, May 14, 2008 – 1:37 pm – g5mac4 – 3960 Section 06 : 3960 Section 06

Year Ended December 31,1111111111111123
2007 2006 20051111 1111 1111
Gross Yield(1):Retail banking . . . . . . . . . . . . . . . . . . . . . . . . . . . . . . . . . . . . . . . . . . 5.6% 5.4% 5.3%Merchant banking . . . . . . . . . . . . . . . . . . . . . . . . . . . . . . . . . . . . . . . 5.0% 5.2% 3.8%Commercial & Private banking . . . . . . . . . . . . . . . . . . . . . . . . . . . . 5.9% 4.7% 4.2%Other banking . . . . . . . . . . . . . . . . . . . . . . . . . . . . . . . . . . . . . . . . . . 4.5% 4.6% 4.6%Total . . . . . . . . . . . . . . . . . . . . . . . . . . . . . . . . . . . . . . . . . . . . . . . . . 5.7% 5.0% 4.2%Interest Spread(2): . . . . . . . . . . . . . . . . . . . . . . . . . . . . . . . . . . . . . .Retail banking . . . . . . . . . . . . . . . . . . . . . . . . . . . . . . . . . . . . . . . . . . 3.1% 3.3% 3.4%Merchant banking . . . . . . . . . . . . . . . . . . . . . . . . . . . . . . . . . . . . . . . 0% 0.7% 0.5%Commercial & Private banking . . . . . . . . . . . . . . . . . . . . . . . . . . . . 0% 2.1% 2.2%Other banking . . . . . . . . . . . . . . . . . . . . . . . . . . . . . . . . . . . . . . . . . . 0% 0.6% 0.5%Total . . . . . . . . . . . . . . . . . . . . . . . . . . . . . . . . . . . . . . . . . . . . . . . . . 1.0% 1.2% 1.2%Interest Margin(3): . . . . . . . . . . . . . . . . . . . . . . . . . . . . . . . . . . . . . .Total Banking . . . . . . . . . . . . . . . . . . . . . . . . . . . . . . . . . . . . . . . . . . 3.1% 1.1% 1.1%
(1) Gross Yield is the average return on the interest bearing assets.
(2) “Interest spread” is the difference between the average interest rate earned on “average interest-earning assets” and the averageinterest rate paid on “average interest-bearing liabilities”. See “Selected Statistical Information — Average Balance Sheets andInterest Rates”.
(3) “Interest margin” is “net interest income” as a percentage of “average interest-earning assets”.
Retail Banking
The following table sets forth selected income statement data for the Retail Banking segment for theperiods indicated.
Year Ended December 31, 2007 vs. 20061111211111344 11112
2007 2006 Change11112 11112 11112
(EUR million)
Income StatementNet interest income . . . . . . . . . . . . . . . . . . . . . . . . . . . . . . . . . . . . . . 2,687 2,675 0%Net commissions and fees . . . . . . . . . . . . . . . . . . . . . . . . . . . . . . . . 1,533 1,362 13%Realized capital gains (losses) . . . . . . . . . . . . . . . . . . . . . . . . . . . . . 64 10 —(Un)realized gains (losses) . . . . . . . . . . . . . . . . . . . . . . . . . . . . . . . . 60 45 33%Dividend and other investment income . . . . . . . . . . . . . . . . . . . . . . 18 18 0%Other income . . . . . . . . . . . . . . . . . . . . . . . . . . . . . . . . . . . . . . . . . . . 502 670 (25)%
11112 11112
Total revenues . . . . . . . . . . . . . . . . . . . . . . . . . . . . . . . . . . . . . . . . . 4,864 4,780 2%11112 11112
Change in provisions for impairment . . . . . . . . . . . . . . . . . . . . . . . . (151) (150) 1%Net revenues . . . . . . . . . . . . . . . . . . . . . . . . . . . . . . . . . . . . . . . . . . . 4,713 4,630 2%Staff expenses . . . . . . . . . . . . . . . . . . . . . . . . . . . . . . . . . . . . . . . . . . (1,320) (1,249) 6%Other operating and administrative expenses . . . . . . . . . . . . . . . . . . (596) (528) 13%Allocated expenses(1) . . . . . . . . . . . . . . . . . . . . . . . . . . . . . . . . . . . . . (1,343) (1,382) (3)%
11112 11112
Total expenses . . . . . . . . . . . . . . . . . . . . . . . . . . . . . . . . . . . . . . . . . (3,259) (3,159) 3%11112 11112
Profit before income tax . . . . . . . . . . . . . . . . . . . . . . . . . . . . . . . . . 1,454 1,471 (1)%Income tax . . . . . . . . . . . . . . . . . . . . . . . . . . . . . . . . . . . . . . . . . . . . . (344) (395) (13)%
11112 11112
Net profit before minority interests . . . . . . . . . . . . . . . . . . . . . . . . . 1,110 1,076 3%11112 11112
Minority interests . . . . . . . . . . . . . . . . . . . . . . . . . . . . . . . . . . . . . . . — — —Net profit . . . . . . . . . . . . . . . . . . . . . . . . . . . . . . . . . . . . . . . . . . . . . 1,110 1,076 3%
(1) The expenses from shared services are recorded in Other banking and allocated to the banking segments.
151
Level: 6 – From: 6 – Wednesday, May 14, 2008 – 1:37 pm – g5mac4 – 3960 Section 06 : 3960 Section 06

Activity-based
Year Ended December 31, 2007 vs. 20061111211111344 11112
2007 2006 Change11112 11112 11112
(unaudited)(EUR million)
Net interest income on interest-margin products . . . . . . . . . . . . . . . 2,687 2,675 0%Capital gains on investment portfolio . . . . . . . . . . . . . . . . . . . . . . . . 64 10 8Treasury and financial markets . . . . . . . . . . . . . . . . . . . . . . . . . . . . . 60 45 33%Total . . . . . . . . . . . . . . . . . . . . . . . . . . . . . . . . . . . . . . . . . . . . . . . . . 2,811 2,730 3%
Since the restatement from accounting view to activity based view primarily relates to a differentpresentation of trading activities, the restatement does not impact the income statement of Retail Bankingand Commercial & Private Banking because Retail Banking and Commercial & Private Banking do nothave trading activities.
Retail Banking Key Performance Indicators
Year Ended December 31,111111111344
2007 20061111 1111
Cost/Income ratio . . . . . . . . . . . . . . . . . . . . . . . . . . . . . . . . . . . . . . . . . . . . . . . . . . 67.0% 66.1%Operating leverage(1) . . . . . . . . . . . . . . . . . . . . . . . . . . . . . . . . . . . . . . . . . . . . . . . . (1.4)% –%— # of FTEs . . . . . . . . . . . . . . . . . . . . . . . . . . . . . . . . . . . . . . . . . . . . . . . . . . . . . . 19,239 17,029— Belgium . . . . . . . . . . . . . . . . . . . . . . . . . . . . . . . . . . . . . . . . . . . . . . . . . . . . . . . 9,361 9,401— Rest of the world . . . . . . . . . . . . . . . . . . . . . . . . . . . . . . . . . . . . . . . . . . . . . . . . 6,158 5,434— Consumer Finance & Mass Retail . . . . . . . . . . . . . . . . . . . . . . . . . . . . . . . . . . 2,483 1,205— Support . . . . . . . . . . . . . . . . . . . . . . . . . . . . . . . . . . . . . . . . . . . . . . . . . . . . . . . 253 190— Asset Management . . . . . . . . . . . . . . . . . . . . . . . . . . . . . . . . . . . . . . . . . . . . . . 984 799Funds under management (in EUR billions) . . . . . . . . . . . . . . . . . . . . . . . . . . . . . 140 128
(1) Operating leverage is defined as the difference in the percentage growth in total revenues, prior to changes in provisions, and in totalexpenses. Operating leverage in 2006 has not been calculated because the numbers for 2005 have not been restated.
As a result of the reorganization in 2007 Retail Banking was divided into two sub-segments: RetailBanking Network and Retail Banking Asset Management. In connection with the reorganization Fortisrestated its financial data for 2006 but not 2005. The following discussion, therefore, discusses RetailBanking Network and Retail Banking Asset Management for 2007 compared to 2006 and then RetailBanking as a whole for 2006 and 2005.
2007 Compared to 2006
Revenues. Total income at Retail Banking was EUR 4,864 million, a 2% increase from EUR 4,780million in 2006 mainly due to the 13% increase in net commissions and fees, the significant increase inrealized capital gains (losses) and the 26% increase in (un)realized gains and losses, partly offset by adecrease in other income of 25%. Including Fortis Banque France, net interest income was stable at EUR2,675 million in 2006 and EUR 2,687 million in 2007. Excluding Fortis Banque France the increase in netinterest income was due to the growth of retail activities in Turkey and overall growth at ConsumerFinance.
152
Level: 6 – From: 6 – Wednesday, May 14, 2008 – 1:37 pm – g5mac4 – 3960 Section 06 : 3960 Section 06

Retail Banking Network
Year Ended December 31, 2007 vs. 20061111211111344 11112
2007 2006 Change11112 11112 11112
(EUR million)
Income StatementNet interest income . . . . . . . . . . . . . . . . . . . . . . . . . . . . . . . . . . . . . . 2,697 2,675 1%Net commissions and fees . . . . . . . . . . . . . . . . . . . . . . . . . . . . . . . . 1,097 1,016 8%Realized capital gains (losses) . . . . . . . . . . . . . . . . . . . . . . . . . . . . . 64 10 —(Un)realized gains (losses) . . . . . . . . . . . . . . . . . . . . . . . . . . . . . . . . 49 39 26%Dividend and other investment income . . . . . . . . . . . . . . . . . . . . . . 8 15 (88)%Other income . . . . . . . . . . . . . . . . . . . . . . . . . . . . . . . . . . . . . . . . . . . 497 664 (25)
11112 11112
Total revenues . . . . . . . . . . . . . . . . . . . . . . . . . . . . . . . . . . . . . . . . . 4,412 4,419 0%11112 11112
Change in provisions for impairment . . . . . . . . . . . . . . . . . . . . . . . . (142) (151) (6)%Net revenues . . . . . . . . . . . . . . . . . . . . . . . . . . . . . . . . . . . . . . . . . . . 4,270 4,268 0%Staff expenses . . . . . . . . . . . . . . . . . . . . . . . . . . . . . . . . . . . . . . . . . . (1,146) (1,107 4%Other operating and administrative expenses . . . . . . . . . . . . . . . . . . (482) (441) 9%Allocated expenses(1) . . . . . . . . . . . . . . . . . . . . . . . . . . . . . . . . . . . . . (1,331) (1,371) (3)%
11112 11112
Total expenses . . . . . . . . . . . . . . . . . . . . . . . . . . . . . . . . . . . . . . . . . (2,959) (2,919) (1)%11112 11112
Profit before income tax . . . . . . . . . . . . . . . . . . . . . . . . . . . . . . . . . 1,311 1,349 (3)%Income tax . . . . . . . . . . . . . . . . . . . . . . . . . . . . . . . . . . . . . . . . . . . . . (309) (362) (15)%
11112 11112
Net profit before minority interests . . . . . . . . . . . . . . . . . . . . . . . . . 1,002 987 2%11112 11112
Minority interests . . . . . . . . . . . . . . . . . . . . . . . . . . . . . . . . . . . . . . . — — —Net profit . . . . . . . . . . . . . . . . . . . . . . . . . . . . . . . . . . . . . . . . . . . . . 1,002 987 2%
(1) The expenses from shared services are recorded in Other banking and allocated to the banking segments.
Activity-based
Year Ended December 31, 2007 vs. 20061111211111344 11112
2007 2006 Change11112 11112 11112
(unaudited)(EUR million)
Net interest income on interest-margin products . . . . . . . . . . . . . . . 2,697 2,675 1%Capital gains on investment portfolio . . . . . . . . . . . . . . . . . . . . . . . . 64 10 —Treasury and financial markets . . . . . . . . . . . . . . . . . . . . . . . . . . . . . 49 39 26%Total . . . . . . . . . . . . . . . . . . . . . . . . . . . . . . . . . . . . . . . . . . . . . . . . . 2,810 2,724 3%
2007 Compared to 2006
Revenues. Retail Banking Network’s total revenues were essentially flat when comparing 2007(EUR 4,412 million) and 2006 (EUR 4,419 million). The increase in net commissions and fees (up EUR81 million or 8% in 2007 to EUR 1,097 million compared to EUR 1,016 million in 2006), higher netinterest income (up EUR 22 million in 2007 to EUR 2,697 million in 2007 compared to EUR 2,675million in 2006) and higher capital gains (up EUR 54 million in 2007 to EUR 64 million compared toEUR 10 million in 2006) were partly offset by lower allocated income from Assets & LiabilitiesManagement (ALM) (down EUR 187 million in “other income”). Expenses in the Benelux countriesremained virtually static. The 5% increase in total expenses was essentially linked to continued investmentin growth engines outside the Benelux countries, particularly in Turkey, Poland, Germany and Ireland.
Profit before income tax. The change in impairments at Retail Banking Network was EUR 142million in 2007, a decrease of EUR 9 million from EUR 151 million in 2006. The change in impairments
153
Level: 6 – From: 6 – Wednesday, May 14, 2008 – 1:37 pm – g5mac4 – 3960 Section 06 : 3960 Section 06

remained in line with growth in the credit portfolio, which is an illustration of the overall good creditquality.
Total expenses at Retail Banking Network increased 1% or EUR 40 million to EUR 2,959 millionin 2007 from EUR 2,919 million in 2006. Costs in Belgium remained virtually stable (up 1% in 2007),benefiting from further efficiency improvements. The increase in total expenses related to continuedinvestments in our distribution networks in Germany, Turkey and Poland aimed at achieving a broadlybased presence in those countries. In 2007, 82 new credit shops were opened in Germany and 41 brancheswere added in Turkey; while the inclusion of Dominet added 185 branches and 77 other sales points inPoland.
Staff expenses increased 4% or EUR 39 million to EUR 1,146 million in 2007 compared with EUR1,107 million in 2006. The increase reflects a 17% increase in the total number of FTEs to 18,255 in 2007compared with 18,025 in 2006. In the Benelux, Markets continued efforts to improve efficiency, mainly insupport functions, contributing to a 2% decrease in FTEs. Expansion in the growth markets, however, wasaccompanied by an increase in FTEs. In Turkey the headcount increased by 1,404 FTEs, including a shiftof 890 FTEs from central support departments to Retail Banking. Poland added 1,064 FTEs mainly due toDominet, while Germany hired 276 new FTEs.
Other operating and administrative expenses increased by EUR 41 million to EUR 482 million in2007 from EUR 441 million in 2006. The increase was mainly due to the rollout of the credit shopnetwork in Germany and the related marketing campaigns, the continued expansion of the Turkish branchnetwork and the inclusion of Dominet. Allocated expenses at EUR 1,331 million were 3% higher than2006, which was consistent with the overall rise in central expenses to support growth, particularly at IT &Operations and Facility & Purchasing.
Net profit. Retail Banking Network’s net profit was EUR 1,002 million in 2007 compared with EUR987 million in 2006 due to a strong commercial performance in the Benelux countries combined withvirtually stable operating costs and further expansion of growth engines.
Customer deposits increased by almost EUR 4 billion or 4% to EUR 93 billion in 2007 from EUR89 billion in 2006. Given relatively high short term interest rates, customers shifted from traditionalsavings deposits to time deposits. Globally, time deposits at Retail Banking increased by EUR 8.8 billionin 2007, which more than compensated for the outflow of EUR 4.4 million from savings deposits. InBelgium, total deposits increased by 2% or EUR 1.1 billion, attributable to a very successful customerretention policy. Underlying this growth, time deposits increased by 21% while saving deposits decreasedby 11%. In addition, Retail Bank Belgium posted net intake of EUR 2 billion in other financial productssuch as life insurance and investment funds. This was due to increased demand for products with aminimum guaranteed return in response to the more volatile market environment. Commercial campaignsin The Netherlands led to a substantial increase in one-year time deposits, resulting in 6% growth in totaldeposits.
Loans to customers increased 9% to EUR 85 billion in 2007 from EUR 78 million in 2006. Theincrease was attributable to growth in residential mortgages in Belgium (up EUR 2 billion in 2007) andThe Netherlands (up EUR 3 billion in 2007), an increase in commercial loans in Belgium (up EUR 0.8billion in 2007) and an increase in consumer loans at Consumer Finance (up EUR 0.9 billion in 2007).
Capital gains increased by EUR 54 million from EUR 10 million in 2006 to EUR 64 million in2007 (activity based). A joint venture between Alpha Credit, a Fortis Consumer Finance company, andEOS was announced in November 2007. EOS acquired 50% of the credit collection activity of Aremas,which resulted in a capital gain of EUR 48 million for Consumer Finance in 2007.
154
Level: 6 – From: 6 – Wednesday, May 14, 2008 – 1:37 pm – g5mac4 – 3960 Section 06 : 3960 Section 06
Retail Banking Asset Management
Year Ended December 31, 2007 vs. 20061111211111344
2007 2006 Change11112 11112 11112
(EUR million)
Income StatementNet interest income . . . . . . . . . . . . . . . . . . . . . . . . . . . . . . . . . . . . . . (10) — —Net commissions and fees . . . . . . . . . . . . . . . . . . . . . . . . . . . . . . . . 436 346 26%Realized capital gains (losses) . . . . . . . . . . . . . . . . . . . . . . . . . . . . . — — —(Un)realized gains (losses) . . . . . . . . . . . . . . . . . . . . . . . . . . . . . . . . 11 6 83%Dividend and other investment income . . . . . . . . . . . . . . . . . . . . . . 10 3 —Other income . . . . . . . . . . . . . . . . . . . . . . . . . . . . . . . . . . . . . . . . . . . 5 6 (17)%
11112 11112 11112
Total revenues . . . . . . . . . . . . . . . . . . . . . . . . . . . . . . . . . . . . . . . . . 452 361 25%11112 11112 11112
Change in provisions for impairment . . . . . . . . . . . . . . . . . . . . . . . . (9) 1 —Net revenues . . . . . . . . . . . . . . . . . . . . . . . . . . . . . . . . . . . . . . . . . . . 443 362 22%Staff expenses . . . . . . . . . . . . . . . . . . . . . . . . . . . . . . . . . . . . . . . . . . (174) (142) 23%Other operating and administrative expenses . . . . . . . . . . . . . . . . . . (114) (87) 31%Allocated expenses(1) . . . . . . . . . . . . . . . . . . . . . . . . . . . . . . . . . . . . . (12) (11) 9%
11112 11112 11112
Total expenses . . . . . . . . . . . . . . . . . . . . . . . . . . . . . . . . . . . . . . . . . (300) (240) 25%11112 11112 11112
Profit before income tax . . . . . . . . . . . . . . . . . . . . . . . . . . . . . . . . . 143 122 17%Income tax . . . . . . . . . . . . . . . . . . . . . . . . . . . . . . . . . . . . . . . . . . . . . (35) (33) 6%
11112 11112 11112
Net profit before minority interests . . . . . . . . . . . . . . . . . . . . . . . . . 108 89 21%11112 11112 11112
Minority interests . . . . . . . . . . . . . . . . . . . . . . . . . . . . . . . . . . . . . . . — — —Net profit . . . . . . . . . . . . . . . . . . . . . . . . . . . . . . . . . . . . . . . . . . . . . 108 89 21%
(1) The expenses from shared services are recorded in Other banking and allocated to the banking segments.
Activity-based
Year Ended December 31, 2007 vs. 20061111211111344
2007 2006 Change11112 11112 11112
(unaudited)(EUR million)
Net interest income on interest-margin products . . . . . . . . . . . . . . . (10) — —Capital gains on investment portfolio . . . . . . . . . . . . . . . . . . . . . . . . — — —Treasury and financial markets . . . . . . . . . . . . . . . . . . . . . . . . . . . . . 11 6 83%Total . . . . . . . . . . . . . . . . . . . . . . . . . . . . . . . . . . . . . . . . . . . . . . . . . 1 6 (83)%
2007 Compared to 2006
Fortis Investments had net inflow of EUR 9.6 billion in 2007 compared with EUR 9.9 billion in2006. The net inflow resulted from an outflow resulting from the offset by global market turmoil, drivenby Chinese equities and absolute return products across all of the key geographies, offset by inflows due tothe integration of the investment trust activities of Commerzbank in Japan and the management of theinvestments of Fortis Insurance Company (Asia) Limited (“FICA”) following Fortis’s acquisition ofPacific Century Insurance Holding. As a result, assets under management at December 31, 2007 wereEUR 133 billion, a 10% increase compared with 2006. This sustained performance was due to strong salesfigures during 2007 and illustrates Fortis Investments’ highly diversified distribution platform and productsolutions. Net commissions and fees increased by 26% to EUR 436 million in 2007 from EUR 346 millionin 2006.
Fortis Investments is active in both the CDO and CLO markets and manages around EUR 9 billionin third-party closed-end funds. In 2007, its corporate CDO business saw no defaults, no transactions were
155
Level: 6 – From: 6 – Wednesday, May 14, 2008 – 1:37 pm – g5mac4 – 3960 Section 06 : 3960 Section 06

placed on negative watch and no deals were downgraded. Fortis Investments ABS CDO’s were, however,impacted by the subprime crisis, although these CDO’s still outperformed the market. Conservativeimpairments have been made, in strict compliance with internal group policy.
Fortis Investments has almost entirely impaired its investments in the equity stakes (i.e., a EUR 9million impairment) in the CDOs it manages invested in the subprime mortgage market. Fund performancewas impacted by the market turbulence in the second half of 2007, with funds registering abovebenchmark performance, declining to 54% on a one-year horizon and 71% on a three-year horizon,respectively.
At the end of January 2008, Fortis received permission from the Dutch central bank (DNB)concerning the proposed demerger of ABN AMRO Asset Management (“AAAM”) from ABN AMRObank. The demerger was completed on April 1, 2008.
Expenses at Fortis Investments were 25% higher than in 2006, reflecting continued investments inIT and staff in line with Fortis Investments’ growth plans for the next five years. Staff expenses increased23% in 2007 compared with 2006, reflecting the significant increase in headcount and higher performancerelated compensation. Other expenses also increased, primarily due to IT-related investments.
Retail Banking
The following table sets forth selected income statement data for the Retail Banking segment asreported for 2006 and 2005.
Year Ended December 31, 2006 vs. 20051111211111344 11112
2006 2005 Change11112 11112 11112
(EUR million)
Income StatementNet interest income . . . . . . . . . . . . . . . . . . . . . . . . . . . . . . . . . . . . . . 2,647 2,467 7%Net commissions and fees . . . . . . . . . . . . . . . . . . . . . . . . . . . . . . . . 1,362 1,092 25%Realized capital gains (losses) . . . . . . . . . . . . . . . . . . . . . . . . . . . . . 11 63 (83)%(Un)realized gains (losses) . . . . . . . . . . . . . . . . . . . . . . . . . . . . . . . . 44 43 2%Dividend and other investment income . . . . . . . . . . . . . . . . . . . . . . 18 16 13%Other income . . . . . . . . . . . . . . . . . . . . . . . . . . . . . . . . . . . . . . . . . . . 724 513 41%
11112 11112 11112
Total revenues . . . . . . . . . . . . . . . . . . . . . . . . . . . . . . . . . . . . . . . . . 4,806 4,194 15%11112 11112 11112
Change in provisions for impairment . . . . . . . . . . . . . . . . . . . . . . . . (150) (130) 15%Net revenues . . . . . . . . . . . . . . . . . . . . . . . . . . . . . . . . . . . . . . . . . . . 4,656 4,064 15%Staff expenses . . . . . . . . . . . . . . . . . . . . . . . . . . . . . . . . . . . . . . . . . . (1,249) (1,111) 12%Other operating and administrative expenses . . . . . . . . . . . . . . . . . . (523) (385) 36%Allocated expenses(1) . . . . . . . . . . . . . . . . . . . . . . . . . . . . . . . . . . . . (1,370) (1,262) 9%
11112 11112 11112
Total expenses . . . . . . . . . . . . . . . . . . . . . . . . . . . . . . . . . . . . . . . . . (3,142) (2,758) 14%11112 11112 11112
Profit before income tax . . . . . . . . . . . . . . . . . . . . . . . . . . . . . . . . . 1,514 1,306 16%Income tax . . . . . . . . . . . . . . . . . . . . . . . . . . . . . . . . . . . . . . . . . . . . . (424) (444) (5)%
11112 11112 11112
Net profit before minority interests . . . . . . . . . . . . . . . . . . . . . . . . . 1,090 862 26%11112 11112 11112
Minority interests . . . . . . . . . . . . . . . . . . . . . . . . . . . . . . . . . . . . . . . — — —Net profit . . . . . . . . . . . . . . . . . . . . . . . . . . . . . . . . . . . . . . . . . . . . . 1,090 862 26%
(1) The expenses from shared services are recorded in Other banking and allocated to the banking segments.
156
Level: 6 – From: 6 – Wednesday, May 14, 2008 – 1:37 pm – g5mac4 – 3960 Section 06 : 3960 Section 06

Activity-based
Year Ended December 31, 2006 vs. 20051111211111344 11112
2006 2005 Change11112 11112 11112
(EUR million)
Net interest income on interest-margin products . . . . . . . . . . . . . . . 2,647 2,467 7%Capital gains on investment portfolio . . . . . . . . . . . . . . . . . . . . . . . . 11 63 (83)%Treasury and financial markets . . . . . . . . . . . . . . . . . . . . . . . . . . . . . 44 43 2%Total . . . . . . . . . . . . . . . . . . . . . . . . . . . . . . . . . . . . . . . . . . . . . . . . . 2,702 2,573 5%
Retail Banking Key Performance Indicators
Year Ended December 31,111111111344
2006 20051111 1111
Cost/Income ratio . . . . . . . . . . . . . . . . . . . . . . . . . . . . . . . . . . . . . . . . . . . . . . . . . . 65.4% 65.8%Operating leverage(1) . . . . . . . . . . . . . . . . . . . . . . . . . . . . . . . . . . . . . . . . . . . . . . . . 0.7% 19.5%
(1) Operating leverage is defined as the difference in the percentage growth in total revenues, prior to changes in provisions, and in totalexpenses.
2006 Compared to 2005
Revenues. Total revenues increased 15% to EUR 4,806 million in 2006 compared with EUR 4,194million in 2005, due principally to higher net commissions and fees and an increased allocation of ALMresults income as well as a 7% increase in net interest income. Net interest income and net commissionand fees represented 83% of total revenues in 2006 compared to 85% of total revenues in 2005.
Net interest income for 2006 increased 7% to EUR 2,647 million in 2006 compared to EUR 2,467million in 2005, primarily due to acquisitions. Excluding the EUR 170 million impact of the consolidationof Consumer Finance Germany and Retail Bank Turkey, net interest income remained stable as marginpressure in the Benelux was largely offset by volume growth.
Customer deposits for total Retail Banking grew to EUR 91.2 billion, up EUR 6.3 billion or 7%from year-end 2005, with more than half of the rise realized in Belgium. Saving deposits became lessattractive as a result of flattening yield curves, making short-term deposits with interest rates equal orhigher then saving accounts more appealing. In addition, the continuous shift from savings depositstowards off-balance sheet products (investment funds) during the last 2 quarters of 2006 resulted in a slightdecrease in the overall balance. Retail Banking Belgium posted a net intake of EUR 3.3 billion for 2006 intotal deposits, mainly due to the success of time deposits (up EUR 3.1 billion), while at the same timerecording EUR 1.6 billion inflow into off-balance products.
The mortgage portfolio grew EUR 7.4 billion (plus 15%) to EUR 56.7 billion in 2006. The bulk ofthe increase (upwards of EUR 4 billion) was attributable to mortgages in The Netherlands, which grewstrongly especially in the first half of the year. In the last few months of the year, Retail Banking opted topursue disciplined growth due to increasing margin pressure. Belgium contributed EUR 2.1 billion to theincrease in the mortgage portfolio. After continuous margin pressure since the start of 2006, RetailBanking Belgium repriced its mortgage rates in Belgium during the month of September in order tostabilize and improve the margins while at the same time protecting its market share. The yield on the loanportfolio increased by 10 basis points; however the funding costs of Retail Banking increased by 30 basispoints, reducing the interest spread during 2006 in Retail Banking from 3.4% in 2005 to 3.3% in 2006.The increase in volumes (Loans to customers +16%, Due to customers +8%) more then compensated forthe lower interest spread.
Net commissions and fees rose 25% to EUR 1,362 million in 2006 compared with EUR 1,092million in 2005. Excluding acquisitions, the increase was 19% above the 2005 level. The steep rise can beattributed to higher asset management fees in the Belgian distribution network, the strong performance ofFortis Investments (contributing EUR 93 million to the increase) and to the EUR 83 million result-related
157
Level: 6 – From: 6 – Wednesday, May 14, 2008 – 1:37 pm – g5mac4 – 3960 Section 06 : 3960 Section 06

commission payment on insurance sales received from Fortis Insurance Belgium due to the transfer of FBInsurance to Fortis Insurance Belgium during 2006.
Fortis Investments had a very strong year, posting net profit of EUR 87 million in 2006, 64% higherthan in 2005. Funds under management increased 15% year-on-year, to EUR 121 billion at the end of2006. The increase in funds under management was due to Fortis Investment’s continued expansion andenhancement of its investment and distribution capabilities in 2006. Significant investments in IT and staffwere made towards the end of the year to support its growth strategy. In addition to setting up a new jointventure with CIT Finance in Russia, Fortis Investments acquired 70% of Cadogan Management LLC andcombined its respective fund of hedge funds activities, as it sees strong demand across the customer basefor this type of product.
Other income, which includes rental income, allocated income from ALM and miscellaneous otheritems increased 41% to EUR 724 million in 2006 compared with EUR 513 million in 2005, dueprincipally to higher ALM results. These higher results were primarily due to higher capital gains on saleof equity holdings in Euronext, Banksys and Arcelor.
Profit before income tax. The change in provisions for impairments was 15% or EUR 20 millionhigher than in 2005, largely due to the acquisitions made in Turkey and Germany and a change in themethod used to compute the IBNR for SME business in accordance with Basel II guidelines. Underlyingcredit provisioning remained low at 21 basis points.
The growth plans both in the core Benelux market and on a European scale impacted costs in theretail bank. Total expenses in 2006 were 14% higher than in 2005 increasing to EUR 3,142 million fromEUR 2,758 million in 2005. Scope changes account for 50% of the EUR 138 million increase (+12%) instaff expenses (EUR 1,249 million in 2006 and EUR 1,111 million in 2005), with the balance made up byFTE transfers in Belgium and The Netherlands, higher staff costs at Fortis Investments due to new hiringand higher bonuses, only partly offset by a reversal of provisions in Belgium and The Netherlands.
Other operating and administrative expenses increased 36% to EUR 523 million in 2006, up EUR138 million, or 17% excluding scope changes, reflecting investments in Consumer Finance, highermarketing costs in The Netherlands, and higher one-off expenses at Fortis Investments. Allocated expensesrose 9% to EUR 1,370 million in 2006 from EUR 1,262 million in 2005, mainly due to higher ITinvestments.
At the end of 2006 the number of FTEs stood at 17,030, a 20% increase on year end 2005. Includedin this increase of some 2,844 FTEs is the effect of the transfers of Fortis Bank Turkey from OtherBanking to the respective business lines of approximately 1,600 FTEs, with respect to the acquisition ofVon Essen bank, 500 FTEs and the transfer of people from Central credit risk to the business line.
Net profit. Net profit passed the EUR 1 billion mark, improving to EUR 1,090 million for 2006, up26% on 2005. This rise was due to the 15% income growth attributable to higher net commissions andfees, increased ALM income and a lower tax rate. The increase of 14% in total expenses, translated into a65 basis-point operating leverage for 2006, despite heavy investments in growth. Excluding theconsolidation of Consumer Finance Germany and Retail Bank Turkey (acquired beginning Q3 2005), totalincome growth (+11%) significantly outpaced cost growth (+6%), which was reflected in a 570 basis-pointorganic operating leverage. The cost/income ratio remained relatively stable improving to 65.4% in 2006compared to 65.8% in 2005.
Merchant & Private Banking
Merchant & Private Banking encompasses a wide range of banking products and skill-orientedfinancial services for large international companies and institutional clients, medium-sized enterprises andentrepreneurs, and private banking clients. Merchant & Private Banking was organized according to aClients-Skills structure in 2007.
The following table sets forth selected income statement data for the Merchant & Private Bankingsegment for the periods indicated.
158
Level: 6 – From: 6 – Wednesday, May 14, 2008 – 1:37 pm – g5mac4 – 3960 Section 06 : 3960 Section 06

Year Ended December 31, 2007 vs. 20061111211111344
2007 2006 Change11112 11112 11112
(EUR million)
Income StatementNet interest income . . . . . . . . . . . . . . . . . . . . . . . . . . . . . . . . . . . . . . 2,618 2,139 22%Net commissions and fees . . . . . . . . . . . . . . . . . . . . . . . . . . . . . . . . 1,555 1,411 10%Realized capital gains (losses) . . . . . . . . . . . . . . . . . . . . . . . . . . . . . 196 140 40(Un)realized gains (losses) . . . . . . . . . . . . . . . . . . . . . . . . . . . . . . . . 978 994 (2)Dividend and other investment income . . . . . . . . . . . . . . . . . . . . . . 191 142 35%Other income . . . . . . . . . . . . . . . . . . . . . . . . . . . . . . . . . . . . . . . . . . . 466 521 (11)%
11112 11112
Total revenues . . . . . . . . . . . . . . . . . . . . . . . . . . . . . . . . . . . . . . . . . 6,004 5,347 12%11112 11112
Change in impairment . . . . . . . . . . . . . . . . . . . . . . . . . . . . . . . . . . . . (2,667) (21) —11112 11112
Net revenues . . . . . . . . . . . . . . . . . . . . . . . . . . . . . . . . . . . . . . . . . . . 3,337 5,326 (37)%11112 11112
Staff expenses . . . . . . . . . . . . . . . . . . . . . . . . . . . . . . . . . . . . . . . . . . (1,374) (1,126) 22%Other operating and administrative expenses . . . . . . . . . . . . . . . . . . (655) (636) 3%Allocated expenses . . . . . . . . . . . . . . . . . . . . . . . . . . . . . . . . . . . . . . (1,493) (1,183) 26%
11112 11112
Total expenses . . . . . . . . . . . . . . . . . . . . . . . . . . . . . . . . . . . . . . . . . (3,522) (2,945) 20%11112 11112
Profit (loss) before income tax . . . . . . . . . . . . . . . . . . . . . . . . . . . . (185) 2,381 —11112 11112
Income tax . . . . . . . . . . . . . . . . . . . . . . . . . . . . . . . . . . . . . . . . . . . . . 699 (278) —11112 11112
Net profit before minority interests . . . . . . . . . . . . . . . . . . . . . . . . 514 2,103 —11112 11112
Minority interests . . . . . . . . . . . . . . . . . . . . . . . . . . . . . . . . . . . . . . . 0 4 (100)%11112 11112
Net profit . . . . . . . . . . . . . . . . . . . . . . . . . . . . . . . . . . . . . . . . . . . . . 514 2,099 —
Activity Based
Year Ended December 31, 2007 vs. 20061111211111344
2007 2006 Change11112 11112 11112
(unaudited)(EUR million)
Net interest income on interest-margin products . . . . . . . . . . . . . . . 2,606 2,058 27%Capital gains on investment portfolio . . . . . . . . . . . . . . . . . . . . . . . . 127 94 35%Treasury and financial markets . . . . . . . . . . . . . . . . . . . . . . . . . . . . . 1,059 1,121 (6)%Total . . . . . . . . . . . . . . . . . . . . . . . . . . . . . . . . . . . . . . . . . . . . . . . . . 3,792 3,273 16%
Merchant and Private Banking Key Performance Indicators
Year Ended December 31, 2006 vs. 20051111211111344
2007 2006 Change11112 11112 11112
Cost/Income ratio . . . . . . . . . . . . . . . . . . . . . . . . . . . . . . . . . . . . . . . 57.7% 55.1% —Operating leverage(1) . . . . . . . . . . . . . . . . . . . . . . . . . . . . . . . . . . . . (7.3)% — —Net profit per FTE (in EUR)(2) . . . . . . . . . . . . . . . . . . . . . . . . . . . . 31,520 146,476 (78)%— # of FTEs . . . . . . . . . . . . . . . . . . . . . . . . . . . . . . . . . . . . . . . . . . . 16,307 14,330 14%
(1) Operating leverage is defined as the difference in the percentage growth in total revenues, prior to changes in provisions and in totalexpenses.
(2) Period average.
159
Level: 6 – From: 6 – Wednesday, May 14, 2008 – 1:37 pm – g5mac4 – 3960 Section 06 : 3960 Section 06

2007 Compared to 2006
The decision to move the retail activities of Fortis Banque France to Merchant & Private Bankingled to a change in reporting as of the second quarter of 2007 although prior periods have not been restated.As a result, year-on-year results are not directly comparable.
Revenues. Total revenues increased by 12% to EUR 6,004 million in 2007, from EUR 5,347 in 2006due to strong performance across all activities.
The US subprime-related investments offset the 12% increase in total income, which was almostentirely supported by the rise in net interest income and net commissions and fees. Merchant & PrivateBanking also continued to invest in products, staff and systems, further reinforcing its profitable clientcoverage and relationships.
Net interest income increased by 22% to EUR 2,618 million in 2007 from EUR 2,139 million in2006, with most businesses recording double-digit growth, in line with the underlying growth in loans tocustomers. Net commissions and fees increased 10%, with solid performances at Private Banking andClearing, Funds & Custody.
Treasury and financial markets activities (activity based) generated strong and resilient results underchallenging market conditions, declining by only 6% to EUR 1,059 million in 2007 from EUR 1,121million in 2006. Negative revaluations in the structured credit business were partly offset by protectionprovided by credit hedges and diversification benefits of trading and non-trading activities. Higher capitalgains on the investment portfolio were also realized on some equity holdings and real estate assets.
Net interest income on interest-margin products (activity based) increased 27% to EUR 2,606million in 2007 from EUR 2,058 million in 2006. This was in line with the 25% underlying growth inloans to customers (excluding securities financing and reverse repurchase agreements), reflecting favorablecommercial developments across all businesses. The increase in credit risk-weighted commitments waslimited to 14% (rising to EUR 174 billion in 2007 from EUR 153 million in 2006) due to EUR 7 billion inrelief provided by conversion of the credit hedge portfolio into single-name credit default swap (“CDS”)protection. These were purchased from highly rated European and American investment banks, covering aEUR 14 billion total notional amount.
Net interest income at Commercial Banking increased 16% in 2007 compared to 2006, with nearlyevery country reporting an increase upwards of 10%. This was in line with the growth in deposits andloans (up 15%), while margins stabilized in the second half. Corporate, Institutional & Public Bankingalso recorded 32% growth in net interest income in 2007 compared to 2006, 4% of which was due toreleases from interest reserves linked to the benign credit environment with Volume growth of 25%supporting the remaining 28% underlying increase in net interest income.
Net interest income at ECT increased 31% in 2007 compared to 2006, due in part toreclassifications (interest related fees booked as net interest income, which were booked as netcommissions and fees in 2006). Excluding the reclassifications, net interest income would have increasedby 22%, attributable to 14% volume growth, due mainly to a strong performance at Commodities andhigher cross-selling. Clearing, Funds & Custody recorded a 27% rise in net interest income, mainly onhigher volumes and margins on deposits and collateralized lending.
Net commissions and fees rose 10% to EUR 1,555 million in 2007 from EUR 1,411 million in2006. Adjusting for the reclassification and for the integration of Retail Bank France, net commissions andfees would have risen by 12%, 3% of which related to the ABN AMRO transaction. The underlying 9%increase in net commissions and fees reflected the solid performance delivered by all activities. Clearing,Funds & Custody recorded a 22% rise in net commissions and fees on the back of higher volumes. Assetsunder custody at Global Clearing & Custody increased by 4% to EUR 326 billion in 2007 compared to2006 and assets under administration at Prime Funds Solutions rose 21% to EUR 116 billion in 2007compared to 2006. Private Banking net commissions and fees increased by 6%, mainly in TheNetherlands, Switzerland, UK and Asia, on higher volumes and margins. Funds under managementincreased by 5% to EUR 82.6 billion in 2007 compared to 2006, supported by EUR 2.7 billion in total net
160
Level: 6 – From: 6 – Wednesday, May 14, 2008 – 1:37 pm – g5mac4 – 3960 Section 06 : 3960 Section 06

inflow. The total net inflow remained strong despite the exit of one large customer, whose temporarydeposit of EUR 2.5 billion was withdrawn in the third quarter of 2007.
Capital gains on the investment portfolio amounted to EUR 127 million in 2007 an increase of EUR33 million from EUR 94 million in 2006, an increase of 35%, due to divestments from equity positions(partly in Private Equity) and some real estate assets.
Treasury and financial markets results were EUR 1,059 million, a decrease of 6% or EUR 62million from EUR 1,121 million in 2006, in an extremely difficult market environment. These results canbe broken down into trading and non-trading income. The year-on-year decline was entirely attributable tonegative revaluations in the structured credit business (Capital Markets Group) while all other trading andnon-trading activities performed better than in 2006. Adjusted for grossing up, the EUR 1,208 millionincome in treasury and financial markets was still firmly above the cycle neutral annual floor due to theirdiversified nature.
Non-trading revenues (mainly Private Equity, Global Securities & Financing Group and CreditHedging) were EUR 659 million in 2007, a 24% increase compared to 2006, attributed to the positivecontribution of the credit portfolio hedge.
• Private Equity recorded EUR 219 million in revenues in 2007, a 4% increase compared to2006, benefiting from exits and revaluations in funds of funds.
• Global Securities & Financing Group (“GSFG”) contributed EUR 334 million in 2007, a 6%increase compared to 2006, despite higher commissions paid on new exclusivity rights’contracts.
• The Credit Portfolio Management unit recorded a total positive revaluation of EUR 40million in 2007. The EUR 54 million gain in the fourth quarter, benefiting from wideningcredit spreads, more than offset the total EUR 14 million loss accounted for in the first ninemonths of the year. Over the last quarter of 2007, the Credit Portfolio Management teamconverted the entire hedging portfolio into single name credit default swap protections. Theynow cover a EUR 14 billion total notional amount, distributed over 136 referencecounterparties that are exclusively highly rated European and American investment banks.This resulted in a EUR 7 billion relief in credit risk-weighted commitments.
Trading revenues (adjusted for grossing-up) amounted to EUR 546 million in 2007, a 36% decrease,due to the US subprime market turmoil and resulting liquidity crisis. Trading revenues are accounted forunder “Other realized and unrealized capital gain” and non-trading revenues are accounted for under“Realized capital gains and losses on investments”. The revenue stream nonetheless benefited fromdiversification. This decline should be seen in the light of an average daily Value at Risk that remainedmoderate throughout 2007, ending at EUR 30 million. The weak performance of the Capital MarketsGroup, which suffered from negative revaluations in the structured credit business, was offset by goodresults at the Forex and Rates Group and Global Equities Group. The Forex and Rates Group benefitedfrom customer flows and movements in the USD/EUR exchange rate, offsetting higher funding costs inthe second half of the year.
Dividend and other investment income increased 35% to EUR 191 million in 2007 from EUR 142million in 2006, mainly due to structured finance transactions at Investment Banking. Their positiveimpact on the “Dividend and other investment income” post was offset by a similar decrease in treasuryand financial markets results.
Profit before income tax. Change in impairments reached EUR 2,667 billion in 2007 mainly due tothe impairments on the US supprime related investments (EUR 2.7 billion). Fortis applied a stringentjudgmental approach to impairments on the super senior CDO portfolio with subprime exposure. Animpairment of EUR 2.4 billion (after tax EUR 1.5 billion) was taken on this exposure in the fourth quarterof 2007. Additionally, an impairment of EUR 0.2 billion was recorded in 2007 on the below super seniortranches and some warehouse positions related to the origination activity. Finally, an impairment of EUR
161
Level: 6 – From: 6 – Wednesday, May 14, 2008 – 1:37 pm – g5mac4 – 3960 Section 06 : 3960 Section 06

0.1 billion was booked in the credit spread portfolio, bringing total subprime impairments taken to EUR2.7 billion in 2007 (after tax EUR 1.7 billion).
Taking these impairments into account, the remaining exposure on US subprime CDO’s stood atEUR 2.9 billion at the end of 2007, EUR 2.6 billion of which is in High Grade super senior tranches andEUR 0.3 billion in Mezzanine super senior tranches. A reclassification of impairments and net interestincome negatively impacted the impairments by EUR 25 million due to further alignment with IFRS. Thisnegative change was partly offset by the release of an IBNR provision of EUR 179 million due to revisionof the parameters of the calculation. With respect to the loan book, specific impairments remained limited.
Total expenses increased by 20% to EUR 3,522 million in 2007 from EUR 2,945 million in 2006,due to higher staff expenses and higher allocation expense. Adjusting for scope changes and one-timeevents, such as Fortis Energy Marketing & Trading, the first-time inclusion of Retail Bank France’sactivities and the ABN AMRO integration costs (EUR 6 million), total expenses grew 14% in 2007. Staffexpenses increased 22% to EUR 1,374 million in 2007 from EUR 1,126 million in 2006, while the numberof FTEs rose by 14% with new hiring mainly at growth engines and outside the Benelux region. Adjustingfor scope changes and one-time events, staff expenses increased 12% due to a 7% underlying increase inthe number of FTEs and wage drift. Non-staff expenses amounted to EUR 655 million in 2007, a 3%increase from EUR 636 million in 2006. Scope changes, combined with a restructuring provision inFrance and ABN AMRO integration costs, accounted for 10% of the increase. The remaining 11%reflected investments in growth in the US, Asia and the UK.
As a result mainly of the change in impairment, profit (loss) before income tax was a loss of EUR185 million in 2007 compared to a profit of EUR 2,381 million in 2006.
Taxation. Merchant & Private Banking recognised a tax credit for 2007, as tax-deductible losses inthe US relating to subprime exposure outweighed the tax expenses on profit realised elsewhere. Excludingthe subprime-related tax credit in the US, the effective tax rate would have stood at a low 13% in 2007,benefiting from the tax exemption on equity gains at Global Markets and favourable tax effects on somePrivate Equity and Structured Finance transactions.
Net profit. Net profit decreased to EUR 514 million in 2007 from EUR 2,103 million in 2006 dueprincipally to the impairments on US subprime-related investments that offset the strong underlyingperformance of all Merchant & Private Banking activities.
162
Level: 6 – From: 6 – Wednesday, May 14, 2008 – 1:37 pm – g5mac4 – 3960 Section 06 : 3960 Section 06

Merchant Banking
The following table sets forth selected income statement data for the Merchant Banking segment for2006 and 2005.
Year Ended December 31, 2006 vs. 20051111211111344
2006 2005 Change11112 11112 11112
(EUR million)
Income StatementNet interest income . . . . . . . . . . . . . . . . . . . . . . . . . . . . . . . . . . . . . . 886 764 16%Net commissions and fees . . . . . . . . . . . . . . . . . . . . . . . . . . . . . . . . 561 459 22%Realized capital gains (losses) . . . . . . . . . . . . . . . . . . . . . . . . . . . . . 128 318 (60)%(Un)realized gains (losses) . . . . . . . . . . . . . . . . . . . . . . . . . . . . . . . . 910 527 73%Dividend and other investment income . . . . . . . . . . . . . . . . . . . . . . 99 114 (13)%Other income . . . . . . . . . . . . . . . . . . . . . . . . . . . . . . . . . . . . . . . . . . . 160 126 27%
11112 11112
Total revenues . . . . . . . . . . . . . . . . . . . . . . . . . . . . . . . . . . . . . . . . . 2,744 2,308 19%11112 11112
Change in impairment . . . . . . . . . . . . . . . . . . . . . . . . . . . . . . . . . . . . 116 107 8%11112 11112
Net revenues . . . . . . . . . . . . . . . . . . . . . . . . . . . . . . . . . . . . . . . . . . . 2,860 2,415 18%11112 11112
Staff expenses . . . . . . . . . . . . . . . . . . . . . . . . . . . . . . . . . . . . . . . . . . (675) (603) 12%Other operating and administrative expenses . . . . . . . . . . . . . . . . . . (345) (364) (5)%Allocated expenses . . . . . . . . . . . . . . . . . . . . . . . . . . . . . . . . . . . . . . (409) (359) 14%
11112 11112
Total expenses . . . . . . . . . . . . . . . . . . . . . . . . . . . . . . . . . . . . . . . . . (1,429) (1,326) 8%11112 11112
Profit before income tax . . . . . . . . . . . . . . . . . . . . . . . . . . . . . . . . . 1,431 1,089 31%11112 11112
Income tax . . . . . . . . . . . . . . . . . . . . . . . . . . . . . . . . . . . . . . . . . . . . . (78) (76) 3%11112 11112
Net profit before minority interests . . . . . . . . . . . . . . . . . . . . . . . . 1,353 1,013 34%11112 11112
Minority interests . . . . . . . . . . . . . . . . . . . . . . . . . . . . . . . . . . . . . . . 5 6 (17)%11112 11112
Net profit . . . . . . . . . . . . . . . . . . . . . . . . . . . . . . . . . . . . . . . . . . . . . 1,348 1,007 34%
Activity Based
Year Ended December 31, 2007 vs. 20061111211111344
2006 2005 Change11112 11112 11112
(unaudited)(EUR million)
Net interest income on interest-margin products . . . . . . . . . . . . . . . 796 705 13%Capital gains on investment portfolio . . . . . . . . . . . . . . . . . . . . . . . . 83 111 (25)%Treasury and financial markets . . . . . . . . . . . . . . . . . . . . . . . . . . . . . 1,045 793 32%Total . . . . . . . . . . . . . . . . . . . . . . . . . . . . . . . . . . . . . . . . . . . . . . . . . 1,924 1,609 20%
163
Level: 6 – From: 6 – Wednesday, May 14, 2008 – 1:37 pm – g5mac4 – 3960 Section 06 : 3960 Section 06

Merchant Banking Key Performance Indicators
Year Ended December 31, 2006 vs. 20051111211111344
2006 2005 Change11112 11112 11112
Cost/Income ratio . . . . . . . . . . . . . . . . . . . . . . . . . . . . . . . . . . . . . . . 52.1% 57.5% —Operating leverage(1) . . . . . . . . . . . . . . . . . . . . . . . . . . . . . . . . . . . . . 11.1% 53.6% —Net profit per FTE (in EUR)(2) . . . . . . . . . . . . . . . . . . . . . . . . . . . . . 287,175 248,449 16%— # of FTEs . . . . . . . . . . . . . . . . . . . . . . . . . . . . . . . . . . . . . . . . . . . 4,694 4,056 16%
(1) Operating leverage is defined as the difference in the percentage growth in total revenues, prior to changes in provisions and in totalexpenses.
(2) Period average.
2006 Compared to 2005
Revenues. Total revenues amounted to EUR 2,744 million in 2006, up 19% compared to 2005,attributable to a 24% growth in commercial loans, increased cross-selling and an improved performance intrading and private equity.
Merchant Banking’s fast-growing niches such as ECT, Structured Products and Securities Financingcontinued to strengthen their leading positions in the Benelux and expanded across Asia and NorthAmerica. These niches became increasingly important to the growth of Merchant Banking in 2006 andrepresented more than 50% of total revenues. Services to hedge funds and other institutional investorsgenerated 27% of total revenues, ECT generated 19% of total revenues and structured products andcomplex financing solutions for financial institutions accounted for 9%.
Net interest income increased by 16% from EUR 764 million in 2005 to EUR 886 million in 2006.Net interest income was impacted by the IFRS treatment of unrealized gains on trading derivatives that aredivided between net interest income and unrealized gains/losses (clean fair value) (market value lessinterest accrued). Because trading positions in derivatives change considerably year on year, net interestincome related thereto is also affected by such changes. Net interest income on interest-margin productsincreased 13% to EUR 796 million in 2006 compared to EUR 705 million in 2005, as higher volumesmore than offset lending margin pressure. Commercial loans increased 24% to EUR 56 billion comparedwith the end of 2005, with growth stemming mainly from ECT activities, Real Estate, Retail and Servicessectors and from Institutional Banking. Net interest income also benefited from interest-related income onseveral transactions in the Metals, Shipping, Energy and Chemicals sectors. Global Securities & FundsSolutions recorded a sharp rise in net interest income on the back of its clients’ portfolio growth and highturnover. Likewise, robust activity and higher financing requirements of professional counterpartiesbenefited Clearing & Custody. The average margin on commercial loans remained under pressurethroughout 2006 due to strong competition in a benign credit environment. Although the interest marginson loans to customers were under pressure, Merchant Banking increased the overall interest spread by 20basis points to 70 basis points compared to 2005 due to the growth in loans to customers (relative highermargins) and a reduction in loans to banks (relatively low margins).
Net commissions and fees rose 22% to EUR 561 million in 2006 compared to EUR 459 million in2005 due principally to robust client activity and higher cross-selling results. Assets under custody (+18%to EUR 313 billion) and assets under administration (+42% to EUR 123 billion) both posted strongvolume growth.
Capital gains on the investment portfolio were EUR 83 million, 25% lower than in the previousyear. Higher capital gains realized on the Private Equity portfolio failed to match 2005’s gains in ECT andCorporate Banking.
Treasury and financial markets income grew by 32% to EUR 1,045 million in 2006, supported bystrong client activity and buoyant capital markets. Securities lending and arbitrage activities contributedEUR 313 million to this revenue line, predominantly in the second quarter, due mainly to higher tradingvolumes. Private Equity also had a very good year, as its portfolio gained EUR 207 million on revaluation.
164
Level: 6 – From: 6 – Wednesday, May 14, 2008 – 1:37 pm – g5mac4 – 3960 Section 06 : 3960 Section 06

Marking-to-market of Merchant Banking’s credit hedge portfolio, however, had a negative impact of EUR87 million as credit spreads almost halved in the second half of 2006. Other miscellaneous factorsunrelated to trading contributed EUR 15 million to Treasury and financial markets income.
In addition to the revenue from securities lending, private equity, credit hedging and others,Treasury and financial markets revenue was EUR 597 million, earned on trading and funding positions atGlobal Markets. This level of revenue should be viewed in conjunction with the effective tax rate as thestructure of trading results strongly influences the balance between Treasury & financial markets revenueand tax expense. The trading results in both years had a large impact on the corporate income tax due tothe recognition of tax exempt gains and realized tax losses. This reduced the tax rate to 5% in 2006 (2005:7%). With a diversified mix of activities, all performed better than in 2005. The average daily Value atRisk (“VaR”) climbed from EUR 14.4 million in 2005 to EUR 24.9 million in 2006, remaining at arelatively low level, close to Fortis’s historical average VaR.
Profit before income tax. The change in impairments amounted to a reversal of EUR 116 million for2006, up 8% over the EUR 107 million reversal in 2005. Substantial provisions were released, in line withimproved financial positions of counterparties or repayment of credit facilities. The continued low level ofloan impairments reflected the quality of the bank’s loan portfolio and the sustained benign creditenvironment.
Total expenses increased 8% to EUR 1,429 million in 2006 compared with EUR 1,326 million in2005, resulting in operating leverage of 11%. More than 70% of this rise was due to staff hiring. While theaverage number of FTEs grew by 16%, staff expenses increased only 12% year-on-year as anextraordinary charge was taken in the fourth quarter of 2005 for upgrading the quality of management.Excluding this charge, staff expenses would have been completely in line with the growth in the averagenumber of FTEs. Other operating and administrative expenses grew by 4% in 2006 compared to 2005, dueprimarily to integration costs and higher IT investment aimed at supporting future growth. Thecost/income ratio for 2006 was 52.1%, a 5 percentage point improvement over 2005.
As a result of the foregoing, profit before income tax increased 31% from EUR 1,089 million in2005 to EUR 1,431 million in 2006.
Net profit. Taxation at Merchant Banking is heavily influenced by the structure of trading results, asgains and losses on the various financial instruments are subject to different tax treatments. The loweffective tax rates in 2006 (5%) and 2005 (7%) reflect the composition of trading results, with large tax-exempt gains and tax-deductible losses. Conversely, reported trading revenues would appear inflated inyears with few tax-exempt gains and tax-deductible losses, but this would be entirely offset by higher taxexpenses. As previously mentioned, Merchant Banking’s trading positions are managed on an after-taxbasis and the structure of trading results ultimately has no impact on net profit.
Net profit increased 34% to EUR 1,348 million in 2006. This increase was mainly due to the 19%rise in total income to EUR 2,744 million, resulting in 11% operating leverage. All businesses benefitedfrom sustained commercial activity, generating a strong 24% growth in commercial loans, increased cross-selling and an exceptional performance in trading and private equity.
165
Level: 6 – From: 6 – Wednesday, May 14, 2008 – 1:37 pm – g5mac4 – 3960 Section 06 : 3960 Section 06

Commercial & Private Banking
The following table sets forth selected income statement data for the Commercial & PrivateBanking segment for 2006 and 2005.
Year Ended December 31, 2006 vs. 20051111211111344
2006 2005 Change11112 11112 11112
(EUR million)
Income StatementNet interest income . . . . . . . . . . . . . . . . . . . . . . . . . . . . . . . . . . . . . . 1,190 1,031 16%Net commissions and fees . . . . . . . . . . . . . . . . . . . . . . . . . . . . . . . . 843 702 20%Realized capital gains (losses) . . . . . . . . . . . . . . . . . . . . . . . . . . . . . 11 16 (31)%(Un)realized gains (losses) . . . . . . . . . . . . . . . . . . . . . . . . . . . . . . . . 85 62 37%Dividend and other investment income . . . . . . . . . . . . . . . . . . . . . . 46 39 18%Other income . . . . . . . . . . . . . . . . . . . . . . . . . . . . . . . . . . . . . . . . . . . 327 238 37%Total revenues . . . . . . . . . . . . . . . . . . . . . . . . . . . . . . . . . . . . . . . . . 2,502 2,088 20%Change in impairment . . . . . . . . . . . . . . . . . . . . . . . . . . . . . . . . . . . . (137) (153) (10)%Net revenues . . . . . . . . . . . . . . . . . . . . . . . . . . . . . . . . . . . . . . . . . . . 2,365 1,935 22%Staff expenses . . . . . . . . . . . . . . . . . . . . . . . . . . . . . . . . . . . . . . . . . . (721) (566) 27%Other operating and administrative expenses . . . . . . . . . . . . . . . . . . (373) (277) 35%Allocated expenses . . . . . . . . . . . . . . . . . . . . . . . . . . . . . . . . . . . . . . (406) (446) (9)%Total expenses . . . . . . . . . . . . . . . . . . . . . . . . . . . . . . . . . . . . . . . . . (1,500) (1,289) 16%Profit before income tax . . . . . . . . . . . . . . . . . . . . . . . . . . . . . . . . . 865 646 34%Income tax . . . . . . . . . . . . . . . . . . . . . . . . . . . . . . . . . . . . . . . . . . . . (194) (186) 4%Net profit before minority interests . . . . . . . . . . . . . . . . . . . . . . . . 671 460 46%Minority interests . . . . . . . . . . . . . . . . . . . . . . . . . . . . . . . . . . . . . . . 0 0 –Net profit . . . . . . . . . . . . . . . . . . . . . . . . . . . . . . . . . . . . . . . . . . . . . 671 460 46%
Activity-based
Year Ended December 31, 2006 vs. 20051111211111344
2006 2005 Change11112 11112 11112
(unaudited)(EUR million)
Activity-based net interest income on interest-margin products . . . 1,190 1,031 15%Capital gains on investment portfolio . . . . . . . . . . . . . . . . . . . . . . . . 11 16 (31)%Treasury and financial markets . . . . . . . . . . . . . . . . . . . . . . . . . . . . . 85 62 37%
Commercial & Private Banking Key Performance Indicators
Year Ended December 31, 2006 vs. 20051111211111344
2006 2005 Change11112 11112 11112
Cost/Income ratio . . . . . . . . . . . . . . . . . . . . . . . . . . . . . . . . . . . . . . . 60.0% 61.7% —Operating leverage(1) . . . . . . . . . . . . . . . . . . . . . . . . . . . . . . . . . . . . . 3.5% 4.5% —Net profit per FTE (in EUR) . . . . . . . . . . . . . . . . . . . . . . . . . . . . . . 8,024 6,119 31%— # of FTEs . . . . . . . . . . . . . . . . . . . . . . . . . . . . . . . . . . . . . . . . . . . 79.0 69.8 13%
(1) Operating leverage is defined as the difference in the percentage growth in total revenues, prior to changes in provisions, and in totalexpenses.
2006 Compared to 2005
Revenues. Total revenues increased by 20% to EUR 2,502 million in 2006 compared to EUR 2,088million in 2005, driven by higher levels of net interest income, net commissions and fees and otherincome. Net interest income rose to EUR 1,190 million, up 16% on 2005 with 10% of such growth due to
166
Level: 6 – From: 6 – Wednesday, May 14, 2008 – 1:37 pm – g5mac4 – 3960 Section 06 : 3960 Section 06

organic growth. 80% of the non-organic growth resulted from the integration of the Turkish activities(Commercial Banking, Lease and Factoring) and the remainder was generated by the Dryden, Dreieck andAtradius Factoring acquisitions completed in late 2005 or early 2006.
Net interest income at Commercial Banking increased 12% to EUR 745 million in 2006 comparedto EUR 663 million in 2005, with EUR 29 million attributable to the Turkish operations. Credits anddeposits contributed equally to the organic growth of net interest income. 8% volume growth in loans tocustomers was spread across all countries. Ongoing competitive pressure slightly depressed marginscompared with 2005. The interest spread decreased as a result of these trends by 10 basis points to 210basis points compared to 220 basis points in 2005. On the deposit side, the rise in short-term ratesadversely affected margins and the product mix in the second half of the year, although the effect on netinterest income was compensated for by volume growth.
Private Banking net interest income advanced 14% to EUR 180 million in 2006 compared withEUR 158 million in 2005. Higher net interest income on Private Banking deposits in 2006 was due tocontinued organic volume growth. Credits provided to High Net Worth Individuals rose EUR 2 billion toEUR 6.8 billion (+40%), with nearly all countries contributing.
Volume growth at all Commercial & Private Banking businesses more than compensated for slightlynarrowing credit margins. On the deposit side, volumes in time deposits and highly remunerated currentaccounts increased considerably in the last quarter, partly due to a shift out of savings, though atsignificantly lower margins.
This resulted in lower quarterly net interest income on deposits at Private Banking, while overallvolume growth compensated for the lower margin at Commercial Banking. Fortis Lease saw net interestincome remain at a high level, benefiting from strong activity towards the end of 2006.
Net interest income at Specialized Financial Services increased 28% to EUR 212 million in 2006compared to EUR 166 million in 2005, with all sub-businesses (Trust, Leasing, Factoring and GlobalTrade Finance) contributing to growth. This result was driven by strong commercial developments(illustrated by a 22% organic growth in the leasing portfolio), acquisitions (Fortis Turkey in Leasing andFactoring, Dreieck in Leasing and Atradius in Factoring) and lower hedging and funding costs at Trust.
Net commissions and fees increased 20% to EUR 843 million in 2006 from EUR 702 million in2005, 11% of which was attributable to organic growth. The Dryden and Atradius acquisitions contributedto this strong performance. Fees from securities transactions rose to EUR 201 million in 2006 from EUR139 million in 2005 due to higher turnover. Commercial & Private Banking had a very strong first half,followed by seasonably lower volumes in the third quarter which picked up again in the fourth quarter inline with higher market volumes and rising equity markets. Total client turnover at Fortis CommercialFinance (Factoring) increased 31% to EUR 34.4 billion in 2006. Trust saw the number of structuresmanaged grow by 2% to 22,465 in 2006, despite losing 201 accounts due to a small disposition.
Other revenues increased due to the allocation of higher ALM results, driven by higher capital gainson shares.
Funds under management at Private Banking rose to EUR 79 billion in 2006, 13% higher than in2005. Ongoing efforts to expand the Private Banking network combined with successful cooperation withCommercial Banking and Fortis Intertrust resulted in a net inflow of EUR 7 billion in 2006 compared toEUR 3.3 billion in 2005. Referrals from Commercial Banking more than doubled, yielding EUR 1.5billion in net inflow. Due to Private Banking’s international strategy, more than half of net inflow wasgenerated outside the Benelux, with 27% of new money coming from Asia and 26% from Europe (outsidethe Benelux). Despite last year’s integration, the former Dryden entities acquired in the fourth quarter of2005 managed to retain funds under management at EUR 8 billion, stable with 2005.
Total expenses increased 16% to EUR 1,500 million in 2006 from EUR 1,289 million in 2005. Asignificant portion of the increase was due to the acquisition of Dryden (consolidated only as of the lastquarter of 2005) and Disbank (Fortis Turkey, consolidated from the first quarter of 2006). Organically, cost
167
Level: 6 – From: 6 – Wednesday, May 14, 2008 – 1:37 pm – g5mac4 – 3960 Section 06 : 3960 Section 06

growth compared to revenue growth remained low at 6% despite investments in the expansion of theCommercial & Private Banking network.
Staff expenses increased 27% to EUR 721 million in 2006 compared to EUR 566 million in 2005.Most of this increase was attributable to the acquisitions made in late 2005 and early 2006. Excludingexpenses attributable to acquisitions, staff expenses increased by 3%, although the number of FTEs(excluding acquisitions) grew by 7%. The lower level of staff expense can be attributed to one-off costs inthe fourth quarter of 2005 for upgrading the quality of management and a release of provisions for pensionschemes in The Netherlands in 2006. Commercial & Private Banking employed a total of 8,024 FTEs atthe end of 2006, representing 31% growth.
Other operating and administrative expenses increased 35% in 2006 to EUR 373 million from EUR277 million in 2005, with organic growth accounting for 22%. Nearly half of the increase in organic costgrowth was due to higher external staff, training and consultancy expenses, about one third was due toone-off factors, and the remainder came from intensified marketing, advertising and public relationsefforts. The faster growth in revenues resulted in a reduction in the cost/income ratio from 61.7% in 2005to 60.0% in 2006 and operating leverage in 2006 of 350 basis points.
As a result of the increase in revenues and slower growth in expenses, profit before income taxincreased 34% in 2006 to EUR 865 million from EUR 646 million in 2005.
Net profit. Net profit for 2006 was EUR 671 million, up 46% on 2005. The effective tax rate was22% for 2006, 7% lower than in 2005. This decrease was due chiefly to one-off tax benefits which aroseduring the course of the year. With organic cost growth of 6%, organic operating leverage stood at 9%.
Other Banking
As of 2007 Other Banking includes all Shared Services activities and the corporate functions ofBanking, Asset & Liability Management (“ALM”) in Belgium, The Netherlands, Luxembourg, Turkey andPoland, and Fortis Hypotheek Bank. The activities of other legal entities previously reported under OtherBanking are now shown as direct costs of the businesses, and the 2006 figures have been restatedaccordingly. As of 2007, the results of Belgolaise are consolidated under Other Banking, using the equitymethod, whereas previously they were fully accounted for. Income and expense related to ALM andShared Services are allocated to Banking business lines (which explains why ‘other income’ is negativeand ‘allocated expenses’ is positive).
168
Level: 6 – From: 6 – Wednesday, May 14, 2008 – 1:37 pm – g5mac4 – 3960 Section 06 : 3960 Section 06

The following table sets forth selected income statement data for Other Banking for the periodspresented.
Year Ended December 31, 2006 vs. 20051111211111344
2007 2006 Change11112 11112 11112
(EUR million)
Income StatementNet interest income (expense) . . . . . . . . . . . . . . . . . . . . . . . . . . . . . (38) 272 —Net commissions and fees . . . . . . . . . . . . . . . . . . . . . . . . . . . . . . . . (23) (9) —Realized capital gains (losses) . . . . . . . . . . . . . . . . . . . . . . . . . . . . . 621 426 45%(Un)realized gains (losses) . . . . . . . . . . . . . . . . . . . . . . . . . . . . . . . . 240 300 (20)%Dividend and other investment income . . . . . . . . . . . . . . . . . . . . . . 299 127 —Other income (including allocations)(1) . . . . . . . . . . . . . . . . . . . . . . . (656) (919) 29%Total revenues . . . . . . . . . . . . . . . . . . . . . . . . . . . . . . . . . . . . . . . . . 443 197 —Change in impairment . . . . . . . . . . . . . . . . . . . . . . . . . . . . . . . . . . . . (17) 13 —Net revenues . . . . . . . . . . . . . . . . . . . . . . . . . . . . . . . . . . . . . . . . . . 426 210 —Staff expenses . . . . . . . . . . . . . . . . . . . . . . . . . . . . . . . . . . . . . . . . . . (1,332) (1,250) 7%Other operating and administrative expenses(2) . . . . . . . . . . . . . . . . . (1,776) (1,526) 16%Allocated expenses . . . . . . . . . . . . . . . . . . . . . . . . . . . . . . . . . . . . . . 2,836 2,565 11%Total expenses . . . . . . . . . . . . . . . . . . . . . . . . . . . . . . . . . . . . . . . . . (272) (211) 29%Profit before income tax . . . . . . . . . . . . . . . . . . . . . . . . . . . . . . . . . 154 (1) —Income tax . . . . . . . . . . . . . . . . . . . . . . . . . . . . . . . . . . . . . . . . . . . . . 4 (19) —Net profit before minority interests . . . . . . . . . . . . . . . . . . . . . . . . . 158 (20) —Minority interests . . . . . . . . . . . . . . . . . . . . . . . . . . . . . . . . . . . . . . . 14 6 —Net profit . . . . . . . . . . . . . . . . . . . . . . . . . . . . . . . . . . . . . . . . . . . . . 144 (26) —
(1) For an explanation of the allocation of revenues and expenses between the segments see “— Segment Reporting”.
Activity-based
Year Ended December 31, 2006 vs. 20051111211111344
2006 2005 Change11112 11112 11112
(unaudited)(EUR million)
Activity-based net interest income on interest-margin products . . . (52) 363 —Capital gains on investment portfolio . . . . . . . . . . . . . . . . . . . . . . . . 615 427 44%Treasury and financial markets . . . . . . . . . . . . . . . . . . . . . . . . . . . . . 260 208 25%Total . . . . . . . . . . . . . . . . . . . . . . . . . . . . . . . . . . . . . . . . . . . . . . . . . 823 998 —
2007 Compared to 2006
Revenues. Net interest income (activity based) was EUR 52 million of net interest expense in 2007,a EUR 415 million decrease from net interest income of EUR 363 million in 2006. This was due to severalfactors. First, rising global interest rates, combined with a yield curve that remained flat, depressed netinterest income. Second, the acquisition of ABN AMRO activities was financed partly with debtinstruments, more specifically CASHES, MCS and a credit facility, impacting interest income by EUR 94million. Furthermore, higher interest rates reduced by EUR 50 million prepayment penalties received onthe mortgage portfolio of Retail Banking Belgium and Fortis Hypotheekbank. Net interest income wasalso adversely impacted by a EUR 38 million one-time correction at Fortis Hypotheek Bank and by higherfunding costs. Lastly, the allocation of interest income to Other Banking and the business lines accountedfor over half of the decrease in net interest income. The business lines receive interest income from ALMon target capital employed. The allocation is based on the level of risk-weighted commitments (RWC) andthe transfer price used. Strong RWC growth during 2007 combined with a higher transfer price resulted ina substantial re-allocation of interest income from Other Banking to the business lines.
169
Level: 6 – From: 6 – Wednesday, May 14, 2008 – 1:37 pm – g5mac4 – 3960 Section 06 : 3960 Section 06

Capital gains on the investment portfolio (activity based) was EUR 615 million in 2007, a 44%increase from EUR 427 million in 2006. This increase was due to the sale of a number of non-strategicequity holdings (including Banco Comercial Português, Kasbank and ICBC (Asia)) in the run-up to thefinancing of the ABN AMRO Acquisition.
Treasury and financial markets income (activity based) increased by 25% to EUR 260 million in2007 compared to EUR 208 million in 2006. The positive impact was driven by prepayment fees on long-term deposits. The result was negatively impacted in the fourth quarter of 2007 by fees on the CASHEStransaction and to a lesser extent by the flat yield curves and the effect of lower volatilities on the value ofhedging positions that do not qualify for hedge accounting.
Expenses. Staff expenses (excluding eliminations) decreased by 3% or EUR 25 million to EUR 865million in 2007. The decline is attributed to the capitalization of key information technology projects inaccordance with IAS 38 rules, the exclusion of Belgolaise and scope changes. Excluding these factors,staff expenses increased by 4%, due to a 2% increase in headcount and normal wage drift.
Other operating and administrative expenses rose EUR 250 million to EUR 1,776 million in 2007compared with EUR 1,526 million in 2006. Underlying expense grew 5%, excluding technical adjustmentsand scope changes amounting to EUR 21 million. Almost three quarters of the underlying increase in otheroperating and administrative expenses relates to Information Services and Technology (IST), reflectingFortis’s continued investment in the infrastructure of its key banking systems (City Plan projects). Some ofthese projects are mandatory, such as SEPA, Basel II and MiFID, while others are in place to supportvarious growth initiatives. Facility costs related to removal and refurbishment costs in Belgium and TheNetherlands (rehousing plan) and network expansion in Turkey are other important reasons for the increasein Other operating expenses.
Major productivity gains have been made at the key processing units of the Operations Department,i.e., Accounts, Payments, Securities Handling and Industrialized Credits. Volumes climbed 12%, whiledirect costs remained stable, due to investment in IT systems.
As a result of the foregoing, profit before income tax was EUR 154 million in 2007 compared withEUR 1 million negative in 2006.
Net profit. Net profit for 2007 increased by EUR 170 million to EUR 144 million compared to EUR26 million negative in 2006.
Other Banking
The following table sets forth selected income statement data for Other Banking for 2006 and 2005.The 2006 figures have not been restated as described above.
A number of major changes significantly affected the comparison of 2006 and 2005 figures. The2005 figures included Fortis Bank Turkey’s total revenues and expenses as of the third quarter whereas the2006 figures include only Turkish income and costs relating to Other Banking. Fortis Bank Turkey wasfully accounted for in the applicable banking business lines beginning in 2006. Belgolaise’s total revenuesand expenses, also, were included for the first time in 2006, as were facility-related costs which were re-invoiced to Insurance. The costs of the Credit risk department of Central Risk Management, previouslyincluded in total expenses, were charged directly to the businesses in 2006.
170
Level: 6 – From: 6 – Wednesday, May 14, 2008 – 1:37 pm – g5mac4 – 3960 Section 06 : 3960 Section 06

Year Ended December 31, 2006 vs. 20051111211111344
2007 2006 Change11112 11112 11112
(EUR million)
Income StatementNet interest income . . . . . . . . . . . . . . . . . . . . . . . . . . . . . . . . . . . . . . 363 391 (7)%Net commissions and fees . . . . . . . . . . . . . . . . . . . . . . . . . . . . . . . . (2) 37 —Realized capital gains (losses) . . . . . . . . . . . . . . . . . . . . . . . . . . . . . 426 315 35%(Un)realized gains (losses) . . . . . . . . . . . . . . . . . . . . . . . . . . . . . . . . 300 173 73%Dividend and other investment income . . . . . . . . . . . . . . . . . . . . . . 124 90 38%Other income (including allocations)(1) . . . . . . . . . . . . . . . . . . . . . . . (939) (605) 55%Total revenues . . . . . . . . . . . . . . . . . . . . . . . . . . . . . . . . . . . . . . . . . 272 401 (32)%Change in impairment . . . . . . . . . . . . . . . . . . . . . . . . . . . . . . . . . . . . 13 (33) —Net revenues . . . . . . . . . . . . . . . . . . . . . . . . . . . . . . . . . . . . . . . . . . . 285 368 (23)%Staff expenses . . . . . . . . . . . . . . . . . . . . . . . . . . . . . . . . . . . . . . . . . . (980) (1,090) (10)%Other operating and administrative expenses . . . . . . . . . . . . . . . . . . (1,449) (1,207) 20%Allocated expenses . . . . . . . . . . . . . . . . . . . . . . . . . . . . . . . . . . . . . . 2,185 2,067 6%Total expenses . . . . . . . . . . . . . . . . . . . . . . . . . . . . . . . . . . . . . . . . . (244) (230) 6%Profit before income tax . . . . . . . . . . . . . . . . . . . . . . . . . . . . . . . . . 41 138 (70)%Income tax . . . . . . . . . . . . . . . . . . . . . . . . . . . . . . . . . . . . . . . . . . . . . 4 (28) —Net profit before minority interests . . . . . . . . . . . . . . . . . . . . . . . . . 45 110 (59)%Minority interests . . . . . . . . . . . . . . . . . . . . . . . . . . . . . . . . . . . . . . . 5 5 0%Net profit . . . . . . . . . . . . . . . . . . . . . . . . . . . . . . . . . . . . . . . . . . . . . 40 105 (62)%
(1) For an explanation of the allocation of revenues and expenses between the segments see “— Segment Reporting”.
Activity-based
Year Ended December 31, 2006 vs. 20051111211111344
2006 2005 Change11112 11112 11112
(unaudited)(EUR million)
Activity-based net interest income on interest-margin products . . . 454 370 23%Capital gains on investment portfolio . . . . . . . . . . . . . . . . . . . . . . . . 426 307 39%Treasury and financial markets . . . . . . . . . . . . . . . . . . . . . . . . . . . . . 209 202 4%Total . . . . . . . . . . . . . . . . . . . . . . . . . . . . . . . . . . . . . . . . . . . . . . . . . 1,089 879 24%
2006 Compared to 2005
Revenues. In the activity-based income statement, net interest income for 2006 recorded an increaseto EUR 454 million, up EUR 84 million or 23% compared to 2005. This increase was attributable to theinvestment of the cash proceeds of Fortis Bank’s sale of FB Insurance to Fortis Insurance which pushed upnet interest income from the second quarter of 2006 onwards, an increased mismatch (expressed by equityduration), higher short-term interest rates and increased volumes. Lower margins on FortisHypotheekbank’s mortgage portfolio depressed overall net interest income
Capital gains on the investment portfolio increased EUR 118 million to EUR 426 million in 2006.The gains realized in 2005 predominately derived from the sale of bonds, whereas the gains in 2006 weremainly realized on the sale of the equity holdings in Euronext, Banksys, Arcelor and a few smallerholdings. Treasury and Financial Markets were stable year-on-year as the positive impact of non-qualifying hedges of EUR 180 million was offset by early repayment penalties on intercompany loans(EUR 91 million) and changes in the value of derivatives.
Profit before income tax. The annual change in impairments improved EUR 46 million due to alower level of impairments at Fortis Hypotheekbank and releases at Belgolaise Bank.
171
Level: 6 – From: 6 – Wednesday, May 14, 2008 – 1:37 pm – g5mac4 – 3960 Section 06 : 3960 Section 06

Staff expenses and other operating and administrative expenses increased EUR 132 million in 2006compared to 2005 reflecting lower staff expenses offset by higher operating and administrative expenses.Staff expenses decreased by EUR 110 million in 2006 from EUR 1,090 million in 2005 to EUR 980million in 2006. The most important factors behind this fall were the transfer of the department of CreditRisk of Central Risk Management to Credits to the business and lower restructuring provisions in 2006compared to the provision made in 2005, offset by the centralization of the Legal and Compliance teamwithin Shared Services and the transfer of the Facilities team of the Insurance business in The Netherlands(whose costs are re-invoiced). Excluding the effects of the above transactions, staff expenses increasedEUR 14 million (1.7%), owing to normal wage drift offset by FTE savings due to improved efficiency.
Other operating and administrative expenses increased EUR 242 million to EUR 1,449 million in2006 compared with EUR 1,207 million in 2005. EUR 140 million of this increase was due to theinclusion in 2006 of the Facilities costs of Fortis Insurance Netherlands (which are re-invoiced) and thenon-recurrence of the releases in 2005 of provisions relating to Belgolaise and other group companies.Excluding these costs, other operating and administrative expenses rose EUR 102 million. By far the mostimportant element was the increase of EUR 88 million at Information Systems and Technology that, beingdemand-led, continued to invest in the banking and infrastructure systems of both businesses and supportservices.
As a result of the foregoing, profit before income tax declined to EUR 41 million in 2006 comparedto EUR 138 million in 2005.
Net profit. Net profit for 2006 was EUR 40 million, a 62% decrease compared to 2005. Thisdecrease was attributable mainly to lower results of Fortis Hypotheekbank (Fortis’s mortgage sellingvehicle), which were adversely effected by penalty interest of EUR 91 million due to an early redemptionof fundings.
172
Level: 6 – From: 6 – Wednesday, May 14, 2008 – 1:37 pm – g5mac4 – 3960 Section 06 : 3960 Section 06

Insurance
The following table sets forth selected financial information for Fortis’s consolidated insuranceoperations for the periods indicated. For purposes of this presentation, a number of customary insuranceperformance indicators are chosen. A reconciliation of these figures to the Fortis income statement isprovided in Note 52 of the Notes to the 2007 Consolidated Financial Statements incorporated by referenceherein. These are only presentation changes and have no impact on net profit.
Year Ended December 31, 2007 vs. 2006 2006 vs. 200511111111111111234 1111 1111
2007 2006 2005 Change Change1111 1111 1111 1111 1111
(EUR million)
Life— Gross earned premiums . . . . . . . . . . 9,688 9,147 8,256 6% 11%— Investment contracts without DPF . . 3,481 2,978 3,225 17% (8)%Gross inflow(1) . . . . . . . . . . . . . . . . . . . . 13,169 12,126 11,481 9% 6%Gross written premiums Non-Life . . . . 5,483 5,033 4,775 9% 5%Technical result . . . . . . . . . . . . . . . . . . — — — — —— Life . . . . . . . . . . . . . . . . . . . . . . . . . . 230 638 691 (64)% (8)%— Non-Life . . . . . . . . . . . . . . . . . . . . . . 319 573 537 (44)% 7%Allocated capital gains . . . . . . . . . . . . . 511 206 206 — 0%Operating margin(2) . . . . . . . . . . . . . . . 1,060 1,417 1,434 (25)% (1)%— Life . . . . . . . . . . . . . . . . . . . . . . . . . . 672 811 858 (17)% (5)%— Non-Life . . . . . . . . . . . . . . . . . . . . . . 388 606 576 (36)% 5%Non-allocated other income and charges 708 373 238 (44)% 57%Profit before income tax . . . . . . . . . . . 1,768 1,790 1,672 5% 7%Income tax . . . . . . . . . . . . . . . . . . . . . . . (183) (390) (473) (53)% (18)%Net gain on discontinued operations . . . 1,013 61 60 — 2%Minority interests . . . . . . . . . . . . . . . . . . 64 41 34 57% 21%Net profit . . . . . . . . . . . . . . . . . . . . . . . . 2,534 1,420 1,225 79% 16%— Life . . . . . . . . . . . . . . . . . . . . . . . . . . 1,995 923 748 — 24%— Non-Life . . . . . . . . . . . . . . . . . . . . . . 545 497 477 10% 4%— Other . . . . . . . . . . . . . . . . . . . . . . . . . (6) — — — —Operating costs(3) . . . . . . . . . . . . . . . . . . (1,413) (1,341) (1,256) 5% 7%
(1) Under IFRS certain insurance products are treated as investment contracts (non-participating investment contracts) and premiumsreceived are treated as policyholder deposits and not reported in the income statement. Management believes that gross inflow is,therefore, a better indication of the total business written by the insurance business during the applicable periods.
(2) Operating margin consists of the technical result plus the capital gains that are allocated to policyholders.
(3) Operating costs include general expenses, including claim handling costs, but excluding deferred acquisition costs and investment-related costs.
The following table sets forth the aggregate of (i) gross inflow (life) and (ii) gross written premiums(non-life) and profit before income tax and minority interests by business line for Fortis’s consolidatedinsurance operations for each of the periods indicated.
173
Level: 6 – From: 6 – Wednesday, May 14, 2008 – 1:37 pm – g5mac4 – 3960 Section 06 : 3960 Section 06

Gross Inflow/Gross Written Premium Profit Before Income Tax11111111111111234 11111111111111234
Year Ended December 31, Year Ended December 31,11111111111111234 11111111111111234
2007 2006 2005 2007 2006 20051111 1111 1111 1111 1111 1111
(unaudited)(EUR million)
Insurance Belgium . . . . . . 7,517 6,744 6,444 566 698 685Insurance Netherlands . . . 5,219 5,380 4,603 1,016 810 751Insurance International . . . 5,916 5,034 5,209 192 343 296Other Insurance (including
eliminations) . . . . . . . . . — — — (6) — 01111 1111 1111 1111 1111 1111
Total . . . . . . . . . . . . . . . . . 18,652 17,158 16,256 1,768 1,851 1,7321111 1111 1111 1111 1111 11111111 1111 1111 1111 1111 1111
Insurance Key Performance Indicators
Year Ended December 31, 2007 vs. 2006 2006 vs. 200511111111111111234 1111 1111
2007 2006 2005 Change Change1111 1111 1111 1111 1111
— # of FTEs . . . . . . . . . . . . . . . . . . . . . 14,967 13,106 13,083 14% —Operating leverage(1) . . . . . . . . . . . . . . . (5.0)% (4.3)% 17.6% — —Life:New business life — APE
(in EUR million) . . . . . . . . . . . . . . . . 1,375 1,336 1,279 3% 4%Non-Life total: . . . . . . . . . . . . . . . . . . . .Claims ratio . . . . . . . . . . . . . . . . . . . . . . 67.4% 61.2% 61.3% — —
1111 1111 1111
Expense ratio . . . . . . . . . . . . . . . . . . . . . 32.7% 34.9% 34.7% — —1111 1111 1111
Combined ratio . . . . . . . . . . . . . . . . . . . 100.1% 96.1% 96.0% — —1111 1111 11111111 1111 1111
Non-Life Property & Casualty(2):Claims ratio . . . . . . . . . . . . . . . . . . . . . . 66.9% 59.1% 58.8% — —Expense ratio . . . . . . . . . . . . . . . . . . . . . 36.9% 39.3% 38.3% — —Combined ratio . . . . . . . . . . . . . . . . . . . 103.9% 98.4% 97.1% — —Non-Life Accident & Health(3):Claims ratio . . . . . . . . . . . . . . . . . . . . . . 68.3% 65.9% 66.9% — —Expense ratio . . . . . . . . . . . . . . . . . . . . . 23.2% 24.7% 26.3% — —
1111 1111 1111
Combined ratio . . . . . . . . . . . . . . . . . . . 91.5% 90.6% 93.2% — —1111 1111 11111111 1111 1111
(1) Operating leverage is defined as the difference in the percentage growth of operating margin excluding operating costs and in thepercentage growth in operating costs.
(2) Property & Casualty includes insurance operations covering property damage and liability claims.
(3) Accident & Health covers insurance operations related to medical cost, illness and disability claims.
European Embedded Value
In connection with its 2006 results, Fortis began publishing the Embedded Value (“EV”) of its lifeinsurance business in accordance with the European Embedded Value (“EEV”) principles established bythe CFO Forum of European insurance companies. In complying with EEV, Fortis has adopted a marketconsistent methodology and now publishes a Market Consistent Embedded Value (“MCEV”). EV of lifeinsurance operations provides additional information on the value of the in-force contracts and the value ofnew business being written. EV excludes any value attributable to future new business but provides anestimate of the expected profits to emerge from a book of life insurance business. The changes in acompany’s EV from year to year provide a measure of the profitability of the company’s life insurancebusiness.
174
Level: 6 – From: 6 – Wednesday, May 14, 2008 – 1:37 pm – g5mac4 – 3960 Section 06 : 3960 Section 06

The 2007 and 2006 figures have been calculated in accordance with the EEV principles. Thetransition to MCEV reporting, which started in 2005, was completed in 2006. The Value Added by NewBusiness (“VANB”) is calculated applying the same Market Consistent approach as used for calculatingthe total EV.
In 2006, Fortis also completed the transition of aligning internal core Risk and Value applicationsincluding Economic capital, Embedded Value and ALM and the migration to a market consistentmethodology. This effort reflects Fortis desire to value and manage its business on an economic basis.Fortis now uses integrated processes with a single platform for stochastic analysis used for a range of riskmanagement purposes including Economic Capital and ALM. This framework allows a bottom-upapproach where the market value of each asset and liability is calculated at model point level, andincludes, among others, an allowance for Cost of Financial Options and Guarantees.
(EUR million)11112
(unaudited)
European Embedded Value beginning 2005 . . . . . . . . . . . . . . . . . . . . . . . . . . . . . . . . . . . . . . 10,44811112
Accrual during the year . . . . . . . . . . . . . . . . . . . . . . . . . . . . . . . . . . . . . . . . . . . . . . . . . . . . . . . . 1,133Accrued value year-end 2005 . . . . . . . . . . . . . . . . . . . . . . . . . . . . . . . . . . . . . . . . . . . . . . . . . . . 11,581Dividend payment to Fortis . . . . . . . . . . . . . . . . . . . . . . . . . . . . . . . . . . . . . . . . . . . . . . . . . . . . . (751)
11112
Embedded Value year-end 2005 . . . . . . . . . . . . . . . . . . . . . . . . . . . . . . . . . . . . . . . . . . . . . . . . 10,830Opening adjustment(1) . . . . . . . . . . . . . . . . . . . . . . . . . . . . . . . . . . . . . . . . . . . . . . . . . . . . . . . . . . (208)Accrual during the year . . . . . . . . . . . . . . . . . . . . . . . . . . . . . . . . . . . . . . . . . . . . . . . . . . . . . . . . 2,898Accrued value year-end 2006 . . . . . . . . . . . . . . . . . . . . . . . . . . . . . . . . . . . . . . . . . . . . . . . . . . . 13,521Dividend payment to Fortis . . . . . . . . . . . . . . . . . . . . . . . . . . . . . . . . . . . . . . . . . . . . . . . . . . . . . (1,214)
11112
Embedded Value year-end 2006 . . . . . . . . . . . . . . . . . . . . . . . . . . . . . . . . . . . . . . . . . . . . . . . . 12,307Opening adjustment . . . . . . . . . . . . . . . . . . . . . . . . . . . . . . . . . . . . . . . . . . . . . . . . . . . . . . . . . . . 220Accrual during the year . . . . . . . . . . . . . . . . . . . . . . . . . . . . . . . . . . . . . . . . . . . . . . . . . . . . . . . . 345Accrual value year-end 2007 . . . . . . . . . . . . . . . . . . . . . . . . . . . . . . . . . . . . . . . . . . . . . . . . . . . . 12,872Dividend payment to Fortis . . . . . . . . . . . . . . . . . . . . . . . . . . . . . . . . . . . . . . . . . . . . . . . . . . . . . (1,153)Embedded Value year-end 2007 . . . . . . . . . . . . . . . . . . . . . . . . . . . . . . . . . . . . . . . . . . . . . . . . 12,411
1111211112
(1) Opening adjustment: reflects changes as a result of completing transition to aligning internal models
Value Added by New Business — Traditional Methodology
The following tables set forth certain measurements applied in determining the value of newbusiness added by each of Fortis’s insurance business segments.
PVNBP(1) VANB(2) New Business Margin(3)
1112111111114 1112111111114 111111124
2007 2006 Change 2007 2006 Change 2007 20061112 1112 1112 1112 1112 1112 1112 1112
(unaudited)(EUR million, except %)
Insurance Belgium . . . . . . 5,305 5,169 3% 207 189 10% 3.90% 3.66%Insurance Netherlands . . . 2,777 2,344 18% 77 85 10% 2.77% 3.63%Insurance International . . . 2,766 2,743 1% 62 53 36% 2.24% 1.93%
1112 1112 1112 1112
Insurance Total . . . . . . . . . 10,848 10,256 6% 346 327 6% 3.19% 3.19%1112 1112 1112 11121112 1112 1112 1112
175
Level: 6 – From: 6 – Wednesday, May 14, 2008 – 1:37 pm – g5mac4 – 3960 Section 06 : 3960 Section 06

PVNBP(1) VANB(2) New Business Margin(3)
1112111111114 1112111111114 111111124
2006 2005 Change 2006 2005 Change 2006 20051112 1112 1112 1112 1112 1112 1112 1112
(unaudited)(EUR million, except %)
Insurance Belgium(4) . . . . . 4,760 4,837 (2)% 240 164 46% 5.04% 3.39%Insurance Netherlands . . . 2,051 2,044 0% 50 45 11% 2.42% 2.22%Insurance International . . . 3,705 3,346 11% 84 91 (8)% 2.26% 2.72%
1112 1112 1112 1112
Insurance Total . . . . . . . . . 10,516 10,227 3% 373 300 24% 3.55% 2.94%1112 1112 1112 11121112 1112 1112 1112
(1) PVNBP = Present Value New Business Premiums.
(2) VANB = Value Added by New Business.
(3) New business margin is the Value Added by New Business as a percentage of the present value of new business premiums.
(4) Insurance Belgium on a look through basis; result related commission between Fortis Insurance Belgium and Fortis Bank.
2007 Compared to 2006
Net profit for the period increased by 13% in a challenging market environment to EUR 1,585million in 2007 from EUR 1,400 million in 2006. Net profit was affected by losses associated with naturaldisasters, dislocation in the global capital markets and additional liabilities booked related to unit-linkedlife policies in The Netherlands. These events were more than offset by a solid business performance dueto a continued focus on profitability and higher capital gains triggered by portfolio protection techniques(“CPPI”) (see “Risk Management—Market Risk in Insurance—ALM risk: Currency risk”) and eventdriven capital gains (e.g., on the ABN AMRO transaction). Net profit at Life increased by 32% to EUR1,223 million in 2007 from EUR 909 million in 2006, driven by higher volumes and capital gains, butoffset by the impact of the capital markets turmoil and additional liabilities in the Dutch life business.Non-Life net profit was adversely affected by the combined impact of Windstorm Kyrill and floods in theUK (EUR 213 million before taxes) which brought down full-year Non-Life net profit by EUR 123million to EUR 368 million in 2007 from EUR 491 million in 2006. In large part, these natural disasterscaused the combined ratio to increase to 100.1% in 2007 compared to 96.1% in 2006. Excluding theexceptional natural disasters in 2007 the Non-Life combined ratio would have been 95.7%.
Total gross inflow was EUR 18.7 billion in 2007, an increase of 9% from EUR 17,158 million in2006, despite 2006 benefiting from an exceptionally large group contract of EUR 0.7 billion. Our marketposition improved in all countries, confirming the effectiveness of our Fortify strategy of productinnovation and multi-channel distribution. Life grew by 9% to EUR 13.2 billion in 2007 from EUR 12.1billion in 2006, due to robust bancassurance sales and the inclusion of the newly acquired Hong Kong Lifeinsurance business, consolidated beginning May 25, 2007. Annualized premium equivalent (“APE”)advanced 17% to EUR 1,375 million in 2007 from EUR 1,174 million in 2006. Non-Life gross writtenpremiums increased by 9% to EUR 5.5 billion in 2007 from EUR 5.0 billion in 2006, based on soundmargins and driven by product innovation across all countries.
The continued drive to enhance efficiency improved the expense ratios, the 5% increase in operatingcosts being offset by 9% premium growth. Tight cost control programs (including a reduction of theexternal workforce in The Netherlands) compensated for start-up costs of new product-marketcombinations in Europe. In Non-Life, the expense ratio improved from 34.9% in 2006 to 32.7% in 2007.
Fortis announced in July 2007 that Fortis and “la Caixa” had mutually decided to end their CaiForjoint venture after 15 years. Consequently, the figures for CaiFor are reported in the income statementunder results on divestments and results on discontinued operations. The transaction was concluded in thefourth quarter of 2007, producing a net capital gain on the divestment of EUR 947 million, EUR 773million of which was realized in Life and EUR 174 million in Non-Life.
176
Level: 6 – From: 6 – Wednesday, May 14, 2008 – 1:37 pm – g5mac4 – 3960 Section 06 : 3960 Section 06

2006 Compared to 2005
Net profit for 2006 increased 16% to EUR 1,420 million (2005 EUR 1,225 million), with Life netprofit increasing 24% to EUR 924 million (2005: EUR 748 million) and Non-Life net profit rising 4% toEUR 496 million (2005 EUR 477 million). At Life, higher investment income and higher capital gains,partly offset by the result-related commission paid to Retail Banking in Belgium, was principallyresponsible for the 11% increase in profit before taxation to EUR 1,113 million as reflected in the segmentreporting in the financial statements. A lower effective tax rate owing to a more favorable capital gains mixfurther contributed to the rise in net profit. Non-Life technical results increased 7%. Higher technicalresults in the Dutch Accident & Health market and better results at Motor more than compensated forlower results at Fire. The increase in net profit at Non-Life before results on divestments was in line withhigher technical results.
Operating costs increased 7% in 2006, owing to business expansion, acquired distribution skills andintegration expenses. Operating costs in The Netherlands remained virtually stable, while volumes grew. InBelgium, operating costs increased as a result of the integration of Fortis AG and FB Insurance. Operatingcosts of the international activities were also higher as Fortis Insurance continued to pursue itsinternational growth strategy and Outright (acquired by Fortis UK) was included for the full year.
Life
The following table sets forth certain technical information with respect to the life insurancebusiness for the periods indicated. The information set forth below has been extracted from thereconciliation of Technical Accounts in Note 52 to Notes to the 2007 Consolidated Financial Statementsincorporated by reference herein.
Technical result Life
Year Ended December 31,1111111111111123
2007 2006 20051111 1111 1111
(EUR million)
Gross earned premiums . . . . . . . . . . . . . . . . . . . . . . . . . . . . . . . . . . 9,688 9,147 8,256Ceded reinsurance earned premiums . . . . . . . . . . . . . . . . . . . . . . . . (82) (56) (50)Financial result and capital gains allocated to technical result . . . . 3,143 4,690 5,496
Fee income . . . . . . . . . . . . . . . . . . . . . . . . . . . . . . . . . . . . . . . . . . . . 184 145 123Other income . . . . . . . . . . . . . . . . . . . . . . . . . . . . . . . . . . . . . . . . . . . (4) 11 67
1111 1111 1111
Total income . . . . . . . . . . . . . . . . . . . . . . . . . . . . . . . . . . . . . . . . . . 12,929 13,937 13,892Benefits and surrenders, gross . . . . . . . . . . . . . . . . . . . . . . . . . . . . . (5,464) (5,733) (4,366)Reinsurers’ share of benefits and surrenders . . . . . . . . . . . . . . . . . . 38 137 206Change in liabilities arising from insurance and investment
contracts including unit-linked contracts . . . . . . . . . . . . . . . . . . . (5,542) (6,151) (7,685)Reinsurers’ share of change in liabilities . . . . . . . . . . . . . . . . . . . . . (6) (115) (170)Profit sharing . . . . . . . . . . . . . . . . . . . . . . . . . . . . . . . . . . . . . . . . . . . (504) (316) (199)
1111 1111 1111
Total technical charges . . . . . . . . . . . . . . . . . . . . . . . . . . . . . . . . . . (11,478) (12,178) (12,214)Commission expenses . . . . . . . . . . . . . . . . . . . . . . . . . . . . . . . . . . . . (589) (532) (364)Change in deferred acquisition costs and VOBA . . . . . . . . . . . . . . . (50) (79) (121)Administrative expenses . . . . . . . . . . . . . . . . . . . . . . . . . . . . . . . . . . (606) (519) (510)Reinsurance commissions and profit participation . . . . . . . . . . . . . . 24 9 8
1111 1111 1111
Total operating expenses . . . . . . . . . . . . . . . . . . . . . . . . . . . . . . . . . . (1,121) (1,121) (987)1111 1111 1111
Technical result Life Insurance before taxation . . . . . . . . . . . . . . . . 230 638 6911111 1111 11111111 1111 1111
177
Level: 6 – From: 6 – Wednesday, May 14, 2008 – 1:37 pm – g5mac4 – 3960 Section 06 : 3960 Section 06

2007 Compared to 2006
Gross inflow at Life increased by 9% to EUR 13,169 million in 2007 from EUR 12,126 million in2006. This increase was due to a strong commercial focus and implementation of the Fortify strategy,which seeks to create revenue synergies by applying the principle of “optimize locally by sharingglobally” or sharing proven skills across borders and across businesses. This strong performance inchallenging market circumstances was underscored by an improved market position in all countries. InBelgium, commercial campaigns promoting Individual Life products continued to increase new businessthrough the banking and broker channels, resulting in 12% growth compared with 2006. In TheNetherlands, inflow decreased by 10% in 2007 due principally to a group insurance contract (EUR 0.7billion) concluded in the fourth quarter of 2006 not repeated in 2007. Excluding this contract, inflowincreased by 14% despite adverse market conditions, due to a strong focus on both individual and GroupLife products. Growth of 22% in International was attributable to growth in all countries, but was achievedmainly on product innovation such as the introduction of twelve new investment products, efforts inPortugal which grew by 19% and the entry in 2007 into new markets.
Life technical result decreased to EUR 230 million in 2007 from EUR 638 million in 2006 due tothe impact of the turmoil in the capital markets (which resulted in the write-down of certain assetsincluding financial result and capital gains allocated to technical result by EUR 1,547 million) andadditional liabilities related to unit-linked policies in The Netherlands. Life technical result was higher in2007 in International, where the technical result almost doubled due to volume growth (EUR 38 million in2006 to EUR 74 million in 2007) and the continued focus on higher margin products, particularly inPortugal. Life technical result, however, declined to a loss in Insurance Netherlands in 2007 compared to2006 and lower profitability in Insurance Belgium in 2007 compared to 2006.
Net profit increased to EUR 1,222 million in 2007, an increase of 32% from EUR 925 million in2006, due to strong commercial growth, capital gains and a lower effective tax rate, offsetting theabovementioned events affecting the Life technical result.
2006 Compared to 2005
Gross inflow at Life increased by 6% in 2006 to EUR 12,125 million (EUR 9,147 million of grossearned premiums and EUR 2,978 million of revenues from investment contracts) from EUR 11,481million in 2005 (EUR 8,256 million of gross earned premiums plus EUR 3,225 million of revenues frominvestment contracts), benefiting from an exceptionally large group life contract in The Netherlands in thefourth quarter involving EUR 710 million. Excluding this contract, growth in The Netherlands (3%) andBelgium (4%) was offset by lower inflows in Portugal, resulting from the decision to favor returns overvolumes in that country. Life technical result in 2006 declined 8% to EUR 638 million from EUR 691million in 2005. The main reason for this decline was due to higher commission expenses, includingpayment of a EUR 75 million result related commission to Retail Bank. As allocated capital gainsremained the same in 2006 and 2005 (EUR 206 million) life operating margin also declined by 5% in2006.
Insurance Life — European Embedded Value and Value Added by New Business
The Embedded Value of life insurance operations provides additional information on the value ofthe contracts in force and the value of new business.
2007 Compared to 2006
After taking into account opening adjustments (including the divestiture of CaiFor), the EmbeddedValue increased by 8% to EUR 13.6 billion before dividends from an opening value of EUR 10.6 billion asof the end of 2006. This increase was mainly driven by a strong contribution of Value Added by NewBusiness (VANB) and higher interest rates, which offset a drop in asset values and impairments on fixedincome investments, such as CDOs. For the insurance business, rising interest rates supported an increasein value as a result of a natural mismatch between assets and liabilities with a longer duration.
178
Level: 6 – From: 6 – Wednesday, May 14, 2008 – 1:37 pm – g5mac4 – 3960 Section 06 : 3960 Section 06

After the dividend payment to Fortis, Embedded Value reached EUR 12.4 billion at year-end 2007.
2006 Compared to 2005
After taking into account opening adjustments, the Embedded Value before dividends increased by27% to EUR 13.5 billion from a restated opening value of EUR 10.6 billion as of the end of 2005. Thisincrease is mainly driven by a strong VANB up 24%, compared to last year and higher investment returnsdue to higher interest rates and strong growth in shares values which returns were higher than theassumptions in the model.
After the dividend payment to Fortis, Embedded Value was EUR 12.3 billion at year-end 2006.
Insurance Life — Value Added by New Business
2007 Compared to 2006
The VANB increased by 6% from EUR 327 million in 2006 to EUR 345 million in 2007 due tohigher volumes and margins which were in turn driven by the successful bank campaigns in Belgium,product innovation efforts in Portugal and sales through the bank channel in France. Difficult marketcircumstances depressed unit-linked sales in The Netherlands, causing a slight decrease in the VANB.
2006 Compared to 2005
The VANB is calculated applying the same Market Consistent approach as used for calculating thetotal EV. The volume of new Life business is measured by the (market consistent) Present Value of NewBusiness Premiums (“PVNBP”). In order to allow for comparison, the VANB and PVNBP 2006 werecalculated applying the traditional method. The traditional method is based on cash flows using real worldinvestment return assumptions and discounted at a discount rate of 7.2% which is the ten year risk freereturn plus 300 basis points equity risk premium. On a traditional basis the VANB increased by 24% fromEUR 300 million in 2005 to EUR 373 million in 2006 driven mainly by higher volumes at InsuranceInternational and higher average margins. The higher margins are due mainly to an increase in investmentmargins at Insurance Belgium funded from the risk premium on shares and property. Although theseincreases in margins are not recognized up front under the market consistent approach, the marketconsistent VANB increased further to EUR 377 million or 26% higher compared to 2005, because of otheradjustments, notably the reduction in the cost of capital. The overall New Business margin under themarket consistent methodology was 3.33%.
179
Level: 6 – From: 6 – Wednesday, May 14, 2008 – 1:37 pm – g5mac4 – 3960 Section 06 : 3960 Section 06
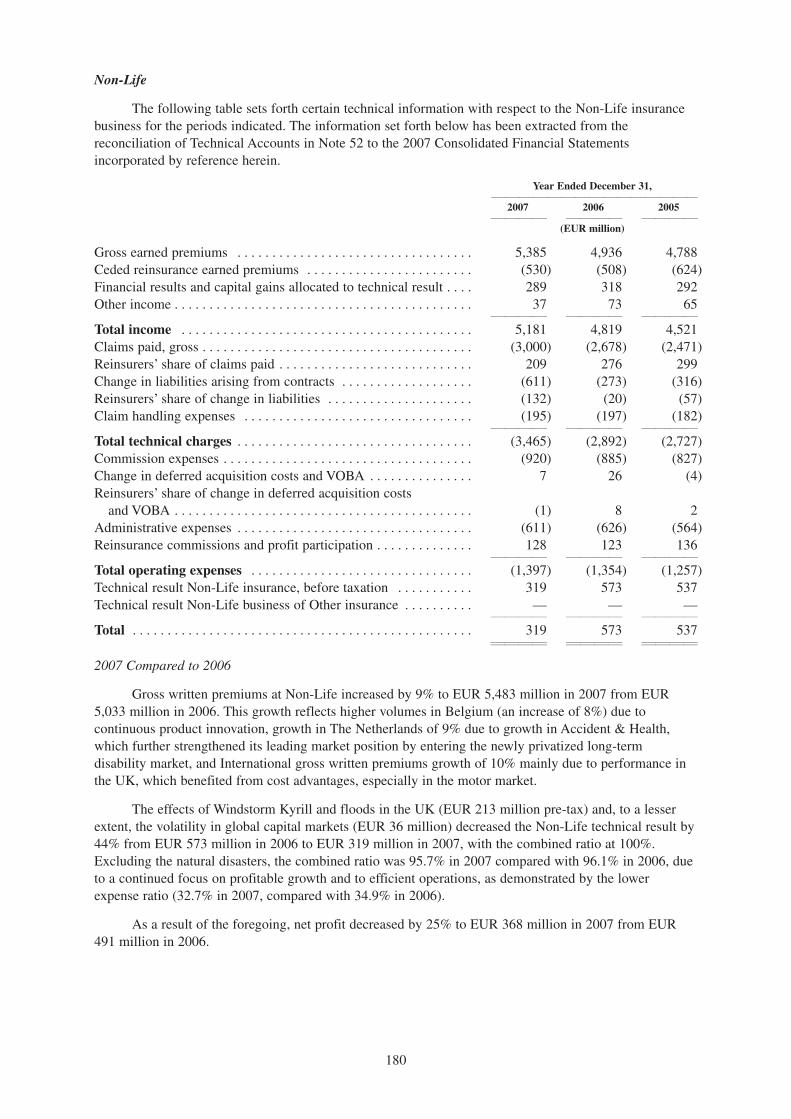
Non-Life
The following table sets forth certain technical information with respect to the Non-Life insurancebusiness for the periods indicated. The information set forth below has been extracted from thereconciliation of Technical Accounts in Note 52 to the 2007 Consolidated Financial Statementsincorporated by reference herein.
Year Ended December 31,1111111111111123
2007 2006 20051111 1111 1111
(EUR million)
Gross earned premiums . . . . . . . . . . . . . . . . . . . . . . . . . . . . . . . . . . 5,385 4,936 4,788Ceded reinsurance earned premiums . . . . . . . . . . . . . . . . . . . . . . . . (530) (508) (624)Financial results and capital gains allocated to technical result . . . . 289 318 292Other income . . . . . . . . . . . . . . . . . . . . . . . . . . . . . . . . . . . . . . . . . . . 37 73 65
1111 1111 1111
Total income . . . . . . . . . . . . . . . . . . . . . . . . . . . . . . . . . . . . . . . . . . 5,181 4,819 4,521Claims paid, gross . . . . . . . . . . . . . . . . . . . . . . . . . . . . . . . . . . . . . . . (3,000) (2,678) (2,471)Reinsurers’ share of claims paid . . . . . . . . . . . . . . . . . . . . . . . . . . . . 209 276 299Change in liabilities arising from contracts . . . . . . . . . . . . . . . . . . . (611) (273) (316)Reinsurers’ share of change in liabilities . . . . . . . . . . . . . . . . . . . . . (132) (20) (57)Claim handling expenses . . . . . . . . . . . . . . . . . . . . . . . . . . . . . . . . . (195) (197) (182)
1111 1111 1111
Total technical charges . . . . . . . . . . . . . . . . . . . . . . . . . . . . . . . . . . (3,465) (2,892) (2,727)Commission expenses . . . . . . . . . . . . . . . . . . . . . . . . . . . . . . . . . . . . (920) (885) (827)Change in deferred acquisition costs and VOBA . . . . . . . . . . . . . . . 7 26 (4)Reinsurers’ share of change in deferred acquisition costs
and VOBA . . . . . . . . . . . . . . . . . . . . . . . . . . . . . . . . . . . . . . . . . . . (1) 8 2Administrative expenses . . . . . . . . . . . . . . . . . . . . . . . . . . . . . . . . . . (611) (626) (564)Reinsurance commissions and profit participation . . . . . . . . . . . . . . 128 123 136
1111 1111 1111
Total operating expenses . . . . . . . . . . . . . . . . . . . . . . . . . . . . . . . . (1,397) (1,354) (1,257)Technical result Non-Life insurance, before taxation . . . . . . . . . . . 319 573 537Technical result Non-Life business of Other insurance . . . . . . . . . . — — —
1111 1111 1111
Total . . . . . . . . . . . . . . . . . . . . . . . . . . . . . . . . . . . . . . . . . . . . . . . . . 319 573 5371111 1111 11111111 1111 1111
2007 Compared to 2006
Gross written premiums at Non-Life increased by 9% to EUR 5,483 million in 2007 from EUR5,033 million in 2006. This growth reflects higher volumes in Belgium (an increase of 8%) due tocontinuous product innovation, growth in The Netherlands of 9% due to growth in Accident & Health,which further strengthened its leading market position by entering the newly privatized long-termdisability market, and International gross written premiums growth of 10% mainly due to performance inthe UK, which benefited from cost advantages, especially in the motor market.
The effects of Windstorm Kyrill and floods in the UK (EUR 213 million pre-tax) and, to a lesserextent, the volatility in global capital markets (EUR 36 million) decreased the Non-Life technical result by44% from EUR 573 million in 2006 to EUR 319 million in 2007, with the combined ratio at 100%.Excluding the natural disasters, the combined ratio was 95.7% in 2007 compared with 96.1% in 2006, dueto a continued focus on profitable growth and to efficient operations, as demonstrated by the lowerexpense ratio (32.7% in 2007, compared with 34.9% in 2006).
As a result of the foregoing, net profit decreased by 25% to EUR 368 million in 2007 from EUR491 million in 2006.
180
Level: 6 – From: 6 – Wednesday, May 14, 2008 – 1:37 pm – g5mac4 – 3960 Section 06 : 3960 Section 06

2006 Compared to 2005
Gross written premiums at Non-Life increased 5% to EUR 5,033 million in 2006 compared to EUR4,775 million. This growth reflected higher volumes at International and Belgium, which more thancompensated for a slight decline in The Netherlands resulting from the decision not to participate in theprice war in medical expenses insurance. All product segments contributed to year-on-year volume growth.Sustained above-market growth rates in Belgium and the successful affinity marketing strategy in the UKpushed up gross earned premiums at Property & Casualty by 4% in 2006. Gross earned premiums atAccident & Health were 3% higher in 2006 compared to 2005, benefiting from strong healthcare growthin Belgium and commercial campaigns for health products in Portugal.
Non-Life operating margin improved 5% to EUR 606 million in 2006 from EUR 576 million in2005. The improvement in operating margin was in line with the Non-Life technical result which rose 7%to EUR 573 million in 2006 compared to EUR 537 million in 2005, mainly due to volume growth and astable combined ratio of 96.1%. The increase was attributable to Accident & Health and Motor in TheNetherlands, which more than compensated for lower results at Fire. The Dutch Accident & Health linehad an exceptionally strong combined ratio of 82.5%, primarily the result of selective underwriting and abenign claims environment. For Fortis as a whole, the combined ratio for Property & Casualty increasedonly slightly from 97.1% in 2005 to 98.4% in 2006, with better technical results at Motor failing to fullyoffset the higher claim frequency at Fire. Fortis Corporate Insurance continued its strong underwritingperformance. As a result of the foregoing, net profit grew 4% to EUR 496 million in 2006 from EUR 477million in 2005.
The following tables set forth the technical result of Fortis’s non-life operations by business line andprincipal product line for the periods indicated.
Accident Property & Casualty 2007and 11111111111111234 1111
Health Motor Fire Other Total1111 1111 1111 1111 1111
(EUR million)
Insurance Netherlands . . . . . . . . . . . . . . 169 22 3 5 199Insurance Belgium . . . . . . . . . . . . . . . . . 50 54 5 9 118Insurance International . . . . . . . . . . . . . 13 (8) (43) 40 2
1111 1111 1111 1111 1111
Total . . . . . . . . . . . . . . . . . . . . . . . . . . . . 232 68 (35) 54 3191111 1111 1111 1111 11111111 1111 1111 1111 1111
Accident Property & Casualty 2006and 11111111111111234 1111
Health Motor Fire Other Total1111 1111 1111 1111 1111
(EUR million)
Insurance Netherlands . . . . . . . . . . . . . . 192 38 27 15 272Insurance Belgium . . . . . . . . . . . . . . . . . 39 54 30 6 129Insurance International . . . . . . . . . . . . . 12 57 65 38 172
1111 1111 1111 1111 1111
Total . . . . . . . . . . . . . . . . . . . . . . . . . . . . 243 149 122 59 5731111 1111 1111 1111 11111111 1111 1111 1111 1111
Accident Property & Casualty 2005and 11111111111111234 1111
Health Motor Fire Other Total1111 1111 1111 1111 1111
(EUR million)
Insurance Netherlands . . . . . . . . . . . . . . 146 18 39 20 223Insurance Belgium . . . . . . . . . . . . . . . . . 47 62 29 1 139Insurance International . . . . . . . . . . . . . 16 53 67 39 175
1111 1111 1111 1111 1111
Total . . . . . . . . . . . . . . . . . . . . . . . . . . . . 209 133 135 60 5371111 1111 1111 1111 11111111 1111 1111 1111 1111
181
Level: 6 – From: 6 – Wednesday, May 14, 2008 – 1:37 pm – g5mac4 – 3960 Section 06 : 3960 Section 06

Insurance Investments
The following table sets forth the carrying amount of the components of the investment portfolio ofFortis’s insurance operations at the dates indicated. Land and buildings are valued at cost less depreciationand impairments. Equity securities, debt securities and investments related to unit-linked contracts arevalued at market value at the end of the relevant period. See Note 19 of the Notes to the 2007Consolidated Financial Statements incorporated by reference in this Prospectus.
Year Ended December 31,1111111111111123
2007 2006 20051111 1111 1111
(EUR million)
Land and buildings . . . . . . . . . . . . . . . . . . . . . . . . . . . . . . . . . . . . . . 2.984 2,447 2,144Equity securities . . . . . . . . . . . . . . . . . . . . . . . . . . . . . . . . . . . . . . . . 8.941 10,239 8,448Debt securities and other fixed-income securities . . . . . . . . . . . . . . 53.660 50,553 46,090Investments in equity associates and joint ventures . . . . . . . . . . . . . 548 548 476Other investments(1) . . . . . . . . . . . . . . . . . . . . . . . . . . . . . . . . . . . . . . 593 560 633
1111 1111 1111
Subtotal . . . . . . . . . . . . . . . . . . . . . . . . . . . . . . . . . . . . . . . . . . . . . . 66,726 64,347 57,7911111 1111 1111
Investments related to unit-linked contracts . . . . . . . . . . . . . . . . . . . 31,395 28,865 25,9071111 1111 1111
Total investments . . . . . . . . . . . . . . . . . . . . . . . . . . . . . . . . . . . . . . . 98,121 93,212 83,6981111 1111 11111111 1111 1111
(1) Includes participations in investment pools, excluding investments in associates and joint ventures.
The following table sets forth the direct income from investments (excluding realized capital gains)of the Fortis insurance operations by asset category for the years indicated. See the Consolidated FinancialStatements incorporated by reference in this Prospectus.
Year Ended December 31,11441111111111111111111111111111234
2007 2006 200511111111134 111111111344 1111111113444
Pre-Tax Pre-Tax Pre-TaxIncome Yield(1) Income Yield(1) Income Yield(1)
1111 1111 1111 1111 1111 1111
(EUR million, except %)
Land and buildings . . . . . . 279 10.3% 263 11.5% 258 12.6%Equity securities . . . . . . . . 279 2.9% 270 2.9% 226 3.1%Debt securities and other
fixed-income securities . 2,426 4.7% 2,095 4.3% 1,903 4.5%Investments in equity
associates and joint ventures . . . . . . . . . . . . 94 17.2% 112 21.9% 82 10.4%
Other investments(2) . . . . . 318 — 262 — 253 —1111 1111 1111 1111 1111 1111
Subtotal . . . . . . . . . . . . . . 3,396 5.2% 3,002 4.9% 2,722 5.1%1111 1111 1111 1111 1111 1111
Investments for account of policyholders(3) . . . . . 626 2.1% 1,949 7.1% 3,255 15.2%
1111 1111 1111 1111 1111 1111
Total income investments(4) . . . . . . . . 4,022 4.2% 4,951 5.6% 5,977 8.0%
1111 1111 1111 1111 1111 11111111 1111 1111 1111 1111 1111
(1) Pre-tax yield is calculated using interest, rental, dividend and other income received for each period, divided by the average ofbeginning and year-end balances on related assets. It does not include realized capital gains (other than under “Investments foraccount of policyholders”).
(2) Includes income from participations in investment pools and Interparking.
(3) Any revaluation of shares that belong to this category is taken to the profit and loss account as investment income for account ofpolicyholders, including realized and unrealized revaluations of shares.
(4) Equal to the sum of “investment income” and “realized/unrealized gains on investments on behalf of policyholders”.
182
Level: 6 – From: 6 – Wednesday, May 14, 2008 – 1:37 pm – g5mac4 – 3960 Section 06 : 3960 Section 06
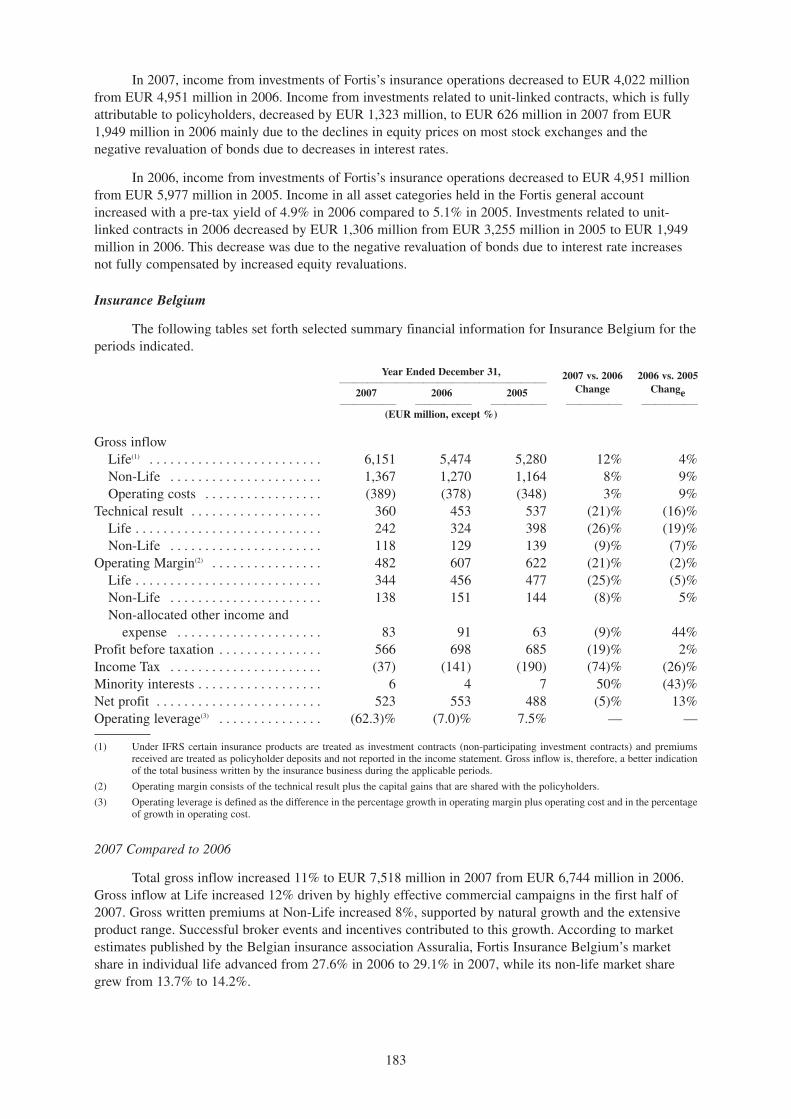
In 2007, income from investments of Fortis’s insurance operations decreased to EUR 4,022 millionfrom EUR 4,951 million in 2006. Income from investments related to unit-linked contracts, which is fullyattributable to policyholders, decreased by EUR 1,323 million, to EUR 626 million in 2007 from EUR1,949 million in 2006 mainly due to the declines in equity prices on most stock exchanges and thenegative revaluation of bonds due to decreases in interest rates.
In 2006, income from investments of Fortis’s insurance operations decreased to EUR 4,951 millionfrom EUR 5,977 million in 2005. Income in all asset categories held in the Fortis general accountincreased with a pre-tax yield of 4.9% in 2006 compared to 5.1% in 2005. Investments related to unit-linked contracts in 2006 decreased by EUR 1,306 million from EUR 3,255 million in 2005 to EUR 1,949million in 2006. This decrease was due to the negative revaluation of bonds due to interest rate increasesnot fully compensated by increased equity revaluations.
Insurance Belgium
The following tables set forth selected summary financial information for Insurance Belgium for theperiods indicated.
Year Ended December 31, 2007 vs. 2006 2006 vs. 200511111111111111234
2007 2006 2005 Change Change1111 1111 1111 1111 1111
(EUR million, except %)
Gross inflowLife(1) . . . . . . . . . . . . . . . . . . . . . . . . . 6,151 5,474 5,280 12% 4%Non-Life . . . . . . . . . . . . . . . . . . . . . . 1,367 1,270 1,164 8% 9%Operating costs . . . . . . . . . . . . . . . . . (389) (378) (348) 3% 9%
Technical result . . . . . . . . . . . . . . . . . . . 360 453 537 (21)% (16)%Life . . . . . . . . . . . . . . . . . . . . . . . . . . . 242 324 398 (26)% (19)%Non-Life . . . . . . . . . . . . . . . . . . . . . . 118 129 139 (9)% (7)%
Operating Margin(2) . . . . . . . . . . . . . . . . 482 607 622 (21)% (2)%Life . . . . . . . . . . . . . . . . . . . . . . . . . . . 344 456 477 (25)% (5)%Non-Life . . . . . . . . . . . . . . . . . . . . . . 138 151 144 (8)% 5%Non-allocated other income and
expense . . . . . . . . . . . . . . . . . . . . . 83 91 63 (9)% 44%Profit before taxation . . . . . . . . . . . . . . . 566 698 685 (19)% 2%Income Tax . . . . . . . . . . . . . . . . . . . . . . (37) (141) (190) (74)% (26)%Minority interests . . . . . . . . . . . . . . . . . . 6 4 7 50% (43)%Net profit . . . . . . . . . . . . . . . . . . . . . . . . 523 553 488 (5)% 13%Operating leverage(3) . . . . . . . . . . . . . . . (62.3)% (7.0)% 7.5% — —
(1) Under IFRS certain insurance products are treated as investment contracts (non-participating investment contracts) and premiumsreceived are treated as policyholder deposits and not reported in the income statement. Gross inflow is, therefore, a better indicationof the total business written by the insurance business during the applicable periods.
(2) Operating margin consists of the technical result plus the capital gains that are shared with the policyholders.
(3) Operating leverage is defined as the difference in the percentage growth in operating margin plus operating cost and in the percentageof growth in operating cost.
2007 Compared to 2006
Total gross inflow increased 11% to EUR 7,518 million in 2007 from EUR 6,744 million in 2006.Gross inflow at Life increased 12% driven by highly effective commercial campaigns in the first half of2007. Gross written premiums at Non-Life increased 8%, supported by natural growth and the extensiveproduct range. Successful broker events and incentives contributed to this growth. According to marketestimates published by the Belgian insurance association Assuralia, Fortis Insurance Belgium’s marketshare in individual life advanced from 27.6% in 2006 to 29.1% in 2007, while its non-life market sharegrew from 13.7% to 14.2%.
183
Level: 6 – From: 6 – Wednesday, May 14, 2008 – 1:37 pm – g5mac4 – 3960 Section 06 : 3960 Section 06

Operating costs rose by only 3% in 2007 to EUR 389 million compared with 2006 (EUR 378million), while total gross inflow increased 11%. Fortis Insurance Belgium continues to be one of the mostcost-efficient insurers in the market as cost-efficiency ratios improved further. The number of FTEsincreased by 2% from 5,182 in 2006 to 5,298 in 2007, in line with hiring targets set to accommodate thebusiness’s ongoing strong growth.
Net profit at Fortis Insurance Belgium was EUR 523 million in 2007, a 5% decrease from EUR 552million in 2006. The decrease is attributable in part to losses associated with Windstorm Kyrill whichreduced Non-Life technical result and the turmoil on the capital markets, offset in part by improvedoperational performance and net capital gains.
2006 Compared to 2005
Gross inflow at Life increased 4% (EUR 5.5 billion in 2006 compared to EUR 5.3 billion in 2005)and at Non-Life 9% (EUR 1.3 billion in 2006 compared to EUR 1.2 billion in 2005). According to marketestimates published by Assuralia, Fortis Insurance Belgium’s market share in individual life advanced from20% in 2005 to 28% in 2006, while its non-life market share grew from 13% to 14%.
Operating margin decreased by 2% or EUR 15 million to EUR 607 million due to the result relatedcommission payable to Retail Bank of EUR 87 million for the first time in 2006, not fully compensated byhigher allocated capital gains of EUR 69 million.
Operating costs rose by 9% due to volume growth and expenses related to the integration of FortisAG and FB Insurance which was sold to Insurance Belgium by Fortis Bank in the third quarter of 2006.Volume growth also drives the increase in the number of FTEs from 5,003 to 5,182. The number of FTEsemployed by Fortis Insurance Belgiums subsidiary Interparking, which is part of Fortis Real Estate, grewby 76 as a result of acquisitions in Spain and new car parks at German railway stations following a dealwith Deutsche Bahn. The number of FTEs employed by the insurance operations went up by 103, in linewith hiring targets set to accommodate the business’s ongoing strong growth.
Net profit at Fortis Insurance Belgium was EUR 553 million in 2006, an increase of 13% comparedwith 2005. Net profit increased despite the EUR 83 million result-related commission paid to Fortis RetailBank, introduced in 2006. This amount was more than offset by higher net capital gains and a lower taxrate (due to the capital gains mix).
Insurance Belgium — Life
Year Ended December 31, 2007 vs. 2006 2006 vs. 200511111111111111234
2007 2006 2005 Change Change1111 1111 1111 1111 1111
(EUR million)
Gross earned premiums . . . . . . . . . . . . . 4,971 4,353 4,139 14% 5%Investment contracts without DPF . . . . 1,180 1,121 1,141 5% (2)%Gross inflow . . . . . . . . . . . . . . . . . . . . . . 6,151 5,474 5,280 12% 4%Technical result . . . . . . . . . . . . . . . . . . 242 324 398 (25)% (19)%Allocated capital gains . . . . . . . . . . . . . 102 132 80 (23)% 65%Operating margin . . . . . . . . . . . . . . . . 344 456 478 (25)% (5)%Non-allocated other income and
charges . . . . . . . . . . . . . . . . . . . . . . . . 83 74 67 12% 10%Profit before income tax . . . . . . . . . . . . 427 530 545 (19)% (3)%Income tax . . . . . . . . . . . . . . . . . . . . . . . 3 (93) (147) — (37)%Minority interests . . . . . . . . . . . . . . . . . . 5 3 6 67% (50)%Net profit . . . . . . . . . . . . . . . . . . . . . . . . 425 434 392 (2)% 11%
New business life — APE . . . . . . . . . . . 585 510 494 15% 3%
184
Level: 6 – From: 6 – Wednesday, May 14, 2008 – 1:37 pm – g5mac4 – 3960 Section 06 : 3960 Section 06

The following table sets forth certain information regarding premiums received by InsuranceBelgium’s life business.
Year Ended December 31,1111111111111123
2007 2006 20051111 1111 1111
(EUR million)
Regular premiums . . . . . . . . . . . . . . . . . . . . . . . . . . . . . . . . . . . . . . . 1,230 1,191 1,567Single premiums . . . . . . . . . . . . . . . . . . . . . . . . . . . . . . . . . . . . . . . . 3,741 3,164 2,571Annualized premium equivalent (APE) . . . . . . . . . . . . . . . . . . . . . . 585 511 494Value Added by New Business(1) . . . . . . . . . . . . . . . . . . . . . . . . . . . . 207 189 164
(1) Market consistent approach excluding result related commissions to Fortis Bank.
2007 Compared to 2006
Revenues. Gross inflow at Life increased 12% to EUR 6,151 million, in 2007 from EUR 5,474million in 2006. The increase was attributable to successful savings campaigns by Fortis Bank whichdistributes Fortis Insurance Belgium’s products as well as successful campaigns through the brokerchannels in early 2007 and the savings campaign during the summer months of 2007.
Funds under management at Life increased 9% to EUR 42.1 billion in 2007 from EUR 38.5 millionin 2006 due to successful savings campaigns utilizing both the bancassurance and broker channels.
According to Assuralia (Belgian Insurance Association) statistics on Life insurance published inDecember 2007 Fortis Insurance Belgium consolidated its market leadership position in both Individualand Group Life. In Individual Life, Fortis Insurance Belgium increased its market share to 32% at the endof the third quarter of 2007 from 25% in the corresponding period in 2006. Comparing the first ninemonths of 2007 with the same period in 2006, Fortis Insurance Belgium grew 36% in Individual Life,while the market excluding Fortis Insurance Belgium decreased by 1%.
Total individual life inflow through the banking channel increased 15% to EUR 3,571 million in2007 from EUR 3,103 million in 2006, due to a record inflow in the first half of 2007 and the SummerHeat campaign. Inflow in savings increased 20%, mainly due to FIP Profit Plus, a principal protectionproduct offering a higher profit-sharing potential with 0% guarantee.
Sales of individual unit-linked products through the banking channel increased by 7% comparedwith 2006 despite the volatile financial market environment. Growth was mainly attributable to safe funds,which implemented a loss-limiting investment approach as they switched from shares to cash when stockmarkets declined based on a dynamic asset allocation model.
Sales through the broker channel increased 10% to EUR 1,609 million in 2007 from EUR 1,462million in 2006. The increase was attributable to savings-products, which grew 16% compared with 2006.Growth at the broker channel was driven mainly by certain savings products, most of which are principalprotection products.
Group life insurance inflow increased 7% to EUR 970 million in 2007 from EUR 904 million in2006. Single premiums increased by 18% (from EUR 3,164 million to EUR 3,741 million) while regularpremiums increased by 3% (from EUR 1,191 million to EUR 1,230 million). In addition to significantinflows from new clients, Fortis Insurance Belgium benefited from the strong growth of Ascento Deposit,a recently launched capitalization product.
Profit before income tax. Despite a 12% increase in gross inflow, which included volume growth inboth Individual and Group Life, the technical result at Life decreased by EUR 82 million to EUR 242million in 2007 from EUR 324 million in 2006, largely due to the impact of turmoil on the capital markets(which reduced investment income by EUR 102 million). The 2006 technical result benefited from therealization of a large, one-off real estate development project.
185
Level: 6 – From: 6 – Wednesday, May 14, 2008 – 1:37 pm – g5mac4 – 3960 Section 06 : 3960 Section 06
Net profit. Net profit at Life was EUR 425 million, in 2007, compared with EUR 434 million in2006. The decrease in net profit was attributable to the lower technical result, which was largely offset byevent-driven capital gains, equity sales triggered by protection techniques (“CPPI model”), (see RiskManagement—Market Risk in Insurance—ALM risk: Currency risk”) and the positive tax effect ensuingfrom the capital gains mix (a tax benefit of EUR 3 million in 2007 and a tax-expense of EUR 93 million in2006.
2006 Compared to 2005
Revenues. Gross inflow at Life increased 4% to EUR 5,474 million in 2006 compared to EUR 5,280million in 2005. Total inflow was split between individual life insurance, EUR 4,570 million, representing83% of total inflow, and EUR 904 million in group life in 2006 compared to EUR 4,347 million inindividual life insurance, representing 82% of total inflow and EUR 933 million in group life in 2005.
New production, expressed as Annual Premium Equivalent (APE) increased to EUR 511 million,3% higher than in 2005. The APE for individual unit-linked business grew by 18% and remained stable inindividual non-unit-linked business. Group life APE increased by 17% compared with last year. Fundsunder management rose 9% to EUR 38.5 billion at the end of 2006 compared to EUR 35.3 billion at theend of 2005.
Individual life insurance inflow in 2006 represented a 5% increase over 2005. This increase was incontrast with a decline in inflow experienced by the Belgian individual life insurance market in 2006.According to Assuralia’s estimates, the total individual life market in Belgium contracted by 22% in 2006.Anticipation of a 1.1% premium tax on most individual life insurance contracts introduced in 2006, causedinflow in the market in the final quarter of 2005 to increase materially as described above, consequentlydepressing inflow in 2006. Fortis Insurance Belgium overcame this market trend, recording higher inflowin 2006 than in 2005. The growing appetite for our successful 0%-guarantee products and our innovativeproduct development — combining unit-linked and traditional features — both contributed to this strongperformance.
Total individual life inflow through the bank channel increased by 2% to EUR 3,103 million in2006, of which EUR 145 million was sold through Bank van De Post. New products introduced in 2005and 2006, such as Target Invest Plan and Planning for Pension, represented 20% of total bank channelinflow in 2006. The broker channel accounted for EUR 1,467 million of life insurance inflow in 2006, up10% compared to 2005.
Sales of individual unit-linked contracts advanced 8% to EUR 1,067 million in 2006, with salesthrough the bank channel growing by 5% and through the broker channel by 20%. 12% of the total inflowfrom unit-linked contracts was generated by products offering a minimum capital guarantee. Inflow inindividual traditional life — insurance products with a guaranteed interest rate — rose by 3% to EUR3,504 million in 2006, mostly driven by the broker channel. Fifty-five percent of the new traditionalbusiness in the broker channel offers a 0% interest rate guarantee.
Group life insurance inflow decreased by 3% to EUR 904 million in 2006 compared to EUR 933million in 2005, mainly due to product reclassification. According to the Assuralia 2006 Annual Report,the Belgian group life market expanded only by 0.5% in 2006 (including first pillar group life insuranceresults). Fortis Insurance Belgium’s growth in group life was mainly driven by second-pillar insurancewhich recorded year-on-year growth of 8%. FBI’s growth rate was higher than the overall second pillarmarket growth of 7%. Second pillar insurance is the market for pensions on top of the state pension plan,taken out by companies for their employees. With a market share of 22%, Fortis Insurance Belgium wasthe leader in group life second-pillar insurance.
Profit before income tax. The technical result at Life decreased by 19% to EUR 324 million in 2006from EUR 398 million in 2005, due to the payment of the result-related commission to the bank channelfollowing the transfer of FB Insurance to Insurance Belgium, which was only partly offset by a gainrelated to the completion of a real estate development project. Excluding the internal commission paid toFortis Retail Bank, the technical result in 2006 remained stable compared with 2005. Higher allocated
186
Level: 6 – From: 6 – Wednesday, May 14, 2008 – 1:37 pm – g5mac4 – 3960 Section 06 : 3960 Section 06

capital gains increased the operating margin to EUR 456 million in 2006, down 4% in 2005. Excluding theresult-related commission, the operating margin grew by 11%. Profit before income tax decreased 3% toEUR 530 million in 2006 from EUR 545 million in 2005.
Net Profit. Net profit for Insurance Belgium Life was EUR 434 million in 2006 compared to EUR392 million in 2005. The increase in net profit (in contrast to the decline in technical results) was due tolower income tax (EUR 93 million in 2006 and EUR 147 million in 2005) due to the nature of the realizedcapital gains which were not taxable.
Insurance Belgium Life — Embedded Value and Value Added by New Business
2005 (traditional2007 2006 based)
1111 1111 1111
(EUR million)(unaudited)
EEV before dividend payment . . . . . . . . . . . . . . . . . . . . . . . . . . . . . 5,834 5,406 4,405VANB . . . . . . . . . . . . . . . . . . . . . . . . . . . . . . . . . . . . . . . . . . . . . . . . 207 240 164PVNBP . . . . . . . . . . . . . . . . . . . . . . . . . . . . . . . . . . . . . . . . . . . . . . . 5,305 5,169 4,837
2007 Compared to 2006
The EV (before dividends) of Fortis Insurance Belgium rose 8% to EUR 5,834 million in 2007compared with EUR 5,406 million in 2006, mainly due to a strong contribution of new business and thepositive effect of increased interest rates, which more than offset the underperformance of capital markets.Measured on a market consistent methodology, VANB increased by 9% to EUR 207 million in 2007 fromEUR 189 million in 2006. The increase was mainly driven by increased sales of savings products, boththrough the bank and broker channel.
2006 Compared to 2005
The EV (before dividends) of Insurance Belgium rose 23% to EUR 5,406 million in 2006 comparedwith EUR 4,405 million in 2005.
The market consistent VANB increased to EUR 189 million or 15% compared to 2005, because ofother adjustments, notably the reduction in the cost of capital. New business margin (VANB divided byPVNBP) was 3.66% in 2006. Measured on a traditional basis VANB increased by 46% to EUR 240million in 2006 from EUR 164 million in 2005 principally due to higher average margins. The highermargins were due mainly to an increase in investment margins attributable to a change in investment mix,more shares and property.
187
Level: 6 – From: 6 – Wednesday, May 14, 2008 – 1:37 pm – g5mac4 – 3960 Section 06 : 3960 Section 06

Insurance Belgium — Non-Life
Year Ended December 31, 2007 vs. 2006 2006 vs. 200511111111111111234
2007 2006 2005 Change Change1111 1111 1111 1111 1111
(EUR million)
Gross written premiums . . . . . . . . . . . . 1,367 1,269 1,164 8% 9%1111 1111 11111111 1111 1111
Technical result . . . . . . . . . . . . . . . . . . 118 129 139 (9)% (7)%Allocated capital gains . . . . . . . . . . . . . 20 22 5 (10)% —
1111 1111 1111
Operating margin . . . . . . . . . . . . . . . . 138 151 144 (11)% 5%1111 1111 1111
Non-allocated other income and charges . . . . . . . . . . . . . . . . . . . . . . . . 1 17 (4) (94)% —
1111 1111 1111
Profit before income tax . . . . . . . . . . . . 139 168 140 (17)% 20%1111 1111 1111
Income tax . . . . . . . . . . . . . . . . . . . . . . . (40) (48) (43) (17)% 12%Minority interests . . . . . . . . . . . . . . . . . . 1 1 1 0% —Net profit . . . . . . . . . . . . . . . . . . . . . . . . 98 119 96 (18)% 24%
1111 1111 11111111 1111 1111
Non-Life total:Claims ratio . . . . . . . . . . . . . . . . . . . . . . 63.7% 61.6% 60.2% — —Expense ratio . . . . . . . . . . . . . . . . . . . . . 36.7 37.4% 36.9% — —
1111 1111 1111
Combined ratio . . . . . . . . . . . . . . . . . . . 100.4% 99.0% 97.1% — —Property & Casualty:Claims ratio . . . . . . . . . . . . . . . . . . . . . . 57.0% 52.7% 52.3% — —Expense ratio . . . . . . . . . . . . . . . . . . . . . 42.2% 43.1% 42.2% — —
1111 1111 1111
Combined ratio . . . . . . . . . . . . . . . . . . . 99.2% 95.8% 94.5% — —1111 1111 11111111 1111 1111
Accident & Health:Claims ratio . . . . . . . . . . . . . . . . . . . . . . 80.1% 83.3% 79.8% — —Expense ratio . . . . . . . . . . . . . . . . . . . . . 23.2% 23.6% 23.6% — —
1111 1111 1111
Combined ratio . . . . . . . . . . . . . . . . . . . 103.2% 106.9 103.4% — —1111 1111 11111111 1111 1111
The following table shows gross premiums written by product line for the Insurance Belgium Non-Life business for the periods indicated.
Year Ended December 31, 2007 vs. 2006 2006 vs. 200511111111111111234
2007 2006 2005 Change Change1111 1111 1111 1111 1111
(EUR million)
Accident & Health . . . . . . . . . . . . . . . . . 393 366 331 7% 11%Property & Casualty . . . . . . . . . . . . . . . 974 903 833 8% 8%
1111 1111 1111
Total . . . . . . . . . . . . . . . . . . . . . . . . . . . . 1,367 1,269 1,164 8% 9%1111 1111 11111111 1111 1111
2007 Compared to 2006
Gross written premiums at Non-life increased by 8% to EUR 1,367 million in 2007 from EUR1,269 million in 2006, mainly due to the motor and fire business lines. This increase was achieved whilemaintaining sound underwriting and pricing practices. Assuralia data published in December 2007 showthat the Non-life business outperformed the market’s growth. During 2007, Fortis Insurance Belgium’sNon-life business grew by 8%. Consequently, Fortis Insurance Belgium increased its market share from13.7% at the end of 2006 to 14.2% at the end of 2007.
188
Level: 6 – From: 6 – Wednesday, May 14, 2008 – 1:37 pm – g5mac4 – 3960 Section 06 : 3960 Section 06

Non-life gross written premiums through the banking channel increased by 6% to EUR 198 millionin 2007. Non-life products sold through the broker channel increased by 9% to EUR 861 million in 2007from EUR 790 million in 2006. The innovative product range, with flexible multi-cover concepts such as“Familis” and “Modulis”, and “Packs” for the retail and SME markets, which offer extended insurancecover for a specific group of risks for a small additional premium, strongly supported this growth. As ofDecember 31, 2007, the Modulis portfolio consisted of 60,300 files (7,900 files were added during 2007),which represents 229,400 policies with an average of 2.3 insurance covers per file. As of December 31,2007, Fortis Familis’ portfolio amounted to 382,900 files (of which 53,200 were added during 2007),representing 883,300 policies. The generic Packs, launched at the end of 2004 (“Pack Auto+” and “PackWoning+”), continued to be very successful. A number of new Packs were officially launched during thebroker road shows in December 2006, such as the “Safety Pack” and “Building Pack”. In 2007, a numberof specific packs were launched both for the retail and SME market (such as “Pack Dentist” and “PackBackery”). At year-end 2007, the number of Packs in portfolio stood at 170,000 (net growth of 80,000Packs over 2007).
Profit before income tax. The technical result at Non-life decreased 9% to EUR 118 million in 2007from EUR 129 million in 2006 due to Windstorm Kyrill (EUR 45 million pre-tax impact). ExcludingWindstrom Kyrill, the technical result would have increased from EUR 128 million in 2006 to EUR 162million in 2007, due to volume growth and operational excellence.
Net profit. Net profit at Non-Life decreased by EUR 21 million from EUR 119 million in 2006 toEUR 98 million in 2007, due to the impact of Windstrom Kyrill.
The combined ratio at Non-life, including Workmen’s Compensation, was 100.4%, compared with99.0% in 2006, and was severely affected by Windstorm Kyrill. Excluding the impact of Windstrom Kyrill,the combined ratio would have been 94.2%.
2006 Compared to 2005
Gross written premiums at Non-Life increased by 9% to EUR 1,269 million in 2006 from EUR1,164 million in 2005 due to strong growth at Accident & Health, mainly due to large group healthcontracts, and to Fire because of the introduction of compulsory natural disaster cover. InsuranceBelgium’s growth rate was more than double the market which, according to Assuralia statistics, expandedby just over 4% in 2006.
Non-Life business distributed through the banking channel grew by 10% to EUR 212 million in2006 compared to EUR 193 million in 2005.
Accident & Health experienced strong growth, as premium income increased by 11% to EUR 366million in 2006 mainly due to large group health contracts. Growth of 12% at Fire — ending the year withan inflow of EUR 400 million — was largely due to the introduction of compulsory natural disaster cover.Excluding this factor, underlying growth in the Property & Casualty segment was 5% in 2006 compared to2005.
Non-Life business sold through the broker channel grew by 7% to EUR 1,057 million. Our strongrelationship with the broker community, reflected in the excellent results of the ICMA broker satisfactionsurvey, helped us to maintain healthy growth without sacrificing our underwriting or pricing criteria. Ourinnovative product offering, including flexible multi-cover concepts such as Familis and Modulis,sustained a solid growth rate. There were nearly 330,000 Familis policies, with an average of 2.3 contractseach, at the end of 2006, a 26% increase compared with 2005. The Modulis concept aimed at the SMEmarket represented more than 52,000 contracts, 20% more than in 2005, with the average number ofcontracts at 3.7. We strengthened our product offering with the introduction of insurance packages aimedat the specific needs of targeted client segments.
Profit before income tax. The technical result decreased by 7% to EUR 129 million in 2006 fromEUR 139 million in 2005, chiefly due to the result-related commission payable to Fortis Retail Bank.Other elements that had a minor negative impact on the technical results were lower positive run-offs from
189
Level: 6 – From: 6 – Wednesday, May 14, 2008 – 1:37 pm – g5mac4 – 3960 Section 06 : 3960 Section 06

previous underwriting years, reserve strengthening in disability insurance, and higher costs related to theactivities for the integration of Fortis AG and FB Insurance and to volume growth. Operating margin,however, reached EUR 151 million, an increase of 5% due to higher levels of allocated capital gains.Together with an increase of EUR 21 million of non-allocated other income and charges (EUR 17 millionin 2006 and EUR (4) million in 2005), profit before income tax increased 20% to EUR 168 million in2006 from EUR 140 million in 2005.
Net profit. Net profit at Non-Life increased 24% to EUR 119 million in 2006 compared with EUR96 million in 2005. This improvement was principally due to the higher net profit before tax for thereasons cited and a lower effective tax rate with respect to non-allocated other income and chargesoffsetting the lower technical result.
The combined ratio was 99.0% for 2006, up from 97.1% in 2005. Excluding the long tail Workers’Compensation insurance business, the combined ratio was 96.3% (94.9% in 2005). The claims ratio onpolicies sold during 2006, excluding Workers’ Compensation, was 62.7%, lower than the 2005 claims ratioof 63.5%, indicating that the quality of the policies in force remains high.
The combined ratio for Workers’ Compensation deteriorated slightly to 120%, compared with 112%in 2005. This high figure, however, does not indicate that this segment is unprofitable. The high reserve-to-premium ratio and the long duration of this business means that the sizeable financial revenues onWorkers’ Compensation provisions should be taken into account when assessing profitability.
The following table shows the technical result by product line for the Insurance Belgium non-lifebusiness for the periods indicated.
Year Ended December 31,11441111111111111111111111111111234
2007 2006 200511111111134 111111111344 1111111113444
Accident Property Accident Property Accident Property& Health & Casualty & Health & Casualty & Health & Casualty1111 1111 1111 1111 1111 1111
(EUR million)
Insurance Belgium . . . . . . — — — — — —Technical Result . . . . . . . . 50 68 39 90 47 92
190
Level: 6 – From: 6 – Wednesday, May 14, 2008 – 1:37 pm – g5mac4 – 3960 Section 06 : 3960 Section 06

Insurance Netherlands
The following tables set forth selected summary financial information for Insurance Netherlands forthe periods indicated.
Year Ended December 31, 2007 vs. 2006 2006 vs. 200511111111111111234 1111 1111
2007 2006 2005 Change Change1111 1111 1111 1111 1111
(EUR million)
Gross inflowLife(1) . . . . . . . . . . . . . . . . . . . . . . . . . 3,108 3,437 2,635 (10)% 30%Non-Life . . . . . . . . . . . . . . . . . . . . . . 2,111 1,943 1,968 9% (1)%
Technical result . . . . . . . . . . . . . . . . . . 113 548 516 — 6%Life . . . . . . . . . . . . . . . . . . . . . . . . . . . (86) 276 293 — (6)%Non-Life . . . . . . . . . . . . . . . . . . . . . . 199 272 223 (28)% 22%
Operating Margin . . . . . . . . . . . . . . . . 473 596 605 (21)% (1)%Life . . . . . . . . . . . . . . . . . . . . . . . . . . . 230 315 355 (27)% (11)%Non-Life . . . . . . . . . . . . . . . . . . . . . . 243 281 250 (14)% 12%Non-allocated other income and
expense . . . . . . . . . . . . . . . . . . . . . 543 214 146 — 47%Profit before taxation and minority
interests . . . . . . . . . . . . . . . . . . . . . . . 1,016 810 751 25% 8%Income Tax . . . . . . . . . . . . . . . . . . . . . . 111 (179) (214) — (16)%Minority interests . . . . . . . . . . . . . . . . . . 16 7 3 — —Net profit . . . . . . . . . . . . . . . . . . . . . . . . 889 624 534 42% 17%Operating leverage(2) . . . . . . . . . . . . . . . — (0.5)% 6.9% — —Operating costs . . . . . . . . . . . . . . . . . . . (561) (553) (556) 1% (1)%
(1) Under IFRS certain insurance products are treated as investment contracts (non-participating investment contracts) and premiumsreceived are treated as policyholder deposits and not reported in the income statement. Gross inflow is, therefore, a better indicationof the total business written by the insurance business during the applicable periods.
(2) Operating leverage is defined as the difference in the percentage growth in operating margins plus operating expense and in thepercentage of growth in operating expenses.
2007 Compared to 2006
Revenues. Life gross written premiums decreased by 10% from EUR 3,437 million in 2006 to EUR3,108 million in 2007. All insurance contracts written in The Netherlands are treated as insurance policiesunder IFRS. 2006 was favorably impacted by an exceptional group Life contract of EUR 710 million. Ifthis contract is excluded gross written premiums would have increased by 14%. Non-Life gross writtenpremiums increased from EUR 1,943 million in 2006 to EUR 2,111 million in 2007. Higher businessvolumes at Life were attributable to pension-related contracts, higher business volumes at Non-Life wereprincipally due to Accident & Health entering new markets.
Operating costs in 2007 increased slightly by 1% despite investments in growth initiatives, such asnew concepts of multi-channel distribution. Investments were also made in IT and processes in order tocomply with the changing regulatory environment, such as the implementation of the Pension Act 2007 atGroup Life.
The number of FTEs increased 10% from 4,210 at the end of 2006 to 4,626 at the end of 2007,partly due to the inclusion of employees of SOS International (118 FTEs) as from the first quarter of 2007and the filling of vacancies.
Net profit. Net profit at Fortis Insurance Netherlands increased 42%, from EUR 624 million in 2006to EUR 889 million in 2007, due to higher result at Life. Both Life and Non-Life profited from asignificantly higher investment result due mainly to higher capital gains on equity. Higher investmentresult at Life in 2007 offset the impact of the turmoil on the global capital markets and additionalliabilities related to unit-linked policies. Non-Life was also affected by the global capital markets turmoiland by Windstorm Kyrill in early 2007.
191
Level: 6 – From: 6 – Wednesday, May 14, 2008 – 1:37 pm – g5mac4 – 3960 Section 06 : 3960 Section 06

2006 Compared to 2005
Revenues. Life recorded growth in gross earned premiums of 30% (EUR 3,437 million in 2006 andEUR 2,635 million in 2005). All insurance contracts written in The Netherlands are treated as insurancepolicies under IFRS. This increase included one exceptional group life contract of EUR 710 millionreceived in the fourth quarter of 2006. Excluding this contract, life gross earned premium income wouldhave increased by 3.5% in 2006 compared to 2005.
Non-Life gross written premiums decreased about 1% in 2006 compared to 2005 due mainly tolower Accident & Health premiums.
Total operating margin declined 1% in 2006 compared to 2005 as a 12% increase in Non-Lifeoperating margin was more than offset by an 11% decline in operating margin for the life business. Thedecline in Life was due to the allocation method for investment income resulting in lower technical resultand lower operating margin but in higher non-allocated other income and expenses.
Operating costs remained tightly under control, benefiting from the integration of Fortis ASR,which was completed in 2006. Despite wage drift, volume growth and the first-time full-year consolidationof SOS International (specialist in worldwide emergency medical and travel assistance) in the fourthquarter, operating costs declined 1% to EUR 553 million in 2006 from EUR 556 million in 2005.Excluding the SOS-related expenses, operating costs fell by 3%. The number of FTEs stood at 4,210 at theend of 2006, down 5% on year-end 2005 (4,416), excluding 236 FTEs who are now employed by GroupResources.
Net Profit. Net profit at Fortis Insurance Netherlands increased to EUR 624 million in 2006, up17% compared with 2005 (EUR 534 million). This increase was due to an excellent combined ratio forNon-Life, a robust performance at Life, taking into consideration the change in allocation method, tightcost control and lower average taxes, partly offset by lower capital gains.
Insurance Netherlands — Life
Year Ended December 31, 2007 vs. 2006 2006 vs. 200511111111111111234
2007 2006 2005 Change Change1111 1111 1111 1111 1111
(EUR million)
Gross earned premiums(1) . . . . . . . . . . . . 3,108 3,437 2,635 (10)% 30%Technical result . . . . . . . . . . . . . . . . . . . (86) 276 293 — (6)%Allocated capital gains . . . . . . . . . . . . . 316 39 62 — (37)%Operating margin . . . . . . . . . . . . . . . . . . 230 315 355 (24)% (11)%Non-allocated other income and
charges . . . . . . . . . . . . . . . . . . . . . . . . 511 198 74 — 168%Profit before income tax . . . . . . . . . . . . 741 513 429 44% 20%Income tax . . . . . . . . . . . . . . . . . . . . . . . (67) (101) (122) (34)% (17)%Minority interests . . . . . . . . . . . . . . . . . . 16 7 3 — 133%Net profit . . . . . . . . . . . . . . . . . . . . . . . . 658 405 304 62% 33%
(1) All contracts written in The Netherlands are treated as insurance contracts under IFRS (not investment contracts) due to the structureof products (transfer of risk).
192
Level: 6 – From: 6 – Wednesday, May 14, 2008 – 1:37 pm – g5mac4 – 3960 Section 06 : 3960 Section 06

The following table sets forth certain information regarding premiums received by InsuranceNetherlands Life business for each of the years indicated.
Year Ended December 31,1111111111111123
2007 2006 20051111 1111 1111
(EUR million)
Regular premiums . . . . . . . . . . . . . . . . . . . . . . . . . . . . . . . . . . . . . . . 1,746 1,772 1,686Single premiums . . . . . . . . . . . . . . . . . . . . . . . . . . . . . . . . . . . . . . . . 1,362 1,666 949Annualized premium equivalent (APE) . . . . . . . . . . . . . . . . . . . . . . 313 275 250Value Added by New Business(1) . . . . . . . . . . . . . . . . . . . . . . . . . . . . 77 50 45
(1) Based on a market consistent approach.
2007 Compared to 2006
Revenues. Gross earned premiums at Life rose 14% to EUR 3,108 million in 2007 (after excludingthe Group Life co-assurance contract of EUR 710 million received in 2006) from EUR 2,727 million in2006. Including the group contract Life gross earned premiums declined by 10%. The increase in grossearned premiums was driven mainly by Group Life (almost doubling inflow to EUR 754 million in 2007,excluding the significant one-time premium received in 2006), which benefited from the strategy offocusing on the pension business as a key area. Individual Life premiums, for regular as well as singlepremiums, remained stable compared with 2006.
A number of initiatives were taken to support growth. The new pension organization, which nowhandles both the administration and marketing and sales activities, concluded several new large pension-related contracts. Fortis Insurance Netherlands increased its market share of new regular individual Lifepolicies gradually over the year from 15.1% in 2006 to 16.9% in 2007. A successful marketing campaign –the “sixties campaign” (focusing on maturing policies of older clients) – contributed to further growth.Ardanta, a specialist label in funeral insurance, entered the Belgium market in 2007, benefiting from thedistribution experience of Fortis Bank Belgium. The Dutch market for unit-linked products was affected bythe debate on transparency of unit-linked products, which significantly reduced the market’s appetite forunit-linked products.
In line with market developments in The Netherlands, new mortgage production was below the levelof 2006. The refinancing market in particular was adversely impacted by rising interest rates, resulting inlower new business volumes. In addition, Fortis Insurance Netherlands declined to compete onunprofitable underwriting in a competitive market. As a result, the production of new mortgages was 33%lower than in 2006. This had a negative impact on the production of mortgage-related Life insuranceproducts, resulting in lower regular new business premiums.
Profit before income tax. The technical result decreased from a profit of EUR 276 million in 2006to a loss of EUR 86 million negative in 2007. This drop was caused by the global capital markets turmoil(EUR 151 million before taxes) and additional liabilities related to unit-linked policies.
Net profit. Net profit increased 62% to EUR 658 million in 2007, from EUR 405 million in 2006mainly due to exceptionally high net capital gains on equity resulting from capital gains triggered byportfolio protection techniques (“CPPI”) (see “Risk Management—Market Risk in Insurance—ALM risk:Currency risk”) and market events.
2006 Compared to 2005
Revenues. Gross earned premiums at Life increased 30% to EUR 3,437 million in 2006 (2005: EUR2,635 million) in a competitive market, due mainly to an exceptionally large group life co-assurancecontract of EUR 710 million received in the fourth quarter of 2006. Excluding this contract, total grossearned premiums would have increased by 3.5%.
193
Level: 6 – From: 6 – Wednesday, May 14, 2008 – 1:37 pm – g5mac4 – 3960 Section 06 : 3960 Section 06

Individual life premiums in traditional and unit-linked contracts grew by 6% in 2006 from EUR2,211 million in 2005 to EUR 2,343 million in 2006.
Group life gross earned premiums increased by 671 million to 1,094 million in 2006 from 423million in 2005 due to the new contract discussed above.
In 2006, Fortis Insurance Netherlands continued to follow its strategy of writing new businesswhere it was able to maintain new business margins, while investing in bank and tied agents distributionmodels. New regular premiums increased by 5% to EUR 1,772 million in 2006 compared with EUR 1,686million in 2005. Regular premium products generally have better business margins than single premiumproducts.
This increase can be attributed to Fortis Insurance Netherlands emphasis on bancassurance (retailbank distribution) which resulted in premium equivalent APE through this distribution channel increasingby 37% to EUR 22 million. Excellent growth of 80% was realized in the production of mortgage-relatedlife insurance products, supported by the introduction in the fourth quarter of 2005 of a new, innovativeproduct in the mortgages segment specially designed for first-time homeowners with bright careerprospects. The increase in single premiums from EUR 949 million in 2005 to EUR 1,666 million in 2006was principally due to the large group contract discussed above.
The value of new production — expressed as APE — increased by 10% compared to 2005 andreached EUR 275 million in 2006 mainly due to good sales of traditional products.
Profit before income tax. The technical result life (EUR 293 million in 2005 and EUR 276 millionin 2006) and operating margin (EUR 355 million in 2005 and EUR 315 million in 2006) both declined in2006. The decline in life technical result of 6% was due to changes in allocation of investment incomebetween life and non-life and between technical result and non-allocated other income and expenses.Notwithstanding such declines, profit before income tax increased by 20% to EUR 513 million in 2006from EUR 429 million in 2005. Such increase was attributable to non-allocated other income and chargesof EUR 198 million in 2006, a EUR 124 million increase over 2005 (EUR 74 million). This increase wasmainly due to the changes in allocation of investment income noted above.
Net profit. Our focus on profitable premium growth and higher investment income (growing fundsunder management), together with a lower effective tax rate, lifted net profit 33% to EUR 405 million in2006 compared to EUR 304 million in 2005.
Insurance Netherlands Life — Embedded Value and Value Added by New Business
2007 2006 20051111 1111 1111
(EUR million)(unaudited)
EEV before dividend payment . . . . . . . . . . . . . . . . . . . . . . . . . . . . . 6,709 6,802 6,016VANB . . . . . . . . . . . . . . . . . . . . . . . . . . . . . . . . . . . . . . . . . . . . . . . . 77 85 45PVNBP . . . . . . . . . . . . . . . . . . . . . . . . . . . . . . . . . . . . . . . . . . . . . . . 2,777 2,344 2,044
2007 Compared to 2006
Fortis Insurance Netherlands’ market consistent EV (before dividends) increased by 1% to EUR6,709 million in 2007 due to higher interest rates, favorable development in cost assumptions and thecontribution of VANB.
On a market consistent basis the VANB decreased by 9% from EUR 85 million in 2006 to EUR 77million in 2007. Volumes (sales, APE) and VANB improved in all product lines except in Individual unit-linked. As a result of market circumstances relating to unit-linked products, sales decreased which resultedin a drop in VANB.
194
Level: 6 – From: 6 – Wednesday, May 14, 2008 – 1:37 pm – g5mac4 – 3960 Section 06 : 3960 Section 06

2006 Compared to 2005
The EV (before dividends) increased by 13% to EUR 6,802 million in 2006. All components,including VANB, expected return and better than anticipated results from investments, contributed to thisresult.
On a market consistent basis, the VANB increased to EUR 85 million in 2006 reflecting therelatively low risk profile of the products and the reduction in cost of capital. On this basis, the newbusiness margin (expressed as VANB divided by PVNBP) increased 122 basis points to 3.64% in 2006compared to 2005. Measured on a traditional basis, the VANB increased by 9% to EUR 50 million in 2006from EUR 45 million in 2005. The increase can be attributed to improved margins as a result of animproved business mix, lower taxes and higher investment income.
Insurance Netherlands — Non-Life
Year Ended December 31, 2007 vs. 2006 2006 vs. 200511111111111111234
2007 2006 2005 Change Change1111 1111 1111 1111 1111
(EUR million, except %)
Gross written premiums . . . . . . . . . . . . 2,111 1,944 1,969 9% (2)%Technical result . . . . . . . . . . . . . . . . . . 199 272 223 (27)% 22%Allocated capital gains . . . . . . . . . . . . . 44 9 27 — (68)%
1111 1111 1111
Operating margin . . . . . . . . . . . . . . . . 243 281 250 (14)% 12%1111 1111 1111
Non-allocated other income and charges 16 . . . . . . . . . . . . . . . . . . . . . 33 16 72 — (78)%
1111 1111 1111
Profit before income tax and minority interests . . . . . . . . . . . . . . . 275 297 322 (7)% (8)%
1111 1111 1111
Income tax . . . . . . . . . . . . . . . . . . . . . . . (44) (78) (92) 44% (15)%1111 1111 1111
Minority interests . . . . . . . . . . . . . . . . . . 0 0 0 — —1111 1111 1111
Net profit . . . . . . . . . . . . . . . . . . . . . . . . 231 219 230 5% (5)%1111 1111 11111111 1111 1111
Non-Life total:Claims ratio . . . . . . . . . . . . . . . . . . . . . . 59.2% 55.8% 57.3%Expense ratio . . . . . . . . . . . . . . . . . . . . . 33.3% 34.8% 34.9%
1111 1111 1111
Combined ratio . . . . . . . . . . . . . . . . . . . 92.5% 90.6% 92.2%1111 1111 11111111 1111 1111
Property & Casualty:Claims ratio . . . . . . . . . . . . . . . . . . . . . . 54.5% 53.4% 52.8%Expense ratio . . . . . . . . . . . . . . . . . . . . . 44.7% 44.1% 42.4%
1111 1111 1111
Combined ratio . . . . . . . . . . . . . . . . . . . 99.1% 97.5% 95.2%1111 1111 11111111 1111 1111
Accident & Health:Claims ratio . . . . . . . . . . . . . . . . . . . . . . 63.8% 58.6% 62.4%Expense ratio . . . . . . . . . . . . . . . . . . . . . 22.2% 23.9% 26.4%
1111 1111 1111
Combined ratio . . . . . . . . . . . . . . . . . . . 86.0% 82.5% 88.8%1111 1111 11111111 1111 1111
195
Level: 6 – From: 6 – Wednesday, May 14, 2008 – 1:37 pm – g5mac4 – 3960 Section 06 : 3960 Section 06
8 The calculation of the Tier 1 capital ratio and CAD ratio for regulatory purposes was only applicable as from January 1, 2006. TheDecember 31, 2005 calculation is only given for comparative purposes.

The following table shows gross written premiums by product line for the Insurance NetherlandsNon-Life business for the periods indicated.
Year Ended December 31,1111111111111123
2007 2006 20051111 1111 1111
(EUR million)
Accident & Health . . . . . . . . . . . . . . . . . . . . . . . . . . . . . . . . . . . . . . 1,130 966 993Property & Casualty . . . . . . . . . . . . . . . . . . . . . . . . . . . . . . . . . . . . . 981 978 976
1111 1111 1111
Total . . . . . . . . . . . . . . . . . . . . . . . . . . . . . . . . . . . . . . . . . . . . . . . . . 2,111 1,944 1,9691111 1111 11111111 1111 1111
2007 Compared to 2006
Revenues. Gross written premiums increased by 9% to EUR 2,111 million in 2007 from EUR 1,944million in 2006 mainly due to Fortis Insurance Netherlands entering new markets. All major business linescontributed to this increase (accident & health grew 17%, motor grew 1% and fire grew 2%), due tosuccessful marketing campaigns, new distribution models (internet and direct distribution) and several newfeatures resulting from product innovation. An example is “contract manager”, a digital tool that offersbrokers and employers a total overview of all pension (Life) and income protection (Non-life) insurancepolicies and the option to manage their portfolio simply and efficiently.
The growth of the accident & health business was consistent with Fortis Insurance Netherlands’strategy and driven mainly by the income-protection specialist label De Amersfoortse. Several marketingcampaigns, like the “three-in-one” promotion (similar to the pack products in Belgium) increased newbusiness volumes. The three-in-one campaign sets out for employers and their intermediaries theconvenience, financial benefits and service offered by the combination of three employer products forsickness benefit insurance (“verzuimverzekering”), disability insurance for companies who bear the risk forpartially disabled employees (“WGA Eigen Risico”) and recovery and reintegration services forsick/disabled employees (“arbeidsdienstverlening”). In the privatized long-term disability market, FortisInsurance Netherlands captured a major share of the businesses that opted for private WGA insurance.Lapses decreased in individual disability, largely owing to a retention program. Without lowering margins,market share was regained in the medical expenses market. Premiums in property & casualty, especially inmotor, were under pressure in 2007 due to aggressive pricing strategies which kept premiums flat year onyear.
Net profit before income tax. The technical result at Non-life decreased 27% to EUR 199 million in2007 from EUR 272 million in 2006. The lower result was due to the impact of Windstorm Kyrill in thefirst quarter (EUR 19 million before taxes), the impact of the global capital markets turmoil in the secondhalf of 2007 (EUR 36 million before taxes), a higher number of fire claims in 2007 and the effect ofrelatively low entrance premiums in the newly privatized long-term disability market of WGA EigenRisico. In anticipation of the full privatization of the WGA expected in the future and cross-sellopportunities with other areas (such as sickness benefit insurance, WGA shortfall insurance, WIA top-upinsurance and pensions), we consider it important to have a sizeable share of the employers’ market. Theinvestments required to compete with the public Employee Insurance Administration (“UWV”) could leadto long-term profitability, provided that they can be combined with effective claims control.
A sustained strong commercial performance, reflected in higher business volumes, combined withstrict cost control helped decrease the expense ratio at Non-life from 34.8% in 2006 to 33.3% in 2007. Theclaims ratio increased from 55.8% in 2006 to 59.2% in 2007 due to several factors influencing thetechnical result, such as Windstorm Kyrill. The combined ratio was 92.5% compared with 90.6% in 2006.
Net profit. Net profit in Non-life 2007 increased 5% to EUR 231 million in 2007 from EUR 219million in 2006. Higher capital gains and a lower average tax rate more than offset the negative impact ofWindstorm Kyrill and the global capital markets turmoil.
196
Level: 6 – From: 6 – Wednesday, May 14, 2008 – 1:37 pm – g5mac4 – 3960 Section 06 : 3960 Section 06

2006 Compared to 2005
Revenues. Gross written premiums were EUR 1,944 million in 2006, flat compared to the 2005figure despite substantially lower premiums in the medical expenses line. The Dutch health insurancesystem was privatized in 2006, creating fierce pricing competition in the medical expenses business line.Fortis Insurance Netherlands decided to include medical expenses in its integrated Accident & Healthproduct offering and not to compete in the price war. Excluding the decline in medical expenses, grosswritten premiums would have risen by 3%. Gross written premium at Accident & Health remained stable,driven by an increase in disability offset by lower gross written premiums in medical expenses. The rise ingross written premiums for disability was favorably influenced by new products introduced in anticipationof legislative amendments and lower lapses.
Motor experienced stiff price competition, though this only had a minor effect on premiums atFortis Insurance Netherlands (decrease of 2% in gross written premiums), mainly due to successfulmarketing campaigns, new distribution models and several new features. Gross written Fire premiumsremained virtually stable at EUR 315 million in 2006 compared to EUR 322 million in 2005.
Net profit before income tax. The technical result at Non-Life improved 22% to EUR 272 million in2006 from EUR 223 million in 2005. This improvement was reflected in the operating margin at Non-Lifewhich increased 12% to EUR 281 million in 2006 from EUR 250 million in 2005. The lower percentageincrease is due to a lower level of allocated capital gains (EUR 27 million in 2005 and EUR 9 million in2006). These improvements were also impacted by the changes in allocation of investment income.
The higher technical result was evidenced in the combined ratio for Non-Life which remained lowat 90.6% (2005: 92.2%). This ratio was predominantly driven by an enhanced performance of the Accident& Health portfolio, lowering the claims ratio to 58.6% (2005: 62.4%). Fortis Insurance Netherlandssucceeded in reducing sickness leave periods of insured employees, thereby improving this segment’sprofitability. Despite a negative one- off influence, relating to decreased settlement time for personal injuryclaims following the so-called Tilburg Agreement, the Motor claims ratio in 2006 improved to 58.0%(2005: 61.7%).
The selective underwriting process that Fortis Insurance Netherlands implemented in the years priorto 2006 and controlled cost growth contributed to Non-Life’s continuing improvements in technical results.
Notwithstanding these factors, profit before income tax declined by 8% to EUR 297 million in 2006from EUR 322 million in 2005, mainly due to high capital gains realized in 2005 that were not repeated in2006. The 6% decrease in life technical result was due to changes in allocation of investment incomebetween life and non-life and between technical result and non-allocated other income and expenses.
Net profit. Net profit in Non-Life declined by 5% to EUR 219 million in 2006 from EUR 230million in 2005, mainly due to the higher capital gains realized in 2005.
The following table shows the technical result by product line for the Insurance Netherlands Non-Life business for the periods indicated.
Year Ended December 31,11441111111111111111111111111111234
2007 2006 200511111111134 111111111344 1111111113444
Accident Property Accident Property Accident Property& Health & Casualty & Health & Casualty & Health & Casualty1111 1111 1111 1111 1111 1111
(EUR million)
Insurance Netherlands Technical result . . . . . . 169 30 192 80 146 77
197
Level: 6 – From: 6 – Wednesday, May 14, 2008 – 1:37 pm – g5mac4 – 3960 Section 06 : 3960 Section 06

Insurance International
The following table sets forth selected summary financial information for Insurance Internationalfor the periods indicated.
Year Ended December 31, 2007 vs. 2006 2006 vs. 200511111111111111234
2007 2006 2005 Change Change1111 1111 1111 1111 1111
(EUR million)
Gross inflow Life . . . . . . . . . . . . . . . . . . 3,911 3,214 3,567 22% (10)%Non-Life . . . . . . . . . . . . . . . . . . . . . . . . 2,005 1,820 1,642 10% 11%Technical result . . . . . . . . . . . . . . . . . . 76 210 175 (64)% 20%Life . . . . . . . . . . . . . . . . . . . . . . . . . . . . . 74 38 0 95% —Non-Life . . . . . . . . . . . . . . . . . . . . . . . . 2 172 175 (99)% (2)%Operating Margin . . . . . . . . . . . . . . . . 106 214 206 (50)% 4%Life . . . . . . . . . . . . . . . . . . . . . . . . . . . . . 99 40 25 — 60%Non-Life . . . . . . . . . . . . . . . . . . . . . . . . 7 174 181 (96)% (4)%Non-allocated other income and
charges . . . . . . . . . . . . . . . . . . . . . . . . 86 129 90 (33)% 43%Profit before taxation . . . . . . . . . . . . . . 192 343 296 44% 16%Income Tax . . . . . . . . . . . . . . . . . . . . . . (35) (70) (69) (50)% 1%Net gain on discontinued operations(2) . . 1,013 — — — —Minority interests . . . . . . . . . . . . . . . . . . 42 30 24 40% 25%Net profit . . . . . . . . . . . . . . . . . . . . . . . . 1,128 243 203 — 20%Operating leverage(1) . . . . . . . . . . . . . . . 68.3% (4.6)% 31.3% — —Operating costs . . . . . . . . . . . . . . . . . . . (462) (411) (353) 12% 16%
(1) Operating leverage is defined as the difference in the percentage growth in operating margins plus operating expense and in thepercentage of growth in operating expenses.
(2) CaiFor has been reclassified to Discontinued operations; figures for 2006 and 2007 are now reported excluding CaiFor.
2007 Compared to 2006
Revenues. Gross inflow at life for the consolidated companies increased 22% to EUR 3,911 millionin 2007 from EUR 3,214 million in 2006. This increase was attributable to various growth initiatives suchas continued successful product development under the Freedom of Services Act in Luxembourg,bancassurance sales in France, gain of market share in the UK, and completion of the PCI acquisition inHong Kong (re-branded Fortis Insurance Company Asia (FICA)). Gross inflow at the non-consolidatedjoint ventures (on a 100% basis) increased by 24% to EUR 2,683 million in 2007, driven by growth inChina and Thailand.
Operating costs increased 12% to EUR 462 million in 2007 from EUR 411 million in 2006, duemainly to the inclusion of newly acquired companies in Europe and Asia.
Net profit. Net profit for 2007 was exceptionally high because of the capital gain on the CaiFordivestment (EUR 947 million). Excluding this capital gain, net profit was EUR 181 million in 2007compared with EUR 243 million in 2006. Net profit for the period at Life increased 98% to EUR 119million in 2007 from EUR 60 million in 2006. The cost of investments in new European markets wereoffset by overall growth in funds under management to EUR 20.1 billion in 2007, a higher profitcontribution from Asian joint ventures and the consolidation of newly acquired FICA (as from May 2007).Natural disasters (Windstorm Kyrill in the first quarter and floods in the United Kingdom in June and July)severely depressed Fortis Insurance International’s Non-Life net profit for the period, which was EUR 38million in 2007 compared with EUR 152 million in 2006.
2006 Compared to 2005
Revenues. Gross inflow at life for the consolidated international companies was EUR 3.2 billion, adecline of EUR 0.4 billion. Non-Life gross inflow offset this decline in part, increasing from EUR 1.6
198
Level: 6 – From: 6 – Wednesday, May 14, 2008 – 1:37 pm – g5mac4 – 3960 Section 06 : 3960 Section 06

billion to EUR 1.8 billion. Including the companies accounted for using the equity method (consisting ofthe life insurance operations in Spain, Malaysia, China and Thailand) on a 100% basis (hereafter referredto as “on a 100% basis”), total gross inflow increased 17% to EUR 3.9 billion with excellent sales inChina and Thailand and reflecting a successful acquisition in Malaysia.
Operating costs rose to EUR 411 million in 2006 from EUR 353 million as a result of the furtherimplementation of the growth strategy and continued investment in growth.
Total operating margin increased 4% in 2006 to EUR 214 million from EUR 206 million in 2005 asa slight decline in Non-Life operating margin was offset by an improvement in life.
Net Profit. Net profit improved 20% to EUR 243 million in 2006 (2005: EUR 203 million). Theincrease in net profit was principally due to Life activities (up 63% to EUR 85 million in 2006), driven bythe Asian operations. Non-Life net profit climbed 5% mainly due to continued effective underwriting andsound risk management.
Life
Life Insurance International — Life
Year Ended December 31, 2007 vs. 2006 2006 vs. 200511111111111111234
2007 2006 2005 Change Change1111 1111 1111 1111 1111
(EUR million)
Gross earned premiums . . . . . . . . . . . . . 1,611 1,357 1,482 19% (8)%Investment contracts without DPF(1) . . . 2,300 1,857 2,084 24% (11)%
1111 1111 1111
Gross inflow(2) . . . . . . . . . . . . . . . . . . . . 3,911 3,214 3,566 22% (10)%1111 1111 11111111 1111 1111
Technical result . . . . . . . . . . . . . . . . . . 74 38 — 95% —Allocated capital gains . . . . . . . . . . . . . 25 2 25 — (92)%
1111 1111 1111
Operating margin . . . . . . . . . . . . . . . . 99 40 25 — 60%1111 1111 11111111 1111 1111
Non-allocated other income and charges . . . . . . . . . . . . . . . . . . . . . . . . 46 78 50 (41)% 56%
1111 1111 1111
Profit before income tax and minority interests . . . . . . . . . . . . . . . 145 118 75 23% 57%
1111 1111 11111111 1111 1111
Income tax . . . . . . . . . . . . . . . . . . . . . . . (26) (10) (9) — 11%Result on discontinued operations . . . . . 826Minority interests . . . . . . . . . . . . . . . . . . 33 23 14 43% 64%Net profit before results on
divestments . . . . . . . . . . . . . . . . . . . . 139 — — — —1111 1111 1111
Results on divestments . . . . . . . . . . . . . 773 — — — —1111 1111 1111
Net profit . . . . . . . . . . . . . . . . . . . . . . . . 912 85 52 — 63%1111 1111 1111
New business life — APE . . . . . . . . . . . 478 387(2) 535 (13)% 3%1111 1111 11111111 1111 1111
(1) Under IFRS certain insurance products are treated as investment contracts (non-participating investment contracts) and premiumsreceived are treated as policyholder deposits and not reported in the income statement. Gross inflow is, therefore, a better indicationof the total business written by the insurance business during the applicable periods.
(2) CaiFor has been reclassified to Discontinued operations; figures for 2006 and 2007 periods are now reported excluding CaiFor.
199
Level: 6 – From: 6 – Wednesday, May 14, 2008 – 1:37 pm – g5mac4 – 3960 Section 06 : 3960 Section 06

The following table sets forth certain information regarding premiums received by InsuranceInternational Life business for each of the years indicated.
Year Ended December 31,1111111111111123
2007 2006 20051111 1111 1111
(EUR million)
Regular premiums . . . . . . . . . . . . . . . . . . . . . . . . . . . . . . . . . . . . . . . 665 496 462Single premiums . . . . . . . . . . . . . . . . . . . . . . . . . . . . . . . . . . . . . . . . 945 862 1,020Annualized premium equivalent (APE) . . . . . . . . . . . . . . . . . . . . . . 478 550 535Value Added by New Business(1) . . . . . . . . . . . . . . . . . . . . . . . . . . . . 62(2) 84 91
(1) Based on a market consistent approach.
(2) Restated to eliminate CaiFor.
2007 Compared to 2006
Revenues. Total gross inflow at fully consolidated Life companies increased by 22% from EUR3,214 million in 2006 to EUR 3,911 million in 2007. The strategy to develop innovative products, alignedto a multi-channel distribution approach, was successful in all countries and contributed significantly toinflow. Millenniumbcp Fortis in Portugal increased penetration rates among clients of the bank distributionpartner. Despite a market decline of 3%, 19% inflow growth was achieved in France on a bancassurancedistribution agreement with Fortis Bank, now including Fortis Private Banking. Growth under the Freedomof Services Act compensated for lower bancassurance results in Luxembourg. FICA in Hong Kong andother new European markets contributed EUR 225 million and EUR 77 million respectively in 2007.
Total Life gross inflow at Life companies reported using the equity method (on a 100% basis) (allAsian, since the CaiFor joint venture in Spain was sold), increased 27% to EUR 2,380 million in 2007from EUR 1,878 million in 2006 (after excluding the previous contribution of CaiFor sold in 2007).Among the Asian joint ventures, TaiPing Life was the largest contributor, posting growth of 38%.
The technical result increased from EUR 38 million in 2006 to EUR 74 million in 2007 reflecting acontinued focus on profitability.
Net profit. Net profit at Life (excluding the net gain on discontinued operations) increased 132% toEUR 86 million in 2007 from EUR 37 million in 2006, due to overall higher funds under management andthe consolidation of FICA in Hong Kong.
2006 Compared to 2005
Revenues. Total gross inflow at fully consolidated Life companies was EUR 3,214 million in 2006(2005: EUR 3,566 million). The decline was due to significantly lower volumes in Portugal only partiallyoffset by higher premium volume in France and Luxembourg. The lower volume in Portugal was due to adecision to favor return versus volume in the Portuguese unit-linked campaigns. The product structure isbeing reviewed, and newly developed open-ended unit-linked contracts will be added to the offering toboost inflows with better returns.
Gross inflow at Life companies reported using the equity method (on a 100% basis) increased by12% to EUR 3,446 million in 2006 compared to EUR 3,080 million in 2005. This rise was largely theresult of excellent top-line growth in China, the incorporation of Malaysia National Insurance Holdings(“MNIH”) and further growth of the bancassurance channel in Thailand. Both Taiping Life (China) andMuang Thai (Thailand) improved their market positions, which expanded from 2.2% to 2.8% and from4.9% to 5.9% respectively (compared with year-end 2005).
The operating margin for the full year improved by 60%, from EUR 25 million to EUR 40 million.This increase was driven by operations in all countries, most notably in Portugal, where the improvementwas attributable to higher assets under management and tight cost control.
200
Level: 6 – From: 6 – Wednesday, May 14, 2008 – 1:37 pm – g5mac4 – 3960 Section 06 : 3960 Section 06

Net profit. Life net profit advanced to EUR 85 million in 2006, up 63% from EUR 52 million in2005, driven by positive trends in all countries, especially in Asia, as well as higher levels of non-allocatedother income and charges.
Insurance International Life — Embedded Value and Value Added by New Business
The EV calculations for Fortis Insurance International include the European subsidiaries and entitiesaccounted for under the equity method on a full EV basis and include the Asian joint ventures on a netequity basis.
2005 (traditional2007 2006 based)
1111 1111 1111
(EUR million)(unaudited)
EEV before dividend payment . . . . . . . . . . . . . . . . . . . . . . . . . . . . . 1,021 1,313 1,160VANB . . . . . . . . . . . . . . . . . . . . . . . . . . . . . . . . . . . . . . . . . . . . . . . . 62 103 91PVNBP . . . . . . . . . . . . . . . . . . . . . . . . . . . . . . . . . . . . . . . . . . . . . . . 2,766 3,822 3,346
2007 Compared to 2006
The market consistent EV of Fortis Insurance International decreased by 22% to EUR 1,021million, due to the sale of CaliFor. However, after opening adjustments and restated for the sale of CaiFor,the VANB increased by 11% to EUR 1,021 million in 2007 before dividends paid, mainly driven by theVANB and higher interest rates.
The VANB, restated for CaiFor, increased by 18% to EUR 62 million in 2007 resulting from highervolumes in unit-linked policies and in term business, a better product design in Portugal and thecontribution of the bank channel in France.
2006 Compared to 2005
The EEV of Fortis Insurance International (before dividends) increased by 19% to EUR 1,313million in 2006, driven by VANB and high investment returns.
Valued on a market consistent basis, the VANB increased to EUR 103 million reflecting therelatively low risk profile of the products and the lower cost of capital. The new business margin remainedstrong at 2.7%. On a traditional basis, the VANB decreased from EUR 91 million to EUR 84 millioncaused mainly by improvements in cash-flow modeling. Underlying New Business margins were generallystable except for a drop for term products in Portugal, which was compensated for by overall increasedbusiness volumes.
201
Level: 6 – From: 6 – Wednesday, May 14, 2008 – 1:37 pm – g5mac4 – 3960 Section 06 : 3960 Section 06

Non-Life
Insurance International — Non-Life
Year Ended December 31, 2007 vs. 2006 2006 vs. 200511111111111111234
2007 2006 2005 Change Change1111 1111 1111 1111 1111
(EUR million, except %)
Gross written premiums . . . . . . . . . . . . 2,005 1,820 1,642 10% 11%Technical result . . . . . . . . . . . . . . . . . . 2 172 175 (99)% (2)%Allocated capital gains . . . . . . . . . . . . . 5 2 6 — (67)%
1111 1111 1111
Operating margin . . . . . . . . . . . . . . . . 7 174 181 (96)% (4)%1111 1111 1111
Non-allocated other income and charges . . . . . . . . . . . . . . . . . . . . . . . . 40 51 40 5% (5)%
1111 1111 1111
Profit before income tax . . . . . . . . . . . 47 212 221 (78)% (4)%1111 1111 1111
Income tax . . . . . . . . . . . . . . . . . . . . . . . (9) (60) (60) (85)% 0%Net gain on discontinued operations(1) . . 187 13 — — —
1111 1111 1111
Minority interests . . . . . . . . . . . . . . . . . . 9 7 10 29% (30)%1111 1111 1111
Net profit . . . . . . . . . . . . . . . . . . . . . . . . 216 158 151 37% 5%Non-Life total:Claims ratio . . . . . . . . . . . . . . . . . . . . . . 79.5% 67.1% 67.7%
Expense ratio . . . . . . . . . . . . . . . . . . . 28.7% 33.0% 32.4%1111 1111 1111
Combined ratio . . . . . . . . . . . . . . . . . 108.2% 100.1% 100.1%1111 1111 11111111 1111 1111
Property & Casualty:Claims ratio . . . . . . . . . . . . . . . . . . . . 80.9% 67.5% 68.1%Expense ratio . . . . . . . . . . . . . . . . . . . 28.7% 33.3% 32.4%
1111 1111 1111
Combined ratio . . . . . . . . . . . . . . . . . 109.6% 100.8% 100.5%1111 1111 11111111 1111 1111
Accident & Health:Claims ratio . . . . . . . . . . . . . . . . . . . . 67.0% 64.3% 64.6%Expense ratio . . . . . . . . . . . . . . . . . . . 28.9% 30.7% 32.2%
1111 1111 1111
Combined ratio . . . . . . . . . . . . . . . . . 95.9% 95.0% 96.8%1111 1111 11111111 1111 1111
(1) Related to CaiFor.
2007 Compared to 2006
Gross written premiums at consolidated Non-Life companies increased 10% to EUR 2,005 millionin 2007 from EUR 1,820 million in 2006. The increase was primarily due to increased sales in the UK andcommercial premium growth at FCI (mainly in marine and liability).
Continuously rising average premiums and a growing number of insured cars further strengthenedthe UK market position. Gross written premiums at Non-Life companies reported using the equity method(consolidated on a 100% basis) increased by 5% from EUR 289 million in 2006 to EUR 303 million in2007.
Windstorm Kyrill and the impact of floods in the UK in June and July of 2007 depressed thetechnical result (in motor and fire) to EUR 2 million in 2007 from EUR 172 million in 2006. Both naturaldisasters decreased Non-Life net profit to EUR 42 million in 2007 compared with EUR 157 million in2006.
202
Level: 6 – From: 6 – Wednesday, May 14, 2008 – 1:37 pm – g5mac4 – 3960 Section 06 : 3960 Section 06

2006 Compared to 2005
Gross written premiums at the fully consolidated companies grew to EUR 1,820 million, up 11%compared with 2005. This increase was driven primarily by growing sales in the UK due to the successfultransfer of Age Concern clients to Fortis and higher volumes at Motor. Gross written premiums at Non-Life companies reported using the equity method (on a 100% basis) advanced to EUR 439 million in 2006from EUR 236 million in 2005 principally as a result of the acquisition of MNIH in Malaysia.
The technical result remained virtually unchanged at EUR 172 million in 2006, on the back of astable combined ratio. This was realized mainly due to the continued strong underwriting performance ofFortis Corporate Insurance and Fortis UK.
Non-Life net profit increased 5% to EUR 158 million due to continued effective underwriting andsound risk management reflected in a consistently recorded combined ratio of 100%.
The following table shows the technical result by product line for the Insurance International Non-Life business for the periods indicated.
Year Ended December 31,11441111111111111111111111111111234
2007 2006 200511111111134 111111111344 1111111113444
Accident Property Accident Property Accident Property& Health & Casualty & Health & Casualty & Health & Casualty1111 1111 1111 1111 1111 1111
(EUR million)
Insurance InternationalTechnical result . . . . . . 13 (11) 12 160 16 159
Developments in Geographic Regions
Fortis holds a 100% interest in the companies listed below, unless otherwise noted. In July 2007Fortis announced the sale of its interests in CaiFor to “la Caixa”, its joint venture partner; this transactionwas completed on November 13, 2007. In 2007, 2006 and 2005 Caifor was accounted for on an equitybasis.
2007 Compared to 2006
Fortis Insurance UK continued to post strong growth in 2007. Gross written premiums increasedby 10% from EUR 1,010 million in 2006 to EUR 1,107 million in 2007, driven by significant growth inprivate cars insured (up 14% in 2007) and continued development of other product lines. Commercial linesgrowth in the small business market grew by 10%. Retail revenues increased 12%. Total broker premiumincome increased to EUR 137 million. The number of customers insured by Fortis in the UK exceeded 6.5million in 2007.
Fortis Corporate Insurance (FCI) is a leading player in the market of mid-sized corporate risks inthe Benelux. FCI performed well in 2007, despite a softening market, the impact of Windstorm Kyrill anda higher claims frequency in fire. Premiums increased by 10% to EUR 656 million in 2007 from EUR 597million in 2006. Growth in marine and liability compensated for lower volumes in fire. Though higherthan in 2006, the net combined ratio remained favorable at 94%. FCI further supported its internationalexpansion by opening a branch office in Paris, which has been fully operational since January 1, 2008. InAugust 2007, Fitch confirmed an A+ rating and in September 2007 Standard & Poor confirmed an Arating, both with a stable outlook.
Fortis Assurances Luxembourg gross inflow increased to EUR 1,372 million in 2007 from EUR1,323 million in 2006. In the local market the fourth quarter was in line with the previous quarters with anabove-average performance of director & officers liability and Group Life. Fire’s decline in market sharewas reversed with the launch of a new product in September 2007.
In the international market, gross premiums written under the Freedom of Services Act grew 7% inthe fourth quarter, resulting in total premium income of EUR 1,352 million in 2007. The performance was
203
Level: 6 – From: 6 – Wednesday, May 14, 2008 – 1:37 pm – g5mac4 – 3960 Section 06 : 3960 Section 06

particularly strong in the French market. Fortis Assurances Luxembourg restructured its internalorganization, focusing specifically on future business development, and hired new people for the SalesSupport Team and the front office for different strategic markets. Fortis Assurances Luxembourg expectsfurther expansion in 2008.
Millenniumbcp Fortis in Portugal (Fortis’s stake: 51.00%) achieved above-market sales growth in2007, both at Life and Non-Life, thereby consolidating its number two ranking in the Portuguese domesticmarket. Pensõesgere also reinforced its market leadership in Pension Funds.
Product-market innovation was the key to success of the company’s strategy, contributing to an 18%growth in gross inflow and an increase in profitability. Twelve new investment products were launched(unit-linked, savings and pension plans) during 2007. Millenniumbcp Fortis’s total assets undermanagement increased 6% to EUR 10 billion in 2007 from EUR 9.1 billion in 2006. Major steps towardsoperational excellence were taken in 2007, leading to improved levels of satisfaction for both thecustomers and the banking branch sales force. Rating agency Fitch gave Ocidental Vida, OcidentalSeguros and CPSS (MEDIS) A+ ratings and stable outlooks. These ratings were awarded based onMillenniumbcp Fortis’s solid stand-alone position in the Portuguese market, its good profitability andstrong capitalization.
The foundations of multi-channel expansion were established in 2007 with the preparation of a newcorporate Non-Life channel launched in early 2008. A tailored product offering will be marketed through arange of carefully selected agents and brokers.
Fortis Assurances France recorded EUR 517 million in gross written premiums, representing anincrease of 19% compared with 2006, while the French Life insurance market decreased by 3% in 2007.The successful partnership with Fortis Bank and the growth of the tied agency network contributed to thisincrease, as did the development of a new product range for Fortis Assurances France’s networks. Over65% of new production was generated through these new products. The productivity of the agent networkgrew by 10% in 2007.
Taiping Life (“TPL”) in China (Fortis’s stake 24.90%) increased its gross inflow from EUR 1,120million in 2006 to EUR 1,548 million in 2007, mainly due to the re-introduction of unit-linked products asbooming financial markets increased the market’s appetite for investment products. TPL’s growth rate of38% is the second fastest among the six major Life insurers in China. The company is expanding fasterthan the market, and its market share grew from 2.7% to 3.2% at the end of last year. TPL currently ranksnumber six in the Life insurance market. TPL’s ongoing focus on shifting its business mix towards regularpremium products continued to perform well as regular premiums increased upwards of 63% comparedwith 2006. Since the end of 2006, the tied agency sales force has grown from 26,400 to more than 40,000.The number of branches and sales offices is nearly 450. Assets under management surpassed EUR 4billion in 2007.
Fortis Insurance Company Asia (“FICA”), the newly acquired insurance company in Hong Kong,contributed EUR 226 million to gross inflow over the period May to December 2007. Despite a turbulentperiod, FICA managed to increase sales and retain key staff and agent teams attributable to new businesssales due to an internal campaign. The number of agents grew from 2,031 in 2006 to 2,698 at the end of2007. FICA maintained its top 10 position in terms of new business, with a market share of 2.5%.
Mayban Fortis in Malaysia (Fortis’s stake 30.95%), posted stable premium income of EUR 800million in 2007. The company underwent a major transition in 2007 with the integration of the combinedmulti-channel organization. The launch of Etiqa finalized the merger with Malaysia National InsuranceHoldings. All these achievements are expected to produce strong results in 2008 and healthy growth rates.Assets under management surpassed EUR 4 billion in 2007.
Muang Thai-Fortis in Thailand (Fortis’s stake 40.00%) continued to grow strongly with grossinflow increasing 45% in 2007 compared with 2006. The company is ranked the second largestbancassurance player in Thailand and the fourth largest Life insurer, with an overall market share of 6.8%compared with 5.8% at the end of 2006. The number of bank sales agents grew rapidly to over 350 in
204
Level: 6 – From: 6 – Wednesday, May 14, 2008 – 1:37 pm – g5mac4 – 3960 Section 06 : 3960 Section 06

2007, more than double the figure at the beginning of 2006. New distribution channels, such as directresponse marketing, are being prepared for introduction in 2008. Non-Life gross inflow increased 24% toEUR 49 million, mainly due to the motor business. This growth is attributable to more aggressivemarketing of existing agents and motor partners, recruitment of agents from the competition and a contractwith a large broker. Assets under management surpassed EUR 1 billion in 2007.
2006 Compared to 2005
Fortis UK (Insurance) posted strong revenue and profit growth in 2006. Profits increasedsignificantly in 2006 supported by strong underwriting results from Fortis Insurance Limited (“FIL”),where written premiums increased by 14% and from its retail businesses (Retirement Insurance AdvisoryServices (“RIAS”), OutRight and Text2Insure), where revenues rose by 14%. Affinity Solutions, itsconsultancy business, served a number of new clients seeking advice in relation to affinity partnerships.Fortis UK’s profit before tax has delivered a CAGR of 16% over the past five years, due to a steady rise inthe number of FIL customers, which reached 6.5 million at the end of 2006, or 15% more than theprevious year. This includes 1.5 million cars insured (compared with 1.37 million at the end of 2005) andover one million Household customers, rising by 66% mainly due to the successful transfer of AgeConcern customers. Meanwhile, RIAS, which specializes in the “over 50s” target group, providedinsurance to more than one million customers for the first time.
Fortis Corporate Insurance (“FCI”) launched several growth initiatives in 2006, increasing itsbusiness in identified niches such as shipyards, large yachts, owner associations and tour operators. FCIalso embarked on prudent expansion outside the Benelux. It strengthened its contacts, for example, withFrench brokers and initiated joint efforts with Fortis Bank Business Centers aimed at the marine market.FCI also launched a two-year quality improvement program, to be completed in 2007, designed to make itthe standard for quality of service in this segment. These growth initiatives helped raise gross writtenpremiums by 3% to EUR 597 million in 2006 (EUR 582 million in 2005), despite softer market conditionsand stiffer competition.
Millenniumbcp Fortis (Portugal, 51% stake) reported total gross inflow of EUR 1,629 million in2006 compared with a total gross inflow of EUR 2,144 million in 2005. Non-Life premiums grew by 17%to EUR 171 million in 2006 but Life inflow declined to EUR 1,458 million in 2006 (EUR 1,997 million in2005). The decline was due to significantly lower volumes as Milleniumbcp sought to improve returns atthe expense of volume growth. A product innovation platform was launched and new products have beendeveloped. The effect of these new products is expected to be felt after their introduction in 2007, based onpositive initial results of a marketing pilot. New distribution channels were launched at Health, supportedby new agreements with brokers and Portuguese insurance companies.
CaiFor (Spain; Life: 40%; Non-Life: 60%) realized gross inflow of EUR 1,719 million in 2006compared with EUR 1,991 million in 2005. The risk business (both at Life and Non-Life) continued todisplay an upward trend, sustaining a strong growth rate. The low-interest rate environment and thegovernment’s fiscal reforms (including 18% taxation on all savings instruments), however, created achallenging business environment for savings products. As usual, commercial efforts in the last quarter ofthe year focused on individual pension plan campaigns, with the launch of two new, innovative productsPlanCaixa Triple 5 and PlanCaixa Invest 16.
Fortis Assurances Luxembourg had another excellent year, as demonstrated by the increase inassets under management, which were EUR 5.2 billion at the end of 2006 compared to EUR 3.9 billion atthe end of 2005. Although gross inflow in 2005 benefited from sales related to the introduction of certainnew tax rules pursuant to Feira, a EU tax harmonization, total gross inflow in 2006 advanced further by13% to EUR 1,323 million. Sales through third parties doubled over 2005 and new production is morediversified, both from a geographic point of view and in terms of distribution. Italy, for example, generated20% of total production in 2006.
Fortis Assurances France (insurance-life), posted growth of 26% in new production, both in thedirect sales network and in the broker network. Growth was fueled by the development strategy for unit-linked contracts, which represented more than 63% of new production. Gross inflow at Fortis Assurances
205
Level: 6 – From: 6 – Wednesday, May 14, 2008 – 1:37 pm – g5mac4 – 3960 Section 06 : 3960 Section 06

rose 10% to EUR 433 million, outstripping the growth rates posted by more traditional insurers. Assetsunder management grew to EUR 3 billion by the end of the year. The fourth quarter of 2006 marked thelaunch of Fortis Assurances France’s partnership with Fortis Banque France and the introduction of twonew products for its traditional networks (direct sales and brokers). These two products resulted in newproduction volume of EUR 40 million in 2006.
Taiping Life (China; Fortis’s stake: 24.9%) Gross inflow exceeded the EUR 1 billion mark for thefirst time in the company’s history (EUR 1,120 million). Taiping Life offers a complete line of life,medical and retirement products for the Chinese market, backed by state-of-the-art computer systems anda skilled staff of insurance professionals. Sales are made primarily through the bancassurance channel,Group Life and an agents network. This strong performance was achieved as the result of the successfulintroduction of several new products sold by agents, filling a gap in the product portfolio targeting high-and medium-end clients and the enhancement of business platforms that support the bancassurance andtied agency distribution channels. In terms of APE, the bancassurance and tied agency channels achievedpremium growth of 67% and 74%, respectively. This growth was partly generated by the company’songoing focus on steadily increasing the proportion of regular premium business across all distributionchannels. The tied agency force grew to more than 23,500 by the end of 2006. Meanwhile, a multi-channeldistribution development program is being implemented, the aim of which is to gradually build a robustthird “leg” alongside the existing distribution channels. Assets under management reached EUR 2.9 billionat year-end 2006, compared with EUR 2.2 billion at the end of 2005.
Mayban Fortis (Malaysia; Fortis’s stake: 30%) finalized the acquisition of MNIH in 2006,positioning itself as a leading multi-channel insurance company in Malaysia. The integration is on trackand is expected to be completed in 2007. Total gross inflow more than doubled to EUR 797 million in2006 and assets under management were EUR 3.7 billion at year-end 2006.
In 2006, Muang Thai Fortis (Thailand; Fortis’s stake: 40%) grew faster than the overall Thaiinsurance industry in 2006, chiefly due to the successful rollout of bancassurance in Thailand, whichconsiderably boosted sales volumes. Muang Thai Fortis is now the second largest player in thebancassurance channel. Total gross inflow grew by 18% to EUR 249 million in 2006. More agents are nowfully dedicated to the bank branches, bringing the total to more than 300 (up from 163 at the end of 2005).A number of new products were presented to the regulator for approval. Total assets under managementgrew by 15% to EUR 0.8 billion at the end of 2006.
General (including eliminations)
General contains all activities not directly related to banking and insurance activities such asCorporate Headquarters costs and financing costs as well as all eliminations between Banking, Insuranceand General.
206
Level: 6 – From: 6 – Wednesday, May 14, 2008 – 1:37 pm – g5mac4 – 3960 Section 06 : 3960 Section 06

General Income Statement
Year Ended December 31, 2007 vs. 2006 2006 vs. 200511111111111111234 1111 1111
2007 2006 2005 Change Change1111 1111 1111 1111 1111
(EUR million)
Insurance premiums . . . . . . . . . . . . . . . . (96) (77) (74) 25% 4%Net interest Income . . . . . . . . . . . . . . . . (413) (226) (233) 83% (3)%Net commissions and fees . . . . . . . . . . . (19) — — — —Realized capital gains (losses) . . . . . . . . 25 (15) 437 — —(Un)realized gains (losses) . . . . . . . . . . 104 40 57 — (30)%Dividend and other investment
income . . . . . . . . . . . . . . . . . . . . . . . . (16) (1) (3) — 67%Other income . . . . . . . . . . . . . . . . . . . . . (117) (120) (59) (3)% —
1111 1111 1111
Total revenues . . . . . . . . . . . . . . . . . . . . (549) (399) 125 (38)% —1111 1111 1111
Change in provisions for impairment . . — — — — —Net revenues . . . . . . . . . . . . . . . . . . . . . (549) (399) 125 (38)% —
1111 1111 1111
Technical charges . . . . . . . . . . . . . . . . . . 185 161 162 (15)% (1)%1111 1111 1111
Staff expenses . . . . . . . . . . . . . . . . . . . . (62) (49) (53) 27% (8)%Other operating and administrative
expenses . . . . . . . . . . . . . . . . . . . . . . . 61 28 5 — —1111 1111 1111
Total expenses . . . . . . . . . . . . . . . . . . . . 184 140 114 (31)% (23)%1111 1111 1111
Profit before income tax . . . . . . . . . . . (365) (259) 238 (41)% —1111 1111 1111
Income tax . . . . . . . . . . . . . . . . . . . . . . . 59 52 43 (13)% (21)%1111 1111 1111
Net profit before minority interests . . . . (306) (207) 282 (48)% —1111 1111 1111
Minority interests . . . . . . . . . . . . . . . . . . 2 11 (0) (82)% —1111 1111 1111
Net profit . . . . . . . . . . . . . . . . . . . . . . . . (308) (218) 282 (41)% —1111 1111 1111
Results on divestments . . . . . . . . . . . . . — — (443) — —1111 1111 1111
Net profit before results ondivestments . . . . . . . . . . . . . . . . . . . . (308) (218) (161) (41)% (35)%
1111 1111 11111111 1111 1111
2007 Compared to 2006
The net negative result increased EUR 91 million to EUR 308 million in 2007 from EUR 217million in 2006.
Major positive contributors to the variance included the EUR 128 million capital gain realized in2007 on the sale of an equity stake, positive eliminations on treasury shares, and higher tax credits.Negative contributors include the EUR 89 million elimination of part of the realized capital gains on ABNAMRO shares, lower favorable fair-value changes in the Assurant Mandatory Exchangeable Bond(“MEB”), the absence of one-time EUR 83 million surrender penalties that contributed positively to the2006 results and increased financing charges.
Fortis’s stake in the ABN AMRO holding structure amounts to 33%. Accordingly, the capital gainsrealized on ABN AMRO in the insurance segment have been eliminated proportionately. The fair valuechanges in the MEB reflect mainly time value changes. Higher financing charges are attributable to theacquisition of Fortis Bank Insurance shares from Fortis Bank Belgium in the context of the FortisInsurance Belgium merger. The merger and the related share transfer occurred on the last day of the firstquarter of 2006. Accordingly, the transaction negatively impacted net interest income only in the last threequarters of 2006, but negatively affected net interest income for the whole of 2007.
207
Level: 6 – From: 6 – Wednesday, May 14, 2008 – 1:37 pm – g5mac4 – 3960 Section 06 : 3960 Section 06

2006 Compared to 2005
The unusually high net profit for 2005 reflects the positive impact of the divestment in Assurant inthe first quarter of 2005. Excluding this, the negative result increased EUR 57 million to EUR 218 millionin 2006 compared with last year. The net decrease results from several offsetting elements.
Positive contributors were EUR 91 million in surrender penalties received from group entitiesowing to early loan repayments and lower eliminations of treasury share revenues. Negative elements werehigher financing charges due to the acquisition of Fortis Bank Insurance from Fortis Bank Belgium in thecontext of the Fortis Insurance Belgium merger, a lower positive change in the fair value of the MEBconvertible into Assurant shares (EUR 52 million compared with EUR 76 million last year) and highercosts related to the promotion of the Fortis brand.
Liquidity and Capital Resources
Combined Cash Flows
Fortis total cash flows are comprised of the net cash flow from operating activities, the net cashflow from investment activities and the net cash flow from financing activities.
The principal sources of funds for Fortis’s operating activities are insurance premiums, income frominvestments of the insurance operations and interest income and other income received from the bankingoperations. Fortis also supplements its funding requirements with borrowings from financial institutions,which consist of both short-term liabilities and long-term debt obligations. Fortis’s major uses of funds arefor payments in connection with life policy benefits, payments of non-life claims, interest expenses,personnel expenses and other expenses, as well as investments in information technology. The net cashflow of Fortis’s operating activities also includes the sales and purchases of its trading portfolio, the netbalance of loan advances and repayments and the change in deposits and other short-term borrowings ofthe banking operations.
Supervision and solvency
As a financial institution, Fortis is subject to regulatory supervision. Fortis is supervised at Fortisconsolidated level and at the level of the individual operating companies.
At the Fortis consolidated level, Fortis is supervised jointly by the Belgian Banking, Finance andInsurance Commission (“BFIC”) and the Dutch Central Bank (“DNB”). Their prudential supervisionincludes verification on a semi-annual basis that Fortis meets the solvency requirements of each differentfinancial sector represented within Fortis. The elements of own funds and the solvency requirements forthe Banking and Insurance activities are calculated in accordance with the corresponding sector rules.Fortis has been identified as a financial conglomerate and is subject to the supplementary supervision ofcredit institutions, insurance undertakings and investment firms in a financial conglomerate as provided forin the EU Directive 2002/87/EC.
The supplementary capital adequacy requirements demand that the own funds of the financialconglomerate calculated on the basis of the consolidated position of the group exceed the sum of thesolvency requirements for each different financial sector represented in the group. Fortis met allrequirements in 2007 as well as in 2006 and 2005.
Fortis’s Banking subsidiaries are subject to the regulations of the various supervisory authorities inthe countries where the subsidiaries operate. These guidelines require the Banking subsidiaries to maintaina minimum level of qualifying capital relative to the on- and off-balance sheet credit commitments and thebank’s trading positions. The positions and credit commitments are weighted according to the level of riskinvolved (risk-weighted commitments). The requirement for total qualifying capital must be maintained ata minimum of 8% of risk-weighted commitments.
208
Level: 6 – From: 6 – Wednesday, May 14, 2008 – 1:37 pm – g5mac4 – 3960 Section 06 : 3960 Section 06

2007 2006 20051111 1111 1111
BankTotal risk bearing capital . . . . . . . . . . . . . . . . . . . . . . . . . . . . . . . . . 27,231 26,664 22,210Risk-weighted commitments . . . . . . . . . . . . . . . . . . . . . . . . . . . . . . 270,207 240,104 212,095Tier 1 ratio . . . . . . . . . . . . . . . . . . . . . . . . . . . . . . . . . . . . . . . . . . . . 9.5% 7.1% 7.4%Total capital ratio . . . . . . . . . . . . . . . . . . . . . . . . . . . . . . . . . . . . . . . 10.1% 11.1% 10.5%
Fortis’s insurance subsidiaries are required to maintain a minimum level of qualifying capitalrelative to the premiums received for Non-life insurance contracts and relative to the Life insuranceliabilities arising from insurance and investment contracts. The consolidated regulatory solvencyrequirements of Fortis’s insurance subsidiaries are EUR 4,108 million at December 31, 2007 (2006: EUR3,689 million; 2005: EUR 3,395 million) and are largely covered by the available qualifying total capital.
Fortis has introduced a new target-based model to manage and communicate its solvency position asfrom 2007 onwards.
Core equity target
The three components of Fortis’s core equity target are:
• A capital target for Fortis Bank equal to a 7% Tier 1 capital to risk-weighted commitments,including 1% hybrid capital. This implies a target of 6% core equity to risk-weightedcommitments.
• A capital target for Fortis Insurance equal at 225% of the regulatory minimum, whichincludes 50% of hybrid capital. This implies a core equity target of 175% of the regulatoryminimum.
• A Group leverage target (at General) set at 15% of the total of the core equity of Bankingplus the core equity of Insurance, implying that 15% of Banking and Insurance combinedtarget core equity could be financed by group debt.
Fortis’s core equity and total capital is composed as follows:General
(incl.Banking Insurance eliminations) Total1111 1111 1111 1111
2007Share capital and reserves . . . . . . . . . . . . . . . . . . . . . . 32,235 3,399 (7,183) 28,451Net profit attributable to shareholders . . . . . . . . . . . . 1,768 2,534 (308) 3,994Unrealised gains and losses . . . . . . . . . . . . . . . . . . . . . (699) 1,225 76 602Shareholders equity . . . . . . . . . . . . . . . . . . . . . . . . . . . 33,304 7,158 (7,415) 33,047Non-innovative hybrid capital instruments . . . . . . . . . 2,756 — 2,927 5,683Minority interests . . . . . . . . . . . . . . . . . . . . . . . . . . . . 429 676 42 1,147Revaluation of real estate to fair value . . . . . . . . . . . . — 1,556 — 1,556Revaluation of debt securities, net of tax and
shadow accounting . . . . . . . . . . . . . . . . . . . . . . . . . 1,070 235 (17) 1,288Revaluation of equity securities, net of tax and
shadow accounting . . . . . . . . . . . . . . . . . . . . . . . . . (385) (137) (6) (528)Goodwill . . . . . . . . . . . . . . . . . . . . . . . . . . . . . . . . . . . (1,025) (490) (1,515)Expected dividend . . . . . . . . . . . . . . . . . . . . . . . . . . . . — — (1,313) (1,313)Other . . . . . . . . . . . . . . . . . . . . . . . . . . . . . . . . . . . . . . (12,897) (405) (13,302)Core equity . . . . . . . . . . . . . . . . . . . . . . . . . . . . . . . . . 23,252 8,593 (5,782) 26,063Innovative capital instruments . . . . . . . . . . . . . . . . . . . 2,440 599 494 3,533Extended core equity . . . . . . . . . . . . . . . . . . . . . . . . . . 25,692 9,192 (5,288) 29,596Subordinated loans . . . . . . . . . . . . . . . . . . . . . . . . . . . 15,582 757 (3,600) 12,739Other prudential filters and deductions on total capital (14,043) (293) — (14,336)
1111 1111 1111 1111
Total capital . . . . . . . . . . . . . . . . . . . . . . . . . . . . . . . . 27,231 9,656 (8,888) 27,9991111 1111 1111 11111111 1111 1111 1111
209
Level: 6 – From: 6 – Wednesday, May 14, 2008 – 1:37 pm – g5mac4 – 3960 Section 06 : 3960 Section 06

General(incl.
Banking Insurance eliminations) Total1111 1111 1111 1111
2006Share capital and reserves . . . . . . . . . . . . . . . . . . . . . . 12,593 4,021 (4,350) 12,264Net profit attributable to shareholders . . . . . . . . . . . . 3,149 1,420 (218) 4,351Unrealised gains and losses . . . . . . . . . . . . . . . . . . . . . 924 2,922 183 4,029Shareholders equity . . . . . . . . . . . . . . . . . . . . . . . . . . . 16,666 8,363 (4,385) 20,644Non-innovative hybrid capital instruments . . . . . . . . . — — 1,108 1,108Minority interests . . . . . . . . . . . . . . . . . . . . . . . . . . . . 198 678 31 907Revaluation of real estate to fair value . . . . . . . . . . . . — 1,465 — 1,465Revaluation of debt securities, net of tax and
shadow accounting . . . . . . . . . . . . . . . . . . . . . . . . . (176) (477) (19) (672)Revaluation of equity securities, net of tax and
shadow accounting . . . . . . . . . . . . . . . . . . . . . . . . . (721) (234) (12) (967)Goodwill . . . . . . . . . . . . . . . . . . . . . . . . . . . . . . . . . . . (749) (268) (1,017)Expected dividend . . . . . . . . . . . . . . . . . . . . . . . . . . . . (225) (520) (321) (1,066)Other . . . . . . . . . . . . . . . . . . . . . . . . . . . . . . . . . . . . . . (490) (392) 12 (870)Core equity . . . . . . . . . . . . . . . . . . . . . . . . . . . . . . . . . 14,503 8,615 (3,586) 19,532Innovative capital instruments . . . . . . . . . . . . . . . . . . . 2,438 600 493 3,531Extended core equity . . . . . . . . . . . . . . . . . . . . . . . . . . 16,941 9,215 (3,093) 23,063Subordinated loans . . . . . . . . . . . . . . . . . . . . . . . . . . . 11,642 819 (1,726) 10,735Other prudential filters and deductions on
total capital . . . . . . . . . . . . . . . . . . . . . . . . . . . . . . . (1,919) (99) — (2,018)1111 1111 1111 1111
Total capital . . . . . . . . . . . . . . . . . . . . . . . . . . . . . . . . 26,664 9,935 (4,819) 31,7801111 1111 1111 11111111 1111 1111 1111
Participating interests that are not fully consolidated are deducted at a level equal to 50% from Coreequity and 50% from Total capital. The amounts deducted include the investment by Fortis in parts ofABN AMRO through RFS Holdings, as this participation is currently accounted for using the equitymethod.
The key capital indicators of Fortis can be shown as follows:
Year Ended Year EndedDecember 31, December 31,
2007 200611112 11211
FortisCore equity . . . . . . . . . . . . . . . . . . . . . . . . . . . . . . . . . . . . . . . . . . . . . . . . . . . . . . . 26,063 19,532Amount of core equity above target . . . . . . . . . . . . . . . . . . . . . . . . . . . . . . . . . . 6,171 1,799Total capital . . . . . . . . . . . . . . . . . . . . . . . . . . . . . . . . . . . . . . . . . . . . . . . . . . . . . . 27,999 31,780Minimum solvency requirements . . . . . . . . . . . . . . . . . . . . . . . . . . . . . . . . . . . . . . 25,725 22,898Amount of total capital above minimum solvency requirements . . . . . . . . . . 2,274 8,882
Fortis’s core equity and total capital is composed as follows:
Insurance Cash Flows
The condensed cash flow statement for the insurance operations is as follows:
2007 2006 20051111 1111 1111
(EUR millions)
Cash and cash equivalents, opening balance . . . . . . . . . . . . . . . . . . 2,240 2,421 2,877Cash flow from operating activities . . . . . . . . . . . . . . . . . . . . . . . . . 5,409 7,720 7,131Cash flow from investing activities . . . . . . . . . . . . . . . . . . . . . . . . . (3,834) (6,830) (6,451)Cash flow from financing activities . . . . . . . . . . . . . . . . . . . . . . . . . (1,488) (1,072) (1,138)Exchange rate differences . . . . . . . . . . . . . . . . . . . . . . . . . . . . . . . . . (14) l 2
210
Level: 6 – From: 6 – Wednesday, May 14, 2008 – 1:37 pm – g5mac4 – 3960 Section 06 : 3960 Section 06

Cash and cash equivalents, closing balance . . . . . . . . . . . . . . . . . . . 2,313 2,240 2,421The main components of the operating cash flows are gross inflows (insurance premiums and
deposits for investment contracts without DPF), benefits, surrenders and claims paid and operatingexpenses including claim handling expenses.
Fortis’s insurance companies generate a substantial operating cash flow from operations becausemost premiums are received in advance of the time when claim payments or policy benefits are required.Other sources of funds include net investment income and proceeds from sales or maturity of investments.The major uses of these funds and premiums received are to acquire investments for policyholders, toprovide life policy benefits, to pay surrenders and profit sharing for life policyholders, to pay non-lifeclaims and related claims expenses, and to pay other operating costs.
The cash flow from financing activities relate primarily to the payment of dividends to the holdingcompanies and the repayments/maturities/issuance of loans.
These positive operating cash flows, along with that portion of the investment portfolio that is heldin cash and highly liquid securities, have historically met the liquidity requirements of Fortis’s insurancecompanies, as evidenced by the overall growth in the insurance investment portfolio.
In the insurance industry, liquidity generally refers to the ability of an enterprise to generateadequate amounts of cash from its normal operations, including its investment portfolio, to meet itsfinancial commitments, which are principally obligations under its insurance contracts. The liquidity needsof Fortis’s life operations are generally affected by trends in actual mortality experience relative to theassumptions with respect to such trends included in the pricing of its life insurance policies, by the extentto which minimum returns or crediting rates are provided in connection with its life insurance products, aswell as by the level of surrenders and withdrawals. The liquidity of Fortis’s non-life operations is affectedby the frequency and severity of losses under its policies, as well as by the persistency of its products.Future catastrophic events, the timing and effect of which are inherently unpredictable, may also createincreased liquidity requirements for Fortis’s non-life operations.
Fortis’s insurance companies’ liquidity requirements are met on both a short-term and long-termbasis by funds provided by insurance premiums collected, investment income and collected reinsurancereceivables, and from the sale and maturity of investments. Fortis’s insurance companies also have short-term credit lines to cover temporary liquidity needs.
Solvency Margins and Capital Requirements
The insurance operations of Fortis are subject to detailed, comprehensive regulation in all thejurisdictions in which Fortis does business. In addition, EC directives have had and will continue to have asignificant impact on the regulation of the insurance industry in the EU as such directives are implementedthrough legislation adopted within each member state, including Belgium and The Netherlands.
Insurance companies in Belgium and The Netherlands are supervised by the Belgian Banking,Finance and Insurance Commission, the Belgian insurance regulator, and the Dutch Central Bank(“DNB”), the Dutch insurance regulator, respectively. Belgium and The Netherlands have adopted the ECDirectives of 1973 and 1979 setting forth certain solvency requirements for non-life and life insurancecompanies, respectively. Such solvency requirements apply to all of Fortis’s insurance subsidiaries in theEU.
Each of Fortis’s Belgian, Dutch and other European insurance subsidiaries is in compliance with theapplicable solvency requirements.
211
Level: 6 – From: 6 – Wednesday, May 14, 2008 – 1:37 pm – g5mac4 – 3960 Section 06 : 3960 Section 06

Bank Cash Flows
The condensed cash flow statement for the Banking operations are as follows:
2007 2006 20051111 1111 1111
(EUR millions)
Cash and cash equivalents, opening balance . . . . . . . . . . . . . . . . . . 20,792 25,594 24,835Cash flow from operating activities . . . . . . . . . . . . . . . . . . . . . . . . . (11,556) (13,624) 8,938Cash flow from investing activities . . . . . . . . . . . . . . . . . . . . . . . . . (12,592) (4,790) (11,663)Cash flow from financing activities . . . . . . . . . . . . . . . . . . . . . . . . . 31,162 13,763 3,348Exchange rate differences . . . . . . . . . . . . . . . . . . . . . . . . . . . . . . . . . (804) (151) 136Cash and cash equivalents, closing balance . . . . . . . . . . . . . . . . . . . 27,002 20,792 25,594
The main elements of the operating cash flow of the bank are the net profits of the period and thebalance between the loans to banks and customers versus the funding from banks and customers.
The principal sources of funds for Fortis’s banking operations are growth of the deposit base,interbank loans, repayments of existing loans and purchases of trading portfolio securities and investments.Interbank funding accounted for 25% of Fortis Bank’s total liabilities and equity at December 31, 2007(2006: 26%; 2005: 27%). The saving deposits and deposits due to customers accounted for 35% of FortisBank’s total liabilities and equity at December 31, 2007 (2006: 39%; 2005: 41%).
The major uses of funds in Fortis’s banking operations are advances of loans and other credits,interbank lending, investments, purchases of trading portfolio securities, interest expense andadministrative expenses.
Capital Adequacy
Capital adequacy and the use of capital are monitored by Fortis and its banking companies,employing techniques based on the guidelines developed by the Basel Committee on Banking Regulationsand Supervisory Practices (the “Basel Committee”) and implemented by the European Central Bank forsupervisory purposes.
The Belgian and Dutch Central Banks, in common with other bank supervisors, regard the riskassets ratio developed by the Basel Committee as a key supervisory tool and set individual ratiorequirements for banks in Belgium and The Netherlands, respectively. This ratio was designed to meet thedual objectives of strengthening the soundness and stability of the international banking system and ofcreating a fair and consistent supervisory framework for international banks by means of an internationalconvergence of capital measurement and capital standards. The technique involves the application of risk-weightings to assets (which for this purpose includes both balance sheet assets and off-balance sheetitems) to reflect the credit and other risks associated with broad categories of transactions andcounterparties.
The Basel Committee guidelines set a minimum total risk asset ratio for all international banks of8%. Bank capital adequacy requirements have also been established to comply with EU Directives. TheseDirectives, as implemented in Belgium and The Netherlands, set forth capital standards similar to those ofthe Basel Committee guidelines.
The principal Directive is the EC Capital Adequacy Directive. This Directive establishes minimumcapital requirements for banks and investment firms. The Capital Adequacy Directive is based on aproposal by the Basel Committee.
The risk asset approach to capital adequacy emphasizes the importance of Tier 1 (core) capital,comprising shareholder’s equity, published reserves (minus revaluation reserves), hybrid loans with Tier 1status and minority interest, minus intangible assets. Secondary or Tier 2 capital consists of revaluationreserves, long-term subordinated loans with a minimum/original maturity of at least five years andcumulative preference shares.
212
Level: 6 – From: 6 – Wednesday, May 14, 2008 – 1:37 pm – g5mac4 – 3960 Section 06 : 3960 Section 06

The concept of risk-weighting assumes that banking activities generally involve some risk of loss.For risk-weighting purposes, commercial lendings are taken as a bench-mark to which a risk-weighting of100% is ascribed. Other transactions that are considered to present lower levels of risk than commerciallending, may qualify for reduced weightings. Off-balance sheet items are generally converted to credit riskequivalents by applying credit conversion factors laid down by the Basel Committee. The resultantamounts are then risk- weighted according to the nature of the counterparty. As a result, credit substitutes,such as standby letters of credit and acceptances, are allocated the same risk-weightings as similar on-balance sheet lending, while transaction-related off-balance sheet items such as performance bonds, areallocated a lower weighting in recognition of the smaller likelihood of loss from these instruments.
In the case of interest and exchange rate-related contracts, the risks involved relate to the potentialloss of cash flows rather than notional principal amounts. These risks are represented by the replacementcost (as defined by the Belgian Central Bank since the Banking, Finance and Insurance Commission isFortis’s primary regulator) of the contracts plus an add-on to reflect potential future volatility inreplacement cost arising from movements in market rates.
Fortis uses Tier 1 and total capital ratios to monitor its solvency. Fortis strives to maintain aminimum Tier 1 capital ratio of 6% in its banking operations.
As of January 1, 2006, the basis for calculating the capital adequacy ratios moved from BelgianGAAP to IFRS. The transition to IFRS had an impact on the equity. The supervisors defined certain filtersto exclude certain elements from equity. Due to the options chosen by Fortis in the transition to IFRS, thebanking Tier 1 equity reduced by EUR 1.6 billion, primarily due to the recognition of deferred pensionexpenses (corridor) of EUR 1.1 billion. As of December 31, 2005, the Tier 1 ratio based on IFRS wouldhave been 6.6%, compared to 7.4% under Belgian GAAP, and the total capital ratio would have been10.1% under IFRS, compared to 10.5% under Belgian GAAP.8
Basel II. The Basel II rules are a set of new, more risk-sensitive rules for capital requirementcalculations that came into effect as of January 1, 2007. The Basel II rules define the minimum capital thata financial institution must hold for unexpected events. These rules also provide minimum qualitativestandards and risk management practices that a financial institution should have in place. The Basel IIrules include capital requirements for operational risk in addition to credit risk and market risk, which arealready covered in the current rules.
The Basel II rules were developed by the Basel Committee for Banking Supervision to replace thecurrent rules, known as Basel I. The committee’s first proposal for revising the capital adequacyframework was published in June 1999. Since then, the revised framework, the International Convergenceof Capital Measurement and Capital Standards, was published in November 2005. Based on therecommendations of the revised framework, the Basel II rules were ratified by the European Union, whichmade necessary amendments to the CRD, the Recast Capital Requirements Directive.
The Basel II rules are represented by three “pillars”: Pillar I addresses the calculation of minimumregulatory capital requirements for credit, market and operational risk. Pillar II addresses the supervisoryreview process, the financial institution’s capital adequacy assessment including other risk not addressedunder Pillar I and the strategy for maintaining capital levels. Pillar III addresses market discipline andrequirements regarding market disclosure of risk-related information.
Under Pillar I, financial institutions can choose from three approaches for the calculation of thecredit risk capital: the Standardized method (which is similar to the current Basel I rules), FoundationInternal Ratings-Based (“IRB”) and advanced IRB — the difference being the sophistication of the capitalrequirement calculations. Under Foundation IRB and Advanced IRB, the financial institution uses its owncalculation of risk-related variables that serve as the input in the calculation of capital requirement. Foroperational risk, financial institutions can also choose from three approaches: the Basic Indicatorapproach, the Standardized approach and the Advanced Measurement Approach (“AMA”) — thedifference being the sophistication of methods and the processes required for operational risk monitoringand quantification.
213
Level: 6 – From: 6 – Wednesday, May 14, 2008 – 1:37 pm – g5mac4 – 3960 Section 06 : 3960 Section 06

Fortis has applied for permission to use the Advanced Internal Ratings Based approach (“AIRBA”)to determine the capital requirements for credit risk and the AMA for determining the capital requirementsfor operational risk as of January 1, 2008. Basel II became applicable as of January 1, 2008 based on thefinal approval of the CBFA. The review related to the request for approval is on-going and based onFortis’s application file.
Fortis expects that Basel II will result in a significant reduction in risk-weighted commitmentsrelated to credit risk and compensated somewhat by the introduction of capital requirements foroperational risk. In the transition period from 2008 to 2010 certain capital floors will be applicable basedon Basel I; the full capital release will only become available over that period.
Liquidity and Capital Resources of Fortis N.V. and Fortis SA/NV
Fortis N.V. and Fortis SA/NV are holding companies whose principal assets are their investments inFortis companies. These investments are their sole assets other than certain “permitted” assets they mayhold from time to time.
As holding companies, Fortis N.V.’s and Fortis SA/NV’s principal source of earnings are thereforecash dividends received from Fortis companies. Fortis companies are subject to restrictions on the amountof funds they may transfer at any given time in the form of cash dividends or otherwise; in addition theinsurance and banking companies are restricted in respect of minimum capital and solvency requirementsthat are imposed by insurance, banking and other regulators in the countries in which Fortis’s subsidiariesoperate.
From time to time the holding companies may raise funds via issuance of debt or equity securities.To issue debt, an issuing vehicle, Fortis Finance N.V., is used, which issues debt under the guarantee ofFortis N.V. and Fortis SA/NV under a EUR 4 billion commercial paper program and a EUR 15 billionEuropean Medium Term Note program. To manage liquidity, Fortis Finance N.V. can cover its liquidityneeds via a credit facility of EUR 1 billion, granted by unaffiliated third parties (maturing in 2009).
The liquidity and capital resource considerations for Fortis N.V. and Fortis SA/NV vary in light ofthe business conducted by the insurance and banking operations of Fortis. Insurance activities (premiumand investment income) traditionally generate more cash inflow than has been required to meet maturities,surrenders, claims and expenses. In addition, at year-end 2007 the insurance activities hold EUR 61 billionin investments available for sale (primarily debt securities and equities at fair value), which representsmore than 92% of net technical provisions.
Almost by definition, banking activities have good access to capital markets. On top of this FortisBank has a strong retail funding base and benefits from a large volume of customer deposits, which covers85% of its customer loan book. Fortis Bank’s liquidity is further enhanced by its available for saleinvestment portfolio (EUR 103 billion at December 31, 2007), which consists primarily of fixed-incomesecurities at fair value.
At December 31, 2007 Fortis N.V. held no receivables to Fortis companies under intercompanylending arrangements (2006: nil; 2005: nil). At December 31, 2007 Fortis N.V. had EUR 54 million ofavailable cash, compared to EUR 37 million end of 2006 and EUR 72 million in 2005.
At December 31 2007 Fortis SA/NV had EUR 55 million available in cash compared to EUR 41million in 2006 and EUR 9 million in 2005.
The dividends declared over any year need to be funded from the dividend upstream of the nextyear.
Financing Programs and Available Credit Lines
Through its financing vehicle, Fortis Finance, Fortis utilizes the capital markets to raise funding,including the European commercial paper market and the Euro Medium Term Note market. At December31, 2007, Fortis Finance had EUR 1.1 billion outstanding under its EUR 4 billion Euro commercial paper
214
Level: 6 – From: 6 – Wednesday, May 14, 2008 – 1:37 pm – g5mac4 – 3960 Section 06 : 3960 Section 06

program. EUR 6.3 billion was outstanding under Fortis’s EUR 15 billion EMTN program at the same date.In addition, Fortis Finance had a standby multi-credit facility for EUR 1 billion. At December 31, 2007, noamount was outstanding under this credit line.
Fortis Bank organizes its own financing programs and credit lines. As co-issuer together with aLuxembourg-based vehicle named Fortis Luxembourg Finance S.A., it utilizes a EUR 15 billion EMTNprogram for funding and capitalization on an opportunistic basis. Via Fortis Luxembourg Finance S.A.,Fortis Bank also accesses the Euro commercial paper market via a EUR 3 billion program, the U.S.commercial paper market via a US$7.5 billion program of Fortis Funding LLC and the Canadiancommercial paper market via a CAD 2.5 billion program of FB Funding Company, and also issues via aUS$3 billion MTN program of its Hong Kong branch. All debt issued under these programs carries aguarantee or subordinated guarantee of Fortis Bank. Since September 2006 Fortis Bank also uses a US$20billion USMTN program, with Fortis Bank New York Branch and Fortis Bank Cayman Branch as co-issuers.
Fortis Bank Luxembourg S.A. and Fortis Bank Nederland (Holding) N.V., both subsidiaries ofFortis Bank, have their own programs. Fortis Banque Luxembourg has access to the capital markets via aUS$15 billion EMTN program, a EUR 3 billion Euro CP program and a US$3 billion U.S. CP program.Fortis Bank Nederland (Holding) N.V. has access under a EUR 10 billion EMTN program. Next to theseprograms, various programs for issuance of Certificates of Deposit exist at the named banks.
On October 18, 2007 Fortis secured a revolving credit facility of EUR 10,000,000,000 with aninternational syndicate of banks. The facility will be used to finance a portion of the consideration payableby Fortis in connection with the ABN AMRO Acquisition.
Embedded Value (unaudited)
Fortis publishes the Embedded Value (“EV”) of its life insurance business in accordance with theEuropean Embedded Value (“EEV”) principles established by the CFO Forum of European insurancecompanies. The EEV Principles provide a framework intended to improve comparability and transparencyin embedded value reporting across Europe. In complying with the EEV principles, Fortis has adopted amarket consistent methodology (“MCEV” or Market Consistent Embedded Value). EV of life insuranceoperations provides additional information on the value of the contracts in-force, including the value addedby new business as sold in the reporting year. EV excludes any value attributable to the sale of future newbusiness after the reporting year. The EV results are unaudited but the methodology and assumptions usedin the calculation have been reviewed by an external reviewer. The changes in a company’s EV from yearto year provides a measure of the profitability of the company’s life insurance business.
Terms which are highlighted in bold below are defined later in this section.
Scope
The Fortis Life entities included in the scope of EV are:
• Fortis Insurance Netherlands (Insurance Netherlands)
• Fortis Insurance Belgium (Insurance Belgium)
• Fortis Insurance International (Insurance International)
• Fortis Assurances in France
• Fortis Luxembourg-Vie in Luxembourg
• Millenniumbcp Fortis in Portugal. In Fortis’s Consolidated Financial Statements,Millenniumbcp Fortis is consolidated on a 100% basis, but is reported on a 51% basisfor EV reporting in line with Fortis’s holding.
215
Level: 6 – From: 6 – Wednesday, May 14, 2008 – 1:37 pm – g5mac4 – 3960 Section 06 : 3960 Section 06

Fortis EV excludes the life insurance business of FICA in Hong Kong, joint ventures in Asia,smaller entities in Insurance International not mentioned above and any insurance business or servicesrelated to ABN AMRO.
EV 2007 results
Embedded Value as calculated at 2007 year-end is set forth in the table below.
Insurance Insurance InsuranceFortis Belgium Netherlands International1111 1111 1111 1111
(EUR million)(unaudited)
EV 2007 year-end . . . . . . . . . . . . . . . . . . . . . . . . . . . . 12,411 5,706 5,706 1,000Total Shareholders’ Equity . . . . . . . . . . . . . . . . . . . . . 6,180 2,842 2,878 459Required Equity . . . . . . . . . . . . . . . . . . . . . . . . . . . . . 3,856 1,716 1,787 354Free Surplus . . . . . . . . . . . . . . . . . . . . . . . . . . . . . . . . 2,324 1,126 1,091 106Value of Operating Business . . . . . . . . . . . . . . . . . . . . 6,902 3,260 3,074 569Certainty Equivalent Values of Operating Business
(“CE-VOB”) . . . . . . . . . . . . . . . . . . . . . . . . . . . . . . 7,721 3,726 3,361 635Cost of Financial Options and Guarantees
“CFOG”) . . . . . . . . . . . . . . . . . . . . . . . . . . . . . . . . (571) (349) (170) (51)Cost of Non-Financial Risks (“CNFR”) . . . . . . . . . . . (248) (117) (117) (14)Cost of Capital (“COC”) . . . . . . . . . . . . . . . . . . . . . . (671) (396) (246) (29)
After taking into account opening adjustments including the divestiture of CaiFor, the EmbeddedValue increased by 8% to EUR 13.6 billion before dividends. This increase was due to a contribution ofValue Added by New Business of EUR 345 million and higher interest rates resulting in an increase ofEUR 653 million. The increase resulting from higher interest rates was offset by a negative variance ofEUR 737 million resulting from a drop in asset values and impairments on fixed income investments, suchas CDOs.
For insurance business, increasing interest rates support an increase in value as a result of thenatural mismatch between assets and liabilities with longer duration. After the dividend payment to Fortis,Embedded Value was EUR 12.4 billion at the end of 2007.
The value of Insurance Belgium would have been EUR 374 million lower if we had not applied the“look through” approach to the result related commission, which does not make allowances in the EV orVANB for any payments under the new result related commission arrangement between InsuranceBelgium and Fortis Bank. In 2007 the result related commission amounted to a post-tax payment to RetailBanking of EUR 50 million.
216
Level: 6 – From: 6 – Wednesday, May 14, 2008 – 1:37 pm – g5mac4 – 3960 Section 06 : 3960 Section 06

Change in Embedded Value
The Analysis of Change explains the movement in Embedded Value at the start of 2007 to the valueat year-end by showing the different underlying components.
Value ofOperating Cost of Shareholder’s Insurance Insurance Insurancebusiness + Capital + Equity = EV Belgium Netherlands International11122 1 11122 1 11122 1 11122 11122 11122 11122
(EUR million)
Year-end 2006 ........ 6,291 (547) 6,562 12,307 4,832 6,249 1,225OpeningAdjustments ......16 19 185 220 403 120 (303)
Year-start 2007........ 6,307 (528) 6,748 12,527 5,235 6,370 922Operatingassumptionchanges .............. (82) (22) 7 (97) (114) 26 (9)
Expected return ...... (355) 21 1,206 872 426 399 47Risk free return .... 291 (17) 223 496 196 260 40Expected returnabove risk free .... 216 0 160 376 230 139 7
Transfer toshareholderequity .................. (862) 38 824 0 0 0 0
Variances ................ (335) (29) (373) (737) (324) (402) (11)Change in interestrates ...................... 851 (69) (129) 653 403 241 9
Value added by newbusiness .............. 516 (44) (127) 345 207 77 62
EV before Dividends 6,902 (671) 7,333 13,564 5,834 6,709 1,021Dividends under EV
Life scope .......... 0 0 (1,153) (1,153) (128) (1,003) (22)Year-end 2007 ........ 6,902 (671) 6,180 12,411 5,706 5,706 1,000
The opening adjustments to the Embedded Value at the start of 2007 include the divestiture ofCaiFor and modeling improvements and corrections. The divestiture of CaiFor resulted in a EUR 219million decrease in value for Insurance International and an increase of EUR 176 million for InsuranceBelgium. In addition, the restatement for Insurance Netherlands includes an assumed increase of benefitsto be granted to policyholders of investment products. Opening adjustments also include EUR 61 millionof capital contributions.
Overall, the changes in Operating Assumptions led to a decrease of EUR 97 million. Changes inOperating Assumptions include changes in persistency assumptions of EUR (58) million, profit sharingrules of EUR (40) million and changes in the level of Required Equity increasing the Cost of Capital, andhence reducing the EV by EUR 32 million at Insurance Belgium. At Fortis Insurance, expense increases atInsurance International of EUR 31 million were offset by a decrease in expenses at the level of InsuranceNetherlands.
Expected Return is the after-tax return on embedded value resulting from projections of assets andliabilities over the year based on expected “real world” returns. The Expected Return is split between therisk free return and the additionally expected return above risk free from investing in more risky assets,such as shares, real estate and corporate bonds. Separately, the expected return reflects the release ofmodeled profits from the Value of the In-force business into Free Surplus, although the movement does notcontribute to a change in value. In total, the Expected Return contributed EUR 872 million. It includes therelease of risk factors, including CFOG and CNFR.
The variance measures the impact on EV of differences between actual compared to expectedexperience in the year. Total variance, divided between economic and non-economic variances, amountedto EUR (737) million in 2007.
Change in interest rate includes the impact on EV of changes in interest rate yield curves andvolatilities and had an impact of EUR 653 million. The main effects are the impact of a higher yieldimproving margins on the block of in-force business with relatively higher guarantees. Also, when interest
217
Level: 6 – From: 6 – Wednesday, May 14, 2008 – 1:37 pm – g5mac4 – 3960 Section 06 : 3960 Section 06
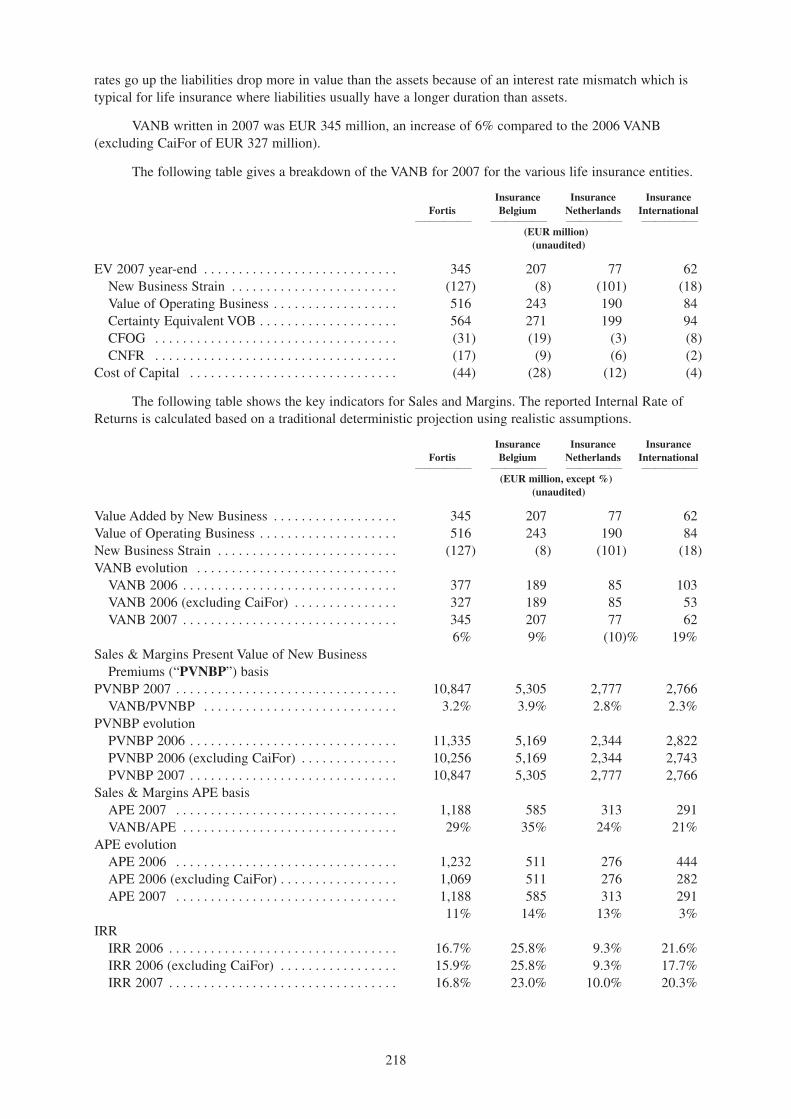
rates go up the liabilities drop more in value than the assets because of an interest rate mismatch which istypical for life insurance where liabilities usually have a longer duration than assets.
VANB written in 2007 was EUR 345 million, an increase of 6% compared to the 2006 VANB(excluding CaiFor of EUR 327 million).
The following table gives a breakdown of the VANB for 2007 for the various life insurance entities.
Insurance Insurance InsuranceFortis Belgium Netherlands International1111 1111 1111 1111
(EUR million)(unaudited)
EV 2007 year-end . . . . . . . . . . . . . . . . . . . . . . . . . . . . 345 207 77 62New Business Strain . . . . . . . . . . . . . . . . . . . . . . . . (127) (8) (101) (18)Value of Operating Business . . . . . . . . . . . . . . . . . . 516 243 190 84Certainty Equivalent VOB . . . . . . . . . . . . . . . . . . . . 564 271 199 94CFOG . . . . . . . . . . . . . . . . . . . . . . . . . . . . . . . . . . . (31) (19) (3) (8)CNFR . . . . . . . . . . . . . . . . . . . . . . . . . . . . . . . . . . . (17) (9) (6) (2)
Cost of Capital . . . . . . . . . . . . . . . . . . . . . . . . . . . . . . (44) (28) (12) (4)
The following table shows the key indicators for Sales and Margins. The reported Internal Rate ofReturns is calculated based on a traditional deterministic projection using realistic assumptions.
Insurance Insurance InsuranceFortis Belgium Netherlands International1111 1111 1111 1111
(EUR million, except %)(unaudited)
Value Added by New Business . . . . . . . . . . . . . . . . . . 345 207 77 62Value of Operating Business . . . . . . . . . . . . . . . . . . . . 516 243 190 84New Business Strain . . . . . . . . . . . . . . . . . . . . . . . . . . (127) (8) (101) (18)VANB evolution . . . . . . . . . . . . . . . . . . . . . . . . . . . . .
VANB 2006 . . . . . . . . . . . . . . . . . . . . . . . . . . . . . . . 377 189 85 103VANB 2006 (excluding CaiFor) . . . . . . . . . . . . . . . 327 189 85 53VANB 2007 . . . . . . . . . . . . . . . . . . . . . . . . . . . . . . . 345 207 77 62
6% 9% (10)% 19%Sales & Margins Present Value of New Business
Premiums (“PVNBP”) basisPVNBP 2007 . . . . . . . . . . . . . . . . . . . . . . . . . . . . . . . . 10,847 5,305 2,777 2,766
VANB/PVNBP . . . . . . . . . . . . . . . . . . . . . . . . . . . . 3.2% 3.9% 2.8% 2.3%PVNBP evolution
PVNBP 2006 . . . . . . . . . . . . . . . . . . . . . . . . . . . . . . 11,335 5,169 2,344 2,822PVNBP 2006 (excluding CaiFor) . . . . . . . . . . . . . . 10,256 5,169 2,344 2,743PVNBP 2007 . . . . . . . . . . . . . . . . . . . . . . . . . . . . . . 10,847 5,305 2,777 2,766
Sales & Margins APE basisAPE 2007 . . . . . . . . . . . . . . . . . . . . . . . . . . . . . . . . 1,188 585 313 291VANB/APE . . . . . . . . . . . . . . . . . . . . . . . . . . . . . . . 29% 35% 24% 21%
APE evolutionAPE 2006 . . . . . . . . . . . . . . . . . . . . . . . . . . . . . . . . 1,232 511 276 444APE 2006 (excluding CaiFor) . . . . . . . . . . . . . . . . . 1,069 511 276 282APE 2007 . . . . . . . . . . . . . . . . . . . . . . . . . . . . . . . . 1,188 585 313 291
11% 14% 13% 3%IRR
IRR 2006 . . . . . . . . . . . . . . . . . . . . . . . . . . . . . . . . . 16.7% 25.8% 9.3% 21.6%IRR 2006 (excluding CaiFor) . . . . . . . . . . . . . . . . . 15.9% 25.8% 9.3% 17.7%IRR 2007 . . . . . . . . . . . . . . . . . . . . . . . . . . . . . . . . . 16.8% 23.0% 10.0% 20.3%
218
Level: 6 – From: 6 – Wednesday, May 14, 2008 – 1:37 pm – g5mac4 – 3960 Section 06 : 3960 Section 06

The increase in VANB resulted from higher volumes and margins, driven by the successful bankcampaigns in Belgium, by product innovation efforts in Portugal and sales through the bank channel inFrance. As a result of difficult market circumstances, Unit Linked sales in The Netherlands dropped,causing a slight decrease of the VANB. The overall VANB for Insurance Belgium would have been EUR56 million lower if we had not applied the “look through” approach to the result related commission whichwas paid by Insurance Belgium to Retail Banking.
EV 2006 results
Completing the transition to a Market Consistent approach and other modeling improvementsresulted in a restatement of the 2005 Embedded Value. This restatement resulted in a reduction of EUR208 million or 1.9%.
Key changes included a reduction of shareholders’ equity mainly due to revaluation of elements ofInsurance Belgium shareholder equity and re-allocation of assets to operating business at InsuranceNetherlands. Both Certainty Equivalent Values of Operating Business (“CE-VOB”) and Cost of FinancialOptions and Guarantees (“CFOG”) reduced mainly because of the bottom-up approach compared to thetop-down transition approach used last year. Additionally, the Cost of Non-Financial Risks (“CNFR”)increased due to a change in modeling approach to align more closely with the Solvency II methodologydevelopments. Finally, the reduction in Cost of Capital (“COC”) was driven by improved modeling oftaxes and investments costs.
Fortis Insurance Belgium Insurance Netherlands Insurance International11111121 11111121 11111121 11111121
2005 2005 2005 20052005 Restated 2005 Restated 2005 Restated 2005 Restated1112 1112 1112 1112 1112 1112 1112 1112
(EUR million)(unaudited)
EV . . . . . . . . . . . . . . . . . . . . . . 10,830 10,623 4,094 3,964 5,612 5,554 1,124 1,105Total Shareholder Equity . . . . . 6,340 5,998 2,292 2,100 3,396 3,249 652 649
Required Equity . . . . . . . . . 4,117 4,276 1,695 1,857 1,776 1,776 646 643Free Surplus . . . . . . . . . . . . 2,223 1,722 596 243 1,620 1,473 7 5
Value of Operating Business . . 5,358 5,291 2,138 2,216 2,664 2,562 556 512Certainty Equivalent VOB . . . . 6,764 6,395 2,876 2,877 3,188 2,878 699 640CFOG . . . . . . . . . . . . . . . . . . . (1,217) (825) (664) (534) (420) (196) (132) (98)CNFR . . . . . . . . . . . . . . . . . . . (189) (279) (74) (126) (104) (120) (10) (33)Cost of Capital . . . . . . . . . . . . (867) (667) (336) (353) (447) (257) (84) (56)
As a consequence of the new result-related commission which Insurance Belgium paid to FortisBank in connection with the distribution of insurance products following the transfer of Fortis BankInsurance to Insurance Belgium, the value of Insurance Belgium would have been EUR 354 million lowerif we had not applied the look-through approach. In the look-through approach the result-relatedcommission was reversed. In 2006, the result-related commission amounted to a post-tax payment toRetail Banking of EUR 49 million.
Compared to the restated 2005 opening value, the Embedded Value before dividends showed anincrease in EV of 27% over Restated 2005 to EUR 13.5 billion at the end of 2006.
Insurance Insurance InsuranceFortis Belgium Netherlands International1111 1111 1111 1111
(EUR million)(unaudited)
EV 2006 year-end . . . . . . . . . . . . . . . . . . . . . . . . . . . . 12,307 4,833 6,249 1,225Total Shareholders’ Equity . . . . . . . . . . . . . . . . . . . . . 6,562 2,230 3,691 640Required Equity . . . . . . . . . . . . . . . . . . . . . . . . . . . . . 3,955 1,472 1,780 702Free Surplus . . . . . . . . . . . . . . . . . . . . . . . . . . . . . . . . 2,608 758 1,911 (61)Value of Operating Business . . . . . . . . . . . . . . . . . . . . 6,291 2,878 2,769 644Certainty Equivalent VOB . . . . . . . . . . . . . . . . . . . . . . 7,251 3,348 3,134 769CFOG . . . . . . . . . . . . . . . . . . . . . . . . . . . . . . . . . . . . . (721) (380) (249) (92)
219
Level: 6 – From: 6 – Wednesday, May 14, 2008 – 1:37 pm – g5mac4 – 3960 Section 06 : 3960 Section 06

CNFR . . . . . . . . . . . . . . . . . . . . . . . . . . . . . . . . . . . . . (239) (91) (116) (33)Cost of Capital . . . . . . . . . . . . . . . . . . . . . . . . . . . . . . (547) (276) (211) (59)
Change in Embedded Value
The Analysis of Change explained the movement in EV at 2006 year-start to the value at year-endby showing the different underlying components. The increase of 27% to EUR 13.5 billion beforedividends was largely due to VANB, higher interest rates and strong growth in share values. The dividendsrepresented the payments out of Life Insurance activities within the EV scope.
Valuein Shareholders Insurance Insurance Insurance
Force + Equity = EV Belgium Netherlands International11122 1 12112 1 11122 11212 12112 12112
(EUR million)(unaudited)
Year-end 2005 . . . . . . . . . . . . . . . . . 4,491 6,340 10,830 4,094 5,612 1,124Opening Adjustments . . . . . . . . . . . 133 (341) (208) (130) (58) (20)
11122 12112 11122 11212 12112 12112
Year-start 2006 . . . . . . . . . . . . . . . . 4,624 5,998 10,623 3,964 5,554 1,105Operating assumption changes . . . . 124 (44) 80 101 (5) (17)Expected return . . . . . . . . . . . . . . . . (307) 1,098 791 276 479 36Variances . . . . . . . . . . . . . . . . . . . . . 338 903 1,241 673 520 48Change in economicassumptions . . . . . . . . . . . . . . . . . . 441 (33) 409 202 168 39
Value Added by New Business . . . . 524 (146) 377 189 85 103EV before Dividends . . . . . . . . . . . 5,744 7,776 13,521 5,406 6,802 1,313Dividends under EV Life scope . . . – (1,214) (1,214) (573) (553) (88)
1112 1112 1112 1112 1112 1112
Year-end 2006 . . . . . . . . . . . . . . . . . 5,744 6,562 12,307 4,833 6,249 1,22511122 12112 11122 11212 12112 1211211122 12112 11122 11212 12112 12112
The principal opening adjustment was restatement of embedded value of 2005 year-end to reflectchanges resulting from the completion of the transition of aligning internal models. Other openingadjustments included a small increase in scope in Insurance Belgium.
Changes in Operating Assumptions included changes in tax and expenses assumptions at InsuranceNetherlands, and changes in lapse assumptions (EUR (120) million) and a reduction in the level ofrequired equity (EUR 137 million) as a result of raising additional admissible sub-debt for InsuranceBelgium. Overall, the changes in Operating assumptions had a relatively small impact on EV of EUR 80million.
Expected return is the after-tax return on embedded value resulting from projections of assets andliabilities over the year based on expected “real world” returns. It included the release of buffers for riskfactors, including CFOG and CNFR. The Expected Return also reflected the release of modeled profitsfrom the Value of the In-force business into Free Surplus, although the movement did not contribute to achange in value. In total, the Expected Return contributed EUR 791 million to the increase.
Variances measured the impact on EV of differences between actual compared to expectedexperience in the year. It included the out performance of actual investment returns against the expectationon Share and Real Estate portfolios. The variance amounted to a total of EUR 1.2 billion.
Change in Economic assumptions included the impact on EV of changes in interest rate yieldcurves and volatilities and had an impact of EUR 409 million. The main effects were the impact of ahigher yield improving margins on the block of in-force business with relatively higher guarantees. Inaddition, when interest rates go up the liabilities drop more in value than the assets because of an interestrate mismatch, which is typical for life insurance where assets have a shorter duration than our liabilities.
VANB written in 2006 was EUR 377 million and was calculated on a Market Consistent basis andincluded an allowance for CFOG and CNFR.
220
Level: 6 – From: 6 – Wednesday, May 14, 2008 – 1:37 pm – g5mac4 – 3960 Section 06 : 3960 Section 06

The following table gives a breakdown of the VANB for 2006 for the various life insurance entities.
Insurance Insurance InsuranceFortis Belgium Netherlands International1111 1111 1111 1111
(EUR million)(unaudited)
VAN 2006 year-end . . . . . . . . . . . . . . . . . . . . . . . . . . . 377 189 85 103New Business Strain . . . . . . . . . . . . . . . . . . . . . . . . (146) (8) (115) (23)Value of Operating Business . . . . . . . . . . . . . . . . . . 568 222 215 132Certainty Equivalent VOB . . . . . . . . . . . . . . . . . . . . 635 258 231 146CFOG . . . . . . . . . . . . . . . . . . . . . . . . . . . . . . . . . . . (48) (28) (9) (11)CNFR . . . . . . . . . . . . . . . . . . . . . . . . . . . . . . . . . . . (18) (8) (7) (3)
Cost of Capital . . . . . . . . . . . . . . . . . . . . . . . . . . . . . . (44) (25) (14) (6)
The following table shows the key indicators for Sales and Margins. The reported IRR is calculatedbased on a traditional deterministic projection using realistic assumptions.
Insurance Insurance InsuranceFortis Belgium Netherlands International1111 1111 1111 1111
(EUR million, except %)(unaudited)
Value Added by New Business . . . . . . . . . . . . . . . . . . 377 189 85 103Value of Operating Business . . . . . . . . . . . . . . . . . . . . 568 222 215 132New Business Strain . . . . . . . . . . . . . . . . . . . . . . . . . . (146) (8) (115) (23)Sales & Margins PVNBP basisPVNBP 2006 . . . . . . . . . . . . . . . . . . . . . . . . . . . . . . . . 11,335 5,169 2,344 3,822
VANB/PVNBP . . . . . . . . . . . . . . . . . . . . . . . . . . . . 3.3% 3.7% 3.6% 2.7%Sales & Margins APE basis
APE 2006 . . . . . . . . . . . . . . . . . . . . . . . . . . . . . . . . 1,230 511 275 444VANB/APE . . . . . . . . . . . . . . . . . . . . . . . . . . . . . . . 31% 37% 31% 23%
IRRIRR 2005 . . . . . . . . . . . . . . . . . . . . . . . . . . . . . . . . . 14.0% 15.6% 9.0% 21.8%IRR 2006 . . . . . . . . . . . . . . . . . . . . . . . . . . . . . . . . . 16.7% 25.8% 9.3% 21.6%
The overall VANB for Insurance Belgium would have been EUR 49 million lower if we had notapplied the “look through” approach to profit-related commissions that will be paid by Insurance Belgiumto Retail Banking, which does not make allowances in the EV or VANB for any such payments.
To allow comparisons to the results of 2005, the 2006 VANB was also calculated on a traditionalmethod based on cash flows using real world investment return assumptions and discounted at a discountrate of 7.2% which is the 10-year risk free return plus 300bps Equity Risk Premium. This comparison isshown in table below.
Fortis FIB FIN FII11111121 11111121 11111121 11111121
2005 2006 2005 2006 2005 2006 2005 20061112 1112 1112 1112 1112 1112 1112 1112
(EUR million)(unaudited)
Value Added by New Business 300 373 164 240 45 50 91 84New Business Strain . . . . . . . . (138) 146 (21) (8) (101) (115) (16) (23)Value of Operating Business . . 541 621 245 300 169 195 127 126Cost of Capital . . . . . . . . . . . . (103) (102) (61) (52) (22) (30) (20) (19)PVNBP . . . . . . . . . . . . . . . . . . 10,227 10,516 4,837 4,760 2,044 2,051 3,346 3,705
On this basis, the VANB increased by 24% from EUR 300 million to EUR 373 million driven byhigher volumes and higher average margins. The higher margins were due mainly to an increase in targetpricing at FIB. This increase was largely due to the assumed expected risk premium on Shares and RealEstate, which was not recognized under market consistent valuation methodology.
221
Level: 6 – From: 6 – Wednesday, May 14, 2008 – 1:37 pm – g5mac4 – 3960 Section 06 : 3960 Section 06

The overall impact of moving to MCEV was slightly positive although the overall result ofmethodology changes varied across businesses. The new methodology had no impact on New BusinessStrain.
The impact of moving to the MCEV basis could have been positive or negative depending on theproduct mix, level of guarantees, asset mix, nature of profit-sharing rules and the prevailing yield curveand level of volatilities.
Cost of Capital reduced because under MCEV it represented only the cost of taxes on investmentreturns and investment expenses relating to the Required Equity.
The Present Value of New Business Premiums (“PVNBP”) was affected because the Risk DiscountRate used in the traditional method was higher than the risk free yield curve used in the MCEV method.
Fortis FIB FIN FII11111121 11111121 11111121 11111121
2006 2006 2006 20062006 Market 2006 Market 2006 Market 2006 Market
Traditional Consistent Traditional Consistent Traditional Consistent Traditional ConsistentMethod Method Method Method Method Method Method Method1112 1112 1112 1112 1112 1112 1112 1112
(unaudited)(EUR million)
Value Added by New Business 373 377 240 189 50 85 84 103New Business Strain . . . . . . . . (146) (146) (8) (8) (115) (115) (23) (23)Value of Operating Business . . 621 568 300 222 195 215 126 132Cost of Capital . . . . . . . . . . . . (102) (44) (52) (25) (30) (14) (19) (6)PVNBP . . . . . . . . . . . . . . . . . . 10,516 11,335 4,760 5,169 2,051 2,344 3,705 3,822
Important Terms
Embedded Value methodology
EV represents a valuation of Fortis’s insurance business and comprises the market value of theshareholders’ equity plus the value of the In-force portfolio. These components are defined as follows:
Embedded Value (EV) = Value of Shareholder Equity (VSE)
— Cost of Capital (CoC) Value of In-force Business (ViF)
+ Value of Operating Business (VOB)
Value of Shareholder Equity (“VSE”)
Shareholder equity equals the market value of the tangible assets backing Fortis’s Life Equityincluding adjustments to ensure consistency with the calculation of the Value of Operating Business(“VOB”).
Value of Operating Business
The Value of Operating Business represents the value of assets and liabilities based on a market-consistent valuation of financial risks. It reflects the risk-adjusted value of the expected earnings emergingfrom the in-force policies by deducting the market consistent value of liabilities from the market consistentvalue of assets. This has previously been referred to as the Present Value of Future Profits (“PVFP”).
The VOB can be split into the following three risk components:
Certainty equivalent value of operating business (“CE-VOB”)
Certainty Equivalent Value corresponds to the value of the business without taking credit for anyfuture investment risk premiums and represents the value as if all cash flows are certain and all investmentassets earn a risk free return (on a market value basis), with the cash flows discounted at the same risk free
222
Level: 6 – From: 6 – Wednesday, May 14, 2008 – 1:37 pm – g5mac4 – 3960 Section 06 : 3960 Section 06

return. This value captures the intrinsic value (or in-the-money value) of the financial options andguarantees.
Cost of Financial Options and Guarantees (“CFOG”)
Cost of Financial Options and Guarantees represents the time value of options and guarantees and isbased on stochastic scenarios, consistent with the approach used in financial markets.
The CFOG is disclosed explicitly to place a market-consistent value on the asymmetry ofshareholder profits around the expected cost of financial options and guarantees embedded in the insurancecash flows. The expected or intrinsic cost of the financial options and guarantees is allowed for in theCertainty Equivalent value. All material financial options and guarantees in the portfolio are accounted forin the Embedded Value. The time value of CFOG is derived as the difference between the CertaintyEquivalent value and the stochastic value.
Cost of Non-Financial Risk (“CNFR”)
The Cost of Non-Financial Risk is an allowance for all other non-financial risks which are currentlynot allowed for in the models. While within a MCEV framework the financial risks arising from optionsand guarantees are addressed through the CFOG, an additional separate adjustment is necessary for allother risks. The CNFR is an explicit deduction to the Certainty Equivalent value of operating business toplace a value on the uncertainty of shareholder profits around the expected insurance and non-hedgeablerisks embedded in the insurance cash flows.
The CNFR is calculated based on an annual charge on a part of the solvency capital required to beheld for these specific risks. This is structurally in-line with Fortis’s understanding of the approachproposed for calculating the Market Value Margin under Solvency II.
Until calibrations and methodological details are more certain and the models can be improved toallow for the uncertainty of shareholder profits around non-financial risks, Fortis has chosen to calibratethe annual charge on the solvency capital held for these risks as a simple 0.5% post-tax charge of theprojected total Required Equity each year.
Cost of Capital (“CoC”)
The operating business cannot exist without Fortis meeting a number of solvency capitalrequirements including local regulatory, rating agency and economic capital. Meeting these requirementsnecessitates the locking in of a portion of the shareholders’ equity (i.e., the Required Equity). Since this islocked in and cannot be released to the shareholder, the shareholder can only benefit via the investmentyield earned on the investment assets backing the equity and therefore pays both the tax costs on thisinvestment yield as well as any investment expenses. The Cost of Capital represents the value lost throughincurring these tax and investment expenses on the Required Equity.
Value Added by New Business
The VANB represents the value added by new business written in the period, and is calculated in asimilar way to the embedded value. It is calculated as the value of the new business written in 2007 that isin-force at December 31, 2007 plus the first year losses (New Business Strain).
The VANB includes only premiums arising from contracts sold during 2007 and does not includefuture new business. The VANB is valued based on year-end assumptions.
Assumptions and Sensitivities
The assumptions underlying the projections of the Embedded Value at 2007 year-end are describedbelow.
223
Level: 6 – From: 6 – Wednesday, May 14, 2008 – 1:37 pm – g5mac4 – 3960 Section 06 : 3960 Section 06

Economic assumptions
Market yield
The basis for the Risk Free investment return assumptions in the market consistent valuation is theEuro swap curve at December 31, 2007 and is sourced from Fortis Bank. These rates are plotted below(rates after year 30 are assumed to remain flat). Fortis uses this curve to extract forward reinvestmentyields that are used for all asset classes.
Fortis uses a stochastic economic scenario generator to produce 1,000 arbitrage free scenarios offuture investment returns on each asset class, based on the yield curve above and the volatilities as given inthe section below.
Volatilities
Volatility for shares is based on an observed implied volatility of a ten year at-the-money equityindex call option as at December 31, 2007. Volatilities for fixed interest assets are based on a selection ofat-the-money swaptions as at December 31, 2007. Volatility for real estate is based on historical marketdata.
2007 2006 2005111211 111211 111211
10 year swap (5 year option/10 year option) . . . . . . . . . . 12.1%/10.7% 13.3% /12.2% 16.2% /14.3%15 year swap (5 year option/10 year option) . . . . . . . . . . 12.0%/10.9% 13.1% /12.2% 15.8% /14.1%Shares . . . . . . . . . . . . . . . . . . . . . . . . . . . . . . . . . . . . . . . . 27.5% 22.7% 22.9%Real estate . . . . . . . . . . . . . . . . . . . . . . . . . . . . . . . . . . . . . 10.0% 10.1% 10.1%
Source: Fortis Bank
Asset mix and correlations
Asset mix is based on Market Value and for assets for the general account, split into assets allocatedto value of shareholders’ equity and to value of operating business.
The economic scenarios have been generated taking into account target correlations between themajor asset classes, being shares, real estate and short rates for fixed income.
2007 2006 2005 restated111111111111111111111111 111111111111111111111111 111111111111111111111111
Insurance Insurance Insurance Insurance Insurance Insurance Insurance Insurance InsuranceFortis Belgium Netherlands International Fortis Belgium Netherlands International Fortis Belgium Netherlands International1312 1312 1132 1312 1132 1132 1132 1132 1132 1132 1123 1123
OperatingBusinessFixed income 80% 77% 82% 90% 85% 82% 84% 97% 86% 82% 86% 97%Shares . . . . . . 9% 10% 9% 7% 10% 13% 10% 2% 9% 12% 8% 2%Others (RealEstate& cash) . . . . 11% 13% 8% 3% 5% 5% 6% 1% 5% 6% 6% 1%
Real world investment return assumptions
The real world investment return assumptions from a traditional point of view are:
• Equity Risk Premium: The Equity Risk Premium has been assumed to be 300bp above therisk free return.
• Real Estate Risk Premium: The real estate risk premium has been assumed to be 200bp abovethe risk free return.
Note that these assumptions do not influence the final valuation, since higher expected returns willhave an equal effect on the variance representing the difference between actual and Expected Return.
224
Level: 6 – From: 6 – Wednesday, May 14, 2008 – 1:37 pm – g5mac4 – 3960 Section 06 : 3960 Section 06

Operating assumptions
Modeled expenses start at the actual 2007 expense level and are modeled taking into account theinflation rate over the projection period. Future commission payments follow the schemes agreed with theparties entitled to the payments. No account is taken of the effect of future expense reduction programs,productivity gains or integration synergies and no material non-recurring expenses have been identified.
The EV allows for the long-term cost of providing pension benefits to Fortis’s staff in the Lifeentities as recognized under IAS 19.
The total unallocated central overheads in 2007 were EUR 218 million relating to all banking,insurance and central activities. The share for the life insurance activities of these expenses have not beenallowed for in the embedded value or Value of New Business.
Expense inflation
Expense inflation is assumed to be 1.9% flat over all years. The expense inflation assumption isused to increase future expenses and is aligned with the outlook of the consumer price index provided bythe Economic Intelligence Unit and European Central Bank.
Mortality and Persistency
Each entity sets mortality and lapse rates at best-estimate level, based on its knowledge of the localmarkets and experience studies. All assumptions are actively reviewed each year and revised if required.
In certain cases, the dynamics of insurance business that reflect either policyholder behaviour orflexibility of management actions and creating asymmetric movements of cash flows around the best-estimate levels are not allowed for in the models. This includes dynamic lapsing (i.e., lapses that varyaccording to economic conditions), and the ability of management to change guarantees on futurepremiums on certain products. The CNFR is an allowance for the uncertainty of shareholder profits aroundthe best-estimate level not currently allowed for in the models.
Tax
Tax is modeled bottom-up. Appropriate tax rates are applied to direct and indirect returns on shares,real estate and fixed income. In all other cases the appropriate local corporate tax rate is applied.
Where tax can be deferred this is generally modeled within the cash flows projections and takeninto account in the valuation. However, in cases where, in principle, tax could be deferred during the entirerun-off period, Fortis takes a more conservative assumption that in practice this may not be sustainable andinstead model the tax rate as converging over time to the local corporate tax rate.
Sensitivities
The Embedded Value calculations are based on the current market conditions and Fortis’s view onbest estimate assumptions. As provided for in the EEV guidance, Fortis provides information on thefollowing sensitivities to demonstrate their impact on the Embedded Value and VANB.
• Risk free rate +100 bp — This sensitivity assumes an upward parallel shift of 100 bp in yieldcurve.
• Risk free rate -100 bp — This sensitivity assumes a downward parallel shift of 100 bp inyield curve.
• Asset values of shares and real estate – 10% — This sensitivity assumes a decrease of theasset values of both shares and real estate by 10%.
• Volatilities equities and properties +10% — This sensitivity assumes a 10% increase of boththe equity and real estate volatility by multiplying the base assumption by a factor of 110%.
225
Level: 6 – From: 6 – Wednesday, May 14, 2008 – 1:37 pm – g5mac4 – 3960 Section 06 : 3960 Section 06

• Volatilities risk-free yields +10% — This sensitivity assumes a 10% increase of the volatilityof the risk free yields by multiplying the base assumption by a factor of 110%.
• Costs -10% — all maintenance costs excluding commissions and acquisition expensesdecrease by 10%. Cost inflation remains unchanged.
• Lapse -10% — This sensitivity assumes that the lapse rates used in the base scenario aremultiplied by a factor of 90%.
• Mortality -5% — This sensitivity assumes that the mortality rates used in the base scenarioare multiplied by a factor of 95%. This has been applied on both annuity and life assurancebusiness.
• Required Capital on the local regulatory minimum level — This sensitivity assumes that theRequired Capital to hold is only to meet the minimum local regulatory requirements. Thissensitivity only impacts the Cost of Capital resulting from a lower level of ShareholdersEquity needed to meet the minimum level of Required Capital.
The following table shows the impact of the above sensitivities on the in-force business for 2007.
Insurance Insurance InsuranceFortis Belgium Netherlands International1111 1111 1111 1111
Base case EV (EUR million) . . . . . . . . . . . . . . . . . . . 12,411 5,706 5,706 1,000Risk free rate +100bp . . . . . . . . . . . . . . . . . . . . . . . . . 2.7% 3.3% 2.6% 0.4%Risk free rate-100bp . . . . . . . . . . . . . . . . . . . . . . . . . . (7.2)% (9.0)% (6.2)% (2.6)%Asset values shares and real estate –10% . . . . . . . . . . (10.8)% (10.5)% (12.5)% (3.6)%Volatilities equities and properties +10% . . . . . . . . . . (0.2)% 0.0% (0.2)% (0.9)%Volatilities risk-free yields +10% . . . . . . . . . . . . . . . . (0.7)% (1.0)% (0.5)% (0.3)%Required Equity (minimum regulatory level) . . . . . . . 2.4% 3.2% 1.9% 0.8%Costs – 10% . . . . . . . . . . . . . . . . . . . . . . . . . . . . . . . . 1.9% 1.9% 1.7% 2.5%Mortality rates – 5% . . . . . . . . . . . . . . . . . . . . . . . . . . 0.2% 0.3% 0.1% 0.0%Lapse rates – 10% . . . . . . . . . . . . . . . . . . . . . . . . . . . . 0.7% 0.6% 0.4% 2.8%
The following table shows the impact of the above sensitivities on the in-force business for 2006.
Insurance Insurance InsuranceFortis Belgium Netherlands International1111 1111 1111 1111
Base case EV (EUR million) . . . . . . . . . . . . . . . . . . . 12,307 4,833 6,249 1,225Risk free rate +100bp . . . . . . . . . . . . . . . . . . . . . . . . . 5.9% 6.6% 4.3% 11.9%Risk free rate-100bp . . . . . . . . . . . . . . . . . . . . . . . . . . (11.9)% (14.3)% (8.6)% (19.5)%Asset values shares and real estate –10% . . . . . . . . . . (8.7)% (11.1)% (8.1)% (2.7)%Volatilities equities and properties +10% . . . . . . . . . . 0.0% (0.1)% 0.2% (0.6)%Volatilities risk-free yields +10% . . . . . . . . . . . . . . . . (0.7)% (1.1)% (0.5)% (0.5)%Required Equity (minimum regulatory level) . . . . . . . 1.6% 1.9% 1.5% 1.0%Costs – 10% . . . . . . . . . . . . . . . . . . . . . . . . . . . . . . . . 2.1% 2.3% 1.7% 3.4%Mortality rates – 5% . . . . . . . . . . . . . . . . . . . . . . . . . . 0.2% 0.4% 0.2% (0.7)%Lapse rates – 10% . . . . . . . . . . . . . . . . . . . . . . . . . . . . 0.0% (0.7)% 0.4% 0.7%
226
Level: 6 – From: 6 – Wednesday, May 14, 2008 – 1:37 pm – g5mac4 – 3960 Section 06 : 3960 Section 06

The following table shows the impact of the above sensitivities on the VANB for 2007.
Insurance Insurance InsuranceFortis Belgium Netherlands International1111 1111 1111 1111
Base case EV (EUR million) . . . . . . . . . . . . . . . . . . . 345 207 77 62Risk free rate +100bp . . . . . . . . . . . . . . . . . . . . . . . . . 2.6% 8.9% (12.5)% 0.1%Risk free rate –100bp . . . . . . . . . . . . . . . . . . . . . . . . . (9.1)% (16.4)% 5.9% (3.3)%Volatilities equities and properties +10% . . . . . . . . . . (1.1)% (1.3)% 0.6% (2.3)%Volatilities risk-free yields +10% . . . . . . . . . . . . . . . . (1.2)% (1.4)% (1.3)% (0.4)%Required Equity (minimum regulatory level) . . . . . . . 6.4% 6.3% 8.4% 4.3%Costs –10% . . . . . . . . . . . . . . . . . . . . . . . . . . . . . . . . . 4.4% 3.0% 8.3% 4.4%Mortality rates –5% . . . . . . . . . . . . . . . . . . . . . . . . . . . 1.9% 1.3% 4.1% 1.1%Lapse rates –10% . . . . . . . . . . . . . . . . . . . . . . . . . . . . 4.0% 2.0% 6.5% 7.9%
The following table shows the impact of the above sensitivities on the VANB for 2006.
Insurance Insurance InsuranceFortis Belgium Netherlands International1111 1111 1111 1111
Base case EV (EUR million) . . . . . . . . . . . . . . . . . . . 377 189 85 103Risk free rate +100bp . . . . . . . . . . . . . . . . . . . . . . . . . 17.6% 21.8% 24.2% 4.2%Risk free rate –100bp . . . . . . . . . . . . . . . . . . . . . . . . . (35.7)% (55.5)% (25.2)% (8.1)%Volatilities equities and properties +10% . . . . . . . . . . 0.7% (0.7)% 6.5% (1.4)%Volatilities risk-free yields +10% . . . . . . . . . . . . . . . . (5.2)% (2.4)% (17.1)% (0.5)%Required Equity (minimum regulatory level) . . . . . . . 4.2% 4.4% 7.0% 1.5%Costs –10% . . . . . . . . . . . . . . . . . . . . . . . . . . . . . . . . . 8.8% 9.7% 11.2% 5.0%Mortality rates –5% . . . . . . . . . . . . . . . . . . . . . . . . . . . 5.6% 2.9% 18.6% (0.4)%Lapse rates –10% . . . . . . . . . . . . . . . . . . . . . . . . . . . . 4.4% (0.0)% 9.8% 8.0%
227
Level: 6 – From: 6 – Wednesday, May 14, 2008 – 1:37 pm – g5mac4 – 3960 Section 06 : 3960 Section 06

SELECTED STATISTICAL INFORMATION
The tables below set forth historical selected statistical information regarding Fortis’s bankingoperations, which was derived from the audited Consolidated Financial Statements prepared in accordancewith IFRS (unless otherwise indicated). Unless otherwise indicated, average balances, when used, arecalculated from quarterly data, and geographic data are based on the domicile of the customer. See“Operating and Financial Review and Prospects — Banking — Net Interest Income” for analysis offluctuations between periods.
The tables below do not include interest related to non-accrual loans, the portion of interest that isnot recognized on partially non-accruing loans or lending commission income. Net interest income is notcalculated on a tax-equivalent basis.
The tables are based on the organizational structure of the group for the periods presented. Thetables for 2007/2006 are based on the organizational structure as of January 1, 2007, with restatedfinancial information for 2006. The tables for 2006/2005 are based on the organizational structure prior toJanuary 1, 2007. See “Operating and Financial Review and Prospects — Segment Reporting.”
Average Balance Sheets and Interest Rates
The following table shows Fortis’s average balances and interest rates for each of the years set forthbelow.
2007 2006111121231111211112 111121231111211112
Average Average Average Average Balance Interest Rate(%) Balance Interest Rate(%)
11112 11112 11112 11112 11112 11112
Interest on balanceNetwork banking . . . . . . . . . . . 238 7 2.8% 467 43 9.3%Asset Management . . . . . . . . . 736 32 4.3% 855 22 2.6%Merchant & Private banking . . 136,792 11,004 8.0% 107,388 5,413 5.0%Other banking . . . . . . . . . . . . . 672 58 8.6% 1,288 146 11.3%
11112 11112 11112 11112 11112 11112
Total Due from banks and Cash and cash equivalents 138,437 11,100 8.0% 109,998 5,624 5.1%
11112 11112 11112 11112 11112 11112
Network banking . . . . . . . . . . . 80,795 4,507 5.6% 75,051 3,946 5.3%Asset Management . . . . . . . . . 12 2 12.6% 27 3 9.9%Merchant & Private banking . . 203,663 10,117 5.0% 185,261 9,580 5.2%Other banking . . . . . . . . . . . . . 31,140 1,472 4.7% 30,773 1,575 5.1%
11112 11112 11112 11112 11112 11112
Total Loans to customers . . . 315,610 16,098 5.1% 291,112 15,104 5.2%11112 11112 11112 11112 11112 11112
Network banking . . . . . . . . . . . 146 7 4.5% 200 6 3.0%Asset Management . . . . . . . . . 34 6 17.4% 27 4 15.5%Merchant & Private banking . . 67,446 3,096 4.6% 77,535 3,205 4.1%Other banking . . . . . . . . . . . . . 51,900 2,217 4.3% 56,170 2,321 4.1%
11112 11112 11112 11112 11112 11112
Total Investments . . . . . . . . . . 119,525 5,326 4.5% 133,932 5,536 4.1%11112 11112 11112 11112 11112 11112
Total Interest-earning assets . 573,572 32,525 5.7% 535,042 26,264 4.9%11112 11112 11112 11112 11112 11112
Interest-earning assets . . . . . . .Network banking . . . . . . . . . . . 81,178 4,520 5.6% 75,717 3,996 5.3%Asset Management . . . . . . . . . 782 39 5.0% 909 29 3.2%Merchant & Private banking . . 407,901 24,217 5.9% 370,184 18,198 4.9%Other banking . . . . . . . . . . . . . 83,711 3,748 4.5% 88,231 4,042 4.6%
11112 11112 11112 11112 11112 11112
Total Interest-earning assets . 573,572 32,525 5.7% 535,042 26,264 4.9%11112 11112 11112 11112 11112 11112
Trading assets . . . . . . . . . . . . . 84,228 56,933 70,212 41,405Other assets . . . . . . . . . . . . . . . 101,429 3,195 76,575 2,526
11112 11112 11112 11112 11112 11112
Total average assets . . . . . . . . 759,229 92,653 12.2% 681,829 70,196 10.3%11112 11112 11112 11112 11112 11112
228
Level: 6 – From: 6 – Wednesday, May 14, 2008 – 1:38 pm – g5mac4 – 3960 Section 07 : 3960 Section 07Level: 6 – From: 6 – Wednesday, May 14, 2008 – 1:38 pm – g5mac4 – 3960 Section 07 : 3960 Section 07

2007 2006111121231111211112 111121231111211112
Average Average Average Average Balance Interest Rate(%) Balance Interest Rate(%)
11112 11112 11112 11112 11112 11112
LiabilitiesNetwork banking . . . . . . . . . . . 319 (14) 4.58% 303 (37) 12.2%Asset Management . . . . . . . . . 4 0 1.6% 6 0 1.2%Merchant & Private banking . . 194,934 (10,703) 5.5% 185,210 (7,809) 4.2%Other banking . . . . . . . . . . . . . 119 (81) 68.1% (897) (114) 12.7%
11112 11112 11112 11112 11112 11112
Total Due to banks . . . . . . . . 195,377 (10,799) 5.5% 184,622 (7,960) 4.3%11112 11112 11112 11112 11112 11112
Network banking . . . . . . . . . . . 93,163 (2,300) 2.5% 90,266 (1,882) 2.1%Asset Management . . . . . . . . . 371 (31) 8.3% 655 (1) 0.2%Merchant & Private banking . . 165,396 (7,716) 4.7% 165,239 (6,683) 4.0%Other banking . . . . . . . . . . . . . 12,250 (485) 4.0% 13,362 (501) 3.7%
11112 11112 11112 11112 11112 11112
Total Due to customers . . . . . 271,181 (10,531) 3.9% 269,522 (9,067) 3.4%11112 11112 11112 11112 11112 11112
Network banking . . . . . . . . . . . 424 (8) 1.8% 541 (12) 2.2%Asset Management . . . . . . . . . 0 0 0 0Merchant & Private banking . . 64,535 (3,353) 5.2% 54,812 (2,388) 4.4%Other banking . . . . . . . . . . . . . 35,058 (1,584) 4.5% 28,414 (956) 3.4%
11112 11112 11112 11112 11112 11112
Total Debt certificates . . . . . . 100,017 (4,945) 4.9% 83,767 (3,356) 4.0%Network banking . . . . . . . . . . . 69 (1) 1.3% 69 (2) 3.1%Asset Management . . . . . . . . . 0 0 — 0 0 —Merchant & Private banking . . 2,319 (94) 4.0% 1,583 (90) 5.7%Other banking . . . . . . . . . . . . . 14,201 (670) 4.7% 12,156 (583) 4.8%
11112 11112 11112 11112 11112 11112
Total Subordinated liabilities . . . . . . . . . . . . . . . 16,590 (765) 4.6% 13,808 (676) 4.9%
11112 11112 11112 11112 11112 11112
Total Interest bearing liabilities . . . . . . . . . . . . . . . 583,164 (27,040) 4.6% 551,719 (21,059) 3.8%
11112 11112 11112 11112 11112 11112
Network banking . . . . . . . . . . . 93,975 (2,323) 2.5% 91,179 (1,933) 2.1%Asset Management . . . . . . . . . 376 (31) 8.2% 661 (1) 0.2%Merchant & Private banking . . 427,185 (21,866) 5.2% 406,843 (16,970) 4.2%Other banking . . . . . . . . . . . . . 61,629 (2,820) 4.6% 53,035 (2,154) 4.1%
11112 11112 11112 11112 11112 1111211112 11112 11112 11112 11112 11112
Total Interest bearing liabilities . . . . . . . . . . . . . . . 583,164 (27,040) 4.6% 551,719 (21,059) 3.8%
11112 11112 11112 11112 11112 11112
Trading assets . . . . . . . . . . . . . 88,322 (58,230) — 63,715 (41,337) —Other assets . . . . . . . . . . . . . . . 66,661 (2,115) — 49,919 (2,716) —
11112 11112 11112 11112 11112 11112
Total average liabilities . . . . . 738,147 — — 665,353 — —Shareholders’ equity . . . . . . . 21,082 — — 16,476 — —
11112 11112 11112 11112 11112 11112
Total average liabilities and shareholders’ equity . . . . . 759,229 — — 681,829 — —
11112 11112 11112 11112 11112 1111211112 11112 11112 11112 11112 11112
Trading assets . . . . . . . . . . . . . 840,228 56,933 — 70,212 41,405 —Trading liabilities . . . . . . . . . . 88,322 (58,230) — 63,715 (41,337) —Other assets . . . . . . . . . . . . . . . 101,429 3,195 — 76,575 2,526 —Other liabilities
(interest-bearing) . . . . . . . . . 2,428 (2,115) — 3,402 (2,724) —Other liabilities
(non-interest bearing) . . . . . 64,233 — — 46,516 — —11112 11112 11112 11112 11112 11112
Total average other interest on balance . . . . . . . 340,638 217 — 260,421 (121) —
11112 11112 11112 11112 11112 11112
Net interest income . . . . . . . . — 5,267 — — 5,086 —11112 11112 11112 11112 11112 11112
(1) The average balances are calculated from quarterly data.
229
Level: 6 – From: 6 – Wednesday, May 14, 2008 – 1:38 pm – g5mac4 – 3960 Section 07 : 3960 Section 07

The following table shows Fortis’s average balances and interest rates for each of the years set forthbelow.
2006 2005111121231111211112 111121231111211112
Average Average Average Average Balance Interest Rate(%) Balance Interest Rate(%)
11112 11112 11112 11112 11112 11112
(EUR million, except %)Interest on balance:Retail banking . . . . . . . . . . . . . 1,267 66 5.2% 993 23 2.3%Merchant banking . . . . . . . . . . 103,236 5,354 5.2% 112,835 3,765 3.3%Commercial & Private banking 2,900 58 2.0% 1,639 16 1.0%Other banking . . . . . . . . . . . . . 1,616 146 9.0% 2,172 54 2.5%
11112 11112 11112 11112 11112 11112
Total Due from banks and Cash and cash equivalents 109,019 5,624 5.2% 117,639 3,858 3.3%
11112 11112 11112 11112 11112 11112
Retail banking . . . . . . . . . . . . . 73,548 3,961 5.4% 63,191 3,366 5.3%Merchant banking . . . . . . . . . . 127,346 7,303 5.7% 98,920 4,554 4.6%Commercial & Private banking 56,461 2,740 4.9% 50,172 2,161 4.3%Other banking . . . . . . . . . . . . . 30,723 1,575 5.1% 29,995 1,647 5.5%
11112 11112 11112 11112 11112 11112
Total Loans to customers . . . 288,078 15,578 5.4% 242,278 11,728 4.8%11112 11112 11112 11112 11112 11112
Retail banking . . . . . . . . . . . . . 185 10 5.5% 19 3 15.6%Merchant banking . . . . . . . . . . 76,711 3,203 4.2% 68,399 2,294 3.4%Commercial & Private banking 61 2 3.7% 76 3 3.4%Other banking . . . . . . . . . . . . . 56,272 2,321 4.1% 56,107 2,321 4.1%
11112 11112 11112 11112 11112 11112
Total Investments . . . . . . . . . . 133,229 5,536 4.2% 124,600 4,620 3.7%11112 11112 11112 11112 11112 11112
Total Interest-earning assets . 530,326 26,738 5.0% 484,517 20,206 4.2%11112 11112 11112 11112 11112 11112
Interest-earning assetsRetail banking . . . . . . . . . . . . . 75,000 4,036 5.4% 64,204 3,391 5.3%Merchant banking . . . . . . . . . . 307,293 15,860 5.2% 280,153 10,614 3.8%Commercial & Private banking 59,421 2,800 4.7% 51,886 2,179 4.2%Other banking . . . . . . . . . . . . . 88,611 4,042 4.6% 88,274 4,022 4.6%
11112 11112 11112 11112 11112 11112
Total Interest-earning assets . 530,326 26,738 5.0% 484,517 20,206 4.2%11112 11112 11112 11112 11112 11112
Trading assets . . . . . . . . . . . . 68,736 — — 64,456 — —11112 11112 11112 11112 11112 11112
Other assets . . . . . . . . . . . . . . 74,240 — — 63,236 — —11112 11112 11112 11112 11112 11112
Total average assets . . . . . . . . 673,302 — — 612,209 — —11112 11112 11112 11112 11112 1111211112 11112 11112 11112 11112 11112
LiabilitiesRetail banking . . . . . . . . . . . . . 282 (37) 13.1% 333 (80) 23.9%Merchant banking . . . . . . . . . . 180,760 (7,757) 4.3% 169,989 (4,587) 2.7%Commercial & Private banking 1,019 (52) 5.1% 768 (57) 7.5%Other banking . . . . . . . . . . . . . 549 (114) 20.7% 779 (84) 10.8%
11112 11112 11112 11112 11112 11112
Total Due to banks . . . . . . . . 182,610 (7,960) 4.4% 171,870 (4,808) 2.8%11112 11112 11112 11112 11112 11112
Retail banking . . . . . . . . . . . . . 89,868 (1,884) 2.1% 82,872 (1,459) 1.8%Merchant banking . . . . . . . . . . 121,641 (5,577) 4.6% 100,089 (4,099) 4.1%Commercial & Private banking 43,097 (1,107) 2.6% 38,225 (710) 1.9%Other banking . . . . . . . . . . . . . 13,668 (500) 3.7% 15,034 (610) 4.1%
11112 11112 11112 11112 11112 11112
Total Due to customers . . . . . 268,274 (9,067) 3.4% 236,221 (6,878) 2.9%11112 11112 11112 11112 11112 11112
Retail banking . . . . . . . . . . . . . 561 (12) 2.1% 698 (14) 2.0%Merchant banking . . . . . . . . . . 52,736 (2,386) 4.5% 40,578 (1,406) 3.5%Commercial & Private banking 221 (2) 0.9% 329 (2) 0.6%Other banking . . . . . . . . . . . . . 28,862 (956) 3.3% 30,917 (1,046) 3.4%
11112 11112 11112 11112 11112 11112
Total Debt certificates . . . . . . 82,379 (3,356) 4.1% 72,522 (2,468) 3.4% 11112 11112 11112 11112 11112 11112
230
Level: 6 – From: 6 – Wednesday, May 14, 2008 – 1:38 pm – g5mac4 – 3960 Section 07 : 3960 Section 07

2006 2005111121231111211112 111121231111211112
Average Average Average Average Balance Interest Rate(%) Balance Interest Rate(%)
11112 11112 11112 11112 11112 11112
(EUR million, except %)
Retail banking . . . . . . . . . . . . . 63 (2) 3.7% 39 0 0.5%Merchant banking . . . . . . . . . . 1,341 (75) 5.6% 1,316 (59) 4.5%Commercial & Private banking 233 (15) 6.3% 63 (5) 7.3%Other banking . . . . . . . . . . . . . 11,934 (583) 4.9% 10,212 (545) 5.3%
11112 11112 11112 11112 11112 11112
Total Subordinated liabilities 13,571 (676) 5.0% 11,630 (609) 5.2%11112 11112 11112 11112 11112 11112
Total Interest bearing liabilities 546,835 (21,059) 3.9% 492,244 (14,762) 3.0%11112 11112 11112 11112 11112 11112
Interest-bearing liabilities:Retail banking . . . . . . . . . . . . . 90,774 (1,935) 2.1% 83,942 (1,553) 1.8%Merchant banking . . . . . . . . . . 356,478 (15,796) 4.4% 311,972 (10,151) 3.3%Commercial & Private banking 44,570 (1,175) 2.6% 39,386 (774) 2.0%Other banking . . . . . . . . . . . . . 55,013 (2,153) 3.9% 56,944 (2,285) 4.0%
11112 11112 11112 11112 11112 11112
Total interest-bearing liabilities . . . . . . . . . . . . . . . 546,835 (21,059) 3.9% 492,244 (14,762) 3.0%
11112 11112 11112 11112 11112 1111211112 11112 11112 11112 11112 11112
Other interest on balance trading liabilities: . . . . . . . . 61,123 (41,337) — 54,573 (43,282) —
Other liabilities (interest-bearing) . . . . . . . . . 24,178 (2,716) — 27,312 (1,999) —
Other liabilities (non-interest bearing) . . . . . 25,349 0 — 25,608 0 —
11112 11112 11112 11112 11112 11112
Shareholders’ equity . . . . . . . 15,818 0 — 12,471 — —11112 11112 11112 11112 11112 11112
Total average liabilities and shareholders’ equity . . . . . 673,302 — — 612,209 — —
11112 11112 11112 11112 11112 1111211112 11112 11112 11112 11112 11112
Trading assets . . . . . . . . . . . . . 68,736 41,405 — 64,456 43,253 —Trading liabilities . . . . . . . . . . 61,123 (41,337) — 54,573 (43,282) —Other assets . . . . . . . . . . . . . . . 74,240 2,052 — 63,236 1,236 —Other liabilities
(interest-bearing) . . . . . . . . . 24,178 (2,714) — 27,312 (1,999) —Other liabilities
(non-interest bearing) . . . . . 25,349 — — 25,608 — —11112 11112 11112 11112 11112 11112
Total average other interest on balance . . . . . . . — (593) — — (792) —
11112 11112 11112 11112 11112 11112
Net interest income . . . . . . . . — 5,086 — — 4,653 —11112 11112 11112 11112 11112 11112
(1) The average balances are calculated from quarterly data.
Selected Ratios — Banking Operations Only
Set forth below are selected ratios relating to Fortis’s banking operations for the years indicated.
Year Ended December 31,1111212341111211112
2007 2006 200511112 11112 11112
Return on banking assets . . . . . . . . . . . . . . . . . . . . . . . . . . . . . . . . . 0.2% 0.5% 0.4%Return on banking equity . . . . . . . . . . . . . . . . . . . . . . . . . . . . . . . . . 8.6% 20.0% 19.6%Banking equity to banking assets . . . . . . . . . . . . . . . . . . . . . . . . . . . 2.7% 2.4% 2.0%
231
Level: 6 – From: 6 – Wednesday, May 14, 2008 – 1:38 pm – g5mac4 – 3960 Section 07 : 3960 Section 07

Yields, Spread and Margins
The tables below show selected yield, spread and margin information applicable to Fortis for theyears indicated. These amounts are derived from the tables of average balances and interest rates above.
Year Ended December 31,11112234411112
2007 200611112 11112
Gross Yield(1):Network banking . . . . . . . . . . . . . . . . . . . . . . . . . . . . . . . . . . . . . . . . . . . . . . . . . . 5.6% 5.4%Asset Management . . . . . . . . . . . . . . . . . . . . . . . . . . . . . . . . . . . . . . . . . . . . . . . . . 5.0% 5.2%Merchant & Private Banking . . . . . . . . . . . . . . . . . . . . . . . . . . . . . . . . . . . . . . . . . 5.9% 4.7%Other banking . . . . . . . . . . . . . . . . . . . . . . . . . . . . . . . . . . . . . . . . . . . . . . . . . . . . . 4.5% 4.6%Interest Spread(2):Network banking . . . . . . . . . . . . . . . . . . . . . . . . . . . . . . . . . . . . . . . . . . . . . . . . . . 3.1% 3.3%Asset Management . . . . . . . . . . . . . . . . . . . . . . . . . . . . . . . . . . . . . . . . . . . . . . . . . 0% 0.7%Merchant & Private Banking . . . . . . . . . . . . . . . . . . . . . . . . . . . . . . . . . . . . . . . . . 0% 2.1%Other banking . . . . . . . . . . . . . . . . . . . . . . . . . . . . . . . . . . . . . . . . . . . . . . . . . . . . . 9% 0.7%Interest Margin(3):Total Banking . . . . . . . . . . . . . . . . . . . . . . . . . . . . . . . . . . . . . . . . . . . . . . . . . . . . . 1.0% 1.0%
(1) “Gross Yield” is the average interest rate earned on average interest-earning assets.
(2) “Interest Spread” is the difference between the average interest rate earned on average interest-earning assets and the average interestrate paid on average interest-bearing liabilities.
(3) “Interest Margin” is “net interest income”, excluding other interest on balance, as a percentage of average interest-earning assets.
Year Ended December 31,11112234411112
2006 200511112 11112
Gross Yield(1):Retail banking . . . . . . . . . . . . . . . . . . . . . . . . . . . . . . . . . . . . . . . . . . . . . . . . . . . . . 5.4% 5.3%Merchant banking . . . . . . . . . . . . . . . . . . . . . . . . . . . . . . . . . . . . . . . . . . . . . . . . . . 5.2% 3.8%Commercial & Private banking . . . . . . . . . . . . . . . . . . . . . . . . . . . . . . . . . . . . . . . 4.7% 4.2%Other banking . . . . . . . . . . . . . . . . . . . . . . . . . . . . . . . . . . . . . . . . . . . . . . . . . . . . . 4.6% 4.7%Interest Spread(2):Retail banking . . . . . . . . . . . . . . . . . . . . . . . . . . . . . . . . . . . . . . . . . . . . . . . . . . . . . 3.3% 3.4%Merchant banking . . . . . . . . . . . . . . . . . . . . . . . . . . . . . . . . . . . . . . . . . . . . . . . . . . 0.7% 0.5%Commercial & Private banking . . . . . . . . . . . . . . . . . . . . . . . . . . . . . . . . . . . . . . . 2.1% 2.2%Other banking . . . . . . . . . . . . . . . . . . . . . . . . . . . . . . . . . . . . . . . . . . . . . . . . . . . . . 0.7% 0.6%Interest Margin(3):Total Banking . . . . . . . . . . . . . . . . . . . . . . . . . . . . . . . . . . . . . . . . . . . . . . . . . . . . . 1.1% 1.1%
(1) “Gross Yield” is the average interest rate earned on average interest-earning assets.
(2) “Interest Spread” is the difference between the average interest rate earned on average interest-earning assets and the average interestrate paid on average interest-bearing liabilities.
(3) “Interest Margin” is “net interest income”, excluding other interest on balance, as a percentage of average interest-earning assets.
Interest margin is presented for the bank as a whole due to certain intra-bank loans being funded byMerchant Banking with funds borrowed from external sources whereby the liabilities for MerchantBanking are not offset by interest income which is eliminated on such intra-company loans.
Changes in Net Interest Revenue — Volume and Rate Analysis
The tables below allocate, by categories of interest-earning assets and interest-bearing liabilities,changes in net interest revenue and expense of Fortis due to changes in average volume and changes inaverage rate for the year ended December 31, 2007 compared to the year ended December 31, 2006 andfor the year ended December 31, 2006 compared to the year ended December 31, 2005. Volume and ratevariances have been calculated based on movements in average balances over the period and changes ininterest rates on average interest-earning assets and average interest-bearing liabilities. See “— Average
232
Level: 6 – From: 6 – Wednesday, May 14, 2008 – 1:38 pm – g5mac4 – 3960 Section 07 : 3960 Section 07

Balance Sheets and Interest Rates”. Changes that are attributable in part to volume and in part to rate areallocated in proportion to their relationship to the amounts of change attributed directly to volume andrate.
2007 over 200611112111111211112
Change due to Increase (Decrease) in11112111111211112
Total Change in
Interest Volume Rate11112 11112 11112
(EUR million)
Interest Income:Network banking . . . . . . . . . . . . . . . . . . . . . . . . . . . . . . . . . . . . . . . . (37) (14) (23)Asset Management . . . . . . . . . . . . . . . . . . . . . . . . . . . . . . . . . . . . . . 9 (4) 14Merchant & Private banking . . . . . . . . . . . . . . . . . . . . . . . . . . . . . . . 5,591 1,924 3,668Other banking . . . . . . . . . . . . . . . . . . . . . . . . . . . . . . . . . . . . . . . . . . (88) (61) (26)
11112 11112 11112
Total Due from banks and Cash and cash equivalents . . . . . . . . 5,476 1,844 3,63211112 11112 11112
Network banking . . . . . . . . . . . . . . . . . . . . . . . . . . . . . . . . . . . . . . . . 561 311 249Asset Management . . . . . . . . . . . . . . . . . . . . . . . . . . . . . . . . . . . . . . (1) (2) 1Merchant & Private banking . . . . . . . . . . . . . . . . . . . . . . . . . . . . . . . 537 933 (395)Other banking . . . . . . . . . . . . . . . . . . . . . . . . . . . . . . . . . . . . . . . . . . (103) 18 (1,210)
11112 11112 11112
Total Loans to customers . . . . . . . . . . . . . . . . . . . . . . . . . . . . . . . . 994 1,260 (267)11112 11112 11112
Network banking . . . . . . . . . . . . . . . . . . . . . . . . . . . . . . . . . . . . . . . . 1 (1) 1Asset Management . . . . . . . . . . . . . . . . . . . . . . . . . . . . . . . . . . . . . . 2 0 2Merchant & Private banking . . . . . . . . . . . . . . . . . . . . . . . . . . . . . . . (109) (263) 154Other banking . . . . . . . . . . . . . . . . . . . . . . . . . . . . . . . . . . . . . . . . . . (103) (317) 214
11112 11112 11112
Total Investments . . . . . . . . . . . . . . . . . . . . . . . . . . . . . . . . . . . . . . (210) (581) 37111112 11112 11112
Network banking . . . . . . . . . . . . . . . . . . . . . . . . . . . . . . . . . . . . . . . . 525 297 228Asset Management . . . . . . . . . . . . . . . . . . . . . . . . . . . . . . . . . . . . . . 10 (6) 16Merchant & Private banking . . . . . . . . . . . . . . . . . . . . . . . . . . . . . . . 6,020 2,593 3,427Other banking . . . . . . . . . . . . . . . . . . . . . . . . . . . . . . . . . . . . . . . . . . (294) (360) 66
11112 11112 11112
Total Interest-earning assets . . . . . . . . . . . . . . . . . . . . . . . . . . . . . 6,260 2,524 3,73611112 11112 11112
Interest Expenses:Network banking . . . . . . . . . . . . . . . . . . . . . . . . . . . . . . . . . . . . . . . . (23) (24) 1Asset Management . . . . . . . . . . . . . . . . . . . . . . . . . . . . . . . . . . . . . . 0 0 0Merchant & Private banking . . . . . . . . . . . . . . . . . . . . . . . . . . . . . . . 2,895 2,423 472Other banking . . . . . . . . . . . . . . . . . . . . . . . . . . . . . . . . . . . . . . . . . (32) (314) 282
11112 11112 11112
Total Due to banks . . . . . . . . . . . . . . . . . . . . . . . . . . . . . . . . . . . . . 2,840 2,085 75511112 11112 11112
Network banking . . . . . . . . . . . . . . . . . . . . . . . . . . . . . . . . . . . . . . . . 417 352 66Asset Management . . . . . . . . . . . . . . . . . . . . . . . . . . . . . . . . . . . . . . 29 41 (12)Merchant & Private banking . . . . . . . . . . . . . . . . . . . . . . . . . . . . . . . 1,034 1,027 7Other banking . . . . . . . . . . . . . . . . . . . . . . . . . . . . . . . . . . . . . . . . . . (16) 27 (43)
11112 11112 11112
Total Due to customers . . . . . . . . . . . . . . . . . . . . . . . . . . . . . . . . . . 1,464 1,446 1811112 11112 11112
Network banking . . . . . . . . . . . . . . . . . . . . . . . . . . . . . . . . . . . . . . . . (4) (2) (2)Asset Management . . . . . . . . . . . . . . . . . . . . . . . . . . . . . . . . . . . . . . 0Merchant & Private banking . . . . . . . . . . . . . . . . . . . . . . . . . . . . . . . 965 501 464Other banking . . . . . . . . . . . . . . . . . . . . . . . . . . . . . . . . . . . . . . . . . . 628 366 262
11112 11112 11112
Total Debt certificates . . . . . . . . . . . . . . . . . . . . . . . . . . . . . . . . . . . 1,588 864 72411112 11112 11112
233
Level: 6 – From: 6 – Wednesday, May 14, 2008 – 1:38 pm – g5mac4 – 3960 Section 07 : 3960 Section 07

2007 over 200611112111111211112
Change due to Increase (Decrease) in11112111111211112
Total Change in
Interest Volume Rate11112 11112 11112
(EUR million)
Network banking . . . . . . . . . . . . . . . . . . . . . . . . . . . . . . . . . . . . . . . . (1) (1) 0Asset Management . . . . . . . . . . . . . . . . . . . . . . . . . . . . . . . . . . . . . . 0Merchant & Private banking . . . . . . . . . . . . . . . . . . . . . . . . . . . . . . . 4 (32) 36Other banking . . . . . . . . . . . . . . . . . . . . . . . . . . . . . . . . . . . . . . . . . . 87 (10) 97
11112 11112 11112
Total Subordinated liabilities . . . . . . . . . . . . . . . . . . . . . . . . . . . . . 89 (44) 13311112 11112 11112
Interest-bearing liabilities:Network banking . . . . . . . . . . . . . . . . . . . . . . . . . . . . . . . . . . . . . . . . 389 324 65Asset Management . . . . . . . . . . . . . . . . . . . . . . . . . . . . . . . . . . . . . . 29 41 (12)Merchant & Private banking . . . . . . . . . . . . . . . . . . . . . . . . . . . . . . . 4,897 3,918 979Other banking . . . . . . . . . . . . . . . . . . . . . . . . . . . . . . . . . . . . . . . . . . 666 68 598
11112 11112 11112
Total interest-bearing liabilities . . . . . . . . . . . . . . . . . . . . . . . . . . . 5,982 4,352 1,63011112 11112 11112
Change in net interest income . . . . . . . . . . . . . . . . . . . . . . . . . . . . . 279 (1,828) 2,106
2006 over 200511112111111211112
Change due to Increase (Decrease) in11112111111211112
Total Change in
Interest Volume Rate11112 11112 11112
(EUR million)
Interest Income:Retail banking . . . . . . . . . . . . . . . . . . . . . . . . . . . . . . . . . . . . . . . . . . 43 10 33Merchant banking . . . . . . . . . . . . . . . . . . . . . . . . . . . . . . . . . . . . . . . 1,589 (409) 1,998Commercial & Private banking . . . . . . . . . . . . . . . . . . . . . . . . . . . . 42 19 24Other banking . . . . . . . . . . . . . . . . . . . . . . . . . . . . . . . . . . . . . . . . . . 91 (32) 123
11112 11112 11112
Total Due from banks and Cash and cash equivalents . . . . . . . . 1,766 (412) 2,17811112 11112 11112
Retail banking . . . . . . . . . . . . . . . . . . . . . . . . . . . . . . . . . . . . . . . . . . 595 555 40Merchant banking . . . . . . . . . . . . . . . . . . . . . . . . . . . . . . . . . . . . . . . 2,749 1,469 1,279Commercial & Private banking . . . . . . . . . . . . . . . . . . . . . . . . . . . . 579 288 291Other banking . . . . . . . . . . . . . . . . . . . . . . . . . . . . . . . . . . . . . . . . . . (72) 39 (111)
11112 11112 11112
Total Loans to customers . . . . . . . . . . . . . . . . . . . . . . . . . . . . . . . . 3,850 2,351 1,50011112 11112 11112
Retail banking . . . . . . . . . . . . . . . . . . . . . . . . . . . . . . . . . . . . . . . . . . 7 17 (9)Merchant banking . . . . . . . . . . . . . . . . . . . . . . . . . . . . . . . . . . . . . . . 909 594 315Commercial & Private banking . . . . . . . . . . . . . . . . . . . . . . . . . . . . 0 1 (1)Other banking . . . . . . . . . . . . . . . . . . . . . . . . . . . . . . . . . . . . . . . . . . 0 (278) 277
11112 11112 11112
Total Investments . . . . . . . . . . . . . . . . . . . . . . . . . . . . . . . . . . . . . . 916 333 58211112 11112 11112
Retail banking . . . . . . . . . . . . . . . . . . . . . . . . . . . . . . . . . . . . . . . . . . 645 581 64Merchant banking . . . . . . . . . . . . . . . . . . . . . . . . . . . . . . . . . . . . . . . 5,246 1,654 3,592Commercial & Private banking . . . . . . . . . . . . . . . . . . . . . . . . . . . . 621 307 314Other banking . . . . . . . . . . . . . . . . . . . . . . . . . . . . . . . . . . . . . . . . . . 19 (271) 290
11112 11112 11112
Total Interest-earning assets . . . . . . . . . . . . . . . . . . . . . . . . . . . . . 6,532 2,272 4,26011112 11112 11112
234
Level: 6 – From: 6 – Wednesday, May 14, 2008 – 1:38 pm – g5mac4 – 3960 Section 07 : 3960 Section 07

2006 over 200511112111111211112
Change due to Increase (Decrease) in11112111111211112
Total Change in
Interest Volume Rate11112 11112 11112
(EUR million)
Interest Expenses:Retail banking . . . . . . . . . . . . . . . . . . . . . . . . . . . . . . . . . . . . . . . . . . (43) (33) (10)Merchant banking . . . . . . . . . . . . . . . . . . . . . . . . . . . . . . . . . . . . . . . 3,170 2,794 376Commercial & Private banking . . . . . . . . . . . . . . . . . . . . . . . . . . . . (6) (21) 16Other banking . . . . . . . . . . . . . . . . . . . . . . . . . . . . . . . . . . . . . . . . . . 30 66 (36)
11112 11112 11112
Total Due to banks . . . . . . . . . . . . . . . . . . . . . . . . . . . . . . . . . . . . . 3,151 2,805 34611112 11112 11112
Retail banking . . . . . . . . . . . . . . . . . . . . . . . . . . . . . . . . . . . . . . . . . . 425 290 135Merchant banking . . . . . . . . . . . . . . . . . . . . . . . . . . . . . . . . . . . . . . . 1,478 543 935Commercial & Private banking . . . . . . . . . . . . . . . . . . . . . . . . . . . . 397 289 108Other banking . . . . . . . . . . . . . . . . . . . . . . . . . . . . . . . . . . . . . . . . . . (110) (57) (53)
11112 11112 11112
Total Due to customers . . . . . . . . . . . . . . . . . . . . . . . . . . . . . . . . . . 2,190 1,065 1,12511112 11112 11112
Retail banking . . . . . . . . . . . . . . . . . . . . . . . . . . . . . . . . . . . . . . . . . . (2) 1 (3)Merchant banking . . . . . . . . . . . . . . . . . . . . . . . . . . . . . . . . . . . . . . . 981 495 486Commercial & Private banking . . . . . . . . . . . . . . . . . . . . . . . . . . . . 0 1 (1)Other banking . . . . . . . . . . . . . . . . . . . . . . . . . . . . . . . . . . . . . . . . . . (90) (21) (69)
11112 11112 11112
Total Debt certificates . . . . . . . . . . . . . . . . . . . . . . . . . . . . . . . . . . . 889 475 41311112 11112 11112
Retail banking . . . . . . . . . . . . . . . . . . . . . . . . . . . . . . . . . . . . . . . . . . 2 2 1Merchant banking . . . . . . . . . . . . . . . . . . . . . . . . . . . . . . . . . . . . . . . 16 15 1Commercial & Private banking . . . . . . . . . . . . . . . . . . . . . . . . . . . . 10 (1) 11Other banking . . . . . . . . . . . . . . . . . . . . . . . . . . . . . . . . . . . . . . . . . . 38 (50) 88
11112 11112 11112
Total Subordinated liabilities . . . . . . . . . . . . . . . . . . . . . . . . . . . . . 67 (34) 10111112 11112 11112
Interest-bearing liabilities:Retail banking . . . . . . . . . . . . . . . . . . . . . . . . . . . . . . . . . . . . . . . . . . 382 259 123Merchant banking . . . . . . . . . . . . . . . . . . . . . . . . . . . . . . . . . . . . . . . 5,645 3,847 1,799Commercial & Private banking . . . . . . . . . . . . . . . . . . . . . . . . . . . . 401 267 134Other banking . . . . . . . . . . . . . . . . . . . . . . . . . . . . . . . . . . . . . . . . . . (132) (62) (70)
11112 11112 11112
Total interest-bearing liabilities . . . . . . . . . . . . . . . . . . . . . . . . . . . 6,296 4,310 1,98611112 11112 11112
Change in net interest income . . . . . . . . . . . . . . . . . . . . . . . . . . . . . 235 (2,038) 2,273
235
Level: 6 – From: 6 – Wednesday, May 14, 2008 – 1:38 pm – g5mac4 – 3960 Section 07 : 3960 Section 07

Investment and Trading Portfolio
The following table shows the book value of Fortis’s banking investment and trading securitiesportfolio at December 31, 2007, 2006 and 2005.
At December 31,1111212341111211112
2007 2006 200511112 11112 11112
(EUR million)
Trading:Belgian national government . . . . . . . . . . . . . . . . . . . . . . . . . . . . . . 1,554 3,428 1,409Dutch national government . . . . . . . . . . . . . . . . . . . . . . . . . . . . . . . . 1,442 1,448 2,281German national government . . . . . . . . . . . . . . . . . . . . . . . . . . . . . . 610 818 1,119Italian national government . . . . . . . . . . . . . . . . . . . . . . . . . . . . . . . 2,140 1,043 738French national government . . . . . . . . . . . . . . . . . . . . . . . . . . . . . . . 827 895 532Greek national government . . . . . . . . . . . . . . . . . . . . . . . . . . . . . . . . 314 176 440Spanish national government . . . . . . . . . . . . . . . . . . . . . . . . . . . . . . 472 424Portuguese national government . . . . . . . . . . . . . . . . . . . . . . . . . . . . 90 71 128Austrian national government . . . . . . . . . . . . . . . . . . . . . . . . . . . . . . 47 90 126Finnish national government . . . . . . . . . . . . . . . . . . . . . . . . . . . . . . 25 67 9Other national governments and other government agencies . . . . . . 1,898 1,379 1,099
11112 11112 11112
Total trading government debt securities . . . . . . . . . . . . . . . . . . . 8,947 9,887 8,30511112 11112 11112
Banks and financial institutions . . . . . . . . . . . . . . . . . . . . . . . . . . . . 3,792 2,674 3,452Other corporate debts . . . . . . . . . . . . . . . . . . . . . . . . . . . . . . . . . . . . 6,023 4,957 5,376Structured credit instruments . . . . . . . . . . . . . . . . . . . . . . . . . . . . . . 3,249 4,981 3,850
11112 11112 11112
Total trading corporate debt securities . . . . . . . . . . . . . . . . . . . . . 13,064 12,566 12,67811112 11112 11112
Total trading debt securities . . . . . . . . . . . . . . . . . . . . . . . . . . . . . 22,011 22,453 20,98311112 11112 11112
Available for Sale:Belgian national government . . . . . . . . . . . . . . . . . . . . . . . . . . . . . . 7,129 9,220 10,521Dutch national government . . . . . . . . . . . . . . . . . . . . . . . . . . . . . . . . 3,204 5,700 6,588German national government . . . . . . . . . . . . . . . . . . . . . . . . . . . . . . 6,824 10,061 9,719Italian national government . . . . . . . . . . . . . . . . . . . . . . . . . . . . . . . 6,073 15,988 18,660French national government . . . . . . . . . . . . . . . . . . . . . . . . . . . . . . . 4,156 7,174 6,933Greek national government . . . . . . . . . . . . . . . . . . . . . . . . . . . . . . . . 3,588 4,430 5,484Spanish national government . . . . . . . . . . . . . . . . . . . . . . . . . . . . . . 487 3,165 3,053Portuguese national government . . . . . . . . . . . . . . . . . . . . . . . . . . . . 2,334 2,271 2,456Austrian national government . . . . . . . . . . . . . . . . . . . . . . . . . . . . . . 1,555 1,582 1,869Finnish national government . . . . . . . . . . . . . . . . . . . . . . . . . . . . . . 957 1,074 1,180Other national governments and other government agencies . . . . . . 5,082 3,784 3,375
11112 11112 11112
Total available for sale government debt securities . . . . . . . . . . . 41,389 64,449 69,83911112 11112 11112
Banks and financial institutions . . . . . . . . . . . . . . . . . . . . . . . . . . . . 20,955 21,024 18,783Other corporate debts . . . . . . . . . . . . . . . . . . . . . . . . . . . . . . . . . . . . 5,298 5,048 4,731Structured credit instruments . . . . . . . . . . . . . . . . . . . . . . . . . . . . . . 31,100 33,895 30,089
11112 11112 11112
Total available for sale corporate debt securities . . . . . . . . . . . . 57,353 59,967 53,60311112 11112 11112
Total available for sale debt securities . . . . . . . . . . . . . . . . . . . . . 98,742 124,416 123,44211112 11112 11112
236
Level: 6 – From: 6 – Wednesday, May 14, 2008 – 1:38 pm – g5mac4 – 3960 Section 07 : 3960 Section 07

At December 31,1111212341111211112
2007 2006 200511112 11112 11112
(EUR million)
Held to Maturity:Belgian national government . . . . . . . . . . . . . . . . . . . . . . . . . . . . . . 1,068 1,371 1,601German national government . . . . . . . . . . . . . . . . . . . . . . . . . . . . . . 816 774 758Italian national government . . . . . . . . . . . . . . . . . . . . . . . . . . . . . . . 388 396 337French national government . . . . . . . . . . . . . . . . . . . . . . . . . . . . . . . 625 595 551Greek national government . . . . . . . . . . . . . . . . . . . . . . . . . . . . . . . . 166 167 168Spanish national government . . . . . . . . . . . . . . . . . . . . . . . . . . . . . . 291 294 296Portuguese national government . . . . . . . . . . . . . . . . . . . . . . . . . . . . 213 196 197Austrian national government . . . . . . . . . . . . . . . . . . . . . . . . . . . . . . 20 20Other national governments and other government agencies . . . . . . 346 398 375
11112 11112 11112
Total held to maturity government debt securities . . . . . . . . . . . 3,933 4,211 4,28311112 11112 11112
Banks and financial institutions . . . . . . . . . . . . . . . . . . . . . . . . . . . . 132 109 868Other corporate debts . . . . . . . . . . . . . . . . . . . . . . . . . . . . . . . . . . . . 168 185 219
11112 11112 11112
Total held to maturity corporate debt securities . . . . . . . . . . . . . 300 294 1,08711112 11112 11112
Total held to maturity debt securities . . . . . . . . . . . . . . . . . . . . . . 4,234 4,505 5,36911112 11112 11112
Held at fair value (through net income):Other corporate debts . . . . . . . . . . . . . . . . . . . . . . . . . . . . . . . . . . . . 24 62 16Structured credit instruments . . . . . . . . . . . . . . . . . . . . . . . . . . . . . . 1,967 2,445 1,591Other asset-backed securities . . . . . . . . . . . . . . . . . . . . . . . . . . . . . . 1,942 2,309 1,521
11112 11112 11112
Total held at fair value (through net income) corporate debt securities . . . . . . . . . . . . . . . . . . . . . . . 1,991 2,507 1,607
11112 11112 11112
Total held at fair value (through net income) debt securities . . 2,015 2,507 1,60711112 11112 11112
Equity securities and convertible debentures . . . . . . . . . . . . . . . . . . 31,985 30,962 21,89011112 11112 11112
Total investment securities . . . . . . . . . . . . . . . . . . . . . . . . . . . . . . . 158,987 184,843 173,29111112 11112 1111211112 11112 11112
At December 31, 2007 and 2006, banking operations held the following debt securities(investments) of the same issuer where the book value exceeded 10% of Fortis’s combined net equity atthat date:
Concentration of RiskAt At
December December 31, 2007 31, 200611112 11112
Book Value Book Value11112 11112
(EUR million)
Belgian national government . . . . . . . . . . . . . . . . . . . . . . . . . . . . . . . . . . . . . . . . . 9,751 14,019Dutch national government . . . . . . . . . . . . . . . . . . . . . . . . . . . . . . . . . . . . . . . . . . 4,646 7,148German national government . . . . . . . . . . . . . . . . . . . . . . . . . . . . . . . . . . . . . . . . . 8,250 11,653Italian national government . . . . . . . . . . . . . . . . . . . . . . . . . . . . . . . . . . . . . . . . . . 8,601 17,427French national government . . . . . . . . . . . . . . . . . . . . . . . . . . . . . . . . . . . . . . . . . . 5,608 8,664Greek national government . . . . . . . . . . . . . . . . . . . . . . . . . . . . . . . . . . . . . . . . . . 4,068 4,773Spanish national government . . . . . . . . . . . . . . . . . . . . . . . . . . . . . . . . . . . . . . . . . 778 3,931Portuguese national government . . . . . . . . . . . . . . . . . . . . . . . . . . . . . . . . . . . . . . 2,637 2,538Austrian national government . . . . . . . . . . . . . . . . . . . . . . . . . . . . . . . . . . . . . . . . 1,622 1,692Finish national government . . . . . . . . . . . . . . . . . . . . . . . . . . . . . . . . . . . . . . . . . . 982 1,141
237
Level: 6 – From: 6 – Wednesday, May 14, 2008 – 1:38 pm – g5mac4 – 3960 Section 07 : 3960 Section 07

Loan Portfolio
At December 31, 2007, Fortis’s banking total loans (as reported under Due from banks and Duefrom customers) amounted to EUR 433,647 million, or 57% of Fortis’s banking assets. Due fromcustomers, which principally includes receivables from governments and official institutions, residentialmortgages, commercial loans and consumer loans, represented 73% of Fortis’s total banking loans atDecember 31, 2007 (2006: 76%; 2005: 78%; 2004: 78%). Receivables from credit institutions, whichprincipally includes current accounts, interest bearing deposits, securities purchased under resaleagreements and loans and advances, represented 27% of Fortis’s total banking loans at December 31, 2007(2006: 24%; 2005: 22%; 2004: 22%). At December 31, 2007 approximately 2% of Due from customerswere loans to the public sector (2006: 2%; 2005: 3%; 2004: 3%) and approximately 98% were loans to theprivate sector (2006: 98%; 2005: 97%; 2004: 97%).
The following table sets forth details of receivables from customers based on the domicile of thecustomer at the date indicated.
At December 31,1111222233333111121111211112
2007 2006 2005 200411112 11112 11112 11112
(EUR million)
Total net Due from customers:Total gross Due from customers . . . . . . . . . . . . . . . . . 317,303 288,078 280,233 228,127Impairment . . . . . . . . . . . . . . . . . . . . . . . . . . . . . . . . . (2,002) (2,201) (2,371) (2,620)
11112 11112 11112 11112
Total net Due from customers . . . . . . . . . . . . . . . . . 315,301 285,877 277,862 225,50711112 11112 11112 1111211112 11112 11112 11112
Breakdown by geography of borrower:BelgiumGovernment and official institutions . . . . . . . . . . . . . . 3,721 4,028 5,974 4,449Residential mortgages . . . . . . . . . . . . . . . . . . . . . . . . . 25,477 23,561 21,706 19,573Commercial loans . . . . . . . . . . . . . . . . . . . . . . . . . . . . 36,805 31,246 27,239 27,391Consumer loans . . . . . . . . . . . . . . . . . . . . . . . . . . . . . . 3,060 2,798 2,652 2,552Other loans . . . . . . . . . . . . . . . . . . . . . . . . . . . . . . . . . 6,625 7,885 6,672 7,672
11112 11112 11112 11112
Total Due from customers Belgium . . . . . . . . . . . . . 75,688 69,518 64,242 61,63711112 11112 11112 11112
The NetherlandsGovernment and official institutions . . . . . . . . . . . . . . 1,645 1,471 1,411 1,101Residential mortgages . . . . . . . . . . . . . . . . . . . . . . . . . 62,571 60,038 54,891 49,347Commercial loans . . . . . . . . . . . . . . . . . . . . . . . . . . . . 27,949 22,512 21,902 19,014Consumer loans . . . . . . . . . . . . . . . . . . . . . . . . . . . . . . 2,865 4,594 4,214 3,865Other loans . . . . . . . . . . . . . . . . . . . . . . . . . . . . . . . . . 8,984 12,192 6,286 4,777
11112 11112 11112 11112
Total Due from customers The Netherlands . . . . . . 104,014 100,808 88,704 78,10311112 11112 11112 11112
Great BritainGovernment and official institutions . . . . . . . . . . . . . . 62 16 0 0Residential mortgages . . . . . . . . . . . . . . . . . . . . . . . . . 303 254 206 177Commercial loans . . . . . . . . . . . . . . . . . . . . . . . . . . . . 7,537 6,359 5,580 3,808Consumer loans . . . . . . . . . . . . . . . . . . . . . . . . . . . . . . 65 38 45 35Other loans . . . . . . . . . . . . . . . . . . . . . . . . . . . . . . . . . 22,241 24,608 29,749 17,828
11112 11112 11112 11112
Total Due from customers Great Britain . . . . . . . . 30,207 31,275 35,580 21,84711112 11112 11112 11112
238
Level: 6 – From: 6 – Wednesday, May 14, 2008 – 1:38 pm – g5mac4 – 3960 Section 07 : 3960 Section 07

At December 31,1111222233333111121111211112
2007 2006 2005 200411112 11112 11112 11112
(EUR million)
United StatesGovernment and official institutions . . . . . . . . . . . . . . 199 28 0 0Residential mortgages . . . . . . . . . . . . . . . . . . . . . . . . . 47 33 26 23Commercial loans . . . . . . . . . . . . . . . . . . . . . . . . . . . . 9,730 7,665 5,136 4,357Consumer loans . . . . . . . . . . . . . . . . . . . . . . . . . . . . . . 4 19 75 75Other loans . . . . . . . . . . . . . . . . . . . . . . . . . . . . . . . . . 18,154 19,091 36,050 26,978
11112 11112 11112 11112
Total Due from customers United States . . . . . . . . 28,133 26,837 41,288 31,43211112 11112 11112 11112
Rest of the WorldGovernment and official institutions . . . . . . . . . . . . . . 1,084 938 445 423Residential mortgages . . . . . . . . . . . . . . . . . . . . . . . . . 5,596 4,754 3,357 3,215Commercial loans . . . . . . . . . . . . . . . . . . . . . . . . . . . . 55,276 41,331 33,001 21,449Consumer loans . . . . . . . . . . . . . . . . . . . . . . . . . . . . . . 3,434 2,495 2,175 1,968Other loans . . . . . . . . . . . . . . . . . . . . . . . . . . . . . . . . . 11,872 7,924 9,071 5,432
11112 11112 11112 11112
Total Due from customers Rest of the World . . . . . 77,261 57,440 48,049 32,48711112 11112 11112 11112
Total net Due from customers . . . . . . . . . . . . . . . . . 315,301 285,877 277,862 255,50711112 11112 11112 1111211112 11112 11112 11112
Breakdown by type of Loan:Government and official institutions . . . . . . . . . . . . . . 6,709 6,481 7,830 5,973Residential mortgages . . . . . . . . . . . . . . . . . . . . . . . . . 93,994 88,640 80,185 72,335Commercial loans . . . . . . . . . . . . . . . . . . . . . . . . . . . . 137,297 109,112 92,858 76,019Consumer loans . . . . . . . . . . . . . . . . . . . . . . . . . . . . . . 9,427 9,944 9,161 8,495Other loans . . . . . . . . . . . . . . . . . . . . . . . . . . . . . . . . . 67,875 71,701 87,828 62,686
11112 11112 11112 11112
Total net Due from customers . . . . . . . . . . . . . . . . . 315,301 285,877 277,862 225,50711112 11112 11112 11112
Loan Commitments
The following table provides loan commitments of the banking activities at December 31, 2007,2006 and 2005.
At December 31,1111212341111211112
2007 2006 200511112 11112 11112
(EUR million)
Guarantees and standby letters of credit . . . . . . . . . . . . . . . . . . . . . . 22,638 24,437 15,151Commercial letters of credit . . . . . . . . . . . . . . . . . . . . . . . . . . . . . . . 819 403 581Documentary credits . . . . . . . . . . . . . . . . . . . . . . . . . . . . . . . . . . . . . 11,305 9,154 7,049Commitments to extend credit . . . . . . . . . . . . . . . . . . . . . . . . . . . . . 322,233 231,954 157,033
11112 11112 11112
Total commitments . . . . . . . . . . . . . . . . . . . . . . . . . . . . . . . . . . . . . 356,995 265,948 179,81411112 11112 1111211112 11112 11112
Risk elements
A credit risk for specific loan impairment is established if there is objective evidence that Fortis willnot be able to collect all amounts due in accordance with contractual terms. The amount of theimpairments is the difference between the carrying amount and the recoverable amount, being the presentvalue of expected cash flows or, alternatively, the collateral value less costs to sell if the loan is secured.
On impaired loans interest continues to be accrued in the income statement based on the originalinterest rates and the new carrying amount.
239
Level: 6 – From: 6 – Wednesday, May 14, 2008 – 1:38 pm – g5mac4 – 3960 Section 07 : 3960 Section 07

An “incurred but not reported” (IBNR) impairment on loans is recorded when there is objectiveevidence that incurred losses are present in components of the loan portfolio, without having specificallyidentified impaired loans. This impairment is estimated based upon historical patterns of losses in eachcomponent, reflecting the current economic climate in which the borrowers operate and taking intoaccount the risk of difficulties in servicing external debt in some foreign countries based on an assessmentof the political and economic situation.
Impairments are recorded as a decrease in the carrying value of due from banks and due fromcustomers.
When a specific loan is identified as uncollectible and all legal and procedural actions have beenexhausted, the loan is written off against the related charge for impairment; subsequent recoveries arecredited to change in provisions for impairment in the income statement.
If Fortis forecloses on real estate or other collateral to satisfy defaulted obligations, some time maypass before it can dispose of such collateral at a reasonable price to satisfy its exposure. The followingtable shows the amount of foreclosed real estate held by Fortis’s banking activities at the dates shown:
At At At December December December
Foreclosed assets in EUR millions 31, 2007 31, 2006 31, 2005111121111211112111121111211112 11112 11112 11112
Foreclosed real estate . . . . . . . . . . . . . . . . . . . . . . . . . . . . . . . . . . . . 34 31 32
Fortis reviews its loan portfolios on a regular basis. The frequency of review depends on the loanclassification, but internal monitoring tools available on a daily basis may trigger a change in classificationat any time.
At December 31, 2007, Fortis’s banking total loans amounted to EUR 434 billion (2006: EUR 375billion; 2005: EUR 358 billion) or 57% (2006: 56%; 2005: 56%) of Fortis’s banking assets. Due fromcustomers, which principally includes receivables from governments and official institutions, commercialloans and consumer loans, represented approximately 73% of Fortis’s banking total loans at December 31,2007 (2006: 76%; 2005: 78%). The following table gives an overview of the impaired loans and theimpairments recorded relative to the total portfolio:
At December 31,11112123441111211112
2007 2006 200511112 11112 11112
(EUR million except %)
Due from banks:Outstanding gross . . . . . . . . . . . . . . . . . . . . . . . . . . . . . . . . . . . . . . . 118,363 89,438 80,086Impaired outstanding . . . . . . . . . . . . . . . . . . . . . . . . . . . . . . . . . . . . 31 26 43Impairments — specific credit loss . . . . . . . . . . . . . . . . . . . . . . . . . (12) (17) (18)— IBNR . . . . . . . . . . . . . . . . . . . . . . . . . . . . . . . . . . . . . . . . . . . . . . (5) (8) (14)
11112 11112 11112
Total impairments to bank . . . . . . . . . . . . . . . . . . . . . . . . . . . . . . . . (17) (25) (32)Total receivable due from banks . . . . . . . . . . . . . . . . . . . . . . . . . . . . 118,346 89,413 80,054Impairments due from banks as a % of outstanding loans . . . . . . . . 0.01% 0.03% 0.04%
11112 11112 11112
Due from customersOutstanding gross . . . . . . . . . . . . . . . . . . . . . . . . . . . . . . . . . . . . . . . 317,303 288,078 280,233Impaired outstanding . . . . . . . . . . . . . . . . . . . . . . . . . . . . . . . . . . . . 5,476 5,937 6,136Impairments . . . . . . . . . . . . . . . . . . . . . . . . . . . . . . . . . . . . . . . . . . .— specific credit loss . . . . . . . . . . . . . . . . . . . . . . . . . . . . . . . . . . . . (1,778) (1,876) (2,064)— IBNR . . . . . . . . . . . . . . . . . . . . . . . . . . . . . . . . . . . . . . . . . . . . . . (224) (325) (307)
11112 11112 11112
(2,002) (2,201) (2,371)11112 11112 11112
Total net receivables from customers . . . . . . . . . . . . . . . . . . . . . . . . 315,301 285,877 277,862Impairments due from customers as a % of outstanding gross . . . . 0.63% 0.76% 0.85%
240
Level: 6 – From: 6 – Wednesday, May 14, 2008 – 1:38 pm – g5mac4 – 3960 Section 07 : 3960 Section 07

At December 31,11112123441111211112
2007 2006 200511112 11112 11112
(EUR million except %)
Credit commitments:Outstanding gross . . . . . . . . . . . . . . . . . . . . . . . . . . . . . . . . . . . . . . . 158,932 165,047 119,446Impaired outstanding . . . . . . . . . . . . . . . . . . . . . . . . . . . . . . . . . . . . 610 365 587Provision for credit losses— specific credit loss . . . . . . . . . . . . . . . . . . . . . . . . . . . . . . . . . . . (398) (150) (143)— IBNR . . . . . . . . . . . . . . . . . . . . . . . . . . . . . . . . . . . . . . . . . . . . . . (49) (80) (88)
11112 11112 11112
Total impairments on commitments . . . . . . . . . . . . . . . . . . . . . . . (447) (230) (231)11112 11112 1111211112 11112 11112
Interest collected on impaired loans . . . . . . . . . . . . . . . . . . . . . . . . . 115 98 97
The table below shows Fortis Bank’s consolidated credit receivables before impairments relating tothe customer loan portfolio at December 31, 2007 and 2006 broken down by industry. These figures do notinclude any value adjustments.
At December 31,1111223411112
2007 200611112 11112
(EUR million)
Agriculture, forestry and fishing . . . . . . . . . . . . . . . . . . . . . . . . . . . . . . . . . . . . . . 1,926 1,341Oil and gas . . . . . . . . . . . . . . . . . . . . . . . . . . . . . . . . . . . . . . . . . . . . . . . . . . . . . . . 4,910 3,806Basic Metals . . . . . . . . . . . . . . . . . . . . . . . . . . . . . . . . . . . . . . . . . . . . . . . . . . . . . . 4,441 3,301Raw & intermediate materials . . . . . . . . . . . . . . . . . . . . . . . . . . . . . . . . . . . . . . . . 971 951Consumer goods . . . . . . . . . . . . . . . . . . . . . . . . . . . . . . . . . . . . . . . . . . . . . . . . . . . 8,185 6,901Wood, pulp and paper products . . . . . . . . . . . . . . . . . . . . . . . . . . . . . . . . . . . . . . . 1,137 907Technology, media and telecom . . . . . . . . . . . . . . . . . . . . . . . . . . . . . . . . . . . . . . . 3,138 2,961Electricity, gas and water supply . . . . . . . . . . . . . . . . . . . . . . . . . . . . . . . . . . . . . . 7,499 5,062Chemicals, rubber and plastic products . . . . . . . . . . . . . . . . . . . . . . . . . . . . . . . . . 6,161 5,221Construction and engineering . . . . . . . . . . . . . . . . . . . . . . . . . . . . . . . . . . . . . . . . . 6,735 5,182Machinery and equipment . . . . . . . . . . . . . . . . . . . . . . . . . . . . . . . . . . . . . . . . . . . 5,197 4,389Automotive . . . . . . . . . . . . . . . . . . . . . . . . . . . . . . . . . . . . . . . . . . . . . . . . . . . . . . . 3,890 3,436Transportation . . . . . . . . . . . . . . . . . . . . . . . . . . . . . . . . . . . . . . . . . . . . . . . . . . . . . 966 968Trade and commodity finance . . . . . . . . . . . . . . . . . . . . . . . . . . . . . . . . . . . . . . . . 14,397 10,456Retail . . . . . . . . . . . . . . . . . . . . . . . . . . . . . . . . . . . . . . . . . . . . . . . . . . . . . . . . . . . . 3,720 2,886Real Estate . . . . . . . . . . . . . . . . . . . . . . . . . . . . . . . . . . . . . . . . . . . . . . . . . . . . . . . 20,983 16,592Financial Services . . . . . . . . . . . . . . . . . . . . . . . . . . . . . . . . . . . . . . . . . . . . . . . . . . 74,671 79,190Holdings & other services . . . . . . . . . . . . . . . . . . . . . . . . . . . . . . . . . . . . . . . . . . . 23,484 14,683Public & social services . . . . . . . . . . . . . . . . . . . . . . . . . . . . . . . . . . . . . . . . . . . . . 14,339 13,444Private persons . . . . . . . . . . . . . . . . . . . . . . . . . . . . . . . . . . . . . . . . . . . . . . . . . . . . 104,179 97,597Non-classified . . . . . . . . . . . . . . . . . . . . . . . . . . . . . . . . . . . . . . . . . . . . . . . . . . . . . 4,372 6,603
11112 11112
Total . . . . . . . . . . . . . . . . . . . . . . . . . . . . . . . . . . . . . . . . . . . . . . . . . . . . . . . . . . . . 315,301 285,87711112 1111211112 11112
The table below shows the changes in the impairments on due from banks and impairments on duefrom customers over the last three years.
241
Level: 6 – From: 6 – Wednesday, May 14, 2008 – 1:38 pm – g5mac4 – 3960 Section 07 : 3960 Section 07

Roll forward of impairments due from banks
2007 2006 20051111223311112 1111223311112 1111223311112
Specific Specific Specific Credit Risk IBNR Credit Risk IBNR Credit Risk IBNR11112 11112 11112 11112 11112 11112
(EUR million)
As at January 1 . . . . . . . . . 17 8 18 14 16 29Increase in impairments . . 2 2 4 4 1 9Release of impairments . . (3) (5) (1) (10) (2) (11)Write-offs of uncollectible loans . . . . . . . . . . . . . . . . . (2) — — — 1Foreign currency translation effects and other adjustments . . . . . . . (2) — (4) — 2 (13)As at December 31 . . . . . . 12 5 17 8 18 14
11112 11112 11112 11112 11112 1111211112 11112 11112 11112 11112 11112
2007 2006 200511112 11112 11112
Impairments/Total due from banks ratio (at December 31) . . . . . . . 0.015% 0.028% 0.041%Average balance due from banks, gross (EUR million) . . . . . . . . . . 114,927 84,199 91,456
Roll forward of impairments due from customers
2007 2006 20051111223311112 1111223311112 1111223311112
Specific Specific Specific Credit Risk IBNR Credit Risk IBNR Credit Risk IBNR11112 11112 11112 11112 11112 11112
(EUR million)
As at January 1 . . . . . . . . . 1,876 325 2,064 307 2,327 293Acquisitions/divestments of subsidiaries . . . . . . . . . 31 4 23 6 46 22Increase in impairments . . 817 23 665 91 883 60Release of impairments . . (511) (133) (511) (73) (683) (82)Write-offs of uncollectible loans . . . . . . . . . . . . . . . . . (343) — (309) — (505) (1)Foreign currency translation effects . . . . . . — — — — — —and other adjustments . . . (92) 5 (56) (6) (4) 15
11112 11112 11112 11112 11112 11112
As at December 31 . . . . . . 1,778 224 1,876 325 2,064 30711112 11112 11112 11112 11112 1111211112 11112 11112 11112 11112 11112
The table below sets forth Fortis banking’s large exposures, based on regulatory reporting underwhich a “large exposure” refers to an exposure that exceeds 10% of regulatory own funds, for the periodsindicated. The data for years 2005-2007 is prepared on a Belgian GAAP basis.
Total Large # of Large Exposures as Total LoansExposures % of Equity to Customers11112 11112 11112
(EUR million)
For year ended (Belgian GAAP)December 31, 2005 . . . . . . . . . . . . . . . . . . . . . . . . . . . . . . . . . . . . . . 15 533% 272,906December 31, 2006 . . . . . . . . . . . . . . . . . . . . . . . . . . . . . . . . . . . . . . 3 61% 285,910December 31, 2007 . . . . . . . . . . . . . . . . . . . . . . . . . . . . . . . . . . . . . . 7 78% 315,719
242
Level: 6 – From: 6 – Wednesday, May 14, 2008 – 1:38 pm – g5mac4 – 3960 Section 07 : 3960 Section 07

Deposits
The aggregate average balance of Fortis banking’s interest-bearing deposits (from banks andcustomer accounts) increased from EUR 291.3 billion in 2006 to EUR 310.8 billion in 2007. Interest ratespaid reflect market conditions. The effect on net interest income depends upon competitive pricing and thelevel of interest income that can be generated through the use of funds.
The following table presents the average balance of, and the amount of interest paid and the averagerate paid on, deposits over 2007 and 2006 (restated).
2007 2006111121231111211112 111121231111211112
Average Average Balance(1) Interest Average Rate Balance(1) Interest Average Rate11112 11112 11112 11112 11112 11112
(EUR million, except %)
Deposits by Businesses:Deposits originated by Retail banking:Non-interest bearing demand deposits . . . . . . . . . . . . . . . . . . 49 0 0.0% 26 0 0.0%Interest bearing demand deposits . . . . . . . . . . . . . . . . . . 21,713 (161) 0.7% 21,317 (191) 0.9%Deposits from central banks . . 8,667 (241) 2.8% 0 0 —Saving deposits . . . . . . . . . . . . 43,372 (870) 2.0% 56,654 (1,169) 2.1%Time deposits . . . . . . . . . . . . . 19,537 (941) 4.8% 11,700 (545) 4.7%
11112 11112 11112 11112 11112 11112
Deposits Retail banking Network . . . . . . . . . . . . . . . . . 93,338 (2,213) 2.4% 90,435 (1,905) 2.1%Deposits originated by Asset management:Non-interest bearing demand depositsInterest bearing demand deposits . . . . . . . . . . . . . . . . . . 364 (30) 8.3% 637 0.0%Deposits from central banksSaving depositsTime deposits
11112 11112 11112 11112 11112 11112
Deposits Asset Management . 364 (30) 8.3% 637 0 0.0%Deposits originated by Commercial and Private bankingNon-interest bearing demand deposits . . . . . . . . . . . . . . . . . . 127 0 0.0% 96 0 0.0%Interest bearing demand deposits . . . . . . . . . . . . . . . . . . 69,267 (1,606) 2.3% 63,658 (2,566) 4.0%Deposits from central banks . . 913 (66) 7.3% 102 0 0.0%Saving deposits . . . . . . . . . . . . 436 (5) 1.1% 1,919 (78) 4.0%Time deposits . . . . . . . . . . . . . 134,532 (7,627)5.7% 122,616 (5,067) 4.1%
11112 11112 11112 11112 11112 11112
Deposits Commercial and Private banking . . . . . . . . . . . 205,275 (9,304) 4.5% 188,391 (7,711) 4.1%Deposits originated by Other banking:Non-interest bearing demand deposits . . . . . . . . . . . . . . . . . . 1 0.0% 12 0 0.0%Interest bearing demand deposits . . . . . . . . . . . . . . . . . . 370 (21) 5.7% 756 (100) 13.3%Deposits from central banks . . 49 0 0 0Saving deposits . . . . . . . . . . . . 8 (2) 21.8%Time deposits . . . . . . . . . . . . . 11,437 (524) 4.6% 10,994 (438) 4.0%Deposits Other banking . . . . . . 11,856 (545) 4.6% 11,770 (540) 4.6%
11112 11112 11112 11112 11112 11112
Total . . . . . . . . . . . . . . . . . . . . . 310,832 (12,092) 3.9% 291,233 (10,156) 3.5%11112 11112 11112 11112 11112 1111211112 11112 11112 11112 11112 11112
243
Level: 6 – From: 6 – Wednesday, May 14, 2008 – 1:38 pm – g5mac4 – 3960 Section 07 : 3960 Section 07
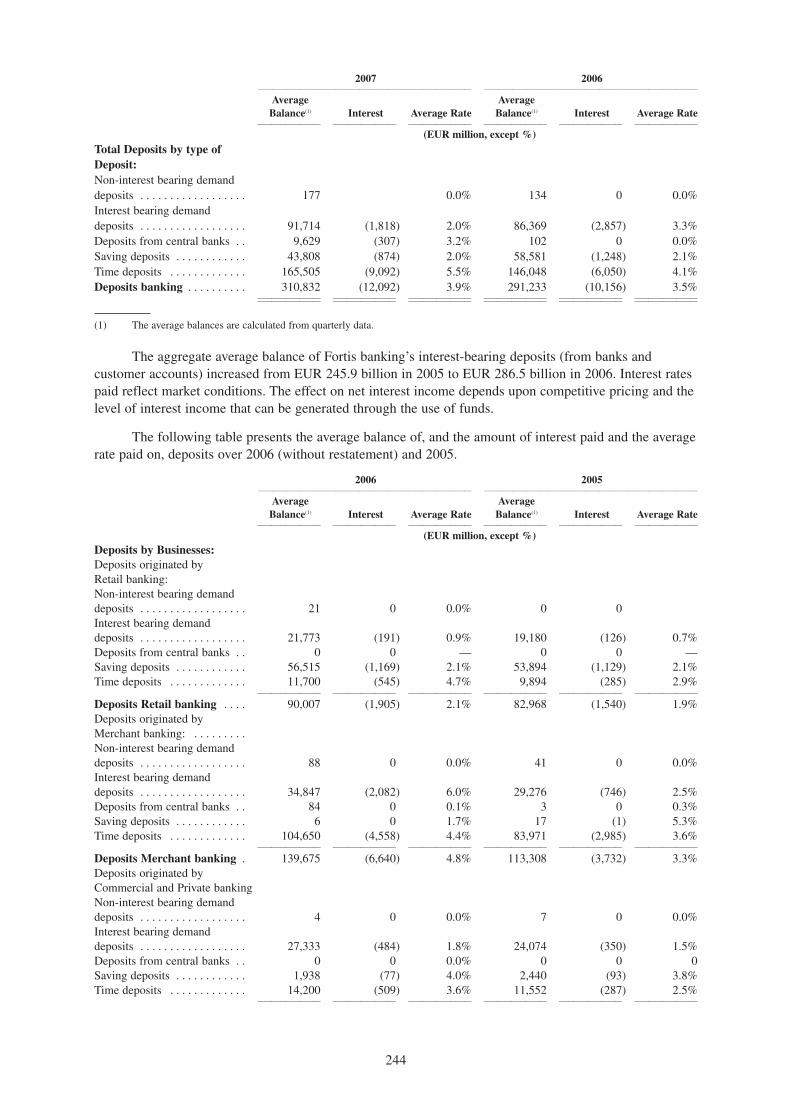
2007 2006111121231111211112 111121231111211112
Average Average Balance(1) Interest Average Rate Balance(1) Interest Average Rate11112 11112 11112 11112 11112 11112
(EUR million, except %)
Total Deposits by type of Deposit:Non-interest bearing demand deposits . . . . . . . . . . . . . . . . . . 177 0.0% 134 0 0.0%Interest bearing demand deposits . . . . . . . . . . . . . . . . . . 91,714 (1,818) 2.0% 86,369 (2,857) 3.3%Deposits from central banks . . 9,629 (307) 3.2% 102 0 0.0%Saving deposits . . . . . . . . . . . . 43,808 (874) 2.0% 58,581 (1,248) 2.1%Time deposits . . . . . . . . . . . . . 165,505 (9,092) 5.5% 146,048 (6,050) 4.1%Deposits banking . . . . . . . . . . 310,832 (12,092) 3.9% 291,233 (10,156) 3.5%
11112 11112 11112 11112 11112 1111211112 11112 11112 11112 11112 11112
(1) The average balances are calculated from quarterly data.
The aggregate average balance of Fortis banking’s interest-bearing deposits (from banks andcustomer accounts) increased from EUR 245.9 billion in 2005 to EUR 286.5 billion in 2006. Interest ratespaid reflect market conditions. The effect on net interest income depends upon competitive pricing and thelevel of interest income that can be generated through the use of funds.
The following table presents the average balance of, and the amount of interest paid and the averagerate paid on, deposits over 2006 (without restatement) and 2005.
2006 2005111121231111211112 111121231111211112
Average Average Balance(1) Interest Average Rate Balance(1) Interest Average Rate11112 11112 11112 11112 11112 11112
(EUR million, except %)Deposits by Businesses:Deposits originated by Retail banking:Non-interest bearing demand deposits . . . . . . . . . . . . . . . . . . 21 0 0.0% 0 0Interest bearing demand deposits . . . . . . . . . . . . . . . . . . 21,773 (191) 0.9% 19,180 (126) 0.7%Deposits from central banks . . 0 0 — 0 0 —Saving deposits . . . . . . . . . . . . 56,515 (1,169) 2.1% 53,894 (1,129) 2.1%Time deposits . . . . . . . . . . . . . 11,700 (545) 4.7% 9,894 (285) 2.9%
11112 11112 11112 11112 11112 11112
Deposits Retail banking . . . . 90,007 (1,905) 2.1% 82,968 (1,540) 1.9%Deposits originated by Merchant banking: . . . . . . . . .Non-interest bearing demand deposits . . . . . . . . . . . . . . . . . . 88 0 0.0% 41 0 0.0%Interest bearing demand deposits . . . . . . . . . . . . . . . . . . 34,847 (2,082) 6.0% 29,276 (746) 2.5%Deposits from central banks . . 84 0 0.1% 3 0 0.3%Saving deposits . . . . . . . . . . . . 6 0 1.7% 17 (1) 5.3%Time deposits . . . . . . . . . . . . . 104,650 (4,558) 4.4% 83,971 (2,985) 3.6%
11112 11112 11112 11112 11112 11112
Deposits Merchant banking . 139,675 (6,640) 4.8% 113,308 (3,732) 3.3%Deposits originated by Commercial and Private bankingNon-interest bearing demand deposits . . . . . . . . . . . . . . . . . . 4 0 0.0% 7 0 0.0%Interest bearing demand deposits . . . . . . . . . . . . . . . . . . 27,333 (484) 1.8% 24,074 (350) 1.5%Deposits from central banks . . 0 0 0.0% 0 0 0Saving deposits . . . . . . . . . . . . 1,938 (77) 4.0% 2,440 (93) 3.8%Time deposits . . . . . . . . . . . . . 14,200 (509) 3.6% 11,552 (287) 2.5%
11112 11112 11112 11112 11112 11112
244
Level: 6 – From: 6 – Wednesday, May 14, 2008 – 1:38 pm – g5mac4 – 3960 Section 07 : 3960 Section 07

2006 2005111121231111211112 111121231111211112
Average Average Balance(1) Interest Average Rate Balance(1) Interest Average Rate11112 11112 11112 11112 11112 11112
(EUR million, except %)
Deposits Commercial and Private banking . . . . . . . . . . . 43,474 (1,070) 2.5% 38,074 (731) 1.9%Deposits originated by Other banking:Non-interest bearing demand deposits . . . . . . . . . . . . . . . . . . 39 0 0.0% 50 0 0.0%Interest bearing demand deposits . . . . . . . . . . . . . . . . . . 1,007 (100) 10.0% 1,197 (18) 1.5%Deposits from central banks . . 0 0 0 0 0 0Saving deposits . . . . . . . . . . . . 17 (2) 10.0% 1,024 (2) 0.1%Time deposits . . . . . . . . . . . . . 12,286 (438) 3.6% 9,301 (501) 5.4%
11112 11112 11112 11112 11112 11112
Deposits Other banking . . . . . . 13,348 (540) 4.0% 11,573 (521) 4.5%Total . . . . . . . . . . . . . . . . . . . . . 286,504 (10,156) 3.5% 245,921 (6,524) 2.7%
11112 11112 11112 11112 11112 1111211112 11112 11112 11112 11112 11112
Total Deposits by type of Deposit:Non-interest bearing demand deposits . . . . . . . . . . . . . . . . . . 150 0 0.0% 98 0 0.0%Interest bearing demand deposits . . . . . . . . . . . . . . . . . . 84,959 (2,857) 3.4% 73,728 (1,240) 1.7%Deposits from central banks . . 84 0 0.1% 3 0 0.3%Saving deposits . . . . . . . . . . . . 58,475 (1,248) 2.1% 57,375 (1,225) 2.1%Time deposits . . . . . . . . . . . . . 142,835 (6,050) 4.2% 114,719 (4,059) 3.5%Deposits banking . . . . . . . . . . 286,504 (10,156) 3.5% 245,923 (6,524) 2.7%
11112 11112 11112 11112 11112 1111211112 11112 11112 11112 11112 11112
(1) The average balances are calculated from quarterly data.
The following table shows the maturities of Fortis banking’s deposits at December 31, 2007 due tobanks and deposits due to customers. The total deposits at December 31, 2007 in this table is the actualamount at the balance sheet date compared to the table above, which is based on average balances.
Within 1-2 2-3 3-4 4-5 Over No 1 Year Years Years Years Years 5 Years Maturity Total
11112 11112 11112 11112 11112 11112 11112 11112
Deposits due to banks:On demand . . . . . . . . . . 957 9,285 10,243 Time deposits . . . . . . . . 72,563 39 10 7 17 286 4,615 77,537 Other deposits . . . . . . . 20 12 13 12 11 32 36 136 Total . . . . . . . . . . . . . . . 73,540 51 23 19 28 318 13,936 87,916 Deposits due to customers:Demand deposits . . . . . 7,776 — — — — — 79,414 87,190 Savings deposits . . . . . . 2,362 9 1 1 1 278 48,144 50,795 Time deposits . . . . . . . . 63,449 1,817 1,398 926 1,312 9,252 1,090 79,245 Other deposits . . . . . . . 34 1 1 1 1 17 249 301 Total . . . . . . . . . . . . . . . 73,621 1,827 1,400 928 1,314 9,547 128,897 217,531Total Deposits . . . . . . . 147,161 1,878 1,423 947 1,342 9,865 142,833 305,447
Short-term Borrowings
Short-term borrowings are borrowings with an original maturity of one year or less. These areincluded in Fortis’s combined balance sheet under the items amounts owed to customers and amountsowed to credit institutions and debt certificates. An analysis of the balance and interest rates paid on suchitem is provided below.
245
Level: 6 – From: 6 – Wednesday, May 14, 2008 – 1:38 pm – g5mac4 – 3960 Section 07 : 3960 Section 07

The following table presents information about Fortis’s short-term borrowings from bankingoperations:
At December 31,1111222231111211112
2007 2006 200511112 11112 11112
(EUR million, except %)
Securities sold under repurchase agreements:Year-end balance . . . . . . . . . . . . . . . . . . . . . . . . . . . . . . . . . . . . . . . . 111,196 109,917 140,663Average balance outstanding during the year . . . . . . . . . . . . . . . . . . 112,370 130,533 129,380Maximum quarter-end balance . . . . . . . . . . . . . . . . . . . . . . . . . . . . . 113,269 144,041 151,103Weighted average interest during the year . . . . . . . . . . . . . . . . . . . . 4.0% 3.7% 3.1%Commercial paper:Year-end balance . . . . . . . . . . . . . . . . . . . . . . . . . . . . . . . . . . . . . . . . 38,144 39,155 39,550Average balance outstanding during the year . . . . . . . . . . . . . . . . . . 43,311 38,895 25,087Maximum quarter end balance . . . . . . . . . . . . . . . . . . . . . . . . . . . . . 48,590 40,672 39,550Weighted average interest during the year . . . . . . . . . . . . . . . . . . . . 4.0% 2.6% 2.5%
Capital
The following table sets forth certain information relating to Fortis Bank’s capital:
At December 31,1111222231111211112
2007 2006 200511112 11112 11112
(EUR million, except %)
Breakdown of assets:Weighted Risks(1) . . . . . . . . . . . . . . . . . . . . . . . . . . . . . . . . . . . . . . . . 270,207 240,104 212,095Total Capital(2) . . . . . . . . . . . . . . . . . . . . . . . . . . . . . . . . . . . . . . . . . . 27,231 26,664 22,210Ratios — Tier 1 Capital(2) . . . . . . . . . . . . . . . . . . . . . . . . . . . . . . . . . 9.5% 7.1% 7.4%Total Capital(2) . . . . . . . . . . . . . . . . . . . . . . . . . . . . . . . . . . . . . . . . . . 10.1% 11.1% 10.5%
(1) Weighted risks also includes off-balance sheet items and market risks.
(2) The basis for calculating these capital adequacy ratios was Belgian GAAP. As of January 1, 2007, the basis for calculating the capitaladequacy rations is IFRS. See “Operating and Financial Review and Prospects — Liquidity and Capital Resources — Bank CashFlow” for discussion of the impact on the equity as a result of the transition to IFRS.
246
Level: 6 – From: 6 – Wednesday, May 14, 2008 – 1:38 pm – g5mac4 – 3960 Section 07 : 3960 Section 07

RISK MANAGEMENT
General
In its daily activities, Fortis is exposed to a range of potential risks, the most significant of whichinclude financial risk, insurance liability risk and operational risk. Financial risk includes credit risk,market risk (the potential loss resulting from unfavorable market movements) and liquidity risk (where anyFortis entity is unable meet its cash demands). Insurance liability risk refers to all underwriting risk ininsurance activities and operational risk is composed of two elements: event risk and business risk.
Due to the nature of its operations, Fortis’s banking operations have market risk exposures in bothits non-trading and trading portfolios. Because Fortis’s insurance operations do not have trading portfolios,they do not incur market risk relating to such activities.
Risk Management Philosophy
Fortis defines risk as the deviation from anticipated outcomes that may affect the value, capital orearnings of Fortis. Fortis’s risk thus stems from its exposure to external or internal risk factors inconducting its business activities. Risk taking is an integral part of Fortis’s value proposition to itsshareholders. Fortis aims to take risks of which it has a good understanding and which can be adequatelymanaged either at individual or at overall portfolio level. Fortis actively seeks exposure to these risks if itis efficient and affordable to do so. Risks that are not actively sought but rather arise as a consequence ofconducting business are reduced to acceptable levels.
Fortis aims to meet its shareholders and stakeholders expectations and to take and manage risks in acontrolled and transparent manner.
At Fortis, risk management is based on the four guiding principles resulting from its riskgovernance framework:
• Optimizing risk/return in a controlled manner at high standards: Fortis is a professional risktaker; assuming risk (both actively and passively) is intrinsic to how Fortis creates value forits shareholders. To ensure Fortis delivers superior shareholder value creation, its risk takingis both controlled and directed towards businesses that provide shareholders with attractiverisk-adjusted returns.
• Clearly established responsibility and accountability: Fortis operates according to theprinciple of delegated authority. Individuals or business units are fully responsible for theirdecisions and their incentives are aligned with Fortis’s business objectives.
• Independent and properly resourced risk management functions: Risk-taking activitiesrequire the independent supervision of the risk management function. Well-resourcedindependent risk management, which is clearly separate from any business decisions, isessential in order to avoid conflicts of interest, to ensure proper risk governance and,consequently, to enforce the Group Risk Policy.
• Open risk culture to promote trust and confidence: Risk transparency and responsiveness tochange are integral to Fortis’s business culture. Fortis has institutionalized processes tofacilitate risk management knowledge sharing within the group and with externalstakeholders.
Risk Monitoring and Management
Fortis’s Risk Management organization is designed to enable the implementation of Fortis’s riskstrategy and to ensure:
• clear responsibility and accountability regarding risk management;
247
Level: 6 – From: 6 – Wednesday, May 14, 2008 – 1:38 pm – g5mac4 – 3960 Section 08 : 3960 Section 08

• independence of the risk management functions; and
• transparent and coherent risk-related decision-making throughout Fortis Group, covering allrisks of the Fortis risk taxonomy.
Risk management and monitoring are performed throughout Fortis Group by delegated authoritiesranging from the local risk management organization in geographical areas, to the business riskmanagement and to Central Risk Management in close cooperation with Asset & Liability Management.For additional information see Note 7.3 “Risk Management Organization” of the Notes to the 2007Consolidated Financial Statements, incorporated by reference herein.
Fortis has established the Central Risk Management (“CRM”) department, which is led by theChief Risk Officer. Its primary role is to ensure that the Fortis Group pursues consistently high standardsof risk management, to raise executive management’s awareness and understanding of the risks beingtaken, to encourage optimization of the risk/return ratio, to measure group-wide economic capital and tovalidate risk models. CRM provides support to the businesses regarding risk issues and supports the workof the various risk committees. It also coordinates the implementation of risk initiatives and riskcommunication. The presence of an integrated risk management framework across the Banking andInsurance activities is perceived as one of Fortis’s strengths by internal parties (Fortis Audit Services,Investor Relations) and external parties (rating agencies, investment analysts and regulators). CRM is alsoresponsible for coordinating communication with these parties.
Asset & Liability Management (“ALM”) is charged with closely monitoring all ALM risks relatedto the balance sheet of Fortis Group and its Banking and Insurance entities. ALM performs its duties inaccordance with the decisions made by the Group Asset and Liability Committee and with due observanceof the conditions set by Fortis Bank, Fortis Insurance and the supervisors. ALM defines Fortis’s riskappetite and manages its risks by setting up risk guidelines and risk levels. It aims to apply the bestpractices in risk management that have been defined by the regulators and rating agencies.
At the level of business risk management, Each business:
• is responsible for managing its inherent risks within the limits, policies and guidelines set byregulators and Central Risk Management
• has a Business Risk Committee, which supports its management team in ensuring that keyrisks are well understood and that appropriate risk management procedures are in place
• is responsible for managing its inherent risks and ensuring that it has comprehensive riskmanagement systems in place which cover the full risk taxonomy.
The double reporting lines between the Business Chief Risk Officer (and the Business ChiefExecutive Officer) and the Group Chief Risk Officer are designed to reinforce the principles of fulltransparency on risk-related information (e.g., risk quantification, profitability, reserves, limits, capital,methodologies, assumptions and risk management organization) between the businesses and CRM,compliance with group policies, guidelines and limits, and independence of the risk function in the riskdecision and monitoring process.
Fortis Audit Services (“FAS”) supports the achievement of Fortis’s objectives by providingprofessional and independent assurance. FAS evaluates the effectiveness of governance, risk and controlprocesses and recommends solutions for optimizing them. Fortis Audit Services regularly audits the riskmanagement functions of Fortis at group, business and local levels.
The overall responsibility for the risks taken by Fortis rests with the Fortis Board, which has put inplace a comprehensive risk committee structure to ensure that risk decisions are taken at the appropriatelevel. In order to fulfill its risk mission, the Fortis Board has the support of both the Fortis Risk andCapital Committee and the Fortis Audit Committee. The Fortis Board has delegated the day-to-daymanagement to the Executive Committee under the leadership of the Chief Executive Officer (CEO). TheFortis Risk Committee Structure is described below.
248
Level: 6 – From: 6 – Wednesday, May 14, 2008 – 1:38 pm – g5mac4 – 3960 Section 08 : 3960 Section 08

Board Risk Committees
Risk and Capital Committee (“RCC”)
Composed of non-executive Board members, the RCC meets at least three times a year and assiststhe Board in understanding the risks run by Fortis that are typically inherent to Banking and Insuranceactivities, overseeing the proper management of these risks, and ensuring the adequacy of Fortis’s capitalrelative to these risks and to those inherent to its overall operations. The main responsibilities of the RCCare to approve the risk governance framework and to make recommendations to the Board on the targetrisk profile and the related relevant policies.
Fortis Audit Committee
Not being a risk committee, the role of the Audit Committee is to assist the Board in fulfilling itssupervision and monitoring responsibilities in respect of internal control in the broadest sense withinFortis, including internal control over financial reporting. At least once a year the Audit Committee, onbehalf of the Board of Directors, reviews the quality and effectiveness of procedures and structures underwhich risks at Fortis are managed, risk-related accounting policies, capital assessment procedures and theperformance of the internal control system.
Executive Risk Committees
The CEO reports to the Fortis Board on Fortis’s risk profile and capital adequacy and presentsproposals to the Fortis Board on risk policies and rules and on financing Fortis Group transactions. TheExecutive Committee is supported in its tasks by the Executive Risk Committees, which include the FortisRisk Committee and the Group Asset and Liability Committee.
Fortis Risk Committee (“FRC”)
The FRC, chaired by the Fortis Chief Risk Officer, supports the CEO and the Executive Committeein ensuring that the Group has an adequate understanding of its key risks and that it has a sound riskmanagement in place. A key role of the FRC is to guarantee the consistency of risk managementapproaches across the Group (Bank and Insurance) and to make sure that risk-related topics at group levelhave been taken into account.
Group Asset and Liability Committee (“Group ALCO”)
The Group ALCO approves the group strategic asset allocation and monitors overall Group-ALMexposure. Its responsibilities are asset and liability management, monitoring and control.
Corporate Risk Committees
The Fortis Board is supported in its tasks by the following Corporate Risk Committees:
• The Central Asset & Liability Management and Market Policy Committee (“ALM &MPC”), which defines the bank’s balance sheet management policies and limits, monitorsthe balance sheet structure, approves ALM risk management structures, agrees on significanttransactions affecting the balance sheet and signs off on new products launched by thebusiness lines. These tasks also include monitoring of trading risk limits.
• The Central Operational risk Policy Committee (“OPC”), which establishes norms, policiesand measurement standards in relation to operational risk-linked exposure.
• The Central Credit Policy Committee (“CPC”), which approves credit risk policies andprocesses, decides on concentration limits, signs off on new credit products and monitorscredit portfolio quality and credit delegation limits.
249
Level: 6 – From: 6 – Wednesday, May 14, 2008 – 1:38 pm – g5mac4 – 3960 Section 08 : 3960 Section 08
• The Central Credit Committee (“CCC”), which decides on individual obligor risks, includingcountry and bank limits, and approves transactions above a certain level affecting the balancesheet, within the lending limit of the bank.
• The Fortis Group Committee on Impairments and Provisions (“FGCIP”), which supervisesworldwide Value Adjustments (“VA”) on a consolidated basis.
• The Insurance Asset and Liability Committee (“Insurance ALCO”), which makes proposalsto the Insurance Risk Committee, which steers the strategic asset allocation at FortisInsurance level and monitors and manages the overall Insurance ALM risk exposure.
Technical Risk Committees & Platforms
The Technical Risk Committees & Platforms consist of the following:
• The Capital Platform, which acts as a discussion forum for group capital related topics. Themain purpose of the Capital Platform is information and know-how-sharing on capital relatedmatters as well as ensuring alignment on capital related topics.
• The Model Acceptance Group (“MAG”), which takes decisions abouttechnical/methodological issues, assessing regulatory compliance and consistency pertainingto credit risk assessment methodologies and model application.
• The Operational ALCO Committee, which is an implementation committee that takes theappropriate measures required to implement decisions taken by the Group ALCO.
• The Liquidity & Funding Competence Centre (“LFCC”), which is responsible for thesteering and prioritization of Fortis’s liquidity and the exchange of cross-sector (Banking-Insurance) knowledge of liquidity issues and advice on solutions for funding liquidityproblems.
Fortis also issued a Compliance Charter setting forth the operating standards and rules applicable inthe centralized risk management structure. Compliance has implemented its Compliance Risk Assessmentmethodology which includes a comprehensive reporting scheme to monitor the development andimplementation of the action plans.
In 2005, Fortis introduced a whistleblower procedure, and on January 1, 2006, Investigations joinedthe Legal and Compliance department to form a single Fortis-wide operating department. The mission ofInvestigations is to pursue Fortis’s zero tolerance to fraud policy and to ensure that the companies withinthe Fortis Group and their employees and intermediaries operate in an ethical manner by investigatingfraudulent acts and other unacceptable behavior and by participating in the prevention, detection andmonitoring of such acts in close collaboration with Compliance and Internal Audit.
Principal Risks
Fortis has classified each type of risk to which it is exposed into core risks and non-core risks. Corerisks are those risks to which Fortis actively seeks exposure when it is efficient for the Fortis Group to doso and where exposure can be contained and managed either at individual or at overall portfolio level. Themain sub-categories of core risks are credit risk, market risk (ALM risk and trading risk), insurance riskand liquidity risk. Insurance risk can be further broken down into property & casualty risk and life &health risk. Liquidity risk can be further split into funding risk and market liquidity risk. Non-core risksare risks that as a rule are not actively sought but arise as a consequence of conducting business. Theseinclude, but are not limited to, operational risk. Operational risk can be further broken down into businessrisk and event risk.
250
Level: 6 – From: 6 – Wednesday, May 14, 2008 – 1:38 pm – g5mac4 – 3960 Section 08 : 3960 Section 08

Operational Risk
All companies face operational risk due to the inherent uncertainty in their operating activities, dueeither to external factors or uncontrolled internal factors. Operational risk is divided into two components:event risk and business risk.
Event risk is the risk of loss resulting from inadequate or failed internal processes, people andsystems or from external events. This definition includes legal risk, but excludes strategic and reputationrisk. Event risk is and can be limited through appropriate management processes and controls.
Business risk is the risk of loss due to changes in the competitive environment that damage thefranchise or operating economics of a business. Typically, the impact is seen through the variation involume, pricing or margins relative to a fixed cost base. Business risk is externally driven, but can bemitigated by effective management practices.
Financial Risk
Fortis risk management distinguishes between the financial risk categories of credit risk, market riskand liquidity risk. In the banking business, credit risk consists primarily of the risk of default on the part ofborrowers or counterparties. This risk largely stems from three possible sources, namely counter party risk,transfer risk and settlement risk. In the insurance business, credit risk consists mainly of counterparty riskinherent in investment portfolios and mortgages.
The main market risks in the banking business can be broken down into risks affecting structuralpositions (ALM risks), risks arising from trading activities (trading risk) and liquidity risk. Trading riskrelates to the trading positions taken to benefit from short-term volatility in the different risk factors of thefinancial markets. This trading risk is the risk of loss due to high volatility in financial markets of shareprices, interest rates, currency rates and real estate prices. In the insurance business, market risk relatesspecifically to the impact of financial changes on structural positions (ALM risk).
ALM risk is measured and managed with consistent methods (e.g., including fair value calculations,stress tests and worst-case sensitivities) and within a unique risk management framework. ALM riskfocuses on value and earnings changes implied by volatility in interest rates, exchange rates, share pricesand real estate prices. The risk of change in volatility is not taken into account in these figures.
Liquidity risk refers to the situation where any entity of Fortis is unable to meet the cash demandsof its deposit, other contract and policyholders without suffering unacceptable losses in realizing assets tofund its financial obligations as and when they fall due, both under normal and difficult circumstances. Itis risk that Fortis does not have sufficient financial resources available to meet its obligations when theyfall due, or is able to secure or sell its assets only at excessive cost.
Insurance Liability Risk
Insurance liability risk refers to all underwriting risks in insurance activities, exclusive of anycomponents that are driven by financial market considerations (such as interest rates). Due to the differentnature of Life, Accident & Health and Property & Casualty operations, the risks in these activities aretreated separately. Life liability risks are also referred to as mortality and longevity risk.
Life risk. Life risk results mainly from discrepancies in the timing and amounts of the cash flowsdue to the incidence of death (mortality risk) or non-incidence of death (longevity risk) depending onwhether the product written by the insurer is life cover or annuity/pension cover. Due to the long-termnature of life business, unexpected changes to lapse behavior and ongoing expenses are also consideredwithin life risk.
Accident & Health risk. Accident & Health risk refers to the variation in claim levels and timingdue to fluctuations in policyholder morbidity and accident claims.
251
Level: 6 – From: 6 – Wednesday, May 14, 2008 – 1:38 pm – g5mac4 – 3960 Section 08 : 3960 Section 08

Property & Casualty risk. Property & Casualty risk is defined as the variability in claims costs andincludes the uncertainty regarding claims reserves (incurred claims on expired contracts) and unearnedpremiums (future claims on unexpired contracts).
Market Risk in Banking
Market Risk: Trading
Trading risk refers to the potential losses resulting from unfavorable market movements, which canarise from trading positions held in financial instruments. In other words, trading risk arises in the tradingportfolio due to changes in the market price of positions held in capital market instruments, includingcommodity securities.
Fortis’s trading risk activities consist of client-related trading activities as well as proprietary tradingactivities. They cover almost the full spectrum of instruments available on modern financial markets andoccur in the dealing rooms of Brussels, Luxembourg, Amsterdam, New York, Houston, Hong Kong,Singapore, Taipei, Shanghai, London, Istanbul and Warsaw. All desks in the local dealing rooms report toBrussels.
Trading risk is limited to the Banking activities of Fortis and complies with the general risk strategy.More specifically, it is a part of the Merchant Banking activities, for which the daily outcome oftransactions depends on developments in market prices, currency rates, interest rates, credit spreads, equitysecurities, commodities and energy prices.
Risk taking is based on a three-pillar Merchant Banking risk structure: risk managementorganization, risk policies and risk decision procedures. Independent risk management providesinformation about the Merchant Banking risk profile to the Merchant Banking management team,Merchant Banking Risk Committees and CRM. Integrated risk management systems are installed in orderto analyze and measure the variety of risk systematically.
Fortis has established limits to define the risk tolerance and to keep trading risk exposure undercontrol. Several risk parameters exist, to cover all risk characteristics of exposures such as position(modified duration, delta, vega), Value at Risk, stress test and concentration limits. All limits are reviewedonce a year in connection with the average limit use, past performance, volatility of income and the newbudget.
Risk information from all locations is centralized in one global risk database. All dealing rooms willbe gradually integrated while front-office information technology systems are centralized.
Fortis applies the Value at Risk (“VaR”) method based on the Extreme Value Distribution (“EVD”)historical simulation mode with full revaluation of derivative products, usually referred to as historicalVaR. The historical VaR is now the target approach for trading risk measurement worldwide
To calculate the historical VaR for the majority of products and activities, Risk Management uses atailor-made system called MrMa (Market risk Management application). This system supports thefollowing trading risk management functions:
• official (end-of-day) Mark to Market (“MtM”) revaluation;
• stress testing and sensitivity analysis; and
• back-testing.
The historical VaR calculations in MrMa are based directly on the returns of each individualinstrument of the portfolio (and not on an ‘associated index + spread’ solution). By using the ExtremeValue Theory, data in the tail is used more efficiently.
Fortis Merchant Banking also manages an important portfolio of products directly exposed to creditspread variations. These products are asset-backed securities, debt instruments and credit derivatives and
252
Level: 6 – From: 6 – Wednesday, May 14, 2008 – 1:38 pm – g5mac4 – 3960 Section 08 : 3960 Section 08

are accounted for as both trading and investment assets. Risk Management has implemented an internallydeveloped VaR spread application on the MrMa platform, where credit spread data comes fromindependent external data providers.
Linear value-at-risk including all risk factors (in EUR million) is as follows:
At December 31,2007 2006 2005
11112 11112 11112
(EUR million)
Highest VaR . . . . . . . . . . . . . . . . . . . . . . . . . . . . . . . . . . . . . . . . . . . 40.1 40.6 22.9Lowest VaR . . . . . . . . . . . . . . . . . . . . . . . . . . . . . . . . . . . . . . . . . . . . 15.2 16.2 10.0Average VaR . . . . . . . . . . . . . . . . . . . . . . . . . . . . . . . . . . . . . . . . . . . 29.5 24.8 14.4
Merchant Banking had a higher risk exposure on average in 2007 than it did in 2006. The VaRincreased progressively during the first half of the year, driven mainly by more aggressive positioning oninterest rates and equities. During the second half, the interest rate risk exposure was progressivelydownsized.
Market Risk: ALM risk
ALM Risk: Interest rate risk
Interest rate volatility is a dominant risk factor in the banking and insurance industries. Fortis’sbanking and insurance activities are characterized by opposite interest rate profiles, thereby triggeringnatural risk mitigation.
The four main sources of interest rate risk actively monitored at Fortis are:
• repricing risk, due to a mismatch of interest rate repricing between assets and liabilities(usual mismatch);
• basis risk resulting from the imperfect connection between different reference rates (e.g.,swap rates and government bond yields);
• changes in the structure of yield curves (parallel, flattening or sloping shifts); and
• optionality, when certain financial instruments carry embedded options (hidden or explicit)that may be exercised depending on the evolution of interest rates on the market.
Fortis measures, monitors and controls its ALM interest rate risk using the following indicators:
• cash flow gap analysis, which illustrates the profile of the interest rate exposure over timeand is used to quantify and compare interest rate sensitive asset and liability exposures bydifferent time buckets; the cash flow gap highlights the mismatch between asset and liabilityexposures at different maturities;
• duration of equity, used as a key indicator for the interest rate risk; it reflects the valuesensitivity to a small parallel interest rate shift;
• interest rate sensitivity of the fair value of an instrument of portfolio by applying stress testsof +/-100bp to the fair value;
• Value-at-Risk (VaR), which calculates the maximum potential structural loss on a fair valuebasis resulting from different possible market fluctuations, based on a timescale of one yearand a confidence interval of 99.97%; and
• Earnings-at-Risk, which is an indicator that simulates the effect of changes in interest rateson future results.
253
Level: 6 – From: 6 – Wednesday, May 14, 2008 – 1:38 pm – g5mac4 – 3960 Section 08 : 3960 Section 08

Additional information on Fortis’s banking exposure to interest rate risk can be found in Note 7.4.2“Market risk” of the Notes to the 2007 Consolidated Financial Statements, incorporated by referenceherein.
ALM risk: Interest rate risk mitigating strategies
Within the banking activities, interest rate risk is mitigated using a range of different instruments.The most important are derivatives, primarily interest rate swaps and options. Interest rate swaps are usedto change the linear risk profile, mainly caused by long-term assets, e.g., fixed rate mortgages and by long-term liabilities, e.g., subordinated liabilities. Options are used to reduce the non-linear risk, which ismainly caused by the embedded options sold to the client, e.g., caps and prepayment options.
ALM risk: Currency risk
No currency risk is taken in the ALM bank position due to the application of the followingprinciples:
• loans and bond investments in currencies other than the functional currency of Fortis must behedged by a funding in the corresponding currency;
• participating interests in currencies other than the functional currency of Fortis must behedged by a funding in the corresponding currency; the Fortis policy for banking activities isto hedge via short-term funding in the corresponding currency wherever possible and net-investment hedge accounting is applied; and
• the results of branches and subsidiaries in currencies other than the functional currency ofFortis activities are hedged on a regular basis (monthly or quarterly).
Exceptions to this general rule must be approved by the ALM & MPC Committee.
Additional information on Fortis’s banking exposure to interest rate risk can be found in Note 7.4.2“Market risk” of the Notes to the 2007 Consolidated Financial Statements, incorporated by referenceherein.
Market Risk in Insurance
Market Risk: ALM risk
In the insurance business, market risk refers specifically to the impact of financial changes onstructural positions.
Fortis reduces the potential negative impact of market fluctuations by carefully considering forecastpayments to policyholders when selecting investments. This means that for many life insurance productswith a savings element, it is necessary to determine the influence of shifts in the financial markets onbenefits paid to policyholders. Within Fortis the actuarial, investment and ALM departments work togetherto model the influence of market conditions on investments and insurance products, to allow the bestpossible investment strategy to be selected.
The tools that Fortis uses to monitor market risk include simulation models, scenario analyses andstress testing. The potential impact of shifts in interest rates, share prices and real estate prices onsolvency, earnings and embedded value is calculated regularly. Fortis uses derivatives to limit its marketrisk.
ALM risk: Interest rate risk
Information on Fortis’s insurance exposure to interest rate risk can be found in Note 7.4.2 “Marketrisk” of the Notes to the 2007 Consolidated Financial Statements, incorporated by reference herein.
254
Level: 6 – From: 6 – Wednesday, May 14, 2008 – 1:38 pm – g5mac4 – 3960 Section 08 : 3960 Section 08

ALM risk: Currency risk
Fortis’s policy regarding currency exposure stemming from foreign holdings states that thestructural foreign exchange risk position of Fortis must be hedged by covering 100% of the net asset valueof foreign participations. Exceptions to those rules must be approved by the IRC.
Within the Insurance activities ALM risk is mitigated using a range of different instrumentsdescribed below.
The equity securities exposure of the Insurance activities is protected through a Constant ProportionPortfolio Insurance (“CPPI”) structure and a portfolio of put options on the AEX index. CPPI is anautomated mechanism for buying/selling equity securities in order to guarantee a minimum value of theequity securities portfolio, referred to as the floor.
The swaptions program provides protection against the downside interest rate risk. This structurehas been allocated to insurance contracts yielding a guaranteed rate equal to the strike rate of theswaptions. This structure ensures payment of the guaranteed rate while retaining the upward potential onrates.
The insurance activities are negatively impacted in a low interest rate environment. This risk arisesfrom the guaranteed rate on the insurance liabilities and the imperfect matching with assets. Fortis has setup a special reserve, the Low Interest Rate Reserve (“LIRR”) for all insurance contracts yielding aguaranteed rate of at least 4%.
Insurance Liability Risk
Insurance liability risk arises in connection with the adequacy of insurance premiums and reservesto meet the obligations incurred through the sale of insurance contracts. The key feature of the insurancebusiness is a transfer of risk from the policyholder to the insurance company. While for the policyholderthis risk may be random and unpredictable, insurance companies are able to pool such individual risks intoportfolios and analyze and model the average underwriting claims and their potential variation for suchportfolios. Uncertainty surrounding future expenses and lapse rates is also included under insuranceliability risk in view of their potential impact on overall claims and provisioning requirements.
Underwriting risk relates to the process in which applications submitted for insurance coverage arereviewed and it is determined whether the coverage being requested for a specified premium will beprovided, as well as the pricing of such risk. The risk management departments within the operating unitsof Fortis are responsible for evaluating and managing these insurance risks, as well as sharingresponsibility with other departments for investment policies (see “— General”), underwriting policies,and product pricing. Fortis’s risk management departments (including its actuaries) regularly assess theadequacy of premium rates and technical provisions.
Fortis manages insurance liability risk through a combination of its underwriting policy, pricing,provisioning and reinsurance arrangements. Underwriting policies are set at the local level and involvereview procedures with actuarial personnel, in which actual loss experience is examined. A range ofindicators and statistical analysis tools are systematically employed to refine underwriting standards inorder to improve loss experience and/or ensure pricing is adjusted appropriately.
Fortis seeks to set premiums at a level that will ensure that the premiums received plus theinvestment income earned on them exceed the total amount of claims and costs of handling those claimsand managing the business. The premium setting on policies (pricing) is performed using statisticalanalysis based on internal and external historical data. The appropriateness of pricing is tested usingtechniques and key performance indicators appropriate for a particular portfolio, on both a priori basis(e.g., profit testing) and a postpriori basis (e.g., embedded value, combined ratios).
The factors taken into consideration in the pricing of insurance vary by product, according to thecoverage and benefits offered, but in general include such items as:
255
Level: 6 – From: 6 – Wednesday, May 14, 2008 – 1:38 pm – g5mac4 – 3960 Section 08 : 3960 Section 08

• expected claims to be made by and expected benefits to be paid to policyholders and theirtiming;
• the level and nature of uncertainty associated with the expected benefits (this includesanalysis of claims statistics as well as consideration of the evolution of jurisprudence, theeconomic environment and demographic trends);
• other costs of producing the relevant product, such as distribution, marketing, policyadministration, and claim administration costs;
• financial conditions, reflecting the time value of money;
• solvency capital requirements and target levels of profitability; and
• insurance market conditions, notably competitor pricing of similar products.
Fortis establishes liabilities for future claims on policies and sets aside assets to support thoseliabilities (provisioning).
Management believes that Fortis’s actuarial departments have consistently established conservativetechnical provisions. The appointed independent actuaries of each Fortis company have given unqualifiedopinions regarding the adequacy of insurance liabilities based on local regulatory requirements as ofDecember 31, 2007. See “— Non-Life Insurance Liabilities; Establishment of Claims Liabilities” and“Life Insurance Liabilities; Establishment of Liabilities”.
Where appropriate, Fortis insurance businesses also enter into reinsurance contracts to limitexposure to underwriting losses. In non-life lines, the predominant use of reinsurance is intended tomanage exposure to weather-related events, natural catastrophes, events involving multiple victims,catastrophic fires, nuclear accidents and general liability. The selection of reinsurance companies is basedprimarily on pricing and counterparty risk management considerations. To meet the diversificationrequirements at group level, reinsurance strategy is coordinated centrally and when appropriate, ischanneled through Fortis Reinsurance, an internal reinsurance company. The role of this company is tobring retentions in defined lines of business up to a level which is sustainable for the consolidated FortisGroup. The reinsurance purchased may be on a policy by policy basis (per risk), or on a portfolio basis(per event) where individual policyholder exposures are within internal limits but where an unacceptablerisk of accumulation of claims exists. See Note 7.6 “Insurance Risk” of the Notes to the 2007Consolidated Financial Statements, incorporated by reference herein.
Non-Life Insurance Liabilities; Establishment of Claims Liabilities
In accordance with industry and accounting practices and applicable insurance laws and regulatoryrequirements, Fortis’s non-life companies establish liabilities for payment of claims and claims expensesfor claims that arise from their respective non-life insurance policies. In general, Fortis companiesestablish claims liabilities by product, coverage and year.
Claim liabilities (also referred to as loss provisions) fall into two categories: liabilities for reportedclaims and claims expenses and for incurred but not yet reported claims and claims expenses.
Liabilities for reported claims and claims expenses are based on estimates of future payments thatwill be made in respect of reported claims, including the expenses relating to the settlement of suchclaims. Such estimates are made on the basis of the facts available at the time the liability is established.These liabilities are established on an undiscounted basis to recognize the estimated costs necessary tobring all pending reported claims to final settlement, taking into account inflation, as well as other factorswhich can influence the amount of liabilities required, some of which are subjective and some of whichare dependent upon future events. Consideration is given to historical trends of disposition patterns andloss payments, pending levels of unpaid claims and types of coverage. In addition, court decisions,economic conditions and public attitudes affect the estimation of liabilities, as well as the ultimate costs ofclaims.
256
Level: 6 – From: 6 – Wednesday, May 14, 2008 – 1:38 pm – g5mac4 – 3960 Section 08 : 3960 Section 08

As time passes between when a claim is reported and final settlement of the claim, circumstancescan change which may require established liabilities to be adjusted either upward or downward. Items suchas changes in law, results of litigation and changes in medical costs, costs of motor and home repairmaterials and labor rates can substantially impact claim costs. Accordingly, claims and liabilities arereviewed and re-evaluated on a regular basis. Amounts ultimately paid in claims and claims expense canvary significantly from the level or liabilities originally set.
Liabilities for incurred but not yet reported claims and claims expenses are established on anundiscounted basis to recognize the estimated cost of losses that have occurred but about which Fortis hasnot yet been notified. The liability, like the liability for reported claims and claims expenses, is establishedto recognize the estimated costs, including expenses, necessary to bring claims arising out of losses to finalsettlement. Since nothing is known about the occurrence, Fortis must rely upon its historical information toestimate the incurred but not yet reported claims and claims expense liability.
Late reported claim trends, claim severity, exposure growth and other factors are used in projectingthe liability requirements. These liabilities are also revised as additional information becomes availableand claims are made.
The time required to learn of and settle claims is an important consideration in establishingliabilities. Short-tail claims, such as motor damage and property damage claims, generally are reportedwithin a few days or weeks and are settled shortly thereafter. Resolution of long-tail claims, such as bodilyinjury or liability claims, can take years to complete. For long-tail claims, due to the nature of the loss,information concerning the event, such as required medical treatment, may not be readily obtainable. Inaddition, the analysis of long-tail losses is more difficult, requires more detailed work and is subject togreater uncertainties than short-tail losses. Analyses are made of, among other things, Fortis’s experiencewith similar cases and historical trends, such as reserving patterns, exposure growth, loss payments,pending levels of unpaid claims, as well as court decisions and economic conditions. Any adjustmentsresulting from changes in liability estimates are reflected in current results of operations. However,because the establishment of claims liabilities is an inherently uncertain process, there can be no assurancethat ultimate losses will not exceed existing claims liabilities, and this risk is covered by the additionalassets held as solvency capital.
Adequacy of Liabilities. On the basis of Fortis’s internal procedures which analyze, among otherthings, Fortis’s experience with similar cases and historical trends (such as reserving patterns, exposuregrowth, loss payments, pending levels of unpaid claims and product mix, as well as court decisions andeconomic conditions), management believes, based on information currently available, that Fortis’s non-life claims liabilities are adequate. Claims liability estimates are regularly reviewed and updated, using themost current information.
Any adjustments resulting from changes in liability estimates are reflected in current results ofoperations. However, because the establishment of claims liabilities is an inherently uncertain process,there can be no assurance that ultimate losses will not exceed existing claims liabilities.
The claims reserves development table shows at December 31, 2007 the movements over time ofthe prudent ultimate claim estimates per accident year and gives insight into the adequacy of claimsliabilities. The table is prepared on the basis of accident year and all material figures quoted areundiscounted.
257
Level: 6 – From: 6 – Wednesday, May 14, 2008 – 1:38 pm – g5mac4 – 3960 Section 08 : 3960 Section 08

Gross Ultimate Claims (cumulative) for both P&C and A&H:
2000 and prior 2001 2002 2003 2004 2005 2006 2007 20081111 1111 1111 1111 1111 1111 1111 1111 1111
(EUR thousands)
At the end of the 1st Accident year . . . . . – 2,239,141 2,497,642 2,578,791 2,830,181 2,724,637 2,803,874 3,352,848 –2002 . . . . . . . . . . . . . . . – 2,260,960 – – – – – – –2003 . . . . . . . . . . . . . . . – 2,209,388 2,471,690 – – – – – –2004 . . . . . . . . . . . . . . . – 2,194,275 2,427,014 2,476,665 – – – – –2005 . . . . . . . . . . . . . . . – 2,236,490 2,395,703 2,369,212 2,646,168 – – – –2006 . . . . . . . . . . . . . . . – 2,180,604 2,379,275 2,329,529 2,515,126 2,698,682 – – –2007 . . . . . . . . . . . . . . . – 2,157,359 2,330,640 2,271,486 2,407,713 2,516,362 2,710,922 – –Gross Ultimate Claims at December 31, 2007 . . – 2,157,359 2,330,640 2,271,486 2,407,713 2,516,362 2,710,922 3,352,848 –Cumulative Gross Paid to date at December 31, 2007 . . . . – 1,995,157 2,081,224 1,979,140 2,035,117 1,960,418 1,913,600 1,552,167 –Gross Outstanding Claims liabilities (including IBNR) . . . . . 958,963 198,201 249,416 292,346 372,596 555,945 797,322 1,800,681 5,225,470Other claims liabilities (not included in the claims above) . . . . . . . . – – – – – – – – 706,672Claims with regard to workers’ compensation and health care . . . . . . . – – – – – – – – 1,189,389
1111 1111 1111 1111 1111 1111 1111 1111 1111
Total claims liabilities – – – – – – – – 7,121,5311111 1111 1111 1111 1111 1111 1111 1111 11111111 1111 1111 1111 1111 1111 1111 1111 1111
Life Insurance Liabilities; Establishment of Liabilities
In the life business, insurance liability risks arise due to uncertainty relating to mortality rates and istherefore also referred to as biometric risk. Claims in relation to term insurance and annuity products aresensitive to changes in mortality rates. An observed mortality rate decrease as compared to the mortalityassumption used in the product pricing is referred to as longevity risk, while increases are referred to asmortality risk. Unexpected increases in mortality rates will lead to higher than expected claims for termproducts but lower claims for annuity products, while decreases in mortality rates (longevity risk) willhave the opposite impact. Given the long-term nature of life business, unexpected changes in lapse ratesand ongoing expenses can also have a significant impact on the level of the required liabilities.
Longevity risk. Longevity risk covers the uncertainty in ultimate claims due to policyholders livinglonger than expected and can arise, for example, in annuity portfolios within life insurance and workers’compensation portfolios within non-life insurance.
Longevity risk is managed through pricing, underwriting policy, by regularly reviewing themortality tables used for pricing and establishing provisions, by limitation of the contract period and byrepricing at renewal. Where longevity is found to be improving faster than assumed in the mortality tables,additional liabilities are established and the tables are updated.
Mortality risk. Mortality risk covers uncertainty in ultimate claims due to policyholders not living aslong as expected and can arise, for example, in term life insurance portfolios within life insurance. Giventhe continuing expected increase in life expectancy of the population the mortality risk in the existingbusiness on a portfolio level is not material at this stage. However, mortality risk could become material ifepidemic diseases were to manifest themselves and the risk that a large number of people are killed by amajor event such as an industrial accident or terrorist attack.
Mortality risk is mitigated through underwriting policy, regular review of mortality tables, but alsothrough several excess-of-loss and catastrophe reinsurance treaties.
258
Level: 6 – From: 6 – Wednesday, May 14, 2008 – 1:38 pm – g5mac4 – 3960 Section 08 : 3960 Section 08

Disability risk. Disability risk covers the uncertainty in claims due to disability rates and levelshigher than expected and can arise, for example, within the portfolios of the disability and health businessand workers’ compensation.
The incidence of disability as well as the recovery from disability is influenced by the economicenvironment, governmental intervention, medical advances and costs as well as standards used fordisability assessment.
This risk is managed through regular review of historical claims patterns, expected future trends andadjusting pricing, provisioning and underwriting policy appropriately. Fortis also mitigates disability riskthrough medical selection strategies and appropriate reinsurance coverage.
Credit Risks for Banking and Insurance Operations
Credit risk is defined as the risk to earnings or capital arising from an obligor’s failure to meet theterms of any contract or to fail in some other way to perform as agreed. Credit risk cannot be measured ormonitored in isolation from other risks, in particular, market, country and legal risks. Credit risk arises inlending, investing, trading and hedging activities.
Credit risk is the risk that a counterparty will fail to repay all or part of the principal and interestowed to the creditor. This failure may be caused either by the counterparty’s non-payment (counterpartyrisk), or by the imposition of transfer restrictions by the country in which the counterparty operates(transfer risk). Counterparty risk arises primarily from borrowers, re-insurers and bond issuers, but alsoincludes trading counterparties and foreign countries that are unable or unwilling to meet their obligations.
All credit risk management within Fortis is governed by one policy, the Fortis Credit Policy. Thispolicy contains a set of principles, rules, guidelines and procedures for identifying, measuring, approvingand reporting credit risk within Fortis. The Fortis Credit Policy establishes a consistent framework for allcredit risk-generating activities, either through direct lending relationships or through other activitiesresulting in credit risk such as investment activities or reinsurance claims.
The basis for effective credit risk management is the identification of existing and potential creditrisk inherent in any product or activity. This process includes the gathering of all relevant informationconcerning the products offered, the counterparties involved and all elements that may influence the creditrisk.
Assessing the credit risk of a proposed agreement consists of:
• analysis of the probability that the counterparty will fail to meet its obligations, including therisk classification on the Fortis Master scale;
• analysis of the possibilities of fulfilling the counterparty’s obligations by other means in theevent where the counterparty fails to meet its obligations by itself; and
• formulation of an independent and substantiated opinion.
Counterparty acceptance criteria are the conditions that Fortis applies to the acceptance of creditcustomers. These conditions reflect the general acceptable credit risk profile that Fortis has defined. Fortisoperates in accordance with sound, well-defined credit-granting criteria in order to protect its reputationand ensure its sustainability. Fortis does not wish to be associated with dubious counterparties or creditfacilities. The counterparty acceptance criteria include a clear indication of the bank’s target market and athorough understanding of the borrower or counterparty, as well as of the purpose and structure of thecredit and the source of its repayment. Core credit risk parameters included in the estimation of expectedloss, unexpected loss, and economic capital are probability of default (“PD”), loss given default (“LGD”),and exposure at default (“EAD”).
Authorized persons or committees make a credit decision, informed by the opinion of a creditanalyst. Delegation of credit authority is the partial transfer of the central credit decision-making authorityto the appropriate management levels of credit risk management and the businesses. The delegation rules
259
Level: 6 – From: 6 – Wednesday, May 14, 2008 – 1:38 pm – g5mac4 – 3960 Section 08 : 3960 Section 08

define the decision-making process regarding the acceptance and management of counterparty risk. Theunderlying principle in the rules is the need to achieve an appropriate balance (in terms of overallprofitability) between two opposite drivers, i.e. maximizing the decision-making autonomy of thebusinesses on the one hand and reducing unexpected counterparty risk on the other.
Monitoring of credit risk is the permanent and automatic control of credit exposures and events withthe primary purpose of early detection and reporting of potential credit problems. Surveillance consists ofdaily monitoring of all individual credit risks. Comprehensive procedures and information systems monitorthe condition of individual credits and single counterparties across the various portfolios. These proceduresdefine criteria for identifying and reporting potential credit problems in order to ensure that they aresubject to proper monitoring, possible corrective action and classification.
Impaired credits are transferred to the so-called “Intensive Care” or “Recovery”. Intensive Caredevelops strategies to rehabilitate an impaired credit or to increase the final repayment. It also providesassistance to the businesses in dealing with non-impaired problem loans. The Intensive Care function issegregated from the area that originated the credit. In the event that a counterparty fails to meet itsobligations and is considered to be unable to meet them in the future, all other means must be applied inorder to fulfill this counterparty’s obligations towards Fortis, such as selling or realizing receivables,collateral or guarantees.
260
Level: 6 – From: 6 – Wednesday, May 14, 2008 – 1:38 pm – g5mac4 – 3960 Section 08 : 3960 Section 08

Credit risk exposure
Fortis’s overall credit risk exposure (before collateral held and other credit enhancements) for theperiods indicated below can be summarized as follows:
At December 31,111122311112
2007 200611112 11112
Cash and cash equivalents . . . . . . . . . . . . . . . . . . . . . . . . . . . . . . . . . . . . . . . . . . . 26,361 20,41411112 11112
Assets held for tradingDebt securities and treasury bills . . . . . . . . . . . . . . . . . . . . . . . . . . . . . . . . . . . . . . 21,620 22,199Derivative financial instruments . . . . . . . . . . . . . . . . . . . . . . . . . . . . . . . . . . . . . . . 28,848 21,545
11112 11112
Total assets held for trading . . . . . . . . . . . . . . . . . . . . . . . . . . . . . . . . . . . . . . . . . . 50,468 43,74411112 11112
Due from banksInterest-bearing deposits . . . . . . . . . . . . . . . . . . . . . . . . . . . . . . . . . . . . . . . . . . . . . 8,186 5,054Loans and advances . . . . . . . . . . . . . . . . . . . . . . . . . . . . . . . . . . . . . . . . . . . . . . . . 8,986 6,230Reverse repurchase agreements . . . . . . . . . . . . . . . . . . . . . . . . . . . . . . . . . . . . . . . 65,858 49,592Securities lending transactions . . . . . . . . . . . . . . . . . . . . . . . . . . . . . . . . . . . . . . . . 27,404 24,425Other . . . . . . . . . . . . . . . . . . . . . . . . . . . . . . . . . . . . . . . . . . . . . . . . . . . . . . . . . . . . 8,619 4,855
11112 11112
Total due from banks . . . . . . . . . . . . . . . . . . . . . . . . . . . . . . . . . . . . . . . . . . . . . . . 119,053 90,156Impairments . . . . . . . . . . . . . . . . . . . . . . . . . . . . . . . . . . . . . . . . . . . . . . . . . . . . . . (17) (25)
11112 11112
Total net due from banks . . . . . . . . . . . . . . . . . . . . . . . . . . . . . . . . . . . . . . . . . . . . 119,036 90,13111112 11112
Due from customersGovernment and official institutions . . . . . . . . . . . . . . . . . . . . . . . . . . . . . . . . . . . 5,780 5,776Residential mortgages . . . . . . . . . . . . . . . . . . . . . . . . . . . . . . . . . . . . . . . . . . . . . . 99,376 93,550Consumer loans . . . . . . . . . . . . . . . . . . . . . . . . . . . . . . . . . . . . . . . . . . . . . . . . . . . 9,787 10,398Commercial loans . . . . . . . . . . . . . . . . . . . . . . . . . . . . . . . . . . . . . . . . . . . . . . . . . . 138,001 111,479Reverse repurchase agreements . . . . . . . . . . . . . . . . . . . . . . . . . . . . . . . . . . . . . . . 27,763 35,797Securities lending . . . . . . . . . . . . . . . . . . . . . . . . . . . . . . . . . . . . . . . . . . . . . . . . . . 21,460 18,355Other . . . . . . . . . . . . . . . . . . . . . . . . . . . . . . . . . . . . . . . . . . . . . . . . . . . . . . . . . . . . 16,183 13,374Total due from customers . . . . . . . . . . . . . . . . . . . . . . . . . . . . . . . . . . . . . . . . . . . . 318,350 288,729
11112 11112
Impairments . . . . . . . . . . . . . . . . . . . . . . . . . . . . . . . . . . . . . . . . . . . . . . . . . . . . . . (2,042) (2,270)11112 11112
Total net due from customers . . . . . . . . . . . . . . . . . . . . . . . . . . . . . . . . . . . . . . . . . 316,308 286,45911112 11112
Interest bearing investmentsTreasury bills . . . . . . . . . . . . . . . . . . . . . . . . . . . . . . . . . . . . . . . . . . . . . . . . . . . . . 313 895Government bonds . . . . . . . . . . . . . . . . . . . . . . . . . . . . . . . . . . . . . . . . . . . . . . . . . 73,935 95,901Corporate debt securities . . . . . . . . . . . . . . . . . . . . . . . . . . . . . . . . . . . . . . . . . . . . 47,491 44,561Structured credit instruments . . . . . . . . . . . . . . . . . . . . . . . . . . . . . . . . . . . . . . . . . 39,180 9,968
11112 11112
Total interest-bearing investments . . . . . . . . . . . . . . . . . . . . . . . . . . . . . . . . . . . . . 160,919 181,32511112 11112
Impairments . . . . . . . . . . . . . . . . . . . . . . . . . . . . . . . . . . . . . . . . . . . . . . . . . . . . . . (2,600) (12)Total net interest bearing instruments . . . . . . . . . . . . . . . . . . . . . . . . . . . . . . . . . . 158,319 181,313
11112 11112
Net Reinsurance and other receivables . . . . . . . . . . . . . . . . . . . . . . . . . . . . . . . . . 9,718 9,18711112 11112
Total net on balance credit risk exposure . . . . . . . . . . . . . . . . . . . . . . . . . . . . . . . . 680,209 631,247Net Off balance credit commitments exposure . . . . . . . . . . . . . . . . . . . . . . . . . . . 158,485 164,817
11112 11112
Total credit risk exposure . . . . . . . . . . . . . . . . . . . . . . . . . . . . . . . . . . . . . . . . . . . . 838,694 796,06411112 1111211112 11112
A concentration of credit risk arises when the credit exposure of a group of counterparties issimilarly impacted by economic trends, changes within a sector or geographical developments. Althoughthe financial instruments in Fortis’s portfolio are spread widely across various sectors, products and
261
Level: 6 – From: 6 – Wednesday, May 14, 2008 – 1:38 pm – g5mac4 – 3960 Section 08 : 3960 Section 08

geographical areas, there is a potential concentration risk due to significant transactions which Fortis Bankconcludes with other financial institutions, particularly in the field of loans (including reverse repurchaseagreements and securities lending transactions), settlement risk and derivative transactions. Additionally,debt securities issued by the Belgian, Dutch, German, Spanish, Italian, French and U.S. governmentsrepresent considerable credit exposure.
The table below shows Fortis’s industry concentration of the customer credit portfolio at December31, 2007 and 2006.
At December 31,111121111211231111211112
2007 20061111223311112 1111223311112
Due from Due fromCustomers % Customers %11112 11112 11112 11112
(EUR million, except %)
Industry SectorAgriculture, forestry and fishing . . . . . . . . . . . . . . . . . 1,929 0.61% 1,346 0.47%Oil and gas . . . . . . . . . . . . . . . . . . . . . . . . . . . . . . . . . 4,910 1.55% 3,808 1.33%Basic Metals . . . . . . . . . . . . . . . . . . . . . . . . . . . . . . . . 4,441 1.40% 3,301 1.15%Raw & intermediate materials . . . . . . . . . . . . . . . . . . . 971 0.31% 951 0.33%Consumer goods . . . . . . . . . . . . . . . . . . . . . . . . . . . . . 8,202 2.59% 6,899 2.41%Wood, pulp and paper products . . . . . . . . . . . . . . . . . 1,137 0.36% 907 0.32%Technology, media and telecom . . . . . . . . . . . . . . . . . 3,138 0.99% 2,959 1.03%Electricity, gas and water . . . . . . . . . . . . . . . . . . . . . . 7,529 2.38% 5,102 1.78%Chemicals, rubber and plastic products . . . . . . . . . . . 6,162 1.95% 5,223 1.82%Construction and engineering . . . . . . . . . . . . . . . . . . . 6,735 2.13% 5,264 1.84%Machinery and equipment . . . . . . . . . . . . . . . . . . . . . . 5,197 1.64% 4,389 1.53%Automotive . . . . . . . . . . . . . . . . . . . . . . . . . . . . . . . . . 3,890 1.23% 3,436 1.20%Transportation . . . . . . . . . . . . . . . . . . . . . . . . . . . . . . . 966 0.31% 968 0.34%Trade and commodity finance . . . . . . . . . . . . . . . . . . . 14,371 4.54% 10,423 3.64%Retail . . . . . . . . . . . . . . . . . . . . . . . . . . . . . . . . . . . . . . 3,720 1.18% 2,886 1.01%Real Estate . . . . . . . . . . . . . . . . . . . . . . . . . . . . . . . . . . 21,093 6.67% 16,631 5.81%Financial Services . . . . . . . . . . . . . . . . . . . . . . . . . . . . 69,684 22.03% 71,377 24.92%Holdings & other services . . . . . . . . . . . . . . . . . . . . . . 23,513 7.43% 16,957 5.92%Public & social services . . . . . . . . . . . . . . . . . . . . . . . 14,826 4.69% 14,040 4.90%Private persons . . . . . . . . . . . . . . . . . . . . . . . . . . . . . . 109,470 34.61% 102,989 35.95%Non-classified . . . . . . . . . . . . . . . . . . . . . . . . . . . . . . . 4,424 1.40% 6,603 2.31%Total Due from customers net . . . . . . . . . . . . . . . . . . . 316,308 100% 286,459 100%
11112 11112
Impairments . . . . . . . . . . . . . . . . . . . . . . . . . . . . . . . . . (2,042) (2,270)11112 11112
Total Due from customers gross . . . . . . . . . . . . . . . . . 318,350 288,72911112 1111211112 11112
Two relatively significant concentrations in the exposure to customers can be noted in the sectors“Financial Services” and “Private persons”, representing respectively 22% and 34.6% of the total customerloans. The first category consists mainly of non-banking financial institutions including investment andinsurance companies. The decrease during 2007 in this sector was to a large extent related to the reverserepurchase and securities borrowing portfolio. “Private persons” consists of residential mortgage loans(91%) and consumer loans (9%). The growth of EUR 6.5 billion compared relative to the previous year isattributable 80% to customers within the Benelux, with the remaining part realised within other Europeancountries.
262
Level: 6 – From: 6 – Wednesday, May 14, 2008 – 1:38 pm – g5mac4 – 3960 Section 08 : 3960 Section 08

The following table outlines the credit quality by investment grade of Fortis’s debt securities atDecember 31, 2007, 2006 and 2005, based on external ratings.
At December 31,111121111122221111211111211112111112
2007 2006 200511112111112 11112111112 11112111112
Carrying Carrying Carrying Value % Value % Value %
11112 11112 11112 11112 11112 11112
(EUR million, except %)
Investment gradeAAA . . . . . . . . . . . . . . . . . 75,085 47.4% 89,477 49.3% 81,070 46.3%AA . . . . . . . . . . . . . . . . . . 45,448 28.7% 54,756 30.2% 61,810 35.3%A . . . . . . . . . . . . . . . . . . . . 31,885 20.2% 31,770 17.5% 25,440 14.5%BBB . . . . . . . . . . . . . . . . . 2,376 1.5% 2,304 1.3% 2,074 1.2%
11112 11112 11112 11112 11112 11112
Investment grade . . . . . . . 154,794 97.8% 178,307 98.3% 170,394 97.3%Below investment grade . . 1,566 1.0% 1,451 0.8% 1,387 0.8%Unrated . . . . . . . . . . . . . . . 1,959 1.2% 1,555 0.9% 3,176 1.9%
11112 11112 11112 11112 11112 11112
Total net investments in interest bearing securities . 158,319 100.0% 181,313 100.0% 174,957 100.0%
11112 11112 11112 11112 11112 1111211112 11112 11112 11112 11112 11112
Impairments . . . . . . . . . . . 2,600 12 3411112 11112 11112
Total gross investments in interest bearing securities . 160,919 181,325 174,991
11112 11112 1111211112 11112 11112
Geographic Exposure
The table below sets out the concentration of on-balance credit risk at December 31, 2007, 2006and 2005, by location of the customer.
At December 31,111121111122221111211111211112111112
2007 2006 200511112111112 11112111112 11112111112
Credit Risk Credit Risk Credit RiskExposure on Exposure on Exposure on
Balance % Balance % Balance %11112 11112 11112 11112 11112 11112
(EUR million, except %)
On-balanceBenelux . . . . . . . . . . . . . . 253,674 37.0% 251,842 39.7% 240,066 39.1%Other European countries 299,399 43.7% 289,364 45.7% 270,445 43.9%North America . . . . . . . . . 97,887 14.3% 70,778 11.2% 79,541 12.9%Asia . . . . . . . . . . . . . . . . . 20,141 3.0% 11,343 1.8% 11,093 1.8%Other . . . . . . . . . . . . . . . . . 13,827 2.0% 10,316 1.6% 14,263 2.3%
11112 11112 11112 11112 11112 11112
Total . . . . . . . . . . . . . . . . . 684,928 100.0% 633,643 100.0% 615,408 100.0%11112 11112 11112 11112 11112 1111211112 11112 11112 11112 11112 11112
263
Level: 6 – From: 6 – Wednesday, May 14, 2008 – 1:38 pm – g5mac4 – 3960 Section 08 : 3960 Section 08

The table below provides information at December 31, 2007 on the on-balance concentration ofcredit risk by location of customer and type of counterparty.
At December 31, 2007111121111122221111211111211112111112
Governmentand Official Credit Corporate RetailInstitutions Institutions Customers Customers Other Total11112 11112 11112 11112 11112 11112
(EUR million)
On-balanceBenelux . . . . . . . . . . . . . . 33,036 12,549 92,473 101,215 14,401 253,674Other European countries 53,334 120,500 92,308 6,232 27,025 299,399North America . . . . . . . . . 906 25,763 58,440 60 12,718 97,887Asia . . . . . . . . . . . . . . . . . 278 9,835 7,732 272 2,024 20,141Other . . . . . . . . . . . . . . . . . 2,101 3,061 7,247 140 1,278 13,827
11112 11112 11112 11112 11112 11112
Total on-balance . . . . . . . . 89,655 171,708 258,200 107,919 57,446 684,92811112 11112 11112 11112 11112 1111211112 11112 11112 11112 11112 11112
In this table, Government and official institutions includes mandatory reserve deposits with centralbanks (EUR 8.2 billion). Credit institutions comprises Due from banks and Debt securities issued by banks(including cash and cash equivalents). Trading assets are reported in the column Other. The upwardevolution in Credit Institutions in North America is mainly driven by the increase in security borrowingactivities in the United States.
Additional information on credit risk exposure can be found in Note 7.4.1 “Credit Risk” of theNotes to the 2007 Consolidated Financial Statements, incorporated by reference herein.
Operational and Legal Risk for Banking and Insurance Operations
Operational Risk
Operational risk comprises all risks that are not directly related to the underlying economics ofFortis’s banking or insurance activities. Operational risk can be split into two categories for reporting andmonitoring purposes. The first category represents the business risk: the risk of losses due to events thatcould damage a business’s franchise or its operating economics, such as shifts in the competitiveenvironment, or legislative or tax changes. The second comprises the risk of losses due to non-recurringevents such as system failure, error, fraud, crime, legal proceedings or damage to property. Operationalrisk can result from any of the following: failure to obtain proper internal authorizations, failure toproperly document transactions, equipment failures, fraud, inadequate training or errors by employees.Operational losses include losses due to a failure of internal controls, personnel unavailability or injuryand external events relating to natural disasters or the failure of external systems.
Central Risk Management has defined an Operational Risk & Management Control (“ORMC”)framework, including policies for the governance of operational risks, for the identification, assessment,measurement and reporting of those risks and for their mitigation. The embedding and use of theframework are assessed periodically.
The ORMC framework is fully implemented across all Banking businesses in compliance withBasel II requirements and will be implemented overtime in an appropriate manner for the Insurancecompanies.
To identify and analyze where operational risk exposures manifest themselves, the businessescontinuously collect loss data (events above the EUR 1,000 threshold, including causal information, in acentral application called OPERA). In 2006 Fortis Bank did not experience any material operationallosses.
264
Level: 6 – From: 6 – Wednesday, May 14, 2008 – 1:38 pm – g5mac4 – 3960 Section 08 : 3960 Section 08

Legal Risk
Legal risk includes the possibility that transactions may not be enforceable under applicable law orregulation and the possibility that changes in law or regulation could adversely affect Fortis’s position. Therisk is greater with respect to derivative financial instruments as applicable law is relatively recent and insome cases incomplete. Fortis manages legal risk by seeking to ensure that transactions are properlyauthorized and by submitting new or unusual transactions to its external legal advisers for review.
While grouped under a single centralized management, Fortis’s legal departments are dedicated tospecific business lines and assess the contracts and monitor developments in the legislative and regulatoryfields relevant to their respective business lines. Fortis has strict procedures in place to ensure that allroutine transactions are approved correctly and that new or unusual transactions are submitted forassessment by its legal advisers. In order to control the risks related to compliance with the applicablelaws and regulations, all Fortis business lines also have a separate compliance function. A centralizedmanagement heads Fortis Group’s various compliance functions and each year draws up a consolidatedreport on compliance that is discussed with the Audit Committee.
Liquidity Risk
The primary goal of the Fortis liquidity policy is to ensure that sufficient cash and liquid assets aremaintained to meet current and future financial obligations at all times, in both normal and exceptionalcircumstances, for every currency in which there is an exposure, and for all its banking, insurance andholding companies, including special purpose vehicles.
Banking
The deposits of customers (retail, commercial, corporate) form a significant part of the primaryfunding sources of the banking activities. Current accounts and savings deposits of retail customers,although payable on demand or at short notice, make a significant contribution to the long-term stability ofthe funding base. This stability depends on maintaining depositor confidence in Fortis’s solvency andsound liquidity management. Professional markets are accessed on a secured and unsecured basis to attractshort-term funding. Reliance on unsecured borrowing is limited by means of the short-term limit systemthat puts a cap on the unsecured position gaps. The monitoring of the issuance of short and long-termpaper has been centralized and the access to the financial markets is coordinated by the Global Liquidityand Funding Team.
Insurance
The investment, actuarial and ALM departments of the insurance operating units jointly bearresponsibility for managing liquidity risk. Liquidity risk is defined as the potential inability to fund illiquidassets. The illiquid investments of the insurance operations include real estate investments, private loans,and certain investments in non-listed equity and debt securities. Because of the importance of the capitalmarkets as a potential source of finance, liquidity risk is closely linked to solvency and creditors’confidence in Fortis’s ability to meet its commitments. Fortis uses stress tests and other contingencyanalyses to monitor the solvency of the insurance sector. The funding sources are primarily insuranceproducts, many of which have terms that penalize or prohibit early surrender, thus ensuring continuedaccess to these funds.
265
Level: 6 – From: 6 – Wednesday, May 14, 2008 – 1:38 pm – g5mac4 – 3960 Section 08 : 3960 Section 08

BUSINESS
Overview
Fortis is a leading provider of financial services in the Benelux region, which is one of Europe’swealthiest.9 Building on that leadership, Fortis has developed an extensive European footprint in the retailbanking market, operating through a variety of distribution channels. Fortis offers financial services tocompanies, institutional clients and high net worth individuals and provides integrated solutions to theenterprise and the entrepreneur. Fortis’s unique expertise has made it a regional and in some cases globalleader in niche markets, such as energy, commodities and transportation, and fund administration. Fortissuccessfully combines its banking and insurance skills in growth markets in Europe and Asia, and has astrong presence in bancassurance in several countries, such as Belgium, Portugal and Malaysia.
Fortis ranks among Europe’s top 20 financial institutions, with a market capitalization of EUR 40billion and total assets of EUR 871 billion at year-end 2007. Together with ABN AMRO, Fortis has apresence in over 50 countries and a dedicated, professional workforce of more than 85,000 employees,making Fortis a leader in financial services in Europe, a top three private banker and top tier assetmanager.
The below listed ratings were confirmed by Fitch Ratings, Moody’s and Standard & Poor’simmediately after the announcement of the terms of the ABN AMRO Acquisition on July 16, 2007, andare still current at the date of publication of this Prospectus although Standard & Poor’s and Moody’srecently changed their outlook from stable to negative.
Long-Term Short-Term Debt Debt Outlook
11112 11112 11112
Fitch Ratings . . . . . . . . . . . . . . . . . . . . . . . . . . . . . . . . . . . . . . . . . . . AA- F1+ StableMoody’s . . . . . . . . . . . . . . . . . . . . . . . . . . . . . . . . . . . . . . . . . . . . . . Aa3 P-1 NegativeStandard & Poor’s . . . . . . . . . . . . . . . . . . . . . . . . . . . . . . . . . . . . . . . A+ A-1 Negative
These ratings are subject to change at any time and are not a guarantee of a company’s financialstrength or security.
Fortis intends to continue growing in Europe, with the enlarged European Union as its home marketand with selective expansion in Asia and North America. Fortis therefore wants to become a fullyintegrated financial service provider, building on its two profitable core competencies, banking andinsurance, and gaining an excellent strategic position with satisfactory critical mass in each business. Thiswill be achieved by means of a combination of organic growth, acquisitions and strategic partnerships.
To realize its ambitions, Fortis has opted expressly for accelerated growth, although in conjunctionwith strict cost control.
For 2004-2011, this translates into the following long-term financial targets:
• Compound annual growth rate (“CAGR”) of net profit per share of at least 15%; thistranslates into a 12% CAGR (for 2006-2011) based on a 2006 cycle-neutral profit base,10
• Return on Equity of 18.5% and Risk-Adjusted Return on Risk-Adjusted Capital(RARORAC) of 18.5%;
• Operating leverage11 of at least 250 basis points;
266
Level: 6 – From: 6 – Wednesday, May 14, 2008 – 1:39 pm – g5mac4 – 3960 Section 09 : 3960 Section 09Level: 6 – From: 6 – Wednesday, May 14, 2008 – 1:39 pm – g5mac4 – 3960 Section 09 : 3960 Section 09
9 Source: Assuralia (http://www.assuralia.be, section: cijfergegevens/chiffres utiles), year 2005 and Assurantie Magazine (AM Jaarboek2006 based on DNB numbers) based on premium income 2005.
10 The 2006 cycle-neutral profit base corresponds to the 2006 net profit of EUR 4.35 billion adjusted to EUR 3.8 billion by substitutingimpairments on loans by their expected loss and adjusting the treasury and financial markets income at Merchant Banking to EUR900 million, due to exceptional gains in trading and private equity.
11 Operating leverage is defined as the difference between the percentage growth in total revenues, prior to changes in provisions, andin total expenses.

• 30% of net profit generated outside the Benelux by 2009; and
• Cash dividend at least stable or growing in line with long-term EPS growth.
History and strategic direction
Fortis was created in 1990 when the activities of AG Group (the predecessor of Fortis SA/NV), alarge Belgian insurer, and AMEV/VSB (the predecessor of Fortis N.V.) combined their respectiveoperations. AMEV, a large Dutch insurer and VSB, a medium-sized Dutch savings bank, merged earlierthat year. At the time of the merger, AG Group held a strong position in the Belgian insurance market andwas a market leader in various sectors but had a fairly restricted international presence and only minimalbanking interests, while AMEV held a relatively strong position in the Dutch insurance market andenjoyed a fairly strong international insurance position. VSB held a strong position in the Dutch retailmarket, but lacked a nationwide distribution network. The parent companies, Fortis AG (now FortisSA/NV) and Fortis AMEV (now Fortis N.V.), remained separate legal entities. Since the merger, theoperating businesses of Fortis have been managed together. Fortis is not a legal entity but collectivelyrefers to Fortis SA/NV and Fortis N.V. and the group of companies owned and/or controlled by FortisSA/NV and Fortis N.V. Since its formation, Fortis has grown significantly through both organicdevelopment and acquisitions.
The positive results in 2005, 2006 and 2007, combined with its new organizational structure, gaveFortis the confidence to reaffirm and accelerate its strategy of becoming a leading European provider ofhigh-quality financial services, with a strong customer focus, pursuing growth in Europe and selectively inAsia and North America.
Fortis strategy is focused on the following three growth levers: Perform, Grow and Expand.
(i) Perform: in its established markets and segments, Fortis will seek to protect and strengthenits leadership positions, building scale and client relevance, increasing cross-selling andenhancing efficiency. Revenue and cost synergies, increased return on the investmentportfolio, positive effects from the new Insurance, Merchant Banking and Asset Management& Private Banking businesses, and Fortis-wide cost management is expected to result inadditional net profit growth. Management believes this lever could generate two-thirds oftotal net profit growth by 2011.
Perform builds on the enhanced operating model: Fortis will strengthen its positions inestablished markets.
• Retail Banking is introducing a more differentiated cross-border distributionorganization focused on three client segments: Mass Retail, Affluent and Professionals& Small Enterprises. It is planning to invest EUR 350 million in a harmonized cross-border core banking platform and will seek to raise customer satisfaction throughservices tailored to each segment.
• The new Merchant Banking and Asset Management & Private Banking organizationwill optimize client service and streamline international expansion throughcoordination among business lines, resulting in integration synergies. Continuedinvestment in IT, recruitment and development will be aimed at reinforcing marketleadership in the Benelux and in specific sectors like shipping and commodities.
• Insurance is building a new, strengthened organization, including new commonfunctions to ensure the sharing of best practices and implementation of a singleinsurance strategy. Strategic initiatives will be developed across the core regions(Belgium, The Netherlands, Europe and Asia) in order to leverage skills globally,while creating scale locally. Further investments will be made in multi-channeldistribution, product/market innovation, operational excellence and enhanced servicelevels.
267
Level: 6 – From: 6 – Wednesday, May 14, 2008 – 1:39 pm – g5mac4 – 3960 Section 09 : 3960 Section 09

(ii) Grow: invest in growth engines (i.e., selected core competencies) to enter new markets,launch new business activities and unlock new value chains. The target for these activities isa compound annual growth rate of at least 15% for the period 2006-2011.
This lever entails propelling our growth rate to a higher level and is expected to contributeone-third of total organic growth to 2011. Businesses will roll out proven models to newmarkets and segments.
• Retail Banking, for example, will expand its Personal Banking and Banking forProfessionals & Small Enterprises in Poland and Turkey. Further investments will bemade in the continued international expansion of consumer finance, primarily inTurkey, Poland and Germany, and in the roll-out of the postal banking model inIreland and selective new markets. Finally, in asset gathering, Fortis Investments willseek to further enhance its product offering and expand geographically (includingTurkey, South Korea, Japan and Indonesia).
• Acceleration in Merchant Banking and Asset Management & Private Banking isexpected to come from building scale in selected countries, such as Turkey and France,seizing market opportunities in Poland and rolling out Merchant & Private Bankingcapabilities in Asia. The business will compete as a global integrated player in theEnergy, Commodities & Transportation sectors and will aim to capture opportunitiesin structured capital markets products and in Clearing, Funds & Custody. It will alsoleverage the “Enterprise & Entrepreneur” model (i.e., offering an integrated range ofsolutions to entrepreneurs, addressing both their corporate/management needs andtheir needs as individuals) by extending the Private Banking offer to corporate clients.
• Insurance, which in 2006 entered five new markets (Germany, Ukraine, Russia, Turkeyand India), will leverage its extensive knowledge of insurance products anddistribution models. This will be done in a number of ways, including expanding thebancassurance model and, in The Netherlands, combining the strengthened brokerdistribution with the extension of other distribution channels. Insurance will also planto transfer innovative products and proven concepts, such as the Portuguese unit-linkedproposition, Belgian multi-product solutions and UK affinity success, to other markets.In Asia, finally, the business is expected to build on strong forecast regional growth tofurther expand its product portfolio and distribution channels.
(iii) Expand: continue to pursue external growth by making further selective add-on acquisitions,within strict investment criteria. Acquisitions should fit from a strategic, resource andfinancial point of view.
Fortis is frequently presented with acquisition opportunities which it considers from time to time.Before making an acquisition, Fortis will consider its overall financial targets, as well as other factors suchas return on investment and strategic fit. As a result, Fortis may decide to pursue an acquisition at any timeif the right opportunities are available.
Relationship with Ping An Insurance (Group) Company of China
On November 28, 2007, Fortis entered into a Memorandum of Understanding (the “MoU”) withPing An Insurance (Group) Company of China Ltd., which had, through a subsidiary, taken a stake ofapproximately 4.18% in Fortis. As a result, Ping An is now the single largest shareholder of Fortis andadheres to the Fortis Governance Statement.
Under the MoU, Ping An, acting alone or in concert, may not hold directly or indirectly, as a resultof a private transaction or of a public offering (from which Ping An commits to refrain), more than 4.99%of the share capital of Fortis without the prior consent of Fortis. Beyond such a stake, Fortis’s approval isrequired in stages, i.e. beyond 4.99% and beyond 7%. Ping An is nonetheless entitled to (i) readjust itsstake up to its previous level if and when any event attributable to Fortis results in a dilution of such stake,
268
Level: 6 – From: 6 – Wednesday, May 14, 2008 – 1:39 pm – g5mac4 – 3960 Section 09 : 3960 Section 09

or (ii) increase its stake in Fortis beyond the limits referred to above should Fortis welcome any thirdparty, acting alone or in concert, to hold a higher percentage than the stake then held by Ping An.
Under the MoU, Ping An is entitled to propose the appointment of one non-executive director to theFortis Board, provided Ping An holds at least 4% of the share capital of Fortis. It is up to the AnnualGeneral Meetings of Shareholders of Fortis to decide on such appointment upon the proposal of the FortisBoard based on the recommendation of the Fortis Nomination and Remuneration Committee. If the non-executive director elected based on Ping An’s proposal disagrees with the majority of the Fortis Boardregarding a resolution to be submitted to the Extraordinary General Meetings of Shareholders, Ping An isentitled to sell its stake in Fortis either to Fortis itself or to a third party designated by Fortis or, should noagreement be reached on the sale price, to such person and in such manner as Ping An shall deem fit.
Under the MoU, if Fortis offers more favorable terms to any other shareholder in the future, it willbe required to extend the same more favorable terms to Ping An. The commitments entered into by PingAn apply to Ping An itself and to its subsidiaries. The MoU was concluded for a three-year term and maybe renewed or terminated by mutual consent. The MoU reflects the intention of Ping An to hold its stakein Fortis as a stable shareholder as long as the MoU remains in force, subject to various events, amongwhich a merger or a general offer for Fortis either recommended by the Fortis Board or in respect of whichmore than 50% of the Fortis shares have been committed by other shareholders. Should Ping An sell itsstake after the expiry date of the MoU, Fortis may exercise a right of pre-emption.
Ping An Asset Management Agreement
On April 2, 2008, Ping An and Fortis signed an agreement that formalized the establishment of aglobal asset management partnership between the two companies. Under the agreement, Ping An agreed toacquire a 50% equity stake in Fortis Investments for EUR 2.15 billion. The partnership is expected toallow Ping An to advance its strategy to establish a global asset management business and a QualifiedDomestic Institutional Investor platform, while Fortis is expected to benefit from enhanced access to thegrowing economies of China and Asia, which would allow Fortis to accelerate the development of itsbusiness in the region.
The agreement confirmed the principal terms set out in the memorandum of understanding betweenthe parties of March 19, 2008. Fortis Investments will be re-branded “Fortis Ping An Investments” and itsboard will consist of twelve directors (six non-executive, two executive and four independent). Fortis andPing An will each nominate three non-executive directors and propose two independent directors. Thesenior management of Fortis Investments will remain unchanged.
The agreement remains subject to certain conditions, such as receipt of applicable regulatoryapprovals, and is expected to close in mid-2008.
Investments
The major and material investments made by Fortis in 2007 (other than the ABN AMRO Businesseswhich are discussed under “Information About the Acquisition of ABN AMRO — The ABN AMROBusinesses”), 2006, and 2005 are described below.
(i) Pacific Century Insurance
On May 25, 2007, Fortis announced that it finalized the acquisition of 50.45% of the share capitalof Pacific Century Insurance Holdings Limited (“PCI”, a listed Hong Kong Life insurer) for a totalconsideration of EUR 341 million (HKD 3.5 billion).
On May 21, 2007 Fortis commenced a mandatory general offer to acquire the remaining shares andoptions of PCI; as a result of such mandatory general offer (which closed on June 11, 2007), Fortisacquired 98.59% of the shares and options of PCI. Following the completion of the offer PCI was renamedFortis Insurance Company Asia (“FICA”). The combined acquisition cost for such shares and options
269
Level: 6 – From: 6 – Wednesday, May 14, 2008 – 1:39 pm – g5mac4 – 3960 Section 09 : 3960 Section 09

totaled EUR 666 million. Fortis has undertaken a compulsory acquisition for the remaining 1.41% of theshares at a price of HKD 8.18 (EUR 0.79).
Fortis considers FICA as a strong platform to become a leading player in the Hong Kong insurancemarket and to build upon the model Fortis has developed in Asia through its partnerships in China,Malaysia, Thailand and more recently India. FICA has more than 280 employees and over 2,000 tiedagents, the fifth largest agency sales force in Hong Kong.
The Value of Business Acquired (“VOBA”) is based on the traditional-embedded value method andamounts to EUR 317 million and the goodwill amounts to EUR 241 million as reflected in the FortisFinancial Statements.
(ii) Dominet
On March 22, 2007, Fortis completed the acquisition of 100% of the shares of Dominet SA, theparent company of Dominet Bank SA, a full-service retail bank with 869 employees and a modernnationwide branch network in Poland. Dominet occupies a strong position in the car finance segment andhas a fast-growing portfolio of cash loans. Dominet also supplies other banking products to retailcustomers.
The acquisition price was EUR 240 million and the goodwill was EUR 222 million as reflected inthe Fortis Financial Statements.
(iii) Fortis Energy Marketing & Trading and FB Energy Canada, Corp.
Fortis completed the acquisition of Cinergy Marketing & Trading, and Cinergy Canada, Inc., fromDuke Energy early October 2006. Fortis renamed the new trading entities to Fortis Energy Marketing &Trading (“FEMT”) in the U.S. and FB Energy Canada, Corp. (“FBECC”) in Canada.
FEMT’s and FBECC’s power and natural gas trading activities are organized into regional desksacross the USA and Canada. FEMT and FBECC employ 200 people, in their Houston-based headquarters,and 25 people in Calgary. FEMT and FBECC results are reported within the Merchant Banking segment.
The purchase price was EUR 356 million (USD 451 million), which includes the base purchaseprice and the value of the current trading portfolio. The amount of goodwill recognized amounted to EUR138 million.
(iv) Cadogan
On November 10, 2006, Fortis Investment Management, Inc. and Cadogan Management, LLCannounced that they had entered into an agreement to combine their respective Fund of Hedge Fundsactivities into a new stand-alone asset management company. The new business trades under the name‘Cadogan’, with Fortis Investments as the majority shareholder, holding 70% of the shares. The acquisitionwas completed at the end of December 2006. Cadogan results are reported within the Retail Bankingsegment.
The purchase price was EUR 119 million (USD 157 million) and the goodwill amounted to EUR116 million.
(v) Disbank
On July 4, 2005, Fortis acquired 89.4% of the shares of Disbank, the seventh largest bank in Turkey,with some 173 branches throughout the country. Disbank is active in the fields of retail banking andcommercial and private banking and serves over one million customers. Disbank was renamed Fortis BankAS.
270
Level: 6 – From: 6 – Wednesday, May 14, 2008 – 1:39 pm – g5mac4 – 3960 Section 09 : 3960 Section 09

On September 23, 2005, Fortis made a public offer on all outstanding shares of Disbank quoted onthe exchange of Istanbul. At year end 2005, Fortis’s interest in Disbank came to 93.3% of the share capitalof Disbank.
The caption “Goodwill and other intangible assets” recognized in the balance sheet upon acquisitionincludes goodwill of EUR 333 million and EUR 49 million for the credit card business of Disbank.
The acquisition price amounted to EUR 919 million and was settled in cash.
(vi) Millenniumbcp Fortis
In the first quarter of 2005, Fortis completed the acquisition of a controlling interest of 51% inMillenniumbcp Fortis. The remaining 49% of the share capital is owned by Banco Commercial dePortugal (“BCP”). Millenniumbcp Fortis is a Portuguese insurance company that sells insurance policiesvia the branch network of BCP.
The caption “Goodwill and other intangible assets” recognized in the balance sheet upon acquisitionincludes goodwill of EUR 165 million and Value of Business Acquired (“VOBA”) of EUR 528 million.
The acquisition price amounted to EUR 514 million and was settled in cash.
(vii) Other
Capitalized Goodwill/Quarter of Acquisition Percentage Intangible (NegativeAcquisition Amount Acquired Assets Goodwill) Segment1111 1111 1111 1111 1111 112311122312
(EUR million, except %)Acquired companyFortis Lease SPA . . . . . . . . . . Q1 2005 52 100% 23 5 Merchant & Private BankingAble Brookers . . . . . . . . . . . . . Q3 2005 27 100% 3 21 Insurance InternationalAtradius . . . . . . . . . . . . . . . . . Q4 2005 64 100% 0 36 Merchant & Private BankingDryden . . . . . . . . . . . . . . . . . . Q4 2005 79 100% 7 (17) Merchant & Private BankingDreieck Industrie Leasing AG . . . . . . . . . . . . . . . Q1 2006 64 100% 29 4 Merchant & Private BankingO’Connor & Company . . . . . . Q1 2006 58 100% 0 14 Merchant & Private BankingVon Essen KG Bankgesellschaft . . . . . . . . . . . Q1 2006 93 100% 3 31 Retail BankingWilliam Properties . . . . . . . . . Q3 2006 100% 15 25 Insurance NetherlandsCaptive Finance Limited . . . . . . . . . . . . . . . . . . Q2 2007 31 100% 0 17 Merchant & Private Banking
The amounts of the capitalized intangible assets and the goodwill presented above are the initialamounts, converted to euro and taking into account changes that were necessary because the accountingfor a business combination was only determined provisionally by the end of the period in which thecombination was effected. Subsequent changes due to net exchange differences and other changes areexcluded. These acquisitions did not have a substantial impact on Fortis’s financial position andperformance.
Fortis announced on October 5, 2006 its agreement with An Post, the Irish postal service, withrespect to a joint venture, called Postbank Ireland Ltd., through which a broad range of financial productsand services will be offered to the Irish market. The new bank is a 50/50 partnership between An Post andFortis with an initial capital of EUR 112 million. The European Commission approved Fortis’s jointventure with An Post on January 12, 2007. On April 18, 2007, the Irish Financial regulator granted AnPost Financial Services a banking license and the joint venture was effectively launched at May 1, 2007.This investment is accounted for using the equity method and is reported in the section Investments inassociates and joint ventures on the balance sheet
Disposals
On July 12, 2007, Fortis and “la Caixa” announced that they agreed that “la Caixa” would acquireall of Fortis’s interests in the Spanish bancassurance joint venture CaiFor for a total cash consideration of
271
Level: 6 – From: 6 – Wednesday, May 14, 2008 – 1:39 pm – g5mac4 – 3960 Section 09 : 3960 Section 09

EUR 980 million, including a 2007 interim dividend of EUR 30 million The transaction was completed onNovember 13, 2007. In accordance with IFRS 5 Non-current Assets held for Sale and DiscontinuedOperations, Fortis’s investment in CaiFor is presented as a discontinued operation as of June 30, 2007.Fortis presents the post-tax results of discontinued operations separately from continuing operations in itsincome statement under the item Net gain (loss) on discontinued operations. Prior period results arereported in line with this presentation. The participation in CaiFor is reported on Fortis’s balance sheetunder the item Investments in Associates and Joint Ventures and amounts to EUR 9 million at June 30,2007 (EUR 7 million at December 31, 2006).
Intellectual property rights
FORTIS® is a registered trademark in the name of Fortis SA/NV and Fortis N.V. FORTIS BANK®is a registered trademark in the name of Fortis SA/NV and Fortis N.V. The companies belonging to theFortis Group also use a logo which is registered as a trademark in the name of Fortis SA/NV and FortisN.V.
Organizational structure
The Fortis Share was created after a unification process, which was completed in December 2001and represents the twinned Fortis SA/NV Shares and Fortis N.V. Shares. The Fortis Share is listed on theregulated market of Euronext Brussels and Eurolist by Euronext Amsterdam. Fortis also has a secondarylisting on the EU Regulated Market of the Luxembourg Stock Exchange and a sponsored over-the-counterADR program in the United States.
As part of the unification process, Fortis implemented a number of mergers and other legal steps.The operating companies of the Fortis Group are owned by Fortis Bank (principally banking and assetmanagement) and Fortis Insurance N.V. (principally insurance). Fortis banking operations, which includeits asset management operations, and Fortis insurance operations contributed 58% and 42%, respectively,to the net profit for 2007. The general segment (which consists of group treasury and finance and otherholding activities) reduced net operating profit by 10% in 2007.
The diagram below summarizes the legal structure of Fortis as of March 31, 2008.
Business overview
Principal activities
Fortis is an international provider of financial services to personal, business and institutionalcustomers. Fortis delivers a total package of financial products and services through its own distributionchannels and via intermediaries and other partners.
Fortis operates in geographical areas that are subject to different rates of profitability, opportunitiesfor growth, future prospects and risk. The primary format for reporting segment information is based onbusiness segments. Fortis’s core activities are banking and insurance.
As of January 1, 2008, Fortis has reorganized its activities into four core businesses:
• Retail Banking: provides financial services to individuals, professionals and small businesses;
• Asset Management & Private Banking: offers integrated and international solutions for theassets and liabilities of high net worth and ultra high net worth individuals;
• Merchant Banking: offers tailored financial products and services to medium-sized Europe-oriented businesses and large international companies and institutions;
• Insurance: provides life and non-life products in the home markets of the Benelux countriesand in selected European and Asian markets.
272
Level: 6 – From: 6 – Wednesday, May 14, 2008 – 1:39 pm – g5mac4 – 3960 Section 09 : 3960 Section 09

On January 1, 2007, Fortis reorganized its activities into three core businesses. The main differencebetween the most recent reorganization and that in 2007 is the reorganization within the Bank segment.The three core businesses in 2007 were:
• Retail Banking
• Merchant & Private Banking
• Insurance
Prior to January 1, 2007, Fortis organized its banking and insurance activities in six business lines.Within Banking, the business lines were Retail Banking, Commercial & Private Banking and MerchantBanking. Within Insurance the business lines were Insurance Belgium, Insurance Netherlands andInsurance International. Each business line was headed by a member of the group Executive Committee.
Fortis businesses are supported by the following support functions:
• Group Resources, including Technology, Operations & Process Services (“TOPS”), HumanResources, Facilities and Purchasing;
• Finance, including Performance Management, Consolidation & Accounting, GroupDevelopment & Acquisitions, Tax and Reporting, Ratings, Structuring & CapitalManagement;
• Strategy, including Strategy, Investor Relations, Global Branding & Communications, PublicAffairs, CSR and Fortis Investments;
• Risk, including Risk, Legal, Compliance, Investigations and Customer & ManagementProcesses. A key objective is to enhance risk strategies and further develop the risk functionacross Fortis. It will also drive the businesses and support functions to improve quality ofprocesses.
• Investment, including Asset & Liability Management (“ALM”), which has been establishedto enhance Fortis-wide synergies in this area and to optimize return on assets.
As per Fortis management structure, each core business and support function is managed by amember of the group Executive Committee.
Segment reporting
Fortis is as of January 1, 2008 organized on a worldwide basis into four businesses, furthersubdivided into business segments as described below:
Retail Banking
Overview
The mission of Retail Banking is to become and remain the preferred “customer” bank forindividuals, professionals and small enterprises in the market segments where it is active through adifferentiated customer approach, offering a full range of financial products and services delivered throughmultiple distribution channels. Retail Banking is currently active in eight countries, with Belgium, TheNetherlands and Luxembourg as home markets. Outside of the Benelux, Retail Banking is active in Polandas a niche bank providing services to affluent customers and small businesses, while Dominet, a Fortissubsidiary, seeks to roll out Retail Banking’s consumer finance and mass retail business in this market. In2005, Retail Banking acquired key assets in Turkey and Germany and during 2006 continued its expansionin Poland and Ireland as more fully described below.
As of December 31, 2007 Retail Banking had over 18,000 employees and contributed 33% of Fortisnet profit. In addition, Retail Banking provided financial services to more than six million customers via arange of distribution channels: more than 1,800 branches or credit shops in more than 350 cities, 2,500
273
Level: 6 – From: 6 – Wednesday, May 14, 2008 – 1:39 pm – g5mac4 – 3960 Section 09 : 3960 Section 09

Selfbank terminals and ATMs, online banking, telephone banking and call centers. Together with ABNAMRO, Retail Banking seeks to strengthen its position as a leading financial institution in TheNetherlands and in the Benelux region. Customers will benefit from a stronger product portfolio through awider branch network with nationwide coverage and full SME-banking.
In pursuit of its goal of becoming the preferred bank for retail customers, Retail Bankingcontinuously aligns its services and commercial organization with the needs and expectations of itscustomers, putting customers firmly at the heart of its service model and culture. Retail Banking isevolving towards a true cross-border distribution organization with a segmented customer approach. Thisrevamped customer approach towards Mass Retail, Affluent and Professionals & Small Businesses(“P&S”) is expected to allow for a greater offer differentiation per segment while targeting the best inclass cost/income ratio. Focusing on these three customer segments with their own specific needs andserving them with a tailored value proposition is expected to raise customer satisfaction and sustain aprofitable growth track.
Strategy
Retail Banking is building on two waves of growth, the strengthening of its leadership position inthe Benelux and the international roll out of proven models.12 In mature and wealthy markets like theBenelux, Retail Banking will continue to focus on its customers by differentiating between segments,selectively deepening relationships and offering integrated, multi-channel accessibility. At the same time, itwill roll out proven models to continue its growth path in developing markets. More specifically, RetailBanking has identified five growth engines to be rolled out internationally, relating to targeted segmentsand distribution, including Affluent Banking, P&S banking, Mass Retail through Consumer Finance, thepostal banking model and Asset Gathering through Fortis Investments.
Key strategic goals
• Improve customer satisfaction by a differentiated service approach;
• Strengthen leadership position in Belgium; and
• International rollout of proven models to expand European presence.
European presence
Retail Banking has a leadership position in the Benelux,13 one of Europe’s wealthiest areas.Following the acquisition of the ABN AMRO Businesses, it is the largest bank in terms of retail financialservices,14 and is a very large credit card issuer, with four million credit card holders in the Benelux andTurkey.
As customer convenience is key for Fortis, Retail Banking continuously invests in its distributionnetwork.
Belgium
Retail Banking Belgium offers banking and insurance services to individuals, professionals andsmall enterprises through an integrated bancassurance model supported by multi-channel distribution. Asof December 31, 2007, Retail Banking Belgium had 1,064 branches, many of which have been upgradedand their opening hours extended. Additionally, at strategic and frequented places throughout Belgium,Retail Banking has installed a network of 45 Cash Points. Under a Fortis branding, these additional salespoints offer customers cash withdrawal and transfer services, compensating for the decreasing number ofATMs. Fortis’s state-of-the-art online banking system has been upgraded and as of December 31, 2007
274
Level: 6 – From: 6 – Wednesday, May 14, 2008 – 1:39 pm – g5mac4 – 3960 Section 09 : 3960 Section 09
12 Source: Investor Day March 2007.
13 Source: The Banker, July 2007, based on total assets 2006.
14 Source: ING broker report: Benelux banks — Chocolate and tulips, October 2006, based on a mix of selected products: mortgages,number of consumers, saving accounts, corporate loans, life insurance, non-life premiums, mutual funds and number of branches.

was actively being used by approximately 1.4 million customers (a 17% increase compared to year-end2006).
In addition to the Fortis labeled network, Fortis banking and insurance products are sold through340 independent agents operating under the Fintro brand.
Banque de la Poste/Bank van de Post, a 50/50 joint venture with the Belgian Post Office, has 1.3million customers and distributes Fortis Bank products through approximately 1,300 post offices givingFortis access to the third largest distribution network in Belgium based on number of outlets.
The Netherlands
Retail Banking Netherlands offers banking and insurance services to the retail customer segment inThe Netherlands, focusing on the mortgage and small business market.
In its proprietary network, Retail Banking expanded its DirectService concept to the majority of its158 branches. This “open concept” is based on the idea that the bank should stimulate qualitative “traffic”in the branch combining cross-channel facilities, convenience and personalized value-added advice tocustomers. The DirectService concept consists of user-friendly multifunctional machines with CustomerService Representatives, as well as dedicated staff who are able to advise customers who have morecomplex needs.
Luxembourg
Retail Banking Luxembourg offers banking and insurance services to the retail customer segment inLuxembourg. Since November 2005, the Luxembourg business is conducted under the Fortis brand. RetailBanking Luxembourg is one of the Grand Duchy’s leading banks, with a network of 37 branches. Inaddition to its branch network, Fortis online banking service, Web Banking, enables customers to carry outstandard transactions over the Internet.
Turkey
In Turkey, Retail Banking offers banking and insurance services to the retail customer segmentthrough 243 branches, all operating under the Fortis brand since November 2005. In 2007, 40 newbranches were opened and an ambitious branch expansion program is in place for the next five years. Inaddition, recent mortgage legislation will facilitate the introduction of new home loan products and newfunding instruments, which Retail Banking will be prepared to provide.
Poland
In Poland, Retail Banking is focusing on the development of the Affluent and P&S bank model.Personal banking is seeking to leverage the contacts from the P&S clients and vice versa. Additionally,through the acquisition of Dominet Bank, Retail Banking gained access to the ninth largest branchfranchise in Poland (over 180 branches) and to an important car dealer distribution network where it cansell its car insurance and financing products.
Ireland
Through the joint venture with An Post in Ireland, named Postbank, Retail Banking made animportant step in extending its multi-channel network throughout Europe. Using Fortis’s internationalexperience and expertise in bancassurance, in particular with the Belgian Banque de la Poste, the newbank in Ireland will offer daily banking, savings products, insurance, mortgages and credit cards. Theseservices were rolled out gradually in the course of 2007 and will include telephone and internet banking inaddition to the distribution network of 2,800 PostPoint agents and 1,400 post office branches. Initialservices included a demand deposit account and a guaranteed investment product and were extended in thefirst quarter of 2008 to include current accounts, credit cards, internet banking and ATM facilities.
275
Level: 6 – From: 6 – Wednesday, May 14, 2008 – 1:39 pm – g5mac4 – 3960 Section 09 : 3960 Section 09

Consumer Finance
Consumer Finance focuses on the distribution of credit cards and consumer loans and is currentlyactive in eight countries. It is the first credit card issuer in the Benelux, leveraging its Dutch InternationalCard Service (ICS) experience. In the past two years, Consumer Finance significantly expanded itsEuropean franchise through the acquisition of Von Essen KG Bankgesellschaft in Germany in the firstquarter of 2006 and the acquisition of Dominet Bank in Poland in March 2007. The acquisition of theABN AMRO Businesses will strengthen that position.
In addition to this external growth, Consumer Finance rolled out its innovative credit shopdistribution model in Germany and Poland. This alternative network of smaller-sized points of sale, called‘credit4me’ in Germany and ‘twojkredit’ in Poland have the same ‘look and feel’ concept as retail outletsand offer a variety of credit products. The credit shops provide consumers a wealth of information onconsumer finance products and qualified credit advisers assist in personal consultation. The leadingprinciple of this service concept is the idea that obtaining credit is comparable to buying any otherconsumer product: easy, fast and reliable. As of December 31, 2007, 292 credit shops were operational.
Products
Fortis provides a comprehensive range of retail banking products and banking solutions to itscustomer segments. The table below sets forth certain data with respect to the retail banking operations ofFortis for the periods presented.
At December 31, 200711112222223111121111211112
Retail Banking Belgium Netherlands Luxembourg Total11112 11112 11112 11112
(EUR billion)
Mortgage loans . . . . . . . . . . . . . . . . . . . . . . . . . . . . . . 25.9 32.0 2.5 61.5Consumer loans . . . . . . . . . . . . . . . . . . . . . . . . . . . . . . 3.0 2.4 0.7 8.1Commercial loans . . . . . . . . . . . . . . . . . . . . . . . . . . . . 10.6 1.5 1.3 15.2Total . . . . . . . . . . . . . . . . . . . . . . . . . . . . . . . . . . . . . . . 39.5 35.8 4.5 84.8Demand deposits . . . . . . . . . . . . . . . . . . . . . . . . . . . . . 12.4 4.3 2.9 20.3Saving deposits . . . . . . . . . . . . . . . . . . . . . . . . . . . . . . 39.8 7.7 2.1 49.7Time deposits . . . . . . . . . . . . . . . . . . . . . . . . . . . . . . . 12.9 2.3 4.6 23.2Total . . . . . . . . . . . . . . . . . . . . . . . . . . . . . . . . . . . . . . . 65.0 14.3 9.6 93.2
At December 31, 200611112222223111121111211112
Retail Banking Belgium Netherlands Luxembourg Total11112 11112 11112 11112
(EUR billion)
Mortgage loans . . . . . . . . . . . . . . . . . . . . . . . . . . . . . . 23.9 29.1 2.2 56.7Consumer loans . . . . . . . . . . . . . . . . . . . . . . . . . . . . . . 2.7 2.3 0.8 7.1Commercial loans . . . . . . . . . . . . . . . . . . . . . . . . . . . . 9.8 1.3 1.1 14.4Total . . . . . . . . . . . . . . . . . . . . . . . . . . . . . . . . . . . . . . . 36.4 32.7 4.1 78.2Demand deposits . . . . . . . . . . . . . . . . . . . . . . . . . . . . . 11.8 5.3 3.2 22.6Saving deposits . . . . . . . . . . . . . . . . . . . . . . . . . . . . . . 44.5 7.8 1.8 54.5Time deposits . . . . . . . . . . . . . . . . . . . . . . . . . . . . . . . 7.5 0.4 3.9 14.5Total . . . . . . . . . . . . . . . . . . . . . . . . . . . . . . . . . . . . . . . 63.9 13.5 8.9 91.6
276
Level: 6 – From: 6 – Wednesday, May 14, 2008 – 1:39 pm – g5mac4 – 3960 Section 09 : 3960 Section 09

At December 31, 200511112222223111121111211112
Retail Banking Belgium Netherlands Luxembourg Total11112 11112 11112 11112
(EUR billion)
Mortgage loans . . . . . . . . . . . . . . . . . . . . . . . . . . . . . . 21.8 25.1 1.7 49.3Consumer loans . . . . . . . . . . . . . . . . . . . . . . . . . . . . . . 1.8 0.9 0.9 6.0Commercial loans . . . . . . . . . . . . . . . . . . . . . . . . . . . . 8.6 1.2 1.1 12.3Other retail loans . . . . . . . . . . . . . . . . . . . . . . . . . . . . . 0.1 — 0.1 0.4Total . . . . . . . . . . . . . . . . . . . . . . . . . . . . . . . . . . . . . . . 32.3 27.2 3.8 68.0Demand deposits . . . . . . . . . . . . . . . . . . . . . . . . . . . . . 12.1 3.8 2.9 20.2Saving deposits . . . . . . . . . . . . . . . . . . . . . . . . . . . . . . 44.2 9.5 1.9 56Time deposits . . . . . . . . . . . . . . . . . . . . . . . . . . . . . . . 4.4 0.5 3.4 8.7Total . . . . . . . . . . . . . . . . . . . . . . . . . . . . . . . . . . . . . . . 60.7 13.7 8.2 84.9
Asset Management & Private Banking
Overview
The mission of Asset Management & Private Banking is to become a leading international assetgatherer through asset management activities for institutional, private and retail clients and private bankingproducts and services for High Net Worth and Ultra High Net Worth individuals as well as Entrepreneurs.As of January 1, 2008, Asset Management has been regrouped into one business to maximize the benefitsfrom the integration of Fortis and ABN AMRO and to better service the needs of Fortis’s growingcustomer base.
As of December 31, 2007, Asset Management & Private Banking had 2,900 employees andcontributed 3% of Fortis net profits. Its extensive asset management products were sold to customers inover 30 countries. Together with ABN AMRO, Asset Management & Private Banking is a leadingEuropean wealth management provider and expects to grow strongly in Asia.
Asset Management & Private Banking is comprised of Fortis Investments and Fortis PrivateBanking. Fortis Investments is the asset manager of Fortis and as at December 31, 2007 had EUR 133billion in assets under management and 21 investment centers in Europe, the United States and Asia. FortisPrivate Banking offers integrated and international asset and liability management solutions to high networth individuals, covering their private and business needs.
Fortis recently sold a stake in Fortis Investments to Ping An Insurance (group) Company of China.See “Business — Ping An Asset Management Agreement”.
Strategy
The strategy behind combining Fortis Investments with the asset management activities of ABNAMRO was to produce a global asset manager in terms of reach and scale. Asset Management & PrivateBanking expects that this combination will also offer access to high-growth markets and capabilities inhigh-growth product areas and is implementing a fast track integration process focused on client retentionand retaining key investment and sales staff to leverage this growth.
The combined strengths of ABN AMRO and Fortis Private Banking will make Private Banking oneof the largest private banks in Europe (based on assets under management). Private Banking will build onits client-driven approach by joining forces with ABN AMRO to become an international private bank witha unique European network and an established European presence. Through Fortis’s deep local roots,Private Banking will offer its clients the best of local and international services and advice. PrivateBanking is continually selecting the best solutions for its clients and innovating the way it interacts. Theincrease in size allows exclusive focus on High Net Worth and Ultra High Net Worth clients. PrivateBanking will continue to pursue the pan-European “enterprise and entrepreneur” approach, offeringdedicated services to business owners, in close cooperation with Commercial banking.
277
Level: 6 – From: 6 – Wednesday, May 14, 2008 – 1:39 pm – g5mac4 – 3960 Section 09 : 3960 Section 09

Asset Management
Fortis Investments is the autonomous asset manager of Fortis, operating through a worldwidenetwork of sales offices and some 40 dedicated investment centres across Europe, Asia and the Americas.and is a multi-centre, multi-product global asset management company. With a leading position in Europe,a substantial position in Asia and an enlarged presence in the Americas, it has a global base of localinvestors, both institutional customers and distribution partners and over 50% of its revenues are generatedby third party clients. Its partnership with Ping An, China’s second largest life insurer, is a developmentthat will bring unique opportunities in one of the world’s fastest developing markets.
During 2007 Fortis Investments’ corporate CDO business did not experience any defaults or haveany of its transactions placed on negative watch or downgraded. Fortis Investments’ ABS CDOs wereimpacted by the subprime crises. Asset gathering of Fortis Investments’ SRI business was due to stronginflows into global sustainability investment products from a broad range of client types.
In the United States, Fortis Investments won a mandate to manage a USD 250 million Equity BestSelection World portfolio for a major institutional client, representing the largest initial funding for anequity mandate won by the company and reflecting the institutional market’s recognition of FortisInvestments as a top global growth equity manager.
Fortis expects the acquisition of the ABN AMRO Businesses will give it the benefits of a largegeographic footprint and enhanced offering to third-party distributors.
At December 31,1111212341111211112
2007 2006 2005(1)
11112 11112 11112
(EUR million)
Funds under management . . . . . . . . . . . . . . . . . . . . . . . . . . . . . . . . . 132,916 120,774 105,067Group . . . . . . . . . . . . . . . . . . . . . . . . . . . . . . . . . . . . . . . . . . . . . . . . 74,122 71,116 66,838Third-party . . . . . . . . . . . . . . . . . . . . . . . . . . . . . . . . . . . . . . . . . . . . 49,229 40,661 32,993Collateralized Debt Obligations . . . . . . . . . . . . . . . . . . . . . . . . . . . . 9,610 8,997 5,236
(1) 2005 has been restated to reflect the Collateralized Debt Obligations (“CDO”) activity on a separate line.
Fortis Investments is structured around 41 dedicated investment centers, each focused on one assetclass/capability and based in over 20 locations worldwide:
• Paris — European equities, emerging markets equities and bonds, Euro-bonds and Europeanconvertibles;
• Frankfurt — Sustainable and responsible investments;
• Boston — U.S. and global equities, U.S. fixed income, U.S. balanced funds and structuredfinance;
• Amsterdam — real estate, balanced funds and Fortis OBAM NV investment fund;
• Luxembourg — funds of funds and balanced funds;
• Brussels — balanced funds and asset allocation;
• London — global fixed income, emerging fixed income and equities and European equitiessmall caps;
• Tokyo — Japanese equities;
• Hong Kong — Asian equities;
• Jakarta — Indonesian balanced funds; and
• Shanghai, through a joint venture with Haitong — Chinese balanced funds.
278
Level: 6 – From: 6 – Wednesday, May 14, 2008 – 1:39 pm – g5mac4 – 3960 Section 09 : 3960 Section 09

These centers, supported by a highly experienced team of some 600 investment professionals, sharetheir information but are autonomous and fully accountable for their investment performance.
Fortis Investments aims to maintain a diversified customer base and fund mix. Through itsdistribution partners division, the company focuses on third-party customers such as funds of funds,private banks and other financial institutions that buy funds in order to sell them to their own clients. TheInstitutional Division concentrates on customers that buy on their own account, such as pension funds,banks and insurers, companies and not-for-profit organizations.
Sales and client services to both segments are provided through local client relationship teams basedaround the world. This ‘global, local’ organization provides Fortis Investments with first-hand knowledgeof local markets and client needs.
Key strategic goals
• Consolidate a global leading position;
• Leverage its extensive, enhanced product and distribution opportunities post-integration;
• Pursue innovation in its product offering;
• Exploit growth potential in Asia, in particular via the proposed Ping An partnership.
The acquisition of the ABN AMRO Businesses is entirely within these strategic goals.
Investment Philosophy
Fortis Investments is an active manager who believes that fundamental analysis, utilising proprietaryresearch and quantitative tools, is the best approach to secure consistent, long-term excess returns. FortisInvestments’ investment process is research-based and consists of three phases:
• Research — decision preparation through top-down macroeconomic research as well asbottom-up equity/bond research;
• Portfolio Construction — decision making through active management of model portfolios,which are customised along client-specific requirements; and
• Risk Assessment and Performance Reporting.
Product Range
The integration with the asset management arm of ABN AMRO has seen Fortis Investmentsextending and developing its range of products/solutions offering to meet growing client needs and to takeadvantage of market developments. New segments have been added to its range of funds allowingcustomers to diversify their exposure and to customize the risk profiles of their investments further. FortisInvestments has a broad range of fixed income, equity, balanced, sector and other funds.
Distribution and Client Service
Fortis Investments provides its services to customers by organizing its distribution and clientservicing by customer segment and by geographic location within customer segments. In Europe, mutualfunds are distributed in Fortis major markets of the Benelux and France using Fortis Bank and insurancedistribution channels as well as third parties. Fortis Investments continues to develop distributionagreements with third parties in other European countries, primarily for distribution of the flagship, FortisL. Fund. For institutional clients, Fortis Investments adopts a direct approach using locally based teams tomarket services which can be managed via discretionary mandates or other suitable vehicles. Clientservicing is also local to ensure close contact with the clients. Fortis Investments’ major markets forinstitutional clients are The Netherlands, the Nordics, France, Belgium, Japan and Australia, with
279
Level: 6 – From: 6 – Wednesday, May 14, 2008 – 1:39 pm – g5mac4 – 3960 Section 09 : 3960 Section 09

aspirations in the United States, United Kingdom and Germany. Institutional clients are made up from,among others, corporate pension plans, endowments, foundations and public funds.
Private Banking
Private Banking aims to be the service provider of choice for high-net-worth and ultra high-net-worth clients, with a broad service offering covering both assets and liabilities, leveraging Fortis’s skillsand network to provide innovative solutions that are enhanced by the “best brains in business” concept(i.e., for products not confined to Fortis, actively seeking the best in class/best of breed provider for aproduct). Private Banking has a client centric approach in which a wide range of services are offered in thefield of Wealth Structuring, Financing, Investments, Real Estate and Insurance.
Close cooperation with Commercial and Merchant Banking has accelerated the development ofdedicated international services for “enterprise and entrepreneur”. These efforts have been recognized byclients and the Private Banking industry, and Fortis won the award for “Outstanding Business Private Bankfor 2006” (Private Banker International). The acquisition of the ABN AMRO Businesses will increase thisstrong market position.
The ambition of Fortis Private Banking is to offer its high-net-worth clients worldwide the best oflocal and international services and advice, throughout the different stages of their lives and in anyeconomic environment, continuously selecting the best solutions for its clients and innovating the wayFortis interacts. At the heart of Private Banking’s distinctive business philosophy is a client needs-basedapproach. As an international provider of Wealth Management Services, Private Banking focuses onestablishing long-term relationships built on an in-depth understanding of each client’s needs and goals.
In 2007, Fortis Private Banking focused on expanding its integrated services and solutions forinternational high net worth clients, both geographically (in the UK and Asia) and in product range. Thelaunch of Private Banking in the UK provides the opportunity to offer full wealth management services tonew and existing UK and international clients, covering Private Investment Management, off-shorebanking, trust and property finance with new banking capabilities. The ambition to expand its serviceoffering with innovative solutions proved successful: various structured products were launched andPrivate Banking realized its biggest new placement ever with the Dynamic Real Estate Fund III.
Despite global market circumstances, assets under management increased from EUR 79 billion as atDecember 31, 2006 to more than EUR 83 billion as at December 31, 2007 by attracting more than EUR 5billion in net new assets. Outstanding credits and loans to Ultra High Net Worth Individuals increasedsignificantly with more than EUR 3.5 billion in 2007. In addition to Lombard Lending, a successfulfinance solution was the Cross Border Mortgage loan for second residences.
In 2007 Fortis Private Banking won the title of “Best Relationship Management” in TheNetherlands and “Best Philanthropy services” in a number of countries, including Belgium, forphilanthropy services.
Merchant Banking
Merchant Banking is the combination into one core business unit of Fortis Bank’s former businesslines: Merchant Banking and Commercial & Private Banking, with Private Banking having been moved tothe Asset Management & Private Banking core business unit as of January 1, 2008. Merchant Banking isorganized around (i) core competences and products: Skills; and (ii) customer relations: Clients.
Merchant Banking offers a comprehensive range of banking products and skill-oriented financialservices to large international companies, institutional customers and medium sized enterprises. MerchantBanking boasts a strong client franchise in the Benelux and in selected European markets, as well as inselected areas of North America and Asia. The solid regional or even global position in many of itsproducts and skills means Fortis is well placed to capture growth.
280
Level: 6 – From: 6 – Wednesday, May 14, 2008 – 1:39 pm – g5mac4 – 3960 Section 09 : 3960 Section 09

Overview
Fortis Bank supports its clients in their international growth by advising them and structuring andarranging financial solutions to meet their often complex financial needs. The solutions Fortis offers itscustomers are based on a variety of activities, including foreign exchange (“Forex”) trading andderivatives, money and capital markets, cash management, equity and fixed-income investments, businessand asset financing, private equity, project finance, structuring, clearing and custody.
In Europe, Merchant Banking is investing in the expansion of its operations in several Europeancountries, including the UK, France, Italy, Germany, Spain, Poland and Turkey. It is also developing itsdealing room coverage and selected niche activities, such as shipping finance, export and project finance,trade and commodity finance, and clearing services on a more global scale, in areas such as the UnitedStates and Asia.
Merchant Banking seeks to optimize its operational structure and effectively streamline processeswith a view to enhancing overall efficiency. Specifically, it will continue to pursue its growth targets byfurther leveraging its core client relationships, by expanding in selected client and product niches and byincreased cross-selling and geographical expansion. At the same time, it will retain its focus onmaintaining tight control of risk exposure. Merchant Banking will use three key levers to meet its goal:revenue growth, cost efficiency and risk management.
Merchant Banking continues to invest in global risk management integrating credit, market andoperational risk, and its real-time management of credit limits on market transactions allows it to minimizerisks and to limit operating costs. In addition, Fortis Bank has developed a Value-at-Risk model that alsotakes non-linearity of complex derivative products into account. The model is used for internal riskmonitoring but also for external solvency reporting. Merchant Banking has also developed a CreditPortfolio Management system whereby credit risk is measured and reviewed on a portfolio basis, enablingbetter control.
In February 2006, Merchant Banking adopted the Equator Principles, guidelines for responsibleproject financing. In so doing, Fortis Bank joined a group of 40 leading international financial institutions.Fortis applies the principles globally to project finance for all industry sectors.
Strategy
Key strategic goals
• Pursue focused growth by leveraging key client relationships and strong product franchises;
• Exploit opportunities in the United States and Asia by following key clients and leveragingexisting expertise;
• Constantly improve sound risk management structure and disciplined cost management;
• Combine product innovation and cross-selling, particularly through cross-selling of productsto existing ABN AMRO customers after the ABN AMRO Acquisition; and
• Superior customer advice backed by international expertise.
Customer Approach and Product Development
The Merchant Banking organization has enhanced its customer focus by placing an emphasis ondeveloping client knowledge and managing client relationships. All corporate and institutional clients havebeen segmented according to their particular needs and circumstances. Each significant client has a globalrelationship manager or client director who oversees the entire client relationship.
In order to provide tailored solutions, client service teams, with specialists from various merchantbanking activities, combine and structure a variety of financial products and services to meet the needs of
281
Level: 6 – From: 6 – Wednesday, May 14, 2008 – 1:39 pm – g5mac4 – 3960 Section 09 : 3960 Section 09

the client. They operate under the coordination of a client director to efficiently provide the variety ofresources that are required by the client.
Fortis has continued to invest in the development of innovative products. In addition to currency,equity and interest rate derivatives, Fortis has established a strong and innovative profile in creditderivatives, energy derivatives, inflation swaps and CO2 emission trading. In 2006, Global Marketsrealized Fortis first Certified Emission Rights (“CER”) transaction. In 2007, Global Markets reinforcedFortis’s global carbon banking leadership through sizeable CER transactions with over 15 counterparties.In addition to currently trading in and providing advice on commodities, Fortis has also become a brokeron the London Metal Exchange, providing a full range of services in precious metals to its client base andwas nominated in 2007 for the third consecutive year for “Best Soft Commodity Finance Bank” by theTrade and Forfaiting Review Magazine. Finally, the acquisition of Cinergy Marketing & Trading (“CMT”)in Texas has provided Fortis with a platform for physical gas and power trading.
Creating a virtual dealing room has enabled Fortis to optimize its customer services, with a morecoordinated product offering, individualized management of customer relationships and preservation ofcustomer contacts with local sales teams and dealing rooms. To this end, it registers and processes allBenelux customer transactions via a single IT platform, which is expected to be gradually extended toother countries. Back offices, risk management and financial control management are administeredcentrally.
Capitalizing on its long-standing relationships with Corporate and Institutional clients, MerchantBanking has set up a coordinated and global sales approach across its various business units. This resultedin continued increase in cross-selling and contributed to the strengthening of its position outside theBenelux.
In 2006, Merchant Banking more than tripled its presence in the United States clearing market byacquiring Chicago-based O’Connor & Co., a leading provider of clearing services to the U.S. equity,futures and options markets. Also in 2006, Merchant Banking acquired HFS, the largest FundAdministrator in the British Virgin Islands. These developments reflect Fortis’s goal of simultaneouslyproviding clients with global reach and with local focus and expertise.
Business Segments
Merchant & Private Banking is organized around four business segments: Markets; Commercial &Investment Banking; Specialized Finance; and Corporate & Public Banking
Markets
Global Markets
Global Markets provides tailored and integrated solutions to corporate clients, financial institutions,medium sized enterprises, private banking clients, governments and public entities in 25 countries acrossEurope, America and Asia.
Its customer-based activities are organized into specialized business units operating in the foreignexchange and money markets, fixed-income securities and derivatives, credit derivatives, securitiesfinancing, equities and equity derivatives as well as commodities and energy derivatives. Services areprovided through trading, sales and research desks.
Fortis Bank’s trading rooms in the major financial centers provide clients with 24-hour coverageand execution. Furthermore, customers have direct access to the trading room via the Merchant Bankingclient portal that allows them to trade currency and money market products on-line in a secureenvironment. They can also view their entire portfolio of trades with Fortis Bank in all financial products.
Merchant Banking participates in the development of a European benchmark credit default modelfor unlisted companies. Fortis Bank operates a rating advisory desk to assist corporate customers in
282
Level: 6 – From: 6 – Wednesday, May 14, 2008 – 1:39 pm – g5mac4 – 3960 Section 09 : 3960 Section 09

negotiations with rating agencies and to enable these companies to attract new sources of finance andexpand the investment alternatives for institutional investors.
Global Markets comprises the Institutional Banking and Clearing, Funds & Custody business lines,which are described below.
Institutional Banking is responsible for the global relationship management of corporate, bankingand institutional clients. It serves large enterprises in their financing needs from pure lending to the mostsophisticated financial structures and leveraged financing. It also offers specialized services to the publicsector and non-commercial customers, where it targets federal, regional and local authorities and publicsector entities and district and public welfare centers and cities in Belgium and The Netherlands.
Institutional Banking offers large international companies an extensive range of financial productsand services.
The Corporate Finance and Capital Markets unit specializes in investment banking advisoryservices to companies. It is active in mergers and acquisitions, initial public offerings and secondaryofferings and structuring. Fortis Bank advises companies, public authorities and institutions on capitalmarket transactions and is one of the leading companies in the field of mergers and acquisitions in theBenelux.
Clearing, Funds & Custody
Clearing, Funds & Custody offers integrated services to institutional investors, banks, mainstreamand alternative fund managers, and professional traders. Its main activities comprise a combination oftransaction processing, financial logistics, risk management, portfolio financing and asset optimization. Inpractice, this means that Global Securities & Funds Solutions offers services in the areas of custody, cashand derivatives clearing, securities financing and administration for on- and offshore investment funds.
Commercial& Investment Banking
Commercial Banking offers business services to medium-sized enterprises with annual salesbetween EUR 2.5 million and EUR 250 million, with an emphasis on internationally active companieswith complex financial needs. In particular, it focuses on businesses seeking multiple banking services,such as leasing, factoring, acquisition finance, trade finance, international credit facilities and internationalcash management. Due to the specific needs of its customer base, Commercial Banking has developed its“Act as One” strategy for these businesses, enabling them to arrange all their financial servicesinternationally through a single contact — the Global Relationship Manager — who provides specialized,tailored solutions via an integrated European network of Business Centers. As of January 1, 2008, thisnetwork consists of 126 dedicated Business Centers in 19 countries covering most of Europe but alsoChina and Turkey. Fortis Bank continued to pursue focused expansion in 2007 by strengthening itsnetwork of Business Centers in Turkey, Germany, Poland and the UK. Through this network, CommercialBanking can provide a broad range of services based on its experience within and outside the Europeanmarket, and its contacts with local networks. This network is being expanded in other regions, whichFortis believes offer strong growth potential at a rate of three new countries and four Business Centers inexisting countries per year. Commercial Banking aims to be present in 25 European countries by 2009. In2007, Commercial Banking brought the total number of customers to 90,000, and looks to further expandin the near future as a result of the acquisition of the ABN AMRO Businesses.
Commercial Banking provides a wide range of financial products and services to its medium-sizedenterprises. With these customers, Fortis pursues a relationship banking approach in order to obtain athorough understanding of a client’s business. It then provides financial solutions designed to meet theclient’s needs. Fortis Bank’s product range includes:
• Payment and electronic banking services, treasury services, and cash and liquiditymanagement;
• Trade services such as documentary credits and guarantees;
283
Level: 6 – From: 6 – Wednesday, May 14, 2008 – 1:39 pm – g5mac4 – 3960 Section 09 : 3960 Section 09

• Financing products such as working capital financing, medium- and long-term financing(including export financing and loan syndication) and asset-backed financing (includingleasing, factoring, receivables financing and asset securitizations);
• Risk management products, covering exchange rate, interest rate, commodity and equityrisks; and
• Advisory and financial engineering (e.g., Private Equity and Trust).
In addition to the network, online banking facilities are crucial to Fortis Bank’s quality of service.Traditional financial products and services geared to the needs of today’s corporate management aredistributed to all enterprises through Fortis Bank’s portal, www.fortisbusiness.com. This portal functions asan information platform not only for existing customers but also for prospective customers. It has adedicated edition for each country in which Commercial Banking is present, addressing customers in thelocal language and English. It currently provides access to foreign exchange and money markettransactions, trade finance transactions, cash management services and payment services, and commercialfinance transactions.
Investment Banking offers a wide variety of financial services, including corporate finance,structured finance and private equity. It provides integrated financial solutions in the fields of export andproject finance, acquisition and leveraged finance and real estate finance.
Private Equity provides venture capital and private equity to small and medium-sized enterprises formanagement buy-outs and corporate restructuring. Capital is contributed both directly, throughshareholdings in companies, and indirectly through investments in private equity funds or fund-of-funds inorder to have a broadly diversified portfolio.
Private Equity manages all the Private Equity assets of Fortis Bank. Total assets under managementat December 31, 2007 exceeded EUR 2.0 billion.
It provides venture, development, buy-out capital and mezzanine finance to a broad spectrum ofcompanies in both traditional and innovative sectors.
Private Equity operates via dedicated local teams focusing on direct investments. Complementary tothese direct investments, it manages a diversified funds-portfolio, made up of top quartile fundrelationships over Europe, the United States and Asia.
Structured Finance offers structured finance products and adds value by offering innovative andtailored solutions.
Specialized Finance
Specialized Finance consists of Energy, Commodities & Transportation, Leasing, Commercialfinance, Global trade services, Trust and Corporate services and Global Cash Management. Each of theseproduct lines and services are managed by separate entities with different internal and external distributionchannels and client bases. A description of each Specialized Finance entity is provided below.
Energy, Commodities & Transportation (“ECT”) offers financial solutions to these three industrysectors in which Fortis has a strong regional or global leadership position. In 2007, ECT was able to growits client base (e.g., in Brazil and Dubai), expand its product range (e.g., commodity derivatives, bases andprecious metals from Hong Kong to New York) and provide all financial products in a “one-stop shop”.
Fortis Lease specializes in leasing investment products such as vehicles, machinery, forklift trucks,IT equipment and real estate. Fortis Lease Group currently operates in Belgium, The Netherlands,Luxembourg, France, Spain, Portugal, the United Kingdom, Germany, Italy, Poland, Switzerland, Hungary,Turkey, the Czech Republic, Romania, Norway, Denmark, Finland, Sweden, Malaysia, Singapore andHong Kong. Through its product expertise, knowledge of the international leasing market and internationalpresence, Fortis Lease believes it is able to meet the growing demand of its customers for European
284
Level: 6 – From: 6 – Wednesday, May 14, 2008 – 1:39 pm – g5mac4 – 3960 Section 09 : 3960 Section 09

solutions. With leasing assets of EUR 3 billion at December 31, 2007, Fortis Lease Group ranks number11 of leasing companies in Europe and is among the top four for those with European coverage.
The objective of Fortis Lease is to consolidate and strengthen its position within the top Europeancross-border leasing companies, and to implement a European Vendor Leasing Business to support itscontinuous growth. During 2007, Fortis Lease strengthened its global footprint to 23 countries byconcluding the acquisition of Captive Finance, which is present in Scandinavia and Asia. Also in 2007,Fortis Lease obtained a license to establish a subsidiary in China.
Fortis Commercial Finance (“FCF”) is active as a factoring company in 20 countries and is thefifth largest factor in Europe based on volume in 2006.15 In 2007, FCF signed a cooperation agreementwith Intermarket Group, allowing FCF to add factoring to its product range in Central Europe.
The acquisition of Atradius Factoring reinforced FCF’s presence in Denmark, Sweden, France, Italyand Germany. A new back-office service provider, Finodis, was set up, offering outsourcing solutions forcorporate credit management, factoring and commercial finance. In September 2006, FCF acquired “4Faktor”, a Polish factor company. FCF is linked to a worldwide network of 180 factoring companies,present in 65 countries. FCF distinguishes itself from its competition by offering pan-European multi-localsolutions and Fortis branded credit cover services. FCF also offers a “factoring factory” (Finodis), a back-office utility aimed at servicing present and future FCF companies and large clients who have decided tooutsource their accounts receivable and credit management.
FCF’s consolidated structure offers several competitive advantages. One advantage is that FortisCommercial Finance can satisfy factoring needs internationally, i.e., the export factor in one’s owncountry. Another advantage is the ability to offer customers across national borders services from theFortis Commercial Finance group operating consistently and with common systems.
The internationalization of its factoring business offers adds value for Fortis clientele.
In addition to European integration, Fortis Commercial Finance is also expanding into creditmanagement, account receivables managements, and financing of commerce. Current developments in e-business and new services areas within the Internet environment complement the internationalization ofFortis Commercial Finance. As part of its growth strategy, FCF regularly considers acquisitionopportunities and joint venturing solutions in a number of European countries.
The Global Trade Services (“GTS”) division of Fortis Bank helps customers to meet payment anddelivery risk, an essential role in both import and export transactions. To this end, it offers a variety ofrisk-mitigating products including letters of credit, collections and international guarantees and providessupport in developing special payment techniques.
Today most of GTS operations are centralized in the European Documentary Credits andCollections Centre, giving customers direct access to back-office systems through the Click n’ Trade on-line application.
Fortis Intertrust is a worldwide leader in Trust and Corporate Services, employing over 1,200people and present in more than 20 countries: Belgium, China, Denmark, Isle of Man, Ireland, Italy, TheNetherlands, The Netherlands Antilles, Liechtenstein, Luxembourg, France, Russia, the United Kingdom,Spain, Sweden, Switzerland, Turkey, the United States, Dubai, Poland, and Singapore.
Fortis Intertrust is able to provide cross-border structuring solutions to private individuals andcorporate clients. Fortis Intertrust often has a spearheading function entering new markets, such as China,Russia and Turkey, or developing highly sophisticated new products and services, such as CorporateGovernance, Carbon Management Trading and Yacht Management services.
Fortis Intertrust set up offices in Russia, Poland and Dubai (“UAE”) and launched new servicessuch as Yacht and Aircraft Solutions in cooperation with Fortis Lease. Global Trade Services established apresence in the majority of the Business Centers and continued centralizing back-office activities to further
285
Level: 6 – From: 6 – Wednesday, May 14, 2008 – 1:39 pm – g5mac4 – 3960 Section 09 : 3960 Section 09
15 Source: FCI Statistics (Factors Chain International)/Business Money UK/Deutscher Factoring (2006).
boost efficiency. The Dubai office offers wealth management services in the Middle East and SoutheastAsia.
Global Cash Management (“GCM”) division of Fortis Bank assists customers with accounts,payments and cash management services. Cash management is the day-to-day management of acompany’s current accounts, payments and collections and liquidity and therefore is an importantcornerstone in delivering Specialized Financial Services for all steps in the financial supply chain ofFortis’s clients, together with the other Specialized Financial Services skills.
Corporate & Public Banking
Corporate & Public Banking is responsible for the global relationship management of corporate,and public sector clients. It serves large enterprises in their financing needs from pure lending to the mostsophisticated financial structures and leveraged financing. It also offers specialized services to the publicsector and non-commercial customers, where it targets federal, regional and local authorities and publicsector entities and district and public welfare centers and cities in Belgium and The Netherlands.
Insurance
Fortis is a prominent player in Europe’s insurance market, and is among the top ten Europeaninsurers based on gross earned premiums.16 Fortis benefits from market leadership in the Benelux where itoffers a comprehensive range of life and non-life insurance products and strong positions in thebancassurance and broker channels. Fortis Insurance leverages its existing skills in distribution, operationsand products from its home markets in the Benelux and has established leading positions in selectedEuropean and Asian markets.
Strategy
Fortis Insurance aims to create revenue synergies by leveraging proven skills across borders andacross businesses. At the same time, it wants to achieve economies of scale in local markets and share bestpractices within the organization. To this end, all the insurance businesses are under the leadership of oneChief Executive Officer and an organizational structure is created to support the sharing of best practices,skills and expertise across borders.
The strategy of Fortis Insurance involves alignment of local business strategies with several keystrategic levers to “fortify” growth and is centered on around products/market innovation, multi-channeldistribution, operational excellence, international expansion and an organization equipped to foreseedevelopments in the insurance industry.
The objective is to get closer to the end-customer and in doing so to improve Fortis Insurance’scompetitive position. Fortis Insurance will use its brand and varied distribution expertise to focus on amulti-channel approach. The strategy may differ between existing markets, depending on the localsituation, and new markets, in which a true multi-channel strategy has yet to be established.
Fortis is implementing a single organization to support and accelerate the growth of FortisInsurance.
The key strategic levers are:
• Multi-channel distribution (Brokers/IFA’s, Bancassurance, Direct, Agents and Affinity);
• Product/market innovation (end-customer focus, exchange and rollout of proven productsacross countries and shared innovation);
• Operational excellence (enhance service levels, lower cost to serve, leverage platforms,optimize local character and lean operation);
286
Level: 6 – From: 6 – Wednesday, May 14, 2008 – 1:39 pm – g5mac4 – 3960 Section 09 : 3960 Section 09
16 Source: Assuralia (http://www.assuralia.be, section: cijfergegevens/chiffres utiles), year 2005 and Assurantie Magazine (AM Jaarboek2006 based on DNB numbers) based on premium income 2005.

• International expansion (selectively expands to new product/markets in Europe/Asia, rolloutJV management/reinforce involvement).
This enhanced strategy aims at increasing the profit potential of Fortis insurance business.
The following table shows the contribution of the business lines within Fortis Insurance to Fortisinsurance results as a whole for the year ended December 31, 2007.
Year Ended December 31, 2007111121123111121111211112
Insurance Insurance Insurance TotalBelgium Netherlands International Insurance(1)
11112 11112 11112 11112
(EUR million)
Result before taxation . . . . . . . . . . . . . . . . . . . . . . . . . 566 1,016 192 1,768Gross earned life premiums . . . . . . . . . . . . . . . . . . . . 4,971 3,108 1,610 9,688Premium inflow deposit accounting . . . . . . . . . . . . . 1,181 2,090 2,300 3,481Gross earned non-life premiums . . . . . . . . . . . . . . . . . 1,357 2,090 1,938 5,385Gross earned inflows . . . . . . . . . . . . . . . . . . . . . . . . . . 7,508 5,198 5,848 18,554Total assets . . . . . . . . . . . . . . . . . . . . . . . . . . . . . . . . . 53,341 39,040 27,081 119,199
(1) Total Insurance, including consolidation eliminations.
Insurance Belgium
Overview
In July 2006, Fortis AG and FB Insurance, two Fortis insurance entities in Belgium, merged intoone single company, resulting in the largest insurance company in Belgium: Fortis Insurance Belgium(“FIB”).17 FIB operates through three distribution channels:
• The Bank Channel distributes life and non-life products, primarily to individuals and smallcompanies, exclusively through the branch networks of Fortis Bank and Banque de LaPoste/Bank van De Post;
• The Broker Channel distributes life and non-life products through independentintermediaries; and
• The Employee Benefits & Health Care (EB/HC) Channel provides group life, pension andhealthcare insurance solutions to mid-sized and large enterprises both directly and throughlarge and international brokers and consultants.
With the merger of the non-life platform, expected in the second quarter of 2008, all integrationprojects with regard to the merger of Fortis AG and FB Insurance will have been completed. FIB’scommercial strategy will remain channel-specific, but FIB expects to benefit from synergies and costsavings by sharing IT and support functions.
FIB’s strategy with the Broker Channel is to strengthen its market position through productinnovation, providing optimum support for intermediaries while controlling costs. The Broker Channelfocuses on profitable growth by deepening relationships with growth-oriented brokers with good technicalprofitability. The growing use of information and communication technology and meeting the qualitydemands of the intermediaries are the main drivers for improved service and efficiency. In order toimprove communication with intermediaries and transaction process, FIB Broker Channel has investedheavily in chain integration. On average more than 1,400 insurance brokers use the online transactionsystem each day. These systems are helping FIB to improve the efficiency and quality of the administrativeprocessing, thus leading to greater satisfaction among intermediaries and clients.
287
Level: 6 – From: 6 – Wednesday, May 14, 2008 – 1:39 pm – g5mac4 – 3960 Section 09 : 3960 Section 09
17 Source: Expertisenews (http://www.expertisenews.be) based on fair value of 2006.

FIB, through the Bank Channel, offers integrated bancassurance solutions to complete or enhancethe product and service range of Fortis Bank, in order to realize a full wealth planning and protectionapproach. Fortis Insurance Belgium’s ten-year insurance distribution agreement with Banque de LaPoste/Bank van De Post became operational in 2005. Under this agreement, FIB launched structured unit-linked products alongside traditional pension products. As a result, inflow of EUR 139.7 million wasrecorded in 2007.
In the employee benefits market, the Employee Benefits & Health Care (EB/HC) Channel aims tobuild on its leadership in the field of employee benefits solutions for mid-sized and large companies. Itstrengthened its position in the market by signing a number of key group healthcare contracts in 2005,2006 and 2007. In the past three years, it has increased its healthcare portfolio from 508,000 affiliates in2004 to 803,000 in 2007.
FIB’s EB/HC channel is the leading second pillar group life insurance (which includes variouscompany plans, sector-wide plans, early-retirement plans and individual plans), provider in Belgium. Itprovides pension plans, disability insurance products and health insurance. The solutions offered to clientshave the benefit of complete customization and flexibility.
Fortis Real Estate NV/SA (“Fortis Real Estate”), which is FIB’s subsidiary for property activities,is the largest real estate asset manager in Belgium (including buildings held for own use).18 Fortis RealEstate continues developing its property activities for the account of third parties.
Strategy
Fortis Insurance Belgium aspires to strengthen its market-leading position in the Belgian insurancemarket.19 It aims to continue showing profitable growth in its three market segments, retail life, non-lifeand employee Benefits, through a multi-channel approach. Its key strategic goals are:
• Reinforce leadership position in the broker and bank channels;
• Sustain focus on innovative product and service offerings leading to competitive advantage;
• Maintain tight relationships with insurance brokers;
• Increase penetration and cross-selling in bancassurance;
• Further cost containment through intensive use of chain integration and synergies;
• Increase client satisfaction and loyalty.
288
Level: 6 – From: 6 – Wednesday, May 14, 2008 – 1:39 pm – g5mac4 – 3960 Section 09 : 3960 Section 09
18 Source: Expertisenews (http://www.expertisenews.be) based on fair value of 2006.
19 Source: Assuralian (http://www.assuralia.be, section: cijfergegevens/chiffres utiles), year 2005.

The following table shows the contribution of insurance in Belgium to Fortis total insurance resultsfor the year ended December 31, 2007.
Year Ended December 31, 2007111121221111211112
InsuranceBelgium as a
Insurance Total % of TotalBelgium Insurance Insurance11112 11112 11112
(EUR million, except %)
Result before taxation . . . . . . . . . . . . . . . . . . . . . . . . . . . . . . . . . . . . 566 1,768 32%Gross earned life premiums . . . . . . . . . . . . . . . . . . . . . . . . . . . . . . . 4,970 9,688 51%Premium inflow deposit accounting . . . . . . . . . . . . . . . . . . . . . . . . 1,181 3,481 34%Gross earned non-life premiums . . . . . . . . . . . . . . . . . . . . . . . . . . . . 1,357 5,385 25%Gross earned inflows . . . . . . . . . . . . . . . . . . . . . . . . . . . . . . . . . . . . 7,509 18,554 40%Assets . . . . . . . . . . . . . . . . . . . . . . . . . . . . . . . . . . . . . . . . . . . . . . . . 53,341 119,199 45%
Market position
According to the Belgian Insurance Industry Association, Assuralia, in 2007, the Belgian insurancemarket had EUR 30,555 billion of total inflow of which EUR 9,597 billion were non-life premiums,primarily motor, fire, accident, health and liability policies. Individual life policies, mostly pensions andsavings products, accounted for the largest segment, EUR 16,826 billion of inflow. Group life, primarilycompanies’ occupational pension schemes, accounted for EUR 4,120 billion.
The Belgian non-life market returned to overall profitability in 2005. A favorable economicenvironment allowed such profitability to continue during 2006 and 2007. The positive trend reflected anumber of factors, including the effect of earlier rate increases and a stable claims frequency, especially inmotor insurance, although price pressure remains high. Non-life premium growth in 2007 was 4.3%,which was higher than the 2.7% rise in GDP.
The Belgian insurance industry is highly concentrated among a few large companies, with the sixlargest insurance groups (Fortis, KBC, Ethias, AXA, Dexia and ING) accounting for 81% of the market interms of 2006 total market inflow. Fortis Insurance Belgium has a strong position in this market for all theproducts and services it provides.
Fortis Insurance Belgium had an overall market share of 24.6% in terms of total gross inflow in2007. According to the globalized market study published by Assuralia in its Annual Report 2007, FortisInsurance Belgium has increased its life insurance market share from 27.6% in 2006 to 29.1% in 2007,and its non-life insurance market share from 13.7% in 2006 to 14.2% in 2007. Through its subsidiaryFortis Real Estate, Fortis Insurance Belgium is the largest real estate asset manager in Belgium (includingbuildings held for own use).20
According to the globalized market study published by Assuralia in its 2007 Annual Report, FortisInsurance Belgium’s market share in individual life increased from 27.1% in 2006 to 29.0% in 2007.Fortis Insurance Belgium posted strong growth in individual life in 2007 (growth of 13.3% while themarket excluding FIB, grew by only 2.8%). When excluding first pillar group life insurance, FIB is thelargest provider of second pillar group life insurance in Belgium, with a market share of 29.5%.21
Product Developments
A focus on innovative products and services is a key strategic priority. Two of these innovativeproducts are “Familis” and “Modulis”. The “Familis” and “Modulis” concepts that distinguish FIB fromits competitors. Familis is a modular multi-product concept for the retail market that enables the client toplace several non-life insurance policies efficiently in a single portfolio, while Modulis targets the SME
289
Level: 6 – From: 6 – Wednesday, May 14, 2008 – 1:39 pm – g5mac4 – 3960 Section 09 : 3960 Section 09
20 Source: Expertisenews (http://www.expertisenews.be) based on fair value of 2006.
21 Source: Assuralia (http://www.assuralia.be, section: cijfergegevens/chiffres utiles), year 2005.

market, self-employed and liberal professions. In addition, the application process, management andprocessing by the intermediary take place rapidly and efficiently via a secure online transaction system.
When Modulis was launched in 1999 and Familis in 2002, the possession rate (i.e., average numberof Property & Casualty policies divided by number of Familis or Modulis policies, as applicable) attained1.5 contracts per client. As of December 31, 2007, the Modulis portfolio consisted of 60,300 files (7,900files were added during 2007), which represents 229,400 policies with an average of 2.3 insurance coversper file. As of December 31, 2007, Fortis Familis’ portfolio amounted to 382,900 files (of which 53,200were added during 2007), representing 883,300 policies.
Another very successful innovative product concept is the “Pack”. A “Pack” offers extendedinsurance cover for a specific group of risks, for a small additional premium only. The generic packs,launched at the end of 2004 (Pack Auto+ and Pack Woning+), continue to be very successful. In 2007, anumber of specific packs have been launched both for the retail and SME market (such as Pack Dentistand Pack Backery). At year-end 2007, the number of Packs in portfolio stood at 170,000 (net growth of+80,000 Packs over 2007).
In March 2008, the “ Fortis V.I.P.” concept was launched. This concept aims at realizing distributionsynergies between the Bank and Broker Channel. Rather than being a Fortis Bank or a Fortis Insuranceclient, this synergy stimulates SMEs to become a total Fortis client (“Fortis V.I.P.”), while benefiting fromthe advice linked to each specific channel (the Bank for banking advice/service and the broker forinsurance advice/service).
Products
The following table sets forth Fortis Insurance Belgium’s gross inflow life and the gross earnedpremiums non-life by type of policy for the periods indicated.
Year Ended December 31,111121231111211112
2007 2006 200511112 11112 11112
(EUR million)
APE(1) . . . . . . . . . . . . . . . . . . . . . . . . . . . . . . . . . . . . . . . . . . . . . . . . . 585 511 494LifeIndividual contracts . . . . . . . . . . . . . . . . . . . . . . . . . . . . . . . . . . . . . . 850 766 614Group contracts . . . . . . . . . . . . . . . . . . . . . . . . . . . . . . . . . . . . . . . . . 970 903 933Investments contracts with discretionary participation features . . . . 3,150 2,684 2,592Total gross written earned premiums life . . . . . . . . . . . . . . . . . . . 4,970 4,353 4,139Investment contracts without discretionary participation featuresand unit-linked investments contracts . . . . . . . . . . . . . . . . . . . . . . . . 1,181 1,121 1,141Gross inflow life . . . . . . . . . . . . . . . . . . . . . . . . . . . . . . . . . . . . . . . . 6,151 5,474 5,280Non-LifeProperty & Casualty . . . . . . . . . . . . . . . . . . . . . . . . . . . . . . . . . . . . . 965 886 830Accident & Health . . . . . . . . . . . . . . . . . . . . . . . . . . . . . . . . . . . . . . 392 367 329
11112 11112 11112
Total gross written earned premiums non-life . . . . . . . . . . . . . . . 1,357 1,253 1,15911112 11112 11112
Total gross written earned premiums . . . . . . . . . . . . . . . . . . . . . . 6,327 6,727 5,29811112 11112 1111211112 11112 11112
(1) New life business annual premiums and 10% of new life business single premiums.
Life Products
Fortis Insurance Belgium’s life products consist of a broad range of participating (with profitsharing) and non-participating (without profit sharing) policies written for both individual and groupcustomers. Participating policies share in either the results of the issuing company or investment returns onspecified assets.
290
Level: 6 – From: 6 – Wednesday, May 14, 2008 – 1:39 pm – g5mac4 – 3960 Section 09 : 3960 Section 09

Individual. FIB’s individual life products include a variety of endowment, pure endowment, termand whole life and universal life type insurance policies designed to meet specific market needs. FIBoffers single and regular premium policies used primarily for the funding of individual retirement benefits.Due to the fiscal segmentation, most of the benefits under these policies are payable at age 60 to 65 or onpremature death.
Fortis Insurance Belgium’s tax-advantaged mortgage funding products include regular premiumendowment policies, as well as policies that combine term insurance and savings features. Regularpremium endowment policies are also marketed as savings products or sold in connection with residentialmortgages. In addition, through its bancassurance distribution channel, Fortis offers investment productssuch as insurance bonds. FIB individual life products are mostly “universal life”, offering investment styleproducts, both investment-linked and non-investment linked.
FIB also offers investment-linked insurance policies, where the policyholder bears the investmentrisk. Premiums are invested in investment funds chosen by the policyholder and the return on theinvestments is reinvested in the fund on behalf of the policyholder. An optional death benefit at specifiedlevels is offered as well. Policy terms allow the policyholder to switch periodically among funds.
Group. FIB’s group life policies are designed to fund private pension benefits offered by a widerange of businesses, public authorities and institutions to their employees as a supplement to government-provided benefits. These benefits include sums assured by life or death, annuities, disability benefits andspouses’ and orphans’ benefits.
For large groups, customized policies are offered to meet the needs of individual employers. Forother groups, standardized policies providing specified benefits are offered.
Legally, the different types of group policies are “traditional” group insurance, key man insurance,early retirement pensions and public sector pensions. Fortis currently offers three different group products.The first consists of contracts with guaranteed interest increased by an annual profit sharing. The secondgroup product consists of contracts with a guaranteed interest rate whereby profit sharing is based on thereturn on a segregated portfolio of investments. These investments are managed separately from otherinvestments and Fortis receives a related management fee. The third type consists of contracts without aguaranteed interest rate whereby the policyholder bears investment risk and the return on the portfolio inwhich premiums are invested are solely for the benefit of the policyholder. Here FIB also receives a relatedmanagement fee.
291
Level: 6 – From: 6 – Wednesday, May 14, 2008 – 1:39 pm – g5mac4 – 3960 Section 09 : 3960 Section 09

The following table sets forth certain data with respect to Fortis Insurance Belgium’s individual andgroup life premiums by type of policy for the periods indicated.
Year Ended December 31,111121231111211112
2007 2006 200511112 11112 11112
(EUR million)
Unit-linked contractsSingle premiums-written . . . . . . . . . . . . . . . . . . . . . . . . . . . . . . . . . . 19 16 8Periodic premiums-written . . . . . . . . . . . . . . . . . . . . . . . . . . . . . . . . 57 39 32
11112 11112 11112
Group business total . . . . . . . . . . . . . . . . . . . . . . . . . . . . . . . . . . . . . 76 55 40Single premiums-written . . . . . . . . . . . . . . . . . . . . . . . . . . . . . . . . . . 1 1 1Periodic premiums-written . . . . . . . . . . . . . . . . . . . . . . . . . . . . . . . . 0 0 0
11112 11112 11112
Individual business total . . . . . . . . . . . . . . . . . . . . . . . . . . . . . . . . . . 1 1 111112 11112 11112
Unit-linked contracts total . . . . . . . . . . . . . . . . . . . . . . . . . . . . . . . 76 56 41Non unit linked contractsSingle premiums-written . . . . . . . . . . . . . . . . . . . . . . . . . . . . . . . . . . 297 256 291Periodic premiums-written . . . . . . . . . . . . . . . . . . . . . . . . . . . . . . . . 597 592 602
11112 11112 11112
Group business total . . . . . . . . . . . . . . . . . . . . . . . . . . . . . . . . . . . . . 894 848 893Single premiums-written . . . . . . . . . . . . . . . . . . . . . . . . . . . . . . . . . . 522 430 185Periodic premiums-written . . . . . . . . . . . . . . . . . . . . . . . . . . . . . . . . 327 335 428
11112 11112 11112
Individual business total . . . . . . . . . . . . . . . . . . . . . . . . . . . . . . . . . . 849 765 61311112 11112 11112
Total non unit linked contracts . . . . . . . . . . . . . . . . . . . . . . . . . . . 1,743 1,613 1,506Investment contracts with discretionary participation featuresSingle premiums-written . . . . . . . . . . . . . . . . . . . . . . . . . . . . . . . . . . 0 0 15Periodic premiums-written . . . . . . . . . . . . . . . . . . . . . . . . . . . . . . . . 0 0 14
11112 11112 11112
Group business total . . . . . . . . . . . . . . . . . . . . . . . . . . . . . . . . . . . . . 0 0 29Single premiums-written . . . . . . . . . . . . . . . . . . . . . . . . . . . . . . . . . . 2,902 2,460 2,071Periodic premiums-written . . . . . . . . . . . . . . . . . . . . . . . . . . . . . . . . 249 224 492
11112 11112 11112
Individual business total . . . . . . . . . . . . . . . . . . . . . . . . . . . . . . . . . . 3,151 2,684 2,56311112 11112 11112
Total investment contracts with discretionary participation features . . . . . . . . . . . . . . . . . . . . . . . . . . . . . . . . . . . . . . . . . . . . . . . 3,151 2,684 2,592
11112 11112 1111211112 11112 11112
Total gross earned premiums . . . . . . . . . . . . . . . . . . . . . . . . . . . . . . 4,970 4,353 4,13911112 11112 1111211112 11112 11112
Non-Life Products
The following table sets forth Fortis Insurance Belgium’s gross earned premium income by productfor the periods indicated:
Gross Earned Premiums111121231111211112
2007 2006 200511112 11112 11112
(EUR million)
Property & Casualty . . . . . . . . . . . . . . . . . . . . . . . . . . . . . . . . . . . . . 965 886 830Accident & Health . . . . . . . . . . . . . . . . . . . . . . . . . . . . . . . . . . . . . . 392 367 329
11112 11112 11112
Total . . . . . . . . . . . . . . . . . . . . . . . . . . . . . . . . . . . . . . . . . . . . . . . . . 1,357 1,235 1,15911112 11112 1111211112 11112 11112
Property & Casualty
Fire. Fortis Insurance Belgium’s fire insurance policies provide coverage to both individual andcommercial customers. Fire policies generally provide coverage for a variety of losses, including fires,
292
Level: 6 – From: 6 – Wednesday, May 14, 2008 – 1:39 pm – g5mac4 – 3960 Section 09 : 3960 Section 09

storms, burglary and other perils. Individual coverage is provided on both a single-risk and multi-riskbasis, with multi-risk policies providing coverage for loss or damage to dwellings, damage to personalgoods, and liability to third parties.
Commercial coverage is provided to Belgian companies for buildings and facilities in Belgium, andincludes ordinary and commercial risks. Fortis Insurance Belgium is the largest provider of fire insurancein Belgium based on gross written premiums, with a market share of 20.3% in 2007.
Motor. The motor policies commercialized by Fortis Insurance Belgium provide coverage toindividual and commercial (fleet) insurers for third-party liability (including property damage and bodilyinjury), as well as coverage for theft, fire and collision damage. Belgian law requires that coverage forthird-party liability be maintained with respect to each licensed motor vehicle. Other coverage, includingcollision, first party medical and damage suffered by the policyholder, the driver of the vehicle or thevehicle itself are optional. Each of the various optional types of coverage provided by Fortis InsuranceBelgium is available with deductibles, which enables policyholders to reduce the cost of coverage byselecting higher deductible amounts. Policies are generally written for a minimum period of one year.
The terms and features of motor insurance offered by FIB are generally similar to those offered byits competitors in the Belgian market, though slight variations may occur as a result of the multi-channelapproach. Because of these factors, competition in the Belgian motor insurance market is predominantlydetermined by the client-broker relationship and price. Fortis Insurance Belgium establishes its premiumrates on the basis of its own historical data and pricing and underwriting experience. Premium levels aredetermined according to numerous variables, including factors related to the age and model of the insuredvehicle as well as age, driving record and other factors related to the policyholder. In addition to premiumlevels, the frequency and severity of loss events affect the results of FIB’s motor business. FIB is a majorplayer in the Belgian motor market, with a market share of 13.3% (in terms of gross written premiums) atthe end of 2007.
At year-end 2007, Fortis Insurance Belgium introduced BA Max, a unique concept in the highlycompetitive Belgian car insurance market. BA Max offers free extension of basic third-party liabilitycoverage, as all zero-claim drivers are automatically covered for bodily injury.
Accident & Health
Accident & Health insurance is provided by Fortis Insurance Belgium on both an individual andgroup basis. The types of risks covered by FIB’s Accident & Health insurance policies include accidentaldeath and temporary and permanent disability. In Belgium, the government’s role is decreasing in the fieldof disability insurance and sick pay, creating new opportunities for insurance companies to provide privatesector coverage for benefits previously provided by the state. Belgian law stipulates that each employermust underwrite an insurance policy (“Workmen’s Compensation”) to cover employees in case ofaccidents in the workplace or on the way to and from the work place and the employee’s home. Unlikemost other European countries, in Belgium the private sector rather than the state social security systemprovides these insurance products. Although provided by the private sector, the levels of premiums aresubject to control of the government that also exerts administrative control of claims handling. FortisInsurance Belgium is a leading player in the Accident & Health market with a market share of 15.9% in2007.
Distribution Channels
In Belgium, Fortis Insurance Belgium distributes its insurance products through three principaldistribution channels: the independent professional intermediary broker channel, bancassurance and theEmployee Benefits & Health Care (EB/HC) channel. These distribution channels offer products, that aretargeted at specific market segments.
Products offered through the brokerage channel are generally aimed at customers who requirespecialized advice. The bancassurance channel generally offers standardized products that together withbank products offer a complete range of financial services to the bank customer.
293
Level: 6 – From: 6 – Wednesday, May 14, 2008 – 1:39 pm – g5mac4 – 3960 Section 09 : 3960 Section 09

Fortis Insurance Belgium has reinforced its leadership position in these two channels through themerger of Fortis AG and FB Insurance in 2006. Activities that are not specific to either the broker or thebank channel have been combined to achieve cost synergies, while channel specific operations have beenkept separate.
Independent Brokers
The products offered by FIB Broker Channel in the retail and small and medium-size enterprisesmarket are distributed exclusively through more than 3,000 professional independent intermediaries. Theprofessional independent intermediaries are individuals or companies, which represent a number ofinsurance companies in a sale and service capacity as third-party contractors. In this respect, FIB BrokerChannel competes with other companies that provide financial products and services through this channel.FIB Broker Channel is a very large provider of insurance products through professional independentbrokers in Belgium. Independent brokers are paid on a commission basis and are not employees of thecompanies they represent.
The independent brokers mostly sell both life and non-life insurance products. According to anAssuralia survey on Belgian insurance distribution, the broker channel is the predominant channel in thenon-life sector, with a market share of 62.4% in 2006.
FIB Broker Channel supports its professional brokers through nine small commercial centers allover Belgium, supported by three administration and management centers, which also performunderwriting and claims handling functions.
Bancassurance
Bancassurance continues to be a growing distribution channel in the Belgian insurance market.According to Assuralia, the bancassurance channel has generated 43.0% of the total life inflow in 2006.Fortis Insurance Belgium is the leading distributor of life insurance in Belgium through the bancassurancedistribution channel and in 2006 had a market share of 42.6% of the non-unit-linked and 28.5% of theunit-linked bancassurance market. It distributes life and non-life products, primarily to individuals andsmall enterprises, through 1,064 branches of Fortis Bank (as of December 31, 2007).
Employee Benefits and Health Care
The EB & HC Channel provides group life, pension and healthcare insurance solutions to largeenterprises in the public and private sectors both directly and through large and international brokers andconsultants.
Insurance Netherlands
Overview
In The Netherlands, Fortis is active in insurance through Fortis ASR, a large generalist insurer andfour specialist insurers, Fortis ASR offers a complete range of life and non-life insurance, mortgage andsavings products to both the private market and small and medium-sized enterprises. The specialistinsurers supply income protection, unit-linked insurance, travel and leisure cover and funeral policies.Fortis ASR and the Dutch activities of the specialist insurers encompass all of Fortis insurance activities inThe Netherlands as well as a number of banking activities offered via intermediaries. With an overallmarket share of 11.6% based on 2006 gross premiums written, Fortis Insurance Netherlands (“FIN”) is thethird largest insurer in The Netherlands.22 It addresses the market through different brands. Its financialproducts are distributed mainly through more than 8,000 independent brokers that vary greatly in terms ofprofile, size and marketing strategy with additional distribution through tied agents, fee consultants, Fortisbank branches and direct distribution.
294
Level: 6 – From: 6 – Wednesday, May 14, 2008 – 1:39 pm – g5mac4 – 3960 Section 09 : 3960 Section 09
22 Source: DNB Verslagstaten based on premium income 2006, excluding medical cost. Life insurance number 4, Non-Life insurancenumber 3.

In 2007, FIN launched the new direct label Ditzo. Ditzo initially is only offering motor insuranceand plans to extend its range to other non-life and life insurance products and mortgages.
Fortis Insurance Netherlands writes a broad range of life and non-life insurance products in TheNetherlands. Life premiums and non-life premiums accounted for 60% and 40%, respectively, of grosspremiums written in 2007 in The Netherlands.
In 2007, Ardanta, one of the four specialist insurers, started distribution of funeral insurances viaFortis Bank in Belgium.
Fortis Insurance Netherlands aims to sustain and further develop its strong market position in TheNetherlands in life, disability, and pension insurance products via a well balanced distribution mix.
Strategy
In response to several decisive and rapidly changing market trends, Fortis Insurance Netherlands hasdefined a new strategy. The key points of this strategy are:
• Focus on profitable growth, in particular in life and disability insurance, pensions,bancassurance;
• Diversify distribution, increasing the contribution from bancassurance and own distributionchannel relative to broker distribution;
• Focus on customer and broker satisfaction;
• Innovate life and non-life products and solutions;
• Improve operational excellence.
To achieve these goals, Fortis Insurance Netherlands will deploy three strategic themes: (1) improvecore activities through the improvement of operational excellence and commercial effectiveness; (2) offerinnovative products and services, develop multi-channel distribution and reinforce customer focus throughproduct innovation and (3) implement enablers (i.e., organization adjustments, process redesign andleadership programs) to enhance client focus in areas such as organization and culture.
The Dutch insurance markets are some of the most sophisticated in Europe, with relatively highproportions of life and pensions sales, deregulation, focus on asset management performance andincreasingly competitive distribution channels. Independent brokers still predominate but bancassuranceand direct writers are significant and increasing competitive forces.
A high level of competition marks all segments of the insurance market in The Netherlands. Thishas led to significant margin pressures in this market. The proliferation of niche segments (by geographyor by product) has exacerbated this competition, though the combination of low top-line growth, excesscapacity and high cost structures suggests that further consolidation is imminent.
295
Level: 6 – From: 6 – Wednesday, May 14, 2008 – 1:39 pm – g5mac4 – 3960 Section 09 : 3960 Section 09

The table below shows the contribution of insurance in The Netherlands to Fortis total insuranceresults as of and for the year ended December 31, 2007.
Year Ended December 31, 2007111121231111211112
InsuranceNetherlands
Insurance Total as a % of Netherlands(1) Insurance Total Insurance11112 11112 11112
(EUR million, except %)
Result before taxation . . . . . . . . . . . . . . . . . . . . . . . . . . . . . . . . . . . . 1,016 1,768 57%Gross earned life premiums . . . . . . . . . . . . . . . . . . . . . . . . . . . . . . . 3,108 9,688 32%Premium inflow deposit accounting . . . . . . . . . . . . . . . . . . . . . . . . — 3,481 —Gross earned non-life premiums . . . . . . . . . . . . . . . . . . . . . . . . . . . . 2,090 5,385 39%Gross earned inflows . . . . . . . . . . . . . . . . . . . . . . . . . . . . . . . . . . . . 5,198 18,554 28%Assets . . . . . . . . . . . . . . . . . . . . . . . . . . . . . . . . . . . . . . . . . . . . . . . . 39,040 119,199 33%
(1) Netherlands Insurance includes Fortis ASR and four specialist insurers.
Market Position
In 2006, Fortis was the third largest provider of insurance products (excluding medical costs), thesecond largest provider of non-life insurance and the fourth largest provider of life insurance products inThe Netherlands. Fortis has a leading market position in individual life and non-life cover, disabilityinsurance, and niche markets such as travel and leisure and funeral policies. Fortis market position in TheNetherlands is based on Fortis’s review of publicly available data and gross premium income in 2006.23
As of December 31, 2006, Fortis Insurance Netherlands was the third largest insurer in the Dutchinsurance market.19 The total market share of the top three players increased from 38% in 2002 to 46% in2006. Assuming this trend continues, this will lead to a concentration of 65% by 2010. Such trend wouldbe in line with the Dutch banking sector, where consolidation has resulted in a 65% market share for thetop three banks.
In addition to consolidation, the insurance sector is being challenged by a number of external trendsand discontinuities. Examples of these developments include changing consumer behavior, as there is agrowing consumer demand for simple products covering basic needs which can be easily accessed throughall channels (Internet, telephone, mail, personal). The importance of the Internet channel continues toincrease.
The purchase of simple risk Property & Casualty products through the Internet is expected toincrease to more than 40% by 2010 (15% in 2007).24
This development towards convenience and transparency is reinforced by new regulations such asthe recently implemented Financial Services Act and the upcoming Transparency in Commissions Act.New legislation regarding the full privatization of the disability risk for employers, has led to thedevelopment of complex disability products which require an enhanced level of customer care and advicein the marketing phase.
296
Level: 6 – From: 6 – Wednesday, May 14, 2008 – 1:39 pm – g5mac4 – 3960 Section 09 : 3960 Section 09
23 Source: Assurantie Magazine (Am Jaarboek based on DNB numbers) based on premium income 2005. Life insurance number 4, Non-Life insurance number 3.
24 Source: GFK TOF Tracker 2007

Products
The following table sets forth Fortis gross inflow life and the gross earned premiums non-life bytype of policy for the periods indicated.
Year Ended December 31,111121231111211112
2007 2006 200511112 11112 11112
(EUR million)
APE(1) . . . . . . . . . . . . . . . . . . . . . . . . . . . . . . . . . . . . . . . . . . . . . . . . . 313 275 250Life Individual contracts . . . . . . . . . . . . . . . . . . . . . . . . . . . . . . . . . . 2,354 2,343 2,212
Group contracts . . . . . . . . . . . . . . . . . . . . . . . . . . . . . . . . . . . . . . . 754 1,094 423Investments contracts with discretionary participation features . . — — —
11112 11112 11112
Total gross earned premiums life . . . . . . . . . . . . . . . . . . . . . . . . . 3,108 3,437 2,63511112 11112 11112
Investment contracts without discretionary participation features . . — — —Gross inflow . . . . . . . . . . . . . . . . . . . . . . . . . . . . . . . . . . . . . . . . . . . 3,108 3,437 2,635
Property & Casualty . . . . . . . . . . . . . . . . . . . . . . . . . . . . . . . . . . . 982 985 986Accident & Health . . . . . . . . . . . . . . . . . . . . . . . . . . . . . . . . . . . . 1,108 959 1,003
11112 11112 11112
Total gross written earned premiums non-life . . . . . . . . . . . . . . . 2,090 1,944 1,98911112 11112 11112
Total gross written earned premiums . . . . . . . . . . . . . . . . . . . . . . 5,198 5,381 4,62411112 11112 1111211112 11112 11112
(1) New life business annual premiums and 10% of new life business single premiums.
Life Products
Fortis life insurance products consist of a broad range of participating (with profit sharing) and non-participating (without profit sharing) policies written for both individual and group customers.Participating policies share in either the results of the issuing company or investment returns on specifiedassets.
297
Level: 6 – From: 6 – Wednesday, May 14, 2008 – 1:39 pm – g5mac4 – 3960 Section 09 : 3960 Section 09

The following table sets forth certain data with respect to Fortis individual and group life insurancepremiums in The Netherlands by type of policy for the periods indicated.
2007 2006 200511112 11112 11112
(EUR million)
Unit-linked contractsSingle earned premiums . . . . . . . . . . . . . . . . . . . . . . . . . . . . . . . . 360 42 43Periodic earned premiums . . . . . . . . . . . . . . . . . . . . . . . . . . . . . . 141 93 87
11112 11112 11112
Group business total . . . . . . . . . . . . . . . . . . . . . . . . . . . . . . . . . . . . . 501 135 13011112 11112 11112
Single earned premiums . . . . . . . . . . . . . . . . . . . . . . . . . . . . . . . . 101 139 116Periodic earned premiums . . . . . . . . . . . . . . . . . . . . . . . . . . . . . . 873 868 867
11112 11112 11112
Individual business total . . . . . . . . . . . . . . . . . . . . . . . . . . . . . . . . . . 975 1,007 98311112 11112 11112
Unit-linked contracts total . . . . . . . . . . . . . . . . . . . . . . . . . . . . . . . 1,475 1,142 1,11311112 11112 11112
Non unit-linked contractsSingle earned premiums . . . . . . . . . . . . . . . . . . . . . . . . . . . . . . . . 93 717 145Periodic earned premiums . . . . . . . . . . . . . . . . . . . . . . . . . . . . . . 160 242 148
11112 11112 11112
Group business total . . . . . . . . . . . . . . . . . . . . . . . . . . . . . . . . . . . . . 253 959 29311112 11112 11112
Single earned premiums . . . . . . . . . . . . . . . . . . . . . . . . . . . . . . . . 808 767 645Periodic earned premiums . . . . . . . . . . . . . . . . . . . . . . . . . . . . . . 572 569 584
11112 11112 11112
Individual business total . . . . . . . . . . . . . . . . . . . . . . . . . . . . . . . . . . 1,380 1,336 1,22911112 11112 11112
Total non unit linked contracts . . . . . . . . . . . . . . . . . . . . . . . . . . . 1,633 2,296 1,52211112 11112 11112
Total gross earned premiums . . . . . . . . . . . . . . . . . . . . . . . . . . . . . 3,108 3,437 2,63511112 11112 1111211112 11112 11112
Individual. Fortis individual life products include a variety of endowment, pure endowment, termand whole life and universal life type insurance policies designed to meet specific market needs. Fortisoffers single and regular premium policies used primarily for the funding of individual retirement benefits.Due to the fiscal segmentation, most of the benefits under these policies are payable at age 60 to 65 or onpremature death.
Fortis tax-advantaged mortgage funding products include regular premium endowment policies, aswell as policies that combine term insurance and savings features. Regular premium endowment policiesare also marketed as savings products or sold in connection with residential mortgages. In addition,through its bancassurance distribution channel, Fortis offers investment products such as insurance bonds.The individual life products offered by Fortis insurance companies in The Netherlands are mostly“universal life”, offering investment style products, both investment-linked and non-investment linked.
Fortis also offers investment-linked insurance policies, where the policyholder bears the investmentrisk. Premiums are invested in investment funds chosen by the policyholder and the return on theinvestments is reinvested in the fund on behalf of the policyholder. An optional death benefit at specifiedlevels is offered as well. Policy terms allow the policyholder to switch periodically among funds.
In addition, Fortis offers products, which have different features or are unique to the Dutch marketsuch as deposit life policies. Under a deposit life policy Fortis administers a savings deposit life insuranceplan, under which the participants surviving for a fixed period of time participate in the value of thesavings deposits and accrued interest at that time. An optional supplementary death benefit is provided bya term insurance policy.
Group. Fortis group life policies are designed to fund private pension benefits offered by a widerange of businesses, public authorities and institutions to their employees as a supplement to governmentprovided benefits. These benefits include sums assured by life or death, annuities, disability benefits andspouses’ and orphans’ benefits.
298
Level: 6 – From: 6 – Wednesday, May 14, 2008 – 1:39 pm – g5mac4 – 3960 Section 09 : 3960 Section 09

For large groups, customized policies are offered to meet the needs of individual employers. Forother groups, standardized policies providing specified benefits are offered.
Legally different types of group policies are “traditional” group insurance, key man insurance, earlyretirement pensions and public sector pensions. Fortis currently offers three different group products. Thefirst consists of contracts with guaranteed interest increased by an annual profit sharing. The second groupproduct consists of contracts with a guaranteed interest rate whereby profit sharing is based on the returnon a segregated portfolio of investments. These investments are managed separately from otherinvestments and Fortis receives a related management fee. The third type consists of contracts without aguaranteed interest rate whereby the policyholder bears investment risk and the return on the portfolio inwhich premiums are invested are solely for the benefit of the policyholder. Here Fortis also receives arelated management fee.
The group policies sold by the Dutch insurance companies are primarily old age and widowspensions sold on both a traditional and investment-linked basis.
Non-Life Products
The following describes the primary non-life insurance products offered by Fortis in TheNetherlands. Non-Life insurance products are also issued by Fortis companies in Belgium as well as othercountries, primarily in Europe.
The following table sets forth Fortis Insurance Netherlands’ gross earned premium income byproduct for the periods indicated.
Gross Premiums1111211112123411112
2007 2006 200511112 11112 11112
(EUR million)
Property & Casualty . . . . . . . . . . . . . . . . . . . . . . . . . . . . . . . . . . . . . 982 985 986Accident & Health . . . . . . . . . . . . . . . . . . . . . . . . . . . . . . . . . . . . . . 1,108 959 1,003
11112 11112 11112
Total . . . . . . . . . . . . . . . . . . . . . . . . . . . . . . . . . . . . . . . . . . . . . . . . . 2,090 1,944 1,98911112 11112 1111211112 11112 11112
Property & Casualty
Motor and fire. The motor policies provided by Fortis in the Dutch market provide coverage toindividual and commercial (fleet) customers for third-party liability (including property damage and bodilyinjury), as well as coverage for theft, fire and collision damage. Dutch law requires that coverage for third-party liability be maintained with respect to each licensed motor vehicle. Other coverage, includingcollision and first-party medical, is optional. Dutch law does not require that insurance be maintained fordamage suffered by the policyholder, the driver of the vehicle or the vehicle itself.
Each of the various types of coverage provided by Fortis is available with deductibles, whichenables policyholders to reduce the cost of coverage by selecting higher deductible amounts. Policies aregenerally written for a minimum period of one year.
Fortis fire insurance policies provide coverage to both individual and commercial customers. Firepolicies generally provide coverage for a variety of losses, including fires, storms, burglary and other peril.Individual coverage is provided on both a single-risk and multi-risk basis, with multi-risk policiesproviding coverage for loss or damage to dwellings, damage to personal goods, and liability to thirdparties.
Other non-life. Other non-life insurance consists of protection of engineering and building projects,cargo insurance, third-party liability insurance, legal assistance and protection against pecuniary loss.
Corporate business. This segment consists primarily of industrial protection and liability lines.
299
Level: 6 – From: 6 – Wednesday, May 14, 2008 – 1:39 pm – g5mac4 – 3960 Section 09 : 3960 Section 09

Accident & Health
Accident & Health is another principal non-life line of business and, because of the privatization ofdisability and health insurance in The Netherlands, is a particularly fast-growing segment. Accident &Health insurance is provided by FIN on both an individual and group basis. The types of risks covered byFIN’s Accident & Health insurance policies include death by accident, and temporary and permanentdisability. In The Netherlands, the government’s role is decreasing in the field of disability insurance andsick pay, creating new opportunities for insurance companies to provide private-sector coverage forbenefits previously provided by the Dutch government. The overall aim of Fortis’s sickness and disabilitystrategy is to be an important player in the employee benefits market.
Distribution Channels
Fortis Insurance Netherlands distributes its insurance products primarily through independentintermediaries. In addition, it is also using Fortis Bank, as well as other banks’ branches for selectedproducts. Finally, Fortis ASR operates a tied agents sales force (VerzekeringsUnie) that primarily sellFortis ASR products (Attentiv). The Fortis strategy is to serve each distribution channel with products,which are not only carefully tailored to the requirements of the target customer, but also to those of theparticular distribution channel.
Independent Brokers
Professional independent brokers are the main distribution channel in The Netherlands for Fortislife and non-life policies. The brokers are individuals or companies, which represent a number ofinsurance companies in a sale and service capacity as third-party contractors. They are paid on acommission of fee basis and are not employees of the companies they represent.
Tied Agents
Fortis Insurance Netherlands has an agency network of approximately 170 agents that sell insuranceproducts primarily to middle-income individuals. Tied agents work exclusively for Fortis and receive acommission based on business produced.
Direct
Due to changes in customer behavior and a growing number of customers’ preference to buy simplerisk products through the Internet, Fortis set up its own distribution channel Ditzo in 2007. In addition,Fortis rolled out an Internet-based sales concept, enabling brokers to sell through their own websites.
Bancassurance
The bancassurance distribution channel, which consists primarily of the network of Fortis Bank inThe Netherlands (158 branches at the end of 2007), mainly sells individual, straightforward productsissued by FIN to retail clients of Fortis Bank and other banks.
Competition
There is a high level of competition in The Netherlands for all insurance products sold by FIN.Competition is strong in the life insurance market as domestic and foreign insurers face a lack of growth inthe life market as a consequence of less attractive tax regulation. However, a number of small domesticand foreign insurers have sold their operations as they lacked scale, and the market in The Netherlandscontinues to experience consolidation.
Although competition in life insurance is strong, competition in the more cyclical non-life market iseven stronger due to the high number of companies active in the non-life market. The large number ofcompanies writing non-life policies in The Netherlands increases competition and results in more
300
Level: 6 – From: 6 – Wednesday, May 14, 2008 – 1:39 pm – g5mac4 – 3960 Section 09 : 3960 Section 09

fragmented market shares; the top five insurance companies wrote 54% of non-life premiums based on2006 data, compared to 73% of life premiums.
Competition with respect to the products and services provided by Fortis insurance companies inThe Netherlands is based on factors such as:
• price;
• financial strength and claims-paying ratings;
• size and strength of distribution channels;
• range of product lines, product quality, reputation and visibility in the marketplace;
• quality of service; and
• asset management performance, with respect to investment-linked and participating lifecontracts.
Insurance International
Overview
Insurance International brings together all the principal insurance activities outside Belgium andThe Netherlands, as well as Fortis Corporate Insurance and Fortis RE. Insurance International sells itsinsurance products in selected markets in the United Kingdom (Fortis UK), Luxembourg (FortisLuxembourg Vie and Fortis Luxembourg IARD), France (Fortis Assurances France) Germany (FortisDeutschland Lebensversicherung), Turkey (Fortis Emiklilik ve Hayat), Russia (Fortis Life InsuranceRussia), Ukraine (Fortis Life Insurance Ukraine) and Hong Kong (FICA), while in Portugal(Millenniumbcp Fortis), China (Taiping Life), Malaysia (Mayban-Fortis) and Thailand (Muang ThaiFortis) and India (IDBI Fortis). Fortis has exploited its know-how in insurance by entering these marketsvia joint ventures with strong local partners. Fortis Corporate Insurance distributes corporate insurance inBelgium and The Netherlands. Through the Freedom of Service Act, Fortis Insurance International sellsalso in Poland (from Germany) and in Italy and Switzerland (from Luxembourg).
Insurance International seeks to leverage Fortis’s existing skills in distribution, operations andproducts and has established a presence in selected European and Asian markets, selling its products via anumber of channels, including brokers, banks, agents and directly. For instance, in Luxembourg, InsuranceInternational principally offers life insurance, distributed through brokers and bank alliances, while in theUK non-life products are distributed via an extensive broker network, affinity groups and a direct network.Life insurance products are sold in France through intermediaries, a network of Fortis agents and recentlyvia Fortis Bank. Fortis has successful joint ventures with strong local banking partners in Portugal, Indiaand Malaysia. Fortis sold its interests in its joint venture insurance operations in Spain to its partner “laCaixa” in the second half of 2007. In Thailand, India, Malaysia and China, Fortis has set up joint venturesaimed not only at the banking channel, but also at alternative channels such as agents. Fortis CorporateInsurance offers non-life products to medium-sized and larger companies, primarily in the Benelux viabrokers. Fortis Re is the reinsurer for the non-life Fortis companies.
Insurance International aims at further accelerating growth in its business by building on its existingmarket positions. At the same time, it will pursue selected new product/market opportunities in Europe andAsia by way of organic expansion, acquisitions and strategic partnerships.
301
Level: 6 – From: 6 – Wednesday, May 14, 2008 – 1:39 pm – g5mac4 – 3960 Section 09 : 3960 Section 09

The following table shows the contribution to Fortis total insurance results as of and for the yearended December 31, 2007.
Year Ended December 31, 20071111211112123411112
InsuranceInternational
Insurance Total as a % of International Insurance Total Insurance11112 11112 11112
(EUR million, except %)
Result before taxation . . . . . . . . . . . . . . . . . . . . . . . . . . . . . . . . . . . . 192 1,768 11%Gross earned life premiums . . . . . . . . . . . . . . . . . . . . . . . . . . . . . . . 1,610 9,688 17%Premium inflow deposit accounting . . . . . . . . . . . . . . . . . . . . . . . . 2,300 3,481 66%Gross earned non-life premiums . . . . . . . . . . . . . . . . . . . . . . . . . . . . 1,938 5,385 36%Gross inflows . . . . . . . . . . . . . . . . . . . . . . . . . . . . . . . . . . . . . . . . . . 5,848 18,554 32%Assets . . . . . . . . . . . . . . . . . . . . . . . . . . . . . . . . . . . . . . . . . . . . . . . . 27,081 119,199 23%
32% of Insurance International total gross earned inflows for 2007 were attributable to Fortisoperations in Portugal, 23% to Luxembourg, 19% to the United Kingdom and 9% to France. As Fortis’sinvestments in Asia are through joint ventures not fully controlled by Fortis, such joint ventures areaccounted for under the equity method and thus are not included in Fortis’s consolidated gross inflowfigures (however, Fortis-consolidated net profit does take into account the relevant share of the results ofthese operations). Fortis Corporate Insurance accounted for 11% of total gross inflows in 2007.
Gross earned non-life premiums at Insurance International increased by 11% to EUR 1,938 millionin 2007.
Insurance International’s strategy is to increase its revenues in existing and, where appropriate, newmarkets. The focus is on multi-channel distribution. The development of new products will be tailored tospecific countries and customer groups, and will leverage existing knowledge and skills within Fortisinsurance companies. When entering new markets, Insurance International will primarily focus on life andpension products, but, in particular for emerging markets, non-life products are also deemed essential.Fortis enters new markets through both joint ventures and full ownership. When entering via jointventures, it applies a rigorous set of criteria before selecting a partner. Fortis’s aim in these joint venturesis to reinforce or achieve management control with management representation in certain key selectedareas.
Insurance International plans to continue to build its organization and business by developing newproducts, ongoing skill and knowledge transfer between units and entering new markets. It will alsooptimize the local character of the acquisitions completed in 2006 and 2007.
Insurance International continued to implement the growth strategy it announced in 2005, by furtherbuilding its existing businesses and by expanding in selected markets in Europe and Asia. Significantprogress with entering new markets was made in 2006 and 2007.
In Europe, Fortis launched a new life insurance company in Russia in 2006. The company workswith a state-of-the-art IT system that is also used by the Chinese joint venture Taiping Life. Its productrange consists of term life insurance, endowment insurance, and pension insurance. Examples are an‘education plan’ product for Russia’s rapidly growing middle class and a pension scheme for corporateemployees. The products will be distributed via the direct channel (the internet and call centers) andthrough account managers targeting Russian corporate enterprises. Launch of the marketing campaignbegan in the first half of 2007.
Fortis acquired life insurers in Ukraine and in Germany. The companies sold life insurance productsunder the Fortis brand during 2007. In Germany, the platform began also supported the sale of insuranceproducts through Fortis Credit4Me consumer finance concept.
Fortis continues to grow its affinity marketing sales in the United Kingdom, building on its earlieracquisitions The Outright Company (“Outright”) and Affinity Solutions. In 2006, Outright’s portfolio
302
Level: 6 – From: 6 – Wednesday, May 14, 2008 – 1:39 pm – g5mac4 – 3960 Section 09 : 3960 Section 09

expanded by 50,000 customers through its new relationship with the UK Armed Forces. Fortis UK endedthe year with more new affinity deals and the acquisition of InsureTech Systems Limited, a small start-upthat will enable Fortis UK to broaden its multi-channel distribution model with Internet sales in the generalinsurance market. In 2007, Fortis UK was recognized as ‘General Insurer of the Year’ at the industry’srenowned awards and successfully secured a number of new affinity partnerships, including major retailersMarks & Spencer and DSG International, through which Fortis UK delivers personal lines insurance.Fortis UK continues to innovate in its distribution capabilities, predicated on customer requirements. Forexample, the combination of its new voice-recognition software together with the use of its Text2Insuremulti-channel platform, which is being used by key partners in the delivery of straight through processingvia SMS and online methods.
In Asia, Insurance International signed a three-way joint venture agreement with Industrial andDevelopment Bank of India (“IDBI”) and Federal Bank, aimed at establishing a new insurance company,which commenced operations in March 8, 2008. Fortis owns 26% of the new company and IDBI andFederal Bank 48% and 26% respectively. Fortis has contributed its experience in bancassurance andproduct know-how, while IDBI and Federal Bank offer their distribution skills. IDBI Fortis has startedoperations with 600 licensed agents and some 30 specialized branches across India. At launch, IDBI Fortisoffers flexible unit linked products, mortgage reducing term insurance and riders like accidentaldeath/disablement benefit, major diseases benefit and hospital cash benefit.
Strong growth is being realized in Asia. In Malaysia, the integration of Malaysian NationalInsurance Holdings has now been completed. The introduction of the new brand name Etiqa marked thelast stage of the integration which created a new multi-channel organization. Mayban Fortis is now aleading player in the Malaysian insurance market, with market leadership positions in life and takafulinsurance. Muang Thai Life (Thailand) reported revenue growth of 45% in 2007, outpacing the Thaiinsurance industry’s 16% growth. The company is the number two bancassurance player in Thailand andthe fourth largest Life insurer, with an overall market share of 6.8% compared with 5.8% at the end of2006. In 2007, Muang Thai Life developed new Takaful products with the assistance of Mayban Fortis. Itis exploring ways to further penetrate the Thai insurance market and has rapidly increased the number ofbank sales agents to over 350, more than doubling the figure at the beginning of 2007. Non-Life grossinflow increased by 24% to EUR 49 million, mainly due to the motor business. This high growth stemsfrom more aggressive marketing of existing agents and motor partners, recruitment of agents from thecompetition and a contract with a large broker. Muang Thai Insurance Co Ltd is preparing anamalgamation with Phatra Insurance, which is a listed non life insurance company. In the first quarter of2008 the amalgamation process took another step as the Office of the Insurance Commissioner gave itsapproval. The amalgamation will create the 7th largest non-life company in the country. Taiping Life(China), too, grew much faster than the overall Chinese market as it increased its year-on-year grossinflow from EUR 1,120 million to EUR 1,548 million. This increase was boosted by the re-introduction ofunit-linked products as booming financial markets increased the market’s appetite for investment products.TPL’s growth rate of 38% is the second fastest among the major six life insurers in China. The company isexpanding faster than the market, and its market share grew from 2.7% to 3.2% at the end of last year.Since the end of 2006 the tied agency sales force has grown from 26,400 to more than 40,000. There arenow well over 400 offices, which basically cover most of the developed and semi-developed areas ofChina.
In Hong Kong the integration of the newly acquired company Fortis Insurance Company Asia(“FICA”) in May 2007, formerly known as PCI, is now nearly completed. In November 2007 the newmanagement team was installed and a comprehensive strategic plan was finalized. Initiatives to improveoverall performance and to enhance customer service are now under way. These include diversification ofthe distribution base and optimization of the product range and internal processes. On August 8, 2007,FICA was re-branded to Fortis which marked Fortis Insurance’s official entry into the Hong Kong marketand is an integral part of its growth strategy in Asia. FICA’s staff, agents and customers have sinceexpressed their overwhelming support for the new name. FICA aims to create a world-class agency salesforce and position itself as an important hub to Fortis Insurance in Asia.
303
Level: 6 – From: 6 – Wednesday, May 14, 2008 – 1:39 pm – g5mac4 – 3960 Section 09 : 3960 Section 09

Business Environment
The non-life environment in Europe has been favorable recently, which may lead to pricing pressureas new players are attracted to the market. The challenge for Insurance International is to maintain positiveunderwriting results, while at the same time maintaining existing market shares. Life insurance is growingsteadily and is likely to continue due to the aging population, especially in countries with a highdependency on state pension provision.
Banks, brokers and agents remain the dominant channels in some countries. However, in others,particularly the UK, new distribution channels are being utilized, such as the Internet, affinity marketingand brand assurance. Straightforward life and non-life products can be readily distributed via these newchannels, whereas more complex ones will probably continue to rely on conventional distribution.Insurance International’s distribution and product mix may change in response to European regulatoryharmonization (e.g., Solvency II), tax changes and shifting consumer behavior.
The life sector in Asia continues to develop at double-digit rates in most markets. Althoughbancassurance has become the dominant distribution channel in some areas, the agency channel is thelargest distributor of life products. Companies pursuing a multi-channel distribution strategy could benefitfrom growth in bancassurance and new distribution channels like the Internet.
The following table sets forth Fortis gross inflow life and the gross earned premiums non-life bytype of policy for the periods indicated.
Year Ended December 31,1111211112123411112
2007 2006 200511112 11112 11112
(EUR million)
APE . . . . . . . . . . . . . . . . . . . . . . . . . . . . . . . . . . . . . . . . . . . . . . . . . . 478(1) 387(1) 535Life Individual contracts . . . . . . . . . . . . . . . . . . . . . . . . . . . . . . . . . . 779 523 481Group contracts . . . . . . . . . . . . . . . . . . . . . . . . . . . . . . . . . . . . . . . . . 131 121 115Investments contracts with discretionary participation features . . . . 700 713 886
11112 11112 11112
Total gross written premiums life . . . . . . . . . . . . . . . . . . . . . . . . . 1,610 1,357 1,48211112 11112 1111211112 11112 11112
(1) CaiFor has been reclassified in discontinued operations; figures for 2006 and 2007 periods are reported excluding CaiFor.
Year Ended December 31,1111211112123411112
2007 2006 200511112 11112 11112
(EUR million)
Single premiums . . . . . . . . . . . . . . . . . . . . . . . . . . . . . . . . . . . . . . . . 5 3 2Periodic premiums . . . . . . . . . . . . . . . . . . . . . . . . . . . . . . . . . . . . . . 126 118 114Group business total . . . . . . . . . . . . . . . . . . . . . . . . . . . . . . . . . . . . . 131 121 116Single premiums . . . . . . . . . . . . . . . . . . . . . . . . . . . . . . . . . . . . . . . . 344 247 216Periodic premiums . . . . . . . . . . . . . . . . . . . . . . . . . . . . . . . . . . . . . . 435 276 264Individual business total . . . . . . . . . . . . . . . . . . . . . . . . . . . . . . . . . . 779 523 480
11112 11112 11112
Total investment contracts with DPF . . . . . . . . . . . . . . . . . . . . . . . . 700 713 88611112 11112 11112
Total gross written premiums . . . . . . . . . . . . . . . . . . . . . . . . . . . . 1,610 1,357 1,48211112 11112 1111211112 11112 11112
304
Level: 6 – From: 6 – Wednesday, May 14, 2008 – 1:39 pm – g5mac4 – 3960 Section 09 : 3960 Section 09

The following table sets forth Fortis Insurance International’s gross life premiums by type of policyfor the periods indicated.
Year Ended December 31,1111211112123411112
2007 2006 200511112 11112 11112
(EUR million)
Unit-linked contractsSingle premiums . . . . . . . . . . . . . . . . . . . . . . . . . . . . . . . . . . . . . . . . 1 1 0Periodic premiums . . . . . . . . . . . . . . . . . . . . . . . . . . . . . . . . . . . . . . 48 43 37
11112 11112 11112
Group business total . . . . . . . . . . . . . . . . . . . . . . . . . . . . . . . . . . . . . 49 44 37Single premiums . . . . . . . . . . . . . . . . . . . . . . . . . . . . . . . . . . . . . . . . 173 128 87Periodic premiums . . . . . . . . . . . . . . . . . . . . . . . . . . . . . . . . . . . . . . 56 45 39Individual business total . . . . . . . . . . . . . . . . . . . . . . . . . . . . . . . . . . 229 173 126Unit-linked contracts total . . . . . . . . . . . . . . . . . . . . . . . . . . . . . . . 278 217 163Non unit-linked contractsSingle premiums . . . . . . . . . . . . . . . . . . . . . . . . . . . . . . . . . . . . . . . . 4 2 2Periodic premiums written . . . . . . . . . . . . . . . . . . . . . . . . . . . . . . . . 78 75 77Group business total . . . . . . . . . . . . . . . . . . . . . . . . . . . . . . . . . . . . . 82 77 79Single premiums . . . . . . . . . . . . . . . . . . . . . . . . . . . . . . . . . . . . . . . . 171 118 130Periodic premiums . . . . . . . . . . . . . . . . . . . . . . . . . . . . . . . . . . . . . . 378 232 225Individual business total . . . . . . . . . . . . . . . . . . . . . . . . . . . . . . . . . . 549 350 355Total non unit linked contracts . . . . . . . . . . . . . . . . . . . . . . . . . . . 631 427 434Investment contracts with discretionary participation featuresSingle premiums . . . . . . . . . . . . . . . . . . . . . . . . . . . . . . . . . . . . . . . . 5 3 2Periodic premiums . . . . . . . . . . . . . . . . . . . . . . . . . . . . . . . . . . . . . . 126 118 114
11112 11112 11112
Group business total . . . . . . . . . . . . . . . . . . . . . . . . . . . . . . . . . . . . . 131 121 116Single premiums . . . . . . . . . . . . . . . . . . . . . . . . . . . . . . . . . . . . . . . . 344 247 216Periodic premiums . . . . . . . . . . . . . . . . . . . . . . . . . . . . . . . . . . . . . . 435 276 264Individual business total . . . . . . . . . . . . . . . . . . . . . . . . . . . . . . . . . . 779 523 480
11112 11112 11112
Total investment contracts with discretionary participation features . . . . . . . . . . . . . . . . . . . . . . . . . . . . . . . . . . . . . . . . . . . . . . . 700 713 886
11112 11112 11112
Total gross earned premiums . . . . . . . . . . . . . . . . . . . . . . . . . . . . . 1,610 1,357 1,48211112 11112 1111211112 11112 11112
The following table sets forth Fortis Insurance International’s gross non-life premiums by type ofpolicy for the periods indicated.
Gross Earned Premiums1111211112123411112
2007 2006 200511112 11112 11112
(EUR million)
Accident & Health . . . . . . . . . . . . . . . . . . . . . . . . . . . . . . . . . . . . . . 203 204 177Property & Casualty . . . . . . . . . . . . . . . . . . . . . . . . . . . . . . . . . . . . . 1,735 1,535 1,463
11112 11112 11112
Total . . . . . . . . . . . . . . . . . . . . . . . . . . . . . . . . . . . . . . . . . . . . . . . . . 1,938 1,739 1,64011112 11112 1111211112 11112 11112
United Kingdom
In the United Kingdom, Fortis UK is active in the non-life insurance market, distributing itsproducts (predominantly motor, household and travel) via brokers, affinity groups and direct to customers.It seeks to combine efficiency with competitive prices and a high level of service. Independent analysis byCitigroup and Datamonitor consistently finds Fortis UK as having the lowest unit cost of production in themotor market, while maintaining a high level of service, as demonstrated by various awards and accoladesfrom brokers, partners and customers.
305
Level: 6 – From: 6 – Wednesday, May 14, 2008 – 1:39 pm – g5mac4 – 3960 Section 09 : 3960 Section 09

In 2007 Fortis UK insured approximately 1.6 million vehicles and ranked fifth in 2007 in motorranked eleventh overall, based upon gross written premiums. During 2007 Fortis UK insured 6.7 millioncustomers. Fortis UK’s strategy is to exploit its reputation and highly efficient operating model to increaseits market share in other areas of insurance for individuals and small businesses through a range ofdistribution channels. During 2006, Fortis UK acquired Text2Insure, providing innovative distributionsolutions via SMS and online, and InsureTech Systems, providing online white labeled insuranceaggregator propositions. The strategic alliance with the Age Concern (an affinity group targeting over theage of 50) was successfully implemented, resulting in the transfer of Age Concern’s portfolio to Fortis,which caused a 66% increase in household customers (to over one million). In 2005, Fortis UK acquiredthe personal lines insurance solutions provider OutRight, now serving in excess of 210,000 policyholderssupported by a new relationship with the UK Armed Forces and its AutoDirect business. Affinity Solutionswas able to leverage on Fortis UK’s expertise and increased its penetration in the affinity market, a fast-growing market segment in the UK.
Fortis Corporate Insurance
Fortis Corporate Insurance is one of the leading non-life insurers for large and medium-sizedcompanies in the Benelux. In addition to offering tailor-made insurance cover, it actively assists clients inmanaging their risks. Clients are served in partnership with specialized insurance brokers. To furtherstrengthen its market position it invests in knowledge about the insured risks, and in its organization andprocesses. Fortis Corporate Insurance employs 350 people working from offices in Amstelveen, Brussels,Rotterdam, Antwerp and Paris. Fortis Corporate Insurance is rated A+ (strong) by Fitch Ratings and A(strong) by Standard & Poor’s.
Luxembourg
Fortis Luxembourg Vie is the second largest life assurance company in Luxembourg and isdeveloping into a pan-European player. In 2007 more than 85% of the gross inflow was obtained via thirdparties (primarily from private banking channels such as JP Morgan). The company is active in Belgium,France, Italy, Germany and Spain. It uses a variety of channels for the distribution of its products, inparticular the branch network of Fortis Bank Luxembourg and financial intermediaries. Fortis LuxembourgIARD also offers non-life insurance products (with the exception of motor insurance) within the GrandDuchy, primarily via intermediaries and for selected products through the Fortis Banque Luxembourgbranches. In 2007, total insurance liabilities grew to EUR 6,332 billion, an increase of 22% compared to2006.
France
In France, Fortis Assurances France is active in the life insurance market for individuals and forbusiness leaders of small and medium-sized companies and their families. Fortis Assurances has redefinedits strategy and is now targeting, via a direct sales force and independent intermediaries, mainly dealers,tradesmen, members of the independent professions and managers, offering insurance and supplementarypension solutions. At the end of 2006 Fortis Assurances started a cooperation with Fortis Bank France,thus adding a third distribution channel. A successful and innovative unit-linked product was developed,which won the 2006 French award for most innovative insurance product (Life Insurance InnovationAward).
Spain
Fortis has been active in Spain since 1992 via CaiFor, a 50% joint venture with “la Caixa”, thelargest savings bank in Spain. CaiFor provides an umbrella for the life insurance company VidaCaixa andthe non-life insurer. In July 2007, Fortis and “la Caixa” announced that they reached an agreement
306
Level: 6 – From: 6 – Wednesday, May 14, 2008 – 1:39 pm – g5mac4 – 3960 Section 09 : 3960 Section 09

pursuant to which “la Caixa” would acquire all Fortis interests in CaiFor for a total cash consideration ofEUR 980 million. The transaction was completed on November 13, 2007.
Portugal
Millenniumbcp Fortis (51% owned by Fortis) realized total gross inflow of EUR 1,916 million in2007. Non-life premiums grew by 3% to EUR 176 million in 2007 and Life inflow amounted to EUR1,740 million in 2007. During 2006 a product innovation program was launched and new products weredeveloped. The effect of these new products were recorded after their introduction in 2007, based onpositive initial results of a marketing pilot. New distribution channels were launched by Health, supportedby new agreements with brokers and Portuguese insurance companies. With a market share of 16% as ofMarch 2007, Millenniumbcp Fortis ranks second in the Portuguese Life and total Insurance market. Medis(the Health brand) is well recognized in the Portuguese market with a market share of 22% in March 2007,ranking second in the market.25 The Pension Fund business continued to perform well in 2007, with fundsunder management of EUR 7.4 billion, an increase of 9% compared to 2006.
China
In China, Fortis operates through the life insurance company Taiping Life, which has a nationaloperating license. Taiping is a life insurance joint venture in which Fortis has a 24.9% stake and the othershareholders are China Insurance Holding Company Limited (CIHC) (25.05%), and China InsuranceInternational Holdings Company Limited (CIIH) (50.05%), a listed Hong Kong company which iscontrolled by CIHC. In 2007 gross inflow increased by 38% compared to 2006 to EUR 1.5 billion. Thecompany has close to 450 branches and sub-branches or distribution offices, with approximately 5,700employees and approximately 44,000 brokers and sales agents as of December 31, 2007. As of December31, 2007, Taiping Life’s market share had increased to 3.2% (based on total premiums) in a fast-growingmarket and was the sixth largest life insurer in China.
Malaysia
In Malaysia, Fortis operates through Mayban Fortis, a joint venture with Maybank, the largestfinancial service-provider in the country with more than 500 bank branches. In this bancassurance jointventure, Fortis has a total of 30,95% equity interest in Mayban Life Assurance Berhad and MaybanGeneral Assurance Berhad. In 2007 gross inflow was EUR 800 million. The company had approximately2,000 employees and 20,000 sales agents as of December 31, 2007. During 2006, Mayban Fortiscompleted the acquisition of Malaysia National Insurance Holdings (“MNIH”), a leading insurancecompany, and this acquisition enabled Mayban Fortis to evolve into a leading multi-channel insurer inMalaysia.
Thailand
In 2004, with a view to achieving a leadership position in the Thai insurance markets, Fortis enteredinto a strategic partnership with Muang Thai in Thailand and its partner bank, Kasikorn Bank. In 2007,Muang Thai Fortis (Life & General) saw its gross inflow rise to EUR 360 million from EUR 250 millionin 2006. Muang Thai Life achieved the highest new business premium growth rate (a 68% increase)among the top five players in the market (on a year-on-year basis) in 2007. The bank doubled its bancinsurance sales specialists to more than 350 in 2007. As a result, sales from the bancassurance channelincreased more than 200% compared with 2005. Muang Thai Life is now the fourth largest life insurer inThailand with approximately 1,500 employees and approximately 17,000 sales agents.
307
Level: 6 – From: 6 – Wednesday, May 14, 2008 – 1:39 pm – g5mac4 – 3960 Section 09 : 3960 Section 09
25 29 Source: Associaçã Portuguesa de Seguradores(APS) based on premium income (http://www.apseguradores.pt).
India
In India, IDBI Fortis, the Life insurance joint venture with Industrial and Development Bank ofIndia (IDBI) and Federal Bank commenced operations on March 8, 2008. Fortis owns 26% of the newcompany and IDBI and Federal Bank own 48% and 26% respectively.
Principal markets
The market segments on which Fortis internationally competes can be divided into three majorbusinesses: retail banking, merchant and private banking and insurance. Fortis occupies a leading positionin all market segments in the Benelux. On the European territory, Fortis ranks among the top 20 financialinstitutions. This position is largely due to its strong footprint in the retail banking segment with more than1,600 branches across Europe, 44 credit shops in Germany and Poland and post office networks inBelgium and Ireland. The insurance business also contributes significantly by way of strong insuranceactivities in selected European countries such as Spain, Portugal, Germany and Russia. Finally, Fortis alsobenefits in Europe from a dynamic growth of some niche markets in the merchant and private andcommercial banking segment. Fortis is a top European player in cross-border leasing and commercialfinance with presence in almost all European countries. Fortis is also a leading financial institution in thefield of trust and corporate services.
Besides its competitive European presence, Fortis also successfully combines its banking andinsurance expertise in growth markets in Europe and Asia. Poland, Turkey and Russia are the principalEuropean growth markets on which Fortis competes. In Asia, Fortis plays an important role in theinsurance market. It is the number six life insurer in China and Thailand and occupies a leading positionfor individual live business in Malaysia. Fortis also has a significant presence in the merchant and privatebanking market segment where it can rely on a strong presence through several business centers in China,Japan and Malaysia.
Also, Fortis intends to become a key player in the United States on several niche markets. It holdsalready a leading position in North America in several niche markets such as shipping, commodity andenergy and transportation.
308
Level: 6 – From: 6 – Wednesday, May 14, 2008 – 1:39 pm – g5mac4 – 3960 Section 09 : 3960 Section 09

SUPERVISION AND REGULATION
General
The banking, investment services, insurance and broker dealer businesses of Fortis are subject todetailed, comprehensive regulation and supervision in all the jurisdictions, including several countries inAsia and the United States, in which Fortis does business. In addition, certain European Union directivesdiscussed more fully below have had and will have a significant impact on the regulation of Fortis’sbanking, investment services, insurance and broker dealer businesses in the European Union when suchdirectives are implemented through local legislation adopted within each member state, including TheNetherlands, Belgium and Luxembourg.
For the purposes of this heading, the following abbreviations have the meaning indicated:
• “BFIC” or “CBFA” means the Belgian Banking, Finance and Insurance Commission(“Commission Bancaire, Financière et des Assurances” — “Commissie voor het Bank-,Financie- en Assurantiewezen”), since January 1, 2004 the single supervisory authority forthe Belgian financial sector, created as a result of the integration of the “Office de Contrôledes Assurances” — “Controledienst voor de Verzekeringen” (Insurance SupervisoryAuthority, hereinafter the “ISA”) into the former Banking and Finance Commission(“BFC”).
• “DNB” means the “De Nederlandsche Bank N.V.”, the Dutch supervisory authority for theprudential supervision of banking, insurance and pensions businesses.
• “AFM” means the “Autoriteit Financiële Markten”, the Dutch supervisory authority for theconduct of business supervision of financial enterprises (including banks and insurancecompanies).
• “CSSF” means the “Commission de Surveillance du Secteur Financier”, the singlesupervisory authority for the Luxembourg financial sector.
• “NBB” means the National Bank of Belgium.
Banking
Basel Standards
The Basel Committee on Banking Supervision of the Bank for International Settlements developedinternational capital adequacy guidelines based on the relationship between a bank’s capital and its creditrisks, which were adopted by the Basel Committee in 1988 (“Basel I”). In June 1999, the BaselCommittee proposed a review of these guidelines. In June 2004, the Basel Committee issued a RevisedFramework for the International Convergence of Capital Measurement and Capital Standards (“Basel II”).The Basel II rules came into effect on January 1, 2007.
Basel II currently has, and will continue to have an impact on risk sensitivity, group structures,equity holdings in non-banks and retail exposures. See “Operating and Financial Review and Prospects —Liquidity and Capital Resources — Bank Cash Flows — Basel II”.
European Union Standards
The EU has adopted a capital adequacy regulation for credit institutions in all its member statesbased on the Basel guidelines. The EU rules seek to harmonize banking regulations and supervisionthroughout the EU by setting minimum standards in key areas and requiring member states to give mutualrecognition of each other’s standards of regulation.
In 1989, the EC adopted the Council Directive of April 17, 1989 on the “own funds” of creditinstitutions (the “Own Funds Directive”), defining qualifying capital “own funds”, and the CouncilDirective of December 18, 1989 on a solvency ratio for credit institutions (the “Capital Base Ratio
309
Level: 6 – From: 6 – Wednesday, May 14, 2008 – 1:39 pm – g5mac4 – 3960 Section 10 : 3960 Section 10

Directive”), setting forth the required ratio of own funds to risk-adjusted assets and off-balance sheetitems.
In 1989, the Second Banking Coordination Directive of December 15, 1989 established aframework for the mutual recognition of the supervision of banks in the EU member states, enabling abank authorized in one EU member state to carry out activities in a branch or cross-border basis in otherEU member states on the basis of a single license provided by the home country supervisory authority.The Investment Services Directive provided equivalent measures for securities firms carrying outinvestment business.
In 2000, the Own Funds Directive, the Capital Base Ratio Directive, the Second EC BankingCoordination Directive and certain other directives were consolidated in EC Directive 2000/12 andrepealed. Directive 2000/12 was subsequently recast by Directive 2006/48/EC dated June 14, 2006. ThisDirective allowed for the Revised Framework for the International Convergence of Capital Measurementand Capital Standards issued by the Basel Committee on Banking Supervision to be transposed into EUlaw (the “Basel II Directive”).
Directive 2006/49/EC of June 14, 2006 established minimum capital standards for the investmentand securities business of banks and investment firms (the “Capital Adequacy Directive”).
The Basel II Directive and Capital Adequacy Directive have been consolidated in the CapitalRequirements Directive which was adopted on June 14, 2006.
The Financial Conglomerates Directive of December 16, 2002 introduces supplementarysupervision of financial conglomerates on a group-wide basis, and complements the existing sectoralsupervision of credit institutions, insurance undertakings and investment firms (regulated entities) that arepart of a financial conglomerate. Regulated entities in a financial conglomerate are subject to asupplementary supervision relating to capital adequacy, risk concentration, intra-group transactions,internal control mechanisms and risk management processes at the level of the financial conglomerate.
The Belgian and Dutch national laws implementing the Directives described above are discussed in“— Regulation of Fortis’s Banking Activities in The Netherlands — Solvency” and “Regulation of Fortis’sBanking Activities in Belgium — Solvency Supervision” below.
Regulation of Fortis’s Banking Activities in Belgium
General
The banking regime in Belgium is governed by the Banking Law of March 22, 1993 (the “BelgianBanking Law”) that, among other things, implements the European legislation as coordinated by ECDirective 2000/12 of March 20, 2000. The Belgian Banking Law sets forth the conditions under whichcredit institutions, including banks, may operate in Belgium and grants regulatory and supervisory powersto the BFIC. The main objective of the Belgian Banking Law is to preserve the strength and the solvencyof each credit institution and the stability of the Belgian banking system in general. Supervision of Belgiancredit institutions is the responsibility of the BFIC, an autonomous public agency. Its legal status andoperation are determined by Chapter III of the Law of August 2, 2002 concerning the supervision of thefinancial sector and financial services.
Its competencies include the following:
• to ensure the supervision of credit institutions, investment firms, investment advisers andexchange offices;
• to ensure the supervision of undertakings for collective investment;
• to ensure compliance with the rules aimed at protecting the interests of the investor intransactions in financial instruments, as well as the smooth running, integrity andtransparency of markets in financial instruments;
310
Level: 6 – From: 6 – Wednesday, May 14, 2008 – 1:39 pm – g5mac4 – 3960 Section 10 : 3960 Section 10

• to contribute towards compliance with the rules aimed at protecting savers and investorsagainst the illegal offer or supply of financial products or services.
The Law of August 2, 2002 empowered the King to bring about an integration of the BFC and ISAand the Royal Decree of March 25, 2003 provided for the integration of the BFC and the ISA into theBFIC. Since January 1, 2004, the BFIC is the single supervisory authority for the Belgian financial sector.
Chapter IV of the Law of August 2, 2002 regulates the coordination of supervision of the Belgianfinancial sector and requires the BFIC and the NBB to work closely on all issues of common interest andin particular with regard to international cooperation in respect of prudential matters, inter-sectoral aspectsof prudential policy, macro-prudential analyses and legal studies.
Two new official bodies are being charged with advancing the coordination of supervision:
• the Supervisory Board of the Financial Services Authority which will provide advice onmatters relating to the organization, operation and coordination of the operation of thefinancial markets and of financial institutions;
• the Committee for Financial Stability which examines matters of common interest such asthe stability of the financial system as a whole, the interactions between prudentialsupervision and supervision of the systematic risks or payment and settlement systems,deposit guarantees and the protection of investors. The Committee for Financial Stability(www.csf-cfs.be) was set up on July 31, 2003. It comprises all the members of themanagement committees of the BFIC and the NBB under the chairmanship of the Governorof the NBB and with the Chairman or Vice-Chairman of the BFIC as vice-chairman.
Supervision of Credit Institutions
General
In its capacity as prudential supervisor, the BFIC ensures that credit institutions meet theauthorization requirements and operating criteria as specified in the relevant laws and regulations. TheBFIC is concerned with whether the credit institution has an appropriate management structure, adequateadministrative and accounting procedures and suitable internal controls.
Licensing
All Belgian credit institutions must obtain a license from the BFIC before they may commenceoperations. In order to obtain and retain a license, each credit institution must fulfill numerous conditions,including certain minimum paid-up capital requirements (an initial paid-up capital of at least EUR6,200,000).
Management
Belgian law and regulatory practices make a fundamental distinction between the management ofbanking activities, which, as a practical matter, lies within the competence of the management committee,and the supervision of this management and the definition of the credit institution’s general policy andstrategy, which must be entrusted to the board of directors.
Shareholding Structure
Any shareholders (directly or indirectly acting in concert with third parties) holding 5% or more ofthe capital or the voting rights of the institution must be of “fit and proper” character (respond to thenecessary professional standing and appropriate experience) to ensure proper and careful management. Ifthe BFIC considers that the participation of a shareholder in a credit institution jeopardizes its sound andprudent management, the supervisory authority can suspend the rights attached to this participation and, ifnecessary, request the shareholder to transfer to a third party its participation in the credit institution’scapital. Prior notification to the BFIC is necessary each time a person intends to acquire a holding
311
Level: 6 – From: 6 – Wednesday, May 14, 2008 – 1:39 pm – g5mac4 – 3960 Section 10 : 3960 Section 10

representing 5% of the capital or the voting rights or a multiple thereof. Furthermore, a shareholder whowishes to sell his participation or a part thereof, which would result in his shareholding dropping belowany of the abovementioned thresholds, needs to notify the BFIC thereof one month in advance of suchtransfer. A Belgian bank is further under an obligation to notify the BFIC of any such transfer when itobtains knowledge thereof.
Reporting
Pursuant to the Belgian Banking Law, the BFIC may, in order to exercise its prudential supervision,require that all information with respect to the organization, functioning, condition and activities of acredit institution be reported to it. The BFIC may supplement these communications by on-siteinspections. The BFIC also exercises its comprehensive supervision of credit institutions through statutoryauditors who collaborate with the BFIC in its prudential supervision. A credit institution selects itsauditors from among the list of auditors or firms of auditors accredited by the BFIC.
The Belgian Banking Law requires credit institutions to provided detailed periodic financialinformation to the BFIC and to the NBB.
Compliance
If the BFIC finds that a credit institution is not operating in accordance with the provisions of theBelgian Banking Law, that its management policy or its financial position is likely to prevent it fromhonoring its commitments or that it does not offer sufficient guarantees for its solvency, liquidity orprofitability, or that its management structure, administrative and accounting procedures or internal controlsystems present serious deficiencies, it will set a deadline by which the situation must be rectified. If thesituation has not been rectified by the deadline, the BFIC has the power to appoint a special commissionerto replace management, to impose additional requirements in respect of solvency, liquidity, concentrationof risks and other limitations, to suspend or dispose of all or part of its activities, to impose theappointment of provisional directors or managers in lieu of the current directors or managers, and finally,to revoke the license of the credit institution.
Solvency Supervision
Solvency regulations pursuant to the relevant EU directives and the internationally agreedrecommendations of the Basel Committee on Banking Supervision require a credit institution to maintain aminimum level of capital for the risk-weighted value of its assets, for market risks and operational risks.Solvency is measured with reference to the solvency ratio, which is calculated broadly by dividing ownfunds by risk-weighted assets. In addition to credit risk, market risk and operational risk are taken intoaccount as well. The required minimum ratio is 8%. This ratio is referred to as the total capital ratio inFortis reports.
Own funds consist of the following elements:
• Tier 1 capital, also referred to as “core capital”;
• Tier 2 capital, also referred to as “supplementary capital”, which is further subdivided intoupper Tier 2 capital and lower Tier 2 capital; and
• Tier 3 capital.
Tier 1 capital includes:
• Paid-up share capital;
• Reserves, excluding revaluation reserves (unrealized gains and losses);
• Balance of interim results (less expected dividends);
• Third-party interests;
312
Level: 6 – From: 6 – Wednesday, May 14, 2008 – 1:39 pm – g5mac4 – 3960 Section 10 : 3960 Section 10

• Tier 1 loans up to 15% of total Tier 1; and
• Other adjustments such as translation differences and shortfall of country risk provisions.
Tier 1 capital excludes intangible assets (goodwill on subsidiaries) and some other items which arededucted from Tier 1 as well as 50% of shares representing more than 10% of the outstanding sharecapital of other banks or financial institutions.
Upper Tier 2 capital includes:
• Debt instruments with an indefinite term and other financial instruments that meet certainspecified criteria; and
• Cumulative preference shares with an indefinite term.
Lower Tier 2 capital includes:
• (Cumulative) preference shares with a fixed term; and
• Long-term subordinated liabilities that meet certain specified criteria.
Tier 3 capital includes:
• Short-term subordinated liabilities.
The aggregate of Tier 2 and Tier 3 capital included in total capital may not exceed the amount ofTier 1 capital. Lower Tier 2 capital may not exceed 50% of the amount of Tier 1 capital. Tier 3 capital thatis only allocated to support market risks may not exceed 200% of the amount of Tier 1 capital that isallocated to support market risks. The aggregate of the Tier 1, Tier 2 and Tier 3 capital, subject to theparameters described in the preceding two sentences, is considered “actual own funds”.
If a bank holds shares representing an interest of more than 10% of the outstanding share capital ofanother bank or financial institution, 50% of such equity must be deducted for Tier 1 purposes and 100%from total actual own funds. Subordinated loans and other capital instruments issued by such other bank orfinancial institution which qualify as actual own funds of such bank or financial institution, and which areheld by a bank, must also be deducted from the latter’s actual own funds.
If a bank holds shares in one or more other banks or financial institutions which, in the case of eachinvestment, represent an interest of 10% or less of the outstanding share capital, or, if such bank does nothold shares but does hold other capital instruments of another institution, the aggregated value of theshares, capital instruments and subordinated liabilities and other financial instruments issued by such otherbanks and financial institutions which qualify as actual own funds of such banks and financial institutions,and which are held by the bank, shall be deducted from the latter’s actual own funds to the extent suchholdings exceed 10% of the bank’s own funds.
On October 17, 2006, the BFIC issued a new regulation establishing capital requirements andcapital adequacy ratios in implementation of the Basel II Directive and the European Directive2006/49/EC. The new solvency reporting requirements are further explained in the BFIC Circular ofFebruary 22, 2007 and are applicable as of January 1, 2008.
The payment of dividends by Belgian credit institutions is limited indirectly through capitaladequacy and solvency requirements by Belgian banking regulations and is also limited by the provisionsof the Belgian Code of Companies.
In addition, each credit institution must become a member of the Depository Guarantee Fund(Fonds de protection des dépôts et des instruments financiers/Beschermingsfonds voor deposito’s enfinanciële instrumenten) in order to provide investors with a minimum level of protection in the event ofbankruptcy of the credit institution.
313
Level: 6 – From: 6 – Wednesday, May 14, 2008 – 1:39 pm – g5mac4 – 3960 Section 10 : 3960 Section 10

Exposure Supervision
No concentration of risks on a single enterprise or on enterprises that are part of the same groupmay exceed a certain proportion of own funds.
For this purpose credit institutions must limit the amount of risk exposure to any single counterpartto 25% of total own funds and the total amount of concentrated risks to 800% of total own funds.
Belgian regulations also require that the credit institutions establish a general provision for countryrisks as determined periodically by the BFIC.
Belgian credit institutions may make equity investments in commercial and industrial companies.However, certain investments “qualified participations” may not exceed: (i) 15% of the total capital of thecredit institution on a per investment basis, or (ii) 45% of the total capital of the credit institution in theaggregate.
Regulation of Fortis’s Banking Activities in The Netherlands
General
In The Netherlands, the banking activities of Fortis are subject to extensive regulations by the DNB,the AFM and the Minister of Finance of The Netherlands.
The banking regulatory system in The Netherlands is a comprehensive system based on theFinancial Supervision Act (Wet op het financieel toezicht). This Act came into force on January 1, 2007,replacing certain other acts including the Act on the Supervision of the Credit System 1992 (Wet toezichtkredietwezen 1992) that had already implemented the relevant EU directives. In general, the DNB ischarged, among other things, with the prudential supervision of banks in The Netherlands and the AFM ischarged, among other things, with the conduct of business supervision of banks in The Netherlands. Noenterprise or institution can carry on the business of a bank in The Netherlands unless it has obtained alicense from the DNB. In general, the license requirements relate to, among other things, (i) expertise andtrustworthiness, (ii) financial safeguards, (iii) conduct of business, (iv) provision of information and (v)safeguards for the adequate supervision of compliance.
The supervision activities of the DNB under the Financial Supervision Act focus on supervision ofsolvency, liquidity, administrative organization, integrity and structure. If, in the opinion of the DNB, acredit institution fails to comply with the Financial Supervision Act and regulations thereunder, the DNBwill notify the bank and it may instruct the bank to behave in a certain manner. Additional supervisorymeasures are available to the DNB including special measures allowing the DNB to appoint a person (maybe publicly announced) to the bank with whom the bodies of the bank must cooperate and whose approvalmay be needed by the bodies of such credit institution for the exercise of their powers.
Fortis Bank Nederland (Holding) N.V. and Fortis Bank (Nederland) N.V. qualify as a “bank” underthe terms of the Financial Supervision Act. The main provisions of the Financial Supervision Act anddirectives issued by the DNB thereunder regarding solvency, liquidity, administrative organization andstructural supervision are summarized below.
Solvency
The solvency regulations, in accordance with the relevant EU directives and the internationallyagreed recommendations of the Basel Committee on Banking Supervision, require that Fortis BankNederland (Holding) N.V. and Fortis Bank (Nederland) N.V. maintain a minimum level of capital for therisk-weighted value of their assets and for market risks and operational risks. Solvency is measured withreference to the solvency ratio, which is calculated broadly by dividing own funds by risk-weighted assets.In addition to credit risk, market risk and operational risk are taken into account as well. The requiredminimum ratio is 8% of Fortis’s risk-weighted assets. This ratio is referred to as the total capital ratio inFortis reports. See “— Regulation of Fortis’s Banking Activities in Belgium — Solvency Supervision” and“Operating and Financial Review and Prospects — Liquidity and Capital Resources — Bank Cash Flows
314
Level: 6 – From: 6 – Wednesday, May 14, 2008 – 1:39 pm – g5mac4 – 3960 Section 10 : 3960 Section 10

— Capital Adequacy” for a discussion of, amongst other things, capital adequacy, risk-weighting andFortis’s (proposed) application of Basel II rules.
The solvency regulations include specific rules with respect to large exposures to a single borroweror group of interconnected borrowers or in relation to certain other businesses that involve a concentrationof risk.
Liquidity
The Financial Supervision Act and the decrees and regulations promulgated thereunder set rules onthe minimum liquidity to be held by banks. The regulations are aimed at ensuring that banks haveadequate liquidity at their disposal to enable them to meet their short-term liabilities promptly and withoutsignificant losses. More particularly, the liquidity regulations seek to ensure that banks are in a position tocope with an acute short-term liquidity deficit.
Administrative organization and control
The Financial Supervision Act and the decrees and regulations promulgated thereunder containprovisions on the organization and control of business processes at banks. The principle is that banks areresponsible for organizing and controlling their business processes in such a way that their business isconducted in a controlled and integrated manner.
The regulations are designed to control the business process risks to which institutions are exposed,including the risks arising from non-compliance, or inadequate compliance, with regulations and frombreaches of sound business conduct. In addition, the aim is to control integrity and solidity of the bank.The latter, in particular, concerns controlling financial risks and other risks that may affect the solidity ofthe bank, as well as maintaining the required financial safeguards. The principle is that the bank itself isresponsible for drawing up procedures, rules and standards, for embedding these in the business processesand for monitoring their effectiveness and compliance therewith. The management board of the bank mustensure that this is achieved in practice.
The regulations focus on such elements as organizational measures, including division of tasks andthe compliance function, recording of rights and obligations of the bank, reporting lines and informationand communication systems.
The regulations aim at creating a framework which is to be expanded on by banks themselves. Thisapproach allows scope for an interpretation that reflects appropriately the individual circumstances of abank and new developments.
Structural supervision
The provisions of the Financial Supervision Act require prior approval for certain changes in thestructure of banks.
Unless it has obtained a declaration of no-objection, a bank shall not:
• reduce its own funds by repayment of capital or distribution of reserves, or makedisbursements from the item comprising the cover for general banking risks;
• hold, acquire or increase an interest of 10% or more in a bank, financial institution,investment firm or insurance company where the balance sheet total of the acquired companyis more than 1% of the consolidated balance sheet total of the bank;
• hold, acquire or increase an interest of 10% or more in other companies (excluding theabove) and the price paid (in total) is more than 1% of the consolidated group equity of thebank;
315
Level: 6 – From: 6 – Wednesday, May 14, 2008 – 1:39 pm – g5mac4 – 3960 Section 10 : 3960 Section 10

• acquire, directly or indirectly, all or a substantial part of the assets and liabilities of anotherenterprise or institution if the total amount of such assets or liabilities is more than 1% of thebank’s consolidated balance sheet total;
• merge with another enterprise or institution if the balance sheet total thereof is more than 1%of the bank’s consolidated balance sheet total;
• commence a financial or corporate reorganization; or
• allow a managing partner to join the bank.
A declaration of no-objection must also be obtained by each person holding or increasing aqualified holding in a bank. For these purposes, a qualified holding is defined as the direct or indirectownership of 10% or more of the issued share capital, the ability to exercise, directly or indirectly, morethan 10% of the voting rights, or the ability to exercise a comparable degree of control.
Supervision of Securities Business
The Financial Supervision Act, together with the decrees and regulations promulgated pursuantthereto, also provide a comprehensive framework for the conduct of securities trading in or from TheNetherlands. It incorporates various EU directives including the Markets in Financial InstrumentsDirective (2004/39/EC) (“MiFID”) and the Capital Adequacy Directive or successive directives.
In addition to regulating the offering of securities, the Financial Supervision Act prohibits, amongother things, the offering and performance of brokerage services and portfolio management serviceswithout a license from the AFM. Banks that are licensed under the Financial Supervision Act can, undercertain circumstances, be exempt from the license requirement. Nevertheless, certain regulationspromulgated under the Financial Supervision Act are applicable with respect to the securities business ofsuch licensed banks. These regulations among others comprise rules of conduct and provisions relating tothe separation of funds, the prevention and disclosure of conflicts of interest, Chinese walls, know-your-customer standards, cost transparency, the form and content of client agreements and integrity.
Supervision of Investment Business
Through Fortis Investment Management Nederland N.V., an indirect subsidiary of Fortis Bank,Fortis is active in the areas of institutional asset management and management of investment funds. Bothactivities are subject to supervision by the DNB and the AFM under the Financial Supervision Act.
Supervision of Trust Business
Through, inter alia, Fortis Intertrust N.V., Fortis is also active in the area of trust business. Thisactivity is subject to supervision by the DNB in accordance with the provisions of the Act on theSupervision of Trust Offices (Wet toezicht trustkantoren).
Regulation of Fortis’ Banking and Related Activities in the United States
Fortis Investment Management USA Inc. is registered as an investment adviser under theInvestment Advisers Act of 1940. Many of the investment instruments managed by this financial servicessubsidiary, including a variety of mutual funds and other pooled investment vehicles, are registered withthe SEC under the Investment Company Act of 1940. The investment advisory activities of this financialservices subsidiary are subject to various U.S. federal and state laws and regulations. These laws andregulations relate to, among other things, limitations on the ability of investment advisers to chargeperformance-based or non-refundable fees to clients, record keeping and reporting requirements,disclosure requirements, limitations on principal transactions between an adviser or its affiliates andadvisory clients, as well as general anti-fraud provisions, The failure to comply with these laws orregulations may result in possible sanctions, including the suspension of individual employees, limitations
316
Level: 6 – From: 6 – Wednesday, May 14, 2008 – 1:39 pm – g5mac4 – 3960 Section 10 : 3960 Section 10

on the activities in which the investment adviser may engage, suspension or revocation of the investmentadviser’s registration as an adviser, censure and/or fines.
Fortis Securities LLC and Fortis Clearing Americas LLC are also registered with the SEC as broker-dealers under the Securities Exchange Act of 1934 and are subject to extensive regulation as such. Inaddition, some of these subsidiaries are members of, and subject to, regulation by self-regulatoryorganizations such as the National Association of Securities Dealers and the New York Stock Exchange.The scope of broker-dealer regulation covers matters such as capital requirements, the use and safekeepingof customers’ funds and securities, advertising and other communications with the public, record-keepingand reporting requirements, supervisory and organizational procedures intended to assure compliance withsecurities laws and rules of the self-regulatory organizations and to prevent improper trading on materialnon-public information, employee-related matters, limitations on extensions of credit in securitiestransactions, and clearance and settlement procedures.
A particular focus of the applicable regulations concerns the relationship between broker-dealersand their customers. As a result, in some instances they may be required to make “suitability”determinations as to certain customer transactions.
Fortis conducts a banking business in the United States through its New York and Connecticutbranches (“Fortis Bank New York” and “Fortis Bank Connecticut”). Fortis Bank New York is licensedby the Superintendent of Banks in the State of New York under the New York Banking Law, and FortisBank Connecticut is licensed by the Connecticut Banking Commissioner under the Connecticut Bankinglaws. Fortis Bank New York is examined by the New York State Banking Department and the Board ofGovernors of the Federal Reserve Systems (the “Federal Reserve Board”) and is subject to banking lawsand regulations applicable to a non-U.S. bank that operates a New York branch. Fortis Bank Connecticut isexamined by the Connecticut Banking Department and the Federal Reserve Board and is subject tobanking laws and regulations applicable to a non-U.S. bank that operates a Connecticut branch.
Fortis Bank is also subject to federal regulation primarily under the International Banking Act of1978, as amended (the “IBA”), and the amendments to the IBA made pursuant to the Foreign BankSupervision Enhancement Act of 1991 (the “FBSEA”), and to examination by the Federal Reserve Board,in its capacity as Fortis Bank’s U.S. “umbrella supervisor.”
Pursuant to the IBA, the Bank Holding Company Act of 1956, as amended (the “BHCA”), imposessignificant restrictions on Fortis Bank’s U.S. non-banking operations and on Fortis Bank’s worldwideholdings of equity securities of companies operating in the United States.
The Gramm-Leach-Bliley Act of 1999 (the “GLBA”) substantially eliminated barriers separatingthe banking, insurance and securities industries in the United States. Under the GLBA, a non-U.S. bankthat has effectively elected to become a financial holding company may conduct business activities, eitherdirectly or through its subsidiaries, that were previously prohibited for bank holding companies. FortisBank is a financial holding company under the GLBA. To qualify as a financial holding company, a non-U.S. bank is required to be well-managed and well-capitalized under the Federal Reserve Board’sregulations and to elect to be treated as a financial holding company with the Federal Reserve Board. Inthe event of non-compliance with these criteria, a financial holding company may be required todiscontinue newly authorized financial activities or, after a certain time period, to terminate authorizedbanking operations or to divest any commercial lending companies that it owns or controls.
The GLBA and the regulations issued thereunder contain certain other provisions that are relevantto Fortis Bank’s U.S. banking operations. One such provision relates to the financial privacy of consumers.In addition, the so-called “push-out” provisions of the GLBA have narrowed and will narrow the exclusionof banks (including Fortis Bank New York) from the definitions of “broker” and “dealer” under the U.S.Securities and Exchange Act of 1934, as amended (the “Exchange Act”). The SEC granted a series oftemporary exemptions that delayed the required implementation of these push-out provisions. Thenarrowed “dealer” definition took effect in 2003, and the narrowed “broker” definition took effect in 2007,but with a transition period allowing additional time to comply with the new “broker” requirements.
317
Level: 6 – From: 6 – Wednesday, May 14, 2008 – 1:39 pm – g5mac4 – 3960 Section 10 : 3960 Section 10

Under the IBA, the Federal Reserve Board may terminate the activities of any U.S. office of a non-U.S. bank if it determines that the non-U.S. bank is not subject to comprehensive regulation on aconsolidated basis in its home country or that there is reasonable cause to believe that the non-U.S. bankor its affiliates have violated U.S. law or engaged in unsafe or unsound banking practice in the UnitedStates, and as a result of such violation or practice, the continued operation of the U.S. office would beinconsistent with the public interest or the purposes of federal banking law.
Fortis Capital Corp. is active in the private equity business. It provides investment managementservices and makes, manages and monitors private equity investments in unaffiliated companies andinvestment funds, and establishes and operates investment funds in which third-party investors makeprivate equity investments. This subsidiary is subject to regulation by the Federal Reserve Board and theSEC.
Insurance
Regulation of Fortis’s Insurance Activities in the European Union
EC directives, including the 1992 third life and non-life EC insurance directives, were implementedin Belgium and The Netherlands in July 1994. These directives are founded on the “home country control”principle, in which the ongoing regulation of insurance companies, including their foreign insuranceoperations, is the responsibility of the home country insurance regulatory authority. The home countryregulatory authority monitors compliance with applicable regulations, the solvency of the insurer and itsactuarial reserves, as well as the assets of the insurer that support such reserves. As a result of theimplementation of these directives, an insurance company that has been licensed to conduct insurancebusiness in one member state of the European Union may conduct business, directly or through foreignbranches, in all other member states without being subject to licensing requirements under the laws ofsuch member states.
In 1998, the EC Directive on the supplementary supervision of the insurance undertakings in aninsurance group was adopted. This directive enables the insurance regulatory authorities involved to form amore sound judgment on the financial situation of insurance undertakings that are part of a group, in orderto provide additional safety to policyholders. Furthermore, the directive aims to prevent distortion ofcompetition and contribute to the safety of the financial markets.
Fortis Insurance subsidiaries are required to maintain a minimum level of qualifying capital relativeto the premiums received for Non-life insurance and investment contracts. EC Directives require aminimum solvency of at least 16% of gross premiums written in the preceding year for Property &Casualty, and generally 4% of insurance reserves, plus 0.3% of the amount at risk under the life insurancepolicies for life insurers. The required solvency was EUR 108 million at December 31, 2007 and arelargely covered by the available qualifying capital.
Regulation of Fortis’s Insurance Activities in The Netherlands
Insurance companies (both life insurers and non-life insurers established in The Netherlands or, ifestablished outside The Netherlands, insofar as their business in The Netherlands (either through a branchor on a cross-border basis) is concerned) are also subject to the Financial Supervision Act. A (legal) personthat carries out a direct insurance business in The Netherlands requires prior authorization from the DNB.Each authorization is granted for a specific type of insurance business.
The Financial Supervision Act implements a large number of European directives relevant to theinsurance industry, including Directive 98/78/EC of October 27, 1998 on the supplementary supervision ofinsurance undertakings in an insurance group. Fortis files its annual report with the supervisor and, inaccordance with this law, Fortis’s life and general insurance subsidiaries in The Netherlands file detailedannual reports. These reports are audited by Fortis’s independent auditors and include:
• balance sheets;
• profit and loss statements;
318
Level: 6 – From: 6 – Wednesday, May 14, 2008 – 1:39 pm – g5mac4 – 3960 Section 10 : 3960 Section 10
• actuarial statements; and
• detailed descriptions of real estate, securities and other investments, mortgages, guaranteesgranted and received and private placement loans.
The technical provisions are prepared in accordance with Dutch GAAP, and are based on the “netlevel premium method”. In common with many companies, Fortis defers and amortizes the variableacquisition cost of new business. Insurance companies are licensed initially by the DNB and monitoredclosely thereafter through annual filings. The authorization granted by the DNB stipulates classes ofbusiness that an insurer may write. In addition, the DNB may require an insurer to submit any otherinformation that it requests and may conduct an audit at any time. The DNB is not empowered to intervenein the running of an insurance company, but can make recommendations with regard to its management. Ifthese recommendations are not followed, the supervisor can publish them and, under certaincircumstances, thereafter withdraw the license of the insurer.
The Financial Supervision Act and the regulations promulgated thereunder and the DNB’s solvencyregulations provide for rules on the amount of equity an insurance company must maintain and provide fora number of other ongoing requirements for insurance companies. The solvency rules applicable toinsurance companies are similar to those for banks.
Regulation of Fortis’s Insurance Operations in Belgium
Insurance activities are regulated in Belgium by the “Supervision Law” of July 9, 1975 and itsimplementing royal decrees, of which the most important one to date is the Royal Decree of February 22,1991, entitled “general rules relating to the supervision of insurance undertakings”.
The Belgian legislation and implementing royal decrees are intended to give effect to applicableEuropean directives and to meet the requirements of European law. Accordingly, the legislation oninsurance supervision establishes the framework under which Belgian, European (EEA) and foreign (non-EEA) insurance companies conduct their insurance business. The legislation and royal decrees imposeobligations on Belgian insurance businesses and create a regime for enforcement.
The basic principles of the Belgian legislation include the following:
• No business may carry on any insurance activity in Belgium absent prior authorization fromthe BFIC.
• Under European and Belgian legislation, supervision of rates and contract terms occurretrospectively. Therefore, although there is no requirement for prior notification by insurancebusinesses of their rates and contract terms, the BFIC has the power to investigate and obtaininformation on rates and terms and to compel changes where it deems necessary. The BFICgenerally reviews rates by sampling a product or category of products. For example, if theBFIC concludes, following a review, that a given contract is not in compliance with thestatutory requirements, it may require cancellation or adjustments of the contract terms.
• European directives and Belgian legislation make a distinction between “life” insurancebusiness and “non-life” insurance business. Subject to certain exceptions, an entityestablished under Belgian law that carries on a “non-life” insurance business is prohibitedfrom carrying on at the same time a “life” insurance business.
• Each insurance company conducting business in Belgium is required to establish andmaintain a solvency margin sufficient for its activities as a whole. In addition, each companyis required to establish and maintain appropriate technical reserves or provisions enabling itto fulfill all its obligations arising from its insurance contracts.
• Transfers of insurance portfolios to other insurance companies require the prior approval ofthe BFIC.
319
Level: 6 – From: 6 – Wednesday, May 14, 2008 – 1:39 pm – g5mac4 – 3960 Section 10 : 3960 Section 10

• The Supervision Law also contains regulations governing the liquidation of an insurancebusiness and relating to insolvency proceedings.
320
Level: 6 – From: 6 – Wednesday, May 14, 2008 – 1:39 pm – g5mac4 – 3960 Section 10 : 3960 Section 10

MANAGEMENT
Governance Structure
Administrative, management, supervisory bodies and senior management
Management structure
The management structure of Fortis provides unity of management within Fortis and contributes tomanagement efficiency. This structure can be summarized as follows:
• one Board, with the Boards of Directors of Fortis SA/NV and Fortis N.V. composed of thesame members with the Chief Executive Officer and the Deputy CEO as the only Boardmembers holding an executive position;
• one Chief Executive Officer;
• one Group Executive Committee, chaired by the Chief Executive Officer responsible for theday-to-day operations of Fortis, with members having overall responsibility for thebusinesses and support functions of Fortis; and
• one Business Executive Committee;
composed of representatives of businesses and support functions assisting the Group ExecutiveCommittee in the execution of the strategy and policy as defined by the Group Executive Committee andadopted by the Fortis Board.
The diagram below outlines Fortis’s management structure as of the date of this Prospectus.
The Fortis Board of Directors
The Boards of Directors of Fortis SA/NV and Fortis N.V. comprise the same members and functionas a single Fortis Board of Directors. The Fortis Board of Directors consists of a maximum of 17members. It has a majority of non-executive board members, and at least two executive board members,being the CEO and the Deputy CEO.
No member of the Fortis Board of Directors has any other significant relationship with Fortis or isaffiliated with a party that does have such a relationship with Fortis.
Members of the Fortis Board of Directors are appointed by the shareholders. Non-executiveDirectors are appointed for a maximum term of four years. The upper age limit for non-executiveDirectors is 70, although exceptions can be made in special circumstances. The upper age limit forexecutive board members is 60, which can be raised to 65.
Individual members of the Fortis Board of Directors are not automatically reappointed. TheNomination and Remuneration Committee evaluates the performance of members who wish to beconsidered for reappointment based on the proposal of the Chairman and then make a recommendation tothe Fortis Board of Directors, which in turn submits the candidate’s reappointment to the General Meetingof Shareholders. Finally, shareholders vote on whether or not to reappoint the proposed individual to theFortis Board of Directors.
The Fortis Board of Directors is responsible for providing strategic direction for Fortis and formonitoring all of Fortis’s affairs. The Fortis Board of Directors’ composition, meetings and decision-making process are specified in the Board Terms of Reference. In principle, the Board has eight scheduledmeetings each year. Additional meetings may be called with appropriate notice at any time to addressspecific needs of the business. The matters to be dealt with are incorporated in an overall annual agenda.The matters to be dealt with at each meeting are prepared in consultation between the Chairman and theChief Executive Officer. Members of the Fortis Board of Directors receive the meeting documents at leastfive days before the meeting to enable them to prepare. In principle, decisions of the Fortis Board of
321
Level: 6 – From: 6 – Wednesday, May 14, 2008 – 1:39 pm – g5mac4 – 3960 Section 10 : 3960 Section 10

Directors are taken by qualified majority voting. In practice, however, all decisions are taken unanimouslyand on a consensus basis.
Requirements regarding independence, competences and qualifications are formulated and reviewedfrom time to time by the Board of Directors, based on a proposal by the Chairman and supported by theNomination and Remuneration Committee. Non-executive Board members are allowed to serve on theboards of other companies, and to take up other engagements or commitments, provided that thosecommitments (i) are outside Fortis, (ii) do not create actual or potential material conflicts of interest, and(iii) do not interfere with the Board member’s ability to fulfill their duties as a Fortis Board member.Executive Board members are prohibited from occupying a position as a board member, be it executive ornon-executive, in any listed company other than Fortis SA/NV and Fortis N.V., unless explicitly approvedby the Board of Directors.
The composition of the Fortis Board of Directors is currently as follows:
Director Term Principal ActivitiesName Position Since Expires Performed outside Fortis111111111 111111 111 11121 1111111111111211
1981 2012 Director of Groupe Bruxelles Lambert,Director of Belgacom, Chairman ofCompagnie Het Zoute, Director of Iscal Sugar,Director of Finasucre, Director of GroupeSucrier, Member of the Trilateral Commission,Member of Insead Belgium Council,Chairman of Guberna, Chairman of CorporateGovernance Committee (Belgium)
2004 2011 Member of the Supervisory Board of ABNAMRO, Member of the Board of Directors ofRFS Holding B.V., Member of theManagement Committee of the Federation ofEnterprises in Belgium, Board Member ofICHEC (Institut Catholique des Hautes ÉtudesCommerciales)
1996 2009 Vice-Chairman of the Supervisory Board ofVastNed Retail N.V., Chairman of theSupervisory Board of ENECO Energie N.V.,Chairman of the Supervisory Board ofConnexxion Holding N.V., Member of theSupervisory Board of FD Media Groep B.V.
2001 2010 Chairman of the Board of Directors of NYSEEuronext, Chairman of the Supervisory Boardof Royal Philips Electronics N.V., Member ofthe Supervisory Board of Heineken N.V.,Member of the International Advisory Boardof the Blackstone Group, Chairman of theSupervisory Board of SC Johnson EuroplantN.V., Chairman Dutch Central PlanningCommittee, Director of Stichting ContinuïteitFortis
2004 2010 Chairman of the Board of Directors of Exmar,Chairman of the Board of Directors ofFloridienne, Member of the Credit SuisseAdvisory Board Europe, Director of AshmoreEnergy (USA), Director of Hermes AssetManage¬ment Europe Ltd., Director ofCobepa/Cobehold
Director FortisIndependent
Baron Philippe Bodson(1944) . . . . . . . . . . . . . . .
Vice-ChairmanDirector Fortis
Jan-Michiel Hessels(1942) . . . . . . . . . . . . . . .
Director FortisIndependent
Klaas Westdijk(1941) . . . . . . . . . . . . . . .
Director FortisChief ExecutiveOfficer
Jean-Paul Votron(1950) . . . . . . . . . . . . . . .
Director FortisChairmanIndependent
Count Maurice Lippens(1943) . . . . . . . . . . . . . . .
322
Level: 6 – From: 6 – Wednesday, May 14, 2008 – 1:39 pm – g5mac4 – 3960 Section 10 : 3960 Section 10

Director Term Principal ActivitiesName Position Since Expires Performed outside Fortis111111111 111111 111 11121 1111111111111211
2004 2009 Non-executive Director of Tate & Lyle PLC,Non-executive Director of JP MorganCazenove Holdings, Council Member andTreasurer of The Open University
2004 2011 Director of Management Consulting GroupPLC, Director of BLB, Director of FrenchInstitute Alliance Française – New York(Member of Finance Committee), Member ofLe Siècle (Paris)
2004 2010 Executive Chairman of Northern Rock,Chairman of the Personal Finance EducationGroup, Member of the FSA’s FinancialCapability Steering Group, Advisor PalamonCapital Partners, Chairman of PaternosterLtd., Chairman of Ironshore Inc.
2004 2011 Non-executive Director of Schlumberger Ltd.,Non-executive Director of Delhi Land andFinance Ltd., Chairman of Sabre CapitalWorldwide, Chairman of Centurion Bank Ltd.,Director of the Indian School of Business
2006 2009 Chief Executive and Director of the LondonStock Exchange PLC, Director of Euro¬clearPLC, Director of LCH Clearnet Group Ltd.,Member of the Advisory Council of thePrince’s Trust, Member of the President’sCommittee of the Confederation of BritishIndustry
2006 2009 Member of the Supervisory Board of BayerSchering Pharmaceutical AG, Member of theSupervisory Board of Wüstenrot &Württembergische AG, Member of theSupervisory Board of E.ON Energie AG,Member of the Supervisory Board of HochtiefFacility Management GmbH, Chairman of theAdvisory Board of Cerberus Germany,Member of the Advisory Board of AON Jauch& Hübener, Member of the Advisory Board ofSteag GmbH, Co-Chairman of the SupervisoryBoard of VHV Allgemeine Insurance
2006 2009 Chairman of the Board of Directors of SolvaySA, Member of the Board of Directors ofMiko N.V.
2007 2010 Professor Extraordinary at the University ofGhent, Director Flemish EconomicAssociation, Member of the ExecutiveCommittee and Board of Directors of the KingBaudouin Foundation, Member of Instituto deEmpresa International Advisory Board(Madrid)
2008 2011 Executive Director, Group President and ChiefFinancial Officer Ping AnDirector Fortis
Louis Cheung(1963) . . . . . . . . . . . . . . .
Director FortisHerman Verwilst(1947) . . . . . . . . . . . . . . .
Director FortisIndependent
Aloïs Michielsen(1942) . . . . . . . . . . . . . . .
Director FortisIndependent
Reinier Hagemann(1947) . . . . . . . . . . . . . . .
Director FortisIndependent
Clara Furse(1957) . . . . . . . . . . . . . . .
Director FortisIndependent
Rana Talwar(1948) . . . . . . . . . . . . . . .
Director FortisIndependent
Ronald Sandler(1952) . . . . . . . . . . . . . . .
Director FortisIndependent
Jacques Manardo(1946) . . . . . . . . . . . . . . .
Director FortisIndependent
Richard Delbridge(1942) . . . . . . . . . . . . . . .
323
Level: 6 – From: 6 – Wednesday, May 14, 2008 – 1:39 pm – g5mac4 – 3960 Section 10 : 3960 Section 10

On April 29, 2008, the General Shareholders Meetings re-elected Jean-Paul Votron as executivedirector for a three-year term. The General Shareholders Meetings re-elected Jacques Manardo and RanaTalwar as non-executive directors for a three-year term. The General Shareholders Meetings re-electedCount Maurice Lippens as non-executive director for a four-year term. Louis Cheung was elected as non-executive Board member for a three –year term.
The Boards of Directors of the sub-holding companies, Fortis Brussels SA/NV and Fortis UtrechtN.V., comprise the members of the Group Executive Committee of Fortis (see below) and are responsiblefor strategic and financial development and control, capital allocation and the representation of Fortis withexternal constituencies.
The business address of the members of the Fortis Board of Directors is Rue Royale/Koningsstraat20, 1000 Brussels.
In relation to each of the members of the Fortis Board of Directors, the Issuers are not aware of (i)any convictions in relation to fraudulent offenses in the last five years, (ii) any bankruptcies, receivershipsor liquidations of any entities in which such members held any office, directorships, or partner or seniormanagement positions in the last five years, or (iii) any official public incrimination and/or sanctions ofsuch members by statutory or regulatory authorities (including designated professional bodies), ordisqualification by a court from acting as a member of the administrative, management or supervisorybodies of an issuer or from acting in the management or conduct of the affairs of any issuer for at least theprevious five years.
Chief Executive Officer, Group Executive Committee and Business Executive Committee
Fortis Chief Executive Officer is responsible for the day-to-day management of Fortis, forformulating the strategic direction for the Group and for implementing these plans after the Fortis Board ofDirectors has approved them. The Chief Executive Officer is Chairman of the Group ExecutiveCommittee.
The Group Executive Committee is assisted by the Business Executive Committee, composed ofrepresentatives of businesses and support functions assisting the Group Executive Committee in theexecution of the strategy and policy as defined by the Group Executive Committee and adopted by theFortis Board.
The Fortis Group Executive Committee is responsible for the daily management of Fortis andimplements Fortis strategy, proposes options for further development of Fortis to the Fortis Board ofDirectors, including acquisitions and dispositions, stimulates the cross-transfer of best practices andimplements synergies within Fortis and manages capital allocation and target setting. The Fortis GroupExecutive Committee meets twice a month according to a fixed timetable and on as many other occasionsas Fortis interests require. Except for the Chief Executive Officer and the Deputy Chief Executive Officer,none of the members of the Group Executive Committee are also members of the Board of Directors. Withthe exception of the Chief Executive Officer, the Board of Directors appoints the Group ExecutiveCommittee members based on a proposal made by the Chief Executive Officer in consultation with theChairman, and supported by the Nomination and Remuneration Committee. As a member of the FortisBoard of Directors, the Chief Executive Officer is appointed by the General Meeting of Shareholders atthe recommendation of the Fortis Board of Directors.
324
Level: 6 – From: 6 – Wednesday, May 14, 2008 – 1:39 pm – g5mac4 – 3960 Section 10 : 3960 Section 10

The Group Executive Committee currently consists of the following members who, with theexception of the Chief Executive Officer, are responsible for individual businesses and support functions.
Principal ActivitiesName Position Performed outside Fortis1111111111 11111111111111 1111111111111111
Jean-Paul Votron . . . . . . . . Member of the Supervisory Board ofABN AMRO, Member of the Board ofDirectors of RFS Holdings B.V.,Member of the Management Committeeof the Federation of Enterprises inBelgium, Board Member of ICHEC(Institut Catholique des Hautes ÉtudesCommerciales)
Herman Verwilst . . . . . . . . Professor Extraordinary at theUniversity of Ghent, Director FlemishEconomic Association, Member of theExecutive Committee and Board ofDirectors of the King BaudouinFoundation, Member of Instituto deEmpresa International Advisory Board(Madrid)
Gilbert Mittler . . . . . . . . . None
Filip Dierckx . . . . . . . . . . Board Member of various companies ofthe Group SD Worx, Board Member ofthe Flemish Economic Association(Voka)
Lex Kloosterman . . . . . . . Treasurer Foundation Zorg & Bijstand,Board Member Foundation TheNetherlands - Sultanate of Oman,Board Member Stichting HetConcertgebouw Fonds, Board MemberDuisenberg School of Finance
Camille Fohl . . . . . . . . . . . Member of the Banking Group of theChamber of Commerce of Luxembourg
Peer van Harten . . . . . . . . None
Alain Deschênes . . . . . . . . None
The business address of the members of the Group Executive Committee is Rue Royale20/Koningsstraat 20, 1000 Brussels.
In relation to each of the members of the Group Executive Committee, the Issuer is not aware of (i)any convictions in relation to fraudulent offenses in the last five years, (ii) any bankruptcies, receivershipsor liquidations of any entities in which such members held any office, directorships, or partner or seniormanagement positions in the last five years, or (iii) any official public incrimination and/or sanctions ofsuch members by statutory or regulatory authorities (including designated professional bodies), or
Responsible for Technology andInformation Services, Operations,Facility, Purchasing and ProcessImprovement
Responsible for Insurance andReal Estate
Responsible for Retail Bankingand Global Branding andCommunications
Responsible for Private Banking,Asset Management, InvestorRelations and Corporate SocialResponsibility.
Responsible for MerchantBanking
Responsible for Finance, Riskand General Counsel.
Deputy Chief Executive Officerand Executive Director,responsible for HumanResources, Public and ExternalAffairs and BusinessTransformation Office.
Chief Executive Officer andExecutive Director. Internal Auditreports directly to the CEO.
325
Level: 6 – From: 6 – Wednesday, May 14, 2008 – 1:39 pm – g5mac4 – 3960 Section 10 : 3960 Section 10

disqualification by a court from acting as a member of the administrative, management or supervisorybodies of an issuer or from acting in the management or conduct of the affairs of any issuer for at least theprevious five years.
Supervisory bodies
Fortis Audit Services reports to the Audit Committee regarding Fortis internal control systems fourtimes a year. In addition to the regular audits, specific topics are also audited every year.
Once a year Fortis Compliance reports on legal compliance to the Audit Committee.
As a bi-national, integrated financial services provider, Fortis is subject to different forms of internaland external supervision. Fortis’s banking activities and investment services are organized on cross-borderbusiness lines, whereby the commercial core is in Belgium, The Netherlands or Luxembourg, dependingon the business line. To ensure proper supervision of these cross-border activities, the relevant regulators(the CBFA in Belgium, the DNB in The Netherlands and the CSSF in Luxembourg) signed aMemorandum of Understanding on 29 March 2001. Fortis’s insurance businesses are not cross-border andare therefore subject to national insurance supervision; given the merger of the insurance and bankingregulators in both Belgium and The Netherlands, the regulation is also exercised respectively by the CBFAand DNB.
The respective supervisors in Belgium and The Netherlands (CBFA, DNB) are of the opinion thatintegration of the activities within a financial services company (or a financial conglomerate) gives rise tospecific risks which require the separate banking and insurance supervision to be supplemented withcomprehensive supervision at the group level. In February 2002, the supervisors agreed on a renewedProtocol (entitled “Framework for the exercise of the supplementary supervision of the Fortis Group”) toprovide for adequate supervision of Fortis.
Administrative, management, supervisory bodies and senior management conflicts of interests
No potential conflicts exist between any duties to Fortis of the Fortis’s directors and GroupExecutive Committee members and their private interests and/or other duties.
Remuneration of Fortis Board members and Executive Managers
The Board and the Nomination and Remuneration Committee comply with the Fortis RemunerationPolicy as set forth in the Fortis Governance Statement, when making all proposals, recommendations anddecisions relating to the remuneration of Board Members and the Executive Managers. The RemunerationPolicy, as applied in 2007 is described below, together with the remuneration information over 2007.
Definitions are as follows:
• Board members: non executive and executive members of the Board of Directors. The CEOand the Deputy CEO are the only executive members.
• Executive Managers: the CEO, the Deputy CEO and other members of the ExecutiveCommittee.
Remuneration of Fortis Board members
Remuneration policy
The remuneration of the Fortis Board members is determined by the Board of Directors incompliance with the prerogatives of the General Meetings of Shareholders.
Detailed proposals for remuneration of non-executive Board members are formulated by theNomination & Remuneration Committee, based upon advice from outside experts.
326
Level: 6 – From: 6 – Wednesday, May 14, 2008 – 1:39 pm – g5mac4 – 3960 Section 10 : 3960 Section 10

For the non-executive Board members, the levels and structure of remuneration are determined inview of their general and specific responsibilities and general international market practice. Theremuneration of non-executive Board members includes both regular basic remuneration for Boardmembership and Board committee meeting attendance fees. The non-executive board members do notreceive annual incentive awards or stock options and are not entitled to pension rights. Non-executiveBoard members are not entitled to any termination indemnity.
The remuneration of the Executive Board members, the CEO and the Deputy CEO, are relatedexclusively to their positions as CEO and Deputy CEO and are therefore determined in line with theRemuneration Policy for Executive Managers.
Remuneration data 2007
Total remuneration of non executive Board members amounted to EUR 2.0 million in the 2007financial year (2006: EUR 1.8 million; 2005: EUR 1.7 million). This includes both basic remuneration forBoard membership and attendance fees for Board committee meetings. The remuneration of the CEO andthe Deputy CEO, who are also Board members, is explained below.
Remuneration of the Fortis Executive Managers
Remuneration policy
The remuneration of the Executive Managers is determined by the Board of Directors, uponproposals by the Nomination & Remuneration Committee, in compliance with the prerogatives of theGeneral Meeting of Shareholders.
Both the levels and structure of remuneration for Fortis Executive Managers are analyzed on anannual basis. At the initiative of the Nomination & Remuneration Committee, Fortis’s remunerationcompetitive positioning is regularly reviewed by and discussed with a leading international firm ofcompensation and benefits consultants, in light of the practices of other major Europe based internationalfinancial services groups and other organizations operating on a global basis.
The remuneration of Executive Managers is designed to:
• ensure the organisation’s continued ability to attract, motivate and retain high calibre andhigh potential executive talent for which Fortis competes in an international market place,
• promote achievement of demanding performance targets in order to align the interests ofexecutives and shareholders in the short, medium and long term,
• stimulate, recognize and reward both strong individual contribution and solid teamperformance.
The reward package for the Executive Managers reflects a concept of integrated total directcompensation, combining the following three major components of pay:
• base salary,
• annual incentive (short-term performance related bonus), and
• long-term incentive.
In calibrating the various remuneration components, the objective is to position the overallremuneration levels in line with compensation practices of other leading multinational firms. The referencemarket is a combination of the financial industry on the one hand and all sectors taken together on theother hand, both at European level and at the level of Belgium and The Netherlands. For the remunerationreview conducted in 2007, the primary reference market was composed of financial services organizationsspread over seven European countries. The variable, performance related payment components are thedominant portion of the total compensation package of Executive Managers, i.e. total ‘pay at-risk’ in terms
327
Level: 6 – From: 6 – Wednesday, May 14, 2008 – 1:39 pm – g5mac4 – 3960 Section 10 : 3960 Section 10

of targeted short and long-term incentives compensation levels represent at least 60% of the ExecutiveManagers total compensation.
The above reward package is part of a contract providing the main characteristics of the status: thedescription of the components of the package, the expiration date (between 60 and 65 years), thetermination clauses and various other clauses such as confidentiality and exclusivity. As of January 1,2005, the contract provides for a termination indemnity, in case of termination without cause by Fortis,which equals twice the amount of the base salary, but also respecting commitments made by Fortis beforethe date of January 1, 2005. The indemnity specifically applicable to the CEO and Deputy CEO isdescribed under “— compensation data for 2007 of the CEO, Deputy CEO and Executive Committee”.
Base salary
Base salary levels are intended to compensate the Executive Managers for their positionresponsibilities and their particular set of competencies. These levels are set in line with general prevailingmarket rates for equivalent type positions and are subject to regular annual reviews. There is, however, nomechanism for automatic adjustment.
Annual incentive
The annual incentive is designed to stimulate, recognize and reward strong individual contributionby the Executive Managers as well as solid performance as head of or as team members within theExecutive Committee. Payout under the annual incentive scheme is directly linked to the actualperformance against a set of predetermined qualitative and quantitative performance objectives.
The variable compensation is calculated according to the following criteria that carry an equalweight:
• a criterion specific to the Executive Committee as a team, based on the achievement of jointobjectives, such as the completion of the budget, key projects, levels of indicators ofperformance achieved, strategy implemented, and priorities for 2007-2008.
• a criterion based on the achievement of personal objectives specific to each ExecutiveManager and linked to his general responsibilities.
For each set of objectives, the performance is rated between one (does not meet expectations) andseven (exceptional). Based on these ratings and the overall outcome of the appraisal process, the actualindividual annual incentive ranges in principle between one third (33%) and five thirds (167%) of thetarget incentive. Target annual incentive payouts are expressed as percentages of base salary and rangebetween 70% and 100%, depending upon the position within the Executive Committee.
Long term incentive
The long-term incentive plan is designed to:
• encourage and support the creation of shareholders’ value and to ensure that the ExecutiveManagers, like the shareholders, share in the company’s successes and setbacks
• provide the opportunity for Executive Managers to receive, within their overall package,competitive rewards for performance as a result of sustained group performance over a longerperiod of time
• enable the organization to outperform a group of Fortis’s peers in the international market,and also take into account the growth potential of the Fortis share.
Key features of the current long-term incentive plan are as follows:
328
Level: 6 – From: 6 – Wednesday, May 14, 2008 – 1:39 pm – g5mac4 – 3960 Section 10 : 3960 Section 10

• the initial target long-term incentive level is set by the Nomination & RemunerationCommittee. It is determined as a percentage of annual base salary and ranges between 70%and 100%.
• actual long-term incentive is recommended by the Nomination & Remuneration Committeeon the basis of Fortis’s actual share performance relative to a peer group of Europe’s top 30financial institutions (as determined by market capitalization).30 The share performance ofFortis and the companies in the peer group is divided into quartiles. Based on this relativeperformance position at the end of December, the Nomination & Remuneration Committeeestablishes a multiplier which varies between zero and two and depends on the quartile inwhich the Fortis share performance falls. Actual long-term incentive level recommended bythe Committee is equal to the initial target long-term incentive multiplied by the multiplier.Actual long-term incentives may not exceed 200% of the target long-term incentive.
The long-term incentive is delivered as a mix of options, cash and/or restricted shares:
• the grant of options stipulates a strike price of 100% of the Fortis share market value at thetime they are granted and an option term of six years. Options can be exercised duringpredetermined ‘open periods’ falling within a time frame ranging from the first day of theyear following the third anniversary of the grant until the end of the option term. Neither thestrike price nor the other conditions regarding the granted options can be modified during theterm of the options, except in certain exceptional circumstances in accordance withestablished market practice.
• the long-term incentive in the form of restricted shares consists of the commitment, taken byFortis, to grant a number of Fortis shares at the end of a three year period, provided theprofessional relationship with Fortis has not been terminated prematurely, unless the Board ofDirectors decides otherwise. At the date of grant, the Executive Manager will be allowed tosell a maximum of 50% of those shares within 10 days in order to finance the tax liabilitiesassociated with the grant. The unsold shares will remain unsalable until six months aftertermination of the professional relationship between Fortis and the Executive Manager, whichemphasizes the Executive Manager’s long-term commitment.
Other remuneration components
The Executive Managers participate in Fortis’s pension schemes in either Belgium or TheNetherlands. These schemes are in line with predominant market practices in the respective geographicenvironments. For the CEO it is a defined contribution plan. For the other Executive Managers it is a non-contributory defined benefit plan. They provide retirement and pre and post-retirement survivors’ pensionsor their lump sum equivalent. Target defined pensions, including state pension, are set at percentages ofbase salary and may not exceed 80% of the latter salary. Other benefits, such as medical and otherinsurance coverage, are provided in line with competitive practices in the market where the ExecutiveManager is employed.
Approval of Remuneration Policy
In accordance with the Dutch law, entered into force on October 1, 2004, the Remuneration Policyfor Fortis Board members was approved by the General Shareholders Meeting of Fortis N.V. on October11, 2004. This meeting also determined the maximum number of options and restricted shares that can beattributed to executive members of the Board of Directors under the long-term incentive scheme. Any
329
Level: 6 – From: 6 – Wednesday, May 14, 2008 – 1:39 pm – g5mac4 – 3960 Section 10 : 3960 Section 10
30 For 2007, the peer group comprised the following financial institutions: ABN AMRO Holding NV, Aegon NV, Allianz AG,Assicurazioni Generali SpA, Aviva Plc, AXA SA, Banca Intesa SpA, Banco Bilbao Vizcaya Argentaria SA, Banco Santander CentralHispano SA, Barclays PLC, BNP Paribas, Crédit Agricole SA, Crédit Suisse Group, Deutsche Bank AG, Dexia, HBOS PLC, HSBCHoldings PLC, ING Groep NV, KBC Groep NV, Lloyds TSB Group Plc, Münchener Rückversicherungs AG, Natixis, Nordea BankAB, Prudential PLC, Royal Bank of Scotland Group Plc, Société Générale, Standard Chartered Plc, UBS AG, UniCredito ItalianoSpA and Zurich Financial Services AG.

amendments to this policy that the Board might consider important to make will in the future be subject tothe approval of the General Meeting of Shareholders of Fortis N.V.
With respect to the Executive Managers who are not members of the Board, the Board has decidedto adopt the same Remuneration Policy as the one applicable for the executive Board members. The Boardhas the authority to amend the Remuneration Policy for these Executives as it sees fit, on the basis ofrecommendations made by the Nomination & Remuneration Committee. In the event of any suchamendments, appropriate comments on them will be drawn up and included, at the latest, in the firstannual report published after the amendments were adopted.
CEO and Deputy CEO Compensation Data 2007
CEO and Deputy CEO
Compensation of the CEO and Deputy CEO, who are also Board Members, relates solely to theirpositions as CEO and Deputy CEO. Their remuneration has been set in accordance with the remunerationpolicy approved on October 11, 2004 by the shareholders meeting of Fortis N.V. The policy states, inparticular, that the effective annual incentive can, in principle, not exceed the target incentive (100% of thebase salary) by more than two thirds. Recognizing his leadership over the past year, the Board has set MrVotron’s annual incentive for 2007 at EUR 2.5 million.
For 2007, Mr Votron’s remuneration consisted of a base salary of EUR 750,000, an annual incentiveof EUR 2.5 million, the grant of 49,655 options, the commitment to grant 41,775 Fortis shares and anamount of EUR 660,800 representing the value of the other remuneration components (pension costs,long-term incentive paid in cash and other expenses). The exercise of Stock Appreciation Rights at the endof Mr Votron’s initial contract entitles him to an amount between the minimum amount of EUR 1.0 millionand EUR 2.75 million depending on the performance of Fortis shares during the term of his initialcontract. Based on the period considered, it is anticipated that Mr Votron will receive no more than theminimum amount (i.e EUR 1.0 million).
The proposal to the General Meetings of Shareholders on April 29, 2008 to re-appoint Mr Votron asexecutive member of the Board for a period of three years expiring after the 2011 shareholders meetingshas no material effect on the terms and conditions agreed with him in 2004 (including the variableremuneration components, i.e. the Annual Incentive and the Long-term incentive) except for the followingamendments thereto:
• Mr Votron annual base salary will amount to EUR 1,300,000 (gross) for 2008 to ensurealignment with the significantly higher amounts of base salary paid by Fortis’s peers to theirCEOs,
• If Fortis terminates the contract, Mr Votron will be paid gross compensation amounting to amaximum of one year base salary instead of two years previously,
• The pension contribution by Fortis will amount to EUR 500,000 plus 25% of the differencebetween the new base salary and the previous one (pension contribution previous contract:EUR 500,000), and
• Mr Votron will not receive new Stock Appreciation Rights.
Mr Verwilst’s remuneration in 2007 consisted of a base salary of EUR 695,000, an annual incentiveof EUR 1.0 million, a grant of 36,560 options, a commitment to grant 27,970 Fortis shares and an amountof EUR 403,370 representing the value of the other remuneration components (pension cost, long-termincentive paid in cash and other expenses). Should Fortis terminate the contract prematurely, Mr Verwilstwill receive a gross sum equal to a maximum of three years cash compensation (base salary and targetannual incentive). Mr Verwilst will not receive any payment if the contract is terminated prematurely dueto gross negligence or wilful misconduct.
330
Level: 6 – From: 6 – Wednesday, May 14, 2008 – 1:39 pm – g5mac4 – 3960 Section 10 : 3960 Section 10

Members of the Board of Directors have not been granted loans or credit other than those granted inthe normal course of Fortis’s financial operations on the same commercial terms as apply to Fortiscustomers.
For more details on the remuneration of Fortis Board members and Executive Managers, see Note11 to the 2007 Consolidated Financial Statements incorporated by reference herein.
Information about the Fortis committees
The Fortis Board of Directors may institute from among its members all committees that itconsiders useful. The Board rules govern the composition and responsibilities of these committees.
Currently, the Fortis Board of Directors has established three committees: the Nomination andRemuneration Committee, the Audit Committee and the Risk and Capital Committee. As a generalprinciple, the Board Committees have an advisory function to the Board.
Each of Fortis SA/NV and Fortis N.V. comply with the corporate governance regime of Belgiumand The Netherlands, respectively, except that Fortis N.V. deviates from the Tabaksblat Code in certainrespects as set forth below in the “— Corporate Governance Statement” section.
Risk and Capital Committee
The members of the Risk and Capital Committee are Philippe Bodson, Clara Furse and AloïsMichielsen. The role of this Committee is to assist the Board in understanding the risks run by Fortis, inoverseeing the proper management of these risks and in ensuring the adequacy of Fortis capital.
Nomination and Remuneration Committee
The members of the Nomination and Remuneration Committee are Maurice Lippens (Chairman),Jan-Michiel Hessels, Jacques Manardo and Rana Talwar. The role of this Committee is to assist the Boardin all matters relating to the appointment and remuneration of Board members and Executive Managers,and in those matters regarding the governance of the group on which the Board or the Chairman wishes toreceive the Committee’s advice.
Audit Committee
The members of the Audit Committee are Klaas Westdijk (Chairman), Richard Delbridge, ReinerHagemann and Ron Sandler. The role of this Committee is to assist the Board in fulfilling its supervisionand monitoring responsibilities in respect of internal control in the broadest sense within Fortis, includinginternal control over financial reporting.
Corporate governance statement
Fortis’s international structure, headed by two listed parent companies, one Dutch and one Belgian,means it has to comply with two corporate governance systems that refer to two separate codes. While theprinciples underlying these codes are largely similar, there are a number of differences too.
Because of the specific cross-border context in which Fortis operates, we have developed our own‘single tier’ governance structure, while naturally observing all the relevant Belgian and Dutch legalrequirements. The structure is described in detail in the Fortis Governance Statement to ensure optimumtransparency and to demonstrate its internal coherence. Those aspects of corporate governance at Fortisthat require additional explanation in the light of the Belgian (Lippens) or Dutch (Tabaksblat) Codes canbe found below.
Fortis and the Lippens Code
The Lippens Code came into force on January 1, 2005. It applies to all companies incorporatedunder Belgian law the shares of which are traded in a regulated market. The Code uses the ‘comply or
331
Level: 6 – From: 6 – Wednesday, May 14, 2008 – 1:39 pm – g5mac4 – 3960 Section 10 : 3960 Section 10

explain’ concept, which means that if a company chooses to deviate from any of the Code’s principles, itmust explain its reasons for doing so in the ‘Corporate Governance’ section of its annual report. Fortisstated in the Fortis Annual Reviews of previous years, that it applies all the Code’s main principles. Threeitems require more detailed explanation:
• Principle 2.3: Independence of directors. The Lippens Code states that: “To be consideredindependent, a director should be free from any business, close family or other relationshipwith the company, its controlling shareholders or the management of either that creates aconflict of interest such as to affect that director’s independent judgment.” The phrasing ofthis principle generally requires little comment. Questions may be raised, however, regardingits implementation and the way specific criteria in respect of a director’s independence areformulated. The Lippens Code, the Tabaksblat Code, Article 524 of the Belgian CompaniesCode and the recommendation of the European Commission of February 15, 2005, forinstance, all set out independence criteria which, if not actually contradictory, neverthelessdiffer from one another. For that reason, we have opted for our own criteria at Fortis, asdefined in our Governance Statement. These match those of the Lippens Code, with theexception that Fortis considers it necessary to limit to listed companies the restrictions oncross-directorships.
• According to principle 7.18, the annual report should disclose the main contractual terms ofemployment and termination arrangements with executive managers. The remunerationpolicy for Fortis directors and Executive Committee members – described in detail in note 11of our Financial Statements – sets out the main terms of our contracts with executivemanagers. As from January 1, 2005, the contracts provide for a termination indemnity, in thecase of termination without cause at the initiative of Fortis. The indemnity equals twice theamount of the base salary, without prejudice to commitments taken by Fortis before January1, 2005.
• The Annual General Meetings of Shareholders in May 2007 endorsed the view that the re-appointment of Baron Piet Van Waeyenberge as non-executive Board Member for a period ofone year would be in Fortis’s interest and that this re-appointment, leading to a total term ofdirectorship of more than the twelve years stipulated by the Fortis Governance Statement,would not affect Baron Van Waeyenberge’s independence.
Fortis and the Tabaksblat Code
Since 2004, listed companies incorporated under Dutch law have been legally required to declare intheir annual reports that they have adhered to the Tabaksblat Code, or to explain any instances in whichthey have deviated from it. Accordingly, Fortis stated in its Annual Reports for 2004, 2005 and 2006 thatthe principles and best practice provisions of the Tabaksblat Code had been met in those financial years,with certain substantiated exceptions. Fortis’s respective statements were discussed at the Annual GeneralMeetings of Shareholders in May 2005, May 2006 and May 2007.
By re-electing Baron Piet Van Waeyenberge non-executive Board Member for a period of one year(i.e. until the close of the Annual General Meetings of Shareholders in 2008), the Annual GeneralMeetings of Shareholders of May 2007 endorsed the view of the Board of Directors that the re-election ofPiet Van Waeyenberge was in Fortis’s interest. The Annual General Meetings of Shareholders thus resolvednot to abide by the maximum term of directorship (twelve years) generally recommended by theTabaksblat Code (Best Practice provision III.3.5). The Annual General Meetings of Shareholders in May2006 had taken a similar position with regard to the re-election of Klaas Westdijk as non-executive BoardMember for a period of three years (i.e. until the close of the Annual General Meetings of Shareholders in2009).
By electing Herman Verwilst executive Board Member as proposed by the Board of Directors, theAnnual General Meetings of Shareholders of May 2007 acknowledged the position taken by the Board thatthis election would have no effect on the contract concluded (in Belgium) in 1999 between Fortis andHerman Verwilst in his capacity as Executive Manager. This includes the contractual termination
332
Level: 6 – From: 6 – Wednesday, May 14, 2008 – 1:39 pm – g5mac4 – 3960 Section 10 : 3960 Section 10

indemnity equal to a maximum of three years’ cash compensation (base salary and target annual incentive)in the absence of gross negligence or wilful misconduct, as specified in the proposal to the Annual GeneralMeetings of Shareholders. This termination indemnity exceeds the maximum set by Best Practiceprovision II.2.7 of the Tabaksblat Code, which is set at one year cash compensation or two years cashcompensation if such is deemed reasonable for Board members during their first term of appointment.
Bearing in mind the points expressed above, we hereby declare that Fortis complied with theprinciples and best practice provisions of the Tabaksblat Code in 2007, which is subject to the followingqualifications and exceptions which have remained unchanged since the financial year 2006.
Qualifications
Our aim at Fortis is to comply with the Tabaksblat Code to the maximum possible extent. Wecannot, however, meet all of the Code’s provisions. Some of them conflict with the internal coherence ofour governance structure, which has been carefully developed over the years to meet the challenges facinga bi-national group. Furthermore, our single-tier board structure creates a specific framework that is notcustomary in The Netherlands and which did not act as the primary frame of reference when theTabaksblat Code was drafted.
When applying the Code, therefore, we have been obliged to translate the various provisions to fitour single-tier structure. Provisions aimed at the Supervisory Board or the Management Board have thusbeen applied to Fortis’s Board of Directors, while provisions for individual members of the SupervisoryBoard have been applied to our non-executive directors and provisions for individual members of theManagement Board to Fortis’s CEO and Deputy CEO.
Some provisions could not, however, be translated into the Fortis context. These include the rulesregarding a ‘delegated supervisory board member’ and a ‘supervisory board member who temporarilytakes on the management of the company’ (respectively III.6.6 and III.6.7 of the Tabaksblat Code). Theseprovisions are geared specifically to supervisory board members and the supervisory tasks they perform,and so cannot be reconciled with the single-tier board model.
Similarly, the provision that the Chairman of the Board should not have held an executive positionat the company (III.8.1) is an anomaly in the context of a single-tier board model, the essence of which isprecisely to combine the expertise of executives and non-executives in one and the same decision-makingbody. Fortis’s Chairman and co-founder, Maurice Lippens, was Co-Chairman of both the Board andExecutive Committee until 2000. Since 2000, he has been a non-executive Board Member and Chairmanof the Board. By re-electing Maurice Lippens, the Annual General Meetings of Shareholders in May 2005endorsed the view of the Board of Directors that the re-election of Fortis Chairman Maurice Lippens for aperiod of three years (i.e. until the close of the 2008 Annual General Meetings of Shareholders) would bein Fortis’s interest, notwithstanding the maximum term of appointment (twelve years) generallyrecommended by the Tabaksblat Code (Best Practice provision III.3.5).
Several provisions of the Tabaksblat Code do not, moreover, apply to Fortis. This is the case withthe following sections: II.2.1 (share options as a conditional remuneration component for managementboard members – Fortis does not offer such options), III.2.1 (all supervisory board members, with theexception of one person only, must be independent – III.8.4 sets out the rule as it applies to Fortis), IV.1.2(voting right on financing preference shares – Fortis does not have this type of preference share) andIV.2–IV.2.8 (depositary receipts for shares – Fortis does not issue this type of depositary receipt). Theseprovisions have not, therefore, been taken into consideration.
With regard to section III.3.5, the view has been taken that Fortis’s rule that nobody may serve as adirector for more than twelve years, with no individual term exceeding four years, does not materiallydeviate from the Code’s requirement of a maximum of three terms of four years each. Lastly, theprovisions regarding the ‘remuneration committee’ and the ‘selection and appointment committee’ havebeen interpreted as applying to our Nomination and Remuneration Committee, since this body combinesthe strongly interrelated selection, appointment and remuneration functions at Fortis.
333
Level: 6 – From: 6 – Wednesday, May 14, 2008 – 1:39 pm – g5mac4 – 3960 Section 10 : 3960 Section 10

Exceptions
(BP refers to the “Best Practice” sections of the Tabaksblat Code.)
BP II.1.6: The management board shall ensure that employees have the possibility of reportingalleged irregularities of a general, operational and financial nature in the company to the chairman of themanagement board or to an official designated by him, without jeopardizing their legal position. Allegedirregularities concerning the functioning of management board members shall be reported to the chairmanof the supervisory board.
• Fortis has introduced a whistleblower procedure (Fortis Internal Alert System), but this hasnot been published on the website. The procedure is intended solely for Fortis employees;external disclosure would not enhance its effectiveness, but could have undesirablerepercussions in countries where procedures of this nature run up against legal and/or culturalobjections.
BP II.2.3: Shares granted to management board members without financial consideration shall beretained for a period of at least five years or until at least the end of the employment, if this period isshorter.
• Under the long-term incentive plan, shares can be awarded only to executive Board members.They may sell up to 50% of the shares in order to pay the tax incurred on them. Theremaining shares may not be sold until six months after termination of their relationship withFortis.
BP II.2.6: The Supervisory Board will draw up regulations concerning ownership of andtransactions in securities by management board members, other than securities issued by their owncompany. The regulations are published on the website. The Compliance Officer is notified at leastquarterly of private investments in securities of Dutch listed companies.
• As explained to the Annual General Meetings of Shareholders in May 2006, Fortis has drawnup and issued the required regulations on insider trading but contrary to Best Practice II.2.6these regulations are not published on the Fortis website, since these regulations arenumerous and tailored to highly specific local and/or business requirements. In line with theobjectives set by the Tabaksblat Code, the Fortis Governance Statement contains a PolicyStatement summarizing principles and guidelines on the use of inside information and privateinvestments to be adhered to by all Board Members, other senior managers, officers andemployees worldwide.
BP III.1.7: The supervisory board shall discuss at least once a year on its own, i.e. without themanagement board being present, both its own functioning and that of its individual members.
• Fortis’s Board of Directors regularly reviews its own performance in an appropriate manner,but not necessarily on an annual basis. The Nomination and Remuneration Committeeevaluates the individual Board Members.
BP III.5.11: The remuneration committee shall not be chaired by the chairman of the supervisoryboard or by a former member of the management board of the company, or by a supervisory boardmember who is a member of the management board of another listed company.
• The Chairman of the Board of Directors at Fortis is responsible for the proper functioning ofthe Board and for initiating all processes relating to this. These include ensuring a Boardmembership that is geared to the needs of the organisation and therefore also entail a leadingrole in the Nomination and Remuneration Committee.
334
Level: 6 – From: 6 – Wednesday, May 14, 2008 – 1:39 pm – g5mac4 – 3960 Section 10 : 3960 Section 10
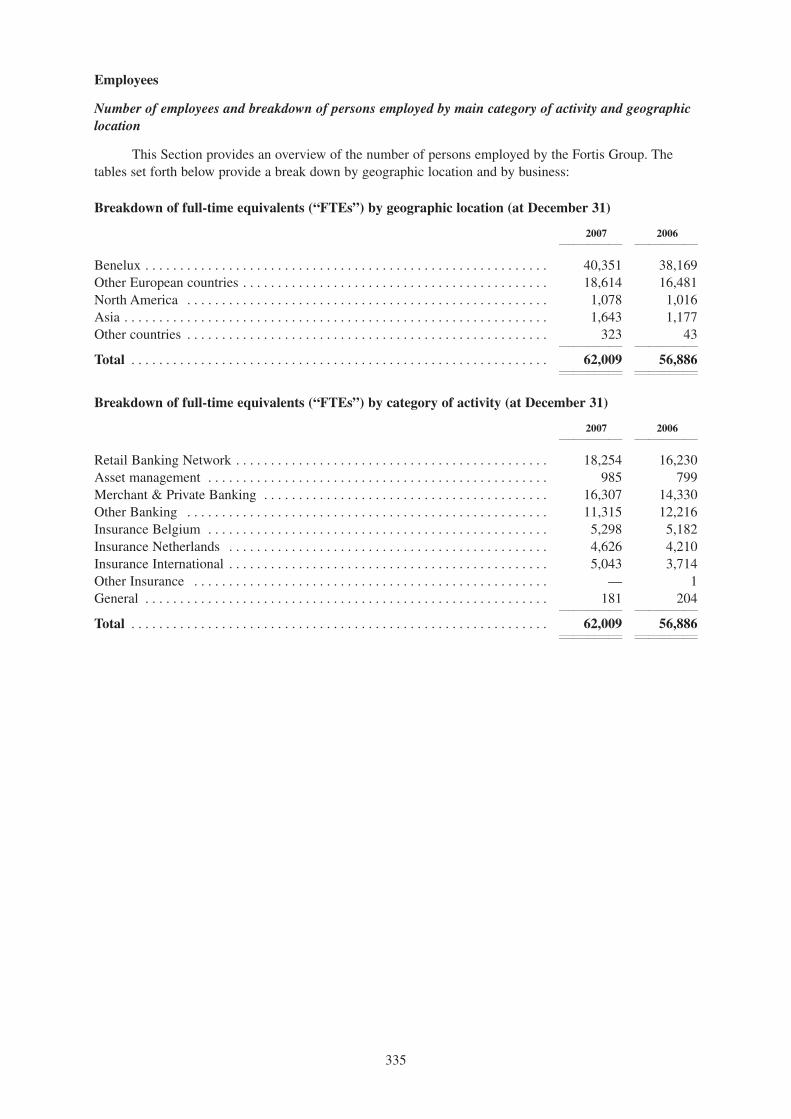
Employees
Number of employees and breakdown of persons employed by main category of activity and geographic
location
This Section provides an overview of the number of persons employed by the Fortis Group. Thetables set forth below provide a break down by geographic location and by business:
Breakdown of full-time equivalents (“FTEs”) by geographic location (at December 31)
2007 200611211 11211
Benelux . . . . . . . . . . . . . . . . . . . . . . . . . . . . . . . . . . . . . . . . . . . . . . . . . . . . . . . . . . 40,351 38,169Other European countries . . . . . . . . . . . . . . . . . . . . . . . . . . . . . . . . . . . . . . . . . . . . 18,614 16,481North America . . . . . . . . . . . . . . . . . . . . . . . . . . . . . . . . . . . . . . . . . . . . . . . . . . . . 1,078 1,016Asia . . . . . . . . . . . . . . . . . . . . . . . . . . . . . . . . . . . . . . . . . . . . . . . . . . . . . . . . . . . . . 1,643 1,177Other countries . . . . . . . . . . . . . . . . . . . . . . . . . . . . . . . . . . . . . . . . . . . . . . . . . . . . 323 43
11211 11211
Total . . . . . . . . . . . . . . . . . . . . . . . . . . . . . . . . . . . . . . . . . . . . . . . . . . . . . . . . . . . . 62,009 56,88611211 1121111211 11211
Breakdown of full-time equivalents (“FTEs”) by category of activity (at December 31)
2007 200611211 11211
Retail Banking Network . . . . . . . . . . . . . . . . . . . . . . . . . . . . . . . . . . . . . . . . . . . . . 18,254 16,230Asset management . . . . . . . . . . . . . . . . . . . . . . . . . . . . . . . . . . . . . . . . . . . . . . . . . 985 799Merchant & Private Banking . . . . . . . . . . . . . . . . . . . . . . . . . . . . . . . . . . . . . . . . . 16,307 14,330Other Banking . . . . . . . . . . . . . . . . . . . . . . . . . . . . . . . . . . . . . . . . . . . . . . . . . . . . 11,315 12,216Insurance Belgium . . . . . . . . . . . . . . . . . . . . . . . . . . . . . . . . . . . . . . . . . . . . . . . . . 5,298 5,182Insurance Netherlands . . . . . . . . . . . . . . . . . . . . . . . . . . . . . . . . . . . . . . . . . . . . . . 4,626 4,210Insurance International . . . . . . . . . . . . . . . . . . . . . . . . . . . . . . . . . . . . . . . . . . . . . . 5,043 3,714Other Insurance . . . . . . . . . . . . . . . . . . . . . . . . . . . . . . . . . . . . . . . . . . . . . . . . . . . — 1General . . . . . . . . . . . . . . . . . . . . . . . . . . . . . . . . . . . . . . . . . . . . . . . . . . . . . . . . . . 181 204
11211 11211
Total . . . . . . . . . . . . . . . . . . . . . . . . . . . . . . . . . . . . . . . . . . . . . . . . . . . . . . . . . . . . 62,009 56,88611211 1121111211 11211
335
Level: 6 – From: 6 – Wednesday, May 14, 2008 – 1:39 pm – g5mac4 – 3960 Section 10 : 3960 Section 10

EMPLOYEE STOCK AND OPTION PLANS
Fortis uses share related instruments as part of the remuneration package for its employees andmembers of Executive Committee. These benefits take the form of:
• Employee share options
• Shares offered at a discount
• Restricted shares
Employee share options
Each year, Fortis decides whether or not to offer options to its employees. In recent years Fortisoffered options on Fortis shares to its senior managers in order to strengthen their commitment to Fortisand to align their interests. The features of the option plans may vary from country to country dependingupon local tax regulations.
The following option plans, including options granted to members of the Executive Committee,were outstanding as at December 31, 2007.
December 31, 2007111121123111121111211112
WeightedAverage Highest Lowest
Outstanding Exercise Exercise Exercise Lapsing Year Options Price Price Price
11112 11112 11112 11112
(in 000s) (in EUR) (in EUR) (in EUR)
2008 . . . . . . . . . . . . . . . . . . . . . . . . . . . . . . . . . . . . . . . 1,549 27.27 29.05 21.082009 . . . . . . . . . . . . . . . . . . . . . . . . . . . . . . . . . . . . . . . 11,441 24.28 26.98 12.442010 . . . . . . . . . . . . . . . . . . . . . . . . . . . . . . . . . . . . . . . 6,182 28.32 29.05 15.312011 . . . . . . . . . . . . . . . . . . . . . . . . . . . . . . . . . . . . . . . 798 19.08 21.08 18.652012 . . . . . . . . . . . . . . . . . . . . . . . . . . . . . . . . . . . . . . . 1,125 22.17 26.58 21.082013 . . . . . . . . . . . . . . . . . . . . . . . . . . . . . . . . . . . . . . . 3,692 14.30 28.62 12.172014 . . . . . . . . . . . . . . . . . . . . . . . . . . . . . . . . . . . . . . . 3,295 15.09 15.31 14.782015 . . . . . . . . . . . . . . . . . . . . . . . . . . . . . . . . . . . . . . . 3,351 18.55 18.65 18.412016 . . . . . . . . . . . . . . . . . . . . . . . . . . . . . . . . . . . . . . . 4,403 24.60 24.68 24.492017 . . . . . . . . . . . . . . . . . . . . . . . . . . . . . . . . . . . . . . . 4,983 28.03 28.62 27.23
11112 11112 11112 11112
Total . . . . . . . . . . . . . . . . . . . . . . . . . . . . . . . . . . . . . . 40,819 23.22 — —11112 11112 11112 1111211112 11112 11112 11112
December 31, 2007111121123111121111211112
WeightedAverage Highest Lowest
Outstanding Exercise Exercise Exercise Lapsing Year Options Price Price Price
11112 11112 11112 11112
(in 000s) (in EUR) (in EUR) (in EUR)
2007 . . . . . . . . . . . . . . . . . . . . . . . . . . . . . . . . . . . . . . . 2,369 28.45 31.45 15.572008 . . . . . . . . . . . . . . . . . . . . . . . . . . . . . . . . . . . . . . . 1,635 27.28 29.05 21.082009 . . . . . . . . . . . . . . . . . . . . . . . . . . . . . . . . . . . . . . . 13,455 24.38 32.15 12.442010 . . . . . . . . . . . . . . . . . . . . . . . . . . . . . . . . . . . . . . . 5,920 28.62 29.05 15.312011 . . . . . . . . . . . . . . . . . . . . . . . . . . . . . . . . . . . . . . . 813 19.12 21.08 18.652012 . . . . . . . . . . . . . . . . . . . . . . . . . . . . . . . . . . . . . . . 1,712 22.74 26.58 21.082013 . . . . . . . . . . . . . . . . . . . . . . . . . . . . . . . . . . . . . . . 3,320 12.33 12.17 12.442014 . . . . . . . . . . . . . . . . . . . . . . . . . . . . . . . . . . . . . . . 3,336 15.09 15.31 14.782015 . . . . . . . . . . . . . . . . . . . . . . . . . . . . . . . . . . . . . . . 3,369 18.55 18.65 18.412016 . . . . . . . . . . . . . . . . . . . . . . . . . . . . . . . . . . . . . . . 4,404 24.60 24.68 24.49
11112 11112 11112 11112
Total . . . . . . . . . . . . . . . . . . . . . . . . . . . . . . . . . . . . . . 40,333 22.97 — —11112 11112 11112 1111211112 11112 11112 11112
336
Level: 6 – From: 6 – Wednesday, May 14, 2008 – 1:40 pm – g5mac4 – 3960 Section 11 : 3960 Section 11Level: 6 – From: 6 – Wednesday, May 14, 2008 – 1:40 pm – g5mac4 – 3960 Section 11 : 3960 Section 11

The changes in outstanding options were as follows:
2007 2006 2005111122211112 111122211112 111122211112
Weighted Weighted WeightedAverage Average Average
Number of Exercise Number of Exercise Number of ExerciseOptions Price Options Price Options Price
11112 11112 11112 11112 11112 11112
(in ‘000) (in ‘000) (in ‘000)
Balance at January 1 . . . . 40,333 22.97 38,729 27.34 38,247 23.98Options granted to Executive Committee Members . . . . . . . . . . . . . . 311 28.62 280 24.68 325 18.65Options granted to other employees . . . . . . . . . . . . . 4,983 28.62 4,575 24.60 3,699 18.55Exercised options . . . . . . . (2,507) — (2,656) — (43) —Lapsed . . . . . . . . . . . . . . . (2,301) — (595) — (3,499) —Balance at December 31 . 40,819 23.22 40,333 22.97 38,729 22.89On existing Fortis shares . 3,309 — 3,303 — 2,966 —On new Fortis shares . . . . 37,510 — 37,030 — 35,763 —Of which are conditional . 13,918 — 13,354 — 5,857 —Of which are unconditional 26,901 — 26,979 — 32,872 —Exercisable in the money . 309 12.44 15,155 24.36 346 14.79Exercisable out of the money 19,497 25.91 8,868 29.21 23,267 26.70
In 2007 Fortis recorded EUR 19 million as staff expenses with respect to the option plans (2006:EUR 16 million; 2005: EUR 7 million). As long as they are not exercised, the options do not have animpact on shareholders’ equity, as the expenses recorded in the income statement are offset by an increasein shareholders’ equity. When the options are exercised, shareholders’ equity is increased by the exerciseprice.
The options granted by Fortis are ten-year American at-the-money call options with a five-yearvesting period, the value is based on the Simple Cox model.
The parameters below were used to calculate the fair value of the options granted.
2007 2006 20051111112 1211111 2111111
Date of grant of options . . . . . . . . . . . . . . . . . . . . . . . March 31, 2007 March 31, 2006 April 11, 2005First exercise date . . . . . . . . . . . . . . . . . . . . . . . . . . . . April 2, 2012 April 3, 2011 April 11, 2010Final maturity . . . . . . . . . . . . . . . . . . . . . . . . . . . . . . . April 2, 2017 April 3, 2016 April 10, 2015Dividend yield . . . . . . . . . . . . . . . . . . . . . . . . . . . . . . 5.82% 5.13% 5.00%10-year interest rate . . . . . . . . . . . . . . . . . . . . . . . . . . 4.08% 3.74% 3.80%Share price on date of grant (in EUR) . . . . . . . . . . . . 32.53 29.48 21.84Volatility . . . . . . . . . . . . . . . . . . . . . . . . . . . . . . . . . . . 26.04% 24.80% 23.27%Fair value of options as % of exercise price . . . . . . . 15.31% 16.01% 15.36%
All option plans and restricted share plans (see “— Restricted Fortis Shares” below) are settled bythe delivery of Fortis Shares rather than in cash. Some option plans and restricted share plans specificallystate that existing Fortis Shares must be delivered upon exercise. New Fortis Shares may be issued in othercases.
Fortis Shares are repurchased in anticipation of options being exercised in order to meet theobligation to deliver existing Fortis Shares. Fortis had 952,788 shares in portfolio for this purpose at yearend 2007 (December 31, 2006: 952,788 shares). It is assumed that this will be sufficient to meet deliveryrequirements. The Fortis Shares in question have been deducted from shareholders’ equity.
337
Level: 6 – From: 6 – Wednesday, May 14, 2008 – 1:40 pm – g5mac4 – 3960 Section 11 : 3960 Section 11

Shares offered to staff
In 2002, 2003 and 2004 Fortis offered its staff the opportunity to buy shares at a discount. Theterms of the offer varied from country to country, depending on local tax regulations. In all cases shares,however, could not be sold until five years after purchase. No shares were offered to staff in 2005, 2006and 2007.
The following table provides an overview of the shares allocated to staff at a discount:
2004 2003 2002111111112 111111112 111111112
(number of shares in 000s)
Number of shares subscribed . . . . . . 2,904 2,821 1,752Share price . . . . . . . . . . . . . . . . . . . . 15.64 12.23 (95 shares) 22,03 (237 shares)
12.04 (2,726 shares) 20,14 (1,515 shares)End of holding period . . . . . . . . . . . November 2, 2009 November 3, 2008 June 8, 2007
In 2004, EUR 9 million of the total staff expenses for Fortis was related to this scheme.
Restricted Fortis Shares
In 2007, as in previous years Fortis committed itself to grant restricted shares to the members of theExecutive Committee and the management committees of several Fortis companies. The conditions of thecommitments to grand and sell these restricted shares are described in Note 11 in the 2007 ConsolidatedFinancial Statements.
At December 31, 2007, the following commitments for the grant of restricted shares were taken:
Total 2007 2006 2005111111 111111 111111 111111
(number of shares in 000s)
Number of commitments to grant restricted shares . . . . . . . . . . 1,160 373 302 485(1)
End of holding period . . . . . . . . . . . . April 2, 2010 April 2, 2009 April 11, 2008
(1) Total includes restricted shares granted before 2004.
The total value of commitments for restricted Fortis Shares granted during 2007 is EUR 8 million;such amount is included in staff expenses (2006: EUR 7 million; 2005: EUR 4 million).
The table below shows the changes in commitments for restricted shares during 2007 and 2006.
2007 200611112 11112
(number of shares in 000s)
Number of restricted Fortis Shares committed to grant at January 1 . . . . . . . . . . 815 898Restricted shares committed to grant . . . . . . . . . . . . . . . . . . . . . . . . . . . . . . . . . . . 373 302Restricted shares sold . . . . . . . . . . . . . . . . . . . . . . . . . . . . . . . . . . . . . . . . . . . . . . . (3) (79)Commitments to restricted Fortis Shares lapsed . . . . . . . . . . . . . . . . . . . . . . . . . . (85) (306)
11112 11112
Number of restricted Fortis Shares committed to grant at December 31 . . . . . . . 1,100 81511112 1111211112 11112
Pension, retirement or similar benefits
The total amounts set aside or incurred by Fortis or its subsidiaries to provide pension, retirement orsimilar benefits, are included in Note 9 in the 2007 Consolidated Financial Statements.
338
Level: 6 – From: 6 – Wednesday, May 14, 2008 – 1:40 pm – g5mac4 – 3960 Section 11 : 3960 Section 11

Related party transactions
Parties related to Fortis include associates, pension funds, joint ventures, Board members (non-executive and executive members of the Fortis Board of Directors), Executive Managers (the ChiefExecutive Officer and the members of the Group Executive Committee), close family members of anyindividual referred to above, entities controlled or significantly influenced by any individual referred toabove and other related entities.
As part of its business operations Fortis frequently enters into transactions with related parties. Suchtransactions mainly relate to loans, deposits and reinsurance contracts and are entered into on the basis ofthe same commercial and market terms that apply to non-related parties.
The remuneration and combined shareholdings of Board members and Executive Managers aredescribed in “— Remuneration of Board of Directors” above.
Credits, loans or bank guarantees in the normal course of business may be granted by Fortiscompanies to Board members and Executive Managers or to close family members of the Board membersand close family members of Executive Managers.
The total outstanding amount at December 31, 2007 relating to loans, credits and guaranteesgranted to Board members and Executive Managers or to close family members of the Board members andclose family members of Executive Managers, was EUR 6 million. The terms and conditions of thesetransactions are entered into on the basis of the same commercial and market terms that apply to non-related-parties, including employees of the company.
The tables below provide an overview of the transactions entered into and the amounts outstandingwith the following related parties for the year ended December 31, 2007:
• Associates and joint ventures;
• Other related parties such as pension funds and significant minority shareholders inassociates.
2007 2006123111121111211112 123111121111211112
Associates Associatesand Joint and JointVentures Other Total Ventures Other Total11112 11112 11112 11112 11112 11112
(in EUR million)
Income and expenses — Related partiesInterest income . . . . . . . . . . 438 5 443 34 4 38Interest expense . . . . . . . . . (499) (9) (508) (26) (10) (36)Fee and commission income 5 5 12 12Realized gains . . . . . . . . . . 174 174 3 3Other income . . . . . . . . . . . 29 8 37 30 5 35Fee and commission expense (31) (4) (35) (24) (4) (28)Operating, administrative and other expenses . . . . . . . (11) (56) (67) (3) (81) (84)Balance sheet — Related partiesInvestments in associates . . 426 846 1,272 162 965 1,127Due from customers . . . . . . 620 620 477 477Due from banks . . . . . . . . . 235 124 359 15 104 119Other assets . . . . . . . . . . . . 422 34 456 16 31 47Due to customers . . . . . . . . 177 3 180 75 4 79Due to banks . . . . . . . . . . . . 1,327 2 1,329 388 6 394Debt certificates, subordinated liabilities and other borrowings 392 – 392 139 – 139Other liabilities . . . . . . . . . . 292 183 475 13 267 280
339
Level: 6 – From: 6 – Wednesday, May 14, 2008 – 1:40 pm – g5mac4 – 3960 Section 11 : 3960 Section 11

With respect to related parties, Fortis granted the following guarantees and irrevocable andconditional commitments:
• EUR 2,049 million with respect to guarantees given to related parties;
• EUR 2,109 million with respect to guarantees obtained from related parties;
• EUR 221 million with respect to unconditional and conditional commitments to relatedparties.
The changes in related party loans, receivables and advances during the year ended December 31were as follows:
Due from Banks Due from Customers11112111112 11111211112
2007 2006 2007 200611112 11112 11112 11112
Related party loans, receivables or advances at January 1 . . . . . . . . . . . . . . . . . . . . . . . . 120 126 494 447Acquisitions/divestments of subsidiaries . . . . . . . . . . 208 10 (18)Additions or advances . . . . . . . . . . . . . . . . . . . . . . . . . 52 18 421 113Repayments . . . . . . . . . . . . . . . . . . . . . . . . . . . . . . . . . (21) (24) (292) (48)Related party loans, receivables or advances at December 31 . . . . . . . . . . . . . . . . . . . . . 359 120 633 494Impairments at January 1 . . . . . . . . . . . . . . . . . . . . . . 1 1 17 18Change in impairments . . . . . . . . . . . . . . . . . . . . . . . . (1)Reversal of impairments . . . . . . . . . . . . . . . . . . . . . . . (1) 1Recoveries . . . . . . . . . . . . . . . . . . . . . . . . . . . . . . . . . . (5)Impairments at December 31 . . . . . . . . . . . . . . . . . . – 1 13 17Related party loans, receivables or advances at December 31 . . . . . . . . . . . . . . . . . . . . . 359 119 620 477
Due to Banks Due to Customers11112111112 11111211112
2007 2006 2007 200611112 11112 11112 11112
Related party loans, receivables or advances at January 1 . . . . . . . . . . . . . . . . . . . . . . . . 394 593 79 102Acquisitions/divestments of subsidiaries . . . . . . . . . . 468 73 (2)Additions or advances . . . . . . . . . . . . . . . . . . . . . . . . . 564 54 741 466Repayments . . . . . . . . . . . . . . . . . . . . . . . . . . . . . . . . . (93) (253) (713) (487)Other . . . . . . . . . . . . . . . . . . . . . . . . . . . . . . . . . . . . . . (4)Related party loans, receivables or advances at December 31 . . . . . . . . . . . . . . . . . . . . . 1,329 394 180 79
340
Level: 6 – From: 6 – Wednesday, May 14, 2008 – 1:40 pm – g5mac4 – 3960 Section 11 : 3960 Section 11

SHAREHOLDING
The table below shows the shareholders of Fortis with participation equal to or exceeding 3% as ofDecember 31, 2007.
At December 31, 200711112
Ping An Insurance (Group) Company of China, Ltd. . . . . . . . . . . . . . . . . . . . . . . . . . . . . . . . . . 4.99%
On November 28, 2007 Fortis entered into a Memorandum of Understanding (the “MoU”) withPing An Insurance (Group) Company of China Ltd., which had, through a subsidiary, taken a stake ofapproximately 4.18% in Fortis. As a result, Ping An is now the single largest shareholder of Fortis andadheres to the Fortis Governance Statement.
Ping An, acting alone or in concert, shall not hold directly or indirectly, as a result of a privatetransaction or of a public offering (from which Ping An commits to refrain), more than 4.99% of the sharecapital of Fortis without the prior consent of Fortis. Beyond that, Fortis’s approval shall be required instages, i.e. beyond 4.99% and beyond 7%. Ping An is nonetheless entitled to (i) readjust its stake up to itsprevious level if and when any event attributable to Fortis results in a dilution of such stake, or (ii) increaseits stake in Fortis beyond the limits referred to above should Fortis welcome any third party, acting alongor in concert, to hold a higher percentage than the stake then held by Ping An. Ping An has declared that itultimately wishes to obtain a 7% shareholding in Fortis, and Fortis has stated that it intends to explorepossible means to that end, without prejudice to what is stated above.
Under the MoU, Ping An is entitled to propose the appointment of one non-executive director to theFortis Board, provided Ping An holds at least 4% of the share capital of Fortis. It is up to the AnnualGeneral Meetings of Shareholders of Fortis to decide on such appointment upon the proposal of the FortisBoard based on the recommendation of the Fortis Nomination and Remuneration Committee. If the non-executive director elected based on Ping An’s proposal disagrees with the majority of the Fortis Boardregarding a resolution to be submitted to the Extraordinary General Meeting of Shareholders, Ping Anshall be entitled to sell its stake in Fortis either to Fortis itself or to a third party designated by Fortis or,should no agreement be reached on the sale price, to such person and in such manner as Ping An shalldeem fit.
Under the MoU, if Fortis offers more favourable terms to any other shareholder in the future, it willbe required to extend the same more favourable terms to Ping An. The commitments entered into by PingAn apply to Ping An itself and to its subsidiaries. The MoU is for a three-year term and may be renewedor terminated by mutual consent. The MoU reflects the intention of Ping An to hold its stake in Fortis as astable shareholder as long as the MoU remains in force, subject to various events, among which a mergeror a general offer for Fortis either recommended by the Fortis Board or in respect of which more than 50%of the Fortis shares have been committed by other shareholders. Should Ping An sell its stake after theexpiry date of the MoU, Fortis may exercise a right of pre-emption.
341
Level: 6 – From: 6 – Wednesday, May 14, 2008 – 1:40 pm – g5mac4 – 3960 Section 11 : 3960 Section 11

CERTAIN TAX CONSIDERATIONS
The following is a general description of certain tax consequences of purchasing, owning anddisposing of Securities. Prospective purchasers of the Securities should consult their own tax advisers as tothe applicable tax consequences of the ownership of Securities based on their particular circumstances.
EU Savings Income Directive
Under Council Directive 2003/48/EC on taxation of savings income in the form of interestpayments, Member States are required to provide to the tax authorities of another Member State details ofpayments of interest and other similar income paid by a paying agent within its jurisdiction to or for anindividual or a residual entity in that other Member State. However, for a transitional period Austria,Belgium and Luxembourg are instead required (unless during such period they elect otherwise) to operatea withholding tax in relation to such payments. The transitional period will end after agreement onexchange of information is reached between the European Union and certain non-European Union states.No withholding will be required where the Securities holder authorizes the person making the payment toreport the payment or presents a certificate from the relevant tax authority establishing exemptiontherefrom. A number of third countries (including Switzerland and Liechtenstein) have adopted equivalentmeasures (a withholding or reporting system in the case of Switzerland and Liechtenstein) and certainEuropean Union dependent or associated territories have adopted the same measures with effect from thesame date. The attention of Securities holders is drawn to item (iii) of the “Additional Amounts” section ofthe Terms and Conditions of the Securities.
Taxation in Luxembourg
The statements herein regarding taxation in Luxembourg are based on the laws in force in theGrand Duchy of Luxembourg as of the date of this Prospectus and are subject to any changes in law. Thefollowing summary does not purport to be a comprehensive description of all the tax considerations whichmay be relevant to a decision to purchase, own or dispose of the Securities. Potential investors are
strongly advised to consult their own professional tax advisers as to the Luxembourg tax consequences
of the acquisition, ownership and disposition of the Securities.
Luxembourg tax position of the holders of the Securities
A holder of the Securities will not become resident, or be deemed to be resident, in Luxembourg byreason only of the holding of the Securities, or the execution, performance, delivery and/or enforcement ofthe Securities.
Withholding tax
Luxembourg non-resident individuals
Under Luxembourg tax law currently in effect and subject to the application of the Luxembourglaws dated June 21, 2005 (the “Laws”) implementing the European Council Directive 2003/48/EC ontaxation of savings income in the form of interest payments (the “Savings Directive”) and severalagreements concluded between Luxembourg and certain dependent or associated territories of theEuropean Union, there is no withholding tax on payments of interest (including accrued but unpaidinterest) made to Luxembourg non-resident holders of Securities. There is also no Luxembourgwithholding tax, upon repayment of the principal or, subject to the application of the Laws, uponredemption or exchange of the Securities.
Under the Laws, a Luxembourg based paying agent (within the meaning of the Savings Directive) isrequired, since July 1, 2005, to withhold tax on interest and other similar income paid by it to (or undercertain circumstances, for the benefit of) an individual or a residual entity in the sense of article 4.2. of theSavings Directive (i.e., an entity without legal personality and whose profits are not taxed under thegeneral arrangements for the business taxation and that is not, or has not opted to be considered as, a
342
Level: 6 – From: 6 – Wednesday, May 14, 2008 – 1:40 pm – g5mac4 – 3960 Section 11 : 3960 Section 11

UCITS recognized in accordance with Council Directive 85/611/EEC) (“Residual Entities”), resident orestablished in another Member State of the European Union unless the beneficiary of the interest paymentselects for an exchange of information or for the tax certificate procedure. The same regime applies topayments to individuals or Residual Entities resident in certain dependent or associated territories of theEuropean Union.
The withholding tax rate is initially 15%, increasing steadily to 20% as from July 1, 2008 and to35% as from July 1, 2011. The withholding tax system will only apply during a transitional period, theending of which depends on the conclusion of certain agreements relating to information exchange withcertain third countries.
Responsibility for the withholding of such tax will be assumed by the Luxembourg paying agent.
Luxembourg resident individuals
Under the Luxembourg law of December 23, 2005, payments of interest or similar income madesince January 1, 2006 (but accrued since July 1, 2005) by a paying agent (within the meaning of theSavings Directive) established in Luxembourg to or for the immediate benefit of an individual beneficialowner who is resident of Luxembourg may be subject to a withholding tax of 10%. Such withholding taxwill be in full discharge of income tax if the beneficial owner is an individual acting in the course of themanagement of his/her private wealth.
Responsibility for the withholding of such tax will be assumed by the Luxembourg paying agent.
Income tax
Taxation of Luxembourg non-residents
Holders of the Securities who are non-residents of Luxembourg and who do not have a permanentestablishment or a permanent representative in Luxembourg to which the Securities are attributable, arenot liable to any Luxembourg income tax, whether they receive payments of principal, payments ofinterest (including accrued but unpaid interest), payments received upon the redemption of the Securities,or realize capital gains on the sale or the exchange of any Securities.
Non-resident holders of the Securities who have a permanent establishment or a permanentrepresentative in Luxembourg to which the Securities are attributable, are subject to Luxembourg incometax on interest accrued or received on the Securities, on any reimbursement premium received at maturityand on any gains realized upon the sale or disposal, in any form whatsoever, of the Securities.
Taxation of Luxembourg residents
Luxembourg resident individuals
The 10% Luxembourg withholding tax (see the above section “— Withholding tax on interest —Luxembourg resident individuals”) represents the final tax liability on interest received for theLuxembourg resident individuals acting in the course of the management of his/her private wealth. Forindividual Luxembourg resident holders of the Securities, receiving the interest as income from theirprofessional asset, the 10% Luxembourg withholding tax levied is credited against their final tax liability.They will not be liable for any Luxembourg taxation on income tax on repayment of principal.
Luxembourg resident individual holders of the Securities acting in the course of the management oftheir private wealth are not subject to taxation on capital gains upon the disposal of the Securities, unlessthe disposal of the Securities precedes the acquisition of the Securities or the Securities are disposed ofwithin six months of the date of acquisition of these Securities. Upon redemption or exchange of theSecurities, such individual Luxembourg resident holders of the Securities must however include theportion of the redemption or exchange price corresponding to accrued but unpaid interest in their taxableincome if it is indicated separately in the redemption or exchange agreement.
343
Level: 6 – From: 6 – Wednesday, May 14, 2008 – 1:40 pm – g5mac4 – 3960 Section 11 : 3960 Section 11
Luxembourg resident individual holders of Securities acting in the course of the management of abusiness undertaking must include any gain realized on the sale, disposal or redemption of the Securitiesin their taxable income for Luxembourg income tax assessment purposes.
Luxembourg resident companies
Luxembourg resident companies (sociétés de capitaux) holders of the Securities or foreign entitiesof the same type which have a permanent establishment or a permanent representative in Luxembourg towhich the Securities are attributed, must include any interest received or accrued, as well as any gainrealized on the sale, disposal or redemption of the Securities, in their taxable income for Luxembourgincome tax assessment purposes.
Holder of the Securities who are companies subject to the law of June 15, 2004 on venture capitalvehicles may benefit from an exemption from income tax derived from the Securities, as well as gainsrealized thereon.
Luxembourg resident companies benefiting from a special tax regime
Holders of the Securities who are holding companies subject to the amended law of July 31, 1929or undertakings for collective investment subject to the amended laws of December 20, 2002 or specializedinvestment funds governed by the law of February 13, 2007 or family wealth management companiessubject to the law of May 11, 2007 are exempt from income and wealth taxes in Luxembourg and thusincome derived from the Securities, as well as gains realized thereon, are not subject to Luxembourgincome taxes.
Net Wealth Tax
Luxembourg net wealth tax will not be levied on a holder of the Securities, unless (i) such holder isa corporate entity resident in Luxembourg other than a holding company subject to the amended law ofJuly 31, 1929, an undertaking for collective investment subject to the amended laws of December 20,2002, a securitization company subject to the law of March 22, 2004 on securitization, a company subjectto the law of June 15, 2004 on venture capital vehicles, a specialized investment fund subject to the law ofFebruary 13, 2007 or a family wealth management company subject to the law of May 11, 2007 or (ii) theSecurities are attributable to an enterprise or part thereof which is carried on in Luxembourg through apermanent establishment or permanent representative in Luxembourg of the holder of the Securities, otherthan an individual.
Other Taxes
Registration taxes and stamp duties
There is no Luxembourg registration tax, stamp duty or any other similar tax or duty payable inLuxembourg by holders of the Securities as a consequence of the issue of the Securities, nor will any ofthese taxes be payable as a consequence of a subsequent transfer, redemption or exchange of theSecurities.
Value added tax
There is no Luxembourg value added tax payable in respect of payments in consideration for theissue of the Securities or in respect of the payment of interest or principal under the Securities or thetransfer of the Securities. Luxembourg value added tax will, however, be payable in respect of feescharged for certain services rendered to the Issuer, if for Luxembourg value added tax purposes suchservices are rendered or are deemed to be rendered in Luxembourg and an exemption from Luxembourgvalue added tax does not apply with respect to such services.
344
Level: 6 – From: 6 – Wednesday, May 14, 2008 – 1:40 pm – g5mac4 – 3960 Section 11 : 3960 Section 11

Inheritance and gift taxes
No Luxembourg estate or inheritance taxes are levied on the transfer of the Securities upon death ofa holder of the Securities in cases where the deceased was not a resident of Luxembourg for inheritancetax purposes. If the holder of the Securities is a resident for tax purposes of Luxembourg at the time ofhis/her death, the Securities are included in his or her taxable estate for inheritance tax purposes.
Gift tax may be due on a gift or donation of the Securities, if embodied in a Luxembourg deed orotherwise registered in Luxembourg.
Taxation in Belgium
The following is a general discussion of certain tax implications under the laws of Belgium of theacquisition, ownership and disposition of the Securities as they may affect investors. The statements beloware general in nature and are based on the tax laws and administrative guidelines in Belgium as of thedate of this Prospectus and are subject to changes in such laws or administrative guidelines, or theinterpretation of those laws or guidelines, possibly with retroactive or retrospective effect. It does notpurport to be a comprehensive overview of all tax considerations that may be relevant to a decision topurchase, hold or dispose of the Securities, and, in particular, does not consider any specific facts orcircumstances that may apply to a particular purchaser or holder. Potential investors are strongly advised
to consult their own professional tax advisers as to the Belgian tax consequences of the acquisition,
ownership and disposition of the Securities.
Withholding tax on interest
If payments of interest are made without the intervention of a Belgian intermediary agent, nointerest withholding tax will be due in Belgium.
However, if the holder of Securities is subject to the Belgian non profit legal entities tax, the holderwill, as a rule, be liable to pay a 15% withholding tax on the interest payments on the Securities.
If payments of interest are made through a Belgian intermediary agent, such payments will inprinciple be subject to a 15% withholding tax in Belgium. However, Belgian tax law provides for anumber of withholding tax exemptions subject to certain conditions.
Income tax on interest and capital gains — Belgian tax residents
Individuals subject to Belgian individual income tax
For holders of Securities who are private individuals, subject to Belgian individual income tax, andwho are holding the Securities as a private investment, the Belgian tax withheld by the Belgian payingagent, will as a rule be final and the Belgian individual will, as a rule, not be liable in Belgium for anyfurther tax on interest payments or capital gains.
In the absence of the application of a Belgian withholding tax regime, the holders of Securities,subject to Belgian individual income tax, holding the Securities as a private investment, will have todeclare the interest income in their annual tax return, such income being, as a rule, taxed at an equivalentseparate tax rate of 15%, to be increased by local taxes.
The pro rata interest included in the capital gain on the Securities is taxable as interest at a rate of15%. In general, the calculation of the pro rata interest is done on a linear basis. However, due to theabsence of clear guidelines in tax laws, the calculation of the interest on a pro rata basis may in practice bedifficult.
If a private individual’s capital gains arise from transactions going beyond the daily course ofmanagement of private property, the private individual will as a rule be subject to income tax at a rate of33%, to be increased with local taxes.
345
Level: 6 – From: 6 – Wednesday, May 14, 2008 – 1:40 pm – g5mac4 – 3960 Section 11 : 3960 Section 11

Non profit entities subject to the Belgian non profit legal entities tax
For holders of Securities who are non profit entities, subject to the Belgian non profit legal entitiestax, the Belgian withholding tax which has been applied to the interest payments will, as a rule, be finaland the non profit entities will in principle not be liable in Belgium for any further tax on interestpayments or capital gains.
The pro rata interest included in the capital gain on the Securities is taxable as interest at a rate of15%. In general, the calculation of the pro rata interest is done on a linear basis. However, due to theabsence of clear guidelines in tax laws, the calculation of the interest on a pro rata basis may in practice bedifficult.
Companies subject to Belgian corporate income tax
Companies, subject to Belgian corporate income tax, will as a rule be taxable at a rate of 33.99% inBelgium on interest payments on the Securities and any gain realised upon transfer of the Securities. TheBelgian withholding tax, if any, will in principle be creditable against any corporate income tax due to theextent that the holder has kept full legal ownership of the Securities during the period to which the interestpayments relate.
Income tax on interest and capital gains — non Belgian tax residents
Non Belgian tax resident holders of Securities not subject to Belgian income tax
Holders of Securities who do not have their fiscal residence in Belgium and who do not have anestablishment in Belgium to which the Securities are attributable should not be liable for any Belgian taxon income or capital gains by reason only of the acquisition/ownership or disposal of the Securities.
Non Belgian tax resident holders of Securities subject to Belgian income tax on non-residents
Non Belgian tax residents who use the Securities for carrying on a business in Belgium through aBelgian establishment will be taxable in Belgium on interest payments on the Securities and any gainrealised upon transfer of the Securities, subject to any relief which may be available under the applicableincome tax treaty. The Belgian withholding tax, if any, should in principle be creditable against anyincome tax due to the extent that the holder has kept full legal ownership of the Securities during theperiod to which the interest payments relate.
Transfer tax
Stock exchange tax
No stock exchange tax will be due upon the subscription of the Securities in Belgium.
Given the characterization of the Securities as a bond, the sale and purchase of the Securities on asecondary market through a professional intermediary in Belgium will give rise to tax on stock exchangetransactions at the rate of, as a rule, 0.07%. Such tax will, however, be limited to a maximum amount ofEUR 500 per taxable transaction and per party. The tax is separately due from each party to any suchtransaction, i.e. the seller and the purchaser, both collected by the professional intermediary.
No stock exchange tax is payable by:
(a) professional intermediaries mentioned in Article 2, 9° and 10° of the Law of August 2, 2002acting for their own account;
(b) insurance companies mentioned in Article 2, § 1 of the Law of July 9, 1975 acting for theirown account;
346
Level: 6 – From: 6 – Wednesday, May 14, 2008 – 1:40 pm – g5mac4 – 3960 Section 11 : 3960 Section 11

(c) institutions for occupational retirement provisions (“instellingen voorbedrijfspensioenvoorziening/institutions de retraite professionelle”) mentioned in Article 2, 1°of the Law of October 27, 2006 acting for their own account;
(d) collective investment institutions mentioned in the Law of July 20, 2004 acting for their ownaccount; and
(e) non-residents acting for their own account and provided they deliver an affidavit to afinancial intermediary in Belgium confirming their non-resident status.
Taxation in The Netherlands
The following summary outlines certain Netherlands tax consequences in connection with theacquisition, ownership and disposal of the Securities. The summary does not purport to present anycomprehensive or complete picture of all Netherlands tax aspects that could be of relevance to a(prospective) holder of Securities who may be subject to special tax treatment. The summary is based onthe tax laws and practice of The Netherlands as in effect on the date of this Prospectus, which are subjectto changes that could prospectively or retrospectively affect the stated tax consequences. Potential
investors are strongly advised to consult their own professional advisers as to The Netherlands tax
consequences of the acquisition, ownership and disposition of the Securities.
Withholding Tax
All payments under the Securities may be made free of withholding or deduction of or for any taxesof whatever nature imposed, levied withheld or assessed by The Netherlands or any political subdivision ortaxing authority thereof or therein.
Taxes on Income and Capital Gains
Holder of Securities resident in The Netherlands: individuals
This summary does not address the tax consequences of a holder of Securities who is an individualresident in The Netherlands and who has a substantial interest in the Issuer. Generally, a holder ofSecurities will have a substantial interest in the Issuer if he, whether alone or together with his spouse orpartner and/or certain other close relatives, holds directly or indirectly,
(a) (x) the ownership of, (y) certain other rights, such as usufruct, over, or (z) rights to acquire(whether or not already issued), shares representing 5 percent or more of the total issued andoutstanding capital (or the issued and outstanding capital of any class of shares) of the Issuer;or
(b) (x) the ownership of, or (y) certain other rights, such as usufruct over, profit participatingcertificates (“winstbewijzen”) that relate to 5 percent or more of the annual profit of theIssuer or to 5 percent or more of the liquidation proceeds of Issuer.
In addition, a holder of Securities has a substantial interest in the Issuer if he, whether alone ortogether with his spouse or partner and/or certain other close relatives, has the ownership of, or otherrights over, shares in, or profit certificates issued by, Issuer that represent less than 5 percent of therelevant aggregate that either (a) qualified as part of a substantial interest as set forth above and whereshares, profit certificates and/or rights there over have been, or are deemed to have been, partially disposedof, or (b) have been acquired, as part of a transaction that qualified for non-recognition of gain treatment.
A holder of Securities, who is an individual, resident or deemed to be resident in The Netherlands,or who has elected to be taxed as resident in The Netherlands for Netherlands income tax purposes, will besubject to regular Netherlands income tax on the income derived from and the gains realized upon theSecurities by the holder thereof, if:
347
Level: 6 – From: 6 – Wednesday, May 14, 2008 – 1:40 pm – g5mac4 – 3960 Section 11 : 3960 Section 11
(a) such holder of Securities has an enterprise or an interest in an enterprise to which theSecurities are attributable; and/or
(b) such income or capital gain forms “a benefit from miscellaneous activities” (“resultaat uitoverige werkzaamheden”) which, for instance, would be the case if the activities with respectto the Securities exceed “normal active asset management” (“normaal, actiefvermogensbeheer”).
If neither of the abovementioned conditions (a) or (b) applies, the holder of Securities who is anindividual, resident or deemed to be resident in The Netherlands, or who has elected to be taxed asresident of The Netherlands, will not be subject to taxes on income and capital gains in The Netherlands.Instead, such individual is taxed at a flat rate of 30 percent on deemed income from “savings andinvestments” (“sparen en beleggen”). This deemed income amounts to 4 percent of the average of theindividual’s “yield basis” (“rendementsgrondslag”), generally, at the beginning of the calendar year and theindividual’s “yield basis” at the end of the calendar year (minus a tax-free threshold).
Holder of Securities resident in The Netherlands: corporate entities
A holder of Securities that is resident or deemed to be resident in The Netherlands for corporateincome tax purposes, and that is:
(a) a corporation;
(b) another entity with a capital divided into shares;
(c) a cooperative (association); or
(d) another legal entity that has an enterprise or an interest in an enterprise to which theSecurities are attributable,
but which is not:
(e) a qualifying pension fund;
(f) a qualifying investment fund (“fiscale beleggingsinstelling”); or
(g) another entity exempt from corporate income tax,
will in general be subject to corporate income tax, generally levied at a rate of 25.5 percent (20percent over profits up to €40,000 and 23 percent over profits between €40,000 and €200,000) overincome derived from and gains realized upon the Securities by the holder thereof.
Holder of Securities outside The Netherlands: individuals
A holder of Securities who is an individual, not resident or deemed to be resident of TheNetherlands, and who has not elected to be taxed as a resident of The Netherlands for Netherlands incometax purposes, will not be subject to any Netherlands taxes on any income derived from and capital gainrealized upon the Securities, unless:
(a) such holder has an enterprise or an interest in an enterprise that is, in whole or in part, carriedon through a permanent establishment or a permanent representative in The Netherlands andto which enterprise or part of an enterprise, as the case may be, the Securities are attributable;and/or
(b) such income or capital gain forms a “benefit from miscellaneous activities” (“resultaat uitoverige werkzaamheden”) in The Netherlands which, for instance, would be the case if theactivities with respect to the Securities exceed “normal active asset management” (“normaal,actief vermogensbeheer”).
348
Level: 6 – From: 6 – Wednesday, May 14, 2008 – 1:40 pm – g5mac4 – 3960 Section 11 : 3960 Section 11

If either of the above-mentioned conditions (a) or (b) applies, income derived from and/or capitalgains realized upon the Securities will in general be subject to Netherland income tax at the progressiverates up to 52 percent.
Holder of Securities resident outside The Netherlands: legal and other entities
A holder of Securities that is a legal entity, another entity with a capital divided into shares, anassociation, a foundation or a fund or trust, not resident or deemed to be resident in The Netherlands forNetherlands corporate income tax purposes, will not be subject to any Netherlands taxes on income orcapital gains realized upon the Securities, unless such holder has an enterprise or an interest in anenterprise that is, in whole or in part, carried on through a permanent establishment or a permanentrepresentative in The Netherlands and to which enterprise or part of an enterprise, as the case may be, theSecurities are attributable.
Gift, Estate and Inheritance Taxes
Holders of Securities resident in The Netherlands
Gift tax may be due in The Netherlands with respect to an acquisition of Securities by way of a giftby a holder of Securities who is resident, deemed to be resident in The Netherlands or is treated (at therequest of the beneficiar(y)(ies) of the gift or estate) as a resident of The Netherlands. Inheritance tax maybe due in The Netherlands with respect to an acquisition or deemed acquisition of Securities by way of aninheritance or bequest on the death of a holder of Securities who is resident, deemed to be resident in TheNetherlands or is treated (at the request of the beneficiar(y)(ies) of the estate or bequest) as a resident ofThe Netherlands, or by way of a gift within 180 days before his death by an individual who is resident ordeemed to be resident in The Netherlands at the time of his death.
For purposes of Netherlands gift and inheritance tax, an individual with a Netherlands nationalitywill be deemed to be resident in The Netherlands if he has been resident in The Netherlands at any timeduring the ten years preceding the date of the gift or his death. For purposes of Netherlands gift tax, anindividual not holding a Netherlands nationality will be deemed to be a resident of The Netherlands if hehas been resident in The Netherlands at any time during the twelve months preceding the date of the gift.
Holders of Securities resident outside The Netherlands
No gift, estate or inheritance taxes will arise in The Netherlands with respect to an acquisition ordeemed acquisition of Securities by way of a gift by, or on the death of, a holder of Securities who isneither resident, deemed to be resident nor treated (at the request of the beneficiar(y)(ies) of the gift orestate) as resident in The Netherlands for Netherlands inheritance and gift tax purposes, unless:
(a) such holder at the time of the gift has or at the time of his death had an enterprise or aninterest in an enterprise that is or was, in whole or in part, carried on through a permanentestablishment or a permanent representative in The Netherlands and to which enterprise orpart of an enterprise, as the case may be, the Securities are or were attributable; or
(b) in the case of a gift of Securities by an individual who at the date of the gift was neitherresident nor deemed to be resident in The Netherlands, such individual dies within 180 daysafter the date of the gift, while being resident or deemed to be resident in The Netherlands.
Turnover Tax
No Netherlands turnover tax will arise in respect of any payment in consideration for the issue ofSecurities, with respect to any cash settlements of Securities or with respect to the delivery of Securities.
349
Level: 6 – From: 6 – Wednesday, May 14, 2008 – 1:40 pm – g5mac4 – 3960 Section 11 : 3960 Section 11

Other Taxes
No Netherlands registration tax, capital tax, customs duty, transfer tax, stamp duty or any othersimilar tax or duty, other than court fees, will be payable in The Netherlands in respect of or in connectionwith the execution, delivery and/or enforcement by legal proceedings (including the enforcement of anyforeign judgment in the Courts of The Netherlands) of the documents relating to the issue of Securities orthe performance by the Issuer of its obligations thereunder or under the Securities.
Taxation in Ireland
The following is a general description of certain tax consequences of Irish resident investorspurchasing, owning and disposing of Securities. The statements herein regarding taxation in the Republicof Ireland (“Ireland”) are based on the laws in force in the Ireland as of the date of this Prospectus andare subject to any changes in law. The following summary does not purport to be a comprehensivedescription of all the tax considerations which may be relevant to a decision to purchase, own or disposeof the Securities. Potential investors are strongly advised to consult their own professional tax advisers
as to the Irish tax consequences of the acquisition, ownership and disposition of the Securities.
Withholding tax on interest
Under Irish tax law there is no obligation on the Issuer to operate any withholding tax on paymentsof interest on the Securities except where the interest has an Irish source. The interest could be consideredto have an Irish source, where for example, interest is paid out of funds maintained in Ireland or where thenotes are secured on Irish situate assets. The mere offering of the Securities to Irish investors will notcause the interest to have an Irish source.
In certain circumstances collection agents and other persons receiving interest on securities inIreland on behalf of an Irish resident investor, will be obliged to operate a withholding tax (EncashmentTax).
Taxation of Irish Residents
Irish Resident Individuals — Such investors will be liable to tax at the marginal rate of income taxcurrently 41 percent (plus health and/or social levies depending on a person’s personal circumstances) onsuch interest income and any gain (calculated without the benefit of indexation relief) accruing to suchinvestor upon the sale or on the disposal of the Securities will also be charged to tax at the standard rate ofincome tax (currently 20%)
Where Luxembourg withholding tax is imposed under the Savings Directive, the investor can (i)avail of a procedure which permits Irish residents, who receive interest payments from Luxembourg, toapply to their local tax districts for a Certificate for Non-Deduction of Withholding Tax (subject tosupplying and obtaining certain information) or alternatively (ii) an individual not in possession of aCertificate for Non-Deduction of Withholding Tax in any given year, may claim a credit for the taxwithheld by way of an end of year review on her/his annual tax return form.
Irish Resident Companies — If the income does not form part of the company’s trading incomethen any income received by the company would be taxable at the passive rate of tax in Ireland (currently25%). Gains (calculated without the benefit of indexation relief) on the sale of the Securities (if any)should be liable to tax at 20%.
If however, the income forms part of the companies trading income then income and gains(calculated without the benefit of indexation relief) received thereon would be subject to the trading rate oftax (currently 12.5%) in Ireland.
Special Regimes — Attention is drawn to the fact that the above rules may not be relevant toparticular types of investors (such as financial institutions, treasury companies, pension funds, etc), whichmay be subject to special rules.
350
Level: 6 – From: 6 – Wednesday, May 14, 2008 – 1:40 pm – g5mac4 – 3960 Section 11 : 3960 Section 11

Other Taxes
Stamp Duty — There is no Irish registration tax, stamp duty or any other similar tax or duty payablein Ireland by holders of the Securities as a consequence of the purchase of the Securities. However, whereany subscription for, redemption, exchange, etc of the Securities is satisfied by the in specie transfer ofother Irish securities, property or other types of assets, Irish stamp duty may arise on the transfer of suchassets.
Value Added Tax — There is no Irish value added tax payable in respect of the receipt of interest orprincipal under the Securities or the transfer of the Securities. Nevertheless, the purchase of theseSecurities may affect the VAT recovery position of the Irish investor.
Capital Acquisitions Tax — A gift or inheritance comprising of the Securities will be within thecharge to capital acquisitions tax (which subject to available exemptions and reliefs, is currently levied at20 percent) if the disponer or the donee/successor in relation to the gift or inheritance is resident orordinarily resident in Ireland (or, in certain circumstances, if the disponer is domiciled in Irelandirrespective of his residence or that of the donee/successor) on the relevant date.
Taxation in the United Kingdom
The following is a general description of certain UK tax considerations relating to the Securitiesbased on current law and practice in the UK. It does not purport to be a complete analysis of all taxconsiderations relating to the Securities. It relates to the position of persons who are the absolutebeneficial owners of Securities and some aspects do not apply to certain classes of taxpayer (such asdealers and holders of the Securities who are connected or associated with the Issuer for relevant taxpurposes). Potential investors are strongly advised to consult their own professional tax advisers as to
the UK tax consequences of the acquisition, ownership and disposition of the Securities.
Taxation of Interest
UK withholding tax on interest
Payments of interest on the Securities may be made without withholding on account of UK taxprovided the interest is not treated as having a UK source.
If interest on the Securities is treated as having a UK source, payments of such interest can still bemade without withholding or deduction for or on account of UK income tax as long as the Securities areand continue to be “quoted Eurobonds” within the meaning of section 987 of the Income Tax Act 2007.This condition will be satisfied if the Securities are issued by a company, listed on a recognised stockexchange and carry a right to interest. The Securities will be treated as listed on a recognised stockexchange if they are admitted to trading on the Luxembourg Stock Exchange or Euronext Amsterdam andare officially listed in Luxembourg or The Netherlands in accordance with provisions corresponding tothose generally applicable in European Economic Area states. Accordingly, payments of interest on theSecurities may be made without withholding on account of UK income tax provided the Securities remainso listed at the time of payment.
If interest on the Securities is treated as having a UK source and the “quoted Eurobond” exemptiondoes not apply, it may fall to be paid under deduction of UK income tax at the savings rate (currently20%), subject to any direction to the contrary by HM Revenue and Customs (“HMRC”) under theprovisions of an applicable double taxation treaty, except that the withholding obligation is disapplied inrespect of holders of the Securities who the Issuer reasonably believes are either a UK resident companyor a non-UK resident company carrying on a trade in the UK through a permanent establishment which iswithin the charge to corporation tax, or who fall within various categories enjoying a special tax status(including charities and pension funds) or are partnerships consisting of such persons (unless HMRCdirects otherwise).
Interest from a UK source may be subject to UK income tax by direct assessment even where paidwithout withholding. However, interest with a UK source received without deduction or withholding on
351
Level: 6 – From: 6 – Wednesday, May 14, 2008 – 1:40 pm – g5mac4 – 3960 Section 11 : 3960 Section 11

account of UK tax will not be chargeable to UK tax in the hands of a Securities holder who is not residentfor tax purposes in the UK unless that Securities holder carries on a trade, profession or vocation in theUK through a UK branch or agency or for holders who are companies through a UK permanentestablishment, in connection with which the interest is received or to which the Securities are attributable.There are exemptions for interest received by certain categories of agent (such as some brokers andinvestment managers).
UK residents
Holders of the Securities who are resident in the UK will, in general, be subject to UK income taxor corporation tax on the full amount of interest on the Securities. Holders of the Securities who are withinthe charge to UK corporation tax will generally be treated for tax purposes as realizing profits or losses inrespect of the Securities on a basis which is broadly in accordance with generally accepted accountingpractice as that term is defined for tax purposes.
Credit may be given by HMRC either unilaterally or in accordance with a double tax treaty forforeign tax suffered by the UK resident holders of the Securities in respect of interest received.
Non-UK residents
On the basis that interest on the Securities is not regarded as income from a source in the UnitedKingdom, a Securities holder who, for UK tax purposes is neither a UK resident or ordinarily residentperson nor a non-UK resident person holding Securities attributable to a trade, profession or vocationcarried on in the UK through a branch or agency or a permanent establishment, will not be subject to UKtax on any interest received on the Securities or any fluctuations in value of the Securities or any otherprofits or gains arising in respect of the Securities.
Individual holders of the Securities who are either not domiciled or not ordinarily resident in theUK may claim that interest on the Securities should not be taxed in the UK under section 831 of theIncome Tax (Trading and Other Income) Act 2005 except to the extent that amounts are remitted to theUK. In certain circumstances, interest that is not actually remitted to the UK may be treated as thoughremitted to the UK for tax purposes. Proposed changes in law are expected to impose certain otherconditions for individuals in relation to this remittance basis.
Provision of Information
Any Paying Agent or other person through whom interest is paid to, or by whom interest is receivedon behalf of, an individual (whether resident in the UK or elsewhere) may be required to provideinformation in relation to the payment and the individual concerned to HMRC. HMRC may communicateinformation to the tax authorities of other jurisdictions.
Taxation of disposal of Securities
UK corporation taxpayers
In general holders of the Securities who are within the charge to UK corporation tax (other thaninvestment trusts, venture capital trusts, authorised unit trusts and open-ended investment companies) willbe treated for tax purposes as realizing profits, gains or losses (including exchange gains and losses) inrespect of the Securities on a basis which is broadly in accordance with generally accepted accountingpractice as that term is defined for tax purposes. Such profits, gains and losses (or where the Securitiesholder’s functional currency is not sterling, then the sterling equivalent of such profits, gains and losses ascomputed in the Securities holder’s functional currency) will be taken into account in computing taxableincome for corporation tax purposes. Holders of the Securities who are investment trusts, venture capitaltrusts, authorised unit trusts or open ended investment companies will be subject to the same taxationtreatment in respect of the Securities as other Securities holders who are within the charge to UKcorporation tax, other than with respect to profits, gains or losses carried to or sustained by a capitalreserve in the case of investment trusts and venture capital trusts, and other than with respect to profits,
352
Level: 6 – From: 6 – Wednesday, May 14, 2008 – 1:40 pm – g5mac4 – 3960 Section 11 : 3960 Section 11

gains or losses which fall to be dealt with under certain headings for gains/losses in the statement of totalreturn for the accounting period in respect of the Securities in the case of authorised unit trusts and open-ended investment companies (or for those investment trusts, venture capital trusts, authorised unit trusts oropen-ended investment companies preparing accounts in accordance with international accountingstandards, profits, gains or losses specified by order made by the Treasury). Such capital profits, gains orlosses will not be brought into charge to corporation tax.
Other UK taxpayers
Holders of the Securities who are either resident or ordinarily resident in the UK will, in general, besubject to UK tax on capital gains on a disposal of the Securities. In addition, Securities holders who areindividuals and who dispose of Securities while they are temporarily non-resident may be subject to UKtax on capital gains as if the capital gain or loss that would have accrued had the Securities holder beenresident or ordinarily resident in the UK at the time of the disposal of the Securities had accrued in the taxyear in which they again become resident or ordinarily resident in the UK. Any capital gain will becalculated by reference to the consideration received for the disposal of the Securities less the allowableoriginal cost to the Securities holder of acquiring such Securities (including currency exchange ratedifferences calculated by ascertaining the difference between the pound sterling equivalent at the date ofacquisition of the consideration given for the Securities and the pound sterling equivalent at the date ofdisposal of the proceeds received on disposal of the Securities). For UK resident investors who areindividuals (or other non-corporate Securities holders), taper relief, which reduces a chargeable gaindepending on the length of time for which an asset is held by the individual, may (subject to anticipatedchanges in law likely to take effect for disposals after 6 April 2008) be available to reduce the amount ofchargeable gain realized on a subsequent disposal. However, Securities holders who are individuals andwho are resident or ordinarily resident in the UK but who are not domiciled in the UK will not be subjectto UK tax on capital gains arising on a disposal of the Securities unless they remit, or are for tax purposesdeemed to remit, the proceeds of the disposal to the UK. Proposed changes in law are expected to imposecertain other conditions for individuals in relation to this remittance basis.
On a disposal of Securities, a holder of those Securities who is resident or ordinarily resident in theUK or carries on a trade or business in the UK through a branch or agency to which the Securities areattributable may be chargeable to UK tax on income on an amount treated as representing interest accruedon the Securities at the time of disposal.
Other Taxes
No stamp duty or stamp duty reserve tax is payable on issue, transfer or redemption of theSecurities.
Taxation in Spain
The following summary describes the material Spanish tax considerations relating to an investmentin the Securities by holders resident in Spain. This summary does not purport to be a comprehensivediscussion of all tax considerations relevant to a holder resident in Spain. In particular, this discussiondoes not consider any specific facts or circumstances that may apply to a particular investor. Thissummary is based on Spanish laws and regulations currently in force and as applied on the date of thisProspectus, which are subject to change. Potential investors are strongly advised to consult their own
professional tax advisers as to the Spanish tax consequences of the acquisition, ownership and
disposition of the Securities.
Spanish resident individuals
Both interest received periodically and income derived from the transfer, redemption or repaymentof the Securities constitute a return on investment obtained from the transfer of own capital to third partiesfor Individual Income Tax purposes, and must be included in the investor’s Individual Income Tax savingstaxable base and taxed at a flat rate of 18%.
353
Level: 6 – From: 6 – Wednesday, May 14, 2008 – 1:40 pm – g5mac4 – 3960 Section 11 : 3960 Section 11

As regards income obtained by Spanish resident individuals under the Securities, no Spanishwithholding taxes should be deducted by the Issuer if it is a Luxembourg tax resident entity which doesnot have a permanent establishment in Spain. In such case, the withholding tax regime will be as follows:
(i) Interest paid to holders of the Securities who are Spanish resident individuals will be subjectto Spanish withholding tax at 18% to be deducted by the custodian entity of the Securities orthe entity in charge of collecting the income derived thereunder, if different, provided suchentities are resident for tax purposes in Spain or have a permanent establishment in theSpanish territory.
(ii) Income obtained upon transfer of the Securities will be subject to Spanish withholding tax at18% to be deducted by the financial entity acting on behalf of the seller, provided such entityis resident for tax purposes in Spain or has a permanent establishment in the Spanishterritory.
(iii) Interest accrued and paid upon redemption of the Securities will be subject to Spanishwithholding tax at 18% to be deducted by the financial entity appointed by the Issuer (if any)for redemption of the Securities, provided such entity is resident for tax purposes in Spain orhas a permanent establishment in the Spanish territory.
Spanish resident corporations
Both interest received and income derived from the transfer or repayment of the Securities aresubject to the Corporate Income Tax at a rate of 30%.
Taking into account that the Securities will be listed on an OECD market, income obtainedthereunder by Spanish resident corporations will be exempt from Spanish withholding taxes.
Spanish Net Wealth Tax
Spanish resident individual holders of the Securities are subject to Spanish Net Wealth Tax at ratesranging from 0.2% to 2.5% on their worldwide net wealth. The Net Wealth Tax is assessed following therules established in corresponding regulations (qualifying debts or liabilities would be deductible for thesepurposes) as of 31 December of each year. Such assessment would include the value of the Securities.Notwithstanding the foregoing, and unless otherwise regulated by the relevant region (ComunidadAutónoma) of residence, Individual Holders will be exempt from any Spanish Net Wealth Tax on the first€108,182.18 of their net wealth.
Note that the Spanish Government has recently announced that the Spanish Net Wealth Tax will beabolished during tax year 2008, with retroactive effect as of January 1, 2008. However, as the lawimplementing such measure has still not been published, there is some uncertainty in this regard.
Transfer Tax, Stamp Duty and Capital Duty
Transfers of Securities will be exempt from any Spanish Transfer Tax or Value Added Tax.Additionally, no Spanish Stamp Duty will be levied on such transfers.
Taxation in Portugal
The statements herein regarding taxation in Portugal are based on Portuguese law in force as of thedate of this Prospectus and on administrative interpretations thereof, and therefore is subject to anychanges in such laws and interpretations thereof occurring after that date, including changes havingretroactive effect. In particular, this description is based on the general provisions established in thePortuguese Corporate Income Tax (“CIT”) Code and in the Personal Income Tax (“PIT”) Code, whichmay not apply to those individuals or legal persons subject to special tax regimes (such as financialentities, exempt entities, cooperatives, or “look-through” entities).
354
Level: 6 – From: 6 – Wednesday, May 14, 2008 – 1:40 pm – g5mac4 – 3960 Section 11 : 3960 Section 11

The following summary does not purport to be a comprehensive description of all the taxconsiderations which may be relevant to a decision to purchase, own or dispose of the Securities. Potential
investors are strongly advised to consult their own professional tax advisers on the Portuguese tax
consequences of the acquisition, ownership and disposition of the Securities.
Portuguese resident individuals
Interest or income arising from the refund or redemption of the Securities
Income derived by Portuguese resident individuals from the Securities will, as a general rule, besubject to a 20% withholding tax if the said income is paid by a Portuguese resident entity. The holders ofthe Securities may choose to treat the withholding tax as a final tax or to tax the interest deriving from theSecurities at the general progressive PIT rates varying between 10.5% and 42%, in which case thewithholding will be treated as a payment on account of the final tax due.
In other cases, as a general rule, the holders of the Securities will have to include the incomederived from the Securities in their PIT returns to be (i) subject to taxation at an autonomous rate of 20%or (ii) to be aggregated with the remaining income to be subject to taxation at the general progressive PITrates varying between 10.5% and 42% at the election of the investor.
Capital gains arising from the transfer of the Securities
Assuming that the Securities will be deemed as bonds or other debt instruments, as a general rule,the capital gains obtained by Portuguese resident individual holders on the transfer of the Securities willnot be subject to Portuguese taxation.
Otherwise, i.e., should the Portuguese tax authorities challenge the qualification of the Securities asbonds or other debt instruments, any capital gains derived from its transfer will be subject to PIT. In thiscase, the individual holders of the Securities will be able to choose between the taxation of the positivedifference between capital gains and losses at an autonomous rate of 10% or to aggregate that income tothe remaining income to be subject to the general PIT rates (maximum marginal rate of 42%). Capitallosses do not take part in the calculation of the net capital gains when the counterpart in the operation isresident in a country or territory listed as a tax haven in order 150/2004 of February 13, 2004.
Portuguese resident corporate entities
As a general rule, interest or income derived by corporate entities resident in Portugal, or non-resident corporate entities with a permanent establishment in Portugal to which the income is attributable,from the refund or redemption of the Securities, as well as capital gains arising from their transfer, will beregarded as taxable income and therefore subject to Portuguese CIT, at a 25% rate, to which a municipalsurcharge of up to 1.5% is eventually may be added, reaching a final maximum rate of 26.5%.
Assuming that the Securities will be deemed as bonds or other debt instruments, losses arising fromthe transfer or redemption of the Securities should be, as a general rule, tax deductible. Otherwise, i.e.,should the Portuguese tax authorities challenge the qualification of the Securities as bonds or other debtinstruments, the corporate holders of the Securities should only be entitled to deduct 50% of the lossesarising from its transfer.
Indirect Taxation
The acquisition, transfer, redemption, reimbursement and exchange of the Securities will not besubject to any Transfer Tax or Stamp Tax in Portugal and will be exempt from Portuguese Value AddedTax, in accordance with the Portuguese legislation.
No indirect taxation will be due in Portugal regarding gratuitous transfers of the Securities.
355
Level: 6 – From: 6 – Wednesday, May 14, 2008 – 1:40 pm – g5mac4 – 3960 Section 11 : 3960 Section 11

Taxation in Hong Kong
The statements herein regarding taxation in the Hong Kong Special Administrative Region arebased on the laws in force in the Hong Kong Special Administrative Region as of the date of thisProspectus and are subject to any changes in law. The following summary does not purport to be acomprehensive description of all the tax considerations which may be relevant to a decision to purchase,own or dispose of the Securities. Each prospective holder or beneficial owner of the Securities shouldconsult its tax advisor as to the tax consequences of the ownership and disposition of the Securities.Please note that there are special rules applicable to certain types of taxpayers (e.g., financial institutionsand insurance companies).
Profits Tax
Profits tax is chargeable on every person carrying on a trade, profession or business in Hong Kongin respect of profits arising in or derived from Hong Kong from such trade, profession or business. Gainsarising from the sale of capital assets are exempt from profits tax.
According to the practice of the Inland Revenue Department, interest on the Securities received by aperson carrying on a trade, profession or business in Hong Kong, other than a financial institution or aperson carrying on a business in the nature of money lending, will not be chargeable to profits tax.
There is no withholding tax in Hong Kong in respect of any payment of interest.
There is no capital gains tax in Hong Kong. In any event, gains arising from the sale and purchaseor redemption of the Securities effected by a broker on the Luxembourg Stock Exchange and/or EuronextAmsterdam will be treated as arising outside Hong Kong and therefore not be subject to profits tax.
Stamp Duty
No stamp duty will be payable on the subscription, transfer or redemption of the Securities.
Estate Duty
There is no estate duty in Hong Kong.
Taxation in Singapore
The following summary describes the material Singapore tax considerations relating to aninvestment in the Securities. This summary does not purport to be a comprehensive description of all thetax considerations which may be relevant to a decision to purchase, own or dispose of the Securities. Thestatements herein regarding taxation in Singapore are based on Singapore laws, regulations, andinterpretation currently in force and as applied on the date of this Prospectus which are subject to change,possibly with retroactive effect and the generally published practice of the Singapore tax authority as atthe date of this Prospectus. The relevant laws and regulations are subject to various interpretations andthe relevant tax authorities or the courts could disagree with the explanations or conclusions set outbelow. Potential investors are strongly advised to consult their own professional tax advisers as to the
Singapore tax consequences of the acquisition, ownership and disposition of the Securities.
For the purpose of the material Singapore tax consequences described herein, it is assumed that atall relevant times:
(a) the Securities will not be arranged by any financial institution in Singapore or by anyfinancial sector incentive (bond market) company;
(b) the interest paid on the Securities will not be borne, directly or indirectly, by a personresident in Singapore or a permanent establishment in Singapore except in respect of anybusiness carried on outside Singapore through a permanent establishment outside Singaporeor any immovable property situated outside Singapore;
356
Level: 6 – From: 6 – Wednesday, May 14, 2008 – 1:40 pm – g5mac4 – 3960 Section 11 : 3960 Section 11

(c) the interest paid on the Securities will not be deductible against any income accruing in orderived from Singapore;
(d) the funds raised from the issue of the Securities will not be brought into or used in Singapore.
Singapore tax position of the holders of the Securities
A holder of the Securities will not become resident, or be deemed to be resident, in Singapore byreason only of the holding of the Securities, or the execution, performance, delivery and/or enforcement ofthe Securities.
In general
Singapore imposes tax on gains of an income nature but does not impose tax on gains of a capitalnature.
A corporate entity is regarded as tax resident in Singapore if its business is controlled and managedin Singapore.
An individual is regarded as tax resident in Singapore if the individual is physically present inSingapore or exercised employment in Singapore (other than as a director of a company) for 183 days ormore in the calendar year preceding the year of assessment, or if the individual ordinarily resides inSingapore.
The current corporate tax rate in Singapore is 18%. In addition, with effect from Year of Assessment2008, 75% of up to the first S$10,000 of a company’s normal chargeable income, and 50% of up to thenext S$290,000 is exempt from corporate tax. If the company has at least one individual shareholder withat least a 10% shareholding, then there will be a full tax exemption of 100% of the first S$100,000 and50% of the next S$200,000 of the company’s income for its first three years of assessment fromincorporation. The remaining chargeable income (after the partial or full tax exemption) will be taxed at18%.
Singapore tax-resident individuals are subject to tax based on progressive rates, currently rangingfrom 0% to 20% with effect from Year of Assessment 2007. For the Year of Assessment 2008, a residentindividual taxpayer will receive an income tax rebate of 20%, capped at S$2,000.
Chargeable income of non-Singapore resident individuals (other than employment income) isgenerally subject to tax at 20% with effect from Year of Assessment 2007.
Taxation of Singapore residents
Singapore resident companies. Singapore tax resident corporate taxpayers are subject to Singaporeincome tax on income accruing in or derived from Singapore and on foreign income received or deemedreceived in Singapore, subject to certain exceptions. Holders of Securities who are Singapore residentcompanies who are receiving the interest as pure interest income and not as trading or business incomewill not be taxed on the interest payable on the Securities unless such interest is received or deemedreceived in Singapore.
Income is deemed to be received in Singapore where such income:
(a) is remitted to, transmitted or brought into, Singapore;
(b) is applied in or towards satisfaction of any debt incurred in respect of a trade or businesscarried on in Singapore; or
(c) is applied to purchase any movable property which is brought into Singapore.
Singapore resident individuals. All foreign-sourced income (including interest) received or deemedreceived in Singapore by a Singapore tax resident individual (except income received through a
357
Level: 6 – From: 6 – Wednesday, May 14, 2008 – 1:40 pm – g5mac4 – 3960 Section 11 : 3960 Section 11

partnership in Singapore) on or after January 1, 2004 is exempt from Singapore income tax if theSingapore Comptroller of Income Tax is satisfied that the tax exemption would be beneficial to theindividual.
Taxation of Singapore non-residents
Singapore non-resident companies. Non-Singapore tax resident corporate taxpayers are subject toSingapore income tax on income accruing in or derived from Singapore, and on foreign income receivedor deemed received in Singapore, subject to certain exceptions. Holders of Securities who are non-Singapore tax resident companies who are receiving the interest as pure interest income and not as tradingor business income will not be taxed on the interest payable on the Securities unless such interest isreceived or deemed received in Singapore.
Singapore non-resident individuals. Non-Singapore tax resident individuals are subject to Singaporeincome tax on income accruing in or derived from Singapore, subject to certain exceptions. All foreign-sourced income (including interest) received or deemed received in Singapore by a non-Singapore taxresident individual is exempt from Singapore income tax.
Gains on Disposal of the Securities
Singapore currently does not impose tax on capital gains. However, there are no specific laws orregulations which deal with the characterisation of gains. In general, gains may be construed to be of anincome nature and subject to Singapore income tax if they arise from activities which the SingaporeComptroller of Income Tax regards as the carrying on of a trade or business in Singapore or if the gainsarise out of a transaction which is not an activity in the ordinary course of trade or business, or an ordinaryincident of some other business activity, and at the time the transaction was entered into the taxpayer hadthe intention or purpose of making a profit from that transaction.
Stamp Duty
Stamp duty is payable in Singapore on instruments relating to the transfer of any interest in stockand shares of any corporation, company, body corporate, body of persons incorporated, society or limitedliability partnership formed or established in Singapore and immovable property in Singapore.
The transfer of any interest in the Securities is however not subject to Singapore stamp dutyprovided that no share register in respect of such Securities is kept in Singapore.
Estate Duty
With effect from February 15, 2008, no estate duty will be leviable in respect of deaths occurring onor after February 15, 2008.
Goods and Services Tax
Singapore generally imposes 7% GST on taxable supplies of goods and services made in Singaporeby a taxable person (i.e. person who is a registered or required to register for GST) in the course orfurtherance of a business. In the case of services, a supply is made in Singapore where the supplier is aperson belonging in Singapore (within the meaning of Section 15 of the GST Act).
The issue, allotment or transfer of ownership of the Securities is an exempt supply not subject toGST.
Taxation in Austria
Investors should be aware that this overview cannot be used as a substitute for individual tax
advice and is not intended to be definitive. There can be no guarantee that the Austrian tax authorities
will adopt the same interpretation of the matters as set out below and due to changes in the settled
358
Level: 6 – From: 6 – Wednesday, May 14, 2008 – 1:40 pm – g5mac4 – 3960 Section 11 : 3960 Section 11

practice of Austrian tax authorities or Austrian case law, the tax treatment of alternative investments
may, even retroactively, vary and lead to different results than those set out herein. Potential investors
are strongly advised to consult their own professional tax advisers as to the Austrian tax consequences
of the acquisition, ownership and disposition of the Securities. The discussion of certain Austrian taxes
set forth below is included for information purposes only.
General
The tax treatment of perpetual securities has not yet been finally clarified by the Austrian FederalMinistry of Finance (Bundesministerium für Finanzen, BMF) or decisions of the Austrian SupremeAdministrative Court (Verwaltungsgerichtshof, VwGH). A perpetual security should qualify as debtinstrument for Austrian tax purposes if the perpetual security does not provide for a participation in theprofits and liquidation profits of the issuer, i.e. if the securities are substantially comparable to other debtinstruments. The following overview is based on the assumption that the Securities qualify as debtinstruments for Austrian tax purposes.
Austrian tax resident individual investors
Interest received by an individual investor resident in Austria for tax purposes (i.e., the individualhas its tax residence/domicile and/or its habitual place of abode in Austria) is subject to Austrian incometax.
If the interest is paid by an Austrian coupon paying agent, withholding tax at a rate of 25% istriggered. Such withholding tax is final (i.e., the investor does not have to include such income in theincome tax return) provided that the Securities are both legally and actually publicly offered. If theinvestor’s applicable average income tax rate is below 25%, the investor may file an income tax returnincluding the interest income and apply for assessment of his income tax liability based on his income taxreturn.
In the absence of an Austrian coupon paying agent, the investor has to include the interest income inthe income tax return and Austrian income tax at the special rate of 25% is due (§ 37(8) of the AustrianIncome Tax Act (EStG)).
A deduction of expenses that are directly economically connected to the Securities, if the incomereceived thereunder is subject to flat and final withholding tax or to the special income tax rate of 25%, isnot available.
Capital gains from the sale of the Securities, held by a private investor, are only taxable if theSecurity is sold prior to or at the end of one year after its acquisition (so called “speculative transaction”).Income tax at the regular rates of up to 50% would be due if the aggregate amount of profits fromspeculative transactions realized by the private investor in a given calendar year exceeds €440. Lossesfrom a speculative transaction realized within the calendar year may only be compensated with income ofthe private investor from speculative transactions realized in the same calendar year.
If the Securities are held as a business asset, capital gains from the sale of the Securities are taxableincome (being subject to income tax at the regular rates of up to 50%) irrespective of any holding period.
Austrian tax resident corporate investor
A corporation that is subject to unlimited corporate income tax liability in Austria (i.e., acorporation that has its seat or place of effective management in Austria) receiving such income will besubject to Austrian corporate income tax at a rate of 25%. The 25% Austrian withholding tax may betriggered but is creditable against the corporate investor’s Austrian corporate income tax liability.Corporate investors may avoid triggering the 25% Austrian withholding tax on interest by filing adeclaration of exemption (§ 94(5) of the Austrian Income Tax Act (EStG)).
Capital gains from the sale of the Securities, held as a business asset, are taxable income (beingsubject to corporate income tax at the rate of 25%) irrespective of any holding period.
359
Level: 6 – From: 6 – Wednesday, May 14, 2008 – 1:40 pm – g5mac4 – 3960 Section 11 : 3960 Section 11

A specific tax rate (12.5%; so called interim taxation) applies to interest income earned by anAustrian private-law foundation (Privatstiftung). That interim corporate income tax may be creditedagainst the tax due on distributions of the private-law foundation.
Capital gains from the sale of the Securities that are held by an Austrian private law foundation maybe subject to Austrian corporate income tax at a rate of 25% as income from speculative transactions.
Non-Austrian tax resident investors
Interest income derived from the Securities by investors that are not resident in Austria for taxpurposes and do not maintain an Austrian permanent establishment to which such interest is attributableshould not be taxable in Austria. Nevertheless, if the interest is paid by an Austrian coupon-paying agent,25% withholding tax is triggered unless the non-Austrian resident investor proves his non-resident statusfor tax purposes to the Austrian coupon-paying agent by presenting an official picture identification card.In addition, Austrian citizens or citizens of an Austrian neighboring state have to provide a writtendeclaration that they neither have a domicile nor their habitual place of abode in Austria. Further, thesecurities under which the interest is paid must be deposited with an Austrian bank. If Austrianwithholding tax on investment income has been deducted by the Austrian coupon paying agent, the non-Austrian tax resident investor may reclaim the withholding tax within five calendar years following thedate of the imposition of the withholding tax. (BMF, EStR 2000 para 7775 et seq). Non-Austrian residentcorporations may avoid the deduction of the Austrian withholding tax at source, if the Securities aredeposited with an Austrian bank and the evidence in writing is forwarded to the bank, confirming that thecorporation is the beneficial owner of the Securities and neither has statutory seat nor a place ofmanagement in Austria (BMF, KStR 2001 para 1464).
Under the Austrian EU-Source Tax Act (EU-QuStG; implementing Directive 2003/48/EC of June 3,2003), interest paid by an Austrian coupon-paying agent to an individual beneficial owner resident inanother EU member state is subject to EU source tax at a rate of currently 15% (as of July 1, 2008: 20%;as of July 1, 2011: 35%). Interest within the meaning of the EU-QuStG are, among others, interest paid orcredited to an account, relating to debt claims of every kind, whether or not secured by mortgage andwhether or not carrying a right to participate in the debtor’s profits, and, in particular, income fromgovernment securities and income from bonds or debentures, including premiums and prizes attaching tosuch securities, bonds or debentures.
An exemption from EU source taxation applies, among others, if the beneficial owner of the interestforwards to the Austrian paying agent documentation issued by the tax office where the tax payer isresident, stating (i) the beneficial owner’s name, address and tax identification number (in the absence of atax identification number the beneficial owner’s date and place of birth), (ii) the paying agent’s name andaddress (iii) the beneficial owner’s address and account number or the security identification number.Further, EU source tax is not triggered if interest within the meaning of the EU-QuStG is paid to aninstitution within the meaning of § 4(2) EU-QuStG resident in another EU Member State and thisinstitution agrees upon written request of the Austrian paying agent to enter into a simplified informationexchange procedure with the Austrian paying agent.
Inheritance and gift tax
Inheritance and gift tax is levied on inheritances, gifts and special purpose donations if either thebeneficiary or the deceased/donor is resident in Austria for inheritance tax purposes. The inheritance andgift tax rate varies from 2% to 60%, depending on the value of the Securities transferred and on therelationship of the beneficiary to the deceased or the donor. Securities held by private investors are exemptfrom inheritance tax (not from gift tax), if they qualify for final income taxation or for the special 25%income tax rate.
In 2007, the Austrian Constitutional Court ruled the Austrian inheritance and gift tax on transfersmortis causa and donations unconstitutional. Austrian inheritance and gift tax on transfers mortis causaand donations will lapse, unless repaired or otherwise re-enacted by the Austrian legislator until August 1,2008. Based on the assumption that Austrian inheritance and gift tax will lapse, current draft legislation
360
Level: 6 – From: 6 – Wednesday, May 14, 2008 – 1:40 pm – g5mac4 – 3960 Section 11 : 3960 Section 11

will provide for a notification obligation with respect to the donations of securities after July 31, 2008 ifthe value of the donation exceeds certain minimum thresholds. The exact reaction of the Austrianlegislation in the present context remains to be awaited.
Taxation in France
The following is a summary addressing the French tax treatment of the holding and disposal of
the Securities. This summary is (i) based on the laws and regulations in full force and effect in France
as at the date hereof, which may be subject to change in the future, potentially with retroactive effect,
and (ii) prepared on the assumption that the Issuer of the Securities is not a French resident for French
tax purposes. Investors should be aware that the comments below are of a general nature and do not
constitute legal or tax advice and should not be understood as such. Potential investors are strongly
advised to consult their own professional tax advisers as to the French tax consequences of the
acquisition, ownership and disposition of the Securities.
French Withholding Tax
Withholding tax treatment of Securities held by French resident legal entities liable for FrenchCorporate Income Tax
Proceeds from the holding (in case of coupon payments), disposal or redemption of the Securitiesshould not be subject to French withholding tax.
Withholding tax treatment of Securities held as private assets by French tax resident individuals
In principle, proceeds from the holding (in case of coupon payments), disposal or redemption of theSecurities should not be subject to any mandatory French withholding tax. French individuals may, incertain cases, elect for the levy of a Final Withholding Tax (as defined below) on income derived fromcoupon payments.
Taxes on income and capital gains
Taxation of French tax resident individuals holding the Securities as private assets and who are notengaged in stock exchange transactions in conditions similar to those that characterize the activityexercised by a person carrying out such transactions on a professional basis
Income paid by the Issuer to a French tax resident individual holding the Securities as private assetsare generally includable in the holder’s global income subject to income tax at a progressive rate (thehighest rate amounting to 40% for income realised in 2007), to which are added social taxes at the rate of11% which break down as follows:
• the general social contribution (CSG) at the rate of 8.2%, 5.8% of which is deductible forincome tax purposes in respect of the year of payment of the CSG;
• the surcharge for the repayment of the social security debt (CRDS) at the rate of 0.5%, nondeductible for income tax purposes;
• the social levy at the rate of 2% (“prélèvement social de 2%”), non deductible for incometax purposes;
• the additional contribution to the social levy of 2% at the rate of 0.3% (“contributionadditionnelle au prélèvement socia”), non deductible for income tax purposes.
French tax resident individuals holding the Securities as private assets and receiving certain types ofincome sourced in France or in another Member State of the European Union are entitled to elect for afinal withholding tax (the Final Withholding tax) in full satisfaction of income tax % (“prélèvementlibératoire”); provided that:
361
Level: 6 – From: 6 – Wednesday, May 14, 2008 – 1:40 pm – g5mac4 – 3960 Section 11 : 3960 Section 11

• the income qualifies as income from fixed income securities (“produits de placements àrevenu fixe”) within the meaning of Articles 125 A I and D of the French Tax Code ;
• the paying agent (“établissement payeur”) is established in France, in another Member Stateof the European Union, or in a country which is a party to the European Economic Areatreaty (excluding Liechtenstein) and which has entered with France into a tax treatyproviding for an administrative assistance to combat fraud or tax evasion; and,
• the debtor (in the case where the paying agent and the debtor are different persons) isestablished in France, in another Member State of the European Union, or in a country whichis a party to the European Economic Area treaty (excluding Liechtenstein) and which hasentered with France into a tax treaty providing for an administrative assistance to combatfraud or tax evasion.
If the above requirements are met and provided that the French tax resident individual elects for theFinal Withholding Tax regime, income from the holding, disposal or redemption of the Securities would besubject to income tax at the flat rate of 18% in lieu of taxation under ordinary rules and in full satisfactionof income tax, to which are added social taxes at the rate of 11% which break down as follows:
• the CSG at the rate of 8.2%, non deductible for income tax purposes;
• the CRDS at the rate of 0.5%, non deductible for income tax purposes;
• the social levy at the rate of 2% (“prélèvement social de 2%”), non deductible for income taxpurposes;
• the additional contribution to the social levy of 2% at the rate of 0.3% (“contributionadditionnelle au prélèvement social”), non deductible for income tax purposes.
In the case of such an election by a French tax resident individual, the Final Withholding Tax (at anaggregate effective rate of 29%) should be levied either by the French tax resident individual or by theforeign paying agent (in the latter case, the French tax resident individual needs to appoint the foreignpaying agent as his/her agent for purposes of levying the Final Withholding tax).
Pursuant to Article 11 of the Directive 2003/48/EEC dated June 3, 2003 (the Savings Directive), asfrom July 1, 2005, the paying agents residing in Austria, Belgium and Luxembourg shall levy awithholding tax where they pay interest to certain European recipients at a rate of 15 % during the firstthree years of the transitional period (i.e., until July 1, 2008), 20 % for the subsequent three years (i.e.,until 1 July 2011) and 35% thereafter. Pursuant to Article 199 ter I-c of the French Tax Code, French taxresident individuals deriving income that has been subject, in the paying agent’s jurisdiction, towithholding tax pursuant to the Savings Directive, are entitled to a tax credit equal to the amount of thatwithholding tax, in the conditions discussed in the official guidelines 5 I-1-06, dated January 12, 2006 and5 I-9-06, dated October 16, 2006.
Capital gains resulting from the transfer of the Securities by individuals are, generally, taxable fromthe first euro if the global amount of transfers of securities or other rights and instruments referred tounder Article 150-0 A of the French Tax Code (excluding transfers benefiting from a tax rollover regime oran exemption by virtue of a special tax provisions such as under the Share Saving Schemes (“PEA”)regime) realised during the calendar year exceeds, per fiscal household (“foyer fiscal”), a thresholdcurrently fixed at €25,000 (for capital gains realised in 2008).
In such a case, such capital gains are subject to income tax at a rate of 18% together with socialtaxes of 11% (resulting in a total rate of 29%) which break down as follows:
• the CSG at the rate of 8.2%, non deductible for income tax purposes;
• the CRDS at the rate of 0.5%, non deductible for income tax purposes;
• the social levy at the rate of 2%, non deductible for income tax purposes;
362
Level: 6 – From: 6 – Wednesday, May 14, 2008 – 1:40 pm – g5mac4 – 3960 Section 11 : 3960 Section 11

• the additional contribution to the social levy of 2% at the rate of 0.3%, non deductible forincome tax purposes.
Capital losses incurred during a given year can only be offset against gains of the same naturerealised during the year of transfer or the following ten years, provided that the transfer thresholdmentioned above has been exceeded in respect of the year during which the capital loss is realised.
Taxation of French tax resident legal entities subject to French corporate income tax
Income derived by French tax resident legal entities subject to French corporate income tax from adebt instrument is generally taxable on an accruals basis, except where such income qualifies as a“redemption premium” within the meaning of Article 238 septies E of the French Tax Code. Under thisprovision, the redemption premium of a debt instrument is equal to the difference between (a) sums orvalues to be received, whatever their nature, except for linear interest paid out each year at regularpayment dates and still to be received after the acquisition, and (b) those paid upon subscription oracquisition. Such redemption premium should be included in each year’s taxable income pursuant to anactuarial allocation of the sums on the duration of the debt instrument. This allocation rule applies if (i) theredemption premium, if any, exceeds 10% of the acquisition price of the debt instrument, and (ii) the issueprice of the debt instrument is equal to or less than 90% of its redemption price.
Income arising under the Securities is taxable at the current standard corporate income tax rate of33.1/3%, increased, as the case may be, by a 3.3% additional contribution assessed on the corporateincome tax after deduction of an amount of €763,000 per twelve month period.
Subject to the conditions set out in Articles 219 I b and 235 ter ZC of the French Tax Code, certainlegal entities may be entitled to a reduced corporate income tax rate of 15% up to a limit of €38,120 pertwelve month period and to an exemption of the 3.3% additional contribution.
Capital gains realised upon the sale of the Securities by French tax resident legal entities are taxableat the current standard corporate income tax rate of 33.1/3%, increased, as the case may be, by a 3.3%additional contribution assessed on the corporate income tax after deduction of an amount of €763,000 pertwelve month period.
Subject to the conditions set out in Articles 219 I b and 235 ter ZC of the French Tax Code, certainlegal entities may be entitled to a reduced corporate income tax rate of 15% up to a limit of €38,120 pertwelve month period and to an exemption of the 3.3% additional contribution.
Registration Duty
No French registration duty will be due on the issue or the transfer of the Securities.
Wealth Tax
Securities held by French tax resident individuals as private assets will be comprised in the taxablebasis of French wealth tax (“impôt de solidarité sur la fortune”) due, as the case may be, by their holder.
Gift and Inheritance Duties
Securities acquired by individuals by way of gift or inheritance may be subject to gift or inheritancetax in France, under the relevant rules provided by French legislation and the provisions of any relevantdouble tax treaty.
Taxation in Germany
The following is a summary of some important German fiscal provisions that are relevant inconnection with the acquisition, the holding and the sale, the assignment or redemption of the Securities.The Summary is based on the German tax law and their interpretation on the date of this Prospectus,
363
Level: 6 – From: 6 – Wednesday, May 14, 2008 – 1:40 pm – g5mac4 – 3960 Section 11 : 3960 Section 11
which may be amended at short notice, even with retroactive effect. The summary will also outline theamendments regarding the new tax regime of investment income and capital gains as it will come intoeffect from January 1, 2009. This summary is not intended to be a comprehensive and completepresentation of all aspects that could be relevant to holders under German tax law. It is not a substitute fortax advice.
Potential investors are strongly advised to consult their own professional tax advisers as to the
German tax consequences of the acquisition, ownership and disposition of the Securities.
German tax residents holders
Interest Payments
All interest payments, including interest having accrued up to the disposition of a Security andcredited separately (“Accrued Interest” – Stückzinsen) paid to a holder being tax resident in Germany(persons whose residence, habitual abode, statutory seat, or place of effective management and control islocated in Germany) are subject to income or corporate tax plus the solidarity surcharge in the amount of5.5% of the relevant income or corporate tax liability. If the Securities are held as assets of a Germancommercial business, these interest payments are also subject to trade tax (Gewerbesteuer). If theSecurities are held as a non-business asset, any Accrued Interest paid by an individual upon the acquisitionof the Securities may give rise to negative income and may, therefore, reduce such holder’s personalincome tax liability.
(a) Withholding tax
If the Securities are held in a custodial account maintained with the German branch of a German ornon-German bank or financial services institution (“Disbursing Agent” – inländische Zahlstelle),withholding tax (Zinsabschlagsteuer) in the amount of 30% (plus a 5.5% solidarity surcharge thereon, i.e.a total of 31.65%) will be withheld from the gross amount of interest, including Accrued Interest, paid to aholder. With effect from 1 January 2009 the amount of withholding tax to be imposed will be reduced to25% plus 5.5% solidarity surcharge for both corporate and private holders.
No tax is withheld by the Disbursing Agent, if the holder is an individual who has filed a certificateof exemption (Freistellungsauftrag) with the Disbursing Agent and the Securities held by such individualare not part of a German commercial business property or generate income from the letting and leasing ofproperty. However, this exemption applies only to the extent that the aggregate interest income derivedfrom the Securities after deduction of Accrued Interest paid upon the purchase of the Securities togetherwith individual’s other investment income administered by the Disbursing Agent, does not exceed theamount of EUR 801 (for individuals) respectively EUR 1,602 for married couples filing a joint assessment(“Maximum Exemption Amount”). There is also no withholding obligation, if the holder submits to theDisbursing Agent a certificate of non-assessment (Nichtveranlagungsbescheinigung) issued by thecompetent tax authority.
(b) Assessment of final income tax liability
Tax withheld by the Disbursing Agent (until December 31, 2008) will be credited as an advancedpayment against the final German income or corporate tax liability of the respective holder in the course ofthe tax assessment procedure. Any potential surplus for the benefit of the holder will be paid out to therespective holder.
However, if the withholding tax (if any) imposed on the interest payments under the Securities willbe paid after December 31, 2008 the withholding tax is definite (flat tax; Abgeltungssteuer) with respect toprivate holders holding the Security as a non-business asset. Private holders may include the capitalinvestment income in their personal income tax return to achieve a lower tax rate. Income not subject towithholding tax (e.g. since there is no Disbursing Agent) will be subject to a special definite tax rate of25% (plus solidarity surcharge and church tax (if any)) upon assessment unless the private holder requeststhe inclusion of the investment income in his tax assessment provided this leads to a lower tax liability.
364
Level: 6 – From: 6 – Wednesday, May 14, 2008 – 1:40 pm – g5mac4 – 3960 Section 11 : 3960 Section 11

Moreover, private holders are not allowed to deduct their expenses relating to the total investment in acalendar year but, instead, are entitled to deduct an annual lump sum of EUR 801 (for individuals)respectively of EUR 1,602 (for married couples filing a joint assessment).
Sale or Redemption of the Securities
The Issuer believes that the Securities qualify as financial innovation (Finanzinnovation) in themeaning of § 20 (2) clause 1 no. 4 of the German Income Tax Act (Einkommensteuergesetz). Thisqualification results in a tax treatment as set out in this summary. However, it is not possible to predictreliably whether or not the competent tax authorities will share this view. If the tax authorities should notconsider the Securities as financial innovation a different tax treatment may apply.
Capital gains from the sale, assignment or redemption of the Securities, including the capital gainsachieved by a second or subsequent purchaser, are considered as interest income. Therefore, they aresubject to personal or corporate income tax plus 5.5% solidarity surcharge thereon under German tax law.If the Securities are held as a German business asset, such profits are also subject to trade tax. The taxablecapital gain from the sale, assignment or redemption of the Securities is calculated as the differencebetween the proceeds from the sale, assignment or redemption and the issue or purchase price of theSecurities (so-called Marktrendite). The tax authorities hold the view, that if financial innovations are heldas non-business assets, losses are deductible as negative investment income in principle. However, theFederal Fiscal Court (Bundesfinanzhof) denied the deduction of losses from the disposal or redemption offinancial innovations or the taxation of gains from financial innovations in the case that the amount ofremuneration for the use of capital and the change of the value of the securities can be separated withoutmajor difficulties, cf. BFH of 13.12.2006 VIII R 79/03, DStR 2007 p. 286; BFH of 20.11.2006 VIII R97/02, DStRE 2007 p. 601; BFH of 13.12.2006 VIII R 62/04, DStR 2007 p. 338; BFH of 11.07.2006 VIIIR 67/04, DStR 2007 p. 106. The tax authorities have joined this view in principle. However, the overallconsequences of these decisions for the taxation of the Securities are currently unclear.
With effect from January 1, 2009 onward capital gains from the sale or redemption of the Securities– in principle calculated as proceeds from the sale minus expenses relating to the sale and minusacquisition costs – qualify as investment income pursuant to § 20 (2) clause 1 no. 7 EStG under the newtax regime.
(a) Withholding tax
For Securities held in a custodial account maintained with a Disbursing Agent since the acquisitionof the Securities, the Disbursing Agent will be required to withhold tax in the amount of 30% (plus a 5.5%solidarity surcharge) of the excess of the proceeds from the sale or redemption over the purchase pricepaid for the Securities if the sale or the redemption occur in the course of the year 2008. If the DisbursingAgent has changed since the acquisition of the Securities, tax is withheld in the amount of 30% (plus a5.5% solidarity surcharge) of the sale or redemption proceeds. With effect from 1 January 2009 onwardthe withholding tax rate will be reduced to 25% plus 5.5% solidarity surcharge thereon, i.e. in total awithholding tax rate of 26.375% will be imposed irrespective of whether the holder qualifies as a privateor a corporate holder. If custody has changed since the acquisition and the acquisition costs have not beencertified by the bank or the financial services institution located in Germany or another EC or EEAcountry which has held the Securities before the change of custody, the tax at a rate of 25% (plussolidarity surcharge) will be imposed on the proceeds from the sale or redemption of the Securities. Incomputing the tax to be withheld, the Disbursing Agent may deduct from the basis of the withholding taxany Accrued Interest previously paid during the calendar year by the holder to the Disbursing Agent. Notax will be withheld, if the holder is an individual whose Security does not form part of the property of aGerman business nor gives rise to income from the letting and leasing of property and who filed acertificate of exemption (Freistellungsauftrag) with the Disbursing Agent to the extent that the interestincome derived from the Securities together with other investment income does not exceed the MaximumExemption Amount shown on this certificate (see above Interest Payments). There is also no withholdingtax imposed if the holder submits to the Disbursing Agent a certificate of non-assessment(Nichtveranlagungsbescheinigung) issued by the competent tax authority.
365
Level: 6 – From: 6 – Wednesday, May 14, 2008 – 1:40 pm – g5mac4 – 3960 Section 11 : 3960 Section 11

(b) Assessment of final tax liability
The tax withheld (until December 31, 2008, see above) will be credited against the holder’s annualincome or corporate tax liability.
However, with respect to private holders holding the Securities as private asset withholding tax (ifany) imposed on the sale or redemption of the Securities occurring after December 31, 2008 will bedefinite and can not be credited against the final tax liability of the holder in principle. This result ensuesfrom the newly implemented flat tax regime which taxes exclusively investment income in the hand ofprivate holders where the asset is held as private asset at a rate of 25% plus 5.5% solidarity surcharge pluschurch tax (if any). However, private holders having a lower personal income tax rate may include thecapital investment income in their personal income tax return to achieve a lower tax rate. Losses from thesale or redemption of the Securities can only be off-set against other investment income. In the event thatan off-set is not possible in the assessment period in which the losses have been realised, such losses canbe carried forward into future assessment periods only and can be off-set against investment incomegenerated in future assessment periods. Moreover, private holders are not allowed to deduct their expensesrelating to the total investment in a calendar year but, instead, are entitled to deduct an annual lump sum ofEUR 801 (for individuals) respectively of EUR 1,602 (for married couples filing a joint assessment).
Corporate holders will remain entitled to credit the withholding tax paid on their final tax liability.Moreover, corporate holders can deduct all expenses relating to the investment and can off-set losses frominvestment income with profits/gains from other income.
Non-resident holders
Interest, including Accrued Interest, paid to a holder and capital gains from the sale or redemptionrealised by a holder not being resident in Germany will generally not be taxable in Germany and no taxwill be withheld (even if the Securities are kept with a Disbursing Agent). However, German withholdingtax has to be imposed, if (i) the Securities are held as a business asset of a permanent Germanestablishment or by a permanent representative of the non-resident holder, if (ii) the interest income ofsuch Securities does otherwise constitute German source income (e.g. income from the letting and leasingof specific real estate located in Germany or income from over-the-counter transactions) and if (iii) thenon-resident holder does not comply with the procedural rules to prove his status as a non-tax resident. Inthese cases, the holder not being resident in Germany will be subject to a tax regime similar to thatdescribed above under “German tax resident holders”. However, in particular in case (iii) withholding taxis not creditable against the holder’s annual income tax liability.
Inheritance and Gift Tax
The transfer of the Securities in case of succession upon death, or by way of a gift among livingpersons is subject to German inheritance and/or gift tax, if the deceased, donor and/or the recipient is aGerman resident. German inheritance and gift tax is also triggered, if neither the deceased, the donor northe recipient of the Securities are German residents, if the Securities are attributable to German businessactivities and if for such business activities a German permanent establishment is maintained or apermanent representative is appointed in Germany. In specific situations, also German expatriates that havebeen tax resident in Germany may be subject to inheritance and gift tax. Double taxation treaties mayprovide for exceptions to the German inheritance and gift tax regulations.
The Inheritance and Gift Tax Act is also currently subject to a reform. The outcome andimplications hereof are remote from being clear
Taxation in Italy
The following is a general description of current Italian tax law and ministerial practice relating tothe purchase, holding and transfer of the Securities. It does not purport to be a complete analysis of all taxconsiderations that may be relevant to a decision to purchase, own or dispose of the Securities and does
366
Level: 6 – From: 6 – Wednesday, May 14, 2008 – 1:40 pm – g5mac4 – 3960 Section 11 : 3960 Section 11
not purport to deal with the tax consequences applicable to all categories of prospective beneficial ownersof Securities, some of which may be subject to special rules.
This summary is based upon Italian tax laws and ministerial practice in effect as at the date of thisProspectus, which may be subject to change, potentially with retroactive effect.
Potential investors are strongly advised to consult their own professional tax advisers as to the
Italian tax consequences of the acquisition, ownership and disposition of the Securities.
1. Italian income taxes
1.1 Interest, Premia and Other Proceeds Payable on the Securities
Italian resident Securityholders
The Italian income tax treatment applicable to Italian resident Securityholders depends upon thequalification under Italian tax law principles of such Securities.
Indeed, if the Securities, in the light of the fact that the Issuer shall pay at maturity (or upon anearly redemption) the principal amount outstanding, are characterized as bonds or similar securitiespursuant to Article 44(2)(b) of Presidential Decree of December 22, 1986, n. 917 (the “Decree
917”), then the tax regime under the Decree 239 will apply (the Decree 239 regime). However,pursuant to a different interpretation, the Securities, being perpetual securities, could be treated as“atypical financial instruments” (titoli atipici), being therefore governed by the provisions of theDecree of September 30, 1983 No. 512 (the Decree 512 regime).
The Decree 239 regime
Pursuant to the Decree 239 regime, a substitute tax (imposta sostitutiva) levied at the rate of 12.5per cent. is currently applicable to interest, premia and any other proceeds in respect of theSecurities (the Interest), issued by a non Italian resident issuer, if derived by an Italian residentbeneficial owner of the Securities which is:
(i) an individual not engaged in a business activity to which the Securities are effectivelyconnected (unless such individual has entrusted the management of his financial assets,including the Securities, to an authorized intermediary and has opted for the so-calledRisparmio Gestito regime according to article 7 of Legislative Decree No. 461 of 21November, 1997 as amended (Decree 461 - the Asset Management Option); or
(ii) a partnership (other than a società in nome collettivo or società in accomandita semplice orsimilar partnership) or de facto partnership not carrying out commercial activities orprofessional associations, or
(iii) a non-commercial private or public institution; or
(iv) an investor exempt from corporate income tax.
The imposta sostitutiva is a final tax and discharges any Italian income tax liabilities in respect ofthe Interest.
Pursuant to the Decree 239, imposta sostitutiva is applied by banks, società di intermediazionemobiliare (“SIMs”), società di gestione del risparmio (“SGR”), fiduciary companies, exchangeagents (agenti di cambio) and other qualified entities identified by the relevant decrees of theMinistry of Finance resident in Italy which intervene in the collection of the Interest (the“Intermediaries” and each an “Intermediary”). For the Intermediaries to be entitled to apply theimposta sostitutiva, they must (i) be (a) resident in Italy or (b) resident outside Italy, with apermanent establishment in Italy or (c) organizations and companies non-resident in Italy, actingthrough a system of centralized administration of securities and directly connected with theDepartment of Revenue of the Ministry of Finance (which include Euroclear and Clearstream,
367
Level: 6 – From: 6 – Wednesday, May 14, 2008 – 1:40 pm – g5mac4 – 3960 Section 11 : 3960 Section 11

Luxembourg) having appointed an Italian representative for the purposes of Decree 239; and (ii) beinvolved, in any way, in the collection of interest or in the transfer of the Securities. For the purposeof the application of imposta sostitutiva, a transfer of Securities includes any assignment or anyother act, either with or without consideration, which results in a change of the ownership of therelevant Securities.
If Interest on the Securities are collected by one of the subjects indicated here above under (i) to (iv)not through the intervention of a Intermediary and as such no imposta sostitutiva is levied, theItalian resident Securityholders are required to include such interest and other proceeds in theiryearly income tax return and to apply and pay final substitute tax at a rate of 12.5% on the amountof such Interest. Alternatively, Italian resident individual Securityholders holding the Securities notin connection with entrepreneurial activity may elect not to apply the substitute taxation regime, butto pay ordinary personal income taxes at progressive rates in respect of Interest on the Securities: ifso, the Securityholders should generally benefit from a tax credit for final withholding taxes appliedoutside Italy, if any.
No imposta sostitutiva is applicable where an Italian resident individual Securityholder holds theSecurities in a discretionary investment portfolio managed by an Italian authorized financialintermediary and opts to be taxed at the flat rate of 12.5 per cent. on the appreciation of theinvestment portfolio accrued, even if not realized, at year-end (which appreciation includes anyInterest accrued on the Securities) pursuant to the so-called Asset Management Option set forth byArticle 7 of the Decree 461.
The imposta sostitutiva is currently applicable also on any Interest derived by an Italian residentbeneficial owner of the Securities which is an individual holding the Securities in connection withentrepreneurial activities. The Interest on the Securities must be included, on an accrual basis, in theaggregate taxable income of such Securityholder. As a consequence, the Interest will be subject topersonal income tax (“IRPEF”), at the applicable progressive rate, and the imposta sostitutivalevied on the Interest will be creditable against IRPEF due by such Securityholder. Furthermore,withholding taxes on the Interest, if any, applied outside of Italy could be creditable in the hands ofsuch Securityholders, pursuant to the provisions governing the foreign tax credit.
No imposta sostitutiva is applicable on Interest payable to Italian resident corporate entities or topermanent establishments in Italy of foreign corporations to which the Securities are effectivelyconnected, provided that the Securities are timely deposited with an authorized financialintermediary. Interest on the Securities must be included, on an accrual basis, in the aggregatetaxable income of the Securityholders for corporation tax purposes (“IRES”, levied at the rate of27.5 per cent.). In certain cases, depending on the status of the Securityholders Interest accrued onthe Securities may also be included in the net value of production subject to regional tax onproductive activities (“IRAP”, generally levied at the rate of 3.9 per cent. (even though regionalsurcharges may apply). In these cases, in general a tax credit for final withholding taxes appliedoutside Italy, if any, should be generally available
No imposta sostitutiva is applicable on Interest payable to Italian pension funds (subject to theregime provided by Article 17, paragraph 1 of Legislative Decree No. 252 of December 5, 2005)and to Italian collective investment funds, provided that the Securities are timely deposited with anauthorized financial intermediary. Interest on the Securities must be included in the calculation ofthe management result of the fund accrued at year-end, which is subject to a substitute tax at therate of 11 per cent. (the latter being the “Pension Fund Tax”) in case of pension funds or to asubstitute tax at the rate of 12.5 per cent. in case of Italian collective investment funds (the latterbeing the “Mutual Fund Tax”).
No imposta sostitutiva is applicable on Interest payable to Italian real estate investment funds towhich the provisions of Law Decree No. 351 of September 25, 2001, as subsequently amended,apply, provided that the Securities are deposited with an authorized financial intermediary. Theincome of such real estate investment funds (which includes the Interest on the Securities) is in
368
Level: 6 – From: 6 – Wednesday, May 14, 2008 – 1:40 pm – g5mac4 – 3960 Section 11 : 3960 Section 11

principle taxed in the hands of the participants to the fund on a cash basis (i.e., upon collection ofthe proceeds derived from the investment).
The Decree 512 regime
In the event that the Securities, being perpetual securities, are treated as “titoli atipici” for Italiantax purposes, any proceeds (including the difference between the amount paid to Securityholders atmaturity and the issue price) on Securities paid to Italian resident beneficial owners who are (i)private individuals holding the Securities not in connection with entrepreneurial activities, (ii) realestate investment funds, (iii) pension fund, (iv) collective investment funds and SICAVs and (v)persons and entities exempt from corporate income tax, shall be subject to final “entrance”withholding tax at rate of 27%, if the Securities are placed (“collocati”) in Italy and an entrustedItalian resident bank or financial intermediary intervenes in the collection of payments on theSecurities, in the repurchase or in the transfer of the Securities. The 27% “entrance” withholding taxshall be levied by such Italian bank or financial intermediary.
If the Securities are not placed (“non collocati”) in Italy and payment of proceeds on the Securitiesare not received through an entrusted Italian resident bank or financial intermediary that intervenesin the collection of payments on the Securities, in the repurchase or in transfer of the Securities, andas such no “entrance” withholding tax is required to be levied, the subjects indicated above (i) to (v)will be required to report the payments in their yearly income tax return and subject them to a finalsubstitute tax at rate of 27%. The individual beneficial owners may elect instead to pay ordinarypersonal income tax at the progressive rates applicable to them in respect of the payments: if so, thebeneficial owners should generally benefit a tax credit for withholding taxes applied outside Italy, ifany.
In case of Italian resident beneficial owners who are corporate entities and commercial partnerships(including permanent establishments in Italy of foreign entities to which the Securities areeffectively connected), payments received on the Securities will not subject to any “entrance”withholding tax and will form part their aggregate taxable business income (and, in certain cases,depending on the status of the Securityholders, may also be included in the taxable net value ofproduction subject to IRAP) subject to tax in Italy according to ordinary tax provisions. A tax creditfor withholding taxes applied outside Italy, if any, should be generally available;.
Non Italian resident Securityholders
Interest on Securities derived by Securityholders who are not resident in Italy for tax purposes,without permanent establishment in Italy to which the Securities are effectively connected, shouldnot be subject to any Italian taxation. If the Securities are deposited with an Italian bank or otherresident intermediary or are sold through an Italian bank or other resident intermediary or in anycase an Italian resident intermediary (or permanent establishment in Italy of foreign intermediary)intervenes in the payment of Interest on the Securities, to ensure payment of Interest on Securitiesgross of substitute tax, a non-Italian resident Securityholder may be required to timely produce tothe Italian bank or other intermediary (or permanent establishment in Italy of foreign intermediary)a self-declaration certifying to be the beneficial owner of payments of Interest on the Securities andnot to be resident in Italy for tax purposes.
1.2 Capital Gains on the Disposal or Redemption of the Securities
Italian resident Securityholders
Pursuant to Decree 461, a 12.5 per cent substitute tax (referred to as “capital gain tax”) is applicableto capital gains realized by Italian resident individuals not engaged in entrepreneurial activities towhich the Securities are connected, on any sale or transfer for consideration of the Securities orredemption thereof.
369
Level: 6 – From: 6 – Wednesday, May 14, 2008 – 1:40 pm – g5mac4 – 3960 Section 11 : 3960 Section 11

In respect of the application of this capital gain tax, taxpayers may opt for one of the three regimesdescribed below.
Under the tax declaration regime (regime della dichiarazione), which is the default regime for thetaxation of capital gains realized by Italian resident individuals not engaged in an entrepreneurial,the 12,5 per cent imposta sostitutiva on capital gains will be chargeable, on a yearly cumulativebasis, on all capital gains, net of any incurred capital losses, realized by the Italian residentindividual Securityholder, holding Securities not in connection with an entrepreneurial activity, inany sale or redemption of the Securities which occurs during any given tax year. Italian residentindividuals holding the Securities not in connection with an entrepreneurial activity must indicatethe overall capital gains realized in any tax year, net of any relevant incurred capital losses, in theannual tax return and pay the capital gain tax on such gains together with any balance due in respectof income tax due for such year. Capital losses in excess of capital gains may be carried forwardagainst capital gains of the same kind realized in any of the four succeeding tax years.
As an alternative to the tax declaration regime, Italian resident individual Securityholders holdingthe Securities not in connection with an entrepreneurial activity may elect to pay the capital gain taxseparately on capital gains realized on each sale or redemption of the Securities (the risparmioamministrato regime provided for by article 6 of Decree 461). Such separate taxation of capitalgains is allowed subject to:
(i) the Securities being deposited with Italian banks, società di intermediazione mobiliare (SIM)or certain authorized financial intermediaries; and
(ii) an express election for the risparmio amministrato regime being made in writing in due timeby the relevant Securityholder.
The intermediary is responsible for accounting for capital the gain tax in respect of capital gainsrealized on each sale or redemption of the Securities (as well as in respect of capital gains realizedupon the revocation of its mandate), net of any incurred capital losses, and is required to pay therelevant amount to the Italian tax authorities on behalf of the taxpayer, deducting a correspondingamount from the proceeds to be credited to the Securityholder or using funds provided by theSecurityholder for this purpose. Under the risparmio amministrato regime, where a sale orredemption of the Securities results in a capital loss, such loss may be deducted from capital gainsof the same kind subsequently realized, within the same relationship of deposit, in the same tax yearor in the four succeeding tax years. Under the risparmio amministrato regime, the Securityholder isnot required to declare the capital gains in its annual tax return and the Securityholder remainsanonymous. Any capital gains realized by Italian resident individuals holding the Securities not inconnection with an entrepreneurial activity who have opted for the Asset Management Option willbe included in the computation of the annual increase in value of the managed assets accrued, evenif not realized, at year end, subject to a 12.5 per cent. substitute tax, to be paid by the managingauthorized intermediary. Under the Asset Management Option, any depreciation of the managedassets accrued at year end may be carried forward against increase in value of the managed assetsaccrued in any of the four succeeding tax years. Also under the Asset Management Option, theSecurityholder is not required to declare the capital gains realized in its annual tax return and theSecurityholder remains anonymous.
Any capital gain realized upon the sale or redemption of the Securities would be treated as part ofthe taxable business income (and, in certain circumstances, depending on the status of theSecurityholder, also as part of the net value of the production for IRAP purposes) subject to tax inItaly according to the relevant tax provisions if derived by an Italian company or a similarcommercial entity (including an Italian permanent establishment of a foreign entity to which theSecurities are effectively connected) or Italian resident individuals engaged in an entrepreneurialactivity, as to any capital gains realized within the scope of the commercial activity carried out.
370
Level: 6 – From: 6 – Wednesday, May 14, 2008 – 1:40 pm – g5mac4 – 3960 Section 11 : 3960 Section 11

Any capital gains realized by a Securityholder which is an Italian collective investment fund or aSICAV will be included in the result of the relevant portfolio accrued at the end of the tax periodand will be subject to the Mutual Fund Tax.
Capital gains on the Securities held by real estate investment funds to which the provisions of LawDecree No. 351 of 25 September 2001, as subsequently amended, apply, are not subject capital gaintax: no tax is levied on the aggregate income of the real estate fund.
Any capital gains realized by a Securityholder which is an Italian pension fund (subject to theregime provided for by for by article 17, paragraph 1 of Legislative Decree No. 252 of December 5,2005) will be included in the results of the relevant portfolio accrued at the end of the tax periodand will be subject to Pension Fund Tax.
Non Italian resident Securityholders
Capital gains realized upon sale of redemption of Securities by Securityholders who are not residentin Italy for tax purposes (private individuals and entities), without permanent establishment in Italyto which the Securities are effectively connected, are not subject to Italian taxation, provided thatthe Securities are held outside the Italian territory.
In case the Securities are held in Italy, in principle capital gains realized by non-Italian residentSecurityholders (private individuals and entities), without permanent establishment in Italy to whichthe Securities are effectively connected, may be taxable in Italy with the same rules as those set outabove, which apply to Italian resident private individuals holding Securities not in connection withentrepreneurial activity.
However, according to Article 23, first paragraph, letter f), of Decree No. 917 capital gains realizedby Securityholders (either individuals or entities) who are not resident in Italy for tax purposes anddo not have a permanent establishment in Italy to which the Securities are effectively connected arenot deemed to be realized in Italy (and as such no Italian income taxes shall be due thereon), if theSecurities are listed on a regulated market, in Italy or abroad,. This applies irrespective as towhether the Securities are held in Italy and regardless of the provisions of any applicable double taxtreaty entered into by Italy. In order to benefit from this exemption from Italian taxation on capitalgains, non-Italian resident Securityholders, without permanent establishment in Italy to which theSecurities are effectively connected, who hold Securities in Italy with an Italian authorized financialintermediary (or permanent establishment in Italy of foreign intermediary) and elect for the AssetManagement Option or are subject to the risparmio amministrato regime, may be required topromptly file with the Italian authorized financial intermediary a self-declaration certifying not to beresident in Italy for tax purposes.
The risparmio amministrato regime provided for by Art 6 of Decree 461 is the ordinary regimeautomatically applicable to non-Italian residents (individuals and entities) in relation to Securitiesdeposited for safekeeping or administration with Italian banks, SIMs and other qualifiedintermediaries. However, non-Italian residents retain the right to waive this regime through timelycommunication, according to the conditions provided for by law.
Furthermore, Article 5(5) of the Decree 461 provides for an exemption in respect of capital gainsrealized on the disposal of Securities which are realized by Securityholders that are resident incountries allowing an adequate exchange of information.
1.3 Early redemption of the Securities
Without prejudice to the above provisions, in the event that the Securities, having an originalmaturity of eighteen months or more, are subject to an early redemption in whole or in part withineighteen months from the date of issue, Italian resident beneficial owners will be generally requiredto pay an additional amount (tax) equal to 20 per cent. in respect of Interest accrued on the earlyredeemed Securities up to the time of the early redemption, in accordance with the provisions of
371
Level: 6 – From: 6 – Wednesday, May 14, 2008 – 1:40 pm – g5mac4 – 3960 Section 11 : 3960 Section 11
Article 26 of the Decree No. 600 of September 29, 1973. Where Italian withholding agentsintervene in the collection of interest on the Securities or in the redemption of Securities, thisadditional amount may be levied by such withholding agents by way of a withholding tax. Inaccordance with one interpretation of Italian tax law, also in the event of purchase of Securities bythe Issuer with subsequent cancellation thereof prior to eighteen months from the date of issue, theIssuer may be required to pay the above 20 per cent additional amount.
2. Inheritance and gift tax
Pursuant to Law Decree No. 262 of October 3, 2006 (converted into law by Law No. 286 ofNovember 24, 2006), the transfer of any asset of value (including shares, bonds or other securities) as aresult of death or donation are taxed as follows:
(i) transfers in favor of spouses and direct descendants are subject to an inheritance and gift taxapplied at a rate of 4 per cent. to the extent that the value of the inheritance or gift exceeds€1,000,000;
(ii) transfers in favor of relatives up to the fourth degree and relatives-in-law to the third degreeare subject to an inheritance and gift tax applied at a rate of 6 per cent. on the entire value ofthe inheritance or gift; and
(iii) any other transfer is subject to an inheritance and gift tax applied at a rate of 8 per cent. onthe entire value of the inheritance or gift.
3. EU Savings Tax Directive
Italy has implemented the EU Savings Directive through Legislative Decree No. 84 of April 18,2005 (“Decree No. 84”). Under Decree No. 84, subject to a number of important conditions being met, inthe case of interest paid starting from July 1, 2005 to individuals which qualify as beneficial owners of theinterest payment and are resident for tax purposes in another Member State, Italian qualified paying agentsreport to the Italian Tax Authorities details of the relevant payments and personal information on theindividual beneficial owner. Such information is transmitted by the Italian Tax Authorities to the competentforeign tax authorities of the State of residence of the beneficial owner.
4. Tax Monitoring:
Italian resident individuals, partnerships (other than società in nome collettivo, società inaccomandita semplice or similar partnerships), de facto partnerships not carrying out commercialactivities, professional associations and public and private entities, other than companies, not carrying outcommercial activities, will be required to report in their yearly income tax return, for tax monitoringpurposes:
(i) the amount of investments held abroad and foreign financial assets generating foreign sourceincome taxable in Italy (including the Securities) held at the end of each tax year, ifexceeding in the aggregate €10,000.00;
(ii) the amount of any transfers from abroad, towards abroad and occurring abroad, related toinvestments held abroad and foreign financial assets generating foreign source incometaxable in Italy (including the Securities), occurring during each tax year, if these transfersexceed in the aggregate €10,000.00 each year. This also applies in the case that at the end ofthe tax year, investments held abroad and foreign financial assets generating foreign sourceincome taxable in Italy (including the Securities) are no longer held by the above-mentionedsubjects.
The above subjects will however not be required to comply with the above reporting requirements ifthe Securities are deposited under a management or administration relationship with qualified Italianfinancial intermediaries (including permanent establishments in Italy of foreign intermediaries), upon
372
Level: 6 – From: 6 – Wednesday, May 14, 2008 – 1:40 pm – g5mac4 – 3960 Section 11 : 3960 Section 11

condition that the items of income derived from the Securities are collected through the intervention of thesame intermediaries.
Taxation in Liechtenstein
The statements herein regarding taxation in Liechtenstein are based on the laws in force in thePrincipality of Liechtenstein at the date hereof. The following explanations are of a preliminary andgeneral nature only and cannot be considered as a comprehensive or complete picture of all Liechtensteintax aspects that could be of relevance for (prospective) investors.
Potential investors are strongly advised to consult their own professional tax advisers as to the
Liechtenstein tax consequences of the acquisition, ownership and disposition of the Securities.
Withholding Tax on Interest
Liechtenstein has entered into a Treaty on Taxation of Interest with the European Union in 2004 andhas subsequently thereto issued a Law on the Taxation of Interest (LGBl. Nr. 112/2005, entered into forceon July 1, 2005) implementing the terms of said treaty. Based on the Liechtenstein Law on the Taxation ofInterest Liechtenstein paying agents are obliged to deduct withholding tax from payments of interest tobeneficiaries with domicile in the European Union.
For investors with domicile in Liechtenstein withholding tax is not deducted by a Liechtensteinpaying agent.
Securities of a Liechtenstein issuer or a foreign issuer purchased and held by an investor inLiechtenstein are subject to capital / wealth tax of 1%. Any kind of proceeds, earnings, revenues fromsecurities, which are subject to capital tax, are tax free in Liechtenstein (Art 45 Liechtenstein Tax Act).
Realised capital gains and speculation profits in case of sale of securities (difference between salesproceeds and purchase price) by a Liechtenstein domiciled investor are subject to income tax. Forcommercial entities, income tax ranges between 7.5 and 15%.
Certain types of legal entities qualifying as “domiciled entities” with no commercial activitieswithin Liechtenstein enjoy privileged flat taxation.
373
Level: 6 – From: 6 – Wednesday, May 14, 2008 – 1:40 pm – g5mac4 – 3960 Section 11 : 3960 Section 11
SUBSCRIPTION AND SALE
Fortis Bank, Merrill Lynch International and Morgan Stanley & Co. International plc (together, the“Managers”) will severally but not jointly agree to procure subscribers for or failing which, themselves tosubscribe for the entire issued amount of the Securities pursuant to an Underwriting Agreement (the“Underwriting Agreement”) dated on or about May 14, 2008, as supplement by a Pricing Supplement tobe dated on or about May 23, 2008 at the issue price of 100% of the principal amount of the Securities. Inaddition, Fortis SA/NV, Fortis N.V. and Fortis Hybrid Financing will agree to indemnify the Managersagainst certain liabilities incurred in connection with the issue of the Securities. The Managers will receivea combined selling, management and underwriting commission as provided for in the UnderwritingAgreement.
The yield will be calculated on the basis of the expected Coupon rate that will be between 8.00%and 8.25% per annum at the Closing Date. The yield will be published on the website of the LuxembourgStock Exchange (www.bourse.lu) and the Euronext Daily Official List (“Officiële Prijscourant”) ofEuronext. It is not an indication of future yield. Both Fortis Hybrid Financing and the Managers will beentitled to terminate the Underwriting Agreement in certain circumstances before the issue of theSecurities.
Addresses of the Managers
Fortis BankMontagne du Parc 31000 BrusselsBelgium
Merrill Lynch InternationalMerrill Lynch Financial Centre2, King Edward StreetLondon EC1A 1HQUnited Kingdom
Morgan Stanley & Co. International plc25 Cabot SquareLondon E14 4QAUnited Kingdom
United States
The Securities have not been and will not be registered under the U.S. Securities Act of 1933, asamended (the “Securities Act”) and may not be offered or sold within the United States or to, or for theaccount or benefit of, U.S. persons except in certain transactions exempt from the registration requirementsof the Securities Act.
Each Manager has agreed that, except as permitted by the Underwriting Agreement, it will not offer,sell or deliver the Securities (i) as part of their distribution at any time, or (ii) otherwise until 40 days afterthe later of the commencement of the offering and the Issue Date within the United States or to, or for theaccount or benefit of, U.S. persons and that it will have sent to each dealer to which it sells any Securitiesduring the distribution compliance period a confirmation or other notice setting forth the restrictions onoffers and sales of the Securities within the United States or to, or for the account or benefit of, U.S.persons. The terms used in the preceding paragraph and in this paragraph have the meaning assigned tothem by Regulation S under Securities Act.
In addition, until 40 days after the completion of the offering, an offer or sale of Securities withinthe United States by any dealer that is not participating in the offering may violate the registrationrequirements of the Securities Act.
374
Level: 6 – From: 6 – Wednesday, May 14, 2008 – 1:40 pm – g5mac4 – 3960 Section 12 : 3960 Section 12Level: 6 – From: 6 – Wednesday, May 14, 2008 – 1:40 pm – g5mac4 – 3960 Section 12 : 3960 Section 12
United Kingdom
Each Manager has represented and agreed that:
• it has only communicated or caused to be communicated and will only communicate or causeto be communicated an invitation or inducement to engage in investment activity (within themeaning of Section 21 of the Financial Services and Markets Act 2000) received by it inconnection with the issue or sale of any Securities in circumstances in which Section 21(1) ofthe Financial Services and Markets Act 2000 does not apply to Fortis Hybrid Financing; and
• it has complied and will comply with all applicable provisions of the Financial Services andMarkets Act 2000 with respect to anything done by it in relation to any Securities in, from orotherwise involving the United Kingdom.
European Economic Area
In relation to each Member State of the European Economic Area which has implemented theProspectus Directive (each, a “Relevant Member State”), each Manager has represented and agreed thatwith effect from and including the date on which the Prospectus Directive is implemented in that RelevantMember State (the “Relevant Implementation Date”) it has not made and will not make an offer ofSecurities which are the subject of the offering contemplated by this Prospectus to the public in thatRelevant Member State other than the offers contemplated in this Prospectus in Austria, Belgium, France,Germany, Ireland, Italy, Luxembourg, Portugal, Spain, The Netherlands, the United Kingdom and thePrincipality of Liechtenstein from the time this Prospectus has been approved by the CSSF and publishedand notified to the relevant competent authorities in accordance with the Prospectus Directive asimplemented in Austria, Belgium, France, Germany, Ireland, Italy, Portugal, Spain, The Netherlands, theUnited Kingdom and the Principality of Liechtenstein until the Issue Date (or such later date as FortisHybrid Financing may permit), except that it may, with effect from and including the RelevantImplementation Date, make an offer of such Securities to the public in that Relevant Member State:
(A) to legal entities which are authorised or regulated to operate in the financial markets or, if notso authorised or regulated, whose corporate purpose is solely to invest in securities; or
(B) to any legal entity which has two or more of (1) an average of at least 250 employees duringthe last financial year; (2) a total balance sheet of more than €43,000,000; and (3) an annualnet turnover of more than €50,000,000, as shown in its last annual or consolidated accounts;or
(C) where such offer is addressed to investors who acquire Securities for a total consideration ofat least Euros 50,000 (or its equivalent) per investor, for each separate offer,
provided that no such offer of the Securities shall require Fortis Hybrid Financing or any Managerto publish a prospectus pursuant to Article 3 of the Prospectus Directive or supplement a prospectuspursuant to Article 16 of the Prospectus Directive.
For the purposes of this provision, the expression an “offer of Securities to the public” in relation toany Securities in any Relevant Member State means the communication in any form and by any means ofsufficient information on the terms of the offer and the Securities to be offered so as to enable an investorto decide to purchase or subscribe the Securities as the same may be varied in that Member State by anymeasure implementing the Prospectus Directive in that Member State and the expression “ProspectusDirective” means Directive 2003/71/EC and includes any relevant implementing measure in each RelevantMember State.
375
Level: 6 – From: 6 – Wednesday, May 14, 2008 – 1:40 pm – g5mac4 – 3960 Section 12 : 3960 Section 12

Hong Kong
Each Manager has represented and agreed that:
(i) it has not offered or sold and will not offer or sell in Hong Kong, by means of any document,any Securities other than (a) to “professional investors” as defined in the Securities andFutures Ordinance (Cap. 571) of Hong Kong and any rules made under that Ordinance; or (b)in other circumstances which do not result in the document being a “prospectus” as definedin the Companies Ordinance (Cap. 32) of Hong Kong or which do not constitute an offer tothe public within the meaning of that Ordinance; and
(ii) it has not issued or had in its possession for the purposes of issue, and will not issue or havein its possession for the purposes of issue, whether in Hong Kong or elsewhere, anyadvertisement, invitation or document relating to the Securities, which is directed at, or thecontents of which are likely to be accessed or read by, the public of Hong Kong (except ifpermitted to do so under the securities laws of Hong Kong) other than with respect toSecurities which are or are intended to be disposed of only to persons outside Hong Kong oronly to “professional investors” as defined in the Securities and Futures Ordinance and anyrules made under that Ordinance.
This Prospectus does not constitute an offer or invitation to the public in Hong Kong to acquire theSecurities and the section titled “Terms and Conditions of the Public Offer” in this Prospectus is notapplicable to any Investor from or in Hong Kong.
A subscription for the Securities is not invited from any person in Hong Kong other than a personwhom a copy of this Prospectus has been issued and if made, will not be accepted. No person to whom acopy of this Prospectus is issued may issue, circulate or distribute this Prospectus in Hong Kong, or make,give or show a copy of this Prospectus to any other person.
WARNING — The contents of this Prospectus have not been reviewed by any regulatory authorityin Hong Kong. You are advised to exercise caution in relation to the offer. If you are in any doubt aboutany of the contents of this Prospectus, you should obtain independent professional advice.
Singapore
Each Manager has acknowledged and agreed that this Prospectus has not been registered as aprospectus with the Monetary Authority of Singapore. Accordingly, each Manager has represented andagreed that it has not offered or sold any Securities or caused the Securities to be made the subject of aninvitation for subscription or purchase nor will it offer or sell the Securities or cause the Securities to bemade the subject of an invitation for subscription or purchase, nor has it circulated or distributed nor will itcirculate or distribute this Prospectus and any other document or material in connection with the offer orsale, or invitation for subscription or purchase, of the Securities, whether directly or indirectly, to personsin Singapore other than (i) to an institutional investor under Section 274 of the Securities and Futures Act,Chapter 289 of Singapore (the “SFA”), (ii) to a relevant person (as defined in Section 275(2) of the SFA)pursuant to Section 275(1) of the SFA, or any person pursuant to Section 275(1 A), and in accordance withthe conditions, specified in Section 275 of the SFA, or (iii) otherwise pursuant to, and in accordance withthe conditions of, any other applicable provision of the SFA.
Where the Securities are subscribed or purchased under Section 275 by a relevant person which is acorporation (which corporation is not an accredited investor as defined in Section 4A of the SFA) the solebusiness of which is to hold investments and the entire share capital of which is owned by one or moreindividuals, each of whom is an accredited investor, Section 276(3) provides that shares, debentures andunits of shares and debentures of such corporation shall not be transferred within 6 months after thecorporation has acquired such Securities except: (1) to an institutional investor under Section 274 of theSFA or to a relevant person (as defined in Section 275 (2)); or pursuant to an offer referred to in Section275 (1A); (2) where no consideration is given for the transfer; or (3) by operation of law.
376
Level: 6 – From: 6 – Wednesday, May 14, 2008 – 1:40 pm – g5mac4 – 3960 Section 12 : 3960 Section 12

Where the Securities are subscribed or purchased under Section 275 by a relevant person which is atrust (where the trustee is not an accredited investor) whose sole purpose is to hold investments and eachbeneficiary is an accredited investor, then Section 276(4) provides that the beneficiaries’ rights and interestin that trust shall not be transferred within 6 months after that trust has acquired such Securities except: (1)to an institutional investor under Section 274 of the SFA or to a relevant person (as defined in Section 275(2)); or pursuant to an offer that is made on terms that such rights or interest are acquired at aconsideration of not less than $200,000 (or its equivalent in a foreign currency) for each transaction,whether such amount is to be paid for in cash or by exchange of securities or other assets; (2) where noconsideration is given for the transfer; or (3) by operation of law.
Switzerland
Only the Prospectus published by Fortis Hybrid Financing on or about May 14, 2008, together withthe Consolidated Financial Statements of Fortis for the financial year ended December 31, 2007, theConsolidated Financial Statements of Fortis for the Three Months ended March 31, 2008, the FinancialStatements of Fortis SA/NV for the financial year ended December 31, 2007, the Financial Statements ofFortis N.V. for the financial year ended December 31, 2007, the Financial Statements of Fortis HybridFinancing for the financial year ended December 31, 2007, the Indenture, the Support Agreement and theSubordinated Guarantee Agreement (and any, additional and updated corporate and financial informationthat shall be provided by Fortis Hybrid Financing, Fortis SA/NV and Fortis N.V.) may be used in thecontext of a public offer in or into Switzerland.
France
Each of the Managers and Fortis Hybrid Financing has agreed that it has only made and will onlymake an offer in the case of a prospectus having been approved by the CSSF, in the period beginning onthe date of notification of such approval to the Autorité des marchés financiers (AMF), all in accordancewith articles L.412-1 and L.621-8 of the French Code monétaire et financier and the Règlement général ofthe AMF and ending at the latest on the Issue Date (or such later date as Fortis Hybrid Financing maypermit).
The legal notice will be published in the Bulletin des Annonces Légales Obligatoires (BALO) datedon or about May 16 2008.
LEGAL MATTERS
Certain matters under United States law relating to the Securities will be passed upon by Davis Polk& Wardwell, U.S. counsel for Fortis Hybrid Financing and Fortis. Certain Luxembourg, Belgian andDutch law matters will be passed upon by Linklaters LLP, counsel for Fortis and Fortis Hybrid Financing.Freshfields Bruckhaus Deringer, counsel for the Managers, will pass upon certain legal matters relating tothe Securities under United States and English law.
INDEPENDENT AUDITORS
The Consolidated Financial Statements of Fortis at December 31, 2007, 2006 and 2005 and for eachof the three years in the period ended December 31, 2007 incorporated by reference in this Prospectushave been jointly audited by KPMG Accountants N.V., a member of the Koninklijk Nederlands Instituutvan Register Accountants, and PricewaterhouseCoopers Reviseurs d’Entreprises SCCRL, a member of theInstitut des Réviseurs d’Entreprises Instituut der Bedrijfsrevisoren, independent public accountants forFortis N.V. and Fortis SA/NV, respectively, as set forth in their report thereon appearing elsewhere herein.
The financial statements of Fortis Hybrid Financing at December 31, 2007 and 2006, and for thefinancial years ended December 31, 2007 and 2006 incorporated by reference in this Prospectus, havebeen audited by PricewaterhouseCoopers S.à r.l., a member of the Institut des Réviseurs d’Entreprises,independent auditor of Fortis Hybrid Financing.
377
Level: 6 – From: 6 – Wednesday, May 14, 2008 – 1:40 pm – g5mac4 – 3960 Section 12 : 3960 Section 12

GENERAL INFORMATION
No Representations
No one is authorized in connection with the offering to give any information or to make anystatement not contained in this Prospectus. Investors should not rely on any such representation as havingbeen authorized by Fortis Hybrid Financing, Fortis or the Managers.
378
Level: 6 – From: 6 – Wednesday, May 14, 2008 – 1:40 pm – g5mac4 – 3960 Section 12 : 3960 Section 12

GENERAL LISTING INFORMATION
Application has been made to list the Securities on the official list of the Luxembourg StockExchange and Euronext Amsterdam and to admit them to trading on the Regulated Market of theLuxembourg Stock Exchange and Euronext. The Securities may not be listed on the official list of theLuxembourg Stock Exchange or Euronext Amsterdam on the Closing Date.
1) Each of Fortis N.V. and Fortis SA/NV believes that, except as disclosed herein, there hasbeen no significant change in its financial position since March 31, 2008 and no materialadverse change in its prospects since December 31, 2007.
2) Except as disclosed herein, we are not and have not been party to any legal or arbitrationproceedings that may have or have had during the 12 months preceding the date of thisProspectus, significant effects on our financial position or profitability, nor, so far as we areaware, are any such proceedings threatened or pending.
3) So long as the Securities are listed on the official list of the Luxembourg Stock Exchange andEuronext Amsterdam and Luxembourg and/or Dutch laws and regulations so require, copies ofthe articles of incorporation of Fortis Hybrid Financing, the Indenture, the Support Agreementand the Subordinated Guarantee Agreement will be available for inspection at the specifiedoffice of the Trustee and the issuing and paying agents in Luxembourg and The Netherlands.The articles of association of Fortis N.V. and Fortis SA/NV are available for inspection at theirrespective principal executive offices (see § 8 and § 9 below) and on Fortis’s website atwww.fortis.com/Governance/articles_of_association.asp. The documents described under“Incorporation of Certain Documents by Reference” can be obtained from the principalexecutive offices of each Parent Company (see § 8 and § 9 below), from Fortis’s website atwww.fortis.com/Shareholders/annualreports.asp and from the offices of the paying agent inLuxembourg.
So long as the Securities are listed on the official list of the Luxembourg Stock Exchange andEuronext Amsterdam and Luxembourg and/or Dutch laws and regulations so require, copiesof (1) the consolidated audited annual financial statements of the Fortis Group, including theunconsolidated audited annual financial statements of Fortis SA/NV and of Fortis N.V., (2)the consolidated unaudited quarterly and semiannual financial statements of the Fortis Group,(3) the Annual Report of Fortis for 2007 and all subsequent fiscal years and (4) the auditedannual financial statements of Fortis Hybrid Financing will be available during normalbusiness hours on any weekday at the offices of the paying agent in Luxembourg and theNetherlands.
4) We have appointed Fortis Banque Luxembourg as our listing and principal paying agent andcommon depositary in Luxembourg and Fortis Bank (Nederland) N.V. as our listing andpaying agent in The Netherlands. We reserve the right to vary those appointments. So long asthe Securities are listed on the official list of the Luxembourg Stock Exchange and TheNetherlands we will maintain an issuing and paying agent and listing agent in Luxembourgand The Netherlands, respectively. Any notices with regard to the Securities may be deliveredto the specified office of the paying agent in Luxembourg and The Netherlands, for furtherdelivery to us or the Trustee or other paying agents, as the case may be. The paying agents inLuxembourg and The Netherlands will act as intermediary between us and the holders ofSecurities and is authorized to receive all declarations and notices of the holders of Securitiesprovided for in the indenture for further delivery to us, the Trustee or other paying agents, asthe case may be.
5) Notices to Holders. Notices to holders of the Securities will be deemed to have been validlygiven (a) if published in an Authorized Newspaper or on the website of the LuxembourgStock Exchange (www.bourse.lu) and in the Euronext Daily Official List (“OfficiëlePrijscourant”) of Euronext on a business day not later than the latest date prescribed for thegiving of such notice and, if the Securities are represented by one or more global certificates,
379
Level: 6 – From: 6 – Wednesday, May 14, 2008 – 1:40 pm – g5mac4 – 3960 Section 12 : 3960 Section 12

delivered to the common depository for Euroclear and Clearstream for communication bythem to their participants (without any additional publication required if such globalcertificates represent the Securities in their entirety) with any such notice deemed to havebeen given to the holders of such Securities on the seventh day after the day on which suchnotice was given to the clearing systems and (b) when the Securities are represented bydefinitive Securities, at the option of Fortis Hybrid Financing, either (i) by publication asprescribed in clause (a) above or (ii) if given in writing and mailed, first-class postageprepaid, to each holder of a definitive Security at the address appearing in the Securitiesregister not later than the latest date (if any), and not earlier than the earliest date (if any)prescribed for the giving of such notice. As long as the Securities are listed on the official listof the Luxembourg Stock Exchange and Luxembourg laws and regulations so require, allnotices to holders will be published on the website of the Luxembourg Stock Exchange(www.bourse.lu). As long as the Securities are listed on Euronext Amsterdam and Dutch lawsand regulations so require, all notices to holders will be published in the Euronext DailyOfficial List (“Officiële Prijscourant”) of Euronext.
6) The Bank of New York is the Trustee and London paying agent under the Indenture.
7) Fortis Hybrid Financing is a special purpose financing vehicle incorporated in the form of alimited liability company (société anonyme) under the laws of Luxembourg on May 24, 2006and registered with the Luxembourg Register of Commerce and Companies with registrationnumber B-116671. The registered office of Fortis Hybrid Financing is located at 65,boulevard Grande Duchesse Charlotte, L-1331 Luxembourg, Luxembourg and the maintelephone number at this location is +352 56 44 95 04. Its corporate seat is at BoulevardGrande Duchesse Charlotte, L-1331 Luxembourg, Luxembourg.
8) Fortis N.V. is a public company with limited liability (naamloze vennootschap) incorporatedunder the laws of The Netherlands on April 19, 1984 for an indefinite period. Article 4 of thearticles of association of Fortis N.V. states the following corporate purpose: (i) the acquisitionand transfer of any participating interest in any business carrying out financing, banking,insurance, re-insurance, industrial, commercial or civil, administrative or technical activities;(ii) the purchase, subscription, exchange, assignment and sale of, and all other similaroperations relating to, every kind of transferable financial instrument, and, in a general way,all rights on movable and immovable property, as well as all forms of intellectual rights; (iii)performing administrative, commercial and financial management support and assistance onbehalf of the businesses and companies in which it has a participating interest; and (iv)carrying out all financial, manufacturing, commercial and civil operations and operationsrelating to movable and immovable assets, including the acquisition, management, leasingout and disposal of all movable and immovable assets useful to achieve its purpose. FortisN.V. was incorporated on April 19, 1984 and the latest amendment to its articles ofassociation was on April 29, 2008. Fortis N.V.’s principal executive offices and corporate seatis at Archimedeslaan 6, 3584 BA Utrecht, The Netherlands, which is also the businessaddress for the board of directors. Fortis N.V. is registered with the Trade Register at theChamber of Commerce of Utrecht under number 30072145. Its telephone number is +31(0)30 226 62 22.
9) Fortis SA/NV is a public company with limited liability (société anonyme/naamlozevennootschap) incorporated under the laws of Belgium on November 16, 1993, for anindefinite period. Article 4 of the articles of association of Fortis SA/NV states the followingcorporate purpose: (i) the acquisition and transfer of any participating interest in any businesscarrying out financing, banking, insurance, re-insurance, industrial, commercial or civil,administrative or technical activities; (ii) the purchase, subscription, exchange, assignmentand sale of, and all other similar operations relating to, every kind of transferable financialinstrument, and, in a general way, all rights on movable and immovable property, as well asall forms of intellectual rights; (iii) performing administrative, commercial and financialmanagement support and assistance on behalf of the businesses and companies in which it
380
Level: 6 – From: 6 – Wednesday, May 14, 2008 – 1:40 pm – g5mac4 – 3960 Section 12 : 3960 Section 12

has a participating interest; and (iv) carrying out all financial, manufacturing, commercial andcivil operations and operations relating to movable and immovable assets, including theacquisition, management, leasing out and disposal of all movable and immovable assetsuseful to achieve its purpose. Fortis SA/NV was incorporated on November 16, 1993 and thelatest amendment to its articles of association was on December 27, 2007. Fortis SA/NV’sprincipal executive offices and corporate seat is at Rue Royale 20, 1000 Brussels, Belgium,which is also the business address for the board of directors. Fortis SA/NV is registered withthe register of legal entities under enterprise number 0451.406.524. Its telephone number is+32(0) 2 565 11 11.
10) The issuance of the Securities was approved by the boards of directors of Fortis SA/NV andFortis N.V. on May 9, 2008 and by the board of directors of Fortis Hybrid Financing on May13, 2008.
11) Copies of this Prospectus, the documents incorporated by reference in this Prospectus, theIndenture, the Support Agreement and the Subordinated Guarantee Agreement may be freelyobtained at Fortis Banque Luxembourg, 50 Avenue J.F. Kennedy, L-2951, Luxembourg, tel:+352 4242 4599 and at Fortis Bank (Nederland) N.V., Rokin 55, 1012 KK Amsterdam, TheNetherlands, tel: +31 20 527 2467 for as long as the Securities are listed on the official list ofthe Luxembourg Stock Exchange or Euronext Amsterdam, respectively.
12) The annual financial statements of Fortis Group are jointly audited by KPMG AccountantsN.V., a member of the Koninklijk Nederlands Instituut van Register Accountants, andPricewaterhouseCoopers Reviseurs d’Entreprises SCCRL, a member of the Institut desRéviseurs d’Entreprises/Instituut der Bedrijfsrevisoren. Fortis N.V.’s auditors are KPMGAccountants N.V. Fortis SA/NV’s auditors are PricewaterhouseCoopers Reviseursd’Entreprises SCCRL. These auditors have audited the Consolidated Financial Statements ofFortis and the individual Financial Statements of Fortis SA/NV and of Fortis N.V. for thefiscal years included in this Prospectus as stated in their audit reports.
13) Fortis Hybrid Financing’s financial statements for the periods ended December 31, 2007 and2006 were audited by PricewaterhouseCoopers S.à r.l., a member of the Institut des Réviseursd’Entreprises, as stated in their audit report.
14) The Securities have been accepted for clearance through Euroclear and Clearstream. TheSecurities have an ISIN of XS0362491291 and a Common Code of 036249129. TheSecurities traded on Euronext Amsterdam are eligible for settlement in the systems ofEuroclear NIEC.
15) The total expenses related to admission to listing are expected to be approximatelyEUR 921,000.
381
Level: 6 – From: 6 – Wednesday, May 14, 2008 – 1:40 pm – g5mac4 – 3960 Section 12 : 3960 Section 12

GLOSSARY
Claims ratio . . . . . . . . . . . . . . . . . The cost of claims as a percentage of the earned premiums, net ofreinsurance. This is the cost of claims, net of reinsurance, excludingthe internal costs of handling non-life claims.
Combined ratio . . . . . . . . . . . . . . The sum of the claims ratio and the expense ratio.
Embedded Value . . . . . . . . . . . . . An alternative method for determining the value and profitability of alife insurance company. Embedded Value is an actuarially determinedestimate of the economic value of a life company, excluding anyvalue attributed to future new business. The changes in a company’sembedded value from year to year, after adjustment for any dividendspaid or capital injected, provide a measure of the profitability of acompany’s life insurance business.
Endowment . . . . . . . . . . . . . . . . . Life insurance under which an insured receives the face value of apolicy if the individual survives the endowment period. If the insureddoes not survive, a beneficiary receives the face value of the policy.
Expense ratio . . . . . . . . . . . . . . . . Only used for non-life insurance business. Expenses as a percentageof the earned premiums, net of reinsurance. Expenses are the costsplus net commissions charged to the financial year, less internalinvestment costs.
Insurance bonds . . . . . . . . . . . . . Insurance policy with a savings character in Belgium.
Investment-linked premiums . . . . Premiums for policies offering benefits that depend to a major extenton the results of investments that are contractually linked to thesepolicies.
Technical provisions . . . . . . . . . . The extent of current commitments to policyholders and other partiesarising out of insurance contracts written.
Term life insurance . . . . . . . . . . . A life insurance product which only stays in effect for a limitedperiod. If an insured dies within that period, the beneficiary receivesthe death payments, and if the insured survives, the policy ends andthe beneficiary receives nothing.
Universal life . . . . . . . . . . . . . . . . A life insurance product under which (1) premiums are generallyflexible, (2) the level of death benefits may be adjusted and (3)expenses and other charges are specifically disclosed to a purchaser.
Value Added by New Business . . One of the measures used to calculate Embedded Value accruedduring any particular year and includes the present value of futureprofits on new business less the cost of required capital.
Whole life insurance . . . . . . . . . . A permanent life insurance product offering guaranteed death benefitsand guaranteed cash values.
382
Level: 6 – From: 6 – Wednesday, May 14, 2008 – 1:40 pm – g5mac4 – 3960 Section 12 : 3960 Section 12

FORTIS HYBRID FINANCING UNAUDITED FINANCIAL INFORMATION
Page11
Unaudited Interim Income Statement for the period January 1, 2008 through March 31, 2008 . . . . . . . . . . . . . . . . . . . . . . . . . . . . . . . . . . . . . . . . . . . . . . . . . . . . . . . . . . . . F-2
Unaudited Interim Balance Sheet as at March 31, 2008 . . . . . . . . . . . . . . . . . . . . . . . . . . . . . . . F-3
F-1
Level: 6 – From: 6 – Wednesday, May 14, 2008 – 1:40 pm – g5mac4 – 3960 Section 13 : 3960 Section 13

INCOME STATEMENT
May 24 through
Three Months Ended Year Ended DecemberMarch 31, 2007 31, 2006
111111113441 1111 1111
2008 20071111 1111
(EUR millions) (EUR millions)(unaudited)
Interest receivable and similar income . . . . . . . . . . . . 0.4 0.1 0.7 0.3Interest income from fixed assets . . . . . . . . . . . . . . . . 10.0 6.4 25.8 7.2Other operating income . . . . . . . . . . . . . . . . . . . . . . . . 0.2 0.0 0.0 0.3
1111 1111 1111 1111
10.6 6.5 26.5 7.8Interest payable and similar charges . . . . . . . . . . . . . . (9.9) (6.3) (26.5) (7.2)Other operating charges . . . . . . . . . . . . . . . . . . . . . . . (0.3) 0.0 (0.1) (0.4)
1111 1111 1111 1111
Amortization issuing premium . . . . . . . . . . . . . . . . . . (0.4) (0.2) (0.8) (0.2)1111 1111 1111 1111
10.6 (6.5) (25.6) (7.8)1111 1111 1111 1111
Net result . . . . . . . . . . . . . . . . . . . . . . . . . . . . . . . . . . 0.0 0.0 0.0 (0.0)1111 1111 1111 11111111 1111 1111 1111
F-2
Level: 6 – From: 6 – Wednesday, May 14, 2008 – 1:41 pm – g5mac4 – 3960 Section 14 : 3960 Section 14Level: 6 – From: 6 – Wednesday, May 14, 2008 – 1:41 pm – g5mac4 – 3960 Section 14 : 3960 Section 14

BALANCE SHEET
At March At December At December 31, 2008 31, 2007 31, 20061111 1111 1111
(EUR millions)(unaudited)
ASSETSFinancial assets . . . . . . . . . . . . . . . . . . . . . . . . . . . . . . . . . . . . . . . . . 997.3 500.0 500.0Debtors . . . . . . . . . . . . . . . . . . . . . . . . . . . . . . . . . . . . . . . . . . . . . . . 25.1 13.8 13.7Prepayments . . . . . . . . . . . . . . . . . . . . . . . . . . . . . . . . . . . . . . . . . . . 16.2 6.4 7.2
1111 1111 1111
Total assets . . . . . . . . . . . . . . . . . . . . . . . . . . . . . . . . . . . . . . . . . . . . 1,083.6 520.2 520.9LIABILITIESDebenture & other loans . . . . . . . . . . . . . . . . . . . . . . . . . . . . . . . . . . 997.3 500 500.0Other creditors . . . . . . . . . . . . . . . . . . . . . . . . . . . . . . . . . . . . . . . . . 23.9 13.8 13.7Deferred income . . . . . . . . . . . . . . . . . . . . . . . . . . . . . . . . . . . . . . . . 17.4 6.4 7.1
1111 1111 1111
Total liabilities . . . . . . . . . . . . . . . . . . . . . . . . . . . . . . . . . . . . . . . . . 1,038.6 520.2 520.91111 1111 11111111 1111 1111
Share capital (320 shares nominal value EUR 100; fully paid up) . 0.0 0.0 0.01111 1111 1111
Total share capital and liabilities . . . . . . . . . . . . . . . . . . . . . . . . . . 1,038.6 520.2 520.91111 1111 11111111 1111 1111
F-3
Level: 6 – From: 6 – Wednesday, May 14, 2008 – 1:41 pm – g5mac4 – 3960 Section 14 : 3960 Section 14Level: 6 – From: 6 – Wednesday, May 14, 2008 – 1:41 pm – g5mac4 – 3960 Section 14 : 3960 Section 14

PRINCIPAL EXECUTIVE OFFICE OF THE ISSUER
Fortis Hybrid Financing65, boulevard Grande Duchesse Charlotte
L-1331 Luxembourg
PRINCIPAL EXECUTIVE OFFICES OF THE PARENT COMPANIES
Fortis SA/NV Fortis N.V.Rue Royale 20 Archimedeslaan 61000 Brussels 3584 BA Utrecht
Belgium The Netherlands
LEGAL ADVISORS TO FORTIS
As to U.S. federal andNew York law: As to Belgian law: As to Luxembourg law: As to Dutch law:
Davis Polk & Wardwell Linklaters LLP Linklaters LLP Linklaters LLP99 Gresham Street Brederode 13 35 Avenue J.F. Kennedy World Trade Centre
London EC2V 7NG 1000 Brussels L-1855 Luxembourg AmsterdamEngland Belgium Luxembourg Tower H, 22(nd) Floor
Zuidplein 1801077 XV Amsterdam
The Netherlands
LEGAL ADVISORS TO THE MANAGERS
As to U.S. federal and New York law:
Freshfields Bruckhaus Deringer65 Fleet Street
London EC4Y 1HSEngland
AUDITORS
As to Fortis SA/NV: As to Fortis N.V.:
PricewaterhouseCoopers KPMG Accountants N.V.Reviseurs d’Entreprises SCCRL Burgemeester Rijnderslaan 10
Woluwedal 18 1185 MC AmstelveenB-1932 Sint-Stevens-Woluwe The Netherlands
Belgium
As to Fortis:
PricewaterhouseCoopers KPMG Accountants N.V.Reviseurs d’Entreprises SCCRL Burgemeester Rijnderslaan 10
Woluwedal 18 1185 MC AmstelveenB-1932 Sint-Stevens-Woluwe The Netherlands
Belgium
Level: 6 – From: 6 – Wednesday, May 14, 2008 – 1:41 pm – g5mac4 – 3960 Section 15 : 3960 Section 15
As to Fortis Hybrid Financing:
PricewaterhouseCoopers S.à r.l.400, route d’Esch
B.P. 1443L-1014 Luxembourg
Luxembourg
TRUSTEE LEGAL ADVISOR TO THE TRUSTEE
The Bank of New York Ashurst LLPOne Canada Square Broadwalk House, 5 Appold StreetLondon E14 5AL London EC2A 2HA
England England
LUXEMBOURG LISTING AGENT AND PRINCIPAL PAYING AGENT
Fortis Banque Luxembourg50 Avenue J.F. Kennedy
L-2951 LuxembourgLuxembourg
NETHERLANDS LISTING AND PAYING AGENT
Fortis Bank (Nederland) N.V.Rokin 55
1012 KK AmsterdamThe Netherlands
Level: 6 – From: 6 – Wednesday, May 14, 2008 – 1:41 pm – g5mac4 – 3960 Section 15 : 3960 Section 15

printed by eprintfinancial.comtel: + 44 (0) 20 7613 1800 document number 3960
Level: 6 – From: 6 – Wednesday, May 14, 2008 – 1:41 pm – g5mac4 – 3960 Section 15 : 3960 Section 15