fossil fuels 85% of the world’s commercial energy coal oilnatural gas
Post on 19-Dec-2015
215 views
TRANSCRIPT

FOSSIL FUELS 85% of the world’scommercial energy
COAL
OILNATURAL GAS


20 richest countries consume:
• 50% of coal
• 80% of natural gas
• 65% of oil

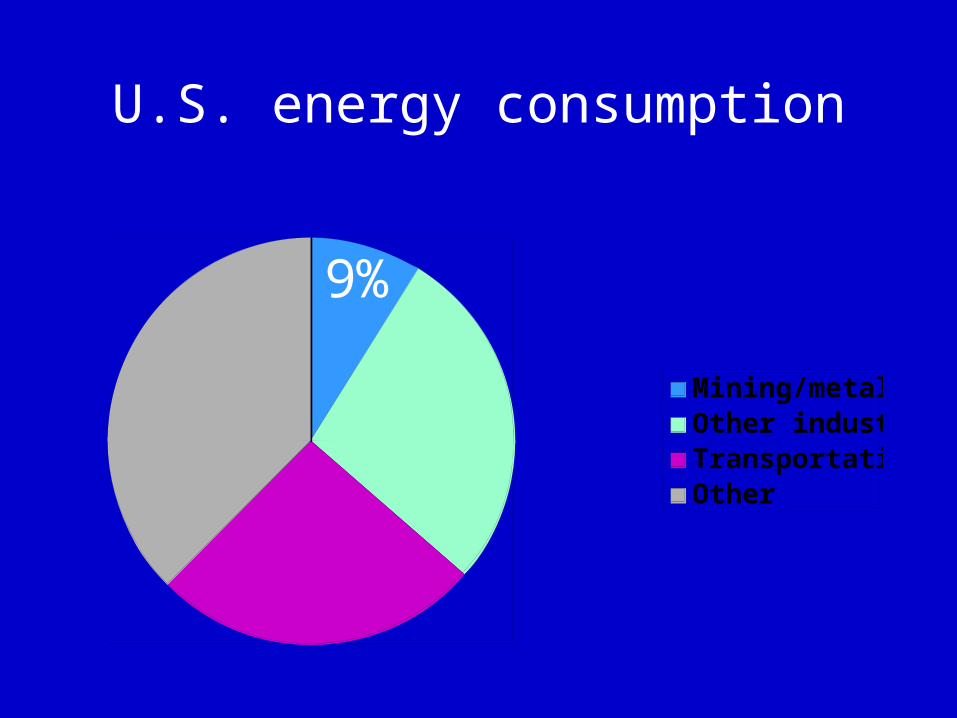
U.S. energy consumption
Mining/metalsOther industryTransportationOther
9%

COAL
Fossilized, condensedcarbon-rich fuel
10 X reserves of oil/gas, last 200 years at present rate


Coal mines
Surface (strip) mine,Western U.S. Underground (shaft) mine,
Eastern U.S.

Coal cheaper,but polluting
Much Eastern U.S. coal hashigh-sulfur content,more expensive to mine
Much Western U.S. coal haslow-sulfur content,cheaper to mine
But mining in semi-arid West
more damaging to land.

Heat value of coal types
Anthracite
Bituminous
Subbituminous
Lignite
51% of U.S. use in coal

Energy lost from coal
10% lost ontransmission lines(stray voltage)
65% lost in power plants
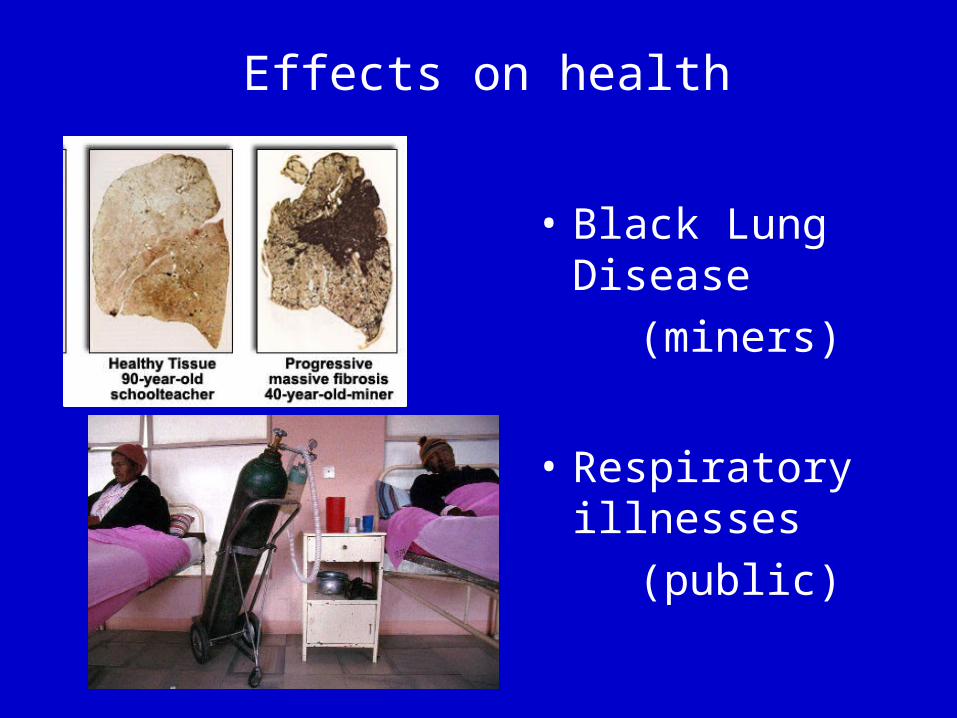
Effects on health
• Black Lung Disease
(miners)
• Respiratory illnesses
(public)

Effects on land
• Coal sludge releases
• Hardpan at strip mines
• Mountaintop removal
• Huge water use– Slurry pipelines

Effects on air
• Greenhouse gases– 3/4 sulfur dioxide– 1/3 nitrogen oxides– 1/2 carbon dioxide
• Toxics– Mercury– Uranium

Acid rain

Acidity of rain
• pH of 6.0– Kills insects, crabs
• pH < 5.0– Kills fish, trees

Sources of Nitrogen Oxides
• Nitrogen oxides and sulfur dioxide create acid rain
• Tall stacks deposit farther
TransportationElectricalplantsOther

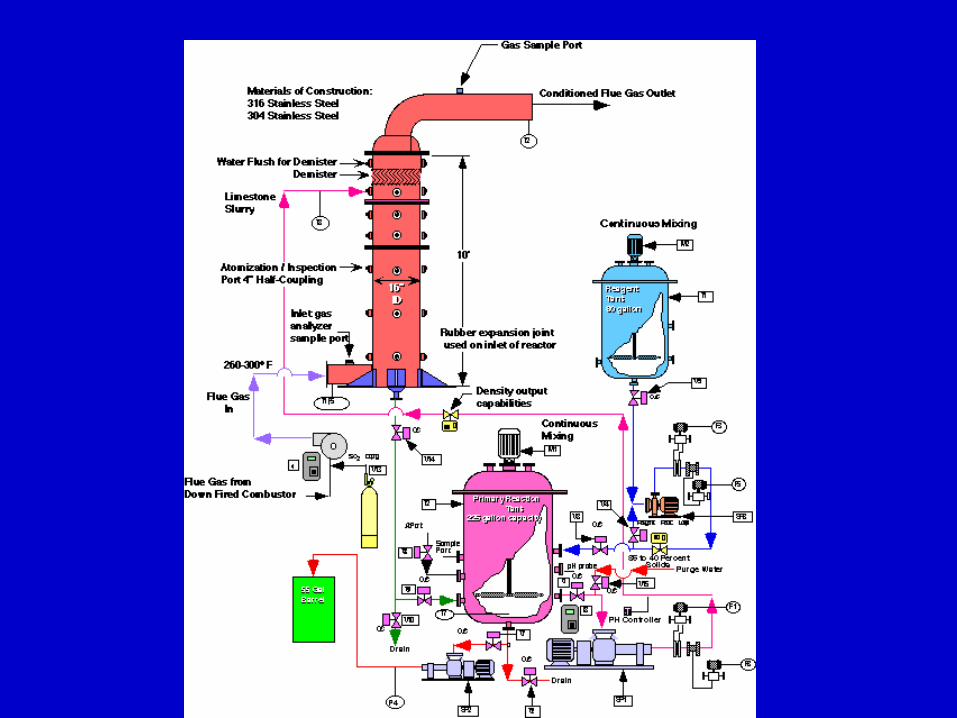
Coal scrubbers

The future? Hydrogen fuel cells

NATURAL GAS
Methane, otherGases in bedrock


Advantages of natural gas
• Cleaner to burn– Half as much CO2 as coal
• More efficient– 10% energy lost
• 60-year supply at current rates
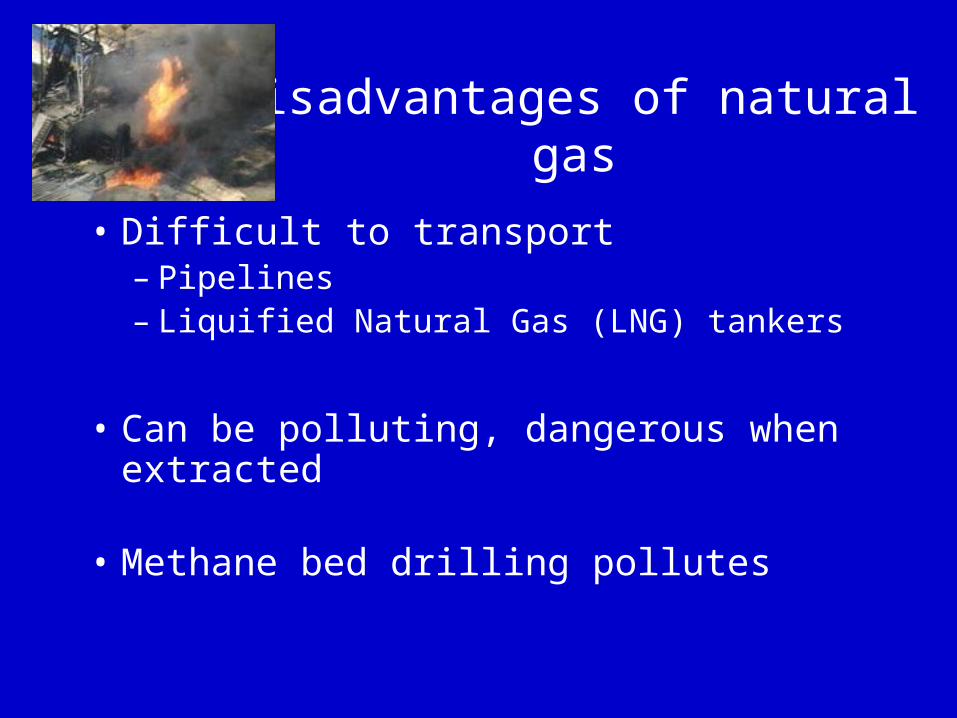
Disadvantages of natural gas
• Difficult to transport– Pipelines– Liquified Natural Gas (LNG) tankers
• Can be polluting, dangerous when extracted
• Methane bed drilling pollutes

OIL (PETROLEUM)
Buried organic matter rich in hydrocarbons


Oil Consumption by Sector (1998)
24.6
9.2
2.13
1.16
0 5 10 15 20 25 30
Transportation
Industry
ResidentialCommercial
Electric Utilities
QUADS of Oil


Proven oil reserves
• 465 billion barrels consumed
• 1 trillion barrels left
• 22 billion consumed a year
• 45 years to go! Party now!

1800
2200
2600
Global Oil Production for Resources of 1800, 2200, and 2600 Billion Barrels
0
5
10
15
20
25
30
35
1950 1960 1970 1980 1990 2000 2010 2020 2030
Billions of Barrels per Year

Distribution of Estimates of Ultimately Recoverable World Crude Oil (1975-1993)
0
5
10
15
20
25
30
35
1400 1600 1800 2000 2200 2400 2600 2800
Billion Barrels
Percentage of Estimates

World Crude Oil Production
0
5
10
15
20
25
30
1950 1960 1970 1980 1990 2000 2010
Billions of Barrels per Year

World Crude Oil Prices(economic crises in oil states)
0
10
20
30
40
50
60
1970 1975 1980 1985 1990 1995 2000
$1992 per barrel

Global trends in oil
• Growing use in China (+10%/year)
• Japan, Europe depend on Mideast
• New reserves around Caspian Sea– Nearly size of Saudi Arabia
• Increasing source of major wars, human rights abuses

Kuwait oil well fires, 1991


Persian Gulfand Caspian Sea


Oil & natural gas pipelines


U.S. trends in oil
• Diverse sources (not Mideast)– Venezuela, Nigeria, etc.
• Opening domestic sources– Alaska controversy
• Polluting technologies?– Oil shale extraction– Synthetic fuels (coal-to-oil)

Exxon Valdez, Alaska 1989

Attempts tocontain spill

Clean-up efforts

Prince William Sound fishing industry damaged


Oil in Ecuador
• Ecuador 2nd largest S. America producer– 70% of exports
• Drilling in Amazon rainforest

Opposition to oil companies
• Construction of roads, pipelines on Indian lands
• Displacement of Indians,• deforestation
• Oil leaks into rivers larger than Valdez spill

Ecuador Indian occupations
Texaco withdrew 1992,Arco met demands
Lawsuit againstTexaco inU.S. courts, 1999

Oil in Nigeria
Largest producer in Africa, mainlyIn Niger Delta
Nigeria had militarygovernments in 1990s

Environmental problemsin Niger Delta region
Homeland of Ogoni, Ijaw groups
Gas flaring hazards
Oil spills in mangrove swamp
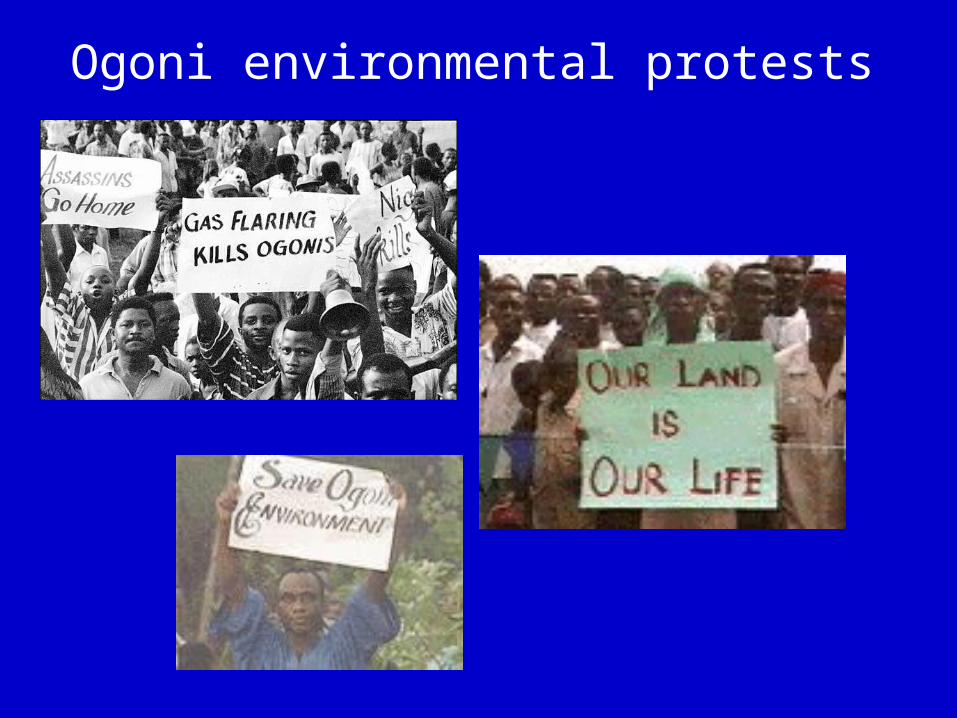
Ogoni environmental protests

Oil companies collude with military
Many Ogoni killed by military
Ogoni leaderDr. Ken Saro-Wiwa executed in 1995
Shell Oil pays,transports soldiers

Nigerian women protest, 2002
Protest against pollution, lack of local jobs
Ijaw womenoccupy Chevronoil docks

Websites on oil industryand global opposition
Rainforest Action Networkhttp://www.ran.org
Project Undergroundhttp://www.moles.org