four sites with contrasting environmental stress in ...2008/grupos... · 346 f. r. scarano et al....
TRANSCRIPT
Botanical Journal of the Linnean Society (2001), 136: 345–364. With 8 figures
doi:10.1006/bojl.2000.0435, available online at http://www.idealibrary.com on
Four sites with contrasting environmental stress insoutheastern Brazil: relations of species, life formdiversity, and geographic distribution toecophysiological parameters
F. R. SCARANO FLS, H. M. DUARTE, K. T. RIBEIRO, P. J. F. P. RODRIGUES andE. M. B. BARCELLOS
Universidade Federal do Rio de Janeiro, CCS, IB, Depto. de Ecologia, caixa postal 68020,cep 21941-970 Rio de Janeiro, RJ, Brazil
A. C. FRANCO
Universidade de Brasılia, Depto. de Botanica, caixa postal 04457, cep 70919-970 Brasılia, DF, Brazil
J. BRULFERT and E. DELEENS
Institut de Biotechnologie des Plantes, UMR CNRS 8618, Universite Paris-Sud, F-91405, Orsay,France
U. LUTTGE∗
Darmstadt University of Technology, Institute of Botany, Schnittspahnstrasse 3-5, D-64287 Darmstadt,Germany
Received August 1999; accepted for publication October 2000
Some ecophysiological parameters related to plant performance and fitness (carbon and nitrogen isotope compositionand total C and N concentrations; in situ chlorophyll fluorescence measurements) were determined for over 30species in four habitats bordering the montane Atlantic rain forest of Brazil, along a gradient of altitude andrainfall: a dry coastal forest, two areas of sandy coastal plain vegetation (restingas), and a high altitude campo.There was a considerable diversity of ecophysiological behaviour within and between the functional groups wecreated based on plant life-forms. For instance, both crassulacean acid metabolism (CAM) and C3 species werefound in most life-forms sampled and throughout all habitats. Despite the variation in rainfall regimes, averageoverall water-use efficiency was similar between sites, particularly for C3 species, while no clear pattern regardingnitrogen-use emerged in this respect. Acute and chronic photoinhibition were found in many species across thisgradient, even in CAM plants. However, on average, chronic photoinhibition and lower energy dissipation capacitywere more characteristic of plants from the restinga habitats. This suggests that, although plants colonizing thesehabitats have evolved features to deal with water shortage, adaptation to high light levels has not been fullyachieved yet. The ecophysiological performance of some individual species in distinct habitats and in distinctmicrohabitats within habitats is also discussed. 2001 The Linnean Society of London
ADDITIONAL KEY WORDS: Atlantic forest – carbon isotopes – chlorophyll a fluorescence – dry forest – highaltitude vegetation – nitrogen isotopes – sandy coastal vegetation.
Corresponding author. E-mail: [email protected]
3450024–4082/01/080345+20 $35.00/0 2001 The Linnean Society of London

346 F. R. SCARANO ET AL.
with different life forms and with different geographicINTRODUCTIONranges of distribution in order to assess how these
The Atlantic rainforest complex in Brazil is famous different strategies related to their ecophysiologicalfor its dominant montane rainforest (Rizzini, 1979), behaviour. Moreover, we were also able to comparewhich stands out as one of the world’s main centres of the ecophysiological performance of some species inbiodiversity (World Conservation Monitoring Centre, distinct habitats and in different microhabitats within1992), with a high species diversity and a high level habitats. This is a first approach in a long term en-of endemism (Fonseca, 1985). The exuberance of this deavour to proceed from autecological ecophysiologyforest, however, often contrasts with its marginal to developing a synecological ecophysiology integratingvegetation types. Although part of the so-called At- plant geographical, phytosociological, morphologicallantic rainforest complex, these marginal habitats are and ecophysiological evidence.not so rich in diversity and, at first sight, not so strikingas a typical dense, tall and multi-layered rainforest.
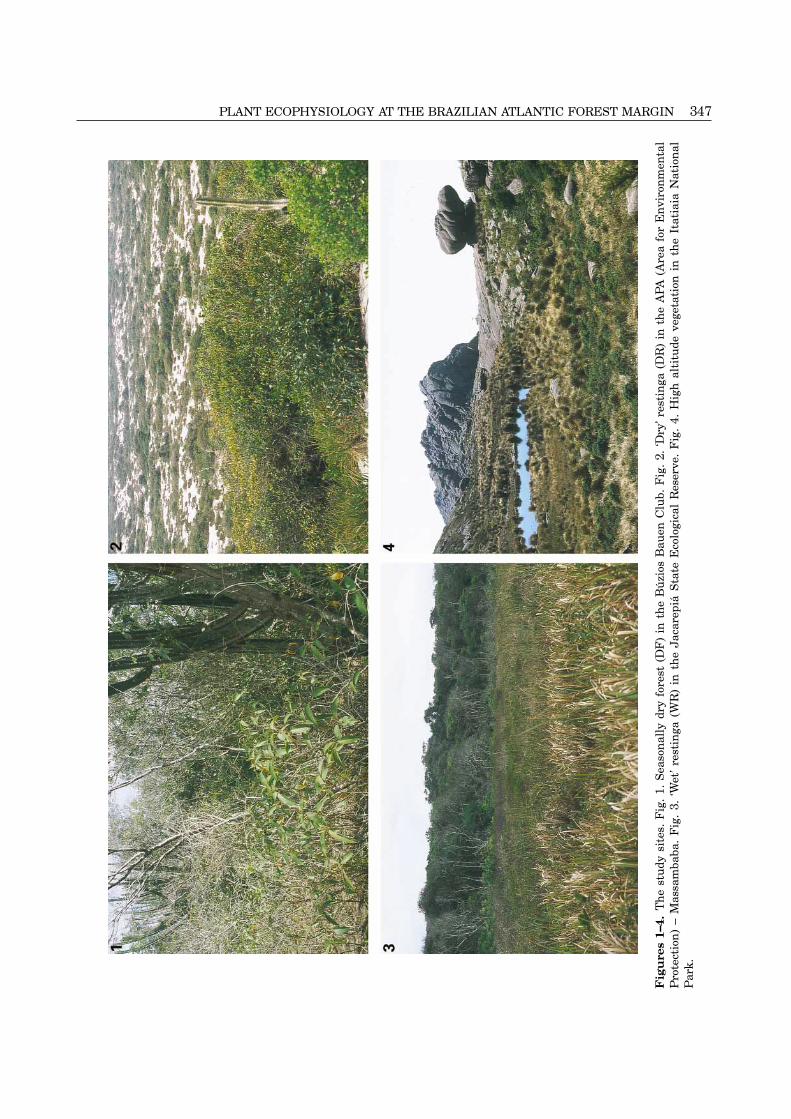
STUDY SITESFor instance, woody shrubs and succulent herbs,gathered in hemispheric clumps surrounded by white The four sites studied are marginal habitats of thesand or granitic rock, dominate the landscape of sandy Atlantic rainforest complex and are described below.coastal plains (Lacerda, Araujo & Maciel, 1993) androcky outcrops (Meirelles, Mattos & Silva, 1997) which
SEASONALLY DRY FOREST (DF)separate the montane forest from the sea. Mono-This site (Fig. 1) is located at the Buzios Bauen Clubdominant swamps (Scarano et al., 1997; Scarano, RiosResort, municipality of Armacao de Buzios (22°49′S,& Esteves, 1998) or seasonally, semi-deciduous dry-41°59′W), state of Rio de Janeiro. Together with theforests (Araujo, 1997) are found at the very feet of thedry restinga (see below), this is the most arid of allmountain chains. A variety of small-sized life formssites, since mean annual rainfall here is around onlyare found at high altitude fields (>2300 m a.s.l.), where800 mm, with a monthly average of less than 80 mm.temperatures in winter nights can be as low as−10°CThe rainy season lasts from the end of spring (No-(Segadas-Vianna, 1965; Segadas-Vianna & Dau, 1965).vember) to summer (January); the dry season runsThe plants growing in these habitats are exposed tofrom June to August, when monthly rainfall is arounda range of extreme conditions (heat, cold, freezing,40 mm (FEEMA, 1988). The vegetation is the lastflooding, drought, wind, salinity, lack of nutrients) andremnant in the state of a typical semi-deciduous forest.are either endemic or found also in montane forest orThis forest has several endemic species and otherother marginal habitats.species with patchy disjunct geographic distribution,Ecophysiological studies traditionally are aut-only to be found otherwise in the semi-arid Brazilianecological in that they are devoted to the behaviour ofnortheast (Araujo, 1997). Pau-brasil (Caesalpinia ech-single species or to the comparative study of a smallinata Lam.), the leguminous tree which has given itsgroup of plant species. In this study, however, wename to the country, is the best known inhabitant ofmeasured some ecophysiological parameters related tothese forests and is now reduced to a few threatenedplant performance and fitness for over 30 species inpopulations (Cunha & Lima, 1992). This site is pro-four habitats bordering the montane Atlantic rain-tected by a beach resort, Buzios Bauen Club, whichforest: two areas of sandy coastal plain vegetationspecializes in ecotourism.(restingas) with different annual rainfall, a dry coastal
forest and a high altitude campo. For such an assess-‘DRY’ RESTINGA (DR)ment of a large number of species and habitats, it was
necessary to use ecophysiological screening methods This site (Fig. 2) is located at the Area for Environ-readily applicable in the field. Analysis of 13C and 15N mental Protection (APA) of Massambaba, municipalitystable isotope composition have been used to assess of Arraial do Cabo (22°56′S, 42°13′W), state of Rio dedifferences in carbon metabolism, water use and the Janeiro. The Massambaba restinga spreads betweenmagnitude of different N sources available for plants the ocean and the Araruama lagoon, Brazil’s secondat the ecosystem level or along geographical gradients largest salt lake. It is composed of two parallel beachof rainfall (Sprent et al., 1996; Pate et al., 1998; Schulze ridges of different ages, separated by a low area, whereet al., 1998). Thus, we used collections of dried leaf Holocene lagoons showing different sedimentationsamples for 13C, 15N analyses giving indications on long- stages are situated (Muehe, 1994). On its east side,term behaviour of the plants in C and N acquisition where plants were selected for this study, the Pleis-and water-use efficiency, and a small portable pulse tocene, innermost beach ridge (Martin & Suguio, 1989)amplitude modulation fluorometer for rapid de- was covered by a dune system c. 2000 years BPtermination of instantaneous parameters of pho- (FEEMA, 1988). Here, the distance between the ocean
and the Araruama lagoon is c. 1.5 km. Mean annualtosynthetic electron flow on site. We selected species
PLANT ECOPHYSIOLOGY AT THE BRAZILIAN ATLANTIC FOREST MARGIN 347
Fig
ure
s1–
4.T
he
stu
dysi
tes.
Fig
.1.
Sea
son
ally
dry
fore
st(D
F)
inth
eB
uzi
osB
auen
Clu
b.F
ig.
2.‘D
ry’r
esti
nga
(DR
)in
the
APA
(Are
afo
rE
nvi
ron
men
tal
Pro
tect
ion
)–
Mas
sam
baba
.F
ig.
3.‘W
et’
rest
inga
(WR
)in
the
Jaca
repi
aS
tate
Eco
logi
cal
Res
erve
.F
ig.
4.H
igh
alti
tude
vege
tati
onin
the
Itat
iaia
Nat
ion
alP
ark.

348 F. R. SCARANO ET AL.
rainfall is c. 800 mm and during the whole year the MATERIAL AND METHODSmonthly precipitation tends to be less than 100 mm,
STUDIED SPECIESwith a minimum of approximately 40 mm during theThe criteria for selection of plant species for this studywinter months (Barbiere, 1984). The result is a soilwere that they should:water deficit throughout the year (Araujo, 1997). Mean
annual temperature is 25°C and daily temperatures(1) represent different life-forms (woody plants, climb-may range from 12° to 36°C (Araujo, 1997).
ers, hemiparasites, graminoids, rosette plants,cacti and geophytes; Figs 5–8);
(2) represent different patterns of geographic dis-tribution (widely neotropical, regional, endemic);
‘WET’ RESTINGA (WR) (3) have distinct habitat preferences (generalists orspecialized);This site (Fig. 3) is located at the State Ecological
(4) occur in more than one of the sites studied.Reserve of Jacarepia (22°47′S–22°57′S, 42°20′W–42°43′W), municipality of Saquarema, state of Rio de
Table 1 shows a list of the 32 species studied, theJaneiro. Between the ocean and the Jacarepia lagoon,habitat where they were sampled, their geographicsome of the most representative vegetation forms ofdistribution, habitat preference and life form. In-the Brazilian restingas occur, including one of the lastformation on geographic distribution and habitat pref-remnants of dry, dune forest in the state. Sa (1992)erence was collected in the literature and, whenprovides a detailed description of this site, which hasliterature was not available, on labels of exsicates inbeen exposed to some damage from man-made fires inthe Herbarium of the Botanic Gardens of Rio de Janeirothe recent past (Cirne & Scarano, 1996). Mean annual(RB). The following references were used: Allagopterarainfall is 1000 mm and mean annual temperaturearenaria (Fernandes, 1994; Morais, 1996), Bou-ranges from 24–26°C.gainvillea spectabilis (Schmidt, 1872; Reitz, 1970), bro-meliads (Smith & Downs, 1977, 1979; Martinelli &Vaz, 1988; Fontoura, Costa & Wendt, 1991; Leme &Marigo, 1993; Van Sluys & Stotz 1995), cacti and
HIGH ALTITUDE VEGETATION (HA) orchids (Britton & Rose, 1937; Rambo, 1961; Scheinvar,1985; Freitas, 1993), Hippeastrum cf. psittacinum (J.The Itatiaia massif (20°25′S, 44°50′W) is located atDutihl, pers. comm.), legumes (Hoehne, 1941; Mattos,the municipality of Itamonte, state of Minas Gerais.1979), Mollugo verticillata (Reitz, 1984), Myrsine sppIts peak, the Agulhas Negras (=black needles), reaches(Pipoly, 1996; Otegui, 1998), Paepalanthus polyanthus2740 m. The study site (Fig. 4) was at 2400 m of altitude(Giulietti & Hensold, 1990), Panicum trinii (Renvoizeand is locally called Prateleiras (shelves). This plateau& Zuloaga, 1984; Sarahyba, 1993), Philodendron cor-is composed of a large boggy plain, crossed in allcovadense (Mayo, 1991), Pleurostima gounnelleanadirections by rocky hills and covered by scattered(Smith & Ayensu, 1976), Psittacanthus dichroos (Mo-boulders. Grassland and bamboo clumps are the mostreira & Rizzini, 1997), Rheedia brasiliensis (Vieira,common vegetation cover, but small shrubs and tree-1997), Roupala impressiuscula (Sleumer, 1954).lets also grow between boulders, and a high diversity
Of the four sites, the seasonally dry forest (DF) isof plant species and life-forms are found on the rockythe least known floristically. Thus, the three taxa wesurfaces (Camerik & Werger, 1981). A list for the wholewere unable to determine to the species level (Crotonplateau gives 415 plant species (Martinelli, Bandeirasp., Myrsine sp. and indetermined graminoid) were& Braganca, 1989). Mean annual rainfall is aboutsampled there. Croton sp. and Myrsine sp. were used2273 mm and there is no marked dry season. Sea-for interspecific comparisons, but the graminoid wassonality is more apparent in regard to solar irradiation,not, since not even the family was determined (seeevaporation and day/night temperature regimes: win-Table 2). However, the graminoid data were used inter months (May–August) are less cloudy than the restsite and life-form comparisons. Without complete iden-of the year. Registered extreme temperature valuestification, we could provide no information on geo-range from a daytime maximum of 23°C in the summergraphic distribution and habitat preferences of these(November–February), to a nocturnal minimum ofspecies, and therefore their data were not included in−10°C in the winter, when temperatures below 0°C arethe calculations of Table 7.common. In the winter, after low night temperatures,
plants are exposed to rapid warming and high in-solation during the day (Segadas-Vianna & Dau, 1965).
FIELD AND LABORATORY MEASUREMENTSThis site, plus the adjacent montane Atlantic forest,is protected by the Itatiaia National Park which is the In situ fluorescence measurements were conducted in
all study sites 8–17 October 1997 on selected fullyoldest National Park in the country.

PLANT ECOPHYSIOLOGY AT THE BRAZILIAN ATLANTIC FOREST MARGIN 349
Figures 5–8. Some of the plant species and life-forms studied. Fig. 5. Juvenile plant of the arboreal cactus Opuntiabrasiliensis in the understory of the dry forest. Fig. 6. Geophyte palm Allagoptera arenaria commonly found in both‘dry’ and ‘wet’ restingas. Fig. 7. Shrub Croton sp. at midday, in a light-exposed patch of the dry forest; despite thewilted appearance of the leaves, no photoinhibition was shown by these plants throughout the whole day. Fig. 8.Neighbouring rosettes of Paepalanthus polyanthus (left-hand side) and Eryngium eurycephalum (right-hand side): astrong morphological convergence for shoot shape and marked differences in nitrogen use (see also Table 6).
350 F. R. SCARANO ET AL.
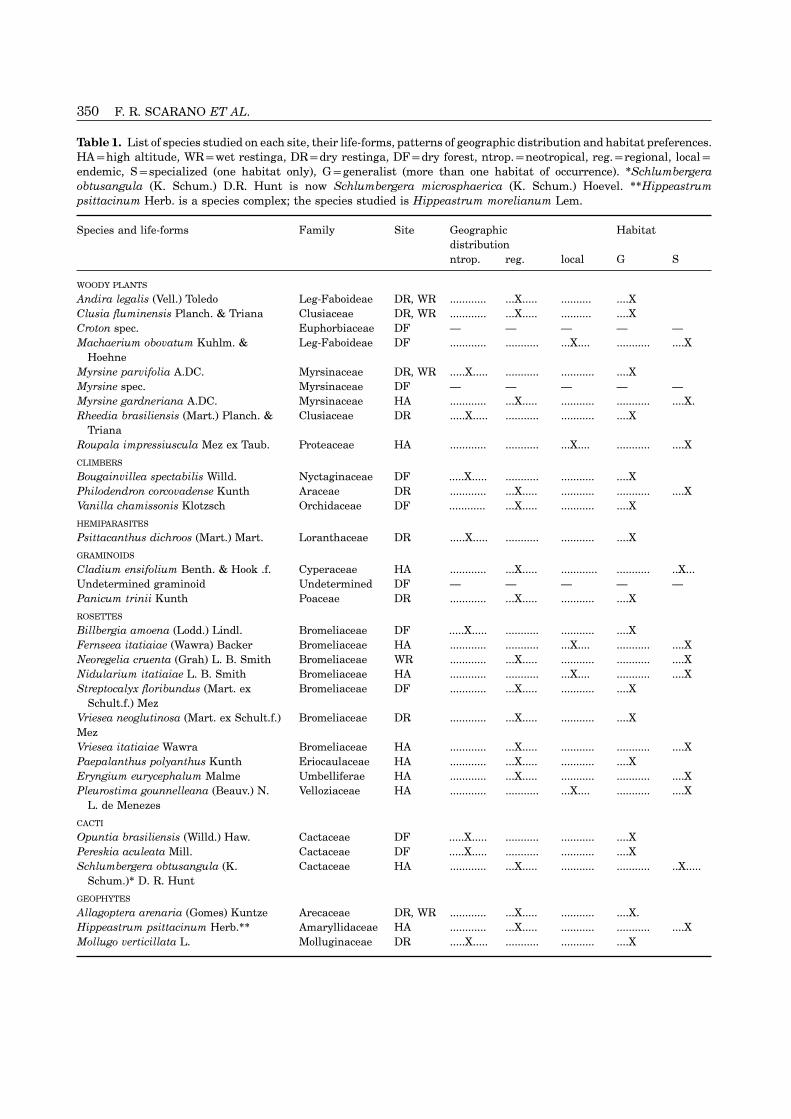
Table 1. List of species studied on each site, their life-forms, patterns of geographic distribution and habitat preferences.HA=high altitude, WR=wet restinga, DR=dry restinga, DF=dry forest, ntrop.=neotropical, reg.=regional, local=endemic, S=specialized (one habitat only), G=generalist (more than one habitat of occurrence). ∗Schlumbergeraobtusangula (K. Schum.) D.R. Hunt is now Schlumbergera microsphaerica (K. Schum.) Hoevel. ∗∗Hippeastrumpsittacinum Herb. is a species complex; the species studied is Hippeastrum morelianum Lem.
Species and life-forms Family Site Geographic Habitatdistributionntrop. reg. local G S
WOODY PLANTS
Andira legalis (Vell.) Toledo Leg-Faboideae DR, WR ............ ...X..... .......... ....XClusia fluminensis Planch. & Triana Clusiaceae DR, WR ............ ...X..... .......... ....XCroton spec. Euphorbiaceae DF — — — — —Machaerium obovatum Kuhlm. & Leg-Faboideae DF ............ ........... ...X.... ........... ....X
HoehneMyrsine parvifolia A.DC. Myrsinaceae DR, WR .....X..... ........... ........... ....XMyrsine spec. Myrsinaceae DF — — — — —Myrsine gardneriana A.DC. Myrsinaceae HA ............ ...X..... ........... ........... ....X.Rheedia brasiliensis (Mart.) Planch. & Clusiaceae DR .....X..... ........... ........... ....X
TrianaRoupala impressiuscula Mez ex Taub. Proteaceae HA ............ ........... ...X.... ........... ....X
CLIMBERS
Bougainvillea spectabilis Willd. Nyctaginaceae DF .....X..... ........... ........... ....XPhilodendron corcovadense Kunth Araceae DR ............ ...X..... ........... ........... ....XVanilla chamissonis Klotzsch Orchidaceae DF ............ ...X..... ........... ....X
HEMIPARASITES
Psittacanthus dichroos (Mart.) Mart. Loranthaceae DR .....X..... ........... ........... ....X
GRAMINOIDS
Cladium ensifolium Benth. & Hook .f. Cyperaceae HA ............ ...X..... ............ ........... ..X...Undetermined graminoid Undetermined DF — — — — —Panicum trinii Kunth Poaceae DR ............ ...X..... ........... ....X
ROSETTES
Billbergia amoena (Lodd.) Lindl. Bromeliaceae DF .....X..... ........... ........... ....XFernseea itatiaiae (Wawra) Backer Bromeliaceae HA ............ ........... ...X.... ........... ....XNeoregelia cruenta (Grah) L. B. Smith Bromeliaceae WR ............ ...X..... ........... ........... ....XNidularium itatiaiae L. B. Smith Bromeliaceae HA ............ ........... ...X.... ........... ....XStreptocalyx floribundus (Mart. ex Bromeliaceae DF ............ ...X..... ........... ....X
Schult.f.) MezVriesea neoglutinosa (Mart. ex Schult.f.) Bromeliaceae DR ............ ...X..... ........... ....XMezVriesea itatiaiae Wawra Bromeliaceae HA ............ ...X..... ........... ........... ....XPaepalanthus polyanthus Kunth Eriocaulaceae HA ............ ...X..... ........... ....XEryngium eurycephalum Malme Umbelliferae HA ............ ...X..... ........... ........... ....XPleurostima gounnelleana (Beauv.) N. Velloziaceae HA ............ ........... ...X.... ........... ....X
L. de Menezes
CACTI
Opuntia brasiliensis (Willd.) Haw. Cactaceae DF .....X..... ........... ........... ....XPereskia aculeata Mill. Cactaceae DF .....X..... ........... ........... ....XSchlumbergera obtusangula (K. Cactaceae HA ............ ...X..... ........... ........... ..X.....
Schum.)∗ D. R. Hunt
GEOPHYTES
Allagoptera arenaria (Gomes) Kuntze Arecaceae DR, WR ............ ...X..... ........... ....X.Hippeastrum psittacinum Herb.∗∗ Amaryllidaceae HA ............ ...X..... ........... ........... ....XMollugo verticillata L. Molluginaceae DR .....X..... ........... ........... ....X

PLANT ECOPHYSIOLOGY AT THE BRAZILIAN ATLANTIC FOREST MARGIN 351
Ta
ble
2.C
arbo
nan
dn
itro
gen
isot
ope
com
posi
tion
(�13
C,
�15N
),ca
rbon
isot
ope
disc
rim
inat
ion
(�13
C),
C/N
rati
oan
dso
me
chlo
roph
yll
afl
uor
esce
nce
para
met
ers
mea
sure
dfr
omle
aves
ofva
riou
ssp
ecie
soc
curr
ing
inh
abit
ats
mar
gin
alto
the
Atl
anti
cra
info
rest
,in
sou
thea
ster
nB
razi
l(H
A=
hig
hal
titu
de,
WR=
wet
rest
inga
,D
R=
dry
rest
inga
,D
F=
dry
fore
st).
HP=
hos
tto
ah
emip
aras
ite.
dark
t(h
:m)=
dark
-ada
ptat
ion
tim
e(h
ours
:min
ute
s)
Spe
cies
and
life
-for
ms
Sit
e�13
C�
13C
carb
on�15
NC
/NF
v/F
mE
TR
PP
FD
atY
ield
atN
PQ
atre
l.ex
PP
FD
atfi
xati
onra
tio
pred
awn
(n)
dark
ened
(n)
dark
tm
axE
TR
max
1 2E
TR
max
1 2E
TR
max
1 2E
TR
max
mod
e(h
:m)
WO
OD
YP
LA
NT
S
An
dir
ale
gali
sD
R−
27.0
19.6
C3
−2.
829
0.78±
0.01
(05)
0.77±
0.02
(09)
0:30
9880
00.
550.
80.
19A
nd
ira
lega
lis
WR
−26
.219
.3C
3−
1.4
31—
0.76±
0.10
(03)
6.00
8258
00.
58—
0.23
Clu
sia
flu
min
ensi
s—ad
ult
DR
−16
.18.
2C
AM
−2.
558
0.78±
0.01
(05)
0.77±
0.01
(10)
0:30
110
540
0.48
2.7
0.39
C.
flu
min
ensi
s—se
edli
ng
expo
sed
DR
——
——
—0.
78±
0.01
(05)
0.76±
0.06
(10)
0:30
146
830
0.34
3.3
0.57
C.
flu
min
ensi
s—se
edli
ng
shad
edD
R—
——
——
0.78±
0.02
(05)
0.77±
0.04
(08)
0:30
4214
20.
650.
80.
17C
.fl
um
inen
sis—
adu
ltW
R−
16.2
8.4
CA
M−
1.1
55—
0.82±
0.01
(03)
0:36
104
485
0.56
—0.
32C
roto
nsp
.D
F—
—C
3—
—0.
84±
0.02
(10)
0.82±
0.02
(19)
6:00
118
1160
0.41
2.1
0.52
Mac
hae
riu
mob
ovat
um
DF
−27
.119
.6C
32.
322
0.81±
0.01
(10)
0.78±
0.04
(19)
6:00
5435
00.
620.
00.
24M
yrsi
ne
parv
ifol
iaD
R−
27.2
19.8
C3
−1.
941
0.78±
0.01
(05)
0.76±
0.01
(04)
0:30
5338
00.
650.
30.
16M
yrsi
ne
parv
ifol
iaW
R−
27.7
20.2
C3
−0.
244
—0.
79±
0.01
(03)
6:00
7141
00.
59—
0.26
Myr
sin
esp
.D
F−
28.1
20.7
C3
3.1
370.
74±
0.03
(10)
0.66±
0.05
(22)
6:00
4250
00.
364.
20.
50M
yrsi
ne
gard
ner
ian
aH
A−
27.5
20.0
C3
−0.
731
0.80±
0.02
(05)
0.78±
0.02
(05)
0:30
8782
00.
461.
10.
43R
hee
dia
bras
ilie
nsi
sD
R−
27.5
20.1
C3
1.3
500.
71±
0.02
(05)
0.73±
0.04
(13)
0:30
8860
00.
481.
00.
32R
hee
dia
bras
ilie
nsi
s(H
P)
DR
——
——
—0.
75±
0.02
(05)
0.75±
0.03
(09)
0:30
3721
00.
620.
90.
17R
oupa
laim
pres
siu
scu
laH
A−
27.2
19.7
C3
2.2
380.
80±
0.04
(05)
0.77±
0.02
(04)
0:30
102
820
0.52
0.1
0.35
CL
IMB
ER
S
Bou
gain
vill
easp
ecta
bili
sD
F−
28.9
21.4
C3
5.9
120.
80±
0.02
(10)
0.78±
0.03
(19)
6:00
5442
50.
570.
70.
28P
hil
oden
dro
nco
rcov
aden
seD
R−
26.3
18.8
C3
−4.
929
0.78±
0.01
(05)
0.80±
0.01
(10)
0:30
7054
80.
621.
00.
22V
anil
lach
amis
son
isD
F−
14.1
6.2
CA
M3.
822
0.73±
0.05
(10)
0.72±
0.06
(14)
6:00
5426
00.
441.
60.
39
HE
MIP
AR
AS
ITE
S
Psi
ttac
anth
us
dic
hro
osD
R−
31.2
23.9
C3
−1.
910
50.
72±
0.02
(05)
0.72±
0.05
(09)
0:30
1916
00.
560.
90.
22
GR
AM
INO
IDS
Cla
diu
men
sifo
liu
mH
A−
20.1
18.6
C3
1.3
370.
81±
0.01
(10)
0.80±
0.01
(10)
0:30
8056
00.
611.
10.
24P
anic
um
trin
iiD
R−
24.1
16.5
C3
−2.
350
0.78±
0.02
(05)
0.76±
0.05
(09)
0:30
6699
00.
312.
30.
60
RO
SE
TT
ES
Bil
lber
gia
amoe
na
DF
−15
.07.
2C
AM
1.0
390.
76±
0.01
(10)
0.69±
0.07
(18)
6:00
1813
50.
400.
00.
49F
ern
seea
itat
iaia
eH
A−
25.3
17.8
C3
−0.
855
—0.
71±
0.06
(07)
0:30
4697
00.
51—
0.37
Neo
rege
lia
cru
enta
WR
−14
.06.
1C
AM
−0.
879
—0.
73±
0.00
(03)
0:36
4037
50.
391.
00.
60N
idu
lari
um
itat
iaia
eH
A−
15.2
7.4
CA
M2.
952
——
——
——
——
Str
epto
caly
xfl
orib
un
du
s(e
xpos
ed)
DF
−14
.97.
0C
AM
1.9
680.
77±
0.03
(10)
0.70±
0.09
(18)
6:00
6658
00.
521.
90.
33S
.fl
orib
un
du
s(s
had
ed)
DF
−14
.36.
4C
AM
2.2
400.
80±
0.02
(10)
0.80±
0.02
(15)
6:00
8042
20.
521.
30.
36V
ries
eait
atia
iae
HA
−24
.516
.9C
3−
2.2
79—
0.69±
0.09
(08)
0:30
3454
00.
39—
0.43
Vri
esea
neo
glu
tin
osa
(exp
osed
)D
R−
24.8
17.2
C3
−2.
158
0.73±
0.03
(05)
0.69±
0.05
(10)
0:36
4451
00.
481.
60.
34V.
neo
glu
tin
osa
(sh
aded
)D
R—
——
——
0.79±
0.01
(05)
0.79±
0.02
(09)
0:36
5746
00.
640.
60.
18P
aepa
lan
thu
spo
lyan
thu
sH
A−
25.2
17.7
C3
2.9
510.
81±
0.01
(05)
0.82±
0.01
(05)
0:30
100
1100
0.50
0.39
Ery
ngi
um
eury
ceph
alu
mH
A−
25.1
17.5
C3
−5.
963
0.79±
0.04
(05)
0.73±
0.02
(04)
0:30
8078
00.
520.
90.
34P
leu
rost
ima
gou
nn
elle
ana
HA
−24
.216
.6C
3−
2.3
19—
0.81±
0.02
(04)
0:30
146
1100
0.59
—0.
26
CA
CT
I
Opu
nti
abr
asil
ien
sis
(exp
osed
)D
F−
13.1
5.1
CA
M3.
5149
0.82±
0.01
(10)
0.78±
0.05
(19)
6:00
110
1011
0.45
3.2
0.48
O.
bras
ilie
nsi
s(s
had
ed)
DF
−12
.44.
4C
AM
5.0
470.
82±
0.02
(10)
0.82±
0.02
(14)
6:00
6022
50.
700.
80.
14P
eres
kia
acu
leat
a(l
eave
s)D
F−
23.5
15.8
C3
5.8
10—
——
——
——
—P.
acu
leat
a(s
tem
)D
F−
25.9
18.4
C3
1.5
34—
——
——
——
—S
chlu
mbe
rger
aob
tusa
ngu
laH
A−
18.7
10.8
CA
M−
0.7
12—
——
——
——
—
GE
OP
HY
TE
S
All
agop
tera
aren
aria
DR
−24
.717
.1C
3−
1.9
410.
75±
0.02
(05)
0.75±
0.01
(08)
0:30
8058
00.
600.
90.
20A
.ar
enar
iaW
R−
26.6
19.1
C3
1.1
46—
0.79±
0.02
(03)
0:36
8852
50.
580.
80.
30H
ippe
astr
um
psit
taci
nu
mH
A−
22.3
14.6
C3
0.2
11—
0.80±
0.02
(04)
0:30
9599
00.
46—
0.43
Mol
lugo
vert
icil
lata
DR
−27
.319
.8C
35.
522
——
——
——
——
352 F. R. SCARANO ET AL.
expanded leaves of the species listed in Table 1. The electron transport rates (ETR) were obtained as0.5×�F/F′m×PPFD, where the factor 0.5 considerschlorophyll a fluorescence measurements were per-that both PSII and PSI are excited by PPFD, andformed using a miniaturized pulse-amplitudeexcitation is equally distributed between the two pho-modulation fluorometer, Mini-PAM (H. Walz, Ef-tosystems.feltrich, Germany). The fibre optics was kept at a
The Stern-Volmer non-photochemical quenchingconstant distance (c. 1 cm) and angle (60°) to the leaf(NPQ) of chlorophyll a fluorescence was obtained asby the leaf clip that comes with the instrument. Meas-NPQ=(Fm−F′m)/F′m (Genty et al., 1989; Bilger & Bjork-urements of photosynthetic photon flux density (PPFD,man, 1990), where we used Fm from the pre-dawn�=400–700 nm) close to the leaf surface were takenmeasurements or, if these were not available, Fm afterby the micro-quantum sensor of the leaf clip calibrated6 h of darkening when Fv /Fm was close to 0.8. Relativeagainst a LI-COR 190 quantum sensor (Lincoln, Neb-excessive PPFD (rel. exPPFD) was calculated as (Fv /raska, USA). For the measurements of the parametersFm−�F/F′m)/Fv /Fm (Bilger, Schreiber & Bock, 1995)in the light adapted state under conditions of ambientagain using pre-dawn measurements or measurementsirradiance, care was taken not to shade the leaves byafter 6 h dark-adaptation for Fv /Fm.the fibre optics and the leaf clip.
The daily course values for all parameters aboveThe pre-dawn measurements of maximum fluor-were plotted against PPFD, for each species. Thisescence (Fm) and minimal fluorescence (F0) were usedindicated the light response characteristics which wereto obtain the ratio between variable fluorescence (Fv=obtained by applying polynomial curve fitting of SigmaFm−F0) to maximum fluorescence (Fv /Fm) giving thePlot. In order to compare the high number of speciespotential quantum yield of photosystem II (PSII). Toobjectively, which sometimes were under different lightassess acute and chronic photoinhibition, in addition toregimes, we selected from the curves the followingthe pre-dawn measurements of Fv /Fm, measurementsdescriptive parameters: maximal apparent electronwere made after 30–40 min and in some cases alsotransport rate (ETRmax), the effective quantum yield ofafter 6 h of darkening of the light-adapted leaves.PSII at 1
2 ETRmax (�F/F′m at 12 ETRmax), non-pho-Darkening in all cases was done by placing clips on
tochemical quenching at 12 ETRmax (NPQ at 1
2 ETRmax)selected leaves, at the peak of irradiance around mid-and relative excessive photosynthetic photon flux dens-day.ity at 1
2 ETRmax (rel. exPPFD at 12 ETRmax).Values of Fv /Fm <0.83 indicate photoinhibition
Determination of C- and N- contents of dried(Bjorkman & Demmig, 1987) given by non-pho-powdered samples and analyses of stable isotope com-tochemical quenching of chlorophyll a fluorescence.position (�13C and �15N) were performed at the InstitutFast components of non-photochemical quenching arede Biotechnologie des Plantes, Universite de Paris Sud,due to a build-up of a trans-thylakoid-membrane elec-France, with an elemental analyser (Carlo Erba, NAtrochemical proton gradient and thermal energy dis-1500, Courtaboef, France), where a complete com-sipation, which are reversible within several tens ofbustion of the matter occurs and which is coupled tominutes, and slow components of non-photochemicalan isotope mass spectrometer (Optima, Micromass,quenching are due to photosystem damage especiallyVilleurbane, France) (Deleens et al., 1997). Standardsat the level of D1 and D2 proteins, and they arefor carbon isotope composition, �13C, were Pee Deereversible only within many hours (Thiele, Krause &belemnite. Nitrogen isotope composition, �15N, in eachWinter, 1998). Thus, we call photoinhibition given bysample was calculated by comparison with the 15N/14NFv /Fm <0.83 after 30–40 min of dark adaptation acuteratio of atmospheric N. 15N in the atmospheric N isphotoinhibition, and given by Fv /Fm <0.83 at the end0.366%.of the night (pre-dawn measurements) chronic photo-
From the measurements of carbon isotope ratioinhibition, not recovering during the entire dark(�13C), 13C discrimination (�13C) was calculated as fol-period. In some cases logistics did not allow us to reachlows:sites before dawn. In these cases, measurements were
taken after 6 h of darkening to obtain potential�=
�a−�p
1000+�p×1000 (‰) (1)quantum yield of PSII.
Light-adapted state fluorescence measurementswere taken at regular intervals along daily courses. where �a and �p (in ‰) are carbon isotope compositionThe effective quantum yield of PSII (�F/F′m) was cal- of the ambient air (assumed here to be−8‰) and driedculated as (F′m−F)/F′m (Genty, Briantais & Baker, plant material, respectively (Farquhar, Ehleringer &1989), where F is the steady-state fluorescence in the Hubick, 1989; Farquhar et al., 1989; Broadmeadow etlight and F′m is the maximum fluorescence in the light al., 1992). For C3-plants this parameter is related towhen a saturating light pulse of 600 ms duration is the overall ratio of internal to external CO2-partialsuperimposed to the prevailing environmental ir- pressure (ci /ca) during photosynthesis, averaged over
the life of the plant material analysed as follows:radiance levels (Schreiber & Bilger, 1993). Apparent

PLANT ECOPHYSIOLOGY AT THE BRAZILIAN ATLANTIC FOREST MARGIN 353
plants (c. −25‰), although it belongs to a sub-familyci /ca=
�−ab−a
=�−4.422.6
(2) (Bromelioideae) where all species have been reportedto be CAM (Medina et al., 1977; Martin, 1994; but see
where a (4.4‰) is 13C discrimination due to CO2 dif- Scarano et al., 1999). In the genus Clusia CAM hasfusion in air and b (27‰) is net fractionation caused been found to be limited to altitudes Ζ1500 m a.s.l.by carboxylation itself (Farquhar et al., 1989a, b; (Dıaz et al., 1996). However CAM, notwithstandingBroadmeadow et al., 1992). Hence, for comparisons cold night temperatures, is performed by e.g. Echeveriaamong C3 plants, �13C and ci /ca are correlated to long- columbiana (Medina & Delgado, 1976) and cactiterm average stomatal opening and, in this way, are (Keeley & Keeley, 1989) in the Andes at elevations upan indirect indicator of integrated plant’s water-use to 4700 m a.s.l. At the high altitude site studied hereefficiency. typical CAM �13C values (c.−15‰) were found for the
bromeliad Nidularium itatiaiae, whose occurrence isapparently restricted to creeks in between boulders,STATISTICSwhere these plants are probably protected from high
Averages are given with standard deviations (SD) and amplitude variations in temperature and relativenumber of replicates (n) where possible and ap- humidity (Table 2).propriate. Assessments of pairwise significant dif-ferences were made using t-test. For multiple sample
COMPARISON OF PLANTS GROUPED ACCORDING TOcomparison, we used one-way analysis of varianceRAINFALL REGIMES, LIFE FORMS AND GEOGRAPHICfollowed by Tukey test (Zar, 1996).
DISTRIBUTION PATTERNS
In an attempt to work out possible synecological ec-RESULTS AND DISCUSSION ophysiological patterns, comparisons were made
grouping the plants according to rainfall regimes, lifeMODE OF PHOTOSYNTHESISforms and types of geographical distribution.
Table 2 shows that there is a considerable diversity of Instantaneous parameters of photosynthesis derivedecophysiological behaviour within and between the from chlorophyll fluorescence measurements did notfunctional groups we created based on plant life-forms. differentiate these groups. For the various groups max-For instance, both crassulacean acid metabolism imal apparent electron transport rate (ETRmax), and(CAM) and C3 species, as assessed by �13C meas- the effective quantum yield of PSII (�F/F′m), non-urements where values down to c. −16‰ were taken photochemical quenching (NPQ) and relative excessiveto indicate CAM and values below−22‰ to correspond photosynthetic photon flux density (rel. exPPFD) meas-to C3 photosynthesis (Luttge, 1997: p. 31, fig. 2.12), can ured at 1
2 ETRmax did not show significant differences.be found with most life-form categories sampled and Likewise potential quantum yield of PSII (Fv /Fm) afterthroughout all habitats. darkening for short periods (30–40 min) or longer
The high altitude site (HA) showed some surprising periods (6 h to overnight) did not significantly dis-results regarding species’ mode of photosynthesis. tinguish these groups. Average values at pre-dawnSchlumbergera obtusangula (Cactaceae) showed a high were mostly close to optimal. Thus, criteria of sites inC3 contribution to photosynthesis, as evidenced by its general, of geographic distribution pattern and of lifeintermediate �13C (−18.6‰) value between the typical form characteristics were not decisive in this respectC3 Cactaceae Pereskia aculeata (−25.9 to −23.5‰) (data analyses for these comparisons derived fromand the typical CAM Opuntia brasiliensis (c. −13‰), Table 2 are not shown). Conversely, long-term carbonboth from the dry forest (DF). It is not clear if S. and nitrogen isotope composition and possible nu-obtusangula might belong to the C3/CAM intermediate tritional relations might be more susceptible and areplants which can switch between the two modes of detailed below.photosynthesis. However, even obligate CAM plants(such as most Cactaceae outside the Pereskioideae and
Plants grouped according to rainfall regimes (sites)some leafy Opuntioideae; Nobel & Hartsock, 1987)may use day-time phases (phases II and IV, sensu As pointed out above, high values of �13C (and ci/ca) in
C3-plants indicate higher overall long-term stomatalOsmond, 1978) for direct CO2 acquisition with openstomata via ribulose bisphosphate carboxylase/oxy- opening and in CAM plants increased use of phases II
and IV with daytime stomatal opening. Hence, in bothgenase (Rubisco) with its very high 13C discrimination,as compared to phosphoenolpyruvate carboxylase C3- and CAM plants higher values of �13C may suggest
reduced water-use efficiency. Carbon contents, �13C(PEPc) operating in dark CO2 fixation during phase Iof CAM. and ci/ca values did not vary significantly between
C3 plants grouped according to sites (Table 3). ThisFernseea itatiaiae (Bromeliaceae), another HA spe-cies, showed �13C values in the range of typical C3 suggests that the different rainfall regimes between
354 F. R. SCARANO ET AL.
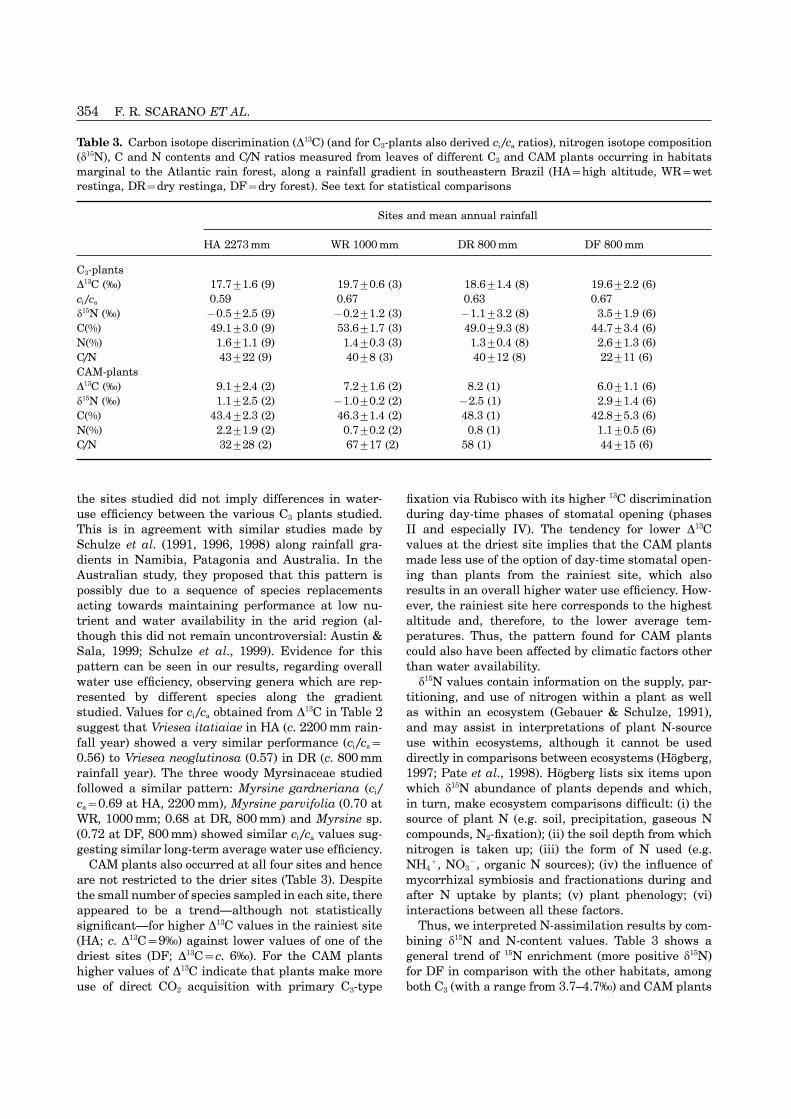
Table 3. Carbon isotope discrimination (�13C) (and for C3-plants also derived ci /ca ratios), nitrogen isotope composition(�15N), C and N contents and C/N ratios measured from leaves of different C3 and CAM plants occurring in habitatsmarginal to the Atlantic rain forest, along a rainfall gradient in southeastern Brazil (HA=high altitude, WR=wetrestinga, DR=dry restinga, DF=dry forest). See text for statistical comparisons
Sites and mean annual rainfall
HA 2273 mm WR 1000 mm DR 800 mm DF 800 mm
C3-plants�13C (‰) 17.7±1.6 (9) 19.7±0.6 (3) 18.6±1.4 (8) 19.6±2.2 (6)ci /ca 0.59 0.67 0.63 0.67�15N (‰) −0.5±2.5 (9) −0.2±1.2 (3) −1.1±3.2 (8) 3.5±1.9 (6)C(%) 49.1±3.0 (9) 53.6±1.7 (3) 49.0±9.3 (8) 44.7±3.4 (6)N(%) 1.6±1.1 (9) 1.4±0.3 (3) 1.3±0.4 (8) 2.6±1.3 (6)C/N 43±22 (9) 40±8 (3) 40±12 (8) 22±11 (6)CAM-plants�13C (‰) 9.1±2.4 (2) 7.2±1.6 (2) 8.2 (1) 6.0±1.1 (6)�15N (‰) 1.1±2.5 (2) −1.0±0.2 (2) −2.5 (1) 2.9±1.4 (6)C(%) 43.4±2.3 (2) 46.3±1.4 (2) 48.3 (1) 42.8±5.3 (6)N(%) 2.2±1.9 (2) 0.7±0.2 (2) 0.8 (1) 1.1±0.5 (6)C/N 32±28 (2) 67±17 (2) 58 (1) 44±15 (6)
the sites studied did not imply differences in water- fixation via Rubisco with its higher 13C discriminationduring day-time phases of stomatal opening (phasesuse efficiency between the various C3 plants studied.
This is in agreement with similar studies made by II and especially IV). The tendency for lower �13Cvalues at the driest site implies that the CAM plantsSchulze et al. (1991, 1996, 1998) along rainfall gra-
dients in Namibia, Patagonia and Australia. In the made less use of the option of day-time stomatal open-ing than plants from the rainiest site, which alsoAustralian study, they proposed that this pattern is
possibly due to a sequence of species replacements results in an overall higher water use efficiency. How-ever, the rainiest site here corresponds to the highestacting towards maintaining performance at low nu-
trient and water availability in the arid region (al- altitude and, therefore, to the lower average tem-peratures. Thus, the pattern found for CAM plantsthough this did not remain uncontroversial: Austin &
Sala, 1999; Schulze et al., 1999). Evidence for this could also have been affected by climatic factors otherthan water availability.pattern can be seen in our results, regarding overall
water use efficiency, observing genera which are rep- �15N values contain information on the supply, par-titioning, and use of nitrogen within a plant as wellresented by different species along the gradient
studied. Values for ci /ca obtained from �13C in Table 2 as within an ecosystem (Gebauer & Schulze, 1991),and may assist in interpretations of plant N-sourcesuggest that Vriesea itatiaiae in HA (c. 2200 mm rain-
fall year) showed a very similar performance (ci /ca= use within ecosystems, although it cannot be useddirectly in comparisons between ecosystems (Hogberg,0.56) to Vriesea neoglutinosa (0.57) in DR (c. 800 mm
rainfall year). The three woody Myrsinaceae studied 1997; Pate et al., 1998). Hogberg lists six items uponwhich �15N abundance of plants depends and which,followed a similar pattern: Myrsine gardneriana (ci /
ca=0.69 at HA, 2200 mm), Myrsine parvifolia (0.70 at in turn, make ecosystem comparisons difficult: (i) thesource of plant N (e.g. soil, precipitation, gaseous NWR, 1000 mm; 0.68 at DR, 800 mm) and Myrsine sp.
(0.72 at DF, 800 mm) showed similar ci /ca values sug- compounds, N2-fixation); (ii) the soil depth from whichnitrogen is taken up; (iii) the form of N used (e.g.gesting similar long-term average water use efficiency.
CAM plants also occurred at all four sites and hence NH4+, NO3
−, organic N sources); (iv) the influence ofmycorrhizal symbiosis and fractionations during andare not restricted to the drier sites (Table 3). Despite
the small number of species sampled in each site, there after N uptake by plants; (v) plant phenology; (vi)interactions between all these factors.appeared to be a trend—although not statistically
significant—for higher �13C values in the rainiest site Thus, we interpreted N-assimilation results by com-bining �15N and N-content values. Table 3 shows a(HA; c. �13C=9‰) against lower values of one of the
driest sites (DF; �13C=c. 6‰). For the CAM plants general trend of 15N enrichment (more positive �15N)for DF in comparison with the other habitats, amonghigher values of �13C indicate that plants make more
use of direct CO2 acquisition with primary C3-type both C3 (with a range from 3.7–4.7‰) and CAM plants
PLANT ECOPHYSIOLOGY AT THE BRAZILIAN ATLANTIC FOREST MARGIN 355
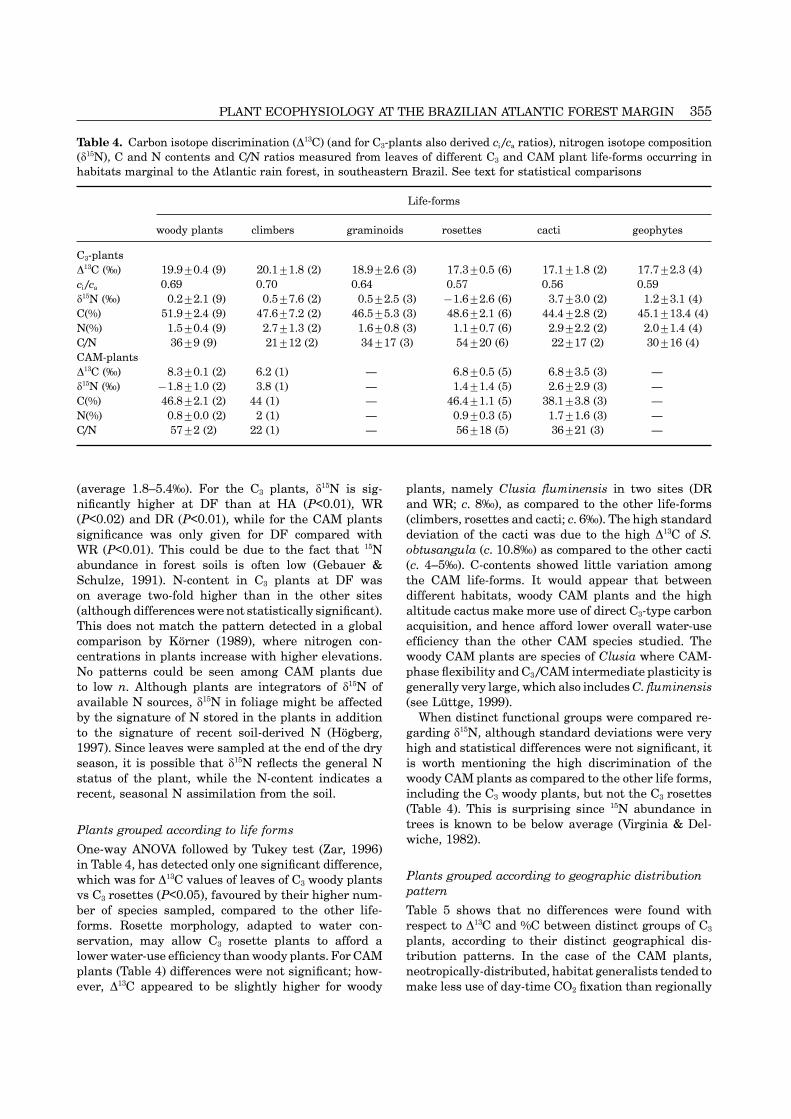
Table 4. Carbon isotope discrimination (�13C) (and for C3-plants also derived ci /ca ratios), nitrogen isotope composition(�15N), C and N contents and C/N ratios measured from leaves of different C3 and CAM plant life-forms occurring inhabitats marginal to the Atlantic rain forest, in southeastern Brazil. See text for statistical comparisons
Life-forms
woody plants climbers graminoids rosettes cacti geophytes
C3-plants�13C (‰) 19.9±0.4 (9) 20.1±1.8 (2) 18.9±2.6 (3) 17.3±0.5 (6) 17.1±1.8 (2) 17.7±2.3 (4)ci /ca 0.69 0.70 0.64 0.57 0.56 0.59�15N (‰) 0.2±2.1 (9) 0.5±7.6 (2) 0.5±2.5 (3) −1.6±2.6 (6) 3.7±3.0 (2) 1.2±3.1 (4)C(%) 51.9±2.4 (9) 47.6±7.2 (2) 46.5±5.3 (3) 48.6±2.1 (6) 44.4±2.8 (2) 45.1±13.4 (4)N(%) 1.5±0.4 (9) 2.7±1.3 (2) 1.6±0.8 (3) 1.1±0.7 (6) 2.9±2.2 (2) 2.0±1.4 (4)C/N 36±9 (9) 21±12 (2) 34±17 (3) 54±20 (6) 22±17 (2) 30±16 (4)CAM-plants�13C (‰) 8.3±0.1 (2) 6.2 (1) — 6.8±0.5 (5) 6.8±3.5 (3) —�15N (‰) −1.8±1.0 (2) 3.8 (1) — 1.4±1.4 (5) 2.6±2.9 (3) —C(%) 46.8±2.1 (2) 44 (1) — 46.4±1.1 (5) 38.1±3.8 (3) —N(%) 0.8±0.0 (2) 2 (1) — 0.9±0.3 (5) 1.7±1.6 (3) —C/N 57±2 (2) 22 (1) — 56±18 (5) 36±21 (3) —
(average 1.8–5.4‰). For the C3 plants, �15N is sig- plants, namely Clusia fluminensis in two sites (DRand WR; c. 8‰), as compared to the other life-formsnificantly higher at DF than at HA (P<0.01), WR
(P<0.02) and DR (P<0.01), while for the CAM plants (climbers, rosettes and cacti; c. 6‰). The high standarddeviation of the cacti was due to the high �13C of S.significance was only given for DF compared with
WR (P<0.01). This could be due to the fact that 15N obtusangula (c. 10.8‰) as compared to the other cacti(c. 4–5‰). C-contents showed little variation amongabundance in forest soils is often low (Gebauer &
Schulze, 1991). N-content in C3 plants at DF was the CAM life-forms. It would appear that betweendifferent habitats, woody CAM plants and the highon average two-fold higher than in the other sites
(although differences were not statistically significant). altitude cactus make more use of direct C3-type carbonacquisition, and hence afford lower overall water-useThis does not match the pattern detected in a global
comparison by Korner (1989), where nitrogen con- efficiency than the other CAM species studied. Thewoody CAM plants are species of Clusia where CAM-centrations in plants increase with higher elevations.
No patterns could be seen among CAM plants due phase flexibility and C3 /CAM intermediate plasticity isgenerally very large, which also includes C. fluminensisto low n. Although plants are integrators of �15N of
available N sources, �15N in foliage might be affected (see Luttge, 1999).When distinct functional groups were compared re-by the signature of N stored in the plants in addition
to the signature of recent soil-derived N (Hogberg, garding �15N, although standard deviations were veryhigh and statistical differences were not significant, it1997). Since leaves were sampled at the end of the dry
season, it is possible that �15N reflects the general N is worth mentioning the high discrimination of thewoody CAM plants as compared to the other life forms,status of the plant, while the N-content indicates a
recent, seasonal N assimilation from the soil. including the C3 woody plants, but not the C3 rosettes(Table 4). This is surprising since 15N abundance intrees is known to be below average (Virginia & Del-Plants grouped according to life formswiche, 1982).
One-way ANOVA followed by Tukey test (Zar, 1996)in Table 4, has detected only one significant difference,
Plants grouped according to geographic distributionwhich was for �13C values of leaves of C3 woody plantspatternvs C3 rosettes (P<0.05), favoured by their higher num-
ber of species sampled, compared to the other life- Table 5 shows that no differences were found withrespect to �13C and %C between distinct groups of C3forms. Rosette morphology, adapted to water con-
servation, may allow C3 rosette plants to afford a plants, according to their distinct geographical dis-tribution patterns. In the case of the CAM plants,lower water-use efficiency than woody plants. For CAM
plants (Table 4) differences were not significant; how- neotropically-distributed, habitat generalists tended tomake less use of day-time CO2 fixation than regionallyever, �13C appeared to be slightly higher for woody

356 F. R. SCARANO ET AL.
Table 5. Carbon isotope discrimination (�13C) and derived ci /ca ratios (for C3 plants), nitrogen isotope composition(�15N), C and N contents, C/N ratios of C3 and CAM plants grouped according to four geographic distribution/habitatoccurrence patterns: neotropical/generalists (NG); regional/generalists (RG); regional/specialist (RS); and endemic/specialists (ES). For CAM plants, RS and ES had one species each and, therefore, are not displayed on this Table. Seetext for statistical comparisons
NG C3 NG CAM RG C3 RG CAM RS C3 ES C3
�13C (‰) 19.4±1.8 (7) 5.6±1.4 (3) 19.1±1.9 (7) 7.2±1.0 (5) 17.4±1.9 (6) 18.4±1.5 (4)ci /ca 0.66 — 0.65 — 0.58 0.62�15N (‰) 2.6±3.2 (7) 3.2±2.0 (3) −0.9±2.4 (7) 0.8±2.6 (5) −2.6±2.4 (6) 0.4±2.3 (4)C(%) 45.2±9.6 (7) 39.8±6.4 (3) 51.5±3.3 (7) 46.1±1.6 (5) 49.6±3.3 (6) 49.5±2.4 (4)N(%) 2.0±1.0 (7) 0.9±0.3 (3) 1.2±1.3 (7) 1.1±0.5 (5) 1.7±1.3 (6) 1.8±0.7 (4)C/N 30.4±15.9 (7) 45.0±5.3 (3) 51.6±24.9 (7) 48.6±17.9 (5) 43.8±24.9 (6) 38.3±16.5 (4)
distributed, habitat generalist plants. Although this dry forest, which reached a high ETRmax ofdifference of �13C values is not statistically significant, 118 �mol m−2s−1, despite a rather wilted appearance,it may indicate that a higher flexibility of using C3 particularly at midday (Fig. 7). �F/F′m at 1
2 ETRmax wasoptions and CAM phases does not necessarily allow often higher (>0.60) for DR species. Out of nine speciesthe colonization of a broader geographical area. Para- with values in this range, six were DR species, however,doxically, a specialized mechanism, such as night-time two of those were shaded.CO2 fixation, may have allowed some species to colonize Among C3 plants high values of NPQ at 1
2 ETRmax
a broader geographical range. (2–4) were found in species of the drier sites (DR, DF)Conversely, �15N was 2–5‰ higher in C3 plants with such as Panicum trinii at DR, Myrsine sp. and Croton
wide neotropical distribution than in those with sp. at DF. This is further confirmed by the highestregional distribution (Tukey; P<0.05 vs regional gen- rel. ex PPFD values for the same C3 plants (>0.50).eralists; P<0.01 vs regional specialists). Endemic Comparing with the ETRmax results, an inverse relationplants did not differ significantly from the others, nor emerges: C3 plants with high ETRmax were found mostlydid groups of CAM plants, possibly due to the small in the rainiest site (HA), whereas high values of NPQnumber of species in these groups. No significant dif- at 1
2 ETRmax were found in the driest coastal sites (DR,ferences were found for N-content between groups. DF). This can possibly be explained by a higher re-These apparent differences in nitrogen metabolism for striction to immediate water loss in the driest sites,plants with distinct geographical distribution patterns resulting in lower photosynthesis and electron trans-suggest that such patterns may be added to the list of port rates. Additionally, in the rainiest site where mostfactors potentially affecting 15N composition in plants, of the highest ETRmax for C3 species are found, overallsuch as several abiotic and biotic factors, plus plant light intensity is also possibly lower than in the coastalcharacteristics such as age or life-form (Stewart et al., sites, due to frequent cloudiness (Segadas-Vianna &1995; Schulze et al., 1999). Dau, 1965).
With respect to photoinhibition among C3 plants,Cladium ensifolium (graminoid, HA), PaepalanthusSPECIFIC COMPARISONSpolyanthus (rosette, HA) and Croton sp. (woody plant,In addition to the attempts at working out syn-DF) showed the highest Fv /Fm values (all above 0.8,ecological ecophysiological relations presented above,i.e. no photoinhibition) both after a daytime dark ad-the data collected also lend themselves to some inter-aptation interval (30 min for the HA plants and 6 hand intraspecific and, in one case, also intra-individualfor the latter) and at pre-dawn. Croton sp. offers a verycomparisons which will be presented below.interesting case. Although its leaves gave a ratherwilted appearance at midday (Fig. 7) it showed par-
Interspecific differences ticularly high rates of ETRmax (see above) combinedwith high NPQ at 1
2 ETRmax and protection from chronicGeneral considerations can be made on the basis ofphotoinhibition and appears to be well adapted toTable 2. The highest values of ETRmax
its dry forest habitat, which calls for more detailed([100 �mol m−2s−1) were reached by some high al-autecological study. Acute, but not chronic photo-titude C3 plants (Pleurostima gounnelleana, Pae-inhibition, was found in Machaerium obovatum (apalanthus polyanthus and Roupala impressiuscula)woody plant with paraheliotropic leaflet movements,and also by some CAM arboreal plants (see below).
The only exception to this trend was Croton sp. in the DF; see Caldas et al., 1997), Myrsine gardneriana,

PLANT ECOPHYSIOLOGY AT THE BRAZILIAN ATLANTIC FOREST MARGIN 357
Table 6. Carbon isotope discrimination (�13C) and de- Paepalanthus polyanthus, Eryngium eurycephalumrived ci /ca ratios, nitrogen isotope composition (�15N), C showed acute photoinhibition which was however re-and N contents, C/N ratios and some chlorophyll a fluor- verted after the night period (Table 6). Moreover, thereescence parameters measured from leaves of high altitude has been a great deal of variation regarding nitrogenrosette plants with a strong morphological convergence: use. Although the two rosette species shown in TablePaepalanthus polyanthus and Eryngium eurycephalum 6 are often found growing side by side (Fig. 8), they
showed very different �15N values (+2.9‰ and−5.0‰Paepalanthus Eryngium respectively). These results are most likely due topolyanthus eurycephalum differences in the soil zone explored by the species’
root systems. We observed in situ that both species�13C (‰) 17.7 17.5have deep root systems, however with different ar-ci /ca 0.59 0.58chitectures: P. polyanthus has numerous, thin fas-�15N (‰) 2.9 −5.0ciculated roots, which are likely to explore a widerC(%) 45.2 47.2subterranean gradient, while E. eurycephalum hasN(%) 0.9 0.8
C/N 50 59 few, axial roots, more likely to explore deeper zones.Fv /Fm (pre-dawn) 0.81±0.01 (5) 0.79±0.04 (5) �15N of soil surfaces in many ecosystems is lower thanFv /Fm (0.5 h dark) 0.82±0.01 (5) 0.73±0.02 (4) further down in the soil (Hogberg, 1997), as the rockyETRmax 100 80 layer is approached. However, in this site, the surfacePPFD at ETRmax 1100 780 is rocky, while peat lies below boulders and in creeksYield at 1
2 ETRmax 0.50 0.52 (see Fig. 4). Thus, axial roots as in E. eurycephalumNPQ 0.8 0.9 may pass the boulders and reach the peat, which mayrel. ex PPFD 0.39 0.34 account for its more negative �15N values.
Among the rosette species, the bromeliads alsoshowed an interesting pattern in regard to �15N values.Although we sampled only terrestrial individuals, allRoupala impressiuscula (woody plants, HA), Bou-species samples were facultative epiphytes (Smith &gainvillea spectabilis (climber, DF) and Eryngium eu-Downs, 1979). Stewart et al. (1995) compared epiphyterycephalum (rosette, HA). Chronic photoinhibitionfoliar �15N for different forests of the world and found(pre-dawn values below 0.75) was detected especiallythat in Brazilian epiphytic bromeliads mean valuesin Allagoptera arenaria at DR, Psittacanthus dichroosranged from −4.9 to −5.2‰, which is at least twiceand Rheedia brasiliensis at DR, exposed Vriesea neo-more negative than the highest value found for ourglutinosa at DR, and Myrsine sp. at DF (Table 2).terrestrial bromeliads (Vriesea itatiaiae;−2.2‰; TableAs seen by the high standard deviations among2). They suggested that epiphytes may utilize 15N-the plant categories we created, both when groupeddepleted nitrogen from atmospheric deposition and N2according to rainfall regimes (Table 3) or according tofixation, while our results seem to indicate that thelife-forms (Table 4), there was a high interspecificterrestrial forms of facultative epiphyte species mayvariation regarding �15N, even within habitats. In DRresort also to the soil as a nitrogen source, and thusalone (Table 2), we found both the lowest (−4.89‰,be more enriched in 15N.Philodendron corcovadense, a climbing Araceae) and
A host-hemiparasite (mistletoe) comparison is madeone of the three highest �15N values (+5.51‰, Mollugoin Table 7. Psittacanthus dichroos showed the highestverticillata, a geophyte). Interspecific variation of up�13C (23.95‰; ci /ca=0.87) of all species studied (Tableto 10‰ within sites have been previously reported only2), that means, it was operating overall at the highestfor high latitude systems (for review see Hogberg,ci /ca-ratios and had the lowest efficiency of water-use.1997). On the other hand, these two species with theSince it is a hemiparasite, this was to be expected. Inlargest difference on �15N had very similar �13C valuesorder to suck sap out of the host xylem, these often(−26.35‰ and −27.33‰ respectively) (Table 2).amphistomatic plants, tend to have high transpirationSpecific comparisons are made in Tables 6 to 10.rates (Schulze, Turner & Glatzel, 1984). The host plant,Table 6 shows the example of two sympatric C3 rosetteRheedia brasiliensis, had a �13C value of 20.1‰ (ci /species. In general, C3 rosettes showed similar �13Cca=0.69; Table 7). Table 7 shows that there was little(and consequently ci /ca), including cases with strongdifference between the photosynthetic parametersmorphological convergence, such as Paepalanthusmeasured for parasite (Psittacanthus dichroos) andpolyanthus and Eryngium eurycephalum occurringhost (Rheedia brasiliensis), although they showed asympatrically in HA (Table 6). Together with theirmarked difference in water-use efficiency as also foundstrong morphological convergence, these two rosettefor many other Brazilian host-mistletoe pairs (Luttgespecies also showed little interspecific variation re-et al., 1998). A non-infected R. brasiliensis showedgarding the photosynthetic parameters measured.
However, while no photoinhibition was detected in higher ETRmax and lower �F/F′m than an infected one,

358 F. R. SCARANO ET AL.
Table 7. Carbon isotope discrimination (�13C) and derived ci /ca ratios (for C3 plants), nitrogen isotope ratios (�15N), Cand N contents, C/N ratios and some chlorophyll a fluorescence parameters measured from leaves of the woody plantRheedia brasiliensis and its hemiparasite (HP) Psittacanthus dichroos at a dry restinga in southeastern Brazil
Rheedia brasiliensis Rheedia brasiliensis Psittacanthus dichroosnon-parasitized host HP
�13C (‰) 20.1 — 23.9ci /ca 0.69 — 0.87�15N (‰) 1.3 — −1.9C(%) 54.2 — 50.6N(%) 1.1 — 0.5C/N 49 — 101Fv /Fm (pre-dawn) 0.71±0.02 (5) 0.75±0.02 (5) 0.72±0.02 (5)Fv /Fm (0.5–0.6 h dark) 0.73±0.04 (13) 0.75±0.03 (9) 0.72±0.05 (5)ETRmax 88 37 19PPFD at ETRmax 600 210 160Yield at 1
2 ETRmax 0.48 0.62 0.56NPQ 1.0 0.8 0.9rel. ex PPFD 0.32 0.17 0.22
Table 8. Nitrogen isotope composition (�15N) and N-con-which could be due to differences in light regime rathertents of potentially nitrogen-fixing C3 woody legumes com-than caused by infection. Fernandes et al. (1998)pared with average results for C3 non-legume speciesshowed that ETR and �F/F′m did not vary between(number of species) in three sites in southeastern Brazil:control and host Mimosa naguirei, infected by theWR=wet restinga, DR=dry restinga, DF=dry forestholoparasite Pilostyles ingae. Both the hemiparasite
Psittacanthus dichroos and its host, Rheedia bra-Site Species �15N (‰) N(%)siliensis, were chronically photoinhibited. Neither
30 min of dark adaptation nor overnight adaptation WR Andira legalis −1.4 1.7brought Fv /Fm values to the optimal range. Curiously, non-legumes (2) +0.4±0.9 1.2±0.0a non-parasitized R. brasiliensis showed even lower DR Andira legalis −2.8 1.8values (Table 2, P<0.02 for predawn values). Therefore, non-legumes (7) +0.9±3.3 1.2±0.3photoinhibition in R. brasiliensis apparently did not DF Machaerium obovatum +2.3 2.2result from P. dichroos parasitism. Hibberd et al. (1996) non-legumes (5) +3.8±2.0 2.7±0.9have found evidence for photoinhibition of grasses, butnot of cowpeas, parasitized by the hemiparasite Strigahermonthica. These results also seem to indicate thatdespite an apparently guaranteed source of water, thehemiparasite P. dichroos is still sensitive to high light the few woody Leguminosae found in open restinga
formations, and Machaerium obovatum (DF) is typ-levels.Woody leguminous plants are often among the dom- ically a dry forest species. We compared �15N and N-
content between these species and non-leguminous C3inant ones in various Atlantic forest sites (Leitao Filho,1982), and Leguminosae are among the six dominant plants in their field sites to assess their potential
as N2-fixing plants (Table 8). M. obovatum and non-families in the restingas of five Brazilian states, whenall life-forms of this family and all plant communities Leguminosae at DF did not differ. The results for A.
legalis did not differ from the non- Leguminosae either,of the restingas are considered (Pereira & Araujo,2000). In marked contrast, woody Leguminosae are given the high standard deviation of the latter group.
However, the trend shown indicates a tendency forvery rarely found in the clumped formations of therestingas, such as the ones studied here (e.g. Ribas, nitrogen fixation in A. legalis in both sites. Faria et al.
(1984, 1989) showed that this species nodulates and1992; Montezuma, 1997; Zaluar, 1997). The seasonaldry forest (DF) studied here (Araujo et al., 1998; Farag, fixes nitrogen, particularly in restinga soils, whereas
in forest soils this does not occur when soil nitrogen1999) and the dune forest neighbouring the openformation studied in WR (Sa & Araujo, unpubl. data) is available. Together with the remarkable phenotypic
plasticity and clonal growth capacity of Andira legalisalso showed woody Leguminosae among the two mostdominant groups. Among the two leguminous trees (Cirne & Scarano, 1996), nitrogen metabolism could
help explain its colonization success in open restingainvestigated, Andira legalis (DR and WR) is one of
PLANT ECOPHYSIOLOGY AT THE BRAZILIAN ATLANTIC FOREST MARGIN 359
formations, unlike most leguminous woody species ori- legalis, Clusia fluminensis and Myrsine parvifoliaginating from the Atlantic forest. showed similar values of �13C, and differences in av-
As explained above, the lowest �13C are expected to erage �13C between sites were only marked for Al-occur among the CAM plants since this is a char- lagoptera arenaria, where the WR plants also showedacteristic of this mode of photosynthesis. Opuntia bra- lower chronic photoinhibition (see below). In this con-siliensis, the arboreal cactus, both when shaded and text it is also of interest, that in WR, in the dry season,exposed had the lowest �13C values found in this study NPQ values were often higher, suggesting a higher ne-(4.43‰ and 5.14‰ respectively; Table 2). This strong cessity for energy dissipation for these species in thelimitation of direct C3-type CO2-acquisition was in rainiest site during the dry season. Regarding photo-marked contrast with that found for the other CAM inhibition for the given species sampled in the two sites,cactus, Schlumbergera obtusangula (10.82‰; see Table Fv /Fm was closer to optimal values after only 6 h of dark-7), and also with the other CAM arboreal plants of ness (following the peak of radiation at midday) in WRClusia fluminensis (8.21‰; Table 2). Some of the high- than after the whole night at pre-dawn in DR for Al-est values of ETRmax (>100 �mol m−2s−1) were reached lagoptera arenaria, Clusia fluminensis and Myrsineby the CAM arboreal plants at PPFD ranging from parvifolia. Andira legalis did not show significant dif-540 (Clusia fluminensis) to 1011 �mol m−2s−1 (Opuntia ferences between the two sites. However, averages werebrasiliensis) (Tables 2 and 9). Also the CAM arboreal never below 0.75 in any of the cases.plants were amongst plants with the highest values Four species were measured under both exposed andof NPQ at 1
2 ETRmax (>3). Opuntia brasiliensis, the only shaded conditions. Table 2 shows that exposed plantscactus in which we measured fluorescence, was the of the CAM species Opuntia brasiliensis (DF; see alsoonly CAM plant to show no chronic photoinhibition Table 9) and seedlings of Clusia fluminensis (DR)when fully exposed. The CAM orchid Vanilla chamis- showed higher ETRmax, �F/F′m at 1
2 ETRmax, NPQ at 12
sonis, three CAM bromeliads, and Clusia fluminensis ETRmax and rel. ex PPFD at 12 ETRmax than their shaded
showed pre-dawn values of Fv /Fm, after a sunny day, counterparts, indicatingacclimationtohighlight levels.ranging from 0.73 to 0.78 (Table 2) indicating some Conversely, for the CAM bromeliad Streptocalyx flo-photoinhibition even in the CAM plants (see also below ribundus in different individuals at the same site (DF),for intraspecific comparisons). ETRmax was higher in shaded plants than in exposed
Among the CAM plants, the higher values for pho- ones (Table 10). This suggests that this facultative epi-tosynthetic parameters which were found in arboreal phyte, here growing terrestrially, is a shade-adaptedforms compared with rosette plants or climbers seem CAM Bromelioideae, similar to Nidularium procerumto indicate that several cases of shade-adapted CAM previously studied by Scarano et al. (1999). Vriesea neo-plants can be found in the latter life-forms which may glutinosa (DR), a C3 bromeliad, also showed higherneed to compromise between conditions of sun and ETRmax and�F/F′m at 1
2 ETRmax in shaded than in exposedshade. Indeed, Vanilla chamissonis is typically a tree plants.climber in the forest understory, while the CAM rosette In the case of Clusia fluminensis, it is relevant thatplants studied have been reported to be facultative in DR, leaves of exposed adults, exposed seedlings andepiphytes (Smith & Downs, 1979). shaded seedlings showed statistically similar Fv /Fm
results ranging from 0.76 to 0.78, both after 30 mindarkness at midday and at pre-dawn. Photosynthetic
Intraspecific differences parameters also showed similar values for exposed ad-ults and seedlings. Franco et al. (1996) had alreadyAmong the species investigated, four were sampled inshown that the CAM tree C. hilariana, the ecologicaleachof twosites (WRandDR),namelythewoodyspeciescounterpart of C. fluminensis, also has seedlings tol-Andira legalis, Clusia fluminensis and Myrsine par-erant of high irradiation, which favours successful es-vifoliaandthegeophyteAllagopteraarenaria.TheCAMtablishment and phytosociological dominance inplants Opuntia brasiliensis and Streptocalyx flo-restingas, further northalongthe coastofRio deJaneiroribundus (DF) and Clusia fluminensis (DR), and theState.C3 plant Vriesea neoglutinosa had different individuals
Exposed cladodes of Opuntia brasiliensis in DF couldstudied at a given site.not resume optimal Fv /Fm values even after 6 h of dark-The four species measured in the two different sitesness, followingthepeakof irradianceatmidday(c. 0.78),showed similar values of ETRmax, PPFD at ETRmax andcontrasting with a better recovery of shaded cladodes�F/F′m at 1
2 ETRmax in both sites (Table 2), except for(c. 0.82). Photoinhibition was not chronic, however, asMyrsine parvifolia which had a slightly higher ETRmax
seenby thepre-dawn values (c. 0.82).On theother hand,in WR (71 �mol m−2s−1) than in DR (53 �mol m−2s−1). Asexposed leaves of the CAM bromeliad Streptocalyx flo-seen for the carbon isotope discrimination data, thereribundus in DF showed chronic photoinhibition, sinceappears to be a maintenance of performance for these
species even in the DR site. The woody species Andira after 6 h of darkness Fv /Fm values remained very low (c.

360 F. R. SCARANO ET AL.
Table 9. Carbon isotope discrimination (�13C), nitrogen isotope composition (�15N), C and N contents, C/N ratios andsome chlorophyll � fluorescence parameters measured from distinct organs of three cacti species: cladodes of exposedand shaded plants of the CAM tree Opuntia brasiliensis and leaves and stem of the C3 plant Pereskia aculeata, in adry forest; and cladodes of Schlumbergera obtusangula, in a high altitude vegetation in southeastern Brazil
Dry forest High altitudeOpuntia brasiliensis Pereskia aculeata Schlumbergera
exposed shaded leaves stem obtusangula
�13C (‰) 5.1 4.4 15.8 18.4 10.8�15N (‰) 3.5 5.0 5.8 1.5 −0.7C(%) 38.3 34.3 42.4 46.4 41.8N(%) 0.8 0.7 4.5 1.4 3.5C/N 48 49 9 33 12Fv /Fm (pre-dawn) 0.82±0.01 (10) 0.82±0.02 (10) — — —Fv /Fm (6 h dark) 0.78±0.05 (19) 0.82±0.02 (14) — — —ETRmax 110 60 — — —PPFD at ETRmax 1011 225 — — —Yield at 1
2 ETRmax 0.45 0.70 — — —NPQ 3.2 0.8 — — —rel. ex PPFD 0.48 0.14 — — —
Table 10. Carbon isotope discrimination (�13C), nitrogen intraspecific differences in �15N found for species com-isotope composition (�15N), C and N contents, C/N ratios mon to this site as compared to DR. �15N can reflectand some chlorophyll � fluorescence parameters measured the different ecological factors a given species has beenfrom leaves of exposed and shaded plants of the CAM experiencing. Hogberg (1997) states that fire consumesbromeliad Streptocalyx floribundus in a dry forest in the upper �15N-depleted surface layer of soil, whichsoutheastern Brazil drives plants to find N in lower horizons and leads to
an increase in �15N of plants. Indeed, the three woodyS. floribundus – S. floribundus – species studied in WR showed �15N values of c. 1–1.5‰exposed shaded higher than individuals of the same species in DR. Al-
lagoptera arenaria, a geophyte palm with even deeper�13C (‰) 7.00 6.4root systems, showed �15N values of c. 3‰ higher in WR�15N (‰) 1.9 2.2than in DR (Table 2).C(%) 47.4 45.8
Intraspecific variation of �15N within a single site wasN(%) 0.7 1.1more marked for Fernseea itatiaiae (Table 2). Four in-C/N 68 42
Fv /Fm (pre-dawn) 0.768±0.030 0.802±0.019 dividuals sampled showed values ranging from−2.52(10) (10) to+1.81‰ (4.3‰ variation), which again might be re-
Fv /Fm (6 h dark) 0.697±0.091 0.803±0.016 lated to root system functioning. This plant establishes(18) (15) itself on bryophyte mats, which vary in depth, before
ETRmax 66 80 reaching bare rock. This range of variation was higherPPFD at ETRmax 580 422 than the small differences found for shaded vs exposedYield at 1
2 ETRmax 0.52 0.52 individuals of Opuntia brasiliensis (Table 9) and Strep-NPQ 1.9 1.3 tocalyx floribundus (a giant CAM bromeliad, which is arel. ex PPFD 0.33 0.36 facultative epiphyte, here occurring mostly as a ter-
restrial plant (Table 10) in DR.
0.70), and overnight it was not capable of full recovery,as pre-dawn values reached an average of c. 0.77. Ex-
Intra-individual differencesposed leaves of the C3 bromeliad Vriesea neoglutinosaPereskia aculeata, a leafy C3 cactus, photosynthesizesin DR were also chronically photoinhibited. In contrast,both in stems and leaves. Table 9 shows that there wereshaded leaves of both bromeliads did not show photo-marked differences in both �13C and �15N values forinhibition.these different organs. The overall water-use efficiencyThe recurrence of illegal man-made fires in WR over
the 1990s (Cirne & Scarano, 1996), may account for the in the leaves (ci /ca=0.51) was higher than in the stems

PLANT ECOPHYSIOLOGY AT THE BRAZILIAN ATLANTIC FOREST MARGIN 361
(ci /ca=0.62), and 15N was more discriminated in the reason for much worry that this wealth may not becapable to cope with the (not so) novel sources of stress:stems (1.53‰) than in the leaves (5.84‰).land speculation and predatory tourism.
CONCLUSIONSACKNOWLEDGEMENTS
It is to be expected that the Atlantic rainforest complex,one of the world’s most outstanding centres of bio- This paper is dedicated to Professor Hubert Ziegler ondiversity (Myers et al., 2000), possesses among its the occasion of his 75th birthday. The investigationplant species a plurality of ecophysiological mech- was supported by the programme PROBRAL fromanisms enhancing fitness and survival. This has never CAPES (Brazil) and DAAD (Germany), by the DFGbeen shown for the Atlantic forest sensu stricto, but (Germany), and by PRONEX-FINEP (Brazil). Wefrom the present results it can certainly be said that thank Buzios Bauen Club for accommodation and facil-ecophysiological diversity is a feature of the habitats ities; Itatiaia National Park (IBAMA) for support;which are marginal to the Atlantic forest. C3 physio- CNPq and CAPES for research grants; E. A. Mattoslogical forms and CAM are not prerogatives of one and U. Rascher for valuable suggestions to the manu-morphological form or another and, moreover, are script; D. S. D. Araujo for updated information onequally subjected to stress, and are often astonishingly restinga and dry forest plants; H. C. Lima and S. M.resistant, as seen by our photoinhibition and photo- Faria for updated information on diversity of Atlanticsynthesis results. forest legumes and nitrogen fixation; A. Costa, J. Du-
It is quite intriguing that both specialists and gen- tilh, M. F. Freitas and T. Wendt for some of the planteralists have on average the same overall water-use identification.efficiency, particularly among C3 plants. This resultindicates a very high genetic potential for acclimation
REFERENCESto a broad spectrum of environmental conditions, whichin some cases seem to have resulted in speciation (as Araujo DSD. 1997. Cabo Frio region, south-eastern Brazil.for the genera Myrsine and Vriesea, with more than In: Davis SD, Heywood VH, Herrera-Macbryde O, Villa-one species, each of them in specific habitats along Lobos J, Hamilton AC, eds. Centres of plant diversity: athe gradient), but in others could be the result of guide and strategy for their conservation 3. The Americas.genetically mediated (see Schlichting & Pigliucci, 1998) Washington: WWF/IUCN, 373–375.phenotypic plasticity (e.g. Andira legalis, Allagoptera Araujo DSD, Lima HC, Farag PRC, Lobao AQ, Sa CFC,arenaria, etc.; for studies in the Atlantic forest see Kurtz BC. 1998. O Centro de Diversidade Vegetal deRocas, Barros & Scarano, 1997). On the other hand, Cabo Frio: levantamento preliminar da flora. Anais do IVadaptation to the high light levels in the restinga Simposio de Ecosistemas Brasileiras, Aguas de Lindoia,
SP. Academia de Ciencias do Estado de Sao Paulo 3:habitats does not seem to have been fully achieved147–157 (Publicacoes ACIESP no. 104-III).yet, as indicated by the commonness of chronic photo-
Austin AT, Sala OE. 1999. Foliar �15N is negatively cor-inhibition and lower energy dissipation capacity whenrelated with rainfall along the IGBP transect in Australia.compared to average values of plants in the dry forestAustralian Journal of Plant Physiology 26: 293–295.and the high altitude vegetation.
Barbiere EB. 1984. Cabo Frio e Iguaba Grande, doisThe interpretation of the results obtained with themicroclimas distintos a um curto intervalo espacial. In:modern techniques used here to investigate plant nitro-Lacerda LD, Araujo DSD, Cerqueira R, Turcq B, eds.gen-use still requires much further research, as in-Restingas: origem, estrutura, processos, Niteroi: CEUFF,dicated by a recent review of the subject (Hogberg,413–423.1997). However, the diversity of responses found within
Bilger W, Bjorkman O. 1990. Role of the xanthophyll cycleand between habitats and within and between lifein photoprotection elucidated by measurements of light-forms, points to ecophysiological richness also in thisinduced absorbance changes, fluorescence and photo-
respect, and deserves future attention.synthesis in leaves of Hedera canariensis. Photosynthesis
The importance of plant traits related to fitness, such Research 25: 173–185.as those measured here, in understanding interspecific Bilger W, Schreiber U, Bock M. 1995. Determination ofinteraction and species roles in ecosystems has already quantum efficiency of photosystem II and of non-photo-been highlighted by Wardle et al. (1998), and is an chemical quenching of chlorophyll fluorescence in the field.obvious application to be expected from our current Oecologia 102: 425–432.results, in future studies. Bjorkman O, Demmig B. 1987. Photon yield of O2 evolution
On the one hand, it is stimulating to see in this first and chlorophyll fluorescence characteristics at 77K amongapproach that there lies a wealth of strategies to vascular plants of diverse origins. Planta 170: 489–504.deal with stress and environmental change in these Britton NL, Rose JN. 1937. The Cactaceae vol. I. Wash-
ington: The Carnegie Institution.apparently fragile vegetations. On the other, there is

362 F. R. SCARANO ET AL.
Broadmeadow MSJ, Griffiths H, Maxwell C, Borland Fonseca GAB. 1985. The vanishing Brazilian Atlantic forest.Biological Conservation 34: 17–43.A. 1992. The carbon isotope ratio of plant organic material
reflects temporal and spatial variations in CO2 within Fontoura T, Costa A, Wendt T. 1991. Preliminary checklistof the Bromeliaceae of Rio de Janeiro State, Brazil. Sel-tropical forest formation in Trinidad. Oecologia 89: 435–
441. byana 12: 5–45.Franco AC, Haag-Kerwer A, Herzog B, Grams TEE, BallCaldas LS, Luttge U, Franco AC, Haridasan M. 1997.
Leaf heliotropism in Pterodon pubescens, a woody legume E, Mattos EA, Scarano FR, Barreto SMB, Garcia MA,Mantovani A, Luttge U. 1996. The effect of light levelsfrom the Brazilian cerrado. Revista Brasileira de Fisiologia
Vegetal 9(1): 1–7. on daily patterns of chlorophyll fluorescence and organicacid accumulation in the tropical CAM tree Clusia hi-Camerik AM, Werger MJA. 1981. Leaf characteristics of
the flora of the High Plateau of Itatiaia, Brazil. Biotropica lariana. Trees Structure and Function 10: 359–365.Freitas MF. 1993. Cactaceae da area de protecao ambiental13(1): 39–48.
Cirne P, Scarano FR. 1996. Rebrotamento apos o fogo de da Massambaba, Rio de Janeiro, Brasil. Unpublished M.Sc.Dissertation. Rio de Janeiro: Botanica, Museu Nacional/Andira legalis (Leguminosae) em restinga fluminense. In:
Miranda HS, Saito CH, Dias BFS, eds. Impactos de quei- Universidade Federal do Rio de Janeiro.Gebauer G, Schulze E-D. 1991. Carbon and nitrogen iso-madas em areas de Cerrado e Restinga: Anais do Simposio
Impacto das Queimadas sobre os Ecosistemas e Mudancas tope ratios in different compartments of a healthy anda declining Picea abies forest in the Fichtelgebirge, NEGlobais. Brasılia: UnB/ECL, 128–136.
Cunha MW, Lima HC. 1992. Viagem a terra do Pau-Brasil. Bavaria. Oecologia 87: 198–207.Genty B, Briantais JM, Baker NR. 1989. The relationshipRio de Janeiro: Agencia Brasileira de Cultura.
Deleens E, Morot-Gaudry JF, Martin F, Thoreux A, between the quantum yield of photosynthetic electrontransport and quenching of chlorophyll fluorescence. Bio-Gojon A. 1997. Methodologie 15N. In: Morot-Gaudry JF,
ed. Assimilation de l’azote chez les plantes: aspects physio- chimica et Biophysica Acta 990: 87–92.Giulietti AM, Hensold N. 1990. Padroes de distribuicaologiques, biochimiques et moleculaires. Paris: INRA Edi-
tions, 265–280. geografica dos generos de Eriocaulaceae. Acta BotanicaBrasilica 4(1): 133–158.Dıaz M, Haag-Kerwer A, Wingfield R, Ball E, Olivares
E, Grams TEE, Ziegler H, Luttge U. 1996. Relationships Hibberd JM, Quick WP, Press MC, Scholes JD. 1996. Theinfluence of the parasitic angiosperm Striga gesnerioides onbetween carbon and hydrogen isotope ratios and nitrogen
levels of Clusia species and two other Clusiaceae genera the growth and photosynthesis of its host, Vigna un-guiculata. Journal of Experimental Botany 47: 507–512.at various sites and different altitudes in Venezuela. Trees
Structure and Function 10: 351–358. Hoehne FC. 1941. Leguminosas Papilionadas: generos Ma-chaerium e Paramachaerium. Flora Brasilica 25(3): 1–99.Farag PRC. 1999. Estrutura do estrato arboreo da mata
litoranea semicaducifolia sobre solo arenoso no Municıpio Hogberg P. 1997. 15N natural abundance in soil-plant sys-tems. New Phytologist 137: 179–203.de Buzios, RJ. Unpublished M.Sc. Dissertation. Rio de
Janeiro: Botanica, Museu Nacional/Universidade Federal Keeley JE, Keeley SC. 1989. Crassulacean acid metabolism(CAM) in high elevation tropical cactus. Plant Cell anddo Rio de Janeiro.
Faria SM, Franco AA de, Jesus RM, Menandro MS de, Environment 12: 331–336.Korner Ch. 1989. The nutritional status of plants from highBaitello JB, Mucci ESF, Dobereiner J, Sprent JI.
1984. New nodulating legume trees from South-East Brazil. altitudes: a worldwide comparison. Oecologia 81: 379–391.Lacerda LD, Araujo DSD, Maciel NC. 1993. Dry coastalNew Phytologist 98: 317–328.
Faria SM, Lewis GP, Sprent JI, Sutherland JM. 1989. ecosystems of the tropical Brazilian coast. In: van derMaarel E, ed. Dry coastal ecosystems: Africa, America, AsiaOccurrence of nodulation in the Leguminosae. New Phy-
tologist 111: 607–619. and Oceania. Amsterdam: Elsevier, 477–493.Leitao Filho HF. 1982. Aspectos taxonomicos das florestasFarquhar GD, Ehleringer JR, Hubick KT. 1989a. Carbon
isotope discrimination and photosynthesis. Annual Review do Estado de Sao Paulo. Silvicultura em Sao Paulo 16a(1):197–206.of Plant Physiology 40: 503–537.
Farquhar GD, Hubick KT, Coudon AG, Richards RA. Leme E, Marigo LC. 1993. Bromelias na natureza. Rio deJaneiro: Marigo Comunicacao Visual.1989b. Carbon isotope fractionation and plant water-use
efficiency. In: Rundel PW, Ehleringer JR, Nagy KA, eds. Luttge U. 1997. Physiological ecology of tropical plants. NewYork: Springer.Stable istopes in ecological research. New York: Springer,
21–40. Luttge U. 1999. One morphotype, three physiotypes: sym-patric species of Clusia with obligate C3 photosynthesis,FEEMA. 1988. Importancia da biota da regiao de Cabo Frio.
Rio de Janeiro: Fundacao Estadual do Meio Ambiente. obligate CAM and C3-CAM intermediate behaviour. PlantBiology 1: 138–148.Fernandes GW, Mattos EA, Franco AC, Luttge U, Ziegler
H. 1998. Influence of the parasite Pilostyles ingae (Raffles- Luttge U, Haridasan M, Fernandes GW, Mattos EA,Trimborn P, Franco AC, Caldas LS, Ziegler H. 1998.iaceae) on some physiological parameters of the host plant,
Mimosa naguirei (Mimosaceae). Botanica Acta 111: 51–54. Photosynthesis of mistletoes in relation to their hosts atvarious sites in tropical Brazil. Trees Structure and Func-Fernandes H de QB. 1994. Native palms of Espırito Santo
state. Acta Horticulturae 360: 95–111. tion 12: 167–174.
PLANT ECOPHYSIOLOGY AT THE BRAZILIAN ATLANTIC FOREST MARGIN 363
Martin CE. 1994. Physiological ecology of the Bromeliaceae. Pipoly JJ. 1996. Contributions toward a new flora of thePhilipines: I. A synopsis of the genus Myrsine (Myr-Botanical Review 60: 1–82.
Martin L, Suguio K. 1989. Excursion route along the Bra- sinaceae). Sida 17: 155–162.Rambo SJB. 1961. Migration routes of the south Brazilianzilian coast between Santos (state of Sao Paulo) and
Campos (northern state of Rio de Janeiro). International rainforest. Iheringia Serie Botanica 5(12): 1–54.Reitz R. 1970. Nictaginaceas. Flora Ilustrada CatarinenseSymposium on Global Changes in South America during
the Quaternary: past, present and future. Sao Paulo: Special 1: 1–52.Reitz R. 1984. Molluginaceas. Flora Ilustrada Catarinensepublication no. 2.
Martinelli G, Vaz AMSF. 1986–88. Padroes fitogeograficos 1: 16.Renvoize SA, Zuloaga F. 1984. The genus Panicum groupem Bromeliaceae dos campos de altitude da floresta pluvial
tropical costeira do Brasil. Rodriguesia 64–66(38–40): 3–10. Lorea (Gramineae). Kew Bulletin 39: 185–202.Ribas LA. 1992. Analise da estrutura e composicao especıficaMartinelli G, Bandeira J, Braganca JO. 1989. Campos
de Altitude. Rio de Janeiro: Editora Index. das comunidades vegetais de moitas de restinga, em Marica– RJ. Unpublished M.Sc. Dissertation. Brasılia: Ecologia,Mattos NF. 1979. O genero Andira Lam. (Leguminosae
Papilionoideae) no Brasil. Acta Amazonica 9: 241–266. Universidade de Brasılia.Rizzini CT. 1979. Tratado de Fitogeografia do Brasil. vol.Mayo S. 1991. A revision of Philodendron subgenus Mecono-
stigma (Araceae). Kew Bulletin 46(4): 601–681. 2. Sao Paulo: Edusp.Rocas G, Barros CF, Scarano FR. 1997. Leaf anatomyMedina E, Delgado M. 1976. Photosynthesis and night CO2
fixation in Echeveria columbiana Poellnitz. Photosynthetica plasticity of Alchornea triplinervia (Euphorbiaceae) underdistinct light regimes in a Brazilian montane Atlantic rain10: 155–163.
Medina E, Delgado M, Troughton JH, Medina JD. 1977. forest. Trees Structure and Function 11: 469–473.Sa CFC. 1992. A vegetacao da restinga de Ipitangas, ReservaPhysiological ecology of CO2 fixation in Bromeliaceae. Flora
166: 137–152. Ecologica Estadual de Jacarepia, Saquarema (RJ); fisio-nomia e listagem das angiospermas. Arquivos do JardimMeirelles ST, Mattos EA, Silva AC. 1997. Potential de-
siccation tolerant vascular plants from southeastern Brazil. Botanico do Rio de Janeiro 31: 87–102.Sarahyba LSP. 1993. Gramineae (Poaceae) da Area dePolish Journal of Environmental Studies 6(4): 17–21.
Montezuma RCM. 1997. Estruturacao da vegetacao de uma Protecao Ambiental da Massambaba, Rio de Janeiro, Bra-sil. Unpublished M.Sc. Dissertation. Rio de Janeiro: Bo-restinga de Ericaceae no Municıpio de Carapebus, RJ.
Unpublished M.Sc. Dissertation. Rio de Janeiro: Ecologia, tanica, Museu Nacional/Universidade Federal do Rio deJaneiro.Universidade Federal do Rio de Janeiro.
Morais M. 1996. Allagoptera (Palmae). Flora Neotropica Scarano FR, Ribeiro KT, Moraes LFD, Lima HC. 1997.Plant establishment on flooded and unflooded patches of aMonographs 73: 1–34.
Moreira BA, Rizzini CM. 1997. Loranthaceae e Viscaceae freshwater swamp forest in southeastern Brazil. Journalof Tropical Ecology 14: 793–803.da APA de Marica, Rio de Janeiro – Brasil. Acta Botanica
Brasilica 11(2): 1–9. Scarano FR, Rios RI, Esteves FA. 1998. Tree speciesrichness, diversity and flooding regime: case studies ofMuehe D. 1994. Lagoa de Araruama: geomorfologia e sedi-
mentacao. Cadernos de Geografia do IBGE 10: 53–62. recuperation after anthropic impact in Brazilian flood-prone forests. International Journal of Ecology and En-Myers N, Mittermeier RA, Mittermeier CG, Fonseca
GAB, Kent J. 2000. Biodiversity hotspots for conservation vironmental Sciences 24: 223–235.Scarano FR, Mattos EA, Franco AC, Herzog B, Ball E,priorities. Nature 403: 853–858.
Nobel PS, Harstsock TL. 1987. Drought-induced shifts Grams TEE, Mantovani A, Barreto S, Haag-KerwerA, Luttge U. 1999. Habitat segregation of C3 and CAMin daily CO2 uptake patterns for leafy cacti. Physiologia
Plantarum 70: 114–118. Nidularium (Bromeliaceae) in response to different lightregimes in the understory of a swamp forest in southeasternOsmond CB. 1978. Crassulacean acid metabolism: a curi-
osity in context. Annual Review of Plant Physiology 29: Brazil. Flora 194: 281–288.Scheinvar L. 1985. Cactaceas. Flora Ilustrada Catarinense379–414.
Otegui M. 1998. Sinopsis del genero Myrsine L. (Myr- 1: 1–384.Schlichting CD, Pigliucci M. 1998. Phenotypic evolution: asinaceae) en el Cono Sur de America del Sur. Candollea
53(1): 133–157. reaction norm perspective. Sunderland: Sinauer Associates.Schmidt JA. 1872. Nyctagineae. In: Martius CFP, EicherPate JS, Unkovich MJ, Erskine PD, Stewart GR. 1998.
Australian mulga ecosystems – 13C and 15N natural abund- AG, eds. Flora Brasiliensis, vol.14, part 2. Munchen, Leip-zig, 345–376.ances of biota components and their ecophysiological sig-
nificance. Plant, Cell and Environment 21: 1231–1242. Schreiber U, Bilger W. 1993. Progress in chlorophyll fluor-escence research: major developments during the last yearsPereira OJ, Araujo DSD. 2000. Analise florıstica das rest-
ingas dos estados do Espırito Santo e Rio de Janeiro. In: in retrospect. Progress in Botany 54: 151–173.Schulze E-D, Turner NC, Glatzel G. 1984. Carbon, waterEsteves FA, Lacerda LD, eds. Ecologia de Restingas e
Lagoas Costeiras do Brasil. Rio de Janeiro: NUPEM-UFRJ, and nutrient relations of two mistletoes and their hosts: ahypothesis. Plant Cell and Environment 7: 293–299.25–63.
364 F. R. SCARANO ET AL.
Schulze E-D, Gebauer G, Ziegler H, Lange OL. 1991. and other plants in the cerrado and neighbouring regionsof Brasil. Oecologia 105: 440–446.Estimates of nitrogen fixation by trees on an aridity gra-
Stewart GR, Schmidt S, Handley LL, Turnbull MH,dient in Namibia. Oecologia 88: 451–455.Erskine PD, Joly CA. 1995. 15N natural abundance ofSchulze E-D, Mooney HA, Sala OE, Jobbagy E, Buch-vascular rainforest epiphytes: implications for nitrogenmann N, Bauer G, Canadell J, Jackson RB, Loreti J,source and acquisition. Plant, Cell and Environment 18:Oesterheld M, Ehleringer JR. 1996. Water availability,85–90.rooting depth, and vegetation zones along an aridity gra-
Thiele A, Krause GH, Winter K. 1998. In situ study ofdient in Patagonia. Oecologia 108: 503–512.photoinhibition of photosynthesis and xanthophyll cycleSchulze E-D, Williams RJ, Farquhar GD, Schulze W,activity in plants growing in natural gaps of the tropicalLangridge J, Miller JM, Walker BH. 1998. Carbon andforest. Australian Journal of Plant Physiology 25: 189–195.nitrogen isotope discrimination and nitrogen nutrition of
van Sluys M, Stotz D. 1995. Padroes de visitacao a Vrieseatrees along a rainfall gradient in northern Australia. Aus-neoglutinosa por beija-flores no Espırito Santo, sudeste dotralian Journal of Plant Physiology 25: 413–425.Brasil. Bromelia 2(3): 27–35.Schulze E-D, Farquhar GD, Miller JM, Schulze W,
Vieira CM. 1997. Clusiaceae Lindley. In: Marques MCM,Walker BH, Williams RJ. 1999. Interpretation of in-ed. Florula da APA Cairucu, Parati, RJ: especies vasculares.creased foliar �15N in woody species along a rainfall gradientSerie Estudos e Contribuicoes no. 14. Rio de Janeiro:
in northern Australia. Australian Journal of Plant Physi-IPJBRJ-IBAMA.
ology 26: 296–298.Virginia RA, Delwiche CC. 1982. Natural 15N abundance of
Segadas-Vianna F. 1965. Ecology of the Itatiaia range,presumed N2-fixing and non-N2-fixing plants from selected
southeastern Brazil. I – altitudinal zonation of the vegeta- ecosystems. Oecologia 54: 317–325.tion. Arquivos do Museu Nacional 53: 7–30. Wardle DA, Barker GM, Bonner KI, Nicholson KS. 1998.
Segadas-Vianna F, Dau L. 1965. Ecology of the Itatiaia Can comparative approaches based on plant eco-range, southeastern Brazil. II – climates. Arquivos do Mu- physiological traits predict the nature of biotic interactionsseu Nacional 53: 31–53. and individual plant species effects in ecosystems? Journal
Sleumer H. 1954. Proteaceae americanae. Botanischer of Ecology 86: 405–420.Jahrbucher 76: 139–211. World Conservation Monitoring Centre. 1992. Global
Smith LB, Ayensu ES. 1976. A revision of American Vel- biodiversity: status of the Earth’s living resources. London:loziaceae. Smithsonian Contributions of Botany 30: 1–172. Chapman & Hall.
Smith LB, Downs RJ. 1977. Tillandsioideae (Bromeliaceae). Zaluar HLT. 1997. Especies focais e a formacao de moitasFlora Neotropica Monograph 14(2): 663–1492. na restinga aberta de Clusia, Carapebus, RJ. Unpublished
Smith LB, Downs RJ. 1979. Bromelioideae (Bromeliaceae). M.Sc. Dissertation. Rio de Janeiro: Ecologia, UniversidadeFlora Neotropica Monograph 14(3): 1493–2142. Federal do Rio de Janeiro.
Sprent JI, Geoghegan IE, Whitty PW, James EK. 1996. Zar JH. 1996. Biostatistical analysis. New Jersey: PrenticeHall.Natural abundance of 15N and 13C in nodulated legumes