fourier transform infrared-attenuated total...
TRANSCRIPT
Quim. Nova, Vol. 37, No. 3, 392-397, 2014Ar
tigo
http://dx.doi.org/10.5935/0100-4042.20140071
*e-mail: [email protected]
FOURIER TRANSFORM INFRARED-ATTENUATED TOTAL REFLECTANCE (FTIR-ATR) SPECTROSCOPY AND CHEMOMETRIC TECHNIQUES FOR THE DETERMINATION OF ADULTERATION IN PETRODIESEL/BIODIESEL BLENDS
Armando Guerrero Peñaa, Francisco Anguebes Franseschia,b,*, Mepivoseth Castelán Estradaa, Victorino Morales Ramosc, Reyes García Zarracinob, José C. Zavala Loríab and Atl V. Córdova Quirozb
aColegio de Postgraduados, Campus Tabasco. Periférico Carlos A. Molina s/n, C. P. 86500, H. Cárdenas, Tab., MéxicobFaculdad de Química, Universidad Autónoma del Carmen. Calle 56 No. 4 Esq. Av. Concordia, Col. Benito Juárez, C. P. 24180, Ciudad del Carmen, Camp., MéxicocColegio de Postgraduados, Campus Córdoba. Carr. Fed. Córdoba-Veracruz, km 348, Amatlán de los Reyes, C. P. 94946, Ver., México
Recebido em 20/03/2013; aceito em 02/11/2013; publicado na web em 26/02/2014
We propose an analytical method based on fourier transform infrared–attenuated total reflectance (FTIR-ATR) spectroscopy to detect the adulteration of petrodiesel and petrodiesel/palm biodiesel blends with African crude palm oil. The infrared spectral fingerprints from the sample analysis were used to perform principal components analysis (PCA) and to construct a prediction model using partial least squares (PLS) regression. The PCA results separated the samples into three groups, allowing identification of those subjected to adulteration with palm oil. The obtained model shows a good predictive capacity for determining the concentration of palm oil in petrodiesel/biodiesel blends. Advantages of the proposed method include cost-effectiveness and speed; it is also environmentally friendly.
Keywords: fuel adulteration; African palm oil; PCA analysis and partial least squares (PLS) regression.
INTRODUCTION
The necessity of reducing oil dependency and greenhouse gas emis-sions has forced many countries to explore the diversification of their energy matrices, incorporating renewable energies.1 Such energies are advantageous because they can be produced from renewable supplies. Biofuels are degradable, favoring an equilibrium of the carbon cycle; furthermore, biofuels have physical and chemical properties similar to those of gasoline and diesel oil and so can be used in combustion engines without requiring significant changes to those engines.2 Among biofuels, biodiesel has experienced an increasing demand all over the world in the last few years. The estimated biodiesel consumption in 2004 in the U.S.A. was about 1.135 × 10⁸ L; whereas the European Union consumed a volume of about 9.27 × 10⁸ L in 2006. Consumption is estimated to increase up to 2.649 × 109 L by 2015.3 Biodiesel is a biofuel obtained from transesterification of vegetable oil or animal fat with a low molecular weight alcohol under the presence of a catalyst.4
The most commonly used oils for synthesizing biodiesel are canola oil, soybean oil, sunflower oil, and palm oil. The cultivation of African palm oil for producing oil has undergone a significant increase in the last few years. In 2012, approximately 25% of the worldwide production of oil was obtained from this source. Its low cost and high yields (up to 5.5 t ha−1) make it a feasible option as a raw material for biodiesel production.5
Biodiesel can be used alone or in blends in diesel motors; cur-rently, several mixtures with petrodiesel are prepared in different ratios: 2%, 5%, 10%, 15%, and 20% (B2, B5, B10, B15, and B20), which are the most commonly used in the world. Its use contributes toward decreasing carbon dioxide emissions into the atmosphere.6
The adulteration of fuels is an illegal but very common practice throughout the world. It involves adding a solvent or vegetable oil to the fuel (diesel, gasoline, or biodiesel), changing the quality of the fuel and so causing it to not comply with quality control specifications.
Adulteration causes serious problems: it can block the injectors of engines, decrease the heat capacity of the fuel leading to increased consumption, and diminish the combustion efficiency with a corre-sponding increase in contaminant emissions such as solid particles, unburned hydrocarbons, and toxic gases, which favor the formation of acid rain, global warming, and the development of both respiratory and cardiac diseases. From the social and economic point of view, the adulteration of fuels causes tax avoidance, unfair competition in the market, and economic losses for the state and the consumer.7
The quality control standards for fuels as established in the ASTM (ASTM 4052, ASTM D 445, ASTM D 4737, ASTM D 93, and ASTM D 86) are based on the measurement of certain physical properties, so it is not possible to determine the adulteration of fuels with vegetable oils by means of these standards.8 To do this, specialized techniques such as ionization mass spectrometry coupled with high-resolution gas chromatography are required. Some inconveniences of this technique are the high cost of the equipment and its maintenance, the high costs of reagents, that qualified personnel are required for its operation, and samples need to be pretreated, thus increasing the overall cost of the analysis.9,10
As the use of petrodiesel/diesel blends increases every day throughout the world, it is becoming necessary to develop precise, fast, easy to use, and inexpensive methods for the determination of adulteration in fuels. Spectroscopic techniques have these advantages and it is feasible to apply them to the evaluation of fuel quality. One of the most useful spectroscopic techniques for this purpose is infrared spectroscopy, which is used for monitoring the synthesis of biodiesel in real time11-17 and for determining the concentration of biodiesel in mixtures with petrodiesel.18-21 Currently, infrared spectroscopy, spectrofluorimetry, RAMAN spectroscopy, and nuclear magnetic resonance spectroscopy, together with chemometric analysis enable the development of predictive models for the determination of adul-teration with vegetable oil of diesel or diesel/biodiesel blends.22–24 On the other hand, analysis using PCA and SIMCA (screening) allows the detection of samples adulterated with used vegetable oil.25–27
Fourier transform infrared-attenuated total reflectance (FTIR-ATR) spectroscopy 393Vol. 37, No. 3
Chemometric methods
Chemometric or multivariate analysis is defined as a chemical discipline that uses mathematical and statistical methods to design me-asurement procedures and to obtain as much chemical information as possible from data analysis.28 Some of these methods are listed below.
Principal components analysis (PCA)
This method is used to reduce the dimensionality of a multivariate data set in exploratory analysis to visualize the significant information from the multivariate signals, and to represent them with a reduced number of components.29
Partial least squares (PLS) regression
This is one of the most commonly used methods in multivariate calibration. It allows determination of the degree of relationship between a set of X-predictor variables and a set of y responses or output variables. It is widely used for multicomponent spectral analy-sis, especially for data obtained from IR, NIR, UV–Vis, RAMAN spectroscopy, and spectrofluorimetry. To build a prediction model using partial least squares (PLS) regression, either regions or the full spectrum that provide relevant information that solves a speci-fic problem can be employed.30 When building a prediction model using PLS regression, mathematically a linear expression is obtained (Equation 1).
(1)
where Y represents the predictive property, in this case the palm oil concentration; I is the intensity of each spectrum in the calibrated region; b is a vector of coefficients calculated during the calibration that relates the physical or chemical property with the spectroscopic data; and e is the matrix containing the errors.31
A large volume of African palm oil is produced worldwide that, because of its low cost, could be used to adulterate fuels. The aim of this work was to develop a methodology using fourier transform in-frared–attenuated total reflectance (FTIR–ATR) spectroscopy together with chemometric techniques for determination of the adulteration of petrodiesel or petrodiesel/biodiesel blends with African crude palm oil, and to develop a prediction model for determining the concen-tration of palm oil in petrodiesel/biodiesel blends.
EXPERIMENTAL
Methanol and sodium hydroxide reactive grade from Fermont were used for the synthesis of biodiesel. African crude palm oil commercial grade was acquired from AGROIPSA S.A. of Jalapa, México. Petrodiesel was acquired from a Petróleos Mexicanos (PEMEX) certified franchise.
Synthesis of biodiesel
The biodiesel used in this study was synthesized in a one-liter spherical glass flask equipped with a straight condenser using water as cooling medium for condensing the methanol vapor. A digital thermometer (Thomas Scientific 0.01 °C) with a platinum sensor was used for the measurement of reaction temperature. Mixing of reagents was performed under heating conditions by using magnetic stirring and a heating mantle.
The catalyst was prepared within the reactor by dissolving sodium hydroxide in methanol under magnetic stirring. Then 500 g of African
crude palm oil was added to the reactor containing the catalyst, the mixture was heated up to 58 °C, and the reaction was maintained for 2 h. A methanol to oil molar ratio of 12:1 and a sodium hydroxide concentration of 2% w/w, based on the weight of the oil, were used.
When the reaction was completed, the mixture was poured into a separator funnel and the biodiesel was washed with distilled water. During this process two immiscible phases were formed. The lower phase, consisting of glycerol and soap, was separated by gravity. The biodiesel washing process was repeated until no more soap was seen. The upper phase, consisting of methyl esters, was poured into a distillation flask and distilled at 100 °C to remove excess methanol and water. To remove trace contaminants, the biodiesel was refined through a glass column packed with 60 g of Amberlite Dry 10 ionic resin. Aliquots were taken for subsequent chemical analysis.
Instrumentation
Chromatographic analysisThe biodiesel composition was determined by chromatographic
analysis. A gas chromatograph model 6890 coupled to a mass detector model 5973N, Agilent, equipped with a chromatographic column HP 5MS 5% diphenyl–95% dimethylsiloxane (25 m × 0.2 mm × 0.33 μm) and ionization technique EI at 70 eV was used. Helium was used as the carrier gas at a flow of 1 mL min−1. The initial oven tempera-ture was set at 40 °C for 1 min; the column temperature was set at 250 °C, the linear increase in temperature was set at a rate of 5 °C min−1 up to 250 °C, and the temperature was maintained at 250 °C for 5 min. The injector and the detector were maintained at 250 °C and 280 °C, respectively. A volume of 500 μL of dichloromethane was added to 2 μL of the test sample, and 1 μL of this was injected into the chromatograph. The mass spectra and retention times were compared with the NIST data base (version 1.7a) to identify all the components of biodiesel and their concentrations. The analysis in-dicated that biodiesel from palm oil had more than 99.5 wt% purity of methyl esters.
FTIR–ATR analysisThe samples were analyzed with a Fourier transform infrared
spectrophotometer Agilent Cary 680, equipped with a diamond tipped ATR accessory. All spectra were acquired at 25 ± 1 °C and 16 scans with a spectral resolution of 2 cm−1 per analyzed sample were performed. The analysis region ranged from 551 cm−1 to 4000 cm−1. The cell was cleaned three times with acetone after each spectrum was acquired.
Software
For the principal components analysis and the development of the prediction model, the numerical data from the acquired spectra were exported into Microsoft Excel 2010 and subsequently exported again into the Piruette V.4.5 of Infometrix software. All absorbance data between 551 cm−1 and 650 cm−1 were removed because of noise in the spectra, which caused these spectra to be not useful for model construction.
Sample preparation
To perform the principal components analysis (PCA), 142 sam-ples were prepared using a balance (OHAUS±0.001 g), at a constant temperature of 25 °C. The 142 analyzed samples were in three diffe-rent classes. The first class, containing 27 samples, was obtained from the mixture of petrodiesel with crude palm oil at different ratios. The petrodiesel concentration ranges from 0 wt% to 100 wt% whereas

Peña et al.394 Quim. Nova
the African crude palm oil concentration ranges from 0 wt% to 19.5 wt%. The second class, containing 83 blends, was obtained from the mixture of petrodiesel, biodiesel and African crude palm oil at different ratios. The petrodiesel concentration was in the interval from 0 wt% to 100 wt%; the biodiesel concentration varied from 0 wt% to 95 wt% and the oil one from 0 wt% to 19.5 wt%. The third class, containing 32 samples, was obtained from the mixture of petrodiesel with biodiesel; additionally, this last group was not adulterated with oil. The petrodiesel and biodiesel concentrations ranged from 0 wt% to 100 wt% and 0 wt% to 95 wt%, respectively.
Chemometric analysis
The infrared spectral data from the analysis of the 142 samples were used to perform the principal components analysis (PCA). The data from each sample contain 1738 variables; a total of 246,796 varia-bles were analyzed. The PCA was constructed using several technical preprocessing methods on the spectra: a central mean, normalization, and multiple transformations to obtain a 95% confidence interval.
To determine the adulteration of petrodiesel/biodiesel blends with palm oil, the prediction model was built using PLS regression, and the infrared spectral data from the analysis of 83 samples of the second class were used. A total of 76 samples were used for the calibration model and seven for the external validation.
The spectral data were statistically and mathematically treated as a central mean and ten components were used for the construction of the calibration model. The model was validated by cross-validation using “leave one out”, and a set of seven samples prepared in the laboratory and not used for the construction of the calibration model were used for the external validation.
To determine the predictive capacity of the model the following statistical parameters were calculated: the optimum number of latent variables; the standard error of calibration (SEC); the standard error of validation (SEV); the similarity criterion by means of the (SEC/SEV) ratio; the coefficient correlation of calibration (r Cal), which determi-nes the degree of correlation between the observed oil concentration and that predicted by the calibration model; the coefficient correlation of validation (r Val), which determines the correlation between the real oil concentration and that predicted by the validation model; the paired data Student’s t-test; and the systematic error (bias).31,32
RESULTS AND DISCUSSION
Classification of petrodiesel-palm oil/petrodiesel-palm biodiesel-palm oil/petrodiesel-palm biodiesel blends using PCA
The PCA analysis is possible because the infrared spectra from petrodiesel, palm biodiesel, and African crude palm oil show di-fferent absorbance regions (Figure 1). The palm biodiesel and the African crude palm oil have multiple absorption bands not present in the petrodiesel. The bands near 1200 cm−1 are assigned to the axial asymmetric stretching vibrations of the bonds pertaining to the CC(=O)-O functional group; those bands near 1168 cm−1 correspond to the axial asymmetric stretching vibrations of bonds characteristic to the O-C-C ester group. The region between 900 cm−1 and 1300 cm−1 is better known as the fingerprint region; it is made up of overlapping bands that correspond to multiple vibrational movements attributed to different types of bonds and functional groups of palm biodiesel and palm oil. The region between 1700 cm−1 and 1800 cm−1 presents a strong absorption band corresponding to stretching vibrations of the carbonyl (C=O) functional group; the esters from the oil have a maximum absorbance at 1742 cm−1, whereas those from biodiesel are at 1745 cm−1.
The third region is in the interval from 2800 cm−1 to 3020 cm−1. The absorption band located at 3010 cm−1 corresponds to stretching motions of the double bond (C=C) in cis position of unsaturated es-ters in biodiesel and crude palm oil. The peaks with high absorption intensities between 2800 cm−1 and 2995 cm−1 are assigned to sym-metric and asymmetric stretching vibrations of the methylene group.
The PCA analysis reveals the differences between the petrodiesel, palm biodiesel, and palm oil spectra. The scores from the three--dimensional plot divide the samples into three groups, as shown in Figure 2. The first component (PC1) was the major contributor to the separation of all samples; therefore the scores were distributed all along PC1, explaining 86.2% of the total variability. The second and third components explained 9% and 2.3% of the variability, respec-tively. The three components correspond to 1490 original variables. The sum of the three PCs explains 97.5% of the total variance and 2.5% corresponds to the cumulative residual variance or unexplai-ned cumulative variance. The contributions of PC2 and PC3 for the separation of petrodiesel/palm oil and petrodiesel/biodiesel/palm oil blends were of a lesser degree than that of PC1. However, their con-tributions were equally important for the separation of unadulterated petrodiesel/biodiesel blends.
In Figure 2, the first class, located in the upper part, corresponds to the 27 petrodiesel/palm oil blends (green points). The variables described in the loading graph are located in the same quadrant of a sample group within the scores graph and they are also the most important ones in describing a particular sample group. Thus, the loading graph indicates that the petrodiesel samples have high palm oil content, related to several variables. This is caused by the
Figure 2. Principal component analysis: the spectral data shows the formation of three groups corresponding to each class of fuel blends
Figure 1. FTIR spectra of (a) petrodiesel, (b) palm oil and (c) palm biodiesel
Fourier transform infrared-attenuated total reflectance (FTIR-ATR) spectroscopy 395Vol. 37, No. 3
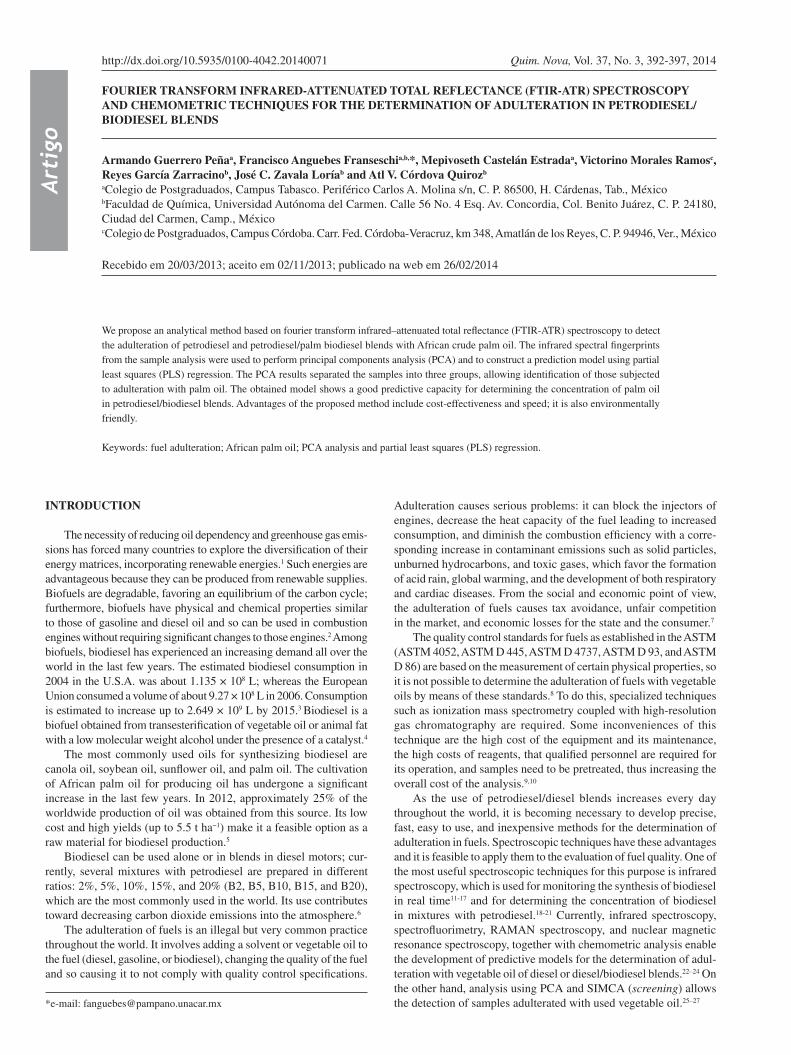
spectral data of petrodiesel and palm oil showing greater differences (Figure 1). These differences in the infrared spectra made it possible to determine the palm oil content in petrodiesel blends (Figure 3).
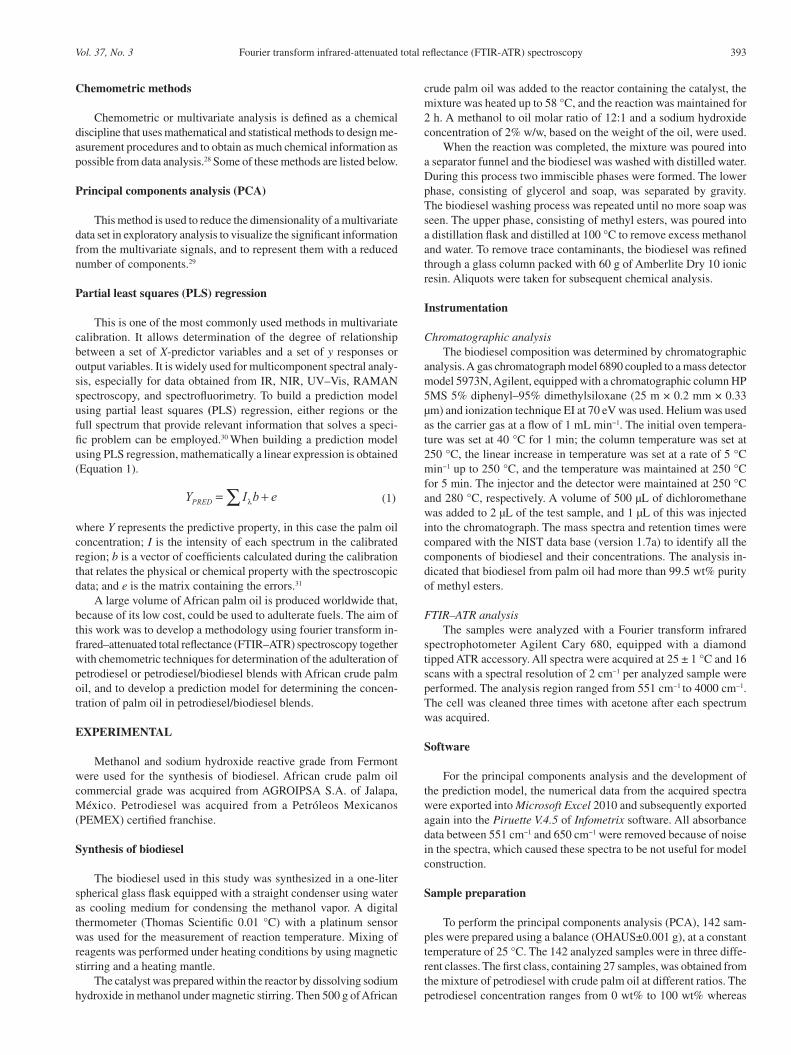
The second class, located in the middle part of Figure 2, corre-sponds to the petrodiesel/palm biodiesel/palm oil blends (red points). The palm biodiesel and the African crude palm oil have different absorption bands (Figure 1). The peak between 1075 cm−1 and 1100 cm−1 corresponds to asymmetric axial stretching of O-CH2-C and the absorption band 1370–1400 cm−1 corresponds to the functional group O-CH2 in the glycerol moiety of triglyceride, diglyceride, and monoglyceride in the palm oil, which are not present in the biodiesel and petrodiesel spectra. The palm biodiesel spectrum presents bands between 1425 cm−1 and 1450 cm−1, which correspond to the asymmet-ric bending of CH3, whereas the bands between 1180 cm−1 and 1200 cm−1 correspond to asymmetric axial stretching of O-CH3, which are not present in the petrodiesel and palm oil spectra. These differences in the infrared spectra made it possible to determinate the palm oil content in petrodiesel blends (Figure 4).
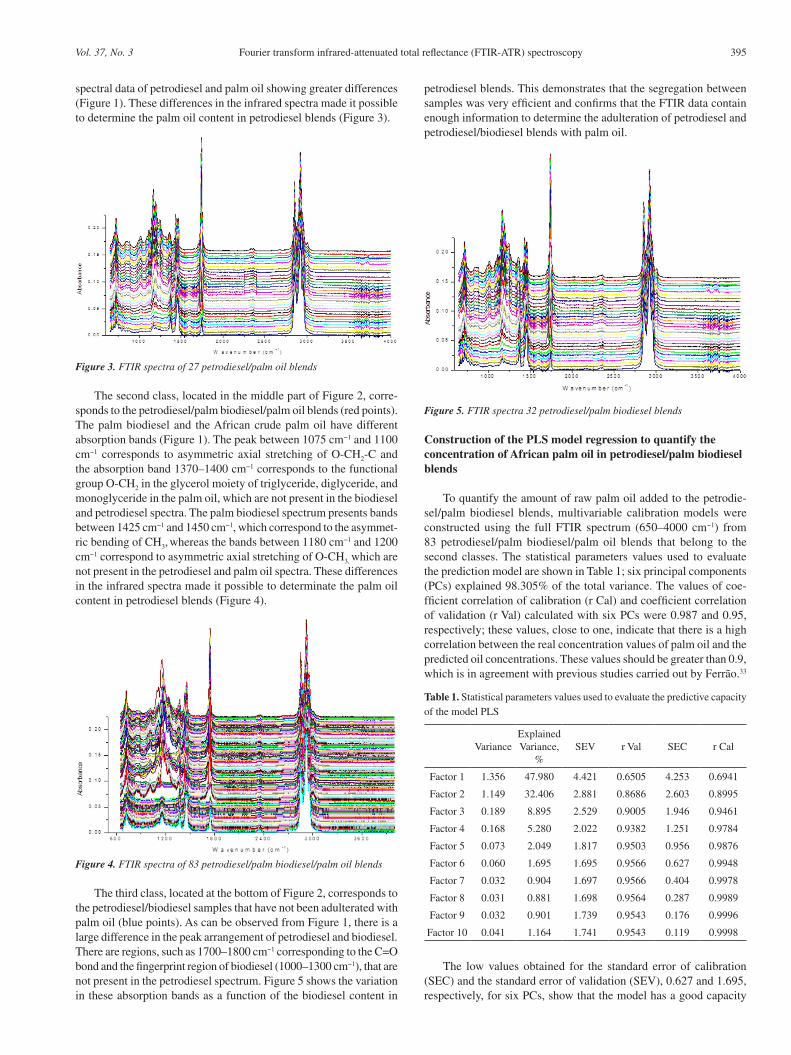
The third class, located at the bottom of Figure 2, corresponds to the petrodiesel/biodiesel samples that have not been adulterated with palm oil (blue points). As can be observed from Figure 1, there is a large difference in the peak arrangement of petrodiesel and biodiesel. There are regions, such as 1700–1800 cm−1 corresponding to the C=O bond and the fingerprint region of biodiesel (1000–1300 cm−1), that are not present in the petrodiesel spectrum. Figure 5 shows the variation in these absorption bands as a function of the biodiesel content in
petrodiesel blends. This demonstrates that the segregation between samples was very efficient and confirms that the FTIR data contain enough information to determine the adulteration of petrodiesel and petrodiesel/biodiesel blends with palm oil.
Construction of the PLS model regression to quantify the concentration of African palm oil in petrodiesel/palm biodiesel blends
To quantify the amount of raw palm oil added to the petrodie-sel/palm biodiesel blends, multivariable calibration models were constructed using the full FTIR spectrum (650–4000 cm−1) from 83 petrodiesel/palm biodiesel/palm oil blends that belong to the second classes. The statistical parameters values used to evaluate the prediction model are shown in Table 1; six principal components (PCs) explained 98.305% of the total variance. The values of coe-fficient correlation of calibration (r Cal) and coefficient correlation of validation (r Val) calculated with six PCs were 0.987 and 0.95, respectively; these values, close to one, indicate that there is a high correlation between the real concentration values of palm oil and the predicted oil concentrations. These values should be greater than 0.9, which is in agreement with previous studies carried out by Ferrão.33
The low values obtained for the standard error of calibration (SEC) and the standard error of validation (SEV), 0.627 and 1.695, respectively, for six PCs, show that the model has a good capacity
Figure 4. FTIR spectra of 83 petrodiesel/palm biodiesel/palm oil blends
Figure 3. FTIR spectra of 27 petrodiesel/palm oil blends
Table 1. Statistical parameters values used to evaluate the predictive capacity of the model PLS
VarianceExplained Variance,
% SEV r Val SEC r Cal
Factor 1 1.356 47.980 4.421 0.6505 4.253 0.6941
Factor 2 1.149 32.406 2.881 0.8686 2.603 0.8995
Factor 3 0.189 8.895 2.529 0.9005 1.946 0.9461
Factor 4 0.168 5.280 2.022 0.9382 1.251 0.9784
Factor 5 0.073 2.049 1.817 0.9503 0.956 0.9876
Factor 6 0.060 1.695 1.695 0.9566 0.627 0.9948
Factor 7 0.032 0.904 1.697 0.9566 0.404 0.9978
Factor 8 0.031 0.881 1.698 0.9564 0.287 0.9989
Factor 9 0.032 0.901 1.739 0.9543 0.176 0.9996
Factor 10 0.041 1.164 1.741 0.9543 0.119 0.9998
Figure 5. FTIR spectra 32 petrodiesel/palm biodiesel blends

Peña et al.396 Quim. Nova
to predict palm oil concentration in petrodiesel/biodiesel blends. This is confirmed by the similarity criterion (SEC/SEV), in which the 0.5263 value shows a good fit of the model, as this value is in the interval between 0.5 and 1, which is the same criterion used by Ferrão in prior studies.34
The slope and intercept in the regression line are close to one and to zero, respectively (Figure 6); this indicates a low systematic error in the regression. This is also confirmed by the low value (0.076) obtai-ned for bias. These results are in agreement with previous studies.7,35
The oil concentrations predicted by the PLS model were compa-red with the real oil concentrations by means of a paired data Student’s t-test. The t (tcal) values were compared with tabulated values (ttab) for 75 degrees of freedom and a 95% confidence value. The calculated tcal
value was 0.0013, while the tabulated ttab value was 1.670; therefore, ttab > tcal. From this, we can conclude with 95% certainty that the predicted palm oil concentrations are not statistically different from the real palm oil concentrations. This confirms that the constructed prediction model using PLS/FTIR–ATR provides similar results to real values and that it can be used to predict palm oil concentrations in petrodiesel/biodiesel blends.
CONCLUSIONS
The spectral fingerprints generated by FTIR-ATR and explained through the chemometric techniques of PCA are sufficient infor-mation to differentiate petrodiesel and petrodiesel/palm biodiesel samples containing African crude palm oil.
The PLS model based on FTIR spectra developed in this work proved to be suitable as a practical analytical method of predicting the African crude palm oil content in petrodiesel/palm biodiesel blends from 0 wt% to 19.5 wt%. The advantages of this method are its ease of application; i.e., it does not require any pretreatment of the samples or the use of standards, and that it is not a destructive method, thus making it environmentally friendly. It is also a fast and inexpensive technique, unlike chromatography techniques.
Our proposed method can be used in quality control systems to differentiate pure biodiesel from diesel/biodiesel blends or adultera-ted biodiesel with palm oil. In addition, it enables estimation of the degree of adulteration.
ACKNOWLEDGMENTS
We thank the Universidad Autónoma del Carmen, the PROMEP project, PROMEP/103.5/09/4363, and Research Line 3: Alternate
Energy and Biomaterials of Colegio de Posgraduados, for the funds to develop this project. We are also grateful to the Centro de Investigaciones Químicas (CIQ) of the Universidad Autónoma del Estado de Morelos, for the chromatographic analysis of biodiesel.
REFERENCES
1. Quanlu, W. M.; Hong, H.; Front. Energy Power Eng. Chin. 2009, 3, 212. 2. Schneider, U. A.; Smih, P.; Energy Effic. 2009, 2, 195. 3. Haas, M. J.; Scott, K. M.; Foglia, T. A.; Marmer, W. N.; J. Am. Oil
Chem. Soc. 2007, 84, 963. 4. Lotero, E.; Liu, Y.; Lopez, D. E.; Suwannakarn, K.; Bruce D. A.;
Goodwin, J. G.; Ind. Eng. Chem. Res. 2005, 44, 5353. 5. Fargione, J. E.; Plevin, R. J.; Hill, J. D.; Annu. Rev. Ecol. Evol. Syst.
2010, 41, 351. 6. Chauhan, S. K.; Gangopadhyay, S.; Singh, N.; Environ. Chem. Lett.
2009, 7, 289. 7. Corgozinho, N. C. C.; Pasa, M. D. V.; Barbeira J. S. P.; Talanta 2008,
76, 479. 8. Oliveira, F. C. C.; Brandao, R. R. C.; Ramalho, H.; Da Costa, A. F. L.;
Suarez, A. Z. P.; Rubim, J. C.; Anal. Chim. Acta 2007, 587, 194. 9. Meira, M.; Quintella, C. M.; Ferrer, T. M.; Gonçalves, H. R.; Guimarães,
K.; Santos, M. A.; Da Costa, N.P. R.; Luri, M. P.; Quim. Nova 2011, 34, 621.
10. Guerrero, A.; Anguebes, F. F.; Silvan de la Fuente, C.; Gutiérrez, G. R.; Ingeniería Química 2012, 512, 66.
11. Knothe, G.; J. Am. Oil Chem. Soc. 2001, 78, 1025. 12. Dubé, M. A.; Zheng, S.; McClean, D. D.; Morris, K.; J. Am. Oil Chem.
Soc. 2004, 81, 599. 13. Zagonel, G. F.; Peralta, Z. P.; Ramos, L. P.; Talanta 2004, 63, 1021. 14. Ghesti, G. F.; Macedo, J. L.; Braga, V. S.; De Souza, T. C. P. A.; Parente,
C. I. V.; Figueredo, E. S.; Resck, I. S.; Dias, J. A.; Dias, S. C. L.; J. Am. Oil Chem. Soc. 2006, 83, 597.
15. Siatis, N. G.; Kimabaris, A. C.; Pappas, C. S.; Tarantilis, P. A.; Polissiou, M. G.; J. Am. Oil Chem. Soc. 2006, 83, 53.
16. Bezerra, L. L. F.; Vera Cruz, V. F.; Fernandes, P. C.; Silveira, P. A. P.; Stragevitch, L.; Pimentel, M. F.; Fuel 2010, 89, 405.
17. Anguebes, F.; Rangel, M. M.; Castelán, E. M.; Guerrero, P. A.; Cervantes. J. M.; Aguilar, V. M.; Herrera, K. W. A.; Ingeniería Química 2011, 498, 238.
18. Mirghani, M. E. S.; Kabbashi, N. N.; Alam, M. Z.; Qudsieh, I.Y.; Alkatib, M. F. R.; J. Am. Oil Chem. Soc. 2011, 88, 1897.
19. Monteiro, M. R.; Ambrozin, R. P.; Da Silva, S. M.; Boffo, E. F.; Rodrigues, P. E.; Morais, L. L.; Ferreira, A. G.; Talanta 2009, 78, 660.
20. Guerrero, A.; Anguebes, F.; Castelán, M.; Morales, V.; León, I.; Zavala, J. C.; Córdova, A. V.; Am. J. Anal. Chem. 2013, 4, 273.
21. Guerrero, A.; Anguebes, F.; Castelán, M.; Morales, V.; García, R.; Córdova, A. V.; Zavala, J. C.; Am. J. Anal. Chem. 2013, 4, 343.
22. Gaydou, V.; Kister, J.; Dupuy, N.; Chemometrics and Intelligent Labora-tory Systems 2011, 106, 190.
23. Soares, P. I.; Rezende, F. T.; De Cassia, R.; Pereira, C.; Dos Santos, G. C.; Fortes, C. P.; J. Braz. Chem. Soc. 2011, 22, 1229.
24. Vera, C. V. F.; Fernandes, B. P. F.; Pimentel, M. F.; Coelho, P. M. J.; Fernandes, P. C.; Anal. Chim. Acta 2012, 716, 101.
25. Soares, P. I.; Monteiro de Oliveira; R. R.; Darnot, P. R. G.; Augusti, R.; Pereira, F. I. C.; Duarte, P. V. M.; Quim. Nova 2011, 34, 1439.
26. Coelho, P. M. J.; Fernandes, P. C.; Pimentel, M. F.; Vera Cruz, V. F.; Brito, S. A. G.; Talanta 2011, 85, 2159.
27. De Souza, A.; Poppi, R. J.; Quim. Nova 2012, 35, 223. 28. Guerrero, P. A.; Disertación de Doctor, Universidad de Salamanca,
España, 2006. 29. Pérez, P. J. L.; Guerrero, P. A.; García, P. C.; Moreno, C. B.; J.
Chromatogr. A 2004, 1047, 101.
Figure 6. Regression model obtained by PLS regression to quantify the concentration of African palm oil (y) in petrodiesel/biodiesel blends, using FTIR-ATR spectral fingerprints

Fourier transform infrared-attenuated total reflectance (FTIR-ATR) spectroscopy 397Vol. 37, No. 3
30. Kumar, K.; Mishra, A. K.; Journal of Fluorescence 2012, 22, 339. 31. Meléndez, L. V.; Lache, A.; Orrego, R. J. A.; Pachón, Z.; Mejía, O. E.;
J. Pet. Sci. Eng. 2012, 90, 56. 32. Braga, J. W. B.; Poppi, R. J.; J. Pharm. Sci. 2004, 93, 2124. 33. Olivieri, A. C.; Faber, N. K. M.; Ferre, J.; Boqué, R.; Kalivas, J. H.;
Mark H.; Pure Appl. Chem. 2006, 78, 633.
34. Ferrão, M. F.; Carvalho, C. W.; Muller, E. I.; Davanzo, C. U.; Ciencia e Tecnologia de Alimentos 2004, 24, 333.
35. Divya, O.; Mishra, A. K.; Anal. Chim. Acta 2007, 82, 592.