fourth quarter 2014 -...
TRANSCRIPT

Page 1 | McGuire Real Estate Quarterly Report - 4th Quarter 2014
* Data is sourced from the San Francisco Multiple Listing Service, the East Bay Region District Listing Service, Bay Area Real Estate Information Services, and MLS Listings (MLS). MLS data is provided by individual listing brokerages. These are sources we deem reliable. We have no reason to doubt their accuracy, but we do not guarantee them. Past performance does not guarantee future performance
FOURTH QUARTER 2014Q U A R T E R LY R E P O R T

Page 2 | McGuire Real Estate Quarterly Report - 4th Quarter 2014
* Data is sourced from the San Francisco Multiple Listing Service, the East Bay Region District Listing Service, Bay Area Real Estate Information Services, and MLS Listings (MLS). MLS data is provided by individual listing brokerages. These are sources we deem reliable. We have no reason to doubt their accuracy, but we do not guarantee them. Past performance does not guarantee future performance

Page 3 | McGuire Real Estate Quarterly Report - 4th Quarter 2014
* Data is sourced from the San Francisco Multiple Listing Service, the East Bay Region District Listing Service, Bay Area Real Estate Information Services, and MLS Listings (MLS). MLS data is provided by individual listing brokerages. These are sources we deem reliable. We have no reason to doubt their accuracy, but we do not guarantee them. Past performance does not guarantee future performance
Letter from the President Page 4
Regional Market Trends Page 5
The Luxury Market Page 8
San Francisco County Page 12
San Mateo County Page 16
Marin County Page 18
Napa County Page 20
Sonoma County Page 22
Alameda County Page 24
Contra Costa County Page 26
Counties Represented
San Francisco
San Mateo
Marin
Contra Costa
Alameda
Sonoma
Napa
Table of Contents
Page 4 | McGuire Real Estate Quarterly Report - 4th Quarter 2014
* Data is sourced from the San Francisco Multiple Listing Service, the East Bay Region District Listing Service, Bay Area Real Estate Information Services, and MLS Listings (MLS). MLS data is provided by individual listing brokerages. These are sources we deem reliable. We have no reason to doubt their accuracy, but we do not guarantee them. Past performance does not guarantee future performance
Charles Moore
President and CEO
view this report on our web site:
mcguire.com/quarterly_report
Prices Up, Sales Low But Stable in Q4 2014Much like the third quarter of 2014, the fourth quarter showed few surprises. Both high average sales prices and low sales volume—products of strong demand and depleted inventory—continued across the Bay Area. For sellers, these combined trends continued to spell major profits.
All seven counties we represent saw year-over-year average home sales price gains of at least 7 percent. Meanwhile, inventory shortages continue to be a major factor for prospective buyers. This quarter’s sales volume numbers were, by and large, very similar to those of Q4 2013.
An emerging trend found in Q4 2014 was that of buyers’ increased due diligence, taking the time to thoroughly investigate the market more so than they did earlier in the year. This was reflected in the average days on market (DOM), which rose to 40 days this quarter—a slight jump from the average 36 DOM in Q3—but in line with the seasonal equilibrium of the previous year.
San Francisco rebounded nicely from a down third quarter, leading the Bay Area with a $1.535 million average home sale price, up an impressive 12 percent from Q3 2014 and 14 percent from Q4 2013. This also occurred as the city saw a 9 percent sales volume gain from Q3. Average condominium sales prices in the city stayed above the $1 million mark for the fifth straight quarter, although sales volume was slightly down both from the previous quarter and from Q4 2013. With a host of massive construction projects underway, the condominium market is expected to open up nicely by 2016.
Looking forward, we feel confident that the market will continue to act in very much the same fashion as it has over the past few years. What this means is sales prices will continue to rise as inventory remains very tight. A recent report from the California Association of REALTORs® (CAR) predicted a 5.2 percent rise in the state’s median home price in 2015, down from more than double that figure as predicted prior to 2014. However, CAR Vice President and Chief Economist Leslie Appleton-Young added, “The state will continue to see a bifurcated market, with the San Francisco Bay Area outperforming other regions, thanks to a more vigorous job market and tighter housing supply.”
Bay Area sellers are well aware that they can fetch record prices for their homes, but the uncertainty remains as to where they would move once transitioned to the buyer side of the fence. In all, this market remains red hot, and will continue to generate great returns for sellers for the foreseeable future. Still, opportunities are certainly at hand for those buyers willing to pay top dollar.
Letter from the President
“An emerging trend found in Q4 2014 was that of buyers’ increased due diligence, taking
the time to thoroughly investigate the market more so than they did earlier in the year.”

Page 5 | McGuire Real Estate Quarterly Report - 4th Quarter 2014
* Data is sourced from the San Francisco Multiple Listing Service, the East Bay Region District Listing Service, Bay Area Real Estate Information Services, and MLS Listings (MLS). MLS data is provided by individual listing brokerages. These are sources we deem reliable. We have no reason to doubt their accuracy, but we do not guarantee them. Past performance does not guarantee future performance
49+49+52+49+50+46+49+48+49+48+57+52+64+58+68+65+68+70+77+69+6847+48+48+50+47+45+51+47+46+45+53+56+52+58+64+65+62+72+74+70+6828+30+28+31+30+29+26+30+28+27+27+31+30+33+31+38+38+38+41+40+4023+24+21+24+24+22+20+23+22+21+20+24+25+25+26+32+32+31+37+36+34
Regional Market Trends
Q4’09 Q1‘10 Q2‘10 Q3‘10 Q4‘10 Q1‘11 Q2‘11 Q3‘11 Q4‘11 Q1‘12 Q2‘12 Q3’12 Q4‘12 Q1‘13 Q2‘13 Q3‘13 Q4‘13 Q1‘14 Q2‘14 Q3‘14 Q4‘14
$1,400
$1,200
$1,000
$800
$600
$400
$200
0
Average Sales Price Five Years/Quarter (in thousands)
East Bay North Bay Mid-Peninsula San Francisco
The fourth quarter of 2014 displayed little variation from the familiar, pervasive trends that have defined the Bay Area as the country’s hottest real estate market. Average home sales prices were up by at least 7 percent year-over-year in all seven counties we represent. This combined for an average home sales price of $879,131 across the Bay Area—up 11 percent from Q4 2013.
While strong prices persisted, so did the dearth of inventory which has been another main story featured over the boom of the past few years. Sales volume, as a whole, was almost exactly in line with Q4 2013, with the 8,379 total homes sold declining just two percent year-over-year. Yet neither fourth quarter figure was impressive, and even the strong gains haven’t completely offset the past year’s reduction in available properties. The average 40 days on market (DOM) before a sale for the all seven counties combined remained tight, but did experience a subtle rise in overall turnaround time. This was mainly
due to buyers practicing a bit more due diligence than during the feeding frenzy of previous quarters.
San Francisco was an area highlight with its average home sale reaching $1.535 million in Q4 2014, a 12 percent rise from the previous quarter and 14 percent rise from the previous year. This monetary gain was further bolstered by a 9 percent gain in sales volume from Q3 2013.
San Mateo County, on the other hand, saw a 28 percent drop in sales volume from Q3. While there’s typically a drop-off from the more popular fall selling season, this number was rather severe. Peninsula homes continue to gain large offers. The problem is that home owners aren’t listing as frequently due to the legitimate concern of finding nearby homes to transition to. In all Q4 2014 was a rather ordinary quarter within a very extraordinary market.
ALL
RE
GIO
NS
AverageSales Price
Days on Market
Average Price Per Sq. Ft.
Quantity
Q4 2014 $879,131 40 $469 8379
change -1% 16% 1% -17%
Q3 2014 $890,520 34 $464 10071
Q4 2014 $879,131 40 $469 8379
change 11% 2% 11% -2%
Q4 2013 $792,431 39 $424 8564
Page 6 | McGuire Real Estate Quarterly Report - 4th Quarter 2014
* Data is sourced from the San Francisco Multiple Listing Service, the East Bay Region District Listing Service, Bay Area Real Estate Information Services, and MLS Listings (MLS). MLS data is provided by individual listing brokerages. These are sources we deem reliable. We have no reason to doubt their accuracy, but we do not guarantee them. Past performance does not guarantee future performance
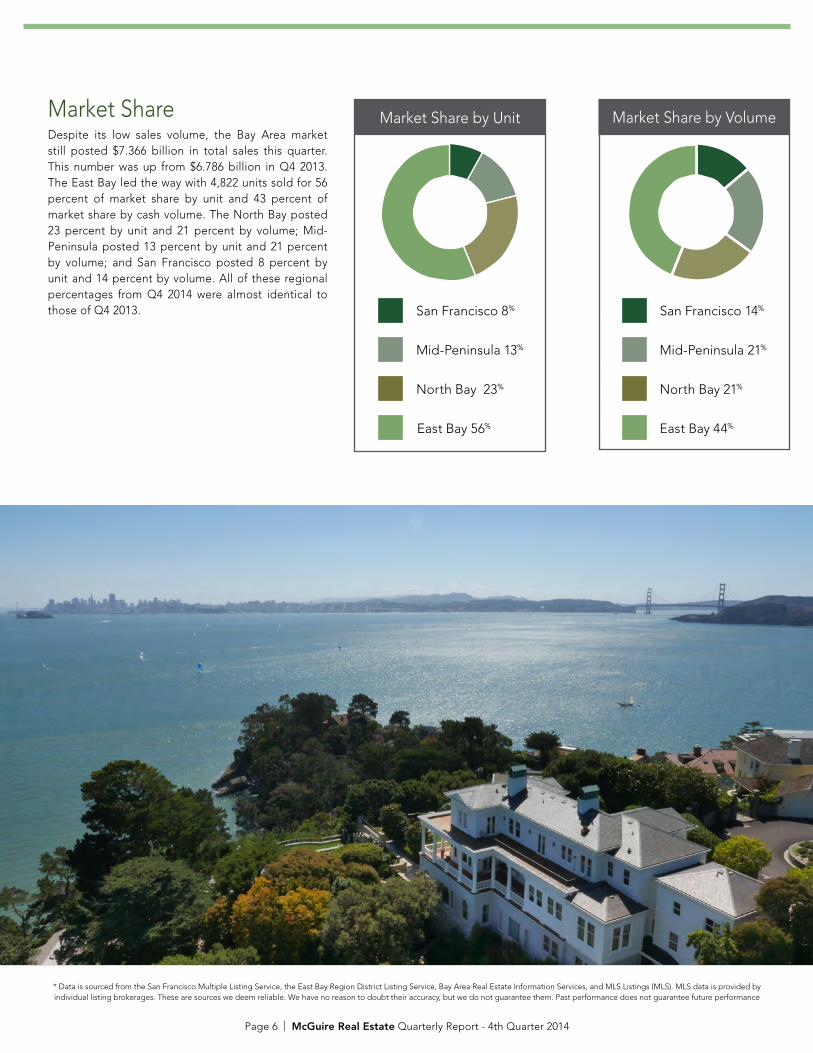
Market ShareDespite its low sales volume, the Bay Area market still posted $7.366 billion in total sales this quarter. This number was up from $6.786 billion in Q4 2013. The East Bay led the way with 4,822 units sold for 56 percent of market share by unit and 43 percent of market share by cash volume. The North Bay posted 23 percent by unit and 21 percent by volume; Mid-Peninsula posted 13 percent by unit and 21 percent by volume; and San Francisco posted 8 percent by unit and 14 percent by volume. All of these regional percentages from Q4 2014 were almost identical to those of Q4 2013.
Market Share by Volume
14+21+21+44+ASan Francisco 14%
Mid-Peninsula 21%
North Bay 21%
East Bay 44%
8+13+23+56+AMarket Share by Unit
San Francisco 8%
Mid-Peninsula 13%
North Bay 23%
East Bay 56%

Page 7 | McGuire Real Estate Quarterly Report - 4th Quarter 2014
* Data is sourced from the San Francisco Multiple Listing Service, the East Bay Region District Listing Service, Bay Area Real Estate Information Services, and MLS Listings (MLS). MLS data is provided by individual listing brokerages. These are sources we deem reliable. We have no reason to doubt their accuracy, but we do not guarantee them. Past performance does not guarantee future performance
Quantity Sold by Price Single-Family Homes
East Bay: 4,722
San Francisco: 652
Mid-Peninsula: 1,107
Marin, Napa, Sonoma
North Bay: 1,898
Contra Costa, Alameda
< $1,000,000
> $1,000,000
< $2,000,000
< $3,000,000
< $4,000,000
> $5,000,000
Page 8 | McGuire Real Estate Quarterly Report - 4th Quarter 2014
* Data is sourced from the San Francisco Multiple Listing Service, the East Bay Region District Listing Service, Bay Area Real Estate Information Services, and MLS Listings (MLS). MLS data is provided by individual listing brokerages. These are sources we deem reliable. We have no reason to doubt their accuracy, but we do not guarantee them. Past performance does not guarantee future performance
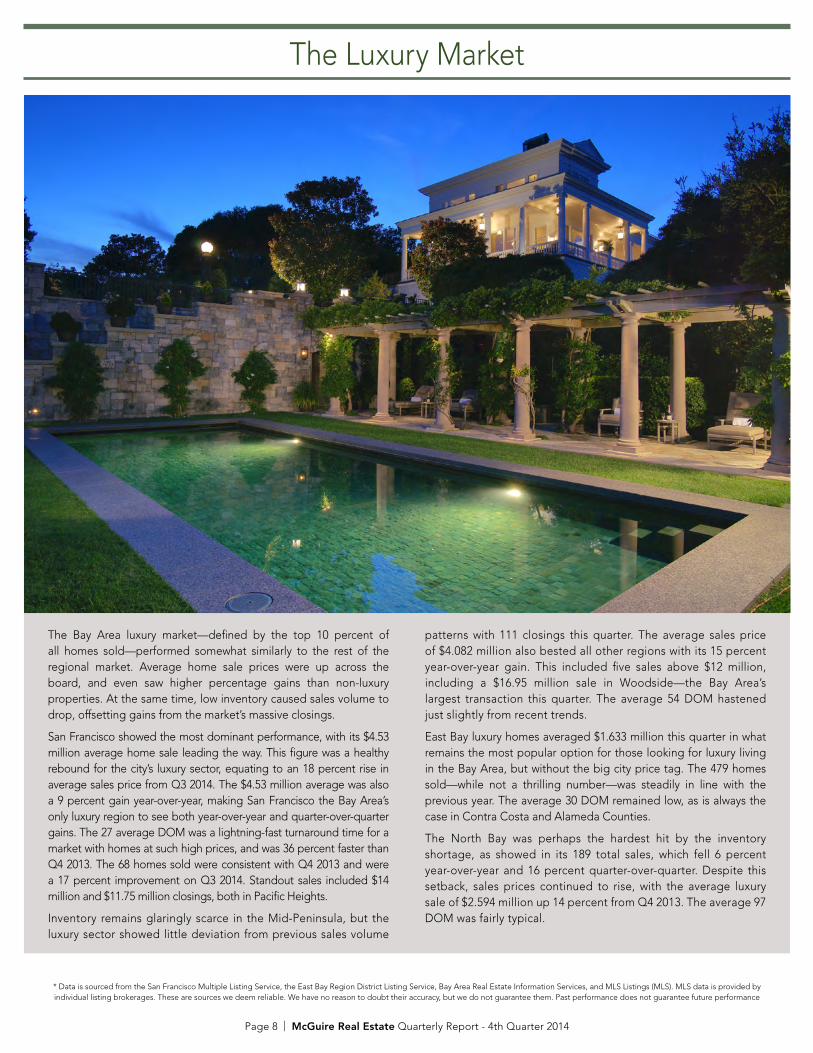
The Bay Area luxury market—defined by the top 10 percent of all homes sold—performed somewhat similarly to the rest of the regional market. Average home sale prices were up across the board, and even saw higher percentage gains than non-luxury properties. At the same time, low inventory caused sales volume to drop, offsetting gains from the market’s massive closings.
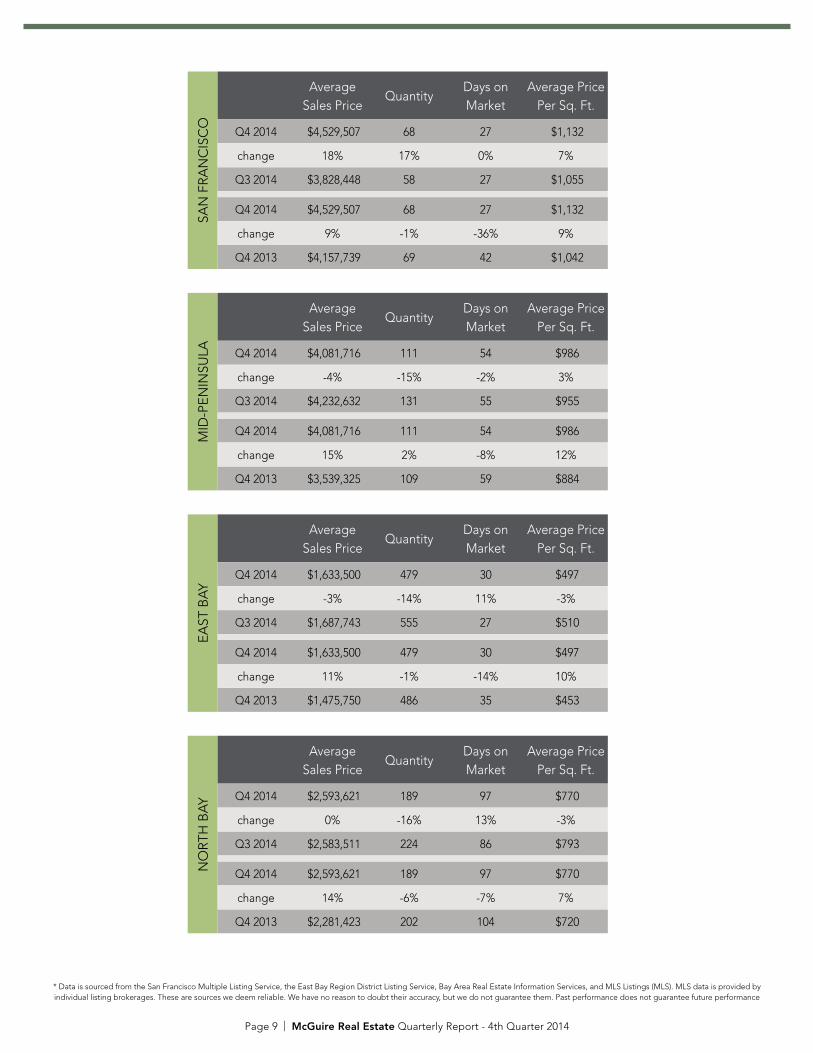
San Francisco showed the most dominant performance, with its $4.53 million average home sale leading the way. This figure was a healthy rebound for the city’s luxury sector, equating to an 18 percent rise in average sales price from Q3 2014. The $4.53 million average was also a 9 percent gain year-over-year, making San Francisco the Bay Area’s only luxury region to see both year-over-year and quarter-over-quarter gains. The 27 average DOM was a lightning-fast turnaround time for a market with homes at such high prices, and was 36 percent faster than Q4 2013. The 68 homes sold were consistent with Q4 2013 and were a 17 percent improvement on Q3 2014. Standout sales included $14 million and $11.75 million closings, both in Pacific Heights.
Inventory remains glaringly scarce in the Mid-Peninsula, but the luxury sector showed little deviation from previous sales volume
patterns with 111 closings this quarter. The average sales price of $4.082 million also bested all other regions with its 15 percent year-over-year gain. This included five sales above $12 million, including a $16.95 million sale in Woodside—the Bay Area’s largest transaction this quarter. The average 54 DOM hastened just slightly from recent trends.
East Bay luxury homes averaged $1.633 million this quarter in what remains the most popular option for those looking for luxury living in the Bay Area, but without the big city price tag. The 479 homes sold—while not a thrilling number—was steadily in line with the previous year. The average 30 DOM remained low, as is always the case in Contra Costa and Alameda Counties.
The North Bay was perhaps the hardest hit by the inventory shortage, as showed in its 189 total sales, which fell 6 percent year-over-year and 16 percent quarter-over-quarter. Despite this setback, sales prices continued to rise, with the average luxury sale of $2.594 million up 14 percent from Q4 2013. The average 97 DOM was fairly typical.
The Luxury Market
Page 9 | McGuire Real Estate Quarterly Report - 4th Quarter 2014
* Data is sourced from the San Francisco Multiple Listing Service, the East Bay Region District Listing Service, Bay Area Real Estate Information Services, and MLS Listings (MLS). MLS data is provided by individual listing brokerages. These are sources we deem reliable. We have no reason to doubt their accuracy, but we do not guarantee them. Past performance does not guarantee future performance
MID
-PE
NIN
SULA
AverageSales Price
QuantityDays on Market
Average PricePer Sq. Ft.
Q4 2014 $4,081,716 111 54 $986
change -4% -15% -2% 3%
Q3 2014 $4,232,632 131 55 $955
Q4 2014 $4,081,716 111 54 $986
change 15% 2% -8% 12%
Q4 2013 $3,539,325 109 59 $884
SAN
FR
AN
CIS
CO
Average Sales Price
QuantityDays on Market
Average Price Per Sq. Ft.
Q4 2014 $4,529,507 68 27 $1,132
change 18% 17% 0% 7%
Q3 2014 $3,828,448 58 27 $1,055
Q4 2014 $4,529,507 68 27 $1,132
change 9% -1% -36% 9%
Q4 2013 $4,157,739 69 42 $1,042
EA
ST B
AY
Average Sales Price
QuantityDays on Market
Average Price Per Sq. Ft.
Q4 2014 $1,633,500 479 30 $497
change -3% -14% 11% -3%
Q3 2014 $1,687,743 555 27 $510
Q4 2014 $1,633,500 479 30 $497
change 11% -1% -14% 10%
Q4 2013 $1,475,750 486 35 $453
NO
RTH
BA
Y
Average Sales Price
QuantityDays on Market
Average Price Per Sq. Ft.
Q4 2014 $2,593,621 189 97 $770
change 0% -16% 13% -3%
Q3 2014 $2,583,511 224 86 $793
Q4 2014 $2,593,621 189 97 $770
change 14% -6% -7% 7%
Q4 2013 $2,281,423 202 104 $720
Page 10 | McGuire Real Estate Quarterly Report - 4th Quarter 2014
* Data is sourced from the San Francisco Multiple Listing Service, the East Bay Region District Listing Service, Bay Area Real Estate Information Services, and MLS Listings (MLS). MLS data is provided by individual listing brokerages. These are sources we deem reliable. We have no reason to doubt their accuracy, but we do not guarantee them. Past performance does not guarantee future performance
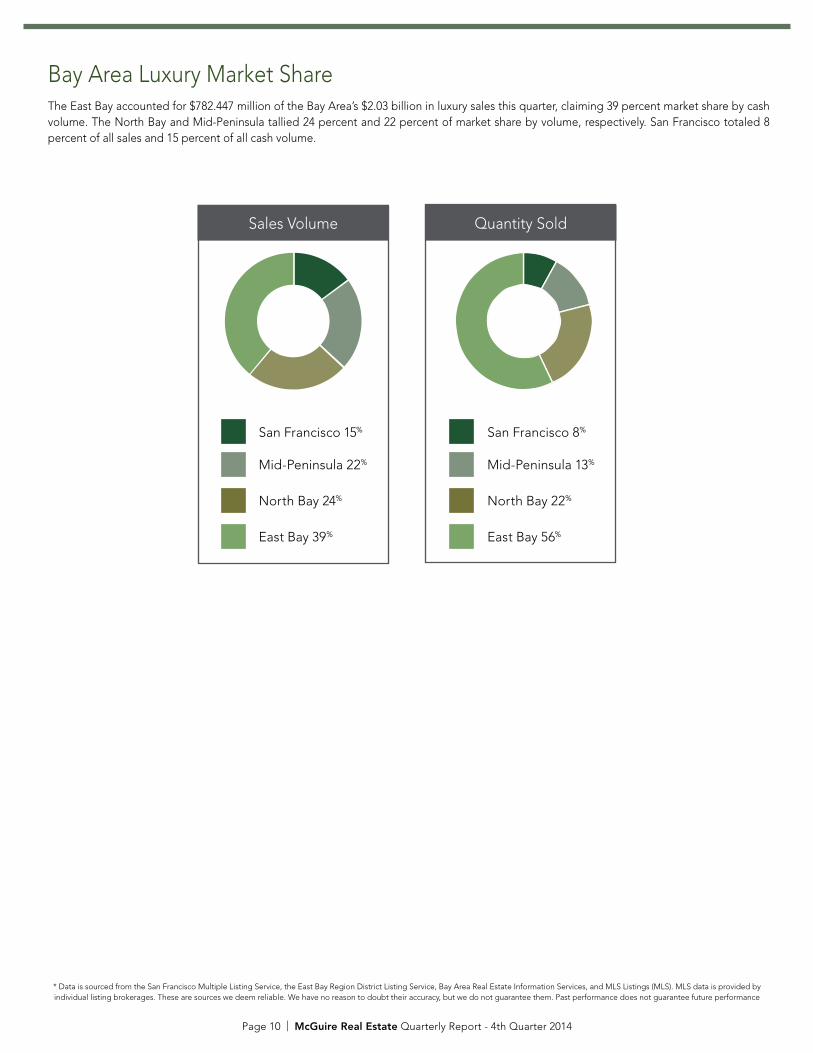
Bay Area Luxury Market ShareThe East Bay accounted for $782.447 million of the Bay Area’s $2.03 billion in luxury sales this quarter, claiming 39 percent market share by cash volume. The North Bay and Mid-Peninsula tallied 24 percent and 22 percent of market share by volume, respectively. San Francisco totaled 8 percent of all sales and 15 percent of all cash volume.
Quantity Sold
8+13+22+57+ASan Francisco 8%
East Bay 56%
Mid-Peninsula 13%
North Bay 22%
Sales Volume
15+22+24+39+ASan Francisco 15%
Mid-Peninsula 22%
North Bay 24%
East Bay 39%

Page 11 | McGuire Real Estate Quarterly Report - 4th Quarter 2014
* Data is sourced from the San Francisco Multiple Listing Service, the East Bay Region District Listing Service, Bay Area Real Estate Information Services, and MLS Listings (MLS). MLS data is provided by individual listing brokerages. These are sources we deem reliable. We have no reason to doubt their accuracy, but we do not guarantee them. Past performance does not guarantee future performance
60% 80% 100%0% 40%20%
60% 80% 100%0% 40%20%
13+43+73+343+470+60=
21+50+60+320+510+40=
21+50+60+320+510+40=20+40+90+390+460+10=
17+30+90+370+460+30=20+50+100+380+430+20=
60% 80% 100%0% 40%20%
Sales Trends
$0-$500K $500K-$1M $1M-$2M $2M-$3M $3M-$5M $5M+
Price Range As a Percent of Sales Luxury Homes Price Per Square Foot
< $500/sqft
>= $500/sqft
>= $700/sqft
>= $900/sqft
>= $1,000/sqft
Mid-Peninsula60% 80% 100%0% 40%20%
3% 46% 37% 9% 3% 1.7%
2% 43% 38% 10% 5% 2%
6% 47% 34% 7% 4% 1.3%
Q4 2014
Q3 2014
Q4 2013
San FranciscoSingle-Family Homes
Q4 2014
Q3 2014
Q4 2013
2.1%
2.1%
1.9%
4% 51% 32% 6% 5%
4% 51% 32% 6% 5%
1% 46% 39% 9% 4%
10+20+30+120+450+370=10+20+30+120+450+370=
1+10+10+100+430+460=
1+2+14+140+450+400=1+10+14+160+470+350=
4+10+20+100+430+430=
North Bay
Q4 2014
Q3 2014
Q4 2013
2%
2%
1%
.3%
43% 43% 11% .4%1%
37% 46% 11% 3%
37% 46% 11% 3%
East Bay
Q4 2014
Q3 2014
Q4 2013
.21%
.21%
.15%
1.34%
0.87%
.02%
.04%
.06%
1.42%
46% 43% 10%
40% 45% 14%
36% 47% 16%
> $1,000/sqft
2%

Page 12 | McGuire Real Estate Quarterly Report - 4th Quarter 2014
* Data is sourced from the San Francisco Multiple Listing Service, the East Bay Region District Listing Service, Bay Area Real Estate Information Services, and MLS Listings (MLS). MLS data is provided by individual listing brokerages. These are sources we deem reliable. We have no reason to doubt their accuracy, but we do not guarantee them. Past performance does not guarantee future performance
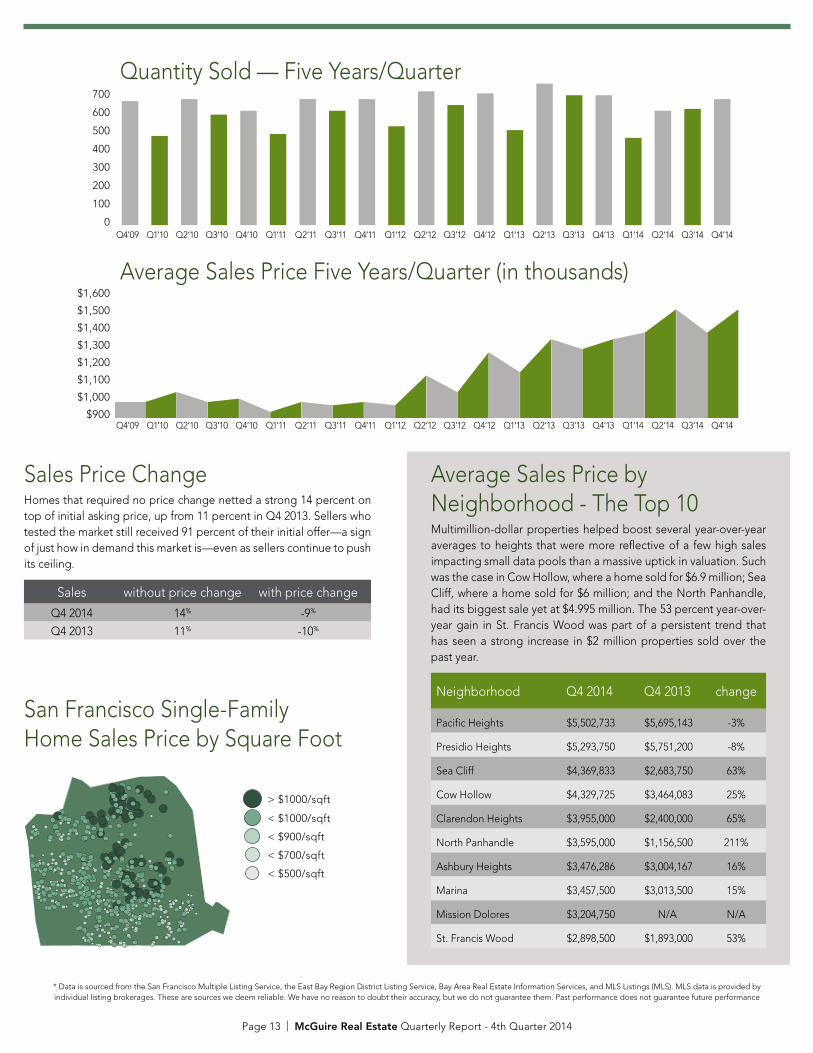
The San Francisco market deviated from patterns across the rest of the Bay Area, as is often the case. This had its upsides for both sellers and buyers in Q4. The average home sale price of $1.535 million increased 12 percent from Q3 2014 and 14 percent from Q4 2013. It was also the second-highest average sales price in the city’s history, as well as a high among all seven Bay Area counties we represent.
Sales volume also rebounded with the 652 homes sold equating to a 9 percent gain from Q3 2014. Despite being down 4 percent in sales volume from Q4 2013, the $3.381 billion in total yearly sales was a slight gain from 2013 and a 20 percent gain from 2012. The average 33 DOM this quarter was typical for the area and season.
San Francisco County Single-Family Homes
SAN
FR
AN
CIS
CO
Average Sales Price
Days onMarket
Average PricePer Sq. Ft.
Q4 2014 $1,534,805 33 $747
change 12% 18% 2%
Q3 2014 $1,368,721 28 $729
Q4 2014 $1,534,805 33 $747
change 14% -8% 12%
Q4 2013 $1,350,104 36 $667
Page 13 | McGuire Real Estate Quarterly Report - 4th Quarter 2014
* Data is sourced from the San Francisco Multiple Listing Service, the East Bay Region District Listing Service, Bay Area Real Estate Information Services, and MLS Listings (MLS). MLS data is provided by individual listing brokerages. These are sources we deem reliable. We have no reason to doubt their accuracy, but we do not guarantee them. Past performance does not guarantee future performance
San Francisco Single-Family Home Sales Price by Square Foot
Sales Price Change Homes that required no price change netted a strong 14 percent on top of initial asking price, up from 11 percent in Q4 2013. Sellers who tested the market still received 91 percent of their initial offer—a sign of just how in demand this market is—even as sellers continue to push its ceiling.
Sales without price change with price change
Q4 2014 14% -9%
Q4 2013 11% -10%
Average Sales Price by Neighborhood - The Top 10Multimillion-dollar properties helped boost several year-over-year averages to heights that were more reflective of a few high sales impacting small data pools than a massive uptick in valuation. Such was the case in Cow Hollow, where a home sold for $6.9 million; Sea Cliff, where a home sold for $6 million; and the North Panhandle, had its biggest sale yet at $4.995 million. The 53 percent year-over-year gain in St. Francis Wood was part of a persistent trend that has seen a strong increase in $2 million properties sold over the past year.
Neighborhood Q4 2014 Q4 2013 change
Pacific Heights $5,502,733 $5,695,143 -3%
Presidio Heights $5,293,750 $5,751,200 -8%
Sea Cliff $4,369,833 $2,683,750 63%
Cow Hollow $4,329,725 $3,464,083 25%
Clarendon Heights $3,955,000 $2,400,000 65%
North Panhandle $3,595,000 $1,156,500 211%
Ashbury Heights $3,476,286 $3,004,167 16%
Marina $3,457,500 $3,013,500 15%
Mission Dolores $3,204,750 N/A N/A
St. Francis Wood $2,898,500 $1,893,000 53%
Quantity Sold — Five Years/Quarter700
600
500
400
300
200
100
0 +64+46+65+57+59+47+65+59+65+51+69+62+68+49+73+67+67+45+59+60+65Q4’09 Q1‘10 Q2‘10 Q3‘10 Q4‘10 Q1‘11 Q2‘11 Q3‘11 Q4‘11 Q1‘12 Q2‘12 Q3’12 Q4‘12 Q1‘13 Q2‘13 Q3‘13 Q4‘13 Q1‘14 Q2‘14 Q3‘14 Q4‘14
Q4’09 Q1‘10 Q2‘10 Q3‘10 Q4‘10 Q1‘11 Q2‘11 Q3‘11 Q4‘11 Q1‘12 Q2‘12 Q3’12 Q4‘12 Q1‘13 Q2‘13 Q3‘13 Q4‘13 Q1‘14 Q2‘14 Q3‘14 Q4‘14
Average Sales Price Five Years/Quarter (in thousands)$1,600
$1,500
$1,400
$1,300
$1,200
$1,100
$1,000
$900 49 +49+52+49+50+46+49+48+49+48+57+52+64+58+68+65+68+70+77+70+77< $500/sqft
< $700/sqft
< $900/sqft
< $1000/sqft
> $1000/sqft
Page 14 | McGuire Real Estate Quarterly Report - 4th Quarter 2014
* Data is sourced from the San Francisco Multiple Listing Service, the East Bay Region District Listing Service, Bay Area Real Estate Information Services, and MLS Listings (MLS). MLS data is provided by individual listing brokerages. These are sources we deem reliable. We have no reason to doubt their accuracy, but we do not guarantee them. Past performance does not guarantee future performance
SAN
FR
AN
CIS
CO
Average Sales Price
Days onMarket
Average PricePer Sq. Ft.
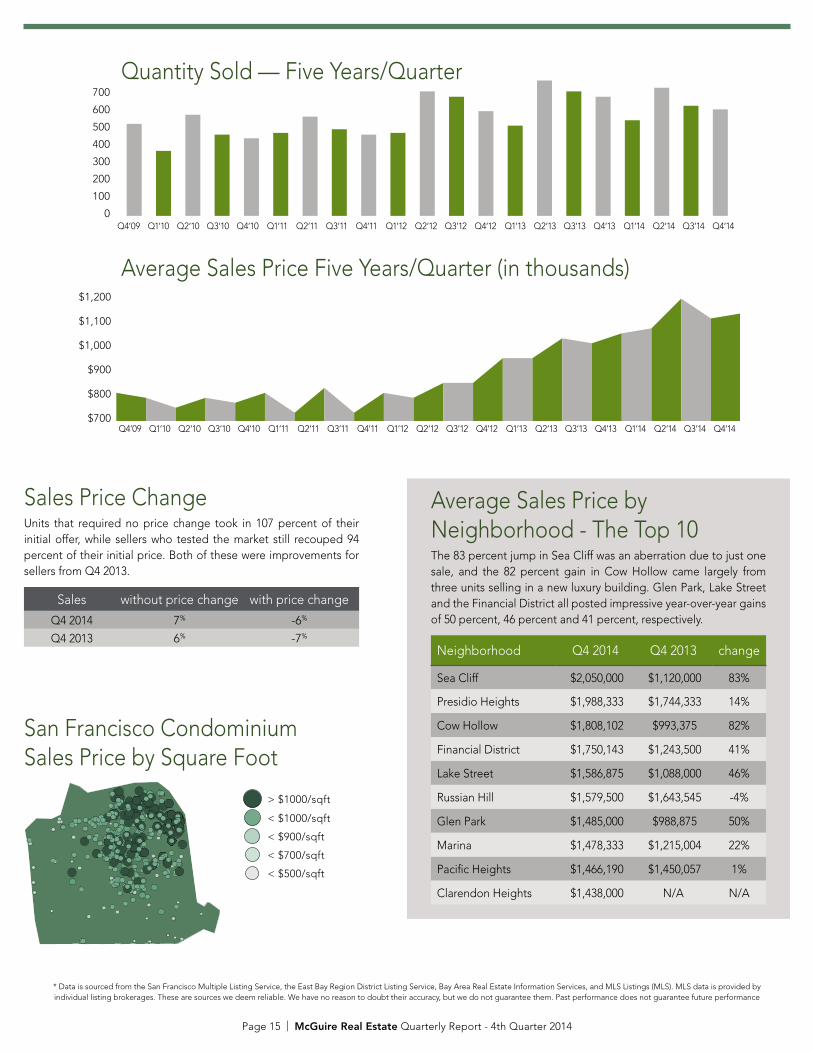
Q4 2014 $1,116,435 39 $909
change 1% 16% -2%
Q3 2014 $1,103,615 34 $924
Q4 2014 $1,116,435 39 $909
change 10% 3% 7%
Q4 2013 $1,017,701 38 $848
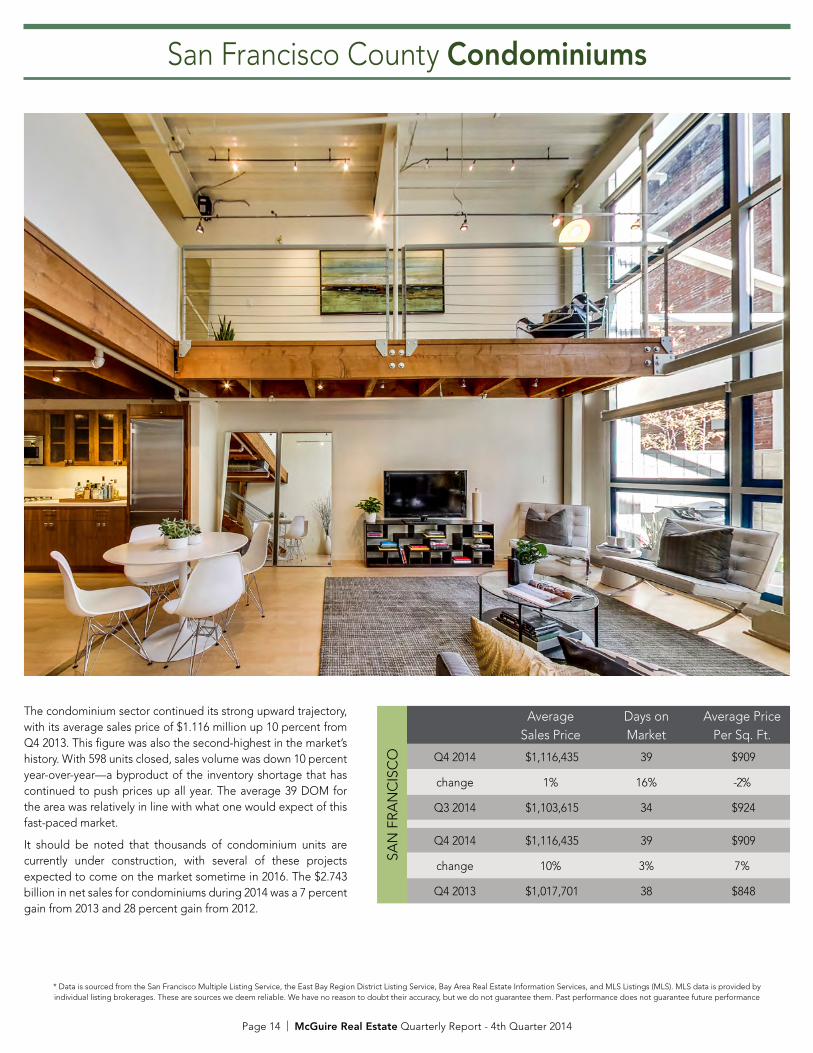
The condominium sector continued its strong upward trajectory, with its average sales price of $1.116 million up 10 percent from Q4 2013. This figure was also the second-highest in the market’s history. With 598 units closed, sales volume was down 10 percent year-over-year—a byproduct of the inventory shortage that has continued to push prices up all year. The average 39 DOM for the area was relatively in line with what one would expect of this fast-paced market.
It should be noted that thousands of condominium units are currently under construction, with several of these projects expected to come on the market sometime in 2016. The $2.743 billion in net sales for condominiums during 2014 was a 7 percent gain from 2013 and 28 percent gain from 2012.
San Francisco County Condominiums
Page 15 | McGuire Real Estate Quarterly Report - 4th Quarter 2014
* Data is sourced from the San Francisco Multiple Listing Service, the East Bay Region District Listing Service, Bay Area Real Estate Information Services, and MLS Listings (MLS). MLS data is provided by individual listing brokerages. These are sources we deem reliable. We have no reason to doubt their accuracy, but we do not guarantee them. Past performance does not guarantee future performance
Neighborhood Q4 2014 Q4 2013 change
Sea Cliff $2,050,000 $1,120,000 83%
Presidio Heights $1,988,333 $1,744,333 14%
Cow Hollow $1,808,102 $993,375 82%
Financial District $1,750,143 $1,243,500 41%
Lake Street $1,586,875 $1,088,000 46%
Russian Hill $1,579,500 $1,643,545 -4%
Glen Park $1,485,000 $988,875 50%
Marina $1,478,333 $1,215,004 22%
Pacific Heights $1,466,190 $1,450,057 1%
Clarendon Heights $1,438,000 N/A N/A
Average Sales Price by Neighborhood - The Top 10The 83 percent jump in Sea Cliff was an aberration due to just one sale, and the 82 percent gain in Cow Hollow came largely from three units selling in a new luxury building. Glen Park, Lake Street and the Financial District all posted impressive year-over-year gains of 50 percent, 46 percent and 41 percent, respectively.
Sales Price Change Units that required no price change took in 107 percent of their initial offer, while sellers who tested the market still recouped 94 percent of their initial price. Both of these were improvements for sellers from Q4 2013.
Sales without price change with price change
Q4 2014 7% -6%
Q4 2013 6% -7%
San Francisco Condominium Sales Price by Square Foot
Average Sales Price Five Years/Quarter (in thousands)$1,200
$1,100
$1,000
$900
$800
$700 39+38+36+38+37+39+35+40+35+39+38+41+41+46+46+50+49+51+52+58+54+55700
600
500
400
300
200
100
051+36+56+45+43+46+55+48+45+46+69+66+58+50+75+69+66+53+71+61+59Quantity Sold — Five Years/Quarter
< $500/sqft
< $700/sqft
< $900/sqft
< $1000/sqft
> $1000/sqft
Q4’09 Q1‘10 Q2‘10 Q3‘10 Q4‘10 Q1‘11 Q2‘11 Q3‘11 Q4‘11 Q1‘12 Q2‘12 Q3’12 Q4‘12 Q1‘13 Q2‘13 Q3‘13 Q4‘13 Q1‘14 Q2‘14 Q3‘14 Q4‘14
Q4’09 Q1‘10 Q2‘10 Q3‘10 Q4‘10 Q1‘11 Q2‘11 Q3‘11 Q4‘11 Q1‘12 Q2‘12 Q3’12 Q4‘12 Q1‘13 Q2‘13 Q3‘13 Q4‘13 Q1‘14 Q2‘14 Q3‘14 Q4‘14
Page 16 | McGuire Real Estate Quarterly Report - 4th Quarter 2014
* Data is sourced from the San Francisco Multiple Listing Service, the East Bay Region District Listing Service, Bay Area Real Estate Information Services, and MLS Listings (MLS). MLS data is provided by individual listing brokerages. These are sources we deem reliable. We have no reason to doubt their accuracy, but we do not guarantee them. Past performance does not guarantee future performance
SAN
MA
TEO
CO
UN
TY
Average Sales Price
Days onMarket
Average PricePer Sq. Ft.
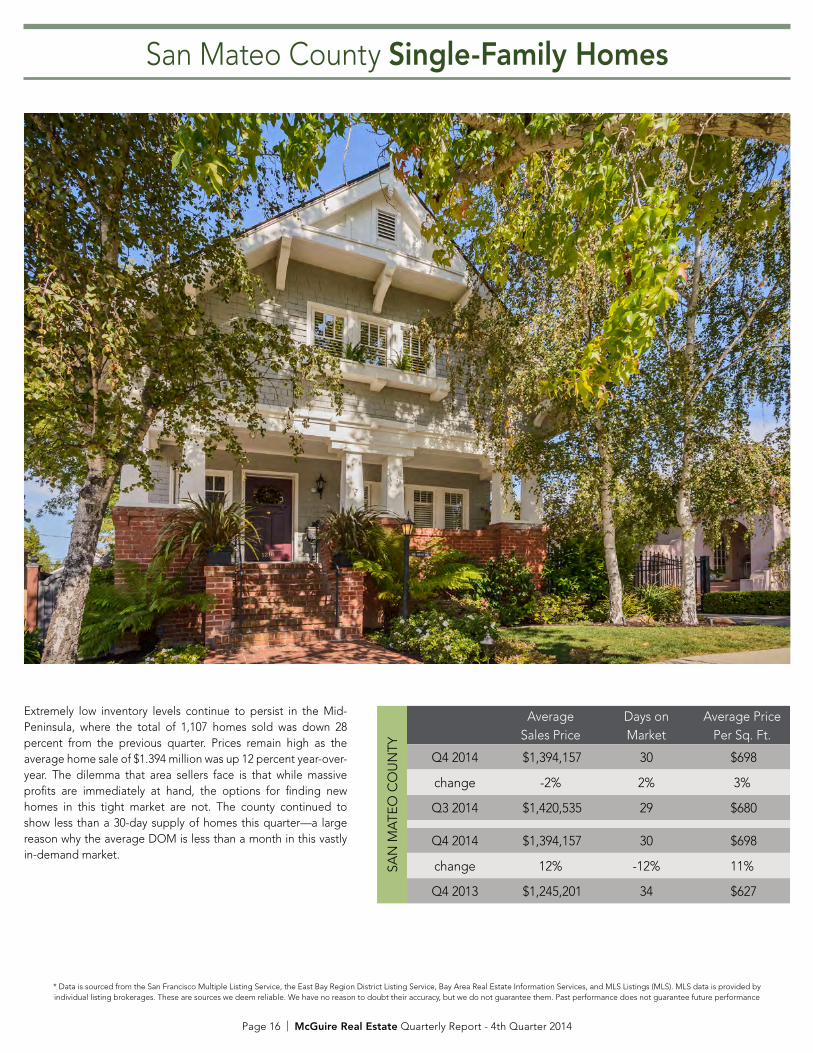
Q4 2014 $1,394,157 30 $698
change -2% 2% 3%
Q3 2014 $1,420,535 29 $680
Q4 2014 $1,394,157 30 $698
change 12% -12% 11%
Q4 2013 $1,245,201 34 $627
Extremely low inventory levels continue to persist in the Mid-Peninsula, where the total of 1,107 homes sold was down 28 percent from the previous quarter. Prices remain high as the average home sale of $1.394 million was up 12 percent year-over-year. The dilemma that area sellers face is that while massive profits are immediately at hand, the options for finding new homes in this tight market are not. The county continued to show less than a 30-day supply of homes this quarter—a large reason why the average DOM is less than a month in this vastly in-demand market.
San Mateo County Single-Family Homes
Page 17 | McGuire Real Estate Quarterly Report - 4th Quarter 2014
* Data is sourced from the San Francisco Multiple Listing Service, the East Bay Region District Listing Service, Bay Area Real Estate Information Services, and MLS Listings (MLS). MLS data is provided by individual listing brokerages. These are sources we deem reliable. We have no reason to doubt their accuracy, but we do not guarantee them. Past performance does not guarantee future performance
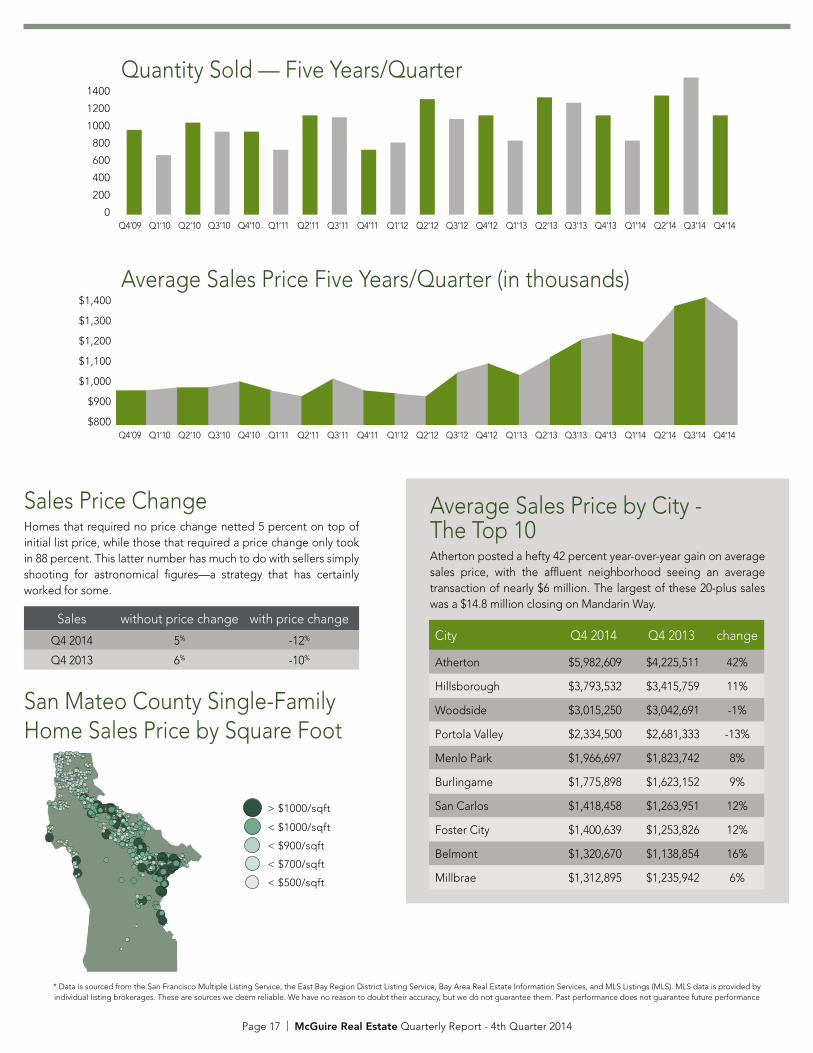
Sales Price Change Homes that required no price change netted 5 percent on top of initial list price, while those that required a price change only took in 88 percent. This latter number has much to do with sellers simply shooting for astronomical figures—a strategy that has certainly worked for some.
Sales without price change with price change
Q4 2014 5% -12%
Q4 2013 6% -10%
San Mateo County Single-Family Home Sales Price by Square Foot
Average Sales Price Five Years/Quarter (in thousands)$1,400
$1,300
$1,200
$1,100
$1,000
$900
$800 47+47+48+48+50+47+45+51+47+46+45+53+56+52+58+64+66+63+75+78+701400
1200
1000
800
600
400
200
047+33+51+46+46+36+55+54+36+40+64+53+55+41+65+62+55+41+66+76+55Quantity Sold — Five Years/Quarter
City Q4 2014 Q4 2013 change
Atherton $5,982,609 $4,225,511 42%
Hillsborough $3,793,532 $3,415,759 11%
Woodside $3,015,250 $3,042,691 -1%
Portola Valley $2,334,500 $2,681,333 -13%
Menlo Park $1,966,697 $1,823,742 8%
Burlingame $1,775,898 $1,623,152 9%
San Carlos $1,418,458 $1,263,951 12%
Foster City $1,400,639 $1,253,826 12%
Belmont $1,320,670 $1,138,854 16%
Millbrae $1,312,895 $1,235,942 6%
Average Sales Price by City -The Top 10Atherton posted a hefty 42 percent year-over-year gain on average sales price, with the affluent neighborhood seeing an average transaction of nearly $6 million. The largest of these 20-plus sales was a $14.8 million closing on Mandarin Way.
< $500/sqft
< $700/sqft
< $900/sqft
< $1000/sqft
> $1000/sqft
Q4’09 Q1‘10 Q2‘10 Q3‘10 Q4‘10 Q1‘11 Q2‘11 Q3‘11 Q4‘11 Q1‘12 Q2‘12 Q3’12 Q4‘12 Q1‘13 Q2‘13 Q3‘13 Q4‘13 Q1‘14 Q2‘14 Q3‘14 Q4‘14
Q4’09 Q1‘10 Q2‘10 Q3‘10 Q4‘10 Q1‘11 Q2‘11 Q3‘11 Q4‘11 Q1‘12 Q2‘12 Q3’12 Q4‘12 Q1‘13 Q2‘13 Q3‘13 Q4‘13 Q1‘14 Q2‘14 Q3‘14 Q4‘14

Page 18 | McGuire Real Estate Quarterly Report - 4th Quarter 2014
* Data is sourced from the San Francisco Multiple Listing Service, the East Bay Region District Listing Service, Bay Area Real Estate Information Services, and MLS Listings (MLS). MLS data is provided by individual listing brokerages. These are sources we deem reliable. We have no reason to doubt their accuracy, but we do not guarantee them. Past performance does not guarantee future performance
MA
RIN
CO
UN
TY
Average Sales Price
Days onMarket
Average PricePer Sq. Ft.
Q4 2014 $1,370,066 65 $575
change 0% 18% -2%
Q3 2014 $1,365,749 55 $584
Q4 2014 $1,370,066 65 $575
change 15% 1% 10%
Q4 2013 $1,195,275 64 $524
Marin County Single-Family Homes
Like the Peninsula, Marin County posted strong average sales price figures that were slightly offset by low inventory and below-average sales volume totals. The $1.37 million average home sale was up 15 percent from Q4 2013, and was the third-highest figure in the market’s history. These homes experienced an average 65 DOM, an 18 percent rise from the previous quarter as buyers have exercised a bit more restraint after the feeding frenzy that consumed much of 2014. The total of 519 homes sold was down 16 percent from the previous quarter and 6 percent from Q4 2013. This was the second-lowest sales volume total for the area in the past seven quarters.

Page 19 | McGuire Real Estate Quarterly Report - 4th Quarter 2014
* Data is sourced from the San Francisco Multiple Listing Service, the East Bay Region District Listing Service, Bay Area Real Estate Information Services, and MLS Listings (MLS). MLS data is provided by individual listing brokerages. These are sources we deem reliable. We have no reason to doubt their accuracy, but we do not guarantee them. Past performance does not guarantee future performance
Sales without price change with price change
Q4 2014 2% -10%
Q4 2013 2% -12%
Sales Price Change When no price change was required, homes netted a modest 2 percent on top of initial list price, which has been a fairly typical number for the area. Sellers who tested the market took in 90 percent of initial asking price, which was a 2 percent gain from Q4 2013.
Marin County Single-Family Homes Sales Price by Square Foot
Average Sales Price Five Years/Quarter (in thousands)$1,400
$1,300
$1,200
$1,100
$1,000
$900 49+54+51+51+47+53+50+48+47+53+50+52+53+61+62+60+70+69+68+69+69700
600
500
400
300
200
100
052+35+57+47+45+37+55+52+44+43+67+66+59+42+77+70+55+42+76+61+52Quantity Sold — Five Years/Quarter
City Q4 2014 Q4 2013 change
Belvedere $3,823,333 $2,344,333 63%
Ross $3,740,385 $4,242,389 -12%
Tiburon $2,929,481 $2,402,739 22%
Stinson Beach $2,901,429 $2,119,014 37%
Kentfield $1,971,100 $2,147,746 -8%
Larkspur $1,629,667 $1,499,115 9%
Nicasio $1,604,123 N/A N/A
Mill Valley $1,575,178 $1,402,093 12%
Corte Madera $1,492,568 $1,178,940 27%
Sausalito $1,480,000 $1,384,925 7%
Average Sales Price by City - The Top TenBelvedere posted a 63 percent year-over-year average sales price gain as all six properties sold this quarter went above $2 million. Stinson Beach also posted a strong 37 percent gain, with an area-record $8 million closing among its seven transactions.
< $500/sqft
< $700/sqft
< $900/sqft
< $1000/sqft
> $1000/sqft
Q4’09 Q1‘10 Q2‘10 Q3‘10 Q4‘10 Q1‘11 Q2‘11 Q3‘11 Q4‘11 Q1‘12 Q2‘12 Q3’12 Q4‘12 Q1‘13 Q2‘13 Q3‘13 Q4‘13 Q1‘14 Q2‘14 Q3‘14 Q4‘14
Q4’09 Q1‘10 Q2‘10 Q3‘10 Q4‘10 Q1‘11 Q2‘11 Q3‘11 Q4‘11 Q1‘12 Q2‘12 Q3’12 Q4‘12 Q1‘13 Q2‘13 Q3‘13 Q4‘13 Q1‘14 Q2‘14 Q3‘14 Q4‘14
Page 20 | McGuire Real Estate Quarterly Report - 4th Quarter 2014
* Data is sourced from the San Francisco Multiple Listing Service, the East Bay Region District Listing Service, Bay Area Real Estate Information Services, and MLS Listings (MLS). MLS data is provided by individual listing brokerages. These are sources we deem reliable. We have no reason to doubt their accuracy, but we do not guarantee them. Past performance does not guarantee future performance
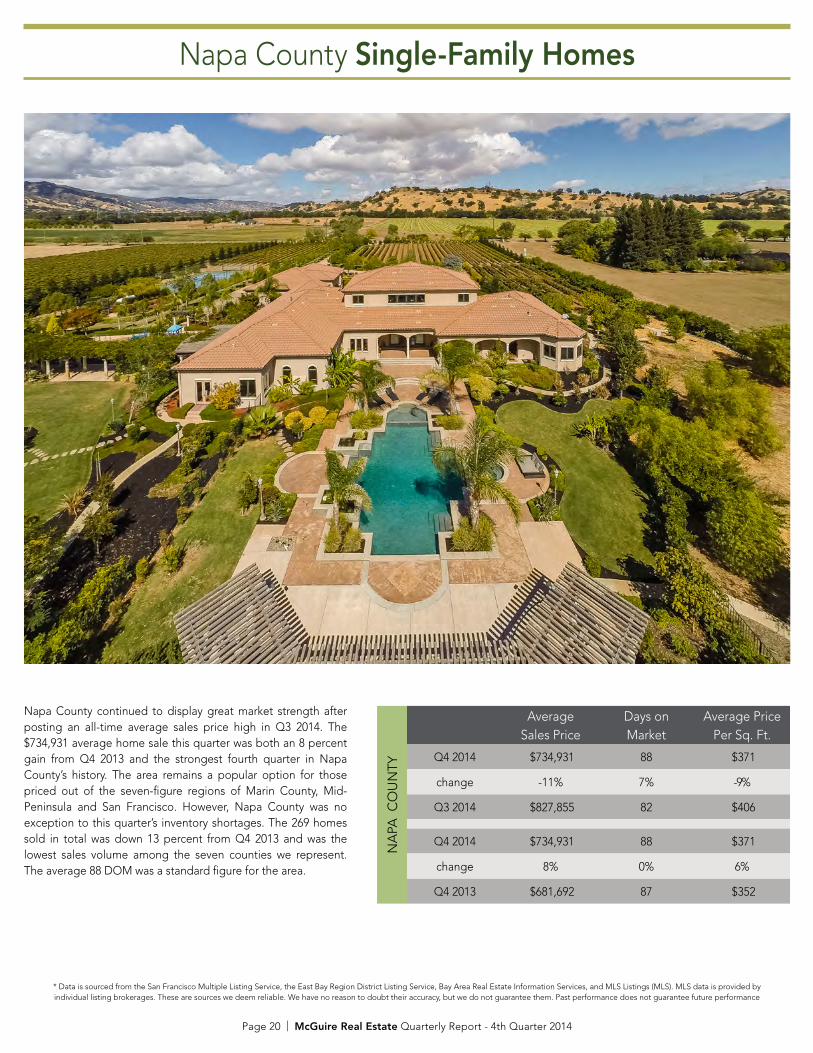
Napa County continued to display great market strength after posting an all-time average sales price high in Q3 2014. The $734,931 average home sale this quarter was both an 8 percent gain from Q4 2013 and the strongest fourth quarter in Napa County’s history. The area remains a popular option for those priced out of the seven-figure regions of Marin County, Mid-Peninsula and San Francisco. However, Napa County was no exception to this quarter’s inventory shortages. The 269 homes sold in total was down 13 percent from Q4 2013 and was the lowest sales volume among the seven counties we represent. The average 88 DOM was a standard figure for the area.
Napa County Single-Family Homes
NA
PA C
OU
NTY
Average Sales Price
Days onMarket
Average PricePer Sq. Ft.
Q4 2014 $734,931 88 $371
change -11% 7% -9%
Q3 2014 $827,855 82 $406
Q4 2014 $734,931 88 $371
change 8% 0% 6%
Q4 2013 $681,692 87 $352
Page 21 | McGuire Real Estate Quarterly Report - 4th Quarter 2014
* Data is sourced from the San Francisco Multiple Listing Service, the East Bay Region District Listing Service, Bay Area Real Estate Information Services, and MLS Listings (MLS). MLS data is provided by individual listing brokerages. These are sources we deem reliable. We have no reason to doubt their accuracy, but we do not guarantee them. Past performance does not guarantee future performance
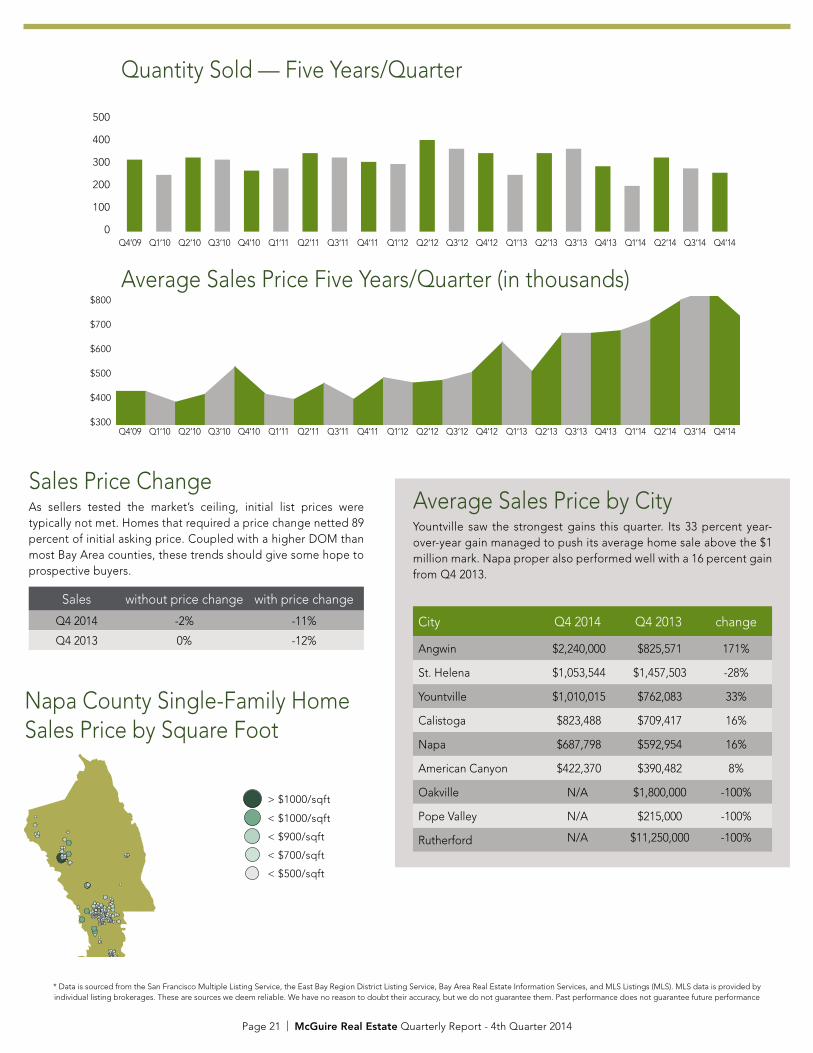
Sales Price Change As sellers tested the market’s ceiling, initial list prices were typically not met. Homes that required a price change netted 89 percent of initial asking price. Coupled with a higher DOM than most Bay Area counties, these trends should give some hope to prospective buyers.
Sales without price change with price change
Q4 2014 -2% -11%
Q4 2013 0% -12%
Napa County Single-Family Home Sales Price by Square Foot
City Q4 2014 Q4 2013 change
Angwin $2,240,000 $825,571 171%
St. Helena $1,053,544 $1,457,503 -28%
Yountville $1,010,015 $762,083 33%
Calistoga $823,488 $709,417 16%
Napa $687,798 $592,954 16%
American Canyon $422,370 $390,482 8%
Oakville N/A $1,800,000 -100%
Pope Valley N/A $215,000 -100%
Rutherford N/A $11,250,000 -100%
Average Sales Price by CityYountville saw the strongest gains this quarter. Its 33 percent year-over-year gain managed to push its average home sale above the $1 million mark. Napa proper also performed well with a 16 percent gain from Q4 2013.
Average Sales Price Five Years/Quarter (in thousands)$800
$700
$600
$500
$400
$300 +46+42+45+55+45+43+49+43+51+49+50+53+64+53+67+67+68+72+79+83+73500
400
300
200
100
033+26+34+33+28+29+36+34+32+31+42+38+36+26+36+38+30+21+34+29+27Quantity Sold — Five Years/Quarter
< $500/sqft
< $700/sqft
< $900/sqft
< $1000/sqft
> $1000/sqft
Q4’09 Q1‘10 Q2‘10 Q3‘10 Q4‘10 Q1‘11 Q2‘11 Q3‘11 Q4‘11 Q1‘12 Q2‘12 Q3’12 Q4‘12 Q1‘13 Q2‘13 Q3‘13 Q4‘13 Q1‘14 Q2‘14 Q3‘14 Q4‘14
Q4’09 Q1‘10 Q2‘10 Q3‘10 Q4‘10 Q1‘11 Q2‘11 Q3‘11 Q4‘11 Q1‘12 Q2‘12 Q3’12 Q4‘12 Q1‘13 Q2‘13 Q3‘13 Q4‘13 Q1‘14 Q2‘14 Q3‘14 Q4‘14
Page 22 | McGuire Real Estate Quarterly Report - 4th Quarter 2014
* Data is sourced from the San Francisco Multiple Listing Service, the East Bay Region District Listing Service, Bay Area Real Estate Information Services, and MLS Listings (MLS). MLS data is provided by individual listing brokerages. These are sources we deem reliable. We have no reason to doubt their accuracy, but we do not guarantee them. Past performance does not guarantee future performance
SON
OM
A C
OU
NTY
Average Sales Price
Days onMarket
Average PricePer Sq. Ft.
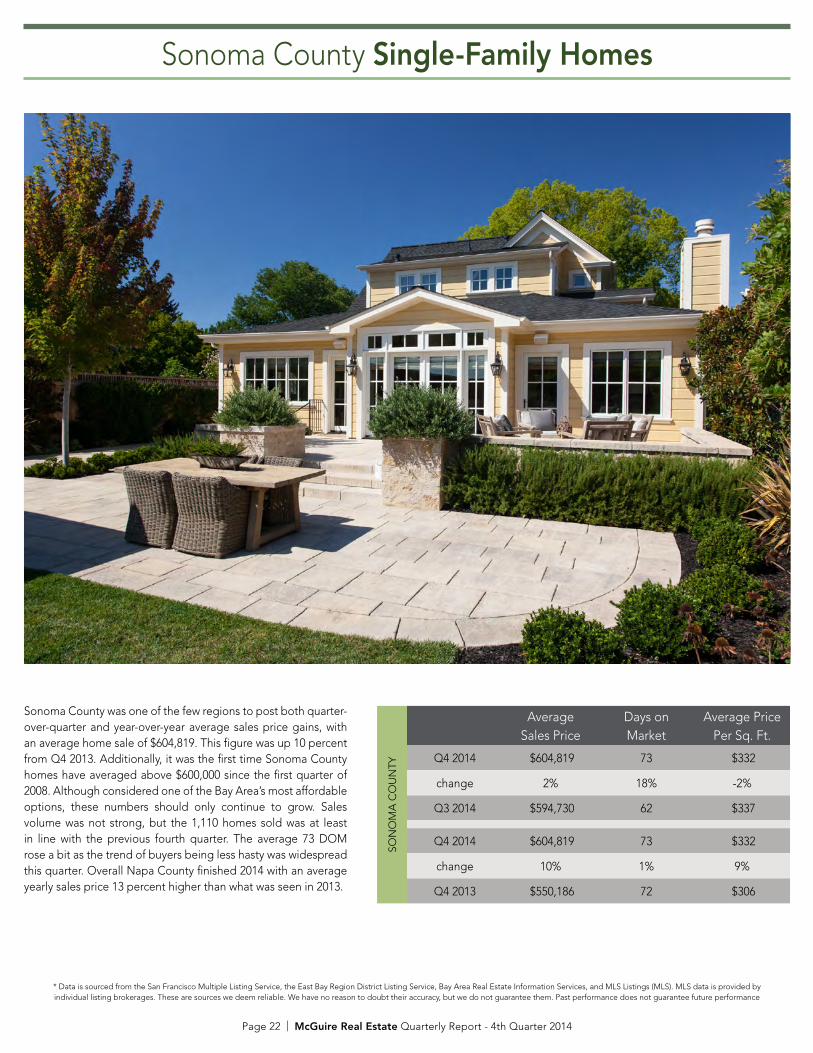
Q4 2014 $604,819 73 $332
change 2% 18% -2%
Q3 2014 $594,730 62 $337
Q4 2014 $604,819 73 $332
change 10% 1% 9%
Q4 2013 $550,186 72 $306
Sonoma County was one of the few regions to post both quarter-over-quarter and year-over-year average sales price gains, with an average home sale of $604,819. This figure was up 10 percent from Q4 2013. Additionally, it was the first time Sonoma County homes have averaged above $600,000 since the first quarter of 2008. Although considered one of the Bay Area’s most affordable options, these numbers should only continue to grow. Sales volume was not strong, but the 1,110 homes sold was at least in line with the previous fourth quarter. The average 73 DOM rose a bit as the trend of buyers being less hasty was widespread this quarter. Overall Napa County finished 2014 with an average yearly sales price 13 percent higher than what was seen in 2013.
Sonoma County Single-Family Homes
Page 23 | McGuire Real Estate Quarterly Report - 4th Quarter 2014
* Data is sourced from the San Francisco Multiple Listing Service, the East Bay Region District Listing Service, Bay Area Real Estate Information Services, and MLS Listings (MLS). MLS data is provided by individual listing brokerages. These are sources we deem reliable. We have no reason to doubt their accuracy, but we do not guarantee them. Past performance does not guarantee future performance
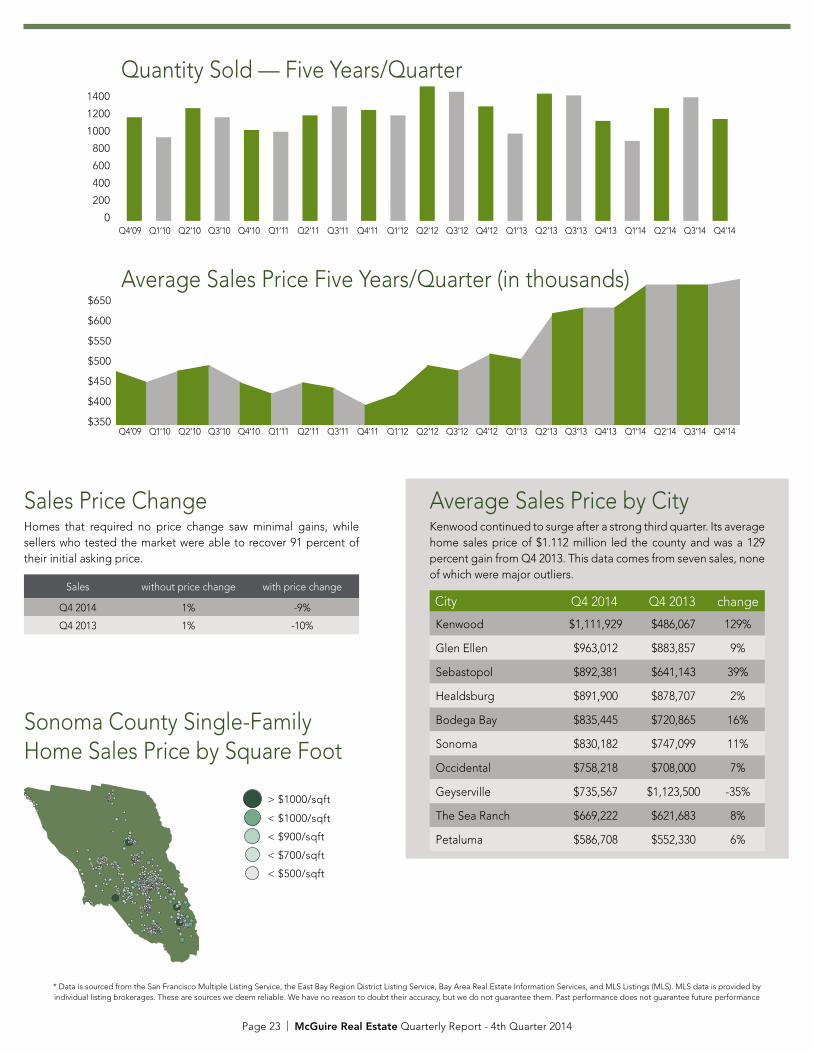
Sales Price Change Homes that required no price change saw minimal gains, while sellers who tested the market were able to recover 91 percent of their initial asking price.
Sales without price change with price change
Q4 2014 1% -9%
Q4 2013 1% -10%
Sonoma County Single-Family Home Sales Price by Square Foot
Average Sales Price Five Years/Quarter (in thousands)$650
$600
$550
$500
$450
$400
$350 44+42+44+45+42+40+42+41+38+40+45+44+47+46+54+55+55+59+59+59+601400
1200
1000
800
600
400
200
057+46+62+57+50+49+58+63+61+58+74+71+63+48+70+69+55+44+62+68+56Quantity Sold — Five Years/Quarter
Average Sales Price by CityKenwood continued to surge after a strong third quarter. Its average home sales price of $1.112 million led the county and was a 129 percent gain from Q4 2013. This data comes from seven sales, none of which were major outliers.
City Q4 2014 Q4 2013 change
Kenwood $1,111,929 $486,067 129%
Glen Ellen $963,012 $883,857 9%
Sebastopol $892,381 $641,143 39%
Healdsburg $891,900 $878,707 2%
Bodega Bay $835,445 $720,865 16%
Sonoma $830,182 $747,099 11%
Occidental $758,218 $708,000 7%
Geyserville $735,567 $1,123,500 -35%
The Sea Ranch $669,222 $621,683 8%
Petaluma $586,708 $552,330 6%
< $500/sqft
< $700/sqft
< $900/sqft
< $1000/sqft
> $1000/sqft
Q4’09 Q1‘10 Q2‘10 Q3‘10 Q4‘10 Q1‘11 Q2‘11 Q3‘11 Q4‘11 Q1‘12 Q2‘12 Q3’12 Q4‘12 Q1‘13 Q2‘13 Q3‘13 Q4‘13 Q1‘14 Q2‘14 Q3‘14 Q4‘14
Q4’09 Q1‘10 Q2‘10 Q3‘10 Q4‘10 Q1‘11 Q2‘11 Q3‘11 Q4‘11 Q1‘12 Q2‘12 Q3’12 Q4‘12 Q1‘13 Q2‘13 Q3‘13 Q4‘13 Q1‘14 Q2‘14 Q3‘14 Q4‘14

Page 24 | McGuire Real Estate Quarterly Report - 4th Quarter 2014
* Data is sourced from the San Francisco Multiple Listing Service, the East Bay Region District Listing Service, Bay Area Real Estate Information Services, and MLS Listings (MLS). MLS data is provided by individual listing brokerages. These are sources we deem reliable. We have no reason to doubt their accuracy, but we do not guarantee them. Past performance does not guarantee future performance
ALA
ME
DA
CO
UN
TY
Average Sales Price
Days onMarket
Average PricePer Sq. Ft.
Q4 2014 $739,297 27 $407
change -2% 18% -3%
Q3 2014 $752,599 23 $418
Q4 2014 $739,297 27 $407
change 12% 6% 9%
Q4 2013 $657,896 25 $374
The East Bay continued to post strong sales prices, as Alameda County’s $739,297 average home sale was a 12 percent year-over-year gain. It was also the third-highest average in county history. The average 27 DOM before a sale—while up slightly both year-over-year and quarter-over-quarter—was still the fastest selling pace in the Bay Area. Home sales volume was low here, as inventory shortages continue in this extremely hot market. The 2,397 homes sold was the highest figure among all seven counties, but was still a 5 percent decline year-over-year.
Alameda County Single-Family Homes
Page 25 | McGuire Real Estate Quarterly Report - 4th Quarter 2014
* Data is sourced from the San Francisco Multiple Listing Service, the East Bay Region District Listing Service, Bay Area Real Estate Information Services, and MLS Listings (MLS). MLS data is provided by individual listing brokerages. These are sources we deem reliable. We have no reason to doubt their accuracy, but we do not guarantee them. Past performance does not guarantee future performance
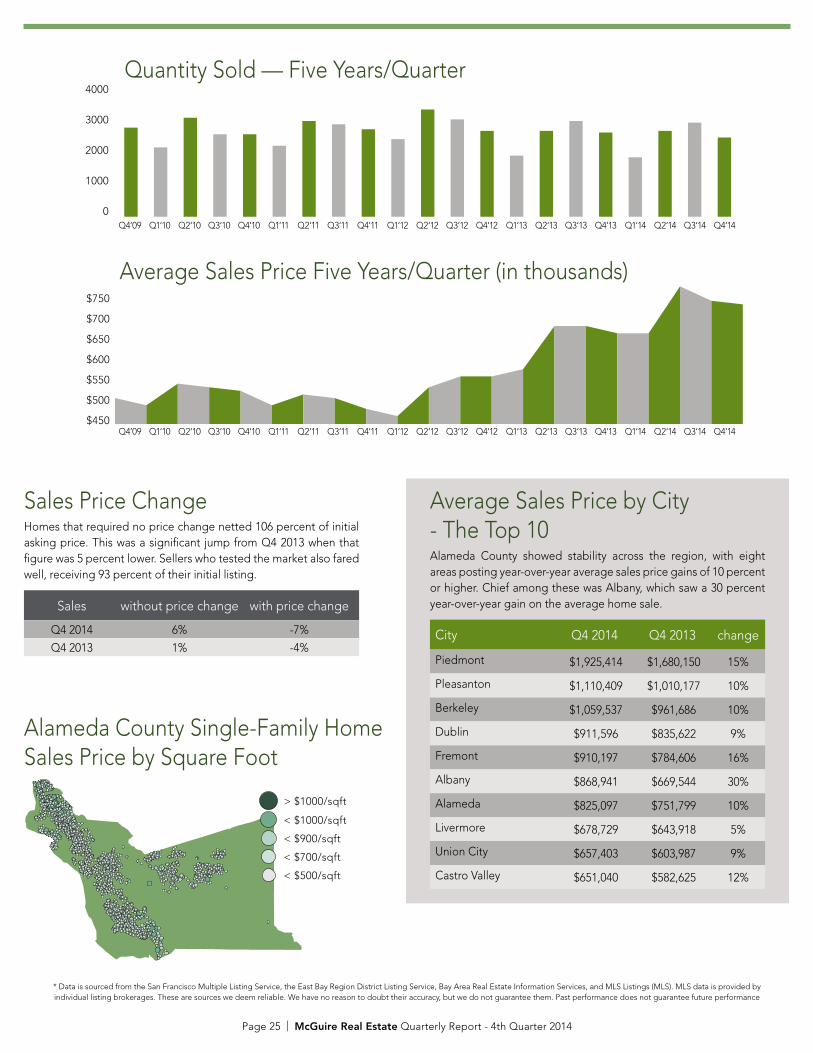
Sales Price Change Homes that required no price change netted 106 percent of initial asking price. This was a significant jump from Q4 2013 when that figure was 5 percent lower. Sellers who tested the market also fared well, receiving 93 percent of their initial listing.
Sales without price change with price change
Q4 2014 6% -7%
Q4 2013 1% -4%
Alameda County Single-Family Home Sales Price by Square Foot
Average Sales Price Five Years/Quarter (in thousands)$750
$700
$650
$600
$550
$500
$450 48+46+52+51+50+46+49+48+45+43+51+54+54+56+68+68+66+66+79+75+744000
3000
2000
1000
054+42+60+50+50+43+58+56+53+47+65+59+52+37+52+58+51+36+52+57+48Quantity Sold — Five Years/Quarter
City Q4 2014 Q4 2013 change
Piedmont $1,925,414 $1,680,150 15%
Pleasanton $1,110,409 $1,010,177 10%
Berkeley $1,059,537 $961,686 10%
Dublin $911,596 $835,622 9%
Fremont $910,197 $784,606 16%
Albany $868,941 $669,544 30%
Alameda $825,097 $751,799 10%
Livermore $678,729 $643,918 5%
Union City $657,403 $603,987 9%
Castro Valley $651,040 $582,625 12%
Average Sales Price by City - The Top 10Alameda County showed stability across the region, with eight areas posting year-over-year average sales price gains of 10 percent or higher. Chief among these was Albany, which saw a 30 percent year-over-year gain on the average home sale.
< $500/sqft
< $700/sqft
< $900/sqft
< $1000/sqft
> $1000/sqft
Q4’09 Q1‘10 Q2‘10 Q3‘10 Q4‘10 Q1‘11 Q2‘11 Q3‘11 Q4‘11 Q1‘12 Q2‘12 Q3’12 Q4‘12 Q1‘13 Q2‘13 Q3‘13 Q4‘13 Q1‘14 Q2‘14 Q3‘14 Q4‘14
Q4’09 Q1‘10 Q2‘10 Q3‘10 Q4‘10 Q1‘11 Q2‘11 Q3‘11 Q4‘11 Q1‘12 Q2‘12 Q3’12 Q4‘12 Q1‘13 Q2‘13 Q3‘13 Q4‘13 Q1‘14 Q2‘14 Q3‘14 Q4‘14

Page 26 | McGuire Real Estate Quarterly Report - 4th Quarter 2014
* Data is sourced from the San Francisco Multiple Listing Service, the East Bay Region District Listing Service, Bay Area Real Estate Information Services, and MLS Listings (MLS). MLS data is provided by individual listing brokerages. These are sources we deem reliable. We have no reason to doubt their accuracy, but we do not guarantee them. Past performance does not guarantee future performance
CO
NTR
A C
OST
A C
OU
NTY
Average Sales Price
Days onMarket
Average PricePer Sq. Ft.
Q4 2014 $632,261 32 $303
change -8% 21% -6%
Q3 2014 $684,636 27 $323
Q4 2014 $632,261 32 $303
change 7% 13% 6%
Q4 2013 $592,632 29 $286
Contra Costa posted its third-highest average sales price ever, with $632,261 realized on the average home. This was a 7 percent gain year-over-year, and helped the county finish 2014 with $6.348 billion in total yearly sales—up 10 percent from 2013. These gains occurred even as sales volume stayed rather low. The 2,325 total sales in Q4 were down 17 percent from the previous quarter, and up just slightly from Q4 2013. The average 32 DOM rose slightly, but will continue to stay low in 2015 as Contra Costa County remains one of the most affordable options in Bay Area housing.
Contra Costa County Single-Family Homes

Page 27 | McGuire Real Estate Quarterly Report - 4th Quarter 2014
* Data is sourced from the San Francisco Multiple Listing Service, the East Bay Region District Listing Service, Bay Area Real Estate Information Services, and MLS Listings (MLS). MLS data is provided by individual listing brokerages. These are sources we deem reliable. We have no reason to doubt their accuracy, but we do not guarantee them. Past performance does not guarantee future performance
City Q4 2014 Q4 2013 change
Diablo $1,934,256 $2,391,333 -19%
Alamo $1,602,367 $1,473,250 9%
Blackhawk $1,576,280 $1,601,105 -2%
Lafayette $1,367,643 $1,341,206 2%
Orinda $1,366,622 $1,209,152 13%
Danville $1,243,536 $1,179,027 5%
Moraga $1,150,056 $1,095,640 5%
Walnut Creek $965,388 $828,813 16%
Kensington $945,429 $896,613 5%
San Ramon $941,798 $895,932 5%
Average Sales Price by City- The Top 10There were no major gains year-over-year on a granular level. Yet Walnut Creek, Orinda and Alamo posted average sales price gains of 16 percent, 13 percent and 9 percent, respectively
Sales Price Change Homes that required no price change took in 102 percent of initial asking price, while sellers who tested the market netted 93 percent of their initial offer. These numbers would indicate that Contra Costa was one of the most well-balanced counties in terms of what buyers were willing to spend and what sellers were willing to accept.
Sales without price change with price change
Q4 2014 2% -7%
Q4 2013 4% -9%
Contra Costa County Single-Family Home Sales Price by Square Foot
Average Sales Price Five Years/Quarter (in thousands)$700
$600
$500
$400
$300
$200 33++38+38+43+44+39+36+41+41+37+37+46+47+47+49+62+63+61+59+69+634000
3000
2000
1000
0 +36+24+35+29+27+25+32+32+28+26+34+30+25+20+27+29+23+18+27+28+23Quantity Sold — Five Years/Quarter
< $500/sqft
< $700/sqft
< $900/sqft
< $1000/sqft
> $1000/sqft
Q4’09 Q1‘10 Q2‘10 Q3‘10 Q4‘10 Q1‘11 Q2‘11 Q3‘11 Q4‘11 Q1‘12 Q2‘12 Q3’12 Q4‘12 Q1‘13 Q2‘13 Q3‘13 Q4‘13 Q1‘14 Q2‘14 Q3‘14 Q4‘14
Q4’09 Q1‘10 Q2‘10 Q3‘10 Q4‘10 Q1‘11 Q2‘11 Q3‘11 Q4‘11 Q1‘12 Q2‘12 Q3’12 Q4‘12 Q1‘13 Q2‘13 Q3‘13 Q4‘13 Q1‘14 Q2‘14 Q3‘14 Q4‘14
Page 28 | McGuire Real Estate Quarterly Report - 4th Quarter 2014
* Data is sourced from the San Francisco Multiple Listing Service, the East Bay Region District Listing Service, Bay Area Real Estate Information Services, and MLS Listings (MLS). MLS data is provided by individual listing brokerages. These are sources we deem reliable. We have no reason to doubt their accuracy, but we do not guarantee them. Past performance does not guarantee future performance
SAN FRANCISCO | MARIN | EAST BAY | PENINSULA | WINE COUNTRY | GLOBAL
MCGUIRE.COM/QUARTERLY_REPORT
Follow McGuire Real Estate