fourth quarter 2017 - liveperson · this list is intended to identify only certain of the ......
TRANSCRIPT

Fourth Quarter 2017Supplemental Earnings Call Slides

2
Safe Harbor ProvisionStatements in this presentation regarding LivePerson that are not historical facts are forward-looking statements and are subject to risks and uncertainties that could cause actual future events or results to differ materially from such statements. Any such forward-looking statements, including but not limited to financial guidance, are made pursuant to the safe harbor provisions of the Private Securities Litigation Reform Act of 1995. It is routine for our internal projections and expectations to change as the quarter and year progress, and therefore it should be clearly understood that the internal projections and beliefs upon which we base our expectations may change. Although these expectations may change, we are under no obligation to inform you if they do. Actual events or results may differ materially from those contained in the projections or forward-looking statements. Some of the factors that could cause actual results to differ materially from the forward-looking statements contained herein include, without limitation: potential fluctuations in our quarterly revenue and operating results; competition in the market for digital engagement technology; our ability to retain existing clients and attract new clients; potential adverse impact due to foreign currency exchange rate fluctuations; privacy concerns relating to the Internet that could result in new legislation or negative public perception; risks related to new regulatory or other legal requirements that could materially impact our business; our ability to effectively operate on mobile devices; failures or security breaches in our services, those of our third party providers, or in the websites of our customers; risks related to industry-specific regulation and unfavorable industry-specific laws, regulations or interpretive positions; the adverse effect that the global economic downturn may have on our business and results of operations; economic conditions and regulatory changes caused by the United Kingdom’s likely exit from the European Union; our ability to retain key personnel, attract new personnel and to manage staff attrition; risks related to the ability to successfully integrate past or potential future acquisitions; additional regulatory requirements, tax liabilities, currency exchange rate fluctuations and other risks as we expand internationally and/or as we expand into direct-to-consumer services; risks related to the regulation or possible misappropriation of personal information belonging to our customers’ Internet users; potential failure to meeting service level commitments to certain customers; technology systems beyond our control and technology-related defects that could disrupt the LivePerson services; risks related to protecting our intellectual property rights or potential infringement of the intellectual property rights of third parties; legal liability and/or negative publicity for the services provided to consumers via our technology platforms; errors, failures or “bugs” in our products may be difficult to correct; increased allowances for doubtful accounts as a result of an increasing amount of receivables due from customers with greater credit risk; payment-related risks; delays in our implementation cycles; impairments to goodwill that result in significant charges to earnings; risks associated with the recent volatility in the capital markets; our ability to secure additional financing to execute our business strategy; our ability to license necessary third party software for use in our products and services, and our ability to successfully integrate third party software; our ability to maintain our reputation; risks related to our recognition of revenue from subscriptions; our lengthy sales cycles; risks related to our operations in Israel, and the civil and political unrest in that region; changes in accounting principles generally accepted in the United States; risks associated with our current or any future stock repurchase programs, including whether such programs will enhance long-term stockholder value, and whether such stock repurchases could increase the volatility of the price of our common stock and diminish our cash reserves; natural catastrophic events and interruption to our business by man-made problems; the high volatility of our stock price; and risks related to our common stock being traded on more than one securities exchange. This list is intended to identify only certain of the principal factors that could cause actual results to differ from those discussed in the forward-looking statements. Readers are referred to the reports and documents filed from time to time by us with the Securities and Exchange Commission for a discussion of these and other important factors that could cause actual results to differ from those discussed in forward-looking statements.

270 BILcustomer service calls each year
85%of callers are put on hold
67%hang up
48%feel unhelped

Click to edit Master text styles 4|
Consumers Already Prefer MessagingThey prefer the freedom of messaging over being tied to a phone call
The average Millennial exchanges an average of 67 text messages per day.
Americans now spend around 5 times longer in messaging apps each day than on voice calls.
WhatsApp and Facebook Messenger alone carry 22 trillion messages per year.
Messages Facebook Whatsapp
Hangouts Twitter Viber
Snapchat Skype WeChat

5
There is a Growing Gap in Customer CareConsumers have moved on from voice, but laggard brands push calls
1950 1960 1970 1980 1990 2000 2010 2020
Consumer phone call volumes
The gap between how consumers communicate in their personal lives and with brands is growing serious
LivePerson Proprietary & Confidential Information. © 2017 LivePerson, Inc. All Rights Reserved.
Brands push consumers to call

6
The Future is Mobile Messaging
Preferred by consumers And up to 4 times as efficient as legacy voice channels
Cost
Messaging can be half the workload of
voice (agents are ~2x as efficient)
Bots & AI
Human agents
Voice calls
Time
And bots can handle half of the work
that remains
Messaging
LivePerson Proprietary & Confidential Information. © 2017 LivePerson, Inc. All Rights Reserved.

7
In-App, Messenger, Google, SMS, and More to ComeConsumers message their favorite brands whenever it suits them. In their pockets, 24-7.
In-app Messenger Click-to-Message SMS
*LivePerson Proprietary & Confidential Information. © 2017 LivePerson, Inc. All Rights Reserved.
LiveEngage Messaging Hub

8
A Transformative Opportunity for Customer Care and LivePerson
TAM of 270 Billion Conversations
270 Billion Calls
10% (27 Billion)
Initial Target
6x-10x Interaction Expansion Opportunity
Up to15%
Source: IBM, Company Reports and estimates
~300 million interactions
9
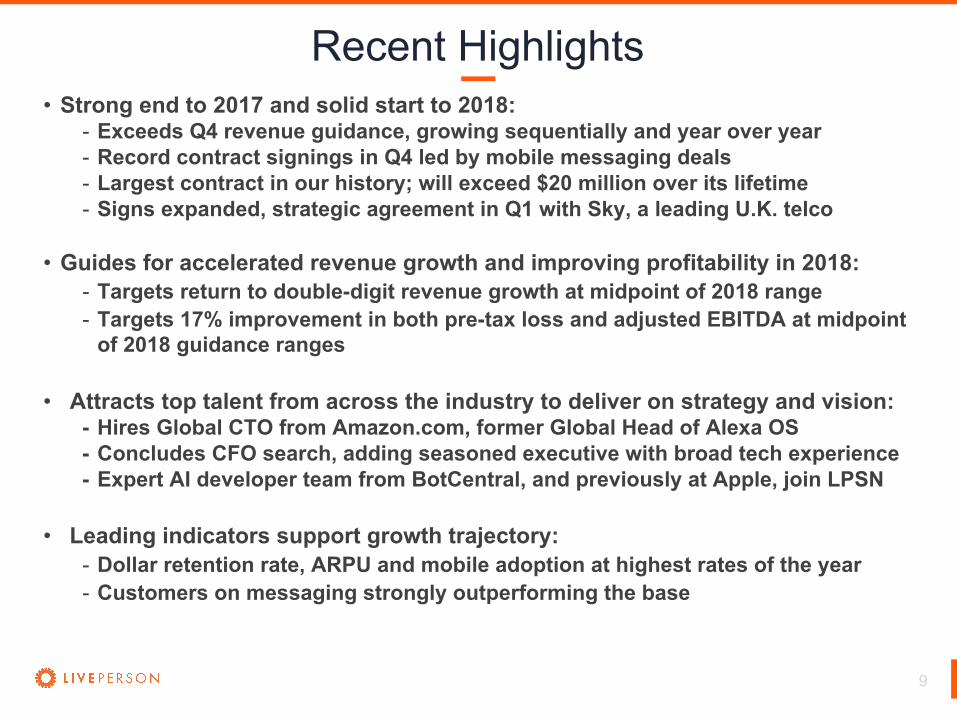
Recent Highlights• Strong end to 2017 and solid start to 2018:
- Exceeds Q4 revenue guidance, growing sequentially and year over year- Record contract signings in Q4 led by mobile messaging deals- Largest contract in our history; will exceed $20 million over its lifetime- Signs expanded, strategic agreement in Q1 with Sky, a leading U.K. telco
• Guides for accelerated revenue growth and improving profitability in 2018:- Targets return to double-digit revenue growth at midpoint of 2018 range- Targets 17% improvement in both pre-tax loss and adjusted EBITDA at midpoint
of 2018 guidance ranges
• Attracts top talent from across the industry to deliver on strategy and vision:- Hires Global CTO from Amazon.com, former Global Head of Alexa OS- Concludes CFO search, adding seasoned executive with broad tech experience- Expert AI developer team from BotCentral, and previously at Apple, join LPSN
• Leading indicators support growth trajectory:- Dollar retention rate, ARPU and mobile adoption at highest rates of the year- Customers on messaging strongly outperforming the base

10
LiveEngage Leading Indicators
LiveEngage Trend 1Q:17 2Q:17 3Q:17 4Q:17
$ Retention Rate* 100%+ 100%+ 100%+ 100%+
Full Service Brands with > 1 Interaction Type ~30% ~30% ~33% ~ 34%
Interactions on Mobile ~35% ~35% ~40% > 40%
Same-Customer YoY Usage Growth > 10% > 10% > 10% > 10%
Trailing Twelve Month ARPU ~ $200K ~ $205K > $215K >$220K
*Note: Dollar retention rate measures the % of revenue retained at quarter end from full service customers that were either on LiveEngage or with LivePerson, respectively, at quarter end in the year ago period.
*Note: ARPU is a measure of the average revenue per enterprise and midmarket customer over the trailing-twelve months.

11
Select Pro-Forma Guidance Measures1
1Q:18 Guidance 2018 Guidance 2017 Actuals
Revenue $56.75 - $57.75 $237.0 - $243.0 $218.9
Gross Margin ~75.0% ~ 76.0% ~ 73.4%
GAAP Net Loss $(7.4) - $(6.4) $(20.3) - $(16.7) $(18.2)
Adjusted EBITDA $3.5 - $4.0 $20.0 - $23.0 $18.4
Adjusted EBITDA Margin 6.2% - 6.9% 8.4% - 9.5% 8.4%
1Notes: Dollar amounts in millions. Adjusted EBITDA is a Non-GAAP financial measure. For a reconciliation of Adjusted EBITDA to net income (loss) please see slide 12. For detailed current financial expectations, please see our Press Release issued on February 20, 2018.
• Target return to double-digit growth at midpoint of 2018 revenue guidance• Continued leverage of COGS and G&A to fund S&M and R&D growth engines• Growth engines include customer summits, new logo hunters, channels and partnerships, robust
product roadmap (messaging, Bots and AI) and globalization of R&D• Target 17% growth in adjusted EBITDA at midpoint of guidance; exit year at double-digit margin• 2017 GAAP net loss includes approximately $6.0 million of projected non-recurring legal fees
Click to edit Master text styles 12|
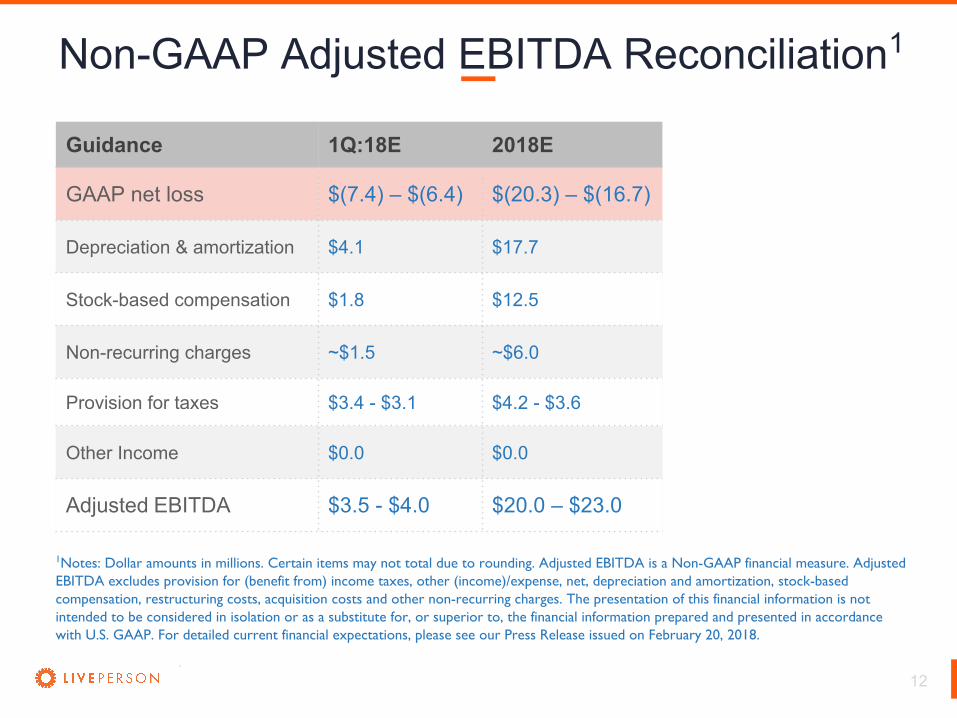
Non-GAAP Adjusted EBITDA Reconciliation1
Guidance 1Q:18E 2018E
GAAP net loss $(7.4) – $(6.4) $(20.3) – $(16.7)
Depreciation & amortization $4.1 $17.7
Stock-based compensation $1.8 $12.5
Non-recurring charges ~$1.5 ~$6.0
Provision for taxes $3.4 - $3.1 $4.2 - $3.6
Other Income $0.0 $0.0
Adjusted EBITDA $3.5 - $4.0 $20.0 – $23.0
1Notes: Dollar amounts in millions. Certain items may not total due to rounding. Adjusted EBITDA is a Non-GAAP financial measure. Adjusted EBITDA excludes provision for (benefit from) income taxes, other (income)/expense, net, depreciation and amortization, stock-based compensation, restructuring costs, acquisition costs and other non-recurring charges. The presentation of this financial information is not intended to be considered in isolation or as a substitute for, or superior to, the financial information prepared and presented in accordance with U.S. GAAP. For detailed current financial expectations, please see our Press Release issued on February 20, 2018.
13
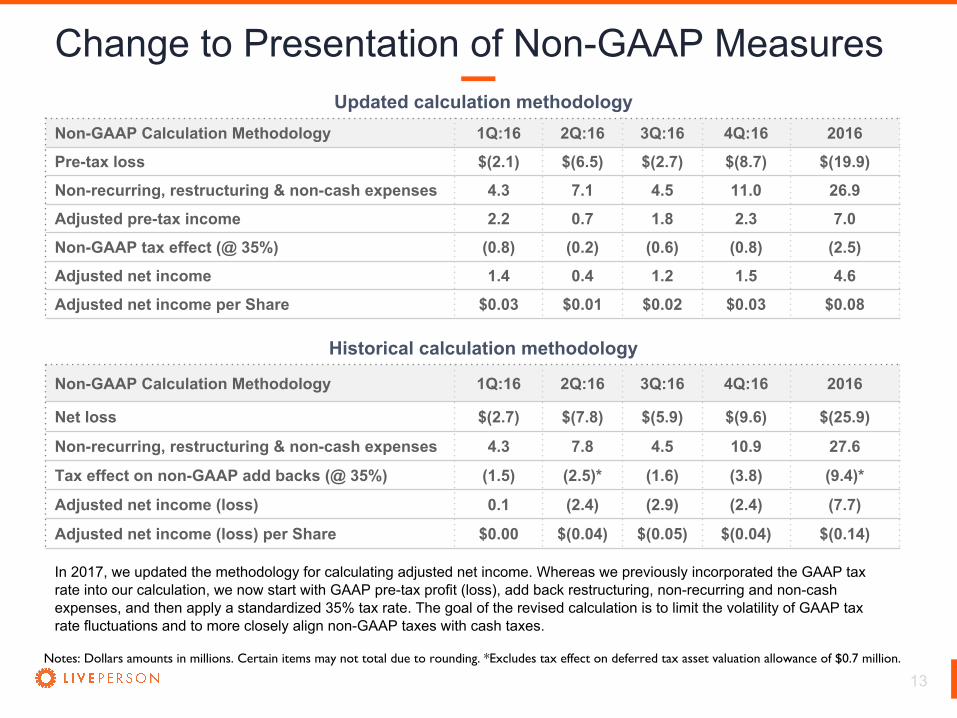
Change to Presentation of Non-GAAP Measures
Historical calculation methodology
Non-GAAP Calculation Methodology 1Q:16 2Q:16 3Q:16 4Q:16 2016
Net loss $(2.7) $(7.8) $(5.9) $(9.6) $(25.9)
Non-recurring, restructuring & non-cash expenses 4.3 7.8 4.5 10.9 27.6
Tax effect on non-GAAP add backs (@ 35%) (1.5) (2.5)* (1.6) (3.8) (9.4)*
Adjusted net income (loss) 0.1 (2.4) (2.9) (2.4) (7.7)
Adjusted net income (loss) per Share $0.00 $(0.04) $(0.05) $(0.04) $(0.14)
Updated calculation methodologyNon-GAAP Calculation Methodology 1Q:16 2Q:16 3Q:16 4Q:16 2016
Pre-tax loss $(2.1) $(6.5) $(2.7) $(8.7) $(19.9)
Non-recurring, restructuring & non-cash expenses 4.3 7.1 4.5 11.0 26.9
Adjusted pre-tax income 2.2 0.7 1.8 2.3 7.0
Non-GAAP tax effect (@ 35%) (0.8) (0.2) (0.6) (0.8) (2.5)
Adjusted net income 1.4 0.4 1.2 1.5 4.6
Adjusted net income per Share $0.03 $0.01 $0.02 $0.03 $0.08
Notes: Dollars amounts in millions. Certain items may not total due to rounding. *Excludes tax effect on deferred tax asset valuation allowance of $0.7 million.
In 2017, we updated the methodology for calculating adjusted net income. Whereas we previously incorporated the GAAP tax rate into our calculation, we now start with GAAP pre-tax profit (loss), add back restructuring, non-recurring and non-cash expenses, and then apply a standardized 35% tax rate. The goal of the revised calculation is to limit the volatility of GAAP tax rate fluctuations and to more closely align non-GAAP taxes with cash taxes.