fourth quarter 2021 - noreco
TRANSCRIPT

Fourth Quarter 2021Oslo, 18 February 2021
THIS PRESENTATION (THE “INFORMATION MATERIAL”) HAS BEEN PRODUCED AND
DELIVERED BY NORWEGIAN ENERGY COMPANY ASA (THE “COMPANY”). THIS
INFORMATION MATERIAL DOES NOT CONSTITUTE AN OFFER, INVITATION OR
SOLICITATION OF AN OFFER TO BUY, SUBSCRIBE OR SELL ANY SHARES IN THE
COMPANY.
THE COMPANY DOES NOT MAKE ANY UNDERTAKING, REPRESENTATION OR
WARRANTY (EXPRESS OR IMPLIED) AS TO THE ACCURACY OR COMPLETENESS
OF THE INFORMATION (WHETHER WRITTEN OR ORAL AND WHETHER INCLUDED
IN THIS INFORMATION MATERIAL OR ELSEWHERE) CONCERNING THE COMPANY
OR OTHER MATTERS DESCRIBED HEREIN. NEITHER THE COMPANY NOR ANY OF
ITS PARENT OR SUBSIDIARY UNDERTAKINGS OR ANY SUCH PERSON’S
AFFILIATES, OFFICERS, EMPLOYEES OR ADVISERS ACCEPT ANY LIABILITY
WHATSOEVER ARISING DIRECTLY OR INDIRECTLY FROM THE USE OF THIS
INFORMATION MATERIAL OR OTHERWISE IN CONNECTION WITH THE MATTERS
DESCRIBED HEREIN.
THE DISTRIBUTION OF THIS INFORMATION MATERIAL IN CERTAIN JURISDICTIONS
IS RESTRICTED BY LAW. THIS INFORMATION MATERIAL IS NOT FOR DISTRIBUTION
OR RELEASE, DIRECTLY OR INDIRECTLY, IN OR INTO ANY JURISDICTION IN
WHICH THE DISTRIBUTION OR RELEASE WOULD BE UNLAWFUL.
THIS INFORMATION MATERIAL MAY CONTAIN CERTAIN FORWARD-LOOKING
STATEMENTS RELATING TO THE BUSINESS, FINANCIAL PERFORMANCE AND
RESULTS OF THE COMPANY AND/OR THE INDUSTRY IN WHICH IT OPERATES.
FORWARD-LOOKING STATEMENTS CONCERN FUTURE CIRCUMSTANCES AND
RESULTS AND OTHER STATEMENTS THAT ARE NOT HISTORICAL FACTS,
SOMETIMES IDENTIFIED BY THE WORDS “BELIEVES”, EXPECTS”, “PREDICTS”,
“INTENDS”, “PROJECTS”, “PLANS”, “ESTIMATES”, “AIMS”, “FORESEES”,
“ANTICIPATES”, “TARGETS”, AND SIMILAR EXPRESSIONS. THE FORWARD-
LOOKING STATEMENTS CONTAINED IN THIS INFORMATION MATERIAL, INCLUDING
ASSUMPTIONS, OPINIONS AND VIEWS OF THE COMPANY OR CITED FROM THIRD
PARTY SOURCES ARE SOLELY OPINIONS AND FORECASTS WHICH ARE SUBJECT
TO RISKS, UNCERTAINTIES AND OTHER FACTORS THAT MAY CAUSE ACTUAL
EVENTS TO DIFFER MATERIALLY FROM ANY ANTICIPATED DEVELOPMENT.
NEITHER THE COMPANY NOR ANY OF ITS SUBSIDIARY UNDERTAKINGS OR ANY
SUCH PERSON’S AFFILIATES, OFFICERS OR EMPLOYEES PROVIDES ANY
ASSURANCE THAT THE ASSUMPTIONS UNDERLYING SUCH FORWARD-LOOKING
STATEMENTS ARE FREE FROM ERRORS, NOR DOES ANY OF THEM ACCEPT ANY
RESPONSIBILITY FOR THE FUTURE ACCURACY OF THE OPINIONS EXPRESSED IN
THIS INFORMATION MATERIAL OR THE ACTUAL OCCURRENCE OF THE
FORECASTED DEVELOPMENTS. THE COMPANY ASSUME NO OBLIGATION TO
UPDATE ANY FORWARD-LOOKING STATEMENTS OR TO CONFIRM THESE
FORWARD-LOOKING STATEMENTS TO OUR ACTUAL RESULTS.
BY ATTENDING OR RECEIVING THIS INFORMATION MATERIAL YOU
ACKNOWLEDGE THAT YOU WILL BE RESPONSIBLE FOR YOUR OWN ASSESSMENT
OF THE MARKET AND THE MARKET POSITION OF THE COMPANY AND THAT YOU
WILL CONDUCT YOUR OWN ANALYSIS AND BE SOLELY RESPONSIBLE FOR
FORMING YOUR OWN VIEW OF THE POTENTIAL FUTURE PERFORMANCE OF THE
COMPANY’S BUSINESS AND A POTENTIAL INVESTMENT IN THE COMPANY.
THE CONTENTS OF THIS INFORMATION MATERIAL ARE NOT TO BE CONSTRUED
AS FINANCIAL, LEGAL, BUSINESS, INVESTMENT, TAX OR OTHER PROFESSIONAL
ADVICE. THIS INFORMATION MATERIAL SPEAKS AS OF 21 AUGUST 2020. NEITHER
THE DELIVERY OF THIS INFORMATION MATERIAL NOR ANY FURTHER
DISCUSSIONS OF THE COMPANY WITH ANY OF THE RECIPIENTS SHALL, UNDER
ANY CIRCUMSTANCES, CREATE ANY IMPLICATION THAT THERE HAS BEEN NO
CHANGE IN THE AFFAIRS OF THE COMPANY SINCE SUCH DATE.
THIS INFORMATION MATERIAL IS SUBJECT TO NORWEGIAN LAW, AND ANY
DISPUTE ARISING IN RESPECT OF THIS INFORMATION MATERIAL IS SUBJECT TO
THE EXCLUSIVE JURISDICTION OF NORWEGIAN COURTS WITH OSLO DISTRICT
COURT AS EXCLUSIVE LEGAL VENUE
Disclaimer
2
AN INVESTMENT IN THE COMPANY INVOLVES RISK, AND SEVERAL FACTORS
COULD CAUSE THE ACTUAL RESULTS, PERFORMANCE OR ACHIEVEMENTS OF
THE COMPANY TO BE MATERIALLY DIFFERENT FROM ANY FUTURE RESULTS,
PERFORMANCE OR ACHIEVEMENTS THAT MAY BE EXPRESSED OR IMPLIED BY
STATEMENTS AND INFORMATION IN THIS INVESTOR PRESENTATION, INCLUDING,
AMONG OTHERS, RISKS OR UNCERTAINTIES ASSOCIATED WITH THE COMPANY’S
BUSINESS, SEGMENTS, DEVELOPMENT, GROWTH MANAGEMENT, FINANCING,
MARKET ACCEPTANCE AND RELATIONS WITH CUSTOMERS, AND, MORE
GENERALLY, GENERAL ECONOMIC AND BUSINESS CONDITIONS, CHANGES IN
DOMESTIC AND FOREIGN LAWS AND REGULATIONS, TAXES, CHANGES IN
COMPETITION AND PRICING ENVIRONMENTS, FLUCTUATIONS IN CURRENCY
EXCHANGE RATES AND INTEREST RATES AND OTHER FACTORS. SHOULD ONE
OR MORE OF THESE RISKS OR UNCERTAINTIES MATERIALISE, OR SHOULD
UNDERLYING ASSUMPTIONS PROVE INCORRECT, ACTUAL RESULTS MAY VARY
MATERIALLY FROM THOSE DESCRIBED IN THIS INVESTOR PRESENTATION. THE
COMPANY DOES NOT INTEND, AND DOES NOT ASSUME ANY OBLIGATION, TO
UPDATE OR CORRECT THE INFORMATION INCLUDED IN THIS INVESTOR
PRESENTATION.
Important Information
3
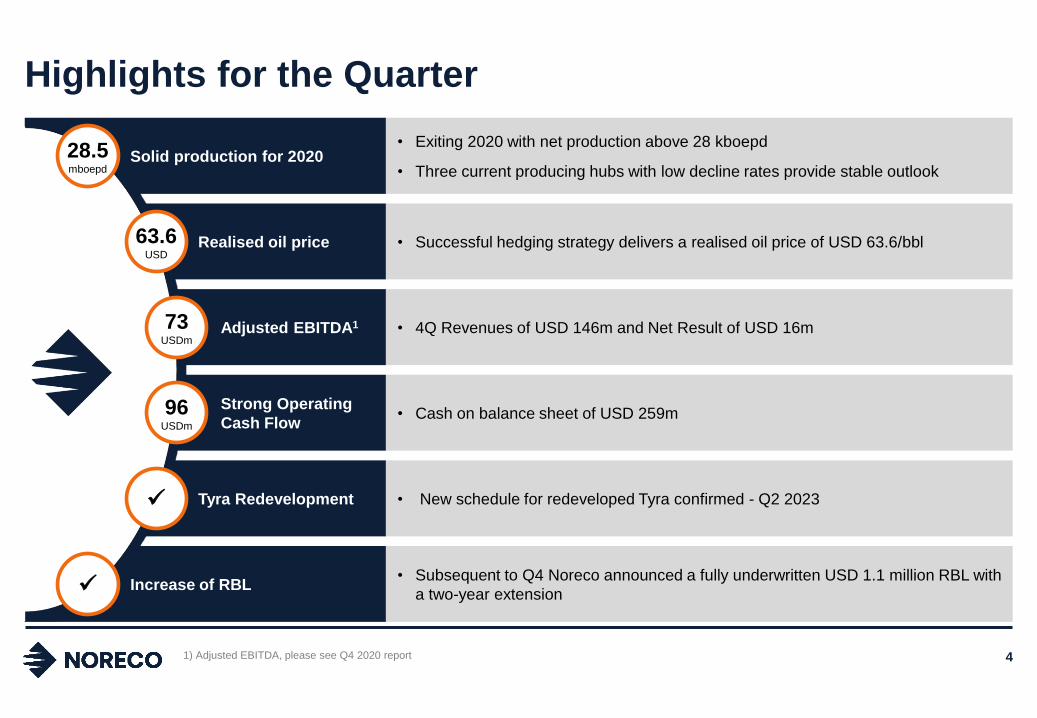
Strong Operating
Cash Flow
Solid production for 2020
Realised oil price
Adjusted EBITDA1
Tyra Redevelopment
Increase of RBL
1) Adjusted EBITDA, please see Q4 2020 report
Highlights for the Quarter
4
• Exiting 2020 with net production above 28 kboepd
• Three current producing hubs with low decline rates provide stable outlook
• Successful hedging strategy delivers a realised oil price of USD 63.6/bbl
• 4Q Revenues of USD 146m and Net Result of USD 16m
• Cash on balance sheet of USD 259m
• New schedule for redeveloped Tyra confirmed - Q2 2023
• Subsequent to Q4 Noreco announced a fully underwritten USD 1.1 million RBL with
a two-year extension
63.6USD
73USDm
96USDm
✓
✓
28.5mboepd

Operational Review

Strong 2020 Production with Low Forward Decline Rate - Stable cash generative production throughout the Tyra Redevelopment period
Production mboepd (net)1
61) figures do not take into account the volume guarantee
2020 2021
28.4Guidance
25.5-27.5
• Full year production averaged 28.5 mboepd
• Full year operational efficiency at ~82% (COVID impacted)
• Added circa 200 boepd in Q4 through gas lift optimization
• Returned to pre-Covid levels of offshore manning
81 %
19 %
Oil sales Gas sales
Hydrocarbon Sales

1) In USD million, net to Noreco
2) Share of expected remaining cost
3) Source: Rystad Energy Base Case NPV as per 1 January in the year of first production from the project (for North
Sea projects under development above 100 mmboe) divided by Rystad Energy remaining resources
Tyra Redevelopment – Milestones & Outlook
7
Indicative Tyra Cost Phasing2
Forward-looking Milestones
o TEH sail away – Q3 2021
o TE WHRP sail away – Q3 2021
o Initiation of offshore hook-up – Q3 2021
o TW WHRP sail away – Q4 2021
o TEG process module sail away – 2022
o First gas – Q2 2023
North Sea Development Projects, NPV (USD)/bbl3
2020 Tyra Cost (actuals)1
40-50% 40-50%
10-20%
2021 2022 2023
160
70 230
60 1 291
CAPEX ABEX Total CAPEX ABEX Total
Q1-Q3 Q4 FY 2020
16,0
13,5
11,2
9,4
7,6
7,2
7,2
Tyra (redevelop), DK
Penguins (redevelop), GB
Pierce (gas blowdown), GB
Johan Castberg, NO
Johan Sverdrup-Phase 2, NO
Njord Future, NO
Martin Linge, NO
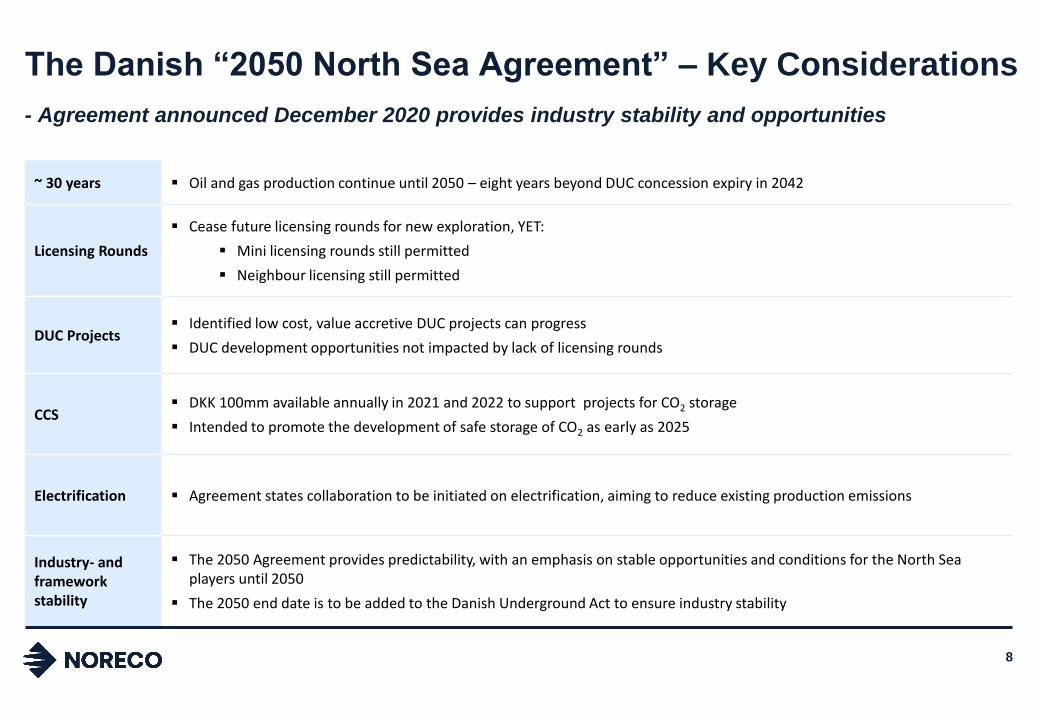
The Danish “2050 North Sea Agreement” – Key Considerations
8
- Agreement announced December 2020 provides industry stability and opportunities
~ 30 years ▪ Oil and gas production continue until 2050 – eight years beyond DUC concession expiry in 2042
Licensing Rounds
▪ Cease future licensing rounds for new exploration, YET:
▪ Mini licensing rounds still permitted
▪ Neighbour licensing still permitted
DUC Projects▪ Identified low cost, value accretive DUC projects can progress
▪ DUC development opportunities not impacted by lack of licensing rounds
CCS▪ DKK 100mm available annually in 2021 and 2022 to support projects for CO2 storage
▪ Intended to promote the development of safe storage of CO2 as early as 2025
Electrification ▪ Agreement states collaboration to be initiated on electrification, aiming to reduce existing production emissions
Industry- and framework stability
▪ The 2050 Agreement provides predictability, with an emphasis on stable opportunities and conditions for the North Sea players until 2050
▪ The 2050 end date is to be added to the Danish Underground Act to ensure industry stability

Financial Review
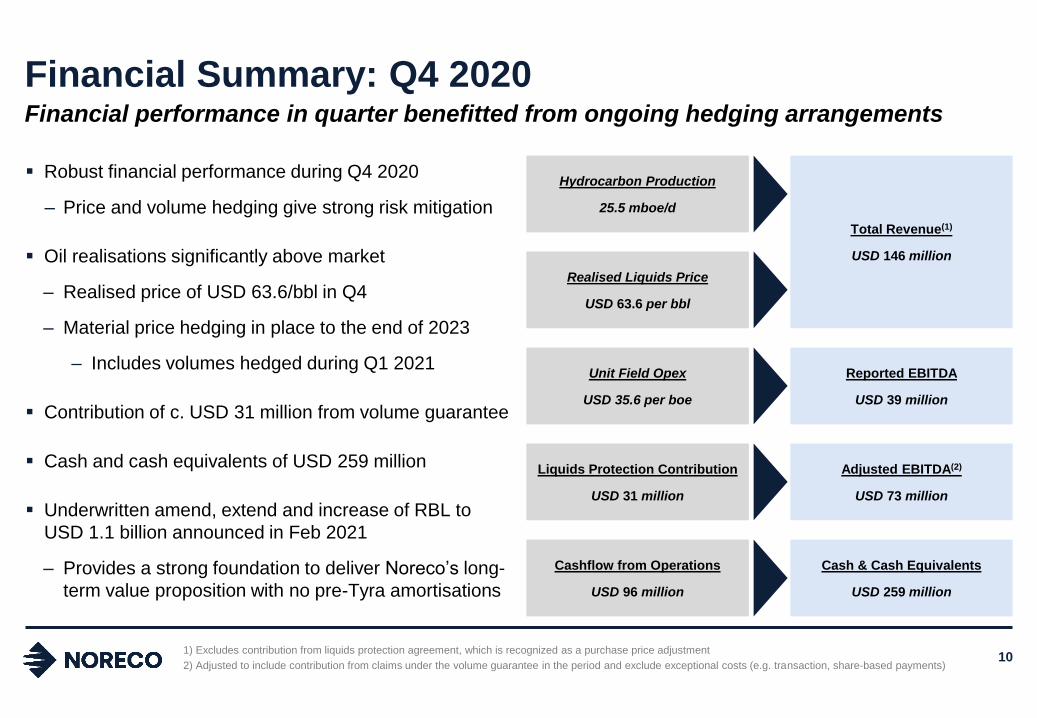
Financial performance in quarter benefitted from ongoing hedging arrangements
Financial Summary: Q4 2020
1) Excludes contribution from liquids protection agreement, which is recognized as a purchase price adjustment
2) Adjusted to include contribution from claims under the volume guarantee in the period and exclude exceptional costs (e.g. transaction, share-based payments)
▪ Robust financial performance during Q4 2020
– Price and volume hedging give strong risk mitigation
▪ Oil realisations significantly above market
– Realised price of USD 63.6/bbl in Q4
– Material price hedging in place to the end of 2023
– Includes volumes hedged during Q1 2021
▪ Contribution of c. USD 31 million from volume guarantee
▪ Cash and cash equivalents of USD 259 million
▪ Underwritten amend, extend and increase of RBL to
USD 1.1 billion announced in Feb 2021
– Provides a strong foundation to deliver Noreco’s long-
term value proposition with no pre-Tyra amortisations
Hydrocarbon Production
25.5 mboe/d
Realised Liquids Price
USD 63.6 per bbl
Unit Field Opex
USD 35.6 per boe
Liquids Protection Contribution
USD 31 million
Cashflow from Operations
USD 96 million
Total Revenue(1)
USD 146 million
Reported EBITDA
USD 39 million
Adjusted EBITDA(2)
USD 73 million
Cash & Cash Equivalents
USD 259 million
10
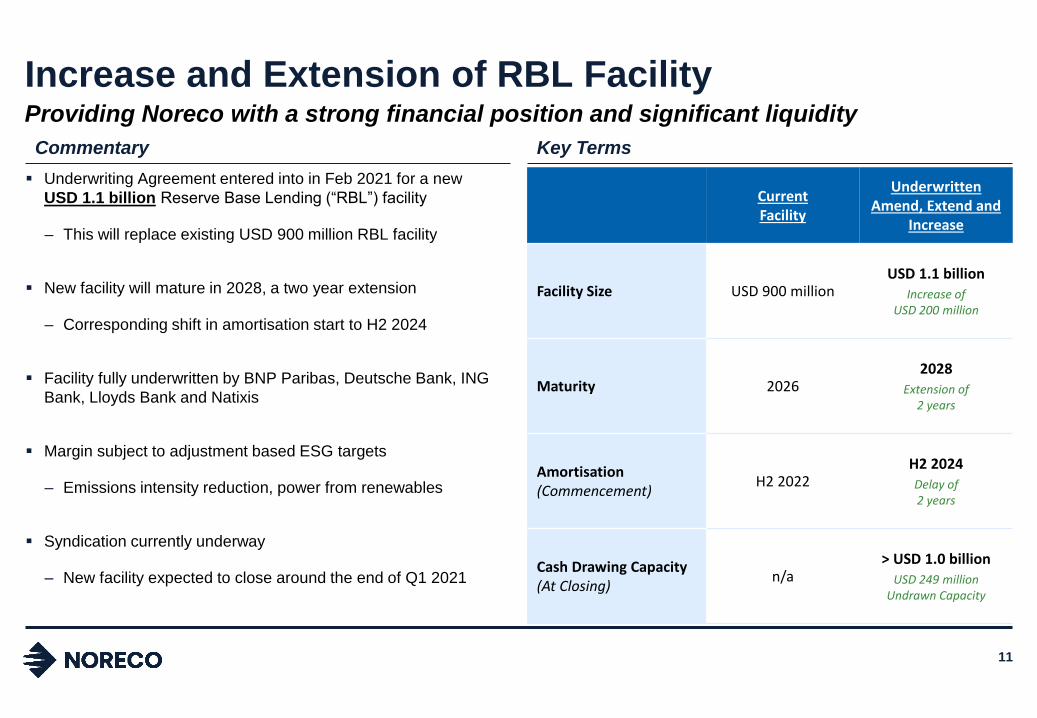
11
▪ Underwriting Agreement entered into in Feb 2021 for a new
USD 1.1 billion Reserve Base Lending (“RBL”) facility
– This will replace existing USD 900 million RBL facility
▪ New facility will mature in 2028, a two year extension
– Corresponding shift in amortisation start to H2 2024
▪ Facility fully underwritten by BNP Paribas, Deutsche Bank, ING
Bank, Lloyds Bank and Natixis
▪ Margin subject to adjustment based ESG targets
– Emissions intensity reduction, power from renewables
▪ Syndication currently underway
– New facility expected to close around the end of Q1 2021
Commentary Key Terms
CurrentFacility
Underwritten Amend, Extend and
Increase
Facility Size USD 900 millionUSD 1.1 billion
Increase of USD 200 million
Maturity 20262028
Extension of2 years
Amortisation (Commencement)
H2 2022H2 2024Delay of2 years
Cash Drawing Capacity(At Closing)
n/a> USD 1.0 billion
USD 249 millionUndrawn Capacity
Providing Noreco with a strong financial position and significant liquidity
Increase and Extension of RBL Facility

75,3
63,6
Q3 2020 Q4 2020
27,6
28,3
Q3 2020 Q4 2020
157
146
Q3 2020 Q4 2020
28,7
25,5
Q3 2020 Q4 2020
Oil & Gas Production and Sales: Q4 2020
(mboepd) (mboepd) (USD/bbl) (USD million)
1) Production figures do not take account of the volume guarantee
Reflects
overlift in the
period of
2.8mboepd
Average
Dated Brent in
Q4 2020 of
USD 46.0/bbl
12
RevenueSalesProduction(1) Realised Liquids Price

Overview of Hedging Arrangements: Q4 2020
▪ Noreco received USD 31 million from the Liquids Protection Agreement with Shell during Q4 2020
– The protection period under this agreement expired at the end of 2020
13
Volume
Hedging
Price
Hedging
▪ Existing price hedging arrangements delivered significant value during Q4 2020
– Realized price of USD 63.6/bbl compared to average Brent price of USD 46.0/bbl
▪ RBL hedge policy: 50% (0-12 months), 40% (13-24 months), 30% (25-36 months) forecast production
– Waiver of minimum 2023 hedge requirement received in Dec 2020 given ongoing market weakness
▪ Current hedge portfolio covers 13.8mmbbl from 2021 to 2023, with 3.3mmbbl executed in Q1 2021
Hedge Volumes Average Hedge Price
(mmbbl) (USD/bbl)
3,23,0
2,4
1,9
2,4
0,9
H1 2021 H2 2021 H1 2022 H2 2022 H1 2023 H2 2023
In place at end Q4 2020
Executed in Q1 2021
55,8 55,7 55,8 55,6 51,7 51,7
H1 2021 H2 2021 H1 2022 H2 2022 H1 2023 H2 2023
In place at end Q4 2020
Executed in Q1 2021
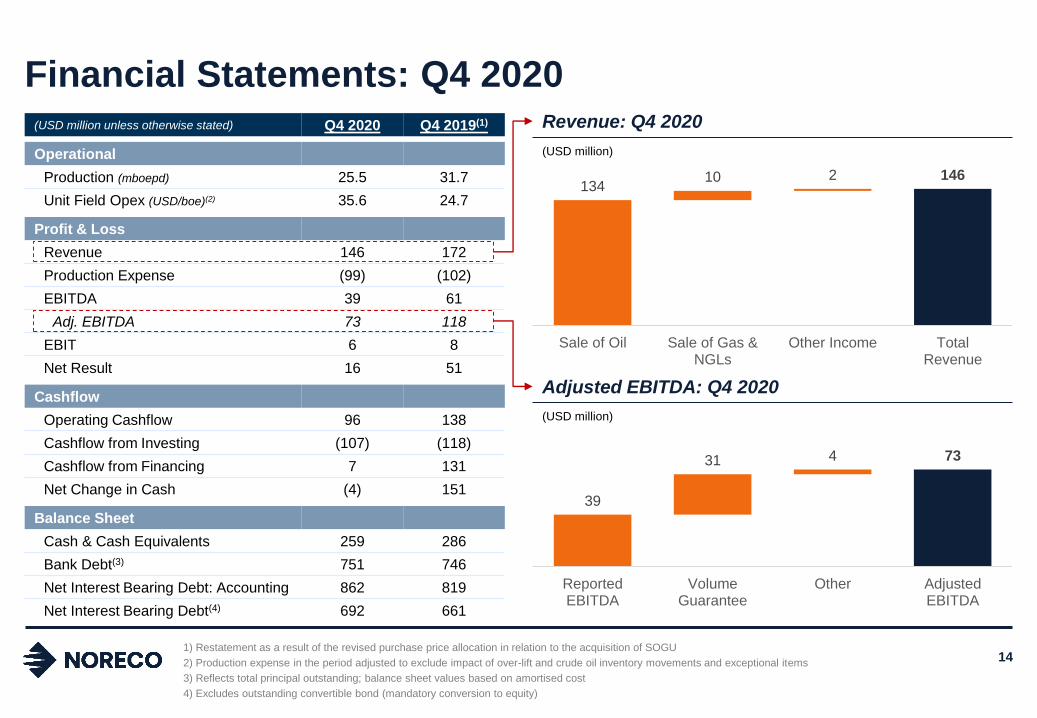
39
31 4 73
ReportedEBITDA
VolumeGuarantee
Other AdjustedEBITDA
Financial Statements: Q4 2020(USD million unless otherwise stated) Q4 2020 Q4 2019(1)
Operational
Production (mboepd) 25.5 31.7
Unit Field Opex (USD/boe)(2) 35.6 24.7
Profit & Loss
Revenue 146 172
Production Expense (99) (102)
EBITDA 39 61
Adj. EBITDA 73 118
EBIT 6 8
Net Result 16 51
Cashflow
Operating Cashflow 96 138
Cashflow from Investing (107) (118)
Cashflow from Financing 7 131
Net Change in Cash (4) 151
Balance Sheet
Cash & Cash Equivalents 259 286
Bank Debt(3) 751 746
Net Interest Bearing Debt: Accounting 862 819
Net Interest Bearing Debt(4) 692 661
1) Restatement as a result of the revised purchase price allocation in relation to the acquisition of SOGU
2) Production expense in the period adjusted to exclude impact of over-lift and crude oil inventory movements and exceptional items
3) Reflects total principal outstanding; balance sheet values based on amortised cost
4) Excludes outstanding convertible bond (mandatory conversion to equity)
13410 2 146
Sale of Oil Sale of Gas &NGLs
Other Income TotalRevenue
14
(USD million)
(USD million)
Revenue: Q4 2020
Adjusted EBITDA: Q4 2020
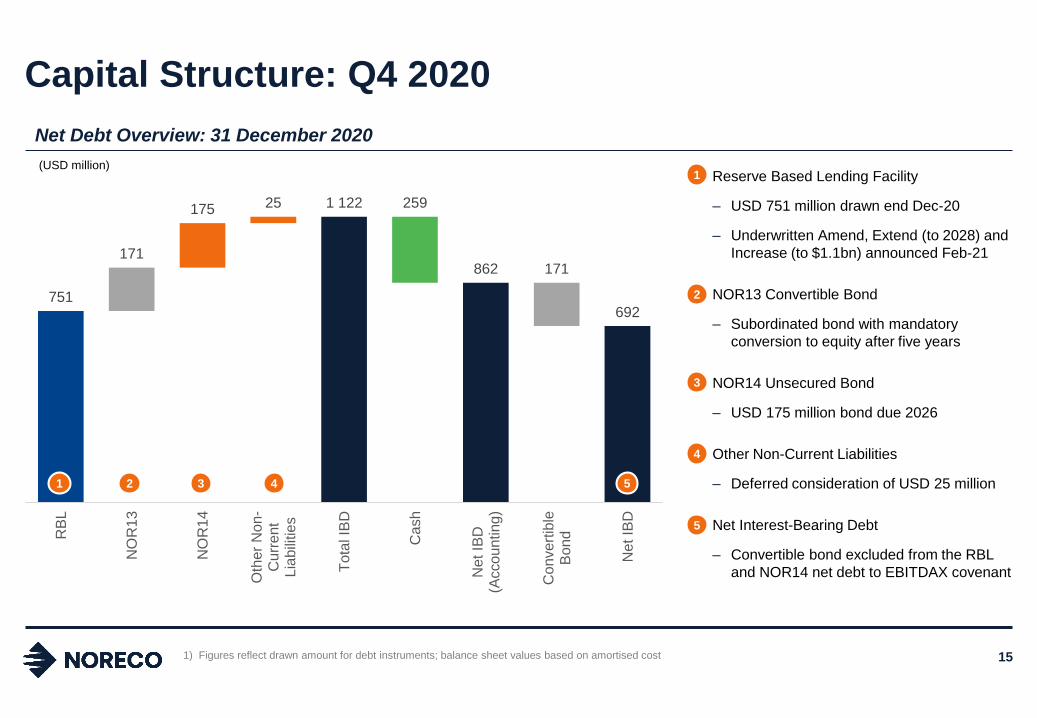
Capital Structure: Q4 2020
▪ Reserve Based Lending Facility
– USD 751 million drawn end Dec-20
– Underwritten Amend, Extend (to 2028) and
Increase (to $1.1bn) announced Feb-21
▪ NOR13 Convertible Bond
– Subordinated bond with mandatory
conversion to equity after five years
– NOR14 Unsecured Bond
– USD 175 million bond due 2026
▪ Other Non-Current Liabilities
– Deferred consideration of USD 25 million
▪ Net Interest-Bearing Debt
– Convertible bond excluded from the RBL
and NOR14 net debt to EBITDAX covenant
751
171
175 25 1 122 259
862 171
692
RB
L
NO
R1
3
NO
R14
Oth
er
No
n-
Cu
rre
nt
Lia
bili
tie
s
Tota
l IB
D
Ca
sh
Ne
t IB
D(A
cco
un
ting
)
Co
nve
rtib
leB
ond
Ne
t IB
D
1 2 3 5
1
2
3
5
4
4
1) Figures reflect drawn amount for debt instruments; balance sheet values based on amortised cost 15
(USD million)
Net Debt Overview: 31 December 2020
Closing Reflections

Spectrum of Growth
Opportunities
Material Reserves &
Resources Base
Substantial
Production
Near-Term Growth
Through Tyra
Cashflow Secured
Through Hedging
Strong Financial Position
Noreco: Attractive Long-Term Value Proposition
17
✓
✓
✓
✓
✓
✓
• 2P reserves of 209 mmboe
• 2C resources of approx. 200 mmboe, with additional projects being progressed
• Consistent production providing significant operational cashflow
• Low decline rates with opportunities to offset through investment
• Noreco expected to produce circa 50 mboepd following Tyra restart
• Significant milestones to demonstrate progress in 2021
• Low risk organic growth identified in high value, low capex projects within the DUC
• Advantageous tax balances support potential inorganic value-additive growth
• Over 14mmbbl of price hedges in place covering 2021 to 2023 volumes
• Average hedge price of USD 56 per boe (2021/22) and USD 52 per boe (2023)
• Diversified sources of funding
• No near-term debt maturities or capital repayments