fourth - vanderbilt
TRANSCRIPT

FOURTH REPORT
Guatemalan Values and the Prospects for Democratic Development: With Emphasis on Civil Society Participation and Attitudes Regarding Crime, Due Process and Authoritarian Regimes
Prepared by: Mitchell A. Seligson, Malcolm B. Young Cynthia Hamill, Dinorah Azpuru de Cuestas and Max Eduardo Lucas Under Contract No. AEP-5468-I-00-6005-00 Delivery Order No. Out-AEP-I-808-96-99995-00 Implemented by: Development Associates, Inc., and its Subcontractors: the University of Pittsburgh and the Asociación de Investigación y Estudios Sociales (ASIES) Commissioned by: USAID Guatemala Office of Democratic Initiatives
Development Associates, Inc. 1730 North Lynn Street Arlington, VA 22209-2023 (703) 276-0677
January 2000

January 2000
Table of Contents
Executive Summary................................................................................................................ 1 Chapter 1 Introduction....................................................................................................... 1-1 Political Context for the Report ....................................................................................... 1-2 Highlights of Prior Surveys Compared to 1999 Results............................................. 1-3 The Survey Sample and Questionnaire......................................................................... 1-6 Comparisons of the Data Sets ........................................................................................ 1-9 Structure of the Report ..................................................................................................... 1-9 Chapter 2 System Support and Tolerance .................................................................... 2-1 System Support, 1993 - 1999.......................................................................................... 2-4 Tolerance, 1993 - 1999 .................................................................................................... 2-9 Leading Indicators of Political Stability .......................................................................... 2-12 Empirical Relationship between Tolerance and System Support in Guatemala ..................................................................................................................... 2-14 Chapter 3 Local Government and Involvement in Community Life ........................... 3-1 Popular Support for Local Government ......................................................................... 3-2 Satisfaction with Local Services...................................................................................... 3-6 Local Sources of Assistance ........................................................................................... 3-9 Extent of Participation....................................................................................................... 3-11 Political Participation......................................................................................................... 3-16 Civil Society Participation and Municipal Participation................................................ 3-17 Civil Society Participation and Support for Local Government .................................. 3-23 Civil Society Participation and Support for Democracy............................................... 3-24 Chapter 4 Importance of Economic Conditions ............................................................ 4-1 Most Serious National Level Problems.......................................................................... 4-1 Most Serious Community Level Problems .................................................................... 4-6 Satisfaction......................................................................................................................... 4-13 Relationship of Concern and Satisfaction with Economy to Civil Society Participation, Tolerance and System Support.................................. 4-20 Chapter 5 Crime: Its Dimensions and Political Impact................................................ 5-1 The Growing Problem of Crime in Latin America......................................................... 5-1 Research on Crime in Latin America ............................................................................. 5-3 The Context of Crime in Guatemala ............................................................................... 5-8 Violence Against Women................................................................................................. 5-12 The Demography of Crime .............................................................................................. 5-16 Gender ................................................................................................................................ 5-17

Guatemalan Values and Democratic Development: Fourth Report ii
January 2000
Geographic Regions and Urbanization.......................................................................... 5-18 Ethnicity............................................................................................................................... 5-20 Socio-Economic Status .................................................................................................... 5-22 The Strongest Predictors ................................................................................................. 5-26 The Impact of Crime on Political Attitudes and Behaviors.......................................... 5-26 System Support ................................................................................................................ 5-29 Tolerance............................................................................................................................ 5-30 Civic Culture ....................................................................................................................... 5-30 Summary and Some Implications ................................................................................... 5-33 Chapter 6 Support for Due Process ................................................................................ 6-1 Support for "Mano dura"................................................................................................... 6-4 Preference for Democracy vs. Dictatorship .................................................................. 6-6 Policy Preferences for Due Process .............................................................................. 6-9 Tough on Crime Dimension............................................................................................. 6-11 Tough on Social Deviance ............................................................................................... 6-16 Support for Democracy and Linkages to Due Process ............................................... 6-19 Multivariate Path Analysis................................................................................................ 6-27 Political Implications of a Preference for Democracy.................................................. 6-31 Chapter 7 The Prospects for Peace and Democratization.......................................... 7-1 Introduction......................................................................................................................... 7-1 Opinions about the Peace Agreement ........................................................................... 7-6 Overall Model of Support for Peace Accords................................................................ 7-10 Appendix 1 Sample Distribution by Region, Department and Year ............................. A-1 Appendix 2 Questionnaire................................................................................................... A-2

Guatemalan Values and Democratic Development: Fourth Report
January 2000
iii
List of Figures
Figure 2.1: System Support 1999: Core Indicators .................................................................2-4 Figure 2.2: System Support, Core Items: 1993 - 1999 ............................................................2-5 Figure 2.3: System Support Index, 1993-1999..........................................................................2-6 Figure 2.4: System Support, Non-Core, 1993-1999 .................................................................2-7 Figure 2.5: Political Tolerance, 1999 ..........................................................................................2-10 Figure 2.6: Political Tolerance, 1993-1999 ................................................................................2-11 Figure 2.7: Tolerance Scale, 1993-1997 ....................................................................................2-12 Figure 3.1: Confidence in Institutions: 1999 .............................................................................3-2 Figure 3.2: Confidence in Local Government: 1997 and 1999 ..............................................3-3 Figure 3.3: Confidence in Local Government by Region: 1997 and 1999...........................3-4 Figure 3.4: Confidence in Local Government by Ethnicity: 1997 and 1999 .........................3-5 Figure 3.5: Satisfaction with Government Agencies: 1999......................................................3-6 Figure 3.6: Most Helpful Institutions: 1995-1999 ......................................................................3-7 Figure 3.7: Adequacy of Municipal Services: 1995 - 1999 ......................................................3-8 Figure 3.8: Percent Who Ask for Help: 1993 - 1999.................................................................3-9 Figure 3.9: Involvement in Local Government: 1995 - 1999 ..................................................3-10 Figure 3.10: Public Communication by the Municipality: 1997 and 1999 ............................3-11 Figure 3.11: Percent Who Participate in Community Groups: 1993 - 1999 .........................3-12 Figure 3.12: Percent Who Participate in Occupation-Related Groups: 1993 - 1999 ..........3-13 Figure 3.13: Participate in Occupational Groups by Type of Employment: 1999 ................3-14 Figure 3.14: Political Party Membership: 1993 - 1999 ............................................................3-16 Figure 3.15: Percent Working in a Political Campaign or Influencing Voters: 1993-1999 ...............................................................................3-17 Figure 3.16: Civil Society Participation and Municipal Attendance: 1995 - 1999 ................3-19 Figure 3.17: Civil Society Participation and Demand-Making on Municipal Government, 1995 - 1999 ........................................................................................3-20 Figure 3.18: Civil Society Participation and Demand-Making by Type of Group, 1999 ..........................................................................................3-21 Figure 3.19: Attendance at Municipal Meetings: 1995 - 1999 ................................................3-22 Figure 3.20: Satisfaction with Service and Demand-Making on Local Government: 1995 - 1999 ................................................................................................................3-23 Figure 3.21: Civil Society Participation and Tolerance: 1995 - 1999.....................................3-24 Figure 3.22: Civil Society Participation and System Support: 1995 - 1999 ..........................3-25 Figure 4.1: Most Serious Problem in Country............................................................................4-1 Figure 4.2: Two Most Serious Problems Facing Guatemala ..................................................4-2 Figure 4.3: Most Serious Problems for Country by Education: 1999....................................4-4 Figure 4.4: Most Serious Problems for Country (By Relative Wealth: 1999) ......................................................................................4-5 Figure 4.5: Most Serious Problems for Country (by Age: 1999) ..........................................................................................................4-6 Figure 4.6: Most Serious Community Problems (1993-1999).................................................4-7 Figure 4.7: Community Problems: Metro Area ...........................................................................4-8 Figure 4.8: Community Problems: North East .........................................................................4-9 Figure 4.9: Community Problems: North West ..........................................................................4-9

Guatemalan Values and Democratic Development: Fourth Report
January 2000
iv
Figure 4.10: Community Problems: South West .......................................................................4-9 Figure 4.11: Community Problems: South East........................................................................4-9 Figure 4.12: Most Serious Problems for Community (by Education: 1999) ........................4-11 Figure 4.13: Most Serious Problems for Community (by Relative Wealth: 1999) ..............4-12 Figure 4.14: Most Serious Problem for Community (by Age: 1999) .....................................4-13 Figure 4.15: What Do You Think About the Economic Situation in General? ......................4-14 Figure 4.16: Generally, Are You Satisfied with Your Life? ......................................................4-15 Figure 4.17: Satisfaction by Region: 1999 ................................................................................4-16 Figure 4.18: Satisfaction by Age: 1999......................................................................................4-17 Figure 4.19: Satisfaction by Education: 1999 ...........................................................................4-18 Figure 4.20: Satisfaction by Relative Wealth: 1999.................................................................4-19 Figure 4.21: Economic/Life Satisfaction and System Support (1999) ...................................4-20 Figure 4.22: Life/Economic Satisfaction and Tolerance ..........................................................4-21 Figure 4.23: Economic and Life Satisfaction and Civil Society Participation .......................4-22 Figure 5.1: Perception of Crime Rate in Last Year in 17 Latin American Countries ...........5-6 Figure 5.2: Victimization of Urban Latin America, 1996...........................................................5-10 Figure 5.3: Seriousness of Violence Against Women..............................................................5-13 Figure 5.4: Seriousness of Violence Against Women by Ethnicity ........................................5-14 Figure 5.5: Seriousness of Violence Against Women by Gender ..........................................5-15 Figure 5.6: Victimization and Fear of Crime by Gender, 1999................................................5-17 Figure 5.7: Victimization and Region by Urbanicity: 1999......................................................5-18 Figure 5.8: Victimization and Region by Gender: 1999 ..........................................................5-19 Figure 5.9: Victimization by Ethnicity (self-identification) .........................................................5-21 Figure 5.10: Victimiza tion and Region ........................................................................................5-22 Figure 5.11: Fear of Crime by Education and Ethnicity ...........................................................5-23 Figure 5.12: Victimization by Wealth and Urbanicity................................................................5-24 Figure 5.13: Fear of Crime by Wealth and Urbanicity..............................................................5-25 Figure 5.14: System Support and Victimization........................................................................5-29 Figure 5.15: Political Tolerance and Victimization .....................................................................5-30 Figure 5.16: Civic Culture and Victimization..............................................................................5-31 Figure 5.17: Satisfaction with Treatment by Institutions and Victimization...........................5-32 Figure 6.1: Preference for Strong-Hand Rule In Guatemala ....................................................6-6 Figure 6.2: Preference for Democracy or Authoritarianism......................................................6-7 Figure 6.3: Need for Search Warrant When There is Serious Suspicion of Criminal Activity......................................................................6-12 Figure 6.4: Approval of Violating Rules to Fight Crime .............................................................6-13 Figure 6.5: View of Lynchings .......................................................................................................6-14 Figure 6.6: Importance of the Rights of the Accused ................................................................6-15 Figure 6.7: The Role of the Army in Fighting Crime ..................................................................6-16 Figure 6.8: Support for the Right of Free Expression for Those with Extreme Ideas....................................................................................6-17 Figure 6.9: Support for Censorship on TV ..................................................................................6-18 Figure 6.10: Preference for Order Over Liberty..........................................................................6-19 Figure 6.11: Impact of Preference for Authoritarianism
on Willingness to Violate the Rights of the Accused, 1999 ................................6-20

Guatemalan Values and Democratic Development: Fourth Report
January 2000
v
Figure 6.12: Impact of Preference for Authoritarianism on Willingness to Use the Army..............................................................................6-21 Figure 6.13: Impact of Preference for Authoritarianism on Willingness to Repress Freedom of Expression.............................................6-22 Figure 6.14: Relationship Between Preference for Authoritarianism and System Support.6-24 Figure 6.15: Impact of News Media Attention on Preference for Democracy .......................6-25 Figure 6.16: Sense of Security in Neighborhood and Support for Democracy .....................6-26 Figure 6.17: Preference for Democracy and Interpersonal Trust............................................6-27 Figure 6.18: Model Explaining Preference for Democracy.......................................................6-28 Figure 6.19: Model Explaining Preference for Limiting Freedom of Expression...................6-30 Figure 6.20: Preference for Democracy and Opinion of Candidates: Berger vs. Portillo ....6-32 Figure 6.21: Preference for Democracy and Opinion of Menchú and Ríos Montt................6-33 Figure 6.22: Support for Democracy and Voted "Yes" in Consulta Popular ..........................6-34 Figure 7.1: "Yes" Vote by Department ........................................................................................7-2 Figure 7.2: "Yes" Vote and Education by Urbanicity................................................................7-3 Figure 7.3: "Yes" Vote, Age and Gender....................................................................................7-4 Figure 7.4: "Yes" Vote and Assessment of Government.........................................................7-5 Figure 7.5: Opinion about the Peace Accords...........................................................................7-6 Figure 7.6: Opinion about the Accords by Age and Gender ...................................................7-7 Figure 7.7: Opinion about the Accords by Education and Urbancity.....................................7-8 Figure 7.8: Opinion about the Peace Accords by Ethnicity .....................................................7-9 Figure 7.9: Support for Peace Accords: Initial Model............................................................7-10
List of Tables
Table 1.1: Selected Characteristics of the Data, 1993 -- 1999...............................................1-9 Table 2.1: Theoretical Relationship Between Tolerance and
System Support in Institutionally Democratic Politics .................................................2-13 Table 2.2: Empirical Relationship Between Tolerance and System Support in Guatemala, 1993-1999* ...................................................................2-16 Table 3.1: Adequacy of Municipal Services: 1999 ....................................................................3-8 Table 3.2: Extent of Civil Society Participation: 1993 – 1999 .................................................3-15 Table 4.1: Most Serious Problem in Country: 1999 .................................................................4-3 Table 4.2: Most serious problem in community: 1999 ..............................................................4-10 Table 5.1: Fear ...............................................................................................................................5-20 Table 5.2: Impact of Victimization on Political Attitudes and Behaviors .................................5-28 Table 6.1: Cross-tabulation of “Mano Dura” with Preference
for Democracy/Authoritarianism ......................................................................................6-8 Table 6.2: Typology of Authoritarianism .....................................................................................6-9

January 2000
Executive Summary
This study describes the state of democratic values relevant to USAID strategic objectives in Guatemala and how those values did and did not change over the past six years. Emphasis in this report is also given to values pertaining to civil society participation and local governments, support for due process rights, the potential effects of crime on support for democracy, and the implications of the defeat of the referendum on the Peace Accords.
The report is based on scientifically drawn, national household probability sample surveys of Guatemala completed in the Spring of 1993, the Spring of 1995, the Spring of 1997, and the Fall of 1999. The questionnaire was based on prior research in Central and South America, Western Europe and the United States. Although most interviews were completed in Spanish, some interviews were conducted in each of the five indigenous languages into which the questionnaire had been carefully translated. Major Findings:
Central to the study are the concepts of system support, support for democratic liberties
and the interrelationship between the two. System support is defined as the legitimacy accorded by the populace to the political system in general and to its component institutions. Support for democratic liberties (or political tolerance) is the set of values that focus on the respect for the rights of political minorities, a vital component of any stable democratic order. The relationship between these two variables provides an indicator of democratic stability. In this regard, the study found: • Since 1993, there has been a steady increase in the level of support for stable democracy
which has reached its highest level to date in 1999. In addition, there has been an overall increase in the proportion of Guatemalans in the larger democracy category (i.e., the combination of stable and unstable democracy) each year; the percent of Guatemalans in this larger category rose from 48 to 55 between 1993 and 1995, and from 61 to 68 between 1997 and 1999.
• The level of political tolerance among the Guatemalan population as a whole increased
between 1993 and 1997, (from 44 in 1993, to 49 in 1995, to 54 in 1997 on a 100-point scale) and has not changed significantly since then. There has been no change in the tolerance level of the indigenous population since 1993, but the levels for Ladinos increased significantly between 1993 and 1995, and again between 1995 and 1997. The level for Ladinos dropped somewhat, between 1997 and 1999, such that in 1999 there is not a significant difference between Ladinos and the indigenous in this regard.
• System support has not significantly changed between 1993 and 1999. Each year the
value has been about 40 on a 100-point scale. This is the case for both Ladinos and the indigenous segments of the population. In other words, unlike tolerance, in which the average of the population is now in the positive end of the continuum, system support is still lagging.
Other major findings from the 1999 survey which are presented in the report include:

Guatemalan Values and Democratic Development: Fourth Report 2
January 2000
• The municipality was judged to be the most helpful of various governmental institutions in
resolving the problems of the community in 1995, 1997 and 1999, and local government was also ranked as among the most trusted of the Guatemalan institutions.
• The extent of participation in civil society organizations has increased since 1993, and
participation in civil society organizations is positively related to confidence in local government and to support for governmental institutions overall. There is also a positive relationship between participation and tolerance for political dissent.
• Nevertheless, the level of trust in the local government dropped from 1997 to 1999, from a
score of 59 to 51 on a 100-point scale. This drop occurred in all regions of the country, for females as well as males, and for the Ladino and especially the indigenous populations. A consistent and similar decline was also present in responses dealing with the helpfulness of local government in resolving community problems, in the adequacy of municipal services, and in the extent to which the municipality kept the public well informed.
• Public confidence in the courts and the justice system has been relatively stable since
1993. On a scale of 1-100, public confidence in the courts has fluctuated from 46 to 49 across the four surveys, varying in statistically insignificant amounts from year to year.
• Public perceptions of the workings of the justice system, on the other hand, have improved
in some important ways. Between 1993 and 1999 the percent of the public who report that they believe that the Police give equal treatment to indigenous and Ladino citizens has increased steadily, from 29% in 1993, to 32% in 1995, to 41% in 1997, to 54% in 1999. Between 1997 and 1999, there has also been an increase in the percent of the population who believe that it is easy to report a crime (28% to 35%).
• The cost of living and other household economic concerns were cited by well over half the
respondents as the most serious problem facing the country. The problem that was second-most frequently cited as most serious was common crime, identified by over a quarter of respondents.
• About twice as many respondents indicate they are afraid of crime as indicate they or a
member of their family has been the victim of a crime in the past 12 months. Crime tends to be perceived to be most serious by those living in urban areas (especially Metropolitan Guatemala City) with higher levels of education or wealth, but it is a nationwide problem that worries most Guatemalans.
• Violence against women is widely perceived to be a serious problem throughout
Guatemala. This is true in all regions of the country, among men as well as women, and among both the Ladino and the indigenous populations.
• Because of the widespread fear of crime, the popularity of political candidates advocating
law and order policies, and reactionary developments in other Latin American countries, the 1999 survey included items to permit investigating the linkages between fear and support for democracy. One such set of items measured public attitudes toward police

Guatemalan Values and Democratic Development: Fourth Report 3
January 2000
treatment of criminal suspects, and another addressed policies with respect to social deviance. Although the results show a general concern for assuring the rights of the accused and freedom of expression, there seems to be a general consensus on the need for limitations on freedoms in both respects.
• The analyses also identify differences between Guatemalans who prefer authoritarian
solutions and those who do not. They show, for example, that fear of crime is an important predictor for both a preference for authoritarianism and for curtailing civil liberties. In addition, they show a positive relationship between support for the political system and a rejection of authoritarianism and suggest that those citizens who do not trust their political system are the ones most likely to be attracted to authoritarian solutions.
• Although the national referendum on the constitutional reforms was not approved by the
voters, DIMS data indicate that the defeat of the Peace Accords is not related to a negative view of the Accords themselves. Despite the negative vote, respondents indicated that they overwhelmingly believe the Accords will be beneficial to the country.
Major Conclusions
The long-term trends in the data are positive with respect to the consolidation of stable democracy in Guatemala. There has been steady progress since 1993 in support for a stable democracy. The survey shows the population to be more tolerant of political dissent, and that both with respect to tolerance and underlying support for political institutions the gap that existed in 1993 between the Ladino and indigenous segments of the population has all but closed.
Programmatically, there are indications from the study that investments in improving
communications and the quality of the direct interactions between governmental agencies and the public would be beneficial to strengthening democracy in Guatemala. Open communications and satisfaction in dealings with governmental institutions are positively related to political system support, which in turn is shown to be related to a preference for democracy and a rejection of authoritarian rule. This suggests that in order to increase support for democratic policies and institutions it would be useful to undertake national and local level dialogues involving the government, civil society organizations and the public at large that address governmental practices and policies pertaining to such major public problems as the reality and the fear of crime, the economy and the quality of services that the national and local governments provide. Guatemalan ExecSum-r84.doc

January 2000
Chapter 1
Introduction
During the past seven years, Guatemala has experienced important political transformations. An attempted coup by an elected president (Jorge Serrano) failed because of both domestic and international pressure. A president chosen by the Guatemalan Congress to replace Serrano completed his term and presided over fair elections that resulted in a peaceful transfer of powers to a president representing a different political orientation. That President, Alvaro Arzú Irigoyen, was able to work reasonably well with a Congress in which his political party had a majority, and then to turn over power to a president from a different political party, Alfonso Portillo. A civil war of some thirty years officially ended, the provisions of peace accords agreed upon by the guerrilla forces and the government have begun to be implemented, and the relative power of the military has been reduced. At the local level, political vehicles for the effective incorporation of the large indigenous population of Guatemala have been developed. In addition, former refugees are returning to the country, former guerrillas are returning to civilian society, and Mayan political leaders have replaced Ladino officials in many locales. The changes have been positive, but not without inducing stresses of their own. Crime, for example, has risen dramatically. The question thus remains whether the positive changes can be institutionalized, both through the establishment and maintenance of effective public and civil society institutions and through the development of an attitudinal framework that supports the process of democratization. The Democratic Indicators Monitoring System (DIMS) undertook baseline surveys in May 1993, April 1995 and April 1997 to measure democratic values in Guatemala, the results of which have been previously reported.1 This report presents the results of a fourth survey, undertaken in September 1999, that permits an examination of shifts in political attitudes relevant to democracy over the past six years, and the exploration in more depth than in the prior reports of attitudes with respect to economic conditions, crime, authoritarianism and the peace accords. In the balance of this chapter we present a brief description of major political events and changes that have occurred between the spring of 1993 and fall of 1999 that will serve as a background for the presentation of the 1999 results, highlights of the
1 Mitchell A. Seligson and Joel M. Jutkowitz, with collaboration of Dinorah Azpuru de Cuestas and Max Eduardo Lucas. Guatemalan Values and the Prospects for Democratic Development , (Arlington, VA: Development Associates, 1994). Malcolm B. Young, Mitchell A. Seligson, and Joel Jutkowitz, with the collaboration of Dinorah Azpuru de Cuestas and Max Eduardo Lucas. Second Report: Guatemalan Values and the Prospects for Democratic Development (Arlington, VA: Development Associates, June 1996). Mitchell A. Seligson and Malcolm B. Young with the professional collaboration of Max Eduardo Lucas P., and Dinorah Azpuru de Cuestas. Third Report: Guatemalan Values and the Prospects for Democratic Development with Emphasis on Civil Society Participation, Local Government and the Justice System (Arlington, VA: Development Associates, January 1998).

Guatemalan Values and Democratic Development: Fourth Report 1-2
January 2000
previous studies along with parallel findings from the 1999 survey, and an overview of the methodological underpinnings of the findings contained in the report. Political Context for the Report The transition to democracy in Guatemala, initiated in 1986, entered an important phase with the signing of the Peace Accords in December 1996. The Peace Accords mark the end of the armed conflict and are the result of negotiations between the two military forces that fought one another for nearly 36 years. The situation has evolved from antagonism to greater tolerance, which in turn has led to negotiations that, for many, were inconceivable. Nevertheless, some tensions remain. Certain groups, in particular those who suffered most during the war, are not satisfied with the agreements reached in the Accords. In addition, some conservative segments of the population do not accept the changes that have been proposed, arguing that they cannot be legally supported. In principle, it can be said that the recent efforts at institutionalizing democracy are beginning to produce results. Since 1984, the Supreme Electoral Tribunal has played a key role in organizing and carrying out 8 general elections, 5 regional elections and 2 national referenda, all of which were conducted in an open and efficient manner However, voter turnout has been decreasing in the most recent elections, as compared to the 1984 election for a National Constitutional Assembly. This is an issue of great concern for a country such as Guatemala, which needs to legitimize its political system in order to strengthen democracy. Despite their long-term importance, the Peace Accords have taken a backseat in public opinion to such issues as economics and rising crime. The failure of the public to ratify the constitutional reforms in the Spring of 1999 came as a surprise and disappointment to many, but there had been little public debate on the provisions of the reforms and the small group of active supporters had failed to fully inform the majority of the population of their provisions and their implications for the democratic process and the future of the country. It is important to note that the government’s economic policy, and the “shock” tactics it had taken to implement that policy, may have had more effect on public opinion than had the peace process. In particular with respect to its policies on land reform and the privatization of public enterprises, the government was, and is, facing opposition, above all from Leftist groups and the unions. The development of democracy in Guatemala requires public consensus, achieved through fair and just treatment of individuals and that takes into account the multicultural and multiethnic nature of Guatemalan society. This, however, leads to the need to address questions of how to resolve the social conflicts that have arisen from the paucity of social policies aimed at social integration and redistribution of wealth,

Guatemalan Values and Democratic Development: Fourth Report 1-3
January 2000
questions whose answers, were delayed by the war. Unequal land ownership continues to be one of Guatemala's most pressing problems and has resulted in frequent illegal land encroachments in the interior of the country. There are many obstacles that can undermine confidence in the success of the peace process. The most critical of these obstacles include: the chronic fear of crime, the constant fear of kidnapping, the lack of faith in the authorities responsible for maintaining the peace and ensuring justice, and the apparent immunity from prosecution enjoyed by many of the perpetrators of the most serious crimes (such as drug-trafficking, smuggling, and murder). All of this provokes tension between the processes favoring democratization and public participation on the one hand, and on the other the functioning of an efficient and effective government that is responsive to the fears of the majority, both of which are necessary for a legitimate state. Finally, it should be noted that, despite the general public's discontent, opportunities have opened up for grassroots organizations, in particular among the indigenous peoples. It is important to mention the latter since political parties in Guatemala have not yet fulfilled their function of social mediation and it is the grassroots movements that seem to be addressing the concerns of the people. Highlights of Prior Surveys Compared to 1999 Results This study describes the state of democratic values and how those values did and did not change over the past six years, based on a scientifically drawn sample. National surveys of Guatemalan households were completed in the Spring of 1993, the Spring of 1995, the Spring of 1997, and the Fall of 1999. The core of the questionnaire was the same for each survey, with some additions and deletions of items in 1995, 1997 and 1999 in order to explore more fully topics of current interest. The questionnaire was based on prior research in Central and South America, Western Europe and the United States, and although most interviews were completed in Spanish, some interviews were conducted in each of the five indigenous languages into which the questionnaires had been carefully transla ted. This report includes an explanation of four areas that were not addressed in great depth in the reports on the 1993, 1995 and 1997 survey results: perceptions of economic conditions, crime, authoritarianism and the peace accords. These are areas that are of particularly timely interest to USAID and the Government of Guatemala. Also of central concern in this report, as in the reports of the prior surveys, are public attitudes related to the concepts of system support, tolerance for political dissent, and the interrelationship between the two, and to the public’s attitudes toward local government and involvement in civil society organizations.
As in the previous three reports, system support is defined throughout as the legitimacy accorded by the populace to the political system in general and to its component institutions. The focus here is not on the government in office but the country's basic political institutions. Tolerance of political dissent (or support for

Guatemalan Values and Democratic Development: Fourth Report 1-4
January 2000
democratic liberties) is the set of values that focus on the acceptance of democratic principles within the context of a democratic order.2 The relationship between these two variables — system support and political tolerance — provides an indicator of democratic stability. It also provides an indicator of values supporting what is characterized as an unstable democracy, as well as oligarchy and a state of democratic breakdown.
Since 1993, there has been a steady increase in the level of support for stable democracy, which has reached its highest level to date in 1999. In addition, there has been an overall increase in the proportion of Guatemalans in the larger democracy category (i.e., the combination of stable and unstable democracy) each year; the percent of Guatemalans in this larger category rose from 48 to 55 between 1993 and 1995, and from 61 to 68 between 1997 and 1999.
Values related to a tolerance for political dissent are of particular importance. The study found that the level of political tolerance among the Guatemalan population as a whole had increased between 1993 and 1995, and has remained steady since then.3 For the years of 1993 to 1999 the composite of system support indicators show slight change. Each year the value has been about 40 on a 100 point scale.
Other major findings from the 1999 survey, which will be expanded on
considerably in the following chapters, include: 4 Local government has been ranked as among the most trusted of the
Guatemalan institutions since it was included in the survey in 1997. The data for 1995, 1997 and 1999 show that the municipality is the most helpful of various governmental institutions in resolving the problems of the community. Nevertheless, although it is clear that the respondents to resolve their problems depend on the municipal government over other agencies or institutions, the level of trust in the local government dropped from 1997 to 1999, from a score of 59 to 51 on a 100 point scale.
4 Participation in civil society organizations and involvement in local government
affairs, through attendance at meetings or making demands on local government, have been positively related across the three survey years (1995, 1997, and 1999) in which comparable data are available.
4 Public confidence in the courts and the justice system has been relatively stable
since 1993. On a scale of 1-100, public confidence in the courts has fluctuated
2 For technical reasons explained in Chapter 3, these composite variables have been constructed in a new manner this year, and as a result the values given for prior survey years differ slightly from those provided in the earlier reports. 3 The tolerance for political dissent level rose from a 44 in 1993 to a 49 in 1995, to a 54 in 1997 and then fell to a 52 on a 100 point scale in 1999. The decline from 1997 to 1999 is not statistically significant.

Guatemalan Values and Democratic Development: Fourth Report 1-5
January 2000
from 49 to 46 across the four surveys, varying in statistically insignificant amounts from year to year.
4 Public perceptions of the workings of the justice system, on the other hand, have
improved in some important ways. Between 1993 and 1999 the percent of the public who report that they believe that the Police give equal treatment to indigenous and Ladino citizens has increased steadily, from 29% in 1993, to 32% in 1995, to 41% in 1997, to 54% in 1999. Between 1997 and 1999, there has also been an increase in the percent of the population who believe that it is easy to report a crime (28% to 35%).
4 Along with the cost of living and other household economic concerns, common
crime is seen as one of the country's most serious problems. Although crime tends to be perceived to be most serious by those with higher levels of education or wealth, and those living in urban areas, (especially Metropolitan Guatemala City), crime is a nationwide problem that worries all Guatemalans.
4 Because of the widespread fear of crime, the popularity of political candidates
advocating law and order policies, and reactionary developments in other Latin American countries, the 1999 survey included items that permit investigating the linkages between fear and support for democracy. One such set of items measured public attitudes toward police treatment of criminal suspects, and another addressed policies with respect to social deviance. Although the results show a general concern for assuring the rights of the accused and freedom of expression, there seems to be a general consensus on the need for limitations on freedoms in both respects.
4 The analyses also identify differences between Guatemalans who prefer
authoritarian solutions and those who do not. They show, for example, that fear of crime is an important predictor for both a preference for authoritarianism and for curtailing civil liberties. In addition, they show a positive relationship between support for the political system and a rejection of authoritarianism and suggest that those citizens who do not trust their political system are the ones most likely to be attracted to authoritarian solutions.
4 Although the national referendum on the constitutional reforms was not approved
by the voters, DIMS data indicate that the defeat of the Peace Accords is not related to a negative view of the Accords themselves. Despite the negative vote, respondents indicated that they overwhelmingly believe the Accords will be beneficial to the country.

Guatemalan Values and Democratic Development: Fourth Report 1-6
January 2000
The Survey Sample and Questionnaire The report on the 1993 survey fully describes the survey instrument used, the basis for its validity and reliability, and the national sample that was drawn.4 The 1995, 1997 and 1999 surveys replicated the 1993 sample design and data collection procedures, although because we had access in 1997 to the 1994 revised census maps we employed those rather than continuing to utilize the old maps. Sample information by region and department is given in Appendix 1. As can be seen, the sample for each of the four surveys is distributed in a very similar fashion. The distribution of the sample in 1999 is shown in a stylized manner in Figure 1.1 (see page 1-8). It will be noted that the sample is widely distributed in Guatemala, although it was not designed to, nor does it, cover all of the Departments of the country. That is because the design, much like studies of the United States, was based on dividing Guatemala into four main geographic regions plus Guatemala City. Each of those regions is indeed covered in the survey as can be noted from the map. The report on the 1993 survey explains the rationale of the weighting technique used for the samples.5 In brief, because results from each of the surveys underestimate the poor, uneducated population, the data were weighted to better emulate the national population. Logical choices for the weighting would be literacy and urban/rural variables, but these have been proven subjective, and therefore the objective criterion used was years of education. The education variable was used to weight the data, using census data to estimate the number of those who had less than 3 years of formal education and adjusting this number to allow for change over time.6 In previous years, the respondents without an education level were not included in the analyses. This year education levels were imputed for the respondents with missing education levels for 1997 and 1999 (only nine cases for each year) using level of literacy and community. For this reason, some of the reported data for 1997 is slightly different than was reported in the 1997 report. The questionnaire design and data collection procedures were essentially the same in each year, although some relatively minor changes were made to the questionnaire. Some items were dropped in 1995, and others in 1997, based on analysis of the prior survey data. On the other hand, the 1995 instrument added several items to explore in more depth the reasons many Guatemalans do not vote and the extent of participation in political parties, and participation at the municipal level. In 1997, additional questions were added pertaining to participation in local and civil 4 Seligson and Jutkowitz, op. cit., pp. 4-8. 5 The appendix of the first report, for the 1993 survey, details the procedure we followed. When they became available in 1997, we used the 1994 census figures to revise the weighting scheme based on education. However, in order to maintain similarity with prior reports, we did not modify the weights for 1993 and 1995 based on a retrospective application of the 1994 census data. 6 See appendix one of Seligson and Jutkowitz, op. cit. for greater details.

Guatemalan Values and Democratic Development: Fourth Report 1-7
January 2000
society organizations and to citizen’s experience with and perceptions of the criminal justice system. In 1999 items were added to examine the attitudes pertaining to due process and the peace accords. This study was designed as a series of successive cross sections, rather than a panel design (in which the same respondent would be interviewed for each wave), because the costs of using a panel study design were considered too high.7 However, the 1993, 1995, 1997 and 1999 surveys were conducted in the same communities, following the same selection protocols. In each survey interviews were conducted in 18 of Guatemala’s 22 Departments plus Guatemala City. Thus, each of the three surveys constitutes a scientifically drawn probability sample of the Guatemalan population over 18 years of age, and direct comparisons can be made between similar groups of Guatemalans across the three surveys. In Guatemala, there is perhaps no more socially relevant characteristic than ethnicity, but unfortunately, there are no universally accepted definitions of ethnic identity. Consequently, it is difficult to select the measure that most clearly distinguishes the Indian population from the non-Indian population. In the questionnaire we used several distinct methods: we determined the respondent’s use of language (Spanish vs. Indian languages); we asked the respondents to self-identify (Indian vs. “Ladino”); and, we noted if the respondent was dressed in Indian or Western clothes. Throughout the report unless we indicate to the contrary, we use self-identification as the basis for ethnic determination.8 A significant concern in the conduct of this, or any other, public opinion survey is its timing. Although certainly not by design, the 1993 survey took place a week before the events that constituted the attempted coup by President Serrano and his subsequent removal from office and replacement by Ramiro de León Carpio. It is very unlikely, given the survey instrument's focus on basic attitudes and values, that this timing affected the quality of the answers received. Indeed, comparisons between the 1993 survey and a 1992 survey of Central American political culture conducted by the University of Pittsburgh9 display a certain consistency of patterns that validates the fundamental nature of the attitudinal measures being used. The 1995 survey took place prior to the presidential electoral campaign at a time that also was not a period of intense political activity. There were no politically significant events surrounding the timing of the 1997 survey, other than the general changes in the economic and public safety conditions in the country that have been previously discussed. The survey in 1999 took place 4 months after the national vote in the ratification of the constitutional reforms and 2 months prior to the presidential elections in November 1999.
7 In Guatemala, a panel design would require a very large sample and suffer from high attrition because many individuals have no telephones and it is, therefore, very easy to lose track of respondents. 8 We systematically conducted separate analyses using each of the definitions and, for the most part, the general findings or conclusions are the same regardless of the measure used. 9 University of Pittsburgh Central American Public Opinion Project, March 1992.

Guatemalan Values and Democratic Development: Fourth Report 1-8
January 2000
Figure 1.1

Guatemalan Values and Democratic Development: Fourth Report 1-9
January 2000
Comparisons of the Data Sets To make comparisons across the three surveys, the demographic characteristics of the 1993, 1995, 1997 and 1999 samples need to be similar. As shown in Table 1.1, overall, the four samples are well matched. There are no statistically significant differences between the samples in terms of language use, gender, education, and voter registration. There are slight differences between the samples with regard to age and urbanicity, but these should have no effect on the comparisons to be made between the surveys. The continued increase of the percentage of the indigenous population included in the sample as measured by ethnic self-identification from 1993-1999 we believe comes as a result of the increasingly open nature of Guatemala society on the issue of ethnic identity, reversing a century-long decline in indigenous self-identification.
Table 1.1 Selected Characteristics of the Data, 1993 -- 1999
Comparison Variable ’93 Data ’95 Data ’97 Data ’99 Data Number Interviewed
Unweighted 1197 1191 1200 1200 Weighted 1199 1191 1200 1200
Mean age 40 years 41 years 42 years 43 years Percent Responding in Spanish 97.9 96.2 97.6 95.9 Percent Male Respondents 49 49 48 48 Mean Education Level 4.5 years 4.7 years 4.5 years 4.6 years Percent Urban Respondents 57 57 51 55 Percent Registered to Vote 77 77 78 74 Percent Indigenous Defined by:
Dress 11 11 11 11 Ability to Speak Indigenous Language
25 24 24 24
Self-Identification 39 43 44 45 Structure of the Report The chapters that follow present the findings of the 1999 survey and the relevant comparisons to the 1993 baseline and subsequent surveys of 1995 and 1997. Chapter 2 covers system support and political tolerance, and Chapter 3 examines local government and involvement in community life. Chapter 4 examines attitudes about economic conditions in Guatemala, while Chapter 5 describes the dimensions and political impact of crime in Guatemala. Chapter 6 investigates the support for due process and possible tendencies toward a reactionary move back to authoritarianism. Chapter 7 provides an analysis of the public response to the Peace Accords. The topics addressed in chapters 4, 5, 6 and 7 have not been dealt with in depth in previous study reports, and they are of current programmatic interest to USAID and other members of the international donor community. Guatemalan Chapter 1-R84.doc

January 2000
Chapter 2
System Support and Tolerance Since 1993 USAID has been tracking system support and political tolerance in Guatemala. It has done so in the belief that these two variables provide an overall assessment of the prospects for democratic stability in that country. In this report we continue that tradition and examine changes in system support and political tolerance that emerge from the analysis of the 1999 data set. Before we do so, it is important to review the definition of these indicators since many readers may not have read the earlier DIMS studies.1 Guatemala has had a very long tradition of non-elected governments, many of which have come to power via coups. Such imposed regimes are, by definition, illegitimate, since they gain and hold power by force, even if the leaders of those regimes try to curry popular favor through policies that benefit one group or another. In contrast, democracies ought to be legitimate because the leaders have been elected by the public. But, this is not necessarily the case, especially in a country like Guatemala where voting turnout is often far less than a majority of the voting-age population. In general, democratic regimes do not automatically win the support of their citizens merely by dint of their having been elected. They have to prove themselves, often repeatedly, of deserving the loyalty of the population. Citizen belief in the legitimacy of democracy develops over relatively long periods of time and depends on the ability of that system to satisfy, over the long term, the needs and demands of the populace. In Guatemala, experience with democratic rule has been recent and limited, and the process of building the legitimacy of that system has only just begun. The stability of a political system, and its ability to weather crises without succumbing to breakdown has been directly linked to legitimacy. Seymour Martin Lipset, one of the leading theorists in the area of democratic stability, defined legitimacy as “the capacity of the system to engender and maintain the belief that the existing political institutions are the most appropriate ones for the society".2 Lipset hypothesized, based primarily upon his observation of the impact of the Great Depression on Europe, that systems viewed by their citizens as being legitimate would survive a crisis of effectiveness (e.g., when the economy takes a nosedive), but those that were seen as illegitimate would tend to collapse under the stress of economic crisis. Lipset refers specifically to Germany, Austria and Spain as examples of fundamentally illegitimate systems that experienced breakdowns of democracy when buffeted by a crisis of effectiveness. The United States 1 This section draws on the prior DIMS studies as well as reports on surveys conducted by Seligson in other Latin American countries. 2 Seymour Martin Lipset, Political Man: The Social Basis of Politics. Baltimore, MD.: Johns Hopkins University Press, 1981, expanded ed., originally published 1961, p. 77. Seymour Martin Lipset, Kyoung-Ryung Seong, and John Charles Torres. "A Comparative Analysis of the Social Requisites of Democracy." International Social Science Journal 136 (May 1993): 155-75. See also, Seymour Martin Lipset. "The Social Requisites of Democracy Revisited." American Sociological Review 59 (February 1994): 1-22.
Guatemalan Values and Democratic Development: Fo urth Report 2-2
January 2000
2 - 2
and Great Britain, however, survived the Great Depression without political breakdown, because of the legitimacy of these systems.3 Lipset recognized that once a system achieved a high degree of legitimacy there was no guarantee that it would not eventually lose it. Just as political systems can undergo a crisis of effectiveness, so too could they undergo crises of legitimacy. Indeed, Lipset has explicitly pointed out that long-term crises of effectiveness could erode legitimacy because legitimacy itself depended upon the ability of the system to "sustain the expectations of major groups." Consequently, "a breakdown of effectiveness, repeatedly or for a long period will endanger even a legitimate system's stability." 4 And Juan Linz makes much the same point in his treatise on the causes of the breakdown of democracies: "Obviously no government is accorded legitimacy in this sense by all its citizens, but no government can survive without that belief on the part of a substantial number of citizens...."5 The effectiveness of the Guatemalan political system in terms of delivering economic growth and increased welfare to its citizens has been limited and therefore the ability of the democratic system to engender legitimacy significantly constrained. During the period 1980-1990, annual growth averaged .8%, and in 1997-98, while improving, it grew at only 2.1%, and as late as 1997 life expectancy averaged only 61 years for males and 67 for females.6 In addition, illiteracy for adult females was an appallingly high 41% in 1997 and infant mortality was 55 per 1,000, compared to a 5% adult illiteracy rate and an infant mortality rate of 15 in Costa Rica. It would not at all be surprising if Guatemalan citizens had reservations about the legitimacy of governments that were in power during this period of poor economic performance. One would hope that over time, steady improvements in the economy and the welfare of its citizens would result in a slow, but steady, building of the legitimacy of the system. As these lines are being written, the entire Third World, and much of the first, faces an uncertain economic future. In Guatemala, is there sufficient belief in the legitimacy of democracy for it to weather future storms, or will Guatemalans turn to authoritarian solutions to their problems? In this chapter, belief in the legitimacy of the Guatemalan system of government will be described, and demographic and socio-economic differences in beliefs will be shown. As a result of a long-term research project at the University of Pittsburgh, a scale of legitimacy called “Political Support/Alienation” (PSA)has been developed, based initially on
3 For more recent statements on this subject see Seymour Martin Lipset, Kyoung-Ryung Seong, and John Charles Torres, `A Comparative Analysis of the Social Requisites of Democracy', International Social Science Journal 136 (May 1993), 155-75; and Seymour Martin Lipset, `The Social Requisites of Democracy Revisited', American Sociological Review 59 (February 1994), 1-22; and Seymour Martin Lipset, `Excerpts from Three Lectures on Democracy', Extensions, (Spring) 1998, 3-13. 4 Lipset, 1981, p. 80. 5 Linz, Juan J, and Alfred Stepan, editors. The Breakdown of Democratic Regimes . Baltimore, MD., 1978, p. 16. 6 World Bank. World Development Report, 1999/2000. Washington, D. C.: Oxford University Press, 1999, p. 232.

Guatemalan Values and Democratic Development: Fo urth Report 2-3
January 2000
2 - 3
studies in Germany and the United States, and later expanded to all of Central America, Peru, Paraguay, Venezuela and, now, Bolivia.7 The scale attempts to tap the level of support citizens have for their system of government, without focusing on the incumbent regime itself. The core of this scale rests on five items, and each item has utilized a seven-point response format, ranging from "not at all" to "a great deal." The full Spanish text of the items are given in the questionnaire that can be found as an appendix to this study (see items 51, 52, 55, 56, 58). The questions asked respondents how much trust they had in the courts, the legislature, the electoral tribunal, public offices and the political parties.8 In order to facilitate reading and interpretation of the items, they have been recalibrated on a 0-100 scale.9 In prior reporting of these results, the items were summed and averaged (dividing the total by five so that the average still ranged from 0-100). That procedure had the disadvantage of eliminating any respondent who failed to answer any of the five items in the index. The result is that the overall sample size was reduced, since in many cases the respondents answered four of the five items, or even three of the five items. It was decided that in order to maximize the sample size, when a given respondent did not reply to all five items, an average of the remaining items was given to that respondent, so long as a minimum of three of the five items had a response. If more than three were missing, the entire cases was scored as “missing” and deleted from the analysis. The result of this operation is to change slightly the scores for each prior year, but in exchange, we now have many more cases with which to conduct the analysis.
7 Mitchell A. Seligson,"On the Measurement of Diffuse Support: Some Evidence from Mexico." Social Indicators Research 12 (January 1983b): 1-24; Mitchell A. Seligson, and Edward N. Muller, "Democratic Stability and Economic Crisis: Costa Rica 1978-1983," 301-26, September, International Studies Quarterly, 1987; in translation as: Mitchell A.,Seligson, and Edward N. Muller, "Estabilidad Democrática y Crisis Económica: Costa Rica, 1978-1983." Anuario de Estudios Centroamericanos 16-17, no. 2 (1990): 71-92, 2.; Edward N. Muller, Thomas O. Jukam, and Mitchell A. Seligson. "Diffuse Political Support and Antisystem Political Behavior: A Comparative Analysis." American Journal of Political Science 26 (May 1982): 240-64.; Mitchell A. Seligson, Political Culture in Paraguay: 1996 Baseline Study of Democratic Values . Asunción, Paraguay: CIRD, 1997. Mitchell A. Seligson, Democratic Values in Nicaragua: 1991-1997. Report to USAID/Nicaragua. Pittsburgh, PA., 1997; Mitchell A. Seligson, La Cultura Política de la Democracia Boliviana, Así piensan los bolivianos, # 60. (La Paz, Bolivia: Encuestas y Estudios, 1999). 8 Note that elsewhere a key item has been “pride in the system.” In Guatemala in the first administration of the questionnaire that item was changed to “pride in being Guatemalan.” Since the focus of the items was on the system and not on nationality, the pride item was deleted from the scale. In subsequent administrations, the item has been changed back to its original format of “pride in the system.” 9 This was done by coding the “mucha” response as 100, the “poca” response as 50 and the “nada” response as 0.

Guatemalan Values and Democratic Development: Fo urth Report 2-4
January 2000
2 - 4
System Support, 1993-1999 The mean scores for the 1999 national sample are shown in Figure 2.1. Two observations are in order before these scores are compared to prior years. First, all of the items average in the negative end of the 0-100 continuum, although the electoral tribunal and the courts come very close to the midpoint of the scale. Second, political parties score very badly, a finding consistent with many other similar studies in other countries.
Figure 2.1: System Support 1999: Core Indicators
System Support 1999: Core Indicators
PartiesPublic officesLegislatureCourtsElectoral tribunal
Deg
ree
of tr
ustw
orth
ines
s
50
40
30
20
29
38
41
4646

Guatemalan Values and Democratic Development: Fo urth Report 2-5
January 2000
2 - 5
A comparison of these same items for the period 1993-1999 is shown in Figure 2.2. For three of the items, the electoral tribunal, the courts and the legislature, little change is evident. On two of them, however, change is evident. In 1999 trust in the generalized “public offices,” by which we mean the bureaucracy, declined, while in the same year, trust in parties increased. Indeed, trust in parties, while still the lowest of the core items, have been increasing steadily since 1993.
Figure 2.2: System Support, Core Items: 1993 - 1999
System Support, 1993--1999, Core Items
PartiesLegislaturePublic officesCourtsElectoral tribunal
60
50
40
30
20
10
Year
1993
1995
1997
1999
29
41
38
4646
25
36
42
49
46
23
39
46
48
51
19
39
46
49
52

Guatemalan Values and Democratic Development: Fo urth Report 2-6
January 2000
2 - 6
The overall scale of system support is next shown in Figure 2.3. As noted above, this is a scale based on the five core items, averaged by year, using the new method of dealing with missing data. As can be seen, system support has been extremely stable over the years of the surveys from 1993-1999. While there has been fluctuation in individual items, the overall level of system support has not changed significantly. This is the case for both the Ladino and the indigenous segments of the population as well as overall.10
Figure 2.3: System Support Index, 1993-1999
10 The mean system support scores for Ladinos are: 1993 = 41.7, 1995 = 41.9, 1997 = 38.4, and 1999 = 40.7. For indigenous they are: 38.8, 41.0, 39.7 and 40.0, respectively.
System Support Index, 1993--1999
Year
1999199719951993
Sys
tem
Sup
port
Cor
e In
dex
100.0
90.0
80.0
70.0
60.0
50.0
40.0
30.0
20.0
10.0
0.0
40.139.441.240.8

Guatemalan Values and Democratic Development: Fo urth Report 2-7
January 2000
2 - 7
It is also important to examine the other items in the questionnaires that measure system support. Not all of these items were included in each year of the survey, however. For example, in 1999 items asking specifically about the police and the Public Ministry were added. Figure 2.4 shows the results. We have displayed this chart in a larger format so that the individual items can be seen. Several comments are in order. First, the pride item is really two items. In 1993 the item referred not to the Guatemalan system of government, but to pride in being a Guatemalan. In the years 1995, 1997 and 1999, this item was changed to its correct format, referring to the political system not to nationality. But, as a check, in 1999 we asked the “pride in being a Guatemalan” as an additional item. Note that the 1993 and 1999 responses on pride in being a Guatemalan are virtually unchanged. Note also that the very high positive response was expected, and helps validate the remainder of the system support scale. That is, respondents were clearly listening to the questions asked since they made a strong, indeed dramatic distinction between their evaluation of their nationality vs. their evaluation of the political system.
Figure 2.4: System Support, Non-Core, 1993-1999
System Support, Non-Core, 1993 -- 1999
Pride in Guatemalan
Pride in System
PolicePublic Ministry
Municipality
Constitutional Ct.
The Army
Human Right Omb
The government
100
90
80
70
60
50
40
30
Year
1993
1995
1997
1999
96
45
50
44
51
39
454543 44
59
4042
53
4846
4242
5452
94
41
62
42

Guatemalan Values and Democratic Development: Fo urth Report 2-8
January 2000
2 - 8
A second observation on this figure is that most of the items are below the mid-point of 50 on the scale. That is, most of them fall into negative territory. A major exception is municipal government, which, while it has fallen between 1997 and 1999 remains in the positive end of the continuum. Third, support for the government reached a high point in 1995 and has fallen back to 1993 levels by 1999. Support for the human rights ombudsman has also fallen from its high point in 1993 (62) to a low of 45 in 1999. The substantial decrease in support for this office since 1993 may be a result of the particularly positive public view of the director, Ramiro de Leon Carpio, in 1993 and an over-identification of the office since the signing of the Peace Accords in December 1996 with international assistance agencies. Support for the army and the constitutional court has remained relatively steady over the years. Finally, the two new items added in 1999, the Public Ministry and the Police, show that the former has average support, while the latter scores quite well. The relatively high showing of the police, exceeding that of the army, may come as a surprise to some observers. Tolerance, 1993 - 1999 The DIMS surveys in Guatemala have also monitored political tolerance over the period 1993-1999.11 Systems may be politically stable for long periods of time, undergirded by high levels of system support. But such systems are not necessarily democratic. In order for a political system to be both stable and democratic, its citizens ought not only believe in the legitimacy of the regime, but also be tolerant of the political rights of others, especially those with whom they disagree. When majorities of citizens are intolerant of the rights of others, the prospects for minority rights are dim, indeed. As Przeworski has argued, in democracies, citizens must agree to “subject their values and interest to the interplay of democratic institutions and comply with [as yet unknown] outcomes of the democratic process.”12 For this reason it is important to measure the tolerance of Guatemalan citizens. The political science literature on political tolerance is vast, and while it was initially concentrated on the United States the studies have now been broadened to include many democratizing countries around the world. Two basic approaches to the measurement of political tolerance have been used in these studies. One of these is called the “least-liked-group” approach.13 In this method, respondents are given a list of groups, normally including extremist groups of the left and right, as well as other potentially unpopular groups such as homosexuals. The respondent selects the group that he/she likes the least, and then is asked a series of questions about his/her willingness to extend a variety of political rights and civil liberties to members of that group.14 The primary limitation of this 11 The discussion that follows, preceding the analysis of the 1999 data, draws on prior DIMS studies as well as other studies conducted elsewhere in Latin America. 12 Adam Przeworski, Democracy and the Market (New York: Cambridge University Press, 1991), p. 51. 13 John L. Sullivan, James E. Pierson, and George E. Marcus, Political Tolerance and American Democracy (Chicago: University of Chicago Press 1982). 14 For an application of this methodology to minorities in Israel and Costa Rica see: Mitchell A. Seligson, and Dan Caspi, `Arabs in Israel: Political Tolerance and Ethnic Conflict', The Journal of Applied Behavioral Science 19 (February 1983), 55-66; Mitchell A. Seligson, and Dan Caspi, `Toward and Empirical Theory of

Guatemalan Values and Democratic Development: Fo urth Report 2-9
January 2000
2 - 9
approach, however, is that in many countries significant portions of the respondents refuse to select any group. This occurs for many reasons, but the net result is that for those respondents, no tolerance information is obtained. For example, in a recent study of South Africa, only 59% of the respondents were willing to name a group.15 The approach was used by USAID in Nicaragua and about one-half of the population did not pick a “least-liked” group.16 There is another important limitation to this approach and that is since each respondent can select a different group, it is difficult to compare intolerance levels across individuals. For example, in a country like Germany, where fascist parties have been outlawed since Germany redemocratized after World War II, it would be difficult to compare intolerance responses to those who selected the Nazi Party, for example, with those who selected a feminist organization. That is, we would tend to accept a high level of intolerance for the civil liberties of a pro-violence, banned political group, more than for a reformist, legal social organization. A further complication with this methodology is that it is difficult to compare intolerance levels across countries since the groups that are salient in one country would likely be different in another. For example, asking about tolerating members of the Sandinista Party would make considerable sense in Nicaragua, but make no sense in Guatemala. The other main method of measuring tolerance is to ask a set of questions that refer to the same group or groups. This method was pioneered many years ago in the United States, where the focus was on tolerance towards communism.17 This approach worked well, so long as communists were perceived as a threat in the United States, but once the threat of communism receded, it was impossible to assume that lowered levels of intolerance toward communists were an indication of a general decline of intolerance. It became evident that a more general approach was needed so that comparisons could be made across time and across countries. That is the approach taken by the University of Pittsburgh Latin American Public Opinion Project.18 The four-item series on tolerance that was developed reads as follows:
There are people who only say bad things, or are against, what the government does, not only the current government, but the past and the future governments as well. Tell me if you agree or disagree that these people should....
P99. Vote?
P100. Participate in protests or peaceful demonstrations? Tolerance: Radical Groups in Israel and Costa Rica', Comparative Political Studies 15 (1983b), 385-404; and Mitchell A. Seligson, and Dan Caspi, `Threat, Ethnicity and Education: Tolerance Toward the Civil Liberties of the Arab Minority in Israel (in Hebrew)', Megamot 15 (May 1982), 37-53. 15 James L. Gibson, and Amanda Gouws, `Social Identity Theory and Political Intolerance in South Africa', Draft, Department of Political Science, University of Houston (1998). 16 Mitchell A. Seligson, Democratic Values in Nicaragua: 1991-1997, Report to USAID/Nicaragua (Pittsburgh, PA., 1997). 17 Samuel C. Stouffer, Communism, Conformity and Civil Liberties (New York: Doubleday, 1955). 18 Even though different measures have been utilized in the study of tolerance, it turns out that they all seem to capture the same underlying dimension. For evidence of this, see James L. Gibson, "Alternative Measures of Political Tolerance: Must Tolerance Be 'Least-Liked?'," American Journal of Political Science 36 May (1992): 560-77.

Guatemalan Values and Democratic Development: Fo urth Report 2-10
January 2000
2 - 1 0
P101. Run for office? P102. Use the radio and TV for their views? The results of the 1999 survey are shown in Figure 2.5. As can be seen, the strongest support is for the right to vote, with two-thirds of the respondents supporting that right. A small majority of the respondents also would grant to critics of the system the right to free speech on radio and TV. A near majority would also grant them the right to demonstrate. However, 60% of Guatemalans would deny the right to run for office to critics of the system. This suggests that majorities are prepared to grant minorities a wide range of civil liberties, but would not allow those minorities to run for office and possibly take power.
Figure 2.5: Political Tolerance, 1999
Political Tolerance, 1999
Free speechRun for officeDemonstrateVote
% a
ppro
ving
this
rig
ht
70%
60%
50%
40%
30%
51
40
48
67

Guatemalan Values and Democratic Development: Fo urth Report 2-11
January 2000
2 - 1 1
How do the 1999 results compare with prior years in this data series? The most notable change is in the steady increase in support for electoral democracy. Moving from a low of less than half of the population in 1993, support for the right of dissidents to vote has increased to over two-thirds of the population. The other rights, however, have remained fairly constant, with a notable increase in the right to demonstrate in 1997, followed by a decline to earlier levels in 1999. The right to run for office increased sharply from the 1993 levels in 1995 and has remained relatively high ever since, although it declined in 1999 (see Figure 2.6).
Figure 2.6: Political Tolerance, 1993-1999
One can conclude from this comparison that electoral democracy seems secure in Guatemala, with a strong trend in the positive direction. Similarly, a majority believes in the right of free speech of critics of the political system, and a near majority believes in the right to demonstrate. The right to run for office, while more strongly supported in 1999 than in 1993, is still opposed by six out of ten Guatemalans.
Political Tolerance, 1993--1999
Free speechRun for officeDemonstrateVote
70
60
50
40
30
20
Year
1993
1995
1997
1999
51
40
48
67
58
43
54
60
51
43
46
56
46
34
46
49

Guatemalan Values and Democratic Development: Fo urth Report 2-12
January 2000
2 - 1 2
The overall scale of political tolerance is shown for the 1993-1999 period in Figure 2.7. As can be seen, tolerance has increased in Guatemala from its levels in 1993, to the point that by 1997 and 1999, the scores averaged in the positive end of the continuum. An insignificant decline was experienced in the overall scale in 1999. Since 1993, there has been no significant change in the tolerance level of the indigenous population; the levels for Ladinos increased significantly between 1993 and 1995, and again between 1995 and 1997, but dropped somewhat, between 1997 and 1999 such that in 1999 there is not a significant difference between Ladinos and the indigenous in this regard.19
Figure 2.7: Tolerance Scale, 1993-1997
Leading Indicators of Political Stability The theory behind this study of system support and political tolerance is that both attitudes are needed for long-term democratic stability. Citizens must both believe in the legitimacy of their political institutions and also be willing to tolerate the political rights of others. In such a system, there can be majority rule accompanying minority rights, a combination of attributes often viewed as a quintessential definition of democracy. In prior studies emerging from the University of Pittsburgh project, the relationship between system support and tolerance has been explored in an effort to develop a predictive model of democratic stability. In this study, we draw on that earlier discussion in 19 The political tolerance scores for the indigenous have ranged from a low of 48.0 in 1993 to a high of 52.6 in 1997; the score in 1999 is 50.6. For the Ladinos they are: 1993 = 39.8, 1995 = 50.4, 1997 = 57.4, and 1999 = 51.5.
Tolerance Scale, 1993--1999
Year
1999199719951993
Tol
eran
ce s
cale
100
90
80
70
60
50
40
30
20
10
0
525449
44

Guatemalan Values and Democratic Development: Fo urth Report 2-13
January 2000
2 - 1 3
order to remind the reader (or to present for the first time to those who have not seen those studies) what these relationships are.20 Table 2.1 represents all of the theoretically possible combinations of system support and tolerance when the two variables are divided between high and low.21
Table 2.1: Theoretical Relationship Between Tolerance and System Support in Institutionally Democratic Politics
TOLERANCE
SYSTEM SUPPORT High Low
High
Stable Democracy
Authoritarian Stability
Low
Unstable Democracy
Democratic Breakdown
Let us review each cell, one-by-one. Political systems populated largely by citizens who have high system support and high political tolerance are those political systems that would be predicted to be the most stable. This prediction is based on the logic that high support is needed in non-coercive environments for the system to be stable. If citizens do not support their political system, and they have the freedom to act, system change would appear to be the eventual inevitable outcome. Systems that are stable, however, will not necessarily be democratic unless minority rights are assured. Such assurance could, of course, come from constitutional guarantees, but unless citizens are willing to tolerate the civil liberties of minorities, there will be little opportunity for those minorities to run for and win elected office. Under those conditions, of course, majorities can always suppress the rights of minorities. Systems that are both politically legitimate, as demonstrated by positive system support and that have citizens who are reasonably tolerant of minority rights, are likely to enjoy stable democracy. 22
20 This framework was first presented in Mitchell A. Seligson and Ricardo Córdova Macías, Perspectivas para una democracia estable en El Salvador (San Salvador: IDELA, 1993). See also Mitchell A. Seligson and Ricardo Córdova M., El Salvador: De la Guerra a la Paz, una Cultura Política en Transición (San Salvador: IDELA y FUNDAUNGO, 1995). The Nicaragua study, based on the 1991 and 1995 data sets is found in Mitchell A. Seligson, Political Culture in Nicaragua: Transitions, 1991-1995. (Managua, Nicaragua: United States Agency for International Development, 1996). See also Mitchell A. Seligson, “Toward A Model of Democratic Stability: Political Culture in Central America.” Estudios interdisciplinarios de América Latina y el Caribe, forthcoming, Volume 11, No. 2, 2000. 21 The scale ranges from 0-100, so the most natural cut-point is 50. In actuality, since the zero also counts as a valid value in the scale, there are 101 points to the scale, and the arithmetic division would be 50.5. In this and other studies we have used 50 because it is more intuitive. 22 Robert Dahl, Polyarchy: Participation and Opposition. New Haven: Yale University Press, 1971.
Guatemalan Values and Democratic Development: Fo urth Report 2-14
January 2000
2 - 1 4
When system support remains high, but tolerance is low, then the system should remain stable (because of the high support), but democratic rule ultimately might be placed in jeopardy. Such systems would tend to move toward authoritarian (oligarchical) rule in which democratic rights would be restricted. Low system support is the situation characterized by the lower two cells in the table, and should be directly linked to unstable situations. Instability, however, does not necessarily translate into the ultimate reduction of civil liberties, since the instability could serve to force the system to deepen its democracy, especially when the values tend toward political tolerance. Hence, in the situation of low support and high tolerance, it is difficult to predict if the instability will result in greater democratization or a protracted period of instability characterized perhaps by considerable violence. On the other hand, in situations of low support and low tolerance, democratic breakdown seems to be the direction of the eventual outcome. One cannot, of course, on the basis of public opinion data alone, predict a breakdown, since so many other factors, including the role of elites, the position of the military and the support/opposition of international players, are crucial to this process. But, systems in which the mass public neither support the basic institutions of the nation, nor support the rights of minorities, are vulnerable to democratic breakdown. It is important to keep in mind two caveats that apply to this scheme. First, note that the relationships discussed here only apply to systems that are already institutionally democratic. That is, they are systems in which competitive, regular elections are held and widespread participation is allowed. These same attitudes in authoritarian systems would have entirely different implications. For example, low system support and high tolerance might produce the breakdown of an authoritarian regime and its replacement by a democracy. Second, the assumption being made is that over the long run, attitudes of both elites and the mass public make a difference in regime type. Attitudes and system type may remain incongruent for many years. Indeed, as Seligson and Booth have shown for the case of Nicaragua, that incongruence might have eventually helped to bring about the overthrow of the Somoza government. But the Nicaraguan case was one in which the extant system was authoritarian and repression had long been used to maintain an authoritarian regime, perhaps in spite of the tolerant attitudes of its citizens.23 Empirical Relationship Between Tolerance and System Support in Guatemala It is now time to put together the two variables that have been the focus of this chapter by examining the joint distribution of the two variables. In other words, we want to find out what percentage of the population in Guatemala have the joint attribute of high system support and and high tolerance. In effect, we are matching our data to the model presented in Table 2.1, and calculate the percentage for each year of our survey, 1993, 1995, 1997 and 1999. Of course, we do not want to limit the calculation to the high 23 Mitchell A. Seligson and John A. Booth, “Political Culture and Regime Type: Evidence from Nicaragua and Costa Rica,” Journal of Politics, Vol. 55, No. 3, August, 1993, pp. 777-792. A different version appears as “Cultura política y democratización: vías alternas en Nicaragua y Costa Rica.” In Carlos Barba Solano, José Luis Barros Horcasitas y Javier Hurtado, Transiciones a la democracia en Europa y América Latina. México: FLACSO y Universidad de Guadalajara, 1991, pp. 628-681. Also appears as “Paths to Democracy and the Political Culture of Costa Rica, Mexico and Nicaragua,” Larry Diamond, ed., Political Culture and Democracy in Developing Countries . Boulder: Lynne Reinner Publishers, 1994, pp. 99-130.

Guatemalan Values and Democratic Development: Fo urth Report 2-15
January 2000
2 - 1 5
support/high tolerance group alone, but want to understand how the entire population is distributed among the four cells in Table 2.1 As will be recalled, the original variables (system support and trust) are scored on a 0-100 metric so as to make them easy for the reader to understand. To be able to produce a table that has only four cells (as in Table 2.1), we dichotomized system support and trust at their mid-points, to produce a "low" and "high" for each variable.24 The overall index of tolerance was utilized, but the scale was divided into high and low at the 50-point. System support is scaled in a similar way, and split at the 50-point to distinguish between high and low.25 That is, if one classifies each respondent's score on the system support scale (see Figure 2.3) and score on the tolerance scale (see Figure 2.7) as either high or low, and then cross tabulates their scores on those two scales, the result is a 4-cell table showing whether the respondent scored high on both scales, low on both scales, or high on one and low on the other (see Table 2.1). The results for the Guatemala 1999 survey are shown in Table 2.2.26 As can be seen, there has been a steady increase in the percent of respondents in the stable democracy cell, reaching its highest level in 1999. On the other hand, the breakdown cell declined markedly from its high levels in 1993 to a lower level in 1997, but experienced an insignificant increase in 1999.27
24 If the variables were left in their original 0-100 format, the table would potentially have 100 cells in each direction, making it impossible to read and interpret. 25 It is important to note that the results presented here differ from those in some earlier presentations of the University of Pittsburgh Public Opinion Project. In many of those presentations the expanded scale of items was utilized, whereas here the focus is on the core list. In addition, in this study an algorithm is used for missing data (i.e., non-response) so as to minimize the number of missing cases in the overall scale. In the tolerance scale, when two or more of the four items are answered, the overall scale score is based on the valid responses. If fewer than two are answered, the case is scored as missing. For the system support measure, a valid score is accepted when at least three of the five questions are answered. As a result of these changes, the percentages reported in the following tables vary somewhat from some earlier reports and publications. 26 The total sample size represented in this chart = 4,033. This means that a total of 757 cases had missing data on either the tolerance or the system support measure and were therefore deleted from this analysis. 27 The prior reports in this series, which used a less elegant method for treating missing data and did not impute education scores to missing data cases for weighting purposes, produced a similar but not identical result. The original scores were: 1993, 19%, 1995, 18%, 1997, 24%.

Guatemalan Values and Democratic Development: Fo urth Report 2-16
January 2000
2 - 1 6
Table 2.2: Empirical Relationship Between Tolerance and System Support in Guatemala, 1993-1999*
TOLERANCE
SYSTEM SUPPORT High Low
High Stable
Democracy Authoritarian
Stability 1993 22% 24% 1995 24 20 1997 24 21 1999 28 22
Low Unstable
Democracy Democracy Breakdown
1993 26 28 1995 31 25 1997 37 18 1999 30 20
* Using improved method of calculating scales for controlling missing data. The evolution of support for stable democracy (the upper-left hand cell in our cross-tabulation of system support and tolerance) can be appreciated by examining Figure 2.8. There it is shown that there has been steady progress since 1993, with the significant difference emerging between 1993, the low-point, and the years that followed. The increase in 1999 over 1997 is just below the level of significance.
Figure 2.8: Support for Stable Democracy, 1993-1999
Support for Stable Democracy, 1993--1999
Post hoc Duncan sig. <.05 for 1993 vs. other years
Year
1999199719951993
Per
cent
Sup
port
ing
Dem
ocra
cy
30.0
28.0
26.0
24.0
22.0
20.0
27.8
24.024.3
21.6

January 2000
Chapter 3
Local Government and Involvement in Community Life
Traditionally political power in Guatemala has been centralized, with a powerful
elite controlling Guatemalan political affairs. In recent years an effort has been made to expand the effective nation to allow citizens on the local level to influence the workings of the government. As a result, this decade has seen the rise of politics in the local arena, which affords a significant opportunity for programming to strengthen democratic institutions. The previous DIMS reports explore local government and community life, and this chapter will continue that analysis and present the results from 1999.
Several major points emerge from this chapter. First, much of the data collected in
1999 regarding citizens and their local government and their involvement in civil society organizations are quite similar to data collected in prior years. Local government continues to be the political institution in which the public places the greatest confidence. It is also the unit of government which people find the most helpful, and for the most part the citizenry finds the services it provides to be adequate. However, the data indicate that there was a significant decline in the trust of local government between 1997 and 1999. Also of importance, the data across the survey years show a consistently positive relationship between participation in civil society organizations and involvement in local government affairs, and between participation and political tolerance and political system support.
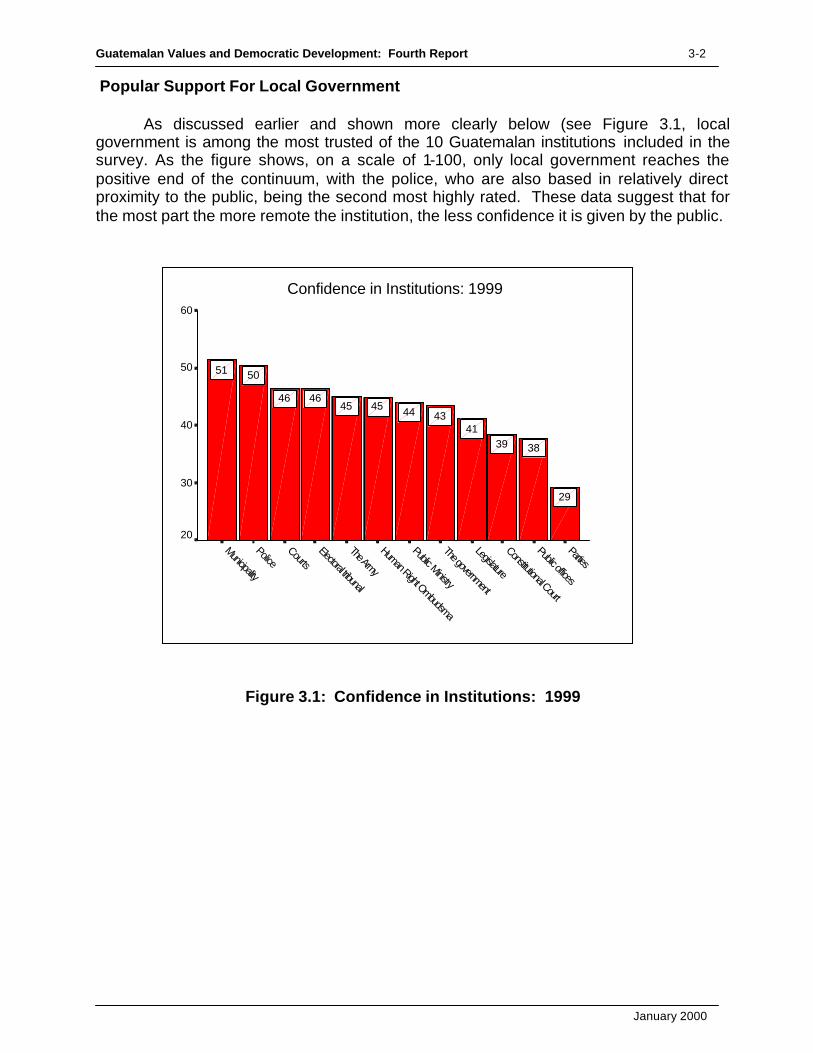
Guatemalan Values and Democratic Development: Fourth Report 3-2
January 2000
Popular Support For Local Government As discussed earlier and shown more clearly below (see Figure 3.1, local government is among the most trusted of the 10 Guatemalan institutions included in the survey. As the figure shows, on a scale of 1-100, only local government reaches the positive end of the continuum, with the police, who are also based in relatively direct proximity to the public, being the second most highly rated. These data suggest that for the most part the more remote the institution, the less confidence it is given by the public.
Figure 3.1: Trust in Institutions: 1999
Figure 3.1: Confidence in Institutions: 1999
Confidence in Institutions: 1999
PartiesPublic offices
Constitutional Court
Legislature
The government
Public Ministry
Human Right Ombudsma
The Army
Electoral tribunal
CourtsPolice
Municipality
60
50
40
30
20
29
383941
434445454646
5051
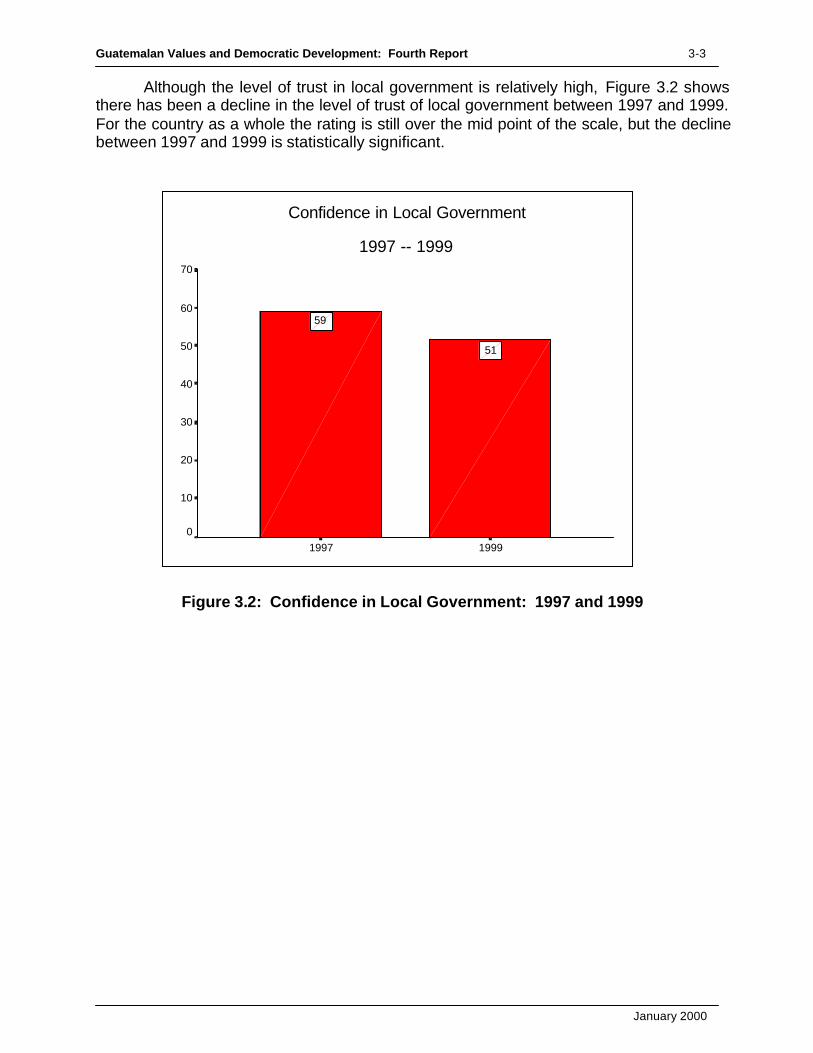
Guatemalan Values and Democratic Development: Fourth Report 3-3
January 2000
Although the level of trust in local government is relatively high, Figure 3.2 shows there has been a decline in the level of trust of local government between 1997 and 1999. For the country as a whole the rating is still over the mid point of the scale, but the decline between 1997 and 1999 is statistically significant.
Figure 3.2: Confidence in Local Government: 1997 and 1999
Confidence in Local Government
1997 -- 1999
19991997
70
60
50
40
30
20
10
0
51
59

Guatemalan Values and Democratic Development: Fourth Report 3-4
January 2000
Looking at the change over the two years more closely shows that the decline has occurred in all regions of the country, among males and females, and among the Ladino and the indigenous populations. As Figure 3.3 shows, the decline in support for local government has been noticeable everywhere, and at statistically significant levels in the Southwest, Metropolitan area, and the Southeast.
Figure 3.3: Confidence in Local Government by Region: 1997 and 1999
With respect to gender, the data show that the decline was statistically significant
for both males and females. In terms of our 100 point scale, the level of support for local government among women went from 57 in 1997 to 52 in 1999. The change was even greater for men, declining from the relatively high level of 61 in 1997 to 51 in 1999.
Confidence in Local Government: 1997 and 1999
South East*
South West*
North West
North East
Metropolitan Area*
70
60
50
40
30
20
10
0
Year
1997
1999
56
515054
47
6360
55
64
55

Guatemalan Values and Democratic Development: Fourth Report 3-5
January 2000
From the perspective of ethnicity, as shown in Figure 3.4, the decline was particularly great among persons who identified themselves as indigenous. Around the time of the 1997 survey the indigenous population was particularly politically active in many local communities and had successfully elected indigenous mayors and other local officials in several important cities and towns. The relatively sharp decline in support for local government among the indigenous population from the particularly high levels in 1997 may be a reflection of the reality that adequate resources, as well as responsive elected officials, are necessary for local governments to meet their residents’ needs.
Figure 3.4: Confidence in Local Government by Ethnicity: 1997 and 1999
Confidence in Local Government
by Ethnicity: 1997 -- 1999
Ethnic self-identification
IndigenousLadino
70
60
50
40
30
20
10
0
Year
1997
1999
4953
6058

Guatemalan Values and Democratic Development: Fourth Report 3-6
January 2000
Satisfaction with Local Services A second series of questions also reveals that citizens of Guatemala feel more positively toward their local governments than toward other public institutions. Figure 3.5 shows the results of asking persons how satisfied they were with the results of transactions they or a member of their family had had with the police, the courts, the Public Ministry, and the municipality. Respondents who indicated that they had not had any formal encounters with one of these institutions have been excluded from the analysis. Using our 100 point scale, the survey shows respondents were much more likely to be satisfied after encounters with their local government than with the police, courts, or the Public Ministry. It also shows that the level of satisfaction was fairly low (44 on a 100 point scale).
Figure 3.5: Satisfaction with Government Agencies: 1999
Perhaps as interesting as the public’s reactions is the percent of the public who
have meaningfully dealt with these institutions. Not surprisingly, the institution with which the largest proportion of the public had had transactions was the local government. About three-fifths (59%) of respondents indicated they or members of their family had had transactions with their municipality. The next most frequently dealt with institution was the police. About two-fifths (43%) of the public has had encounters with the police. Only about a third of the public indicated they had dealt significantly with the courts or the Public Ministry; 36 percent of the respondents indicated they or a family member had transactions with the courts and 31 percent with the Public Ministry.
Satisfaction with Governmental Agencies
1999
Responses only from persons having transactions
MunicipalityPublic MinistryCourtsPolice
Mea
n
50
40
30
44
36
34
40

Guatemalan Values and Democratic Development: Fourth Report 3-7
January 2000
Consistent with this relatively positive picture of local government are the responses of people who were asked ‘who best resolves the problems of this community: the municipality, the central government, or legislative deputies’. Respondents could also indicate that all are the same or that none of these potential sources of help resolves the community’s problems. As shown in Figure 3.6, the respondents overwhelmingly answered that the municipality has been most helpful1. However, consistent with the answers about confidence in local government earlier discussed (see Figure 3.2), there has been a decline in the public's belief that their municipal government could help resolve their community's problems.
Figure 3.6: Most Helpful Institutions: 1995-1999
1 This item was not asked in 1993.
Who has been most helpful in resolving the problems of your community?
Deputies
All the same
None
Central government
Municipality
Per
cent
60
50
40
30
20
10
0
Year
1995
1997
199945
2021
50
57
13
19
56
7
1922
50

Guatemalan Values and Democratic Development: Fourth Report 3-8
January 2000
Also consistent but slightly more positive are the responses to a question asking whether the services provided by the municipality were “excellent”, “good”, “average”, “bad” or “very bad”. As shown in Table 3.1, about a third (34%) of respondents characterized local services as “good” or “excellent”, and almost half (49%) characterized them as adequate.
Table 3.1 Adequacy of Municipal Services: 1999
Quality of Service Percent
Excellent 6 Good 28 Adequate 49 Bad 11 Very Bad 6
Figure 3.7 compares the responses to this item for the 1995, 1997 and 1999 surveys using our 100 point scale 2. From the figure we see that in all three years the level of satisfaction was above the mid-point on the scale and that the level for 1999 was about the same as for 1995. However, we again see a statistically significant decline from 1997 to 1999, which was also true for Ladinos and indigenous respondents when analyzed separately.
Figure 3.7: Adequacy of Municipal Services: 1995 - 1999
2 The data were recoded such that a response of “excellent” received a score of 100, “good” a score of 75, “adequate” a score of 50, “bad a score of 25, and “very bad” a score of 0.
Adequacy of Municipal Service
1995, 1997 and 1999
Year
199919971995
60
50
40
54
59
53

Guatemalan Values and Democratic Development: Fourth Report 3-9
January 2000
Local Sources of Assistance
From the previous responses we see that citizens tend to rely more on the municipality than the central government when they have problems. In another series of questions, respondents were asked who they go to for help when they have problems in their community. The four different items allowed the respondents to select the frequency with which they had asked the central government, the alcalde municipal, a Congressional deputy, or a ‘comite, consejo or junta comunal’ for help. The responses are shown in Figure 3.8. This figure shows that the respondents relied on the alcalde municipal with more frequency in all four of the years in which data were gathered. Consistent with the previously shown data on the confidence in local government, the responses here show a decline between 1997 and 1999 in reliance on the alcalde as a source help. Again, the decline in 1999 may be a result of unrealistically high expectations for newly elected office holders in 1997.
Figure 3.8: Percent Who Ask for Help: 1993 - 1999
Percent who ask for Help to Resolve Community Problems
from selected sources, 1993 -- 1999
Comite o Consejo
Congress Deputy
Alcalde Municipal
Central Govt
50
40
30
20
10
0
Year
1993
1995
1997
1999
16
8
33
21
17
10
43
22
11
34
19
9
29
16

Guatemalan Values and Democratic Development: Fourth Report 3-10
January 2000
To investigate this area further, respondents were asked whether in the past 12 months they had made demands on (i.e., had petitioned or asked for help from) the alcalde, another local official or a municipal office. They were also asked if they had attended a meeting of any kind called by the local government during that 12 month period. The percentage of respondents in the sample who answered that they had asked for help and the percentage who had attended municipal meetings remained the same from 1995 through 19993. Figure 3.9 shows that there has been essentially no change since 1995, and that in all three years slightly higher levels of respondents asked for municipal help than those who attended meetings at the municipality. It appears that the citizens are more likely to rely on the municipality for help than to participate in municipal meetings on an ongoing basis.
Figure 3.9: Involvement in Local Government: 1995 - 1999
When we looked at these data in terms of ethnicity, we found the same result as for the population overall. However, when assessed in terms of gender we found that women are not as likely to ask for help as men. In 1999 about 14 percent of women said they had requested help from the local government in the last 12 months, as opposed to 22 percent of men. The responses in 1997 were almost exactly the same.
3 These questions were not asked in 1993.
Involvement in local government
1995 -- 1999
Municipal helpMunicipal meetings
40
30
20
10
Year
1995
1997
1999
18
12
18
13
19
13

Guatemalan Values and Democratic Development: Fourth Report 3-11
January 2000
In part, at least, the low level of attendance at meetings is likely related to the widespread sense among respondents that they are not kept well informed by their local government. Figure 3.10 displays the responses to an item that asked: Does the alcaldia here keep you well informed of what it is doing? As the figure shows, in both 1997 and 1999, less than 10 percent of the respondents felt that they were very well informed by their local government officials. It also appears that communication declined between 1997 and 1999.
Figure 3.10: Public Communication by the Municipality: 1997 and 1999
Extent of Participation Meaningful participation in local affairs is not, of course, limited to participation in officially sponsored activities. Indeed, in recent years there has been increasing attention among social scientists to the importance of a citizenry that is active in non-governmental organizations. Research from around the world is extending and confirming the observation of Alexis de Tocqueville in his classic Democracy in America published in 1835, that the strength of democracy in the United States emanated from the highly active involvement of its citizens in community life.4
4 See, for example, Robert D. Putnam, Making Democracy Work: Civic Traditions in Modern Italy (Princeton, NJ: Pr Press, 1993) and Bob Edwards and Michael Foley, American Behavioral Scientist, “Social Capital, Civil Society, and Contemporary democracy,” vol. 40 (March/April, 1997).
How well does the municipality keep you informed?
1997 -- 1999
Very well informed
Somewhat informed
Not well informed
Not at all informed
Per
cent
60
50
40
30
20
10
0
Year
1997
19996
27
13
53
7
32
14
47

Guatemalan Values and Democratic Development: Fourth Report 3-12
January 2000
Intensity of participation: Since 1993 respondents have been asked if they attend meetings of specific types of groups and if so, how frequently. The possible responses to the questions are: frequently, sometimes and never. The respondents have been asked about different types of groups each year, and the eight included on the survey since 1995 are: church groups, school groups, community development groups, professional groups, service clubs, unions, cooperatives and comités civicos. These eight types of organizations can be broken into two categories: community groups, and occupation-related groups. Figure 3.11 presents the data for participation in community groups for the years of 1993 to 1999. One can see that the percentage of people who participate in church groups is consistently higher than those who participate in school or community development groups, and that participation in community development groups has been increasing slightly but steadily since 1993.
Figure 3.11: Percent Who Participate in Community Groups: 1993 - 1999
Looking more closely at the respondents who participate in religious groups, we find that the percentage of ‘Christian, not Catholic’ respondents who participate in church groups is 66 percent in 1999. This is a much higher participation level than the Catholic respondents (50%), the respondents who are an “other” religion (44%), or the respondents who indicated they did not have a religion (14%). We also find that the non-Catholic Christians are about twice as likely as Catholics (38% vs. 19%) to participate “often”, as opposed to “sometimes”. From the perspective of ethnic background, members of the indigenous population are somewhat more likely to participate in church related committees than Ladinos (55% vs. 48%), but there is no difference between the two groups in the percentage who participate “often” (23%).
Percent who participate in community groups
1993 -- 1999
*Civic committee not asked in 1993.
Civic committee*
Service Club
Community Assoc Dev
School Group
Church Group
60
50
40
30
20
10
0
Year
1993
1995
1997
199987
28
44
52
57
27
45
54
57
23
43
56
7
22
39
49

Guatemalan Values and Democratic Development: Fourth Report 3-13
January 2000
Some persons participate in groups associated with their profession or place of employment, and Figure 3.12 presents the percent of persons who participate in three types of occupation-related groups. The participation in these groups is lower than participation in community groups. The level of participation in professional groups is higher than in service clubs, unions or cooperatives, and in 1999 participation in professional groups was higher than in the prior survey years.
Figure 3.12: Percent Who Participate in Occupation-Related Groups: 1993 - 1999
Participation in Occupation-Related Groups
1993 -- 1999
CooperativesUnionsProfess. groups
50
40
30
20
10
0
Year
1993
1995
1997
1999
11
7
24
9
5
16
9
6
21
9
5
19

Guatemalan Values and Democratic Development: Fourth Report 3-14
January 2000
In Figure 3.13 we return to our 100 point scale to compare the level of participation among persons with different types of occupations. For this analysis the responses were recoded such that those who participated “frequently” received a score of 100, those who participated “sometimes” were given a score of 50 and those who never participated were scored 0. As the data for 1999 show, teachers have the highest level of participation in these groups, while domestic workers have the lowest. In no case is the level high, and fully 48 percent of the teachers, and an even larger percent of the other groups, indicated they never participate in an occupational related group.
Figure 3.13: Participate in Occupational Groups by Type of Employment: 1999
Breadth of participation: The extent of civil society participation data can also be viewed from the perspective of the number of groups in which people participate. To understand the breadth of participation, that is to see how many participants are active in more than one group, the number of types of groups selected by a respondent can be assessed.
Participation in Occupation-related Groups, 1999
Occupation
Domestic
Housewife
Factory Worker
Rural Worker
Soldier/Police
Student
OwnerOther
Technician
Office Worker
Professional
DriverTeacher
30
20
10
03
46
77889
12
151616
19

Guatemalan Values and Democratic Development: Fourth Report 3-15
January 2000
Table 3.2 presents these data for all four years. The table shows that the percentage of people in the ‘none’ (no participation) category declined considerably between 1993 and 1995 but has risen since then to return in 1999 to about the level of 1993. On the other hand, the percent of people participating in three or more types of civil society groups has risen steadily from 19 percent in 1993 to 28 percent in 1999.
Table 3.2
Extent of Civil Society Participation 1993 – 1999
1993 1995 1997 1999 % % % % None 29 23 25 27 1 group 29 29 29 26 2 groups 23 24 23 19 3 groups 11 13 13 13 4 groups 5 6 5 7 5-8 groups* 3 5 5 8 Total 100 100 100 100
*The groups included in this analysis are: Church, school, community development association, professional, service club, union, cooperative, and civic committee. The civic committee item was not asked in 1993, therefore the percent for participation in only 5-7 groups applies for 1993.
To see whether the people who do not participate in civil society groups are different than those who do, we compared the two groups in terms of their education, ethnicity, gender, age and relative wealth. The data show that there is not an obvious ‘type’ of person who does not participate in civil society groups. In terms of the characteristics we investigated, the respondents who do not participate in civil society groups are about the same as the respondents who do.

Guatemalan Values and Democratic Development: Fourth Report 3-16
January 2000
Political Participation To explore political participation we examined the percent of the population registered in a political party, as well as the percent of the population that worked for political campaigns and those who said that they tried to influence the votes of others. Although these figures are low, Figure 3.14 shows that in 1999, 9.4 percent of the population consider themselves to be a member of a political party which is a slight increase from the percent registered in 1993 (7.6%). Across the four surveys the percent who identify themselves as being a member of a political party has been between seven and nine percent.
Figure 3.14: Political Party Membership: 1993 - 1999
Percent members in a political party
by Year
1999199719951993
10.0
9.5
9.0
8.5
8.0
7.5
7.0
6.5
6.0
9.4
8.9
6.7
7.6

Guatemalan Values and Democratic Development: Fourth Report 3-17
January 2000
A slightly higher percent of the population indicate they have worked in political campaigns, and, not surprisingly, even more say they have tried to influence the votes of others. Figure 3.15 presents these data and shows that the level of participation in political campaigns increased from 1993 to 1997 but declined slightly in 1999. The percent of the population that has tried to influence the votes of others has also followed a similar path.
Figure 3.15: Percent Working in a Political Campaign or
Influencing Voters: 1993-1999 Civil Society Participation and Municipal Participation
There are many reasons to suspect that participation in civil society organizations is related to participation in local government. Civil society organizations are often involved in seeking solutions to local problems. For example school committees may interact with the municipal governments to provide materials or pressure the Ministry of Education to build new classrooms. These organizations also serve to develop leadership skills in their members and to embolden and encourage them to participate in municipal meetings. Similarly, religious-based groups directly, or indirectly through individual members or spin-off organizations, often provide health and welfare services that must be coordinated with governmental agencies or they advocate improvements in local conditions through petitions on other types of pressure on local and central government officials. Unions, cooperatives, professional groups and service clubs also can have these potentially important secondary results.
Percent working in a political campaign
or influencing voters: 1993 -- 1999
Influence votersPolitical campaign
30
20
10
0
Year
1993
1995
1997
1999
23
11
26
13
23
8
20
7

Guatemalan Values and Democratic Development: Fourth Report 3-18
January 2000
To test these theoretical assumptions about the relationship between participation in community and occupational-related groups, the third DIMS report (1998) included analyses relating participation in civil society organizations and attendance at municipal meetings, demand-making on municipal government, and satisfaction with local services. In brief, strong relationships were found. Statistical path analyses, using the data from the 1997 and earlier surveys, found that participation in civil society organizations was positively related to attendance at municipal meetings and that both participation and attendance contributed to satisfaction with services. It was found that civil society participation was also related to political tolerance and system political support. To assess the stability of these relationships we have compared the results from the 1999 survey with those from 1997, and where available from 1995. It is important to determine whether the findings from 1997 represented an unusual point in time, or whether the results are generally consistent from one year to the next. For these analyses we have combined the responses with respect to participation in community groups, occupational groups and political parties (9 types of groups overall).

Guatemalan Values and Democratic Development: Fourth Report 3-19
January 2000
Figure 3.16 shows there is a strong and consistent relationship between the measure of the number of groups in which persons participate and attendance at municipal meetings. The pattern in each of the three years is the same: those who do not participate at all or those who participate in only one group are much less likely to attend municipal meetings than those who participate in three groups or more.
Civil Society Participation and
Municipal Attendance, 1995 -- 1999
Total civil society participation
5-9 groups4 groups3 groups2 groups1 groupNone
% A
ttend
ing
50%
40%
30%
20%
10%
0%
Year
1995
1997
1999
Figure 3.16: Civil Society Participation and Municipal Attendance: 1995 - 1999

Guatemalan Values and Democratic Development: Fourth Report 3-20
January 2000
The likelihood of making demands on local government and participation in civil society organizations are also consistently related across the three survey years. As shown in Figure 3.17, the greater the level of civil society participation, the greater the frequency of demands made on local government.
Civil Society Participation and
Demand-Making on Municipal Government, 1995 --1999
Total civil society participation
5-9 groups4 groups3 groups2 groups1 groupNone% m
akin
g de
man
ds o
n m
unic
ipal
gov
ernm
ent
60%
50%
40%
30%
20%
10%
0%
Year
1995
1997
1999
Figure 3.17: Civil Society Participation and Demand-Making on Municipal Government, 1995 - 1999
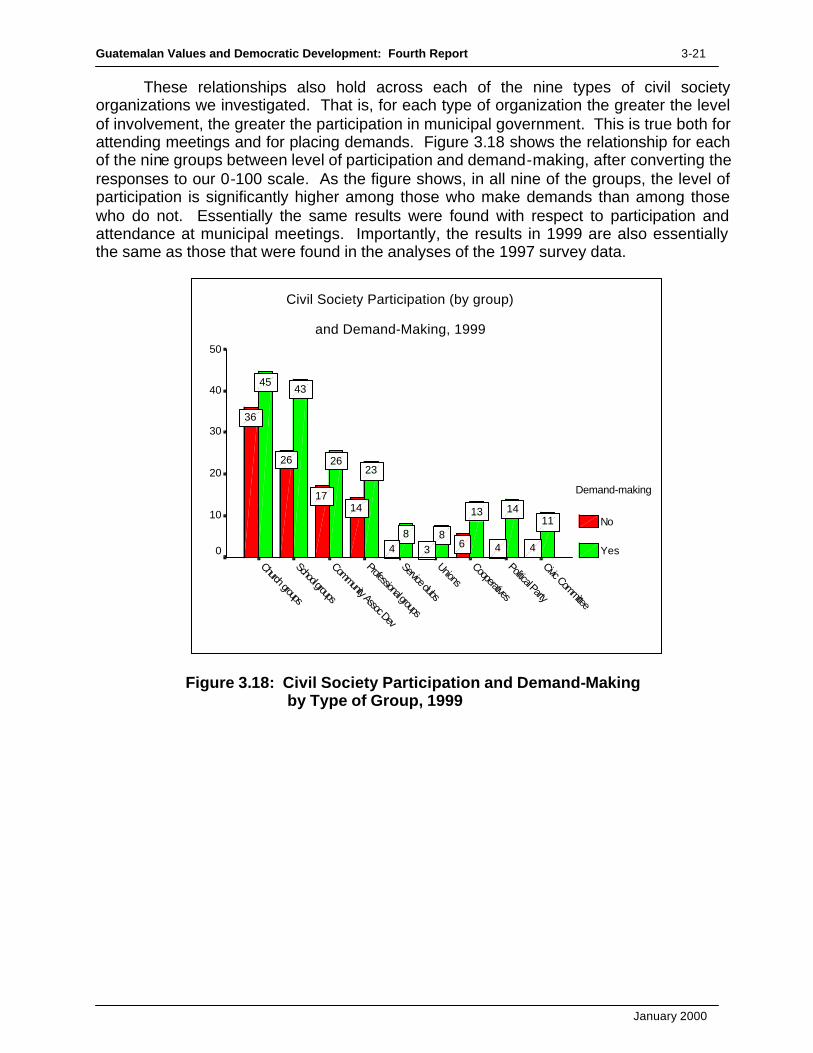
Guatemalan Values and Democratic Development: Fourth Report 3-21
January 2000
These relationships also hold across each of the nine types of civil society organizations we investigated. That is, for each type of organization the greater the level of involvement, the greater the participation in municipal government. This is true both for attending meetings and for placing demands. Figure 3.18 shows the relationship for each of the nine groups between level of participation and demand-making, after converting the responses to our 0-100 scale. As the figure shows, in all nine of the groups, the level of participation is significantly higher among those who make demands than among those who do not. Essentially the same results were found with respect to participation and attendance at municipal meetings. Importantly, the results in 1999 are also essentially the same as those that were found in the analyses of the 1997 survey data.
Civil Society Participation (by group)
and Demand-Making, 1999
Civic Committee
Political Party
Cooperatives
Unions
Service clubs
Professional groups
Community Assoc Dev
School groups
Church groups
50
40
30
20
10
0
Demand-making
No
Yes
111413
88
2326
4345
44634
1417
26
36
Figure 3.18: Civil Society Participation and Demand-Making by Type of Group, 1999

Guatemalan Values and Democratic Development: Fourth Report 3-22
January 2000
In 1997 we also took the next logical step and investigated the relationship between participation in local government and satisfaction with municipal services. The data from the 1997 survey showed a positive relationship between both attendance at municipal meetings and placing demands on the municipality and satisfaction. Figure 3.19 and Figure 3.20 show the results for the three years of 1995, 1997 and 1999.
Figure 3.19 shows the relationship between satisfaction and meeting attendance. In all three years, the results are largely the same, with those who attended meetings most often being the most satisfied with the services they receive. Interestingly, in 1997, and even more noticeably in 1999, the respondents who gave local services the worst possible rating were also more likely to have attended local government meetings than were those who considered them only “bad”. It may be that efforts in the past several years to make local governments more open and accessible are starting to bear fruit, and that persons with serious grievances or complaints about the quality of services are more willing or able to make their feelings known.
Figure 3.19: Attendance at Municipal Meetings: 1995 - 1999
Attendance at Municipal Meetings
and Satisfaction with Service, 1995 --1999
Satisfaction with service
ExcellentGoodAverageBadVery bad
% A
ttend
ed m
unic
ipal
mee
tings
40
30
20
10
0
Year
1995
1997
1999
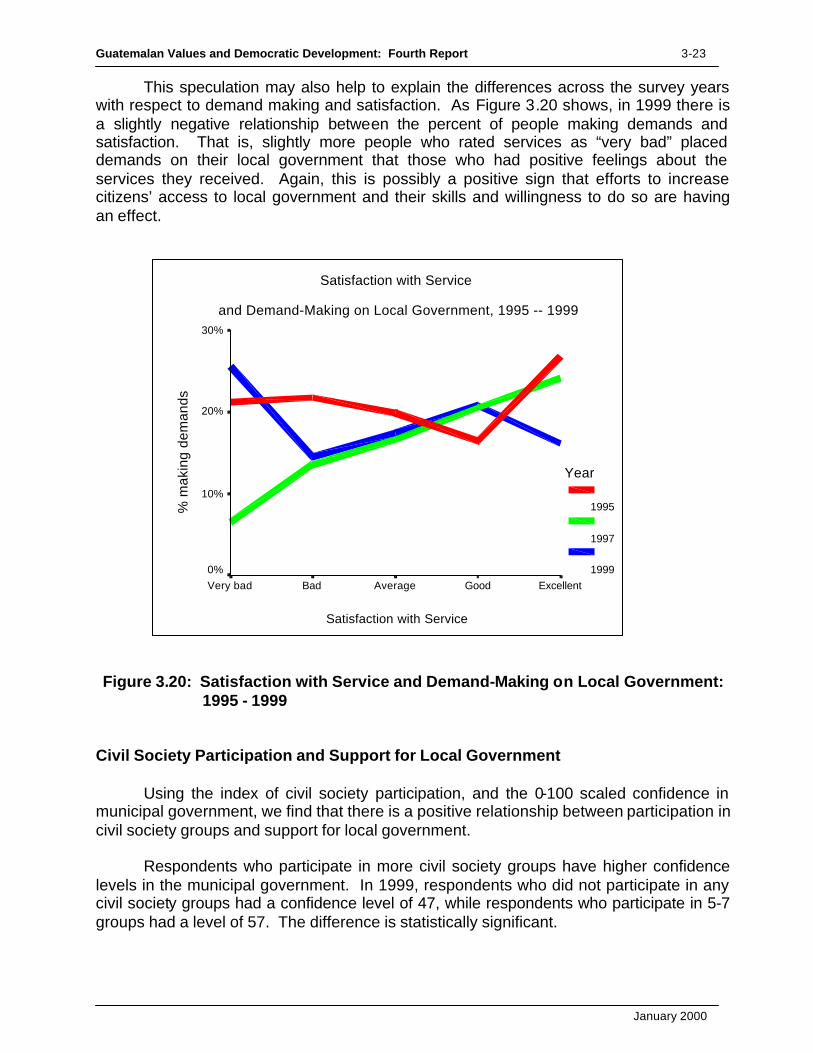
Guatemalan Values and Democratic Development: Fourth Report 3-23
January 2000
This speculation may also help to explain the differences across the survey years with respect to demand making and satisfaction. As Figure 3.20 shows, in 1999 there is a slightly negative relationship between the percent of people making demands and satisfaction. That is, slightly more people who rated services as “very bad” placed demands on their local government that those who had positive feelings about the services they received. Again, this is possibly a positive sign that efforts to increase citizens’ access to local government and their skills and willingness to do so are having an effect.
Figure 3.20: Satisfaction with Service and Demand-Making on Local Government:
1995 - 1999 Civil Society Participation and Support for Local Government Using the index of civil society participation, and the 0-100 scaled confidence in municipal government, we find that there is a positive relationship between participation in civil society groups and support for local government. Respondents who participate in more civil society groups have higher confidence levels in the municipal government. In 1999, respondents who did not participate in any civil society groups had a confidence level of 47, while respondents who participate in 5-7 groups had a level of 57. The difference is statistically significant.
Satisfaction with Service
and Demand-Making on Local Government, 1995 -- 1999
Satisfaction with Service
ExcellentGoodAverageBadVery bad
% m
akin
g de
man
ds
30%
20%
10%
0%
Year
1995
1997
1999

Guatemalan Values and Democratic Development: Fourth Report 3-24
January 2000
Civil Society Participation and Support for Democracy As discussed in Chapter 2, two critical elements in building a sustainable democracy are public attitudes with respect to political tolerance and the public's support for the fundamental institutions of government. Figure 3.21 and Figure 3.22 display the relationships between civil society participation and tolerance and system support across three survey years. As the figures show, in all three surveys for which there are comparable data (1995, 1997 and 1999), the relationships are basically consistent and positive. The relationship between participation and tolerance is shown in Figure 3.21. In 1995 and 1999 it is quite clear that people who participate are much more likely to be tolerant of the political rights of others than those who do not. Although the shape of the data in 1997 is not as clear, the same overall conclusion can be drawn.
Figure 3.21: Civil Society Participation and Tolerance: 1995 - 1999
Civil Society Participation and Tolerance
1995 -- 1999
Civil Society Participation (9 items)
5-9 groups4 groups3 groups2 groups1 groupNone
Tol
eran
ce
70
60
50
40
Year
1995
1997
1999
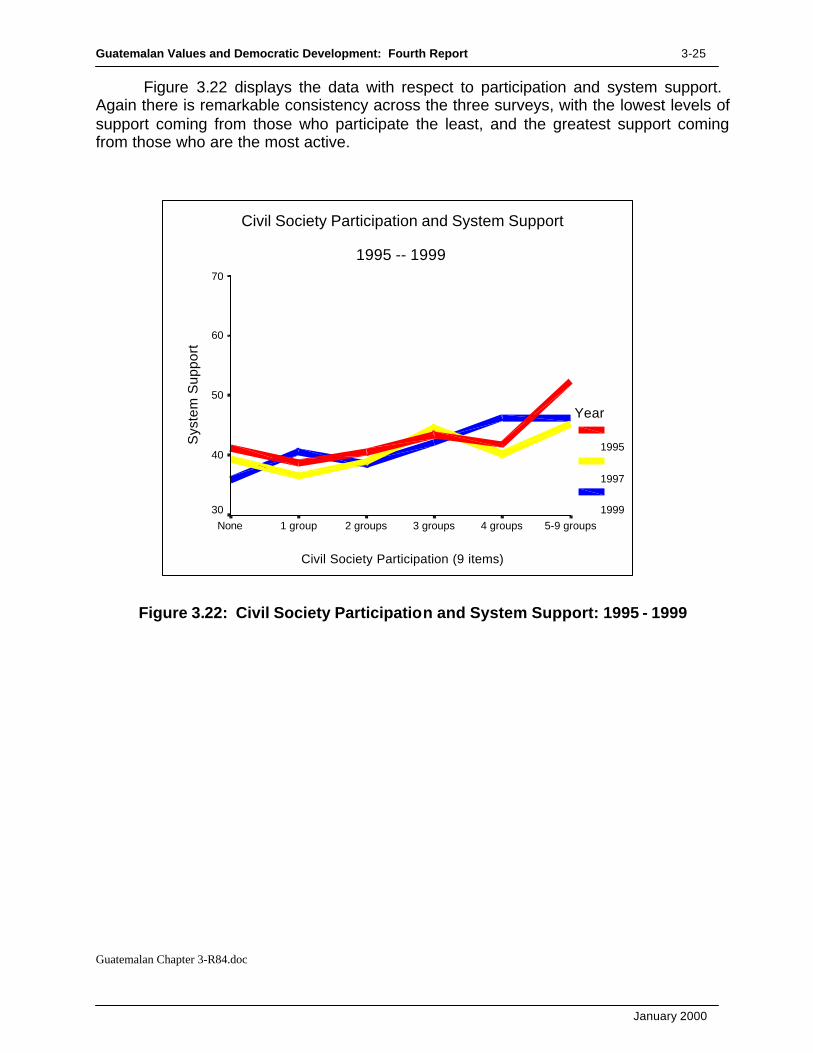
Guatemalan Values and Democratic Development: Fourth Report 3-25
January 2000
Figure 3.22 displays the data with respect to participation and system support. Again there is remarkable consistency across the three surveys, with the lowest levels of support coming from those who participate the least, and the greatest support coming from those who are the most active.
Figure 3.22: Civil Society Participation and System Support: 1995 - 1999
Guatemalan Chapter 3-R84.doc
Civil Society Participation and System Support
1995 -- 1999
Civil Society Participation (9 items)
5-9 groups4 groups3 groups2 groups1 groupNone
Sys
tem
Sup
port
70
60
50
40
30
Year
1995
1997
1999

January 2000
Chapter 4
Importance of Economic Conditions In this chapter we look at the relationships between respondents’ perceptions of economic conditions, the extent of their political tolerance, their support for the political system, and participation in civil society organizations. Prior analyses of the DIMS survey data have made considerable use of information about the relative wealth of each of the respondents. However, little use has been made of the questions dealing with the respondents’ sense of the most serious problems at the national and community levels, or with items concerning satisfaction with their personal situation and the country’s economic conditions. Most Serious National Level Problems Very early in the interview the respondents were asked: “What do you think is the most serious problem in all of Guatemala?” Figure 4.1 provides a summary of their answers for each of the four years of the survey. Clearly, from these data the two most serious concerns of the population are the cost of living and common crime. To make the presentation more understandable, only the five most frequently given responses from the 1999 survey are displayed in Figure 4.1. Frequent responses that are not shown are: bad government, lack of potable water, transportation and roads, pollution, housing, malnutrition and health, and corruption (all at less than 2% of the respondents).
Figure 4.1: Most Serious Problem in Country
Most Serious Problem in Country*
1993 -- 1999
* Five most frequently given responses in 1999
Common crime
Education/illiteracy
Low salaries
Unemployment
Cost of living
Per
cent
60
50
40
30
20
10
0
Year
1993
1995
1997
1999
28
44
13
38
26
13
41
19
10
42
94
11
50

Guatemalan Values and Democratic Development: Fourth Report 4-2
January 2000
As Figure 4.1 shows, the “cost of living” was identified as the country’s most serious problem by the greatest number of respondents in each of the survey years, but the percentage giving this response has declined each year. The public’s perception of the problem of common crime, on the other hand, has risen steadily, and easily accounts for the decreases in the percent identifying “cost of living” as the country’s most serious problem. Clearly, for many Guatemalans concern about crime has replaced concern about the economy. As will be discussed more fully in Chapter 5 which is devoted specifically to the topic of violence and crime, the two issues are related. Thus, these data should not be interpreted as a positive change in perceptions with respect to the economy.
Indeed, although concern with common crime has clearly risen substantially since 1993, when we combine the “cost of living”, “unemployment” and “low salaries” responses we see that in 1999 well over half (56%) of the respondents still identified economic circumstances that affect individuals and families as the most serious problem facing the country. As shown in Figure 4.2 one of these three responses, which in combination we will refer to throughout this chapter as “household economics”, was given by 64 percent of the respondents in 1993, 55 percent in 1995, 57 percent in 1997, and 56 percent in 1999. Thus, while “cost of living” as a response has declined in each year of the survey, the combined response category regarding the importance of family or household level economic conditions has not changed from 1995 to 1999.
Figure 4.2: Two Most Serious Problems Facing Guatemala
Two Most Serious Problems Facing Guatemala
1993 -- 1999
Common crimeFamily economics
Per
cent
70
60
50
40
30
20
10
0
Year
1993
1995
1997
1999
28
56
26
57
19
55
9
64

Guatemalan Values and Democratic Development: Fourth Report 4-3
January 2000
To gain some insight into the characteristics of respondents who considered household or family level economics to be the country’s most serious problem we analyzed the data fur ther in terms of geographic region, gender, ethnicity, age, education and relative wealth. Table 4.1 shows the percent of Guatemalans in each region, and also by gender and ethnic group, who identified “household economics” or “common crime” as the most serious problem facing the country. As the table shows, in every category “household economics” is identified substantially more often than common crime, the second-most frequently given response.
Table 4.1
Most Serious Problem in Country: 1999
Household Economics Common Crime % %
Metropolitan Area 55 25 North East 63 23 North West 57 25 South West 47 34
Region
South East 63 31 Female 51 34 Gender Male 60 23 Ladino 55 28 Ethnic self-
identification Indigenous 55 28 From the perspective of region, we see that the South West is the only part of the
country where household economics was not identified as the most serious problem by more than half of the population. Interestingly, this was the region in which the percentage of people identifying crime as most serious was the highest. It is also interesting to note that although there are differences in the responses of men and women, the differences with respect to household economics are accounted for almost exactly by the differences in the identification of common crime; when the two are added together, the responses of men and women are virtually the same (85% for females and 83% for males). The table also shows that responses are even more similar when comparing results by the two major ethnic groups. There is essentially no difference between Ladinos and the indigenous population in the percentage identifying household economics as the most serious problem, and the same is true with respect to the percentage citing common crime.

Guatemalan Values and Democratic Development: Fourth Report 4-4
January 2000
Figures 4.3, 4.4 and 4.5 show the relationship in 1999 of these two most commonly identified most serious problems to level of education, relative wealth, and age of the respondents. Figure 4.3 shows that crime is much more likely to be cited as the major problem by respondents with less education than high, while the inverse is the case with respect to household economics. About a third (32% of the respondents with a primary school education identified crime as the most serious problem, while this was cited as most serious by only about a sixth (16%) with a university level education. The exception to this pattern is for persons with essentially no education; they are particularly concerned about their economic situation.
Figure 4.3: Most Serious Problems for Country by Education: 1999
Most Serious Problems for Country
By Education: 1999
Education Level
University
High School
Jr. High
Primary
None
Per
cent
70
60
50
40
30
20
10
0
Most serious problem
Household economics
Common crime
16
2530
32
25
61
555354
60

Guatemalan Values and Democratic Development: Fourth Report 4-5
January 2000
Figure 4.4 shows the relationship of the two variables in terms of the relative wealth of the respondents. As in prior years, the measure of wealth that we use in the survey is far from perfect, but does provide a reasonably accurate relative measure of household wealth. It yields a ranking of respondents in terms of material possessions and provides a basis for comparing respondents in terms of their relative wealth. The first three times the survey was administered respondents were asked to indicate whether they were employed and the amount of their own and their household’s monthly income. They were also asked a series of questions about the number of appliances (e.g., radios, televisions (black and white and/or color), refrigerators, washing machines, cars and telephones) they had in their home1. In an attempt to be less intrusive and thereby improve the quality of responses, the 1999 survey asked for income estimates in several categories. Unfortunately, the analyses have consistently indicated that the quality of the monthly income data is seriously flawed. Survey respondents are often reluctant to be forthcoming in answering questions of this kind, and also some respondents have erratic cash incomes and do not relate well to the question while others simply do not know. The data on material possessions, on the other hand, are consistently available and their analyses provide plausible and useful results.
Figure 4.4 shows that household economics was cited as most serious by over
half the respondents in all but one of the wealth categories, and it was identified most often by respondents with the most and least resources. Common crime, on the other hand, was the answer most frequently provided by respondents in the middle categories of relative wealth, although crime was cited by at least 25 percent of the respondents in all but the highest two categories.
Figure 4.4: Most Serious Problems for Country (By Relative Wealth: 1999)
1 The variable is created by summing the total number of possessions. For example, a respondent who owns a radio and a refrigerator would have a 2 on the relative wealth scale.
Most Serious Problems for Country
By Relative Wealth: 1999
Relative Wealth
7.00
6.00
5.00
4.00
3.00
2.00
1.00
.00
80
70
60
50
40
30
20
10
0
Most serious problem
Household economics
Common crime
13
222729
32
26
32
25
63
5458
5652
60
47
70

Guatemalan Values and Democratic Development: Fourth Report 4-6
January 2000
Figure 4.5 shows the relationship of age to the identification of the two most serious problems. As one might expect, the data indicate that crime is a greater concern for the relatively young (under 25) and relatively old (over 55), while the economics of their households is of greater concern to Guatemalans in the middle years.
Figure 4.5: Most Serious Problems for Country
(by Age: 1999)
Most Serious Community Level Problems
The questionnaire also includes an item that helps us understand what respondents consider to be “the most important problem” in their community. It is interesting to note that respondents make a clear distinction between the problems facing their community and those facing the country as a whole.
Most Serious Problems for Country
by Age: 1999
Age
56 & up46-5536-4526-3518-25
70
60
50
40
30
20
10
Most serious problem
Household economics
Common crime
33
2226
2931
54
67
5655
47

Guatemalan Values and Democratic Development: Fourth Report 4-7
January 2000
Figure 4.6 presents the three most popular responses to this question2. As can be seen from the figure, at the community level the most frequently given response in 1993 and 1995 was a “lack of potable water”, which was replaced in 1997 and 1999 by a greater concern with household economics. It is interesting to note that while important, common crime is not as frequently cited when the question deals with the community level than when the focus is on the country as a whole.
Figure 4.6: Most Serious Community Problems (1993-1999)
2 Responses that are not shown include: transportation and roads at 10% in 1999, and pollution, malnutrition and health, education/illiteracy, housing, bad government, drug trafficking, and corruption, each at 4% or less in 1999.
Most Serious Community Problems
1993-1999
Common crimePotable waterHousehold economics
Per
cent
40
30
20
10
0
Year
1993
1995
1997
1999
14
24
31
18
23
34
10
37
26
5
35
27

Guatemalan Values and Democratic Development: Fourth Report 4-8
January 2000
Throughout the country, the same three concerns were identified as the most serious problems at the community level, but as shown in Figures 4.7 through 4.11 the relative importance of each varies by region and by year. For example, Figure 4.7 presents the data from the Metropolitan region in which the respondents identified common crime as the most important problem in their community in 1997 and household economics as most important in 1999. In 1997, 53 percent of respondents gave common crime as the most serious problem, as opposed to 28 percent who identified household economics. In 1999, on the other hand, household economics was identified by 39 percent of respondents in the metropolitan region, while 34 percent answered that it was common crime. It is unclear from the survey data if this change between 1997 and 1999 is a result of a greater sense of safety on the part of residents of the metropolitan area, perhaps associated with the recent public use of motorized police patrols in the crime reduction effort, or a perceived worsening of economic conditions for average citizens.
Figure 4.7: Community Problems: Metro Area
Most Serious Community Problems
1993 -- 1999
REGION: 1 Metropolitan Area
Common crimePotable WaterHousehold economics
Per
cent
70
60
50
40
30
20
10
0
Year
1993
1995
1997
1999
34
7
39
53
4
28
35
7
34
14
2124

Guatemalan Values and Democratic Development: Fourth Report 4-9
January 2000
In the North East and North West (see Figures 4.8 and 4.9), household economics again was most frequently identified as the most serious problem (26% and 35%, respectively). In these regions the lack of potable water was the next most frequently noted problem, with this being identified as most serious by 21 percent of the respondents in the North East and 17 percent of those in the North West. In both these regions common crime was given as the most serious community problem by 10 percent or less of the respondents (10% in the North East and 6% in the North West).
Figure 4.8: Community Problems: North East Figure 4.9: Community Problems: North West
Although the same three problems were consistently identified as the most important in all five regions, in 1999 the ‘lack of potable water’ is the most highly ranked problem in the South East and the South West (see Figures 4.10 and 4.11). Indeed, in the South East this was identified as the most serious problem by over half (52%) of the respondents, with household economics ranking second (28%) and common crime a distant third (6%). In the South West, lack of potable water was tied with household economics, with both identified as most serious by 29 percent of respondents, while 11 percent of the respondents answered that common crime is the most serious problem.
Figure 4.10: Community Problems: South West Figure 4.11: Community Problems: South East
Most Serious Community Problems
1993 -- 1999
REGION: 3 North West
Common crimePotable WaterHousehold economics
Per
cent
70
60
50
40
30
20
10
0
Year
1993
1995
1997
19996
17
35
5
24
35
41
33
40
27
Most Serious Community Problems
1993 -- 1999
REGION: 4 South West
Common crimePotable WaterHousehold economics
Per
cent
70
60
50
40
30
20
10
0
Year
1993
1995
1997
1999
11
2928
10
27
37
45
23
39
25
Most Serious Community Problems
1993 -- 1999
REGION: 5 South East
Common crimePotable WaterHousehold economics
Per
cent
70
60
50
40
30
20
10
0
Year
1993
1995
1997
19996
52
28
10
4035
7
65
11
57
22
Most Serious Community Problems
1993 -- 1999
REGION: 2 North East
Common crimePotable WaterHousehold economics
Per
cent
70
60
50
40
30
20
10
0
Year
1993
1995
1997
1999
10
2126
15
23
35
5
35
2426
38

Guatemalan Values and Democratic Development: Fourth Report 4-10
January 2000
Table 4.2 shows the percentage of the population in 1999 in each region identifying household economics, common crime and potable water as the most serious community level problem. The table also provides comparisons in terms of gender and ethnicity. There is essentially no difference in the percent of females and males who identified household economics as the most serious problem (31% and 32%), or in the percent citing potable water (25% and 23%). The same is true when analyzing the data in terms of ethnicity. There is essentially no difference between Ladinos and the indigenous population with respect to their identification of household economics or potable water as the most serious problem faced by their community . Common crime, however, was slightly more likely to be identified as the most serious problem by women (17%) than by men (11%), and by Ladinos (17%) than indigenous residents (12%).
Table 4.2
Most serious problem in community: 1999
Household economics
Common crime
Potable Water
% % % Metropolitan Area 39 34 7 North East 26 10 21 North West 35 6 17 South West 28 11 29
Region
South East 28 6 52 Female 31 17 25 Gender Male 32 11 23 Ladino 30 17 23 Ethnic self-
identification Indigenous 32 12 24

Guatemalan Values and Democratic Development: Fourth Report 4-11
January 2000
Figure 4.12 and Figure 4.13 compare the responses regarding community problems in terms of education and relative wealth. There is little difference in the shape of the distribution of responses associated with level of education, except that the percentage of respondents citing common crime increases with education (from 12% of the least educated to 22% of the most). Figure 4.12 shows that across all education level categories, household economics was identified most frequently as the most serious problem in the community. The lack of potable water was the second-most frequently identified problem among all the education levels except for those respondents with a University level education. The second-most frequently cited problem among University level respondents was common crime.
Figure 4.12: Most Serious Problems for Community (by Education: 1999)
Most Serious Problems for Community
By Education: 1999
Education Level
University
High School
Jr. High
Primary
None
40
30
20
10
0
Most Serious Problem
Household economics
Potable water
Common crime
22
18
131212
15
2123
2625
34
303131
29

Guatemalan Values and Democratic Development: Fourth Report 4-12
January 2000
Figure 4.13 shows the responses in terms of relative wealth. Again, household economics is the most frequently cited problem: it was given as an answer most often in all but one of the relative wealth groups. Although not nearly as frequently cited as economics, crime was identified as the most serious problem by about a quarter of the respondents in the wealthiest two categories. The lack of potable water does not seem to be much of a concern for persons in the top two wealth categories, nor for the lowest wealth category, otherwise it was the second-most frequently given response.
Figure 4.13: Most Serious Problems for Community (by Relative Wealth: 1999)
Most Serious Problems for Community
by Relative Wealth: 1999
Relative Wealth
7.00
6.00
5.00
4.00
3.00
2.00
1.00
.00
40
30
20
10
0
Most Serious Problem
Household economics
Potable water
Common crime
2523
14
17
1313
5
18
14
9
2826
30
26
21
10
3233
30
24
32
36
32
29

Guatemalan Values and Democratic Development: Fourth Report 4-13
January 2000
Figure 4.14 presents responses in terms of age. The respondents 46 and above most frequently cited household economics as the most serious problem in the community, and were not as concerned with crime as the youngest age group.
Figure 4.14: Most Serious Problem for Community (by Age: 1999)
Satisfaction
A second set of items asked early in the interview dealt with the respondents’
satisfaction with the general economic situation, and then, more personally, with their current way of life. In each case respondents were asked to indicate if they were “satisfied” or “dissatisfied”. Interviewers were provided a place on the survey instrument to record a response of “partially” or “somewhat” satisfied, but they did not explicitly offer this as an option to the persons being interviewed.3
3 More specifically, respondents were asked: “What do you think of the economic situation in general? Are you satisfied or dissatisfied?” They were then asked: “In general terms, are you satisfied with your current way of life? Would you say you feel satisfied or dissatisfied?”
Most Serious Problems for Community
by Age: 1999
Age
56 & up46-5536-4526-3518-25
40
30
20
10
0
Most Serious Problem
Household economics
Potable water
Common crime
10
121213
22 22
2827
2122
3635
28
32
25

Guatemalan Values and Democratic Development: Fourth Report 4-14
January 2000
Figure 4.15 shows the respondents’ views with respect to the country’s economic situation in general. The percent of the respondents who are satisfied or partially satisfied rose from 45 percent to 50 percent from 1993 to 1995, stayed at 50 percent in 1997, and dropped to 35 percent in 1999.
Figure 4.15: What Do You Think About the Economic Situation in General?
What do you think about the economic situation in general?
1993 -- 1999
1999199719951993
80
60
40
20
0
Partially satisfied
Satisfied
4
1415
12
31
363533

Guatemalan Values and Democratic Development: Fourth Report 4-15
January 2000
The responses to the question concerning the respondents’ own lives were consistently higher but followed the same pattern as the responses about the general economic conditions. In each of the four survey years there is a 20 to 25 percent difference between the two items. As shown in Figure 4.16, the percent of respondents who are satisfied or somewhat satisfied rose from 70 percent to 74 percent from 1993 to 1995, stayed at 74 percent in 1997 and then dropped to 55 percent in 1999.
Looking more closely at the responses shown in Figures 4.15 and 4.16 we see that although there was a decline from 1997 to 1999, a large portion of that decline in both cases was in the percent indicating they were only partially or somewhat satisfied. This suggests that respondents in 1999 were much more strongly negative in their opinions than in prior years, and that the level of dissatisfaction was much higher in 1999 than before.
Figure 4.16: Generally, Are You Satisfied with Your Life?
Generally, are you satisfied with your life?
1993 -- 1999
1999199719951993
80
60
40
20
0
Partially satisfied
Satisfied
5
151413
50
596057

Guatemalan Values and Democratic Development: Fourth Report 4-16
January 2000
Figures 4.17 through 4.20 show the results of looking further at the responses of those in 1999 who indicated they were satisfied (the partially satisfied group is not included). Figure 4.17 shows there are differences among the regions with respect to both questions. As the figure shows, the North East is the region with the lowest level of satisfaction, both in terms of general economic conditions (only 26% were satisfied) and with the respondents’ own way of life (only 37% satisfied). The metropolitan region shows the greatest disparity in the answers to the two questions. While only 29 percent on the respondents were satisfied with economic conditions in general, well over half (57%) were satisfied with their current way of life.
Figure 4.17: Satisfaction by Region: 1999
Satisfaction by Region: 1999
Region
South East
South West
North West
North East
Metropolitan Area
Per
cent
Sat
isfie
d
60
50
40
30
20
Economic
Satisfaction
Life Satisfaction
57
48
54
37
57
3134
32
26
29

Guatemalan Values and Democratic Development: Fourth Report 4-17
January 2000
Figure 4.18 shows the distribution of the responses by age. As the figure shows, the youngest respondents are the most satisfied with their life (58% of those 18-25 years old say they are satisfied) and also have the most positive views of economic conditions (40% say they are satisfied). About 52 percent of those between 26 and 45 said they were satisfied with their current way of life, as did 44 percent of those 46 to 55 and 47 percent of those who were over 55 years of age.
Figure 4.18: Satisfaction by Age: 1999
Satisfaction by Age: 1999
Age
56 & up46-5536-4526-3518-25
Per
cent
Sat
isfie
d
70
60
50
40
30
20
Economic
satisfaction
Life Satisfaction
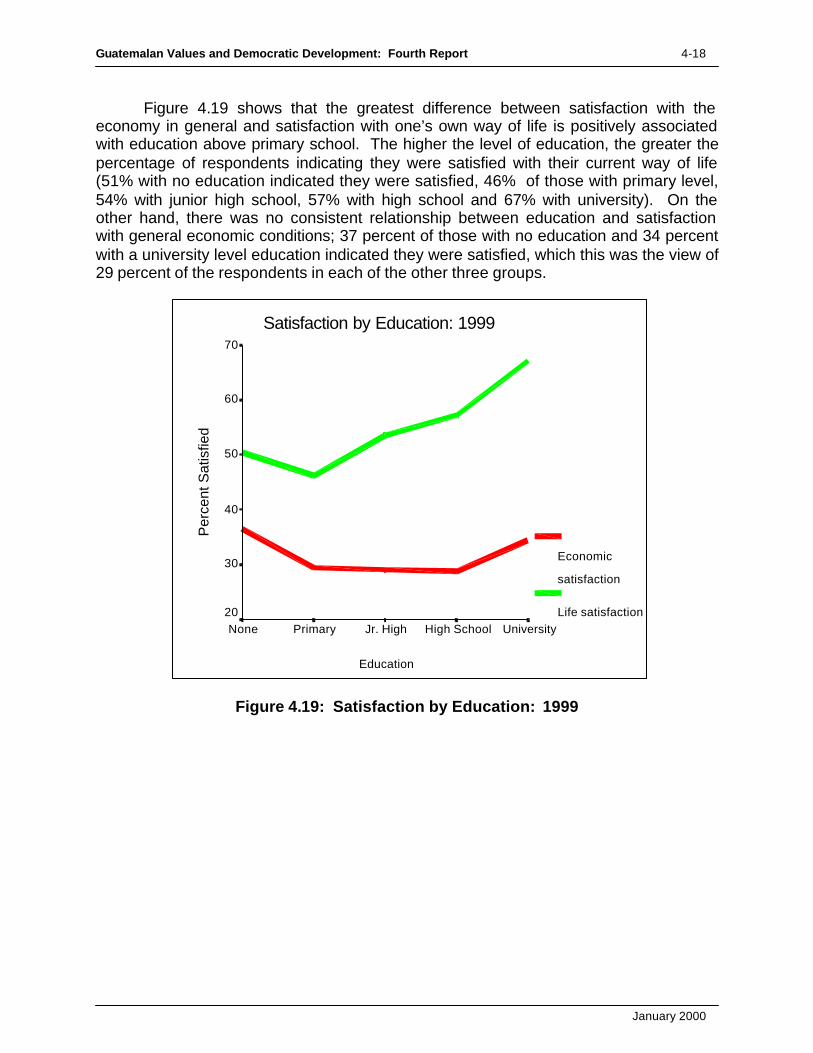
Guatemalan Values and Democratic Development: Fourth Report 4-18
January 2000
Figure 4.19 shows that the greatest difference between satisfaction with the economy in general and satisfaction with one’s own way of life is positively associated with education above primary school. The higher the level of education, the greater the percentage of respondents indicating they were satisfied with their current way of life (51% with no education indicated they were satisfied, 46% of those with primary level, 54% with junior high school, 57% with high school and 67% with university). On the other hand, there was no consistent relationship between education and satisfaction with general economic conditions; 37 percent of those with no education and 34 percent with a university level education indicated they were satisfied, which this was the view of 29 percent of the respondents in each of the other three groups.
Figure 4.19: Satisfaction by Education: 1999
Satisfaction by Education: 1999
Education
UniversityHigh SchoolJr. HighPrimaryNone
Per
cent
Sat
isfie
d
70
60
50
40
30
20
Economic
satisfaction
Life satisfaction

Guatemalan Values and Democratic Development: Fourth Report 4-19
January 2000
Figure 4.20 shows the relation between the two types of satisfaction and relative wealth. There is little relationship between satisfaction in general and with the economy and wealth, except for among the most affluent. In the lower seven of the categories of relative wealth the percentage indicating they were satisfied ranged from 29 percent (categories 1 and 3) to 36 percent (category 5). Satisfaction with one's current way of life, however, is clearly related to relative wealth, ranging from a low of 41 percent satisfied in the lowest category to 64 percent in the highest. These responses indicate that the respondents interpreted the questions as intended, with the question about the economy pertaining to society in general and the question about way of life pertaining directly to the respondents themselves.
Figure 4.20: Satisfaction by Relative Wealth: 1999
Satisfaction by Relative Wealth: 1999
Relative Wealth
7.006.005.004.003.002.001.00.00
Per
cent
Sat
isfie
d
70
60
50
40
30
20
Economic
Satisfaction
Life Satisfaction
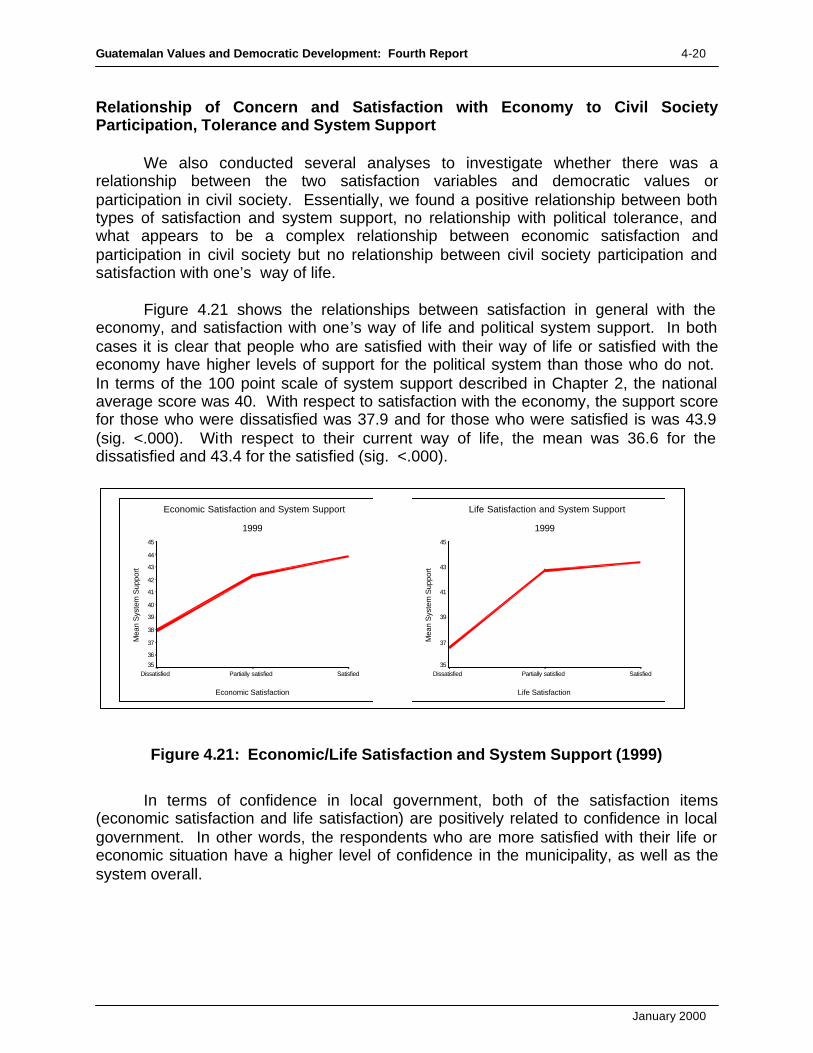
Guatemalan Values and Democratic Development: Fourth Report 4-20
January 2000
Relationship of Concern and Satisfaction with Economy to Civil Society Participation, Tolerance and System Support
We also conducted several analyses to investigate whether there was a relationship between the two satisfaction variables and democratic values or participation in civil society. Essentially, we found a positive relationship between both types of satisfaction and system support, no relationship with political tolerance, and what appears to be a complex relationship between economic satisfaction and participation in civil society but no relationship between civil society participation and satisfaction with one’s way of life.
Figure 4.21 shows the relationships between satisfaction in general with the economy, and satisfaction with one’s way of life and political system support. In both cases it is clear that people who are satisfied with their way of life or satisfied with the economy have higher levels of support for the political system than those who do not. In terms of the 100 point scale of system support described in Chapter 2, the national average score was 40. With respect to satisfaction with the economy, the support score for those who were dissatisfied was 37.9 and for those who were satisfied is was 43.9 (sig. <.000). With respect to their current way of life, the mean was 36.6 for the dissatisfied and 43.4 for the satisfied (sig. <.000).
Figure 4.21: Economic/Life Satisfaction and System Support (1999)
In terms of confidence in local government, both of the satisfaction items (economic satisfaction and life satisfaction) are positively related to confidence in local government. In other words, the respondents who are more satisfied with their life or economic situation have a higher level of confidence in the municipality, as well as the system overall.
Economic Satisfaction and System Support
1999
Economic Satisfaction
SatisfiedPartially satisfiedDissatisfied
Mea
n S
yste
m S
uppo
rt
45
44
43
42
41
40
39
38
37
36
35
Life Satisfaction and System Support
1999
Life Satisfaction
SatisfiedPartially satisfiedDissatisfied
Mea
n S
yste
m S
uppo
rt
45
43
41
39
37
35

Guatemalan Values and Democratic Development: Fourth Report 4-21
January 2000
The relationships with respect to tolerance for political dissent are shown in Figure 4.22. In both cases the lines are essentially flat. The mean tolerance score with respect to outlook on the economy was 50.4 for the satisfied and 52.3 for the dissatisfied, a difference which is not significant statistically. For satisfaction with their current way of life the differences were even less, 51.8 for the satisfied and 50.8 for those who were dissatisfied.
Figure 4.22: Life/Economic Satisfaction and Tolerance
Life Satisfaction and Tolerance
1999
Life Satisfaction
SatisfiedPartially satisfiedDissatisfied
Mea
n To
lera
nce
60.0
50.0
40.0
30.0
Economic Satisfaction and Tolerance
1999
Economic Satisfaction
SatisfiedPartially satisfiedDissatisfied
Mea
n To
lera
nce
60.0
50.0
40.0
30.0

Guatemalan Values and Democratic Development: Fourth Report 4-22
January 2000
Figure 4.23 shows the relationships with civil society participation. As the figure suggests, there is no relationship between satisfaction with one’s current way of life and the number of groups in which one participates. The data with respect to the relationship between economic outlook and participation, however, are a bit less clear. Converting the three possible responses to the satisfaction with the economy question to a 100 point scale (satisfied = 100, somewhat satisfied = 50 and dissatisfied = 0), we see that those who participate in one group (mean 38) are significantly (at the .05 level) more positive than those who participate in three or four groups (mean scores of 28 and 24, respectively).
Figure 4.23: Economic and Life Satisfaction and Civil Society Participation
Guatemalan Chapter 4-r84.doc
Economic and Life Satisfaction
and Civil Society Participation, 1999
Civil Society Participation
5-9 groups
4 groups
3 groups
2 groups
1 group
None
Mea
n S
atis
fact
ion
60
50
40
30
20
Economic
Satisfaction
Life Satisfaction

January 2000
Chapter 5
Crime: Its Dimensions And Political Impact1 Political peace in Central America, following decades of armed conflict, has been accompanied by a growing tidal wave of criminality. Newspapers and television reports throughout the region are filled daily with shocking reports of murder, kidnapping assault and countless burglaries and robberies. The situation seems to be particularly serious in Guatemala, where the post-war peace has been accompanied by a major increase in common crime. Despite the widespread popular concern over this crime wave, little social science attention has been focused on it. This chapter addresses the issue of crime in Guatemala. It begins with a discussion of the regional context of crime and a discussion of crime as a growing problem in the developing world. Through the use of the 17-nation Latin Barometer data set and other available information, Guatemala is shown to have one of the highest crime rates in the Latin American region. Based on the DIMS survey data from 1999, the chapter also describes the victims of crime in terms of gender, residence, age, ethnicity and socio-economic status. Also explored is the topic of violence against women, presenting analyses of a question first asked in the DIMS of 1999. Lastly, the chapter explores the impact of crime on political stability by examining its impact on democratic attitudes and behaviors. We also note here at the start that this chapter will not focus on the causes --social, economic or political -- that may be at the root of crime. Studies of that nature are legion. Nor does it deal with the perpetrators of crime and their characteristics. Rather, the focus is on exploring who are the victims of crime and what impact it has on them politically. The ultimate goal is to determine if there exists a linkage between victimization or fear of crime and declining trust in the political system, thus addressing the issue of how this phenomenon may be having an adverse impact on democracy in Guatemala. The Growing Problem of Crime in Latin America The world-wide concern with the problem of crime is particularly acute in Latin America if we consider that the region has had the highest rates of crime and violence in the whole world. Homicide rates usually are considered to constitute a reliable indicator of crime, since few murders go unreported. It is estimated that the homicide
1It is important to clarify the meaning of crime in this chapter. Not all crimes are violent, but all violence can be considered a crime. Except in our discussion of violence against women, we are not concerned here with intra-familial violence which, while we consider it to be a crime, many Latin Americans do not. Our focus group research has shown us that while common in Latin America, intra-family violence is not a crime for which individuals hold the state responsible. Individuals do, however, directly hold the state responsible for street crime and house burglaries. It is this form of crime that we consider to constitute a potential challenge to democracy, since individuals can blame the state for its failure to protect them. The classification made by the Criminal Justice Research Center in New York is useful for this purpose: crime in their studies includes major personal crimes (murder, rape, robbery, assault, kidnapping) and major property crimes (burglary, larceny and other forms of theft).

Guatemalan Values and Democratic Development: Fourth Report 5-2
January 2000
rate in Latin America is of 30 murders per 100,000 persons per year, whereas it is about eight in the United States and about two in the United Kingdom, Spain, and Switzerland. This means that in the region there are 140,000 homicides each year. According to this and other indicators, violence in Latin America is five times higher than in other places in the world.2 Moreover, according to Gaviria and Pages, the homicide rates are not only consistently higher in Latin America but the differences are growing larger.3 Consistent with the above data, using 1970-1994 data from the United Nations World Crime Surveys, Fajnzylber et. al found that Latin America and the Caribbean have the highest homicide rates, followed by Sub-Saharan African countries. There are, however, important differences among the countries of the region included in their study.4 Only Argentina and Chile experienced a decline in their homicide rates since the early 1970's. Colombia experienced the most significant increase in the homicide rate, jumping from an average of 16 intentional homicides per 100,000 population during the period 1970-1974 to over 80 in the period 1990-1994. Another finding to be noted is that several small countries (Bahamas, Jamaica, Nicaragua and El Salvador) have had intentional homicide rates in excess of 20 per 100,000 population, higher than most large Latin American countries.5 Crime is a growing concern in Central America, especially Guatemala, as a factor that may challenge the ability of the region to consolidate its democracies. In the late 1970s and the early 1980s, Central America was the center of attention for US and European policy-makers and academics who engaged in heated debates about the most appropriate ways to bring peace and democracy to the region. With the exception of Costa Rica, all Central American countries were under military rule, as was the case in most other Latin American countries. Repression by the military, poverty, injustice, revolution and even communist expansion were the issues debated within these countries and abroad. Today, however, at the end of the 20th Century, all countries in Central America have democratic civilian governments, elected in competitive, free and
2 See Carta Economica, October 1998 (Guatemala, Centro de Investigaciones Económicas Nacionales, CIEN). Fajinzylber, P. Lederman, D. and Loayza, N. Determinants of Crime Rates in Latin America and the World: An Empirical Assessment. Diagnóstico de la Violencia en Guatemala, 1999 (Guatemala, CIEN).
3 Gaviria, A. and Pagés, C., 1999. Patterns of Crime Victimization in Latin America (Washington, D.C., Interamerican Development Bank).
4 Fajnzylber, P., Lederman, D. and Loayza, N. A total of 34 countries were included in their study. The countries of Latin America and the Caribbean that are included are Mexico, Colombia, Brazil, Venezuela, Ecuador, Uruguay, Argentina, Chile, Peru, Bahamas, Jamaica, Nicaragua, Barbados, Costa Rica, Trinidad & Tobago, Bermuda, Suriname, Honduras, Antigua, Dominica, Belize, Panama, Guyana, Cuba and El Salvador 5 Of the smaller countries, only Costa Rica has shown a decrease in homicide rates. Overall only Argentina, Chile and Costa Rica showed a decrease in homicide rates.

Guatemalan Values and Democratic Development: Fourth Report 5-3
January 2000
fair national elections. In a similar vein, most Latin American countries enjoy democratic rule.6 Over the past few years the political and the academic focus on Central America has evolved from the issues of political violence, human rights violations, military aid, revolution and counterrevolution to the new topics of institution-building, electoral processes and political parties, civil society participation in the new democratic context and economic liberalization.7 In short, the debate over democratization in Latin America has progressively switched from the topic of democratic transition to the broader topic of democratic consolidation. Crucial to consolidation is the manner in which the state handles new challenges to social peace, and in Guatemala, crime certainly presents a major challenge. The problem of growing crime, we believe, may be linked to sustainability of democracy over the long-run. Overall, the issue of the impact of crime on democracy is related to the larger topic of democratic beliefs among the people, since citizens who show little support for their institutions and who embark upon vigilante justice by “solving” crimes through summary justice, threaten the legitimacy of the courts, the police and, perhaps most importantly, civil liberties. Agüero, for example, contends that the protracted decline in democratic mass beliefs can be a serious cause of democratic breakdowns.8 It appears that Guatemala, as other countries in Latin America as well, has succeeded in establishing freedom of speech, freedom of association and other democratic liberties, but simultaneously has also seen an increase in the levels of crime. It is difficult to know precisely why this has occurred, or if the democratization process has anything directly to do with it. It may well be, however, that the withdrawal of the military from police functions, accompanied by the reintegration of former military and former guerrillas into society, coupled with the inevitable “growing pains” of revitalized civilian institutions such as the police and the courts, each play a role. Moreover, the existence today of a free press and less fear on the part of citizens may be producing an increased willingness to talk openly about crime, thus giving the appearance of greater crime rates. Research on Crime in Latin America It was not until the second half of the 1990s that the problem of common crime in Latin America began to be addressed seriously as one of the most acute problems for
6Cuba is the only exception. Evaluations of the level of democracy in Latin America and throughout the world are available on an annual basis in the Freedom House reports. See, for example., Raymond D.Gastil, 1989. Freedom in the World: Political Rights and Civil Liberties, 1988-1989. (Lanham, MD: Freedom House.)
7For a discussion on this issue see for instance Linz, J. and Stepan, A., 1996. Problems of Democratic Transition and Consolidation, (Baltimore and London, The Johns Hopkins University Press).
8 Agüero, Felipe and Stark, Jeffrey, 1999. Fault Lines of Democracy in Post-Transition Latin America (Miami, North-South Center Press, The University of Miami, distributed by Lynne Rienner), p. 46.

Guatemalan Values and Democratic Development: Fourth Report 5-4
January 2000
the new democracies in the region. According to the World Bank,9 this was part of a larger concern throughout the democratizing world with the impact of crime and violence on the achievement of development objectives. Thus, crime began to be addressed as a major problem with pernicious effects on economic activity and on citizen quality of life. In the United States, the problem of crime had been long addressed as a national problem but the academic research on the subject was done either focusing on the individual determinants of criminal behavior (within the framework of psychology or criminal law) or focusing on the socio-economic determinants and impact of criminal behavior (this within the framework of economics). Few researchers suggested that crime in the United States or other consolidated democracies presented a serious threat to the stability of the political order. Yet, in one recent study of the breakdown of democracy in the interwar period in Europe, crime rates were found to be the major factor explaining why some democracies broke down while others survived.10 In the fragile democracies that have been consolidating in the 1980s and 1990s, both in Latin America and in Eastern Europe, concerns are growing that crime might threaten the viability of these regimes. Today, crime and violence are one of the most important concerns of international organizations such as the World Bank, the Interamerican Development Bank, the Pan American Health Organization and others. Not only have crime rates for the world as a whole been rising since the mid-1970s, but there is now an awareness that common crime and violence can have an impact on the quality of life of citizens across the developing world. Moreover, recent research efforts have shown that high levels of crime can have an important impact in economic development -- because of the high cost associated with it. All of this has led to ambitious research projects that attempt to grasp in more detail the determinants and the impact of crime and violence11. Nonetheless, the focus of the analysis carried out by these organizations has not yet been on the political impact of crime and violence. Very recently, however, some social scientists have begun to pay attention to the issue of crime as a political problem. Shifter asserts that partially because of more open political systems, the problems of crime, drugs and corruption are beginning to find a place on the Latin American region’s political agenda.12 In spite of the successes of democracy in the region in achieving relative economic stabilization (especially dramatic declines in inflation after their astronomical levels during the military regime years in
9 Fanjzylber, P., Lederman, D. and Loayza. N., 1998. Determinants of Crime Rates in Latin America and the World Bank Latin American and Caribbean Studies, Viewpoints, (Washington, D.C., The World Bank)
10Bermeo, Nancy. 1999. Getting Mad or Going Mad: Citizen, Scarcity and the Breakdown of Democracy in Interwar Europe. Center for the Study of Democracy Working Papers. Irvine: University of California at Irvine. 11 See for instance La Violencia en El Salvador en los años noventa. Magnitud, costos y factores posibilitadores, 1998, Banco Interamericano de Desarrollo (San Salvador, Universidad Centroamericana Simeon Cañas).
12 Schifter, Michael, 1996. Tensions and Dilemmas of Democratic Politics in Latin America, paper prepared for the Sol M. Linowitz Forum (Washington, D.C., Inter-American Dialogue)

Guatemalan Values and Democratic Development: Fourth Report 5-5
January 2000
many countries), the reduction in political violence, and the expansion of the arena of political participation and civil liberties, Shifter argues that democracy has not been capable of dealing effectively with other problems that citizens care a great deal about. Among these are the problems of economic inequality, unemployment and the problems of crime, drugs and corruption. In a similar vein, Agüero states that crime, impunity and violation of citizen rights are among the “fault lines” of democracy. The issue of crime is also related to one of the long-standing concerns in Latin American democracies: the role of the military in the region, who for many years were involved in matters of internal security. Hunter, for example, contends that one of the challenges within the framework of the new civil-military relations in the Southern Cone is to keep military personnel away from regular involvement in internal security roles.13 Rampant street crime, narcotrafficking and corruption also has become an important issue in most Latin American countries. Fruhling finds that in El Salvador and Nicaragua common crime increased after the end of the civil wars in those countries, to a great extent owing to the demobilization of military and guerrilla personnel who lacked training for civilian life and who began earning a living through criminal acts. Many Latin American institutions that are directly or indirectly related to the fight against crime or the enforcement of the law exhibit serious weaknesses.14 The study conducted by Fajnzylber et. al also explored a series of explanatory variables for the variation in crime rates across countries. Two important determinants of crime rates stand out: inequality and deterrence. In other words, greater inequality is associated with higher intentional homicide and robbery rates15 and the existence of certain “deterrence” factors such as conviction rates, as is the number of police personnel per 100,000 which were also determined to be significant in explaining the differences in crime rates. Such other factors as the average years of schooling, the GNP per capita, the growth of the GDP, the urbanization rate, the political assassinations rate and other variables did not prove to be significant explanatory variables. Finally, the researchers found that homicide rates rise during periods of low economic growth and that such
13 Aguero and Stark, p. 311 14 Aguero and Stark, p. 243-244 15 In another study, Gaviria and Pages found that in Latin America wealth also turns out to be a central predictor for crime victimization, but some details must be noted. As inequality increases, the relationship between income and crime becomes weaker. Thus, in Brazil, which is the most unequal country in Latin America as measured by the Gini coefficient, a rich household is as likely to be victimized as a poor household. They explain that this difference may be associated with the differentiation in types of crime. Property crime (defined as crimes with clear economic motive), which is the main type of crime, is likely to occur in richer households, while violent offenses (assaults and homicides) seem much more prevalent among the poorer sectors.

Guatemalan Values and Democratic Development: Fourth Report 5-6
January 2000
factors as the rise in drug trafficking in Colombia in the 1970s can raise the national crime rate.16 Given the dramatic increases in homicide rates, it is no wonder that common crime is becoming one of the major issues of concern for Latin Americans. Even in Chile, where violent crime is among the lowest in Latin America, the main concern of the population, as measured by different surveys, has become the rise in street crimes, as well as the increase in drug trafficking and consumption.17 Information provided by the Latin Barometer for 1997, shows that 80 percent of the urban population in Latin America believed that common crime had increased a lot in the past 5 years (this would be 1992-1997).18 The detail of this can be seen in Figure 5.1.
Figure 5.1: Perception of Crime Rate in Last Year in 17 Latin American Countries
16 The relative explanatory value of variables such as income inequality has proved to be an important determinant of crime rates. However, in certain countries there may be other factors that override the explanatory power of income inequality, such as drug trafficking in the case of Columbia. 17 Aguero, F. and Stark, J. 243 18 The entire sample of over 18,000 respondents has been weighted so as to correct for an undersampling of respondents with lower education, and has also been weighted so that respondents from every country have identical weights.
Perception of Crime Rate in Last Year
Source: Latin Barometer, 1997, N = 17,765
80.6%
Decreased or DK
No change
Small increase
Large increase

Guatemalan Values and Democratic Development: Fourth Report 5-7
January 2000
In a study more directly related to the inquiries posed in this chapter, Gaviria and Pages found in 1999 that the victims of crime in urban Latin America are relatively more affluent and tend to live in larger cities.19 They also found that rapid city growth has a positive effect on crime rates, independent of the city size effect. In addition, rapid city growth is associated with lower levels of trust in the police and the judiciary. Based on the Latin Barometer data sets over three years (1996, 1997 and 1998), they found that Uruguay, Panama and Chile have the lowest victimization rates whereas Venezuela, El Salvador and Guatemala have the highest victimization rates. However, even in the low crime rate countries, more than a quarter of all households reported being victims of some crime.
Also related to our line of research, a study conducted by Cruz et al. in El Salvador20 also used the figures of intentional homicides per 100,000 population to determine the crime rates in that country. Notwithstanding their acknowledgment of the difficulties in obtaining accurate data, they found that the country has one of the highest murder rates in the hemisphere: 138 per 100,000 inhabitants between 1994 and 1995. This figure is much higher than the 33/100,000 intentional homicide rate that El Salvador had in 1974 according to reports of the Pan American Health Organization21. The Cruz et al. study emphasizes the discussion of the so called “facilitating factors,” which may help explain not only the historically high crime rates in the country but also the presumed rise in crime rates in the post-war period. Overall, they assert that the current levels of crime-related violence that exist in El Salvador are only part of a long cycle of violence in the country. They point out that the civil war that lasted for 12 years and left a death toll of over 75,000 persons is at the base of the present levels of criminal violence. Thus, those long years of war helped fuel an already existent culture of violence and the peace accords signed in 1992 did not address the problem of non-political violence that was prone to erupt after the political settlement between the guerrillas and the Salvadorean government. In addition to their view of the importance of a culture of violence as a by-product of the civil war, the increase in common crime can also be explained in terms of the weakness and inefficiency of the governmental institutions in charge of preventing crime and enforcing the law, in particular the police and the system of justice. The availability of arms and the creation of unfulfilled expectations among the population when the peace accords were signed can also help explain the phenomenon. Cruz et. al. found that the victims of violence and the aggressors (the criminals) in El Salvador are part of the same demographic group. Hence, between 70 and 85 percent of the victims of homicide are males and more than half are young persons between 15 and 30 years of age. Thus a young male has ten times more risk of being a
19 Gaviria, A. and Pages, C. Patterns of Crime Victimization in Latin America 20 La Violencia en El Salvador en los años noventa. Magnitud, costos y factores posibilitadores, 1998, Banco Interamericano de Desarrollo (San Salvador, Universidad Centroamericana Simeon Cañas). Cruz, M., Gonzalez, L., Romano, L. and Sisti.
21 Nevertheless, this figure for 1974 was already higher than the figure for other Latin American countries.

Guatemalan Values and Democratic Development: Fourth Report 5-8
January 2000
victim of violence than women in general. However, an important detail must be noted: there are no significant differences in terms of sex and age of the victims of other sorts of common crime. For example, both men and women from every age group are as prone to becoming victims of assault. In contrast, education is an important explanatory variable: those with higher education levels are more prone to becoming victims of common crime. These latter findings suggest, according to Cruz et. al., that violent homicides are not necessarily a product of common delinquency actions. Rather, they may be related to other factors such as the phenomenon of youth gangs, or the psychological trauma from the war. The Context of Crime in Guatemala If crime is becoming one of the major problems of governance in Latin America, Guatemala is no exception. Diverse research institutions and international organizations have pointed to the upsurge of violence and personal insecurity in Guatemala as a serious threat to peace and democratization.22 In fact, Colombia and Guatemala were the only countries in the hemisphere to be considered as “high risk” areas for foreign tourists in 1998.23 As demonstrated in the previous section, the case of El Salvador stands out as exceptional, even in the Latin American context. In that country high levels of political violence seemed to form a seamless web of high levels of violence and crime. Guatemala shares with El Salvador many of these same exceptional characteristics, in some ways to an even greater extent. Not only did the armed conflict in Guatemala last much longer than in El Salvador (36 years), but the death toll and the ruthlessness of the war was even more profound. Unfortunately, the availability of data related to violence and crime is almost nonexistent for the case of Guatemala until recent years. Unlike El Salvador and other countries which were included in the United Nations Victimization Surveys, or in the reports of the Pan American Health Organization, Guatemala was consistently left out in terms of statistics of crime. The country was notable for its unfavorable record of violations of human rights, which probably overshadowed other types of violence in the country, and much of what is considered common crime today may have been classified as part of the armed conflict. More recent research efforts have been carried out to measure and better understand the problems of violence and crime in Guatemala. However these exploratory studies have demonstrated that the unavailability of historical data is a major obstacle to the understanding of the trends of non-political violence in the country and moreover to the comparison of the present levels of violence with those of previous years or decades.
22 See Guatemala: Setting the Course, Quickening the Pace, 1998 (Stockholm, International IDEA). The publication asserts that “a new form of insecurity is spreading in the country brought on by widespread delinquency”.
23 According to a world-map published by Newsweek magazine, February 22, 1999, p. 65, “Be Careful Out There”. The source for their information is Pinkerton Global Intelligence and the State Department listings.

Guatemalan Values and Democratic Development: Fourth Report 5-9
January 2000
The Centro de Investigaciones Económicas Nacionales (CIEN) reported in May of 1999 a national violent death rate of 58.68 per 100,000 inhabitants in 1996 in Guatemala. The rate of violent deaths includes deaths caused by guns, knives or other violent causes. There is a marked difference between the gender of the victims: whereas the violent death rate is of 98.94 per 100,000 for males, it is only 17.66 per 100,000 for females. Similar to the case of El Salvador, it is the younger men -- in this case males between 20 and 29 years of age -- who are most affected. On the other hand, the outgrowth of the current levels of violence as a by-product of the long, armed conflict is also similar to El Salvador. Guatemala shares with its neighboring country the legacy of a culture of violence, the institutional weakness of its law-enforcement agencies and the high levels of popular hope derived from the Peace Accords. The occurrence of over 200 public lynchings of criminals between January of 1996 and May of 199924 reflects the volatility of the situation in Guatemala. There appear to be two major problems with the usage of the data available on violent deaths in Guatemala. On the one hand, the unavailability of data has not permitted the construction of a variable such as the intentional homicide rate in the country that could be directly comparable to the one used in other countries in Latin America or in other parts of the world 25. Furthermore, even if an appropriate violent death rate indicator could be constructed, it would only go back a few years and it would not allow us to make a comparison across time. The limitations of existing information on crime rates makes survey data on victimization by crime and violence particularly important. Because political violence had such a central role in national life in Guatemala, however, most of the relatively few public opinion studies that were carried out prior to the signature of the Peace Accords in December of 1996 asked not about victimization of common crime, but asked instead about victimization of political violence. This was the case of the DIMS surveys in 1993 and 1995, with questions about common crime first appearing in the 1997 survey.
24 Investigando la Violencia en Guatemala, Algunas Consideraciones Conceptuales y Metodológicas , Centro de Investigaciones Economicas Nacionales, Guatemala, junio de 1999, p.
25 Interview with Carlos Mendoza from CIEN (via email), who is the head researcher in charge of the project of violence at the institution.

Guatemalan Values and Democratic Development: Fourth Report 5-10
January 2000
The first public opinion survey to ask about victimization by common crime in Guatemala may have been the Latin Barometer in 1996. As can be seen in Figure 5.2 comparing responses from residents of urban areas in 17 Latin American countries, in 1996, Guatemala had the highest level of victimization by crime. In that year, 67 percent of urban Guatemalans said that they or someone in their family had been the victim of an assault, an aggression or another type of crime.
Figure 5.2: Victimization of Urban Latin America, 1996
In 1997, data from the DIMS survey showed that at the national level 22 percent of Guatemalans reported that they or their family had been victims of a criminal act, including an assault, robbery or kidnapping within the last year. The percentage for 1999 is similar to that of 1997: 22.5 percent of the respondents said they or their relatives had been victims. In addition, a nation-wide public opinion survey was conducted by Borge & Asociados in July of 1999 using the same question as in the Latin Barometer. This survey found that 34 percent of the respondents or their family members had been victims of crime in the past 12 months. It also provides the following breakdown of victimization: 30 percent had been victims of robbery, 3 percent had been victims of homicides, .3 percent had been victims of rape and .6 percent had been victims of kidnapping.26 This survey also shows the sharp differences that exist in victimization 26 Borge & Asociados, Encuesta Nacional de Opinion Pública, Guatemala, July 1999.
Victimization in Urban Latin America, 1996
Source: Latinbarometer, 1996
Uruguay
Panama
Argentina
BoliviaHonduras
Nicaragua
Costa Rica
BrazilParaguay
ChileEcuador
PeruColombia
Venezuela
Mexico
El Salvador
Guatemala
Crim
e vi
ctim
70%
60%
50%
40%
30%
20%
10%
1921
272929
32333334
363637
3943
48
57
67

Guatemalan Values and Democratic Development: Fourth Report 5-11
January 2000
between the residents of urban and rural areas. It found that 42 percent of its urban respondents indicated they or a family member were a victim, as compared to only 27 percent respondents in rural areas. The difference between DIMS, the Latin Barometer, and the Borges results are due partially to the differences in the samples and partially to differences in how the questions were phrased. The high rate of victimization reported by the Latin Barometer is in large part because the survey covered only urban areas. When the DIMS are analyzed by geographic region, we find that if the focus is on Guatemala City alone, which comprises about one-quarter of the national population, 47 percent of the population in 1997 and 54 percent in 1999 reported they or a family member had been a victim of crimes. It is also important to note that the wording of questions asked in the two surveys differed. In the Latin Barometer, the item read:
¿Ha sido Ud. o alguien de su familia asaltado, agredido, o víctima de un delito en los últimos doce meses? (Have you or someone in your family been assaulted or the victim of a crime in the past twelve months?)
In the DIMS survey, however, the item read:
Durante los últimos 12 meses, ¿Usted o algún miembro de su familia ha sido víctima de robos, asaltos, agresiones o secuestros? (During the past twelve months, have you or a member of your family have been victims of a robbery, an assault or, attack or a kidnaping?)
Our reading of these two items is that the Latin Barometer question is broader. It includes “delitos,” which could be any kind of minor or major infraction or crime. In the DIMS, we focused on serious crimes alone: robbery, assaults, or kidnapping. What we do know is that both questions elicit a very high level of victimization, and that when the identical item was asked throughout Latin America, Guatemala easily scored at the very top of the ranking for crime. It is also important to note that the Latin Barometer and the DIMS ask about crime suffered by the respondent or by a family member. This introduces two complications when interpreting the results. First, the word “family” is potentially ambiguous. Some respondents may be thinking of their immediate families, while others may be thinking an extended family. However, our experience in focus groups, showed that most people were thinking of their immediate family. Second, and more serious, is that we do not know whether the crimes were suffered by the respondent or by other family members (who might have different socio-economic characteristics). However, we have some evidence that this problem may not be as great as it first may seem. A 1998 national sample in Bolivia included two questions measuring victimization; the first

Guatemalan Values and Democratic Development: Fourth Report 5-12
January 2000
asked exclusively about the respondent and the second exclusively about the family. 27 Of those who reported that their family members had been a victim, 43 percent also reported personally having been a victim. It was also found that among those who reported that their family was not a victim, 84 percent reported that they personally had not been a victim. This suggests a large overlap between the two categories. Also, some of the socio-economic characteristics (i.e., residence, relative income, and ethnicity) of one family member are likely to be similar if not identical to all other family members, so characterizing victims based on those variables is not likely to be far from the mark. Violence Against Women
In addition to crime and violence in general, in 1999 the survey asked about violence to women. This is an issue that has emerged during the 1990s as a focus of international concern. In 1994, for example, the Organization of American States negotiated the Inter-American Convention to Prevent, Punish and Eradicate Violence Against Women, and by the end of 1998, 27 Latin American countries had ratified the convention. Many cultures have beliefs, norms, and social institutions that legitimize or perpetuate violence against women, and around the world at least one woman in three has been beaten, coerced into sex, or otherwise abused in her lifetime according to a new report from the Johns Hopkins School of Public Health and the Center for Gender Equity. According to the co-director of the Center and lead author of the publication, the problem of violence against women is strikingly similar throughout the world. Surveys have found that many women do not report the violence against them to authorities or even members of their families, and in countries as different as Mexico and Bangladesh the Hopkins study found that many people do not see certain kinds of violence against women as a crime.28 Because of the growing interest in the issue by the Government of Guatemala and international donor agencies, a question was added to the 1999 DIMS questionnaire that asked respondents to indicate how serious a problem they believed that violence against women was in Guatemala. The item on the questionnaire provided for six responses ranging from “very serious” to “not a problem”, which for clarity of presentation we have collapsed into the following three: “very serious”, “somewhat serious”, and “not serious”.
27 Seligson, Mitchell A. 1998. The Political Culture of Democracy in Bolivia, 1998. Report for the United States Agency for International Development, Bolivia. La Paz, Bolivia. 28 Heise, L. Ellsberg, M. and Gottemoeller, M. “Ending Violence Against Women”. Population Reports, vol. XXVII, Number 4. Series L, Number 11. Johns Hopkins School of Public Health. Baltimore, MD. December 1999.

Guatemalan Values and Democratic Development: Fourth Report 5-13
January 2000
As Figure 5.3 shows, well over half (57%) of the population of Guatemala responded that they believe violence against women is a serious problem, and almost another third (31%) said it was somewhat of a problem in the country.
Figure 5.3: Seriousness of Violence Against Women
Analyzing the results in terms of region, we found that there were some significant differences. About two-thirds of the respondents in the metropolitan region (69%), the North West (66%), and the South West (64%) perceive the problem to be very serious, while this is the case for about half the respondents in the North East (53%) and only two-fifths of those is the South East (41%). We cannot be sure whether these differences are a reflection of a greater prevalence of violence in some areas or of the respondents’ greater sensitivity and openness regarding the problem. In any event, what is most important to note is that violence against women was acknowledged to be at least somewhat serious by at least 90 percent of the people in all five regions of Guatemala.
Seriousness of Violence Against Women, 1999
6%
6%
31%57%
Missing
Not Serious
Somewhat serious Very serious

Guatemalan Values and Democratic Development: Fourth Report 5-14
January 2000
It is also of interest to note that as shown in Figure 5.4, the responses of members of the Ladino and the indigenous communities regarding violence against women are close to exactly the same. For both groups this is perceived to be a serious problem by over three-fifths of the population, and to be not a problem at all by only around 5 percent.
Figure 5.4: Seriousness of Violence Against Women by Ethnicity
Seriousness of Violence Against Women
By Ethnicity, 1999
Not SeriousSomewhat seriousVery serious
Per
cent
70
60
50
40
30
20
10
0
Self-identification
Ladino
Indigenous5
33
62
6
33
62

Guatemalan Values and Democratic Development: Fourth Report 5-15
January 2000
As shown in Figure 5.5, violence against women is more likely to be perceived as a serious problem by women than by men. What is perhaps more interesting, however, is the closeness of the responses when the data were analyzed by gender. Rather than an overwhelming difference, well over half of the men responded that they perceived the problem to be vary serious, and the percentage who reported it as not a problem at all was almost the same as for women (5% versus 7%).
Figure 5.5: Seriousness of Violence Against Women by Gender
We also looked at the relationship with education and income. We found there was no systematic relationship between either of these variables and the extent to which the respondents perceived violence against women to be a problem.
Seriousness of Violence Against Women
By Gender, 1999
Not seriousSomewhat seriousVery serious
Per
cent
70
60
50
40
30
20
10
0
Gender
Female
Male7
36
57
5
31
64

Guatemalan Values and Democratic Development: Fourth Report 5-16
January 2000
The Demography of Crime and Fear
In the brief review of literature presented at the start of the chapter we saw that victims of crime in Latin America are more likely to be male than female, and to live in urban than rural areas. They are also likely to have limited education and to be relatively poor. However, those conclusions were largely drawn from police records and they may contain a major bias; some crimes are far more likely to be reported to the police than others. For example, rapes of women are woefully under-reported in most countries, and even more generally, it may be that crimes against women are seriously under-reported. Indeed, the distortions of reporting have been found to be so large that the Inter-American Development Bank effort to model crime in Latin America failed to predict crimes other than homicide. Our survey data in part overcome the problem of under-reporting. We asked respondents to tell our interviewers, not the police, about victimization. In doing so, they are not making accusations, which later might have to be defended in a judicial setting. Furthermore, since our question did not focus exclusively on the respondent but on the respondent and family, there was less reason for personal embarrassment than when reporting a crime. Moreover, we asked about all kinds of common crimes and not other types of deaths (like accidents or drunken violence), which have been a source of confusion in trying to construct data on levels of violence and crime in Guatemala. For all of those reasons, we believe our question provides a more accurate picture of crime in Guatemala than do studies that rely upon police reports. We acknowledge, however, that no one source of crime data can ever been considered comprehensive, given the multiple problems in reporting.
Indeed, as we earlier discussed, the way in which the question on crime victimization was asked in our survey has some drawbacks. For instance, we cannot tell with confidence the gender or the age of the victims. In previous studies in other countries, it has been found that crime is perceived as a problem not only by its victims but by other citizens who feel insecure as well. Therefore, in this analysis we have also included analyses of a question that directly addresses citizens' fear of crime, since this is a factor that may impact the political attitudes and values of Guatemalans. That question asks how secure the respondent feels in his or her neighborhood at night. Because it is directed exclusively toward the respondent, this question allows us to see the differences in gender, age and other highly personal characteristics.

Guatemalan Values and Democratic Development: Fourth Report 5-17
January 2000
Gender Earlier in this chapter we summarized literature that shows that in Guatemala, the violent death rate for men is about five times higher than for women. In Figure 5.6 we show the percent of men and women who indicate they or a member of their family have been a victim of crime within the past 12 months. As the figure shows, there is essentially no difference in the 1999 survey with respect to gender. An analysis of the data for 1997 show similar results, the percent of males and females responding that they or a family member have been a victim of crime is the same (22%), and only one percent lower than in 1999. Figure 5.6 also compares men and women with respect to fear of crime in their neighborhood. Respondents were asked to indicate whether they felt "very secure", "more or less secure", "a little insecure" or "very insecure" when they walked in their neighborhood at night. To make the responses more clear, we have combined the responses to create a new variable we call fear of crime. The two answers indicating the respondent felt secure we have interpreted as indicating the respondent generally feels "safe", and the other two responses as feeling "not safe", or "in fear of crime". As the figure shows, 53 percent of females and 47 percent of males do not feel secure in their neighborhood. This difference is significant at the .05 level.
Figure 5.6: Victimization and Fear of Crime by Gender, 1999
Victim and Fear
by Gender, 1999
Not SafeVictim
60
50
40
30
20
10
Gender
Female
Male
47
23
53
23

Guatemalan Values and Democratic Development: Fourth Report 5-18
January 2000
Geographic Region and Urbanization
World-wide, crime is higher in urban areas than it is rural areas. In Guatemala we found that victimization varied substantially by geography, with the major difference being between the Metropolitan area of Guatemala City, where crime is perceived to be unusually high, and the rest of the country, where it is far lower. Figure 5.7 shows that outside of the Metropolitan area, crime is higher in urban areas than in rural. In the case of the Southwestern region (the departments of Chimaltenanago, Escuintla, Quezaltenango, and Suchitepequez), there is virtually no difference, with rural areas having slightly more individuals reporting having been a victim of crime than in urban areas.
Figure 5.7: Victimization and Region by Urbanicity: 1999
Victimization and Region
By Urbanicity, 1999
Both sig. <.005
Region
South East
South West
North West
North East
Metropolitan Area
% v
ictim
of c
rime
in la
st y
ear
60%
50%
40%
30%
20%
10%
0%
Urbanicity
Urban
Rural
1417
7
1518
15
2124
53

Guatemalan Values and Democratic Development: Fourth Report 5-19
January 2000
We can also observe differences in victimization by gender, broken down by region. Figure 5.8 shows that in the Guatemala City area, men and women are equally likely to report having been a crime victim. In the Northeast, however, females are far more likely than males to have been victims, whereas in the Southeast, the reverse is the case. In the other two regions, the difference is not meaningful.
Figure 5.8: Victimization and Region by Gender: 1999
Victimization and Region
By Gender, 1999
Region
South East
South West
North West
North East
Metropolitan Area
% v
ictim
of c
rime
in la
st y
ear
60%
50%
40%
30%
20%
10%
0%
Gender
Female
Male
22
161614
54
11
1612
25
53
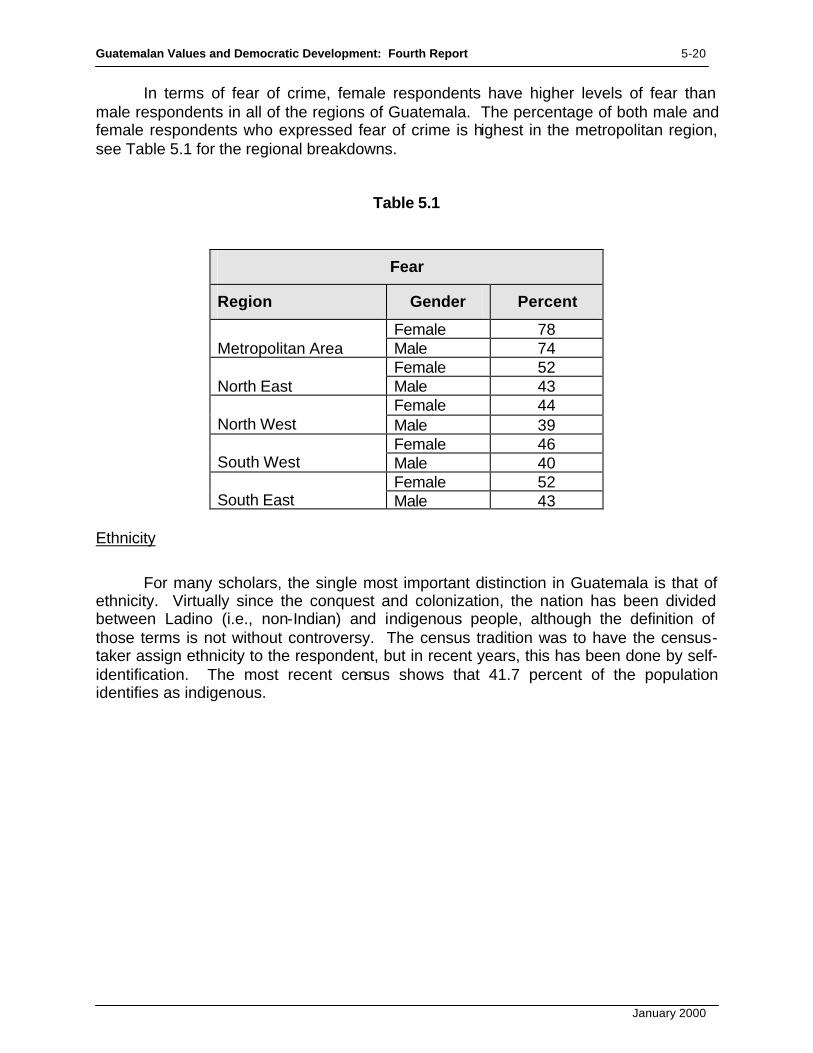
Guatemalan Values and Democratic Development: Fourth Report 5-20
January 2000
In terms of fear of crime, female respondents have higher levels of fear than male respondents in all of the regions of Guatemala. The percentage of both male and female respondents who expressed fear of crime is highest in the metropolitan region, see Table 5.1 for the regional breakdowns.
Table 5.1
Fear
Region Gender Percent
Female 78 Metropolitan Area Male 74
Female 52 North East Male 43
Female 44 North West Male 39
Female 46 South West Male 40
Female 52 South East Male 43
Ethnicity
For many scholars, the single most important distinction in Guatemala is that of ethnicity. Virtually since the conquest and colonization, the nation has been divided between Ladino (i.e., non-Indian) and indigenous people, although the definition of those terms is not without controversy. The census tradition was to have the census-taker assign ethnicity to the respondent, but in recent years, this has been done by self-identification. The most recent census shows that 41.7 percent of the population identifies as indigenous.

Guatemalan Values and Democratic Development: Fourth Report 5-21
January 2000
Figure 5.9 shows that those who self-identified as indigenous were significantly less likely to have been victims of a crime. They were also significantly less likely to indicate they were afraid of crime in their immediate neighborhoods. While 55 percent of the Ladino respondents answered that they did not feel safe, this was the case for only 47 percent of the indigenous. This difference of fear of crime by ethnic groups probably has to do with the fact that more Ladinos live in urban areas where the crime is higher.
Figure 5.9: Victimization by Ethnicity (self-identification)
As mentioned earlier, female respondents are more fearful of crime than male respondents. Ladino females have a higher level of fear of crime than the Ladino males (59% and 49% respectively), as do the indigenous females versus the indigenous males (50% and 45%). In terms of victimization, there is virtually no difference in the percent of female versus male Ladinos who reported they or a family member had been a victim of crime (27% and 28%), or the percent of indigenous females versus indigenous males (17% and 19%).
Victimization by Ethnicity, 1999
sig. < .005
Ethnic self-identification
LadinoIndigenous
% v
ictim
of c
rime
last
yea
r
30
25
20
15
10
27
18

Guatemalan Values and Democratic Development: Fourth Report 5-22
January 2000
Socio-Economic Status
We can look at that the association between socio-economic status and crime in a variety of ways. Looking first at education, Figure 5.10 shows a strong relationship with being the victim of crime, particularly within the Ladino population. Among Ladinos, 14 percent of those with no education indicated they or a family member had been a victim of crime, while this was the case for 40 percent of those with high school and 50 percent of those with university level education. Among the indigenous population the relationship is not marked. However, there is still a lower level of victimization among those with lower levels of education.
Figure 5.10: Victimization and Region
Victimization, Education and Ethnicity, 1999
Both sig. <.005
Education
UniversityHigh SchoolJr. HighPrimaryNone
% V
ictim
of c
rime
60%
50%
40%
30%
20%
10%
0%
Self-identification
Ladino
Indigenous

Guatemalan Values and Democratic Development: Fourth Report 5-23
January 2000
Looking at the relationship between education, ethnicity and fear of crime, Figure 5.11 shows that the Ladino population shows relatively similar levels regardless of education. Only among those Ladinos with higher than a High School education does the fear of crime decrease. This may be a function of the areas where they live (i.e. people with higher education tend to live in areas which are better protected). Among the indigenous population, on the other hand, there is a great deal of variation. Among those with no education, the fear of crime is very low, whereas it goes up significantly among those with Junior High education to decrease again among those with High School education or University training. As with Ladino group, the more educated may live in safer areas, while the indigenous with the least education tend to live in rural areas.
Figure 5.11: Fear of Crime by Education and Ethnicity
Fear of Crime By Education and Ethnicity, 1999
Both sig. <.05
Education
UniversityHigh SchoolJr. HighPrimaryNone
Mea
n F
ear
of c
rime
70%
60%
50%
40%
30%
Self-identification
Ladino
Indigenous
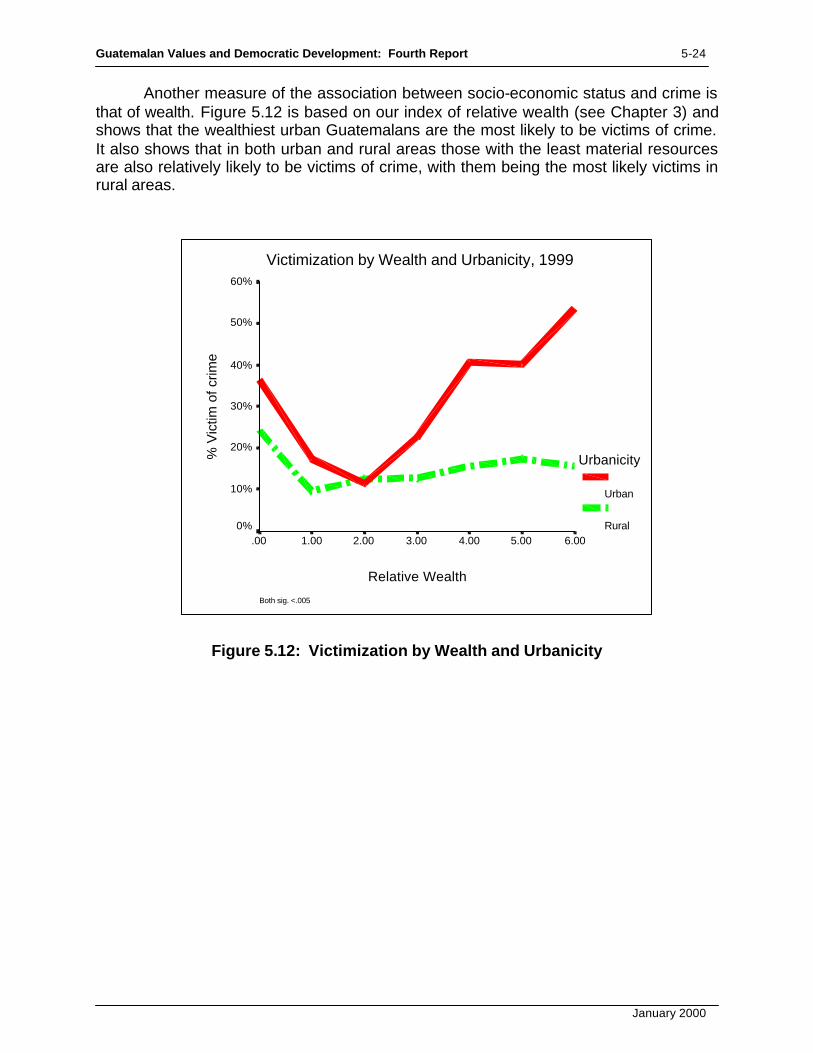
Guatemalan Values and Democratic Development: Fourth Report 5-24
January 2000
Another measure of the association between socio-economic status and crime is that of wealth. Figure 5.12 is based on our index of relative wealth (see Chapter 3) and shows that the wealthiest urban Guatemalans are the most likely to be victims of crime. It also shows that in both urban and rural areas those with the least material resources are also relatively likely to be victims of crime, with them being the most likely victims in rural areas.
Figure 5.12: Victimization by Wealth and Urbanicity
Victimization by Wealth and Urbanicity, 1999
Both sig. <.005
Relative Wealth
6.005.004.003.002.001.00.00
% V
ictim
of c
rime
60%
50%
40%
30%
20%
10%
0%
Urbanicity
Urban
Rural

Guatemalan Values and Democratic Development: Fourth Report 5-25
January 2000
A somewhat similar picture is provided in Figure 5.13 which shows the association between wealth and residence with the fear of crime.29 Those Guatemalans who are most fearful — i.e., those with relatively more material resources living in urban areas — are most likely to report that they or a family member has been the victim of crime. It is also interesting to note when comparing the figures dealing with victimization and fear that there is a fairly consistent relationship across all of the variables we explored. As a general rule, many more Guatemalans indicated they were fearful at night in their own neighborhoods than had actually been a victim of a crime.
Figure 5.13: Fear of Crime by Wealth and Urbanicity
29 These last two figures only include respondents who have up to 6 electric appliances in the house. We excluded those who have 7 because the number of respondents who had these many in the rural areas was too low and misleading.
Fear of Crime
by Wealth and Urbanicity, 1999
Urbanicity sig. <.005
Relative Wealth
6.005.004.003.002.001.00.00
Mea
n F
ear
of c
rime
70
60
50
40
30
20
10
0
Urban or rural
Urban
Rural

Guatemalan Values and Democratic Development: Fourth Report 5-26
January 2000
The Strongest Predictors Thus far, we have examined each of the demographic and socio-economic
characteristics of the sample for which we have data and found that people who report that they or a family member had been a victim of a crime in the past year are:
h Just as likely to be male as female h Just as likely to be old as young h More likely to be well educated than poorly educated h More likely to be relatively rich than poor h Far more likely to be living in Metropolitan Guatemala City than other areas h More likely to be in urban areas than rural h More likely to be Ladinos than indigenous
These findings, however, are entirely based upon a bivariate examination of the predictors of victimization, but we know that many of these variables are related to each other (e.g., urban residents are more likely to be more highly educated and wealthier and less likely to be indigenous). To determine which factors remain important predictors of victimization when all others are held constant, we developed a multivariate logit model.30 Logistic regression is called for because the dependent variable (victimization of crime) is a dichotomy. Since all predictors must be either continuous or dichotomous "dummy" variables, the urban/rural variable was used in place of the regions.
An examination of our results shows that only three of the factors -- relative wealth, education and urban/rural residence -- are significant predictors of victimization when all other variables are held constant. These findings suggest that wealthy, well-educated, urban Guatemalans stand a much higher chance of being victims of a crime, than do poorer, less well-educated, rural Guatemalans. Age, gender, and ethnicity have little direct impact on predicting victimization. The Impact of Crime on Political Attitudes and Behaviors Unlike many efforts at causal analysis in the social science, the causal ordering of the impact of crime seems clear. We know that criminals do not select their victims based on their political attitudes, at least for those crimes that are not political in nature.
30 Table 1 contains the results of the logit analyses. The overall model explains 80 percent of the variance.
Table 1
Variable B S.E. Wald df Sig R Exp(B) AGE .0396 .0594 .4446 1 .5049 .0000 1.0404 WEALTH .1877 .0552 11.5844 1 .0007 .0918 1.2065 EDUCATION .1759 .0802 4.8079 1 .0283 .0497 1.1923 RESIDENCE -.6217 .1712 13.1894 1 .0003 -.0992 .5370 GENDER .0002 .0016 .0256 1 .8730 .0000 1.0002 ETHNICITY .1763 .1660 1.1283 1 .2881 .0000 1.1929 Constant -1.6371 .4392 13.8916 1 .0002
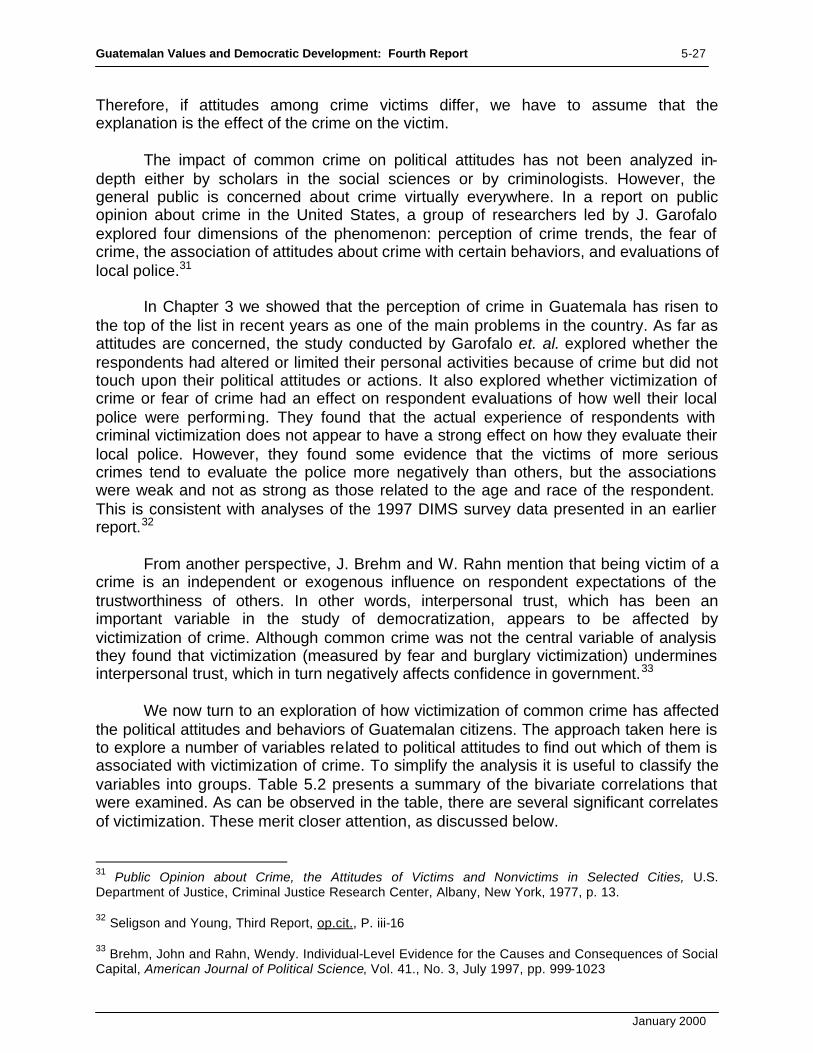
Guatemalan Values and Democratic Development: Fourth Report 5-27
January 2000
Therefore, if attitudes among crime victims differ, we have to assume that the explanation is the effect of the crime on the victim. The impact of common crime on political attitudes has not been analyzed in-depth either by scholars in the social sciences or by criminologists. However, the general public is concerned about crime virtually everywhere. In a report on public opinion about crime in the United States, a group of researchers led by J. Garofalo explored four dimensions of the phenomenon: perception of crime trends, the fear of crime, the association of attitudes about crime with certain behaviors, and evaluations of local police.31 In Chapter 3 we showed that the perception of crime in Guatemala has risen to the top of the list in recent years as one of the main problems in the country. As far as attitudes are concerned, the study conducted by Garofalo et. al. explored whether the respondents had altered or limited their personal activities because of crime but did not touch upon their political attitudes or actions. It also explored whether victimization of crime or fear of crime had an effect on respondent evaluations of how well their local police were performing. They found that the actual experience of respondents with criminal victimization does not appear to have a strong effect on how they evaluate their local police. However, they found some evidence that the victims of more serious crimes tend to evaluate the police more negatively than others, but the associations were weak and not as strong as those related to the age and race of the respondent. This is consistent with analyses of the 1997 DIMS survey data presented in an earlier report.32 From another perspective, J. Brehm and W. Rahn mention that being victim of a crime is an independent or exogenous influence on respondent expectations of the trustworthiness of others. In other words, interpersonal trust, which has been an important variable in the study of democratization, appears to be affected by victimization of crime. Although common crime was not the central variable of analysis they found that victimization (measured by fear and burglary victimization) undermines interpersonal trust, which in turn negatively affects confidence in government.33 We now turn to an exploration of how victimization of common crime has affected the political attitudes and behaviors of Guatemalan citizens. The approach taken here is to explore a number of variables related to political attitudes to find out which of them is associated with victimization of crime. To simplify the analysis it is useful to classify the variables into groups. Table 5.2 presents a summary of the bivariate correlations that were examined. As can be observed in the table, there are several significant correlates of victimization. These merit closer attention, as discussed below.
31 Public Opinion about Crime, the Attitudes of Victims and Nonvictims in Selected Cities, U.S. Department of Justice, Criminal Justice Research Center, Albany, New York, 1977, p. 13. 32 Seligson and Young, Third Report, op.cit., P. iii-16 33 Brehm, John and Rahn, Wendy. Individual-Level Evidence for the Causes and Consequences of Social Capital, American Journal of Political Science, Vol. 41., No. 3, July 1997, pp. 999-1023

Guatemalan Values and Democratic Development: Fourth Report 5-28
January 2000
Table 5.2
Impact of Victimization on Political Attitudes and Behaviors
SYSTEM SUPPORT (trust in the following institutions): h Human Rights Prosecutor h Electoral Tribunal h Courts h Congress h Incumbent government h Public offices h Political parties h The Army h National Police h Public Ministry
-.046 .017
-.089** -.062* -.040 -.052 -.036 -.036 -.074* -.026
TOLERANCE (political tolerance towards others)
h Right to vote h Right to demonstrate h Right to run for office h Right to free speech
-.001 -.062* -.003 -.003
CIVIC CULTURE h Life satisfaction h Interpersonal trust h Preference for radical (revolutionary) societal change
-.014 -.057 .072*
TREATMENT BY INSTITUTIONS/EVALUATION OF PERFORMANCE h Satisfaction with treatment of victim by the police h Satisfaction with treatment of victim by the courts h Evaluation of the performance of the President (A. Arzú) h Belief that Army should also participate in fight against crime
-.142** -.166** -.070* -.007
DEMOCRATIC CONVICTIONS/ATTITUDES h Preference for democracy h Preference for strong-hand government (instead of participation) h Acceptance of summary justice h Support for coup d’etat h Vote in next elections (Nov. 7/1999)
.035 -.002 .034 .051 .026
** Pearson correlation is significant at the 0.01 level (2-tailed) * Pearson correlation is significant at the 0.05 level (2-tailed)

Guatemalan Values and Democratic Development: Fourth Report 5-29
January 2000
System Support: As discussed in Chapter 2, public support for the institutions that comprise a democracy is essential for political stability and respondents were asked to indicate how much trust they had in a set of Guatemalan political institutions. Figure 5.14 shows the pattern that emerged for respondents who were victims and respondents who were not. As the figure shows, the victims of crime showed lower levels of trust in the institutions that are perceived by the population as responsible in one way or another for the maintenance of public security. More specifically, the mean levels of trust in the courts and the National Police by the victims of crime is significantly lower than the mean trust levels showed by those Guatemalans who did not report being victims. Both the courts and the police are clearly responsible for the protection of the population from criminals or for the enforcement of the law.34
Figure 5.14: System Support and Victimization
34 Trust in the other three institutions are identified in Chapter 2 as making up the system support index (i.e., the Human Rights Prosecutor, the Electoral Tribunal and Congress) showed no significant effect of victimization.
System Support and Victimization, 1999
Trust in Institutions
* Sig. <.05
Parties
Public offices
Congress
The government
The Army
*Courts
*Police
60
50
40
30
20
Victim
No
Yes
27
35
38
4143
41
46
30
39
4244
46
48
52
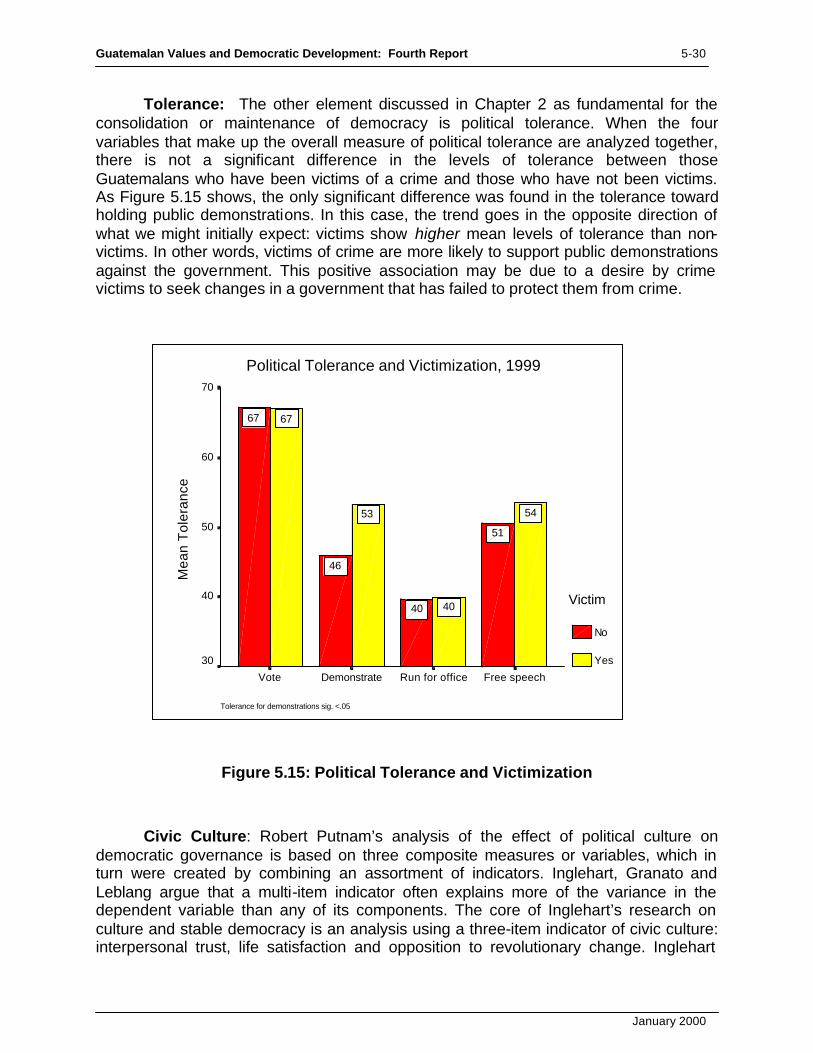
Guatemalan Values and Democratic Development: Fourth Report 5-30
January 2000
Tolerance: The other element discussed in Chapter 2 as fundamental for the consolidation or maintenance of democracy is political tolerance. When the four variables that make up the overall measure of political tolerance are analyzed together, there is not a significant difference in the levels of tolerance between those Guatemalans who have been victims of a crime and those who have not been victims. As Figure 5.15 shows, the only significant difference was found in the tolerance toward holding public demonstrations. In this case, the trend goes in the opposite direction of what we might initially expect: victims show higher mean levels of tolerance than non-victims. In other words, victims of crime are more likely to support public demonstrations against the government. This positive association may be due to a desire by crime victims to seek changes in a government that has failed to protect them from crime.
Figure 5.15: Political Tolerance and Victimization
Civic Culture: Robert Putnam’s analysis of the effect of political culture on democratic governance is based on three composite measures or variables, which in turn were created by combining an assortment of indicators. Inglehart, Granato and Leblang argue that a multi-item indicator often explains more of the variance in the dependent variable than any of its components. The core of Inglehart’s research on culture and stable democracy is an analysis using a three-item indicator of civic culture: interpersonal trust, life satisfaction and opposition to revolutionary change. Inglehart
Political Tolerance and Victimization, 1999
Tolerance for demonstrations sig. <.05
Free speechRun for officeDemonstrateVote
Mea
n T
oler
ance
70
60
50
40
30
Victim
No
Yes
54
40
53
67
51
40
46
67
Guatemalan Values and Democratic Development: Fourth Report 5-31
January 2000
demonstrates in his research that this composite variable has a positive and statistically significant effect on democratic stability. 35 Questions related to these three items were included in the 1999 version of the DIMS and the results of their analyses are shown in Figure 5.16. As it can be observed, victimization by crime is associated with lower levels of interpersonal trust and life satisfaction, but not to a statistically significant degree. However, being victim of a crime is significantly related to support for revolutionary change (which we call preference for radical change).
Figure 5.16: Civic Culture and Victimization
35 Jackman, R. And Miller, R. “A Renaissance of Political Culture?”, American Journal of Political Science, Vol. 40, No. 3, August 1996, pp. 632-659. Putnam’s composite measure of civic community for instance is formed by four indicators: preference voting, referendum turnout, newspaper readership and the frequency of sports and cultural associations. Jackman and Miller criticize the use of some of the composite measures used as dependent or as independent variables by Putnam and Inglehart.
Civic Culture and Victimization, 1999
* Sig. <.05
*Pref radical changeInterpersonal trustLife satisfaction
60
50
40
30
Victim
No
Yes
40
46
51
34
50
53

Guatemalan Values and Democratic Development: Fourth Report 5-32
January 2000
Treatment by Institutions and Evaluation of Performance As can be seen in Figure 5.17, we found that victims of crime reported more frequently than non-victims that they were dissatisfied with the outcome of their dealings with the police and the courts. Victims also reported a significantly lower evaluation of the performance of the incumbent government than non victims. The difference in all three cases was statistically significant. Therefore, better attention by the authorities to the victims’ problems may influence their attitude towards the political system. That is, although the problem of crime may not be resolved in the short-term, better treatment of the victims by state institutions may serve to diminish their mistrust in the system and therefore may increase their support for democracy.
Figure 5.17: Satisfaction with Treatment by Institutions and Victimization
Democratic Convictions/Attitudes The above findings are important inasmuch as they show that crime may be affecting some aspects of political development of Guatemala. In order to understand these results further, we examined these variables together with variables such as age, wealth, ethnicity, education and gender as well as with the variables associated with stable democracy, such as system support and interpersonal trust.
Treatment by Institutions and Victimization, 1999
All variables sig. <.05
Treatment by CourtsTreatment by PoliceGovt Evaluation
80
70
60
50
40
30
20
Victim
No
Yes26
34
61
38
43
68

Guatemalan Values and Democratic Development: Fourth Report 5-33
January 2000
Being the victim of crime still held its role as a significant explanatory variable in equations controlling for: trust in the courts, evaluation of the incumbent government, interpersonal trust, preference for radical change, and treatment by the police and the courts. An area that seems to be particularly highly associated with victimization by crime is that of the trust in the courts. 36 Consequently, it can be concluded that being a victim of crime can influence significantly not only the support for political institutions but also a broader set of civic culture variables frequently associated with the stability of democracy. In Chapter 6 on due process, we will see that crime victimization has an important impact on support for democracy and for the rights of the accused. Crime victimization creates greater fear among the populace, which in turn reduces support for democracy and increases support for vigilante justice. Summary and Some Implications From this and the preceding chapter, it is clear that the problem of crime is among the challenges facing democratic governance in Guatemala. A summary of our findings can put this statement into perspective: • Citizens increasingly point to crime as one of the main problems in the country; • Guatemala stands out as one of the countries in Latin America with higher levels
of common crime; • Common crime (as opposed to violence in general) is prone to victimize
Guatemalans regardless of their age or their gender. • Although crime tends to affect most those with higher levels of education or
wealth, and those living in urban areas, it is a nation-wide problem that affects and worries all Guatemalans;
• Common crime is significantly related to the political attitudes of victims.
36The results can be seen in this equation: Coefficients Unstandardized Coefficients Standardized Coefficients Sig. Model B Std. Error Beta (Constant) 2.121 .120 17.717 .000 Residence -7.548E-02 .045 -.060 -1.682 .093 Gender -5.354E-04 .000 -.043 -1.278 .201 Age 6.146E-03 .016 -.014 .382 .702 Wealth 9.096E-03 .015- .024 .598 .550 Education 1.130E-02 .023 -.021 .491 .623 Ethnicity -1.106E-02 .044 -.009 -.251 .802 Crime Victim 1.142E-03 .000 -.078 2.298 .022
Dependent Variable: Do you trust the Court of Justice? 1 = a lot of trust, 2 = some trust, 3 = no trust.

January 2000
Chapter 6
Support for Due Process
Democracies have emerged throughout the world over the past decade, but events over the past few years have brought into question the long-term stability of those regimes.1 The October 1999 coup d’etat in Pakistan that ended a (deeply flawed) constitutional rule that dated back to 1985, is an illustration of the most definitive and dramatic mechanism by which democracies can be extinguished. Coups, however, are far less frequent today than they once were, perhaps in part because the world community frowns on such overt assaults on democracy. More common ways to circumvent democracy have involved the election of “strongmen” who take office with clearly authoritarian agendas. In Eastern Europe and the former Soviet Union there are many instances in which voters have overwhelmingly elected iron-fisted leaders who spout jingoistic rhetoric justifying severe curtailment of civil liberties, especially for ethnic minorities. The former Yugoslavia is perhaps the most dramatic illustration, but the absence of a viable opposition and repeated violations of human rights in Belarus, Kazakhstan, Tajikistan, and Uzbekistan also come to mind.2 In Latin America, the election of Hugo Chávez in 1998, who campaigned on the promise of eliminating the existing judicial and legislative structures, and who has already made good on that promise, raises eerie memories of Germany in 1933. In both countries the elected head of state had led a coup attempt against the democracies that eventually elected them and in both cases the leaders had been imprisoned for their anti-democratic actions. The main and most troubling difference between Venezuela in 1998 and Germany in 1933 is that in Venezuela, unlike Weimar Germany, it was not a minority of voters who supported Chávez, but a landslide majority, and when it came to a plebiscite to rewrite the constitution, 85 percent of voters supported it. Indeed, as Nancy Bermeo has shown, in none of the 13 European countries in which democracy broke down in the 1920s and 30s, did anywhere close to a majority support the fascist parties that took over. Fascism got the most votes in Germany, but even there in 1933 Hitler’s party won only 33 percent of the votes, while 1See Guillermo O'Donnell, `Illusions About Consolidation',in Consolidating Third Wave Democracies: Themes and Perspectives, ed. by Larry Diamond, Marc F. Plattner, Yun-han Chu and Hung-mao Tien (Baltimore: Johns Hopkins University Press, 1997) and Abraham F. Lowenthal, `Battling the Undertow in Latin America', in Consolidating Third Wave Democracies: Themes and Perspectives , ed. by Larry Diamond, Marc F. Plattner, Yun-han Chu and Hung-mao Tien (Baltimore: Johns Hopkins University Press, 1997). 2An excellent review of challenges to democratic consolidation is contained in Juan J. Linz and Alfred Stepan, Problems of Democratic Transition and Consolidation: Southern Europe, South America and Post-Communist Europe (Baltimore, Md.: Johns Hopkins University Press, 1996). For a focus entirely on Eastern Europe see Richard Rose, William Mishler and Christian Haerpfer, Democracy and Its Alternatives: Understanding Post-Communist Societies (Oxford: Oxford University Press, 1998). For recent information on the degree of democracy throughout the world see the annual updates by Freedom House, http://freedomhouse.org/survey99/.

Guatemalan Values and Democratic Development: Fourth Report 6-2
January 2000
elsewhere, as Bermeo shows, “In none of the other European states did fascist or other anti-democratic right-wing parties (individually or combined) come close to winning the loyalty of a majority of the electorate.” In Italy, for example, Mussolini’s party attracted only 6 percent of the vote before his take-over in 1922.3 What causes voters in democracies to turn to authoritarian leaders? Beginning with the pioneering work of Adorno et. al. at the end of World War II, social psychologists have been searching for ways to measure authoritarian predilections among the mass public.4 The difficulties with the initial “F-Scale” are well known, however. Bob Altemeyer has made major advances in the construction of a reliable and valid “Right-Wing Authoritarianism” Scale (RWA), but we have little or no data linking this scale to direct support for dictators since the scale has been developed and refined in Canada. Moreover, attempts to use items from the Altemeyer scale in Bolivia, a country in which the current president is also, like Venezuela’s Chávez, a former military man who staged a coup (this one successful) and later was elected by popular vote, proved unfruitful because the RWA scale items are all set up in an “agree/disagree” format, that is especially susceptible to acquiescence response set bias. Indeed, the RWA scale, which was highly reliable in Canada, proved unreliable in Bolivia5 because the response set bias was so prevalent. Looking further into the explanation for the preference of citizens in a democracy to support authoritarian leaders, the work of Bermeo is highly suggestive. Many theories focus on economic crisis, arguing that Germany’s democracy broke down because of the extreme inflation suffered prior to the election of Hitler. Bermeo has shown that this explanation simply does not work because those democracies that survived in Europe in the 1930s suffered economically no less than those that broke down. Bermeo’s important insight is that crime rates clearly distinguish the surviving democracies from those that collapsed. Her data show that in the cases of breakdown, pre-existing homicide rates averaged three times those of the surviving cases. Consistent with this view, are those who have studied the German case and have argued persuasively that voters were supporting a “law and order” candidate.6 If Bermeo is correct, and social disorder in the form of crime is a significant factor driving voters to support authoritarian solutions, then Latin America is a good place to 3See Nancy Bermeo, “Getting Mad or Going Mad? Citizens, Scarcity and the Breakdown of Democracy in Interwar Europe.” Unpublished paper, Princeton University, 1998. For details on the votes in Germany in the 1930s see the two classic books Richard F. Hamilton, Who Voted for Hitler? (Princeton, N.J.: Princeton University Press, 1982); Thomas Childers, The Nazi Voter: The Social Foundations of Fascism in German, 1919-1933 (Chapel Hill: University of North Carolina Press, 1983). 4See T.W. Adorno, D. J. Levinson E. Frenkely-Brunswik and R. N. Sanford, The Authoritarian Personality (New York: Harper and Row, 1950), and Altemeyer, 1996, op. cit. 5Mitchell A. Seligson, La Cultura Política de la Democracia Boliviana, Así piensan los bolivianos, # 60. (La Paz, Bolivia: Encuestas y Estudios, 1999). 6This point is argued by Bob Altemeyer, The Authoritarian Specter (Cambridge: Harvard University Press, 1996), p. 91. For brilliant review of the various explanations of the Hitler phenomenon see Ron Rosenbaum, Explaining Hitler (New York: Random House, 1998).

Guatemalan Values and Democratic Development: Fourth Report 6-3
January 2000
test the thesis. In Bermeo’s inter-war data set, the homicide rate for the countries in which democracy broke down averaged seven per 100,000 population. Compare those rates with data from Latin America. As was discussed in Chapter 5, the region has the dubious distinction of having the highest rates of crime and violence in the world. Since few murders go unreported7, homicide rates usually are considered to constitute the most reliable indicator of crime. It is estimated that the homicide rate in Latin America is 30 murders per 100,000 persons per year, whereas it is about eight in the United States, and about two in the United Kingdom, Spain, and Switzerland. The Pan American Health Organization, which reports a lower average for Latin America as a whole of 20 per 100,000 people, says that “violence is one of the main causes of death in the Hemisphere....In some countries, violence is the main cause of death and in others it is the leading cause of injuries and disability.”8 This means that in the region there are 140,000 homicides each year, and according to this and other indicators, violence in Latin America is five times higher than in other places in the world.9 Moreover, according to Gaviria and Pages, the homicide rates are not only consistently higher in Latin America but the differences with the rest of the world are growing larger. Consistent with the above data, using 1970-1994 data from the United Nations World Crime Surveys, Fajnzylber et. al found that Latin America and the Caribbean have the highest homicide rates, followed by Sub-Saharan African countries.10 If Latin America is a good place to study the impact of crime on attenuating support for democracy, Guatemala is ideal. Elsewhere in this and prior studies in this series we have reported extensively on the crime problem, and we will not repeat that information here. Suffice it to note that according to Centro de Investigaciones Económicas Nacionales (CIEN) in May of 1999 a national violent death rate for 1996 was calculated at 58.68 per 100,000 inhabitants.11 That is a level eight times higher than found, on average, in the European democracies that broke down in the 1920s and
7In South Africa during apartheid, this was not the case among the non-white population, where murders were overlooked with great frequency. 8July, 17, 1997 Pan American Health Organization press release (www.paho.org/english/DPI/ rl970717.htm) 9See Carta Economica, October 1998 (Guatemala, Centro de Investigaciones Económicas Nacionales, CIEN). Fajinzylber, P. Lederman, D. and Loayza, N. Determinants of Crime Rates in Latin America and the World: An Empirical Assessment . Diagnóstico de la Violencia en Guatemala, 1999 (Guatemala, CIEN). 10Fajnzylber, P., Lederman, D. and Loayza, N. 34 countries were included in their study. The countries of Latin America and the Caribbean which are included are Mexico, Colombia, Brazil, Venezuela, Ecuador, Uruguay, Argentina, Chile, Peru, Bahamas, Jamaica, Nicaragua, Barbados, Costa Rica, Trinidad & Tobago, Bermuda, Suriname, Honduras, Antigua, Dominica, Belize, Panama, Guyana, Cuba and El Salvador 11Centro de Investigaciones Económicas Nacionales (CIEN), “Investigando la violencia en Guatemala: Algunas consideraciones conceptuales y metodológicas.” Guatemala City, June, 1999.

Guatemalan Values and Democratic Development: Fourth Report 6-4
January 2000
1930s, and fifty times higher than the ones that survived. The rate of violent deaths includes deaths caused by guns, knives or othe r violent causes.12 Is it possible to link crime, the fear of crime, and the desire of citizens to seek law and order? This chapter examines that question. It does so by focusing on support for due process, and the factors that help explain why some Guatemalans support due process, even for suspected criminals, while others do not. In order to do this we construct a measure of support/opposition to democracy based on two items in the DIMS survey, one of which was used for the first time in the 1999 survey. We then see how this general support relates to specific support for policies related to suspected criminals and social deviants. We then examine the factors that may be associated with support/opposition to democracy, looking especially at system support, a variable frequently analyzed in the DIMS studies. Finally, we examine the linkages of support for democracy to the recent national plebiscite on constitutional reforms related to the peace process and to electoral preferences of the citizens. Support for “Mano Dura” A number of surveys in recent years that have been carried out in Latin America have asked respondents if they wished to be governed by a “mano dura” leader. In English, there are various trans lations for “mano dura,” ranging anywhere from “firm hand” to “an iron fist,” but they each seem to suggest a preference for a non-democratic regime. Conclusions have been drawn that directly link responses on this question to the assertion that Latin Americans are fundamentally authoritarian in nature. Recent survey data from Costa Rica, universally acknowledged as Latin America’s most consolidated democracy, presents findings that question the putative linkage between preference for a “mano dura” government and a preference for dictatorship. In October 1999, 62.4 percent of the respondents in a national sample of Costa Ricans said that they preferred a “mano dura” leader.13 What are to we make of these results? They seem to indicate that even in a consolidated Latin American democracy, citizens prefer authoritarianism. But this conclusion is belied by another item in the same survey in which strong majorities opposed having a leader such as Venezuela’s Chávez become President of Costa Rica. Even more telling is that in a survey including national samples of Mexico, Chile and Costa Rica carried out in 1998, nearly 84 percent of Costa Ricans said that democracy was preferable to any other form of government, whereas only 53 percent of Chileans and 52 percent of Mexicans
12For details on these and other related data see Mitchell A. Seligson and Dinorah Azpuru, “The Demography of Crime in Guatemala and its Political Impact.” Paper delivered at International Seminar: The Population of the Central American Isthmus at the End of the Millennium, Jacó, Costa Rica, October 20-22, 1999. 13Survey carried out by UNIMER on a national probability sample of 1,201 respondents. Details of the method and other finding are found in La Nación, October 23, 1999, p. 1 and in the electronic edition, www.nacion.co.cr for that date.
Guatemalan Values and Democratic Development: Fourth Report 6-5
January 2000
responded that way. 14 These results suggest that respondents in Latin America can simultaneously prefer leaders who rule with a strong hand, while they prefer democracy over dictatorship. “Strong-hand” leadership may be another way of saying that some citizens are demanding decisiveness, the ability to make decisions and carry out policy, rather than a preference for dictatorship. On the other hand, there may be other citizens who not only want a “strong hand” at the helm of government, but who also would prefer dictatorship to democracy as a form of government. In Costa Rica, only six percent of respondents in the 1998 survey just mentioned selected the response: “under certain circumstances a dictatorship is preferable to democracy.” What do we find in Guatemala, a country with a very long tradition of authoritarian rule? When the identical question was asked in Guatemala, nearly one-third of respondents had no opinion, and an additional one-quarter of the respondents either preferred dictatorship or indicated it made no difference to them if the country were run as a democracy or a dictatorship. Only 44 percent of all respondents unequivocally preferred democracy over dictatorship, compared to 80 percent in Costa Rica. These results suggest far weaker support for democracy in Guatemala than was found in Costa Rica. These results suggest that there may exist a hierarchy of respondents, ranging from those who both oppose a “strong hand” and favor a democracy to those who favor a “strong hand” and are not committed to democracy. In this chapter, that hierarchy is constructed and then used to attempt to explain support/rejection of due process. First, however, it is important to provide the basic information on preference or rejection of Guatemalans for “strong-hand” rule. The actual question asked in Guatemala differs from the one used in Costa Rica by UNIMER, where respondents were asked to approve or disapprove of “strong-hand” rule. In Guatemala, the question asked was as follows: 36 ¿Cree usted que en nuestro país hace falta un gobierno de mano dura, o que los problemas pueden
resolverse con la participación de todos? 1 MANO DURA 7 NO SABE 2 PARTICIPACIÓN DE TODOS 8 NO RESPONDE
14See Mitchell A. Seligson, `Costa Rican Exceptionalism: Why the ‘Ticos' Are Different', in Democracy Through Latin American Lenses: Citizen Views from Mexico, Costa Rica and Chile, ed. by Roderic Ai Camp (Pittsburgh: University of Pittsburgh Press, forthcoming).

Guatemalan Values and Democratic Development: Fourth Report 6-6
January 2000
This format provides a balanced choice between two reasonable alternatives and entirely avoids the agree/disagree format that may be responsible for producing high levels of acquiescence response set in Latin American settings. This identical item was included in the DIMS national probability samples in Guatemala in 1993, 1995, 1997 and again in the most recent survey in 1999. The results for this series of surveys is shown in Figure 6.1. Two findings become evident. First, there is far more support for strong-hand rule than there is for participation of the population. Second, the support for “strong-hand” rule was very stable from 1993 through 1997, but then increased significantly in 1999.
Figure 6.1: Preference for Strong-Hand Rule In Guatemala
Preference for Democracy vs. Dictatorship The second question that will help build the hierarchy of preference for dictatorship or democracy asks respondents to directly select between democracy and authoritarianism. The wording is as follows: 60C. ¿Con cuál de las siguientes tres frases está usted más de acuerdo? 1 LA DEMOCRACIA ES PREFERIBLE A CUALQUIER OTRA FORMA DE GOBIERNO 2 EN ALGUNAS CIRCUNSTANCIAS, UN GOBIERNO AUTORITARIO PUEDE SER PREFERIBLE A UNO DEMOCRÁTICO
Preference for Strong-Hand Rule in Guatemala
1993--1999
1997/1999 difference sig. <.001
1999199719951993
100%
80%
60%
40%
20%
0%
Don't know
Participation
Strong-hand
11131212
29374140
60
504848

Guatemalan Values and Democratic Development: Fourth Report 6-7
January 2000
3 A LA GENTE NOS DA LO MISMO UN RÉGIMEN DEMOCRÁTICO QUE UN RÉGIMEN NO DEMOCRÁTICO 8 NO SABE/NO RESPONDE The wording of this item, which is taken from the Latinbarometer of 1996 and 1997, gives respondents a clear choice between opting for democracy versus dictatorship. Importantly, it also allows them to express an indifferent view (choice 3), which is different from the “don’t know” response. Those who select choice 3 are saying that they see dictatorship and democracy as about the same, with no strong preference for either one. Figure 6.2 shows how Guatemalans responded when we asked this question in 1999, the first time it was included in the survey. The results show that only slightly more than two-fifths of the respondents unequivocally prefer democracy, yet less than one-in-ten would outright prefer an authoritarian regime, far less than the three-fifths of the sample who opted for the “mano dura” response. The largest group of respondents either don’t know or see democracy and dictatorship as being indistinguishable from each other.
Figure 6.2: Preference for Democracy or Authoritarianism
It is now possible to put these two sets of results together. It is already evident that since the proportion of Guatemalans who selected the “mano dura” response greatly exceeds those who prefer outright authoritarianism, it is a serious error to interpret a preference for a “firm hand” as necessarily indicating a preference for dictatorship. In order to examine more carefully the relationship between the desire for a firm hand and the political system preferences expressed by the respondents, it is
Preference for Democracy or Authoritarianism
1999 Sample
15.5%
9.2%
43.5%
31.8%
No difference
Authoritarianism
Democracy
Don't know

Guatemalan Values and Democratic Development: Fourth Report 6-8
January 2000
necessary to cross-tabulate the two questions, as is done in Table 6.1. These results show that although those who prefer participation over “mano dura” are more likely to prefer democracy over authoritarianism, the difference is small (i.e. 69.8% vs. 61.4%). More important, among those who selected “mano dura” over three-fifths (61.4%) would also prefer democracy to authoritarianism. This suggests that these two questions are actually measuring two distinct dimensions, and that it would be wrong to assume that merely because most Guatemalans prefer a “mano dura” government they would also abandon democracy in favor of a dictatorship. “Mano dura” appears to be a preference for leadership and decisiveness. But only a minority of those who prefer “mano dura” are also supporters of dictatorship (14.5%).
Table 6.1
Cross-tabulation of “Mano Dura” with Preference for Democracy/Authoritarianism
Prefer “mano dura” over
popular participation
Preference for:
Participation of all
Mano dura Total
Democracy 69.8% 61.4% 64.5% Preference for Democracy or Authoritarianism
Authoritarian government 11.1% 14.5% 13.2%
No difference 19.1% 24.2% 22.3%
Total 100.0% 100.0% 100.0%
Sig. = NS In light of these findings, it is possible to construct a more nuanced picture of authoritarian values in Guatemala. This can be done by examining the various combinations of responses from the cross-tabulation of the two questions analyzed above (see Table 6.1) to develop a typology of authoritarianism. We then use that typology to examine the policy implications of this combination of attitudes. The typology has six possible parts, four of which are conceptually logical and two that seem to make little sense. Table 6.2 presents the typology. The first three rows of the table include the respondents who prefer the “mano dura.” The most clearly authoritarian of these responses are in the first two rows, comprised of those who prefer the “mano dura” and are indifferent as to what form of government rules (17.0%) and those who prefer the “mano dura” and authoritarianism (10.3%). The largest concentration of the “mano dura” respondents prefer both “mano dura” and democracy, comprising 43.4 percent of the valid responses. The fourth row of Table 6.2 demonstrates that 29.3 percent of the respondents are committed democrats.

Guatemalan Values and Democratic Development: Fourth Report 6-9
January 2000
The two illogical combinations are those who reject the “mano dura” but either prefer authoritarianism (n=32) or are indifferent (n=55). They are excluded from the third and fourth columns of Table 6.2, and will be excluded in further analyses. These two illogical groups comprise only a small number of respondents and may involve misunderstanding of the question, or some logic that is not obvious to us.
Table 6.2
Typology of Authoritarianism
Entire Sample Percent of
Frequency Percent Respondents Cumulative
Percent
“Mano dura” & democracy same as authoritarianism 117 9.7 17.0 17.0 “Mano dura” & prefer authoritarianism 70 5.9 10.3 27.3
“Mano dura” & prefer democracy 297 24.7 43.4 70.7 Committed democrats: Reject “mano dura” & prefer democracy 201 16.7 29.3 100.0
Valid Total 685 57.1 100.0
Total excluded from this analysis* 515 42.9
Total 1200 100.0
* There are 428 respondents who did not have an opinion for either question (p60c or p36), and they are coded as missing here. Also excluded are the 87 illogical responses (see text). For analytical purposes, from here on in this chapter we will work with the first four categories. Policy Preferences for Due Process In the 1999 survey we included for the first time a series of items designed to measure the policy preferences of Guatemalans regarding crime, the treatment of suspected criminals, and toward the treatment of social deviance. The series includes the following eight questions: 35A En varias comunidades se han linchado a supuestos delincuentes. Algunos dicen que cuando las
autoridades no cumplen con su responsabilidad la gente puede hacer justicia con su propia mano, otros dicen que no debe recurrirse a esas medidas. Con qué opinión está usted más de acuerdo?
1. DE ACUERDO CON JUSTICIA PROPIA 2. SOLO EN ALGUNAS OCASIONES DEBE RECURRIRSE A ESO 3. NUNCA DEBE HACERSE JUSTICIA POR MANO PROPIA 8. NO SABE/NO RESPONDE 35B ¿Con cuáles de las siguientes frases está usted más de acuerdo? Para que las autoridades puedan luchar contra la delincuencia, nunca deberían violar las reglas o leyes o algunas veces tienen que violar las reglas o leyes.

Guatemalan Values and Democratic Development: Fourth Report 6-10
January 2000
1. NUNCA DEBERÍAN VIOLAR LAS REGLAS O LEYES 2. ALGUNAS VECES TIENEN QUE VIOLAR LAS REGLAS O LEYES 8. NO SABE/NO RESPONDE 35C Cuando se trata de combatir la delincuencia común, ¿con qué frase está más de acuerdo?
Parar la delincuencia, aunque a veces se violan los derechos de la persona acusada, o nunca se debe violar los derechos de la persona acusada.
1. PARAR LA DELINCUENCIA, AUNQUE A VECES SE VIOLAN LOS DERECHOS DE LA
PERSONA ACUSADA, O 2. NUNCA SE DEBE VIOLAR LOS DERECHOS DE LA PERSONA ACUSADA 8. NO SABE/NO RESPONDE 35D Cuando se tienen serias sospechas de las actividades criminales de una persona, ¿cree usted que:
Se debería esperar a que el juzgado de la orden respectiva, o la policía debe entrar a su casa sin necesidad de una orden judicial.
1. SE DEBERÍA ESPERAR A QUE EL JUZGADO DE LA ORDEN RESPECTIVA, O
2. LA POLICÍA DEBE ENTRAR A SU CASA SIN NECESIDAD DE UNA ORDEN JUDICIAL 8. NO SABE/NO RESPONDE 35E ¿Qué cree usted que es mejor? Vivir en una sociedad ordenada aunque se limiten algunas libertades, o
respetar todos los derechos y libertades, aun si eso causa algo de desorden. 1. VIVIR EN UNA SOCIEDAD ORDENADA AUNQUE SE LIMITEN ALGUNAS LIBERTADES , O
2. RESPETAR TODOS LOS DERECHOS Y LIBERTADES, AUN SI ESO CAUSA ALGO DE DESORDEN.
8. NO SABE/NO RESPONDE 35F ¿Con cuál opinión está usted más de acuerdo: Algunas personas tienen ideas tan extrañas que es mejor
limitarles su derecho de expresarse, o nunca se debería limitar el derecho de expresarse a una persona, no importando que tan extremas sean sus ideas.
1. ALGUNAS PERSONAS TIENEN IDEAS TAN EXTRAÑAS QUE ES MEJOR LIMITARLES SU
DERECHO DE EXPRESARSE, O 2. NUNCA SE DEBERÍA LIMITAR EL DERECHO DE EXPRESARSE A UNA PERSONA, NO
IMPORTANDO QUE TAN EXTREMAS SEAN SUS IDEAS 8. NO SABE/NO RESPONDE 35G ¿Con cuál opinión esta usted más de acuerdo: Que para proteger los valores morales de la sociedad algunas
veces hay que prohibir que algunas ideas y comentarios sean transmitidas por televisión, o no se debe controlar lo que es transmitido por televisión.
1. QUE PARA PROTEGER LOS VALORES MORALES DE LA SOCIEDAD ALGUNAS VECES HAY QUE PROHIBIR QUE ALGUNAS IDEAS Y COMENTARIOS SEAN TRANSMITIDAS POR TELEVISIÓN.
2. NO SE DEBE CONTROLAR LO QUE ES TRANSMITIDO POR TELEVISIÓN 8. NO SABE/NO RESPONDE 36A. ¿Cree usted que el ejército debería combatir la delincuencia o que sólo la policía debería hacerse cargo de
esos asuntos? 1 EL EJÉRCITO DEBERÍA PARTICIPAR EN LA LUCHA CONTRA LA DELINCUENCIA
2 SOLO LA POLICÍA DEBERÍA ENCARGARSE DE COMBATIR LA DELINCUENCIA 8 NO SABE/NO RESPONDE

Guatemalan Values and Democratic Development: Fourth Report 6-11
January 2000
We hypothesized that these items would form two dimensions. One was conceived as comprising a “tough on crime” dimension (comprised of questions P35A, P35B, P35C, P35D and P36A) and the other a “tough on social deviance” dimension (comprised of questions P35E, P35F, P35G). The survey results conformed to these expectations, as shown by the factor analysis contained in the footno te.15 Nonetheless, there is wide variation in response to these items, and it is important to make clear this important variation prior to tracing the connections between support/opposition to authoritarian rule and support/opposition to policy measures in dealing with crime and social deviance. Tough on Crime Dimension The series of five items measuring attitudes toward police treatment of criminal suspects produced very wide variation in response, ranging from fewer than one-fifth to close to one half of the respondents supporting the violation of the accused. In no case, however, did a majority of Guatemalans (as a whole) support the violation of the rights of someone accused of a crime. This is a finding that stands in marked contrast to the grim view presented by the “mano dura” question alone. Once again this suggests that it is very important to use multiple questions to analyze public opinion, and it also suggests significant variation in the particular circumstances that would justify violation of the rights of the accused.
15A principal component factor analysis on these eight items produced the following results. Variables are reordered to emphasize the two distinct factors, as shown by the boxed loadings.
Rotated Component Matrix Component loadings 1 2 P35AR Favor vigilante justice .541 .132 P35BR Combat crime by breaking rules .598 -.337 P35CR Combat crime by violating rights of accused .537 .440 P35DR Combat crime by illegal searches .591 -.203 P36AR Army should have role in combating crime .356 .078 P35ER Prefer order to liberty -.102 .516 P35FR Limit freedom of expression of extremist ideas .243 .666 P35GR Protect morality by TV censorship _0.034 .523
Extraction Method: Principal Component Analysis. Rotation Method: Varimax with Kaiser Normalization. Rotation converged in 3 iterations.

Guatemalan Values and Democratic Development: Fourth Report 6-12
January 2000
The first item (35D)16 asks, “When there are serious suspicions of criminal activities of a person, do you think that 1)the appropriate court order should be awaited, or 2)the police ought to enter the house [of the accused] without need of a court order.” Before presenting the results of this question, it should be noted that when the identical item was used in Nicaragua it was found that some respondents believed that the reference was being made to the respondent’s own home rather that of the accused. This misunderstanding may have been responsible for the reluctance to select the option that implies violations of the rights of the accused. In any event, Figure 6.3 shows the results. As can be seen, nearly three-quarters of the respondents support the rights of the accused to have a judge issue a search warrant prior to the police entering their homes.
Figure 6.3: Need for Search Warrant When There is Serious Suspicion of Criminal Activity
The second item also saw strong support for the rights of the accused. This question asked, “With which of these two statements are you in more agreement? In order for the authorities to be able to fight crime, they never ought to violate the rules or laws, or sometimes they have to violate the rules or laws.”
16“First” in the sense that this item had the lowest support for violation of the rights of the accused.
When have serious suspicion of criminal activity:
1999 Sample
16.5%
71.1%
12.4%
Search w/o warrant
Wait for warrant
Don't know
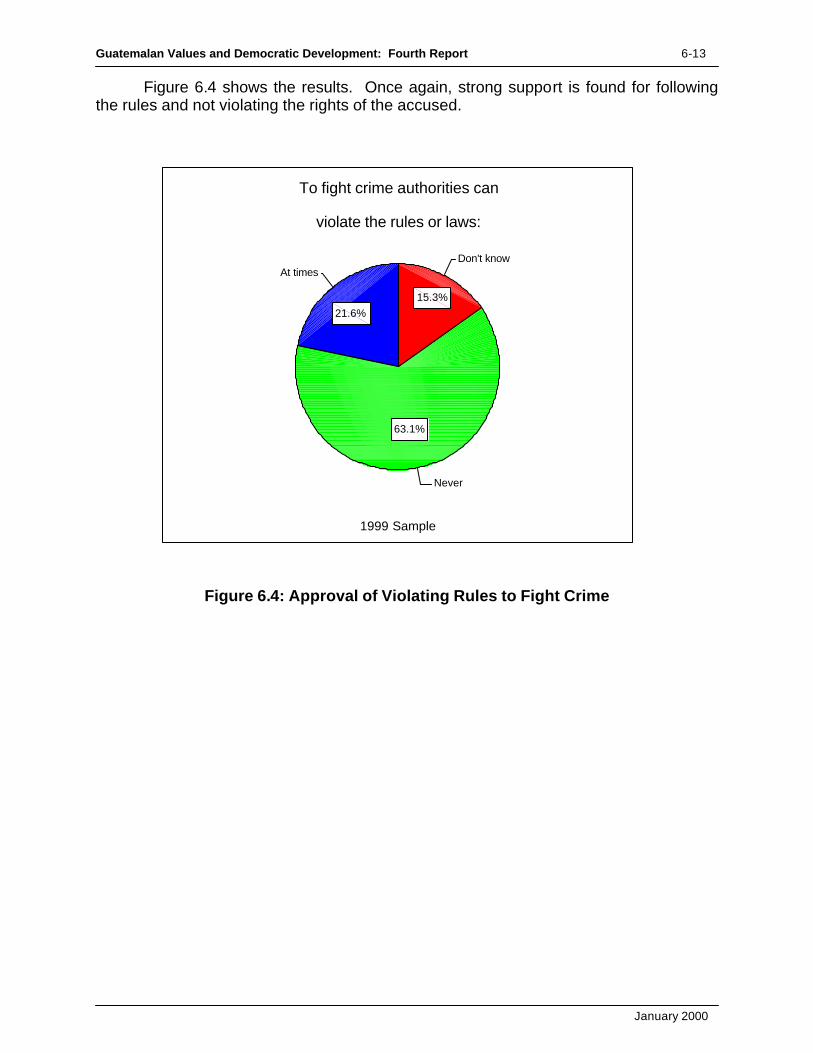
Guatemalan Values and Democratic Development: Fourth Report 6-13
January 2000
Figure 6.4 shows the results. Once again, strong support is found for following the rules and not violating the rights of the accused.
Figure 6.4: Approval of Violating Rules to Fight Crime
To fight crime authorities can
violate the rules or laws:
1999 Sample
21.6%
63.1%
15.3%
At times
Never
Don't know

Guatemalan Values and Democratic Development: Fourth Report 6-14
January 2000
A somewhat larger degree of support for violation of the rights of suspected criminals was found in the following item: “In various communities suspected criminals have been lynched. Some say that when the authorities do not fulfill their responsibilities the people can take justice into their own hands, while others say that these means should not be resorted to. With which view are you more in agreement?” Figure 6.5 shows the results. As can be seen, nearly one-third of the respondents see lynching suspected criminals as an acceptable form of justice.
Figure 6.5: View of Lynchings
View of Lynchings
1999 Sample
49.6%
12.0%
29.0%
9.5%
Always reject
Approve sometimes
Approve
Don't know

Guatemalan Values and Democratic Development: Fourth Report 6-15
January 2000
Even less support for the rights of the accused is found in the following item: “When it comes to combating common crime, with which sentence are you more in agreement: 1) Stop crime, even though at times this violates the rights of the accused, or 2)The rights of the accused person should never be violated." Figure 6.6 shows that over one-third of the respondents are willing to tolerate violation of the rights of the accused. The non-response to this item was considerably higher than the others. It is of note that this item, unlike the ones that preceded it, is more general, since no specific violation is mentioned.
Figure 6.6: Importance of the Rights of the Accused
To stop common crime
the rights of the accused:
1999 Sample
43.9%
36.8%
19.3%
Never violate
Can be violated
Don't know

Guatemalan Values and Democratic Development: Fourth Report 6-16
January 2000
The final item in the series is the one on which there is strongest agreement. This item does not directly relate to the rights of the accused but to the role of the military in fighting crime. Most Guatemalans, as can be seen in Figure 6.7, support the military playing an anti-crime role. The question was: “Do you think that the military ought to fight crime or that only the police should take charge of these matters?”
Figure 6.7: The Role of the Army in Fighting Crime
Tough on Social Deviance The three items measuring willingness to violate civil liberties of social deviants show higher levels of intolerance in Guatemala (than do the tough on crime items). Support for the rights of those outside the mainstream was in the majority on only one of the three items (the question on the support for free expression), and then only by 51 percent of the respondents. This item also had a higher level of non-response than the other items. Among those who responded to the support for free expression item, only about one-third favored the right of free expression. On the other two questions, majorities favored limiting civil liberties.
The role of the army in fighting crime
1999 Sample
19.0%
70.5%
10.5%
Only the police
Army has a role
Don't know
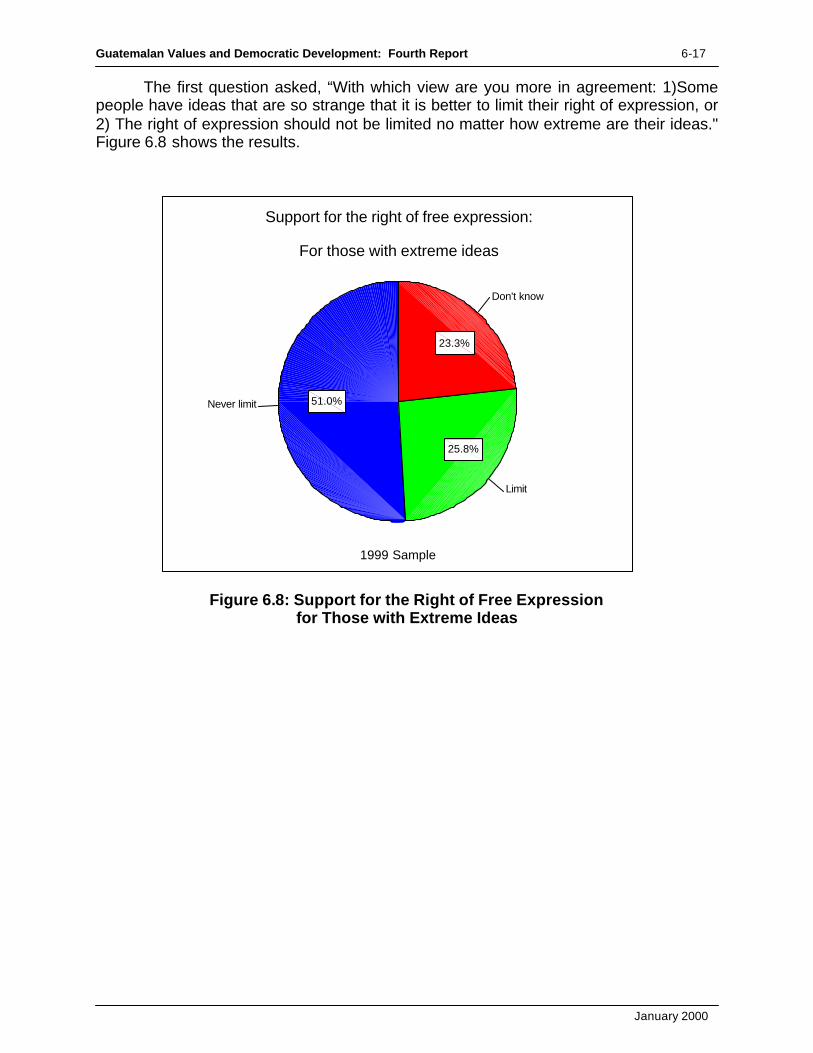
Guatemalan Values and Democratic Development: Fourth Report 6-17
January 2000
The first question asked, “With which view are you more in agreement: 1)Some people have ideas that are so strange that it is better to limit their right of expression, or 2) The right of expression should not be limited no matter how extreme are their ideas." Figure 6.8 shows the results.
Figure 6.8: Support for the Right of Free Expression for Those with Extreme Ideas
Support for the right of free expression:
For those with extreme ideas
1999 Sample
51.0%
25.8%
23.3%
Never limit
Limit
Don't know

Guatemalan Values and Democratic Development: Fourth Report 6-18
January 2000
Censorship of the media was supported by a majority of Guatemalans who responded. They were asked: “With which view are you more in agreement? 1)To protect the moral values of the society, sometimes it is necessary to prohibit the transmission of some ideas by television, or 2)What is shown on TV should not be controlled." As shown in Figure 6.9, only about 30 percent of Guatemalans are clearly opposed to censoring the media at least to some extent.
Figure 6.9: Support for Censorship on TV
Censorship on TV
1999 Sample
29.6%
48.7%
21.7%
Oppose Censorship
Approve Censorship
Don't know

Guatemalan Values and Democratic Development: Fourth Report 6-19
January 2000
The last item in the series shows the highest levels of support for violation of the rights of social deviants. The actual question read: “What do you think is better: 1) To live in an orderly society even though some liberties are limited, or 2) To respect all of the rights and liberties, even if this causes some disorder?" Figure 6.10 shows the results. As can be seen, only one-quarter of the respondents chose the freedom with disorder option.
Figure 6.10: Preference for Order Over Liberty
Support for Democracy and Linkages to Due Process Now it is possible to combine the analysis made at the beginning of this chapter for a preference for a strong hand and/or democracy with the above discussion of the various anti-crime and deviance measures. It is hypothesized that the two are linked, with those who support a strong hand and an authoritarian government more likely to support the violation of due process. Recall that a four -fold typology was developed at the beginning of this chapter. The most authoritarian were speculated to be those who preferred a strong hand and did not see any difference between authoritarian or democratic rule. Prior research suggests that those respondents who essentially do not care about the kind of system under which they live are actually less democratic in most of their attitudes than those who explicitly profess a preference for an authoritarian regime. Thus, slightly less authoritarian were those who preferred a strong hand and authoritarian rule. Moving in the more democratic direction were those, who while still supporting a strong hand, preferred democracy over dictatorship. Finally, at the most
Order versus Liberty
1999 Sample
24.7%
57.5%
17.9%
Liberty and disorder
Order--limit liberty
Don't know

Guatemalan Values and Democratic Development: Fourth Report 6-20
January 2000
democratic end, were those who rejected the strong hand and preferred democracy over dictatorship. The research question becomes: does a preference for a strong-hand and authoritarian rule translate into a willingness to violate the due process rights of the accused? Figure 6.11 shows that it does. In every case, those who reject strong-hand rule and prefer democracy are less willing to violate the due process rights of the accused than are those who prefer strong-hand rule and reject democracy.17 Thus, beliefs in democracy matter.
Figure 6.11: Impact of Preference for Authoritarianism on Willingness to Violate the Rights of the Accused, 1999
17The line for illegal searches shows that those who both prefer strong-hand rule and dictatorship are more willing to violate the rights of the accused than those who prefer strong-hand rule and are indifferent regarding dictatorship vs. democracy.
Impact of Preference for Authoritarianism
on Willingness to Violate Accused Rights, 1999
All sig. <.001
Reject strong hand
Strong hand & democ.
Strong hand & dict.
Strong hand & indif
Sup
port
for
viol
atio
n of
rig
hts
60
50
40
30
20
10
Violate rights
Vigilante justice
Breaking rules
Illegal searches

Guatemalan Values and Democratic Development: Fourth Report 6-21
January 2000
Further evidence of the connection between these preferences for democracy and due process comes in the question regarding use of the army to fight crime. The use of the army in such a role per se is not a violation of due process rights, but armies are not trained in police procedures, and in the particular case of Guatemala the long history of human rights violations perpetrated by the army does not bode well for the rights of the accused. Figure 6.12 shows that the results conform to the pattern shown above.
Figure 6.12: Impact of Preference for Authoritarianism on Willingness to Use the Army
Impact of Preference for Authoritarianism
on willingness to use the Army, 1999
All sig. <.001
Reject strong handStrong hand & democ.Strong hand & dict.Strong hand & indif
Arm
y sh
ould
hav
e ro
le in
com
batti
ng c
rime
86
84
82
80
78
76
74
72

Guatemalan Values and Democratic Development: Fourth Report 6-22
January 2000
Support for Freedom of Expression The second series of questions analyzed earlier in this chapter related to freedom of expression. Is there a greater willingness to support freedom of expression among those who oppose a firm hand and support democracy as a preferred system? Figure 6.13 shows that there is. All three of the questions in this series show higher levels of willingness to repress freedom of expression among those who prefer strong hand rule. Perhaps of equally important note, however, is that even among those who reject strong hand rule and prefer democracy, strong majorities favor order over civil liberties and censorship of TV to protect viewers. In other words, in Guatemala there seems to be a societal consensus on the need for limitations in the freedom of expression.
Figure 6.13: Impact of Preference for Authoritarianism on Willingness to Repress Freedom of Expression
Impact of Preference for Authoritarianism
on Willingness to Repress Freedom of Expression, 1999
All sig. <.001
Reject strong hand
Strong hand & democ.
Strong hand & dict.
Strong hand & indif
% W
illin
g to
vio
late
rig
hts
90%
80%
70%
60%
50%
40%
30%
20%
Prefer order
TV censorship
Censor extremists

Guatemalan Values and Democratic Development: Fourth Report 6-23
January 2000
Factors That Explain Preference for Authoritarian Solutions Much research suggests that authoritarian values are common to the working-class. Much of this research, again, came out of the World War II experience.18 An analysis of the factors that might help us explain differences among Guatemalans in their views on the due process rights of the accused and their support for censorship was undertaken using logistic regression. In this analysis, the predictors employed were: age, gender, urban/rural residence, wealth (as measured by material artifacts), income, ethnicity (as measured by self-identification and dress) and education. In addition, included was the 4-category measure of the combination of a preference/opposition for a strong-hand rule and a preference for democracy or dictatorship. In each of the regression equations in which the questions on the rights of the accused were employed, the 4-category measure was a significant predictor. Age, income, wealth gender and urban/rural residence and education were not significant predictors, nor was ethnicity for most of the variables. The working-class authoritarianism thesis does not seem to fit in the Guatemalan case.
18The classic articles are: Seymour Martin Lipset, `Democracy and Working-Class Authoritarianism', American Sociological Review, 24 (1959), 482-502; Seymour Martin Lipset, `Working-Class Authoritarianism: A Re-Evaluation', American Sociological Review, 30 (1965), 103-09. A refutation is contained in Paul Dekker and Peter Ester, `Working-Class Authoritarianism: A Reexamination of the Lipset Thesis', European Journal of Political Research, 15 (1987), 395-415.

Guatemalan Values and Democratic Development: Fourth Report 6-24
January 2000
These results suggest that Guatemalan views on the rights of the accused are not a function of socio-economic, demographic or ethnic differences. Rather, they stem directly from their attitudes toward the kind of government they prefer–democracy or authoritarianism. This, then, raises the question: what is responsible for variation in the preference for strong-hand rule/democracy? An examination of the system support measure reveals the answer. Figure 6.14 shows that those who prefer democracy and reject strong-hand rule have significantly higher system support than do other Guatemalans. Since system support has been linked in other research to long-term stability of political systems, the importance of this connection cannot be overstated. Guatemalans who believe in strong-hand rule and dictatorship, are both less willing to extend due process guarantees to the accused, and are less supportive of their political system in general.
Figure 6.14: Relationship Between Preference for Authoritarianism and System Support
Relationship between
Preference for Authoritarianism and System Support, 1999
sig. <.001
Preference for Strong hand and authoritarianism or democracy
Reject strong handStrong hand & democ.Strong hand & dict.Strong hand & indif
Sys
tem
Sup
port
48
46
44
42
40
38
36
34

Guatemalan Values and Democratic Development: Fourth Report 6-25
January 2000
These findings suggest that in order to increase support for democratic policies (e.g., protecting the rights of the accused) a national dialogue needs to be undertaken not directed at any sector in particular (since the differences in views are not determined by demographic, socio-economic or ethnic differences) but directed at the nation as a whole. How this can be done in the current climate of high crime is difficult to envision, but given the linkages to democratic stability of these findings, the task is an important one. But one clear clue is the media. While socio-economic and demographic differences are not correlated to support for democracy vs. authoritarianism on our four-point scale, reading news in the newspapers is. The relationship of the media to support for democracy is shown in Figure 6.15. Among those who reject the “mano dura” and prefer democracy, over 60 percent read newspaper news, while among those who prefer the “mano dura” and are indifferent about democracy vs. dictatorship, readership drops to only about 45 percent.
Figure 6.15: Impact of News Media Attention on Preference for Democracy
Impact of News Media Attention
on Preference for Democracy, 1999
Newspapers sig. <.001
Preference for Strong hand and authoritarianism or democracy
Reject strong hand
Strong hand & democ.
Strong hand & dict.
Strong hand & indif
% w
ho r
ead/
see
90
80
70
60
50
40
Listen to redio news
Listen to TV news
Read newspaper news

Guatemalan Values and Democratic Development: Fourth Report 6-26
January 2000
Fear of crime is also an important predictor of both preference for authoritarian rule and for curtailing civil liberties. Importantly, it is not victimization by criminals, but fear that has this impact. Figure 6.16 shows the relationship between sense of security walking through one’s neighborhood at night and the four categories of support for democracy. Only among respondents who reject the “strong hand” and prefer democracy does the sense of security score average in the positive end of the continuum.
Figure 6.16: Sense of Security in Neighborhood and Support for Democracy
Sense of Security in Neighborhood
and Support for Democracy, 1999
Sig. <.001
Reject strong hand
Strong hand & democ.
Strong hand & dict.
Strong hand & indif
Fee
ling
of S
ecur
ity
60
50
40
30
58
45
36
46

Guatemalan Values and Democratic Development: Fourth Report 6-27
January 2000
Interpersonal trust is also linked to a preference for democratic rule and opposition to “mano dura.” Figure 6.17 shows that trust increases along with an increasing preference for democracy.
Figure 6.17: Preference for Democracy and and Interpersonal Trust
Multivariate Path Analysis It is clear from the above analysis that a preference for democracy is important in terms of its implications for policy preferences. It has also been shown that a preference for democracy versus authoritarianism itself is a function of other variables, but the analysis thus far has largely been confined to the bivariate results. A global picture of the linkages between background factors, crime victimization, feelings of security/insecurity on the one hand, and a preference for democracy on the other would be helpful. Taking this model the next step, it would be useful to see how all of this connects to policy preferences regarding the rights to due process of suspected criminals.
Preference for Democracy
and Interpersonal Trust, 1999
Sig. <.001
Reject strong hand
Strong hand & democ.
Strong hand & dict.
Strong hand & indif
Inte
rper
sona
l tru
st
58
56
54
52
50
48
46
44
42
56
48
4546

Guatemalan Values and Democratic Development: Fourth Report 6-28
January 2000
The easiest way to describe such a relationship is by using a causal modeling approach, specifically structural modeling. In the analysis that follows, “maximum likelihood” estimates are made for the variables of interest, based upon the bivariate analysis we presented above.19 It would be tedious to repeat this analysis for each of the policy variables we explored, so we have chosen to take one variable from the “tough on crime” set and one from the “tough on social deviance” set and examine the results. Figure 6.18 shows the structural model for support for vigilante justice (P35A). The two-headed arrows show the correlation coefficients of the exogenous variables (i.e., with personal trust, education, wealth, system support, read newspaper news and crime victim). The singleheaded arrows show standardized coefficients. Above the boxes (and to the right) that represent the endogenous variables (i.e., preference for democracy, vigilante justice, and favor security) are the Multiple R-squared total effects. The model also contains three error terms (e1, e2 and e3) that are required for regression analyses to run properly. The model presented here is a strong one, with an NFI (normed fit index) of .978 and a CFI (comparative fit index) of .979.20
Figure 6.18: Model Explaining Preference for Democracy
19The analysis was conducted using AMOS 4.0 in conjunction with SPSS 10.01. AMOS does not operate with weighted data, so the results presented here differ slightly from an OLS approach. AMOS has the advantage of being able to handle missing data, a common problem in survey research. 20These indices should be over .9 to indicate a good model fit.
Readnewspaper
news
Interpersonaltrust
Education
Wealth
System Support
Preference forDemocracy
Favorvigilantejustice
Feeling of security Crime Victim
e1
e3
e2
-.19.04
.08 -.01
-.18
.03.06
.07
.09
.08
.07
.14
.22
.08
.46
-.02
.03

Guatemalan Values and Democratic Development: Fourth Report 6-29
January 2000
Essentially, this model shows that, among the background variables that predict a preference for democracy, by far the strongest is system support. In other words, those who support the system are also supporters of democracy, an apparently obvious finding. But thought of in inverse terms, this finding takes on greater importance. It means that those citizens who do not trust their political system are the ones most likely to be attracted to authoritarian solutions. This finding underscores the importance of tracking system support in Guatemala, as has been done in this project for all of the 1990s. A second finding is that crime victimization has no direct impact on preference for democracy or for favoring vigilante justice. Rather, the impact of crime is on fear, the feeling of personal security that Guatemalans have or do not have. That feeling, in turn, impacts the preference for democracy. A third finding is that the strongest path in the entire analysis is between a preference for democracy and opposition to vigilante justice. Finally, variables such as reading newspaper news, interpersonal trust, education and wealth each make a modest contribution to a preference for democracy.

Guatemalan Values and Democratic Development: Fourth Report 6-30
January 2000
The second structural equation produces a very similar result. Here the attempt is to try to explain a policy preference for limiting the freedom of expression of those who express extreme ideas (P35F). As can be seen in Figure 6.19, crime victimization has no linkage to a preference for democracy, but its impact is mediated through feelings of security/insecurity. The other variables present a virtually identical picture to the one just shown above (Figure 6.18). 21
.06
Preference for Democracy
.04
Feeling of security
Education
Crime Victim
Wealth
System Support
Read newspaper
newsInterpersonal trust
.07
.13
e2.09
.03
Limit freedomof expressionof extremist
ideas
.08
-.16
e1
.51
.02
.09
.07
e3
.09
-.19
Figure 6.19: Model Explaining Preference for Limiting Freedom of Expression
21 The NFI of this model is .976 and the CFI is .977.

Guatemalan Values and Democratic Development: Fourth Report 6-31
January 2000
Political Implications of a Preference for Democracy In contemporary Guatemala citizens have the power of the vote, and with that power they can determine the direction of key public policies. The 1999 survey was conducted prior to the November, 1999 national elections, and the initial analyses were being carried out as the elections were being held. The results of the November elections were clear but not decisive. According to law, to be elected President a candidate must have garnered over 50 percent of the votes cast. In November, 1999 Portillo had 48 percent of the votes, and as a result a run-off election between Portillo and Berger, who had 30 percent of the November votes, was scheduled for the 26th of December 1999. The result of the run-off election was a victory by Portillo who garnered about 70 percent of the votes cast. To investigate what differentiates the supporters of the leading candidates in terms of the attitudes of their support base we turn once again to the four-fold categorization of support for democracy. From the survey results, it is clear that there are significant differences among these support bases. In the survey, respondents were asked about their opinions toward the leading candidates on a scale from very favorable to very unfavorable. This scale was converted into the familiar 0-100 range used throughout this report.

Guatemalan Values and Democratic Development: Fourth Report 6-32
January 2000
Figure 6.20 shows the results for the two leading presidential candidates. Supporters of Berger were much less likely to be supportive of the “mano dura,” whereas the “mano dura” response was the most common among the Portillo supporters.
Figure 6.20: Preference for Democracy and Opinion of Candidates: Berger vs. Portillo
Two other important political figures about which survey questions were asked are Rigoberta Menchú and Ríos Montt. Menchú is a Nobel Peace Prize winner and symbol of indigenous rights and opposition to military control. Montt is a former General who was President during some of the harshest years of the civil unrest and is a symbol of the imposition of governmental force to assure civil peace and order. Montt was running for a legislative seat in the 1999 elections from the same political party as Portillo and was widely discussed as potentially the next leader of the legislature. In the fall 1999 elections, he was in fact elected and subsequently was chosen to be the head of the Congress.
Preference for Democracy
and Opinion of Candidates: Berger vs. Portillo, 1999
Both candidates sig. <.001
Reject strong hand
Strong hand & democ.
Strong hand & dict.
Strong hand & indif
Mea
n P
refe
renc
e
60
50
40
30
Oscar Berger
Alfonso Portillo

Guatemalan Values and Democratic Development: Fourth Report 6-33
January 2000
Figure 6.21 shows that these two popular figures, Menchú and Montt, had almost identical support bases across three of the four categories, but differed strongly on the last. Not surprisingly, Ríos Montt supporters were far more likely to prefer “mano dura,” while the Menchú supporters are far more likely than Montt supporters to reject the “mano dura” choice.
Figure 6.21: Preference for Democracy and Opinion of Menchú and Ríos Montt
Preference for Democracy
and Opinion of Menchu and Rios Montt, 1999
Both sig. <.001
Reject strong hand
Strong hand & democ.
Strong hand & dict.
Strong hand & indif
Mea
n pr
efer
ence
50
40
30
20
Rigoberta Menchú
Efraín Ríos Montt

Guatemalan Values and Democratic Development: Fourth Report 6-34
January 2000
Finally, as we will discuss fully in the next chapter, we examined the relationship between support for democracy and support for the peace process. The Consulta Popular in Guatemala involved a national referendum on key components of the peace process. It was defeated, however, and an extensive analysis is provided in Chapter 7 of this report. Here we take note only of the connection between support for democracy and support for the constitutional reforms voted upon in the Consulta. Figure 6.22 contains the results. As can be seen, there is a direct linkage between the two, with those who reject a strong hand and prefer democracy more supportive of the constitutional reforms.
Figure 6.22: Support for Democracy and Voted "Yes" in Consulta Popular
Guatemalan chapter 6-r84.doc
Support for Democracy and
Voted "Yes" in Consulta Popular, 1999
Sig. <.05
Reject strong hand
Strong hand & democ.
Strong hand & dict.
Strong hand & indif
% v
otin
g in
favo
r of
the
cons
ulta
42%
40%
38%
36%
34%
32%
30%
41
33
34
31

January 2000
Chapter 7
The Prospects For Peace And Democratization
Introduction
Three years have gone by since the final Peace Accords were signed in
Guatemala in December of 1996. The signing of these accords between the Government of Guatemala and the Unidad Revolucionaria Nacional Guatemalteca was an important event in the eyes of the international community and for the many Guatemalans who were involved in one way or another in the 5 years of peace negotiations.
The discussion of the content and impact for democracy in Guatemala of the Peace Accords goes beyond the scope of this final chapter. It is taken for granted that a consolidated democracy could not emerge while there was an ongoing armed conflict, which itself justified the militarization of the country and which for many years was a source of gross violations of human rights. Rather, the purpose here is to find out whether, after three years of a new era of peace in Guatemala, there exists popular support for the ongoing peace process and what are the characteristics of those Guatemalans who are more and less supportive.
By May of 1999 those involved in following up the many commitments contained
in the peace agreements were confident that the constitutional reforms linked to those agreements were going to be ratified by the population. The international community seemed to share that positive outlook. But, surprisingly for those many who were certain about the popular backing for the “Yes” in the referendum (Consulta Popular), the reforms were overwhelmingly rejected by the population. The “No” won in the referendum and, therefore, none of the reforms were approved.
Right after the Consulta Popular, there was a serious concern in government and
academic circles that the rejection of the reforms might imply a rejection of the peace process itself. Newspaper columnists and a few academics tried to explain the results, but many of their points of view were contradictory. Some blamed the Congress -- which instead of 12 reforms linked directly to the Peace Accords, drafted a set of 50 reforms; some blamed ethnic prejudice on the part of the Ladino population; others blamed the government for not promoting the reforms. Few in-depth analyses of what really happened were carried out. It is especially important, therefore, to take an objective, data-based look back at what happened in May of 1999 so that we might be able to understand prospects for popular support for the peace process in the future.
In order to examine this issue, we will use two dependent variables from the
1999 DIMS survey to determine who in the population rejected the constitutional reforms in May of 1999 and why they may have done so. Before moving to the DIMS data, however, it is useful to first take a look at the geographic distribution of the vote in

Guatemalan Values and Democratic Development: Fourth Report 7-2
January 2000
the Consulta Popular. In Figure 7.1, we can see the distribution by department of the support for the “Yes” vote in the Consulta.1
Figure 7.1: Yes Votes by Department
As can be observed, the departments in which the indigenous population predominates generally had a higher support for the “Yes” vote in the Consulta Popular, whereas in the departments that are predominantly Ladino, including Guatemala City, the “No” vote had the greatest support. These results are consistent with several authors2 who have concluded that there was a clear differentiation in the vote in the Consulta between the urban and the rural areas and between the Ladino-populated areas and the indigenous areas.
1 This chart was taken from the publication "The Consulta Popular and the Peace Process in Guatemala in the New Century", C. Arnson, Ed., Woodrow Wilson Center, Working Papers # 241, Washington, DC, October 1999. 2 Arnson, Cynthia J., Comparative Peace Processes in Latin America (Washington and Stanford: Woodrow Wilson Center Press and Stanford University Press, 1999), Introduction.
Yes Vote by Department
Department
SololaPeten
Alta Verapaz
El Quiche
Huehuetenango
Totonicapan
Baja Verapaz
Chimaltenango
San Marcos
JalapaIzabal
Chiquimula
Quetzaltenango
Retalhuleu
Suchitepequez
JutiapaEscuintla
Santa Rosa
Zacapa
Sacatepequez
El Progreso
Guatemala
Ave
rage
Yes
Vot
e (4
que
stio
ns)
80%
70%
60%
50%
40%
30%
20%
10%
7572
6968
63
57555454
5047
454242
414040
34323231
26

Guatemalan Values and Democratic Development: Fourth Report 7-3
January 2000
Figure 7.2, based on the 1999 DIMS survey, shows that those who supported the “Yes” in the Consulta had lower levels of education. This was true both in the rural areas and in the urban areas of Guatemala. It can also be observed that, overall, the rural areas displayed a much higher support for the “Yes.”
Figure 7.2: "Yes" Vote and Education by Urbanicity
Vote and Education
By Urbanicity, 1999
Both sig. <.05
Education
UniversityHigh SchoolJr. HighPrimaryNone
Per
cent
age
votin
g "Y
es"
60%
50%
40%
30%
20%
10%
0%
Urban or rural
Urban
Rural

Guatemalan Values and Democratic Development: Fourth Report 7-4
January 2000
We now turn to age and gender to determine whether those characteristics made a difference in the referendum. As it can be observed in Figure 7.3, males overall were more favorable to the “Yes” vote than females. In terms of age, although the differences between groups are statistically significant, there do not seem to be sharp contrasts. In both groups -- males and females -- it is notable that the age-group between 46 and 55 years of age had the lowest support for the “Yes.”
Figure 7.3: "Yes" Vote, Age and Gender
Vote Yes, Age and Gender, 1999
Age
56 & up46 - 5536 - 4526 - 3518 - 25
Per
cent
age
votin
g "Y
es"
60
50
40
30
20
10
0
Gender
Female
Male

Guatemalan Values and Democratic Development: Fourth Report 7-5
January 2000
Finally, Figure 7.4 shows the impact of ethnicity and of an assessment of the work of the current government3. As the figure shows, the indigenous population of Guatemala displayed higher levels of support for the “Yes” than the Ladino population. Figure 7.4 also shows that the evaluation of the government, regardless of ethnic group, can be considered an important explanatory factor for the outcome at the Consulta. A regression analysis that was done to identify the variables that significantly help to explain the "yes" vote, showed that in fact the opinion about the work of the government of Alvaro Arzú, was, in the end, one of the most significant variables at play, even more important than other variables such as fear of ethnic conflict. That analysis also showed that there was no association between the rejection of the reforms (“No” vote) and the assessment of the peace process. In other words, those who opted for the “No,” did it because of diverse reasons but not because of a lack of support for the Peace Accords, which as will be described below, are well regarded by Guatemalans.
Figure 7.4: "Yes" Vote and Assessment of Government
3 Respondents were asked: "Do you believe the government of President Arzú is working very well, well, badly, or very badly?" Interviewers were provided a place to record a somewhat" or "regular" or "don't know" response, but did not offer these as an alternative. In analyzing the responses the "somewhat" response was treated as a middle point
Yes Vote
and Assessment of the Government, 1999
Both sig. <.05
Assessment of the Government
GoodAverageBad
Per
cent
age
votin
g "Y
es"
60
50
40
30
20
10
0
Self-identification
Ladino
Indigenous

Guatemalan Values and Democratic Development: Fourth Report 7-6
January 2000
Opinions About the Peace Agreements
In contemplating the future of Guatemalan democracy, perhaps even more important than looking back at the results of the Consulta is to see what Guatemalans think about the peace agreements themselves. As part of the 1999 DIMS survey, respondents were asked: "Do you consider the Peace Accords to be: very good, fairly good, or not good for the country?" The responses are shown in Figure 7.5. As we can see, a vast majority of the population has either a “very good” or a “fairly good” opinion about the Peace Accords.
Figure 7.5: Opinion about the Peace Accords
In order to understand these opinions in terms of demographic variables, we have converted the opinion about the peace accords item to a 100-point scale. A 'very good' opinion is 100 on the scale, 'somewhat good' equals 50, and a 'not very good' opinion is a zero.
Opinion about the Peace Accords, 1999
43.8%
49.2%
6.9%
Very good
Somewhat good
Not good

Guatemalan Values and Democratic Development: Fourth Report 7-7
January 2000
Using this 100 point scale, we now take a look at some socio-demographic variables in order to investigate further the nature of the support for the Peace Accords. Figure 7.6 shows that there does not appear to be a difference in the opinion of the Accords when analyzed by age or by gender. About two-thirds or more of the respondents, regardless of age or sex, indicated they had at least a fairly positive view of the Accords.
Figure 7.6: Opinion about the Accords by Age and Gender
Opinion about the Accords by Age
and Gender, 1999
Age
56 & up46 - 5536 - 4526 - 3518 - 25
Ave
rage
opi
nion
of t
he A
ccor
ds
100
90
80
70
60
50
40
Gender
Female
Male

Guatemalan Values and Democratic Development: Fourth Report 7-8
January 2000
The pattern of responses about the Accords is similar when the data are analyzed in terms of education or place of residence. As can be observed in Figure 7.7, between 60% and 80% of respondents, regardless of level of education or whether they lived in a rural or urban area expressed a positive or fairly positive view. Interestingly, although residents of urban areas were clearly more likely than people in rural areas to vote "No" in the Consulta Popular, they do not have more negative feelings about the accords themselves.
Figure 7.7: Opinion about the Accords by Education and Urbancity
Opinion about the Accords by Education
and Urbanicity, 1999
Both sig. <.05
Education
UniversityHigh SchoolJr. HighPrimaryNone
Ave
rage
opi
nion
of t
he A
ccor
ds
100
90
80
70
60
50
40
Urbanicity
Urban
Rural
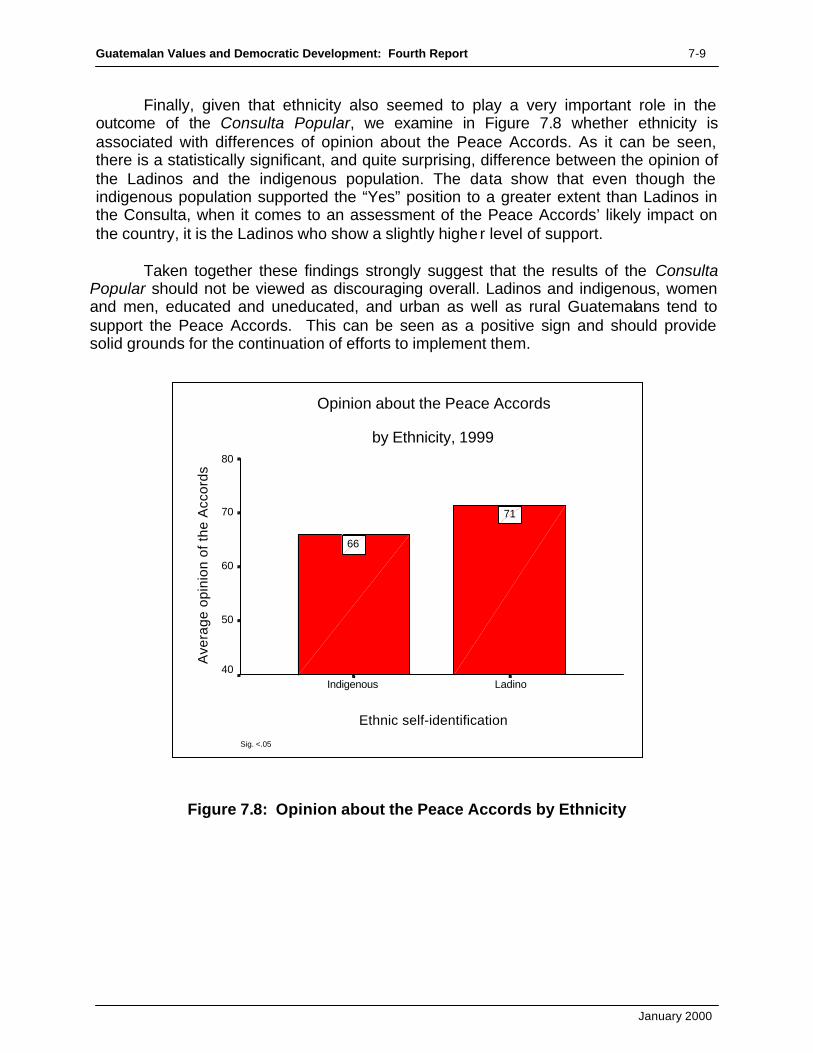
Guatemalan Values and Democratic Development: Fourth Report 7-9
January 2000
Finally, given that ethnicity also seemed to play a very important role in the outcome of the Consulta Popular, we examine in Figure 7.8 whether ethnicity is associated with differences of opinion about the Peace Accords. As it can be seen, there is a statistically significant, and quite surprising, difference between the opinion of the Ladinos and the indigenous population. The data show that even though the indigenous population supported the “Yes” position to a greater extent than Ladinos in the Consulta, when it comes to an assessment of the Peace Accords’ likely impact on the country, it is the Ladinos who show a slightly higher level of support.
Taken together these findings strongly suggest that the results of the Consulta Popular should not be viewed as discouraging overall. Ladinos and indigenous, women and men, educated and uneducated, and urban as well as rural Guatemalans tend to support the Peace Accords. This can be seen as a positive sign and should provide solid grounds for the continuation of efforts to implement them.
Figure 7.8: Opinion about the Peace Accords by Ethnicity
Opinion about the Peace Accords
by Ethnicity, 1999
Sig. <.05
Ethnic self-identification
LadinoIndigenous
Ave
rage
opi
nion
of t
he A
ccor
ds
80
70
60
50
40
71
66

Guatemalan Values and Democratic Development: Fourth Report 7-10
January 2000
Overall Model of Support for the Peace Accords
An examination of support for the Peace Accords as a function of the key variables that we have examined in this study is now appropriate. As we have done before, we will use a structural equation model that shows the relationship between system support, relative wealth, education, interpersonal trust, getting news from the newspaper, and being a victim of crime with: feelings of security, a preference for democracy and a positive view of the Peace Accords4. Figure 7.9 shows that a positive view of the Peace Accords is a direct function of a preference for democracy in Guatemala. This is an important finding. It suggests a congruence between one key value, preference for democracy, and another key value, support for the Peace Accords. Consistent with the analyses shown in Chapter 6, Figure 7.9 also shows that the preference for democracy is a function of a set of background variables, including feelings of security. Crime victimization, on the other hand, has almost no direct impact on preference for democracy and none on support for the Accords.
Figure 7.9: Support for Peace Accords: Initial Model
4 See Chapter 6 for a definition of each of the variables in the model. The CFI for this model is .98.
Readnewspaper
news
Interpersonaltrust
Education
Wealth
System Support
Preference forDemocracy
Positive view ofPeace Accords
Feeling of security Crime Victim
Support for Peace Accords: Initial Model
e1
e3
e2
-.19
.04
.07-.01
-.17
.03.06
.09
.09
.09
.06
.14
.22
.08
.46
-.02
.03

Guatemalan Values and Democratic Development: Fourth Report 7-11
January 2000
Our overall conclusion from these findings is that even though the national referendum on the constitutional reforms was not approved by the voters, Guatemalans still support the Peace Accords. Moreover, those accords are strongly linked to overall support for democracy. We conclude that the failure of the “consulta” was more of a failure to communicate their meaning to a public that, like many publics around the world, is skeptical of change, especially radical change. The refe rendum was exceptionally complex, and voters may have felt, “when in doubt, punt.” Future governments may be able to build support for the reforms by taking them piecemeal, explaining them thoroughly, and presenting first to voters the ones upon which survey data shows strong support. With the approval of some reforms, the approval of others should be possible. Guatemalan Chapter 7-R84.doc

Interview
s, 1999 (dot positions w
ithin departments are illustrative)
1 dot = 6 respondents
Figure 1.1
Distrib
utio
n o
f the S
amp
le

APPENDIX 1
Sample Distribution

Guatemalan Values and Democratic Development: Fourth Report A-1
January 2000
Appendix 1 Sample Distribution by Region, Department and Year
Year Total 1993 1995 1997 1999 Count
Count Count Count Count Department GUATEMALA 257 251 215 217 940
Metro Area Group Total 257 251 215 217 940
Department BAJA VERAPAZ 30 29 38 23 121 ALTA VERAPAZ 60 63 64 49 236
IZABAL 37 34 29 42 143 ZACAPA 67 63 51 71 252
CHIQUIMULA 1 1
North East
Group Total 193 190 183 186 752
Department SOLOLA 27 26 29 30 113 TOTONICAPAN 33 29 37 32 131 QUETZALTENANGO 32 33 31 27 123
SAN MARCOS 57 60 51 57 226 HUEHUETENANGO 93 94 95 93 375
QUICHE 30 28 29 39 126
North West
Group Total 273 270 272 279 1093
Department CHIMALTENANGO 58 53 55 73 238 ESCUINTLA 130 138 150 144 562 QUETZALTENANGO 73 81 79 68 301
SUCHITEPEQUEZ 63 53 58 66 240 South West
Group Total 324 325 342 351 1341
Department EL PROGRESO 31 36 38 32 137 CHIQUIMULA 28 30 26 35 119 JALAPA 27 26 48 34 135 South East
JUTIAPA 66 62 77 66 271
Region
Group Total 152 154 189 167 662
Table Total 1199 1191 1200 1200 4790

APPENDIX 2
Questionnaire

Cultura Democrática - Guatemala, Julio 20, 1999 (versión 10) 1
ENCUESTA DE CONOCIMIENTOS,
ACTITUDES Y PRACTICAS DE DEMOCRACIA
GUATEMALA, 1999
VERSIÓN 13 AGOSTO 11, 1999
CEOP
____________________________________________________________________________ Al Entrevistador: LAS MAYÚSCULAS EN NEGRITA SON INSTRUCCIONES ESPECIFICAS AL ENCUESTADOR. NO DEBEN LEERSE EN VOZ ALTA ANTE EL ENTREVISTADO. LAS MAYÚSCULAS SIMPLES, SON OPCIONES PARA CODIFICAR LA RESPUESTA DEL ENTREVISTADO; Y, A MENOS QUE APAREZCA INSTRUCCIÓN EN CONTRARIO, TAMPOCO DEBEN LEERSE AL ENTREVISTADO. Las minúsculas en negrita son opciones de respuesta que se deben leer al entrevistado. Los textos en minúscula simple, corresponden a las preguntas que deben presentarse al entrevistado. Las palabras o frases subrayadas son puntos de énfasis que deben hacerse al presentar la pregunta. Instrucciones Generales 1. Antes de dirigirse a la vivienda que le corresponde, VERIFIQUE que la hoja de respuestas esté total y correctamente
llenada en los códigos de "NO.", "REG.", "U/R", "DEPTO.", "MPIO.", y "SECTOR CENSAL". 2. IDENTIFIQUE al informante: Que sea nacido en el país; que esté dentro de la cuota por sexo que le fue asignada; y que
ha sido escogido conforme a las instrucciones que ha recibido para la selección dentro del hogar CENSAL. 3. PRESÉNTESE: - Vengo en nombre de ASIES (Asociación de Investigación y Estudios Sociales). Estamos haciendo una encuesta
en todo el país sobre aspectos muy importantes de la situación nacional, incluyendo los problemas que vivimos los guatemaltecos.
Esta casa ha sido seleccionada por sorteo para hacer una entrevista, por lo que le agradeceré que nos dedique unos minutos.
Estas encuestas son confidenciales y no le vamos a preguntar su nombre ni apellido. No hay respuestas correctas ni incorrectas, todas son importantes para nosotros. Por favor, contésteme las preguntas de acuerdo a lo que usted cree o piensa.
4. ANOTE en el primer renglón de la hoja de respuestas, el SEXO (1 = HOMBRE, 2 = MUJER) y la EDAD
(años cumplidos) del informante, la HORA DE INICIO de la entrevista y el idioma en que se realiza la misma: [IDIOMA1.]1 = ESPAÑOL, 2 = MAM, 3 = Q'EQCHI', 4 = KAQCHIKEL, 5 = K'ICHE', 6 =IXIL.

Cultura Democrática - Guatemala, Julio 20, 1999 (versión 10) 2
01 [A4A.]Para empezar: Como usted sabe, todas las comunidades tienen problemas, unos más grandes que otros. ¿Cuál cree usted que es el problema más serio que tienen los habitantes de [DIGA EL NOMBRE DEL LUGAR]? No me refiero al principal problema de todo el país, sino sólo de esta [DIGA CIUDAD, ALDEA, COMUNIDAD] ACEPTE SOLO UN PROBLEMA Y CODIFIQUELO EN LA HOJA DE RESPUESTAS: 01 COSTO DE LA VIDA/POBREZA 14 DELINCUENCIA COMÚN 02 DESEMPLEO/POCO TRABAJO 15 CONTAMINACIÓN AMBIENTAL 03 BAJOS SALARIOS/INGRESOS 16 TRANSPORTE/CAMINOS 04 POCA VENTA/MALA COSECHA 17 OTRO [NO ESPECIFIQUE] 05 TIERRA ESCASA/CARA 18 LA VIOLENCIA EN GENERAL 06 EDUCACIÓN/ANALFABETISMO 19 NARCOTRÁFICO 09 VIVIENDA ESCASA/CARA 20 CORRUPCIÓN 10 DESNUTRICIÓN/MALA SALUD 21 MAL GOBIERNO 11 FALTA DE AGUA POTABLE 12 POCA UNIÓN/ORGANIZACIÓN 07 NO SABE 13 GUERRA/TERRORISMO 08 NO RESPONDE _____________________________________________________________________ 02 [A4.]Ahora sí, hablando de todo el país, ¿cuál cree usted que es el problema más serio que tenemos en toda
Guatemala? ACEPTE SOLO UN PROBLEMA Y CODIFIQUELO EN LA HOJA DE RESPUESTAS: 01 COSTO DE LA VIDA/POBREZA 14 DELINCUENCIA COMÚN 02 DESEMPLEO/POCO TRABAJO 15 CONTAMINACIÓN AMBIENTAL 03 BAJOS SALARIOS/INGRESOS 16 TRANSPORTE/CAMINOS 04 POCA VENTA/MALA COSECHA 17 OTRO [NO ESPECIFIQUE] 05 TIERRA ESCASA/CARA 18 LA VIOLENCIA EN GENERAL 06 EDUCACIÓN/ANALFABETISMO 19 NARCOTRÁFICO 09 VIVIENDA ESCASA/CARA 20 CORRUPCIÓN 10 DESNUTRICIÓN/MALA SALUD 21 MAL GOBIERNO 11 FALTA DE AGUA POTABLE 12 POCA UNIÓN/ORGANIZACIÓN 07 NO SABE 13 GUERRA/TERRORISMO 08 NO RESPONDE ________________________________________________________________ 03 [LS2.]¿Qué piensa de su situación económica en general? ¿Se siente satisfecho o insatisfecho? TRATE DE LOGRAR UNA RESPUESTA DEFINIDA. SOLO EN CASO EXTREMO, ANOTE LA RESPUESTA "SATISFECHO A MEDIAS" 1 SATISFECHO 3 SATISFECHO A MEDIAS 2 INSATISFECHO 8 NO RESPONDE _________________________________________________________________ 05 [LS3.]En términos generales, ¿está usted satisfecho de su forma de vida actual? ¿Diría usted que se siente satisfecho o insatisfecho? TRATE DE LOGRAR UNA RESPUESTA DEFINIDA. SOLO EN CASO EXTREMO, ANOTE LA RESPUESTA "SATISFECHO A MEDIAS" 1 SATISFECHO 3 SATISFECHO A MEDIAS 2 INSATISFECHO 8 NO RESPONDE __________________________________________________

Cultura Democrática - Guatemala, Julio 20, 1999 (versión 10) 3
______________ ¿Acostumbra usted escuchar algún programa de noticias? [Leer cada uno y marcar en la hoja de respuestas]
5A1. POR RADIO 1. Sí 0. No 8. NS/NR
5A2. POR TELEVISIÓN 1. Sí 0. No 8. NS/NR
5A3. LEE NOTICIAS EN EL PERIÓDICO 1. Sí 0. No 8. NS/NR
Ahora le voy a mencionar varios tipos de organizaciones, para que usted me diga si asiste a reuniones de algunos de estos grupos, y si lo hace frecuentemente, pocas veces o nunca: VAYA LEYENDO LA LISTA, REPITIENDO LA PREGUNTA SI ES NECESARIO, Y ANOTANDO LAS RESPUESTAS CON EL CÓDIGO CORRESPONDIENTE, EN LA HOJA DE RESPUESTAS: FREC. POCAS V. NUNCA N/R 6 [CP6.]Comité o Asociación en la Iglesia? 1 2 3 8 7 [CP7.]Asociación de Padres en la Escuela? 1 2 3 8 8 [CP8.]Comité Pro-mejoramiento en la comunidad? 1 2 3 8 9 [CP9.]Asociación de personas que tienen la misma ocupación que usted? 1 2 3 8 10 [CP12.]Asociación o Club de Servicio (como Leones, Bomberos, etc.) 1 2 3 8 11 [CP10.]Sindicato de trabajadores o de campesinos? 1 2 3 8 12 [CP11.]Cooperativa? 1 2 3 8 12a [ ] Partido político 1 2 3 8 12b Comité Cívico 1 2 3 8 12c Comités o Asociaciones de beneficio o desarrollo comunal
(Por ejemplo: Comités Pro-Agua, Pro-Luz, etc.) 1 2 3 8
Para resolver problemas propios o de la comunidad, ¿ha pedido usted muchas veces o pocas veces la ayuda de... VAYA LEYENDO LA LISTA, REPITIENDO LA PREGUNTA SI ES NECESARIO, Y ANOTANDO LAS RESPUES TAS CON EL CÓDIGO CORRESPONDIENTE, EN LA HOJA DE RESPUESTAS: MUCHAS POCAS NUNCA N/R 13 [CP4.]...el Gobierno? 1 2 3 8 14 [CP3.]...el Alcalde Municipal? 1 2 3 8 15 [CP2.]...algún Diputado al Congreso? 1 2 3 8 15a algún Comité, Consejo o Junta Comunal 1 2 3 8

Cultura Democrática - Guatemala, Julio 20, 1999 (versión 10)
Dígame si las siguientes instituciones ayudan mucho, poco o nada, para resolver los problemas más importantes del país: VAYA LEYENDO LA LISTA, REPITIENDO LA PREGUNTA SI ES NECESARIO, Y ANOTANDO LAS RESPUESTAS CON EL CÓDIGO CORRESPONDIENTE, EN LA HOJA DE RESPUESTAS: MUCHO POCO NADA N/R 16 [DD14.]El Gobierno 1 2 3 8 17 [DD15.]Las Iglesias de cualquier religión 1 2 3 8 18 [DD16.]Los militares 1 2 3 8 19 [DD18.]Los Jueces, los tribunales de justicia 1 2 3 8 20 [DD19.]Los sindicatos 1 2 3 8 21 [DD20.]La prensa, ya sea escrita, por radio, o por televisión 1 2 3 8 22 [DD21.]Los partidos políticos 1 2 3 8 23 [DD24.]Los diputados del Congreso 1 2 3 8 23a Grupos o Asociaciones Mayas o Indígenas 1 2 3 8
23b Empresarios 1 2 3 8
Ahora vamos a hablar de la municipalidad de este municipio. 23A [NP1]. ¿Ha tenido usted la oportunidad de asistir a una sesión o reunión convocada por la municipalidad durante los últimos 12 meses? 1. SI 2. NO 8. NO SABE/ NO RECUERDA 23B [NP2]. ¿Ha solicitado ayuda o hecho alguna petición a funcionarios, alcaldes auxiliares, concejales o síndicos o alguna
oficina de la municipalidad durante los últimos 12 meses? 1. SI 2. NO. 8. NO SABE/ NO RECUERDA 23D [SGL1]. ¿Cree usted que los servicios que esta municipalidad está dando a los vecinos son excelentes, buenos, regulares,
malos o pésimos? 1. EXCELENTE 4. MALO 2. BUENO 5. PÉSIMO 3. REGULAR 8. NO SABE/NO RESPONDE 23F [LGL1]. Para ayudar a resolver los problemas de esta comunidad, quién ha respondido mejor? ¿El Gobierno Central? ¿Los diputados? o ¿La municipalidad? 1. EL GOBIERNO CENTRAL 3. LA MUNICIPALIDAD 5. TODOS IGUAL 2. LOS DIPUTADOS 4. NINGUNO 8. NO SABE/NO RESPONDE [No leer # 4 o # 5] 23G La Alcaldía o Municipalidad de este lugar, ¿ Lo mantiene a usted muy bien informado, algo informado, no bien
informado o nada informado de las actividades que realiza? 1. MUY BIEN INFORMADO 3. NO BIEN INFORMADO 8. NO SABE/NO RESPONDE 2. ALGO INFORMADO 4. NADA INFORMADO __________________________________________________________________

Cultura Democrática - Guatemala, Julio 20, 1999 (versión 10)
24 [VB1.]¿Está ud. Empadronado para votar? 1 SI.........................................SIGA A LA PRÓXIMA PREGUNTA 2 NO..................... ..................PASE A LA PREGUNTA 27a. Y MARQUE 9 “NO APLICA” EN LA P.25 Y 99 EN LA P.25A 8 NO RESPONDE.................PASE A LA PREGUNTA 27a. Y MARQUE 9 “NO APLICA” EN LA P.25 Y 99 EN LA P.25A 25 [VB2.]¿Votó usted en las elecciones Presidenciales de 1995? 1 SI..........................................PASE A LA PROXIMA PREGUNTA 2 NO........................................PASE A LA PREGUNTA 27a. Y MARQUE 99 “NO APLICA” EN LA P.25A 8 NO RESPONDE .................PASE A LA PREGUNTA 27a. Y MARQUE 99 “NO APLICA” EN LA P.25A 9 NO APLICA 25A. ¿Por cuál partido votó para presidente en 1995? 01. DEMOCRACIA CRISTIANA GUATEMALTECA DCG UNIÓN DEL CENTRO NACIONAL UCN PARTIDO SOCIAL DEMÓCRATA PSD 02. FRENTE REPUBLICANO GUATEMALTECO FRG 03. PARTIDO DE AVANZADA NACIONAL PAN 04. MOVIMIENTO DE LIBERACIÓN NACIONAL MLN 05. DESARROLLO INTEGRAL AUTENTICO DIA 06. 0FRENTE DE UNIDAD NACIONAL FUN PARTIDO INSTITUCIONAL DEMOCRÁTICO PID 07. PARTIDO REFORMADOR GUATEMALTECO PREG 08. MOVIMIENTO DE LOS DESCAMISADOS MD 09. CENTRAL AUTENTICA NACIONALISTA CAN 10. FUERZA DEMOCRÁTICA POPULAR FDP 11. MOVIMIENTO PATRIÓTICO LIBERTAD MPL PARTIDO DE CONCILIACIÓN NACIONAL PCN 12. PARTIDO PROGRESISTA PP 13. ALIANZA POPULAR CINCO AP5 14. UNIÓN DEMOCRÁTICA UD 15. PARTIDO LIBERTADOR PROGRESISTA PLP 16. PARTIDO DEMÓCRATA GUATEMALTECO PDG 17. CAMBIO HISTÓRICO NACIONAL CAMHINA 18. PARTIDO DEL PUEBLO PDP 19. FRENTE DEMOCRÁTICO NUEVA GUATEMALA FDNG 20. NO VOTO 77. NULO O BLANCO 88. NO SABE/NO CONTESTA 99. NO APLICA
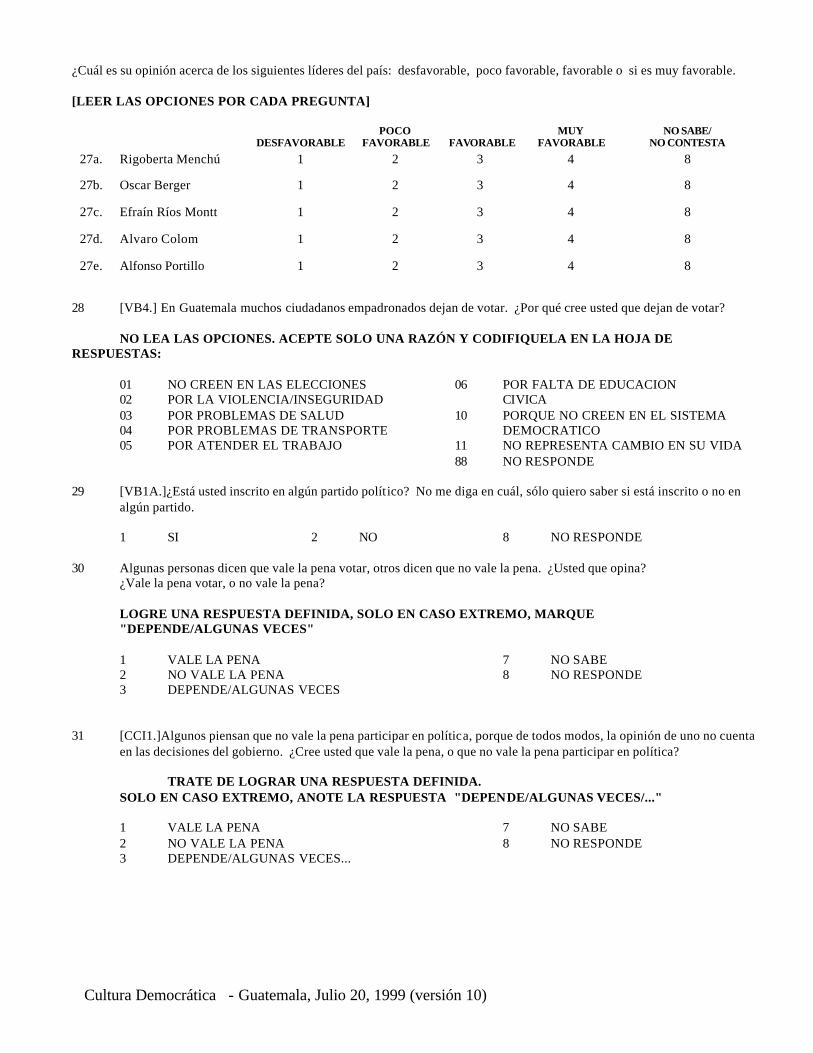
Cultura Democrática - Guatemala, Julio 20, 1999 (versión 10)
¿Cuál es su opinión acerca de los siguientes líderes del país: desfavorable, poco favorable, favorable o si es muy favorable. [LEER LAS OPCIONES POR CADA PREGUNTA]
DESFAVORABLE
POCO FAVORABLE
FAVORABLE
MUY FAVORABLE
NO SABE/ NO CONTESTA
27a. Rigoberta Menchú 1 2 3 4 8
27b. Oscar Berger 1 2 3 4 8
27c. Efraín Ríos Montt 1 2 3 4 8
27d. Alvaro Colom 1 2 3 4 8
27e. Alfonso Portillo 1 2 3 4 8
28 [VB4.] En Guatemala muchos ciudadanos empadronados dejan de votar. ¿Por qué cree usted que dejan de votar? NO LEA LAS OPCIONES. ACEPTE SOLO UNA RAZÓN Y CODIFIQUELA EN LA HOJA DE RESPUESTAS: 01 NO CREEN EN LAS ELECCIONES 06 POR FALTA DE EDUCACION 02 POR LA VIOLENCIA/INSEGURIDAD CIVICA 03 POR PROBLEMAS DE SALUD 10 PORQUE NO CREEN EN EL SISTEMA 04 POR PROBLEMAS DE TRANSPORTE DEMOCRATICO 05 POR ATENDER EL TRABAJO 11 NO REPRESENTA CAMBIO EN SU VIDA 88 NO RESPONDE 29 [VB1A.]¿Está usted inscrito en algún partido polít ico? No me diga en cuál, sólo quiero saber si está inscrito o no en
algún partido. 1 SI 2 NO 8 NO RESPONDE 30 Algunas personas dicen que vale la pena votar, otros dicen que no vale la pena. ¿Usted que opina? ¿Vale la pena votar, o no vale la pena? LOGRE UNA RESPUESTA DEFINIDA, SOLO EN CASO EXTREMO, MARQUE "DEPENDE/ALGUNAS VECES" 1 VALE LA PENA 7 NO SABE 2 NO VALE LA PENA 8 NO RESPONDE 3 DEPENDE/ALGUNAS VECES 31 [CCI1.]Algunos piensan que no vale la pena participar en política, porque de todos modos, la opinión de uno no cuenta
en las decisiones del gobierno. ¿Cree usted que vale la pena, o que no vale la pena participar en política? TRATE DE LOGRAR UNA RESPUESTA DEFINIDA.
SOLO EN CASO EXTREMO, ANOTE LA RESPUESTA "DEPENDE/ALGUNAS VECES/..." 1 VALE LA PENA 7 NO SABE 2 NO VALE LA PENA 8 NO RESPONDE 3 DEPENDE/ALGUNAS VECES...

Cultura Democrática - Guatemala, Julio 20, 1999 (versión 10)
31A. ¿Votó usted en la Consulta Popular de mayo? 1. SI............................................................. SIGA LA SIGUIENTE PREGUNTA 2. NO........................................................... MARQUE 9 “NO APLICA” EN LA P.31B Y PASE A LA P.31C 8. NO RESPONDE......................................MARQUE 9 “NO APLICA” EN LA P.31B Y PASE A LA P.31C 9. NO APLICA (No esta empadronado) 31B. En general, ¿votó usted por el sí o por el no en la Consulta? 1. SI 2. NO 8.NO RESPONDE 9. NO APLICA (NO VOTO) 31C. Si las elecciones presidenciales fueran mañana, ¿por cuál partido político votaría usted? 1. 0DEMOCRACIA CRISTIANA DC 2. 0FRENTE REPUBLICANO GUATEMALTECO FRG 3. 0MOVIMIENTO DE LIBERACIÓN NACIONAL MLN 4. 0PARTIDO DE AVANZADA NACIONAL PAN 5. 0UNIÓN DEL CENTRO NACIONAL UCN 6. 0FRENTE DEMOCRÁTICO NUEVA GUATEMALA FDNG 7. 0PARTIDO LIBERTADOR PROGRESISTA PLP 8. 0ALIANZA DEMOCRÁTICA AD 9. 0PARTIDO UNION VERDE PUV 10. ACCION RECONCILIADORA DEMOCRATICA ARDE 11. ALIANZA NUEVA NACION (URNG-DIA-UNID) ANN 12. ALIANZA RECONCILIADORA NACIONAL ARENA 20. NO PIENSO VOTAR.............. MARQUE 99 EN LA 31D Y 3 EN 31E Y SIGA A LA 32 77. NULO O BLANCO ................. MARQUE 99 EN LA 31D Y 3 EN 31E Y SIGA A LA 32 88. NO SABE/NO RESPONDE....MARQUE 99 EN LA 31D Y 3 EN 31E Y SIGA A LA 32 31D. ¿Por que votaría usted por ese partido? (NO LEA LAS OPCIONES) 01. PORQUE VAN A PONER ORDEN 02. PORQUE TIENE GENTE CAPAZ 03. PORQUE TIENEN UN BUEN CANDIDATO PRESIDENCIAL 04. PORQUE TIENEN BUENOS CANDIDATOS A DIPUTADOS 05. PORQUE PUEDEN AYUDAR A RESOLVER EL PROBLEMA DE LA POBREZA-COSTO DE VIDA 06. PORQUE PUEDEN AYUDAR A RESOLVER EL PROBLEMA DE LA DELINCUENCIA 07. PORQUE COMPARTE SUS IDEAS POLÍTICAS 10. PORQUE TIENE GENTE HONRADA 11. OTRO (ESPECIFIQUE)____________________ 88. NO SABE/NO RESPONDE 99. NO APLICABLE (NO ESTA EMPADRONADO) 31E. ¿Qué tan probable es que Usted vaya a votar? 1. MUY PROBABLE 2. ALGO PROBABLE 3. NADA PROBABLE 8. NO SABE/NO RESPONDE
Cultura Democrática - Guatemala, Julio 20, 1999 (versión 10)
32 [CCI2.]¿Cómo cree usted que la mayoría de los empleados públicos lo atienden a usted? ¿Muy bien..., bien..., mal... o muy mal? TRATE DE LOGRAR UNA RESPUESTA DEFINIDA. SOLO EN CASO EXTREMO, ANOTE LA RESPUESTA "REGULAR" 1 MUY BIEN 5 REGULAR 2 BIEN 7 NO LE CONSTA 3 MAL 8 NO RESPONDE 4 MUY MAL 32A ¿Cree usted que avisar o denunciar un delito a la policía, autoridad o juzgados es fácil, difícil o muy difícil? 1. FÁCIL 6. NO LE CONSTA 2. DIFÍCIL 8. NO RESPONDE 3. MUY DIFÍCIL 32C Durante los últimos 12 meses, ¿Usted o algún miembro de su familia ha sido víctima de robos, asaltos, agresiones o secuestros? 1. SI..................................................... PASE A LA SIGUIENTE PREGUNTA 2. NO.................................................. MARQUE 9 EN LA 32D Y PASE A LA 32E 8. NO SABE/NO RESPONDE.......... MARQUE 9 EN LA 32D Y PASE A LA 32E 32D ¿Lo ha denunciado o dado aviso a la policía, autoridad o juzgado? 1. SI 8. NO RESPONDE 2. NO 9. NO APLICA
De los trámites que usted o alguien de su familia ha hecho con las siguientes entidades, ¿Se siente muy satisfecho, satisfecho, o insatisfecho de los resultados obtenidos?
MUY SATISFECHO
SATISFECHO INSATISFECHO NS/NR
(NO HA HECHO TRAMITES)
32E. La Policía 1 2 3 8 9
32G. Los Juzgados o los Tribunales de Justicia
1 2 3 8 9
32H. El Ministerio Público 1 2 3 8 9
32I. La municipalidad 1 2 3 8 9
35A En varias comunidades se han linchado a supuestos delincuentes. Algunos dicen que cuando las autoridades no cumplen
con su responsabilidad la gente puede hacer justicia con su propia mano, otros dicen que no debe recurrirse a esas medidas. Con qué opinión está usted más de acuerdo?
1. DE ACUERDO CON JUSTICIA PROPIA 2. SOLO EN ALGUNAS OCASIONES DEBE RECURRIRSE A ESO 3. NUNCA DEBE HACERSE JUSTICIA POR MANO PROPIA 8. NO SABE/NO RESPONDE

Cultura Demo crática - Guatemala, Julio 20, 1999 (versión 10)
35B ¿Con cuáles de las siguientes frases está usted más de acuerdo? Para que las autoridades puedan luchar contra la delincuencia, nunca deberían violar las reglas o leyes o algunas veces tienen que violar las reglas o leyes. 1. NUNCA DEBERÍAN VIOLAR LAS REGLAS O LEYES 2. ALGUNAS VECES TIENEN QUE VIOLAR LAS REGLAS O LEYES 8. NO SABE/NO RESPONDE 35C Cuando se trata de combatir la delincuencia común, ¿con qué frase está más de acuerdo? Parar la delincuencia, aunque a veces se violan los derechos de la persona acusada, o nunca se debe violar los derechos
de la persona acusada.
1. PARAR LA DELINCUENCIA, AUNQUE A VECES SE VIOLAN LOS DERECHOS DE LA PERSONA ACUSADA, O 2. NUNCA SE DEBE VIOLAR LOS DERECHOS DE LA PERSONA ACUSADA 8. NO SABE/NO RESPONDE 35D Cuando se tienen serias sospechas de las actividades criminales de una persona, ¿cree usted que:
Se debería esperar a que el juzgado de la orden respectiva, o la policía debe entrar a su casa sin necesidad de una orden judicial.
1. SE DEBERÍA ESPERAR A QUE EL JUZGADO DE LA ORDEN RESPECTIVA, O
2. LA POLICÍA DEBE ENTRAR A SU CASA SIN NECESIDAD DE UNA ORDEN JUDICIAL 8. NO SABE/NO RESPONDE 35E ¿Qué cree usted que es mejor? Vivir en una sociedad ordenada aunque se limiten algunas libertades, o respetar todos los
derechos y libertades, aun si eso causa algo de desorden. 1. VIVIR EN UNA SOCIEDAD ORDENADA AUNQUE SE LIMITEN ALGUNAS LIBERTADES, O 2. RESPETAR TODOS LOS DERECHOS Y LIBERTADES, AUN SI ESO CAUSA ALGO DE DESORDEN. 8. NO SABE/NO RESPONDE 35F ¿Con cuál opinión está usted más de acuerdo: Algunas personas tienen ideas tan extrañas que es mejor limitarles su
derecho de expresarse, o nunca se debería limitar el derecho de expresarse a una persona, no importando que tan extremas sean sus ideas.
1. ALGUNAS PERSONAS TIENEN IDEAS TAN EXTRAÑAS QUE ES MEJOR LIMITARLES SU
DERECHO DE EXPRESARSE, O 2. NUNCA SE DEBERÍA LIMITAR EL DERECHO DE EXPRESARSE A UNA PERSONA, NO IMPORTANDO
QUE TAN EXTREMAS SEAN SUS IDEAS 8. NO SABE/NO RESPONDE 35G ¿Con cuál opinión esta usted más de acuerdo: Que para proteger los valores morales de la sociedad algunas veces hay
que prohibir que algunas ideas y comentarios sean transmitidas por televis ión, o no se debe controlar lo que es transmitido por televisión.
1. QUE PARA PROTEGER LOS VALORES MORALES DE LA SOCIEDAD ALGUNAS VECES HAY QUE PROHIBIR QUE ALGUNAS IDEAS Y COMENTARIOS SEAN TRANSMITIDAS POR TELEVISIÓN.
2. NO SE DEBE CONTROLAR LO QUE ES TRANSMITIDO POR TELEVISIÓN 8. NO SABE/NO RESPONDE 36 [URG21B10.]¿Cree usted que en nuestro país hace falta un gobierno de mano dura, o que los problemas pueden
resolverse con la participación de todos? 1 MANO DURA 7 NO SABE 2 PARTICIPACIÓN DE TODOS 8 NO RESPONDE

Cultura Demo crática - Guatemala, Julio 20, 1999 (versión 10)
36A. ¿Cree usted que el ejército debería combatir la delincuencia o que sólo la policía debería hacerse cargo de esos asuntos? 1 EL EJÉRCITO DEBERÍA PARTICIPAR EN LA LUCHA CONTRA LA DELINCUENCIA
2 SOLO LA POLICÍA DEBERÍA ENCARGARSE DE COMBATIR LA DELINCUENCIA 8 NO SABE/NO RESPONDE 36B ¿Qué tan seguro se siente usted de caminar por la noche en su vecindario? Muy seguro, mas o menos seguro, un poco
inseguro o bastante inseguro. 1 MUY SEGURO 2 MAS O MENOS SEGURO
3 UN POCO INSEGURO 4. BASTANTE INSEGURO 8. NO SABE/NO RESPONDE
Si usted decidiera participar en algunas de las actividades que le voy a mencionar, ¿lo haría usted con toda libertad, con un poco de miedo, o con mucho miedo? VAYA LEYENDO LA LISTA, REPITIENDO LA PREGUNTA SI ES NECESARIO, Y ANOTANDO LAS RESPUESTAS CON EL CÓDIGO CORRESPONDIENTE, EN LA HOJA DE RESPUESTAS: CON
LIBERTAD POCO
MIEDO MUCHO MIEDO
NS/NR
40 [DERECHO1.]Participar en resolver problemas de su comunidad 1 2 3 8
41 [DERECHO2.]Votar en una elección nacional 1 2 3 8 42 [DERECHO3.]Participar en una manifestación pacífica 1 2 3 8
43 [DERECHO4.]Postularse para un cargo de elección popular 1 2 3 8 La gente a veces realiza actividades para lograr algún objetivo popular. ¿Dígame si usted aprueba o desaprueba que esta gente... VAYA LEYENDO LA LISTA, REPITIENDO LA PREGUNTA SI ES NECESARIO, Y ANOTANDO LAS RESPUESTAS CON EL CÓDIGO CORRESPONDIENTE, EN LA HOJA DE RESPUESTAS

Cultura Democrática - Guatemala, Julio 20, 1999 (versión 10)
SI NO INDIFERENTE NS/NR
44 [E5.]...participe en manifestaciones permitidas por la Ley? 1 2 3 8 45 ...cierre una calle o carretera 1 2 3 8 46 [E14.]...invada casas desocupadas, o terrenos desocupados? 1 2 3 8 47 [E2.]...ocupe fábricas, oficinas o edificios? 1 2 3 8 48 [E3.]...trate de derrocar por la fuerza un gobierno que ha sido elegido
por el pueblo? 1 2 3 8
49 [E8.]...participe en asociaciones o grupos para tratar de resolver problemas de la comunidad?
1 2 3 8
50 [E11.]...trabaje por un partido o un candidato durante la campaña electoral?
1 2 3 8
De las instituciones y personas que leeré a continuación, voy a pedirle que me diga si tiene mucha, poca o ninguna confianza en ellas. ¿Confía usted mucho, poco o nada en... VAYA LEYENDO LA LISTA, REPITIENDO LA PREGUNTA SI ES NECESARIO, Y ANOTANDO EN LA HOJA DE RESPUESTAS CON EL CÓDIGO CORRESPONDIENTE MUCHA POCA NADA NS/NR 51 [B1.]Los Tribunales de Justicia? 1 2 3 8 52 [B13.]El Congreso de la República? 1 2 3 8 53 [B14.]El actual Gobierno? 1 2 3 8 54 [B15.]El Procurador de los Derechos Humanos? 1 2 3 8 55 [B11.]El Tribunal Supremo Electoral? 1 2 3 8 56 [B2.] Otras oficinas públicas? 1 2 3 8 57 [B12.]El Ejército Nacional? 1 2 3 8 58 [B17.]Los Partidos Políticos? 1 2 3 8
58A La Corte de Constitucionalidad? 1 2 3 8 58B En su Municipalidad? 1 2 3 8
58C El Ministerio Público? 1 2 3 8
58D La Policía? 1 2 3 8
60 [B4.] ¿Se siente usted muy orgulloso, un poco orgulloso o nada orgulloso del sistema de gobierno en Guatemala? 1 MUY ORGULLOSO 2 UN POCO ORGULLOSO 3 NADA ORGULLOSO 8 NO SABE/NO RESPONDE 60A ¿Se siente usted muy orgulloso, un poco orgulloso o nada orgulloso de ser guatemalteco? 1 MUY ORGULLOSO 2 UN POCO ORGULLOSO 3 NADA ORGULLOSO 8 NO SABE/NO RESPONDE

Cultura Democrática - Guatemala, Julio 20, 1999 (versión 10)
60B En una palabra, ¿me puede decir qué es la democracia? [NO LEER OPCIONES] 01. LIBERTAD 06. LEGALIDAD 02. ELECCIONES LIBRES 07. CAPITALISMO, LIBRE EMPRESA 03. IGUALDAD 10. PARTICIPACIÓN 04. FORMA DE GOBIERNO 11. DERECHO/JUSTICIA 05. BIENESTAR, PROGRESO 88. NO SABE/NO RESPONDE 60C. ¿Con cuál de las siguientes tres frases está usted más de acuerdo? 1 LA DEMOCRACIA ES PREFERIBLE A CUALQUIER OTRA FORMA DE GOBIERNO 2 EN ALGUNAS CIRCUNSTANCIAS, UN GOBIERNO AUTORITARIO PUEDE SER PREFERIBLE A UNO DEMOCRÁTICO 3 A LA GENTE NOS DA LO MISMO UN RÉGIMEN DEMOCRÁTICO QUE UN RÉGIMEN NO DEMOCRÁTICO 8 NO SABE/NO RESPONDE 61 [M1.]¿Cree usted que el gobierno del Presidente Arzú está trabajando muy bien..., bien..., mal... o muy mal? TRATE DE LOGRAR UNA RESPUES TA DEFINIDA. SOLO EN CASO EXTREMO, ANOTE LA RESPUESTA "REGULAR" 1 MUY BIEN 5 REGULAR 2 BIEN 7 NO SABE 3 MAL 8 NO RESPONDE 4 MUY MAL Si usted pudiera calificar al gobierno del Presidente Arzú en ciertas cosas que ha hecho o ha dejado de hacer, ¿cómo diría que ha trabajado en los siguientes aspectos? LEER CADA UNA MUY
BIEN BIEN MAL MUY
MAL NS/ NR
61.A1 Combatir la delincuencia? 1 2 3 4 8
61.A2 Combatir la corrupción en el gobierno? 1 2 3 4 8
61.A3 Mejorar la salud? 1 2 3 4 8
61.A4 Ayudar en la educación de los niños? 1 2 3 4 8
61.A5 Cumplir los acuerdos de paz? 1 2 3 4 8
61B Teniendo en cuenta su experiencia o lo que ha oído, ¿la corrupción de los funcionarios públicos está muy generalizada,
poco generalizada o nada generalizada? 1. MUY GENERALIZADA 2. POCO GENERALIZADA 3. NADA GENERALIZADA 8 NO SABE/NO RESPONDE

Cultura Democrática - Guatemala, Julio 20, 1999 (versión 10)
62 [WC1.] ¿Durante el conflicto armado, sufrió usted o algún miembro de su familia algún tipo de violencia política, como secuestros, asesinatos, bombas, o matanzas?. 1 SI 2 NO 8 NO SABE/NO RESPONDE 62A. ¿Considera usted que las personas cuyos familiares fueron víctimas de la violencia política, deberían buscar que se haga
justicia o eso ya es cosa del pasado y es mejor para el país que las cosas se queden como están? 1. DEBERÍA HACERSE JUSTICIA 2. SOLO EN ALGUNOS CASOS DEBERÍA HACERSE JUSTICIA 3. ES MEJOR PARA EL PAIS QUE NO BUSQUEN JUSTICIA 8. NO RESPONDE ¿Cree usted que las personas o instituciones que voy a mencionar, le dan a los indígenas igual, mejor o peor trato que a los ladinos? VAYA LEYENDO LA LISTA, REPITIENDO LA PREGUNTA SI ES NECESARIO, Y ANOTANDO LAS RESPUESTAS CON EL CÓDIGO CORRESPONDIENTE, EN LA HOJA DE RESPUESTAS: MEJOR IGUAL PEOR N/S N/R 69 [IND1]La Policía 1 2 3 8 70 [IND2]El Ejército 1 2 3 8 71 [IND3]Los Tribunales de Justicia 1 2 3 8 72 [IND4]Los maestros de las escuelas 1 2 3 8 72A. Guatemala es un país con muchas culturas. ¿Cree usted que las diferentes culturas deberían unificarse o cada cultura
debe de mantener su propia identidad? 1. DEBERÍAN UNIRSE 2. DEBERÍAN MANTENER SUS PROPIAS CULTURAS 8. NO SABE/NO RESPONDE 72B. ¿Cree usted que es probable que en Gu atemala se de un conflicto étnico en el futuro? 1. ES MUY PROBABLE 2. ES POCO PROBABLE 3. NO ES PROBABLE 8. NO SABE/NO RESPONDE 74 ¿Puede decirme el nombre de algún diputado de este departamento? (ESCRIBALO TEXTUALMENTE EN LA HOJA DE RESPUESTAS Y CODIFIQUELO DESPUÉS) 1. CORRECTO 2. INCORRECTO 7. NO SABE 8. NO RESPONDE 75 [GI1A.]¿Puede decirme el nombre del actual Vicepresidente de nuestro país? 1 CORRECTO = LUIS FLORES ASTURIAS 2 INCORRECTO 7 NO SABE
Cultura Democrática - Guatemala, Julio 20, 1999 (versión 10)
8 NO RESPONDE 76 [GI7.]¿Puede decirme el nombre del actual Presidente de México? 1 CORRECTO = ERNESTO ZEDILLO 2 INCORRECTO 7 NO SABE 8 NO RESPONDE 76A ¿Puede decirme el nombre del Presidente de Estados Unidos? 1 CORRECTO= (WILLIAM) BILL CLINTON 2 INCORRECTO 7 NO SABE 8 NO RESPONDE 77 [IT1]¿Cree usted que la mayoría de la gente es confiable, poco confiable o nada confiable? 1 CONFIABLE 2 POCO CONFIABLE 3 NADA CONFIABLE 7 NO SABE 8 NO RESPONDE 78 [IT2.]¿Cree usted que la mayoría de la gente se preocupa sólo por sí misma o trata de ayudar al prójimo? 1 SOLO POR SI MISMO 2 AYUDAN AL PRÓJIMO 7 NO SABE 8 NO RESPONDE 79 [IT3.]¿Cree usted que la mayoría de la gente, si tienen oportunidad, trataría de aprovecharse de usted, o cree que no se aprovecharía? 1 LA MAYORÍA SE APROVECHARÍA 2 LA MAYORÍA NO SE APROVECHARÍA 7 NO SABE 8 NO RESPONDE 80A Considera usted que los acuerdos de paz son ¿muy buenos para el país, un poco buenos o no son buenos? 1 MUY BUENOS 2 UN POCO 3 NO SON BUENOS 8 NO SABE/ NO RESPONDE 80B En esta escala, políticamente, ¿dónde se ubicaría usted? [USAR TARJETA] 1 2 3 4 5 6 7 8 9 10 88 NS/NR .............................................. ................................ IZQUIERDA CENTRO DERECHA
85 [PP2.]¿Alguna vez ha trabajado por algún partido o por algún candidato durante una campaña electoral? 1 SI 2 NO 8 NO RESPONDE
Cultura Democrática - Guatemala, Julio 20, 1999 (versión 10)
86 [PP1.]En tiempos de elecciones, ¿acostumbra usted aconsejar o tratar de convencer a otras personas por quién votar? ¿Esto lo hace usted mucho, poco o nunca? 1 MUCHO 2 POCO 3 NUNCA 8 NO RESPONDE Voy a leerle algunos de los problemas que tenemos en el país, para que me diga quién cree usted que puede solucionarlos mejor; si un gobierno civil electo por el pueblo, un gobierno militar electo por el pueblo o un gobierno militar impuesto por la fuerza: VAYA LEYENDO LA LISTA, REPITIENDO LA PREGUNTA SI ES NECESARIO, Y ANOTANDO LAS RESPUESTAS CON EL CÓDIGO CORRESPONDIENTE, EN LA HOJA DE RESPUESTAS: GOBIERNO
CIVIL ELECTO
GOBIERNO MILITAR ELECTO
GOBIERNO MILITAR
IMPUESTO
NINGUNO
N/S N/R
89 [DD1.]El desempleo 1 2 3 4 8 90 [DD2.]Los abusos contra trabajadores y campesinos 1 2 3 4 8 91 [DD4.]La violencia política 1 2 3 4 8 92 [DD5.]La pobreza 1 2 3 4 8 93 [DD6.]Las deudas que tenemos con otros países 1 2 3 4 8 94 [DD7.]La inmoralidad de la gente 1 2 3 4 8 95 El costo de la vida 1 2 3 4 8 96 [DD9.]La delincuencia común 1 2 3 4 8 97 [DD11.]La corrupción en el gobierno 1 2 3 4 8 98 [BC15.]¿Cree usted que alguna vez puede haber razón suficiente para que los militares ocupen el gobierno por la fuerza
a través de un golpe de estado, o cree que nunca hay suficiente razón para eso? 1 SI PODRÍA HABER RAZÓN 2 NUNCA HABRÍA RAZÓN 8 NO SABE/NO RESPONDE Hay personas que siempre hablan mal, o están en contra de lo que hace el gobierno, sea el gobierno actual, el pasado o el que viene Dígame si está usted de acuerdo o en desacuerdo con que esas personas... VAYA LEYENDO LA LISTA, REPITIENDO LA PREGUNTA SI ES NECESARIO, Y ANOTANDO LAS RESPUESTAS CON EL CÓDIGO CORRESPONDIENTE, EN LA HOJA DE RESPUESTAS: DE ACUERDO DESACUERDO N/R 99 [D1.]...voten? 1 2 8 100 [D2.]...partic ipen en protestas o manifestaciones pacíficas? 1 2 8 101 [D3.]...se propongan para ser electos para cargos públicos
(por ejemplo, diputados) 1 2 8
102 [D4.]...usen la radio o la televisión para sus expresiones? 1 2 8

Cultura Democrática - Guatemala, Julio 20, 1999 (versión 10)
107 [ACR1]En relación con la necesidad de hacer cambios de la forma en que está organizada nuestra sociedad, voy a
plantearle tres opciones, para que me diga cuál le parece mejor: Cambios radicales por una revolución, reformas graduales, debemos defenderla tal como está
1 CAMBIOS RADICALES POR UNA REVOLUCIÓN 2 REFORMAS GRADUALES 3 DEBEMOS DEFENDERLA TAL COMO ESTÁ 7 NO SABE 8 NO RESPONDE 107A ¿Sería mejor para el país que más mujeres ocupen cargos públicos, o esto sería malo para el país?
4. QUE MAS MUJERES OCUPEN CARGOS PÚBLICOS 5. SERIA MALO
81. NO SABE/NO RESPONDE 107B ¿Cree usted que en este país el grado de la violencia contra las mujeres es: Muy grave, algo grave, no tan grave, grave, no grave o no es un problema.
4. MUY GRAVE 5. ALGO GRAVE 6. NO TAN GRAVE 7. GRAVE 8. NO GRAVE 9. NO ES UN PROBLEMA
9. NO SABE/NO RESPONDE Como últimas preguntas, le voy a pedir algunos datos personales: 108 [Q1C.]¿Se considera usted indígena, o ladino? 1 INDÍGENA 2 LADINO 7 NO SABE 8 NO RESPONDE 108a Voy a mencionarle varios grupos de personas y quisiera que me indicara con cuáles de ellos usted se siente mejor:
Con los indígenas de su comunidad, con los ladinos de su comunidad , con los indígenas de otras partes del país, con los ladinos de otras partes del país.
1 CON LOS INDÍGENAS DE SU COMUNIDAD? 2 CON LOS LADINOS DE SU COMUNIDAD? 3 CON LOS INDÍGENAS DE OTRAS PARTES DEL PAÍS? 4 CON LOS LADINOS DE OTRAS PARTES DEL PAÍS? NO LEER LAS SIGUIENTES OPCIONES, SOLO ANOTAR SI LAS RESPUESTAS COINCIDEN 5 CON TODOS? 6 CON NINGUNO? 7 NO SABE 8 NO RESPONDE

Cultura Democrática - Guatemala, Julio 20, 1999 (versión 10)
109 [Q1B.]¿Habla usted algún idioma indígena? SI LA RESPUESTA ES QUE HABLA MAS DE UN IDIOMA INDÍGENA, ANOTE EL IDIOMA NATIVO.
SI EL IDIOMA NATIVO ES EL ESPAÑOL, ANOTE EL IDIOMA INDÍGENA QUE MAS UTILIZA EN LA ACTUALIDAD 1 KAQCHIKEL 2 MAM 3 Q'EQCHI' 4 K'ICHE' 5 NINGUNO 6 IXIL 7 OTRO (ESPECIFIQUE)______________ 8 NO RESPONDE 110 [ED.]¿Cuál fue el último grado que aprobó usted en la escuela? 88 NO RECUERDA/NO RESPONDE SIGA A LA PRÓXIMA PREGUNTA 00 NO FUE A LA ESCUELA SIGA A LA PRÓXIMA PREGUNTA 01 1ero. DE PRIMARIA SIGA A LA PRÓXIMA PREGUNTA 02 2do. DE PRIMARIA SIGA A LA PRÓXIMA PREGUNTA 03 3ro. DE PRIMARIA SIGA A LA PRÓXIMA PREGUNTA 04 4to. DE PRIMARIA SIGA A LA PRÓXIMA PREGUNTA 05 5to. DE PRIMARIA SIGA A LA PRÓXIMA PREGUNTA 06 6to. DE PRIMARIA . . . . . . . . . . . . . . . . . . . . . . . . . . . . . . . . . . . . . . . . . . . . . . . . . . . . SIGA A LA PRÓXIMA PREGUNTA 07 1ro. BÁSICO . . . . . . . . . . . . . . . . . . . . . . . . . . . . . . . . . . . . . . . . . . . . . . . . . . MARQUE 9 EN LA 111 Y PASE A LA PREGUNTA 112 08 2do. BÁSICO IDEM 09 3ro. BÁSICO IDEM 10 4to. SECUNDARIA IDEM 11 5to. SECUNDARIA IDEM 12 6to. SECUNDARIA IDEM 13 UNIVERSIDAD INCOMPLETA IDEM 14 UNIVERSIDAD COMPLETA IDEM 15 POST-GRADO IDEM _______________________________________________________________ PARA LOS QUE TIENEN 6 AÑOS O MENOS, DE ESCOLARIDAD 111 ¿Sabe usted leer y escribir? 1 SI 2 NO 8 NO RESPONDE 9 NO APLICA (6 Años o más de escolaridad) 112 [Q3.]¿Cuál es su religión? 1 CATÓLICA 2 CRISTIANA NO CATÓLICA 3 OTRA NO CRISTIANA 4 NINGUNA

Cultura Democrática - Guatemala, Julio 20, 1999 (versión 10)
8 NO RESPONDE 113A ¿Cuál es su estado civil? 1. SOLTERO [NO DIVORCIADO] 4. DIVORCIADO/SEPARADO 2. CASADO 5. VIUDO 3. UNIDO DE HECHO 113B ¿Tiene usted hijos? (SI DICE “SÍ,”) CUANTOS?____________________ [00 = no tiene hijos] 113C ¿Cual es su ocupación? 01. PROFESIONAL 02. OFICINISTA 03. TRABAJADOR DE FABRICA 04. TRABAJADOR RURAL 05. SOLDADO/POLICÍA 06. DUEÑO O PROPIETARIO 07. ESTUDIANTE 08. CHOFER 09. EMPLEADA DOMESTICA 10. AMA DE CASA 11. MAESTRO 12. TÉCNICO 13. OTRO 88. NO RESPONDE 115 [Q6.]¿Trabaja usted y recibe pago o ingresos en dinero por su trabajo? 1. SI 2. NO............................... MARQUE 99 NO APLICA EN LA P.115A Y PASE A LA P115B. 8. NO RESPONDE 9. NO APLICA 115A [Q8.] ¿Cuánto gana, o recibe usted cada mes por su trabajo? UBIQUE LA RESPUESTA EN EL RANGO QUE CORRESPONDA 00. MENOS DE Q.100 07. Q.1,751 - Q. 2,000 01. Q.101 - Q. 200 08. Q.2,001 - Q. 3,000 02. Q.201 - Q. 500 09. Q.3,001 - Q. 4,000 03. Q.501 - Q. 750 10. Q.4,001 - Q. 5,000 04. Q.751 - Q. 1,000 11. Q.5,001 - Q. 7,000 05. Q.1,001 - Q. 1,500 12. Q.7,001 - Q. 10,000 06. Q.1,501 - Q. 1,750 13. Q.10,001 - Q. 15,000
14. MAS DE Q. 15,000 88 NO RESPONDE

Cultura Democrática - Guatemala, Julio 20, 1999 (versión 10)
99 NO APLICA 115B [Q9.]¿Entre todas las personas de este hogar, que trabajan, cuánto ganan o reciben por mes? UBIQUE LA RESPUESTA EN EL RANGO QUE CORRESPONDA 00. MENOS DE Q.100 07. Q.1,751 - Q. 2,000 01. Q.101 - Q. 200 08. Q.2,001 - Q. 3,000 02. Q.201 - Q. 500 09. Q.3,001 - Q. 4,000 03. Q.501 - Q. 750 10. Q.4,001 - Q. 5,000 04. Q.751 - Q. 1,000 11. Q.5,001 - Q. 7,000 05. Q.1,001 - Q. 1,500 12. Q.7,001 - Q. 10,000 06. Q.1,501 - Q. 1,750 13. Q.10,001 - Q. 15,000
14. MAS DE Q. 15,000 77. NO SABE 88. NO RESPONDE
Finalmente, ¿podría decirme si en su casa tienen... NO TIENE TIENE UNO MAS DE UNO N/R
116 [ ]Radio 1 2 3 8 117 [R1.]Televisor a color 1 2 3 8 118 [R2.]Televisor blanco y negro 1 2 3 8 119 [R3.]Refrigerador 1 2 3 8 120 [R6.]Lavadora 1 2 3 8 121 [R5.]Automóvil o tractor 1 2 3 8
122 [R4.]Teléfono 1 2 3 8 122a [ ] Microonda 1 2 3 8 122b [ ] Aspiradora 1 2 3 8 122c [ ] Computadora 1 2 3 8 122d [ ] Estéreo 1 2 3 8 123 [R12.]¿Con qué cocinan en su casa (qué combustible se emplea para cocinar)? 1 LEÑA 5 ELECTRICIDAD 2 CARBÓN 6 OTRO [NO ESPECIFIQUE] 3 KEROSINA LIQUIDO 8 NO RESPONDE 4 GAS PROPANO __________________________________________________________________________ AGRADEZCA LA ENTREVISTA Y DESPÍDASE ========================================================================== CONCLUIDA LA ENTREVISTA, ANOTE LO SIGUIENTE EN LA HOJA DE RESPUESTAS:

Cultura Democrática - Guatemala, Julio 20, 1999 (versión 10)
MARQUE EN LA HOJA DE RESPUESTAS EN LA CASILLA IDIOMA, EL IDIOMA EN QUE SE REALIZO LA ENTREVISTA 1. ESPAÑOL 2. MAM 3. Q’EQCHI’ 4. KAQCHIKEL 5. K’ICHE’ 6. IXIL _________________________________________________________________ 124 [IDIOMA2.]La entrevista se realizó... 1 ...totalmente en español. 2 ...más en español que en lengua indígena. 3 ...mitad en español y mitad en lengua indígena. 4 ...más en lengua indígena que en español. 5 ...totalmente en lengua indígena. __________________________________________________________________________ 125 [ ]¿Vestía el entrevistado traje indígena? 1 SI 2 NO ___________________________________________________________________________ 126 [R11.]¿Qué material pudo observar que predomina en las paredes de la casa? 1 CARTÓN/LAMINAS/OTRO SIMILAR 5 MADERA TRABAJADA 2 CAÑAS 6 ADOBE 3 BAJAREQUE 7 LADRILLO/BLOCK/CONCRETO 4 TABLAS 8 OTRO [NO ESPECIFIQUE] __________________________________________________________________________ OBSERVE: ¿Tiene la vivienda... CODIFIQUE SU OBSERVACIÓN EN LA HOJA DE RESPUESTAS SI NO NO SE VIO 127 [R8.]...luz eléctrica? 1 2 3 128 [R9.]...agua entubada? 1 2 3 130 [R10.]OBSERVE: ¿Qué clase de servicio sanitario tiene la casa? CODIFIQUE SU OBSERVACIÓN EN LA HOJA DE RESPUESTAS 1 NO TIENE 2 LETRINA 3 CUARTO(S) DE BAÑO 4 OTRO [NO ESPECIFIQUE] 5 NO SE VIO 131 [R13.]OBSERVE: ¿El local de habitación consiste en...

Cultura Democrática - Guatemala, Julio 20, 1999 (versión 10)
1 ...un solo cuarto? 2 ...más de un cuarto? 3 NO SE VIO __________________________________________________________________________ INSTRUCCIONES PARA EL ENTREVISTADOR PONGA SU NOMBRE Y LUGAR DONDE HIZO LA ENTREVISTA.