fpwatch study reference document india outlet …...ankit sharma ankur kumar anurag verma anurag...
TRANSCRIPT

www.FPwatch.info Copyright © Population Services International (PSI). All rights reserved.
FPwatch Study Reference Document
INDIA
Outlet Survey
2016

www.FPwatch.info Page 0
Released May 2017 Suggested citation FPwatch Group. (2017). FPwatch Study Reference Document: Uttar Pradesh and Bihar States, India 2016. Washington DC: PSI. Contact
Tarryn Haslam Deputy Director, Malaria & Child Survival PSI | 1120 19th St NW Suit 600 Washington DC 20036 [email protected]
Dr. Vivek Sharma Director of Research and Evaluation PSI/India|C-445, Chittranjan Park New Delhi - 110019 +91-11 - 47312200 / 210 Email: [email protected]
Acknowledgements FPwatch is funded by the Bill and Melinda Gates Foundation. This study was implemented by Population Services International.
PSI - India Dr. Vivek Sharma P. Prabhu Tariq Mohd FPwatch Team Dr. Bryan Shaw Dr. Katie Bates Dr. Nirali Chakraborty Dr. Justin Rahariniaina Patrick ‘Mac’ Schoen, MSc Keith Esch Rachel Thompson Pravinkumar Sharma Katherine ‘Kate’ Thanel Aliza Lailari Danielle Garfinkel Christina Riley Catherine Hurley Tarryn Haslam Dr. Megan Littrell Jen Pope Technical Advisory Group Dr. Jane Bertrand Veronique Dupont Janine Hum Amy Lin Dr. Scott Radloff Dr. Prashant Yadav TNS Team Pramod Bhatt Sachin Singhal Swapnil Gupta Honey Arora Field Coordinators Praveen Kumar Arjun Kumar Anish Sharma
Field Supervisors Prabhat Kumar Sinha Mritunjaya Kumar Santosh Kumar Vijay Kumar Vinod Kumar Man Singh Arjun Kumar Field Quality Controllers Pranshul Kumar Sandeep Mishra Rohit Sharma Adil Khan Sudeep Kumar Karan Kasyap Gyanendra Kumar Netra Pal Singh Akhilesh Singh Gaurav Yadav Dharmendra Singh Rahul Gupta Devendra Kumar Sahu Narayan Pathak Interviewers Abhay Kumar Sinha Adil Khan Aditiya Kumar Ajad Miyan Ajay Kumar Alok Kumar Alok Kumar Pandey Alok Kumar Shula Aman Kumar Mishra Ambuj Kumar Amit Kumar Amrish Kumar Ankit Kumar Ankit Sharma Ankur Kumar Anurag Verma
Anurag Yadav Arun Kumar Arvind Kumar Ashish Pandey Ashok Kumar Avinash Kumar Avinash Mishra Babloo Kumar Bhanu Pratap Singh Bhuvnesh Verma Bijendra Sharma Chandan Singh Chandra Prakash Chhiij Kumar Deepak Kumar Deepak Kumar Dhiraj Kumar Dhirendra Kumar Dilip Kumar Dilip Kumar Dinesh Kumar Durgadeen Gajendra Mandal Gangaram Gaurav Singh Harveer Singh Himanshu Indal Kumar Jay Shankay Kumar Jitendra Kumar Kanchan Kumar Kuldeep Kumar Kuldip Kumar Lalit Gupta Manish Kumar Manoj Kumar Mmithlesh Paswan Mukesh Kumar Munendra Kumar Nikhil Kumar Nityanand Pandey Om Prakash
Ovendra Kumar Pankaj Singh Patandeen Pradeep Kr. Pandey Pradeep Kumar Pramod Kumar Prasant Kumar Awsthi Prashant Singh Prince Kumar Tiwari Puspendra Kr.Kushwaha Rahul Kumar Rahul Pandey Raj Kishor Yadav Rajbalam Kumar Rajendra Kumar Rajit Kumar Raushan Kumar Ravi Kasaudhan Ravi Kasoudhan Ravi Kumar Awasthi Ravi Kumar Mishra Ravi Kumar Tiwari Ravi Prakash Rinku Singh Ritesh Singh Rohit Sanjay Singh Sanjeev Kumar Shishank Bhardwaj Shiv Mohan Shiv Raj Shiv Saran Tiwari Shiv Shankar Shiva Ji Awsthi Shivam Bajpai Shivam Gupta Shivendra Ku Mishra Shivendra Mishra Sikandar Ali Siv Shankar Sohan Kumar Suhel Zia
Suraj Kumar Tazim Hussain Tilakdhari Singh Uday Pratap Singh Umesh Kumar Vijay Kumar Vijay Kumar Vikrant Kumar Vinay Kr. Pandey Vinod Kumar

www.FPwatch.info Page 1
Table of Contents
LIST OF TABLES ............................................................................................................................................ 2
LIST OF FIGURES .......................................................................................................................................... 4
ACRONYMS ................................................................................................................................................. 6
DEFINITIONS ................................................................................................................................................ 7
INTRODUCTION ......................................................................................................................................... 11
SUMMARY OF METHODS AND DATA COLLECTION .................................................................................. 12
SUMMARY OF KEY FINDINGS .................................................................................................................... 15
UTTAR PRADESH ....................................................................................................................................... 15
UTTAR PRADESH METRO / URBAN / RURAL GEOGRAPHIC STRATA ......................................................... 40
BIHAR ........................................................................................................................................................ 79
BIHAR METRO / URBAN / RURAL GEOGRAPHIC STRATA ........................................................................ 103
ANNEXES ................................................................................................................................................. 143 ANNEX 1: FPWATCH BACKGROUND .......................................................................................................................... 143 ANNEX 2: INDIA FP BACKGROUND ............................................................................................................................ 145 ANNEX 3: OUTLET SURVEY METHODS ....................................................................................................................... 149 ANNEX 4: SAMPLED CLUSTERS ................................................................................................................................. 153 ANNEX 5: MAP OF SAMPLED CLUSTERS ..................................................................................................................... 168 ANNEX 6: DETAILED SAMPLE DESCRIPTIONS ............................................................................................................... 169 ANNEX 7: QUESTIONNAIRE ...................................................................................................................................... 173 ANNEX 8: DETAILED BRAND LISTING WITH QUALITY-ASSURANCE INDICATION .................................................................. 191 ANNEX 9. SAMPLING WEIGHTS ................................................................................................................................ 196 ANNEX 10: FPWATCH INDICATOR LIST ....................................................................................................................... 198 ANNEX 11. COUPLE-YEARS OF PROTECTION (CYP) ...................................................................................................... 211 ANNEX 12: CONTRACEPTIVE METHOD VOLUMES ........................................................................................................ 213

www.FPwatch.info Page 2
List of Tables
Core Indicators
Table A1: Modern contraceptive method market composition: Relative proportion of outlets with 1 or more methods, by outlet type – Uttar Pradesh, 2016 ....................................................................................... 15
Table A2: Availability of modern contraceptive method categories, among outlets screened, by outlet type – Uttar Pradesh, 2016 ................................................................................................................................. 16
Table A3: Availability of selected contraceptive commodities, among outlets screened, by outlet type – Uttar Pradesh, 2016 ........................................................................................................................................... 17
Table A4: Availability of modern contraceptive method diversity, among outlets screened, by outlet type – Uttar Pradesh, 2016 ........................................................................................................................................... 18
Table A5: Current stock out of selected modern contraceptive commodities on day of survey, among outlets reportedly stocking method in previous 3 months, by outlet type – Uttar Pradesh, 2016 ..................... 19
Table A6: Median price of selected modern contraceptive methods in INR*, USD, and USD per CYP†‡, by private outlet type – Uttar Pradesh, 2016 ............................................................................................................ 21
Table A7: Median markup percentage for selected modern contraceptive commodities with interquartile range, by private outlet type – Uttar Pradesh, 2016........................................................................................... 24
Table A8: Private sector contraceptive method market share: Relative proportion of total CYP sold / distributed, by method and outlet type – Uttar Pradesh ............................................................................................ 25
Table A9: Contraceptive method market share within outlet type: Relative proportion of total CYP sold / distributed within outlet type, by method – Uttar Pradesh, 2016 .......................................................... 26
Table A10: Availability of selected contraceptive services, among outlets screened, by outlet type – Uttar Pradesh, 2016 ........................................................................................................................................... 27
Table A11: Service readiness* to provide provider-dependent contraceptive services, among outlets reportedly offering the procedure, by outlet type – Uttar Pradesh, 2016 ................................................................ 28
Table B1: Modern contraceptive method market composition: Relative proportion of outlets with 1 or more methods, by outlet type – Uttar Pradesh Strata, 2016 ............................................................................ 40
Table B2: Availability of modern contraceptive method types, among outlets screened, by outlet type – Uttar Pradesh Strata, 2016 ................................................................................................................................ 41
Table B3: Availability of selected contraceptive methods, among outlets screened, by outlet type – Uttar Pradesh Strata, 2016 .............................................................................................................................................. 43
Table B4: Availability of modern contraceptive method diversity, among outlets screened, by outlet type – Uttar Pradesh Strata, 2016 ................................................................................................................................ 46
Table B5: Current stock out* of selected modern contraceptive commodities on day of survey, among outlets reportedly stocking method in previous 3 months, by outlet type – Uttar Pradesh Strata, 2016 .......... 48
Table B6: Median price of selected modern contraceptive methods in INR*, USD, and USD per CYP†‡, by private outlet type – Uttar Pradesh Strata, 2016 ................................................................................................. 50
Table B7: Median markup percentage for selected modern contraceptive commodities with interquartile range, by private outlet type – Uttar Pradesh Strata, 2016 ................................................................................ 57
Table B8: Private sector contraceptive method market share: Relative proportion of total CYP sold / distributed, by method and outlet type – Uttar Pradesh Strata, 2016 ........................................................................ 58
Table B9: Contraceptive method market share within outlet type: Relative proportion of total CYP sold / distributed within outlet type, by method – Uttar Pradesh Strata, 2016 ................................................ 61
Table B10: Availability of selected contraceptive services, among outlets screened, by outlet type – Uttar Pradesh Strata, 2016 ................................................................................................................................ 63

www.FPwatch.info Page 3
Table B11: Service readiness* to provide provider-dependent contraceptive services, among outlets reportedly offering the procedure, by outlet type – Uttar Pradesh Strata, 2016 ...................................................... 65
Table C1: Modern contraceptive method market composition: Relative proportion of outlets with 1 or more methods, by outlet type – Bihar, 2016 ..................................................................................................... 79
Table C2: Availability of modern contraceptive method types, among outlets screened, by outlet type – Bihar, 2016 .......................................................................................................................................................... 80
Table C3: Availability of selected contraceptive commodities, among outlets screened, by outlet type – Bihar, 2016 .......................................................................................................................................................... 81
Table C4: Availability of modern contraceptive method diversity, among outlets screened, by outlet type – Bihar, 2016 .......................................................................................................................................................... 82
Table C5: Current stock out* of selected modern contraceptive commodities on day of survey, among outlets reportedly stocking method in previous 3 months, by outlet type – Bihar, 2016 ................................... 83
Table C6: Median price of selected modern contraceptive methods in INR*, USD, and USD per CYP†‡, by private outlet type – Bihar, 2016 .......................................................................................................................... 84
Table C7: Median markup percentage for selected modern contraceptive commodities with interquartile range, by private outlet type – Bihar, 2016 ......................................................................................................... 87
Table C8: Private sector contraceptive method market share: Relative proportion of total CYP sold / distributed, by method and outlet type – Bihar .......................................................................................................... 88
Table C9: Contraceptive method market share within outlet type: Relative proportion of total CYP sold / distributed within outlet type, by method – Bihar, 2016 ........................................................................ 89
Table C10: Availability of selected contraceptive services, among outlets screened, by outlet type – Bihar, 2016 .................................................................................................................................................................. 90
Table C11: Service readiness* to provide provider-dependent contraceptive services, among outlets reportedly offering the procedure, by outlet type – Bihar, 2016 .............................................................................. 91
Table D1: Modern contraceptive method market composition: Relative proportion of outlets with 1 or more methods, by outlet type – Bihar Strata, 2016 ........................................................................................ 103
Table D2: Availability of modern contraceptive method types, among outlets screened, by outlet type – Bihar Strata, 2016 ............................................................................................................................................ 104
Table D3: Availability of selected contraceptive methods, among outlets screened, by outlet type – Bihar Strata, 2016 ........................................................................................................................................................ 106
Table D4: Availability of modern contraceptive method diversity, among outlets screened, by outlet type – Bihar Strata, 2016 ............................................................................................................................................ 109
Table D5: Current stock out* of selected modern contraceptive commodities on day of survey, among outlets reportedly stocking method in previous 3 months, by outlet type – Bihar Strata, 2016 ...................... 111
Table D6: Median price of selected modern contraceptive methods in INR*, USD, and USD per CYP†‡, by private outlet type – Bihar Strata, 2016 ............................................................................................................. 113
Table D7: Median markup percentage for selected modern contraceptive commodities with interquartile range, by private outlet type – Bihar Strata, 2016 ............................................................................................ 121
Table D8: Private sector contraceptive method market share: Relative proportion of total CYP sold / distributed, by method and outlet type – Bihar Strata, 2016 .................................................................................... 122
Table D9: Contraceptive method market share within outlet type: Relative proportion of total CYP sold / distributed within outlet type, by method – Bihar Strata, 2016 ............................................................ 125
Table D10: Availability of selected contraceptive services, among outlets screened, by outlet type – Bihar Strata, 2016 ........................................................................................................................................................ 127
Table D11: Service readiness* to provide provider-dependent contraceptive services, among outlets reportedly offering the procedure, by outlet type – Bihar Strata, 2016 .................................................................. 129
Table X1. Sampled Clusters .................................................................................................................................... 153

www.FPwatch.info Page 4
Table X2: CYP Conversion Factors .......................................................................................................................... 211
Table X3: Reported Contraceptive Method Volumes: Uttar Pradesh, 2016.......................................................... 213
Table X4: Reported Contraceptive Method Volumes: Uttar Pradesh, Metro, 2016 ............................................. 215
Table X5: Reported Contraceptive Method Volumes: Uttar Pradesh, Urban, 2016 .............................................. 217
Table X6: Reported Contraceptive Method Volumes: Uttar Pradesh, Rural, 2016 ............................................... 219
Table X7: Reported Contraceptive Method Volumes: Bihar, 2016 ........................................................................ 221
Table X8: Reported Contraceptive Method Volumes: Bihar, Metro, 2016 ........................................................... 223
Table X9: Reported Contraceptive Method Volumes: Bihar, Urban, 2016 ............................................................ 225
Table X10: Reported Contraceptive Method Volumes: Bihar, Rural, 2016 ........................................................... 227
Grey text for data appearing in report tables indicates that the estimate provided was derived from a small sample size. Specifically, grey text is used to indicate point estimates for availability indicators derived from an n of equal to or less than 50 and estimates for price indicators derived from an n of equal to or less than 5. Total contraceptive market share (table 8) is not shown for Uttar Pradesh or Bihar. Sterilization services are so concentrated into a few higher-level facilities that, with our small sample of these outlet types, the results would have been skewed, and would not have been an accurate portrayal of the total market.
List of Figures
Figure A1. Modern contraceptive method market composition – Uttar Pradesh, 2016......................................... 30
Figure A2. Percentage of modern contraceptive commodity-stocking outlets with selected contraceptives available – Uttar Pradesh, 2016 ............................................................................................................... 31
Figure A3. Percentage of outlets with selected method mixes available – Uttar Pradesh, 2016............................ 32
Figure A4. Percentage of outlets with stock outs of selected contraceptive methods – Uttar Pradesh, 2016 ....... 33
Figure A5. Price of contraceptive methods in the private sector – Uttar Pradesh, 2016 ........................................ 34
Figure A6. Price of contraceptive methods in the private sector – Uttar Pradesh, 2016 ........................................ 35
Figure A7. Percentage private sector market share for contraceptives methods – Uttar Pradesh, 2016 .............. 36
Figure A8. Within outlet market share for contraceptive methods – Uttar Pradesh, 2016 .................................... 37
Figure A9. Percentage of outlets with selected contraceptive services available – Uttar Pradesh, 2016 .............. 38
Figure A10. Service readiness to offer provider-dependent contraceptive services – Uttar Pradesh, 2016 .......... 39
Figure B1. Modern contraceptive method market composition – Uttar Pradesh Strata, 2016 .............................. 68
Figure B2. Percentage of modern contraceptive commodity-stocking outlets with selected contraceptives available – Uttar Pradesh Strata, 2016 ..................................................................................................... 69
Figure B3. Percentage of outlets with selected method mixes available – Uttar Pradesh Strata, 2016 ................. 70
Figure B4. Percentage of outlets with stock outs of selected contraceptive methods – Uttar Pradesh Strata, 2016 .................................................................................................................................................................. 71
Figure B5. Price of contraceptive methods in the private sector - Uttar Pradesh Metro, 2016.............................. 72
Figure B6. Price of contraceptive methods in the private sector - Uttar Pradesh Urban, 2016 .............................. 73
Figure B7. Price of contraceptive methods in the private sector - Uttar Pradesh Rural, 2016 ............................... 74
Figure B8. Percentage private sector market share for contraceptives methods – Uttar Pradesh Strata, 2016 .... 75
Figure B9. Within outlet private sector market share for contraceptive methods – Uttar Pradesh Strata, 2016 .. 76
Figure B10. Percentage of outlets with selected contraceptive services available – Uttar Pradesh Strata, 2016 .. 77
Figure B11. Service readiness to offer provider-dependent contraceptive services – Uttar Pradesh Strata, 2016 78
Figure C1. Modern contraceptive method market composition – Bihar, 2016 ....................................................... 93

www.FPwatch.info Page 5
Figure C2. Percentage of modern contraceptive commodity-stocking outlets with selected contraceptives available – Bihar, 2016 ............................................................................................................................. 94
Figure C3. Percentage of outlets with selected method mixes available – Bihar, 2016 .......................................... 95
Figure C4. Percentage of outlets with stock outs of selected contraceptive methods – Bihar, 2016 ..................... 96
Figure C5. Price of contraceptive methods in the private sector – Bihar, 2016 ...................................................... 97
Figure C6. Price of contraceptive methods in the private sector – Bihar, 2016 ...................................................... 98
Figure C7. Percentage private market share for contraceptives methods – Bihar, 2016 ........................................ 99
Figure C8. Within outlet private market share for contraceptive methods – Bihar, 2016 .................................... 100
Figure C9. Percentage of outlets with selected contraceptive services available – Bihar, 2016 ........................... 101
Figure C10. Service readiness to offer provider-dependent contraceptive services – Bihar, 2016 ...................... 102
Figure D1. Modern contraceptive method market composition – Bihar Strata, 2016 .......................................... 132
Figure D2. Percentage of modern contraceptive commodity-stocking outlets with selected non-hormonal short-acting contraceptives available – Bihar Strata, 2016 ............................................................................. 133
Figure D3. Percentage of outlets with selected method mixes available – Bihar Strata, 2016 ............................. 134
Figure D4. Percentage of outlets with stock outs of selected contraceptive methods – Bihar Strata, 2016 ........ 135
Figure D5. Price of contraceptive methods in the private sector - Bihar Metro ................................................... 136
Figure D6. Price of contraceptive methods in the private sector - Bihar Urban ................................................... 137
Figure D7. Price of contraceptive methods in the private sector - Bihar Rural ..................................................... 138
Figure D8. Percentage private market share for contraceptives methods – Bihar Strata, 2016 ........................... 139
Figure D9. Within outlet private market share for contraceptive methods – Bihar Strata, 2016 ......................... 140
Figure D10. Percentage of outlets with selected contraceptive services available – Bihar Strata, 2016 .............. 141
Figure D11. Service readiness to offer provider-dependent contraceptive services – Bihar Strata, 2016 ........... 142
Figure X1. Maps of Uttar Pradesh and Bihar Selected Districts ............................................................................. 146

www.FPwatch.info Page 6
Acronyms 3MDG The Three Millennium Development Goal Fund ANM Auxiliary Nurse Midwife ASHA Accredited Social Health Activist AWW Anganwadi Worker AYUSH Ayurveda, Yoga, Unani, Siddha, & Homeopathy BMGF The Bill and Melinda Gates Foundation CAPI Computer-Assisted Personal Interviewing CHC Community Health Center CI 95% Confidence Interval COC Combined Oral Contraceptive CPR Contraceptive Prevalence Rate CSA Census Sampling Area CYP Couple Years of Protection DHS Demographic and Health Survey EDC Electronic Data Collection FP Family Planning FP2020 GOI GPS HC
Family Planning 2020 Initiative Government of India Global Positioning System Health Center
INR India Rupees IQR Interquartile Range IRB Institutional Review Board IUD Intrauterine Device KII Key Informant Interview LARC Long-Acting Reversible Contraceptive LA/PM Long-Acting Reversible Contraceptive or Permanent Method mCPR Modern Contraceptive Prevalence Rate MOFHW Ministry of Family Health and Welfare-India MSI Marie Stopes International NGO NHM
Non-governmental Organization National Health Mission
OS Outlet Survey PHC Primary Health Center PI Principal Investigator PMA2020 Performance, Monitoring and Accountability 2020 study POP Progesterone-only Pill PPS Probability Proportionate to Size PSI Population Services International PSI-DC Population Services International-Washington DC PSI-I Population Services International-India QC Quality Controller REB Research Ethics Board-PSI RMP Rural Medical Practitioner SD Secure Digital SEA Standard Enumeration Areas SRA Stringent Regulatory Authority TFR Total Fertility Rate TOT Training of the Trainers UHC Urban Health Center USAID United States Agency for International Development USD United States Dollar
WHO World Health Organization
www.FPwatch.info Page 7
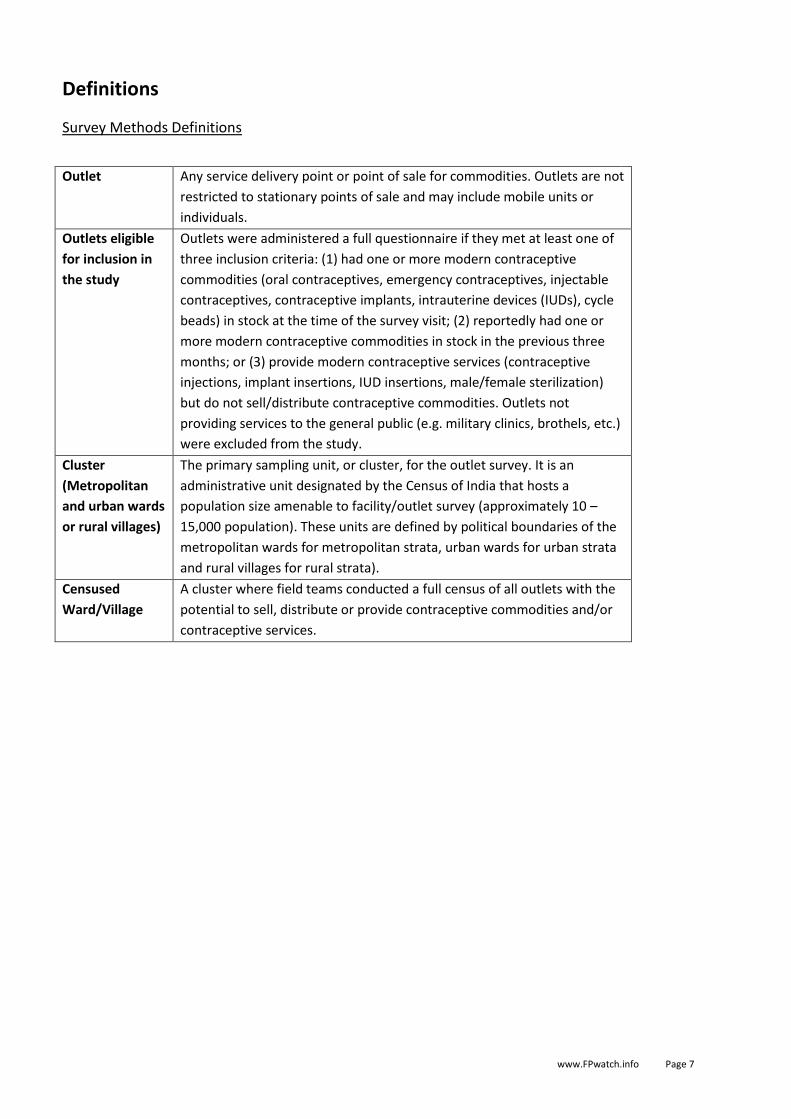
Definitions
Survey Methods Definitions
Outlet Any service delivery point or point of sale for commodities. Outlets are not
restricted to stationary points of sale and may include mobile units or
individuals.
Outlets eligible
for inclusion in
the study
Outlets were administered a full questionnaire if they met at least one of
three inclusion criteria: (1) had one or more modern contraceptive
commodities (oral contraceptives, emergency contraceptives, injectable
contraceptives, contraceptive implants, intrauterine devices (IUDs), cycle
beads) in stock at the time of the survey visit; (2) reportedly had one or
more modern contraceptive commodities in stock in the previous three
months; or (3) provide modern contraceptive services (contraceptive
injections, implant insertions, IUD insertions, male/female sterilization)
but do not sell/distribute contraceptive commodities. Outlets not
providing services to the general public (e.g. military clinics, brothels, etc.)
were excluded from the study.
Cluster
(Metropolitan
and urban wards
or rural villages)
The primary sampling unit, or cluster, for the outlet survey. It is an
administrative unit designated by the Census of India that hosts a
population size amenable to facility/outlet survey (approximately 10 –
15,000 population). These units are defined by political boundaries of the
metropolitan wards for metropolitan strata, urban wards for urban strata
and rural villages for rural strata).
Censused
Ward/Village
A cluster where field teams conducted a full census of all outlets with the
potential to sell, distribute or provide contraceptive commodities and/or
contraceptive services.

www.FPwatch.info Page 8
Family Planning Terminology
Family planning The ability of individuals and couples to anticipate and attain their desired number of
children and the spacing and timing of their births.
(Modern)
Contraceptive
commodity
Used in reference to the actual product. This is any commodity recognized by the World
Health Organization (WHO) as a modern form for the prevention of pregnancy and
assigned a Couple-Years of Protection (CYP) conversion factor by the United States Agency
for International Development (USAID) (https://www.usaid.gov/what-we-do/global-
health/family-planning/couple-years-protection-cyp). Traditional methods (e.g., herbs) not
recognized by the WHO/USAID were not included in analysis. Behavioral methods without
a tangible commodity but with a CYP conversion factor (e.g., fertility awareness methods)
were not included in analysis.
Contraceptive
service
Used in reference to the provider-assisted procedure associated for use of some
contraceptive commodities. This is a medical procedure to deliver a contraceptive
commodity or a surgical procedure to prevent pregnancy. For analysis, these include the
delivery of an injection for an injectable contraceptive, an insertion of a contraceptive
implant, an insertion of an intrauterine device (IUD) and/or a male/female sterilization
procedure. Procedures typically require specialized training and equipment. These are also
referred to as provider-dependent procedures.
Contraceptive
method
Contraceptive method is used in a general sense to distinguish among categories of ‘choice’
for a consumer regardless of whether a commodity or service.
Couple years of
protection
(CYP)
CYP is the estimated protection provided by contraceptive methods during a one-year
period, based upon the volume of all contraceptives sold or distributed free of charge to
clients during that period. The CYP is calculated by multiplying the quantity of each method
distributed to clients by a conversion factor, to yield an estimate of the duration of
contraceptive protection provided per unit of that method. See Annex 11 for more
description of how CYP was used in the study.
Diversity/range
of methods
Indicators that measure contraceptive method choice for an individual consumer.
Commonly accepted indicators include three or more and five or more methods available
to a consumer from: male condoms, female condoms, oral contraceptives, emergency
contraceptives, injectable contraceptives, contraceptive implants, IUDs, male sterilizations,
female sterilizations, vaginal rings, birth control patches, vaginal pessaries and/or standard
days method with commodity (e.g. Cyclebeads).
Short-acting
methods
Short-acting methods are those that are designed to offer a one-time or up to three
months of protection against pregnancy. They include male and female condoms,
CycleBeads, vaginal rings, birth control patches, oral contraceptives, vaginal pessaries,
emergency contraceptives and injectables.
Long-acting,
reversible
contraceptive
(LARC) methods
Long-acting contraceptives are those that offer more than one year of protection against
pregnancy. They include all types of implants and IUDs.
Permanent
methods
Permanent methods include male (vasectomy) and female (tubal ligations) sterilizations
and typically provide life-time protection against pregnancy and are not easily reversible.
They are often grouped together with LARCs for analytic purposes as long-acting and
permanent methods (LA/PMs).

www.FPwatch.info Page 9
Outlet Categories for India
Higher-level public
facilities (DWH, CHC,
UPHC & PHC)
This category is comprised of government
facilities including: government/district hospitals
(DW)/district women’s hospitals (DWH),
government dispensaries, urban health centers
(UHC)/urban family welfare centers
(UFWC)/urban primary health centers (UPHC),
first referral units (FRU)/community health
centers (CHC), rural hospital/primary health
centers (PHC). These healthcare facilities are
equipped with a range of contraceptives to be
provided free of charge or at nominal cost.
Estimates are given grouping all public hospitals,
DWHs, UHCs, UFWCs, UPHCs, FRUs, CHCs, PHCs
into Higher-Level Public Facility; Estimates are also
given combining all public outlets into a Public
Total category.
Public health care facilities
provide family planning
services per the operational
guidelines and availability of
infrastructure. Short-acting
methods and LARC services can
be provided at all facilities, and
sterilization services are
provided at the CHC level and
above.
Sub
center/ANM/ASHA
Sub-centres and affiliated auxiliary nurse
midwives (ANMs) or Accredited Social Health
Activists (ASHAs) are included in the Sub-
centre/ANM/ASHA category. Estimates are also
given combining all public outlets into a Public
Total category.
Short-acting methods can be
provided at all facilities, and
LARC services are provided by
sub-centres.
Anganwadi workers
(AWWs)
Anganwadi workers provide basic contraceptive
counseling and supplies. Estimates are also given
combining all public outlets into a Public Total
category.
Short-acting methods can be
provided.
Not-for-profit health
facilities (NGOs)
This includes NGOs, trust or faith-based/mission
health facilities including hospitals, health centers
and clinics. These facilities provide commodities
and services for a nominal service fee and are
staffed by providers with health qualifications.
Estimates are given grouping all NGO health
facilities into the NGO category. Given their small
number, NGO outlets are grouped into Public
Total category.
NGO organizations, trust
hospitals/clinics can provide
services on family planning
including the short-acting and
LARC methods.
Private health
facilities
Private healthcare facilities include private
hospitals and private doctors/clinics, private
mobile clinics. These facilities are registered to
provide health care products and services by the
Drug Control Department of India.
Estimates are given grouping all private health
facilities into the Private Health Facility category.
The majority of private higher
and medium health facilities
can provide all short-acting and
LARC methods including
sterilization. Lower private
clinics can provide all short-
acting methods.

www.FPwatch.info Page 10
Private health facilities are combined with
pharmacies/chemists to give estimates for the
Total Private Medical category.
Pharmacies/Chemists Pharmacies/chemists are licensed by the Drug
Control Department of India to qualified
degree/diploma holders. The large majority of
pharmacies are privately run.
Estimates are given grouping all pharmacies into
the Pharmacy/Chemist category.
Pharmacies/Chemists are combined with private
health facilities to give estimates for the Total
Private Medical category.
Pharmacies/chemists can
provide all short-acting
methods. Injectables can be
sold but the service must be
performed elsewhere.
AYUSH providers Practitioners licensed to practice in non-
biomedical health care. These include
Vaidya/hakim/homeopathic outlets. These
facilities are registered to provide health care
products and services by the Drug Control
Department of India.
Estimates are given grouping all AYUSH providers
into the AYUSH Provider category. These outlets
are combined with private rural medical
practitioners and general retailers to give
estimates for the Total Private Other category.
AYUSH providers may provide
short-acting methods to
consumers.
Rural medical
practitioners (RMPs)
Non-licensed practitioners providing health care
services in many rural areas but lacking proper
credentials.
Estimates are given grouping all rural medical
practitioners into the Rural Medical Practitioner
(RMP) category. These outlets are combined with
private AYUSH providers and general retailers to
give estimates for the Total Private Other
category.
Some efforts are being made to
train rural medical practitioners
in providing health care
services including dispensing
family planning products.
However, most are not trained.
General retailers Non-traditional outlets and other general stores
may stock family planning products. Retailers may
have over-the-counter medicines including family
planning commodities available.
Estimates are given grouping all general retailers
and non-traditional outlets into the General
Retailer category. These outlets are combined
with private AYUSH providers and rural medical
practitioners to give estimates for the Total
Private Other category.
The condom is the most
commonly available family
planning product at non-
traditional and general retailer
outlets.

www.FPwatch.info Page 11
Introduction This country reference document is a detailed presentation of the 2015 FPwatch outlet survey conducted in India. The survey was conducted in the two states of Uttar Pradesh and Bihar. These two states were selected to investigate a variety of urban, rural and metropolitan zones and areas of the country expected to be different in terms of availability of family planning products and services. FPwatch is a multi-country research project implemented by Population Services International (PSI) (www.psi.org). The project is designed to provide timely, relevant and high-quality, modern contraceptive commodity and associated services market evidence, and employs standardized tools and approaches to provide comparable data across countries and over time. The goal of providing this market evidence is to inform and monitor national and global policy, strategy and funding decisions for improving availability of a range of quality FP information and contraceptive methods. FPwatch was launched in 2014 with funding from the Bill and Melinda Gates Foundation (BMGF) for Ethiopia, Nigeria, the Democratic Republic of the Congo (DRC) and India, and is currently funded through 2016 by the BMGF. The project is an expansion of PSI’s ACTwatch project, focusing on national antimalarial markets, and a response to the Family Planning 2020 (FP2020) goal to enable 120 million additional women and girls to have informed choice and access to family planning information and a range of modern contraceptive methods. Additional funding was secured through the Three Millennium Development Goal (3MDG) Fund for FPwatch in Myanmar. See Annex 1 for more information about the FPwatch project. FPwatch contraceptive method market monitoring in India has been implemented in the context of strategies designed and implemented to improve availability and choice in contraceptive methods. See Annex 2 for more information about the FP context in the India. These include national efforts to:
Increase the contraceptive prevalence rate (mCPR) to 63.7% by 2020;
Reach an additional 48 million women and girls with a range of modern contraceptive methods as part of the FP2020 Initiative;
Sustain the coverage of over 100 million (10 Crore) women currently using contraceptives;
Improve access to voluntary family planning services, supplies and information in both the public and private sector;
Expand the basket of choices and scale up the usage of current methods available;
Increase the quality of Family Planning services;
Generate demand for Family Planning;
Develop and strengthen an efficient logistical system to manage contraceptives; and
Implement a reliable evaluation system to measure results
Report notes
This document is a complete reference for the 2015 outlet survey. Please see annexes for information about the study context, design, implementation and data analysis.
Grey text for data appearing in report tables indicates that the estimate provided was derived from a small sample size. Specifically, grey text is used to indicate point estimates for availability indicators derived from an n of equal to or less than 50 and estimates for price indicators derived from an n of equal to or less than 5.
Contraceptive commodity and service prices are reported in US dollars. Price information is captured in local currency and converted to US dollars based on exchange rates available from http://www.oanda.com/currency/historical-rates using the historical exchange rates tool. The average exchange rate over the entire data collection period is used for converting local currency captured during data collection to US dollars.

www.FPwatch.info Page 12
Summary of Methods and Data Collection A geographically-representative FP-focused outlet survey was conducted between June 9th and September 11th 2016. A full description of research design and methods is provided in Annex 3. Briefly, a representative sample of geographic areas was selected from each of the two states of Uttar Pradesh and Bihar with selected clusters listed in Annex 4 and a map of selected primary clusters in Annex 5. Within selected health areas, a census of all outlets with the potential to sell or distribute modern contraceptives and/or provide associated FP services was completed. Outlets were then screened to determine eligibility. Outlets eligible for the survey met at least one of three criteria: 1) one or more modern contraceptive commodities (including cycle beads, oral contraceptives, emergency contraceptives, injectables, implants and/or IUDs were in stock on the day of the survey; 2) one or more modern contraceptive commodities were in stock in the three months preceding the survey; and/or 3) contraceptive services associated with commodities (contraceptive injections, implant insertions, IUD insertions) and/or permanent methods with no commodity (male/female sterilizations) were available. Outlets were not eligible for inclusion if they did not have any modern contraceptive commodities currently or in the past three months and did not offer contraceptive services. No stock information was collected among non-eligible outlets. Questions relating to condoms were asked of all outlets, regardless of eligibility for the full audit or provider interview. Outlets that do not serve the general public (e.g., military facilities) were excluded from the study. The results of the census are summarized in Figure 1. A detailed sample summary is provided in Annex 6.
A structured questionnaire was used to complete an audit of all modern contraceptive commodities as well as a provider interview for questions relating to contraceptive services (see Annex 7 for the FPwatch 2016 India questionnaire). See Annex 8 for detailed summaries of modern contraceptive commodities audited. Key informant interviews (KIIs) were conducted with specific stakeholders to supplement information for the country background.
Electronic data collection (EDC) was used for the FPwatch India survey. The interview was conducted using electronic devices (Android phones or tablets) with Computer-Assisted Personal Interviewing (CAPI) software. All data cleaning and analysis was performed using Stata 13.1 (©StataCorp, College Station, TX). Data were weighted to account for variation in probability of outlet selection (see Annex 9), and standard error calculation reflected clustering of outlets at ward or village level. Standard indicators were constructed according to definitions applied across FPwatch project countries (see Annex 10).

www.FPwatch.info Page 13
Figure 1a: Survey flow diagram, Total, India 2016
1 = [2,012] 2 = [31] 3 = [42]
1 = [2,009] 2= [31] 3= [42]
1: Modern contraceptive (including oral contraceptives, emergency contraceptives, injectables, implants or IUDs) in stock on day of visit
2: Modern contraceptives reportedly in stock during the previous 3 months but not on the day of the visit 3: Modern family planning services (including injections, implant or IUD insertions, or sterilizations) available but no
modern contraceptives in stock * Identified as outlets with potential to sell or distribute modern contraceptive commodities (condoms, oral
contraceptives, emergency contraceptives, injectables, implants, IUDs) and/or provide contraceptive procedures (contraceptive injections, implant insertions, IUD insertionss, male/female sterilizations) during the census
† Administered questions assessing condom availability, price and volume regardless of eligibility ‡ Administered questions to assess current or recent (previous 3 months) availability of modern contraceptives and
modern family planning services § A partial or complete interview was conducted with an outlet representative ** No stock information was collected from outlets that did not meet eligibility criteria
A Outlets enumerated*
20,512
A 2015
Outlets enumerated*
8,455
B
Outlets screened† 19,772
Outlets screened with condoms
4,404
B
Outlets screened**
8,299
Outlets not screened
740
Outlets not screened
156
D
Outlets interviewed§ 4,083
1 = 3,460 2 = 308 3 = 315
D
Outlets interviewed 2,080
1 =2,009
2= 31 3= 42
Outlets that did not meet
screening criteria**
16,362
Outlets that did
not meet screening
criteria 6,213
Outlets not interviewed
67
Outlets not interviewed
3
C
Outlets that met screening criteria‡
4,150 1 = 3,518 2 = 312 3 = 320
C
Outlets that met
screening criteria 2,083
1 = 2,012
2 = 31 3 = 42
Respondents not available
9 Outlets closed at time of visit
36 Outlets closed permanently
176 Other
32 Refused
487
Outlets with interview
interrupted 67

www.FPwatch.info Page 14
1: Modern contraceptive (including oral contraceptives, emergency contraceptives, injectables, implants or IUDs) in stock on day of visit
2: Modern contraceptives reportedly in stock during the previous 3 months but not on the day of the visit 3: Modern family planning services (including injections, implant or IUD insertions, or sterilizations) available but no
modern contraceptives in stock * Identified as outlets with potential to sell or distribute modern contraceptive commodities (condoms, oral
contraceptives, emergency contraceptives, injectables, implants, IUDs) and/or provide contraceptive procedures (contraceptive injections, implant insertions, IUD insertionss, male/female sterilizations) during the census
† Administered questions assessing condom availability, price and volume regardless of eligibility ‡ Administered questions to assess current or recent (previous 3 months) availability of modern contraceptives and
modern family planning services ** No stock information was collected from outlets that did not meet eligibility criteria § A partial or complete interview was conducted with an outlet representative
Figure 1b: Survey flow diagram, Uttar Pradesh and Bihar States, India 2016
A Outlets enumerated*
8,661
A 2015
Outlets enumerated*
8,455
B
Outlets screened† 8,439
Uttar Pradesh Bihar
D
Outlets interviewed§ 1,567
1 = 1,177 2 = 238 3 = 152
D
Outlets interviewed 2,080
1 =2,009 2= 31
3= 42
C
Outlets that met screening criteria‡**
1,587 1 = 1,193 2 = 240 3 = 154
C
Outlets that met
screening criteria
2,083 1 = 2,012
2 = 31
3 = 42
A Outlets enumerated*
11,851
A 2015
Outlets enumerated* 8,455
B
Outlets screened† 11,333
D Outlets interviewed§
2,516 1 = 2,283 2 = 70 3 = 163
D
Outlets interviewed 2,080 1 =2,009 2= 31 3= 42
C Outlets that met
screening criteria‡** 2,563
1 = 2,325 2 = 72 3 = 166
C
Outlets that met screening criteria
2,083 1 = 2,012 2 = 31 3 = 42

www.FPwatch.info Page 15
Summary of Key Findings
Uttar Pradesh
Table A1: Modern contraceptive method market composition: Relative proportion of outlets with 1 or more methods, by outlet type – Uttar Pradesh, 2016
Higher Public Health
Facility*
Sub-centre / ANM / ASHA†
AWW NGO Public Total‡
Private facility
Pharmacy/ Chemist
Private Medical Total‡
AYUSH Provider
RMP General Retailer
Private Other Total‡
Proportion of outlet types stocking / providing at least 1 modern contraceptive method on the day of the survey, of all outlets stocking / providing at least 1 modern contraceptive method§:
% (95% CI)
% (95% CI)
% (95% CI)
% (95% CI)
% (95% CI)
% (95% CI)
% (95% CI)
% (95% CI)
% (95% CI)
% (95% CI)
% (95% CI)
% (95% CI)
Any method available, including condoms only outlets|| N=3,345
0.5 52.1 22.2 0.0 74.9 2.2 14.0 16.2 0.3 0.2 8.4 8.8
(0.1, 2.2) (47.9, 56.3) (13.3, 34.7) (0.0, 0.2) (62.8, 84.1) (1.3, 3.8) (9.0, 21.3) (10.3, 24.6) (0.1, 0.5) (0.1, 0.6) (5.3, 13.0) (5.6, 13.7)
Any method available, excluding condoms only outlets** N=2,358
0.6 55.8 25.9 0.1 82.4 1.9 15.1 16.9 0.1 0.1 0.5 0.7
(0.2, 2.6) (51.1, 60.4) (16.5, 38.3) (0.0, 0.2) (71.5, 89.7) (1.0, 3.6) (8.9, 24.5) (9.9, 27.5) (0.1, 0.4) (0.0, 0.3) (0.2, 1.3) (0.3, 1.5)
* Includes: Government/municipal hospitals, government dispensaries, UHC/UHP/UFWCs, CHC/rural hospitals, and PHC/FRUs.
† In Uttar Pradesh Sub-centres and ASHA are equipped to provide family planning services. ANM are not. ‡ Public Total category = higher public health facility + sub-centre/ANM/ASHA + AWW + NGO categories; Private Medical Total category = Private facility + Pharmacy/Chemist categories; Private Other Total category = AYUSH provider + RMP + general retailer categories § Contraceptive commodity-stocking outlets have at least one family planning commodity in stock on the day of the survey, verified by the presence of at least one family planning commodity recorded in an audit sheet. There were 47 family planning commodity-stocking outlets in UP with partially completed interviews, which were excluded from the denominator. || Includes: male condoms, female condoms, cyclebeads, vaginal pessaries, oral contraceptives, emergency contraceptive pills, contraceptive injectables and/or IUDs. Birth control patches, diaphragms, vaginal rings or contraceptive implants were not found in UP or Bihar by the FPwatch study. ** Includes: oral contraceptives, emergency contraceptive pills, contraceptive injectables and/or IUDs.
Source: FPwatch Outlet Survey, India, 2016

www.FPwatch.info Page 16
Table A2: Availability of modern contraceptive method categories, among outlets screened, by outlet type – Uttar Pradesh, 2016
Higher Public Health
Facility*
Sub-centre / ANM / ASHA†
AWW NGO Public Total‡
Private facility
Pharmacy/Chemist Private Medical Total‡
AYUSH Provider
RMP General Retailer
Private Other Total‡
All Outlets
%
(95% CI) %
(95% CI) %
(95% CI) %
(95% CI) %
(95% CI) %
(95% CI) %
(95% CI) %
(95% CI) %
(95% CI) %
(95% CI) %
(95% CI) %
(95% CI) %
(95% CI)
Proportion of outlets screened, currently stocking / providing§:
N=18 N=627 N=387 N=5 N=1,037 N=917 N=1,722 N=2,639 N=204 N=62 N=7,377 N=7,643 N=11,319
Any modern method
98.4 95.4 65.8 100.0 84.2 27.5 92.7 69.9 15.4 18.3 10.2 10.4 50.6
(88.8, 99.8) (92.2, 97.3) (42.2, 83.6) (100, 100) (73.7, 91.0) (21.0, 35.2) (88.9, 95.2) (65.2, 74.3) (8.7, 26.0) (8.2, 35.9) (8.1, 12.6) (8.4, 12.8) (41.9, 59.3)
Any short-acting method
98.4 95.2 65.8 92.0 84.1 26.1 92.7 69.4 15.4 18.3 10.2 10.4 50.5
(88.8, 99.8) (92.0, 97.2) (42.2, 83.6) (51.3, 99.2) (73.6, 90.9) (19.6, 33.9) (88.9, 95.2) (64.7, 73.8) (8.7, 26.0) (8.2, 35.9) (8.1, 12.6) (8.4, 12.8) (41.8, 59.3)
Any LARC method 16.9 3.7 0.0 0.0 2.4 1.1 0.2 0.5 0.0 0.0 0.0 0.0 1.1
(3.3, 54.4) (1.9, 6.9) - - (1.2, 4.6) (0.6, 1.9) (0.1, 0.6) (0.3, 0.8) - - - - (0.7, 1.9)
Any permanent method
5.7 0.0 0.0 8.0 0.1 2.5 0.0 0.9 0.0 0.0 0.0 0.0 0.1
(1.1, 25.2) - - (0.8, 48.7) (0.1, 0.1) (1.5, 4.1) - (0.5, 1.4) - - - - (0.1, 0.2)
Any LA/PM 18.3 3.7 0.0 8.0 2.4 3.1 0.2 1.2 0.0 0.0 0.0 0.0 1.2
(3.6, 57.1) (1.9, 6.9) - (0.8, 48.7) (1.2, 4.6) (2.0, 4.8) (0.1, 0.6) (0.9, 1.8) - - - - (0.7, 2.0)
* Includes: Government/municipal hospitals, government dispensaries, UHC/UHP/UFWCs, CHC/rural hospitals, and PHC/FRUs. † In Uttar Pradesh Sub-centres and ASHA are equipped to provide family planning services. ANM are not. ‡ Public Total category = higher public health facility + sub-centre/ANM/ASHA + AWW + NGO categories; Private Medical Total category = Private facility + Pharmacy/Chemist categories; Private Other Total category = AYUSH provider + RMP + general retailer categories § The denominator includes 47 outlets that met screening criteria for a full interview but did not complete the interview (were not interviewed or completed a partial interview).
Source: FPwatch Outlet Survey, India, 2016

www.FPwatch.info Page 17
Table A3: Availability of selected contraceptive commodities, among outlets screened, by outlet type – Uttar Pradesh, 2016
Higher Public Health
Facility*
Sub-centre / ANM / ASHA†
AWW NGO Public Total‡
Private facility
Pharmacy/Chemist
Private Medical Total‡
AYUSH Provider
RMP General Retailer
Private Other Total‡
All Outlets
%
(95% CI) %
(95% CI) %
(95% CI) %
(95% CI) %
(95% CI) %
(95% CI) %
(95% CI) %
(95% CI) %
(95% CI) %
(95% CI) %
(95% CI) %
(95% CI) %
(95% CI)
Proportion of outlets screened, currently stocking§:
N=18 N=627 N=387 N=5 N=1,037 N=917 N=1,722 N=2,639 N=204 N=62 N=7,377 N=7,643 N=11,319
Male condoms 98.4 93.5 31.6 79.3 70.0 18.2 91.9 66.2 14.0 15.2 10.0 10.2 43.8
(88.8, 99.8) (89.4, 96.1) (13.9, 56.8) (31.3, 97.0) (57.8, 80.0) (12.9, 24.9) (88.2, 94.6) (61.7, 70.5) (7.6, 24.4) (6.6, 31.1) (8.1, 12.4) (8.2, 12.5) (37.8, 49.8)
Female condoms 0.0 0.0 0.0 0.0 0.0 0.0 0.4 0.3 0.0 0.0 0.0 0.0 0.0
- - - - - - (0.1, 1.2) (0.1, 0.8) - - - - (0.0, 0.1)
Cyclebeads 0.0 0.0 0.0 0.0 0.0 0.0 0.0 0.0 0.0 0.0 0.0 0.0 0.0
- - - - - - (0.0, 0.3) (0.0, 0.2) - - - - -
Vaginal Pessaries 0.0 0.0 0.0 0.0 0.0 0.5 7.5 5.0 0.0 0.0 0.0 0.0 0.6
- - - - - (0.2, 1.3) (5.1, 10.7) (3.5, 7.2) - - - - (0.4, 0.9)
Oral contraceptives 94.7 83.5 62.8 92.0 75.8 15.5 78.1 56.2 6.2 4.4 0.4 0.6 41.0
(76.7, 99.0) (72.9, 90.5) (38.4, 82.1) (51.3, 99.2) (61.4, 86.0) (9.7, 23.9) (72.9, 82.4) (50.7, 61.6) (2.5, 14.7) (1.4, 13.3) (0.2, 1.2) (0.3, 1.3) (30.5, 52.5)
Combined oral contraceptives
94.7 83.4 62.8 92.0 75.7 10.7 59.9 42.8 6.2 4.4 0.1 0.3 39.3
(76.7, 99.0) (72.7, 90.4) (38.4, 82.1) (51.3, 99.2) (61.3, 86.0) (6.7, 16.6) (53.7, 65.9) (37.5, 48.2) (2.5, 14.7) (1.4, 13.3) (0.1, 0.3) (0.2, 0.5) (28.4, 51.3)
Progestin-only pills
0.0 0.0 0.0 0.0 0.0 0.0 0.0 0.0 0.0 0.0 0.0 0.0 0.0
- - - - - - (0.0, 0.2) (0.0, 0.1) - - - - -
Centchroman pills 0.0 0.9 0.4 77.8 0.7 6.3 43.9 30.8 1.2 1.4 0.3 0.4 4.1
- (0.2, 3.9) (0.1, 1.8) (30.1, 96.6) (0.2, 2.4) (3.1, 12.2) (37.8, 50.1) (26.2, 35.8) (0.2, 8.0) (0.2, 8.2) (0.1, 1.2) (0.1, 1.1) (2.9, 5.8)
Emergency contraceptives
18.6 42.3 3.3 92.0 27.4 8.9 61.3 43.0 2.1 0.0 0.0 0.1 17.4
(3.4, 59.5) (24.2, 62.7) (1.2, 8.3) (51.3, 99.2) (18.5, 38.5) (5.6, 14.0) (55.8, 66.5) (38.3, 47.8) (0.6, 7.4) - (0.0, 0.1) (0.0, 0.2) (12.4, 24.0)
Contraceptive injectables (All DMPA)
1.5 0.3 0.0 0.0 0.2 3.2 5.4 4.6 0.0 0.0 0.0 0.0 0.6
(0.1, 13.9) (0.1, 2.0) - - (0.0, 1.2) (1.6, 6.1) (3.7, 7.7) (3.3, 6.3) - - - - (0.4, 1.0)
IUDs (All Copper T) 16.9 3.7 0.0 0.0 2.4 1.1 0.2 0.5 0.0 0.0 0.0 0.0 1.1
(3.3, 54.4) (1.9, 6.9) - - (1.2, 4.6) (0.6, 1.9) (0.1, 0.6) (0.3, 0.8) - - - - (0.7, 1.9)
* Includes: Government/municipal hospitals, government dispensaries, UHC/UHP/UFWCs, CHC/rural hospitals, and PHC/FRUs. † In Uttar Pradesh Sub-centres and ASHA are equipped to provide family planning services. ANM are not. ‡ Public Total category = higher public health facility + sub-centre/ANM/ASHA + AWW + NGO categories; Private Medical Total category = Private facility + Pharmacy/Chemist categories; Private Other Total category = AYUSH provider + rural medical practitioner + general retailer categories § The denominator includes 47 outlets that met screening criteria for a full interview but did not complete the interview (were not interviewed or completed a partial interview).
Source: FPwatch Outlet Survey, India, 2016

www.FPwatch.info Page 18
Table A4: Availability of modern contraceptive method diversity, among outlets screened, by outlet type – Uttar Pradesh, 2016
Higher Public Health
Facility*
Sub-centre / ANM / ASHA†
AWW NGO Public Total‡
Private facility
Pharmacy/Chemist Private Medical Total‡
AYUSH Provider
RMP General Retailer
Private Other Total‡
All Outlets
%
(95% CI) %
(95% CI) %
(95% CI) %
(95% CI) %
(95% CI) %
(95% CI) %
(95% CI) %
(95% CI) %
(95% CI) %
(95% CI) %
(95% CI) %
(95% CI) %
(95% CI)
Proportion of outlets screened, currently stocking / providing§:
N=18 N=627 N=387 N=5 N=1,037 N=917 N=1,722 N=2,639 N=204 N=62 N=7,377 N=7,643 N=11,319
3+ methods||
24.4 41.0 0.7 79.3 25.7 6.5 57.4 39.6 1.4 0.0 0.0 0.0 16.2
(4.6, 68.5) (22.9, 62.0) (0.2, 2.8) (31.3, 97.0) (16.5, 37.6) (3.5, 11.6) (51.7, 62.9) (34.8, 44.7) (0.2, 7.6) - (0.0, 0.1) (0.0, 0.1) (11.1, 23.2)
3+ methods with LARC
16.9 3.3 0.0 0.0 2.1 0.8 0.2 0.4 0.0 0.0 0.0 0.0 1.0
(3.3, 54.4) (1.7, 6.3) - - (1.1, 4.2) (0.4, 1.4) (0.1, 0.6) (0.2, 0.7) - - - - (0.6, 1.7)
3+ methods with LA/PM
18.3 3.3 0.0 0.0 2.1 1.2 0.2 0.6 0.0 0.0 0.0 0.0 1.0
(3.6, 57.1) (1.7, 6.3) - - (1.1, 4.2) (0.7, 2.1) (0.1, 0.6) (0.4, 0.9) - - - - (0.6, 1.8)
5+ methods** 4.2 0.0 0.0 0.0 0.0 0.6 1.0 0.9 0.0 0.0 0.0 0.0 0.1
(0.7, 21.0) - - - (0.0, 0.1) (0.3, 1.3) (0.6, 1.7) (0.5, 1.4) - - - - (0.1, 0.2)
* Includes: Government/municipal hospitals, government dispensaries, UHC/UHP/UFWCs, CHC/rural hospitals, and PHC/FRUs. † In Uttar Pradesh Sub-centres and ASHA are equipped to provide family planning services. ANM are not. ‡ Public Total category = higher public health facility + sub-centre/ANM/ASHA + AWW + NGO categories; Private Medical Total category = Private facility + Pharmacy/Chemist categories; Private Other Total category = AYUSH provider + RMP + general retailer categories § The denominator includes 47 outlets that met screening criteria for a full interview but did not complete the interview (were not interviewed or completed a partial interview). || 3 or more among: male condom, female condom, cyclebeads, vaginal pessary, oral contraceptive, emergency contraceptive, contraceptive injectable, IUD commodities and/or male sterilization, female sterilization services. No other modern contraceptive methods were found in sampled outlets. ** 5 or more among: male condom, female condom, cyclebeads, vaginal pessary, oral contraceptive, emergency contraceptive, contraceptive injectable, IUD commodities and/or male sterilization, female sterilization services. No other modern contraceptive methods were found in sampled outlets.
Source: FPwatch Outlet Survey, India, 2016

www.FPwatch.info Page 19
Table A5: Current stock out of selected modern contraceptive commodities on day of survey, among outlets reportedly stocking method in previous 3 months, by outlet type – Uttar Pradesh, 2016
Higher Public
Health Facility*
Sub-centre / ANM / ASHA†
AWW NGO Public Total‡ Private facility
Pharmacy/ Chemist
Private Medical Total‡
AYUSH Provider
RMP General Retailer
Private Other Total‡
Proportion of outlets reportedly stocking method in previous 3 months, currently stocked out of§,||:
% (n) (95% CI)
% (n) (95% CI)
% (n) (95% CI)
% (n) (95% CI)
% (n) (95% CI)
% (n) (95% CI)
% (n) (95% CI)
% (n) (95% CI)
% (n) (95% CI)
% (n) (95% CI)
% (n) (95% CI)
% (n) (95% CI)
Oral contraceptives 0.0 3.6 0.1 0.0 2.5 11.1 1.9 2.9 23.4 0.0 11.8 2.6
[0.0, 0.0] (13) [1.8, 6.9] (483) [0.0, 0.4] (143) [0.0, 0.0] (4) [1.1, 5.3] (643) [3.8,28.0] (113) [1.2, 3.2] (1,434) [1.7,5.0] (1,547) [3.4,72.8] (9) [0.0, 0.0] (3) [2.1,45.7] (23) [1.4,4.9] (2,225)
Emergency contraceptives
0.0 7.6 10.7 0.0 7.7 19.7 2.5 4.0 10.5 100.0 22.0 6.8
[0.0, 0.0] (8) [2.9, 18.2] (211) [2.4, 37.2] (20) [0.0, 0.0] (4) [3.1, 17.7] (243) [4.8, 54.1] (77) [1.6, 3.9] (1,169) [2.0, 7.8] (1,246) [1.1, 54.6] (6) [0.0, 0.0] (2) [7.4, 49.8] (14) [3.5,12.8] (1,511)
Contraceptive injectables
0.0 0.0 - - 0.0 13.1 17.3 16.3 - 100.0 0.0 16.0 (1) [0.0, 0.0] (2) - - [0.0, 0.0] (3) [4.9, 30.8] (33) [5.8, 41.3] (128) [6.7, 34.7] (161) - (1) (1) [6.9, 32.9] (166)
IUDs 0.0 7.3 - - 7.0 18.9 19.4 19.1 - - - 7.8
[0.0, 0.0] (9) [2.7, 18.3] (38) - - [2.6, 17.5] (47) [6.7, 43.2] (23) [4.1, 57.9] (7) [8.3, 38.0] (30) - - - [3.3, 17.3] (77)
* Includes: Government/municipal hospitals, government dispensaries, UHC/UHP/UFWCs, CHC/rural hospitals, and PHC/FRUs. † In Uttar Pradesh Sub-centres and ASHA are equipped to provide family planning services. ANM are not. ‡ Public Total category = higher public health facility + sub-centre/ANM/ASHA + AWW + NGO categories; Private Medical Total category = Private facility + Pharmacy/Chemist categories; Private Other Total category = AYUSH provider + RMP + general retailer categories § This indicator is among all screened outlets that reportedly stocked the method in the previous 3 months. It does not account for whether the outlet is expected to provide the commodity according to national regulations. It is a point-in-time stock out indicator from https://www.rhsupplies.org/fileadmin/uploads/rhsc/Issues/Addressing_Stockouts/Takestock/Documents/Using_the_Power_of_Partnership_to_Speak_the_Same_Language_on_Stockouts.pdf. It is defined as the percentage of facilities reporting that they have stocked the method in the previous 3 months but were stocked out on the day of the assessment. || The denominator includes 47 outlets that met screening criteria for a full interview but did not complete the interview (were not interviewed or completed a partial interview). Source: FPwatch Outlet Survey, India, 2016


www.FPwatch.info Page 21
Table A6: Median price of selected modern contraceptive methods in INR*, USD, and USD per CYP†‡, by private outlet type – Uttar Pradesh, 2016 Private facility Pharmacy/Chemist Private Medical Total|| Private Other Total||
Median price of method, with interquartile range§,∞:
Median (N) [IQR]
Median (N)
[IQR]
Median (N)
[IQR]
Median (N)
[IQR]
Male condoms
INR per condom INR 3.33 (117) INR 25.00 (1,598) INR 25.00 (1,715) INR 5.00 (757)
[1.67, 25.00] [5.00, 60.00] [5.00, 60.00] [1.67, 8.33]
USD per condom $0.05 (117) $0.37 (1,598) $0.37 (1,715) $0.07 (757)
[0.02, 0.37] [0.07, 0.89] [0.07, 0.89] [0.02, 0.12]
USD per CYP $2.98 (117) $6.71 (1,598) $5.97 (1,715) $8.95 (757)
[1.07, 14.91] [4.47, 17.90] [3.36, 15.66] [2.51, 14.91]
Female condoms
INR per condom - INR 32.00 (5) INR 32.00 (5) -
- [24.00, 80.00] [24.00, 80.00] -
USD per condom - $0.48 (5) $0.48 (5) -
- [0.36, 1.19] [0.36, 1.19] -
USD per CYP - $26.85 (5) $26.85 (5) -
- [7.16, 42.95] [7.16, 42.95] -
Cyclebeads
INR per Cyclebeads - INR 5.00 (1) INR 5.00 (1) -
- [5.00, 5.00] [5.00, 5.00] -
USD per Cyclebeads - $0.07 (1) $0.07 (1) -
- [0.07, 0.07] [0.07, 0.07] -
USD per CYP - $1.12 (1) $1.12 (1) -
- [1.12, 1.12] [1.12, 1.12] -
Vaginal pessaries
INR per pill INR 6.00 (7) INR 6.00 (161) INR 6.00 (168) -
[6.00, 7.00] [6.00, 6.80] [6.00, 6.80] -
USD per pill $0.09 (7) $0.09 (161) $0.09 (168) -
[0.09, 0.10] [0.09, 0.10] [0.09, 0.10] -
USD per CYP $10.74 (7) $10.74 (161) $10.74 (168) -
[10.74, 12.53] [10.74, 12.17] [10.74, 12.17] -
Oral contraceptives
INR per cycle INR 25.00 (130) INR 25.00 (2,268) INR 25.00 (2,398) INR 10.00 (35)
[5.00, 25.00] [5.00, 25.00] [5.00, 25.00] [5.00, 25.00]
USD per cycle $0.37 (130) $0.37 (2,268) $0.37 (2,398) $0.15 (35)
[0.07, 0.37] [0.07, 0.37] [0.07, 0.37] [0.07, 0.37]
USD per CYP $5.59 (130) $5.59 (2,268) $5.59 (2,398) $2.24 (35)
[1.12, 5.59] [1.12, 5.59] [1.12, 5.59] [1.12, 5.59]
Combined oral contraceptives
INR per cycle INR 5.00 (93) INR 11.00 (1,571) INR 10.00 (1,664) INR 5.00 (27)
[3.00, 31.00] [3.00, 30.00] [3.00, 30.00] [3.00, 15.00]
USD per cycle $0.07 (93) $0.16 (1,571) $0.15 (1,664) $0.07 (27)
[0.04, 0.46] [0.04, 0.45] [0.04, 0.45] [0.04, 0.22]
USD per CYP $1.12 (93) $2.46 (1,571) $2.24 (1,664) $1.12 (27)
[0.67, 6.94] [0.67, 6.71] [0.67, 6.71] [0.67, 3.36]

www.FPwatch.info Page 22
Progestin-only pills
INR per cycle - INR 25.00 (1) INR 25.00 (1) -
- [25.00, 25.00] [25.00, 25.00] -
USD per cycle - $0.37 (1) $0.37 (1) -
- [0.37, 0.37] [0.37, 0.37] -
USD per CYP - $5.59 $5.59 -
- [5.59, 5.59] [5.59, 5.59] -
Centchroman pills
INR per 8 pill cycle INR 25.00 (37) INR 25.00 (697) INR 25.00 (734) INR 10.00 (8)
[25.00, 25.00] [25.00, 25.00] [25.00, 25.00] [10.00, 25.00]
USD per 8 pill cycle $0.37 (37) $0.37 (697) $0.37 (734) $0.15 (8)
[0.37, 0.37] [0.37, 0.37] [0.37, 0.37] [0.15, 0.37]
USD per CYP $5.59 (37) $5.59 (697) $5.59 (734) $2.24 (8)
[5.59, 5.59] [5.59, 5.59] [5.59, 5.59] [2.24, 5.59]
Emergency contraceptives
INR per dose INR 80.00 (81) INR 80.00 (1,313) INR 80.00 (1,394) INR 70.00 (19)
[75.00, 80.00] [60.00, 80.00] [60.00, 80.00] [70.00, 80.00]
USD per dose $1.19 (81) $1.19 (1,313) $1.19 (1,394) $1.04 (19)
[1.12, 1.19] [0.89, 1.19] [0.89, 1.19] [1.04, 1.19]
USD per CYP $23.86 (81) $23.86 (1,313) $23.86 (1,394) $20.88 (19)
[22.37, 23.86] [17.90, 23.86] [17.90, 23.86] [20.88, 23.86]
Contraceptive injectables
INR per dose INR 150.00 (21) INR 150.00 (64) INR 150.00 (85) INR 470.00 (1)
[100.00, 250.00] [90.00, 254.00] [100.00, 254.00] [470.00, 470.00]
USD per dose $2.24 (21) $2.24 (64) $2.24 (85) $7.01 (1)
[1.49, 3.73] [1.34, 3.79] [1.49, 3.79] [7.01, 7.01]
USD per CYP $8.95 (21) $8.95 (64) $8.95 (85) $28.04 (1)
[5.97, 14.91] [5.37, 15.15] [5.97, 15.15] [28.04, 28.04]
IUDs
INR per IUD INR 500.00 (11) INR 150.00 (2) INR 500.00 (13) -
[350.00, 500.00] [150.00, 250.00] [150.00, 500.00] -
USD per IUD $7.46 (11) $2.24 (2) $7.46 (13) -
[5.22, 7.46] [2.24, 3.73] [2.24, 7.46] -
USD per CYP $1.62 (11) $0.49 (2) $1.62 (13) -
[1.13, 1.62] [0.49, 0.81] [0.49, 1.62] -
Male sterilization
INR per sterilization INR 1000.00 (12) - INR 1000.00 (12) -
[500.00, 2500.00] - [500.00, 2500.00] -
USD per sterilization $14.91 (12) - $14.91 (12) -
[7.46, 37.29] - [7.46, 37.29] -
USD per CYP $1.15 (12) - $1.15 (12) -
[0.57 2.87] - [0.57 2.87] -
Female sterilization
INR per sterilization INR 2500.00 (28) - INR 2500.00 (28) -
[1000.00, 4000.00] - [1000.00, 4000.00] -
USD per sterilization $37.29 (28) - $37.29 (28) -
[14.91, 59.66] - [14.91, 59.66] -

www.FPwatch.info Page 23
USD per CYP $2.87 (28) - $2.87 (28) -
[1.15, 4.59] - [1.15, 4.59] -
* Based on the average rate of exchange from June 9th to September 10th, 2016 of 67.0478 INR per 1 USD. † This price is determined for the unit used in CYP conversion factors: condoms: 1 condom; cyclebeads: 1 product/string; vaginal pessaries: 1 tablet; oral contraceptives: 1 cycle or blister package; emergency contraceptives: 1 dose; injectables: 1 dose/injection; IUDs: 1 IUD. ‡ CYP – Couple Year Protection is the estimated protection provided by contraceptive methods during a one-year period, based upon the volume of all contraceptives sold or distributed free of charge to clients during that period (see Annex 11). § Price for all commodities with provider-dependent service (injectables, IUDs) may include a service charge. ∞ In UP, the number of family planning products captured in audits sheets with missing price information are as follows: 37 male condoms, 0 female condoms, 0 cyclebeads, 7 vaginal pessaries, 43 oral contraceptives (32 COCs; 1 POP; 10 Centchroman), 19 emergency contraceptives, 55 injections, and 11 IUDs, 6 male sterilizations and 8 female sterilizations. || Private Medical Total category = Private facility + Pharmacy/Chemist categories; Private Other Total category = AYUSH provider + RMP + general retailer categories.
Source: FPwatch Outlet Survey, India, 2016

www.FPwatch.info Page 24
Table A7: Median markup percentage for selected modern contraceptive commodities with interquartile range, by private outlet type – Uttar Pradesh, 2016
Private facility Pharmacy/Chemist Private Medical Total§ Private Other Total§
Median markup percentage of commodity, with interquartile range*,†,‡:
Median % (N) [IQR %]
Median % (N)
[IQR %]
Median % (N)
[IQR %]
Median % (N)
[IQR %]
Oral contraceptives 50% (103) 33% (1,993) 33% (2,096) 20% (30)
[25%, 67%] [20%, 50%] [22%, 50%] [18%, 25%]
Emergency contraceptives 50% (60) 40% (1,104) 20% (1,164) 17% (16)
[33%, 80%] [20%, 100%] [10%, 43%] [12%, 23%]
Contraceptive injectables 43% (17) 30% (51) 33% (68) 24% (1)
[12%, 131%] [25%, 43%] [20%, 67%] [24%, 24%]
IUDs 43% (8) 25% (2) 43% (10) -
[25%, 138%] [0%, 25%] [25%, 100%] -
* The number of family planning products captured in audit sheets with missing retail and/or wholesale price information are as follows: 348 oral contraceptives, 250 emergency contraceptives, 72 injections and 14 IUDs. † To determine median markup percentage, we first determined the profit margin for selected modern contraceptives at private sector outlet categories: retail price – wholesale price. We then determined a profit margin proportion by: profit margin/retail price. Finally, we converted profit margin to markup by: wholesale price/(1- profit margin proportion). We converted to a percentage and determined the median markup with IQR range. ‡ Price for all commodities with provider-dependent service (injectables, implants, IUDs) may include service charge. § Private Medical Total category = Private facility + Pharmacy/Chemist categories; Private Other Total category = AYUSH provider + RMP + general retailer categories.
Source: FPwatch Outlet Survey, India, 2016

www.FPwatch.info Page 25
Table A8: Private sector contraceptive method market share: Relative proportion of total CYP sold / distributed, by method and outlet type – Uttar Pradesh
CYPs sold or distributed in previous 1 month by outlet type and contraceptive method type as a % of total CYPs sold / distributed§,||:
Private facility Pharmacy/Chemist Private Medical
Total‡ AYUSH Provider RMP General Retailer Private Other
Total‡ All Outlets
% % % % % % % %
1. Male condoms 1.9 30.5 32.4 0.2 0.1 10.1 10.4 42.8
2. Female condoms 0.0 0.0 0.0 0.0 0.0 0.0 0.0 0.0
3. Cyclebeads 0.0 0.4 0.4 0.0 0.0 0.0 0.0 0.4
4. Vaginal pessaries 0.0 0.5 0.5 0.0 0.0 0.0 0.0 0.5
5. Oral contraceptives 1.9 23.8 25.6 0.1 0.1 0.4 0.5 26.2
Combined oral contraceptives 1.5 15.8 17.3 0.1 0.0 0.1 0.3 17.5
Progestin-only pills 0.0 0.0 0.0 0.0 0.0 0.0 0.0 0.0
Centchroman pills 0.4 8.0 8.4 0.0 0.0 0.2 0.2 8.6
6. Emergency contraceptives 0.6 10.9 11.6 0.0 0.0 0.0 0.0 11.6
7. Contraceptive injectables 0.9 0.8 1.7 0.0 0.0 0.0 0.0 1.7
8. IUDs 3.0 0.0 3.0 0.0 0.0 0.0 0.0 3.0
9. Male sterilization 1.1 0.0 1.1 0.0 0.0 0.0 0.0 1.1
10. Female sterilization 12.6 0.0 12.6 0.0 0.0 0.0 0.0 12.6
OUTLET TYPE TOTAL** 22.1 66.9 89.0 0.4 0.2 10.5 11.0 100.0
‡ Private Medical Total category = Private facility categories; Private Other Total category = AYUSH provider + RMP + general retailer categories § A total of 254,021.3 CYPs (weighted) were reportedly distributed in the previous 1 month in UP in the private sector. This is based on the number of commodities reportedly sold for categories 1-8 (not number of services performed for categories 7-8) and number of sterilizations reportedly performed for categories 9-10. || In the UP study area, 5,115 FP products were audited, not including condoms or cycle beads (3,087 oral contraceptives, 1,642 emergency contraceptives, 176 vaginal pessaries, 144 injectables, 66 IUDs). 3,179 outlets reported one or more brands of male condoms, female condoms and/or Cyclebeads, and volume information was collected for each brand. Volume of sterilizations performed was collected from 44 and 97 outlets for male or female sterilizations, respectively. Volume information was excluded due to missing information or as a volume outlier for: 22 outlets with male condoms, 1 outlet with female condoms, 0 outlets with Cyclebeads, 0 audits of vaginal pessaries, 11 audits of oral contraceptives, 12 audits of emergency contraceptives, 1 audit of injectables, 6 audits of IUDs, 0 outlets with male sterilizations and 0 outlets with female sterilizations. ** Row total: CYP volume for the specified contraceptive method type. Column total: market share for the specified outlet type method categories 1-10.
Public sector market share is not shown. Sterilization services are concentrated into a few higher-level facilities; due to our small sample of these outlet types, the results would have been skewed, and shown an inaccurate portrayal of the total market. Source: FPwatch Outlet Survey, India, 2016

www.FPwatch.info Page 26
Table A9: Contraceptive method market share within outlet type: Relative proportion of total CYP sold / distributed within outlet type, by method – Uttar Pradesh, 2016
CYPs sold or distributed in previous 1 month by outlet type and contraceptive method type as a % of total CYPs sold / distributed§,||:
Higher Public Health
Facility*
Sub-centre / ANM / ASHA†
AWW NGO Public Total‡
Private facility
Pharmacy/Chemist
Private Medical Total‡
AYUSH Provider
RMP General Retailer
Private Other Total‡
All Outlets
% % % % % % % % % % % % %
1. Male condoms 4.8 35.5 39.2 38.9 29.4 8.8 45.5 36.4 62.8 65.0 96.4 94.7 33.3
2. Female condoms 0.0 0.0 0.0 0.0 0.0 0.0 0.0 0.0 0.0 0.0 0.0 0.0 0.0
3. Cyclebeads 0.0 0.0 0.0 0.0 0.0 0.0 0.6 0.5 0.0 0.0 0.0 0.0 0.1
4. Vaginal pessaries 0.0 0.0 0.0 0.0 0.0 0.1 0.8 0.6 0.0 0.0 0.0 0.0 0.2
5. Oral contraceptives 4.6 39.2 57.8 50.7 33.4 8.4 35.6 28.8 31.4 35.0 3.3 4.8 31.3
6. Emergency contraceptives
0.2 5.1 2.9 10.4 3.9 2.9 16.3 13.0 5.9 0.0 0.2 0.4 6.1
7. Contraceptive injectables
0.3 0.0 0.0 0.0 0.1 4.2 1.2 1.9 0.0 0.0 0.0 0.0 0.6
8. IUDs 7.8 20.1 0.0 0.0 16.0 13.6 0.0 3.4 0.0 0.0 0.0 0.0 12.2
9. Male sterilization 3.1 0.0 0.0 0.0 0.6 5.1 0.0 1.3 0.0 0.0 0.0 0.0 0.8
10. Female sterilization 79.4 0.0 0.0 0.0 16.6 56.9 0.0 14.1 0.0 0.0 0.0 0.0 15.4
* Includes: Government/municipal hospitals, government dispensaries, UHC/UHP/UFWCs, CHC/rural hospitals, and PHC/FRUs. † In Uttar Pradesh Sub-centres and ASHA are equipped to provide family planning services. ANM are not. ‡ Public Total category = public health facility + community health worker + NGO categories; Private Medical Total category = Private facility categories; Private Other Total category = AYUSH provider + RMP + general retailer categories § A total of 1,001,674.9 CYPs (weighted) were reportedly distributed in the previous 1 month in UP. This is based on the number of commodities reportedly sold for categories 1-8 (not number of services performed for categories 7-8) and number of sterilizations reportedly performed for categories 9-10. || In the UP study area, 5,115 FP products were audited, not including condoms or cycle beads (3,087 oral contraceptives, 1,642 emergency contraceptives, 176 vaginal pessaries, 144 injectables, 66 IUDs). 3,179 outlets reported one or more brands of male condoms, female condoms and/or Cyclebeads, and volume information was collected for each brand. Volume of sterilizations performed was collected from 44 and 97 outlets for male or female sterilizations, respectively. Volume information was excluded due to missing information or as a volume outlier for: 22 outlets with male condoms, 1 outlet with female condoms, 0 outlets with Cyclebeads, 0 audits of vaginal pessaries, 11 audits of oral contraceptives, 12 audits of emergency contraceptives, 1 audit of injectables, 6 audits of IUDs, 0 outlets with male sterilizations and 0 outlets with female sterilizations.
Source: FPwatch Outlet Survey, India, 2016
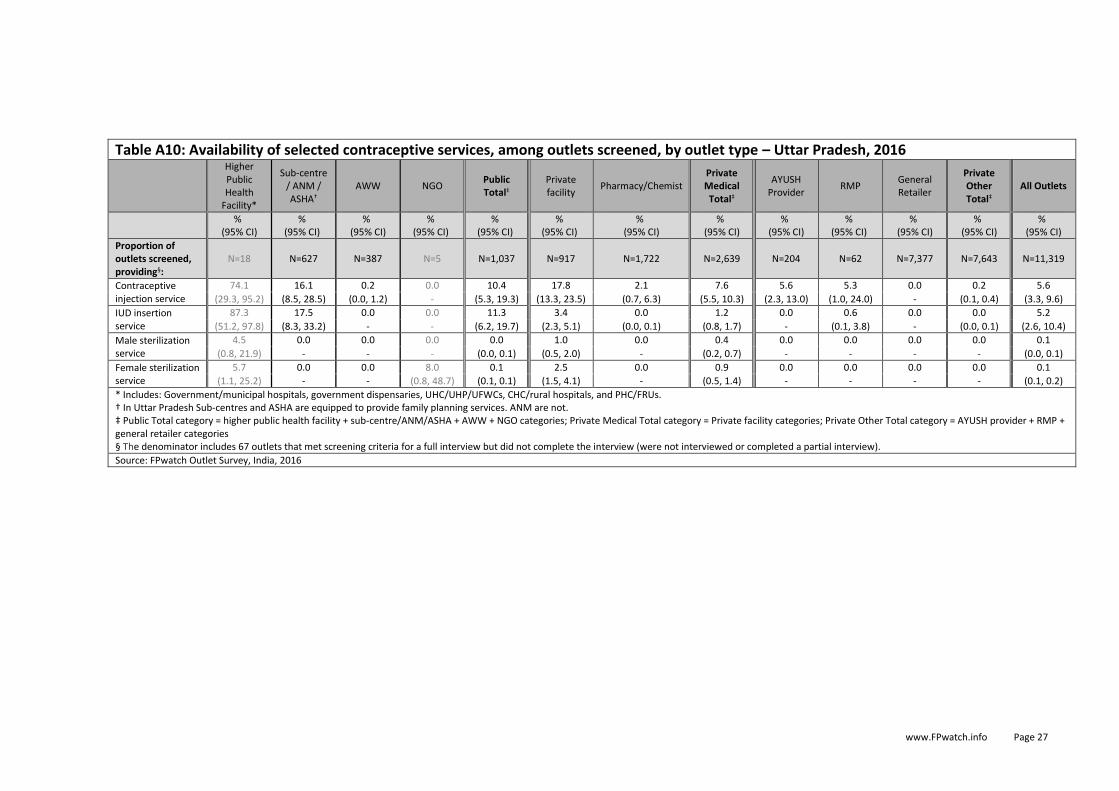
www.FPwatch.info Page 27
Table A10: Availability of selected contraceptive services, among outlets screened, by outlet type – Uttar Pradesh, 2016
Higher Public Health
Facility*
Sub-centre / ANM / ASHA†
AWW NGO Public Total‡
Private facility
Pharmacy/Chemist Private Medical Total‡
AYUSH Provider
RMP General Retailer
Private Other Total‡
All Outlets
%
(95% CI) %
(95% CI) %
(95% CI) %
(95% CI) %
(95% CI) %
(95% CI) %
(95% CI) %
(95% CI) %
(95% CI) %
(95% CI) %
(95% CI) %
(95% CI) %
(95% CI)
Proportion of outlets screened,
providing§: N=18 N=627 N=387 N=5 N=1,037 N=917 N=1,722 N=2,639 N=204 N=62 N=7,377 N=7,643 N=11,319
Contraceptive injection service
74.1 16.1 0.2 0.0 10.4 17.8 2.1 7.6 5.6 5.3 0.0 0.2 5.6
(29.3, 95.2) (8.5, 28.5) (0.0, 1.2) - (5.3, 19.3) (13.3, 23.5) (0.7, 6.3) (5.5, 10.3) (2.3, 13.0) (1.0, 24.0) - (0.1, 0.4) (3.3, 9.6)
IUD insertion service
87.3 17.5 0.0 0.0 11.3 3.4 0.0 1.2 0.0 0.6 0.0 0.0 5.2
(51.2, 97.8) (8.3, 33.2) - - (6.2, 19.7) (2.3, 5.1) (0.0, 0.1) (0.8, 1.7) - (0.1, 3.8) - (0.0, 0.1) (2.6, 10.4)
Male sterilization service
4.5 0.0 0.0 0.0 0.0 1.0 0.0 0.4 0.0 0.0 0.0 0.0 0.1
(0.8, 21.9) - - - (0.0, 0.1) (0.5, 2.0) - (0.2, 0.7) - - - - (0.0, 0.1)
Female sterilization service
5.7 0.0 0.0 8.0 0.1 2.5 0.0 0.9 0.0 0.0 0.0 0.0 0.1
(1.1, 25.2) - - (0.8, 48.7) (0.1, 0.1) (1.5, 4.1) - (0.5, 1.4) - - - - (0.1, 0.2)
* Includes: Government/municipal hospitals, government dispensaries, UHC/UHP/UFWCs, CHC/rural hospitals, and PHC/FRUs. † In Uttar Pradesh Sub-centres and ASHA are equipped to provide family planning services. ANM are not. ‡ Public Total category = higher public health facility + sub-centre/ANM/ASHA + AWW + NGO categories; Private Medical Total category = Private facility categories; Private Other Total category = AYUSH provider + RMP + general retailer categories § The denominator includes 67 outlets that met screening criteria for a full interview but did not complete the interview (were not interviewed or completed a partial interview).
Source: FPwatch Outlet Survey, India, 2016

www.FPwatch.info Page 28
Table A11: Service readiness* to provide provider-dependent contraceptive services, among outlets reportedly offering the procedure, by outlet type – Uttar Pradesh, 2016
Higher Public
Health Facility†
Sub-centre / ANM / ASHA‡
AWW NGO Public Total Private facility Pharmacy/
Chemist Private
Medical Total
AYUSH Provider
RMP General Retailer
Private Other Total
Proportion of outlets offering service, with§:
% (n) (95% CI)
% (n) (95% CI)
% (n) (95% CI)
% (n) (95% CI)
% (n) (95% CI)
% (n) (95% CI)
% (n) (95% CI)
% (n) (95% CI)
% (n) (95% CI)
% (n) (95% CI)
% (n) (95% CI)
% (n) (95% CI)
Contraceptive injection service
Availability of commodity
2.0 1.9 0.0 - 1.9 18.3 11.5 17.0 0.0 0.0 - 0.0
[0.1, 22.7] (7) [0.2, 13.4] (78) [0.0, 0.0] (2) - [0.3, 12.3] (87) [10.1, 30.8]
(194) [2.2, 42.5] (18) [9.5, 28.5] (212) [0.0, 0.0] (11) [0.0, 0.0] (3) - [0.0, 0.0] (14)
Availability of credentials
100.0 95.1 99.2 - 95.4 77.7 56.9 73.9 94.9 0.0 - 56.1
[100, 100] (7) [84.9, 98.5] (78) [89.3, 100.0] (2) - [85.8, 98.6] (87) [66.3, 86.0]
(194) [13.6, 91.7](18) [60.9, 83.8](212) [78.4, 99.0] (11) [0.0, 0.0] (3) - [17.5, 88.5] (14)
Availability of equipment
98.9 93.5 99.2 - 93.8 97.8 98.3 97.9 82.9 100.0 - 89.9
[86.4, 99.9] (7) [79.0, 98.2] (72) [89.3, 100.0] (2) - [80.3, 98.2] (81) [95.2, 99.0]
(192) [90.9, 99.7](18) [95.7, 99.0](210) [35.2, 97.7] (11) [100, 100] (3) - [50.4, 98.7] (14)
Service readiness 2.0 1.9 0.0 - 1.9 18.2 0.2 14.9 0.0 0.0 - 0.0
[0.1, 22.7] (7) [0.2, 13.8] (72) [0.0, 0.0] (2) - [0.3, 12.7] (81) [10.0, 30.9]
(192) [0.0, 1.8] (18) [7.9, 26.6] (210) [0.0, 0.0] (11) [0.0, 0.0] (3) - [0.0, 0.0] (14)
IUD insertion service
Availability of commodity
19.3 12.0 - - 12.3 29.3 0.0 29.0 - 0.0 - 0.0
[3.0, 64.6] (12) [3.5, 33.8] (66) - - [3.8, 33.1] (78) [16.3, 46.8] (54) [0.0, 0.0] (2) [16.2, 46.3] (56) - (1) - (1)
Availability of credentials
99.1 97.9 - - 98.0 100.0 100.0 100.0 - 0.0 - 0.0
[89.9, 99.9] (12) [90.8, 99.6] (66) - - [91.4, 99.5] (78) [100, 100] (54) [100, 100] (2) [100, 100] (56) - (1) - (1)
Availability of equipment
98.5 80.7 - - 81.5 95.2 0.0 94.3 - 0.0 - 0.0 [88.8, 99.8] (12) [51.9, 94.2] (66) - - [54.8, 94.1] (78) [86.8, 98.4] (54) [0.0, 0.0] (2) [86.0, 97.8] (56) - (1) - (1)
Service readiness 17.8 10.5 - - 10.8 28.6 0.0 28.3 - 0.0 - 0.0
[2.8, 62.0] (12) [3.0, 30.8] (66) - - [3.3, 30.1] (78) [15.8, 46.2] (54) [0.0, 0.0] (2) [15.7, 45.7] (56) - (1) - (1)
Male sterilization service
Availability of credentials
100.0 - - - 100.0 98.1 - 98.1 - - - -
[100, 100] (3) - - - [100, 100] (3) [86.7, 99.7](19) - [86.7, 99.7](19) - - - -
Availability of equipment
100.0 - - - 100.0 93.4 - 93.4 - - - -
[100, 100] (3) - - - [100, 100] (3) [64.3, 99.1](19) - [64.3, 99.1](19) - - - -
Service readiness
100.0 - - - 100.0 91.5 - 91.5 - - - -
[100, 100] (3) - - - [100, 100] (3) [65.8, 98.3]
(19) - [65.8, 98.3](19) - - - -
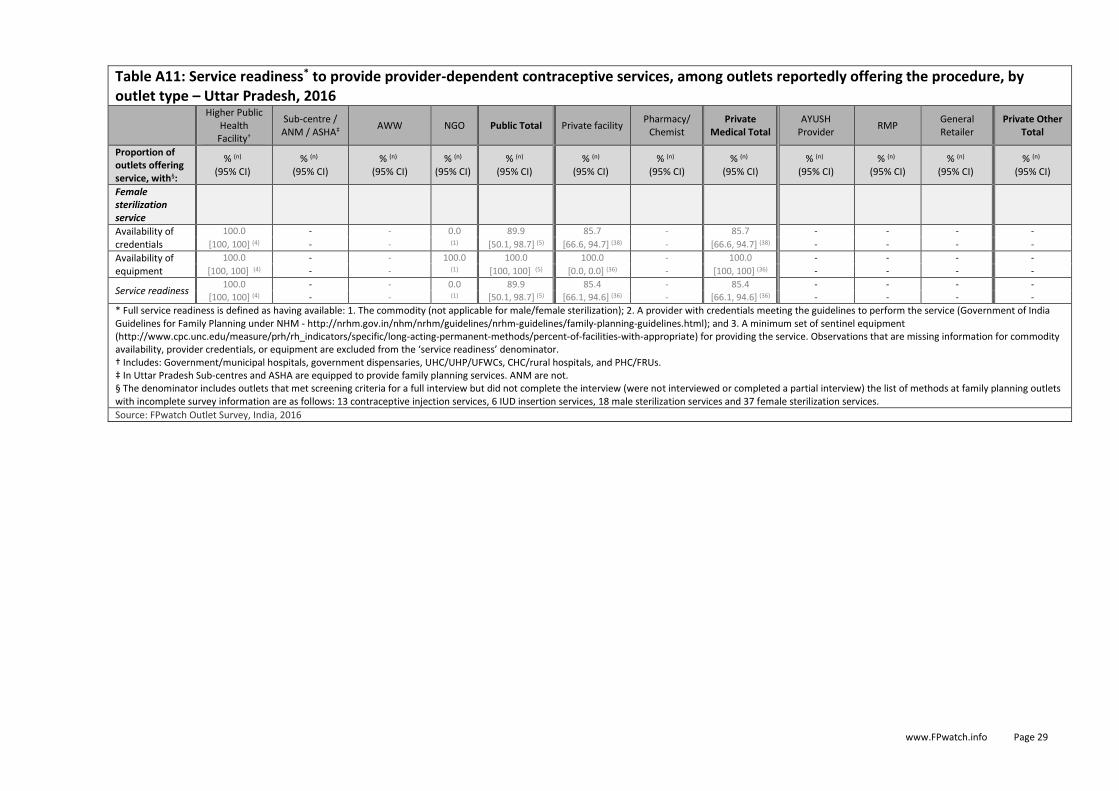
www.FPwatch.info Page 29
Table A11: Service readiness* to provide provider-dependent contraceptive services, among outlets reportedly offering the procedure, by outlet type – Uttar Pradesh, 2016
Higher Public
Health Facility†
Sub-centre / ANM / ASHA‡
AWW NGO Public Total Private facility Pharmacy/
Chemist Private
Medical Total
AYUSH Provider
RMP General Retailer
Private Other Total
Proportion of outlets offering service, with§:
% (n) (95% CI)
% (n) (95% CI)
% (n) (95% CI)
% (n) (95% CI)
% (n) (95% CI)
% (n) (95% CI)
% (n) (95% CI)
% (n) (95% CI)
% (n) (95% CI)
% (n) (95% CI)
% (n) (95% CI)
% (n) (95% CI)
Female sterilization service
Availability of credentials
100.0 - - 0.0 89.9 85.7 - 85.7 - - - -
[100, 100] (4) - - (1) [50.1, 98.7] (5) [66.6, 94.7] (38) - [66.6, 94.7] (38) - - - -
Availability of equipment
100.0 - - 100.0 100.0 100.0 - 100.0 - - - -
[100, 100] (4) - - (1) [100, 100] (5) [0.0, 0.0] (36) - [100, 100] (36) - - - -
Service readiness 100.0 - - 0.0 89.9 85.4 - 85.4 - - - -
[100, 100] (4) - - (1) [50.1, 98.7] (5) [66.1, 94.6] (36) - [66.1, 94.6] (36) - - - -
* Full service readiness is defined as having available: 1. The commodity (not applicable for male/female sterilization); 2. A provider with credentials meeting the guidelines to perform the service (Government of India Guidelines for Family Planning under NHM - http://nrhm.gov.in/nhm/nrhm/guidelines/nrhm-guidelines/family-planning-guidelines.html); and 3. A minimum set of sentinel equipment (http://www.cpc.unc.edu/measure/prh/rh_indicators/specific/long-acting-permanent-methods/percent-of-facilities-with-appropriate) for providing the service. Observations that are missing information for commodity availability, provider credentials, or equipment are excluded from the ‘service readiness’ denominator. † Includes: Government/municipal hospitals, government dispensaries, UHC/UHP/UFWCs, CHC/rural hospitals, and PHC/FRUs. ‡ In Uttar Pradesh Sub-centres and ASHA are equipped to provide family planning services. ANM are not. § The denominator includes outlets that met screening criteria for a full interview but did not complete the interview (were not interviewed or completed a partial interview) the list of methods at family planning outlets with incomplete survey information are as follows: 13 contraceptive injection services, 6 IUD insertion services, 18 male sterilization services and 37 female sterilization services.
Source: FPwatch Outlet Survey, India, 2016

www.FPwatch.info Page 30
Figure A1. Modern contraceptive method market composition – Uttar Pradesh, 2016 Among all outlets stocking at least 1 modern contraceptive or providing at least 1 contraceptive service, excluding condoms-only outlets, by outlet type
In UP, 82 percent of outlets stocking at least one modern contraceptive, among outlets above the level of stocking condoms only among those screened, came from the public sector and 18 percent from the private sector. Higher-level public health facilities and sub-centres/ANM/ASHAs accounted for 56 percent of the market composition and AWWs (anganwadi workers) comprised another 26 percent. Most of the market composition from private outlets came from pharmacies/chemists, which comprised 15 percent of the market composition and private health facilities, which comprised 2 percent of the market. Other outlet types made up less than 1 percent of the contraceptive market composition. *Includes: Government/municipal hospitals, government dispensaries, UHC/UHP/UFWCs, CHC/rural hospitals, and PHC/FRUs. Note: Sub-centres and affiliated auxiliary nurse midwives (ANMs) or Accredited Social Health Activists (ASHAs) are included in the Sub-centres/ANM/ASHAs category. Note: In Uttar Pradesh, Sub-Centres and ASHA are equipped to provide family planning services. ANM are not.

www.FPwatch.info Page 31
Figure A2. Percentage of modern contraceptive commodity-stocking outlets with selected contraceptives available – Uttar Pradesh, 2016 Among all screened outlets, by outlet type
For short-acting methods in UP, over 90 percent of sub-centres/ANM/ASHAs stocked male condoms and over 70 percent stocked oral contraceptives. More than 40 percent of sub-centres/ANM/ASHAs stocked emergency contraceptives. AWWs commonly stocked male condoms (about one-third) and oral contraceptives (almost two-thirds). In the private sector, only pharmacies/chemists commonly stocked short-acting methods with nearly all stocking male condoms, about 80 percent stocking oral contraceptives and 60 percent stocking emergency contraceptives. Female condoms and injectables were rarely stocked across all outlet types. For types of oral contraceptives, most outlets stocking oral contraceptives stocked combined oral contraceptives while few stocked progestin-only pills. Less than 20 percent of private facilities, AYUSH providers, RMPs (rural medical practitioners) and general retailers stocked male condoms and fewer other short-acting methods. Among LARC methods, only higher-level public health facilities* (not shown due to small sample size) and sub-centres/ANM/ASHAs in the public sector were found to be stocking IUDs and only private facilities and pharmacies/chemists were found to be stocking IUDs, but percentages of these facilities stocking IUDs were very low (<2 percent). * Higher-level public health facilities include: government/municipal hospitals, government dispensaries, UHC/UHP/UFWCs, CHC/rural hospitals, and PHC/FRUs. Note: Note: Sub-centres and affiliated auxiliary nurse midwives (ANMs) or Accredited Social Health Activists (ASHAs) are included in the Sub-centres/ANM/ASHAs category. In Uttar Pradesh, Sub-Centres and ASHA are equipped to provide family planning services. ANM are not. Note: Categories with a small sample size (n<30) are not shown.
N = 11,319

www.FPwatch.info Page 32
Figure A3. Percentage of outlets with selected method mixes available – Uttar Pradesh, 2016 Among all screened outlets, by outlet type
In UP, over 90 percent of sub-centres/ANM/ASHAs and pharmacies/chemists stocked at least one modern family planning method. One-quarter or fewer private health facilities, AYUSH providers or RMPs or general retailers stocked at least one method. Only public health sub-centres (about 24 percent) and pharmacies/chemists (almost 60 percent) commonly stocked three or more modern contraceptive methods. Very few outlet types stocked five or more modern contraceptive methods. Note: Note: Sub-centres and affiliated auxiliary nurse midwives (ANMs) or Accredited Social Health Activists (ASHAs) are included in the Sub-centres/ANM/ASHAs category. In Uttar Pradesh, Sub-centres and ASHA are equipped to provide family planning services. ANM are not. Note: Categories with a small sample size (n<30) are not shown.
N = 11,319

www.FPwatch.info Page 33
Figure A4. Percentage of outlets with stock outs of selected contraceptive methods – Uttar Pradesh, 2016 Among all outlets reportedly stocking the method at any time in the previous three months, by outlet type
Stock outs among those outlets reportedly stocking a method in the last three months were generally low across the public sector. Ten percent or less of any public sector outlet type carrying a method in the previous three months reported stock outs of oral contraceptives, emergency contraceptives, injectables and/or IUDs. The percentages of private sector outlets reportedly carrying a method in the previous three months and currently stocked out of a method is higher compared to the public sector, especially with private facilities reporting 10 – 20 percent of outlets stocking a given method in the last three months that were stocked out of oral contraceptives, emergency contraceptives, injectables and/or IUDs when surveyed. Stock outs were less common in pharmacies/chemists, but nearly 20 percent of pharmacies/chemists reportedly carrying injectables or IUDs in the previous three months reported a stock out of that method during data collection. Note: Sub-centres and affiliated auxiliary nurse midwives (ANMs) or Accredited Social Health Activists (ASHAs) are included in the Sub-centres/ANM/ASHAs category. In Uttar Pradesh, Sub-Centres and ASHA are equipped to provide family planning services. ANM are not. Note: Categories with a small sample size (n<30) are not shown.

www.FPwatch.info Page 34
Figure A5. Price of contraceptive methods in the private sector – Uttar Pradesh, 2016 Median price in USD and USD/CYP with interquartile range, by contraceptive method
The median price per CYP of contraceptive methods varies by method in UP. The median price per CYP of male condoms was $5.97 which was similar to $5.59 per CYP for oral contraceptives. The price per CYP for injectables was higher at $8.95 for injectables. LA/PM methods were typically cheaper compared to short-acting methods at $1.62 per CYP for IUDs, $2.87 per CYP for male sterilizations, but $5.59 per CYP for female sterilizations performed in the private sector. Note: Categories with a small sample size (n<5) are not shown.

www.FPwatch.info Page 35
Figure A6. Price of contraceptive methods in the private sector – Uttar Pradesh, 2016 Median price in rupees with interquartile range, by contraceptive method
The median price of contraceptive methods in rupees varies by method in UP. The median price of male condoms was 25 INR which was the same for oral contraceptives. The price for injectables was higher at 150 INR for injectables. LA/PM methods were typically more expensive compared to short-acting methods at 500 INR for IUDs, 1,000 INR for male sterilizations and 2,500 INR for female sterilizations performed in the private sector; however, the opposite trend is found when looking at price per CYP. Note: Categories with a small sample size (n<5) are not shown.

www.FPwatch.info Page 36
Figure A7. Percentage private sector market share for contraceptives methods – Uttar Pradesh, 2016 As a % of total CYPs sold/distributed, by outlet type
As a proportion of the total volume of CYP sold/distributed for all methods and outlet types accounted for by the FPwatch study in UP, the private medical sub-sector accounted for the majority of the total private sector market share in UP. Condoms, primarily distributed by pharmacies/chemists, were responsible for almost one-third of the total private sector market share. Oral contraceptives, also primarily from pharmacies/chemists accounted for over one-quarter of total private market share. Female sterilizations in private health facilities made up about 13 percent of the total private sector market share. In the private other sub-sector, the majority of market share came from male condoms in general retailers. Oral contraceptives sold/distributed by AYUSH providers and RMPs accounted for very little of the UP private other total market share. Note: Graph displays private-sector only. ‘Private Medical Total’ includes private health facility and pharmacy/chemist. ‘Private Other Total’ includes AYUSH provider, RMP, and general retailer.
0
20
40
60
80
100
Private Health Facility Pharmacy/Chemist AYUSH Provider RMP General Retailer Private Medical Total Private Other Total
Female sterilization
Male sterilization
IUDs
Injectables
Emergency contraceptives
Oral contraceptives
Vaginal pessaries
CycleBeads
Female condoms
Male condoms

www.FPwatch.info Page 37
Figure A8. Within outlet market share for contraceptive methods – Uttar Pradesh, 2016 As a % of total CYPs sold/distributed within outlet type, by outlet type and sector
Looking at proportion of CYP volume by method within outlet types in UP, some clear trends emerge. In the public sector, the market share for higher-level public health facilities is primarily from female sterilizations while market share for sub-centres/ANM/ASHAs is more varied with about one-fifth from IUDs and greater than one-third each from oral contraceptives and male condoms. The market share for AWWs comes primarily from oral contraceptives (about 60 percent) and male condoms (about 40 percent). In the private sector, most of the market share for AYUSH providers, RMPs and general retailers comes from male condoms with significant portions from oral contraceptives among AYUSH providers and RMPs. The market share from pharmacies/chemists is about 40 percent each from male condoms and oral contraceptives with about 15 percent from emergency contraceptives. Private facility market share is more diverse, but the majority (about 55 percent) comes from female sterilization and a further 10 – 15 percent each from IUDs, oral contraceptives and male condoms. * Higher-level public health facilities include: government/municipal hospitals, government dispensaries, UHC/UHP/UFWCs, CHC/rural hospitals, and PHC/FRUs. Note: Sub-centres and affiliated auxiliary nurse midwives (ANMs) or Accredited Social Health Activists (ASHAs) are included in the Sub-centres/ANM/ASHAs category. In Uttar Pradesh, Sub-Centres and ASHA are equipped to provide family planning services. ANM are not.
0
20
40
60
80
100
Female sterilization
Male sterilization
IUDs
Injectables
Emergency contraceptives
Oral contraceptives
Vaginal pessaries
CycleBeads
Female condoms
Male condoms

www.FPwatch.info Page 38
Figure A9. Percentage of outlets with selected contraceptive services available – Uttar Pradesh, 2016 Among all screened outlets, among outlets screened, by outlet type
Among all screened outlets, very few offered selected contraceptive services across outlet types. Private health facilities offered relatively higher access to selected services compared with other outlet types. Slightly less than 20 percent of sub-centres/ANM/ASHAs and private for-profit facilities offered contraceptive injection services. About 20 percent of sub-centres/ANM/ASHAs offered IUD insertion services. Small numbers (five percent or less) of pharmacies/chemists, AYUSH provider and RMPs reportedly offered contraceptive injection services. For male and female sterilizations, less than five percent of public or private facilities screened by the study reportedly offered male or female sterilizations. Note: Sub-centres and affiliated auxiliary nurse midwives (ANMs) or Accredited Social Health Activists (ASHAs) are included in the Sub-centres/ANM/ASHAs category. In Uttar Pradesh, Sub-Centres and ASHA are equipped to provide family planning services. ANM are not. Note: Categories with a small sample size (n<30) are not shown.
N = 11,319

www.FPwatch.info Page 39
Figure A10. Service readiness to offer provider-dependent contraceptive services – Uttar Pradesh, 2016 Among outlets reportedly offering the service, by outlet type
`
Looking at service readiness—comprising of having a commodity, trained staff and a minimum level of equipment—for contraceptive services in UP among outlets reportedly offering the service, less than five percent of public sub-centres and less than 20 percent of private facilities reportedly offering contraceptive injection services were found to be service ready, primarily due to lack of availability of the injectable commodity. Only about 10 percent of sub-centres and nearly 30 percent of private facilities were found to be service ready for IUD insertions, again, with those found not to be service ready primarily due to lack of the commodity. For female sterilizations, 85 percent of private facilities were found to be service ready. Male sterilization is not shown due to small sample size. Note: In Uttar Pradesh, Sub-Centres and ASHA are equipped to provide family planning services. ANM are not. Note: Categories with a small sample size (n<30) are not shown.

www.FPwatch.info Page 40
Uttar Pradesh Metro / Urban / Rural Geographic Strata
Table B1: Modern contraceptive method market composition: Relative proportion of outlets with 1 or more methods, by outlet type – Uttar Pradesh Strata, 2016
Higher Public
Health Facility*
Sub-centre / ANM / ASHA†
AWW NGO Public Total‡
Private facility
Pharmacy/ Chemist
Private Medical Total‡
AYUSH Provider
RMP General Retailer
Private Other Total‡
Proportion of outlet types stocking / providing at least 1 modern contraceptive method on the day of the survey, of all outlets stocking / providing at least 1 modern contraceptive method§:
% (95% CI)
% (95% CI)
% (95% CI)
% (95% CI)
% (95% CI)
% (95% CI)
% (95% CI)
% (95% CI)
% (95% CI)
% (95% CI)
% (95% CI)
% (95% CI)
Any method available, including condoms only outlets||
Metro 0.5 - 1.5 0.1 2.1 3.7 64.4 68.1 1.9 - 28.0 29.8 N=785 (0.1, 1.6) - (0.4, 5.1) (0.0, 0.8) (0.8, 5.2) (2.0, 6.6) (53.7, 73.8) (57.3, 77.2) (0.3, 10.0) - (20.7, 36.7) (21.7, 39.5)
Urban N=1644
0.6 0.8 1.0 0.4 2.9 7.2 61.6 68.8 1.2 0.2 27.0 28.4
(0.3, 1.3) (0.4, 1.8) (0.5, 2.1) (0.1, 1.4) (1.9, 4.4) (5.0, 10.3) (56.7, 66.2) (63.9, 73.2) (0.6, 2.3) (0.1, 0.6) (22.7, 31.7) (24.1, 33.1)
Rural N=916
0.5 60.8 25.8 - 87.1 1.5 5.9 7.4 0.1 0.2 5.2 5.5
(0.1, 2.7) (54.7, 66.7) (16.3, 38.2) - (78.6, 92.6) (0.7, 3.2) (3.3, 10.3) (4.1, 12.9) (0.0, 0.3) (0.1, 0.8) (2.9, 9.1) (3.1, 9.5)
Any method available, excluding condoms only outlets**
Metro 0.5 - 2.2 0.2 2.9 4.2 91.1 95.2 0.9 - 1.0 1.9 N=550 (0.1, 2.2) - (0.6, 8.0) (0.0, 1.2) (1.0, 8.0) (2.3, 7.5) (85.1, 94.8) (90.0, 97.8) (0.2, 5.4) - (0.2, 4.3) (0.6, 6.1)
Urban N=1087
1.0 1.0 1.0 0.5 3.5 9.2 82.4 91.6 0.9 0.1 3.8 4.9
(0.5, 2.0) (0.4, 2.5) (0.4, 2.6) (0.1, 2.1) (2.2, 5.6) (6.1, 13.6) (77.1, 86.7) (86.3, 95.0) (0.3, 2.8) (0.0, 0.8) (1.3, 11.1) (2.0, 11.3)
Rural N=721
0.6 62.9 29.1 - 92.7 1.1 6.0 7.1 0.0 0.1 0.1 0.2
(0.1, 3.2) (55.3, 70.0) (19.6, 41.0) - (86.3, 96.2) (0.4, 2.7) (3.1, 11.4) (3.7, 13.4) (0.0, 0.2) (0.0, 0.3) (0.0, 0.7) (0.1, 0.7)
* Includes: Government/municipal hospitals, government dispensaries, UHC/UHP/UFWCs, CHC/rural hospitals, and PHC/FRUs. † In Uttar Pradesh Sub-centres and ASHA are equipped to provide family planning services. ANM are not. SC are found in rural areas and managed by ANM workers, ASHA can be found across strata. ‡ Public Total category = higher public health facility + sub-centre/ANM/ASHA + AWW + NGO categories; Private Medical Total category = Private facility categories; Private Other Total category = AYUSH provider + RMP + general retailer categories § Contraceptive commodity-stocking outlets have at least one family planning commodity in stock on the day of the survey, verified by the presence of at least one family planning commodity recorded in an audit sheet. There were 47 family planning commodity-stocking outlets in UP with partially completed interviews, which were excluded from the denominator (7 from UP Metro stratum, 29 from UP Urban stratum and 11 from UP Rural stratum). || Includes: male condoms, female condoms, cyclebeads, vaginal pessaries, oral contraceptives, emergency contraceptives, injectables or IUDs. Birth control patches, diaphragms or implants were not found in UP or Bihar. ** Includes: oral contraceptives, emergency contraceptives, injectables or IUDs.
Source: FPwatch Outlet Survey, India, 2016

www.FPwatch.info Page 41
Table B2: Availability of modern contraceptive method types, among outlets screened, by outlet type – Uttar Pradesh Strata, 2016
Higher Public Health
Facility*
Sub-centre / ANM / ASHA†
AWW NGO Public Total‡
Private facility
Pharmacy/ Chemist
Private Medical Total‡
AYUSH Provider
RMP General Retailer
Private Other Total‡
All Outlets
%
(95% CI) %
(95% CI) %
(95% CI) %
(95% CI) %
(95% CI) %
(95% CI) %
(95% CI) %
(95% CI) %
(95% CI) %
(95% CI) %
(95% CI) %
(95% CI) %
(95% CI)
Proportion of outlets screened, currently stocking / providing§:
Metro: N=3
Urban: N=9
Rural: N=6
Metro: N=1
Urban: N=41 Rural: N=585
Metro: N=15
Urban: N=62 Rural: N=310
Metro: N=1
Urban: N=4
Rural: N=0
Metro: N=20
Urban: N=116 Rural: N=901
Metro: N=222 Urban: N=611 Rural: N=84
Metro: N=530 Urban:
N=1,051 Rural: N=141
Metro: N=752 Urban:
N=1,662 Rural: N=225
Metro: N=61
Urban: N=134 Rural: N=9
Metro: N=2
Urban: N=17 Rural: N=43
Metro: N=1,983 Urban:
N=4,640 Rural: N=754
Metro: N=2,046 Urban:
N=4,791 Rural: N=806
Metro: N=2,818 Urban:
N=6,569 Rural:
N=1,932
Any modern method
Metro 100.0 0.0 68.3 100.0 69.5 13.4 96.4 72.1 18.9 0.0 10.2 10.5 26.3
(100,100) - (27.2, 92.5) - (36.2, 90.2) (7.7, 22.3) (92.4, 98.3) (63.2, 79.6) (5.1, 49.9) - (7.3, 14.1) (7.5, 14.6) (21.4, 31.8)
Urban 96.7 53.3 41.3 100.0 56.2 21.6 92.7 69.0 13.9 28.7 11.0 11.1 27.8
(78.8, 99.6) (26.6, 78.2) (25.1, 59.6) (100,100) (42.5, 69.0) (15.1, 29.9) (87.3, 95.9) (62.3, 74.9) (6.9, 25.9) (5.9, 71.9) (8.7, 13.6) (8.9, 13.7) (24.8, 30.9)
Rural 98.6 95.5 66.0 - 84.4 37.6 91.1 70.4 16.4 17.8 9.7 9.9 59.1
(84.6, 99.9) (92.4, 97.4) (42.1, 83.8) - (73.9, 91.2) (25.7, 51.2) (82.1, 95.8) (61.4, 78.0) (3.6, 50.6) (7.4, 36.9) (6.6, 13.9) (6.9, 14.0) (49.5, 68.1)
Any short-acting method
Metro 100.0 0.0 68.3 0.0 66.1 10.8 96.4 71.4 18.9 0.0 10.2 10.5 26.0
(100,100) - (27.2, 92.5) - (31.7, 89.1) (6.2, 18.0) (92.4, 98.3) (62.4, 78.9) (5.1, 49.9) - (7.3, 14.1) (7.5, 14.6) (21.2, 31.6)
Urban 96.7 53.3 41.1 100.0 56.1 19.6 92.7 68.3 13.9 28.7 11.0 11.1 27.6
(78.8, 99.6) (26.6, 78.2) (24.9, 59.5) (100,100) (42.5, 69.0) (13.3, 27.9) (87.3, 95.9) (61.7, 74.2) (6.9, 25.9) (5.9, 71.9) (8.7, 13.6) (8.9, 13.7) (24.6, 30.7)
Rural 98.6 95.4 66.0 - 84.3 37.2 91.1 70.2 16.4 17.8 9.7 9.9 59.1
(84.6, 99.9) (92.2, 97.3) (42.1, 83.8) - (73.8, 91.1) (25.3, 50.9) (82.1, 95.8) (61.2, 77.9) (3.6, 50.6) (7.4, 36.9) (6.6, 13.9) (6.9, 14.0) (49.4, 68.1)
Any LARC method
Metro 40.1 0.0 0.0 0.0 6.4 3.9 0.6 1.6 0.0 0.0 0.0 0.0 0.4
(5.0, 89.5) - - - (0.7, 39.8) (1.7, 8.5) (0.2, 1.8) (0.9, 2.8) - - - - (0.3, 0.8)
Urban 85.9 4.9 0.0 0.0 12.5 1.4 0.3 0.6 0.0 0.0 0.0 0.0 0.4
(51.4, 97.2) (0.7, 28.2) - - (5.8, 24.9) (0.7, 3.0) (0.1, 1.2) (0.3, 1.2) - - - - (0.2, 0.6)
Rural 4.9 3.7 0.0 - 2.3 0.0 0.0 0.0 0.0 0.0 0.0 0.0 1.4
(0.4, 41.0) (1.9, 6.9) - - (1.2, 4.5) - - - - - - - (0.8, 2.6)
Any permanent method
Metro 40.1 0.0 0.0 100.0 9.8 3.8 0.0 1.1 0.0 0.0 0.0 0.0 0.4
(5.0, 89.5) - - - (1.8, 38.9) (1.6, 8.6) - (0.5, 2.6) - - - - (0.2, 0.8)
Urban 33.5 0.0 0.0 0.0 4.3 4.0 0.0 1.3 0.0 0.0 0.0 0.0 0.4
(10.4, 68.4) - - - (1.4, 12.7) (2.2, 7.2) - (0.7, 2.4) - - - - (0.2, 0.8)
Rural 0.0 0.0 0.0 - 0.0 0.5 0.0 0.2 0.0 0.0 0.0 0.0 0.1
- - - - - (0.1, 3.4) - (0.1, 1.3) - - - - (0.1, 0.1)
Any LA/PM

www.FPwatch.info Page 42
Table B2: Availability of modern contraceptive method types, among outlets screened, by outlet type – Uttar Pradesh Strata, 2016
Higher Public Health
Facility*
Sub-centre / ANM / ASHA†
AWW NGO Public Total‡
Private facility
Pharmacy/ Chemist
Private Medical Total‡
AYUSH Provider
RMP General Retailer
Private Other Total‡
All Outlets
%
(95% CI) %
(95% CI) %
(95% CI) %
(95% CI) %
(95% CI) %
(95% CI) %
(95% CI) %
(95% CI) %
(95% CI) %
(95% CI) %
(95% CI) %
(95% CI) %
(95% CI)
Proportion of outlets screened, currently stocking / providing§:
Metro: N=3
Urban: N=9
Rural: N=6
Metro: N=1
Urban: N=41 Rural: N=585
Metro: N=15
Urban: N=62 Rural: N=310
Metro: N=1
Urban: N=4
Rural: N=0
Metro: N=20
Urban: N=116 Rural: N=901
Metro: N=222 Urban: N=611 Rural: N=84
Metro: N=530 Urban:
N=1,051 Rural: N=141
Metro: N=752 Urban:
N=1,662 Rural: N=225
Metro: N=61
Urban: N=134 Rural: N=9
Metro: N=2
Urban: N=17 Rural: N=43
Metro: N=1,983 Urban:
N=4,640 Rural: N=754
Metro: N=2,046 Urban:
N=4,791 Rural: N=806
Metro: N=2,818 Urban:
N=6,569 Rural:
N=1,932
Metro 40.1 0.0 0.0 100.0 9.8 6.5 0.6 2.4 0.0 0.0 0.0 0.0 0.7
(5.0, 89.5) - - - (1.8, 38.9) (3.4, 12.0) (0.2, 1.8) (1.4, 3.9) - - - - (0.4, 1.0)
Urban 96.7 4.9 0.0 0.0 13.9 4.8 0.3 1.8 0.0 0.0 0.0 0.0 0.7
(78.8, 99.6) (0.7, 28.2) - - (6.8, 26.5) (2.8, 8.0) (0.1, 1.2) (1.1, 2.9) - - - - (0.5, 1.1)
Rural 4.9 3.7 0.0 - 2.3 0.5 0.0 0.2 0.0 0.0 0.0 0.0 1.4
(0.4, 41.0) (1.9, 6.9) - - (1.2, 4.5) (0.1, 3.4) - (0.1, 1.3) - - - - (0.8, 2.6)
* Includes: Government/municipal hospitals, government dispensaries, UHC/UHP/UFWCs, CHC/rural hospitals, and PHC/FRUs. † In Uttar Pradesh Sub-centres and ASHA are equipped to provide family planning services. ANM are not. SC are found in rural areas and managed by ANM workers, ASHA can be found across strata. ‡ Public Total category = higher public health facility + sub-centre/ANM/ASHA + AWW + NGO categories; Private Medical Total category = Private facility categories; Private Other Total category = AYUSH provider + RMP + general retailer categories § The denominator includes 47 outlets that met screening criteria for a full interview but did not complete the interview (were not interviewed or completed a partial interview). This includes 7 from UP Metro stratum, 29 from UP Urban stratum and 11 from UP Rural stratum).
Source: FPwatch Outlet Survey, India, 2016
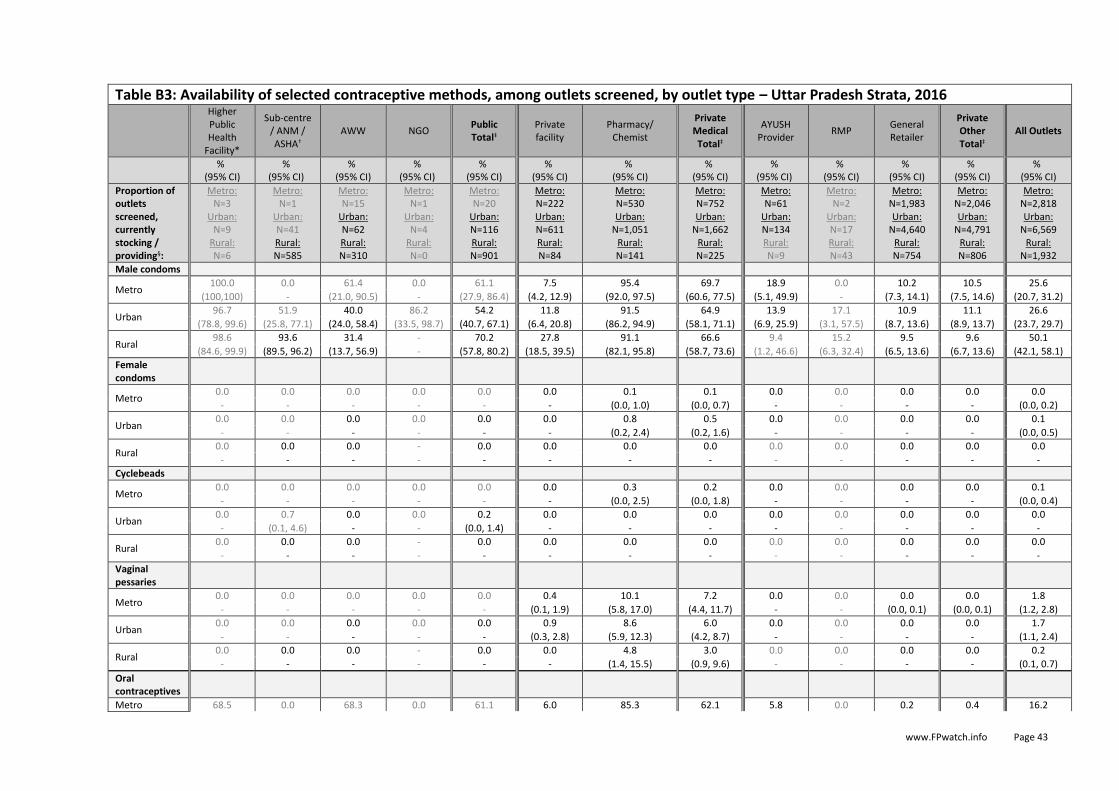
www.FPwatch.info Page 43
Table B3: Availability of selected contraceptive methods, among outlets screened, by outlet type – Uttar Pradesh Strata, 2016
Higher Public Health
Facility*
Sub-centre / ANM / ASHA†
AWW NGO Public Total‡
Private facility
Pharmacy/ Chemist
Private Medical Total‡
AYUSH Provider
RMP General Retailer
Private Other Total‡
All Outlets
%
(95% CI) %
(95% CI) %
(95% CI) %
(95% CI) %
(95% CI) %
(95% CI) %
(95% CI) %
(95% CI) %
(95% CI) %
(95% CI) %
(95% CI) %
(95% CI) %
(95% CI)
Proportion of outlets screened, currently stocking / providing§:
Metro: N=3
Urban: N=9
Rural: N=6
Metro: N=1
Urban: N=41 Rural: N=585
Metro: N=15
Urban: N=62 Rural: N=310
Metro: N=1
Urban: N=4
Rural: N=0
Metro: N=20
Urban: N=116 Rural: N=901
Metro: N=222 Urban: N=611 Rural: N=84
Metro: N=530 Urban:
N=1,051 Rural: N=141
Metro: N=752 Urban:
N=1,662 Rural: N=225
Metro: N=61
Urban: N=134 Rural: N=9
Metro: N=2
Urban: N=17 Rural: N=43
Metro: N=1,983 Urban:
N=4,640 Rural: N=754
Metro: N=2,046 Urban:
N=4,791 Rural: N=806
Metro: N=2,818 Urban:
N=6,569 Rural:
N=1,932
Male condoms
Metro 100.0 0.0 61.4 0.0 61.1 7.5 95.4 69.7 18.9 0.0 10.2 10.5 25.6
(100,100) - (21.0, 90.5) - (27.9, 86.4) (4.2, 12.9) (92.0, 97.5) (60.6, 77.5) (5.1, 49.9) - (7.3, 14.1) (7.5, 14.6) (20.7, 31.2)
Urban 96.7 51.9 40.0 86.2 54.2 11.8 91.5 64.9 13.9 17.1 10.9 11.1 26.6
(78.8, 99.6) (25.8, 77.1) (24.0, 58.4) (33.5, 98.7) (40.7, 67.1) (6.4, 20.8) (86.2, 94.9) (58.1, 71.1) (6.9, 25.9) (3.1, 57.5) (8.7, 13.6) (8.9, 13.7) (23.7, 29.7)
Rural 98.6 93.6 31.4 - 70.2 27.8 91.1 66.6 9.4 15.2 9.5 9.6 50.1
(84.6, 99.9) (89.5, 96.2) (13.7, 56.9) - (57.8, 80.2) (18.5, 39.5) (82.1, 95.8) (58.7, 73.6) (1.2, 46.6) (6.3, 32.4) (6.5, 13.6) (6.7, 13.6) (42.1, 58.1)
Female condoms
Metro 0.0 0.0 0.0 0.0 0.0 0.0 0.1 0.1 0.0 0.0 0.0 0.0 0.0
- - - - - - (0.0, 1.0) (0.0, 0.7) - - - - (0.0, 0.2)
Urban 0.0 0.0 0.0 0.0 0.0 0.0 0.8 0.5 0.0 0.0 0.0 0.0 0.1
- - - - - - (0.2, 2.4) (0.2, 1.6) - - - - (0.0, 0.5)
Rural 0.0 0.0 0.0 - 0.0 0.0 0.0 0.0 0.0 0.0 0.0 0.0 0.0
- - - - - - - - - - - - -
Cyclebeads
Metro 0.0 0.0 0.0 0.0 0.0 0.0 0.3 0.2 0.0 0.0 0.0 0.0 0.1
- - - - - - (0.0, 2.5) (0.0, 1.8) - - - - (0.0, 0.4)
Urban 0.0 0.7 0.0 0.0 0.2 0.0 0.0 0.0 0.0 0.0 0.0 0.0 0.0
- (0.1, 4.6) - - (0.0, 1.4) - - - - - - - -
Rural 0.0 0.0 0.0 - 0.0 0.0 0.0 0.0 0.0 0.0 0.0 0.0 0.0
- - - - - - - - - - - - -
Vaginal pessaries
Metro 0.0 0.0 0.0 0.0 0.0 0.4 10.1 7.2 0.0 0.0 0.0 0.0 1.8
- - - - - (0.1, 1.9) (5.8, 17.0) (4.4, 11.7) - - (0.0, 0.1) (0.0, 0.1) (1.2, 2.8)
Urban 0.0 0.0 0.0 0.0 0.0 0.9 8.6 6.0 0.0 0.0 0.0 0.0 1.7
- - - - - (0.3, 2.8) (5.9, 12.3) (4.2, 8.7) - - - - (1.1, 2.4)
Rural 0.0 0.0 0.0 - 0.0 0.0 4.8 3.0 0.0 0.0 0.0 0.0 0.2
- - - - - - (1.4, 15.5) (0.9, 9.6) - - - - (0.1, 0.7)
Oral contraceptives
Metro 68.5 0.0 68.3 0.0 61.1 6.0 85.3 62.1 5.8 0.0 0.2 0.4 16.2

www.FPwatch.info Page 44
Table B3: Availability of selected contraceptive methods, among outlets screened, by outlet type – Uttar Pradesh Strata, 2016
Higher Public Health
Facility*
Sub-centre / ANM / ASHA†
AWW NGO Public Total‡
Private facility
Pharmacy/ Chemist
Private Medical Total‡
AYUSH Provider
RMP General Retailer
Private Other Total‡
All Outlets
%
(95% CI) %
(95% CI) %
(95% CI) %
(95% CI) %
(95% CI) %
(95% CI) %
(95% CI) %
(95% CI) %
(95% CI) %
(95% CI) %
(95% CI) %
(95% CI) %
(95% CI)
Proportion of outlets screened, currently stocking / providing§:
Metro: N=3
Urban: N=9
Rural: N=6
Metro: N=1
Urban: N=41 Rural: N=585
Metro: N=15
Urban: N=62 Rural: N=310
Metro: N=1
Urban: N=4
Rural: N=0
Metro: N=20
Urban: N=116 Rural: N=901
Metro: N=222 Urban: N=611 Rural: N=84
Metro: N=530 Urban:
N=1,051 Rural: N=141
Metro: N=752 Urban:
N=1,662 Rural: N=225
Metro: N=61
Urban: N=134 Rural: N=9
Metro: N=2
Urban: N=17 Rural: N=43
Metro: N=1,983 Urban:
N=4,640 Rural: N=754
Metro: N=2,046 Urban:
N=4,791 Rural: N=806
Metro: N=2,818 Urban:
N=6,569 Rural:
N=1,932
(14.5, 96.5) - (27.2, 92.5) - (27.9, 86.4) (3.2, 10.9) (74.8, 91.9) (50.4, 72.5) (1.4, 20.5) - (0.0, 1.2) (0.1, 1.4) (11.8, 21.8)
Urban 85.6 39.7 25.5 100.0 42.9 13.0 74.3 53.9 6.1 11.6 1.0 1.2 16.3
(50.5, 97.2) (17.2, 67.6) (10.8, 49.3) (100,100) (28.9, 58.1) (7.4, 21.8) (67.8, 79.9) (47.3, 60.3) (1.7, 20.1) (1.3, 56.2) (0.3, 3.4) (0.4, 3.2) (14.2, 18.8)
Rural 97.1 83.7 63.1 - 76.0 20.8 80.1 57.1 7.0 4.1 0.2 0.3 50.1
(79.4, 99.7) (73.0, 90.7) (38.4, 82.4) - (61.5, 86.2) (10.0, 38.1) (69.2, 87.8) (46.0, 67.5) (0.9, 38.6) (1.1, 14.1) (0.0, 1.1) (0.1, 1.0) (37.8, 62.3)
Combined oral contraceptives
Metro 68.5 0.0 68.3 0.0 61.1 6.0 75.8 55.3 5.8 0.0 0.2 0.4 14.5
(14.5, 96.5) - (27.2, 92.5) - (27.9, 86.4) (3.2, 10.9) (66.4, 83.2) (44.8, 65.4) (1.4, 20.5) - (0.0, 1.2) (0.1, 1.4) (10.6, 19.6)
Urban 85.6 39.7 25.5 100.0 42.9 10.6 55.7 40.7 6.1 11.6 0.3 0.5 12.2
(50.5, 97.2) (17.2, 67.6) (10.8, 49.3) (100,100) (28.9, 58.1) (5.4, 19.8) (50.6, 60.8) (35.2, 46.4) (1.7, 20.1) (1.3, 56.2) (0.1, 0.8) (0.2, 1.1) (10.6, 14.1)
Rural 97.1 83.6 63.1 - 75.9 12.1 59.0 40.8 7.0 4.1 0.0 0.2 48.9
(79.4, 99.7) (72.9, 90.6) (38.4, 82.4) - (61.4, 86.2) (5.8, 23.3) (44.1, 72.4) (30.1, 52.6) (0.9, 38.6) (1.1, 14.1) (0.0, 0.2) (0.1, 0.5) (36.4, 61.6)
Progestin-only pills
Metro 0.0 0.0 0.0 0.0 0.0 0.0 0.2 0.1 0.0 0.0 0.0 0.0 0.0
- - - - - - (0.0, 1.3) (0.0, 0.9) - - - - (0.0, 0.2)
Urban 0.0 0.0 0.0 0.0 0.0 0.0 0.0 0.0 0.0 0.0 0.0 0.0 0.0
- - - - - - - - - - - - -
Rural 0.0 0.0 0.0 - 0.0 0.0 0.0 0.0 0.0 0.0 0.0 0.0 0.0
- - - - - - - - - - - - -
Centchroman pills
Metro 0.0 0.0 0.0 0.0 0.0 0.5 27.3 19.4 0.0 0.0 0.0 0.0 4.8
- - - - - (0.1, 3.5) (20.2, 35.8) (14.8, 25.1) - - (0.0, 0.1) (0.0, 0.1) (3.4, 6.8)
Urban 0.0 0.0 0.0 84.6 6.0 4.0 45.7 31.8 2.1 0.0 0.7 0.7 9.4
- - - (33.4, 98.4) (1.2, 25.1) (2.2, 7.0) (38.7, 52.8) (26.4, 37.6) (0.3, 13.2) - (0.1, 3.7) (0.1, 3.4) (7.6, 11.5)
Rural 0.0 0.9 0.4 - 0.7 10.3 48.3 33.6 0.0 1.5 0.2 0.2 2.6
- (0.2, 3.9) (0.1, 1.8) - (0.2, 2.4) (4.1, 23.5) (35.6, 61.4) (24.4, 44.2) - (0.2, 8.7) (0.0, 1.2) (0.0, 1.0) (1.4, 4.6)
Emergency contraceptives
Metro 40.1 0.0 0.0 0.0 6.4 3.7 66.9 48.4 0.9 0.0 0.2 0.2 12.2
(5.0, 89.5) - - - (0.7, 39.8) (1.5, 8.9) (56.9, 75.6) (43.4, 53.5) (0.2, 4.5) - (0.0, 0.5) (0.1, 0.6) (10.3, 14.4)
Urban 43.9 29.1 0.4 100.0 21.8 11.5 62.4 45.4 3.2 0.0 0.1 0.2 13.0

www.FPwatch.info Page 45
Table B3: Availability of selected contraceptive methods, among outlets screened, by outlet type – Uttar Pradesh Strata, 2016
Higher Public Health
Facility*
Sub-centre / ANM / ASHA†
AWW NGO Public Total‡
Private facility
Pharmacy/ Chemist
Private Medical Total‡
AYUSH Provider
RMP General Retailer
Private Other Total‡
All Outlets
%
(95% CI) %
(95% CI) %
(95% CI) %
(95% CI) %
(95% CI) %
(95% CI) %
(95% CI) %
(95% CI) %
(95% CI) %
(95% CI) %
(95% CI) %
(95% CI) %
(95% CI)
Proportion of outlets screened, currently stocking / providing§:
Metro: N=3
Urban: N=9
Rural: N=6
Metro: N=1
Urban: N=41 Rural: N=585
Metro: N=15
Urban: N=62 Rural: N=310
Metro: N=1
Urban: N=4
Rural: N=0
Metro: N=20
Urban: N=116 Rural: N=901
Metro: N=222 Urban: N=611 Rural: N=84
Metro: N=530 Urban:
N=1,051 Rural: N=141
Metro: N=752 Urban:
N=1,662 Rural: N=225
Metro: N=61
Urban: N=134 Rural: N=9
Metro: N=2
Urban: N=17 Rural: N=43
Metro: N=1,983 Urban:
N=4,640 Rural: N=754
Metro: N=2,046 Urban:
N=4,791 Rural: N=806
Metro: N=2,818 Urban:
N=6,569 Rural:
N=1,932
(15.0, 77.5) (9.2, 62.5) (0.1, 2.8) (100,100) (10.8, 39.0) (6.1, 20.6) (56.3, 68.1) (39.4, 51.5) (0.8, 12.5) - (0.0, 0.2) (0.1, 0.5) (11.2, 15.1)
Rural 13.7 42.3 3.3 - 27.4 7.5 57.5 38.1 0.0 0.0 0.0 0.0 19.1
(1.6, 60.3) (24.2, 62.8) (1.2, 8.4) - (18.5, 38.6) (3.4, 15.9) (44.9, 69.1) (28.8, 48.4) - - - - (12.8, 27.5)
Contraceptive injectables (All DMPA)
Metro 0.0 0.0 0.0 0.0 0.0 3.6 6.2 5.4 0.0 0.0 0.0 0.0 1.4
- - - - - (1.7, 7.5) (3.1, 11.8) (3.3, 8.8) - - (0.0, 0.1) (0.0, 0.1) (0.8, 2.2)
Urban 11.2 0.0 0.0 0.0 1.4 3.5 5.9 5.1 0.0 0.0 0.0 0.0 1.4
(1.5, 50.4) - - - (0.2, 9.4) (1.7, 7.2) (4.2, 8.4) (3.7, 7.2) - - - - (1.0, 2.1)
Rural 0.0 0.3 0.0 - 0.2 2.7 4.2 3.6 0.0 0.0 0.0 0.0 0.3
- (0.1, 2.0) - - (0.0, 1.3) (0.6, 11.1) (1.5, 11.6) (1.6, 8.1) - - - - (0.1, 0.9)
IUDs (All Copper T)
Metro 40.1 0.0 0.0 0.0 6.4 3.9 0.6 1.6 0.0 0.0 0.0 0.0 0.4
(5.0, 89.5) - - - (0.7, 39.8) (1.7, 8.5) (0.2, 1.8) (0.9, 2.8) - - - - (0.3, 0.8)
Urban 85.9 4.9 0.0 0.0 12.5 1.4 0.3 0.6 0.0 0.0 0.0 0.0 0.4
(51.4, 97.2) (0.7, 28.2) - - (5.8, 24.9) (0.7, 3.0) (0.1, 1.2) (0.3, 1.2) - - - - (0.2, 0.6)
Rural 4.9 3.7 0.0 - 2.3 0.0 0.0 0.0 0.0 0.0 0.0 0.0 1.4
(0.4, 41.0) (1.9, 6.9) - - (1.2, 4.5) - - - - - - - (0.8, 2.6)
* Includes: Government/municipal hospitals, government dispensaries, UHC/UHP/UFWCs, CHC/rural hospitals, and PHC/FRUs. † In Uttar Pradesh Sub-centres and ASHA are equipped to provide family planning services. ANM are not. SC are found in rural areas and managed by ANM workers, ASHA can be found across strata. ‡ Public Total category = higher public health facility + sub-centre/ANM/ASHA + AWW + NGO categories; Private Medical Total category = Private facility categories; Private Other Total category = AYUSH provider + RMP + general retailer categories § The denominator includes 47 outlets that met screening criteria for a full interview but did not complete the interview (were not interviewed or completed a partial interview). This includes 7 from UP Metro stratum, 29 from UP Urban stratum and 11 from UP Rural stratum.
Source: FPwatch Outlet Survey, India, 2016

www.FPwatch.info Page 46
Table B4: Availability of modern contraceptive method diversity, among outlets screened, by outlet type – Uttar Pradesh Strata, 2016
Higher Public Health
Facility*
Sub-centre / ANM / ASHA†
AWW NGO Public Total‡
Private facility
Pharmacy/ Chemist
Private Medical Total‡
AYUSH Provider
RMP General Retailer
Private Other Total‡
All Outlets
%
(95% CI) %
(95% CI) %
(95% CI) %
(95% CI) %
(95% CI) %
(95% CI) %
(95% CI) %
(95% CI) %
(95% CI) %
(95% CI) %
(95% CI) %
(95% CI) %
(95% CI)
Proportion of outlets screened, currently stocking / providing§:
Metro: N=3
Urban: N=9
Rural: N=6
Metro: N=1
Urban: N=41 Rural: N=585
Metro: N=15
Urban: N=62 Rural: N=310
Metro: N=1
Urban: N=4
Rural: N=0
Metro: N=20
Urban: N=116 Rural: N=901
Metro: N=222 Urban: N=611 Rural: N=84
Metro: N=530 Urban:
N=1,051 Rural: N=141
Metro: N=752 Urban:
N=1,662 Rural: N=225
Metro: N=61
Urban: N=134 Rural: N=9
Metro: N=2
Urban: N=17 Rural: N=43
Metro: N=1,983 Urban:
N=4,640 Rural: N=754
Metro: N=2,046 Urban:
N=4,791 Rural: N=806
Metro: N=2,818 Urban:
N=6,569 Rural:
N=1,932
3+ methods||
Metro 40.1 0.0 0.0 0.0 6.4 5.5 63.5 46.5 0.5 0.0 0.1 0.1 11.7
(5.0, 89.5) - - - (0.7, 39.8) (2.8, 10.3) (53.5, 72.5) (40.8, 52.3) (0.0, 4.2) - (0.0, 0.6) (0.0, 0.5) (9.7, 14.0)
Urban 96.7 25.8 0.4 86.2 26.6 8.0 55.8 39.9 2.1 0.0 0.0 0.1 11.5
(78.8, 99.6) (7.2, 61.0) (0.1, 2.8) (33.5, 98.7) (14.5, 43.6) (3.3, 18.0) (49.2, 62.3) (33.8, 46.3) (0.3, 13.0) - (0.0, 0.1) (0.0, 0.4) (9.7, 13.5)
Rural 12.3 41.1 0.7 - 25.7 5.2 56.9 36.9 0.0 0.0 0.0 0.0 18.0
(1.4, 58.5) (22.9, 62.1) (0.2, 2.9) - (16.4, 37.8) (1.9, 13.4) (44.4, 68.6) (27.4, 47.5) - - - - (11.5, 26.9)
3+ methods with LARC
Metro 40.1 0.0 0.0 0.0 6.4 2.5 0.6 1.2 0.0 0.0 0.0 0.0 0.3
(5.0, 89.5) - - - (0.7, 39.8) (1.0, 6.0) (0.2, 1.8) (0.7, 2.1) - - - - (0.2, 0.6)
Urban 85.9 4.9 0.0 0.0 12.5 1.0 0.3 0.5 0.0 0.0 0.0 0.0 0.3
(51.4, 97.2) (0.7, 28.2) - - (5.8, 24.9) (0.4, 2.4) (0.1, 1.2) (0.2, 1.1) - - - - (0.2, 0.5)
Rural 4.9 3.3 0.0 - 2.0 0.0 0.0 0.0 0.0 0.0 0.0 0.0 1.2
(0.4, 41.0) (1.7, 6.3) - - (1.0, 4.1) - - - - - - - (0.7, 2.3)
3+ methods with LA/PM
Metro 40.1 0.0 0.0 0.0 6.4 3.2 0.6 1.4 0.0 0.0 0.0 0.0 0.4
(5.0, 89.5) - - - (0.7, 39.8) (1.4, 6.9) (0.2, 1.8) (0.8, 2.4) - - - - (0.2, 0.6)
Urban 96.7 4.9 0.0 0.0 13.9 1.9 0.3 0.8 0.0 0.0 0.0 0.0 0.4
(78.8, 99.6) (0.7, 28.2) - - (6.8, 26.5) (1.0, 3.6) (0.1, 1.2) (0.4, 1.4) - - - - (0.3, 0.7)
Rural 4.9 3.3 0.0 - 2.0 0.0 0.0 0.0 0.0 0.0 0.0 0.0 1.3
(0.4, 41.0) (1.7, 6.3) - - (1.0, 4.1) - - - - - - - (0.7, 2.4)
5+ methods**
Metro 40.1 0.0 0.0 0.0 6.4 0.7 1.8 1.5 0.0 0.0 0.0 0.0 0.4
(5.0, 89.5) - - - (0.7, 39.8) (0.1, 3.5) (0.9, 3.5) (0.7, 3.0) - - (0.0, 0.1) (0.0, 0.1) (0.2, 0.8)
Urban 22.6 0.0 0.0 0.0 2.9 1.1 1.2 1.2 0.0 0.0 0.0 0.0 0.4
(5.5, 59.5) - - - (0.7, 11.0) (0.4, 2.7) (0.6, 2.6) (0.6, 2.2) - - - - (0.2, 0.7)
Rural 0.0 0.0 0.0 - 0.0 0.0 0.3 0.2 0.0 0.0 0.0 0.0 0.0
- - - - - - (0.0, 2.4) (0.0, 1.5) - - - - (0.0, 0.1)
* Includes: Government/municipal hospitals, government dispensaries, UHC/UHP/UFWCs, CHC/rural hospitals, and PHC/FRUs. † In Uttar Pradesh Sub-centres and ASHA are equipped to provide family planning services. ANM are not. SC are found in rural areas and managed by ANM workers, ASHA can be found across strata. ‡ Public Total category = higher public health facility + sub-centre/ANM/ASHA + AWW + NGO categories; Private Medical Total category = Private facility categories; Private Other Total category = AYUSH provider + RMP + general retailer categories

www.FPwatch.info Page 47
Table B4: Availability of modern contraceptive method diversity, among outlets screened, by outlet type – Uttar Pradesh Strata, 2016
Higher Public Health
Facility*
Sub-centre / ANM / ASHA†
AWW NGO Public Total‡
Private facility
Pharmacy/ Chemist
Private Medical Total‡
AYUSH Provider
RMP General Retailer
Private Other Total‡
All Outlets
%
(95% CI) %
(95% CI) %
(95% CI) %
(95% CI) %
(95% CI) %
(95% CI) %
(95% CI) %
(95% CI) %
(95% CI) %
(95% CI) %
(95% CI) %
(95% CI) %
(95% CI)
Proportion of outlets screened, currently stocking / providing§:
Metro: N=3
Urban: N=9
Rural: N=6
Metro: N=1
Urban: N=41 Rural: N=585
Metro: N=15
Urban: N=62 Rural: N=310
Metro: N=1
Urban: N=4
Rural: N=0
Metro: N=20
Urban: N=116 Rural: N=901
Metro: N=222 Urban: N=611 Rural: N=84
Metro: N=530 Urban:
N=1,051 Rural: N=141
Metro: N=752 Urban:
N=1,662 Rural: N=225
Metro: N=61
Urban: N=134 Rural: N=9
Metro: N=2
Urban: N=17 Rural: N=43
Metro: N=1,983 Urban:
N=4,640 Rural: N=754
Metro: N=2,046 Urban:
N=4,791 Rural: N=806
Metro: N=2,818 Urban:
N=6,569 Rural:
N=1,932
§ The denominator includes 47 outlets that met screening criteria for a full interview but did not complete the interview (were not interviewed or completed a partial interview). This includes 7 from UP Metro stratum, 29 from UP Urban stratum and 11 from UP Rural stratum. || 3 or more among: male condom, female condom, cyclebeads, vaginal pessary, oral contraceptive, emergency contraceptive, injectable, IUD commodities and/or male sterilization, female sterilization services. No other modern contraceptive methods were found in sampled outlets. ** 5 or more among: male condom, female condom, cyclebeads, vaginal pessary, oral contraceptive, emergency contraceptive, injectable, IUD commodities and/or male sterilization, female sterilization services. No other modern contraceptive methods were found in sampled outlets.
Source: FPwatch Outlet Survey, India, 2016
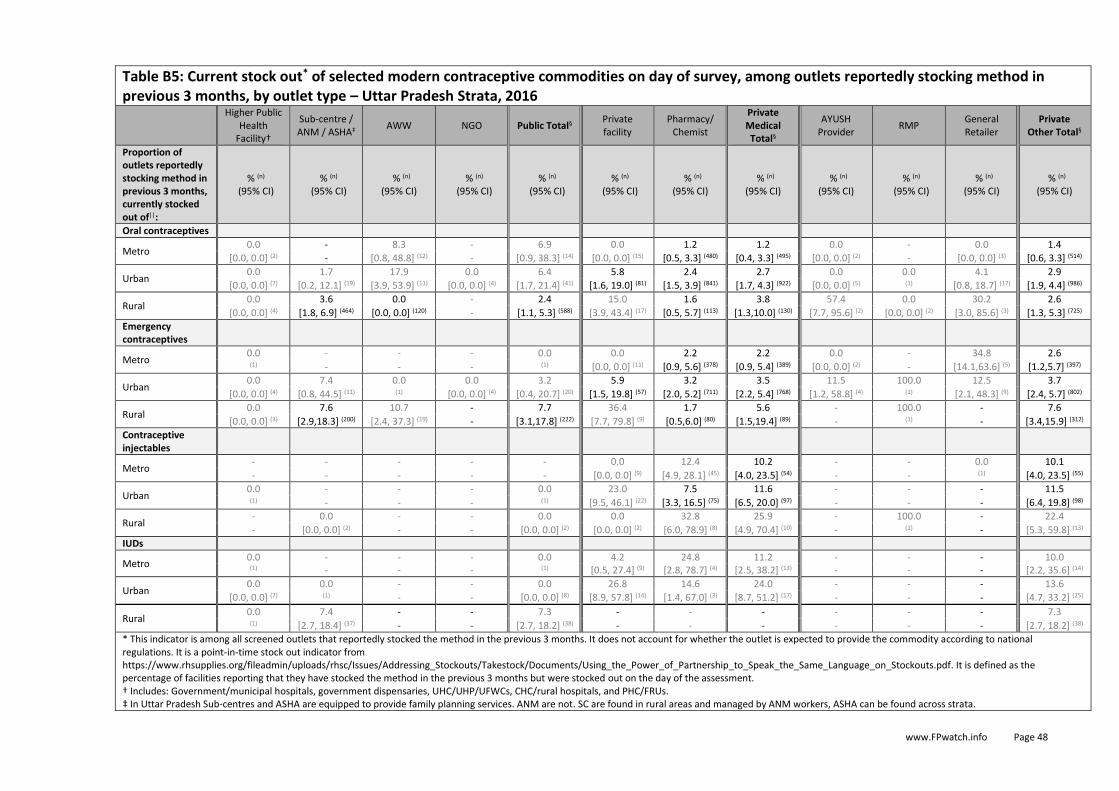
www.FPwatch.info Page 48
Table B5: Current stock out* of selected modern contraceptive commodities on day of survey, among outlets reportedly stocking method in previous 3 months, by outlet type – Uttar Pradesh Strata, 2016
Higher Public
Health Facility†
Sub-centre / ANM / ASHA‡
AWW NGO Public Total§ Private facility
Pharmacy/ Chemist
Private Medical Total§
AYUSH Provider
RMP General Retailer
Private Other Total§
Proportion of outlets reportedly stocking method in previous 3 months, currently stocked out of||:
% (n) (95% CI)
% (n) (95% CI)
% (n) (95% CI)
% (n) (95% CI)
% (n) (95% CI)
% (n) (95% CI)
% (n) (95% CI)
% (n) (95% CI)
% (n) (95% CI)
% (n) (95% CI)
% (n) (95% CI)
% (n) (95% CI)
Oral contraceptives
Metro 0.0 - 8.3 - 6.9 0.0 1.2 1.2 0.0 - 0.0 1.4
[0.0, 0.0] (2) - [0.8, 48.8] (12) - [0.9, 38.3] (14) [0.0, 0.0] (15) [0.5, 3.3] (480) [0.4, 3.3] (495) [0.0, 0.0] (2) - [0.0, 0.0] (3) [0.6, 3.3] (514)
Urban 0.0 1.7 17.9 0.0 6.4 5.8 2.4 2.7 0.0 0.0 4.1 2.9
[0.0, 0.0] (7) [0.2, 12.1] (19) [3.9, 53.9] (11) [0.0, 0.0] (4) [1.7, 21.4] (41) [1.6, 19.0] (81) [1.5, 3.9] (841) [1.7, 4.3] (922) [0.0, 0.0] (5) (1) [0.8, 18.7] (17) [1.9, 4.4] (986)
Rural 0.0 3.6 0.0 - 2.4 15.0 1.6 3.8 57.4 0.0 30.2 2.6
[0.0, 0.0] (4) [1.8, 6.9] (464) [0.0, 0.0] (120) - [1.1, 5.3] (588) [3.9, 43.4] (17) [0.5, 5.7] (113) [1.3,10.0] (130) [7.7, 95.6] (2) [0.0, 0.0] (2) [3.0, 85.6] (3) [1.3, 5.3] (725)
Emergency contraceptives
Metro 0.0 - - - 0.0 0.0 2.2 2.2 0.0 - 34.8 2.6
(1) - - - (1) [0.0, 0.0] (11) [0.9, 5.6] (378) [0.9, 5.4] (389) [0.0, 0.0] (2) - [14.1,63.6] (5) [1.2,5.7] (397)
Urban 0.0 7.4 0.0 0.0 3.2 5.9 3.2 3.5 11.5 100.0 12.5 3.7
[0.0, 0.0] (4) [0.8, 44.5] (11) (1) [0.0, 0.0] (4) [0.4, 20.7] (20) [1.5, 19.8] (57) [2.0, 5.2] (711) [2.2, 5.4] (768) [1.2, 58.8] (4) (1) [2.1, 48.3] (9) [2.4, 5.7] (802)
Rural 0.0 7.6 10.7 - 7.7 36.4 1.7 5.6 - 100.0 - 7.6
[0.0, 0.0] (3) [2.9,18.3] (200) [2.4, 37.3] (19) - [3.1,17.8] (222) [7.7, 79.8] (9) [0.5,6.0] (80) [1.5,19.4] (89) - (1) - [3.4,15.9] (312)
Contraceptive injectables
Metro - - - - - 0.0 12.4 10.2 - - 0.0 10.1
- - - - - [0.0, 0.0] (9) [4.9, 28.1] (45) [4.0, 23.5] (54) - - (1) [4.0, 23.5] (55)
Urban 0.0 - - - 0.0 23.0 7.5 11.6 - - - 11.5
(1) - - - (1) [9.5, 46.1] (22) [3.3, 16.5] (75) [6.5, 20.0] (97) - - - [6.4, 19.8] (98)
Rural - 0.0 - - 0.0 0.0 32.8 25.9 - 100.0 - 22.4
- [0.0, 0.0] (2) - - [0.0, 0.0] (2) [0.0, 0.0] (2) [6.0, 78.9] (8) [4.9, 70.4] (10) - (1) - [5.3, 59.8] (13)
IUDs
Metro 0.0 - - - 0.0 4.2 24.8 11.2 - - - 10.0
(1) - - - (1) [0.5, 27.4] (9) [2.8, 78.7] (4) [2.5, 38.2] (13) - - - [2.2, 35.6] (14)
Urban 0.0 0.0 - - 0.0 26.8 14.6 24.0 - - - 13.6
[0.0, 0.0] (7) (1) - - [0.0, 0.0] (8) [8.9, 57.8] (14) [1.4, 67.0] (3) [8.7, 51.2] (17) - - - [4.7, 33.2] (25)
Rural 0.0 7.4 - - 7.3 - - - - - - 7.3
(1) [2.7, 18.4] (37) - - [2.7, 18.2] (38) - - - - - - [2.7, 18.2] (38)
* This indicator is among all screened outlets that reportedly stocked the method in the previous 3 months. It does not account for whether the outlet is expected to provide the commodity according to national regulations. It is a point-in-time stock out indicator from https://www.rhsupplies.org/fileadmin/uploads/rhsc/Issues/Addressing_Stockouts/Takestock/Documents/Using_the_Power_of_Partnership_to_Speak_the_Same_Language_on_Stockouts.pdf. It is defined as the percentage of facilities reporting that they have stocked the method in the previous 3 months but were stocked out on the day of the assessment. † Includes: Government/municipal hospitals, government dispensaries, UHC/UHP/UFWCs, CHC/rural hospitals, and PHC/FRUs. ‡ In Uttar Pradesh Sub-centres and ASHA are equipped to provide family planning services. ANM are not. SC are found in rural areas and managed by ANM workers, ASHA can be found across strata.

www.FPwatch.info Page 49
Table B5: Current stock out* of selected modern contraceptive commodities on day of survey, among outlets reportedly stocking method in previous 3 months, by outlet type – Uttar Pradesh Strata, 2016
Higher Public
Health Facility†
Sub-centre / ANM / ASHA‡
AWW NGO Public Total§ Private facility
Pharmacy/ Chemist
Private Medical Total§
AYUSH Provider
RMP General Retailer
Private Other Total§
Proportion of outlets reportedly stocking method in previous 3 months, currently stocked out of||:
% (n) (95% CI)
% (n) (95% CI)
% (n) (95% CI)
% (n) (95% CI)
% (n) (95% CI)
% (n) (95% CI)
% (n) (95% CI)
% (n) (95% CI)
% (n) (95% CI)
% (n) (95% CI)
% (n) (95% CI)
% (n) (95% CI)
§ Public Total category = higher public health facility + sub-centre/ANM/ASHA + AWW + NGO categories; Private Medical Total category = Private facility categories; Private Other Total category = AYUSH provider + RMP + general retailer categories || The denominator includes 47 outlets that met screening criteria for a full interview but did not complete the interview (were not interviewed or completed a partial interview). This includes 7 from UP Metro stratum, 29 from UP Urban stratum and 11 from UP Rural stratum.
Source: FPwatch Outlet Survey, India, 2016

www.FPwatch.info Page 50
Table B6: Median price of selected modern contraceptive methods in INR*, USD, and USD per CYP†‡, by private outlet type – Uttar Pradesh Strata, 2016
Private facility Pharmacy/Chemist Private Medical Total Private Other Total
Median price of method, with interquartile range§,∞:
Median (N) Median (N) Median (N) Median (N)
[IQR] [IQR] [IQR] [IQR]
Male condoms
Metro
INR per condom INR 6.67 (17) INR 30.00 (503) INR 30.00 (520) INR 6.67 (221)
[3.00, 80.00] [8.33, 80.00] [8.33, 80.00] [3.33, 8.33]
USD per condom $0.10 (17) $0.45 (503) $0.45 (520) $0.10 (221)
[0.04, 1.19] [0.12, 1.19] [0.12, 1.19] [0.05, 0.12]
USD per CYP $8.95 (17) $13.42 (503) $12.53 (520) $11.93 (221)
[1.49, 11.93] [4.47, 23.86] [4.47, 23.86] [5.97, 14.91]
Urban
INR per condom INR 80.00 (77) INR 25.00 (968) INR 25.00 (1,045) INR 5.00 (444) [5.00, 80.00] [6.33, 65.00] [6.33, 70.00] [3.33, 8.33]
USD per condom $1.19 (77) $0.37 (968) $0.37 (1,045) $0.07 (444)
[0.07, 1.19] [0.09, 0.97] [0.09, 1.04] [0.05, 0.12]
USD per CYP $22.37 (77) $8.95 (968) $10.74 (1,045) $8.95 (444)
[5.97, 23.86] [5.37, 17.90] [5.37, 20.88] [5.97, 14.91]
Rural
INR per condom INR 3.00 (23) INR 25.00 (127) INR 15.00 (150) INR 3.00 (92) [1.67, 5.00] [5.00, 30.00] [3.33, 25.00] [0.60, 6.67]
USD per condom $0.04 (23) $0.37 (127) $0.22 (150) $0.04 (92)
[0.02, 0.07] [0.07, 0.45] [0.05, 0.37] [0.01, 0.10]
USD per CYP $2.98 (23) $5.59 (127) $5.59 (150) $5.37 (92)
[0.67, 5.97] [3.36, 11.93] [2.98, 11.93] [1.07, 11.93]
Female condoms
Metro
INR per condom - INR 450.00 (1) INR 450.00 (1) - - [450.00, 450.00] [450.00, 450.00] -
USD per condom - $6.71 (1) $6.71 (1) - - [6.71, 6.71] [6.71, 6.71] -
USD per CYP - $26.85 (1) $26.85 (1) - - [26.85, 26.85] [26.85, 26.85] -
Urban
INR per condom - INR 24.00 (4) INR 24.00 (4) - - [24.00, 32.00] [24.00, 32.00] -
USD per condom - $0.36 (4) $0.36 (4) - - [0.36, 0.48] [0.36, 0.48] -
USD per CYP - $42.95 (4) $42.95 (4) - - [7.16, 42.95] [7.16, 42.95] -
Rural
INR per condom - - - - - - - -
USD per condom - - - -
- - - -
USD per CYP - - - - - - - -
Cyclebeads

www.FPwatch.info Page 51
Table B6: Median price of selected modern contraceptive methods in INR*, USD, and USD per CYP†‡, by private outlet type – Uttar Pradesh Strata, 2016
Private facility Pharmacy/Chemist Private Medical Total Private Other Total
Median price of method, with interquartile range§,∞:
Median (N) Median (N) Median (N) Median (N)
[IQR] [IQR] [IQR] [IQR]
Metro
INR per Cyclebeads - INR 5.00 (1) INR 5.00 (1) - - [5.00, 5.00] [5.00, 5.00] -
USD per Cyclebeads - $0.07 (1) $0.07 (1) - - [0.07, 0.07] [0.07, 0.07] -
USD per CYP - $1.12 (1) $1.12 (1) - - [1.12, 1.12] [1.12, 1.12] -
Urban
INR per Cyclebeads - - - - - - - -
USD per Cyclebeads - - - - - - - -
USD per CYP - - - - - - - -
Rural
INR per Cyclebeads - - - -
- - - -
USD per Cyclebeads - - - -
- - - -
USD per CYP - - - -
- - - -
Vaginal pessaries
Metro
INR per pill INR 6.00 (2) INR 6.80 (64) INR 6.80 (66) - [6.00, 7.00] [6.80, 8.00] [6.80, 8.00] -
USD per pill $0.09 (2) $0.10 (64) $0.10 (66) -
[0.09, 0.10] [0.10, 0.12] [0.10, 0.12] -
USD per CYP $10.74 (2) $12.17 (64) $12.17 (66) -
[10.74, 12.53] [12.17, 14.32] [12.17, 14.32] -
Urban
INR per pill INR 6.00 (5) INR 6.00 (89) INR 6.00 (94) - [6.00, 7.00] [6.00, 6.80] [6.00, 6.80] -
USD per pill $0.09 (5) $0.09 (89) $0.09 (94) -
[0.09, 0.10] [0.09, 0.10] [0.09, 0.10] -
USD per CYP $10.74 (5) $10.74 (89) $10.74 (94) -
[10.74, 12.53] [10.74, 12.17] [10.74, 12.17] -
Rural
INR per pill - INR 6.00 (8) INR 6.00 (8) -
- [6.00, 6.80] [6.00, 6.80] -
USD per pill - $0.09 (8) $0.09 (8) -
- [0.09, 0.10] [0.09, 0.10] -
USD per CYP - $10.74 (8) $10.74 (8) -
- [10.74, 12.17] [10.74, 12.17] -
Oral contraceptives

www.FPwatch.info Page 52
Table B6: Median price of selected modern contraceptive methods in INR*, USD, and USD per CYP†‡, by private outlet type – Uttar Pradesh Strata, 2016
Private facility Pharmacy/Chemist Private Medical Total Private Other Total
Median price of method, with interquartile range§,∞:
Median (N) Median (N) Median (N) Median (N)
[IQR] [IQR] [IQR] [IQR]
Metro
INR per cycle INR 30.00 (24) INR 25.00 (836) INR 25.00 (860) INR 42.50 (7)
[3.00, 140.00] [12.00, 40.00] [12.00, 45.00] [42.50, 80.00]
USD per cycle $0.45 (24) $0.37 (836) $0.37 (860) $0.63 (7)
[0.04, 2.09] [0.18, 0.60] [0.18, 0.67] [0.63, 1.19]
USD per CYP $6.71 (24) $5.59 (836) $5.59 (860) $9.51 (7)
[0.67, 31.32] [2.68, 8.95] [2.68, 10.07] [9.51, 17.90]
Urban
INR per cycle INR 25.00 (92) INR 25.00 (1,263) INR 25.00 (1,355) INR 10.00 (22) [5.00, 30.00] [5.00, 25.00] [5.00, 25.00] [5.00, 10.00]
USD per cycle $0.37 (92) $0.37 (1,263) $0.37 (1,355) $0.15 (22)
[0.07, 0.45] [0.07, 0.37] [0.07, 0.37] [0.07, 0.15]
USD per CYP $5.59 (92) $5.59 (1,263) $5.59 (1,355) $2.24 (22)
[1.12, 6.71] [1.12, 5.59] [1.12, 5.59] [1.12, 2.24]
Rural
INR per cycle INR 25.00 (14) INR 20.00 (169) INR 20.00 (183) INR 25.00 (6) [3.00, 25.00] [3.00, 25.00] [3.00, 25.00] [5.00, 25.00]
USD per cycle $0.37 (14) $0.30 (169) $0.30 (183) $0.37 (6)
[0.04, 0.37] [0.04, 0.37] [0.04, 0.37] [0.07, 0.37]
USD per CYP $5.59 (14) $4.47 (169) $4.47 (183) $5.59 (6)
[0.67, 5.59] [0.67, 5.59] [0.67, 5.59] [1.12, 5.59]
Combined oral contraceptives
Metro
INR per cycle INR 30.00 (23) INR 25.00 (671) INR 25.00 (694) INR 43.75 (6)
[3.00, 160.00] [5.00, 68.00] [5.00, 70.00] [42.50, 80.00]
USD per cycle $0.45 (23) $0.37 (671) $0.37 (694) $0.65 (6)
[0.04, 2.39] [0.07, 1.01] [0.07, 1.04] [0.63, 1.19]
USD per CYP $6.71 (23) $5.59 (671) $5.59 (694) $9.79 (6)
[0.67, 35.80] [1.12, 15.21] [1.12, 15.66] [9.51, 17.90]
Urban
INR per cycle INR 5.00 (61) INR 12.00 (805) INR 11.00 (866) INR 5.00 (17)
[5.00, 50.00] [3.00, 45.00] [3.00, 45.00] [3.00, 5.00]
USD per cycle $0.07 (61) $0.18 (805) $0.16 (866) $0.07 (17)
[0.07, 0.75] [0.04, 0.67] [0.04, 0.67] [0.04, 0.07]
USD per CYP $1.12 (61) $2.68 (805) $2.46 (866) $1.12 (17)
[1.12, 11.19] [0.67, 10.07] [0.67, 10.07] [0.67, 1.12]
Rural
INR per cycle INR 5.00 (9) INR 5.00 (95) INR 5.00 (104) INR 5.00 (4) [3.00, 5.00] [3.00, 20.00] [3.00, 20.00] [0.00, 70.00]
USD per cycle $0.07 (9) $0.07 (95) $0.07 (104) $0.07 (4)
[0.04, 0.07] [0.04, 0.30] [0.04, 0.30] [0.00, 1.04]
USD per CYP $1.12 (9) $1.12 (95) $1.12 (104) $1.12 (4)
[0.67, 1.12] [0.67, 4.47] [0.67, 4.47] [0.00, 15.66]
Progestin-only pills
Metro INR per cycle - INR 25.00 (1) INR 25.00 (1) -

www.FPwatch.info Page 53
Table B6: Median price of selected modern contraceptive methods in INR*, USD, and USD per CYP†‡, by private outlet type – Uttar Pradesh Strata, 2016
Private facility Pharmacy/Chemist Private Medical Total Private Other Total
Median price of method, with interquartile range§,∞:
Median (N) Median (N) Median (N) Median (N)
[IQR] [IQR] [IQR] [IQR]
- [25.00, 25.00] [25.00, 25.00] -
USD per cycle - $0.37 (1) $0.37 (1) -
- [0.37, 0.37] [0.37, 0.37] -
USD per CYP - $5.59 (1) $5.59 (1) -
- [5.59, 5.59] [5.59, 5.59] -
Urban
INR per cycle - - - -
- - - -
USD per cycle - - - -
- - - -
USD per CYP - - - -
- - - -
Rural
INR per cycle - - - - - - - -
USD per cycle - - - - - - - -
USD per CYP - - - - - - - -
Centchroman pills
Metro
INR per 8 pill cycle INR 28.00 (1) INR 25.00 (165) INR 25.00 (166) INR 24.00 (1)
[28.00, 28.00] [25.00, 26.00] [25.00, 26.00] [24.00, 24.00]
USD per 8 pill cycle $0.42 (1) $0.37 (165) $0.37 (166) $0.36 (1)
[0.42, 0.42] [0.37, 0.39] [0.37, 0.39] [0.36, 0.36]
USD per CYP $6.26 (1) $5.59 (165) $5.59 (166) $5.37 (1)
[6.26, 6.26] [5.59, 5.82] [5.59, 5.82] [5.37, 5.37]
Urban
INR per 8 pill cycle INR 25.00 (31) INR 25.00 (458) INR 25.00 (489) INR 10.00 (5)
[25.00, 25.00] [25.00, 25.00] [25.00, 25.00] [10.00, 10.00]
USD per 8 pill cycle $0.37 (31) $0.37 (458) $0.37 (489) $0.15 (5)
[0.37, 0.37] [0.37, 0.37] [0.37, 0.37] [0.15, 0.15]
USD per CYP $5.59 (31) $5.59 (458) $5.59 (489) $2.24 (5)
[5.59, 5.59] [5.59, 5.59] [5.59, 5.59] [2.24, 2.24]
Rural
INR per cycle INR 25.00 (5) INR 25.00 (74) INR 25.00 (79) INR 25.00 (2)
[25.00, 25.00] [25.00, 25.00] [25.00, 25.00] [25.00, 25.00]
USD per cycle $0.37 (5) $0.37 (74) $0.37 (79) $0.37 (2)
[0.37, 0.37] [0.37, 0.37] [0.37, 0.37] [0.37, 0.37]
USD per CYP $5.59 (5) $5.59 (74) $5.59 (79) $5.59 (2)
[5.59, 5.59] [5.59, 5.59] [5.59, 5.59] [5.59, 5.59]
Emergency contraceptives
Metro INR per dose INR 80.00 (14) INR 80.00 (455) INR 80.00 (469) INR 80.00 (8)

www.FPwatch.info Page 54
Table B6: Median price of selected modern contraceptive methods in INR*, USD, and USD per CYP†‡, by private outlet type – Uttar Pradesh Strata, 2016
Private facility Pharmacy/Chemist Private Medical Total Private Other Total
Median price of method, with interquartile range§,∞:
Median (N) Median (N) Median (N) Median (N)
[IQR] [IQR] [IQR] [IQR]
[67.00, 85.00] [80.00, 80.00] [80.00, 80.00] [78.00, 80.00]
USD per dose $1.19 (14) $1.19 (455) $1.19 (469) $1.19 (8)
[1.00, 1.27] [1.19, 1.19] [1.19, 1.19] [1.16, 1.19]
USD per CYP $23.86 (14) $23.86 (455) $23.86 (469) $23.86 (8)
[19.99, 25.36] [23.86, 23.86] [23.86, 23.86] [23.27, 23.86]
Urban
INR per dose INR 80.00 (59) INR 80.00 (777) INR 80.00 (836) INR 70.00 (11)
[80.00, 90.00] [60.00, 80.00] [68.00, 80.00] [65.00, 80.00]
USD per dose $1.19 (59) $1.19 (777) $1.19 (836) $1.04 (11)
[1.19, 1.34] [0.89, 1.19] [1.01, 1.19] [0.97, 1.19]
USD per CYP $23.86 (59) $23.86 (777) $23.86 (836) $20.88 (11)
[23.86, 26.85] [17.90, 23.86] [20.28, 23.86] [19.39, 23.86]
Rural
INR per dose INR 70.00 (8) INR 70.00 (81) INR 70.00 (89) -
[60.00, 80.00] [55.00, 75.00] [55.00, 75.00] -
USD per dose $1.04 (8) $1.04 (81) $1.04 (89) -
[0.89, 1.19] [0.82, 1.12] [0.82, 1.12] -
USD per CYP $20.88 (8) $20.88 (81) $20.88 (89) -
[17.90, 23.86] [16.41, 22.37] [16.41, 22.37] -
Contraceptive injectables
Metro
INR per dose INR 300.00 (4) INR 280.00 (28) INR 280.00 (32) INR 470.00 (1)
[100.00, 320.00] [150.00, 450.00] [150.00, 350.00] [470.00, 470.00]
USD per dose $4.47 (4) $4.18 (28) $4.18 (32) $7.01 (1)
[1.49, 4.77] [2.24, 6.71] [2.24, 5.22] [7.01, 7.01]
USD per CYP $17.90 (4) $16.70 (28) $16.70 (32) $28.04 (1)
[5.97, 19.09] [8.95, 26.85] [8.95, 20.88] [28.04, 28.04]
Urban
INR per dose INR 150.00 (15) INR 100.00 (33) INR 100.00 (48) -
[100.00, 300.00] [90.00, 250.00] [98.00, 250.00] -
USD per dose $2.24 (15) $1.49 (33) $1.49 (48) -
[1.49, 4.47] [1.34, 3.73] [1.46, 3.73] -
USD per CYP $8.95 (15) $5.97 (33) $5.97 (48) -
[5.97, 17.90] [5.37, 14.91] [5.85, 14.91] -
Rural
INR per dose INR 150.00 (2) INR 150.00 (3) INR 150.00 (5) -
[150.00, 250.00] [90.00, 254.00] [150.00, 250.00] -
USD per dose $2.24 (2) $2.24 (3) $2.24 (5) -
[2.24, 3.73] [1.34, 3.79] [2.24, 3.73] -
USD per CYP $8.95 (2) $8.95 (3) $8.95 (5) -
[8.95, 14.91] [5.37, 15.15] [8.95, 14.91] -
IUDs
Metro INR per IUD INR 500.00 (5) INR 250.00 (1) INR 350.00 (6) -
[300.00, 500.00] [250.00, 250.00] [300.00, 500.00] -

www.FPwatch.info Page 55
Table B6: Median price of selected modern contraceptive methods in INR*, USD, and USD per CYP†‡, by private outlet type – Uttar Pradesh Strata, 2016
Private facility Pharmacy/Chemist Private Medical Total Private Other Total
Median price of method, with interquartile range§,∞:
Median (N) Median (N) Median (N) Median (N)
[IQR] [IQR] [IQR] [IQR]
USD per IUD $7.46 (5) $3.73 (1) $5.22 (6) -
[4.47, 7.46] [3,73, 3.73] [4.47, 7.46] -
USD per CYP $1.62 (5) $0.81 (1) $1.13 (6) -
[0.97, 1.62] [0.81, 0.81] [0.97, 1.62] -
Urban
INR per IUD INR 500.00 (6) INR 150.00 (1) INR 500.00 (7) -
[500.00, 500.00] [150.00, 150.00] [150.00, 500.00] -
USD per IUD $7.46 (6) $2.24 (1) $7.46 (7) -
[7.46, 7.46] [2.24, 2.24] [2.24, 7.46] -
USD per CYP $1.62 (6) $0.49 (1) $1.62 (7) -
[1.62, 1.62] [0.49, 0.49] [0.49, 1.62] -
Rural
INR per IUD - - - - - - - -
USD per IUD - - - - - - - -
USD per CYP - - - - - - - -
Male sterilization
Metro
INR per sterilization INR 1500.00 (1) - INR 1500.00 (1) - [1500, 1500] - [1500, 1500] -
USD per sterilization $22.37 (1) - $22.37 (1) -
[22.37, 22.37] - [22.37, 22.37] -
USD per CYP $1.72 (1) - $1.72 (1) -
[1.72, 1.72] - [1.72, 1.72] -
Urban
INR per sterilization INR 1000.00 (11) - INR 1000.00 (11) -
[500.00, 2500.00] - [500.00, 2500.00] -
USD per sterilization $14.91 (11) - $14.91 (11) -
[7.46, 37.29] - [7.46, 37.29] -
USD per CYP $1.15 (11) - $1.15 (11) -
[0.57, 2.87] - [0.57, 2.87] -
Rural
INR per sterilization - - - - - - - -
USD per sterilization - - - - - - - -
USD per CYP - - - - - - - -
Female sterilization
Metro INR per sterilization INR 2500.00 (4) - INR 2500.00 (4) -
[2000.00, 10000.00] - [2000.00, 10000.00] -
USD per sterilization $37.29 (4) - $37.29 (4) -

www.FPwatch.info Page 56
Table B6: Median price of selected modern contraceptive methods in INR*, USD, and USD per CYP†‡, by private outlet type – Uttar Pradesh Strata, 2016
Private facility Pharmacy/Chemist Private Medical Total Private Other Total
Median price of method, with interquartile range§,∞:
Median (N) Median (N) Median (N) Median (N)
[IQR] [IQR] [IQR] [IQR]
[29.83, 149.15] - [29.83, 149.15] -
USD per CYP $2.87 (4) - $2.87 (4) -
[2.29, 11.47] - [2.29, 11.47] -
Urban
INR per sterilization INR 2000.00 (22) - INR 2000.00 (22) -
[700.00, 4000.00] - [700.00, 4000.00] -
USD per sterilization $29.83 (22) - $29.83 (22) -
[10.44, 59.66] - [10.44, 59.66] -
USD per CYP $4.02 (22) - $4.02 (22) -
[2.29, 11.19] - [2.29, 11.19] -
Rural
INR per sterilization INR 0.00 (2) - INR 0.00 (2) - [0.00, 0.00] - [0.00, 0.00] -
USD per sterilization $0.00 (2) - $0.00 (2) -
[0.00, 0.00] - [0.00, 0.00] -
USD per CYP $0.00 (2) - $0.00 (2) - [0.00] - [0.00] -
* Based on the average rate of exchange from June 9th to September 10th, 2016 of 67.0478 INR per 1 USD. † This price is determined for the unit used in CYP conversion factors: condoms: 1 condom; cyclebeads: 1 product/string; vaginal pessaries: 1 tablet; oral contraceptives: 1 cycle or blister package; emergency contraceptives: 1 dose; injectables: 1 dose/injection; IUDs: 1 IUD. ‡ CYP – Couple Year Protection is the estimated protection provided by contraceptive methods during a one-year period, based upon the volume of all contraceptives sold or distributed free of charge to clients during that period (see Annex 11). § Price for all commodities with provider-dependent service (injectables, IUDs) may include a service charge. ∞ In UP, the number of family planning products captured in audits sheets with missing price information are as follows: 37 male condoms (11 metro, 25 urban, 1 rural), 0 female condoms, 0 cyclebeads, 7 vaginal pessaries (7 metro), 43 oral contraceptives (21 metro, 21 urban, 1 rural), 19 emergency contraceptives (8 metro, 11 urban), 55 injections (16 metro, 36 urban, 3 rural), 11 IUDs (5 metro, 6 urban), 6 male sterilizations (2 metro, 4 urban) and 8 female sterilizations (4 metro, 4 urban).
Source: FPwatch Outlet Survey, India, 2016

www.FPwatch.info Page 57
Table B7: Median markup percentage for selected modern contraceptive commodities with interquartile range, by private outlet type – Uttar Pradesh Strata, 2016
Private facility Pharmacy/Chemist Private Medical Total Private Other Total
Median markup percentage of commodity, with interquartile range*,†,‡:
Median % (N) [IQR %]
Median % (N)
[IQR %] Median % (N)
[IQR %] Median % (N)
[IQR %]
Oral contraceptives
Metro 3% (26) 25% (855) 25% (881) 36% (6)
[-95%, 50%] [0%, 47%] [0%, 47%] [2%, 45%]
Urban 39% (96) 33% (1,279) 33% (1,375) 18% (18)
[20%, 67%] [19%, 50%] [19%, 50%] [18%, 33%]
Rural 50% (14) 25% (170) 25% (184) 25% (6)
[25%, 56%] [20%, 50%] [20%, 50%] [20%, 25%]
Emergency contraceptives
Metro -98% (14) 20% (461) 20% (475) 15% (7)
[-99%, 22%] [11%, 33%] [10%, 33%] [6%, 31%]
Urban 78% (61) 46% (785) 50% (846) 17% (9)
[33%, 80%] [14%, 100%] [14%, 95%] [12%, 22%]
Rural 33% (8) 33% (81) 33% (89) -
[3%0, 40%] [14%, 79%] [17%, 79%] -
Contraceptive injectables
Metro 43% (6) 25% (28) 25% (34) 24% (1)
[-20%, 43%] [0, 36] [0%, 43%] [24%, 24%]
Urban 7% (15) 26% (33) 25% (48) -
[3%, 60%] [22%, 43%] [7%, 43%] -
Rural 131% (2) 27% (3) 125% (5) -
[12%, 131%] [-99%, 125%] [12%, 131%] -
IUDs
Metro 50% (7) 0% (2) 25% (9) -
[25%, 751%] [0%, 200%] [25%, 400%] -
Urban 50% (9) 25% (1) 43% (10) -
[0%, 138%] [25%, 25%] [25%, 138%] -
Rural - - - -
- - - -
* The number of family planning products captured in audit sheets with missing retail and/or wholesale price information are as follows: 348 oral contraceptives (124 metro, 201 urban, 23 rural), 250 emergency contraceptives (81 metro, 158 urban, 11 rural), 72 injections (23 metro, 45 urban, 4 rural) and 14 IUDs (8 metro, 6 urban). † To determine median markup percentage, we first determined the profit margin for selected modern contraceptives at private sector outlet categories: retail price – wholesale price. We then determined a profit margin proportion by: profit margin/retail price. Finally, we converted profit margin to markup by: wholesale price/(1- profit margin proportion). We converted to a percentage and determined the median markup with IQR range. ‡ Price for all commodities with provider-dependent service (injectables, implants, IUDs) may include service charge.
Source: FPwatch Outlet Survey, India, 2016

www.FPwatch.info Page 58
Table B8: Private sector contraceptive method market share: Relative proportion of total CYP sold / distributed, by method and outlet type – Uttar Pradesh Strata, 2016
CYPs sold or distributed in previous 1 month by outlet type and contraceptive method type as a % of total CYPs sold / distributed§,||:
Private facility Pharmacy/
Chemist Private Medical
Total‡ AYUSH Provider RMP General Retailer Private Other
Total‡ All Private Outlets
% % % % % % % %
1. Male condoms
Metro 0.5 24.6 25.1 0.4 0.0 6.6 7.0 32.1
Urban 0.9 29.8 30.8 0.3 0.0 6.6 6.9 37.6
Rural 5.0 35.5 40.5 0.0 0.5 19.7 20.2 60.7
2. Female condoms
Metro 0.0 0.0 0.0 0.0 0.0 0.0 0.0 0.0
Urban 0.0 0.0 0.0 0.0 0.0 0.0 0.0 0.0
Rural 0.0 0.0 0.0 0.0 0.0 0.0 0.0 0.0
3. Cyclebeads
Metro 0.0 2.6 2.6 0.0 0.0 0.0 0.0 2.6
Urban 0.0 0.0 0.0 0.0 0.0 0.0 0.0 0.0
Rural 0.0 0.0 0.0 0.0 0.0 0.0 0.0 0.0
4. Vaginal pessaries
Metro 0.0 0.7 0.7 0.0 0.0 0.0 0.0 0.7
Urban 0.0 0.5 0.6 0.0 0.0 0.0 0.0 0.6
Rural 0.0 0.4 0.4 0.0 0.0 0.0 0.0 0.4
5. Oral contraceptives
Metro 0.9 28.0 28.9 0.2 0.0 0.1 0.2 29.1
Urban 1.7 22.3 24.0 0.1 0.0 0.5 0.6 24.6
Rural 2.9 24.3 27.1 0.2 0.3 0.2 0.6 27.7
Combined oral contraceptives
Metro 0.9 23.3 24.1 0.2 0.0 0.1 0.2 24.4
Urban 1.4 13.9 15.4 0.1 0.0 0.2 0.3 15.7
Rural 2.1 14.9 17.0 0.2 0.2 0.0 0.4 17.3
Progestin-only pills
Metro 0.0 0.0 0.0 0.0 0.0 0.0 0.0 0.0
Urban 0.0 0.0 0.0 0.0 0.0 0.0 0.0 0.0
Rural 0.0 0.0 0.0 0.0 0.0 0.0 0.0 0.0
Centchroman pills
Metro 0.0 4.7 4.8 0.0 0.0 0.0 0.0 4.8
Urban 0.2 8.4 8.6 0.0 0.0 0.3 0.3 8.9
Rural 0.8 9.4 10.2 0.0 0.1 0.2 0.3 10.4
6. Emergency contraceptives
Metro 0.3 12.6 13.0 0.1 0.0 0.0 0.1 13.1
Urban 0.5 11.4 12.0 0.0 0.0 0.0 0.0 12.0

www.FPwatch.info Page 59
Table B8: Private sector contraceptive method market share: Relative proportion of total CYP sold / distributed, by method and outlet type – Uttar Pradesh Strata, 2016
CYPs sold or distributed in previous 1 month by outlet type and contraceptive method type as a % of total CYPs sold / distributed§,||:
Private facility Pharmacy/
Chemist Private Medical
Total‡ AYUSH Provider RMP General Retailer Private Other
Total‡ All Private Outlets
% % % % % % % %
Rural 1.1 8.7 9.7 0.0 0.0 0.0 0.0 9.7
7. Contraceptive injectables
Metro 0.8 1.0 1.8 0.0 0.0 0.0 0.0 1.8
Urban 0.8 0.9 1.8 0.0 0.0 0.0 0.0 1.8
Rural 1.2 0.3 1.5 0.0 0.0 0.0 0.0 1.5
8. IUDs
Metro 5.9 0.0 5.9 0.0 0.0 0.0 0.0 5.9
Urban 3.6 0.0 3.6 0.0 0.0 0.0 0.0 3.6
Rural 0.0 0.0 0.0 0.0 0.0 0.0 0.0 0.0
9. Male sterilization
Metro 0.0 0.0 0.0 0.0 0.0 0.0 0.0 0.0
Urban 2.0 0.0 2.0 0.0 0.0 0.0 0.0 2.0
Rural 0.0 0.0 0.0 0.0 0.0 0.0 0.0 0.0
10. Female sterilization
Metro 14.6 0.0 14.6 0.0 0.0 0.0 0.0 14.6
Urban 17.8 0.0 17.8 0.0 0.0 0.0 0.0 17.8
Rural 0.0 0.0 0.0 0.0 0.0 0.0 0.0 0.0
OUTLET TYPE TOTAL§
Metro 23.1 69.5 92.6 0.6 0.0 6.8 7.4 100.0
Urban 27.4 65.1 92.5 0.4 0.0 7.1 7.5 100.0
Rural 10.1 69.0 79.2 0.2 0.7 19.9 20.8 100.0
‡ Private Medical Total category = Private facility categories; Private Other Total category = AYUSH provider + RMP + general retailer categories § A total of 254,021.3 CYPs (weighted) were reportedly distributed in the previous 1 month in UP in the private sector (144,437.8 in metro UP, 67,307.0 in urban UP and 42,276.5 in rural UP). This is based on the number of commodities reportedly sold for categories 1-8 (not number of services performed for categories 7-8) and number of sterilizations reportedly performed for categories 9-10. || In the metropolitan UP study area, 1,523 FP products were audited, not including condoms or cycle beads (902 oral contraceptives, 486 emergency contraceptives, 74 vaginal pessaries, 49 injectables, 12 IUDs). 763 outlets reported one or more brands of male condoms, female condoms and/or Cyclebeads, and volume information was collected for each brand. Volume of sterilizations performed was collected from 3 and 12 outlets for male or female sterilizations, respectively. Volume information was excluded due to missing information or as a volume outlier for: 7 outlets with male condoms, 0 outlets with female condoms, 0 outlets with Cyclebeads, 0 audits of vaginal pessaries, 3 audits of oral contraceptives, 2 audits of emergency contraceptives, 1 audit of injectables, 3 audits of IUDs, 0 outlets with male sterilizations and 0 outlets with female sterilizations. In the urban UP study area, 2,518 FP products were audited, not including condoms or cycle beads (1,439 oral contraceptives, 878 emergency contraceptives, 94 vaginal pessaries, 85 injectables, 22 IUDs). 1,568 outlets reported one or more brands of male condoms, female condoms and/or Cyclebeads, and volume information was collected for each brand. Volume of sterilizations performed was collected from 29 and 44 outlets for male or female sterilizations, respectively. Volume information was excluded due to missing information or as a volume outlier for: 10 outlets with male condoms, 1 outlet with female condoms, 0 outlets with Cyclebeads, 0 audits of vaginal pessaries, 4 audits of oral contraceptives, 7 audits of emergency contraceptives, 0 audits of injectables, 3 audits of IUDs, 0 outlets with male sterilizations and 0 outlets with female sterilizations. In the rural UP study area, 1,074 FP products were audited, not including condoms or cycle beads (746 oral contraceptives, 278 emergency contraceptives, 8 vaginal pessaries, 10 injectables, 32 IUDs). 848 outlets reported one or more brands of male condoms, female condoms and/or Cyclebeads, and volume information was collected for each brand. Volume of sterilizations performed was collected from 12 and 41 outlets for male or female sterilizations, respectively. Volume information was excluded due to missing information or as a volume outlier for: 5 outlets with male condoms, 0 outlets with female condoms, 0 outlets with

www.FPwatch.info Page 60
Table B8: Private sector contraceptive method market share: Relative proportion of total CYP sold / distributed, by method and outlet type – Uttar Pradesh Strata, 2016
CYPs sold or distributed in previous 1 month by outlet type and contraceptive method type as a % of total CYPs sold / distributed§,||:
Private facility Pharmacy/
Chemist Private Medical
Total‡ AYUSH Provider RMP General Retailer Private Other
Total‡ All Private Outlets
% % % % % % % %
Cyclebeads, 0 audits of vaginal pessaries, 4 audits of oral contraceptives, 3 audits of emergency contraceptives, 0 audits of injectables, 0 audits of IUDs, 0 outlets with male sterilizations and 0 outlets with female sterilizations. § Row total: CYP volume for the specified contraceptive method type. Column total: market share for the specified outlet type method categories 1-10.
Public sector market share is not shown. Sterilization services are concentrated into a few higher-level facilities; due to our small sample of these outlet types, the results would have been skewed, and shown an inaccurate portrayal of the total market.
Source: FPwatch Outlet Survey, India, 2016
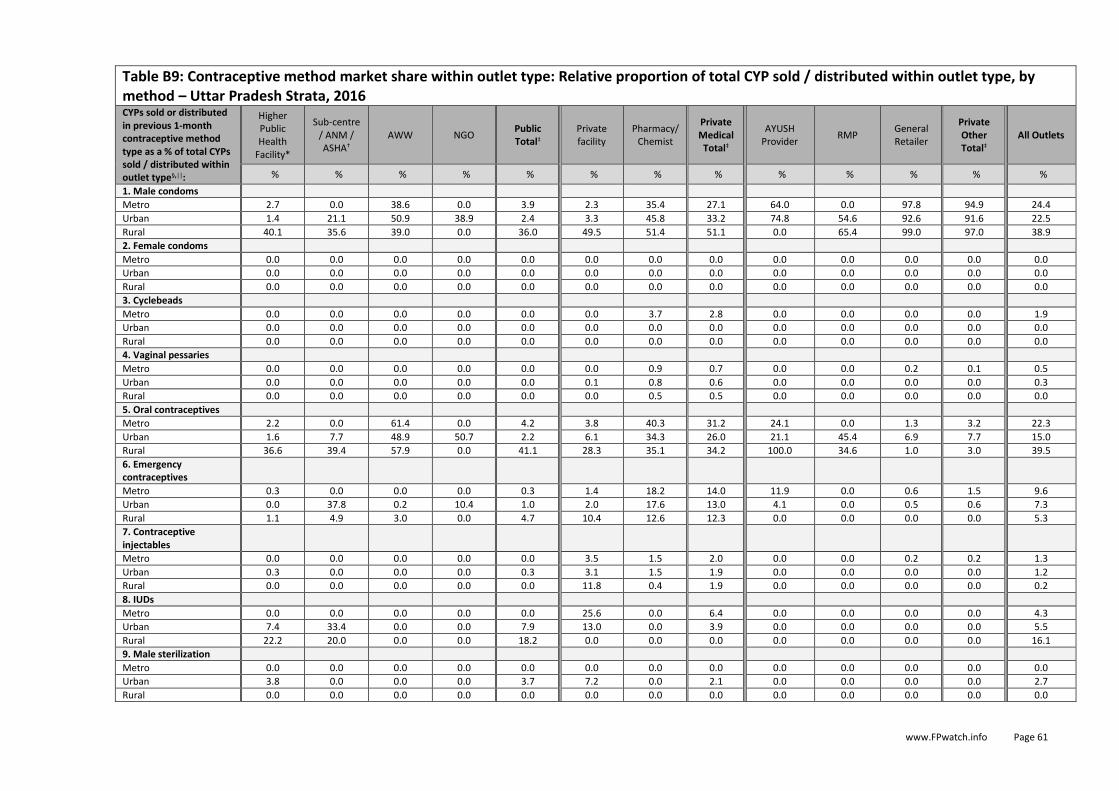
www.FPwatch.info Page 61
Table B9: Contraceptive method market share within outlet type: Relative proportion of total CYP sold / distributed within outlet type, by method – Uttar Pradesh Strata, 2016 CYPs sold or distributed in previous 1-month contraceptive method type as a % of total CYPs sold / distributed within outlet type§,||:
Higher Public Health
Facility*
Sub-centre / ANM / ASHA†
AWW NGO Public Total‡
Private facility
Pharmacy/ Chemist
Private Medical Total‡
AYUSH Provider
RMP General Retailer
Private Other Total‡
All Outlets
% % % % % % % % % % % % %
1. Male condoms
Metro 2.7 0.0 38.6 0.0 3.9 2.3 35.4 27.1 64.0 0.0 97.8 94.9 24.4
Urban 1.4 21.1 50.9 38.9 2.4 3.3 45.8 33.2 74.8 54.6 92.6 91.6 22.5
Rural 40.1 35.6 39.0 0.0 36.0 49.5 51.4 51.1 0.0 65.4 99.0 97.0 38.9
2. Female condoms
Metro 0.0 0.0 0.0 0.0 0.0 0.0 0.0 0.0 0.0 0.0 0.0 0.0 0.0
Urban 0.0 0.0 0.0 0.0 0.0 0.0 0.0 0.0 0.0 0.0 0.0 0.0 0.0
Rural 0.0 0.0 0.0 0.0 0.0 0.0 0.0 0.0 0.0 0.0 0.0 0.0 0.0
3. Cyclebeads
Metro 0.0 0.0 0.0 0.0 0.0 0.0 3.7 2.8 0.0 0.0 0.0 0.0 1.9
Urban 0.0 0.0 0.0 0.0 0.0 0.0 0.0 0.0 0.0 0.0 0.0 0.0 0.0
Rural 0.0 0.0 0.0 0.0 0.0 0.0 0.0 0.0 0.0 0.0 0.0 0.0 0.0
4. Vaginal pessaries
Metro 0.0 0.0 0.0 0.0 0.0 0.0 0.9 0.7 0.0 0.0 0.2 0.1 0.5
Urban 0.0 0.0 0.0 0.0 0.0 0.1 0.8 0.6 0.0 0.0 0.0 0.0 0.3
Rural 0.0 0.0 0.0 0.0 0.0 0.0 0.5 0.5 0.0 0.0 0.0 0.0 0.0
5. Oral contraceptives
Metro 2.2 0.0 61.4 0.0 4.2 3.8 40.3 31.2 24.1 0.0 1.3 3.2 22.3
Urban 1.6 7.7 48.9 50.7 2.2 6.1 34.3 26.0 21.1 45.4 6.9 7.7 15.0
Rural 36.6 39.4 57.9 0.0 41.1 28.3 35.1 34.2 100.0 34.6 1.0 3.0 39.5
6. Emergency contraceptives
Metro 0.3 0.0 0.0 0.0 0.3 1.4 18.2 14.0 11.9 0.0 0.6 1.5 9.6
Urban 0.0 37.8 0.2 10.4 1.0 2.0 17.6 13.0 4.1 0.0 0.5 0.6 7.3
Rural 1.1 4.9 3.0 0.0 4.7 10.4 12.6 12.3 0.0 0.0 0.0 0.0 5.3
7. Contraceptive injectables
Metro 0.0 0.0 0.0 0.0 0.0 3.5 1.5 2.0 0.0 0.0 0.2 0.2 1.3
Urban 0.3 0.0 0.0 0.0 0.3 3.1 1.5 1.9 0.0 0.0 0.0 0.0 1.2
Rural 0.0 0.0 0.0 0.0 0.0 11.8 0.4 1.9 0.0 0.0 0.0 0.0 0.2
8. IUDs
Metro 0.0 0.0 0.0 0.0 0.0 25.6 0.0 6.4 0.0 0.0 0.0 0.0 4.3
Urban 7.4 33.4 0.0 0.0 7.9 13.0 0.0 3.9 0.0 0.0 0.0 0.0 5.5
Rural 22.2 20.0 0.0 0.0 18.2 0.0 0.0 0.0 0.0 0.0 0.0 0.0 16.1
9. Male sterilization
Metro 0.0 0.0 0.0 0.0 0.0 0.0 0.0 0.0 0.0 0.0 0.0 0.0 0.0
Urban 3.8 0.0 0.0 0.0 3.7 7.2 0.0 2.1 0.0 0.0 0.0 0.0 2.7
Rural 0.0 0.0 0.0 0.0 0.0 0.0 0.0 0.0 0.0 0.0 0.0 0.0 0.0

www.FPwatch.info Page 62
Table B9: Contraceptive method market share within outlet type: Relative proportion of total CYP sold / distributed within outlet type, by method – Uttar Pradesh Strata, 2016 CYPs sold or distributed in previous 1-month contraceptive method type as a % of total CYPs sold / distributed within outlet type§,||:
Higher Public Health
Facility*
Sub-centre / ANM / ASHA†
AWW NGO Public Total‡
Private facility
Pharmacy/ Chemist
Private Medical Total‡
AYUSH Provider
RMP General Retailer
Private Other Total‡
All Outlets
% % % % % % % % % % % % %
10. Female sterilization
Metro 94.9 0.0 0.0 0.0 91.6 63.3 0.0 15.8 0.0 0.0 0.0 0.0 35.6
Urban 85.5 0.0 0.0 0.0 82.4 65.1 0.0 19.3 0.0 0.0 0.0 0.0 45.6
Rural 0.0 0.0 0.0 0.0 0.0 0.0 0.0 0.0 0.0 0.0 0.0 0.0 0.0
* Includes: Government/municipal hospitals, government dispensaries, UHC/UHP/UFWCs, CHC/rural hospitals, PHC/FRUs
† In Uttar Pradesh Sub-centres and ASHA are equipped to provide family planning services. ANM are not. SC are found in rural areas and managed by ANM workers, ASHA can be found across strata. ‡ Public Total category = public health facility + community health worker + NGO categories; Private Medical Total category = Private facility categories; Private Other Total category = AYUSH provider + RMP + general retailer categories § A total of 1,001,674.9 CYPs (weighted) were reportedly distributed in the previous 1 month in UP (57,852.2 in metro UP, 255,891.1 in urban UP and 687,931.6 in rural UP). This is based on the number of commodities reportedly sold for categories 1-8 (not number of services performed for categories 7-8) and number of sterilizations reportedly performed for categories 9-10. || In the metropolitan UP study area, 1,523 FP products were audited, not including condoms or cycle beads (902 oral contraceptives, 486 emergency contraceptives, 74 vaginal pessaries, 49 injectables, 12 IUDs). 763 outlets reported one or more brands of male condoms, female condoms and/or Cyclebeads, and volume information was collected for each brand. Volume of sterilizations performed was collected from 3 and 12 outlets for male or female sterilizations, respectively. Volume information was excluded due to missing information or as a volume outlier for: 7 outlets with male condoms, 0 outlets with female condoms, 0 outlets with Cyclebeads, 0 audits of vaginal pessaries, 3 audits of oral contraceptives, 2 audits of emergency contraceptives, 1 audit of injectables, 3 audits of IUDs, 0 outlets with male sterilizations and 0 outlets with female sterilizations. In the urban UP study area, 2,518 FP products were audited, not including condoms or cycle beads (1,439 oral contraceptives, 878 emergency contraceptives, 94 vaginal pessaries, 85 injectables, 22 IUDs). 1,568 outlets reported one or more brands of male condoms, female condoms and/or Cyclebeads, and volume information was collected for each brand. Volume of sterilizations performed was collected from 29 and 44 outlets for male or female sterilizations, respectively. Volume information was excluded due to missing information or as a volume outlier for: 10 outlets with male condoms, 1 outlet with female condoms, 0 outlets with Cyclebeads, 0 audits of vaginal pessaries, 4 audits of oral contraceptives, 7 audits of emergency contraceptives, 0 audits of injectables, 3 audits of IUDs, 0 outlets with male sterilizations and 0 outlets with female sterilizations. In the rural UP study area, 1,074 FP products were audited, not including condoms or cycle beads (746 oral contraceptives, 278 emergency contraceptives, 8 vaginal pessaries, 10 injectables, 32 IUDs). 848 outlets reported one or more brands of male condoms, female condoms and/or Cyclebeads, and volume information was collected for each brand. Volume of sterilizations performed was collected from 12 and 41 outlets for male or female sterilizations, respectively. Volume information was excluded due to missing information or as a volume outlier for: 5 outlets with male condoms, 0 outlets with female condoms, 0 outlets with Cyclebeads, 0 audits of vaginal pessaries, 4 audits of oral contraceptives, 3 audits of emergency contraceptives, 0 audits of injectables, 0 audits of IUDs, 0 outlets with male sterilizations and 0 outlets with female sterilizations.
Source: FPwatch Outlet Survey, India, 2016

www.FPwatch.info Page 63
Table B10: Availability of selected contraceptive services, among outlets screened, by outlet type – Uttar Pradesh Strata, 2016
Higher Public Health
Facility*
Sub-centre / ANM / ASHA†
AWW NGO Public Total‡
Private facility
Pharmacy/ Chemist
Private Medical Total‡
AYUSH Provider
RMP General Retailer
Private Other Total‡
All Outlets
%
(95% CI) %
(95% CI) %
(95% CI) %
(95% CI) %
(95% CI) %
(95% CI) %
(95% CI) %
(95% CI) %
(95% CI) %
(95% CI) %
(95% CI) %
(95% CI) %
(95% CI)
Proportion of outlets screened, providing§:
Metro: N=3
Urban: N=9
Rural: N=5
Metro: N=1
Urban: N=41 Rural: N=585
Metro: N=15
Urban: N=62 Rural: N=310
Metro: N=1
Urban: N=4
Rural: N=0
Metro: N=20
Urban: N=116 Rural: N=901
Metro: N=222 Urban: N=611 Rural: N=84
Metro: N=530 Urban:
N=1,051 Rural: N=141
Metro: N=752 Urban:
N=1,662 Rural: N=225
Metro: N=61
Urban: N=134 Rural: N=9
Metro: N=2
Urban: N=17 Rural: N=43
Metro: N=1,983 Urban:
N=4,640 Rural: N=754
Metro: N=2,046 Urban:
N=4,791 Rural: N=806
Metro: N=2,818 Urban:
N=6,569 Rural:
N=1,932
Contraceptive injection service
Metro 59.9 0.0 0.0 0.0 9.6 18.4 0.0 5.4 1.2 0.0 0.0 0.0 1.4
(10.5, 95.0) - - - (2.3, 32.7) (9.6, 32.3) - (2.7, 10.5) (0.2, 6.2) - - (0.0, 0.2) (0.7, 2.8)
Urban 32.0 5.4 0.1 0.0 5.8 24.3 0.8 8.6 4.2 4.4 0.0 0.2 2.5
(10.3, 65.9) (1.8, 15.2) (0.0, 1.1) - (2.6, 12.6) (18.1, 31.8) (0.4, 1.6) (6.5, 11.3) (1.5, 11.3) (0.5, 28.4) - (0.1, 0.4) (1.9, 3.3)
Rural 81.4 16.2 0.2 - 10.4 10.7 4.7 7.0 14.2 5.4 0.0 0.2 6.9
(32.3, 97.6) (8.5, 28.6) (0.0, 1.3) - (5.3, 19.4) (4.7, 22.4) (1.2, 17.0) (3.3, 14.2) (2.9, 47.3) (0.9, 26.2) - (0.1, 0.7) (3.7, 12.5)
IUD insertion service
Metro 71.6 0.0 0.0 0.0 11.4 6.8 0.0 2.0 0.0 0.0 0.0 0.0 0.6
(16.5, 97.0) - - - (2.3, 41.2) (3.5, 12.8) - (1.0, 4.0) - - - - (0.3, 1.0)
Urban 96.7 11.8 0.0 0.0 16.1 5.7 0.0 1.9 0.0 0.0 0.0 0.0 0.8
(78.8, 99.6) (3.7, 31.6) - - (8.5, 28.2) (3.5, 9.0) (0.0, 0.2) (1.2, 3.0) - - - - (0.5, 1.1)
Rural 86.3 17.5 0.0 - 11.3 0.0 0.0 0.0 0.0 0.6 0.0 0.0 6.9
(40.9, 98.3) (8.3, 33.3) (- - (6.2, 19.8) - - - - (0.1, 4.1) - (0.0, 0.1) (3.5, 13.1)
Male sterilization service
Metro 0.0 0.0 0.0 0.0 0.0 1.0 0.0 0.3 0.0 0.0 0.0 0.0 0.1
- - - - - (0.3, 3.9) - (0.1, 1.1) - - - - (0.0, 0.3)
Urban 33.5 0.0 0.0 0.0 4.3 2.0 0.0 0.7 0.0 0.0 0.0 0.0 0.2
(10.4, 68.4) - - - (1.4, 12.7) (0.9, 4.2) - (0.3, 1.4) - - - - (0.1, 0.4)
Rural 0.0 0.0 0.0 - 0.0 0.0 0.0 0.0 0.0 0.0 0.0 0.0 0.0
- - - - - - - - - - - - -
Female sterilization service
Metro 40.1 0.0 0.0 100.0 9.8 3.8 0.0 1.1 0.0 0.0 0.0 0.0 0.4
(5.0, 89.5) - - - (1.8, 38.9) (1.6, 8.6) - (0.5, 2.6) - - - - (0.2, 0.8)
Urban 33.5 0.0 0.0 0.0 4.3 4.0 0.0 1.3 0.0 0.0 0.0 0.0 0.4
(10.4, 68.4) - - - (1.4, 12.7) (2.1, 7.3) - (0.7, 2.4) - - - - (0.2, 0.8)
Rural 0.0 0.0 0.0 - 0.0 0.5 0.0 0.2 0.0 0.0 0.0 0.0 0.1
- - - - - (0.1, 3.5) - (0.1, 1.3) - - - - (0.1, 0.1)
* Includes: Government/municipal hospitals, government dispensaries, UHC/UHP/UFWCs, CHC/rural hospitals, PHC/FRUs
† In Uttar Pradesh Sub-centres and ASHA are equipped to provide family planning services. ANM are not. SC are found in rural areas and managed by ANM workers, ASHA can be found across strata.

www.FPwatch.info Page 64
Table B10: Availability of selected contraceptive services, among outlets screened, by outlet type – Uttar Pradesh Strata, 2016
Higher Public Health
Facility*
Sub-centre / ANM / ASHA†
AWW NGO Public Total‡
Private facility
Pharmacy/ Chemist
Private Medical Total‡
AYUSH Provider
RMP General Retailer
Private Other Total‡
All Outlets
%
(95% CI) %
(95% CI) %
(95% CI) %
(95% CI) %
(95% CI) %
(95% CI) %
(95% CI) %
(95% CI) %
(95% CI) %
(95% CI) %
(95% CI) %
(95% CI) %
(95% CI)
Proportion of outlets screened, providing§:
Metro: N=3
Urban: N=9
Rural: N=5
Metro: N=1
Urban: N=41 Rural: N=585
Metro: N=15
Urban: N=62 Rural: N=310
Metro: N=1
Urban: N=4
Rural: N=0
Metro: N=20
Urban: N=116 Rural: N=901
Metro: N=222 Urban: N=611 Rural: N=84
Metro: N=530 Urban:
N=1,051 Rural: N=141
Metro: N=752 Urban:
N=1,662 Rural: N=225
Metro: N=61
Urban: N=134 Rural: N=9
Metro: N=2
Urban: N=17 Rural: N=43
Metro: N=1,983 Urban:
N=4,640 Rural: N=754
Metro: N=2,046 Urban:
N=4,791 Rural: N=806
Metro: N=2,818 Urban:
N=6,569 Rural:
N=1,932
‡ Public Total category = higher public health facility + sub-centre/ANM/ASHA + AWW + NGO categories; Private Medical Total category = Private facility categories; Private Other Total category = AYUSH provider + RMP + general retailer categories § The denominator includes 47 outlets that met screening criteria for a full interview but did not complete the interview (were not interviewed or completed a partial interview). This includes 7 from UP Metro stratum, 29 from UP Urban stratum and 11 from UP Rural stratum.
Source: FPwatch Outlet Survey, India, 2016

www.FPwatch.info Page 65
Table B11: Service readiness* to provide provider-dependent contraceptive services, among outlets reportedly offering the procedure, by outlet type – Uttar Pradesh Strata, 2016 Higher
Public Health
Facility†
Sub-centre / ANM / ASHA‡
AWW NGO Public Total Private facility Pharmacy/
Chemist Private Medical
Total
AYUSH Provider
RMP General Retailer
Private Other Total
Proportion of outlets offering service, with§:
% (n) (95% CI)
% (n) (95% CI)
% (n) (95% CI)
% (n) (95% CI)
% (n) (95% CI)
% (n) (95% CI)
% (n) (95% CI)
% (n) (95% CI)
% (n) (95% CI)
% (n) (95% CI)
% (n) (95% CI)
% (n) (95% CI)
Contraceptive injection service
Metro
Availability of commodity
0.0 - - - 0.0 19.6 - 19.6 0.0 - - 0.0
[0.0, 0.0] (2) - - - [0.0, 0.0] (2) [10.0,34.8](53) - [10.0,34.8](53) [0.0, 0.0] (2) - - [0.0, 0.0] (2)
Availability of credentials
100.0 - - - 100.0 82.0 - 82.0 62.2 - - 62.2
[100,100] (2) - - - [100,100] (2) [64.2, 92.0](53) - [64.2, 92.0] (53) [8.1, 96.9] (2) - - [8.1, 96.9] (2)
Availability of equipment
100.0 - - - 100.0 94.5 - 94.5 100.0 - - 100.0
[100,100] (2) - - - [100,100] (2) [77.5, 98.8](53) - [77.5, 98.8] (53) [100,100] (2) - - [100,100] (2)
Service readiness
0.0 - - - 0.0 19.6 - 19.6 0.0 - - 0.0
[0.0, 0.0] (2) - - - [0.0, 0.0] (2) [10.0, 34.8](53) - [10.0, 34.8] (53) [0.0, 0.0] (2) - - [0.0, 0.0] (2)
Urban
Availability of commodity
34.9 0.0 0.0 - 24.6 14.9 33.9 16.1 0.0 0.0 - 0.0
[5.2, 84.0] (4) [0.0, 0.0] (9) (1) - [3.8, 72.9](14) [7.7, 26.9](129) [8.9, 72.8](15) [8.9, 27.4](144) [0.0, 0.0] (7) (1) - [0.0, 0.0] (8)
Availability of credentials
100.0 42.2 0.0 - 82.3 77.8 28.0 74.7 92.5 0.0 - 85.8
[100,100] (4) [14.0,76.6](9) (1) - [50.4,95.5](14) [66.2,86.3](129) [9.9, 57.9](15) [64.0,83.0](144) [61.0,99.0](7) (1) - [54.0, 96.9](8)
Availability of equipment
80.9 28.2 0.0 - 69.2 97.6 65.8 95.6 100.0 100.0 - 100.0
[30.2,97.6](4) [3.3, 82.0] (6) (1) - [30.9,91.9](11) [93.9,99.1](127) [27.0,91.0](15) [89.5, 98.2](142) [100,100] (7) (1) - [100,100] (8)
Service readiness
34.9 0.0 0.0 - 27.4 14.8 1.1 13.9 0.0 0.0 - 0.0
[5.2, 84.0] (4) [0.0, 0.0] (6) (1) - [4.2, 76.4] (11) [7.5, 27.0] (127) [0.1, 7.8] (15) [7.0, 25.6] (142) [0.0, 0.0] (7) (1) - [0.0, 0.0] (8)
Rural
Availability of commodity
0.0 1.9 0.0 - 1.8 25.8 6.2 17.7 0.0 0.0 - 0.0 (1) [0.2, 13.5](69) (1) - [0.2, 12.8](71) [5.8, 66.4] (12) [0.6, 43.6] (3) [4.4, 50.2] (15) [0.0, 0.0] (2) [0.0, 0.0] (2) - [0.0, 0.0] (4)
Availability of credentials
100.0 95.2 100.0 - 95.4 75.2 63.7 70.5 100.0 0.0 - 43.8 (1) [84.9,98.6](69) (1) - [85.7,98.6](71) [38.1,93.7](12) [11.8,95.8](3) [36.7, 90.8] (15) [0.0, 0.0] (2) [0.0, 0.0] (2) - [7.3, 88.4] (4)
Availability of equipment
100.0 93.5 100.0 - 93.8 100.0 100.0 100.0 66.5 100.0 - 85.3 (1) [79.0,98.2](66) (1) - [80.2,98.3](68) [100,100] (12) [100,100] (3) [100,100] (15) [11.0, 97.0](2) [100,100] (2) - [35.1, 98.4](4)
Service readiness
0.0 1.9 0.0 - 1.8 25.8 0.0 15.2 0.0 0.0 - 0.0 (1) [0.2, 13.9] (66) (1) - [0.2, 13.2] (68) [5.8, 66.4](12) [0.0, 0.0] (3) [3.2, 49.0] (15) [0.0, 0.0] (2) [0.0, 0.0] (2) - [0.0, 0.0] (4)
IUD insertion service
Metro
Availability of commodity
56.0 - - - 56.0 49.7 - 49.7 - - - -
[6.3, 96.0] (2) - - - [6.3, 96.0] (2) [22.5, 77.1] (18) - [22.5, 77.1] (18) - - - -
Availability of credentials
100.0 - - - 100.0 100.0 - 100.0 - - - -
[100,100] (2) - - - [100,100] (2) [100,100] (18) - [100,100] (18) - - - -
Availability of equipment
100.0 - - - 100.0 92.5 - 92.5 - - - -
[100,100] (2) - - - [100,100] (2) [72.3, 98.3] (18) - [72.3, 98.3] (18) - - - -
Service readiness
56.0 - - - 56.0 49.7 - 49.7 - - - -
[6.3, 96.0] (2) - - - [6.3, 96.0] (2) [22.5, 77.1] (18) - [22.5, 77.1] (18) - - - -
Urban
Availability of commodity
88.8 41.5 - - 78.2 22.9 0.0 22.6 - - - -
[49.3,98.5](8) [6.6, 87.8] (8) - - [48.9, 93.0] (16) [10.2, 43.6] (36) [0.0, 0.0] (2) [10.1, 43.1] (38) - - - -
Availability of credentials
93.7 58.4 - - 85.7 100.0 100.0 100.0 - - - -
[64.6,99.2](8) [16.2, 91.1](8) - - [60.4, 95.9] (16) [100,100] (36) [100,100] (2) [100,100] (38) - - - -

www.FPwatch.info Page 66
Table B11: Service readiness* to provide provider-dependent contraceptive services, among outlets reportedly offering the procedure, by outlet type – Uttar Pradesh Strata, 2016 Higher
Public Health
Facility†
Sub-centre / ANM / ASHA‡
AWW NGO Public Total Private facility Pharmacy/
Chemist Private Medical
Total
AYUSH Provider
RMP General Retailer
Private Other Total
Proportion of outlets offering service, with§:
% (n) (95% CI)
% (n) (95% CI)
% (n) (95% CI)
% (n) (95% CI)
% (n) (95% CI)
% (n) (95% CI)
% (n) (95% CI)
% (n) (95% CI)
% (n) (95% CI)
% (n) (95% CI)
% (n) (95% CI)
% (n) (95% CI)
Availability of equipment
89.6 52.9 - - 81.4 96.1 0.0 94.8 - - - -
[63.0, 97.8] (8) [13.5, 89.0] (8) - - [56.6, 93.6] (16) [84.5, 99.1] (36) [0.0, 0.0] (2) [84.0, 98.4] (38) - - - -
Service readiness
78.5 41.5 - - 70.1 22.0 0.0 21.7 - - - -
[44.6, 94.3] (8) [6.6, 87.8] (8) - - [41.4, 88.6] (16) [9.6, 42.9] (36) [0.0, 0.0] (2) [9.5, 42.3] (38) - - - -
Rural
Availability of commodity
5.7 11.9 - - 11.6 - - - - 0.0 - 0.0
[0.4, 49.4] (2) [3.4, 33.8] (58) - - [3.5, 32.3] (60) - - - - (1) - (1)
Availability of credentials
100.0 98.0 - - 98.1 - - - - 0.0 - 0.0
[100,100] (2) [90.8, 99.6](58) - - [91.3, 99.6] (60) - - - - (1) - (1)
Availability of equipment
100.0 80.7 - - 81.5 - - - - 0.0 - 0.0
[100,100] (2) [51.8, 94.2](58) - - [54.4, 94.2] (60) - - - - (1) - (1)
Service readiness
5.7 10.4 - - 10.2 - - - - 0.0 - 0.0
[0.4, 49.4] (2) [2.9, 30.8] (58) - - [3.0, 29.5] (60) - - - - (1) - (1)
Male sterilization service
Metro
Availability of credentials
- - - - - 83.8 - 83.8 - - - -
- - - - - [28.7, 98.5] (3) - [28.7, 98.5] (3) - - - -
Availability of equipment
- - - - - 100.0 - 100.0 - - - -
- - - - - [100,100] (3) - [100,100] (3) - - - -
Service readiness
- - - - - 83.8 - 83.8 - - - -
- - - - - [28.7, 98.5] (3) - [28.7, 98.5] (3) - - - -
Urban
Availability of credentials
100.0 - - - 100.0 100.0 - 100.0 - - - -
[100,100] (3) - - - [100,100] (3) [100,100] (16) - [100,100] (16) - - - -
Availability of equipment
100.0 - - - 100.0 92.5 - 92.5 - - - -
[100,100] (3) - - - [100,100] (3) [60.4, 99.0] (16) - [60.4, 99.0] (16) - - - -
Service readiness
100.0 - - - 100.0 92.5 - 92.5 - - - -
[100,100] (3) - - - [100,100] (3) [60.4, 99.0] (16) - [60.4, 99.0] (16) - - - -
Rural
Availability of credentials
- - - - - - - - - - - -
- - - - - - - - - - - -
Availability of equipment
- - - - - - - - - - - -
- - - - - - - - - - - -
Service readiness
- - - - - - - - - - - -
- - - - - - - - - - - -
Female sterilization service
Metro
Availability of credentials
100.0 - - 0.0 65.2 82.8 - 82.8 - - - - (1) - - (1) [9.1, 97.2] (2) [53.7, 95.3] (10) - [53.7, 95.3] (10) - - - -
Availability of equipment
100.0 - - 100.0 100.0 100.0 - 100.0 - - - - (1) - - (1) [100,100] (2) [100,100] (10) - [100,100] (10) - - - -
Service readiness
100.0 - - 0.0 65.2 82.8 - 82.8 - - - - (1) - - (1) [9.1, 97.2] (2) [53.7, 95.3] (10) - [53.7, 95.3] (10) - - - -

www.FPwatch.info Page 67
Table B11: Service readiness* to provide provider-dependent contraceptive services, among outlets reportedly offering the procedure, by outlet type – Uttar Pradesh Strata, 2016 Higher
Public Health
Facility†
Sub-centre / ANM / ASHA‡
AWW NGO Public Total Private facility Pharmacy/
Chemist Private Medical
Total
AYUSH Provider
RMP General Retailer
Private Other Total
Proportion of outlets offering service, with§:
% (n) (95% CI)
% (n) (95% CI)
% (n) (95% CI)
% (n) (95% CI)
% (n) (95% CI)
% (n) (95% CI)
% (n) (95% CI)
% (n) (95% CI)
% (n) (95% CI)
% (n) (95% CI)
% (n) (95% CI)
% (n) (95% CI)
Urban
Availability of credentials
100.0 - - - 100.0 84.7 - 84.7 - - - -
[100,100] (3) - - - [100,100] (3) [58.8, 95.6] (27) - [58.8, 95.6] (27) - - - -
Availability of equipment
100.0 - - - 100.0 100.0 - 100.0 - - - -
[100,100] (3) - - - [100,100] (3) [100,100] (25) - [100,100] (25) - - - -
Service readiness
100.0 - - - 100.0 84.3 - 84.3 - - - -
[100,100] (3) - - - [100,100] (3) [58.0, 95.4] (25) - [58.0, 95.4] (25) - - - -
Rural
Availability of credentials
- - - - - 100.0 - 100.0 - - - -
- - - - - (1) - (1) - - - -
Availability of equipment
- - - - - 100.0 - 100.0 - - - -
- - - - - (1) - (1) - - - -
Service readiness
- - - - - 100.0 - 100.0 - - - -
- - - - - (1) - (1) - - - -
* Full service readiness is defined as having available: 1. The commodity (not applicable for male/female sterilization); 2. A provider with credentials meeting the guidelines to perform the service (Government of India Guidelines for Family Planning under NHM - http://nrhm.gov.in/nhm/nrhm/guidelines/nrhm-guidelines/family-planning-guidelines.html); and 3. A minimum set of sentinel equipment (http://www.cpc.unc.edu/measure/prh/rh_indicators/specific/long-acting-permanent-methods/percent-of-facilities-with-appropriate) for providing the service. Observations that are missing information for commodity availability, provider credentials, or equipment are excluded from the ‘service readiness’ denominator. † Includes: Government/municipal hospitals, government dispensaries, UHC/UHP/UFWCs, CHC/rural hospitals, and PHC/FRUs.
‡ In Uttar Pradesh Sub-centres and ASHA are equipped to provide family planning services. ANM are not. SC are found in rural areas and managed by ANM workers, ASHA can be found across strata. § The denominator includes outlets that met screening criteria for a full interview but did not complete the interview (were not interviewed or completed a partial interview) the list of methods at family planning outlets with incomplete survey information are as follows: 13 contraceptive injection services (9 urban, 4 rural), 6 IUD insertion services (4 urban, 2 rural), 18 male sterilization services (1 metro, 8 urban, 9 rural) and 37 female sterilization services (3 metro, 15 urban, 19 rural).
Source: FPwatch Outlet Survey, India, 2016

www.FPwatch.info Page 68
Figure B1. Modern contraceptive method market composition – Uttar Pradesh Strata, 2016 Among all outlets stocking at least 1 modern contraceptive or providing at least 1 contraceptive service, excluding condoms-only outlets, by outlet type
In UP metro areas, 97 percent of outlets stocking at least one modern contraceptive, among outlets above the level of stocking condoms only, came from the private sector with 91 percent of the market composition consisting of pharmacies/chemists. In urban areas, 96 percent of the market composition was from the private sector, predominantly from pharmacies/chemists (82 percent) and about 9 percent of the composition from private facilities. In rural areas, however, 93 percent of the market composition was from the public sector with nearly two-thirds from public sub-centres/ANM/ASHAs and over one-quarter from AWWs. * Higher-level public health facilities include: government/municipal hospitals, government dispensaries, UHC/UHP/UFWCs, CHC/rural hospitals, and PHC/FRUs. Note: In Uttar Pradesh, Sub-Centres and ASHA are equipped to provide family planning services. ANM are not. Sub-centres are found in rural areas and managed by ANM workers, ASHA can be found across strata.
Rural Urban Metro
N = 550 N = 1,087 N = 721
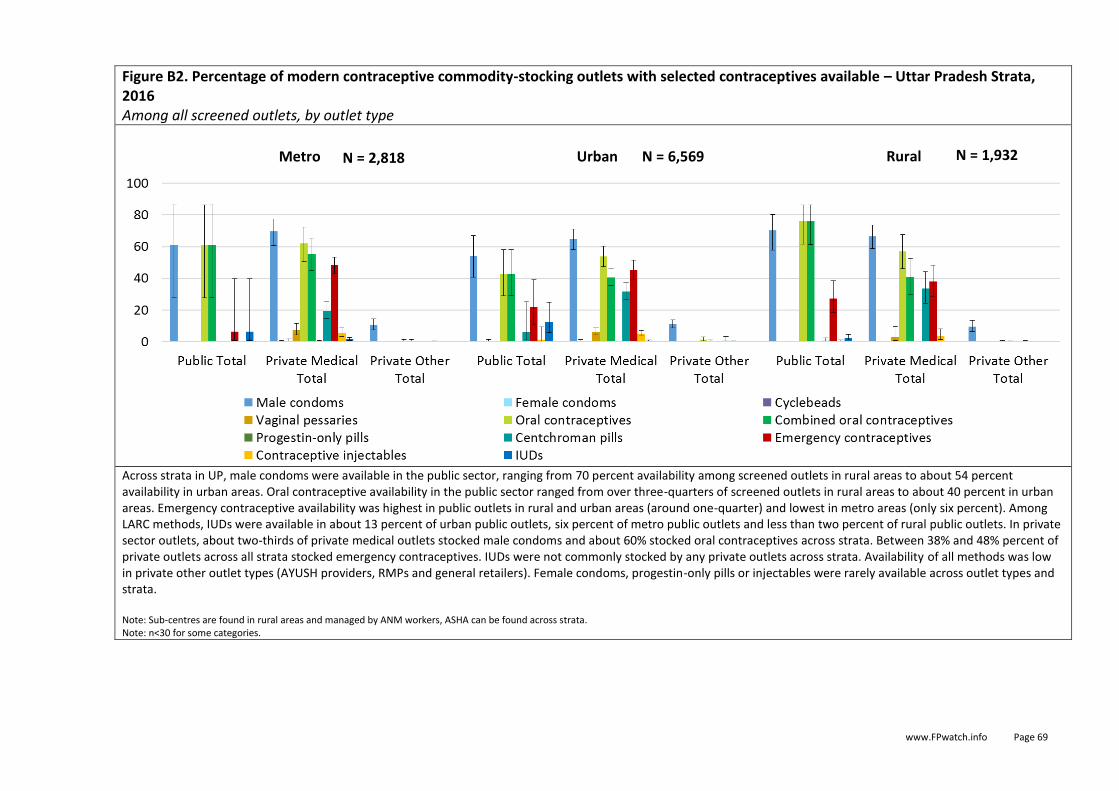
www.FPwatch.info Page 69
Figure B2. Percentage of modern contraceptive commodity-stocking outlets with selected contraceptives available – Uttar Pradesh Strata, 2016 Among all screened outlets, by outlet type
Across strata in UP, male condoms were available in the public sector, ranging from 70 percent availability among screened outlets in rural areas to about 54 percent availability in urban areas. Oral contraceptive availability in the public sector ranged from over three-quarters of screened outlets in rural areas to about 40 percent in urban areas. Emergency contraceptive availability was highest in public outlets in rural and urban areas (around one-quarter) and lowest in metro areas (only six percent). Among LARC methods, IUDs were available in about 13 percent of urban public outlets, six percent of metro public outlets and less than two percent of rural public outlets. In private sector outlets, about two-thirds of private medical outlets stocked male condoms and about 60% stocked oral contraceptives across strata. Between 38% and 48% percent of private outlets across all strata stocked emergency contraceptives. IUDs were not commonly stocked by any private outlets across strata. Availability of all methods was low in private other outlet types (AYUSH providers, RMPs and general retailers). Female condoms, progestin-only pills or injectables were rarely available across outlet types and strata. Note: Sub-centres are found in rural areas and managed by ANM workers, ASHA can be found across strata. Note: n<30 for some categories.
Rural Urban Metro N = 2,818 N = 6,569 N = 1,932

www.FPwatch.info Page 70
Figure B3. Percentage of outlets with selected method mixes available – Uttar Pradesh Strata, 2016 Among all screened outlets, by outlet type
There were few major differences in method mixes by strata. Rural UP outlets tended to have slightly higher availability of at least one modern method compared to metro outlets which were slightly higher than urban outlets. Private medical outlets in metro areas were slightly more likely to have three or more modern methods available, but few private medical or private other outlet types had LARC or PM methods available. Public outlets in metro areas were less likely to have three or more modern methods available compared to urban and rural outlets in the public sector. Urban public outlets were the most likely to have three or more methods available (almost 30 percent), with many of these with at least one LARC or PM available (about 14 percent). Note: Sub-centres are found in rural areas and managed by ANM workers, ASHA can be found across strata. Note: n<30 for some categories.
Rural Urban Metro N = 2,818 N = 6,569 N = 1,932

www.FPwatch.info Page 71
Figure B4. Percentage of outlets with stock outs of selected contraceptive methods – Uttar Pradesh Strata, 2016 Among all outlets reportedly stocking the method at any time in the previous three months, by outlet type
There were some small differences in stock outs of methods by outlets reportedly stocking the method in the previous three months, across strata. There were higher stock outs of emergency contraceptives and IUDs in the public sector in rural areas (about eight percent) compared to metro and urban areas. In private outlets reportedly stocking a method in the previous three months, there were slightly higher stock outs of IUDs (about one-quarter) in urban areas and injectables (about one-quarter) in rural areas. Note: Sub-centres are found in rural areas and managed by ANM workers, ASHA can be found across strata. Note: n<30 for some categories.
Rural Urban Metro

www.FPwatch.info Page 72
Figure B5. Price of contraceptive methods in the private sector - Uttar Pradesh Metro, 2016 Median price in USD and USD/CYP with interquartile range, by contraceptive method
Price was relatively consistent across strata, with price in USD per CYP being lower for LARC/PMs compared with short-acting methods. Note: Categories with a small sample size (n<5) are not shown.
Metro

www.FPwatch.info Page 73
Figure B6. Price of contraceptive methods in the private sector - Uttar Pradesh Urban, 2016 Median price in USD and USD/CYP with interquartile range, by contraceptive method
Price was relatively consistent across strata, with price in USD per CYP being lower for LARC/PMs compared with short-acting methods. Note: Categories with a small sample size (n<5) are not shown.
Urban

www.FPwatch.info Page 74
Figure B7. Price of contraceptive methods in the private sector - Uttar Pradesh Rural, 2016 Median price in USD and USD/CYP with interquartile range, by contraceptive method
Price was relatively consistent across strata, with price in USD per CYP being lower for LARC/PMs compared with short-acting methods. Note: Categories with a small sample size (n<5) are not shown.
Rural

www.FPwatch.info Page 75
Figure B8. Percentage private sector market share for contraceptives methods – Uttar Pradesh Strata, 2016 As a % of total CYPs sold/distributed, by outlet type
In UP, over 90 percent of the private sector market share came from the private medical sub-sector in metro and urban areas. Whereas, in rural areas, the private medical sub-sector comprised roughly 80 percent of the private sector total market share. Method profiles across sub-sectors and strata were relatively consistent. In the private medical sub-sector, male condoms made up a slightly higher proportion of market share in rural areas (41 percent). Oral contraceptive market share was slightly lower in urban areas compared with metro and rural areas within the private medical sub-sector. While sterilizations (primarily female) and IUDs comprised just over one-fifth of metro and urban private medical sub-sector market share, these methods were not seen in the rural private medical sub-sector. An appreciable share of emergency contraceptives were also seen across the private medical sub-sector strata. For the private other sub-sector, method profiles were similar across strata, with most market share coming from male condoms.
Rural Urban Metro
0
20
40
60
80
100
Private Medical Total Private Other Total Private Medical Total Private Other Total Private Medical Total Private Other Total
Female sterilizationMale sterilizationIUDsInjectablesEmergency contraceptivesOral contraceptivesVaginal pessariesCycleBeadsFemale condomsMale condoms

www.FPwatch.info Page 76
Figure B9. Within outlet private sector market share for contraceptive methods – Uttar Pradesh Strata, 2016 As a % of total CYPs sold/distributed within outlet type and sector, by outlet type and sector
UP metro and urban medical and other private sector outlets, had similar contraceptive profiles. Metro and urban private medical sector outlets had 15-20 percent market share attributable to female sterilizations; however, in rural areas no market share came from female sterilizations in private medical outlets. Instead, male condoms and oral contraceptives comprised a higher proportion of the market share in rural private medical outlets.
0
20
40
60
80
100
Private MedicalTotal
Private Other Total Private MedicalTotal
Private Other Total Private MedicalTotal
Private Other Total
Female sterilization
Male sterilization
IUDs
Injectables
Emergency contraceptives
Oral contraceptives
Vaginal pessaries
CycleBeads
Female condoms
Male condoms
Metro Urban Rural

www.FPwatch.info Page 77
Figure B10. Percentage of outlets with selected contraceptive services available – Uttar Pradesh Strata, 2016 Among all screened outlets, among outlets screened, by outlet type
In UP, less than 20 percent of screened outlets of all types reported provision of key modern contraceptive services. The key differences seen were fewer public outlets reporting offering male sterilizations in metro and rural areas compared to urban areas, a higher number offering female sterilizations in metro areas than urban and rural areas, and slightly fewer offering IUD insertions in rural and metro areas compared to urban areas. There were very low percentages of private outlets among those screened offering all services across the three strata. Note: Sub-centres are found in rural areas and managed by ANM workers, ASHA can be found across strata. Note: n<30 for some categories.
Rural Urban Metro N = 2,818 N = 6,569 N = 1,932

www.FPwatch.info Page 78
Figure B11. Service readiness to offer provider-dependent contraceptive services – Uttar Pradesh Strata, 2016 Among outlets reportedly offering the service, by outlet type
Among outlets reportedly offering a provider-dependent service, metro and urban areas showed higher service readiness across types of service compared to rural areas. The majority of public and private medical outlets in metro and urban areas were found to be service ready for IUD insertions as well as female sterilizations. However, in rural areas, few public sector outlets were found to be service ready for IUD insertions (usually due to lacking the IUD commodity) and few private outlets were found to be service ready for female sterilizations due to lacking key equipment or trained staff. Note: Sub-centres are found in rural areas and managed by ANM workers, ASHA can be found across strata. Note: n<30 for some categories.
Rural Urban Metro

www.FPwatch.info Page 79
Bihar
Table C1: Modern contraceptive method market composition: Relative proportion of outlets with 1 or more methods, by outlet type – Bihar, 2016
Higher Public Health
Facility*
Sub-centre / ANM /
ASHA AWW NGO
Public Total†
Private facility
Pharmacy/ Chemist
Private Medical Total†
AYUSH Provider
RMP General Retailer
Private Other Total†
Proportion of outlet types stocking / providing at least 1 modern contraceptive method on the day of the survey, of all outlets stocking / providing at least 1 modern contraceptive method‡:
% (95% CI)
% (95% CI)
% (95% CI)
% (95% CI)
% (95% CI)
% (95% CI)
% (95% CI)
% (95% CI)
% (95% CI)
% (95% CI)
% (95% CI)
% (95% CI)
Any method available, including condoms only outlets§ N=1638
1.7 54.5 1.1 0.1 57.4 5.4 22.4 27.5 0.7 7.7 6.7 15.1
(0.8, 3.6) (46.9, 61.9) (0.5, 2.7) (0.0, 0.2) (49.9, 64.5) (2.9, 9.0) (17.3, 28.3) (21.8, 34.0) (0.3, 1.7) (4.5, 12.9) (5.0, 8.8) (11.2, 20.2)
Any method available, excluding condoms only outlets|| N=1237
2.1 61.6 0.8 0.1 64.6 4.3 23.6 27.8 0.6 6.3 0.7 7.6
(1.0, 4.5) (53.2, 69.4) (0.2, 3.3) (0.0, 0.2) (56.4, 72.1) (2.0, 8.9) (17.9, 30.3) (21.4, 35.3) (0.2, 1.9) (3.5, 11.9) (0.3, 1.7) (4.5, 12.4)
* Includes: Government/municipal hospitals, government dispensaries, UHC/UHP/UFWCs, CHC/rural hospitals, PHC/FRUs
† Public Total category = higher public health facility + sub-centre/ANM/ASHA + AWW + NGO categories; Private Medical Total category = Private facility categories; Private Other Total category = AYUSH provider + RMP + general retailer categories ‡ Contraceptive commodity-stocking outlets have at least one family planning commodity in stock on the day of the survey, verified by the presence of at least one family planning commodity recorded in an audit sheet. There were 20 family planning commodity-stocking outlets in Bihar with partially completed interviews, which were excluded from the denominator. § Includes: male condoms, female condoms, cyclebeads, vaginal pessaries, oral contraceptives, emergency contraceptives, injectables or IUDs. Birth control patches, diaphragms or implants were not found in UP or Bihar. || Includes: oral contraceptives, emergency contraceptives, injectables or IUDs.
Source: FPwatch Outlet Survey, India, 2016
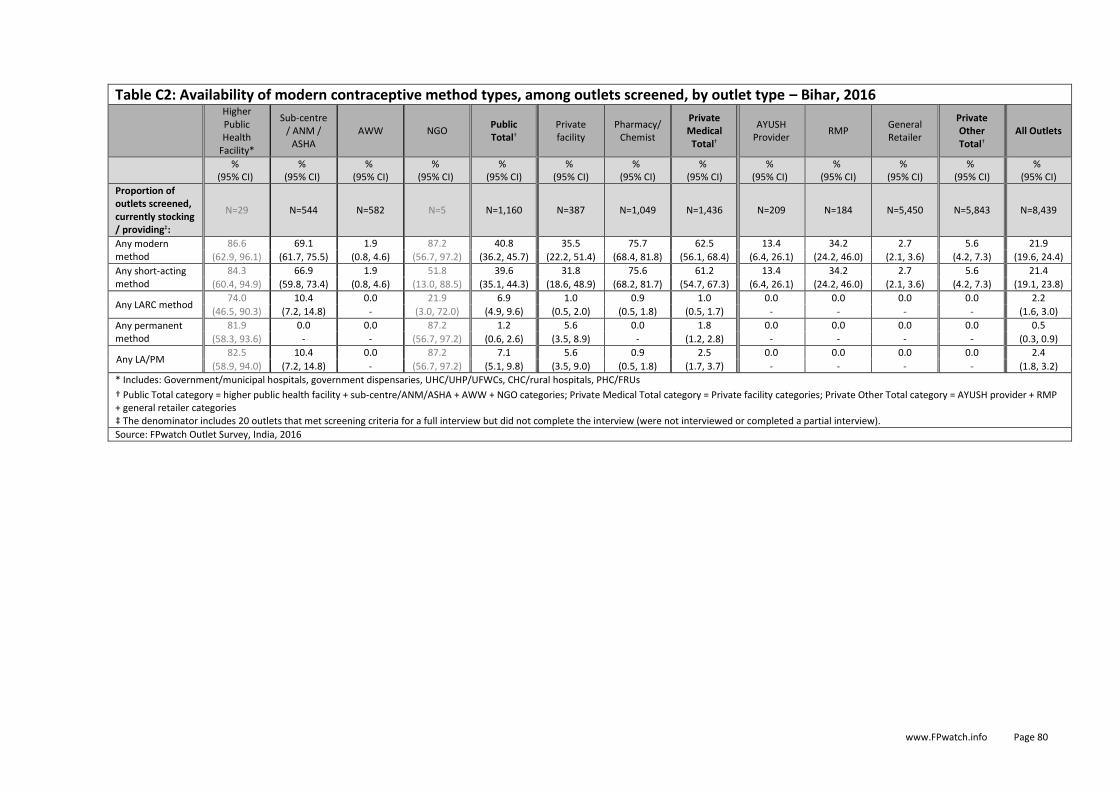
www.FPwatch.info Page 80
Table C2: Availability of modern contraceptive method types, among outlets screened, by outlet type – Bihar, 2016
Higher Public Health
Facility*
Sub-centre / ANM /
ASHA AWW NGO
Public Total†
Private facility
Pharmacy/ Chemist
Private Medical Total†
AYUSH Provider
RMP General Retailer
Private Other Total†
All Outlets
%
(95% CI) %
(95% CI) %
(95% CI) %
(95% CI) %
(95% CI) %
(95% CI) %
(95% CI) %
(95% CI) %
(95% CI) %
(95% CI) %
(95% CI) %
(95% CI) %
(95% CI)
Proportion of outlets screened, currently stocking / providing‡:
N=29 N=544 N=582 N=5 N=1,160 N=387 N=1,049 N=1,436 N=209 N=184 N=5,450 N=5,843 N=8,439
Any modern method
86.6 69.1 1.9 87.2 40.8 35.5 75.7 62.5 13.4 34.2 2.7 5.6 21.9
(62.9, 96.1) (61.7, 75.5) (0.8, 4.6) (56.7, 97.2) (36.2, 45.7) (22.2, 51.4) (68.4, 81.8) (56.1, 68.4) (6.4, 26.1) (24.2, 46.0) (2.1, 3.6) (4.2, 7.3) (19.6, 24.4)
Any short-acting method
84.3 66.9 1.9 51.8 39.6 31.8 75.6 61.2 13.4 34.2 2.7 5.6 21.4
(60.4, 94.9) (59.8, 73.4) (0.8, 4.6) (13.0, 88.5) (35.1, 44.3) (18.6, 48.9) (68.2, 81.7) (54.7, 67.3) (6.4, 26.1) (24.2, 46.0) (2.1, 3.6) (4.2, 7.3) (19.1, 23.8)
Any LARC method 74.0 10.4 0.0 21.9 6.9 1.0 0.9 1.0 0.0 0.0 0.0 0.0 2.2
(46.5, 90.3) (7.2, 14.8) - (3.0, 72.0) (4.9, 9.6) (0.5, 2.0) (0.5, 1.8) (0.5, 1.7) - - - - (1.6, 3.0)
Any permanent method
81.9 0.0 0.0 87.2 1.2 5.6 0.0 1.8 0.0 0.0 0.0 0.0 0.5
(58.3, 93.6) - - (56.7, 97.2) (0.6, 2.6) (3.5, 8.9) - (1.2, 2.8) - - - - (0.3, 0.9)
Any LA/PM 82.5 10.4 0.0 87.2 7.1 5.6 0.9 2.5 0.0 0.0 0.0 0.0 2.4
(58.9, 94.0) (7.2, 14.8) - (56.7, 97.2) (5.1, 9.8) (3.5, 9.0) (0.5, 1.8) (1.7, 3.7) - - - - (1.8, 3.2)
* Includes: Government/municipal hospitals, government dispensaries, UHC/UHP/UFWCs, CHC/rural hospitals, PHC/FRUs
† Public Total category = higher public health facility + sub-centre/ANM/ASHA + AWW + NGO categories; Private Medical Total category = Private facility categories; Private Other Total category = AYUSH provider + RMP + general retailer categories ‡ The denominator includes 20 outlets that met screening criteria for a full interview but did not complete the interview (were not interviewed or completed a partial interview).
Source: FPwatch Outlet Survey, India, 2016

www.FPwatch.info Page 81
Table C3: Availability of selected contraceptive commodities, among outlets screened, by outlet type – Bihar, 2016
Higher Public Health
Facility*
Sub-centre / ANM /
ASHA AWW NGO
Public Total†
Private facility
Pharmacy/ Chemist
Private Medical Total†
AYUSH Provider
RMP General Retailer
Private Other Total†
All Outlets
%
(95% CI) %
(95% CI) %
(95% CI) %
(95% CI) %
(95% CI) %
(95% CI) %
(95% CI) %
(95% CI) %
(95% CI) %
(95% CI) %
(95% CI) %
(95% CI) %
(95% CI)
Proportion of outlets screened, currently stocking‡:
N=29 N=544 N=582 N=5 N=1,160 N=387 N=1,049 N=1,436 N=209 N=184 N=5,450 N=5,843 N=8,439
Male condoms 81.0 58.5 1.1 21.9 34.5 28.4 70.2 56.4 9.1 26.0 2.7 4.8 18.9
(57.0, 93.2) (51.5, 65.2) (0.5, 2.4) (3.0, 72.0) (30.3, 38.9) (15.2, 46.7) (62.4, 77.0) (49.7, 62.9) (4.5, 17.6) (16.0, 39.4) (2.1, 3.6) (3.6, 6.3) (17.0, 21.0)
Female condoms 0.0 0.0 0.0 0.0 0.0 0.0 0.0 0.0 0.0 0.0 0.0 0.0 0.0
- - - - - - - - - - - - -
Cyclebeads 0.0 0.0 0.0 0.0 0.0 0.1 0.0 0.0 0.0 0.0 0.0 0.0 0.0
- - - - - (0.0, 0.7) - (0.0, 0.2) - - - - -
Vaginal Pessaries 0.0 0.0 0.0 0.0 0.0 0.0 1.3 0.9 0.0 0.0 0.0 0.0 0.1
- - - - - - (0.8, 2.4) (0.5, 1.6) - - (0.0, 0.0) (0.0, 0.0) (0.0, 0.2)
Oral contraceptives 81.0 58.5 1.1 51.8 34.5 9.0 55.6 40.3 8.6 18.6 0.2 1.9 15.6
(57.0, 93.2) (51.2, 65.4) (0.3, 4.5) (13.0, 88.5) (29.9, 39.3) (4.1, 18.8) (48.1, 62.9) (33.7, 47.2) (2.9, 23.1) (11.9, 27.8) (0.1, 0.6) (1.1, 3.2) (13.5, 18.0)
Combined oral contraceptives
81.0 58.5 1.1 51.8 34.5 8.4 49.1 35.7 8.4 18.6 0.2 1.9 15.1
(57.0, 93.2) (51.2, 65.4) (0.3, 4.5) (13.0, 88.5) (29.9, 39.3) (3.6, 18.5) (42.6, 55.7) (29.8, 42.1) (2.7, 23.1) (11.9, 27.8) (0.1, 0.6) (1.1, 3.2) (13.0, 17.5)
Progestin-only pills
0.0 0.0 0.0 0.0 0.0 0.0 0.1 0.1 0.0 0.0 0.0 0.0 0.0
- - - - - (0.0, 0.1) (0.0, 0.4) (0.0, 0.3) - - (0.0, 0.2) (0.0, 0.1) (0.0, 0.1)
Centchroman pills 0.0 0.0 0.0 0.0 0.0 0.7 13.2 9.1 0.2 0.2 0.0 0.0 0.9
- - - - - (0.1, 3.7) (9.0, 18.9) (6.2, 13.1) (0.0, 1.3) (0.0, 1.1) (0.0, 0.0) (0.0, 0.1) (0.6, 1.3)
Emergency contraceptives
64.7 42.7 0.0 21.9 24.9 13.8 43.8 33.9 4.1 4.0 0.0 0.4 11.2
(34.1, 86.6) (35.5, 50.3) - (3.0, 72.0) (20.7, 29.6) (4.4, 35.8) (37.1, 50.6) (28.0, 40.3) (1.2, 13.2) (1.9, 8.2) (0.0, 0.1) (0.2, 0.8) (9.5, 13.2)
Contraceptive injectables (All DMPA)
0.0 0.0 0.0 51.8 0.0 4.6 12.1 9.6 1.6 5.0 0.0 0.5 1.2
- - - (13.0, 88.5) (0.0, 0.1) (1.7, 11.6) (8.9, 16.2) (7.2, 12.7) (0.2, 9.7) (2.2, 11.0) (0.0, 0.2) (0.2, 1.1) (0.9, 1.7)
IUDs (All Copper T) 74.0 10.4 0.0 21.9 6.9 1.0 0.9 1.0 0.0 0.0 0.0 0.0 2.2
(46.5, 90.3) (7.2, 14.8) - (3.0, 72.0) (4.9, 9.6) (0.5, 2.0) (0.5, 1.8) (0.5, 1.7) - - - - (1.6, 3.0)
* Includes: Government/municipal hospitals, government dispensaries, UHC/UHP/UFWCs, CHC/rural hospitals, PHC/FRUs
† Public Total category = higher public health facility + sub-centre/ANM/ASHA + AWW + NGO categories; Private Medical Total category = Private facility categories; Private Other Total category = AYUSH provider + RMP + general retailer categories ‡ The denominator includes 20 outlets that met screening criteria for a full interview but did not complete the interview (were not interviewed or completed a partial interview).
Source: FPwatch Outlet Survey, India, 2016

www.FPwatch.info Page 82
Table C4: Availability of modern contraceptive method diversity, among outlets screened, by outlet type – Bihar, 2016
Higher Public Health
Facility*
Sub-centre / ANM /
ASHA AWW NGO
Public Total†
Private facility
Pharmacy/ Chemist
Private Medical Total†
AYUSH Provider
RMP General Retailer
Private Other Total†
All Outlets
%
(95% CI) %
(95% CI) %
(95% CI) %
(95% CI) %
(95% CI) %
(95% CI) %
(95% CI) %
(95% CI) %
(95% CI) %
(95% CI) %
(95% CI) %
(95% CI) %
(95% CI)
Proportion of outlets screened, currently stocking / providing‡:
N=29 N=544 N=582 N=5 N=1,160 N=387 N=1,049 N=1,436 N=209 N=184 N=5,450 N=5,843 N=8,439
3+ methods§ 81.0 39.4 0.0 51.8 23.3 6.9 38.8 28.3 4.1 4.0 0.1 0.5 10.2
(57.0, 93.2) (32.8, 46.5) - (13.0, 88.5) (19.4, 27.8) (3.3, 13.8) (32.1, 46.0) (23.4, 33.8) (1.2, 13.2) (1.9, 8.5) (0.0, 0.2) (0.2, 0.9) (8.5, 12.0)
3+ methods with LARC
74.0 7.8 0.0 21.9 5.5 1.0 0.7 0.8 0.0 0.0 0.0 0.0 1.8
(46.5, 90.3) (5.1, 11.9) - (3.0, 72.0) (3.7, 8.0) (0.5, 2.0) (0.3, 1.6) (0.4, 1.5) - - - - (1.2, 2.5)
3+ methods with LA/PM
80.2 7.8 0.0 51.8 5.6 1.8 0.7 1.1 0.0 0.0 0.0 0.0 1.8
(56.1, 92.7) (5.1, 11.9) - (13.0, 88.5) (3.8, 8.1) (0.9, 3.6) (0.3, 1.6) (0.6, 1.9) - - - - (1.3, 2.6)
5+ methods|| 73.4 0.0 0.0 21.9 1.1 0.3 0.8 0.6 0.0 0.0 0.0 0.0 0.4
(45.9, 90.0) - - (3.0, 72.0) (0.4, 2.5) (0.1, 0.8) (0.4, 1.9) (0.3, 1.3) - - - - (0.2, 0.8)
* Includes: Government/municipal hospitals, government dispensaries, UHC/UHP/UFWCs, CHC/rural hospitals, PHC/FRUs
† Public Total category = higher public health facility + sub-centre/ANM/ASHA + AWW + NGO categories; Private Medical Total category = Private facility categories; Private Other Total category = AYUSH provider + RMP + general retailer categories ‡ The denominator includes 20 outlets that met screening criteria for a full interview but did not complete the interview (were not interviewed or completed a partial interview). § 3 or more among: male condom, female condom, cyclebeads, vaginal pessary, oral contraceptive, emergency contraceptive, injectable, IUD commodities and/or male sterilization, female sterilization services. No other modern contraceptive methods were found in sampled outlets. || 5 or more among: male condom, female condom, cyclebeads, vaginal pessary, oral contraceptive, emergency contraceptive, injectable, IUD commodities and/or male sterilization, female sterilization services. No other modern contraceptive methods were found in sampled outlets.
Source: FPwatch Outlet Survey, India, 2016

www.FPwatch.info Page 83
Table C5: Current stock out* of selected modern contraceptive commodities on day of survey, among outlets reportedly stocking method in previous 3 months, by outlet type – Bihar, 2016
Higher Public Health Facility†
Sub-centre / ANM / ASHA
AWW NGO Public Total‡ Private facility
Pharmacy/ Chemist
Private Medical Total‡
AYUSH Provider
RMP General Retailer
Private Other Total‡
Proportion of outlets reportedly stocking method in previous 3 months, currently stocked out of†:
% (n) (95% CI)
% (n) (95% CI)
% (n) (95% CI)
% (n) (95% CI)
% (n) (95% CI)
% (n) (95% CI)
% (n) (95% CI)
% (n) (95% CI)
% (n) (95% CI)
% (n) (95% CI)
% (n) (95% CI)
% (n) (95% CI)
Oral contraceptives 0.0 (19) 20.4 (385) 74.7 (30) 0.0 (2) 22.1 (436) 16.5 (36) 13.4 (753) 13.6 (789) 24.7 (8) 45.6 (51) 32.5 (10) 43.0 (69)
- (14.3, 28.2) (37.3, 93.6) - (15.9, 29.9) (6.0, 38.0) (7.5, 22.8) (8.0, 22.2) (3.9, 72.5) (26.8, 65.7) (5.6, 79.6) (26.2, 61.7)
Emergency contraceptives 0.0 (15) 21.6 (286) 100.0 (5) 0.0 (1) 21.9 (307) 7.3 (26) 17.0 (690) 15.8 (716) 0.0 (4) 73.8 (24) 0.0 (4) 67.7 (32)
- (14.9, 30.4) (100,100) - (15.3, 30.3) (1.5, 29.0) (10.0, 27.3) (9.3, 25.7) - (54.0, 87.1) - (48.2, 82.6)
Contraceptive injectables - - - 0.0 (2) 0.0 (2) 20.0 (25) 22.5 (200) 22.2 (225) 0.0 (1) 54.4 (17) 0.0 (1) 50.9 (19)
- - - - - (6.8, 46.0) (11.6, 39.3) (11.7, 37.9) - (26.1, 80.1) - (24.7, 76.6)
IUDs 0.0 (16) 0.4 (42) - 57.7 (2) 0.7(61) 22.1 (12) 26.8 (26) 25.2 (38) - - - -
- (0.1, 2.8) - (8.5, 95.2) (0.2, 2.2) (3.7, 68.1) (9.9, 54.8) (11.1, 47.6) - - - -
* This indicator is among all screened outlets that reportedly stocked the method in the previous 3 months. It does not account for whether the outlet is expected to provide the commodity according to national regulations. It is a point-in-time stock out indicator from https://www.rhsupplies.org/fileadmin/uploads/rhsc/Issues/Addressing_Stockouts/Takestock/Documents/Using_the_Power_of_Partnership_to_Speak_the_Same_Language_on_Stockouts.pdf. It is defined as the percentage of facilities reporting that they have stocked the method in the previous 3 months but were stocked out on the day of the assessment. † Includes: Government/municipal hospitals, government dispensaries, UHC/UHP/UFWCs, CHC/rural hospitals, PHC/FRUs
‡ Public Total category = higher public health facility + sub-centre/ANM/ASHA + AWW + NGO categories; Private Medical Total category = Private facility categories; Private Other Total category = AYUSH provider + RMP + general retailer categories § The denominator includes 20 outlets that met screening criteria for a full interview but did not complete the interview (were not interviewed or completed a partial interview). Source: FPwatch Outlet Survey, India, 2016

www.FPwatch.info Page 84
Table C6: Median price of selected modern contraceptive methods in INR*, USD, and USD per CYP†‡, by private outlet type – Bihar, 2016 Private facility Pharmacy/Chemist Private Medical Total Private Other Total
Median price of method, with interquartile range§,∞:
Median (N) [IQR]
Median (N)
[IQR]
Median (N)
[IQR]
Median (N)
[IQR]
Male condoms
INR per condom INR 5.00 (39) INR 25.00 (772) INR 25.00 (811) INR 5.00 (271)
[1.67, 80.00] [8.33, 80.00] [8.00, 80.00] [2.00, 6.67
USD per condom $0.07 (39) $0.37 (772) $0.37 (811) $0.07 (271)
[0.02, 1.19] [0.12, 1.19] [0.12, 1.19] [0.03, 0.10]
USD per CYP $8.95 (39) $11.93 (772) $11.93 (811) $8.95 (271)
[0.67, 23.86] [4.47, 20.88] [3.58, 20.88] [3.58, 11.93]
Female condoms
INR per condom - INR 33.33 (1) INR 33.33 (1) -
- [33.33, 33.33] [33.33, 33.33] -
USD per condom - $0.50 (1) $0.50 (1) -
- [0.50, 0.50] [0.50, 0.50] -
USD per CYP - $59.66 (1) $59.66 (1) -
- [59.66, 59.66] [59.66, 59.66] -
Cyclebeads
INR per Cyclebeads INR 0.00 (1) - INR 0.00 (1) -
[0.00, 0.00] - [0.00, 0.00] -
USD per Cyclebeads $0.00 (1) - $0.00 (1) -
[0.00, 0.00] - [0.00, 0.00] -
USD per CYP $0.00 (1) - $0.00 (1) -
[0.00, 0.00] - [0.00, 0.00] -
Vaginal pessaries
INR per pill - INR 6.80 (39) INR 6.80 (39) INR 7.80 (1)
- [6.00, 7.80] [6.00, 7.80] [7.80, 7.80]
USD per pill - $0.10 (39) $0.10 (39) $0.12 (1)
- [0.09, 0.12] [0.09, 0.12] [0.12, 0.12]
USD per CYP - $12.17 (39) $12.17 (39) $13.96 (1)
- [10.74, 13.96] [10.74, 13.96] [13.96, 13.96]
Oral contraceptives
INR per cycle INR 60.00 (35) INR 25.00 (1,170) INR 25.00 (1,205) INR 10.00 (55)
[8.33, 70.00] [10.00, 69.00] [10.00, 69.00] [8.33, 25.00]
USD per cycle $0.89 (35) $0.37 (1,170) $0.37 (1,205) $0.15 (55)
[0.12, 1.04] [0.15, 1.03] [0.15, 1.03] [0.12, 0.37]
USD per CYP $13.42 (35) $5.59 (1,170) $5.59 (1,205) $2.24 (55)
[1.86, 15.66] [2.24, 15.44] [2.24, 15.44] [1.86, 5.59]
Combined oral contraceptives
INR per cycle INR 60.00 (31) INR 30.00 (1,011) INR 30.00 (1,042) INR 10.00 (50)
[8.33, 71.00] [10.00, 70.00] [10.00, 70.00] [8.33, 25.00]
USD per cycle $0.89 (31) $0.45 (1,011) $0.45 (1,042) $0.15 (50)
[0.12, 1.06] [0.15, 1.04] [0.15, 1.04] [0.12, 0.37]
USD per CYP $13.42 (31) $6.71 (1,011) $6.71 (1,042) $2.24 (50)
[1.86, 15.88] [2.24, 15.66] [2.24, 15.66] [1.86, 5.59]

www.FPwatch.info Page 85
Table C6: Median price of selected modern contraceptive methods in INR*, USD, and USD per CYP†‡, by private outlet type – Bihar, 2016 Private facility Pharmacy/Chemist Private Medical Total Private Other Total
Median price of method, with interquartile range§,∞:
Median (N) [IQR]
Median (N)
[IQR]
Median (N)
[IQR]
Median (N)
[IQR]
Progestin-only pills
INR per cycle INR 215.00 (4) INR 330.00 (6) INR 330.00 (10) INR 14.00 (1)
[90.00, 330.00] [257.00, 345.00] [257.00, 330.00] [14.00, 14.00]
USD per cycle $3.21 (4) $4.92 (6) $4.92 (10) $0.21 (1)
[1.34, 4.92] [3.83, 5.15] [3.83, 4.92] [0.21, 0.21]
USD per CYP $48.85 (4) $73.83 (6) $73.83 (10) $3.13 (1)
[14.91, 73.83] [57.50, 77.18] [57.50, 73.83] [3.13, 3.13]
Centchroman pills
INR per 8 pill cycle INR 25.00 (2) INR 25.00 (155) INR 25.00 (157) INR 25.00 (4)
[25.00, 25.00] [25.00, 25.00] [25.00, 25.00] [25.00, 25.00]
USD per 8 pill cycle $0.37 (2) $0.37 (155) $0.37 (157) $0.37 (4)
[0.37, 0.37] [0.37, 0.37] [0.37, 0.37] [0.37, 0.37]
USD per CYP $5.59 (2) $5.59 (155) $5.59 (157) $5.59 (4)
[5.59, 5.59] [5.59, 5.59] [5.59, 5.59] [5.59, 5.59]
Emergency contraceptives
INR per dose INR 80.00 (22) INR 80.00 (690) INR 80.00 (712) INR 80.00 (19)
[70.00, 80.00] [70.00, 80.00] [70.00, 80.00] [65.00, 80.00]
USD per dose $1.19 (22) $1.19 (690) $1.19 (712) $1.19 (19)
[1.04, 1.19] [1.04, 1.19] [1.04, 1.19] [0.97, 1.19]
USD per CYP $23.86 (22) $23.86 (690) $23.86 (712) $23.86 (19)
[20.88, 23.86] [20.88, 23.86] [20.88, 23.86] [19.39, 23.86]
Contraceptive injectables
INR per dose INR 100.00 (19) INR 100.00 (127) INR 100.00 (146) INR 100.00 (8)
[100.00, 100.00] [98.00, 120.00] [98.00, 108.00] [80.00, 100.00]
USD per dose $1.49 (19) $1.49 (127) $1.49 (146) $1.49 (8)
[1.49, 1.49] [1.46, 1.79] [1.46, 1.61] [1.19, 1.49]
USD per CYP $5.97 (19) $5.97 (127) $5.97 (146) $4.77 (8)
[5.97, 5.97] [5.85, 7.16] [5.85, 6.44] [5.97, 5.97]
IUDs
INR per IUD INR 884.00 (10) INR 340.00 (15) INR 399.00 (25) -
[500.00, 1000.00] [250.00, 435.00] [250.00, 700.00] -
USD per IUD $13.18 (10) $5.07 (15) $5.95 (25) -
[7.46, 14.91] [3.73, 6.49] [3.73, 10.44] -
USD per CYP $2.87 (10) $1.10 (15) $1.29 (25) -
[1.62, 3.24] [0.81, 1.41] [0.81, 2.27] -
Male sterilization
INR per sterilization INR 1500.00 (12) - INR 1500.00 (12) -
[1000.00, 2500.00] - [1000.00, 2500.00] -
USD per sterilization $22.37 (12) - $22.37 (12) -
[14.91, 37.29] - [14.91, 37.29] -
USD per CYP $1.72 (12) - $1.72 (12) -
[1.15, 2.87] - [1.15, 2.87] -

www.FPwatch.info Page 86
Table C6: Median price of selected modern contraceptive methods in INR*, USD, and USD per CYP†‡, by private outlet type – Bihar, 2016 Private facility Pharmacy/Chemist Private Medical Total Private Other Total
Median price of method, with interquartile range§,∞:
Median (N) [IQR]
Median (N)
[IQR]
Median (N)
[IQR]
Median (N)
[IQR]
Female sterilization
INR per sterilization INR 1700.00 (46) - INR 1700.00 (46) -
[1500.00, 3000.00] - [1500.00, 3000.00] -
USD per sterilization $25.36 (46) - $25.36 (46) -
[22.37, 44.74] - [22.37, 44.74] -
USD per CYP $1.95 (46) - $1.95 (46) -
[1.72, 3.44] - [1.72, 3.44] -
* Based on the average rate of exchange from June 9th to September 10th, 2016 of 67.0478 INR per 1 USD. † This price is determined for the unit used in CYP conversion factors: condoms: 1 condom; cyclebeads: 1 product/string; vaginal pessaries: 1 tablet; oral contraceptives: 1 cycle or blister package; emergency contraceptives: 1 dose; injectables: 1 dose/injection; IUDs: 1 IUD. ‡ CYP – Couple Year Protection is the estimated protection provided by contraceptive methods during a one-year period, based upon the volume of all contraceptives sold or distributed free of charge to clients during that period (see Annex 11). § Price for all commodities with provider-dependent service (injectables, IUDs) may include a service charge. ∞ In Bihar, the number of family planning products captured in audits sheets with missing price information are as follows: 9 male condoms, 0 female condoms, 0 cyclebeads, 0 vaginal pessaries, 5 oral contraceptives (5 COCs), 2 emergency contraceptives, 17 injections, 5 IUDs, 1 male sterilizations and 7 female sterilizations.
Source: FPwatch Outlet Survey, India, 2016

www.FPwatch.info Page 87
Table C7: Median markup percentage for selected modern contraceptive commodities with interquartile range, by private outlet type – Bihar, 2016
Private facility Pharmacy/Chemist Private Medical Total Private Other Total
Median markup percentage of commodity, with interquartile range*,†,‡:
Median % (N) [IQR %]
Median % (N)
[IQR %]
Median % (N)
[IQR %]
Median % (N)
[IQR %]
Oral contraceptives 25% (36) 25% (1,174) 25% (1,210) 25% (51)
[-99% 50%] [9%, 43%] [5%, 45%] [20%, 50%]
Emergency contraceptives 100% (22) 33% (692) 40% (714) 33% (16)
[25%, 100%] [17%, 100%] [17%, 100%] [7%, 80%]
Contraceptive injectables 11% (19) 26% (127) 25% (146) 43% (8)
[-100%, 25%] [11%, 67%] [10%, 60%] [23%, 134%]
IUDs 250% (10) 67% (15) 67% (25) -
[150%, 254%] [36%, 67%] [36%, 150%] -
* The number of family planning products captured in audit sheets with missing retail and/or wholesale price information are as follows: 203 oral contraceptives, 130 emergency contraceptives, 52 injections and 9 IUDs. † To determine median markup percentage, we first determined the profit margin for selected modern contraceptives at private sector outlet categories: retail price – wholesale price. We then determined a profit margin proportion by: profit margin/retail price. Finally, we converted profit margin to markup by: wholesale price/(1- profit margin proportion). We converted to a percentage and determined the median markup with IQR range. ‡ Price for all commodities with provider-dependent service (injectables, implants, IUDs) may include service charge.
Source: FPwatch Outlet Survey, India, 2016

www.FPwatch.info Page 88
Table C8: Private sector contraceptive method market share: Relative proportion of total CYP sold / distributed, by method and outlet type – Bihar
CYPs sold or distributed in previous 1 month by outlet type and contraceptive method type as a % of total CYPs sold / distributed§,||:
Private facility Pharmacy/Chemist Private Medical
Total‡ AYUSH Provider RMP General Retailer Private Other
Total‡ All Outlets
% % % % % % % %
1. Male condoms 2.4 19.9 22.3 0.3 3.2 2.7 6.3 28.5
2. Female condoms 0.0 0.0 0.0 0.0 0.0 0.0 0.0 0.0
3. Cyclebeads 0.0 0.0 0.0 0.0 0.0 0.0 0.0 0.0
4. Vaginal pessaries 0.0 0.1 0.1 0.0 0.0 0.0 0.0 0.1
5. Oral contraceptives 1.9 12.7 14.6 0.1 2.2 0.4 2.7 17.3
Combined oral contraceptives 1.8 10.8 12.6 0.1 2.1 0.4 2.6 15.3
Progestin-only pills 0.0 0.0 0.0 0.0 0.0 0.0 0.0 0.0
Centchroman pills 0.1 1.9 2.0 0.0 0.0 0.0 0.0 2.0
6. Emergency contraceptives 0.5 4.9 5.4 0.1 0.2 0.0 0.3 5.7
7. Contraceptive injectables 0.8 3.1 3.8 0.0 1.2 0.0 1.2 5.0
8. IUDs 1.5 3.0 4.6 0.0 0.0 0.0 0.0 4.6
9. Male sterilization 1.4 0.0 1.4 0.0 0.0 0.0 0.0 1.4
10. Female sterilization 37.4 0.0 37.4 0.0 0.0 0.0 0.0 37.4
OUTLET TYPE TOTAL** 45.9 43.7 89.6 0.5 6.8 3.1 10.4 100.0
‡ Private Medical Total category = Private facility categories; Private Other Total category = AYUSH provider + RMP + general retailer categories ‡ A total of 123,182.5 CYPs (weighted) were reportedly distributed in the previous 1 month in Bihar in the private sector. This is based on the number of commodities reportedly sold for categories 1-8 (not number of services performed for categories 7-8) and number of sterilizations reportedly performed for categories 9-10. § In the Bihar study area in the private sector, 2,844 FP products were audited, not including condoms or cycle beads (1,575 oral contraceptives, 963 emergency contraceptives, 40 vaginal pessaries, 174 injectables, 92 IUDs). 1,427 outlets reported one or more brands of male condoms, female condoms and/or Cyclebeads, and volume information was collected for each brand. Volume of sterilizations performed was collected from 34 and 84 outlets for male or female sterilizations, respectively. Volume information was excluded due to missing information or as a volume outlier for: 15 outlets with male condoms, 0 outlets with female condoms, 0 outlets with Cyclebeads, 0 audits of vaginal pessaries, 3 audits of oral contraceptives, 3 audits of emergency contraceptives, 1 audit of injectables, 8 audits of IUDs, 0 outlets with male sterilizations and 1 outlet with female sterilizations. || Row total: CYP volume for the specified contraceptive method type. Column total: market share for the specified outlet type method categories 1-10.
Public sector market share is not shown. Sterilization services are concentrated into a few higher-level facilities; due to our small sample of these outlet types, the results would have been skewed, and shown an inaccurate portrayal of the total market. Source: FPwatch Outlet Survey, India, 2016
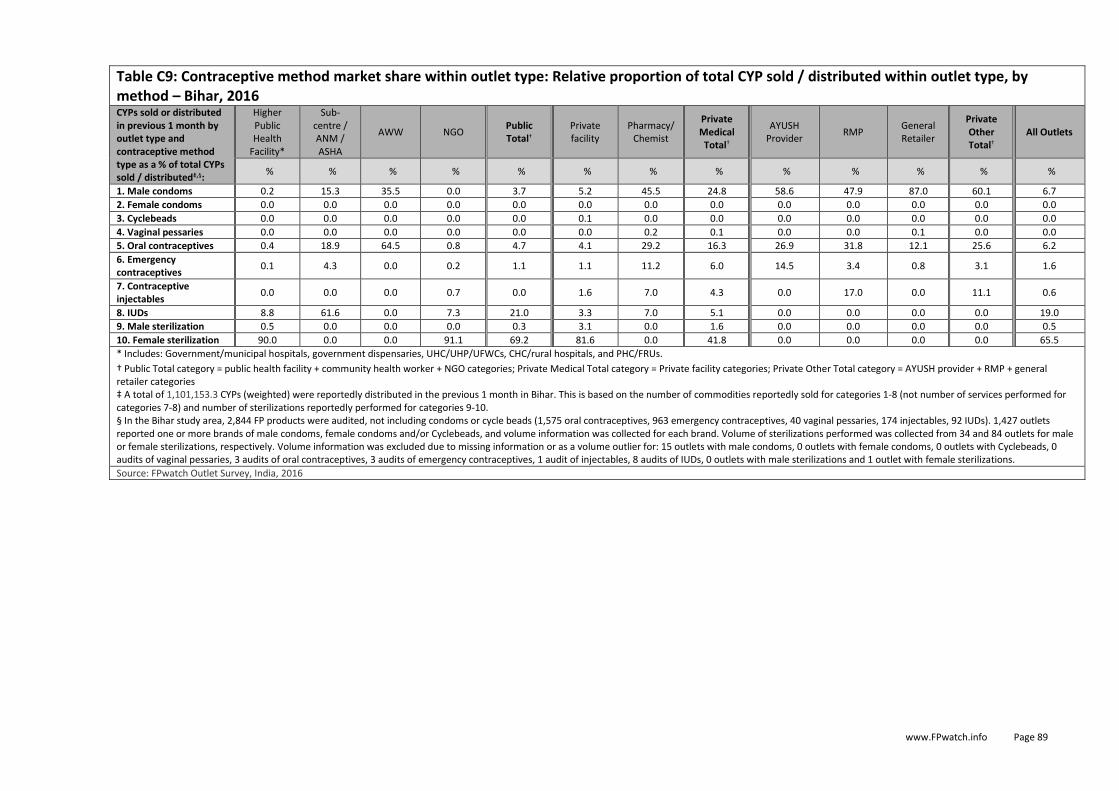
www.FPwatch.info Page 89
Table C9: Contraceptive method market share within outlet type: Relative proportion of total CYP sold / distributed within outlet type, by method – Bihar, 2016
CYPs sold or distributed in previous 1 month by outlet type and contraceptive method type as a % of total CYPs sold / distributed‡,§:
Higher Public Health
Facility*
Sub-centre / ANM / ASHA
AWW NGO Public Total†
Private facility
Pharmacy/Chemist
Private Medical Total†
AYUSH Provider
RMP General Retailer
Private Other Total†
All Outlets
% % % % % % % % % % % % %
1. Male condoms 0.2 15.3 35.5 0.0 3.7 5.2 45.5 24.8 58.6 47.9 87.0 60.1 6.7
2. Female condoms 0.0 0.0 0.0 0.0 0.0 0.0 0.0 0.0 0.0 0.0 0.0 0.0 0.0
3. Cyclebeads 0.0 0.0 0.0 0.0 0.0 0.1 0.0 0.0 0.0 0.0 0.0 0.0 0.0
4. Vaginal pessaries 0.0 0.0 0.0 0.0 0.0 0.0 0.2 0.1 0.0 0.0 0.1 0.0 0.0
5. Oral contraceptives 0.4 18.9 64.5 0.8 4.7 4.1 29.2 16.3 26.9 31.8 12.1 25.6 6.2
6. Emergency contraceptives
0.1 4.3 0.0 0.2 1.1 1.1 11.2 6.0 14.5 3.4 0.8 3.1 1.6
7. Contraceptive injectables
0.0 0.0 0.0 0.7 0.0 1.6 7.0 4.3 0.0 17.0 0.0 11.1 0.6
8. IUDs 8.8 61.6 0.0 7.3 21.0 3.3 7.0 5.1 0.0 0.0 0.0 0.0 19.0
9. Male sterilization 0.5 0.0 0.0 0.0 0.3 3.1 0.0 1.6 0.0 0.0 0.0 0.0 0.5
10. Female sterilization 90.0 0.0 0.0 91.1 69.2 81.6 0.0 41.8 0.0 0.0 0.0 0.0 65.5
* Includes: Government/municipal hospitals, government dispensaries, UHC/UHP/UFWCs, CHC/rural hospitals, and PHC/FRUs.
† Public Total category = public health facility + community health worker + NGO categories; Private Medical Total category = Private facility categories; Private Other Total category = AYUSH provider + RMP + general retailer categories ‡ A total of 1,101,153.3 CYPs (weighted) were reportedly distributed in the previous 1 month in Bihar. This is based on the number of commodities reportedly sold for categories 1-8 (not number of services performed for categories 7-8) and number of sterilizations reportedly performed for categories 9-10. § In the Bihar study area, 2,844 FP products were audited, not including condoms or cycle beads (1,575 oral contraceptives, 963 emergency contraceptives, 40 vaginal pessaries, 174 injectables, 92 IUDs). 1,427 outlets reported one or more brands of male condoms, female condoms and/or Cyclebeads, and volume information was collected for each brand. Volume of sterilizations performed was collected from 34 and 84 outlets for male or female sterilizations, respectively. Volume information was excluded due to missing information or as a volume outlier for: 15 outlets with male condoms, 0 outlets with female condoms, 0 outlets with Cyclebeads, 0 audits of vaginal pessaries, 3 audits of oral contraceptives, 3 audits of emergency contraceptives, 1 audit of injectables, 8 audits of IUDs, 0 outlets with male sterilizations and 1 outlet with female sterilizations.
Source: FPwatch Outlet Survey, India, 2016

www.FPwatch.info Page 90
Table C10: Availability of selected contraceptive services, among outlets screened, by outlet type – Bihar, 2016
Higher Public
Health Facility*
Sub-centre / ANM /
ASHA AWW NGO
Public Total†
Private facility
Pharmacy/Chemist Private Medical Total†
AYUSH Provider
RMP General Retailer
Private Other Total†
All Outlets
%
(95% CI) %
(95% CI) %
(95% CI) %
(95% CI) %
(95% CI) %
(95% CI) %
(95% CI) %
(95% CI) %
(95% CI) %
(95% CI) %
(95% CI) %
(95% CI) %
(95% CI)
Proportion of outlets screened,
providing‡: N=29 N=544 N=582 N=5 N=1,160 N=387 N=1,049 N=1,436 N=209 N=184 N=5,450 N=5,843 N=8,439
Contraceptive injection service
55.3 6.0 0.2 92.6 4.3 26.7 8.0 14.3 3.2 42.4 0.0 3.5 4.7
(25.7, 81.6) (3.5, 10.0) (0.1, 0.7) (61.2, 99.0)
(2.7, 6.7) (16.9, 39.6)
(5.3, 12.0) (10.3, 19.5)
(0.7, 13.7) (31.5, 54.1) - (2.2, 5.3) (3.7, 6.0)
IUD insertion service
51.4 11.4 0.0 51.8 7.2 6.3 0.0 2.1 0.0 0.8 0.0 0.1 2.4
(21.1, 80.8) (7.9, 16.2) - (13.0, 88.5)
(5.2, 10.0) (3.8, 10.1) - (1.4, 3.1) - (0.1, 5.7) - (0.0, 0.5) (1.8, 3.3)
Male sterilization service
74.1 0.0 0.0 21.9 1.1 2.1 0.0 0.7 0.0 0.0 0.0 0.0 0.4
(48.7, 89.6) - - (3.0, 72.0) (0.4, 2.5) (1.1, 3.9) - (0.4, 1.3) - - - - (0.2, 0.8)
Female sterilization service
79.0 0.0 0.0 87.2 1.2 5.7 0.0 1.9 0.0 0.0 0.0 0.0 0.5
(54.7, 92.1) - - (56.7, 97.2)
(0.5, 2.6) (3.5, 9.0) - (1.3, 2.8) - - - - (0.3, 0.9)
* Includes: Government/municipal hospitals, government dispensaries, UHC/UHP/UFWCs, CHC/rural hospitals, and PHC/FRUs.
† Public Total category = higher public health facility + sub-centre/ANM/ASHA + AWW + NGO categories; Private Medical Total category = Private facility categories; Private Other Total category = AYUSH provider + RMP + general retailer categories ‡ The denominator includes 20 outlets that met screening criteria for a full interview but did not complete the interview (were not interviewed or completed a partial interview).
Source: FPwatch Outlet Survey, India, 2016

www.FPwatch.info Page 91
Table C11: Service readiness* to provide provider-dependent contraceptive services, among outlets reportedly offering the procedure, by outlet type – Bihar, 2016
Higher Public
Health Facility†
Sub-centre / ANM / ASHA
AWW NGO Public Total Private facility
Pharmacy/ Chemist
Private Medical
Total
AYUSH Provider
RMP General Retailer
Private Other Total
Proportion of outlets offering service, with‡:
% (n) (95% CI)
% (n) (95% CI)
% (n) (95% CI)
% (n) (95% CI)
% (n) (95% CI)
% (n) (95% CI)
% (n) (95% CI)
% (n) (95% CI)
% (n) (95% CI)
% (n) (95% CI)
% (n) (95% CI)
% (n) (95% CI)
Contraceptive injection service
Availability of commodity
0.0 0.0 0.0 55.9 0.5 17.4 38.9 25.4 0.0 12.4 0.0 12.1
[0.0, 0.0] (10) [0.0, 0.0] (39) [0.0, 0.0] (4) [12.9,91.6](4) [0.1, 2.0] (57) [7.2, 36.2](101) [23.2,57.3](75) [15.8,38.2](176) [0.0, 0.0] (3) [5.6, 25.0] (76) (1) [5.5, 24.6] (80)
Availability of credentials
100.0 74.2 70.3 100.0 79.2 56.5 34.0 48.1 88.0 95.3 100.0 95.2
[100,100] (10) [43.8,91.4](39) [35.8, 91.0] (4) [100,100] (4) [52.1,93.0](57) [33.4,77.1](101) [19.7,52.0](75) [33.5,63.2](176) [36.2, 99.0] (3) [87.4,98.4](76) (1) [87.6, 98.2] (80)
Availability of equipment
42.3 90.0 100.0 100.0 81.4 82.2 83.1 82.5 88.0 92.3 100.0 92.3
[8.8, 84.9] (10) [67.9,97.5](39) [100,100] (4) [100,100] (4) [55.2, 94.0] (57) [56.4,94.3](100) [57.5, 94.7] (75) [64.9,92.4](175) [36.2, 99.0] (3) [80.8,97.2](76) (1) [81.0, 97.1] (80)
Service readiness 0.0 0.0 0.0 55.9 0.5 8.9 13.7 10.7 0.0 10.2 0.0 10.0
[0.0, 0.0] (10) [0.0, 0.0] (39) [0.0, 0.0] (4) [12.9,91.6](4) [0.1, 2.0] (57) [3.4, 21.3] (100) [6.1, 27.7] (75) [5.7, 19.1] (175) [0.0, 0.0] (3) [4.8, 20.4] (76) (1) [4.7, 20.0] (80)
IUD insertion service
Availability of commodity
88.3 65.4 - 42.3 67.7 15.8 - 15.8 - 0.0 - 0.0
[64.7,96.9](18) [43.0,82.5](41) - [4.8, 91.5](2) [47.0, 83.2] (61) [9.5, 25.2] (55) - [9.5, 25.2] (55) - (1) - (1)
Availability of credentials
100.0 97.1 - 100.0 97.4 100.0 - 100.0 - 0.0 - 0.0
[100,100] (18) [81.9,99.6](41) - [100,100] (2) [83.6, 99.6] (61) [100,100] (55) - [100,100] (55) - (1) - (1)
Availability of equipment
92.7 68.9 - 100.0 71.5 94.1 - 94.1 - 0.0 - 0.0
[72.3,98.4](18) [49.6,83.4](41) - [100,100] (2) [53.9, 84.3] (61) [83.3,98.1](55) - [83.3,98.1](55) - (1) - (1)
Service readiness 85.5 43.6 - 42.3 48.0 12.7 - 12.7 - 0.0 - 0.0
[62.1,95.5](18) [25.0,64.3](41) - [4.8, 91.5](2) [30.2, 66.2] (61) [6.9, 22.1] (55) - [6.9, 22.1] (55) - (1) - (1)
Male sterilization service
Availability of credentials
96.3 - - 100.0 96.3 100.0 - 100.0 - - - -
[74.9,99.6](14) - - (1) [75.1, 99.6] (15) [100,100] (16) - [100,100] (16) - - - -
Availability of equipment
100.0 - - 100.0 100.0 91.2 - 91.2 - - - -
[100,100] (14) - - (1) [100,100] (15) [58.7, 98.7] (16) - [58.7, 98.7] (16) - - - -
Service readiness 96.3 - - 100.0 96.3 91.2 - 91.2 - - - -
[74.9, 99.6] (14) - - (1) [75.1, 99.6] (15) [58.7, 98.7] (16) - [58.7, 98.7] (16) - - - -
Female sterilization service
Availability of credentials
93.6 - - 65.8 92.7 75.6 - 75.6 - - - -
[73.7, 98.7] (17) - - [15.5,95.3](3) [74.1, 98.3] (20) [58.1, 87.4] (53) - [58.1, 87.4] (53) - - - -
Availability of equipment
85.8 - - 100.0 86.2 97.4 - 97.4 - - - -
[53.0, 97.0] (17) - - [100,100] (3) [54.3, 97.0] (20) [83.8, 99.6] (50) - [83.8, 99.6] (50) - - - -
Service readiness 82.3 - - 65.8 81.8 79.1 - 79.1 - - - -
[50.2, 95.6] (17) - - [15.5,95.3](3) [51.0, 95.1] (20) [60.1, 90.4] (50) - [60.1, 90.4] (50) - - - -
* Includes: Government/municipal hospitals, government dispensaries, UHC/UHP/UFWCs, CHC/rural hospitals, and PHC/FRUs.

www.FPwatch.info Page 92
Table C11: Service readiness* to provide provider-dependent contraceptive services, among outlets reportedly offering the procedure, by outlet type – Bihar, 2016
Higher Public
Health Facility†
Sub-centre / ANM / ASHA
AWW NGO Public Total Private facility
Pharmacy/ Chemist
Private Medical
Total
AYUSH Provider
RMP General Retailer
Private Other Total
Proportion of outlets offering service, with‡:
% (n) (95% CI)
% (n) (95% CI)
% (n) (95% CI)
% (n) (95% CI)
% (n) (95% CI)
% (n) (95% CI)
% (n) (95% CI)
% (n) (95% CI)
% (n) (95% CI)
% (n) (95% CI)
% (n) (95% CI)
% (n) (95% CI)
† Full service readiness is defined as having available: 1. The commodity (not applicable for male/female sterilization); 2. A provider with credentials meeting the guidelines to perform the service (Government of India Guidelines for Family Planning under NHM - http://nrhm.gov.in/nhm/nrhm/guidelines/nrhm-guidelines/family-planning-guidelines.html); and 3. A minimum set of sentinel equipment (http://www.cpc.unc.edu/measure/prh/rh_indicators/specific/long-acting-permanent-methods/percent-of-facilities-with-appropriate) for providing the service. Observations that are missing information for commodity availability, provider credentials, or equipment are excluded from the ‘service readiness’ denominator. ‡ The denominator includes outlets that met screening criteria for a full interview but did not complete the interview (were not interviewed or completed a partial interview). No outlets had incomplete service information on services in Bihar.
Source: FPwatch Outlet Survey, India, 2016

www.FPwatch.info Page 93
Figure C1. Modern contraceptive method market composition – Bihar, 2016 Among all outlets stocking at least 1 modern contraceptive or providing at least 1 contraceptive service, excluding condoms-only outlets, by outlet type
In Bihar, 65 percent of outlets stocking at least one modern contraceptive, among outlets above the level of stocking condoms only among those screened, came from the public sector and 35 percent from the private sector. Public sub-centres/ANM/ASHAs accounted for 61 percent of the market composition and higher-level public health facilities and AWWs comprised only two and one percent, respectively. The majority of the market composition from private outlets came from pharmacies/chemists, which comprised 24 percent of the market composition and another four percent from private facilities. AYUSH providers, RMPs and general retailers made up less than eight percent of the contraceptive market composition with RMPs accounting for six percent of the Bihari contraceptive market composition. * Higher-level public health facilities include: government/municipal hospitals, government dispensaries, UHC/UHP/UFWCs, CHC/rural hospitals, and PHC/FRUs. Note: Sub-centres and affiliated auxiliary nurse midwives (ANMs) or Accredited Social Health Activists (ASHAs) are included in the Sub-centres/ANM/ASHAs category.

www.FPwatch.info Page 94
Figure C2. Percentage of modern contraceptive commodity-stocking outlets with selected contraceptives available – Bihar, 2016 Among all screened outlets, by outlet type
For short-acting methods in Bihar, about 60 percent of public sub-centres/ANM/ASHAs stocked male condoms and/or oral contraceptives and just over 40 percent stocked emergency contraceptives. AWWs did not commonly stock modern contraceptive methods. Higher-level public health facilities* (not shown; N<30) were less frequently encountered than other public sector outlets, but commonly stocked (>60 percent) male condoms, oral contraceptives and emergency contraceptives. In the private sector, only pharmacies/chemists commonly stocked short-acting methods with about three-quarters stocking male condoms, about 60 percent stocking oral contraceptives and 40 percent stocking emergency contraceptives. Female condoms and injectables were rarely stocked across outlet types, except for injectables at pharmacies/chemists (about 10 percent). For types of oral contraceptives, most outlets stocking oral contraceptives stocked combined oral contraceptives while few stocked progestin-only pills. Thirty percent or fewer of private facilities, AYUSH providers, RMPs and general retailers stocked male condoms and fewer than 20 percent stocked other short-acting methods. Among LARC methods, only 10 percent of public sub-centres/ANM/ASHAs were found to be commonly stocking IUDs. * Higher-level public health facilities include: government/municipal hospitals, government dispensaries, UHC/UHP/UFWCs, CHC/rural hospitals, and PHC/FRUs. Note: Categories with a small sample size (n<30) are not shown. Note: Sub-centres and affiliated auxiliary nurse midwives (ANMs) or Accredited Social Health Activists (ASHAs) are included in the Sub-centres/ANM/ASHAs category.
N = 8,439

www.FPwatch.info Page 95
Figure C3. Percentage of outlets with selected method mixes available – Bihar, 2016 Among all screened outlets, by outlet type
In Bihar, over 70 percent of sub-centres/ANM/ASHAs and pharmacies/chemists stocked at least one modern family planning method, about one-third of private facilities and RMPs stocked at least one method, and fewer than 15 percent of AYUSH providers and fewer than five percent of AWWs or general retailers stocked at least one method. Public sub-centres (40 percent) and pharmacies/chemists (about 40 percent) commonly stocked three or more modern contraceptive methods. Very few outlet types stocked five or more modern contraceptive methods. Note: Categories with a small sample size (n<30) are not shown. Note: Sub-centres and affiliated auxiliary nurse midwives (ANMs) or Accredited Social Health Activists (ASHAs) are included in the Sub-centres/ANM/ASHAs category.
N = 8,439
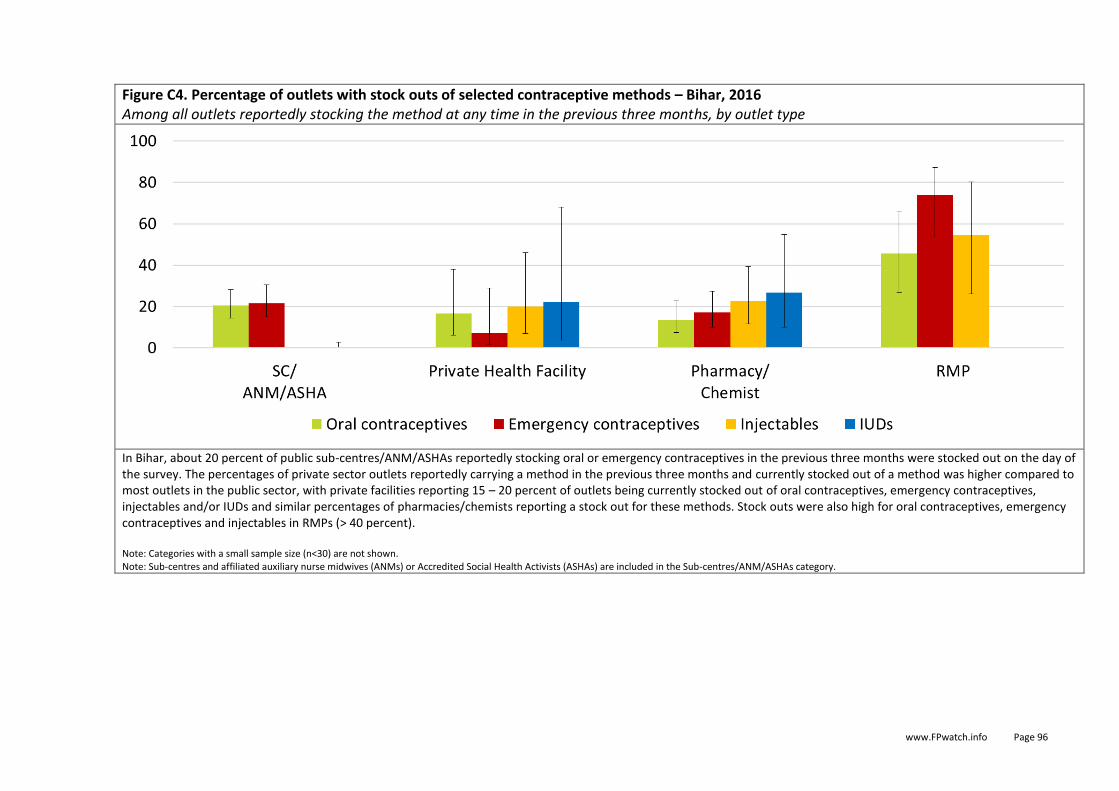
www.FPwatch.info Page 96
Figure C4. Percentage of outlets with stock outs of selected contraceptive methods – Bihar, 2016 Among all outlets reportedly stocking the method at any time in the previous three months, by outlet type
In Bihar, about 20 percent of public sub-centres/ANM/ASHAs reportedly stocking oral or emergency contraceptives in the previous three months were stocked out on the day of the survey. The percentages of private sector outlets reportedly carrying a method in the previous three months and currently stocked out of a method was higher compared to most outlets in the public sector, with private facilities reporting 15 – 20 percent of outlets being currently stocked out of oral contraceptives, emergency contraceptives, injectables and/or IUDs and similar percentages of pharmacies/chemists reporting a stock out for these methods. Stock outs were also high for oral contraceptives, emergency contraceptives and injectables in RMPs (> 40 percent). Note: Categories with a small sample size (n<30) are not shown. Note: Sub-centres and affiliated auxiliary nurse midwives (ANMs) or Accredited Social Health Activists (ASHAs) are included in the Sub-centres/ANM/ASHAs category.

www.FPwatch.info Page 97
Figure C5. Price of contraceptive methods in the private sector – Bihar, 2016 Median price in USD and USD/CYP with interquartile range, by contraceptive method
The median price per CYP of contraceptive methods varies by method in Bihar. The median price per CYP of male condoms was $11.93. This was considerably higher compared to $5.59 per CYP for oral contraceptives and $5.97 for injectables. LA/PM methods were typically cheaper compared to short-acting methods at $1.29 per CYP for IUDs, $1.72 per CYP for male sterilizations and $1.95 per CYP for female sterilizations performed in the private sector. Note: Categories with a small sample size (n<5) are not shown.

www.FPwatch.info Page 98
Figure C6. Price of contraceptive methods in the private sector – Bihar, 2016 Median price in rupees, with interquartile range, by contraceptive method
The median price in rupees of contraceptive methods varies by method in Bihar. The median price of male condoms and for oral contraceptiveswas 25 INR. This was considerably lower compared to 100 INR for injectables. LA/PM methods were typically more expensive compared to short-acting methods at 399 INR for IUDs, 1,500 INR for male sterilizations and 1,700 INR for female sterilizations performed in the private sector. However, this trend was reversed when looking at price per CYP. Note: Categories with a small sample size (n<5) are not shown.

www.FPwatch.info Page 99
Figure C7. Percentage private market share for contraceptives methods – Bihar, 2016 As a % of total CYPs sold/distributed, by outlet type
As a proportion of the total volume of CYP sold/distributed for all methods and outlet types accounted for by the FPwatch study in Bihar, the private medical sub-sector accounted for 90 percent of the private market share in Bihar. Private health facilities and pharmacists/chemists made up roughly equal proportions of the private medical sub-sector market share. Female sterilizations from private health facilities accounted for over a third of total private sector market share, with most other private health facility market share coming from short-acting methods. One-fifth of total private sector market share was contributed by condoms from pharmacists/chemists. Thirteen percent of total private market share was accounted for by oral contraceptives distributed/sold by pharmacies/chemists. Emergency contraceptives, injectables, and IUDs comprised the remaining market share among pharmacies/chemists. The private other sub-sector made up roughly 11 percent of the total private sector market share, with most accounted for by RMPs and general retailers. Together, male condoms from these two outlet types contributed six percent of the total private sector market share.
0
20
40
60
80
100
Private Health Facility Pharmacy/Chemist AYUSH Provider RMP General Retailer Private Medical Total Private Other Total
Female sterilizationMale sterilizationIUDsInjectablesEmergency contraceptivesOral contraceptivesVaginal pessariesCycleBeadsFemale condomsMale condoms

www.FPwatch.info Page 100
Figure C8. Within outlet private market share for contraceptive methods – Bihar, 2016 As a % of total CYPs sold/distributed within outlet type and sector, by outlet type and sector
Looking at the proportion of CYP volume by method within outlet types in Bihar, some clear trends emerge in the private sector. Private facility market share is primarily from female sterilizations (> 80 percent). The market share from pharmacies/chemists is about 45 percent from male condoms, 30 percent from oral contraceptives with about 5 – 10 percent each from emergency contraceptives, injectables and IUDs. Looking at the private other sub-sector, most of the market share for AYUSH providers, RMPs and general retailers is attributable to male condoms with significant portions from oral contraceptives in AYUSH providers and RMPs. Injectables, primarily from RMPs, comprise 11 percen tof the total private other sub-sector market share.
0
20
40
60
80
100
Female sterilization
Male sterilization
IUDs
Injectables
Emergency contraceptives
Oral contraceptives
Vaginal pessaries
CycleBeads
Female condoms
Male condoms

www.FPwatch.info Page 101
Figure C9. Percentage of outlets with selected contraceptive services available – Bihar, 2016 Among all screened outlets, among outlets screened, by outlet type
Among all screened outlets, very few offered selected contraceptive services across outlet types in Bihar. Private health facilities offered relatively higher access to selected services than other outlet types, with about one-quarter of private facilities offering contraceptive injection services. In addition, about six percent of private facilities offered IUD insertion services. Smaller numbers (eight percent) of pharmacies/chemists and AYUSH providers (three percent) reportedly offered contraceptive injection services, but over 40 percent of RMPs reportedly offered contraceptive injection services. For male and female sterilizations, just two percent of screened private health facilities offered male sterilization and six percent of screened private health facilities offered female sterilization. Note: Categories with a small sample size (n<30) are not shown. Note: Sub-centres and affiliated auxiliary nurse midwives (ANMs) or Accredited Social Health Activists (ASHAs) are included in the Sub-centres/ANM/ASHAs category.
N = 8,439
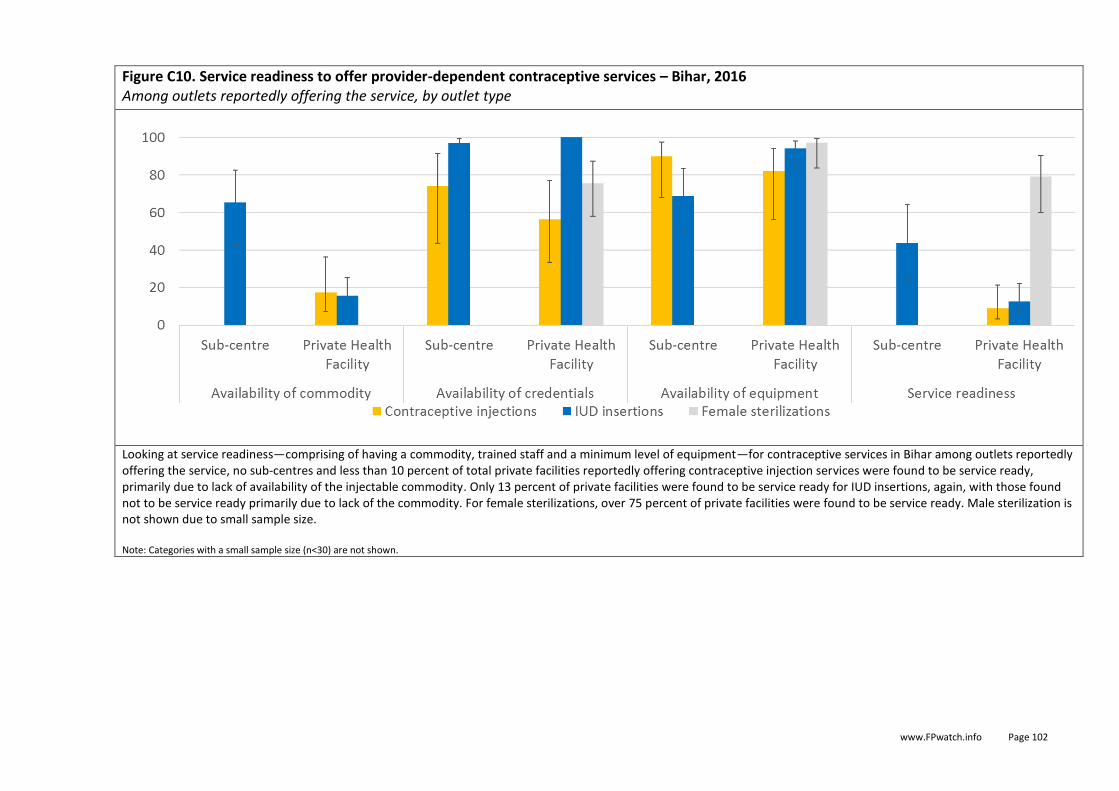
www.FPwatch.info Page 102
Figure C10. Service readiness to offer provider-dependent contraceptive services – Bihar, 2016 Among outlets reportedly offering the service, by outlet type
Looking at service readiness—comprising of having a commodity, trained staff and a minimum level of equipment—for contraceptive services in Bihar among outlets reportedly offering the service, no sub-centres and less than 10 percent of total private facilities reportedly offering contraceptive injection services were found to be service ready, primarily due to lack of availability of the injectable commodity. Only 13 percent of private facilities were found to be service ready for IUD insertions, again, with those found not to be service ready primarily due to lack of the commodity. For female sterilizations, over 75 percent of private facilities were found to be service ready. Male sterilization is not shown due to small sample size. Note: Categories with a small sample size (n<30) are not shown.

www.FPwatch.info Page 103
Bihar Metro / Urban / Rural Geographic Strata
Table D1: Modern contraceptive method market composition: Relative proportion of outlets with 1 or more methods, by outlet type – Bihar Strata, 2016
Higher Public
Health Facility*
Sub-centre / ANM / ASHA†
AWW NGO Public Total‡
Private facility
Pharmacy/ Chemist
Private Medical Total‡
AYUSH Provider
RMP General Retailer
Private Other Total‡
Proportion of outlet types stocking / providing at least 1 modern contraceptive method on the day of the survey, of all outlets stocking / providing at least 1 modern contraceptive method§:
% (95% CI)
% (95% CI)
% (95% CI)
% (95% CI)
% (95% CI)
% (95% CI)
% (95% CI)
% (95% CI)
% (95% CI)
% (95% CI)
% (95% CI)
% (95% CI)
Any method available, including condoms only outlets||
Metro 0.0 0.1 0.8 0.0 0.9 12.0 66.8 78.7 0.4 0.0 20.0 20.4 N=282 (0.0, 0.8) (0.2, 2.7) - (0.3, 2.6) (6.7, 20.4) (55.4, 76.5) (70.3, 85.2) (0.1, 2.0) - (13.4, 28.7) (13.6, 29.3)
Urban N=704
0.6 6.1 2.1 0.4 9.2 6.4 64.9 71.3 1.6 0.4 17.4 19.5
(0.3, 1.4) (2.7, 13.3) (0.6, 7.0) (0.1, 1.2) (4.8, 17.0) (4.7, 8.7) (53.6, 74.7) (60.0, 80.5) (0.5, 5.2) (0.1, 1.3) (12.3, 24.2) (13.3, 27.5)
Rural N=652
1.9 62.2 1.0 0.0 65.1 4.9 15.6 20.5 0.6 8.8 4.9 14.4
(0.9, 4.2) (54.0, 69.7) (0.3, 3.0) - (57.1, 72.3) (2.4, 9.6) (11.2, 21.3) (15.3, 27.0) (0.2, 1.8) (5.2, 14.8) (3.3, 7.4) (10.0, 20.4)
Any method available, excluding condoms only outlets**
Metro 0.0 0.2 0.0 0.0 0.2 13.7 84.9 98.6 0.2 0.0 1.2 1.3 N=207 (0.0, 1.0) - - (0.0, 1.0) (6.8) (73.1, 92.0) (95.6, 99.5) (0.02, 1.3) - (0.3, 4.5) (0.4, 4.3)
Urban N=520
0.8 8.2 2.2 0.6 11.8 8.0 78.1 86.1 0.3 0.3 1.6 2.2
(0.3, 1.9) (3.5, 18.0) (0.5, 9.7) (0.2, 1.6) (5.8, 22.3) (5.7, 11.1) (68.0, 85.6) (75.1, 92.7) (0.1, 1.1) (0.1, 1.1) (0.5, 5.5) (0.8, 5.7)
Rural N=510
2.3 69.2 0.6 0.0 72.2 3.7 15.9 19.6 0.6 7.1 0.5 8.3
(1.0, 5.1) (60.3, 76.8) (0.1, 4.3) - (63.5, 79.4) (1.4, 9.6) (11.1, 22.3) (13.9, 26.9) (0.2, 2.1) (3.9, 12.7) (0.1, 1.9) (4.9, 13.9)
* Includes: Government/municipal hospitals, government dispensaries, UHC/UHP/UFWCs, CHC/rural hospitals, and PHC/FRUs.
† SC are found in rural areas and managed by ANM workers, ASHA can be found across strata. ‡ Public Total category = higher public health facility + sub-centre/ANM/ASHA + AWW + NGO categories; Private Medical Total category = Private facility categories; Private Other Total category = AYUSH provider + RMP + general retailer categories § Contraceptive commodity-stocking outlets have at least one family planning commodity in stock on the day of the survey, verified by the presence of at least one family planning commodity recorded in an audit sheet. There were 20 family planning commodity-stocking outlets in Bihar with partially completed interviews, which were excluded from the denominator (5 from Bihar Metro stratum, 8 from Bihar Urban stratum, and 11 from Bihar Rural stratum). || Includes: male condoms, female condoms, cyclebeads, vaginal pessaries, oral contraceptives, emergency contraceptives, injectables or IUDs. Birth control patches, diaphragms or implants were not found in UP or Bihar. ** Includes: oral contraceptives, emergency contraceptives, injectables or IUDs.
Source: FPwatch Outlet Survey, India, 2016

www.FPwatch.info Page 104
Table D2: Availability of modern contraceptive method types, among outlets screened, by outlet type – Bihar Strata, 2016
Higher Public Health
Facility*
Sub-centre / ANM / ASHA†
AWW NGO Public Total‡
Private facility
Pharmacy/ Chemist
Private Medical Total‡
AYUSH Provider
RMP General Retailer
Private Other Total‡
All Outlets
%
(95% CI) %
(95% CI) %
(95% CI) %
(95% CI) %
(95% CI) %
(95% CI) %
(95% CI) %
(95% CI) %
(95% CI) %
(95% CI) %
(95% CI) %
(95% CI) %
(95% CI)
Proportion of outlets screened, currently stocking / providing§:
Metro: N=2
Urban: N=9
Rural: N=18
Metro: N=1
Urban: N=40 Rural: N=503
Metro: N=39
Urban: N=139 Rural: N=404
Metro: N=2
Urban: N=3
Rural: N=0
Metro: N=44
Urban: N=191 Rural: N=925
Metro: N=109 Urban: N=189 Rural: N=89
Metro: N=208 Urban: N=631 Rural: N=210
Metro: N=317 Urban: N=820 Rural: N=299
Metro: N=62
Urban: N=112 Rural: N=35
Metro: N=0
Urban: N=19 Rural: N=165
Metro: N=1,480 Urban:
N=2,287 Rural:
N=1,683
Metro: N=1,542 Urban:
N=2,418 Rural:
N=1,883
Metro: N=1,903 Urban:
N=3,429 Rural:
N=3,107
Any modern method
Metro 0.0 100.0 5.5 0.0 5.7 27.7 90.9 67.4 1.9 - 3.9 3.8 15.1
- - (1.3, 21.0) - (1.5, 19.2) (14.9, 45.6) (81.3, 95.8) (55.5, 77.5) (0.4, 9.1) - (2.8, 5.5) (2.7, 5.4) (12.1, 18.6)
Urban 54.8 65.9 7.8 100.0 24.5 25.2 80.7 67.4 9.1 11.7 4.9 5.2 19.3
(24.8, 81.6) (42.3, 83.6) (2.5, 22.2) (100,100) (15.3, 36.9) (18.3, 33.6) (70.8, 87.8) (60.7, 73.5) (3.1, 23.8) (3.7, 31.1) (3.9, 6.2) (4.1, 6.6) (14.8, 24.6)
Rural 89.2 69.1 1.5 - 41.5 38.8 72.4 60.0 17.5 34.7 2.2 5.7 22.4
(61.2, 97.7) (61.6, 75.7) (0.5, 4.7) - (36.6, 46.5) (21.8, 58.9) (61.1, 81.4) (50.6, 68.7) (6.7, 38.7) (24.4, 46.6) (1.5, 3.3) (4.1, 7.9) (19.8, 25.3)
Any short-acting method
Metro 0.0 100.0 5.5 0.0 5.7 16.8 90.2 63.0 1.9 - 3.9 3.8 14.3
- - (1.3, 21.0) - (1.5, 19.2) (6.2, 38.3) (81.2, 95.2) (51.4, 73.3) (0.4, 9.1) - (2.8, 5.5) (2.7, 5.4) (11.7, 17.3)
Urban 54.8 65.9 7.8 59.4 24.1 12.6 80.3 64.1 9.1 11.7 4.9 5.2 18.6
(24.8, 81.6) (42.3, 83.6) (2.5, 22.2) (12.4, 93.8) (14.9, 36.5) (7.0, 21.5) (69.9, 87.8) (57.2, 70.4) (3.1, 23.8) (3.7, 31.1) (3.9, 6.2) (4.1, 6.6) (14.4, 23.6)
Rural 86.7 67.0 1.5 - 40.2 38.1 72.4 59.8 17.5 34.7 2.2 5.7 22.0
(59.7, 96.6) (59.6, 73.5) (0.5, 4.7) - (35.5, 45.0) (21.2, 58.5) (61.1, 81.4) (50.4, 68.5) (6.7, 38.7) (24.4, 46.6) (1.5, 3.3) (4.1, 7.9) (19.4, 24.8)
Any LARC method
Metro 0.0 0.0 0.0 0.0 0.0 4.4 5.8 5.3 0.0 - 0.0 0.0 0.9
- - - - - (1.6, 11.7) (2.7, 12.2) (3.0, 9.2) - - - - (0.4, 2.0)
Urban 43.0 3.5 0.0 25.1 2.4 3.2 2.0 2.3 0.0 0.0 0.0 0.0 0.6
(17.1, 73.4) (0.6, 18.6) - (3.2, 77.5) (0.9, 5.8) (1.6, 6.3) (0.9, 4.3) (1.3, 4.1) - - - - (0.4, 1.1)
Rural 76.6 10.5 0.0 - 7.1 0.3 0.2 0.2 0.0 0.0 0.0 0.0 2.5
(46.6, 92.4) (7.3, 15.0) - - (5.0, 9.9) (0.0, 1.9) (0.0, 1.0) (0.0, 1.3) - - - - (1.8, 3.5)
Any permanent method
Metro 0.0 0.0 0.0 0.0 0.0 13.3 0.0 4.9 0.0 - 0.0 0.0 0.9
- - - - - (8.9, 19.2) - (3.7, 6.6) - - - - (0.5, 1.4)
Urban 33.6 0.0 0.0 100.0 2.0 18.7 0.0 4.5 0.0 0.0 0.0 0.0 1.1
(11.5, 66.5) - - (100,100) (0.8, 5.0) (13.2, 25.8) - (3.0, 6.6) - - - - (0.7, 1.7)
Rural 85.7 0.0 0.0 - 1.2 1.4 0.0 0.5 0.0 0.0 0.0 0.0 0.5
(59.0, 96.1) - - - (0.5, 2.7) (0.5, 4.4) - (0.2, 1.6) - - - - (0.2, 0.9)

www.FPwatch.info Page 105
Table D2: Availability of modern contraceptive method types, among outlets screened, by outlet type – Bihar Strata, 2016
Higher Public Health
Facility*
Sub-centre / ANM / ASHA†
AWW NGO Public Total‡
Private facility
Pharmacy/ Chemist
Private Medical Total‡
AYUSH Provider
RMP General Retailer
Private Other Total‡
All Outlets
%
(95% CI) %
(95% CI) %
(95% CI) %
(95% CI) %
(95% CI) %
(95% CI) %
(95% CI) %
(95% CI) %
(95% CI) %
(95% CI) %
(95% CI) %
(95% CI) %
(95% CI)
Proportion of outlets screened, currently stocking / providing§:
Metro: N=2
Urban: N=9
Rural: N=18
Metro: N=1
Urban: N=40 Rural: N=503
Metro: N=39
Urban: N=139 Rural: N=404
Metro: N=2
Urban: N=3
Rural: N=0
Metro: N=44
Urban: N=191 Rural: N=925
Metro: N=109 Urban: N=189 Rural: N=89
Metro: N=208 Urban: N=631 Rural: N=210
Metro: N=317 Urban: N=820 Rural: N=299
Metro: N=62
Urban: N=112 Rural: N=35
Metro: N=0
Urban: N=19 Rural: N=165
Metro: N=1,480 Urban:
N=2,287 Rural:
N=1,683
Metro: N=1,542 Urban:
N=2,418 Rural:
N=1,883
Metro: N=1,903 Urban:
N=3,429 Rural:
N=3,107
Any LA/PM
Metro 0.0 0.0 0.0 0.0 0.0 14.8 5.8 9.1 0.0 - 0.0 0.0 1.6
- - - - - (10.1, 21.0) (2.7, 12.2) (6.3, 13.1) - - - - (0.8, 3.1)
Urban 43.0 3.5 0.0 100.0 3.1 18.7 2.0 6.0 0.0 0.0 0.0 0.0 1.5
(17.1, 73.4) (0.6, 18.6) - (100,100) (1.4, 7.0) (13.2, 25.8) (0.9, 4.3) (4.2, 8.6) - - - - (0.9, 2.3)
Rural 85.7 10.5 0.0 - 7.2 1.4 0.2 0.6 0.0 0.0 0.0 0.0 2.6
(59.0, 96.1) (7.3, 15.0) - - (5.1, 10.0) (0.5, 4.4) (0.0, 1.0) (0.2, 2.0) - - - - (1.9, 3.6)
* Includes: Government/municipal hospitals, government dispensaries, UHC/UHP/UFWCs, CHC/rural hospitals, and PHC/FRUs.
† SC are found in rural areas and managed by ANM workers, ASHA can be found across strata. ‡ Public Total category = higher public health facility + sub-centre/ANM/ASHA + AWW + NGO categories; Private Medical Total category = Private facility categories; Private Other Total category = AYUSH provider + RMP + general retailer categories § The denominator includes 20 outlets that met screening criteria for a full interview but did not complete the interview (were not interviewed or completed a partial interview). This includes 5 from Bihar Metro stratum, 8 from Bihar Urban stratum and 7 from Bihar Rural stratum).
Source: FPwatch Outlet Survey, India, 2016

www.FPwatch.info Page 106
Table D3: Availability of selected contraceptive methods, among outlets screened, by outlet type – Bihar Strata, 2016
Higher Public Health
Facility*
Sub-centre / ANM / ASHA†
AWW NGO Public Total‡
Private facility
Pharmacy/ Chemist
Private Medical Total‡
AYUSH Provider
RMP General Retailer
Private Other Total‡
All Outlets
%
(95% CI) %
(95% CI) %
(95% CI) %
(95% CI) %
(95% CI) %
(95% CI) %
(95% CI) %
(95% CI) %
(95% CI) %
(95% CI) %
(95% CI) %
(95% CI) %
(95% CI)
Proportion of outlets screened, currently stocking / providing§:
Metro: N=2
Urban: N=9
Rural: N=18
Metro: N=1
Urban: N=40 Rural: N=503
Metro: N=39
Urban: N=139 Rural: N=404
Metro: N=2
Urban: N=3
Rural: N=0
Metro: N=44
Urban: N=191 Rural: N=925
Metro: N=109 Urban: N=189 Rural: N=89
Metro: N=208 Urban: N=631 Rural: N=210
Metro: N=317 Urban: N=820 Rural: N=299
Metro: N=62
Urban: N=112 Rural: N=35
Metro: N=0
Urban: N=19 Rural: N=165
Metro: N=1,480 Urban:
N=2,287 Rural:
N=1,683
Metro: N=1,542 Urban:
N=2,418 Rural:
N=1,883
Metro: N=1,903 Urban:
N=3,429 Rural:
N=3,107
Male condoms
Metro 0.0 100.0 5.5 0.0 5.7 13.8 87.2 60.0 1.9 - 3.9 3.8 13.7
- - (1.3, 21.0) - (1.5, 19.2) (4.5, 35.4) (74.5, 94.1) (47.7, 71.1) (0.4, 9.1) - (2.8, 5.5) (2.7, 5.4) (11.3, 16.6)
Urban 54.8 60.5 7.6 25.1 22.2 6.3 72.1 56.3 9.1 11.7 4.9 5.2 16.8
(24.8, 81.6) (37.7, 79.5) (2.3, 22.2) (3.2, 77.5) (13.4, 34.5) (2.9, 13.0) (58.1, 82.8) (47.3, 65.0) (3.1, 23.8) (3.7, 31.1) (3.9, 6.2) (4.1, 6.6) (13.6, 20.6)
Rural 83.2 58.5 0.7 - 35.0 35.4 68.5 56.3 9.7 26.3 2.2 4.7 19.3
(56.7, 94.9) (51.3, 65.3) (0.3, 2.0) - (30.6, 39.5) (18.5, 57.1) (57.8, 77.5) (47.1, 65.1) (3.7, 23.0) (16.0, 40.0) (1.5, 3.3) (3.3, 6.7) (17.1, 21.8)
Female condoms
Metro 0.0 0.0 0.0 0.0 0.0 0.0 0.1 0.1 0.0 - 0.0 0.0 0.0
- - - - - - (0.0, 1.1) (0.0, 0.7) - - - - (0.0, 0.1)
Urban 0.0 0.0 0.0 0.0 0.0 0.0 0.0 0.0 0.0 0.0 0.0 0.0 0.0
- - - - - - - - - - - - -
Rural 0.0 0.0 0.0 - 0.0 0.0 0.0 0.0 0.0 0.0 0.0 0.0 0.0
- - - - - - - - - - - - -
Cyclebeads
Metro 0.0 0.0 0.0 0.0 0.0 0.0 0.0 0.0 0.0 - 0.0 0.0 0.0
- - - - - - - - - - - - -
Urban 0.0 0.0 0.0 0.0 0.0 0.4 0.0 0.1 0.0 0.0 0.0 0.0 0.0
- - - - - (0.1, 3.1) - (0.0, 0.8) - - - - (0.0, 0.1)
Rural 0.0 0.0 0.0 - 0.0 0.0 0.0 0.0 0.0 0.0 0.0 0.0 0.0
- - - - - - - - - - - - -
Vaginal pessaries
Metro 0.0 0.0 0.0 0.0 0.0 0.0 13.1 8.2 0.0 - 0.1 0.1 1.5
- - - - - - (6.5, 24.7) (3.8, 16.8) - - (0.0, 0.4) (0.0, 0.4) (0.7, 3.2)
Urban 0.0 0.0 0.0 0.0 0.0 0.0 2.9 2.2 0.0 0.0 0.0 0.0 0.5
- - - - - - (1.3, 6.4) (1.0, 4.9) - - - - (0.2, 2.4)
Rural 0.0 0.0 0.0 - 0.0 0.0 0.0 0.0 0.0 0.0 0.0 0.0 0.0
- - - - - - - - - - - - -
Oral contraceptives
Metro 0.0 100.0 0.0 0.0 0.7 3.9 68.4 44.5 0.5 - 0.1 0.1 7.9
- - - - (0.1, 5.1) (1.4, 10.2) (56.7, 78.1) (33.7, 55.8) (0.1, 3.6) - (0.0, 0.7) (0.0, 0.6) (6.1, 10.3)

www.FPwatch.info Page 107
Table D3: Availability of selected contraceptive methods, among outlets screened, by outlet type – Bihar Strata, 2016
Higher Public Health
Facility*
Sub-centre / ANM / ASHA†
AWW NGO Public Total‡
Private facility
Pharmacy/ Chemist
Private Medical Total‡
AYUSH Provider
RMP General Retailer
Private Other Total‡
All Outlets
%
(95% CI) %
(95% CI) %
(95% CI) %
(95% CI) %
(95% CI) %
(95% CI) %
(95% CI) %
(95% CI) %
(95% CI) %
(95% CI) %
(95% CI) %
(95% CI) %
(95% CI)
Proportion of outlets screened, currently stocking / providing§:
Metro: N=2
Urban: N=9
Rural: N=18
Metro: N=1
Urban: N=40 Rural: N=503
Metro: N=39
Urban: N=139 Rural: N=404
Metro: N=2
Urban: N=3
Rural: N=0
Metro: N=44
Urban: N=191 Rural: N=925
Metro: N=109 Urban: N=189 Rural: N=89
Metro: N=208 Urban: N=631 Rural: N=210
Metro: N=317 Urban: N=820 Rural: N=299
Metro: N=62
Urban: N=112 Rural: N=35
Metro: N=0
Urban: N=19 Rural: N=165
Metro: N=1,480 Urban:
N=2,287 Rural:
N=1,683
Metro: N=1,542 Urban:
N=2,418 Rural:
N=1,883
Metro: N=1,903 Urban:
N=3,429 Rural:
N=3,107
Urban 54.8 59.7 5.9 59.4 21.1 6.6 58.8 46.3 1.1 2.5 0.3 0.3 11.2
(24.8, 81.6) (36.7, 79.0) (1.3, 22.3) (12.4, 93.8) (12.3, 33.8) (3.3, 12.6) (48.7, 68.3) (39.5, 53.3) (0.3, 3.9) (0.4, 15.2) (0.1, 1.1) (0.1, 1.0) (8.5, 14.7)
Rural 83.2 58.5 0.8 - 35.0 9.9 53.4 37.4 14.9 18.9 0.2 2.3 16.5
(56.7, 94.9) (51.0, 65.5) (0.1, 5.5) - (30.3, 40.0) (3.8, 23.7) (42.4, 64.1) (28.1, 47.7) (4.8, 37.9) (12.1, 28.3) (0.1, 0.7) (1.3, 3.9) (14.0, 19.3)
Combined oral contraceptives
Metro 0.0 100.0 0.0 0.0 0.7 3.9 60.2 39.3 0.0 - 0.1 0.1 7.0
- - - - (0.1, 5.1) (1.4, 10.2) (52.6, 67.3) (31.2, 48.1) - - (0.0, 0.7) (0.0, 0.7) (5.2, 9.3)
Urban 54.8 59.7 5.9 59.4 21.1 6.6 52.7 41.6 0.6 2.5 0.3 0.3 10.3
(24.8, 81.6) (36.7, 79.0) (1.3, 22.3) (12.4, 93.8) (12.3, 33.8) (3.3, 12.6) (45.5, 59.7) (36.7, 46.7) (0.1, 3.8) (0.4, 15.2) (0.1, 1.1) (0.1, 1.0) (7.6, 13.7)
Rural 83.2 58.5 0.8 - 35.0 9.1 46.8 32.9 14.9 18.9 0.2 2.3 16.1
(56.7, 94.9) (51.0, 65.5) (0.1, 5.5) - (30.3, 40.0) (3.2, 23.5) (36.9, 56.9) (24.5, 42.6) (4.8, 37.9) (12.1, 28.3) (0.1, 0.7) (1.3, 3.9) (13.7, 18.9)
Progestin-only pills
Metro 0.0 0.0 0.0 0.0 0.0 0.5 1.4 1.1 0.0 - 0.0 0.0 0.2
- - - - - (0.1, 3.9) (0.6, 3.5) (0.5, 2.5) - - - - (0.1, 0.5)
Urban 0.0 0.0 0.0 0.0 0.0 0.0 0.2 0.1 0.0 0.0 0.0 0.0 0.0
- - - - - - (0.0, 1.4) (0.0, 1.1) - - - - (0.0, 0.2)
Rural 0.0 0.0 0.0 - 0.0 0.0 0.0 0.0 0.0 0.0 0.0 0.0 0.0
- - - - - - - - - - (0.0, 0.2) (0.0, 0.2) (0.0, 0.1)
Centchroman pills
Metro 0.0 0.0 0.0 0.0 0.0 0.0 23.0 14.5 0.5 - 0.1 0.1 2.6
- - - - - - (12.5, 38.4) (7.4, 26.4) (0.1, 3.6) - (0.0, 0.7) (0.0, 0.6) (1.7, 4.2)
Urban 0.0 0.0 0.0 0.0 0.0 0.3 12.4 9.5 0.5 0.0 0.0 0.0 2.0
- - - - - (0.0, 2.2) (6.7, 22.0) (5.3, 16.6) (0.1, 3.1) - - (0.0, 0.2) (1.4, 2.8)
Rural 0.0 0.0 0.0 - 0.0 0.8 13.2 8.7 0.0 0.2 0.0 0.0 0.7
- - - - - (0.1, 5.2) (8.0, 21.2) (5.0, 14.5) - (0.0, 1.2) - (0.0, 0.1) (0.4, 1.2)
Emergency contraceptives
Metro 0.0 100.0 0.0 0.0 0.7 9.3 72.2 48.9 0.5 - 0.2 0.2 8.7
- - - - (0.1, 5.1) (1.9, 34.6) (59.0, 82.4) (37.1, 60.8) (0.1, 3.6) - (0.0, 0.6) (0.1, 0.6) (6.7, 11.3)
Urban 42.0 47.3 0.0 25.1 13.2 5.1 53.8 42.1 0.5 5.8 0.0 0.1 9.6
(16.6, 72.6) (30.2, 65.1) - (3.2, 77.5) (7.3, 22.5) (1.9, 13.4) (43.9, 63.5) (35.1, 49.5) (0.1, 3.1) (1.4, 21.3) (0.0, 0.3) (0.0, 0.3) (7.1, 12.9)

www.FPwatch.info Page 108
Table D3: Availability of selected contraceptive methods, among outlets screened, by outlet type – Bihar Strata, 2016
Higher Public Health
Facility*
Sub-centre / ANM / ASHA†
AWW NGO Public Total‡
Private facility
Pharmacy/ Chemist
Private Medical Total‡
AYUSH Provider
RMP General Retailer
Private Other Total‡
All Outlets
%
(95% CI) %
(95% CI) %
(95% CI) %
(95% CI) %
(95% CI) %
(95% CI) %
(95% CI) %
(95% CI) %
(95% CI) %
(95% CI) %
(95% CI) %
(95% CI) %
(95% CI)
Proportion of outlets screened, currently stocking / providing§:
Metro: N=2
Urban: N=9
Rural: N=18
Metro: N=1
Urban: N=40 Rural: N=503
Metro: N=39
Urban: N=139 Rural: N=404
Metro: N=2
Urban: N=3
Rural: N=0
Metro: N=44
Urban: N=191 Rural: N=925
Metro: N=109 Urban: N=189 Rural: N=89
Metro: N=208 Urban: N=631 Rural: N=210
Metro: N=317 Urban: N=820 Rural: N=299
Metro: N=62
Urban: N=112 Rural: N=35
Metro: N=0
Urban: N=19 Rural: N=165
Metro: N=1,480 Urban:
N=2,287 Rural:
N=1,683
Metro: N=1,542 Urban:
N=2,418 Rural:
N=1,883
Metro: N=1,903 Urban:
N=3,429 Rural:
N=3,107
Rural 66.5 42.6 0.0 - 25.3 16.5 37.2 29.5 7.0 3.9 0.0 0.5 11.5
(33.4, 88.7) (35.3, 50.4) - - (21.0, 30.3) (4.6, 44.6) (27.6, 47.9) (21.3, 39.4) (1.9, 22.3) (1.8, 8.3) (0.0, 0.2) (0.3, 1.0) (9.5, 13.8)
Contraceptive injectables (All DMPA)
Metro 0.0 0.0 0.0 0.0 0.0 7.2 21.1 16.0 0.0 - 0.0 0.0 2.8
- - - - - (2.7, 17.5) (14.6, 29.6) (11.2, 22.2) - - - - (1.6, 4.7)
Urban 0.0 0.0 0.0 59.4 0.6 1.5 13.3 10.5 0.0 0.0 0.2 0.2 2.3
- - - (12.4, 93.8) (0.2, 2.4) (0.6, 4.0) (8.2, 20.9) (6.7, 16.0) - - (0.0, 1.2) (0.0, 1.2) (1.6, 3.4)
Rural 0.0 0.0 0.0 - 0.0 5.4 11.1 9.0 2.9 5.1 0.0 0.6 1.0
- - - - - (1.8, 15.3) (7.1, 16.8) (6.0, 13.3) (0.5, 16.1) (2.3, 11.2) - (0.2, 1.3) (0.7, 1.5)
IUDs (All Copper T)
Metro 0.0 0.0 0.0 0.0 0.0 4.4 5.8 5.3 0.0 - 0.0 0.0 0.9
- - - - - (1.6, 11.7) (2.7, 12.2) (3.0, 9.2) - - - - (0.4, 2.0)
Urban 43.0 3.5 0.0 25.1 2.4 3.2 2.0 2.3 0.0 0.0 0.0 0.0 0.6
(17.1, 73.4) (0.6, 18.6) - (3.2, 77.5) (0.9, 5.8) (1.6, 6.3) (0.9, 4.3) (1.3, 4.1) - - - - (0.4, 1.1)
Rural 76.6 10.5 0.0 - 7.1 0.3 0.2 0.2 0.0 0.0 0.0 0.0 2.5
(46.6, 92.4) (7.63 15.0) - - (5.0, 9.9) (0.0, 1.9) (0.0, 1.0) (0.0, 1.3) - - - - (1.8, 3.5)
* Includes: Government/municipal hospitals, government dispensaries, UHC/UHP/UFWCs, CHC/rural hospitals, and PHC/FRUs.
† SC are found in rural areas and managed by ANM workers, ASHA can be found across strata. ‡ Public Total category = higher public health facility + sub-centre/ANM/ASHA + AWW + NGO categories; Private Medical Total category = Private facility categories; Private Other Total category = AYUSH provider + RMP + general retailer categories § The denominator includes 20 outlets that met screening criteria for a full interview but did not complete the interview (were not interviewed or completed a partial interview) (5 in Bihar Metro, 8 for Bihar Urban, and 7 for Bihar Rural).
Source: FPwatch Outlet Survey, India, 2016

www.FPwatch.info Page 109
Table D4: Availability of modern contraceptive method diversity, among outlets screened, by outlet type – Bihar Strata, 2016
Higher Public Health
Facility*
Sub-centre / ANM / ASHA†
AWW NGO Public Total‡
Private facility
Pharmacy/ Chemist
Private Medical Total‡
AYUSH Provider
RMP General Retailer
Private Other Total‡
All Outlets
%
(95% CI) %
(95% CI) %
(95% CI) %
(95% CI) %
(95% CI) %
(95% CI) %
(95% CI) %
(95% CI) %
(95% CI) %
(95% CI) %
(95% CI) %
(95% CI) %
(95% CI)
Proportion of outlets screened, currently stocking / providing§:
Metro: N=2
Urban: N=9
Rural: N=18
Metro: N=1
Urban: N=40 Rural: N=503
Metro: N=39
Urban: N=139 Rural: N=404
Metro: N=2
Urban: N=3
Rural: N=0
Metro: N=44
Urban: N=191 Rural: N=925
Metro: N=109 Urban: N=189 Rural: N=89
Metro: N=208 Urban: N=631 Rural: N=210
Metro: N=317 Urban: N=820 Rural: N=299
Metro: N=62
Urban: N=112 Rural: N=35
Metro: N=0
Urban: N=19 Rural: N=165
Metro: N=1,480 Urban:
N=2,287 Rural:
N=1,683
Metro: N=1,542 Urban:
N=2,418 Rural:
N=1,883
Metro: N=1,903 Urban:
N=3,429 Rural:
N=3,107
3+ methods||
Metro 0.0 100.0 0.0 0.0 0.7 6.9 62.5 41.9 0.5 - 0.2 0.2 7.5
- - - - (0.1, 5.1) (2.6, 17.2) (51.3, 72.5) (31.4, 53.1) (0.1, 3.6) - (0.0, 0.6) (0.1, 0.6) (5.8, 9.7)
Urban 54.8 42.7 0.0 59.4 12.7 5.4 44.8 35.4 0.5 2.5 0.2 0.2 8.3
(24.8, 81.6) (27.7, 59.1) - (12.4, 93.8) (7.4, 21.1) (2.6, 11.0) (34.0, 56.2) (27.7, 43.9) (0.1, 3.1) (0.4, 15.2) (0.0, 1.2) (0.0, 1.0) (6.5, 10.6)
Rural 83.2 39.4 0.0 - 23.7 7.3 34.6 24.6 7.0 4.1 0.0 0.5 10.5
(56.7, 94.9) (32.6, 46.6) - - (19.6, 28.3) (2.9, 17.2) (25.2, 45.3) (17.9, 32.7) (1.9, 22.3) (1.9, 8.7) (0.0, 0.2) (0.3, 1.1) (8.6, 12.8)
3+ methods with LARC
Metro 0.0 0.0 0.0 0.0 0.0 3.7 5.2 4.6 0.0 - 0.0 0.0 0.8
- - - - - (1.2, 10.9) (2.4, 11.0) (2.6, 8.0) - - - - (0.4, 1.9)
Urban 43.0 3.5 0.0 25.1 2.4 3.2 1.3 1.8 0.0 0.0 0.0 0.0 0.5
(17.1, 73.4) (0.6, 18.6) - (3.2, 77.5) (0.9, 5.8) (1.6, 6.3) (0.4, 4.5) (0.8, 3.9) - - - - (0.3, 1.0)
Rural 76.6 7.9 0.0 - 5.6 0.3 0.2 0.2 0.0 0.0 0.0 0.0 2.0
(46.6, 92.4) (5.1, 12.0) - - (3.8, 8.2) (0.0, 1.9) (0.0, 1.0) (0.0, 1.3) - - - - (1.3, 2.9)
3+ methods with LA/PM
Metro 0.0 0.0 0.0 0.0 0.0 3.9 5.2 4.7 0.0 - 0.0 0.0 0.8
- - - - - (1.4, 11.0) (2.4, 11.0) (2.8, 8.0) - - - - (0.4, 1.9)
Urban 43.0 3.5 0.0 59.4 2.7 5.1 1.3 2.2 0.0 0.0 0.0 0.0 0.7
(17.1, 73.4) (0.6, 18.6) - (12.4, 93.8) (1.1, 6.5) (2.4, 10.7) (0.4, 4.5) (1.0, 4.8) - - - - (0.4, 1.1)
Rural 83.2 7.9 0.0 - 5.7 0.8 0.2 0.4 0.0 0.0 0.0 0.0 2.0
(56.7, 94.9) (5.1, 12.0) - - (3.9, 8.3) (0.2, 3.2) (0.0, 1.0) (0.1, 1.5) - - - - (1.4, 2.9)
5+ methods**
Metro 0.0 0.0 0.0 0.0 0.0 1.8 6.0 4.4 0.0 - 0.0 0.0 0.8
- - - - - (0.4, 8.3) (2.8, 12.5) (2.2, 8.7) - - - - (0.3, 1.7)
Urban 33.6 0.0 0.0 25.1 1.2 1.0 2.0 1.7 0.0 0.0 0.0 0.0 0.4
(11.5, 66.5) - - (3.2, 77.5) (0.5, 3.2) (0.2, 3.9) (0.7, 5.6) (0.7, 4.5) - - - - (0.2, 0.9)
Rural 76.6 0.0 0.0 - 1.0 0.0 0.0 0.0 0.0 0.0 0.0 0.0 0.4
(46.6, 92.4) - - - (0.4, 2.6) - - - - - - - (0.2, 0.9)
* Includes: Government/municipal hospitals, government dispensaries, UHC/UHP/UFWCs, CHC/rural hospitals, and PHC/FRUs.
† SC are found in rural areas and managed by ANM workers, ASHA can be found across strata.

www.FPwatch.info Page 110
Table D4: Availability of modern contraceptive method diversity, among outlets screened, by outlet type – Bihar Strata, 2016
Higher Public Health
Facility*
Sub-centre / ANM / ASHA†
AWW NGO Public Total‡
Private facility
Pharmacy/ Chemist
Private Medical Total‡
AYUSH Provider
RMP General Retailer
Private Other Total‡
All Outlets
%
(95% CI) %
(95% CI) %
(95% CI) %
(95% CI) %
(95% CI) %
(95% CI) %
(95% CI) %
(95% CI) %
(95% CI) %
(95% CI) %
(95% CI) %
(95% CI) %
(95% CI)
Proportion of outlets screened, currently stocking / providing§:
Metro: N=2
Urban: N=9
Rural: N=18
Metro: N=1
Urban: N=40 Rural: N=503
Metro: N=39
Urban: N=139 Rural: N=404
Metro: N=2
Urban: N=3
Rural: N=0
Metro: N=44
Urban: N=191 Rural: N=925
Metro: N=109 Urban: N=189 Rural: N=89
Metro: N=208 Urban: N=631 Rural: N=210
Metro: N=317 Urban: N=820 Rural: N=299
Metro: N=62
Urban: N=112 Rural: N=35
Metro: N=0
Urban: N=19 Rural: N=165
Metro: N=1,480 Urban:
N=2,287 Rural:
N=1,683
Metro: N=1,542 Urban:
N=2,418 Rural:
N=1,883
Metro: N=1,903 Urban:
N=3,429 Rural:
N=3,107
‡ Public Total category = higher public health facility + sub-centre/ANM/ASHA + AWW + NGO categories; Private Medical Total category = Private facility categories; Private Other Total category = AYUSH provider + RMP + general retailer categories § The denominator includes 47 outlets that met screening criteria for a full interview but did not complete the interview (were not interviewed or completed a partial interview). This includes 5 from Bihar Metro stratum, 8 from Bihar Urban stratum and 7 from Bihar Rural stratum. || 3 or more among: male condom, female condom, cyclebeads, vaginal pessary, oral contraceptive, emergency contraceptive, injectable, IUD commodities and/or male sterilization, female sterilization services. No other modern contraceptive methods were found in sampled outlets. ** 5 or more among: male condom, female condom, cyclebeads, vaginal pessary, oral contraceptive, emergency contraceptive, injectable, IUD commodities and/or male sterilization, female sterilization services. No other modern contraceptive methods were found in sampled outlets.
Source: FPwatch Outlet Survey, India, 2016

www.FPwatch.info Page 111
Table D5: Current stock out* of selected modern contraceptive commodities on day of survey, among outlets reportedly stocking method in previous 3 months, by outlet type – Bihar Strata, 2016
Higher Public
Health Facility†
Sub-centre / ANM / ASHA‡
AWW NGO Public Total§ Private facility
Pharmacy/ Chemist
Private Medical Total§
AYUSH Provider
RMP General Retailer
Private Other Total§
Proportion of outlets reportedly stocking method in previous 3 months, currently stocked out of||:
% (n) (95% CI)
% (n) (95% CI)
% (n) (95% CI)
% (n) (95% CI)
% (n) (95% CI)
% (n) (95% CI)
% (n) (95% CI)
% (n) (95% CI)
% (n) (95% CI)
% (n) (95% CI)
% (n) (95% CI)
% (n) (95% CI)
Oral contraceptives
Metro - 0.0 (1) 100.0 (2) - 90.2 (3) 57.2 (10) 5.8 (156) 9.3 (166) 0.0 (1) - 0.0 (1) 0.0 (2)
- - (100,100) - (34.8, 99.4) (31.4, 79.5) (3.0, 11.1) (5.5, 15.4) - - - -
Urban 0.0 (5) 17.4 (27) 49.5 (13) 0.0 (2) 25.5 (47) 35.0 (16) 18.3 (461) 19.0 (477) 46.5 (3) 0.0 (1) 11.7 (4) 18.9 (8)
- (5.8, 42.1) (13.4, 86.2) - (10.0, 51.3) (12.4, 67.2) (9.6, 32.2) (10.8, 31.5) (7.8, 89.9) - (1.3, 57.5) (4.0, 56.8)
Rural 0.0 (14) 20.4 (357) 79.2 (15) - 22.0 (386) 10.2 (10) 10.5 (136) 10.5 (146) 23.1 (4) 45.6 (50) 37.8 (5) 43.6 (59)
- (14.3, 28.4) (31.1, 97.0) - (15.6, 30.0) (2.1, 37.6) (4.4, 23.0) (4.7, 21.8) (2.8, 75.6) (26.8, 65.8) (5.4, 86.6) (26.3, 62.7)
Emergency contraceptives
Metro - 0.0 (1) - - 0.0 (1) 10.7 (9) 6.3 (167) 6.7 (176) 0.0 (1) - 0.0 (2) 0.0 (3)
- - - - - (0.9, 62.3) (2.7, 14.2) (3.1, 13.9) - - - -
Urban 0.0 (4) 10.1 (20) - 0.0 (1) 9.1 (25) 15.7 (9) 18.7 (427) 18.6 (436) 0.0 (1) 0.0 (2) 0.0 (1) 0.0 (4)
- (2.8, 30.3) - - (2.6, 27.1) (3.5, 49.0) (9.2, 34.3) (9.1, 34.3) - - -
Rural 0.0 (11) 21.8 (265) 100.0 (5) - 22.1 (281) 6.3 (8) 16.3 (96) 14.4 (104) 0.0 (2) 74.3 (22) 0.0 (1) 68.9 (25)
- (14.9, 30.7) (100,100) - (15.4, 30.7) (0.9, 32.4) (7.5, 31.8) (6.8, 28.1) - (54.3, 87.6) - (49.0, 83.6)
Contraceptive injectables
Metro - - - - - 14.5 (9) 5.1 (39) 6.8 (48) - - - -
- - - - - (2.4, 54.0) (1.2, 18.6) (2.0, 20.5) - - - -
Urban - - - 0.0 (2) 0.0 (2) 73.4 (10) 34.1 (117) 37.3 (127) - - 0.0 (1) 0.0 (1)
- - - - - (44.0, 90.7) (17.3, 56.2) (20.7, 57.5) - - - -
Rural - - - - - 4.6 (6) 13.8 (44) 11.9 (50) 0.0 (1) 54.4 (17) - 52.5 (18)
- - - - - (0.5, 30.0) (3.9, 38.6) (3.3, 35.0) - (26.1, 80.1) - (25.3, 78.3)
IUDs
Metro - - - - - 0.0 (4) 17.4 (9) 12.7 (13) - - - - - - - - - - (2.9, 59.9) (2.0, 50.7) - - - -
Urban 0.0 (4) 45.7 (2) - 57.7 (2) 36.3 (9) 29.4 (7) 31.0 (16) 30.5 (23) - - - -
- (5.4, 92.5) - (8.5, 95.2) (12.1, 70.3) (4.9, 77.1) (11.0, 62.1) (13.6, 55.0) - - - -
Rural 0.0 (12) 0.0 (40) - - 0.0 (52) 0.0 (1) 0.0 (1) 0.0 (2) - - - -
- - - - - - - - - - - -
* This indicator is among all screened outlets that reportedly stocked the method in the previous 3 months. It does not account for whether the outlet is expected to provide the commodity according to national regulations.
It is a point-in-time stock out indicator from
https://www.rhsupplies.org/fileadmin/uploads/rhsc/Issues/Addressing_Stockouts/Takestock/Documents/Using_the_Power_of_Partnership_to_Speak_the_Same_Language_on_Stockouts.pdf. It is defined as the percentage
of facilities reporting that they have stocked the method in the previous 3 months but were stocked out on the day of the assessment.
† Includes: Government/municipal hospitals, government dispensaries, UHC/UHP/UFWCs, CHC/rural hospitals, and PHC/FRUs.
‡SC are found in rural areas and managed by ANM workers, ASHA can be found across strata.

www.FPwatch.info Page 112
Table D5: Current stock out* of selected modern contraceptive commodities on day of survey, among outlets reportedly stocking method in previous 3 months, by outlet type – Bihar Strata, 2016
Higher Public
Health Facility†
Sub-centre / ANM / ASHA‡
AWW NGO Public Total§ Private facility
Pharmacy/ Chemist
Private Medical Total§
AYUSH Provider
RMP General Retailer
Private Other Total§
Proportion of outlets reportedly stocking method in previous 3 months, currently stocked out of||:
% (n) (95% CI)
% (n) (95% CI)
% (n) (95% CI)
% (n) (95% CI)
% (n) (95% CI)
% (n) (95% CI)
% (n) (95% CI)
% (n) (95% CI)
% (n) (95% CI)
% (n) (95% CI)
% (n) (95% CI)
% (n) (95% CI)
§ Public Total category = higher public health facility + sub-centre/ANM/ASHA + AWW + NGO categories; Private Medical Total category = Private facility categories; Private Other Total category = AYUSH provider + RMP + general retailer categories || The denominator includes 47 outlets that met screening criteria for a full interview but did not complete the interview (were not interviewed or completed a partial interview). This includes 5 from Bihar Metro stratum, 8 from Bihar Urban stratum and 7 from Bihar Rural stratum.
Source: FPwatch Outlet Survey, India, 2016

www.FPwatch.info Page 113
Table D6: Median price of selected modern contraceptive methods in INR*, USD, and USD per CYP†‡, by private outlet type – Bihar Strata, 2016
Private facility Pharmacy/Chemist Private Medical Total Private Other Total
Median price of method, with interquartile range§,∞:
Median (N) Median (N) Median (N) Median (N)
[IQR] [IQR] [IQR] [IQR]
Male condoms
Metro
INR per condom INR 8.33 (13) INR 70.00 (182) INR 70.00 (195) INR 8.00 (58) [6.67, 80.00] [10.00, 90.00] [8.33, 80.00] [5.00, 8.33]
USD per condom $0.12 (13) $1.04 (182) $1.04 (195) $0.12 (58)
[0.10, 1.19] [0.15, 1.34] [0.12, 1.19] [0.07, 0.12]
USD per CYP $11.93 (13) $15.66 (182) $15.21 (195) $14.32 (58)
[6.71, 14.91] [11.93, 23.86] [11.34, 23.86] [8.95, 14.91]
Urban
INR per condom INR 6.67 (10) INR 60.00 (437) INR 60.00 (447) INR 6.67 (122)
[6.67, 100.00] [8.33, 80.00] [8.33, 80.00] [2.50, 8.00]
USD per condom $0.10 (10) $0.89 (437) $0.89 (447) $0.10 (122)
[0.10, 1.49] [0.12, 1.19] [0.12, 1.19] [0.04, 0.12]
USD per CYP $11.93 (10) $14.91 (437) $14.91 (447) $11.93 (122)
[7.16, 20.88] [7.16, 23.86] [7.16, 23.86] [4.47, 14.32]
Rural
INR per condom INR 5.00 (16) INR 25.00 (153) INR 20.00 (169) INR 5.00 (91) [1.67, 80.00] [8.33, 70.00] [5.00, 70.00] [2.00, 6.67]
USD per condom $0.07 (16) $0.37 (153) $0.30 (169) $0.07 (91)
[0.02, 1.19] [0.12, 1.04] [0.07, 1.04] [0.03, 0.10]
USD per CYP $8.95 (16) $6.71 (153) $7.16 (169) $8.95 (91)
[0.67, 23.86] [2.24, 17.90] [2.24, 20.88] [3.58, 11.93]
Female condoms
Metro
INR per condom - INR 33.33 (1) INR 33.33 (1) - - [33.33, 33.33] [33.33, 33.33] -
USD per condom - $0.50 (1) $0.50 (1) - - [0.50, 0.50] [0.50, 0.50] -
USD per CYP - $59.66 (1) $59.66 (1) - - [59.66, 59.66] [59.66, 59.66] -
Urban
INR per condom - - - - - - - -
USD per condom - - - - - - - -
USD per CYP - - - - - - - -
Rural INR per condom - - - - - - - -
USD per condom - - - -
- - - -

www.FPwatch.info Page 114
Table D6: Median price of selected modern contraceptive methods in INR*, USD, and USD per CYP†‡, by private outlet type – Bihar Strata, 2016
Private facility Pharmacy/Chemist Private Medical Total Private Other Total
Median price of method, with interquartile range§,∞:
Median (N) Median (N) Median (N) Median (N)
[IQR] [IQR] [IQR] [IQR]
USD per CYP - - - - - - - -
Cyclebeads
Metro
INR per Cyclebeads - - - - - - - -
USD per Cyclebeads - - - - - - - -
USD per CYP - - - - - - - -
Urban
INR per Cyclebeads INR 0.00 (1) - INR 0.00 (1) - [0.00, 0.00] - [0.00, 0.00] -
USD per Cyclebeads $0.00 (1) - $0.00 (1) -
[0.00, 0.00] - [0.00, 0.00] -
USD per CYP $0.00 (1) - $0.00 (1) -
[0.00, 0.00] - [0.00, 0.00] -
Rural
INR per Cyclebeads - - - -
- - - -
USD per Cyclebeads - - - -
- - - -
USD per CYP - - - -
- - - -
Vaginal pessaries
Metro
INR per pill - INR 6.80 (27) INR 6.80 (27) INR 7.80 (1) - [6.80, 7.80] [6.80, 7.80] [7.80, 7.80]
USD per pill - $0.10 (27) $0.10 (27) $0.12 (1) - [0.10, 0.12] [0.10, 0.12] [0.12, 0.12]
USD per CYP - $12.17 (27) $12.17 (27) $13.96 (1) - [12.17, 13.96] [12.17, 13.96] [13.96, 13.96]
Urban
INR per pill - INR 6.80 (12) INR 6.80 (12) - - [6.00, 7.80] [6.00, 7.80] -
USD per pill - $0.10 (12) $0.10 (12) - - [0.09, 0.12] [0.09, 0.12] -
USD per CYP - $12.17 (12) $12.17 (12) - - [10.74, 13.96] [10.74, 13.96] -
Rural INR per pill - - - -

www.FPwatch.info Page 115
Table D6: Median price of selected modern contraceptive methods in INR*, USD, and USD per CYP†‡, by private outlet type – Bihar Strata, 2016
Private facility Pharmacy/Chemist Private Medical Total Private Other Total
Median price of method, with interquartile range§,∞:
Median (N) Median (N) Median (N) Median (N)
[IQR] [IQR] [IQR] [IQR]
- - - -
USD per pill - - - -
- - - -
USD per CYP - - - -
- - - -
Oral contraceptives
Metro
INR per cycle INR 30.00 (10) INR 68.00 (307) INR 65.00 (317) INR 10.00 (4) [8.00, 192.00] [25.00, 150.00] [25.00, 150.00] [3.00, 25.00]
USD per cycle $0.45 (10) $1.01 (307) $0.97 (317) $0.15 (4)
[0.12, 2.86] [0.37, 2.24] [0.37, 2.24] [0.04, 0.37]
USD per CYP $6.71 (10) $15.21 (307) $14.54 (317) $2.24 (4)
[1.79, 42.95] [5.59, 33.56] [5.59, 33.56] [0.67, 5.59]
Urban
INR per cycle INR 71.00 (16) INR 65.00 (681) INR 68.00 (697) INR 30.00 (8)
[68.00, 167.00] [20.00, 133.00] [25.00, 140.00] [8.33, 30.00]
USD per cycle $1.06 (16) $0.97 (681) $1.01 (697) $0.45 (8)
[1.01, 2.49] [0.30, 1.98] [0.37, 2.09] [0.12, 0.45]
USD per CYP $15.88 (16) $14.54 (681) $15.21 (697) $6.71 (8)
[15.21, 37.36] [4.47, 29.75] [5.59, 31.32] [1.86, 6.71]
Rural
INR per cycle INR 20.00 (9) INR 20.00 (182) INR 20.00 (191) INR 10.00 (43) [8.33, 68.00] [10.00, 35.00] [10.00, 35.00] [8.33, 25.00]
USD per cycle $0.30 (9) $0.30 (182) $0.30 (191) $0.15 (43)
[0.12, 1.01] [0.15, 0.52] [0.15, 0.52] [0.12, 0.37]
USD per CYP $4.47 (9) $4.47 (182) $4.47 (191) $2.24 (43)
[1.86, 15.21] [2.24, 7.83] [2.24, 7.83] [1.86, 5.59]
Combined oral contraceptives
Metro
INR per cycle INR 30.00 (8) INR 68.00 (253) INR 68.00 (261) INR 6.50 (2)
[8.00, 170.00] [25.00, 160.00] [25.00, 160.00] [3.00, 10.00]
USD per cycle $0.45 (8) $1.01 (253) $1.01 (261) $0.10 (2)
[0.12, 2.54] [0.37, 2.39] [0.37, 2.39] [0.04, 0.15]
USD per CYP $6.71 (8) $15.21 (253) $15.21 (261) $1.45 (2)
[1.79, 38.03] [5.59, 35.80] [5.59, 35.80] [0.67, 2.24]
Urban
INR per cycle INR 133.00 (15) INR 68.00 (603) INR 68.00 (618) INR 30.00 (7) [68.00, 167.00] [10.00, 146.00] [10.00, 146.00] [7.00, 30.00]
USD per cycle $1.98 (15) $1.01 (603) $1.01 (618) $0.45 (7)
[1.01, 2.49] [0.15, 2.18] [0.15, 2.18] [0.10, 0.45]

www.FPwatch.info Page 116
Table D6: Median price of selected modern contraceptive methods in INR*, USD, and USD per CYP†‡, by private outlet type – Bihar Strata, 2016
Private facility Pharmacy/Chemist Private Medical Total Private Other Total
Median price of method, with interquartile range§,∞:
Median (N) Median (N) Median (N) Median (N)
[IQR] [IQR] [IQR] [IQR]
USD per CYP $29.75 (15) $15.21 (603) $15.21 (618) $6.71 (7)
[15.21, 37.36] [2.24, 32.66] [2.24, 32.66] [1.57, 6.71]
Rural
INR per cycle INR 10.00 (8) INR 10.00 (155) INR 10.00 (163) INR 10.00 (41) [8.33, 68.00] [8.33, 60.00] [8.33, 60.00] [8.33, 25.00]
USD per cycle $0.15 (8) $0.15 (155) $0.15 (163) $0.15 (41)
[0.12, 1.01] [0.12, 0.89] [0.12, 0.89] [0.12, 0.37]
USD per CYP $2.24 (8) $2.24 (155) $2.24 (163) $2.24 (41)
[1.86, 15.21] [1.86, 13.42] [1.86, 13.42] [1.86, 5.59]
Progestin-only pills
Metro
INR per cycle INR 215.00 (4) INR 360.00 (4) INR 345.00 (8) -
[90.00, 330.00] [345.00, 360.00] [330.00, 360.00] -
USD per cycle $3.21 (4) $5.37 (4) $5.15 (8) -
[1.34, 4.92] [5.15, 5.37] [4.92, 5.37] -
USD per CYP $48.85 (4) $80.54 (4) $77.18 (8) -
[14.91, 73.83] [77.18, 80.54] [73.83, 80.54] -
Urban
INR per cycle - INR 293.50 (2) INR 293.50 (2) -
- [257.00, 330.00] [257.00, 330.00] -
USD per cycle - $4.38 (2) $4.38 (2) -
- [3.83, 4.92] [3.83, 4.92] -
USD per CYP - $65.66 (2) $65.66 (2) -
- [57.50, 73.83] [57.50, 73.83] -
Rural
INR per cycle - - - INR 14.00 (1) - - - [14.00, 14.00]
USD per cycle - - - $0.21 (1) - - - [0.21, 0.21]
USD per CYP - - - $3.13 (1) - - - [3.13, 3.13]
Centchroman pills
Metro
INR per 8 pill cycle - INR 25.00 (51) INR 25.00 (51) INR 25.00 (2)
- [25.00, 25.00] [25.00, 25.00] [25.00, 25.00]
USD per 8 pill cycle - $0.37 (51) $0.37 (51) $0.37 (2)
- [0.37, 0.37] [0.37, 0.37] [0.37, 0.37]
USD per CYP - $5.59 (51) $5.59 (51) $5.59 (2)
- [5.59, 5.59] [5.59, 5.59] [5.59, 5.59]
Urban INR per 8 pill cycle INR 20.00 (1) INR 25.00 (77) INR 25.00 (78) INR 25.00 (1)

www.FPwatch.info Page 117
Table D6: Median price of selected modern contraceptive methods in INR*, USD, and USD per CYP†‡, by private outlet type – Bihar Strata, 2016
Private facility Pharmacy/Chemist Private Medical Total Private Other Total
Median price of method, with interquartile range§,∞:
Median (N) Median (N) Median (N) Median (N)
[IQR] [IQR] [IQR] [IQR]
[20.00, 20.00] [25.00, 25.00] [25.00, 25.00] [25.00, 25.00]
USD per 8 pill cycle $0.30 (1) $0.37 (77) $0.37 (78) $0.37 (1)
[0.30, 0.30] [0.37, 0.37] [0.37, 0.37] [0.37, 0.37]
USD per CYP $4.47 (1) $5.59 (77) $5.59 (78) $5.59 (1)
[4.47, 4.47] [5.59, 5.59] [5.59, 5.59] [5.59, 5.59]
Rural
INR per cycle INR 25.00 (1) INR 25.00 (27) INR 25.00 (28) INR 25.00 (1)
[25.00, 25.00] [25.00, 25.00] [25.00, 25.00] [25.00, 25.00]
USD per cycle $0.37 (1) $0.37 (27) $0.37 (28) $0.37 (1)
[0.37, 0.37] [0.37, 0.37] [0.37, 0.37] [0.37, 0.37]
USD per CYP $5.59 (1) $5.59 (27) $5.59 (28) $5.59 (1)
[5.59, 5.59] [5.59, 5.59] [5.59, 5.59] [5.59, 5.59]
Emergency contraceptives
Metro
INR per dose INR 80.00 (8) INR 80.00 (240) INR 80.00 (248) INR 100.00 (5)
[80.00, 80.00] [80.00, 100.00] [80.00, 100.00] [80.00, 100.00]
USD per dose $1.19 (8) $1.19 (240) $1.19 (248) $1.49 (5)
[1.19, 1.19] [1.19, 1.49] [1.19, 1.49] [1.19, 1.49]
USD per CYP $23.86 (8) $23.86 (240) $23.86 (248) $29.83 (5)
[23.86, 23.86] [23.86, 29.83] [23.86, 29.83] [23.86, 29.83]
Urban
INR per dose INR 80.00 (8) INR 80.00 (367) INR 80.00 (375) INR 80.00 (4)
[80.00, 80.00] [80.00, 80.00] [80.00, 80.00] [75.00, 80.00]
USD per dose $1.19 (8) $1.19 (367) $1.19 (375) $1.19 (4)
[1.19, 1.19] [1.19, 1.19] [1.19, 1.19] [1.12, 1.19]
USD per CYP $23.86 (8) $23.86 (367) $23.86 (375) $23.86 (4)
[23.86, 23.86] [23.86, 23.86] [23.86, 23.86] [22.37, 23.86]
Rural
INR per dose INR 80.00 (6) INR 80.00 (83) INR 80.00 (89) INR 80.00 (10)
[70.00, 80.00] [70.00, 80.00] [70.00, 80.00] [65.00, 80.00]
USD per dose $1.19 (6) $1.19 (83) $1.19 (89) $1.19 (10)
[1.04, 1.19] [1.04, 1.19] [1.04, 1.19] [0.97, 1.19]
USD per CYP $23.86 (6) $23.86 (83) $23.86 (89) $23.86 (10)
[20.88, 23.86] [20.88, 23.86] [20.88, 23.86] [19.39, 23.86]
Contraceptive injectables
Metro
INR per dose INR 140.00 (12) INR 250.00 (35) INR 250.00 (47) -
[100.00, 160.00] [120.00, 278.00] [100.00, 278.00] -
USD per dose $2.09 (12) $3.73 (35) $3.73 (47) -
[1.49, 2.39] [1.79, 4.15] [1.49, 4.15] -

www.FPwatch.info Page 118
Table D6: Median price of selected modern contraceptive methods in INR*, USD, and USD per CYP†‡, by private outlet type – Bihar Strata, 2016
Private facility Pharmacy/Chemist Private Medical Total Private Other Total
Median price of method, with interquartile range§,∞:
Median (N) Median (N) Median (N) Median (N)
[IQR] [IQR] [IQR] [IQR]
USD per CYP $8.35 (12) $14.91 (35) $14.91 (47) -
[5.97, 9.55] [7.16, 16.59] [5.97, 16.59] -
Urban INR per dose INR 130.00 (2) INR 100.00 (61) INR 100.00 (63) -
[130.00, 288.00] [98.00, 150.00] [98.00, 150.00] -
USD per dose $1.94 (2) $1.49 (61) $1.49 (63) -
[1.94, 4.30] [1.46, 2.24] [1.46, 2.24] -
USD per CYP $7.76 (2) $5.97 (61) $5.97 (63) -
[7.76, 17.18] [5.85, 8.95] [5.85, 8.95] -
Rural
INR per dose INR 100.00 (5) INR 100.00 (31) INR 100.00 (36) INR 100.00 (8)
[100.00, 100.00] [98.00, 100.00] [98.00, 100.00] [80.00, 100.00]
USD per dose $1.49 (5) $1.49 (31) $1.49 (36) $1.49 (8)
[1.49, 1.49] [1.46, 1.49] [1.46, 1.49] [1.19, 1.49]
USD per CYP $5.97 (5) $5.97 (31) $5.97 (36) $5.97 (8)
[5.97, 5.97] [5.85, 5.97] [5.85, 5.97] [4.77, 5.97]
IUDs
Metro
INR per IUD INR 1000.00 (3) INR 350.00 (5) INR 400.00 (8) -
[400.00, 1000.00] [230.00, 435.00] [300.00, 450.00] -
USD per IUD $14.91 (3) $5.22 (5) $5.97 (8) -
[5.97, 14.91] [3.43, 6.49] [4.47, 6.71] -
USD per CYP $3.24 (3) $1.13 (5) $1.30 (8) -
[1.30, 3.24] [0.75, 1.41] [0.97, 1.46] -
Urban
INR per IUD INR 884.00 (6) INR 360.00 (9) INR 399.00 (15) -
[500.00, 1000.00] [250.00, 500.00] [250.00, 570.00] -
USD per IUD $13.18 (6) $5.37 (9) $5.95 (15) -
[7.46, 14.91] [3.73, 7.46] [3.73, 8.50] -
USD per CYP $2.87 (6) $1.17 (9) $1.29 (15) -
[1.62, 3.24] [0.81, 1.62] [0.81, 1.85] -
Rural
INR per IUD INR 700.00 (1) INR 340.00 (1) INR 520.00 (2) -
[700.00, 700.00] [340.00, 340.00] [340.00, 700.00] -
USD per IUD $10.44 (1) $5.07 (1) $7.76 (2) -
[10.44, 10.44] [5.07, 5.07] [5.07, 10.44] -
USD per CYP $2.27 (1) $1.10 (1) $1.69 (2) -
- - [1.10, 2.27] -
Male sterilization
Metro INR per sterilization INR 1500.00 (2) - INR 1500.00 (2) -
[1500.00, 1500.00] - [1500.00, 1500.00] -

www.FPwatch.info Page 119
Table D6: Median price of selected modern contraceptive methods in INR*, USD, and USD per CYP†‡, by private outlet type – Bihar Strata, 2016
Private facility Pharmacy/Chemist Private Medical Total Private Other Total
Median price of method, with interquartile range§,∞:
Median (N) Median (N) Median (N) Median (N)
[IQR] [IQR] [IQR] [IQR]
USD per sterilization $22.37 (2) - $22.37 (2) -
[22.37, 37.29] - [22.37, 37.29] -
USD per CYP $1.72 (2) - $1.72 (2) -
[1.72, 1.72] - [1.72, 1.72] -
Urban
INR per sterilization INR 1500.00 (7) - INR 1500.00 (7) -
[1000.00, 3000.00] - [1000.00, 3000.00] -
USD per sterilization $22.37 (7) - $22.37 (7) -
[14.91, 44.74] - [14.91, 44.74] -
USD per CYP $1.72 (7) - $1.72 (7) -
[1.15, 3.44] - [1.15, 3.44] -
Rural
INR per sterilization INR 2500.00 (3) - INR 2500.00 (3) -
[1500.00, 2500.00] - [1500.00, 2500.00] -
USD per sterilization $37.29 (3) - $37.29 (3) -
[22.37, 37.29] - [22.37, 37.29] -
USD per CYP $2.87 (3) - $2.87 (3) -
[1.72, 2.87] - [1.72, 2.87] -
Female sterilization
Metro
INR per sterilization INR 2500.00 (12) - INR 2500.00 (12) -
[1200.00, 3000.00] - [1200.00, 3000.00] -
USD per sterilization $37.29 (12) - $37.29 (12) -
[17.90, 44.74] - [17.90, 44.74] -
USD per CYP $2.87 (12) - $2.87 (12) -
[1.38, 3.44] - [1.38, 3.44] -
Urban
INR per sterilization INR 1700.00 (29) - INR 1700.00 (29) -
[1000.00, 3000.00] - [1000.00, 3000.00] -
USD per sterilization $25.36 (29) - $25.36 (29) -
[14.91, 44.74] - [14.91, 44.74] -
USD per CYP $1.95 (29) - $1.95 (29) -
[1.15, 3.44] - [1.15, 3.44] -
Rural
INR per sterilization INR 1500.00 (5) - INR 1500.00 (5) -
[1500.00, 3000.00] - [1500.00, 3000.00] -
USD per sterilization $22.37 (5) - $22.37 (5) -
[22.37, 44.74] - [22.37, 44.74] -
USD per CYP $1.72 (5) - $1.72 (5) -
[1.72, 3.44] - [1.72, 3.44] - * Based on the average rate of exchange from June 9th to September 10th, 2016 of 67.0478 INR per 1 USD.

www.FPwatch.info Page 120
Table D6: Median price of selected modern contraceptive methods in INR*, USD, and USD per CYP†‡, by private outlet type – Bihar Strata, 2016
Private facility Pharmacy/Chemist Private Medical Total Private Other Total
Median price of method, with interquartile range§,∞:
Median (N) Median (N) Median (N) Median (N)
[IQR] [IQR] [IQR] [IQR] † This price is determined for the unit used in CYP conversion factors: condoms: 1 condom; cyclebeads: 1 product/string; vaginal pessaries: 1 tablet; oral contraceptives: 1 cycle or blister package; emergency contraceptives: 1 dose; injectables: 1 dose/injection; IUDs: 1 IUD. ‡ CYP – Couple Year Protection is the estimated protection provided by contraceptive methods during a one-year period, based upon the volume of all contraceptives sold or distributed free of charge to clients during that period (see Annex 11). § Price for all commodities with provider-dependent service (injectables, IUDs) may include a service charge. ∞ In Bihar, the number of family planning products captured in audits sheets with missing price information are as follows: 9 male condoms (3 metro, 4 urban, 2 rural), 0 female condoms, 0 cyclebeads, 0 vaginal pessaries, 5 oral contraceptives (3 metro, 2 urban), 2 emergency contraceptives (1 metro, 1 urban), 17 injections (4 metro, 9 urban, 4 rural), 5 IUDs (4 metro, 1 urban), 1 male sterilization (1 urban) and 7 female sterilizations (2 metro, 5 urban).
Source: FPwatch Outlet Survey, India, 2016

www.FPwatch.info Page 121
Table D7: Median markup percentage for selected modern contraceptive commodities with interquartile range, by private outlet type – Bihar Strata, 2016
Private facility Pharmacy/Chemist Private Medical Total Private Other Total
Median markup percentage of commodity, with interquartile range*,†,‡:
Median % (N) [IQR %]
Median % (N)
[IQR %] Median % (N)
[IQR %] Median % (N)
[IQR %]
Oral contraceptives
Metro 30% (10) 25% (310) 25% (320) 67% (4)
[13%, 33%] [4%, 50%] [4%, 50%] [60%, 108%]
Urban 31% (17) 25% (682) 25% (699) 15% (8)
[0%, 34%] [13%, 45%] [13%, 44%] [0%, 39%]
Rural 25% (9) 25% (182) 25% (191) 25% (39)
[-100%, 50%] [-41%, 40%] [-64%, 43%] [14%, 50%]
Emergency contraceptives
Metro -100% (8) 29% (241) 25% (249) 47% (5)
[-100, 20] [-97%, 10%] [-98%, 100%] [25%, 100%]
Urban 100% (8) 50% (368) 50% (376) 33% (3)
[25%, 100%] [18%, 116%] [19%, 117%] [25%, 33%]
Rural 100% (6) 33% (83) 33% (89) 33% (8)
[25%, 100%] [17%, 60%] [17%, 100%] [7%, 80%]
Contraceptive injectables
Metro -44% (12) 23% (35) 23% (47) -
[-98%, 25%] [-99%, 40%] [-98%, 25%] -
Urban 136% (2) 37% (61) 37% (63) -
[20%, 136%] [12%, 86%] [14%, 86%] -
Rural 11% (5) 25% (31) 25% (36) 43% (8)
[-100%, 25%] [11%, 67%] [-86%, 47%] [23%, 134%]
IUDs
Metro 33% (3) 59% (5) 33% (8) -
[-80%, 186%] [15%, 74%] [15%, 74%] -
Urban 254% (6) 67% (9) 67% (15) -
[0%, 300%] [49%, 67%] [49%, 150%] -
Rural 250% (1) 36% (1) 143% (2) -
[250%, 250%] [36%, 36%] [36%, 250%] -
* The number of family planning products captured in audit sheets with missing retail and/or wholesale price information are as follows: 203 oral contraceptives (85 metro, 77 urban, 31 rural), 130 emergency contraceptives (77 metro, 39 urban, 14 rural), 52 injections (24 metro, 17 urban, 11 rural) and 9 IUDs (5 metro, 3 urban, 1 rural). † To determine median markup percentage, we first determined the profit margin for selected modern contraceptives at private sector outlet categories: retail price – wholesale price. We then determined a profit margin proportion by: profit margin/retail price. Finally, we converted profit margin to markup by: wholesale price/(1- profit margin proportion). We converted to a percentage and determined the median markup with IQR range. ‡ Price for all commodities with provider-dependent service (injectables, implants, IUDs) may include service charge.
Source: FPwatch Outlet Survey, India, 2016

www.FPwatch.info Page 122
Table D8: Private sector contraceptive method market share: Relative proportion of total CYP sold / distributed, by method and outlet type – Bihar Strata, 2016
CYPs sold or distributed in previous 1 month by outlet type and contraceptive method type as a % of total CYPs sold / distributed§,||:
Private facility Pharmacy/
Chemist Private Medical
Total‡ AYUSH Provider RMP General Retailer Private Other
Total‡ All Private Outlets
% % % % % % % %
1. Male condoms
Metro 0.8 18.3 19.1 0.1 0.0 2.9 2.9 22.1
Urban 0.1 15.3 15.4 0.1 0.1 2.0 2.2 17.6
Rural 5.8 26.6 32.4 0.6 8.1 3.7 12.4 44.8
2. Female condoms
Metro 0.0 0.0 0.0 0.0 0.0 0.0 0.0 0.0
Urban 0.0 0.0 0.0 0.0 0.0 0.0 0.0 0.0
Rural 0.0 0.0 0.0 0.0 0.0 0.0 0.0 0.0
3. Cyclebeads
Metro 0.0 0.0 0.0 0.0 0.0 0.0 0.0 0.0
Urban 0.1 0.0 0.1 0.0 0.0 0.0 0.0 0.1
Rural 0.0 0.0 0.0 0.0 0.0 0.0 0.0 0.0
4. Vaginal pessaries
Metro 0.0 0.4 0.4 0.0 0.0 0.1 0.1 0.5
Urban 0.0 0.1 0.1 0.0 0.0 0.0 0.0 0.1
Rural 0.0 0.0 0.0 0.0 0.0 0.0 0.0 0.0
5. Oral contraceptives
Metro 0.3 13.9 14.2 0.0 0.0 0.3 0.3 14.5
Urban 0.7 11.7 12.4 0.0 0.0 0.1 0.1 12.5
Rural 3.8 14.1 17.8 0.3 5.4 0.8 6.6 24.4
Combined oral contraceptives
Metro 0.3 11.4 11.6 0.0 0.0 0.2 0.2 11.8
Urban 0.7 10.1 10.7 0.0 0.0 0.1 0.1 10.8
Rural 3.6 11.8 15.5 0.3 5.4 0.8 6.5 22.0
Progestin-only pills
Metro 0.0 0.1 0.2 0.0 0.0 0.0 0.0 0.2
Urban 0.0 0.0 0.0 0.0 0.0 0.0 0.0 0.0
Rural 0.0 0.0 0.0 0.0 0.0 0.0 0.0 0.0
Centchroman pills
Metro 0.0 2.4 2.4 0.0 0.0 0.2 0.2 2.5
Urban 0.0 1.7 1.7 0.0 0.0 0.0 0.0 1.7
Rural 0.1 2.2 2.3 0.0 0.0 0.0 0.0 2.4
6. Emergency contraceptives
Metro 0.2 8.6 8.8 0.0 0.0 0.2 0.2 9.1
Urban 0.1 4.8 4.9 0.0 0.0 0.0 0.0 4.9

www.FPwatch.info Page 123
Table D8: Private sector contraceptive method market share: Relative proportion of total CYP sold / distributed, by method and outlet type – Bihar Strata, 2016
CYPs sold or distributed in previous 1 month by outlet type and contraceptive method type as a % of total CYPs sold / distributed§,||:
Private facility Pharmacy/
Chemist Private Medical
Total‡ AYUSH Provider RMP General Retailer Private Other
Total‡ All Private Outlets
% % % % % % % %
Rural 1.1 4.6 5.7 0.2 0.6 0.0 0.8 6.5
7. Contraceptive injectables
Metro 1.5 2.7 4.2 0.0 0.0 0.0 0.0 4.2
Urban 0.1 3.4 3.6 0.0 0.0 0.0 0.0 3.6
Rural 1.6 2.6 4.2 0.0 2.9 0.0 2.9 7.1
8. IUDs
Metro 2.6 7.3 9.9 0.0 0.0 0.0 0.0 9.9
Urban 2.5 4.9 7.4 0.0 0.0 0.0 0.0 7.4
Rural 0.0 0.0 0.0 0.0 0.0 0.0 0.0 0.0
9. Male sterilization
Metro 0.0 0.0 0.0 0.0 0.0 0.0 0.0 0.0
Urban 0.9 0.0 0.9 0.0 0.0 0.0 0.0 0.9
Rural 2.3 0.0 2.3 0.0 0.0 0.0 0.0 2.3
10. Female sterilization
Metro 39.8 0.0 39.8 0.0 0.0 0.0 0.0 39.8
Urban 53.0 0.0 53.0 0.0 0.0 0.0 0.0 53.0
Rural 14.9 0.0 14.9 0.0 0.0 0.0 0.0 14.9
OUTLET TYPE TOTAL§
Metro 45.2 51.2 96.4 0.1 0.0 3.5 3.6 100.0
Urban 57.5 40.2 97.7 0.1 0.1 2.1 2.3 100.0
Rural 29.4 47.9 77.3 1.1 17.0 4.6 22.7 100.0
‡ Private Medical Total category = Private facility categories; Private Other Total category = AYUSH provider + RMP + general retailer categories † A total of 123,182.5 CYPs (weighted) were reportedly distributed in the previous 1 month in Bihar in the private sector (69,595.8 in metro Bihar, 48,534.7 in urban Bihar, and 5,052.1 in rural Bihar). This is based on the number of commodities reportedly sold for categories 1-8 (not number of services performed for categories 7-8) and number of sterilizations reportedly performed for categories 9-10. ‡ In the metro Bihar study area, 671 FP products were audited, not including condoms or cycle beads (325 oral contraceptives, 255 emergency contraceptives, 28 vaginal pessaries, 51 injectables, 12 IUDs). 261 outlets reported one or more brands of male condoms, female condoms and/or Cyclebeads, and volume information was collected for each brand. Volume of sterilizations performed was collected from 3 and 14 outlets for male or female sterilizations, respectively. Volume information was excluded due to missing information or as a volume outlier for: 4 outlets with male condoms, 0 outlets with female condoms, 0 outlets with Cyclebeads, 0 audits of vaginal pessaries, 0 audits of oral contraceptives, 0 audits of emergency contraceptives, 1 audit of injectables, 0 audits of IUDs, 0 outlets with male sterilizations and 1 outlet with female sterilizations. In the urban Bihar study area, 1,245 FP products were audited, not including condoms or cycle beads (736 oral contraceptives, 400 emergency contraceptives, 12 vaginal pessaries, 74 injectables, 23 IUDs). 602 outlets reported one or more brands of male condoms, female condoms and/or Cyclebeads, and volume information was collected for each brand. Volume of sterilizations performed was collected from 12 and 40 outlets for male or female sterilizations, respectively. Volume information was excluded due to missing information or as a volume outlier for: 7 outlets with male condoms, 0 outlets with female condoms, 0 outlets with Cyclebeads, 0 audits of vaginal pessaries, 1 audit of oral contraceptives, 2 audits of emergency contraceptives, 0 audits of injectables, 3 audits of IUDs, 0 outlets with male sterilizations and 0 outlets with female sterilizations. In the rural Bihar study area, 928 FP products were audited, not including condoms or cycle beads (514 oral contraceptives, 308 emergency contraceptives, 0 vaginal pessaries, 49 injectables, 57 IUDs). 564 outlets reported one or more brands of male condoms, female condoms and/or Cyclebeads, and volume information was collected for each brand. Volume of sterilizations performed was collected from 19 and 30 outlets for male or female sterilizations, respectively. Volume information was excluded due to missing information or as a volume outlier for: 4 outlets with male condoms, 0 outlets with female condoms, 0 outlets with

www.FPwatch.info Page 124
Table D8: Private sector contraceptive method market share: Relative proportion of total CYP sold / distributed, by method and outlet type – Bihar Strata, 2016
CYPs sold or distributed in previous 1 month by outlet type and contraceptive method type as a % of total CYPs sold / distributed§,||:
Private facility Pharmacy/
Chemist Private Medical
Total‡ AYUSH Provider RMP General Retailer Private Other
Total‡ All Private Outlets
% % % % % % % %
Cyclebeads, 0 audits of vaginal pessaries, 2 audits of oral contraceptives, 1 audit of emergency contraceptives, 0 audits of injectables, 5 audits of IUDs, 0 outlets with male sterilizations and 0 outlets with female sterilizations. § Row total: CYP volume for the specified contraceptive method type. Column total: market share for the specified outlet type method categories 1-10.
Public sector market share is not shown. Sterilization services are concentrated into a few higher-level facilities; due to our small sample of these outlet types, the results would have been skewed, and shown an inaccurate portrayal of the total market. Source: FPwatch Outlet Survey, India, 2016

www.FPwatch.info Page 125
Table D9: Contraceptive method market share within outlet type: Relative proportion of total CYP sold / distributed within outlet type, by method – Bihar Strata, 2016 CYPs sold or distributed in previous 1-month contraceptive method type as a % of total CYPs sold / distributed within outlet type§,||:
Higher Public Health
Facility*
Sub-centre / ANM / ASHA†
AWW NGO Public Total‡
Private facility
Pharmacy/Chemist
Private Medical Total‡
AYUSH Provider
RMP General Retailer
Private Other Total‡
All Outlets
% % % % % % % % % % % % %
1. Male condoms
Metro 0.0 0.0 100.0 0.0 99.0 1.9 35.7 19.8 81.0 0.0 82.0 82.0 22.2
Urban 0.7 26.8 32.8 0.0 1.8 0.2 38.0 15.8 88.1 80.4 95.5 94.4 11.8
Rural 0.2 15.2 34.8 0.0 3.8 19.6 55.6 41.9 52.9 47.6 81.9 54.8 6.0
2. Female condoms
Metro 0.0 0.0 0.0 0.0 0.0 0.0 0.0 0.0 0.0 0.0 0.0 0.0 0.0
Urban 0.0 0.0 0.0 0.0 0.0 0.0 0.0 0.0 0.0 0.0 0.0 0.0 0.0
Rural 0.0 0.0 0.0 0.0 0.0 0.0 0.0 0.0 0.0 0.0 0.0 0.0 0.0
3. Cyclebeads
Metro 0.0 0.0 0.0 0.0 0.0 0.0 0.0 0.0 0.0 0.0 0.0 0.0 0.0
Urban 0.0 0.0 0.0 0.0 0.0 0.1 0.0 0.1 0.0 0.0 0.0 0.0 0.0
Rural 0.0 0.0 0.0 0.0 0.0 0.0 0.0 0.0 0.0 0.0 0.0 0.0 0.0
4. Vaginal pessaries
Metro 0.0 0.0 0.0 0.0 0.0 0.0 0.8 0.4 0.0 0.0 3.0 2.9 0.5
Urban 0.0 0.0 0.0 0.0 0.0 0.0 0.2 0.1 0.0 0.0 0.0 0.0 0.1
Rural 0.0 0.0 0.0 0.0 0.0 0.0 0.0 0.0 0.0 0.0 0.0 0.0 0.0
5. Oral contraceptives
Metro 0.0 100.0 0.0 0.0 1.0 0.6 27.2 14.7 8.6 0.0 8.8 8.8 14.5
Urban 0.5 21.5 67.2 0.8 1.8 1.2 29.2 12.7 10.5 14.7 4.2 5.1 8.6
Rural 0.3 18.8 65.2 0.0 4.8 12.9 29.4 23.1 30.1 31.9 17.5 28.9 5.8
6. Emergency contraceptives
Metro 0.0 0.0 0.0 0.0 0.0 0.4 16.9 9.2 10.4 0.0 6.2 6.3 9.0
Urban 0.0 7.2 0.0 0.2 0.4 0.2 11.9 5.0 1.4 4.8 0.2 0.5 3.2
Rural 0.1 4.3 0.0 0.0 1.1 3.7 9.6 7.3 17.0 3.4 0.7 3.5 1.4
7. Contraceptive injectables
Metro 0.0 0.0 0.0 0.0 0.0 3.4 5.2 4.4 0.0 0.0 0.0 0.0 4.2
Urban 0.0 0.0 0.0 0.7 0.2 0.2 8.5 3.6 0.0 0.0 0.0 0.0 2.3
Rural 0.0 0.0 0.0 0.0 0.0 5.3 5.5 5.4 0.0 17.1 0.0 12.9 0.4
8. IUDs
Metro 0.0 0.0 0.0 0.0 0.0 5.8 14.2 10.2 0.0 0.0 0.0 0.0 9.9
Urban 2.7 44.4 0.0 7.3 5.7 4.4 12.1 7.5 0.0 0.0 0.0 0.0 6.7
Rural 9.1 61.7 0.0 0.0 21.7 0.0 0.0 0.0 0.0 0.0 0.0 0.0 20.5
9. Male sterilization
Metro 0.0 0.0 0.0 0.0 0.0 0.0 0.0 0.0 0.0 0.0 0.0 0.0 0.0
Urban 2.9 0.0 0.0 0.0 2.1 1.5 0.0 0.9 0.0 0.0 0.0 0.0 1.3
Rural 0.3 0.0 0.0 0.0 0.3 7.9 0.0 3.0 0.0 0.0 0.0 0.0 0.4

www.FPwatch.info Page 126
Table D9: Contraceptive method market share within outlet type: Relative proportion of total CYP sold / distributed within outlet type, by method – Bihar Strata, 2016 CYPs sold or distributed in previous 1-month contraceptive method type as a % of total CYPs sold / distributed within outlet type§,||:
Higher Public Health
Facility*
Sub-centre / ANM / ASHA†
AWW NGO Public Total‡
Private facility
Pharmacy/Chemist
Private Medical Total‡
AYUSH Provider
RMP General Retailer
Private Other Total‡
All Outlets
% % % % % % % % % % % % %
10. Female sterilization
Metro 0.0 0.0 0.0 0.0 0.0 87.9 0.0 41.3 0.0 0.0 0.0 0.0 39.7
Urban 93.3 0.0 0.0 91.1 88.1 92.2 0.0 54.3 0.0 0.0 0.0 0.0 65.9
Rural 89.9 0.0 0.0 0.0 68.4 50.7 0.0 19.3 0.0 0.0 0.0 0.0 65.5
* Includes: Government/municipal hospitals, government dispensaries, UHC/UHP/UFWCs, CHC/rural hospitals, and PHC/FRUs.
† SC are found in rural areas and managed by ANM workers, ASHA can be found across strata. ‡ Public Total category = public health facility + community health worker + NGO categories; Private Medical Total category = Private facility categories; Private Other Total category = AYUSH provider + RMP + general retailer categories § A total of 1,101,153.3 CYPs (weighted) were reportedly distributed in the previous 1 month in Bihar (5,034.7 in metro Bihar, 110,058.7 in urban Bihar, and 986,059.9 in rural Bihar). This is based on the number of commodities reportedly sold for categories 1-8 (not number of services performed for categories 7-8) and number of sterilizations reportedly performed for categories 9-10. || In the metro Bihar study area, 671 FP products were audited, not including condoms or cycle beads (325 oral contraceptives, 255 emergency contraceptives, 28 vaginal pessaries, 51 injectables, 12 IUDs). 261 outlets reported one or more brands of male condoms, female condoms and/or Cyclebeads, and volume information was collected for each brand. Volume of sterilizations performed was collected from 3 and 14 outlets for male or female sterilizations, respectively. Volume information was excluded due to missing information or as a volume outlier for: 4 outlets with male condoms, 0 outlets with female condoms, 0 outlets with Cyclebeads, 0 audits of vaginal pessaries, 0 audits of oral contraceptives, 0 audits of emergency contraceptives, 1 audit of injectables, 0 audits of IUDs, 0 outlets with male sterilizations and 1 outlet with female sterilizations. In the urban Bihar study area, 1,245 FP products were audited, not including condoms or cycle beads (736 oral contraceptives, 400 emergency contraceptives, 12 vaginal pessaries, 74 injectables, 23 IUDs). 602 outlets reported one or more brands of male condoms, female condoms and/or Cyclebeads, and volume information was collected for each brand. Volume of sterilizations performed was collected from 12 and 40 outlets for male or female sterilizations, respectively. Volume information was excluded due to missing information or as a volume outlier for: 7 outlets with male condoms, 0 outlets with female condoms, 0 outlets with Cyclebeads, 0 audits of vaginal pessaries, 1 audit of oral contraceptives, 2 audits of emergency contraceptives, 0 audits of injectables, 3 audits of IUDs, 0 outlets with male sterilizations and 0 outlets with female sterilizations. In the rural Bihar study area, 928 FP products were audited, not including condoms or cycle beads (514 oral contraceptives, 308 emergency contraceptives, 0 vaginal pessaries, 49 injectables, 57 IUDs). 564 outlets reported one or more brands of male condoms, female condoms and/or Cyclebeads, and volume information was collected for each brand. Volume of sterilizations performed was collected from 19 and 30 outlets for male or female sterilizations, respectively. Volume information was excluded due to missing information or as a volume outlier for: 4 outlets with male condoms, 0 outlets with female condoms, 0 outlets with Cyclebeads, 0 audits of vaginal pessaries, 2 audits of oral contraceptives, 1 audit of emergency contraceptives, 0 audits of injectables, 5 audits of IUDs, 0 outlets with male sterilizations and 0 outlets with female sterilizations.
Source: FPwatch Outlet Survey, India, 2016

www.FPwatch.info Page 127
Table D10: Availability of selected contraceptive services, among outlets screened, by outlet type – Bihar Strata, 2016
Higher Public Health
Facility*
Sub-centre / ANM / ASHA†
AWW NGO Public Total‡
Private facility
Pharmacy/Chemist
Private Medical Total‡
AYUSH Provider
RMP General Retailer
Private Other Total‡
All Outlets
%
(95% CI) %
(95% CI) %
(95% CI) %
(95% CI) %
(95% CI) %
(95% CI) %
(95% CI) %
(95% CI) %
(95% CI) %
(95% CI) %
(95% CI) %
(95% CI) %
(95% CI)
Proportion of outlets screened, providing§:
Metro: N=2
Urban: N=9
Rural: N=18
Metro: N=1
Urban: N=40 Rural: N=503
Metro: N=39
Urban: N=139 Rural: N=404
Metro: N=2
Urban: N=3
Rural: N=0
Metro: N=44
Urban: N=191 Rural: N=925
Metro: N=109 Urban: N=189 Rural: N=89
Metro: N=208 Urban: N=631 Rural: N=210
Metro: N=317 Urban: N=820 Rural: N=299
Metro: N=62
Urban: N=112 Rural: N=35
Metro: N=0
Urban: N=19 Rural: N=165
Metro: N=1,480 Urban:
N=2,287 Rural:
N=1,683
Metro: N=1,542 Urban:
N=2,418 Rural:
N=1,883
Metro: N=1,903 Urban:
N=3,429 Rural:
N=3,107
Contraceptive injection service
Metro 0.0 0.0 0.0 42.2 2.0 26.7 5.8 13.6 0.0 - 0.0 0.0 2.4
- - - (4.0, 92.7) (0.4, 9.9) (17.2, 39.1) (3.1, 10.7) (9.8, 18.6) - - - - (1.5, 3.9)
Urban 44.5 12.3 0.4 100.0 5.6 25.0 7.2 11.5 1.8 38.1 0.0 0.4 3.0
(18.0, 74.5) (3.5, 35.0) (0.1, 2.3) (100,100) (2.5, 12.0) (18.0, 33.5) (4.1, 12.4) (7.8, 16.8) (0.5, 6.3) (17.9, 63.6) (0.0, 0.2) (0.2, 0.9) (2.4, 3.9)
Rural 56.3 5.9 0.2 - 4.2 27.3 8.5 15.6 4.5 42.5 0.0 4.2 5.1
(24.8, 83.4) (3.4, 10.0) (0.0, 0.8) - (2.6, 6.8) (14.8, 44.8) (4.8, 14.6) (10.1, 23.2) (0.6, 26.7) (31.3, 54.4) - (2.7, 6.5) (3.9, 6.6)
IUD insertion service
Metro 0.0 0.0 0.0 0.0 0.0 15.2 0.0 5.7 0.0 - 0.0 0.0 1.0
- - - - - (9.2, 24.1) - (3.8, 8.4) - - - - (0.5, 1.9)
Urban 54.8 9.2 0.0 59.4 5.5 17.4 0.0 4.2 0.0 0.0 0.0 0.0 1.2
(24.8, 81.6) (3.4, 22.6) - (12.4, 93.8) (2.9, 10.1) (12.0, 24.6) - (2.8, 6.2) - - - - (0.8, 1.9)
Rural 51.4 11.4 0.0 - 7.3 2.6 0.0 1.0 0.0 0.8 0.0 0.1 2.7
(19.3, 82.4) (7.8, 16.3) - - (5.2, 10.2) (1.0, 6.6) - (0.4, 2.4) - (0.1, 5.9) - (0.0, 0.6) (1.9, 3.7)
Male sterilization service
Metro 0.0 0.0 0.0 0.0 0.0 3.0 0.0 1.1 0.0 - 0.0 0.0 0.2
- - - - - (0.6, 13.5) - (0.3, 4.7) - - - - (0.0, 0.8)
Urban 21.2 0.0 0.0 25.1 0.9 5.2 0.0 1.3 0.0 0.0 0.0 0.0 0.3
(5.4, 56.0) - - (3.2, 77.5) (0.3, 2.6) (2.6, 10.1) - (0.6, 2.7) - - - - (0.2, 0.5)
Rural 78.2 0.0 0.0 - 1.1 1.2 0.0 0.4 0.0 0.0 0.0 0.0 0.4
(51.0, 92.5) - - - (0.4, 2.6) (0.4, 3.8) - (0.1, 1.4) - - - - (0.2, 0.9)
Female sterilization service
Metro 0.0 0.0 0.0 0.0 0.0 13.4 0.0 5.0 0.0 - 0.0 0.0 0.9
- - - - - (9.1, 19.4) - (3.7, 6.7) - - - - (0.5, 1.4)
Urban 33.6 0.0 0.0 100.0 2.0 19.1 0.0 4.6 0.0 0.0 0.0 0.0 1.1
(11.5, 66.5) - - (100,100) (0.8, 5.1) (13.5, 26.2) - (3.1, 6.8) - - - - (0.7, 1.7)
Rural 82.6 0.0 0.0 - 1.1 1.4 0.0 0.5 0.0 0.0 0.0 0.0 0.4
(55.9, 94.7) - - - (0.5, 2.7) (0.5, 4.5) - (0.2, 1.6) - - - - (0.2, 0.9)
* Includes: Government/municipal hospitals, government dispensaries, UHC/UHP/UFWCs, CHC/rural hospitals, and PHC/FRUs.
† SC are found in rural areas and managed by ANM workers, ASHA can be found across strata.

www.FPwatch.info Page 128
Table D10: Availability of selected contraceptive services, among outlets screened, by outlet type – Bihar Strata, 2016
Higher Public Health
Facility*
Sub-centre / ANM / ASHA†
AWW NGO Public Total‡
Private facility
Pharmacy/Chemist
Private Medical Total‡
AYUSH Provider
RMP General Retailer
Private Other Total‡
All Outlets
%
(95% CI) %
(95% CI) %
(95% CI) %
(95% CI) %
(95% CI) %
(95% CI) %
(95% CI) %
(95% CI) %
(95% CI) %
(95% CI) %
(95% CI) %
(95% CI) %
(95% CI)
Proportion of outlets screened, providing§:
Metro: N=2
Urban: N=9
Rural: N=18
Metro: N=1
Urban: N=40 Rural: N=503
Metro: N=39
Urban: N=139 Rural: N=404
Metro: N=2
Urban: N=3
Rural: N=0
Metro: N=44
Urban: N=191 Rural: N=925
Metro: N=109 Urban: N=189 Rural: N=89
Metro: N=208 Urban: N=631 Rural: N=210
Metro: N=317 Urban: N=820 Rural: N=299
Metro: N=62
Urban: N=112 Rural: N=35
Metro: N=0
Urban: N=19 Rural: N=165
Metro: N=1,480 Urban:
N=2,287 Rural:
N=1,683
Metro: N=1,542 Urban:
N=2,418 Rural:
N=1,883
Metro: N=1,903 Urban:
N=3,429 Rural:
N=3,107
‡ Public Total category = higher public health facility + sub-centre/ANM/ASHA + AWW + NGO categories; Private Medical Total category = Private facility categories; Private Other Total category = AYUSH provider + RMP + general retailer categories § The denominator includes 20 outlets that met screening criteria for a full interview but did not complete the interview (were not interviewed or completed a partial interview) (5 in Bihar Metro, 8 for Bihar Urban, and 7 for Bihar Rural).
Source: FPwatch Outlet Survey, India, 2016
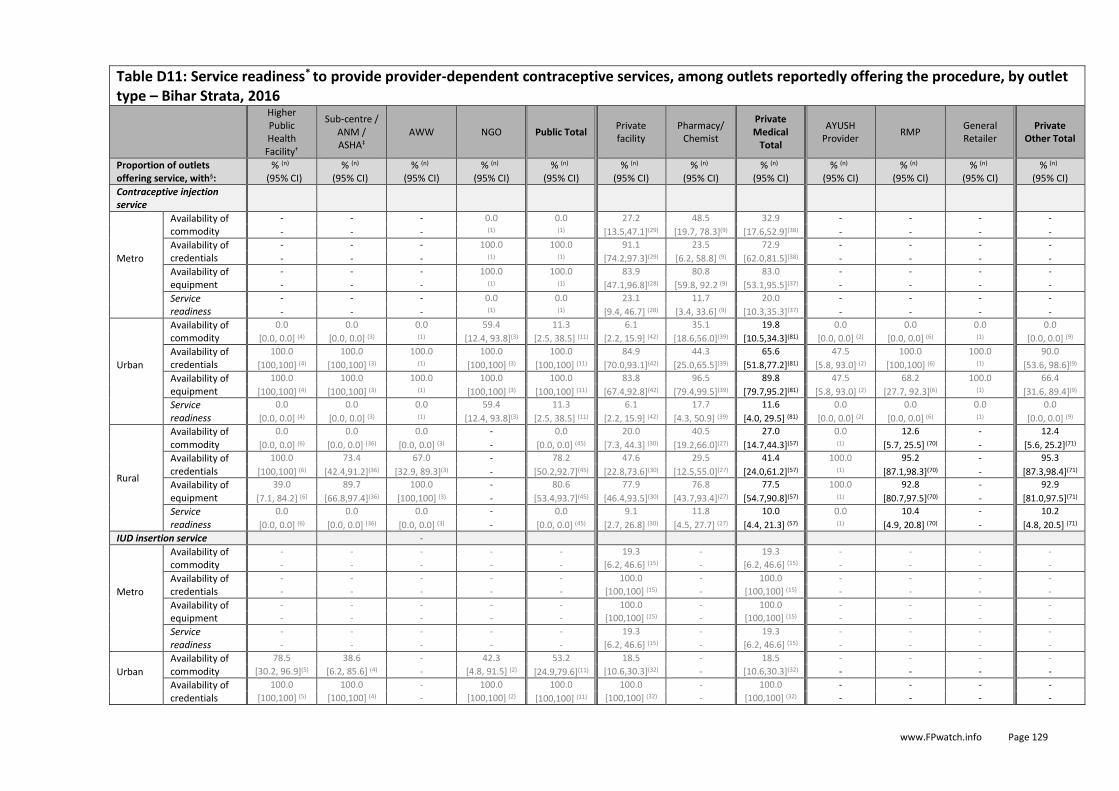
www.FPwatch.info Page 129
Table D11: Service readiness* to provide provider-dependent contraceptive services, among outlets reportedly offering the procedure, by outlet type – Bihar Strata, 2016 Higher
Public Health
Facility†
Sub-centre / ANM / ASHA‡
AWW NGO Public Total Private facility
Pharmacy/ Chemist
Private Medical
Total
AYUSH Provider
RMP General Retailer
Private Other Total
Proportion of outlets offering service, with§:
% (n) (95% CI)
% (n) (95% CI)
% (n) (95% CI)
% (n) (95% CI)
% (n) (95% CI)
% (n) (95% CI)
% (n) (95% CI)
% (n) (95% CI)
% (n) (95% CI)
% (n) (95% CI)
% (n) (95% CI)
% (n) (95% CI)
Contraceptive injection service
Metro
Availability of commodity
- - - 0.0 0.0 27.2 48.5 32.9 - - - -
- - - (1) (1) [13.5,47.1](29) [19.7, 78.3](9) [17.6,52.9](38) - - - -
Availability of credentials
- - - 100.0 100.0 91.1 23.5 72.9 - - - -
- - - (1) (1) [74.2,97.3](29) [6.2, 58.8] (9) [62.0,81.5](38) - - - -
Availability of equipment
- - - 100.0 100.0 83.9 80.8 83.0 - - - -
- - - (1) (1) [47.1,96.8](28) [59.8, 92.2 (9) [53.1,95.5](37) - - - -
Service readiness
- - - 0.0 0.0 23.1 11.7 20.0 - - - -
- - - (1) (1) [9.4, 46.7] (28) [3.4, 33.6] (9) [10.3,35.3](37) - - - -
Urban
Availability of commodity
0.0 0.0 0.0 59.4 11.3 6.1 35.1 19.8 0.0 0.0 0.0 0.0
[0.0, 0.0] (4) [0.0, 0.0] (3) (1) [12.4, 93.8](3) [2.5, 38.5] (11) [2.2, 15.9] (42) [18.6,56.0](39) [10.5,34.3](81) [0.0, 0.0] (2) [0.0, 0.0] (6) (1) [0.0, 0.0] (9)
Availability of credentials
100.0 100.0 100.0 100.0 100.0 84.9 44.3 65.6 47.5 100.0 100.0 90.0
[100,100] (4) [100,100] (3) (1) [100,100] (3) [100,100] (11) [70.0,93.1](42) [25.0,65.5](39) [51.8,77.2](81) [5.8, 93.0] (2) [100,100] (6) (1) [53.6, 98.6](9)
Availability of equipment
100.0 100.0 100.0 100.0 100.0 83.8 96.5 89.8 47.5 68.2 100.0 66.4
[100,100] (4) [100,100] (3) (1) [100,100] (3) [100,100] (11) [67.4,92.8](42) [79.4,99.5](39) [79.7,95.2](81) [5.8, 93.0] (2) [27.7, 92.3](6) (1) [31.6, 89.4](9)
Service readiness
0.0 0.0 0.0 59.4 11.3 6.1 17.7 11.6 0.0 0.0 0.0 0.0
[0.0, 0.0] (4) [0.0, 0.0] (3) (1) [12.4, 93.8](3) [2.5, 38.5] (11) [2.2, 15.9] (42) [4.3, 50.9] (39) [4.0, 29.5] (81) [0.0, 0.0] (2) [0.0, 0.0] (6) (1) [0.0, 0.0] (9)
Rural
Availability of commodity
0.0 0.0 0.0 - 0.0 20.0 40.5 27.0 0.0 12.6 - 12.4
[0.0, 0.0] (6) [0.0, 0.0] (36) [0.0, 0.0] (3) - [0.0, 0.0] (45) [7.3, 44.3] (30) [19.2,66.0](27) [14.7,44.3](57) (1) [5.7, 25.5] (70) - [5.6, 25.2](71)
Availability of credentials
100.0 73.4 67.0 - 78.2 47.6 29.5 41.4 100.0 95.2 - 95.3
[100,100] (6) [42.4,91.2](36) [32.9, 89.3](3) - [50.2,92.7](45) [22.8,73.6](30) [12.5,55.0](27) [24.0,61.2](57) (1) [87.1,98.3](70) - [87.3,98.4](71)
Availability of equipment
39.0 89.7 100.0 - 80.6 77.9 76.8 77.5 100.0 92.8 - 92.9
[7.1, 84.2] (6) [66.8,97.4](36) [100,100] (3) - [53.4,93.7](45) [46.4,93.5](30) [43.7,93.4](27) [54.7,90.8](57) (1) [80.7,97.5](70) - [81.0,97.5](71)
Service readiness
0.0 0.0 0.0 - 0.0 9.1 11.8 10.0 0.0 10.4 - 10.2
[0.0, 0.0] (6) [0.0, 0.0] (36) [0.0, 0.0] (3) - [0.0, 0.0] (45) [2.7, 26.8] (30) [4.5, 27.7] (27) [4.4, 21.3] (57) (1) [4.9, 20.8] (70) - [4.8, 20.5] (71)
IUD insertion service -
Metro
Availability of commodity
- - - - - 19.3 - 19.3 - - - -
- - - - - [6.2, 46.6] (15) - [6.2, 46.6] (15) - - - -
Availability of credentials
- - - - - 100.0 - 100.0 - - - -
- - - - - [100,100] (15) - [100,100] (15) - - - -
Availability of equipment
- - - - - 100.0 - 100.0 - - - -
- - - - - [100,100] (15) - [100,100] (15) - - - -
Service readiness
- - - - - 19.3 - 19.3 - - - -
- - - - - [6.2, 46.6] (15) - [6.2, 46.6] (15) - - - -
Urban
Availability of commodity
78.5 38.6 - 42.3 53.2 18.5 - 18.5 - - - -
[30.2, 96.9](5) [6.2, 85.6] (4) - [4.8, 91.5] (2) [24.9,79.6](11) [10.6,30.3](32) - [10.6,30.3](32) - - - -
Availability of credentials
100.0 100.0 - 100.0 100.0 100.0 - 100.0 - - - -
[100,100] (5) [100,100] (4) - [100,100] (2) [100,100] (11) [100,100] (32) - [100,100] (32) - - - -

www.FPwatch.info Page 130
Table D11: Service readiness* to provide provider-dependent contraceptive services, among outlets reportedly offering the procedure, by outlet type – Bihar Strata, 2016 Higher
Public Health
Facility†
Sub-centre / ANM / ASHA‡
AWW NGO Public Total Private facility
Pharmacy/ Chemist
Private Medical
Total
AYUSH Provider
RMP General Retailer
Private Other Total
Proportion of outlets offering service, with§:
% (n) (95% CI)
% (n) (95% CI)
% (n) (95% CI)
% (n) (95% CI)
% (n) (95% CI)
% (n) (95% CI)
% (n) (95% CI)
% (n) (95% CI)
% (n) (95% CI)
% (n) (95% CI)
% (n) (95% CI)
% (n) (95% CI)
Availability of equipment
100.0 88.5 - 100.0 94.2 95.5 - 95.5 - - - -
[100,100] (5) [45.4, 98.6](4) - [100,100] (2) [67.8,99.2](11) [82.2,99.0](32) - [82.2,99.0](32) - - - -
Service readiness
78.5 38.6 - 42.3 53.2 18.5 - 18.5 - - - -
[30.2, 96.9](5) [6.2, 85.6] (4) - [4.8, 91.5] (2) [24.9,79.6](11) [10.6,30.3](32) - [10.6,30.3](32) - - - -
Rural
Availability of commodity
89.1 65.7 - - 68.0 9.9 - 9.9 - 0.0 - 0.0
[62.5,97.6](13) [42.9,83.0](37) - - [46.7,83.8](50) [1.9, 38.2] (8) - [1.9, 38.2] (8) - (1) - (1)
Availability of credentials
100.0 97.1 - - 97.4 100.0 - 100.0 - 0.0 - 0.0
[100,100] (13) [81.5,99.6](37) - - [83.2,99.6](50) [100,100] (8) - [100,100] (8) - (1) - (1)
Availability of equipment
92.1 68.7 - - 71.0 90.1 - 90.1 - 0.0 - 0.0
[70.0,98.3](13) [49.0,83.4](37) - - [53.0,84.2](50) [61.8, 98.1](8) - [61.8, 98.1](8) - (1) - (1)
Service readiness
86.1 43.7 - - 47.9 0.0 - 0.0 - 0.0 - 0.0
[60.3,96.2](13) [24.8,64.7](37) - - [29.7,66.6](50) [0.0, 0.0] (8) - [0.0, 0.0] (8) - (1) - (1)
Male sterilization service -
Metro
Availability of credentials
- - - - - 100.0 - 100.0 - - - -
- - - - - [100,100] (3) - [100,100] (3) - - - -
Availability of equipment
- - - - - 100.0 - 100.0 - - - -
- - - - - [100,100] (3) - [100,100] (3) - - - -
Service readiness
- - - - - 100.0 - 100.0 - - - -
- - - - - [100,100] (3) - [100,100] (3) - - - -
Urban
Availability of credentials
100.0 - - 100.0 100.0 100.0 - 100.0 - - - -
[100,100] (2) - - (1) [100,100] (3) [100,100] (9) - [100,100] (9) - - - -
Availability of equipment
100.0 - - 100.0 100.0 83.7 - 83.7 - - - -
[100,100] (2) - - (1) [100,100] (3) [40.5, 97.5](9) - [40.5, 97.5](9) - - - -
Service readiness
100.0 - - 100.0 100.0 83.7 - 83.7 - - - -
[100,100] (2) - - (1) [100,100] (3) [40.5, 97.5](9) - [40.5, 97.5](9) - - - -
Rural
Availability of credentials
96.2 - - - 96.2 100.0 - 100.0 - - - -
[74.2,99.6](12) - - - [74.2,99.6](12) [100,100] (4) - [100,100] (4) - - - -
Availability of equipment
100.0 - - - 100.0 100.0 - 100.0 - - - -
[100,100] (12) - - - [100,100] 12) [100,100] (4) - [100,100] (4) - - - -
Service readiness
96.2 - - - 96.2 100.0 - 100.0 - - - -
[74.2,99.6](12) - - - [74.2,99.6](12) [100,100] (4) - [100,100] (4) - - - -
Female sterilization service -
Metro
Availability of credentials
- - - - - 84.0 - 84.0 - - - -
- - - - - [64.3,93.9](14) - [64.3,93.9](14) - - - -
Availability of equipment
- - - - - 100.0 - 100.0 - - - -
- - - - - [100,100] (14) - [100,100] (14) - - - -
Service readiness
- - - - - 84.0 - 84.0 - - - -
- - - - - [64.3,93.9](14) - [64.3,93.9](14) - - - -

www.FPwatch.info Page 131
Table D11: Service readiness* to provide provider-dependent contraceptive services, among outlets reportedly offering the procedure, by outlet type – Bihar Strata, 2016 Higher
Public Health
Facility†
Sub-centre / ANM / ASHA‡
AWW NGO Public Total Private facility
Pharmacy/ Chemist
Private Medical
Total
AYUSH Provider
RMP General Retailer
Private Other Total
Proportion of outlets offering service, with§:
% (n) (95% CI)
% (n) (95% CI)
% (n) (95% CI)
% (n) (95% CI)
% (n) (95% CI)
% (n) (95% CI)
% (n) (95% CI)
% (n) (95% CI)
% (n) (95% CI)
% (n) (95% CI)
% (n) (95% CI)
% (n) (95% CI)
Urban
Availability of credentials
100.0 - - 65.8 82.0 68.5 - 68.5 - - - -
[100,100] (3) - - [15.5,95.3](3) [46.2,96.0](6) [48.7,83.3](34) - [48.7,83.3](34) - - - -
Availability of equipment
100.0 - - 100.0 100.0 96.3 - 96.3 - - - -
[100,100] (3) - - [100,100] (3) [100,100] (6) [77.6,99.5](31) - [77.6,99.5](31) - - - -
Service readiness
100.0 - - 65.8 82.0 72.5 - 72.5 - - - -
[100,100] (3) - - [15.5, 95.3](3) [46.2, 96.0](6) [50.8,87.1](31) - [50.8,87.1](31) - - - -
Rural
Availability of credentials
93.4 - - - 93.4 100.0 - 100.0 - - - -
[72.6,98.7](14) - - - [72.6,98.7](14) [100,100] (5) - [100,100] (5) - - - -
Availability of equipment
85.3 - - - 85.3 100.0 - 100.0 - - - -
[51.5,97.0](14) - - - [51.5,97.0](14) [100,100] (5) - [100,100] (5) - - - -
Service readiness
81.8 - - - 81.8 100.0 - 100.0 - - - -
[48.6,95.5](14) - - - [48.6,95.5](14) [100,100] (5) - [100,100] (5) - - - -
* Full service readiness is defined as having available: 1. The commodity (not applicable for male/female sterilization); 2. A provider with credentials meeting the guidelines to perform the service (Government of India Guidelines for Family Planning under NHM - http://nrhm.gov.in/nhm/nrhm/guidelines/nrhm-guidelines/family-planning-guidelines.html); and 3. A minimum set of sentinel equipment (http://www.cpc.unc.edu/measure/prh/rh_indicators/specific/long-acting-permanent-methods/percent-of-facilities-with-appropriate) for providing the service. Observations that are missing information for commodity availability, provider credentials, or equipment are excluded from the ‘service readiness’ denominator. † Includes: Government/municipal hospitals, government dispensaries, UHC/UHP/UFWCs, CHC/rural hospitals, and PHC/FRUs.
‡ SC are found in rural areas and managed by ANM workers, ASHA can be found across strata. § The denominator includes outlets that met screening criteria for a full interview but did not complete the interview (were not interviewed or completed a partial interview). No outlets had incomplete service information on services in Bihar.
Source: FPwatch Outlet Survey, India, 2016

www.FPwatch.info Page 132
Figure D1. Modern contraceptive method market composition – Bihar Strata, 2016 Among all outlets stocking at least 1 modern contraceptive or providing at least 1 contraceptive service, excluding condoms-only outlets, by outlet type
In Bihar metro areas, 99 percent of outlets stocking at least one modern contraceptive, among outlets above the level of stocking condoms only, came from the private sector with 85 percent of the market composition consisting of pharmacies/chemists and another 14 percent from private facilities. In urban areas, 88 percent of the market composition was from the private sector, predominantly from pharmacies/chemists (78 percent), and about eight percent of the composition from public sub-centres/ANM/ASHAs facilities. In rural areas, however, 72 percent of the market composition was from the public sector with nearly all from public sub-centres/ANM/ASHAs facilities. In rural areas, 28 percent of the market composition is made up by the private sector, with 16 percent from pharmacies/chemists and four percent from private facilities; unlike in UP, seven percent of the market composition in Bihar comes from RMPs. * Higher-level public health facilities include: government/municipal hospitals, government dispensaries, UHC/UHP/UFWCs, CHC/rural hospitals, and PHC/FRUs. Note: Sub-centres are found in rural areas and managed by ANM workers, ASHA can be found across strata.
Urban Rural Metro
N = 207 N = 520 N = 510
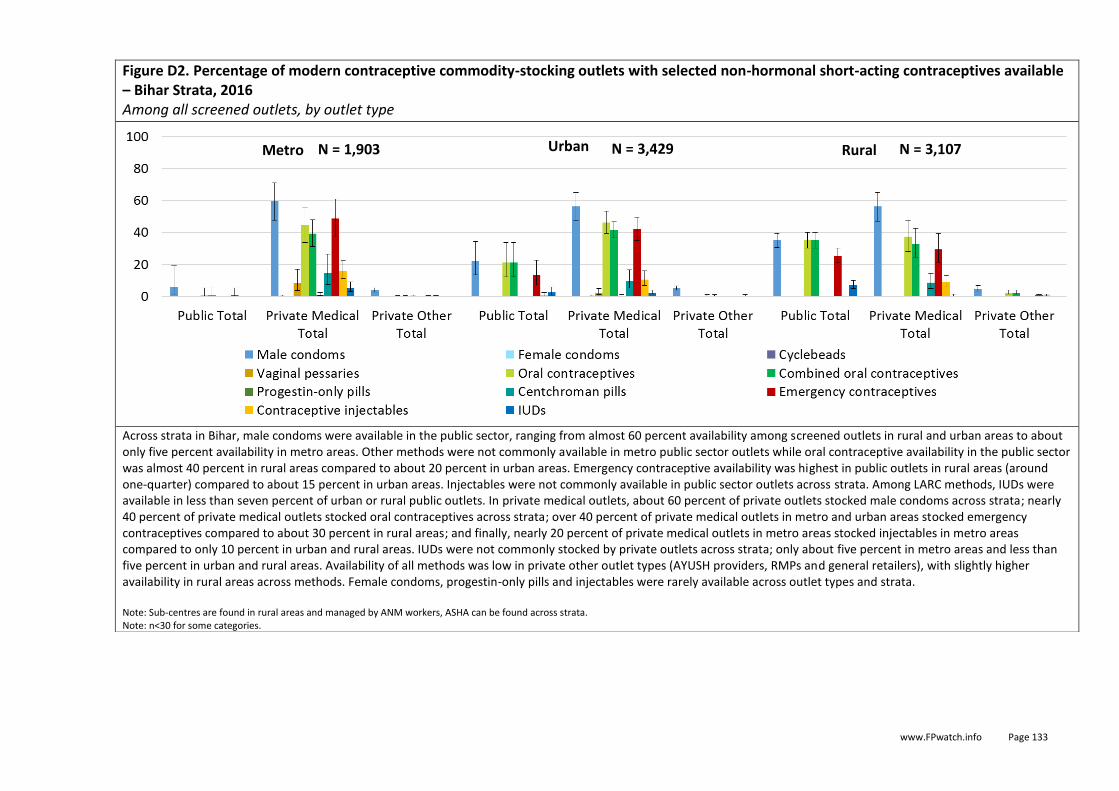
www.FPwatch.info Page 133
Figure D2. Percentage of modern contraceptive commodity-stocking outlets with selected non-hormonal short-acting contraceptives available – Bihar Strata, 2016 Among all screened outlets, by outlet type
Across strata in Bihar, male condoms were available in the public sector, ranging from almost 60 percent availability among screened outlets in rural and urban areas to about only five percent availability in metro areas. Other methods were not commonly available in metro public sector outlets while oral contraceptive availability in the public sector was almost 40 percent in rural areas compared to about 20 percent in urban areas. Emergency contraceptive availability was highest in public outlets in rural areas (around one-quarter) compared to about 15 percent in urban areas. Injectables were not commonly available in public sector outlets across strata. Among LARC methods, IUDs were available in less than seven percent of urban or rural public outlets. In private medical outlets, about 60 percent of private outlets stocked male condoms across strata; nearly 40 percent of private medical outlets stocked oral contraceptives across strata; over 40 percent of private medical outlets in metro and urban areas stocked emergency contraceptives compared to about 30 percent in rural areas; and finally, nearly 20 percent of private medical outlets in metro areas stocked injectables in metro areas compared to only 10 percent in urban and rural areas. IUDs were not commonly stocked by private outlets across strata; only about five percent in metro areas and less than five percent in urban and rural areas. Availability of all methods was low in private other outlet types (AYUSH providers, RMPs and general retailers), with slightly higher availability in rural areas across methods. Female condoms, progestin-only pills and injectables were rarely available across outlet types and strata. Note: Sub-centres are found in rural areas and managed by ANM workers, ASHA can be found across strata. Note: n<30 for some categories.
Rural Metro Urban N = 1,903 N = 3,429 N = 3,107

www.FPwatch.info Page 134
Figure D3. Percentage of outlets with selected method mixes available – Bihar Strata, 2016 Among all screened outlets, by outlet type
There were a few major differences in method mixes by strata. Public sector outlets in Bihar metro areas were not likely to carry any modern contraceptive methods. Urban public sector outlets were more likely to have at least one method available or to have three or more methods available. In the metro private medical sector, considerably higher availability of one or more or three or more methods was observed compared to the public sector metro outlets and it was also slightly higher compared to urban private medical outlets. It also had nearly twice the percentage of private medical outlets with three or more methods compared to rural private medical outlets. Few outlets had five or more methods and few other (non-medical) private sector outlets had any modern contraceptive methods. Note: Sub-centres are found in rural areas and managed by ANM workers, ASHA can be found across strata. Note: n<30 for some categories.
Urban Rural Metro N = 1,903 N = 3,429 N = 3,107
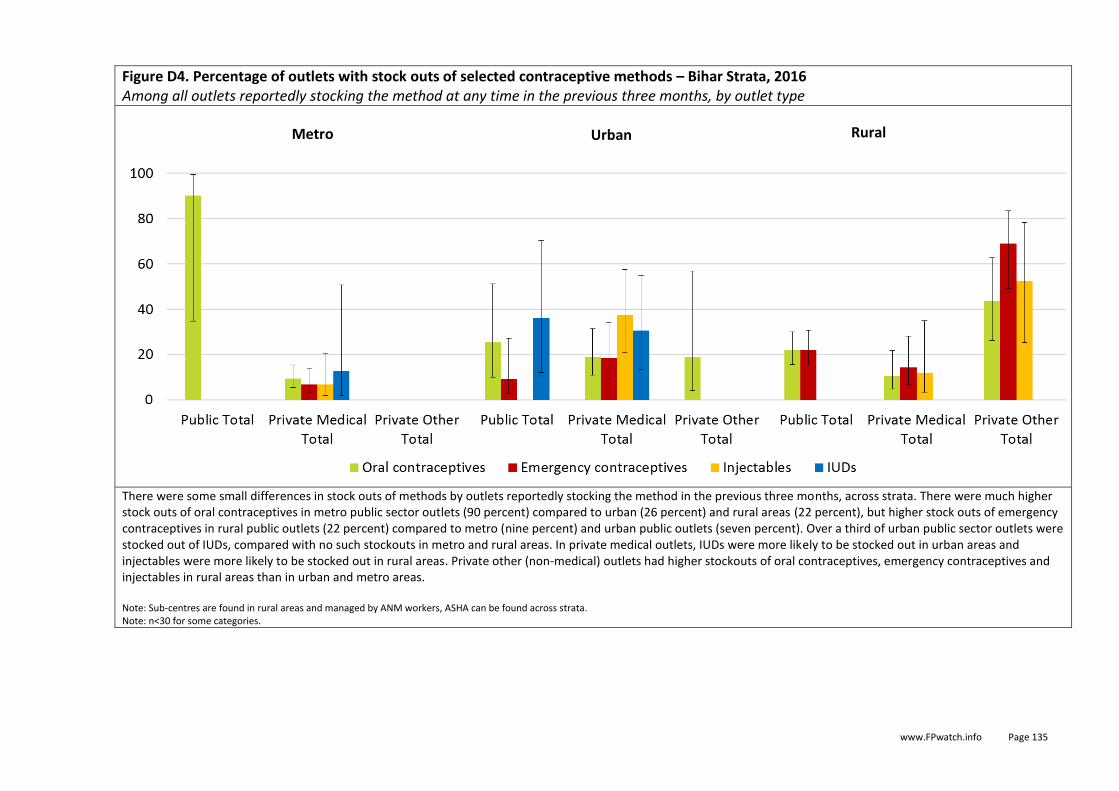
www.FPwatch.info Page 135
Figure D4. Percentage of outlets with stock outs of selected contraceptive methods – Bihar Strata, 2016 Among all outlets reportedly stocking the method at any time in the previous three months, by outlet type
There were some small differences in stock outs of methods by outlets reportedly stocking the method in the previous three months, across strata. There were much higher stock outs of oral contraceptives in metro public sector outlets (90 percent) compared to urban (26 percent) and rural areas (22 percent), but higher stock outs of emergency contraceptives in rural public outlets (22 percent) compared to metro (nine percent) and urban public outlets (seven percent). Over a third of urban public sector outlets were stocked out of IUDs, compared with no such stockouts in metro and rural areas. In private medical outlets, IUDs were more likely to be stocked out in urban areas and injectables were more likely to be stocked out in rural areas. Private other (non-medical) outlets had higher stockouts of oral contraceptives, emergency contraceptives and injectables in rural areas than in urban and metro areas. Note: Sub-centres are found in rural areas and managed by ANM workers, ASHA can be found across strata. Note: n<30 for some categories.
Rural Urban Metro

www.FPwatch.info Page 136
Figure D5. Price of contraceptive methods in the private sector - Bihar Metro Median price in USD and USD/CYP with interquartile range, by contraceptive method
Price was relatively consistent across strata, with USD price per CYP being lower for LARC/PMs compared with short-acting methods. For male condoms and oral contraceptives, price was lower in rural Bihar compared with urban and metro Bihar. Note: Categories with a small sample size (n<5) are not shown.
Metro

www.FPwatch.info Page 137
Figure D6. Price of contraceptive methods in the private sector - Bihar Urban Median price in USD and USD/CYP with interquartile range, by contraceptive method
Price was relatively consistent across strata, with USD price per CYP being lower for LARC/PMs compared with short-acting methods. For male condoms and oral contraceptives, price was lower in rural Bihar compared with urban and metro Bihar. Note: Categories with a small sample size (n<5) are not shown.
Urban

www.FPwatch.info Page 138
Figure D7. Price of contraceptive methods in the private sector - Bihar Rural Median price in USD and USD/CYP with interquartile range, by contraceptive method
Price was relatively consistent across strata, with USD price per CYP being lower for LARC/PMs compared with short-acting methods. For male condoms and oral contraceptives, price was lower in rural Bihar compared with urban and metro Bihar. Note: Categories with a small sample size (n<5) are not shown.
Rural

www.FPwatch.info Page 139
Figure D8. Percentage private market share for contraceptives methods – Bihar Strata, 2016 As a % of total CYPs sold/distributed, by outlet type
In Bihar, larger market shares came from private medical outlets than private other outlet types in metro and urban areas (95 percent or higher) than in rural areas, where private medical outlets comprised just over three-fourths of total private sector market share. The profile of market share from private medical outlets in metro and urban areas was similar, with most from female sterilizations, but with significant shares from male condoms and oral contraceptives. The majority of market share coming from private other outlet types was from male condoms in all three strata.
0
20
40
60
80
100
Private Medical Total Private Other Total Private Medical Total Private Other Total Private Medical Total Private Other Total
Female sterilizationMale sterilizationIUDsInjectablesEmergency contraceptivesOral contraceptivesVaginal pessariesCycleBeadsFemale condomsMale condoms
Urban Rural Metro

www.FPwatch.info Page 140
0
20
40
60
80
100
Private MedicalTotal
Private OtherTotal
Private MedicalTotal
Private OtherTotal
Private MedicalTotal
Private OtherTotal
Female sterilization
Male sterilization
IUDs
Injectables
Emergency contraceptives
Oral contraceptives
Vaginal pessaries
CycleBeads
Female condoms
Male condoms
Figure D9. Within outlet private market share for contraceptive methods – Bihar Strata, 2016 As a % of total CYPs sold/distributed within outlet type and sector, by outlet type and sector
In Bihar, metro and urban private medical outlets had similar market share profiles with the majority of the market share coming from female sterilizations, but rural private medical outlets showed higher proportions of the market share coming from male condoms and oral contraceptives. Male condoms were primarily responsible for the market share in private other outlet types (non-medical) across strata.
Urban Rural Metro

www.FPwatch.info Page 141
Figure D10. Percentage of outlets with selected contraceptive services available – Bihar Strata, 2016 Among all screened outlets, among outlets screened, by outlet type
In Bihar, availability of services was low across metro, urban and rural areas. It was particularly low in metro public sector outlets and private other urban and rural outlets, where only contraceptive injections were available. Service availability was also generally lower in public sector outlets compared with private medical outlets in metro and urban Bihar. Less than 10 percent of screened outlets across sectors had IUD services available. For both male and female sterilizations, availability of services among screened outlets did not exceed five percent across sectors and strata. Note: Sub-centres are found in rural areas and managed by ANM workers, ASHA can be found across strata. Note: n<30 for some categories.
Urban Rural Metro N = 1,903 N = 3,429 N = 3,107

www.FPwatch.info Page 142
Figure D11. Service readiness to offer provider-dependent contraceptive services – Bihar Strata, 2016 Among outlets reportedly offering the service, by outlet type
In Bihar, few metro public outlets offered selected contraceptive services. However, about 20 percent of private medical metro outlets reportedly offering the service were service ready for contraceptive injections and/or IUD insertions, while over 80 percent were service ready for female sterilizations. Similar service readiness trends were observed in urban and rural areas for private medical outlets. In public outlets in urban areas, only about 10 percent of outlets offering contraceptive injections were found to be service ready, however, 53 and 48 percent of public outlets in urban and rural areas, respectively, were found to be service ready for IUD insertions. Of the very few private other outlet types that offered selected contraceptive services, none were service ready across strata. Note: Sub-centres are found in rural areas and managed by ANM workers, ASHA can be found across strata. Note: n<30 for some categories.
Urban Rural Metro

www.FPwatch.info Page 143
Annexes Annex 1: FPwatch Background FPwatch is a multi-country research project implemented by PSI (www.psi.org). Standardized tools and approaches are employed to provide comparable data across countries and over time. Project countries include: Ethiopia, the DRC, India, Nigeria and Myanmar. The project was launched in 2014 with funding from the BMGF for four project countries, and is currently funded through April 2017 by the BMGF. Funding for Myanmar was secured through the 3MDG Fund in 2015. FPwatch is designed to provide timely, relevant and high-quality modern contraceptives and associated services market evidence. The goal of providing this market evidence is to inform and monitor national and global policy, strategy and funding decisions for understanding FP markets. FPwatch is monitoring family planning markets in the context of increased investments in family planning as part of the FP2020 Initiative, a partnership aiming to expand access to family planning information, services and supplies to an additional 120 million women and girls in 69 of the world’s poorest countries by 2020.1 The project implements a set of research tools designed to: 1) Provide a picture of the total market for distribution of modern family planning methods including: all providers
carrying condoms, oral contraceptives, emergency contraceptives, injectables, contraceptive implants or IUDs or providing provider-dependent contraceptive services including: injections, implant insertions, IUD insertions or male or female sterilizations; the relative modern contraceptive market share for each provider type; stock outs; and price markups.
2) Monitor the readiness of market components for distribution of modern family planning methods, including:
availability of modern contraceptives and services; and provider qualifications, training and essential equipment for providing services.
3) Monitor the performance of market components for distribution of modern family planning methods, including:
the relative market share for each method and for short-acting relative to long-acting methods; consumer price; quality-assurance indicators for contraceptives.
FPwatch research tools for FP market monitoring include: 1. Outlet surveys Outlet surveys entail collecting quantitative data from all outlets and providers with the potential to sell or distribute modern contraceptives and/or provide provider-dependent contraceptive services. These include health facilities, community health workers, pharmacies/chemists, drug stores, retail outlets, market stalls and mobile providers. Information on male and female condoms is collected from all enumerated outlets including brand, price of most popular condom and volume of all condoms sold. A screening process identifies outlets that provide modern contraceptives above the level of oral contraceptives and/or provide provider-dependent family planning services. Among these eligible outlets, service providers are interviewed and all modern contraceptives are audited. The audit collects information about each modern contraceptive in stock (e.g. brand name, drug active ingredients and strengths, manufacturer, etc.) and retailer reports on consumer price and sale/distribution volumes for each product. A provider interview is conducted among those outlets where services including contraceptive injections, implant and IUD insertions and male and female sterilizations are available. The provider interview on services collects information on price and volume of services, provider qualifications available at the outlet and the availability of a minimum set of equipment needed to provide the service. A representative sample of outlets is identified within target study domains such that findings from the outlet survey provide estimates of contraceptive availability, price and relative market share across the entire market as well as within key market segments.
1 FP2020. 2016. FP2020 Website. Accessed via: http://www.familyplanning2020.org/ on January 1, 2016.

www.FPwatch.info Page 144
2. Key informant interviews The outlet survey was complemented by in-depth interviews conducted with key informants at the national and state levels. The interviews provided context for national family planning trends, policies and strategy for interpreting the data.

www.FPwatch.info Page 145
Annex 2: India FP Background
India is the second most populous country in the world and harbours 17.5% of the world’s population. At the current growth rate of 16-18 million people per year, India’s population is projected to exceed that of China’s before 2030.2 Despite having one of the ten fastest growing economies in the world, India struggles with providing adequate access to the family planning and reproductive health services required to match population growth. India continues to have almost 100,000 maternal deaths each year, and possibly 20-30 times that figure that suffer from ill health and near-death sicknesses, thus making maternal health a continuing challenge for the country.3 Family planning has proven to be one of the most cost-effective investments developing countries can make to improve the quality of life for women, and reduce maternal mortality rates. The Government of India (GOI) recognizes that family planning and birth spacing can play an integral role in reducing maternal mortality and morbidity, but despite the implementation of a national family planning program for 60 years (since 1951), only 56.3% of married women in India practice any form of birth control.4 There are still limited availability of contraceptive choices and lack of emphasis on spacing. Research has shown that increasing the number of methods of contraception available, as well as increasing access to those methods, leads to the increased use of contraception.5 Ensuring that women around the world have access to high-quality family planning information, services and commodities requires commitments such as those made as part of Family Planning 2020 (FP2020). India’s FP2020 commitments include a shift from limiting and long-lasting methods to delaying and spacing methods with an expansion of method choice, focusing on IUDs. India committed ensuring access to family planning services to 48 million additional women by 2020 (40% of the FP 2020 goal) while sustaining the coverage of 100 million women currently using contraceptives in India. In addition, the pledge includes a commitment to greater equity and quality, with a new focus on more and better training of health workers. While the government’s shift in strategy is important, there are widespread concerns that these commitments may not translate into adequate protection of women’s rights and quality of FP services. In India, modern contraceptive prevalence rate (mCPR) has increased from 42% (DLHS-1) to 48% (DLHS-3) but still is very low. Unmet need for family remains high among married women. According to DLHS-3, the estimates of total unmet need for family planning need was 20.5% at the national level comprising 13.3 percent for limiting and 7.2 percent for the spacing method of family planning. The socioeconomic and demographic differentials in unmet need for family planning services were found to be higher for women’s age, living number of children and wealth quintiles. Among the major states, the total unmet need for family planning was higher than the national average in the states of Bihar (35.9 percent), and Uttar Pradesh (32.6 percent). Uttar Pradesh and Bihar are highly populated states in India with the population density of 829 and 1102 people per sq. kilometer respectively. The large unmet need for family planning, is an area requiring unprecedented focus in these states.
With an estimated population of 200 million and 100 million respectively, Uttar Pradesh and Bihar are among India’s most populous states as well as the poorest. Both are among India’s least developed regions with low urbanisation and one-third or more of the population is living below the poverty level. The states also experience significantly higher maternal, neonatal and child mortality rates compared to the national average. Approximately one in five married women have an unmet need for family planning services, defined as the proportion of women who want to delay or limit childbearing but are not using any family planning method, in each state.
2 Population Projections (2001-2026) by Technical Group on Population Projections, Office of Registrar General, India. 3 UNICEF 2008 - Progress For Children A Report Card on Maternal Mortality Number 7, September 2008. 4 International Institute for Population Sciences (IIPS) and Macro International. (2007). National Family Health Survey (NFHS-3). 5 Bruce and Jain, 1992.

www.FPwatch.info Page 146
Figure X1. Maps of Uttar Pradesh and Bihar Selected Districts
Uttar Pradesh
Bihar

www.FPwatch.info Page 147
Healthcare system The public health system in India constitutes a set of state-owned health care facilities which are funded and controlled by the government of India. Some of these agencies are overseen by the central government and some by states. The Ministry of Health & Family Welfare, which is part of the central government is the main public health governing entity and Governmental spending on health care in India is exclusively through this system, hence most of the treatments in public institutions are either fully or partially subsidised. Family planning services in India are primarily provided through the public sector. UP and Bihar’s health system consist of a diverse network of providers including public, private for-profit and non-profit, traditional complementary and alternative medicine, informal and faith healers. Maternal and neonatal health services are provided through the State Government’s NHM program which employs Accredited Social Health Activists (ASHAs) as incentive-based frontline health volunteers at the village level. ASHAs are linked to the Auxiliary Nurse Midwife (ANM), who oversees the lowest level health centers serving approximately 5,000 people. At block level there is a secondary level Community Health Center (CHC) for every 100,000 population and a primary health center (PHC) for every 50,000 population. The District Hospital is the main referral center at the district level and also houses the office of the chief health administrator for the district. NHM also has a District Programme Management Unit located at the district headquarters and a Block Programme Management Unit at block level. There are several grades of primary and secondary facilities in UP and Bihar – the Block PHC is equivalent to CHC, while the additional or new PHC is a sub center that has been recently upgraded to PHC. In spite of having a well-established health infrastructure and substantial state resources, UP and Bihar continue to lag behind other states on mortality reduction and on almost all other indicators of basic health services.
FP2020 and Family Planning Policy In 2000, UP and Bihar adopted a population policy to improve the quality of life of the inhabitants through population stabilization. They established the goals of reaching replacement level fertility (2.1 children per woman) and improving maternal and child health by 2016.6 Achieving the population policy would require reducing the high unmet need for family planning which in turn would help to reduce fertility rates to targeted levels. Targeted actions were set in 2007 in response to recommendations by the USAID Health Policy Initiative, Task Order 1 to focus communication strategies, strengthen community participation, stimulate private sector involvement and public-private collaborations, make postpartum family planning a standard service, ensure contraceptive security, and produce higher quality data and analysis as a way to ensure progress towards achieving the State’s overall maternal and child health improvement and population stabilization goals. These actions would involve increasing the availability of maternal health, reproductive health, and child health services by providing round-the-clock services in primary health centers, exploring the acceptability of intrauterine devices, expanding choices for family planning methods and improving access to high quality services by having fixed days for sterilization instead of periodic sterilization days. In addition, India’s commitment to the FP2020 goals has called for the strengthening of existing strategies as well as offering innovative strategies to improve service delivery. The ministry of health in India has allocated funds through the RMNCH+A family planning programme and taken steps to promote various initiatives aimed at increasing service accessibility and availability of information on family planning services. Achieving universal accessibility of contraceptives would enable eligible couples to make informed choices regarding their reproductive health. As such, community based schemes like home delivery of contraceptives, ensuring spacing at birth and pregnancy testing kits implemented through ASHAs have been initiated in addition to regular static services. These schemes are intended to overcome multiplicity of demand side obstacles including ignorance about basket of choices of contraceptives and benefits of spacing in births, reluctance of couples to seek contraceptives from health facilities and minimizing costs incurred on seeking reproductive health care. Inspired by the success of community based schemes under NHM, the government piloted an innovative strategy of home delivery of contraceptives through ASHAs in 233 districts across the country. Since 2012, the services of 5.9 lakh (0.59 million) ASHAs have been utilized to counsel beneficiaries on
6 Family Planning Division, Ministry of Health and Family Welfare, Government of India. India’s ‘Vision FP 2020.’ November,
2014. http://ec2-54-210-230-186.compute-1.amazonaws.com/wp-content/uploads/2015/04/Indias-Vision-FP2020.pdf

www.FPwatch.info Page 148
advantages of healthy birth spacing, delaying the first birth by two years and maintaining the birth interval of at least three years between two children. The GOI has also been implementing a centrally sponsored scheme since 1981 to promote permanent methods such as sterilization by offering to compensate the acceptors of sterilization for the loss of wages during the period they require for recuperation following sterilization procedures. These schemes have been especially enhanced in areas of high unmet need.
Modern contraceptive methods usage
In India, 47.1% of eligible couples are using some modern contraceptive method. Commonly used methods include condoms (5.9%), pills (4.2%), IUD (1.9%), male sterilizations (1%), traditional methods (6.7%) and female sterilizations (34%). Traditionally FP efforts have focused on female sterilizations as a contraceptive method, However, with the introduction of long acting reversible contraceptive methods and an improvement in the knowledge and choices of other available contraceptive options, it is expected that use of this preferred method will decline. In an effort to expand the basket of choices for contraceptive methods for women and increase uptake of family planning methods, the government of India allowed the introduction of the 3-month injectable through the private sector. Currently this service is only available in the private sector and efforts are being made to expand to the public sector. Generally, there has been an increase in uptake of injectable methods prompting an increase in the number of distributors for the product. While significant improvements have been made there are still significant challenges and barriers to methods uptake, mainly provider biases and the reluctance by physicians to prescribe or recommend specific methods. Discontinuation of use among women initiating injectable methods due to concerns about changes in menstruation is another challenge including community myths and perceptions as well as safety concerns about invasive methods such as IUDs. Efforts have been made through various agencies partnering with the state government to reduce barriers through advocacy, community and provider outreach and education, as well as the provision of counselling and follow-up services to clients.

www.FPwatch.info Page 149
Annex 3: Outlet Survey Methods
Design and Study Population FPwatch implements cross-sectional outlet surveys in project countries. The study population is defined as all outlets with the potential to sell or distribute modern contraceptives and/or provide associated contraceptive services. In India this includes the following outlet types:
Public health care facilities
This category is comprised of government facilities including: government/municipal hospitals, government dispensaries, urban health centers (UHC), community health centers (CHC), rural hospital/primary health centers (PHC)/ sub-centres, government mobile clinics and Anganwadi centers. These healthcare facilities are equipped with a range of contraceptives to be provided free of charge to the community.
Public health care facilities provide family planning services per the operational guidelines and availability of infrastructure. LARC and sterilization services are provided at the CHC level and above.
NGO health facilities This included NGOs, trust or faith-based/mission health facilities including hospitals, health centers and clinics. These facilities provide commodities and services for a nominal service fee and are staffed by providers with health qualifications.
NGO organizations, trust hospitals/clinics can provide services on family planning including the short-acting and LARC methods.
Private health facilities
Private healthcare facilities include private hospitals, private doctors/clinics, private mobile clinics and Vaidya/hakim/homeopathic outlets. These facilities are registered to provide health care products and services by the Drug Control Department of India.
The majority of private higher and medium health facilities can provide all short-acting and LARC methods including sterilization. Lower private clinics can provide all short-acting methods.
Pharmacies/chemists Pharmacies/chemists are licensed by the Drug Control Department of India to qualified degree/diploma holders. The large majority of pharmacies/chemists are privately run.
Pharmacies/chemists can provide all short-acting methods and misoprostol. Injectables can be sold but the service must be performed elsewhere.
Nontraditional outlets/ General retailers
Non-traditional outlets and other general stores may stock family planning products. Retailers may have over-the-counter medicines including family planning commodities available.
The condom is the most commonly available family planning product at non-traditional and general retailer outlets.
Stratification The FPwatch outlet survey was conducted in Uttar Pradesh and Bihar, the first and third most populous states, respectively, and accounting for 25% of the total national population. Based on 2011 India Census figures, Uttar Pradesh is comprised of 71 districts which includes 9 metropolitan cities, 937 semi-urban and urban towns and 97,814 rural villages, and Bihar is comprised of 37 districts which includes 2 metropolitan cities, 203 semi-urban and urban towns and 39,073 rural villages. Stratification occurred at two levels i.e. State and village/ward level. Estimates were generated for three domains in each of Bihar and Uttar Pradesh states, for a total of six study domains. The three domains included urban wards, rural villages and metropolitan wards.
1) Rural (villages): This research domain drew from all areas designated as rural villages within districts as designated by the India government for administrative and census purposes. Rural villages typically consist of less than 10,000 residents. There are 39,073 rural villages in Bihar and 97,814 in Uttar Pradesh.
2) Urban (wards): This research domain drew from all areas designated as Tier-6 through Tier-1 towns within districts as designated by the India government for administrative and census purposes. This classification accounts for urban towns, typically consisting of fewer than 1,000,000 residents. There are 3,212 wards in Bihar and 11,213 wards in Uttar Pradesh meeting this designation.

www.FPwatch.info Page 150
3) Metropolitan (wards): This research domain drew from all areas designated as metropolitan centers within districts as designated by the India government for administrative and census purposes. This classification accounts for metropolitan areas, typically consisting of greater than 1 million residents. There are 2 metropolitan areas (73 wards) in Bihar and 9 (659 wards) in Uttar Pradesh meeting this designation.
Eligibility Criteria All outlets with the potential to provide modern contraceptive methods were included in the census screening. Outlets were eligible for a provider interview and product audit if they met at least one of three study criteria: 1) one or more modern contraceptives at the level of oral contraceptives and above (including: oral contraceptives, emergency contraceptives, injectable contraceptives, contraceptive implants, IUDs, cycle beads) reportedly available on the day of the survey; 2) one or more of these modern contraceptives reportedly available within the three months preceding the survey; or 3) the ability to provide provider-dependent contraceptive services including contraceptive injections, contraceptive implant insertions, IUD insertions and/or male and female sterilizations. Outlets that only stock condoms and do not have potential to provide other modern contraceptives (e.g., bars, brothels, general retailers) were excluded from the study. Outlets not serving the general public (e.g., military facilities) were also excluded from the study. Sampling A representative sample was selected for each research domain using multi-stage cluster sampling. The primary sampling approach taken for facility-based surveys entails sampling a set of administrative units (geographic clusters) with a corresponding population of approximately 10,000 to 15,000 inhabitants. In India, a two-stage sampling procedure was implemented using probability proportionate to size (PPS). Using the district as the primary sampling unit, 20 districts were selected for Uttar Pradesh and 10 districts were selected for Bihar. Population estimates rather than the number of outlets were used to guide PPS sampling. Rural villages for rural strata and urban wards for metropolitan, urban and semi-urban strata were used as the secondary sampling unit. A census of all outlets with the potential to sell or distribute family planning commodities was then conducted in sampled clusters. Sample Size The survey sample size is powered based on an estimate of an 60% proportion of outlets with three or more modern methods of contraception available on the day of the survey, among both public and private outlets with at least one modern contraceptive method available, in each of the four selected regions. This indicator was chosen because it is highly relevant for FP2020 goals for women and girls to have informed choice and access to family planning information and a range of modern contraceptive methods. A series of calculations was completed to identify the minimum sample size requirements to provide estimates for this indicator for each of the strata.
Required number of Outlets
The sample size required to calculate a 95% confidence interval for the proportion of outlets with three or more modern methods of contraception in stock the day of the survey with a margin of error no more than 0.05, for each regional domain is given by:
𝑑𝑒𝑓𝑓 × [𝑍1−𝛼2 × 𝑃(1−𝑃)]
𝑑2
Where: n = desired sample size deff = the design effect in multi-stage cluster sample design; 2.0 for all strata
Z1- = the standard normal deviate value for a type II error; 1.96 P = the expected proportion of outlets with three or more modern methods of contraception available in stock on day of survey; 0.50 d = acceptable margin of error; 0.05 The sample size required will be increased by 10% to account for potential non-response.
n =

www.FPwatch.info Page 151
Using these values, the sample size required is approximately 860 outlets each for of the six strata for a total of 5,160 eligible outlets.
Required number of clusters (townships, wards and village tracts)
Information obtained from the Uttar Pradesh and Bihar Family Planning Landscape studies in 2015 by PSI-India was used to generate the average outlet density in wards and villages and to estimate the number of clusters required to achieve the desired outlet sample sizes for each domain. Based on this information, outlet density was expected to be 38.3 outlets per ward in metro areas, 5.8 outlets per urban ward and 3.3 outlets per rural village in Uttar Pradesh and 67.1 outlets per ward in metro areas, 9.1 outlets per urban ward and 7.5 outlets per rural village in Bihar. Considering sample size requirements to calculate a 95% confidence interval for the proportion of outlets with three or more modern methods available the day of the survey (50% conservative assumption) with a margin of error no more than 0.05, the optimal minimum number clusters is outlined in the table below:
Required # outlets Estimated HF density/ward or village
Required # of wards or villages
Bihar
Metro 860 67.1 30
Urban 860 9.1 100
Rural 860 7.5 120
Uttar Pradesh
Metro 860 38.3 3024
Urban 860 5.8 150
Rural 860 3.3 260
Based on these figures, 30 metro wards in Bihar were selected by probability proportional to size (PPS) sampling from all metro towns of Bihar (2) and 30 metro wards were selected by PPS from all metro towns of Uttar Pradesh (9) in a one-step sampling process. The populations of these metro areas were then subtracted from their corresponding district-level populations for the sampling frame for urban and rural areas. For Bihar, 10 districts were selected by PPS with 10 urban wards and 12 rural villages selected by PPS from each district in a two-step sampling process. For Uttar Pradesh, 20 districts were selected by PPS with 7-8 urban wards and 13 rural villages selected by PPS from each district in a two-step sampling process. In total, 10 districts and 234 clusters were selected for Bihar and 20 districts and 434 clusters were selected for Uttar Pradesh. Data collection reached 100% of the original sample without substitution covering all selected rural, urban and Metropolitan wards. FPwatch India covered 5362 CEBs inside 678 wards or villages. Data Collection Interviewers, supervisors, and quality controllers received training that included an orientation to the study, questionnaire, and classroom training on completing contraceptive product audits, and a field exercise. Following training, data collection was implemented from June 9th to September 11th A structured questionnaire was used for all interviews (see Annex 6). A series of screening questions was administered at all outlets to determine eligibility for the survey. Outlets where contraceptives were reportedly sold and/or services was reportedly provided were invited to participate in the full survey. Following informed consent procedures, an audit of all available contraceptive commodities was conducted. Contraceptive audit information included formulation, package size, brand name, active ingredients and strengths, manufacturer, country of manufacture, reported sale/distribution in the week preceding the survey, retail price, and wholesale price. Detailed descriptions of contraceptives audited are provided in Annex 7 and Annex 8. In addition to the product audit, a series of questions was administered to the senior-most provider on contraceptive services as well as provider training and qualifications.). Electronic data collection (EDC) was used for the FPwatch India survey. The interview was conducted using electronic devices (Android phones or tablets) with (computer-assisted personal interviewing) CAPI software. The questionnaire, including the information sheet and informed consent, were translated and back-translated to confirm valid

www.FPwatch.info Page 152
translations in Hindi. The electronic data collection forms were also programmed with automated skips and range checks to prevent missing data and/or entering impossible or implausible information. Up to three visits were made to all outlets to complete the screening process, audit, and provider interview as needed (e.g. where outlets were closed or providers were not available Geo-coordinates were collected for each outlet using Garmin Etrex ® GPS devices. Protection of Human Subjects The outlet survey protocol was submitted to and approved by the PSI Research Ethics Board. Provider interviews and product audits were completed only after administration of a standard informed consent form and provider consent to participate in the study. Timeframe Data collection occurred between June 9th and September 11th following a 10-day fieldworker training in each state and take up to eight weeks to complete data collection.
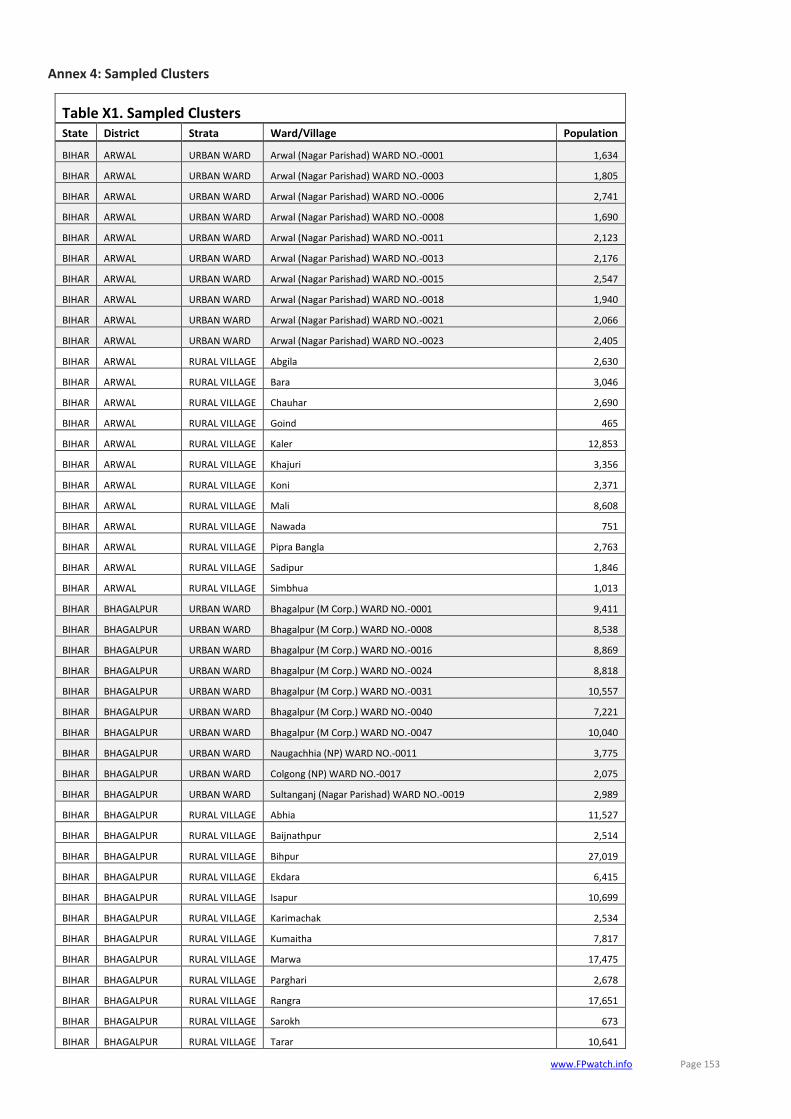
www.FPwatch.info Page 153
Annex 4: Sampled Clusters
Table X1. Sampled Clusters State District Strata Ward/Village Population
BIHAR ARWAL URBAN WARD Arwal (Nagar Parishad) WARD NO.-0001 1,634
BIHAR ARWAL URBAN WARD Arwal (Nagar Parishad) WARD NO.-0003 1,805
BIHAR ARWAL URBAN WARD Arwal (Nagar Parishad) WARD NO.-0006 2,741
BIHAR ARWAL URBAN WARD Arwal (Nagar Parishad) WARD NO.-0008 1,690
BIHAR ARWAL URBAN WARD Arwal (Nagar Parishad) WARD NO.-0011 2,123
BIHAR ARWAL URBAN WARD Arwal (Nagar Parishad) WARD NO.-0013 2,176
BIHAR ARWAL URBAN WARD Arwal (Nagar Parishad) WARD NO.-0015 2,547
BIHAR ARWAL URBAN WARD Arwal (Nagar Parishad) WARD NO.-0018 1,940
BIHAR ARWAL URBAN WARD Arwal (Nagar Parishad) WARD NO.-0021 2,066
BIHAR ARWAL URBAN WARD Arwal (Nagar Parishad) WARD NO.-0023 2,405
BIHAR ARWAL RURAL VILLAGE Abgila 2,630
BIHAR ARWAL RURAL VILLAGE Bara 3,046
BIHAR ARWAL RURAL VILLAGE Chauhar 2,690
BIHAR ARWAL RURAL VILLAGE Goind 465
BIHAR ARWAL RURAL VILLAGE Kaler 12,853
BIHAR ARWAL RURAL VILLAGE Khajuri 3,356
BIHAR ARWAL RURAL VILLAGE Koni 2,371
BIHAR ARWAL RURAL VILLAGE Mali 8,608
BIHAR ARWAL RURAL VILLAGE Nawada 751
BIHAR ARWAL RURAL VILLAGE Pipra Bangla 2,763
BIHAR ARWAL RURAL VILLAGE Sadipur 1,846
BIHAR ARWAL RURAL VILLAGE Simbhua 1,013
BIHAR BHAGALPUR URBAN WARD Bhagalpur (M Corp.) WARD NO.-0001 9,411
BIHAR BHAGALPUR URBAN WARD Bhagalpur (M Corp.) WARD NO.-0008 8,538
BIHAR BHAGALPUR URBAN WARD Bhagalpur (M Corp.) WARD NO.-0016 8,869
BIHAR BHAGALPUR URBAN WARD Bhagalpur (M Corp.) WARD NO.-0024 8,818
BIHAR BHAGALPUR URBAN WARD Bhagalpur (M Corp.) WARD NO.-0031 10,557
BIHAR BHAGALPUR URBAN WARD Bhagalpur (M Corp.) WARD NO.-0040 7,221
BIHAR BHAGALPUR URBAN WARD Bhagalpur (M Corp.) WARD NO.-0047 10,040
BIHAR BHAGALPUR URBAN WARD Naugachhia (NP) WARD NO.-0011 3,775
BIHAR BHAGALPUR URBAN WARD Colgong (NP) WARD NO.-0017 2,075
BIHAR BHAGALPUR URBAN WARD Sultanganj (Nagar Parishad) WARD NO.-0019 2,989
BIHAR BHAGALPUR RURAL VILLAGE Abhia 11,527
BIHAR BHAGALPUR RURAL VILLAGE Baijnathpur 2,514
BIHAR BHAGALPUR RURAL VILLAGE Bihpur 27,019
BIHAR BHAGALPUR RURAL VILLAGE Ekdara 6,415
BIHAR BHAGALPUR RURAL VILLAGE Isapur 10,699
BIHAR BHAGALPUR RURAL VILLAGE Karimachak 2,534
BIHAR BHAGALPUR RURAL VILLAGE Kumaitha 7,817
BIHAR BHAGALPUR RURAL VILLAGE Marwa 17,475
BIHAR BHAGALPUR RURAL VILLAGE Parghari 2,678
BIHAR BHAGALPUR RURAL VILLAGE Rangra 17,651
BIHAR BHAGALPUR RURAL VILLAGE Sarokh 673
BIHAR BHAGALPUR RURAL VILLAGE Tarar 10,641
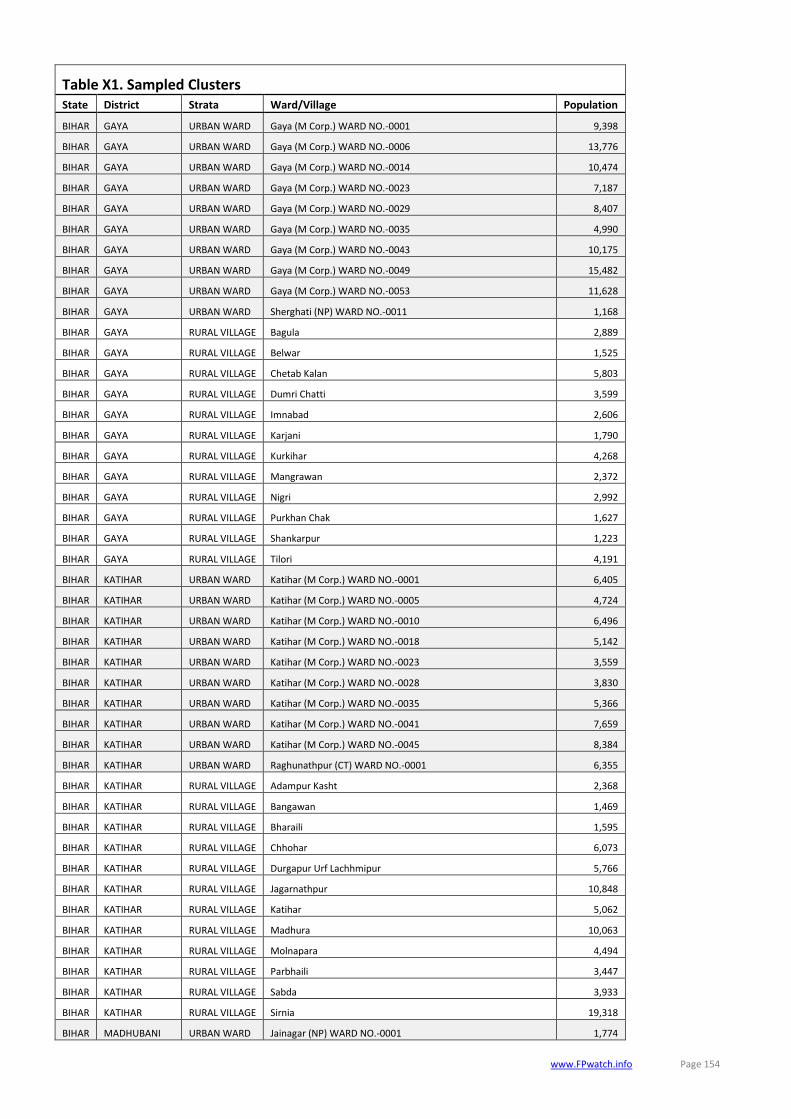
www.FPwatch.info Page 154
Table X1. Sampled Clusters State District Strata Ward/Village Population
BIHAR GAYA URBAN WARD Gaya (M Corp.) WARD NO.-0001 9,398
BIHAR GAYA URBAN WARD Gaya (M Corp.) WARD NO.-0006 13,776
BIHAR GAYA URBAN WARD Gaya (M Corp.) WARD NO.-0014 10,474
BIHAR GAYA URBAN WARD Gaya (M Corp.) WARD NO.-0023 7,187
BIHAR GAYA URBAN WARD Gaya (M Corp.) WARD NO.-0029 8,407
BIHAR GAYA URBAN WARD Gaya (M Corp.) WARD NO.-0035 4,990
BIHAR GAYA URBAN WARD Gaya (M Corp.) WARD NO.-0043 10,175
BIHAR GAYA URBAN WARD Gaya (M Corp.) WARD NO.-0049 15,482
BIHAR GAYA URBAN WARD Gaya (M Corp.) WARD NO.-0053 11,628
BIHAR GAYA URBAN WARD Sherghati (NP) WARD NO.-0011 1,168
BIHAR GAYA RURAL VILLAGE Bagula 2,889
BIHAR GAYA RURAL VILLAGE Belwar 1,525
BIHAR GAYA RURAL VILLAGE Chetab Kalan 5,803
BIHAR GAYA RURAL VILLAGE Dumri Chatti 3,599
BIHAR GAYA RURAL VILLAGE Imnabad 2,606
BIHAR GAYA RURAL VILLAGE Karjani 1,790
BIHAR GAYA RURAL VILLAGE Kurkihar 4,268
BIHAR GAYA RURAL VILLAGE Mangrawan 2,372
BIHAR GAYA RURAL VILLAGE Nigri 2,992
BIHAR GAYA RURAL VILLAGE Purkhan Chak 1,627
BIHAR GAYA RURAL VILLAGE Shankarpur 1,223
BIHAR GAYA RURAL VILLAGE Tilori 4,191
BIHAR KATIHAR URBAN WARD Katihar (M Corp.) WARD NO.-0001 6,405
BIHAR KATIHAR URBAN WARD Katihar (M Corp.) WARD NO.-0005 4,724
BIHAR KATIHAR URBAN WARD Katihar (M Corp.) WARD NO.-0010 6,496
BIHAR KATIHAR URBAN WARD Katihar (M Corp.) WARD NO.-0018 5,142
BIHAR KATIHAR URBAN WARD Katihar (M Corp.) WARD NO.-0023 3,559
BIHAR KATIHAR URBAN WARD Katihar (M Corp.) WARD NO.-0028 3,830
BIHAR KATIHAR URBAN WARD Katihar (M Corp.) WARD NO.-0035 5,366
BIHAR KATIHAR URBAN WARD Katihar (M Corp.) WARD NO.-0041 7,659
BIHAR KATIHAR URBAN WARD Katihar (M Corp.) WARD NO.-0045 8,384
BIHAR KATIHAR URBAN WARD Raghunathpur (CT) WARD NO.-0001 6,355
BIHAR KATIHAR RURAL VILLAGE Adampur Kasht 2,368
BIHAR KATIHAR RURAL VILLAGE Bangawan 1,469
BIHAR KATIHAR RURAL VILLAGE Bharaili 1,595
BIHAR KATIHAR RURAL VILLAGE Chhohar 6,073
BIHAR KATIHAR RURAL VILLAGE Durgapur Urf Lachhmipur 5,766
BIHAR KATIHAR RURAL VILLAGE Jagarnathpur 10,848
BIHAR KATIHAR RURAL VILLAGE Katihar 5,062
BIHAR KATIHAR RURAL VILLAGE Madhura 10,063
BIHAR KATIHAR RURAL VILLAGE Molnapara 4,494
BIHAR KATIHAR RURAL VILLAGE Parbhaili 3,447
BIHAR KATIHAR RURAL VILLAGE Sabda 3,933
BIHAR KATIHAR RURAL VILLAGE Sirnia 19,318
BIHAR MADHUBANI URBAN WARD Jainagar (NP) WARD NO.-0001 1,774

www.FPwatch.info Page 155
Table X1. Sampled Clusters State District Strata Ward/Village Population
BIHAR MADHUBANI URBAN WARD Jainagar (NP) WARD NO.-0011 1,040
BIHAR MADHUBANI URBAN WARD Madhubani (Nagar Parishad) WARD NO.-0005 2,207
BIHAR MADHUBANI URBAN WARD Madhubani (Nagar Parishad) WARD NO.-0012 1,910
BIHAR MADHUBANI URBAN WARD Madhubani (Nagar Parishad) WARD NO.-0019 1,501
BIHAR MADHUBANI URBAN WARD Madhubani (Nagar Parishad) WARD NO.-0025 3,574
BIHAR MADHUBANI URBAN WARD Madhubani (Nagar Parishad) WARD NO.-0030 3,351
BIHAR MADHUBANI URBAN WARD Jhanjharpur (NP) WARD NO.-0001 2,306
BIHAR MADHUBANI URBAN WARD Jhanjharpur (NP) WARD NO.-0009 1,461
BIHAR MADHUBANI URBAN WARD Ghoghardiha (NP) WARD NO.-0002 2,007
BIHAR MADHUBANI RURAL VILLAGE Balua 3,206
BIHAR MADHUBANI RURAL VILLAGE Belahi 5,746
BIHAR MADHUBANI RURAL VILLAGE Bisfi 13,981
BIHAR MADHUBANI RURAL VILLAGE Dumra 5,829
BIHAR MADHUBANI RURAL VILLAGE Jagban 10,744
BIHAR MADHUBANI RURAL VILLAGE Khairi Banka 17,713
BIHAR MADHUBANI RURAL VILLAGE Madhepur 25,831
BIHAR MADHUBANI RURAL VILLAGE Meghban 4,629
BIHAR MADHUBANI RURAL VILLAGE Paraul 3,641
BIHAR MADHUBANI RURAL VILLAGE Raiam 15,696
BIHAR MADHUBANI RURAL VILLAGE Sihula 2,572
BIHAR MADHUBANI RURAL VILLAGE Tingri 1,409
BIHAR NALANDA URBAN WARD Biharsharif (M Corp.) WARD NO.-0001 5,043
BIHAR NALANDA URBAN WARD Biharsharif (M Corp.) WARD NO.-0008 6,064
BIHAR NALANDA URBAN WARD Biharsharif (M Corp.) WARD NO.-0015 6,944
BIHAR NALANDA URBAN WARD Biharsharif (M Corp.) WARD NO.-0022 8,584
BIHAR NALANDA URBAN WARD Biharsharif (M Corp.) WARD NO.-0028 3,349
BIHAR NALANDA URBAN WARD Biharsharif (M Corp.) WARD NO.-0035 3,908
BIHAR NALANDA URBAN WARD Biharsharif (M Corp.) WARD NO.-0043 7,574
BIHAR NALANDA URBAN WARD Hilsa (Nagar Parishad) WARD NO.-0011 1,901
BIHAR NALANDA URBAN WARD Islampur (NP) WARD NO.-0006 2,723
BIHAR NALANDA URBAN WARD Rajgir (NP) WARD NO.-0012 1,721
BIHAR NALANDA RURAL VILLAGE Ajnaura 3,038
BIHAR NALANDA RURAL VILLAGE Bara Khurd 9,812
BIHAR NALANDA RURAL VILLAGE Bind 10,478
BIHAR NALANDA RURAL VILLAGE Dhamauli 2,658
BIHAR NALANDA RURAL VILLAGE Gor Bigha 1,110
BIHAR NALANDA RURAL VILLAGE Kadi Bigha 2,262
BIHAR NALANDA RURAL VILLAGE Konand 11,324
BIHAR NALANDA RURAL VILLAGE Majidpur 596
BIHAR NALANDA RURAL VILLAGE Nagar Nahusa 11,008
BIHAR NALANDA RURAL VILLAGE Patasang 3,232
BIHAR NALANDA RURAL VILLAGE Sadha 1,654
BIHAR NALANDA RURAL VILLAGE Sonsa 5,160
BIHAR PATNA URBAN WARD Dinapur Nizamat (Nagar Parishad) WARD NO.-0001 4,445
BIHAR PATNA URBAN WARD Dinapur Nizamat (Nagar Parishad) WARD NO.-0018 6,506

www.FPwatch.info Page 156
Table X1. Sampled Clusters State District Strata Ward/Village Population
BIHAR PATNA URBAN WARD Dinapur Nizamat (Nagar Parishad) WARD NO.-0037 5,187
BIHAR PATNA URBAN WARD Dinapur Cantonment (CB) WARD NO.-0007 6,534
BIHAR PATNA URBAN WARD Phulwari Sharif (Nagar Parishad) WARD NO.-0010 3,082
BIHAR PATNA URBAN WARD Bihta (NP) WARD NO.-0001 1,538
BIHAR PATNA URBAN WARD Bikram (NP) WARD NO.-0002 1,914
BIHAR PATNA URBAN WARD Masaurhi (Nagar Parishad) WARD NO.-0023 1,735
BIHAR PATNA URBAN WARD Bakhtiarpur (NP) WARD NO.-0005 3,500
BIHAR PATNA URBAN WARD Barh (Nagar Parishad) WARD NO.-0019 1,145
BIHAR PATNA RURAL VILLAGE Akharia 410
BIHAR PATNA RURAL VILLAGE Barhanpura 765
BIHAR PATNA RURAL VILLAGE Chak Daulat 2,386
BIHAR PATNA RURAL VILLAGE Dhanak Dobh 3,501
BIHAR PATNA RURAL VILLAGE Gyan Chak 3,392
BIHAR PATNA RURAL VILLAGE Kalianpur 6,349
BIHAR PATNA RURAL VILLAGE Lakhipur 1,884
BIHAR PATNA RURAL VILLAGE Mobarakpur 4,775
BIHAR PATNA RURAL VILLAGE Pabhera 6,690
BIHAR PATNA RURAL VILLAGE Raili 5,026
BIHAR PATNA RURAL VILLAGE Samaya NO 10 (Balwa) 3,443
BIHAR PATNA RURAL VILLAGE Sohgi 7,971
BIHAR PATNA METRO WARD Patna (M Corp.) WARD NO.-0001 35,074
BIHAR PATNA METRO WARD Patna (M Corp.) WARD NO.-0005 37,704
BIHAR PATNA METRO WARD Patna (M Corp.) WARD NO.-0010 23,387
BIHAR PATNA METRO WARD Patna (M Corp.) WARD NO.-0016 11,962
BIHAR PATNA METRO WARD Patna (M Corp.) WARD NO.-0022 100,261
BIHAR PATNA METRO WARD Patna (M Corp.) WARD NO.-0026 20,515
BIHAR PATNA METRO WARD Patna (M Corp.) WARD NO.-0031 39,768
BIHAR PATNA METRO WARD Patna (M Corp.) WARD NO.-0036 26,640
BIHAR PATNA METRO WARD Patna (M Corp.) WARD NO.-0043 21,752
BIHAR PATNA METRO WARD Patna (M Corp.) WARD NO.-0047 28,966
BIHAR PATNA METRO WARD Patna (M Corp.) WARD NO.-0052 24,906
BIHAR PATNA METRO WARD Patna (M Corp.) WARD NO.-0058 34,166
BIHAR PATNA METRO WARD Patna (M Corp.) WARD NO.-0062 22,227
BIHAR PATNA METRO WARD Patna (M Corp.) WARD NO.-0068 16,396
BIHAR PURNIA URBAN WARD Purnia (M Corp.) WARD NO.-0001 5,971
BIHAR PURNIA URBAN WARD Purnia (M Corp.) WARD NO.-0007 6,513
BIHAR PURNIA URBAN WARD Purnia (M Corp.) WARD NO.-0013 3,809
BIHAR PURNIA URBAN WARD Purnia (M Corp.) WARD NO.-0020 5,517
BIHAR PURNIA URBAN WARD Purnia (M Corp.) WARD NO.-0025 6,752
BIHAR PURNIA URBAN WARD Purnia (M Corp.) WARD NO.-0030 7,746
BIHAR PURNIA URBAN WARD Purnia (M Corp.) WARD NO.-0035 7,073
BIHAR PURNIA URBAN WARD Purnia (M Corp.) WARD NO.-0040 5,994
BIHAR PURNIA URBAN WARD Purnia (M Corp.) WARD NO.-0046 7,952
BIHAR PURNIA URBAN WARD Banmankhi Bazar (NP) WARD NO.-0015 623
BIHAR PURNIA RURAL VILLAGE Bahadurpur Khan Jahan 2,168

www.FPwatch.info Page 157
Table X1. Sampled Clusters State District Strata Ward/Village Population
BIHAR PURNIA RURAL VILLAGE Begampur khata 7,404
BIHAR PURNIA RURAL VILLAGE Bisrupa 1,004
BIHAR PURNIA RURAL VILLAGE Dansar 3,117
BIHAR PURNIA RURAL VILLAGE Ganeshpur 16,745
BIHAR PURNIA RURAL VILLAGE Ichalo 4,539
BIHAR PURNIA RURAL VILLAGE Khokha 19,277
BIHAR PURNIA RURAL VILLAGE Maharajpur 5,505
BIHAR PURNIA RURAL VILLAGE Mohaddipur 1,683
BIHAR PURNIA RURAL VILLAGE Raghunathpur 3,902
BIHAR PURNIA RURAL VILLAGE Sahiaganj 12,014
BIHAR PURNIA RURAL VILLAGE Tamaut 4,205
BIHAR SARAN URBAN WARD Chapra (Nagar Parishad) WARD NO.-0001 6,123
BIHAR SARAN URBAN WARD Chapra (Nagar Parishad) WARD NO.-0008 4,226
BIHAR SARAN URBAN WARD Chapra (Nagar Parishad) WARD NO.-0015 5,818
BIHAR SARAN URBAN WARD Chapra (Nagar Parishad) WARD NO.-0023 4,260
BIHAR SARAN URBAN WARD Chapra (Nagar Parishad) WARD NO.-0031 4,939
BIHAR SARAN URBAN WARD Chapra (Nagar Parishad) WARD NO.-0039 4,324
BIHAR SARAN URBAN WARD Revelganj (NP) WARD NO.-0005 1,547
BIHAR SARAN URBAN WARD Sanrha (CT) WARD NO.-0001 11,362
BIHAR SARAN URBAN WARD Marhaura (NP) WARD NO.-0016 1,693
BIHAR SARAN URBAN WARD Sonepur (NP) WARD NO.-0002 2,604
BIHAR SARAN RURAL VILLAGE Bangra 6,706
BIHAR SARAN RURAL VILLAGE Bhithi 2,956
BIHAR SARAN RURAL VILLAGE Dayalpur 9,223
BIHAR SARAN RURAL VILLAGE Gheghta 4,514
BIHAR SARAN RURAL VILLAGE Jerha 4,366
BIHAR SARAN RURAL VILLAGE Kopa 18,779
BIHAR SARAN RURAL VILLAGE Mani 4,979
BIHAR SARAN RURAL VILLAGE Nagra 5,459
BIHAR SARAN RURAL VILLAGE Partappur 4,837
BIHAR SARAN RURAL VILLAGE Rasauli 11,332
BIHAR SARAN RURAL VILLAGE Shahpur 13,547
BIHAR SARAN RURAL VILLAGE Totaha Jagatpur 3,652
BIHAR SIWAN URBAN WARD Siwan (Nagar Parishad) WARD NO.-0001 3,402
BIHAR SIWAN URBAN WARD Siwan (Nagar Parishad) WARD NO.-0006 5,098
BIHAR SIWAN URBAN WARD Siwan (Nagar Parishad) WARD NO.-0011 2,300
BIHAR SIWAN URBAN WARD Siwan (Nagar Parishad) WARD NO.-0017 5,253
BIHAR SIWAN URBAN WARD Siwan (Nagar Parishad) WARD NO.-0023 2,621
BIHAR SIWAN URBAN WARD Siwan (Nagar Parishad) WARD NO.-0028 4,279
BIHAR SIWAN URBAN WARD Siwan (Nagar Parishad) WARD NO.-0033 3,462
BIHAR SIWAN URBAN WARD Siwan (Nagar Parishad) WARD NO.-0037 4,993
BIHAR SIWAN URBAN WARD Maharajganj (NP) WARD NO.-0007 2,053
BIHAR SIWAN URBAN WARD Mairwa (NP) WARD NO.-0003 2,405
BIHAR SIWAN RURAL VILLAGE Bahuara qadir 3,511
BIHAR SIWAN RURAL VILLAGE Belaur 3,325

www.FPwatch.info Page 158
Table X1. Sampled Clusters State District Strata Ward/Village Population
BIHAR SIWAN RURAL VILLAGE Chandpur 1,353
BIHAR SIWAN RURAL VILLAGE Fatehpur 1,813
BIHAR SIWAN RURAL VILLAGE Hasanpura 8,159
BIHAR SIWAN RURAL VILLAGE Karanpura 7,660
BIHAR SIWAN RURAL VILLAGE Lakri 17,266
BIHAR SIWAN RURAL VILLAGE Mohiuddinpur 6,309
BIHAR SIWAN RURAL VILLAGE Parasia Khurd 564
BIHAR SIWAN RURAL VILLAGE Rohara 3,456
BIHAR SIWAN RURAL VILLAGE Shampur 3,025
BIHAR SIWAN RURAL VILLAGE Tetahli 5,404
UP AGRA URBAN WARD Etmadpur (NPP) WARD NO.-0006 802
UP AGRA URBAN WARD Agra (CB) WARD NO.-0005 4,629
UP AGRA URBAN WARD Patholi (CT) WARD NO.-0001 7,884
UP AGRA URBAN WARD Azizpur (CT) WARD NO.-0001 11,103
UP AGRA URBAN WARD Achhnera (NPP) WARD NO.-0005 1,198
UP AGRA URBAN WARD Fatehpur Sikri (NPP) WARD NO.-0009 943
UP AGRA URBAN WARD Kheragarh (NP) WARD NO.-0006 1,741
UP AGRA URBAN WARD Fatehabad (NP) WARD NO.-0004 1,701
UP AGRA RURAL VILLAGE Gidron 143
UP AGRA RURAL VILLAGE Sikari Hissa Ii 1,214
UP AGRA RURAL VILLAGE Manona 1,695
UP AGRA RURAL VILLAGE Garhima 2,092
UP AGRA RURAL VILLAGE Danda 2,554
UP AGRA RURAL VILLAGE Bisahara 2,943
UP AGRA RURAL VILLAGE Rasulpur 3,549
UP AGRA RURAL VILLAGE Benai 4,244
UP AGRA RURAL VILLAGE Naharra 4,912
UP AGRA RURAL VILLAGE Pharaira 5,662
UP AGRA RURAL VILLAGE Tehu 7,050
UP AGRA RURAL VILLAGE Saimari 8,568
UP AGRA RURAL VILLAGE Midhakur 12,102
UP AGRA METRO WARD Agra (M Corp.) WARD NO.-0051 9,691
UP AGRA METRO WARD Agra (M Corp.) WARD NO.-0032 16,784
UP AGRA METRO WARD Agra (M Corp.) WARD NO.-0037 23,182
UP ALLAHABAD URBAN WARD Mau Aima (NP) WARD NO.-0001 2,032
UP ALLAHABAD URBAN WARD Lal Gopalganj Nindaura (NP) WARD NO.-0010 2,010
UP ALLAHABAD URBAN WARD Phulpur (NP) WARD NO.-0004 1,665
UP ALLAHABAD URBAN WARD Jhusi Kohna (CT) WARD NO.-0001 20,023
UP ALLAHABAD URBAN WARD Bihka Urf Pura Mufti (CT) WARD NO.-0001 10,749
UP ALLAHABAD URBAN WARD Jasra (CT) WARD NO.-0001 5,483
UP ALLAHABAD URBAN WARD Pura Pandey (CT) WARD NO.-0001 4,066
UP ALLAHABAD URBAN WARD Sirsa (NP) WARD NO.-0005 1,234
UP ALLAHABAD RURAL VILLAGE Chak Sulatan Urf Newada 676
UP ALLAHABAD RURAL VILLAGE Abdul Wahabpur 1,011
UP ALLAHABAD RURAL VILLAGE Neemi Ta. Utraon 1,278
UP ALLAHABAD RURAL VILLAGE Janwan 1,552

www.FPwatch.info Page 159
Table X1. Sampled Clusters State District Strata Ward/Village Population
UP ALLAHABAD RURAL VILLAGE Bhavanipur 1,856
UP ALLAHABAD RURAL VILLAGE Piparhatta 2,172
UP ALLAHABAD RURAL VILLAGE Fatehpur Maphi 2,480
UP ALLAHABAD RURAL VILLAGE Belwa 2,849
UP ALLAHABAD RURAL VILLAGE Paigamberpur 3,360
UP ALLAHABAD RURAL VILLAGE Anjana 4,042
UP ALLAHABAD RURAL VILLAGE Samhai 4,904
UP ALLAHABAD RURAL VILLAGE Kathauli 6,323
UP ALLAHABAD RURAL VILLAGE Manda Khas 10,537
UP ALLAHABAD METRO WARD Allahabad (M Corp.) WARD NO.-0067 6,087
UP ALLAHABAD METRO WARD Allahabad (M Corp.) WARD NO.-0014 14,163
UP ALLAHABAD METRO WARD A.D.A. Colony (OG) WARD NO.-0086 (Rural MDDS CODE:161843) 22,774
UP AZAMGARH URBAN WARD Azamgarh (NPP) WARD NO.-0001 1,991
UP AZAMGARH URBAN WARD Azamgarh (NPP) WARD NO.-0012 6,383
UP AZAMGARH URBAN WARD Azamgarh (NPP) WARD NO.-0022 2,974
UP AZAMGARH URBAN WARD Jiyanpur (NP) WARD NO.-0007 915
UP AZAMGARH URBAN WARD Mubarakpur (NPP) WARD NO.-0011 1,958
UP AZAMGARH URBAN WARD Chak Sikari (CT) WARD NO.-0001 8,820
UP AZAMGARH URBAN WARD Amilo (CT) WARD NO.-0001 30,339
UP AZAMGARH URBAN WARD Sarai Mir (NP) WARD NO.-0010 1,386
UP AZAMGARH RURAL VILLAGE Balipur 411
UP AZAMGARH RURAL VILLAGE Tikari 675
UP AZAMGARH RURAL VILLAGE Parmeshwar Pur 909
UP AZAMGARH RURAL VILLAGE Dharmdaspur 1,109
UP AZAMGARH RURAL VILLAGE Allipur 1,338
UP AZAMGARH RURAL VILLAGE Sham Shallipur 1,579
UP AZAMGARH RURAL VILLAGE Dihpur 1,837
UP AZAMGARH RURAL VILLAGE Basti Chak Gulara 2,171
UP AZAMGARH RURAL VILLAGE Kharevan 2,521
UP AZAMGARH RURAL VILLAGE Beenapara 3,031
UP AZAMGARH RURAL VILLAGE Sarawan 3,729
UP AZAMGARH RURAL VILLAGE Gomadih 4,863
UP AZAMGARH RURAL VILLAGE Sethaval 7,108
UP BALRAMPUR URBAN WARD Balrampur (NPP) WARD NO.-0001 2,302
UP BALRAMPUR URBAN WARD Balrampur (NPP) WARD NO.-0007 3,035
UP BALRAMPUR URBAN WARD Balrampur (NPP) WARD NO.-0012 3,126
UP BALRAMPUR URBAN WARD Balrampur (NPP) WARD NO.-0019 3,227
UP BALRAMPUR URBAN WARD Bishunipur (CT) WARD NO.-0001 4,302
UP BALRAMPUR URBAN WARD Tulsipur (NP) WARD NO.-0011 1,435
UP BALRAMPUR URBAN WARD Pachperwa (NP) WARD NO.-0010 1,433
UP BALRAMPUR URBAN WARD Utraula (NPP) WARD NO.-0009 1,954
UP BALRAMPUR RURAL VILLAGE Mahri 678
UP BALRAMPUR RURAL VILLAGE Badalpur Chaukharia 1,157
UP BALRAMPUR RURAL VILLAGE Katara 1,466
UP BALRAMPUR RURAL VILLAGE Singahi 1,730
UP BALRAMPUR RURAL VILLAGE Suganagar 1,959

www.FPwatch.info Page 160
Table X1. Sampled Clusters State District Strata Ward/Village Population
UP BALRAMPUR RURAL VILLAGE Mahadeo Seopur 2,347
UP BALRAMPUR RURAL VILLAGE Gugauli Khurd 2,554
UP BALRAMPUR RURAL VILLAGE Dulhapur 2,802
UP BALRAMPUR RURAL VILLAGE Kather 3,127
UP BALRAMPUR RURAL VILLAGE Ramwapur 3,707
UP BALRAMPUR RURAL VILLAGE Baluwa Balui 4,332
UP BALRAMPUR RURAL VILLAGE Gainjahwa 5,914
UP BALRAMPUR RURAL VILLAGE Balrampur(Rural) 8,915
UP BAREILLY URBAN WARD Bareilly (M Corp.) WARD NO.-0001 10,195
UP BAREILLY URBAN WARD Bareilly (M Corp.) WARD NO.-0014 14,058
UP BAREILLY URBAN WARD Bareilly (M Corp.) WARD NO.-0029 11,040
UP BAREILLY URBAN WARD Bareilly (M Corp.) WARD NO.-0046 40,925
UP BAREILLY URBAN WARD Bareilly (M Corp.) WARD NO.-0060 9,079
UP BAREILLY URBAN WARD Faridpur (NP) WARD NO.-0010 660
UP BAREILLY URBAN WARD Aonla (NPP) WARD NO.-0017 2,971
UP BAREILLY URBAN WARD Mohenpur (CT) WARD NO.-0001 21,812
UP BAREILLY RURAL VILLAGE Matkula 416
UP BAREILLY RURAL VILLAGE Bijasin 792
UP BAREILLY RURAL VILLAGE Fardia Mankara 1,099
UP BAREILLY RURAL VILLAGE Karuatal 1,326
UP BAREILLY RURAL VILLAGE Dabhora Khanjanpur 1,590
UP BAREILLY RURAL VILLAGE Tera 1,835
UP BAREILLY RURAL VILLAGE Gularia Mohammad Hussain 2,123
UP BAREILLY RURAL VILLAGE Khanjanpur Khanjania 2,461
UP BAREILLY RURAL VILLAGE Grem 2,908
UP BAREILLY RURAL VILLAGE Shahpur 3,361
UP BAREILLY RURAL VILLAGE Sirohi 4,136
UP BAREILLY RURAL VILLAGE Chaneta 5,346
UP BAREILLY RURAL VILLAGE Pachdeora Kalan 7,975
UP BUDAUN URBAN WARD Budaun (NPP) WARD NO.-0001 5,291
UP BUDAUN URBAN WARD Budaun (NPP) WARD NO.-0015 6,220
UP BUDAUN URBAN WARD Gawan (NP) WARD NO.-0002 996
UP BUDAUN URBAN WARD Faizganj (NP) WARD NO.-0001 1,197
UP BUDAUN URBAN WARD Wazirganj (NP) WARD NO.-0008 1,532
UP BUDAUN URBAN WARD Sahaswan (NPP) WARD NO.-0016 3,371
UP BUDAUN URBAN WARD Ujhani (NPP) WARD NO.-0019 2,824
UP BUDAUN URBAN WARD Kakrala (NPP) WARD NO.-0025 1,613
UP BUDAUN RURAL VILLAGE Sundar Nagar 734
UP BUDAUN RURAL VILLAGE Nareli Mahaura 1,070
UP BUDAUN RURAL VILLAGE Sihora 1,315
UP BUDAUN RURAL VILLAGE Nagala Baran 1,537
UP BUDAUN RURAL VILLAGE Majhara 1,788
UP BUDAUN RURAL VILLAGE Harganpur 2,033
UP BUDAUN RURAL VILLAGE Deoria Asguna 2,363
UP BUDAUN RURAL VILLAGE Dhaurera 2,750
UP BUDAUN RURAL VILLAGE Garhi 3,212

www.FPwatch.info Page 161
Table X1. Sampled Clusters State District Strata Ward/Village Population
UP BUDAUN RURAL VILLAGE Ahmad Nagar Asouli 3,952
UP BUDAUN RURAL VILLAGE Butla Daulat 4,784
UP BUDAUN RURAL VILLAGE Bhawanipur Kheru 6,550
UP BUDAUN RURAL VILLAGE Shekhupur 16,007
UP DEORIA URBAN WARD Deoria (NPP) WARD NO.-0001 6,224
UP DEORIA URBAN WARD Deoria (NPP) WARD NO.-0007 7,980
UP DEORIA URBAN WARD Deoria (NPP) WARD NO.-0014 3,905
UP DEORIA URBAN WARD Deoria (NPP) WARD NO.-0023 4,516
UP DEORIA URBAN WARD Rudrapur (NP) WARD NO.-0006 4,127
UP DEORIA URBAN WARD Gaura Barhaj (NPP) WARD NO.-0012 1,654
UP DEORIA URBAN WARD Majhauliraj (NP) WARD NO.-0004 1,423
UP DEORIA URBAN WARD Lar (NP) WARD NO.-0003 2,128
UP DEORIA RURAL VILLAGE Sonbah Ahatmali 555
UP DEORIA RURAL VILLAGE Sukarouli 864
UP DEORIA RURAL VILLAGE Garib Patti 1,106
UP DEORIA RURAL VILLAGE Mundwar 1,341
UP DEORIA RURAL VILLAGE Kotha 1,570
UP DEORIA RURAL VILLAGE Motipur Tikait 1,827
UP DEORIA RURAL VILLAGE Deokali Jairam 2,092
UP DEORIA RURAL VILLAGE Jungle Parsotima 2,479
UP DEORIA RURAL VILLAGE Majhawalia 3,009
UP DEORIA RURAL VILLAGE Tirmasahun 3,525
UP DEORIA RURAL VILLAGE Mahuawan Bajaratar 4,424
UP DEORIA RURAL VILLAGE Nautan Hathiagarh 6,015
UP DEORIA RURAL VILLAGE Kaparwar 10,839
UP FARRUKHABAD URBAN WARD Farrukhabad-cum-Fatehgarh (NPP) WARD NO.-0001 8,754
UP FARRUKHABAD URBAN WARD Farrukhabad-cum-Fatehgarh (NPP) WARD NO.-0007 12,474
UP FARRUKHABAD URBAN WARD Farrukhabad-cum-Fatehgarh (NPP) WARD NO.-0013 6,337
UP FARRUKHABAD URBAN WARD Farrukhabad-cum-Fatehgarh (NPP) WARD NO.-0020 7,173
UP FARRUKHABAD URBAN WARD Farrukhabad-cum-Fatehgarh (NPP) WARD NO.-0027 7,507
UP FARRUKHABAD URBAN WARD Farrukhabad-cum-Fatehgarh (NPP) WARD NO.-0034 6,511
UP FARRUKHABAD URBAN WARD Kaimganj (NPP) WARD NO.-0019 1,598
UP FARRUKHABAD URBAN WARD Fatehgarh (CB) WARD NO.-0007 1,517
UP FARRUKHABAD RURAL VILLAGE Husainpur Masmuley Dariyapur 688
UP FARRUKHABAD RURAL VILLAGE Dhadhuliya Patti 1,028
UP FARRUKHABAD RURAL VILLAGE Darapur 1,298
UP FARRUKHABAD RURAL VILLAGE Musepur 1,541
UP FARRUKHABAD RURAL VILLAGE Raukri 1,763
UP FARRUKHABAD RURAL VILLAGE Veerpur 2,099
UP FARRUKHABAD RURAL VILLAGE Gudera 2,504
UP FARRUKHABAD RURAL VILLAGE Dhansua 2,787
UP FARRUKHABAD RURAL VILLAGE Singhirampur 3,561
UP FARRUKHABAD RURAL VILLAGE Sarha 4,237
UP FARRUKHABAD RURAL VILLAGE Papiha Pur 5,456
UP FARRUKHABAD RURAL VILLAGE Bartal 7,097
UP FARRUKHABAD RURAL VILLAGE Sirauli 18,600

www.FPwatch.info Page 162
Table X1. Sampled Clusters State District Strata Ward/Village Population
UP GHAZIABAD URBAN WARD Modinagar (NPP) WARD NO.-0001 6,419
UP GHAZIABAD URBAN WARD Loni (NPP) WARD NO.-0005 15,915
UP GHAZIABAD URBAN WARD Loni (NPP) WARD NO.-0022 12,910
UP GHAZIABAD URBAN WARD Loni (NPP) WARD NO.-0039 13,342
UP GHAZIABAD URBAN WARD Khora (CT) WARD NO.-0001 190,005
UP GHAZIABAD URBAN WARD Hapur (NPP) WARD NO.-0013 14,351
UP GHAZIABAD URBAN WARD Muradnagar (NPP) WARD NO.-0002 2,852
UP GHAZIABAD URBAN WARD Dasna (NP) WARD NO.-0008 2,990
UP GHAZIABAD RURAL VILLAGE Abdulapur Dateri 63
UP GHAZIABAD RURAL VILLAGE Nig Rayati 1,425
UP GHAZIABAD RURAL VILLAGE Patna 1,932
UP GHAZIABAD RURAL VILLAGE Phaphrana 2,354
UP GHAZIABAD RURAL VILLAGE Jahangirpur 2,850
UP GHAZIABAD RURAL VILLAGE Muradnagar 3,311
UP GHAZIABAD RURAL VILLAGE Nan 3,871
UP GHAZIABAD RURAL VILLAGE Chhapkauli 4,271
UP GHAZIABAD RURAL VILLAGE Raoli Kalan 5,347
UP GHAZIABAD RURAL VILLAGE Saunda 6,042
UP GHAZIABAD RURAL VILLAGE Salai 8,131
UP GHAZIABAD RURAL VILLAGE Dautai 11,510
UP GHAZIABAD RURAL VILLAGE Bhajeda Kalan 15,957
UP GHAZIABAD METRO WARD Ghaziabad (M Corp.) WARD NO.-0021 15,031
UP GHAZIABAD METRO WARD Ghaziabad (M Corp.) WARD NO.-0048 25,375
UP GHAZIABAD METRO WARD Ghaziabad (M Corp.) WARD NO.-0058 69,739
UP GORAKHPUR URBAN WARD Gorakhpur (M Corp.) WARD NO.-0001 11,245
UP GORAKHPUR URBAN WARD Gorakhpur (M Corp.) WARD NO.-0010 12,858
UP GORAKHPUR URBAN WARD Gorakhpur (M Corp.) WARD NO.-0020 11,452
UP GORAKHPUR URBAN WARD Gorakhpur (M Corp.) WARD NO.-0032 4,773
UP GORAKHPUR URBAN WARD Gorakhpur (M Corp.) WARD NO.-0043 13,284
UP GORAKHPUR URBAN WARD Gorakhpur (M Corp.) WARD NO.-0054 8,567
UP GORAKHPUR URBAN WARD Gorakhpur (M Corp.) WARD NO.-0065 8,759
UP GORAKHPUR URBAN WARD Pipraich (NP) WARD NO.-0004 1,191
UP GORAKHPUR RURAL VILLAGE Bishunpur Khurd 503
UP GORAKHPUR RURAL VILLAGE Diwa 766
UP GORAKHPUR RURAL VILLAGE Raepur 1,021
UP GORAKHPUR RURAL VILLAGE Jhudiya 1,243
UP GORAKHPUR RURAL VILLAGE Bhat Ganwa 1,540
UP GORAKHPUR RURAL VILLAGE Ankatahawa 1,836
UP GORAKHPUR RURAL VILLAGE Chadraw 2,199
UP GORAKHPUR RURAL VILLAGE Narainpur No.2 2,690
UP GORAKHPUR RURAL VILLAGE Majurikhas 3,262
UP GORAKHPUR RURAL VILLAGE Kaithawalia 3,952
UP GORAKHPUR RURAL VILLAGE Palikhas 5,238
UP GORAKHPUR RURAL VILLAGE Raiganj 7,502
UP GORAKHPUR RURAL VILLAGE Jungle Rasoolpur No.2 13,420
UP JALAUN URBAN WARD Orai (NPP) WARD NO.-0001 5,404

www.FPwatch.info Page 163
Table X1. Sampled Clusters State District Strata Ward/Village Population
UP JALAUN URBAN WARD Orai (NPP) WARD NO.-0008 5,770
UP JALAUN URBAN WARD Orai (NPP) WARD NO.-0014 4,524
UP JALAUN URBAN WARD Orai (NPP) WARD NO.-0024 4,504
UP JALAUN URBAN WARD Umri (NP) WARD NO.-0007 749
UP JALAUN URBAN WARD Jalaun (NPP) WARD NO.-0016 2,208
UP JALAUN URBAN WARD Kalpi (NPP) WARD NO.-0015 2,014
UP JALAUN URBAN WARD Konch (NPP) WARD NO.-0003 2,033
UP JALAUN RURAL VILLAGE Ganeshpura 308
UP JALAUN RURAL VILLAGE Takawali 709
UP JALAUN RURAL VILLAGE Chamari 888
UP JALAUN RURAL VILLAGE Husepura Surai 1,094
UP JALAUN RURAL VILLAGE Sarangpur 1,325
UP JALAUN RURAL VILLAGE Chamarsena 1,647
UP JALAUN RURAL VILLAGE Paharpura 1,916
UP JALAUN RURAL VILLAGE Harshankarpur Mustakil 2,233
UP JALAUN RURAL VILLAGE Mahewa 2,736
UP JALAUN RURAL VILLAGE Kukar Gaon 3,321
UP JALAUN RURAL VILLAGE Sahao 4,061
UP JALAUN RURAL VILLAGE Mohammdabad 4,933
UP JALAUN RURAL VILLAGE Parsan 9,008
UP KANNAUJ URBAN WARD Samdhan (NP) WARD NO.-0001 2,010
UP KANNAUJ URBAN WARD Gursahaiganj (NPP) WARD NO.-0002 2,551
UP KANNAUJ URBAN WARD Gursahaiganj (NPP) WARD NO.-0021 1,609
UP KANNAUJ URBAN WARD Chhibramau (NPP) WARD NO.-0008 4,023
UP KANNAUJ URBAN WARD Chhibramau (NPP) WARD NO.-0022 2,782
UP KANNAUJ URBAN WARD Kannauj (NPP) WARD NO.-0001 3,856
UP KANNAUJ URBAN WARD Kannauj (NPP) WARD NO.-0012 3,429
UP KANNAUJ URBAN WARD Kannauj (NPP) WARD NO.-0023 3,105
UP KANNAUJ RURAL VILLAGE Tandha 474
UP KANNAUJ RURAL VILLAGE Ayub Pur 960
UP KANNAUJ RURAL VILLAGE Dilawar Pur 1,279
UP KANNAUJ RURAL VILLAGE Rasulpur 1,627
UP KANNAUJ RURAL VILLAGE Tamiya Mau 1,927
UP KANNAUJ RURAL VILLAGE Fatehpur Kapoorapur 2,303
UP KANNAUJ RURAL VILLAGE Salempur Raupalpur 2,629
UP KANNAUJ RURAL VILLAGE Chiasar Shahpur 3,224
UP KANNAUJ RURAL VILLAGE Kabirpur 3,571
UP KANNAUJ RURAL VILLAGE Gorakhpur Harbhanpur 4,523
UP KANNAUJ RURAL VILLAGE Bhunna 5,603
UP KANNAUJ RURAL VILLAGE Kasawa 6,557
UP KANNAUJ RURAL VILLAGE Sakrawa 9,148
UP KANPUR NAGAR METRO WARD Kanpur (M Corp.) WARD NO.-0094 19,043
UP KANPUR NAGAR METRO WARD Kanpur (M Corp.) WARD NO.-0002 22,551
UP KANPUR NAGAR METRO WARD Kanpur (M Corp.) WARD NO.-0101 25,874
UP KANPUR NAGAR METRO WARD Kanpur (M Corp.) WARD NO.-0066 30,434
UP KANPUR NAGAR METRO WARD Kanpur (M Corp.) WARD NO.-0067 41,670

www.FPwatch.info Page 164
Table X1. Sampled Clusters State District Strata Ward/Village Population
UP KHERI URBAN WARD Lakhimpur (NPP) WARD NO.-0001 9,266
UP KHERI URBAN WARD Lakhimpur (NPP) WARD NO.-0010 4,118
UP KHERI URBAN WARD Lakhimpur (NPP) WARD NO.-0021 7,183
UP KHERI URBAN WARD Suthana Barsola (CT) WARD NO.-0001 9,936
UP KHERI URBAN WARD Mailani (NP) WARD NO.-0008 1,122
UP KHERI URBAN WARD Gola Gokaran Nath (NPP) WARD NO.-0023 3,802
UP KHERI URBAN WARD Mohammadi (NPP) WARD NO.-0022 1,693
UP KHERI URBAN WARD Kheri (NP) WARD NO.-0013 1,533
UP KHERI RURAL VILLAGE Dubaila 72
UP KHERI RURAL VILLAGE Ram Nagar 908
UP KHERI RURAL VILLAGE Jadaura 1,380
UP KHERI RURAL VILLAGE Laukikhera 1,765
UP KHERI RURAL VILLAGE Gaura 2,144
UP KHERI RURAL VILLAGE Khamereya 2,522
UP KHERI RURAL VILLAGE Mohammadisray 2,919
UP KHERI RURAL VILLAGE Bhagawant Nagar 3,355
UP KHERI RURAL VILLAGE Singawer 4,218
UP KHERI RURAL VILLAGE Jamuniya 4,927
UP KHERI RURAL VILLAGE Garhaiya 6,373
UP KHERI RURAL VILLAGE Chedui Pateya 8,556
UP KHERI RURAL VILLAGE Paduwa 12,264
UP LUCKNOW METRO WARD Lucknow (M Corp.) WARD NO.-0083 16,256
UP LUCKNOW METRO WARD Lucknow (M Corp.) WARD NO.-0026 19,965
UP LUCKNOW METRO WARD Lucknow (M Corp.) WARD NO.-0107 23,720
UP LUCKNOW METRO WARD Lucknow (M Corp.) WARD NO.-0040 31,412
UP LUCKNOW METRO WARD Lucknow (M Corp.) WARD NO.-0105 41,909
UP LUCKNOW METRO WARD Lucknow (M Corp.) WARD NO.-0021 68,993
UP MAHA-NAGAR URBAN WARD Hathras (NPP) WARD NO.-0001 6,535
UP MAHA-NAGAR URBAN WARD Hathras (NPP) WARD NO.-0007 6,250
UP MAHA-NAGAR URBAN WARD Hathras (NPP) WARD NO.-0015 6,250
UP MAHA-NAGAR URBAN WARD Hathras (NPP) WARD NO.-0024 3,745
UP MAHA-NAGAR URBAN WARD Sikandrarao (NPP) WARD NO.-0005 1,936
UP MAHA-NAGAR URBAN WARD Purdilnagar (NP) WARD NO.-0003 1,372
UP MAHA-NAGAR URBAN WARD Mursan (NP) WARD NO.-0004 1,187
UP MAHA-NAGAR URBAN WARD Sadabad (NP) WARD NO.-0004 3,207
UP MAHA-NAGAR RURAL VILLAGE Rajnagar 570
UP MAHA-NAGAR RURAL VILLAGE Ram Pur 973
UP MAHA-NAGAR RURAL VILLAGE Tonda 1,231
UP MAHA-NAGAR RURAL VILLAGE Arifpur Bhogpur 1,528
UP MAHA-NAGAR RURAL VILLAGE Raj Nagar 1,897
UP MAHA-NAGAR RURAL VILLAGE Kharwa 2,210
UP MAHA-NAGAR RURAL VILLAGE Nagla Salem 2,649
UP MAHA-NAGAR RURAL VILLAGE Jatoi 3,124
UP MAHA-NAGAR RURAL VILLAGE Mahmud Barsai 3,624
UP MAHA-NAGAR RURAL VILLAGE Mau Chirayal 4,272
UP MAHA-NAGAR RURAL VILLAGE Baramai Nagla Bijan 5,040

www.FPwatch.info Page 165
Table X1. Sampled Clusters State District Strata Ward/Village Population
UP MAHA-NAGAR RURAL VILLAGE Barwana 6,857
UP MAHA-NAGAR RURAL VILLAGE Kachaura 10,259
UP MAU URBAN WARD Maunath Bhanjan (NPP) WARD NO.-0001 9,099
UP MAU URBAN WARD Maunath Bhanjan (NPP) WARD NO.-0009 6,236
UP MAU URBAN WARD Maunath Bhanjan (NPP) WARD NO.-0016 7,827
UP MAU URBAN WARD Maunath Bhanjan (NPP) WARD NO.-0023 7,268
UP MAU URBAN WARD Maunath Bhanjan (NPP) WARD NO.-0033 11,082
UP MAU URBAN WARD Ghosi (NP) WARD NO.-0008 2,610
UP MAU URBAN WARD Kopaganj (NP) WARD NO.-0017 1,603
UP MAU URBAN WARD Muhammadabad (NP) WARD NO.-0010 1,966
UP MAU RURAL VILLAGE Awasthi Brahim 364
UP MAU RURAL VILLAGE Kakarha 666
UP MAU RURAL VILLAGE Larewa 938
UP MAU RURAL VILLAGE Saddopur Basdeopur 1,205
UP MAU RURAL VILLAGE Tesu Pur 1,482
UP MAU RURAL VILLAGE Khushamadpur 1,831
UP MAU RURAL VILLAGE Mau Kuber 2,211
UP MAU RURAL VILLAGE Parashurampur 2,581
UP MAU RURAL VILLAGE Majhawara 3,063
UP MAU RURAL VILLAGE Bhatkol 3,559
UP MAU RURAL VILLAGE Khurahat 4,164
UP MAU RURAL VILLAGE Alinagar 5,360
UP MAU RURAL VILLAGE Sarwan 10,297
UP MEERUT METRO WARD Meerut (M Corp.) WARD NO.-0029 15,155
UP MEERUT METRO WARD Meerut (M Corp.) WARD NO.-0023 21,345
UP MORADABAD URBAN WARD Moradabad (M Corp.) WARD NO.-0001 20,438
UP MORADABAD URBAN WARD Moradabad (M Corp.) WARD NO.-0013 21,346
UP MORADABAD URBAN WARD Moradabad (M Corp.) WARD NO.-0026 20,014
UP MORADABAD URBAN WARD Moradabad (M Corp.) WARD NO.-0043 20,387
UP MORADABAD URBAN WARD Moradabad (M Corp.) WARD NO.-0060 9,104
UP MORADABAD URBAN WARD Sambhal (NPP) WARD NO.-0013 8,360
UP MORADABAD URBAN WARD Chandausi (NPP) WARD NO.-0017 2,370
UP MORADABAD URBAN WARD Pakbara (CT) WARD NO.-0001 36,728
UP MORADABAD RURAL VILLAGE Dhampur 764
UP MORADABAD RURAL VILLAGE Nagla 1,201
UP MORADABAD RURAL VILLAGE Peelakpur Sheoram 1,570
UP MORADABAD RURAL VILLAGE Bahadar Ganj 1,890
UP MORADABAD RURAL VILLAGE Pasia Pura Padarath 2,235
UP MORADABAD RURAL VILLAGE Bhulawai 2,633
UP MORADABAD RURAL VILLAGE Akberpur 3,064
UP MORADABAD RURAL VILLAGE Sonakpur 3,542
UP MORADABAD RURAL VILLAGE Mukhtyarpur Nawada 4,039
UP MORADABAD RURAL VILLAGE Dhrampur Kalan 4,901
UP MORADABAD RURAL VILLAGE Bhartal Sirsi 5,801
UP MORADABAD RURAL VILLAGE Mohemmadpur Bastaur 7,276
UP MORADABAD RURAL VILLAGE Janaita 14,604

www.FPwatch.info Page 166
Table X1. Sampled Clusters State District Strata Ward/Village Population
UP PRATAPGARH URBAN WARD Manikpur (NP) WARD NO.-0001 1,553
UP PRATAPGARH URBAN WARD Kunda (NP) WARD NO.-0004 1,801
UP PRATAPGARH URBAN WARD Antu (NP) WARD NO.-0002 668
UP PRATAPGARH URBAN WARD Bela Pratapgarh (NPP) WARD NO.-0004 3,198
UP PRATAPGARH URBAN WARD Bela Pratapgarh (NPP) WARD NO.-0012 3,287
UP PRATAPGARH URBAN WARD Bela Pratapgarh (NPP) WARD NO.-0020 3,009
UP PRATAPGARH URBAN WARD Pratapgarh City (NP) WARD NO.-0004 1,525
UP PRATAPGARH URBAN WARD Dahilamau (CT) WARD NO.-0001 6,016
UP PRATAPGARH RURAL VILLAGE Ghorkata 46
UP PRATAPGARH RURAL VILLAGE Shankarpur 597
UP PRATAPGARH RURAL VILLAGE Sarai Santram 879
UP PRATAPGARH RURAL VILLAGE Gopalapur 1,104
UP PRATAPGARH RURAL VILLAGE Barahda 1,336
UP PRATAPGARH RURAL VILLAGE Balapur 1,599
UP PRATAPGARH RURAL VILLAGE Masauli 1,890
UP PRATAPGARH RURAL VILLAGE Kutilya Sanddei 2,222
UP PRATAPGARH RURAL VILLAGE Hinahun 2,570
UP PRATAPGARH RURAL VILLAGE Kanja Sarai Gulami 2,985
UP PRATAPGARH RURAL VILLAGE Buapur 3,468
UP PRATAPGARH RURAL VILLAGE Dileeppur 4,221
UP PRATAPGARH RURAL VILLAGE Ramapur 5,802
UP SAHARANPUR URBAN WARD Saharanpur (M Corp.) WARD NO.-0001 7,881
UP SAHARANPUR URBAN WARD Saharanpur (M Corp.) WARD NO.-0015 9,592
UP SAHARANPUR URBAN WARD Saharanpur (M Corp.) WARD NO.-0029 12,227
UP SAHARANPUR URBAN WARD Saharanpur (M Corp.) WARD NO.-0043 8,542
UP SAHARANPUR URBAN WARD Saharanpur (M Corp.) WARD NO.-0056 33,372
UP SAHARANPUR URBAN WARD Saharanpur (M Corp.) WARD NO.-0079 5,695
UP SAHARANPUR URBAN WARD Sarsawa (NPP) WARD NO.-0018 1,154
UP SAHARANPUR URBAN WARD Deoband (NPP) WARD NO.-0006 4,401
UP SAHARANPUR RURAL VILLAGE Dariapur 401
UP SAHARANPUR RURAL VILLAGE Bhatpura 1,027
UP SAHARANPUR RURAL VILLAGE Padam Nagli 1,378
UP SAHARANPUR RURAL VILLAGE Mahmoodpur 1,736
UP SAHARANPUR RURAL VILLAGE Pilkhani 2,070
UP SAHARANPUR RURAL VILLAGE Ibrahimpura 2,398
UP SAHARANPUR RURAL VILLAGE Fatehpur Dhola 2,727
UP SAHARANPUR RURAL VILLAGE Salar-Pura 3,156
UP SAHARANPUR RURAL VILLAGE Halgoya Must. 3,577
UP SAHARANPUR RURAL VILLAGE Kulsath 4,207
UP SAHARANPUR RURAL VILLAGE Khudana 4,835
UP SAHARANPUR RURAL VILLAGE Nanauta Dehat 6,324
UP SAHARANPUR RURAL VILLAGE Jadauda Panda 10,590
UP SIDDHAR URBAN WARD Barhani Bazar (NP) WARD NO.-0001 1,376
UP SIDDHAR URBAN WARD Shohratgarh (NP) WARD NO.-0007 1,004
UP SIDDHAR URBAN WARD Siddharthnagar (NPP) WARD NO.-0016 989
UP SIDDHAR URBAN WARD Uska Bazar (NP) WARD NO.-0013 3,676
UP SIDDHAR URBAN WARD Bansi (NPP) WARD NO.-0004 1,679

www.FPwatch.info Page 167
Table X1. Sampled Clusters State District Strata Ward/Village Population
UP SIDDHAR URBAN WARD Bansi (NPP) WARD NO.-0016 1,766
UP SIDDHAR URBAN WARD Itwa (CT) WARD NO.-0001 8,253
UP SIDDHAR URBAN WARD Domariyaganj (NP) WARD NO.-0011 1,144
UP SIDDHAR RURAL VILLAGE Panditpur 30
UP SIDDHAR RURAL VILLAGE Pokhar Bhitawa 489
UP SIDDHAR RURAL VILLAGE Bharwtiya 652
UP SIDDHAR RURAL VILLAGE Kateser Nath 810
UP SIDDHAR RURAL VILLAGE Gangadhar Pur 952
UP SIDDHAR RURAL VILLAGE Gularaha 1,085
UP SIDDHAR RURAL VILLAGE Tilgadiya Bujurg 1,266
UP SIDDHAR RURAL VILLAGE Kati Bandh 1,475
UP SIDDHAR RURAL VILLAGE Maina 1,741
UP SIDDHAR RURAL VILLAGE Barainiya 2,043
UP SIDDHAR RURAL VILLAGE Semri 2,566
UP SIDDHAR RURAL VILLAGE Sohas Daramiyani 3,481
UP SIDDHAR RURAL VILLAGE Bhararia 5,516
UP SULTANPUR URBAN WARD Sultanpur (NPP) WARD NO.-0001 4,531
UP SULTANPUR URBAN WARD Sultanpur (NPP) WARD NO.-0006 5,587
UP SULTANPUR URBAN WARD Sultanpur (NPP) WARD NO.-0011 4,288
UP SULTANPUR URBAN WARD Sultanpur (NPP) WARD NO.-0017 3,642
UP SULTANPUR URBAN WARD Sultanpur (NPP) WARD NO.-0023 3,233
UP SULTANPUR URBAN WARD Kathaura (CT) WARD NO.-0001 11,605
UP SULTANPUR URBAN WARD Amethi (NP) WARD NO.-0008 1,216
UP SULTANPUR URBAN WARD Koeripur (NP) WARD NO.-0007 1,071
UP SULTANPUR RURAL VILLAGE Sahupara 407
UP SULTANPUR RURAL VILLAGE Saray Kalyan 771
UP SULTANPUR RURAL VILLAGE Lauhara 1,020
UP SULTANPUR RURAL VILLAGE Sanaha 1,251
UP SULTANPUR RURAL VILLAGE Purushottampur 1,492
UP SULTANPUR RURAL VILLAGE Bahorakha 1,775
UP SULTANPUR RURAL VILLAGE Pindara Thakur 2,111
UP SULTANPUR RURAL VILLAGE Gauraytikari 2,417
UP SULTANPUR RURAL VILLAGE Urer Mau 2,872
UP SULTANPUR RURAL VILLAGE Ganeshpur Kaithouli 3,442
UP SULTANPUR RURAL VILLAGE Punn Pur 4,107
UP SULTANPUR RURAL VILLAGE Dehdhagupur 5,140
UP SULTANPUR RURAL VILLAGE Daulatpur Lonhat 6,910
UP VARANASI METRO WARD Varanasi (M Corp.) WARD NO.-0015 10,037
UP VARANASI METRO WARD Varanasi (M Corp.) WARD NO.-0029 15,805


www.FPwatch.info Page 169
Annex 6: Detailed Sample Descriptions
Uttar Pradesh Sample Description
Higher Public Health Facility
Sub-Centre / ANM /
ASHA AWW NGO
Public Total*
Private facility
Pharmacy/Chemist
Private Medical Total*
AYUSH Provider
RMP General Retailer
Private Other Total*
All Outlets
Number of outlets screened (Figure 1b Box B)
24 621 387 5 1,037 917 1,722 2,639 204 62 7,377 7,643 11,333†
Number of outlets eligible and interviewed (Figure 1b Box D)
19 500 150 5 674 281 1,506 1,787 20 6 29 55 2,516
Number of outlets eligible but not interviewed (interview non-participation)
0 5 2 0 7 3 35 38 1 0 1 2 47
Number of interviewed outlets with at least one modern contraceptive (excluding condoms) on the day of the survey (Figure 1b, Box D1)
17 461 145 4 627 131 1,488 1,619 9 3 25 37 2,283
Number of interviewed outlets with at least one modern contraceptive in stock in the previous 3 months, but not on the day of the survey (Figure 1b, Box D1)
0 30 3 0 33 16 16 32 1 0 4 5 70
Number of interviewed outlets that provide associated FP services, but do not stock modern contraceptives (excluding condoms) (Figure 1b Box D3)
2 9 2 1 14 134 2 136 10 3 0 13 163
* Public Total category = higher public health facility + sub-centre/ANM/ASHAs + AWW + NGO categories; Private Medical Total category = Private facility categories; Private Other Total category = AYUSH provider + RMP + general retailer categories † This includes an additional 14 outlets that could not be classified into existing categories. None of the 14 outlets were eligible for the study.

www.FPwatch.info Page 170
Uttar Pradesh Metro/Urban/Rural Sample Description
Higher Public Health Facility
Sub-Centre/ ANM / ASHA
AWW NGO Public Total*
Private facility
Pharmacy/Chemist
Private Medical Total*
AYUSH Provider
RMP General Retailer
Private Other Total*
All Outlets
Number of outlets screened
Metro 3 1 15 1 20 222 530 752 61 2 1,983 2,046 2,818
Urban 11 39 62 4 116 611 1,051 1,662 134 17 4,640 4,791 6,583†
Rural 10 581 310 0 901 84 141 225 9 43 754 806 1,932
Number of outlets eligible and interviewed
Metro 3 0 12 1 16 60 497 557 5 0 5 10 583
Urban 9 23 12 4 48 195 896 1,091 12 2 21 35 1,174
Rural 7 477 126 0 610 26 113 139 3 4 3 10 759
Number of outlets eligible but not interviewed
Metro 0 0 0 0 0 0 7 7 0 0 0 0 7
Urban 0 0 0 0 0 3 24 27 1 0 1 2 29
Rural 0 5 2 0 7 0 4 4 0 0 0 0 11
Number of interviewed outlets with at least one modern contraceptive (excluding condoms) on the day of the survey
Metro 2 0 11 0 13 20 496 516 3 0 5 8 537
Urban 9 22 9 4 44 97 882 979 5 1 18 24 1,047
Rural 6 439 125 0 570 14 110 124 1 2 2 5 699
Number of interviewed outlets with at least one modern contraceptive in stock in the previous 3 months, but not on the day of the survey
Metro 0 0 1 0 1 2 1 3 0 0 0 0 4
Urban 0 0 2 0 2 10 13 23 0 0 3 3 28
Rural 0 30 0 0 30 4 2 6 1 0 1 2 38
Number of interviewed outlets that provide associated FP services, but do not stock modern contraceptives (excluding condoms)
Metro 1 0 0 1 2 38 0 38 2 0 0 2 42
Urban 0 1 1 0 2 88 1 89 7 1 0 8 99
Rural 1 8 1 0 10 8 1 9 1 2 0 3 22
* Public Total category = higher public health facility + sub-centre/ANM/ASHA + AWW + NGO categories; Private Medical Total category = Private facility categories; Private Other Total category = AYUSH provider + RMP + general retailer categories † This includes an additional 14 outlets that could not be classified into existing categories. None of the 14 outlets were eligible for the study.

www.FPwatch.info Page 171
Bihar Sample Description
Higher Public Health Facility
Sub-Centre / ANM /
ASHA AWW NGO
Public Total*
Private facility
Pharmacy/Chemist
Private Medical Total*
AYUSH Provider
RMP General Retailer
Private Other Total*
All Outlets
Number of outlets screened (Figure 1b Box B)
29 544 582 5 1,160 387 1,049 1,436 209 184 5,450 5,843 8,439
Number of outlets eligible and interviewed (Figure 1b Box D)
23 416 33 4 476 128 840 968 9 101 13 123 1,567
Number of outlets eligible but not interviewed (interview non-participation)
0 2 0 0 2 2 14 16 0 2 0 2 20
Number of interviewed outlets with at least one modern contraceptive (excluding condoms) on the day of the survey (Figure 1b, Box D1)
18 310 5 2 336 42 747 789 6 36 10 52 1,177
Number of interviewed outlets with at least one modern contraceptive in stock in the previous 3 months, but not on the day of the survey (Figure 1b, Box D1)
0 87 25 0 112 13 87 100 2 22 2 26 238
Number of interviewed outlets that provide associated FP services, but do not stock modern contraceptives (excluding condoms) (Figure 1b Box D3)
4 19 3 2 28 73 6 79 1 43 1 45 152
* Public Total category = higher public health facility + sub-centre/ANM/ASHA + AWW + NGO categories; Private Medical Total category = Private facility categories; Private Other Total category = AYUSH provider + RMP + general retailer categories

www.FPwatch.info Page 172
Bihar Metro/Urban/Rural Sample Description
Higher Public Health Facility
Sub-centre / ANM /
ASHA AWW NGO
Public Total*
Private facility
Pharmacy/Chemist
Private Medical Total*
AYUSH Provider
RMP General Retailer
Private Other Total*
All Outlets
Number of outlets screened
Metro 2 1 39 2 44 109 208 317 62 0 1,480 1,542 1,903
Urban 9 40 139 3 191 189 631 820 112 19 2,287 2,418 3,429
Rural 18 503 404 0 925 89 210 299 35 165 1,683 1,883 3,107
Number of outlets eligible and interviewed
Metro 0 1 2 1 4 36 181 217 1 0 2 3 224
Urban 7 29 13 3 52 55 509 564 4 6 6 16 632
Rural 16 386 18 0 420 37 150 187 4 95 5 104 711
Number of outlets eligible but not interviewed
Metro 0 0 0 0 0 0 5 5 0 0 0 0 5
Urban 0 0 0 0 0 2 5 7 0 1 0 1 8
Rural 0 2 0 0 2 0 4 4 0 1 0 1 7
Number of interviewed outlets with at least one modern contraceptive (excluding condoms) on the day of the survey
Metro 0 1 0 1 1 13 175 188 1 0 2 3 192
Urban 5 20 3 2 30 16 437 453 2 1 4 7 490
Rural 14 289 20 0 305 13 135 148 3 35 4 42 495
Number of interviewed outlets with at least one modern contraceptive in stock in the previous 3 months, but not on the day of the survey
Metro 0 0 2 0 2 4 6 10 0 0 0 0 12
Urban 0 8 10 0 18 5 70 75 1 0 1 2 95
Rural 0 79 13 0 92 4 11 15 1 22 1 24 131
Number of interviewed outlets that provide associated FP services, but do not stock modern contraceptives (excluding condoms)
Metro 0 0 0 1 1 19 0 19 0 0 0 0 20
Urban 2 1 0 1 4 34 2 36 1 5 1 7 47
Rural 2 18 3 0 23 20 4 24 0 38 0 38 85
* Public Total category = higher public health facility + sub-centre/ANM/ASHA + AWW + NGO categories; Private Medical Total category = Private facility categories; Private Other Total category = AYUSH provider + RMP + general retailer categories

Outlet ID : [___|___|___]-[___]-[___|___]-[___|___|-[___| - [___|___|___]
www.FPwatch.info Page 173
Annex 7: Questionnaire
FPwatch Outlet Survey INDIA 2016
SECTION 1: CENSUS INFORMATION: Interviewer completes this section for ALL OUTLETS!
Outlet ID : [___|___|___]-[___]-[___|___]-[___|___|-[___| - [___|___|___]
[Interviewer code ]-[State]-[District]-[Ward/Village code]-[Stratum code]-[Outlet ID]
C1. Today’s date (dd/mm/yyyy) [___][___]/[___][___]/[ 2 ][ 0 ][ 1 ][ 6 ]
C2. Interviewer’s name
[_____________________________________] C2a. Interviewer’s code [___|___|___]
C3. State [___] C4. District [___][___]
C5. Ward/Village [___][___] C12. Stratum Code [___|
C6. Village/ street ____________________________________________________________________
C7. Name of outlet
(If no name, record “no name.”)
_____________________________
_____________________________
C7a. Outlet code [___|___|___]
C8. Type of Outlet [___][___]
Public / Government
01 Government / Municipal Hospital
02 Government Dispensary
03 UHC / UHP / UFWC
04 CHC / Rural Hospital
05 PHC/FRU
06 Sub-centre / ANM/ASHA
07 Government Mobile Clinic
08 Camp – Government Run
09 Anganwadi Center
10 Other Public Sector Outlet / adolescent clinics
(specify):[_____________________________]
Note: Code 04 if camp organized at CHC else
record 08 if organized individually
NGO
11 NGO or Trust Hospital
12 NGO or Trust Clinic
Private
21 Private for-profit Hospital
22 Private for-profit Doctor / Clinic
23 Private for-profit Mobile Clinic
31 Private Pharmacy/Chemist or Drug Store
32 Ayurveda/ Unani/Siddha / Homeopath (AYUSH)
33 RMP/ Less than fully qualified
41 Shop, General Store, Supermarket
50 Other Private Medical Outlet:
(specify):[______________________________]
96 Other Outlet or Facility:
(specify):[______________________________]
Interviewer: Ask only if C8, type of outlet option is 11 – 34. C8a. Does this Hopsiptal/Clinics have Provide Maternity
Service
1 = Yes 0 = No
|___]
(READ TO OUTLET PROVIDER)
Hello, my name is _________________, I work on behalf of Population Services International. We are conducting
a study on the availability of family planning products and services. The results will be used to improve the availability of modern family planning products and services in India. I would like to ask you a few questions to see if you could be part of the survey. The interview will take approximately 10 minutes to one hour, depending on the availability and number of family planning methods at this location.
We are not here to inspect your business and no information about this specific outlet will be passed on to the regulatory authorities. We will not share individual information about you or other participants with anyone beyond
our research team.
Participation in this study is voluntary. You are free to decide if you want to take part or not. If you do agree, you can change your mind at any time. You can refuse to answer any specific questions, or stop the interview at any time. If you choose not to answer a question, stop the interview or even not participate at all in the study, it will not affect your working conditions today or in the future.

Outlet ID : [___|___|___]-[___]-[___|___]-[___|___|-[___| - [___|___|___]
www.FPwatch.info Page 174
SECTION 2: SCREENING CONDOMS: Interviewer completes this section for ALL OUTLETS! Read to the provider: I have just a few questions for you about availability of condoms
If oulet is multiple department facility, record volume only for family planning department
Con1. Do you have any MALE condoms available at this location today? 1 = Yes
0 = No (Verify with Prompt Card) (Go to Con6)
|___]
Con2. What brands of MALE condoms do you have in stock today? (Show Prompt Card)
[_______________________________________]
[_______________________________________] [_______________________________________] [_______________________________________] [_______________________________________]
[_______________________________________]
[_______________________________________] [_______________________________________] [_______________________________________] [_______________________________________]
Con3. What is the MOST COMMON BRAND of MALE condom you sell / distribute to individual consumers?
(Include brand and type). [_____________________________________________________________]
Con4. What is the price for this MOST COMMON BRAND of MALE condom (in Con3) you sell to individual consumers?
(If condoms are sold individually, record ‘01’ for package size.)
This outlet sells a package of [___|___] condom(s) for [___|___|___] INR
98 = Don’t know 998 = Don’t know 99 = Refused 999 = Refused
000 = Free
Con5. How many MALE condoms OF ALL BRANDS total have you sold / distributed to individual consumers at this location in the LAST 7 DAYS?
This outlet sold / distributed [___|___|___|___|___] single condoms in the LAST 7 DAYS) 99998 = Don’t know 99999 = Refused
Con6. Do you have any FEMALE condoms available at this location today? 1 = Yes
0 = No (Verify with Prompt Card) (Go to Con11)
|___]
Con7. What brands of FEMALE condoms do you have in stock today? (Show Prompt Card)
[_______________________________________]
[_______________________________________]
[_______________________________________]
[_______________________________________]
Con8. What is the MOST COMMON BRAND of FEMALE condom you sell / distribute to individual consumers? (Include brand and type). [_____________________________________________________________]
Con9. What is the price for this MOST COMMON BRAND of FEMALE condom (in Con8) you sell to individual consumers? (If condoms are sold individually, record ‘01’ for package size.)
This outlet sells a package of [___|___] condom(s) for [___|___|___] INR 98 = Don’t know 998 = Don’t know
99 = Refused 999 = Refused 000 = Free
Con10. How many FEMALE condoms OF ALL BRANDS total have you sold / distributed to individual consumers at this location in the LAST 7 DAYS? This outlet sold / distributed [___|___|___|___|___] single condoms in the LAST 7 DAYS)
99998 = Don’t know 99999 = Refused
Interviewer: Following questions are FOR PRIVATE PHARMACY/CHEMIST/DRUG STORE ONLY
(C8=31).
For all other outlet types, please skip to SECTION 2a question ORS1
Con11. Do you generally buy family planning products on cash, credit or a combination? 1=Cash 2=Credit
3=Combination of cash and credit
|___]
Con12. Are promotional materials for any family planning products visible in the outlet? [Interviewer, OBSERVE ONLY AND RECORD]
S No. Promotional materials visible in the outlet Yes No Code
1 Poster 1 0 |___]
2 Dangler 1 0 |___]
3 Sticker 1 0 |___]
4 Dispensers 1 0 |___]
5 Signboard 1 0 |___]
6 Banner 1 0 |___]
7 Others (specify____________) 1 0 |___]
Con13. Where is the family planning products (especially condoms) placed within the outlet? [Interviewer, OBSERVE ONLY AND RECORD]
S No. Family planning product placed in the outlet Yes No Code
1 At the counter 1 0 |___]
2 Visible at eye level 1 0 |___]

Outlet ID : [___|___|___]-[___]-[___|___]-[___|___|-[___| - [___|___|___]
www.FPwatch.info Page 175
SECTION 2a: SCREENING ORS, Zinc & Amoxicillin: Please complete this section for ALL outlets
Read to the provider: I have just few questions for you about availability of treatments for diarrhea and
pneumonia. If oulet is multiple department facility, record volume only for family planning
department
ORS1. Do you have any oral rehydration salts, also known as ORS in stock today? (Show ORS PRMOPT Card)
1 = Yes 0 = No
|___]
ORS2. Do you have any zinc tablets for treatment of diarrhea in children in stock today? (Show Zinc PRMOPT Card)
1 = Yes 0 = No Go to AB1
|___]
ORS3. Which strength of zinc tablets for treatment of diarrhea in children do you have in stock today? (Read list, select ALL that apply)
S. No. Strength Yes No Don’t Know Code
1 10 mg 1 0 8 |___]
2 20 mg 1 0 8 |___]
3 Others, Specify : [_______________________] 1 0 8 |___]
.
ORS4. Do you have any ORS that is packaged together with zinc treatment for diarrhea in children in stock today today?
(Show ORS / ZINC PRMOPT Card) 1 = Yes 0 = No
|___]
AB1. Do you have any antibiotics in stock today? 1 = Yes
0 = No |___]
AB2. Do you have any amoxicillin dispersible tablets, also known as Amax DT? (Show Amax DT PROMPT CARD. Ask to see the product and verify that it is dispersible amoxicillin)
1 = Yes 0 = No Go to AB4
|___]
AB3. Which strength of amoxicillin dispersible tablets, also known as Amax DT, do you have in stock today?
(Read list, select ALL that apply)
S. No. Strength Yes No Don’t Know Code
1 125 mg 1 0 8 |___]
2 250 mg 1 0 8 |___]
3 Others, Specify : [_______________________] 1 0 8 |___]
.
AB4. Do you have any amoxicillin syrups or suspensions?
(Show Amax syrups and suspensions PROMPT CARD. Ask to see the product and verify that it is an amoxicillin syrup or suspension)
1 = Yes 0 = No Go to Section 3 question S1
|___]
AB5. Which strength of amoxicillin syrup or suspension do you have in stock today?
(Read list, select ALL that apply)
S. No. Strength Yes No Don’t Know Code
1 125 mg / 5mL 1 0 8 |___]
2 250 mg / 5mL 1 0 8 |___]
3 Others, Specify : [_______________________] 1 0 8 |___]
.

Outlet ID : [___|___|___]-[___]-[___|___]-[___|___|-[___| - [___|___|___]
www.FPwatch.info Page 176
SECTION 3 SCREENING & ELIGIBILIY: Please complete this section for ALL OUTLETS! Read to the provider: I have just few questions about the availability of family planning products and services.
S1. Do you have any of the following family planning products available at this location TODAY?
(Read all options and show PROMPT CARDS for each.)
S. No. Product available today Yes No Code
1 Oral contraceptive Tablets 1 0 |___]
2 Emergency contraceptive Tablets 1 0 |___]
3 Injectable contraceptives 1 0 |___]
4 Contraceptive implants 1 0 |___]
5 Contraceptive IUDs 1 0 |___]
Note:
If outlet contains only Misoprostol tablet or birth control patches or vaginal birth control rings or vaginal
foaming tablets in “S. No. 1” then code ‘0’.
If any of the category is coded “1” then go to SECTION 4 question ‘FP0’ else go to question ‘S2’
S2. Are there any of the following family planning products that are out of stock today, but that you stocked in
the PAST 3 MONTHS at this location? (Read all options and show PROMPT CARDS for each)
S. No. Product out of stock today Yes No Code
1 Oral contraceptive tablets 1 0 |___]
2 Emergency contraceptive tablets 1 0 |___]
3 Injectable contraceptives 1 0 |___]
4 Contraceptive implants 1 0 |___]
5 Contraceptive IUDs 1 0 |___]
Note:
If outlet had only Misoprostol tablet or birth control patches or vaginal birth control rings or vaginal
foaming tablets in past 3 months “S. No. 1” then code ‘0’.
If any of the category is coded “1” then go to SECTION 4 question ‘A15’ else go to question ‘S3’
S3. Do you provide any of the following family planning services at this location? (Read all options)
S. No. Service available today Yes No Code
1 Injection of contraceptive injections 1 0 |___]
2 Insertion/removal of contraceptive implants 1 0 |___]
3 Insertion/removal of contraceptive IUDs 1 0 |___]
4 Female sterilizations 1 0 |___]
5 Male sterilizations 1 0 |___]
Note: If any of the category is coded “1” then go to SECTION 5 question ‘P1’ else go to question ‘C9’
C9. Result of visit(s).
C9a.Date
Visit 1 Visit 2 Visit 3
[___][___]/[___][___]/2016 (dd) (mm) (yy)
[___][___]/[___][___]/2016 (dd) (mm) (yy)
[___][___]/[___][___]/2016 (dd) (mm) (yy)
C9b.Time started [___][___] : [___][___] [___][___] : [___][___] [___][___] : [___][___]
C9c.Time Completed [___][___] : [___][___] [___][___] : [___][___] [___][___] : [___][___]
C9d.Result [___][___] [___][___] [___][___]
Result Codes 01 Outlet eligible & survey
completed
02 Outlet ineligible(does not meet any screening criteria) 03 Interview interrupted 04 Respondent not available / time not convenient 05 Outlet not open at the time
06 Outlet closed permanently 96 Other (specify):[_______] 99 Refused
01 Outlet eligible & survey
completed
02 Outlet ineligible(does not meet any screening criteria) 03 Interview interrupted 04 Respondent not available / time not convenient
05 Outlet not open at the time 06 Outlet closed permanently 96 Other (specify):[_______] 99 Refused
01 Outlet eligible & survey
completed
02 Outlet ineligible(does not meet any screening criteria) 03 Interview interrupted 04 Respondent not available / time not convenient
05 Outlet not open at the time 06 Outlet closed permanently 96 Other (specify):[_______] 99 Refused
C10. If the provider refused, please record the main reason? [___] 1 Customer load (Ask respondent for a time they would prefer to be interviewed and note in C11) 2 Thinks it’s an inspection / nervous about license 3 Not interested 6 Other (specify):[___________________________________________________________________]
9 Refuses to give reason
C11. Use this space to record call back details. If it is not possible to complete the interview at another time, Note: After recording call back details, please go to SECTION E question ‘E1’

Outlet ID : [___|___|___]-[___]-[___|___]-[___|___|-[___| - [___|___|___]
www.FPwatch.info Page 177
SECTION E: Ending the interview
E1. Name of respondent [_________________________________] [___| 5 Not applicable, no respondent; 9 Refused
E2. Physical address or location identifiers of outlet (not PO box or pin code) Note: Give detailed description that will help supervisor to find the outlet.
E3. Telephone / Mobile number [___|___|___|___|___|___|___|___|___|___]
9999999995 No respondent or has no telephone/mobile 9999999999 Refused
E4. Latitude:
[ N ]-[___|___|___]•[___|___|___|___|___]
E5. Longitude:
[ E ]-[___|___|___]•[___|___|___|___|___]
E6. Additional observations by interviewer (if any)
_________________________________________________________________________
_________________________________________________________________________
_________________________________________________________________________
_________________________________________________________________________
_________________________________________________________________________
_________________________________________________________________________
_________________________________________________________________________
_________________________________________________________________________
_________________________________________________________________________
_________________________________________________________________________
_________________________________________________________________________
_________________________________________________________________________
THANK THE PROVIDER AND END INTERVIEW.
(If applicable, remember to record, on paper, the call-back details until 3rd attempt is completed)

Outlet ID : [___|___|___]-[___]-[___|___]-[___|___|-[___| - [___|___|___]
www.FPwatch.info Page 178
Note: Please visit all departments indicated above to complete audit sheets. In all audit sheets, complete the Sub-Outlet Code (as well as Product Number) for each drug audited. These codes are listed below. (A through G means outlet has multiple points of distribution to individuals)
Section 4: FAMILY PLANNING PRODUCT AUDIT Module Note: Before going to the full interview ensure you have given the respondent a study information sheet, explained the study and obtained informed consent.
FP0: Can you please show us the full range of family planning products that you currently have in stock?
Prompt entire list using family planning prompt cards;
Oral contraceptive tablets such as Mala-D, Saheli, Pearl brands
Emergency contraceptive tablets such as Unwanted-72, I-Pill brands
Contraceptive injections such as Depo-Provera, B-Sure DMPA, Freedom Inject brands
Contraceptive implants such as Implanon, Jadelle brands
Contraceptive IUDs such as SMB, Freedom, MCare brands
Misoprostol tablets such as Safe-Abort Kit, Unwanted Kit, Misoprostol Tablets brands
Birth control patches, vaginal birth control rings, vaginal foaming tablets
Vaginal pessaries such as Today brand
Note:
Please do not record any response for this question
If the outlet has no family planning products in stock today, check screening results.
Please ask question ‘FP1’ if facility is hospital or multidepartment facility
FP1: Where are the following products located in other departments at this facility? Read all. - Oral contraceptive tablets including Misoprostol tablet, Birth control patches, vaginal birth control rings,
vaginal foaming tablets
- Emergency contraceptive tablets
- Contraceptive injections
- Contraceptive implants
- Contraceptive IUDs
S. No. Product located in the department Yes No Code
1 Family planning clinic 1 0 |___]
2 Dispensary / Pharmacy/Chemist / Outpatient 1 0 |___]
3 Antenatal / Maternity / MCH 1 0 |___]
4 Operation theatre 1 0 |___]
5 Injection department 1 0 |___]
6 Other department, please specify:__________ 1 0 |___]
Please ask question ‘FP2’ if facility is PRIVATE hospital or clinic
FP2: How many beds are available in the entire facility? [___|
SUB-OUTLET CODES
X All outlets that have only ONE dispensing/distribution point for medicines / diagnostics
A Outpatient department / dispensary / Main Pharmacy/Chemist (if used by all patients)
B Antenatal / maternity clinic / MCH
C ART / HIV/AIDS clinic
D Private dispensing unit
E Postnatal / family planning clinic
F Maternity ward
G AYUSH
Z Other (specify the type in the space for audit comments – TAB 13, INJ 15 or INS 15)
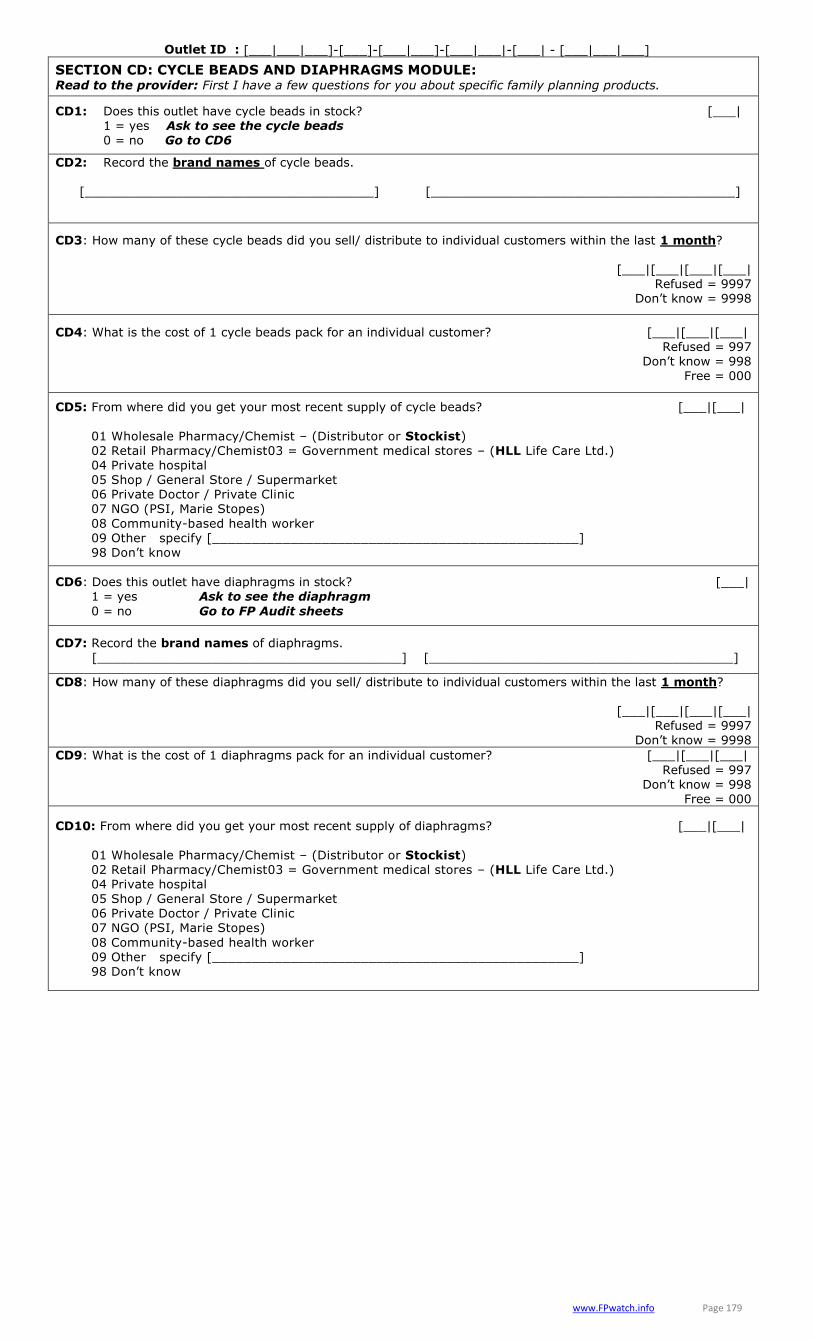
Outlet ID : [___|___|___]-[___]-[___|___]-[___|___|-[___| - [___|___|___]
www.FPwatch.info Page 179
SECTION CD: CYCLE BEADS AND DIAPHRAGMS MODULE: Read to the provider: First I have a few questions for you about specific family planning products.
CD1: Does this outlet have cycle beads in stock? [___| 1 = yes Ask to see the cycle beads
0 = no Go to CD6
CD2: Record the brand names of cycle beads.
[______________________________________] [________________________________________]
CD3: How many of these cycle beads did you sell/ distribute to individual customers within the last 1 month?
[___|[___|[___|[___| Refused = 9997
Don’t know = 9998
CD4: What is the cost of 1 cycle beads pack for an individual customer? [___|[___|[___| Refused = 997
Don’t know = 998 Free = 000
CD5: From where did you get your most recent supply of cycle beads? [___|[___|
01 Wholesale Pharmacy/Chemist – (Distributor or Stockist) 02 Retail Pharmacy/Chemist03 = Government medical stores – (HLL Life Care Ltd.) 04 Private hospital 05 Shop / General Store / Supermarket 06 Private Doctor / Private Clinic 07 NGO (PSI, Marie Stopes)
08 Community-based health worker 09 Other specify [_______________________________________________] 98 Don’t know
CD6: Does this outlet have diaphragms in stock? [___| 1 = yes Ask to see the diaphragm
0 = no Go to FP Audit sheets
CD7: Record the brand names of diaphragms.
[________________________________________] [________________________________________]
CD8: How many of these diaphragms did you sell/ distribute to individual customers within the last 1 month?
[___|[___|[___|[___| Refused = 9997
Don’t know = 9998
CD9: What is the cost of 1 diaphragms pack for an individual customer? [___|[___|[___|
Refused = 997 Don’t know = 998
Free = 000
CD10: From where did you get your most recent supply of diaphragms? [___|[___|
01 Wholesale Pharmacy/Chemist – (Distributor or Stockist) 02 Retail Pharmacy/Chemist03 = Government medical stores – (HLL Life Care Ltd.) 04 Private hospital 05 Shop / General Store / Supermarket
06 Private Doctor / Private Clinic 07 NGO (PSI, Marie Stopes)
08 Community-based health worker 09 Other specify [_______________________________________________] 98 Don’t know
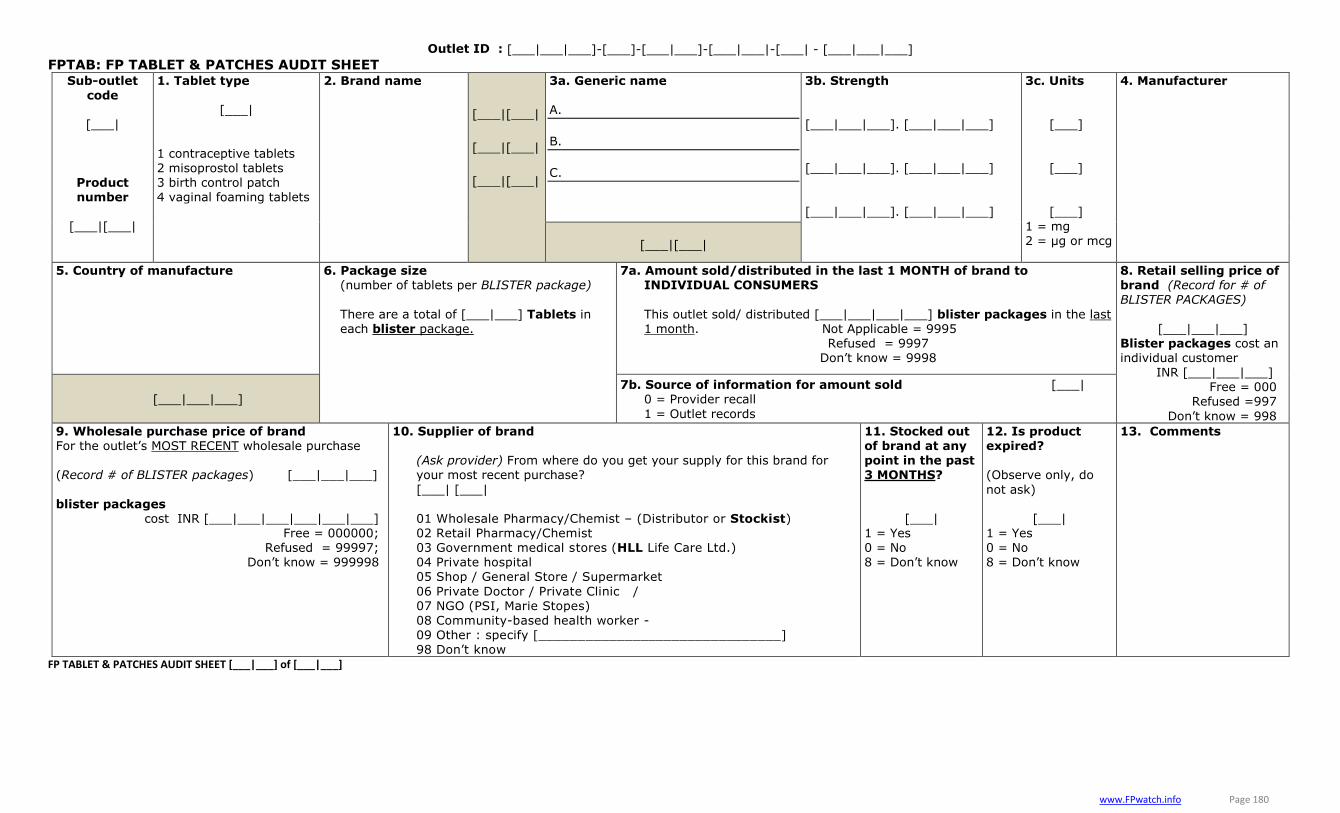
Outlet ID : [___|___|___]-[___]-[___|___]-[___|___|-[___| - [___|___|___]
www.FPwatch.info Page 180
FPTAB: FP TABLET & PATCHES AUDIT SHEET Sub-outlet
code
[___|
Product number
[___|[___|
1. Tablet type
[___|
1 contraceptive tablets 2 misoprostol tablets 3 birth control patch 4 vaginal foaming tablets
2. Brand name
[___|[___|
[___|[___|
[___|[___|
3a. Generic name
A.
B.
C.
3b. Strength
[___|___|___]. [___|___|___]
[___|___|___]. [___|___|___] [___|___|___]. [___|___|___]
3c. Units
[___]
[___]
[___]
1 = mg 2 = μg or mcg
4. Manufacturer
[___|[___|
5. Country of manufacture
6. Package size (number of tablets per BLISTER package)
There are a total of [___|___] Tablets in each blister package.
7a. Amount sold/distributed in the last 1 MONTH of brand to INDIVIDUAL CONSUMERS
This outlet sold/ distributed [___|___|___|___] blister packages in the last 1 month. Not Applicable = 9995
Refused = 9997 Don’t know = 9998
8. Retail selling price of brand (Record for # of BLISTER PACKAGES)
[___|___|___]
Blister packages cost an individual customer
INR [___|___|___] Free = 000
Refused =997
Don’t know = 998
[___|___|___] 7b. Source of information for amount sold [___|
0 = Provider recall
1 = Outlet records
9. Wholesale purchase price of brand
For the outlet’s MOST RECENT wholesale purchase (Record # of BLISTER packages) [___|___|___]
blister packages
cost INR [___|___|___|___|___|___] Free = 000000;
Refused = 99997; Don’t know = 999998
10. Supplier of brand
(Ask provider) From where do you get your supply for this brand for your most recent purchase?
[___| [___| 01 Wholesale Pharmacy/Chemist – (Distributor or Stockist) 02 Retail Pharmacy/Chemist 03 Government medical stores (HLL Life Care Ltd.) 04 Private hospital 05 Shop / General Store / Supermarket
06 Private Doctor / Private Clinic / 07 NGO (PSI, Marie Stopes)
08 Community-based health worker - 09 Other : specify [_______________________________] 98 Don’t know
11. Stocked out
of brand at any point in the past 3 MONTHS?
[___| 1 = Yes 0 = No 8 = Don’t know
12. Is product
expired? (Observe only, do
not ask)
[___| 1 = Yes 0 = No 8 = Don’t know
13. Comments
FP TABLET & PATCHES AUDIT SHEET [___|___] of [___|___]

Outlet ID : [___|___|___]-[___]-[___|___]-[___|___|-[___| - [___|___|___]
www.FPwatch.info Page 181
FPINJ: FP INJECTION AUDIT SHEET
Sub-outlet
code
[___|
Product
number
[___|[___|
1. Brand name
[___|[___|
[___|[___|
2a. Generic name
A.
B.
2b. Strength per mL
[__|__|__]. [__] mg / [__|__]. [__|__] mL [__|__|__]. [__] mg / [__|__]. [__|__] mL
3. Manufacturer
4. Country of
manufacture
[___|[___| [___|[___|[___|
5. Package contents Does package with ampoule
/vial contain disposable needle for injection?
[___|
1 = Yes 0 = No
6. Package size
There are a total of
[___|___|___].[__|__] mL in each ampoule/vial.
7a. Do you, or other staff, perform injection services for this brand of injectable at this
outlet/facility? [___] 1 = Yes
0 = No Go to Q9a 8 = Don’t know Go to Q9a
7b. If yes, what is the TOTAL COST to have an injection for this brand, including PRODUCT
COST AND SERVICE FEE?
[___|___|___|___] INR Free = 0000
Refused = 9997 Don’t know = 9998
8a. How many injection procedures for this brand have
been conducted at this outlet/facility in the LAST 1
MONTH?
[___|___|___|___] Refused = 9997 Don’t know = 9998
8b. Source of information for # injections [___]
0 = Provider recall 1 = Outlet records
9a. Does this outlet/ facility provides this brand of injectable for customers TO TAKE
AWAY for injection procedures somewhere else?
[___] 1 = Yes 0 = No Go to Q11 8 = Don’t know Go to Q11
9b. If yes, what is cost of 1 ampoule/vial for this brand for an INDIVIDUAL CUSTOMER?
INR [___|___|___|___]
Free = 0000 Refused = 9997
Don’t know = 9998
10a. How many injectables of this brand have been sold/distributed FOR TAKE AWAY at this outlet/ facility in the LAST 1 MONTH?
[___|___|___|___]
Refused = 9997 Don’t know = 9998
10b. Source of information for # take
away [___]
0 = Provider recall 1 = Outlet records
11. Wholesale purchase price of brand
For the outlet’s MOST RECENT wholesale purchase
[___|___|___|___]
ampoules/vials cost
INR [___|___|___|___|___|___]
Free = 000000 Refused = 999997
Don’t know = 999998
12. Supplier of brand (Ask provider) From where do you get your supply for this brand for your most recent purchase?
[___| [___| 01 Wholesale Pharmacy/Chemist – (Distributor or Stockist)
02 Retail Pharmacy/Chemist 03 Government medical stores (HLL Life Care Ltd.)
04 Private hospital 05 Shop / General Store / Supermarket 06 Private Doctor / Private Clinic / 07 NGO (PSI, Marie Stopes) 08 Community-based health worker - 09 Other : specify [____________________________]
13. Stocked out of brand at any point in the past 3
MONTHS?
[___|
1 = Yes 0 = No 8 = Don’t know
14. Is product expired? (Observe only, do
not ask)
[___| 1 = Yes
0 = No 8 = Don’t know
15. Comments
FP INJECTION AUDIT SHEET [___|___] of [___|___]
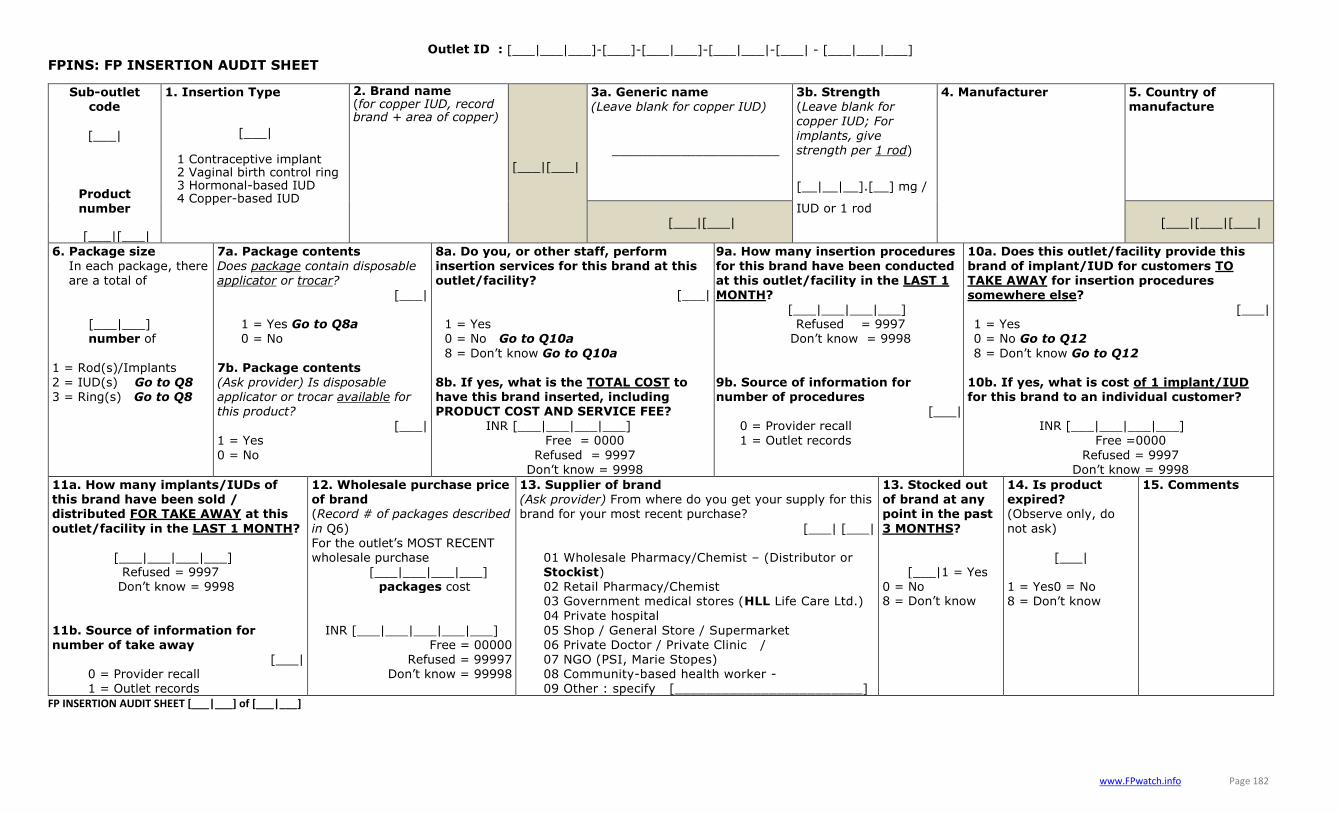
Outlet ID : [___|___|___]-[___]-[___|___]-[___|___|-[___| - [___|___|___]
www.FPwatch.info Page 182
FPINS: FP INSERTION AUDIT SHEET
FP INSERTION AUDIT SHEET [___|___] of [___|___]
Sub-outlet code
[___|
Product number
[___|[___|
1. Insertion Type
[___|
1 Contraceptive implant 2 Vaginal birth control ring 3 Hormonal-based IUD 4 Copper-based IUD
2. Brand name (for copper IUD, record brand + area of copper)
[___|[___|
3a. Generic name (Leave blank for copper IUD) ______________________
3b. Strength (Leave blank for copper IUD; For implants, give strength per 1 rod)
[__|__|__].[__] mg /
IUD or 1 rod
4. Manufacturer
5. Country of manufacture
[___|[___| [___|[___|[___|
6. Package size
In each package, there are a total of
[___|___] number of
1 = Rod(s)/Implants 2 = IUD(s) Go to Q8 3 = Ring(s) Go to Q8
7a. Package contents
Does package contain disposable applicator or trocar?
[___|
1 = Yes Go to Q8a 0 = No
7b. Package contents (Ask provider) Is disposable applicator or trocar available for this product?
[___|
1 = Yes
0 = No
8a. Do you, or other staff, perform
insertion services for this brand at this outlet/facility?
[___|
1 = Yes 0 = No Go to Q10a
8 = Don’t know Go to Q10a 8b. If yes, what is the TOTAL COST to have this brand inserted, including PRODUCT COST AND SERVICE FEE? INR [___|___|___|___]
Free = 0000
Refused = 9997 Don’t know = 9998
9a. How many insertion procedures
for this brand have been conducted at this outlet/facility in the LAST 1 MONTH?
[___|___|___|___] Refused = 9997
Don’t know = 9998
9b. Source of information for number of procedures
[___| 0 = Provider recall
1 = Outlet records
10a. Does this outlet/facility provide this
brand of implant/IUD for customers TO TAKE AWAY for insertion procedures somewhere else?
[___| 1 = Yes 0 = No Go to Q12
8 = Don’t know Go to Q12 10b. If yes, what is cost of 1 implant/IUD for this brand to an individual customer?
INR [___|___|___|___]
Free =0000
Refused = 9997 Don’t know = 9998
11a. How many implants/IUDs of this brand have been sold / distributed FOR TAKE AWAY at this
outlet/facility in the LAST 1 MONTH?
[___|___|___|___] Refused = 9997 Don’t know = 9998
11b. Source of information for number of take away
[___| 0 = Provider recall 1 = Outlet records
12. Wholesale purchase price of brand (Record # of packages described
in Q6) For the outlet’s MOST RECENT wholesale purchase
[___|___|___|___] packages cost
INR [___|___|___|___|___] Free = 00000
Refused = 99997 Don’t know = 99998
13. Supplier of brand (Ask provider) From where do you get your supply for this brand for your most recent purchase?
[___| [___| 01 Wholesale Pharmacy/Chemist – (Distributor or Stockist) 02 Retail Pharmacy/Chemist 03 Government medical stores (HLL Life Care Ltd.)
04 Private hospital
05 Shop / General Store / Supermarket 06 Private Doctor / Private Clinic / 07 NGO (PSI, Marie Stopes) 08 Community-based health worker - 09 Other : specify [________________________]
13. Stocked out of brand at any point in the past
3 MONTHS?
[___|1 = Yes 0 = No 8 = Don’t know
14. Is product expired? (Observe only, do
not ask)
[___|
1 = Yes0 = No 8 = Don’t know
15. Comments

Outlet ID : [___|___|___]-[___]-[___|___]-[___|___|-[___| - [___|___|___]
www.FPwatch.info Page 183
A15. Are there any family planning products that are out of stock today, but that you stocked in the
past 3 months? 1 = Yes 0 = No Go to Section 5: FP Provider Module P1
8 = Don’t know Go to Section 5: FP Provider Module P1
[___|
A16. Do you know the names of the products that are out of stock? Will accept generic or brand names. Record one product per line.
1 = Yes, specify (brand and type of product, e.g. oral contraceptives, emergency contraceptives, injectables, implants, IUDs [__________________________________] [__________________________________] [__________________________________] [__________________________________] [__________________________________] [__________________________________] [__________________________________] [__________________________________]
[__________________________________] [__________________________________] 0 = No
[___|
A17. In the past 3 months, has this outlet/facility been out of stock, even for one day, of all brands of:
READ LIST
S. No. Product stocked out in past three months Yes No
Method not offered/ sold
Code
1 Oral Contraceptive Tablets 1 0 2 |___]
2 Emergency Contraceptive tablets 1 0 2 |___]
3 Contraceptives Injections 1 0 2 |___]
4 Contraceptive Implants 1 0 2 |___]
5 Contraceptive IUDs 1 0 2 |___]
6 Other department If other, specify:__________ 1 0 2 |___]
SECTION 5: FAMILY PLANNING PROVIDER Module This section should be completed primarily by the provider who is responsible for providing family planning counseling and/or provider-dependent methods including IUD insertion and implants. Completing the questions may require speaking with more than 1 staff member at the outlet. If the respondent does not know the answer to a question in this section, ask to speak with another staff member who can provide the information.
Interviewer read: First I have some questions about family planning counseling.
P1. Does this outlet refer clients for family planning counseling to help clients choose a family planning method?
1 = Yes 0 = No GO TO P3
[___|
P2. Where do you typically refer clients for family planning counseling? [___|[___|
Public sector
01 Government / Municipal
Hospital
02 Government Dispensary
03 UHC / UHP / UFWC UFWC 04 CHC / Rural Hospital
05 PHC/FRU
06 Sub-centre / ANM 07 Government Mobile Clinic 08 Camp
09 Anganwadi Center
NGO or Trust
11 NGO or Trust Hospital 12 NGO or Trust Clinic
Private sector
21 Private for-profit Hospital
22 Private for-profit Doctor / Clinic
23 Private for-profit Mobile Clinic
31 Private Pharmacy/Chemist or
Drug Store
32 Ayurveda/Unani/Siddha/
Homeopath (AYUSH)/Clinic
33 Traditional Healer1 Shop, General
Store, Supermarket
Individual Provider
81 Doctor
82 Nurse
83 Midwife
84 Community Health
Worker
85 ASHA (Accredited Social
Health Activist)
86 LHV (Lady Health Visitor)
87 AYUSH Provider
88 RMP/ Less than fully
qualifiedOther
96 Other, specify:
[______________________
]
P3. Does this outlet provide counseling to help clients choose a family planning method? 1 = Yes 0 = No GO TO P8
[___|
P4. If a client came in today, could s/he receive counseling on choosing a family planning method today?
1 = Yes 0 = No
[___|
P5. Have you or any other current staff member at this outlet/facility received any training in the last 1 years on counseling clients on which type of family planning methods to use? (This
includes pre-service training and stand-alone workshops)? 1 = Yes
0 = No GO TO P7 8 = Don’t know GO TO P7
[___|

Outlet ID : [___|___|___]-[___]-[___|___]-[___|___|-[___| - [___|___|___]
www.FPwatch.info Page 184
Interviewer: Ask only if C8, type of outlet option is 01 – 34. Otherwise, skip to P11.
P10. How many staff members do you have with the following qualifications and what is their gender?
S. No. Health qualification Numbers
Male Female
1 MBBS |___] |___]
2 MBBS with DGO |___] |___]
3 OBGYN |___] |___]
4 MS/MD with OBGYN |___] |___]
5 Master of Surgery -MS (Not OBGYN) |___] |___]
6 MD (Not OBGYN) |___] |___]
7 DM Super Specility |___] |___]
8 Ayurveda/ Unani/ Homeopath |___] |___]
9 RMP/ Less than fully qualified |___] |___]
10 Nurse / Midwife |___] |___]
11 Compounder / Male Nurse |___] |___]
P10a: How many years of professional experience do the senior-most staff member at this facility has?
|___]|___]
P6. From which organization(s) did you, or staff from this outlet/facility, receive training on
counseling clients on which types of family planning methods to use? 1 = Yes, specify: (name of organizations)
[_________________________________] [_______________________________________]
[_________________________________] [_______________________________________] 0 = No 8 = Don’t know
[___|
P7. Does this outlet have any job aids / IEC material for counseling clients on which type of family planning method to choose? (Ask to the respondent to see job aids.) 1 = Yes, observed 2 = Yes, not observed , 0 = No
8 = Don’t know
[___|
P8. Have you or any other current staff member at this outlet/facility received any training in the last 1 year on the national guidelines for family planning?
1 = Yes 0 = No 8 = Don’t know
[___|
P9. What is your highest qualification?
01 = MBBS 02 = MBBS with DGO 03 = OBGN
04 = MS (Not OBGN) 05 = MD (Not OBGN)
06 = Bachelor in Ayurveda
07 = Unani
08 = Homeopath 09 = Bachelor in Siddha 10 = Greater than Graduate 11 = 12th Standard Completed
12 = 8th to 10th Standard 13 = 5th to 7th Standard
14 = Less than 5th Standard
15 = Illiterate
[___|
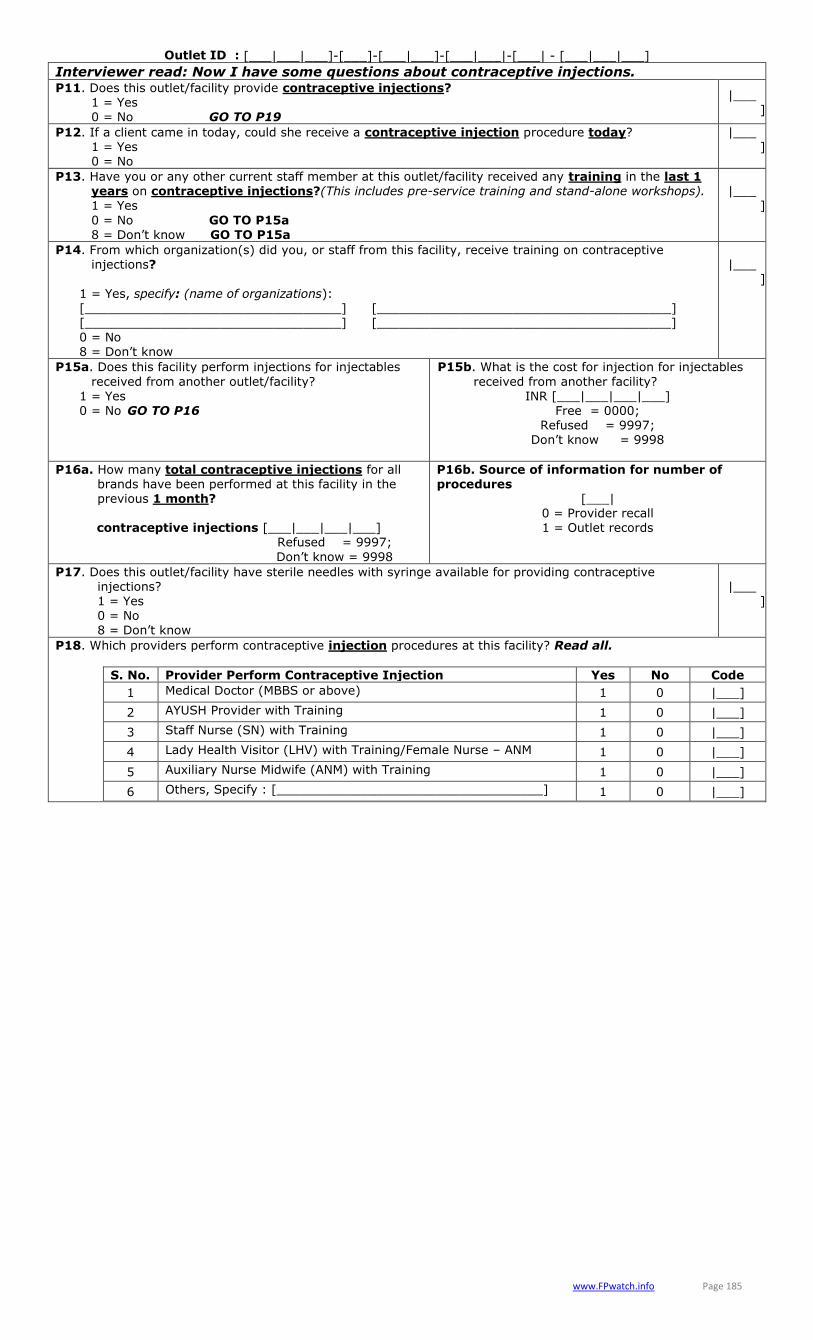
Outlet ID : [___|___|___]-[___]-[___|___]-[___|___|-[___| - [___|___|___]
www.FPwatch.info Page 185
Interviewer read: Now I have some questions about contraceptive injections. P11. Does this outlet/facility provide contraceptive injections?
1 = Yes 0 = No GO TO P19
|___]
P12. If a client came in today, could she receive a contraceptive injection procedure today? 1 = Yes 0 = No
|___]
P13. Have you or any other current staff member at this outlet/facility received any training in the last 1 years on contraceptive injections?(This includes pre-service training and stand-alone workshops). 1 = Yes
0 = No GO TO P15a 8 = Don’t know GO TO P15a
|___]
P14. From which organization(s) did you, or staff from this facility, receive training on contraceptive injections?
1 = Yes, specify: (name of organizations): [__________________________________] [_______________________________________] [__________________________________] [_______________________________________] 0 = No 8 = Don’t know
|___
]
P15a. Does this facility perform injections for injectables
received from another outlet/facility?
1 = Yes 0 = No GO TO P16
P15b. What is the cost for injection for injectables
received from another facility?
INR [___|___|___|___] Free = 0000;
Refused = 9997; Don’t know = 9998
P16a. How many total contraceptive injections for all brands have been performed at this facility in the previous 1 month?
contraceptive injections [___|___|___|___]
Refused = 9997;
Don’t know = 9998
P16b. Source of information for number of procedures
[___| 0 = Provider recall 1 = Outlet records
P17. Does this outlet/facility have sterile needles with syringe available for providing contraceptive injections? 1 = Yes 0 = No 8 = Don’t know
|___]
P18. Which providers perform contraceptive injection procedures at this facility? Read all.
S. No. Provider Perform Contraceptive Injection Yes No Code
1 Medical Doctor (MBBS or above) 1 0 |___]
2 AYUSH Provider with Training 1 0 |___]
3 Staff Nurse (SN) with Training 1 0 |___]
4 Lady Health Visitor (LHV) with Training/Female Nurse – ANM 1 0 |___]
5 Auxiliary Nurse Midwife (ANM) with Training 1 0 |___]
6 Others, Specify : [___________________________________] 1 0 |___]

Outlet ID : [___|___|___]-[___]-[___|___]-[___|___|-[___| - [___|___|___]
www.FPwatch.info Page 186
Interviewer read: Now I have some questions about contraceptive implant insertion. P19. Does this outlet/facility provide contraceptive implant insertions?
1 = Yes 0 = No GO TO P28
|___]
P20. If a client came in today, could she receive a contraceptive implant insertion procedure today? 1 = Yes 0 = No
|___]
P21. Have you or any other current staff member at this outlet/facility received any training in the last 1 years on contraceptive implant insertions?
(This includes pre-service training and stand-alone workshops).
1 = Yes 0 = No GO TO P23a 8 = Don’t know GO TO P23a
|___]
P22. From which organization(s) did you, or staff from this facility, received training on contraceptive implant insertions?
1 = Yes, specify: (name of organizations): [__________________________________] [_______________________________________] [__________________________________] [_______________________________________] 0 = No 8 = Don’t know
|___]
P23a. Does this facility perform insertions for contraceptive
implants bought from another outlet/facility? 1 = Yes 0 = No GO TO P24
P23b. What is the cost for insertion bought from
another facility? INR [___|___|___|___]
Free = 0000; Refused = 9997;
Don’t know = 9998
P24a. How many total contraceptive implant procedures have been performed at this facility in the previous 1 month?
contraceptive implant insertions [___|___|___|___]
Refused = 9997; Don’t know = 9998
P24b. Source of information for number of procedures
[___| 0 = Provider recall 1 = Outlet records
P25. Does this facility have a private area for providing contraceptive implant insertions? (Please observe) 1 = Available 0 = Not available
8 = Don’t know
|___]
P26. Does facility have the following equipment for providing contraceptive implant procedures: (READ LIST and ask to observe equipment. When asking to locate each piece of equipment, verify each option with PROMPT CARDS.)
S. No. List of Equipments Reported- Available
Reported- Not Available
Don’t Know
Code
1 Trocar (disposable or non-disposable) 1 0 8 |___]
2 Iodine 1 0 8 |___]
3 Scalpel with blade (for removal) 1 0 8 |___]
4 Straight mosquito forceps (for removal) 1 0 8 |___]
P27. Which providers perform contraceptive implant procedures at this facility? Read all.
S. No. Provider Perform Contraceptive Implant insertions Yes No Code
1 Medical Doctor (MBBS or above) 1 0 |___]
2 AYUSH Provider with Training 1 0 |___]
3 Staff Nurse (SN) with Training 1 0 |___]
4 Lady Health Visitor (LHV) with Training 1 0 |___]
5 Auxiliary Nurse Midwife (ANM) with Training
6 Others, Specify : [___________________________________] 1 0 |___]

Outlet ID : [___|___|___]-[___]-[___|___]-[___|___|-[___| - [___|___|___]
www.FPwatch.info Page 187
Interviewer read: Now I have some questions about IUD insertion. P28. Does this outlet/facility provide IUD insertions?
1 = Yes 0 = No GO TO P37
|___]
P29. If a client came in today, could she receive an IUD insertion procedure today? 1 = Yes 0 = No
|___]
P30. Have you or any other current staff member at this outlet/facility received any training in the last 1 years on IUD insertions?
(This includes pre-service training and stand-alone workshops).
1 = Yes 0 = No GO TO P32a 8 = Don’t know GO TO P32a
|___]
P31. From which organization(s) did you, or staff from this facility, received training on IUD insertions?
1 = Yes, specify: (name of organizations): [__________________________________] [_______________________________________] [__________________________________] [_______________________________________] 0 = No 8 = Don’t know
|___]
P32a. Does this facility perform insertion procedures for
IUDs bought from another outlet/facility?
1 = Yes 0 = No GO TO P33
P32b. What is the cost for insertion of an IUD
bought from another facility?
INR [___|___|___|___] Free = 0000;
Refused = 9997; Don’t know = 9998
P33a. How many total IUD insertion procedures have been performed at this facility in previous 1 month?
IUD insertion procedures [___|___|___|___]
Refused = 9997; Don’t know = 9998
P33b. Source of information for number of procedures
[___| 0 = Provider recall 1 = Outlet records
P34. Does this facility have a private area for providing IUD insertions? (Please observe) 1 = Available 0 = Not available 8 = Don’t know
|___]
P35. Does facility have the following equipment for providing IUD insertion procedures: (READ LIST and ask to observe equipment. When asking to locate each piece of equipment, verify
each option with PROMPT CARDS.)
S. No. List of Equipments Reported-
Available
Reported-
Not Available
Don’t
Know Code
1 Examination table 1 0 8 |___]
2 Iodine 1 0 8 |___]
3 Tenaculum 1 0 8 |___]
4 Speculum 1 0 8 |___]
5 Uterine Sound 1 0 8 |___]
6 IUD string retriever (for removal) 1 0 8 |___]
P36. Which providers perform IUD insertions in this facility? Read all.
S. No. Provider Perform IUD insertions Yes No Code
1 Medical Doctor (MBBS or above) 1 0 |___]
2 AYUSH Provider with Training 1 0 |___]
3 Staff Nurse (SN) with Training 1 0 |___]
4 Lady Health Visitor (LHV) with Training 1 0 |___]
5 Auxiliary Nurse Midwife (ANM) with Training 1 0 |___]
6 Others, Specify : [___________________________________] 1 0 |___]

Outlet ID : [___|___|___]-[___]-[___|___]-[___|___|-[___| - [___|___|___]
www.FPwatch.info Page 188
Interviewer read: Now I have some questions about female sterilization. Completing the questions may require speaking with more than 1 staff member at the outlet. If the respondent does not know the answer to a question in this section, ask to speak with another staff member who can provide the information.
P37. Does this outlet/facility provide female sterilization?
1 = Yes 0 = No GO TO P43
|___]
P38. Which of the following types of female sterilization procedures are available at this facility: (READ LIST AND RECORD FOR ALL RESPONSES.)
S. No. Types of Female Sterilization Yes No Don’t Know Code
1 Minilaparotomy 1 0 8 |___]
2 Laparascopy 1 0 8 |___]
3 Trans-cervical (no surgery) 1 0 8 |___]
P39. What is the total cost for a female sterilization at this outlet/facility? INR [___|___|___|___|___|___]
free = 000000; Refused = 999997;
Don’t know = 999998
P40a. How many female sterilizations have you performed at this facility in the previous 1 month?
female sterilizations [___|___|___] in 1 month Refused = 997;
Don’t know = 998
P40b. Source of information for number of procedures
[___| 0 = Provider recall 1 = Outlet records
P40c. How many female sterilizations have you performed at this facility in the previous 1 year?
female sterilizations [___|___|___] in 1 year Refused = 997;
Don’t know = 998
P40d. Source of information for number of procedures
[___| 0 = Provider recall 1 = Outlet records
P41. Does facility have the following equipment for providing female sterilization procedures: (READ LIST and ask to observe equipment. When asking to locate each piece of equipment, verify each option with PROMPT CARDS.)
S. No. List of Equipments Reported- Available
Reported- Not Available
Don’t Know
Code
1 Surgical / Examination table 1 0 8 |___]
2 Blood pressure apparatus 1 0 8 |___]
3 Lidocaine 1 0 8 |___]
4 Sterile needle with syringe 1 0 8 |___]
5 Scalpe with blade 1 0 8 |___]
6 Uterine elevator 1 0 8 |___]
7 Tubal hook 1 0 8 |___]
P42. Which providers perform Female sterilization in this facility? Read all.
S. No. Provider Perform Female sterilization Yes No Code
1 Medical Doctor (MBBS) with Surgical Specialty 1 0 |___]
2 Medical Doctor (MBBS) with DGO, MD/MS in ObGyn 1 0 |___]
5 Others, Specify : [___________________________________] 1 0 |___]

Outlet ID : [___|___|___]-[___]-[___|___]-[___|___|-[___| - [___|___|___]
www.FPwatch.info Page 189
Interviewer read: Now I have some questions about male sterilization. Completing the questions may require speaking with more than 1 staff member at the outlet. If the respondent does not know the answer to a question in this section, ask to speak with another staff member who can provide the information.
P43. Does this outlet/facility provide male sterilization?
1 = Yes 0 = No GO TO Section FPATS
|___]
P44. Which of the following types of male sterilization procedures are available at this facility: (READ LIST AND RECORD FOR ALL RESPONSES.)
S. No. Types of Male Sterilization Yes No Don’t Know Code
1 Scalpel vasectomy 1 0 8 |___]
2 No - Scalpel vasectomy 1 0 8 |___]
P45. What is the total cost for a male sterilization at this outlet/facility? INR [___|___|___|___|___|___]
free = 000000; Refused = 999997;
Don’t know = 999998
P46a. How many male sterilizations have you performed at
this facility in the previous 1 month? male sterilizations [___|___|___] in 1 month
Refused = 997; Don’t know = 998
P46b. Source of information for number of
procedures [___|
0 = Provider recall 1 = Outlet records
P46c. How many male sterilizations have you performed at this facility in the previous 1 year?
male sterilizations [___|___|___] in 1 year Refused = 997;
Don’t know = 998
P46d. Source of information for number of procedures
[___| 0 = Provider recall 1 = Outlet records
P47. Does facility have the following equipment for providing male sterilization procedures: (READ LIST and ask to observe equipment. When asking to locate each piece of equipment, verify each option with PROMPT CARDS.)
S. No. List of Equipments Reported-
Available
Reported-
Not Available
Don’t
Know Code
1 Surgical / Examination table 1 0 8 |___]
2 Lidocaine 1 0 8 |___]
3 Sterile needle with syringe 1 0 8 |___]
4 Scalpe with blade 1 0 8 |___]
5 Ringed clamp / forceps 1 0 8 |___]
6 Dissecting forceps 1 0 8 |___]
P48. Which providers perform Male sterilization in this facility? Read all.
S. No. Provider Perform Male sterilization Yes No Code
1 Medical Doctor (MBBS and above trained in Conventional vasectomy)
1 0 |___]
2 Medical Doctor (MBBS and above trained in No Scalpel vasectomy) 1 0 |___]
5 Others, Specify : [___________________________________] 1 0 |___]
Interviewer: Go to FAMILY PLANNING AUDIT TRACKING SHEET (NEXT PAGE)

Outlet ID : [___|___|___]-[___]-[___|___]-[___|___|-[___| - [___|___|___]
www.FPwatch.info Page 190
GO TO VISIT RESULT SECTION E: ENDING THE INTERVIE
SECTION FPATS: Family Planning Audit Tracking Sheet
T1. Were there any family planning tablets including oral contraceptives, misoprostol, emergency contraceptives, vaginal foaming tablets and/or birth control patches in stock at this outlet?
1=Yes
0=No Go to T4 8=Don’t Know Go to T4
|___]
T2. Total number of FP TAB audit sheets completed? 0=No
|___]|___]
T3. Did you complete audit sheet information for all available family planning tablets including oral contraceptives, misoprostol, emergency contraceptives, vaginal foaming tablets and/or birth control patches?
1 = Yes, audit complete 0 = No, audit not complete
|___]
T4. Were there any family planning injections including injectable contraceptives in stock at this outlet?
1=Yes 0=No Go to T7 8=Don’t Know Go to T7
|___]
T5. Total number of FP INJ audit sheets completed?
|___]|___]
T6. Did you complete audit sheet information for all available family planning injections including injectable contraceptives?
1 = Yes, audit complete
0 = No , audit not complete
|___]
T7. Were there any family planning insertions including contraceptive implants, IUDs and/or vaginal birth control rings in stock at this outlet?
1=Yes 0=No Go to T10
8=Don’t Know Go to T10
|___]
T8. Total number of FP INS audit sheets completed?
|___]|___]
T9. Did you complete audit sheet information for all available family planning insertions including
contraceptive implants, IUDs and/or vaginal birth control rings?
1 = Yes, audit complete 0 = No, audit not complete
|___]
T10. COMMENTS: Reason for incomplete audit sheets (if response is no to T3, T6, or T9):
__________________________________________________________________________________
__________________________________________________________________________________ __________________________________________________________________________________

www.FPwatch.info Page 191
Annex 8: Detailed Brand Listing with Quality-Assurance Indication
Contraceptive Commodity
Brand Formulation Manufacturer Country of Manufacture
WHO Prequalified or SRA List*
Tablets CRISANTA
Drospirenone + Ethinylestradiol CIPLA INDIA No
CRISANTA LS
Drospirenone + Ethinylestradiol CIPLA INDIA No
DRONIS 20
Drospirenone + Ethinylestradiol
SUN PHARMA LABORATORIES LTD Yes
YAMINI
Drospirenone + Ethinylestradiol LUPIN LTD INDIA No
YAMINI
Drospirenone + Ethinylestradiol
ONTOP PHARMACEUTICALS PVT LTD INDIA No
YAMINI LS
Drospirenone + Ethinylestradiol
ONTOP PHARMACEUTICALS PVT LTD INDIA No
YASMIN
Drospirenone + Ethinylestradiol BAYER PHARMA AG GERMANY Yes
YAZ
Drospirenone + Ethinylestradiol BAYER PHARMA AG GERMANY Yes
DIVACON
Levonorgestrel + Ethinylestradiol
JAGSONPAL PHARMACEUTICALS LTD INDIA No
DUOLUTON L
Levonorgestrel + Ethinylestradiol
ZYDUS HEALTHCARE LTD INDIA No
EVRON-L
Levonorgestrel + Ethinylestradiol
ACCENT PHARMACEUTICAL AND DIAGNOSTICS INDIA No
LOETTE
Levonorgestrel + Ethinylestradiol WYETH LTD INDIA No
LOETTE
Levonorgestrel + Ethinylestradiol PFIZER LTD INDIA No
OVIPAUZ-L
Levonorgestrel + Ethinylestradiol PHAARMASIA PVT LTD INDIA No
OVRAL L
Levonorgestrel + Ethinylestradiol PFIZER LTD INDIA No
OVRAL L
Levonorgestrel + Ethinylestradiol WYETH LTD INDIA No
SUVIDA 21
Levonorgestrel + Ethinylestradiol ESKAG PHARMA LTD INDIA No
T-PILL 21
Levonorgestrel + Ethinylestradiol UNICURE PVT LTD INDIA No
TRIQUILAR
Levonorgestrel + Ethinylestradiol SCHERING AG INDIA No
UNWANTED 21
Levonorgestrel + Ethinylestradiol
AKUMS DRUG AND PHARMACEUTICALS LTD INDIA No
UNWANTED 21
Levonorgestrel + Ethinylestradiol
SYNOKEM PHARMACEUTICALS LTD INDIA No
UNWANTED 21
Levonorgestrel + Ethinylestradiol
RELAX PHARMACEUTICALS PVT LTD INDIA No
UNWANTED 21
Levonorgestrel + Ethinylestradiol
THEON PHARMACEUTICALS LTD INDIA No
UNWANTED 21
Levonorgestrel + Ethinylestradiol MANKIND PHARMA LTD INDIA No
UNWANTED 21
Levonorgestrel + Ethinylestradiol
ACME FORMULATION PVT LTD INDIA No
ASPARA
Levonorgestrel + Ethinylestradiol + Ferrous Fumerate (Iron) HLL LIFECARE LTD INDIA No

www.FPwatch.info Page 192
ASPARA
Levonorgestrel + Ethinylestradiol + Ferrous Fumerate (Iron)
INDIAN DRUGS AND PHARMACEUTICALS LTD INDIA No
ASPARA
Levonorgestrel + Ethinylestradiol + Ferrous Fumerate (Iron) PHAARMASIA PVT LTD INDIA No
CHOICE
Levonorgestrel + Ethinylestradiol + Ferrous Fumerate (Iron) PHAARMASIA PVT LTD INDIA No
CHOICE
Levonorgestrel + Ethinylestradiol + Ferrous Fumerate (Iron)
INDIAN DRUGS AND PHARMACEUTICALS LTD INDIA No
CHOICE
Levonorgestrel + Ethinylestradiol + Ferrous Fumerate (Iron)
RELAX PHARMACEUTICALS PVT LTD INDIA No
CHOICE
Levonorgestrel + Ethinylestradiol + Ferrous Fumerate (Iron) HLL LIFECARE LTD INDIA No
ECROZ
Levonorgestrel + Ethinylestradiol + Ferrous Fumerate (Iron) HLL LIFECARE LTD INDIA Yes
KHUSHI OC
Levonorgestrel + Ethinylestradiol + Ferrous Fumerate (Iron) PHAARMASIA PVT LTD INDIA No
KHUSHI OC
Levonorgestrel + Ethinylestradiol + Ferrous Fumerate (Iron) HLL LIFECARE LTD INDIA No
MALA D
Levonorgestrel + Ethinylestradiol + Ferrous Fumerate (Iron) HLL LIFECARE LTD INDIA No
MALA D
Levonorgestrel + Ethinylestradiol + Ferrous Fumerate (Iron)
INDIAN DRUGS AND PHARMACEUTICALS LTD INDIA No
MALA D
Levonorgestrel + Ethinylestradiol + Ferrous Fumerate (Iron) PHAARMASIA PVT LTD INDIA No
MALA D
Levonorgestrel + Ethinylestradiol + Ferrous Fumerate (Iron) CIPLA INDIA No
MALA D
Levonorgestrel + Ethinylestradiol + Ferrous Fumerate (Iron) FAMY CARE LTD INDIA No
MALA D
Levonorgestrel + Ethinylestradiol + Ferrous Fumerate (Iron)
ACCENT PHARMACEUTICAL AND DIAGNOSTICS INDIA No
MALA D
Levonorgestrel + Ethinylestradiol + Ferrous Fumerate (Iron)
RELAX PHARMACEUTICALS PVT LTD INDIA No
MALA N
Levonorgestrel + Ethinylestradiol + Ferrous Fumerate (Iron) HLL LIFECARE LTD INDIA No
MALA N
Levonorgestrel + Ethinylestradiol + Ferrous Fumerate (Iron)
INDIAN DRUGS AND PHARMACEUTICALS LTD INDIA No
MALA N
Levonorgestrel + Ethinylestradiol + Ferrous Fumerate (Iron) FAMY CARE LTD INDIA No
MALA N
Levonorgestrel + Ethinylestradiol + Ferrous Fumerate (Iron)
ACCENT PHARMACEUTICAL AND DIAGNOSTICS INDIA No

www.FPwatch.info Page 193
MALA N
Levonorgestrel + Ethinylestradiol + Ferrous Fumerate (Iron) PHAARMASIA PVT LTD INDIA No
MALA N
Levonorgestrel + Ethinylestradiol + Ferrous Fumerate (Iron)
RELAX PHARMACEUTICALS PVT LTD INDIA No
PEARL
Levonorgestrel + Ethinylestradiol + Ferrous Fumerate (Iron) PHAARMASIA PVT LTD INDIA No
PEARL
Levonorgestrel + Ethinylestradiol + Ferrous Fumerate (Iron) HLL LIFECARE LTD INDIA No
PEARL
Levonorgestrel + Ethinylestradiol + Ferrous Fumerate (Iron)
INDIAN DRUGS AND PHARMACEUTICALS LTD INDIA No
PEARL
Levonorgestrel + Ethinylestradiol + Ferrous Fumerate (Iron) FAMY CARE LTD INDIA No
SUNEHRI
Levonorgestrel + Ethinylestradiol + Ferrous Fumerate (Iron) PHAARMASIA PVT LTD INDIA No
SUNEHRI
Levonorgestrel + Ethinylestradiol + Ferrous Fumerate (Iron) HLL LIFECARE LTD INDIA No
SUVIDA
Levonorgestrel + Ethinylestradiol + Ferrous Fumerate (Iron) ESKAG PHARMA LTD INDIA No
UNWANTED 72
Levonorgestrel + Ethinylestradiol + Ferrous Fumerate (Iron)
RELAX PHARMACEUTICALS PVT LTD INDIA No
UNWANTED 72
Levonorgestrel + Ethinylestradiol + Ferrous Fumerate (Iron) HLL LIFECARE LTD INDIA No
Injectables B-SURE
Medroxyprogesterone Acetate MMG HEALTHCARE LTD No
B-SURE
Medroxyprogesterone Acetate MMG HEALTHCARE LTD INDIA No
B-SURE
Medroxyprogesterone Acetate
ACCENT PHARMACEUTICAL AND DIAGNOSTICS INDIA No
B-SURE
Medroxyprogesterone Acetate HLL LIFECARE LTD INDIA No
B-SURE
Medroxyprogesterone Acetate
BHARAT PHARMACEUTICALS INDIA No
B-SURE
Medroxyprogesterone Acetate PFIZER LTD BELGIUM No
DEPO KARE
Medroxyprogesterone Acetate DEV LIFE CORPORATION INDIA No
DEPO KARE
Medroxyprogesterone Acetate
ACCENT PHARMACEUTICAL AND DIAGNOSTICS INDIA No
DEPO-PROVERA
Medroxyprogesterone Acetate PFIZER LTD BELGIUM No
DEPO-PROVERA
Medroxyprogesterone Acetate FAMY CARE LTD BELGIUM No
EVRON
Medroxyprogesterone Acetate
ACCENT PHARMACEUTICAL AND DIAGNOSTICS INDIA No
FREEDOM INJECT
Medroxyprogesterone Acetate FAMY CARE LTD INDIA No

www.FPwatch.info Page 194
GENERIC MED-ACE
Medroxyprogesterone Acetate
ACCENT PHARMACEUTICAL AND DIAGNOSTICS INDIA No
KHUSHI DEPO INJ
Medroxyprogesterone Acetate
ACCENT PHARMACEUTICAL AND DIAGNOSTICS INDIA No
KHUSHI DEPO INJ
Medroxyprogesterone Acetate WEALTH LLC INDIA No
KHUSHI DEPO INJ
Medroxyprogesterone Acetate MMG HEALTHCARE LTD INDIA No
KHUSHI DEPO INJ
Medroxyprogesterone Acetate DEV LIFE CORPORATION INDIA No
PARI
Medroxyprogesterone Acetate
ACCENT PHARMACEUTICAL AND DIAGNOSTICS INDIA No
PARI
Medroxyprogesterone Acetate ACME CARE PVT LTD INDIA No
PARI
Medroxyprogesterone Acetate FAMY CARE LTD INDIA No
PROLUTON DEPOT
Hydroxyprogesterone Caproate
CADILA HEALTHCARE LIMITED INDIA No
PROLUTON DEPOT
Hydroxyprogesterone Caproate
CADILA HEALTHCARE LIMITED No
IUDs and Implants
EMILY Levonorgestrel HLL LIFECARE LTD INDIA Yes
FIONA Levonorgestrel MERIL ENDO SURGERY PVT LTD INDIA Yes
COPPER TCU 375 Copper / Cu 375 HLL LIFECARE LTD INDIA No
FREEDOM 5 CU 375 Copper / Cu 375 FAMY CARE LTD INDIA No
FREEDOM 5 CU 375 Copper / Cu 375 MANKIND PHARMA LTD INDIA No
FREEDOM 5 CU 375 Copper / Cu 375
PREGNA INTERNATIONAL LTD INDIA No
FREEDOM 5 CU 375 Copper / Cu 375
SMB CORPORATION OF INDIA INDIA No
FREEDOM 5 CU 375 Copper / Cu 375 PFIZER INDIA No
INARA CU 375 Copper / Cu 375 PREGNA INTERNATIONAL LTD INDIA No
KHUSHI CU 375 Copper / Cu 375 SMB CORPORATION OF INDIA INDIA No
M CARE CU 375 Copper / Cu 375 HLL LIFECARE LTD INDIA No
M CARE CU 375 Copper / Cu 375 FAMY CARE LTD INDIA No
MERITE CU 375 Copper / Cu 375 MERIL ENDO SURGERY PVT LTD INDIA No
PREGNA CU375 Copper / Cu 375 PREGNA INTERNATIONAL LTD INDIA No
PREGNA CU375 Copper / Cu 375 HLL LIFECARE LTD INDIA No
SAKHI SLEEK CU 375 Copper / Cu 375
PREGNA INTERNATIONAL LTD INDIA No
SMB CU 375 Copper / Cu 375 SMB CORPORATION OF INDIA INDIA No
STERILE CU 375 Copper / Cu 375 HLL LIFECARE LTD INDIA Yes
STERILE CU 375 Copper / Cu 375 CONTECH DEVICES PVT. LTD. INDIA Yes
U-KARE CU 375 Copper / Cu 375 PREGNA INTERNATIONAL LTD INDIA No
URVASHI CU 375 Copper / Cu 375 FAMY CARE LTD INDIA No
COPPER TCU 380A Copper / Cu 380a HLL LIFECARE LTD INDIA No

www.FPwatch.info Page 195
COPPER TCU 380A Copper / Cu 380a 99 INDIA No
PREGNA TCU 380A Copper / Cu 380a
PREGNA INTERNATIONAL LTD INDIA No
STERILE TCU 380A Copper / Cu 380a HLL LIFECARE LTD INDIA No
M CARE CU 250 Copper / Cu 250 HLL LIFECARE LTD INDIA Yes
MULTILOAD CU250 Copper / Cu 250
M/S NANJING ORGANON PHARMACEUTICAL CO LIMITED Yes
U-KARE CU 250 Copper / Cu 250 PREGNA INTERNATIONAL LTD INDIA No
EMILY Levonorgestrel HLL LIFECARE LTD INDIA Yes
Contraceptive Commodity
Brand Brand Brand Brand
Male condoms 18 PLUS FANTASY MANWISH SAWAN
24 HOURS FIRE MASTER SENSEX
24CARAT FORCH MASTI SEXY GIRL
AASTHABERRY FUN TIME MIDNIGHT SHIKANDAR
ADDICTION HAIND MILAN SKOR
AGNI HANY BUNNY MITHUN SKORE
AHSAAS HIT ME MITWA SKYN
ALBELA HOT PLEASURE MOODS SOASHH
APOLLO HOT ROMANCE MOOV SPEED RIDER
APSARA HOTSHOT MORE FUN STAY-ON
BIG DOM JAGALI NAUTY TIME STRQ
BIG FUN JANANI NEEL KAMAL STYLE
BLACK PANTHER JOSH NEW HEAVEN SURE SHOT
BLISS JOYSTIK NIRODH THRILL
BOONG KAM TRUPTI OASIS TIME MAX
BULL KAMA SUTRA OLLA TIYE WAN
CAMBLE KAMAGNI OUA TOUCH ME
CAN VAS KIK PARTNER TRISHNA
CATCH ME KLY-MAX PLAYGARD TRY
COBRA KOHINOOR POWER JON USTAD
COCMAX LA-FORCE PROFORCE VERSION
CONVEX LIONOUR RA VIGORA
COUPLES LOVE 20-20 RAKSHAK VOLTRA
DOVE LOVE ME RIDER WOLTRA
DUREX MAN XXX ROCK X- MAN
ENJOY MANFORCE ROMANCE XXX
EXOTIC MANLOVE ROWDY Z - PLUS
FAIR MANPRIDE SAJAN ZAROOR
Female condoms FC2
VELVET

www.FPwatch.info Page 196
Annex 9. Sampling Weights
Sampling weights were applied for analysis of the India 2015 – 2016 outlet survey data to account for variations in probability of selection as a result of the sampling design: 1) Stratification: Disproportionate allocation stratification was used to ensure adequate sample size within the
regional domains to allow for domain-specific estimates. A representative sample was selected within each domain.
2) One-stage cluster sampling: Metro (urban) wards were selected from a sampling frame with PPS. Within each metro ward, a census of all outlets with the potential to sell or distribute modern contraceptives and/or provide associated contraceptive procedures was conducted.
3) Two-stage cluster sampling: For urban and rural strata, districts were first selected from a urban/rural-
specific sampling frame with PPS. Within selected districts, urban wards and rural villages were then chosen at a second stage from selected districts using PPS. Within each selected urban ward or rural village, a census of all outlets with the potential to sell or distribute modern contraceptives and/or provide associated contraceptive procedures was conducted.
The sampling weights applied during analysis are the inverse of the probability of selection.
For metro wards (one-stage):
𝑊𝑖 =1
a × Mα
∑ Mα
Where:
Mα = estimated metro ward population size
ΣMα = sum of estimated metro ward population sizes in the entire stratum
a = number of metro wards selected within the stratum
For urban and rural strata, weights were calculated for both district probability of selection and urban ward/rural
village probability of selection. Final weights were calculated by multiplying the corresponding woreda weight by a
given kebele weight:
The sampling weights applied during analysis are the inverse of the probability of selection.
For urban wards and rural villages (two-stage):
𝑊𝑖 =1
a ×Dα
∑ Dα× b ×
Mα
∑ Mα
Where:
1st Stage of selection:
Dα = estimated district population size
ΣDα = sum of estimated district population sizes
a = number of districts selected
2nd Stage of selection:

www.FPwatch.info Page 197
Mα = estimated urban ward or rural village population size
ΣMα = sum of estimated urban ward or rural village sizes in the stratum (urban or rural)
b = number of urban wards or rural villages selected within the district
Sampling weights are calculated at the cluster level and are applied to all outlets within a given cluster, regardless of
outlet type.
The population estimates used to select health areas with PPS and to create sampling weights were obtained from the 2014 Housing and Population Census. A sampling frame with population sizes was used for selecting the sample because accurate estimates on the total number of outlets per geographic/administrative unit that may be eligible for a medicine outlet survey do not exist. The major assumption in using population figures for sampling and weighting is that distribution of outlets and/or distribution of medicines moving through outlets in a given cluster is correlated with population size.

www.FPwatch.info Page 198
Annex 10: FPwatch Indicator List
Indicator 1: Modern contraceptive method market composition Table 1 reports the distribution of outlet types among outlets: 1. With at least one modern contraceptive method available on the day of the survey. Outlet types will be broad-based (public vs. private) as well as for major outlet types by country. Market composition is reported for provincial (Uttar Pradesh, Bihar) as well as for urban/rural estimates.
Numerator By outlet type, the number of outlets with any modern contraceptive method in stock at the time of the survey visit, as confirmed by presence of at least 1 brand/generic of 1 modern contraceptive method in the FP commodity audit section or condoms module or contraceptive procedure recorded in the FP provider section.
Denominator Total number of outlets with any modern contraceptive method in stock or available at the time of the survey visit, as confirmed by presence of at least 1 brand/generic of 1 modern contraceptive method (male/female condoms, oral contraceptives, emergency contraceptives, injectables implants, IUDs) recorded in the contraceptive method audit section or condoms section or type of contraceptive procedure in the FP provider section.
Calculation Numerator for each outlet type divided by the denominator.
Handling missing values
All outlets with at least 1 modern contraceptive method recorded in the contraceptive audit section or reporting availability of condoms in screening section or reporting availability of at least 1 contraceptive procedure will contribute to the indicator. This includes outlets where the interview was not fully completed (partial interview).
Notes and considerations
None.

www.FPwatch.info Page 199
Indicator 2: Availability of at least 1 method of modern contraception Table 2 reports the proportion of all outlets screened that had any modern contraceptive method (male/female condoms, oral contraceptives, emergency contraceptives, injectables, implants, IUDs, cycle beads) in stock or offering male/female sterilization procedures at the time of the survey visit. Modern contraceptive method availability is reported for States (Uttar Pradesh, Bihar) as well as for urban/rural estimates. Availability is reported among all outlets as well as among: individual outlet types and comparing all public outlets to all private for profit and NGO outlets.
Numerator 1. Number of outlets with any modern contraceptive commodity in stock at the time of the survey visit, as confirmed by presence of at least 1 brand/generic of 1 modern contraceptive commodity recorded in the contraceptive commodity audit section, offering male/female sterilization procedures as indicated in the service provider interview, or reporting availability of condoms in condoms module.
Denominator Number of outlets screened.
Calculation Numerator divided by denominator.
Handling missing values
All screened outlets will contribute to the denominator. This includes outlets with commodities/procedures available but: 1) were not interviewed; or 2) the interview was partially completed.
Notes and considerations
Given partial or non-completion of interviews among eligible outlets and the inclusion of these outlets in the denominator, these availability indicators can be considered conservative estimates of modern contraceptive method availability. Outlets that only offer procedures for injectables, implants and/or IUDs but do not have the commodity in stock, will not be counted as having the method available.

www.FPwatch.info Page 200
Indicator 3: Availability of selected modern contraceptive methods Table 3 reports the proportion of modern contraceptive commodity-stocking or procedure-providing (no contraceptive commodities available but providing injections, implant/IUD insertions and/or male/female sterilizations) outlets with specific modern contraceptive commodities in stock at the time of the survey visit. Modern contraceptive method availability is reported for provincial (Uttar Pradesh, Bihar) as well as for urban/rural estimates. Availability is reported among all outlets as well as among: individual outlet types and comparing all public outlets to all private for profit and NGO outlets.
Numerator Number of outlets with X modern contraceptive commodity/procedure type in stock/available at the time of the survey visit, as confirmed by presence of at least 1 brand/generic of X modern contraceptive commodity for the commodity type recorded in the FP audit section. For condoms, this includes outlets with condoms only as indicated in the condoms module. For procedures, this includes outlets indicating availability of X service in the provider section.
Denominator Number of outlets with any modern contraceptive commodity in stock or providing any contraceptive procedure at the time of the survey visit, as confirmed by presence of at least 1 brand/generic of 1 modern contraceptive commodity recorded in the FP method audit section, reporting availability of condoms in condoms module or reporting availability of at least one modern contraceptive procedure.
Calculation Numerator for each modern contraceptive commodity/service type divided by the denominator.
Handling missing values
All outlets with any modern contraceptive method available will contribute to the denominator. This includes outlets with commodities/procedures available but the interview was partially completed.
Notes and considerations
Given partial completion of interviews among outlets potentially providing modern contraceptive methods and the inclusion of these outlets in the denominator, these availability indicators can be considered conservative estimates of modern contraceptive method availability.

www.FPwatch.info Page 201
Indicator 4: Availability of range/diversity of modern contraceptive methods Table 4 reports the proportion of modern contraceptive commodity-stocking and procedure-providing outlets with 3 or more modern FP methods (commodity and/or service) in stock or available at the time of the survey visit, 3 or more methods with at least one method a LARC and 5 or more methods. Modern contraceptive method availability is reported for provincial (Uttar Pradesh, Bihar) as well as for urban/rural estimates. Availability is reported among all outlets as well as among: individual outlet types and comparing all public outlets to all private for profit and NGO outlets.
Numerator 1. Number of outlets with 3 or more modern contraceptive methods available at the time of the survey visit, as confirmed by presence of at least 1 brand/generic for any 3 or more combinations of modern contraceptive commodities (male condoms, female condoms, oral contraceptives, emergency contraceptives, injectables, implants, IUDs) recorded in the contraceptive method audit section, and/or condoms module and/or types of contraceptive procedures (male/female sterilizations) recorded in the FP provider section. 2. Number of outlets with 3 or more modern FP methods, including at least 1 LARC (implants, IUDs), available at the time of the survey visit, as confirmed by presence of at least 1 brand/generic for any 3 or more combinations, including at least 1 LARC, of modern contraceptive commodities (male condoms, female condoms, oral contraceptives, emergency contraceptives, injectables, implants, IUDs) recorded in the contraceptive audit section and/or condoms module and/or types of contraceptive procedures (male or female sterilizations) recorded in the FP provider section. 3. Number of outlets with 5 or more modern contraceptive methods available at the time of the survey visit, as confirmed by presence of at least 1 brand/generic for any 5 or more combinations of modern contraceptive commodities (male condoms, female condoms, oral contraceptives, emergency contraceptives, injectables, implants, IUDs) recorded in the contraceptive method audit section, and/or condoms module and/or types of contraceptive procedures (male/female sterilizations) recorded in the FP provider section.
Denominator 1. Number of outlets with any modern contraceptive commodity in stock or providing any contraceptive procedure at the time of the survey visit, as confirmed by presence of at least 1 brand/generic of 1 modern contraceptive commodity recorded in the contraceptive method audit section, reporting availability of condoms in condoms module or reporting availability of at least one contraceptive procedure.
Calculation Numerator divided by denominator.
Handling missing values
All outlets with any modern contraceptive method available will contribute to the denominator. This includes outlets with commodities/procedures available but the interview was partially completed.
Notes and considerations
Given partial completion of interviews among outlets potentially providing modern contraceptive methods and the inclusion of these outlets in the denominator, these availability indicators can be considered conservative estimates of modern contraceptive method availability.

www.FPwatch.info Page 202
Indicator 5: Stock outs Table 5 reports the proportion of outlets reporting a current stock out of a method (oral contraceptives, emergency contraceptives, injectables, implants, IUDs) that the outlet has reportedly had in stock in the previous 3 months. Stock outs are reported among all outlets as well as among: individual outlet types and comparing all public outlets to all private for profit and NGO outlets.
Numerator Number of outlets reporting a stock out of a method, as confirmed by report of a current stock out in the FP provider section, and the outlet does not have the method currently available, as confirmed in the contraceptive method audit section.
Denominator Number of outlets reportedly offering the method at any point in the previous 3 months.
Calculation Numerator for each modern FP commodity type divided by the denominator.
Handling missing values
All outlets reportedly offering the method will contribute to the denominator. This includes outlets with products available but the interview was partially completed.
Notes and considerations
This indicator only applies to outlets that reportedly offered the method in the previous three months. Those outlets that did not offer the method in the previous three months but might be expected to carry the product will not appear in this indicator. Instead, they will be seen in the converse (non-availability) of the availability of methods indicator.

www.FPwatch.info Page 203
Indicator 6: Price of modern contraceptive methods Table 6 provides the median retail price, by method, combining all brands of X method. The IQR is provided as a measure of dispersion. Commodities with a service component (injections, implant and IUD insertions) may include a procedure price in addition to the commodity cost. Methods without a commodity (male/female sterilizations) will be reported on the price of procedure only. Median price is reported for States (Uttar Pradesh, Bihar) as well as for urban/rural estimates and among all outlets as well as among: individual outlet types and comparing all public outlets to all private for profit and NGO outlets.
Calculation Median retail price for each modern contraceptive method price in US dollars with IQR.
Handling missing values
Contraceptive brands/generics with missing price information are excluded from the median price calculation.
Notes and considerations
For methods with an associated procedure (injection, implant and IUD insertion, male/female sterilization), cost will be determined for commodity (if there is commodity) and may include a service charge. Price in US dollars is calculated based on exchange rates available from www.oanda.com using the historical exchange rates tool. The average exchange rate over the entire data collection period is used for converting local currency captured during data collection to US dollars.

www.FPwatch.info Page 204
Indicator 7: Price of modern contraceptive methods in CYP Table 7 provides the median retail price of 1 CYP by method, combining all brands/generics of X method. The IQR is provided as a measure of dispersion. Commodities with a service component (injections, implant and IUD insertions) may include a procedure price in addition to the commodity cost. Methods without a commodity (male/female sterilizations) will be reported on the price of procedure only. Median price is reported for provincial (Uttar Pradesh, Bihar) as well as for urban/rural estimates and among all outlets as well as among individual outlet types and comparing all public outlets to all private for profit and NGO outlets.
Calculation Median retail price for 1 CYP of each modern contraceptive method price in US dollars with IQR.
Handling missing values
Contraceptive brands/generics with missing price information are excluded from the median price calculation.
Notes and considerations
Price per CYP will be determined by multiplying retail price by the CYP conversion factor. CYP conversion factors are used from http://www.cpc.unc.edu/measure/prh/rh_indicators/specific/fp/cyp. See Annex 11 for description of CYP calculation. For methods with an associated procedure (injection, implant and IUD insertion, male/female sterilization), cost will be determined for commodity (if there is commodity) and may include a service charge. Price in US dollars is calculated based on exchange rates available from www.oanda.com using the historical exchange rates tool. The average exchange rate over the entire data collection period is used for converting local currency captured during data collection to US dollars.

www.FPwatch.info Page 205
Indicator 8: Median markup percentage of modern contraceptives Table 8 provides the median percentage markup (mean of retail price minus wholesale price) by selected methods combining the price for all brands/generics of a given method. The IQR is provided as a measure of dispersion. Median markups are reported for States (Uttar Pradesh, Bihar) as well as for urban/rural estimates and among all outlets as well as among individual outlet types and comparing all public outlets to all private for profit and NGO outlets.
Calculation Median with IQR of: [(Retail price – wholesale price)/wholesale price] x 100
Handling missing values
Brands/generics with missing retail or wholesale price information will be excluded.
Notes and considerations
Given missing information among eligible outlets, potential variation for cost of methods within an outlet and the difficulties in disaggregating service/procedure cost from commodity cost this indicator should be interpreted with caution.

www.FPwatch.info Page 206
Indicator 9: Modern contraceptive method market share Modern contraceptive method market share is the volume in CYP reportedly sold or distributed in the previous month for a selected contraceptive method as a percentage of the total CYP sold or distributed in the previous month across all method types. Expressed as a percentage, market share is the amount of a specific contraceptive method sold/distributed by a specific outlet type relative to the entire contraceptive market (total volume in CYP across all method types). Totals are reported per modern contraceptive method type. Across modern contraceptive method types, percentages in the entire table sum to 100% (the total market). Method market shares are reported for provincial (Uttar Pradesh, Bihar) as well as for urban/rural estimates.
Numerator Total number of CYPs sold/distributed for X method and Y outlet.
Denominator Total number of CYP sold/distributed for all methods.
Calculation Numerator divided by denominator.
Handling missing values
CYPs sold/distributed are calculated among audited modern contraceptive methods with complete and consistent information. Modern contraceptive methods with incomplete or inconsistent information among key variables that define CYP sold/distributed (package size, amount sold/distributed) are excluded from the calculation.
Notes and considerations
See description of CYP calculation in Annex 11.

www.FPwatch.info Page 207
Indicator 10: Modern contraceptive market share within outlet types Outlet market share is the volume in CYP reportedly sold or distributed in the previous month for a selected method type as a percentage of the total CYP sold or distributed in the previous month across within a given outlet type. Expressed as a percentage, market share is the volume in CYP sold/distributed for a given method relative to the total volume in CYP for that a given outlet type. Outlet types will be broad-based (public vs. private vs. NGO) as well as for major outlet types by country. Within outlet categories, percentages sum to 100% (the total market). Outlet market shares are reported for provincial (Uttar Pradesh, Bihar) as well as for urban/rural estimates.
Numerator Total number of CYPs sold/distributed for X method in Y outlet.
Denominator Total number of CYP sold/distributed in Y outlet category.
Calculation Numerator divided by denominator.
Handling missing values
CYPs sold/distributed are calculated among audited modern contraceptive methods with complete and consistent information. Modern contraceptive methods with incomplete or inconsistent information among key variables that define CYP sold/distributed (package size, amount sold/distributed) are excluded from the calculation.
Notes and considerations
See description of CYP calculation in Annex 11.

www.FPwatch.info Page 208
Indicator 11: Availability of provider skills and certification for contraceptive procedures Table 11 provides the proportion of outlets with a trained provider available for key modern contraceptive procedures (injection, implant and IUD insertion, male/female sterilization) among: 1. All screened outlets; and 2. Outlets recorded as providing the method, regardless of legality. Proportions are reported for selected outlet types and for provincial as well as for urban/rural estimates.
Numerator Number of outlets with at least 1 provider having credentials to legally provide X contraceptive procedure (injection, implant and IUD insertion, male/female sterilization).
Denominator 1. All screened outlets; and 2. Outlets reportedly providing X provider-dependent method.
Calculation Numerator divided by denominator 1 and denominator 2, for each method type.
Handling missing values
Methods with missing certification/training information will be excluded.
Notes and considerations
Necessary certifications for provider-dependent FP methods found in the Government of India Guidelines for Family Planning under NHM, available at : http://nrhm.gov.in/nhm/nrhm/guidelines/nrhm-guidelines/family-planning-guidelines.html
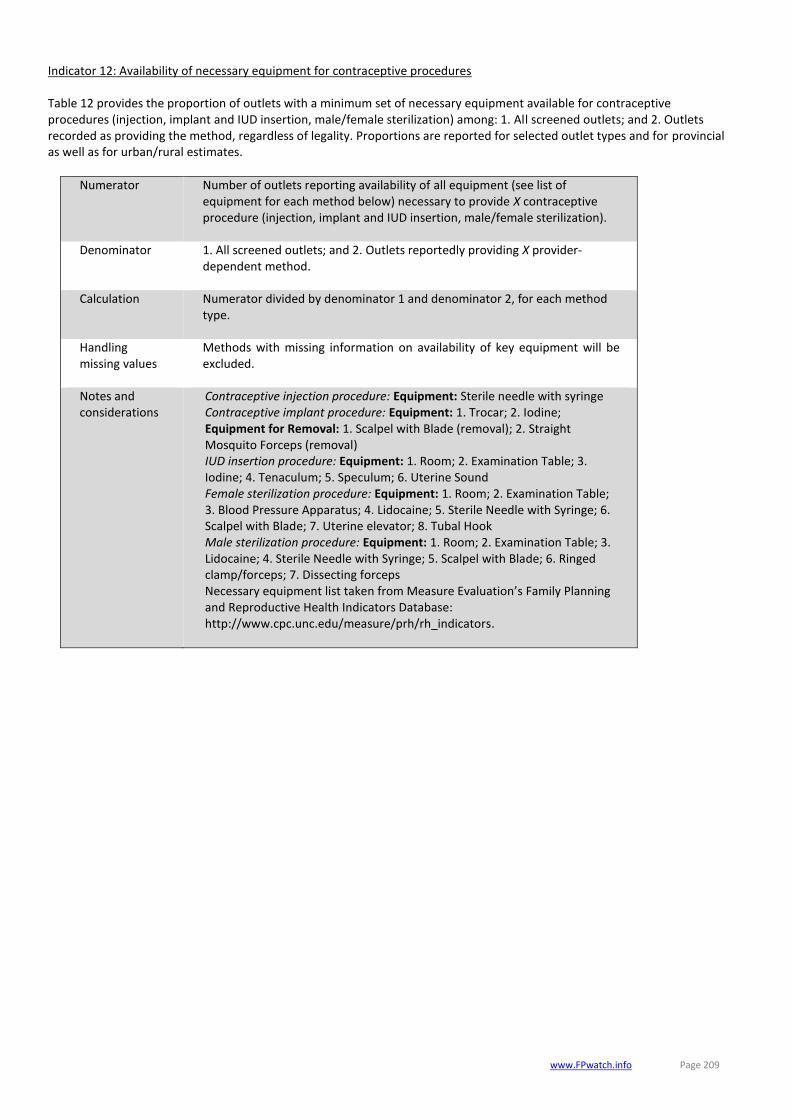
www.FPwatch.info Page 209
Indicator 12: Availability of necessary equipment for contraceptive procedures Table 12 provides the proportion of outlets with a minimum set of necessary equipment available for contraceptive procedures (injection, implant and IUD insertion, male/female sterilization) among: 1. All screened outlets; and 2. Outlets recorded as providing the method, regardless of legality. Proportions are reported for selected outlet types and for provincial as well as for urban/rural estimates.
Numerator Number of outlets reporting availability of all equipment (see list of equipment for each method below) necessary to provide X contraceptive procedure (injection, implant and IUD insertion, male/female sterilization).
Denominator 1. All screened outlets; and 2. Outlets reportedly providing X provider-dependent method.
Calculation Numerator divided by denominator 1 and denominator 2, for each method type.
Handling missing values
Methods with missing information on availability of key equipment will be excluded.
Notes and considerations
Contraceptive injection procedure: Equipment: Sterile needle with syringe Contraceptive implant procedure: Equipment: 1. Trocar; 2. Iodine; Equipment for Removal: 1. Scalpel with Blade (removal); 2. Straight Mosquito Forceps (removal) IUD insertion procedure: Equipment: 1. Room; 2. Examination Table; 3. Iodine; 4. Tenaculum; 5. Speculum; 6. Uterine Sound Female sterilization procedure: Equipment: 1. Room; 2. Examination Table; 3. Blood Pressure Apparatus; 4. Lidocaine; 5. Sterile Needle with Syringe; 6. Scalpel with Blade; 7. Uterine elevator; 8. Tubal Hook Male sterilization procedure: Equipment: 1. Room; 2. Examination Table; 3. Lidocaine; 4. Sterile Needle with Syringe; 5. Scalpel with Blade; 6. Ringed clamp/forceps; 7. Dissecting forceps Necessary equipment list taken from Measure Evaluation’s Family Planning and Reproductive Health Indicators Database: http://www.cpc.unc.edu/measure/prh/rh_indicators.

www.FPwatch.info Page 210
Indicator 13: Full service readiness to provide contraceptive procedures Table 13 provides the proportion of outlets with full service readiness for contraceptive procedures defined as: 1. Having at least one brand/generic of a selected contraceptive commodity available on the day of the survey (for injections, implants, IUDs); 2. Having at least one provider trained/certified for a selected method available at the outlet (for injections, implants, IUDs, sterilizations); and 3. Having a minimum, necessary set of equipment for providing a selected method available at the outlet. Outlets meeting each of these three criteria will be classified as “service ready.” Proportions are reported for selected outlet types and for provincial as well as for urban/rural estimates.
Numerator Number of outlets reporting availability of commodity and provider credentials and all necessary equipment for a selected method.
Denominator 1. All screened outlets; and 2. Outlets reportedly providing X contraceptive procedure.
Calculation Numerator divided by denominator 1 and denominator 2, for each method type.
Handling missing values
Methods with missing information on availability of commodities, provider credentials or key equipment will be excluded.
Notes and considerations
None.
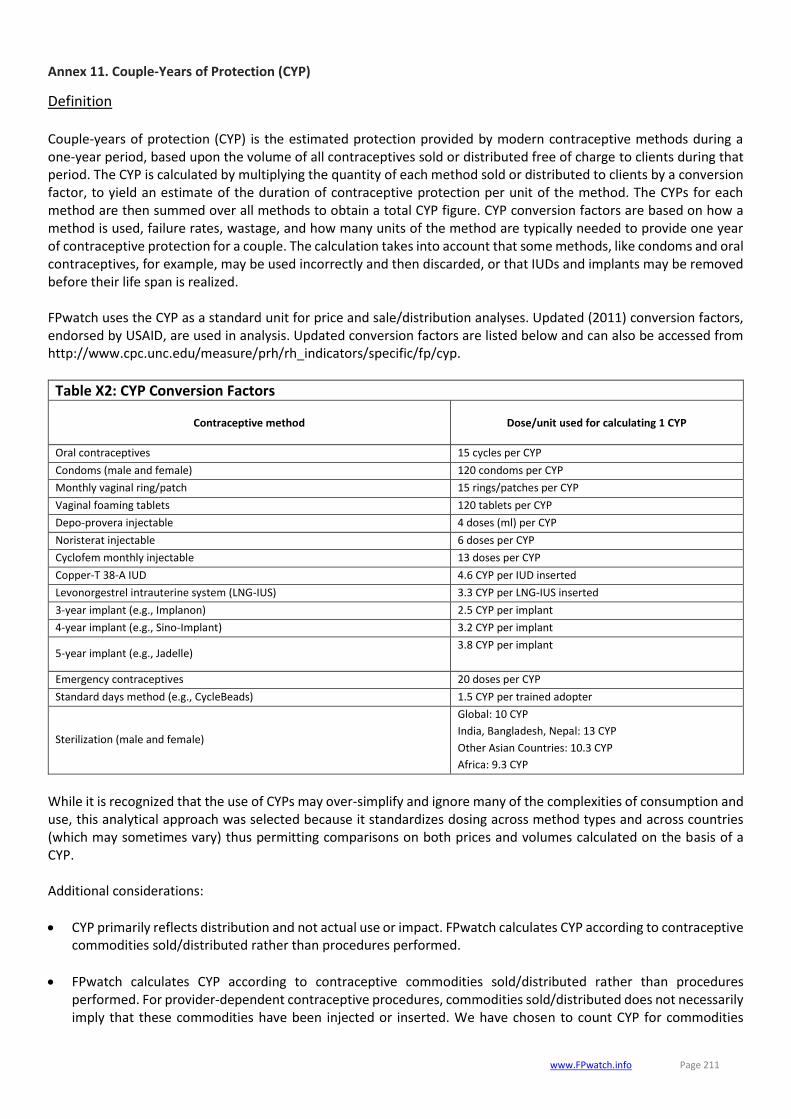
www.FPwatch.info Page 211
Annex 11. Couple-Years of Protection (CYP)
Definition Couple-years of protection (CYP) is the estimated protection provided by modern contraceptive methods during a one-year period, based upon the volume of all contraceptives sold or distributed free of charge to clients during that period. The CYP is calculated by multiplying the quantity of each method sold or distributed to clients by a conversion factor, to yield an estimate of the duration of contraceptive protection per unit of the method. The CYPs for each method are then summed over all methods to obtain a total CYP figure. CYP conversion factors are based on how a method is used, failure rates, wastage, and how many units of the method are typically needed to provide one year of contraceptive protection for a couple. The calculation takes into account that some methods, like condoms and oral contraceptives, for example, may be used incorrectly and then discarded, or that IUDs and implants may be removed before their life span is realized. FPwatch uses the CYP as a standard unit for price and sale/distribution analyses. Updated (2011) conversion factors, endorsed by USAID, are used in analysis. Updated conversion factors are listed below and can also be accessed from http://www.cpc.unc.edu/measure/prh/rh_indicators/specific/fp/cyp.
Table X2: CYP Conversion Factors
Contraceptive method
Dose/unit used for calculating 1 CYP
Oral contraceptives 15 cycles per CYP
Condoms (male and female) 120 condoms per CYP
Monthly vaginal ring/patch 15 rings/patches per CYP
Vaginal foaming tablets 120 tablets per CYP
Depo-provera injectable 4 doses (ml) per CYP
Noristerat injectable 6 doses per CYP
Cyclofem monthly injectable 13 doses per CYP
Copper-T 38-A IUD 4.6 CYP per IUD inserted
Levonorgestrel intrauterine system (LNG-IUS) 3.3 CYP per LNG-IUS inserted
3-year implant (e.g., Implanon) 2.5 CYP per implant
4-year implant (e.g., Sino-Implant) 3.2 CYP per implant
5-year implant (e.g., Jadelle) 3.8 CYP per implant
Emergency contraceptives 20 doses per CYP
Standard days method (e.g., CycleBeads) 1.5 CYP per trained adopter
Sterilization (male and female)
Global: 10 CYP
India, Bangladesh, Nepal: 13 CYP
Other Asian Countries: 10.3 CYP
Africa: 9.3 CYP
While it is recognized that the use of CYPs may over-simplify and ignore many of the complexities of consumption and use, this analytical approach was selected because it standardizes dosing across method types and across countries (which may sometimes vary) thus permitting comparisons on both prices and volumes calculated on the basis of a CYP. Additional considerations:
CYP primarily reflects distribution and not actual use or impact. FPwatch calculates CYP according to contraceptive commodities sold/distributed rather than procedures performed.
FPwatch calculates CYP according to contraceptive commodities sold/distributed rather than procedures performed. For provider-dependent contraceptive procedures, commodities sold/distributed does not necessarily imply that these commodities have been injected or inserted. We have chosen to count CYP for commodities

www.FPwatch.info Page 212
sold/distributed across all methods, assuming that contraceptive procedures on sold contraceptives requiring a procedure are performed.
Calculation Price and volume data were entered according to how an outlet reported selling the contraceptive commodity. For example, if they sold oral contraceptives in packages of three blisters, they reported sales for a package of three blisters. If they sold blisters individually, there was an option to report sales by blister rather than package of three. During analysis, price and volume data were divided by how the units were sold. For example, if oral contraceptives are sold in a package of three blisters, volume and price is manipulated to give volume and price for each one unit. The units considered are those listed for CYP conversion rates. No product was sold by less than the CYP unit (e.g., by single oral contraceptive tablet vs. a blister (cycle)). Price per CYP was determined by multiplying the given price by the CYP conversion factor (if short-acting method because all < 1 year) and dividing by the CYP conversion factor (if long-acting method because all > 1 year). Volume of CYP was determined by dividing the number of units sold by the CYP conversion factor (if short-acting method) and multiplying by the CYP conversion factor (if long-acting method). Some prices/volumes are given for an entire method that may use multiple conversion factors. For example, the volume of implants was reported by combining all 3-, 4- and 5-year implants using each of their appropriate CYP conversion factors.

www.FPwatch.info Page 213
Annex 12: Contraceptive Method Volumes
Table X3: Reported Contraceptive Method Volumes: Uttar Pradesh, 2016 CYPs sold or distributed in previous 1 month by outlet type and contraceptive method type†
Higher Public Health Facility
Sub-centre / ANM / ASHA
AWW NGO Public Total* Private facility
Pharmacy/Chemist
Private Medical Total*
AYUSH Provider
RMP General Retailer
Private Other Total* All Outlets
Vol CYP (95% CI)
Vol CYP (95% CI)
Vol CYP (95% CI)
Vol CYP (95% CI)
Vol CYP (95% CI)
Vol CYP (95% CI)
Vol CYP (95% CI)
Vol CYP (95% CI)
Vol CYP (95% CI)
Vol CYP (95% CI)
Vol CYP (95% CI)
Vol CYP (95% CI)
Vol CYP (95% CI)
1. Male condoms 6309.9 159034.8 19193.0 140.7 184678.4 4915.0 77349.6 82264.6 578.8 331.0 25606.7 26516.5 293459.5
(0.0, 14378.2)
(123897.1, 194172.5)
(11882.1, 26503.8) (0.0, 579.2)
(144752.0, 224604.8)
(2886.0, 6944.0)
(62625.9, 92073.3)
(67255.4, 97273.8) - (51.4, 610.6)
(19238.5, 31974.9)
(20136.1, 32896.9)
(247449.0, 339470.0)
2. Female condoms
0.0 0.0 0.0 0.0 0.0 0.0 2.8 2.8 0.0 0.0 0.0 0.0 2.8
- - - - - - - - - - - - -
3. CycleBeads 0.0 0.0 0.0 0.0 0.0 0.0 1090.8 1090.8 0.0 0.0 0.0 0.0 1090.8
- - - - - - - - - - - - -
4. Vaginal pessaries
0.0 0.0 0.0 0.0 0.0 44.7 1291.4 1336.1 0.0 0.0 4.7 4.7 1340.7
- - - - - (0.0, 94.8) (738.2, 1844.5)
(763.4, 1908.7) - - (0.0, 13.7) (0.0, 13.7)
(765.0, 1916.5)
5. Oral contraceptives
6008.1 175398.7 28277.9 183.3 209868.0 4726.2 60413.3 65139.5 289.4 178.1 890.0 1357.5 276365.0
(0.0, 14067.3) -
(17381.7, 39174.2) -
(169265.1, 250471.0)
(2056.6, 7395.9)
(51158.3, 69668.2)
(54866.9, 75412.1) (4.5, 574.3) (0.0, 430.9)
(64.6, 1715.4)
(454.1, 2260.9)
(233721.4, 319008.6)
Combined oral contraceptives
6008.1 174227.8 25839.8 123.9 206199.6 3830.1 40015.5 43845.6 270.2 122.6 329.7 722.6 250767.8
(0.0, 14067.3) -
(17037.1, 34642.4) -
(166031.6, 246367.5)
(1313.6, 6346.7)
(33579.1, 46451.9)
(36643.5, 51047.8) (0.0, 548.1) (0.0, 285.3) (9.6, 649.9)
(273.3, 1171.9)
(209290.2, 292245.5)
Progestin-only pills 0.0 0.0 0.0 0.0 0.0 0.0 0.0 0.0 0.0 0.0 0.0 0.0 0.0
- - - - - - - - - - - - -
Centchroman pills 0.0 1170.9 2438.2 59.4 3668.5 896.1 20397.8 21293.8 19.1 55.5 560.2 634.9 25597.2
- - (0.0, 5814.3) - (10.3,
7326.6) (76.9,
1715.2) (15576.0, 25219.5)
(16279.7, 26307.9) (0.0, 56.4) (0.0, 169.6) (0.0, 1268.0) (0.0, 1351.4)
(19056.2, 32138.1)
6. Emergency contraceptives
208.4 23059.5 1436.9 37.6 24742.4 1642.2 27714.6 29356.8 54.2 0.0 64.3 118.5 54217.7
(30.2, 386.7) - (144.2, 2729.5) -
(17718.3, 31766.6)
(725.5, 2558.8)
(20505.9, 34923.3)
(22052.8, 36660.8) (0.0, 119.9) - (15.7, 112.9) (34.4, 202.6)
(43823.8, 64611.7)
7. Contraceptive injectables (all DMPA)
339.0 193.7 0.0 0.0 532.7 2372.6 1995.1 4367.6 0.0 0.0 5.6 5.6 4905.9
(0.0, 1045.4) - - - (0.0, 1287.5) (567.6, 4177.5)
(930.1, 3060.0)
(2216.8, 6518.5) - - (0.0, 16.4) (0.0, 16.4)
(2520.4, 7291.4)
8. IUDs (all Copper T)
10173.8 90137.0 0.0 0.0 100310.9 7662.6 0.0 7662.6 0.0 0.0 0.0 0.0 107973.4
(0.0, 22394.3) - - -
(25741.3, 174880.5)
(2019.2, 13305.9) -
(2012.5, 13312.7) - - - -
(33235.5, 182711.4)

www.FPwatch.info Page 214
Table X3: Reported Contraceptive Method Volumes: Uttar Pradesh, 2016 CYPs sold or distributed in previous 1 month by outlet type and contraceptive method type†
Higher Public Health Facility
Sub-centre / ANM / ASHA
AWW NGO Public Total* Private facility
Pharmacy/Chemist
Private Medical Total*
AYUSH Provider
RMP General Retailer
Private Other Total* All Outlets
Vol CYP (95% CI)
Vol CYP (95% CI)
Vol CYP (95% CI)
Vol CYP (95% CI)
Vol CYP (95% CI)
Vol CYP (95% CI)
Vol CYP (95% CI)
Vol CYP (95% CI)
Vol CYP (95% CI)
Vol CYP (95% CI)
Vol CYP (95% CI)
Vol CYP (95% CI)
Vol CYP (95% CI)
9. Male Sterilization
4023.8 0.0 0.0 0.0 4023.8 2858.2 0.0 2858.2 0.0 0.0 0.0 0.0 6882.0
(0.0, 12499.7) - - -
(0.0, 12499.7)
(971.7, 4744.8) -
(971.7, 4744.8) - - - -
(1600.3, 12163.7)
10. Female Sterilization
104148.3 0.0 0.0 0.0 104200.1 31939.5 0.0 31939.5 0.0 0.0 0.0 0.0 136139.6
- - - - (0.0,
313942.3) - - (0.0,
63914.6) - - - - (0.0,
317388.2)
Total Volume 131211.3 447823.8 48907.78 361.6 628356.3 56160.9 169857.6 226018.5 922.3 509.1 26571.3 28002.7 882377.6
(0.0, 312233.2)
(343662.7, 551984.9)
(32823.3, 64992.3) -
(426408.4, 830304.1)
(18630.9, 93691.0)
(143132.0, 196583.1)
(179237.2, 272799.8)
(385.8, 1458.9) (20.2, 998.1)
(20100.5, 33042.1)
(21503.3, 34502.1)
(661355.4, 1103399.8)
* Public Total category = higher public health facility + sub-centre/ANM/ASHA + AWW + NGO categories; Private Medical Total category = Private facility categories; Private Other Total category = AYUSH provider + RMP + general retailer categories † A total of 1,001,674.9 CYPs (weighted) were reportedly distributed in the previous 1 month in Uttar Pradesh state. This is based on the number of commodities reportedly sold for categories 1-8 (not number of services performed for categories 7-8) and number of sterilizations reportedly performed for categories 9-10.

www.FPwatch.info Page 215
Table X4: Reported Contraceptive Method Volumes: Uttar Pradesh, Metro, 2016 CYPs sold or distributed in previous 1 month by outlet type and contraceptive method type†
Higher Public Health Facility
Sub-centre / ANM / ASHA
AWW NGO Public Total* Private facility
Pharmacy/Chemist
Private Medical Total*
AYUSH Provider
RMP General Retailer
Private Other Total* All Outlets
Vol CYP (95% CI)
Vol CYP (95% CI)
Vol CYP (95% CI)
Vol CYP (95% CI)
Vol CYP (95% CI)
Vol CYP (95% CI)
Vol CYP (95% CI)
Vol CYP (95% CI)
Vol CYP (95% CI)
Vol CYP (95% CI)
Vol CYP (95% CI)
Vol CYP (95% CI)
Vol CYP (95% CI)
1. Male condoms 409.9 0.0 212.1 0.0 622.0 221.6 10385.7 10607.2 171.1 0.0 2809.1 2980.2 14209.4
(0.0, 1675.0) - (0.0, 599.9) - (0.0, 1386.1) (111.1, 332.1)
(7788.8, 12982.5)
(7986.1, 13228.4) (0.0, 547.1) -
(1879.5, 3738.6)
(1974.2, 3986.1)
(10995.2, 17423.6)
2. Female condoms
0.0 0.0 0.0 0.0 0.0 0.0 0.3 0.3 0.0 0.0 0.0 0.0 0.3
- - - - - - - - - - - - -
3. CycleBeads 0.0 0.0 0.0 0.0 0.0 0.0 1090.8 1090.8 0.0 0.0 0.0 0.0 1090.8
- - - - - - - - - - - - -
4. Vaginal pessaries
0.0 0.0 0.0 0.0 0.0 4.8 276.4 281.2 0.0 0.0 4.7 4.7 285.9
- - - - - (0.0, 11.6) (87.2, 465.6) (91.8, 470.6) - - (0.0, 14.1) (0.0, 14.1) (87.6, 484.1)
5. Oral contraceptives
333.6 0.0 337.8 0.0 671.5 371.1 11845.5 12216.6 64.5 0.0 37.2 101.6 12989.7
(0.0, 1316.5) - (0.0, 939.4) - (0.0, 1419.4) (110.6, 631.7)
(7296.3, 16394.6)
(7677.1, 16756.1) (0.0, 184.4) - (0.0, 95.4) (0.0, 234.9)
(8303.1, 17676.4)
Combined oral contraceptives
333.6 0.0 337.8 0.0 671.5 365.8 9839.7 10205.5 64.5 0.0 24.7 89.2 10966.1
(0.0, 1316.5) - (0.0, 939.4) - (0.0, 1419.4) (104.5, 627.0)
(5885.2, 13794.2)
(6257.7, 14153.2) (0.0, 184.4) - (0.0, 60.3) (0.0, 212.2)
(6864.9, 15067.4)
Progestin-only pills 0.0 0.0 0.0 0.0 0.0 0.0 0.0 0.0 0.0 0.0 0.0 0.0 0.0
- - - - - - - - - - - - -
Centchroman pills 0.0 0.0 0.0 0.0 0.0 5.4 2005.8 2011.1 0.0 0.0 12.4 12.4 2023.6
- - - - - (0.0, 16.3) (1075.0, 2936.6)
(1076.6, 2945.7) - - (0.0, 37.7) (0.0, 37.7)
(1074.8, 2972.3)
6. Emergency contraceptives
43.4 0.0 0.0 0.0 43.4 137.4 5344.5 5481.9 31.7 0.0 16.4 48.2 5573.5
(0.0, 226.8) - - - (0.0, 141.7) (0.0, 301.3) (2671.6, 8017.4)
(2825.7, 8138.1) (0.0, 94.4) - (0.0, 37.2) (0.0, 116.6)
(2866.9, 8280.1)
7. Contraceptive injectables (all DMPA)
0.0 0.0 0.0 0.0 0.0 342.1 430.2 772.4 0.0 0.0 5.6 5.6 778.0
- - - - - (0.0, 819.3) (142.1, 718.4)
(236.7, 1308.0) - - (0.0, 17.0) (0.0, 17.0)
(240.3, 1315.7)
8. IUDs (all Copper T)
0.0 0.0 0.0 0.0 0.0 2503.8 0.0 2503.8 0.0 0.0 0.0 0.0 2503.8
- - - - - (305.7, 4701.9) -
(298.3, 4709.3) - - - -
(298.3, 4709.3)
9. Male Sterilization
0.0 0.0 0.0 0.0 0.0 0.0 0.0 0.0 0.0 0.0 0.0 0.0 0.0
- - - - - - - - - - - - -

www.FPwatch.info Page 216
Table X4: Reported Contraceptive Method Volumes: Uttar Pradesh, Metro, 2016 CYPs sold or distributed in previous 1 month by outlet type and contraceptive method type†
Higher Public Health Facility
Sub-centre / ANM / ASHA
AWW NGO Public Total* Private facility
Pharmacy/Chemist
Private Medical Total*
AYUSH Provider
RMP General Retailer
Private Other Total* All Outlets
Vol CYP (95% CI)
Vol CYP (95% CI)
Vol CYP (95% CI)
Vol CYP (95% CI)
Vol CYP (95% CI)
Vol CYP (95% CI)
Vol CYP (95% CI)
Vol CYP (95% CI)
Vol CYP (95% CI)
Vol CYP (95% CI)
Vol CYP (95% CI)
Vol CYP (95% CI)
Vol CYP (95% CI)
10. Female Sterilization
14513.2 0.0 0.0 0.0 14513.2 6182.0 0.0 6182.0 0.0 0.0 0.0 0.0 20695.2
- - - - (0.0,
195532.5) (0.0,
18064.3) - (0.0,
18064.3) - - - - (0.0,
54312.3)
Total Volume 15300.2 0.0 549.9 0.0 15850.1 9762.9 29373.3 39136.2 267.3 0.0 2872.9 3140.2 58126.6
(0.0, 78990.8) - (0.0, 1564.9) -
(0.0, 51979.1)
(0.0, 21275.8)
(20987.9, 37758.8)
(25411.7, 52860.7) (0.0, 785.8) -
(1914.2, 3831.7)
(2033.5, 4247.0)
(25487.5, 90765.7)
* Public Total category = higher public health facility + sub-centre/ANM/ASHA + AWW + NGO categories; Private Medical Total category = Private facility categories; Private Other Total category = AYUSH provider + RMP + general retailer categories † A total of 57,852.2 CYPs (weighted) were reportedly distributed in the previous 1 month in the Uttar Pradesh metro stratum. This is based on the number of commodities reportedly sold for categories 1-8 (not number of services performed for categories 7-8) and number of sterilizations reportedly performed for categories 9-10.

www.FPwatch.info Page 217
Table X5: Reported Contraceptive Method Volumes: Uttar Pradesh, Urban, 2016 CYPs sold or distributed in previous 1 month by outlet type and contraceptive method type†
Higher Public Health Facility
Sub-centre / ANM / ASHA
AWW NGO Public Total* Private facility
Pharmacy/Chemist
Private Medical Total*
AYUSH Provider
RMP General Retailer
Private Other Total* All Outlets
Vol CYP (95% CI)
Vol CYP (95% CI)
Vol CYP (95% CI)
Vol CYP (95% CI)
Vol CYP (95% CI)
Vol CYP (95% CI)
Vol CYP (95% CI)
Vol CYP (95% CI)
Vol CYP (95% CI)
Vol CYP (95% CI)
Vol CYP (95% CI)
Vol CYP (95% CI)
Vol CYP (95% CI)
1. Male condoms 1473.6 589.9 421.4 140.7 2625.6 1317.4 43100.4 44417.7 407.7 9.6 9523.8 9941.1 56984.4
(206.4, 2740.7) (0.0, 1268.5) (88.8, 754.0) (0.0, 579.2)
(1191.0, 4060.3)
(425.5, 2209.2)
(32768.8, 53431.9)
(33909.3, 54926.2)
(201.7, 613.7) (0.0, 20.8)
(6784.5, 12263.1)
(7194.1, 12688.0)
(45681.6, 68287.2)
2. Female condoms
0.0 0.0 0.0 0.0 0.0 0.0 2.6 2.6 0.0 0.0 0.0 0.0 2.6
- - - - - - (0.0, 13.4) (0.0, 13.4) - - - - (0.0, 13.4)
3. CycleBeads 0.0 0.0 0.0 0.0 0.0 0.0 0.0 0.0 0.0 0.0 0.0 0.0 0.0
- - - - - - - - - - - - -
4. Vaginal pessaries
0.0 0.0 0.0 0.0 0.0 39.9 773.5 813.4 0.0 0.0 0.0 0.0 813.4
- - - - - (0.0, 89.8) (394.8, 1152.2)
(406.6, 1220.1) - - - -
(405.6, 1221.1)
5. Oral contraceptives
1637.5 215.8 405.2 183.3 2441.9 2427.5 32243.2 34670.7 115.1 8.0 712.9 835.9 37948.5
(0.0, 3513.6) (0.0, 458.3) (0.0, 899.9) (0.0, 621.6) (562.4, 4321.3)
(318.4, 4536.6)
(25737.7, 38748.7)
(27336.2, 42005.2) (0.0, 262.3) (0.0, 27.0) (0.0, 1503.6)
(34.2, 1637.6)
(30217.3, 45679.7)
Combined oral contraceptives
1637.5 215.8 405.2 123.9 2382.5 2073.6 20147.3 22220.9 95.9 8.0 287.7 391.6 24995.0
(0.0, 3513.6) (0.0, 458.3) (0.0, 899.9) (0.0, 436.5) (509.4, 4255.6) (2.2, 4144.9)
(16470.2, 23824.4)
(17642.0, 26799.8) (0.0, 228.8) (0.0, 27.0) (0.0, 605.6) (49.1, 734.1)
(19975.8, 30014.1)
Progestin-only pills 0.0 0.0 0.0 0.0 0.0 0.0 0.0 0.0 0.0 0.0 0.0 0.0 0.0
- - - - - - - - - - - - -
Centchroman pills 0.0 0.0 0.0 59.4 59.4 353.9 12095.9 12449.8 19.1 0.0 425.2 444.3 12953.5
- - - (0.0, 189.2) (0.0, 150.7) (105.4, 602.4)
(8308.0, 15883.7)
(8607.8, 16291.8) (0.0, 56.5) - (0.0, 1093.6) (0.0, 1113.5)
(8979.1, 16927.9)
6. Emergency contraceptives
40.2 1054.6 1.3 37.6 1133.8 794.3 16522.6 17316.9 22.4 0.0 47.9 70.3 18521.0
(0.0, 118.4) (0.0, 3122.6) (0.0, 4.0) (0.0, 111.9) (0.0, 3121.5) (183.8, 1404.9)
(10284.1, 22761.0)
(11007.5, 23626.3) (0.0, 53.2) - (3.3, 92.5) (16.7, 123.9)
(11941.1, 25100.9)
7. Contraceptive injectables (all DMPA)
339.0 0.0 0.0 0.0 339.0 1224.4 1370.3 2594.8 0.0 0.0 0.0 0.0 2933.7
(0.0, 1103.3) - - - (0.0, 1005.4) (232.2, 2216.6)
(384.0, 2356.7)
(1101.4, 4088.1) - - - -
(1154.1, 4713.3)
8. IUDs (all Copper T)
7717.8 931.2 0.0 0.0 8649.0 5158.7 0.0 5158.7 0.0 0.0 0.0 0.0 13807.8
(0.0, 19674.9) (0.0, 2837.2) - -
(0.0, 19700.9)
(0.0, 10422.9) -
(0.0, 10423.6) - - - -
(1734.0, 25881.5)
9. Male Sterilization
4023.8 0.0 0.0 0.0 4023.8 2858.2 0.0 2858.2 0.0 0.0 0.0 0.0 6882.0
(0.0, 12499.7) - - -
(0.0, 12499.7)
(905.7, 4810.7) -
(905.7, 4810.7) - - - -
(1501.0, 12263.0)

www.FPwatch.info Page 218
Table X5: Reported Contraceptive Method Volumes: Uttar Pradesh, Urban, 2016 CYPs sold or distributed in previous 1 month by outlet type and contraceptive method type†
Higher Public Health Facility
Sub-centre / ANM / ASHA
AWW NGO Public Total* Private facility
Pharmacy/Chemist
Private Medical Total*
AYUSH Provider
RMP General Retailer
Private Other Total* All Outlets
Vol CYP (95% CI)
Vol CYP (95% CI)
Vol CYP (95% CI)
Vol CYP (95% CI)
Vol CYP (95% CI)
Vol CYP (95% CI)
Vol CYP (95% CI)
Vol CYP (95% CI)
Vol CYP (95% CI)
Vol CYP (95% CI)
Vol CYP (95% CI)
Vol CYP (95% CI)
Vol CYP (95% CI)
10. Female Sterilization
89635.0 0.0 0.0 0.0 89686.8 25757.6 0.0 25757.6 0.0 0.0 0.0 0.0 115444.4
(0.0, 431263.6) - - -
(0.0, 345364.2)
(0.0, 57167.5) -
(0.0, 57167.5) - - - -
(0.0, 300557.7)
Total Volume 104866.9 2791.5 828.0 361.6 108899.8 39578.0 94012.5 133590.5 545.2 17.5 10284.6 10847.3 253337.7
(0.0, 299154.8) (0.0, 7472.1)
(19.5, 1636.5) (0.0, 1211.9)
(0.0, 280513.2)
(3445.6, 75710.5)
(73167.5, 114857.5)
(91354.6, 175826.5)
(195.8, 894.6) (3.7, 31.3)
(7321.2, 13247.9)
(7869.5, 13825.1)
(67453.2, 439222.1)
* Public Total category = higher public health facility + sub-centre/ANM/ASHA + AWW + NGO categories; Private Medical Total category = Private facility categories; Private Other Total category = AYUSH provider + RMP + general retailer categories † A total of 255,891.1 CYPs (weighted) were reportedly distributed in the previous 1 month in the Uttar Pradesh urban stratum. This is based on the number of commodities reportedly sold for categories 1-8 (not number of services performed for categories 7-8) and number of sterilizations reportedly performed for categories 9-10.

www.FPwatch.info Page 219
Table X6: Reported Contraceptive Method Volumes: Uttar Pradesh, Rural, 2016 CYPs sold or distributed in previous 1 month by outlet type and contraceptive method type†
Higher Public Health Facility
Sub-centre / ANM / ASHA
AWW NGO Public Total* Private facility
Pharmacy/Chemist
Private Medical Total*
AYUSH Provider
RMP General Retailer
Private Other Total* All Outlets
Vol CYP (95% CI)
Vol CYP (95% CI)
Vol CYP (95% CI)
Vol CYP (95% CI)
Vol CYP (95% CI)
Vol CYP (95% CI)
Vol CYP (95% CI)
Vol CYP (95% CI)
Vol CYP (95% CI)
Vol CYP (95% CI)
Vol CYP (95% CI)
Vol CYP (95% CI)
Vol CYP (95% CI)
1. Male condoms 4426.4 158444.9 18559.4 0.0 181430.8 3376.1 23863.6 27239.7 0.0 321.4 13273.8 13595.3 222265.7
(0.0, 14574.0)
(123301.3, 193588.5)
(11229.2, 25889.6) -
(141502.6, 221358.9)
(1448.4, 5303.7)
(13510.9, 34216.3)
(16672.5, 37806.8) - (19.4, 623.5)
(7512.7, 19035.0)
(7838.9, 19351.7)
(177658.5, 266872.9)
2. Female condoms
0.0 0.0 0.0 0.0 0.0 0.0 0.0 0.0 0.0 0.0 0.0 0.0 0.0
- - - - - - - - - - - - -
3. CycleBeads 0.0 0.0 0.0 0.0 0.0 0.0 0.0 0.0 0.0 0.0 0.0 0.0 0.0
- - - - - - - - - - - - -
4. Vaginal pessaries
0.0 0.0 0.0 0.0 0.0 0.0 241.5 241.5 0.0 0.0 0.0 0.0 241.5
- - - - - - (0.0, 607.6) (0.0, 606.7) - - - - (0.0, 604.7)
5. Oral contraceptives
4036.9 175182.9 27534.9 0.0 206754.7 1927.5 16324.6 18252.1 109.8 170.2 139.9 419.9 225426.8
(0.0, 13510.8)
(138406.1, 211959.7)
(16646.4, 38423.3) -
(166158.4, 247351.0)
(265.3, 3589.8)
(11282.6, 21366.6)
(12421.3, 24083.0) (0.0, 368.6) (0.0, 428.0) (0.0, 382.9) (14.7, 825.1)
(183637.2, 267216.4)
Combined oral contraceptives
4036.9 174012.0 25096.7 0.0 203145.6 1390.8 10028.5 11419.3 109.8 114.7 17.3 241.9 214806.7
(0.0, 13510.8)
(137317.0, 210707.0)
(16309.5, 33883.9) -
(162984.9, 243306.3) (0.0, 2839.4)
(6269.7, 13787.2)
(7270.2, 15568.4) (0.0, 368.6) (0.0, 280.1) (0.0, 51.4) (0.0, 510.8)
(173734.3, 255879.1)
Progestin-only pills 0.0 0.0 0.0 0.0 0.0 0.0 0.0 0.0 0.0 0.0 0.0 0.0 0.0
- - - - - - - - - - - - -
Centchroman pills 0.0 1170.9 2438.2 0.0 3609.1 536.8 6296.1 6832.9 0.0 55.5 122.6 178.1 10620.1
- (0.0, 2618.2) (0.0, 5818.5) - (0.0, 7269.8) (0.0, 1333.8) (3397.6, 9194.7)
(3693.9, 9971.9) - (0.0, 172.1) (0.0, 363.3) (0.0, 441.8)
(5478.8, 15761.3)
6. Emergency contraceptives
124.8 22004.9 1435.6 0.0 23565.3 710.4 5847.5 6558.0 0.0 0.0 0.0 0.0 30123.2
(0.0, 287.9) (15533.6, 28476.3)
(141.3, 2729.8) -
(16809.8, 30320.7)
(28.6, 1392.2)
(3201.8, 8493.3)
(3808.6, 9307.4) - - - -
(22456.5, 37790.0)
7. Contraceptive injectables (all DMPA)
0.0 193.7 0.0 0.0 193.7 806.0 194.5 1000.5 0.0 0.0 0.0 0.0 1194.2
- (0.0, 574.0) - - (0.0, 573.9) (0.0, 2276.7) (0.0, 502.6) (0.0, 2479.4) - - - - (0.0, 2711.7)
8. IUDs (all Copper T)
2456.0 89205.8 0.0 0.0 91661.9 0.0 0.0 0.0 0.0 0.0 0.0 0.0 91661.9
(0.0, 8745.1) (15476.2, 162935.4) - -
(17808.2, 165515.5) - - - - - - -
(17779.4, 165544.4)
9. Male Sterilization 0.0 0.0 0.0 0.0 0.0 0.0 0.0 0.0 0.0 0.0 0.0 0.0 0.0

www.FPwatch.info Page 220
Table X6: Reported Contraceptive Method Volumes: Uttar Pradesh, Rural, 2016 CYPs sold or distributed in previous 1 month by outlet type and contraceptive method type†
Higher Public Health Facility
Sub-centre / ANM / ASHA
AWW NGO Public Total* Private facility
Pharmacy/Chemist
Private Medical Total*
AYUSH Provider
RMP General Retailer
Private Other Total* All Outlets
Vol CYP (95% CI)
Vol CYP (95% CI)
Vol CYP (95% CI)
Vol CYP (95% CI)
Vol CYP (95% CI)
Vol CYP (95% CI)
Vol CYP (95% CI)
Vol CYP (95% CI)
Vol CYP (95% CI)
Vol CYP (95% CI)
Vol CYP (95% CI)
Vol CYP (95% CI)
Vol CYP (95% CI)
- - - - - - - - - - - - -
10. Female Sterilization
0.0 0.0 0.0 0.0 0.0 0.0 0.0 0.0 0.0 0.0 0.0 0.0 0.0
- - - - - - - - - - - - -
Total Volume 11044.2 445032.3 47529.9 0.0 503606.3 6820.0 46471.7 53291.8 109.8 491.6 13413.8 14015.2 570913.3
(0.0, 30874.4)
(340925.1, 549139.4)
(31440.3, 63619.4) -
(392092.8, 615119.8)
(3286.9, 10353.1)
(31496.5, 61447.0)
(37415.7, 69167.8) (0.0, 1500.2) (0.0, 1046.4)
(7654.0, 19173.6)
(8258.7, 19771.7)
(453631.3, 688195.3)
* Public Total category = higher public health facility + sub-centre/ANM/ASHA + AWW + NGO categories; Private Medical Total category = Private facility categories; Private Other Total category = AYUSH provider + RMP + general retailer categories † A total of 687,931.6 CYPs (weighted) were reportedly distributed in the previous 1 month in the Uttar Pradesh rural stratum. This is based on the number of commodities reportedly sold for categories 1-8 (not number of services performed for categories 7-8) and number of sterilizations reportedly performed for categories 9-10.

www.FPwatch.info Page 221
Table X7: Reported Contraceptive Method Volumes: Bihar, 2016 CYPs sold or distributed in previous 1 month by outlet type and contraceptive method type†
Higher Public Health Facility
Sub-centre / ANM / ASHA
AWW NGO Public Total* Private facility
Pharmacy/Chemist
Private Medical Total*
AYUSH Provider
RMP General Retailer
Private Other Total* All Outlets
Vol CYP (95% CI)
Vol CYP (95% CI)
Vol CYP (95% CI)
Vol CYP (95% CI)
Vol CYP (95% CI)
Vol CYP (95% CI)
Vol CYP (95% CI)
Vol CYP (95% CI)
Vol CYP (95% CI)
Vol CYP (95% CI)
Vol CYP (95% CI)
Vol CYP (95% CI)
Vol CYP (95% CI)
1. Male condoms 1523.2 32073.1 136.2 0.0 33732.5 2928.6 24486.7 27415.2 363.9 3993.6 3348.4 7705.9 68853.6
(722.6, 2323.8) - (15.4, 256.9) -
(25665.3, 41799.6)
(890.5, 4966.7)
(16953.4, 32019.9)
(19309.5, 35521.0) (75.9, 651.9)
(1342.3, 6644.9)
(2636.1, 4060.7)
(4972.1, 10439.7)
(56582.2, 81125.0)
2. Female condoms
0.0 0.0 0.0 0.0 0.0 0.0 0.0 0.0 0.0 0.0 0.0 0.0 0.0
- - - - - - - - - - - - -
3. CycleBeads 0.0 0.0 0.0 0.0 0.0 48.5 0.0 48.5 0.0 0.0 0.0 0.0 48.5
- - - - - - - - - - - - -
4. Vaginal pessaries
0.0 0.0 0.0 0.0 0.0 0.0 81.5 81.5 0.0 0.0 5.3 5.3 86.8
- - - - - - (31.2, 131.8) (31.1, 131.9) - - (0.0, 14.6) (0.0, 14.6) (35.7, 137.9)
5. Oral contraceptives
2430.9 39602.8 247.8 72.2 42353.7 2317.5 15693.8 18011.3 167.2 2651.1 464.8 3283.1 63648.1
(0.0, 5037.4) - (0.0, 590.8) (0.0, 182.6) (30346.0, 54361.3) (0.0, 5414.9)
(10621.2, 20766.5)
(12039.0, 23983.7) (0.0, 417.3)
(532.9, 4769.3) (0.0, 1092.1)
(1041.4, 5524.8)
(49465.2, 77831.1)
Combined oral contraceptives
2430.9 39602.8 247.8 72.2 42353.7 2246.6 13327.6 15574.2 162.5 2645.7 445.2 3253.4 61181.3
(0.0, 5037.4) - (0.0, 590.8) (0.0, 182.6) (30346.0, 54361.3) (0.0, 5345.1)
(8524.1, 18131.1)
(9864.4, 21284.1) (0.0, 412.5)
(527.8, 4763.6) (0.0, 1050.0)
(1018.3, 5488.4)
(47175.9, 75186.7)
Progestin-only pills 0.0 0.0 0.0 0.0 0.0 0.9 8.9 9.8 0.0 0.0 11.8 11.8 21.6
- - - - - (0.0, 2.4) (0.5, 17.3) (1.1, 18.4) - - (0.0, 34.9) (0.0, 34.9) (0.0, 46.2)
Centchroman pills 0.0 0.0 0.0 0.0 0.0 70.0 2357.3 2427.3 4.7 5.4 7.8 17.9 2445.2
- - - - - (0.0, 200.7) (1387.5, 3327.2)
(1358.0, 3496.7) (0.0, 13.0) (0.0, 16.1) (0.0, 21.7) (0.0, 37.1)
(1361.1, 3529.4)
6. Emergency contraceptives
827.9 8999.4 0.0 14.3 9841.6 603.6 6001.5 6605.1 90.4 282.7 28.9 402.0 16848.7
(0.0, 1875.8) - - (0.0, 57.5) (6537.2, 13145.9) (0.0, 1289.3)
(4009.1, 7993.9)
(4476.9, 8733.4) (0.0, 238.8) (1.4, 563.9) (0.0, 63.5) (84.9, 719.1)
(12832.2, 20865.2)
7. Contraceptive injectables (all DMPA)
0.0 0.0 0.0 62.9 62.9 924.0 3793.0 4717.0 0.0 1417.2 0.0 1417.2 6197.1
- - - (0.0, 194.1) (0.0, 157.7) (64.7,
1783.3) (2222.5, 5363.5)
(2940.6, 6493.4) - (0.0, 3587.1) - (0.0, 3562.4)
(3396.6, 8997.5)
8. IUDs (all Copper T)
61110.4 129277.6 0.0 656.0 191044.0 1880.0 3751.5 5631.4 0.0 0.0 0.0 0.0 196675.4
(8209.3, 114011.4) - - (0.0, 2645.9)
(104945.0, 277142.9) (0.0, 3779.5) (0.0, 8224.9)
(736.5, 10526.4) - - - -
(110517.3, 282833.6)
3112.8 0.0 0.0 0.0 3112.8 1730.2 0.0 1730.2 0.0 0.0 0.0 0.0 4843.0

www.FPwatch.info Page 222
Table X7: Reported Contraceptive Method Volumes: Bihar, 2016 CYPs sold or distributed in previous 1 month by outlet type and contraceptive method type†
Higher Public Health Facility
Sub-centre / ANM / ASHA
AWW NGO Public Total* Private facility
Pharmacy/Chemist
Private Medical Total*
AYUSH Provider
RMP General Retailer
Private Other Total* All Outlets
Vol CYP (95% CI)
Vol CYP (95% CI)
Vol CYP (95% CI)
Vol CYP (95% CI)
Vol CYP (95% CI)
Vol CYP (95% CI)
Vol CYP (95% CI)
Vol CYP (95% CI)
Vol CYP (95% CI)
Vol CYP (95% CI)
Vol CYP (95% CI)
Vol CYP (95% CI)
Vol CYP (95% CI)
9. Male Sterilization (0.0, 6501.0) - - - (0.0, 6578.3) (0.0, 3688.9) - (0.0, 3688.9) - - - -
(619.5, 9066.5)
10. Female Sterilization
622454.3 0.0 0.0 8213.9 630668.2 46128.8 0.0 46128.8 0.0 0.0 0.0 0.0 676796.9
(0.0, 1408748.6) - -
(0.0, 30150.3)
(0.0, 1409049.8)
(8265.8, 83991.7) -
(8265.8, 83991.7) - - - -
(0.0, 1426272.3)
Total Volume 691459.4 209952.9 384.0 9019.2 910815.6 56561.2 53808.0 110369.1 621.5 8344.5 3847.4 12813.4 1033998.1
(0.0, 1470065.5) - (30.6, 737.3)
(0.0, 33726.4)
(134382.0, 1687249.1)
(17056.0, 96066.3)
(37515.0, 70100.9)
(57156.9, 163581.3) (0.0, 1263.3)
(2525.7, 14163.2)
(2749.2, 4945.6)
(6927.5, 18699.4)
(256903.2, 1811093.1)
* Public Total category = higher public health facility + sub-centre/ANM/ASHA + AWW + NGO categories; Private Medical Total category = Private facility categories; Private Other Total category = AYUSH provider + RMP + general retailer categories † A total of 1,101,153.3 CYPs (weighted) were reportedly distributed in the previous 1 month in Bihar state. This is based on the number of commodities reportedly sold for categories 1-8 (not number of services performed for categories 7-8) and number of sterilizations reportedly performed for categories 9-10.

www.FPwatch.info Page 223
Table X8: Reported Contraceptive Method Volumes: Bihar, Metro, 2016 CYPs sold or distributed in previous 1 month by outlet type and contraceptive method type†
Higher Public Health Facility
Sub-centre / ANM / ASHA
AWW NGO Public Total* Private facility
Pharmacy/Chemist
Private Medical Total*
AYUSH Provider
RMP General Retailer
Private Other Total* All Outlets
Vol CYP (95% CI)
Vol CYP (95% CI)
Vol CYP (95% CI)
Vol CYP (95% CI)
Vol CYP (95% CI)
Vol CYP (95% CI)
Vol CYP (95% CI)
Vol CYP (95% CI)
Vol CYP (95% CI)
Vol CYP (95% CI)
Vol CYP (95% CI)
Vol CYP (95% CI)
Vol CYP (95% CI)
1. Male condoms 0.0 0.0 7.7 0.0 7.7 42.7 923.1 965.7 3.7 0.0 145.2 149.0 1122.4
- - (4.5, 10.9) - (0.0, 22.7) (0.0, 104.2) (546.6, 1299.5)
(604.9, 1326.6) (0.0, 31.7) - (75.1, 215.4) (79.7, 218.2)
(764.5, 1480.4)
2. Female condoms
0.0 0.0 0.0 0.0 0.0 0.0 0.0 0.0 0.0 0.0 0.0 0.0 0.0
- - - - - - - - - - - - -
3. CycleBeads 0.0 0.0 0.0 0.0 0.0 0.0 0.0 0.0 0.0 0.0 0.0 0.0 0.0
- - - - - - - - - - - - -
4. Vaginal pessaries
0.0 0.0 0.0 0.0 0.0 0.0 21.0 21.0 0.0 0.0 5.3 5.3 26.2
- - - - - - (4.3, 37.7) (4.3, 37.7) - - (0.0, 15.5) (0.0, 15.5) (7.5, 45.0)
5. Oral contraceptives
0.0 0.1 0.0 0.0 0.1 14.3 702.0 716.2 0.4 0.0 15.6 16.0 732.4
- - - - (0.0, 0.2) (0.0, 29.1) (360.4, 1043.5)
(375.4, 1057.1) (0.0, 1.2) - (0.0, 46.0) (0.0, 46.4)
(382.5, 1082.2)
Combined oral contraceptives
0.0 0.1 0.0 0.0 0.1 13.4 574.1 587.5 0.0 0.0 7.8 7.8 595.4
- - - - (0.0, 0.2) (0.0, 27.3) (291.0, 857.2)
(305.7, 869.3) - - (0.0, 23.0) (0.0, 23.0)
(308.3, 882.6)
Progestin-only pills 0.0 0.0 0.0 0.0 0.0 0.9 7.4 8.3 0.0 0.0 0.0 0.0 8.3
- - - - - (0.0, 2.6) (0.0, 16.0) (0.0, 17.2) - - - - (0.0, 17.2)
Centchroman pills 0.0 0.0 0.0 0.0 0.0 0.0 120.4 120.4 0.4 0.0 7.8 8.2 128.7
- - - - - - (43.3, 197.6) (43.3, 197.6) (0.0, 1.2) - (0.0, 23.0) (0.0, 23.4) (50.9, 206.4)
6. Emergency contraceptives
0.0 0.0 0.0 0.0 0.0 9.9 436.5 446.4 0.5 0.0 11.0 11.4 457.9
- - - - - (0.0, 26.2) (257.3, 615.7)
(267.3, 625.6) (0.0, 1.4) - (0.0, 30.8) (0.0, 31.3)
(275.3, 640.5)
7. Contraceptive injectables (all DMPA)
0.0 0.0 0.0 0.0 0.0 76.7 135.4 212.0 0.0 0.0 0.0 0.0 212.0
- - - - - (5.5, 147.8) (46.6, 224.2) (72.9, 351.2) - - - - (72.9, 351.2)
8. IUDs (all Copper T)
0.0 0.0 0.0 0.0 0.0 132.0 367.1 499.0 0.0 0.0 0.0 0.0 499.0
- - - - - (0.0, 330.7) (0.0, 796.5) (56.5, 941.6) - - - - (56.5, 941.6)
9. Male Sterilization
0.0 0.0 0.0 0.0 0.0 0.0 0.0 0.0 0.0 0.0 0.0 0.0 0.0
- - - - - - - - - - - - -

www.FPwatch.info Page 224
Table X8: Reported Contraceptive Method Volumes: Bihar, Metro, 2016 CYPs sold or distributed in previous 1 month by outlet type and contraceptive method type†
Higher Public Health Facility
Sub-centre / ANM / ASHA
AWW NGO Public Total* Private facility
Pharmacy/Chemist
Private Medical Total*
AYUSH Provider
RMP General Retailer
Private Other Total* All Outlets
Vol CYP (95% CI)
Vol CYP (95% CI)
Vol CYP (95% CI)
Vol CYP (95% CI)
Vol CYP (95% CI)
Vol CYP (95% CI)
Vol CYP (95% CI)
Vol CYP (95% CI)
Vol CYP (95% CI)
Vol CYP (95% CI)
Vol CYP (95% CI)
Vol CYP (95% CI)
Vol CYP (95% CI)
10. Female Sterilization
0.0 0.0 0.0 0.0 0.0 2009.9 0.0 2009.9 0.0 0.0 0.0 0.0 2009.9
- - - - - (764.8, 3255.0) -
(764.8, 3255.0) - - - -
(764.8, 3255.0)
Total Volume 0.0 0.1 7.7 0.0 7.8 2285.4 2584.9 4870.3 4.6 0.0 177.1 181.7 5059.9
- - (4.5, 10.9) - (0.0, 22.4) (811.9, 3758.9)
(1337.9, 3831.9)
(2910.4, 6830.3) (0.0, 22.5) - (87.1, 267.1) (93.1, 270.4)
(3071.2, 7048.6)
* Public Total category = higher public health facility + sub-centre/ANM/ASHA + AWW + NGO categories; Private Medical Total category = Private facility categories; Private Other Total category = AYUSH provider + RMP + general retailer categories † A total of 5,034.7 CYPs (weighted) were reportedly distributed in the previous 1 month in the Bihar metro stratum. This is based on the number of commodities reportedly sold for categories 1-8 (not number of services performed for categories 7-8) and number of sterilizations reportedly performed for categories 9-10.
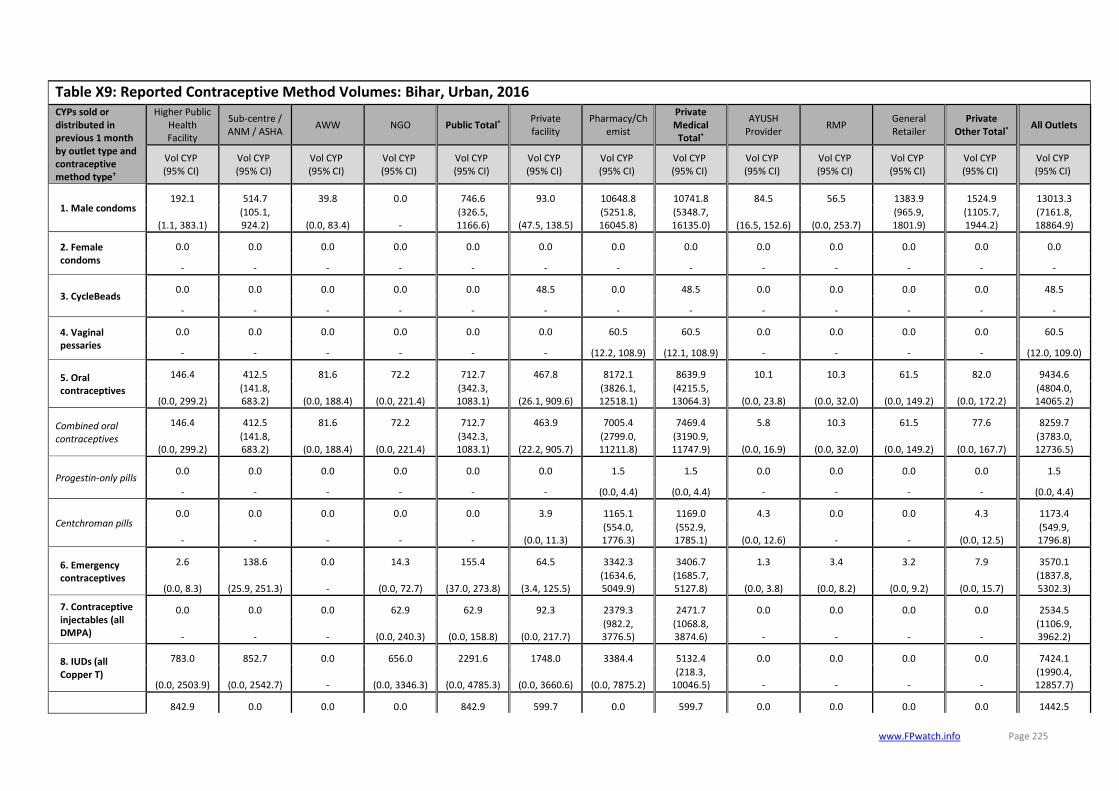
www.FPwatch.info Page 225
Table X9: Reported Contraceptive Method Volumes: Bihar, Urban, 2016 CYPs sold or distributed in previous 1 month by outlet type and contraceptive method type†
Higher Public Health Facility
Sub-centre / ANM / ASHA
AWW NGO Public Total* Private facility
Pharmacy/Chemist
Private Medical Total*
AYUSH Provider
RMP General Retailer
Private Other Total* All Outlets
Vol CYP (95% CI)
Vol CYP (95% CI)
Vol CYP (95% CI)
Vol CYP (95% CI)
Vol CYP (95% CI)
Vol CYP (95% CI)
Vol CYP (95% CI)
Vol CYP (95% CI)
Vol CYP (95% CI)
Vol CYP (95% CI)
Vol CYP (95% CI)
Vol CYP (95% CI)
Vol CYP (95% CI)
1. Male condoms 192.1 514.7 39.8 0.0 746.6 93.0 10648.8 10741.8 84.5 56.5 1383.9 1524.9 13013.3
(1.1, 383.1) (105.1, 924.2) (0.0, 83.4) -
(326.5, 1166.6) (47.5, 138.5)
(5251.8, 16045.8)
(5348.7, 16135.0) (16.5, 152.6) (0.0, 253.7)
(965.9, 1801.9)
(1105.7, 1944.2)
(7161.8, 18864.9)
2. Female condoms
0.0 0.0 0.0 0.0 0.0 0.0 0.0 0.0 0.0 0.0 0.0 0.0 0.0
- - - - - - - - - - - - -
3. CycleBeads 0.0 0.0 0.0 0.0 0.0 48.5 0.0 48.5 0.0 0.0 0.0 0.0 48.5
- - - - - - - - - - - - -
4. Vaginal pessaries
0.0 0.0 0.0 0.0 0.0 0.0 60.5 60.5 0.0 0.0 0.0 0.0 60.5
- - - - - - (12.2, 108.9) (12.1, 108.9) - - - - (12.0, 109.0)
5. Oral contraceptives
146.4 412.5 81.6 72.2 712.7 467.8 8172.1 8639.9 10.1 10.3 61.5 82.0 9434.6
(0.0, 299.2) (141.8, 683.2) (0.0, 188.4) (0.0, 221.4)
(342.3, 1083.1) (26.1, 909.6)
(3826.1, 12518.1)
(4215.5, 13064.3) (0.0, 23.8) (0.0, 32.0) (0.0, 149.2) (0.0, 172.2)
(4804.0, 14065.2)
Combined oral contraceptives
146.4 412.5 81.6 72.2 712.7 463.9 7005.4 7469.4 5.8 10.3 61.5 77.6 8259.7
(0.0, 299.2) (141.8, 683.2) (0.0, 188.4) (0.0, 221.4)
(342.3, 1083.1) (22.2, 905.7)
(2799.0, 11211.8)
(3190.9, 11747.9) (0.0, 16.9) (0.0, 32.0) (0.0, 149.2) (0.0, 167.7)
(3783.0, 12736.5)
Progestin-only pills 0.0 0.0 0.0 0.0 0.0 0.0 1.5 1.5 0.0 0.0 0.0 0.0 1.5
- - - - - - (0.0, 4.4) (0.0, 4.4) - - - - (0.0, 4.4)
Centchroman pills 0.0 0.0 0.0 0.0 0.0 3.9 1165.1 1169.0 4.3 0.0 0.0 4.3 1173.4
- - - - - (0.0, 11.3) (554.0, 1776.3)
(552.9, 1785.1) (0.0, 12.6) - - (0.0, 12.5)
(549.9, 1796.8)
6. Emergency contraceptives
2.6 138.6 0.0 14.3 155.4 64.5 3342.3 3406.7 1.3 3.4 3.2 7.9 3570.1
(0.0, 8.3) (25.9, 251.3) - (0.0, 72.7) (37.0, 273.8) (3.4, 125.5) (1634.6, 5049.9)
(1685.7, 5127.8) (0.0, 3.8) (0.0, 8.2) (0.0, 9.2) (0.0, 15.7)
(1837.8, 5302.3)
7. Contraceptive injectables (all DMPA)
0.0 0.0 0.0 62.9 62.9 92.3 2379.3 2471.7 0.0 0.0 0.0 0.0 2534.5
- - - (0.0, 240.3) (0.0, 158.8) (0.0, 217.7) (982.2, 3776.5)
(1068.8, 3874.6) - - - -
(1106.9, 3962.2)
8. IUDs (all Copper T)
783.0 852.7 0.0 656.0 2291.6 1748.0 3384.4 5132.4 0.0 0.0 0.0 0.0 7424.1
(0.0, 2503.9) (0.0, 2542.7) - (0.0, 3346.3) (0.0, 4785.3) (0.0, 3660.6) (0.0, 7875.2) (218.3,
10046.5) - - - - (1990.4, 12857.7)
842.9 0.0 0.0 0.0 842.9 599.7 0.0 599.7 0.0 0.0 0.0 0.0 1442.5

www.FPwatch.info Page 226
Table X9: Reported Contraceptive Method Volumes: Bihar, Urban, 2016 CYPs sold or distributed in previous 1 month by outlet type and contraceptive method type†
Higher Public Health Facility
Sub-centre / ANM / ASHA
AWW NGO Public Total* Private facility
Pharmacy/Chemist
Private Medical Total*
AYUSH Provider
RMP General Retailer
Private Other Total* All Outlets
Vol CYP (95% CI)
Vol CYP (95% CI)
Vol CYP (95% CI)
Vol CYP (95% CI)
Vol CYP (95% CI)
Vol CYP (95% CI)
Vol CYP (95% CI)
Vol CYP (95% CI)
Vol CYP (95% CI)
Vol CYP (95% CI)
Vol CYP (95% CI)
Vol CYP (95% CI)
Vol CYP (95% CI)
9. Male Sterilization (0.0, 2878.1) - - - (0.0, 2671.3) (0.0, 1917.7) - (0.0, 1917.7) - - - - (0.0, 3078.9)
10. Female Sterilization
27495.0 0.0 0.0 8213.9 35708.9 36879.7 0.0 36879.7 0.0 0.0 0.0 0.0 72588.6
(0.0, 118824.4) - -
(0.0, 30150.3)
(0.0, 96178.1)
(0.0, 75148.7) -
(0.0, 75148.7) - - - -
(8370.2, 136807.0)
Total Volume 29462.0 1918.4 121.4 9019.2 40521.0 39993.5 27987.5 67981.0 96.0 70.2 1448.6 1614.8 110116.8
(0.0, 91912.9) (0.0, 3921.7) (11.1, 231.6)
(0.0, 33726.4)
(0.0, 92268.9)
(952.5, 79034.5)
(13264.9, 42710.1)
(16532.5, 119429.5) (34.3, 157.6) (0.0, 245.0)
(963.3, 1933.9)
(1131.2, 2098.3)
(31691.6, 188541.9)
* Public Total category = higher public health facility + sub-centre/ANM/ASHA + AWW + NGO categories; Private Medical Total category = Private facility categories; Private Other Total category = AYUSH provider + RMP + general retailer categories † A total of 110,058.7 CYPs (weighted) were reportedly distributed in the previous 1 month in the Bihar urban stratum. This is based on the number of commodities reportedly sold for categories 1-8 (not number of services performed for categories 7-8) and number of sterilizations reportedly performed for categories 9-10.

www.FPwatch.info Page 227
Table X10: Reported Contraceptive Method Volumes: Bihar, Rural, 2016 CYPs sold or distributed in previous 1 month by outlet type and contraceptive method type†
Higher Public Health Facility
Sub-centre / ANM / ASHA
AWW NGO Public Total* Private facility
Pharmacy/Chemist
Private Medical Total*
AYUSH Provider
RMP General Retailer
Private Other Total* All Outlets
Vol CYP (95% CI)
Vol CYP (95% CI)
Vol CYP (95% CI)
Vol CYP (95% CI)
Vol CYP (95% CI)
Vol CYP (95% CI)
Vol CYP (95% CI)
Vol CYP (95% CI)
Vol CYP (95% CI)
Vol CYP (95% CI)
Vol CYP (95% CI)
Vol CYP (95% CI)
Vol CYP (95% CI)
1. Male condoms 1331.1 31558.4 88.7 0.0 32978.2 2792.9 12914.8 15707.7 275.6 3937.1 1819.2 6032.0 54717.8
(522.0, 2140.2)
(23462.9, 39653.9) (0.0, 245.3) -
(24903.1, 41053.3)
(616.0, 4969.8)
(7529.6, 18300.0)
(9529.6, 21885.8) (0.0, 665.3)
(1274.7, 6599.5)
(1224.9, 2413.6)
(3280.5, 8783.5)
(43852.7, 65583.0)
2. Female condoms
0.0 0.0 0.0 0.0 0.0 0.0 0.0 0.0 0.0 0.0 0.0 0.0 0.0
- - - - - - - - - - - - -
3. CycleBeads 0.0 0.0 0.0 0.0 0.0 0.0 0.0 0.0 0.0 0.0 0.0 0.0 0.0
- - - - - - - - - - - - -
4. Vaginal pessaries
0.0 0.0 0.0 0.0 0.0 0.0 0.0 0.0 0.0 0.0 0.0 0.0 0.0
- - - - - - - - - - - - -
5. Oral contraceptives
2284.4 39190.2 166.2 0.0 41640.9 1835.4 6819.8 8655.2 156.7 2640.7 387.7 3185.1 53481.2
(0.0, 4963.6) (27362.8, 51017.7) (0.0, 494.0) -
(29589.6, 53692.1) (0.0, 4963.5)
(4127.6, 9512.0)
(4578.4, 12732.0) (0.0, 421.4)
(512.0, 4769.4) (0.0, 1011.6)
(933.5, 5436.7)
(40001.3, 66961.1)
Combined oral contraceptives
2284.4 39190.2 166.2 0.0 41640.9 1769.3 5748.0 7517.3 156.7 2635.4 375.9 3167.9 52326.1
(0.0, 4963.6) (27362.8, 51017.7) (0.0, 494.0) -
(29589.6, 53692.1) (0.0, 4898.5)
(3349.7, 8146.4)
(3670.3, 11364.3) (0.0, 421.4)
(507.0, 4763.8) (0.0, 977.4)
(922.9, 5413.0)
(38981.4, 65670.9)
Progestin-only pills 0.0 0.0 0.0 0.0 0.0 0.0 0.0 0.0 0.0 0.0 11.8 11.8 11.8
- - - - - - - - - - (0.0, 35.0) (0.0, 35.0) (0.0, 35.0)
Centchroman pills 0.0 0.0 0.0 0.0 0.0 66.1 1071.8 1137.9 0.0 5.4 0.0 5.4 1143.2
- - - - - (0.0, 199.2) (307.0, 1836.6)
(254.5, 2021.3) - (0.0, 16.1) - (0.0, 15.9)
(251.6, 2034.9)
6. Emergency contraceptives
825.3 8860.8 0.0 0.0 9686.1 529.2 2222.7 2752.0 88.6 279.3 14.7 382.6 12820.7
(0.0, 1903.9) (5670.1, 12051.6) - -
(6370.3, 13001.9) (0.0, 1225.8)
(1172.2, 3273.2)
(1480.5, 4023.4) (0.0, 245.9) (0.0, 561.9) (0.0, 43.8) (64.5, 700.8)
(9177.0, 16464.5)
7. Contraceptive injectables (all DMPA)
0.0 0.0 0.0 0.0 0.0 755.0 1278.3 2033.3 0.0 1417.2 0.0 1417.2 3450.5
- - - - - (0.0, 1619.9) (534.0, 2022.6)
(926.5, 3140.1) - (0.0, 3598.0) - (0.0, 3573.8)
(1026.7, 5874.3)
8. IUDs (all Copper T)
60327.4 128425.0 0.0 0.0 188752.3 0.0 0.0 0.0 0.0 0.0 0.0 0.0 188752.3
(5898.8, 114756.0)
(60627.8, 196222.1) - -
(102335.9, 275168.7) - - - - - - -
(102335.9, 275168.7)
2269.9 0.0 0.0 0.0 2269.9 1130.5 0.0 1130.5 0.0 0.0 0.0 0.0 3400.4

www.FPwatch.info Page 228
Table X10: Reported Contraceptive Method Volumes: Bihar, Rural, 2016 CYPs sold or distributed in previous 1 month by outlet type and contraceptive method type†
Higher Public Health Facility
Sub-centre / ANM / ASHA
AWW NGO Public Total* Private facility
Pharmacy/Chemist
Private Medical Total*
AYUSH Provider
RMP General Retailer
Private Other Total* All Outlets
Vol CYP (95% CI)
Vol CYP (95% CI)
Vol CYP (95% CI)
Vol CYP (95% CI)
Vol CYP (95% CI)
Vol CYP (95% CI)
Vol CYP (95% CI)
Vol CYP (95% CI)
Vol CYP (95% CI)
Vol CYP (95% CI)
Vol CYP (95% CI)
Vol CYP (95% CI)
Vol CYP (95% CI)
9. Male Sterilization (0.0, 5674.4) - - - (0.0, 5674.4) (0.0, 4116.2) - (0.0, 4116.2) - - - - (0.0, 7536.9)
10. Female Sterilization
594959.3 0.0 0.0 0.0 594959.3 7239.2 0.0 7239.2 0.0 0.0 0.0 0.0 602198.4
(0.0, 1390601.6) - - -
(0.0, 1390601.6)
(0.0, 24082.5) -
(0.0, 24082.5) - - - -
(0.0, 1394227.6)
Total Volume 661997.4 208034.4 254.9 0.0 870286.8 14282.2 23235.6 37517.8 520.9 8274.3 2221.7 11016.9 918821.4
(0.0, 1455394.5)
(130456.5, 285612.3) (0.0, 674.3) -
(93588.9, 1646984.6)
(2436.6, 26127.9)
(15977.8, 30493.3)
(22324.6, 52711.0) (0.0, 1306.3)
(2432.5, 14116.1)
(1206.8, 3236.6)
(5049.4, 16984.4)
(141552.5, 1696090.4)
* Public Total category = higher public health facility + sub-centre/ANM/ASHA + AWW + NGO categories; Private Medical Total category = Private facility categories; Private Other Total category = AYUSH provider + RMP + general retailer categories † A total of 986,059.9 CYPs (weighted) were reportedly distributed in the previous 1 month in the Bihar rural stratum. This is based on the number of commodities reportedly sold for categories 1-8 (not number of services performed for categories 7-8) and number of sterilizations reportedly performed for categories 9-10.