fragranced consumer products: sources of emissions
TRANSCRIPT

1
Fragranced Consumer Products:
Sources of Emissions, Exposures, and Health Effects in the United Kingdom
Anne Steinemann
Professor of Civil Engineering
Chair of Sustainable Cities
Department of Infrastructure Engineering
Melbourne School of Engineering
The University of Melbourne
Melbourne Victoria 3010 Australia
Adjunct Professor
College of Science, Technology and Engineering
James Cook University
Townsville Queensland 4811 Australia
Research Associate
Climate, Atmospheric Sciences, and Physical Oceanography
Scripps Institution of Oceanography
University of California, San Diego
La Jolla, CA 92093 USA
email: [email protected]
phone: +61 03 8344 5001
published in Air Quality, Atmosphere & HealthDOI 10.1007/s11869-018-0550-zThe final publication is available at link.springer.com

2
Emissions from Fragranced Consumer Products:
Sources of Emissions, Exposures, and Effects in the United Kingdom
Abstract
Common in society, fragranced consumer products such as cleaning supplies and air fresheners are a primary source of volatile emissions that contribute to pollutants indoors and to personal exposure. Further, fragranced products have been associated with adverse health effects. This study investigates the sources of emissions, human exposures, and health and societal impacts from fragranced consumer products in the United Kingdom (UK). It examines the prevalence and types of fragranced product use, associated health effects, exposure situations, awareness of product emissions, and preferences for fragrance-free policies and indoor environments. Using a nationally representative population sample (n=1,100), data were collected in June 2016 using an online survey of adults in the UK, comprising England, Wales, Northern Ireland, and Scotland. Across the UK population, 27.8% report health problems, such as migraine headaches (8.4%) and asthma attacks (6.8%), when exposed to fragranced products. Yet 99.3% of the population are exposed to fragranced products at least once a week. When given a choice, more people would prefer that workplaces, health care facilities and professionals, hotels, and airplanes were fragrance-free rather than fragranced. Although fragranced products, even ones called green and organic, can emit potentially hazardous yet undisclosed pollutants, 75.0% of the population were not aware of this, and more than half would stop using their product if they knew it emitted such pollutants. This study provides important evidence that the UK population is regularly exposed to fragranced products, that these exposures are associated with adverse and often serious health effects, and that the public is largely unaware of their potential exposures. While more research is needed, reducing exposure to fragranced products, such as through fragrance-free policies, can provide an immediate step to reduce health risks and improve air quality.
Keywords: fragranced consumer product, fragrance, fragrance-free policy, indoor air quality
Article published in Air Quality, Atmosphere & Health, 2018
The final publication is available at Springer via http://link.springer.com

3
Introduction
"Fragranced consumer products" (or for brevity "fragranced products") are chemically
formulated products with the addition of a fragrance or scent (Steinemann 2015), and include
numerous everyday products such as air fresheners, cleaning supplies, soaps, lotions, hand
sanitizers, laundry detergents, baby shampoo, household items, and cosmetics. Fragranced
products are pervasive in society; used daily in homes, workplaces, schools, businesses,
transportation, and other public and private buildings; and used by individuals, industries,
and institutions (Steinemann 2009).
Fragranced consumer products emit a complex mixture of dozens of volatile organic
compounds (VOCs), such as terpenes (e.g., limonene, alpha-pinene, beta-pinene), ethanol,
acetone, and acetaldehyde (Steinemann 2015), which can dominate pollutants found indoors.
A study of homes in the UK found "unexpectedly high" indoor concentrations of limonene
and alpha-pinene (five-day average up to 1,439 µgm-3 and 229 µgm-3 respectively), which
were also the most abundant compounds in 94% of the homes and related to fragranced
product use (Wang et al. 2017). In addition, fragranced product emissions of terpenes can
generate a range of secondary pollutants, which include acetaldehyde, formaldehyde, and
secondary organic aerosols (e.g., Carslaw 2013; Nazaroff and Weschler 2004).
Fragranced products have been associated with adverse health effects including headaches
and migraines (Steinemann 2016, 2017; Kelman 2004; Farrow et al. 2003), asthma and
asthmatic reactions (Steinemann 2016, 2017; Weinberg et al. 2017), breathing difficulties
(Caress and Steinemann 2009), mucosal symptoms (Elberling et al. 2005; Millqvist and
Löwhagen, 1996), and contact dermatitis (Johansen 2003; Rastogi et al. 2007). In two other
studies parallel to this one, nationally representative surveys in the USA (Steinemann 2016)
and Australia (Steinemann 2017) found that 34.7% and 33.0% of the population

4
(respectively) reported one or more type of adverse health effects from exposure to
fragranced products.
Emissions from fragranced consumer products are generally unknown and undisclosed to the
public. Currently, no law in the UK, or in any other country, requires the disclosure of all
ingredients in fragranced consumer products (Lunny et al. 2017). Protections on ingredient
disclosure depend on the product. First, for cosmetics, the general term "fragrance" (or
"parfum") can be listed on the label, rather than the specific and numerous ingredients in the
added fragrance. Second, for other types of consumer products, such as air fresheners,
laundry supplies, cleaning products, and household items, ingredients do not need to be fully
listed on the product label, not even the general term "fragrance."
Emissions from fragranced products create risks for both voluntary exposure and involuntary
exposure. In an analogy to secondhand smoke, "secondhand scents" (Steinemann 2016) refers
to indirect exposure to others' use of fragranced products. As a response, fragrance-free
policies (similar to smoke-free policies) have been implemented by businesses, agencies, and
institutions in the UK and other countries (e.g., CDCP, 2009; CCOHS, 2015) to restrict the
use of fragranced products within indoor environments such as workplaces, schools,
hospitals, and public places.
This article reports results from a population-based study of the UK to investigate the sources
of emissions, exposures, and effects from fragranced consumer products. New data on the
extent of the problems point to opportunities to reduce the adverse effects by reducing
exposure to these types of products.

5
Methods
Using a national random sample representative of age, gender, and region (n=1,100;
confidence limit=95%, confidence interval=3%), an on-line survey was conducted of the
adult UK population. The survey instrument was developed and tested over a two-year period
before full implementation in June 2016. The survey drew upon participants from a large
web-based UK panel (approximately 950,000 people) held by Survey Sampling International.
Participant recruitment followed a randomized process as detailed in SSI (2016). All
responses were anonymous. The survey response rate was 97%. The research study received
ethics approval from the University of Melbourne. Demographic information is provided in
Table 1. Details on the survey methodology, including the checklist for reporting results of
internet e-surveys (CHERRIES, Eysenbach 2004), are provided in the Supplementary
Material.
Survey questions investigated the following: use and exposure to fragranced products, both
from one's own use and from others' use; health effects related to exposures to fragranced
consumer products; specific exposure situations; impacts of fragranced product exposure in
the workplace and in society; awareness of fragranced product ingredients and labelling;
preferences for fragrance-free environments and policies; and demographic information.
Fragranced products were categorized as follows: (a) Air fresheners and deodorizers (e.g.,
sprays, solids, oils, disks); (b) Personal care products (e.g., soaps, hand sanitizer, lotions,
deodorant, sunscreen, shampoos); (c) Cleaning supplies (e.g., all-purpose cleaners,
disinfectants, and dishwashing soap); (d) Laundry products (e.g., detergents, fabric softeners,
dryer sheets); (e) Household products (e.g., scented candles, toilet paper, trash bags, baby
products); (f) Fragrance (e.g., perfume, cologne, after-shave); and (g) Other.

6
Health effects were categorized as follows: (a) Migraine headaches; (b) Asthma attacks; (c)
Neurological problems (e.g., dizziness, seizures, head pain, fainting, loss of coordination); (d)
Respiratory problems (e.g., difficulty breathing, coughing, shortness of breath); (e) Skin
problems (e.g., rashes, hives, red skin, tingling skin, dermatitis); (f) Cognitive problems (e.g.,
difficulties thinking, concentrating, or remembering); (g) Mucosal symptoms (e.g., watery or
red eyes, nasal congestion, sneezing); (h) Immune system problems (e.g., swollen lymph
glands, fever, fatigue); (i) Gastrointestinal problems (e.g., nausea, bloating, cramping,
diarrhea); (j) Cardiovascular problems (e.g., fast or irregular heartbeat, jitteriness, chest
discomfort); (k) Musculoskeletal problems (e.g., muscle or joint pain, cramps, weakness); (j)
Other.
Specific exposure contexts were investigated: air fresheners or deodorizers used in public
restrooms and other places, scented laundry products vented outdoors, being in a room after it
was cleaned with scented cleaning products, being near someone wearing a fragranced
product, entering a business with the scent of fragranced products, fragranced soap used in
public restrooms, and ability to access environments that used fragranced products.
In addition, questions investigated awareness of fragranced product emissions and ingredient
disclosure, preferences for fragrance-free environments (e.g., workplaces, health care
facilities, airplanes, and hotels), and lost workdays due to fragranced product exposure.
Demographic questions were asked regarding age, gender, household income, and region in
the UK.
Results

7
Main findings are summarized in this section, with complete data for responses to the survey
questions provided in the Supplementary Material.
Fragranced product use:
Of the general population surveyed in the UK, 98.5% are exposed to fragranced products at
least once a week, from their own use: 71.4% air fresheners and deodorizers; 91.3% personal
care products; 80.7% cleaning supplies; 83.7% laundry products; 77.3% household products;
75.7% fragrance; 2.0% other.
Further, 89.0% are exposed to fragranced product at least once a week, from others' use:
53.3% air fresheners and deodorizers; 60.0% personal care products; 49.4% cleaning
supplies; 42.7% laundry products; 46.9% household products; 65.9% fragrance; 1.9% other.
Collectively, 99.3% of the population are exposed to fragranced products at least once a week
from their own use, others' use, or both.
Health effects:
Overall, 27.8% of the population reported one or more types of adverse health effects from
exposure to one or more types of fragranced products. The most common types of adverse
effects were as follows: 11.6% respiratory problems; 9.2% mucosal symptoms; 8.4%
migraine headaches; 9.8% skin problems; 6.8% asthma attacks; 3.7% neurological problems;
2.8% cognitive problems; 3.0% gastrointestinal problems; 3.2% cardiovascular problems;
1.9% immune system problems; 2.0% musculoskeletal problems; and 2.1% other. (See Table
2.)

8
Of the 27.8% of the population reporting adverse health effects, 53.9% are female and 46.1%
are male. Thus, proportionately more females report adverse effects than males, relative to
the general population (female 50.0%, male 50.0%). Among all gender and age group
classifications, proportionately more females aged 35-44 report adverse effects (14.1%)
relative to the general population (12.3%). (See Table 1.)
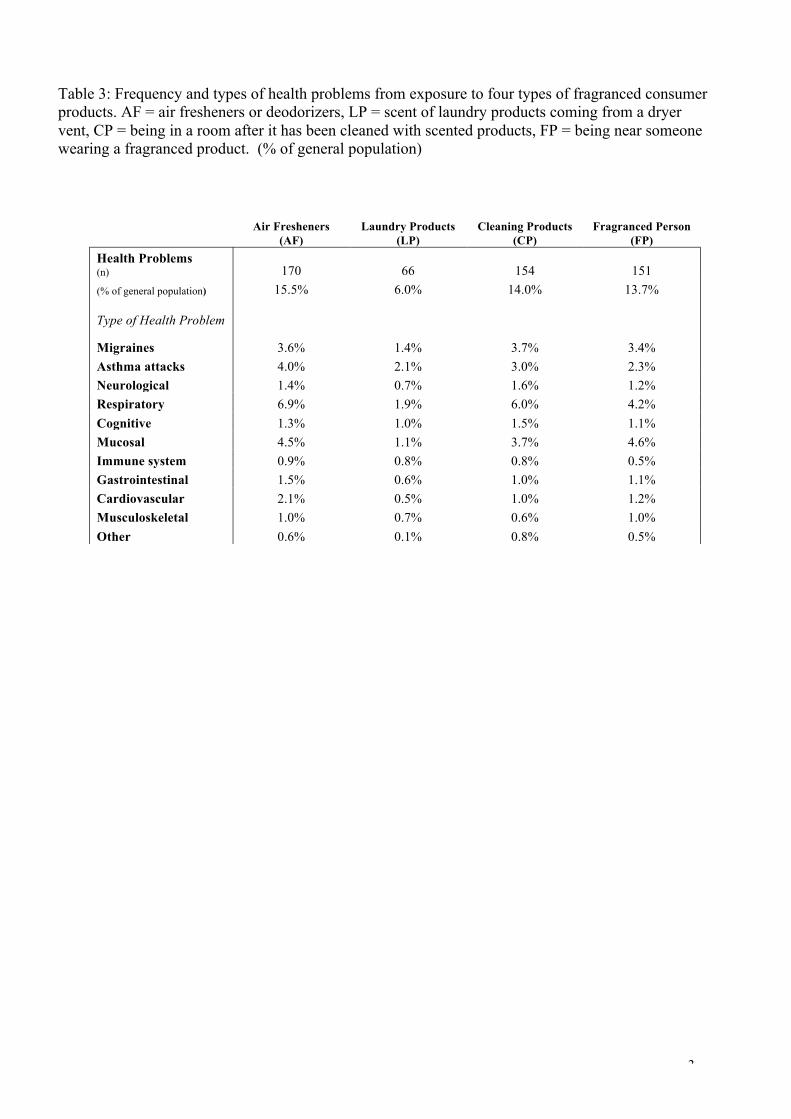
Specific fragranced products and exposure situations that trigger adverse health effects
include the following (see Table 3):
Air fresheners and deodorizers: 15.5% reported health problems when exposed to air
fresheners or deodorizers. This compares to studies of the USA and Australia (Steinemann
2016, 2017) that found 20.4% and 16.4% (respectively) reported health problems when
exposed to air fresheners or deodorizers.
Scented laundry products vented outdoors: 6.0% reported health problems from the scent of
laundry products coming from a dryer vent. This compares to studies of the USA and
Australia (Steinemann 2016, 2017) that found 12.5% and 6.1% (respectively) reported health
problems from the scent of laundry products coming from a dryer vent.
Fragranced cleaning products: 14.0% reported health problems from being in a room after it
has been cleaned with scented products. This compares to studies of the USA and Australia
(Steinemann 2016, 2017) that found 19.7% and 15.3% (respectively) reported health
problems from being in a room after it has been cleaned with scented products.
Proximity to fragranced person: 13.7% reported health problems from being near someone
who is wearing a fragranced product. This compares to studies of the USA and Australia

9
(Steinemann 2016, 2017) that found 23.6% and 19.4% (respectively) reported health
problems from being near someone who is wearing a fragranced product.
Severity of the health problems resulting from exposure to one or more types of fragranced
products was investigated, using language from the Equality Act (EA 2010) to determine
disability: "Do any of these health problems cause a substantial, likely to recur, and adverse
effect on your ability to carry out normal day-to-day activities?" Of those adversely affected
by fragranced products, 25.5% answered yes, indicating that the severity of effects from
fragranced product exposure was potentially disabling.
Ingredient disclosure and product claims:
Fragranced products, even ones called green or organic, typically emit numerous volatile
organic compounds, including hazardous air pollutants, but relatively few are disclosed to the
public (Steinemann 2015).
Of the general population surveyed, 68.4% were not aware that fragrance chemicals do not need to
be fully disclosed on the product label or material safety data sheet. Also, 70.7% were not aware that
fragranced products typically emit hazardous air pollutants such as formaldehyde, and 75.0% were
not aware that even so-called natural, green, and organic fragranced products typically emit
hazardous air pollutants. Yet 53.5% would not still use a fragranced product if they knew it emitted
hazardous air pollutants.
Societal and workplace effects:
The use of fragranced products creates a cascade of effects throughout society. Of the general
population, 12.1% are unable or reluctant to use the restrooms in a public place, because of the

10
presence of an air freshener, deodorizer, or scented product. Also, 10.3% are unable or reluctant to
wash their hands with soap in a public place, because they know or suspect that the soap is
fragranced. Further, 13.1% of the population reported that if they enter a business, and smell air
fresheners or some fragranced product, they want to leave as quickly as possible. And 13.5% have
been prevented from going to some place because they would be exposed to a fragranced product
that would make them sick. Notably, 6.3% of the UK population reported that exposure to
fragranced products in their work environment has caused them to become sick, lose workdays, or
lose a job.
Fragrance-free policies receive support from nearly half of those surveyed. Of the population
surveyed, 44.7% would be supportive of a fragrance-free policy in the workplace (compared to
23.3% that would not). Also, 43.3% would prefer that health care facilities and health care
professionals be fragrance-free (compared to 26.7% that would not).
If given a choice between flying on an airplane that pumped scented air throughout the passenger
cabin, or did not pump scented air throughout the passenger cabin, 61.9% would choose an airplane
without scented air (compared to 18.4% with scented air). Thus, over 3 times more passengers
would prefer an airplane without scented air than with scented air. Similarly, if given a choice
between staying in a hotel with fragranced air, or without fragranced air, 53.8% would choose a
hotel without fragranced air (compared to 28.1% with fragranced air). Thus, nearly 2 times more
hotel guests would choose a hotel without fragranced air than with fragranced air.
Discussion
Emissions from fragranced consumer products can impair indoor air quality, as prior studies
have shown. This study demonstrates they can also impair human health, workplace
productivity, access in society, and quality of life. Over one-fourth of the population in the

11
UK suffer adverse health effects when exposed to fragranced products. In nearly one-fourth
of those individuals, the effects can be potentially disabling.
Of particular concern are exposure situations, often involuntary, that impose health risks and
restrict access in society: 12.1% of the population are unable to use restrooms in public
places because of air fresheners or deodorizers, 10.3% unable to wash their hands with soap
in public places because of fragranced soap, and 13.5% unable to go someplace because of
the presence of a fragranced product.
In addition, 15.5% report health problems from air fresheners and deodorizers used in public
restrooms and elsewhere, 6.0% from scented laundry products coming from a dryer vent,
14.0% from being in a room after it was cleaned with scented products, and 13.7% from
being near someone wearing a fragranced product.
Nearly half of those surveyed would prefer fragrance-free environments than fragranced
environments. And 13.1% would enter but then leave a business as quickly as possible if they
smell fragranced products. Significantly, 6.3% have lost workdays or a job due to fragranced
product exposures in the workplace. A sensible solution is to implement a fragrance-free
policy for workplaces, health care facilities, and other indoor environments.
Limitations of the study include the following: (a) all possible products and health effects
were not included, although the low percentages for responses in the "other" category
indicates the survey captured the primary products and effects, (b) data were based on self-
reports, although a standard method for survey research, it was not possible to measure
emissions, exposures, and effects directly for each respondent, (c) the cross-sectional design
of the study, which useful for determining prevalence, is limited in the ability to determine
temporal relationships and trends.
12
Results of this study provide important evidence that common fragranced consumer products
are associated with adverse effects on human health and society. Together with the results
from the US (Steinemann 2016) and Australia (Steinemann 2017), indicating that 34.7% and
33.0% (respectively) report adverse health effects, exposure to common fragranced products
can be considered a widespread public health problem. Significantly, further research is
needed to understand the types of product ingredients, emissions, and concentrations that are
associated with these health effects. However, in the meantime, a prudent and practical
approach to reduce adverse effects would be to reduce exposure, both voluntary and
involuntary, to fragranced consumer products.
Acknowledgements
I thank Amy Davis for her valuable assistance. I also thank the staff of Survey Sampling
International for their superb work. I declare that I have no actual or potential competing
financial interests.
13
References
Caress SM, Steinemann AC. 2009. Prevalence of Fragrance Sensitivity in the American
Population. Journal of Environmental Health 71(7):46-50.
Carslaw N 2013. A mechanistic study of limonene oxidation products and pathways
following cleaning activities. Atmospheric Environment 80:507-513.
CCOHS 2015. Canadian Centre for Occupational Health and Safety. Scent-free policy for the
workplace. http://www.ccohs.ca/oshanswers/hsprograms/scent_free.html. (accessed
November 23, 2017)
CDCP 2009. Centers for Disease Control and Prevention, Department of Health and Human
Services. Indoor Environmental Quality Policy CDC-SM-2009-01, Section C(1).
http://www.drsteinemann.com/Resources/CDC%20Indoor%20Environmental%20Quality%2
0Policy.pdf (accessed November 23, 2017)
Elberling J, Linneberg A, Dirksen A, Johansen JD, Frølund L, Madsen F, Nielsen NH,
Mosbech H 2005. Mucosal symptoms elicited by fragrance products in a population-based
sample in relation to atopy and bronchial hyper-reactivity. Clinical and Experimental Allergy
35(1):75–81.
(EA) Equality Act 2010. Chapter 15. Parliament of the United Kingdom.
https://www.legislation.gov.uk/ukpga/2010/15/pdfs/ukpga_20100015_en.pdf

14
Eysenbach G 2004. Improving the Quality of Web Surveys: The Checklist for Reporting
Results of Internet E-Surveys (CHERRIES). Journal of Medical Internet Research 6(3):e34.
Farrow A, Taylor H, Northstone K, et al. 2003. Symptoms of Mothers and Infants Related to
Total Volatile Organic Compounds in Household Products. Archives of Environmental
Health: An International Journal 58(10):633-641.
Johansen JD 2003. Fragrance contact allergy: a clinical review. American Journal of Clinical
Dermatology 4(11):789–98.
Kelman L 2004. Osmophobia and taste abnormality in migraineurs: a tertiary care study.
Headache 44(10):1019–23.
Lunny S, Nelson R, Steinemann A. 2017. Something in the Air but not on the Label: A Call
for Increased Regulatory Ingredient Disclosure for Fragranced Consumer Products.
University of New South Wales Law Journal (in press).
Millqvist E, Löwhagen O 1996. Placebo-controlled challenges with perfume in patients with
asthma-like symptoms. Allergy 51(6):434–9.
Nazaroff WW, Weschler CJ 2004. Cleaning products and air fresheners: exposure to primary
and secondary air pollutants. Atmospheric Environment 38(18):2841–65.
Rastogi SC, Johansen JD, Bossi R 2007. Selected important fragrance sensitizers in
perfumes—current exposures. Contact Dermatitis 56(4):201–4.

15
SSI (Survey Sampling International) 2016. Dynamix Sampling Approach. Available from:
https://www.surveysampling.com/technology/ssi-dynamix/ (accessed August 3, 2016)
Steinemann A. 2017. Health and Societal Effects from Fragranced Consumer Products.
Preventive Medicine Reports 5:45-47.
Steinemann A. 2016. Fragranced Consumer Products: Exposures and Effects from
Emissions. Air Quality, Atmosphere, and Health 9(8):861-866.
Steinemann A 2015. Volatile emissions from common consumer products. Air Quality,
Atmosphere & Health 8(3): 273–281.
Steinemann AC 2009. Fragranced consumer products and undisclosed ingredients.
Environmental Impact Assess Review 29(1):32–8.
Wang CM, Barratt B, Carslaw N, Doutsi A, Dunmore RE, Warda MW, Lewis AC 2017.
Unexpectedly high concentrations of monoterpenes in a study of UK homes. Environmental
Science: Processes & Impacts 19:528–537.
Weinberg JL, Flattery J, Harrison R 2017. Fragrances and work-related asthma–California
surveillance data, 1993–2012. Journal of Asthma:1-10.

1
Table 1: Demographic information.
Health Problems
Fragranced Products General
Population
N N N
% of column total % of general
population row % of column total
Total 306 306 1100 100.0% 27.8% 100.0% Male/Female All Males 141 141 550 46.1% 25.6% 50.0% All Females 165 165 550 53.9% 30.0% 50.0% Gender-Age Male 18-24 20 20 83 6.5% 24.1% 7.5% Male 25-34 39 39 102 12.7% 38.2% 9.3% Male 35-44 30 30 107 9.8% 28.0% 9.7% Male 45-54 27 27 135 8.8% 20.0% 12.3% Male 55-65 25 25 123 8.2% 20.3% 11.2% Female 18-24 22 22 81 7.2% 27.2% 7.4% Female 25-34 41 41 129 13.4% 31.8% 11.7% Female 35-44 43 43 135 14.1% 31.9% 12.3% Female 45-54 33 33 108 10.8% 30.6% 9.8% Female 55-65 26 26 97 8.5% 26.8% 8.8%

2
Table 2: Frequency and types of adverse health effects reported from exposure to fragranced consumer products.
Health Problems Frequency
(n)
(% of general population) Total 306 27.8%
T
Type of Health Problem
Migraine headaches 92 8.4% Asthma attacks 75 6.8% Neurological problems 41 3.7% Respiratory problems 128 11.6% Skin problems 108 9.8% Cognitive problems 31 2.8% Mucosal symptoms 101 9.2% Immune system problems 21 1.9% Gastrointestinal problems 33 3.0% Cardiovascular problems 35 3.2% Musculoskeletal problems 22 2.0% Other 23 2.1%
3
Table 3: Frequency and types of health problems from exposure to four types of fragranced consumer products. AF = air fresheners or deodorizers, LP = scent of laundry products coming from a dryer vent, CP = being in a room after it has been cleaned with scented products, FP = being near someone wearing a fragranced product. (% of general population)
Air Fresheners
(AF) Laundry Products
(LP) Cleaning Products
(CP) Fragranced Person
(FP) Health Problems (n)
170 66 154 151
(% of general population) 15.5% 6.0% 14.0% 13.7% Type of Health Problem Migraines 3.6% 1.4% 3.7% 3.4% Asthma attacks 4.0% 2.1% 3.0% 2.3% Neurological 1.4% 0.7% 1.6% 1.2% Respiratory 6.9% 1.9% 6.0% 4.2% Cognitive 1.3% 1.0% 1.5% 1.1% Mucosal 4.5% 1.1% 3.7% 4.6% Immune system 0.9% 0.8% 0.8% 0.5% Gastrointestinal 1.5% 0.6% 1.0% 1.1% Cardiovascular 2.1% 0.5% 1.0% 1.2% Musculoskeletal 1.0% 0.7% 0.6% 1.0% Other 0.6% 0.1% 0.8% 0.5%

SurveyMethodologyFollowingEysenbachG,2004,ImprovingtheQualityofWebSurveys:TheChecklistforReportingResultsofInternetE-Surveys(CHERRIES),JournalofMedicalInternetResearch,Jul-Sep;6(3):e34. ChecklistforReportingResultsofInternetE-Surveys(CHERRIES)ItemCategory ChecklistItem ExplanationDesign Describesurveydesign Targetpopulation:nationalrandomsampleofadults(ages18-65)in
theUK,representativeofage,gender,andregion(n=1,100,confidencelimit=95%,marginoferror=3%).Thesurveydrewuponparticipantsfromalargeweb-basedpanel(~950,000participants)heldbySurveySamplingInternational(SSI).Participantrecruitmentfollowedarandomizedprocess(Dynamix).Allresponseswereanonymous.Surveycompletiontimewasapproximatelytenminutes.
IRB(InstitutionalReviewBoard)approvalandinformedconsentprocess
IRBapproval EthicsapprovalwasobtainedbytheUniversityofMelbourne,SchoolofEngineeringHumanEthicsAdvisoryGroup,application1646894,onMay9,2016.
Informedconsent ParticipantshadalreadyprovidedinformedconsentaspartoftheSSIweb-basedpanel.Forthissurvey,participantsweregiventhefollowingintroduction:aimsofthestudy;principalresearchername,affiliation,andcontactinformation;humanethicsapproval;lengthofsurvey(lessthan15minutestocomplete);assurancethatparticipationiscompletelyvoluntaryandthatalldataprovidedareconfidential;assurancethatparticipantscanwithdrawatanytime;outputsofresearch(findingswillbeprovidedthroughjournalarticlesandwebsite,freeofcharge);universityhumanethicscontactinformation;andaspecificquestiontoindicateconsent:"Ifyouwouldliketoparticipateinthisproject,pleaseclickthenextbuttontoproceed('GoToSurvey')."
Dataprotection Selectedsurveysoftwareandserverswereusedtoensuredataprotection.Nopersonalinformationwaslinkedtothesurveyresults.Thedataset(withoutanyidentifyinginformation)iskeptonpasswordprotectedcomputers.

Developmentandpre-testing Developmentandtesting Thesurveyinstrumentwasa35-itemquestionnaire,developedand
testedoveratwo-yearperiod,includingcognitivetestingwith10individualsandpilotingwithover100individuals,beforefullimplementationinJune2016.
Recruitmentprocessanddescriptionofthesamplehavingaccesstothequestionnaire
Thesurveyinvitationisanopeninvitation,ratherthanadirectinvite,tothepoolofpanelistsavailableatthetime.Thepoolisfilteredtoachievearepresentativesamplethroughasetofinitialquestionsforbasicdemographiccharacteristics.
Opensurveyversusclosedsurvey
Closedsurvey(onlySSIparticipants),generalpopulation,randomsamplenationallyrepresentativeofdemographics.
Contactmode Thesurveyprovider,SSI,providedanopeninvitationtopotentialparticipants.Thesurveytargetedthegeneralpopulationratherthanaspecificcohort.
Advertisingthesurvey Anopeninvitationwasissuedtorandomlyselectedmembersoftheweb-basedpanel.Thesurveywasnotadvertised.
Surveyadministration Web/E-mail Thesurveywasweb-based,withmultiplechoiceandopenformat
answers.Allresponseswereanonymous,andcollectedthroughtheonlinesurveyplatformandstoredonlocalpasswordprotectedservers.
Context SSIisasurveyresearchcompanyandonlinepanelprovider. Mandatory/voluntary Voluntary.Prospectiveparticipantswererandomlyinvitedtothe
survey. Incentives Respondentswereprovidedincentivesfortheirparticipationbythe
panelprovider,SSI,withpointsthatcanberedeemedformoneyorrewardprograms.
Time/Date DatawerecollectedwithinoneweekinJune2016. Randomizationofitemsor
questionnairesTopreventbiasesinresponse,fivesetsofquestionswererandomizedfortheirmultiple-choiceitems.
Adaptivequestioning Eightquestionswereconditionallydisplayedbasedonresponsestootheritems.
NumberofItems Thesurveycontained35questions.Eachpagecontainedonequestionwithmultiplechoiceandopenformatresponsecategories.
Numberofscreens(pages) Overall,36to44pageswerepresented(includingtheintroductorypage),dependingonresponsestoconditionalitems.
Completenesscheck Allquestionswererequiredtobecompleted.Allquestionsprovidednon-responseoptionssuchas"don'tknow/notsure"and"declinetoanswer."Onlycompletedsurveyswereincludedforanalysis.
Reviewstep Respondentswereallowedoneattemptperquestion,oncetheyclick"next"toreviewthenextquestion;theyarenotallowedtogobacktothepreviousquestionsoranswers.

Responserates Surveyresponserate:97%.Numberofinitialresponses:1,139;numberofdropouts:18;numberofscreenouts:21;numberofcompletes:1,100;Panelsize:~950,000.
Uniquesitevisitor EachrespondentgoesthroughstringentverificationofidentityuponsigninguponSSIpanel(includingname,contactdetails,andIP).Onceopt-inprocessiscompleted,eachrespondentistaggedwithuniquepanelID.
Viewrate(Ratioofuniquesurveyvisitors/uniquesitevisitors)
notapplicable
Participationrate(Ratioofuniquevisitorswhoagreedtoparticipate/uniquefirstsurveypagevisitors)
SSIrespondentsareinvitedtosurveythroughgeneralpopulationrandomselection.Uniqueclicksorvisitorstothefirstpageofthesurveycanbethosewhocompletesurvey,dropout,orscreenout.
Completionrate(Ratioofuserswhofinishedthesurvey/userswhoagreedtoparticipate)
UK97%(1,139initial;18dropouts;21screenout;1,100completes).
Preventingmultipleentriesfromthesameindividual
Cookiesused notused IPcheck
SSIprogrammingsoftwareandsamplingtool,Dynamix,controlsthetrafficandensuresuniqueentries.UsinguniquePanelIDandIP,eachrespondentcanattemptthesurveyonlyonce.
Logfileanalysis notused Registration ThisisaclosedsurveyforSSIrespondentsonly.Surveyinviteis
mailedspecificallytothee-mailaddressuseduponjoiningsurveyandverified.
Analysis Handlingofincomplete
questionnairesOnlycompletedquestionnaireswereincludedinthefinaldatasetforanalysis.
Questionnairessubmittedwithanatypicaltimestamp
Minimumsurveycompletiontimewas5minutes;averagewas10minutes.Asmallnumberofrespondentswereomittedforcompletingtheitemstooquickly.
Statisticalcorrection Alldemographicsubgroupsobtainedstatisticallyvalidnumberstoensureanationalrepresentativeness.

Table1D1.Whatisyourgender?Base:AllRespondents
GenPopTotal 1100 100.00%Male 550 50.00%Female 550 50.00%Other - -SUM 1100 100.00%

Table2D2.Whatisyourage?Base:AllRespondents
GenPopTotal 1100 100.00%18-24 164 14.90%25-34 231 21.00%35-44 242 22.00%45-54 243 22.10%55-65 220 20.00%SUM 1100 100.00%
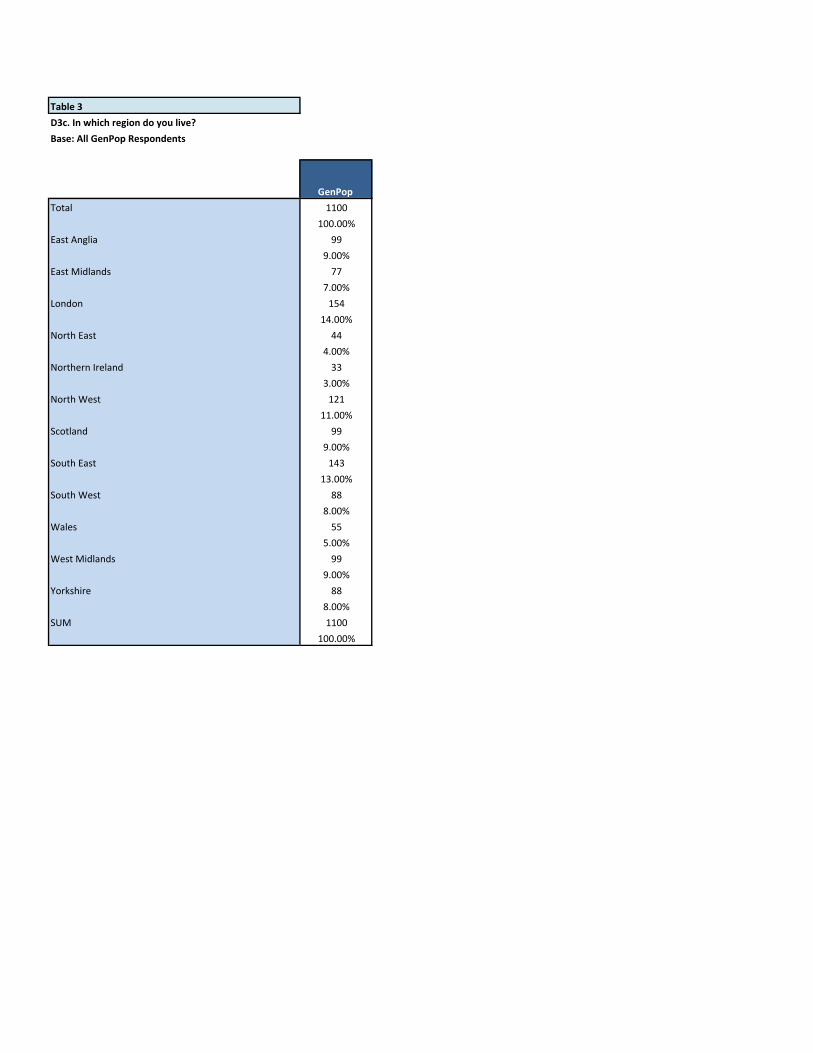
Table3D3c.Inwhichregiondoyoulive?Base:AllGenPopRespondents
GenPopTotal 1100 100.00%EastAnglia 99 9.00%EastMidlands 77 7.00%London 154 14.00%NorthEast 44 4.00%NorthernIreland 33 3.00%NorthWest 121 11.00%Scotland 99 9.00%SouthEast 143 13.00%SouthWest 88 8.00%Wales 55 5.00%WestMidlands 99 9.00%Yorkshire 88 8.00%SUM 1100 100.00%

Table4Q1.Whichfragrancedproductsareyouexposedto,atleastonceaweek,fromyourownuse?Base:AllRespondents
GenPop
Total 1100
100.00%
Airfreshenersanddeodorizers(e.g.,sprays, 785
solids,oils,disks) 71.40%
Personalcareproducts(e.g.,soaps,hand 1004
sanitizer,lotions,deodorant,sunscreen,shampoos) 91.30%
Cleaningsupplies(e.g.,all-purposecleaners, 888
disinfectants,anddishwashingsoap) 80.70%
Laundryproducts(e.g.,detergents,fabric 921
softeners,dryersheets) 83.70%
Householdproducts(e.g.,scentedcandles,toilet 850
paper,trashbags,babyproducts) 77.30%
Fragrance(e.g.,perfume,cologne,after-shave) 833
75.70%
Other 22
2.00%
None 17
1.50%
SUM 5320
483.60%

Table5Q1a.Whichfragrancedproductsareyouexposedto,atleastonceaweek,fromothers'use?Base:AllRespondents
GenPop
Total 1100
100.00%
Airfreshenersanddeodorizers(e.g.,sprays, 586
solids,oils,disks) 53.30%
Personalcareproducts(e.g.,soaps,hand 660
sanitizer,lotions,deodorant,sunscreen,shampoos) 60.00%
Cleaningsupplies(e.g.,all-purposecleaners, 543
disinfectants,anddishwashingsoap) 49.40%
Laundryproducts(e.g.,detergents,fabric 470
softeners,dryersheets) 42.70%
Householdproducts(e.g.,scentedcandles,toilet 516
paper,trashbags,babyproducts) 46.90%
Fragrance(e.g.,perfume,cologne,after-shave) 725
65.90%
Other 21
1.90%
None 121
11.00%
SUM 3642
331.10%

Table6Q2.Doyouexperienceanyhealthproblemswhenexposedtoairfreshenersordeodorizers?Base:AllRespondents
GenPopTotal 1100 100.00%Yes 170 15.50%No 798 72.50%Don'tknow/notsure 130 11.80%Declinetoanswer 2 0.20%SUM 1100 100.00%

Table7BA.Whichofthefollowinghealthproblemsdoyoudoyouexperience?Base:Respondentswhoexperiencedbelowhealthproblemswhenexposedtoairfreshenersordeodorizers
GenPop
Total 170
100.00%
Migraineheadaches 40
23.50%
Asthmaattacks 44
25.90%
Neurologicalproblems(e.g.,dizziness,seizures, 15
headpain,fainting,lossofcoordination) 8.80%
Respiratoryproblems(e.g.,difficultybreathing, 76
coughing,shortnessofbreath) 44.70%
Skinproblems(e.g.,rashes,hives,redskin, 50
tinglingskin,dermatitis) 29.40%
Cognitiveproblems(e.g.,difficultiesthinking, 14
concentrating,orremembering) 8.20%
Mucosalsymptoms(e.g.,wateryorredeyes,nasal 49
congestion,sneezing) 28.80%
Immunesystemproblems(e.g.,swollenlymph 10
glands,fever,fatigue) 5.90%
Gastrointestinalproblems(e.g.,nausea,bloating, 17
cramping,diarrhea) 10.00%
Cardiovascularproblems(e.g.,fastorirregular 23
heartbeat,jitteriness,chestdiscomfort) 13.50%
Musculoskeletalproblems(e.g.,muscleorjoint 11
pain,cramps,weakness) 6.50%
Other 7
4.10%
SUM 356
209.40%
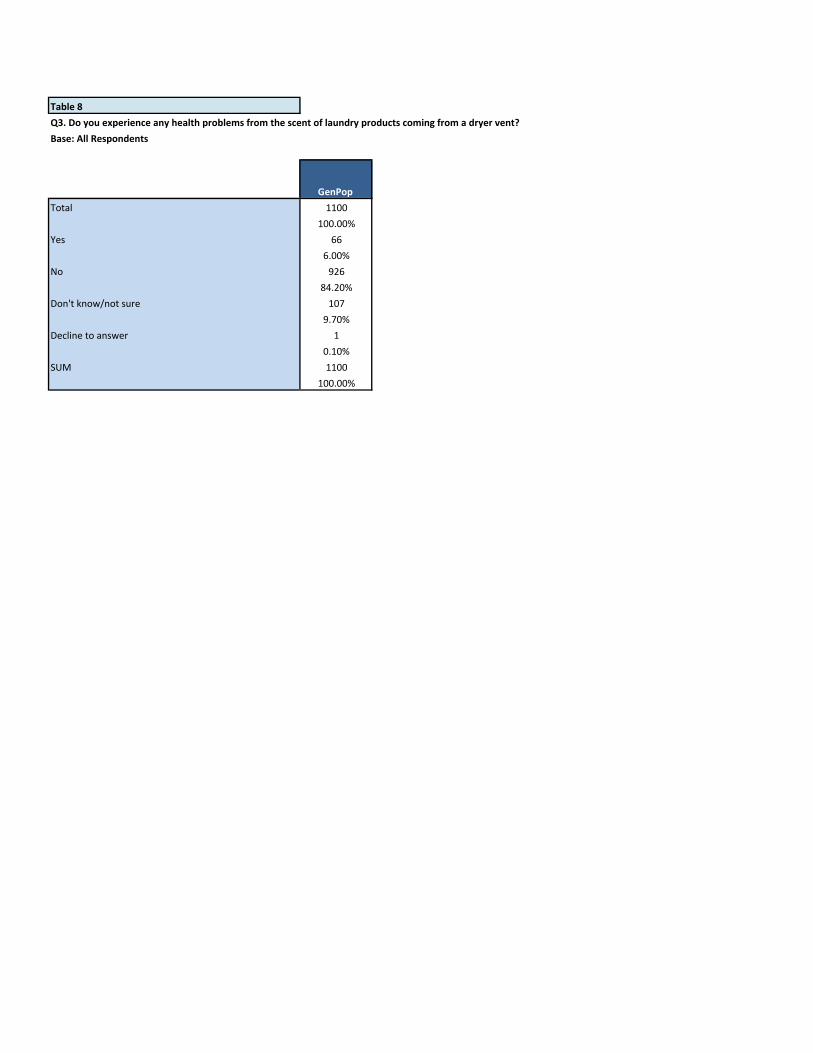
Table8Q3.Doyouexperienceanyhealthproblemsfromthescentoflaundryproductscomingfromadryervent?Base:AllRespondents
GenPopTotal 1100 100.00%Yes 66 6.00%No 926 84.20%Don'tknow/notsure 107 9.70%Declinetoanswer 1 0.10%SUM 1100 100.00%

Table9BA.Whichofthefollowinghealthproblemsdoyoudoyouexperience?Base:Respondentswhoexperiencedbelowhealthproblemsfromthescentoflaundryproductscomingfromadryervent
GenPop
Total 66
100.00%
Migraineheadaches 15
22.70%
Asthmaattacks 23
34.80%
Neurologicalproblems(e.g.,dizziness,seizures, 8
headpain,fainting,lossofcoordination) 12.10%
Respiratoryproblems(e.g.,difficultybreathing, 21
coughing,shortnessofbreath) 31.80%
Skinproblems(e.g.,rashes,hives,redskin, 17
tinglingskin,dermatitis) 25.80%
Cognitiveproblems(e.g.,difficultiesthinking, 11
concentrating,orremembering) 16.70%
Mucosalsymptoms(e.g.,wateryorredeyes,nasal 12
congestion,sneezing) 18.20%
Immunesystemproblems(e.g.,swollenlymph 9
glands,fever,fatigue) 13.60%
Gastrointestinalproblems(e.g.,nausea,bloating, 7
cramping,diarrhea) 10.60%
Cardiovascularproblems(e.g.,fastorirregular 6
heartbeat,jitteriness,chestdiscomfort) 9.10%
Musculoskeletalproblems(e.g.,muscleorjoint 8
pain,cramps,weakness) 12.10%
Other 1
1.50%
SUM 138
209.10%

Table10Q4.Doyouexperienceanyhealthproblemsfrombeinginaroomafterithasbeencleanedwithscentedproducts?
GenPopTotal 1100 100.00%Yes 154 14.00%No 839 76.30%Don'tknow/notsure 105 9.50%Declinetoanswer 2 0.20%SUM 1100 100.00%

Table11BA.Whichofthefollowinghealthproblemsdoyoudoyouexperience?Base:Respondentswhoexperiencedbelowhealthproblemsfrombeinginaroomafterithasbeencleanedwithscentedproducts
GenPop
Total 154
100.00%
Migraineheadaches 41
26.60%
Asthmaattacks 33
21.40%
Neurologicalproblems(e.g.,dizziness,seizures, 18
headpain,fainting,lossofcoordination) 11.70%
Respiratoryproblems(e.g.,difficultybreathing, 66
coughing,shortnessofbreath) 42.90%
Skinproblems(e.g.,rashes,hives,redskin, 36
tinglingskin,dermatitis) 23.40%
Cognitiveproblems(e.g.,difficultiesthinking, 16
concentrating,orremembering) 10.40%
Mucosalsymptoms(e.g.,wateryorredeyes,nasal 41
congestion,sneezing) 26.60%
Immunesystemproblems(e.g.,swollenlymph 9
glands,fever,fatigue) 5.80%
Gastrointestinalproblems(e.g.,nausea,bloating, 11
cramping,diarrhea) 7.10%
Cardiovascularproblems(e.g.,fastorirregular 11
heartbeat,jitteriness,chestdiscomfort) 7.10%
Musculoskeletalproblems(e.g.,muscleorjoint 7
pain,cramps,weakness) 4.50%
Other 9
5.80%
SUM 298
193.50%

Table12Q5.Doyouexperienceanyhealthproblemsfrombeingnearsomeonewhoiswearingafragrancedproduct?Base:AllRespondents
GenPopTotal 1100 100.00%Yes 151 13.70%No 872 79.30%Don'tknow/notsure 76 6.90%Declinetoanswer 1 0.10%SUM 1100 100.00%
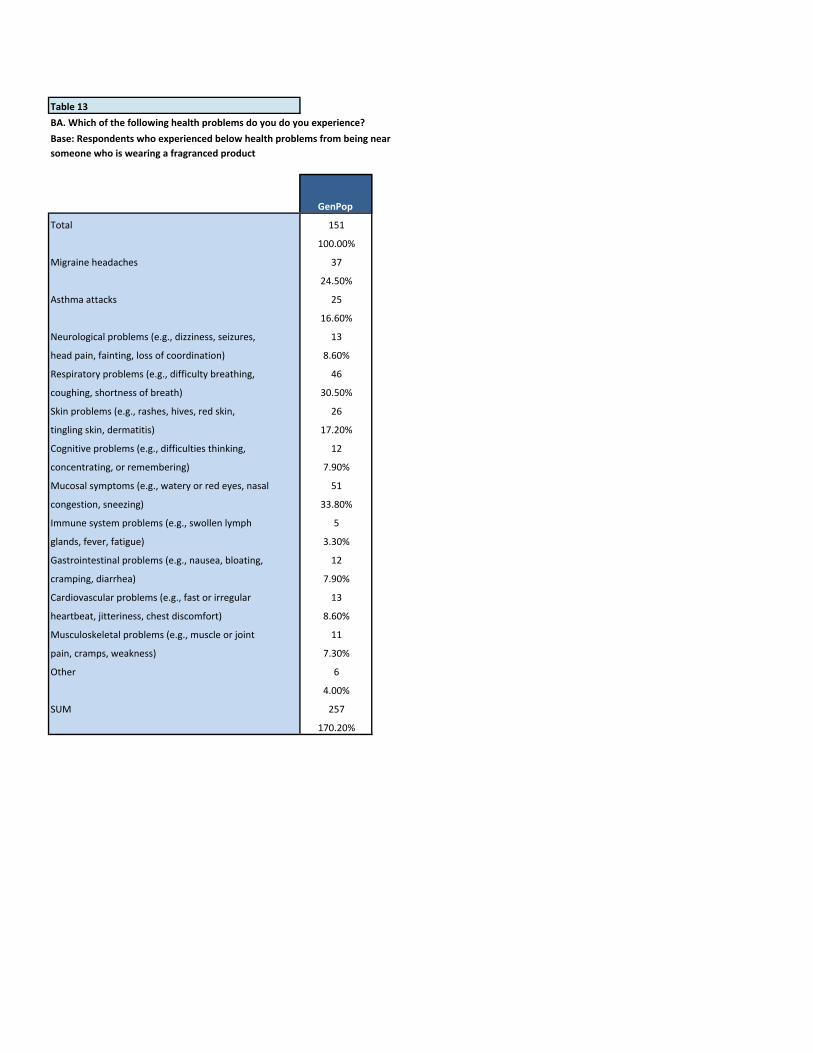
Table13BA.Whichofthefollowinghealthproblemsdoyoudoyouexperience?Base:Respondentswhoexperiencedbelowhealthproblemsfrombeingnearsomeonewhoiswearingafragrancedproduct
GenPop
Total 151
100.00%
Migraineheadaches 37
24.50%
Asthmaattacks 25
16.60%
Neurologicalproblems(e.g.,dizziness,seizures, 13
headpain,fainting,lossofcoordination) 8.60%
Respiratoryproblems(e.g.,difficultybreathing, 46
coughing,shortnessofbreath) 30.50%
Skinproblems(e.g.,rashes,hives,redskin, 26
tinglingskin,dermatitis) 17.20%
Cognitiveproblems(e.g.,difficultiesthinking, 12
concentrating,orremembering) 7.90%
Mucosalsymptoms(e.g.,wateryorredeyes,nasal 51
congestion,sneezing) 33.80%
Immunesystemproblems(e.g.,swollenlymph 5
glands,fever,fatigue) 3.30%
Gastrointestinalproblems(e.g.,nausea,bloating, 12
cramping,diarrhea) 7.90%
Cardiovascularproblems(e.g.,fastorirregular 13
heartbeat,jitteriness,chestdiscomfort) 8.60%
Musculoskeletalproblems(e.g.,muscleorjoint 11
pain,cramps,weakness) 7.30%
Other 6
4.00%
SUM 257
170.20%

Table14Q6.Ingeneral,doyouexperienceanyhealthproblemsfromexposuretoanytypeoffragrancedproduct?Base:AllRespondents
GenPopTotal 1100 100.00%Yes 153 13.90%No 830 75.50%Don'tknow/notsure 116 10.50%Declinetoanswer 1 0.10%SUM 1100 100.00%

Table15BA.Whichofthefollowinghealthproblemsdoyoudoyouexperience?Base:Respondentswhoexperiencedbelowhealthproblemsfromexposuretoanytypeoffragrancedproduct
GenPop
Total 153
100.00%
Migraineheadaches 33
21.60%
Asthmaattacks 30
19.60%
Neurologicalproblems(e.g.,dizziness,seizures, 15
headpain,fainting,lossofcoordination) 9.80%
Respiratoryproblems(e.g.,difficultybreathing, 51
coughing,shortnessofbreath) 33.30%
Skinproblems(e.g.,rashes,hives,redskin, 45
tinglingskin,dermatitis) 29.40%
Cognitiveproblems(e.g.,difficultiesthinking, 13
concentrating,orremembering) 8.50%
Mucosalsymptoms(e.g.,wateryorredeyes,nasal 48
congestion,sneezing) 31.40%
Immunesystemproblems(e.g.,swollenlymph 11
glands,fever,fatigue) 7.20%
Gastrointestinalproblems(e.g.,nausea,bloating, 11
cramping,diarrhea) 7.20%
Cardiovascularproblems(e.g.,fastorirregular 13
heartbeat,jitteriness,chestdiscomfort) 8.50%
Musculoskeletalproblems(e.g.,muscleorjoint 10
pain,cramps,weakness) 6.50%
Other 10
6.50%
SUM 290
189.50%

Table16B3.Doanyofthesehealthproblemscauseasubstantial,likelytorecur,andadverseeffectonyourabilitytocarryoutnormalday-to-dayactivities?Base:AllRespondentswhoareexperiencinghealthproblems
GenPopTotal 306 100.00%Yes 78 25.50%No 195 63.70%Don'tknow/notsure 33 10.80%Declinetoanswer - -SUM 306 100.00%

Table17Haveyoueverbeenunableorreluctanttousethetoiletsinapublicplace,product?becauseofthepresenceofanairfreshener,deodorizer,orscentedBase:AllRespondents
GenPopTotal 1100 100.00%Yes 133 12.10%No 891 81.00%Neutral/notsure 72 6.50%Declinetoanswer 4 0.40%SUM 1100 100.00%

Table18Ifyouenterabusiness,andyousmellairfreshenersorsomefragrancedproduct,doyouwanttoleaveasquicklyaspossible?Base:AllRespondents
GenPopTotal 1100 100.00%Yes 144 13.10%No 827 75.20%Neutral/notsure 125 11.40%Declinetoanswer 4 0.40%SUM 1100 100.00%
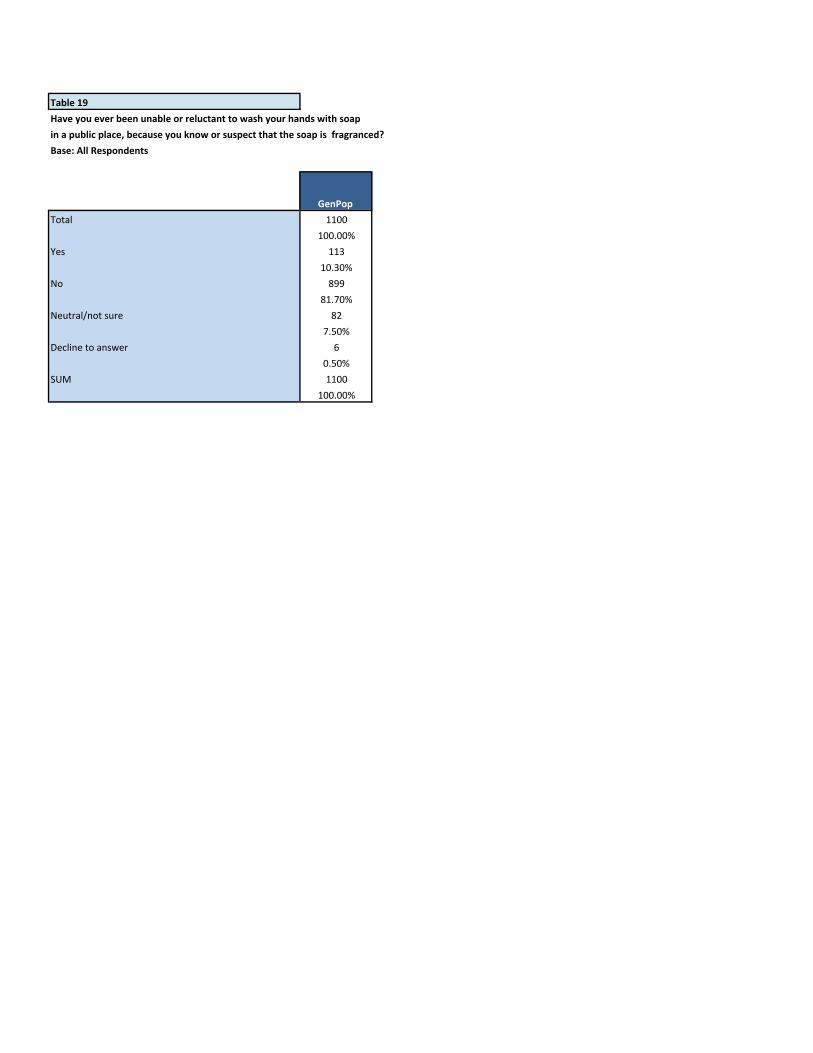
Table19Haveyoueverbeenunableorreluctanttowashyourhandswithsoapinapublicplace,becauseyouknoworsuspectthatthesoapisfragranced?Base:AllRespondents
GenPopTotal 1100 100.00%Yes 113 10.30%No 899 81.70%Neutral/notsure 82 7.50%Declinetoanswer 6 0.50%SUM 1100 100.00%

Table20Areyouawarethatfragrancechemicalsdonotneedtobefullydisclosedontheproductlabelormaterialsafetydatasheet?Base:AllRespondents
GenPopTotal 1100 100.00%Yes 213 19.40%No 752 68.40%Don'tknow/notsure 128 11.60%Declinetoanswer 7 0.60%SUM 1100 100.00%

Table21Areyouawarethatfragrancedproductstypicallyemithazardousairpollutantssuchasformaldehyde?Base:AllRespondents
GenPopTotal 1100 100.00%Yes 207 18.80%No 778 70.70%Don'tknow/notsure 112 10.20%Declinetoanswer 3 0.30%SUM 1100 100.00%

Table22Areyouawarethatevenso-callednatural,green,andorganicfragrancedproductstypicallyemithazardousairpollutants?Base:AllRespondents
GenPopTotal 1100 100.00%Yes 171 15.50%No 825 75.00%Don'tknow/notsure 100 9.10%Declinetoanswer 4 0.40%SUM 1100 100.00%

Table23Ifyouknewthatafragrancedproductemittedhazardousairpollutants,wouldyoustilluseit?Base:AllRespondents
GenPopTotal 1100 100.00%Yes 150 13.60%No 588 53.50%Don'tknow/notsure 354 32.20%Declinetoanswer 8 0.70%SUM 1100 100.00%

Table24Haveyoueverbeenpreventedfromgoingtosomeplacebecauseyouwouldbeexposedtoafragranceproductthatwouldmakeyousick?Base:AllRespondents
GenPopTotal 1100 100.00%Yes 148 13.50%No 873 79.40%Don'tknow/notsure 76 6.90%Declinetoanswer 3 0.30%SUM 1100 100.00%

Table25Hasanyexposuretofragrancedproductsinyourworkenvironmentcausedyoutobecomesick,loseworkdays,orloseajob?Base:AllRespondents
GenPopTotal 1100 100.00%Yes 69 6.30%No 953 86.60%Don'tknow/notsure 74 6.70%Declinetoanswer 4 0.40%SUM 1100 100.00%

Table26Wouldyoubesupportiveofafragrance-freepolicyintheworkplace?Base:AllRespondents
GenPopTotal 1100 100.00%Yes 492 44.70%No 256 23.30%Neutral/notsure 344 31.30%Declinetoanswer 8 0.70%SUM 1100 100.00%

Table27Wouldyoupreferthathealthcarefacilitiesandhealthcareprofessionalsbefragrance-free?Base:AllRespondents
GenPopTotal 1100
100.00%
Yes 476 43.30%No 294 26.70%Neutral/notsure 324 29.50%Declinetoanswer 6 0.50%SUM 1100 100.00%

Table28FlyingOnAnAirplaneThatPumped/DidNotPumpScentedAirThroughoutThePassengerCabin,WhichWouldYouChoose?Base:AllRespondents
GenPopTotal 1100
100.00%
Airplanewithscentedair 202 18.40%Airplanewithoutscentedair 681 61.90%Neutral/notsure 214 19.50%Declinetoanswer 3 0.30%SUM 1100 100.00%

Table29StayingInAHotelWith/WithoutFragrancedAir,WhichWouldYouChoose?Base:AllRespondents
GenPopTotal 1100
100.00%
Hotelwithfragrancedair 309 28.10%Hotelwithoutfragrancedair 592 53.80%Neutral/notsure 197 17.90%Declinetoanswer 2 0.20%SUM 1100 100.00%

Table30Q1/Q1a.WhoAnswer“Yes”ToOneOrMoreOfTheseOptionsForQ1/Q1A(ownuse,other'suse).Base:AllRespondents
GenPop
Total 1100
100.00%
Yes(Net) 1092
99.30%
Airfreshenersanddeodorizers(e.g.,sprays, 868
solids,oils,disks) 78.90%
Personalcareproducts(e.g.,soaps,hand 1034
sanitizer,lotions,deodorant,sunscreen,shampoos) 94.00%
Cleaningsupplies(e.g.,all-purposecleaners, 954
disinfectants,anddishwashingsoap) 86.70%
Laundryproducts(e.g.,detergents,fabric 968
softeners,dryersheets) 88.00%
Householdproducts(e.g.,scentedcandles, 892
toiletpaper,trashbags,babyproducts) 81.10%
Fragrance(e.g.,perfume,cologne,after-shave) 912
82.90%
Other 31
2.80%
None 130
11.80%
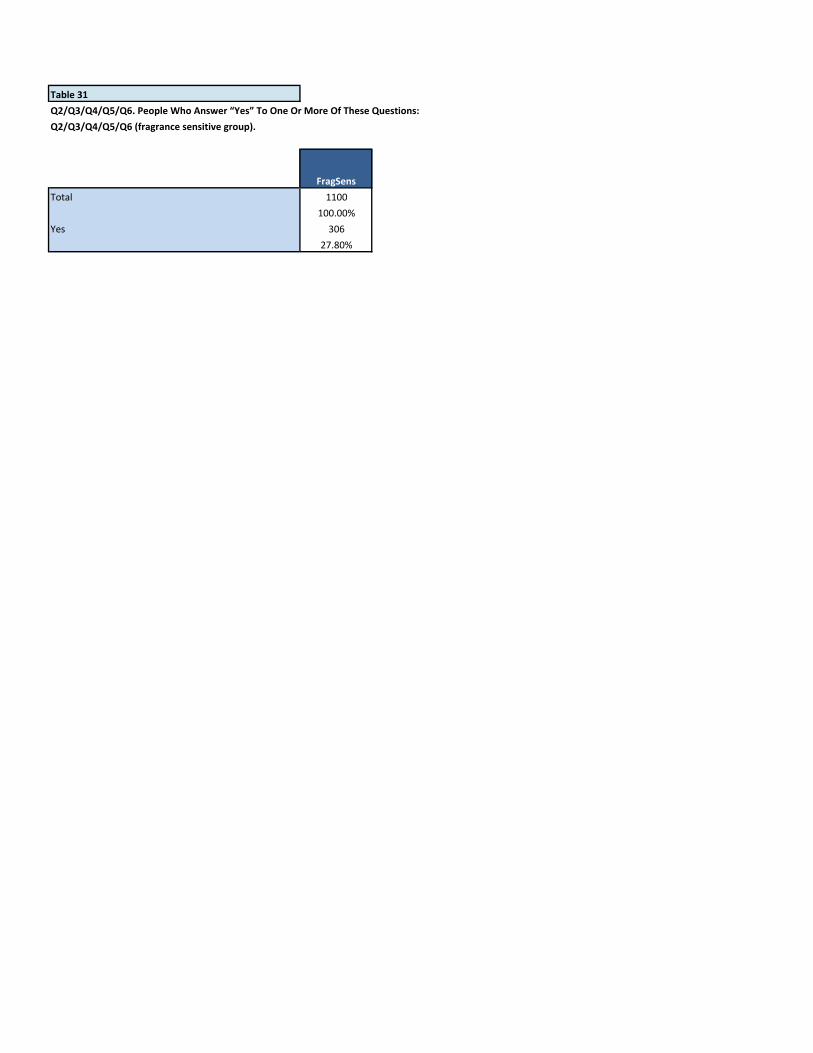
Table31Q2/Q3/Q4/Q5/Q6.PeopleWhoAnswer“Yes”ToOneOrMoreOfTheseQuestions:Q2/Q3/Q4/Q5/Q6(fragrancesensitivegroup).
FragSensTotal 1100 100.00%Yes 306 27.80%
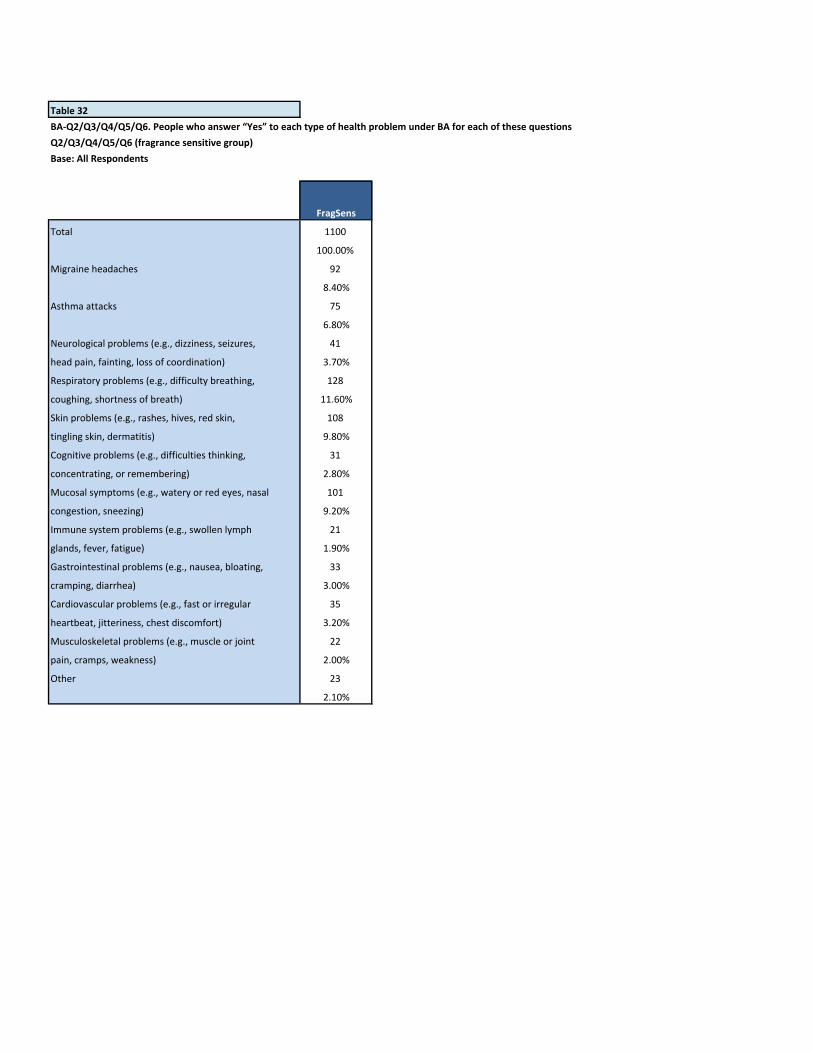
Table32BA-Q2/Q3/Q4/Q5/Q6.Peoplewhoanswer“Yes”toeachtypeofhealthproblemunderBAforeachofthesequestionsQ2/Q3/Q4/Q5/Q6(fragrancesensitivegroup)Base:AllRespondents
FragSens
Total 1100
100.00%
Migraineheadaches 92
8.40%
Asthmaattacks 75
6.80%
Neurologicalproblems(e.g.,dizziness,seizures, 41
headpain,fainting,lossofcoordination) 3.70%
Respiratoryproblems(e.g.,difficultybreathing, 128
coughing,shortnessofbreath) 11.60%
Skinproblems(e.g.,rashes,hives,redskin, 108
tinglingskin,dermatitis) 9.80%
Cognitiveproblems(e.g.,difficultiesthinking, 31
concentrating,orremembering) 2.80%
Mucosalsymptoms(e.g.,wateryorredeyes,nasal 101
congestion,sneezing) 9.20%
Immunesystemproblems(e.g.,swollenlymph 21
glands,fever,fatigue) 1.90%
Gastrointestinalproblems(e.g.,nausea,bloating, 33
cramping,diarrhea) 3.00%
Cardiovascularproblems(e.g.,fastorirregular 35
heartbeat,jitteriness,chestdiscomfort) 3.20%
Musculoskeletalproblems(e.g.,muscleorjoint 22
pain,cramps,weakness) 2.00%
Other 23
2.10%

Table33DemographicsbyAgeandGenderBase:AllRespondents
GenPopTotal 1100 100.00%Male/FemaleAllMales 550 50.00%AllFemales 550 50.00%GendervsAgeMale18-24 83 7.50%Male25-34 102 9.30%Male35-44 107 9.70%Male45-54 135 12.30%Male55-65 123 11.20%Female18-24 81 7.40%Female25-34 129 11.70%Female35-44 135 12.30%Female45-54 108 9.80%Female55-65 97 8.80%

Table34DemographicsbyAgeandGenderPeoplewhoanswer“Yes”toeachtypeofhealthproblemunderBAforeachofthesequestionsQ2/Q3/Q4/Q5/Q6(fragrancesensitivegroup)
FragSensTotal 306 100.00%Male/FemaleAllMales 141 46.10%AllFemales 165 53.90%GendervsAgeMale18-24 20 6.50%Male25-34 39 12.70%Male35-44 30 9.80%Male45-54 27 8.80%Male55-65 25 8.20%Female18-24 22 7.20%Female25-34 41 13.40%Female35-44 43 14.10%Female45-54 33 10.80%Female55-65 26 8.50%