framework for site characterization for monitored … of research and development national risk...
TRANSCRIPT

Office of Research and DevelopmentNational Risk Management Research Laboratory, Ada, Oklahoma 74820
Framework for Site Characterizationfor Monitored Natural Attenuation of Volatile Organic Compounds in Ground Water
EPA 600/R-12/712 | December 2012 | www.epa.gov/ada

Framework for Site Characterization for Monitored Natural Attenuation of Volatile Organic Compounds in
Ground Water
Bruce E. Pivetz Shaw Environmental & Infrastructure, Inc.
David AbshireU.S. EPA Region 6
Dallas, TX
William Brandon and Stephen MangionU.S. EPA Region 1
Boston, MA
Brad RobertsU.S. EPA Region 7
Kansas City, KS
Bruce Stuart Missouri Department of Natural Resources
Luanne VanderpoolU.S. EPA Region 5
Chicago, IL
Barbara WilsonDynamac Corporation
Steven D. Acree Ground Water and Ecosystems Restoration Division
National Risk Management Research LaboratoryAda, OK
EPA/600/R-12/712December 2012
Ground Water and Ecosystems Restoration Division National Risk Management Research Laboratory
Office of Research and DevelopmentU.S. Environmental Protection Agency
Cincinnati, OH 45268
by
EP-C-08-034

NOTICE
The U.S. Environmental Protection Agency through its Office of Research and Development funded and managed the research described here under contract to Shaw Environmental & Infrastructure, Inc. (EP-C-08-034). It has been subjected to the Agency’s peer and administrative review and has been approved for publication as an EPA document. Mention of trade names or commercial products does not constitute endorsement or recommendation for use.
Nothing in this document changes Agency policy regarding remedial selection criteria, remedial expectations, or the selection and implementation of MNA. This document does not supersede any previous guidance and is intended for use in conjunction with other documents, including the OSWER Directive 9200.4-17P, Use of Monitored Natural Attenuation at Superfund, RCRA Corrective Action, and Underground Storage Tank Sites (U.S. EPA, 1999).
ii

Contents2.0
CONTENTS NOTICE . . . . . . . . . . . . . . . . . . . . . . . . . . . . . . . . . . . . . . . . . . . . . . . . . . . . . . . . . . . . . . . . . . . . . . . . . . . . . . . ii LIST OF FIGURES . . . . . . . . . . . . . . . . . . . . . . . . . . . . . . . . . . . . . . . . . . . . . . . . . . . . . . . . . . . . . . . . . . . . . . v
LIST OF TABLES . . . . . . . . . . . . . . . . . . . . . . . . . . . . . . . . . . . . . . . . . . . . . . . . . . . . . . . . . . . . . . . . . . . . . . . v
ACKNOWLEDGMENTS . . . . . . . . . . . . . . . . . . . . . . . . . . . . . . . . . . . . . . . . . . . . . . . . . . . . . . . . . . . . . . . . vii ABSTRACT . . . . . . . . . . . . . . . . . . . . . . . . . . . . . . . . . . . . . . . . . . . . . . . . . . . . . . . . . . . . . . . . . . . . . . . . . . . . ix
1.0 INTRODUCTION . . . . . . . . . . . . . . . . . . . . . . . . . . . . . . . . . . . . . . . . . . . . . . . . . . . . . . . . . . . . . . . . . . . . 11.1 Purpose . . . . . . . . . . . . . . . . . . . . . . . . . . . . . . . . . . . . . . . . . . . . . . . . . . . . . . . . . . . . . . . . . . . . . . . . 11.2 Scope and Limitations . . . . . . . . . . . . . . . . . . . . . . . . . . . . . . . . . . . . . . . . . . . . . . . . . . . . . . . . . . . . 2
1.2.1 Contaminants . . . . . . . . . . . . . . . . . . . . . . . . . . . . . . . . . . . . . . . . . . . . . . . . . . . . . . . . . . . . . . . . 21.2.2 Nonaqueous Phase Liquids . . . . . . . . . . . . . . . . . . . . . . . . . . . . . . . . . . . . . . . . . . . . . . . . . . . . . 3 1.2.3 Geologic Setting . . . . . . . . . . . . . . . . . . . . . . . . . . . . . . . . . . . . . . . . . . . . . . . . . . . . . . . . . . . . . 3
2.0 MNA SITE CHARACTERIZATION OBJECTIVES AND VARIABLES . . . . . . . . . . . . . . . . . . . . . . . . . 4 2.1 Introduction . . . . . . . . . . . . . . . . . . . . . . . . . . . . . . . . . . . . . . . . . . . . . . . . . . . . . . . . . . . . . . . . . . . . 4 2.2 MNA Site Characterization Objectives . . . . . . . . . . . . . . . . . . . . . . . . . . . . . . . . . . . . . . . . . . . . . . . 5 2.3 Conceptual Site Model . . . . . . . . . . . . . . . . . . . . . . . . . . . . . . . . . . . . . . . . . . . . . . . . . . . . . . . . . . . . 7
2.3.1 Systems Engineering Approach . . . . . . . . . . . . . . . . . . . . . . . . . . . . . . . . . . . . . . . . . . . . . . . . . . 8 2.3.2 Representative Zones . . . . . . . . . . . . . . . . . . . . . . . . . . . . . . . . . . . . . . . . . . . . . . . . . . . . . . . . . 10
2.4 MNA Site Characterization Variables - Introduction . . . . . . . . . . . . . . . . . . . . . . . . . . . . . . . . . . . . 112.4.1 Site Characterization and Professional Judgement . . . . . . . . . . . . . . . . . . . . . . . . . . . . . . . . . . 14
2.5 Geological Variables . . . . . . . . . . . . . . . . . . . . . . . . . . . . . . . . . . . . . . . . . . . . . . . . . . . . . . . . . . . . . 142.6 Hydrogeological Variables . . . . . . . . . . . . . . . . . . . . . . . . . . . . . . . . . . . . . . . . . . . . . . . . . . . . . . . . 16
2.6.1 Flow Paths . . . . . . . . . . . . . . . . . . . . . . . . . . . . . . . . . . . . . . . . . . . . . . . . . . . . . . . . . . . . . . . . . 182.6.2 Background Ground Water . . . . . . . . . . . . . . . . . . . . . . . . . . . . . . . . . . . . . . . . . . . . . . . . . . . . 19
2.7 Anthropogenic Variables and Receptors . . . . . . . . . . . . . . . . . . . . . . . . . . . . . . . . . . . . . . . . . . . . . . 202.7.1 Receptor Identification and Vulnerability . . . . . . . . . . . . . . . . . . . . . . . . . . . . . . . . . . . . . . . . . 21
2.8 Contaminant Variables . . . . . . . . . . . . . . . . . . . . . . . . . . . . . . . . . . . . . . . . . . . . . . . . . . . . . . . . . . . 212.8.1 Source Area Contamination . . . . . . . . . . . . . . . . . . . . . . . . . . . . . . . . . . . . . . . . . . . . . . . . . . . . 232.8.2 Source Control History . . . . . . . . . . . . . . . . . . . . . . . . . . . . . . . . . . . . . . . . . . . . . . . . . . . . . . . 262.8.3 Transformation Products and Byproducts . . . . . . . . . . . . . . . . . . . . . . . . . . . . . . . . . . . . . . . . . 262.8.4 Tracers . . . . . . . . . . . . . . . . . . . . . . . . . . . . . . . . . . . . . . . . . . . . . . . . . . . . . . . . . . . . . . . . . . . . 27
2.9 Geochemical Variables . . . . . . . . . . . . . . . . . . . . . . . . . . . . . . . . . . . . . . . . . . . . . . . . . . . . . . . . . . . 272.10 Biological Variables . . . . . . . . . . . . . . . . . . . . . . . . . . . . . . . . . . . . . . . . . . . . . . . . . . . . . . . . . . . . . 29
2.10.1Direct Approaches to Evaluation of Biodegradation . . . . . . . . . . . . . . . . . . . . . . . . . . . . . . . . . 34 2.10.1.1 Microbiological and Molecular Techniques . . . . . . . . . . . . . . . . . . . . . . . . . . . . . . . . . . . 34 2.10.1.2 Stable Isotope Evaluation . . . . . . . . . . . . . . . . . . . . . . . . . . . . . . . . . . . . . . . . . . . . . . . . . 35 2.10.1.3 Microcosm Studies . . . . . . . . . . . . . . . . . . . . . . . . . . . . . . . . . . . . . . . . . . . . . . . . . . . . . . 35
3 .0 THE MNA SITE CHARACTERIZATION PROCESS . . . . . . . . . . . . . . . . . . . . . . . . . . . . . . . . . . . . . . . 373.1 Introduction . . . . . . . . . . . . . . . . . . . . . . . . . . . . . . . . . . . . . . . . . . . . . . . . . . . . . . . . . . . . . . . . . . . 373.2 MNA Site Characterization Activities . . . . . . . . . . . . . . . . . . . . . . . . . . . . . . . . . . . . . . . . . . . . . . . 38
3.2.1 Site Characterization Methods . . . . . . . . . . . . . . . . . . . . . . . . . . . . . . . . . . . . . . . . . . . . . . . . . . 43 3.2.2 Site Characterization Locations . . . . . . . . . . . . . . . . . . . . . . . . . . . . . . . . . . . . . . . . . . . . . . . . . 43
iii
4 .0 INTEGRATING AND EVALUATING SITE DATA . . . . . . . . . . . . . . . . . . . . . . . . . . . . . . . . . . . . . . . . 494.1 Introduction . . . . . . . . . . . . . . . . . . . . . . . . . . . . . . . . . . . . . . . . . . . . . . . . . . . . . . . . . . . . . . . . . . . 494.2 Data Analysis Considerations . . . . . . . . . . . . . . . . . . . . . . . . . . . . . . . . . . . . . . . . . . . . . . . . . . . . . . 49
4.2.1 Data Quality Assessment (DQA) Process . . . . . . . . . . . . . . . . . . . . . . . . . . . . . . . . . . . . . . . . . 494.2.2 Statistical Considerations . . . . . . . . . . . . . . . . . . . . . . . . . . . . . . . . . . . . . . . . . . . . . . . . . . . . . 50
4.3 Data Analysis . . . . . . . . . . . . . . . . . . . . . . . . . . . . . . . . . . . . . . . . . . . . . . . . . . . . . . . . . . . . . . . . . . 514.3.1 Data Comparisons . . . . . . . . . . . . . . . . . . . . . . . . . . . . . . . . . . . . . . . . . . . . . . . . . . . . . . . . . . . 514.3.2 Hydrogeologic and Contaminant Transport Calculations . . . . . . . . . . . . . . . . . . . . . . . . . . . . . 524.3.3 Contaminant Mass Loss Calculations . . . . . . . . . . . . . . . . . . . . . . . . . . . . . . . . . . . . . . . . . . . . 524.3.4 Plume Stability . . . . . . . . . . . . . . . . . . . . . . . . . . . . . . . . . . . . . . . . . . . . . . . . . . . . . . . . . . . . . 53 4.3.5 Attenuation Rates . . . . . . . . . . . . . . . . . . . . . . . . . . . . . . . . . . . . . . . . . . . . . . . . . . . . . . . . . . . 54
4.3.5.1 Concentration vs. Distance Attenuation Rates . . . . . . . . . . . . . . . . . . . . . . . . . . . . . . . . . 55 4.3.5.2 Concentration vs. Time Attenuation Rates . . . . . . . . . . . . . . . . . . . . . . . . . . . . . . . . . . . . 564.3.5.3 Biodegradation Rate Constants . . . . . . . . . . . . . . . . . . . . . . . . . . . . . . . . . . . . . . . . . . . . 56
4.3.6 Modeling . . . . . . . . . . . . . . . . . . . . . . . . . . . . . . . . . . . . . . . . . . . . . . . . . . . . . . . . . . . . . . . . . . 564.3.7 Remediation Time Frames . . . . . . . . . . . . . . . . . . . . . . . . . . . . . . . . . . . . . . . . . . . . . . . . . . . . . 58
4.4 Site Characterization, Decision-Making, and Remedy Selection . . . . . . . . . . . . . . . . . . . . . . . . . . . 58
5 .0 REFERENCES . . . . . . . . . . . . . . . . . . . . . . . . . . . . . . . . . . . . . . . . . . . . . . . . . . . . . . . . . . . . . . . . . . . . . 60References Cited . . . . . . . . . . . . . . . . . . . . . . . . . . . . . . . . . . . . . . . . . . . . . . . . . . . . . . . . . . . . . . . . . 60Annotated Additional References . . . . . . . . . . . . . . . . . . . . . . . . . . . . . . . . . . . . . . . . . . . . . . . . . . . . 64
6.0 GLOSSARY . . . . . . . . . . . . . . . . . . . . . . . . . . . . . . . . . . . . . . . . . . . . . . . . . . . . . . . . . . . . . . . . . . . . . . . . 68
iv

LIST OF FIGURES
Figure 1. Elements of a Conceptual Site Model for Monitored Natural Attenuation. . . . . . . . . . . . . . . . . . 8 Figure 2. Systems Engineering Approach to the Conceptual Site Model for Monitored Natural
Attenuation . . . . . . . . . . . . . . . . . . . . . . . . . . . . . . . . . . . . . . . . . . . . . . . . . . . . . . . . . . . . . . . . . . . 9 Figure 3. Conceptual Site Model, Example of Representative Zones. . . . . . . . . . . . . . . . . . . . . . . . . . . . 11 Figure 4. Variation in Ground-Water Flow Paths, Directions, and Gradients. . . . . . . . . . . . . . . . . . . . . . 19 Figure 5. Contaminant Distribution. . . . . . . . . . . . . . . . . . . . . . . . . . . . . . . . . . . . . . . . . . . . . . . . . . . . . . . 25 Figure 6. Transect Development. . . . . . . . . . . . . . . . . . . . . . . . . . . . . . . . . . . . . . . . . . . . . . . . . . . . . . . . . 47 Figure 7. Site Characterization Sampling Locations. . . . . . . . . . . . . . . . . . . . . . . . . . . . . . . . . . . . . . . . . . 48 Figure 8. Conceptual Approach to Data Analysis for Attenuation Rates. . . . . . . . . . . . . . . . . . . . . . . . . . 57
LIST OF TABLES
Table 1. MNA Performance Monitoring Objectives and Their Relationship to Site Characterization. . . . 6 Table 2 MNA Site Characterization Variables. . . . . . . . . . . . . . . . . . . . . . . . . . . . . . . . . . . . . . . . . . . . . 13 Table 3 Approach to and Sequence of MNA Site Characterization Activities. . . . . . . . . . . . . . . . . . . . . 40
v

vi

ACKNOWLEDGMENTS
The lead author was Bruce Pivetz (Shaw Environmental & Infrastructure, Inc.). Extensive review comments and additional text were provided by David Abshire (U.S. EPA/Region 6), William Brandon (U.S. EPA/Region 1), Stephen Mangion (U.S. EPA/ORD/Region 1), Brad Roberts (U.S. EPA/Region 7), Bruce Stuart (Missouri Department of Natural Resources), and Luanne Vanderpool (U.S. EPA/Region 5). Additional text was provided by Steven D. Acree (U.S. EPA/ORD/NRMRL/ GWERD). A contributing author was Barbara Wilson (formerly with Dynamac Corporation).
Contributors of text to early development efforts for this document included Kelly Hurt (formerly with Dynamac Corporation), Daniel F. Pope (Shaw Environmental & Infrastructure, Inc.), Wayne Kellogg (formerly with Dynamac Corporation), Gary A. Robbins (University of Connecticut), Michael J. Barcelona (Western Michigan University), Richard J. Brainerd (MACTEC Engineering and Consulting, Inc.), and Kenneth Banks (formerly with Dynamac Corporation).
Kathy Tynsky (SRA International, Inc., a contractor to U.S. EPA at the R.S. Kerr Environmental Research Center in Ada, Oklahoma) prepared the final figures for publication. Martha Williams (SRA International, Inc.) assisted with final editing and formatting for publication.
Project management and review was provided by Steven D. Acree (U.S. EPA/ORD/NRMRL/ GWERD). The work assignment manager was David Burden (U.S. EPA/ORD/NRMRL/GWERD).
Peer review comments were provided by Mark Malinowski (California Department of Toxic Substances Control), Mark Ferrey (Minnesota Pollution Control Agency/Environmental Outcomes Division), and R. Ryan Dupont (Utah State University/Utah Water Research Laboratory). Additional review comments were provided by Hal White (U.S. EPA/OSWER/OUST), John T. Wilson (U.S. EPA/ORD/NRMRL/GWERD), James Weaver (U.S. EPA/ORD/NRMRL/GWERD), Dominic DiGiulio (U.S. EPA/ORD/NRMRL/GWERD), and members of the U.S. EPA Ground Water Forum .
vii

viii

ABSTRACT
Monitored Natural Attenuation (MNA) is unique among remedial technologies in relying entirely on natural processes to achieve site-specific objectives. Site characterization is essential to provide site-specific data and interpretations for the decision-making process (i.e., to determine if site remedial goals can be met with MNA in appropriate remedial time frames), and to provide site-specific data and interpretations to design a performance monitoring system (i.e., to determine the necessary monitoring parameters, locations, and frequency for monitoring).
This publication provides a framework for site characterization in the context of MNA and is intended primarily for project managers to use during the planning, tasking, implementation, and/ or review of site characterization where MNA may be considered as a potential remedial technol-ogy. This document presents a broad overview of technical issues including development of a conceptual site model, characterization variables, sampling locations and frequencies, problematic issues encountered at MNA sites and approaches to overcome them, and the interpretations related to the MNA decision-making process.
ix

1.1 Purpose The Office of Solid Waste and Emergency Response (OSWER) Directive 9200.4-17P (U.S. EPA, 1999) defines monitored natural attenuation (MNA) as “the reliance on natural attenuation processes (within the context of a carefully controlled and monitored site cleanup approach) to achieve site-specific remediation objectives within a time frame that is reason-able compared to that offered by other more active methods.” Natural attenuation processes “include a variety of physical, chemical, or biological processes that, under favorable conditions, act without human intervention to reduce the mass, toxicity, mobility, volume, or concentration of contaminants in soil or ground water. These in-situ processes include biodegradation; dispersion; dilution; sorption; volatilization; radioactive decay; and chemi-cal or biological stabilization, transformation, or destruction of contaminants” (U .S . EPA, 1999). MNA is unique among remedial technologies in relying entirely on natural processes to achieve site-specific objectives. Effective evaluation of these natural processes often requires a thorough and detailed three-dimensional characterization and understanding of subsurface conditions and contaminant trans-port and fate. Site characterization is essential to provide site-specific data and interpretations for the decision-making process on the appli-cability and selection of MNA as a remedial technology for a site (i.e., to determine if site remedial goals can be met with MNA in appropriate remedial time frames and with an allowable spatial extent of contaminants), and to provide site-specific data and interpretations to design and initiate the MNA remedial tech-nology (i.e., to determine the necessary param-eters, locations, and frequency for monitoring).
1.0 INTRODUCTION
This publication provides a framework for site characterization in the context of MNA and is intended primarily for project managers to use during the planning, tasking, implementation, and/or review of site characterization for sites where MNA may be considered as a potential remedial technology. This document presents a broad overview of technical issues including development of a conceptual site model, char-acterization variables, sampling locations and frequencies, problematic issues encountered at MNA sites and approaches to overcome them, and the interpretations required for the MNA decision-making process. It outlines strategies and concepts regarding how site characteriza-tion fits into the overall scope of investigation and remediation of ground-water contamination sites where MNA may be considered.
This publication is intended to be easily utilizable by project managers, by providing sufficient explanation and detail to under-stand the scope and interpretation of the site characterization for a potential MNA site, in a relatively short and easily read (yet com-prehensive) document. Other MNA protocols and technical guidance documents have been previously published (see National Research Council, 2000, for a list of such documents) and can provide valuable additional scientific discussion on specific topics, yet may be too lengthy or detailed for ease of use by a project manager. Some of the existing documents may not sufficiently describe the overall framework of site characterization in the context of MNA, or may not sufficiently address some aspects of the site characterization activities.
Nothing in this document changes Agency policy regarding remedial selection criteria, remedial expectations, or the selection and
1

implementation of MNA. This document does not supersede any guidance. It is a technical reference to be used in conjunction with other documents, including:
decision-making flowchart for MNA, tables summarizing NA processes and the param-eters used for indicating NA, and a glossary of relevant terms .
• OSWER Directive 9200.4-17P, Use of Monitored Natural Attenuation at Superfund, RCRA Corrective Action, and Underground Storage Tank Sites (U.S. EPA, 1999). The Directive clarifies EPA’s policy regarding the role of MNA in remediation of contaminated soil and ground water, provides background information on MNA, and discusses imple-mentation of MNA.
• Technical Protocol for Evaluating Natural Attenuation of Chlorinated Solvents in Ground Water (Wiedemeier et al., 1998). This document provides technical back-ground primarily on the biological processes responsible for natural attenuation for chlorinated solvents, specific information on the data collection and analysis for MNA evaluation, and a protocol for the overall evaluation of MNA. It does not specifically address in detail the overall site character-ization or long-term monitoring for MNA remedies.
• Performance Monitoring of MNA Remedies for VOCs in Ground Water (Pope et al., 2004). This document provides technical recommendations on the design and imple-mentation of monitoring to evaluate the effectiveness of natural attenuation . It is to be used after site characterization has been conducted and MNA has been selected as a component of a remedy (although reference to it can be useful during remedy selection to help with estimating potential costs of performance monitoring).
• Region 5 Framework for Monitored Natural Attenuation Decisions for Ground Water (U.S. EPA, 2000). This concise document provides a framework outlining the data needed for an MNA remedy decision, a
1.2 Scope and Limitations For this document to be accessible and use-ful to a wide audience with varying levels of expertise, discussions on some topics are kept general. Details of particular methodologies for sampling, analysis, or modeling are beyond the scope and are not provided. Detailed informa-tion on such topics is readily available in the technical and scientific literature; a selection of the literature is referenced in the text.
1.2.1 Contaminants
This document focuses on characterization of sites where MNA is being considered for re-mediation of the portion of the site with dis-solved-phase volatile organic compound (VOC) ground-water contamination. It will be most appropriate for VOC-contaminated sites with chlorinated solvent compounds and/or petro-leum hydrocarbon compounds, as these con-taminants are known to be readily susceptible to degradative natural attenuation processes (under the appropriate conditions). It may be less applicable to sites with other types of contami-nants such as wood-treating chemicals, pesti-cides, or energetics (e.g., explosives, propel-lants). Natural attenuation processes for these other contaminants may be less understood or be less effective than those occurring with the chlorinated solvent and petroleum hydrocarbon contaminants .
This document is not intended for characteriza-tion of sites where MNA is being considered for remediation of inorganic contaminants. However, inorganic compounds are discussed to the extent that they impact, or are impacted by, natural attenuation processes related to the VOCs. MNA of a variety of inorganic com-pounds (metals, non-metals, and radionuclides)
2

is discussed in Ford et al. (2007a1 and 2007b) and Ford and Wilkin (2010).
1.2.2 Nonaqueous Phase Liquids
Much of the site characterization discussed in this document focuses on the portion of the site with dissolved-phase contamina-tion (this portion of the site will also have sorbed-phase contamination that results from contaminant partitioning). However, many VOC-contaminated sites have a source zone containing nonaqueous phase liquids (either dense nonaqueous phase liquids (DNAPLs2 ) or light nonaqueous phase liquids (LNAPLs)) as the source of the dissolved-phase contamina-tion. Site characterization for consideration of MNA as a remedial technology should include sufficient characterization of the contribution of contamination from the source (i .e ., mass flux (rate of flow) from the source zone) to permit evaluation of the use of MNA as part of the overall site cleanup approach. Extensive characterization of the NAPL source area itself is not a primary focus of this document.
Key Point
Caution – Many NAPL source areas are unlikely to be effectively remediated in a reasonable time frame using MNA alone. The portions of the site with significant contaminant mass flux from the source area may not allow remediation solely by MNA in a reasonable time frame either.
1.2.3 Geologic Setting
The site characterization discussed here focuses on the saturated porous media zone. However, the unsaturated zone can influence natural
1 Reference citations in bold font are included in the Annotated Additional References.
2 Terms indicated using underlined bold italic font when the term’s first significant usage appears in the text are defined and further discussed in the Glossary. The reader is strongly encour-aged to read the entry in the Glossary before proceeding.
attenuation processes and contaminant distribu-tion, fate, and transport in the saturated zone. For example, ground-water fluctuations can release contamination that may be in previously unsaturated media, and water infiltrating down-ward from the unsaturated zone can alter the characteristics of the ground water. MNA site characterization should include such portions of the unsaturated zone.
Site characterization for MNA in karst or fractured rock with fracture-dominated flow is beyond the scope of this document due to the significant difficulty in determining contami-nant transport and fate pathways and processes in such settings. Specialized characterization techniques may be required for those sites, in addition to those techniques discussed in this document for use in porous media.
Cross-media transfer pathways, such as ground water to surface water, or ground water to soil gas to indoor air, are not addressed in this document; however, site characterization for any remedy typically would include character-izing all significant pathways by which con-taminants may move away from source areas and ground-water plumes to impact receptors (e.g., surface water and indoor air).
3
2.0 MNA SITE CHARACTERIZATION OBJECTIVES AND VARIABLES
2.1 Introduction The unique aspect of MNA as a remedial technology is its reliance on naturally occur-ring processes (as opposed to active engineered intervention) to achieve remedial goals within a plume and to control the plume before any receptors are reached. Determination of the flow paths, rates of contaminant migration, and rates of attenuation processes, is necessary to understand the current behavior and stability of the plume, and to predict the future behavior of the plume with an acceptable degree of cer-tainty. Site characterization at potential MNA sites provides the information necessary for this detailed understanding of the plume behavior and stability, and the attenuation rate estimates. The initial site characterization that typically occurs at any contaminated site generally lacks sufficient detail or the specific information required for an evaluation of MNA, but can serve as a starting point for MNA-related site characterization activities.
A three-tiered approach to an evaluation of MNA may be followed to demonstrate that natural attenuation is occurring at a site . In this approach, successively more detailed informa-tion is collected as required to document a net loss of contaminants and the natural attenua-tion processes responsible for this loss, and to determine rates of attenuation. Three catego-ries of site-specific information are commonly referred to (U.S. EPA, 1999) and used as “lines of evidence”. The three lines of evidence are:
• Ground-water and/or soil chemistry data (i.e., contaminant measurements) that dem-onstrate a reduction in concentration and/or mass of contaminants .
• Hydrogeologic and geochemical data that indirectly indicate the processes causing contaminant reduction.
• Field or laboratory microcosm data (e.g., reactants involved in contaminant loss) that directly demonstrate the processes causing the contaminant loss .
The uncertainty for any one line of evidence may be managed by using more than one approach for that line of evidence. Uncertainty is diminished if the multiple approaches yield comparable conclusions. Uncertainty may also be managed by using more than one of the three lines of evidence, by seeking comparable conclusions from the various lines of evidence. In some cases, the first line of evidence may be sufficient if the “historical data are of sufficient quality and duration” (U.S. EPA, 1999); how-ever, generally the first two lines of evidence are needed. The third line of evidence is used if the other two lines of evidence are inconclu-sive. The need for multiple lines of evidence will be dependent on the scale, complexity, and level of concern at the site .
There are a number of variables required to evaluate and judge these three lines of evidence. This document will use the term “variable” in a generic manner to refer to data, information, or concepts that can be qualita-tively described or quantitatively measured for the subsurface properties and processes. This usage of the term “variable” follows from its first and broadest dictionary definition “n. 1. Something that varies or is prone to variation.” (Houghton Mifflin Co., 1997). The variables are items to be measured or evaluated during the site characterization. It is important to
4

understand that quantitative estimates for the values of variables will always likely be subject to some uncertainty, for example, due to an incomplete understanding of flow paths.
Key Point
In this document, the term “variables” refers to the data, information, or con-cepts that qualitatively describe or quanti-tatively measure the subsurface properties and processes.
Site characterization provides data for MNA remedy decision-making. The challenge in evaluating MNA is not merely demonstrat-ing that natural attenuation processes are occurring; this can be a relatively easy task. Rather, the evaluation of MNA as a remedial alternative also requires making the determina-tion that the natural attenuation processes are occurring at an acceptable rate to meet site remedial goals in a timely manner, and that there is a reasonable expectation that these processes are sustainable and can be relied upon as a long-term solution. For example, MNA may not be sustainable when it relies on the presence of two or more contaminants (or other variables) that are each required in combination to facilitate contaminant degrada-tion . In this case, it is necessary to estimate if the quantity of each of the contaminants (or of the other variables) is adequate to sustain the required reactions.
2.2 MNA Site Characterization Objectives
The objectives of MNA site characterization are to:
• Provide information for the evaluation of MNA as a remedial technology.
• Provide information for planning and implementing performance and long-term
monitoring of MNA.
Specific objectives (i.e., intermediate steps) during the MNA site characterization are to:
• Define the geology of the site.
• Define and quantify the hydrogeology and the ground-water flow field and flow paths.
• Define and quantify the contaminant, geochemical, and biological variables.
• Identify the source and nature of the contaminant(s), and estimate the source mass and mass flux.
• Measure and understand the subsurface physical (geological and hydrogeological), geochemical, and biological processes.
• Determine and understand the three-dimensional nature and spatial variability of conditions and processes at the site (i.e., the spatial distribution of the values of the variables).
• Determine and understand the seasonal and longer-term temporal variability of the subsurface conditions and processes at the site .
• Estimate attenuation rates .
• Evaluate plume behavior (including the potential for future plume migration).
Site characterization activities for MNA differ from the site characterization activities routinely conducted at contaminated sites, in requiring collection of more specific data on fate and transport of contaminants and other solutes, especially on the biological and geochemical processes leading to attenuation. MNA site characterization should produce a detailed understanding of site conditions and processes in three dimensions and of any changes that might occur with time (season-ally and longer-term). The subsurface con-tains varying degrees of heterogeneity: the
5

biological, hydrogeological, and geochemical variables that define contaminant migration and degradation can vary both spatially and temporally. Beneficial microbial processes may not occur in all portions of a plume; attenuation rates may vary within a plume and with time. Identifying and understanding in detail these spatial and temporal variations is of fundamental importance for the character-ization and assessment of MNA.
Site characterization provides the information for evaluating MNA as a potential remedial technology. If MNA is selected as part of the remedy, performance monitoring will then be conducted as the remedy is implemented (refer to Pope et al. (2004) for a discussion of per-
formance monitoring) . Although site char-acterization occurs initially, and performance monitoring is a subsequent activity, the two are linked, complementary activities. Much of the site characterization information will be useful in planning the performance monitoring and evaluating the monitoring results. Thus, it is important to understand the relationship of performance monitoring objectives to site characterization (Table 1). If monitoring of the plume needs to extend over a multi-year period as part of the site characterization in order to understand the plume behavior prior to decision-making, some of the site characteriza-tion activities may transition into performance monitoring .
Table 1 MNA Performance Monitoring Objectives and Their Relationship to Site Characterization.
MNA Performance Monitoring Objectives (U.S. EPA, 1999) Relationship to MNA Site Characterization
• Demonstrate that natural attenuation is • Expectations of performance are largely based on the occurring according to expectations. data, calculations, assumptions, and estimates developed
during site characterization. If expectations are not being met (which might occur due to changing conditions or an incorrect conceptual model), the conceptual model may need updating and an additional iteration of field activi-ties may be necessary.
• Detect changes in environmental condi- • Site characterization provides the baseline conditions tions (e.g., hydrogeologic, geochemical, used to detect changes. microbiological, or other changes) that may reduce the efficacy of any of the natural attenuation processes.
• Identify any potentially toxic and/or • Transformation products (e.g., daughter products) should mobile transformation products. be identified during site characterization. Transformation
products can also include naturally occurring compounds (such as metals) that may become mobilized due to changes in geochemical conditions.
• Verify that the plume(s) is not expand-ing (either downgradient, laterally or vertically) .
• The baseline extent of the plume should be defined during the initial site characterization activities. This baseline plume definition, when coupled with longer-term plume monitoring during follow-up site characterization activities, should be used to evaluate the plume stability.
• Verify no unacceptable impact to down-gradient receptors.
• The location of, and flow paths to, downgradient recep-tors, and suitable monitoring locations, should be identi-fied during site characterization.
6

• Detect new releases of contaminants to the environment that could impact the effectiveness of the natural attenuation remedy
• Source areas and potential source areas should be identified and delineated during site characterization, and monitored for new releases of site contaminants. Naturally occurring compounds (such as metals) may become mobilized due to changes in geochemical condi-tions, and represent new contamination.
• Demonstrate the efficacy of institutional controls that were put in place to protect potential receptors.
• This is a performance monitoring task, but based on expectations developed during site characterization.
• Verify attainment of remediation objectives.
• This is a performance monitoring task, but based on expectations developed during site characterization.
2.3 Conceptual Site Model Development of a conceptual site model (CSM), or “conceptual model” is an important means to integrate all the information known and collected for the site. A CSM is “a three-dimensional representation that conveys what is known or suspected about contamination sources, release mechanisms, and the transport and fate of those contaminants” (U .S . EPA, 1999).
The subsurface is complex, containing many different materials and having numerous interacting processes. The typical investigative and characterization activities conducted by various parties at a site produce a large amount of information on the subsurface materials and processes that is presented in numerous reports, tables, figures, graphs, diagrams, etc. In order to effectively use and understand all the site information, it is necessary to first compile, organize, and distill it into a coher-ent mental, written, and visual picture, in which all the information converges to yield a scientifically valid and internally consistent interpretation of the subsurface. A good CSM equates to a comprehensive, clear, logical, three-dimensional understanding of site conditions and processes. Figure 1 is a visual representation of a CSM, presenting with one glance important concepts about the site, such as physical setting, ground-water flow, extent of contamination, and source of contamination.
Additional visual representations can present other aspects of the CSM (e.g., Figures 2, 3, 4, and 5) and the CSM can be expressed in concise, well-written summary text. Once the CSM is developed and understood, the sup-porting documentation such as figures, maps, tables, logs, text, etc. can be referred to as needed for the detailed data and information about the site.
A conceptual site model is developed by placing each piece of information about the site variables in its proper position and context within the three-dimensional volume of the site, and visualizing the distribution of the information, while recognizing that the information may also change with time. A CSM can be constructed step-wise. First, the basic physical framework of the site is estab-lished based on the geology and then the hydrogeology. The problem at the site (i.e., the contamination) is described, and then more complexity is added regarding processes active at the site (i.e., the geochemistry and biology). The interactions of the variables with each other also need to be incorporated into the CSM. These interactions have to be scientifi-cally consistent, following the physical laws which govern them (e.g., two processes that are mutually exclusive cannot be assumed to occur in the same place at the same time; or two variables that are physically interrelated, such as bulk density and porosity, must be
7
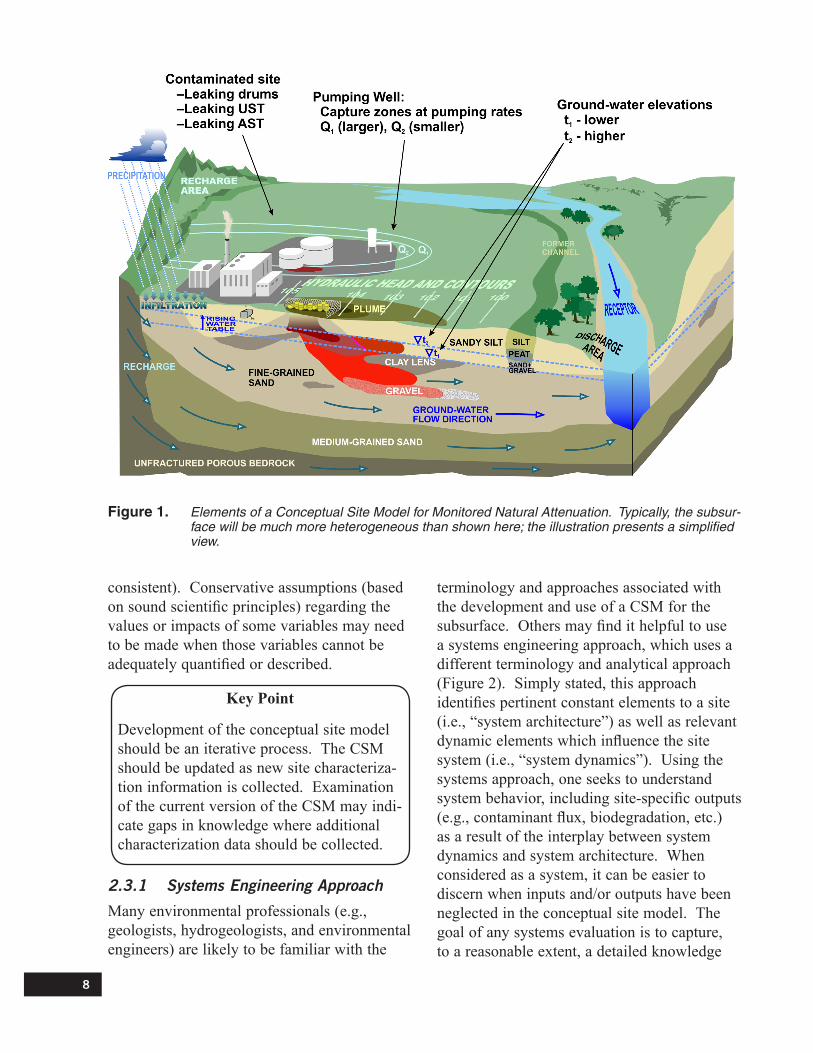
Figure 1. Elements of a Conceptual Site Model for Monitored Natural Attenuation. Typically, the subsurface will be much more heterogeneous than shown here; the illustration presents a simplified view.
consistent). Conservative assumptions (based on sound scientific principles) regarding the values or impacts of some variables may need to be made when those variables cannot be adequately quantified or described.
Key Point
Development of the conceptual site model should be an iterative process. The CSM should be updated as new site characteriza-tion information is collected. Examination of the current version of the CSM may indi-cate gaps in knowledge where additional characterization data should be collected.
2.3.1 Systems Engineering Approach
Many environmental professionals (e.g., geologists, hydrogeologists, and environmental engineers) are likely to be familiar with the
terminology and approaches associated with the development and use of a CSM for the subsurface. Others may find it helpful to use a systems engineering approach, which uses a different terminology and analytical approach (Figure 2). Simply stated, this approach identifies pertinent constant elements to a site (i.e., “system architecture”) as well as relevant dynamic elements which influence the site system (i.e., “system dynamics”). Using the systems approach, one seeks to understand system behavior, including site-specific outputs (e.g., contaminant flux, biodegradation, etc.) as a result of the interplay between system dynamics and system architecture. When considered as a system, it can be easier to discern when inputs and/or outputs have been neglected in the conceptual site model. The goal of any systems evaluation is to capture, to a reasonable extent, a detailed knowledge
8
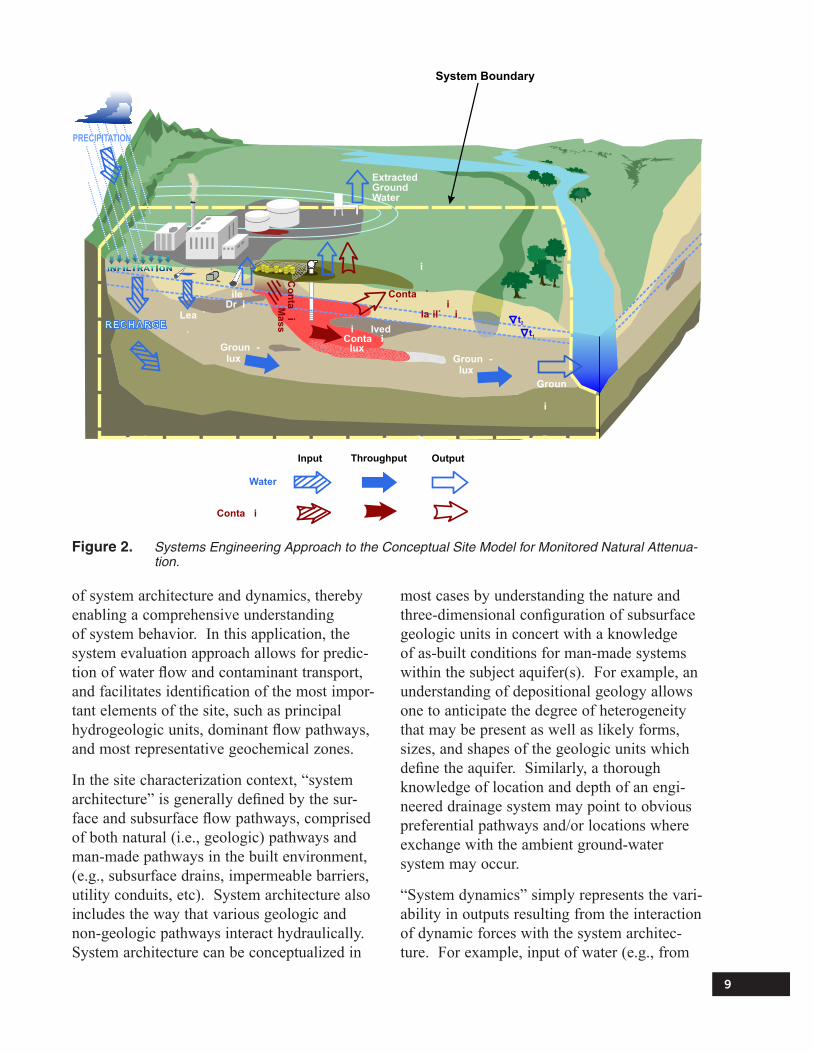
Figure 2. Systems Engineering Approach to the Conceptual Site Model for Monitored Natural Attenuation.
of system architecture and dynamics, thereby enabling a comprehensive understanding of system behavior. In this application, the system evaluation approach allows for predic-tion of water flow and contaminant transport, and facilitates identification of the most impor-tant elements of the site, such as principal hydrogeologic units, dominant flow pathways, and most representative geochemical zones.
In the site characterization context, “system architecture” is generally defined by the sur-face and subsurface flow pathways, comprised of both natural (i.e., geologic) pathways and man-made pathways in the built environment, (e.g., subsurface drains, impermeable barriers, utility conduits, etc). System architecture also includes the way that various geologic and non-geologic pathways interact hydraulically. System architecture can be conceptualized in
most cases by understanding the nature and three-dimensional configuration of subsurface geologic units in concert with a knowledge of as-built conditions for man-made systems within the subject aquifer(s). For example, an understanding of depositional geology allows one to anticipate the degree of heterogeneity that may be present as well as likely forms, sizes, and shapes of the geologic units which define the aquifer. Similarly, a thorough knowledge of location and depth of an engi-neered drainage system may point to obvious preferential pathways and/or locations where exchange with the ambient ground-water system may occur .
“System dynamics” simply represents the vari-ability in outputs resulting from the interaction of dynamic forces with the system architec-ture. For example, input of water (e.g., from
9

precipitation - infiltration) and withdrawals from the aquifer (e.g., from pumping), are both dynamic elements which vary with time, and are influenced by the inherent system architec-ture. System dynamics may also be impacted by ground-water withdrawals or additions which are caused by ongoing site operations where a business remains on-site (e.g., pump-ing footing tile drains to protect foundations, leaking water or sewer lines). The complex interaction of these multiple site-specific inputs and outputs, in the context of the site-specific system architecture, determines the resulting throughput and output variability, such as ground-water flux through the aquifer. For instance, system dynamics revealed by a monitoring system at a site located adjacent to a river may have wide variability in flow and head based on changes in river stage and the relative connection of various geologic units with the river. There may be significant changes in horizontal gradients to and from the river, in response to rising or falling river stage. Vertical gradients may also reverse direction (e.g., from upward to downward) if different geologic units react to stimulus (e.g., pumping or change in river stage) at differ-ent rates. The reversals in gradient might be perplexing without consideration of the system. This example demonstrates the value of the systems approach, suggesting that a more simplistic approach, such as collection and evaluation of limited data from a single point in time could be misleading or erroneous. In this manner, the systems approach provides a feedback loop which assists in understanding current information as well as streamlining future data collection needs in consideration of the particular system dynamics.
2.3.2 Representative Zones
A useful component of the CSM for MNA site characterization is the representative zone . The representative zone is a tool or means (not an end), and is the term used in this docu-ment to denote and conceptualize the different
portions or zones (each with its own set of variable values) that make up the subsurface. At each sampled point in the subsurface, information is collected or assumed for the values of the variables. Evaluation of the data relative to contaminant fate, contaminant transport, and natural attenuation processes, will indicate which variables are most critical, predominant, or descriptive of the conditions most affecting plume migration and attenuation at each particular location. That set or com-bination of these predominant variables will “represent” the conditions at that location. All the subsurface locations with that same set of predominant variables are grouped together in a representative zone. A representative zone is defined here as a three-dimensional portion of the subsurface in which a unique set or com-bination of the predominant variables has the same value or range of values for each variable at all locations within that three-dimensional volume. Different portions of the subsurface are likely to have different conditions (i.e., dif-ferent sets of variables, and/or different values for the sets of variables); thus, the subsurface can be divided up into more than one represen-tative zone. Different representative zones are different from each other in some manner (e.g., they may be hydraulically distinct, geochemi-cally distinct, or microbiologically distinct). Figure 3 illustrates, conceptually, a subsurface volume divided up into different representative zones. The entire subsurface of the site could be divided up into many different zones so that each zone has different sets of variables and specific values for those variables. However, it is likely that there will be a limited number of different predominant sets of variables (i.e., a small number of representative zones neces-sary to adequately define the site). Further, the important representative zones are those that contain the contamination plume, those that are downgradient between the plume and any receptors, and/or those in surrounding areas where shifts in ground-water flow direction might expand the plume. The number of
10
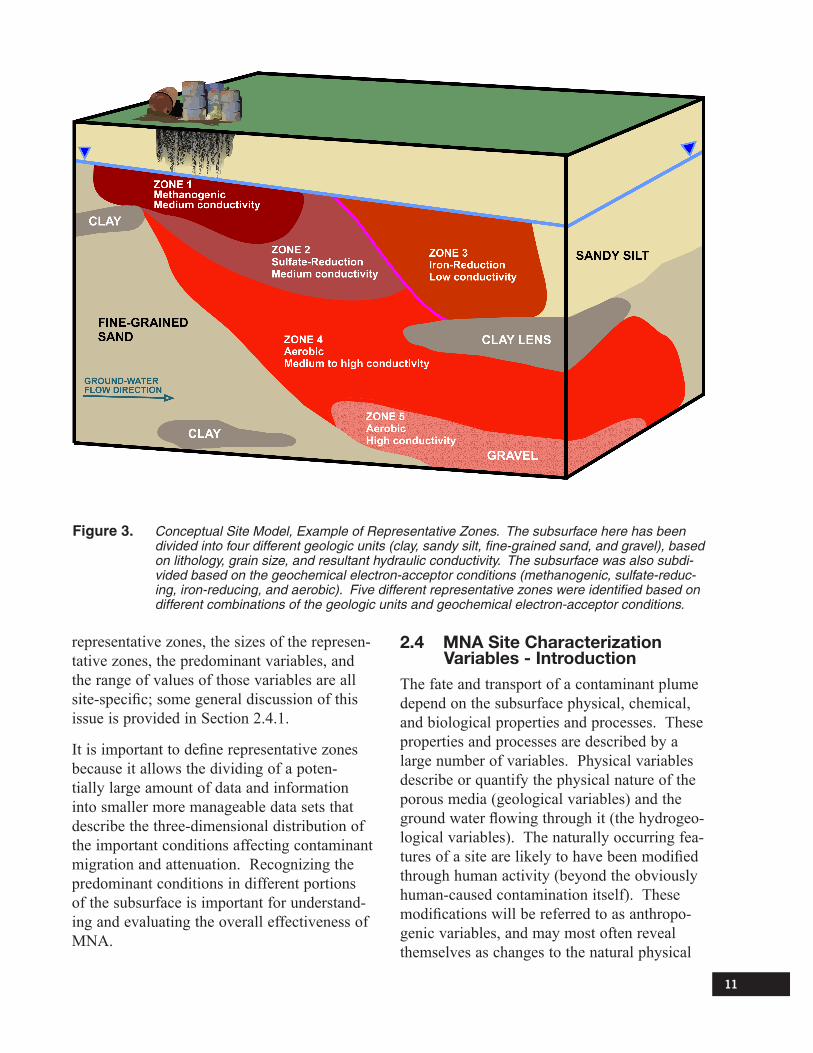
Figure 3. Conceptual Site Model, Example of Representative Zones. The subsurface here has been divided into four different geologic units (clay, sandy silt, fine-grained sand, and gravel), based on lithology, grain size, and resultant hydraulic conductivity. The subsurface was also subdivided based on the geochemical electron-acceptor conditions (methanogenic, sulfate-reducing, iron-reducing, and aerobic). Five different representative zones were identified based on different combinations of the geologic units and geochemical electron-acceptor conditions.
representative zones, the sizes of the represen-tative zones, the predominant variables, and the range of values of those variables are all site-specific; some general discussion of this issue is provided in Section 2.4.1.
It is important to define representative zones because it allows the dividing of a poten-tially large amount of data and information into smaller more manageable data sets that describe the three-dimensional distribution of the important conditions affecting contaminant migration and attenuation. Recognizing the predominant conditions in different portions of the subsurface is important for understand-ing and evaluating the overall effectiveness of MNA.
2.4 MNA Site Characterization Variables - Introduction
The fate and transport of a contaminant plume depend on the subsurface physical, chemical, and biological properties and processes. These properties and processes are described by a large number of variables. Physical variables describe or quantify the physical nature of the porous media (geological variables) and the ground water flowing through it (the hydrogeo-logical variables). The naturally occurring fea-tures of a site are likely to have been modified through human activity (beyond the obviously human-caused contamination itself). These modifications will be referred to as anthropo-genic variables, and may most often reveal themselves as changes to the natural physical
11

setting of a site . Other naturally occurring features can be of concern to human activity; these will be called anthropocentric variables. Chemical variables describe or quantify the contamination (contaminant variables), as well as the geochemistry of the ground water and porous media (geochemical variables) and the geochemical interactions with the contami-nant. Biological variables describe or quantify the subsurface microbial community and its interaction with the contaminant, and the porous media and ground-water geochemistry. Measurements of the hydrogeological and contaminant variables are used to determine the direction and rate of migration of con-taminants (i.e., transport). Measurements of the contaminant, geochemical, and biological variables are used to evaluate the destruction of contaminants (i .e ., fate) .
Table 2 lists the descriptive or quantifiable variables associated with the subsurface physical, chemical, and biological properties and processes that are most commonly mea-sured at potential MNA sites. Some variables may overlap the categories in Table 2 since they may interact among physical, chemical, and biological processes. The use of these variables for an MNA evaluation is discussed in following sections. The sequential order of collecting information on the variables during an actual site characterization will be discussed in Chapter 3. Additional discussion of some variables is provided in the glos-sary, and further information on the variables can be obtained from the extensive technical literature on hydrogeology, microbiology, and geochemistry .
The subsurface is often heterogeneous and anisotropic, and the subsurface variables can vary spatially. This variability may significantly impact plume behavior or change plume behavior from one location to another. This requires characterization efforts to be conducted longitudinally, laterally, and verti-cally (i.e., three-dimensionally) relative to the
plume, for example, using transects (i .e ., lines of sampling locations). Transects are typically transverse (perpendicular to the ground-water flow direction), or longitudinal (parallel to the ground-water flow direction). Having multiple vertical and horizontal sampling points in these various transects provides three-dimensional characterization of the subsurface. Further, there can be variation in time (temporal vari-ability) in the values of many of the variables on a seasonal basis or during the migration and lifespan of the plume. Time-series data for the hydrogeologic, geochemical, and biological variables should be collected and assessed for changes with time.
Key Point
Characterization of the site and contaminant plume in three dimensions is often critical due to the heterogeneity and spatial vari-ability of the subsurface.
12

Physical Variables Geological Variables
• Lithology • Mineralogy • Stratigraphy • Depositional environments/features • Structural features • Texture (grain-size distribution) • Porosity • Bulk density • Particle (solid) density
Hydrogeological Variables • Hydraulic head • Hydraulic conductivity • Porosity • Ground-water recharge and discharge (location
and extent) • Surface water bodies, and interactions with site
ground water (location and extent) • Precipitation • Dilution • Dispersion
Chemical Variables Contaminant Variables
• Identity of contaminant(s) • Contaminant concentrations • Contaminant solubility • Contaminant density • Contaminant mixtures (i .e ., commingling) • Partition (or Distribution) Coefficients (soil/water,
NAPL/water) • Henry’s Law Constant • Source area contamination • Source control history
Geochemical Variables • Oxidation-reduction potential (ORP) or redox
potential • Dissolved oxygen • Nitrate • Manganese • Iron • Sulfate • Methane • Dissolved hydrogen • Metals and metalloids (as site-specific contaminants,
such as arsenic, and as reactants with contaminants) • pH • Alkalinity • Soil organic carbon (Total organic carbon (TOC),
fraction of organic carbon (f ), or soil organic matter oc (OM))
• Temperature • Additional major ions • Isotopes (relevant stable isotopes and radioisotopes)
Anthropogenic and Anthropocentric Variables • Engineered features • Nearby wells • Human-caused ground-water recharge and
discharge • Receptors
Biological Variables • Contaminant concentrations • Daughter products • Byproducts • Oxidation-reduction potential (ORP) or redox
potential • Ground-water organic carbon (Total organic carbon
(TOC) and dissolved organic carbon (DOC)) • pH • Temperature • Alkalinity • Dissolved oxygen • Nitrate • Manganese • Iron • Sulfate • Methane • Dissolved hydrogen • Microbial community • Stable isotopes (2H/1H and 13C/12C)
Table 2 MNA Site Characterization Variables. Categorization and listing of variables for MNA site characterization. The variables are discussed in the corresponding sections of the text.
13

2.4.1 Site Characterization and Professional Judgement
An important part of the site characterization effort involves deciding the level of detail and at what scale and frequency the sampling is to be conducted (which translates into the number of samples to be collected). Each site is different, so guidelines on specific numbers of sampling locations and samples, or frequency of sampling, cannot be provided that would be applicable to all sites. There are no widely-accepted protocols for deciding the particular level of detail that is necessary for site char-acterization. This document does not propose any hard-and-fast rules for deciding the level of detail, but rather, provides a discussion of the factors that affect the choice of the level of detail. In general, the sampling density (including the number of transects) and level of detail investigated should match the scale, complexity, and level of concern at the site. Different numbers of samples may need to be collected for different variables, depending on the subsurface heterogeneity and resultant potential wide range of measured values for each specific variable. For example, grain-size distribution is likely to vary much more across the site than does ground-water temperature. The sampling frequency can be influenced by the frequency of significant events at the site (e.g., seasonal changes). Professional knowl-edge and experience are used to determine what variables are the most critical, where data gaps may be, or where and how many addi-tional samples are required. Subsequent site characterization can then focus on these more critical variables.
This document lists the variables that may need to be characterized in an evaluation of MNA. Existing knowledge and data for the site can be used to modify the number of variables requiring data collection during the MNA-related site characterization. However, it is often not possible a priori to determine which variables will be most critical at a
particular site. Evaluation of the previously existing data and the initial MNA site charac-terization data may identify which variables are most critical, and which are to be focused on. This can also indicate how to group the predominant and/or most critical variable values together into representative zones. The evaluation will also identify if and how many additional data points may be needed for further investigation of each of these variables.
2.5 Geological Variables Geological variables impact the direction, magnitude, and variability of ground-water, dissolved-contaminant, and NAPL-phase flow. The geological variables are discussed below. Geological variables include:
• Lithology. The lithology can provide indications on how water and contaminants can flow and react in a consolidated porous medium.
• Mineralogy. The properties of the miner-als that make up the porous media impact the subsurface geochemistry, and how the porous media physically and geochemically interacts with contaminants and microbes. Reactive iron and sulfur minerals have been shown to contribute to abiotic degradation of halogenated hydrocarbon contaminants in ground water (He et al., 2009). Weathering and solubilization of the various minerals can release different constituents into the ground water, resulting in varying aqueous geochemistries. Minerals of different densi-ties, and varying proportions of those miner-als, can result in different average particle densities and overall bulk densities.
• Stratigraphy. The nature of the layering of consolidated and unconsolidated porous media can impact the direction and rate of ground-water and contaminant flow.
• Depositional environments/features. Site-specific definition of the depositional
14

environments and features aids in under-standing the potential for heterogeneity in sediment characteristics and in determin-ing if there are potential preferential flow zones. For example, a site that includes subsurface sediments deposited by a stream may have areas of higher-hydraulic-conductivity gravel that act as preferential pathways for faster contaminant migration.
• Structural features. Features such as cracks, joints, faults, worm holes, root openings, or other preferential flow paths affect the direction of ground-water and contaminant flow.
• Texture (grain-size distribution). The size, range of sizes (i.e., distribution), and arrangement of the solid grains at a site affect how water and contaminants flow through the porous media, and can impact geochemical and biological processes.
• Porosity. The porosity can be used in an equation to calculate ground-water velocity and contaminant retardation factor (which are then used to calculate contaminant velocities and travel times). It can also be used to calculate the volumes of water, solid phase, and/or NAPL phase in a given volume of the subsurface.
• Bulk density. The bulk density can be used to derive the value of porosity. It is also used in the equation to calculate the con-taminant retardation factor.
• Particle (solid) density. The particle density is used, along with bulk density, to calculate the porosity.
A review of the regional geology using exist-ing information or by conducting a recon-naissance of the surrounding area provides a starting point for developing the geologic components of the conceptual model. At a regional scale, the variables that must be defined are the regional lithology, stratigraphy,
depositional environments, and structural fea-tures, which will indicate what type of geology might be expected at the site. This informa-tion will help to determine which investigative tools and techniques will be appropriate (e.g., direct push methods may not work well in very rocky till). Knowledge of the regional depositional environment will help to assess the level of effort needed to characterize the subsurface geology (e.g., a meandering stream depositional environment would be expected to exhibit more variability than a beach-like depositional environment). Knowledge of regional stratigraphy may also point to the type of aquifer(s) that make up the site.
Site-specific definition of the lithology, mineralogy, and stratigraphy is also critical, including the type, thickness, lateral continuity, and orientation of geologic units and bedding features. The lithologic and stratigraphic information can be used to determine if there may be any potential barriers to flow (such as a thick, laterally continuous clay layer). Stratigraphic barriers or lithologic interfaces may be sites of DNAPL accumula-tion. Detailed definition is important because lithologic differences or bedding (even when subtle) can impact flow paths or DNAPL migration. DNAPL constituents may dif-fuse into lower-permeability media, where they represent a long-term ongoing source of contamination as the contaminants diffuse back out into the ground water in the higher-permeability media. Texture (grain size dis-tribution), porosity, bulk density, and particle (solid) density should be determined for each of the geologic units involved in or influencing contaminant transport (this can include aquita-rds in addition to contaminated aquifers).
Site-specific geologic information can be obtained from subsurface core samples, surface geophysical measurements, and/or geophysical logging of boreholes. Literature or “typical” values are sometimes used for some of the variables, such as bulk density or porosity.
15

However, actual site-specific measurements are recommended for bulk density and grain-size distribution, due to the importance of these variables in hydrogeologic calculations. For variables that are harder to measure, values can be assumed (e.g., for particle density) or calculated (e.g., porosity) based on measured related variables (e.g., bulk density).
2.6 Hydrogeological Variables Hydrogeology provides the foundation for understanding the behavior of subsurface water. Knowledge of the site-specific hydroge-ology is used in conjunction with the site-specific geologic and contaminant variables to determine the ground-water and contaminant flow paths, contaminant migration rates, and subsurface variability. Ground-water and contaminant velocity calculations (Chapter 4) involve the use of some hydrogeologic vari-ables. The hydrogeologic variables included in MNA site characterization, in rough order of more important to less important are:
• Hydraulic head. Hydraulic heads are used to determine the direction of ground-water flow (from higher head to lower head), the horizontal and vertical hydraulic gradients (for determining the ground-water flow velocities), and to define the piezometric surface for each hydrologic unit (aquifer or aquitard) at the site. The hydraulic heads should be determined within each geologic unit involved in or influencing contaminant transport (this can include aquitards in addi-tion to contaminated aquifers). Hydraulic gradients are likely to be different within different hydrogeologic units and should be calculated using measurements from within the different units. Water levels (i.e., hydraulic heads) are typically variable with time (e.g., water-table fluctuations are frequently observed), and it is important to make regular, periodic measurements. The frequency of the water-level measure-ments will be determined by site-specific
dynamics, which are affected by both natural and anthropogenic events. The variations in hydraulic heads and gradients in response to external influences on site hydrology (e.g., seasonal or longer term pre-cipitation patterns, tidal cycles, and changes in patterns of ground-water withdrawal or irrigation) should be determined.Hydraulic conductivity. Hydraulic conductivity should be determined for each geologic unit involved in or influencing contaminant transport (this can include aquitards in addi-tion to contaminated aquifers). Hydraulic conductivity data are used in conjunction with hydraulic gradients to determine the magnitude of ground-water flow.
• Porosity. Porosity is a geological variable determined as part of the geological charac-terization. It is a critical variable for hydro-geological calculations of ground-water and contaminant flow velocities. Total porosity defines the entire pore space (i.e., space not occupied by solid material), is designated as a fraction of a unit volume, and in the saturated zone is occupied by ground water. The effective porosity is the pore space through which ground-water flow actually occurs. A more accurate understanding of ground-water flow (and associated calcula-tions) can be obtained by using the value of effective porosity rather than the value of total porosity.
• Ground-water recharge and discharge . Identification of regional and local ground-water recharge and discharge areas provides a preliminary indicator for the general direction of ground-water movement. The amount and variation of recharge and discharge can impact the hydraulic gradient, ground-water and contaminant velocities and flux, and ground-water flow direc-tion (e.g., changing river stage or tides can reverse ground-water flow direction). Anthropogenic water additions (e.g., from septic systems or leaking water utility pipes)
16

or withdrawals (e.g., by nearby production wells, footing tile drains, etc.) can act as localized recharge or discharge, respec-tively, and can alter local-scale ground-water gradients and flow directions.
• Surface water bodies, and interactions with site ground water. Surface water bodies (e.g., lakes, streams, or marine waters) can interact with ground-water flow at a site and influence contaminant migration. They can affect ground-water geochemistry, as with saline water near a seashore. Surface water bodies are often discharge areas for site ground water; however, some are recharge areas. Due to spatial and temporal variability, they may be both recharge and discharge areas at different times (e.g., seasonally or with tidal fluctuations) or in different locations. Information required on surface water bodies can include the position relative to the site, water elevations and fluctuations, water movement and biogeochemical pro-cesses within the hyporheic zone, sediment characteristics, and water chemistry. Stream bottom leakage will sometimes be important information to obtain for a stream at or near the site, involving measurement of streambed thickness and vertical hydraulic conductivity, and calculation of leakance.
• Precipitation. A portion of rainfall at a site will infiltrate into the subsurface and recharge the ground water, and could lead to some dilution of contamination. Infiltrating rainfall can also leach additional contami-nant mass from the unsaturated zone into the ground water. Aquifer recharge from infiltrated water might push contaminant plumes downward, rather than diluting contaminant concentrations .
• Dilution. Mixing of the plume with infiltrating uncontaminated water can lead to non-destructive decreases in contaminant concentration. Quantifying the amount of
dilution from this mechanism can help in properly attributing concentration decreases to either non-destructive or destructive processes. Dilution of contaminant con-centrations in a ground-water sample, or in the plume in the local vicinity of a monitor-ing well, can also occur in the well by the mixing of water from both contaminated and uncontaminated zones.
• Dispersion. Dispersion is the spreading and mixing of contaminants into uncontami-nated water flow paths via several mecha-nisms related to the motion of the ground water and the properties of the porous media through which it flows. This has essentially a diluting effect, and can lead to non-destructive decreases in contaminant concentration. Assessing dispersion can help in properly attributing concentra-tion decreases to either non-destructive or destructive processes. However, it may not be possible to distinguish the effects of dispersion from those of any dilution caused by infiltration of uncontaminated water.
A review of the regional hydrogeology pro-vides a starting point for developing the hydro-geologic components of the conceptual model. The regional ground-water flow can suggest the direction of site-specific ground-water flow, and indicate potential areas for initial investigations. However, since site-specific ground-water flow directions may vary signifi-cantly from the regional patterns, the detailed three-dimensional ground-water flow direction or directions at the site need to be confirmed.
Key Point
The direction of ground-water flow and plume migration in portions of a site may be different from what might be expected by examining regional or even local ground-water flow directions, due to subsurface heterogeneity and preferential flow paths.
17

Additional details on hydrogeological char-acterization are provided in many references, including U.S. EPA (1986).
2.6.1 Flow Paths
A flow path is an imaginary line that traces the path a water molecule would follow as it flows through the aquifer. Contaminants dissolved in that ground water would also follow this flow path. A plume centerline is the flow path along the longitudinal central axis of the plume, and in an idealized conceptual plume, would define the highest concentration portion of the plume at each distance downgradient. Plume behav-ior and attenuation rates are determined, in large part, through identifying and monitoring flow paths with time. Attenuation rate calcula-tions (discussed in Chapter 4) use data from monitoring points along the flow paths, ideally, along the plume centerline. In practice, however, a plume centerline cannot be defini-tively identified, for the reasons discussed below. Identification of a broader region along the longitudinal axis of the plume extending from the source to the end (toe) of the plume is more likely.
Temporal variations in ground-water flow direction may occur, which result in temporal variations in contaminant flow paths and com-plicate attempts to define the flow paths and calculate the attenuation rates. For example, if the ground-water flow direction changed slightly each year, a given molecule of water and a dissolved contaminant emanating from a specific location at the contaminant source would be carried along a curving and twisting flow path, and a hypothetical, ideal plume cen-terline would appear to curve and twist, rather than being straight. Further, in subsequent years, other molecules of water and dissolved contaminants emanating from the same spe-cific location at the contaminant source would follow different flow paths, shifted slightly from each other. There would not be a unique, spatially and temporally stable plume cen-terline, and the plume centerline would shift
away from a given set of monitoring wells that might sample it one year (but not the next). Figure 4 conceptually illustrates changes in ground-water flow paths and directions.
During characterization, the potential for temporal flow direction variations should be investigated, by examining historic ground-water head data and by measuring ground-water levels at different times of the year. For some sites, tidal fluctuations can also be a con-founding factor in determining ground-water flow and flow path directions. For other sites, the intermittent or changing operation of well fields can cause variations in ground-water flow direction. Any such flow direction varia-tions can be integrated to produce an average or generalized direction of flow, resulting in a somewhat wider central region of the plume rather than a narrow unique plume centerline flow path. A more accurate longitudinal transect (line of monitoring points extending longitudinally along the central axis of the plume) can then be based on this understand-ing of flow directions, especially when coupled with contaminant concentration data that may help to define the plume.
Definition of flow paths can also be difficult if preferential flow paths are present. Preferential flow paths are flow paths where ground water and contaminants travel at increased veloci-ties and/or in different directions compared to the ground water in the surrounding area. Preferential flow paths can be due to natural features such as highly permeable stream deposits or to anthropogenic features such as buried utility lines, heterogeneous fill, drain-age ditches, etc. The potential for preferential flow paths should be investigated during the site characterization by assessing site informa-tion for anthropogenic features and by careful logging of subsurface borings in conjunction with an understanding of geologic preferential pathways potentially present in the area.
Given the state of site characterization tools and technology, and further difficulties due to
18

Figure 4. Variation in Ground-Water Flow Paths, Directions, and Gradients. The ground-water flow direction (lateral direction is shown by the larger solid arrows) may change from time to time (e.g., t1 and t2) due to natural causes (e.g., changes in precipitation and infiltration) or anthropogenic causes (e.g., changes in ground-water pumping, Q1 and Q2 ). Contamination carried by the ground water will follow the changing ground-water flow paths. The contaminant flow path resulting from changing ground-water flow directions will differ from a straight-line flow path (a presumed plume centerline) that is based on the flow direction at any given time, or that is based on an average flow direction. Monitoring well or transect placement needs to take into account the changing ground-water flow directions. Contaminant concentrations measured at monitoring locations also need to be interpreted based on an understanding of the changing ground-water flow directions.
the possible temporal variations in flow direc-tions, it is more realistic to attempt to delineate general zones of similarity along transects instead of attempting to define discrete flow paths. Although transect sampling cannot overcome all temporal and spatial variability issues, acquisition and integration of multiple laterally and vertically discrete data yields an assessment more representative of the entire range of conditions.
water. Knowledge of the background ground-water quality is critical, for comparison to the contaminated site ground water. Differences in water quality and geochemical variables between the background (i.e., “background levels” of measured variables) and the plume can indicate the changes that may have occurred due to MNA fate processes, and help in estimating potential changes that may occur in the future .
2.6.2 Background Ground Water Establishing background may not be straight-forward, and often involves more than just Background ground water, or background,
generally refers to the ground water that is found upgradient of the contaminated ground
one well upgradient of a plume (U.S. EPA, 1986). The determination of background
19
includes consideration of many things (depths and thicknesses of geologic units, ground-water flow directions, screen lengths, etc.). Background samples need to be taken from areas representative of ground water not impacted by contaminants from the site, pref-erably upgradient (rather than sidegradient), and from the originally same geological and geochemical environment as the downgradient contaminated ground water. If ground-water contamination exists regionally in the vicinity of the site, and/or the areas upgradient of the plume have naturally different geological and geochemical conditions, it may not be possible to collect a suitable upgradient background sample. A background sample might need to come from a different area of the site, and comparisons of differences between samples should recognize the less-than-ideal sample. For adequate comparisons, background well screens need to be placed to sample ground water at the depths and in the geologic units that correspond to those in the plume. Well clusters may be necessary. To compare electron acceptor and electron donor concen-trations, the background samples need to be taken from ground water that will subsequently move through the site (i.e., be in the upgradi-ent portion of the flow paths through the site). This consideration also applies to other water quality/geochemistry variables, such as metals. It is likely that multiple background wells will be required to reflect the subsurface geologic variability. There may also be natural spatial or temporal variability in the uncontaminated ground-water geochemistry. An understanding of natural geochemical variability is needed so that geochemical variations observed in the plume can be accurately assessed and to avoid misinterpreting the relationships between observed geochemical variations in the plume and levels of microbial activity.
2.7 Anthropogenic Variables and Receptors
Anthropogenic or human-related variables, in addition to the natural geological and hydro-geological variables discussed above, can affect contaminant fate and transport at a site. These anthropogenic variables include:
• Engineered features. The engineered features or “built environment” of the site may influence the movement of surface drainage, infiltration, and ground water. Engineered features such as storm drains, other subsurface utilities, catch basins, and paved or other impervious areas should be identified during the site characteriza-tion. Subsurface engineered features such as buried utility corridors may often form preferential flow paths disrupting the natural ground-water flow direction and magnitude. Interpretations of ground-water flow paths and subsequent calculations of contaminant travel time and attenuation rates may be inaccurate if influences of preferential flow paths are not identified.
• Wells. The location and characteristics of nearby water-supply, irrigation, or injection wells should be determined. Pumping from or injection into nearby wells can change the ambient ground-water flow direction, ground-water flow rates, and ground-water gradients, and impact contaminant migra-tion. The significance of these wells often depends on their proximity to the potential MNA site and on their extraction or injec-tion rates .
• Anthropogenic ground-water recharge and discharge. As mentioned in Sections 2.3.1 and 2.6, small-scale localized ground-water recharge and discharge can occur due to anthropogenic features. Water from leaking water utility pipes or from septic systems can not only alter ground-water gradients and flow directions locally, but could result in anomalous ground-water
20

chemistry (either from potable water enter-ing the subsurface or from septage contami-nants and nutrients). Removal of ground water by anthropogenic drainage systems can also locally alter ground-water gradients and flow directions.
2.7.1 Receptor Identification and Vulnerability
Potential receptors, receptor locations, and exposure routes should be identified to deter-mine if MNA can be applied to a site without the risk of exposing a receptor to adverse envi-ronmental or health conditions during the time period of the MNA remediation. Receptors, receptor locations, and exposure routes relevant to MNA of a ground-water plume of dissolved contaminants may include:
• Nearby water supply wells (public or pri-vate), which may represent the most likely pathway of human exposure to subsurface contaminants .
• Nearby surface water bodies, including lakes, streams, springs, or wetlands, which may be discharge locations for ground water from the site. Risks may be environmental, or human if the water body is used for recreation .
• Nearby residents or onsite commercial workers, who may be exposed through vapor intrusion into a residence or commer-cial building, or through ingestion of ground water from a private water supply well.
• Remedial workers, who may be exposed during the ground-water and soil monitoring that may occur during MNA, which may occur over a longer period of time than with active remediation technologies.
• On-site construction workers, who may be exposed through vapor inhalation or dermal contact with contaminated soil or ground water when working on utilities or excavations .
The locations of these potential receptors should be assessed to determine if they are within or downgradient of the plume flow paths, and could be reached during the lifespan of the plume.
2.8 Contaminant Variables The transport of contaminants in the subsur-face is affected by media and contaminant properties. Further, the hydrodynamic, abiotic, and biotic processes that affect the fate of the chemicals during transport are strongly influenced by the contaminant properties:
• Contaminant identity. Contaminant identity is an obvious, yet critical, vari-able. Characterization should include not only specified “contaminants of concern” (COCs) and compounds with regulatory remedial goals, but other compounds that might have an impact on the subsurface fate and transport of the COCs. Emerging or overlooked contaminants can also impact natural attenuation, and should be consid-ered during characterization. Also of inter-est may be tentatively identified compounds (TICs), which may have been indicated by some analyses to be possibly present, but not positively identified. These compounds should be positively identified to determine their risk potential and effect on remediation alternatives .
• Contaminant concentrations. The concen-trations of dissolved contaminants are used to delineate the contaminant distribution. It may be desirable to prepare figures that show the distribution of contaminants pres-ent at levels greater than regulatory accep-tance. Real-time data acquisition (obtained by using field tests, or field GC and GC/ MS) coupled with laboratory analysis of samples from temporary wells and evalu-ation of the results can be used to select appropriate locations for permanent moni-toring points. Contaminant distribution may also imply additional sources, previously unidentified.
21

• Contaminant solubility. The contaminant solubility in water is an approximate indicator of the expected maximum levels of dissolved contaminants. However, the aqueous solubility of constituents of a NAPL is a function of their concentration within the NAPL. In relative terms, source contaminants with higher water solubility will be capable of producing higher con-centrations of dissolved contaminants in the plume.
• Contaminant (NAPL) density . Contaminant density is generally not an issue for sites without NAPL and with just dissolved con-taminants (although, in rare cases, a dense aqueous phase plume (DAPL) may be pres-ent at a site). Knowledge of the contami-nant density is important for NAPL sites, with LNAPL sites often having dissolved-phase contamination near the water table, and DNAPL sites often having NAPL-phase and dissolved-phase contamination extend-ing below the water table (potentially to significant depths).
• Contaminant mixture. Information about different NAPL-phase contaminants that may occur mixed together is used to deter-mine solubility, density, and persistence of such mixed contaminant sources, and can serve as an indicator of contaminants that will be encountered in the dissolved plume. Some contaminants are more soluble when co-dissolved with other classes of con-taminants. Each contaminant present in the source area should be included in plume investigations. In addition, commingling of different NAPL source contaminants may result in a neutrally buoyant source area contaminant mixture and/or produce unex-pected dissolved contaminant distributions. For example, commingling of tetrachloro-ethene (PCE) (a DNAPL) and gasoline (an LNAPL) source contaminants can lead to the unexpected presence of a large portion of dissolved PCE near the water table due
to PCE in the LNAPL phase. This would be in addition to PCE in the dissolved phase found considerably below the water table due to the downward movement of PCE in the DNAPL phase (some PCE NAPL phase might be found at the water table along with PCE in the dissolved phase; the distribution of PCE also depends on the mass spilled).
A mixture of different contaminants can also occur in the dissolved phase. Knowledge of the different compounds in this type of contaminant mixture is also important in cases where one contaminant or type of contaminant may be an electron donor for other contaminants. For example, BTEX compounds can be electron donors for biodegradation of chlorinated compounds.
• Partition (or Distribution) Coefficient . Partition coefficients of each contaminant in the dissolved-phase plume indicate how compounds partition between different subsurface phases, such as between soil organic carbon and ground water. The soil organic carbon/water partition coefficient is used (in conjunction with the fraction of organic carbon or fraction of organic matter present in the soil) to estimate how much of a compound might be sorbed to the soil organic matter if the ground-water concen-tration is known. This partition coefficient is also used to calculate the contaminant’s retardation factor and velocity. If the source area contains NAPL, it is important to understand the partitioning of individual compounds between the NAPL phase and the dissolved phase.
• Henry’s Law Constant. The Henry’s Law constant for a compound is a distribution coefficient that is used to estimate vapor phase concentration values if the water phase concentration is known, and to estimate the degree to which a contaminant might partition from ground water to the unsaturated zone vapor phase.
22

• Source Area Contamination. Sorbed organic contaminants and NAPL in the unsaturated and saturated zones are common sources of continuing dissolved-phase ground-water contamination. NAPLs, if present, generally represent the greatest fraction of total contaminant mass at a site, and can represent a very significant source of continuing dissolved-phase ground-water contamination . Since natural attenua-tion processes do not reduce NAPL mass rapidly, NAPL contamination and sources might introduce insurmountable technical challenges to MNA if there is significant NAPL mass and resultant flux of dissolved contaminants. Prediction and characteriza-tion of the movement and distribution of DNAPL is especially problematic, par-ticularly if it has moved into the saturated zone. It is important to carefully evaluate the nature and distribution of source area contamination, because they strongly impact the nature and characteristics of the dissolved-phase contaminant plume, potential effectiveness of MNA, and the design of an MNA performance monitoring program. Characterization of source area contamination requires a broad set of site characterization variables that encompasses a variety of types of information, discussed below in Section 2.8.1. The source area contamination variables include all infor-mation regarding the contaminant source, such as the source release location, history, type, size, dimensions, volume, mass, and distribution.
• Source Control History. It is important to carefully evaluate any source control activi-ties, because they (as do the characteristics of the source) strongly impact the nature and characteristics of the dissolved-phase contaminant plume, potential effective-ness of MNA, and the design of an MNA performance monitoring program. Source control history is a broad site characteriza-tion variable that encompasses a variety of
types of information, discussed below in Section 2.8.2. The source control history includes all information regarding activities for removing and/or containing the source area contamination .
2.8.1 Source Area Contamination
A number of items should be considered when attempting to develop an understanding of the spatial distributions of contaminants in subsur-face source areas (i .e ., source architecture), and the resulting dissolved-phase plumes:
• The location of the source area is used as a basis for developing the conceptual model of contaminant distribution. Identification and delineation of the point of entry into ground water of infiltrating (leaching) dissolved contamination or of NAPL, along with knowledge of the ground-water flow direction, can help delineate the dissolved-phase plume and provide some general indication of the approximate NAPL migration pathways. Initial dissolved contaminant investigations are directed downgradient of source areas. If DNAPL is present, dissolved contamination may occur downgradient of whatever (potentially complex) path the DNAPL took. However, the direction of the DNAPL flow pathway may differ significantly from the direction of ground-water flow (Cohen and Mercer, 1993).
• The source area size and dimensions are influenced by the source history, which includes the spill amount, source release date (i.e., time since release), spill type and duration (e.g., a slow release or a catastrophic event), and spill phase (free product and/or dissolved phase).
• The source area size and dimensions can also depend on the chemical properties of the spilled compounds; subsurface finger-ing, relative permeabilities, and heteroge-neities of the subsurface media; amount of
23
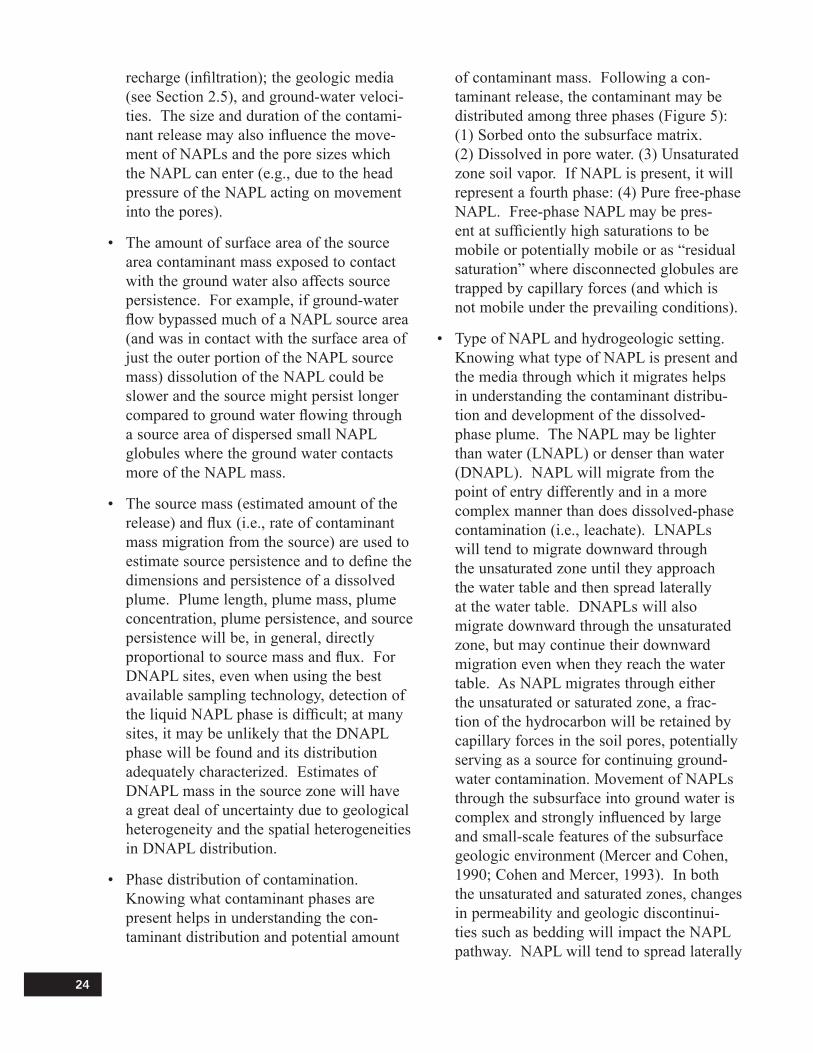
recharge (infiltration); the geologic media (see Section 2.5), and ground-water veloci-ties. The size and duration of the contami-nant release may also influence the move-ment of NAPLs and the pore sizes which the NAPL can enter (e.g., due to the head pressure of the NAPL acting on movement into the pores).
• The amount of surface area of the source area contaminant mass exposed to contact with the ground water also affects source persistence. For example, if ground-water flow bypassed much of a NAPL source area (and was in contact with the surface area of just the outer portion of the NAPL source mass) dissolution of the NAPL could be slower and the source might persist longer compared to ground water flowing through a source area of dispersed small NAPL globules where the ground water contacts more of the NAPL mass .
• The source mass (estimated amount of the release) and flux (i.e., rate of contaminant mass migration from the source) are used to estimate source persistence and to define the dimensions and persistence of a dissolved plume. Plume length, plume mass, plume concentration, plume persistence, and source persistence will be, in general, directly proportional to source mass and flux. For DNAPL sites, even when using the best available sampling technology, detection of the liquid NAPL phase is difficult; at many sites, it may be unlikely that the DNAPL phase will be found and its distribution adequately characterized. Estimates of DNAPL mass in the source zone will have a great deal of uncertainty due to geological heterogeneity and the spatial heterogeneities in DNAPL distribution.
• Phase distribution of contamination. Knowing what contaminant phases are present helps in understanding the con-taminant distribution and potential amount
of contaminant mass. Following a con-taminant release, the contaminant may be distributed among three phases (Figure 5): (1) Sorbed onto the subsurface matrix. (2) Dissolved in pore water. (3) Unsaturated zone soil vapor. If NAPL is present, it will represent a fourth phase: (4) Pure free-phase NAPL. Free-phase NAPL may be pres-ent at sufficiently high saturations to be mobile or potentially mobile or as “residual saturation” where disconnected globules are trapped by capillary forces (and which is not mobile under the prevailing conditions).
• Type of NAPL and hydrogeologic setting. Knowing what type of NAPL is present and the media through which it migrates helps in understanding the contaminant distribu-tion and development of the dissolved-phase plume. The NAPL may be lighter than water (LNAPL) or denser than water (DNAPL). NAPL will migrate from the point of entry differently and in a more complex manner than does dissolved-phase contamination (i .e ., leachate) . LNAPLs will tend to migrate downward through the unsaturated zone until they approach the water table and then spread laterally at the water table. DNAPLs will also migrate downward through the unsaturated zone, but may continue their downward migration even when they reach the water table. As NAPL migrates through either the unsaturated or saturated zone, a frac-tion of the hydrocarbon will be retained by capillary forces in the soil pores, potentially serving as a source for continuing ground-water contamination. Movement of NAPLs through the subsurface into ground water is complex and strongly influenced by large and small-scale features of the subsurface geologic environment (Mercer and Cohen, 1990; Cohen and Mercer, 1993). In both the unsaturated and saturated zones, changes in permeability and geologic discontinui-ties such as bedding will impact the NAPL pathway. NAPL will tend to spread laterally
24

Figure 5. Contaminant Distribution. Contaminant mass can occur in the dissolved, sorbed, and vapor phases, and in the NAPL phase if the release included NAPL. The contaminant distribution will vary with depth, with the type of subsurface geologic media, and with the type of NAPL released (i.e., LNAPL or DNAPL).
25

on low permeability layers. Migration of the NAPL will depend, in part, on subsur-face topography and permeability of the low permeability layer or permeability transition zone, and the NAPL will tend to flow down-slope by gravity.
2.8.2 Source Control History
In general, MNA would be more likely to be effective at sites where any remaining sources (such as NAPL) are controlled so as to prevent further input of contaminants to ground water, or where there are no source area contami-nants that could provide continuing sources of dissolved contaminants to site ground water (perhaps through previous removal of source area contaminants) . At some sites, such as with deep DNAPL sources, source control may not be achievable. At such sites, assessment of MNA effectiveness will depend on a thorough analysis of the site characterization data, espe-cially of data indicating that source mass is minor and not mobile, dissolved contaminant flux is minor, and/or the dissolved-phase plume is stable or receding.
The history of contaminant releases and implementation/effectiveness of source con-trols affect contaminant distribution and the temporal trends in dissolved contaminants at any given monitoring point downgradient of the source. For example, the current plume configuration at a site may have been strongly influenced by characteristics of the source (e.g., source contaminant mass) before any source removal or control activities had been conducted, especially if a significant amount of time had elapsed between the contaminant release and the source control activities (note that plume configuration could also have been influenced by previous flow regimes different from the current regime). Interpreting plume development based on post-source control source characteristics could be misleading. Thus, it is important to assess any historical information about the nature and distribu-tion of the source prior to source control,
in addition to the current characteristics of any remaining source area contaminants and associated source control mechanisms.
Knowledge of the location, approximate time, and relative mass of contaminant releases and the timing and effectiveness of previously implemented source controls is important for the evaluation of observed temporal trends. It can be problematic to use pre- and post-source control data (such as contaminant levels or MNA indicators) from wells located downgra-dient of source areas for trend analyses and/or degradation rates unless the potential impacts of the source control activities are recognized. For example, a declining trend in contaminant concentrations downgradient of a source area may be predominantly due to the effects of a previous removal action rather than natural attenuation processes (due to reduced dissolved contaminant flux from the source, rather than degradation of dissolved contaminants in the plume). Estimates of contaminant transport rates based on the hydrogeologic data, com-parisons with the behavior of more conserva-tive solutes found in the source material, and other lines of evidence may aid in distinguish-ing the effects of source history and controls from those of natural attenuation processes. If modeling of the plume is conducted, the modeling simulations should take into account any source removal activities .
2.8.3 Transformation Products and Byproducts
Physical and biological processes associated with natural attenuation can result in changes to ground-water geochemistry, especially in pH and Eh. Such changes can lead to the release and mobilization of metals or non-metals found in naturally occurring minerals in the subsurface soils and sediments. For example, naturally occurring arsenic and manganese may be released at sites where the subsurface system is driven to anaerobic conditions by biological degradation of organic compounds such as petroleum hydrocarbons. Mobilization
26
may also occur for metals introduced during site activities; in either case, the metals may be of concern as contaminants. In addition, the biodegradation of PCE and trichloroethene (TCE) can result in the formation of cis-1,2-di-chloroethene (cis-DCE) and vinyl chloride (Wiedemeier et al., 1998). At some sites, cis-DCE may accumulate since the biodegradation of PCE and TCE may occur more readily than biodegradation of cis-DCE. Similarly, vinyl chloride may accumulate under anaerobic conditions that favor PCE, TCE, and cis-DCE biodegradation (whereas the vinyl chloride could be more readily biodegradable under aer-obic conditions). The transformation product vinyl chloride is more toxic and mobile than the parent compound (U.S. EPA, 1999). The characterization of such degradation products should be part of the site evaluation (Pope et al., 2004). Some reaction products (such as acetylene) are unique to abiotic reactions (He et al., 2009), and monitoring of ground water for these products can indicate the occurrence of abiotic, rather than biological, degradation. Due to potential temporal changes or spatial variability, it may be necessary to continue to monitor for transformation products and byproducts or to monitor in different locations along a flow path.
2.8.4 Tracers
Measuring the concentration of conservative tracers along a flow path may help to deter-mine the contribution of adsorption, dilution, and volatilization to contaminant loss. The apparent reduction in the conservative tracer along the flow path is assumed to be due to those non-destructive processes. Loss of contaminant greater than the loss of the conser-vative tracer is assumed to be due to degrada-tion, if the geochemical evidence indicates that degradation is occurring. The conservative tracer should have chemical and physical properties as similar to the contaminants as possible, while being resistant to degradation under the prevailing environmental conditions.
Some inorganic or organic compounds pres-ent in the ground water or in the contaminant might be used as tracers. Organic tracers have included 1,2,3,4-tetramethylbenzene present in a light-crude-oil-contaminated ground water (Cozzarelli et al., 1990) and 2,3-dimethyl-pentane in a gasoline-contaminated ground water (Wilson et al., 1994). Chloride can also be a tracer, for example, by examining the changes along a flow path from a source in the proportions of inorganic chloride produced and organic chloride lost during reductive dechlorination of chlorinated solvents. Tracer use can be problematic if there are external sources (such as for chloride in areas of road salting) or if there are multiple sources along a flow path.
2.9 Geochemical Variables The geochemistry of the subsurface porous media and ground water affects the transport and fate of contaminants via abiotic and biotic reactions and mechanisms (e.g., sorption and degradation). Degradation reactions primar-ily occur in the dissolved phase; however, the solid-phase mineral content can enable certain biological reactions (e.g., Fe(III) may be a terminal electron acceptor(TEA)). The solid phase geochemistry may also be important in abiotic degradation of certain contaminants such as chlorinated VOCs. He et al. (2009) indicate that reactions occurring at the surface of reactive iron and sulfur minerals present in the solid phase can increase the rate of reductive dechlorination of some chlorinated contaminants, with the mineral surfaces acting as electron donors and/or reaction mediators. Characterization of the relative significance of abiotic processes in natural attenuation is a promising area of research, and biological processes have been the focus at almost all MNA sites. However, with increasing aware-ness of abiotic natural attenuation processes, the geochemical variables relevant to abiotic degradation may become more routinely incor-porated into MNA site characterization.
27
Some of the geochemical variables listed below are relevant for biologically-mediated reactions; additional discussion of these variables is in the section on biological vari-ables. Biodegradation processes may cause changes in geochemical variables, leaving an observable geochemical “footprint” that can be related to biodegradation processes (such geochemical variables have been referred to as “indicator parameters”, i.e., variables that are indicative of biodegradation of contami-nants). For example, petroleum compounds usually serve as electron donors during microbial degradation of the compounds (i.e., the compounds are oxidized during microbial metabolism). During this process, TEAs (e.g., oxygen, Fe(III), sulfate) are used, and form reduced products (e.g., carbon dioxide, Fe(II), sulfide, respectively). The decreases in TEA concentrations can be determined, and in many cases, the reduced products can also be measured; the resulting data can be used to indirectly evaluate biodegradation. Geochemical variables can also indicate whether redox conditions or other geochemi-cal conditions could enhance the mobility of inorganic anthropogenic or naturally occurring compounds such as manganese or arsenic. The geochemical variables to be characterized for the hydrogeological units of interest and in background samples are:
• Dissolved oxygen. Dissolved oxygen is a TEA for contaminant biodegradation. It also inhibits reductive processes (i.e., reduc-tive dechlorination).
• Nitrate (NO3- ). Nitrate is a TEA for
contaminant biodegradation. It may inhibit reductive processes.
• Manganese. Mn(IV) may act as a TEA. Mn(II) may become mobilized as a reduction product of Mn(IV). Mn(II) measurement may be conducted at sites where manganese has the potential to be a ground-water contaminant, or for assessing
contaminant biodegradation where Mn(IV) has acted as a TEA (e.g., in DCE degrada-tion under manganese-reducing conditions).
• Iron. Solid-phase ferric iron (Fe(III)) is frequently present, may be bioavailable, and can be used as a TEA by many microorgan-isms. Measurement of Fe(II) in ground water can be used for assessing contaminant biodegradation where Fe(III) has acted as an electron acceptor. Reactive iron minerals can facilitate abiotic degradation of chlori-nated organic compounds.
• Sulfate (SO42- ). Sulfate is a TEA for
contaminant biodegradation.
• Methane (CH4 ). Methane can be a byproduct of the biodegradation of petro-leum hydrocarbons and other contaminants, where carbon dioxide is used as a TEA under strongly reducing conditions, and can be indicative of reducing conditions in ground water.
• Dissolved hydrogen. Dissolved hydrogen can be used to help identify the terminal electron-accepting process occurring in the ground water. It can also be a primary electron donor (this is discussed further in Section 2.10).
• Oxidation-reduction potential (ORP) or redox potential. Important chemi-cal changes in contaminants or naturally occurring compounds can occur through oxidation-reduction reactions, involving transfer of electrons and changes in oxida-tion states. The ORP can be an indicator of the transfer of electrons between com-pounds, and of the tendency for particular transformations to occur (e.g., reductive dechlorination takes place at low redox potentials). However, ORP field measure-ments may not correlate well with other redox reaction data.
• Metals and metalloids. Some metals (e .g .,
28

chromium) may be of particular concern as contaminants or potential contaminants at a site. They may be anthropogenic con-taminants at the site, or may occur naturally and become mobilized by the changing conditions occurring during natural attenua-tion (e.g., manganese or arsenic). Reactive solid-phase iron minerals can increase the rate of reductive dechlorination of some chlorinated contaminants.
• pH. The ground-water pH can affect what species of compounds occur and what reac-tions may occur . Also, the activity of many microorganisms is affected by pH.
• Alkalinity. Ground-water alkalinity can be indicative of the dissolution of carbonate minerals by dissolved CO2 (carbonic acid) and can be indicative of microbial activity. Alkalinity also serves to buffer pH.
• Soil organic carbon (Total organic carbon (TOC) or fraction of organic carbon ( foc )). Organic contaminants can sorb to carbon-containing organic matter in the subsurface; thus, measurement of the organic carbon contained in the subsurface matrix is important for calculations of contaminant sorption, velocities, and travel times. Some porous media analyses might measure organic matter (%OM); this quantity can be converted to foc .
• Temperature. Different ground-water flow zones may have slightly different water tem-peratures; different ground-water tempera-tures may be useful in distinguishing flow paths and representative zones.
• Additional major ions. Major ion (or element) geochemistry involves analysis and interpretation of concentrations and ratios of common dissolved ions in ground water (e.g., Ca2+, Mg2+, K+, Na+, Cl-, SO4
2-, CO3
2-, HCO3- ). Major ion geochemistry can
be used to determine if ground waters in different portions of the site have similar
geochemistry and possibly similar sources, to differentiate waters derived from dif-ferent semi-confined aquifers, to detect ground water influenced by surface water infiltration from a contaminated pond, or to evaluate mixing of different ground waters. Some of these major ions are also discussed elsewhere in this document if they have other specific uses.
• Isotopes. Stable isotope and radioisotope geochemistry evaluates concentrations of isotopes of elements to indicate ground-water sources and mixing. The abundance patterns of different isotopes are influenced by their sources and movement through the ecosphere. Isotope geochemistry has been applied to determine ground-water age (i.e., when meteoric water entered the subsurface) and evaluate mixing of waters from subsurface aquifers and surface waters (see Clark and Fritz, 1997, for a discussion of isotopes for these uses). Stable isotope geochemistry has also been used to identify contaminant sources and evaluate contami-nant degradation (see Section 2.10.1.1).
2.10 Biological Variables Biodegradation of contaminants has primarily been evaluated indirectly by determining con-taminant mass or concentration changes, and by determining changes in the geochemistry of the contaminated media caused or influenced by biodegradation or biodegradation-related processes. Generally, at many sites, in-situ biodegradation of contaminants has not been measured directly, although direct methods continue to be developed and the use of these methods has become more established (as discussed in Section 2.10.1).
Biodegradation of contaminants through redox reactions requires utilization of electron acceptors and electron donors. Contaminants that are oxidized during the biodegradation (e.g., BTEX) are electron donors, and require suitable terminal electron acceptors. Other
29

contaminants that are reduced during biodeg-radation (e.g., chlorinated solvents undergoing reductive dechlorination) are electron accep-tors and require a suitable electron donor. Collection and interpretation of data on elec-tron donor and TEA identity, concentration, mass, and behavior is a vital part of MNA site characterization. This information addresses the second line of evidence for evaluating MNA (introduced in Section 2.1).
Subsurface TEAs are utilized in the sequence dissolved oxygen (under aerobic conditions), then nitrate, Mn(IV), Fe(III), sulfate, and carbon dioxide (under anaerobic conditions). This sequence will generally not be well-defined or distinct temporally or spatially, as different terminal electron-accepting processes may occur in close proximity in time or space (and some overlapping of the processes may occur) .
Data indicating the supply of TEAs are used to determine the sustainability of the oxida-tive biodegradation processes. Sufficient TEA supply must be available for the mass of contaminant present that is to undergo oxida-tive biodegradation. The amount of a specific TEA present will limit the extent and/or rate of biodegradation occurring under that electron-accepting microbial process. Huling et al. (2002) discuss the methodology for examining the balance between available TEA and the TEA required for natural attenuation at a site with a dissolved-phase BTEX plume resulting from an LNAPL source area. The presence of degradable organic carbon compounds other than contaminants can lead to an overestima-tion of the amount of contaminant biodegra-dation that will occur, as TEAs are used to oxidize non-contaminant organic compounds, causing a decline in TEAs that is not accompa-nied by contaminant degradation.
A continuous supply of electron donor is required to support sustained reductive dechlo-rination. As the electron donor is degraded,
the concentrations of the naturally occurring subsurface TEAs may change if these TEAs are also being used during degradation of the electron donors. Characterizing changes in these TEAs (including a contaminant acting as an electron acceptor) and electron donors provides information used to determine if the subsurface conditions are suitable for the biodegradation of the contaminant. In addi-tion to decreasing concentrations of TEAs and electron donors, microbial metabolism of TEAs and electron donors produces metabolic byproducts that may also be easily detected and quantified as additional evidence of the nature and extent of contaminant biodegrada-tion at a site .
The biological variables, and relevant chemical or geochemical variables related to biodegra-dation, include:
• Contaminant concentrations. Decreasing contaminant (parent compound) concentra-tions are a primary line of evidence for natural attenuation. However, for the most effective natural attenuation, decreases in contaminant concentration should be linked to contaminant destruction rather than to non-destructive processes such as dilution. At high concentrations, the contaminant toxicity may be an impediment to microbial degradation of a compound.
• Daughter products. Degradation of a contaminant produces degradation prod-ucts (daughter products). The increase in daughter product concentrations should be proportional to the decrease in parent com-pound concentrations. The parent/daughter product proportionality can be determined by examining the stoichiometry of the degradation reaction. Daughter products should be measured for evaluating the rate and extent of biodegradation of chlorinated solvents. Reductive dechlorination of PCE yields TCE, which then degrades to DCE, which then degrades to VC, which finally
30

degrades to ethene/ethane (Wiedemeier et al., 1998). The relative distribution of daughter products along the ground-water flow path will indicate the presence or absence of required metabolic processes for subsequent reductive pathways, and allows the determination of rates of reduc-tive dechlorination taking place under field conditions. Daughter products of petroleum compounds such as BTEX are fermentation products (alcohols, fatty acids, etc.) that are considered to be relatively nontoxic and readily biodegradable and non-persistent under most aquifer conditions (Wiedemeier et al., 1998).
• Byproducts. Byproducts may result fromthe biodegradation of a contaminant, such aschloride in the case of chlorinated solvents.
• Oxidation-reduction potential (ORP) orredox potential. The ORP is a generalfield measurement sometimes used as arough indication of petroleum hydrocarbonbiodegradation (and thus, approximatingthe plume location (Wiedemeier et al.,1999)) and type of microorganism likely tobe present and active (e.g., methanogens atlow ORP). Highly negative redox readingstypically are indicative of the biodegrada-tion of electron-donating contaminants(e.g., readily degradable contaminants suchas petroleum hydrocarbons). Oxidation-reduction potential decreases as oxygen, andthen other TEAs (i .e ., nitrate, manganese,sulfate) are removed from the system duringbiodegradation).
• Ground-water organic carbon (Totalorganic carbon (TOC) and dissolvedorganic carbon (DOC)). Both anthropo-genic organic carbon and natural organiccarbon can serve as electron donors, as inthe reductive dechlorination of chlorinatedcompounds (Wiedemeier et al., 1998). Ifanthropogenic organic carbon is lacking,collection of a ground-water sample andmeasurement of the organic carbon content
can indicate if natural organic carbon may be present to serve as an electron donor (Wiedemeier et al., 1998). The heterotro-phic bacteria responsible for much of the biodegradation occurring in natural attenu-ation use organic carbon as their carbon source; inorganic carbon is not used in this process, although heterotrophs have been reported to assimilate small quantities of CO2 (Alexander, 1977). Inorganic carbon, however, does have a role in the carbon cycle, which impacts the ground-water geochemistry .
• pH. Biodegradation processes are pH-sensitive (Wiedemeier et al., 1998); forexample, reductive dechlorination of PCEby Dehalococcoides ethenogenes strain 195is optimum at pH 6.8 to 7.5 (Maymo-Gatell,1997). Changes in pH may occur due toproduction of organic acids during biodeg-radation of organic compounds.
• Temperature. The rate of microbialactivity (e.g., biodegradation) generallyincreases with increasing temperature(although, if there are other limiting factors,increased microbial activity may not occurwith increasing temperatures (Alexander,1994)). Increased microbial activity withincreasing temperature is likely only withinthe range of temperatures tolerated by thebiodegrading microbes. Most soil bacteriaare able to grow at temperatures between15 °C and 45 °C, and have optimal activ-ity between 25 °C and 35 °C (Alexander,1977). Temperatures above those rangescan adversely impact microbial activity andsurvival .
At most sites and under normal conditions,however, temperature would rarely havea significant impact on natural attenuation(geothermal water perhaps being an excep-tion). Significant temperature variations areunlikely since ground-water temperaturesare relatively constant. However, for near-surface soils and ground water in colder
31

northern regions, seasonal effects may • Iron. The TEA ferric iron (Fe(III)) is occur, such as with the warmer temperatures during summer (Alexander, 1994).
• Alkalinity. Increases in ground-water alkalinity are expected in response to the production of carbonic acid as CO2 from microbial activity (in areas with carbonate minerals, dissolution of the minerals by the carbonic acid also contributes to alkalinity).
• Dissolved oxygen. Microorganisms preferentially use DO as a TEA when using organic carbon contaminants as electron donors. Areas of petroleum hydrocarbon or other organic carbon contamination will be expected to have DO depletion compared to background DO levels. If background DO levels are high, little or no DO at a site is usually indicative of the presence of contamination, which may or may not be the contaminants of primary concern, acting as electron donors for a viable population of aerobic microbes. Some biodegradative processes and microorganisms are inhibited by oxygen; for example, the presence of oxygen prevented reductive dechlorination of PCE by Dehalococcoides ethenogenes strain 195 (Maymo-Gatell, 1997).
• Nitrate. Nitrate depletion with respect to background indicates that nitrate is serv-ing as a TEA when contaminants or other sources of organic carbon are acting as an electron donor. If background nitrate levels are high, low levels of nitrate at the site may be indicative of the presence of contamination acting as electron donors for nitrate-reducing microbes.
• Manganese. Mn(II) may be present as a reduction product of the TEA Mn(IV). Manganese has been a less commonly measured TEA and transformation product; however, it should be routinely measured to provide additional information on the electron-accepting processes occurring at a site .
seldom measured, as it occurs in the solid phase rather than the dissolved phase. However, the soluble ferrous iron, Fe(II) is a reduction product of Fe(III) and is more easily measured. Elevated levels of ferrous iron with respect to background levels typi-cally indicate that contaminants and other sources of organic carbon are being utilized by iron-reducing microbes. If background ferrous iron concentrations are low, then higher concentrations on site may be used as an indication of petroleum hydrocarbon biodegradation and of the relationship between the plume and the metabolic by-product Fe(II) (Wiedemeier et al., 1998).
• Sulfate. Depletion of sulfate with respect to background sulfate concentrations indicates that sulfate is serving as a TEA when contaminants or other organic materi-als are acting as a carbon source. If back-ground sulfate levels are high, low levels of sulfate at the site may be indicative of contamination biodegradation accomplished by sulfate-reducing bacteria. Sulfide is a product from the reduction of sulfate; sulfide is readily reoxidized to sulfate in the presence of oxygen, or precipitated as metal sulfides, so sulfide may not be present in high concentrations even if significant sulfate reduction is taking place.
• Methane. Methane is produced during methanogenesis, when CO2 is used as a TEA during biodegradation of petroleum hydrocarbons and other organic compounds. The presence of methane above background levels may indicate that microbes have depleted all other TEAs. Elevated levels of methane may sometimes be used as an indication of petroleum hydrocarbon bio-degradation. However, methane may also be formed under natural conditions (e.g., “swamp gas” in wetlands). The presence of naturally formed methane may pose difficul-ties in attributing methane to the presence
32

and natural attenuation biodegradation of contamination .
• Dissolved hydrogen. Dissolved hydrogen is an electron donor for halorespiration of some chlorinated compounds, and is produced by fermentation of various organic compounds such as petroleum hydrocar-bons and other organic carbon compounds (Wiedemeier et al., 1999). The dissolved hydrogen concentration can be used to determine whether reductive dechlorina-tion is possible. Also, dissolved hydrogen can be used to more accurately identify the actual terminal electron-accepting processes when other indicators are incon-clusive (Lovley et al., 1994 and Löffler et al., 1999). This is a specialized, and less common measurement, although there are commercial labs that provide these analyses on a routine basis.
• Microbial community. The subsurface microorganisms can be classified based on their characteristics, the environmental conditions under which they live, or on their effects. In general, aerobes (aerobic populations) live under aerobic condi-tions, anaerobes (anaerobic populations) under anaerobic conditions, and faculta-tive microorganisms can live under either aerobic or anaerobic conditions. The microbes may also be classified as to the geochemical impact they have (i.e., sulfate reducers or methanogens), or by their genus or species (e.g., Dehalococcoides sp., or Dehalococcoides ethenogenes) . Some general identification, measurement, and classification of the subsurface micro-organisms as to their behavior or effects will provide greater understanding of the microbial processes occurring at the site. This characterization can include the com-position and physiological capabilities of the microbial community, and the density (population) of its various components. Characterization of the microbiological
community is important primarily for sites with chlorinated solvents, since complete biodegradation of the toxic chlorinated compounds requires the presence of spe-cific microbes that are not always present at a site .
• Stable isotopes (2H/1H and 13C/12C). Stable isotope geochemistry has been used to evaluate contaminant biodegradation (dis-cussed in more detail in Section 2.10.1.1). For example, stable isotope geochemistry has been used to indicate if a particular chlorinated compound is a daughter product resulting from biodegradation or whether it was a compound present in the original contamination source .
Changes in various geochemical indicators accompany biodegradation, and help not only to show that biodegradation is occurring but also indicate what primary TEA processes are occurring throughout a site . Geochemical data and trends can be used to provide the following kinds of information related to biodegradation:
• Whether ambient redox conditions and processes favor biodegradation of the contaminants, as well as identifying the dominant degradation processes and long-term monitoring parameters indicative of the continuing effectiveness of the biodegra-dation processes.
• Whether stoichiometric relationships between TEA (oxygen, nitrate, sulfate, etc.) utilization and contaminant biodegradation are observable. If a clear relationship is observed, this may help provide an indica-tion of the rate of contaminant loss during biodegradation; Dupont et al. (1998) state that the rate and extent of microbial utiliza-tion of TEAs during biodegradation should correspond to observed contaminant loss.
• Identification of zones beyond the current
33

plume boundaries where soluble electron acceptors or donors are depleted or non-hazardous reaction products are enriched with respect to ambient ground water but contaminants are not detected. The water in these zones has been called “treated water” (i.e., water that once was contaminated but has been remediated through natural attenuation biodegradation). Monitoring the geochemistry of such zones helps to determine plume stability.
Geochemical variables and trends that may be useful indicators of biodegradation processes are discussed in more detail in Wiedemeier et al. (1998; 1999) and Wiedemeier and Haas (2002). As discussed in these references, the individual variables diagnostic of dominant processes and most useful depend on site-specific conditions.
Key Point
Measurement and interpretation of the biological and geochemical variables provide indirect indications that subsurface processes are occurring to reduce contami-nation. This is the second line of evidence mentioned in the OSWER Directive on MNA (U.S. EPA, 1999).
2.10.1 Direct Approaches to Evaluation of Biodegradation
The site characterization methods and vari-ables discussed above generally involve indirect indicators of subsurface biodegrada-tion processes. Other, more direct methods of evaluating biodegradation have been devel-oped, such as analysis of stable isotopes and evaluation of microbial community structure and dynamics.
2.10.1.1 Microbiological and Molecular Techniques
Techniques have been developed to evaluate microbial community structure and dynam-ics. These techniques are used to determine
whether the microorganisms have the capabil-ity to produce specific contaminant-degrading enzymes, or to categorize the microorganisms relative to functionality (e.g., methanotrophs) or community structure (e.g., population dynamics). For example, the presence and activity of populations of particular species known to carry out biotransformations (e.g., Dehalococcoides sp., associated with reductive dehalogenation of halogenated solvents) can be measured. These relatively more recent meth-ods may become more widely used in MNA site characterization as experience is gained in their use, and as they start providing direct evidence of naturally occurring biodegrada-tion at sites where current information may be inconclusive. Weiss and Cozzarelli (2008) and ITRC (2011) provide thorough and valuable overviews of numerous existing and emerging microbial and molecular methods that can be used for evaluating natural attenuation. They provide examples and discussion of how these methods have been used to investigate subsur-face biogeochemistry at contaminated sites and how they can provide information to evaluate the potential for natural attenuation at a site, or to identify indicators of contaminant biodeg-radation. Microbial and molecular methods include:
• Nucleic acid techniques employing the polymerase chain reaction (PCR) can be uti-lized to detect and enumerate specific gene sequences (Weiss and Cozzarelli, 2008). Quantitative PCR (qPCR) can provide quan-titative information on the genes involved in biodegradation of specific contaminants.
• Fluorescence in-situ hybridization (FISH), which uses fluorescent molecules to mark genes or chromosomes, allows identification of microorganisms containing genes for specific enzymes of interest (e.g., enzymes that remove Cl- from chlorinated solvents). Yang and Zeyer (2003) report on the use of FISH for detecting Dehalococcoides species.
34

• Terminal restriction fragment length poly-morphism (T-RFLP) analysis is a technique that allows rapid profiling of diverse forms of an individual gene (such as 16S rRNA genes (i.e., 16S rDNA)) to help assess the diversity, structure, and population changes of the various functional groups of bacteria (e.g., autotrophic ammonia oxidizers, deni-trifiers, methanotrophs, and methanogens). This may help to determine if particular microorganism groups are present at a site. Lorah et al. (2003) illustrate the use of T-RFLP, in an investigation of anaerobic degradation of 1,1,2,2-tetrachloroethane during natural attenuation of chlorinated VOCs in wetland sediments.
• Phospholipid fatty acid analyses (PLFA) measure the lipids present in the viable microbial biomass and can be used to help differentiate between various groups within microbial communities, and moni-tor changes in the microbial community as contaminant and geochemical concentra-tions and conditions change. PLFA was one of the methods used by Davis et al. (2002) to estimate total biomass for an evaluation of natural attenuation of chlorinated ethenes.
2.10.1.2 Stable Isotope Evaluation Stable isotope fractionation techniques (i.e., compound-specific isotope analysis, or CSIA) can be used to evaluate the biodegradation of organic contaminants such as PCE, TCE, DCE, and VC. Biological degradation of organic compounds using enzymatic processes causes changes in the ratio of hydrogen (2H and 1H) or carbon (13C and 12C) isotopes in the parent compounds and daughter products. The light isotopes are enriched in the daughter products, and the heavy isotopes are enriched in the parent compound as the parent is transformed to the daughter by biological processes. For example, 12C has a smaller mass, forms weaker bonds, and is more reactive than 13C . As TCE is dechlorinated by microorganisms, 12C bonds
are preferentially broken, causing an isotopic enrichment of the remaining TCE in 13C . The relative abundances of 12C and 13C in the supposed parent and daughter compounds can indicate whether the presence of a daughter product is due to biodegradation or whether it was present as an initial contaminant, and can also provide information about the rates of degradation. The use of stable isotopes for investigating biodegradation is discussed in Hunkeler et al. (2008). Further examples of the usage of stable carbon isotopes are pro-vided by Hunkeler et al. (2005), McKelvie et al. (2007), Song et al. (2002), and Wilson et al. (2005) .
2.10.1.3 Microcosm Studies The third line of evidence for evaluating MNA is data from field or laboratory microcosms that can directly demonstrate the processes causing contaminant loss. If the first two lines of evidence are inconclusive (i.e., if informa-tion collected during site characterization of the variables discussed above cannot conclu-sively demonstrate the occurrence of NA), then microcosms studies can be conducted. Laboratory or in-situ microcosms consist of small amounts of environmental media (soil, sediments, ground water) that are isolated or partially isolated from the environment and studied to determine how contaminants degrade in the media.
Microcosm studies may be useful in cases where the contaminant biodegradation path-ways are not well known or where specific site conditions are considered likely to inhibit biodegradation. Biodegradation of common petroleum contaminants is well documented and therefore microcosm studies are not likely to be required. Degradation pathways of chlorinated solvents are fairly well understood, and microcosm studies may not be useful unless the usual site-specific field-derived evidence for degradation is equivocal. In some cases, microcosm studies may be useful to indicate likely ranges of contaminant
35
biodegradation rates, although degradation rates achieved in laboratory microcosms often differ dramatically from those rates calculated from field data. Transformation products may be identified using microcosm studies. The use of appropriate experimental conditions and controls, mass balance measurements, and identification of transformation products may assist in distinguishing and elucidating biotic and abiotic loss mechanisms. The result from microcosm studies conducted by Ferrey et al. (2004) suggested that abiotic degradation processes were responsible for the observed loss of cis-DCE that had been produced by biological reductive dechlorination of TCE. Microcosm studies can also help determine the need for, or impacts of, additives such as nutrients, electron donors, electron acceptors, or bioaugmentation cultures, and to detect toxicity problems (i.e., inhibition of degraders by contaminants or environmental conditions). Ex-situ microcosms, consisting of small amounts of site media brought to the labora-tory, have been widely used for these purposes. In-situ microcosms, involving some method of partially isolating the environmental media (e.g., by driving a pipe into the subsurface to partially isolate the media forced into the pipe from the rest of the subsurface), have been less commonly used.
Ex-situ microcosm studies suffer from prob-lems associated with removal of samples from the site (e.g., shock to microorganisms upon sampling and removal to laboratory conditions) and the general differences in environmental conditions between the laboratory and field (e.g., contaminant and geochemical fluxes, temperature cycles, and other natural fluctuations under field condi-tions). In-situ microcosms are considered more likely to be representative of field conditions, but may involve more expense for preparation and monitoring than ex-situ microcosms. Both types of microcosms suffer from the fact that the media used in the microcosm represent a very small portion of
the subsurface, considering the well-known temporal and spatial variability of subsurface conditions. Therefore, although microcosm studies can provide a general indication of the items discussed in the preceding paragraph, the results may not apply to all portions of the subsurface. However, for contaminants where there may be some uncertainty regard-ing their biodegradability, a microcosm study may provide one additional piece of evidence in deciding whether or not to continue the site characterization and MNA evaluation.
Key Point
Microcosm studies are part of the third line of evidence mentioned in the OSWER Directive on MNA (U.S. EPA, 1999). Information from this line of evidence may be particularly useful if the information from the other two lines of evidence is inconclusive .
36
3.0 THE MNA SITE CHARACTERIZATION PROCESS
3.1 Introduction Contaminated sites generally undergo the fol-lowing sequential stages of investigative and remedial activities:
• Recognition of a contamination problem.
• Initial assessment of currently available information about the site.
• Site characterization, encompassing the collection of more detailed, current site information through field investigations and monitoring (e.g., ground-water data).
• Assessment and screening of potential remedial approaches.
• Collection of detailed data specific to a par-ticular issue and/or to designing, implement-ing, and monitoring a particular remedial approach.
• Design, implementation, and monitoring of the remedial approach.
At some point during these activities (e.g., during the site characterization stage), the potential for the use of MNA as a remedial technology may be suggested if it is noted that NA processes may be occurring at the site, if it is realized that the site may have characteristics common to other MNA sites, or if the dissolved contaminant plume is stable or receding. At that point, specific activities relevant to and constituting the MNA site characterization can be undertaken. For sites with contaminants and conditions poten-tially amenable to MNA (e.g., chlorinated solvents sites with anaerobic ground water, or petroleum-hydrocarbon fuel sites), collec-tion of information relevant to MNA (such as
TEA concentrations) at the beginning of the site characterization process could speed the assessment of MNA.
A significant portion of site characterization activities consists of mobilization to the field and collection of soil and ground-water quality data. An expedited approach, such as the EPA Triad approach (discussed in Section 3.2.1), can be a powerful and cost effective strategy in conducting these activities. However, in a broad sense, site characterization involves acquisition of information that will help in understanding the contamination and potential remediation of a site; this occurs during all site activities and not just during one field mobili-zation. Thus, some site characterization could occur and be useful during any of the investi-gative and remedial stages mentioned above. In this broad sense, site characterization should be an iterative process, in which additional information is collected to address additional questions or potential approaches that arise.
On-going development and refinement of a detailed conceptual site model is especially important during MNA site characterization, as collection and interpretation of the numerous types of field data provide new insights on the subsurface conditions and processes relevant to effective MNA. Uncertainties regarding specific values of variables can be addressed by making conservative assumptions for those values, and conducting sensitivity analyses to determine the impact of those assumed values. This allows the site characterization and the MNA decision-making process to move forward.
37

3.2 MNA Site Characterization Activities
The general likelihood of the potential for successful MNA can be assessed during the initial MNA site characterization activities. Initial activities for assessing the potential for MNA and the scope of further characterization should address the following issues:
• Identification of unacceptable current impacts on receptors, or a realization that contaminants are very unlikely to degrade to acceptable levels before they reach the potential receptors, suggests that MNA will not be effective and that some active reme-dial technology would be needed to stop the current or impending receptor impact.
• The types of contaminants present (based on the historical records and sample analytical results from monitoring wells) should be identified to assess if they are amenable to MNA. Sites with a single contaminant (e.g., benzene or PCE) or single class of contaminant (e.g., petro-leum hydrocarbons or chlorinated ethenes) often are more appropriate for MNA than those sites with multiple different types of compounds (e.g., a site with chlorinated ethenes, chlorinated ethanes, heavy metals, and PAHs). However, sites with both petroleum hydrocarbons and chlorinated solvents are especially amenable to MNA. Further, some VOCs are more recalcitrant than others and less easily attenuated under certain site conditions. The initial identifi-cation of VOCs at a site may indicate that potentially more recalcitrant byproducts (such as cis-DCE and vinyl chloride at chlo-rinated ethene sites) have accumulated; this indicates that natural attenuation processes may not be occurring sufficiently to meet remedial goals.
• Sites with significant geologic complex-ity will likely have a lower probability than sites with less complex geology of
definitively documenting success using MNA, and will likely be more difficult and expensive to accurately characterize.
• The tools and techniques used to character-ize the site for MNA should be evaluated. The costs for the methods used should be weighed against the amount and quality of information that can be obtained. Sampling and analysis costs will also affect any assessment of costs for MNA characteriza-tion methods, especially if some longer-term monitoring is needed to collect sufficient data for evaluating plume behavior as part of the MNA site characterization.
• Ground-water flow should be assessed by monitoring a sufficient number of piezom-eters and/or ground-water monitoring wells (including wells in transects) on a sufficient basis to determine temporal variations of the flow pattern over seasonal changes throughout the year .
• The geochemistry required to promote natural attenuation needs to be addressed. If the geochemistry of the site is shown to be highly variable (either temporally, spatially, or both), then it may be difficult to correlate TEA and electron donor (e.g., petroleum hydrocarbon contaminant) use to demonstrate that the MNA will achieve site remedial goals across the site and through-out time .
If MNA appears to have only a limited chance for success, those site characterization activi-ties relevant only to MNA can be stopped, and other remedies can be considered. However, the MNA site characterization may indicate that while MNA might not be effective, enhanced bioremediation technologies perhaps might be effective, and the MNA site charac-terization could continue as characterization for those technologies. In cases where MNA appears to be a potential alternative, MNA site characterization would continue.
38
Table 3 lists the MNA site characterization activities, in a general sequential order from initial steps (recognizing that MNA might have potential applicability at a site) through final steps (making recommendations for imple-menting MNA). The activities are discussed throughout the rest of this document. Not all of these activities will be necessary at every site. The activities to be conducted depend on the scale and complexity of the site, the type and amount of existing information, and other activities at the site; they can also be influ-enced by cost and time constraints. Additional discussions regarding the site characterization process can be found in Wiedemeier et al. (1998).
MNA site characterization is not likely to be a stand-alone activity; it occurs in conjunction with other activities at a site. Some of the site characterization activities would be conducted even if MNA were not being investigated, for example, during the Remedial Investigation (RI) phase of the CERCLA process. The variables that may be unique or specific to an MNA site characterization are the microbio-logical and geochemical variables, which relate to biodegradation processes. However, those variables may be investigated even if MNA is not being proposed, for example, during evalu-ation of enhanced bioremediation.
MNA may be evaluated as a potential remedial technology, for example, during the Feasibility Study (FS) phase of the CERCLA process. For some sites, it may be a stand-alone tech-nology; however, for many sites where MNA appears potentially effective, it is likely to be part of a set of combined technologies. This may involve using MNA for the downgradi-ent, lower-concentration portion of a dissolved plume and/or as a longer-term polishing step in an area that is first treated with a more aggres-sive technology. The role of MNA in overall site remediation can affect the type, location, and duration of the MNA site characterization activities, since the impacts or monitoring
requirements of any other site activities need to be considered.
39

Table 3 Approach to and Sequence of MNA Site Characterization Activities.
PRELIMINARY ACTIVITIES Review Existing Information • Review existing conceptual site model. • Review site setting, history of site uses, contaminant characteristics, and waste release history. • Review existing contaminant concentration data. • Obtain and review existing literature on local and site-specific geology and hydrogeology. • Review previous characterization activities and data on geology, hydrogeology, contaminants, and
geochemistry . • Review past and present remedial activities. • Review potential receptor locations.
Preliminary Evaluation of Natural Attenuation • Examine preliminary evidence for the occurrence of natural attenuation processes, based on existing
information . • Establish preliminary remedial goals. • Conduct literature review of the efficacy of biodegradation or other attenuation processes for the contaminants
of concern . • Develop preliminary MNA conceptual site model. • Make recommendations for continuing MNA-specific site characterization and investigation.
FIELD SITE CHARACTERIZATION ACTIVITIES Planning • Evaluate suitability of existing monitoring locations for MNA data collection. • Determine if there is suitable recent hydrogeological information (to include piezometric surface elevations);
evaluate this information for ground-water flow directions. • Assess site geological conditions to determine appropriate subsurface boring techniques and methods, subsur-
face contaminant delineation techniques, and geophysical measurement techniques. • Plan monitoring point or monitoring well locations and construction details. • Plan location, number, and description of transects. • Establish monitoring parameters, analytical methods, and sampling frequency. • Prepare Sampling and Analysis Plan. • Prepare Quality Assurance Project Plan. • Prepare Health and Safety Plan, as needed.
Implementation Some of these items may require additional iterations, as data are evaluated, although the use of the Triad approach (expedited characterization) should minimize such iterations. • Conduct site-specific reconnaissance and surface mapping. • Conduct comprehensive synoptic round of piezometric surface elevation measurements, contaminant and
geochemical sampling, and laboratory analyses using existing monitoring locations (only if suitable for use for MNA variables).
• Conduct surface geophysical measurements. • Conduct direct-push borings, temporary well installation, logging, soil sample collection, ground-water sample
collection, and subsurface contaminant delineation. • Install monitoring wells, based on direct-push results and/or laboratory results from temporary wells.
• Conduct geophysical logging of newly installed wells. • Conduct comprehensive synoptic MNA-specific baseline round of piezometric surface elevation measure-
ments, contaminant and geochemical sampling, and laboratory analyses using all suitable monitoring locations (including newly installed wells).
• Conduct real-time evaluation of sample results and assessment for additional sampling locations. • Perform hydrogeological measurements (e.g., aquifer tests), as needed • Conduct periodic synoptic rounds of piezometric surface elevation measurements in monitoring wells. • Conduct periodic synoptic rounds of monitoring well contaminant and geochemical sampling and laboratory
analyses .
40

Table 3 continued...
• As samples are collected, conduct laboratory analyses and measurements of soil and ground water for geological, hydrogeological, contaminant, and geochemical variables (e.g., grain size, hydraulic conductivity, contaminant concentrations, TOC, and DOC).
MICROBIOLOGICAL LABORATORY STUDIES (As Needed) • Microbiological and molecular techniques to identify microbes and determine if suitable microbes are present. • Stable isotope evaluation. • Conduct microcosm studies.
CHARACTERIZATION DATA ORGANIZATION FOR UPDATING CONCEPTUAL SITE MODEL
Geological and Hydrogeological Variables Information • Describe stratigraphy, lithology, geological structures, geological units, and hydrostratigraphic units . • Prepare tables of geologic and hydrogeological data (e.g., grain size, hydraulic conductivity), with appropriate
statistical measures . • Prepare maps and transect cross-sections showing the geologic and hydrogeologic setting of the site. • Prepare piezometric surface maps for each hydrostratigraphic unit.
Anthropogenic and Anthropocentric Variables Information • Describe engineered features, wells, and receptors. • Assess impact of anthropogenic variables on contaminant fate and transport.
Contaminant Variables Information • Prepare tables of contaminant concentration data, with appropriate statistical measures. • Prepare maps of contaminant concentration data for each hydrostratigraphic unit. • Prepare cross-sections with contaminant concentration data for each transect (transverse to plume, and longitu-
dinal/plume centerline.).
Geochemical Variables Information • Prepare tables of geochemical data (i.e., TOC/DOC, electron acceptor, electron donor, daughter product, and
reaction byproduct concentrations), with appropriate statistical measures. • Prepare maps of geochemical data for each hydrostratigraphic unit. • Prepare cross-sections with geochemical data for each transect (transverse and longitudinal/plume centerline.).
Biological Variables Information • Prepare tables of biological and microbiological data, with appropriate statistical measures. • Prepare maps of biological and microbiological data for each hydrostratigraphic unit. • Summarize relevant literature on biodegradation of site contaminants.
CHARACTERIZATION DATA ANALYSIS AND INTERPRETATION • Update conceptual site model (an iterative process as data are collected). • Evaluate contaminant properties and applicable attenuation processes. • Evaluate contaminant phase distributions (dissolved, sorbed, NAPL), and controls on the phase distribution. • Evaluate and describe contaminant source(s). • Identify microbial populations, applicable degradative processes, and the necessary environmental conditions
for microbial activity. • Conduct statistical evaluation of data, to assess uncertainty. • Identify the three-dimensional nature, spatial variability, and temporal variability of conditions and processes at
the site, and their impact on the MNA interpretations
41

Table 3 continued...
• Prepare maps and cross sections showing spatial distribution and relationships of hydrogeology, contaminant concentrations, and geochemical data.
• Identify and map representative zones and flow paths. • Calculate contaminant velocities in ground water, retardation, and travel times to receptors. • Estimate contaminant mass or mass flux, and spatial or temporal changes at or between transects. • Analyze trends in contaminant, geochemical, and biological data and relevance to natural attenuation
processes. • Calculate attenuation rates (Concentration vs. Distance, Concentration vs. Time, and biological). • Conduct mathematical modeling of contaminant fate and transport. • Evaluate impact on MNA of other actual or potential remedial activities, and other near-site activities. • Calculate MNA remedial time frames, relative to the remedial goals for the site. • Prepare MNA site characterization report and recommendations.
RECOMMENDATIONS (AS WARRANTED) • Provide recommendations on the need for longer-term characterization and trend evaluation prior to MNA
remedy decision-making.• Provide recommendations on the applicability and use of MNA as a stand-alone technology or as part of a set
of combined technologies for all or portions of the site. • Provide recommendations on monitoring locations, frequencies, parameters, sampling methods, and analytical
methods for longer-term characterization and trend evaluation prior to MNA remedy decision-making, and/or for MNA performance monitoring.
42

3.2.1 Site Characterization Methods
Site characterization for MNA will often require the acquisition of relatively large amounts of vertically and laterally discrete data. The speed and ease of direct-push sampling, if geologic conditions permit its use, allow data to be gathered from many discrete locations (and some direct-push equipment has continuous logging capabilities). The direct-push characterization data, as well as data from temporary wells, can also be used to select the most representative permanent sampling locations for MNA performance monitor-ing. At sites where direct-push equipment cannot be used due to geological conditions, nests of conventional monitoring wells can be installed at depth intervals appropriate to the site geology, hydrogeology, and contaminant distribution.
In some cases, innovative technologies can be used to expedite the site characterization. Surface geophysical techniques, soil conduc-tivity probes, and contaminant sensors such as membrane interface probes (MIP) may aid in determining the location for monitoring points, in the collection of information on the MNA variables, and in initial delineation of repre-sentative zones. They can aid in delineation of the source area, providing information on the source area variables to be used in attenu-ation time frame calculations. However, they may not provide data of quality comparable to laboratory analytical data for items such as ground-water contaminant concentrations.
Accomplishing a detailed MNA site char-acterization investigation in a cost-effective manner often requires the use of rapid sample acquisition and analysis technologies by highly trained field personnel, and the flex-ibility to adjust the field activities based on real-time data. EPA and other Federal and State agencies developed the “Triad” approach (Crumbling, 2001), a set of strategies to use new sampling and analysis techniques along with real-time communication with interested
parties to enable investigators to support field-based decision making. This approach was developed to decrease the total costs of site characterization, as well as of subsequent remediation and performance monitoring. The Triad approach consists of three fundamental elements:
• Systematic planning based on an evolving conceptual site model.
• Dynamic work strategies (i.e., a work plan that is modified in the field based on field results) .
• Real-time measurement technologies, using rapid sampling techniques such as direct-push technologies, fast-turnaround fixed laboratory analyses, and/or on-site analysis, which allow rapid use of the results to influ-ence the field activities.
The expedited site assessment (ESA) approach and specific relevant methods and techniques are discussed in U.S. EPA (1997), focusing on use at underground storage tank locations. U.S. EPA (1997) describes the ESA approach and how it compares to conventional site assessment approaches. It provides detailed information on surface geophysical methods, soil-gas surveys, direct push technologies, and field analysis of petroleum hydrocarbons. A variety of sampling and analysis techniques are described in numerous other technical docu-ments, such as U.S. EPA (1986; 1991; 1993) and Wiedemeier et al. (1998).
3.2.2 Site Characterization Locations
The overall objective of MNA site character-ization is to provide site information regarding natural attenuation processes that will allow evaluation of MNA as a potential remedial technology. This requires selecting locations for sampling and monitoring, discussed below. The MNA site characterization activities may gradually transform into longer-term monitor-ing if MNA is implemented as a remedial
43

technology. The monitoring locations selected and used during the site characterization and initial evaluation of MNA might be utilized during early performance monitoring and longer-term monitoring (i.e., during long-term stewardship of the MNA site), since, presum-ably, they have been carefully selected to yield information specific to MNA. However, the total number and density of transects and monitoring locations may be different during these different stages of monitoring. For example, fewer transects might be used during the longer-term monitoring if the focus is on compliance boundaries rather than three-dimensional monitoring of the entire plume. In some cases, new transects might be needed for the longer-term monitoring, for example, if the site characterization has better identified the location of a critical flow path. In any case, the site characterization will provide data to establish the detailed three-dimensional CSM so that monitoring point locations and sampling frequency for performance monitor-ing can be determined.
MNA site characterization locations are based on the following considerations:
• Plume lateral (i.e., sidegradient) boundaries should be defined. A cluster of wells can be placed on each side of the plume in uncon-taminated ground water, for each transverse transect across the plume. These boundary monitoring wells can be placed a short distance outside each lateral plume bound-ary and, ideally, coupled with another well just inside the plume boundary (i.e., paired well clusters to define the plume bound-ary). Variations or trends in contaminant concentrations in these coupled wells can be used to monitor for lateral expansion or shifting of the plume. If the plume bound-ary location shifts, new paired well clusters can be installed.
• Plume vertical boundaries should be defined, by well clusters or points extending
to an uncontaminated interval beneath the plume.
• The downgradient extent of the plume should be defined and monitored, using a transect of wells or points placed downgra-dient of the plume and in its flow path, and upgradient of potential receptors. These downgradient locations can be used to allow detection of an expanding plume and initia-tion of an alternate remedial action prior to contaminants impacting the receptors.
• Background wells or a transverse transect of background wells upgradient of the source area will provide the background geochemi-cal variable data necessary for comparison to information collected within the plume.
• A longitudinal transect (i.e., a transect along the plume centerline, which is the longitudi-nal axis of the plume) can provide the con-taminant, geochemical, and microbiological variable information necessary to calculate attenuation rates. The individual locations in this longitudinal transect ideally are placed in the highest concentration portion of successive downgradient cross-sections (i.e., transverse transects) of the plume. The initial presumed plume centerline location can be estimated based on the initial site data. This estimated location of the plume centerline may need to be reconsidered and/or refined as additional data are col-lected and as a better understanding of the site develops through interpretation of the data. A well-defined plume centerline may not exist: rather, there may be a somewhat broader region encompassing the center of the plume.
• Multiple transverse transects across the plume at different locations along its flow path will provide information on the spatial variability of, and changes in, the MNA variables. Comparison of flux rates across these transects should allow the determina-tion of contaminant degradation rates in
44

the plume. Each transverse transect should encompass the entire plume width at that location. A transverse transect located immediately downgradient of the source area provides information on the contamina-tion leaving the source area (i .e ., the source area flux) and moving downgradient into the dissolved-phase plume. The use of three or more transverse transects will help in accu-rately understanding the three-dimensional hydrogeological and geochemical environ-ments of the site. For example, transects could be spaced so that each transect measures contaminants at significantly lower concentrations (such as at order of magnitude changes) than the preceding upgradient transect. Correct placement of these transects to achieve such a spacing may require some initial sampling along the longitudinal axis of the plume.
• The spacing and number of locations laterally for each transverse transect should be based on the size, heterogeneity, and geologic complexity of the site. The initial sampling location can be near the initially presumed plume centerline. Once sampling locations have been established to define the lateral boundaries, additional lateral transect sampling locations within each side of the plume can be placed halfway between the plume centerline location and the boundary locations. Three locations within the plume would be considered the minimum number needed within the plume for each transverse transect (in addition to two outside the plume to define the plume boundaries). Sites with broad plumes might need addi-tional sampling locations in a given trans-verse transect. Additional transect sampling locations can continue to be placed halfway between each previous set of adjoining sampling locations, resulting in a progres-sively denser network of sampling points. In general, the density of lateral sampling points is increased until a consistent and identifiable pattern is evident in contaminant
or geochemical concentrations along the transverse transect. Figure 6 provides an example of transect development.
• The depth, location, and length of well screens, and the number of sampling loca-tions vertically at each transect location, depend on the geological and hydrogeologic complexity of the subsurface. At least one sampling location is necessary within each discrete vertical zone of interest (i.e., zone of contaminated ground water). Sites with a number of different relatively thin geologic units and flow zones (and thin flow zones in thick geologic units) might necessitate more intensive sampling and shorter well screens to differentiate the different units. Relatively thick or homogeneous geologic units could be characterized with longer well screens or more widely spaced vertical or lateral sampling locations.
• All hydrostratigraphic units in contaminated and adjacent areas at the site should be represented in the transects and sampling locations (areally and vertically).
Figure 7 illustrates a hypothetical ideal set of transects and sampling locations for an MNA site. Transect development and sample spac-ing are discussed by Guilbeault et al. (2005) and Kao and Wang (2001). In general, the number and spacing of both lateral and vertical sampling locations (i.e., sampling density and transect complexity) need to match the geo-logical complexity of the site. For example, interbedded sands, silts, and clays may require a higher lateral and vertical density of sam-pling points since the units may not be laterally continuous and are likely to be relatively thin. Further, it may be necessary to factor in the potential for multiple sources, multiple path-ways, and natural or anthropogenic preferential pathways. In many cases, there is a focus on defining the boundary of a plume, and poten-tial additional sources inside the plume could
45

be missed if the sampling points inside the plume are too sparse.
Due to site conditions (e.g., engineered features) or constraints on resources or time, it may not be possible to have an ideal number of transverse transects, with their resulting increased number of lateral and vertical data points. The transect approach, however, even with fewer transects, will often provide more valuable information than the use of more scattered sampling points or the use of existing monitoring wells that may not permit adequate delineation of ground-water flow paths or estimation of contaminant flux.
46

Figure 6. Transect Development. Placement of transverse and longitudinal transects occurs in a sequential manner until the areal and vertical extent of the plume is well-defined and the three-dimensional nature of the subsurface is understood. (a) An initial transverse transect is placed near the presumed source area. (b) Additional locations are investigated along the initial transect. (c) The results from subsurface sampling provide definition of the vertical and transverse extent of contamination along the first transverse transect. (d) Second and third transverse transects are placed downgradient of the first transect. (e) Sampling locations are placed along the presumed longitudinal axis of the plume. (f) A transverse transect downgradient of the previous transects defines the downgradient extent of the plume.
47
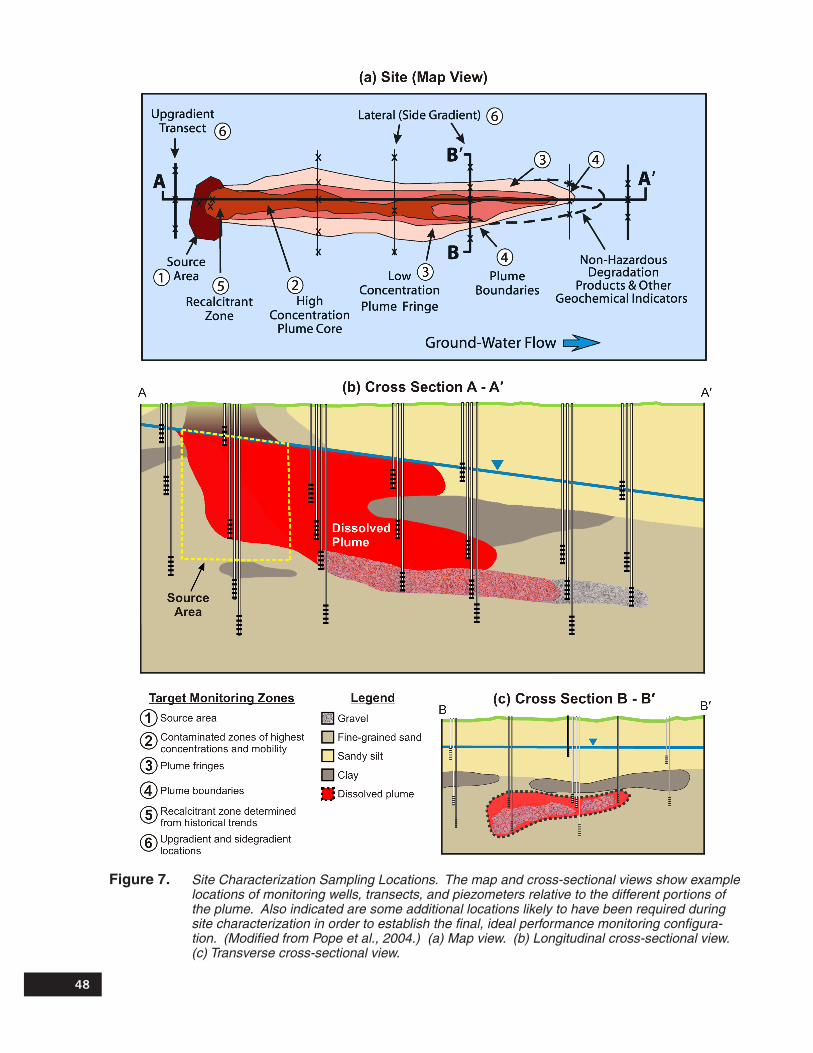
Figure 7. Site Characterization Sampling Locations. The map and cross-sectional views show example locations of monitoring wells, transects, and piezometers relative to the different portions of the plume. Also indicated are some additional locations likely to have been required during site characterization in order to establish the final, ideal performance monitoring configuration. (Modified from Pope et al., 2004.) (a) Map view. (b) Longitudinal cross-sectional view. (c) Transverse cross-sectional view.
48

4.0 INTEGRATING AND EVALUATING SITE DATA
4.1 Introduction Data collected during initial site characteriza-tion activities and during subsequent more detailed site characterization activities focusing on MNA are used to develop the conceptual site model, an understanding of subsurface processes, and attenuation rate estimates, in order to assess the potential for MNA as a site remedial technology.
Assessment and integration of the data involve several basic steps:
• Placing the data in a context of time, loca-tion, sampling protocols, and analytical protocols. The time context includes data collected during the site characterization, supplemented by historical data (although the historical data must be scrutinized for comparability to the data collected during the MNA site characterization). The loca-tion context includes the geological (i.e., stratigraphic) setting, as well as the lateral and vertical position of the data within the site. Sampling protocol context includes the lengths and positions of well screens, as well as sampling methods. Analytical protocol context includes analytes measured and detection limits.
• Calculation of basic statistical measures (means, ranges) . In calculating means from data, one should consider whether the data fit normal distributions (e.g., porosity data), log normal distributions (e.g., hydraulic conductivity data), or some other form of distribution.
• Presentation and visualization of the data using tables, graphs, charts, maps, time-series plots, and cross-sections. Use of a variety of visualization methods can
enhance the understanding and interpreta-tion of the relationships and patterns among time, location (distribution), physical processes, biological processes, and geo-chemical processes in the subsurface.
• Applying appropriate statistical tests to detect changes and trends, to assess the potential for attainment of goals.
• Making decisions based on the data.
The conceptual model for MNA, the site characterization program, and the data assess-ment are modified in an iterative manner as necessary during the data evaluation process to reflect new data and new understandings of the site architecture and processes.
4.2 Data Analysis Considerations 4.2.1 Data Quality Assessment (DQA)
Process
Established standards of practice should apply to MNA site characterization data analysis, such as the U.S. EPA’s Data Quality Assessment (DQA). DQA is “the scientific and statistical evaluation of environmental data to determine if they meet the planning objectives of the project, and thus are of the right type, quality, and quantity to support their intended use” (U.S. EPA, 2006). Given the large amount and numerous types of data developed during MNA site characterization, a thorough evaluation of the data type, qual-ity, and quantity is critical. The DQA process is discussed fully in U.S. EPA (2006) and is discussed relative to MNA performance monitoring in Pope et al. (2004).
The DQA process provides a means for determining changes and trends. Data on contaminant concentrations, geochemical
49

variables, and ground-water flow variables are assessed with respect to levels, changes, and trends. Contaminant changes are direct measures of remediation goals, and geochemi-cal and ground-water flow data are important for assessing contaminant transport, fate, and attenuation processes. The data must be inter-preted in light of data variability so that real changes or trends in data values can be distin-guished from data variability. This is particu-larly important in visualizing and quantifying three-dimensional concentration distributions, in estimating rates of natural attenuation, and in making predictions of the time frame to achieve remediation goals. Evaluations should be performed to determine the uncertainties and variability associated with data or analyses (and the degree of variability associated with an individual measurement, or the means of measurements, should be indicated).
4.2.2 Statistical Considerations
It is prudent to consult a statistician or appropriate literature on statistics during the planning phase (before collecting data) with respect to statistical considerations. This will help ensure that a sufficient amount of data, and the right type of data, are collected to address any hypotheses that are established up front. Detailed discussions on the statisti-cal issues mentioned below is provided in U.S. EPA (2009).
In order to use characterization data from indi-vidual locations or sets of locations to make scientifically-defensible inferences about other parts of the site (i.e., the rest of the plume), it is necessary to use statistical procedures that provide a systematic way to estimate plume characteristics from individual data points or sets of data points, or to evaluate changes and trends.
In choosing and applying an appropriate statistical test for a particular analysis, it is necessary to consider:
• The purpose of the test (i.e., detect a trend, compare means to a threshold value, etc.). MNA characterization data are primarily used to investigate trends, examine correla-tions between variables, and estimate rates of degradation.
• Sampling design (sampling location). Most commonly used statistical tests assume that the data are the result of random sampling (i.e., that the data are taken from randomly chosen sampling locations). However, monitoring well location is often based on professional judgement, and sampling tran-sects for MNA site characterization are not randomly located. In those cases, results from random-sample-based statistical tests should be viewed with caution; preferably, more appropriate statistical tests should be used.
• Sampling design (sampling frequency). Statistical tests can require sample statistical independence. Contaminant concentra-tions in a well at different sampling events are often related to each other because they are derived from the same source and are transported by the same processes. If the data are not independent, some basic analyses may be readily adjusted to account for non-independence using methods in U.S. EPA (2009; 1992). Spacing sampling events appropriately in time can help attain physical independence of samples from a well. Discussion and guidance on taking physically independent samples is found in U.S. EPA (2009; 1992).
• Data characteristics. Probability-based statistical test (the two major types are parametric and nonparametric) selection is based on the probability distribution of the data. Parametric tests rely on certain underlying assumptions about the form and parameters of the data distribution (e.g., normal or log-normal distribution). Testing for normality and equal variance (see
50

U.S. EPA (2009; 2006; 2002a)), and data transformation may be needed for paramet-ric tests. Nonparametric tests do not require any assumptions about the distribution of the data.
• Outliers are data values that are extremely large or extremely small when compared to the bulk of the data. They may be true data or a result of error. Excluding true data or including erroneous data in a statistical test will distort the results of the statisti-cal analysis. Identification of outliers (see U.S. EPA (2009; 2006; 2002a)) and a course of action if outliers are identified may be necessary. The first step in assessing potential errors in data would be to conduct a data quality review, prior to applying statistical tests to the data set.
• Non-detects. Quantitative values must be established to conduct statistical tests using data sets that contain any “non-detect” values. Methods to do so are discussed in U.S. EPA (2009), Chapter 13 of Helsel and Hirsch (2002), and in Gibbons and Coleman (2001).
• Multiple comparisons. Statistical analyses of data sets often involve making many comparisons within and among data sets. However, multiple comparisons for many probability-based statistical methods can increase the possibility of a false posi-tive (Type I error), and using methods to control for Type I error can increase the possibility of a false negative (Type II error). U.S. EPA (2009; 2006; 2002a; 1992) contain methods for assessing the effects of Type I and Type II errors.
For a detailed discussion of the considerations for choosing statistical tests, as well as step-by-step methods or guidance for calculations, see U.S. EPA (2009; 2006; 2002a; 1992). Statistical software resources are listed at http://www.epa.gov/QUALITY/qa_links.
html#software . If necessary, a statistician with experience in working with contaminated sites should be consulted to determine the most appropriate statistical methods for analysis of the data.
4.3 Data Analysis 4.3.1 Data Comparisons
Data comparisons are often made as part of the performance monitoring phase of an MNA remedy (Pope et al., 2004); these data com-parisons can also have utility during the site characterization phase. The data comparisons include:
• Comparisons with background levels. Differences in parameter values between the plume and background locations can indi-cate the occurrence of biological processes, as discussed in Section 2.7.1.2.
• Comparisons of contaminant levels with regulatory requirements can be used to identify and map the portion of a plume that exceeds regulatory levels, and to identify sampling and transect locations.
• Comparisons to determine if contaminant or daughter product levels are increasing or decreasing. These comparisons include both trend tests to determine upward or downward concentration trends through time, and intrawell comparison tests (Gibbons, 1994), which compare recent data at a monitoring location to historical or previously collected (e.g., baseline) data at the same location. The monitoring period required to reliably determine if contami-nant levels are increasing or decreasing is likely to be longer than the time allotted for the site characterization, so trends may not be as readily apparent during the site char-acterization as during performance monitor-ing. It may be possible to integrate site characterization data with prior, historical data to assess trends, although care must be taken to ensure that data are comparable. In
51
particular, care must be taken when compar-ing ground-water data pre- and post-source zone actions. Another approach would be to conduct an extended monitoring period up to several years following an initial period of intensive site characterization, before final decisions are made on the use of MNA as a remedial technology.
• Comparisons with existing literature and laboratory studies (e.g., how the attenuation rates compare with those at other sites or in laboratory studies). Comparison of site characterization data with laboratory or literature data can indicate if the character-ization data are in the range that could be expected, or that are realistic. However, it should be remembered that site-specific conditions can vary significantly from other sites or from laboratory results.
• Spatial trends are also important in the data evaluation process. For example, compari-sons of contaminant concentrations and geochemical indicators of microbial activity as seen in different portions of subsurface cross sections can indicate the lateral dis-tribution of contaminants and can delineate areas of varying microbial activity.
4.3.2 Hydrogeologic and Contaminant Transport Calculations
One of the basic uses for the hydrogeologic characterization data is the calculation of the contaminant velocities in ground water. The contaminant velocities help in estimating how much time there is until a potential receptor might be impacted, which is one factor in developing a remedial strategy. As an under-standing of the attenuation processes (e.g., biodegradation) and rates is developed, the contaminant travel time to the receptor and expected concentrations at the receptor can be estimated (and the remedial time frame estimated).
The contaminant velocity calculations involve the use of some measured or derived variables.
Variables used:
• Hydraulic conductivity (horizontal and/or vertical). • Hydraulic gradient (horizontal and/or vertical). • Total or effective porosity. • Fraction of soil organic carbon. • Partition coefficient.
The values used for these variables in the cal-culations should reflect the ground-water and contaminant flow paths of most significance at the site. The use of values averaged arithmeti-cally from all site-wide locations is likely to result in misleading results.
The calculated values are:
• Specific discharge, also known as the Darcy flux, Darcy velocity, and apparent velocity, calculated using Darcy’s Law.
• Seepage velocity, also known as average linear velocity .
• Retardation factor (R). The higher the R value, the slower the contaminant travels in ground water relative to the ground-water velocity and the longer it will take to travel a given distance.
The equations for calculating these quantities are given in general texts on ground water such as Freeze and Cherry (1979), Fetter (1993), and Domenico and Schwartz (1998).
4.3.3 Contaminant Mass Loss Calculations
The dissolved-phase mass flux through a cross-section (transect) can be estimated using the contaminant concentrations and calculated ground-water discharge at and through the transect. The mass flux across a given transect can be compared to that of a downgradient transect to estimate the mass of contami-nant being degraded between the transects. However, changes in concentrations could also be due to non-degradative processes such as dilution or sorption, and errors in the measure-ment of the ground-water variables lead to
52

uncertainties in the calculated ground-water 4.3.4 Plume Stability flux. Further, the two transects would each have to sample the same ground-water flow paths.
Total contaminant mass in the plume can be calculated from contaminant concentration results, interpolating concentrations between sampling locations, and making assumptions about the three-dimensional volumes con-taining given concentrations . Contaminant mass estimates can be made for each of the dissolved, sorbed, and NAPL phases (a mass estimate for a source area with NAPL would include all three phases; a mass estimate for the dissolved phase would include the dis-solved and/or sorbed phases). These mass esti-mates are “mass-in place” estimates (ideally, representing the entire contaminant mass in the plume). If prepared in a consistent manner, mass estimates from one sampling event can be compared to those from subsequent sam-pling events to establish trends and determine the amount of mass loss due to destructive processes (as long as any apparent losses due to non-destructive processes such as dilution or sorption are understood). However, it is extremely difficult to know that the mass esti-mates represent the mass actually in the plume or in the source, especially if there is signifi-cant subsurface heterogeneity or variability in contaminant distribution. NAPL presence in a source area makes accurate estimates virtually impossible for the source area. Contaminant mass estimates for the dissolved phase plume might be better for a slightly-sorbing dissolved-phase contaminant, especially if the mass estimates use only the dissolved-phase concentrations and neglect the sorbed-phase concentrations. These mass and mass change estimates are useful as one piece of derived information and should be attempted; however, their limitations and assumptions must be recognized.
One criterion for determining whether MNA is an appropriate remedial technology at a given site is “whether or not the contaminant plume is stable” (U.S. EPA, 1999). Information is also necessary on whether or not the environ-mental conditions that influence plume stabil-ity may change with time, and thus change the stability condition of the plume. Geochemical data collected during the site characterization (within the plume and in background locations) are useful for assessing the environmental conditions and the potential for change.
Plume stability assessment is an important aspect of evaluating the potential use of MNA at a site, as the OSWER Directive (U.S. EPA, 1999) indicates that “sites where the contami-nant plumes are no longer increasing in extent, or are shrinking, would be the most appropri-ate candidates for MNA remedies”. The MNA site characterization activities provide informa-tion used in this assessment. The state of a plume (i.e., the plume trend) is often described using the terms expanding, stable, or shrink-ing. It may be very difficult to conclusively show that a plume is stable (and incorrect to use statistics to prove stability), thus, “a plume that is stable” may be more accurately consid-ered to be “a plume that appears stable” or “a plume that is showing relatively little change”. However, statistics can be used to prove (or show) that a plume is not stable.
The underlying foundation for assessing the state of a plume (regardless of the specific plume stability method used) is, essentially, the use of ground-water contaminant concentra-tions (from monitoring wells located through-out and around the plume) and examinations of changes (trends) over a period of time. While the simplest interpretation of changes in ground-water contaminant concentrations in the monitoring wells would be that increases in concentrations signify an expanding plume, decreases in concentrations signify a shrinking plume, and relatively constant concentrations
53
signify a stable plume, the evaluation of plume stability is less straightforward and there are a number of issues to consider. These simple apparent trends may not accurately indicate the plume behavior since contaminant concentra-tions in a well (or wells) can be affected by:
• Fluctuations in ground-water levels leading to exposure of ground water to a greater or a lesser thickness interval of contaminated media or uncon-taminated media.
• Changes in ground-water flow direction. • “Hot spots” of contamination passing by the well. • Changes in the TEA supply that change the extent
of biodegradation. • Sampling and laboratory error and variability.
Collection of the site characterization informa-tion discussed throughout this document will help in understanding the potential impacts of these issues, and will help prevent misinter-pretation of the monitoring well contaminant trends. It is important to obtain information from a network of monitoring wells that ade-quately defines the three-dimensional extent of the plume and which allows a well-defined plume boundary region. Robust monitoring data are needed. It is also important to rec-ognize that since there is often uncertainty in subsurface conditions and processes, periodic review of the data and data interpretations may be needed.
Under certain conditions, the state of the plume (expanding or shrinking) can be assessed using temporal trends in contaminant concentrations at a number of individual moni-toring locations around the leading edge of the plume. The state of the plume (expanding, stable, or shrinking) can also be determined by changes in well-defined plume boundaries.
A variety of methods have been used to evalu-ate plume stability, examining either the tem-poral changes in contaminant concentrations throughout the network of monitoring wells, or examining the temporal changes in contami-nant mass throughout the plume. Wiedemeier et al. (1999) discuss visual and statistical tests
using concentration data; Dupont et al. (1998) describe the use of Thiessen polygons for the estimation of plume mass and plume centroid of mass; Looney et al. (2006) discuss empiri-cal and deterministic approaches for quantify-ing plume stability, and present a mass balance concept for documenting the relative stability of a plume; and Ricker (2008) describes visu-alization, numerical, and statistical techniques for assessing plume stability in terms of plume area, average concentration, contaminant mass, and center of mass. It can be advantageous to use more than one method to evaluate plume stability, especially where there is uncertainty about the plume being stable or expanding.
4.3.5 Attenuation Rates
Decisions on MNA as an appropriate remedial technology for a given site generally incorpo-rate estimates of the rates of natural attenua-tion processes, expressed with respect to either time or distance from the source, and based on site characterization data (decisions on MNA also incorporate other estimates, such as the source area mass flux and source persistence). U.S. EPA (1999) indicates that time-based estimates are used to predict remedial time frames and distance-based estimates to evalu-ate potential plume expansion, stability, or shrinkage. One objective of MNA site char-acterization is the calculation of one or more of the three types of attenuation rate constants (concentration vs . time (C vs . T), concentration vs. distance (C vs. D), and biodegradation); U.S. EPA guidance on the use of rate constants for MNA is provided and thoroughly discussed in Newell et al. (2002).
Methods for estimating attenuation rate constants include numerical models, or simple empirical methods that entail regressions of concentration vs. distance, relative concentra-tion vs. distance, concentration vs. time, or mass vs. time data.
Beyer et al. (2007) used numerically-simulated contaminant plumes and different hypothetical
54

monitoring networks to evaluate strategies for estimating first-order degradation rate con-stants. They compared plume centerline rate constant methods and a rate constant method using all simulated data. Their findings illustrate that significant potential uncertain-ties in estimated attenuation rate constants can arise, which are due to monitoring locations being off the plume centerline and inadequate estimates of hydrogeologic variables, as well as source and plume width. These uncertain-ties are also significant in a method presented by Buscheck and Alcantar (1995), in which an overall attenuation rate (encompassing contaminant concentration decreases from all attenuation mechanisms) was estimated using a regression of contaminant concentration data as a function of distance along a plume centerline. They then calculated a degradation rate (encompassing contaminant concentra-tion decreases from destructive mechanisms, presumably due to biodegradation) by subtract-ing the estimated contaminant concentration changes due to hydrodynamic effects (diffu-sion, dilution, etc.) from concentration changes indicated by the overall attenuation rate. However, this method incorporated numerous assumptions, such as a steady-state distribution of contaminant concentrations downgradient of a continuous source . An evaluation of the influence of input parameters on the Buscheck and Alcantar method is provided by McNab and Dooher (1998). The uncertainties and difficulties in determining the attenuation rates indicate that site characterization activities for MNA need to obtain sufficient suitable infor-mation and data on the relevant variables, to lessen the impact of these uncertainties.
Newell et al. (2002) discuss the calculation and use of attenuation and biodegradation rate constants. Concentration vs. distance (C vs. D) attenuation rate constants (obtained by examining contaminant concentration data along a flow path extending away from the source) indicate how rapidly dissolved-phase contamination is diminished after leaving the
source area . Concentration vs . time (C vs . T) attenuation rate constants (obtained by examin-ing contaminant concentration with time at individual monitoring locations within the plume) are used to assess natural attenuation because such rates are directly applicable for determinations of plume lifetime in the locations where the data were collected. Biodegradation rate constants are used in solute transport models. The analyses for the three types of rate constants are shown concep-tually in Figure 8 .
4.3.5.1 Concentration vs. Distance Attenuation Rates
C vs. D attenuation rate constants track the change in contaminant concentration or mass along a plume, using data from a series of sampling points at different distances from the source along the longitudinal axis (centerline) of the plume. The calculation and use of C vs. D attenuation rate constants assumes a stable plume. However, clues to plume stabil-ity can be gleaned from these rate constants. The change in such a rate constant, calculated from data taken at different sampling times from the same group of sampling locations, can suggest whether the plume is relatively stable, expanding, or shrinking. For example, a lower rate constant at the later sampling time would suggest that the plume might be expanding. However, such an interpretation is not definitive; rather the apparently lower rate might have been due to other factors, such as a shift in the plume direction or a changed ground-water flow velocity. Newell et al. (2002) provide a method using the C vs. D rate constant to estimate if a plume is “showing relatively little change”.
Collection of data for use in the C vs. D calculation requires knowledge of site geol-ogy and hydrogeology since the data should be from sequential points along a flow path. The site hydrogeology should be understood sufficiently so that flow paths can be identified and sampled to produce representative data.
55

Beyer et al. (2007) discuss these issues and uncertainties .
Historically, a single C vs. D rate constant has been used to quantify the applicability of MNA at a site; however, this implicitly assumes that:
• An individual flow path can be identified and monitored over time with a static moni-toring network (i.e., assuming temporally stable flow paths).
• An individual flow path is representative of the entire plume (e.g., in terms of attenua-tion of contaminants, and potential impact to receptors).
• Sampling methods provide discrete data from only the flow path of concern.
• Dissolved contaminant concentration data from the series of sampling points used for the C vs. D attenuation rate constant are comparable over time (e.g., assuming temporally stable source loading). Source strength changes with time have to be understood (Amerson and Johnson, 2003).
• Dissolved contaminants emanate from a single discrete source (e.g., there are not multiple sources along the plume).
• Natural attenuation processes (especially, microbial processes) are temporally stable and spatially consistent throughout the plume.
It is unlikely that all or even most of these assumptions are true at a given site, so use of a single C vs. D attenuation rate constant to assess the potential for MNA at a site is problematic. A more suitable approach is cal-culation of C vs. D attenuation rate constants from a variety of flow paths representing the identified representative zones.
4.3.5.2 Concentration vs. Time Attenuation Rates
Concentration vs . time (C vs . T) attenuation rate constants (point decay rate constants) track the change in contaminant concentra-tions or mass with time at one sampling point in the plume, using data taken at multiple times from the single sampling point. If the mass flux from the source is significantly decreasing and the plume is shrinking, the source lifetime can be estimated using these rate constants, because the rate of source attenuation is a significant factor in determin-ing contaminant concentration changes with time at a given point in the plume. However, proper evaluation of source lifetime using C vs. T rate constants requires rate constants calculated from data taken from multiple points distributed throughout the entire plume to integrate the effects of variations in source strength and longevity across the width of the source area .
C vs. T rate constants can be used to estimate the time needed to achieve a specific contami-nant concentration at the location where the data were collected. The data for C vs. T rate constant calculations must be compiled over several years (three to five years or longer) so that longer-term contaminant concentration trends can be differentiated from source varia-tions, seasonal changes in ground-water flow paths, changes in microbial activity, etc.
4.3.5.3 Biodegradation Rate Constants Biodegradation rate constants track the rate of biological degradation of a contaminant, unlike the C vs. D and C vs. T rate con-stants that lump together all the attenuat-ing processes, including biodegradation. Biodegradation rate constants are most often used as an input parameter to models that inte-grate the major fate and transport parameters.
4.3.6 Modeling
Computer models integrate information on hydrogeological, geochemical, and biological
56

Figure 8. Conceptual Approach to Data Analysis for Attenuation Rates. (a) Plotting contaminant concentrations from one location at different times provides an estimate of the concentration vs. time attenuation rate constant. (b) Plotting contaminant concentrations from different locations along the longitudinal axis of the plume at one time provides an estimate of the concentration vs. distance attenuation rate constant. (c) Comparing migration of a tracer to migration of the contaminant, or calibration of a solute transport model provides information on the biodegradation rate constant. (Modified from Newell et al., 2002.)
57

variables collected during MNA site character-ization (such as observed flow data, contami-nant distribution data, and changes in concen-trations with time). Screening-level contami-nant fate and transport models can be used to simulate and compare plume behavior at different times and under different conditions (under certain sets of assumptions specific to each model). The model simulations can be used to assess attenuation rates and remedia-tion time frames. Numerous models have been developed and are in use to simulate natural attenuation of contaminants such as petroleum hydrocarbons or chlorinated solvents. Among these are BIOPLUME III, BIOSCREEN, and BIOCHLOR (U.S. EPA, 2011).
4.3.7 Remediation Time Frames
Projections of the time frame to achieve remediation goals can either involve estimates based on observations of mass or concentration dissipation, or simulations using calibrated fate and transport models. Mass and concentration dissipation-based estimates involve monitoring mass or concentration changes as a function of time, fitting some function to the mass-time or concentration-time data and extrapolat-ing the function to determine the time when a remediation goal is achieved. Computer models can be used to simulate concentration distributions with time to estimate when a remediation goal is achieved. The site-specific validity of the assumptions underlying each estimation method should be evaluated prior to application.
The empirical estimation methods use data and provide estimates representing an averaging of site conditions that influence contami-nant migration and are inherently biased by monitoring locations, ground-water conditions during sampling, concentration averaging if monitoring wells are used, and other factors. Furthermore, they assume underlying condi-tions that influence contaminant concentrations remain constant with time (e.g., microbial degradative activity remains constant as the
contamination diminishes, ground-water flow directions do not change). Similar issues plague estimates based on transport models. However, to evaluate uncertainties in simula-tion estimates, sensitivity analyses can and should be used with these models.
The time required to reach a specific concen-tration of a specific contaminant is likely to differ from the time frame to reach the same or a different specific concentration of a different contaminant, due to the varied contaminant, geological, geochemical, and biological condi-tions present throughout a site. In addition, these time frame estimates may vary for different portions of a site. Thus, the estimates of contaminant attenuation time frames may produce a range of time frames. In estimating the remedial time frame for MNA at the site (i.e., the estimated time required to achieve remedial goals for all the contaminants of interest), all of these time frame estimates will need to be examined for the longest time frame (i.e., the last contaminant to reach its remedial goal) .
4.4 Site Characterization, Decision-Making, and Remedy Selection
At all sites, a variety of physical, chemical, and biological processes have the capacity to attenuate environmental contaminants . The success of a decision to rely on natural attenu-ation processes as part of a site-remediation strategy depends on both the occurrence of those natural attenuation processes and on their ability to meet site-specific remediation goals within an acceptable remediation timeframe. MNA decisions are supported by a detailed understanding of subsurface conditions and contaminant transport and fate. Site charac-terization provides the site-specific data and interpretations for making a decision whether site remedial goals can be met with MNA. The decision-making process evaluates the applicability of MNA as a remedy for a site and determines whether to: (1) select MNA as the remedy, (2) select MNA as a component
58

of the remedy in conjunction with one or more other remedial technologies or enhancements (i.e., a treatment train), or (3) reject MNA and select another remedial technology. ITRC (2008) provides information on potential enhancements to complement MNA.
MNA should be carefully evaluated along with other viable remedial approaches or technolo-gies (including innovative technologies) within the applicable remedy selection framework. The evaluation of MNA as a remedial alterna-tive requires making the determination that natural attenuation processes are taking place at a rate that is protective of human health and the environment, that there is a reasonable expectation that these processes will continue at acceptable rates for the required remedial time frame, and that the MNA remedy is capable of achieving the site-specific reme-diation objectives within a time frame that is reasonable compared to other remedial alternatives .
An informed decision as to the applicability of MNA as a remedy or portion of a remedy at a site requires that the site characterization provides information on the occurrence, type, and extent of natural attenuation processes; the stability and sustainability of these processes; and estimates of the past, present, and future effects of these processes on contaminant fate and transport (including rates and time frames). The assessment of the potential effectiveness of MNA for a set of site-specific conditions allows a decision to either move forward with MNA or to rule out MNA as a component of the remedy.
The preceding sections of this document present discussions on technical aspects of site characterization for sites where MNA is a potential remedy, including development of a site conceptual model, characterization variables, sampling locations and frequen-cies, and the interpretations required for the MNA decision-making process. It is the site
characterization discussed in this document which provides the framework for the evalua-tion of MNA as a remedial alternative and for making remedy selection decisions involving MNA.
59

5.0 REFERENCES
References Cited
Alexander, M. 1977. Introduction to Soil Microbiology. John Wiley & Sons, New York, NY. 467 pp.
Alexander, M. 1994. Biodegradation and Bioremediation. Academic Press, San Diego, CA. 302 pp.
Amerson, I., and R. Johnson. 2003. Natural gradient tracer test to evaluate natural attenuation of MTBE under anaerobic conditions. Ground Water Monitoring &Remediation. 23(1):54-61.
Bates, R.L., and J.A. Jackson. 1984. Dictionary of Geological Terms, Third Edition. Anchor Books, Doubleday, New York, NY. 571 pp.
Beyer, C., C. Chen, J. Gronewold, O. Kolditz, and S. Bauer. 2007. Determination of first-order degradation rate constants from monitoring networks. Ground Water. 45(6):774-785.
Buscheck, T.E., and C.M. Alcantar. 1995. Regression techniques and analytical solutions to demonstrate intrinsic bio-remediation. In: R.E. Hinchee, J.T. Wilson, and D.C. Downey (Eds.), Intrinsic Bioremediation, Proceedings of the Third International In Situ and On-Site Bioreclamation Symposium. Battelle Press, Columbus, OH. Bioremediation Series 3(1):109-116.
Clark, I. D., and P. Fritz. 1997. Environmental Isotopes in Hydrogeology. CRC Press, Boca Raton, FL. 328 pp.
Cohen, R.M., and J.W. Mercer. 1993. DNAPL Site Evaluation. C.K. Smoley, Inc., CRC Press, Boca Raton, FL. 360 pp.
Cozzarelli, I.M., R.P. Eganhouse, and M.J. Baedecker. 1990. Transformation of monoaromatic hydrocarbons to organic acids in anoxic ground water environ-ment . Environmental Geology and Water Sciences. 16(2):135-141.
Crumbling, D.M. 2001. Using the Triad Approach to Improve the Cost-Effectiveness of Hazardous Waste Site Cleanups, Current Perspectives in Site Remediation and Monitoring. EPA 542-R-01-016. U.S. Environmental Protection Agency, Office of Solid Waste and Emergency Response, Washington DC. http://www.epa.gov/tio/ download/char/triad2.pdf
Davis, J.W., J.M. Odom, K.A. DeWeerd, D.A. Stahl, S.S. Fishbain, R.J. West, G.M. Klecka, and J.G. DeCarolis. 2002. Natural attenuation of chlorinated solvents at Area 6, Dover Air Force Base: character-ization of microbial community structure. Journal of Contaminant Hydrology. 57:41-59.
Domenico, P.A., and F.W. Schwartz. 1998. Physical and Chemical Hydrogeology, Second Edition. John Wiley & Sons, Inc., New York, NY. 506 pp.
Dupont, R.R., D.L. Sorensen, M. Kemblowski, M. Bertleson, D. McGinnis, I. Kamil, and Y. Ma. 1998. Monitoring and Assessment of In-Situ Biocontainment of Petroleum Contaminated Ground-Water Plumes. EPA/600/R-98/020. U.S. Environmental Protection Agency, Office of Research and Development, National Exposure Research Laboratory, Research Triangle Park, NC.
Ferrey, M.L., R.T. Wilkin, R.G. Ford, and J.T. Wilson. 2004. Nonbiological removal of
60

cis-dichloroethylene and 1,1-dichloroethyl-ene in aquifer sediment containing magne-tite . Environmental Science & Technology. 38(6):1746-1752.
Fetter, C.W. 1993. Contaminant Hydrogeology. MacMillan Publishing Company, New York, NY. 458 pp.
Ford, R.G., and R.T. Wilkin (eds.). 2010. Monitored Natural Attenuation of Inorganic Contaminants in Ground Water, Volume 3, Assessment for Radionuclides Including Tritium, Radon, Strontium, Technetium, Uranium, Iodine, Radium, Thorium, Cesium, and Plutonium-Americium. EPA/600/R-10/093. U.S. Environmental Protection Agency, Office of Research and Development, National Risk Management Research Laboratory, Cincinnati, OH. 127 pp. Find link for document under “Year” tab at: http://www. epa.gov/nrmrl/gwerd/publications.html
Ford, R.G., R.T. Wilkin, and R.W. Puls (eds). 2007a. Monitored Natural Attenuation of Inorganic Contaminants in Ground Water, Volume 1, Technical Basis for Assessment. EPA/600/R-07/139. U.S. Environmental Protection Agency, Office of Research and Development, National Risk Management Research Laboratory, Cincinnati, OH. 77 pp. Find link for document under “Year” tab at: http://www.epa.gov/nrmrl/gwerd/ publications.html
Ford, R.G., R.T. Wilkin, and R.W. Puls (eds). 2007b. Monitored Natural Attenuation of Inorganic Contaminants in Ground Water, Volume 2, Assessment for Non-Radionuclides Including Arsenic, Cadmium, Chromium, Copper, Lead, Nickel, Nitrate, Perchlorate, and Selenium. EPA/600/R-07/140. U.S. Environmental Protection Agency, Office of Research and Development, National Risk Management Research Laboratory, Cincinnati, OH. 108 pp. Find link for document under “Year”
tab at: http://www.epa.gov/nrmrl/gwerd/ publications.html
Freeze, R.A., and J.A. Cherry. 1979. Groundwater. Prentice-Hall, Inc., Englewood Cliffs, NJ. 604 pp.
Gibbons, R.D. 1994. Statistical Methods for Ground-Water Monitoring. John Wiley & Sons, New York, NY. 286 pp.
Gibbons, R.D., and D.E. Coleman. 2001. Statistical Methods for Detection and Quantification of Environmental Contamination. John Wiley & Sons, Inc., New York, NY. 400 pp.
He, Y., C. Su, J. Wilson, R. Wilkin, C. Adair, T. Lee, P. Bradley, and M. Ferrey. 2009. Identification and Characterization Methods for Reactive Minerals Responsible for Natural Attenuation of Chlorinated Organic Compounds in Ground Water. EPA 600/R-09/115. U.S. Environmental Protection Agency, Office of Research and Development, National Risk Management Research Laboratory, Ada, OK. 152 pp.
Helsel, D.R., and R.M. Hirsch. 2002. Chapter A3, Statistical Methods in Water Resources, Book 4, Hydrologic Analysis and Interpretation, Techniques of Water-Resources Investigations of the United States Geological Survey. U .S . Geological Survey. USGS—TWRI Book 4, Chapter A3. http://water.usgs.gov/pubs/ twri/twri4a3/
Hem, J.D. 1985. Study and Interpretation of the Chemical Characteristics of Natural Water, Third Edition. U .S . Geological Survey Water-Supply Paper 2254. 263 pp. http://pubs.usgs.gov/wsp/wsp2254/pdf/ wsp2254a.pdf
Houghton Mifflin Co. 1997. The American Heritage College Dictionary, Third
61

Edition. Houghton Mifflin Company, Boston, MA. 1630 pp.
Huling, S.G., B. Pivetz, and R. Stransky. 2002. Terminal electron accep-tor mass balance: light nonaqueous phase liquids and natural attenuation. Journal of Environmental Engineering . 128(3):246-252.
Hunkeler, D., R.U. Meckenstock, B. Sherwood-Lollar, T.C. Schmidt, and J.T. Wilson. 2008. A Guide for Assessing Biodegradation and Source Identification of Organic Ground Water Contaminants Using Compound Specific Isotope Analysis (CSIA). EPA 600/R-08/148. U.S. Environmental Protection Agency, Office of Research and Development, National Risk Management Research Laboratory, Ada, OK. 82 pp. Find link for document under “Year” tab at: http://www.epa.gov/ nrmrl/gwerd/publications.html
ITRC (Interstate Technology & Regulatory Council). 2011. Environmental Molecular Diagnostics Fact Sheets. EMD-1. Washington, D.C.: Interstate Technology & Regulatory Council, Environmental Molecular Diagnostics Team. http://www. itrcweb.org/Documents/EMD1.pdf
Löffler, F.E., J.M. Tiedje, and R.A. Sanford. 1999. Fraction of electrons consumed in electron acceptor reduction and hydrogen thresholds as indicators of halorespiratory physiology. Applied and Environmental Microbiology. 65(9):4049-4056.
Looney, B.B., F. Chapelle, T.O. Early, K.M. Vangelas, K.M. Adams, and C.H. Sink. 2006. Mass Balance: A Key to Advancing Monitored and Enhanced Attenuation for Chlorinated Solvents. WSRC-STI-2006-00082. Savannah River National Laboratory, Aiken, SC. 91 pp. http://sti. srs.gov/fulltext/WSRC-STI-2006-00082.pdf
Lorah, M.M., M.A. Voytek, J.D. Kirshtein, and E.J. (Phillips) Jones. 2003. Anaerobic Degradation of 1,1,2,2-Tetrachloroethane and Association with Microbial Communities in a Freshwater Tidal Wetland, Aberdeen Proving Ground, Maryland: Laboratory Experiments and Comparisons to Field Data. U .S . Geological Survey, Baltimore, MD. Water-Resources Investigations Report 02-4157. http://pubs.usgs.gov/wri/wri024157/wrir-02-4157.pdf
Lovley, D.R., F.H. Chapelle, and J.C. Woodward. 1994. Use of dissolved H2 concentrations to determine distribution of microbially catalyzed redox reactions in anaerobic groundwater. Environmental Science & Technology. 28(7):1205-1210.
Maymo-Gatell, X. 1997. “Dehalococcoides ethenogenes” Strain 195, A Novel Eubacterium that Reductively Dechlorinates Tetrachloroethene (PCE) to Ethene. Report AL/EQ-TR-1997-0029. Air Force Research Laboratory, Tyndall AFB, FL. Find link for document at: http://www.dtic.mil/docs/citations/ ADA357948
McNab, W.W., Jr., and B.P. Dooher. 1998. A critique of a steady-state analytical method for estimating contaminant degradation rates . Ground Water. 36(6):983-987.
Mercer, J.W., and R.M. Cohen. 1990. A review of immiscible fluids in the subsur-face: properties, models, characterization and remediation. Journal of Contaminant Hydrology. 6(2):107-163.
National Research Council. 2000. Natural Attenuation for Ground Water Remediation. National Academy Press, Washington DC. Find links to read free on-line at: http://www.nap.edu/catalog. php?record_id=9792
62

Newell, C.J., H.S. Rifai, J.T. Wilson, J.A. Connor, J.A. Aziz, and M.P. Suarez. 2002. Calculation and Use of First-Order Rate Constants for Monitored Natural Attenuation Studies - Ground Water Issue . EPA/540/S-02/500. U.S. Environmental Protection Agency, Office of Research and Development, National Risk Management Research Laboratory, Cincinnati, OH. Find link for document under “Year” tab at: http://www.epa.gov/nrmrl/gwerd/publica-tions.html
Pope, D.F., S.D. Acree, H. Levine, S. Mangion, J. van Ee, K. Hurt, and B. Wilson. 2004. Performance Monitoring of MNA Remedies for VOCs in Ground Water. EPA/600/R-04/027. U.S. Environmental Protection Agency, Office of Research and Development, National Risk Management Research Laboratory, Cincinnati, OH. Find link for document under “Year” tab at: http://www.epa.gov/nrmrl/gwerd/publica-tions.html
Ricker, J.A. 2008. A practical method to evaluate ground water contaminant plume stability. Ground Water Monitoring & Remediation. 28(4):85-94.
U.S. EPA. 1986. RCRA Ground-Water Monitoring Technical Enforcement Guidance Document. OSWER-9950.1. U .S . Environmental Protection Agency, Office of Waste Programs Enforcement and Office of Solid Waste and Emergency Response, Washington DC. 208 pp. http://nepis.epa.gov/Exe/ZyPURL. cgi?Dockey=20012BRN.txt
U.S. EPA. 1991. Site Characterization for Subsurface Remediation. EPA/625/4-91/026. U.S. Environmental Protection Agency, Office of Research and Development, Washington DC. 259 pp. http://www.epa.gov/oust/cat/sitchasu.pdf
U.S. EPA. 1992. Methods for Evaluating the Attainment of Cleanup Standards, Volume 2: Ground Water. EPA/230/R-92/014. U .S . Environmental Protection Agency, Office of Policy, Planning, and Evaluation, Environmental Statistics and Information Division, Washington DC. 290 pp. http:// www.epa.gov/superfund/policy/remedy/ pdfs/230r-92014-s.pdf
U.S. EPA. 1993. Subsurface Characterization and Monitoring Techniques, A Desk Reference Guide, Volume I: Solids and Ground Water, Appendices A and B. EPA/625/R-93/003a. U.S. Environmental Protection Agency, Office of Research and Development, Washington DC. 498 pp.
U.S. EPA. 1997. Expedited Site Assessment Tools For Underground Storage Tank Sites: A Guide For Regulators. EPA 510-B-97-001. U.S. Environmental Protection Agency, Office of Solid Waste and Emergency Response, Washington DC. Find links for document at: http://www.epa. gov/oust/pubs/sam.htm
U.S. EPA. 1999. Use of Monitored Natural Attenuation at Superfund, RCRA Corrective Action, and Underground Storage Tank Sites. OSWER Directive 9200.4-17P. U.S. Environmental Protection Agency, Office of Solid Waste and Emergency Response, Washington DC. 32 pp. http://www.epa. gov/oust/directiv/d9200417.pdf
U.S. EPA. 2000. Region 5 Framework for Monitored Natural Attenuation Decisions for Ground Water. U .S . Environmental Protection Agency, Region 5, Chicago, IL. 30 pp. http://www.epa.gov/region5/ cleanup/r5-superfund-mna-frame-work-200009.pdf
U.S. EPA. 2002a. Guidance for Quality Assurance Project Plans. EPA QA/G-5, EPA/240/R-02/009. U.S. Environmental
63
Protection Agency, Washington DC. http:// www.epa.gov/quality/qs-docs/g5-final.pdf
U.S. EPA. 2002b. A Lexicon of Cave and Karst Terminology with Special Reference to Environmental Karst Hydrology. EPA/600/R-02/003. U.S. Environmental Protection Agency, Office of Research and Development, Washington DC. 214 pp. http://cfpub.epa.gov/ncea/cfm/recordisplay. cfm?deid=54964
U.S. EPA. 2006. Data Quality Assessment: Statistical Methods for Practitioners. EPA QA/G-9S, EPA/240/B-06/003. U.S. Environmental Protection Agency, Office of Environmental Information, Washington DC. 190 pp. http://www.epa.gov/quality1/ qs-docs/g9s-final.pdf
U.S. EPA. 2009. Statistical Analysis of Groundwater Monitoring Data at RCRA Facilities Unified Guidances. EPA/530/R-09/007. U.S. Environmental Protection Agency, Office of Resource Conservation and Recovery, Washington DC. 888 pp.
U.S. EPA. 2011. Center for Subsurface Modeling Support of the U .S . Environmental Protection Agency, Office of Research and Development, National Risk Management Research Laboratory, Ada, OK. http://www.epa.gov/ nrmrl/gwerd/csmos/index.html
Weiss, J.V., and I.M. Cozzarelli. 2008. Biodegradation in contaminated aquifers: Incorporating microbial/molecular meth-ods. Ground Water. 46(2):305-322.
Wiedemeier, T.H., M.A. Swanson, D.E. Moutoux, E.K. Gordon, J.T. Wilson, B.H. Wilson, D.H. Kampbell, P.E. Haas, R.N. Miller, J.E. Hansen, and F.H. Chapelle. 1998. Technical Protocol for Evaluating Natural Attenuation of Chlorinated Solvents in Ground Water.
EPA/600/R-98/128. U.S. Environmental Protection Agency, Office of Research and Development, National Risk Management Research Laboratory, Cincinnati, OH. Find link for document under “Year” tab at: http://www.epa.gov/nrmrl/gwerd/publi-cations.html
Wiedemeier, T.H., H.S. Rifai, C.J. Newell, and J.T. Wilson. 1999. Natural Attenuation of Fuels and Chlorinated Solvents in the Subsurface. John Wiley & Sons, Inc., New York, NY. 632 pp.
Wiedemeier, T.H., and P.E. Haas. 2002. Designing monitoring programs to effec-tively evaluate the performance of natural attenuation . Ground Water Monitoring & Remediation. 22(3):124-135.
Wilson, J.T., D.H. Kampbell, and J. Armstrong. 1994. Natural Bioreclamation of Alkylbenzenes (BTEX) from a Gasoline Spill in Methanogenic Groundwater. In Hinchee, R.E., B.C. Alleman, R.E. Hoeppel, and R.N. Miller (eds.). Hydrocarbon Bioremediation. Second International Symposium on In Situ and On-Site Bioreclamation, San Diego, CA, Lewis Publishers, Boca Raton, FL. 477 pp.
Yang, Y., and J. Zeyer. 2003. Specific detection of Dehalococcoides species by fluorescence in situ hybridization with 16S rRNA-targeted oligonucleotide probes. Applied and Environmental Microbiology. 69(5):2879-2883.
Annotated Additional References
Ford, R.G., R.T. Wilkin, and R.W. Puls. 2007a. Monitored Natural Attenuation of Inorganic Contaminants in Ground Water, Volume 1, Technical Basis for Assessment . EPA/600/R-07/139. U.S. Environmental Protection Agency, Office of Research and Development, National Risk Management
64

Research Laboratory, Cincinnati, OH. 77 pp. Find link for document under “Year” tab at: http://www.epa.gov/nrmrl/gwerd/ publications.html
Site characterization for MNA of inorgan-ics emphasizes different aspects than site characterization for MNA of organics, with more focus on the solid phase; geochemistry; and contaminant speciation, adsorption and precipitation. However, there are common elements (see Table 1.1). Section IC discusses a tiered approach to characterization. Section IIIA discusses and emphasizes the importance of hydrogeological characterization.
Guilbeault, M.A., B.L. Parker, and J.A. Cherry. 2005. Mass and flux distribution from DNAPL zones in sandy aquifers. Ground Water. 43(1):70-86.
The site characterization focused on tech-niques for delineation of DNAPL in sandy aquifers and was oriented on researching the factors governing DNAPL distribution, rather than on a typical MNA site characterization. However, the work describes in detail some methods and considerations for the small-scale delineation that might be needed at MNA sites for characterizing spatial heterogeneities and aquifer variability, flow paths, and dissolved-phase contamination (here, resulting from DNAPL source areas). One of the sites was being investigated for natural attenuation of chlorinated compounds. Direct-push methods (using the Waterloo Profiler) and field-based analytical methods are described. Discussion on determining the appropriate sample spac-ing (especially vertically) is included. The text and figures illustrate and describe vertical contaminant profiles in transects downgradient of the source areas, for three different sites. Contaminant plume mass-flux calculations are described and their use is discussed.
Hunkeler, D., R. Aravena, K. Berry-Spark, and E. Cox. 2005. Assessment of degradation pathways in an aquifer with mixed chlo-rinated hydrocarbon contamination using
stable isotope analysis. Environmental Science & Technology. 39:5975-5981.
This paper discusses data from a field site contaminated with at least 14 different chlo-rinated hydrocarbons. Stable carbon isotopes were used to identify the specific degradation pathways that were occurring at the site that contained a complex mixture of chlorinated compounds. Stable carbon isotope data were used to confirm that TCE was present due to dehydrochlorination of 1,1,2,2-PCA and not reductive dechlorination of PCE. Isotope data were also used to confirm that vinyl chloride and ethene present in the ground water were due to dichloroelimination of 1,1,2- trichlo-roethane and 1,2-dichloroethane rather than reductive dechlorination of PCE, TCE, or 1,2-DCE.
ITRC (Interstate Technology & Regulatory Council). 2008. Enhanced Attenuation: Chlorinated Organics. EACO-1. Washington, DC: Interstate Technology & Regulatory Council, Enhanced Attenuation: Chlorinated Organics Team. http://www. itrcweb.org/Guidance/ListDocuments?Topi cID=8&SubTopicID=4
ITRC (2008) discusses and provides a proto-col for “enhanced attenuation” (EA). EA is a strategy for plume remediation transitioning between source-zone treatment and MNA, or between MNA and slightly more aggressive technologies. The EA concept complements MNA by utilizing possible enhancements, intended for sites where MNA may not be sufficient to meet regulatory goals. The docu-ment provides information on plume stability evaluation, enhancement technologies, a flowchart with direction on how to incorporate EA into the site remediation, an appendix on calculating plume mass balance, an extensive glossary, and discussion of regulatory issues.
Kao, C.M., and Y.S. Wang. 2001. Field investigation of the natural attenuation and intrinsic biodegradation rates at an under-ground storage tank site. Environmental Geology. 40(4-5):622-630.
65
This paper describes a transect approach used in evaluating MNA rates in a petroleum hydrocarbon plume at a gasoline spill site. Sampling locations are discussed on pages 623-625, and three map and cross-section figures illustrate the transect and sampling locations. The remainder of the paper discusses the analysis of the geochemical data and evaluation of biodegradation rates.
McKelvie, J.R., S.K. Hirschorn, G. Lacrampe-Couloume, J. Lindstrom, J. Braddock, K. Finneran, D. Trego, and B. Sherwood-Lollar. 2007. Evaluation of TCE and MTBE in situ biodegradation: integrating stable isotope, metabolic intermediate, and microbial lines of evidence. Ground Water Monitoring & Remediation. 27(4):63-73.
This paper illustrates the integration of multiple characterization techniques to clarify the meaning of potentially ambiguous site information. At a TCE-contaminated site and a MTBE-contaminated site, the geochemi-cal conditions and intermediate compounds suggested that biodegradation had occurred; however stable isotope analyses indicated that the presence of presumed metabolic interme-diates was due to the presumed intermediate being present as an initial co-contaminant rather than to biodegradation. This integrated characterization approach revealed that natural attenuation biodegradation was not a significant process at the site.
Song, D.L., M.E. Conrad, K.S. Sorenson, and L. Alvarez-Cohen. 2002. Stable carbon isotope fractionation during enhanced in situ bioremediation of trichloroethene. Environmental Science & Technology. 36:2262-2268.
Stable carbon isotope data were collected at a field site (Idaho National Engineering and Environmental Laboratory Test Area North) contaminated with chlorinated solvents under-going reductive dechlorination. Multiple sources and variable concentrations made contaminant concentration data difficult to use for evaluation of biological processes. Stable carbon isotope analysis of the chlorinated
solvents allowed the attenuation effects of ground-water transport and bioremediation to be separated from each other. The complete biological conversion of TCE to ethene was confirmed using stable carbon isotopes.
U.S. EPA. 1986. RCRA Ground-Water Monitoring Technical Enforcement Guidance Document. OSWER-9950.1. U .S . Environmental Protection Agency, Office of Waste Programs Enforcement and Office of Solid Waste and Emergency Response, Washington DC. 208 pp. http://nepis.epa.gov/Exe/ZyPURL. cgi?Dockey=20012BRN.txt
The introductory Chapter 1 of the “TEGD” covers many aspects of the geological and hydrogeological characterization of a site, focusing on the need to identify and characterize contaminant pathways. It provides details on appropriate observations, measurements, and interpretations needed to understand the subsurface geology and ground-water flow. Section 2.2 (pages 66 to 69) discusses important considerations for the placement and number of background wells. It should be noted that the discussion is specific to RCRA; however, there are general recommendations that can be applied to MNA sites. Chapter 5, which discusses statistical analyses, and Appendix A, with a checklist for hydrogeological site characterization, are also useful .
U.S. EPA. 2006. Data Quality Assessment: Statistical Methods for Practitioners. EPA QA/G-9S, EPA/240/B-06/003. U.S. Environmental Protection Agency, Office of Environmental Information, Washington DC. 190 pp. http://www.epa.gov/quality1/ qs-docs/g9s-final.pdf
This document was prepared by the U.S. EPA Quality Staff as a quality management guid-ance document to assist users in implementing the U.S. EPA Quality System. It discusses the scientific and statistical evaluation of environ-mental data sets to determine if they meet the planning objectives of the project, and thus are of the right type, quality, and quantity to
66

support their intended use (i.e., Data Quality Assessment (DQA)). It also describes the Data Quality Objectives (DQO) Process, used to define criteria for determining the number, location, and timing of samples to be collected in order to produce a result with a desired level of certainty. The guidance document provides background information and statistical tools for assessing data qual-ity. It is organized around the five steps of the iterative DQA process: (1) reviewing the project objectives and sampling design; (2) conducting a preliminary data review; (3) selecting the statistical method; (4) verify-ing the assumptions of the statistical method; and (5) drawing conclusions from the data. Appendices contain statistical tables, refer-ences, and information on publications for in-depth statistical analyses.
Wilson, J.T., P.M. Kaiser, and C. Adair. 2005. Monitored Natural Attenuation of MTBE as a Risk Management Option at Leaking Underground Storage Tank Sites. EPA/600/R-04/179. U.S. Environmental Protection Agency, Office of Research and Development, National Risk Management Research Laboratory, Cincinnati, OH. 74 pp. Find link for document under “Year” tab at: http://www.epa.gov/nrmrl/ gwerd/publications.html
The report reviews the current state of knowl-edge on the transport and fate of MTBE in ground water, emphasizing the processes that could be used to evaluate monitored natural attenuation of MTBE, or to manage the risk associated with MTBE in ground water. The report provides recommendations concern-ing data required for site characterization for evaluation of natural attenuation or manage-ment of risk. It demonstrates data procedures, including stable carbon isotope information, that can be used to assess MTBE risk. The fundamentals of stable carbon isotopes usage are presented.
67

6.0 GLOSSARY
Note: Some terms in this Glossary may have definitions that were developed or modified for specific use only within this document.
Anisotropic This term indicates that the hydrogeological properties of the aquifer are different in different directions. For example, if the horizontal hydraulic conductivity is greater than the vertical hydraulic conductivity, the aquifer would be considered anisotropic with respect to hydraulic conductivity.
Background Background refers to the ground water found upgradient of the contaminated ground water. In some ground-water inves-tigations, background ground-water samples may have been collected in any uncontami-nated ground water outside of a plume (includ-ing in sidegradient locations). However, for MNA site characterization the background samples should be taken from the upgradi-ent, uncontaminated portion of flow paths of ground water that will eventually flow through the MNA zone of the plume whenever pos-sible. This is because the geochemistry of that upgradient ground water needs to be compared to the geochemistry of the water within the MNA zone to investigate the presence of electron acceptors, donors, and transforma-tion products. This upgradient ground water could be the source of the dissolved electron acceptors or electron donors that will eventu-ally flow into the plume and sustain any MNA occurring there .
Bulk density The bulk density is the mass of a porous media per unit volume. Bulk density can be measured and expressed after the sample has been dried to remove the soil water (a dry weight bulk density) or using the sample as received, with the soil water present (a wet weight bulk density). The dry weight
bulk density is the preferred form for many evaluations .
Byproduct A compound formed during degradation (i.e., a fragment resulting from breakdown of another compound, e.g., chloride from chlorinated solvents), or a compound formed or transformed as a result of a geo-chemical change (e .g ., Fe(II) resulting from reduction of Fe(III)).
Conceptual Site Model (CSM) The CSM is a three-dimensional representation of the subsurface and contaminant plume. It incorpo-rates all the information about the subsurface conditions and processes regarding the pres-ence, transport, and fate of the contaminant plume.
Contaminant concentration (C) Of major importance in any site characterization is the delineation of contamination at different con-centration levels. Regulatory limits may be set at a specific concentration for a given contami-nant at a given site . The concentration of a particular contaminant may be used to estimate the required amount of electron acceptor or electron donor, using the appropriate reaction stoichiometry .
Contaminant (NAPL) densityEvaluation of NAPL needs to consider that the density of the NAPL phase in-situ may have been altered from that of the original pure-phase product, due to “weathering” (i.e., loss of some con-stituents of the NAPL) or through dissolution in a co-solvent .
Contaminant identity (single compound or mixtures) Identification of contaminants should include tentatively identified com-pounds (TICs) and emerging or overlooked contaminants .
68

Contaminant toxicity This term is used here specifically to indicate the adverse impact of a compound on useful, biodegrading subsurface microbes. The contaminant concentrations relative to a toxic level are important for predicting where biodegradation may or may not occur. For example, high contaminant concentrations near NAPL source areas may inhibit biodegradation.
Darcy’s Law Darcy’s Law is an empirical equation expressing the volumetric discharge of water moving through a porous medium:
Q = -KA(dh/dl) where Q = discharge [L3/T]
(volume per time, or flow rate, of water) K = proportionality constant, defined as
hydraulic conductivity [L/T] A = cross-sectional area through which
the water flows [L2] dh/dl = hydraulic gradient [L/L]
where dh = change in the hydraulic head between measurement points
dl = distance between measurement points
Daughter product A compound produced from degradation of an initial compound (the initial compound changes into the daughter compound). Daughter products of some common contaminants can occur in a sequence, for example, PCE degrades to TCE, which then degrades to DCE, followed by further degradation to VC. The relative con-centrations of parent and daughter products for the chlorinated ethenes can indicate the extent/ completeness of reductive dechlorination, and the presence of appropriate microorganisms.
Depositional environments/features The environment in which sediments were depos-ited influences the types of sediments depos-ited and how those sediments will be oriented and organized.
Dilution Dilution is quantified using a “dilution factor”, which indicates the relative amount of uncontaminated water that is mixed with the contaminated ground water.
Dispersion Hydrodynamic dispersion is the movement of dissolved contamination through both mechanical mixing of ground-water flow and any molecular diffusion. Dispersion is quantified using a dispersion coefficient, which gives the sum of the molecular diffusion and the mechanical mixing. The mechanical mixing portion of the dispersion coefficient is the mathematical product of the ground-water velocity and the dispersivity (a physical char-acteristic of the porous medium having units of length). Dispersion is typically not evalu-ated as part of the characterization; however, if ground-water modeling is conducted or the dispersion coefficient needs to be calculated, literature values of dispersivity and molecular diffusion generally can be assumed and used along with the site-specific ground-water velocity to estimate a dispersion coefficient.
Dissolved hydrogen (H2 ) Dissolved hydro-gen is an electron donor that is used directly by some microorganisms to biodegrade chlori-nated solvent compounds. Some microbes may use it preferentially over other electron donors. Different electron-accepting processes generally occur at different ranges of dissolved hydrogen concentrations; thus, measurement of the dissolved hydrogen concentration can provide information on the dominant electron-accepting process in a specific region at a site and help in delineating a representative zone. Collection and analysis of samples for dissolved hydrogen analysis can be difficult, and must be done carefully, due to a number of complicating issues (e.g., samples should not be collected from wells with metal screens or casing, as hydrogen may be produced by the presence of the metal).
DNAPL Dense nonaqueous phase liquid, such as chlorinated solvents, coal tar, or
69

creosote. The density of DNAPL is greater than the density of water.
Effective porosity (ne ) Effective porosity is the pore space (i.e., porosity) through which flow can actually occur (some water in the pore spaces is held in a thin film by capillary forces and does not move through the aqui-fer; in addition, some pores may be closed). Effective porosity is always less than total porosity. Though more difficult to achieve, determination of effective porosities can refine estimates of ground-water and contaminant velocities, and may be the desired value to be used in modeling.
Electron acceptor An electron acceptor is a compound that receives (gains) an electron during the microbially mediated transfer of electrons from a second compound (the micro-organism gains energy during this transfer). The electron acceptor is reduced during the coupled oxidation-reduction reactions. The electron acceptors important in biodegradation of petroleum hydrocarbons are oxygen, nitrate, manganese (IV), iron (III), sulfate, and carbon dioxide (each of these is the terminal electron acceptor (TEA) for a specific redox reac-tion). Chlorinated ethenes such as PCE, TCE, DCE, and vinyl chloride can also be electron acceptors.
Electron donor An electron donor is a compound that provides (loses) an electron during the microbially mediated transfer of electrons to a second compound (the microor-ganism gains energy during this transfer). The electron donor is oxidized during the coupled oxidation-reduction reactions. Common electron donors can be petroleum hydrocarbon contaminants, naturally occurring organic carbon compounds, dissolved hydrogen, or organic carbon compounds added to the ground water during active remediation.
Flow path A flow path is the subsurface pathway followed by a water molecule or solute as it travels in the ground water.
Ground-water discharge Discharge is the ground water leaving the saturated zone, primarily when it enters a surface water body. A ground-water discharge area is the end point of ground-water flow paths.
Ground-water recharge Water that is added to a saturated media is termed recharge. The ground water can be replenished by pre-cipitation or surface water infiltrating through the unsaturated zone down into the saturated zone, or by surface water directly in contact with the saturated zone. A recharge area is the area where ground-water flow paths begin.
Henry’s Law Constant The Henry’s Law Constant gives the proportionality between the concentration of a dissolved component in the aqueous phase and its concentration in the gas above the aqueous phase at equilibrium. The value of the constant is temperature-dependent; thus, accurate measurement of the ground-water temperature is important if calculations of vapor-phase contaminants are conducted.
Heterogeneity Heterogeneity is “A charac-teristic of a medium in which material prop-erties vary from point to point” (U .S . EPA, 2002b). The subsurface is generally not uniform or homogeneous throughout . Even small portions of a site that appear homoge-neous are likely to have some variations that affect contaminant fate and transport. Many of the calculations for values of some variables, estimates, rates, etc., discussed here (as well as the use of some models) assume homogeneous subsurface conditions. Since the subsurface is heterogeneous, it should be recognized that such calculations and model simulations will always have some degree of uncertainty.
Hydraulic conductivity (K) Hydraulic con-ductivity is the capacity of a material to trans-mit water and, as expressed in Darcy’s law, is a proportionality constant for the volume of ground water flowing in unit time through a unit area of porous media under a unit hydraulic gradient. Hydraulic conductivity is
70

commonly expressed with units of L/T. The hydraulic conductivity of the aquifer can be determined from aquifer tests (pumping tests, slug tests, or tracer tests). Due to heterogene-ity of the subsurface media, hydraulic conduc-tivity values generally vary spatially within a site .
Horizontal hydraulic conductivity (Kh ) and vertical hydraulic conductivity (Kv ) values are likely to differ, as most subsurface units are anisotropic (i.e., the unit’s properties differ depending on the direction, such as horizontal vs . vertical) . Kh and K v data may be used to estimate the potential for “plume diving” (i.e., downward migration), as low Kh/Kv ratios may indicate that the plume may be more likely to migrate downward.
Hydraulic gradient (dh/dl, or i) Hydraulic gradient is the change in total hydraulic head between two points, divided by the distance between the points.
Hydraulic (piezometric) head (h)Hydraulic head is the sum of the elevation head and pressure head of ground water at a point. The hydraulic heads are determined using water level gauging data in monitoring wells or piezometers (water level data from pumping wells generally should not be used), preferably, having discrete points or very short vertical screened intervals. In theory, hydraulic head is a point measurement. However, in most circumstances this is not possible as a practi-cal matter, and short (5 to 10 foot length) well screens are commonly used. At sites where specific hydrogeologic units have substantial thicknesses (e.g., thick bedrock units in the midwestern US), slightly longer screen lengths may be used. However, long screen lengths are not commonly used and are not recom-mended, since long well screens could span hydrogeologic units of substantially different properties (the heads are likely to vary within the different units).
Hydrogeology The science of subsurface waters and related geologic aspects of surface water (Bates and Jackson, 1984). It encom-passes the solid porous media (i.e., the geol-ogy) and the ground water.
Hydrostratigraphic unit A geologic unit, group of units, or part of a unit that has similar hydrogeologic characteristics throughout (modified from Domenico and Schwartz, 1998).
Indicator parameter (variable) A vari-able that is indicative of the degradation of a contaminant. Its presence or concentration indicates that a chemical, geochemical, and/or microbiological process is likely to be contrib-uting to a change (generally a reduction) in the contaminant concentration or mass .
Lithology This refers to the composition of the solids in the porous media, and helps to describe the physical character of rock units at the site .
LNAPL Light nonaqueous phase liquid, such as gasoline. The density of LNAPL is less than the density of water.
Major ions Hem (1985) defines major constituents in ground water as those dissolved constituents “commonly present in concentra-tions exceeding 1.0 mg/L” . These constituents are primarily cations (Ca2+, Mg2+, Na+, and K+) and anions (SO4
2-, Cl-, F-, NO3–, HCO3
–, and CO3
2- ), but also includes nonionic Si (reported as the oxide SiO2 ). Major ion geochemistry analysis is not always necessary for natural attenuation characterization; however, it can be important when investigating and differ-entiating different ground waters in order to understand ground-water flow paths. Further, some of the major ions can be electron accep-
–tors (SO4 2– and NO3 ) or byproducts (e.g.,
Cl– resulting from reductive dechlorination of chlorinated solvents).
71

Microbial community Microbiologists classify microorganisms in a variety of ways, for example, based on their characteristics, the environmental conditions under which they live, or on their effects . General categories are used in this document. In general, aerobes (aerobic populations) live under aerobic condi-tions, and anaerobes (anaerobic populations) under anaerobic conditions. The microbes may also be classified as to the geochemical impact they have (i.e., sulfate reducers or methanogens), or by their genus or species (e .g ., Dehalococcoides sp., or Dehalococcoides ethenogenes) .
Organic matter (OM) Organic material that exists within a soil or aquifer material. Soil analyses may report the percent of organic matter (%OM) in a sample. This can be converted to a fraction of organic carbon using the approximation foc = 0.59(%OM/100).
Oxidation-reduction potential (ORP) or redox potential Microbial biodegradation requires transfer of electrons. The ORP measured in a sample (relative to a refer-ence electrode) provides an indication of the expected electron acceptor.
Particle (solid) density Particle density is used to calculate porosity. For most sites, the solid density can be assumed to be 2.65 g/cm3 .
Partition (or Distribution) coefficient (Kd ) Contaminants can be found in the sorbed phase on solid material or in the dissolved phase in ground water. The relative amount of the contaminant in each of these phases is described by a distribution coefficient or a partition coefficient (the names are often used interchangeably):
= S/C Kd
where Kd = partition coefficient [L3/M] (cm3/g, mL/g)
S = sorbed concentration [M/M] (g/g)
C = dissolved concentration [M/L3] (g/mL)
This is often written as:
S = KdC
This equation assumes a linear adsorption isotherm, which occurs for many organic com-pounds. The partition coefficient Kd can be estimated using the Koc value and the fraction of organic carbon in the subsurface:
Kd = Kocfoc
where Kd = partition coefficient [L3/M] (cm3/g, mL/g)
Koc = the organic carbon partition coefficient [L3/M] (cm3/g, mL/g)
foc = the fraction of organic carbon
Piezometric surface (also called poten-tiometric surface) This is a surface defined by the value of total hydraulic head (i.e., the piezometric head) at each point in a subsurface unit. For an unconfined aquifer, it is defined by the elevation of the water table at all loca-tions. For a confined aquifer, the piezometric surface is defined by the piezometric head in short-screened wells in that aquifer.
Porosity (n) (see also the Glossary entry for Effective porosity) Porosity (or pore space) is that portion of the total subsurface volume that is not occupied by solid particles (i.e., the void space (open space) in the porous media). The solid particles or grains making up a porous media will have empty space between them. In a saturated porous medium, the pore space will be fully occupied by water. Porosity is commonly expressed as a fraction of the total volume (e.g., a porosity of 0.30 means that 30% of a unit volume will be empty space - though filled with water in a saturated porous medium - and 70% of the unit volume will be occupied by solid particles). One pore volume of a specific subsurface
72

volume will be that specific subsurface volume multiplied by the porosity.
The value of porosity can be calculated using the following equation:
n = 1 - ρb/ρ s
where n = porosity
= soil bulk densityρb
ρ s = average soil particle density (solid density), typically 2.65 g/cm3
The void ratio, used in engineering, is a similar concept for describing the subsurface solid and empty volumes, but expressed on a different basis. The void ratio (e) is the ratio of the volume of void (empty) space to the volume of solids, expressed as a percentage (e.g., 30%) or as a fraction (e.g., 0.30):
Porosity and void ratio are related by:
e = n/(1-n)and n = e/(1 + e)
Preferential flow Ground-water flow in a porous medium is generally idealized to flow throughout an entire porous medium in a uniform manner. However, the subsurface often has areas of greater hydraulic conductiv-ity in which ground water may “preferentially” flow at a greater rate than predicted based on the idealized ground-water flow. Subsurface gravel lenses, fractures, and buried utility lines are examples of preferential flow paths. Water and contamination flowing in preferential flow paths may appear at greater distances and at shorter times than predicted based on bulk properties of the porous medium.
Receptors A receptor is an “ecological entity exposed to a stressor” (U.S. EPA, 1997). Receptors or potential receptors may be human (i.e., people using downgradient drinking water wells or using downgradient water bodies for recreation) or environmental (i.e., downgradi-ent water bodies such as wetlands or streams,
and the plants or animals living there). The prevention of contamination from reaching or contacting receptors is the primary driving force behind a site remediation.
Representative zone A representative zone is a three-dimensional portion of the subsur-face throughout which the value or range of values is similar for each individual variable within a given set of predominant variables. For example, if 20 locations were sampled and there were 15 locations with a fine-to-medium sand and 5 locations with silt, then the subsur-face could be divided into two representative zones ((1) sand and (2) silt) based on this predominant variable of grain size. If 10 of the 15 sand locations had sulfate-reducing conditions and 5 had methanogenic condi-tions, and the five silt locations had sulfate-reducing conditions, then the subsurface would be divided into three representative zones ((1) sand with sulfate-reducing conditions, (2) sand with methanogenic conditions, and (3) silt with sulfate-reducing conditions). Generally, the predominant variables used to distinguish representative zones include grain size (i.e., texture or lithology, which often relates to hydraulic conductivity), contaminant type and concentration, and electron acceptor.
Retardation factor (or coefficient) (R) A common measure of contaminant travel in ground water in a saturated porous media, relative to the average linear ground-water velocity (i.e., seepage velocity), is the retarda-tion factor, calculated as:
R = 1 + ρbKd/n
where R = retardation factor (dimensionless)
ρb = bulk density (g/cm3) Kd = partition coefficient
(cm3/g) n = porosity (dimensionless)
73

Calculating the retardation factor allows an estimation of the contaminant velocity in ground water:
vc = v/R where v = average linear ground-
water velocity (L/T) vc = contaminant velocity
(L/T)
The retardation factor can also be expressed as: R = v/vc
If Kd > 0, or R > 1, the contaminant travel velocity will be retarded relative to the average velocity of the ground water. The higher the R value, the slower the contaminant travels in ground water relative to the ground-water velocity and the shorter distance it will migrate in a given time (compared to contaminants with a lower R value).
Seepage velocity (v)The seepage velocity of moving ground water is the calculated aver-age velocity at which the ground water would move in a straight line, such as between two points on a map. It is calculated by dividing the specific discharge by the effective poros-ity. The seepage velocity is also referred to as average linear velocity . This is the veloc-ity that is used when calculating how fast a contaminant will travel at a site. The value of seepage velocity may vary for different flow paths throughout a site. When calculating the velocity of a contaminant using the seepage velocity to estimate travel time to a receptor, the maximum value of the range of site seep-age velocities should be used in order to be conservative .
Soil organic carbon (sometimes referred to as total organic carbon or TOC) or frac-tion of organic carbon (foc) Organic carbon in the aquifer matrix affects sorption of organic contaminants . The soil organic carbon can be measured through laboratory analysis of the solid phase, and expressed as
foc , the weight fraction of organic carbon in a subsurface solid sample. The foc can also be derived using the generally more commonly reported percent organic matter (%OM), using f = 0.59(%OM/100). f is used when oc oc calculating a partition coefficient (Kd) from an organic carbon partition coefficient (Koc), using K = f K , where K is the organic carbon d oc oc oc partition coefficient.
Source The source can refer to both the type and the initial location of the contamina-tion released to the subsurface.
Source architecture The term “architecture” has been used to refer to the spatial arrange-ment of the contaminant source, including the source distribution, surface area, and location relative to ground water.
Source release(s) The entry of the contaminant(s) into the subsurface. The release(s) could have been intentional or acci-dental; slow or rapid; one-time, intermittent, or continuous; small or large (catastrophic); in one or more discrete locations; and with any number or mixture of contaminants.
Specific discharge (q) The specific discharge is the volume of ground water flowing per unit time through a given cross-section (i .e ., a volu-metric flow rate per unit area). It is calculated as the discharge (volume of water flow per unit time) divided by the cross-sectional area through which the water flows. It has units of L/T, the same as a velocity. Specific discharge is calculated using Darcy’s Law. The specific discharge is also referred to as Darcy flux, Darcy velocity, apparent velocity, or discharge velocity. The symbols “V” or “vs” are used by some authors to denote the specific discharge; however, this may create confusion with the use of “V” for the seepage velocity.
Stratigraphy This refers to the layering of the solids in the porous media. Description of the stratigraphy includes the thicknesses and
74

sequencing of the layers, and the nature of the interfaces between the layers.
Structural features Lenses; orientation of layers; preferential flow paths; fractures; faults.
Synoptic This refers to an overall view of the whole of a site, at a given time. When used here in terms of ground-water sampling, it means that all monitoring wells would be sampled at one time.
Texture (grain-size distribution) This refers to the proportions of the different size fractions of the particles in the porous media (i.e., sand, silt, and clay). Grain size distributions are also used to select an appropriate well screen opening size.
Total organic carbon (TOC) Organic carbon in the ground water can be measured to estimate the concentration of electron donors. The total organic carbon (TOC) is measured using an unfiltered ground-water sample, and dissolved organic carbon (DOC) is measured using a filtered sample.
The organic carbon in soil (i.e., in the solid phase) can be measured (see the Glossary entry on soil organic carbon). In some usage, this has been referred to as total organic carbon (or TOC) when discussing the solid phase (i.e., soil) .
Transect A transect is a line of sampling loca-tions. Transects are typically oriented perpen-dicular to the ground-water flow direction (a transverse transect, across the plume width) or parallel to the ground-water flow direc-tion (a longitudinal transect). Each location in a transect would ideally have two or more sampled depths. The sampling locations in a transect form a plane, and represent a slice or cross-section of the plume.
Transformation product A general term for a compound produced from or due to an initial compound during a geochemically (abiotic) or
biologically (biotic) mediated reaction. It may be a daughter product or a byproduct.
Variable This document will use the generic term “variable” to refer to data, information, or concepts that can be qualitatively described or quantitatively measured for the subsurface properties and processes, yet which are subject to variation. A “variable” can range from a broad descriptive concept (e.g., the variable of “depositional environment” could be described as “unconsolidated floodplain deposits”) to a specific quantifiable property (e.g., the variable of “porosity” for a given geologic unit within those unconsolidated floodplain deposits could have a measured value of 0.3). A variable may also be the numerical value resulting from an equation containing one or more other variables. The term is not meant in the formal, strictly quantitative mathematical sense. The term “variable” is intended to replace similar or related terms such as parameter, factor, property, element, component, etc. Further, the term reinforces the important concept that whatever is being described by a particular “variable” is subject to change (i.e., vary) spatially or with time.
75


Office of Research and Development (8101R) Washington, DC 20460
Official Business Penalty for Private Use $300
PRESORTED STANDARDPOSTAGE & FEES PAID
EPAPERMIT NO. G-35