france telecom orange · 2 cautionary statement this presentation contains forward-looking...
TRANSCRIPT

3Q11 results
France TelecomOrange
October 27th, 2011
Gervais Pellissier, Deputy CEO & CFO
2
cautionary statement
this presentation contains forward-looking statements about France Telecom’s business, in particular for 2011, 2012 and 2013. Although France Telecom believes these statements are based on reasonable assumptions, these forward-looking statements are subject to numerous risks and uncertainties, including matters not yet known to us or not currently considered material by us, and there can be no assurance that anticipated events will occur or that the objectives set out will actually be achieved. Important factors that could cause actual results to differ materially from the results anticipated in the forward-looking statements include, among others, overall trends in the economy in general and in France Telecom’s markets, the effectiveness of the “Conquests 2015” Action Plan and other strategic, operating and financial initiatives, France Telecom’s ability to adapt to the ongoing transformation of the telecommunications industry, regulatory developments and constraints, as well as the outcome of legal proceedings and the risks and uncertainties related to international operations and exchange rate fluctuations.
more detailed information on the potential risks that could affect France Telecom's financial results can be found in the Registration Document filed with the French Autorité des Marchés Financiers and in the Form 20-F filed with the U.S. Securities and Exchange Commission. Except to the extent required by law, in particular sections 223-1 et seq. of the General regulation of the Autorité des Marchés Financiers, France Telecom does not undertake any obligation to update forward-looking statements.

3
agenda
3Q11 highlights1
2
3 outlook and conclusion
business reviews

1 3Q11 highlights

5
sustained commercial performance in 3Q while protecting EBITDA
*including Meditel since 2011 **company estimates ***cb
confirmed sustained commercial performance sustained commercial performance sustained commercial performance sustained commercial performance
throughout the Group with customer base up by 8.6%* to over 221 million customers
new steps in offers segmentation implemented in France driving successful momentumsuccessful momentumsuccessful momentumsuccessful momentum
share of broadband net adds at 35.3%**, stabilised market share on mobile at 40.5%**and data revenue as a % of personal services revenues increase by +5.0 pts yoy to 36.7%
operational outperformanceoutperformanceoutperformanceoutperformance in Spain confirmed
+4.8% revenue growth in 3Q*** (+7.4% excl. regulation***)
and improving trendimproving trendimproving trendimproving trend in Poland
+1.3 pts of revenue growth vs 2Q***
as anticipated, underlying revenue stabilityrevenue stabilityrevenue stabilityrevenue stability
with 9m growth of +0.1%*** (excl. regulation)
3Q11 contained restated EBITDA margin erosioncontained restated EBITDA margin erosioncontained restated EBITDA margin erosioncontained restated EBITDA margin erosion trend***
at -1.2pts after -1.5pts in 1H thanks to a disciplined and efficient commercial costs policy
FY 2011 guidance of operating cash flow: expected slightly above slightly above slightly above slightly above €€€€9bn9bn9bn9bn

6
2,735
11.2%
1,262
35.4%
3,998
11,280
3Q11
actual
+0.5pt
-1.2pts
-8.3%
+2.1%
-5.2%
-2.1%
-0.5%
3Q
var. cbin €m 9m10cb9m11
actual
9m
var. cb key points
revenue
excl. regulation
34,393 33,848 -1.6%
+0.1%
� regulation impact: -€567m, o/w -€188m in 3Q
� VAT impact:-€105m, o/w -€29m in 3Q
� as anticipated, slowdown in 2H
EBITDA* 12,275 11,611 -5.4%
� regulation impact: -€171m, o/w - €58m in 3Q
� VAT impact:-€129m, o/w -€29m in 3Q
� erosion trend contained in 3Q
� in line with FY Group trends
in % of rev 35.7% 34.3% -1.4pts
CAPEX 3,469 3,731 +7.5%� in line with 2011 indication of
~13% of revenue with catch up expected in 4Q
in % of rev 10.1% 11.0% +0.9pt
EBITDA* –
CAPEX8,806 7,880 -10.5%
� Group FY operating cash flow guidance slightly above €9bn
key financial achievements
*EBITDA restated – cf.slide 27

7
Africa & Middle East
personal customer base (in millions)
707070706767676766666666
2Q111Q11 3Q11
well oriented indicators demonstrate potential for growth group customers now at 221 million customers, +8.6% yoy*
*including Meditel since 2011 ** France, Spain, Poland, Belgium, Romania, Slovakia, Switzerland, *** data revenue in % of personal service revenue on a weighted average in France, Spain, Poland, Belgium, Romania, Slovakia and Switzerland
data monetisation
++++14%14%14%14%
3Q11
31.1%31.1%31.1%31.1%
3Q10
27.3%27.3%27.3%27.3%
smartphones in Europe**(in millions)
data revenue***
Dominican RepublicCaribbean
ArmeniaMauritius
Reunion
Vanuatu
2.7 million
Orange Money customers
3Q11
35.3%35.3%35.3%35.3%
2Q11
27.4%27.4%27.4%27.4%
1Q11
22.4%22.4%22.4%22.4%
France
best DSL share of net adds since 1Q09
Orange Spain
outperforming the market on portability(in thousands)
3Q11
++++93939393
2Q11
++++57575757
1Q11
++++56565656
45.2%45.3%45.5% ~x 2
3Q11
14.214.214.214.2
3Q10
7.27.27.27.2
M/S

8 *SPCI: social performance composite indicator
3Q update on Conquests 2015
� 2011 refinancing of around €3.9bn in € and across several markets ($, CHF, HK$, etc)
� €690m securitization programs maturing in 2012 o/w €250m already renewed and extended in amount and duration to €500m with 5-year maturity
� no bond redemption in 2H and favorable liquidity position
� 2011 French tax cash out anticipated ~€400m
performance � Buyin, procurement JV with Deutsche Telekom operational from Oct 17th
� launch of Chrysalid 2011-2015 performance programs
employees� SPCI* 1H 2011 results improving
� allocation of free shares for an amount of €142m
portfolio &
international
development
� sale process of Orange Switzerland on track
� acquisition of 100% stake in CCT on Oct, 21st in DRC
customers
& QoS
� Sosh, 100% digital mobile brand launched on October 6th
� in France, 2*20 MHz won at 4G 2.6 GHz spectrum
� in Spain, 2*10 MHz won at 800 MHz spectrum & 2*20 MHz won at 2.6 GHz
� reinforcement of distribution network with 100% of CET henceforth owned
debt
governance� Olaf Swantee starting at Everything Everywhere in Sept. as new CEO, new and tighter management team
� Yves Gauthier & Jean Marc Harionappointed new CEO of Mobinil & Mobistar
� Gervais Pellissier appointed CEO Delegate
� 3 new Deputy CEOs: DelphineErnotte Cunci, Pierre Louette and Bruno Mettling

9
9m11 Group revenue stability excluding regulation
-1.4%
-1.1%
-4.1%
+4.3%
-3.1%
-1.6%
∆ vs9m10cb
-1.1%
-1.0%
-3.7%
+4.8%
-4.6%
-2.1%
∆ vs3Q10cb
1,734
2,222
899
1,039
5,569
11,280
actual
3Q11
-1.4%
+1.0%
-2.8%
+6.9%
-1.3%
+0.1%
∆ vs 9m10cb excl. reg.
5,282
6,503
2,801
2,982
16,873
33,848
actual
9m11
5,357
6,578
2,923
2,858
17,411
34,393
9m10cb
Enterprise
ROW
Poland
Spain
France
Group revenue
in €m
-1.1%
+0.7%
-1.7%
+7.4%
-2.8%
-0.5%
∆ vs 3Q10cb excl. reg.
� 9m11 revenue stability (+0.1%) excl. regulatory effects resulting from a diversified and balanced portfolio of assets with complementary dynamics
� regulation impact on revenue -1.7 pts ytd, impact in line with 2011 anticipations of a lower amount than in 2010
� compared to H1, France revenue trend was mostly impacted in 3Q by lower equipment revenue, smaller growth of incoming traffic and reprice effect from Open
� Spain confirmed its outperformance with a 9m growth of +6.9% excl. regulation, and a 4th quarter of growth in a row incl.regulation
� Africa & Middle East 9m revenue growth at +6.5% excluding Egypt and Ivory Coast
insight
*cb
9m11
33,848
other
+213
Egypt and Ivory Coast
-86
VAT impact
-105
regulation
-567
9m10cb
34,393
9m11 revenue evolution
in €m++++22222222
+140-75
-86+154
-80
+192-223
Group ∆ex reg
Egypt & Iv. Coast
ICSS & elim
in millions of euros

10
commercial costs stabilizing allowing to contain margin erosion in 3Q11
---- 1.4 pts1.4 pts1.4 pts1.4 pts
9m11
11,61111,61111,61111,611
commercial costs
-329
other costs**
+85
interconnect. costs
revenue
+230
-545
labour opex
9m10 cb
-105
12,27512,27512,27512,275 � EBITDA* impacted by regulation -€171m and VAT episode -€129m
� labour opex increase, mainly due to price effect in France
� interconnection costs savings due to lower termination rates more than compensating usage and “off-net” traffic growth
� efficient control of commercial costs in 3Q11 after a high level of investment in 1H11
� margin erosion contained at -1.2pts
� after 4 quarters in a row of increase, commercial costs stabilization in 3Q with a decrease in France
EBITDA* evolution
in millions of euros
34.3%
insight
35.7%
+79
labour opex
-9
revenue
-240
3Q10 cb
4,2194,2194,2194,219
interconnect. costs
---- 1.2 pts1.2 pts1.2 pts1.2 pts
3,9983,9983,9983,998
commercial costs
-17
3Q11other costs ***
-34
36.6% 35.4%
9m
11
3Q
11
*EBITDA restated – cf.slide 27 ** o/w +€185m of content provision utilisation on 9m 11 *** o/w +€54m of content provision utilisation on 3Q 11
9m11
3Q11
11
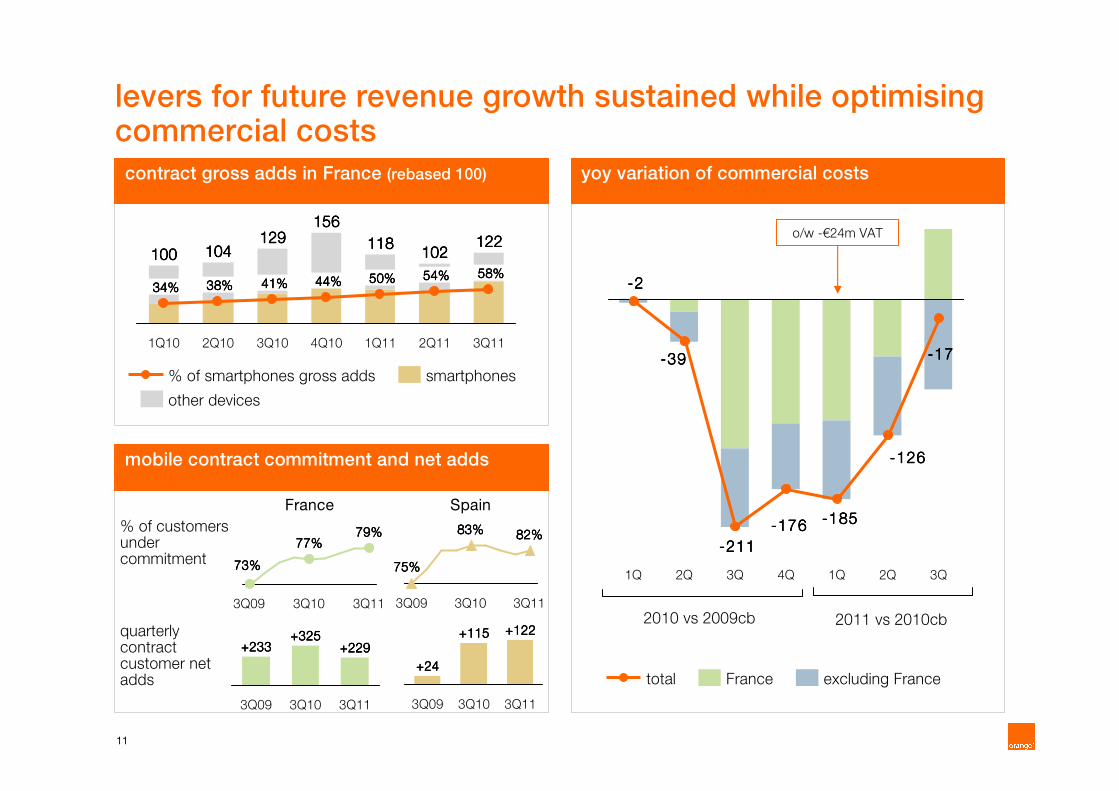
levers for future revenue growth sustained while optimising commercial costs
France Spain
% of customers under commitment
quarterly contract customer net adds
129129129129
41%41%41%41%
2Q10
104104104104
38%38%38%38%
1Q10
100100100100
34%34%34%34%
122122122122
58%58%58%58%
2Q11
102102102102
54%54%54%54%
1Q11
118118118118
50%50%50%50%
4Q10
156156156156
44%44%44%44%
3Q10 3Q11
smartphones
other devices
% of smartphones gross adds
mobile contract commitment and net adds
contract gross adds in France (rebased 100)
3Q11
82%82%82%82%
3Q10
83%83%83%83%
3Q09
75%75%75%75%
3Q11
79%79%79%79%
3Q10
77%77%77%77%
3Q09
73%73%73%73%
++++24242424
3Q10 3Q11
++++115115115115 ++++122122122122
3Q093Q11
++++229229229229
3Q10
++++233233233233++++325325325325
3Q09
2010 vs 2009cb 2011 vs 2010cb
-17-17-17-17
-126-126-126-126
-185-185-185-185-176-176-176-176
-211-211-211-211
-39-39-39-39
-2-2-2-2
3Q2Q1Q4Q3Q2Q1Q
excluding FranceFrancetotal
o/w -€24m VAT
yoy variation of commercial costs

12
programs in place to improve operational efficiency
� FY 2011 savings expected between 15-20% of 2015 target
� first implementations launched:– France: reduction of field interventions in broadband
– Spain: RAN-renewal and mobile backhaul refresh– Poland: RAN-sharing program with PTC, gradual roll
out starting in 2012
– AMEA: solar stations on radio sites
– Europe: RAN-renewal, IT architecture improvement, energy consumption of networks and buildings, near-shoring (Moldova)
– Enterprise: network cost optimisation (in particular access)
500500500500
2012e
200200200200
2015e and beyond
2014e
<<<<900900900900800800800800
2013e
OPEX CAPEX
main initiatives and ambitions first achievements
� JV operations started from Oct. 17th, implementation in group entities and with suppliers from 4Q
� expected areas of savings:– terminal devices, with ~70 million devices to be
bought / year
– mobile communications networks
– fixed-network equipment
– service platforms
in millions of euros
Buyin, sourcing JV with DT
Chrysalid 2011-2015
€2.5bn, of which more than 60% by 2013
0.1-0.2
0.2-0.3
0.1-0.2
0.9-1.1
0.9-1.1
2015 annual savings planned vs. 2010 cost
base, in €bn
2015 average obj. % of
achievement*
France
Europe**
AMEA
OBS
ICSS
Group
*end of June 2011 *including Spain and Poland

13
CAPEX evolution
CAPEX acceleration to enhance customer satisfaction, network evolution and future growth
in millions of euros
+8%+8%+8%+8%
9m11
3,7313,7313,7313,731
delta
+262
9m10 CB
3,4693,4693,4693,469
10.1%
11.0%
� increased CAPEX/sales ratio by +0.9pt in 9m11 at 11.0%, in line with 2011 indication of ~13% of revenue
� France– increase of CPE* investments driven by the
success of Open, new Livebox offers and box renewals
– acceleration of FTTH investments in France (€104m ytd, +€68m yoy)
� Spain– increase of CAPEX related to CPE’s, DSL
coverage & capacity driven by the success of fixed broadband offers
� Poland– acceleration of high speed mobile broadband
– sustained investments in fixed broadband network aiming to increase triple play penetration
� ROW– Ivory Coast: network recovery plan boosting Q3
capex after events in Q2
– acceleration of mobile roll out in Mali, Niger and Kenya mainly linked to launch of 3G offers
– higher investments on submarine cables driven by ACE and LION2
insight
in % of revenues
strong 9m CAPEX increase on networks, ITand CPE’s
319231
+6%+6%+6%+6%
+40%+40%+40%+40%+6%+6%+6%+6%
shops, real estate
& other
service platform
CPE’s*
412
IT
775
network
1,993
9m119m10cb
*customer premises equipments

2 business review

15
in €m 3Q11var
in cb9m11
var in cb
revenue 5,569 -4.6% 16,873 -3.1%
personal 2,695 -1.6% 8,141 +1.1%
home 3,184 -4.8% 9,640 -4.9%
3Q11 France financialstop line trend starts reflecting our more segmented commercial approach
� 9 months yoy mobile growthmobile growthmobile growthmobile growth excluding regulation (+4.6%):
– data & sms usage continue to compensate the decrease in voice excluding regulation
– steady growth in our contract customer base, driven by Origami and Open success
– wholesale revenue growth driven by the recent commercial success of MVNO hosted on our network
– however, while maintaining the outgoing ARPU, 3Q revenue decrease driven by:
– lower equipment revenue related to the decrease in commercial cost and iPhone 4 calendarization effect
– slower growth of incoming traffic (sms, voice and roaming)
– Open reprice effect because of the growth of the customer base
– home revenuehome revenuehome revenuehome revenue decrease driven by PSTN line losses partially balanced by broadband growth. 3Q broadband revenue back to growth after a slow growth in 1H.
insight
ex-reg mobile growth still resilient3Q11 revenue (3Q revenue -2.8%* excl. regulatory impacts)
+426
9m11
+16,873+16,873+16,873+16,873
mobilehome
-547
VAT
-104
regulatory impacts
-313
9m10cb
+17,411+17,411+17,411+17,411
in €m
* yoy on cb

16
3Q11 France personal KPIsstrong commercial momentum and market share stabilization
� while tightly managing commercial costs we have been able to:
– almost stabilize our retail market share
– reduce churn rate to normalized level after the 1Q VAT episode
– protect the value of our customer base with strong net adds in contract (+229 k)
� continuous ARPU ex-reg improvement thanksto the growth in data and sms usages
insight
retail market sharenetwork market share
3Q11
40.5%40.5%40.5%40.5%****
45.5%45.5%45.5%45.5%****
2Q11
40.7%40.7%40.7%40.7%
45.9%45.9%45.9%45.9%
1Q11
41.0%41.0%41.0%41.0%
45.8%45.8%45.8%45.8%
4Q10
41.7%41.7%41.7%41.7%
46.1%46.1%46.1%46.1%
3Q10
41.9%41.9%41.9%41.9%
46.2%46.2%46.2%46.2%
ARCEP market figures * company estimates in 3Q
stabilized mobile retail market share
in euros
56 61
61 72
----2.4% and 2.4% and 2.4% and 2.4% and +1.6%+1.6%+1.6%+1.6% excl. excl. excl. excl. regulationregulationregulationregulation
3Q11
379379379379
246
3Q10
389389389389
272
voice
sms
data
+12%
+17%
annual rolling mobile ARPU* evolution churn level normalized and strong growthin net adds
3Q112Q111Q11
contract net adds (in k)quarterly contract churn rate
-86
+127 +229
20.0%
14.3% 15.2%
*yoy on cb, ARPU excluding Machine to Machine (revenue and customer base) and insurance revenue added

17
� >35% conquest market share in ADSL and stabilized market share. target of 30% ADSL net adds market share for FY11 confirmed
� broadband ARPU back to 36€/month level
– lower reprice effect
– strong level of adoption of livebox Star offers representing more than 50% of gross adds
� PSTN line losses slowing and better win back performance
3Q11 France home KPIsBroadband net adds at >35% and PSTN erosion slowing down
insight
* ARPU excluding Machine to Machine (revenue and customer base) and insurance revenue added
3Q11
36.036.036.036.0
29.1
6.9
2Q11
35.535.535.535.5
28.9
6.6
3Q10
36.136.136.136.1
28.6
7.5
accessservices
in €/month
3Q11
34.634.634.634.6
17.1
17.5
2Q11
34.634.634.634.6
17.5
17.1
3Q10
34.934.934.934.9
18.8
16.1
PSTNinternet
home usage ARPUannual rolling
Broadband ARPUquarterly
naked ADSL & otherPSTN & ADSLPSTN only
-471 -353 -290
var 3Q11vs 2Q11
-183
++++275275275275
-168
var 2Q11vs 1Q11
-289
++++192192192192
-128
var 1Q11vs 4Q10
-370
++++314314314314
-213
variance in thousand of lines
variance of Orange customer fixed line improved
broadband ARPU back at 36€/month
ADSL net addsADSL market share
3Q11
35.3%35.3%35.3%35.3%****29.2%29.2%29.2%29.2%
45.2%45.2%45.2%45.2%****
2Q11
46.0%46.0%46.0%46.0%
27.4%27.4%27.4%27.4%
45.3%45.3%45.3%45.3%
3Q10 1Q11
22.4%22.4%22.4%22.4%27.6%27.6%27.6%27.6%
45.5%45.5%45.5%45.5%
4Q10
46.3%46.3%46.3%46.3%
ARCEP market figures * company estimates in 3Q
ADSL conquest share strong growth

18
France marketing: segmentation preserves value
20112007/2008
MVNO
inte
rnet
Net/Formuleco
mm
itm
en
t/lo
yalty
wh
ole
sale
mo
bile
subsidized
market
non
subsidized
marketprepaid
Orange Intense
Orange Classique
valueco
nverg
en
ce
national
roaming
agreement
Smart
subsidized
market
prepaid
sim-only
origami
premium offer:
Livebox Star
Orange
Fibre
basic offer:
Livebox Zen
non
subsidized
market
quadruple
play
triple-play:
3 offers
MVNO &
Roaming
Agreement
inte
rnet
co
mm
itm
ent/
loyalty
wh
ole
sale
mo
bile
value
triple play:
1 offer
since 2007/2008, segmentation has allowed the rebalancing of commercial costs while protecting the whole customer base from a reprice effect

19
3Q11 Spainkeeps on outperforming with 4th quarter in a row of growth incl. regulation
in thousands
+1.1%+1.1%+1.1%+1.1%
3Q11
32.032.032.032.0
3Q10
31.731.731.731.7
in €/month
+6.2%+6.2%+6.2%+6.2%
3Q11
12,33912,33912,33912,339
4,894
7,445
3Q10
11,62011,62011,62011,620
4,682
6,938
prepaid basecontract base broadband ARPU
+7.3%
X 5.5X 5.5X 5.5X 5.5
3Q11
++++38383838
2Q11
++++37373737
1Q11
++++35353535
4Q10
++++25252525
3Q10
++++7777
broadband net adds
218 205
20213324
----1.8%1.8%1.8%1.8%+1.2%+1.2%+1.2%+1.2% ex. reg.ex. reg.ex. reg.ex. reg.
3Q11
258258258258
3Q10
263263263263
€/year
+36%
in thousands
3Q11
7.4%7.4%7.4%7.4%
4.8%4.8%4.8%4.8%
2Q11
0.70.70.70.7%%%%
6.7%6.7%6.7%6.7%
4.2%4.2%4.2%4.2%
1Q11
0.90.90.90.9%%%%
6.5%6.5%6.5%6.5%
4.0%4.0%4.0%4.0%
4Q10
0.60.60.60.6%%%%
3.1%3.1%3.1%3.1%
0.9%0.9%0.9%0.9%
3Q10
0.2%0.2%0.2%0.2%
3.3%3.3%3.3%3.3%
----0.8%0.8%0.8%0.8%
2Q10
0.0%0.0%0.0%0.0%
2.9%2.9%2.9%2.9%
----1.8%1.8%1.8%1.8%
1Q10
2.0%2.0%2.0%2.0%
----2.8%2.8%2.8%2.8%
4Q09
1.9%1.9%1.9%1.9%
----3.3%3.3%3.3%3.3%
3Q09
----0.2%0.2%0.2%0.2%
----4.7%4.7%4.7%4.7%
GDP*
Orange Spain, excl.reg.
Orange Spain
(1)
* source eurostat ; (1) data not available
in €m 3Q11var
in cb 9m11var
in cb
revenue 1,039 +4.8% 2,982 +4.3%
personal 862 +4.5% 2,464 +4.4%
home 177 +6.5% 518 +4.3%
* yoy on cb
robust ADSL net adds and ARPU sustainedby VoIP penetration
ongoing revenue growth greater than GDP evolution*
increasing mobile customer base with improved contract mix and growing data ARPU
3Q11 revenue*(3Q revenue +7.4% excl. regulatory impacts)
voice
sms
data

20
3Q11 Polandrevenue trend improving
� 3Q revenue trend improving� mobile: +4.3% yoy growth in 3Q (excl. regulatory
impacts) driven by:– a +3.3% yoy customer base growth, thanks to both
postpaid customers (+2.1%) and prepaid customers (+4.5%)
– a strong growth in data only service revenue (+19.4%)
� home: slow down of fixed revenue decline in 3Q– declining fixed voice trend slightly improved since 2Q
11 (-15.8% yoy in 3Q11 vs -17.9% yoy in 2Q11)– partly offset by sustained customer base growth for
broadband and IPTV coupled with a stabilizing broadband ARPU
insight
++++3.3%3.3%3.3%3.3%
3Q11
14,61414,61414,61414,614
3Q10
14,14114,14114,14114,141
mobile customer base (k)
615615615615497497497497
+23.7%+23.7%+23.7%+23.7%
3Q11
26.4%
3Q10
21.9%
3Q11
2,2692,2692,2692,269 2,3322,3322,3322,332
3Q10
++++2.8%2.8%2.8%2.8%
broadband customer baseTV penetration in retail BB*
total TV customers
* includes TP’s M-, L-packages, Orange Sport and HBO
19%19%19%19%
3Q10
31%31%31%31%
+12pts
3Q11
*total smartphones in acquisition and retention in the period
in €m 3Q11var
in cb9m11
var in cb
revenue 899 -3.7% 2,801 -4.1%
personal 476 +0.2% 1,443 +1.1%
home 489 -6.1% 1,559 -7.4%
increasing broadband base will stimulate growth of triple play
growing customer base and >30% share of smartphones in postpaid sales *
3Q11 revenue*(3Q revenue -1.7% excl. regulatory impacts)
* yoy on cb
share of smartphones in postpaid salesand retention

21
3Q11 Rest of the Worldpositive excl. reg. trend maintained despite negative impact of Egypt
� Africa & Middle East: positive revenue trend of +5.4% in 3Q, excluding Egypt & the Ivory Coast. This was driven by Cameroon at +6.9% (vs +18% in H1) and by new operations such as Guinea, Uganda & Niger
– the performance in Egypt, at -7.4% in Q3 (vs -3.9% in H1), was negatively impacted by a boycott period since the end of June. However, this is partly offset by a faster than expected recovery in the Ivory Coast with 3Q at -3.5% (vs -28% in Q2), aided by a significant level of network rebuild
� European countries: improved revenue trend in 3Q at -2.5% helped notably by a further trend improvementin Romania, at -2.0% in Q3 (vs -5.6% in H1). Underlying growth in Q3 was at +0.5% yoy** driven by Moldova (+5.5%) & Switzerland (+2.9%)
– non-voice services now represent 28.6% of 3Q personal services revenues, up by +2.9 pts yoy
� other countries: improved trend in Rep. Dom. with 3Q revenue growth at +4.8% (vs +2.1% in H1)
insight
** yoy cb, excluding regulatory impacts
-3.1%3,324-2.5%1,139European countries
in €m 3Q11var
in cb9m11
var in cb
total ROW 2,222 -1.0% 6,503 -1.1%
Africa & Middle East 949 -0.2% 2,769 +0.1%
other countries 137 +6.1% 418 +6.9%other countries 39.2
Belgium 3.9
Ivory Coast 5.7
Romania 10.2
Egypt 31.6
totaltotaltotaltotal 95.195.195.195.1
Cameroon 4.5
+20.7%
+11.2%
-2.1%
+15.4%
+44.8%
+6.1%
+38.8%
rankvar
2 of 3
1 of 4
1 of 5
2 of 2
2 of 3
ROW mobile customer base 3Q11 revenue*: -1.0%(+0.7% excl. regulatory impacts)
in millions
* yoy cb

22
439
85
686
523
1,734
3Q11
+11.6%
+10.3%
+1.3%
-13.4%
-1.1%
var in cb
-1.4%5,282total enterprise
in €m 9m11var
in cb
legacy networks 1,660 -11.8%
mature networks 2,076 +0.5%
growing networks 262 +14.7%
services 1,284 +8.8%
3Q11 enterprise improvement in revenue trend sustained by large service deal deliveries
in €m
+10.7%+10.7%+10.7%+10.7%
9m119m10
352352352352 390390390390
� legacy networks: migration to new technologies continues to impact Data products, while the decline of voice legacy is similar to previous quarters
� mature networks: IPVPN back to growth since Q2 (bothin terms of customer base and bandwidth upgrade), compensating broadcasting & Business Everywhere decline
� growing networks: driven by VoIP and satellite accesses growth
� services: growth of services, sustained by international and large project deliveries in the summer
insight
in thousands
3Q113Q103Q09
274.0274.0274.0274.0270.7270.7270.7270.7274.0274.0274.0274.0
+1.1%+1.1%+1.1%+1.1%----1.1%1.1%1.1%1.1%
revenues with emerging markets still growingmature networks: IPVPN accesses in France
3Q11 enterprise revenue* : -1.1%
* yoy on cb

23
EE: growing revenue excluding regulation and market low churn rate in postpaid reflecting higher loyalty
Customer loyalty focus
1.7%1.5% 1.4% 1.4% 1.3% 1.3%
1.1% 1.1%
Q4/09 Q1/10 Q2/10 Q3/10 Q4/10 Q1/11 Q2/11 Q3/11
Industry leading postpaid churn*
* monthly average (3 month rolling)
185k
300k
160k
236k
185k
Q3/ 10 Q4/ 10 Q1/11 Q2/ 11 Q3/ 11
Strong postpaid net adds
Orange
T-Mobile
Postpaid net adds
Service revenues growing +3.8% ex regulation, £m
regulationQ3/10 Q3/11prepaidpostpaid
1,586
(87)
1,499
+91
(34)
1,556
-1.9%
Q3/10 ex
regulation
+3.8%
Operational Excellence
� Underlying service revenue growth driven by growth in postpaid base, 881k net adds in the last 12m
� Consistent turnaround in T-Mobile postpaid base� Focus on future value through investment in postpaid growth
and longer term commitments, 70% (47% Q3/10) of postpaid base on 24m contracts
� Improving network with 3G roaming from October
� Leadership team reduced from 26 to 10 and - Senior management team structure across business reducedby 25%
� On track for £3.5bn+ in synergy savings by 2014

3 outlookand conclusion
25
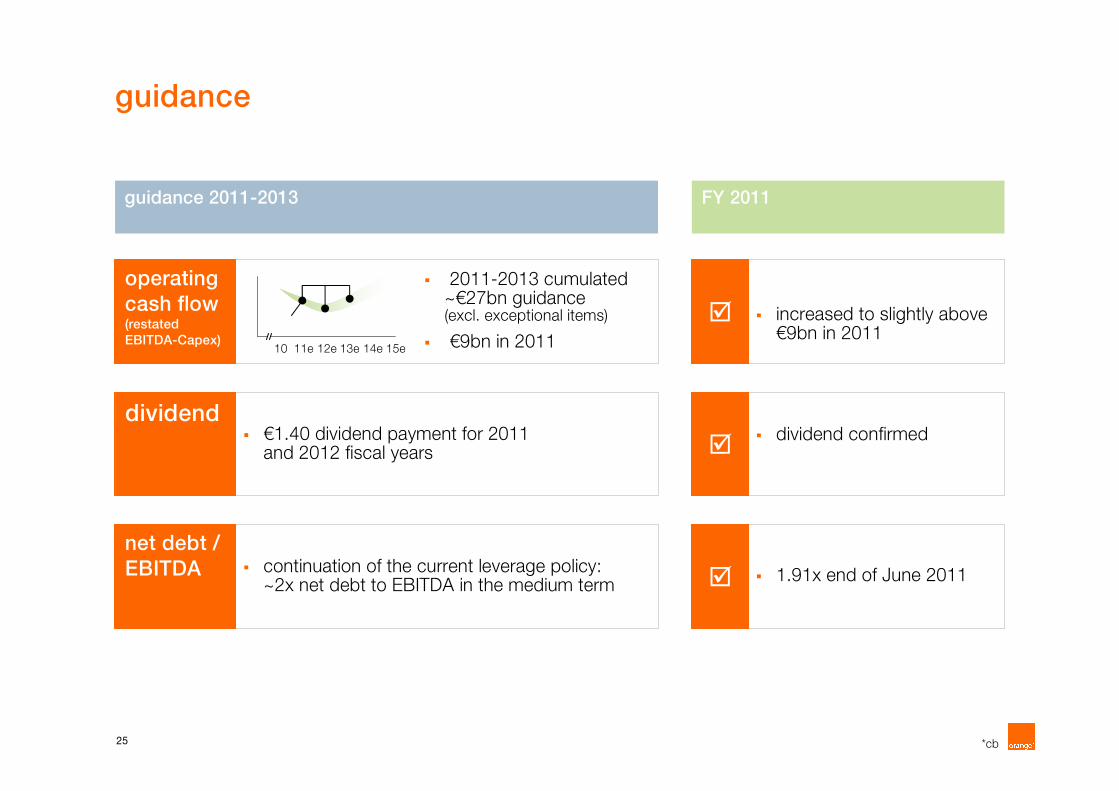
guidance
� €1.40 dividend payment for 2011 and 2012 fiscal years
� 2011-2013 cumulated ~€27bn guidance (excl. exceptional items)
� €9bn in 201115e14e13e12e11e10
� increased to slightly above €9bn in 2011
� 1.91x end of June 2011
� dividend confirmed
� continuation of the current leverage policy: ~2x net debt to EBITDA in the medium term
*cb
guidance 2011-2013 FY 2011
�
dividend
operating
cash flow (restated
EBITDA-Capex)
�
�
net debt /
EBITDA

appendix

27
EBITDA restatements
2323free share plan
11,63711,9393,9563,9207,6818,019EBITDA reported
(197)(197)Emitel disposal
other
327019331337part-time senior plan
labour related
115115EU fine on TPSA
266266DPTG
litigations
11,61112,2753,9984,2197,6138,056EBITDA restated
9m119m10cb3Q113Q10cb1H111H10cbin €m

28
details on revenue
change 2011/2010*
in €m 3Q10 A forex perimeter 3Q10 CB 3Q11 €m %% excl.
regul
Group revenue 11,628 (108) 0 11,520 11,280 (240) -2.1% -0.5%
France 5,841 - (7) 5,835 5,569 (266) -4.6% -2.8%
personal 2,738 - - 2,738 2,695 (43) -1.6% +1.7%
home 3,351 - (7) 3,345 3,184 (161) -4.8% -3.8%
eliminations (248) - - (248) (311) (63)
Spain 991 - - 991 1,039 48 +4.8% +7.4%
personal 825 - - 825 862 37 +4.5% +7.6%
home 166 - - 166 177 11 +6.5% +6.5%
Poland 972 (20) (19) 934 899 (35) -3.7% -1.7%
personal 485 (10) - 475 476 1 +0.2% +4.3%
home 553 (12) (21) 520 489 (32) -6.1% -5.9%
eliminations (65) 1 3 (62) (66) (4)
ROW 2,291 (54) 9 2,245 2,222 (23) -1.0% +0.7%
Enterprise 1,781 (34) 6 1,753 1,734 (19) -1.1% -1.1%
International carrier & SS 419 (1) 8 426 413 (14) -3.2% -3.2%
eliminations (667) 0 3 (664) (595) 68
* yoy on cb